UNITED STATES
SECURITIES AND EXCHANGE COMMISSION
WASHINGTON, D.C. 20549
FORM N-CSR
CERTIFIED SHAREHOLDER REPORT OF REGISTERED MANAGEMENT
INVESTMENT COMPANIES
Investment Company Act file number 811-21289
Birmiwal Investment Trust
(Exact name of registrant as specified in charter)
5270 Highland Drive, Bellevue, WA 98006
(Address of principal executive offices)
(Zip code)
Kailash Birmiwal
5270 Highland Drive, Bellevue, WA 98006
(Name and address of agent for service)
Registrant's telephone number, including area code: (425) 957-9436
Date of fiscal year end: March 31
Date of reporting period: March 31, 2006
Form N-CSR is to be used by management investment companies to file reports with the Commission not later than 10 days after the transmission to stockholders of any report that is required to be transmitted to stockholders under Rule 30e-1 under the Investment Company Act of 1940 (17 CFR 270.30e-1). The Commission may use the information provided on Form N-CSR in its regulatory, disclosure review, inspection and policymaking roles.
A registrant is required to disclose the information specified by Form N-CSR, and the Commission will make this information public. A registrant is not required to respond to the collection of information contained in Form N-CSR unless the Form displays a currently valid Office of Management and Budget ("OMB") control number. Please direct comments concerning the accuracy of the information collection burden estimate and any suggestions for reducing the burden to Secretary, Securities and Exchange Commission, 450 Fifth Street, NW, Washington, DC 20549-0609. The OMB has reviewed this collection of information under the clearance requirements of 44 U.S.C. § 3507.
Item 1. Reports to Stockholders.
Birmiwal Oasis Fund
For Investors Seeking Capital Appreciation
ANNUAL REPORT
March 31, 2006
Birmiwal Investment Trust
www.birmiwal.com
1-800-417-5525
Birmiwal Oasis Fund
Annual Report
March 31, 2006
Dear Fellow Shareholders,
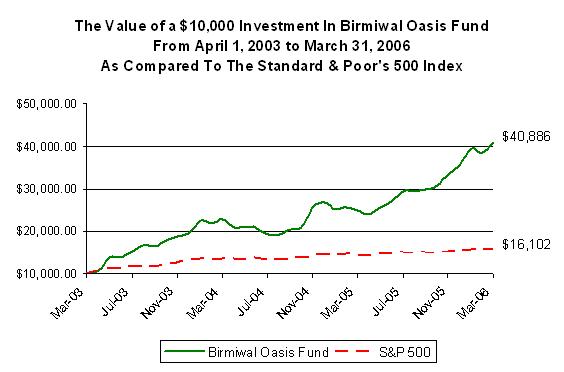
We are pleased to report that for the fiscal year ending March 31 2006, the Fund's total return is 63.83% compared to 11.73% for the S&P 500, primarily due to individual stock picks.
The Fund has completed three fiscal years. The total and annualized returns over this period have been 308.87% and 59.90%, respectively, in comparison to 60.02% and 17.19% for the S&P 500.
We are proud to report that the Fund was ranked number one in 2005 in the small cap core category (source: Lipper - 637 funds in the category). You may also note that the Fund was top performer in 2004 in the small cap core category (source: Lipper), and top performer in 2003 (partial year) in the new fund category (source: USA Today).
As always, we thank you for your continued support and trust in us.
Sincerely,
![[birmiwalncsr033106001.jpg]](https://capedge.com/proxy/N-CSR/0001162044-06-000231/birmiwalncsr033106001.jpg)
Kailash Birmiwal, Ph. D.
All returns include change in share prices and in each case includes reinvestment of any dividends and capital gain distributions.
The information provided in this material should not be considered a recommendation to purchase or sell any security. It should not be assumed that any security transactions or holdings were or will be profitable or that the investment recommendations or decisions we make in the future will be profitable.
PAST PERFORMANCE DOES NOT GUARANTEE FUTURE RESULTS.
2006 Annual Report 1
BIRMIWAL OASIS FUND
PERFORMANCE INFORMATION
AVERAGE ANNUAL RATE OF RETURN (%) FOR THE PERIODS ENDED MARCH 31, 2006.
3/31/06 NAV $37.19
Since
1 Year(A) Inception(A)
Birmiwal Oasis Fund
63.83% 59.90%
S&P 500(B)
11.73% 17.19%
(A) 1 Year and Since Inception returns include change in share prices and in each case includes reinvestment of any dividends and capital gain distributions. The inception date of the Birmiwal Oasis Fund was April 1, 2003.
(B) The S&P 500 is a broad market-weighted average dominated by blue-chip stocks and is an unmanaged group of stocks whose composition is different from the Fund.
PAST PERFORMANCE DOES NOT GUARANTEE FUTURE RESULTS. INVESTMENT RETURN AND PRINCIPAL VALUE WILL FLUCTUATE SO THAT SHARES, WHEN REDEEMED, MAY BE WORTH MORE OR LESS THAN THEIR ORIGINAL COST. RETURNS DO NOT REFLECT THE DEDUCTION OF TAXES THAT A SHAREHOLDER WOULD PAY ON FUND DISTRIBUTIONS OR THE REDEMPTION OF FUND SHARES. CURRENT PERFORMANCE MAY BE LOWER OR HIGHER THAN THE PERFORMANCE DATA QUOTED. TO OBTAIN PERFORMANCE DATA CURRENT TO THE MOST RECENT MONTH END, PLEASE CALL 1-800-417-5525.
2006 Annual Report 2
Proxy Voting Guidelines (Unaudited)
Birmiwal Asset Management, Inc., the Fund’s Adviser, is responsible for exercising the voting rights associated with the securities held by the Fund. A description of the policies and procedures used by the Adviser in fulfilling this responsibility is available without charge on the Fund’s website at www.birmiwal.com. It is also included in the Fund’s Statement of Additional Information, which is available on the Securities and Exchange Commission’s website at http://www.sec.gov.
Information regarding how the Fund voted proxies, Form N-PX, relating to portfolio securities during the most recent 12-month period ended June 30 is available without charge, upon request, by calling our toll free number (1-800-417-5525). This information is also available on the Securities and Exchange Commission’s website at http://www.sec.gov.
2006 Annual Report 3
Availability of Quarterly Schedule of Investments (Unaudited)
The Fund files its complete schedule of portfolio holdings with the Securities and Exchange Commission ("SEC") for the first and third quarters of each fiscal year on Form N-Q. The Fund’s Forms N-Q are available on the SEC's website at http://www.sec.gov. The Fund’s Forms N-Q may also be reviewed and copied at the SEC's Public Reference Room in Washington, DC. Information on the operation of the Public Reference Room may be obtained by calling 1-800-SEC-0330.
Disclosure of Expenses (Unaudited)
Shareholders of this Fund incur ongoing operating expenses consisting solely of a base management fee and a performance-based management fee. The following example is intended to help you understand your ongoing costs of investing in the Fund and to compare these costs with similar costs of investing in other mutual funds. The example is based on an investment of $1,000 invested in the Fund on September 30, 2005 and held through March 31, 2006.
The first line of the table below provides information about actual account values and actual expenses. In order to estimate the expenses a shareholder paid during the period covered by this report, shareholders can divide their account value by $1,000 (for example, an $8,600 account value divided by $1,000 = 8.6) and then multiply the result by the number in the first line under the heading entitled "Expenses Paid During the Period."
The second line of the table below provides information about hypothetical account values and hypothetical expenses based on the Fund's actual expense ratio and an assumed rate of return of 5% per year before expenses, which is not the Fund’s actual return. The hypothetical account values and expenses may not be used to estimate the actual ending account balance or expenses paid by a shareholder for the period. Shareholders may use this information to compare the ongoing costs of investing in this Fund and other funds. To do so, compare this 5% hypothetical example with the 5% hypothetical examples that appear in other funds' shareholder reports.
Expenses Paid & nbsp;
Beginning Ending During the Period*
Account Value Account Value September 30, 2005
September 30, 2005 March 31, 2006 to March 31, 2006
Actual $1,000.00 $1,322.12 $27.21
Hypothetical $1,000.00 $1,001.50 $23.45
(5% annual return
before expenses)
* Expenses are equal to the Fund’s annualized expense ratio of 4.70%, multiplied
by the average account value over the period, multiplied by 182/365 (to reflect the
one-half year period.)
2006 Annual Report 4
Birmiwal Oasis Fund | | | |
| | | | | |
| | | Schedule of Investments |
| | | March 31, 2006 |
| | | | | |
Shares/Principal Amount | | Market Value | % of Net Assets |
| | | | | |
COMMON STOCKS | | | |
| | | | | |
Agricultural Chemicals | | | |
5,000 | Bodisen Biotech Inc. * ** | | $ 78,850 | 0.48% |
| | | | | |
Agricultural Prod-Livestock & Animal Specialties | | | |
60,000 | Cal-Maine Foods Inc. | | 436,200 | 2.67% |
| | | | | |
Biological Products, (No Diagnostic Substances) | | | |
152,400 | Nabi Biopharmaceuticals * | | 859,536 | |
2,000 | Serono SA ** | | 34,820 | |
| | | | 894,356 | 5.48% |
| | | | | |
Chemicals & Allied Products | | | |
2,000 | Pioneer Companies Inc. * | | 61,000 | 0.37% |
| | | | | |
Commercial Banks | | | |
5,000 | Mitsubishi UFJ Financial Group, Inc. * ** | | 76,050 | 0.47% |
| | | | | |
Communications Services | | | |
30,000 | WPCS International Inc. * | | 232,500 | 1.42% |
| | | | | |
Computer Communications Equipment | | | |
8,000 | Silicom Ltd. * ** | | 84,800 | 0.52% |
| | | | | |
Computer Storage Devices | | | |
22,000 | Overland Storage Inc. * | | 199,760 | |
15,000 | Xyratex Ltd. * ** | | 472,500 | |
| | | | 672,260 | 4.12% |
| | | | | |
Construction Machinery & Equipment | | | |
2,000 | Manitowoc Co. Inc. | | 182,300 | 1.12% |
| | | | | |
Crude Petroleum & Natural Gas | | | |
3,000 | Energy Partners Ltd. * | | 70,740 | 0.43% |
| | | | | |
Deep Sea Foreign Transportation of Freight | | | |
5,000 | Excel Maritime Carriers Ltd. * ** | | 48,900 | 0.30% |
| | | | | |
Electric Lighting & Wiring Equipment | | | |
3,000 | Lamson & Sessions Co. * | | 83,490 | 0.51% |
| | | | | |
Household Audio & Video Equipment | | | |
10,000 | Directed Electronics, Inc. * | | 167,500 | 1.03% |
| | | | | |
Iron & Steel Foundries | | | |
83,700 | Grupo Simec SA de CV * ** | | 588,411 | 3.60% |
| | | | | |
Metal Mining | | | | |
90,000 | Northern Orion Resources Inc. * ** | | 406,800 | 2.49% |
| | | | | |
Miscellaneous Chemical Product | | | |
183,484 | Ronson Corp. * | | 776,139 | 4.75% |
| | | | | |
Miscellaneous Food Preparation | | | |
8,400 | Medifast Inc. * | | 77,532 | 0.47% |
| | | | | |
Motor Vehicles & Passenger Car Bodies | | | |
7,000 | Tata Motors Ltd. ** | | 145,880 | 0.89% |
| | | | | |
Oil & Gas Field Exploration Services | | | |
2,000 | Houston Exploration Co. * | | 105,400 | 0.65% |
| | | | | |
Petroleum Refining | | | |
1,000 | Alon USA Energy Inc. | | 24,620 | 0.15% |
| | | | | |
Pharmaceutical Preparations | | | |
1,000 | Adams Respiratory Therapeutics Inc. * | | 39,770 | |
3,000 | Aspreva Pharmaceuticals Corporation * ** | 74,670 | |
3,000 | Biovail Corp. ** | | 73,050 | |
10,000 | ViroPharma Inc. * | | 127,000 | |
| | | | 314,490 | 1.93% |
| | | | | |
Plastic Materials, Synth Resin/Rubber, Cellulos (No Glass) | | |
5,000 | Chemtura Corporation | | 58,900 | 0.36% |
| | | | | |
Radio & Tv Broadcasting & Communications Equipment | | |
2,000 | Nokia Corp. ** | | 41,440 | 0.25% |
| | | | | |
Railroad Equipment | | | |
2,000 | Greenbrier Companies | | 80,100 | 0.49% |
| | | | | |
Real Estate Investment Trusts | | | |
10,000 | Impac Mortgage Holdings Inc. | | 96,400 | 0.59% |
| | | | | |
Retail - Computer & Computer Software Stores | | | |
2,000 | GameStop Corp. * | | 94,280 | 0.58% |
| | | | | |
*Non-Income Producing Securities.
**ADR - American Depository Receipt.
The accompanying notes are an integral part of the financial
statements.
2006 Annual Report 5
Birmiwal Oasis Fund | | | |
| | | | | |
| | | Schedule of Investments |
| | | March 31, 2006 |
| | | | | |
Shares/Principal Amount | | Market Value | % of Net Assets |
| | | | | |
COMMON STOCKS | | | |
| | | | | |
Rolling Drawing & Extruding of Nonferrous Metals | | | |
2,000 | Mueller Industries Inc. | | 71,380 | 0.44% |
| | | | | |
Security & Commodity Brokers, Dealers, Exchanges & Services | | |
1,000 | NYSE Group, Inc. * | | 79,250 | 0.49% |
| | | | | |
Semiconductors & Related Devices | | | |
10,000 | Actions Semiconductor Co., Ltd. * ** | | 97,000 | |
75,000 | Amkor Technology Inc. * | | 648,000 | |
2,000 | AU Optronics Corp. ** | | 29,820 | |
9,000 | Leadis Technology Inc. * | | 51,120 | |
7,586 | Sigmatel Inc. * | | 66,302 | |
| | | | 892,242 | 5.47% |
| | | | | |
Services - Business Services | | | |
305,000 | Webzen Inc. * ** | | 2,202,100 | |
5,000 | WiderThan Co., Ltd. * ** | | 66,100 | |
| | | | 2,268,200 | 13.89% |
| | | | | |
Services - Computer Integrated Systems Design | | | |
10,000 | Sento Corp. * | | 77,000 | 0.47% |
| | | | | |
Services - Computer Processing & Data Preparation | | |
12,000 | Linktone Ltd. * ** | | 78,600 | 0.48% |
| | | | | |
Services - Computer Programming | | | |
3,000 | Patni Computer Systems Ltd. * ** | | 61,350 | |
5,000 | RealNetworks Inc. * | | 41,250 | |
| | | | 102,600 | 0.63% |
| | | | | |
Services - Prepackaged Software | | | |
25,000 | CDC Corp. * ** | | 110,000 | |
5,000 | I2 Technologies, Inc. * | | 86,000 | |
1,000 | Microsoft Corp. | | 27,210 | |
82,862 | VA Software Corp. * | | 396,908 | |
| | | | 620,118 | 3.80% |
| | | | | |
Special Industry Machinery | | | |
10,000 | Amtech Systems Inc. * | | 73,100 | 0.45% |
| | | | | |
Steel Works, Blast Furnaces & Rolling Mills (Coke Ovens) | | |
1,000 | Chaparral Steel Company * | | 64,920 | |
20,000 | Gerdau AmeriSteel Corp. | | 186,000 | |
2,000 | Mittal Steel Company ** | | 75,500 | |
8,000 | Novamerica Steel Inc. * ** | | 367,600 | |
2,000 | Oregon Steel Mills * | | 102,340 | |
16,000 | Ternium * ** | | 453,600 | |
| | | | 1,249,960 | 7.66% |
| | | | | |
Telephone Communications (No Radiotelephone) | | | |
2,000 | Global Crossing Ltd. * ** | | 53,000 | |
2,000 | Nippon Telegraph & Telephone Corp. ** | | 43,100 | |
3,000 | Videsh Sanchar Nigam Ltd. ** | | 64,380 | |
| | | | 160,480 | 0.98% |
| | | | | |
Telephone & Telegraph Apparatus | | | |
5,000 | Ditech Communications Corp. * | | 52,250 | |
10,000 | Ikanos Communications * | | 197,100 | |
| | | | 249,350 | 1.53% |
| | | | | |
Wholesale - Groceries & Related Products | | | |
10,000 | Schiff Nutrition International Inc. * | | 59,800 | 0.37% |
| | | | | |
Total for Common Stock (Cost $10,602,515) | | 11,881,418 | 72.78% |
| | | | | |
Warrants | | | | |
40,000 | Services Acquisition Corp. International * (expires 6-28-2009) | 166,800 | 1.02% |
| | Total for Warrants (Cost $122,938) | | | |
| | | | | |
Cash and Equivalents | | | |
5,051,433 | First American Government Obligation Fund Cl A 3.99% *** | 5,051,433 | 30.94% |
| | (Cost $5,051,433) | | | |
| | | | | |
| | Total Investments Securities | | 17,099,651 | 104.74% |
| | (Cost $15,776,886) | | | |
| | | | | |
| Liabilities In Excess of Other Assets | | (773,626) | -4.74% |
| | | | | |
| | Net Assets | | $ 16,326,025 | 100.00% |
*Non-Income Producing Securities.
**ADR - American Depository Receipt.
***Variable rate security; the Yield Rate shown represents the rate
at March 31, 2006.
The accompanying notes are an integral part of the financial
statements.
2006 Annual Report 6
Birmiwal Oasis Fund | |
| | |
Statement of Assets and Liabilities | |
March 31, 2006 | |
| | |
Assets: | |
Investment Securities at Market Value | $ 17,099,651 |
(Identified Cost - $15,776,886) | |
Receivables: | |
Receivable for Securities Sold | 655,298 |
Dividends and Interest | 15,176 |
Total Assets | 17,770,125 |
Liabilities | |
Management Fees Payable | |
Base Management Fee Payable to Adviser | 38,181 |
Performance Adjustment Payable to Adviser | 19,676 |
Payable For Securities Purchased | 1,386,243 |
Total Liabilities | 1,444,100 |
Net Assets | $ 16,326,025 |
Net Assets Consist of: | |
Paid In Capital | 12,594,048 |
Realized Gain on Investments - Net | 2,409,212 |
Unrealized Appreciation in Value | |
of Investments Based on Identified Cost - Net | 1,322,765 |
Net Assets, for 438,984 Shares Outstanding | $ 16,326,025 |
(Unlimited number of shares authorized without par value) | |
Net Asset Value and Redemption Price | |
Per Share ($16,326,025/438,984 shares) | $ 37.19 |
| | |
Statement of Operations | |
For the year ended March 31, 2006 | |
| | |
Investment Income: | |
Dividends (Net of foreign withholding tax of $2,785) | $ 82,817 |
Interest | 47,777 |
Total Investment Income | 130,594 |
Expenses: (Note 3) | |
Management Fees | |
Base Management Fees | 316,402 |
Performance Adjustment | 197,296 |
Total Expenses | 513,698 |
| | |
Net Investment Loss | (383,104) |
| | |
Realized and Unrealized Gain on Investments: | |
Net Realized Gain on Investments | 4,247,620 |
Net Realized Gain on Short Positions | 4,117 |
Net Realized Gain on Options | 2,988 |
Net Change In Unrealized Appreciation on Investments | 1,657,342 |
Net Realized and Unrealized Gain on Investments | 5,912,067 |
Net Increase in Net Assets from Operations | $ 5,528,963 |
The accompanying notes are an integral part of the
financial statements.
2006 Annual Report 7
Birmiwal Oasis Fund | | | | | |
| | | | | | |
Statement of Changes in Net Assets | | | | | |
| | 4/1/2005 | | 4/1/2004 | | |
| | to | | to | | |
| | 3/31/2006 | | 3/31/2005 | | |
From Operations: | | | | | |
Net Investment Loss | $ (383,104) | | $ (261,770) | | |
Net Realized Gain on Investments, Short Sales and Options | 4,254,725 | | 1,533,704 | | |
Net Change In Unrealized Appreciation (Depreciation) | 1,657,342 | | (573,639) | | |
Increase (Decrease) in Net Assets from Operations | 5,528,963 | | 698,295 | | |
From Distributions to Shareholders: | | | | | |
Net Investment Income | 0 | | 0 | | |
Net Realized Gain from Security Transactions | (2,620,863) | | (1,611,100) | | |
Change in Net Assets from Distributions | (2,620,863) | | (1,611,100) | | |
From Capital Share Transactions: | | | | | |
Proceeds From Sale of Shares | 4,236,383 | | 716,770 | | |
Shares Issued on Reinvestment of Dividends | 2,620,597 | | 1,611,100 | | |
Cost of Shares Redeemed | (1,516,311) | | (235,966) | | |
Net Increase from Shareholder Activity | 5,340,669 | | 2,091,904 | | |
| | | | | | |
Net Increase in Net Assets | 8,248,769 | | 1,179,099 | | |
| | | | | | |
Net Assets at Beginning of Period | 8,077,256 | | 6,898,157 | | |
Net Assets at End of Period (including accumulated | $ 16,326,025 | | $ 8,077,256 | | |
undistributed net investment income of $0 and $0) | | | | | |
| | | | | |
Share Transactions: | | | | | |
Issued | 123,912 | | 24,540 | | |
Reinvested | 84,021 | | 66,629 | | |
Redeemed | (44,204) | | (9,417) | | |
Net Increase in Shares | 163,729 | | 81,752 | | |
Shares Outstanding Beginning of Period | 275,255 | | 193,503 | | |
Shares Outstanding End of Period | 438,984 | | 275,255 | | |
| | | | | | |
Financial Highlights | | | | | |
Selected data for a share outstanding throughout the period: | 4/1/2005 | | 4/1/2004 | | 4/1/2003 ** |
| | to | | to | | to |
| | 3/31/2006 | | 3/31/2005 | | 3/31/2004 |
Net Asset Value - | | | | | |
Beginning of Period | $ 29.34 | | $ 35.65 | | $ 20.00 |
Net Investment Income/(Loss)* | (1.18) | | (1.03) | | (0.43) |
Net Gains or Losses on Securities | | | | | |
(realized and unrealized) | 18.15 | | 2.86 | | 24.15 |
Total from Investment Operations | 16.97 | | 1.83 | | 23.72 |
| | | | | | |
Distributions (From Net Investment Income) | 0.00 | | 0.00 | | 0.00 |
Distributions (From Capital Gains) | (9.12) | | (8.14) | | (8.07) |
Total Distributions | (9.12) | | (8.14) | | (8.07) |
| | | | | | |
Net Asset Value - | | | | | |
End of Period | $ 37.19 | | $ 29.34 | | $ 35.65 |
| | | | | | |
Total Return (a) | 63.83% | | 9.99% | | 126.90% |
Ratios/Supplemental Data | | | | | |
Net Assets - End of Period (Thousands) | 16,326 | | 8,077 | | 6,898 |
| | | | | | |
Before Waivers | | | | | |
Ratio of Expenses to Average Net Assets | 4.70% | | 4.26% | | 2.90% |
Ratio of Net Investment Loss to Average Net Assets | -3.50% | | -3.72% | | -2.68% |
| | | | | | |
After Waivers | | | | | |
Ratio of Expenses to Average Net Assets | 4.70% | | 4.26% | | 1.50% |
Ratio of Net Investment Loss to Average Net Assets | -3.50% | | -3.72% | | -1.28% |
Portfolio Turnover Rate | 637.98% | | 1050.35% | | 1015.55% |
| | | | | | |
| | | | | | |
* Per share amounts were calculated using the average shares method. | | | | | |
** Commencement of Operations. | | | | | |
(a) Total return in the above table represents the rate that the investor would | | | | |
have earned or lost on an investment in the Fund assuming reinvestment of all | | | | |
Fund distributions. | | | | | |
The accompanying notes are an integral part of these
financial statements.
2006 Annual Report 8
NOTES TO THE FINANCIAL STATEMENTS
BIRMIWAL OASIS FUND
March 31, 2006
1.) ORGANIZATION
Birmiwal Oasis Fund (the "Fund") is a non-diversified series of the Birmiwal Investment Trust (the "Trust"), an open-end investment company. The Trust was organized in Ohio as a business trust on January 3, 2003 and commenced operations on April 1, 2003. The Fund may offer shares of beneficial interest in a number of separate series, each series representing a distinct fund with its own investment objectives and policies. At present, there is only one series authorized by the Trust. Birmiwal Asset Management, Inc. is the adviser to the Fund (the "Adviser"). As of the close of business on January 30, 2006, the Fund closed to new investors and will not take additional purchases from existing investors, except shareholders of record on January 30, 2006 may continue to add to their existing accounts only through the reinvestment of dividends and/or capital gain distributions from shares owned, and t rustees of the Fund, as well as directors, officers and employees of the Adviser may continue to open new accounts and make additional purchases in existing accounts. The Fund's primary investment objective is to seek capital appreciation. Significant accounting policies of the Fund are presented below:
2.) SIGNIFICANT ACCOUNTING POLICIES
SECURITY VALUATION: Securities that are traded on any exchange or on the NASDAQ over-the-counter market are valued at the last quoted sale price. Lacking a last sale price, a security is valued at its last bid price except when, in the Adviser's opinion, the last bid price does not accurately reflect the current value of the security. All other securities for which over-the-counter market quotations are readily available are valued at their last bid price. When market quotations are not readily available, when the Adviser determines the last bid price does not accurately reflect the current value or when restricted securities are being valued, such securities are valued as determined in good faith by the Adviser, in conformity with guidelines adopted by and subject to review of the Board of Trustees.
Fixed income securities generally are valued by using market quotations, but may be valued on the basis of prices furnished by a pricing service when the Adviser believes such prices accurately reflect the fair market value of such securities. A pricing service utilizes electronic data processing techniques based on yield spreads relating to securities with similar characteristics to determine prices for normal institutional-size trading units of debt securities without regard to sale or bid prices. If the Adviser decides that a price provided by the pricing service does not accurately reflect the fair market value of the securities, when prices are not readily available from a pricing service or when restricted or illiquid securities are being valued, securities are valued at fair value as determined in good faith by the Adviser, in conformity with guidelines adopted by and subject to review of the Board of Trustees. Short term investments in fixed inco me securities with maturities of less than 60 days when acquired, or which subsequently are within 60 days of maturity, are valued by using the amortized cost method of valuation, which the Board of Trustees has determined will represent fair value.
In accordance with the Trust’s good faith pricing guidelines, the Adviser is required to consider all appropriate factors relevant to the value of securities for which it has determined other pricing sources are not available or reliable as described above. No single standard for determining fair value controls, since fair value depends upon the circumstances of each individual case. As a general principle, the current fair value of securities being valued by the Adviser would appear to be the amount which the owner might reasonably expect to receive for them upon their current sale. Methods which are in accord with this principle may, for example, be based on (i) a multiple of earnings; (ii) a discount from market of a similar freely traded security (including a derivative security or a basket of securities traded on other markets, exchanges or among dealers); or (iii) yield to maturity with respect to debt issues, or a combination of these and oth er methods.
2006 Annual Report 9
Notes to the Financial Statements – continued
SHORT SALES: The Fund may sell a security it does not own in anticipation of a decline in the fair value of that security. When the Fund sells a security short, it must borrow the security sold short and deliver it to the broker-dealer through which it made the short sale. A gain, limited to the price at which the Fund sold the security short, or a loss, unlimited in size, will be recognized upon the termination of a short sale.
FEDERAL INCOME TAXES: The Fund’s policy is to continue to comply with the requirements of Subchapter M of the Internal Revenue Code that are applicable to regulated investment companies and to distribute all of its taxable income to its shareholders. Therefore, no federal income tax provision is required. It is the Fund's policy to distribute annually, prior to the end of the calendar year, dividends sufficient to satisfy excise tax requirements of the Internal Revenue Service. This Internal Revenue Service requirement may cause an excess of distributions over the book year-end accumulated income. In addition, it is the Fund's policy to distribute annually, after the end of the fiscal year, any remaining net investment income and net realized capital gains.
DISTRIBUTIONS TO SHAREHOLDERS: Distributions to shareholders, which are determined in accordance with income tax regulations, are recorded on the ex-dividend date.
The treatment for financial reporting purposes of distributions made to shareholders during the year from net investment income or net realized capital gains may differ from their ultimate treatment for federal income tax purposes. These differences are caused primarily by differences in the timing of the recognition of certain components of income, expense, or realized capital gain for federal income tax purposes. Where such differences are permanent in nature, they are reclassified in the components of the net assets based on their ultimate characterization for federal income tax purposes. Any such reclassifications will have no effect on net assets, result of operations, or net asset values per share of the Fund. For the fiscal year ended March 31, 2006, net investment loss of $383,104 was reclassified to accumulated undistributed net realized short-term gains.
USE OF ESTIMATES: The preparation of financial statements in conformity with accounting principles generally accepted in the United States of America requires management to make estimates and assumptions that affect the reported amounts of assets and liabilities and disclosure of contingent assets and liabilities at the date of the financial statements and the reported amounts of revenues and expenses during the reporting period. Actual results could differ from those estimates.
OTHER:The Fund records security transactions based on a trade date. Dividend income is recognized on the ex-dividend date, and interest income is recognized on an accrual basis. Discounts and premiums on securities purchased are amortized over the lives of the respective securities. Withholding taxes on foreign dividends have been provided for in accordance with the Fund’s understanding of the applicable country’s tax rules and rates.
3.) INVESTMENT ADVISORY AGREEMENT
The Fund has entered into an Investment Advisory Agreement with Birmiwal Asset Management, Inc. (the "Adviser"). Under the terms of the Investment Advisory Agreement, the Adviser manages the investment portfolio of the Fund, subject to policies adopted by the Trust’s Board of Trustees. Under the Investment Advisory Agreement, the Adviser, at its own expense and without reimbursement from the Trust, furnishes office space and all necessary office facilities, equipment and executive personnel necessary for managing the assets of the Fund. The Adviser also pays the salaries and fees of all of its officers and employees that serve as officers and trustees of the Trust. The Adviser pays all operating expenses of the Fund, with the exception of taxes, borrowing expenses (such as (i) interest and (ii) dividend expenses on securities sold short), brokerage commissions and extraordinary expenses.
For its services and its agreement to pay the Fund’s operating expenses, the Adviser receives a variable performance-based management fee comprised of a base rate of 2.90% of the
2006 Annual Report 10
Notes to the Financial Statements – continued
Fund's average daily net assets. The performance adjustment increases or decreases the fee paid by the Fund to the Adviser based on the Fund's performance relative to the S&P 500 Index over the most recent 12-month period. If the Fund's return for the period is within 2.00% (two percentage points) of the return on the S&P 500 Index, no adjustment is made. If the difference between the performance of the Fund and the S&P 500 Index exceeds 2.00% (two percentage points), the performance adjustment is made at a rate that varies linearly with the difference between the Fund's performance and that of the S&P 500 Index. The resulting performance adjustment rate can be as high as 2.40% if the Fund outperforms the S&P 500 Index by 14% (fourteen percentage points) or more, and as low as -2.40% if the Fund underperforms the S&P 500 Index by 14% (fourteen percentage points) or more.
For the year ended March 31, 2006 the Adviser earned management fees totaling $316,402 and performance-based management fees totaling $197,296. At March 31, 2006, the Fund owed the Adviser management fees in the amount of $57,857, which consisted of a base fee of $38,181 and performance-based management fees of $19,676.
4.) RELATED PARTY TRANSACTIONS
Kailash Birmiwal, Ph. D. is the control person of the Adviser and also serves as a trustee/officer of the Fund. This individual receives benefits from the Adviser resulting from management fees paid to the Adviser by the Fund. The Fund has entered into agreements with Mutual Shareholder Services (“MSS”) for fund accounting and transfer agency services. An officer and shareholder of MSS is also an officer of the Fund. Fees paid to MSS are paid by the Adviser.
The Trustees who are not interested persons of the Fund were paid a total of $4,000 in Trustee fees for the year ended March 31, 2006 by the Adviser.
5.) CAPITAL STOCK
The Trust is authorized to issue an unlimited number of shares. Paid in capital at March 31, 2006 was $12,594,048 representing 438,984 shares outstanding.
6.) INVESTMENT TRANSACTIONS
For the year ended March 31, 2006, purchases and sales of investment securities other than U.S. Government obligations and short-term investments aggregated $53,400,887 and $52,517,570, respectively. Purchases and sales of U.S. Government obligations aggregated $0 and $0, respectively.
For federal income tax purposes, the cost of total investment securities owned at March 31, 2006 was $15,810,884. At March 31, 2006, the composition of unrealized appreciation (the excess of value over tax cost) and depreciation (the excess of tax cost over value), was as follows:
Appreciation (Depreciation) Net Appreciation (Depreciation)
$1,658,431 ($369,664) $1,288,767
7.) CONTROL OWNERSHIP
The beneficial ownership, either directly or indirectly, of more than 25% of the voting securities of a fund creates a presumption of control of the fund, under Section 2(a)(9) of the Investment Company Act of 1940. As of March 31, 2006, Kailash Birmiwal, Ph. D. held, in aggregate, approximately 66% of the Fund.
2006 Annual Report 11
Notes to the Financial Statements – continued
8.) DISTRIBUTIONS TO SHAREHOLDERS
The tax character of distributions paid was as follows:
Distributions paid from:
Year ended Year ended
March 31, 2006 March 31, 2005
Ordinary Income:
$ 0
$ 0
Short-term Capital Gain
2,591,017
1,611,100
Long-term Capital Gain
29,846
0
$ 2,620,863
$ 1,611,100
As of March 31, 2006, the components of distributable earnings on a tax basis were as follows:
Undistributed ordinary
income/(accumulated losses) $2,277,992
Undistributed long-term capital
gain/(accumulated losses) 165,218
Unrealized appreciation/(depreciation) 1,288,767
$ 3,731,977
The difference between book basis and tax basis unrealized appreciation is attributable to the tax deferral of losses on wash sales.
2006 Annual Report 12
Cohen McCurdy
800 Westpoint Pkwy, Ste 1100
Certified Public Accountants
Westlake, Ohio 44145
Phone: (440) 835-8500
Fax: (440) 835-1093
www.cohenmccurdy.com
REPORT OF INDEPENDENT REGISTERED PUBLIC ACCOUNTING FIRM
To The Shareholders and
Board of Trustees of
Birmiwal Oasis Fund
We have audited the accompanying statement of assets and liabilities, including the schedule of investments, of the Birmiwal Oasis Fund as of March 31, 2006, and the related statement of operations for the year then ended, the statements of changes in net assets for each of the two years then ended, and financial highlights for each of the three periods then ended. These financial statements and financial highlights are the responsibility of the Fund's management. Our responsibility is to express an opinion on these financial statements and financial highlights based on our audits.
We conducted our audits in accordance with the standards of the Public Company Accounting Oversight Board (United States). Those standards require that we plan and perform the audits to obtain reasonable assurance about whether the financial statements and financial highlights are free of material misstatement. An audit includes examining, on a test basis, evidence supporting the amounts and disclosures in the financial statements. Our procedures included confirmation of securities owned as of March 31, 2006 by correspondence with the Fund's custodian and brokers. An audit also includes assessing the accounting principles used and significant estimates made by management, as well as evaluating the overall financial statement presentation. We believe that our audits provide a reasonable basis for our opinion.
In our opinion, the financial statements and financial highlights referred to above present fairly, in all material respects, the financial position of Birmiwal Oasis Fund as of March 31, 2006, the results of its operations for the year then ended, the changes in its net assets for each of the two years then ended, and the financial highlights for each of the three periods then ended, in conformity with accounting principles generally accepted in the United States of America.
![[birmiwalncsr033106004.jpg]](https://capedge.com/proxy/N-CSR/0001162044-06-000231/birmiwalncsr033106004.jpg)
Cohen McCurdy, Ltd.
Westlake, Ohio
May 4, 2006
2006 Annual Report 13
TRUSTEES AND OFFICERS - Unaudited
The Board of Trustees supervises the business activities of the Trust. The names of the Trustees and executive officers of the Trust are shown below. Each Trustee serves until the Trustee sooner dies, resigns, retires or is removed. Officers hold office for one year and until their respective successors are chosen and qualified. For more information regarding the Trustees, please refer to the Statement of Additional Information, which is available upon request by calling 1-800-417-5525. The trustees and officers of the Trust and their principal business activities during the past five years are:
Interested Trustees
Name, Address(1),
and Age |
Position with the Trust |
Length of
Time Served |
Principal
Occupation(s)
During
Past 5 Years |
Number of Portfolios
Overseen By Trustee |
Other Directorships Held By
Trustee Or Officer |
Kailash Birmiwal, Ph.D.(2)
1957
Lea R. Birmiwal, Ph.D.
1960 | President, Treasurer, and Trustee
Secretary | Since 2003
Since 2003 | Managing personal assets (1994 to 2003). President of the Fund’s Adviser since 2003.
Homemaker. | 1
1 | None
None |
(1) The address of each trustee and officer is c/o Birmiwal Investment Trust, 5270 Highland Drive, Bellevue, WA 98006.
(2) Kailash Birmiwal is considered an "interested persons" as defined in Section 2(a)(19) of the Investment Company Act of 1940 by virtue of his affiliation with the Adviser.
Independent Trustees
Name, Address(3),
and Age |
Position with the Trust |
Length of
Time Served |
Principal
Occupation(s)
During
Past 5 Years |
Number of Portfolios
Overseen By Trustee |
Other Directorships Held By
Trustee Or Officer |
Rajendra K. Bordia, Ph.D.
1957
Hemant K. Gupta, Ph.D.
1958
Veera S. Karukonda
1957
Bal K. Sharma, Dr.
1953 | Trustee
Trustee
Trustee
Trustee | Since 2003
Since 2003
Since 2003
Since 2003 | Professor, Department of Materials Science and Engineering, University of Washington (2003-Present). Chair (1998-2005), Associate Professor (1991-2003), Department of Materials Science and Engineering, University of Washington. President of Gupta Inc., a Retail Corporation (1996-Present). Assistant Professor, University of Connecticut (1986-1998). Civil Engineer, City of Hartford, CT (1988-2003). Civil Engineering Consultant (2003-2004). Signal Systems Engineer, City of Stamford, CT (2004-Present).
Administrator (Chief of Respiratory Division), V.A. Medical Center, North Chicago (1990-Present). | 1
1
1
1 | None
None
None
None |
(3)The address of each trustee and officer is c/o Birmiwal Investment Trust, 5270 Highland Drive, Bellevue, WA 98006.
2006 Annual Report 14
Board of Trustees
Kailash Birmiwal, Ph. D.
Rajendra K. Bordia, Ph. D.
Hemant K. Gupta, Ph. D.
Veera S. Karukonda
Bal K. Sharma, Dr.
Investment Adviser
Birmiwal Asset Management, Inc.
5270 Highland Drive
Bellevue, WA 98006
Dividend Paying Agent,
Shareholders' Servicing Agent,
Transfer Agent
Mutual Shareholder Services, LLC
8000 Town Centre Dr., Ste 400
Broadview Hts, OH 44147
Custodian
U.S. Bank, NA
425 Walnut Street
P.O. Box 1118
Cincinnati, OH 45201
Fund Administrator
Premier Fund Solutions Inc.
480 N. Magnolia Avenue, Suite 103
El Cajon, CA 92020
Legal Counsel
Thompson Hine LLP
312 Walnut Street, 14th Floor
Cincinnati, OH 45202
Independent Auditors
Cohen McCurdy, Ltd.
826 Westpoint Pkwy., Ste 1250
Westlake, OH 44145-1594
This report is provided for the general information of the shareholders of the Birmiwal Oasis Fund. This report is not intended for distribution to prospective investors in the funds, unless preceded or accompanied by an effective prospectus.
Birmiwal Oasis Fund
5270 Highland Drive
Bellevue, WA 98006
Item 2. Code of Ethics.
The registrant has adopted a code of ethics that applies to the registrant’s principal executive officer and the principal financial officer. The registrant has not made any amendments to its code of ethics during the covered period. The registrant has not granted any waivers from any provisions of the code of ethics during the covered period. A copy of the registrant’s Code of Ethics is filed herewith.
Item 3. Audit Committee Financial Expert.
The registrant’s Board of Trustees has determined that it does not have an audit committee financial expert serving on its audit committee. The registrant believes that the experience provided by each member of the audit committee together offers the registrant adequate oversight for the registrant’s level of financial complexity.
Item 4. Principal Accountant Fees and Services.
(a-d) The following table details the aggregate fees billed for each of the last two fiscal years for audit fees, audit-related fees, tax fees and other fees by the principal accountant to the registrant. The principal accountant has provided no services to the adviser or any entity controlled by, or under common control with the adviser that provides ongoing services to the registrant.
| FYE 3/31/06 | FYE 3/31/05 |
Audit Fees | $13,640 | $14,871 |
Audit-Related Fees | $0 | $0 |
Tax Fees | $2,350 | $1,345 |
All Other Fees | $650 | $0 |
Nature of Tax Fees: preparation of Excise Tax Statement and 1120 RIC.
Nature of All Other Fees: Review of Semi-Annual Report.
(e) (1) The audit committee approves all audit and non-audit related services and, therefore, has not adopted pre-approval policies and procedures described in paragraph (c)(7) of Rule 2-01 of Regulation S-X.
(e) (2) None of the services described in paragraph (b) through (d) of this Item were approved by the audit committee pursuant to paragraph (c)(7)(i)(C) of Rule 2-01 of Regulation S-X.
(f) All of the principal accountant’s hours spent on auditing the registrant’s financial statements were attributed to work performed by full-time permanent employees of the principal accountant.
(g) The following table indicates the aggregate non-audit fees billed by the registrant’s principal accountant for services to the registrant , the registrant’s investment adviser (not sub-adviser), and any entity controlling, controlled by, or under common control with the adviser that provides ongoing services to the registrant, for the last two years.
Non-Audit Fees | FYE 3/31/06 | FYE 3/31/05 |
Registrant | $3,000 | $1,345 |
Registrant’s Investment Adviser | $0 | $0 |
(h) The principal accountant provided no services to the investment adviser or any entity controlling, controlled by, or under common control with the adviser that provides ongoing services to the registrant.
Item 5. Audit Committee of Listed Companies. Not applicable.
Item 6. Schedule of Investments. Schedule filed with Item 1.
Item 7. Disclosure of Proxy Voting Policies and Procedures for Closed-End Management Investment Companies. Not applicable.
Item 8. Portfolio Managers of Closed End Management Investment Companies. Not applicable.
Item 9. Purchases of Equity Securities by Closed-End Management Investment Companies and Affiliated Purchasers. Not applicable.
Item 10. Submission of Matters to a Vote of Security Holders.
The registrant has not adopted procedures by which shareholders may recommend nominees to the registrant’s board of trustees.
Item 11. Controls and Procedures.
(a)
The registrant’s president and chief financial officer concluded that the disclosure controls and procedures (as defined in Rule 30a-3(c) under the Investment Company Act of 1940 (the “Act”)) were effective as of a date within 90 days of the filing date of this report, based on the evaluation of these controls and procedures required by Rule 30a-3(b) under the Act.
(b)
There were no changes in the registrant’s internal control over financial reporting (as defined in Rule 30a-3(d) under the Act) that occurred during the registrant’s second fiscal quarter of the period covered by this report that have materially affected, or are reasonably likely to materially affect, the registrant’s internal control over financial reporting.
Item 12. Exhibits.
(a)(1)
Code of Ethics. Filed herewith.
(a)(2)
Certifications pursuant to Section 302 of the Sarbanes-Oxley Act of 2002. Filed herewith.
(b) Certification pursuant to Section 906 Certification of the Sarbanes-Oxley Act of 2002. Filed herewith.
SIGNATURES
Pursuant to the requirements of the Securities Exchange Act of 1934 and the Investment Company Act of 1940, the registrant has duly caused this report to be signed on its behalf by the undersigned, thereunto duly authorized.
Birmiwal Investment Trust
By : /s/ Kailash Birmiwal
Kailash Birmiwal
President
Date: 6-8-06
Pursuant to the requirements of the Securities Exchange Act of 1934 and the Investment Company Act of 1940, this report has been signed below by the following persons on behalf of the registrant and in the capacities and on the dates indicated.
By : /s/ Kailash Birmiwal
Kailash Birmiwal
President
Date: 6-8-06
By : /s/ Kailash Birmiwal
Kailash Birmiwal
Chief Financial Officer
Date: 6-8-06