The following items were the subject of a Form 12b-25 and are included herein: portions of Items 3, portions of Item 4, Item 5, Item 11, Item 15, Item 18 and Item 19 (Exhibits 12.1, 12.2 and 13). |
As filed with the Securities and Exchange Commission on July 17, 2007.
SECURITIES AND EXCHANGE COMMISSION
Washington, D.C. 20549
FORM 20-F/A
(Amendment No. 1)
ANNUAL REPORT PURSUANT TO SECTION 13 OR 15(d) OF THE
SECURITIES EXCHANGE ACT OF 1934
For the fiscal year ended December 31, 2006
Commission file number 001-32555
MASISA S.A.
(formerly known as Terranova S.A.)
(Exact name of Registrant as specified in its charter)
Republic of Chile
(Jurisdiction of incorporation or organization)
Av. Apoquindo 3650, Piso 10, Las Condes, Santiago, Chile
(Address of principal executive offices)
Securities registered or to be registered pursuant to Section 12(b) or the Act:
Title of each class | Name of each exchange on which registered | |
| None | None |
Securities registered or to be registered pursuant to Section 12(g) of the Act:
None
Securities for which there is a reporting obligation pursuant to Section 15(d) of the Act:
American Depositary Shares
Common Stock
Number of outstanding shares as of December 31, 2006:
Common Stock: 5,667,750,881
Indicate by check mark if the registrant is a well-known seasoned issuer, as defined in Rule 405 of the Securities Act. Yes o No x
If this report is an annual or transition report, indicate by check mark if the registrant is not required to file reports pursuant to Section 13 or 15(d) of the Securities Exchange Act of 1934. Yes ¨ No x
Indicate by check mark whether the registrant (1) has filed all reports required to be filed by Section 13 or 15(d) of the Securities Exchange Act of 1934 during the preceding 12 months (or for such shorter period that the registrant was required to file such reports), and (2) has been subject to such filing requirements for the past 90 days. Yes x No ¨
Indicate by check mark whether the registrant is a large accelerated filer, an accelerated filer, or a non-accelerated filer. See definition of “accelerated filer and large accelerated filer” in Rule 12b-2 of the Exchange Act. (Check One):
Large accelerated filer ¨ | Accelerated filer x | Non-accelerated filer ¨ |
Indicate by check mark which financial statement item the registrant has elected to follow. Item 17 ¨ Item 18 x
If this is an annual report, indicate by check mark whether the registrant is a shell company (as defined in Rule 12b-2 of the Exchange Act). Yes ¨ No x
EXPLANATORY NOTE
Pursuant to Rule 12b-25 under the Securities Exchange Act of 1934, as amended, our Company, Masisa S.A., previously filed parts of this Annual Report on Form 20-F on July 2, 2007. We are amending and restating this annual report in its entirety in order to include the selected financial data, management's discussion and analysis of financial condition and results of operations, management's annual report on internal control over financial reporting, financial statements and other information required by Items 3, 4, 5, 11, 15 and 18, as well as certain exhibits to the filing. This Amendment No. 1 on Form 20-F/A does not reflect events occurring after the filing of the original Annual Report on Form 20-F on July 2, 2007.
TABLE OF CONTENTS
| Page | |
| PART I | |
| Item 1. Identity of Directors, Senior Management and Advisers | 1 |
| Item 2. Offer Statistics and Expected Timetable | 1 |
| Item 3. Key Information | 1 |
| Selected Financial Data | 1 |
| Exchange Rates | 3 |
| Risk Factors | 3 |
| Item 4. Information on the Company | 12 |
| Our Company | 12 |
| Our Competitive Strengths | 13 |
| History and Development of the Company | 14 |
| The Merger of Terranova and Masisa | 16 |
| Corporate Structure | 16 |
| The Grupo Nueva Group and Our Management Framework | 18 |
| Business Strategy | 19 |
| Operational Organization | 20 |
| Facilities and Offices | 21 |
| Description of Properties | 22 |
| Capital Expenditures | 24 |
| Principal Products | 24 |
| Wood Products Sales | 27 |
| Markets and Distribution | 28 |
| Production | 40 |
| Forestry Operations | 48 |
| Insurance | 52 |
| Raw Materials and Suppliers | 52 |
| Environmental Regulation | 55 |
| Item 4A. Unresolved Staff Comments | 59 |
| Item 5. Operating and Financial Review and Prospects | 59 |
| Introduction | 59 |
| Overview | 59 |
| Results of Operations | 62 |
| Liquidity and Capital Resources | 77 |
| Research and Development | 83 |
-ii-
Table of Contents
(continued)
| Page | |
| Trend Information | 83 |
| Off-Balance Sheet Arrangements | 83 |
| Contractual Obligations | 83 |
| Impact of Inflation and Devaluation | 84 |
| Critical Accounting Policies | 84 |
| Item 6. Directors, Senior Management and Employees | 87 |
| Directors | 87 |
| Board Committees | 88 |
| Senior Management | 90 |
| Director and Executive Officer Compensation | 92 |
| Share Ownership | 93 |
| Employees | 93 |
| Item 7. Major Shareholders and Related Party Transactions | 95 |
| Major Shareholders | 95 |
| Related Party Transactions | 97 |
| Item 8. Financial Information | 98 |
| Consolidated Financial Statements | 98 |
| Export Sales | 98 |
| Legal and Arbitration Proceedings | 98 |
| Dividend Policy | 99 |
| Significant Changes | 100 |
| Item 9. The Offer and Listing | 100 |
| Stock Price History | 100 |
| Markets | 101 |
| Item 10. Additional Information | 101 |
| Memorandum and Articles of Association | 101 |
| Material Contracts | 107 |
| Exchange Controls | 107 |
| Taxation | 108 |
| Documents on Display | 113 |
| Summary of Significant Differences between the Company’s Corporate Governance Practices and the NYSE’s Corporate Governance Standards | 114 |
| Item 11. Quantitative and Qualitative Disclosure About Market Risk | 114 |
| Qualitative Disclosure | 114 |
| Quantitative Disclosure | 114 |
-iii-
Table of Contents
(continued)
| Page | |
| Item 12. Description of Securities Other than Equity Securities | 118 |
| PART II | |
| Item 13. Defaults, Dividend Arrearages and Delinquencies | 119 |
| Item 14. Material Modifications to the Rights of Security Holders and Use of Proceeds | 119 |
| Item 15. Controls and Procedures | 119 |
| Item 16A. Audit Committee Financial Expert | 121 |
| Item 16B. Code of Ethics | 122 |
| Item 16C. Principal Accountant Fees and Services | 122 |
| Item 16D. Exemptions from the Listing Standards for Audit Committees | 122 |
| Item 16E. Purchase of Equity Securities by the Issuer and Affiliated Purchasers | 123 |
| PART III | |
| Item 17. Financial Statements | 124 |
| Item 18. Financial Statements | 124 |
| Item 19. Exhibits | 125 |
-iv-
PRESENTATION OF INFORMATION
Masisa S.A. is a publicly held corporation (sociedad anónima abierta) organized under the laws of Chile.
We changed our name to Masisa S.A. on May 31, 2005 as part of our merger with our former subsidiary, which was known as Masisa S.A. before that merger. Prior to that merger, our name was Terranova S.A. Except as otherwise specifically noted, when in this document we refer to “Terranova” or “Terranova S.A.” we are referring to ourselves and our consolidated subsidiaries prior to our merger with our former subsidiary Masisa S.A. Prior to the consummation of that merger of Masisa into and with Terranova, Terranova owned 52.43% of the shares of Masisa and Masisa was one of Terranova’s consolidated subsidiaries. When we describe Terranova we include our former subsidiary Masisa S.A. and its consolidated subsidiaries in that description.
When in this annual report we refer to “Masisa” or “Masisa S.A.” with respect to any date after the merger on May 31, 2005, those terms, together with the terms “we”, “our”, “us” and the “Company” refer to our merged company and its consolidated subsidiaries. When we refer to “Masisa” or “Masisa S.A.” with respect to any date before May 31, 2005, we mean our former subsidiary Masisa S.A. and its consolidated subsidiaries before its merger into and with us, and separate from the other businesses of Terranova S.A.
In this document, unless otherwise specified, all references to “Chilean pesos,” “pesos” or “Ch$” are to Chilean pesos, references to “U.S. dollars,” “dollars” or “US$” are to United States dollars, references to the “Consumer Price Index” or “CPI” are to the Indice de Precios al Consumidor published by the Chilean Instituto Nacional de Estadísticas (“Chilean National Institute of Statistics”) and references to “UF” or “Unidades de Fomento” are to Unidades de Fomento, a Chilean financial index adjusted for changes in the CPI. The Company publishes its financial statements in U.S. dollars. Unless otherwise specified, financial data in our consolidated financial statements and elsewhere in this document are presented in accordance with accounting principles generally accepted in Chile (“Chilean GAAP”). Chilean GAAP differs in certain significant respects from accounting principles generally accepted in the United States (“U.S. GAAP”). Note 23 of our audited consolidated financial statements appearing elsewhere in this document provides a description of the principal differences between Chilean GAAP and U.S. GAAP, and contains a reconciliation to U.S. GAAP of our total shareholders’ equity as of December 31, 2005 and 2006 and our net income for the years ended December 31, 2005 and December 31, 2006, respectively.
For the convenience of the reader, certain amounts have been translated from Chilean pesos into U.S. dollars at the rate specified herein. U.S. dollar equivalent information related to acquisitions, dispositions or other corporate transactions described in this document is based on the Dólar Observado (the “Observed Exchange Rate”) in effect at the relevant time of such transactions. No representation is made that the Ch$ or US$ amounts shown in this document could have been or could be converted into US$ or Ch$, as the case may be, at any particular rate. The Observed Exchange Rate, as would be used for accounting purposes, for December 31, 2006 was Ch$532.39= US$1.00. See “Item 3. Key Information—Exchange Rates” for information regarding historical exchange rates since January 2002. The UF on December 31, 2006 had a value of Ch$18,358.28.
Each “hectare” or “ha” equals approximately 2.471 acres, each “kilometer” equals approximately 0.621 miles, each “cubic meter” or “m3” equals approximately 35.315 cubic feet or 1.308 cubic yards and each “metric ton” equals 1,000 kilograms or approximately 2,205 pounds.
Percentages and certain amounts contained in this annual report have been rounded for ease of presentation. Any discrepancies in any figure between totals and the sums of the amounts presented are due to rounding market information.
This annual report contains statements that constitute forward looking statements within the meaning of the Private Securities Litigation Reform Act of 1995. These statements appear throughout this annual report and include statements regarding the intent, belief or current expectations of the Company and its management, including with respect to
· the Company’s business, plans and operations,
-v-
· trends affecting the Company’s financial condition or results of operations and
· the future impact of competition and regulations.
Such forward looking statements are not guarantees of future performance and involve risks and uncertainties. Actual results may differ from those described in such forward looking statements included in this annual report, depending upon a number of factors, including without limitation
· the ability of the Company to implement its business plan,
· the nature and extent of future competition in the Company’s principal markets and
· political, economic and demographic developments in Chile, Argentina, Brazil, Mexico, Venezuela and other markets.
See “Item 5. Operating and Financial Review and Prospects” for further discussion of factors that could cause such material differences.
We have prepared this annual report on the basis of information which we have or have obtained from sources we believe to be reliable. You are urged to consult your own legal, tax and business advisors regarding an investment in our shares of common stock or ADSs.
-vi-
PART I
Item 1. Identity of Directors, Senior Management and Advisers
Not applicable.
Item 2. Offer Statistics and Expected Timetable
Not applicable.
Item 3. Key Information
Selected Financial Data
The following table presents certain historical financial information about us at the dates and for each of the indicated periods. The following table should be read in conjunction with, and is qualified in its entirety by our financial statements appearing elsewhere in this document. The financial statements are prepared in accordance with Chilean GAAP, which differs in certain significant respects from U.S. GAAP. Note 23 to our audited consolidated financial statements appearing elsewhere in this document provides a description of the material differences between Chilean GAAP and U.S. GAAP and a reconciliation to U.S. GAAP of net income and shareholders’ equity as of and for the years ended December 31, 2005 and 2006.
1
SELECTED FINANCIAL INFORMATION
As of and for the year ended December 31, | ||||||||||||||||
2002 | 2003 | 2004 | 2005(1) | 2006 | ||||||||||||
| (in millions of US$, except per share and per ADS amounts) | US$ | US$ | US$ | US$ | US$ | |||||||||||
| INCOME STATEMENT DATA | ||||||||||||||||
| Chilean GAAP: | ||||||||||||||||
| Net sales | 295.0 | 480.1 | 651.0 | 744.0 | 886.5 | |||||||||||
| Operating income | 28.7 | 21.6 | 95.1 | 79.5 | 83.6 | |||||||||||
| Non-operating results, net | (6.1 | ) | (47.5 | ) | (11.2 | ) | (47.6 | ) | (41.4 | ) | ||||||
| Income taxes | 1.7 | 0.6 | (11.7 | ) | (13.1 | ) | (23.3 | ) | ||||||||
| Net income | 21.0 | (20.0 | ) | 56.8 | 24.4 | 29.5 | ||||||||||
Net earnings per share (2) | 0.007 | (0.006 | ) | 0.014 | 0.005 | 0.005 | ||||||||||
Net earnings per ADS (3) | 0.36 | (0.30 | ) | 0.72 | 0.27 | 0.26 | ||||||||||
Dividends per share (2) | — | — | — | 0.011 | 0.002 | |||||||||||
Dividends per ADS (3) | — | — | — | 0.57 | 0.10 | |||||||||||
| U.S. GAAP: | ||||||||||||||||
| Net sales | — | 485.9 | 651.0 | 744.0 | 886.5 | |||||||||||
| Operating income | — | 12.9 | 138.2 | 73.9 | 72.0 | |||||||||||
| Net income | — | (30.2 | ) | 71.4 | 24.9 | 24.5 | ||||||||||
| Basic and diluted earnings per share | — | (0.009 | ) | 0.018 | 0.005 | 0.004 | ||||||||||
Net earnings per ADS (2) | — | (0.45 | ) | 0.91 | 0.27 | 0.22 | ||||||||||
| Weighted average number of shares (in thousands) | 2,940,285 | 3,391,168 | 3,918,428 | 4,591,227 | 5,664,496 | |||||||||||
| BALANCE SHEET DATA | ||||||||||||||||
| Chilean GAAP | ||||||||||||||||
| Total assets | 1,630.1 | 1,854.5 | 1,880.5 | 1,956.5 | 2,007.5 | |||||||||||
| Long-term liabilities | 377.8 | 518.4 | 533.9 | 333.8 | 542.1 | |||||||||||
| Shareholders’ equity | 656.6 | 730.6 | 778.1 | 1,094.3 | 1,186.4 | |||||||||||
| U.S. GAAP | ||||||||||||||||
| Shareholders’ equity | — | 520.6 | 574.9 | 874.8 | 937.6 | |||||||||||
| (1) | Our consolidated financial statements under Chilean GAAP for the year ended December 31, 2005, previously issued in the Chilean market, have been restated to reflect an adjustment for inventory costing of approximately US$1.9 million. See Note 2 a) to our audited consolidated financial statements appearing elsewhere in this document. |
| (2) | Under Chilean GAAP, there are no authoritative pronouncements relating to the calculation of earnings per share. For comparative purposes, the calculation has been based on the same number of weighted average shares outstanding as used for the U.S. GAAP calculation. For more information see Note 23 to our audited consolidated financial statements appearing elsewhere in this document. |
| (3) | Per ADS amounts are determined by multiplying per share amounts by 50, because one ADS is equal to 50 shares of common stock. |
2
Exchange Rates
The following table sets forth the annual low, high, average and period-end Observed Exchange Rates for U.S. dollars, as would be used for accounting purposes, for each year beginning in 2002, as reported by the Chilean Central Bank, expressed in peso per U.S. dollar.
Daily Observed Exchange Rate Ch$ per US$ | |||||||||||||
Year | Low(1) | High(1) | Average(2) | Period End | |||||||||
| 2002 | 641.75 | 756.56 | 688.94 | 718.61 | |||||||||
| 2003 | 593.10 | 758.21 | 691.40 | 593.80 | |||||||||
| 2004 | 559.21 | 649.45 | 609.52 | 557.40 | |||||||||
| 2005 | 509.70 | 592.75 | 559.77 | 512.50 | |||||||||
| 2006 | 511.44 | 549.63 | 530.28 | 532.39 | |||||||||
Low(1) | High(1) | ||||||
2006 | |||||||
| December | 524.78 | 534.43 | |||||
2007 | |||||||
| January | 538.27 | 545.18 | |||||
| February | 535.29 | 548.67 | |||||
| March | 535.36 | 541.95 | |||||
| April | 525.96 | 539.69 | |||||
| May | 517.64 | 527.62 | |||||
Source: The Central Bank of Chile.
| (1) | Rates shown are the actual low and high, on a day-to-day basis, for each period. |
| (2) | Average of month end rates. |
The Observed Exchange Rate, as would be used for accounting purposes, on December 31, 2006 and on June 15, 2007 were Ch$532.39 = US$1.00 and Ch$526.43 = US$1.00, respectively.
Risk Factors
A decision to invest in our shares or ADSs involves certain risks. Below, we discuss significant risks, including
| · | Risks relating to our business, |
| · | Risks relating to our forestry operations, |
| · | Risks relating to our operations in Latin America, and |
| · | Risks relating to the securities markets and the ownership of our ADSs and shares. |
You should read carefully these risk factors before deciding whether to invest in our company.
Risks relating to our business
We are dependent on the furniture and construction industries and lower than expected growth or a downturn in demand for our products in those industries could adversely affect our results of operations.
The sales of our products are dependent to a significant degree on the level of activity in the furniture manufacturing and construction industries. In recent years we have expanded our production capacity for medium-density fiberboard (“MDF”), particle board, oriented strand board (“OSB”) and MDF mouldings in the expectation of growth in demand. Because of the cyclicality of demand for our products, we may have short- or long-term overcapacity as a result of this expansion and other capital expenditures, and decreased demand for wood products may result in an inability to maximize our productive resources. Furthermore, it is possible that the expected growth in demand from companies in the furniture manufacturing and construction industries may not occur. The demand for such products can be adversely affected by several factors, including decreases in the level of new residential construction activity, which is subject to changes in economic conditions, increases in interest rates, decreases in population and other factors. Additionally, weakness in the economies of countries in which we sell our products as well as any downturn or continuation of current downturns in these economies, is likely to have a material adverse effect on the construction, home building and remodeling industries, as well as on the demand for furniture items manufactured with our products.
3
We face competition in the markets in which we sell our products. Increased competition from new competitors or increased production capacity by existing competitors could adversely affect both our share of our markets as well as the price at which we sell our products.
Currently, we face competition from competitors in most of the countries and regions in which we operate. In addition, we may face increased competition as a result of existing competitors increasing their production capacity or from new competitors entering the markets in which we operate. An increase in competition in the markets in which we operate could adversely affect both our share of those markets as well as the price at which we are able to sell our products.
The majority of raw wood materials and resins used to produce our board products are supplied by outside mills and companies.
Our boards are produced by combining wood chips, wood shavings, strands and sawdust. We procure the majority of the raw wood materials that we use to manufacture our boards from unaffiliated companies in Chile, Argentina, Mexico and Brazil in accordance with long standing relationships between us and the suppliers. We may not be able to maintain these relationships and continue to secure the raw materials to produce our boards at existing commercial conditions in the future. In addition, the prices we pay for raw materials may increase as a result of higher fuel costs paid by our suppliers. An inability to secure the raw materials used in the production of our boards or to transport such materials in a cost-effective manner could have a material adverse effect on our operations.
We may experience manufacturing problems in Brazil due to a lack of supply of logs.
In Brazil, we depend on a large supply of logs to produce our wood products. Our Brazilian OSB mill and saw mills depend to a large extent on supplies of pulp log and saw log from third parties. We have experienced a tight market in Brazil in the past and we may not be able to continue to secure logs for our mills.
Adverse developments relating to maritime transport and import and export restrictions could adversely affect our results of operations.
Our ability to make, transport and sell our products in some of our key markets could be affected by import and export restrictions as well as the general market unavailability of maritime transport. If our ability to sell our products competitively in one or more of our principal export markets were to be impaired by import or export restrictions, it could be difficult for us to re-allocate our products to other markets on equally favorable terms. In addition, as we depend on maritime means to transport products to offshore markets, increases in fuel prices, other transport costs or maritime demand may also increase our shipping costs. These challenges to the maritime transport of our products and the regulation of the sale of our products in offshore markets could have a material adverse effect on our profitability.
Our dependence on a limited number of distributors and customers may affect our profitability.
We are dependent to a significant degree on a small number of third-party distributors to achieve our sales in one or more of our principal markets. For example, our eight largest customers for solid wood products accounted for approximately 82% and 84% of net sales in the United States for the years ended December 31, 2005 and 2006, respectively. Our solid wood products sales made in the United States represented approximately 22% and 23% of our total consolidated sales for the years ended December 31, 2005 and December 31, 2006, respectively. Our largest customer, Masonite International (“Masonite”), accounted for approximately 52% and 41% of such solid wood products’ sales during the years ended December 31, 2005 and 2006, respectively. We cannot assure you that, under current market conditions, the loss of our largest distributor or customer in certain markets would not have a material adverse effect on us.
4
We may not be able to maintain present favorable tax treatment or exemptions from certain tax payments in certain jurisdictions in which we operate.
We may not be able to maintain important exemptions from certain tax regimes in the various jurisdictions in which we operate. Currently, Chilean tax authorities are challenging our treatment of certain losses related to our Venezuelan subsidiaries in previous tax years. We estimate that an adverse determination by Chilean tax authorities would affect approximately US$39.2 million of our deferred taxes, recoverable taxes and tax losses already utilized. See Note 21 to our audited consolidated financial statements appearing elsewhere in this document. Unfavorable tax treatment of our company in the future or an increase in the taxes levied on us, may have a material adverse effect on our results of operations.
Currency devaluations and foreign exchange fluctuations may adversely affect us.
We are exposed, both in terms of assets and liabilities, to fluctuations in the value of the U.S. dollar versus other currencies. Changes in the value against the U.S. dollar of the Chilean peso and other currencies in which we complete transactions, such as Argentinean pesos, Brazilian reales, Mexican pesos, Venezuelan bolivares and Colombian pesos, among others, could adversely affect our financial condition and results of operations. The Chilean peso, Argentinean peso, Brazilian real, Mexican peso, Venezuelan bolivar and Colombian peso, among others, have each been subject to large nominal devaluation events in the past. The value of any of these currencies against the U.S. dollar may fluctuate significantly in the future. A significant part of our indebtedness is denominated in U.S. dollars and certain of our revenues and operating expenses are denominated in local currencies. As a result, fluctuations in the local currency/U.S. dollar exchange rate may affect our financial condition and results of operations. For example, as a result of the Chilean peso appreciation and Venezuelan bolivar devaluation during 2006, we saw a loss of US$7.0 and US$10.8 million in our consolidated financial statements related to our assets and liabilities denominated in each of these currencies, respectively. In addition, as our boards business is mostly a local business and our solid wood business is mostly an export business, part of our sales are denominated in local currencies and part are denominated in U.S. dollars. As our production cost is partially dependent on wood and resin prices, which in the medium- and long-term are correlated to the U.S. dollar, part of our costs are indexed to the U.S. dollar. As a result, a decrease in the value of the U.S. dollar against the currencies of other countries from which we export products can also negatively affect our sales margins on sales of such products.
Inflation could adversely affect the value of our ADSs and financial condition and results of operations.
In the past, Latin American countries in which we operate have experienced high levels of inflation and significant changes in the levels of inflation. For example, in the late 1980s and in 1990, Chile’s inflation rate exceeded 20%. Although recent inflation levels in Chile have been below 10% for the last 10 years and below 5% since 1999, including inflation of 3.4% in 2006, high levels of inflation in the future could adversely affect the Chilean economy and have an adverse effect on our results of operations and, indirectly, the value of our common shares and of our ADSs. We estimate, for example, that a 1% increase in the annual inflation rate in Chile not accompanied by a devaluation of the Chilean Peso against the U.S. dollar would reduce our consolidated gross margin as a percentage of sales by less than 0.3 percentage points. See “Item 5. Operating and Financial Review and Prospects.”
Changes in environmental regulations to which we are subject could adversely affect our results of operations and prospects.
We are subject to changing international, national and local environmental laws concerning, among other things, health, the handling and disposal of wastes, discharges into the air, soil and water, forestry management and endangered species. During 2004, 2005, and 2006, we spent on a consolidated basis US$3.2 million, US$3.6 million and US$3.5 million, respectively, on environmental projects related to complying with environmental regulation. We expect to continue to make the necessary expenditures to comply with such environmental requirements. Changes in such laws, or the interpretation of such laws, may require us to incur significant unforeseen capital or operating expenditures to comply with such requirements.
5
A significant percentage of our employees are unionized and work slowdowns, work stoppages or strikes could adversely affect our results of operations.
Approximately 67%, 50%, 35% and 5% of our employees in Chile, Venezuela, Mexico and Brazil, respectively, are covered by collective bargaining agreements with labor unions. Most of these collective bargaining agreements have terms of two to four years, although collective bargaining agreements in Mexico have a term of one year. If a work slowdown, a work stoppage or strike were to occur prior to or upon the expiration of our various collective bargaining agreements, that work slowdown, stoppage or strike could adversely affect our sales and cash flows and have a material adverse effect on our business, financial condition, results of operations or prospects.
Risks factors relating to our forestry operations
Wind storms, fires, disease and pests could adversely affect our forests.
Our forests are subject to naturally occurring threats such as wind and fire. Damage caused by strong windstorms in Chile, such as uprooting and stems breakage, is considered by management to be a major natural risk to our forests. Fire is a risk to all of our forests, warehouses and operations. For example, in January 2007, we suffered a forest fire in the Bio-Bio region of Chile which burned approximately 1,171 hectares. We may experience other fires in the future and such fires may materially adversely affect us. Disease or pests may also have a material adverse effect on our forests and plantations in the future. Although our business and results of operations have not been materially adversely affected by these risks in the past, there can be no assurance that this will be the case in the future.
We may experience difficulties with the quality of service provided by some of our contractors and our forestry operations could be adversely affected.
We use third-party contractors that provide us specialized services in our forestry operations such as planting, harvesting and trucking. If our service contractors do not continue to fulfill past quality levels, or if our contractual relationships become the subject of litigation or regulation, our forestry operations could be adversely affected.
Conflict with native communities or other social movements in Chile and Brazil could threaten a portion of our forestry assets.
Chilean law protects the rights of indigenous people. Since 1992, disputes have arisen among Chile’s indigenous communities and the forestry industry. We are currently named in three land disputes with communities claiming rights to ancestral lands or rights based on titles granted by decree at the beginning of the 19th century. These disputes could imply partial or total overlap with our legal titles to the land involved in such disputes. The land involved in these disputes totals 1,701 hectares, of which 351 hectares correspond to planted forests (i.e. representing less than 1% of our total planted forest holdings). Since 2002, we have been in negotiations with several communities and their representatives in order to resolve and avoid possible conflicts. It is possible that we might not be able to resolve the ongoing disputes with native communities in Chile. In addition, since 1995, the Brazilian organization “Movimiento de los Trabajadores Rurales Sin Tierra” (MST) has been initiating public action to promote agrarian reform and the expropriation of property from large land estates in Brazil. We are not currently named in any land dispute with MST. A deterioration of our relationship with indigenous peoples and other social movements could affect our forestry operations and have a material adverse effect on our company.
Risks factors relating to our operations in Latin America
Political and economic developments in Latin American countries in which we operate, may adversely affect us.
Our business strategies, financial condition and results of operations could be adversely affected by changes in government policies of the Latin American countries in which we operate, other political developments in or affecting these countries, and regulatory and legal changes or administrative practices of their authorities, over which we have no control. In addition, recent rates of gross domestic product growth in these countries may not continue in the future, and future developments in or affecting their economies could impair our ability to proceed with our business plan or materially adversely affect our business, financial condition or results of operations.
6
Energy shortages and increased energy costs in Chile could adversely affect our business.
Starting in April 2004 and continuing to the present, Argentina began restricting deliveries of natural gas to Chile due to supply and distribution problems in Argentina, Chile’s principal supplier. Such restrictions have led to reduced supplies of natural gas to Chilean electricity producers, particularly during winter months. A significant portion of Chile’s electricity is produced from natural gas. Shortages of natural gas have forced and could continue to force Chile’s electric utilities to use costlier petroleum based fuels to produce electricity or could cause disruptions in the supply of electricity. While we do not use material amounts of natural gas directly, during 2006 electricity represented approximately 9.4% of our wood board production costs in Chile compared to 9.9% in 2005. In 2007, we were unable to renew certain long-term electricity contracts related to our Cabrero industrial complex in Chile at our previous rates. As a result, we are experiencing higher electricity costs as we have had to rely on purchases in the electricity spot market. For the five months ended May 31, 2007, our electricity costs represented approximately 14.7% of our wood board production costs in Chile. In addition, Chile and Brazil have each experienced energy shortages or disruptions in the past. Higher electricity costs or disruptions in the supply of electricity or natural gas could materially adversely affect our financial condition and results of operations.
Foreign exchange controls established by the Venezuelan government may limit our ability to transfer excess funds out of Venezuela.
The Ministry of Finance and the Central Bank of Venezuela established the system for administration of foreign exchange and fixed the official exchange rate for purchases and sales of Venezuelan bolivars by the Central Bank of Venezuela. These rules restrict our access to foreign exchange and limit our ability to transfer excess funds out of Venezuela. As of December 31, 2006, foreign currency activities have not been fully normalized and requests for approval for foreign currency exchange continue to be limited. Dividend payments, debt payments and foreign transfers of income from capital and interest, to individuals and corporations must be registered with the Superintendencia de Inversiones Extranjeras (Foreign Investment Superintendency). If the Foreign Investment Superintendency denies the approval of our dividend payments, debt payments or foreign transfers of income, we will be prohibited from, or will face increased costs for, transferring such funds from our subsidiaries in Venezuela to our operations outside that country.
Adverse Argentinean political and economic conditions may have a direct and adverse impact on our Argentinean operations.
In 2002, the Argentinean economy experienced critical difficulties. During the first six months of 2002, the Argentinean government eliminated the U.S. dollar-Argentinean peso parity resulting in a devaluation of Argentina’s currency in 2002 of 237%. Additionally, the Argentinean government imposed restrictions on cash withdrawals from bank accounts, on transfers of funds from Argentinean to foreign accounts and publicly announced its inability to pay its debt to foreign lenders. During 2002, Argentina also experienced higher rates of unemployment and a general inflation of prices. Consequently, Argentina’s “country risk” rose to record high levels. In 2003, the economy began to recover and some of the government financial restrictions were lifted. Since 2004, the Argentinean economy has continued its recovery.
Because our business strategy in Argentina is to some extent focused on anticipated growth in demand for particle board and MDF, our Argentinean operations and results of operations could be negatively affected if Argentina’s economy falls back into a recession.
7
Risk factors relating to the securities markets and the ownership of our ADSs and shares
The market price of our securities may be adversely affected by developments in other emerging markets.
The market value of securities of Chilean companies is, to varying degrees, affected by economic and market conditions in other emerging market countries. Investors’ reactions to developments in any of these other countries may have an adverse effect on the market value of securities of Chilean issuers regardless of whether or not economic conditions in Chile are comparable to those countries. Events in other countries, particularly Argentina, Venezuela and other emerging market countries, could adversely affect the market value of, or market for, our common stock or ADSs.
The significant share ownership of our controlling shareholders may have an adverse effect on the future market price of our ADSs and shares.
Grupo Nueva S.A. (“Grupo Nueva”), a Chilean holding company formerly known as Compañía de Inversiones Suizandina S.A., beneficially owns directly, and indirectly through its subsidiary Inversiones Forestales Los Andes S.A., in the aggregate 53.3% of our outstanding shares of common stock. A disposition by Grupo Nueva of a significant number of our shares, or the perception that such a disposition might occur, could adversely affect the trading price of our shares on the Santiago Stock Exchange (“Bolsa de Comercio de Santiago”), the Valparaíso Stock Exchange (“Bolsa de Corredores de Valparaíso”), the Chilean Electronic Stock Exchange (“Bolsa Electrónica de Chile”) as well as the market price of our ADSs on the New York Stock Exchange.
Our controlling shareholders are able to exercise significant control over our company, and also own a significant minority interest in many of our international subsidiaries which could result in conflicts of interest.
Grupo Nueva is in a position to direct our management and to determine the result of substantially all matters to be decided by majority vote of our shareholders, including the election of a majority of the members of our board of directors, determining the amount of dividends distributed by us (subject to the legally mandated minimum of 30% of net income), adopting certain amendments to our by-laws, enforcing or waiving our rights under existing agreements, leases and contractual arrangements. As a result, circumstances may occur in which the interests of Grupo Nueva could be in conflict with your interests as a holder of our ADSs or shares of common stock.
Grupo Nueva also owns a direct 40% interest in Inversiones Internacionales Terranova S.A. (“IITSA”), which holds directly and indirectly substantially all of our interest in some of our international subsidiaries, accordingly our ability to direct these operations may be affected by the rights of Grupo Nueva as a minority shareholder. Conflicts of interest may arise between us and Grupo Nueva as a result of its ownership interest in our shares and the shares of IITSA. The Directors Committee reviews and resolves these potential conflicts of interest.
Our status as a controlled company and a foreign private issuer exempts us from certain of the corporate governance standards of the New York Stock Exchange, limiting the protections afforded to investors.
We are a “controlled company” and a “foreign private issuer” within the meaning of the New York Stock Exchange corporate governance standards and, under the New York Stock Exchange rules, we are exempt from certain New York Stock Exchange corporate governance requirements. In addition, a foreign private issuer may elect to comply with the practice of its home country and not to comply with certain New York Stock Exchange corporate governance requirements, including the requirements that (1) a majority of the board of directors consist of independent directors, (2) a nominating and corporate governance committee be established that is composed entirely of independent directors and has a written charter addressing the committee’s purpose and responsibilities, and (3) an annual performance evaluation of the nominating and corporate governance and compensation committees be undertaken. We currently use these exemptions and intend to continue using these exemptions. Accordingly, you do not have the same protections afforded to shareholders of companies that are subject to all of the New York Stock Exchange corporate governance requirements.
8
There may be a lack of liquidity and market for our shares and ADSs.
Prior to the merger of Terranova S.A. and its subsidiary Masisa S.A., in May 2005, there was no public market for our shares of common stock outside Chile or for our ADSs. In connection with the merger, our ADSs were listed on the New York Stock Exchange. Although there is a trading market for our ADSs on the NYSE, there can be no assurance that an active trading market will develop or be sustained in the future. In addition, the small size of the Chilean equities market, its low liquidity in general, its increased volatility compared to major securities markets in the United States and the concentrated ownership of our shares in particular, may impair the ability of an ADS holder to sell in the Chilean market on the Santiago Stock Exchange, the Valparaiso Stock Exchange or the Chilean Electronic Stock Exchange, on which our shares are traded, the Masisa shares obtained upon withdrawal of such shares from the Masisa ADR facility in the amount and at the price and time that ADS holder desires, and could increase the volatility of the price of our ADSs.
Chile may impose controls or other restrictions on foreign investment and repatriation of investments that may affect your investment in, and earnings from, our ADSs.
Equity investments into Chile from abroad are subject to the requirement that investors provide Chile’s Central Bank with information related to such equity investments and conduct any operations in connection with the repatriation of investments and earnings on them within Chile’s Mercado Cambiario Formal, or Formal Exchange Market. See “Item 10. Additional Information—Exchange Controls.”
Owners of ADSs are entitled to receive dividends on the underlying shares to the same extent as the holders of shares of common stock. Dividends received by holders of ADSs will be converted into U.S. dollars and distributed net of foreign currency exchange fees and expenses and fees of The Bank of New York, the depositary under the Masisa ADR program (the “Depositary”) and will be subject to Chilean withholding tax, currently imposed at a rate of 35% (subject to credits in certain cases as described under “Item 10. Taxation— Chilean tax consequences of ownership of Masisa shares or ADSs by foreign holders - Taxation of dividends”). If for any reason, including changes in Chilean laws or regulations, the Depositary were unable to convert Chilean pesos to U.S. dollars, investors may receive dividends and other distributions, if any, in Chilean pesos.
Additional Chilean restrictions applicable to the holders of our ADSs and other foreign investors in Chile could be imposed in the future. The Central Bank of Chile has the authority to impose at any time certain controls, restrictions or obligations on foreign investors in Chile. Such restrictions could include, but are not limited to, the requirement to obtain the Central Bank of Chile’s prior approval for the repatriation of the proceeds from the disposition of shares underlying the ADSs or the payment of dividends. We cannot advise you as to the duration or impact of any such restrictions if imposed.
Preemptive rights may be unavailable to ADS holders or U.S. holders of shares in certain circumstances and, as a result, U.S. owners of shares or ADSs would be subject to potential dilution.
The Ley sobre Sociedades Anónimas No. 18,046 and the Reglamento de Sociedades Anónimas, which we refer to in this document collectively as the Chilean Corporations Law, require us, whenever we issue new shares for cash and sell treasury shares, to grant preemptive rights to all of our shareholders (including shares represented by ADSs), giving them the right to purchase a sufficient number of shares to maintain their existing ownership percentage. It is possible that, in connection with any future issuances of shares, we may not be able to offer shares to U.S. holders of shares or ADSs pursuant to preemptive rights granted to our shareholders and, as a result such U.S. holders of shares or ADSs would be subject to potential dilution.
We will not be able to offer shares to ADS holders or U.S. holders of shares pursuant to preemptive rights that we grant to our shareholders in connection with any future issuance of shares or sale of treasury shares unless a registration statement under the U.S. Securities Act of 1933, as amended (the “Securities Act”), is effective with respect to such rights and shares, or an exemption from the registration requirements of the Securities Act is available.
9
ADS holders may not be able to effect service of process on, or enforce judgments or bring original actions against, us, our directors or our executive officers, which may limit the ability of holders of ADSs to seek relief against us.
We are a Chilean corporation. None of our directors are residents of the United States and most of our executive officers reside outside the United States. In addition, a substantial portion of our assets and the assets of our directors and executive officers are located outside the United States. As a result, it may be difficult for ADS holders to effect service of process outside Chile upon us or our directors and executive officers or to bring an action against us or such persons in the United States or Chile to enforce liabilities based on U.S. federal securities laws. It may also be difficult for ADS holders to enforce in the United States or in Chilean courts judgments obtained in United States courts against us or our directors and executive officers.
ADS holders may not be able to exercise withdrawal rights that are granted by the Chilean Corporations Law to registered shareholders of publicly traded Chilean corporations.
Under the Chilean Corporations Law, if any of the following resolutions are adopted by our shareholders at any extraordinary shareholders meeting, dissenting shareholders have the right to withdraw from Masisa and to require us to repurchase their shares, subject to the fulfillment of certain terms and conditions. A dissenting shareholder is a shareholder who either attends the shareholders meeting and votes against a resolution which results in a withdrawal right or, if absent from the shareholders meeting, a shareholder who notifies the company in writing within 30 days of the shareholders meeting of his opposition to the resolution and that he is exercising his right to withdraw from the company.
The resolutions that result in a shareholder’s right to withdraw are the following:
| · | the transformation of Masisa into a different type of legal entity; |
| · | the merger of Masisa with or into another company; |
| · | the disposition of 50% or more of our assets, whether or not that sale includes our liabilities or the proposal or amendment of any business plan involving the transfer of more than 50% of our assets; |
| · | the granting of security interests or personal guarantees to secure or guarantee third parties’ obligations exceeding 50% of our assets, except with regard to our subsidiaries; |
| · | the creation of preferential rights for a class of shares or an amendment to those already existing, in which case the right to withdraw only accrues to dissenting shareholders of the class or classes of shares adversely affected; |
| · | the amendment of our bylaws to correct any formal defect in our incorporation, or any amendment of our bylaws that grants a shareholder a right to withdraw; |
| · | the approval by our shareholders of our ceasing to be subject to the regulations applicable to publicly held corporations in the event we no longer meet the requirements under Chilean law to qualify as such a corporation; and |
| · | any other causes as may be established by Chilean law and our bylaws (our bylaws currently do not establish any instances). |
In addition, shareholders of a publicly held corporation, such as Masisa, have the right to withdraw if a person acquires two-thirds or more of the outstanding voting stock of the company and does not make a tender offer for the remaining shares within 30 days of that acquisition at a price not lower than the price that would be paid shareholders exercising their rights to withdraw. However, the right of withdrawal described in the previous sentence does not apply in the event the company reduces its capital as a result of not having fully subscribed and paid an increase of capital within the statutory term.
10
ADS holders own a beneficial interest in shares held by the Depositary and, accordingly, they are not listed as shareholders on the share registry of the Company. The Depositary will not exercise withdrawal rights on behalf of ADS holders. Accordingly, in order to ensure a valid exercise of withdrawal rights, an ADS holder must cancel his or her ADSs and become a registered shareholder of the Company no later than the date which is five Chilean business days before the shareholders’ meeting at which the vote which would give rise to withdrawal rights is taken, or the applicable record date for withdrawal rights that arise other than as a result of a shareholder vote. Withdrawal rights must then be exercised in the manner prescribed in the notice to shareholders that is required to be sent to shareholders of Chilean public companies advising such holders of their right of withdrawal. If an event occurs that gives rise to withdrawal rights, ADS holders will have a limited time to cancel their ADSs and to become registered shareholders of the Company prior to the record date for the shareholders meeting or other event giving rise to such withdrawal rights. If an ADS holder does not become a registered shareholder of the Company prior to such record date he or she will not be able to exercise the withdrawal rights available to registered shareholders.
Chile has different corporate disclosure and accounting standards than those you may be familiar with in the United States and you may receive less information about us, and the information about us available to you will not be the same as the information available to shareholders of a comparable U.S. company.
There are important differences between Chilean and U.S. accounting and financial reporting standards. As a result, Chilean financial statements and reported earnings generally differ in important respects from those reported based on U.S. accounting and reporting standards. As a foreign private issuer, we are permitted to present our financial statements under Chilean GAAP, with reconciliation to U.S. GAAP, in our Securities Act registration statements and in our filings under the U.S. Securities Exchange Act of 1934, as amended (the “Exchange Act”). We present our financial statements under Chilean GAAP as permitted and, accordingly, the information available to you will differ from the information that would be available to you if we prepared our financial statements under U.S. GAAP. For a description of the principal differences between Chilean GAAP and U.S. GAAP as such differences relate to us, see Note 23 to our audited consolidated financial statements contained elsewhere in this document.
In addition, Chilean disclosure requirements differ from those in the United States in some important respects. For example, Chilean law does not require us to disclose our officers’ compensation on an individual basis and, as a foreign private issuer, we are permitted to report such compensation on an aggregate basis in our Securities Act registration statements and in our Exchange Act filings. Also, Chilean legal restrictions on insider trading and price manipulation are different from those in the United States and in certain respects the Chilean securities markets are not as highly regulated and supervised as the U.S. securities markets.
U.S. securities laws do not require us to disclose as much information to investors as a U.S. issuer is required to disclose, and you may receive less information about us than you might otherwise receive from a comparable U.S. company.
The corporate disclosure requirements applicable to us may not be equivalent to the requirements applicable to a U.S. company and, as a result, you may receive less information about us than you might otherwise receive in connection with a comparable U.S. company. We are subject to the periodic reporting requirements of the Exchange Act that apply to non-U.S. issuers. The periodic disclosure required of non-U.S. issuers under the Exchange Act is more limited than the periodic disclosure required of U.S. issuers. For example:
| · | We are required only to file an annual report on Form 20-F, but we are not required to file any quarterly reports. A U.S. registrant must file an annual report on Form 10-K and three quarterly reports on Form 10-Q. |
| · | We are required to file current reports on Form 6-K, but the information that we must disclose in those reports is governed primarily by Chilean law disclosure requirements and may differ from Form 8-K’s current reporting requirements imposed on a U.S. issuer. |
| · | We are not subject to the proxy requirements of Section 14 of the Exchange Act and our officers, directors and principal shareholders are not subject to the short swing insider trading reporting and recovery requirements under Section 16 of the Exchange Act. |
11
Chilean law provides for fewer and less well-defined shareholders’ rights.
Our corporate affairs are governed by our estatutos (which serve the combined function of the articles of incorporation and the bylaws of a U.S. corporation), and the laws of Chile. Under such laws and our estatutos, our shareholders may have fewer or less well-defined rights than they might have as shareholders of a corporation incorporated in a U.S. jurisdiction. For example, our shareholders would not be entitled to appraisal rights in the event of a merger or other business combination undertaken by us. See “Item 10. Additional Information— Memorandum and Articles of Association—Shareholders’ meetings and voting rights” and “—Dividend and liquidation rights.”
Currency devaluations, foreign exchange fluctuations and foreign currency conversion costs may adversely affect the U.S. dollar value of any cash distributions made to ADS holders in respect of ADSs.
If the value of the Chilean peso falls relative to the U.S. dollar, the value of the ADSs and any distributions to be received from the Depositary for the ADSs could be adversely affected. Cash distributions made in respect of the ADSs are received by the Depositary in Chilean pesos, are then converted by the Depositary into U.S. dollars at the then prevailing exchange rate and distributed to the holders of the ADRs evidencing those ADSs. In addition, the Depositary will incur foreign currency conversion costs (to be borne by the holders of the ADSs) in connection with the foreign currency conversion and subsequent distribution of dividends or other payments with respect to ADSs.
Item 4. Information on the Company
Our Company
Masisa is a leading vertically integrated Latin American wood boards company. We also grow and harvest timber in plantations located in most of the fastest tree growth rate areas in the world and sell our manufactured products primarily to the construction and furniture industries, mainly in Latin America and the United States, as well as to customers in other markets such as Europe and Asia. Our main products include wood boards for furniture, solid wood products, sawn lumber and saw and pulp logs.
In 2006, approximately 56% of our consolidated sales were in the investment grade countries of Chile, Mexico and the United States, which accounted for 16.3%, 13.2% and 26.0%, respectively, of our consolidated sales in that year. The rest of Latin America accounted for approximately 41% of our consolidated sales in 2006 with Brazil, Venezuela, Argentina, Colombia, Peru and Ecuador accounting for 16.4%, 10.4%, 7.9%, 2.8%, 2.4% and 1.1%, respectively, of our consolidated sales in that year. The remaining 3.5% of our consolidated sales in 2006 was from exports to 50 countries outside of Latin America and the United States.
We are a leading wood board manufacturer in Latin America with an annual installed capacity of 2.3 million cubic meters, which accounts for approximately 18% of the region’s installed capacity. Our principal board products include MDF (medium density fiberboard), PB (particle board) and OSB (oriented strand board) that are mainly sold in the Latin American region. Latin American board consumption has grown in the past and is expected to continue to grow due to existing housing deficits and expected higher demand for housing in the Latin American region, particularly in Brazil and Mexico. We believe additional housing activity will generate increased demand for furniture and boards.
In sawn lumber, we have an annual installed capacity of 707,000 cubic meters. We sell our sawn lumber primarily in the Mexican and Venezuelan markets.
In addition, we produce value-added products such as MDF mouldings, finger-joint mouldings and solid wood doors and have an installed annual capacity for each product of 224,400, 168,000 and 42,000 cubic meters, respectively, as of December 31, 2006. These products are sold principally in the United States. In February 2007, as part of a cost reduction program, we closed our 36,000 cubic meter MDF moulding plant located in Charleston, South Carolina. The production line will be relocated, during 2007, to our industrial complex in Cabrero, Chile.
12
In the United States, we have our own commercialization company, Masisa USA. In 2006, Masisa sold approximately one million solid wood pine doors as well as finger-joint and MDF mouldings. We also participate in the structural panels market in the United States, selling OSB produced in our Brazilian operation. We distribute our products in the United States principally through Masonite, as well as wholesale building products distributors such as Builders First Source, OrePack and Weyerhaeuser that resell our products to retailers. Over the last year, principally due to the increase in MDF moulding sales and the increased diversification and more numerous distribution channels for our solid wood door products, we have increased the percentage of our U.S. sales that are made to new customers.
Increasing environmental concerns around the world, coupled with increased demand for wood fiber by pulp and energy producers, have made planted timber a more desirable resource in the forest products industry. We own 241,417 hectares of renewable planted forests (i.e. mainly composed of pines and eucalyptus trees) including 140,734 hectares in Chile, Brazil and Argentina, three of four of the fastest tree growth rate areas in the world, giving us access to a sustainable, low-cost source of raw material. Our forests are managed under international environmental standards, including the International Organization for Standardization’s (“ISO”) 14,001 certification and compliance certifications from the Forestry Stewardship Council (“FSC”), allowing us better access to developed world markets in which compliance with such standards is often of interest to consumers.
In Latin America, Masisa’s business is complemented by a substantial distribution network of independently owned stores selling our products called Placacentros Masisa (“Placacentros”). Board demand in Latin America is highly fragmented due to the importance of general contractors and independent furniture manufacturers. Placacentros are designed to provide services that increase these contractors’ and manufacturers’ productivity and enhance demand for our products. Placacentro stores also offer a variety of products related to furniture manufacturing and provide related services, such as computer aided furniture design, and customized board sizing and drilling, improving our customers’ productivity. The Placacentro concept has been successful in developing our customer base to include more small to medium sized businesses. The network, which is present in 10 countries in the Latin American region, has grown from 49 stores in 2000 to 232 stores in 2004 and 300 stores as of December 31, 2006. Placacentros have been an instrumental factor in allowing us to increase our market share in various Latin American board markets over the last few years, and we believe they have also contributed to the overall growth in several of the markets we have entered. Our board sales through this channel represent approximately 31% of our consolidated board sales (i.e. excluding board exports) for 2006.
Our Competitive Strengths
| · | Leading producer of wood boards for furniture in Latin America. |
We have approximately 22.7% of the total installed wood board for furniture production capacity in the region (i.e. excluding plywood, which in some Latin American countries is utilized for manufacturing furniture), and a capacity approximately 9% greater than our next closest competitor as of December 2006. We own wood board production facilities in Chile, Brazil, Argentina, Venezuela and Mexico, which coupled with our Placacentros distribution network that is present in the majority of the Latin American markets, represent a strong production and commercial network. This regional footprint provides us with commercial flexibility to optimize production and product sales destinations within the region, based on the dynamics of the different Latin American markets.
| · | Strong brand positioning |
In the markets in which we operate, we have developed into a wood products manufacturer whom customers seek out because of our focus on meeting and exceeding our customers’ needs. For example, in Mexico our particle board plant has been certified as “Green Partner,” which will allow us to target customers, such as Asian electronics manufacturers, who would otherwise have to purchase such certified particle board from Asian producers. Providing offerings such as this and continually delivering innovative products and services to our customers has lead to greater customer loyalty and interest and increased consumption of Masisa’s products.
13
| · | Established and expanding distribution network. |
Our Placacentro distribution network has proved successful in Latin America, resulting in growth from 49 stores in 2000 to 220 stores in 2004 and 300 stores as of December 31, 2006. Our Placacentro stores, which are oriented toward independent furniture manufacturers and general contractors, offer a wide range of wood panels, solid wood, accessories and services required by these customers to increase their productivity. Placacentros are an important part of Masisa’s marketing strategy to increase the per capita consumption of Masisa’s products, increase brand awareness and positioning and to create competitive advantages to address the current and future competition by other market participants.
| · | Quality low cost forest resources. |
The location of our forests in fast growth rate areas lowers our raw materials cost, providing us with an important competitive advantage compared to competitors that rely on raw materials from plantations in slower tree growth rate regions. We expect that the progressive maturity of our forests will allow us to increase our annual harvest in the future, and that our consistent forest management practices that we have followed for more than a decade will permit us to improve the quality of our harvested wood, allowing us to add higher quality products to our product mix. Due to increasing environmental concerns around the world and as industrial capacity has started to match industrial forest availability, access to fiber from planted timber plantations has become a strategic asset.
| · | Modern manufacturing facilities and competitive operations. |
48% of our board production capacity, 72% of our moulding production capacity and 86% of our saw mill capacity were built after 2000. Our primary production facilities are located in Chile, Brazil, Argentina and Venezuela where our forests are located. Modern manufacturing facilities, access to low cost raw material, economies of scale derived from the overall size of our operations, and the relatively low labor costs in the Latin American countries in which we operate, provide us with a competitive cost structure.
| · | Geographic diversification. |
We sell our products in every major economy in Latin America as well as the United States. Our largest market, the United States, represents approximately 26% of our sales and our largest Latin American market represents no more than 17% of our sales. This geographic diversification diminishes to a certain extent our vulnerability to market downturns in any one country.
| · | Significant cost advantages in value-added wood products. |
We are able to capitalize on rapid forest growth and low manufacturing costs to achieve a cost advantage in supplying the North American market compared to manufacturers that serve the North American market from other regions in the world.
History and Development of the Company
We are a sociedad anónima abierta, or publicly held corporation, organized under the laws of Chile. We were incorporated into our present form on October 31, 2003 under the name Terranova S.A. Our predecessor company, Forestal Terranova S.A. was incorporated on August 2, 1994. In April 2005, the shareholders of Terranova S.A. and Masisa S.A. approved the merger of the two companies with Terranova as the surviving entity. At the same shareholder meetings, the shareholders of each company approved changing the merged company’s name to Masisa S.A., our legal and commercial name. For additional information regarding the merger see “-The Merger of Terranova and Masisa-.”.
We are controlled by our majority shareholder, Grupo Nueva S.A., formerly known as Compañía de Inversiones Suizandina S.A. Grupo Nueva S.A. is a Chilean holding company and is part of a larger group of affiliated investment companies, held by Nueva Holding, Inc. Our legal domicile is Santiago, Chile and our principal executive office is located at Avenida Apoquindo 3650, Piso 10, Las Condes, Santiago, Chile. Our telephone number is +56 (2) 350-6000. Our agent in the United States is Masisa USA, Inc., which is located at 900 Circle Seventy-five Parkway, Suite 720, Atlanta, Georgia 30339. Masisa USA was formerly known as Terranova Forest Products, Inc.
14
Our history began in the 1970s with a sawmill operation in southern Chile. In the years up to 2002, through acquisitions and other transactions, we and our predecessor companies expanded our forestry assets in Chile, Venezuela and Brazil; acquired and established manufacturing and marketing capabilities in the markets of northern Latin America and the United States in order to allow us to more efficiently utilize our forestry resources; and worked to improve the coordination and management of those resources. During this period, we expanded our operations within Chile to include additional sawmills and facilities to manufacture MDF and market skin and moulded doors. Outside Chile, we significantly expanded to add forestry assets in Venezuela and Brazil, sawmills in Venezuela and Brazil, board manufacturing facilities in Brazil, Argentina and Venezuela, a moulding mill in the United States and distribution and marketing operations in the United States and numerous markets in northern Latin America. As of 2002, our forestry assets and manufacturing operations were held directly and indirectly through our predecessor, Forestal Terranova, with our U.S. operations being coordinated through Forestal Terranova’s subsidiary, Masisa USA, and our non-Chilean subsidiaries and affiliates being held by, and their products marketed through, Terranova Internacional S.A., also known as TISA.
In January 2001, Forestal Terranova subscribed to approximately 81 million newly issued shares of Masisa, giving it an approximate 8.8% interest in Masisa. In July 2002, Forestal Terranova acquired Maspanel’s 43.16% interest in Masisa and became Masisa’s controlling shareholder with 51.9% of Masisa’s total shares then paid and outstanding. Effective as of July 1, 2002, Forestal Terranova began consolidating Masisa into its financial results. On May 27, 2003, Forestal Terranova increased its ownership interest in Masisa to 486,861,555 shares (52.43%) of common stock through open market purchases on the Santiago Stock Exchange.
On November 15, 2005 we increased our participation share in our Chilean forestry company, Forestal Tornagaleones from 60.45% to 94.91% through the purchase of a significant minority shareholder’s interest for US$29.9 million. In addition, during the first quarter of 2006, Forestal Tornagaleones increased its participation share in Forestal Argentina S.A., our Argentinean forestry investment company, from 50.10% to 98.68% through the purchase of aggregate minority shareholders’ interests of 48.58% for approximately US$24.3 million.
At the end of 2005 and beginning of 2006 we successfully completed a capital increase, with total proceeds of US$117.5 million, divided into two phases. The first phase, which was completed on December 7, 2005, yielded proceeds of US$75 million. Of this amount, 66% was placed in the U.S. market via the Company’s ADR program. The second phase of this process was completed on January 5, 2006, upon the completion of a preemptive rights offering period. The principal objectives of the capital increase were to finance the Company’s investment projects, which include a new MDF plant in Chile.
In January 2006, we successfully issued bonds in the Chilean market for UF4.75 million (US$162.95 million). The funds obtained by this bond issuance were primarily used to pay financial obligations of the Company.
In October 2006, we reviewed our corporate strategy, including our core business and competitive strategies, (see “Item 4, - Business Strategy” and “Item 4 Operational Organization”). In this process, we determined our core business to be the production and commercialization of wood boards for furniture and interior architecture (MDF and PB) in Latin America. In addition to our core business of wood boards, we have initiated the restructuring of our forestry assets, solid wood products (i.e. MDF mouldings, finger-joint mouldings and solid wood doors) and retail operations (i.e. Placacentros) from being organized by countries to be organized by business operations, specifically into three complimentary business units that will focus their respective strategies and future investments on supporting the growth of our wood board business. We will continue to carry out the same operations as before, but now they will be organized by business units rather than country. As part of this process, we also established a financial and investment plan that will allow us to strenghthen our existing leading position within the wood board industry in Latin America.
We are committed to sustainable development and are interested in developing activities designed to provide solutions to climate change challenges which are also good business opportunities. In this regard, in December 2006 we joined the Chicago Climate Exchange (“CCX”) and have committed to reduce our carbon emissions by 6% by 2010, which offers the possibility of trading our positive carbon balance at convenient conditions.
15
We expect our new MDF plant at Cabrero, Chile, to start operations by the second half of 2007, and expect it to be operating at full capacity by the beginning of 2008. This new plant will have an installed capacity of 340,000 cubic meters of annual production, thus representing a 15% increase in our existing wood board production capacity.
In February 2007, as part of a cost reduction program, we closed the Charleston MDF moulding plant (i.e. 36,000 cubic meters, representing 9% of our total moulding capacity). Most of the industrial assets previously used at the Charleston, Sout Carolina plant will be relocated to our industrial complex in Cabrero, Chile.
The Merger of Terranova and Masisa
On April 12 and April 13, 2005, respectively, the shareholders of our former majority-owned subsidiary Masisa S.A. and Terranova S.A approved the merger by incorporation of the former Masisa into and with Terranova. At the same shareholder meetings of Masisa and Terranova at which the merger was approved, the shareholders of each company also approved changing the name of the merged company from Terranova S.A. to Masisa S.A.
The merger became effective on May 31, 2005. As a consequence, the company known as Masisa before May 31, 2005 no longer exists. Terranova’s name was changed to Masisa at the effective time of the merger and continues as the surviving entity and is the legal successor of the former Masisa for all purposes.
Corporate Structure
As indicated in the following charts, we and a number of our subsidiaries conduct manufacturing operations. However, most of our sales to third parties are made through Masisa USA, Maderas y Sinteticos Mexico S.A. de C.V., Forestal Terranova Mexico, Masisa Chile, Masisa Argentina, Masisa do Brazil, Masisa Madeiras Ltda., Maderas y Sinteticos del Peru S.A.C., Masisa Ecuador, Fibranova C.A.(Venezuela), Andinos C.A. (Venezuela) and Masisa Colombia. The principal exceptions are Forestal Tornagaleones and Forestal Argentina, which are directly responsible for selling their own products.
16
Our group’s business structure, as of June 15, 2007, is set forth in the following chart:
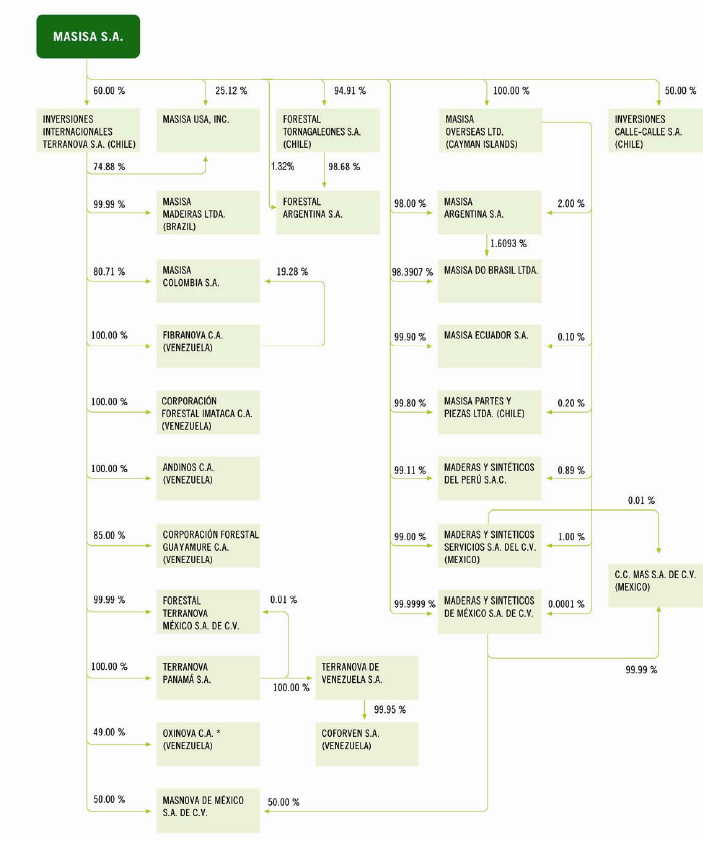
17
The following table shows on a consolidated basis our direct and indirect ownership interest in each of our subsidiaries and affiliates that formed a part of our group as of December 31, 2006 as well as the country of incorporation for each such subsidiary and affiliate. Unless specifically noted otherwise, our ownership interest in each subsidiary and affiliate as of December 31, 2006 was equal to our proportionate voting power in that entity.
Ownership interest | ||||||||||||||||
Country of | 12/31/2006 | 12/31/2005 | ||||||||||||||
Company | Incorporation | Direct | Indirect | Total | Total | |||||||||||
| Inversiones Internacionales Terranova S.A. | Chile | 60.0000 | 0.0000 | 60.0000 | 60.0000 | |||||||||||
| Forestal Tornagaleones S.A. | Chile | 94.9061 | 0.0000 | 94.9061 | 94.9061 | |||||||||||
Masisa Inversiones Limitada 1 | Chile | 0.0000 | 0.0000 | 0.0000 | 100.0000 | |||||||||||
Masisa Concepcion Limitada 2 | Chile | 0.0000 | 0.0000 | 0.0000 | 100.0000 | |||||||||||
Inversiones Coronel Limitada 3 | Chile | 0.0000 | 0.0000 | 0.0000 | 100.0000 | |||||||||||
Masisa Partes y Piezas Limitada4 | Chile | 99.8000 | 0.2000 | 100.0000 | 100.0000 | |||||||||||
| Masisa Overseas Ltd. | Cayman Islands | 100.0000 | 0.0000 | 100.0000 | 100.0000 | |||||||||||
| Maderas y Sinteticos del Perú S.A.C. | Peru | 99.0114 | 0.8897 | 99.9011 | 99.9011 | |||||||||||
| Masisa USA, Inc | U.S. | 25.1200 | 44.9280 | 70.0480 | 70.0480 | |||||||||||
| Maderas y Sinteticos Servicios S.A. de C.V. | Mexico | 99.0000 | 1.0000 | 100.0000 | 100.0000 | |||||||||||
| Masisa Ecuador S.A. | Ecuador | 99.9000 | 0.1000 | 100.0000 | 100.0000 | |||||||||||
| Masisa Do Brasil Ltda. | Brazil | 98.3907 | 1.6093 | 100.0000 | 100.0000 | |||||||||||
| Maderas y Sinteticos Mexico S.A. de C.V. | Mexico | 99.9999 | 0.0001 | 100.0000 | 100.0000 | |||||||||||
| Terranova Panama S.A. | Panama | 0.0000 | 60.0000 | 60.0000 | 60.0000 | |||||||||||
| Terranova de Venezuela S.A. | Venezuela | 0.0000 | 60.0000 | 60.0000 | 60.0000 | |||||||||||
| Coforven S.A. | Venezuela | 0.0000 | 59.9700 | 59.9700 | 59.9700 | |||||||||||
| Forestal Terranova Mexico S.A. de C.V. | Mexico | 0.0000 | 59.9940 | 59.9940 | 59.9940 | |||||||||||
| Cor.Forestal Guayamure C.A. | Venezuela | 0.0000 | 51.0000 | 51.0000 | 51.0000 | |||||||||||
| Masisa Madeiras Ltda. | Brazil | 0.0000 | 59.9940 | 59.9940 | 59.9940 | |||||||||||
| Masisa Colombia S.A. | Colombia | 0.0000 | 59.9940 | 59.9940 | 59.9940 | |||||||||||
| Cor.Forestal Imataca C.A. | Venezuela | 0.0000 | 60.0000 | 60.0000 | 60.0000 | |||||||||||
| Andinos C.A. | Venezuela | 0.0000 | 60.0000 | 60.0000 | 60.0000 | |||||||||||
Forestal Argentina S.A. 5 | Argentina | 0.0000 | 93.6530 | 93.6530 | 47.5480 | |||||||||||
| Masisa Argentina S.A. | Argentina | 98.0000 | 2.0000 | 100.0000 | 100.0000 | |||||||||||
| Fibranova C.A. | Venezuela | 0.0000 | 60.0000 | 60.0000 | 60.0000 | |||||||||||
| Masnova S.A. | Mexico | 0.0000 | 80.0000 | 80.0000 | 80.0000 | |||||||||||
CC Mas S.A de C.V. 6 | Mexico | 0.0000 | 100.0000 | 100.0000 | 0.0000 | |||||||||||
| (1) | Masisa Inversiones Limitada was merged into Masisa S.A. during 2006. |
| (2) | Masisa Concepcion Limitada was merged into Masisa S.A. during 2006. |
| (3) | Inversiones Coronel Limitada was merged into Masisa S.A. during 2006. |
(4) During March 2007, 100% of Masisa Partes y Piezas Limitada’s assets were sold to third parties.
(5) On January 6, 2006, our subsidiary Forestal Tornagaleones S.A. acquired an additional 22,406,455 shares of Forestal Argentina S.A., equivalent to 48.58% of Forestal Argentina’s equity. Prior to this, Forestal Tornagaleones S.A. owned 50.1% of Forestal Aregentina S.A. Forestal Tornagaleones S.A. paid cash in the amount of US$ 24.34 million for these shares and registered negative goodwill for the excess cash paid over the book value of the net assets received. On May 15, 2007, we acquired a 1.32% ownership stake in Forestal Argentina S.A. for US$2.3 million. As a result of this transaction, the ownership structure of Forestal Argentina S.A. is as follows: Forestal Tornagaleones S.A. owns 98.68% and Masisa owns the remaining 1.32%. On May 31, 2007, we entered into a binding agreement with Los Boldos, S.A., a subsidiary of Diversified International Timber Holdings LLC, and Grupo Nueva S.A., to sell 90% of our ownership in Forestal Argentina S.A. This sale is subject to customary closing conditions and approval by Argentina’s National Border Zone Commission.
(6) On August 22, 2006, the subsidiaries Maderas y Sintéticos de México S.A. de C.V. and Maderas y Sintéticos Servicios S.A. de C.V. created a subsidiary denominated CC Mas S.A. de C.V., this subsidiary is a variable capital closed corporation. Maderas y Sintéticos de México S.A. de C.V. owns 99.99% of CC MAS S.A. de C.V. and Maderas y Sintéticos Servicios S.A. de C.V. owns 0.01%.
The Grupo Nueva Group and Our Management Framework
We are controlled by the Grupo Nueva group, or Nueva Holding, Inc., a Panamanian company, which through its Chilean subsidiaries Grupo Nueva S.A. and Inversiones Forestales Los Andes S.A., owned a 76.38% interest in us prior to the merger between us and our former subsidiary Masisa. As a result of and immediately following the merger, Grupo Nueva S.A. beneficially owned in the aggregate approximately 59.5% of the outstanding shares of the merged company. However, following the completion of our capital increase in January 2006, Grupo Nueva’s interest in us was reduced to 52.8%. As of December 31, 2006, Grupo Nueva owned 53.3% of Masisa S.A. For additional information regarding our capital increase, see “Item 5— Operating and Financial Review and Prospects”. Grupo Nueva S.A. is, directly and indirectly, a wholly owned subsidiary of Nueva Holding, Inc. Inversiones Forestales Los Andes is, directly and indirectly, a wholly owned subsidiary of Grupo Nueva S.A. In addition, Grupo Nueva owns directly a 40% interest in our subsidiary IITSA and, as a result, owns 40% of IITSA’s interest in many of our indirect international subsidiaries.
18
As part of the Grupo Nueva group, we adhere to certain common management principles. These principles include management and business practices which promote high standards of business ethics and compliance with the law, as well as the use of practices that promote cultural development and social and environmentally responsible objectives. For further information on Grupo Nueva, please refer to its website at http:\\www.gruponueva.com. We are not incorporating the contents of the Grupo Nueva website into this annual report.
Business Strategy
2006 was a year of growth and consolidation for Masisa. After the successful merger process carried out in 2005 that established the base for our long-term growth, in 2006 we focused on reviewing our competitive strategy for becoming the leading wood board company for furniture and interior architechture in Latin America with a long-term vision assuring the sustainable profitability of the business. Based on this review process, in October 2006 we determined our core business to be the production and marketing of wood boards for furniture and interior architecture in Latin America. This strategic decision provides a focus for operations, enabling us to prioritize our activities and align our efforts and those of our business partners, creating innovative products and services that meet the needs of our customers and generate shareholder value.
Starting in 2007, Masisa was structured in four business units: boards (our core business); forestry; solid wood; and retail. The three complimentary business units focus their respective strategies and future investments to enhance the core board business, while continuing to generate value for our shareholders.
The following are the key aspects of our competitive strategy:
Strong customer awareness
As the only company in the Latin America wood board industry with an affiliated retail chain focused on carpenters and small furniture manufacturers, we are able to directly serve these customers through our Placacentros. Our strong focus on meeting and exceeding our customers' needs has allowed us, for example, to reach strategic commercial alliances with large furniture manufacturers in Brazil. Through these alliances, we are able to provide the participating furniture manufacturers with special services and exclusive melamine designs which are tailor made to meet the needs of their respective customers.
Based on recent independent market research, we believe we are the leading company in Latin America in terms of both market recall and top of mind. The market research results support the success of our marketing efforts as the Masisa brand name for survey participants reached approximately 74% and 50% market recall and a 44% and 27% top of mind in the distributor and carpenter market segments, respectively.
Focus on product innovation and addressing customer needs
In the markets in which we operate, we have developed into a wood products manufacturer whom customers seek out because of our ability to meet and exceed their respective needs. Our ability to develop new products plays an important part in meeting and exceeding such demands. For example, in Chile, we recently started marketing our “native wood” melamine designs to carpenters and small furniture manufacturers and are currently developing similar products in most of the other markets in which we operate. In addition, we are the only company in Latin America to produce and market E-1 standard wood boards (i.e., low formaldehyde emissions). The Masisa Nature board, produced by our Ponta Grossa facility in Brazil, is currently used by Bausch Decor, a decorative prints manufacturer, which recently received a Best of the Best Interzum Awards as one of the top eight most innovative products in the supplier industry. With this product, Masisa became the first company in the world to manufacture boards for the furniture industry using Syncrone Pore technology, which assures perfect synchronism between melamine design and wood-like texture. Also, in Mexico, our particle board plant has been certified as "Green Partner," which will allow us to target customers, such as Asian electronics manufacturers, who would otherwise have to purchase such certified particle board from Asian producers. Providing offerings such as these and continually delivering innovative products and services to our customers has lead to greater customer loyalty and interest and increased consumption of Masisa's products.
19
Leverage growth opportunities in Latin America.
We believe the increasing use of wood boards in the Latin American furniture industry, along with the unmet housing demand in countries in the region, will be sources of future growth for us. Based on this growth outlook, we are evaluating the possible construction of new industrial plants and/or entering into associations with existing market participants, mainly in Brazil.
Expand and enhance the Placacentro distribution network.
We plan to maintain a strong customer-focused approach throughout the production and distribution chain and continue to build upon our strong distribution network. We aim to focus upon our well-established Placacentro distribution network. We intend to continue with Masisa’s Placacentro network development program in Chile, Brazil, Argentina, Peru, Mexico, Ecuador, Paraguay, Colombia, Venezuela and Uruguay and to extend the Placacentro concept to new countries in the medium term as well. We plan to reach approximately 360 Placacentros branded stores in the region by the end of 2008. We aim to leverage our Placacentro network by offering a broader product mix, including more of our own products as well as third party products such as accessories and complementary products. We intend to develop the best store format in the best locations and offer a complete range of products and services targeted to carpenters and small and medium size furniture producers in order to become their preferred supplier through a “one stop shopping” concept. We will work closely with our customers to offer specific solutions to problems they face and to better satisfy their needs. We believe that the expansion of the Placacentro distribution network program will further enhance Masisa’s brand name and the distribution of its products.
Continue to focus on sustainable development.
Environmentally we seek to find more efficient uses of raw materials and by-products, and to continuously improve the environmental impact of our affiliates. With respect to social responsibility, our goal is that our operations and businesses have a positive impact on the surrounding communities and on our business partners. The aim of this strategic focus is to reduce environmental risk and allow us to meet customer demand for products manufactured and marketed pursuant to international environmental standards.
A key component to our commitment towards sustainable development is our recent membership in the CCX, the first carbon bond stock market in the world. Our entrance into the CCX provides business and shareholder value generation opportunities for us. As examples of these opportunities, we have aligned our forestry expansion plans with our efforts to develop sustainable forests from which we can source our wood fiber needs and we are able to focus on improving our energy efficiency, as approximately 12% of our total consolidated production costs correspond to energy costs. Additionally, our membership in the CCX has strengthened the Masisa® brand as a leading company committed to addressing the effects of global warming, as we have committed to reduce our greenhouse gas emissions by 6% by the year 2010.
Operational Organization
Prior to the merger between Terranova and Masisa, our businesses were organized by geographic segments within each of Terranova and its subsidiary Masisa. For example, we had a “Chile” segment for Terranova and a separate “Chile” segment for Masisa. Our operations within each of those geographic segments were managed by country heads with administrative, financial and treasury, marketing and related support services being provided out of Terranova’s and Masisa’s respective corporate offices.
20
Since the merger, we have combined our operations in each significant jurisdiction in which we operate, resulting in only one segment with respect to each such jurisdiction. During 2006, we managed our operations within each geographic segment through a country head with responsibility for the overall operations in that jurisdiction, including the manufacturing, marketing and distribution of all products, as well as responsibility for the financial performance of our activities in that jurisdiction. Operations, sales and marketing support services and assistance with respect to boards, solid wood and forestry products were provided to each country head by senior officers in our corporate offices who were organized into divisions—boards, solid wood and forestry—and who have company-wide responsibility for the products in their areas. Some general administrative, financial and treasury, and related support services were provided throughout the Company from our corporate offices.
In October 2006, we undertook a review of our corporate strategy and determined our core business to be the production and marketing of wood boards for the furniture and interior architecture in Latin America. As part of this review, we modified our structure to create four separate business units, namely wood boards (core business), forestry, solid wood and retail. Starting in 2007, Masisa implemented this new operational structure. We are currently implementing this new operational structure across all of our operating subsidiaries and expect that this process will be completed by late 2007 or early 2008. In addition, it is possible that our new operational structure will result in changes in our segment reporting structure from a geographic basis to a business unit basis.
Facilities and Offices
The map below illustrates the location of our principal offices, forests, production facilities and Placacentros as of December 31, 2006. In February 2007, as part of a cost reduction program, we closed our 36,000 cubic meter per year MDF moulding plant located in Charleston, South Carolina. Most of this production line will be relocated during 2007 to our Cabrero industrial complex in Chile.
For information regarding our offices, plantations, forests, production and processing facilities, see “—Description of Properties” in this Item.
21
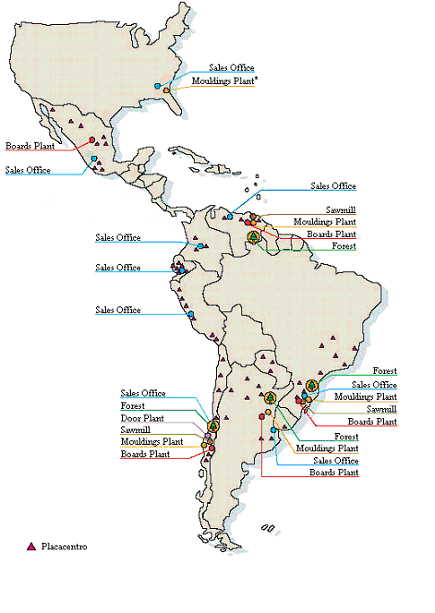
(*) Our MDF moulding plant in Charleston, South Carolina, was closed in February 2007. Most of this production line will be relocated during 2007 to our Cabrero industrial complex in Chile.
Description of Properties
The following tables show our material properties, excluding our forestry holdings, as of December 31, 2006 and include information regarding the size (in square meters) and use of the properties, as well as whether the properties are leased, owned or used pursuant to service agreements. Service agreements are contracts to use a variable amount of space or services in a facility managed by a service provider and therefore do not constitute a lease. For information regarding our forestry holdings, see “—Forestry Operations—Land ownership and rights” in this Item.
22
LAND / PROPERTIES
Location | Country | Function | Leased/ Owned/ Service (**) | Size (square meters) | ||||
| Santiago (Apoquindo) | Chile | Administrative | Leased | 523.00 | ||||
| Santiago (Apoquindo) | Chile | Administrative | Owned | 1,566.00 | ||||
| Cabrero | Chile | Production | Owned | 56,064.00 | ||||
| Chillán | Chile | Production | Owned | 17,739.00 | ||||
| Cabrero | Chile | Production | Owned | 26,391.00 | ||||
| Concepción (Chiguayante) | Chile | Production | Owned | 13,346.00 | ||||
| Concepción (Coronel) | Chile | Production | Owned | 28,877.00 | ||||
| Valdivia (Valdivia) | Chile | Production | Owned | 37,753.00 | ||||
| Valdivia (Carlos Puschmann) | Chile | Production | Owned | 12,731.00 | ||||
| Antofagasta | Chile | Distribution | Service | 2,125.00 | ||||
| Concepción | Chile | Distribution | Service | 3,009.00 | ||||
| Concepción (Cintac) | Chile | Distribution | Leased | 7,000.00 | ||||
| Santiago | Chile | Distribution | Service | 10,000.00 | ||||
| Valdivia | Chile | Distribution | Service | 3,176.00 | ||||
| Menque | Chile | Production | Owned | 21,886.00 | ||||
| Temuco | Chile | Administrative | Leased | 150.00 | ||||
| Linares | Chile | Administrative | Leased | 60.00 | ||||
| Curitiba | Brazil | Administrative | Leased | 900.00 | ||||
| Paraná | Brazil | Administrative | Owned | (included in production facilities) | ||||
| Rio Grande do Sul | Brazil | Administrative | Leased | 80.00 | ||||
| Santa Catarina | Brazil | Administrative | Owned | 2,062.00 | ||||
| Paraná | Brazil | Production | Owned | 59,558.00 | ||||
| Santa Catarina | Brazil | Production | Owned | 70,458.00 | ||||
| Paraná | Brazil | Distribution | Owned | (included in production facilities) | ||||
| Rio de Janeiro | Brazil | Administrative | Leased | 120.00 | ||||
| Porto Alegre | Brazil | Distribution | Leased | 4,200.00 | ||||
| Sao Paulo | Brazil | Distribution | Leased | 5,000.00 | ||||
| Recife | Brazil | Distribution | Leased | 3,000.00 | ||||
| Bogotá D.C. | Colombia | Administrative | Leased | 250.00 | ||||
| Cucuta | Colombia | Distribution | Service | 7,500 | ||||
| Bogota | Colombia | Distribution | Service | 510.00 | ||||
| México D.F. | Mexico | Distribution | Service | 2,700.00 | ||||
| México D.F. | Mexico | Administrative | Leased | 271.00 | ||||
| Durango | Mexico | Production | Owned | 176,891.00 | ||||
| Durango | Mexico | Administrative | Owned | 8,102.00 | ||||
| Durango | Mexico | Distribution | Owned | 47,746.00 | ||||
| Altamira. Tamaulipas | Mexico | Distribution | Owned | 36,148.00 | ||||
| Tampico | Mexico | Distribution | Leased | 9,000.00 | ||||
| Atlanta | United States | Administrative | Leased | 568.00 | ||||
| Charleston (*) | United States | Administrative | Owned | 557.00 | ||||
| Charleston (*) | United States | Production | Owned | 11,148.00 | ||||
| Charleston (*) | United States | Distribution | Owned | 7,432.00 | ||||
| Baltimore | United States | Distribution | Service | 5,574.00 |
23
LAND / PROPERTIES
Location | Country | Function | Leased/ Owned/ Service (**) | Size (square meters) | ||||
| Long Beach | United States | Distribution | Service | 1,858.00 | ||||
| Houston | United States | Distribution | Service | 2,323.00 | ||||
| Oakland | United States | Distribution | Service | 1,394.00 | ||||
| Savannah | United States | Distribution | Service | 3,252.00 | ||||
| Bolívar | Venezuela | Administrative | Leased | 278.00 | ||||
| Bolívar | Venezuela | Administrative | Leased | 160.00 | ||||
| Bolívar | Venezuela | Administrative | Leased | 120.00 | ||||
| Caracas | Venezuela | Administrative | Leased | 218.20 | ||||
| Caracas | Venezuela | Administrative | Leased | 328.00 | ||||
| Estado Anzoátegui | Venezuela | Production | Owned | 43,000.00 | ||||
| Estado de Carabobo | Venezuela | Distribution | Leased | 12,000.00 | ||||
| Buenos Aires | Argentina | Administrative | Leased | 600.00 | ||||
| Entre Ríos | Argentina | Production | Owned | 57,400.00 | ||||
| Lima | Peru | Administrative | Leased | 136.00 | ||||
| Lima | Peru | Distribution | Service | 3,000.00 | ||||
| Guayaquil | Ecuador | Administrative | Leased | 90.00 | ||||
| Guayaquil | Ecuador | Distribution | Service | 3,000.00 |
(*) Our MDF moulding plant was closed in February 2007. Most of this production line will be relocated during 2007 to our Cabrero industrial complex in Chile. Administrative functions in the United States will now be concentrated in Atlanta.
(**) Service includes property lease and other services, including, but not limited to, storage, maintenance.
A discussion of environmental issues that affect our business generally is presented below under “—Environmental regulation”.
Capital Expenditures
For a description of our principal capital expenditures, see “Item 5. Operating and Financial Review and Prospects—Liquidity and Capital Resources—Investing activities.”
Principal Products
The following table sets forth the sales of each of our principal products as a percentage of our total consolidated net sales for the years ended December 31, 2004, 2005 and 2006:
OUR PRODUCTS
Year ended December 31, | ||||||||||
| (as a percentage of consolidated net sales) | 2004 | 2005 | 2006 | |||||||
MDF | 33.2 | % | 33.6 | % | 36.1 | % | ||||
Particle board | 19.3 | % | 20.7 | % | 21.1 | % | ||||
Finger-joint mouldings | 12.5 | % | 11.2 | % | 10.6 | % | ||||
Sawn lumber | 8.6 | % | 9.0 | % | 8.2 | % | ||||
MDF mouldings | 5.0 | % | 6.4 | % | 7.3 | % | ||||
OSB | 8.2 | % | 8.0 | % | 5.5 | % | ||||
Saw and pulp logs | 4.2 | % | 4.0 | % | 4.8 | % | ||||
Solid-wood doors | 5.8 | % | 4.4 | % | 4.5 | % | ||||
Other products(1) | 3.2 | % | 2.7 | % | 1.9 | % | ||||
Total | 100.0 | % | 100.0 | % | 100.0 | % | ||||
(1) Includes principally wood chips, sawdust, door parts, fiberboard doors and wood plies.
24
MDF (Medium density fiberboard)
MDF is manufactured by removing the fibers from wood chips and sawdust, mixing the wood fiber pulp with adhesives and forming the mixture into flat sheets which are dried, heated, pressed, cooled, cut-to-size and finished. MDF has broad applications in furniture, cabinet and millwork manufacturing. Machining qualities make MDF well-suited for the production of pieces with critically shaped and profiled edges. Its uniformly dense surface gives superior results when grain-printed or painted. MDF shapes and routs with precision, drills easily and cuts cleanly. It is an effective core material for high-pressure laminates, fast-cycle melamine and veneers. MDF is more versatile than particle board. However, compared to the production of particle board, the MDF production process requires higher-quality wood, a greater quantity of adhesives and more energy. Due to its resulting higher production costs, MDF generally commands a higher price than particle board of the same thickness. We produce all the standard thicknesses and densities of MDF, including thin-MDF, melamine-laminated MDF and a small amount of wood-veneered MDF. Melamine-laminated MDF is MDF covered on one or both sides with paper impregnated with melamine, a plastic laminate. We also produce a high density MDF to be used for flooring. We market our MDF under the brand name “MDF Masisa.” For the year ended December 31, 2006, MDF sales represented 36.1% of our consolidated net sales compared to 33.6% for the same period in 2005.
Particle board
Raw particle board is manufactured by mixing wood chips, wood shavings and sawdust with adhesives and rolling or pressing the mixture into large flat sheets of varying sizes and thickness, which are then cut-to-size, quality-analyzed and packaged. Raw particle board is used in a variety of applications in the construction industry, such as ceilings, floors and closets, and is also widely used in the manufacture of furniture. We produce different types of raw particle board that are marketed under the brand names “Placa Masisa,” “Masisa Panel,” “Ecoplac,” “Facilplac” and “HR100.” We also produce melamine-laminated particle boards which are raw particle boards covered on one or both sides with paper impregnated with melamine. Melamine-laminated boards are widely used in the manufacture of furniture and cabinets and are also used in construction for walls, counters and in other applications. Melamine-laminated board sales generate a higher margin than raw particle board sales. For the year ended December 31, 2006, particle board sales accounted for 21.1% of our consolidated net sales compared to 20.7% for the same period in 2005.
Particle board competes, in certain uses, with gypsum and asbestos-cement boards, as well as solid wood, plywood, fiber board (including both hard board and MDF) and OSB. MDF and particle board are competing products in some applications in the furniture industry. Lumber and gypsum board are the main competing products in the construction industry. Plywood may also be substituted for particle board, MDF and OSB in certain applications.
Finger-joint mouldings
Finger-joint mouldings are produced from small pieces of wood which have been cross-cut and dried. The drying process is followed by a surfacing procedure in which any knots, imperfections or irregularities are extracted. The wood pieces are then joined, shaped and packaged for distribution. We offer four types of mouldings including raw mouldings, painted mouldings, jesso mouldings and stiles. These mouldings are ornamental strips used to decorate a surface, and are often used to accent or emphasize the ornamentation of a structure or to conceal surface areas or angle joints. For the year ended December 31, 2006, finger-joint moulding sales represented 10.6% of our consolidated net sales compared to 11.2% for the same period in 2005.
Sawn lumber
We produce green and kiln dried sawn lumber from timber harvested from forestry plantations. The timber is sawn into logs, debarked and classified according to its diameter and length. The lumber is sawn into various sizes. Our sawmills produce high quality dried lateral wood from the outer portion of the log for the re-manufacturing process and lower quality dried center wood from the center portion of the log. In Chile and Brazil, the lateral wood is used for manufacturing finger-joint mouldings, door frames, boards, sidings and furniture as well as doors, which are manufactured only in Chile. The center wood is used for manufacturing, packaging and construction. For the year ended December 31, 2006, sales of sawn lumber represented 8.2% of our consolidated net sales compared to 9.0% for the same period in 2005.
25
MDF mouldings
We manufacture our MDF mouldings from superior, ultra-light MDF (32 pounds per cubic foot density) which makes them comparable to any standard wood moulding. Their light weight substantially reduces the cost disadvantages associated with transportation, handling and installation of standard density MDF mouldings. We manufacture primed and jesso-coated MDF mouldings. We offer a wide range of patterns for our mouldings, including the casing and base, crowns, jambs and S4S boards. We produce MDF mouldings in 7, 8, 10, 14 and 16 foot lengths. For the year ended December 31, 2006, MDF moulding sales represented 7.3% of our consolidated net sales compared to 6.4% for the same period in 2005.
OSB (Oriented strand board)
OSB is structural panel board manufactured from pulp logs. The logs are debarked and reduced to thin wood strands. The strands are put into a drying machine to remove humidity from the wood in order to avoid shrinkage and swelling during use. The dried wood strands are placed into a blending machine where they are mixed with chemical adhesives. The resin-blended strands are then mechanically aligned into several layers in a forming line, with each layer laid down separately along the conveyor belt, to build up a mat. This mat is cut-to-size compressed and heated in the main press to form the boards. The compressed and heated boards are then cooled and finished. OSB’s outstanding physical-mechanical properties make the boards highly suitable for use in applications requiring great structural resistance, such as those that occur in the construction and packaging industries. Our Masisa OSB is marketed under the “Masisa OSB” brand name, and is manufactured at Masisa’s Brazilian plant. For the year ended December 31, 2006, OSB sales represented 5.5% of our consolidated net sales compared to 8.0% for the same period in 2005.
Saw and pulp logs
We sell saw and pulp logs directly and through our subsidiaries Terranova Venezuela, Masisa Madeiras, Forestal Tornagaleones, Forestal Argentina and Masisa do Brasil. For the year ended December 31, 2006, saw and pulp log sales represented 4.8% of our consolidated net sales compared to 4.0% for the same period in 2005.
Solid wood doors
We manufacture solid wood interior stile and rail doors in Chile, and market them under the brand name “Masisa.” Our doors are manufactured in a range of thicknesses, heights and widths to fit standard doorways and closets. Masisa doors are available in a variety of styles and are manufactured from solid pine wood with engineered stiles and rails that are edge-glued, finger-jointed and laminated with clear veneer. They are also available with solid raised panels with a characteristic double hip pattern, emphasizing the relief. Our solid wood doors are distributed throughout the United States principally by Masonite International Corporation. However, as a result of the Company’s distribution strategy for the U.S. market, which aims to diversify its distribution network, as of December 31, 2006 approximately 60% of our total doors sales in the United States were made through Masonite compared to approximately 98% of our total door sales for the same period in 2005. For the year ended December 31, 2006, door sales represented 4.5% of our consolidated net sales compared to 4.4% for the same period in 2005.
Other products
Other products include principally wood shavings, wood chips, sawdust, door parts, fiberboard doors and pine veneer wood plies. We manufacture fiberboard doors in Chile, which are marketed under the brand name “Exit.” The manufacture of our doors is the most labor intensive of our businesses. Our doors are made with a cardboard honeycomb core. Our wood shavings, wood chips and sawdust are byproducts of our sawmill and industrial operations and are sold to pulp manufacturers and other third party manufacturers. Wood plies, which we sell to third parties, are sheets of solid wood coiled off of saw logs and serve as the principal raw material for plywood.
26
On a consolidated basis, all of our “other products” accounted for 1.9% of our consolidated net sales for the year ended December 31, 2006 and 2.7% for the same period in 2005.
Wood Products Sales
The following tables show our consolidated net sales of our principal wood products in millions of U.S. dollars and physical volume in cubic meters for the years ended December 31, 2004, 2005 and 2006.
CONSOLIDATED SALES OF OUR PRINCIPAL WOOD PRODUCTS
Year ended December 31, | ||||||||||
| (in millions of US$) | 2004 | 2005 | 2006 | |||||||
MDF | 215.9 | 250.2 | 319.6 | |||||||
Particle board | 125.9 | 154.0 | 187.5 | |||||||
Finger-joint mouldings | 81.5 | 83.1 | 94.1 | |||||||
Sawn lumber | 56.9 | 66.6 | 72.9 | |||||||
MDF mouldings | 32.8 | 47.3 | 65.2 | |||||||
OSB | 53.4 | 59.7 | 48.3 | |||||||
Saw and pulp logs | 27.1 | 30.1 | 42.7 | |||||||
Solid-wood doors | 37.9 | 32.8 | 39.6 | |||||||
CONSOLIDATED SALES OF OUR PRINCIPAL WOOD PRODUCTS
Year ended December 31, | ||||||||||
| (in thousands of cubic meters) | 2004 | 2005 | 2006 | |||||||
Saw and pulp logs | 1,361.4 | 1,197.0 | 1,426.4 | |||||||
MDF | 931.6 | 880.9 | 978.2 | |||||||
Particle board | �� | 649.7 | 700.1 | 763.7 | ||||||
Sawn lumber | 299.7 | 327.8 | 343.4 | |||||||
OSB | 241.6 | 261.1 | 219.9 | |||||||
Finger-joint mouldings | 171.6 | 180.0 | 190.4 | |||||||
MDF mouldings | 90.3 | 113.7 | 157.9 | |||||||
Solid-wood doors | 42.6 | 35.7 | 42.5 | |||||||
Total sales of our principal wood products, which increased by 20% during 2006 compared to 2005, mainly due to a general increase in prices as well as a general increase in volume for most of our principal products, are dependent, to a significant extent, on the condition of the economies in the United States, Mexico, Chile, Venezuela, Argentina and Brazil, our principal markets. In particular, sales of our processed wood products are related to the levels of activity in the construction and furniture industries in those countries. Construction activity is subject to cyclical fluctuations due to changes in economic conditions, interest rates, population growth and other economic and demographic factors. An economic downturn in any of those countries is likely to materially adversely affect its construction industry and, accordingly, sales of our products.
The “do-it-yourself,” new residential construction industry and re-modeling industry in the United States, as well as the construction and pallet manufacturing industries in Mexico are the principal end-users of our solid wood products. The furniture manufacturing industries in Chile, Argentina, Mexico, Brazil and Venezuela are the principal users of our board products. In addition, we market our boards in Colombia, Peru, Ecuador and Uruguay. See “Item 5. Operating and Financial Review and Prospects.”
The international market for our processed wood products is highly competitive in terms of price and quality. We compete with producers from the United States, Canada, Chile, Brazil, New Zealand and China. Competitive factors within a market area generally include price, species and grade of the logs used in the production of the end-product, proximity to wood consuming facilities and ability to meet customers’ requirements. Environmental certification has also become a point of differentiation. In numerous markets and in the United States in particular, wood products manufacturers are increasingly encouraged or required to supply environmentally certified finished product. Our production facilities and plantations have been certified under ISO 14,001 and OHSAS 18,001, and our plantations have received the Forest Stewardship Certification (FSC). The FSC certifies that the wood in a product, whether a finished product or an intermediate product, is produced in accordance with FSC standards.
27
Markets and Distribution
We present the information of our company by country within each of our “solid wood and forestry” and “boards” business groups. These country segments include, for our solid wood and forestry businesses, the United States, Chile, Brazil, Mexico and Venezuela, and for our board businesses, Chile, Argentina, Brazil and Mexico.
In the United States, we operate through our subsidiary Masisa USA. In this market, we sell approximately one million solid wood pine doors per year as well as finger-joint and MDF mouldings. We distribute our products in the United States principally through regional distributors that resell our products to retailers. Historically, we also participated in the United States structural panels market, selling OSB produced in our Brazilian operation. However, OSB exports to the United States from Brazil were suspended during the second half of 2006 given the slowdown of the U.S. construction industry, that resulted in unfavorable market conditions for this product. Currently, we are selling and marketing our OSB production mainly in Latin America, East Europe and Asia.
In Latin America, Masisa started its Placacentro program in 1991 in order to broaden its distribution channels, stimulate and increase demand for its products, improve volume security and achieve closer contact with its customers. Placacentros are licensed or franchised retail stores distributed across Latin America, operating under the same brand and business format. These stores focus on independent furniture manufacturers and general contractors and offer a wide range of wood panels, solid wood, accessories and services required by these customers to increase their productivity. Placacentro operators receive training and technical assistance from Masisa, regarding products and their applications, as well as “best practices” in store operations and sales and marketing issues. Placacentros are an important part of Masisa’s marketing strategy to increase the per capita consumption of Masisa’s products, increase brand awareness and positioning and to create competitive advantages to address the current and future competition by other market participants. We also hope to create and capture a greater portion of the profit pool in the value chain. Masisa has developed its Placacentro distribution network in Chile, Mexico, Brazil, Argentina, Peru, Ecuador, Colombia, Venezuela, Paraguay and Uruguay. As of December 31, 2006, 52 Placacentros stores were operating in Chile, 47 in Argentina, 21 in Peru, 40 in Brazil, 71 in Mexico, 15 in Ecuador, 3 in Paraguay, 28 in Colombia, 22 in Venezuela and 1 in Uruguay. The Company expects to grow its network by approximately 19 new stores primarily in these Latin American countries during 2007.
The following table sets forth our aggregate sales as a percentage of consolidated net sales in each of our principal markets by destination for the years ended December 31, 2004, 2005 and 2006.
OUR MARKETS
Year ended December 31, | ||||||||||
| (as a percentage of consolidated net sales) | 2004 | 2005 | 2006 | |||||||
United States | 29.2 | % | 28.0 | % | 26.0 | % | ||||
Brazil | 14.1 | % | 14.0 | % | 16.4 | % | ||||
Chile | 16.8 | % | 16.5 | % | 16.3 | % | ||||
Mexico | 16.1 | % | 15.0 | % | 13.2 | % | ||||
Venezuela | 6.0 | % | 8.3 | % | 10.4 | % | ||||
Argentina | 6.7 | % | 7.6 | % | 7.9 | % | ||||
Other countries | 11.1 | % | 10.6 | % | 9.8 | % | ||||
Total | 100.0 | % | 100.0 | % | 100.0 | % | ||||
28
The following table sets forth our aggregate sales for each of our principal markets by destination for the years ended December 31, 2004, 2005 and 2006.
OUR MARKETS
Year ended December 31, | ||||||||||
| (in millions of US$) | 2004 | 2005 | 2006 | |||||||
United States | 190.0 | 208.1 | 230.2 | |||||||
Brazil | 91.6 | 104.5 | 145.7 | |||||||
Chile | 109.3 | 122.4 | 144.4 | |||||||
Mexico | 105.1 | 111.8 | 117.2 | |||||||
Venezuela | 39.0 | 62.0 | 92.4 | |||||||
Argentina | 43.4 | 56.3 | 69.6 | |||||||
Other countries | 72.6 | 78.9 | 87.0 | |||||||
Total | 651.0 | 744.0 | 886.5 | |||||||
United States
General
For the 12 months ended December 31, 2006, GDP grew 3.3%, inflation was 3.2% and the trade balance deficit was US$765.3 billion. At December 31, 2006, the unemployment rate was 4.6%. The U.S. economy experienced moderate growth because of an increase in customer demand and business investment spending.
The following table shows our sales of finger-joint mouldings, solid wood doors, MDF mouldings and, OSB, MDF and other products in the United States in millions of U.S. dollars for the indicated periods.
UNITED STATES
PRINCIPAL WOOD PRODUCTS SALES
Year ended December 31, | ||||||||||
| (in millions of US$) | 2004 | 2005 | 2006 | |||||||
Solid Wood and Forestry | ||||||||||
Finger-joint mouldings | 81.4 | 83.0 | 93.9 | |||||||
Solid wood doors | 37.3 | 32.1 | 38.7 | |||||||
Boards | ||||||||||
MDF mouldings | 32.6 | 46.3 | 64.5 | |||||||
OSB | 30.8 | 39.7 | 22.5 | |||||||
MDF | 4.2 | 2.4 | 2.1 | |||||||
Marketing and distribution
The United States is Masisa’s most significant market as measured by aggregate sales. Our total consolidated sales in the United States for the year ended December 31, 2006 represented 26.0% of total sales compared to 28.0% in 2005. This decrease was partially due to strong demand in our principal Latin American board markets and a decrease of OSB demand in the United States due to the cooling of the residential housing market which was partially offset by increased finger-joint and MDF moulding and solid wood door sales during 2006.
Most of our products are sold in the United States through approximately 40 customers that serve primarily the “do-it-yourself” and new residential construction industries. The U.S. do-it-yourself market is heavily consolidated and is dominated by large chain retailers such as Home Depot, Lowes and Menards.
29
Solid wood and forestry
Our eight largest customers for solid wood products accounted for approximately 82% and 84% of our total sales in the United States for the years ended December 31, 2005 and 2006, respectively. Our largest customer, Masonite, accounted for approximately 52% and 41% of such sales during the years ended December 31, 2005 and 2006, respectively. Our principal U.S. solid wood customers are Bluelinx Corporation, Boston Cedar & Millwork and Steves & Sons Inc., Builders First Source, Jim White Lumber Sales Inc., Masonite, Wholesale Millwork Inc. and W. M. Tinder Inc. Although we believe that, under current market conditions, the loss of any one customer would not have a material adverse effect on us, there can be no assurance that any such loss in the future will not have such a material adverse effect. We store our products primarily in three distribution warehouses located at Charleston, South Carolina, Baltimore, Maryland, and Houston, Texas. We ship our products from U.S. warehouses to our customers primarily by truck. Shipments are delivered to our distribution warehouses by ship from our production facilities in Chile, Brazil and Argentina.
Finger-Joint Mouldings Market. We manufacture solid wood finger-joint mouldings which are sold in the United States. Our total sales of finger-joint mouldings in 2006 were US$93.9 million compared to US$83.0 million in 2005. This increase in finger-joint moulding sales was due primarily to higher prices resulting from an increased sales focus and a customer pruning process that targeted sales to certain of our significant customers.
We currently produce our finger-joint mouldings at our Cabrero plant in Chile and our Rio Negrinho plant in Brazil. The market for finger-joint mouldings in the United States is highly competitive. In general, we are able to produce solid wood finger-joint mouldings at our Chilean and Brazilian plants at a low cost compared to U.S. and Canadian manufacturers. Additionally, freight prices from our South American plants are comparatively low and we are able to sell our mouldings in the United States at competitive prices. Our principal competitors in the finger-joint mouldings market are Arauco, Braspine, Sierra Pacific and Woodgrain.
Solid Wood Doors Market. We manufacture residential interior solid wood stile and rail doors which are sold in the United States, which is considered a niche market. Our total solid wood door sales in the United States in 2006 were US$38.7 million compared to US$32.1 million in 2005. This increase is primarily due to higher physical volume sales, and the introduction of new solid wood door styles that allowed us to improve our average prices.
Almost all of the solid wood doors we sell in the United States are manufactured at our production facilities in Chillán, Chile. Solid wood door sales in the United States are a competitive market. Our principal competitors in this market are Frameport, Sincol and Woodgrain.
Boards
Our eight largest customers for board products accounted for approximately 54% and 66% of our total board sales in the United States for the years ended December 31, 2005 and 2006, respectively. The largest customer accounted for approximately 9% and 11% of such sales during the years ended December 31, 2005 and 2006, respectively. Our 7 principal U.S. board customers that purchased in 2006 were Alexandria Moulding, BlueLinx Corporation, Builders First Source, Guararapes, Kelleher, North Pacific Lumber Co. and Thunderbird Moulding. Although we believe that, under current market conditions, the loss of any one customer would not have a material adverse effect on us, there can be no assurance that any such loss in the future will not have such a material adverse effect. We store our products primarily in five distribution warehouses located at Charleston, South Carolina, Baltimore, Maryland, Houston, Texas, Long Beach, California and Oakland, California. We ship our products from U.S. warehouses to our customers primarily by truck. Shipments are delivered to our distribution warehouses by ship from our production facilities in Chile, Brazil and Argentina.
MDF Moulding Market. We manufacture MDF mouldings which are sold in the United States. Our total sales of MDF mouldings during the year ended December 31, 2006 were US$64.5 million compared to US$46.3 million during the same period in 2005. This increase in MDF moulding sales of approximately 39% was principally due to the increase in production capacity in both our Argentina and Chilean production facilities and better pricing as a result of our improved sales effort.
30
We produced the MDF mouldings that we sold in the United States during 2005 and 2006 at the Masisa USA plant in Charleston, South Carolina and our Masisa plants in Argentina and Chile. However, in February 2007, as part of a cost reduction program we closed our MDF moulding plant in Charleston, South Carolina. Most of this production line will be relocated during 2007 to our Cabrero industrial complex in Chile. The market for mouldings in the United States is highly competitive. In general, we are able to produce MDF mouldings at our Chilean and Argentinean plants at a low cost relative to U.S. and Canadian manufacturers. Additionally, due to the light weight of these products, freight prices from our South American plants are comparatively low and we are able to sell our mouldings in the United States at competitive prices. Our principal competitors in the MDF mouldings market are Arauco (Trupan), Corza, PacTrim, Polincay and Sierra Pine.
Commission Sales. In May 2004, Masisa USA entered into a sales commission agreement with Masisa to market and distribute Masisa’s board products in the United States. Masisa USA currently sells Masisa’s MDF mouldings under this contract. This contract is still in force.
Beginning in 2005, Masisa Brazil began marketing OSB sales in the United States through Masisa USA, and a Brazilian forest products broker called Guararapes. During 2006, our OSB sales in the U.S. were US$22.5 million, down from US$39.7 million in 2005. The main reason for the reduction in sales was the slowdown experienced during 2006 in residential housing construction in the United States.
Brazil
General
For the year ended December 31, 2006, GDP grew 3.7%, inflation was 3.14% and the trade balance surplus was US$46.1 billion. At December 31, 2006, the unemployment rate was 10%.
The following table shows our sales of saw and pulp logs, MDF, OSB and particle board in Brazil in millions of U.S. dollars for the indicated periods.
BRAZIL
PRINCIPAL WOOD PRODUCTS SALES
Year ended December 31, | ||||||||||
| (in millions of US$) | 2004 | 2005 | 2006 | |||||||
Solid Wood and Forestry | ||||||||||
Saw and pulp logs | 4.3 | 4.3 | 7.8 | |||||||
Boards | ||||||||||
MDF | 65.5 | 77.6 | 111.1 | |||||||
OSB | 10.7 | 11.2 | 15.4 | |||||||
Particle board | 9.2 | 8.4 | 8.4 | |||||||
Solid wood and forestry marketing and distribution
Masisa Madeiras was an important investment for a number of reasons. Brazil offers a well-developed market for forest products and is ranked as the world’s ninth largest economy with a population of approximately 188 million in 2006. Additionally, a favorable climate and year-round rainfall allow a comparatively greater rate of tree growth compared to other pine growing countries. In addition, the Rio Negrinho area provides an adequate pool of skilled labor that currently supports approximately 500 furniture factories of varying sizes. Our knowledge and experience gained in Chile enabled Masisa Madeiras to supply finger-joint mouldings, primarily to Masisa USA for sale in the United States.
The majority of the solid wood products produced by our businesses in Brazil are sold in export markets. Our total saw and pulp log sales during the year ended December 31, 2006 was US$7.8 million compared to US$4.3 million during the same period in 2005. This increase was principally due to higher prices and appreciation of the Brazilian reales against the U.S. dollar. All of the saw and pulp logs sold in Brazil are harvested at our plantations.
31
Board marketing and distribution
Masisa established Masisa Brazil in 1995. Masisa Brazil has already achieved a significant position as a particle board and MDF supplier to southern Brazil’s furniture industry. Particle board is supplied and delivered to the Brazilian market principally by truck from Masisa Argentina’s Concordia plant. The strategic location of the Concordia Plant and the establishment of MERCOSUR have made Brazil a favored market for Masisa Argentina’s exports. In the past, MDF was supplied to the Brazilian market from both the Argentinean Concordia plant and the Chilean Mapal plant, but since 2001 these exports have been gradually replaced by production from the MDF plant located in Ponta Grossa, Brazil.
Our combined sales of particle board, MDF and OSB in Brazil reached US$134.9 million for the year ended December 31, 2006, compared to US$97.2 million in 2005, representing a 38.8% increase. This increase in wood board sales was primarily due to the appreciation of the Brazilian reales against the U.S. dollar and higher board volume and prices.
Due to the large size of Brazilian manufacturers, sales in Brazil are primarily made directly to the manufacturers. There are generally no independent distributor chains for these materials. However, in order to meet the needs of carpenters, architects and decorators, we have established and expanded our Placacentro distribution network that has been in place since 1996. In 2006, we opened two new Placacentro stores in Brazil. As of December 31, 2006, Masisa had opened 41 Placacentro stores in Brazil and expects to grow its network by 5 additional stores in 2007. For the years ended December 31, 2005 and 2006, approximately 30% and 23%, respectively, of Masisa Brazil’s total sales were made through Placacentros.
Masisa is expending considerable effort to develop its sales in Brazil by, among other activities, opening distribution warehouses, expanding its client base and participating in promotional activities, expositions and trade shows. Currently, Masisa sells MDF and OSB through 440 and 600 distributors, respectively, in Brazil. For the years ended December 31, 2005 and 2006, approximately 21% and 20%, respectively, of our net sales in the Brazilian market were generated by 20 principal customers and our largest single customer accounted for approximately 2% of those sales in each of those years. Masisa’s principal customers in Brazil are A. Romanzza Moveis Ltda., Bertolini S/A, Chapecomp Distribuidora de Produtos, Riberplak Com. de Compensados Ltda. and Todeschini S/A Industria e Comercio.
MDF Market. Based in part on Masisa’s experience in the Argentinean market, we believe that the MDF market will expand rapidly in Brazil as MDF becomes more widely available as a result of the new domestic MDF production capacity in Brazil. Our total sales of MDF increased 43.1% to US$111.1 million for the year ended December 31, 2006 from US$77.6 million for the same period in 2005. The increase was mainly due to a 20.1% increase in prices and a 19.2% increase in volume, in addition to the above-mentioned currency appreciation.
Our principal competitors in Brazil’s MDF market are Duratex, the Isdra Group, Placas do Paraná and Tafisa Brasil.
OSB Market. As the first and only producer of OSB boards in Brazil, we are currently involved in consolidating our market position with respect to this product. Our total sales of OSB increased by 37.5% to US$15.4 million for the year ended December 31, 2006 from US$11.2 million for the same period in 2005. This growth is mainly due to the introduction of new products and the increase in the number of new customers.
Particle Board Market. Given its relatively large population, we view Brazil as an attractive market for particle board. Our total sales of particle board remained stable at US$ 8.4 million for the year ended December 31, 2006, the same amount of sales we had in 2005. Particle board sales remained constant in 2006 compared to 2005 primarily due to constraints for supplying the Brazilian market at a time when there were increased particle board sales within the domestic Argentinean market.
Our principal competitors in this market include Berneck, Duratex, Eucatex, Placas do Paraná, Satipel and Tafisa.
32
Chile
General
For the year ended December 31, 2006, GDP grew 4.0%, inflation was 3.4% and the trade balance surplus was US$22.2 billion. At December 31, 2006, the unemployment rate was 8.0%. Chile’s economic growth in 2006 was primarily the result of generally improved global economic conditions and increased commodity prices, although the unemployment rate remained relatively high.
The following table shows our sales of saw and pulp logs, solid wood doors, particle board, MDF and OSB in Chile in millions of U.S. dollars for the indicated periods.
CHILE
PRINCIPAL WOOD PRODUCTS SALES
Year ended December 31, | ||||||||||
| (in millions of US$) | 2004 | 2005 | 2006 | |||||||
Solid Wood and Forestry | ||||||||||
Saw and pulp logs | 18.2 | 20.6 | 28.3 | |||||||
Solid wood doors | 0.5 | 0.6 | 0.8 | |||||||
Boards | ||||||||||
Particle board | 49.9 | 60.3 | 70.9 | |||||||
MDF | 34.7 | 29.2 | 34.6 | |||||||
OSB | 1.4 | 2.3 | 1.7 | |||||||
Solid wood and forestry marketing and distribution
Most of the solid wood and forestry products that we sell in Chile are saw and pulp logs, which we sell to pulp and other manufacturers. Our three largest customers accounted for approximately 43% and 53% of our total sales in Chile for the years ended December 31, 2005 and 2006, respectively. The largest customer accounted for approximately 36% and 30%, respectively, of these sales for such periods. Our principal Chilean customers are CMPC Celulosa S.A., Forestal Mininco S.A. and Paneles Arauco S.A. Our products are shipped mainly by truck to domestic customer locations.
Saw and Pulp Logs Market. Our solid wood and forestry businesses sell saw and pulp logs to manufacturers in Chile. Our total saw and pulp log sales for the year ended December 31, 2006 were US$28.3 million compared to US$20.6 million for the same period in 2005. This increase in saw and pulp logs was primarily due to increased demand coupled with higher market prices.
All of the saw and pulp logs we sell in Chile are harvested at our Chilean plantations. Our principal competitors in this market are Arauco and CMPC.
Solid Wood Doors Market. We sell a relatively small number of residential interior rail and stile solid wood doors in Chile. Our total solid wood door sales in Chile were US$0.8 million for year ended December 31, 2006 compared to US$0.6 million for the same period in 2005.
Boards marketing and distribution
Most of our board products are sold in Chile through approximately 170 independent distributors serving the construction and furniture manufacturing industries. A small portion of our board products are sold directly to furniture manufacturers. Our 30 largest board customers accounted for approximately 81% and 79% of our total sales in Chile for the years ended December 31, 2005 and in 2006, respectively. The largest customer accounted for approximately 15% and 14% of such sales for the years ended December 31, 2005 and 2006, respectively. Our principal Chilean customers for board products are Construmart S.A., Dimad S.A., Easy S.A., Electrocom S.A., Maderama, Mafor S.A., Maderas Imperial Ltda., Polincay Export Ltda., Silva y Compañía Ltda., Sodimac S.A. and Youseff Comercial Ltda. In 2006, furniture continued to be one of the leading products imported to Chile, competing with the furniture products of Chilean producers which form a significant part of our customer base. Specifically, “ready-to-assemble” furniture products are becoming an increasingly popular import in Chile, although they account for a relatively small portion of current furniture sales in Chile. We work through our Placacentros stores to assist our customers in developing ways of using our products to respond to changing market conditions. Although we believe that, under current market conditions, the loss of any one distributor or customer would not have a material adverse effect on us, there can be no assurance that any such loss in the future will not have such a material adverse effect.
33
Masisa’s products are stored in four warehouses and sales offices throughout Chile and are shipped mainly by truck to domestic customer locations. Shipments to the Antofagasta warehouse, in the northern part of Chile, are also delivered by ship.
As of December 31, 2006, there were 52 Placacentro stores located throughout Chile. We expect to grow our network by adding one Placacentro store in Chile during 2007. The Placacentro chain is the largest chain of stores in the country in terms of sales to furniture manufacturers and small contractors. Our board sales to Placacentros in the Chilean market during the years ended December 31, 2005 and 2006 represented approximately 25% and 26% of our sales, respectively. The remainder were direct sales and sales to other distributors.
Particle Board Market. We manufacture raw, melamine-laminated and wood-veneered particle board in Chile. Our total particle board sales in 2006 increased to US$70.9 million from US$60.3 million in 2005 primarily due to better local market conditions and higher local prices.
Rio Itata is the only competitor in the particle board production industry in Chile. The excess of local supply over local demand is exported.
Due to the economic crisis in Argentina in 2002, which reduced particle board consumption in such country to nearly half its 2001 level, and the devaluation of the Argentinean peso, some Argentinean manufacturers began to export part of their production to the Chilean market. This resulted in price pressure for all competitors in Chile. We believe that the excess capacity in particle board production in Chile and the resulting price pressure, combined with high transportion costs for particle board imports, are the primary factors that discouraged imports to Chile of particle boards in previous years. The situation experienced in 2002 was unique and as the Argentinean economy and consumption began to recover in the second half of 2003 and continued its recovery during 2004, the situation started to return to prior levels. During 2005 and 2006 imports from Argentina had no significant effect on our sales. However, there can be no assurance that significant price pressure from imports of particle board into Chile will not occur in the future.
MDF Market. Masisa manufactures MDF board in Chile. The Chilean MDF market is relatively undeveloped compared to the European and North American markets. Although the first Chilean MDF plant did not begin production until 1988, the market has exhibited strong growth since then. Nevertheless, Chilean MDF producers devote most of their production to exports. Our total MDF board sales for the year ended December 31, 2006 increased to US$34.6 million compared to US$29.2 million for the same period in 2005, partially due to higher volume, as well as higher averages prices compared to 2005. Although we experienced a decline in Chilean MDF moulding demand this was offset by an increased demand of MDF boards by local non-moulding customers.
We expect our new MDF plant to start operations in Cabrero, Chile, in July 2007, increasing our production capacity by approximately 340,000 cubic meters per year. This new plant will be used for exports.
Our only established competitor in the Chilean MDF market is Paneles Arauco S.A. It is expected that Polincay will build a MDF plant with an annual production capacity of approximately 60,000 cubic meters that should be completed by the end of 2007 or in early 2008.
Mexico
General
For the year ended December 31, 2006, GDP grew 4.8%, year to year, inflation was 4.05% and the trade balance deficit was US$5.8 billion. At December 31, 2006, the unemployment rate was 3.6%. Mexico’s economy is expected to continue to grow because of the increase in demand from the United States, Mexico’s principal trading partner. The economic recovery has contributed to greater demand for wood products and higher wood prices.
34
The following table shows our sales of sawn lumber, MDF, particle board and OSB in Mexico in millions of U.S. dollars for the indicated periods.
MEXICO
PRINCIPAL WOOD PRODUCTS SALES
Year ended December 31, | ||||||||||
| (in millions of US$) | 2004 | 2005 | 2006 | |||||||
Solid Wood and Forestry | ||||||||||
Sawn lumber | 46.3 | 47.3 | 45.2 | |||||||
Boards | ||||||||||
MDF | 22.4 | 30.8 | 36.9 | |||||||
Particle board | 21.7 | 24.6 | 32.0 | |||||||
OSB | 3.4 | 2.1 | 1.2 | |||||||
Solid wood and forestry marketing and distribution
We sell most of our sawn lumber in Mexico either directly or through independent distributors to the construction and pallet manufacturing industry. Our 25 largest customers accounted for approximately 70% and 71% of our total sales in Mexico for the years ended December 31, 2005 and in 2006, respectively. The largest customer accounted for approximately 17% and 12%, respectively, of these sales during such periods. Our principal customers in Mexico are Chep México S.A. de C.V., Losifra S.A. de C.V., Maderas y Empaques para Cada Uso, Madereria Nasa S.A. de C.V., Productora de Tarimas del Sur and Unipallet S.A. de C.V. Although we do not believe that under current market conditions, the loss of any one distributor or customer would have a material adverse effect on us, there can be no assurance that any such loss in the future will not have such a material adverse effect. In addition to our own products, we also sell sawn wood produced by third parties, principally located in Chile. Our products are stored in our Tampico, Mexico, warehouse and are shipped mainly by truck to domestic customer locations. The sawn lumber we sell in the Mexican market is harvested and processed primarily in Chile.
Sawn Lumber. Mexico is the principal market in which we market our sawn lumber. Mexico does not have well developed forestry resources and, as a result, our principal competitors in this market are also importers. Our total sawn lumber sales during the year ended December 31, 2006 were US$45.2 million compared to US$47.3 million during the same period in 2005. The decrease in sawn lumber sales was due to a decrease in physical sales volume.
Sawn lumber in Mexico is a highly competitive market. Our principal competitor in this market is Arauco. The Mexican market has a good but limited national supply system as well.
Board marketing and distribution
In August 2001, Masisa established Maderas y Sintéticos de México S.A. de C.V. (“Masisa Mexico”) as a vehicle for entering the Mexican wood products market. On January 8, 2002, Masisa Mexico acquired a particle board plant located in Durango, Mexico, from MacMillan Guadiana, a subsidiary of the U.S. forestry company, Weyerhaeuser Company Limited. This plant has an installed capacity of 120,000 cubic meters per year. With this acquisition, Masisa now supplies particle boards to the Mexican market mainly from the Durango plant’s production. Masisa imports MDF into the Mexican market from its plants in Chile and Venezuela. Since 2004, we have also imported OSB into the Mexican market from our OSB plant in Brazil; however, due to increased price pressure from OSB imports from the United States, we are planning to phase out our OSB sales within Mexico. Our net board sales in Mexico for the years ended December 31, 2005 and 2006 represented 7.7% and 7.9%, respectively, of our total consolidated net sales.
35
Given its relatively large population, the relatively low market penetration of wood boards and a growing scarcity and increasing cost of sawn lumber (the principal competing product of Masisa’s wood boards), we believe the Mexican market has substantial potential for increased consumption of wood board, whether produced locally at the Durango plant or imported from our plants in Chile, Argentina, Brazil or Venezuela.
Currently, Masisa sells particle board and MDF to Mexican furniture manufacturers directly and through distributors, with a total of approximately 210 customers. For the years ended December 31, 2005 and 2006, approximately 86% and 84%, respectively, of our net sales in the Mexican market were generated by 63 principal customers. The largest customer accounted for approximately 5% and 8%, respectively, of these sales during such periods. Masisa’s principal distributors of particle board in Mexico are Aglomerados y Triplay Vic S.A. de C.V., Maderas Polanco S.A. de C.V., Mexicana Pacific S.A. de C.V., Promotora Grocer S.A. de C.V., RAMPE S.A. de C.V., Triplay Alameda S.A de C.V., Triplay Market S.A. de C.V., Triplay Tableros De Ecatepec S.A., Triplay y Laminados Pega, Triplay y Maderas Nacionales S.A., and Triplay y Tableros Nacionales S.A. Although we believe that, under current market conditions, the loss of any one distributor would not have a material adverse effect on us, there can be no assurance that any such loss in the future will not have such a material adverse effect.
In 2005 and 2006, Masisa successfully expanded its Placacentros network in Mexico. Masisa Mexico has opened 70 stores throughout the country as of December 31, 2006. During 2007, we expect to increase our focus on increasing our same store sales. For the years ended December 31, 2005 and 2006, approximately 40% and 39%, respectively, of Masisa Mexico’s total sales volume was made through Placacentros.
MDF Market. Masisa has traditionally supplied the Mexican MDF market from its Chilean facilities, and to a lesser degree, from its Argentinean facilities. Since 2002, the Fibranova plant in Venezuela has also exported MDF to Mexico. Our total MDF sales for the year ended December 31, 2006 were US$36.9 million compared to US$30.8 million for the same period in 2005. The increase in MDF sales during 2006 was due to a strong local demand. Our principal competitors in this market are Maderas Conglomeradas S.A. de C.V., MJB S.A. de C.V. and Paneles Arauco S.A.
Particle Board Market. Particle board consumption in Mexico is relatively low. Our total sales of particle board for the year ended December 31, 2006 were US$32.0 million compared to US$24.6 million for the same period in 2005. The increase in particle board sales during 2006 compared to 2005 was due mainly to greater physical sales volume and higher prices. Our main competitors in this market are Duraplay S.A. de C.V. and Rexcel S.A. de C.V.
Venezuela
General
For the year ended December 31, 2006, GDP grew 10.3% and the trade balance surplus was US$27.2 billion. At December 31, 2006, the unemployment rate was 9.5%. At December 31, 2006, the annual rate of inflation was 17.0%. During 2006, Venezuela’s economy experienced strong growth due to increased oil revenue and general economic recovery following economic instability during 2003. This growth has increased domestic demand and prices for wood products. No assurance can be given that this past level of growth will continue, or that political and economic developments in Venezuela will not deteriorate. See “Item 3. Key Information—Risk Factors—Risks relating to our operations in Latin America—Political and economic developments in Latin America countries in which we operate, may adversely affect us.”
The following table shows our sales of sawn lumber, MDF and particle board in Venezuela in millions of U.S. dollars for the indicated periods.
36
VENEZUELA
PRINCIPAL WOOD PRODUCTS SALES
Year ended December 31, | ||||||||||
| (in millions of US$) | 2004 | 2005 | 2006 | |||||||
Solid Wood and Forestry | ||||||||||
Sawn lumber | 7.3 | 14.9 | 19.3 | |||||||
Boards | ||||||||||
MDF | 24.1 | 37.0 | 56.2 | |||||||
Particle board | 7.6 | 9.1 | 14.6 | |||||||
Marketing and distribution
We sell most of our products in Venezuela through approximately 31 independent distributors serving the furniture manufacturing and construction industries. Our 20 largest solid wood and forestry product customers accounted for approximately 86% and 81% of our solid wood and forestry sales in Venezuela for the years ended December 31, 2005 and 2006, respectively. Our largest solid wood and forestry products customer accounted for approximately 12% and 72%, respectively, of these sales for such periods. Our principal solid wood products customers in Venezuela are Grupo Imeca, Madenova C.A. and Madera La Ojedeña C.A.
Our 20 largest board product customers accounted for approximately 95% and 87% of our board sales in Venezuela for the years ended December 31, 2005 and 2006, respectively. Our largest board products customer accounted for approximately 22% and 60%, respectively, of these sales for such periods. Our principal board products customers in Venezuela are Aserradero El Sol C.A., Grupo Imeca and Madenova C.A. Although we do not believe that, under current market conditions, the loss of any one distributor or customer would have a material adverse effect on us, there can be no assurance that any such loss in the future will not have such a material adverse effect.
Our products are stored in two warehouses, at our Macapaima plant and in Puerto Cabello and are shipped mainly by truck to domestic customer locations. We also have a sales office in Caracas, Venezuela. The wood products we sell in the Venezuelan market are produced at our Macapaima plant in Anazoategui, Venezuela.
In 2006, Masisa successfully expanded its Placacentros network in Venezuela. As of December 31, 2006, Masisa Venezuela had 22 stores located throughout the country and expects to grow its network by 12 additional stores during 2007.
Solid wood and forestry
Sawn lumber market. We sell sawn lumber to distributors and pallet manufacturers and other industries in Venezuela. Our total sales of sawn lumber for the year ended December 31, 2006 were US$19.3 million compared to US$14.9 million for the same period in 2005. This increase in sawn lumber sales was primarily due to a decrease in demand for native timber species that compete with our lumber, as well as an increase in demand by pallet manufacturers for the food industry.
All of the sawn lumber we sell in Venezuela is harvested at our plantations in the Uverito area, and processed at our sawmill, in the Macapaima complex in Anazoategui, Venezuela. The sawn lumber market in Venezuela had historically been dominated by wood species native to Venezuela and imported radiata pine from Chile. Caribbean pine wood is relatively new to the Venezuelan market, but demand is growing fast due to the high quality of caribbean pine wood and demand for quality wood from the construction and pallet manufacturing industries. In addition, due to the Venezuelan government’s policy of limiting the exploitation of native wood species, we believe that there will be a significant increase in the amount of imported radiata pine from Chile as well as caribbean pine wood. We believe demand from pallet manufacturers will be more important in the coming years due to the fact that the distribution industries are increasingly converting to palletized systems and new regulations in packaging, which support the use of standardized pallets. Our principal competitors in this market are smaller volume domestic sawmills including Aserradero Carabobo, Forestal Soledad and Pinoven.
37
Boards
MDF market. We sell MDF to distributors in Venezuela. Our total MDF sales in 2006 were US$56.2million compared to US$37.0 million for the same period in 2005. The increase in MDF sales was primarily due to higher prices and greater physical sales volume, which stemmed from improved domestic economic conditions.
All of the MDF board we sell in Venezuela is produced at our Macapaima plant in Anzoátegui, Venezuela. We believe we have an advantage in this market as a domestic competitor. We also believe sales through our Venezuelan Placacentros network will enable us to increase sales significantly.
Particle board market. Our businesses sell raw and melamine-coated particle board to distributors in Venezuela. Our total particle board sales in 2006 were US$14.6 million compared to US$9.1 million in 2005. This increase in particle board sales was primarily due to higher prices and greater physical sales volume, which stemmed from improved domestic economic conditions.
All of the particle board we sell in Venezuela is produced at our Macapaina plant in Anzoátegui, Venezuela. Sales of particle board in Venezuela declined greatly in 2002 and 2003 as a result of economic instability and a general economic recession. The market began to improve in 2004, and has continued to improve through 2006. As the local market improves, we are focusing on developing our boards and melamine products to support this growing market.
Argentina
General
For the year ended December 31, 2006, GDP grew 8.5%, inflation was 9.8% and the trade balance surplus was US$8.1 billion. At December 31, 2006, the unemployment rate was 8.7%. The Argentinean economy has continued to show strong growth since 2003 and has supported the growth of the local construction and furniture industries. As a result of the increased demand for wood products to support the growth of these industries, the particle board and MDF board demand has equaled, and in some instances surpassed, the levels achieved for these products during the late 1990s.
The following table shows our MDF, particle board, OSB and MDF mouldings sales in Argentina in millions of U.S. dollars for the indicated periods.
ARGENTINA
PRINCIPAL WOOD PRODUCTS SALES
Year ended December 31, | ||||||||||
| (in millions of US$) | 2004 | 2005 | 2006 | |||||||
Boards | ||||||||||
MDF | 21.4 | 28.1 | 33.1 | |||||||
Particle board | 15.8 | 20.5 | 23.5 | |||||||
OSB | 1.9 | 2.2 | 3.2 | |||||||
MDF mouldings | 0.2 | 0.3 | 0.5 | |||||||
Marketing and distribution
Argentina has more than twice the population of Chile and has a significant housing deficit. However, following the devaluation of its currency on January 2002, Argentina’s per capita income was reduced to half of its pre-devaluation levels. The low per capita consumption is primarily the result of this economic crisis. As Argentina’s economy has recovered, demand for Masisa’s products has recovered as well. We expect that future demand for Masisa’s products in Argentina will be largely dependent upon the growth of the Argentinean economy and particularly on the growth of the Argentinean construction and furniture manufacturing industries.
38
We sell particle board and MDF to Argentinean furniture manufacturers through approximately 150 distributors. For the years ended December 31, 2005 and 2006, approximately 69% and 65% of our total sales in the Argentinean market were generated by 20 principal distributors, respectively. The largest customer accounted for approximately 10% of these sales during each of these periods. Masisa’s principal distributors in Argentina are Cencosud S.A., Distribuidora Aglolam S.A., Distribuidora Argentina de Chapas S.A.C., Distribuidora Placasur S.A., Dolinsky S.A., Maderas Amiano S.R.L., Madergold S.A., NBC Maderas S.R.L., Sacheco S.A. and Taru Parq S.R.L.
Given the successful development of Masisa’s Placacentro program in Chile and Peru, Masisa Argentina started to develop this distribution channel in 2000. As of December 31, 2006, 51 stores were managed from Argentina (47 in Argentina, 1 in Uruguay and 3 in Paraguay). Masisa Argentina expects to grow its network by 7 additional stores in Argentina in 2007. For the years ended December 31, 2005 and 2006, approximately 43% of our total sales in Argentina in each year were made through the Argentinean Placacentros network.
We have focused our marketing efforts on furniture and cabinet manufacturers and on the construction industry. We are pursuing several strategies in Argentina to encourage the use of our particle board and MDF products in lieu of other materials currently favored by local manufacturers. As in Chile, we hold regular meetings with Argentinean furniture manufacturers, offer service and technical assistance to these consumers and regularly participate in trade fairs and furniture shows. In addition, we offer technical training courses for Masisa-product installers.
After the devaluation of the Argentinean peso in 2002 and in response to the adverse macroeconomic scenario in Argentina, Masisa Argentina redirected the majority of the production from its Argentinean operations to export markets primarily in Brazil, Mexico, the United States and the Far East. However, with the recovery of the Argentinean local market, this trend has been reversed.
MDF Market. We have continued to actively develop the market for this product through advertising campaigns, events held directly with our customers and our participation in trade shows, all of which are designed to demonstrate the board’s quality and multiple uses for furniture manufacturers, architects and decorators.
Masisa is the largest MDF manufacturer in the Argentinean market. Our total MDF board sales in 2006 were US$33.1 million compared to US$28.1 million in 2005. The increase in MDF board sales was due primarily to greater sales volume and higher local prices as a result of strong local demand in 2006. We believe the positive growth trend in the Argentinean economy will continue in the short-term and that the market for wood board products will continue to recover as a result. However, there can be no assurance that the economy will continue to recover or that sales of wood board products will increase as a result. Alto Paraná (Paneles Arauco) and Tableros Guillermina S.A. are our only competitors in the Argentinean MDF market.
Particle Board Market. Masisa is one of the three largest particle board manufacturers in the Argentinean market. Masisa’s principal Argentinean competitors in particle board are Alto Paraná (Faplac S.A.), Cuyoplacas S.A. and Sadepan Latinoamericana S.A. There are other smaller Argentinean particle board producers, such as Tableros del Paraná S.A., who have a minimal market presence and use older and less efficient technology than Masisa utilizes at its Concordia facility. As in Chile, particle board products compete with other types of board products, such as gypsum, as well as solid wood and plywood.
Our total particle board sales in 2006 increased to US$23.5 million compared to US$20.5 million in 2005, due to strong local demand. The large increases in sales in 2006, 2005 and 2004 follow a steep decline in 2002, when, in order to minimize the impact of the devaluation, Masisa Argentina shifted particle board sales to exports.
Other markets
Colombia
We sell particle board and MDF products in the Colombian market mainly through exports from Venezuela. Our particle board sales in Colombia increased by 23% from US$10.6 million in 2005 to US$13.1 million in 2006. The growth of such sales was principally due to strong demand for particle boards. Our MDF board sales in Colombia increased by 3.1% in dollar terms, from US$11.7 million in 2005 to US$12.1 million in 2006. As in the case of particle board, the increase in MDF board sales was principally due to strong demand.
39
During 2006, we opened seven Placacentros stores in Colombia. As of December 31, 2006, 28 Placacentros were operating in Colombia.
Perú
We sell particle board and MDF products into the Peruvian market mainly through exports from Chile. We established our Peruvian subsidiary, Masisa Peru, in 1999 to conduct commercial and distribution activities in that country.
Our board sales in Peru increased by 30.2% from US$15.9 million in 2005 to US$20.7 million in 2006. This increase in our board sales was principally due to deeper market penetration through our Placacentro distribution network and the selling and marketing efforts of our MDF board products and strong demand for particle board.
As of December 31, 2006, 21 Placacentros were operating in Peru. We expect to grow the network by adding three new stores in Peru during 2007.
Ecuador
We sell MDF and particle board products into the Ecuadorian market mainly through exports from Venezuela and Chile. We established Masisa Ecuador in 2002 to conduct commercial and distribution activities in that country. Its main address is located in the city of Guayaquil.
Our board sales in Ecuador increased by 32.2% from US$7.4 million in 2005 to US$9.8 million in 2006. The increase in our board sales was principally due to deeper market penetration through our Placacentro distribution network and the selling and marketing efforts of our MDF board products.
As of December 31, 2006, 15 Placacentros stores were operating in Ecuador. We expect to grow the network by adding three new stores in Ecuador during 2007.
Other
Our board businesses generally achieve higher margins from the sale of their principal products in the markets in which they participate directly (Chile, Argentina, Brazil, Mexico and Venezuela) than from exports to third markets (i.e. Colombia, Peru, Ecuador, China, Guatemala, Uruguay, Germany, Italy, among others). Accordingly, our board businesses have traditionally preferred to satisfy demand in their respective markets first, and then export any surplus products. However, we have built a solid business network outside the markets in which we have manufacturing capacity in order to diversify our market risk and to enable us to respond promptly to changes in market conditions in Chile, Argentina, Brazil, Mexico and Venezuela. After the political and economic crisis began in Argentina in 2002, we utilized this export network and experience to substitute lost sales in the Argentinean market for sales to foreign markets. This was possible as a result of the increased competitiveness of products produced in Argentina resulting from the currency devaluation in that country.
Approximately 9.8% of our consolidated net sales in 2006 were derived from U.S., Chilean, Mexican, Brazilian, Venezuelan and Argentinean export sales to markets other than United States, Chile, Mexico, Brazil, Venezuela and Argentina, compared to the approximately 10.5% of our consolidated net sales in 2005.
Production
As of December 31, 2006 we owned and operated production facilities in Chile, Venezuela, Brazil, Argentina, the United States and Mexico. Our Chilean production facilities are located in Cabrero, Coronel, Chiguayante, Valdivia and Chillán. Our Venezuelan production facilities are located in Macapaima, near the city of Puerto Ordaz in the southern part of the state of Anzoátegui. Our Brazilian production facilities are located in Rio Negrinho in the State of Santa Catarina and Ponta Grossa in the State of Paraná. Our Argentinean production facilities are located in Concordia, in the province of Entre Rios. Our U.S. production facilities were located in Charleston, South Carolina. In February 2007, as part of a cost reduction program, we closed the Charleston MDF moulding plant (i.e. 36,000 cubic meters, representing 9% of our total moulding capacity). Most of the industrial assets will be relocated to our industrial complex in Cabrero, Chile. Our Mexican production facilities are located in Durango, in the state of Nuevo León.
40
Our production by country
Chile
The following table sets forth for each of our Chilean production lines the installed annual production capacity in cubic meters as of December 31, 2006.
CHILE WOOD PRODUCTS PRODUCTION LINES
Plant | Line | Product | Annual installed capacity(1) | |||
| Cabrero (Solid wood) | Sawmill | Various | 337,000 | |||
| Finger-joint mouldings | Finger-joint mouldings | 103,000 | ||||
| MDF mouldings | MDF mouldings | 52,000 | ||||
| Cabrero (Boards) | MDF | MDF | 160,000 | |||
| Chiguayante (Boards) | Line 1 | Particle board | 82,000 | |||
| Laminating | Melamine board | 45,000 | ||||
| Chillán (Solid wood) | Doors | Solid wood doors | 42,000 | |||
| Mapal (Boards) | Line 1 | Particle board | 95,000 | |||
| Line 2 | Particle board | 60,000 | ||||
| MDF | MDF | 140,000 | ||||
| Laminating | Melamine board | 110,000 | ||||
| Puschmann (Boards) | Line 1 | Particle board | 86,000 | |||
| Valdivia (Boards) | Line 1 | Particle board | 90,000 | |||
| Laminating | Melamine board | 55,000 | ||||
| Veneering | Wood-veneered board | 40,000 | ||||
| Doors | Fiberboard doors | 500,000 |
| (1) | Units are in cubic meters, except fiberboard doors, which are in square meters. The annual installed capacity may vary slightly depending upon the thickness of the boards produced and other production factors. Actual production can exceed capacity because capacity is estimated assuming an average board thickness and actual board thickness may vary. |
Cabrero (Solid Wood). Our Cabrero solid wood facilities are located in city of Cabrero, Chile. Its operations include a sawmill and wood drying unit and plants for the production of finger-joint mouldings, MDF mouldings and solid wood doors.
Sawmill. Our sawmill in Cabrero was constructed during 2000 and reached full operational capacity in May 2001. It was constructed to replace our then-existing Cabrero sawmill, which we had operated for 15 years and which we still partially operate. The new mill is a state-of-the-art facility equipped with a software control system that provides automatic control of the production line and allows for a high speed production line. The software system also uses special scanners and sensors for the cutting of wood and offers automatic packaging. With this new equipment, the volume of processed wood has increased to 106.8 cubic meters per hour, and the yield of wood per log has increased by 1%. Maintenance costs have also increased due to the technological change, but the labor requirement has fallen from around 180 people to approximately 52 people. Since May 2001, the new sawmill has increased wood processing volumes and volumetric output with a corresponding decrease in by-products production. The sawmill currently has a maximum annual yield of 337,000 cubic meters of sawn wood, the majority of which is used in the production of finger-joint mouldings and solid wood doors.
41
The solid wood industrial complexes also include drying facilities in Cabrero. Their annual operational capacity is sufficient to dry most saw lumber currently produced at the Cabrero sawmill. This enables us to manufacture our wood products with kiln-dried wood with a moisture content of 12% or less.
Finger-joint moulding plant. The finger-joint moulding plant has an annual production capacity of approximately 103,000 cubic meters. We designed and constructed this plant to produce high-quality linear mouldings and doorframes of various styles intended for use in interior architecture. Within these product lines, we manufacture products meeting a variety of standardized design specifications as well as custom made products designed and finished according to specifications supplied by our customers.
MDF moulding lines. In June 2004, we added an MDF moulding line with an annual production capacity of 34,000 cubic meters. In August 2005, a new MDF moulding line was added to this facility, increasing our production capacity to 52,000 cubic meters per year.
Cabrero (Boards). This plant has been operating since August 1992. It has a single MDF board line with an annual production capacity of 160,000 cubic meters. It is expected that in July 2007, a new MDF plant will start operations, increasing our production capacity by approximately 340,000 cubic meters per year. The estimated total investment of this new MDF plant is approximately US$93.0 million. This new plant will be oriented to the export market.
Mapal. Our Mapal industrial site, which is located in Coronel near the city of Concepción, 320 miles south of Santiago, has two particle board lines, one MDF line and one melamine-laminating line, which includes a melamine impregnating line. The two particle board production lines have an aggregate annual production capacity of approximately 155,000 cubic meters: one for thin particle board (60,000 cubic meters per year capacity) and another for thicker boards (95,000 cubic meters per year capacity). The MDF line commenced operations in January 1996, and has an annual production capacity of approximately 140,000 cubic meters. The melamine paper impregnating line produces most of the melamine paper used by our melamine-laminating lines. The Mapal facility laminates a portion of its total particle board and MDF production.
An additional melamine-laminating line in the Mapal plant began full operations in 2003, with an annual production capacity of 110,000 cubic meters, replacing an existing melamine-laminating line. We increased melamine production capacity through this new line in response to an increase in demand for melamine-laminated products generated by our developing Placacentros network, as well as an anticipated increase in demand for such boards in our Chilean and export markets.
Chiguayante. Our Chiguayante facility is located 16 miles from our Mapal facility. The Chiguayante facility has a single particle board line with an annual production capacity of approximately 82,000 cubic meters. We upgraded the facility in 1994 so that particle board manufactured at Chiguayante would be similar in quality to that produced at the Mapal facility.
The Chiguayante plant also has a melamine-laminating line with an annual production capacity of approximately 45,000 cubic meters.
Chillán. The doors plant, located in the city of Chillán, has an annual production capacity of approximately 42,000 cubic meters of solid wood doors. This plant was designed to manufacture products primarily for the United States and other North American markets. Its principal products are solid raised-panel pine wood interior stile and rail doors. We produce our solid wood doors in a range of widths and market them for use as interior and closet doors. The stiles and rails are composed of a finger-jointed center and a face made of laminated clear pine and thin MDF boards. The panels are edge-glued solid wood pieces with a double-hip profile. This structure gives the door substantial stability.
42
Valdivia and Puschmann. We have two production complexes in Valdivia, a city located approximately 520 miles south of Santiago. The main facility is referred to as the “Valdivia” plant and has an annual production capacity of approximately 90,000 cubic meters of particle board. The second facility is named “Puschmann”, in memory of Carlos Puschmann, a distinguished Masisa employee who passed away in 1999.
Masisa acquired the Puschmann plant for US$17.0 million in August 1998 when it purchased the assets of Tableros Nobel S.A., which was a wholly-owned subsidiary of Infodema S.A. (“lnfodema”). The Puschmann facility has an annual production capacity of approximately 86,000 cubic meters of particle board.
In addition to producing raw particle board, the Valdivia plant produces melamine-laminated boards, wood-veneered particle board and all of the fiberboard doors produced by Masisa in Chile.
The melamine-laminating line and the wood-veneering line have estimated annual production capacities of 55,000 cubic meters and 40,000 cubic meters, respectively. Our fiberboard door production line is located in the same facility and has an estimated annual production capacity of 500,000 square meters.
During 2006 the wood veneer strips line was closed. As a result, 66 employees left the company in December 2006, and 25 left during the first quarter of 2007.
The capacity utilization rate for our sawmill production facility in Chile was 97% in 2006 compared to 100% in 2005. The capacity utilization rate for our finger-joint moulding production facilities in Chile was 91% in 2006 compared to 86% in 2005. The capacity utilization rate for our solid wood doors production facilities in Chile was 91% in 2006 compared to 93% in 2005. The capacity utilization rate for our particle board production facilities in Chile was 91% in 2006 compared to 87% in 2005. The capacity utilization rate for our MDF production facilities in Chile was 100% in 2006, the same as in 2005. The capacity utilization rate for our MDF moulding production facilities in Chile was 83% in 2006 compared to 64% in 2005. It is important to note that actual production can exceed capacity because capacity is estimated assuming an average board thickness and actual board thickness may vary.
Brazil
The following table sets forth for each of our Brazilian production lines the product manufactured and the installed annual production capacity in cubic meters as of December 31, 2006.
BRAZIL WOOD PRODUCTS PRODUCTION LINES
Plant | Line | Product | Annual installed capacity(1) | |||
| Ponta Grossa (Boards) | Line 1 | MDF | 280,000 | |||
| OSB | OSB | 300,000 | ||||
| Laminating | Melamine board | 220,000 | ||||
| Rio Negrinho (Solid wood) | Finger-joint mouldings | Finger-joint mouldings | 65,000 | |||
| Sawmill | Various | 220,000 |
(1) Units are in cubic meters. The annual installed capacity may vary slightly depending upon the thickness of the boards produced and other production factors. Actual production can exceed capacity because capacity is estimated assuming an average board thickness and actual board thickness may vary.
Ponta Grossa. In December 2000, we finished the construction of our MDF production facility in the city of Ponta Grossa, in the State of Paraná, Brazil. Originally, this facility had an annual installed production capacity of 240,000 cubic meters and reached full production during the second half of 2001. During 2006, additional investments in this facility were made, increasing the annual production capacity to 280,000 cubic meters. In the same complex, with a total investment cost of US$8.0 million, we installed two melamine-laminating lines that are used for coating MDF and particle board. These laminating lines have a total annual production capacity of approximately 220,000 cubic meters. Also, in May 2006, we finished construction of a new paper impregnation line in the Ponta Grossa facility that is used to supply melamine paper for the laminating line. This line required an investment of approximately US$4.0 million and has an annual installed production capacity of 36 million square meters. The capacity utilization rate for the MDF production facility in Brazil was 102% in 2006 compared to 94% in 2005. The capacity utilization rate for melamine laminating facilities in Brazil was 74% in 2006 compared to 65% in 2005.
43
The Ponta Grossa OSB plant is the first of its type in Brazil. The plant has an annual installed production capacity of 300,000 cubic meters and became fully operational during the fourth quarter of 2002. The capacity utilization rate for Masisa Brazil OSB production facilities in Brazil was 63% in 2006 and 87% in 2005. The OSB plant’s production has been adjusted to match the lower demand observed for this product.
Rio Negrinho. We began operations at Masisa Madeiras Limitada (“Masisa Madeiras,” formerly known as Terranova Brasil) in 1997 with the acquisition of a sawmill and pine plantations. The saw logs harvested from Masisa Madeiras’ plantations are processed at its sawmill located in Rio Negrinho in the State of Santa Catarina, Brazil. The 32,000 square meter industrial plant includes a sawmill and a finger-joint moulding processing plant.
Masisa Madeiras currently has three principal product lines which are sold to three markets: finger-joint mouldings oriented to the United States; door parts exported to Chile; and sawn lumber for pallet manufacturers in Brazil.
Masisa Madeiras’ mouldings plant is designed to produce mouldings which meet specifications for sale into the U.S. market. The plant’s principal products are raw and primed seven, fourteen and sixteen foot finger-joint mouldings and door frames. These products are then sold through Masisa USA to distributors and wholesalers.
Currently, all door parts produced at the Rio Negrinho plant are sold to our plant in Chillán, Chile, where our solid wood doors are produced. We produce door parts in a variety of widths (e.g., 2 ½, 5 and 5 ½ inches), lengths (e.g., 24 ½ and 45 inches and 7 feet), and thicknesses (e.g., 3/4, 5/4 and 6/4 inches). The total volume of door parts produced by Masisa Madeiras depends on the quality of the logs and the drying process. Currently, the Rio Negrinho plant produces up to 1,200 cubic meters per month of door components.
Wood processed and sold for use in pallet manufacturing is taken from the center of the log. Most of the wood processed by Masisa Madeiras for this purpose is sold in Brazil, where it undergoes further processing or is sold directly to the end-user.
The capacity utilization rate for our finger-joint moulding production facilities in Brazil was 86% in 2006 compared to 91% in 2005. The capacity utilization rate for our sawmill production facilities in Brazil was 86% in 2006 compared to 82% in 2005.
Venezuela
The following table sets forth for each of our Venezuelan production lines the product manufactured and the installed annual production capacity in cubic meters as of December 31, 2006.
VENEZUELA WOOD PRODUCTS PRODUCTION LINES
Plant | Line | Product | Annual installed capacity(1) | |||
| Andinos (Solid wood) | Sawmill | Various | 150,000 | |||
| Fibranova (Boards) | Lines 1 & 2 | Particle board | 120,000 | |||
| Line 1 | MDF | 250,000 | ||||
| Line 1 | Melamine boards | 60,000 | ||||
| Line 1 | MDF mouldings | 12,000 | ||||
(1) Units are in cubic meters. The annual installed capacity may vary slightly depending upon the thickness of the boards produced and other production factors. Actual production can exceed capacity because capacity is estimated assuming an average board thickness and actual board thickness may vary.
Andinos CA. We completed construction of our Andinos sawmill in November of 2000. The sawmill is located in Puerto Ordaz in the Macapaima Industrial Complex, in the southern part of the state of Anzoátegui, Venezuela. The sawmill’s equipment and machinery are designed to process logs of varying diameters as required by the market and custom orders, and have an annual production capacity of 150,000 cubic meters. The sawmill includes a treated log yard with a 20,000 square meter paved area and dryer kilns where we dry 100% of the production.
44
The pine-sawn lumber produced by the Andinos sawmill is characterized by high density, small firm knots, and greater hardness. Our sawn lumber is used primarily in the manufacturing of pallets and packages. A smaller percentage is sold for use in ceiling and furniture construction. During 2006, we began an expansion project for this sawmill, which it is expected to be finished during 2007.
The capacity utilization rate for our sawmill production facilities in Venezuela was 72% in 2006 compared to 95% in 2005.
Fibranova C.A. Our Fibranova plant processes intermediate wood products to produce MDF board and particle board. Its facilities are located also in Macapaima, Puerto Ordaz and include two processing lines for the production of particle board and MDF board, and a third line for the covering of melamine-laminated board. From January 2003 through the effective time of our merger with Masisa in 2005, this plant was administered and managed by our former subsidiary, Masisa, pursuant to a management contract. Since the merger, the contract has been assumed by us.
The raw material used in the production process is supplied by the caribbean pine plantations managed by Terranova Venezuela and from the chips and other by-products produced by the Andinos sawmill. Fibranova’s installations have a current annual production capacity of 120,000 cubic meters of particle board, 250,000 cubic meters of MDF board, 60,000 cubic meters of melamine-laminated boards and 12,000 cubic meters of MDF mouldings.
In 1999, we formed a joint venture with Establecimientos Industriales Oxiquim S.A., a Chilean resins manufacturer, to provide resin to Fibranova C.A.’s production processes. The joint venture began operations in July 2001 and is called Oxinova C.A., a Venezuelan corporation. Oxinova currently produces and supplies resin to our board production plants in Venezuela.
The capacity utilization rate for our particle board production facilities in Venezuela was 89% in 2006 compared to 78% in 2005. The capacity utilization rate for our MDF production facilities in Venezuela was 97% in 2006 compared to 88% in 2005. Our MDF mouldings production facilities in Venezuela suspended its operations due to strong local market demand for MDF boards, which is the principal raw material for this product. Accordingly, in 2006 the capacity utilization rate for our MDF mouldings production facilities in Venezuela was 0% compared to 2% in 2005.
Argentina
The following table sets forth for each of our Argentinean production lines the product manufactured and the installed annual production capacity in cubic meters as of December 31, 2006.
ARGENTINA WOOD PRODUCTS PRODUCTION LINES
Plant | Line | Product | Annual installed capacity(1) | |||
| Concordia (Boards) | Line 1 | Particle board | 160,000 | |||
| Line 2 | Particle board | 25,000 | ||||
| MDF | MDF | 150,000 | ||||
| Thin-MDF | Thin-MDF | 120,000 | ||||
| Laminating | Melamine board | 200,000 | ||||
| Foil | Foil-lined board | 48,000 | ||||
| Moulding | MDF mouldings | 104,400 |
(1) Units are in cubic meters. The annual installed capacity may vary slightly depending upon the thickness of the boards produced and other production factors. Actual production can exceed capacity because capacity is estimated assuming an average board thickness and actual board thickness may vary.
45
Masisa Argentina’s production facilities are located in Concordia, an industrial town in the Province of Entre Rios on the Uruguay River, approximately 250 miles north of Buenos Aires, Argentina. The Concordia particle board production facility has the capacity to produce 185,000 cubic meters per year of raw particle board in two lines. The particle board line for thin particle board (under nine millimeters) has an annual production capacity of 25,000 cubic meters. The particle board line for greater board thickness has an annual production capacity of 160,000 cubic meters. The Concordia facility commenced operations in June 1994. The capacity utilization rate for Masisa Argentina’s particle board production facilities was 99% in 2006 compared to 85% in 2005
In September 1995, Masisa Argentina completed the installation of an MDF facility adjacent to its particle board facilities. In 1997 Masisa increased this MDF facility’s annual production capacity from 120,000 cubic meters to 138,000 cubic meters. In 1999, Masisa further increased its production capacity to 150,000 cubic meters.
In October 2001, Masisa Argentina completed the construction of a thin-MDF plant at the Concordia Industrial Complex. The plant, which became fully operational by mid-2002, has an installed capacity of 120,000 cubic meters per year and represented an investment of approximately US$30.0 million. The capacity utilization rate for Masisa Argentina’s MDF production facilities was 94% in 2006 compared to 88% in 2005.
The Concordia plant also includes a melamine-laminating line with an installed capacity of 200,000 cubic meters per year, as well as a foil lining process with an installed capacity of 48,000 cubic meters per year.
In March 2002, Masisa Argentina began construction of its first line of pre-painted MDF mouldings in Argentina at the Concordia Industrial Complex. Production at the MDF moulding plant is primarily directed to the United States. This line became fully operational during the second quarter of 2003. An additional 36,000 cubic meters of production capacity was added during 2004. The current annual production capacity of 104,400 cubic meters was reached in February 2005 with the addition of a new production line. The capacity utilization rate for Masisa Argentina’s MDF mouldings production facilities was 69% in 2006 compared to 51% in 2005. The relatively low utilization rate during 2006 is primarly due to a focus on more profitable production. Accordingly, in 2006 we focused our selling and marketing efforts for our MDF boards on the local Argentinean market rather than exporting such boards as MDF mouldings to the United States, where given the downturn in the construction sector, pricing for this product was less attractive to us. The low utilization rate during 2005 was due mainly to the addition of increased capacity during this period.
46
Mexico
The following table sets forth for each of our Mexican production lines the product manufactured and the installed annual production capacity in cubic meters as of December 31, 2006.
MEXICO WOOD PRODUCTS PRODUCTION LINES
Plant | Line | Product | Annual installed capacity(1) | |||
| Durango | Line 1 | Particle board | 65,500 | |||
| Line 2 | Particle board | 88,000 | ||||
| Laminating | Melamine board | 73,450 |
(1) Units are in cubic meters. The annual installed capacity may vary slightly depending upon the thickness of the boards produced and other production factors. Actual production can exceed capacity because capacity is estimated assuming an average board thickness and actual board thickness may vary.
In December 2001, Masisa reached an agreement with Weyerhaeuser Company Limited to purchase from Weyerhaeuser’s subsidiary, MacMillan Guadiana, a particle board plant located in the city of Durango, Mexico. As of December 2006, the plant had a total installed capacity of 153,500 cubic meters per year in two independent production lines. The plant also includes a melamine-laminating line, with a total installed capacity of 21,600 cubic meters per year. In June 2005, the former Mapal, Chile melamine-laminating line started operating in Mexico, extending the capacity up to 73,450 cubic meters per year. The capacity utilization rate for Masisa Mexico’s particle board production facilities was 82% in 2006 compared to 92% in 2005. The capacity utilization rate for our melamine laminating facility in Mexico was 88% in 2006 compared to 57% in 2005. Most of the 2006 and 2005 production at this plant was directed toward the local market.
United States
The following table sets forth for each of our U.S. production line the product manufactured and the installed annual production capacity in cubic meters as of December 31, 2006.
UNITED STATES WOOD PRODUCTS PRODUCTION LINES(2)
Plant | Line | Product | Annual installed capacity(1) | |||
Charleston, South Carolina | MDF moulding | MDF moulding | 36,000 |
| (1) | Units are in cubic meters. The annual installed capacity may vary depending upon the thickness of the MDF mouldings produced, number of production shifts, and other production factors. Actual production can exceed capacity because capacity is estimated assuming an average board thickness and actual board thickness may vary. |
| (2) | In February 2007, as part of a cost reduction program, we closed the Charleston MDF moulding plant (i.e. 36,000 cubic meters, representing 9% of our total moulding capacity). Most of the industrial assets previously used at the Charleston, South Carolina plant will be relocated to our industrial complex in Cabrero, Chile. |
Masisa USA (formerly Terranova Forest Products, Inc.) was established to market and distribute our products in the United States as part of our strategy of locating our commercial operations as close to our customers as economically feasible. Terranova Forest Products was organized in 1993 as a joint venture with Fiberform Wood Products, Inc. under the name Fiberform Andinos Corporation. In January 1996, we purchased Fiberform’s interest in the joint venture and changed its name to Terranova Forest Products.
In April 2005, Masisa USA moved its headquarters and marketing operations to Atlanta, Georgia. Atlanta’s Hartsfield-Jackson airport serves as a major connecting hub serving destinations around the globe, providing easier access to our customers throughout the U.S. and to our world headquarters in Chile.
47
Our MDF mouldings line had a total installed capacity of 36,000 cubic meters per year. The capacity utilization rate for our MDF mouldings line was 67% in 2006 compared to 78% in 2005. As previously noted, in February 2007, as part of a cost reduction plan, we closed our MDF moulding plant in Charleston, South Carolina. Most of this production line will be relocated during 2007 to our Cabrero industrial complex, in Chile.
Forestry Operations
Overview
We and our forestry subsidiaries manage and operate the cultivation of our tree stock in our nurseries and the planting and management of our forests, log manufacturing, log sales and marketing, log trading, transport and supply chain activities. The logs and other raw materials produced by us and our forestry subsidiaries and affiliates are sold to our production and processing subsidiaries primarily at market conditions in arms-length transactions. Our sales to unaffiliated third parties represented 53.6% and 56.4% of our consolidated forest products sales for the years 2006 and 2005, respectively.
As a result of the review in October 2006 of our competitive strategy for becoming the leading wood board company for the furniture and interior architecture industries in Latin America and identifying the wood boards business as our core business (for further details, please refer to “Item 4. Information on the Company—Business Strategy”), our forestry operations have become a complimentary business to our wood boards business. We intend to create value for our core wood boards business through our forestry assets by (i) securing the fiber supply for our industrial facilities, (ii) positioning our forestry assets in a manner to increase the Company’s overall financial flexibility, and (iii) optimizing the geographic distribution of our forestry assets in line with projected industrial growth. Our management team is developing two complementary efforts to achieve these results. The first is a forestry leveraging program that will use portions of our existing forestry assets to generate cash resources principally to finance growth opportunities in both, the core wood boards business unit and Greenfield forest projects, while maintaining long term fiber supply from the forests for our industrial business units. Our second effort is the development of Greenfield forest projects.
In May 2007, we entered into a binding agreement to sell 90% of our ownership in Forestal Argentina S.A., 80% to Los Boldos, S.A., a subsidiary of Diversified International Timber Holdings LLC, a U.S. forestry investment company, and 10% to Grupo Nueva, with the Company retaining ownership of the remaining 10%. The sales price for Forestal Argentina S.A. is based on a financial value of US$107.2 million for its forestry assets. Closing of this sale is subject to customary closing conditions and approval by Argentina’s National Border Zone Commission. Forestal Argentina owns approximately 38,000 hectares of pine and eucalyptus plantations and plantable landholdings in the Entre Ríos and Corrientes provinces in Argentina. As part of our agreement with Los Boldos and Grupo Nueva, we expect to (i) enter into a long-term supply agreement in order to receive a significant percentage of the wood production from Forestal Argentina’s forestry assets, (ii) enter into a forest management arrangement whereby Los Boldos will manage under the FSC standard the forestry assets on behalf of the other shareholders in Forestral Argentina, (iii) have an option to repurchase the leveraged forestry assets under certain circumstances, and (iv) retain the carbon credit rights equivalent to 55,000 annual tons of carbon dioxide from the forestry assets, which will assist us to meet our commitment to the CCX to reduce our carbon emissions by 6% by 2010. This is the first forest leveraging project we have entered into and we continue to evaluate additional opportunities for leveraging other portions of our forestry assets. The proceeds from the sale of Forestal Argentina will be used to repay outstanding indebtedness. Proceeds from future leveraging transactions will be utilized to finance new industrial developments for our wood boards business in Latin America, to finance future Greenfield forest projects and repay financial debt.
The second approach we are exploring to achieve the strategic goals we have to support our wood boards business is to develop Greenfield forest projects. These projects are intended to address the strategic role that access to wood fiber plays and will continue to play in the future in our wood products business, particularly as wood fiber becomes more scarce due to the increased demand for wood fiber from pulp and energy producers. We are seeking these investment opportunities on our own and in cooperation with outside third parties throughout Latin America. When structuring future Greenfield forest projects, we intend to secure long-term fiber supply and improve our wood fiber logistics by owning forests, or having access to fiber, located in close proximity to our present and future production facilities.
48
The leveraging of a portion of our forestry assets, does not mean that we are exiting the forestry business. In 2006, we acquired 7,841 hectares of land and 9,422 hectares of planted forests in Argentina, Chile and Brazil, and expect to continue with these efforts in the future.
Additionally, in June 2007, we signed a Master Investment Agreement ("MIA") with Diversified International Timber Holdings LLC and Grupo Nueva to jointly explore, analyze and develop forestry projects. This co-investment agreement is an important element of our growth strategy for Masisa and it will enable us to undertake global scale forestry projects in the future.
Land ownership and rights
As of December 31, 2006, our group’s forestry assets included an interest in approximately 374,505 hectares of land, of which 241,417 hectares are planted with renewable trees. Of our forestry assets, approximately 264,537 hectares (71%) are owned by our group, and the remaining 109,968 hectares (29%) are held under leases, forestry rights and forestry licenses, mainly in Venezuela.
Our leases enable us to use the forestry land for terms ranging from 15 to 33 years, depending on the location, which is generally the equivalent of one to two forestry rotations. Forestry rights permit someone other than the owner to plant, manage and harvest, an estate of trees on the leased land.
Distribution of forestry assets
Our forests are located in Chile, Brazil, Venezuela and Argentina. On a consolidated basis, caribbean, radiata/oregon and eliotti/taeda pines are softwood pine species which constitute approximately 41.7%, 34.71%, and 11.96% of our plantations, respectively. In addition, our forests include 28,084 hectares of eucalyptus trees, equal to approximately 11.63% of our total plantations.
The following table sets out the number of hectares and types of uses of our land holdings and rights at December 31, 2006 for each of our forestry operations.
Forestry Assets | ||||||||||||||||
(in hectares) | Chile | Argentina | Venezuela | Brazil | Consolidated | |||||||||||
| Total forestry holdings | 143,839 | 49,177 | 147,443 | 34,046 | 374,505 | |||||||||||
| Owned | 143,644 | 49,177 | 40,244 | 31,473 | 264,537 | |||||||||||
| Rights/Leased | 196 | - | 107,199 | 2,573 | 109,968 | |||||||||||
| Total planted land | 87,730 | 35,609 | 100,682 | 17,395 | 241,417 | |||||||||||
Plantations: | - | |||||||||||||||
| Caribbean pine | - | - | 100,661 | - | 100,661 | |||||||||||
| Radiata pine | 82,818 | - | - | - | 82,818 | |||||||||||
| Taeda/elliotti pine | - | 12,093 | - | 16,775 | 28,868 | |||||||||||
| Eucalyptus | 3,947 | 23,517 | - | 620 | 28,084 | |||||||||||
| Oregon pine & others | 965 | - | 21 | - | 986 | |||||||||||
| To be replanted | 4,997 | 2,313 | 25,990 | 3,391 | 36,690 | |||||||||||
| Protected lands | 25,519 | 4,191 | 2,065 | 4,241 | 36,015 | |||||||||||
| Native forests | 18,347 | - | - | 2,820 | 21,167 | |||||||||||
| Other (Araucaria conifer) | 2,217 | - | - | 5 | 2,222 | |||||||||||
| Legal reserve | - | - | - | 5,195 | 5,195 | |||||||||||
| Roads, encampments and other uses | 5,029 | 7,064 | 18,706 | 999 | 31,798 | |||||||||||
Certain of our forestry assets in Chile and all of our forestry assets in Argentina are held through Forestal Tornagaleones S.A. and Forestal Argentina S.A., respectively. On October 26, 2005, Masisa entered into an agreement with the holder of a significant minority interest in each of these companies to acquire that holder's 34.5% interest in the common equity stock of Forestal Tornagaleones S.A. for approximately US$29.9 million in cash and its 29.2% interest in the common equity stock of Forestal Argentina S.A. for approximately US$14.5 million in cash. Before the acquisition, Masisa owned 60.45% of the equity ownership of Forestal Tornagaleones S.A., and Forestal Tornagaleones S.A. owned 50.1% of the equity ownership of Forestal Argentina S.A. The closing of the purchase of the significant minority shareholder's interest in Forestal Tornagaleones S.A. for US$29.9 million occurred on November 15, 2005. Masisa also made an offer to the remaining minority shareholder in Forestal Tornagaleones S.A. to purchase its interests at the same price per share of common equity that was paid to the significant minority shareholder under the Forestal Tornagaleones S.A. purchase agreement. That offer expired without being accepted. Under the terms of a shareholders' agreement of Forestal Argentina S.A. entered into by Masisa, the holder of the significant minority interest and the remaining minority shareholders, the minority shareholders had (i) a right of first refusal to purchase the interest of the significant minority shareholder and (ii) a tag along right to sell their interests together with the significant minority shareholder. Pursuant to such shareholders' agreement, the significant minority shareholder had delivered to the remaining minority shareholders of Forestal Argentina S.A. a notice informing them of the purchase agreement entered into with Masisa and requesting such minority shareholders to give notice of their intent to exercise or not their right of first refusal or tag along right. During the first quarter of 2006, ten of the eleven remaining minority shareholders of Forestal Argentina S.A. exercised their tag along right. The total purchase price paid by Masisa’s subsidiary, Forestal Tornagaleones, including for shares purchased from the significant minority shareholder, was approximately US$24.3 million. On December 20, 2005, the Comisión de Defensa de la Libre Competencia of Argentina declined to review the purchase of the significant minority interest, satisfying a condition to the closing of that transaction. As a result of the purchase of the minority interests, Forestal Tornagaleones now controls 98.68% of the share capital of Forestal Argentina S.A. On May 15, 2007, we acquired a 1.32% ownership stake in Forestal Argentina S.A. from the minority shareholders for US$2.3 million. As a result of this transaction, the above mentioned shareholders’ agreement was terminated. On May 31, 2007, we entered into a binding agreement with Los Boldos, S.A., a subsidiary of Diversified International Timber Holdings LLC, and Grupo Nueva S.A., to sell 90% of our ownership in Forestal Argentina S.A. This sale is subject to customary closing conditions and approval by Argentina’s National Border Zone Commission.
49
Forest management
Our forestry subsidiaries cultivate, administer and manage our forestry assets in Chile, Argentina, Venezuela and Brazil. We manage our forestry assets to maximize the value of the wood; except in Venezuela, where, due to the longer growth cycles of our forests, our forest management systems take into account the existing, medium annual growth index of our forests and aligns production amounts to our existing local industrial operations’ requirements. We seek to maximize the value of the wood through the use of planting, soil and site preparation, maintenance of optimum soil quality through monitoring and fertilization, underbrush control, and management of tree density through thinning and pruning. This management system in Chile, Argentina and Brazil increases our forests’ production of larger diameter trees with fewer knots and other defects and, as a result, can produce a higher overall yield of clear wood. Clear wood, whether sold to third parties as lumber or used by our production facilities to produce our processed wood products, generally commands a higher price than knotted wood.
A significant variable affecting the profitability of our forestry operations is the age at which a tree is harvested, or the “rotation length.” The rotation length has a direct impact on timber quality, unit volume and economic return obtained from the investment. We currently consider our forestry management objectives, described above, to be achievable on an average rotation length of approximately 23, 24, 26 and 22 years for radiata, caribbean, eliotti and taeda pine, respectively, and 12 years for eucalyptus. The optimal rotation length can vary depending on past management practices, the cost of capital and prevailing market conditions.
50
The following tables set forth the age profile by hectares of our forests at December 31, 2006 on a consolidated basis and for each of our forestry operations.
Consolidated | ||||||||||
Age Range (Years) | Pine | Eucalyptus | Oregon pine & Others | |||||||
(in hectares) | ||||||||||
| 0 - 5 | 35,840 | 8,751 | 78 | |||||||
| 6 - 10 | 27,653 | 15,816 | 301 | |||||||
| 11 - 15 | 47,463 | 2,322 | 229 | |||||||
| 16 - 20 | 67,249 | 631 | 10 | |||||||
| 21+ | 34,142 | 564 | 368 | |||||||
| Total | 212,347 | 28,084 | 986 | |||||||
Chile | Argentina | ||||||||||||||||||
Age Range (Years) | Pine | Eucalyptus | Oregon pine & Others | Pine | Eucalyptus | Oregon pine & Others | |||||||||||||
(in hectares) | |||||||||||||||||||
| 0 - 5 | 12,944 | 1,773 | 78 | 6,392 | 6,747 | - | |||||||||||||
| 6 - 10 | 14,189 | 1,116 | 280 | 5,209 | 14,701 | - | |||||||||||||
| 11 - 15 | 30,966 | 963 | 229 | 212 | 1,359 | - | |||||||||||||
| 16 - 20 | 19,918 | 88 | 10 | 259 | 543 | - | |||||||||||||
| 21+ | 4,801 | 8 | 368 | 20 | 167 | - | |||||||||||||
| Total | 82,818 | 3,947 | 965 | 12,093 | 23,517 | - | |||||||||||||
Venezuela | Brazil | ||||||||||||||||||
Age Range (Years) | Pine | Eucalyptus | Oregon pine & Others | Pine | Eucalyptus | Oregon pine & Others | |||||||||||||
(in hectares) | |||||||||||||||||||
| 0 - 5 | 8,308 | - | 0 | 8,195 | 231 | - | |||||||||||||
| 6 - 10 | 5,891 | - | 21 | 2,364 | 0 | - | |||||||||||||
| 11 - 15 | 15,865 | - | 0 | 420 | 0 | - | |||||||||||||
| 16 - 20 | 45,598 | - | 0 | 1,475 | 0 | - | |||||||||||||
| 21+ | 24,999 | - | 0 | 4,321 | 389 | - | |||||||||||||
| Total | 100,661 | - | 21 | 16,775 | 620 | - | |||||||||||||
Sustainable development and forestry management systems
We adhere to ISO management systems and certification under the FSC. FSC is an international organization funded to support environmentally appropriate, socially beneficial and economically viable management of the world’s forests. The FSC certification standard is recognized by The Home Depot, one of the key end-users to which our products are marketed through Masonite in the United States.
Certification of our forest products and management systems has enabled us to access international markets such as the United States, where chain of custody certification of products is frequently preferred by customers. It has also given our products greater environmental credibility in the international marketplace by allowing our customers to readily and reliably determine that the product they are purchasing comes from a forest managed according to internationally agreed social and environmental principles and criteria.
Forest protection
Our forestry assets are exposed to risk of loss due to fire, wind, pests and disease. Accordingly, our forestry subsidiaries have established programs for the prevention and control of each of these risk factors. Our forestry operations’ prevention efforts include, among others, identifying risks neighboring our forests, public education of communities located near our forests and maintenance of firebreaks. We also cooperate with other forestry companies, when possible, to undertake joint prevention measures with respect to pest and disease control.
51
During January 2007, we were negatively affected by a fire that burned 1,171 has. in the Bio-Bio Region of Chile. These forests were insured under standard market conditions.
Insurance
We insure our assets and operations against a variety of risks associated with our business activities. The types and amounts of coverage we maintain depend on the kind of facility or asset being insured, as well as its location. These plans include insurance policies against fire damage, loss attributed to natural disasters, risks related to the construction of projects, losses resulting from delays in commencing such projects and business interruption.
In Chile, we maintain coverage of our fixed assets in an aggregate amount of US$705.2 million. This amount includes US$374.6 million for losses on our plantations and US$330.6 million for losses due to interruptions in the operations of our plants and broken equipment.
In Brazil, we maintain coverage of our fixed assets in an aggregate amount of US$378.9 million. This amount includes US$102.3 million for losses on our plantations and US$276.6 million for losses due to interruptions in the operations of our plants and broken equipment.
In Venezuela, we maintain coverage of US$281.3 million for losses due to interruptions in the operations of our plants and broken equipment. Our plantations in Venezuela are not insured because Venezuela’s insurance market does not offer convenient insurance coverage for these types of risks.
In Argentina, we maintain coverage of our fixed assets in an aggregate amount of US$274.2 million. This amount includes US$54.2 million for losses on our plantations and US$220.0 million for losses due to interruptions in the operations of our plants and broken equipment.
In Mexico, we maintain coverage of US$58.9 million for losses due to interruptions in the operations of our plants and broken equipment.
In United States, we maintain coverage of US$28.0 million for losses due to interruptions in the operations of our plants and broken equipment, and coverage of US$42.0 million for liabilities arising out of civil responsibility claims.
We maintain coverage of US$10 million for liabilities arising out of civil corporate responsibility claims.
As of December 31, 2006, a high number of our personnel, including our executive officers, have travel and life insurance.
Raw Materials and Suppliers
Our principal suppliers in each country in which we have industrial facilities and the products or raw materials they supply to us in connection with our board, solid wood and forestry business are listed in the following table:
52
PRINCIPAL SUPPLIERS OF RAW MATERIALS & SERVICES
CHILE | PRODUCT | ARGENTINA | PRODUCT | |||
| Georgia Pacific Resinas Ltda. | Resins | Impress Diseño Iberia S.A. | Paper | |||
| Metso Panelboard A.B. | Machinery & spare parts | Isogama Industria Química Ltda. | Chemicals | |||
| Forestal Mininco S.A. | Wood | Lamigraf S.A. | Paper | |||
| Siempelkamp Maschinen | Machinery & spare parts | MD Papéis Ltda . | Paper | |||
| Aserraderos Arauco S.A. | Wood | MSC | Maritime transport | |||
| Empresa Constructora Tecsa S.A. | Assembly services | Resinas Concordia | Resins | |||
| Forestal Bio Bio S.A. | Wood | Schattdecor | Paper | |||
| Forestal Santa Elena Ltda. | Wood | SIA Ltd. | Sandpaper bands | |||
| Kontra Anlagentechnik Gmbh | Machinery & spare parts | Terminal Zárate | Port | |||
| Empresa Nacional de Electricidad S.A. | Energy | |||||
| Servicios Forestales El Bosque S.A. | Machinery | |||||
| Forestal del Sur S.A. | Wood | |||||
| Promasa S.A. | Wood | |||||
| Derquim S.A. | Chemicals | |||||
| Lamigraf S.A. | Paper | |||||
| Anthon Gmbh Maschinen & Anlagenbau | Machinery & spare parts | |||||
| Zanella Eng.Ind.de Maquinas Ltda. | Methalic structures | |||||
| Ing. y Const. Quezada y Boetsch S.A. | Construction services | |||||
| CMPC Maderas S A | Wood | |||||
| Soc. Austral de Electricidad S.A. | Energy |
BRAZIL | PRODUCT | MEXICO | PRODUCT | |||
| Hexion Química Indústria e Comércio | Resins and Adhesives | Despachos Aduanales Castañeda S.C. | Customs agency | |||
| Synteko Produtos Químicos S/A | Resins and Adhesives | Alta Cargo S.A. de C.V. | Logistics | |||
| Dynea Brasil S/A | Resins, Adhesives and y impregnated sheets | Dynea México SA de CV | Resins | |||
| Coveright Surfaces do Brasil | Impregnated sheets | Comisión federal de Electricidad | Energy | |||
| Md Papeis Ltda | Paper | Coveright Canadá | Impregnated paper | |||
| Isogama Indústria Química Ltda | Chemicals | Agencia Aduanal Zamudio | Customs agency | |||
| Rodo Mar Veículos e Máquinas Ltda | Logistics | Centro de Acopio para Madera | Sawn Lumber / Wood chips | |||
| Resinas Internacionais Ltda. | Resins and Adhesives | Despachos Aduanales Castañeda S.C. | Customs agency | |||
| Lamigraf S.A. | Paper | Alta Cargo S.A. de CV | Logistics | |||
| Imbau Transportes E Serviços Ltda | Logistics | Juan C. Balerio | Sawn Lumber | |||
| Bayer S/A | Resins and Adhesives | Melfi Marin (Agnamex) | Maritime transport | |||
| Rafter Serviços Ltda. | Transport | Maersk | Maritime transport | |||
| TSG Ltda - Tecnologia em Serviços | Cleaning services | Hamburg Sud | Maritime transport | |||
| Schattdecor do Brasil Industria | Paper | Costa Container | Maritime transport | |||
| Gordo Transportes Ltda | Transport |
53
BRAZIL | PRODUCT | MEXICO | PRODUCT | |||
| Unimed | Health services |
VENEZUELA | PRODUCT | |
| Servicios y Mantenimiento Macapaima, C.A. | Equipment rental | |
| Consorcio Vettor, C.A. | Transport | |
| Transporte at Mantis, C.A. | Transport | |
| Servicios Madereros Carmen, C.A. | Personnel service - Outsourcing | |
| Serviequipos Roraima, C.A. | Equipment rental | |
| Construcciones 2e-b, C.A. | Personnel service - Outsourcing | |
| Corporación Venezolana de Sum.y Serv., S.A. | Harvest services | |
| Orinoco Express, C.A. | Transport | |
| Transporte Sánchez Polo de Venezuela, C.A. | Transport | |
| Servicios Evcaven, C.A. | Cleaning services | |
| PDVSA-GAS, S.A. | Gas supply | |
| CVG Electrificación del Carona, C.A. | Energy | |
| Teléfonos de Venezuela (CANTV) | Telecommunications | |
| Transporte El Pinar, C.A. | Transport | |
| Técnicas Forestales y Agroambientales R.T.B.R, C.A. | Fire protection services |
Solid wood and forestry business
The most significant direct costs associated with our solid wood products and forestry operations are adhesives, fertilizers, wood fungicides, lumber, water-based paint, plants, chemicals, logs, labor and energy.
In general, the prices of raw materials we use in our forestry operations are cyclical. The prices of raw materials we use in our wood products operations depend on factors such as wood, pulp and oil prices and tend to fluctuate according to economic cycles and world supply.
In the forestry sector, all operations are carried out through a select set of third party contractors, who provide their services to our forestry subsidiaries and affiliates in accordance with the technical, legal, and administrative requirements established in our manual for service companies and the specific contracts entered into in connection with the provision of such services. However, due to an interpretation of the existing Brazilian Subcontracting Law, we have had to perform ourselves forest management functions that had previously been performed by third party contractors in Brazil. The services contracted by our forestry operations range from logistical support (meals, transport, cleaning and maintenance, security, reception and dispatch of products, among others) to production activities (harvest, transport, planting, thinning, pruning, road construction, and others).
In the industrial sector, our subsidiaries and affiliates subcontract with third-party providers for a variety of services at our sawmills and manufacturing facilities. These services include, among others, packaging, separating sticks, movement of logs and lumber, and industrial cleaning. However, due to the new Chilean Subcontracting Law, we have had to perform ourselves certain of these functions that had previously been performed by third party contractors in Chile. Specific contracts are established for each of these services outlining technical, economic and administrative specifications.
Boards business
The most significant direct costs associated with the production of particle board, MDF and OSB in connection with our board operations are chemicals, wood, labor and energy.
In 2006, chemical adhesives used in the production of particle board and MDF in Chile and Argentina were manufactured by the chemical plants of Georgia Pacific Resinas Ltda. (formerly GPM) and Resinas Concordia S.A., respectively. These two plants also manufactured most of the chemical catalysts used by the Company in those countries. Until early 2001, Masisa had a 50% interest in both companies under a joint venture with Georgia-Pacific. In January 2001, Masisa sold its participation in those companies to Georgia-Pacific. However, before this transaction, Masisa Chile and Masisa Argentina reached long-term resin supply contracts with GPM and Resinas Concordia S.A. to ensure the normal supply of resins for existing and future operations, including calculations for future growth of the Company in Chile and Argentina. In Brazil, the principal chemical adhesives used in the production of MDF and OSB were supplied by Borden Químicos Indústria e Com. Ltd. and Synteko Produtos Químicos S.A. In Mexico, the principal chemical adhesives used in the production of the particle boards were supplied by Dynea Mexico S.A. de C.V. In Venezuela, we have a partnership relationship as well as a long-term resin supply contract with Oxinova, which supplies 100% of our resin needs. Oxinova was formed as a partnership by Terranova and Oxiquim, and it is managed by Oxiquim.
54
We have a long-term resin supply contract with Georgia Pacific Resinas Ltda. in Chile to ensure the normal supply of resins for existing and future operations, taking into account our future growth. Payments made under the contract in 2006 totaled US$34.4 million. The contract does not oblige us to purchase a minimum amount from Georgia Pacific Resinas Ltda. In Argentina, Resina Concordia S.A. supplies us with resin.
We believe that the market for the chemicals used in our board operations is sufficiently competitive and accessible such that we could satisfy our chemical requirements through other suppliers on terms similar to those obtained from our current suppliers. There is more than one producer of chemical raw materials in each country in which we have industrial facilities, granting us flexibility as to our suppliers. We also have a number of suppliers for the raw materials used in our production processes. We believe that the loss of any one of these suppliers, individually, would not have a material adverse effect on our operations or financial results. Raw materials are also available from countries in the region as well as more distant ones, such as the United States and Japan.
Fluctuations in resin prices affect our production costs because adhesives, a combination of resin and chemical additives, represent approximately 35% of our board production costs. Urea and methanol, components of resin, are derived from natural gas. The increased price of natural gas during 2006 therefore led to increased resin prices.
Historically, Forestal Tornagaleones provided Masisa’s Chilean plants with small supplies of wood. Masisa, however, has not purchased a material amount of wood from Forestal Tornagaleones since 2000. In Argentina, approximately 96% of the wood consumed by Masisa Argentina in 2006 was purchased from several unrelated sawmills and forest growers and the remaining 4% of the wood was purchased from Forestal Argentina. The wood consumed by Masisa for the production of MDF in Brazil was purchased either from owned forests or from several unrelated sawmills and forest growers. With respect to the particle board plant in Mexico, Masisa obtains wood from third-party suppliers that serviced the plant under its previous ownership.
In Venezuela, we are self sufficient in terms of our wood supply. We satisfy all of our wood requirements through our forestry companies, namely Forestal Guayamure, Forestal Imataca and Terranova de Venezuela.
We believe that adequate supplies of wood are available. We do not use material amounts of native wood for our production processes. With respect to wood supply, we have several alternatives in forestry companies, including our subsidiaries Forestal Tornagaleones and Forestal Argentina. We may also obtain supplies from the forest plantations that we own in Brazil.
The steam we use in our manufacturing operations is largely generated by burning our own scrap wood and defective wood products. Other energy requirements, such as electricity, are obtained from commercial suppliers.
In 2006, high and steadily rising oil prices increased our energy costs, as well as the cost for the adhesives we use to manufacture board products.
Environmental Regulation
Masisa maintains a strong commitment to sustainable development and we aspire to create economic value while being recognized as a leading company in social and environmental management. Our policy is to maintain high standards of environmental performance and to make all efforts to comply with all applicable environmental laws and regulations. During 2004, 2005 and 2006 we spent, on a consolidated basis, US$3.2 million, US$ 3.6 million and US$3.5 million, respectively, on environmental projects related to complying with environmental regulation. We expect to continue to make the necessary expenditures to comply with such environmental requirements.
55
Certifications: The ISO 14,001 certification is a voluntary procedure in which an operation’s environmental practices are evaluated against a specified set of criteria. Our forestry and manufacturing operations have obtained the ISO 14,001 compliance certifications. Our solid wood operations in Chile will recertify under a unified management system in the first semester 2007, including the Occupational Health and Safety Management System (the “OHSAS”) 18,001 certification process.
Additionally, all of our forestry and production operations, except forestry operations in Argentina and solid wood industrial operations in Chile have obtained the OHSAS 18,001 compliance certifications.
Our forestry operations also obtained FSC compliance certifications regarding sustainable management of forestry assets. We have obtained the “FSC Chain of Custody” certification, which allows identifying products with the FSC seal for our solid wood products from Brazil, Venezuela and Chile, as well as MDF products from Venezuela.
In addition, in 2003 our MDF production plants in Chile, Brazil and Argentina obtained the “Certificate for Recycled Content” granted by the Scientific Certification System (“SCS”). This certificate confirms that the raw material used in production comes from material recycled from other forestry processes. This practice helps reduce the demand for forestry resources, recycle materials considered waste in other lines of business and reduce manufacturing costs.
Environmental Regulation: We are subject to extensive and frequently changing environmental regulation in the countries in which we operate. Such regulations cover, among other things, the discharge of water and discharges into the water and air.
As part of Grupo Nueva, we are committed to transparency in our environmental and social performance, and publish sustainability reports every two years. In 2006, Masisa was recognized with the “Leaders for a Living Planet” award by WWF, as well as the “Corporate Sustainable Standard-Setter” by the Rainforest Alliance. Our local companies have also received recognitions, such as the award for Corporate Environmental Excellency in Argentina, and the “Fritz Müller” award by environmental authorities in Brazil.
A discussion of some of the key environmental regulations for each country in which our most significant operations are located is set forth below.
Chile: Chilean companies, including Masisa, are subject to several national and local environmental laws, regulations, decrees and municipal ordinances concerning, among other things, discharges into air and water, handling and disposal of solid and hazardous wastes and health. Chilean environmental regulations have become increasingly stringent in recent years, particularly for the approval of new projects, and this trend is likely to continue. We have made, and will continue to make, substantial expenditures to comply with such environmental laws, regulations, decrees and ordinances. We believe that our operations are currently in material compliance with applicable local and national environmental regulations.
We have further developed our environmental activities and compliance in Chile by subscribing, along with 13 other companies, to the “Acuerdo de Producción Limpia,” an environmental cooperation agreement between environmental authorities and industry for managing our solid wood operations in Chile. We are currently discussing a similar agreement for the production of boards.
Chilean legislation to which we are subject includes the Chilean Environmental Basic Law (Law 19,300 of 1994 organized by the Supreme Decree N° 95), based upon article 19 No. 8 of the National Constitution, which establishes the general structure of the Chilean environmental law. Law 19,300 defines the Government agencies responsible, among other things, for assessing environmental impact studies, overseeing the implementation of projects in accordance with their environmental impact statements and coordinating environmental regulations.These agencies are Comisión Nacional del Medio Ambiente (National Environmental Commission or “CONAMA”) and Comisiones Regionales del Medio Ambiente (Regional Environmental Commissions or “COREMA”).
56
We are subject to other regulations, such as:
| · | DS 146 (Ministry of Health) on environmental noise, |
| · | DS 609 (Public Works Ministry) on water deposition in sewer and DFL 725 (Ministry of Health) on human health, |
| · | DS 46 (Ministry of the Presidency) on discharges of industrial effluents to underground water bodies, DS 90 (Ministry of the Presidency) on discharges of industrial effluents to surface water bodies, DS 148 (Ministry of the Health) regarding management of hazard industrial waste, |
| · | DS 594 (Ministry of Health), and DS 298 (Transportation Ministry) on handling and transportation of waste and hazardous waste, |
| · | DFL 1 (Ministry of Health), DFL 725 (Ministry of Health) and DS 594 (Ministry of Health) on health issues in the work place. Regulation DS 95 (Ministry of the Presidency) requires us and all companies in Chile to conduct environmental impact studies of any future projects or activities that may effect the environment, and |
| · | In 2007, we expect new regulation in relation to air emissions (“emisiones atmoféricas”) to be applied only in the area of Concepción. This new regulation will be implemented through an anti-pollution plan (“Plan de descontaminación”). |
Affected persons, including private citizens, public agencies and local governmental authorities, can sue under the Chilean Environmental Basic Law to enforce environmental compliance. Enforcement remedies can include temporary or permanent closure of facilities and fines. Private citizens are also allowed to object to the plans or environmental impact studies submitted by project owners. While we seek to implement our business strategy by complying with environmental legislation and by being proactive with environmental and community matters, the application of environmental laws may have an adverse affect on our operations.
Brazil: We are subject to Brazilian environmental legislation, including regulation by municipal, provincial and federal governmental authorities. We believe that our operations are currently in material compliance with applicable local and national environmental regulations. In addition, because our production processes are based on wood from planted trees and because all of our forestry operations involve planted trees, we do not believe that there are material environmental concerns applicable to us that result from the use of natural forest resources.
Laws 6938/81, 9605/98 and 4771/65 give the general framework for environmental legislation in Brazil. Other norms applicable to Masisa in Brazil include Resolution 237/97 on environmental licenses, Resolution SEMA 54/06, which defines norms for air emissions, Law 9433/97 and Resolution CONAMA (National Environmental Council) 357/05, which regulates effluents and water resources management, Law 12493/99 that regulates management of waste and dangerous waste and Resolution 01/90 on noise. Regional norms applicable to our plant in Ponta Grossa include Paraná Law 13.448/02 on environmental audits, and Paraná Law 13.806/02 - Resolution SEMA 54/06 on air emissions.
Our plants in Brazil possess the necessary environmental permits and licenses issued by FATMA (Foundation for the Environment) and IAP (Environmental Institute of Paraná), SUDERHSA (Superintendência de Recursos Hídricos do Paraná), and IBAMA (Instituto Brasileiro de Meio Ambiente). In 2006, CONAMA approved Resolution 382/06, which defines national limits on air emissions. These requirements will be applicable to the renewal of the licenses to be issued to both of our Brazilian industrial plants.
All of Masisa’s operations in Brazil have obtained ISO 14,001 and OHSAS 18,001 certifications. Our forestry plantations and Chain of Custody are certified under FSC, so too are our Ponta Grossa and Rio Negrinho plants.
Venezuela: Our Venezuelan operations are subject to Venezuelan environmental legislation, including regulation by municipal, provincial and national governmental authorities. We believe that our operations are currently in material compliance with applicable local and national environmental regulations. Such regulations include, among others, (i) the Law Regarding Dangerous Substances Materials and Waste (“Ley sobre Substancias, Materiales y Desechos Peligrosos”), (ii) Decree 638 regulating air emissions and norm COVENIN (Comisión Venezolana de Normas Industriales) 2253:2001 regulating emissions in the work place, (iii) Decrees 1257, 2635 and 2216 regulating the management of waste and hazardous waste, (iv) Decree 1847 and norms COVENIN 2268:96 and 2817:91 regulating the transportation and management of chemical products, (v) Decree 883 regulating effluents to water, (vi) Decree 2217 regulating environmental noise, and (vi) the Organic Law of Prevention, Conditions, and Workplace Environment regulating safety at the workplace. The solid wood, MDF and particle board operations in Venezuela have FSC Chain of Custody certifications, which allows products to be identified with an FSC green seal.
57
In 2007, Masisa Venezuela will apply for the renewal of its ISO 14,001 certificate and the OHSAS 18,001 certificate.
Mexico: Our operations in Mexico are subject to a constantly growing number of federal, state and local environmental provisions. Among the most relevant, are the General Law of Ecological Equilibrium and Environmental Protection (Ley General de Equilibrio Ecológico y la Protección al Medio Ambiente, 1988), enforced by the Attorney General’s Office for the Protection of the Environment (Procuraduría Federal de Protección al Ambiente, PROFEPA) and the local Environmental Law issued by the State of Durango (Ley Estatal del Equilibrio Ecológico y Protección al Ambiente, 2001), enforced by the Secretaría de Recursos Naturales y Medio Ambiente, Durango. We believe that we are in material compliance with all applicable environmental laws and regulations affecting our facilities and products in Mexico.
Our plant in Durango possesses a Comprehensive Environmental License (Licencia Ambiental Única) from the State of Durango. Air emissions at this plant comply with the emissions Regulations "Reglamento de la Ley General del Equilibrio Ecológico y la Protección al Ambiente en materia de Registro de Emisiones y Transferencia de contaminantes," 2004 and with Official Mexican Standard NOM-043-SEMARNAT-1993, enforced by the State of Durango, Secretaría de Recursos Naturales y Medio Ambiente. The General Law for Prevention and Management of Waste, 2003, its Regulations, 2006, and Official Mexican Standard NOM-052, regulate management of hazardous waste. Water management is regulated by the National Water Law of 1992, while our wastewater discharges comply with the State Regulations on Wastewater Control of 2003 (Reglamento del Gobierno del Estado sobre Control de Aguas Residuales), and with Official Mexican Standard NOM-002-SEMARNAT-1996. Masisa Mexico obtained ISO 14,001 and OHSAS 18,001 certifications in 2004.
Argentina: Masisa’s Argentina industrial plant began using scrubbers in its particle board lines to decrease the particulate matter in air. We possess Sanitary Authorization from the Department of Development, Ecology and Environmental Control from the Province of Entre Ríos. All companies in Argentina, including Masisa, are subject to several national and local environmental laws, regulations, decrees and municipal ordinances concerning, among other things, discharges into air and water, handling and disposal of solid and hazardous wastes. Provincial Law No. 6260 “Contamination Prevention by the Industries” with its Reglamentary Decree No. 5837 regulates the wastewater discharges and air quality, solid waste handling and noise. National Law No. 24051 “Hazardous Wastes—generation, handling, transport and treatment” and its Reglamentary Decree No. 831 regulate the management of hazardous wastes and air emissions".
In October 2006, we successfully completed an external audit of our Environmental Management System, Quality Management System and Security and Occupational Health Management maintenance audit which allowed us to renew our ISO 9,001, ISO 14,001 and OHSAS 18,001 certifications, respectively. Our next external audit is currently scheduled for June 2007. We also submit our Environmental Management System to two internal audits to verify that it complies with the relevant certification requirements and whether such system has been efficiently implemented. We also have the SCS certification, which certifies that our boards have 100% recycled and reclaimed fiber content. We believe that our operations are currently in material compliance with applicable local and national environmental regulations.
United States: Our MDF moulding facility operated under several environmental permits and regulations. The Conditional Major Air Quality Permit is issued under the provisions of the Pollution Control Act, Sections 48-1-50(5) and 48-1-110(a), and the 1976 Code of Laws of South Carolina, Regulation 61-62. The permit allows an emission rate of 100 TPY of VOC’s and PM emissions, and we have successfully maintained levels of less than 1.3 TPY VOC’s and less than 30 TPY PM Emissions. As of February 15, 2007, the Charleston MDF moulding facility has been shutdown, and thus no further emissions will be generated. We have decided to cancel the Conditional Major Air Quality Permit, since the permit is firm and site specific, and thus can not be assigned to another company.
58
The facility operated a closed loop waste water recycling system that is permitted under the Clean Water Act, CERCLA 40 CFR 302 and the NPDES General Permit No. SCR000000. The production facility did not generate any hazardous wastes and maintained an extensive recycling program for waste disposal under South Carolina US Code Title 44. As a result of the recycling efforts, we recycled approximately 95%, 92% and 94% of all waste products, by volume, in 2004, 2005 and 2006, respectively. The Masisa USA operation does not foresee issues with environmental legislation in the USA, especially now that the manufacturing plant has been shutdown as previously mentioned. Nevertheless, as part of the plant shut-down procedures, we plan to carry out a phase-1 environmental site assessment at the facility, to help facilitate any decision regarding the disposition of these assets.
Masisa USA was certified ISO 14,001 and OHSAS 18,001 in December of 2003 and successfully maintained these certifications with no major non-conformities. Our operating philosophy is to minimize all environmental impacts through sound engineering and operational practices and continuous improvement.
Item 4A. Unresolved Staff Comments
Not applicable.
Item 5. Operating and Financial Review and Prospects
Introduction
Operating and Financial Review and Prospects begins with a brief Overview of our business and products, the most important events affecting our financial performance for the years ended December 31, 2006, 2005 and 2004 and other issues which are material to a reader’s understanding of the information presented in this section. The Overview concludes with our business outlook for 2007 and an overview of significant factors affecting the comparability of our historical results of operations and financial condition for each of the periods compared in our Results of Operations discussion. This is followed by a discussion of our Results of Operations for the year ended December 31, 2006 compared to the same period in 2005 and for the year ended December 31, 2005 compared to the same period in 2004. The next section provides an analysis of our Liquidity and Capital Resources, including changes in our balance sheet and cash flows, and discusses our financial commitments. The last two sections discuss the impact of currency devaluation on our results and our critical accounting policies.
The following discussion is based upon, and should be read in conjunction with, our audited consolidated financial statements, including the notes thereto, included elsewhere in this document. This section contains a number of forward-looking statements, all of which are based on our current expectations and could be affected by the uncertainties and risk factors described throughout this filing and particularly in the “—Business outlook” section. These uncertainties and risk factors could cause actual results to differ materially from those described in the forward-looking statements.
Overview
Business and products
| · | Our primary source of revenue is the sale of MDF, particle board, mouldings, sawn lumber, OSB and solid wood doors. |
Our business strategy is to be an integrated Latin American wood boards for furniture products company with plantations in rapid growth regions, a competitive industrial capacity, a strong distribution channel in Latin America. We have production facilities in five of our principal markets —Chile, Argentina, Brazil and Venezuela and Mexico — with access to environmentally-friendly, long-term, low-cost supplies of wood, principally in Chile, Argentina and Brazil. Although we also export to other Latin American and world-wide markets, our performance in our principal markets is, and will continue to be, fundamental to our strategy and results of operations. In an effort to diversify, we have recently expanded our distribution channels to non-principal markets, such as Peru, Ecuador and Colombia, by opening new commercial offices and increasing the number of Placacentro stores throughout Latin America. We are also actively seeking to incorporate into our product mix higher margin products such as melamine-laminated panels and expand into new products that have significant synergies with our core boards business. For example, in November 2006, we started a Placacentro network consolidated purchasing scheme within Mexico, managed by Masisa, which seeks to supply these stores with highly competitive complimentary products for the furniture industry, such as hardware, adhesives, paintings and lacquer. The objective is to expand through Latin America during 2007.
59
| · | Demand for our products is principally driven by the construction and furniture industries. |
Demand for our products is significantly influenced by growth in the construction and furniture industries, which are highly correlated with regional economic conditions. Our most important market currently is the United States, where we have observed a downturn in the construction industry that has negatively affected our commercial operations in that market, especially affecting OSB and moulding prices. Latin America, our primary market for boards, has recently shown strong economic growth resulting in increased market demand and pricing for our board products.
| · | Most of our products are commodity products which are currently benefiting from a global high cycle for commodities |
Most of our products have experienced increased demand as a result of the global increase in demand for commodity products. Although this trend may prompt our competitors to add new capacity in the regions where we produce and sell our products, we do not expect such additional capacity to exceed the increased demand. For OSB, the increase in demand in recent years was accompanied by new added capacity, particularly in the United States, that when coupled with the recent downturn in the construction industry has led to a large decrease in OSB prices. As a result, we have shifted our OSB selling efforts toward the Brazilian market, Asia and Eastern Europe. Because our products are commodity products, prices are subject to certain volatility, and we have limited control over the degree and timing of price fluctuations of our products.
| · | Our strategy is to balance our sales in a number of markets representing a portfolio of currencies. |
The majority of our sales and transactions are indexed to U.S. dollars in the medium-term. This means that in the short-term, a Latin American currency appreciation can significantly increase our sales when translated into U.S. dollars. In contrast, devaluation in a Latin American currency decreases our local performance, but can significantly increase our competitiveness and ability to export to the United States and other export markets.
Impact of general economic conditions
As explained above, regional economic conditions have a significant impact on our results of operations. The table below presents the GDP growth rates for each of our most important markets in addition to forecasts by the International Monetary Fund for growth in 2007.
Year ended December 31, | Forecast* | ||||||||||||
| 2004 | 2005 | 2006 | 2007 | ||||||||||
| United States | 3.9 | % | 3.2 | % | 3.3 | % | 2.2 | % | |||||
| Chile | 6.0 | % | 5.7 | % | 4.0 | % | 5.2 | % | |||||
| Argentina | 9.0 | % | 9.2 | % | 8.5 | %(*) | 7.5 | % | |||||
| Venezuela | 18.3 | % | 10.3 | % | 10.3 | % | 6.2 | % | |||||
| Brazil | 5.7 | % | 2.9 | % | 3.7 | % | 4.4 | % | |||||
| Mexico | 4.2 | % | 2.8 | % | 4.8 | % | 3.4 | % | |||||
Source: International Monetary Fund, World Economic Outlook, Globalization and Inflation, April 2007
* IMF staff estimates.
60
Business outlook
We do not expect significant changes in market conditions during 2007. In addition, we expect continued economic stability in Latin America due to the strong cycle for commodities. This should positively affect the demand for our board products in these markets. Regarding our export business to the United States, we believe that the slowdown in the construction sector will continue during 2007, thus negatively affecting our moulding and OSB businesses. We do not foresee signs of recovery for these businesses in the short-term.
However, several factors could negatively impact our performance during 2007. Prices for our products periodically fluctuate in “price cycles,” which are highly unpredictable. A decline in the housing market could affect demand for our products and reduce prices. Higher oil prices could result in further increases in the cost of resin, an important raw material for boards’ production, which could negatively affect our costs. Additionally, increased oil prices affect energy prices which could further increase our costs. The appreciation of local currencies where we operate, particularly the Brazilian reales and the Chilean peso, against the U.S. dollar could negatively affect our export business.
Significant factors affecting the comparability of our historical results of operations and financial condition
The following is a summary of the most significant factors that affected our results for each of the periods compared in our Results of Operations discussion, which follows this Overview. Although these are not the only factors which affected our results, we believe these factors are key to understanding our financial performance for the periods specified.
Year ended December 31, 2006:
| · | Continued market strength in all our board markets, coupled with successful marketing efforts, allowed us to transfer cost increases into prices to our customers, which resulted in the recovery of operating margins during the second half of 2006. |
| · | Slowdown of the U.S. construction sector, coupled with an oversupply condition in the U.S. finger-joint and OSB markets, leading to lower prices for our products. |
| · | High and steadily rising oil prices during the first half of 2006, leading to further price increases for the adhesives we use to manufacture board products. |
| · | Higher non-recurring expenses mainly due to increased control procedures related to the merger of Masisa and Terranova in 2005. |
| · | Currency appreciation, particularly in Brazil and Chile, increasing labor and other local raw material costs. |
Year ended December 31, 2005:
| · | High and steadily rising oil prices during 2005, leading to further price increases for the adhesives we use to manufacture board products. |
| · | Currency appreciation, particularly in Chile and Brazil, increasing labor and other local raw material costs. |
| · | Higher administrative and sales expenses, mainly due to the merger between Masisa and Terranova during 2005. |
| · | Continued market strength in all our board markets. |
| · | Oversupplied conditions in the U.S. finger-joint market, leading to lower prices but partially recovering by the end of the year. |
61
Year ended December 31, 2004:
| · | Higher OSB prices cycles in the United States during the first quarter of 2004, declining moderately in the second and third quarter and increasing again in the fourth quarter. |
| · | Strong demand and high prices for MDF mouldings in the United States, particularly during the second and third quarters of 2004. |
| · | Economic recovery in Argentina, strong growth in Brazil’s economy, and significant growth in each of Mexico and Chile, thereby improving demand for our products. |
| · | High and steadily rising oil prices during 2004, leading to price increases for the adhesives we use to manufacture board products. |
| · | High freight costs resulting from high oil prices and scarcity of container and shipping availability. |
Results of Operations
Consolidated
The discussion below analyzes and compares on a consolidated level the period-on-period comparisons of our results of operation for the year ended December 31, 2006 to 2005 and the year ended December 31, 2005 to 2004. A more detailed understanding of our business segments and product performance can be obtained by reading the geographic segments and product sections that follow. The following table summarizes our consolidated financial results for the indicated periods. Under Chilean GAAP, the merger between Masisa S.A. and Terranova S.A. has been accounted for as a merger of commonly controlled companies on a prospective basis as of January 1, 2005. As such, the historical financial statements for the periods prior to the merger are not restated under Chilean GAAP.
Year ended December 31, | ||||||||||
(in millions of US$, except percentages) | 2004 | 2005 | 2006 | |||||||
| Net sales | 651.0 | 744.0 | 886.5 | |||||||
| Gross margin | 189.2 | 192.1 | 207.6 | |||||||
| Operating income | 95.1 | 79.5 | 83.6 | |||||||
| Non-operating results | (11.2 | ) | (47.6 | ) | (41.4 | ) | ||||
Net income(1) | 56.8 | 24.4 | 29.5 | |||||||
Depreciation, amortization and depletion(2) | 70.6 | 75.0 | 70.2 | |||||||
Physical volume sales (thousands of cubic meters)(3) | 3,788.4 | 3,696.4 | 4,122.4 | |||||||
Average price per cubic meter (US$)(3) | 166 | 196 | 211 | |||||||
| Net sales growth % | 35.6 | % | 14.3 | % | 19.2 | % | ||||
| Gross margin %* | 29.1 | % | 25.8 | % | 23.4 | % | ||||
| Operating income margin %* | 14.6 | % | 10.7 | % | 9.4 | % | ||||
| Net income margin %* | 8.7 | % | 3.3 | % | 3.3 | % | ||||
| * | Amounts are expressed as percentages of net sales. |
| (1) | Due to the incorporation of Masisa into and with the Company and the acquisition of part of the minority interest in Forestal Tornagaleones, and its effect on minority interest, net income for 2004 and 2005 are not comparable. Please see the discussion on Minority Interest below for further information. |
| (2) | Depletion, which is included in costs of sales, are costs attributed to timber harvested and are determined by each identifiable farm block that is in the harvesting stage based on the relationship of unamortized timber costs to the estimated volume of recoverable timber multiplied by the amount of timber cut. See Note 2 to our Consolidated Financial Statements. |
| (3) | Includes MDF, particle board, finger-joint mouldings, OSB, sawn lumber, solid wood doors, MDF mouldings and saw and pulp logs. |
62
Year ended December 31, 2006 compared to 2005
Net sales increased 19.2% to US$886.5 million in 2006 compared to US$744.0 million in 2005. The increase was due mainly to strong or moderate growth in net sales across all our geographic segments and for most of our products, with the exception of OSB. The average price of our principal wood products per cubic meter in 2006 was US$211 compared to US$196 per cubic meter in 2005. Consolidated sales of our principal wood products by physical volume decreased by 11.5% to 4,122.4 thousand cubic meters in 2006 compared to 3,696.4 thousand cubic meters in 2005.
Gross margin increased from US$192.1 million in 2005 to US$207.6 million in 2006, but decreased as a percentage of net sales from 26.1% of net sales in 2005 to 23.4% in 2005 due to higher raw material and energy costs which lead to higher average costs of sales.
Selling and administrative expenses totaled US$124.0 million, or 14.0% of net sales, in 2006, representing a 10.1% increase from US$112.6 million, or 15.1% of net sales, in 2005. This increase was due primarily to increased sales, local currency appreciation and merger related expenses.
Operating income increased by 5.2% to US$83.6 million, or 9.4% of net sales, in 2006 compared to US$79.5 million, or 10.7% of net sales, in 2005. The increase in operating income is attributable mainly to higher sales. However, the decrease in operating income to sales is mainly explained by higher cost of goods sold and selling and administrative expenses, which offset partially higher sales.
Year ended December 31, | |||||||
(in millions of US$) | 2005 | 2006 | |||||
| NON-OPERATING RESULTS | |||||||
Financial income | 3.9 | 8.7 | |||||
Share of income from unconsolidated affiliates | 0.7 | 0.6 | |||||
Other non-operating income | 2.8 | 6.9 | |||||
Amortization of goodwill | (0.8 | ) | (0.1 | ) | |||
Amortization of negative goodwill | 3.4 | 4.6 | |||||
Financial expenses | (38.8 | ) | (35.4 | ) | |||
Other non-operating expenses | (8.4 | ) | (15.9 | ) | |||
Price-level restatements | 0 | 0.6 | |||||
Foreign exchange (losses) gains | (10.4 | ) | (11.5 | ) | |||
Non-operating results | (47.6 | ) | (41.5 | ) | |||
Non-operating results improved from a loss of US$47.6 million in 2005 to a loss of US$41.5 million in 2006. Foreign exchange losses were US$11.5 million in 2006 compared to a foreign exchange loss of US$10.4 million in 2005. The foreign exchange loss in 2006 was due principally to the effect of the appreciation of the Chilean peso on our debt denominated in UF. We use derivative instruments, such as swaps or cross currency contracts, which are based directly or indirectly upon interest rates and currencies, to manage and reduce the risk inherent in currency and interest rate fluctuations. Financial income increased 121.3% from US$3.9 million in 2005 to US$8.7 million in 2006 due to higher interest earning cash balances. Share of income from unconsolidated affiliates decreased 14.9% from US$0.7 million in 2005 to US$0.6 million in 2006. Other non-operating income increased 146.4% from US$2.8 million in 2005 to US$6.9 million in 2006 due to a non-recurring gain on fixed asset revaluation impairment for approximately US$3.0 million in 2006. Amortization of goodwill decreased 89.3% from US$(0.8) million in 2005 to US$(0.1) million in 2006. Amortization of negative goodwill increased 34.4% from US$3.4 million in 2005 to US$4.6 million in 2006. Financial expenses decreased 8.7% from US$38.8 million in 2005 to US$35.4 million in 2006 mainly due to reduced levels of debt and successful debt refinancing efforts. Other non-operating expenses increased 89.3% from US$8.4 million in 2005 to US$15.9 million in 2006 due to (i) asset write-offs for US$ 1.4 million, (ii) provisions related to our Venezuelan moulding plant for US$2.2 million and (iii) a termination payment and sawmill repair costs of US$4.8 million which were payable to Proforca (CVG Productos Forestales de Oriente, C.A.), a large Venezulean public company in the forestry sector, in connection the cancellation of a lease for a sawmill in Venezuela
63
Minority interest benefit was US$10.7 million in 2006 compared to a benefit of US$5.7 million in 2005. This increase in minority interest benefit in 2006 reflects primarily losses at our Venezuelan subsidiaries and the purchase of a significant part of the minority interest in Forestal Tornagaleones S.A., and the resulting elimination of the associated minority interest expense.
Income tax expense increased 71.4% to US$23.3 million in 2006 compared to US$13.6 million in the year 2005.
We reported net income of US$29.5 million, or 3.3% of net sales, in 2006 compared to net income of US$26.4 million, or 3.5% of net sales, in 2005.
Year ended December 31, 2005 compared to 2004
Net sales increased 14.3% to US$744.0 million in 2005 compared to US$651.0 million in 2004. The increase was due mainly to strong or moderate growth in net sales across all our geographic segments and for most of our products, with the exception of solid wood doors. The average price of our principal wood products per cubic meter in 2005 was US$196 compared to US$166 per cubic meter in 2004. Consolidated sales of our principal wood products by physical volume decreased by 2.4% to 3,696.4 thousand cubic meters in 2005, compared to 3,788.4 thousand cubic meters in 2004.
Gross margin increased from US$189.2 million in 2004 to US$192.1 million in 2005, but decreased as a percentage of net sales from 29.1% of net sales, in 2004, to 25.8%, in 2005 due to higher raw material and energy costs leading to higher average costs of sales.
Selling and administrative expenses totaled US$112.6 million, or 15.1% of net sales, in 2005, representing a 19.6% increase from US$94.1 million, or 14.5% of net sales, in 2004. This increase was due primarily to increased sales, local currency appreciation and merger related expenses.
Operating income decreased by 16.4% to US$79.5 million, or 10.7% of net sales, in 2005 compared to US$95.1 million, or 14.6% of net sales, in 2004. The decrease in operating income is attributable mainly to higher selling and administrative expenses and higher costs of sales, offset partially by higher sales.
Year ended December 31, | |||||||
(in millions of US$) | 2004 | 2005 | |||||
| NON-OPERATING RESULTS | |||||||
Financial income | 1.9 | 3.9 | |||||
Share of income from unconsolidated affiliates | 1.3 | 0.7 | |||||
Other non-operating income | 47.3 | 2.8 | |||||
Amortization of goodwill | (0.8 | ) | (0.8 | ) | |||
Amortization of negative goodwill | 3.3 | 3.4 | |||||
Financial expenses | (39.3 | ) | (38.8 | ) | |||
Other non-operating expenses | (21.8 | ) | (8.4 | ) | |||
Price-level restatements | 0.5 | 0 | |||||
Foreign exchange (losses) gains | (3.7 | ) | (10.4 | ) | |||
Non-operating results | (11.2 | ) | (47.6 | ) | |||
Non-operating results worsened from a loss of US$11.2 million in 2004 to a loss of US$47.6 million in 2005. Foreign exchange losses were US$10.4 million in 2005 compared to a foreign exchange loss of US$3.7 million in 2004. The foreign exchange loss in 2005 was due principally to the effect of the appreciation of the Chilean peso on our debt denominated in UF. We use derivative instruments, such as swaps or cross currency contracts, which are based directly or indirectly upon interest rates and currencies, to manage and reduce the risk inherent in currency and interest rate fluctuations. Financial income increased 105.2% from US$1.9 million in 2004 to US$3.9 million in 2005 due to higher interest earning cash balances. Share of income from unconsolidated affiliates decreased 46.2% from US$1.3 million in 2004 to US$0.7 million in 2005. Other non-operating income decreased 94.1% from US$47.3 million in 2004 to US$2.8 million in 2005 due to a non-recurring gain on the sale of mainly forestry assets for approximately US$44.3 million in 2004. Amortization of goodwill was flat in 2005, compared to the same period in 2004. Amortization of negative goodwill increased 3.0% from US$3.3 million in 2004 to US$3.4 million in 2005. Financial expense decreased 1.3% from US$39.3 million in 2004 to US$38.8 million in 2005 mainly due to reduced levels of debt. Other non-operating expenses decreased 61.5% from US$21.8 million in 2004 to US$8.4 million in 2005 due to (i) a provision for idle assets recognized by the company during the fourth quarter of 2004; and (ii) a provision for a non-operational doubtful account in 2004; partially offset by the expenses incurred, as well as depreciation and amortization generated by the temporary shutdown of Masisa’s industrial plants during 2005.
64
Minority interest benefit was US$5.7 million in 2005 compared to an expense of US$15.4 million in 2004. This reflects primarily losses at our Venezuelan subsidiaries and the incorporation of the former Masisa into and with the Company during 2005, as well as the purchase of a significant part of the minority interest in Forestal Tornagaleones S.A., and the resulting elimination of the associated minority interest expense.
Income tax expense increased 16.1% to US$13.6 million in 2005, compared to US$11.7 million in the year 2004.
We reported net income of US$26.4 million, or 3.5% of net sales, in 2005 compared to net income of US$56.8 million, or 8.7% of net sales, in 2004. However, these results are not comparable due to the incorporation of the former Masisa into and with the Company and the resulting elimination of the associated minority interest expense.
Geographic segments
The discussion below analyzes and compares our results of operations by geographic segments based on the location in which the sale is originated, as reported in Note 23(2)(e) of the audited consolidated financial statements appearing elsewhere in this document, for the years ended December 31, 2004, 2005 and 2006. However, you should also note that in October 2006 we undertook a review of our competitive strategy and identified our wood boards business as our core business and we are currently in the process of implementing, but have not yet completed, the reorganization of our business into four business units: the wood boards business unit, the forestry business unit, the solid wood business unit and the retail business unit.
You should also note that some of our geographic segments include significant inter-company sales, especially in Chile, Brazil and Venezuela. To better understand our business and results of operations we have included inter-company sales separately in the tables below.
65
Years ended December 31, 2006, 2005 and 2004 compared by geographic segment
United States
Year ended December 31, | ||||||||||
(in millions of US$, except percentages) | 2004 | 2005 | 2006 | |||||||
| Net Sales to Third Parties | 139.6 | 191.5 | 211.8 | |||||||
| Inter-company Sales | — | — | — | |||||||
| Net Sales | 139.6 | 191.5 | 211.8 | |||||||
| Gross Margin | 15.6 | 15.0 | 17.1 | |||||||
| Selling and Administrative Expenses | (8.9 | ) | (13.0 | ) | (13.5 | ) | ||||
| Operating Income | 6.7 | 2.0 | 3.6 | |||||||
Depreciation, amortization and depletion(1) | 0.7 | 0.7 | 0.6 | |||||||
| Net Sales Growth % | — | 37.2 | % | 10.6 | % | |||||
| Gross Margin % * | 11.2 | % | 7.8 | % | 8.1 | % | ||||
| Operating Income Margin % * | 4.8 | % | 1.0 | % | 1.7 | % | ||||
| * | Amounts are expressed as percentages of net sales. |
| (1) | Depletion, which is included in costs of sales, consists of costs attributed to timber harvested and are determined by each identifiable farm block that is in the harvesting stage based on the relationship of unamortized timber costs to the estimated volume of recoverable timber multiplied by the amount of timber cut. See Note 2, i) to our audited consolidated financial statements appearing elsewhere in this document. |
Year ended December 31, 2006 compared to 2005. In the United States, net sales increased 10.6% to $211.8 million in 2006 compared to US$191.5 million in 2005. The sales increase was due mainly to the strong growth in physical volume of sales of MDF mouldings and solid wood doors, and better average pricing of finger-joint mouldings. This increase was partially offset by a drop in OSB sales volume. Gross margin increased 14% due to higher net sales, as well as an improved mix of higher margin products sold to customers. Gross margin as a percent of sales increased due to greater growth in higher margin products, such as solid wood doors and finger-joint mouldings, as well as a reduction in the volume of sales of lower priced OSB in the United States. Due to higher volumes, higher finger-joint moulding average prices, and a drop in selling and administrative expenses as a percentage of net sales, operating income increased US$1.5 million, or 0.7% of net sales, in 2006.
Year ended December 31, 2005 compared to 2004. In the United States, net sales increased 37.2% to $191.5 million in 2005 compared to US$139.6 million in 2004. The sales increase was due mainly to the strong growth in physical volume sales of MDF mouldings and the introduction of OSB as part of Masisa USA’s product mix. Gross margin declined 4.0% despite the increased volume as market prices for all product lines fell throughout 2005. Gross margin as a percent of sales declined due to the introduction of lower priced OSB and MDF moulding through Masisa USA’s commercial network. Despite an increase in physical volume sales, operating income decreased to US$2.0 million, or 1.0% of net sales, in 2005. The decrease in operating income is attributable to a reduction in gross margin as a consequence of increased outbound freight expenses resulting from higher overall volumes, increased fuel prices and increased payroll expenses for the larger sales force and logistical team required to handle the increased unit volume.
66
Chile
Year ended December 31, | ||||||||||
(in millions of US$, except percentages) | 2004 | 2005 | 2006 | |||||||
| Net Sales to Third Parties | 134.7 | 138.1 | 168.4 | |||||||
| Inter-company Sales | 103.6 | 107.4 | 142.3 | |||||||
| Net Sales | 238.3 | 245.6 | 310.7 | |||||||
| Gross Margin | 57.0 | 53.8 | 64.4 | |||||||
| Selling and Administrative Expenses | (36.1 | ) | (35.6 | ) | (47.2 | ) | ||||
| Operating Income | 20.8 | 18.2 | 17.2 | |||||||
Depreciation, amortization and depletion(1) | 26.7 | 26.3 | 23.7 | |||||||
| Net Sales Growth % | — | 3.1 | % | 26.5 | % | |||||
| Gross Margin % * | 23.9 | % | 21.9 | % | 20.7 | % | ||||
| Operating Income Margin % * | 8.7 | % | 7.4 | % | 5.5 | % | ||||
| * | Amounts are expressed as percentages of net sales. |
| (1) | Depletion, which is included in costs of sales, consists of costs attributed to timber harvested and are determined by each identifiable farm block that is in the harvesting stage based on the relationship of unamortized timber costs to the estimated volume of recoverable timber multiplied by the amount of timber cut. See Note 2 to our audited consolidated financial statements appearing elsewhere in this document. |
Year ended December 31, 2006 compared to 2005. In Chile, net sales increased 26.5% to US$310.7 million in 2006 compared to US$245.6 million in 2005. This was mainly due to higher physical volume of sales and higher prices of MDF board as well as higher sales of particle board in the local Chilean market.
Gross margin increased to US$64.4 million, or 20.7% of net sales, in 2006 compared to US$53.8 millions or 21.9% of net sales, in 2005. The decrease in gross margin as a percentage of net sales was due primarily to increased costs due to higher prices of wood, resin and energy, and the appreciation of the Chilean peso. Operating income decreased to US$17.2 million, or 5.5% of net sales, in 2006 compared to US$18.2 million, or 7.4% of net sales, in 2005. This decrease was due to lower gross margin as well as higher selling and administrative expenses.
Year ended December 31, 2005 compared to 2004. In Chile, net sales increased 3.1% to US$245.6 million in 2005 compared to US$238.3 million in 2004. This was mainly due to higher physical volume sales and prices of particle board in the local market and higher physical volume export sales of MDF moulding to the United States, partially offset by lower physical volume sales of finger-joint mouldings. Gross margin decreased to US$53.8 million, or 21.9% of net sales in 2005 compared to US$57.0 million or 23.9% of net sales in 2004. The decrease in gross margin is due primarily to increase costs due to higher prices of wood, resin and energy, and the appreciation of the Chilean peso. Operating income decreased slightly to US$18.2 million or 7.4% of net sales in 2006, compared to US$20.8 million or 8.7% of net sales in 2005. This decrease is due mainly to lower gross margin partially offset by lower selling and administrative expenses.
67
Brazil
Year ended December 31, | ||||||||||
(in millions of US$, except percentages) | 2004 | 2005 | 2006 | |||||||
| Net Sales to Third Parties | 117.9 | 102.5 | 135.5 | |||||||
| Inter-company Sales | 36.5 | 54.0 | 50.8 | |||||||
| Net Sales | 154.4 | 156.4 | 186.3 | |||||||
| Gross Margin | 53.9 | 35.6 | 40.3 | |||||||
| Selling and Administrative Expenses | (11.8 | ) | (14.5 | ) | (16.9 | ) | ||||
| Operating Income | 42.1 | 21.1 | 23.4 | |||||||
Depreciation, amortization and depletion(1) | 16.1 | 19.5 | 18.4 | |||||||
| Net Sales Growth % | - | 1.3 | % | 19.1 | % | |||||
| Gross Margin % * | 34.9 | % | 22.7 | % | 21.6 | % | ||||
| Operating Income Margin % * | 27.3 | % | 13.5 | % | 12.6 | % | ||||
| * | Amounts are expressed as percentages of net sales. |
| (1) | Depletion, which is included in costs of sales, consists of costs attributed to timber harvested and are determined by each identifiable farm block that is in the harvesting stage based on the relationship of unamortized timber costs to the estimated volume of recoverable timber multiplied by the amount of timber cut. See Note 2 to our audited consolidated financial statements appearing elsewhere in this document. |
Year ended December 31, 2006 compared to 2005. In Brazil, net sales increased 19.1% to US$186.3 million in 2006 compared to US$156.4 million in 2005. The increase was mainly due to higher prices in the local Brazilian boards market and a shift in our MDF product mix to higher priced laminated MDF. The increase in sales was also due to the appreciation of the Brazilian reales. Gross margin increased to US$40.3 million, or 21.6% of net sales, for the year ended December 31, 2006 compared to US$35.6 million, or 22.7% of net sales, for the same period in 2005. Operating income increased to US$23.4 million, or 12.6% of net sales, in 2006 compared to US$21.1 million, or 13.5% of net sales, in 2005. The increase in operating income is attributable to higher gross margin.
Year ended December 31, 2005 compared to 2004. In Brazil, net sales increased 1.3% to US$156.4 million in 2005 compared to US$154.4 million in 2004. The increase was mainly due to higher prices in the local boards market and a shift in our MDF product mix to higher priced laminated MDF, which was partially offset by lower price of OSB and finger-joint mouldings in the United States export market. The increase in sales was also due to the appreciation of the Brazilian real. Gross margin decreased to US$35.6 million, or 22.7% of net sales, during the year ended December 31, 2005 compared to US$53.9 million, or 34.9% of net sales, for the same period in 2004. Despite an increase in net sales, gross margin declined due to lower OSB and finger-joint mouldings prices, combined with higher wood and resin costs and the appreciation of the Brazilian real. Operating income decreased to US$21.1 million, or 13.5% of net sales, in 2005 compared to US$42.1 million, or 27.3% of net sales, in 2004. The decrease in operating income is attributable to lower gross margin and higher selling and administrative expenses due to the strengthening of the Brazilian real.
68
Venezuela
Year ended December 31, | ||||||||||
(in millions of US$, except percentages) | 2004 | 2005 | 2006 | |||||||
| Net Sales to Third Parties | 45.0 | 70.7 | 98.2 | |||||||
| Inter-company Sales | 36.9 | 28.8 | 28.2 | |||||||
| Net Sales | 82.0 | 99.5 | 126.4 | |||||||
| Gross Margin | 17.8 | 18.6 | 23.9 | |||||||
| Selling and Administrative Expenses | (13.5 | ) | (15.1 | ) | (17.6 | ) | ||||
| Operating Income | 4.4 | 3.5 | 6.3 | |||||||
Depreciation, amortization and depletion(1) | 15.2 | 16.6 | 16.3 | |||||||
| Net Sales Growth % | — | 21.5 | % | 27.0 | % | |||||
| Gross Margin % * | 21.7 | % | 18.7 | % | 18.9 | % | ||||
| Operating Income Margin % * | 5.3 | % | 3.5 | % | 5.0 | % | ||||
| * | Amounts are expressed as percentages of net sales. |
| (1) | Depletion, which is included in costs of sales, consists of costs attributed to timber harvested and are determined by each identifiable farm block that is in the harvesting stage based on the relationship of unamortized timber costs to the estimated volume of recoverable timber multiplied by the amount of timber cut. See Note 2 to our audited consolidated financial statements appearing elsewhere in this document. |
Year ended December 31, 2006 compared to 2005. In Venezuela, net sales increased 27.0% to US$126.4 million in 2006 compared to US$99.5 million in 2005. This increase was mainly due to higher physical volume of sales in the local board market, which resulted in higher average prices compared to our export prices, and, to a lesser extent increased physical volume of sales of sawn lumber. Gross margin increased 28.5% in 2006 to US$23.9 million, or 18.9% of net sales, compared to US$18.6 million, or 18.7% of net sales, in 2005. This increase was mainly due to higher net sales which were partially offset by increased production costs due to higher resin prices. Operating income increased to US$6.3 million, or 5.0% of net sales, in 2006 compared to US$3.5 million, or 3.5% of net sales, in 2005. The decrease in operating income is attributable to higher selling and administrative expenses as a result of a new collective labor agreement and higher inland freight costs, which were partially offset by a higher gross margin.
Year ended December 31, 2005 compared to 2004. In Venezuela, net sales increased 21.5% to US$99.5 million in 2005 compared to US$82.0 million in 2004. The increase was mainly due to higher physical volume sales in the local board market, which resulted in higher average prices compared to our export prices, and, to a lesser extent, increased physical volume sales of sawn lumber. Gross margin increased 4.5% in 2005 to US$18.6 million, or 18.7% of net sales, compared to US$17.8 million, or 21.7% of net sales, in 2004. This increase was mainly due higher net sales partially offset by increased production costs due to higher resin prices. Operating income decreased to US$3.5 million, or 3.5% of net sales, in 2005 compared to US$4.4 million, or 5.3% of net sales, in 2004. The decrease in operating income is attributable to higher selling and administrative expenses as a result of a new collective labor agreement and higher inland freight costs, partially offset by a higher gross margin.
69
Mexico
Year ended December 31, | ||||||||||
(in millions of US$, except percentages) | 2004 | 2005 | 2006 | |||||||
| Net Sales to Third Parties | 103.5 | 113.3 | 118.3 | |||||||
| Inter-company Sales | 0.2 | 0.2 | 0.2 | |||||||
| Net Sales | 103.7 | 113.5 | 118.5 | |||||||
| Gross Margin | 18.0 | 17.8 | 19.0 | |||||||
| Selling and Administrative Expenses | (10.8 | ) | (17.1 | ) | (12.2 | ) | ||||
| Operating Income | 7.3 | 0.7 | 6.8 | |||||||
Depreciation, amortization and depletion(1) | 1.5 | 1.8 | 1.5 | |||||||
| Net Sales Growth % | — | 9.5 | % | 4.4 | % | |||||
| Gross Margin % * | 17.4 | % | 15.7 | % | 16.0 | % | ||||
| Operating Income Margin % * | 7.0 | % | 0.6 | % | 5.7 | % | ||||
| * | Amounts are expressed as percentages of net sales. |
| (1) | Depletion, which is included in costs of sales, consists of costs attributed to timber harvested and are determined by each identifiable farm block that is in the harvesting stage based on the relationship of unamortized timber costs to the estimated volume of recoverable timber multiplied by the amount of timber cut. See Note 2 to our audited consolidated financial statements appearing elsewhere in this document. |
Year ended December 31, 2006 compared to 2005. In Mexico, net sales increased 4.4 % to US$118.5 million in 2006 compared to US$113.5 million in 2005. This increase was mainly due to a higher prices and higher physical volume of sales of MDF and of particle board which were partially offset by lower physical volume of sales in sawn lumber. Gross margin increased to US$19.0 million, or 16.0% of net sales, in 2006 compared to US$17.8 million, or 15.7% of net sales, in 2005. This increase was mainly due to higher net sales which were partially offset by higher raw material costs and provisions for a deficit in inventories. Operating income increased to US$6.8 million, or 5.7% of net sales, in 2006 compared to US$0.7 million, or 0.6% of net sales, in 2005. This increase in operating income was due to increased selling and administrative expenses control.
Year ended December 31, 2005 compared to 2004. In Mexico, net sales increased 9.5 % to US$113.5 million in 2005 compared to US$103.7 million in 2004. The increase was mainly due to a higher prices and physical volume sales of MDF and particle board offset by lower physical volume sales in sawn lumber. Gross margin decreased to US$17.8 million, or 15.7% of net sales, in 2005 compared to US$18.0 million, or 17.4% of net sales, in 2004. This decrease was mainly due to higher raw material costs and provisions for a deficit in inventories which were partially offset by higher net sales. Operating income decreased to US$0.7 million, or 0.6% of net sales, in 2005 compared to US$7.3 million, or 7.0% of net sales, in 2004. This decrease in operating income was due to higher selling and administrative expenses as a result of higher sales commissions, provisions for employees’ benefits (profit sharing), and provisions for a doubtful receivables account.
70
Argentina
Year ended December 31, | ||||||||||
(in millions of US$, except percentages) | 2004 | 2005 | 2006 | |||||||
| Net Sales to Third Parties | 77.7 | 81.5 | 96.9 | |||||||
| Inter-company Sales | 12.2 | 23.4 | 25.3 | |||||||
| Net Sales | 90.0 | 104.9 | 122.2 | |||||||
| Gross Margin | 23.2 | 29.0 | 33.6 | |||||||
| Selling and Administrative Expenses | (8.6 | ) | (9.5 | ) | (10.2 | ) | ||||
| Operating Income | 14.6 | 19.5 | 23.4 | |||||||
Depreciation, amortization and depletion(1) | 11.0 | 10.0 | 9.6 | |||||||
| Net Sales Growth % | — | 16.6 | % | 16.5 | % | |||||
| Gross Margin % * | 25.8 | % | 27.6 | % | 27.5 | % | ||||
| Operating Income Margin % * | 16.3 | % | 18.6 | % | 19.1 | % | ||||
| * | Amounts are expressed as percentages of net sales. |
| (1) | Depletion, which is included in costs of sales, consists of costs attributed to timber harvested and are determined by each identifiable farm block that is in the harvesting stage based on the relationship of unamortized timber costs to the estimated volume of recoverable timber multiplied by the amount of timber cut. See Note 2 to our audited consolidated financial statements appearing elsewhere in this document. |
Year ended December 31, 2006 compared to 2005. In Argentina, net sales increased 16.5% to US$122.2 million in 2006 compared to US$104.9 million in 2005. This increase was mainly due to continued improvement in the Argentinean local market as a result of the economic recovery and higher prices and export sales in regional markets which were partially offset by weaker export sales of MDF mouldings to the United States. The improved local market for boards has allowed us to reduce our lower margin export sales, leading to improved board pricing. Gross margin increased to US$33.6 million, or 27.5% of net sales, in 2006 compared to US$29.0 million, or 27.6% of net sales, in 2005. This increase was mainly due to higher net sales, as discussed above, which were partially offset by increased cost of sales due to higher resin, wood and energy prices. Operating income increased to US$23.4 million, or 19.1% of net sales, in 2006 compared to US$19.5 million, or 18.6% of net sales, in 2005. The increase in operating income was attributable to higher sales and gross margin which was partially offset by a moderate increase in selling and administrative expenses due to, among other things, higher export expenses.
Year ended December 31, 2005 compared to 2004. In Argentina, net sales increased 16.6% to US$104.9 million in 2005 compared to US$90.0 million in 2004. The increase was mainly due to continued improvement in the Argentinean local market as a result of the economic recovery and higher prices and export sales in regional markets which were partially offset by weaker export sales of MDF mouldings to the United States. The improved local market for boards has allowed us to reduce our lower margin export sales, leading to improved board pricing. Gross margin increased to US$29 million, or 27.6% of net sales, in 2005 compared to US$23.2 million, or 25.8% of net sales, in 2004. This increase was mainly due to higher net sales, as discussed above, which were partially offset by increased cost of sales due to higher resin, wood and energy prices. Operating income increased to US$19.5 million, or 18.6% of net sales, in 2005 compared to US$14.6 million, or 16.3% of net sales, in 2004. The increase in operating income was attributable to higher sales and gross margin partially offset by a moderate increase in selling and administrative expenses due to, among other things, higher export expenses.
71
Product sections
MDF
Year ended December 31, | ||||||||||
2004 | 2005 | 2006 | ||||||||
| Net sales (millions of US$) | 215.9 | 250.2 | 319.6 | |||||||
| Physical volume sales (thousands of cubic meters) | 931.6 | 880.9 | 978.2 | |||||||
| Average price per cubic meter (US$) | 232 | 284 | 327 | |||||||
| % of consolidated net sales | 33.2 | % | 33.6 | % | 36.1 | % | ||||
| Net sales growth % | - | 15.9 | % | 27.7 | % | |||||
| Volume growth % | - | (5.4 | )% | 11.0 | % | |||||
| Price change % | - | 22.6 | % | 15.1 | % | |||||
Year ended December 31, 2006 compared to 2005. MDF sales generated US$319.6 million, or 36.1% of our total net sales, in 2006 compared to US$250.2 million, or 33.6% of total net sales, in 2005. MDF physical volume of sales increased by 11.0% from 880.9 thousand cubic meters in 2005 to 978.2 thousand cubic meters in 2006. This increase was mainly attributable to greater use of raw MDF for MDF mouldings and higher physical volume of sales in all our Latin American markets due to the strong demand resulting from the improved performance of the construction sector in the region. Average prices in U.S. dollars for our consolidated MDF sales increased 15.1% to US$327 per cubic meter in 2006 compared to US$284 in 2005. We were able to transfer part of the cost pressures we faced during the first half of 2006 into prices increases given the strong demand in all our Latin American markets.
Year ended December 31, 2005 compared to 2004. MDF sales generated US$250.2 million, or 33.6% of our total net sales, in 2005 compared to US$215.9 million, or 33.2% of total net sales, in 2004. MDF physical volume of sales decreased by 5.4% from 931.6 thousand cubic meters in 2004 to 880.9 thousand cubic meters in 2005. This decrease was mainly attributable to greater use of raw MDF for MDF mouldings and lower physical volume of sales in the Brazilian market which was partially offset by higher physical volume sales in the Venezuelan market. Average prices in U.S. dollars for our consolidated MDF sales increased 22.6% to US$284 per cubic meter in 2005 compared to US$232 in 2004. This increase in MDF prices was mainly due to an increase in market prices for MDF in all of our principal markets.
Particle board
Year ended December 31, | ||||||||||
2004 | 2005 | 2006 | ||||||||
| Net sales (millions of US$) | 125.9 | 154.0 | 187.5 | |||||||
| Physical volume sales (thousands of cubic meters) | 649.7 | 700.1 | 763.7 | |||||||
| Average price per cubic meter (US$) | 194 | 220 | 246 | |||||||
| % of consolidated net sales | 19.3 | % | 20.7 | % | 21.2 | % | ||||
| Net sales growth % | - | 22.4 | % | 21.7 | % | |||||
| Volume growth % | - | 7.8 | % | 9.1 | % | |||||
| Price change % | - | 13.6 | % | 11.8 | % | |||||
Year ended December 31, 2006 compared to 2005. Particle board sales generated US$187.5 million, or 21.2% of our total net sales, in 2006 compared to US$154.0 million, or 20.7% of total net sales, in 2005. Particle board physical volume of sales increased by 9.1% from 700.1 thousand cubic meters in 2005 to 763.7 thousand cubic meters in 2006. The increase in physical volume of sales was mainly attributable to improved overall market conditions in our local markets, except for a small decrease in Brazil’s physical volume of sales. Average prices in U.S. dollars for our consolidated particle board sales increased 11.8% to US$246 per cubic meter in 2006 compared to US$220 in 2005. The increase in particle board prices was mainly due to improved local market conditions in all our Latin American markets, which allowed us to transfer cost increases into the prices we charged for particle board products starting in the second quarter of 2006.
72
Year ended December 31, 2005 compared to 2004. Particle board sales generated US$154.0 million, or 20.7% of our total net sales, in 2005 compared to US$125.9 million, or 19.3% of total net sales, in 2004. Particle board physical volume of sales increased by 7.8% from 649.7 thousand cubic meters in 2004 to 700.1 thousand cubic meters in 2005. This small increase in physical volume of sales is mainly attributable to improved overall market conditions in our local markets, except for a small decrease in Brazil’s physical volume of sales. Average prices in U.S. dollars for our consolidated particle board sales increased 13.6% to US$220 per cubic meter in 2005 compared to US$194 in 2004. This increase in particle board prices was mainly due to improved local market conditions in Brazil and Chile that allowed us to reduce lower margin export sales.
Finger-joint mouldings
Year ended December 31, | ||||||||||
2004 | 2005 | 2006 | ||||||||
| Net sales (millions of US$) | 81.5 | 83.1 | 94.1 | |||||||
| Physical volume sales (thousands of cubic meters) | 171.6 | 180.0 | 190.4 | |||||||
| Average price per cubic meter (US$) | 474 | 462 | 494 | |||||||
| % of consolidated net sales | 12.5 | % | 11.2 | % | 10.6 | % | ||||
| Net sales growth % | - | 2.0 | % | 13.2 | % | |||||
| Volume growth % | - | 4.8 | % | 5.8 | % | |||||
| Price change % | - | (2.7 | )% | 6.9 | % | |||||
Year ended December 31, 2006 compared to 2005. Finger-joint moulding sales generated US$94.1 million, or 10.6% of our total net sales, in 2006 compared to US$83.1 million, or 11.2% of net sales, in 2005. Finger-joint moulding physical volume of sales increased by 5.8% from 180.0 thousand cubic meters in 2005 to 190.4 thousand cubic meters in 2006. Average prices in U.S. dollars for our consolidated finger-joint moulding sales increased 6.9% to $494 per cubic meter in 2006 compared to US$462 in 2005. Despite the slowdown in the construction of new houses in the United States, we observed increased finger-joint moulding prices and volume during 2006. This was mainly explained by higher demand by distributors who were increasing their extraordinary low inventory levels.
Year ended December 31, 2005 compared to 2004. Finger-joint moulding sales generated US$83.1 million, or 11.2% of our total net sales, in 2005 compared to US$81.5 million, or 12.5% of total net sales, in 2004. Finger-joint moulding physical volume of sales increased by 4.8% from 171.6 thousand cubic meters in 2004 to 180.0 thousand cubic meters, in 2005. This increase in physical volume was mainly attributable to increased sales focus and new customers. Average prices in U.S. dollars for our consolidated finger-joint moulding sales declined 2.7% to $462 per cubic meter in 2005 compared to US$474 in 2004. This decline in finger-joint prices was mainly due to increased industry capacity and our distributors’ high inventory levels. The majority of finger-joint moulding production sold by Masisa USA was produced by us.
OSB
Year ended December 31, | ||||||||||
2004 | 2005 | 2006 | ||||||||
| Net sales (millions of US$) | 53.4 | 59.7 | 48.3 | |||||||
| Physical volume sales (thousands of cubic meters) | 241.6 | 261.1 | 219.9 | |||||||
| Average price per cubic meter (US$) | 221 | 229 | 220 | |||||||
| % of consolidated net sales | 8.2 | % | 8.0 | % | 5.4 | % | ||||
| Net sales growth % | - | 11.8 | % | (19.1 | %) | |||||
| Volume growth % | - | 8.1 | % | (15.8 | %) | |||||
| Price change % | - | 3.4 | % | (3.9 | %) | |||||
Year ended December 31, 2006 compared to 2005. OSB sales generated US$48.3 million, or 5.4% of our total net sales, in 2006 compared to US$59.7 million, or 8.0% of total net sales, in 2005. OSB physical volume of sales decreased by 15.8% from 261.1 thousand cubic meters in 2005 to 219.9 thousand cubic meters in 2006, mainly due to lower physical volume of sales in the United States resulting from the slowdown in the construction sector. Average prices in U.S. dollars for our consolidated OSB sales decreased 3.9% to US$220 per cubic meter in 2006 compared to US$229 in 2005. This decrease in OSB prices was mainly due to the slowdown in the construction sector in the United States, coupled with increased OSB production capacity in North America which added to the abundant supply of OSB.
73
Year ended December 31, 2005 compared to 2004. OSB sales generated US$59.7 million, or 8.0% of our total net sales, in 2005 compared to US$53.4 million, or 8.2% of total net sales, in 2004. OSB physical volume sales increased by 8.1% from 241.6 thousand cubic meters in 2004 to 261.1 thousand cubic meters in 2005 mainly due to increased physical sales volume in the United States. This year was the first year that Masisa USA marketed OSB with the initial sales completed in February. Average prices in U.S. dollars for our consolidated OSB sales increased 3.4% to US$229 per cubic meter in 2005 compared to US$221 in 2004. This increase in OSB prices was mainly due to an increase in the Brazilian market price, offset by a lower price cycle in the United States.
Sawn lumber
Year ended December 31, | ||||||||||
2004 | 2005 | 2006 | ||||||||
| Net sales (millions of US$) | 56.0 | 66.6 | 72.9 | |||||||
| Physical volume sales (thousands of cubic meters) | 299.7 | 327.8 | 343.4 | |||||||
| Average price per cubic meter (US$) | 187 | 203 | 212 | |||||||
| % of consolidated net sales | 8.6 | % | 9.0 | % | 8.2 | % | ||||
| Net sales growth % | - | 19.0 | % | 9.5 | % | |||||
| Volume growth % | - | 9.4 | % | 4.8 | % | |||||
| Price change % | - | 8.8 | % | 4.4 | % | |||||
Year ended December 31, 2006 compared to 2005. Sawn lumber sales generated US$72.9 million, or 8.2% of our total net sales, in 2006 compared to US$66.6 million, or 9.0% of total net sales, in 2005. Average prices in U.S. dollars for our consolidated sawn lumber sales increased 4.4% to US$212 per cubic meter in 2006 compared to US$203 in 2005. This price increase mainly reflects the scarcity of wood and higher raw material costs. Sawn lumber physical volume of sales increased by 4.8% from 327.8 thousand cubic meters in 2005 to 343.4 thousand cubic meters in 2006. This increase in physical volume sales was mainly attributable to increased lumber trading activities.
Year ended December 31, 2005 compared to 2004. Sawn lumber sales generated US$66.6 million, or 9.0% of our total net sales, in 2005 compared to US$56.0 million, or 8.6% of total net sales, in 2004. Average prices in U.S. dollars for our consolidated sawn lumber sales increased 8.8% to US$203 per cubic meter in 2005 compared to US$187 in 2004. This price increase mainly reflects the scarcity of wood and higher raw material costs. Sawn lumber physical volume of sales increased by 9.4% from 299.7 thousand cubic meters in 2004 to 327.8 thousand cubic meters in 2005. This increase in physical volume sales was mainly attributable to increased trading activities.
74
Solid wood doors
Year ended December 31, | ||||||||||
2004 | 2005 | 2006 | ||||||||
| Net sales (millions of US$) | 37.9 | 32.8 | 39.6 | |||||||
| Physical volume sales (thousands of cubic meters) | 42.6 | 35.7 | 42.5 | |||||||
| Average price per cubic meter (US$) | 889 | 920 | 931 | |||||||
| % of consolidated net sales | 5.8 | % | 4.4 | % | 4.5 | % | ||||
| Net sales growth % | - | (13.4 | )% | 20.7 | % | |||||
| Volume growth % | - | (16.4 | )% | 19.2 | % | |||||
| Price change % | - | 3.5 | % | 1.2 | % | |||||
Year ended December 31, 2006 compared to 2005. Solid wood door sales generated US$39.6 million, or 4.5% of our total net sales, in 2006 compared to US$32.8 million, or 4.4% of total net sales, in 2005. Solid wood door physical volume of sales increased by 19.2% from 35.7 thousand cubic meters in 2005 to 42.5 thousand cubic meters in 2006. This increase in physical volume was due to the sale during 2006 of approximately 200,000 doors that were manufactured during 2005 but due to contractual negotiations with a customer delayed their sale until fiscal 2006. Production levels remained stable during 2006 compared to 2005. Average sales prices in U.S. dollars for our consolidated solid wood door sales increased by 1.2% to US$931 per cubic meter in 2006 compared to US$920 in 2005. Solid wood door prices increased mainly due to increased diversification of our distribution channels and the development of new door models. All solid wood door sold in the United States are produced by Masisa in Chile.
Year ended December 31, 2005 compared to 2004. Solid wood door sales generated US$32.8 million, or 4.4% of our total net sales, in 2005 compared to US$37.9 million, or 5.8% of total net sales, in 2004. Solid wood door physical volume of sales decreased by 16.4% from 42.6 thousand cubic meters in 2004 to 35.7 thousand cubic meters in 2005. This decrease in physical volume was due to both lower production levels in Chile and reduced inventory purchasing during the second half of 2005 by Masisa’s largest US door customer. Our production volume decreased primarily because we shifted some of our resources to the production of doors that require less wood. Our largest US door customer reduced its inventory purchasing for operational reasons. Average sales prices in U.S. dollars for our consolidated solid wood door sales increased by 3.5% to US$920 per cubic meter in 2005 compared to US$889 in 2004. Solid wood door prices increased mainly due to new pricing agreed with our main customer. All solid wood door sold by us in the United States, are produced by us in Chile.
MDF mouldings
Year ended December 31, | ||||||||||
2004 | 2005 | 2006 | ||||||||
| Net sales (millions of US$) | 32.8 | 47.3 | 65.2 | |||||||
| Physical volume sales (thousands of cubic meters) | 90.3 | 113.7 | 157.9 | |||||||
| Average price per cubic meter (US$) | 363 | 416 | 413 | |||||||
| % of consolidated net sales | 5.0 | % | 6.4 | % | 7.4 | % | ||||
| Net sales growth % | - | 44.3 | % | 37.8 | % | |||||
| Volume growth % | - | 25.9 | % | 38.9 | % | |||||
| Price change % | - | 14.6 | % | (0.7 | %) | |||||
Year ended December 31, 2006 compared to 2005. MDF moulding sales generated $65.2 million, or 7.4% of total net sales, in 2006 compared to US$47.3 million, or 6.4% of total net sales, in 2005. MDF moulding physical volume of sales increased by 38.9% from 113.7 thousand cubic meters in 2005 to 157.9 thousand cubic meters in 2006. This increase in physical volume of sales was mainly attributable to additional production capacity in Chile (i.e. the moulding plant located in Cabrero operating at higher capacity during 2006) and growing acceptance of MDF mouldings by customers in the United States. Average prices in U.S. dollars for our consolidated MDF moulding sales remained relatively stable, exhibiting a 0.7% decrease to US$413 per cubic meter in 2006 compared to US$416 in 2005.
75
Year ended December 31, 2005 compared to 2004. MDF moulding sales generated $47.3 million, or 6.4% of total net sales, in 2005 compared to US$32.8 million, or 5.0% of total net sales, in 2004. MDF moulding physical volume of sales increased by 25.9% from 90.3 thousand cubic meters in 2004 to 113.7 thousand cubic meters in 2005. The increase in physical volume of sales was mainly attributable to additional production capacity in Chile, increased capacity in Argentina and growing acceptance of MDF mouldings by customers in the United States. Average prices in U.S. dollars for our consolidated MDF moulding sales increased 14.6% to US$416 per cubic meter in 2005 compared to US$363 in 2004. Beginning in 2005, we began marketing most of our MDF mouldings sales in the United States through Masisa USA leading to increased sales in that market.
Saw and pulp logs
Year ended December 31, | ||||||||||
2004 | 2005 | 2006 | ||||||||
| Net sales (millions of US$) | 27.1 | 30.1 | 42.7 | |||||||
| Physical volume sales (thousands of cubic meters) | 1,361.4 | 1,197.0 | 1,426.4 | |||||||
| Average price per cubic meter (US$) | 20 | 25 | 30 | |||||||
| % of consolidated net sales | 4.2 | % | 4.0 | % | 4.8 | % | ||||
| Net sales growth % | - | 11.1 | % | 41.9 | % | |||||
| Volume growth % | - | (12.1 | )% | 19.2 | % | |||||
| Price change % | - | 26.3 | % | 20.0 | % | |||||
Year ended December 31, 2006 compared to 2005. Saw and pulp log sales generated US$42.7 million, or 4.8% of our total net sales, in 2006 compared to US$30.1 million, or 4.0% of total net sales, in 2005. Saw and pulp log physical volume of sales increased by 19.2% from 1,197.0 thousand cubic meters in 2005 to 1,426.4 thousand cubic meters in 2006. This increase in sales was driven primarily by higher prices, mainly attributable to (i) increased product diversification in Argentina and Brazil and (ii) improved market conditions in Chile. Average prices in U.S. dollars for our consolidated saw and pulp log sales were US$30 per cubic meter in 2006 compared to US$25 in 2005. The increase in physical volume sales was mainly attributable to higher availability of harvestable trees from our forests, coupled with increased demand. We expect to continue to increase our sales of saw and pulp logs to third parties.
Year ended December 31, 2005 compared to 2004. Saw and pulp log sales generated US$30.1 million, or 4.0% of our total net sales, in 2005 compared to US$27.1 million, or 4.2% of total net sales, in 2004. Saw and pulp log physical volume of sales decreased by 12.1% from 1,361.4 thousand cubic meters in 2004 to 1,197.0 thousand cubic meters in 2005. This increase in sales was mainly driven by higher prices in our principal markets which were partially offset by lower physical volume of sales. Higher prices are mainly attributable to the scarcity of logs in Brazil, Argentina and Chile. This decrease in physical volume of sales was mainly attributable to a decreased supply of trees due to a severe wind storm that knocked down trees in Chile, as well as an increase in inter-company log sales for our production and processing subsidiaries, especially in Brazil and Argentina. Average prices in U.S. dollars for our consolidated saw and pulp log sales were US$25 per cubic meter in 2005 compared to US$20 in 2004.
Other products
Other products include principally wood chips, sawdust, door parts, fiberboard doors and wood plies.
Year ended December 31, | ||||||||||
2004 | 2005 | 2006 | ||||||||
| Net sales (millions of US$) | 20.6 | 20.0 | 16.7 | |||||||
| % of consolidated net sales | 3.2 | % | 2.7 | % | 1.9 | % | ||||
| Net sales growth % | - | (2.7 | )% | (16.5 | ) | |||||
Year ended December 31, 2006 compared to 2005. Other product sales generated US$16.7 million, or 1.9% of our total net sales in 2006 compared to US$20.0 million, or 2.7% of total net sales, in 2005.
76
Year ended December 31, 2005 compared to 2004. Other product sales generated US$20.0 million, or 2.7% of our total net sales, in 2005 compared to US$20.6 million, or 3.2% of total net sales, in 2004.
Liquidity and Capital Resources
Overview
Our principal sources of liquidity are existing cash balances, cash generated from operations and our ability to borrow under credit facilities. Therefore, our financing activities relate principally to replacing our existing long-term credit sources as they periodically mature or when cost of debt may be reduced. However, if our planned capital expenditures change or increase, we may need to seek additional financing.
The most significant financing events thus far in 2007 were (i) the issuance of public bonds by Masisa for an amount of UF2.50 million (equivalent to US$88.0 million), the proceeds of which were used mainly to prepay Masisa’s Series A long-term bond obligations.
The most significant financing events in 2006 were (i) the issuance of public bonds by Masisa for an amount of US$163 million, the proceeds of which were used to prepay Terranova’s Series A and Series B long-term bond obligations and (ii) a new syndicated loan for an amount US$110 million, which was primarily used to prepay long term debt.
As of December 31, 2006, we had cash and a cash equivalent balance of US$97.8 million.
The most significant financing event during 2005 after the merger between Masisa and Terranova was the capital increase of US$117.5 million which is being used to finance the Company’s plans for investment and construction of new plants. The capital increase was completed into two phases. The first phase, completed on December 7, 2005, yielded proceeds of US$75 million. The second phase of this process was completed on January 5, 2006. See “—Financing Activities” in this Item.
The most significant financing events during 2004 were five new long-term bank loans for an aggregate amount of US$47 million and the sale of US$73.2 million in forestry assets in Chile not deemed necessary for current operations. Cash generated in operating activities during the year and part of proceeds from the sale of forestry assets were used to pay or prepay short and long term financial debt, which was reduced by US$95.9 million during 2004. Although the company intended to further reduce financial debt, some of the maturing debt could not be prepaid in December 2004 due to contractual restrictions. The company ended the year with cash and a cash equivalent balance of US$58.5 million, which was mainly used to pay or prepay maturing debt during the first half of 2005.
Dividend payments and the payment to shareholders of Terranova and Masisa that exercised their rights to withdraw from the respective company in which they held shares, which arose as a result of the merger of Terranova with Masisa, were financed by Terranova with existing cash balances and by Masisa with existing cash balances and new short-term borrowings.
Operating activities
Our net cash provided by operating activities was US$132.0 million for the year ended December 31, 2006 compared to US$103.8 million for 2005. The increase in net cash provided by operating activities in 2006 is explained in part by a 39.9% increase in collections of accounts receivable from US$879.9million in 2005 to US$1,230.9 million in the same period in 2006, which was mostly offset by a 40.8% increase in payments to suppliers and personnel, from US$748.2 million in 2005 to US$1,053.8 million in 2006. The increase in collections is explained by (i) growth in net sales, due to higher physical volume sales, in conjunction with overall higher prices and (ii) increased and more effective collection efforts (i.e. days account receivables reduced from 67.3 days in 2005 to 58.4 days in 2006). Cash payments to suppliers also increased as a consequence of higher physical volumes produced and sold. During 2006, the Company increased its IVA (value added tax) cash payments compared to 2005 (i.e. US$20.0 million versus US$18.0 million, respectively). Income tax payments have remained stable at US$11.3 million in 2006 compared to US$11.6 million in 2005. Interest payments increased from US$27.8 million in 2005 to US$50.0 million in 2006. This increase is mainly explained by higher consolidated financial debt held during 2006, which was partly offset by lower interest rate.
77
| · | Our net cash provided by operating activities was US$103.8 million for the year ended December 31, 2005 compared to US$49.8 million for 2004. The increase in net cash provided by operating activities in 2005 is explained in part by a 20% increase in collections from US$734.0 million in 2004 to US$879.9 million in the same period in 2005, which was mostly offset by a 15% increase in payments to suppliers, from US$650.5 million in 2004 to US$748.2 million in 2005. The increase in collections is explained by growth in net sales, due to higher physical volume sales, in conjunction with overall higher prices. Cash payments to suppliers also increased as a consequence of higher physical volumes produced and sold. In addition, financial revenues increased from US$2.2 million in 2004 to US$2.6 million in 2005. During 2005, the Company increased its income taxes and IVA (value added tax) cash payments compared to 2004. Income tax payments have increased from US$6.9 million in 2004 to US$11.6 million in 2005, principally due to increased income tax payments in some of our Chilean and Venezuelan subsidiaries. Interest payments decreased from US$31.5 million in 2004 to US$27.8 million in 2005. This decrease is due mainly to lower consolidated financial debt and a lower interest rate environment. |
See, “Consolidated Statements of Cash Flows” for the years ended December 31, 2006, 2005 and 2004 at page F-5.
Investing activities
The table below summarizes our significant capital spending by geographic segment for the years ended December 31, 2006, 2005 and 2004.
Investing activities for the year ended 2006
Year ended December 31, (in millions of US$) | 2006 | |||
| Chile | 72.7 | |||
| Brazil | 31.4 | |||
| Venezuela | 14.1 | |||
| Argentina | 9.0 | |||
| Mexico | 1.0 | |||
| United States | 0.1 | |||
| Other | 0.5 | |||
Total | 128.8 | |||
Our capital expenditures incurred during 2006 were funded with internally generated cash and short-term and long-term bank loans.
Our significant capital expenditures during the year ended December 31, 2006 were as follows:
| · | In Chile: US$46.0 million for the MDF plant in Cabrero; US$ 19.6 million for timberland planting, management and other forestry investments; |
| · | In Brazil: US$23.5 million for timberland planting, management and other forestry investments; US$3.8 million for an impregnation line. |
| · | In Venezuela: US$5.0 million for timberland planting, management and other forestry investments; US$4.8 million for an impregnation line and US$ 2.7 millions to increase the sawmill output. |
78
| · | In Argentina: US$4.7 million for timberland planting, management and other forestry investments; US$4.3 million for upgrades, debottle necking and efficiency increases. |
| · | The remaining capital expenditures were related to various smaller projects in México, United States, Peru, Ecuador and Colombia. |
We plan to make approximately US$141 million of capital expenditures in 2007. We plan to make aggregate capital investments of approximately US$92 million in Chile, US$25 million in Brazil, US$10 million in Venezuela, US$10 million in Argentina and US$2 million in the remaining countries where we have operations. All of these investments will be financed from our internal operations and existing cash. In Chile, the principal investments are related to the last payments of the new MDF plant, and other investments that are expected to include new forest plantations, a melamine line, industrial upgrading and other improvements. In Venezuela, the investment plan includes new forest plantations and industrial improvements. In Argentina, the investment plan includes mainly new forest plantations and industrial operational improvements. In Brazil, the investments are expected to include chiefly new forest plantations and industrial efficiency improvements.
Investing activities for the year ended 2005
Year ended December 31, (in millions of US$) | 2005 | |||
| Chile | 35.2 | |||
| Brazil | 18.6 | |||
| Argentina | 8.8 | |||
| Venezuela | 8.2 | |||
| Mexico | 1.6 | |||
| United States | 0.6 | |||
| Other | 0.2 | |||
Total | 73.2 | |||
Our capital expenditures incurred during 2005 were funded with internally generated cash and short-term and long-term bank loans.
Our significant capital expenditures during the year ended December 31, 2005 were as follows:
| · | In Chile: US$21.3 million for timberland planting and management; US$3.5 million in roads, bridges and other forestry investments; US$1.3 million for a jesso mouldings line; and US$2.0 million for two jesso application lines; |
| · | In Brazil: US$8.3 million for timberland planting and management; US$2.9 million for a defibrator; US$4.0 million for a melaminating press line; and US$0.3 million for forestry roads; |
| · | In Argentina: US$4.8 million for timberland planting and management; US$0.9 million for the second moulding line; US$0.2 million for a conveyor rollers system; and US$0.1 million for a particle board scrubber; |
| · | In Venezuela: US$2.5 million for timberland planting and management; US$1.1 million for an impregnation line; US$0.6 million for repairs to office buildings damaged by fire; US$0.4 million to modify an MDF gas extraction system; and US$0.2 million for a formaldehyde extraction system; |
| · | In Mexico: an aggregate of US$1.6 for various small projects; and |
| · | In the United States: an aggregate of US$0.6 million for various small projects. |
The remaining capital expenditures were related to various smaller projects.
79
Investing activities for the year ended 2004
Year ended December 31, (in millions of US$) | 2004 | |||
| Chile | 20.6 | |||
| Brazil | 12.2 | |||
| Argentina | 6.7 | |||
| Venezuela | 4.3 | |||
| Mexico | 2.1 | |||
| United States | 0.1 | |||
| Other | — | |||
Total | 46.1 | |||
Most of our capital expenditures incurred during 2004 were funded with internally generated cash and short-term and long-term bank loans.
Our significant capital expenditures in 2004 were as follows:
| · | In Chile: US$10.0 million for the planting and maintenance of timberland; US$1.7 million for forest plantation roads; US$1.5 million for a MDF mouldings line; US$1.3 million in capitalized interest; US$0.7 million in set-up and office furniture expenses for our new administrative offices; US$0.7 million for machinery replacement parts; US$0.6 million for buildings related to the MDF mouldings line; US$0.5 million for air ventilation ducts and filters for the moulding line; US$0.3 million for implementation of SAP R/3 version 4.06C; US$0.3 million for mouldings machinery; and US$0.3 million for a plastic wrapping machine and Ripsaw; |
| · | In Brazil: US$5.6 million for the acquisition, planting and maintenance of timberland; US$2.1 million for new buildings; US$1.1 million for new factory layout; US$0.8 million for machines and equipment for the OSB line; and US$0.4 million for a second MDF defibering machine; |
| · | In Argentina: US$2.3 million for the planting and maintenance of timberland; US$2.1 million for moulding line equipment and buildings; and US$0.5 million for machinery replacement parts; |
| · | In Venezuela: US$1.9 million for the planting of timberland; US$0.7 million for the effluent treatment plant; US$1.0 million for conveyor belts and Placacentros and US$0.6 million for a ventilation system and thermal isolating unit; and |
| · | In Mexico: US$1.2 million for a new board forming line; US$0.4 million for a laminating line; and US$0.1 million for a sanding machine. |
The remaining capital expenditures were related to various smaller projects.
Financing activities
The most significant financing activities of Masisa are its long-term borrowings and long-term financing facilities, since short-term debt is mainly raised and repaid to adjust short-term needs to cash availability. Accordingly, the following paragraphs describe the long-term borrowings Masisa subscribed and/or repaid during the indicated periods. No seasonal factors materially affect our financing activities.
The most significant financing event thus far in 2007 was:
| · | In June 2007, we completed a bond offering of UF2.50 million (equivalent to US$88.0 million). The proceeds of this offering were used mainly to prepay our Series A long-term bond obligations. |
80
The most significant financing events during 2006 were:
| · | In January 2006, we completed a Chilean bond offering of UF4.75 million fixed rate bonds (equivalent to US$163 million). The proceeds of this offering were used primarily to refinance the Terranova Series A and Series B long-term bonds outstanding. This refinancing improved our debt maturity structure and took advantage of the favorable interest rate available in the bond market. |
| · | Also in January 2006, the completion of a syndicated credit contract between our subsidiary Masisa Overseas Ltd., as debtor, and the Cooperative Centrale Raiffelsen-Boerenleenbank B.A. (“Rabobank International New York Branch”, henceforth also known as “Rabobank”), as agency bank and creditor, together with a syndicate of banks, for US$110.0 million. This credit agreement has a six-year term and is guaranteed by Masisa and its subsidiaries, Masisa Argentina S.A. and Masisa do Brazil Ltd. The funds were used for refinancing our financial liabilities and finance certain investment projects. |
In addition to the above events, our other principal financing activities in 2006 related to refinancing our existing debt (including our Venezuelan bolivar denominated bank loans), new long-term borrowings to finance capital expenditures and paying maturing long-term borrowings. Our short-term borrowings and long-term borrowings maturing within one year decreased by US$225 million, from US$376 million on December 31, 2005 to US$151 million on December 31, 2006. Our significant new long-term borrowings during the same period were our Chilean fixed rate bond issuance and our syndicated credit agreement, for an aggregate amount of US$273 million. Significant repayment of long-term borrowings during 2006 included (i) UF 500,000 (equivalent to US$17.1 million) in principal payments for our Series A fixed rate bonds, (ii) US$9.0 million of a partial maturity of a private placement, (iii) US$18.9 million for the prepayment of our Kredinstalt für Wiederaufbau credit facility (US$9.4 million and US$9.5 million relating to current and long-term portions of such credit facility, respectively), and (iv) US$16.0 million payment relating to our maturing U.S. dollar denominated Venezuelan bank loans.
The most significant financing events during 2005 were:
| · | The successful completion of the merger by incorporation of Masisa into and with Terranova. |
| · | The successful completion of a capital increase, with total proceeds of approximately US$117.5 million, divided into two phases. The first phase, completed on December 7, 2005, yielded proceeds of US$75 million. Of this amount, 66% was placed in the U.S. market via the Company’s ADR program. The second phase of this process was completed on January 5, 2006, upon the completion of a preemptive rights offering period. The principal objectives of the capital increase were to finance part of the Company’s investment projects, which include a new MDF plant in Chile. |
Our principal financing activities in 2005 related mainly to paying maturing long-term borrowings and dividends with cash and new short-term borrowings. Our short-term borrowings and long-term borrowings maturing within one year increased by US$239.8 million during 2005, from US$136.6 million on December 31, 2004. Our significant new short-term borrowings during the same period were bank loans, for an aggregate amount of US$66.3 million relating to several bank financings. Significant repayment of long-term borrowings during 2005 included the payment of US$35 million of partial maturities of long term debt and US$9 million of a partial maturity of a private placement.
Masisa’s principal financing activities in the year 2004 related mainly to reducing short-term borrowings, replacing maturing long-term borrowings and the sale of approximately 21,000 hectares of our Chilean forests for US$73.2 million. Our short-term borrowings and long-term borrowings maturing within one year declined by US$80.9 million during 2004, from US$217.6 million on December 31, 2003 to US$136.6 million on December 31, 2004. Significant repayments of short-term borrowings in 2004 included repaying an aggregate amount of US$53.3 million relating to several bank financings. Significant repayments of long-term borrowings during 2004 included the repayment of US$28.5 million to Rabobank Ireland and the payment of US$21.0 million of partial maturities of long term debt and US$9.0 million of a partial maturity of a private placement. Our significant new long-term borrowings during 2004 were five bank loans, including a borrowing from Kreditanstalt Fur Weideraufbau for US$19.0 million, a borrowing of US$12.5 million from BCI, a borrowing of US$12.5 million from Rabobank Nederland, a borrowing of US$2.0 million from Itau BBA, and a borrowing of US$1.0 million from HSBC. For more information on the sale of forest assets, see “Item 4. Information on the Company—Forestry operations—Distribution of forestry assets.”
81
As of December 31, 2006, Masisa’s total debt, calculated as the sum of short-term bank borrowings, the current portion of long-term bank borrowings, the current portion of bonds and promissory notes, the current portion of other long-term borrowings, long-term bank borrowings, bonds and promissory notes, and other long-term borrowings, was US$598.0 million, compared to total debt of US$651.6 million as of December 31, 2005. Of the total debt as of December 31, 2006, US$151.3 million was short-term debt plus the current portion of long-term debt, compared to US$376.4 million as of December 31, 2005.
As of December 31, 2005, Masisa’s total debt, calculated as the sum of short-term bank borrowings, the current portion of long-term bank borrowings, the current portion of bonds and promissory notes, the current portion of other long-term borrowings, long-term bank borrowings, bonds and promissory notes, and other long-term borrowings, was US$651.6 million, compared to total debt of US$622.8 million as of December 31, 2004. Of the total debt as of December 31, 2005, US$376.4 million was short-term debt plus the current portion of long-term debt, compared to US$136.6 million as of December 31, 2004.
For more details regarding short- and long-term financings and their respective restrictive covenants, please see Notes 14, 15 and 16 of our audited consolidated financial statements included elsewhere in this annual report.
In addition, total net financial liabilities, calculated as total debt less financial assets (cash, time deposits and marketable securities), amounted to US$550.0 million as of December 31, 2006, compared to US$553.7 million as of December 31, 2005 and US$564.3 million as of December 31, 2004.
As of December 31, 2006, our subscribed capital was US$812.9 million, representing 5,667,750,881 shares, which was an increase of US$43.0 million compared to December 31, 2005. In December 2005 and January 2006, we completed a two phase capital increase of 622,500,000 shares which yielded approximately US$75 million and US$42.5 million, respectively. As of December 31, 2005, our subscribed capital was US$769.8 million, representing 5,437,018,860 shares. On April 14, 2005, the shareholders of the Company approved a capital increase in connection with the merger with its former majority owned subsidiary Masisa S.A. In connection with this increase in share capital, 668 million shares were issued representing US$112.7 million of paid-in capital. There were no common stock capital increases during 2004.
Liquidity
At December 31, 2006, 2005 and 2004 Masisa’s ratio of current assets to current liabilities was 1.80:1.00, 1.11:1.00 and 2.05:1.00, respectively.
Total current assets were US$466.5 million, US$519.8 million and US$467.7 million on December 31, 2006, 2005 and 2004, respectively.
The 10.3% decrease in current assets between December 31, 2006 and December 31, 2005 was mainly due to a decrease in time deposits, marketable securities and a increase in deferred taxes. The 11.1% increase in current assets between December 31, 2004 and December 31, 2005 was mainly due to an increase in time deposits, sundry debtors and inventories all due to higher sales.
Total current liabilities were US$258.5 million, US$468.3 million and US$228.6 million on December 31, 2006, 2005 and 2004, respectively.
The 44.8% decrease in current liabilities between December 31, 2006 and December 31, 2005 was mainly due to the issuance in new bonds in the local Chilean market for UF4.75 million as well as our new US$110.0 million syndicated loan.
The 104.9% increase in current liabilities between December 31, 2004 and December 31, 2005 was mainly due to the change in classification to short-term obligations of long-term obligations maturing in a year, due to the prepayment of Terranova’s Series A and Series B long-term bonds announced in December 2005, an increase in short-term bank borrowings and dividends paid, offset by cash generation.
82
Research and Development
Our research and development efforts do not involve material expenditures, as we rely primarily on technology and equipment purchased or licensed from foreign companies.
Trend Information
For a discussion of trend information, see “Item 5. Operating and Financial Review and Prospects.”
Off-Balance Sheet Arrangements
We have guaranteed certain debt of our un-consolidated Venezuela subsidiary, Oxinova C.A., of which IITSA has a 49% ownership interest. As of December 31, 2006, the outstanding balance of the guaranteed Oxinova credit facility with the Banco de Chile was US$4.9 million, maturing on November 2008.
Other than the guarantees described in the previous paragraph, we do not have any other off-balance sheet arrangements including any transactions, agreements or other contractual arrangements involving any other unconsolidated entity under which we have:
| · | made guarantees; |
| · | a retained or a contingent interest in transferred assets; |
| · | an obligation under derivative instruments classified as equity; or |
| · | any obligation arising out of a material variable interest in an unconsolidated entity that provides financing, liquidity, market risk or credit risk support to the company, or that engages in leasing, hedging or research and development arrangements with the company. |
See Note 21 to our audited consolidated financial statements for a more detailed discussion of contingencies, including guarantees appearing elsewhere in this document.
Contractual Obligations
The following table summarizes our significant long-term contractual obligations as of December 31, 2006.
Payments due by period (in millions of US$) | Total | Less Than 1 Year | 1-3 Years | 3-5 Years | More Than 5 Years | |||||||||||
| Long-term debt obligations | 526.9 | 81.8 | 177.9 | 142.0 | 125.2 | |||||||||||
| Interest debt payments | 100.5 | 3.9 | 38.8 | 21.9 | 35.9 | |||||||||||
| Capital lease obligations | - | - | - | - | - | |||||||||||
Operating lease olbligations(1) | 25.0 | 6.8 | 9.6 | 6.3 | 2.2 | |||||||||||
Purchase obligations(2) | 176.7 | 17.7 | 35.3 | 35.3 | 88.3 | |||||||||||
| Other long-term liabilities on the company's balance sheet under GAAP | - | - | - | - | - | |||||||||||
Total Contractual Obligations | 829.1 | 110.2 | 261.6 | 205.5 | 251.6 | |||||||||||
(1) Operating lease obligations include long-term forestry land lease agreements in Masisa Brazil and our short and long-term office, facility and IT (including PCs, printers, systems and software among others) leases. For information regarding our leased properties, see “Item 4. Information on the Company — Description of properties”
(2) Purchase obligations include a long-term resin supply contract with Oxinova in Venezuela that requires us to purchase a minimum amount of resin annually.
83
Impact of Inflation and Devaluation
The principal effects of changes in the local currency-U.S. dollar exchange rate are manifested in certain monetary assets and liabilities denominated in local currencies, which have been subject to periods of exposure to exchange rate fluctuations and have had material effects in our results of operations. These effects have principally resulted from exposure to exchange rate fluctuations with respect to the Chilean peso, Argentinean peso, Brazilian real, Venezuelan Bolivar and Mexican peso, including the following:
| · | In Venezuela we recorded (i) a loss for US$10.2 million in 2006 and a gain for US$1.9 million in 2005 related to our bank borrowing; (ii) a loss for US$1.7 million in 2005 associated with recoverable taxes; and (iii) a loss for US$4.1 million in 2005 associated with other liabilities. |
| · | Additionally, in Chile we recorded (i) a loss for US$4.5 million in 2006 associated with our term deposits and marketable securities; (ii) a loss for US$1.2 million in 2006 and a gain for US$0.4 million in 2005 related to our cash holdings; (iii) a gain for US$0.2 million in 2006 and a gain of US$2.7 million in 2005 associated with certain of our accounts receivables denominated in Chilean pesos; and (iv) a gain for US$5.6 million in 2006 and a loss for US$9.4 million in 2005 due to our UF denominated bonds. |
| · | Finally, in Brazil we recorded (i) a gain for US$1.3 million in 2006 associated with marketable securities; (ii) a loss for US$1.7 million in 2006 and a gain for US$2.4 million in 2005 regarding other liabilities; (iii) a loss for US$1.0 million in 2006 and a loss for US$0.04 million in 2005 associated with income taxes; and (iv) a gain for US$1.9 million in 2006 and US$2.4 million in 2005 associated with certain of our accounts receivables denominated in Brazilian real. |
Critical Accounting Policies
A summary of our significant accounting policies is included in Note 2 of the audited consolidated financial statements, which are included elsewhere in this annual report. The preparation of financial statements requires our management to make estimates and assumptions that affect the amounts reported in the consolidated financial statements and accompanying footnotes. Our estimates and assumptions are based on historical experiences and changes in the business environment. However, actual results may differ from estimates under different conditions, sometimes materially. Critical accounting policies and estimates are defined as those that are both most important to the portrayal of our financial condition and results and require management’s most subjective judgments. Our most critical accounting policies and estimates are described below.
Property, plant and equipment
The key judgments Masisa must make under the property, plant, and equipment policy include the estimation of the useful lives of its various asset types, the election to utilize primarily the straight-line method for recording depreciation, management’s judgment regarding appropriate capitalization or expensing of costs related to fixed assets, and its determination that no impairment exists.
Property, plant, and equipment is stated on Masisa’s balance sheet at cost less accumulated depreciation. Depreciation of buildings, equipment, and other depreciable assets is determined using primarily the straight-line method. The estimation of useful lives for fixed assets impacts the level of annual depreciation expense recorded. In estimating the useful lives and expected residual value of fixed assets, Masisa has primarily relied on actual experience with similar plant and equipment and recommendations from engineers and manufacturers. Utilization of the straight-line method for recording depreciation or any of the other acceptable methods for depreciating assets will result in the same amount of depreciation over the life of an asset; however, the amount of annual depreciation expense and the resulting carrying amount of net property, plant, and equipment can vary significantly depending on the method elected.
Expenditures that substantially improve and/or increase the useful life of facilities or equipment are capitalized. Maintenance and repair costs are expensed as incurred. Masisa’s evaluation of whether an expenditure related to property, plant, and equipment substantially improves and/or increases the useful life of an asset and is appropriately capitalized as an addition to the asset’s cost basis or is expensed as normal maintenance and repair expense can significantly affect results of operations for a given period, as well as its financial position.
84
Property, plant, and equipment assets are evaluated for possible impairment on a specific asset basis or in groups of similar assets, as applicable. This process requires Masisa’s estimate of future cash flows generated by each asset or group of assets. In addition, Masisa must make assumptions regarding product pricing, raw material costs, volumes of product sold, and growth rates to analyze the future cash flows for asset impairment assessments. If our estimates of projected undiscounted future cash flows were too high by 10%, there would be no impact on the reported value of property, plant and equipment test for impairment on our Consolidated Balance Sheet. Management believes that the estimates of future cash flows are reasonable; however, changes in estimates of such cash flows, changes in the likelihood of alternative outcomes, and changes in estimates of fair value could affect the evaluations.
Forests
Masisa determines the value of its forests by a technical appraisal process. Masisa appraises the value of its forests annually, based on the expected present value of future cash flows to be generated by its forests. This discounted cash flow analysis takes into account the forecasted harvests for the upcoming years based on tree growth and fluctuations in the cost and price of wood products.
Masisa initially carries a new plantation at the historical cost including tree development and forest maintenance. When the technical appraisal indicates that the value of a plantation has changed because it begins to have commercial value, Masisa accounts for this by increasing or decreasing forestry plantations (which is a part of property, plant and equipment) and making a corresponding increase or decrease to the forestry reserves component of shareholders’ equity.
At the end of each year, Masisa moves to inventory the appraised value of trees it expects to harvest in the next twelve months. Masisa carries these trees in inventory at appraised value until harvesting. No reduction in shareholders’ equity is made when standing trees are moved to inventory in anticipation of harvesting.
The reserve is reversed from shareholders’ equity and from Masisa’s assets when the forestry plantation is sold.
When Masisa appraises the value of its forests it makes judgments about estimated growth rates, current market conditions and statistical techniques. The value of Masisa’s forests is significant and, accordingly, the results of these judgments can have material affects on the reported amounts of assets and shareholders’ equity on Masisa’s balance sheet. If the estimated appraised value of our timber resources were too high by 10%, our net equity and the reported value of our forests assets would be overstated by US$43.8 million and US$63.0 million, respectively. However, there would be no impact on our reported net income as the changes to fair values of forests has no impact on earnings as discussed above.
Depletion
Depletion, or costs attributed to timber harvested, is recorded as trees are harvested. Depletion rates are adjusted annually. Depletion rates are determined by each identifiable farm block and computed by dividing the original cost of the timber less previously recorded depletion by the total timber volume that is estimated to be harvested over the harvest cycle. The length of the harvest cycle varies by geographic region and species of timber. The depletion rate calculations do not include an estimate for future silviculture costs associated with existing stands, future reforestation costs associated with a stand’s final harvest, or future volume in connection with the replanting of a stand subsequent to its final harvest.
Significant estimates and judgments are required to determine the volume of timber available for harvest over the harvest cycle. Some of the factors affecting the estimates are changes in weather patterns, the effect of fertilizer and pesticide applications, changes in environmental regulations and restrictions that may limit Masisa’s ability to harvest certain timberlands, changes in harvest plans, the scientific advancement in seedling and growing technology, and changes in harvest cycles.
85
Inventories
Inventories of finished goods, forests and plantations in the process of exploitation, materials and supplies are stated at the lower of direct production cost or market (net realizable value), primarily using the average cost method. Finished goods include certain indirect costs as appropriate. Determination of the net realizable value of each component of inventory is based on the current invoice price. Forests and plantations in the process of exploitation are stated at the commercially appraised value at which these forests were transferred from fixed assets. These estimates can affect the carrying value for inventories, and any required inventory write-down can affect results of operations in both current and future periods. Our inventory reserves at December 31, 2006 amounted to US$6.4 million which represents 3.4% of our total inventory of finished goods, materials and supplies. Additionally, our inventory write-offs for the year ended December 31, 2006 represented 0.3% of our cost of sales during the same period. Had our inventory reserves and write-downs been underestimated by 10%, our cost of sales would not be materially affected.
Deferred income tax
Effective January 1, 2000, the effects of deferred income taxes arising from temporary differences between the basis of assets and liabilities for tax and financial statement purposes are recorded in accordance with Technical Bulletin No. 60 of the Chilean Institute of Accountants. The effects of deferred income taxes at January 1, 2000, which were not previously recorded, are recognized in income beginning in 2000 as the temporary differences reverse. Under Technical Bulletin No. 60, deferred tax assets are reduced by a valuation allowance if it is more likely than not that some portion or all of the deferred tax asset will be realized. In making this determination, Masisa considers both positive and negative evidence and make certain assumptions, including projections of taxable income. Changes in these assumptions may have a material impact on results. If our projections of taxable income were too high by 10% there would be no impact on the balance of our reported valuation allowance at December 31, 2006.
Differences between Chilean GAAP and U.S. GAAP
Our audited consolidated financial statements are prepared in accordance with Chilean GAAP, which differs in certain significant respects from U.S. GAAP. See Note 23 to our audited consolidated financial statements included in this annual report for a discussion of these differences and their effect on our results of operations.
Our net income determined under U.S. GAAP would have been US$24.5 million in 2006 and US$24.9 million in 2005, as compared with net income under Chilean GAAP of US$29.5 million in 2006 and net income of US$24.4 million in 2005. These differences could be material to the financial information presented in accordance with Chilean GAAP. The main differences affecting the determination of net income include the different treatment for acquisition accounting and related amortization of goodwill, capitalization of interest and exchange differences, long-term non-interest bearing payable related to tax settlement, adjustments for differences in the deferred tax provision as calculated under U.S. GAAP, and certain gains related to derivative instruments that do not qualify as hedging relationships under U.S. GAAP.
Shareholders’ equity determined under U.S. GAAP would have been US$937.6 million in 2006 and US$874.8 million in 2005, as compared with shareholders’ equity under Chilean GAAP US$1,186.4 million in 2006 and US$1,094.3 million in 2005, principally due to adjustments for the revaluation of timber resources, capitalization of interest, the impact of changes in reporting and functional currency, provisions for deferred income taxes and goodwill amortization.
On May 31, 2005, the merger by incorporation of our former subsidiary Masisa S.A. into and with the Company became effective (See Note 1 to the audited consolidated financial statements included elsewhere in this annual report). Under Chilean GAAP, the transaction, including the acquisition of the 47.566% minority interest of Masisa, was accounted for as a merger of commonly controlled companies on a prospective basis as of January 1, 2005. Accordingly, Masisa was treated as if it had always been part of the Company, and the historical values of the Masisa assets and liabilities were combined with the Company’s. Historical financial statements for periods prior to the merger are not restated under Chilean GAAP. Under U.S. GAAP the acquisition of the 47.566% minority interest of Masisa was accounted for in accordance with the purchase method of accounting. The acquired 47.566% minority interest of our former subsidiary Masisa S.A. was incorporated into the Company (formerly known as Terranova S.A.) using the purchase price as determined based on the market value of the Company’s shares offered in accordance with the step acquisition method for the newly acquired interest of our former subsidiary. The book values of individual assets and liabilities were adjusted to their fair values on the acquisition date for the proportional interest of our former subsidiary that was acquired. From a U.S. GAAP perspective, goodwill and intangible assets with indefinite lives are not amortized.
86
Item 6. Directors, Senior Management and Employees
Directors
Our administration is conducted by our board of directors which, in accordance with our estatutos, or bylaws, consists of seven directors. The entire board of directors is elected every three years. Our current board of directors was elected on June 6, 2005 for a term of three years. Cumulative voting is permitted for the election of directors. Our Chief Executive Officer is appointed by the board of directors and holds office at the board of directors’ discretion. Scheduled meetings of the board of directors are held at least monthly. Extraordinary board of directors meetings may be called by the Chairman, when requested by at least five directors or, in limited circumstances, when requested by one director.
Our current directors are as follows:
Directors | Position | Age | |||||
| Julio Moura | Chairman | 55 | |||||
Ronald Jean Degen | Vice-President | 63 | |||||
Patrick A. Nielson | Director | 57 | |||||
| Jorge Carey T. | Director | 64 | |||||
| Juan Carlos Méndez G | Director | 61 | |||||
Enrique Seguel M. | Director | 68 | |||||
| Antonio Tuset J. | Director | 63 |
Unless otherwise noted, the business address of each director is Avenida Apoquindo 3650, Piso 10, Las Condes, Santiago, Chile.
Julio Moura, 55 years old, has been the Chairman of our Board of Directors since 2002. Mr. Moura has also served as Chairman of the Board of Directors and Chief Executive Officer of Grupo Nueva since 1998. Grupo Nueva, a holding company, is, beneficially, a controlling shareholder of Masisa. He has served as Member of the Executive Committee and Executive Vice-President for the Schindler Group and Sika Finanz in Switzerland, as well as Director of companies belonging to these Groups and of Messerli A.G., among others. From 1980 until 1983, he was Senior Associate of the Consulting Company Booz Allen & Hamilton. Mr. Moura obtained a degree in mechanical engineering from the Swiss Federal Institute of Technology (ETH) in Zurich, Switzerland and holds an MBA from M.I.T., Sloan Management School of Management, USA.
Ronald Jean Degen, 63 years old, became Vice-President of our Board in 2003. He is also the Chairman, President and Chief Executive Officer of The Plycem Company and a Director of the Board of Amanco. Mr. Degen has served as Vice-President for Mergers and Acquisitions of Grupo Nueva since 2004. Prior to joining Grupo Nueva, Mr. Degen was Chairman of the Board, President and Chief Executive Officer of Amanco Brasil, a PVC pipe manufacturer and affiliate company of Grupo Nueva, from 2000-2004. He was also President and Chief Executive Officer of Companhia Paulista de Força e Luz (CPFL), a Director of the Board of Bandeirantes de Energia, a Director of the Board of Mercado Atacadista de Energia (MAE), President and Chief Executive Officer of Schindler Brasil, Vice-President of Grupo Abril, Executive Director and Chief Operating Officer of Editora Abril, Executive Director and Chief Executive Officer of Listel, Executive Director of Indústria Villares and Project Director of Booz Allen & Hamilton International. He has a Professional Electrical Engineering Degree from Escola de Engenharia Mauá Brazil, is a graduate in Automation from the Swiss Federal Institute of Technology (ETH) Switzerland, and has an MBA from the University of Michigan, USA.
Patrick A. Nielson, 57 years old, became a Director on our Board of Directors in 2003. He has served as the Vice-President, General Counsel and Secretary of Grupo Nueva since 2002. He has also served on the Board of Directors of Masisa S.A. since 2002. Prior to 2002, he was Vice-President, General Counsel—Food Operations and Vice-President International Legal and Regulatory Affairs of Dole Food Company, Inc., a food company, where he began working in 1983. He has also been a member of the Board of Directors of Pascual Hermanos, S.A. of Spain and The Western Growers Association. Mr. Nielson holds a Bachelor of Arts in Political Science from Lewis & Clark College and a Juris Doctor from Hastings College of the Law, University of California.
87
Jorge Carey T., 64 years old, has served as a Director on our Board since 2004. Mr. Carey also serves on the board of directors of Masisa since 2002. He has been a senior partner of Carey y Cia., a Chilean legal firm, since 1976. Carey y Cia. serves as outside counsel to Masisa from time to time. Mr. Carey is a board member of several publicly traded corporations, including Cemento Melón S.A. (of which he is the Chairman), Quebrada Blanca S.A., Enaex S.A. and CCU. He is also a board member of several other Chilean institutions, including Corporación del Patrimonio Cultural de Chile and Consejo Nacional de Television and of several non-Chilean organizations, including Aur Resources Inc in Toronto, Canada, The Center for International and American Law in Dallas, Texas, U.S.A. and the Moneda Chile Fund in Bermuda. Mr. Carey worked early in his career for three years as a staff attorney in Washington D.C. for the International Monetary Fund and the International Finance Corporation. He has been a professor of law at the Catholic University of Chile Law School and chairman of both the Chilean British Chamber of Commerce and the Chile Canada Chamber of Commerce in Santiago, Chile. He received his law degree from the Catholic University of Chile Law School and a Master's degree in Comparative Jurisprudence from the School of Law of New York University where he was a Fulbright scholar.
Juan Carlos Méndez G., 61 years old, joined the Company in 1994, and has served as a Director on our Board since 1994. In addition, Mr. Méndez serves as Director of the Board of Cap S.A., Director of the Board of Moneda AFI, member of the Coordination Committee of the National Concesions System and member of the Audit Committee of Banco Estado Chile. Mr. Méndez has also served as a Director of David del Curto S.A., Jordan S.A., Novaterra and lansa. Mr. Méndez holds a degree in agricultural engineering from the Catholic University of Chile, a masters degree in agricultural economics from the Catholic University of Chile and a masters degree in economics and is a candidate for a PhD in economics from the University of Chicago, USA.
Enrique Seguel M., 68 years old, joined the Company in 2004, and has served as a Director on our Board since April 2004. Mr. Seguel has served as Chief Executive Officer of Inmobilaria y Constructora Germania S.A., a property development company, since 1996 and as President of Asesorias e Inversiones ECAD S.A. an investment consulting firm, since 1996. Mr. Seguel is a Director of Rhein (Chile) S.A. He has also served as Minister of Finance of Chile, President of the Central Bank of Chile, Director of Entel S.A., Director of Delta S.A. and Director of Invertec S.A. Mr. Seguel holds a business degree from the Catholic University of Chile and an MBA from ESADE business school in Spain. He also is a retired General of the Army of Chile.
Antonio Tuset J.,63 years old, has served as a Director on our Board since June 2005. Mr. Tuset is a board member of several companies including Banmédica S.A., Isapre Banmédica S.A., Cristalerías de Chile S.A., Aeropuerto Internacional de Santiago S.A., Sociedad Concesionaria and Tricolor S.A. He has served as Advisor to the Chairman of Agrosuper Ltda., CEO of Celulosa Arauco y Constitución S.A., CEO of Forestal Arauco Ltda., Forestal Celco Ltda., Forestal Pedro de Valdivia Ltda., Director of Compañía Cervecerías Unidas S.A., Director of Viña Santa Carolina S.A., Director of Alimentos Watt's S.A., Director of Pesquera Guanaye S.A., Assistant General Manager of the Corporación de Fomento de la Producción and General Manager of Industria Procesadora de Acero S.A. Mr. Tuset holds a business degree and is a certified accountant from the University of Chile and holds a diploma in philosophy from the Universidad de Los Andes.
Board Committees
Directors Committee. Under the Chilean Stock Companies Act, all public companies must have a comité de directores, or directors committee, which is responsible for:
| · | examining and commenting on the financial statements and external auditor’s report that is delivered to the Company prior to the final presentation of such financial information at the annual shareholders’ meeting; |
| · | recommending the external auditors and rating agencies that will be presented for approval at the annual shareholders’ meeting; |
88
| · | evaluating and reporting to the Board of Directors on transactions with related parties pursuant to Article 89 of the Chilean Stock Companies Act as well as transactions in which a director, manager or executive officer of the Company has an interest as required by Article 44 of the Chilean Stock Companies Act; and |
| · | advising on the compensation of the Company’s senior management. |
Masisa's directors' committee is composed of three director members and was created in April 2001. The current members of the committee are Enrique Seguel (Chairman), Juan Carlos Méndez and Antonio Tuset.
Audit Committee. Our board of directors has established an audit committee which currently consists of Antonio Tuset (Chairman), Enrique Seguel, Ronald Jean Degen and Patrick Nielson. Our board of directors has determined that all of the voting members of our audit committee meet the criteria for independence set forth in Rule 10A-3(b)(1) of the Exchange Act, and that the requirements under Rule 10A-3(b)(1)(iv)(D) for Masisa's audit committee to include as members two non-voting representatives of the controlling shareholders are met. Our audit committee is responsible for, among other things:
| · | assuring the integrity of financial statements; |
| · | reviewing accounting policies; |
| · | monitoring legal and regulatory compliance by the Company; |
| · | discussing audited financial reports with the external auditors; |
| · | proposing external auditors to the board of directors; |
| · | reviewing and discussing with the external auditors the Company’s internal controls; and |
| · | evaluating potential claims and litigation as well as strategies for managing such risks. |
Compensation Committee: The Compensation Committee currently consists of Enrique Seguel (Chairman), Antonio Tuset, Ronald Jean Degen and Patrick Nielson. The main functions of this committee are:
| · | To review and approve corporate objectives in reference to remuneration and compensation of the Chief Executive Officer of Masisa., including by determining clear economic objectives for the Company. |
| · | To evaluate the performance of the Chief Executive Officer according to the objectives defined and, based on such evaluation, to make proposals to the Board regarding the compensation of the Chief Executive Officer. |
| · | To review the level of remuneration of each second line executive (division managers and the corporate management line), together with the compensation structure, the criteria for the payment of variable incentives, the benefits related to the position and other strategies for the retention of key personnel. |
| · | To determine the most appropriate way to motivate the Company’s executives and provide incentives for them to use their talents and experience for the benefit of the organization. |
Disclosure Committee: The Disclosure Committee currently consists of the Enrique Cibie (CEO), Patricio Reyes (General Counsel), Eugenio Arteaga (CFO), Rodrigo Saldivia (Chief Accounting Officer) and Luís Zuniga (Internal Audit). The main functions of this committee are:
| · | To review the financial statements |
89
| · | To review important events filings and other communications to the Chilean Superintendence of Securities and Insurance (SVS) |
| · | To assure the timely disclosure and treatment of material information |
Senior Management
Our current executive officers are as follows:
Executive Officers | Position | Age | ||
| Enrique Cibié Bluth | Chief Executive Officer | 53 | ||
| Jaime Valenzuela Fernández | Chief Wood Board Business Unit Officer | 54 | ||
| Alejandro Espinosa Carey | Chief Retail Business Unit Officer and Word Board Business Unit Commercial Manager | 51 | ||
| Tomás Morales Jaureguiberry | Chief Solid Wood Business Unit Officer | 37 | ||
| Jorge Correa Drubi | Chief Forestry Business Unit Officer | 58 | ||
| Eugenio Arteaga Infante | Chief Financial Officer | 41 | ||
| María Emilia Correa Pérez | Chief Sustainable Development Officer | 49 | ||
| Matías Mackenna García-Huidobro | Chief Business Development Officer | 33 | ||
| Patricio Reyes Urrutia | General Counsel and Secretary of the Board of Directors | 39 | ||
| Leo Schlesinger Grandi | Chief Human Capital Officer | 36 | ||
| Ignacio González Guzmán | Chief Communications and Brand Officer | 41 | ||
| Rosangela Mac Cord Faria | Chief Corporate Governance Officer | 49 | ||
| Luis Zúñiga Medina | Chief Auditing Officer | 44 |
Enrique Cibié B., 53 years old, joined Masisa in September 2005 and has served as Chief Executive Officer of Masisa since then. Prior to joining Masisa, he was Chief Executive Officer of Farmacias Ahumada S.A. from 2001 to 2005 leading its internationalization process within Latin America. He is currently Chairman of the Board of Boticas FASA and Terramater S.A. and is on the Board of Directors of Interamericana Compañía de Seguros de Vida S.A., Fundación Alter Ego, Empresas San Cristóbal and Colegio Mariano de Schoenstatt. Mr. Cibié holds an MBA from Stanford University and a Business degree from Catholic University of Chile.
Jaime Valenzuela F., 54 years old, joined Masisa in 1981 and currently serves as the Chief Wood Board Business Unit Officer. He has previously has served as General Manager for South America, General Manager of Masisa Argentina and Chief Financial Officer of Masisa S.A. Prior to joining Masisa, Mr. Valenzuela was Chief Financial Officer of Mapal S.A. He holds a Business, Accounting and Statistics degree from the Universidad de Chile and a Masters degree from the Advanced Management Program at the Wharton School of the University of Pennsylvania.
Alejandro Espinosa C., 51 years old, joined Masisa in January of 2006 as Chief Operating Officer for the Retail Division. Before joining Masisa, he spent 25 years with Royal Dutch Shell Group in the following areas: Global Retail Organization at Shell International; Portfolio Projects Manager at Shell Oil Products Latin America; Vice President of Retail, Vice President of Central America and General Manager of Guatemala with Shell Caribbean & Central America; and various jobs including Marketing & Sales Director with Shell Chile. Mr. Espinosa holds a degree in Electrical Engineering from the Universidad de Chile and a postgraduate degree in Business Administration from the Universidad Adolfo Ibáñez.
Tomas Morales J., 37 years old, has served as the Chief Solid Wood Business Unit Officer of Masisa since November 2005. Prior to his current position, he was the Corporate Development Officer of Masisa from 2003-2004. Prior to joining Masisa, Mr. Morales served as a Senior Consultant for Risk Capital Management, Inc., in New York from 2002 to 2003. He attended graduate school from 2000 to 2002. Mr. Morales holds a degree in Forestry Engineering from Universidad Austral de Chile and an MBA from Harvard Business School.
90
Jorge Correa D., 58 years old, joined Masisa in 1997 and has served as Chief Officer of our Forestry Business Unit since January 2005. Mr. Correa has also served as Chief Executive Officer of Forestal Tornagaleones and Forestal Argentina, forestry subsidiaries of Masisa, since joining the Company in 1997. He divides his time approximately equally among his responsibilities at Forestal Tornagaleones, Forrestal Argentina and as Chief Officer of our Forestry Division. Mr. Correa also works as a part-time Professor of Forestry Engineering at the University of Chile and at Mayor University. Mr. Correa holds degree in Forestry Engineering from the University of Chile.
Eugenio Arteaga Infante, 41 years old, joined Masisa in September 2006, and has served as Chief Financial Officer since then. Between 1998 and 2002, Mr. Arteaga held the position of Chief Financial Officer of Emel S.A., a subsidiary of Pennsylvania Power & Light (PPL) Corporation, and later became the Chief Financial Director (CFO) of PPL Global for Latin America, with responsibility for the areas of Accounting, Comptrolling, Taxes, Management Control and Finances for PPL’s assets in the region. In addition, Mr. Arteaga held the position of Treasurer of PPL Global in Latin America. Mr. Arteaga holds an accounting and business administration degree from the Catholic University of Chile. Additionally, he holds an MBA degree from the same university.
Maria Emilia Correa, 49 years old, joined Grupo Nueva in 2000, and has served as Vice-President, Social and Environmental Responsibility, since then. Additionally, Ms. Correa has served as Chief Social and Environmental Officer for Masisa since July 2004. Ms. Correa served as Executive Director of Colombian BCSD from 1995 to 2000. Ms. Correa holds a law degree from the Universidad de los Andes of Bogota in Colombia and a Masters degree in sociology from the New School for Social Research, New York, USA.
Matías Mackenna, G.H., 33 years old, joined Masisa in 2003 and has served as Corporate Development Officer since October 2004. Prior to his current position, he was Vice President of Planning and Management Control. Prior to joining Masisa, Mr. Mackenna served in different positions in the planning area of the Angelini Group. Mr. Mackenna holds a degree in Industrial Engineering from the Pontificia Universidad Católica de Chile and a Masters in Business Administration from Babson College.
Patricio Reyes U., 39 years old, joined Masisa in 1999, and has served as General Counsel since 2002. He also serves as a Director of IITSA, Oxinova S.A. and Forestal Tornagaleones S.A. Prior to joining Masisa, Mr. Reyes worked as associate attorney for Estudio Arturo Alessandri, a Chilean law firm. Mr. Reyes holds a law degree and a Masters degree in corporate law from the Catholic University of Chile. He is a practicing lawyer in Chile as designated by the Supreme Court of Chile and is a member of the Chilean College of Lawyers.
Leo Schlesinger, 36 years old, joined Masisa in January of 2005 and has served as Chief Human Resources Officer since then. Prior to joining Masisa, from 2001 to 2004, Mr. Schlesinger was Vice President of HHRR for Cigna in the United States and the United Kingdom. From 1999 to 2001 Mr. Schlesinger was Vice President of HHRR of Citibank’s UK Consumer Businesses and Europe International Personal Bank. He was also previously Assistant Vice President of HHRR Compensation and Benefits and International Management Associate with Citibank. Mr. Schlesinger has a degree in psychology from Universidad Gabriela Mistral and an MBA from the London Business School.
Ignacio González, 41 years old, joined Masisa in 1993 and currently serves as Chief Communications and Brand Officer. He previously served as the Marketing Manager in Argentina. Prior to joining Masisa, he worked for Banco de Chile. Mr. González holds a degree in Business Administration from the Universidad de Chile and a Masters in Marketing from Universidad de San Andrés in Buenos Aires.
Rosangela Mac Cord Faria, 49 years old, joined Masisa in December 2006 as Corporate Governance Manager. Prior to joining Masisa, from 2003 to 2006, Ms. Faria was Chief Risk Officer of GrupoNueva, and previously she spent 21 years with ExxonMobil Corporation in various areas in Latin America, such as LA Shared Services Center, LA Lubricants Business Control, Audit, Controller, Tax, Financial Reporting, Special Projects, in different business segments as Chemicals, Lubricants, Distribution, Aviation and Corporate Management, in positions as Director, Corporate Manager and Advisor. She holds a MBA from FGV-Fundação Getulio Vargas and an Accounting & Administration degree in Brazil.
Luis Zúñiga Medina, 44 years old, joined Masisa in October 2007 and currently serves as the Corporate Auditing Officer.He previously served as Corporate Internal Auditing Officer at Farmacias Ahumada S.A. (2003-2006) and as Corporate Internal Auditing Officer at Embotelladora Andina S.A. (1998-2003). Mr. Zúñiga holds a business administration, masters and MBA degrees from the University of Santiago, Chile.
91
Director and Executive Officer Compensation
For the period ended December 31, 2006, the aggregate amount of compensation we paid to our directors and executive officers was US$5.96 million. Members of our Board of Directors received per diem fees for attendance at meetings of the Directors' Committee meetings, as applicable. In 2006, we paid annual attendance fees of US$60,000 to our directors, US$120,000 to our Vice-President of the Board of Directors and US180,000 to our Chairman. At our recent ordinary shareholders meeting held on April 20, 2007, our shareholders agreed to establish the annual compensation for members of our Board of Directors for 2007. Under this recent compensation plan, we will pay annual attendance fees of US$60,000 to our directors, US$120,000 to our Vice-President of the Board of Directors and US180,000 to our Chairman. Additionally, our directors will be eligible to receive a variable compensation of 1.5% of our annual consolidated net income with the Chairman and Vice-President of the board receiving five times and two times, respectively, the amount received by the other directors. At an extraordinary shareholders' meeting held on June 6, 2005, we adopted a profit sharing plan for our directors that was in place for 2005 and 2006. Under this plan, our directors were eligible to receive 1.5% of our annual consolidated net income, with the Chairman and Vice-President of the board receiving five times and two times, respectively, the amount received by the other directors and with a maximum of US$40,000 for directors, US$80,000 for the Vice-President and US$200,000 for the Chairman. Neither we nor our subsidiaries maintain any pension or retirement programs for our or their directors or executive officers, respectively. Amounts under our profit sharing plan will only be paid after our audited consolidated and individual financial statements for the year ended December 31, 2007 have been sent to the Superintendency of Securities and Insurance.
The table below shows the compensation paid to directors in 2006 for attendance fees, and these are expressed in U.S. dollars for the year ended December 31, 2006:
(in US$) | Attendance Fee | Profit Sharing | Directors’ Committee Attendance Fee | Audit Committee Attendance Fee | Compensation Committee Attendance Fee | |||||||||||
Director | 2006 | 2006 | 2006 | 2006 | 2006* | |||||||||||
| Julio Moura | 180,000 | 143,642.95 | - | - | - | |||||||||||
| Ronald Jean Degen | 120,000 | 57,457.18 | - | 3,600 | 400 | |||||||||||
| Patrick Nielson | 60,000 | 28,728.59 | - | 3,600 | 400 | |||||||||||
| Juan Carlos Méndez | 60,000 | 28,728.59 | 4,800 | - | - | |||||||||||
| Jorge Carey Tagle | 60,000 | 28,728.59 | - | - | - | |||||||||||
| Enrique Seguel Morel | 60,000 | 28,728.59 | 8,400 | 3,600 | 400 | |||||||||||
| Antonio Tuset Jorratt | 60,000 | 28,728.59 | 4,800 | 7,200 | 400 | |||||||||||
| Michel Stuart-Smith | - | - | - | - | - | |||||||||||
| Ignacio García Reyes | - | - | - | - | - | |||||||||||
| René Reyes Schifferli | - | - | - | - | - | |||||||||||
| Carlos Marín Olalla | - | - | - | - | - | |||||||||||
Total | 600,000 | 344,743.08 | 18,000 | 18,000 | 1,600 | |||||||||||
* 2006 accrued annual payment payable in 2007
On July 3, 2006, we informed the Superintendency of Securities and Insurance of an adjustment to our audited financial statements for the year ended December 31, 2005, which lowered our accumulated income by US$1.9 million. As a result of this adjustment, the directors had to return US$29,000 in aggregate, of their profit sharing payment.
We paid our executive officers an aggregate amount of compensation of US$5.36 million and severance payments of US$0.24 million during the period ended December 31, 2006. Our directors and officers who worked as directors and managers of our affiliates no not receive any compensation for holding such office or offices.
92
We have a short-term incentive program (an annual bonus) for our executive officers and other employees selected by management. Our short-term incentive plan is structured to reward individual performance as well economic value added by employees over time. The main components of this program are our financial results and the achievement of objective and personal performance goals established and evaluated each year under our performance evaluation system. We do not have incentive programs like payment in shares or Company share purchase options.
Share Ownership
None of our officers or directors beneficially owned any of our shares as of June 15, 2007, except for Mr. Enrique Cibié Bluth (CEO), who owned 2,455,191 shares.
The Company has no stock option plan for its directors, executive officers or employees.
Employees
As of December 31, 2006, we had 5,239 employees, including employees of all our Chilean, Brazilian, Venezuelan, Argentinean, Mexican, U.S., Colombian, Peruvian and Ecuadorian subsidiaries. The following table sets forth the number of employees by main category of activity and geographic location as of the end of each year in the three-year period ended December 31, 2006:
EMPLOYEES BY JOB-CATEGORY(1) AND LOCATION
Executives | Professionals | Workers | Consolidated | ||||||||||||||||||||||||||||||||||||||||||||||
December 31, | 2003 | 2004 | 2005 | 2006 | 2003 | 2004 | 2005 | 2006 | 2003 | 2004 | 2005 | 2006 | 2003 | 2004 | 2005 | 2006 | |||||||||||||||||||||||||||||||||
Chile(2) | 82 | 51 | 65 | 76 | 403 | 396 | 446 | 493 | 1417 | 2,026 | 2,250 | 2,291 | 1,902 | 2,473 | 2,761 | 2,860 | |||||||||||||||||||||||||||||||||
| Brazil | 12 | 8 | 8 | 42 | 99 | 89 | 89 | 168 | 733 | 820 | 886 | 898 | 844 | 917 | 983 | 1,108 | |||||||||||||||||||||||||||||||||
| Venezuela | 16 | 15 | 14 | 21 | 171 | 114 | 114 | 128 | 191 | 234 | 255 | 285 | 378 | 363 | 383 | 434 | |||||||||||||||||||||||||||||||||
| United States | 7 | 2 | 3 | 3 | 14 | 23 | 53 | 22 | 50 | 62 | 35 | 39 | 71 | 87 | 91 | 64 | |||||||||||||||||||||||||||||||||
| Mexico | 11 | 9 | 8 | 4 | 53 | 73 | 76 | 84 | 125 | 112 | 111 | 127 | 189 | 194 | 195 | 215 | |||||||||||||||||||||||||||||||||
| Colombia | 5 | 1 | 2 | 3 | 6 | 7 | 8 | 3 | 6 | 1 | 1 | 4 | 17 | 9 | 11 | 10 | |||||||||||||||||||||||||||||||||
| Costa Rica | 1 | 0 | 0 | 0 | 3 | 0 | 0 | 0 | 1 | 0 | 0 | 0 | 5 | 0 | 0 | 0 | |||||||||||||||||||||||||||||||||
Argentina(3) | 9 | 11 | 12 | 14 | 45 | 46 | 47 | 74 | 142 | 290 | 289 | 448 | 196 | 347 | 348 | 536 | |||||||||||||||||||||||||||||||||
| Peru/Ecuador | 1 | 1 | 1 | 3 | 5 | 5 | 5 | 9 | 0 | 0 | 4 | 0 | 6 | 6 | 10 | 12 | |||||||||||||||||||||||||||||||||
Total | 144 | 98 | 113 | 166 | 799 | 753 | 838 | 981 | 2,665 | 3,545 | 3,831 | 4,092 | 3,608 | 4,396 | 4,782 | 5,239 | |||||||||||||||||||||||||||||||||
(1) Executives include the CEO, Chief Managers, Deputy Chief Managers and Plant Head Managers. Professionals include Middle Managers, Supervisors and professionals in positions without supervision. Workers include all employees other than executives and professionals.
(2) Includes Forestal Tornagaleones and Masisa Partes y Piezas.
(3) Includes Forestal Argentina.
Chile. As of December 31, 2006, we had 2,860 permanent employees in Chile. Approximately 67% of our Chilean employees are represented by ten labor unions.
Chilean law protects the rights of our workers, whether unionized or specially organized as a group (i.e., “Negotiating Group”), for the purpose of the collective bargaining process and to strike in the event that an agreement on labor contracts is not reached. Labor relations for unionized and non-unionized employees in each of our facilities are governed by one or more separate collective bargaining agreements between us and one or more of the unions or Negotiating Groups of which the employees at the facility are members.
During 2006, we negotiated collective bargaining agreements with one union and did not experience any work stoppages in Chile. The agreements are for 48-month terms and will expire during 2010. We believe we have good relationships with the labor unions. We have no reason to believe that future collective bargaining processes will not follow past practice and we do not anticipate any work stoppages at any of our facilities. Compensation for unionized personnel and employees is established in accordance with the relevant collective bargaining agreements. Pursuant to these agreements, employees receive a salary according to a scale that is based upon job function, performance and seniority. Unionized employees also receive certain benefits provided for by law and certain benefits that vary depending upon the terms of their collective bargaining agreement.
93
All employees who are dismissed for reasons other than misconduct are entitled by law to severance pay. Non-unionized permanent employees are entitled to a basic payment of one month’s salary (with a maximum of UF90, equivalent to US$3.088 as of December 31, 2006) for each year or fraction thereof worked, provided that the fraction is at least six months. This severance payment is limited to a total payment of no more than 11 months’ salary for employees hired after August 14, 1981. Severance payments to employees hired before August 14, 1981 are not subject to this limitation.
We do not maintain any pension or retirement programs for our employees in Chile. Workers in Chile are subject to a national pension law that establishes a system of independent pension plans which are administered by Administradoras de Fondos de Pensiones (Pension Fund Administrators). We have no liability for the performance of the pension plans or any pension payments to be made to our employees in Chile.
Brazil. As of December 31, 2006, we had 1,108 permanent employees in Brazil. Approximately 4.6% of our Brazilian employees are represented by labor unions.
In Brazil, collective bargaining agreements are negotiated on an industry-wide basis. Our Brazilian employees are members of one industry-wide union. Therefore, all of the collective bargaining agreements between us and the union are the result of industry-wide collective bargaining. The collective bargaining agreements are renewed on an annual basis. We believe our relationship with our employees is good.
We do not maintain any pension or retirement programs for our employees in Brazil. Based on total payroll, we make monthly contributions to severance indemnity plans, government pension and social security. These payments are expensed as incurred. We do not have any liability for the performance of the pension plans or any pension payments to be made to our employees in Brazil.
Venezuela. As of December 31, 2006, we had 434 permanent employees in Venezuela.
Approximately 50% of our Venezuelan employees are represented by labor unions.
Venezuelan law protects the rights of our workers, whether unionized or specially organized as a group, for the purpose of the collective bargaining process (“Negotiating Group”) to strike in the event that an agreement on labor contracts is not reached. Labor relations for unionized and non-unionized employees in each of our facilities are governed by one or more separate collective bargaining agreements between us and one or more of the unions or Negotiating Groups of which our Venezuelan employees are members.
We do not maintain any pension or retirement programs for our employees in Venezuela. Based on total payroll, we make monthly contributions to severance indemnity plans, government pension and social security, and such payments are expensed as incurred. We do not have any liability for the performance of the pension plans or any pension payments to be made to our employees in Venezuela.
Argentina. As of December 31, 2006, we had 536 permanent employees in Argentina.
In Argentina, collective bargaining agreements are negotiated on an industry-wide basis. Our employees are members of two industry-wide unions. Therefore, all the collective bargaining agreements between us and the unions are the result of industry-wide bargaining. The collective bargaining agreements are renewed on an annual basis. We believe our relationship with our employees is good.
All employees who are dismissed without cause are entitled by law to severance pay, which is based, among other things, on length of service. These severance payments are subject to a minimum of at least two months salary.
We do not maintain any pension or retirement programs for our employees in Argentina. As in Chile, pension plans in Argentina are administered by independent Administradoras de Fondos de Jubilaciones y Pensiones (Pension Fund Managers). We do not have liability for the performance of the pension plans or any pension payments to be made to our employees in Argentina.
94
Mexico. As of December 31, 2006, we had 215 permanent employees in Mexico. Approximately 35% of our Mexican employees are unionized and are all represented by one labor union.
In Mexico as in Brazil and Argentina, collective bargaining agreements are negotiated on an industry-wide basis. Our employees at Maderas y Sintéticos de México S.A. de C.V. and Maderas y Sintéticos Servicios S.A. de C.V. belong to one industry-wide union, and all of the collective bargaining agreements between those companies and the union are the result of industry-wide collective bargaining. The collective bargaining agreements are renewed each year. The current collective bargaining agreement was entered into in January 2005.
All employees who are dismissed for reasons other than misconduct are entitled by law to severance pay equal to three months salary plus twelve days salary for each year or fraction thereof that the employee has worked for the company.
We do not maintain any pension or retirement programs for our employees in Mexico. As in Brazil and Argentina, we make monthly contributions to severance indemnity plans, government pension and social security, and such payments are expensed as incurred. We have no liability for the performance of the pension plans or any pension payments to be made to the employees in Mexico.
Item 7. Major Shareholders and Related Party Transactions
Major Shareholders
Except as otherwise noted, the following table sets forth information concerning the beneficial ownership of our shares as of May 31, 2007, for the following each person or entity who is known by us to own beneficially more than 1% of our outstanding shares. None of our officers or directors beneficially owned any of our shares as of June 15, 2006, except for Mr. Enrique Cibié Bluth (CEO), who owned 2,455,191 shares.
We are required under Chilean regulations to disclose our twelve largest shareholders, and this information is also included in the following table. None of our major shareholders have different voting rights than any other shareholder of our company.
The number and percentage of shares beneficially owned by each shareholder is determined in accordance with Rule 13d-3 of the Exchange Act and the information provided below is not necessarily indicative of beneficial ownership for any other purpose. Under this rule, beneficial ownership includes any shares as to which the individual or entity has voting power and/or investment power and any shares that the individual has the right to beneficially acquire within sixty days of the date of this document through the exercise of any stock option or other right. Unless otherwise indicated in the footnotes or table, each person or entity has sole voting and investment power (or shares that power with his or her spouse) with respect to the shares shown as beneficially owned.
Our only outstanding voting securities are shares of our common stock without nominal (par) value. As of May 31, 2007, there were 5,667,750,881shares (excluding treasury shares), with no nominal (par) value, of Masisa issued and outstanding. Six record holders resident in the United States held 280,437,082 shares as of May 31, 2007.
95
Shares Owned | |||||||
Shareholder | Total Beneficial Ownership | Percentage of Outstanding Shares | |||||
| GRUPO NUEVA S.A. | 1,762,466,482 | 31.1 | % | ||||
| INVERSIONES FORESTALES LOS ANDES S.A. | 1,258,801,116 | 22.2 | % | ||||
| AFP PROVIDA S.A. | 409,688,896 | 7.2 | % | ||||
| AFP HABITAT S.A. | 381,889,607 | 6.7 | % | ||||
| THE BANK OF NEW YORK | 280,437,082 | 4.9 | % | ||||
| AFP CUPRUM S.A. | 272,429,841 | 4.8 | % | ||||
| CITIBANK CHILE CTA. DE TERCEROS CAP. XIV RES | 265,933,952 | 4.7 | % | ||||
| AFP SANTA MARIA S.A | 169,684,104 | 3.0 | % | ||||
| AFP BANSANDER S.A. | 138,446,354 | 2.4 | % | ||||
| ULTRA FONDO DE INVERSIÓN | 37,983,486 | 0.7 | % | ||||
| OTROS | 689,989,961 | 12.2 | % | ||||
* Grupo Nueva S.A. owns 99.9% of the outstanding share capital of Inversiones Forestales Los Andes S.A.
As of May 31, 2007, Grupo Nueva, Masisa's largest shareholder, directly and indirectly owns 53.3% of Masisa's common stock. Nueva Holding Inc. ("Nueva Holding"), a foreign corporation, owns 100% of Grupo Nueva's shares through a chain of successive companies. Nueva Holding is a wholly owned subsidiary of Inversiones VIVA Finance S.A., BVI ("VIVA Finance"). The final and irrevocable owner of 100% of Nueva Holding's shares, through ownership of 100% of the outstanding shares of VIVA Finance, is the Bamont Trust Company Limited ("Bamont"), which acts as trustee (the "Trustee") representing the interests of the VIVA Trust (the "VIVA Trust"), an irrevocable trust established for the benefit of certain charities and charitable purposes under the laws of the Commonwealth of The Bahamas. Bamont acquired all of the outstanding Nueva Holding stock as a result of an irrevocable donation by its former owner and Swiss entrepreneur Stephan Schmidheiny (the “Settlor”) on April 3, 2003.
The Trustee manages the VIVA Trust property as directed by the advisory committee (the “Advisory Committee”) of the VIVA Trust. The Advisory Committee is a committee established as part of the VIVA Trust which must consist of between two and seven members and may only act by majority vote. The Advisory Committee, through the Trustee, controls VIVA Finance. None of the members of the Advisory Committee currently have, nor may any of them have at any future time, an economic interest in the property held in trust by the VIVA Trust.
Pursuant to the terms of the VIVA Trust, the members of the Advisory Committee and the Trustee may be appointed and removed, subject to applicable law, by the Protector of the VIVA Trust (the "Protector"). The current protector of the VIVA Trust is Roberto Artavia Loria. In addition, the Protector casts the deciding vote on any matter voted on by the Advisory Committee in the event of an even cast of votes by its members. The Settlor had the power to appoint and remove the Protector, subject to applicable law, but on May 21, 2007 the Settlor transferred this power to his son, Alex Max Schmidheiny. Neither the Settlor nor Alex Max Schmidheiny currently has, and neither can have at any future time, an economic interest in the property held in trust by the VIVA Trust. Roberto Artavia, as Protector, and Alex Max Schmidheiny, as the person with the power to appoint and remove the Protector, may be considered directly, or indirectly, to have, or to share, the power to direct the voting or disposition of the Masisa shares held by Grupo Nueva and Inversiones Forestales Los Andes, S.A.
For information regarding limitations on certain share purchases see “Item 10. Additional Information—Memorandum and Articles of Association.”
Related Party Transactions
In the ordinary course of our business, we engage in a variety of transactions with certain affiliates and related parties. Financial information concerning these transactions is set forth in Note 6 to our audited consolidated financial statements located elsewhere in this annual report. Article 89 of the Chilean Corporations Law requires our transactions with related parties be on a market basis or on similar terms to those customarily prevailing in the market. Article 89 requires us to compare the terms of any such transaction to those prevailing in the market at the date the transaction is to be entered into. Directors of companies that violate Article 89 are liable for losses resulting from such violation. In addition, Article 44 of the Chilean Corporations Law provides that any transaction in which a director has a personal interest or is acting on behalf of a third party must be previously approved by the board of directors, which will do so only when it has been informed of such director’s interest and the terms of such transaction are similar to those prevailing in the market. If the proposed transaction involves amounts considered to be material, the board must, in order to approve the transaction, previously determine that such transaction is made on market terms. If it is not possible to reach such a judgment, the board may appoint two independent evaluators. The evaluators’ final conclusions must be made available to shareholders and directors for a period of 20 business days, during which shareholders representing 5% or more of the issued voting shares may request that the board call a shareholders meeting to resolve the matter, with the agreement of two-thirds of the issued voting shares. For purposes of this regulation, the law deems the amount of a proposed transaction to be material if
| · | it exceeds 1% of the company’s paid-in capital and reserves, provided that it also exceeds 2,000 UF or |
96
| · | it exceeds 20,000 UF. |
All resolutions approving such transactions must be reported to the Company’s shareholders at the next annual shareholders meeting. Violation of Article 44 may result in administrative or criminal sanctions and civil liability to shareholders or third parties who suffer losses as a result of such violation. We believe that we have complied with the requirements of Article 89 and Article 44 in all transactions with related parties and affirm that we will continue to comply with such requirements. See Note 6 to our audited consolidated financial statements located elsewhere in this annual report for a more detailed accounting of transactions with related parties.
In the ordinary course of operations, we enter into related party transactions concerning our normal business matters. These agreements address issues such as the purchase and supply of raw materials and finished wood products and inter-company account receivable or account payable transactions. In addition, we and our subsidiaries have entered into a number of administrative service agreements with certain of our affiliated entities.
Accounts receivable from related companies are commercial accounts and loans granted to subsidiaries to carry out their activities. These accounts receivable in some cases accrue interest at the 180-day London Interbank Offering Rate (“LIBOR”) plus a spread ranging from 1.7% to 2.2%. Maturities of these loans are subject to cash availability of our subsidiaries, while commercial accounts have normal collection terms. For more information regarding transactions between us and our related parties, see Note 6 to our audited consolidated financial statements located elsewhere in thus annual report.
In 1999, we entered into a long-term supply contract with Oxinova C.A., our affiliate in Venezuela, which requires us to purchase all of our resin from Oxinova C.A. Pursuant to the contract, we also have the obligation to purchase an annual minimum amount of resin from Oxinova C.A. Although the contract holds that we have to buy all of our resin from Oxinova C.A., the agreement also allows us to accept other competitive offers to purchase resin from other resin suppliers in the market, pursuant to certain conditions established in the agreement.
In June 2003, Forestal Terranova S.A. entered into an administrative services agreement with Masisa. Pursuant to this agreement, Masisa provided Forestal Terranova S.A. with administrative management services in corporate areas of its business, including human resources, information technology, and treasury. Under the same agreement, Forestal Terranova S.A. provided to Masisa legal services and administrative management services for corporate areas including supply chain management and social and environmental responsibility. The services provided to Forestal Terranova S.A. by Masisa and by Forestal Terranova S.A. to Masisa with respect to such areas of our operations included guidance regarding, among other things, the staffing and assigning of personnel to operations, the organization of sub-divisions of our main corporate areas, the pricing and contracting of external service contractors and suppliers, and the re-negotiation of existing contracts and business relationships. Upon completion of the merger by incorporation of Masisa into and with Terranova, this contract expired.
In addition, in 2003, Terranova S.A. entered into other service agreements with Masisa at the subsidiary level of several of Terranova S.A.’s respective businesses. In Brazil, Masisa Madeiras, which was formerly known as Terranova Brasil, entered into an administrative and forestry services agreement with Masisa do Brasil Limitada. Under this contract, as amended and restated on January 1, 2005, Masisa Brasil provides administrative management for both companies in Brazil. Masisa Madeiras pays Masisa Brasil a monthly fee of US$38,477.70 for these services. Likewise, Masisa’s Mexican subsidiary, Masisa Mexico, entered into a similar administrative management and financial services agreement with Masisa Servicios, another of Masisa’s Mexican subsidiaries. Pursuant to this agreement, Masisa Servicios manages administrative and financial corporate services for Masisa Mexico. Masisa Servicios charges Masisa Mexico the cost of the administrative services in addition to a five percent commission rate. Masisa Servicios charges Masisa Mexico a monthly fee of approximately US$297,000. In addition, Terranova Mexico leases a small amount of office space from Masisa Mexico in Mexico City, and, through 2004, Masisa Mexico leased from Terranova Mexico office space in Mexico City.
97
In 2004, Masisa USA, entered into an agreement with Masisa and Masisa Argentina under which Masisa USA sells and distributes MDF mouldings produced by Masisa and Masisa Argentina in the United States. The terms of the agreement provide that Masisa USA will purchase MDF mouldings from Masisa and Masisa Argentina according to specific orders Masisa USA receives from its customers. Masisa USA pays the purchase price that its clients pay for the MDF mouldings less a discount of three percent commission and logistical and other transport costs.
Item 8. Financial Information
Consolidated Financial Statements
See “Item 18. Financial Statements” and pages F-1 through F-66.
Export Sales
For a discussion of the Company’s export sales, see “Item 4. Information on the Company—Wood Product Sales” and “Item 5. Operating and Financial Review and Prospects—Results of Operations.”
Legal and Arbitration Proceedings
Chilean law protects the rights of indigenous people. Since 1992, disputes have arisen among Chile’s indigenous communities and the forestry industry. We are currently named in three land disputes with communities claiming rights to ancestral land or tenure rights based on titles granted by decree at the beginning of the 19th Century. These disputes could imply partial or total overlap with our legal titles to the land involved in such disputes. The total amount of land as to which our title is disputed is 1,706 hectares or 1.4% of our total land. During 2000, 2001 and 2002 we were in negotiations with several communities and their representatives in order to resolve and avoid possible conflicts. On November 9, 2001, Forestal Millalemu (a subsidiary of ours which was merged into us in 2003) signed an agreement with three indigenous communities in connection with disputes regarding our Santa Elisa and Porthue properties. With this agreement we resolved our conflicts with these three native communities and agreed to use labor from the indigenous communities in the next harvest season with respect to approximately 200 hectares of the disputed lands. After the initial harvest, we also granted the three indigenous communities the right to use 5,000 square meters of land in the Santa Elisa and Porthue properties for their own use for two years. These agreements allowed us to further solve our conflicts with certain indigenous communities and continue our cooperation with them in order to achieve resolution of our disputes. On April 24, 2005, we sold 363.3 hectares near Purén in Chile’s Region IX to Corporación Nacional de Desarrollo Indigena (National Corporation for indigenous Development) for a total purchase price of Ch$382,967,235. The sale of this property settled the claim to title over such land by the Mapuche community. For more information regarding our legal proceedings, see Note 21 to our audited consolidated financial statements included elsewhere in this document.
By way of Resolution No. 203, the Servicio de Impuestos Internos (the “Chilean Internal Revenue Service” or “SII”) notified us not to proceed for corporate income tax purposes with the recognition in Chile of the results of some of our foreign affiliates. According to the information available to us, Resolution No. 203 would affect US$30.4 million of deferred taxes, recoverable taxes and tax losses already recognized or utilized. We have disputed Resolution No. 203 in accordance with the reclamation procedure established in Articles 123 et seq. of the Tax Code. Based on the information available to us, the opinion of our legal advisors and the administrative jurisprudence of the SII in connection with Resolution No. 203, we have estimated as remote the probability that the final decision would be unfavorable to us and that it would have any effect on the US$39.2 million related to deferred taxes, recoverable taxes and tax losses already recognized or utilized.
98
In connection with the matters addressed by Resolution No. 203, during 2005 the SII sent to us a tax deficiency assessment (the “Liquidación No. 126”). According to the Liquidación No. 126, we should have not recognized the result of some of our foreign affiliates in the tax year 2002 and we should amend our loss carry-forward for the same tax year. The consequences for us of the Liquidación No. 126 are already considered in the effects of Resolution No. 203, because the deficiencies described in the Liquidación No. 126 were already part of Resolution No. 203. In addition, during September 2006, the IRS notified to us concerning Resolution No. 169 and tax deficiency assessments (the “Liquidaciones Nos. 225, 226 and 227”) regarding the same tax issues addressed by Resolution No. 203, but for the tax years 2003, 2004 and 2005. In addition, in the Liquidaciones Nos. 225, 226 and 227, the IRS challenged the deduction of certain tax charges taken by us. The consequences for us of the Resolution No. 169 and the Liquidaciones Nos. 225, 226 and 227 are, in part, considered in the effects of Resolution No. 203, because the deficiencies described in the Liquidación No. 126 were already part of Resolution No. 203. According to the information available to us, the Resolution No. 169 and the Liquidaciones No. 225, 226 and 227 would have an incremental effect, beyond the consequences of Resolution No. 203, of US$ 97.01 million. We have disputed the Liquidación No. 126, the Resolution No. 169 and the Liquidaciones Nos. 225, 226 and 227 in accordance with the procedure established in Articles 123 et. seq. of the Tax Code. Based on the information available to us, the opinion of our legal advisors and the administrative jurisprudence of the SII in connection with the Tax Assessment, we have estimated as remote the probability that the final decision would be unfavorable to us.
Brazil
In 1997, members of indigenous communities occupied forests owned by Hacienda Born Sucesso, one of our Brazilian subsidiaries in Brazil. The land and plantation occupied by the Duque de Caxias indigenous community has a book value of approximately US$531,000. This indigenous community occupying the land has cut an estimated 10% of the value of the affected plantations. Because Hacienda Born Sucesso is entitled to indemnification by the Brazilian government with respect to all such losses, no reserves have been set aside.
Dividend Policy
As required by the Chilean Corporations Law, unless otherwise approved by unanimous vote of holders of our Common Stock, we must distribute a cash dividend in an amount equal to at least 30% of the Company’s consolidated net income for each year (on a Chilean GAAP basis), unless and except to the extent we have a deficit in retained earnings for that year.
Dividends are paid to shareholders of record on the fifth Chilean business day preceding the date set for payment of the dividend. The holders of the ADRs on the applicable record dates for the ADSs are entitled to participate fully in all dividends declared after their acquisitions of the ADSs, subject to payment of the applicable taxes. For additional information, see “Item 10. Additional Information—Taxation”. Dividends are not price level adjusted between the end of the preceding year and the date of the declaration of the final dividend.
Finally, the Board of Directors must determine the Company’s dividend policy and announce it at the annual shareholders’ meeting. Shareholder approval of the dividend policy is not required. At Masisa’s Annual General Shareholders meeting for fiscal year 2006, the shareholders approved a dividend equal to approximately 47% of the Company’s 2005 net income, and at Masisa's Annual General Shareholders meeting for fiscal year 2005, the Company’s shareholders approved a dividend equal to approximately 38% of the Company’s 2004 net income.
Significant Changes
There have been no significant changes since the date of Masisa’s most recent financial statements.
99
Item 9. The Offer and Listing
Stock Price History
Our shares of common stock are traded in Chile on the Santiago Stock Exchange, the Chilean Electronic Stock Exchange, and the Valparaíso Stock Exchange (collectively referred to as the Chilean Stock Exchanges). Since August 5, 2005, our ADSs, each representing 50 shares of common stock, have been listed on the New York Stock Exchange (NYSE) under the symbol ‘‘MYS’’. The Bank of New York is the Depositary with respect to the ADSs.
The table below shows the high and low daily closing prices of our common shares in Chilean pesos on the Santiago Stock Exchange for the last five years. The table also shows the high and low daily closing prices of our ADSs on the New York Stock Exchange.
Share Prices on the Santiago Stock Exchange | ADS Prices on the NYSE(2) | ||||||||||||
Ch$ per Share(1) | US$ per ADS | ||||||||||||
High | Low | High | Low | ||||||||||
| 2002 | 79.20 | 50.99 | — | — | |||||||||
| 2003 | 78.11 | 62.92 | — | — | |||||||||
| 2004 | 156.00 | 64.01 | — | — | |||||||||
| 2005 | 155.20 | 93.00 | 13.35 | 9.12 | |||||||||
| 2006 | 113.50 | 79.50 | 10.88 | 7.20 | |||||||||
2005 | |||||||||||||
| 1st Quarter | 155.20 | 132.40 | — | — | |||||||||
| 2nd Quarter | 150.00 | 123.99 | — | — | |||||||||
| 3rd Quarter | 150.00 | 124.00 | 13.35 | 11.48 | |||||||||
| 4th Quarter | 138.00 | 93.00 | 13.19 | 9.12 | |||||||||
2006 | |||||||||||||
| 1st Quarter | 113.50 | 96.50 | 10.88 | 9.05 | |||||||||
| 2nd Quarter | 101.50 | 79.50 | 9.80 | 7.20 | |||||||||
| 3rd Quarter | 92.99 | 79.51 | 8.60 | 7.42 | |||||||||
| 4th Quarter | 110.50 | 89.10 | 10.60 | 8.30 | |||||||||
2007 | |||||||||||||
| 1st Quarter | 138.50 | 102.00 | 12.76 | 9.52 | |||||||||
2006 | |||||||||||||
| December | 110.50 | 103.00 | 10.60 | 9.70 | |||||||||
2007 | |||||||||||||
| January | 127.01 | 102.00 | 11.80 | 9.52 | |||||||||
| February | 138.50 | 120.25 | 12.76 | 11.05 | |||||||||
| March | 128.76 | 120.00 | 11.94 | 11.20 | |||||||||
| April | 137.13 | 122.00 | 12.91 | 11.33 | |||||||||
| May | 144.92 | 130.01 | 13.52 | 12.31 | |||||||||
| (1) | Chilean pesos per share reflect nominal price at trade date per share of Common Stock; the price has not been restated in constant Chilean pesos. |
| (2) | We listed our ADSs on the New York Stock Exchange on August 5, 2005. Before that date we did not have any ADSs issued and outstanding. |
Sources: Santiago Stock Exchange Official Quotations Bulletin; NYSE.
Markets
The Chilean securities markets are substantially smaller, less liquid and more volatile than major securities markets in the United States. The Santiago Stock Exchange, which is Chile’s principal exchange, had a market capitalization of approximately US$174.5 billion as of December 31, 2006 and an average monthly trading volume of approximately US$2.4 billion for 2006 The Santiago Stock Exchange was established in 1893 and is a private company whose equity consists of 48 shares held by 44 shareholders. As of December 31, 2006, 265 share series were listed on the Santiago Stock Exchange. The Santiago Stock Exchange accounts for approximately 85.95% of all amounts traded in Chile.
100
Equity, closed-end funds, fixed-income securities, short-term and money market securities, gold and U.S. dollars are traded on the Santiago Stock Exchange. In 1991, the Santiago Stock Exchange initiated a futures market with two instruments: U.S. dollars futures and Selective Share Price Index (“IPSA”) futures. In 1994, the Santiago Stock Exchange initiated an option market. Regarding securities, they are traded primarily through an electronic system of trade, called Telepregón, which operates from 9:30 a.m. to 4:30 p.m. The Electronic Stock Exchange of Chile operates continuously from 9:30 a.m. to 4:30 p.m. on each business day.
The three main share price indices for the Santiago Stock Exchange are the General Share Price Index (the “IGPA”), the IPSA and the Inter-10. The IGPA is calculated using the prices of 154 issues and is broken into five main sectors (although there are 15 sectors in total): banks and finance, farming and forest products, mining, industrials and miscellaneous. The IPSA is a major company index, currently including the Exchange’s 40 most active stocks. Shares included in the IPSA are weighted according to the value of shares traded and account for more than 80% of the entire market capitalization. The Inter-10 corresponds to the quarterly 10 most active Chilean ADRs. Masisa’s stock is included in both the IGPA and the IPSA. In addition, there are two main share price indices for the Electronic Stock Exchange, the Global Index and the ADRIAN. The Global Index is composed of the 42 shares most representative of the Chilean economy and is integrated by four industrial sectors: electricity, services, industry and natural resources. The ADRIAN incorporates all the Chilean ADRs.
In addition to the Santiago Stock Exchange, the Chilean securities market includes two additional exchanges: The Chilean Electronic Stock Exchange, an electronic trading market which was created by banks and non-member brokerage houses; and the Valparaíso Stock Exchange. As of December 31, 2006, approximately 13.40% of equity trading was conducted on the Chilean Electronic Stock Exchange, and the remaining 0.65% of equity was traded on the Valparaíso Stock Exchange.
Item 10. Additional Information
Memorandum and Articles of Association
Set forth below is material information concerning our share capital and a brief summary of the significant provisions of our estatutos and Chilean law. As explained above, our estatutos effectively serve the purpose of both the articles or certificate of incorporation and the bylaws of a company incorporated in the United States. For convenience, in this document we refer to our estatutos as our “Bylaws”. This description contains all material information concerning the shares. You are encouraged to review our estatutos (a copy of which has been filed as an exhibit to this annual report), the Chilean Corporations Law and the Ley de Mercado de Valores No. 18,045, or the Securities Market Law, each referred to below.
For more information regarding our share capitalization, the history of our share capital for the last three years and our markets, see “Item 7. Major Shareholders and Related Party Transactions—Major Shareholders” and “Item 9. The Offer and Listing.”
Memorandum and articles of association
Set forth below is certain information concerning Masisa S.A.’s capital stock and a brief summary of certain significant provisions of its estatutos (the “Bylaws”) and Chilean law. You are encouraged to review our Bylaws, which are filed as Exhibit 3.1 of this annual report.
Organization and register
We are a publicly-held stock corporation (sociedad anónima abierta) organized under the laws of Chile and have an indefinite corporate duration. We were incorporated by a public deed dated July 17, 1996, an abstract of which was published in the Diario Oficial de la República de Chile No. 15,109 (Official Gazette of Chile No. 15.109) on August 10, 1996. This publication is recorded on page 19,525 No. 15,190 of the Registro de Comercio de Santiago (Commercial Registry of Santiago) for the year 1996. Our corporate purpose, as stated in our Bylaws, is broadly defined to include the production and sale of wood products, as more fully set forth in the Third Article of our Bylaws.
101
Shareholder rights
Shareholder rights in Chilean companies are governed generally by a company’s bylaws (which effectively serve the purpose of both the articles, or certificate, of incorporation, and the bylaws of a United States company). Additionally, the Chilean Corporations Law governs the operation of Chilean stock corporations and provides for certain shareholder rights.
Shareholder rights can be amended through an agreement adopted in an Extraordinary Shareholders Meeting, which shall subsequently agree upon the corresponding amendment to the bylaws. However, there are certain provisions of Chilean law that cannot be waived by the shareholders, such as the legal formalities prescribed by the Chilean Corporations Law for the organization and validity of a corporation or for the amendment of its by-laws; provisions dealing with the protection of minority shareholders, including the minimum number of board members, the existence of a committee of directors, the list of matters that shareholders may decide upon in an ordinary and/or extraordinary shareholders meeting of the company, the quorum required for the approval of certain supermajority matters; and other public policy provisions, such as the rules for the liquidation of a company, tender offer rules and, generally, all securities market regulation.
The Chilean securities markets are principally regulated by the Superintendencia de Valores y Seguros (the Chilean Securities and Insurance Commission) (“SVS”) under the Securities Market Law and the Chilean Corporations Law. These two laws provide for disclosure requirements, restrictions on insider trading and price manipulation, and protection of minority investors. The Chilean Corporations Law clarifies rules and requirements for establishing publicly-held stock corporations while eliminating government supervision of privately-held companies. The Securities Market Law establishes requirements for public offerings, stock exchanges and brokers, and outlines disclosure requirements for companies that issue publicly offered securities.
Under Articles 12 and 54 and Title XV of the Securities Market Law, certain information regarding transactions in shares of publicly-held corporations must be reported to the SVS and the Chilean exchanges on which such shares are listed. Holders of shares of publicly-held corporations are required to report to the SVS and the Chilean exchanges:
| · | any acquisition or sale of shares that results in the holder’s acquiring or disposing of 10% or more of the corporation’s capital; and |
| · | any acquisition or sale of shares or options to buy or sell shares, in any amount, if made by a holder of 10% or more of the corporation’s capital or if made by a director, liquidator, main officer, general manager or manager of such corporation. |
Persons or entities intending to acquire control of a publicly-held corporation are also required to inform the public in advance through a notice published in a Chilean newspaper, which must disclose the price and conditions of any negotiations. Prior to such publication, a written communication to such effect must be sent to the SVS and the Chilean exchanges.
Chilean law does not contain any provision that discriminates against shareholders or prospective shareholders who own a substantial number of shares. However, a special public offering procedure applies should the controlling shareholder of a company decide to increase its stock in the company, according to which the offer must be made to all shareholders on a pro rata basis in proportion to their respective stock.
102
Capitalization
Under Chilean law, a corporation increases its capital as soon as the shareholders authorize both the capital increase and the issuance of new stock, provided that the minutes of the corresponding shareholders meeting are put into a public deed, and an abstract of said deed is published in the Official Gazette and registered in the Commercial Registry corresponding to the company’s domicile. In addition, in the case of publicly-held stock corporations, the new shares must be registered in the Securities Registry of the SVS before they may be offered to the public. When a shareholder subscribes for shares, the shares are transferred to such shareholder’s name, and the shareholder is treated as a shareholder for all purposes, except receipt of dividends in the proportion corresponding to the unpaid price of such shares, unless otherwise stipulated in the bylaws of the corporation. The shareholder becomes eligible to receive dividends once such shareholder has paid for the shares. If a shareholder does not pay for shares for which such shareholder has subscribed on or prior to the date agreed upon for payment, the corporation is entitled to auction the shares on the stock exchange, and has a cause of action against the shareholder for the difference between the subscription price and the price received at auction. However, until such shares are sold at auction, the shareholder continues to exercise all the rights of a shareholder (except the right to receive dividends). Authorized shares which have not been paid for within the period ending three years from the date when the capital increase agreement was made at the shareholders’ meeting, are deemed cancelled under Chilean law and are no longer available for sale by the Chilean corporation. At that time, the capital of the corporation is automatically reduced to the amount effectively paid within such period.
The Bylaws authorize a single series of common stock, without par value.
Director requirements
Our Bylaws require the board to consist of seven directors. The entire board is elected every three years. There is no requirement that a director be a stockholder of Masisa.
Our Bylaws do not contain any provision regarding a mandatory retirement age for directors, nor does Chilean law contain any provision in this respect.
According to Chilean Corporations Law, a company can only execute transactions wherein one or more directors have a personal interest or is acting on behalf of a third party if the transaction is previously known to and approved by the Board, which will do so only when the terms of such transaction are similar to those prevailing in the market. Board agreements thereto must be informed in the next shareholders meeting. For this purpose, the law assumes that a director has an interest in any transaction in which:
| · | he or she intervenes personally or through his or her spouse or relatives up to second degree (brothers or sisters, parents, grandparents, sons or daughters and grandsons or granddaughters); |
| · | through the companies or partnerships in which the director owns more than 10% of their capital; |
| · | through the companies or partnerships wherein any of the aforementioned persons is a director, or directly or indirectly own more than 10% of its capital; |
| · | if the director acts as attorney-in-fact of the company’s counterpart; or |
| · | if the director or his or her related parties act as counsel in connection with the transaction. |
If the transaction wherein the director has an interest involves a relevant amount (more than 1% of the company’s equity, provided such transaction exceeds the equivalent of 2,000 UF, or in any case if it exceeds the equivalent to 20,000 UF) and the Board considers that it is not possible to determine if it is an arm’s-length transaction, the Board may approve or reject the execution of the transaction, with the abstention of the interested director, or appoint two independent evaluators. The evaluators’ report shall be made available to the shareholders. If shareholders representing at least 5% of the company’s voting stock consider that the transaction is not in the company’s best interest, or if the evaluators’ report differ considerably, they may request that the Board call for an Extraordinary Shareholders Meeting in order to approve or reject the execution of such transaction, in the former case by at least two-thirds of the company’s voting stock. The related party that intends to carry out the operation with the company must provide to the Board all relevant information pertaining to such operation.
103
Any of our borrowings by a director is treated under Chilean law as a related party transaction and is subject to the rules set forth above.
Pursuant to the Chilean Corporations Law, if the bylaws of a company establish compensation for directors, such compensation must be agreed to in a Shareholders Meeting. Our Bylaws establish that the directors will be compensated in an amount determined by the Annual Shareholders Meeting, notwithstanding the right of the Board to agree to compensate a director for the performance of any other duty different from his or her duty as a director.
Preemptive rights and increases of share capital
The Chilean Corporations Law grants certain preemptive rights to shareholders of all Chilean companies. The Chilean Corporations Law generally requires Chilean companies to offer to shareholders the right to purchase a sufficient number of shares or convertible securities to maintain their existing ownership percentage in the company whenever it issues new shares or convertible securities and prior to any sale in the market of its treasury shares of common stock.
Dividend and liquidation rights
In accordance with Chilean law, Masisa must distribute mandatory cash dividends of 30% of its consolidated net income calculated in accordance with Chilean GAAP unless otherwise decided by a unanimous vote of the holders of the Shares. See “Item 8. Financial Information—Dividend Policy.”
At our option, the portion of any dividend which exceeds the mandatory limits established pursuant to Chilean law may be paid in cash, in our shares or in shares of corporations owned by us. Shareholders who do not expressly elect to receive a dividend other than in cash are legally presumed to have decided to receive the dividend in cash.
Those dividends not collected by the shareholders entitled thereto within five years as of payment date, must be donated by us to the Chilean Firemen Corps.
In the event of a liquidation of our company, the holders of fully paid shares of common stock would participate in the assets available after payment of all creditors in proportion to the number of shares held by them.
Shareholders’ meetings and voting rights
We hold our annual meeting of the shareholders (an “Annual Shareholders’ Meeting”) during the first fourth months of each year. Extraordinary meetings (an “Extraordinary Shareholders Meeting”) may be called by the board of directors when deemed appropriate or when requested by shareholders representing at least 10% of the issued voting shares or by the SVS. Notice to convene the Annual Shareholders’ Meeting or an Extraordinary Meeting is given by means of a notice in a newspaper published in Masisa’s corporate domicile (currently Santiago) or in the Official Gazette in a prescribed manner. Notice must also be mailed to each shareholder and given to the SVS 15 days in advance of the meeting.
The quorum for a shareholders’ meeting is established by the presence, in person or by power of attorney, of shareholders representing at least the absolute majority of our issued voting shares. If a quorum is not present at the first meeting, the meeting can be reconvened and upon the meeting being reconvened, shareholders present at the reconvened meeting are deemed to constitute a quorum regardless of the percentage of the shares represented. However, if a shareholders’ meeting is called for the purpose of:
| · | considering a change of our organization, merger or division, |
| · | an amendment to the term of duration or early dissolution, |
| · | a change in our corporate domicile, |
104
| · | a decrease of our corporate capital, |
| · | approval of capital contributions in assets other than cash and their assessments, |
| · | modification of the authority reserved to shareholders meetings or limitations on the Board of Directors, |
| · | reduction in the number of members of our Board of Directors, |
| · | the disposition of 50% or more of our assets, whether or not that sale includes our liabilities or the proposal or amendment of any business plan involving the transfer of more than 50% of our assets, |
| · | the form of distributing corporate benefits, |
| · | the granting of security interests or personal guarantees to secure or guarantee third parties’ obligations exceeding 50% of our assets, except with regard to our subsidiaries, |
| · | our purchase of our issued stock in accordance with articles 27A and 27B of Law No. 18,046, |
| · | the amendment of any formal defect in our incorporation, or any amendment of our bylaws that contains one or more of the above mentioned issues, |
| · | approving or rejecting a transaction involving a director of the Company who has a material interest in the transaction, where shareholders representing at least 5% of the Company’s voting stock have determined that such transaction is not in the best interest of the Company or where an independent evaluator’s report on the transaction differs materially from the terms of the transaction, |
| · | the approval of our ceasing to be subject to the regulations applicable to publicly held corporations in the event we no longer meet the requirements under Chilean law to qualify as such a corporation, or |
| · | other matters as may be set forth in our bylaws, |
then the vote required at such meeting is a two-thirds majority of the issued common stock.
Chilean law does not require a publicly-held Chilean company to provide the level and type of information that United States securities laws require a reporting company to provide to its shareholders in connection with a solicitation of proxies. Under Chilean law, a notice of a shareholders’ meeting listing the matters to be addressed must be mailed to shareholders and the SVS not fewer than 15 days prior to the date of a meeting. In cases of an Annual Shareholders’ Meeting, an annual report of our activities, which includes our audited financial statements, must also be mailed to shareholders.
The Chilean Corporations Law provides that whenever shareholders representing 10% or more of the issued voting shares so request, a Chilean company’s annual report must include within the materials dispatched by the board of directors to shareholders, the comments and proposals of such shareholders in relation to the company’s affairs. Similarly, the Chilean Corporations Law provides that whenever the board of directors of a publicly-held company convenes a meeting of shareholders and solicits proxies for the meeting, information supporting its decisions or other similar materials, it is obligated to include the pertinent comments and proposals that may have been made by shareholders owning 10% or more of the company’s voting shares who request that such comments and proposals be so included.
Only shareholders registered as such with Masisa at least five Chilean business days prior to the date of a shareholders meeting are entitled to attend and vote their shares. A shareholder may appoint by power of attorney another individual (who need not be a shareholder) as his attorney-in-fact to attend and vote on his behalf. Every shareholder entitled to attend and vote at a shareholders meeting shall have one vote for every share subscribed.
105
Right of dissenting shareholders to tender their shares
The Chilean Corporations Law provides that upon the adoption at an Extraordinary Shareholders Meeting of any of the resolutions enumerated below, dissenting shareholders acquire the right to withdraw from a Chilean company and to compel that company to repurchase their shares, subject to the fulfillment of certain terms and conditions.
“Dissenting” shareholders are defined as those which vote against a resolution which results in the withdrawal right, or if absent at such a meeting, those who state in writing to the company their opposition to the respective resolution. Dissenting shareholders must perfect their withdrawal rights by tendering their stock to the company within 30 days of the resolution (except in the case of pension fund shareholders as discussed below).
The price paid to a dissenting shareholder of a publicly-held company for such shares is the weighted average of the closing sales prices for the shares as reported on the stock exchanges for the two-month period preceding the event giving rise to the withdrawal right.
The resolutions that result in a shareholder’s right to withdraw are the following:
| · | the transformation of Masisa into a different type of legal entity; |
| · | the merger of Masisa with or into another company; |
| · | the disposition of 50% or more of our assets, whether or not that sale includes our liabilities or the proposal or amendment of any business plan involving the transfer of more than 50% of our assets; |
| · | the granting of security interests or personal guarantees to secure or guarantee third parties’ obligations exceeding 50% of our assets, except with regard to our subsidiaries; |
| · | the creation of preferential rights for a class of shares or an amendment to those already existing, in which case the right to withdraw only accrues to the dissenting shareholder of the class or classes of shares adversely affected; |
| · | the amendment of our bylaws to correct any formal defect in our incorporation, or any amendment of our bylaws that grants a shareholder a right to withdraw; |
| · | the approval by our shareholders of our ceasing to be subject to the regulations applicable to publicly held corporations in the event we no longer meet the requirements under Chilean law to qualify as such a corporation; and |
| · | any other causes as may be established by Chilean law and our bylaws (our bylaws currently do not establish any instances). |
In addition, shareholders of a publicly held corporation, such as Masisa, have the right to withdraw if a person acquires two-thirds or more of the outstanding voting stock of the company (except in the event the company reduces its capital as a result of not having fully subscribed and paid an increase of capital within the statutory term) and does not make a tender offer for the remaining shares within 30 days of that acquisition at a price not lower than the price that would be paid shareholders exercising their rights to withdraw.
Material Contracts
One of Masisa’s most important contracts is between Fibranova C.A. and Oxinova C.A. to supply the Fibranova plant in Venezuela with resin over a period of 15 years. The companies also have three other contracts in which Fibranova C.A. provides administration and financial services, human resources, and legal advice to Oxinova C.A.
106
The group in Venezuela has other important contracts with CVG y CVG Proforca. The most important one is the wood sale contract, which by means of the right to use forestry resources provides raw materials to the Venezuelan companies, thus allowing the normal development of industrial operations. Specifically, on January 12, 1989, our subsidiary in Venezuela, Corporación Forestal Imataca, C.A., entered into a lease agreement with the Republic of Venezuela (the “Venezuela Lease”), for the lease of a lot of 42,632.90 hectares in the Maturín District of Monagas State, Venezuela. The Venezuela Lease has a term of 50 years and may be extended for an additional 50 years. Under
Another Masisa’s relevant contract is that signed with Georgia Pacific Corp. in 1998 to supply the productive plants with chemical resins over a 20-year period. The contract lays down the quality standards and costs.
Masonite international Corporation (“Masonite”) distributes most of our solid wood doors in the United States. Masonite entered into an agreement with our predecessor, Forestal Terranova and Premdor Inc. (“Premdor”), dated December 1, 2000 (the “Masonite Agreement”). The Masonite Agreement had an initial term of five years. Under the Masonite Agreement, we and Premdor agreed to work together to develop new markets, new products, share technologies and eliminate redundant costs in connection with the distribution of the products covered by the agreement. These products included forest products we manufacture, which can be used by Premdor in its door and entry system business and may also include other millwork products purchased by Premdor’s customer base, such as mouldings. The prices of the products covered by the Masonite Agreement were subject to agreements between us and Premdor and are reviewed from time to time. This contract expired on December 1, 2005. We continue to conduct business with Masonite in the ordinary course of business.
Exchange Controls
The Central Bank of Chile, among other duties, is responsible for monetary policies and for exchange controls in Chile. On April 19, 2001 and on January 23, 2002, the Central Bank of Chile substantially liberalized Chilean exchange controls by issuing new rules that virtually eliminated the restrictions and limitations that had been previously in force. As a result of these changes, Chapter XXVl of the Compendio de Normas de Cambios Internacionales of the Central Bank of Chile, which addressed the issuance of ADSs by Chilean corporations, was eliminated. According to the new regulations, investments made by non-residents of Chile in shares underlying ADSs issued by Chilean corporations are now governed by Chapter XlV of the Compendio de Normas de Cambios Internacionales of the Central Bank of Chile (“Chapter XIV”), which provides that such investments must be carried out through Chile’s Mercado Cambiario Formal or the Formal Exchange Market and reported to the Central Bank of Chile. The Formal Exchange Market includes all commercial banks and certain exchange houses and stock broker-dealers authorized by the Central Bank of Chile pursuant to Chapter III of the Compendio de Normas de Cambios Internacionales.
Since the completion of our merger with our former subsidiary Masisa in May 2005 and the share exchange in connection with the merger that occurred on August 4, 2005, all holders of our ADSs representing shares of our common stock have been governed by Chapter XIV.
Pursuant to Chapter XIV, foreign currency payments or remittances to parties abroad (outside of Chile) or made with funds held abroad, that correspond to capital, interest, inflation adjustments, profits and other benefits in connection with our ADSs must be carried out through the Formal Exchange Market and reported to the Central Bank of Chile.
Taxation
Material United States federal income tax consequences
The following discussion is a description of the United States tax consequences to a U.S. Holder (as defined below) of the acquisition, ownership and disposition of Masisa shares or ADSs. This discussion:
| · | does not purport to be a complete analysis of all the potential tax consequences that may be important to a holder of shares of Masisa common stock or ADSs, which we refer to as a “Holder” (as defined below) based on the Holder’s particular tax situation; |
107
| · | is based on the current provisions of the United States Internal Revenue Code of 1986, as amended, which we refer to as the “Internal Revenue Code,” the existing applicable United States federal income tax regulations promulgated or proposed under the Internal Revenue Code, which we refer to as the “Treasury Regulations,” judicial authority and current administrative rulings and practice, all of which are subject to change, possibly with retroactive effect; |
| · | is applicable only to Holders who hold the Masisa common stock or ADSs as capital assets for U.S. federal income tax purposes; |
| · | does not describe all aspects of United States federal income taxation that may be relevant to Holders in light of their particular circumstances or to Holders subject to special rules, such as: |
| · | banks, thrifts, regulated investment companies and other financial institutions; |
| · | insurance companies; |
| · | tax-exempt entities; |
| · | pension funds; |
| · | brokers, dealers and certain traders in securities or foreign currency and traders that elect to mark-to-market their securities; |
| · | persons holding the shares or ADSs as part of a position in a constructive sale transaction, a risk reduction transaction, hedging transaction, “straddle” or other integrated transaction for U.S. federal income tax purposes; |
| · | individuals subject to special rules as a result of the termination of their U.S. citizenship or residency; |
| · | Holders subject to the alternative minimum tax; |
| · | corporations that accumulate earnings in order to avoid U.S. federal income tax; |
| · | U.S. Holders that have a functional currency that is not the U.S. dollar; and |
| · | partnerships and other pass-through entities for U.S. federal income tax purposes that hold the shares or ADSs and investors holding interests in such partnerships or pass-through entities; |
| · | does not discuss any possible applicability of any United States state or local, non-U.S. taxes or any other United States federal tax other than the income tax, including but not limited to, the United States federal gift tax and estate tax; and |
| · | does not discuss any reporting requirements of or other consequences under the Treasury Regulations relating to certain tax shelter transactions. |
We have not sought and will not seek any rulings from the Internal Revenue Service with respect to any matter discussed herein. No assurance can be given that the Internal Revenue Service would not assert, or that a court would not sustain a position contrary to any of the tax characterizations and tax consequences set forth below.
Holders are urged to consult with their own tax advisors concerning the U.S. federal, state and local and non-U.S. income and other tax consequences of the acquisition, ownership and disposition of Masisa shares or ADSs.
108
As used herein, the term “U.S. Holder” means a Holder that, for U.S. federal income tax purposes, is:
| · | a citizen or individual resident of the United States; |
| · | a corporation, or other entity taxable as a corporation for U.S. federal income tax purposes, created or organized in or under the laws of the United States, any state thereof or the District of Columbia; |
| · | an estate, the income of which is subject to U.S. federal income taxation regardless of its source; or |
| · | a trust if a court within the United States is able to exercise primary supervision over the trust’s administration, and one or more “United States persons,” as defined in section 7701(a)(30) of the Internal Revenue Code, have the authority to control all of the substantial decisions of that trust. |
Notwithstanding the preceding sentence, certain electing trusts in existence on August 20, 1996 that were treated as United States persons prior to such date may also be treated as U.S. Holders.
If a partnership, including any entity or arrangement treated as a partnership for U.S. federal income tax purposes, is a Holder of Masisa common stock or ADSs, then the tax treatment of a partner in such partnership generally will depend upon the status of the partner and the activities of the partnership. Such partners and partnerships should consult their own tax advisors regarding an investment in Masisa common stock or ADSs.
Holders are urged to consult their own tax advisors with respect to the application of the U.S. income tax laws to their particular situations, as well as any tax consequences arising under the laws pertaining to any other U.S. tax, the laws of any state, local or non-U.S. taxing jurisdiction and any applicable treaty.
U.S. Tax Consequences of Ownership of Masisa Shares or ADSs by U.S. Holders
In general, for United States federal income tax purposes, a U.S. Holder of ADSs will be treated as the beneficial owner of the shares of Masisa common stock represented by the ADSs. Accordingly, deposits and withdrawals of shares of Masisa common stock in exchange for ADSs will not result in the realization of gain or loss for United States federal income tax purposes.
The U.S. Treasury Department has expressed concern that depositaries for American Depositary Receipts, or other intermediaries between the holders of shares of an issuer and the issuer, may be taking actions that are inconsistent with the claiming of U.S. foreign tax credits by U.S. holders of such receipts or shares. Such actions would also be inconsistent with the claiming of the reduced rate of tax, described below, applicable to dividends received by certain non-corporate holders. Accordingly, the analysis regarding the availability of a U.S. foreign tax credit for Chilean taxes and sourcing rules described below could be affected by future actions that may be taken by the depositaries or other intermediaries or the U.S. Treasury Department.
Taxation of Distributions. The gross amount of cash distributions or property distributions (other than certain distributions, if any, of Masisa shares or ADSs distributed pro rata to all of Masisa’s shareholders, including Holders of ADSs) with respect to Masisa shares or ADSs, to the extent paid out of current or accumulated earnings and profits of Masisa (as determined under U.S. federal income tax principles), including the net amount of the Chilean withholding tax withheld on the distribution (after taking into account the credit for Chilean corporate income tax (the “First Category Tax”)), will be included as a dividend in the gross income of a U.S. Holder of Masisa shares or ADSs as ordinary income when the dividends are received by the depositary or the Holder, as the case may be. To the extent, if any, that the amount of any distribution by Masisa exceeds its current or accumulated earnings and profits as determined under U.S. federal income tax principles, such distribution will be treated first as a tax-free return of the U.S. Holder’s adjusted tax basis in its shares or ADSs and, thereafter, as capital gain. Since Masisa does not maintain calculations of its earnings and profits for U.S. federal income tax purposes, it is expected that a U.S. Holder generally will be required to treat distributions as taxable dividends.
Eligible dividends received by a non-corporate U.S. Holder in tax years beginning on or before December 31, 2010 in respect of shares of Masisa common stock or ADSs will generally be taxed at a special reduced rate, provided that certain requirements are met, including a requirement that the U.S. Holder hold the shares or ADSs, as applicable, for more than 60 days during the 121-day period beginning 60 days before the ex-dividend date. Such distributions will not be eligible for the dividends received deduction generally allowed to corporations under the Internal Revenue Code.
109
Dividends paid in Chilean pesos will be included in the income of a U.S. Holder in a U.S. dollar amount, regardless of whether the payment is in fact converted into U.S. dollars, calculated by reference to the exchange rate in effect on the day they are received, in the case of ADSs, by the depositary or, in the case of shares of Masisa common stock, the Holder, as the case may be. A U.S. Holder may recognize foreign currency gain or loss, which would be treated as ordinary gain or loss, if the dividend is not converted into U.S. dollars on the date of receipt. U.S. Holders are urged to consult their own tax advisors regarding the treatment of foreign currency gain or loss, if any, on any Chilean pesos received that are converted into U.S. dollars on a date subsequent to receipt. The amount of any distribution of property other than cash will be the fair market value of such property on the date of distribution.
The Chilean withholding tax (after taking into account the credit for the First Category Tax) will be treated as a foreign income tax that a U.S. Holder may elect to deduct in computing its income tax or, subject to certain complex limitations and conditions generally applicable to foreign tax credits under the Internal Revenue Code and to the discussion above regarding concerns expressed by the U.S. Treasury, to credit against its U.S. federal income tax liability. Dividends generally will constitute foreign source “passive income” or “general category income,” which may be relevant for purposes of determining a U.S. Holder’s foreign tax credit limitation. U.S. Holders are urged to consult their own advisors concerning the availability of, and limitations on, any such foreign tax credits in light of their particular circumstances.
Tax Treatment of Capital Gains or Losses. Upon the sale, exchange or other disposition of Masisa shares or ADSs, a U.S. Holder will recognize gain or loss for U.S. federal income tax purposes in an amount equal to the difference between the U.S. dollar value of the amount of cash or the fair market value of property received for the shares or ADSs at the time of disposition (including any Chilean taxes withheld) and such U.S. Holder’s adjusted tax basis (determined in U.S. dollars) in such shares or ADSs. Any such gains or losses generally will be capital gains or losses and will be long-term capital gains or losses if the U.S. Holder has held the shares or ADSs as capital assets for more than one year at the time of disposition. Long-term capital gains recognized by an individual U.S. Holder generally will be subject to a reduced rate of tax. The deductibility of capital losses is subject to limitations.
Chilean income taxes imposed on a sale or other disposition of Masisa shares or ADSs, net of any refund available to the U.S. Holder, generally will be treated as foreign income taxes eligible for credit against a U.S. Holder’s U.S. federal income tax liability. Gain realized by a U.S. Holder on a sale or other disposition of Masisa shares or ADSs generally will be treated as U.S. source income. Because a U.S. Holder generally may not use a foreign tax credit to reduce its U.S. federal income tax liability in respect of its U.S. source income, in the case of a disposition of shares (which, unlike a disposition of ADSs, would be taxable in Chile), such U.S. Holder generally will not be able to utilize foreign tax credits in respect of Chilean tax imposed on such a disposition unless such Holder has other income from foreign sources, in the appropriate category, for purposes of the foreign tax credit limitation rules. U.S. Holders are urged to consult their tax advisors regarding the application of the foreign tax credit limitation rules to their investment in and disposition of Masisa shares.
Passive Foreign Investment Company. The Company believes that it should not be considered a passive foreign investment company, or “PFIC,” for United States federal income tax purposes for 2007, and does not expect to be considered a PFIC in the foreseeable future. However, because PFIC status depends upon an annual determination of the composition of a company’s income and assets, including its proportionate share of the assets and income of corporations in which it owns a 25% or greater equity interest, there can be no assurance that Masisa would not be considered a PFIC for any taxable year. If the Company were treated as a PFIC for any taxable year during which a U.S. Holder held an ADS or share of Masisa common stock, then certain adverse consequences would apply to the U.S. Holder, including the imposition of higher amounts of tax than would otherwise apply and additional tax form filing requirements. U.S. Holders are urged to consult their own tax advisors regarding the U.S. federal tax consequences if the Company were considered a PFIC.
U.S. Backup Withholding Tax and Information Reporting Requirements
U.S. backup withholding tax and information reporting requirements generally apply to certain payments made within the United States to certain non-corporate U.S. Holders of stock or ADSs. Information reporting generally will apply to payments of dividends on, and to proceeds from the sale or other disposition of, shares of common stock or ADSs made within the United States to a Holder of shares or ADSs other than an “exempt recipient.” The term “exempt recipient” includes a corporation, a payee that is not a U.S. person that provides an appropriate certification and certain other persons.
110
A payor will generally be required to withhold backup withholding tax from any payments of dividends on, or the proceeds from the sale or redemption of, shares or ADSs within the United States to a Holder of shares or ADSs other than an “exempt recipient” if such Holder (i) fails to furnish its correct taxpayer identification number and certain other information, certified under penalty of perjury, in the manner required, (ii) fails to certify that the Holder is eligible for an exemption to backup withholding or (iii) otherwise fails to comply with the backup withholding tax requirements. The current backup withholding tax rate is 28 percent. Amounts withheld as backup withholding are allowable as a refund or a credit against the Holder’s U.S. federal income tax upon furnishing certain required information on a timely basis to the Internal Revenue Service.
Material Chilean tax consequences
The following discussion is a description of the Chilean tax consequences of the ownership of Masisa shares or ADSs to a holder who is not domiciled in or resident of Chile or a legal entity that is not organized under Chilean law and does not have a permanent establishment in Chile (a “Foreign Holder”).
For purposes of Chilean tax law, an individual is a resident of Chile if he has resided in Chile either
| · | more than six months in one calendar year; or |
| · | a total of more than six months, in two consecutive tax years. |
Under Chilean law, certain provisions contained in statutes such as tax rates applicable to foreign investors, the computation of taxable income for Chilean purposes and the manner in which Chilean taxes are imposed and collected may only be amended by another statute. In addition, the Chilean tax authorities issue rulings and regulations of either general or specific application and interpret the provisions of Chilean tax law. Chilean taxes may not be assessed retroactively against taxpayers who act in good faith relying on such rulings, regulations and interpretations. Chilean tax authorities may, however, change such rules, regulations and interpretations prospectively. There is no general income tax treaty between Chile and the United States.
This discussion:
| · | is based upon the tax laws of Chile as in effect on the date of this annual report, including applicable regulations and rulings, and including ruling No. 324 of January 29, 1990 of the Chilean tax administration; and |
| · | is not intended as Chilean tax advice to any particular Foreign Holder, which can be rendered only in light of its particular circumstances, and does not purport to be a complete analysis of the potential Chilean tax consequences that may be important to a Foreign Holder based on that Foreign Holder’s particular tax situation or circumstances. |
We have not sought and will not seek any rulings from the Chilean tax administration with respect to any matter discussed herein. No assurance can be given that the Chilean tax administration would not assert, or that a court would not sustain a position contrary to any of the tax characterizations and tax consequences set forth below.
Foreign Holders are urged to consult with their own tax advisors concerning the Chilean tax consequences of the ownership of Masisa shares or ADSs.
Chilean Tax Consequences of Ownership of Masisa Shares or ADSs by Foreign Holders
The following discussion contains a description of the material Chilean tax consequences relevant to the purchase, ownership and disposition of Masisa shares or ADSs by a Foreign Holder. This description is based, in part, on the representations of the depositary and the assumption that each obligation in the Deposit Agreement and any related agreement will be performed in accordance with its terms.
111
Taxation of Dividends. Cash dividends paid by Masisa with respect to its common stock or ADSs held by Foreign Holders will be subject to Chile’s withholding tax at a rate of 35% (the “Withholding Tax”), unless the dividend is paid out of income exempt from the Withholding Tax. The Withholding Tax must be withheld and paid over to the Chilean Treasury by Masisa. A credit against the Withholding Tax is available in the amount of the First Category Tax actually borne by Masisa on the income paid as a dividend. The basis of the Withholding Tax will be equal to the amount of the cash dividend plus the amount of any available First Category Tax credit.
The example below illustrates the effective Chilean Withholding Tax burden on a cash dividend received by a Foreign Holder, assuming a Withholding Tax rate of 35%, an effective First Category Tax rate of 17% and a distribution of all of the net proceeds available after payment of the First Category Tax.
| Taxable income | US$ | 100 | ||
| First Category Tax (17% of US$100) | (17 | ) | ||
| Net proceeds available | 83 | |||
| Dividend payment | 83 | |||
Withholding Tax (35% of the sum of the dividend (US$83) and the available First Category Tax credit (US$17) | (35 | ) | ||
| First Category Tax credit | 17 | |||
| Net dividend received | 65 | |||
| Payable Withholding Tax | US$ | (18 | ) |
The tax character of the dividend (taxable or exempt from Withholding Tax) and the amount of any First Category Tax credit will be determined in accordance with the dividend imputation rules contained in Chile’s income tax law. Such rules generally provide that dividends are imputed first to the company’s oldest profits subject to Withholding Tax, then to any profits exempt from Withholding Tax, and finally to any book-profits in excess of taxable and exempt profits. Masisa did not have retained taxable profits as of December 31, 2006. As a result, while Masisa’s current retained-taxable-profits position is sustained, dividends subject to Withholding Tax will not carry any First Category Tax credit.
Dividend distributions made in property (other than shares of common stock) will be taxed as if a cash dividend in the amount of the fair market value of the distributed property had been paid. Stock dividends are not subject to Chilean taxation upon distribution. The exercise of preemptive rights relating to common stock will not be subject to Chilean taxation. Gains from the sale of preemptive rights relating to common stock will be subject to both the First Category Tax and the Withholding Tax (subject to the credit outlined above).
Taxation of Capital Gains. Gains realized on the sale, exchange or other disposition by a Foreign Holder of the ADSs (or ADRs evidencing ADSs) will not be subject to any Chilean taxes, provided that such sale, exchange or other disposition occurs outside of Chile. The deposit and withdrawal of common stock in exchange for ADRs is not subject to any Chilean taxes.
The tax basis of the shares of common stock received in exchange for ADSs will be the acquisition cost of the shares adjusted for the CPI variation between the month preceding the exchange and the month preceding the sale. The valuation procedure set forth in the deposit agreement, which values shares of common stock that are being exchanged at the highest reported sale price at which they trade on the Santiago Stock Exchange on the date the exchange is recorded on the books of the Company, will determine the acquisition cost for this purpose. Consequently, the conversion of ADSs into common stock and the same-day sale of such common stock for the value established under the deposit agreement will not generate a taxable capital gain in Chile.
Gain recognized on a sale or exchange of common stock (as distinguished from a sale or exchange of ADSs representing such common stock) held by Foreign Holders will be subject to Chilean income taxes at an effective rate of 35% if either:
| · | the Foreign Holder has held the common stock for less than one year, counted from the date of acquisition of such common stock or since exchanging the ADSs for such common stock, |
112
| · | the Foreign Holder acquired and disposed of the common stock in the ordinary course of its business or as a regular trader of shares, or |
| · | the sale is made to a related entity. |
Otherwise, gain on the sale or other disposition of common stock will be subject generally to the First Category Tax as a sole income tax, currently imposed at a rate of 17%.
In certain cases and provided certain requirements are met, capital gains realized on the sale of actively traded stock of Chilean public companies may be exempt from Chilean income taxes. The stock of Masisa is currently considered an actively traded stock in the Santiago Stock Exchange, and Foreign Holders of the stock may qualify for an income tax exemption. Foreign Holders are urged to consult with their own tax advisors to determine whether an exemption applies to them.
Other Chilean Taxes.
There are no Chilean inheritance, gift or succession taxes applicable to the ownership, transfer or disposition of ADSs by a Foreign Holder, but such taxes may apply to transfers from inheritance, gifts or successions of the Masisa common stock if the transferor acquired the ADSs with Chilean-source resources. There are no Chilean stamp, issue, registration or similar taxes or duties payable by a Foreign Holder of common stock or ADSs.
Chilean Withholding Tax Certificates.
Upon request, Masisa will provide to Foreign Holders appropriate documentation evidencing the payment of the Withholding Tax (net of applicable First Category Tax).
Documents on Display
We are subject to the information requirements of the Securities Exchange Act of 1934 applicable to foreign private issuers, and accordingly we file or furnish reports, information statements and other information with the U.S. Securities and Exchange Commission (the “SEC”). These reports and other information filed by us can be inspected at, and subject to the payment of any required fees, copies may be obtained from, the public reference room of the U.S. Securities and Exchange Commission, 100 F Street, N.E., Room 1580, Washington, D.C. 20549, and at the U.S. Securities and Exchange Commission’s Regional Offices located at 233 Broadway, New York, New York 10279 and at Citicorp Center, 500 West Madison Street, Suite 1400, Chicago, Illinois 60661. These reports and other information may also be inspected and copied at the offices of the New York Stock Exchange, 20 Broad Street, New York, New York 10005.
Our SEC filings and submissions are also available from commercial retrieval services and, with respect to filings and submissions made after November 2002, may be obtained over the Internet at the website maintained by the SEC at www.sec.gov.
As a foreign private issuer, we are exempt from the proxy requirements of Section 14 of the Exchange Act and from the short-swing profit recovery rules of Section 16 of the Exchange Act, although the rules of the New York Stock Exchange may require us to solicit proxies from our shareholders under some circumstances.
Summary of Significant Differences between the Company’s Corporate Governance Practices and the NYSE’s Corporate Governance Standards
A general summary of the significant differences between the corporate governance practices followed by the Company under Chilean Law and guidelines and those required by the listing standards of the New York Stock Exchange (“NYSE”) for U.S. companies that have common stock listed on the NYSE may be found on the Company’s website at www.masisa.com.
113
Item 11. Quantitative and Qualitative Disclosure About Market Risk
Qualitative Disclosure
We are subject to the market risk that losses could occur in the values of financial instruments from fluctuations in interest rates, foreign currency exchange rates and commodity prices. We are exposed to these risks in the normal course of our business due to our use of certain financial instruments and transactions in various foreign currencies. Based on current market conditions, our Chief Executive Officer and Chief Financial Officer establish policies for new loans, derivative contracts, time deposits, marketable securities and securities with resale agreements and policies.
New long-term loans for financing new investments, or refinancing existing long-term loans, must be approved by the Company’s Board of Directors. In each country where we have operations, management is able to incur new short-term loans to finance working capital needs in the normal course of business. Intercompany loans between our subsidiaries, or within our subsidiaries, are settled with fixed interest rates, on a case-by-case basis.
Our Chief Executive Officer and Chief Financial Officer from time to time establish policies to manage our financial risk. Hedging interest rate exposure and foreign currency risk through the use of derivative contracts is specifically considered for purposes of managing such risks. Derivative instruments, such as swaps or cross currency contracts, which are based directly or indirectly upon interest rates and currencies, are used by the Company to manage and reduce the risk inherent in currency and interest rate fluctuations. We do not utilize derivative instruments for speculative purposes. Interest rate swap instruments utilized are transaction-specific so that a specific debt instrument or contract determines the amount, maturity and other terms of the hedge while currency instruments are either transaction specific or based on anticipated cash flows from operations.
Quantitative Disclosure
Interest rate risk
Our primary interest rate risk exposures arise from our U.S. dollar long-term fixed rate bank borrowings and private placement, our bond liabilities denominated in UF and other variable long-term liabilities. Assuming other factors are held constant, interest rate changes generally affect the fair value of fixed rate debt, but do not impact the carrying value, earnings or cash flows. Of our long-term interest bearing debt, as of December 31, 2006, 62.5% was fixed rate debt and 37.5% was variable compared to 50.5% and 49.5% for the year ended 2005. The following table provides information as of December 31, 2006 about our interest-earning assets and liabilities, including our long-term debt, our bonds and our private placement with U.S. insurance companies and other institutional investors, which are sensitive to changes in interest rates, based upon their respective contractual maturity dates.
(Amounts in thousands of US$) | 2007 | 2008 | 2009 | 2010 | 2011 | There after | Total | Estimated fair Market Value | |||||||||||||||||
INTEREST EARNING ASSETS | |||||||||||||||||||||||||
| US$ denominated fixed rate (short and long term): | |||||||||||||||||||||||||
| Time deposits | 20,315 | - | - | - | - | - | 20,315 | 20,315 | |||||||||||||||||
| Weighted average interest rate | 4.5 | % | - | - | - | - | - | - | - | ||||||||||||||||
| Chilean peso denominated Marketable securities | 956 | - | - | - | - | - | 956 | 956 | |||||||||||||||||
| Weighted average interest rate | 5.0 | % | - | - | - | - | - | - | - | ||||||||||||||||
114
| Euro denominated: | |||||||||||||||||||||||||
| Time deposits | 68 | - | - | - | - | - | 68 | 68 | |||||||||||||||||
| Weighted average interest rate | 2.9 | % | - | - | - | - | - | - | - | ||||||||||||||||
| Brazil Real denominated: | |||||||||||||||||||||||||
| Time deposits | 6,198 | - | - | - | - | - | 6,198 | 6,198 | |||||||||||||||||
| Weighted average interest rate | 12.7 | % | - | - | - | - | - | - | - | ||||||||||||||||
| Venezuelan Bolivares denominated: | |||||||||||||||||||||||||
| Time deposits | 931 | - | - | - | - | - | 931 | 931 | |||||||||||||||||
| Weighted average interest rate | 4.4 | % | - | - | - | - | - | - | - | ||||||||||||||||
| Colombian Peso denominated: | |||||||||||||||||||||||||
| Time deposits | 1,876 | - | - | - | - | - | 1,876 | 1,876 | |||||||||||||||||
| Weighted average interest rate | 4.4 | % | - | - | - | - | - | - | - |
INTEREST BEARING LIABILITIES | |||||||||||||||||||||||||
Fixed Rate: (1) | |||||||||||||||||||||||||
| Chilean peso − UF denominated bank debt | - | - | - | - | - | - | - | - | |||||||||||||||||
| Weighted average interest rate | - | - | - | - | - | - | - | - | |||||||||||||||||
| Bonds and other long-term Borrowings: | |||||||||||||||||||||||||
| Chilean peso - UF denominated | 23,690 | 35,733 | 36,227 | 35,733 | 19,873 | 107,546 | 258,802 | 265,727 | |||||||||||||||||
| Weighted average interest rate | 4.8 | % | - | - | - | - | - | - | - | ||||||||||||||||
| Bonds and other long-term Borrowings: | |||||||||||||||||||||||||
| US$ | 62 | 30,000 | - | - | - | - | 30,062 | 29,912 | |||||||||||||||||
| Weighted average interest rate | 4.9 | % | - | - | - | - | - | - | - | ||||||||||||||||
| Private Placement, Bonds and other long-term Borrowings | 9,185 | 9,000 | - | - | - | - | 18,185 | 18,615 | |||||||||||||||||
| Weighted average interest rate | 8.1 | % | - | - | - | - | - | - | - | ||||||||||||||||
| PAE and short-term Borrowings | 4,316 | - | - | - | - | - | 4,316 | 4,316 | |||||||||||||||||
| Weighted average interest rate | 5.2 | % | - | - | - | - | - | - | - | ||||||||||||||||
| Venezuelan Bolivares bank debt | 61,213 | - | - | - | - | - | 61,213 | 61,213 | |||||||||||||||||
| Weighted average interest rate | 10.2 | % | - | - | - | - | - | - | - | ||||||||||||||||
Variable Rate: | |||||||||||||||||||||||||
| US$ denominated bank debt | 52,787 | 33,137 | 33,809 | 39,939 | 58,440 | 5,619 | 223,731 | 223,731 | |||||||||||||||||
| Weighted average interest rate | 3.83 | % | - | - | - | - | - | - | - | ||||||||||||||||
| Argentinean Pesos bank debt | - | - | - | - | - | - | - | - | |||||||||||||||||
| Weighted average interest rate | - | - | - | - | - | - | - | - |
115
(Amounts in thousands of US$) | 2007 | 2008 | 2009 | 2010 | 2011 | There after | Total | Estimated fair Market Value | |||||||||||||||||
DERIVATIVE CONTRACTS | |||||||||||||||||||||||||
Interest rate Swaps US$ (2) | |||||||||||||||||||||||||
| Pay fixed, receive variable (6M Libor) Amounts to be paid | - | - | - | - | - | - | - | - | |||||||||||||||||
| Weighted average interest fixed rate | - | - | - | - | - | - | - | - | |||||||||||||||||
| Expected amounts to be received | - | - | - | - | - | - | - | - | |||||||||||||||||
| Weighted average variable rate Expected | - | - | - | - | - | - | - | - | |||||||||||||||||
Cross Currency Swaps (3) | |||||||||||||||||||||||||
| Pay USD, receive UF | |||||||||||||||||||||||||
| Amounts to be paid | 26,109 | 19,256 | 18,446 | 17,636 | 2,860 | 17,566 | 101,873 | - | |||||||||||||||||
| Weighted average interest fixed rate USD | 6.4 | % | - | - | - | - | - | - | - | ||||||||||||||||
| Expected amounts to be received | 24,089 | 17,104 | 16,957 | 16,785 | 2,337 | 18,759 | 96,031 | 5,842 | |||||||||||||||||
| Weighted average variable fixed rate UF | 4.6 | % | - | - | - | - | - | - | - | ||||||||||||||||
| Pay MXN receive USD (3) | |||||||||||||||||||||||||
| Amounts to be paid | 5,637 | 612 | 389 | 167 | - | 6,805 | (2,155 | ) | |||||||||||||||||
| Weighted average interest fixed rate MXN | 11.8 | % | - | - | - | - | - | - | - | ||||||||||||||||
| Expected amounts to be received | 3,348 | 682 | 434 | 186 | - | 4,650 | |||||||||||||||||||
| Weighted average interest fixed rate USD | 6.2 | % | - | - | - | - | - | - | - | ||||||||||||||||
| (1) | The UF- dollar exchange rate differs from the peso-dollar exchange rate in that the UF automatically adjusts in accordance with Chilean inflation and is tied in part to the peso-dollar debt. |
| (2) | The fair value of swaps is determined based on bank confirmations. The related expected payments and receipts were determined based on these fair values utilizing a weighted average variable rate expected to match this fair value. |
| (3) | Amounts were calculated utilizing the fair value of the swap contract at market exchange and interest rates at December 31, 2005. |
116
Foreign currency risk
We are subject to foreign currency exchange rate risks associated with assets and liabilities and transactions in currencies other than our functional currency. We periodically enter into foreign exchange contracts when deemed necessary to “hedge” or offset the risk of loss due to currency fluctuations of assets and liabilities and transactions denominated in foreign currencies. When hedging foreign currency exposures, our practice is to hedge such exposures with foreign exchange forward contracts denominated in the same currency and with similar critical terms as the underlying exposure, and therefore, the instruments are effective at generating offsetting changes in the earnings and fair value. Additionally, a portion of our subsidiaries’ operating revenues and assets and liabilities are in currencies that differ from our functional currency. However, since both their operating revenues and expenses are in the same currency, this creates a partial natural hedge. The following table summarizes the financial instruments, as well as assets and liabilities, denominated in the stated currencies we hold as of December 31, 2006, based upon their respective contractual maturity dates:
(Amounts in thousands of US$) | 2006 | 2007 | 2008 | 2009 | 2010 | Thereafter | Total | Estimated fair Market Value | |||||||||||||||||
ASSETS | |||||||||||||||||||||||||
| Chilean Peso | 956 | - | - | - | - | - | 956 | - | |||||||||||||||||
| Brasilian Peso | 6,198 | - | - | - | - | - | 6,198 | - | |||||||||||||||||
| Venezuelan Bolivar | 931 | - | - | - | - | - | 931 | - | |||||||||||||||||
| Other currencies non US Dollar | 1,944 | - | - | - | - | - | 1,944 | - | |||||||||||||||||
LIABILITIES | |||||||||||||||||||||||||
| Chilean Peso (excluding debt) | 83 | - | - | - | - | - | 83 | - | |||||||||||||||||
| Mexican Peso | 4,617 | - | - | - | - | - | 4,617 | - | |||||||||||||||||
| Venezuelan Bolivar (excluding debt) | 9,476 | - | - | - | - | - | 9,476 | - | |||||||||||||||||
| Other currencies non US Dollar | 84,902 | - | - | - | - | - | 84,902 | - | |||||||||||||||||
| Chilean peso − UF denominated bank debt | - | - | - | - | - | - | - | - | |||||||||||||||||
| Weighted average interest rate | - | - | - | - | - | - | - | - | |||||||||||||||||
| Bonds and other long−term Borrowings: | |||||||||||||||||||||||||
| Chilean peso - UF denominated | 23,690 | 35,733 | 36,227 | 35,733 | 19,873 | 107,546 | 258,802 | 265,727 | |||||||||||||||||
| Weighted average interest rate | 4.8 | % | - | - | - | - | - | - | - | ||||||||||||||||
| Bonds and other long−term Borrowings: | |||||||||||||||||||||||||
| US$ | 62,034 | 72,137 | 33,809 | 39,939 | 58,440 | 5,619 | 271,978 | 271,978 | |||||||||||||||||
| Weighted average interest rate | 5.8 | % | - | - | - | - | - | - | - | ||||||||||||||||
| Bank debt short-term Borrowings: | |||||||||||||||||||||||||
| US$ | 4,316 | - | - | - | - | - | 4,316 | 4,316 | |||||||||||||||||
| Weighted average interest rate | 3.8 | % | - | - | - | - | - | - | - | ||||||||||||||||
| Venezuelan Bolivar bank debt | 61,213 | - | - | - | - | - | 61,213 | 61,213 | |||||||||||||||||
| Weighted average interest rate | 10.2 | % | - | - | - | - | - | - | - | ||||||||||||||||
DERIVATIVE CONTRACTS | |||||||||||||||||||||||||
Pay USD, receive UF (1) | |||||||||||||||||||||||||
| Amounts to be paid | 26,109 | 19,256 | 18,446 | 17,636 | 2,860 | 17,566 | 101,873 | - | |||||||||||||||||
| Weighted average interest fixed rate USD | 6.4 | % | - | - | - | - | - | - | - | ||||||||||||||||
| Expected amounts to be received | 24,089 | 17,104 | 16,957 | 16,785 | 2,337 | 18,759 | 96,031 | 5,842 | |||||||||||||||||
| Weighted average variable fixed rate UF | 4.6 | % | - | - | - | - | - | - | - | ||||||||||||||||
Pay MXN receive USD (1) | |||||||||||||||||||||||||
| Amounts to be paid | 5,637 | 612 | 389 | 167 | - | 6,805 | (2,155 | ) | |||||||||||||||||
| Weighted average interest fixed rate MXN | 11.8 | % | - | - | - | - | - | - | - | ||||||||||||||||
| Expected amounts to be received | 3,348 | 682 | 434 | 186 | - | 4,650 | |||||||||||||||||||
| Weighted average interest fixed rate USD | 6.2 | % | - | - | - | - | - | - | - | ||||||||||||||||
(1) Amounts were calculated utilizing the fair value of the swap contract at market exchange and interest rates at December 31, 2006
117
Item 12. Description of Securities Other than Equity Securities
Not applicable.
118
PART II
Item 13. Default, Dividend Arrearages and Delinquencies
Not applicable.
Item 14. Material Modifications to the Rights of Security Holders and Use of Proceeds
Not applicable.
Item 15. Controls and Procedures
(a) Evaluation of Disclosure Controls and Procedures
For fiscal 2006, we performed an evaluation of the effectiveness of the design and operation of our disclosure controls and procedures (as defined in Rules 13a-15(e) and 15d-15(e) under the Exchange Act). We maintain a set of disclosure controls and procedures designed to ensure that information required to be disclosed by us in reports that we file or submit under the Exchange Act is recorded, processed, summarized and reported within the time periods specified in the SEC rules and forms and is accumulated and communicated to our management, including our Chief Executive Officer and Chief Financial Officer, as appropriate to allow timely decisions regarding required disclosure. Under the supervision and with the participation of our management, including our Chief Executive Officer and our Chief Financial Officer, an evaluation was performed on the effectiveness of the design and operation of our disclosure controls and procedures as of December 31, 2006.
Based on the foregoing, our management, including our Chief Executive Officer and Chief Financial Officer, concluded that Masisa’s disclosure controls and procedures were effective as of December 31, 2006.
(b) Management’s Annual Report on Internal Control Over Financial Reporting
The management of Masisa is responsible for establishing and maintaining adequate internal control over financial reporting, as such term is defined in Rules 13a-15(f) and 15d-15(f) of the Exchange Act. Masisa’s internal control over financial reporting is designed to provide reasonable assurance regarding the reliability of financial reporting and the preparation of financial statements for external purposes in accordance with Chilean GAAP and its reconciliation with U.S. GAAP.
Because of its inherent limitations, internal control over financial reporting may not prevent or detect misstatements or fraud. Also, projections of any evaluation of effectiveness to future periods are subject to the risk that controls may become inadequate because of changes in conditions, or that the degree of compliance with the policies or procedures may deteriorate.
Under the supervision and with the participation of our management, including our internal audit department, our Audit Committee and our Disclosure Committee, we conducted an evaluation of the effectiveness of the Company’s internal control over financial reporting as of December 31, 2006. In making this assessment, we used the criteria set forth by the Committee of Sponsoring Organizations of the Treadway Commission (COSO) in “Internal Control—Integrated Framework.”
119
Based on the aforementioned evaluation, our Chief Executive Officer and our Chief Financial Officer have concluded that our internal control over financial reporting was effective as of December 31, 2006.
This annual report does not include an attestation report of the Company's registered public accounting firm regarding internal control over financial reporting. Management’s report was not subject to attestation by the Company’s registered public accounting firm pursuant to temporary rules of the SEC that permit the Company to provide only management’s report in this annual report.
(c) Changes in Internal Control Over Financial Reporting
Other than described in the subsequent paragraphs, there have been no changes in the Company’s internal control over financial reporting that occurred during fiscal 2006, which have materially affected, or are reasonably likely to materially affect, the Company’s internal control over financial reporting.
Our internal controls associated with inventory control procedures were strengthened during 2006 in response to control deficiencies detected in our operations in Mexico, Venezuela and Chile as part of our evaluation of the effectiveness of our internal control over financial reporting. The identified control deficiencies were due to (i) inadequate or partial application of inventory reconciliation procedures, (ii) accounting entries of in-transit goods without physical control based on generic system user profiles and (ii) measurement errors in raw material consumption. These control deficiencies resulted in significant inventory adjustments, mainly consisting of physical inventory differences, being recorded prior to December 31, 2006.
The new internal controls that we implemented during 2006 included more frequent and comprehensive physical inventory evaluation process, monitoring of in-transit goods and reconciliation of stock with physical inventories.
Item 16A. Audit Committee Financial Expert
Our Board of Directors has determined that we have at least one “audit committee financial expert,” as defined in Item 16A of Form 20-F, serving on the Audit Committee. Enrique Seguel is the director whom our Board of Directors has determined to be an audit committee financial expert. Mr. Seguel is an independent director. Holders of ADSs should understand that this designation is a disclosure requirement of the SEC related to Mr. Seguel’s experience and understanding with respect to certain accounting and auditing matters. The designation does not impose on Mr. Seguel any duties, obligations or liability that are greater than are generally imposed on him as a member of the Audit Committee and Board of Directors, and his designation as an audit committee financial expert pursuant to this SEC requirement does not affect the duties, obligations or liability of any other member of the Audit Committee or Board of Directors.
120
Item 16B. Code of Ethics
We adopted a code of ethics that applies to all of our employees and directors, including our principal executive officer, principal financial officer and principal accounting officer. The code of ethics is available on our website at http://www.masisa.com.
Item 16C. Principal Accountant Fees and Services
Audit Fees. Fees paid to PricewaterhouseCoopers for the audit of the annual consolidated financial statements included in our Annual Report on Form 20-F for the years ended 2006 and 2005 were US$1,012,858 and US$1,234,941, respectively.
Audit-Related Fees. Fees paid to PricewaterhouseCoopers for audit-related services, including consultations regarding the Sarbanes-Oxley Act and other items, were US$294,767 and US$149,013, respectively, for the years ended 2006 and 2005.
Tax Fees. Fees paid to PricewaterhouseCoopers associated with tax compliance and tax consultation were US$24,030 and US$159,201, respectively, for the years ended 2006 and 2005.
All Other Fees. Fees paid to other audit firms for other services, including services related to our Sustainability Report and other items, were US$70,711 and US$90,330, respectively, for the years ended 2006 and 2005.
Audit Committee Pre-Approval Policies. The Audit Committee has adopted a formal policy on auditor independence requiring the approval by the Audit Committee of all professional services rendered by our independent auditor prior to the commencement of the specified services. The Audit Committee will consider annually and, if appropriate, approve the provision of audit services by our independent auditor and consider and, if appropriate, pre-approve the provision of certain defined audit and non-audit services. The Audit Committee will also consider on a case-by-case basis and, if appropriate, approve specific engagements that are not otherwise pre-approved.
Any proposed engagement that does not fit within the definition of a pre-approved service may be presented to the Audit Committee for consideration at its next regular meeting or, if earlier consideration is required, to the Audit Committee for action by written consent. The Audit Committee has also delegated to the Chair of the Audit Committee the authority to pre-approve audit-related and non-audit services not prohibited by law to be performed by our independent auditors and associated fees up to a maximum for any one non-audit service of $100,000, provided that the Chair shall report any decisions to pre-approve such audit-related or non-audit services and fees to the full Audit Committee at its next regular meeting.
Item 16D. Exemptions from the Listing Standards for Audit Committees
We have applied and have received approval to list our ADSs on the NYSE. As a Chilean company, we are not required to comply with all of the NYSE’s listing standards for audit committees. In reliance on the exemption provided by Exchange Act Rule 10A-3(b)(1)(iv)(D), our audit committee has two non-voting members that are representatives of the controlling shareholders. We do not believe that reliance on this exemption will materially adversely affect the ability of our audit committee to act independently. A comparison of NYSE corporate governance standards, including the standards for audit committees of listed companies, and our corporate governance practices is posted on our website at http://www.masisa.com.
121
Item 16E. Purchase of Equity Securities by the Issuer and Affiliated Purchasers
To our knowledge, the following purchases of our equity securities were carried out during 2006 by Grupo Nueva S.A. and its subsidiary, Inversiones Forestales Los Andes, S.A., each an “affiliated purchaser” (as such term is defined in Rule 10b−18(a) (3) under the Securities Exchange Act of 1934):
Period | Total Number of Shares Purchased | Average Price Paid per Share | Total Number of Shares Purchased as Part of Publicly Announced Plans or Programs | Maximum Number (or Appropriate Dollar Value) of Shares that May Yet Be Purchased Under the Plans or Programs | |||||||||
| June 1 - June 30, 2006 | 5,538,017 | CLP$ | 79.50 | None | None | ||||||||
| July 1 - July 31, 2006 | 5,538,018 | CLP$ | 79.50 | None | None | ||||||||
| September 1 - September 30, 2006 | 11,663,505 | CLP$ | 85.93 | None | None | ||||||||
| November 1 - November 30, 2006 | 5,579,961 | CLP$ | 84.52 | None | None | ||||||||
| December 1 - December 31, 2006 | 161,848,037 | (*) | - | None | None | ||||||||
| Total shares repurchased during 2006 | 28,319,501 | ||||||||||||
(*) On December 29, 2006, Grupo Nueva transferred in a private transaction 161,848,037 shares of common stock of Masisa to its subsidiary, Inversiones Forestales Los Andes S.A.
Except for the December 2006 transaction, all of the purchases were made through open−market transactions and were not part of a publicly announced program.
However, in the future, we may, with the approval of our shareholders, initiate a stock repurchase or similar program or engage in other transactions pursuant to which we would repurchase, directly or indirectly, the Company’s ordinary shares, ADSs or both. In addition, we or our subsidiaries may enter into transactions involving purchases of derivatives or other instruments with returns linked to the Company’s ordinary shares, ADSs or both. The timing and amount of repurchase transactions under any such program, or purchases of derivatives or other instruments, would depend on market conditions as well as other corporate and regulatory considerations.
122
PART III
Item 17. Financial Statements
Our statements have been prepared in accordance with Item 18.
Item 18. Financial Statements
See pages F-1 through F-66, incorporated herein by reference. The following is an index to the financial statements:
Page | ||||
Consolidated Financial Statements for Terranova S.A. and Subsidiaries | ||||
| Report of Independent Registered Accounting Firm | F-1 | |||
| Consolidated Balance Sheets as of December 31, 2005 and 2006 | F-2 | |||
| Consolidated Statements of Income for each of the three years ended December 31, 2004, 2005 and 2006 | F-4 | |||
| Consolidated Statement of Cash Flows for each of the three years ended December 31, 2004, 2005 and 2006 | F-5 | |||
| Notes to the Consolidated Financial Statements | F-7 | |||
123
Item 19. Exhibits
Documents filed as exhibits to this Annual Report:
Exhibit Number | Description | |
| 1 | Estatutos of Terranova, which include its Articles of Association (previously filed with the Securities and Exchange Commission as Exhibit 3.1 to our Registration Statement on Form F-4 (File No. 333-123459) filed on March 18, 2005, as subsequently amended, and incorporated by reference herein). | |
| 2.1 | Form of deposit agreement among Terranova, The Bank of New York and holders from time to time of ADSs issued thereunder, including the form of ADRs representing the ADSs (incorporated by reference to Exhibit 2.1 to the Registration Statement on Form F-6, File No. 333-123484, filed on March 22, 2005). | |
| 4.1 | Strategic Alliance Agreement, dated December 1, 2000, between Forestal Terranova S.A. and Premdor Inc. and Letter Agreement, dated January 12, 2001, between Premdor Inc. and Forestal Terranova S.A., previously filed with the Securities and Exchange Commission as Exhibit 10.1 to our Registration Statement on Form F-4 (File No. 333-123459) filed on March 18, 2005, as subsequently amended, and incorporated by reference herein. | |
| 4.2 | Lease Contract, dated January 12, 1989, between the Republic of Venezuela and Corporación Forestal Imataca, C.A., previously filed with the Securities and Exchange Commission as Exhibit 10.2 to our Registration Statement on Form F-4 (File No. 333-123459) filed on March 18, 2005, as subsequently amended, and incorporated by reference herein. | |
| 8.1 | List of Terranova’s subsidiaries. | |
| 12.1 | Certification by Chief Executive Officer of Masisa S.A. pursuant to Section 302 of the Sarbanes-Oxley Act of 2002. | |
| 12.2 | Certification by Chief Financial Officer of Masisa S.A. pursuant to Section 302 of the Sarbanes-Oxley Act of 2002. | |
| 13 | Certification pursuant to Section 906 of the Sarbanes-Oxley Act of 2002 (furnished under Section 18 of the Securities Exchange Act of 1934) |
124
SIGNATURES
Pursuant to the requirements of Section 12 of the Securities Exchange Act of 1934, the Registrant certifies that it meets all of the requirements for filing on Form 20-F and has duly caused this annual report to be signed on its behalf by the undersigned, thereunto duly authorized.
Date: July 17, 2007
| MASISA S.A. | ||
| | | |
| By: | /s/ EUGENIO ARTEAGA I. | |
Eugenio Arteaga I. Chief Financial Officer | ||
125
MASISA S.A. (formerly TERRANOVA S.A.) AND SUBSIDIARIES
Consolidated Financial Statements
December 31, 2006
CONTENTS
| Report of Independent Registered Public Accounting Firm | F-1 | |
| Consolidated Balance Sheets at December 31, 2006 and 2005 | F-2 to F-3 | |
| Consolidated Statements of Income for the three years ended December 31, 2006 | F-4 | |
| F-5 to F-6 | ||
| Notes to the consolidated financial statements | F-7 |
| Ch$ | - | Chilean pesos |
| ThCh$ | - | Thousands of Chilean pesos |
| US$ | - | United States dollars |
| ThUS$ | - | Thousands of United States dollars |
| UF | - | A UF (Unidad de Fomento) is an inflation-indexed peso-denominated monetary unit. The UF rate is set daily in advance based on the previous month's inflation rate. |

REPORT OF INDEPENDENT REGISTERED PUBLIC ACCOUNTING FIRM
To the Board of Directors and Shareholders of
Masisa S.A. (formerly Terranova S.A.)
| 1 | We have audited the accompanying consolidated balance sheets of Masisa S.A. (formerly Terranova S.A.) and its subsidiaries (the “Company”) as of December 31, 2006 and 2005 and the related consolidated statements of income and of cash flows for each of the three years in the period ended December 31, 2006, all expressed in thousands of United States dollars. These financial statements are the responsibility of the Company’s management. Our responsibility is to express an opinion on these financial statements based on our audits. |
| 2 | We conducted our audits in accordance with auditing standards generally accepted in Chile and the standards of the Public Company Accounting Oversight Board (United States). Those standards require that we plan and perform the audit to obtain reasonable assurance about whether the financial statements are free of material misstatement. An audit includes examining, on a test basis, evidence supporting the amounts and disclosures in the financial statements. An audit also includes assessing the accounting principles used and significant estimates made by management, as well as evaluating the overall financial statement presentation. We believe that our audits provide a reasonable basis for our opinion. |
| 3 | In our opinion, based on our audits, the consolidated financial statements referred to above, present fairly, in all material respects, the financial position of Masisa S.A. (formerly Terranova S.A.) and its subsidiaries at December 31, 2006 and 2005 and the results of their operations and their cash flows for each of the three years in the period ended December 31, 2006, in conformity with accounting principles generally accepted in Chile. |
| 4 | Accounting principles generally accepted in Chile vary in certain significant respects from accounting principles generally accepted in the United States of America. Information relating to the nature and effect of such differences is presented in Note 23 to the consolidated financial statements. |
/s/ PricewaterhouseCoopers
Santiago, Chile
July 12, 2007
F-1
MASISA S.A. (formerly TERRANOVA S.A.) AND SUBSIDIARIES
CONSOLIDATED BALANCE SHEETS
| December 31, | |||||||
| 2006 | 2005 | ||||||
| ThUS$ | ThUS$ | ||||||
ASSETS | |||||||
| CURRENT ASSETS | |||||||
| Cash | 16,705 | 11,987 | |||||
| Time deposits | 29,388 | 82,906 | |||||
| Marketable securities (Note 4) | 956 | 2,424 | |||||
| Accounts receivable (net) (Note 5) | 154,051 | 133,608 | |||||
| Notes and accounts receivable from related companies (Note 6) | 7,378 | 5,296 | |||||
| Inventories (Note 7) | 185,777 | 220,036 | |||||
| Recoverable taxes (Note 8) | 53,414 | 45,767 | |||||
| Prepaid expenses | 6,504 | 8,036 | |||||
| Deferred taxes (Note 8) | 9,876 | 2,632 | |||||
| Other current assets (Note 9) | 2,479 | 5,205 | |||||
| Total current assets | 466,528 | 517,897 | |||||
| PROPERTY, PLANT AND EQUIPMENT (Note 10) | |||||||
| Land and forests | 772,800 | 696,366 | |||||
| Buildings and other infrastructure | 220,140 | 224,661 | |||||
| Machinery and equipment | 849,262 | 824,958 | |||||
| Other | 127,207 | 77,450 | |||||
| Technical reappraisal of property, plant and equipment | 7,390 | 7,390 | |||||
| Less: Accumulated depreciation | (419,451 | ) | (374,828 | ) | |||
| Total property, plant and equipment | 1,557,348 | 1,455,997 | |||||
| OTHER ASSETS | |||||||
| Investments in unconsolidated affiliates (Note 11) | 4,651 | 4,060 | |||||
| Investment in foreign subsidiaries | 206 | 207 | |||||
| Goodwill (net) (Note 12) | 1,165 | 1,249 | |||||
| Negative goodwill (net) (Note 12) | (58,352 | ) | (53,460 | ) | |||
| Long-term receivables | 4,113 | 4,901 | |||||
Notes and accounts receivable from related companies (Note 6) | 1,406 | - | |||||
| Other assets (Note 13) | 30,446 | 25,680 | |||||
| Total other assets | (16,365 | ) | (17,363 | ) | |||
| Total assets | 2,007,511 | 1,956,531 | |||||
The accompanying Notes 1 to 23 are an integral part of these consolidated financial statements.
F-2
MASISA S.A. (formerly TERRANOVA S.A.) AND SUBSIDIARIES
CONSOLIDATED BALANCE SHEETS
| December 31, | |||||||
| 2006 | 2005 | ||||||
| ThUS$ | ThUS$ | ||||||
LIABILITIES AND SHAREHOLDERS' EQUITY | |||||||
| CURRENT LIABILITIES | |||||||
| Short-term bank borrowings (Note 14) | 65,529 | 115,121 | |||||
| Current portion of long-term bank borrowings (Note 15) | 52,787 | 76,032 | |||||
| Current portion of bonds and promissory notes (Note 16) | 32,937 | 185,286 | |||||
| Current portion of other long-term borrowings | - | 1 | |||||
| Dividends payable | 473 | 323 | |||||
| Accounts payable and sundry creditors | 55,036 | 54,728 | |||||
| Notes and accounts payable to related companies (Note 6) | 5,451 | 3,450 | |||||
| Accrued liabilities (Note 17) | 31,742 | 21,574 | |||||
| Withholdings | 14,244 | 11,324 | |||||
| Deferred taxes (Note 8) | - | - | |||||
| Other current liabilities | 326 | 473 | |||||
| Total current liabilities | 258,525 | 468,312 | |||||
| LONG-TERM LIABILITIES | |||||||
| Long-term bank obligations (Note 15) | 170,944 | 135,524 | |||||
| Bonds and promissory notes (Note 16) | 274,112 | 137,961 | |||||
| Deferred taxes (Note 8) | 77,957 | 38,694 | |||||
| Other long-term borrowings | 1,736 | 1,662 | |||||
| Other long-term liabilities | 17,320 | 19,965 | |||||
| Total long-term liabilities | 542,069 | 333,806 | |||||
| MINORITY INTEREST | 20,562 | 60,116 | |||||
| COMMITMENTS AND CONTINGENCIES (Note 21) | |||||||
| SHAREHOLDERS' EQUITY (Note 18) | |||||||
| Paid-in capital | 808,364 | 766,221 | |||||
| Other reserves | 224,010 | 192,090 | |||||
| Retained earnings: | |||||||
| Accumulated gains | 124,496 | 111,552 | |||||
| Net income for the year | 29,485 | 24,434 | |||||
| Total shareholders’ equity | 1,186,355 | 1,094,297 | |||||
| Total liabilities and shareholders’ equity | 2,007,511 | 1,956,531 | |||||
The accompanying Notes 1 to 23 are an integral part of these consolidated financial statements.
F-3
MASISA S.A. (formerly TERRANOVA S.A.) AND SUBSIDIARIES
CONSOLIDATED STATEMENTS OF INCOME
| For the years ended December 31, | ||||||||||
| 2006 | 2005 | 2004 | ||||||||
| ThUS$ | ThUS$ | ThUS$ | ||||||||
| OPERATING RESULTS | ||||||||||
| Net sales | 886,507 | 743,993 | 651,000 | |||||||
| Cost of sales | (678,956 | ) | (551,930 | ) | (461,778 | ) | ||||
| Gross margin | 207,551 | 192,063 | 189,222 | |||||||
| Selling and administrative expenses | (123,972 | ) | (112,594 | ) | (94,105 | ) | ||||
| Operating income | 83,579 | 79,469 | 95,117 | |||||||
| NON-OPERATING RESULTS | ||||||||||
| Financial income | 8,716 | 3,939 | 1,920 | |||||||
| Share of income from unconsolidated affiliates (Note 11) | 613 | 720 | 1,333 | |||||||
| Other non-operating income (Note 19) | 6,898 | 2,799 | 47,252 | |||||||
| Amortization of goodwill (Note 12) | (85 | ) | (791 | ) | (792 | ) | ||||
| Amortization of negative goodwill (Note 12) | 4,552 | 3,388 | 3,325 | |||||||
| Financial expenses | (35,371 | ) | (38,756 | ) | (39,294 | ) | ||||
| Other non-operating expenses (Note 20) | (15,883 | ) | (8,489 | ) | (21,767 | ) | ||||
| Price-level restatements | 628 | 30 | 544 | |||||||
| Foreign exchange losses | (11,513 | ) | (10,438 | ) | (3,731 | ) | ||||
| Non-operating results | (41,445 | ) | (47,598 | ) | (11,210 | ) | ||||
| Income (loss) before minority interest and income tax (expense) benefit | 42,134 | 31,871 | 83,907 | |||||||
| Minority interest | 10,695 | 5,690 | (15,401 | ) | ||||||
| Income tax (expense) benefit | (23,344 | ) | (13,127 | ) | (11,728 | ) | ||||
| NET INCOME (LOSS) | 29,485 | 24,434 | 56,778 | |||||||
The accompanying Notes 1 to 23 are an integral part of these consolidated financial statements.
F-4
MASISA S.A. (formerly TERRANOVA S.A.) AND SUBSIDIARIES
CONSOLIDATED STATEMENTS OF CASH FLOWS
| For the years ended December 31, | ||||||||||
| 2006 | 2005 | 2004 | ||||||||
| ThUS$ | ThUS$ | ThUS$ | ||||||||
| CASH FLOWS FROM OPERATING ACTIVITIES | ||||||||||
| Collection of trade receivables | 1,230,899 | 879,940 | 733,997 | |||||||
| Financial revenues received | 8,708 | 2,592 | 2,196 | |||||||
| Other income received | 29,742 | 31,001 | 20,939 | |||||||
| Payments to suppliers and employees | (1,053,794 | ) | (748,178 | ) | (650,495 | ) | ||||
| Interest paid | (49,995 | ) | (27,764 | ) | (31,525 | ) | ||||
| Income taxes paid | (11,346 | ) | (11,550 | ) | (6,897 | ) | ||||
| Other expenses paid | (2,229 | ) | (4,305 | ) | (3,133 | ) | ||||
| VAT and other taxes paid | (19,950 | ) | (17,974 | ) | (15,258 | ) | ||||
| Net cash provided by operating activities | 132,035 | 103,762 | 49,824 | |||||||
| CASH FLOWS FROM FINANCING ACTIVITIES | ||||||||||
| Proceeds from sale of common shares | 44,012 | 75,383 | - | |||||||
| Borrowings from banks and other | 242,536 | 125,121 | 138,894 | |||||||
| Proceeds from issuance of bonds | 162,965 | - | - | |||||||
| Loans from related companies | 73 | 1,396 | - | |||||||
| Dividend paid | (11,491 | ) | (52,111 | ) | - | |||||
| Payment of borrowings | (291,108 | ) | (82,901 | ) | (183,138 | ) | ||||
| Payment of bonds | (178,338 | ) | (26,594 | ) | (9,000 | ) | ||||
| Payment of loans from related companies | (709 | ) | (71 | ) | (2,262 | ) | ||||
| Payment of expenses for share issuance | (903 | ) | (3,613 | ) | - | |||||
| Other financing activities | - | - | (1,934 | ) | ||||||
| Net cash (used in) provided by financing activities | (32,963 | ) | 36,610 | (57,440 | ) | |||||
| CASH FLOWS FROM INVESTING ACTIVITIES | ||||||||||
| Proceeds from sales of property, plant and equipment | 1,565 | 2,193 | 77,707 | |||||||
| Purchase of property, plant and equipment | (128,779 | ) | (73,166 | ) | (46,065 | ) | ||||
| Acquisition of subsidiary, net of cash acquired | (27,229 | ) | (29,890 | ) | - | |||||
| Other loans to related companies- | - | - | (82 | ) | ||||||
| Other investing activities | 4,575 | (181 | ) | - | ||||||
| Net cash (used in) provided by investing activities | (149,868 | ) | (101,044 | ) | 31,560 | |||||
| Net cash (used in) provided by operating, financing and investing activities | (50,796 | ) | 39,328 | 23,944 | ||||||
| Inflation effect on cash and cash equivalents | (13 | ) | - | (29 | ) | |||||
| NET INCREASE IN CASH AND CASH EQUIVALENTS | (50,809 | ) | 39,328 | 23,915 | ||||||
| CASH AND CASH EQUIVALENTS AT BEGINNING OF YEARS | 97,858 | 58,530 | 34,615 | |||||||
| CASH AND CASH EQUIVALENTS AT END OF YEARS | 47,049 | 97,858 | 58,530 | |||||||
F-5
MASISA S.A. (formerly TERRANOVA S.A.) AND SUBSIDIARIES
CONSOLIDATED STATEMENTS OF CASH FLOWS - (Continued)
| For the years ended December 31, | ||||||||||
| 2006 | 2005 | 2004 | ||||||||
| ThUS$ | ThUS$ | ThUS$ | ||||||||
| RECONCILIATION OF NET INCOME (LOSS) TO CASH FLOWS PROVIDED BY OPERATING ACTIVITIES | ||||||||||
| Net income (loss) | 29,485 | 24,434 | 56,778 | |||||||
| Adjustments to reconcile net income (loss) to net cash provided by operating activities: | ||||||||||
| Gains on sale of assets | (31 | ) | (60 | ) | (44,300 | ) | ||||
| Depreciation | 50,303 | 50,691 | 48,378 | |||||||
| Amortization of intangibles | 439 | 874 | 808 | |||||||
| Write-offs and provisions | 5,995 | 3,085 | 16,398 | |||||||
| Share of income from unconsolidated affiliates | (613 | ) | (720 | ) | (1,333 | ) | ||||
| Amortization of goodwill | 85 | 791 | 792 | |||||||
| Amortization of negative goodwill | (4,552 | ) | (3,388 | ) | (3,325 | ) | ||||
| Price-level restatements | (628 | ) | (30 | ) | (544 | ) | ||||
| Foreign exchange losses | 11,513 | 10,438 | 3,731 | |||||||
| Other charges to income not representing cash flows | 1,098 | 1,251 | (1,174 | ) | ||||||
| Changes in assets and liabilities | ||||||||||
| Trade accounts receivable | (1,825 | ) | 8,034 | (31,890 | ) | |||||
| Inventories | 65,060 | 1,673 | (19,980 | ) | ||||||
| Other assets | (17,210 | ) | 2,190 | (2,155 | ) | |||||
| Accounts payable | (12,830 | ) | 5,904 | 3,820 | ||||||
| Interest payable | 2,434 | (3,160 | ) | 3,309 | ||||||
| Income taxes payable | 3,185 | 5,467 | 1,967 | |||||||
| Value added and other taxes payable | 10,822 | 1,978 | 3,143 | |||||||
| (10,695 | ) | (5,690 | ) | 15,401 | ||||||
| Net cash provided by operating activities | 132,035 | 103,762 | 49,824 | |||||||
The accompanying Notes 1 to 23 are an integral part of these consolidated financial statements,
F-6
MASISA S.A. (formerly TERRANOVA S.A.) AND SUBSIDIARIES
NOTES TO THE CONSOLIDATED FINANCIAL STATEMENTS
NOTE 1 - THE COMPANY
Masisa S.A. (formerly Terranova S.A.) (together with its controlled subsidiaries, the “Company”) is a “sociedad anónima abierta” (a public corporation) whose common stock is listed on the Santiago Stock Exchange. Accordingly, the Company is subject to the regulations of the Superintendency of Securities and Insurance in Chile (“SVS”).
The Company is a forestry and wood products industry conglomerate with forestry plantations in Chile, Brazil, Argentina and Venezuela and commercial and industrial operations in Chile, Brazil, Argentina, the United States, Mexico, Venezuela and Colombia. Through its subsidiary Masisa S.A. (“Masisa”), Masisa is a leader in the production and distribution of wood boards in Latin America.
On April 12 and April 13, 2005, respectively, the shareholders of the Company and it’s then 52.434% owned and consolidated subsidiary Masisa S.A. (“Old Masisa”), approved the merger by incorporation of Old Masisa into and with the Company. Holders of Old Masisa common stock received the right to receive 2.56 shares of the Company’s shares for each share of Old Masisa common stock they owned and the right to receive 1.536 American depositary shares (“ADSs”) of the Company for each Old Masisa ADS owned.
Conditions required to ratify the merger were completed on May 31, 2005. The Company continued as the surviving entity and is the legal successor of Old Masisa for all purposes. The merger by incorporation of the subsidiary resulted in all of the shareholders and net worth of Old Masisa being incorporated into the Company. As a consequence of the merger, Old Masisa no longer exists. At the same shareholder meetings, the shareholders of each company approved changing the name of the merged company from Terranova S.A. to Masisa S.A.
In accordance with the merger agreement, shares and ADSs of Old Masisa were exchanged for shares and ADSs of the Company. The Company issued 1,130,632,161 shares of common stock in May 2005 with no nominal value or privileges. These shares were distributed to Old Masisa shareholders in August 2005 in accordance with the merger exchange ratio. This issuance resulted in a capital increase of ThUS$ 112,742. (see Note 18).
The merger transaction was accounted for in accordance with Technical Bulletin No. 72 of Generally Accepted Accounting Principles in Chile (TB 72). In accordance with TB 72, as the Company and Old Masisa were considered to be under common control, the acquisition of the 47.566% was accounted for as a merger of commonly controlled companies prospectively as of January 1, 2005. Accordingly, the merged assets of Old Masisa were combined with the Company and recorded at book value and prior year balances were not restated.
F-7
NOTE 2 - SUMMARY OF SIGNIFICANT ACCOUNTING POLICIES
a) Presentation
The consolidated financial statements have been prepared in accordance with accounting principles generally accepted in Chile and the accounting regulations of the SVS.
The preparation of financial statements in conformity with generally accepted accounting principles (GAAP) requires management to make estimates and assumptions that affect the reported amounts of assets and liabilities, revenues and expenses and disclosures of contingent liabilities. Management makes its best estimate of the ultimate outcome for these items based on historical trends and other information available when the financial statements are prepared. Changes in estimates are recognized in accordance with the accounting rules for the estimate, which is typically in the period when new information becomes available to management. Areas where the nature of the estimate makes it reasonably possible that actual results could differ from amounts estimated include: valuation of long-lived assets, valuation of accounts receivable, valuation of inventory, assumptions used in the valuation and accounting for timber resources, accounting for income taxes and accounting for potential litigation claims and contingencies. The Company has issued its statutory consolidated financial statements in Spanish and in conformity with accounting principles generally accepted in Chile, which include certain notes and additional information required by the SVS for statutory purposes. Management believes that these additional notes and information are not essential for the complete understanding of the consolidated financial statements and, accordingly, these notes and additional information have been excluded from the accompanying consolidated financial statements.
The consolidated financial statements as of and for the year ended December 31, 2005 differed from those submitted to the SVS on March 1, 2006. These financial statements have been restated to properly reflect a subsequent adjustment for inventory costing. The effect of this adjustment on previously reported retained earings as of December 31, 2005 and consolidated net income for the year then ended is set forth below:
| ThUS$ | ||||
| Net income as previously reported | 26,369 | |||
| Adjustment for inventory costing | (1,935 | ) | ||
| Net income as adjusted | 24,434 | |||
| ThUS$ | ||||
| Retained earnings as previously reported | 137,921 | |||
| Adjustment for inventory costing | (1,935 | ) | ||
| Retained earnings as adjusted | 135,986 | |||
For Chilean GAAP purposes, such adjustments were recorded directly to the January 1, 2006 beginning retained earnings balance. Accordingly, the consolidated financial statements as of and for the year ended December 31, 2005 continue to differ from those submitted to the SVS, but not the consolidated financial statements as of and for the year ended December 31, 2006.
F-8
b) Currency
Foreign Currency Translation of “Stable” Currencies
In the case of the Company and those subsidiaries authorized to maintain their accounting records in U.S. dollars as well as those foreign subsidiaries considered as an extension of the Company’s operation, assets and liabilities denominated in other currencies are remeasured to U.S. dollars at the exchange rates prevailing on December 31 of each year except for inventory, property, plant and equipment and certain other assets and liabilities. Inventory, property, plant and equipment and certain other assets and liabilities are remeasured at either; (1) the historical exchange rates if the corresponding asset or liability originated subsequent to the date on which an authorization to maintain the accounting records in U.S. dollars was received; or (2) at exchange rate in effect on the date the approval to maintain the Company’s accounting records in US dollars was received for those assets or liabilities originated prior to such approval date. Revenues and expenses are generally translated at the exchange rates on the dates of the transactions. Gains or losses from foreign currency remeasurement as described above are included in Consolidated net (loss) income.
For those subsidiaries that maintain their accounting records in currencies other than the U.S. dollar and are “not extensions” of the Company’s operations (Forestal Tornagaleones S.A.), all assets, liabilities, revenues and expenses are translated into U.S. dollars using the exchange rates prevailing on the final day of the period presented. The translation adjustment derived from the effect of the variation of the exchange rate between the beginning and the closing of the year over beginning of the year Shareholders’ equity is reported as a Cumulative translation gain/(loss) as a separate component of Shareholders’ equity.
Foreign Currency Translation of “Not Stable” Currencies
In accordance with Technical Bulletin No. 64 of the Chilean Institute of Accountants for all periods presented, the financial statements of subsidiaries located in countries that are subject to significant risks, restrictions or fluctuations due to inflationary or exchange effects (so called “not stable” countries) must be remeasured in U.S. dollars. Accordingly, the financial statements of the subsidiaries located in Argentina, Brazil, Venezuela, Colombia and Ecuador are remeasured in U.S. dollars as follows:
| 1. | Monetary assets and liabilities were translated at year-end rates of exchange between the U.S. dollar and the local currency. |
| 2. | All non-monetary assets and liabilities and shareholders’ equity were translated at historical rates of exchange between the U.S. dollar and the local currency. |
| 3. | Income and expense accounts were translated at average rates of exchange between the U.S. dollar and the local currency for the period, except for those arising from non-monetary accounts, which are included at historic rates of exchange. |
| 4. | Any exchange differences which arise were included in the results of operations for the period. |
The difference between the investment’s equity value arising from the financial statements remeasured as explained above and the net equity value at the beginning of the year, plus the proportional share of the investment’s net income for the year, was recorded in the account, Cumulative translation gain/(loss) as a separate component of Shareholders’ equity.
F-9
In addition, exchange differences (netted from Chilean inflation) arising from debt obligations that qualify as foreign currency hedges of the foreign investments mentioned above were also recorded in the account “Cumulative Translation Adjustment”.
c) Consolidation
The Company´s consolidated financial statements include the accounts of Masisa and the following subsidiaries which it controls:
| Company | 2006 | Ownership December 2005 | 2004 | |||||||
| % | % | % | ||||||||
| Inversiones Internacionales Terranova S.A | 60.0000 | 60.0000 | 60.0000 | |||||||
| Masisa S.A. (1) | - | - | 52.4340 | |||||||
| Inversiones Coronel Ltda. (2) | 0.0000 | 100.0000 | 52.4340 | |||||||
| Masisa Inversiones Ltda. (2) | 0.0000 | 100.0000 | 52.4340 | |||||||
| Masisa Concepción Ltda. (2) | 0.0000 | 100.0000 | 52.4340 | |||||||
| Masisa Partes y Piezas Ltda. | 100.0000 | 100.0000 | 52.4340 | |||||||
| Forestal Tornagaleones S.A. (3) | 94.9061 | 94.9061 | 31.6960 | |||||||
| Masisa Overseas Ltd | 100.0000 | 100.0000 | 52.4340 | |||||||
| Masisa USA, Inc | 70.0480 | 70.0480 | 70.0480 | |||||||
| Terranova Panamá S.A. | 60.0000 | 60.0000 | 60.0000 | |||||||
| Terranova de Venezuela S.A. y Filial | 60.0000 | 60.0000 | 60.0000 | |||||||
| Coforven S.A. | 59.9700 | 59.9700 | 59.9700 | |||||||
| Forestal Terranova Mexico S.A. de C.V. | 59.9940 | 59.9940 | 59.9940 | |||||||
| Cor. Forestal Guayamure C.A. | 51.0000 | 51.0000 | 51.0000 | |||||||
| Cor. Forestal Imataca C.A. | 60.0000 | 60.0000 | 60.0000 | |||||||
| Andinos C.A. | 60.0000 | 60.0000 | 60.0000 | |||||||
| Fibranova C.A. | 60.0000 | 60.0000 | 60.0000 | |||||||
| Masisa Madeiras Ltda. | 59.9940 | 59.9940 | 59.9940 | |||||||
| Masisa Colombia S.A. | 59.9940 | 59.9940 | 59.9940 | |||||||
| Masisa do Brasil Ltda. | 100.0000 | 100.0000 | 52.4340 | |||||||
| Forestal Argentina S.A. (4) | 93.6530 | 47.5480 | 15.8810 | |||||||
| Masisa Argentina S.A. | 100.0000 | 100.0000 | 52.4340 | |||||||
| Masisa Ecuador S.A. | 100.0000 | 100.0000 | 52.4340 | |||||||
| Maderas y Sintéticos del Perú S.A.C | 99.9011 | 99.9011 | 52.3820 | |||||||
| Maderas y Sintéticos Mexico S.A. de C.V | 100.0000 | 100.0000 | 52.4340 | |||||||
| Maderas y Sintéticos Servicios S.A. de C.V | 100.0000 | 100.0000 | 52.4340 | |||||||
| Masnova S.A. | 80.0000 | 80.0000 | 56.2170 | |||||||
| C.C. MAS S.A.de C.V. (5) | 100.0000 | - | - | |||||||
All significant inter-company accounts and transactions have been eliminated in the consolidated financial statements, and the participation of the minority investors has been recognized, presented as minority interest.
| (1) | On July 22, 2002, the Company acquired 400,776,639 shares of Masisa S.A. (“Old Masisa”), representing 43.16% of Old Masisa’s equity. As a result of this acquisition, the Company’s interest in Old Masisa totalled 481,861,555 shares, representing 51.89% of Old Masisa’s equity. Therefore, commencing July 22, 2002, the financial statements of Old Masisa are consolidated with the Company. |
F-10
On June 27, 2003, the Company acquired 5,000,000 shares, equivalent to 0.544% of Old Masisa’s equity. The purchase price for the shares amounted to ThUS$ 1,256 and was accounted for consistent with the policy described in Note 2 m).
On April 12 and 13, 2005 the shareholders of the Company approved the merger by incorporation of the Old Masisa S.A. into Terranova through an exchange of shares and ADSs as explained in Note 1.
| (2) | Subsidiaries were merged and incorporated into the Company as of June 21, 2006. |
| (3) | On November 15, 2005, the Company acquired an additional 9,987,400 shares of Forestal Tornagaleones S.A. (Tornagaleones), equivalent to 34.452% of Tornagaleones’s equity. the Company cash in the amount of ThUS$ 29,890 for these shares and registered negative goodwill for the excess cash paid over the fair value of the net assets received. (see Note 12). |
| (4) | On January 6, 2006, Tornagaleones acquired an additional 22,406,455 shares of Forestal Argentina S.A. (FASA) equivalent to 48.58% of FASA’s equity. Prior to this, Tornagaleones owned 50.1% of FASA. Tornagaleones paid cash in the amount of ThUS$ 24,340 for these shares and registered negative goodwill for the excess cash paid over the book value of the net assets received. (see Note 12). |
| (5) | On August 22, 2006, the subsidiaries Maderas y Sintéticos de México S.A. de C.V. and Maderas y Sintéticos Servicios S.A. de C.V. created a subsidiary named CC MAS S.A. de C.V., which is a variable capital closed corporation. Maderas y Sintéticos de México S.A. de C.V. owns 99.99% of CC MAS S.A. de C.V. and Maderas y Sintéticos Servicios S.A. de C.V. owns 0.01%. |
| In accordance with Circular Letter No. 150 issued by the SVS, the Company has completed an evaluation of the net asset value of its subsidiaries in Brazil, Venezuela, Argentina and Mexico by estimating cash flows to be generated by the subsidiaries in the future. Based on these estimates, the Company concluded that at December 31, 2006 no impairment adjustments are necessary. |
At December 31, 2006 and 2005, the Company held investments in Venezuela, through its subsidiary Inversiones Internacionales Terranova S.A., as follows:
- Terranova Venezuela S.A.
- Fibranova C.A.
- Andinos C.A.
- Oxinova C.A.
- Corporacion Forestal Itamaca C.A.
- Corporacion Forestal Guayamure C.A.
In December 2002, business associations, trade unions as well as political and civil organizations called a National Civic Strike in Venezuela that had a significant impact on the economic activities of the country, primarily in the oil and petrochemical industry. Recently, the government announced the nationalization of certain business sectors, incuding the energy sector. This situation has led to an irregular supply of raw material necessary for the manufacturing operation of the subsidiaries in Venezuela.
F-11
Additionally, on January 21, 2003, the National Executive enabled the Finance Ministry to confirm with the Central Bank of Venezuela (BCV), temporary measures to establish limits and restrictions to convertibility of the Bolivar (Bs) and to the transfer of funds abroad. Based on this action, on the same date the Finance Ministry and the BCV agreed to suspend the trading of foreign currencies in Venezuela. On February 5, 2003, two exchange agreements to establish a new system of foreign exchange management were established. The exchange rate was fixed at Bs 1,596/US$ 1 (buying) and Bs 1,600/US$ 1 (selling). This exchange was modified in March 2006, and was fixed at Bs 2,144/US$.1 (buying) and Bs 2,150/US$ 1 (selling).
To date, the respective regulation has not been removed and it is not possible to fully evaluate the effects such measure may have on the Company’s future operations.
The financial statements have been prepared assuming that the subsidiaries in Venezuela will continue their operations as a going concern. Consequently, the adjustments that could result from these uncertain circumstances have not been included.
d) Price-level restatements
Certain of the Company´s subsidiaries have not received approval to maintain their accounting records in U.S. dollars. Tornagaleones continues to maintain Chilean peso accounting records and apply the principle of price-level restatements in accordance with Chilean GAAP. For this purpose, non-monetary assets, liabilities and equity accounts have been restated by charges or credits to income, unless not required by TB 64. Furthermore, the income and expense accounts have been restated in terms of year-end constant Chilean pesos.
In accordance with Chilean tax regulations and accounting practices, the restatements are calculated based on the official Consumer Price Index of the National Institute of Statistics, applied one month in arrears, which was 2.1% and 3.6% for the years ended November 30, 2006 and 2005, respectively. This index is considered by the business community, the accounting profession and the Chilean government to be the index which most closely complies with the technical requirement to reflect the variation in the general level of prices in the country and, consequently, is widely used for financial reporting purposes in Chile.
The above-mentioned price-level restatements do not purport to present appraised or replacement values and are only intended to restate all non-monetary financial statement components in terms of local currency of a single purchasing power and to include in the net result for each year the gain or loss in purchasing power arising from the holding of monetary assets and liabilities exposed to the effects of inflation.
F-12
e) Assets and liabilities denominated in foreign currencies
Assets and liabilities denominated in currencies other than the U.S. dollar have been translated into the U.S. dollar at the observed exchange rates, as reported by the Central Bank of Chile. The observed exchange rates for foreign currencies into one U.S. dollar as of December 31, 2006, 2005 and 2004, were as follows:
| At December 31, | ||||||||||
| 2006 | 2005 | 2004 | ||||||||
| Brazilian reais | 2.138 | 2.336 | 2.654 | |||||||
| Bolivian bolivars | 2,150.000 | 2,150.000 | 1,920.000 | |||||||
| Argentine peso | 3.062 | 3.025 | 2.979 | |||||||
| Chilean peso | 532.390 | 512.500 | 557.400 | |||||||
| Colombian peso | 2,238.790 | 2,284.220 | 2,389.750 | |||||||
| Mexican peso | 10.875 | 10.611 | 11.218 | |||||||
| Euro | 0.788 | 0.8470 | - | |||||||
| Unidad de Fomento (1) | 0.029 | 0.0289 | 0.032 | |||||||
| (1) | An inflation-indexed-Chilean peso-denominated monetary unit. The UF rate is set daily in advance based on the previous month’s inflation rate. |
f) Marketable securities
Marketable securities consist of investments in money market funds and are stated at market value based on year-end quoted values.
g) Allowance for doubtful accounts
The Company has recorded an allowance for doubtful accounts determined on the basis of the aging of accounts receivable and additional allowances for specific customers where collection is doubtful.
h) Inventories
Inventories are valued at the lower of production or acquisition cost, including indirect manufacturing costs, or market value. Inventory costs are determined using the average cost method. The valuation of inventories are assessed periodically and, if necessary, a write-down of the value for estimated excess and obsolete inventory is recorded based on estimates about future demand and actual usage.
As of each period end, forests and plantation inventories in the process of exploitation are stated at the commercially appraised value at which these forests were transferred from fixed assets in conjunction with the revaluation of timber resources described in Note 2 i), below.
F-13
i) Property, plant and equipment
Property, plant and equipment, except timber resources, are stated at cost, which includes capitalized interest.
Timber and timberlands are stated at cost less cost of timber harvested. The costs incurred in developing and growing timber such as site preparation, property taxes, seedlings, planting, fertilization, insect and wildlife control, herbicide application and thinning, are capitalized. These capitalized costs are accumulated by specifically identifiable farm blocks. Accounting practices for these costs do not change when timber becomes merchantable and harvesting commences. Costs incurred related to logging roads are capitalized and amortized over their expected useful lives or as the related timber is harvested. These capitalized costs are included in the historical cost of the timber. At each period-end, the timber resources are adjusted to reflect values based on technical appraisals performed by specialized forestry engineers.
Depletion, or costs attributed to timber harvested, is determined by each identifiable farm block that is in the harvesting stage based on the relationship of unamortized timber costs to the estimated volume of recoverable timber multiplied by the amount of timber cut. The estimated volume of recoverable timber is determined using statistical information and other data related to growth rates and yields gathered from physical observations, models, and other information gathering techniques. Changes in yields are generally due to adjustments in growth rates and similar matters and are accounted for prospectively as changes in estimates. The cost of timber harvested is included in the carrying values of raw materials and product inventories and in the cost of products sold as these inventories are sold to third parties. The depletion rate calculations do not include an estimate for future costs associated with existing stands, future reforestation costs associated with a stand’s final harvest, or future volume in connection with the replanting of a stand subsequent to its final harvest.
As a result of the above accounting treatment, the Company records timber resources at appraisal value prior to cutting with the offsetting adjustment recorded as Forestry Reserves in Shareholders’ equity. When the timber is cut and sold, the component of Cost of sales associated with the appraisal value is offset against Forestry Reserves in Shareholders’ equity.
Financing costs of projects requiring major investments in long-term construction and those costs incurred from financing specific projects are capitalized and amortized over the estimated useful lives of the related assets. Direct and indirect interest costs incurred in connection with the development of forests are also capitalized.
Other fixed assets include spare parts inventories with turnover of less than one-year. Those items with significant value and with an ongoing benefit are depreciated in the same period of time as the asset with which they are associated, while those items with frequent use are charged to cost of production when used.
Assets purchased under financing leases are recorded at their fair value on the date of the lease agreement, which is determined by discounting the amounts payable in installments and the bargain purchase option, if any, at the interest rate implicit, or explicit, in the contract. These assets are not legally considered property of the Company until the purchase option is exercised and are presented under Other assets.
F-14
Disbursements for the development of internal use software are charged to the results of operations as incurred. External direct costs of materials and services rendered in developing an enterprise resource planning system (an SAP R/3 system) and interest costs incurred during development are capitalized. Payroll related costs were not material and have been expensed. Training costs and data conversion costs are expensed as incurred.
Assets to be disposed of at year-end have been recorded under Other assets at fair value based on an independent appraisal.
j) Depreciation
Depreciation for most fixed assets is calculated using the straight-line method based on the estimated useful life of each asset, which were as follows:
| Years | |
| Plants, buildings and other installations | 25-40 |
| Machinery and equipment | 10-20 |
| Other fixed assets | 1-10 |
Depreciation for the years ended December 31, 2006, 2005 and 2004 amounted to ThUS$ 50,303, ThUS$ 50,691 and ThUS$ 48,378, respectively.
Certain machinery, moving equipment and other similar items are depreciated based on the number of production hours used in relation to an estimated maximum number of productive hours.
k) Impairment of long-lived assets
The Company periodically evaluates the carrying value of its long-lived assets for impairment. The carrying value of a long-lived asset is considered impaired by the Company when the expected undiscounted cash flows from such asset are separately identifiable and less than its carrying value. In that event, a loss would be recognized based on the amount by which the carrying value exceeds the fair market value of the long-lived asset. Fair market value is determined primarily using the anticipated cash flows discounted at a rate commensurate with the risk involved or based on independent appraisals.
l) Investments in unconsolidated affiliates
Investments in unconsolidated affiliates are accounted for using the equity method when they represent between 20% and 50% of the voting stock of the investee. Accordingly, the Company’s proportional share in the net income (or loss) of each investee is recognized on an accrual basis, after eliminating any unrealized profits or losses from transactions with the investees in Non-operating results in the Consolidated Statements of Income.
m) Goodwill and negative goodwill
Under Chilean GAAP, for acquisitions before January 1, 2004, goodwill arose from the excess of the purchase price of companies acquired over their net book value; negative goodwill arose when net book value of the acquired company exceeds the purchase price of companies acquired. Effective January 1, 2004, TB 72 requires the determination of goodwill and negative goodwill based on the fair value of the acquired company.
Goodwill and negative goodwill are amortized over ten to twenty years considering the expected period of return of the investment. The Company evaluates the recoverability of goodwill on a periodic basis.
F-15
n) Bonds and promissory notes
Bonds and promissory notes are recorded at face value plus accrued interest. The discount on, and expenses incurred, in the issuance of the bonds are included in Prepaid expenses and other assets in the Consolidated Balance Sheets and are amortized using the interest method of amortization over the term of the instruments. Total capitalized costs associated with bonds were ThUS$ 9,184 and ThUS$ 4,832 as of December 31, 2006 and 2005, respectively, of which ThUS$ 2,356, ThUS$ 1,744 and ThUS$ 951 was amortized to expense in the years ended December 31, 2006, 2005 and 2004, respectively.
o) Income tax and deferred taxes
The effects of deferred income taxes arising from temporary differences between the basis of assets and liabilities for tax and financial statement purposes are recorded in accordance with Technical Bulletins Nos. 60, 68 and 69 of the Chilean Institute of Accountants and Circular No. 1,466 of the SVS. The effects of deferred income taxes at January 1, 2000 that were not previously recorded, were recognized, in accordance with the transitional period provided by Technical Bulletin No. 60 (TB 60), against a contra asset or liability account (“complementary accounts”) and were recorded to offset the effects of the deferred tax assets and liabilities not recorded prior to January 1, 2000. Complementary accounts are amortized to income over the estimated average reversal periods corresponding to underlying temporary differences to which the deferred tax asset or liability relates.
Deferred income tax assets are reduced by a valuation allowance if, based on the weight of available evidence, it is more likely than not that some portion or all of the deferred income tax assets will not be realized. The valuation allowance should be sufficient to reduce the deferred income tax asset to an amount that is more likely than not to be realized.
p) Employee vacations
The cost of employee vacations is recognized as an expense on an accrual basis as the vacations are earned by employees and are included in Accrued liabilities in the Consolidated Balance Sheets.
q) Revenue recognition
Revenues are recorded at the time of shipment of products to the customer. The following criteria must be met in order to recognize revenue: (1) persuasive evidence of an arrangement exists; (2) delivery has occurred or services have been rendered; (3) the price to the buyer is fixed or determinable; and (4) collection is reasonably assured. Revenues which the Company has billed and collected in advance are deferred until the related products are shipped and the criteria above have been met.
r) Derivative contracts
The Company enters into hedging contracts including interest rate swap agreements and forward exchange contracts. The contracts are accounted for in accordance with Technical Bulletin No. 57, “Accounting for Derivative Contracts” (TB 57) of the Chilean Institute of Accountants. Under TB 57, all derivative financial instruments are recognized on the Consolidated Balance Sheets at their fair value.
The Company has derivative instruments which index are considered hedges of forecasted transactions these derivative instruments are stated at fair value on the Consolidated Balance Sheets and any change in the fair value are recognized on the balance sheet as an unrealized gain or loss in Other current liabilities or in Other assets. When the contract is settled, the unrealized gain or loss on the instrument is recognized in earnings in Non-operating income in the Consolidated Statements of Income.
F-16
One of the qualifying criteria for hedge accounting is that the hedging relationship between the hedging instrument and the hedged item must be highly effective in achieving the offset of changes in those fair values or cash flows that are attributable to the hedged risk, both at the inception of the hedge and on an ongoing basis. If, at any point, the prospective consideration indicates that the hedging instrument is not expected to be highly effective in the future, hedge accounting is discontinued from that point forward.
The impact of the Company’s hedging activities included in Financial expenses for the years ended December 31, 2006, 2005 and 2004 totaled ThUS$ 4,537, ThUS$ 4,034 and ThUS$ 4,038, respectively. The unrealized gains included in Other long-term liabilities as of December 31, 2006 and 2005 totaled ThUS$ 3,776 and ThUS$ 3,588, respectively. The unrealized losses included in Other assets as of December 31, 2006 and 2005 totaled ThUS$ - and ThUS$ 20, respectively.
s) Securities purchased under resale agreements
Time deposits are recorded at cost plus accrued interest at each period-end. Securities purchased under resale agreements are presented at cost plus accrued interest at the period-end. The values of these investments did not exceed their respective market values at December 31, 2006 and 2005.
t) Research and development expenses
Research and development expenses are charged to income in the period in which they occur. The Company has not incurred significant research and development expenses during the years ended December 31, 2006, 2005 and 2004.
u) Development stage accumulated deficit
Investments in majority-owned subsidiaries considered to be in the development stage are recorded in accordance with the equity method of accounting on the Consolidated Balance Sheets; however, the Company’s share of the investee’s results of operations during the development stage are recorded as a reserve which forms part of Shareholders’ equity.
v) Cash equivalents
The Company considers all short-term, highly-liquid investment securities purchased with original maturities of three months or less to be cash equivalents for purposes of the Consolidated Statements of Cash Flows.
The balances of cash and cash equivalents were as follows:
| December 31, | ||||||||||
| 2006 | 2005 | 2004 | ||||||||
| ThUS$ | ThUS$ | ThUS$ | ||||||||
| Cash | 16,705 | 11,987 | 13,126 | |||||||
| Time deposits and money market funds | 29,388 | 85,330 | 45,404 | |||||||
| Securities purchased under resale agreements (Note 9) | 956 | 541 | - | |||||||
| Total | 47,049 | 97,858 | 58,530 | |||||||
F-17
NOTE 3 - ACCOUNTING CHANGES
During the year ended on December 31, 2006, the Company changed its method of accounting for a long-term non-interest bearing payable related to certain tax balances in Brazil. The Company previously recorded this payable balance at its undiscounted face amount. Upon applying the new methodology, the payable balance is now recorded at its present value based on a discount rate, which consideres among other things, the estimated borrowing rate of the Company under similar terms. This change in accounting principle was based on the application of Financial Interpretation 06-08 issued under International Financial Reporting Standards in August 2006. The cumulative effect of this change as of January 1, 2006 resulted in an increase in financial income of ThUS$ 3,987.
NOTE 4 - MARKETABLE SECURITIES
Marketable securities are summarized as follows:
| December 31, | |||||||
| 2006 | 2005 | ||||||
| ThUS$ | ThUS$ | ||||||
| Money market funds | 956 | 2,424 | |||||
| Total marketable securities | 956 | 2,424 | |||||
NOTE 5 - ACCOUNTS RECEIVABLE (NET)
Accounts receivable (net) includes the following:
| Accounts receivable aging | December 31, | |||||||||
| 1-90 days | 91-360 days | 2006 | ||||||||
| ThUS$ | ThUS$ | ThUS$ | ||||||||
| Trade accounts receivable | 115,764 | 14,955 | 130,719 | |||||||
| Notes receivable | 10,085 | 595 | 10,680 | |||||||
| Other accounts receivable | 15,986 | 3,136 | 19,122 | |||||||
| Less: Allowances for doubtful accounts | (6,470 | ) | ||||||||
| Total | 154,051 | |||||||||
| Accounts receivable aging | December 31, | |||||||||
| 1-90 days | 91-360 days | 2005 | ||||||||
| ThUS$ | ThUS$ | ThUS$ | ||||||||
| Trade accounts receivable | 92,231 | 12,136 | 104,367 | |||||||
| Notes receivable | 11,717 | 2,440 | 14,157 | |||||||
| Other accounts receivable | 14,328 | 6,349 | 20,677 | |||||||
| Less: Allowance for doubtful accounts | (5,593 | ) | ||||||||
| Total | 133,608 | |||||||||
F-18
NOTE 6 - BALANCES AND TRANSACTIONS WITH RELATED COMPANIES
Accounts receivable from related companies are commercial accounts and loans granted to subsidiaries to carry out their activities. These are expressed in US dollars and in some cases accrue interest at the 180-day London Interbank Offering Rate (“LIBOR”) plus a spread.
Maturities of loans are subject to cash availability of the subsidiaries, while commercial accounts have normal collection terms.
a) Notes and accounts receivable from related companies
| Short-term December 31, | Long-term December 31, | ||||||||||||
| Company | 2006 | 2005 | 2006 | 2005 | |||||||||
| ThUS$ | ThUS$ | ThUS$ | ThUS$ | ||||||||||
| Oxinova C.A. | 6,151 | 4,862 | - | - | |||||||||
| Plycem Construsistemas de Costa Rica | 517 | 140 | - | - | |||||||||
| Amanco Tubosistemas Honduras | 279 | 112 | - | - | |||||||||
| Amanco Brasil Limitada | 221 | - | 1,406 | - | |||||||||
| Plycem Construsistemas Nicaragua S.A. | 82 | 10 | - | - | |||||||||
| Plycem Construsistemas Guatemala S.A. | 77 | 117 | - | - | |||||||||
| Plycem Construsistemas El Salvador S.A. | 51 | 55 | - | - | |||||||||
| 7,378 | 5,296 | 1,406 | - | ||||||||||
b) Notes and accounts payable to related companies
| Short-term December 31, | Long-term December 31, | ||||||||||||
| Company | 2006 | 2005 | 2006 | 2005 | |||||||||
| ThUS$ | ThUS$ | ThUS$ | ThUS$ | ||||||||||
| Oxinova C.A. | 4,628 | 3,033 | - | - | |||||||||
| Tek Board Overseas Inc. Amanco. | 823 | 417 | - | - | |||||||||
| 5,451 | 3,450 | - | - | ||||||||||
F-19
c) Transactions
| 2006 | December 31, 2005 | 2004 | |||||||||||||||||||||||
| Company | Relationship | Transactions | Amount | Effects in results (charge)/credit | Amount | Effects in results (charge)/credit | Amount | Effects in results (charge)/credit | |||||||||||||||||
| ThUS$ | ThUS$ | ThUS$ | ThUS$ | ThUS$ | ThUS$ | ||||||||||||||||||||
| Plycem Construsistemas Costa Rica S.A. | Affiliate | Sale of products | 1,062 | 340 | 798 | 279 | 721 | 238 | |||||||||||||||||
| Plycem Construsistemas Guatemala S.A. | Affiliate | Sale of products | 544 | 212 | 278 | 106 | 268 | 88 | |||||||||||||||||
| Plycem Construsistemas Honduras S.A. | Affiliate | Sale of products | 51 | 6 | - | - | 58 | 19 | |||||||||||||||||
| Plycem Construsistemas Nicaragua S.A. | Affiliate | Sale of products | 361 | 119 | 82 | 29 | 163 | 54 | |||||||||||||||||
| Plycem Construsistemas El Salvador S.A. | Affiliate | Sale of products | 424 | 153 | 95 | 35 | 317 | 105 | |||||||||||||||||
| Oxinova C.A. | Investee | Rental of assets | 12 | 12 | 14 | 14 | 12 | 12 | |||||||||||||||||
Investee | Administrative services | 72 | 72 | 82 | 82 | 72 | 72 | ||||||||||||||||||
Investee | Purchase of chemical products | 20,448 | (20,448 | ) | 18,230 | (18,230 | ) | 17,655 | (17,655 | ) | |||||||||||||||
| Forestal Río Calle-Calle S.A. | Investee | Interest on loans | - | - | - | - | 34 | 34 | |||||||||||||||||
F-20
NOTE 7 - INVENTORIES
Inventories include the following:
| December 31, | |||||||
| 2006 | 2005 | ||||||
| ThUS$ | ThUS$ | ||||||
| Standing timber | 33,526 | 30,857 | |||||
| Finished products and work in progress | 85,407 | 114,658 | |||||
| Products for the resale | 21,988 | 26,870 | |||||
| Materials, spare parts, supplies and other items | 44,856 | 47,651 | |||||
| 185,777 | 220,036 | ||||||
As of December 31, 2006 and 2005, inventories are shown net of the allowance for obsolescence amounting to ThUS$ 3,146 and ThUS$ 2,489, respectively, and allowance to reduce inventories to net realizable value of ThUS$ 3,220 and ThUS$ 2,887, respectively.
NOTE 8 - DEFERRED TAXES AND INCOME TAX
a) Income tax
The income tax provisions in the Consolidated Statements of Income were as follows:
NOTE 8 - DEFERRED TAXES AND INCOME TAX
a) Income tax
The income tax provisions in the Consolidated Statements of Income were as follows:
| (Charges)/credits December 31, | ||||||||||
| 2006 | 2005 | 2004 | ||||||||
| ThUS$ | ThUS$ | ThUS$ | ||||||||
| Current year provision for income tax | (8,823 | ) | (7,455 | ) | (6,117 | ) | ||||
| Deferred income tax (expense) benefit | (10,138 | ) | (2,672 | ) | (3,003 | ) | ||||
| Other | (4,383 | ) | (3,000 | ) | (2,608 | ) | ||||
| Total | (23,344 | ) | (13,127 | ) | (11,728 | ) | ||||
b) Taxes recoverable and payable were as follows:
| December 31, | ||||||||||
| 2006 | 2005 | 2004 | ||||||||
| ThUS$ | ThUS$ | ThUS$ | ||||||||
| Income tax provision | (8,823 | ) | (7,455 | ) | (6,117 | ) | ||||
| Refund of income taxes of prior years | 17,836 | 15,158 | 11,681 | |||||||
| Provisional monthly income tax prepayments | 14,359 | 4,944 | 5,554 | |||||||
| Value added taxes recoverable | 24,356 | 24,679 | 24,916 | |||||||
| Other | 5,685 | 8,441 | 8,587 | |||||||
| Total | 53,414 | 45,767 | 44,621 | |||||||
F-21
c) Accumulated tax losses carryforward
The detail of accumulated tax losses for the Company and each subsidiary is as follows:
| December 2006 | Tax rate | December 2005 | Tax rate | Expiration date | ||||||||||||
| ThUS$ | % | ThUS$ | % | |||||||||||||
| Masisa S.A. | 197,749 | 17.0 | 292,235 | 17.0 | No term | |||||||||||
| Fibranova C.A. | 3,913 | 34.0 | 30,805 | 34.0 | 2 years | |||||||||||
| Andinos C.A. | 8,698 | 34.0 | 12,160 | 34.0 | 3 years | |||||||||||
| Terranova Venezuela S.A. | 50,851 | 34.0 | 2,640 | 34.0 | 3 years | |||||||||||
| Inversiones Internacional Terranova S.A. | 64,718 | 17.0 | 64,718 | 17.0 | No term | |||||||||||
| Masisa Madeiras Ltd. | 7,321 | 34.0 | 4,912 | 34.0 | No term | |||||||||||
| Masisa USA, Inc. | - | 37.5 | 288 | 37.5 | 19 years | |||||||||||
| Masisa Argentina S.A. | - | 35.0 | 923 | 35.0 | - | |||||||||||
| Masisa do Brasil Ltd. | 41,013 | 34.0 | 37,191 | 34.0 | No term | |||||||||||
| Masisa de Mexico S.A. | 2,745 | 29.0 | 4,738 | 29.0 | 8 years | |||||||||||
| Forestal Tornagaleones S.A. | 22,272 | 17.0 | 25,524 | 17.0 | No term | |||||||||||
| Forestal Argentina S.A. | 2,649 | 35.0 | 7,880 | 35.0 | No term | |||||||||||
| Masisa del Perú S.A.C | 213 | 30.0 | - | - | 1 Years | |||||||||||
| Masisa Ecuador S.A. | 287 | 30.0 | 480 | 30.0 | No term | |||||||||||
| Total tax losses | 402,429 | 484,494 | ||||||||||||||
F-22
d) Deferred taxes
The accumulated balances from deferred taxes originating from temporary differences were as follows:
| December 31, 2006 | December 31, 2005 | ||||||||||||||||||||||||
| Deferred assets | Deferred liabilities | Deferred assets | Deferred liabilities | ||||||||||||||||||||||
| Short-term | Long-term | Short-term | Long-term | Short-term | Long-term | Short-term | Long-term | ||||||||||||||||||
| ThUS$ | ThUS$ | ThUS$ | ThUS$ | ThUS$ | ThUS$ | ThUS$ | ThUS$ | ||||||||||||||||||
Temporary differences | |||||||||||||||||||||||||
| Allowance for doubtful accounts | 1,544 | - | - | - | 1,173 | - | - | - | |||||||||||||||||
| Vacation accrual | 835 | - | - | - | 656 | - | - | - | |||||||||||||||||
| Overhead costs | - | - | 980 | - | - | - | 552 | - | |||||||||||||||||
| Depreciation | - | - | - | 34,374 | - | - | - | 31,769 | |||||||||||||||||
| Other events | 2,515 | 1,882 | 68 | 2,359 | 1,231 | 2,574 | 148 | 511 | |||||||||||||||||
| Other provisions | 1,342 | 253 | - | 16,715 | 289 | 346 | 422 | 10,257 | |||||||||||||||||
| Tax losses carryforward | 7,555 | 80,733 | - | - | 504 | 99,044 | - | - | |||||||||||||||||
| Cost of forest | - | - | 1,005 | 15,445 | - | - | 64 | 17,730 | |||||||||||||||||
| Forest reserve | - | - | - | 59,590 | - | - | - | 48,682 | |||||||||||||||||
| Asset financing cost | - | - | - | 6,149 | - | - | - | 7,021 | |||||||||||||||||
| Provision for particle board line | - | 1,451 | - | - | - | 1,049 | - | - | |||||||||||||||||
| Complementary account forest reserve net of amortization | - | - | - | (10,178 | ) | - | - | - | (10,325 | ) | |||||||||||||||
| Complementary accounts net of amortization | - | (1,110 | ) | - | (16,915 | ) | (35 | ) | (1,469 | ) | - | (18,259 | ) | ||||||||||||
| Valuation allowance | (1,862 | ) | (53,627 | ) | - | - | - | (52,852 | ) | - | - | ||||||||||||||
| Total | 11,929 | 29,582 | 2,053 | 107,539 | 3,818 | 48,692 | 1,186 | 87,386 | |||||||||||||||||
F-23
NOTE 9 - OTHER CURRENT ASSETS
Other current assets include the following:
| December 31, | |||||||
| 2006 | 2005 | ||||||
| ThUS$ | ThUS$ | ||||||
| Bond issuance costs | 2,288 | 2,305 | |||||
| Unrealized losses on interest rate swap agreements | - | 385 | |||||
| Securities purchased under resale agreements | - | 541 | |||||
| Treasury stock | - | 1,842 | |||||
| Other | 191 | 132 | |||||
| Total | 2,479 | 5,205 | |||||
NOTE 10 - PROPERTY, PLANT AND EQUIPMENT
Property, plant and equipment include the following:
| December 31, | |||||||||||||||||||
| 2006 | 2005 | ||||||||||||||||||
| Gross value | Accumulated depreciation | Net value | Gross value | Accumulated depreciation | Net value | ||||||||||||||
| ThUS$ | ThUS$ | ThUS$ | ThUS$ | ThUS$ | ThUS$ | ||||||||||||||
| Land | |||||||||||||||||||
| Land | 142,758 | - | 142,758 | 132,130 | - | 132,130 | |||||||||||||
| Plantations | 630,042 | - | 630,042 | 564,236 | - | 564,236 | |||||||||||||
| Buildings and infrastructure | 220,140 | (74,650 | ) | 145,490 | 224,661 | (67,469 | ) | 157,192 | |||||||||||
| Machinery and equipment | 849,262 | (299,521 | ) | 549,741 | 824,958 | (262,286 | ) | 562,672 | |||||||||||
| Other property, plant and equipment | 127,207 | (40,973 | ) | 86,234 | 77,450 | (40,795 | ) | 36,655 | |||||||||||
| Reappraisals Land | 2,672 | - | 2,672 | 2,671 | - | 2,671 | |||||||||||||
| Buildings and infrastructure | 4,718 | (4,307 | ) | 411 | 4,719 | (4,278 | ) | 441 | |||||||||||
| Total | 1,976,799 | (419,451 | ) | 1,557,348 | 1,830,825 | (374,828 | ) | 1,455,997 | |||||||||||
Capitalized plantation financing costs for the years ended December 31, 2006 and 2005 amounted to ThUS$ 6,534 and ThUS$ 5,182, respectively.
Government grants awarded for forestry activities are accounted for as a reduction of Plantations. Grants balances related to non-harvested plantations amounted to ThUS$ 5,305 and ThUS$ 5,686 as of December 31, 2006 and 2005, respectively.
F-24
NOTE 11 - INVESTMENTS IN UNCONSOLIDATED AFFILIATES
Investments in unconsolidated affiliates included the following at December 31, 2006 and 2005:
| Number of | Ownership percentage | Shareholders’ equity of investee | Result for the year | Equity in earnings (losses) | Equity value | Investment book value | ||||||||||||||||||||||||||||||||||||||||||||||
| Company | Country | Currency | shares | 2006 | 2005 | 2006 | 2005 | 2006 | 2005 | 2004 | 2006 | 2005 | 2004 | 2006 | 2005 | 2006 | 2005 | |||||||||||||||||||||||||||||||||||
| % | % | ThUS$ | ThUS$ | ThUS$ | ThUS$ | ThUS$ | ThUS$ | ThUS$ | ThUS$ | ThUS$ | ThUS$ | ThUS$ | ThUS$ | |||||||||||||||||||||||||||||||||||||||
| Oxinova C.A. | Venezuela | Dollar | 1,963,564 | 49.000 | 49.000 | 9,492 | 8,285 | 1,250 | 1,493 | 2,720 | 613 | 720 | 1,333 | 4,651 | 4,060 | 4,651 | 4,060 | |||||||||||||||||||||||||||||||||||
| Total | 4,651 | 4,060 | 4,651 | 4,060 | ||||||||||||||||||||||||||||||||||||||||||||||||
F-25
NOTE 12 - GOODWILL AND NEGATIVE GOODWILL
Goodwill includes the following:
| December 31, | December 31, | ||||||||||||
| 2006 | 2005 | ||||||||||||
| Company | Amount amortized in the period | Balance of goodwill | Amount amortized in the period | Balance of goodwill | |||||||||
| ThUS$ | ThUS$ | ThUS$ | ThUS$ | ||||||||||
| Masisa USA, Inc. (1) | - | - | 706 | - | |||||||||
| Masisa Cabrero S.A. (2) | 85 | 1,165 | 85 | 1,249 | |||||||||
| Total | 85 | 1,165 | 791 | 1,249 | |||||||||
Negative goodwill includes the following:
| December 31, | December 31, | ||||||||||||
| 2006 | 2005 | ||||||||||||
| Company | Amount amortized in the period | Balance of goodwill | Amount amortized in the period | Balance of goodwill | |||||||||
| ThUS$ | ThUS$ | ThUS$ | ThUS$ | ||||||||||
| Corporación Forestal | |||||||||||||
| Guayamure C.A. (3) | 124 | 1,751 | 124 | 1,874 | |||||||||
| Masisa (4) | 2,766 | 29,301 | 2,766 | 32,067 | |||||||||
| Forestal Tornagaleones S.A. (5) | 855 | 12,622 | 163 | 13,480 | |||||||||
| Inversiones Internacionales Terranova S.A. (6) | 335 | 5,703 | 335 | 6,039 | |||||||||
| Forestal Argentina S.A. (7) | 472 | 8,975 | - | - | |||||||||
| Total | 4,552 | 58,352 | 3,388 | 53,460 | |||||||||
| (1) | This subsidiary was acquired in 1997 and goodwill was amortized over ten years. |
| (2) | During 2000, the Company’s then existing consolidated subsidiary Old Masisa purchased a 92.61% interest in Masisa Cabrero S.A. from Forestal Terranova and Fibras del Noreste S.A. for ThUS$ 43,469, which resulted in goodwill of ThUS$ 1,593. The goodwill is being amortized over twenty years. |
| (3) | This negative goodwill originated as a result of the acquisition of Corporación Forestal Guayamure C.A., a Venezuelan company, and is being amortized over twenty years. |
| (4) | The acquisition of a 43.16% interest in Old Masisa in July 2002 and a 0.544% interest in June 2005 resulted in negative goodwill.This negative goodwill is being amortized over fifteen years. |
| (5) | On June 27, 2002, the Company, through it then existing subsidiary Old Masisa, made a capital investment of ThUS$ 7,372 in its subsidiary Forestal Tornagaleones S.A., which increased its ownership by 6.45%. This investment resulted in negative goodwill of ThUS$ 2,012. This negative goodwill is being amortized over twenty years. |
On November 15, 2005, the Company purchased 9,987,400 shares, equivalent to 34.35% of Tornagaleones, generating a negative goodwill of ThUS$ 11,890 that it is being amortized over twenty years.
F-26
| (6) | In October 2004, the Company, through its subsidiary Masisa (formerly Forestal Terranova S.A.), acquired a 39.99% interest in Inversiones Internacionales Terranova S.A. resulting in negative goodwill of ThUS$ 6,709. This negative goodwill is being amortized over twenty years. |
| (7) | In January 2006, Tornagaleones purchased 22,406,455 shares, equivalent to 48.58% of FASA, generating negative goodwill of ThUS$ 9,447. This negative goodwill is being amortized over twenty years. |
NOTE 13 - OTHER ASSETS
Other assets include the following:
| At December 31, | |||||||
| 2006 | 2005 | ||||||
| ThUS$ | ThUS$ | ||||||
| Forestry exploitation rights (1) | 10,321 | 10,759 | |||||
| Assets for disposal | 1,320 | 942 | |||||
| Fees paid and tax credits (2) | - | 463 | |||||
| Receivable for swap agreements | 5,842 | 2,350 | |||||
| Fair value swap agreements | - | 20 | |||||
| Discount on bonds issued | 5,080 | 7,443 | |||||
| Bond issuance costs | 5,918 | 2,416 | |||||
| Other | 1,739 | 1,287 | |||||
| Total | 30,220 | 25,680 | |||||
| (1) | In May 1997, the Company entered into a US$ 28.5 million contract with CVG-Proforca, a Venezuelan governmental entity, for the rights to use and harvest 59,000 hectares of plantation consisting of Caribbean type lumber for a term of 30 years. As a condition to enter into this contract, the Company was required to enter into a fifteen year operating lease contract for a sawmill owned by CVG-Proforca requiring a payment of US$ 10.0 million. At the inception of both contracts, the Company paid the full amounts totaling US$ 38.5 million. |
Under Chilean GAAP, the US$ 28.5 million paid was capitalized as purchased timber resources and included in Property, plant and equipment in the Consolidated Balance Sheets. The accounting policy pursuant to Chilean GAAP for timber resources is described above in Note 2 i). Further, under Chilean GAAP, the US$ 10 million paid for the lease contract was capitalized as an intangible and included under Other assets in the Consolidated Balance Sheets. This intangible is amortized proportionally based on the cubic meters of forest harvested as a percentage of total forests estimated to be harvested.
During 2000, Terranova de Venezuela S.A. acquired from its subsidiary Coforven S.A., the exploitation rights to 236,000 annual cubic meters of lumber and a sawmill for ThUS$ 3,324. The exploitation rights are being amortized according to the amount of cubic meters of harvested products from the forest owned by Terranova de Venezuela S.A. and used to supply the plants. The balance of Coforven’s goodwill amounted to ThUS$ 987 at the date of sale, has been included as part of exploitation rights since Terranova de Venezuela acquired a significant part of the production assets of Coforven S.A.
| (2) | Corresponds to prepaid fees and tax expenses incurred for obtaining long-term loans by the Company and its subsidiary Inversiones Internacionales Terranova S.A. These expenses are amortized over the term of the loans. |
F-27
NOTE 14 - SHORT-TERM BANK BORROWINGS
Short-term bank borrowings maturing in one year or less included the following at December 31, 2006 and 2005:
| Currency or indexation rate borrowing denominated in | |||||||||||||||||||
| Other foreign | |||||||||||||||||||
| US Dollars | currencies | Total | |||||||||||||||||
| Issuer | 2006 | 2005 | 2006 | 2005 | 2006 | 2005 | |||||||||||||
| ThUS$ | ThUS$ | ThUS$ | ThUS$ | ThUS$ | ThUS$ | ||||||||||||||
| Banco del Desarrollo | - | 3,042 | - | - | - | 3,042 | |||||||||||||
| Banco Itau BBA S.A | 615 | - | - | - | 615 | - | |||||||||||||
| Banco de Chile | - | 5,030 | - | - | - | 5,030 | |||||||||||||
| ABN AMRO Bank | 3,701 | 8,046 | - | 5,102 | 3,701 | 13,148 | |||||||||||||
| HSBC Bank USA | - | 4,668 | - | - | - | 4,668 | |||||||||||||
| Banco Corpbanca | - | 9,064 | - | - | - | 9,064 | |||||||||||||
| Banco Mercantil | - | - | 26,835 | 16,339 | 26,835 | 16,339 | |||||||||||||
| Banco Boston N.A | - | 23,143 | - | - | - | 23,143 | |||||||||||||
| Citibank NA | - | 13,372 | - | - | - | 13,372 | |||||||||||||
| Banco de Venezuela | - | - | 19,370 | 24,293 | 19,370 | 24,293 | |||||||||||||
| Banco BBVA | - | 3,022 | - | - | - | 3,022 | |||||||||||||
| Banco Provincial | - | - | 8,423 | - | 8,423 | - | |||||||||||||
| Citibank Venezuela | - | - | 6,585 | - | 6,585 | - | |||||||||||||
| Totales | 4,316 | 69,387 | 61,213 | 45,734 | 65,529 | 115,121 | |||||||||||||
| Principal outstanding | 3,729 | 68,800 | 59,472 | 45,456 | 63,201 | 114,256 | |||||||||||||
| Average annual interest rate | 5.25 | % | 4.64 | % | 10.86 | % | 14.28 | % | |||||||||||
F-28
Accrued interest totaling ThUS$ 2,328 and ThUS$ 865 at December 31, 2006 and 2005, respectively, is included in the outstanding balances.
At December 31, 2006, the Company had ThUS$ 509,724 of short-term lines of credit, of which ThUS$ 327,295 were unused and available for borrowing on an unsecured basis.
NOTE 15 - LONG-TERM BANK OBLIGATIONS
| a) | Current portion of long-term bank borrowings with banks and financial institutions are summarized as follows at December 31, 2006 and 2005: |
| Currency or indexation rate borrowing denominated in | |||||||||||||||||||||||||
| US Dollars | Other foreign currencies | UF | Total | ||||||||||||||||||||||
| Issuer | 2006 | 2005 | 2006 | 2005 | 2006 | 2005 | 2006 | 2005 | |||||||||||||||||
| ThUS$ | ThUS$ | ThUS$ | ThUS$ | ThUS$ | ThUS$ | ThUS$ | ThUS$ | ||||||||||||||||||
| Westdeutsche Landesbank (1) | 1,827 | 2,960 | - | - | - | - | 1,827 | 2,960 | |||||||||||||||||
| Kreditanstal Fur Wieder a (2) | 4,059 | 13,458 | - | - | - | - | 4,059 | 13,458 | |||||||||||||||||
| Banco BBVA, Chile (3) | 2,235 | 1,521 | - | - | - | - | 2,235 | 1,521 | |||||||||||||||||
| Banco Del Estado De Chile (4) | 6,662 | 4,456 | - | - | - | - | 6,662 | 4,456 | |||||||||||||||||
| Corpbanca (5) | 16,546 | 9,771 | - | - | - | - | 16,546 | 9,771 | |||||||||||||||||
| Raboinvestments Chile S.A. (6) | 2,166 | 833 | - | - | - | - | 2,166 | 833 | |||||||||||||||||
| Banco Crédito e Inversiones (7) | 8,383 | 6,938 | - | - | - | 3,056 | 8,383 | 9,994 | |||||||||||||||||
| Comerica Bank | - | 4,357 | - | - | - | - | - | 4,357 | |||||||||||||||||
| Citibank N.A. | 84 | - | - | - | - | - | 84 | - | |||||||||||||||||
| Banco de Chile - New York (9) | - | 4,410 | - | - | - | - | - | 4,410 | |||||||||||||||||
| The Bank of Nova Scotia (10) | 84 | 7,996 | - | - | - | - | 84 | 7,996 | |||||||||||||||||
| Corpbanca Venezuela (11) | - | - | - | 3,889 | - | - | - | 3,889 | |||||||||||||||||
| Banco Santander Chile (12) | 5,044 | 5,900 | - | - | - | - | 5,044 | 5,900 | |||||||||||||||||
| Banco Security (13) | 2,584 | 1,905 | - | - | - | - | 2,584 | 1,905 | |||||||||||||||||
| Rabobank Nederland (14) | 3,076 | 2,571 | - | - | - | - | 3,076 | 2,571 | |||||||||||||||||
| Banco Itau BBA | - | 2,011 | - | - | - | - | - | 2,011 | |||||||||||||||||
| ABN Amro Bank | 37 | - | - | - | - | - | 37 | - | |||||||||||||||||
| Others | - | - | - | - | - | - | - | - | |||||||||||||||||
| Totales | 52,787 | 69,087 | - | 3,889 | - | 3,056 | 52,787 | 76,032 | |||||||||||||||||
| Principal outstanding | 50,886 | 66,320 | - | 3,844 | - | 2,990 | 50,886 | 73,154 | |||||||||||||||||
Accrued interest totaling ThUS $1,901 and ThUS$ 2,878 at December 31, 2006 and 2005, respectively, is included in the outstanding balances.
F-29
b) Long-term bank borrowings with banks and financial institutions are summarized as follows at December 31, 2006 and 2005:
| Maturities | December 31, 2006 | December 31, 2005 | ||||||||||||||||
| Average | Average | |||||||||||||||||
| 1year to | 2 years to | 3 years to | 5 years to | Total | annual | Total | annual | |||||||||||
| Issuer | Currency | 2 years | 3 years | 5 years | 10 years | long-term | interest rate | long term | interest rate | |||||||||
| ThUS$ | ThUS$ | ThUS$ | ThUS$ | ThUS$ | % | ThUS$ | % | |||||||||||
| Westdeutsche Landesbank (1) | US$ | 1,741 | 5,821 | 7,425 | 12,375 | 27,362 | LIBOR+ 0.4875 | 7,864 | LIBOR+ 0.4500 | |||||||||
| Kreditanstal Fur Wieder (2) | US$ | 3,800 | 3,800 | 1,900 | - | 9,500 | LIBOR+ 2.2000 | 26,620 | LIBOR+ 2.2000 | |||||||||
| BBVA Banco (3) | US$ | 1,252 | - | - | - | 1,252 | LIBOR+ 1.1000 | 2,890 | LIBOR+ 1.1000 | |||||||||
| BBVA Banco | US$ | 193 | - | - | - | 193 | LIBOR+ 1.1000 | - | - | |||||||||
| Banco Estado (4) | US$ | 4,233 | - | - | - | 4,233 | LIBOR+ 1.1000 | 8,464 | LIBOR+ 1.1000 | |||||||||
| Corpbanca (5) | US$ | 8,011 | - | - | - | 8,011 | LIBOR+ 1.1000 | 18,386 | LIBOR+ 1.1000 | |||||||||
| Raboinvestments Chile S.A. (6) | US$ | 1,500 | 1,500 | 3,500 | 4,000 | 10,500 | LIBOR+ 0.9000 | 12,500 | LIBOR+ 0.9000 | |||||||||
| Banco Crédito Inversiones (7) | US$ | 5,278 | 2,778 | 1,388 | - | 9,444 | LIBOR+ 1.1000 | 14,723 | LIBOR+ 1.1000 | |||||||||
| Comerica Bank | US$ | - | - | - | - | - | - | 2,143 | LIBOR+ 1.3500 | |||||||||
| Citibank N.A. (8) | US$ | - | 4,950 | 19,800 | - | 24,750 | LIBOR+ 0.4875 | - | - | |||||||||
| Banco Chile New York | US$ | - | - | - | - | - | - | 4,250 | LIBOR+ 1.2500 | |||||||||
| The Bank of Nova Scotia (9) | US$ | - | 4,950 | 19,800 | - | 24,750 | LIBOR+ 0.4875 | 13,750 | LIBOR+ 1.1500 | |||||||||
| CorpBanca Venezuela | Bol | - | - | - | - | - | - | 4,155 | LIBOR+ 1.3500 | |||||||||
| Banco Santander Chile (10) | US$ | 2,923 | - | - | - | 2,923 | LIBOR+ 1.1000 | 3,479 | LIBOR+ 1.1000 | |||||||||
| Banco Security (11) | US$ | 1,166 | - | - | - | 1,166 | LIBOR+ 1.1000 | 2,331 | LIBOR+ 1.1000 | |||||||||
| Banco Rabobank Nederland (12) | US$ | 3,040 | 7,810 | 23,390 | 1,620 | 35,860 | LIBOR+ 0.4875 | 13,969 | LIBOR+ 1.0000 | |||||||||
| ABN AMRO Bank (13) | US$ | - | 2,200 | 8,800 | - | 11,000 | LIBOR+ 0.4875 | - | ||||||||||
| Total | 33,137 | 33,809 | 86,003 | 17,995 | 170,944 | 135,524 | ||||||||||||
F-30
| (1) | Corresponds to two loans. First loan with an outstanding balance of ThUS$ 4,354 is repayable in six semi-annual installments starting in June 2007. Second loan with an outstanding balance of ThUS$ 24,750 is repayable in six semi-annual installments starting in June 2009. |
| (2) | Corresponds to two loans. First loan with an outstanding balance of ThUS$ 1,330 is repayable in seven semi-annual installments starting in April 2007. Second loan with an outstanding balance of ThUS$ 11,970 is repayable in seven semi-annual installments starting in April 2007. |
| (3) | The outstanding balance of this loan as of December 31, 2006 is repayable in four semi-annual installments starting in March 2007 with semi-annual interest payments. |
| (4) | The outstanding balance of this loan as of December 31, 2006 is repayable in four semi-annual installments, starting in March 31, 2007, with semi-annual interest payments. |
| (5) | The outstanding balance of this loan as of December 31, 2006 is repayable in four semi-annual installments, starting in April 30, 2007, with semi-annual interest payments. |
| (6) | Corresponds to two loans. First loan is repayable in twelve semi-annual installments starting in April 2007. Second loan is repayable in seven semi-annual installments starting in May 2007. |
| (7) | The outstanding balance of this loan as of December 31, 2006 is repayable in four semi-annual installments, commencing April 2007, with interest payments to be made semi-annually. |
| (8) | This loan is repayable in six semi-annual installments, commencing June 2009, with semi-annual interest payments. |
| (9) | This loan is repayable in six semi-annual installments, commencing June 2009, with semi-annual interest payments. |
| (10) | This loan is repayable in four semi-annual installments, commencing March 2007, with semi-annual interest payments. |
| (11) | This loan is repayable in four semi-annual installments, commencing March 2007, with semi-annual interest payments. |
| (12) | Corresponds to two loans. First loan is repayable in twelve semi-annual installments starting in April 2007. Second loan is repayable in six semi-annual installments starting in June 2009. |
| (13) | The outstanding balance of this loan as of December 31, 2006 is repayable in six semi-annual installments, starting in June 2009, with semi-annual interest payments. |
F-31
Scheduled payments of long-term bank borrowings at December 31, 2006 are as follows:
| Amounts payable during the | ||||
| years ending December 31, | ThUS$ | |||
| 2007 | 118,316 | |||
| 2008 | 33,137 | |||
| 2009 | 33,809 | |||
| 2010 | 39,939 | |||
| 2011 and thereafter | 64,059 | |||
| Total | 289,260 | |||
F-32
NOTE 16 - BONDS AND PROMISSORY NOTES
Bonds and promissory notes include the following.
| Notional | Interest | Maturity | Commencement of interest | Principal | At December 31, | |||||||||||||||||||||||
| Series | amounts | Currency | rate | date | payment | repayment | 2006 | 2005 | ||||||||||||||||||||
| (in thousands) | % | ThUS$ | ThUS$ | |||||||||||||||||||||||||
Short-term portion | ||||||||||||||||||||||||||||
| Terranova bonds | A | 3,500 | U.F. | 5.00 | 06/15/2009 | Semi-annually | 2006 | - | 123,007 | |||||||||||||||||||
| Terranova bonds | B | 1,000 | U.F. | 6.00 | 06/15/2024 | Semi-annually | 2009 | - | 35,160 | |||||||||||||||||||
| Terranova bonds | C | 30,000 | US$ | 4.92 | 06/15/2008 | Semi-annually | 2008 | 62 | 62 | |||||||||||||||||||
| Masisa bonds | A | 500 | U.F. | 4.92 | 12/15/2010 | Semi-annually | 2006 | 17,362 | 17,716 | |||||||||||||||||||
| Masisa bonds | B | 702 | U.F. | 6.16 | 12/15/2024 | Semi-annually | 2011 | 62 | 63 | |||||||||||||||||||
| Masisa bonds | D | - | U.F. | 4.21 | 10/15/2012 | Semi-annually | 2008 | 604 | 0 | |||||||||||||||||||
| Masisa bonds | E | 137 | U.F. | 4.70 | 10/15/2026 | Semi-annually | 2007 | 5,662 | 0 | |||||||||||||||||||
| Private Placement | B | 9,000 | US$ | 8.06 | 05/14/2008 | Semi-annually | 2006 | 9,185 | 9,278 | |||||||||||||||||||
| Total | 32,937 | 185,286 | ||||||||||||||||||||||||||
Long-term portion | ||||||||||||||||||||||||||||
| Terranova bonds | C | 30,000 | US$ | 4.94 | 06/15/2008 | Semi-annually | 2008 | 30,000 | 30,000 | |||||||||||||||||||
| Masisa bonds | A | 2,000 | U.F. | 4.94 | 12/15/2010 | Semi-annually | 2006 | 52,666 | 65,340 | |||||||||||||||||||
| Masisa bonds | B | 702 | U.F. | 6.16 | 06/15/2024 | Semi-annually | 2011 | 24,178 | 24,621 | |||||||||||||||||||
| Masisa bonds | D | 2,000 | U.F. | 4.21 | 10/15/2012 | Semi-annually | 2008 | 67,957 | - | |||||||||||||||||||
| Masisa bonds | E | 2,612 | U.F. | 4.70 | 10/15/2026 | Semi-annually | 2007 | 90,311 | - | |||||||||||||||||||
| Private Placement | B | 9,000 | US$ | 8.06 | 06/15/2008 | Semi-annually | 2008 | 9,000 | 18,000 | |||||||||||||||||||
| Total | 274,112 | 137,961 | ||||||||||||||||||||||||||
F-33
a) Bonds
In June 2003, the Company issued UF 4,000,000 Series A fixed rate UF denominated bonds in the Chilean market. Series A bonds mature on June 15, 2009 and pay interest at 5.0%. Interest is payable on June 15 and December 15 of each year with the first payment having been paid on December 15, 2003. Principal is payable on June 15 and December 15 of each year with the first payment due on December 15, 2006.
In June 2003, the Company issued UF 1,000,000 Series B fixed rate UF denominated bonds in the Chilean market. Series B bonds mature on June 15, 2024 and pay interest at 6.0 %. Interest is payable on June 15 and December 15 of each year with the first payment having been paid on December 15, 2005. Principal is payable on June 15 and December 15 of each year with the first payment due on December 15, 2009.
In June 2003, the Company issued ThUS$ 30,000 Series C fixed rate US$ denominated bonds in the Chilean market. Series C bonds mature on June 15, 2008 and pay interest at 5.0%. Interest is payable on June 15 and December 15 of each year with the first payment having been paid on December 15, 2005.
In December 2003, the Company´s subsidiary (Old Masisa S.A.) issued ThUS$ 91,453 of fixed rate bonds in the Chilean market. Series A bonds of ThUS$ 71,394 mature in seven years and pay interest at 5.0%. Series B bonds of ThUS$ 20,059 mature in twenty one years and pay interest at 6.25%. Interest is payable on both Series A and B bonds on June 15 and December 15 of each year with the first payment due on June 15, 2005.
On December 22, 2005, the holders of the Series A and B bonds issued in June 2003 were notified of their respective prepayment planned for January 23, 2006. As a result, the Company classified such bonds as current for the year ended December 31, 2005. These bonds were prepaid in January 2006 and similar bonds, Series D and Series E, were issued, under the following terms and conditions:
· | Series D UF 2,000,000 fixed rate bonds: Series D bonds mature on October 15, 2012 and pay interest at 4.25%. Interest is payable on October 15 and April 15 of each year with the first payment having been paid on April 15, 2006. Principal is payable on April 15 and October 15 of each year with the first payment due on April 15, 2008. |
· | Series E UF 2,750,000 fixed rate bonds: Series E bonds mature on October 15, 2026 and pay interest at 4.75%. Interest is payable on October 15 and April 15 of each year with the first payment having been paid on April 15, 2006. Principal is payable on April 15 and October 15 of each year with the first payment due on April 15, 2007. |
b) Promissory notes
In May, 1996, the Company’s indirect subsidiary Masisa Overseas Ltd., issued ThUS$ 70,000 of fixed rate Promissory notes. Series A Promissory notes of ThUS$ 25,000 matured in 2003 and paid interest at 7.82%. Series B Promissory notes outstanding of ThUS$ 22,000 mature in 2008 and pay interest at 8.06%.
F-34
Scheduled payments of the long-term portion of bonds and promissory notes at December 31, 2006 are as follows:
| Amounts payable during the years ending December 31, | ThUS$ | |||
| 2007 | 32,937 | |||
| 2008 | 74,733 | |||
| 2009 | 36,227 | |||
| 2010 | 35,733 | |||
| 2011 and thereafter | 127,419 | |||
| Total | 307,049 | |||
NOTE 17 - ACCRUED LIABILITIES
Accrued liabilities include the following:
| December 31, | |||||||
| 2006 | 2005 | ||||||
| ThUS$ | ThUS$ | ||||||
| Accrued vacations | 6,356 | 5,256 | |||||
| Provision for bonuses | 4,406 | 1,266 | |||||
| Consulting services | 2,223 | 925 | |||||
| Export expenses and freight | 588 | 787 | |||||
| Services | 1,664 | 1,508 | |||||
| Fines from Venezuela | 1,624 | 1,784 | |||||
| Provision for major repairs | 98 | 1,382 | |||||
| Other taxes | 6,219 | 3,087 | |||||
| Others | 8,564 | 5,579 | |||||
| Total | 31,742 | 21,574 | |||||
F-35
NOTE 18 - SHAREHOLDERS’ EQUITY
| a) | Changes in capital and reserve accounts for the years ended December 31, 2006, 2005 and 2004 were as follows: |
| Common stock | Other reserves | Retained earnings | Development stage deficit | Net (loss) income for the year | Total Equity | ||||||||||||||
| ThUS$ | ThUS$ | ThUS$ | ThUS$ | ThUS$ | ThUS$ | ||||||||||||||
2004 | |||||||||||||||||||
| Balance at December 31, 2003 | 602,117 | 113,551 | 39,122 | (4,133 | ) | (20,010 | ) | 730,647 | |||||||||||
| Transfer to retained earnings | - | - | (24,143 | ) | 4,133 | 20,010 | - | ||||||||||||
| Cancellation of treasury shares | (18,378 | ) | - | - | - | - | (18,378 | ) | |||||||||||
| Increase in forestry reserve due to appraisal | - | 9,795 | - | - | - | 9,795 | |||||||||||||
| Cumulative translation adjustment | - | (703 | ) | - | - | - | (703 | ) | |||||||||||
| Net income for the year | - | - | - | - | 56,778 | 56,778 | |||||||||||||
| Balance at December 31, 2004 | 583,739 | 122,643 | 14,979 | - | 56,778 | 778,139 | |||||||||||||
| Common stock | Other reserves | Retained earnings | Development stage deficit | Net (loss) income for the year | Total Equity | ||||||||||||||
| ThUS$ | ThUS$ | ThUS$ | ThUS$ | ThUS$ | ThUS$ | ||||||||||||||
2005 | |||||||||||||||||||
| Balance at December 31, 2004 | 583,739 | 122,643 | 14,979 | - | 56,778 | 778,139 | |||||||||||||
| Transfer to retained earnings | - | - | 56,778 | - | (56,778 | ) | - | ||||||||||||
| Dividends paid | - | - | (52,111 | ) | - | - | (52,111 | ) | |||||||||||
| Capital increase | 69,740 | - | - | - | - | 69,740 | |||||||||||||
| Capital effects due to merger | 112,742 | 33,403 | 91,906 | - | - | 238,051 | |||||||||||||
| Increase in forestry reserve due to appraisal | - | 32,842 | - | - | - | 32,842 | |||||||||||||
| Cumulative translation adjustment | - | 3,202 | - | - | - | 3,202 | |||||||||||||
| Net income for the year | - | - | - | - | 24,434 | 24,434 | |||||||||||||
| Balance at December 31, 2005 | 766,221 | 192,090 | 111,552 | - | 24,434 | 1,094,297 | |||||||||||||
| Common stock | Other reserves | Retained earnings | Development stage deficit | Net (loss) income for the year | Total Equity | ||||||||||||||
| ThUS$ | ThUS$ | ThUS$ | ThUS$ | ThUS$ | ThUS$ | ||||||||||||||
2006 | |||||||||||||||||||
| Balance at December 31, 2005 | 766,221 | 192,090 | 111,552 | - | 24,434 | 1,094,297 | |||||||||||||
| Transfer to retained earnings | - | - | 24,434 | - | (24,434 | ) | - | ||||||||||||
| Dividends paid | - | - | (11,490 | ) | - | - | (11,490 | ) | |||||||||||
| Capital increase | 42,143 | - | - | - | - | 42,143 | |||||||||||||
| Increase in forestry reserve due to appraisal | - | 33,330 | - | - | - | 33,330 | |||||||||||||
| Cumulative translation adjustment | - | (1,410 | ) | - | - | - | (1,410 | ) | |||||||||||
| Net income for the year | - | - | - | - | 29,485 | 29,485 | |||||||||||||
| Balance at December 31, 2006 | 808,364 | 224,010 | 124,496 | - | 29,485 | 1,186,355 | |||||||||||||
F-36
b) Paid-in capital
At December 31, 2006 and 2005, the capital of the Company was divided into 5,667,750,881 and 5,437,018,860 shares outstanding without nominal value, respectively.
At the extraordinary shareholders’ meeting held on August 29, 2005, the Company agreed to an increase in capital of US$ 150,000,000 through the issue, subscription and payment of 650,000,000 shares with no par value stock.
During 2005, 387,958,843 shares were subscribed and paid, for a total amount of ThUS$ 69,740. In January 2006, with the subscription and payment of 234,544,225 additional shares for a total amount of ThUS$ 42,143, the Company terminated its subscription process.
At the extraordinary shareholders’ meetings of the former Masisa S.A. and the former Terranova S.A. held on April 12 and 13, 2005, the shareholders approved the merger of the former Masisa S.A. into the former Terranova S.A. (see Note 1).
The extraordinary shareholders’ meeting of the former Terranova S.A. approved modifications to its bylaws, the principal ones being a change in the company’s name to Masisa S.A. and an increase in the capital of the Company, to ThUS$ 696,481 divided into 5,049,060,017 shares of no par value, through the issue of 1,130,632,161 new shares of no par value, to be issued fully to shareholders of the former Masisa S.A. in the appropriate proportion according to the agreed share exchange.
c) Other reserves
Other reserves include the following:
| December 31, | |||||||
| 2006 | 2005 | ||||||
| ThUS$ | ThUS$ | ||||||
| Forestry reserves | 193,186 | 159,856 | |||||
| Capital effects due to merger | 33,403 | 33,403 | |||||
| Cumulative translation adjustment | (5,792 | ) | (4,382 | ) | |||
| Other | 3,183 | 3,213 | |||||
| Total | 224,010 | 192,090 | |||||
d)Dividends
The dividend policy established by the Company is to distribute annually to shareholders a sum, to be defined at the ordinary shareholders’ meeting, of no less than 30% and no more than 50% of the consolidated net income for each year, without the payment of interim dividends.
F-37
e) Treasury shares
As a result of the previous merger between the Company and its consolidated subsidiary Forestal Terranova, the Company acquired 87,871,054 of its own shares that were held by Forestal Terranova S.A. before the merger. Additionally, as allowed by Chilean Law, certain dissenting shareholders of Forestal Terranova S.A. exercised their redemption rights for the receipt of cash payments. As a result, the Company acquired 2,937,494 shares of Forestal Terranova S.A. which after the merger resulted in the Company holding 13,538,394 of its own shares. These treasury shares did not have voting rights, were recorded at cost and included under Other long-term assets in the Consolidated Balance Sheets. On December 26, 2004, the treasury shares were cancelled. As a result,, common stock was decreased by ThUS$ 18,378 and outstanding shares were reduced by 101,409,448 during the fourth quarter of 2004.
As a result of the merger transaction between the Company and Old Masisa, the Company acquired 18,078,984 shares of Old Masisa shares for ThUS$ 4,581 from certain dissenting shareholder’s. These treasury shares are recorded in Other current assets.
As part of the December 2005 increase in capital, the Company placed 10,806,939 treasury shares in the market and the resulting treasury stock balance at December 31, 2005, was 7,272,045 with a value of ThUS$1,842. During 2006, the Company placed 3,459,841 treasury shares in the Chilean market for a value of ThUS$649. The book value of these shares was ThUS$ 876. The remaining treasury shares, with a book value of ThUS$ 966, were retired resulting in a decrease in capital. The impact of the treasury share offering in the market resulted in loss of ThUS$ 227 in 2006 which was recorded as an Other non-operating expense.
NOTE 19 - OTHER NON-OPERATING INCOME
Other non-operating income during each period includes the following:
| Year ended December 31, | ||||||||||
| 2006 | 2005 | 2004 | ||||||||
| ThUS$ | ThUS$ | ThUS$ | ||||||||
| Gain on sale of forests | 1,280 | 2,149 | 44,284 | |||||||
| Fixed asset impairment reversal (1) | 3,038 | - | - | |||||||
| Tax devolution | 884 | - | - | |||||||
| Gain on sale of goods and services | 433 | - | 364 | |||||||
| Lease of offices, parking lots and other | - | 110 | 474 | |||||||
| Compensation from insurance | - | - | 1,120 | |||||||
| Other | 1,263 | 540 | 1,010 | |||||||
| Total | 6,898 | 2,799 | 47,252 | |||||||
| (1) | During 2006, the Company evaluated the estimated future cash flows expected from its Valdivia plant. As a result of the evaluation, the Company concluded that the previous impairment provision on the plant was no longer required. Accordingly, such provision was reversed with effect in earnings. |
F-38
NOTE 20 - OTHER NON-OPERATING EXPENSES
Other non-operating expenses during each period includes the following:
| Year ended December 31, | ||||||||||
| 2006 | 2005 | 2004 | ||||||||
| ThUS$ | ThUS$ | ThUS$ | ||||||||
| Provision for idle assets (1) | - | - | 9,190 | |||||||
| Temporary shut-down of industrial plant | 570 | 1,019 | 155 | |||||||
| Depreciation and amortization | 969 | 1,181 | 1,004 | |||||||
| Provision for doubtful accounts non-operational accounts | - | - | 2,762 | |||||||
| Donations | 445 | 118 | 350 | |||||||
| Loss on sale of goods and services | 821 | 996 | 63 | |||||||
| Severance indemnities | 539 | 449 | 2,094 | |||||||
| Patents, taxes and commissions | 542 | 962 | 385 | |||||||
| Corporate reorganization expenses | - | - | 411 | |||||||
| Lease of assets from third parties | - | 50 | 1,376 | |||||||
| Fines and penalties | 446 | 470 | - | |||||||
| Cost of losses (damages) | 1,356 | 288 | 987 | |||||||
| Provisions for molding plant in Venezuela | 2,150 | - | - | |||||||
| Write-off and other expenses | 1,405 | - | - | |||||||
| Severance and sawmill reparation costs (2) | 4,804 | - | - | |||||||
| Write-down of fixed assets | 635 | - | - | |||||||
| Other | 1,201 | 2,956 | 2,990 | |||||||
| Total | 15,883 | 8,489 | 21,767 | |||||||
| (1) | During the fourth quarter of 2004, the Company recognized a ThUS$ 4,912 provision for wood scanners in Chile and Brazil that after a testing period and negotiations with the supplier were determined to be unusable for their intended purpose. The provision was for the total cost of the equipment. Additionally, the Company recognized a provision for ThUS$ 1,023 during 2004 as a result of obsolete particle board line equipment in Masisa Mexico. The equipment was partially used to recondition a different particle board line and the remaining balance was completely written off since the expected recoverable value is negligible. The Company also recognized a provision for ThUS$ 640 during 2005 for equipment on Masisa Argentina’s impregnation line considered obsolete. The provision was for the entire book value of the equipment. The remaining ThUS$ 2,615 provisions were for various obsolete plant and equipment in Terranova Chile and Venezuela representing the entire book value of such equipment since the expected recoverable value is negligible. |
| (2) | In March 2006, The Company early terminated its sawmill rental agreement with Proforca. This termination resulted in a compensation payment of ThUS$1,097 and expenses related to the sawmill for ThUS$3,707. |
F-39
NOTE 21 - COMMITMENTS AND CONTINGENCIES
The following are the contingencies and commitments outstanding for the year ended December 31, 2006:
a) Financial covenants.
In the ordinary course of business, the Company has certain restrictive convenants associated with its short-term and long-term bank obligations and its bonds and promissory notes. Such covenanents include, among other restrictions, compliance with certain financial ratios including debt and expense ratios, prohibitions of selling or transferring certain assets, and maintaining insurance policies on select assets. All of the Company’s covenants are being met at the date of these financial statements.
b) Deferred customs duties
At December 31, 2006, the Company owed deferred customs duties of ThUS$ 18 (ThUS$ 195 in 2005). These duties are not presented as liabilities as the Company plans to utilize export incentives that provide exemption from the payment of these.
c) Other contingencies
On August 26, 2003, the Internal Tax Service in Chile notified the Company that it incorrectly recognized in its taxable income the results of its foreign agencies. This impacted the Company´s calculation of taxable losses for which the Company has booked US$ 39.2 million in recoverable taxes and unused tax losses as of December 31, 2006. The Company has appealed this claim. Based on the opinion of its legal counsel, management believes that this claim will not have a material adverse effect on the Company’s financial position or results of operations that have not already been recognized on the consolidated financial statements.
d) Sale of Shares and Shareholders Agreement
| · | The Company's Venezuelan subsidiary, Oxinova C.A., signed a shareholder’s agreement with Oxiquim S.A. restricting the sale of its shares and prohibiting pledges or liens over any shares held and maintained by Fibranova C.A. |
| · | The Chilean subsidiary Inversiones Internacionales Terranova S.A., on May 23, 2002, signed a shareholder’s agreement with the state Corporación Venezolana de Guayana (CVG), to regulate the obligations of a Venezuelan corporation formed for the construction, management and operation of a river port on the north bank of the Orinoco River, Macapaima, Venezuela on behalf of the Company. |
e) Timber purchase contract
The subsidiary Terranova de Venezuela S.A. (TDVSA) has a timber purchase contract that covers a total of 59,000 hectares in the State of Monagas, Venezuela, comprising two areas of 30,000 and 29,000 hectares each. The exploitation period for these forest plantations is 30 years, which began in 1997. The contract includes certain procedural restrictions.
f) Usufruct agreement over 30,000 hectares
In May 1997, TDVSA signed an agreement with CVG-Proforca C.A. for water rights over a plot of land of 30,000 hectares. The term of the contract is 30 years, but the usage rights will cease once TDVSA has exploited all the forest resources following the twentieth year.
F-40
g) Annual sales contract with CVG PROFORCA C.A.
During April 2000, TDVSA signed an annual sales contract with CVG-Proforca C.A. for 400,000 cubic meters of commercial Caribbean pine timber. The contract identifies specific timber and sets forth a set unit price, to be indexed annually according to changes in the U.S. Consumer Price Index (CPI) during the preceding year.
h) Resin supply contract
The Company´s Venezuelan subsidiary Fibranova C.A. entered into a 10 years resin supply agreement with Oxinova C.A. for the purchase of a minimum amount of resin of ThUS$ 17,667 per year.
i) Operating lease obligatins
The Company maintains operating lease obligations under long-term forestry land lease agreements and other short and long-terms office, facility and IT leases. The following are the future minimum payments under these agreements:
| Year | Amount | |||
| ThUS$ | ||||
| 2007 | 6,807 | |||
| 2008 | 6,182 | |||
| 2009 | 3,553 | |||
| 2010 | 3,250 | |||
| 2011 | 2,931 | |||
| Thereafter | 2,227 | |||
| 24,951 | ||||
NOTE 22 - SUBSEQUENT EVENTS
During January 2007, a total of 1,171 hectares of planted forests belonging to Masisa S.A. (1,065 hectares) and Tornagaleones (106 hectares), both located in the eighth region of Chile, were affected by forest fires. The affected properties of both companies are covered by policies of insurance and settlement is in process.
During January 2007, the Company’s Board of Directors decided to close the operations of their MDF moulding plant in Charleston, South Carolina (USA). The plan was closed at the beginning of February 2007 and included the termination of approximately 35 employees. The MDF moulding production line will be relocated during 2007 to the Company´s Cabrero Industrial Complex. The assets that may ultimately be liquidated will not have a material effect on the future results of the Company. The net book value of the plant at December 31, 2006 was ThUS$ 2,386.
In June 2007, The Company subscribed an agreement to sell a 90% ownership interest in Forestal Argentina S.A. to Los Boldos S.A. (a subsidiary of Diversified International Timber Holdings LLC) and Grupo Nueva S.A. (a subsidiary of Nueva Holding Inc.) for US$ 107.2 million. As a result of this sale Masisa will recognize a gain of US$ 29 million in fiscal year 2007.
From December 31, 2006, to the date of our opinion, we do not have knowledge of any other material subsequent events.
F-41
NOTE 23 - DIFFERENCES BETWEEN CHILEAN AND UNITED STATES GENERALLY ACCEPTED ACCOUNTING PRINCIPLES
Accounting principles generally accepted in Chile (“Chilean GAAP”) vary in certain important respects from the accounting principles generally accepted in the United States of America (“US GAAP”). Such differences involve certain methods for measuring the amounts shown in the financial statements, as well as additional disclosures required by US GAAP.
1. Differences in measurement methods
The principal methods applied in the preparation of the accompanying financial statements which have resulted in amounts which differ from those that would have otherwise been determined under US GAAP are as follows:
a) Functional currency, reporting currency and inflation accounting
i) The Company (previously “Terranova”)
Since the year ended December 31, 1992, the functional and reporting currency of the Company has been the U.S. dollar. For the years prior to 1992, the Company presented its financial statements in Chilean pesos restated to reflect the full effects of the change in the purchasing power of the Chilean peso on the financial position and results of operations of reporting entities. The method, described in Note 2 d), is based on a model which enables the calculation of net inflation gains or losses caused by monetary assets and liabilities exposed to changes in the purchasing power of the local currency by restating all non-monetary accounts in the financial statements. The model prescribes that the historical cost of such accounts be restated for general price-level changes between the date of origin of each item and the year-end, and allows direct utilization of replacement values for the restatement of inventories as an alternative to the price-level restatement of those assets, but only if the resulting variation is not material.
As a result of the change in functional and reporting currency in 1992, for Chilean GAAP purposes, the Company’s accounting records, which until December 31, 1991 had been maintained in its former functional currency, Chilean pesos adjusted for the effects of price level changes, were translated to U.S. dollars by dividing all of the Company’s assets and liabilities by the Chilean peso-U.S. dollar exchange rate prevailing on December 31, 1991.
Pursuant to US GAAP, when a change in functional currency occurs previously issued financial statements should not be restated and a change in the functional currency should be reported prospectively from the date of the change. If the functional currency changes from a non-inflation adjusted local currency to the U.S. dollar, the translated amounts using the exchange rate prevailing at the end of the period prior to the change for non-monetary assets and liabilities and equity accounts become the accounting basis in the period of the change and in subsequent periods. However, in the case of a change from a price-level adjusted currency, such as the Chilean peso, to the U.S. dollar, US GAAP requires the elimination of the accumulated inflation effects on all assets and liabilities for all periods prior to the date of the change before the translation to U.S. dollar. Accordingly, for the reconciliation of net income and equity from Chilean GAAP to US GAAP for the year ended December 31, 2006 and 2005, the Company has (1) eliminated all price-level adjustments of all non-monetary assets and liabilities originated prior to January 1, 1992 and (2) translated all non-monetary assets, liabilities and shareholders’ equity accounts based on the prevailing exchange rate on December 31, 1991. The above reconciling items result in an adjustment included in paragraph 1 r) below.
F-42
ii) Old Masisa
Until the date of the merger, the reporting currency of the consolidated subsidiary Old Masisa was the U.S. dollar. Prior to January 1, 2003, Old Masisa reported its financial statements in Chilean pesos. Effective January 1, 2003 and following the approval of the appropriate Chilean regulatory authorities, Old Masisa changed its reporting currency to the U.S. dollar in order to be consistent with Terranova’s financial functional and reporting currency and to facilitate Terranova’s consolidation process for financial reporting purposes. Old Masisa’s functional currency has not changed and remains the U.S. dollar.
As a result of the change in reporting currency in 2003, for Chilean GAAP purposes, Old Masisa’s accounting records, which until December 31, 2002 had been maintained in Chilean pesos adjusted for the effects of price level changes, were translated to U.S. dollars by dividing all of the Company’s assets and liabilities by the Chilean peso-U.S. dollar exchange rate prevailing on December 31, 2002.
Under US GAAP, a change in reporting currency from a price-level adjusted currency such as the Chilean peso to the U.S. dollar requires the prior year financial statements be recast as if the U.S. dollar had been used for all periods. Accordingly, for the reconciliation of net income and equity from Chilean GAAP to US GAAP for all periods presented, the Company has (1) eliminated all price-level adjustments; (2) remeasured all monetary assets and liabilities at current exchange rates; and (3) remeasured non-monetary assets and liabilities based upon exchange rates at the date of acquisition of Terranova’s control or historical exchange rates if later. The resulting adjustment is included in paragraph 1 r) below.
iii) Subsidiaries with accounting records maintained in inflation adjusted Chilean pesos
The Company consolidates those subsidiaries that maintain their accounting records in Chilean pesos adjusted for inflation by translating all peso adjusted for inflation assets, liabilities, revenues and expenses using the exchange rate prevailing at the end of each period. Also, in accordance with Chilean GAAP, the Company records a translation adjustment included in shareholders’ equity derived from the net difference between the value of its investment in those subsidiaries resulting from the movement in the exchange rate between the Chilean peso and the U.S. dollar, the Company’s functional currency.
Pursuant to US GAAP, subsidiaries which maintain their records in a currency other than its functional currency, must remeasure their financial statements into the functional currency before translating to the reporting currency. For all subsidiaries, the functional currency is the U.S. dollar for US GAAP purposes. All monetary assets and liabilities are remeasured based on current exchange rates and all non-monetary assets and liabilities and shareholders’ equity are remeasured based on historical exchange rates. Revenues and expenses are remeasured at the weighted-average of the exchange rates in the period. All remeasurement effects are recorded as a component of net income.
Accordingly, for the reconciliation of net income and equity from Chilean GAAP to US GAAP for December 31, 2006 and 2005, the Company has (1) eliminated all price-level adjustments; (2) remeasured all monetary assets and liabilities at current exchange rates; (3) remeasured non-monetary assets, liabilities and shareholders’ equity accounts based on historical exchange rates; and (4) revenues and expenses at the weighted-average of the exchange rates in the period.
In accordance with Chilean GAAP, for subsidiaries that maintain accounting records in Chilean pesos, monetary assets or liabilities denominated in U.S. dollars are translated to Chilean pesos at year-end exchange rates and the corresponding adjustment is included in net income for the subsidiary. Pursuant to US GAAP, this adjustment is not required for monetary assets and liabilities denominated in U.S. dollars as the Company’s functional currency is the US dollar.
F-43
The effects resulting from the above differences between the Chilean GAAP financial statement presentation and currency translation and the methods described above for US GAAP purposes are presented as an adjustment to Chilean GAAP net income. The cumulative effect of these adjustments has been presented net of the corresponding tax effect as an adjustment to Chilean GAAP net equity. Resulting adjustment for this is reflected in paragraph 1 r) below.
b) Income taxes
Under Chilean GAAP, effective January 1, 2000, the Company began applying TB 60 of the Chilean Institute of Accountants concerning deferred income taxes. TB 60 requires the recognition of deferred income taxes for all temporary differences, whether recurring or not, using an asset and liability approach. For US GAAP purposes, in prior years the Company applied Statement of Financial Accounting Standard (“SFAS”) No. 109, “Accounting for Income Taxes”, whereby income taxes are also recognized using substantially the same asset and liability approach. Deferred income tax assets and liabilities established for temporary differences between the financial reporting basis and tax basis of the Company’s assets and liabilities are based on enacted rates at the dates that the temporary differences are expected to reverse. The effect of changes in tax rates is included in income for the period that includes the enactment date.
After the year ended December 31, 1999, Chilean GAAP and US GAAP differ due to the recognition for US GAAP purposes of the reversal of deferred income taxes included in the US GAAP reconciliation in years prior to 2000.
Prior to the implementation of TB 60, no deferred income taxes were recorded under Chilean GAAP if the related timing differences were expected to be offset in the year that they were projected to reverse by new timing differences of a similar nature.
Furthermore, deferred income tax assets under both Chilean and US GAAP should be reduced by a valuation allowance if, based on the weight of available evidence, it is more likely than not that some portion or all of the deferred income tax assets will not be realized. The valuation allowance should be sufficient to reduce the deferred income tax asset to an amount that is more likely than not to be realized.
The effect of providing for deferred income taxes for the differences between the amounts shown for assets and liabilities in the balance sheet and the tax basis of those assets and liabilities is included in paragraph 1 r) below and certain disclosures required under SFAS No. 109 are set forth in paragraph 2 a) below.
c) Revaluation of timber resources
As mentioned in Note 2 i) above, certain timber assets are reported in the financial statements at amounts determined in accordance with an annual technical appraisal. Revaluation of property, plant and equipment is an accounting principle that is not generally accepted in the United States. The effects of the reversal of this revaluation for both investments in unconsolidated affiliates and consolidated subsidiaries are shown in the reconciliation of shareholder’s equity in paragraph 1 r), below. As previously indicated in Note 2 i) above, the revaluation of timber resources is not given effect in the Consolidated Statements of Income under Chilean GAAP and therefore no US GAAP adjustment is necessary.
F-44
d) Revaluation of property, plant and equipment
As described in Note 2 i) above, certain property, plant and equipment has been reported in the financial statements at amounts determined in accordance with a one-time technical appraisal. The revaluation of property, plant and equipment is an accounting principle not generally accepted under U.S. GAAP. The effects of the reversal of this revaluation as well as the related accumulated depreciation and depreciation expense for the year is shown in the Chilean GAAP to U.S. GAAP reconciliation below under paragraph 1 r).
e) Business combinations, goodwill and negative goodwill
Under US GAAP, the purchase method is used for all business combinations. The acquired company’s assets and liabilities are adjusted to give effect to the purchase price paid by the acquiring company. If, after the assets, including intangibles, and liabilities of the acquired company have been adjusted to their fair value, at the acquisition date, the purchase price exceeds the amount of such fair value, the excess is recorded as goodwill. SFAS No. 141, “Business Combinations”, establishes specific criteria for the recognition of intangible assets separately from goodwill and it requires unallocated negative goodwill to be allocated pro rata to the acquired assets or written-off immediately as an extraordinary gain. Goodwill and certain specifically identified intangibles are assigned an indefinite useful life. Accordingly, no goodwill amortization expense is recorded for US GAAP purposes. Goodwill and indefinite life intangibles are subject to annual impairment tests based on the fair value method.
Until December 31, 2003, under Chilean GAAP, the excess of cost over the net book value of a purchased company is recorded as goodwill (the book value purchase method), which is then amortized to income over a maximum period of twenty years. Amortization of goodwill may be accelerated if the acquired company generates sufficient income to absorb the additional amortization in any given year. The excess of net book value over the cost of an investment is considered to be negative goodwill under Chilean GAAP and is also amortized to income over a maximum period of twenty years. The amortization of negative goodwill may be accelerated if the acquired company sustains losses. Beginning January 1, 2004, goodwill and negative goodwill are calculated based on the net fair value of the assets acquired, except in situations where minority interest of consolidated subsidiaries are purchased, in which case a business combination is not deemed to have occurred and any goodwill and negative goodwill are based on the net book value of the assets acquired.
i) Transactions with Old Masisa
Acquisition of remaining minority interest and merger with Old Masisa in 2005
In April 2005, the shareholders of the Company and its 52.434% owned subsidiary, Old Masisa, approved the merger by incorporation of the subsidiary into and with the Company. Conditions required to ratify the merger were completed on May 31, 2005. See Note 1 for details.
Under Chilean GAAP, the acquisition of the 47.566% of Old Masisa, was accounted for similarly to a merger of commonly controlled companies on a prospective basis as of January 1, 2005. Thus, effective January 1, 2005, the historical values of Old Masisa’s assets and liabilities were combined with the Company’s and the minority interest related to Old Masisa was eliminated as of that date. Accordingly, under Chilean GAAP, the operating results for the year ended December 31, 2005 reflect no minority interest impact for Old Masisa as the subsidiary was considered wholly-owned beginning January 1, 2005. Historical financial statements for periods prior to the merger are not restated under Chilean GAAP. Costs related to the merger were expensed under Chilean GAAP.
F-45
Under US GAAP, the merger transaction was accounted for in accordance with Statement of Financial Accounting Standards (SFAS) No. 141, “Business Combinations”. Accordingly, the acquired 47.566% interest of the former subsidiary was incorporated into the Company using the purchase method of accounting. The purchase price was determined based on the market value of the Company shares offered as of May 31, 2005 (the date of the merger under US GAAP), plus incremental direct costs. The book values of individual assets and liabilities were adjusted to their fair values as of the merger date for the proportional interest that was acquired. As for Chilean GAAP purposes, the merger transaction became effective on January 1, 2005 whereas for US GAAP purposes the date of the merger was May 31, 2005, there is a reconciling amount to provide for the minority interest in the operating results of Old Masisa under Chilean GAAP for the first five months of the year. Additionally, as a result of the application of SFAS No. 141 and the fair value adjustments under US GAAP, the Company recognized an intangible asset for the Masisa brand name which was not recognized under Chilean GAAP. The impact of the amortization charge for the difference in the book value and fair value of the assets acquired is reflected as a reconciling item and included in the line item, Business combinations, acquisition of Old Masisa. For U.S. GAAP purposes, goodwill is not amortized but is subject to annual impairment tests based on the fair value method. The purchase accounting adjustments and related calculation of goodwill related to the merger are as follows:
| ThUS$ | ||||
| Net book value of Old Masisa under US GAAP (as of date of acquistion) | 421,346 | |||
Incremental fair value of identified intangible asset (i) (net of deferred taxes of ThUS$ 3,512) | 17,146 | |||
| Adjustment to net assets of Old Masisa to reconcile to fair value (net of deferred taxes of ThUS$ 17,355) | (96,282 | ) | ||
| Fair value of Old Masisa (at date of acquisition) | 342,210 | |||
| Fair value of minority interest acquired in Old Masisa (47.566%) | 162,776 | |||
Purchase price, including expenses related to the acquisition (ii) | 249,857 | |||
| Goodwill under US GAAP | 87,801 | |||
| (i) | Identified intangible associated with Masisa brand name. |
| (ii) | The purchase price represents the market value on the Santiago Stock Exchange at May 31, 2005 of 1,130,632,161 of Company´s shares at a price of US$ 0.2178, plus external incremental cost directly related to the acquisition amounting to ThUS$ 3,560. Such incremental costs were expensed under Chilean GAAP. |
As a result of the different accounting treatment followed for the merger transaction, the shareholder’s equity reconciliation shows a reconciling item for the difference between the capital increase recorded under Chilean GAAP (ThUS$ 238,051) and the capital increase determined under US GAAP (ThUS$ 246,297), amounting to ThUS$ 8,246.
Initial acquisition of Old Masisa in 2002
The Company´s subsidiary Old Masisa was acquired through the purchase of a 43.16% interest in Old Masisa in July 2002 resulting in negative goodwill amounting to ThUS$ 40,381 as described in Note 12 above.
F-46
The following table sets forth the US GAAP purchase accounting adjustment relating to the purchase of 43.06% interest in Old Masisa:
| ThUS$ | ||||
| Net book value of Old Masisa (as of date of acquisition) | 426,086 | |||
| Incremental fair value of identified intangible asset (1) | 20,658 | |||
| Increase in deferred taxes for intangible asset | (3,512 | ) | ||
| Elimination of acquired Old Masisa’s goodwill and negative goodwill | (695 | ) | ||
| Adjustment to net tangible assets of Old Masisa to reconcile to fair value | (64,718 | ) | ||
| Increase in deferred taxes for adjustment to net tangible assets of Old Masisa to reconciliable to fair value | 13,012 | |||
| Fair value of Old Masisa as of date of acquisition | 390,831 | |||
| Fair value of interest acquired in Old Masisa (43.16%) | 168,683 | |||
| Purchase price (2) | 145,580 | |||
| Negative goodwill under US GAAP allocated to property, plant and equipment and intangible assets (3) | (29,295 | ) | ||
| 6,192 | ||||
| 1) | Identified intangible with an indefinite life associated with Masisa brand name. |
| 2) | Purchase price pursuant to US GAAP includes acquisition expenses amounting to ThUS$ 957 Under Chilean GAAP, acquisition expenses are expensed as incurred. |
| 3) | Negative goodwill has been allocated as a pro rata reduction to property, plant and equipment, intangible assets and related deferred income taxes effects, in accordance with the provisions of SFAS No. 141. |
ii) Acquisition of 34.35% of Tornagaleones in November 2005
As discussed in Note 1, in November 2005, the Company acquired an additional 34.35% of its consolidated subsidiary Tornagaleones for cash of ThUS$ 29,890 Under Chilean GAAP, the acquisition of the additional 34.35% of Tornagaleones was accounted for as a purchase based on the proportional share of the net book value of the assets acquired. The transaction under Chilean GAAP resulted in negative goodwill of ThUS$ 11,890 as the book value of the proportional net assets received exceeded the purchase price.
Under US GAAP, the acquisition was accounted for in accordance with Statement of Financial Accounting Standards (SFAS) No. 141, “Business Combinations”. Accordingly, the acquired 34.35% interest was recorded using the purchase method of accounting considering the fair value of the net assets acquired. The purchase price was determined based on cash value paid of ThUS$ 29,890, plus incremental direct costs. The book values of individual assets (primarily forest) and liabilities were substantially equal to the fair values at the acquisition date as forestry asset values are adjusted annually based on current revaluations for Chilean GAAP. Additionally, the Company did not identify any intangible assets under Chilean GAAP or US GAAP. For US GAAP purposes, the excess of the fair value of the net assets acquired over the purchase price, negative goodwill, was allocated as a pro rata reduction to the acquired assets.
F-47
iii) Maderas y Paneles S.A., Masisa Cabrero S.A. and Forestal Tornagaleones S.A.
Under Chilean GAAP, goodwill and negative arising from the purchases made by Old Masisa of Maderas y Paneles S.A., Masisa Cabrero S.A. and Forestal Tornagaleones S.A in years prior to its acquisition from the Company in 2002 are recorded at book values and amortized over 20 years. Under US GAAP, an acquiring company should not recognize the goodwill previously recorded by an acquired entity. Such differences in amortization are presented in paragrapg 1 r) below.
iv) Corporación Forestal Guayamure C.A.
Negative goodwill resulting from the purchase by the Company of Corporación Forestal Guayamure C.A. is being amortized over 20 years under Chilean GAAP. Under US GAAP, this negative goodwill would have been allocated prorata to particular forests as of the acquisition date resulting in lower cost of sales when the forest acquired was harvested. The difference between amortizing the negative goodwill to income over 20 years under Chilean GAAP and the impact under the full allocation method pursuant to US GAAP has been included in the reconciliation of net income and shareholders’ equity in paragraph 1 r) below.
v) Terranova International S.A acquisition
As described in Note 12, the Company (formerly Masisa S.A.) acquired the remaining 40% interest in Terranova International S.A. from its indirect controlling shareholder in October 2005. Under Chilean GAAP, the difference between the consideration paid and the book value of Terranova Internacional S.A. was recorded as negative goodwill which is being amortized to income over 20 years. Under US GAAP, the shares acquired from indirect controlling shareholders were considered to be an exchange of ownership interests between companies under common control. As such, the difference between the purchase price paid by Terranova and the 40% of net book value of Terranova International S.A. would have been considered a capital investment and recorded as additional paid-in capital in the consolidated shareholders’ equity of Terranova.
vi) Forestal Argentina S.A.
As described in Note 12, The Company´s subsidiary, Tornaglaeones acquired an additionl 48.58% of FASA. As FASA was already a 50.1% consolidated subsidiary of Tornagaleones, for Chilean GAAP purposes, this additional acquisition of a unrelated minority interest was not considered a business combination. Accordingly, the proportionate share of the acquired assets was transferred at book value. Negative goodwill was recorded for the excess of the book value of the net acquired assets over the purchase price which is being amortized to income over 20 years. For US GAAP purposes, this transaction was accounted for in accordance with SFAS 141 and the puchase method of accounting applied. Accordingly, the proportionate book value of the assets and liabilities acquired were adjusted to their fair values. No intangible assets were identified. For US GAAP, the excess of the fair value of the assets over the purchase price also resulted in negative goodwill. However, for US GAAP this exess was allocated as a pro rata reduction to the acquired assets. As a result of this allocation, the new carrying value of the net assets acquired was less then the carry value recoreded under Chilean GAAP in ThUS$ 8,687. The impact of this difference is reflected below in paragraph 1 r) below.
F-48
vii) Amortization of Goodwill and Intangible Assets
Under US GAAP, the Company adopted Statement of Financial Accounting Standard No. 142, “Goodwill and Other Intangible Assets”, (SFAS No. 142) as of January 1, 2002. SFAS No. 142 applies to all goodwill and identified intangible assets acquired in a business combination. Beginning January 1, 2002, all goodwill, including that acquired before initial application of the standard, and indefinite-lived intangible assets are not amortized, but must be tested for impairment at least annually. The Company has performed the annual impairment test of the goodwill originated on its acquisitions and did not identify any impairment.
The adjustments for the differences in accounting for business combinations, goodwill and negative goodwill between Chilean GAAP and US GAAP, as described above, are shown in the reconciliation of net income and shareholder’s equity in paragraph 1 r) below.
f) Capitalization of interest and exchange differences
Under Chilean GAAP, the capitalization of interest costs is optional. As described in Note 2 i), the Company capitalizes financing costs on long-term investment projects in a manner consistent with US GAAP.
Under Chilean GAAP, foreign exchange gains and losses associated with foreign-currency denominated debt, which qualifies for interest capitalization, can be netted against the corresponding capitalized interest. Under US GAAP, only the interest on the qualifying debt related to investment projects is capitalized and foreign currency gains and losses on foreign-currency denominated debt is recorded in income as a non-operating gain or loss.
Under Chilean GAAP, the Company also capitalizes interest costs incurred in connection with the development of its forests. Under US GAAP, interest costs incurred to finance the development of forests are not normally capitalized.
The adjustments for the reversal of capitalizing interest costs incurred in connection with the development of forests and the netting of foreign-currency gains and losses against interest capitalized pursuant to Chilean GAAP is shown in the reconciliations of net income and shareholder’s equity in paragraph 1 r) below.
g) Treasury stock
As mentioned in Note 18 e), as a result of the merger transaction, the Company recorded its own shares obtained in the legal reorganization described in Note 1 and it's shares purchased from dissenting shareholders who exercised their redemption rights as an asset. Under US GAAP, such shares would have been recorded as treasury stock as a reduction of Shareholders’ equity. In 2006, a portion of these treasury shares were placed in the market and the remaining shares retired. The effect of such difference at December 31, 2005 and 2006 is included under paragraph 1 r) below.
h) Derivative contracts
At December 31, 2006 and 2005, the Company had derivative contracts consisting of interest rate swap agreements which have been designated as hedges of forecasted transactions. These contracts were obtained to mitigate interest rate risk with respect to certain variable interest rate debt.
F-49
Pursuant to Chilean GAAP, derivatives are accounted for in accordance with Technical Bulletin No. 57, “Accounting for Derivative Contracts” (TB 57). Pursuant to TB 57, all derivative financial instruments should be recognized on the balance sheet at their fair value. In addition, TB 57 requires that derivative financial instruments be classified as non-hedging (investment) instruments and hedging instruments, the latter further divided into those covering recognized assets or liabilities or an unrecognized firm commitment and those covering forecasted transactions.
Contracts to hedge forecasted transactions are those that have the objective of protecting cash flow risks of a transaction expected to occur in the future (a cash flow hedge). The hedging instrument should be recorded at its fair value and the changes in fair value should be stated on the balance sheet as unrealized gains or losses. When the contract is closed, the unrealized gains or losses on the derivative instrument should be recognized in earnings without affecting the cost or sales price of the asset acquired or sold in the transaction. However, probable losses arising from purchase commitments should not be deferred.
For US GAAP reconciliation purpose only, the Company has adopted SFAS No. 133 “Accounting for Derivative Instruments and Hedging Activities,” as amended by SFAS No. 137 and SFAS 138 (collectively referred to herein as SFAS 133). SFAS No. 133 establishes accounting and reporting standards for derivative instruments, including certain derivative instruments embedded in other contracts, and for hedging activities. It requires that an entity recognize all derivatives as either assets or liabilities in the consolidated balance sheet and measure those instruments at fair value. If certain conditions are met, a derivative may be specifically designated as (a) a hedge of the exposure to changes in the fair value of a recognized asset or liability or an unrecognized firm commitment, (b) a hedge of the exposure to variable cash flows of a forecasted transaction or to the variability of the cash flows that are to be received or paid in connection with a recognized asset or liability or (c) a hedge of the foreign currency exposure of a net investment in a foreign operation, an unrecognized firm commitment, an available-for-sale security, a foreign-currency-denominated forecasted transaction or a recognized asset or liability.
While the Company entered into derivatives for the purpose of mitigating its interest rate risk, these contracts do not meet the requirements to qualify for hedge accounting under US GAAP. Therefore, changes in the respective fair values of all derivative instruments are reported in earnings when they occur.
The effect of the differences in accounting for derivative financial instruments are included in the reconciliation of Chilean GAAP and US GAAP in paragraph 1 r) below.
| i) | Timber cutting rights |
In May 1997, the Company entered into a US$ 28.5 million contract with CVG-Proforca, a Venezuelan governmental entity, for the rights to use and harvest 59,000 hectares of plantation consisting of Caribbean type lumber for a term of 30 years. As a condition to enter into this contract, the Company was required to enter into a 15 year operating lease contract for a sawmill owned by CVG-Proforca requiring a payment of US$ 10 million. At the inception of both contracts, the Company paid the full amounts totaling US$ 38.5 million. In March 2006, such operating lease agreement was early terminated by The Company.
Under Chilean GAAP, the US$ 28.5 million paid was capitalized as purchased timber resources and included in Property, plant and equipment in the Consolidated Balance Sheets. The accounting policy pursuant to Chilean GAAP for timber resources is described above in Note 2 i). Further, under Chilean GAAP, the US$ 10 million paid for the lease contract was capitalized as an intangible and included under Other assets in the Consolidated Balance Sheets. This intangible is amortized proportionally based on the cubic meters of forest harvested as a percentage of total forests estimated to be harvested.
F-50
Under US GAAP, the US$ 38.5 paid would be allocated to the estimated fair values of (1) the timber purchased as of the date of the contract, (2) the lease contract for the sawmill with an estimated useful life of 18 years, and (3) the intangible asset acquired for the right to cut timber. The Company is not using the sawmill in its own operations; however, it is sub-leased to a third party under an operating lease. Additionally, based on the conditions of the lease contract, the lease would be accounted for as a capital lease. Subsequently, the cost of the timber purchased would be charged to cost of sales proportionally based on the cubic meters of timber harvested as a percentage of total timber purchased. Cost of sales would also include the amortization of the intangible (forest rights), which would be amortized based on the volume of timber harvested as a percentage of total timber to be harvested under the contract.
The effect of the differences in accounting for the contracts described above are included in the reconciliation of Chilean GAAP and US GAAP in paragraph 1 r) below.
| j) | Asset retirement obligation |
As part of the contract with CVG-Proforca for the right to use and harvest 59,000 hectares of plantation, the Company is required to reforest 7,500 hectares upon the termination of the contract on May 23, 2027. The contract requires that on expiration of the contract, each hectares should have at least four hundred Caribbean type lumber trees with a minimum age of ten years.
Pursuant to US GAAP, the Company adopted SFAS No. 143, “Accounting for Asset Retirement Obligations” (SFAS No. 143) as of January 1, 2004. SFAS No. 143 requires entities to record the fair value of a liability for an asset retirement obligation in the period in which it is incurred. When the liability is initially recorded, the entity capitalizes the cost by increasing the carrying amount of the related long-lived asset. Over time, the liability is accreted to its present value each period and the capitalized cost is depreciated over the useful life of the related asset. Upon settlement of the liability, the entity either settles the obligation for the amount recorded or incurs a gain or loss. For US GAAP purposes, the Company considers that the contractual obligation to reforest 7,500 hectares meets the definition of an asset retirement obligation under SFAS No. 143.
Under Chilean GAAP, in 2004 there was no specific pronouncement related to asset retirement obligations and such obligations were not accounted for by the Company. However, under current practice, the cost associated with an asset retirement obligation is accrued based on the present value of the estimated obligation. At December 31, 2006, the Company has registered an accrual associated with this obligation for Chilean GAAP reporting.
The adjustments for the differences in accounting for asset retirement obligations between Chilean GAAP and US GAAP, as described above, are shown in the reconciliation of net income and shareholder’s equity in paragraph 1 r) below.
| k) | Direct financing lease agreement |
During 2001 and 2002, the Company’s subsidiary, Masisa Madeiras, sold certain harvesting equipment to unrelated third parties financed without interest charges over 48 months. The Company retained title with respect to the machinery. The agreements were consummated as part of an outsourcing initiative related to harvesting activities. Contemporaneous with the sale of the equipment, service agreements were consummated with such parties to whom the equipment was sold to provide services to Masisa Madeiras. Payments due from Masisa Madeiras to the counterparties for service provided to Masisa Madeiras are reduced by the amount of the installments due by such counterparties under the financed sale of equipment.
F-51
Pursuant to Chilean GAAP, the Company has classified the historical cost of equipment sold under the agreement under Other assets in the Consolidated Balance Sheets and has not depreciated the equipment since the date of the sale agreements. A liability has been recorded under Other current liabilities in the Consolidated Balance Sheets for installments paid by the counterparties or for which service payments were reduced in the amount of the installments.
Under US GAAP, this transaction is accounted for as a sale pursuant to a direct financing lease agreement.
An adjustment to derecognize the equipment and the liability received for payments received from the Consolidated Balance Sheets and to recognize the receivable from counterparties discounted to present value and the interest earned has been included in the Chilean GAAP to US GAAP reconciliation below under paragraph 1 r).
| l) | Equipment held for sale |
The Company’s subsidiary, Masisa Madeiras, discontinued the use of certain equipment in 2003 and decided to list it for sale. In June 2006, such equipment was sold. Under Chilean GAAP, the Company discontinued annual depreciation and the equipment was reclassified to Other assets in the Consolidated Balance Sheets as of December 31, 2005.
For US GAAP purposes, and until December 31, 2002, such equipment did not meet the criteria of a long-lived asset to be disposed of by sale or otherwise as defined by SFAS No. 144, “Accounting for the Impairment or Disposal of long-lived Assets.” During 2003, the conditions for considering the equipment as an asset to be disposed of by sale were met. As such, the equipment would be recorded at the lower of carrying amount or fair value less costs to sell in the US GAAP balance sheet as of December 31, 2005.
An adjustment to recognize depreciation expense and accumulated depreciation until the date the equipment qualified as an asset held for sale under US GAAP and to recognize the difference between carrying amount and fair value less cost to sell has been included in the Chilean GAAP to US GAAP reconciliation below under paragraph 1 r).
| m) | Minority interest |
The proportional effects of the US GAAP adjustments described above related to the Company’s subsidiaries have been included in the reconciliation of net income and Shareholder’s equity in paragraph 1 r) below.
| n) | Balance sheet and income statement classifications under US GAAP |
| i) | As disclosed in Note 2 n), under Chilean GAAP, the Company has classified the discount on the issuance of bonds amounting to ThUS$ 6,457 and ThUS$ 9,076 as of December 31, 2006 and 2005, respectively, in prepaid assets and other assets. Under US GAAP, in accordance with APB Opinion No. 21, “Interest on Receivables and Payables”, the discount on the issuance of bonds should be reported in the balance sheet as a direct reduction from the face amount of the related bonds instead of a deferred charge. |
F-52
| ii) | As disclosed in Notes 19 and 20, under Chilean GAAP, the Company has classified certain items in non-operating results (i.e., certain gains and losses on sales of property, plant and equipment; write-downs of property, plant and equipment; depreciation of equipment temporarily out of service, certain provisions for non operating accounts receivable losses, etc.) that under US GAAP, are included in operating income. In addition, differences in classification of income and expenses and goodwill as well as other differences between Chilean GAAP and US GAAP exist. As a result of these reclassifications pursuant to US GAAP, operating income amounted to ThUS$72,001 and ThUS$ 73,897, for the years ended December 31, 2006 and 2005, respectively. |
| o) | Minimum dividend |
As required by the Chilean Companies Act, unless otherwise decided by the unanimous vote of the holders of issued and subscribed shares, the Company must distribute a cash dividend in an amount equal to at least 30% of the Company's net income for each year as determined in accordance with Chilean GAAP, unless and except to the extent the Company has unabsorbed prior year losses. Since the payment of the 30% dividend out of each year’s income is a legal requirement in Chile, a provision has been made in the accompanying US GAAP reconciliation in paragraph 1 p) below to recognize the corresponding decrease in Shareholder’s equity at December 31 of the year to which the minimum dividend is attributed.
| p) | Change in accounting policy applied for Chilean GAAP |
The Company changed its method of accounting for a long-term non-interest bearing payable related to certain tax balances in Brazil. The Company previously recorded this payable balance at its undiscounted face amount. Upon applying the new methodology, the payable balance is now recorded at its present value based a discount rate of 9.9%. This discount rate considers, among other things, the estimated borrowing rate of the Company under similar terms. This change in accounting principle for Chilean GAAP was based on the application of Financial Interpretation 06-08 issued under International Financial Reporting Standards in August 2006. The effect of this change for Chilean GAAP was recorded prospectively and resulted in an approximate gain of US$ 3.1 million, before tax. The gain was recored as an increase in financial income for 2006. For US GAAP purposes, there was no change in the accounting treatment for this payable and the liability remains carried at its face value as the payable is related to a tax settlement from a governmental agency. An adjustment to reverse this gain and the related impacts has been included in the Chilean GAAP to US GAAP reconciliation below under paragraph 1 r).
| q) | Reversal of impairment loss on long-lived assets |
In 2003, the Company recorded an asset impairment related to its Valdivia Plant. The impairment considered a projection of losses associated with the use of certain production lines and on-going cash flows deficits. In 2006, the Company’s estimates of future cash flows associated with the plant’s existing service potencial resulted in the reversal of impairment losses previously recognized amounting to ThUS$ 3,038, with the effect being included in Other non-operating income in the consolidated statement of Income. Under USGAAP, the restoration of a previously recognized impairment loss for a depreciable long-lived asset in prohibited.
F-53
| r) | Effects of conforming to US GAAP |
The adjustments to reported net income pursuant to Chilean GAAP required to conform with accounting principles generally accepted in the United States of America include the following:
| Year ended | |||||||
| December 31, | |||||||
| 2006 | 2005 | ||||||
| ThUS$ | ThUS$ | ||||||
| Net income (loss) as shown in the Chilean GAAP financial statements | 29,485 | 24,434 | |||||
| Effect for change in functional currency (par. 1 a) | 1,361 | 1,300 | |||||
| Effect for change in reporting currency (par. 1 a) | 351 | (4,843 | ) | ||||
| Inflation adjustments (par. 1 a) | (239 | ) | (239 | ) | |||
| Deferred income taxes-reversal of complementary accounts (par. 1 b) | 950 | 1,442 | |||||
| Revaluation of property, plant and equipment (par. 1 d) | 30 | 29 | |||||
| Business combinations, goodwill and negative goodwill (par. 1 e): | |||||||
· Capitalization of acquisition costs related to the 2005 Masisa merger (par. 1 e) i) | - | 3,560 | |||||
· Minority interest effect of the 2005 Masisa merger (par. 1 e) i)) | - | (4,765 | ) | ||||
· Goodwill and negative goodwill amortization (par. 1 e) iv) and v)) | (459 | ) | 247 | ||||
· Acquisition of Old Masisa 2002 - amortization of fair value of assets and liabilities (par. 1 e) vii)) | 4,196 | 4,196 | |||||
· Elimination of acquired goodwill and negative goodwill - Old Masisa (par. 1 e) ii), iii) and vi)) | (4,008 | ) | (2,844 | ) | |||
| Capitalization of interest (par. 1 f) | (2,499 | ) | (4,518 | ) | |||
| Capitalization of exchange differences (par. 1 f) | 402 | (1,029 | ) | ||||
| Derivative contracts (par. 1 h) | 232 | 3,415 | |||||
| Timber cutting rights (par. 1 i) | 736 | 1,071 | |||||
| Asset retirement obligation (par. 1 j) | - | 539 | |||||
| Direct financing lease agreement (par. 1 k) | (98 | ) | 74 | ||||
| Equipment held for sale (par. 1 l) | 73 | 232 | |||||
| Change in Chilean GAAP accounting policy (par. 1 p) | (3,038 | ) | - | ||||
| Reversal of impairment loss on long-lived assets (par. 1 q) | (3,038 | ) | - | ||||
| Net deferred income tax effects on US GAAP adjustments (par. 1 b) | 130 | 1,533 | |||||
| Net effects of US GAAP adjustments on minority interest (par. 1 m) | (28 | ) | 1,035 | ||||
| Net income in accordance with US GAAP | 24,539 | 24,869 | |||||
| Other comprehensive income (loss) adjustments: | |||||||
· Foreign currency translation adjustments | (1,410 | ) | 3,202 | ||||
| Comprehensive income in accordance with USGAAP (par. 2 c)) | 23,129 | 28,071 | |||||
Accumulated other comprehensive income amounted to ThUS$ 15,618 and ThUS$ 17,028 as of December 31, 2006 and 2005, respectively.
F-54
The adjustments required to conform shareholders’ equity to US GAAP include the following:
| At December 31, | |||||||
| 2006 | 2005 | ||||||
| ThUS$ | ThUS$ | ||||||
| Shareholders’ equity as shown in the Chilean GAAP financial statements | 1,186,355 | 1,094,297 | |||||
| Effect for change in functional currency (par. 1 a) | (19,752 | ) | (21,113 | ) | |||
| Effect for change in reporting currency (par. 1 a) | 73,982 | 73,631 | |||||
| Inflation adjustments (par. 1 a) | (55,332 | ) | (55,093 | ) | |||
| Deferred income taxes - reversal of complementary accounts (par. 1 b) | (15,805 | ) | (16,755 | ) | |||
| Revaluation of timber resources (par. 1 c) | (193,186 | ) | (159,856 | ) | |||
| Revaluation of property, plant and equipment (par. 1 d) | (3,083 | ) | (3,113 | ) | |||
| Business combinations, goodwill and negative goodwill (par. 1 e): | |||||||
· Effect of purchase accounting 2005 - Old Masisa merger (par. 1 e) i)) | 8,246 | 8,246 | |||||
· Capitalization of acquisition costs - Old Masisa merger (par. 1 e) i)) | 3,560 | 3,560 | |||||
· Effect of Old Masisa merger on minority interest (par. 1 e) i)) | (4,765 | ) | (4,765 | ) | |||
· Goodwill and negative goodwill amortization (par. 1 e) iv) and v)) | 6,497 | 6,956 | |||||
· Acquisition of Old Masisa 2002 - amortization of fair value of assets and liabilities par. 1 e) vii)) | 19,338 | 15,142 | |||||
· Elimination of acquired goodwill and negative goodwill - Old Masisa (par. 1 e) ii), iii) and vi)) | (13,092 | ) | (9,084 | ) | |||
· Acquisition of Forestal Argentina - adjustment to fair value (par. 1 e) vi)) | 8,687 | - | |||||
| Capitalization of interest (par. 1 f) | (54,942 | ) | (51,924 | ) | |||
| Capitalization of exchange differences (par. 1 f) | (3,678 | ) | (4,599 | ) | |||
| Treasury stock (par. 1 g) | - | (1,842 | ) | ||||
| Derivative contracts (par. 1 h) | 3,776 | 3,544 | |||||
| Timber cutting rights (par. 1 i) | 1,942 | 1,025 | |||||
| Direct financing lease agreement (par. 1 k) | - | 98 | |||||
| Equipment held for sale (par. 1 l) | - | (73 | ) | ||||
| Net deferred income tax effects on US GAAP adjustments (par. 1 b) | 4,881 | 4,751 | |||||
| Minimum dividend (par. 1 o) | (8,846 | ) | (7,380 | ) | |||
| Change in Chilean GAAP accounting policy (par. 1 p) | (3,038 | ) | - | ||||
| Reversal of impairment loss on long-lived assets (par. 1 q) | (3,038 | ) | - | ||||
| Net effect of US GAAP adjustments on minority interest (par. 1 m) | (931 | ) | (903 | ) | |||
| Shareholders’ equity in accordance with US GAAP | 937,595 | 874,750 | |||||
F-55
The changes in shareholders’ equity determined under US GAAP were as follows:
| ThUS$ | ||||
| Balance at December 31, 2004 | 574,942 | |||
| Capital increase - merger | 246,297 | |||
| Paid dividend | (52,111 | ) | ||
| Minimum dividend - reversal | 17,033 | |||
| Treasury stock | (1,842 | ) | ||
| Minimun dividend | (7,380 | ) | ||
| Capital increase | 69,740 | |||
| Cumulative translation adjustment | 3,202 | |||
| Net income for the period | 24,869 | |||
| Balance at December 31, 2005 | 874,750 | |||
| Capital increase | 42,143 | |||
| Fair value acquisition of shares of Forestal Argentina | 8,687 | |||
| Paid dividend | (11,490 | ) | ||
| Minimum dividend - reversal | 7,380 | |||
| Treasury stock | 1,842 | |||
| Minimun dividend | (8,846 | ) | ||
| Cumulative translation adjustment | (1,410 | ) | ||
| Net income for the period | 24,539 | |||
| Balance at December 31, 2006 | 937,595 | |||
F-56
| 2. | Additional US GAAP disclosure requirements |
| a) | Earnings per share |
SFAS No. 128, “Earning Per Share”, requires the disclosure of basic and diluted earnings per share (EPS). Basic EPS is calculated using income available to common stockholders divided by the weighted-average of common shares outstanding during the year. Diluted EPS is similar to basic EPS except that the weighted-average of common shares outstanding is increased to include the number of additional common shares that would have been outstanding if the dilutive potential common shares, such as options, had been issued. The treasury stock method is used to calculate dilutive shares which reduce the gross number of dilutive shares by the number of shares that can be acquired from the proceeds of the options assumed to be exercised. Diluted EPS is equal to basic EPS for all periods presented as the Company did not have any potentially dilutive securities. The following disclosure of earnings per share information is not generally required for presentation in the financial statements under Chilean GAAP but is required under US GAAP:
| Year ended | |||||||
| December 31, | |||||||
| 2006 | 2005 | ||||||
| US$ | US$ | ||||||
| Basic and diluted earnings (losses) per share under Chilean GAAP | 0.005 | 0.005 | |||||
| Basic and diluted earnings (losses) per share under US GAAP | 0.004 | 0.005 | |||||
| Weighted average number of shares of | |||||||
| common stock outstanding (in thousands) | 5,664,496 | 4,591,227 | |||||
F-57
b) Income taxes
The provisions for income taxes charged to the results of operations pursuant to US GAAP were as follows:
| Year ended | |||||||
| December 31, | |||||||
| 2006 | 2005 | ||||||
| ThUS$ | ThUS$ | ||||||
| Deferred tax expense (benefit) under Chilean GAAP: | |||||||
| Chile | 2,444 | (6,186 | ) | ||||
| Foreign | 7,200 | 8,858 | |||||
| Additional deferred tax expense (benefit) under US GAAP: | |||||||
| Chile adjustment | (491 | ) | (3,248 | ) | |||
| Foreign adjustment | (589 | ) | 273 | ||||
| Total deferred tax provision under US GAAP | 8,564 | (303 | ) | ||||
| Current year provision for income tax: | |||||||
| Chile | 1,346 | 433 | |||||
| Foreign | 12,354 | 10,022 | |||||
| Total current income tax provision under US GAAP | 13,700 | 10,455 | |||||
| Total provision under US GAAP | 22,264 | 10,152 | |||||
All of the income tax provision in each year arises from Chilean, Argentinean, Mexican, Ecuadorian, Peruvian, Venezuelan, United States and Brazilian sources.
F-58
Deferred tax assets (liabilities) are summarized as follows:
| At December 31, | |||||||
| 2006 | 2005 | ||||||
| ThUS$ | ThUS$ | ||||||
| Property, plant and equipment | (55,020 | ) | (50,517 | ) | |||
| Inventories | (980 | ) | (552 | ) | |||
| Other | (16,731 | ) | (12,654 | ) | |||
| Gross deferred tax liabilities | (72,214 | ) | (63,723 | ) | |||
| Tax loss carryforwards | 88,288 | 99,548 | |||||
| Valuation allowance | (55,489 | ) | (52,852 | ) | |||
| Notes and accounts receivable | 1,544 | 1,173 | |||||
| Accrued vacations | 835 | 656 | |||||
| Other provisions | 3,046 | 4,205 | |||||
| Other | 4,397 | 1,284 | |||||
| Gross deferred tax assets | 42,621 | 54,014 | |||||
| Net deferred tax liabilities under US GAAP | (29,593 | ) | (9,709 | ) | |||
F-59
The provision for income taxes differs from the amount of income tax determined by applying the applicable Chilean statutory income tax rate (17% in 2005 and 17% in 2006) to US GAAP pretax income as a result of the following differences:
| Year ended | |||||||
| December 31, | |||||||
| 2006 | 2005 | ||||||
| ThUS$ | ThUS$ | ||||||
| US GAAP pretax income | |||||||
| Chile | 10,338 | 1,806 | |||||
| Foreign | 36,465 | 33,215 | |||||
| Total | 46,803 | 35,021 | |||||
| At statutory Chilean tax rates | |||||||
| Chile | 1,758 | 307 | |||||
| Foreign | 6,199 | 5,647 | |||||
| Total | 7,957 | 5,954 | |||||
| Increase (decrease) in rates resulting from: | |||||||
| Foreign exchange differences | 5,425 | 22,899 | |||||
| Non-taxable income | 965 | 156 | |||||
| Non-deductible expenses | 280 | 152 | |||||
| Adjustments of income tax provision of prior year | 213 | 930 | |||||
| Other local income taxes | 5 | (2,102 | ) | ||||
| Difference between tax rate in Chile and foreign subsidiaries | 4,782 | 1,355 | |||||
| Change in valuation allowance | 2,637 | (19,192 | ) | ||||
| Other | - | - | |||||
| 22,264 | 10,152 | ||||||
| c) | Comprehensive income |
Comprehensive income (loss) is the change in equity of a business enterprise during a period from transactions and other events and circumstances from non-owner sources. For US GAAP purposes, companies are required to report comprehensive income and its components in a full set of general purpose financial statements. US GAAP requires that all items that are required to be recognized under accounting standards as components of comprehensive income be reported in a financial statement that is displayed with the same prominence as other financial statements. Under Chilean GAAP, the Cumulative Translation Adjustment originated by certain investments in foreign subsidiaries and the investment in Forestal Tornagaleones S.A. is recorded in Shareholders' Equity (see Note 2b). For US GAAP, this difference would be reported in Comprehensive Income. Other Comprehensive Income and Accumulated Other Comprehensive Income required to be disclosed by this standard is shown in paragraph 1 r).
F-60
d) The following methods and assumptions were used to estimate the fair value of each class of financial instrument at December 31, 2006 and 2005 for which it is practicable to estimate that value:
| · | For cash, time deposits, marketable securities, securities purchased under resale agreements, short-term bank loans, current accounts receivable and current accounts payable, the carrying amounts approximate fair value due to the short-term maturity of these instruments. |
· | For long-term receivables, the fair values were estimated using the interest rate the Company could obtain on long-term time deposits with a term similar to the estimated collection period of the receivable. |
· | For long-term time deposits, the fair values were estimated using interest rates available for time deposits with similar remaining terms. |
· | For long-term bank borrowings, bonds and promissory notes, other long-term borrowings and other long-term liabilities, the fair values were estimated based on rates available to the Company for obligations with similar terms and remaining maturities. |
· | For interest rate swaps, fair values were estimated based on quotes obtained from brokers for derivatives with similar terms and remaining maturities. |
December 31, 2006 | December 31, 2005 | ||||||||||||
| Carrying | Fair | Carrying | Fair | ||||||||||
| amount | value | amount | value | ||||||||||
| ThUS$ | ThUS$ | ThUS$ | ThUS$ | ||||||||||
| Assets | |||||||||||||
| Cash | 16,705 | 16,705 | 11,987 | 11,987 | |||||||||
| Time deposits (short-term) | 29,388 | 29,388 | 82,906 | 82,906 | |||||||||
| Marketable securities | 956 | 956 | 2,424 | 2,424 | |||||||||
| Accounts receivable (current) | 154,051 | 154,051 | 133,608 | 133,608 | |||||||||
| Accounts receivable (long-term) | 4,113 | 4,113 | 4,901 | 4,901 | |||||||||
| Derivative contracts | - | - | 334 | 334 | |||||||||
| Liabilities | |||||||||||||
| Short-term bank borrowings | 65,529 | 65,529 | 115,121 | 115,121 | |||||||||
| Accounts payable (current) | 55,036 | 55,036 | 54,728 | 54,728 | |||||||||
| Long-term bank borrowings (including | |||||||||||||
| current portion) | 223,731 | 223,731 | 211,556 | 211,578 | |||||||||
| Bonds and promissory notes (including | |||||||||||||
| current portion) | 307,049 | 314,254 | 323,247 | 329,281 | |||||||||
| Other long-term borrowings (including | |||||||||||||
| 1,736 | 1,736 | 1,662 | 1,662 | ||||||||||
| Other long-term liabilities | 17,320 | 17,320 | 19,965 | 19,965 | |||||||||
F-61
e) Concentration of credit risk
The assets of the Company that are potentially subject to significant concentrations of credit risk are deposits held with banks and financial institutions, investments in derivative instruments and trade accounts receivable.
The Company holds accounts with a variety of banks and does not hold significant deposits or derivative instruments with any single bank. The Company performs periodic evaluations of the relative credit standing of these financial institutions and limits the amount of credit exposure with any institution. The Company has a wide customer base and trades with a large number of small customers. Consequently, the Company does not believe that it had any significant concentrations of credit risk at December 31, 2006.
f) Segment information
SFAS No. 131, “Disclosures about Segments of an Enterprise and Related Information”, establishes standards for public enterprises to determine and report information about operating segments in their annual and interim reports. The “management approach” designates the internal organization that is used by management for making operating decisions and assessing performance as the source of the Company’s reportable segments.
As a result of the merger with its previously consolidated subsidiary, the Company and its key decision makers have revised the segments of the Company and how they utilize such information. The Company has determined that the information used by the Company’s key decision makers for making operating decisions and assessing performance is now based primarily on geographical segments. The Company’s reportable geographical segments are the United States, Chile, Brazil, Venezuela, Mexico, Argentina and Other. Historical segment presentations have been restated to reflect these new segments. Management views these segments as key components of the entity’s business and expects the segments to meet the quantitative thresholds in future years.
The Company measures its reportable segments and evaluates their performance based on operating income (loss), which includes inter-segment revenues and corporate expenses that are allocated to the operating segments. The Company is not dependent on any single customer. The accounting policies underlying the reported segment data are the same as those described in the summary of significant accounting policies (see Note 2).
F-62
The following table below presents sales information about reportable segments based on the location in which the sale is originated for the year ended December 31, 2006 and 2005:
| United | Other | ||||||||||||||||||||||||
| December 31, 2006 | Chile | Brazil | Venezuela | México | States | Argentina | (1) | Total | |||||||||||||||||
| ThUS$ | ThUS$ | ThUS$ | ThUS$ | ThUS$ | ThUS$ | ThUS$ | ThUS$ | ||||||||||||||||||
| Sales | 310,733 | 186,285 | 127,121 | 118,510 | 211,833 | 122,181 | (190,156 | ) | 886,507 | ||||||||||||||||
| Operating income | 17,146 | 23,432 | 6,261 | 6,772 | 3,567 | 23,423 | 2,978 | 83,579 | |||||||||||||||||
| Capital expenditures | 72,683 | 31,423 | 14,077 | 871 | 68 | 9,022 | 635 | 128,779 | |||||||||||||||||
| Depreciation | 14,484 | 12,851 | 12,545 | 1,372 | 585 | 8,326 | 140 | 50,303 | |||||||||||||||||
United | Other | ||||||||||||||||||||||||
| December 31, 2005 | Chile | Brazil | Venezuela | México | States | Argentina | (1) | Total | |||||||||||||||||
| ThUS$ | ThUS$ | ThUS$ | ThUS$ | ThUS$ | ThUS$ | ThUS$ | ThUS$ | ||||||||||||||||||
| Sales | 245,592 | 156,440 | 99,548 | 113,520 | 191,520 | 104,890 | (167,517 | ) | 743,993 | ||||||||||||||||
| Operating income | 18,233 | 21,092 | 3,453 | 683 | 1,996 | 19,517 | 14,495 | 79,469 | |||||||||||||||||
| 35,233 | 18,620 | 8,239 | 1,629 | 541 | 8,785 | 119 | 73,166 | ||||||||||||||||||
| Depreciation | 15,935 | 12,232 | 11,983 | 1,454 | 728 | 8,331 | 28 | 50,691 | |||||||||||||||||
| (1) | Other includes inter-company eliminations. |
F-63
The following table presents sales information based on the location to which the product is shipped and long-lived asset information by geographic area:
| Sales for the | Property, plant | ||||||||||||
| year ended | and equipment at | ||||||||||||
| December 31, | December 31, | ||||||||||||
| 2006 | 2005 | 2006 | 2005 | ||||||||||
| ThUS$ | ThUS$ | ThUS$ | ThUS$ | ||||||||||
| Domestic: | |||||||||||||
| Chile | 144,343 | 122,436 | 682,218 | 626,918 | |||||||||
| Argentina | 69,622 | 56,260 | 220,347 | 218,818 | |||||||||
| Brazil | 145,706 | 104,520 | 332,884 | 281,252 | |||||||||
| Mexico | 117,207 | 111,835 | 23,882 | 24,701 | |||||||||
| United Status | 230,222 | 208,093 | 9,797 | 10,313 | |||||||||
| Venezuela | 92,391 | 61,990 | 287,856 | 293,776 | |||||||||
| Other | 25,218 | 22,358 | 275 | 199 | |||||||||
| Foreign | 61,798 | 56,501 | 89 | 20 | |||||||||
| 886,507 | 743,993 | 1,557,348 | 1,455,997 | ||||||||||
Foreign revenue in the table above includes sales from Chile, México, Argentina, Venezuela and Brazil to other countries. Such amounts are detailed by major geographic area as follows, for year ended December 31, 2006 and 2005:
| Year ended | |||||||
| December 31, | |||||||
| 2006 | 2005 | ||||||
| ThUS$ | ThUS$ | ||||||
| Central and South America | 51,812 | 42,649 | |||||
| Asia | 6,834 | 9,994 | |||||
| Africa | 392 | 559 | |||||
| Oceania | 9 | - | |||||
| Europe | 2,751 | 3,299 | |||||
| Total export sales from Chile, México, Argentina, | |||||||
| Venezuela and Brazil | 61,798 | 56,501 | |||||
| as a percentage of total sales | 6.97 | % | 7.59 | % | |||
F-64
Enterprise wide sales information based on the Company’s products follows:
| Year ended | |||||||
| December 31, | |||||||
| 2006 | 2005 | ||||||
| ThUS$ | ThUS$ | ||||||
| Particle Board | 187,484 | 154,039 | |||||
| MDF | 319,578 | 250,241 | |||||
| OSB | 48,302 | 59,734 | |||||
| Solid wood-doors | 39,594 | 32,815 | |||||
| MDF Mouldings | 65,158 | 47,310 | |||||
| Finger-Joint Mouldings | 94,062 | 83,067 | |||||
| Sawn Lumber | 72,915 | 66,638 | |||||
| Saw and pulp logs | 42,667 | 30,105 | |||||
| Other products | 16,747 | 20,044 | |||||
| Total | 886,507 | 743,993 | |||||
g) Consolidated valuation and qualifying accounts
Accounts receivable - Reserves
Balance at | Charge to | |||||||||||||||
| beginning of | costs and | Amounts | Exchange | Balance at | ||||||||||||
| Year ended | period | expenses | Written-off | rate impact | end of period | |||||||||||
ThUS$ | ThUS$ | ThUS$ | ThUS$ | ThUS$ | ||||||||||||
| December 31, 2006 | 5,593 | 1,106 | (224 | ) | (5 | ) | 6,470 | |||||||||
| December 31, 2005 | 5,182 | 1,237 | (1,231 | ) | 405 | 5,593 | ||||||||||
| December 31, 2004 | 4,899 | 796 | (379 | ) | (134 | ) | 5,182 | |||||||||
Notes and accounts receivable from related companies - Reserves
| Balance at | Charge to | |||||||||||||||
| beginning of | costs and | Amounts | Exchange | Balance at | ||||||||||||
| Year ended | period | expenses | Written-off | rate impact | end of period | |||||||||||
ThUS$ | ThUS$ | ThUS$ | ThUS$ | ThUS$ | ||||||||||||
| December 31, 2006 | - | - | - | - | - | |||||||||||
| - | - | - | - | - | ||||||||||||
| December 31, 2004 | - | 2,762 | (2,762 | ) | - | - | ||||||||||
Inventories - Reserves
| Balance at | Charge to | |||||||||||||||
| beginning of | costs and | Amounts | Exchange | Balance at | ||||||||||||
| Year ended | period | expenses | Written-off | rate impact | end of period | |||||||||||
ThUS$ | ThUS$ | ThUS$ | ThUS$ | ThUS$ | ||||||||||||
| December 31, 2006 | 5,376 | 2,777 | (1,741 | ) | (46 | ) | 6,366 | |||||||||
| 5,498 | 1,702 | (1,895 | ) | 71 | 5,376 | |||||||||||
| December 31, 2004 | 4,930 | 5,597 | (5,035 | ) | 6 | 5,498 | ||||||||||
F-65
Valuation allowance
| Balance at | Charge to | ||||||||||||
| beginning of | costs and | Amounts | Balance at | ||||||||||
| Year ended | period | expenses | written-off | end of period | |||||||||
| ThUS$ | ThUS$ | ThUS$ | ThUS$ | ||||||||||
| December 31, 2006 | 52,852 | 10,761 | (8,124 | ) | 55,489 | ||||||||
| 72,044 | 6,021 | (25,213 | ) | 52,852 | |||||||||
| December 31, 2004 | 37,470 | 48,717 | (14,143 | ) | 72,044 | ||||||||
h) Accounting developments
In July 2006, the FASB issued FASB Interpretation No. 48, “Accounting for Uncertainty in Income Taxes, an Interpretation of FASB Statement No. 109” (FIN 48). FIN 48 provides guidance on the financial statement recognition and measurement of a tax position taken or expected to be taken in a tax return. FIN 48 requires that the Company recognize in the financial statements the impact of a tax position if that position will more likely than not be sustained on audit, based on the technical merits of the position. FIN 48 also provides guidance on derecognition, classification, interest and penalties, accounting in interim periods, disclosures, and transition provisions. Any transition adjustment recognized on the date of adoption will be recorded as an adjustment to retained earnings as of the beginning of the adoption period. FIN 48 is effective for fiscal years beginning after December 15, 2006. Based on current evaluation, the Company does not expect the adoption of this interpretation to have a material impact on its financial position or results of operations.
In September 2006, the FASB issued SFAS No. 157, "Fair Value Measurements" (SFAS No. 157). SFAS No. 157 defines fair value, establishes a framework for measuring fair value in accordance with generally accepted accounting principles, and expands disclosures about fair value measurements. This statement does not require any new fair value measurements; rather, it applies to other accounting pronouncements that require or permit fair value measurements. The provisions of this statement are to be applied prospectively as of the beginning of the fiscal year in which this statement is initially applied, with any transition adjustment recognized as a cumulative-effect adjustment to the opening balance of retained earnings. The provisions of SFAS No. 157 are effective for the fiscal years beginning after November 15, 2007; therefore, the Company anticipates adopting this standard as of January 1, 2008. It has not determined the effect, if any, the adoption of this statement will have on its financial condition or results of operations.
In September 2006, the SEC issued Staff Accounting Bulletin No. 108, “Considering the Effects of Prior Year Misstatements when Quantifying Misstatements in Current Year Financial Statements” (SAB 108). SAB 108 provides guidance on how prior year misstatements should be taken into consideration when quantifying misstatements in current year financial statements for purposes of determining whether the current year’s financial statements are materially misstated. SAB 108 permits registrants to record the cumulative effect of initial adoption by recording the necessary "correcting" adjustments to the carrying values of assets and liabilities as of the beginning of that year with the offsetting adjustment recorded to the opening balance of retained earnings only if material under the dual method. SAB 108 is effective for fiscal years ending on or after November 15, 2006. The adoption of SAB 108 had no impact on the Company´s financial condition or results of operations.
F-66