UNITED STATES
SECURITIES AND EXCHANGE COMMISSION
Washington, D.C. 20549
FORM 6-K
Report of Foreign Private Issuer
Pursuant to Rule 13a-16 or 15d-16
of the Securities Exchange Act of 1934
For the month of February 2008
Masisa S.A.
(Exact name of registrant as specified in its charter)
Masisa S.A.
(Translation of Registrant's name into English)
Av. Apoquindo 3650, Piso 10, Las Condes
Santiago, Chile
(Address of principal executive offices)
Indicate by check mark whether the registrant files or will file annual reports under cover
Form 20-F or Form 40-F.
Form 20-F x Form 40-F o
Indicate by check mark if the registrant is submitting the Form 6-K in paper as permitted by Regulation S-T Rule 101(b)(1): ____
Indicate by check mark if the registrant is submitting the Form 6-K in paper as permitted by Regulation S-T Rule 101(b)(7): ____
Indicate by check mark whether the registrant by furnishing the information contained in this Form, the registrant is also thereby furnishing the information to the Commission pursuant to Rule 12g3-2(b) under Securities Exchange Act of 1934.
Yes o No x
If "Yes" is marked, indicate below the file number assigned to the registrant in connection with Rule 12g3-2(b): 82-_____
Item 1. Earnings release issued by Masisa S.A. on February 20, 2008:
For further information, please contact: | Investor Relations |
| (56 2) 350 6038 | |
| investor.relations@masisa.com | |
| Internet: www.masisa.com |
PRESS RELEASE
MASISA S.A. POSTS FINANCIAL RESULTS AS OF DECEMBER 31, 2007
Santiago, Chile, February 20, 2008 - MASISA S.A. (NYSE: MYS) (hereinafter referred to as “Masisa” or “the Company”), a leading wood board for furniture manufacturing and marketing company in Latin America, today posted its consolidated financial statements for the fourth quarter of 2007.
Q4’07 HIGHLIGHTS | |
| · | Sales in the fourth quarter of 2007 amounting to US$259.7 million, they were 16.6% up on the same period of 2006, driven by higher prices of wood boards for furniture (MDF and PB), which offset the lower sales of MDF and finger joint mouldings and sawn wood, mainly due to the slowdown of the housing sector in the United States. |
| · | The gross margin on sales improved, from 24.2% to 26.9% compared with the same quarter in 2006, mainly driven by the Company’s ability to rice prices above its cost increases, specially in the wood boards business. Also, the Company has been successful in its commercial efforts of opening new markets such as Vietnam (for sawn lumber exports) and re-routing exports that were initially oriented to the United States towards other markets, which is specially true for OSB boards. |
| · | The ratio, of sales and administrative expenses to sales, improved in the fourth quarter of 2007, representing 15.3% of sales, which was lower than the fourth quarter of 2006 when they were for 16.1 % of sales, thus showing a more efficient operation. |
| · | Operating income increased by US$12.1 million (+66.6%) when compared to the same quarter in 2006, reaching to US$30.2 million, boosted by higher sales margins (as a result of successful commercial efforts). |
| · | Fourth quarter net income reached US$14.6 million, a 40.2% increase compared to the same quarter of 2006. This higher net income is the result of the good operational results that more than offset lower non operational results. |
| · | The Company´s solid operating performance is also reflected in an operating working capital to sales ratio for the period ended on December 31 of 2007, of 31.1%, down from 32.3% as of December 31, 2006. |
| · | On December 20, 2007, Masisa and Louisiana-Pacific (“LP”), executed a binding agreement for Masisa to sell to LP 75% its OSB plant located in Ponta Grossa, Brazil. The production capacity of such OSB plant is 350,000 cubic meters per annum. The price for the 100% of the fixed assets is approximately US$75,000,000, which is similar to the book value, thus this sale should not have significant earning effect. The proceeds will mainly be used to reducing indebtedness. Final closing is subject to due diligence, which is expected to be completed during the first quarter of 2008. Masisa’s decision to sell its OSB assets is aligned with its intention of focusing on its core business, which is PB and MDF wood boards for furniture in Latin America. |
| · | On January 15, 2008, Masisa and Brascan Brazil Ltda., executed a share purchase and sale agreement, whereby Masisa indirectly acquired, 37% of the shareholding of Tafisa Brazil S.A. Tafisa Brazil’s main line of business is the manufacturing of wood boards and owns an industrial plant in the state of Paraná, Brazil, with production capacities of 380,000 m3 of MDF, 260,000 m3 of MDP and 300,000 m3 of melamine boards. The price was US$70,000,000. The ultimate controller of Tafisa is Sonae Indústria, SGPS, S.A., a Portuguese publicly-traded corporation. Additionally, Sonae Indústria and Masisa have committed to work in the implementation of the combination of the businesses of Tafisa Brazil and of Masisa do Brazil Ltda. with the objective of positioning the combined entity as a leading company in the Brazilian market. |
Quarter ended | ||||||||||||||||
Dic 31, | Mar 31, | Jun 30, | Sep 30, | Dic 31, | ||||||||||||
2006 | 2007 | 2007 | 2007 | 2007 | ||||||||||||
| (in millions of US$, except per share information in %) | ||||||||||||||||
Sales | 222.7 | 216.5 | 241.9 | 247.7 | 259.7 | |||||||||||
Gross margin | 53.9 | 53.5 | 57.7 | 62.2 | 69.9 | |||||||||||
% over sales (2) | 24.2 | % | 24.7 | % | 23.9 | % | 25.1 | % | 26.9 | % | ||||||
Selling and Administrative Expenses | (35.8 | ) | (30.8 | ) | (32.6 | ) | (33.4 | ) | (39.7 | ) | ||||||
% over sales (2) | -16.1 | % | -14.2 | % | -13.5 | % | -13.5 | % | -15.3 | % | ||||||
Operating Income | 18.1 | 22.7 | 25.1 | 28.8 | 30.2 | |||||||||||
%over sales (2) | 8.1 | % | 10.5 | % | 10.4 | % | 11.6 | % | 11.6 | % | ||||||
EBITDA(3) | 35.4 | 39.0 | 43.5 | 46.2 | 47.8 | |||||||||||
| %over sales | 15.9 | % | 18.0 | % | 18.0 | % | 18.7 | % | 18.4 | % | ||||||
Net Income for the Period | 10.4 | 3.2 | 16.3 | 7.0 | 14.6 | |||||||||||
Earnings per Share (US$) | 0.0018 | 0.0006 | 0.0029 | 0.0012 | 0.0026 | |||||||||||
Earnings per ADS (US$) (1) | 0.09 | 0.03 | 0.14 | 0.06 | 0.13 | |||||||||||
(1): An ADS equals 50 common shares.
(2): As % of Sales for the quarter.
(3): EBITDA represents Operating Income + Depreciation + Amortization + Depletion.
2 / 24
INDEX
Q4’07 HIGHLIGHTS | 2 | |||
| FINANCIAL OVERVIEW | 2 | |||
INDEX | 3 | |||
Q4'07 EARNINGS' CONFERENCE CALL | 4 | |||
CONSOLIDATED INCOME STATEMENT | 5 | |||
| NET SALES | 5 | |||
| OPERATING INCOME | 7 | |||
| EBITDA | 8 | |||
| NON-OPERATING INCOME | 8 | |||
| NET INCOME | 9 | |||
CONSOLIDATED BALANCE SHEET | 10 | |||
| ASSETS | 10 | |||
| LIABILITIES | 10 | |||
| SHAREHOLDERS' EQUITY | 12 | |||
FINANCIAL OVERVIEW (TABLES) | 13 | |||
| FOURTH QUARTER AT DEC 2007 | 13 | |||
| ACCUMULATED AT FOURTH QUARTER OF 2007 | 13 | |||
| BREAKDOWN BY GEOGRAPHICAL SEGMENT (US$) | 14 | |||
| SALES BY COUNTRY (%) | 15 | |||
SALES BY PRODUCT (US$ and M3) | 16 | |||
| BREAKDOWN OF PRODUCTION COSTS | 17 | |||
CONSOLIDATED FINANCIAL STATEMENTS | 18 | |||
| STATEMENT OF INCOME AT DEC 2007 | 18 | |||
| BALANCE SHEET AT DEC 2007 | 19 | |||
| STATEMENT OF CASH FLOW AT DEC 2007 | 21 | |||
| CASH FLOW-NET INCOME RECONCILIATION | 22 | |||
FORECASTS AND ESTIMATES | 23 |
3 / 24
Masisa S.A Announces Conference Call to Discuss Q4 2007 Results
Masisa S.A. (NYSE:MYS) a leading Latin American producer of wood boards for furniture, will hold its quarterly conference call on Thursday February 21, 2008 at 9:00 a.m. New York Eastern Time. The Company will discuss results for the quarter ended December 31, 2007.
To participate on the conference call, please dial 888-680-0869 (domestic, USA) or 617-213-4854 (international) five to ten minutes before the call and reference the pass code 81192975. A simultaneous live Webcast of the call will be available over the Internet at http://www.masisa.com, under the Investor Relations heading.
Participants may pre-register for the call at anytime, including up to and after the call start time, at https://www.theconferencingservice.com/prereg/key.process?key=PYW696QJW. Pre-registrants will be issued a pin number to use when dialing into the live call, which will provide quick access to the conference.
A replay of the call will be available beginning on Thursday, February 21 2008 at 11:00 a.m. (New York Eastern Time) by dialing 888-286-8010 (domestic, USA) or 617-801-6888 (international) and providing the following replay code: 40705598. In addition, the Webcast will be available on the Company's web site at http://www.masisa.com.
CONTACT: Masisa S.A
Rodrigo Hahn
Investor Relations
(56 2) 707 8608
rodrigo.hahn@masisa.com
4 / 24
CONSOLIDATED INCOME STATEMENT
NET SALES
Q4´07 versus Q4’06
The Company had sales of US$259.7 million in the fourth quarter of 2007, representing a US$37.1 million (+16.6%) increase compared to the fourth quarter of 2006.
The main factors explaining this sales increase in the fourth quarter of 2007 compared with the same quarter in 2006, are:
Boards
| · | MDF board sales were up by US$23.3 million (+26.5%), mainly driven by price increases across all markets (consolidated increase of +22.0%), except in Mexico, where prices dropped slightly (-4.1%) due to higher competition coming from the United States. The commercialized volume increased slightly to 256,000 cubic meters, partly due to the new MDF production line in Cabrero (Chile), which produced 20,633 cubic meters in the period. This new capacity is mainly oriented towards export markets. During this period, the Company continued improving its product mix, increasing its production of ultra-thin boards, which exhibit higher commercialization margins, and decreasing ultra-light boards for mouldings which have been negatively affected by the slowdown of the construction sector in the US. |
| · | Particleboard (PB) sales were also up and increased by US$ 6.3 million (+12.8%), largely due to a 17.9% price increase (equivalent to US$8.8 million), across most of the markets, namely in Brazil, Colombia, Argentina, Chile and Venezuela with rises of 13.8%, 27.6%, 22.1%, 23.1% and 10.9% respectively. This reflects the strong demand for PB in the region. The increase in prices offsets lower volumes sold (-4.3%), which are explained by: (i) a decrease of 9,000 m3 (-23.9%) in Mexico due to lower product availability and to higher competition from wood boards coming from the United States and; (ii) a decrease of 3,300 m3 (-31.9%) in Colombia due to lower product availability coming from Venezuela resulting from higher margins the Company obtains in the Venezuelan market and due to some export restrictions from Venezuela to Colombia. These exports are currently in transit and will be commercialized in the Colombian market during the next quarter. |
| · | OSB board sales continued showing a recovery, with an increase in sales of US$6.1 million (+71.6%), mainly resulting from successful re-routing of exports that were initially destined to the United States to other markets, mainly to China, and to other markets outside the Latin American region for US$4.7 million (+451.3%). Additionally, OSB sales in Brazil (the most. important market for Masisa’s OSB) increased by 70.9% compared to the fourth quarter of 2006, reaching total US$7.6 million. |
Solid Wood
| · | Finger joint mouldings sales were down US$3.6 million (-18.2%), mainly due to a 14.8% drop in prices in the United States along with a 5.8% decrease in volume in that market. This as a result of the contraction in the construction sector in the United States. MDF mouldings sales were down by US$4.9 million (-29.4%), driven by 29.3% decrease in volume in the US market. This volume reduction is part of the Company’s commercial strategy to assure the profitability of its exports, by sacrificing volume in order to maintain prices. Such volume was commercialized as MDF boards in Latin America, where demand was strong. The decrease in volume of both products not only results from a market condition, but also due to the fact that the Company has adjusted its production and commercialization in order to avoid margin deteriorations. |
| · | Solid wood doors had a slight decrease in sales by US$0.3 million (-2.7%), explained by a 6.4% decrease in volume sold, that was partly offset by 3.9% price increase. The volume decrease is mainly explained by some plant adjustments that affected the normal operations and a slight decrease in the home improvement market in the US. |
| · | Sawn lumber sales were up by US$4.3 million (+31.0%), which is explained by a 20.0% increase in volume along with a 9.2% price increase. The Company has been successful in replacing green lumber by dry lumber for the Mexican market and it has also been successful in diversifying markets. |
5 / 24
Forestry
| · | Higher saw log sales of US$0.9 million (+8.2), due to a 9.5% price increase which offsets a 1.2% decrease in volume. |
Q4’07 versus Q3’07
The Company had sales of US$259.7 million in the fourth quarter of 2007, which were US$12.0 million (+4.9%) higher than the third quarter of 2007
The main changes in sales in the fourth quarter of 2007 compared with the third quarter of 2007 are:
Boards
| · | MDF sales were up by US$8.1 million (+7.8%). This increase is explained by higher sales volumes in the period (+0.4%), along with a 7.4% consolidated price increase. This increase is mainly explained by favorable commercial conditions in all Latin American markets, where the Company is facing strong demand, specially in: (i) Brazil, with higher sales by US$3.9 million (+11.1%), due to an 4.3% increase in volume, and a 5.4% price increase, and; (ii) Venezuela, with higher sales by US$6.0 million (+23.1%), mainly explained by a 16.4% higher volume and a 5.7% higher price. Also, the increase in volume was partly due to the new MDF production line in Cabrero (Chile), which produced 20,633 cubic meters in the period. This new capacity is mainly oriented towards export markets. These higher sales volume, more than offset a 23.7% lower sales volume in Chile, due to lower sales to local moulders. |
| · | Particleboard (PB) sales increased by US$4.6 million (+8.9%) as a result of higher volume (+4.2%) along with a 4.5% price increase. Higher sales are mainly explained by: (i) higher sales in Chile by US$3.7 million (+19.6%), and ;(ii) higher sales in Venezuela of US$1.1 million (+26.3%), in both cases due to the high demand. |
| · | OSB sales were up by US$0.5 million (+3.3%), which is mainly explained by higher prices (+2.9%). The Company has continued with its successful strategy of re-routing OSB exports that were initially destined to the United States, to other markets, mainly to the local Brazilian market. Brazil had an increase in OSB sales of US$0.8 million (+11.0%), with higher volume (+5.3%) along with a price increase (+5.4%). There was a slight decrease of US$0.2 million (-4.4%) in OSB sales to markets outside the region, especially to China. However, we continue observing favorable commercial conditions, which as evidenced in a price increase of 1.5%. |
Solid Wood
| · | MDF mouldings sales were down by US$1.3 million (-10.0%) and finger joint mouldings sales decreased by US$1.3 million (-7.3%), in both cases mainly explained by the lower demand for these kind of products in the United States. |
| · | Sales of solid wood doors were down by US$0.7 million (-6.1%), due to a decrease in volume (-6.0%). This decrease in volume is explained by some plant adjustments that affected the normal operations and a slight decrease in the home improvement market in the US. |
| · | Sawn lumber sales decreased by US$0.2 million (-0.9%), due to a 2.3% decrease in volume, which offsets a 1.4% increase in price. |
Forestry
| · | Decrease in saw log sales of US$0.1 million (-1.1%), due to a 8.8% price decrease. |
6 / 24
OPERATING INCOME
Q4’07 versus Q4’06
Operating income amounted to US$30.2 million in the fourth quarter of 2007, US$12.1 million (+66.6%) higher than in the fourth quarter of 2006.
Consolidated gross margin was US$69.9 million in the fourth quarter of 2007, an increase of US$16.0million (+29.7%) compared to the same quarter of the previous year. As a percentage of the Company’s total sales, the gross margin was higher, increasing from 24.2% in the fourth quarter of 2006 to 26.9% in the fourth quarter of 2007.
The main factors explaining this higher operating income in the fourth quarter of 2007 compared with the same quarter in 2006, are:
Boards
| · | Operating income grew due to higher MDF and PB prices (+22.0% and +17.9%, respectively), coupled with higher MDF volume sales (+3.7%), which were partly offset by lower volume sales of PB (-4.3%). OSB sales recovered, showing a considerable 71.6% sales increase. The successful commercial efforts carried out by the Company, have enabled it to do a pass through, increased costs to prices and to diversify end markets (especially in OSB). In effect actions the Company more than offsets the strong rising cost scenario, especially in resins, wood and energy, which jointly account for approximately 66.6% of the total consolidated board manufacturing cost. This has enabled the Company to improve its consolidated gross margin as a percentage of the total consolidated sales. |
Solid Wood
| · | Operating income fell as a result of reduced sales of all the solid wood products (MDF mouldings, fingerjoint mouldings and solid wood doors) except in sawn lumber, which showed a 31.0% sales increase. This is explained by the slowdown in the United States construction sector, the main end market for Masisa. Despite of the Company’s commercial efforts, they have been insufficient to compensate for the cost pressures related to an increase in the wood price, greater logistical costs due to the higher oil price and the appreciation of the Brazilian real and the Chilean peso. |
The sales and administrative expenses to sales ratio decreased from 16.1% in the fourth quarter of 2006 to 15.3% in the fourth quarter of 2007. Sales and administrative expenses amounted to US$39.7 million, and were US$3.9 million (+11.0%) higher than the fourth quarter of the previous year. The increase in sales and administrative expenses in the fourth quarter of 2007 are mainly explained by; (i) higher consolidated sales, thus, higher commercial costs; (ii) higher level of provisions due to a change and application of a new uncollectible accounts provisions policy (+US$0.7 million) and higher sundry provisions (+US$1.5 million) and; (iii) sawn lumber shipment re-routing expenses (+US$1.3 million).
Q4’07 versus Q3’07
The Company’s operating income amounted to US$30.2 million in the fourth quarter of 2007, an increase of US$1.4 million (+5.0%) compared to the third quarter of 2007.
Consolidated gross margin was US$69.9 million in the fourth quarter of 2007, an increase of US$7.7 million (+12.4%) compared to the third quarter of 2007. As a percentage of the Company’s total sales, gross margin reached 26.9%, higher than 25.1% in the third quarter of 2007.
The main factors explaining this higher operating income in the fourth quarter of 2007 compared with the third quarter of 2007 are:
Boards
| · | Both PB and MDF benefited from price increases (+4.5% and +7.4% respectively), which enabled the Company to continue with a healthy consolidated gross margin. This more than offset the higher board production costs, mainly in energy (accounting for approximately 10.5% of the total board cost), wood (24.5% of the total board cost) and resins (31.5% of the total board cost). |
7 / 24
Solid Wood
| · | During the period, there was an operational improvement in finger joint mouldings, MDF mouldings and solid wood doors when compared to the third quarter of 2007. This was due to a decrease in production resulting from an adjustment in the productive factors given the slowdown in the US housing market. This led to a decrease in supply, which allowed price increases in all product lines ranging from 1.4% to 4.8% (except in solid wood doors which had stable prices) All these actions have allowed to limit the negative effects caused by: (i) the US market slowdown; (ii) appreciation of the Brazilian real (+3.9%) and the Chilean peso (+3.0%) against the US dollar, and; (iii) rising costs of wood and energy. |
The sales and administrative expenses to sales ratio, increased from 13.5% during the third quarter of 2007 to 15.3% during the fourth quarter of 2007. Sales and administrative expenses amounted to US$39.7 million, and were US$6.3 million (+18.8%) up on the third quarter of 2007. The increase in sales and administrative expenses in the fourth quarter of 2007 are mainly explained by; (i) higher consolidated sales, thus, higher commercial costs; (ii) higher level of provisions due to a change and application of a new uncollectible accounts provisions policy (+US$0.7 million) and higher sundry provisions (+US$1.5 million) and; (iii) sawn lumber shipment re-routing expenses (+US$1.3 million).
EBITDA
Q4’07 versus Q4’06
In line with the increase in sales, mainly driven by the furniture board business (MDF and PB) and despite cost pressures, the Company’s EBITDA was up US$12.4 million (+35.2%), amounting to US$47.8 million. The EBITDA margin improved to 18.4% from 15.9% the prior year.
Q4’07 versus Q3’07
The Company had a higher operating cash flow generation (EBITDA) than that in the third quarter of 2007. The fourth quarter EBITDA was US$47.8 million, an increase of US$1.6 million (+3.5%). EBITDA margin remained relatively stable, reaching 18.4%.
NON-OPERATING INCOME
Q4’07 versus Q4’06
Non-operating income decreased by US$5.4 million (-53.3%) against the fourth quarter of 2006 amounting to -US$15.5 million. This is mainly explained by negative foreign exchange differences, which increased by US$6.9 million (-507.1%) from -US$1.4 million in the fourth quarter of 2006 to -US$8.4 million in the fourth quarter of 2007 and due to a decrease in financial income by -US$3.8 million (-77.4%). This negative effect was partially offset by lower interest expenses during the fourth quarter of 2007, which were down by US$4.8 million (-51.4%) from -US$9.3 million in the fourth quarter to -US$4.5 million in the fourth quarter of 2007. This is explained by :(i) decrease in the Libor rate and; (ii) better financing conditions obtained as a result of a bond refinancing in June 2007.
Q4’07 versus Q3’07
Non-operating income amounted to -US$15.5 million, a decrease of US$1.3 million on the -US$14.2 million of the third quarter of 2007. This is mainly explained by negative foreign exchange differences, which increased by US$2.7 million, from US$-5.7 million in the third quarter to -US$8.4 million on the fourth quarter and to an increase in other non-operating expenses in -US$3.8 million mainly explained by severance payments (-US$3,3 million) associated with the Solid Wood Business Unit. This negative effect is partially offset by lower financial expenses during the fourth quarter of 2007 which were down US$3.9 million (-46.1%) from -US$8.4 million in the third quarter to -US$4.5 million in the fourth quarter of 2007. This is explained by:(i) decrease in the Libor rate and; (ii) better financing conditions obtained as a result of a bond refinancing in June 2007.
8 / 24
NET INCOME
Q4’07 versus Q4’06
Net income amounted to US$14.6 million, which was up by US$4.2 million (+40.2%). This increase is explained by the better operating results that more than offset lower non operational results.
Q4’07 versus Q3’07
Net income was US$14.6 million which is an increase of US$7.6 million (+108.4%). This increase is explained by better operational results that more than offset lower non operational results.
9 / 24
CONSOLIDATED BALANCE SHEET
ASSETS (December 31, 2007 versus December 31, 2006)
The Company’s total assets amount to US$2,211.5 million as of December 31, 2007, which is a 9.7% year-on-year increase.
Current Assets
These amount to US$500.2 million, which is a US$24.8 million (+5.2%) increase on December 31, 2006. This increase is mainly explained by higher accounts receivable (+US$10.3 million), inventories (+US$26.7 million) and expenses paid in advance (+US$1.8 million), that offset the decrease in cash (-US$4.8 million), time deposits (-US$4.7 million) and recoverable tax (-US$4.6 million). Current assets mainly consist of cash and cash equivalents (time deposits and marketable securities) amounting to US$37.9 million, accounts receivable of US$135.4 million, inventories of US$212.5 million and recoverable taxes of US$57.7 million.
As of December 31, 2007, the Company had a suitable operating performance, compared with the same period in 2006:
Q4’07 | Q4’06 | |
| (i) Accounts Receivable Turnover (times) (*) | 6.88 | 6.89 |
| (ii) Inventory Turnover (times) (**) | 3.61 | 3.48 |
| (iii) Operating Working Capital/Sales (%) (***) | 31.1 | 32.3 |
(*) Accounts Receivable Turnover corresponds to (TTM Sales / TTM Average Accounts Receivable).
(**) Inventory Turnover corresponds to (TTM Sales / TTM Average Inventories).
(***)Operating Working Capital/Sales corresponds to ((Accounts receivable + Documents receivable + Sundry debtors + Doc. & Accts. Receivable from related companies - Accounts payable - Documents payable - Sundry creditors - Doc. & Acct. Payable to related companies)/ TTM Sales)).
Fixed Assets
These amount to US$1,702.4 million, which was a US$145.1 million (+9.3%) increase on December 31, 2006. This increase is mainly explained by higher other fixed assets net of depreciation (+US$157.6 million), which is largely explained by the higher forestry asset appraisal (+US$90.5 million) and construction works of the new MDF plant (+US$66.9 million). This increase offset the drop in machinery and equipment net of depreciation (-US$30.8 million). Fixed assets mainly consist of machinery and equipment net of depreciation amounting to US$518.5 million and forestry plantations (stated in other fixed assets) of US$720.5 million.
The investment in fixed assets in the twelve-month period ending December 31, 2007, amounted to US$139.7 million, accounting for 177.8% of the depreciation in the period.
Other Assets
These amount to US$8.9 million, and improved on the -US$16.4 million of the fourth quarter of 2006.
LIABILITIES (December 31, 2007 versus December 31, 2006)
Total liabilities amounted to US$924.7 million, which was an increase of US$115.3 million (+14.2%) on the total liabilities as of December 31, 2006.
Banks
Masisa’s debt with financial institutions amounts to US$294.8 million, which was a US$5.5 million (+1.9%) increase on December 31, 2006. This is mainly explained by an increase in short term debt in (i) Brazil of US$23.8 million and (ii) Venezuela of US$2.4 million, due to increased working capital requirements and the financing of ongoing investments. This increase was partially offset by a debt reduction in Argentina of US$10.6 million and in Chile of US$ 10.1 million, which were financed with internally generated cash flows and long term debt respectively.
10 / 24
Bonds
Masisa´s bonds amount to US$349.8 million, which was a US$42.7 million (+13.9%) increase on December 31, 2006. This is mainly explained by (i) exchange differences of US$37.4 million and (ii) the placement of bond series F, G and H, for a total of UF (Unidad de Fomento) 2.5 million (approx. US$88.8 million). These funds were used for the refinancing of the Series A bond for UF 2.0 million (approx. US$71.0 million), and the pre payment of short term debt in Chile. The latter was partially offset by the payment of (i) US$4.8 million related to series E bonds and (ii) US$9.0 million from the Private Placement occurred during 2007.
Masisa S.A.’s Financial Debt Maturity Structure as of December 31, 2007
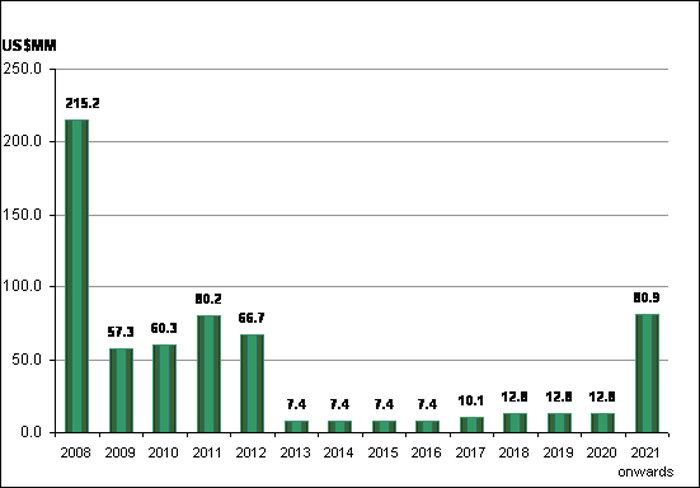
Note: The amounts may differ from the information submitted in the Uniformly Coded Statistical Record (FECU), due to the book appreciation of the bonds and to accrued and unpaid interest, which are included in the FECU.
The 2008 debt maturities include short term local loan payments of US$87.1 million in Venezuela, which have a 1-year term and which the Company has been systematically refinancing since the last few years, steadily improving the conditions.
11 / 24
SHAREHOLDERS’ EQUITY (December 31, 2007 versus December 31, 2006)
Masisa’s shareholders’ equity amounts to US$1,272.0 million as of December 31, 2007, which is an increase of US$85.6 million (+7.2%) on December 31, 2006.
Paid-in Capital
The paid-in capital amounts to US$812.9 million, unchanged when compared to that at December 31, 2006.
Other Reserves
These are US$276.5 million, which is an increase of US$57.1 million (+25.9%). This account is mainly the forestry reserve, which amounts to US$262.7 million. This increase is explained by a higher difference between the appraisal value of forestry plantations and their respective historical cost.
Retained Earnings
This amounts to US$182.6 million, which is an increase of US$28.6 million (+18.6%). This increase is explained by the higher accumulated net income, which rose by US$17.0 million (+23.3%). Such increase went hand in hand with a higher net income for the period ending on December 31, 2007, amounting to US$41.1 million against the US$29.5 million at December 31, 2006, i.e., an increase of US$11.6 million (+39.3%).
12 / 24
FINANCIAL OVERVIEW
Fourth quarter ended December 31, 2007:
The table below shows the Company’s main consolidated financial figures in the quarter and the year-on-year percentage change.
Quarter ended | ||||||||||
Dec 31st, | Dec 31st, | Variation | ||||||||
2007 | 2006 | % | ||||||||
| (in millions of US$) | ||||||||||
Sales | 259.7 | 222.7 | 16.6 | % | ||||||
Gross Margin | 69.9 | 53.9 | 29.7 | % | ||||||
Selling and Administrative Expenses | (39.7 | ) | (35.8 | ) | 11.0 | % | ||||
Operating Income | 30.2 | 18.1 | 66.6 | % | ||||||
Net Income for the Period | 14.6 | 10.4 | 40.2 | % | ||||||
Depreciation + Amortization | 13.02 | 13.00 | 0.2 | % | ||||||
Depletion(1) | 4.6 | 4.2 | 8.1 | % | ||||||
EBITDA | 47.8 | 35.4 | 35.2 | % | ||||||
Earnings per Share (US$) (2) | 0.0026 | 0.0018 | 40.2 | % | ||||||
Earnings per ADS (US$) (2) | 0.13 | 0.09 | 40.2 | % | ||||||
| (1) | Corresponds to the sold/consumed saw log cost in the period which does not represent cash flow. |
| (2) | One ADS is equivalent to 50 common shares. The ADS of Masisa (former Terranova) started to be traded on August 5, 2005. |
Note: For rounding-up effects, the sum of the figures stated may differ from the total.
Twelve-month period ended December 31, 2007:
The table below shows the Company’s main consolidated financial figures for the quarter ended December 31, 2007 and the year-on-year percentage change.
Aggregate | ||||||||||
Dec 31st, | Dec 31st, | Variation | ||||||||
2007 | 2006 | % | ||||||||
| (in millions of US$) | ||||||||||
Income | 965.8 | 886.5 | 8.9 | % | ||||||
Gross Margin | 243.3 | 207.6 | 17.2 | % | ||||||
Selling and Administrative Expenses | (136.5 | ) | (124.0 | ) | 10.1 | % | ||||
Operating Income | 106.8 | 83.6 | 27.7 | % | ||||||
Net Income for the Period | 41.1 | 29.5 | 39.3 | % | ||||||
Depreciation + Amortization | 51.3 | 51.0 | 0.7 | % | ||||||
Depletion(1) | 18.4 | 19.2 | -3.8 | % | ||||||
EBITDA | 176.6 | 153.7 | 14.8 | % | ||||||
Earnings per Share (US$) (2) | 0.0072 | 0.0052 | 39.3 | % | ||||||
Earnings per ADS (US$) (2) | 0.36 | 0.26 | 39.3 | % | ||||||
| (1) | Corresponds to the sold/consumed saw log cost in the period which does not represent cash flow. |
| (2) | One ADS is equivalent to 50 common shares. The ADS of Masisa (former Terranova) started to be traded on August 5, 2005. |
Note: For rounding-up effects, the sum of the figures stated may differ from the total.
13 / 24
Information by Geographic Segment:
The table below describes the main company segments, according to the origin of sales for the indicated periods.
Quarter ended | Aggregate | ||||||||||||
Dec 31st, | Dec 31st, | Dec 31st, | Dec 31st, | ||||||||||
2007 | 2006 | 2007 | 2006 | ||||||||||
(in millions of US$) | (in millions of US$) | ||||||||||||
Net Sales | |||||||||||||
| Chile | 90.7 | 89.2 | 333.9 | 321.4 | |||||||||
| Brazil | 58.6 | 46.7 | 217.2 | 188.6 | |||||||||
| Venezuela | 46.7 | 49.9 | 168.4 | 141.7 | |||||||||
| Mexico | 23.2 | 33.3 | 90.1 | 124.8 | |||||||||
| USA | 40.1 | 48.6 | 165.5 | 211.8 | |||||||||
| Argentina | 39.9 | 32.1 | 144.8 | 122.4 | |||||||||
| Colombia | 5.5 | 6.3 | 28.8 | 25.2 | |||||||||
| Peru | 7.1 | 5.5 | 26.7 | 21.0 | |||||||||
| Ecuador | 3.4 | 2.4 | 12.4 | 10.0 | |||||||||
| Others (1) | (55.5 | ) | (91.3 | ) | (222.2 | ) | (280.5 | ) | |||||
Total | 259.7 | 222.7 | 965.8 | 886.5 | |||||||||
Gross Margin | |||||||||||||
| Chile | 17.3 | 11.4 | 60.8 | 63.0 | |||||||||
| Brazil | 15.1 | 7.5 | 53.8 | 38.1 | |||||||||
| Venezuela | 17.4 | 3.5 | 50.2 | 22.6 | |||||||||
| Mexico | 0.1 | 5.2 | 9.8 | 18.6 | |||||||||
| USA | 2.4 | 3.3 | 7.4 | 17.1 | |||||||||
| Argentina | 14.4 | 9.6 | 45.9 | 34.2 | |||||||||
| Colombia | 1.0 | 1.3 | 5.8 | 5.6 | |||||||||
| Peru | 1.6 | 1.4 | 6.8 | 5.3 | |||||||||
| Ecuador | 0.6 | 0.7 | 2.9 | 3.0 | |||||||||
| Others (1) | 0.0 | 10.0 | 0.0 | 0.0 | |||||||||
Total | 69.9 | 53.9 | 243.3 | 207.6 | |||||||||
Operating Income | |||||||||||||
| Chile | 1.4 | (4.7 | ) | 6.0 | 15.6 | ||||||||
| Brazil | 8.5 | 3.0 | 31.4 | 21.2 | |||||||||
| Venezuela | 11.6 | (1.1 | ) | 29.4 | 5.0 | ||||||||
| Mexico | (4.4 | ) | 2.5 | (2.5 | ) | 6.4 | |||||||
| USA | 0.7 | 0.1 | 0.1 | 3.6 | |||||||||
| Argentina | 11.2 | 6.7 | 34.5 | 24.0 | |||||||||
| Colombia | 0.3 | 0.6 | 2.8 | 3.4 | |||||||||
| Peru | 1.1 | 0.8 | 4.2 | 2.8 | |||||||||
| Ecuador | (0.2 | ) | 0.3 | 0.7 | 1.3 | ||||||||
| Others (1) | 0.0 | 10.0 | 0.0 | 0.4 | |||||||||
Total | 30.2 | 18.1 | 106.8 | 83.6 | |||||||||
Depreciation (2) + Amortization | |||||||||||||
| Chile | 4.4 | 2.7 | 15.8 | 13.7 | |||||||||
| Brazil | 3.5 | 3.3 | 13.5 | 12.9 | |||||||||
| Venezuela | 2.8 | 4.4 | 10.9 | 13.9 | |||||||||
| Mexico | 0.4 | 0.5 | 1.7 | 1.6 | |||||||||
| USA | 0.0 | 0.1 | 0.2 | 0.6 | |||||||||
| Argentina | 2.3 | 2.1 | 8.6 | 8.3 | |||||||||
| Colombia | 0.1 | (0.1 | ) | 0.2 | 0.0 | ||||||||
| Peru | 0.0 | 0.0 | 0.0 | 0.0 | |||||||||
| Ecuador | 0.0 | 0.0 | 0.0 | 0.0 | |||||||||
| Others (1) | 0.0 | 0.0 | 0.0 | 0.0 | |||||||||
Total | 13.4 | 13.0 | 50.9 | 51.0 | |||||||||
Depletion | |||||||||||||
| Chile | 2.5 | 2.1 | 9.6 | 9.0 | |||||||||
| Brazil | 0.8 | 1.1 | 4.6 | 5.6 | |||||||||
| Venezuela | 1.0 | 0.6 | 3.4 | 3.3 | |||||||||
| Mexico | 0.0 | 0.0 | 0.0 | 0.0 | |||||||||
| USA | 0.0 | 0.0 | 0.0 | 0.0 | |||||||||
| Argentina | 0.2 | 0.4 | 0.9 | 1.3 | |||||||||
| Colombia | 0.0 | 0.0 | 0.0 | 0.0 | |||||||||
| Peru | 0.0 | 0.0 | 0.0 | 0.0 | |||||||||
| Ecuador | 0.0 | 0.0 | 0.0 | 0.0 | |||||||||
| Others (1) | 0.0 | 0.0 | 0.0 | 0.0 | |||||||||
Total | 4.6 | 4.2 | 18.4 | 19.2 | |||||||||
(1): Inter-Company sales adjustments.
(2): Includes only operational depreciation. Note: For rounding-up effects, the sum of the figures stated may differ from the total.
14 / 24
Sales by Country:
The table below shows the breakdown of consolidated sales by product export market for the periods indicated.
Note: The amounts differ from income by geographical segment outlined on page 13, due to inter-company sales and exports.
Quarter ended | Aggregate | ||||||||||||||||||
Dec 31st, | Dec 31st, | Variation | Dec 31st, | Dec 31st, | Variation | ||||||||||||||
2007 | 2006 | % | 2007 | 2006 | % | ||||||||||||||
| (in millions of US$) | (in millions of US$) | ||||||||||||||||||
Brazil | 53.3 | 38.9 | 36.9 | % | 190.4 | 145.7 | 30.7 | % | |||||||||||
Venezuela | 45.9 | 29.4 | 56.3 | % | 146.3 | 92.4 | 58.3 | % | |||||||||||
USA | 40.9 | 50.7 | -19.2 | % | 172.3 | 230.2 | -25.2 | % | |||||||||||
Chile | 37.4 | 34.7 | 7.6 | % | 144.6 | 144.3 | 0.1 | % | |||||||||||
Argentina | 26.8 | 19.8 | 35.7 | % | 90.9 | 69.6 | 30.6 | % | |||||||||||
Mexico | 24.3 | 26.4 | -8.1 | % | 101.6 | 117.2 | -13.3 | % | |||||||||||
Peru | 7.1 | 5.5 | 29.6 | % | 26.7 | 21.0 | 27.4 | % | |||||||||||
Colombia | 5.5 | 6.3 | -12.2 | % | 28.8 | 25.2 | 14.3 | % | |||||||||||
Ecuador | 3.4 | 2.4 | 39.6 | % | 12.4 | 10.0 | 23.9 | % | |||||||||||
Others | 15.1 | 8.6 | 76.6 | % | 51.8 | 30.8 | 68.2 | % | |||||||||||
Total | 259.7 | 222.7 | 16.6 | % | 965.8 | 886.5 | 8.9 | % | |||||||||||
Note: For rounding-up effects, the sum of the figures stated may differ from the total.
The table below shows the percentage breakdown of consolidated sales by product export market for the periods indicated.
Quarter ended | Aggregate | ||||||||||||
Dec 31st, | Dec 31st, | Dec 31st, | Dec 31st, | ||||||||||
2007 | 2006 | 2007 | 2006 | ||||||||||
Brazil | 20,5 | % | 17,5 | % | 19,7 | % | 16,4 | % | |||||
Venezuela | 17,7 | % | 13,2 | % | 15,1 | % | 10,4 | % | |||||
USA | 15,8 | % | 22,8 | % | 17,8 | % | 26,0 | % | |||||
Chile | 14,4 | % | 15,6 | % | 15,0 | % | 16,3 | % | |||||
Argentina | 10,3 | % | 8,9 | % | 9,4 | % | 7,9 | % | |||||
Mexico | 9,4 | % | 11,9 | % | 10,5 | % | 13,2 | % | |||||
Peru | 2,7 | % | 2,5 | % | 2,8 | % | 2,4 | % | |||||
Colombia | 2,1 | % | 2,8 | % | 3,0 | % | 2,8 | % | |||||
Ecuador | 1,3 | % | 1,1 | % | 1,3 | % | 1,1 | % | |||||
Others | 5,8 | % | 3,8 | % | 5,4 | % | 3,5 | % | |||||
Total | 100 | % | 100 | % | 100 | % | 100 | % | |||||
Note: For rounding-up effects, the sum of the figures stated may differ from the total.
15 / 24
Sales by Product:
The table below shows a breakdown of the Company’s consolidated sales by type of product for the periods indicated.
Quarter ended | Aggregate | ||||||||||||||||||
Dec 31st, | Dec 31st, | Variation | Dec 31st, | Dec 31st, | Variation | ||||||||||||||
2007 | 2006 | % | 2007 | 2006 | % | ||||||||||||||
| (in millions of US$) | (in millions of US$) | ||||||||||||||||||
MDF | 111.0 | 87.7 | 26.5 | % | 397.7 | 319.6 | 24.4 | % | |||||||||||
Particel Board | 55.6 | 49.3 | 12.8 | % | 207.5 | 187.5 | 10.7 | % | |||||||||||
Sawn Wood | 18.3 | 14.0 | 31.0 | % | 64.4 | 72.9 | -11.7 | % | |||||||||||
Finger-joint Mouldings | 16.2 | 19.8 | -18.2 | % | 71.3 | 94.1 | -24.2 | % | |||||||||||
OSB | 14.5 | 8.5 | 71.6 | % | 51.5 | 48.3 | 6.7 | % | |||||||||||
Saw Logs | 12.4 | 11.4 | 8.2 | % | 48.9 | 42.7 | 14.6 | % | |||||||||||
MDF Mouldings | 11.8 | 16.8 | -29.4 | % | 49.0 | 65.2 | -24.8 | % | |||||||||||
Solid wood Doors | 10.4 | 10.7 | -2.7 | % | 40.6 | 39.6 | 2.5 | % | |||||||||||
Other products | 9.4 | 4.4 | 112.0 | % | 34.9 | 16.7 | 108.5 | % | |||||||||||
Total | 259.7 | 222.7 | 16.6 | % | 965.8 | 886.5 | 8.9 | % | |||||||||||
Note: For rounding-up effects, the sum of the figures stated may differ from the total.
The table below shows a breakdown of the cubic meters sold by type of product, related to the consolidated sales of the Company’s main products for the periods indicated.
Quarter ended | Aggregate | ||||||||||||||||||
Dec 31st, | Dec 31st, | Variation | Dec 31st, | Dec 31st, | Variation | ||||||||||||||
2007 | 2006 | % | 2007 | 2006 | % | ||||||||||||||
(thousands of m3) | (thousands of m3) | ||||||||||||||||||
Saw Logs | 376.9 | 381.4 | -1.2 | % | 1.448.2 | 1.426.4 | 1.5 | % | |||||||||||
MDF | 255.7 | 246.6 | 3.7 | % | 990.0 | 978.2 | 1.2 | % | |||||||||||
Particel Board | 182.5 | 190.8 | -4.3 | % | 720.2 | 763.7 | -5.7 | % | |||||||||||
Sawn Wood | 73.6 | 61.3 | 20.0 | % | 270.8 | 343.4 | -21.2 | % | |||||||||||
OSB | 59.4 | 40.4 | 46.9 | % | 217.5 | 219.9 | -1.1 | % | |||||||||||
Finger-joint Mouldings | 38.2 | 39.6 | -3.7 | % | 173.5 | 190.4 | -8.9 | % | |||||||||||
MDF Mouldings | 26.4 | 36.9 | -28.6 | % | 116.3 | 157.9 | -26.3 | % | |||||||||||
Solid wood Doors | 10.4 | 11.2 | -6.4 | % | 41.4 | 42.5 | -2.6 | % | |||||||||||
Other products | 130.9 | 256.3 | -48.9 | % | 718.1 | 995.3 | -27.8 | % | |||||||||||
Total | 1,154.0 | 1,264.5 | -8.7 | % | 4,696.0 | 5,117.7 | -8.2 | % | |||||||||||
Note: For rounding-up effects, the sum of the figures stated may differ from the total.
16 / 24
Breakdown of Production Costs:
The table below shows a percentage breakdown of the average consolidated production costs for bare (without melamine) particleboards, MDF and OSB, for the periods indicated.
Quarter ended | Aggregate | ||||||||||||
Dec 31st, | Dec 31st, | Dec 31st, | Dec 31st, | ||||||||||
2007 | 2006 | 2007 | 2006 | ||||||||||
Wood | 24.5 | % | 22.8 | % | 24.1 | % | 23.4 | % | |||||
Chemicals | 31.5 | % | 34.5 | % | 32.3 | % | 34.9 | % | |||||
Energy | 10.5 | % | 8.1 | % | 10.5 | % | 8.3 | % | |||||
Personnel | 8.3 | % | 8.6 | % | 8.1 | % | 7.9 | % | |||||
Depreciation | 7.5 | % | 9.9 | % | 8.1 | % | 10.8 | % | |||||
Others* | 17.7 | % | 16.0 | % | 16.9 | % | 14.7 | % | |||||
Total | 100.0 | % | 100.0 | % | 100.0 | % | 100.0 | % | |||||
Note: For rounding-up effects, the sum of the figures stated may differ from the total.
*Others include mainly: maintenance, spare parts and materials and packaging expenses.
The table below shows a percentage breakdown of the average consolidated production costs for doors, finger-joint mouldings and sawn lumber, for the periods indicated.
Quarter ended | Aggregate | ||||||||||||
Dec 31st, | Dec 31st, | Dec 31st, | Dec 31st, | ||||||||||
2007 | 2006 | 2007 | 2006 | ||||||||||
Wood | 29.0 | % | 28.9 | % | 31.0 | % | 33.0 | % | |||||
Materials and Supplies | 8.1 | % | 10.2 | % | 8.1 | % | 9.6 | % | |||||
Services | 16.8 | % | 14.4 | % | 14.9 | % | 14.0 | % | |||||
Energy | 7.3 | % | 3.4 | % | 6.7 | % | 3.3 | % | |||||
Personnel | 27.4 | % | 27.6 | % | 26.2 | % | 25.1 | % | |||||
Depreciation | 6.7 | % | 7.4 | % | 6.7 | % | 7.4 | % | |||||
Others* | 4.7 | % | 8.0 | % | 6.5 | % | 7.6 | % | |||||
Total | 100.0 | % | 100.0 | % | 100.0 | % | 100.0 | % | |||||
Note: For rounding-up effects, the sum of the figures stated may differ from the total.
*Others include mainly: maintenance, spare parts and materials and packaging expenses.
17 / 24
MASISA S.A. AND SUBSIDIARIES
CONSOLIDATED FINANCIAL STATEMENTS
Aggregate | |||||||
CONSOLIDATED INCOME STATEMENTS | Dec 31st, | Dec 31st, | |||||
2007 | 2006 | ||||||
(in thousands of US$) | |||||||
| Operating Income | 965,816 | 886,507 | |||||
| Operating Costs (less) | (722,511 | ) | (678,956 | ) | |||
| OPERATING MARGIN | 243,305 | 207,551 | |||||
| Selling and Administrative Expenses (less) | (136,538 | ) | (123,972 | ) | |||
OPERATING INCOME | 106,767 | 83,579 | |||||
| Financial Income | 4,314 | 8,716 | |||||
| Financial expenses (less) | (33,774 | ) | (35,371 | ) | |||
Net financial expenses | (29,460 | ) | (26,655 | ) | |||
| Net income related company investments | 0 | 613 | |||||
| Loss related company investments (less) | (197 | ) | 0 | ||||
Net earnings related company investments | (197 | ) | 613 | ||||
| Other non-operating income | 4,075 | 6,898 | |||||
| Other non-operating expenses (less) | (20,827 | ) | (15,883 | ) | |||
| Amortization of goodwill (less) | (122 | ) | (85 | ) | |||
| Currency correction | 3,885 | 628 | |||||
| Exchange differences | (13,605 | ) | (11,513 | ) | |||
NON-OPERATING INCOME | (56,251 | ) | (45,997 | ) | |||
| Income before income taxes and extraordinary items | 50,516 | 37,582 | |||||
| Income tax | (22,705 | ) | (23,344 | ) | |||
| Extraordinary items | 0 | 0 | |||||
| Net Income (loss) before minoritary interest | 27,811 | 14,238 | |||||
| Minoritary interest | 8,661 | 10,695 | |||||
| Net Income (loss) | 36,472 | 24,933 | |||||
| Amortization of negative goodwill | 4,586 | 4,552 | |||||
NET INCOME (LOSS) FOR THE PERIOD | 41,058 | 29,485 | |||||
Note: For rounding-up effects, the sum of the figures stated may differ from the total.
18 / 24
MASISA S.A. AND SUBSIDIARIES
CONSOLIDATED FINANCIAL STATEMENTS
Aggregate | |||||||
CONSOLIDATED BALANCE | Dec 31st, | Dec 31st, | |||||
2007 | 2006 | ||||||
(in thousands of US$) | |||||||
ASSETS | |||||||
CURRENT ASSETS: | |||||||
| Cash and equivalents | 11,929 | 16,705 | |||||
| Time deposits | 24,689 | 29,388 | |||||
| Negotiable securities (net) | 1,363 | 956 | |||||
| Sales debtors (net) | 135,357 | 125,107 | |||||
| Documents receivables (net) | 9,901 | 10,130 | |||||
| Sundry debtors (net) | 19,567 | 18,814 | |||||
| Documents and accounts receivables to related companies | 7,326 | 7,378 | |||||
| Inventories (net) | 212,455 | 185,777 | |||||
| Recoverable taxes | 57,665 | 62,237 | |||||
| Anticipated paid expenses | 8,308 | 6,504 | |||||
| Differed taxes | 9,953 | 9,876 | |||||
| Other current assets | 1,671 | 2,479 | |||||
Total Current assets | 500,184 | 475,351 | |||||
FIXED ASSETS: | |||||||
| Lands | 165,089 | 142,758 | |||||
| Construction and infrastructure works | 218,451 | 220,140 | |||||
| Machinery and equipments | 857,467 | 849,262 | |||||
| Others fixed assets | 918,183 | 757,249 | |||||
| Higher value for technical reappraisal of fixed assets | 7,390 | 7,390 | |||||
| Depreciation (less) | -464,163 | -419,451 | |||||
Total Fixed assets | 1,702,417 | 1,557,348 | |||||
OTHERS ASSETS: | |||||||
| Related company investments | 4,170 | 4,651 | |||||
| Other company investments | 217 | 206 | |||||
| Lower value of investments | 2,308 | 1,165 | |||||
| Higher value of investments (less) | -54,408 | -58,352 | |||||
| Long term debtors | 4,711 | 4,113 | |||||
| Long term documents and accounts receivable to related companies | 0 | 1,406 | |||||
| Long term differed taxes | 0 | 0 | |||||
| Intangibles | 11,564 | 267 | |||||
| Amortization (less) | -938 | -41 | |||||
| Others | 41,238 | 30,220 | |||||
Total Others Assets | 8,862 | (16,365 | ) | ||||
TOTAL ASSETS | 2,211,463 | 2,016,334 | |||||
Note: For rounding-up effects, the sum of the figures stated may differ from the total.
19 / 24
MASISA S.A. AND SUBSIDIARIES
CONSOLIDATED FINANCIAL STATEMENTS
Aggregate | |||||||
CONSOLIDATED BALANCE | Dec 31st, | Dec 31st, | |||||
2007 | 2006 | ||||||
(in thousands of US$) | |||||||
LIABILITIES | |||||||
CURRENT LIABILITIES: | |||||||
| Short term obligations with banks and financial institutions | 113,600 | 65,529 | |||||
| Long term obligations with banks and financial institutions - short term portion | 45,119 | 52,787 | |||||
| Obligations to the public - short term portion (bonds) | 62,643 | 32,937 | |||||
| Long term obligations with one-year maturity | 0 | 0 | |||||
| Dividends payable | 444 | 473 | |||||
| Accounts payable | 74,129 | 52,260 | |||||
| Documents payable | 999 | 707 | |||||
| Sundry creditors | 2,044 | 2,069 | |||||
| Documents and accounts payable to related companies | 7,472 | 5,451 | |||||
| Provisions | 42,063 | 31,742 | |||||
| Retentions | 16,923 | 14,244 | |||||
| Income tax | 21,633 | 8,823 | |||||
| Incomes received in advance | 274 | 279 | |||||
| Others current liabilities | 0 | 47 | |||||
Total Current Liabilities | 387,343 | 267,348 | |||||
LONG TERM LIABILITIES: | |||||||
| Obligations with banks and financial institutions | 136,117 | 170,944 | |||||
| Long term obligations to the public (bonds) | 287,107 | 274,112 | |||||
| Long term sundry creditors | 57 | 74 | |||||
| Long term provisions | 1,716 | 1,662 | |||||
| Long term differed taxes | 95,950 | 77,957 | |||||
| Others long term liabilities | 16,396 | 17,320 | |||||
Total Long Term Liabilities | 537,343 | 542,069 | |||||
MINORITARY INTEREST: | 14,777 | 20,562 | |||||
NET WORTH: | |||||||
| Paid in capital | 812,880 | 812,880 | |||||
| Capital revalorization reserve | 0 | 0 | |||||
| Overpricing in sale of treasury shares | 0 | 0 | |||||
| Other reserves | 276,549 | 219,494 | |||||
| Retained earnings | 182,571 | 153,981 | |||||
| Future dividend reserves | 51,424 | 51,424 | |||||
| Earnings aggregate | 90,089 | 73,072 | |||||
| Loss aggregate (less) | 0 | 0 | |||||
| Net income (loss) for the period | 41,058 | 29,485 | |||||
| Provisory Dividends (less) | 0 | 0 | |||||
| Aggregate deficit for development period | 0 | 0 | |||||
Total Net Worth | 1,272,000 | 1,186,355 | |||||
TOTAL LIABILITIES | 2,211,463 | 2,016,334 | |||||
Note: For rounding-up effects, the sum of the figures stated may differ from the total.
20 / 24
MASISA S.A. AND SUBSIDIARIES
CONSOLIDATED FINANCIAL STATEMENTS
Aggregate | |||||||
CASH FLOW STATEMENT - DIRECT | Dec 31st, | Dec 31st, | |||||
2007 | 2006 | ||||||
(in thousands of US$) | |||||||
FLOW ORIGINATED BY OPERATING ACTIVITIES: | |||||||
| Sales debtors collection | 1,188,447 | 1,230,899 | |||||
| Financial income received | 3,435 | 36,851 | |||||
| Dividends and other distributions received | 0 | 0 | |||||
| Other incomes received | 43,591 | 29,742 | |||||
| Supplier and personnel payment (less) | (976,399 | ) | (1,053,794 | ) | |||
| Interests paid (less) | (44,780 | ) | (78,138 | ) | |||
| Income tax paid (less) | (12,718 | ) | (11,346 | ) | |||
| Other expenses paid (less) | (4,172 | ) | (2,229 | ) | |||
| VAT and similar others paid (less) | (54,893 | ) | (19,950 | ) | |||
Net Flow Originated by Operating Activities | 142,511 | 132,035 | |||||
FLOW ORIGINATED BY FINANCING ACTIVITIES: | |||||||
| Payment shares placement | 0 | 44,012 | |||||
| Loans granted | 258,583 | 242,536 | |||||
| Obligations to the public | 87,842 | 162,965 | |||||
| Documented loans to related companies | 24 | 0 | |||||
| Others loans granted to related companies | 0 | 73 | |||||
| Other financing sources | 7,786 | 0 | |||||
| Dividend payment (less) | (12,467 | ) | (11,491 | ) | |||
| Capital distribution (less) | 0 | 0 | |||||
| Loan payment (less) | (262,290 | ) | (291,108 | ) | |||
| Obligations to the public payment(less) | (84,171 | ) | (178,338 | ) | |||
| Documented loans to related companies payment (less) | 0 | 0 | |||||
| Others loans granted to related companies payment (less) | 0 | (709 | ) | ||||
| Emission and share placement expenses payment (less) | 0 | (903 | ) | ||||
| Emission and obligations to the public placement expenses payment (less) | 0 | 0 | |||||
| Others financing disbursements (less) | 0 | 0 | |||||
Net Flow Originated by Financing Activities | (4,693 | ) | (32,963 | ) | |||
FLOW ORIGINATED BY INVESTMENT ACTIVITIES: | |||||||
| Fixed asset sales | 1,441 | 1,565 | |||||
| Permanent investment sales | 0 | 0 | |||||
| Other investment sales | 0 | 1,698 | |||||
| Documented loans to related companies collection | 0 | 0 | |||||
| Other loans to related companies collection | 0 | 0 | |||||
| Others investment income | 0 | 2,877 | |||||
| Fixed assets incorporation (less) | (139,689 | ) | (121,843 | ) | |||
| Capitalized interests payment (less) | (6,359 | ) | (6,936 | ) | |||
| Permanent investments (less) | (2,303 | ) | (27,229 | ) | |||
| Financial instrument investments (less) | 0 | 0 | |||||
| Documented loans to related companies (less) | 0 | 0 | |||||
| Others loans to related companies (less) | 0 | 0 | |||||
| Others investment disbursements (less) | 0 | 0 | |||||
Net Flow Originated by Investment Activities | (146,910 | ) | (149,868 | ) | |||
TOTAL NET FLOW FOR THE PERIOD: | (9,092 | ) | (50,796 | ) | |||
| Inflation effect over cash and cash equivalents | 24 | (12 | ) | ||||
| Net variation of cash and cash equivalents | (9,068 | ) | (50,808 | ) | |||
| Initial balance of cash and cash equivalents | 47,049 | 97,857 | |||||
FINAL BALANCE OF CASH AND CASH EQUIVALENTS | 37,981 | 47,049 | |||||
Note: For rounding-up effects, the sum of the figures stated may differ from the total.
21 / 24
MASISA S.A. AND SUBSIDIARIES
CONSOLIDATED FINANCIAL STATEMENTS
Aggregate | |||||||
FLOW-INCOME CONCILIATION | Dec 31st, | Dec 31st, | |||||
2007 | 2006 | ||||||
| (in thousands of US$) | |||||||
Net Income for the period | 41,058 | 29,485 | |||||
ASSET SALE INCOME | |||||||
| (Net Income) Loss in fixed asset sales | (11 | ) | (31 | ) | |||
| Net Income in investment sales (less) | 0 | 0 | |||||
| Loss in investment sales | 0 | 0 | |||||
| (Net Income) Loss in others asset sales | 785 | 0 | |||||
Asset sales income | 774 | (31 | ) | ||||
CHARGES (INCOME) TO INCOME WHICH DOES NOT REPRESENT CASH FLOW | |||||||
| Depreciation for the period | 50,290 | 50,563 | |||||
| Intangibles amortization | 1,044 | 439 | |||||
| Punishments and provisions | 4,276 | 5,995 | |||||
| Net income paid for investments in related companies (less) | 0 | (613 | ) | ||||
| Loss paid for investments in related companies | 197 | 0 | |||||
| Amortization of goodwill | 122 | 85 | |||||
| Amortization of negative goodwill (less) | (4,586 | ) | (4,552 | ) | |||
| Net currency correction | (3,885 | ) | (628 | ) | |||
| Net exchange difference | 13,602 | 11,513 | |||||
| Other income to income which does not represent cash flow (less) | (2,316 | ) | (64 | ) | |||
| Other charges to income which does not represent cash flow | 20,304 | 20,070 | |||||
Cargos (Charges) to income which does not represent cash flow | 79,048 | 82,808 | |||||
VARIATION OF ASSET WHICH AFFECT CASH FLOW: | |||||||
| Sale debtors | 3,326 | (1,825 | ) | ||||
| Inventories | (29,608 | ) | 45,892 | ||||
| Other assets | 15,360 | (17,210 | ) | ||||
Variation of assets which affect cash flow increase (decrease) | (10,922 | ) | 26,857 | ||||
VARIATION OF LIABILITIES WHICH AFFECT CASH FLOW | |||||||
| Accounts payable related to operating income | 11,286 | (19,545 | ) | ||||
| Interests payable | 6,707 | 2,434 | |||||
| Income tax payable (net) | (1,267 | ) | 3,185 | ||||
| Other accounts payable related to non operating income | 23,748 | 6,715 | |||||
| VAT and similar others payable (net) | 740 | 10,822 | |||||
Variation of liabilities which affect cash flow increase (decrease) | 41,214 | 3,611 | |||||
Net income (Loss) of minoritary interest | (8,661 | ) | (10,695 | ) | |||
NET FLOW ORIGINATED BY OPERATING ACTIVITIES | 142,511 | 132,035 | |||||
Note: For rounding-up effects, the sum of the figures stated may differ from the total.
22 / 24
Forecasts and Estimates
This press release may contain forecasts, which are different statements from historical facts or current conditions, and include the management’s current vision and estimates of future circumstances, industry conditions and the Company’s performance. Some forecasts may be identified by the use of terms such as “may,” “should,” “anticipates,” “believes,” “estimates,” “expects,” “plans,” “intends,” “forecasts” and other similar expressions. Statements about future market share, projected future competitive strengths, the implementation of significant operating and financial strategies, the direction of future operations, and the factors or trends affecting financial conditions, liquidity, or operating income are examples of forecasts. Such statements reflect the current management vision and are subject to various risks and uncertainties. There is no guarantee that the expected events, trends or results will actually occur. These statements are made based on many assumptions and factors, including general economic and market conditions, industry conditions and operating factors. Any changes in such assumptions or factors could lead to the current results of Masisa, and the projected Company activities, to materially differ from current expectations.
23 / 24
SIGNATURE
Pursuant to the requirements of the Securities Exchange Act of 1934, the registrant has duly caused this report to be signed on its behalf by the undersigned, thereunto duly authorized.
Date: February 20, 2008
| Masisa S.A. | ||
| By: | /s/ Patricio Reyes | |
Patricio Reyes General Counsel | ||
24 / 24