Leslie M, Kidney Transplant Recipient Focused on improving care across the entire transplant patient journey The Transplant Company™ Earnings Presentation Q4 and FY 2022
These slides and the accompanying oral presentation contain forward-looking statements, including statements with respect to expectations regarding CareDx’s upcoming milestones, vision and 2023 revenue guidance. All statements other than statements of historical fact contained in this presentation, including statements regarding the future financial position of CareDx, Inc. (together with its subsidiaries, “CareDx” or the “Company”), including financial targets, business strategy, and plans and objectives for future operations, are forward-looking statements. CareDx has based these forward- looking statements on its estimates and assumptions and its current expectations and projections about future events. These forward-looking statements are subject to a number of risks, uncertainties and assumptions, all of which are difficult to predict and many of which are beyond the Company's control, including general economic and market factors, global economic and marketplace uncertainties related to the COVID-19 pandemic and those contained in the “Risk Factors” section of the Company’s most recent Annual Report on Form 10-K and Quarterly Reports on Form 10-Q that the Company has filed or may subsequently file with the U.S. Securities and Exchange Commission (the “SEC”). In light of these risks, uncertainties and assumptions, the forward-looking events and circumstances discussed in this presentation are inherently uncertain and may not occur, and actual results could differ materially and adversely from those anticipated or implied in the forward-looking statements. Accordingly, you should not rely upon forward-looking statements as predictions of future events. CareDx undertakes no obligation to update publicly or revise any forward-looking statements for any reason after the date of this presentation or to conform these statements to actual results or to changes in CareDx’s expectations. These slides and the accompanying oral presentation contain certain non-GAAP financial measures, which are provided to assist in an understanding of the business and performance of CareDx. These measures should always be considered only as a supplement to, and not as superior to, financial measures prepared in accordance with GAAP. These non-GAAP financial measures are not necessarily comparable to similarly-titled measures presented by other companies. Please refer to the Appendix included in these slides for a reconciliation of the non-GAAP financial measures included in these slides and the accompanying oral presentation to the most directly comparable financial measures prepared in accordance with GAAP. Certain data in this presentation was obtained from various external sources, and neither the Company nor its affiliates, advisers or representatives has verified such data with independent sources. Accordingly, neither the Company nor any of its affiliates, advisers or representatives makes any representations as to the accuracy or completeness of that data or undertakes any obligation to update such data after the date of this presentation. Such data involves risks and uncertainties and is subject to change based on various factors. The trademarks included herein are the property of the owners thereof and are used for reference purposes only. Such use should not be construed as an endorsement of the products or services of the Company. Safe Harbor Statement 2
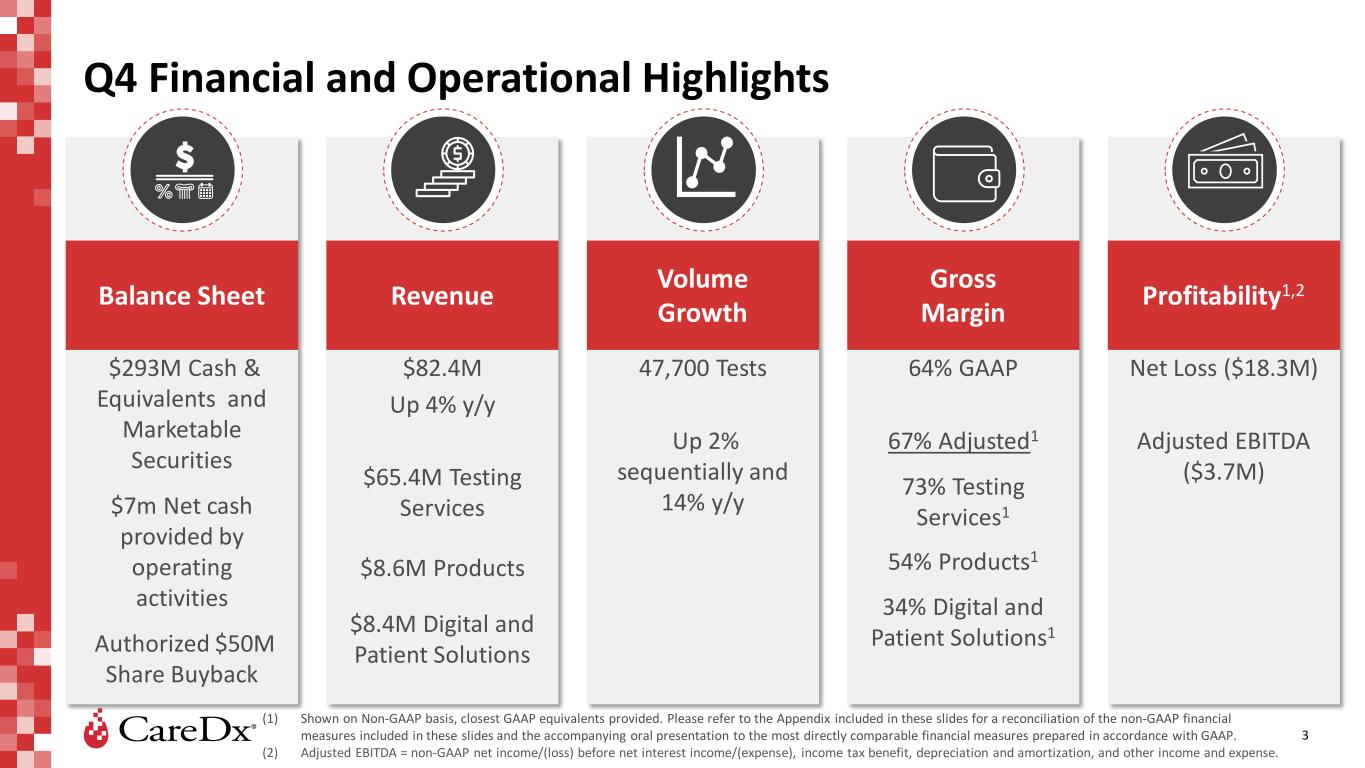
Q4 Financial and Operational Highlights 3 (1) Shown on Non-GAAP basis, closest GAAP equivalents provided. Please refer to the Appendix included in these slides for a reconciliation of the non-GAAP financial measures included in these slides and the accompanying oral presentation to the most directly comparable financial measures prepared in accordance with GAAP. (2) Adjusted EBITDA = non-GAAP net income/(loss) before net interest income/(expense), income tax benefit, depreciation and amortization, and other income and expense. $293M Cash & Equivalents and Marketable Securities $7m Net cash provided by operating activities Authorized $50M Share Buyback Balance Sheet $82.4M Up 4% y/y $65.4M Testing Services $8.6M Products $8.4M Digital and Patient Solutions Revenue 47,700 Tests Up 2% sequentially and 14% y/y Volume Growth 64% GAAP 67% Adjusted1 73% Testing Services1 54% Products1 34% Digital and Patient Solutions1 Gross Margin Net Loss ($18.3M) Adjusted EBITDA ($3.7M) Profitability1,2
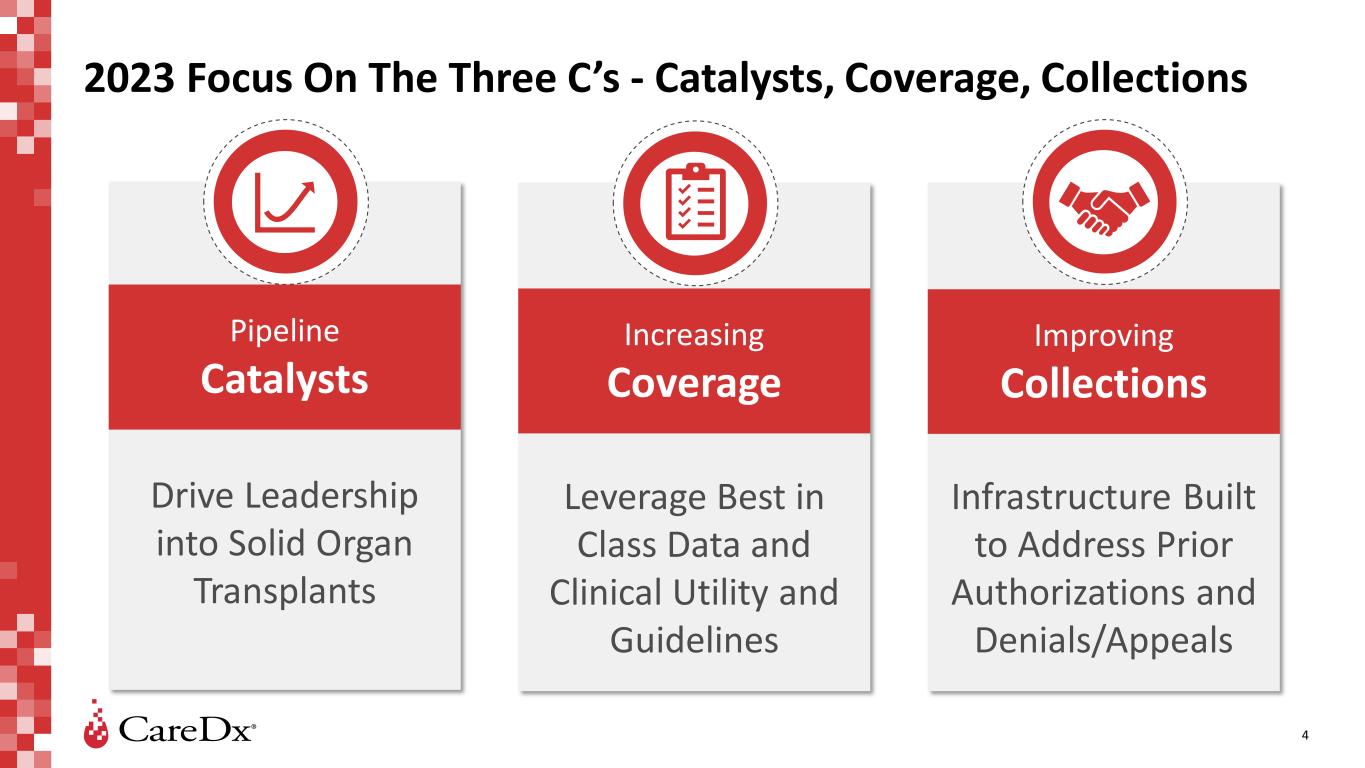
Infrastructure Built to Address Prior Authorizations and Denials/Appeals 2023 Focus On The Three C’s - Catalysts, Coverage, Collections 4 Drive Leadership into Solid Organ Transplants Pipeline Catalysts Leverage Best in Class Data and Clinical Utility and Guidelines Increasing Coverage Improving Collections
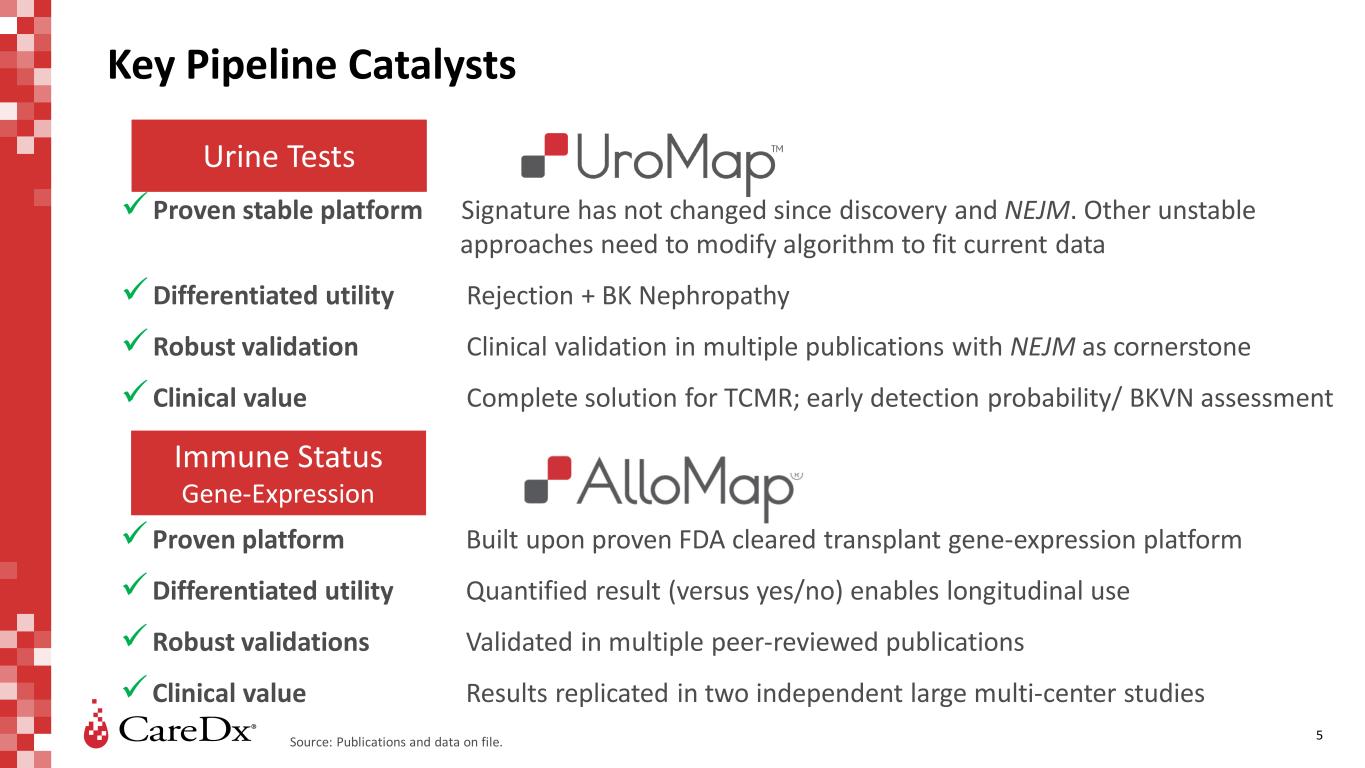
Key Pipeline Catalysts Proven stable platform Signature has not changed since discovery and NEJM. Other unstable approaches need to modify algorithm to fit current data Differentiated utility Rejection + BK Nephropathy Robust validation Clinical validation in multiple publications with NEJM as cornerstone Clinical value Complete solution for TCMR; early detection probability/ BKVN assessment Urine Tests Proven platform Built upon proven FDA cleared transplant gene-expression platform Differentiated utility Quantified result (versus yes/no) enables longitudinal use Robust validations Validated in multiple peer-reviewed publications Clinical value Results replicated in two independent large multi-center studies Immune Status Gene-Expression Source: Publications and data on file. 5
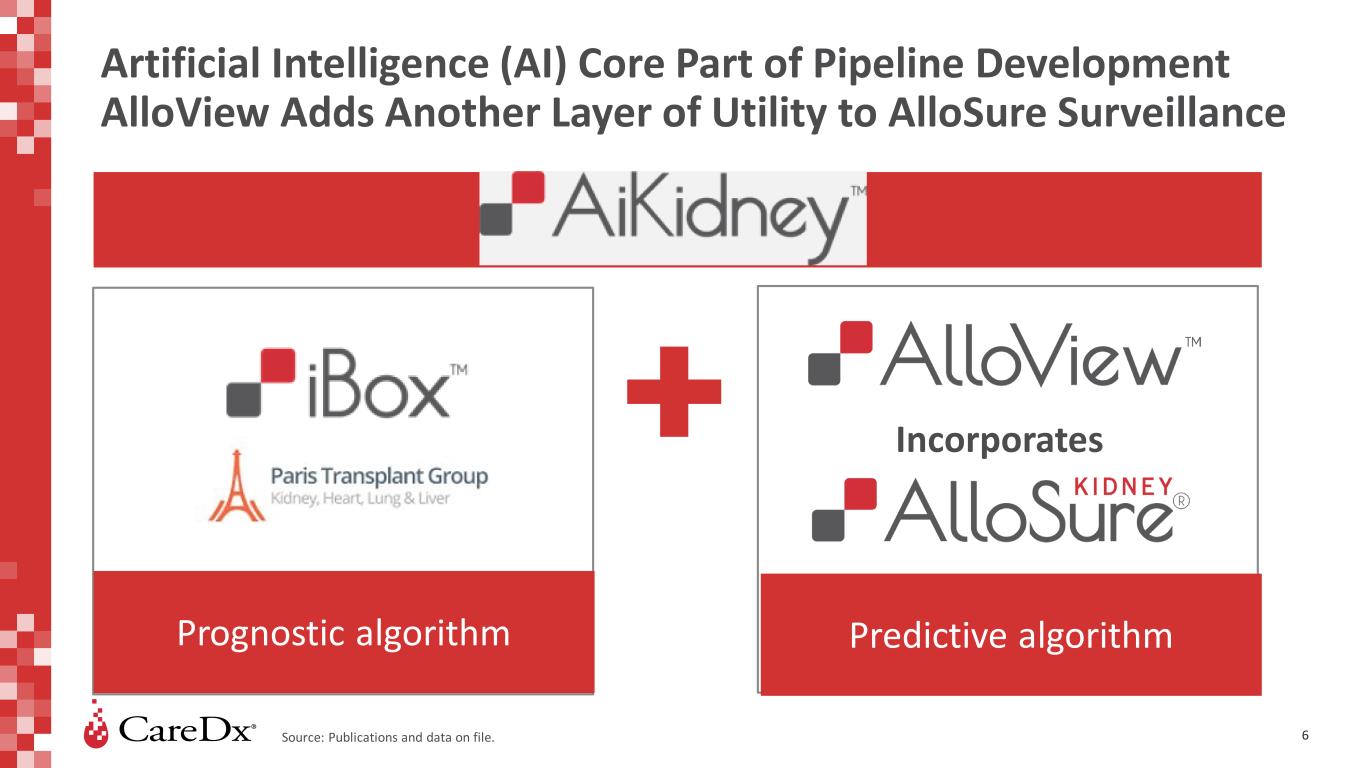
Artificial Intelligence (AI) Core Part of Pipeline Development AlloView Adds Another Layer of Utility to AlloSure Surveillance Prognostic algorithm Predictive algorithm Incorporates Source: Publications and data on file. 6
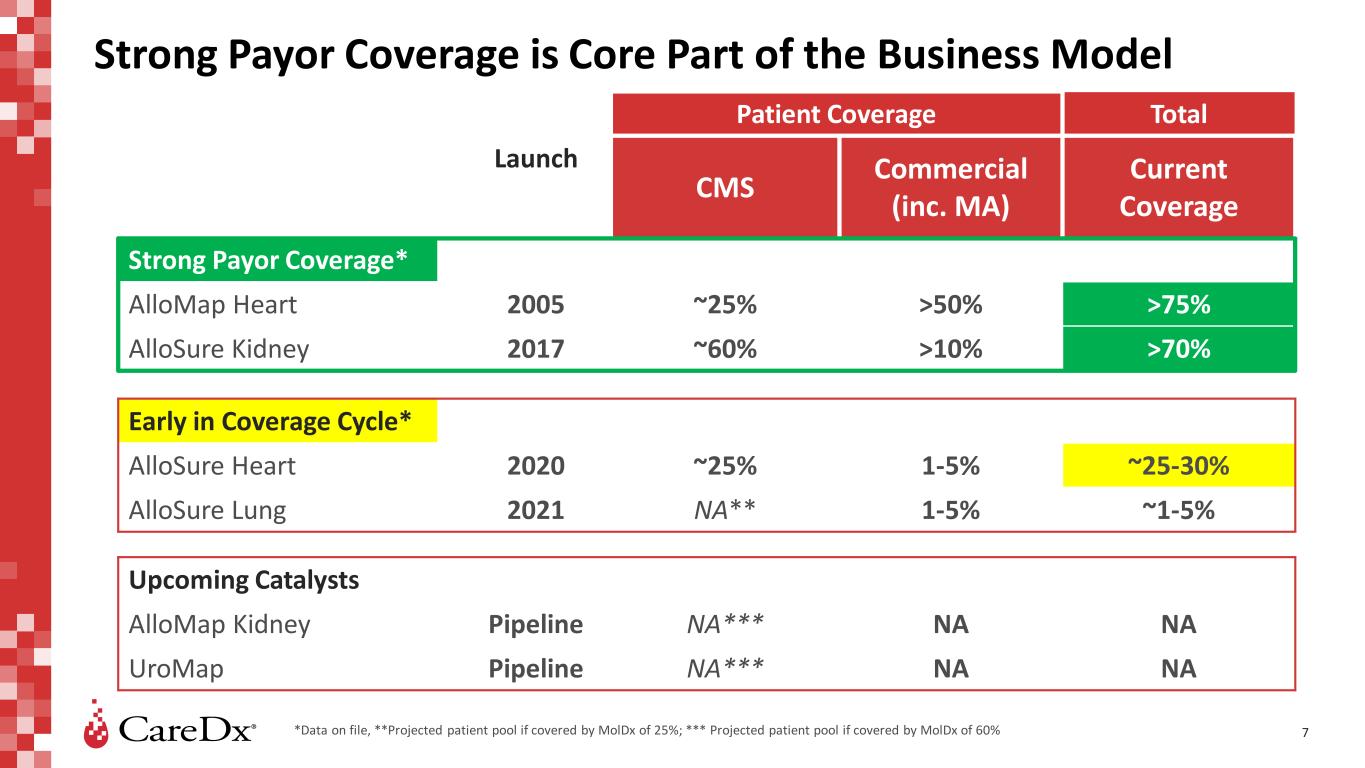
Strong Payor Coverage is Core Part of the Business Model 7 Patient Coverage Total Launch CMS Commercial (inc. MA) Current Coverage Strong Payor Coverage* AlloMap Heart 2005 ~25% >50% >75% AlloSure Kidney 2017 ~60% >10% >70% Early in Coverage Cycle* AlloSure Heart 2020 ~25% 1-5% ~25-30% AlloSure Lung 2021 NA** 1-5% ~1-5% Upcoming Catalysts AlloMap Kidney Pipeline NA*** NA NA UroMap Pipeline NA*** NA NA *Data on file, **Projected patient pool if covered by MolDx of 25%; *** Projected patient pool if covered by MolDx of 60%
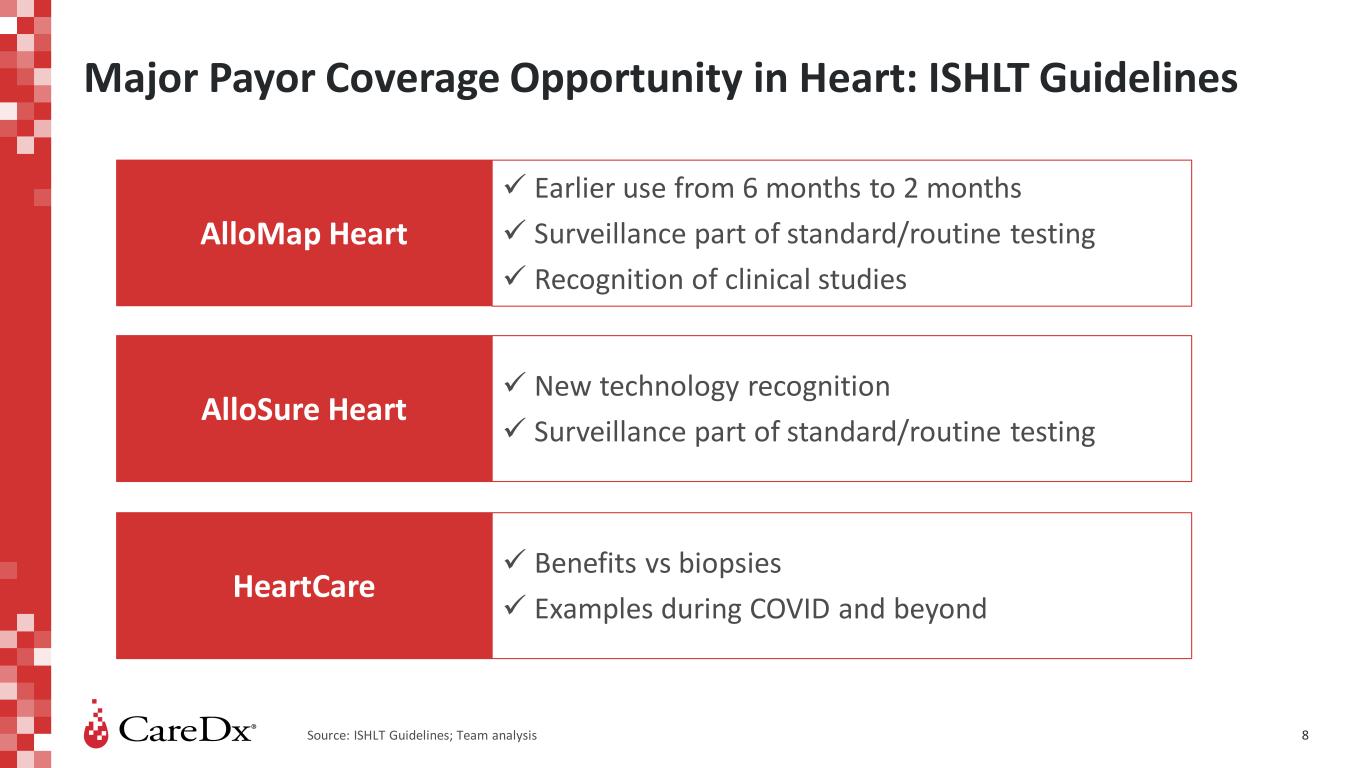
Major Payor Coverage Opportunity in Heart: ISHLT Guidelines 8 AlloMap Heart AlloSure Heart HeartCare Earlier use from 6 months to 2 months Surveillance part of standard/routine testing Recognition of clinical studies New technology recognition Surveillance part of standard/routine testing Benefits vs biopsies Examples during COVID and beyond Source: ISHLT Guidelines; Team analysis
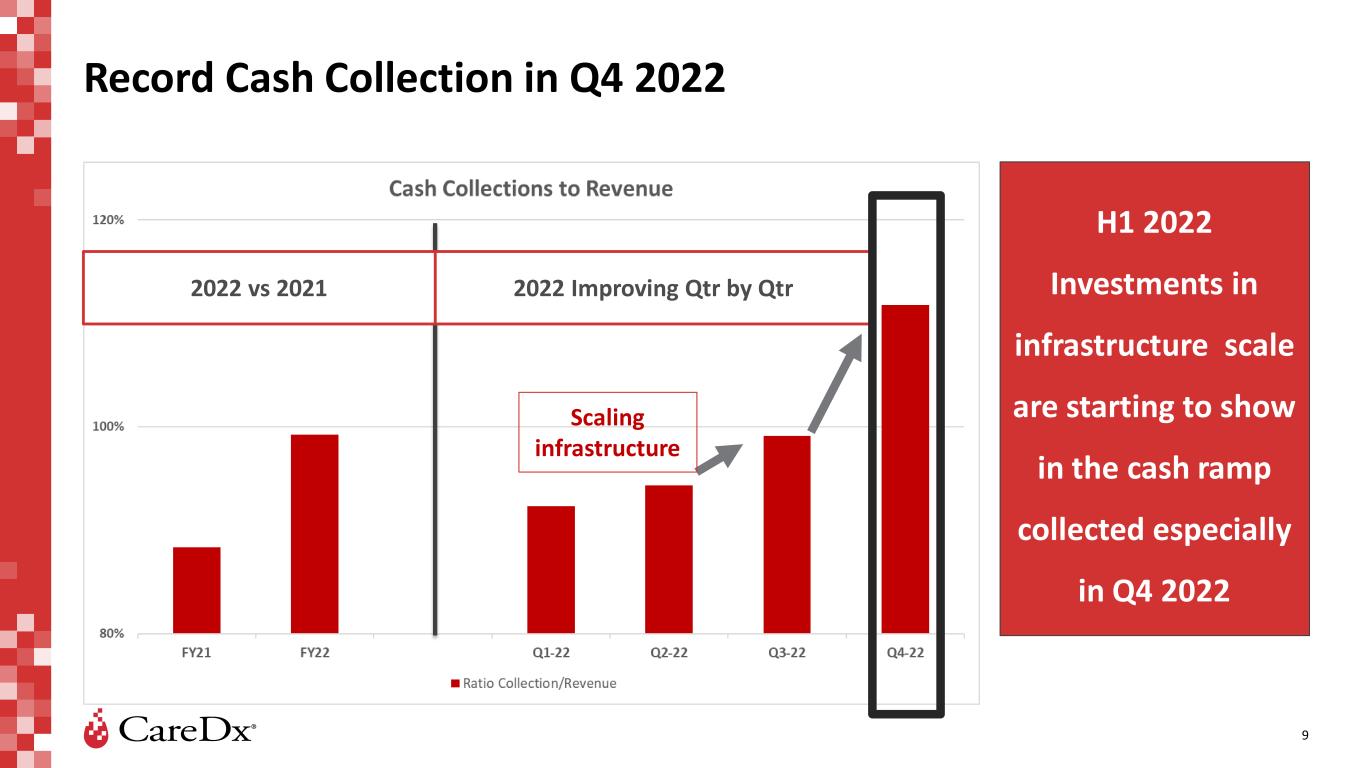
Record Cash Collection in Q4 2022 9 H1 2022 Investments in infrastructure scale are starting to show in the cash ramp collected especially in Q4 2022 2022 vs 2021 2022 Improving Qtr by Qtr Scaling infrastructure
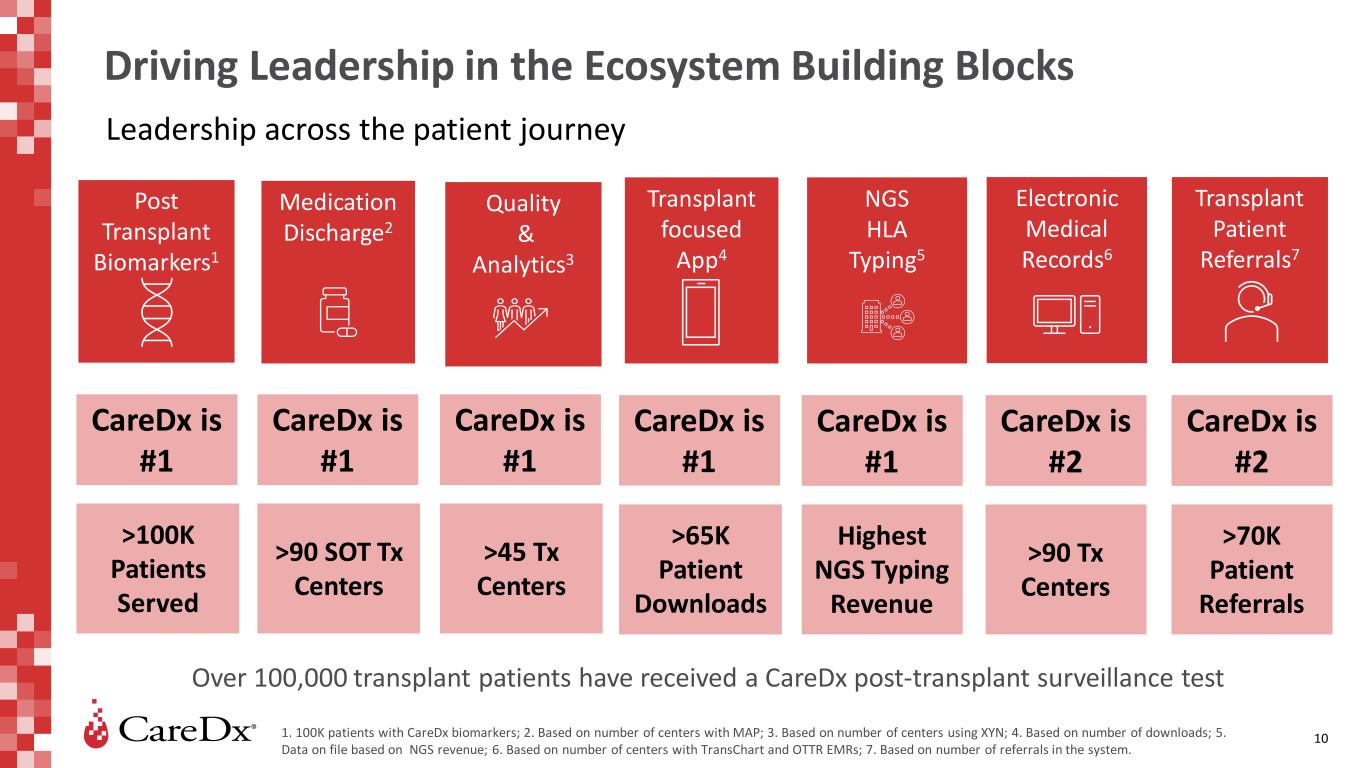
Post Transplant Biomarkers1 Driving Leadership in the Ecosystem Building Blocks 10 Leadership across the patient journey Electronic Medical Records6 Quality & Analytics3 Transplant focused App4 Medication Discharge2 CareDx is #1 CareDx is #1 CareDx is #1 CareDx is #2 CareDx is #2 Over 100,000 transplant patients have received a CareDx post-transplant surveillance test NGS HLA Typing5 CareDx is #1 Transplant Patient Referrals7 CareDx is #1 1. 100K patients with CareDx biomarkers; 2. Based on number of centers with MAP; 3. Based on number of centers using XYN; 4. Based on number of downloads; 5. Data on file based on NGS revenue; 6. Based on number of centers with TransChart and OTTR EMRs; 7. Based on number of referrals in the system. >70K Patient Referrals >90 Tx Centers Highest NGS Typing Revenue Tx Centers >100K Patients Served >45 Tx Centers >65K Patient Downloads >90 SOT Tx Centers
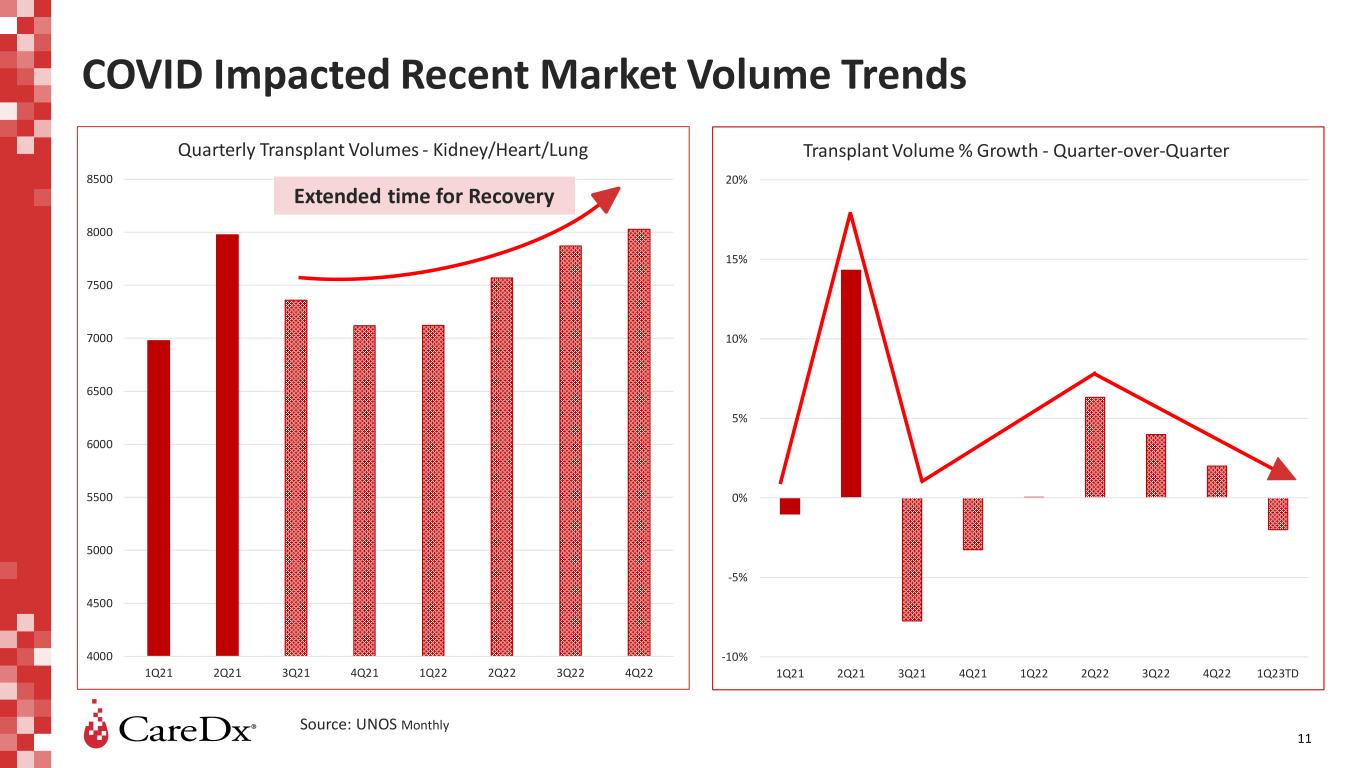
-10% -5% 0% 5% 10% 15% 20% 1Q21 2Q21 3Q21 4Q21 1Q22 2Q22 3Q22 4Q22 1Q23TD Transplant Volume % Growth - Quarter-over-Quarter 4000 4500 5000 5500 6000 6500 7000 7500 8000 8500 1Q21 2Q21 3Q21 4Q21 1Q22 2Q22 3Q22 4Q22 Quarterly Transplant Volumes - Kidney/Heart/Lung COVID Impacted Recent Market Volume Trends Source: UNOS Monthly Extended time for Recovery 11

0 1000 2000 3000 4000 5000 6000 1Q19 2Q19 3Q19 4Q19 1Q20 2Q20 3Q20 4Q20 1Q21 2Q21 3Q21 4Q21 1Q22 2Q22 3Q22 4Q22 LD DD Kidney Transplant Recovery Driven by Deceased Donors Source: UNOS Weekly Pre-COVID up to Q1, 2020 COVID no Vaccines (Vx) Vx to Omicron Early Recovery Stages 12
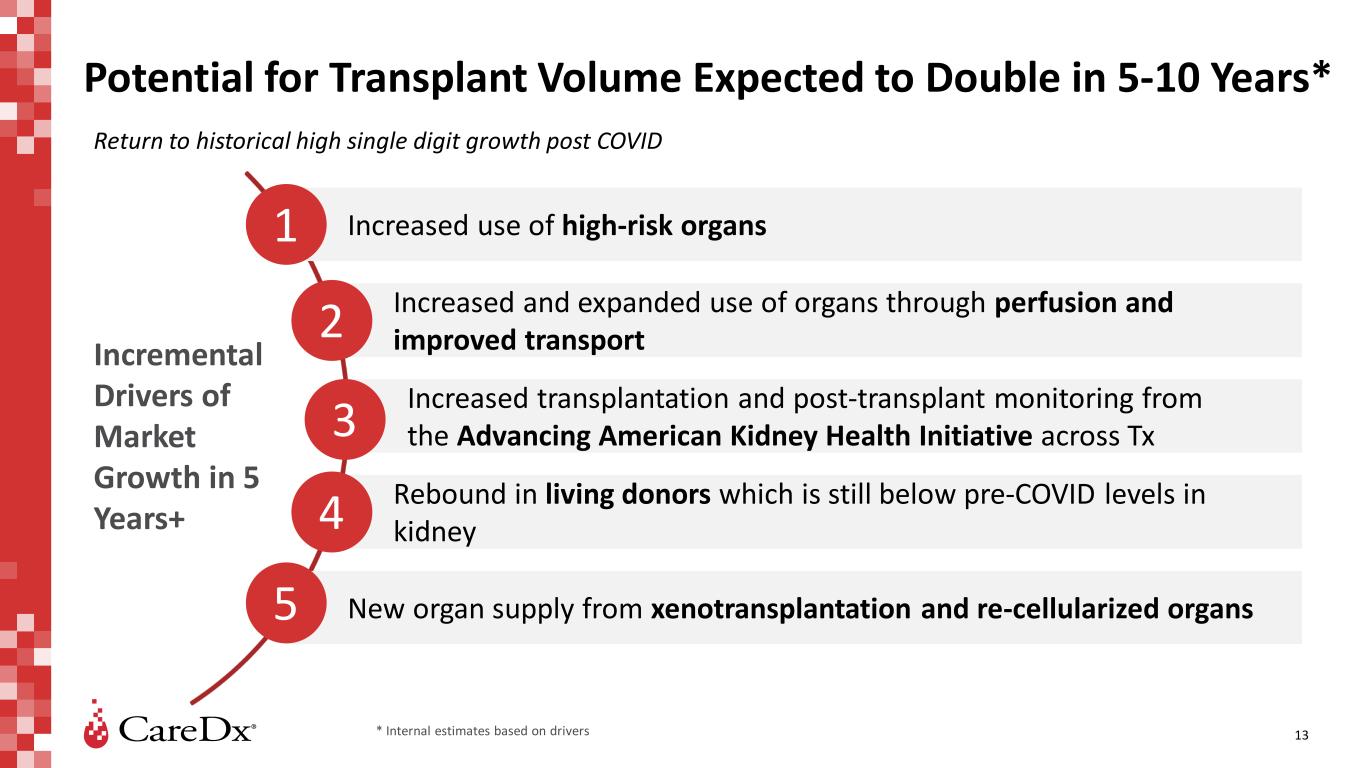
Potential for Transplant Volume Expected to Double in 5-10 Years* Increased use of high-risk organs Increased and expanded use of organs through perfusion and improved transport Increased transplantation and post-transplant monitoring from the Advancing American Kidney Health Initiative across Tx Rebound in living donors which is still below pre-COVID levels in kidney New organ supply from xenotransplantation and re-cellularized organs Incremental Drivers of Market Growth in 5 Years+ 1 2 Return to historical high single digit growth post COVID 3 4 5 * Internal estimates based on drivers 13
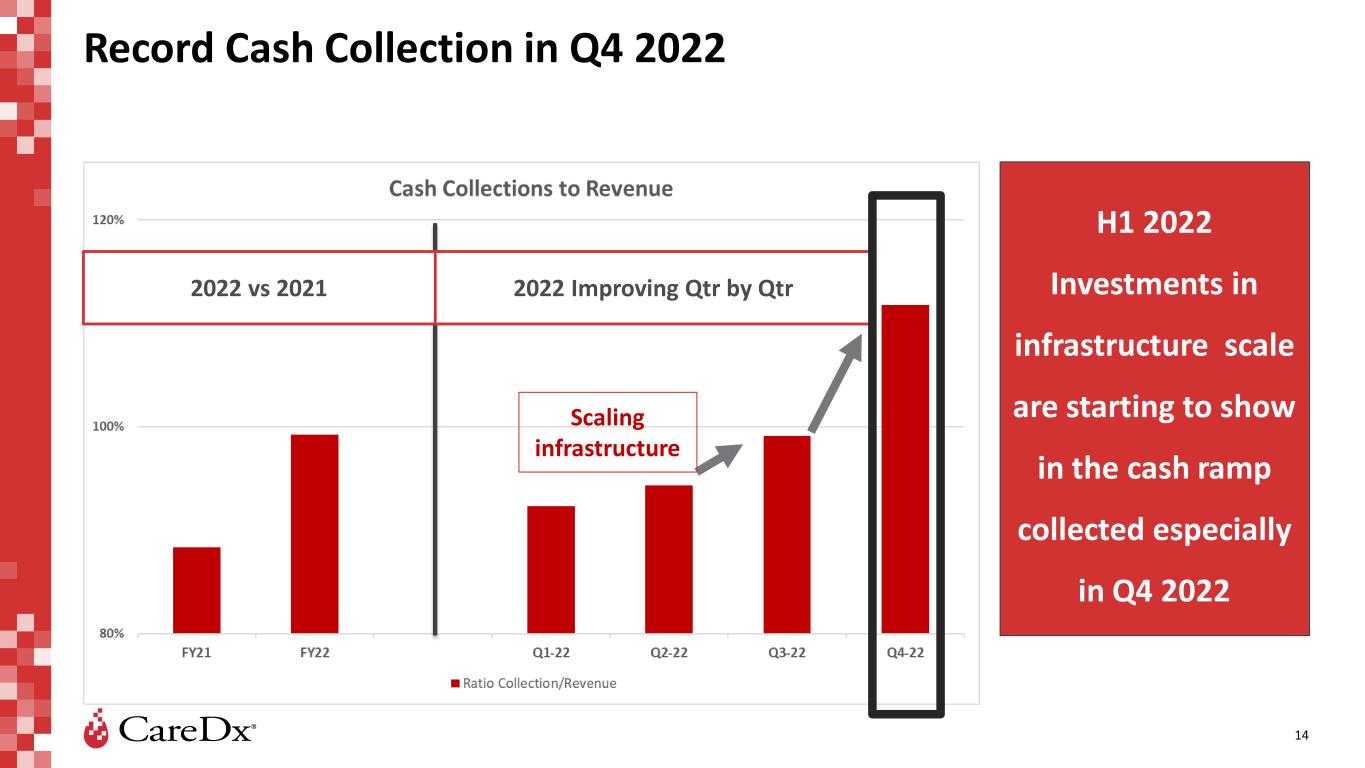
14 Record Cash Collection in Q4 2022 H1 2022 Investments in infrastructure scale are starting to show in the cash ramp collected especially in Q4 2022 2022 vs 2021 2022 Improving Qtr by Qtr Scaling infrastructure
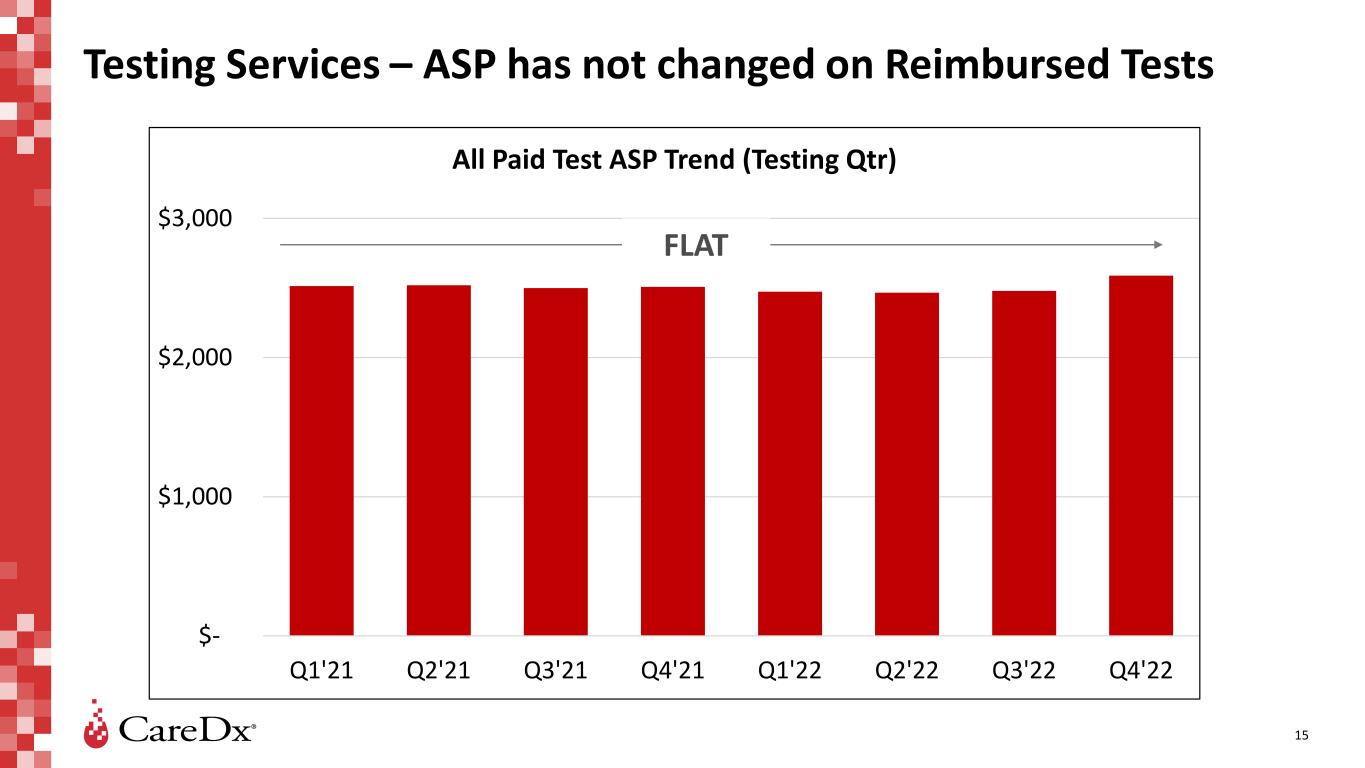
$- $1,000 $2,000 $3,000 Q1'21 Q2'21 Q3'21 Q4'21 Q1'22 Q2'22 Q3'22 Q4'22 All Paid Test ASP Trend (Testing Qtr) 15 Testing Services – ASP has not changed on Reimbursed Tests FLAT
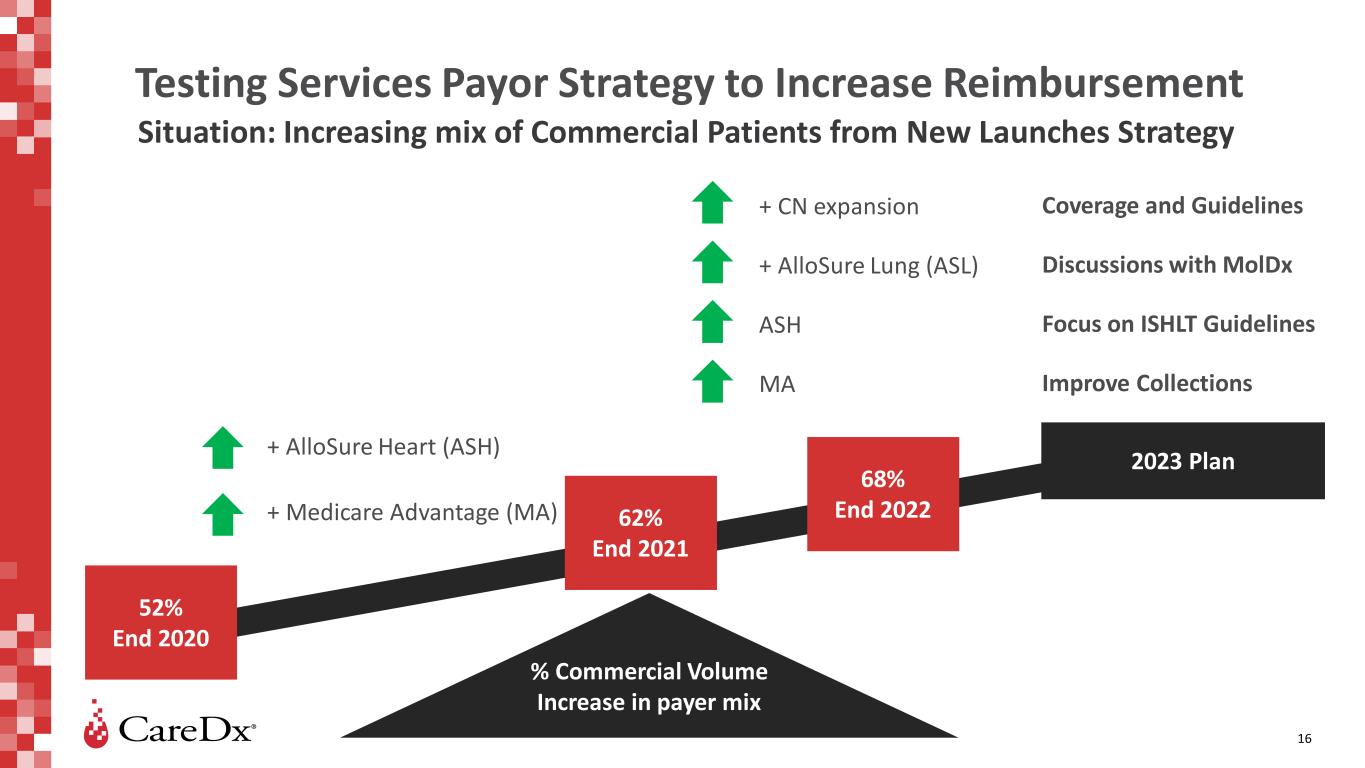
Testing Services Payor Strategy to Increase Reimbursement Situation: Increasing mix of Commercial Patients from New Launches Strategy 16 % Commercial Volume Increase in payer mix + CN expansion + AlloSure Lung (ASL) ASH MA 52% End 2020 62% End 2021 2023 Plan+ AlloSure Heart (ASH) + Medicare Advantage (MA) 68% End 2022 Coverage and Guidelines Discussions with MolDx Focus on ISHLT Guidelines Improve Collections
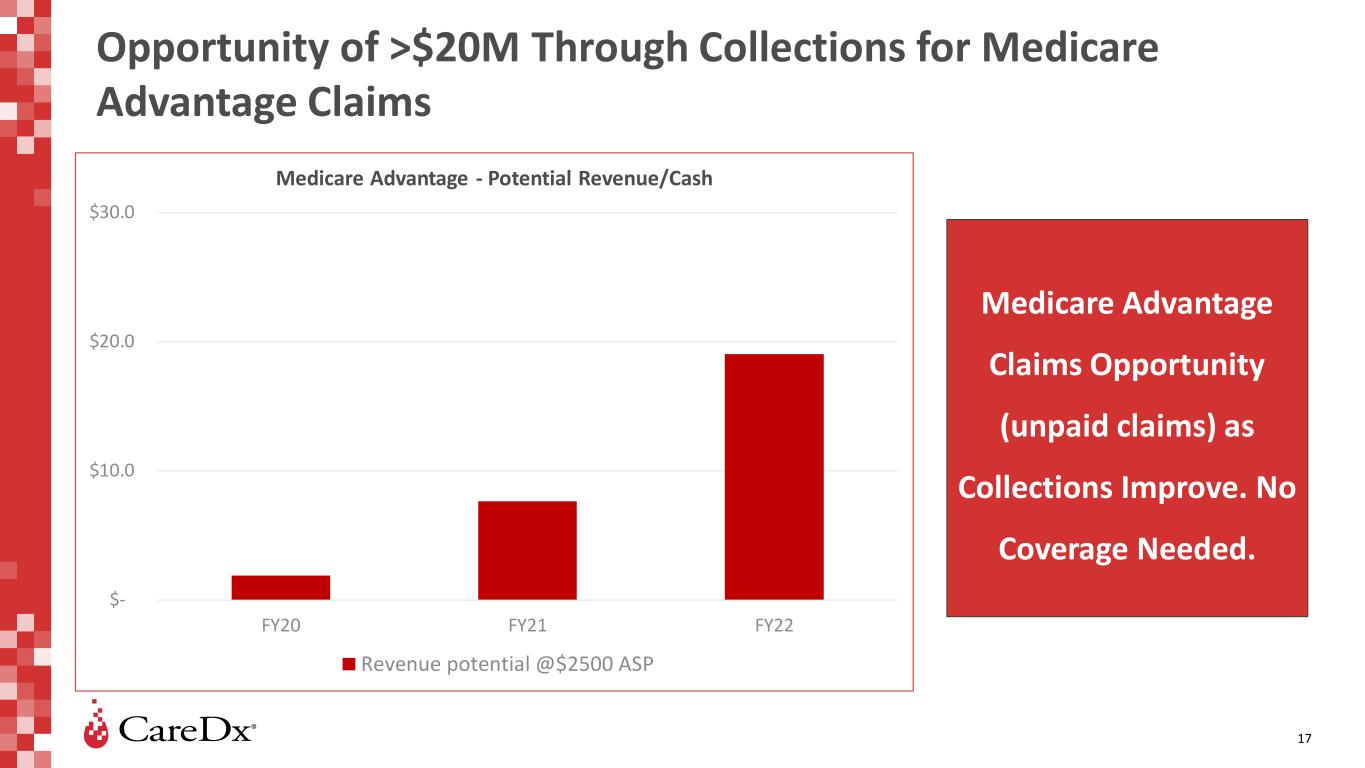
Opportunity of >$20M Through Collections for Medicare Advantage Claims 17 Medicare Advantage Claims Opportunity (unpaid claims) as Collections Improve. No Coverage Needed. $- $10.0 $20.0 $30.0 FY20 FY21 FY22 Medicare Advantage - Potential Revenue/Cash Revenue potential @$2500 ASP
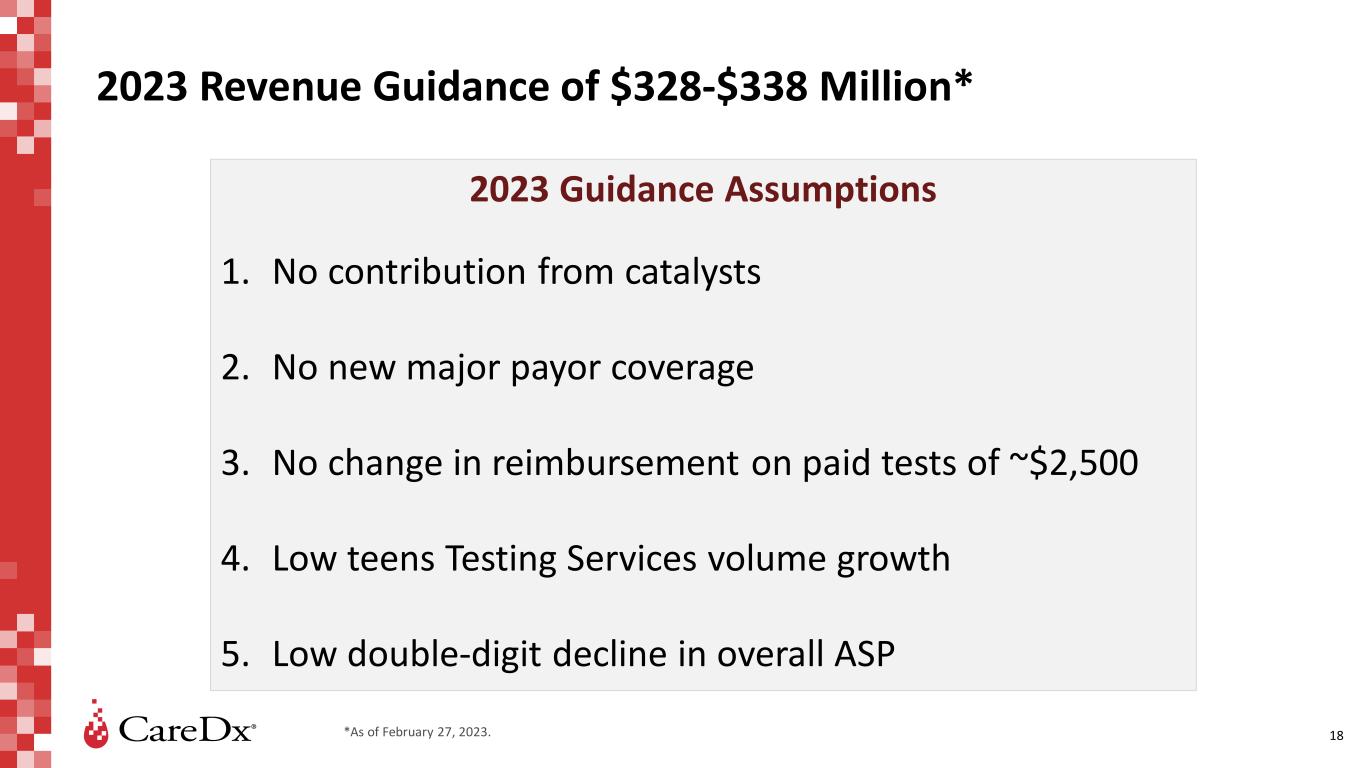
2023 Revenue Guidance of $328-$338 Million* 18 2023 Guidance Assumptions 1. No contribution from catalysts 2. No new major payor coverage 3. No change in reimbursement on paid tests of ~$2,500 4. Low teens Testing Services volume growth 5. Low double-digit decline in overall ASP *As of February 27, 2023.

19

Appendix 20
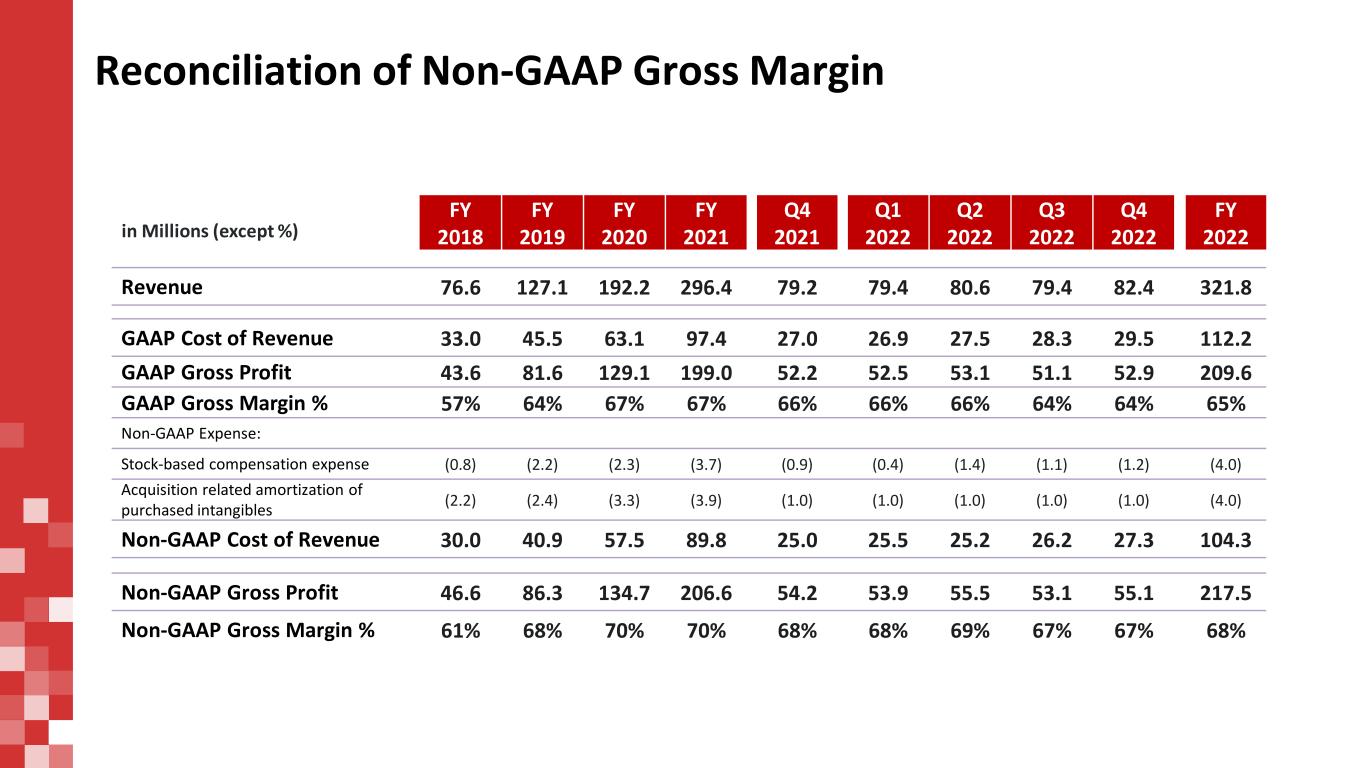
Reconciliation of Non-GAAP Gross Margin FY 2018 FY 2019 FY 2020 FY 2021 Q4 2021 Q1 2022 Q2 2022 Q3 2022 Q4 2022 FY 2022 Revenue 76.6 127.1 192.2 296.4 79.2 79.4 80.6 79.4 82.4 321.8 GAAP Cost of Revenue 33.0 45.5 63.1 97.4 27.0 26.9 27.5 28.3 29.5 112.2 GAAP Gross Profit 43.6 81.6 129.1 199.0 52.2 52.5 53.1 51.1 52.9 209.6 GAAP Gross Margin % 57% 64% 67% 67% 66% 66% 66% 64% 64% 65% Non-GAAP Expense: Stock-based compensation expense (0.8) (2.2) (2.3) (3.7) (0.9) (0.4) (1.4) (1.1) (1.2) (4.0) Acquisition related amortization of purchased intangibles (2.2) (2.4) (3.3) (3.9) (1.0) (1.0) (1.0) (1.0) (1.0) (4.0) Non-GAAP Cost of Revenue 30.0 40.9 57.5 89.8 25.0 25.5 25.2 26.2 27.3 104.3 Non-GAAP Gross Profit 46.6 86.3 134.7 206.6 54.2 53.9 55.5 53.1 55.1 217.5 Non-GAAP Gross Margin % 61% 68% 70% 70% 68% 68% 69% 67% 67% 68% in Millions (except %)
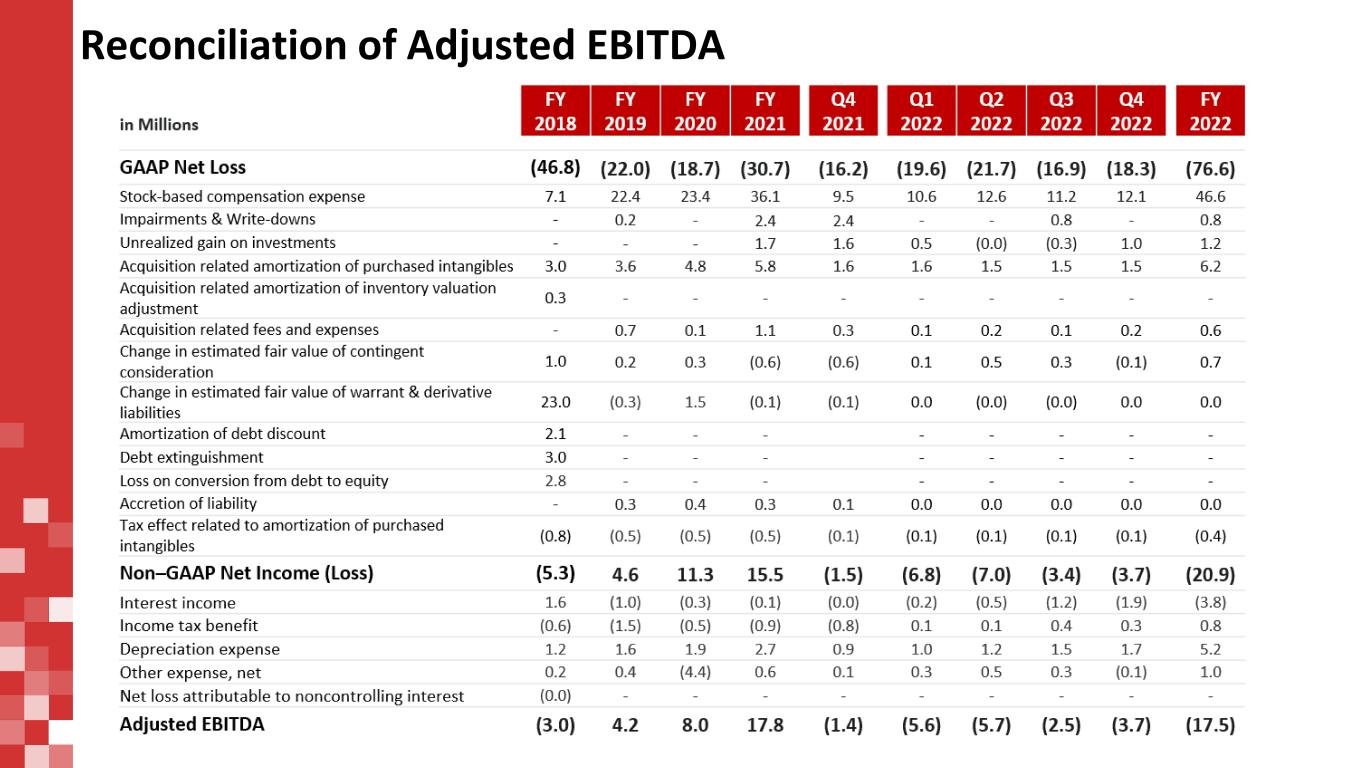
Reconciliation of Adjusted EBITDA


