UNITED STATES
SECURITIES AND EXCHANGE COMMISSION
Washington, D.C. 20549
FORM N-CSR
CERTIFIED SHAREHOLDER REPORT OF REGISTERED
MANAGEMENT INVESTMENT COMPANIES
Investment Company Act file number: 811-21295
JPMorgan Trust I
(Exact name of registrant as specified in charter)
270 Park Avenue
New York, NY 10017
(Address of principal executive offices) (Zip code)
Frank J. Nasta
270 Park Avenue
New York, NY 10017
(Name and Address of Agent for Service)
Registrant’s telephone number, including area code: (800) 480-4111
Date of fiscal year end: August 31
Date of reporting period: September 1, 2014 through August 31, 2015
Form N-CSR is to be used by management investment companies to file reports with the Commission not later than 10 days after the transmission to stockholders of any report that is required to be transmitted to stockholders under Rule 30e-1 under the Investment Company Act of 1940 (17 CFR 270.30e-1). The Commission may use the information provided on Form N-CSR in its regulatory, disclosure review, inspection, and policymaking roles.
A registrant is required to disclose the information specified by Form N-CSR, and the Commission will make this information public. A registrant is not required to respond to the collection of information contained in Form N-CSR unless the Form displays a currently valid Office of Management and Budget (“OMB”) control number. Please direct comments concerning the accuracy of the information collection burden estimate and any suggestions for reducing the burden to Secretary, Securities and Exchange Commission, 450 Fifth Street, NW, Washington, DC 20549-0609. The OMB has reviewed this collection of information under the clearance requirements of 44 U.S.C. Section 3507.
ITEM 1. REPORTS TO STOCKHOLDERS.
The following is a copy of the report transmitted to shareholders pursuant to Rule 30e-1 under the Investment Company Act of 1940 (17 CFR 270.30e-1).
Annual Report
J.P. Morgan Funds
August 31, 2015
JPMorgan Diversified Real Return Fund

CONTENTS
Investments in the Fund are not bank deposits or obligations of, or guaranteed or endorsed by, any bank and are not insured or guaranteed by the FDIC, the Federal Reserve Board or any other government agency. You could lose money if you sell when the Fund’s share price is lower than when you invested.
Past performance is no guarantee of future performance. The general market views expressed in this report are opinions based on market and other conditions through the end of the reporting period and are subject to change without notice. These views are not intended to predict the future performance of the Fund or the securities markets. References to specific securities and their issuers are for illustrative purposes only and are not intended to be, and should not be interpreted as, recommendations to purchase or sell such securities. Such views are not meant as investment advice and may not be relied on as an indication of trading intent on behalf of the Fund.
Prospective investors should refer to the Fund’s prospectus for a discussion of the Fund’s investment objective, strategies and risks. Call J.P. Morgan Funds Service Center at 1-800-480-4111 for a prospectus containing more complete information about the Fund, including management fees and other expenses. Please read it carefully before investing.
CEO’S LETTER
September 25, 2015 (Unaudited)
As the U.S. economy continued to strengthen and policy makers moved toward a more normalized monetary policy over the twelve months ended August 31, 2015, central bankers in Europe, Japan and Asia unleashed unprecedented stimulus measures to bolster flagging growth. Over the same period, financial market volatility increased until it truly erupted in mid-August amid acute worries that China’s economy – the world’s second largest economy – was faltering.
| | |
 | | “The U.S. economic recovery remained largely intact amid historically low interest rates, while central banks in the U.S., Europe, Japan and China continued to provide or increase growth stimulus.” - George C.W. Gatch |
Though U.S. financial markets largely recovered by the end of August, the shock from the global sell-off in equities, along with other considerations, was apparently enough to convince the U.S. Federal Reserve (the “Fed”) to postpone an interest rate increase in September.
Amid an environment of low interest rates, falling energy prices and global growth, U.S. equity prices rose through the end of 2014 and essentially remained near their closing highs for the first five months of 2015, hitting a peak in mid-May. Meanwhile, U.S. bond markets provided lackluster returns, caught between investor concerns about the timing and impact of a Fed interest rate increase and periodic “flights to safety” as investors reacted to specific market or geopolitical events.
While there was notable weakness in the U.S. economy in the first three months of 2015 – mainly due to severe winter weather and a labor dispute at vital West Coast ports -- the upward trajectory of the economy resumed in the second quarter and U.S. gross domestic product rose 3.9%. Unemployment continued its steady decline throughout the twelve months ended August 31, 2015, dropping to 5.1% from 6.1%.
Importantly, inflationary pressure remained subdued in the U.S. amid lower energy prices and nearly stagnant wage growth. Global oil prices dipped below $60 a barrel in March 2015, before rebounding somewhat and then dropping again to below $50 a barrel by August. Global commodities prices also fell sharply through the summer of 2015.
Part of the decline in commodities prices was attributable to signs of slowing growth in China, the world’s leading consumer of raw materials. In response to falling domestic equity prices and weakening economic data, Chinese policy makers enacted a range of stimulus measures, including cutting interest rates and easing bank lending rules in June and July of 2015. Then on August 11, China’s central bank shocked global markets by
devaluing the yuan by nearly 2% and two days later, weaker-than-expected retail sales and industrial production data again shook investor confidence.
On Monday, August 24th, China’s stock market suffered its biggest one-day drop since 2011. The Shanghai Composite Index closed down 8.5% for the day. Chinese regulators suspended trading in hundreds of stocks that had each lost 10% or more. The selloff spread rapidly and key equity indexes in developed markets from Asia to Europe closed down by roughly 5%. Emerging market equities also fell, dragging local currencies lower. In U.S. trading, the Standard & Poor’s 500 Index closed down -3.9% for the day.
Government bonds of developed market nations initially benefitted from the sell-off as investors sought the perceived safety of fixed income securities. But prices for longer-dated U.S. Treasury bonds declined, partly due to massive selling of foreign-exchange reserves (including U.S. Treasuries) by China and partly due to expectations of an imminent Fed interest rate increase.
While the global economic environment at the end of August 2015 was markedly different than it was twelve months earlier, in fundamental ways it remained unchanged. The U.S. economic recovery remained largely intact amid historically low interest rates, while central banks in the U.S., Europe, Japan and China continued to provide or increase growth stimulus. Global energy prices remained under pressure. What appeared to have changed is the intensity of investor concern about both the health of China’s economy and the timing of any increase in U.S. interest rates. This uncertain environment and its effects on financial markets may provide opportunities for those investors who have long-term objectives and a well-diversified portfolio.
On behalf of everyone at J.P. Morgan Asset Management, thank you for your continued support. We look forward to managing your investment needs for years to come. Should you have any questions, please visit www.jpmorganfunds.com or contact the J.P. Morgan Funds Service Center at 1-800-480-4111.
Sincerely yours,

George C.W. Gatch
CEO, Global Funds Management
J.P. Morgan Asset Management
| | | | | | | | |
| | | |
| AUGUST 31, 2015 | | J.P. MORGAN FUNDS | | | | | 1 | |
JPMorgan Diversified Real Return Fund
FUND COMMENTARY
TWELVE MONTHS ENDED AUGUST 31, 2015 (Unaudited)
| | | | |
| REPORTING PERIOD RETURN: | | | |
| Fund (Select Class Shares)* | | | (8.00)% | |
| Barclays 1-10 Year U.S. TIPS Index | | | (2.35)% | |
| |
| Net Assets as of 8/31/2015 | | $ | 49,888,060 | |
INVESTMENT OBJECTIVE**
The JPMorgan Diversified Real Return Fund (the “Fund”) seeks to maximize long-term real return.
HOW DID THE MARKET PERFORM?
U.S. equity markets performed well during the first two-thirds of the twelve month reporting period, fueled by domestic growth, low interest rates, falling energy prices and healthy corporate earnings. The Standard & Poor’s 500 Index (the “S&P 500”) reached several new closing highs in late 2014 and early 2015 before hitting a peak in mid-May. Signs of slowing growth in China and a June sell-off in the Shanghai-Shenzhen market increased volatility in U.S. markets.
On August 24, 2015, a stock market selloff that began in China spread to other markets in Asia, Europe, the Mideast and North America. The S&P 500 closed the day down 3.9%. Commodities prices, particularly for crude oil, declined sharply. Government bonds in the U.S., U.K. and Germany gained as investors sought the perceived safety of such securities.
Financial markets rebounded somewhat during the final days of August and leading U.S. equity indexes posted a small positive return for the twelve month reporting period.
WHAT WERE THE MAIN DRIVERS OF THE FUND’S PERFORMANCE?
The Fund sought to achieve lower volatility than that of U.S. equities, as represented by the S&P 500, by maintaining meaningful allocation to Treasury Inflation Protected Securities (“TIPS”) and inflation sensitive fixed income investment strategies. The Fund gained exposure to these asset classes primarily through its investments in underlying J.P. Morgan Funds. For the twelve months ended August 31, 2015, the Fund’s Select Class Shares underperformed the Barclays 1-10 Year U.S. TIPS Index (the “Benchmark”). The Benchmark only tracks TIPS, while the Fund is invested in a broad range of assets.
During the twelve month reporting period, prices for oil and other commodities came under pressure amid global oversupply and slowing growth in China. The Fund’s strategic asset allocation to the metals and mining sector and the energy sector through the use of exchange-traded funds (ETFs) was a leading detractor from both absolute performance and performance relative to the Benchmark during the twelve months ended August 31, 2015. The Fund’s allocation to commodities also detracted from relative performance. Prices for
oil and commodities fell during the twelve month reporting period.
The Fund’s allocation to real estate investment trusts (REITs) was a leading contributor to both absolute and relative performance during the reporting period. The Fund’s allocation to U.S. equities and high yield bonds (also known as “junk bonds”) also contributed to absolute and relative performance. The ongoing economic recovery in the U.S. bolstered prices for REITs and supported U.S. equities and high yield bonds.
HOW WAS THE FUND POSITIONED?
During the reporting period, the Fund’s portfolio managers targeted a long-term strategic asset allocation, consisting of the following weights: 16% in TIPS; 30% in other inflation protected fixed income securities; 14% in floating rate securities; 10% in real estate securities; 10% in commodities; 10% in natural resources equities, including a direct equity investment in securities of agriculture and agricultural-related companies; 5% in infrastructure equities and 5% in cash and cash equivalents, such as money market funds. The Fund’s portfolio managers employed a momentum-based rebalancing strategy, making tactical investments based on the market conditions facing each asset class in their view of longer-term strategic allocation. At the end of the reporting period, the Fund had significantly less exposure to TIPS and floating rate securities, while maintaining overweight exposures to REITs and high yield agricultural sector securities compared with the target weights in its longer-term strategic asset allocation.
| | | | | | | | |
| TOP TEN HOLDINGS OF THE PORTFOLIO*** | |
| | 1. | | | JPMorgan Inflation Managed Bond Fund, Class R6 Shares | | | 28.7 | % |
| | 2. | | | JPMorgan Realty Income Fund, Class R5 Shares | | | 11.9 | |
| | 3. | | | JPMorgan Floating Rate Income Fund, Class R6 Shares | | | 11.1 | |
| | 4. | | | JPMorgan High Yield Fund, Class R6 Shares | | | 9.1 | |
| | 5. | | | SPDR Barclays TIPS ETF | | | 9.0 | |
| | 6. | | | JPMorgan Commodities Strategy Fund, Class R6 Shares | | | 6.9 | |
| | 7. | | | iShares Global Infrastructure ETF | | | 5.7 | |
| | 8. | | | iShares TIPS Bond ETF | | | 5.3 | |
| | 9. | | | JPMorgan Prime Money Market Fund, Institutional Class Shares | | | 4.0 | |
| | 10. | | | iShares Global Energy ETF | | | 2.2 | |
| | | | | | |
| | | |
| 2 | | | | J.P. MORGAN FUNDS | | AUGUST 31, 2015 |
| | | | |
PORTFOLIO COMPOSITION BY ASSET CLASS*** | |
| Fixed Income | | | 63.1 | % |
| Alternative Assets | | | 18.9 | |
| International Equity | | | 11.7 | |
| U.S. Equity | | | 1.9 | |
| Others (each less than 1.0%) | | | 0.4 | |
| Short-Term Investment | | | 4.0 | |
| * | | The return shown is based on the net asset values calculated for shareholder transactions and may differ from the return shown in the financial highlights, which reflects adjustments made to the net asset values in accordance with accounting principles generally accepted in the United States of America. |
| ** | | The adviser seeks to achieve the Fund’s objective. There can be no guarantee it will be achieved. |
| *** | | Percentages indicated are based on total investments as of August 31, 2015. The Fund’s portfolio composition is subject to change. |
| | | | | | | | |
| | | |
| AUGUST 31, 2015 | | J.P. MORGAN FUNDS | | | | | 3 | |
JPMorgan Diversified Real Return Fund
FUND COMMENTARY
TWELVE MONTHS ENDED AUGUST 31, 2015 (Unaudited) (continued)
| | | | | | | | | | | | | | | | |
AVERAGE ANNUAL TOTAL RETURNS AS OF AUGUST 31, 2015 | |
| | | | |
| | | INCEPTION DATE OF
CLASS | | | 1 YEAR | | | 3 YEAR | | | SINCE
INCEPTION | |
CLASS A SHARES | | | March 31, 2011 | | | | | | | | | | | | | |
Without Sales Charge | | | | | | | (8.21 | ) | | | (1.61 | ) | | | (0.67 | ) |
With Sales Charge* | | | | | | | (12.34 | ) | | | (3.11 | ) | | | (1.70 | ) |
CLASS C SHARES | | | March 31, 2011 | | | | | | | | | | | | | |
Without CDSC | | | | | | | (8.67 | ) | | | (2.10 | ) | | | (1.16 | ) |
With CDSC** | | | | | | | (9.67 | ) | | | (2.10 | ) | | | (1.16 | ) |
CLASS R2 SHARES | | | March 31, 2011 | | | | (8.44 | ) | | | (1.85 | ) | | | (0.91 | ) |
CLASS R5 SHARES | | | March 31, 2011 | | | | (7.97 | ) | | | (1.29 | ) | | | (0.32 | ) |
SELECT CLASS SHARES | | | March 31, 2011 | | | | (8.00 | ) | | | (1.37 | ) | | | (0.41 | ) |
| * | | Sales Charge for Class A Shares is 4.50%. |
| ** | | Assumes a 1% CDSC (contingent deferred sales charge) for the one year period and 0% CDSC thereafter. |
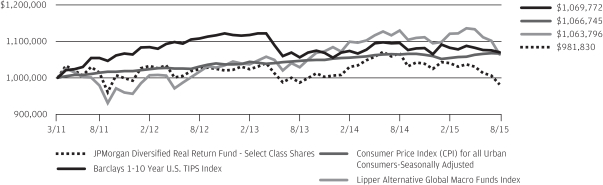
LIFE OF FUND PERFORMANCE (3/31/11 — 8/31/15)
The performance quoted is past performance and is not a guarantee of future results. Mutual funds are subject to certain market risks. Investment returns and principal value of an investment will fluctuate so that an investor’s shares, when redeemed, may be worth more or less than their original cost. Current performance may be higher or lower than the performance data shown. For up-to-date, month-end performance information please call 1-800-480-4111.
The Fund commenced operations on March 31, 2011.
The graph illustrates comparative performance for $1,000,000 invested in Select Class Shares of the JPMorgan Diversified Real Return Fund, the Barclays 1-10 Year U.S. TIPS Index, the Consumer Price Index (CPI) for All Urban Consumers-Seasonally Adjusted and the Lipper Alternative Global Macro Funds Index from March 31, 2011 to August 31, 2015. The performance of the Fund assumes reinvestment of all dividends and capital gain distributions, if any, and does not include a sales charge. The performance of the Barclays 1-10 Year U.S. TIPS Index and the Consumer Price Index (CPI) for All Urban Consumers-Seasonally Adjusted does not reflect the deduction of expenses or a sales charge associated with a mutual fund. The performance of the Barclays 1-10 Year U.S. TIPS Index has been adjusted to reflect reinvestment of all dividends and capital gain distributions of the securities included in the benchmark, if applicable. The performance of the Lipper Alternative Global Macro Funds Index includes expenses associated with a mutual fund, such as investment management fees. These expenses are not identical to the expenses incurred by the Fund. The Barclays 1-10 Year U.S. TIPS Index represents the performance
of intermediate (1-10 year) U.S. Treasury Inflation Protection Securities. The Consumer Price Index (CPI) for All Urban Consumers-Seasonally Adjusted is a measure of the change in prices of goods and services purchased by urban consumers. Seasonal adjustment removes the effects of recurring seasonal influences from many economic series, including consumer prices. The adjustment process quantifies seasonal patterns and then factors them out of the series to permit analysis of non-seasonal price movements. Changing climatic conditions, production cycles, model changeovers, holidays, and sales can cause seasonal variation in prices. The Lipper Alternative Global Macro Funds Index is an index based on total returns of certain mutual funds within the Fund’s designated category as determined by Lipper, Inc. Investors cannot invest directly in an Index.
Select Class Shares have a $1,000,000 minimum initial investment.
Fund performance may reflect the waiver of the Fund’s fees and reimbursement of expenses for certain periods since the inception date. Without these waivers and reimbursements, performance would have been lower. Also, performance shown in this section does not reflect the deduction of taxes that a shareholder would pay on Fund distributions or redemption of Fund shares.
The returns shown are based on net asset values calculated for shareholder transactions and may differ from the returns shown in the financial highlights, which reflect adjustments made to the net asset values in accordance with accounting principles generally accepted in the United States of America.
| | | | | | |
| | | |
| 4 | | | | J.P. MORGAN FUNDS | | AUGUST 31, 2015 |
JPMorgan Diversified Real Return Fund
SCHEDULE OF PORTFOLIO INVESTMENTS
AS OF AUGUST 31, 2015
| | | | | | | | |
| SHARES | | | SECURITY DESCRIPTION | | VALUE($) | |
| Common Stocks — 4.1% | |
| | | | Consumer Staples — 1.6% | | | | |
| | | | Food Products — 1.6% | | | | |
| | 139 | | | AAK AB, (Sweden) | | | 9,217 | |
| | 3,300 | | | Archer-Daniels-Midland Co. | | | 148,467 | |
| | 100 | | | Ariake Japan Co., Ltd., (Japan) | | | 4,159 | |
| | 1,884 | | | Associated British Foods plc, (United Kingdom) | | | 91,833 | |
| | 438 | | | Austevoll Seafood ASA, (Norway) | | | 2,598 | |
| | 193 | | | Bakkafrost P/F, (Faroe Islands) | | | 5,855 | |
| | 11 | | | Barry Callebaut AG, (Switzerland) (a) | | | 12,065 | |
| | 3,500 | | | BRF S.A., (Brazil), ADR | | | 66,675 | |
| | 800 | | | Bunge Ltd. | | | 57,960 | |
| | 200 | | | Cal-Maine Foods, Inc. | | | 10,624 | |
| | 360 | | | Chia Tai Enterprises International Ltd., (Hong Kong) (a) | | | 149 | |
| | 11,000 | | | China Agri-Industries Holdings Ltd., (Hong Kong) (a) | | | 4,170 | |
| | 7,000 | | | China Yurun Food Group Ltd., (China) (a) | | | 1,617 | |
| | 44 | | | CJ CheilJedang Corp., (South Korea) | | | 14,614 | |
| | 34,000 | | | CP Pokphand Co., Ltd., (Hong Kong) | | | 3,640 | |
| | 700 | | | Darling Ingredients, Inc. (a) | | | 8,988 | |
| | 10 | | | Emmi AG, (Switzerland) (a) | | | 3,862 | |
| | 2,400 | | | First Resources Ltd., (Singapore) | | | 2,596 | |
| | 200 | | | Fresh Del Monte Produce, Inc. | | | 7,918 | |
| | 857 | | | Glanbia plc, (Ireland) | | | 17,175 | |
| | 31,300 | | | Golden Agri-Resources Ltd., (Singapore) | | | 6,991 | |
| | 898 | | | GrainCorp Ltd., (Australia), Class A | | | 5,203 | |
| | 100 | | | Hokuto Corp., (Japan) | | | 1,811 | |
| | 400 | | | Ingredion, Inc. | | | 34,536 | |
| | 500 | | | Maple Leaf Foods, Inc., (Canada) | | | 8,483 | |
| | 1,740 | | | Marine Harvest ASA, (Norway) | | | 20,939 | |
| | 200 | | | Maruha Nichiro Corp., (Japan) | | | 3,001 | |
| | 1,000 | | | NH Foods Ltd., (Japan) | | | 23,044 | |
| | 2,000 | | | Nichirei Corp., (Japan) | | | 12,200 | |
| | 1,000 | | | Nippon Flour Mills Co., Ltd., (Japan) | | | 6,366 | |
| | 1,500 | | | Nippon Suisan Kaisha Ltd., (Japan) | | | 4,695 | |
| | 400 | | | Pilgrim’s Pride Corp. | | | 8,390 | |
| | 100 | | | Sakata Seed Corp., (Japan) | | | 1,616 | |
| | 261 | | | Salmar ASA, (Norway) | | | 3,964 | |
| | 200 | | | Sanderson Farms, Inc. | | | 13,808 | |
| | 2 | | | Seaboard Corp. (a) | | | 6,640 | |
| | 355 | | | Select Harvests Ltd., (Australia) | | | 3,046 | |
| | 1,000 | | | Showa Sangyo Co., Ltd., (Japan) | | | 3,952 | |
| | 374 | | | Suedzucker AG, (Germany) | | | 5,448 | |
| | 2,508 | | | Tate & Lyle plc, (United Kingdom) | | | 20,639 | |
| | 500 | | | Toyo Suisan Kaisha Ltd., (Japan) | | | 18,720 | |
| | 1,600 | | | Tyson Foods, Inc., Class A | | | 67,648 | |
| | | | | | | | |
| SHARES | | | SECURITY DESCRIPTION | | VALUE($) | |
| | | | | | | | |
| | | | Food Products — continued | | | | |
| | 6,000 | | | Vitasoy International Holdings Ltd., (Hong Kong) | | | 8,900 | |
| | 385 | | | Wessanen, (Netherlands) | | | 4,067 | |
| | 13,400 | | | Wilmar International Ltd., (Singapore) | | | 27,072 | |
| | | | | | | | |
| | | | Total Consumer Staples | | | 795,361 | |
| | | | | | | | |
| | | | Industrials — 0.7% | | | | |
| | | | Construction & Engineering — 0.0% (g) | | | | |
| | 314 | | | OCI N.V., (Netherlands) (a) | | | 9,237 | |
| | | | | | | | |
| | | | Machinery — 0.7% | | | | |
| | 100 | | | Ag Growth International, Inc., (Canada) | | | 2,882 | |
| | 400 | | | AGCO Corp. | | | 19,616 | |
| | 5,505 | | | CNH Industrial N.V., (United Kingdom) | | | 43,544 | |
| | 1,800 | | | Deere & Co. | | | 147,204 | |
| | 1,000 | | | Iseki & Co., Ltd., (Japan) | | | 1,591 | |
| | 6,000 | | | Kubota Corp., (Japan) | | | 93,388 | |
| | 100 | | | Lindsay Corp. | | | 7,623 | |
| | 200 | | | Titan International, Inc. | | | 1,836 | |
| | | | | | | | |
| | | | | | | 317,684 | |
| | | | | | | | |
| | | | Total Industrials | | | 326,921 | |
| | | | | | | | |
| | | | Materials — 1.8% | | | | |
| | | | Chemicals — 1.8% | | | | |
| | 800 | | | Agrium, Inc., (Canada) | | | 83,071 | |
| | 117 | | | American Vanguard Corp. | | | 1,563 | |
| | 1,300 | | | CF Industries Holdings, Inc. | | | 74,594 | |
| | 10,000 | | | China BlueChemical Ltd., (China), Class H | | | 2,839 | |
| | 300 | | | Intrepid Potash, Inc. (a) | | | 2,373 | |
| | 2,119 | | | Israel Chemicals Ltd., (Israel) | | | 11,933 | |
| | 13 | | | Israel Corp., Ltd. (The), (Israel) | | | 3,942 | |
| | 898 | | | K+S AG, (Germany) | | | 33,516 | |
| | 2,600 | | | Monsanto Co. | | | 253,890 | |
| | 1,700 | | | Mosaic Co. (The) | | | 69,411 | |
| | 300 | | | Nihon Nohyaku Co., Ltd., (Japan) | | | 2,331 | |
| | 908 | | | Nufarm Ltd., (Australia) | | | 4,610 | |
| | 408 | | | PhosAgro OAO, (Russia), Reg. S, GDR | | | 5,732 | |
| | 4,600 | | | Potash Corp. of Saskatchewan, Inc., (Canada) | | | 119,790 | |
| | 300 | | | Scotts Miracle-Gro Co. (The), Class A | | | 18,657 | |
| | 500 | | | Sociedad Quimica y Minera de Chile S.A., (Chile), ADR | | | 7,840 | |
| | 494 | | | Syngenta AG, (Switzerland) | | | 165,619 | |
| | 966 | | | Uralkali PJSC, (Russia), Reg. S, GDR (a) | | | 14,777 | |
| | 913 | | | Yara International ASA, (Norway) | | | 40,741 | |
| | | | | | | | |
| | | | Total Materials | | | 917,229 | |
| | | | | | | | |
| | | | Total Common Stocks
(Cost $2,027,655) | | | 2,039,511 | |
| | | | | | | | |
SEE NOTES TO FINANCIAL STATEMENTS.
| | | | | | | | |
| | | |
| AUGUST 31, 2015 | | J.P. MORGAN FUNDS | | | | | 5 | |
JPMorgan Diversified Real Return Fund
SCHEDULE OF PORTFOLIO INVESTMENTS
AS OF AUGUST 31, 2015 (continued)
| | | | | | | | |
| SHARES | | | SECURITY DESCRIPTION | | VALUE($) | |
| Exchange Traded Funds — 23.8% | |
| | | | Fixed Income — 14.3% | | | | |
| | 23,476 | | | iShares TIPS Bond ETF | | | 2,619,452 | |
| | 81,191 | | | SPDR Barclays TIPS ETF (a) | | | 4,501,229 | |
| | | | | | | | |
| | | | Total Fixed Income | | | 7,120,681 | |
| | | | | | | | |
| | | | International Equity — 9.5% | | | | |
| | 35,855 | | | iShares Global Energy ETF | | | 1,108,278 | |
| | 73,577 | | | iShares Global Infrastructure ETF | | | 2,843,751 | |
| | 51,032 | | | iShares MSCI Global Metals & Mining Producers ETF | | | 548,084 | |
| | 18,209 | | | Market Vectors Gold Miners ETF | | | 256,929 | |
| | | | | | | | |
| | | | Total International Equity | | | 4,757,042 | |
| | | | | | | | |
| | | | Total Exchange Traded Funds
(Cost $12,309,843) | | | 11,877,723 | |
| | | | | | | | |
| Investment Companies — 67.7% (b) | |
| | | | Alternative Assets — 18.9% | | | | |
| | 365,768 | | | JPMorgan Commodities Strategy Fund, Class R6 Shares (a) | | | 3,456,509 | |
| | 455,722 | | | JPMorgan Realty Income Fund, Class R5 Shares | | | 5,960,844 | |
| | | | | | | | |
| | | | Total Alternative Assets | | | 9,417,353 | |
| | | | | | | | |
| | | | Fixed Income — 48.8% | | | | |
| | 577,715 | | | JPMorgan Floating Rate Income Fund, Class R6 Shares | | | 5,528,728 | |
| | 618,018 | | | JPMorgan High Yield Fund, Class R6 Shares | | | 4,523,890 | |
| | | | | | | | |
| SHARES | | | SECURITY DESCRIPTION | | VALUE($) | |
| | | | | | | | |
| | | | Fixed Income — continued | | | | |
| | 1,409,137 | | | JPMorgan Inflation Managed Bond Fund, Class R6 Shares | | | 14,316,829 | |
| | | | | | | | |
| | | | Total Fixed Income | | | 24,369,447 | |
| | | | | | | | |
| | | | Total Investment Companies
(Cost $34,186,239) | | | 33,786,800 | |
| | | | | | | | |
| | |
PRINCIPAL
AMOUNT($) | | | | | | |
| U.S. Treasury Obligation — 0.4% | |
| | 195,000 | | | U.S. Treasury Note, 0.375%, 01/31/16 (k)
(Cost $195,132) | | | 195,119 | |
| | | | | | | | |
| | |
| SHARES | | | | | | |
| Short-Term Investment — 4.0% | |
| | | | Investment Company — 4.0% | | | | |
| | 2,003,491 | | | JPMorgan Prime Money Market Fund, Institutional Class Shares, 0.060% (b) (l)
(Cost $2,003,491) | | | 2,003,491 | |
| | | | | | | | |
| | | | Total Investments — 100.0%
(Cost $50,722,360) | | | 49,902,644 | |
| | | | Liabilities in Excess of
Other Assets — 0.0% (g) | | | (14,584 | ) |
| | | | | | | | |
| | | | NET ASSETS — 100.0% | | $ | 49,888,060 | |
| | | | | | | | |
Percentages indicated are based on net assets.
| | | | | | | | | | | | | | | | | | | | |
| Futures Contracts | | | | |
NUMBER OF
CONTRACTS | | | DESCRIPTION | | EXPIRATION
DATE | | | TRADING
CURRENCY | | | NOTIONAL
VALUE AT
AUGUST 31, 2015 | | | NET
UNREALIZED
APPRECIATION
(DEPRECIATION) | |
| | | | Long Futures Outstanding | | | | | | | | | | | | | | | | |
| | 24 | | | E-mini S&P 500 | | | 09/18/15 | | | | USD | | | $ | 2,363,040 | | | $ | (141,438 | ) |
| | 3 | | | U.S. Long Bond | | | 12/21/15 | | | | USD | | | | 463,875 | | | | (5,803 | ) |
| | | | Short Futures Outstanding | | | | | | | | | | | | | | | | |
| | (15 | ) | | 2 Year U.S. Treasury Note | | | 12/31/15 | | | | USD | | | | (3,277,031 | ) | | | 5,453 | |
| | | | | | | | | | | | | | | | | | | | |
| | | | | | | | | | | | | | | | | | $ | (141,788 | ) |
| | | | | | | | | | | | | | | | | | | | |
SEE NOTES TO FINANCIAL STATEMENTS.
| | | | | | |
| | | |
| 6 | | | | J.P. MORGAN FUNDS | | AUGUST 31, 2015 |
NOTES TO SCHEDULE OF PORTFOLIO INVESTMENTS
AS OF AUGUST 31, 2015
| | |
| ADR | | — American Depositary Receipt |
| ETF | | — Exchange Traded Fund |
| GDR | | — Global Depositary Receipt |
| MSCI | | — Morgan Stanley Capital International |
| Reg. S | | — Security was purchased pursuant to Regulation S under the Securities Act of 1933, which exempts from registration securities offered and sold outside of the United States. Such a security cannot be sold in the United States without either an effective registration statement filed pursuant to the Securities Act of 1933, or pursuant to an exemption from registration. |
| SPDR | | — Standard & Poor’s Depositary Receipts |
| TIPS | | — Treasury Inflation Protected Security |
| USD | | — United States Dollar |
| |
| (a) | | — Non-income producing security. |
| (b) | | — Investment in affiliate. Fund is registered under the Investment Company Act of 1940, as amended, and advised by J.P. Morgan Investment Management Inc. |
| (g) | | — Amount rounds to less than 0.1%. |
| | |
| (k) | | — All or a portion of this security is deposited with the broker as collateral for futures or with brokers as initial margin for future contracts. |
| (l) | | — The rate shown is the current yield as of August 31, 2015. |
The value and percentage, based on total investments, of the investments that apply the fair valuation policy for the international investments as described in Note 2.A. of the Notes to Financial Statements are $745,479 and 1.5%, respectively.
Detailed information about investment portfolios of the underlying funds can be found in shareholder reports filed with the Securities and Exchange Commission (SEC) by each such underlying fund semi-annually on Form N-CSR and in certified portfolio holdings filed quarterly on Form N-Q, and are available for download from both the SEC’s as well as each respective underlying fund’s website. Detailed information about underlying J.P. Morgan Funds can also be found at www.jpmorganfunds.com or by calling 1-800-480-4111.
SEE NOTES TO FINANCIAL STATEMENTS.
| | | | | | | | |
| | | |
| AUGUST 31, 2015 | | J.P. MORGAN FUNDS | | | | | 7 | |
STATEMENT OF ASSETS AND LIABILITIES
AS OF AUGUST 31, 2015
| | | | |
| | |
Diversified Real
Return Fund | |
ASSETS: | | | | |
Investments in non-affiliates, at value | | $ | 14,112,353 | |
Investments in affiliates, at value | | | 35,790,291 | |
| | | | |
Total investment securities, at value | | | 49,902,644 | |
Cash | | | 44,343 | |
Foreign currency, at value | | | 5,119 | |
Receivables: | | | | |
Investment securities sold | | | 7,205,611 | |
Fund shares sold | | | 21,447 | |
Interest and dividends from non-affiliates | | | 1,840 | |
Dividends from affiliates | | | 112 | |
Tax reclaims | | | 4,371 | |
Due from Adviser | | | 22,168 | |
| | | | |
Total Assets | | | 57,207,655 | |
| | | | |
| |
LIABILITIES: | | | | |
Payables: | | | | |
Investment securities purchased | | | 7,137,092 | |
Fund shares redeemed | | | 36,587 | |
Variation margin on futures contracts | | | 24,741 | |
Accrued liabilities: | | | | |
Distribution fees | | | 821 | |
Shareholder servicing fees | | | 1,253 | |
Custodian and accounting fees | | | 22,788 | |
Trustees’ and Chief Compliance Officer’s fees | | | 24 | |
Other | | | 96,289 | |
| | | | |
Total Liabilities | | | 7,319,595 | |
| | | | |
Net Assets | | $ | 49,888,060 | |
| | | | |
SEE NOTES TO FINANCIAL STATEMENTS.
| | | | | | |
| | | |
| 8 | | | | J.P. MORGAN FUNDS | | AUGUST 31, 2015 |
| | | | |
| | |
Diversified Real
Return Fund | |
NET ASSETS: | | | | |
Paid-in-Capital | | $ | 55,178,533 | |
Accumulated undistributed (distributions in excess of) net investment income | | | 130,009 | |
Accumulated net realized gains (losses) | | | (4,458,661 | ) |
Net unrealized appreciation (depreciation) | | | (961,821 | ) |
| | | | |
Total Net Assets | | $ | 49,888,060 | |
| | | | |
| |
Net Assets: | | | | |
Class A | | $ | 2,020,268 | |
Class C | | | 494,218 | |
Class R2 | | | 159,377 | |
Class R5 | | | 33,033,858 | |
Select Class | | | 14,180,339 | |
| | | | |
Total | | $ | 49,888,060 | |
| | | | |
| |
Outstanding units of beneficial interest (shares) ($0.0001 par value; unlimited number of shares authorized): | | | | |
Class A | | | 148,398 | |
Class C | | | 36,444 | |
Class R2 | | | 11,682 | |
Class R5 | | | 2,414,762 | |
Select Class | | | 1,037,994 | |
| |
Net Asset Value (a): | | | | |
Class A — Redemption price per share | | $ | 13.61 | |
Class C — Offering price per share (b) | | | 13.56 | |
Class R2 — Offering and redemption price per share | | | 13.64 | |
Class R5 — Offering and redemption price per share | | | 13.68 | |
Select Class — Offering and redemption price per share | | | 13.66 | |
Class A maximum sales charge | | | 4.50 | % |
Class A maximum public offering price per share
[net asset value per share/(100% — maximum sales charge)] | | $ | 14.25 | |
| | | | |
| |
Cost of investments in non-affiliates | | $ | 14,532,630 | |
Cost of investments in affiliates | | | 36,189,730 | |
Cost of foreign currency | | | 5,158 | |
| (a) | Per share amounts may not recalculate due to rounding of net assets and/or shares outstanding. |
| (b) | Redemption price for Class C Shares varies based upon length of time the shares are held. |
SEE NOTES TO FINANCIAL STATEMENTS.
| | | | | | | | |
| | | |
| AUGUST 31, 2015 | | J.P. MORGAN FUNDS | | | | | 9 | |
STATEMENT OF OPERATIONS
FOR THE YEAR ENDED AUGUST 31, 2015
| | | | |
| | |
Diversified Real
Return Fund | |
INVESTMENT INCOME: | | | | |
Dividend income from non-affiliates | | $ | 284,766 | |
Dividend income from affiliates | | | 929,468 | |
Interest income from non-affiliates | | | 218 | |
Foreign taxes withheld | | | (2,537 | ) |
| | | | |
Total investment income | | | 1,211,915 | |
| | | | |
| |
EXPENSES: | | | | |
Investment advisory fees | | | 54,329 | |
Administration fees | | | 54,329 | |
Distribution fees: | | | | |
Class A | | | 4,978 | |
Class C | | | 3,366 | |
Class R2 | | | 668 | |
Shareholder servicing fees: | | | | |
Class A | | | 4,978 | |
Class C | | | 1,122 | |
Class R2 | | | 334 | |
Class R5 | | | 18,456 | |
Select Class | | | 37,113 | |
Custodian and accounting fees | | | 47,326 | |
Interest expense to affiliates | | | 250 | |
Professional fees | | | 87,028 | |
Trustees’ and Chief Compliance Officer’s fees | | | 565 | |
Printing and mailing costs | | | 20,138 | |
Registration and filing fees | | | 90,440 | |
Transfer agent fees | | | 6,770 | |
Sub-transfer agent fee (See Note 2.G.) | | | 7,110 | |
Other | | | 7,748 | |
| | | | |
Total expenses | | | 447,048 | |
| | | | |
Less fees waived | | | (152,583 | ) |
Less expense reimbursements | | | (127,517 | ) |
| | | | |
Net expenses | | | 166,948 | |
| | | | |
Net investment income (loss) | | | 1,044,967 | |
| | | | |
| |
REALIZED/UNREALIZED GAINS (LOSSES): | | | | |
Net realized gain (loss) on transactions from: | | | | |
Investments in non-affiliates | | | (252,683 | ) |
Investments in affiliates | | | (512,331 | ) |
Futures | | | (144,240 | ) |
Foreign currency transactions | | | (1,099 | ) |
| | | | |
Net realized gain (loss) | | | (910,353 | ) |
| | | | |
Distributions of capital gains received from investment company affiliates | | | 271,895 | |
| | | | |
Change in net unrealized appreciation/depreciation on: | | | | |
Investments in non-affiliates | | | (2,375,938 | ) |
Investments in affiliates | | | (2,497,195 | ) |
Futures | | | (141,788 | ) |
Foreign currency translations | | | (57 | ) |
| | | | |
Change in net unrealized appreciation/depreciation | | | (5,014,978 | ) |
| | | | |
Net realized/unrealized gains (losses) | | | (5,653,436 | ) |
| | | | |
Change in net assets resulting from operations | | $ | (4,608,469 | ) |
| | | | |
SEE NOTES TO FINANCIAL STATEMENTS.
| | | | | | |
| | | |
| 10 | | | | J.P. MORGAN FUNDS | | AUGUST 31, 2015 |
STATEMENTS OF CHANGES IN NET ASSETS
FOR THE PERIODS INDICATED
| | | | | | | | |
| | | Diversified Real Return Fund | |
| | | Year Ended
August 31, 2015 | | | Year Ended
August 31, 2014 | |
CHANGE IN NET ASSETS RESULTING FROM OPERATIONS: | | | | | | | | |
Net investment income (loss) | | $ | 1,044,967 | | | $ | 1,280,360 | |
Net realized gain (loss) | | | (910,353 | ) | | | (1,418,746 | ) |
Distributions of capital gains received from investment company affiliates | | | 271,895 | | | | 255,927 | |
Change in net unrealized appreciation/depreciation | | | (5,014,978 | ) | | | 5,995,052 | |
| | | | | | | | |
Change in net assets resulting from operations | | | (4,608,469 | ) | | | 6,112,593 | |
| | | | | | | | |
| | |
DISTRIBUTIONS TO SHAREHOLDERS: | | | | | | | | |
Class A | | | | | | | | |
From net investment income | | | (31,193 | ) | | | (58,121 | ) |
Class C | | | | | | | | |
From net investment income | | | (5,570 | ) | | | (22,202 | ) |
Class R2 | | | | | | | | |
From net investment income | | | (1,217 | ) | | | (17,739 | ) |
Class R5 | | | | | | | | |
From net investment income | | | (769,210 | ) | | | (981,802 | ) |
Select Class | | | | | | | | |
From net investment income | | | (261,707 | ) | | | (386,832 | ) |
| | | | | | | | |
Total distributions to shareholders | | | (1,068,897 | ) | | | (1,466,696 | ) |
| | | | | | | | |
| | |
CAPITAL TRANSACTIONS: | | | | | | | | |
Change in net assets resulting from capital transactions | | | (8,870,662 | ) | | | (35,400,942 | ) |
| | | | | | | | |
| | |
NET ASSETS: | | | | | | | | |
Change in net assets | | | (14,548,028 | ) | | | (30,755,045 | ) |
Beginning of period | | | 64,436,088 | | | | 95,191,133 | |
| | | | | | | | |
End of period | | $ | 49,888,060 | | | $ | 64,436,088 | |
| | | | | | | | |
Accumulated undistributed (distributions in excess of) net investment income | | $ | 130,009 | | | $ | 110,659 | |
| | | | | | | | |
SEE NOTES TO FINANCIAL STATEMENTS.
| | | | | | | | |
| | | |
| AUGUST 31, 2015 | | J.P. MORGAN FUNDS | | | | | 11 | |
STATEMENTS OF CHANGES IN NET ASSETS
FOR THE PERIODS INDICATED (continued)
| | | | | | | | |
| | | Diversified Real Return Fund | |
| | | Year Ended
August 31, 2015 | | | Year Ended
August 31, 2014 | |
CAPITAL TRANSACTIONS: | | | | | | | | |
Class A | | | | | | | | |
Proceeds from shares issued | | $ | 721,688 | | | $ | 640,623 | |
Distributions reinvested | | | 31,193 | | | | 58,121 | |
Cost of shares redeemed | | | (529,278 | ) | | | (2,215,174 | ) |
| | | | | | | | |
Change in net assets resulting from Class A capital transactions | | $ | 223,603 | | | $ | (1,516,430 | ) |
| | | | | | | | |
Class C | | | | | | | | |
Proceeds from shares issued | | $ | 324,562 | | | $ | 37,174 | |
Distributions reinvested | | | 4,957 | | | | 21,585 | |
Cost of shares redeemed | | | (230,509 | ) | | | (1,778,174 | ) |
| | | | | | | | |
Change in net assets resulting from Class C capital transactions | | $ | 99,010 | | | $ | (1,719,415 | ) |
| | | | | | | | |
Class R2 | | | | | | | | |
Proceeds from shares issued | | $ | 155,744 | | | $ | 5,144 | |
Distributions reinvested | | | 550 | | | | 17,261 | |
Cost of shares redeemed | | | (35,876 | ) | | | (1,341,312 | ) |
| | | | | | | | |
Change in net assets resulting from Class R2 capital transactions | | $ | 120,418 | | | $ | (1,318,907 | ) |
| | | | | | | | |
Class R5 | | | | | | | | |
Proceeds from shares issued | | $ | 24,389,836 | | | $ | 43,629,505 | |
Distributions reinvested | | | 758,828 | | | | 978,295 | |
Cost of shares redeemed | | | (31,095,872 | ) | | | (75,735,934 | ) |
| | | | | | | | |
Change in net assets resulting from Class R5 capital transactions | | $ | (5,947,208 | ) | | $ | (31,128,134 | ) |
| | | | | | | | |
Select Class | | | | | | | | |
Proceeds from shares issued | | $ | 5,302,966 | | | $ | 2,238,888 | |
Distributions reinvested | | | 257,511 | | | | 383,931 | |
Cost of shares redeemed | | | (8,926,962 | ) | | | (2,340,875 | ) |
| | | | | | | | |
Change in net assets resulting from Select Class capital transactions | | $ | (3,366,485 | ) | | $ | 281,944 | |
| | | | | | | | |
Total change in net assets resulting from capital transactions | | $ | (8,870,662 | ) | | $ | (35,400,942 | ) |
| | | | | | | | |
SEE NOTES TO FINANCIAL STATEMENTS.
| | | | | | |
| | | |
| 12 | | | | J.P. MORGAN FUNDS | | AUGUST 31, 2015 |
| | | | | | | | |
| | | Diversified Real Return Fund | |
| | | Year Ended
August 31, 2015 | | | Year Ended
August 31, 2014 | |
SHARE TRANSACTIONS: | | | | | | | | |
Class A | | | | | | | | |
Issued | | | 50,064 | | | | 43,670 | |
Reinvested | | | 2,189 | | | | 3,997 | |
Redeemed | | | (36,543 | ) | | | (149,658 | ) |
| | | | | | | | |
Change in Class A Shares | | | 15,710 | | | | (101,991 | ) |
| | | | | | | | |
Class C | | | | | | | | |
Issued | | | 22,612 | | | | 2,538 | |
Reinvested | | | 349 | | | | 1,503 | |
Redeemed | | | (15,958 | ) | | | (120,622 | ) |
| | | | | | | | |
Change in Class C Shares | | | 7,003 | | | | (116,581 | ) |
| | | | | | | | |
Class R2 | | | | | | | | |
Issued | | | 10,766 | | | | 354 | |
Reinvested | | | 39 | | | | 1,199 | |
Redeemed | | | (2,484 | ) | | | (90,134 | ) |
| | | | | | | | |
Change in Class R2 Shares | | | 8,321 | | | | (88,581 | ) |
| | | | | | | | |
Class R5 | | | | | | | | |
Issued | | | 1,683,548 | | | | 2,990,640 | |
Reinvested | | | 52,949 | | | | 66,779 | |
Redeemed | | | (2,142,113 | ) | | | (5,168,503 | ) |
| | | | | | | | |
Change in Class R5 Shares | | | (405,616 | ) | | | (2,111,084 | ) |
| | | | | | | | |
Select Class | | | | | | | | |
Issued | | | 364,317 | | | | 152,058 | |
Reinvested | | | 18,004 | | | | 26,213 | |
Redeemed | | | (615,175 | ) | | | (160,725 | ) |
| | | | | | | | |
Change in Select Class Shares | | | (232,854 | ) | | | 17,546 | |
| | | | | | | | |
SEE NOTES TO FINANCIAL STATEMENTS.
| | | | | | | | |
| | | |
| AUGUST 31, 2015 | | J.P. MORGAN FUNDS | | | | | 13 | |
FINANCIAL HIGHLIGHTS
FOR THE PERIODS INDICATED
| | | | | | | | | | | | | | | | | | | | | | | | | | | | |
| | | Per share operating performance | |
| | | | | | Investment operations | | | Distributions | |
| | | Net asset
value,
beginning
of period | | | Net
investment
income
(loss) (b) | | | Net realized
and unrealized
gains
(losses) on
investments | | | Total from
investment
operations | | | Net
investment
income | | | Net
realized
gain | | | Total
distributions | |
Diversified Real Return Fund | | | | | | | | | | | | | | | | | | | | | | | | | | | | |
Class A | | | | | | | | | | | | | | | | | | | | | | | | | | | | |
Year Ended August 31, 2015 | | $ | 15.08 | | | $ | 0.23 | (h)(i) | | $ | (1.47 | ) | | $ | (1.24 | ) | | $ | (0.23 | ) | | $ | — | | | $ | (0.23 | ) |
Year Ended August 31, 2014 | | | 14.25 | | | | 0.22 | (h)(i) | | | 0.89 | | | | 1.11 | | | | (0.28 | ) | | | — | | | | (0.28 | ) |
Year Ended August 31, 2013 | | | 15.07 | | | | 0.21 | (h) | | | (0.78 | ) | | | (0.57 | ) | | | (0.24 | ) | | | (0.01 | ) | | | (0.25 | ) |
Year Ended August 31, 2012 | | | 15.14 | | | | 0.21 | (h)(i) | | | (0.11 | ) | | | 0.10 | | | | (0.17 | ) | | | — | (j) | | | (0.17 | ) |
March 31, 2011 (k) through August 31, 2011 | | | 15.00 | | | | 0.10 | (h)(i) | | | 0.08 | | | | 0.18 | | | | (0.04 | ) | | | — | | | | (0.04 | ) |
| | | | | | | |
Class C | | | | | | | | | | | | | | | | | | | | | | | | | | | | |
Year Ended August 31, 2015 | | | 15.05 | | | | 0.16 | (h)(i) | | | (1.47 | ) | | | (1.31 | ) | | | (0.18 | ) | | | — | | | | (0.18 | ) |
Year Ended August 31, 2014 | | | 14.20 | | | | 0.14 | (h)(i) | | | 0.89 | | | | 1.03 | | | | (0.18 | ) | | | — | | | | (0.18 | ) |
Year Ended August 31, 2013 | | | 15.03 | | | | 0.12 | (h) | | | (0.76 | ) | | | (0.64 | ) | | | (0.18 | ) | | | (0.01 | ) | | | (0.19 | ) |
Year Ended August 31, 2012 | | | 15.13 | | | | 0.14 | (h)(i) | | | (0.12 | ) | | | 0.02 | | | | (0.12 | ) | | | — | (j) | | | (0.12 | ) |
March 31, 2011 (k) through August 31, 2011 | | | 15.00 | | | | 0.08 | (h)(i) | | | 0.08 | | | | 0.16 | | | | (0.03 | ) | | | — | | | | (0.03 | ) |
| | | | | | | |
Class R2 | | | | | | | | | | | | | | | | | | | | | | | | | | | | |
Year Ended August 31, 2015 | | | 15.12 | | | | 0.16 | (h)(i) | | | (1.44 | ) | | | (1.28 | ) | | | (0.20 | ) | | | — | | | | (0.20 | ) |
Year Ended August 31, 2014 | | | 14.24 | | | | 0.18 | (h)(i) | | | 0.89 | | | | 1.07 | | | | (0.19 | ) | | | — | | | | (0.19 | ) |
Year Ended August 31, 2013 | | | 15.06 | | | | 0.16 | (h) | | | (0.76 | ) | | | (0.60 | ) | | | (0.21 | ) | | | (0.01 | ) | | | (0.22 | ) |
Year Ended August 31, 2012 | | | 15.14 | | | | 0.18 | (h)(i) | | | (0.12 | ) | | | 0.06 | | | | (0.14 | ) | | | — | (j) | | | (0.14 | ) |
March 31, 2011 (k) through August 31, 2011 | | | 15.00 | | | | 0.09 | (h)(i) | | | 0.08 | | | | 0.17 | | | | (0.03 | ) | | | — | | | | (0.03 | ) |
| | | | | | | |
Class R5 | | | | | | | | | | | | | | | | | | | | | | | | | | | | |
Year Ended August 31, 2015 | | | 15.15 | | | | 0.29 | (h)(i) | | | (1.49 | ) | | | (1.20 | ) | | | (0.27 | ) | | | — | | | | (0.27 | ) |
Year Ended August 31, 2014 | | | 14.31 | | | | 0.26 | (h)(i) | | | 0.91 | | | | 1.17 | | | | (0.33 | ) | | | — | | | | (0.33 | ) |
Year Ended August 31, 2013 | | | 15.11 | | | | 0.26 | (h) | | | (0.78 | ) | | | (0.52 | ) | | | (0.27 | ) | | | (0.01 | ) | | | (0.28 | ) |
Year Ended August 31, 2012 | | | 15.16 | | | | 0.19 | (h)(i) | | | (0.03 | ) | | | 0.16 | | | | (0.21 | ) | | | — | (j) | | | (0.21 | ) |
March 31, 2011 (k) through August 31, 2011 | | | 15.00 | | | | 0.12 | (h)(i) | | | 0.09 | | | | 0.21 | | | | (0.05 | ) | | | — | | | | (0.05 | ) |
| | | | | | | |
Select Class | | | | | | | | | | | | | | | | | | | | | | | | | | | | |
Year Ended August 31, 2015 | | | 15.13 | | | | 0.26 | (h)(i) | | | (1.47 | ) | | | (1.21 | ) | | | (0.26 | ) | | | — | | | | (0.26 | ) |
Year Ended August 31, 2014 | | | 14.29 | | | | 0.26 | (h)(i) | | | 0.89 | | | | 1.15 | | | | (0.31 | ) | | | — | | | | (0.31 | ) |
Year Ended August 31, 2013 | | | 15.10 | | | | 0.24 | (h) | | | (0.78 | ) | | | (0.54 | ) | | | (0.26 | ) | | | (0.01 | ) | | | (0.27 | ) |
Year Ended August 31, 2012 | | | 15.16 | | | | 0.28 | (h)(i) | | | (0.14 | ) | | | 0.14 | | | | (0.20 | ) | | | — | (j) | | | (0.20 | ) |
March 31, 2011 (k) through August 31, 2011 | | | 15.00 | | | | 0.12 | (h)(i) | | | 0.08 | | | | 0.20 | | | | (0.04 | ) | | | — | | | | (0.04 | ) |
| (a) | Annualized for periods less than one year, unless otherwise noted. |
| (b) | Net investment income (loss) is affected by timing of distributions from Underlying Funds. |
| (c) | Not annualized for periods less than one year. |
| (d) | Includes adjustments in accordance with accounting principles generally accepted in the United States of America and as such, the net asset values for financial reporting purposes and the returns based upon those net asset values may differ from the net asset values and returns for shareholder transactions. |
| (e) | Includes earnings credits and interest expense, if applicable, each of which is less than 0.01% unless otherwise noted. |
| (f) | Does not include expenses of Underlying Funds. |
| (g) | Portfolio turnover is calculated by dividing the lesser of total purchases or sales of portfolio securities for the reporting period by the monthly average value of portfolio securities owned during the reporting period. Excluded from both the numerator and denominator are amounts relating to derivatives and securities whose maturities or expiration dates at the time of acquisition were one year or less. |
| (h) | Calculated based upon average shares outstanding. |
| (i) | Net investment income (loss) may appear disproportionate among classes due to the timing of recognition of income and changes in the relative size of the classes. |
| (j) | Amount rounds to less than $0.01. |
| (k) | Commencement of operations. |
| (l) | Certain non-recurring expenses incurred by the Fund were not annualized for the period ended August 31, 2011. |
SEE NOTES TO FINANCIAL STATEMENTS.
| | | | | | |
| | | |
| 14 | | | | J.P. MORGAN FUNDS | | AUGUST 31, 2015 |
��
| | | | | | | | | | | | | | | | | | | | | | | | | | |
| | | Ratios/Supplemental data | |
| | | | | | | | | | Ratios to average net assets (a) | | | | |
Net asset
value,
end of
period | | | Total return
(excludes
sales charge) (c)(d) | | | Net assets,
end of
period | | | Net
expenses (e)(f) | | | Net
investment
income
(loss) (b)(e) | | |
Expenses
without waivers,
reimbursements and
earnings credits (f) | | | Portfolio
turnover
rate (c)(g) | |
| | | | | | | | | | | | | | | | | | | | | | | | | | |
| | | | | | | | | | | | | | | | | | | | | | | | | | |
| $ | 13.61 | | | | (8.28 | )% | | $ | 2,020,268 | | | | 0.61 | % | | | 1.58 | %(i) | | | 1.29 | % | | | 91 | % |
| | 15.08 | | | | 7.88 | | | | 2,001,598 | | | | 0.61 | | | | 1.51 | (i) | | | 1.13 | | | | 59 | |
| | 14.25 | | | | (3.81 | ) | | | 3,345,116 | | | | 0.61 | | | | 1.39 | | | | 0.99 | | | | 39 | |
| | 15.07 | | | | 0.70 | | | | 1,904,463 | | | | 0.61 | | | | 1.43 | (i) | | | 1.29 | | | | 42 | |
| | 15.14 | | | | 1.21 | | | | 189,874 | | | | 0.61 | (l) | | | 1.64 | (i)(l) | | | 31.73 | (l) | | | 13 | |
| | | | | | |
| | | | | | | | | | | | | | | | | | | | | | | | | | |
| | 13.56 | | | | (8.74 | ) | | | 494,218 | | | | 1.11 | | | | 1.10 | (i) | | | 1.78 | | | | 91 | |
| | 15.05 | | | | 7.34 | | | | 443,103 | | | | 1.11 | | | | 0.98 | (i) | | | 1.60 | | | | 59 | |
| | 14.20 | | | | (4.29 | ) | | | 2,073,901 | | | | 1.11 | | | | 0.82 | | | | 1.49 | | | | 39 | |
| | 15.03 | | | | 0.16 | | | | 2,091,357 | | | | 1.11 | | | | 0.96 | (i) | | | 1.88 | | | | 42 | |
| | 15.13 | | | | 1.06 | | | | 338,775 | | | | 1.11 | (l) | | | 1.28 | (i)(l) | | | 30.38 | (l) | | | 13 | |
| | | | | | |
| | | | | | | | | | | | | | | | | | | | | | | | | | |
| | 13.64 | | | | (8.51 | ) | | | 159,377 | | | | 0.86 | | | | 1.09 | (i) | | | 1.55 | | | | 91 | |
| | 15.12 | | | | 7.60 | | | | 50,821 | | | | 0.86 | | | | 1.25 | (i) | | | 1.34 | | | | 59 | |
| | 14.24 | | | | (4.03 | ) | | | 1,309,391 | | | | 0.86 | | | | 1.06 | | | | 1.24 | | | | 39 | |
| | 15.06 | | | | 0.45 | | | | 1,329,140 | | | | 0.86 | | | | 1.23 | (i) | | | 1.47 | | | | 42 | |
| | 15.14 | | | | 1.12 | | | | 50,563 | | | | 0.86 | (l) | | | 1.37 | (i)(l) | | | 33.56 | (l) | | | 13 | |
| | | | | | |
| | | | | | | | | | | | | | | | | | | | | | | | | | |
| | 13.68 | | | | (7.97 | ) | | | 33,033,858 | | | | 0.26 | | | | 2.01 | (i) | | | 0.74 | | | | 91 | |
| | 15.15 | | | | 8.24 | | | | 42,715,599 | | | | 0.26 | | | | 1.74 | (i) | | | 0.66 | | | | 59 | |
| | 14.31 | | | | (3.44 | ) | | | 70,551,417 | | | | 0.26 | | | | 1.73 | | | | 0.54 | | | | 39 | |
| | 15.11 | | | | 1.08 | | | | 42,521,881 | | | | 0.26 | | | | 1.26 | (i) | | | 0.64 | | | | 42 | |
| | 15.16 | | | | 1.39 | | | | 60,354 | | | | 0.26 | (l) | | | 1.93 | (i)(l) | | | 32.71 | (l) | | | 13 | |
| | | | | | |
| | | | | | | | | | | | | | | | | | | | | | | | | | |
| | 13.66 | | | | (8.06 | ) | | | 14,180,339 | | | | 0.36 | | | | 1.80 | (i) | | | 0.94 | | | | 91 | |
| | 15.13 | | | | 8.16 | | | | 19,224,967 | | | | 0.36 | | | | 1.75 | (i) | | | 0.90 | | | | 59 | |
| | 14.29 | | | | (3.58 | ) | | | 17,911,308 | | | | 0.36 | | | | 1.59 | | | | 0.74 | | | | 39 | |
| | 15.10 | | | | 0.95 | | | | 12,897,374 | | | | 0.36 | | | | 1.86 | (i) | | | 1.00 | | | | 42 | |
| | 15.16 | | | | 1.37 | | | | 1,097,846 | | | | 0.36 | (l) | | | 1.82 | (i)(l) | | | 32.78 | (l) | | | 13 | |
SEE NOTES TO FINANCIAL STATEMENTS.
| | | | | | | | |
| | | |
| AUGUST 31, 2015 | | J.P. MORGAN FUNDS | | | | | 15 | |
NOTES TO FINANCIAL STATEMENTS
AS OF AUGUST 31, 2015
1. Organization
JPMorgan Trust I (the “Trust”) was formed on November 12, 2004, as a Delaware statutory trust, pursuant to a Declaration of Trust dated November 5, 2004 and is registered under the Investment Company Act of 1940, as amended (the “1940 Act”), as an open-end management investment company.
The following is a separate fund of the Trust (the “Fund”) covered by this report:
| | | | |
| | | Classes Offered | | Diversified/Non-Diversified |
| Diversified Real Return Fund | | Class A, Class C, Class R2, Class R5 and Select Class | | Diversified |
The investment objective of the Fund is to seek to maximize long-term real return.
Class A Shares generally provide for a front-end sales charge while Class C Shares provide for a contingent deferred sales charge (“CDSC”). No sales charges are assessed with respect to Class R2, Class R5 and Select Class Shares. All classes of shares have equal rights as to earnings, assets and voting privileges, except that each class may bear different sub-transfer agency, distribution and shareholder servicing fees and each class has exclusive voting rights with respect to its distribution plan and shareholder servicing agreements. Certain Class A Shares, for which front-end sales charges have been waived, may be subject to a CDSC as described in the Fund’s prospectus.
2. Significant Accounting Policies
The following is a summary of significant accounting policies followed by the Fund in the preparation of its financial statements. The Fund is an investment company and, accordingly, follows the investment company accounting and reporting guidance of the Financial Accounting Standards Board Accounting Standards Codification Topic 946 — Investment Companies, which is part of U.S. generally accepted accounting principles (“GAAP”). The preparation of financial statements in conformity with GAAP requires management to make estimates and assumptions that affect the reported amounts of assets and liabilities and disclosure of contingent assets and liabilities at the date of the financial statements and the reported amounts of increases and decreases in net assets from operations during the reporting period. Actual results could differ from those estimates.
A. Valuation of Investments — The valuation of the investments is in accordance with GAAP and the Fund’s valuation policies set forth by and under the supervision and responsibility of the Board of Trustees (the “Board”), which established the following approach to valuation, as described more fully below: (i) investments for which market quotations are readily available shall be valued at such unadjusted quoted prices and (ii) all other investments for which market quotations are not readily available shall be valued at their fair value as determined in good faith by the Board.
JPMorgan Funds Management, Inc. (the “Administrator”) has established the J.P. Morgan Asset Management Americas Valuation Committee (“AVC”) to assist the Board with the oversight and monitoring of the valuation of the Fund’s investments. The Administrator implements the valuation policies of the Fund’s investments, as directed by the Board. The AVC oversees and carries out the policies for the valuation of investments held in the Fund. This includes monitoring the appropriateness of fair values based on results of ongoing valuation oversight, including but not limited to consideration of macro or security specific events, market events and pricing vendor and broker due diligence. The Administrator is responsible for discussing and assessing the potential impacts to the fair values on an ongoing basis, and at least on a quarterly basis with the AVC and the Board.
Equities and other exchange-traded instruments are valued at the last sale price or official market closing price on the primary exchange on which the instrument is traded before the net asset values (“NAV”) of the Fund are calculated on a valuation date. Certain foreign equity instruments shall be valued by applying an international fair value factor provided by an approved Pricing Service. The factors seek to adjust the local closing price for movements of local markets post closing, but prior to the time the NAVs are calculated.
Investments in open-end investment companies excluding exchange-traded funds (“ETFs”) (the “Underlying Funds”), are valued at each Underlying Fund’s NAV per share as of the report date.
Fixed income instruments are valued based on prices received from approved pricing vendors or third party broker-dealers (collectively referred to as “Pricing Services”). The Pricing Services use multiple valuation techniques to determine the valuation of fixed income instruments. In instances where sufficient market activity exists, the Pricing Services may utilize a market-based approach through which trades or quotes from market makers are used to determine the valuation of these instruments. In instances where sufficient market activity may not exist, the Pricing Services also utilize proprietary valuation models which may consider market transactions in comparable securities and the various relationships between securities in determining fair value and/or market characteristics in order to estimate the relevant cash flows, which are then discounted to calculate the fair values.
Futures are generally valued on the basis of available market quotations.
Valuations reflected in this report are as of the report date. As a result, changes in valuation due to market events and/or issuer related events after the report date and prior to issuance of the report are not reflected herein.
The various inputs that are used in determining the valuation of the Fund’s investments are summarized into the three broad levels listed below.
| • | | Level 1 — Unadjusted inputs using quoted prices in active markets for identical investments. |
| • | | Level 2 — Other significant observable inputs including, but are not limited to, quoted prices for similar investments, inputs other than quoted prices that are observable for investments (such as interest rates, prepayment speeds, credit risk, etc.) or other market corroborated inputs. |
| • | | Level 3 — Significant inputs based on the best information available in the circumstances, to the extent observable inputs are not available (including the Fund’s assumptions in determining the fair value of investments). |
| | | | | | |
| | | |
| 16 | | | | J.P. MORGAN FUNDS | | AUGUST 31, 2015 |
A financial instrument’s level within the fair value hierarchy is based on the lowest level of any input, both individually and in the aggregate, that is significant to the fair value measurement. The inputs or methodology used for valuing instruments are not necessarily an indication of the risk associated with investing in those instruments.
The following table represents each valuation input as presented on the Schedule of Portfolio Investments (“SOI”):
| | | | | | | | | | | | | | | | |
| | | Level 1 Quoted prices | | | Level 2
Other significant
observable inputs | | | Level 3 Significant
unobservable inputs | | | Total | |
Investments in Securities | | | | | | | | | | | | | | | | |
Common Stocks | | | | | | | | | | | | | | | | |
Consumer Staples | | $ | 440,286 | | | $ | 355,075 | | | $ | — | | | $ | 795,361 | |
Industrials | | | 222,705 | | | | 104,216 | | | | — | | | | 326,921 | |
Materials | | | 636,922 | | | | 280,307 | | | | — | | | | 917,229 | |
| | | | | | | | | | | | | | | | |
Total Common Stocks | | | 1,299,913 | | | | 739,598 | | | | — | | | | 2,039,511 | |
| | | | | | | | | | | | | | | | |
Debt Security | | | | | | | | | | | | | | | | |
U.S. Treasury Obligation | | | — | | | | 195,119 | | | | — | | | | 195,119 | |
Exchange Traded Funds | | | 11,877,723 | | | | — | | | | — | | | | 11,877,723 | |
Investment Companies | | | 33,786,800 | | | | — | | | | — | | | | 33,786,800 | |
Short-Term Investment | | | | | | | | | | | | | | | | |
Investment Company | | | 2,003,491 | | | | — | | | | — | | | | 2,003,491 | |
| | | | | | | | | | | | | | | | |
Total Investments in Securities | | $ | 48,967,927 | | | $ | 934,717 | | | $ | — | | | $ | 49,902,644 | |
| | | | | | | | | | | | | | | | |
Appreciation in Other Financial Instruments | | | | | | | | | | | | | | | | |
Futures Contracts | | $ | 5,453 | | | $ | — | | | $ | — | | | $ | 5,453 | |
| | | | | | | | | | | | | | | | |
Depreciation in Other Financial Instruments | | | | | | | | | | | | | | | | |
Futures Contracts | | $ | (147,241 | ) | | $ | — | | | $ | — | | | $ | (147,241 | ) |
| | | | | | | | | | | | | | | | |
There were no significant transfers between levels 1 and 2 during the year ended August 31, 2015.
B. Investment Transactions with Affiliates — The Fund invests in Underlying Funds which are advised by J.P. Morgan Investment Management Inc. (the “Adviser” or “JPMIM”), or its affiliates pursuant to Section 12(d)(1)(G) of the 1940 Act. An issuer which is under common control with the Fund may be considered an affiliate. For the purposes of the financial statements, the Fund assumes the issuers listed in the table below to be affiliated issuers. Underlying Funds’ distributions may be reinvested into the Underlying Funds. Reinvestment amounts are included in the purchase cost amounts in the table below. Included in the realized gain (loss) amounts in the table below are distributions of realized capital gains, if any, received from the Underlying Funds.
| | | | | | | | | | | | | | | | | | | | | | | | | | | | |
| | | | | | For the year ended August 31, 2015 | | | | | | | |
| Affiliate | | Value at
August 31,
2014 | | | Purchase
Cost | | | Sales
Proceeds | | | Realized
Gain (Loss) | | | Dividend
Income | | | Shares at
August 31,
2015 | | | Value at
August 31,
2015 | |
JPMorgan Commodities Strategy Fund, Class R6 Shares | | $ | 5,451,751 | | | $ | 2,044,603 | | | $ | 2,636,728 | | | $ | (543,262 | ) | | $ | — | | | | 365,768 | | | $ | 3,456,509 | |
JPMorgan Floating Rate Income Fund, Class R6 Shares | | | 11,938,745 | | | | 3,221,504 | | | | 9,239,263 | | | | (159,692 | ) | | | 307,182 | | | | 577,715 | | | | 5,528,728 | |
JPMorgan High Yield Fund, Class R6 Shares | | | — | | | | 6,188,622 | | | | 1,360,997 | | | | 9,264 | | | | 165,936 | | | | 618,018 | | | | 4,523,890 | |
JPMorgan Inflation Managed Bond Fund, Class R6 Shares | | | 21,859,288 | | | | 7,733,398 | | | | 14,516,666 | | | | (209,901 | ) | | | 239,872 | | | | 1,409,137 | | | | 14,316,829 | |
JPMorgan Prime Money Market Fund, Institutional Class Shares | | | 1,378,004 | | | | 27,710,846 | | | | 27,085,359 | | | | — | | | | 598 | | | | 2,003,491 | | | | 2,003,491 | |
JPMorgan Real Return Fund, Institutional Class Shares | | | 3,136,098 | | | | 11,567,165 | | | | 14,441,892 | | | | (194,926 | ) | | | 80,087 | | | | — | | | | — | |
JPMorgan Realty Income Fund, Class R5 Shares | | | 7,595,802 | | | | 3,838,132 | | | | 5,583,238 | | | | 858,081 | | | | 135,793 | | | | 455,722 | | | | 5,960,844 | |
| | | | | | | | | | | | | | | | | | | | | | | | | | | | |
Total | | $ | 51,359,688 | | | | | | | | | | | $ | (240,436 | ) | | $ | 929,468 | | | | | | | $ | 35,790,291 | |
| | | | | | | | | | | | | | | | | | | | | | | | | | | | |
C. Futures Contracts — The Fund used index, treasury or other financial futures contracts to manage and hedge equity price and interest rate risk associated with portfolio investments and to seek to enhance portfolio performance.
Futures contracts provide for the delayed delivery of the underlying instrument at a fixed price or are settled for a cash amount based on the change in the value of the underlying instrument at a specific date in the future. Upon entering into a futures contract, the Fund is required to
| | | | | | | | |
| | | |
| AUGUST 31, 2015 | | J.P. MORGAN FUNDS | | | | | 17 | |
NOTES TO FINANCIAL STATEMENTS
AS OF AUGUST 31, 2015 (continued)
deposit with the broker, cash or securities in an amount equal to a certain percentage of the contract amount, which is referred to as the initial margin deposit. Subsequent payments, referred to as variation margin, are made or received by the Fund periodically and are based on changes in the market value of open futures contracts. Changes in the market value of open futures contracts are recorded as Change in net unrealized appreciation/depreciation on the Statement of Operations. Realized gains or losses, representing the difference between the value of the contract at the time it was opened and the value at the time it was closed, are reported on the Statement of Operations at the closing or expiration of the futures contract. Securities deposited as initial margin are designated on the SOI and cash deposited is recorded on the Statement of Assets and Liabilities. A receivable from and/or a payable to brokers for the daily variation margin is also recorded on the Statement of Assets and Liabilities.
The use of futures contracts exposes the Fund to equity price and interest rate risk. The Fund may be subject to the risk that the change in the value of the futures contract may not correlate perfectly with the underlying instrument. Use of long futures contracts subjects the Fund to risk of loss in excess of the amounts shown on the Statement of Assets and Liabilities, up to the notional amount of the futures contracts. Use of short futures contracts subjects the Fund to unlimited risk of loss. The Fund may enter into futures contracts only on exchanges or boards of trade. The exchange or board of trade acts as the counterparty to each futures transaction; therefore, the Fund’s credit risk is limited to failure of the exchange or board of trade. Under some circumstances, futures exchanges may establish daily limits on the amount that the price of a futures contract can vary from the previous day’s settlement price, which could effectively prevent liquidation of positions.
The table below discloses the volume of the Fund’s futures contracts activity during the year ended August 31, 2015:
| | | | | | | | |
| | | Average
Notional
Balance | | | Ending
Notional
Balance | |
Long Futures Contracts: | | | | | | | | |
Equity | | $ | 1,826,099 | (a) | | $ | 2,363,040 | |
Interest Rate | | | 1,257,101 | (b) | | | 463,875 | |
| | |
Short Futures Contracts: | | | | | | | | |
Interest Rate | | | 3,928,471 | (a) | | | 3,277,031 | |
| (a) | Average for the period February 1, 2015 through August 31, 2015. |
| (b) | Average for the period December 1, 2014 through August 31, 2015. |
The Fund’s futures contracts are not subject to master netting arrangements (the right to close out all transactions traded with a counterparty and net amounts owed or due across transactions).
D. Summary of Derivative Information — The following table presents the value of derivatives held as of August 31, 2015, by their primary underlying risk exposure and respective location on the Statement of Assets and Liabilities:
| | | | | | |
| Derivative Contracts | | Statement of Assets and Liabilities Location | | | |
| Gross Assets: | | | | Futures Contracts (a) | |
Interest rate contracts | | Receivables, Net Assets — Unrealized Appreciation | | $ | 5,453 | |
| | | | | | |
| | |
Gross Liabilities: | | | | | |
Equity contracts | | Receivables, Net Assets — Unrealized Depreciation | | $ | (141,438 | ) |
Interest rate contracts | | Receivables, Net Assets — Unrealized Depreciation | | | (5,803 | ) |
| | | | | | |
Total | | | | $ | (147,241 | ) |
| | | | | | |
| (a) | This amount represents the cumulative appreciation (depreciation) of futures contracts as reported on the SOI. The Statement of Assets and Liabilities only reflect the current day variation margin receivable/payable from/to brokers. |
The following tables present the effect of derivatives on the Statement of Operations for the year ended August 31, 2015, by primary underlying risk exposure:
| | | | |
| Amount of Realized Gain (Loss) on Derivatives Recognized on Statement of Operations | |
| Derivative Contracts | | Futures Contracts | |
Equity contracts | | $ | 13,584 | |
Interest rate contracts | | | (157,824 | ) |
| | | | |
Total | | $ | (144,240 | ) |
| | | | |
| | | | | | |
| | | |
| 18 | | | | J.P. MORGAN FUNDS | | AUGUST 31, 2015 |
The following tables present the effect of derivatives on the Statement of Operations for the year ended August 31, 2015, by primary underlying risk exposure:
| | | | |
| Amount of Change in Unrealized Appreciation (Depreciation) on Derivatives Recognized on Statement of Operations | |
| Derivative Contracts | | Futures Contracts | |
Equity contracts | | $ | (141,438 | ) |
Interest rate contracts | | | (350 | ) |
| | | | |
Total | | $ | (141,788 | ) |
| | | | |
The Fund’s derivatives contracts held at August 31, 2015 are not accounted for as hedging instruments under GAAP.
E. Foreign Currency Translation — The books and records of the Fund are maintained in U.S. dollars. Foreign currency amounts are translated into U.S. dollars at the prevailing exchange rates of such currencies against the U.S. dollar. The market value of investment securities and other assets and liabilities are translated at the exchange rate as of the valuation date. Purchases and sales of investment securities, income and expenses are translated at the exchange rate prevailing on the respective dates of such transactions.
The Fund does not isolate the effect of changes in foreign exchange rates from changes in market prices on securities held. Accordingly, such changes are included within Change in net unrealized appreciation/depreciation on investments on the Statement of Operations.
Reported realized foreign currency gains and losses arise from the disposition of foreign currency, currency gains or losses realized between the trade and settlement dates on securities transactions, and the difference between the amounts of dividends, interest and foreign withholding taxes recorded on the Fund’s books on the transaction date and the U.S. dollar equivalent of the amounts actually received or paid. These reported realized foreign currency gains and losses are included in Net realized gain (loss) on foreign currency transactions on the Statement of Operations. Unrealized foreign currency gains and losses arise from changes (due to changes in exchange rates) in the value of foreign currency and other assets and liabilities denominated in foreign currencies, which are held at year end and are included in Change in net unrealized appreciation/depreciation on foreign currency translations on the Statement of Operations.
F. Security Transactions and Investment Income — Investment transactions are accounted for on the trade date (the date the order to buy or sell is executed). Securities gains and losses are calculated on a specifically identified cost basis. Interest income is determined on the basis of coupon interest accrued using the effective interest method which adjusts for amortization of premiums and accretion of discounts. Dividend income net of foreign taxes withheld, if any, and distributions of net investment income and realized capital gains from the Underlying Funds and ETFs, if any, are recorded on the ex-dividend date or when the Fund first learns of the dividend.
G. Allocation of Income and Expenses — Expenses directly attributable to a fund are charged directly to that fund, while the expenses attributable to more than one fund of the Trust are allocated among the respective funds. In calculating the NAV of each class, investment income, realized and unrealized gains and losses and expenses, other than class specific expenses, are allocated daily to each class of shares based upon the proportion of net assets of each class at the beginning of each day.
Sub-transfer agent fees are class-specific expenses. The amount of the sub-transfer agent fees charged to each class of the Fund for the year ended August 31, 2015 are as follows:
| | | | | | | | | | | | | | | | | | | | |
| | | Class A | | | Class C | | | Class R2 | | | Class R5 | | | Select Class | |
Sub-transfer agent fees | | | 1,644 | | | | 123 | | | | 44 | | | | 5,195 | | | | 104 | |
The Fund invests in Underlying Funds and ETFs and, as a result, bears a portion of the expenses incurred by these Underlying Funds and ETFs. These expenses are not reflected in the expenses shown on the Statement of Operations and are not included in the ratios to average net assets shown in the Financial Highlights. Certain expenses of affiliated Underlying Funds and ETFs are waived as described in Note 3.F.
H. Federal Income Taxes — The Fund is treated as a separate taxable entity for Federal income tax purposes. The Fund’s policy is to comply with the provisions of the Internal Revenue Code of 1986, as amended (the “Code”), applicable to regulated investment companies and to distribute to shareholders all of its distributable net investment income and net realized capital gains on investments. Accordingly, no provision for Federal income tax is necessary. Management has reviewed the Fund’s tax positions for all open tax years and has determined that as of August 31, 2015, no liability for income tax is required in the Fund’s financial statements for net unrecognized tax benefits. However, management’s conclusions may be subject to future review based on changes in, or the interpretation of, the accounting standards or tax laws and regulations. The Fund’s Federal tax returns for the prior three fiscal years remain subject to examination by the Internal Revenue Service.
I. Foreign Taxes — The Fund may be subject to foreign taxes on income, gains on investments or currency purchases/repatriation, a portion of which may be recoverable. The Fund will accrue such taxes and recoveries as applicable, based upon its current interpretation of tax rules and regulations that exist in the markets in which it invests.
J. Distributions to Shareholders — Distributions from net investment income are generally declared and paid quarterly and are declared separately for each class. No class has preferential dividend rights; differences in per share rates are due to differences in separate class expenses. Net realized capital gains, if any, are distributed by the Fund at least annually. The amount of distributions from net investment income and net realized capital
| | | | | | | | |
| | | |
| AUGUST 31, 2015 | | J.P. MORGAN FUNDS | | | | | 19 | |
NOTES TO FINANCIAL STATEMENTS
AS OF AUGUST 31, 2015 (continued)
gains is determined in accordance with Federal income tax regulations, which may differ from GAAP. To the extent these “book/tax” differences are permanent in nature (i.e., that they result from other than timing of recognition — “temporary differences”), such amounts are reclassified within the capital accounts based on their Federal tax-basis treatment.
The following amounts were reclassified within the capital accounts:
| | | | | | | | | | | | |
| | | Paid-in-Capital | | | Accumulated
undistributed
(distributions in excess of)
net investment
income | | | Accumulated
net realized
gains (losses) | |
| | $ | — | | | $ | 43,280 | | | $ | (43,280 | ) |
The reclassifications for the Fund relate primarily to investments in regulated investment companies.
3. Fees and Other Transactions with Affiliates
A. Investment Advisory Fee — Pursuant to the Investment Advisory Agreement, the Adviser, an indirect, wholly-owned subsidiary of JPMorgan Chase & Co. (“JPMorgan”), supervises the investments of the Fund and for such services is paid a fee. The fee is accrued daily and paid monthly at an annual rate of 0.10% of the Fund’s average daily net assets.
The Adviser waived Investment Advisory fees and/or reimbursed expenses as outlined in Note 3.F.
B. Administration Fee — Pursuant to an Administration Agreement, the Administrator, an indirect, wholly-owned subsidiary of JPMorgan, provides certain administration services to the Fund. In consideration of these services, the Administrator receives a fee accrued daily and paid monthly at an annual rate of 0.10% of the Fund’s average daily net assets on the first $500 million in Fund assets; 0.075% of the Fund’s average daily net assets between $500 million and $1 billion and 0.05% of the Fund’s average daily net assets in excess of $1 billion. For the year ended August 31, 2015, the effective rate was 0.10% of the Fund’s average daily net assets, notwithstanding any fee waivers and/or expense reimbursements.
The Administrator waived Administration fees as outlined in Note 3.F.
JPMorgan Chase Bank, N.A. (“JPMCB”), a wholly-owned subsidiary of JPMorgan, serves as the Fund’s sub-administrator (the “Sub-administrator”). For its services as Sub-administrator, JPMCB receives a portion of the fees payable to the Administrator.
C. Distribution Fees — Pursuant to a Distribution Agreement, JPMorgan Distribution Services, Inc. (the “Distributor”), a wholly-owned subsidiary of JPMorgan, serves as the Trust’s exclusive underwriter and promotes and arranges for the sale of the Fund’s shares.
The Board has adopted a Distribution Plan (the “Distribution Plan”) for Class A, Class C and Class R2 Shares of the Fund in accordance with Rule 12b-1 under the 1940 Act. The Distribution Plan provides that the Fund shall pay distribution fees, including payments to the Distributor, at annual rates of 0.25%, 0.75% and 0.50% of the average daily net assets of Class A, Class C and Class R2 Shares, respectively.
In addition, the Distributor is entitled to receive the front-end sales charges from purchases of Class A Shares and the CDSC from redemptions of Class C Shares and certain Class A Shares for which front-end sales charges have been waived. For the year ended August 31, 2015, the Distributor retained the following amounts:
| | | | | | | | |
| | | Front-End Sales Charge | | | CDSC | |
| | $ | 656 | | | $ | 22 | |
D. Shareholder Servicing Fees — The Trust, on behalf of the Fund, has entered into a Shareholder Servicing Agreement with the Distributor under which the Distributor provides certain support services to the shareholders. For performing these services, the Distributor receives a fee that is accrued daily and paid monthly equal to a percentage of the average daily net assets as shown in the table below:
| | | | | | | | | | | | | | | | | | | | |
| | | Class A | | | Class C | | | Class R2 | | | Class R5 | | | Select Class | |
| | | 0.25 | % | | | 0.25 | % | | | 0.25 | % | | | 0.05 | % | | | 0.25 | % |
The Distributor has entered into shareholder services contracts with affiliated and unaffiliated financial intermediaries who provide shareholder services and other related services to their clients or customers who invest in the Fund under which the Distributor will pay all or a portion of such fees earned to financial intermediaries for performing such services.
The Distributor waived Shareholder Servicing fees as outlined in Note 3.F.
E. Custodian and Accounting Fees — JPMCB provides portfolio custody and accounting services to the Fund. For these services, the Fund pays JPMCB transaction and asset-based fees that vary according to the number of transactions and positions, plus out-of-pocket expenses. The amounts paid directly to JPMCB by the Fund for custody and accounting services are included in Custodian and accounting fees on the Statement of Operations. Payments to the custodian may be reduced by credits earned by the Fund, based on uninvested cash balances held by the custodian. Such earnings credits, if any, are presented separately on the Statement of Operations.
Interest income earned on cash balances at the custodian, if any, is included in Interest income from affiliates on the Statement of Operations.
| | | | | | |
| | | |
| 20 | | | | J.P. MORGAN FUNDS | | AUGUST 31, 2015 |
Interest expense paid to the custodian related to cash overdrafts, if any, is included in Interest expense to affiliates on the Statement of Operations.
F. Waivers and Reimbursements — The Adviser, Administrator and Distributor have contractually agreed to waive fees and/or reimburse expenses to the extent that total annual operating expenses of the Fund (excluding acquired fund “Underlying Funds and ETFs” fees and expenses, dividend expenses related to short sales, interest, taxes, expenses related to litigation and potential litigation, extraordinary expenses and expenses related to the Board’s deferred compensation plan) exceed the percentages of the Fund’s respective average daily net assets as shown in the table below:
| | | | | | | | | | | | | | | | | | | | |
| | | Class A | | | Class C | | | Class R2 | | | Class R5 | | | Select Class | |
| | | 0.61 | % | | | 1.11 | % | | | 0.86 | % | | | 0.26 | % | | | 0.36 | % |
The expense limitation agreement was in effect for the year ended August 31, 2015 and is in place until at least December 31, 2015. In addition, the Fund’s service providers have voluntarily waived fees during the year ended August 31, 2015. However, the Fund’s service providers are under no obligation to do so and may discontinue such voluntary waivers at any time.
For the year ended August 31, 2015, the Fund’s service providers waived fees and/or reimbursed expenses for the Fund as follows. None of these parties expect the Fund to repay any such waived fees and/or reimbursed expenses in future years.
| | | | | | | | | | | | | | | | | | | | |
| | | Contractual Waivers | | | | |
| | | Investment
Advisory | | | Administration | | | Shareholder
Servicing | | | Total | | | Contractual
Reimbursements | |
| | $ | 54,184 | | | $ | 53,923 | | | $ | 44,070 | | | $ | 152,177 | | | $ | 127,517 | |
| | | | | |
| | | | | | | | | | | | | | | Voluntary Waivers | |
| | | | | | | | | | | | | | | Administration | |
| | | | | | | | | | | | | | | | | | | $406 | |
Additionally, the Fund may invest in one or more money market funds advised by the Adviser or its affiliates. The Adviser, Administrator and Distributor, as shareholder servicing agent, waive fees in an amount sufficient to offset the respective fees each charges to the affiliated money market fund on the Fund’s investment in such affiliated money market fund.
There were no waivers resulting from investments in these money market funds for the year ended August 31, 2015.
The Underlying Funds may impose separate shareholder servicing fees. To avoid charging a shareholder servicing fee at an effective rate above 0.25% for Class A, Class C, Class R2 and Select Class Shares and above 0.05% for Class R5 Shares, the Fund’s Distributor may waive shareholder servicing fees with respect to the Fund in an amount equal to the weighted average pro-rata amount of shareholder servicing fees charged by the affiliated Underlying Funds. This waiver may be in addition to any waivers required to meet the Fund’s contractual expense limitations, but will not exceed the Fund’s shareholder servicing fees.
G. Other — Certain officers of the Trust are affiliated with the Adviser, the Administrator and the Distributor. Such officers, with the exception of the Chief Compliance Officer, receive no compensation from the Fund for serving in their respective roles.
The Board appointed a Chief Compliance Officer to the Fund in accordance with Federal securities regulations. The Fund, along with other affiliated funds, makes reimbursement payments, on a pro-rata basis, to the Administrator for a portion of the fees associated with the Office of the Chief Compliance Officer. Such fees are included in Trustees’ and Chief Compliance Officer’s fees on the Statement of Operations.
The Trust adopted a Trustee Deferred Compensation Plan (the “Plan”) which allows the Independent Trustees to defer the receipt of all or a portion of compensation related to performance of their duties as Trustees. The deferred fees are invested in various J.P. Morgan Funds until distribution in accordance with the Plan.
During the year ended August 31, 2015, the Fund may have purchased securities from an underwriting syndicate in which the principal underwriter or members of the syndicate are affiliated with the Adviser.
The Fund may use related party broker-dealers. For the year ended August 31, 2015, the Fund did not incur any brokerage commissions with broker-dealers affiliated with the Adviser.
The Securities and Exchange Commission (“SEC”) has granted an exemptive order permitting the Fund to engage in principal transactions with J.P. Morgan Securities, Inc., an affiliated broker, involving taxable money market instruments, subject to certain conditions.
The SEC has granted an exemptive order permitting the Fund to invest in certain financial instruments in addition to Underlying Funds and securities.
4. Investment Transactions
During the year ended August 31, 2015, purchases and sales of investments (excluding short-term investments) were as follows:
| | | | | | | | | | | | | | | | |
| | | Purchases
(excluding
U.S. Government) | | | Sales
(excluding
U.S. Government) | | | Purchases
of U.S.
Government | | | Sales
of U.S.
Government | |
| | $ | 48,417,879 | | | $ | 58,198,598 | | | $ | 25,052 | | | $ | — | |
| | | | | | | | |
| | | |
| AUGUST 31, 2015 | | J.P. MORGAN FUNDS | | | | | 21 | |
NOTES TO FINANCIAL STATEMENTS
AS OF AUGUST 31, 2015 (continued)
5. Federal Income Tax Matters
For Federal income tax purposes, the estimated cost and unrealized appreciation (depreciation) in value of investment securities held at August 31, 2015 were as follows:
| | | | | | | | | | | | | | | | |
| | | Aggregate
Cost | | | Gross
Unrealized
Appreciation | | | Gross
Unrealized
Depreciation | | | Net Unrealized
Appreciation
(Depreciation) | |
| | $ | 51,217,422 | | | $ | 1,848,006 | | | $ | (3,162,784 | ) | | $ | (1,314,778 | ) |
The difference between book and tax basis appreciation (depreciation) on investments is primarily attributed to wash sale loss deferrals.
The tax character of distributions paid during the year ended August 31, 2015 was as follows:
| | | | | | | | | | | | |
| | | Ordinary
Income | | | Net
Long-Term
Capital Gains | | | Total
Distributions Paid | |
| | $ | 1,068,897 | | | $ | — | | | $ | 1,068,897 | |
The tax character of distributions paid during the year ended August 31, 2014 was as follows:
| | | | | | | | | | | | |
| | | Ordinary
Income | | | Net
Long-Term
Capital Gains | | | Total
Distributions Paid | |
| | $ | 1,466,696 | | | $ | — | | | $ | 1,466,696 | |
As of August 31, 2015, the estimated components of net assets (excluding paid-in-capital) on a tax basis were as follows:
| | | | | | | | | | | | |
| | | Current
Distributable
Ordinary
Income | | | Current
Distributable
Long-Term
Capital Gain or
(Tax Basis
Loss Carryover) | | | Unrealized
Appreciation
(Depreciation) | |
| | $ | 131,392 | | | $ | (3,756,325 | ) | | $ | (1,315,095 | ) |
The cumulative timing differences primarily consist of post-October capital loss deferrals, wash sale loss deferrals and mark to market of futures contracts.
As of August 31, 2015, the Fund had net capital loss carryforwards as follows:
| | | | | | | | |
| | | Capital Loss
Carryforward Character | |
| | | Short-Term | | | Long-Term | |
| | $ | 2,940,897 | | | $ | 815,428 | |
During the year ended August 31, 2015, the Fund utilized capital loss carryforwards as follows:
| | | | | | | | |
| | | Capital Loss
Carryforwards Utilized | |
| | | Short-Term | | | Long-Term | |
| | $ | — | | | $ | 6,210 | |
Specified ordinary losses and net capital losses incurred after October 31 within the taxable year are deemed to arise on the first business day of the Fund’s next taxable year. For the year ended August 31, 2015, the Fund deferred to September 1, 2015 the following specified ordinary losses and net capital losses of:
| | | | | | | | | | | | |
| | | Net Capital Loss | | | Specified
Ordinary
Losses | |
| | | Short-Term | | | Long-Term | | |
| | $ | 481,717 | | | $ | (132,657 | ) | | $ | 797 | |
6. Borrowings
The Fund relies upon an exemptive order granted by the SEC (the “Order”) permitting the establishment and operation of an Interfund Lending Facility (the “Facility”). The Facility allows the Fund to directly lend and borrow money to or from any other fund relying upon the Order at rates beneficial to both the borrowing and lending funds. Advances under the Facility are taken primarily for temporary or emergency purposes, including
| | | | | | |
| | | |
| 22 | | | | J.P. MORGAN FUNDS | | AUGUST 31, 2015 |
the meeting of redemption requests that otherwise might require the untimely disposition of securities, and are subject to the Fund’s borrowing restrictions. The Interfund loan rate is determined, as specified in the Order, by averaging the current repurchase agreement rate and the current bank loan rate. The Order was granted to JPMorgan Trust II and may be relied upon by the Fund because the Fund and the series of JPMorgan Trust II are both investment companies in the same “group of investment companies” (as defined in Section 12(d)(1)(G) of the 1940 Act).
In addition, the Trust and JPMCB have entered into a financing arrangement. Under this arrangement, JPMCB provides an unsecured, uncommitted credit facility in the aggregate amount of $100 million to certain of the J.P. Morgan Funds, including the Fund. Advances under the arrangement are taken primarily for temporary or emergency purposes, including the meeting of redemption requests that otherwise might require the untimely disposition of securities, and are subject to the Fund’s borrowing restrictions. Interest on borrowings is payable at a rate determined by JPMCB at the time of borrowing. This agreement has been extended until November 9, 2015.
The Fund had no borrowings outstanding from another fund or from the unsecured, uncommitted credit facility at, August 31, 2015, or at any time during the year then ended.
7. Risks, Concentrations and Indemnifications
In the normal course of business, the Fund enters into contracts that contain a variety of representations which provide general indemnifications. The Fund’s maximum exposure under these arrangements is unknown. The amount of exposure would depend on future claims that may be made against the Fund that have not yet occurred. However, based on experience, the Fund expects the risk of loss to be remote.
The Fund has one or more shareholders, which are accounts maintained by financial intermediaries on behalf of their clients, that own a significant portion of the Fund’s outstanding shares.
The Adviser or an affiliate may from time to time exercise discretion on behalf of certain of their clients with respect to the purchase or sale of a significant portion of the Fund’s outstanding shares. Investment activities on behalf of these shareholders could impact the Fund.
Significant shareholder transactions by these shareholders may impact the Fund’s performance.
Because of the Fund’s investments in Underlying Funds and ETFs, the Fund indirectly pays a portion of the expenses incurred by the Underlying Funds and ETFs. As a result, the cost of investing in the Fund may be higher than the cost of investing in a mutual fund that invests directly in individual securities and financial instruments. The Fund is also subject to certain risks related to the Underlying Funds’ and ETFs’ investments in securities and financial instruments such as fixed income securities, including high yield, asset-backed and mortgage-related securities, including collateralized mortgage obligations and stripped mortgage-backed securities, equity securities, commodities and real estate securities and convertible securities. These securities are subject to risks specific to their structure, sector or market. The Fund invests in unaffiliated ETFs. ETFs are pooled investment vehicles whose ownership interests are purchased and sold on a securities exchange. ETFs may be structured as investment companies, depositary receipts or other pooled investment vehicles and may be passively or actively managed. Passively managed ETFs generally seek to track the performance of a particular market index, including broad-based market indexes, as well as indexes relating to particular sectors, markets, regions or industries. Actively managed ETFs do not seek to track the performance of a particular market index. The price movement of an index-based ETF may not track the underlying index and may result in a loss. In addition, ETFs may trade at a price below or above their NAV (also known as a discount or premium, respectively).
In addition, the Underlying Funds and ETFs may use derivative instruments in connection with their individual investment strategies including futures, forward foreign currency exchange contracts, options, swaps and other derivatives, which are also subject to specific risks related to their structure, sector or market and may be riskier than investments in other types of securities.
Specific risks and concentrations present in the Underlying Funds and ETFs are disclosed within their individual financial statements and registration statements, as appropriate.
| | | | | | | | |
| | | |
| AUGUST 31, 2015 | | J.P. MORGAN FUNDS | | | | | 23 | |
REPORT OF INDEPENDENT REGISTERED PUBLIC ACCOUNTING FIRM
To the Trustees of JPMorgan Trust I and the Shareholders of JPMorgan Diversified Real Return Fund:
In our opinion, the accompanying statement of assets and liabilities, including the schedule of portfolio investments, and the related statements of operations and of changes in net assets and the financial highlights present fairly, in all material respects, the financial position of JPMorgan Diversified Real Return Fund (a separate fund of JPMorgan Trust I) (the “Fund”) at August 31, 2015, the results of its operations for the year then ended, the changes in its net assets for each of the two years in the period then ended and the financial highlights for each of the periods presented, in conformity with accounting principles generally accepted in the United States of America. These financial statements and financial highlights (hereafter referred to as “financial statements”) are the responsibility of the Fund’s management. Our responsibility is to express an opinion on these financial statements based on our audits. We conducted our audits of these financial statements in accordance with the standards of the Public Company Accounting Oversight Board (United States). Those standards require that we plan and perform the audit to obtain reasonable assurance about whether the financial statements are free of material misstatement. An audit includes examining, on a test basis, evidence supporting the amounts and disclosures in the financial statements, assessing the accounting principles used and significant estimates made by management, and evaluating the overall financial statement presentation. We believe that our audits, which included confirmation of securities at August 31, 2015 by correspondence with the transfer agent, custodian and brokers, provide a reasonable basis for our opinion.
PricewaterhouseCoopers LLP
New York, New York
October 28, 2015
| | | | | | |
| | | |
| 24 | | | | J.P. MORGAN FUNDS | | AUGUST 31, 2015 |
TRUSTEES
(Unaudited)
The Fund’s Statement of Additional Information includes additional information about the Fund’s Trustees and is available, without charge, upon request by calling 1-800-480-4111 or on the J.P. Morgan Funds’ website at www.jpmorganfunds.com.
| | | | | | |
Name (Year of Birth); Positions With the Fund (1) | | Principal Occupations During Past 5 Years | | Number of
Portfolios in Fund
Complex Overseen
by Trustee (2) | | Other Directorships Held Outside Fund Complex During Past 5 Years |
Independent Trustees | | |
| | | |
| John F. Finn (1947); Trustee of Trust since 2005; Trustee of heritage One Group Mutual Funds since 1998. | | Chairman (1985-present), President and Chief Executive Officer, Gardner, Inc. (supply chain management company serving industrial and consumer markets) (1974-present). | | 148 | | Director, Greif, Inc. (GEF) (industrial package products and services) (2007-present); Trustee, Columbus Association for the Performing Arts (1988-present); Director, Cardinal Health, Inc. (CAH) (1994-2014). |
| | | |
| Dr. Matthew Goldstein (1941); Chairman since 2013; Trustee of Trust since 2005; Trustee of heritage J.P. Morgan Funds since 2003. | | Chancellor Emeritus, City University of New York (2015-present); Professor, City University of New York (2013-present); Chancellor, City University of New York (1999-2013); President, Adelphi University (New York) (1998-1999). | | 148 | | Trustee, Museum of Jewish Heritage (2011-present). |
| | | |
| Robert J. Higgins (1945); Trustee of Trust since 2005; Trustee of heritage J.P. Morgan Funds since 2002. | | Retired; Director of Administration of the State of Rhode Island (2003-2004); President — Consumer Banking and Investment Services, Fleet Boston Financial (1971-2001). | | 148 | | None |
| | | |
| Frankie D. Hughes (1952), Trustee of Trust since 2008. | | President, Ashland Hughes Properties (property management) (2014-present); President and Chief Investment Officer, Hughes Capital Management, Inc. (fixed income asset management) (1993-2014). | | 148 | | Trustee, The Victory Portfolios
(2000-2008) (Investment companies). |
| | | |
| Peter C. Marshall (1942); Trustee of Trust since 2005; Trustee of heritage One Group Mutual Funds since 1985. | | Self-employed business consultant
(2002-present). | | 148 | | None |
| | | |
| Mary E. Martinez (1960); Trustee of Trust since 2013. | | Associate, Special Properties, a Christie’s International Real Estate Affiliate (2010-present); Managing Director, Bank of America (Asset Management) (2007-2008); Chief Operating Officer, U.S. Trust Asset Management, U.S. Trust Company (asset management) (2003-2007); President, Excelsior Funds (registered investment companies) (2004-2005). | | 148 | | None |
| | | |
| Marilyn McCoy* (1948); Trustee of Trust since 2005; Trustee of heritage One Group Mutual Funds since 1999. | | Vice President of Administration and Planning, Northwestern University (1985-present). | | 148 | | Trustee, Carleton College
(2003-present). |
| | | |
| Mitchell M. Merin (1953); Trustee of Trust since 2013. | | Retired; President and Chief Operating Officer, Morgan Stanley Investment Management, Member Morgan Stanley & Co. Management Committee (registered investment adviser) (1998-2005). | | 148 | | Director, Sun Life Financial (SLF) (2007-2013) (financial services and insurance); Trustee, Trinity College, Hartford, CT (2002-2010). |
| | | |
| William G. Morton, Jr. (1937); Trustee of Trust since 2005; Trustee of heritage J.P. Morgan Funds since 2003. | | Retired; Chairman Emeritus (2001-2002), and Chairman and Chief Executive Officer, Boston Stock Exchange (1985-2001). | | 148 | | Director, Radio Shack Corp. (electronics) (1987-2008); Director, National Organization of Investment Professionals (2010-present); Trustee of the Stratton Mountain School (2001-present). |
| | | | | | | | |
| | | |
| AUGUST 31, 2015 | | J.P. MORGAN FUNDS | | | | | 25 | |
TRUSTEES
(Unaudited) (continued)
| | | | | | |
Name (Year of Birth); Positions With the Fund (1) | | Principal Occupations During Past 5 Years | | Number of
Portfolios in Fund
Complex Overseen
by Trustee (2) | | Other Directorships Held Outside Fund Complex During Past 5 Years |
Independent Trustees (continued) | | |
| | | |
| Dr. Robert A. Oden, Jr. (1946); Trustee of Trust since 2005; Trustee of heritage One Group Mutual Funds since 1997. | | Retired; President, Carleton College
(2002-2010); President, Kenyon College
(1995-2002). | | 148 | | Chairman, Dartmouth-Hitchcock Medical Center (2011-present); Trustee, American Schools of Oriental Research (2011-present); Trustee, American University in Cairo (1999-2014); Trustee, American Museum of Fly Fishing (2013-present). |
| | | |
| Marian U. Pardo** (1946); Trustee of Trust since 2013. | | Managing Director and Founder, Virtual Capital Management LLC (Investment Consulting) (2007-present); Managing Director, Credit Suisse Asset Management (portfolio manager) (2003-2006). | | 148 | | Member, Board of Governors, Columbus Citizens Foundation (not-for-profit supporting philanthropic and cultural programs) (2006-present). |
| | | |
| Frederick W. Ruebeck (1939); Trustee of Trust since 2005; Trustee of heritage One Group Mutual Funds since 1994. | | Consultant (2000-present); Adviser, JP Greene & Associates, LLC (broker-dealer)
(2000-2009); Chief Investment Officer, Wabash College (2004-present); Director of Investments, Eli Lilly and Company (pharmaceuticals) (1988-1999). | | 148 | | Trustee, Wabash College
(1988-present); Chairman, Indianapolis Symphony Foundation (1994-present). |
| | | |
| James J. Schonbachler (1943); Trustee of Trust since 2005; Trustee of heritage J.P. Morgan Funds since 2001. | | Retired; Managing Director of Bankers Trust Company (financial services) (1968-1998). | | 148 | | None |
| (1) | The Trustees serve for an indefinite term, subject to the Trust’s current retirement policy, which is age 78 for all Trustees. |
| (2) | A Fund Complex means two or more registered investment companies that hold themselves out to investors as related companies for purposes of investment and investor services or have a common investment adviser or have an investment adviser that is an affiliated person of the investment adviser of any of the other registered investment companies. The J.P. Morgan Funds Complex for which the Board of Trustees serves currently includes eleven registered investment companies (148 funds). |
| * | Two members of the Board of Trustees of Northwestern University are executive officers of registered investment advisers (not affiliated with JPMorgan) that are under common control with sub-advisers to certain J.P. Morgan Funds. |
| ** | In connection with prior employment with JPMorgan Chase, Ms. Pardo is the recipient of non-qualified pension plan payments from JPMorgan Chase in the amount of approximately $2,055 per month, which she irrevocably waived effective January 1, 2013, and deferred compensation payments from JPMorgan Chase in the amount of approximately $7,294 per year, which ended in January 2013. In addition, Ms. Pardo receives payments from a fully funded qualified plan, which is not an obligation of JPMorgan Chase. |
The contact address for each of the Trustees is 270 Park Avenue, New York, NY 10017.
| | | | | | |
| | | |
| 26 | | | | J.P. MORGAN FUNDS | | AUGUST 31, 2015 |
OFFICERS
(Unaudited)
| | |
Name (Year of Birth), Positions Held with the Trust (Since) | | Principal Occupations During Past 5 Years |
| |
Robert L. Young (1963),
President and Principal Executive Officer (2013)* | | Chief Operating Officer and Director, J.P. Morgan Investment Management Inc. since 2010; Senior Vice President, J.P. Morgan Funds (2005-2010), Chief Operating Officer, J.P. Morgan Funds (2005-2010); Director and various officer positions for JPMorgan Funds Management, Inc. (formerly One Group Administrative Services) and JPMorgan Distribution Services, Inc. (formerly One Group Dealer Services, Inc.) from 1999 to present. Mr. Young has been with JPMorgan Chase & Co. (formerly Bank One Corporation) since 1997. |
| |
Laura M. Del Prato (1964),
Treasurer and Principal Financial Officer (2014) | | Managing Director, JPMorgan Funds Management, Inc. since 2014; Partner, Cohen Fund Audit Services, Ltd. (2012-2013); Partner (2004-2012) and various other titles (1990-2004) at KPMG, LLP. |
| |
Frank J. Nasta (1964),
Secretary (2008) | | Managing Director and Associate General Counsel, JPMorgan Chase since 2008; Previously, Director, Managing Director, General Counsel and Corporate Secretary, J. & W. Seligman & Co. Incorporated; Secretary of each of the investment companies of the Seligman Group of Funds and Seligman Data Corp.; Director and Corporate Secretary, Seligman Advisors, Inc. and Seligman Services, Inc. |
| |
Stephen M. Ungerman (1953),
Chief Compliance Officer (2005) | | Managing Director, JPMorgan Chase & Co.; Mr. Ungerman has been with JPMorgan Chase & Co. since 2000. |
| |
Elizabeth A. Davin (1964), Assistant Secretary (2005)* | | Executive Director and Assistant General Counsel, JPMorgan Chase since February 2012; formerly Vice President and Assistant General Counsel, JPMorgan Chase from 2005 to February 2012; Senior Counsel, JPMorgan Chase (formerly Bank One Corporation) from 2004 to 2005. |
| |
Jessica K. Ditullio (1962),
Assistant Secretary (2005)* | | Executive Director and Assistant General Counsel, JPMorgan Chase since February 2011; Ms. Ditullio has served as an attorney with various titles for JPMorgan Chase (formerly Bank One Corporation) since 1990. |
| |
John T. Fitzgerald (1975),
Assistant Secretary (2008) | | Executive Director and Assistant General Counsel, JPMorgan Chase since February 2011; formerly, Vice President and Assistant General Counsel, JPMorgan Chase from 2005 to February 2011. |
| |
Carmine Lekstutis (1980),
Assistant Secretary (2011) | | Executive Director and Assistant General Counsel, JPMorgan Chase since February 2015; formerly Vice President and Assistant General Counsel, JPMorgan Chase from 2011 to February 2015; Associate, Skadden, Arps, Slate, Meagher & Flom LLP (law firm) from 2006 to 2011. |
| |
Gregory S. Samuels (1980),
Assistant Secretary (2010) | | Executive Director and Assistant General Counsel, JPMorgan Chase since 2014; formerly Vice President and Assistant General Counsel, JPMorgan Chase since 2010; Associate, Ropes & Gray (law firm) from 2008 to 2010; Associate, Clifford Chance LLP (law firm) from 2005 to 2008. |
| |
Pamela L. Woodley (1971),
Assistant Secretary (2012)** | | Vice President and Assistant General Counsel, JPMorgan Chase since November 2004. |
| |
Michael M. D’Ambrosio (1969),
Assistant Treasurer (2012) | | Managing Director, JPMorgan Funds Management, Inc. since May 2014; formerly Executive Director, JPMorgan Funds Management, Inc. from 2012 to May 2014; prior to joining JPMorgan Chase, Mr. D’Ambrosio was a Tax Director at PricewaterhouseCoopers LLP since 2006. |
| |
Joseph Parascondola (1963),
Assistant Treasurer (2011) | | Vice President, JPMorgan Funds Management, Inc. since August 2006. |
| |
Matthew J. Plastina (1970),
Assistant Treasurer (2011) | | Vice President, JPMorgan Funds Management, Inc. since August 2010; prior to August 2010, Vice President and Controller, Legg Mason Global Asset Management. |
| |
Julie A. Roach (1971),
Assistant Treasurer (2012)* | | Vice President, JPMorgan Funds Management, Inc. since August 2012; prior to joining JPMorgan Chase, Ms. Roach was a Senior Manager with Deloitte since 2001. |
| |
Gillian I. Sands (1969),
Assistant Treasurer (2012) | | Vice President, JPMorgan Funds Management, Inc. since September 2012; Assistant Treasurer, Wells Fargo Funds Management (2007-2009). |
The contact address for each of the officers, unless otherwise noted, is 270 Park Avenue, New York, NY 10017.
| * | The contact address for the officer is 460 Polaris Parkway, Westerville, OH 43082. |
| ** | The contact address for the officer is 4 New York Plaza, Floor 21, New York, NY 10004. |
| | | | | | | | |
| | | |
| AUGUST 31, 2015 | | J.P. MORGAN FUNDS | | | | | 27 | |
SCHEDULE OF SHAREHOLDER EXPENSES
(Unaudited)
Hypothetical $1,000 Investment
As a shareholder of the Fund, you incur two types of costs: (1) transaction costs, including sales charges (loads) on purchase payments and (2) ongoing costs, including investment advisory fees, administration fees, distribution fees and other Fund expenses. The examples below are intended to help you understand your ongoing costs (in dollars) of investing in each Class (not including expenses of the Underlying Funds and ETFs) and to compare these ongoing costs with the ongoing costs of investing in other mutual funds. The examples assume that you had a $1,000 investment in each Class at the beginning of the reporting period, March 1, 2015 and continued to hold your shares at the end of the reporting period, August 31, 2015.
Actual Expenses
For each Class of the Fund in the table below, the first line provides information about actual account values and actual expenses. You may use the information in this line, together with the amount you invested, to estimate the expenses that you paid over the period. Simply divide your account value by $1,000 (for example, an $8,600 account value divided by $1,000 = 8.6), then multiply the result by the number in the first line of each Class under the heading entitled “Expenses Paid During the Period” to estimate the expenses you paid on your account during this period.
Hypothetical Example for Comparison Purposes
The second line of each Class in the table below provides information about hypothetical account values and hypothetical expenses based on the Class’ actual expense ratio and an assumed rate of return of 5% per year before expenses, which is not the Class’ actual return. The hypothetical account values and expenses may not be used to estimate the actual ending account balance or expenses you paid for the period. You may use this information to compare the ongoing costs of investing in the Class of the Fund and other funds. To do so, compare this 5% hypothetical example with the 5% hypothetical examples that appear in the shareholder reports of the other funds. Please note that the expenses shown in the table are meant to highlight your ongoing costs only and do not reflect any transaction costs, such as sales charges (loads) or redemption fees and expenses of the Underlying Funds and ETFs. Therefore, the second line for each Class in the table is useful in comparing ongoing costs only, and will not help you determine the relative total costs of owning different funds. In addition, if these transaction costs were included, your costs would have been higher. The examples also assume all dividends and distributions have been reinvested.
| | | | | | | | | | | | | | | | |
| | | Beginning
Account Value
March 1, 2015 | | | Ending
Account Value
August 31, 2015 | | | Expenses
Paid During
the Period* | | | Annualized
Expense
Ratio | |
Diversified Real Return Fund | | | | | | | | | | | | | | | | |
Class A | | | | | | | | | | | | | | | | |
Actual | | $ | 1,000.00 | | | $ | 941.60 | | | $ | 2.99 | | | | 0.61 | % |
Hypothetical | | | 1,000.00 | | | | 1,022.13 | | | | 3.11 | | | | 0.61 | |
Class C | | | | | | | | | | | | | | | | |
Actual | | | 1,000.00 | | | | 939.20 | | | | 5.43 | | | | 1.11 | |
Hypothetical | | | 1,000.00 | | | | 1,019.61 | | | | 5.65 | | | | 1.11 | |
Class R2 | | | | | | | | | | | | | | | | |
Actual | | | 1,000.00 | | | | 940.50 | | | | 4.21 | | | | 0.86 | |
Hypothetical | | | 1,000.00 | | | | 1,020.87 | | | | 4.38 | | | | 0.86 | |
Class R5 | | | | | | | | | | | | | | | | |
Actual | | | 1,000.00 | | | | 943.40 | | | | 1.27 | | | | 0.26 | |
Hypothetical | | | 1,000.00 | | | | 1,023.89 | | | | 1.33 | | | | 0.26 | |
Select Class | | | | | | | | | | | | | | | | |
Actual | | | 1,000.00 | | | | 942.90 | | | | 1.76 | | | | 0.36 | |
Hypothetical | | | 1,000.00 | | | | 1,023.39 | | | | 1.84 | | | | 0.36 | |
| * | Expenses are equal to each Class’ respective annualized expense ratio, multiplied by the average account value over the period, multiplied by 184/365 (to reflect the one-half year period.) |
| | | | | | |
| | | |
| 28 | | | | J.P. MORGAN FUNDS | | AUGUST 31, 2015 |
BOARD APPROVAL OF INVESTMENT ADVISORY AGREEMENT
(Unaudited)
The Board of Trustees has established various standing committees composed of Trustees with diverse backgrounds, to which the Board of Trustees has assigned specific subject matter responsibilities to further enhance the effectiveness of the Board’s oversight and decision making. The Board of Trustees and its investment committees (money market and alternative products, equity, and fixed income) meet regularly throughout the year and consider factors that are relevant to their annual consideration of investment advisory agreements at each meeting. They also meet for the specific purpose of considering investment advisory agreement annual renewals. The Board of Trustees held meetings in person in June and August 2015, at which the Trustees considered the continuation of the investment advisory agreement for the Fund whose annual report is contained herein (the “Advisory Agreement”). At the June meeting, the Board’s investment committees met to review and consider performance, expense and related information for the Fund and other J.P. Morgan Funds in which the Fund invests (the “Underlying Funds”). Each investment committee reported to the full Board, which then considered the investment committee’s preliminary findings. At the August meeting, the Trustees continued their review and consideration. The Trustees, including a majority of the Trustees who are not “interested persons” (as defined in the 1940 Act) of any party to the Advisory Agreement or any of their affiliates, approved the continuation of the Advisory Agreement on August 19, 2015.
As part of their review of the Advisory Agreement, the Trustees considered and reviewed performance and other information about the Fund and Underlying Funds received from the Adviser. This information includes the Fund’s and Underlying Funds’ performance as compared to the performance of the Fund’s and Underlying Funds’ peers and benchmarks and analyses by the Adviser of the Fund’s and Underlying Funds’ performance. In addition, the Trustees have engaged an independent management consulting firm (“independent consultant”) to report on the performance of certain J.P. Morgan Funds at each of the Trustees’ regular meetings. The Adviser also periodically provides comparative information regarding the Fund’s and Underlying Funds’ expense ratios and those of their peer groups. In addition, in preparation for the June and August meetings, the Trustees requested, received and evaluated extensive materials from the Adviser, including, with respect to the Fund and/or Underlying Funds, performance and expense information compiled by Lipper Inc. (“Lipper”), an independent provider of investment company data. The Trustees’ independent consultant also provided additional analyses of the performance of certain J.P. Morgan Funds with greater than two years of performance history in connection with the Trustees’ review of the Advisory Agreement. Before voting on the proposed Advisory Agreement, the Trustees reviewed the proposed Advisory Agreement with representatives of the Adviser, counsel to the Trust, and independent legal counsel, and
received a memorandum from independent legal counsel to the Trustees discussing the legal standards for their consideration of the proposed Advisory Agreement. The Trustees also discussed the proposed Advisory Agreement in executive sessions with independent legal counsel at which no representatives of the Adviser were present. Set forth below is a summary of the material factors evaluated by the Trustees in determining whether to approve the Advisory Agreement.
The Trustees considered information provided with respect to the Fund and Underlying Funds over the course of the year. Each Trustee attributed different weights to the various factors and no factor alone was considered determinative. From year to year, the Trustees consider and place emphasis on relevant information in light of changing circumstances in market and economic conditions. The Trustees determined that the compensation to be received by the Adviser from the Fund under the Advisory Agreement was fair and reasonable and that the continuance of the Advisory Agreement was in the best interests of the Fund and its shareholders.
The factors summarized below were considered and discussed by the Trustees in reaching their conclusions:
Nature, Extent and Quality of Services Provided by the Adviser
The Trustees received and considered information regarding the nature, extent and quality of the services provided to the Fund under the Advisory Agreement. The Trustees took into account information furnished throughout the year at Trustee meetings, as well as the materials furnished specifically in connection with this annual review process. The Trustees considered the background and experience of the Adviser’s senior management and the expertise of, and the amount of attention given to the Fund by, investment personnel of the Adviser. In addition, the Trustees reviewed the qualifications, backgrounds and responsibilities of the portfolio management team primarily responsible for the day-to-day management of the Fund and the infrastructure supporting the team. The Trustees also considered information provided by the Adviser and JPMorgan Distribution Services, Inc. (“JPMDS”) about the structure and distribution strategy of the Fund. The Trustees reviewed information relating to the Adviser’s risk governance model and reports showing the Adviser’s compliance structure and ongoing compliance processes. The Trustees also considered the quality of administrative services provided by JPMorgan Funds Management, Inc. (“JPMFM”), an affiliate of the Adviser.
The Trustees also considered their knowledge of the nature and quality of the services provided by the Adviser and its affiliates to the Fund and Underlying Funds gained from their experience as Trustees of the J.P. Morgan Funds. In addition, they considered the overall reputation and capabilities of the Adviser and its affiliates, the commitment of the Adviser to provide high quality service to the Fund and Underlying Funds, their overall confidence in the Adviser’s integrity and
| | | | | | | | |
| | | |
| AUGUST 31, 2015 | | J.P. MORGAN FUNDS | | | | | 29 | |
BOARD APPROVAL OF INVESTMENT ADVISORY AGREEMENT
(Unaudited) (continued)
the Adviser’s responsiveness to questions or concerns raised by them, including the Adviser’s willingness to consider and implement organizational and operational changes designed to improve investment results and the services provided to the Fund and Underlying Funds.
Based upon these considerations and other factors, the Trustees concluded that they were satisfied with the nature, extent and quality of the investment advisory services provided to the Fund by the Adviser.
Costs of Services Provided and Profitability to the Adviser and its Affiliates
The Trustees received and considered information regarding the profitability to the Adviser and its affiliates in providing services to the Fund and Underlying Funds. The Trustees reviewed and discussed this data. The Trustees recognized that this data is not audited and represents the Adviser’s determination of its and its affiliates’ revenues from the contractual services provided to the Fund and Underlying Funds, less expenses of providing such services. Expenses include direct and indirect costs and are calculated using an allocation methodology developed by the Adviser. The Trustees also recognized that it is difficult to make comparisons of profitability from fund investment advisory contracts because comparative information is not generally publicly available and is affected by numerous factors, including the structure of the particular adviser, the types of funds it manages, its business mix, numerous assumptions regarding allocations and the fact that publicly-traded fund managers’ operating profits and net income are net of distribution and marketing expenses. Based on their review, the Trustees concluded that the profitability to the Adviser under the Advisory Agreement was not unreasonable in light of the services and benefits provided to the Fund and Underlying Funds.
Fall-Out Benefits
The Trustees reviewed information regarding potential “fallout” or ancillary benefits received by the Adviser and its affiliates as a result of their relationship with the J.P. Morgan Funds including the benefits received by the Adviser and its affiliates in connection with the Fund’s investments in the Underlying Funds. The Trustees also reviewed the Adviser’s allocation of fund brokerage for the J.P. Morgan Funds complex, including allocations to brokers who provide research to the Adviser.
The Trustees also considered that JPMFM and JPMDS, affiliates of the Adviser, earn fees from the Fund and/or Underlying Funds for providing administrative and shareholder services. The Trustees also considered the payments of Rule 12b-1 fees to JPMDS, which also acts as the Fund’s distributor and that these fees are in turn generally paid to financial intermediaries that sell the Fund, including financial intermediaries that are affiliates of the Adviser. The Trustees also considered the fees
paid to JPMorgan Chase Bank, N.A. (“JPMCB”) for custody and fund accounting and other related services for the Fund and/or Underlying Funds.
Economies of Scale
The Trustees considered the extent to which the Fund may benefit from economies of scale. The Trustees considered that there may not be a direct relationship between economies of scale realized by the Fund and those realized by the Adviser as assets increase. The Trustees noted that the proposed investment advisory fee schedule for the Fund does not contain breakpoints, but that the fees remain competitive with peer funds. The Trustees also considered that the Adviser has implemented fee waivers and expense limitations (“Fee Caps”) which allows the Fund’s shareholders to share potential economies of scale from the Fund’s inception. The Trustees also considered that the Adviser has shared economies of scale by adding or enhancing services to the Fund over time, noting the Adviser’s substantial investments in its business in support of the Fund, including investments in trading systems and technology (including cybersecurity improvements), retention of key talent, additions to analyst and portfolio management teams, and regulatory support enhancements. The Trustees also considered whether it would be appropriate to add advisory fee breakpoints and the Trustees concluded that the current fee structure was reasonable in light of the Fee Caps that the Adviser has in place that serve to limit the overall net expense ratios of the Fund at competitive levels. The Trustees concluded that the Fund’s shareholders received the benefits of potential economies of scale through the Fee Caps and the Adviser’s reinvestment in its operations to serve the Fund and its shareholders.
Independent Written Evaluation of the Fund’s Chief Compliance Officer
The Trustees noted that, upon their direction, the Chief Compliance Officer for the Fund had prepared an independent written evaluation in order to assist the Trustees in determining the reasonableness of the proposed management fees. The Trustees considered the written evaluation in determining whether to continue the Advisory Agreement.
Fees Relative to Adviser’s Other Clients
The Trustees received and considered information about the nature and extent of investment advisory services and fee rates offered to other clients of the Adviser, including institutional separate accounts and/or funds sub-advised by the Adviser, and for investment management styles substantially similar to that of the Fund. The Trustees considered the complexity of investment management for registered mutual funds relative to the Adviser’s other clients and noted differences in the regulatory, legal and other risks and responsibilities of providing services to the different clients. The Trustees considered that
| | | | | | |
| | | |
| 30 | | | | J.P. MORGAN FUNDS | | AUGUST 31, 2015 |
serving as an adviser to a registered mutual fund involves greater responsibilities and risks than acting as a sub-adviser and observed that sub-advisory fees may be lower than those charged by the Adviser to the Fund. The Trustees also noted that the adviser, not the mutual fund, pays the sub-advisory fee and that many responsibilities related to the advisory function are retained by the primary adviser. The Trustees concluded that the fee rates charged to the Fund in comparison to those charged to the Adviser’s other clients were reasonable.
Investment Performance
The Trustees received and considered absolute and/or relative performance for the Fund in a report prepared by Lipper. The Trustees considered the total return performance information, which included the ranking of the Fund within a performance universe made up of funds with the same Lipper investment classification and objective (the “Universe Group”) by total return for the applicable one- and three-year periods. The Trustees reviewed a description of Lipper’s methodology for selecting mutual funds in the Fund’s Universe Group. The Lipper materials provided to the Trustees highlighted information with respect to certain representative classes to assist the Trustees in their review. As part of this review, the Trustees also reviewed the Fund’s performance against its benchmark and considered the performance information provided for the Fund at regular Board meetings by the Adviser and the Trustees’ independent consultant and also considered the special analysis prepared by the Trustees’ independent consultant. The Lipper performance data noted by the Trustees as part of their review and the determinations made by the Trustees with respect to the Fund’s performance for certain representative classes are summarized below:
The Trustees noted that the Fund’s performance was in the third and fifth quintiles for both Class A and Select Class shares for the one- and three-year periods ended December 31, 2014, respectively, and that the independent consultant indicated
that the Fund’s overall performance needed enhancement. The Trustees discussed the performance and investment strategy of the Fund with the Adviser and, based upon this discussion, the Adviser’s and/or independent consultant’s analysis and various other factors, concluded that the Fund’s performance was reasonable.
Advisory Fees and Expense Ratios
The Trustees considered the contractual advisory fee rate paid by the Fund to the Adviser and compared that rate to the information prepared by Lipper concerning management fee rates paid by other funds in the same Lipper category as the Fund. The Trustees recognized that Lipper reported the Fund’s management fee rate as the combined contractual advisory fee and administration fee rates. The Trustees also reviewed information about other expenses and the expense ratios for the Fund. The Trustees considered the fee waiver and/or expense reimbursement arrangements currently in place for the Fund and considered the net advisory fee rate after taking into account any waivers and/or reimbursements. The Trustees recognized that it is difficult to make comparisons of advisory fees because there are variations in the services that are included in the fees paid by other funds. The Trustees’ determinations as a result of the review of the Fund’s advisory fees and expense ratios for certain representative classes are summarized below:
The Trustees noted that the Fund’s net advisory fee for both Class A and Select Class shares was in the first quintile and that the actual total expenses for Class A and Select Class shares were in the first and second quintiles, respectively, of the Universe Group. After considering the factors identified above, in light of this information, the Trustees concluded that the advisory fee was reasonable and that such fees would be for services provided in addition to, rather than duplicative of, services provided under the advisory contracts of the Underlying Funds in which the Fund invests.
| | | | | | | | |
| | | |
| AUGUST 31, 2015 | | J.P. MORGAN FUNDS | | | | | 31 | |
TAX LETTER
(Unaudited)
Certain tax information for the J.P. Morgan Fund is required to be provided to shareholders based upon the Fund’s income and distributions for the taxable year ended August 31, 2015. The information and distributions reported in this letter may differ from the information and taxable distributions reported to the shareholders for the calendar year ending December 31, 2015. The information necessary to complete your income tax returns for the calendar year ending December 31, 2015 will be provided under separate cover.
Dividends Received Deductions (DRD)
The Fund had 1.37% or maximum allowable percentage, of ordinary income distributions eligible for the 70% dividend received deduction for corporate rate shareholders for the fiscal year ended August 31, 2015.
Qualified Dividend Income (QDI)
The Fund had $184,833, or maximum allowable amount, of ordinary income distributions treated as qualified dividends for the fiscal year ended August 31, 2015.
| | | | | | |
| | | |
| 32 | | | | J.P. MORGAN FUNDS | | AUGUST 31, 2015 |

Rev. January 2011
| | |
| FACTS | | WHAT DOES J.P. MORGAN FUNDS DO WITH YOUR PERSONAL INFORMATION? |
| | |
| Why? | | Financial companies choose how they share your personal information. Federal law gives consumers the right to limit some but not all sharing. Federal law also requires us to tell you how we collect, share, and protect your personal information. Please read this notice carefully to understand what we do. |
| | |
| What? | | The types of personal information we collect and share depend on the product or service you have with us. This information can include: ¡ Social Security number and account balances ¡ transaction history and account transactions ¡ checking account information and wire transfer instructions When you are no longer our customer, we continue to share your information as described in this notice. |
| | |
| How? | | All financial companies need to share customers’ personal information to run their everyday business. In the section below, we list the reasons financial companies can share their customers’ personal information; the reasons J.P. Morgan Funds chooses to share; and whether you can limit this sharing. |
| | | | |
| Reasons we can share your personal information | | Does J.P. Morgan
Funds share? | | Can you limit this
sharing? |
For our everyday business purposes — such as to process your transactions, maintain your account(s), respond to court orders and legal investigations, or report to credit bureaus | | Yes | | No |
For marketing purposes — to offer our products and services to you | | Yes | | No |
| For joint marketing with other financial companies | | No | | We don’t share |
For our affiliates’ everyday business purposes — information about your transactions and experiences | | No | | We don’t share |
For our affiliates’ everyday business purposes — information about your creditworthiness | | No | | We don’t share |
| For nonaffiliates to market to you | | No | | We don’t share |
| | |
| | |
| Questions? | | Call 1-800-480-4111 or go to www.jpmorganfunds.com |

| | |
| Who we are |
| Who is providing this notice? | | J.P. Morgan Funds |
| | |
| What we do |
| How does J.P. Morgan Funds protect my personal information? | | To protect your personal information from unauthorized access and use, we use security measures that comply with federal law. These measures include computer safeguards and secured files and buildings. We authorize our employees to access your information only when they need it to do their work and we require companies that work for us to protect your information. |
How does J.P. Morgan Funds collect my personal information? | | We collect your personal information, for example, when you: ¡ open an account or provide contact information ¡ give us your account information or pay us by check ¡ make a wire transfer We also collect your personal information from others, such as credit bureaus, affiliates and other companies. |
| Why can’t I limit all sharing? | | Federal law gives you the right to limit only ¡ sharing for affiliates’ everyday business purposes – information about your creditworthiness ¡ affiliates from using your information to market to you ¡ sharing for nonaffiliates to market to you State laws and individual companies may give you additional rights to limit sharing. |
| | |
| Definitions |
| Affiliates | | Companies related by common ownership or control. They can be financial and nonfinancial companies. ¡ J.P. Morgan Funds does not share with our affiliates. |
| Nonaffiliates | | Companies not related by common ownership or control. They can be financial and nonfinancial companies. ¡ J.P. Morgan Funds does not share with nonaffiliates so they can market to you. |
| Joint Marketing | | A formal agreement between nonaffiliated financial companies that together market financial products or services to you. ¡ J.P. Morgan Funds doesn’t jointly market. |
J.P. Morgan Funds are distributed by JPMorgan Distribution Services, Inc., which is an affiliate of JPMorgan Chase & Co. Affiliates of JPMorgan Chase & Co. receive fees for providing various services to the funds.
Contact JPMorgan Distribution Services, Inc. at 1-800-480-4111 for a fund prospectus. You can also visit us at www.jpmorganfunds.com. Investors should carefully consider the investment objectives and risk as well as charges and expenses of the mutual fund before investing. The prospectus contains this and other information about the mutual fund. Read the prospectus carefully before investing.
Investors may obtain information about the Securities Investor Protection Corporation (SIPC), including the SIPC brochure by visiting www.sipc.org or by calling SIPC at 202-371-8300.
The Fund files a complete schedule of its fund holdings for the first and third quarters of its fiscal year with the SEC on Form N-Q. The Fund’s Forms N-Q are available on the SEC’s website at http://www.sec.gov and may be reviewed and copied at the SEC’s Public Reference Room in Washington, DC. Information on the operation of the SEC’s Public Reference Room may be obtained by calling 1-800-SEC-0330. Shareholders may request the Form N-Q without charge by calling 1-800-480-4111 or by visiting the J.P. Morgan Funds’ website at www.jpmorganfunds.com.
A description of the Fund’s policies and procedures with respect to the disclosure of the Fund’s holdings is available in the prospectus and Statement of Additional Information.
A copy of proxy policies and procedures is available without charge upon request by calling 1-800-480-4111 and on the Fund’s website at www.jpmorganfunds.com. A description of such policies and procedures is on the SEC’s website at www.sec.gov. The Trustees have delegated the authority to vote proxies for securities owned by the Fund to the Adviser. A copy of the Fund’s voting record for the most recent 12-month period ended June 30 is available on the SEC’s website at www.sec.gov or at the Fund’s website at www.jpmorganfunds.com no later than August 31 of each year. The Fund’s proxy voting record will include, among other things, a brief description of the matter voted on for each fund security, and will state how each vote was cast, for example, for or against the proposal.


J.P. Morgan Asset Management is the marketing name for the asset management business of JPMorgan Chase & Co. Those businesses include, but are not limited to, J.P. Morgan Investment Management Inc., Security Capital Research & Management Incorporated and J.P. Morgan Alternative Asset Management, Inc.
| | | | |
| | © JPMorgan Chase & Co., 2015. All rights reserved. August 2015. | | AN-DRR-815 |
Annual Report
J.P. Morgan Income Funds
August 31, 2015
JPMorgan Global Bond Opportunities Fund

CONTENTS
Investments in the Fund are not bank deposits or obligations of, or guaranteed or endorsed by, any bank and are not insured or guaranteed by the FDIC, the Federal Reserve Board or any other government agency. You could lose money if you sell when the Fund’s share price is lower than when you invested.
Past performance is no guarantee of future performance. The general market views expressed in this report are opinions based on market and other conditions through the end of the reporting period and are subject to change without notice. These views are not intended to predict the future performance of the Fund or the securities markets. References to specific securities and their issuers are for illustrative purposes only and are not intended to be, and should not be interpreted as, recommendations to purchase or sell such securities. Such views are not meant as investment advice and may not be relied on as an indication of trading intent on behalf of the Fund.
Prospective investors should refer to the Fund’s prospectus for a discussion of the Fund’s investment objectives, strategies and risks. Call J.P. Morgan Funds Service Center at 1-800-480-4111 for a prospectus containing more complete information about the Fund, including management fees and other expenses. Please read it carefully before investing.
CEO’S LETTER
September 25, 2015 (Unaudited)
Dear Shareholder,
As the U.S. economy continued to strengthen and policy makers moved toward a more normalized monetary policy over the twelve months ended August 31, 2015, central bankers in Europe, Japan and Asia unleashed unprecedented stimulus measures to bolster flagging growth. Over the same period, financial market volatility increased until it truly erupted in mid-August amid acute worries that China’s economy — the world’s second largest economy — was faltering.
| | |
 | | “The U.S. economic recovery remained largely intact amid historically low interest rates, while central banks in the U.S., Europe, Japan and China continued to provide or increase growth stimulus.” |
Though U.S. financial markets largely recovered by the end of August, the shock from the global sell-off in equities, along with other considerations, was apparently enough to convince the U.S. Federal Reserve (the “Fed”) to postpone an interest rate increase in September.
Amid an environment of low interest rates, falling energy prices and global growth, U.S. equity prices rose through the end of 2014 and essentially remained near their closing highs for the first five months of 2015, hitting a peak in mid-May. Meanwhile, U.S. bond markets provided lackluster returns, caught between investor concerns about the timing and impact of a Fed interest rate increase and periodic “flights to safety” as investors reacted to specific market or geopolitical events.
While there was notable weakness in the U.S. economy in the first three months of 2015 – mainly due to severe winter weather and a labor dispute at vital West Coast ports — the upward trajectory of the economy resumed in the second quarter and U.S. gross domestic product rose 3.9%. Unemployment continued its steady decline throughout the twelve months ended August 31, 2015, dropping to 5.1% from 6.1%.
Importantly, inflationary pressure remained subdued in the U.S. amid lower energy prices and nearly stagnant wage growth. Global oil prices dipped below $60 a barrel in March 2015, before rebounding somewhat and then dropping again to below $50 a barrel by August. Global commodities prices also fell sharply through the summer of 2015.
Part of the decline in commodities prices was attributable to signs of slowing growth in China, the world’s leading consumer of raw materials. In response to falling domestic equity prices and weakening economic data, Chinese policy makers enacted a range of stimulus measures, including cutting interest rates
and easing bank lending rules in June and July of 2015. Then on August 11th, China’s central bank shocked global markets by devaluing the yuan by nearly 2% and two days later, weaker-than-expected retail sales and industrial production data again shook investor confidence.
On Monday, August 24th, China’s stock market suffered its biggest one-day drop since 2011. The Shanghai Composite Index closed down 8.5% for the day. Chinese regulators suspended trading in hundreds of stocks that had each lost 10% or more. The selloff spread rapidly and key equity indexes in developed markets from Asia to Europe closed down by roughly 5%. Emerging market equities also fell, dragging local currencies lower. In U.S. trading, the Standard & Poor’s 500 Index closed down 3.9% for the day.
Government bonds of developed market nations initially benefitted from the sell-off as investors sought the perceived safety of fixed income securities. But prices for longer-dated U.S. Treasury bonds declined, partly due to massive selling of foreign-exchange reserves (including U.S. Treasuries) by China and partly due to expectations of an imminent Fed interest rate increase.
While the global economic environment at the end of August 2015 was markedly different than it was twelve months earlier, in fundamental ways it remained unchanged. The U.S. economic recovery remained largely intact amid historically low interest rates, while central banks in the U.S., Europe, Japan and China continued to provide or increase growth stimulus. Global energy prices remained under pressure. What appeared to have changed is the intensity of investor concern about both the health of China’s economy and the timing of any increase in U.S. interest rates. This uncertain environment and its effects on financial markets may provide opportunities for those investors who have long-term objectives and a well-diversified portfolio.
On behalf of everyone at J.P. Morgan Asset Management, thank you for your continued support. We look forward to managing your investment needs for years to come. Should you have any questions, please visit www.jpmorganfunds.com or contact the J.P. Morgan Funds Service Center at 1-800-480-4111.
Sincerely yours,

George C.W. Gatch
CEO, Global Funds Management
J.P. Morgan Asset Management
| | | | | | | | |
| | | |
| AUGUST 31, 2015 | | J.P. MORGAN INCOME FUNDS | | | | | 1 | |
JPMorgan Global Bond Opportunities Fund
FUND COMMENTARY
TWELVE MONTHS ENDED AUGUST 31, 2015 (Unaudited)
| | | | |
| Reporting Period Return: | |
| Fund (Select Class Shares)* | | | (0.97)% | |
| Barclays Multiverse Index | | | (6.60)% | |
| |
| Net Assets as of 8/31/2015 (In Thousands) | | | $1,134,151 | |
| Duration as of 8/31/2015 | | | 4.2 years | |
INVESTMENT OBJECTIVE**
The JPMorgan Global Bond Opportunities Fund (the “Fund”) seeks to provide total return.
HOW DID THE MARKET PERFORM?
Over the twelve month period, global central bank policies remained accommodative, including aggressive asset purchase programs from the European Central Bank and the Bank of Japan. The period was marked by low inflationary pressure, weakness in oil prices and a strong U.S. dollar.
Volatility increased in the latter half of the reporting period amid signs of slowing growth in China’s economy and expectations of an increase in U.S. interest rates. A global sell-off in equities in August drove some investors to seek safety in select developed market government bonds and also drove emerging market currencies lower.
WHAT WERE THE MAIN DRIVERS OF THE FUND’S PERFORMANCE?
For the twelve months ended August 31, 2015, the Fund outperformed the Barclays Multiverse Index (the “Index”). The Fund’s hedging of foreign currency positions was a leading contributor to performance relative to the unhedged Index (although it detracted from absolute performance), as the U.S. dollar strengthened during the twelve month reporting period.
The Fund’s allocation to corporate high yield bonds (also known as “junk bonds”) detracted from absolute performance over the twelve month reporting period due to market volatility amid investor concerns over slowing economic growth in China and volatility in commodities prices. The Fund’s allocation to government bonds also detracted from absolute performance as a temporary breakdown in negotiations to resolve the Greek debt crises hurt bonds of some smaller European nations.
The Fund’s allocation to investment grade corporate debt and securitized debt made a positive contribution to absolute performance.
HOW WAS THE FUND POSITIONED?
During the reporting period, the Fund invested opportunistically across different markets and sectors. The Fund’s managers applied a flexible investment approach and did not manage to a benchmark. This allowed the Fund to shift its allocations based on changing market conditions. The Fund had exposure to a broad range of asset classes during the reporting period, including high yield and investment grade corporate bonds, agency and non-agency mortgage-backed securities, asset-backed securities, commercial mortgage-backed securities, emerging markets debt, convertible bonds and foreign government securities.
During the reporting period, the Fund’s managers slightly increased their allocation to high yield assets as European and U.S. high yield securities continued to have attractive valuations. The managers continued to generally avoid the energy sector, given the poor commodities outlook. The Fund’s exposure to investment grade corporate bonds increased slightly over the period, while its emerging markets debt position was reduced. The Fund’s duration increased over the period. In particular, U.S. Treasury bond duration was added later in the period as market risks increased. Duration measures the price sensitivity of a portfolio of debt securities to changes in interest rates. Bonds with longer maturities will generally experience a larger increase or decrease in price as interest rates fall or rise, respectively, versus bonds with shorter maturities. The Fund’s duration rose to 4.20 years at August 31, 2015, from 3.30 years twelve months earlier.
| | | | | | |
| | | |
| 2 | | | | J.P. MORGAN INCOME FUNDS | | AUGUST 31, 2015 |
| | | | |
PORTFOLIO COMPOSITION*** | |
| Corporate Bonds | | | 47.5 | % |
| Foreign Government Securities | | | 13.7 | |
| Commercial Mortgage-Backed Securities | | | 9.7 | |
| Asset-Backed Securities | | | 5.4 | |
| Preferred Securities | | | 5.2 | |
| Loan Assignments | | | 4.5 | |
| Collateralized Mortgage Obligations | | | 4.4 | |
| Convertible Bonds | | | 2.0 | |
| Common Stock | | | 0.0 | (a) |
| Short-Term Investment | | | 7.6 | |
| | | | |
PORTFOLIO COMPOSITION BY COUNTRY*** | |
| United States | | | 50.9 | % |
| United Kingdom | | | 8.6 | |
| Luxembourg | | | 4.2 | |
| Spain | | | 3.0 | |
| Italy | | | 2.5 | |
| France | | | 2.4 | |
| Netherlands | | | 2.4 | |
| Mexico | | | 2.1 | |
| Germany | | | 2.0 | |
| Hungary | | | 1.7 | |
| Canada | | | 1.7 | |
| South Africa | | | 1.6 | |
| Ireland | | | 1.3 | |
| Switzerland | | | 1.0 | |
| Cayman Islands | | | 1.0 | |
| Others (each less than 1.0%) | | | 6.0 | |
| Short-Term Investment | | | 7.6 | |
| * | | The return shown is based on net asset values calculated for shareholder transactions and may differ from the return shown in the financial highlights, which reflects adjustments made to the net asset values in accordance with accounting principles generally accepted in the United States of America. |
| ** | | The adviser seeks to achieve the Fund’s objective. There can be no guarantee it will be achieved. |
| *** | | Percentages indicated are based on total investments as of August 31, 2015. The Fund’s portfolio composition is subject to change. |
| (a) | | Amount rounds to less than 0.1%. |
| | | | | | | | |
| | | |
| AUGUST 31, 2015 | | J.P. MORGAN INCOME FUNDS | | | | | 3 | |
JPMorgan Global Bond Opportunities Fund
FUND COMMENTARY
TWELVE MONTHS ENDED AUGUST 31, 2015 (Unaudited) (continued)
| | | | | | | | | | | | |
AVERAGE ANNUAL TOTAL RETURNS AS OF AUGUST 31, 2015 | |
| | | |
| | | INCEPTION DATE OF
CLASS | | | 1 YEAR | | | SINCE
INCEPTION | |
CLASS A SHARES | | | September 4, 2012 | | | | | | | | | |
Without Sales Charge | | | | | | | (1.26 | )% | | | 4.23 | % |
With Sales Charge* | | | | | | | (4.94 | ) | | | 2.90 | |
CLASS C SHARES | | | September 4, 2012 | | | | | | | | | |
Without CDSC | | | | | | | (1.63 | ) | | | 3.83 | |
With CDSC** | | | | | | | (2.63 | ) | | | 3.83 | |
CLASS R6 SHARES | | | September 4, 2012 | | | | (0.86 | ) | | | 4.64 | |
SELECT CLASS SHARES | | | September 4, 2012 | | | | (0.97 | ) | | | 4.50 | |
| * | | Sales Charge for Class A Shares is 3.75%. |
| ** | | Assumes a 1% CDSC (contingent deferred sales charge) for the one year period and 0% CDSC thereafter. |
LIFE OF FUND PERFORMANCE (9/4/12 TO 8/31/15)
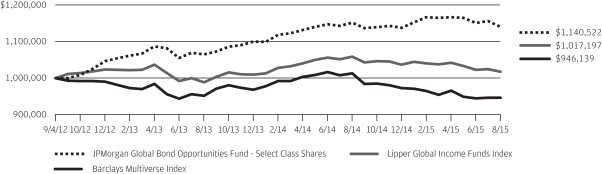
The performance quoted is past performance and is not a guarantee of future results. Mutual funds are subject to certain market risks. Investment returns and principal value of an investment will fluctuate so that an investor’s shares, when redeemed, may be worth more or less than their original cost. Current performance may be higher or lower than the performance data shown. For up-to-date month-end performance information please call 1-800-480-4111.
The Fund commenced operations on September 4, 2012.
The graph illustrates comparative performance for $1,000,000 invested in the Select Class Shares of JPMorgan Global Bond Opportunities Fund, the Barclays Multiverse Index and the Lipper Global Income Funds Index from September 4, 2012 to August 31, 2015. The performance of the Lipper Global Income Funds Index reflects an initial investment at the end of the month closest to the Fund’s inception. The performance of the Fund assumes reinvestment of all dividends and capital gain distributions, if any, and does not include a sales charge. The performance of the Barclays Multiverse Index does not reflect the deduction of expenses or a sales charge associated with a mutual fund, if applicable. The performance of the Lipper Global Income Funds Index includes expenses associated with a mutual fund, such as investment management fees. These expenses are not identical to the expenses incurred by the Fund. The Barclays Multiverse Index provides a broad-based measure of the international fixed income bond market. The Barclays Multiverse Index represents the union of the
Barclays Global Aggregate Index and the Barclays Global High Yield Index. The Barclays Global Aggregate Index is a measure of global investment grade debt from twenty-four different local currency markets. The Barclays Global High Yield Index provides a broad-based measure of the global high-yield fixed income markets. The Lipper Global Income Funds Index represents the total returns of certain mutual funds within the Fund’s designated category as determined by Lipper, Inc. Investors cannot invest directly in an index.
Select Class Shares have a $1,000,000 minimum initial investment.
Subsequent to the inception of the Fund on September 4, 2012 until May 31, 2013, the Fund did not experience any shareholder purchase and sale activity. If such activity had occurred, the Fund’s performance may have been impacted.
Fund performance may reflect the waiver of the Fund’s fees and reimbursement of expenses for certain periods since the inception date. Without these waivers and reimbursements, performance would have been lower. Also, performance shown in this section does not reflect the deduction of taxes that a shareholder would pay on Fund distributions or redemption of Fund shares.
The returns shown are based on net asset values calculated for shareholder transactions and may differ from the returns shown in the financial highlights, which reflect adjustments made to the net asset values in accordance with accounting principles generally accepted in the United States of America.
| | | | | | |
| | | |
| 4 | | | | J.P. MORGAN INCOME FUNDS | | AUGUST 31, 2015 |
JPMorgan Global Bond Opportunities Fund
SCHEDULE OF PORTFOLIO INVESTMENTS
AS OF AUGUST 31, 2015
(Amounts in U.S. Dollars, unless otherwise noted)
(Amounts in thousands)
| | | | | | | | |
PRINCIPAL
AMOUNT | | | SECURITY DESCRIPTION | | VALUE | |
| Asset-Backed Securities — 5.4% | |
| | | | Cayman Islands — 0.3% | |
| | 525 | | | Benefit Street Partners CLO Ltd., Series 2014-IVA, Class A1A, VAR, 1.777%, 07/20/26 (e) | | | 522 | |
| | 250 | | | Carlyle Global Market Strategies Commodities Funding Ltd., Series 2014-1A, Class A, VAR, 2.189%, 10/15/21 (e) | | | 250 | |
| | 1,000 | | | Flatiron CLO Ltd., Series 2013-1A, Class A1, VAR, 1.689%, 01/17/26 (e) | | | 995 | |
| | 250 | | | LCM LP, Series 16A, Class A, VAR, 1.789%, 07/15/26 (e) | | | 249 | |
| | 250 | | | OZLM Funding IV Ltd., Series 2013-4A, Class A1, VAR, 1.445%, 07/22/25 (e) | | | 247 | |
| | 218 | | | Rockwall CDO II Ltd., Series 2007-1A, Class A1LA, VAR, 0.550%, 08/01/24 (e) | | | 211 | |
| | 420 | | | Sound Point CLO IV Ltd., Series 2013-3A, Class A, VAR, 1.662%, 01/21/26 (e) | | | 416 | |
| | 336 | | | Symphony CLO Ltd., Series 2014-14A, Class A2, VAR, 1.766%, 07/14/26 (e) | | | 336 | |
| | 250 | | | THL Credit Wind River CLO Ltd., Series 2014-1A, Class A, VAR, 1.807%, 04/18/26 (e) | | | 249 | |
| | 420 | | | Venture CDO Ltd., Series 2014-17A, Class A, VAR, 1.769%, 07/15/26 (e) | | | 418 | |
| | | | | | | | |
| | | | | | | 3,893 | |
| | | | | | | | |
| | | | Ireland — 0.1% | |
| | 785 | | | Trafigura Securitisation Finance plc, Series 2014-1A, Class B, VAR, 2.448%, 10/15/21 (e) | | | 785 | |
| | | | | | | | |
| | | | Italy — 0.0% (g) | |
| EUR | 10 | | | Atlante Finance Srl, Series 1, Class A, Reg. S, VAR, 0.171%, 07/28/47 | | | 11 | |
| EUR | 45 | | | Italfinance Securitisation Vehicle Srl, Series 2005-1, Class A, Reg. S, VAR, 0.136%, 03/14/23 | | | 50 | |
| | | | | | | | |
| | | | | | | 61 | |
| | | | | | | | |
| | | | United States — 5.0% | |
| | 133 | | | ABFC Trust, Series 2004-OPT2, Class M2, VAR, 1.699%, 07/25/33 | | | 127 | |
| | 120 | | | ACE Securities Corp. Home Equity Loan Trust, Series 2004-OP1, Class M2, VAR, 1.774%, 04/25/34 | | | 111 | |
| | 131 | | | Argent Securities, Inc., Series 2003-W7, Class M2, VAR, 2.824%, 03/25/34 | | | 128 | |
| | 130 | | | Argent Securities, Inc., Asset-Backed Pass-Through Certificates, Series 2004-W3, Class A3, VAR, 1.019%, 02/25/34 | | | 116 | |
| | | | | | | | |
PRINCIPAL
AMOUNT | | | SECURITY DESCRIPTION | | VALUE | |
| | | | | | | | |
| | | | United States — continued | |
| | 62 | | | Bear Stearns Asset Backed Securities Trust, Series 2002-1, Class 1A5, SUB, 6.890%, 12/25/34 | | | 63 | |
| | 3,400 | | | CAM Mortgage LLC, Series 2015-1, Class M, VAR, 4.750%, 07/15/64 (e) | | | 3,379 | |
| | 400 | | | Consumer Credit Origination Loan Trust, Series 2015-1, Class B, 5.210%, 03/15/21 (e) | | | 405 | |
| | | | Countrywide Asset-Backed Certificates, | | | | |
| | 97 | | | Series 2002-4, Class M1, VAR, 1.324%, 12/25/32 | | | 89 | |
| | 228 | | | Series 2004-2, Class M1, VAR, 0.949%, 05/25/34 | | | 217 | |
| | 153 | | | Series 2004-BC1, Class M3, VAR, 2.299%, 10/25/33 | | | 127 | |
| | 4,903 | | | Series 2004-ECC2, Class M2, VAR, 1.174%, 12/25/34 | | | 4,672 | |
| | 3,430 | | | Series 2005-AB3, Class 1A1, VAR, 0.449%, 02/25/36 | | | 3,013 | |
| | 387 | | | Credit-Based Asset Servicing and Securitization LLC, Series 2005-CB5, Class AV3, VAR, 0.589%, 08/25/35 | | | 374 | |
| | | | Exeter Automobile Receivables Trust, | | | | |
| | 100 | | | Series 2013-2A, Class C, 4.350%, 01/15/19 (e) | | | 102 | |
| | 444 | | | Series 2014-3A, Class B, 2.770%, 11/15/19 (e) | | | 448 | |
| | 173 | | | First Franklin Mortgage Loan Trust, Series 2004-FF5, Class A1, VAR, 0.919%, 08/25/34 | | | 164 | |
| | 860 | | | FirstKey Lending Trust, Series 2015-SFR1, Class D, VAR, 4.367%, 03/09/47 (e) | | | 853 | |
| | 198 | | | Flagship Credit Auto Trust, Series 2014-2, Class C, 3.950%, 12/15/20 (e) | | | 199 | |
| | 95 | | | Fremont Home Loan Trust, Series 2004-2, Class M2, VAR, 1.129%, 07/25/34 | | | 89 | |
| | 250 | | | Gallatin CLO VI LLC, Series 2013-2A, Class A1, VAR, 1.726%, 01/15/25 (e) | | | 249 | |
| | 1,168 | | | GLC II Trust, Series 2014-A, Class A, 4.000%, 12/18/20 (e) | | | 1,168 | |
| | 340 | | | GMAT Trust, Series 2013-1A, Class M, VAR, 5.000%, 11/25/43 (e) | | | 325 | |
| | 39 | | | Home Equity Asset Trust, Series 2004-6, Class M2, VAR, 1.099%, 12/25/34 | | | 33 | |
| | 2,900 | | | LV Tower 52 Issuer LLC, Series 2013-1, Class M, 7.500%, 07/15/19 (e) | | | 2,883 | |
| | 218 | | | Merrill Lynch Mortgage Investors Trust, Series 2003-OPT1, Class M1, VAR, 1.174%, 07/25/34 | | | 198 | |
SEE NOTES TO FINANCIAL STATEMENTS.
| | | | | | | | |
| | | |
| AUGUST 31, 2015 | | J.P. MORGAN INCOME FUNDS | | | | | 5 | |
JPMorgan Global Bond Opportunities Fund
SCHEDULE OF PORTFOLIO INVESTMENTS
AS OF AUGUST 31, 2015 (continued)
(Amounts in U.S. Dollars, unless otherwise noted)
(Amounts in thousands)
| | | | | | | | |
PRINCIPAL
AMOUNT | | | SECURITY DESCRIPTION | | VALUE | |
| Asset-Backed Securities — continued | |
| | | | United States — continued | |
| | 170 | | | Mid-State Capital Corp. Trust, Series 2006-1, Class M2, 6.742%, 10/15/40 (e) | | | 181 | |
| | 141 | | | Morgan Stanley ABS Capital I, Inc. Trust, Series 2004-HE1, Class M1, VAR, 1.054%, 01/25/34 | | | 134 | |
| | 600 | | | Nationstar HECM Loan Trust, Series 2015-1A, Class A, 3.844%, 05/25/18 (e) | | | 600 | |
| | 91 | | | New Century Home Equity Loan Trust, Series 2003-4, Class M2, VAR, 2.929%, 10/25/33 | | | 88 | |
| | 2,469 | | | NRPL Trust, Series 2015-2A, Class A1, VAR, 3.750%, 10/25/57 (e) | | | 2,457 | |
| | 1,920 | | | OAK Hill Advisors Residential Loan Trust, Series 2014-NPL2, Class A2, SUB, 4.000%, 04/25/54 (e) | | | 1,897 | |
| | | | OneMain Financial Issuance Trust, | | | | |
| | 300 | | | Series 2014-1A, Class B, 3.240%, 06/18/24 (e) | | | 302 | |
| | 182 | | | Series 2014-2A, Class C, 4.330%, 09/18/24 (e) | | | 183 | |
| | 151 | | | Series 2014-2A, Class D, 5.310%, 09/18/24 (e) | | | 150 | |
| | 1,266 | | | Series 2015-1A, Class A, 3.190%, 03/18/26 (e) | | | 1,281 | |
| | 608 | | | Series 2015-1A, Class C, 5.120%, 03/18/26 (e) | | | 622 | |
| | 125 | | | Option One Mortgage Acceptance Corp. Asset-Backed Certificates, Series 2003-2, Class M1, VAR, 1.174%, 04/25/33 | | | 111 | |
| | 243 | | | Option One Mortgage Loan Trust, Series 2003-1, Class A2, VAR, 1.039%, 02/25/33 | | | 227 | |
| | 340 | | | Park Place Securities, Inc., Asset-Backed Pass-Through Certificates, Series 2005-WCH1, Class M3, VAR, 1.039%, 01/25/36 | | | 324 | |
| | 326 | | | People’s Choice Home Loan Securities Trust, Series 2004-2, Class M1, VAR, 1.099%, 10/25/34 | | | 323 | |
| | 1,534 | | | Pretium Mortgage Credit Partners I LLC, Series 2015-NPL2, Class A1, SUB, 3.750%, 07/27/30 (e) | | | 1,532 | |
| | 1,400 | | | Progress Residential Trust, Series 2015-SFR2, Class D, 3.684%, 06/12/32 (e) | | | 1,360 | |
| | | | RASC Trust, | | | | |
| | 2,986 | | | Series 2005-EMX1, Class M1, VAR, 0.844%, 03/25/35 | | | 2,786 | |
| | 116 | | | Series 2005-KS2, Class M1, VAR, 0.844%, 03/25/35 | | | 106 | |
| | | | Renaissance Home Equity Loan Trust, | | | | |
| | 1,149 | | | Series 2004-1, Class M1, VAR, 0.779%, 05/25/34 | | | 1,045 | |
| | | | | | | | |
PRINCIPAL
AMOUNT | | | SECURITY DESCRIPTION | | VALUE | |
| | | | | | | | |
| | | | United States — continued | |
| | 1,546 | | | Series 2005-1, Class AF6, SUB, 4.970%, 05/25/35 | | | 1,569 | |
| | 301 | | | Saxon Asset Securities Trust, Series 2004-3, Class M1, VAR, 1.099%, 12/26/34 | | | 273 | |
| | 75 | | | Selene Non-Performing Loans LLC, Series 2014-1A, Class A, SUB, 2.981%, 05/25/54 (e) | | | 74 | |
| | 800 | | | SpringCastle America Funding LLC, Series 2014-AA, Class C, 5.590%, 10/25/33 (e) | | | 814 | |
| | 237 | | | Structured Asset Investment Loan Trust, Series 2003-BC10, Class A4, VAR, 1.199%, 10/25/33 | | | 228 | |
| | 965 | | | Sunset Mortgage Loan Co. LLC, Series 2014-NPL2, Class A, SUB, 3.721%, 11/16/44 (e) | | | 963 | |
| | | | Truman Capital Mortgage Loan Trust, | | | | |
| | 840 | | | Series 2014-NPL1, Class A2, SUB, 4.250%, 07/25/53 (e) | | | 828 | |
| | 270 | | | Series 2014-NPL3, Class A2, SUB, 4.000%, 04/25/53 (e) | | | 264 | |
| | 1,501 | | | U.S. Residential Opportunity Fund III Trust, Series 2015-1III, Class A, 3.721%, 01/27/35 (e) | | | 1,497 | |
| | 1,715 | | | Vericrest Opportunity Loan Trust, Series 2015-NPL3, Class A1, SUB, 3.375%, 10/25/58 (e) | | | 1,709 | |
| | 857 | | | VOLT XIX LLC, Series 2014-NP11, Class A1, SUB, 3.875%, 04/25/55 (e) | | | 858 | |
| | 242 | | | VOLT XVI LLC, Series 2014-NPL5, Class A2, SUB, 4.000%, 09/25/58 (e) | | | 238 | |
| | 2,619 | | | VOLT XXV LLC, Series 2015-NPL8, Class A1, SUB, 3.500%, 06/26/45 (e) | | | 2,616 | |
| | 749 | | | VOLT XXVI LLC, Series 2014-NPL6, Class A2, SUB, 4.250%, 09/25/43 (e) | | | 738 | |
| | 1,838 | | | VOLT XXVII LLC, Series 2014-NPL7, Class A2, SUB, 4.750%, 08/27/57 (e) | | | 1,839 | |
| | 6,353 | | | VOLT XXXVII LLC, Series 2015-NP11, Class A1, SUB, 3.625%, 07/25/45 (e) | | | 6,346 | |
| | 186 | | | Westlake Automobile Receivables Trust, Series 2014-2A, Class D, 2.860%, 07/15/21 (e) | | | 186 | |
| | | | | | | | |
| | | | | | | 56,281 | |
| | | | | | | | |
| | | | Total Asset-Backed Securities
(Cost $60,836) | | | 61,020 | |
| | | | | | | | |
| Collateralized Mortgage Obligations — 4.4% | |
| | | | Agency CMO — 1.9% | |
| | | | United States — 1.9% | |
| | | | Federal Home Loan Mortgage Corp. REMIC | | | | |
| | 312 | | | Series 3110, Class SL, IF, IO, 5.952%, 02/15/26 | | | 38 | |
SEE NOTES TO FINANCIAL STATEMENTS.
| | | | | | |
| | | |
| 6 | | | | J.P. MORGAN INCOME FUNDS | | AUGUST 31, 2015 |
| | | | | | | | |
PRINCIPAL
AMOUNT | | | SECURITY DESCRIPTION | | VALUE | |
| Collateralized Mortgage Obligations — continued | |
| | | | United States — continued | |
| | 1,465 | | | Series 3160, Class SA, IF, IO, 6.952%, 05/15/36 | | | 241 | |
| | 1,202 | | | Series 3459, Class JS, IF, IO, 6.052%, 06/15/38 | | | 175 | |
| | 445 | | | Series 3716, Class PI, IO, 4.500%, 04/15/38 | | | 62 | |
| | 360 | | | Series 3736, Class QB, 4.000%, 05/15/37 | | | 369 | |
| | 1,954 | | | Series 3775, Class LI, IO, 3.500%, 12/15/20 | | | 126 | |
| | 1,542 | | | Series 3907, Class AI, IO, 5.000%, 05/15/40 | | | 299 | |
| | 4,874 | | | Series 3907, Class SW, IF, IO, 6.452%, 07/15/26 | | | 845 | |
| | 2,017 | | | Series 3914, Class LS, IF, IO, 6.602%, 08/15/26 | | | 353 | |
| | 6,109 | | | Series 3926, Class MS, IF, IO, 6.552%, 11/15/25 | | | 723 | |
| | 2,426 | | | Series 3958, Class MS, IF, IO, 6.502%, 08/15/26 | | | 385 | |
| | 3,951 | | | Series 3998, Class KS, IF, IO, 6.502%, 02/15/27 | | | 712 | |
| | 776 | | | Series 4018, Class HI, IO, 4.500%, 03/15/41 | | | 153 | |
| | 1,102 | | | Series 4030, Class IL, IO, 3.500%, 04/15/27 | | | 116 | |
| | 4,134 | | | Series 4043, Class PI, IO, 2.500%, 05/15/27 | | | 358 | |
| | 349 | | | Series 4056, Class BI, IO, 3.000%, 05/15/27 | | | 38 | |
| | 2,528 | | | Series 4057, Class UI, IO, 3.000%, 05/15/27 | | | 267 | |
| | 6,186 | | | Series 4059, Class SA, IF, IO, 5.802%, 06/15/42 | | | 1,331 | |
| | 758 | | | Series 4073, Class IQ, IO, 4.000%, 07/15/42 | | | 190 | |
| | 3,154 | | | Series 4097, Class CI, IO, 3.000%, 08/15/27 | | | 372 | |
| | 910 | | | Series 4119, Class LI, IO, 3.500%, 06/15/39 | | | 125 | |
| | 1,865 | | | Series 4120, Class UI, IO, 3.000%, 10/15/27 | | | 209 | |
| | 397 | | | Series 4136, Class IN, IO, 3.000%, 11/15/27 | | | 46 | |
| | 373 | | | Series 4146, Class AI, IO, 3.000%, 12/15/27 | | | 39 | |
| | 1,740 | | | Series 4173, Class I, IO, 4.000%, 03/15/43 | | | 392 | |
| | 1,069 | | | Series 4215, Class LI, IO, 3.500%, 07/15/41 | | | 170 | |
| | 2,392 | | | Series 4280, Class KI, IO, 3.500%, 09/15/31 | | | 266 | |
| | 1,070 | | | Series 4304, Class DI, IO, 2.500%, 01/15/27 | | | 101 | |
| | | | | | | | |
PRINCIPAL
AMOUNT | | | SECURITY DESCRIPTION | | VALUE | |
| | |
| | | | United States — continued | |
| | 3,192 | | | Series 4311, Class QI, IO, 3.000%, 10/15/28 | | | 320 | |
| | 3,005 | | | Series 4313, Class UI, IO, 3.000%, 03/15/29 | | | 376 | |
| | 607 | | | Series 4323, Class IW, IO, 3.500%, 04/15/28 | | | 73 | |
| | 1,572 | | | Series 4324, Class AI, IO, 3.000%, 11/15/28 | | | 143 | |
| | 7,748 | | | Series 4351, Class GI, IO, 5.000%, 11/15/19 | | | 362 | |
| | 2,821 | | | Series 4372, Class SY, IF, IO, 5.902%, 08/15/44 | | | 490 | |
| | 700 | | | Federal Home Loan Mortgage Corp. STRIPS, Series 305, Class IO, IO, 3.500%, 03/15/28 | | | 92 | |
| | | | Federal National Mortgage Association REMIC | | | | |
| | 1,393 | | | Series 2009-101, Class SI, IF, IO, 5.551%, 12/25/39 | | | 180 | |
| | 486 | | | Series 2010-102, Class IP, IO, 5.000%, 12/25/39 | | | 57 | |
| | 1,625 | | | Series 2011-144, Class SA, IF, IO, 6.451%, 11/25/25 | | | 223 | |
| | 4,581 | | | Series 2012-9, Class SM, IF, IO, 6.501%, 12/25/26 | | | 748 | |
| | 358 | | | Series 2012-25, Class AI, IO, 3.500%, 03/25/27 | | | 42 | |
| | 1,632 | | | Series 2012-93, Class SG, IF, IO, 5.901%, 09/25/42 | | | 331 | |
| | 544 | | | Series 2012-107, Class IG, IO, 3.500%, 10/25/27 | | | 65 | |
| | 456 | | | Series 2012-118, Class DI, IO, 3.500%, 01/25/40 | | | 63 | |
| | 1,694 | | | Series 2012-120, Class DI, IO, 3.000%, 03/25/31 | | | 198 | |
| | 368 | | | Series 2012-128, Class KI, IO, 3.000%, 11/25/27 | | | 41 | |
| | 383 | | | Series 2012-144, Class EI, IO, 3.000%, 01/25/28 | | | 46 | |
| | 578 | | | Series 2012-144, Class SK, IF, IO, 5.901%, 01/25/43 | | | 149 | |
| | 4,113 | | | Series 2012-145, Class EI, IO, 3.000%, 01/25/28 | | | 465 | |
| | 476 | | | Series 2012-148, Class JI, IO, 3.500%, 12/25/39 | | | 63 | |
| | 417 | | | Series 2012-150, Class BI, IO, 3.000%, 01/25/28 | | | 50 | |
| | 10,006 | | | Series 2013-4, Class ST, IF, IO, 5.951%, 02/25/43 | | | 2,132 | |
| | 459 | | | Series 2013-5, Class BI, IO, 3.500%, 03/25/40 | | | 71 | |
SEE NOTES TO FINANCIAL STATEMENTS.
| | | | | | | | |
| | | |
| AUGUST 31, 2015 | | J.P. MORGAN INCOME FUNDS | | | | | 7 | |
JPMorgan Global Bond Opportunities Fund
SCHEDULE OF PORTFOLIO INVESTMENTS
AS OF AUGUST 31, 2015 (continued)
(Amounts in U.S. Dollars, unless otherwise noted)
(Amounts in thousands)
| | | | | | | | |
PRINCIPAL
AMOUNT | | | SECURITY DESCRIPTION | | VALUE | |
| Collateralized Mortgage Obligations — continued | |
| | | | United States — continued | |
| | 342 | | | Series 2013-9, Class IO, IO, 3.000%, 02/25/28 | | | 41 | |
| | 421 | | | Series 2013-9, Class YI, IO, 3.500%, 02/25/28 | | | 53 | |
| | 5,854 | | | Series 2013-15, Class IO, IO, 2.500%, 03/25/28 | | | 560 | |
| | 496 | | | Series 2013-15, Class QI, IO, 3.000%, 03/25/28 | | | 58 | |
| | 1,997 | | | Series 2013-18, Class AI, IO, 3.000%, 03/25/28 | | | 225 | |
| | 1,354 | | | Series 2013-18, Class NS, IF, IO, 5.901%, 03/25/43 | | | 298 | |
| | 426 | | | Series 2013-26, Class IJ, IO, 3.000%, 04/25/28 | | | 51 | |
| | 2,062 | | | Series 2013-31, Class DI, IO, 3.000%, 04/25/28 | | | 242 | |
| | 399 | | | Series 2013-31, Class YI, IO, 3.500%, 04/25/28 | | | 47 | |
| | 2,091 | | | Series 2013-64, Class LI, IO, 3.000%, 06/25/33 | | | 280 | |
| | 4,151 | | | Series 2014-35, Class KI, IO, 3.000%, 06/25/29 | | | 557 | |
| | 2,644 | | | Series 2014-44, Class QI, IO, 3.000%, 08/25/29 | | | 302 | |
| | | | Federal National Mortgage Association STRIPS | | | | |
| | 4,582 | | | Series 401, Class C6, IO, 4.500%, 10/25/29 | | | 415 | |
| | 1,204 | | | Series 409, Class 23, IO, VAR, 3.500%, 04/25/27 | | | 144 | |
| | 18,142 | | | Series 410, Class C12, IO, 5.500%, 07/25/24 | | | 1,531 | |
| | | | Government National Mortgage Association | | | | |
| | 2,200 | | | Series 2002-24, Class AG, IF, IO, 7.752%, 04/16/32 | | | 506 | |
| | 1,728 | | | Series 2003-69, Class SB, IF, IO, 6.402%, 08/16/33 | | | 392 | |
| | 1,434 | | | Series 2011-13, Class S, IF, IO, 5.752%, 01/16/41 | | | 254 | |
| | | | | | | | |
| | | | | | | 21,237 | |
| | | | | | | | |
| | | | Non-Agency CMO — 2.5% | |
| | | | Italy — 0.0% (g) | |
| EUR | 120 | | | Intesa Sec S.p.A., Series 3, Class B, Reg. S, VAR, 0.179%, 10/30/33 | | | 129 | |
| | | | | | | | |
| | | | Spain — 0.0% (g) | |
| EUR | 113 | | | TDA 13-Mixto Fondo de Titulizacion de Activos, Series 13, Class A2, VAR, 0.291%, 09/30/32 | | | 125 | |
| | | | | | | | |
| | | | | | | | |
PRINCIPAL
AMOUNT | | | SECURITY DESCRIPTION | | VALUE | |
| | | | | | | | |
| | | | United States — 2.5% | |
| | | | Alternative Loan Trust | | | | |
| | 139 | | | Series 2005-6CB, Class 1A6, 5.500%, 04/25/35 | | | 132 | |
| | 2,598 | | | Series 2005-21CB, Class A17, 6.000%, 06/25/35 | | | 2,657 | |
| | 215 | | | Chase Mortgage Finance Trust, Series 2007-A1, Class 2A3, VAR, 2.665%, 02/25/37 | | | 216 | |
| | 2,067 | | | DSLA Mortgage Loan Trust, Series 2005-AR4, Class 2A1A, VAR, 0.465%, 08/19/45 | | | 1,843 | |
| | 59 | | | First Horizon Mortgage Pass-Through Trust, Series 2005-5, Class 1A6, 5.500%, 10/25/35 | | | 57 | |
| | 209 | | | GSMSC Pass-Through Trust, Series 2008-2R, Class 2A1, VAR, 7.500%, 10/25/36 (e) | | | 170 | |
| | 306 | | | HarborView Mortgage Loan Trust, Series 2007-6, Class 2A1A, VAR, 0.395%, 08/19/37 | | | 259 | |
| | 747 | | | Structured Adjustable Rate Mortgage Loan Trust, Series 2005-1, Class 5A1, VAR, 2.498%, 02/25/35 | | | 744 | |
| | | | Wells Fargo Mortgage-Backed Securities Trust | | | | |
| | 2,266 | | | Series 2004-BB, Class A5, VAR, 2.620%, 01/25/35 | | | 2,287 | |
| | 4,561 | | | Series 2004-M, Class A1, VAR, 2.740%, 08/25/34 | | | 4,636 | |
| | 4,677 | | | Series 2004-N, Class A6, VAR, 2.730%, 08/25/34 | | | 4,683 | |
| | 4,676 | | | Series 2004-N, Class A7, VAR, 2.730%, 08/25/34 | | | 4,683 | |
| | 3,115 | | | Series 2005-AR2, Class 2A1, VAR, 2.618%, 03/25/35 | | | 3,112 | |
| | 715 | | | Series 2005-AR2, Class 2A2, VAR, 2.618%, 03/25/35 | | | 726 | |
| | 659 | | | Series 2005-AR4, Class 2A2, VAR, 2.636%, 04/25/35 | | | 662 | |
| | 986 | | | Series 2005-AR16, Class 3A1, VAR, 2.657%, 03/25/35 | | | 987 | |
| | 140 | | | Series 2007-2, Class 3A5, 5.250%, 03/25/37 | | | 143 | |
| | | | | | | | |
| | | | | | | 27,997 | |
| | | | | | | | |
| | | | | | | 28,251 | |
| | | | | | | | |
| | | | Total Collateralized Mortgage Obligations
(Cost $49,099) | | | 49,488 | |
| | | | | | | | |
| Commercial Mortgage-Backed Securities — 9.6% | |
| | | | Cayman Islands — 0.0% (g) | |
| | 112 | | | ACRE Commercial Mortgage Trust, Series 2014-FL2, Class D, VAR, 3.598%, 08/15/31 (e) | | | 111 | |
| | 255 | | | PFP III Ltd., Series 2014-1, Class AS, VAR, 1.844%, 06/14/31 (e) | | | 255 | |
| | | | | | | | |
| | | | | | | 366 | |
| | | | | | | | |
SEE NOTES TO FINANCIAL STATEMENTS.
| | | | | | |
| | | |
| 8 | | | | J.P. MORGAN INCOME FUNDS | | AUGUST 31, 2015 |
| | | | | | | | |
PRINCIPAL
AMOUNT | | | SECURITY DESCRIPTION | | VALUE | |
| Commercial Mortgage-Backed Securities — continued | |
| | | | United States — 9.6% | |
| | 250 | | | A10 Securitization LLC, 4.733%, 01/09/20 | | | 250 | |
| | | | Banc of America Commercial Mortgage Trust, | | | | |
| | 200 | | | Series 2006-2, Class B, VAR, 5.960%, 05/10/45 | | | 202 | |
| | 2,400 | | | Series 2007-3, Class B, VAR, 5.741%, 06/10/49 | | | 2,438 | |
| | 2,350 | | | Series 2007-4, Class AJ, VAR, 6.002%, 02/10/51 | | | 2,420 | |
| | 100 | | | Banc of America Merrill Lynch Commercial Mortgage, Inc., Series 2005-4, Class B, VAR, 5.118%, 07/10/45 | | | 100 | |
| | | | Bear Stearns Commercial Mortgage Securities Trust, | | | | |
| | 2,600 | | | Series 2006-PW13, Class B, VAR, 5.660%, 09/11/41 (e) | | | 2,545 | |
| | 1,350 | | | Series 2006-PW14, Class AJ, 5.273%, 12/11/38 | | | 1,360 | |
| | 1,210 | | | Series 2007-PW16, Class AJ, VAR, 5.895%, 06/11/40 | | | 1,229 | |
| | 1,700 | | | Series 2007-PW17, Class AJ, VAR, 6.082%, 06/11/50 | | | 1,738 | |
| | 1,720 | | | CD Commercial Mortgage Trust, Series 2007-CD4, Class AMFX, VAR, 5.366%, 12/11/49 | | | 1,780 | |
| | 1,815 | | | CG-CCRE Commercial Mortgage Trust, Series 2014-FL2, Class A, VAR, 2.041%, 11/15/31 (e) | | | 1,827 | |
| | | | Citigroup Commercial Mortgage Trust, | | | | |
| | 4,335 | | | Series 2015-P1, Class A5, 3.717%, 09/15/48 | | | 4,439 | |
| | 3,440 | | | Series 2015-P1, Class D, 3.225%, 09/15/48 (e) | | | 2,580 | |
| | | | COMM Mortgage Trust, | | | | |
| | 835 | | | Series 2014-LC15, Class D, VAR, 5.109%, 04/10/47 (e) | | | 782 | |
| | 2,200 | | | Series 2015-CR23, Class CMC, VAR, 3.807%, 05/10/48 (e) | | | 2,176 | |
| | 6,450 | | | Series 2015-CR24, Class A5, 3.696%, 08/10/48 | | | 6,614 | |
| | 1,990 | | | Series 2015-CR25, Class A4, 3.759%, 08/10/48 | | | 2,047 | |
| | 2,880 | | | Series 2015-PC1, Class A5, 3.902%, 07/10/50 | | | 3,000 | |
| | 100 | | | Commercial Mortgage Trust, Series 2004-GG1, Class H, VAR, 6.238%, 06/10/36 (e) | | | 101 | |
| | 3,010 | | | Credit Suisse Commercial Mortgage Trust, Series 2006-C1, Class E, VAR, 5.646%, 02/15/39 | | | 3,017 | |
| | | | CSAIL Commercial Mortgage Trust, | | | | |
| | 3,115 | | | Series 2015-C1, Class D, VAR, 3.945%, 04/15/50 (e) | | | 2,670 | |
| | | | | | | | |
PRINCIPAL
AMOUNT | | | SECURITY DESCRIPTION | | VALUE | |
| | | | | | | | |
| | | | United States — continued | |
| | 4,075 | | | Series 2015-C3, Class A4, 3.718%, 08/15/48 | | | 4,168 | |
| | 230 | | | CSMC, Series 2014-ICE, Class D, VAR, 2.348%, 04/15/27 (e) | | | 228 | |
| | 2,120 | | | GMAC Commercial Mortgage Securities, Inc., Series 2006-C1, Class AM, VAR, 5.290%, 11/10/45 | | | 2,127 | |
| | | | GS Mortgage Securities Trust, | | | | |
| | 100 | | | Series 2006-GG8, Class AJ, 5.622%, 11/10/39 | | | 101 | |
| | 1,615 | | | Series 2015-GC32, Class A4, 3.764%, 07/10/48 | | | 1,664 | |
| | | | JP Morgan Chase Commercial Mortgage Securities Trust, | | | | |
| | 120 | | | Series 2005-LDP2, Class D, VAR, 4.941%, 07/15/42 | | | 121 | |
| | 160 | | | Series 2005-LDP5, Class D, VAR, 5.560%, 12/15/44 | | | 160 | |
| | 1,395 | | | Series 2006-LDP8, Class C, VAR, 5.549%, 05/15/45 | | | 1,411 | |
| | 3,895 | | | Series 2007-LD11, Class AM, VAR, 5.961%, 06/15/49 | | | 4,047 | |
| | 2,870 | | | LB Commercial Mortgage Trust, Series 2007-C3, Class AJ, VAR, 6.096%, 07/15/44 | | | 2,965 | |
| | | | LB-UBS Commercial Mortgage Trust, | | | | |
| | 5,205 | | | Series 2007-C1, Class AJ, 5.484%, 02/15/40 | | | 5,359 | |
| | 1,410 | | | Series 2007-C1, Class B, 5.514%, 02/15/40 | | | 1,441 | |
| | 5,605 | | | Series 2007-C1, Class C, VAR, 5.533%, 02/15/40 | | | 5,673 | |
| | 5,030 | | | Series 2007-C6, Class AJ, VAR, 6.324%, 07/15/40 | | | 5,187 | |
| | 125 | | | ML-CFC Commercial Mortgage Trust, Series 2006-4, Class AJ, 5.239%, 12/12/49 | | | 125 | |
| | 4,200 | | | Morgan Stanley Bank of America Merrill Lynch Trust, Series 2015-C24, Class A4, 3.732%, 05/15/48 | | | 4,307 | |
| | | | Morgan Stanley Capital I Trust, | | | | |
| | 2,810 | | | Series 2005-HQ7, Class D, VAR, 5.373%, 11/14/42 | | | 2,809 | |
| | 255 | | | Series 2006-HQ8, Class D, VAR, 5.663%, 03/12/44 | | | 237 | |
| | 2,630 | | | Series 2006-HQ9, Class D, VAR, 5.862%, 07/12/44 | | | 2,667 | |
| | 5,005 | | | Series 2007-HQ11, Class AJ, VAR, 5.508%, 02/12/44 | | | 5,104 | |
| | | | Wachovia Bank Commercial Mortgage Trust, | | | | |
| | 100 | | | Series 2005-C21, Class F, VAR, 5.451%, 10/15/44 (e) | | | 99 | |
SEE NOTES TO FINANCIAL STATEMENTS.
| | | | | | | | |
| | | |
| AUGUST 31, 2015 | | J.P. MORGAN INCOME FUNDS | | | | | 9 | |
JPMorgan Global Bond Opportunities Fund
SCHEDULE OF PORTFOLIO INVESTMENTS
AS OF AUGUST 31, 2015 (continued)
(Amounts in U.S. Dollars, unless otherwise noted)
(Amounts in thousands)
| | | | | | | | |
PRINCIPAL
AMOUNT | | | SECURITY DESCRIPTION | | VALUE | |
| Commercial Mortgage-Backed Securities — continued | |
| | | | United States — continued | |
| | 1,020 | | | Series 2006-C23, Class D, VAR, 5.703%, 01/15/45 | | | 1,030 | |
| | 2,825 | | | Series 2006-C24, Class AJ, VAR, 5.658%, 03/15/45 | | | 2,839 | |
| | 2,530 | | | Series 2007-C33, Class AJ, VAR, 6.150%, 02/15/51 | | | 2,604 | |
| | 2,600 | | | Series 2007-C33, Class B, VAR, 6.150%, 02/15/51 | | | 2,625 | |
| | 2,600 | | | Series 2007-C33, Class C, VAR, 6.150%, 02/15/51 | | | 2,603 | |
| | 250 | | | Series 2007-C34, Class AJ, VAR, 6.144%, 05/15/46 | | | 259 | |
| | 1,250 | | | Wells Fargo Commercial Mortgage Trust, Series 2015-NXS2, Class A5, 3.767%, 07/15/58 | | | 1,284 | |
| | 1,940 | | | WFRBS Commercial Mortgage Trust, Series 2014-C25, Class D, VAR, 3.803%, 11/15/47 (e) | | | 1,612 | |
| | | | | | | | |
| | | | | | | 108,171 | |
| | | | | | | | |
| | | | Total Commercial Mortgage-Backed Securities (Cost $109,596) | | | 108,537 | |
| | | | | | | | |
| | |
| SHARES | | | | | | |
| Common Stock — 0.0% (g) | |
| | | | United States — 0.0% (g) | |
| | 3 | | | NII Holdings, Inc. (a) (Cost $44) | | | 23 | |
| | | | | | | | |
| | |
PRINCIPAL
AMOUNT | | | | | | |
| Convertible Bonds — 1.9% | |
| | | | Netherlands — 0.1% | |
| | 1,565 | | | NXP Semiconductors N.V., 1.000%, 12/01/19 (e) | | | 1,699 | |
| | | | | | | | |
| | | | United Kingdom — 0.0% (g) | |
| | 200 | | | Billion Express Investments Ltd., Reg. S, 0.750%, 10/18/15 | | | 199 | |
| | | | | | | | |
| | | | United States — 1.8% | |
| | 850 | | | Envestnet, Inc., 1.750%, 12/15/19 | | | 752 | |
| | 2,225 | | | Finisar Corp., 0.500%, 12/15/33 | | | 2,083 | |
| | 2,045 | | | General Cable Corp., SUB, 4.500%, 11/15/29 | | | 1,449 | |
| | 815 | | | Griffon Corp., 4.000%, 01/15/17 (e) | | | 1,013 | |
| | 1,680 | | | HealthSouth Corp., 2.000%, 12/01/43 | | | 2,046 | |
| | 2,320 | | | HomeAway, Inc., 0.125%, 04/01/19 | | | 2,158 | |
| | 2,325 | | | Iconix Brand Group, Inc., 1.500%, 03/15/18 | | | 1,889 | |
| | 25 | | | Ixia, 3.000%, 12/15/15 | | | 25 | |
| | 245 | | | Jarden Corp., 1.125%, 03/15/34 | | | 284 | |
| | 2,585 | | | Live Nation Entertainment, Inc., 2.500%, 05/15/19 | | | 2,679 | |
| | | | | | | | |
PRINCIPAL
AMOUNT | | | SECURITY DESCRIPTION | | VALUE | |
| | | | | | | | |
| | | | United States — continued | |
| | 1,145 | | | Newpark Resources, Inc., 4.000%, 10/01/17 | | | 1,154 | |
| | 1,460 | | | ON Semiconductor Corp., Series B, 2.625%, 12/15/26 | | | 1,643 | |
| | 1,855 | | | Web.com Group, Inc., 1.000%, 08/15/18 | | | 1,745 | |
| | 1,310 | | | WebMD Health Corp., 1.500%, 12/01/20 | | | 1,346 | |
| | | | | | | | |
| | | | | | | 20,266 | |
| | | | | | | | |
| | | | Total Convertible Bonds
(Cost $23,563) | | | 22,164 | |
| | | | | | | | |
| Corporate Bonds — 46.9% | |
| | | | Australia — 0.0% (g) | |
| | 180 | | | Bluescope Steel Finance Ltd./Bluescope Steel Finance USA LLC, 7.125%, 05/01/18 (e) | | | 177 | |
| | 35 | | | Nufarm Australia Ltd., 6.375%, 10/15/19 (e) | | | 35 | |
| | | | | | | | |
| | | | | | | 212 | |
| | | | | | | | |
| | | | Bahamas — 0.0% (g) | |
| | 565 | | | Ultrapetrol Bahamas Ltd., 8.875%, 06/15/21 | | | 441 | |
| | | | | | | | |
| | | | Belgium — 0.2% | |
| | EUR 2,200 | | | Ontex Group N.V., Reg. S, 4.750%, 11/15/21 | | | 2,587 | |
| | | | | | | | |
| | | | Bermuda — 0.1% | |
| | 310 | | | Aircastle Ltd., 7.625%, 04/15/20 | | | 352 | |
| | 200 | | | Seadrill Ltd., 6.625%, 09/15/20 (e) | | | 138 | |
| | 36 | | | Viking Cruises Ltd., 8.500%, 10/15/22 (e) | | | 40 | |
| | | | | | | | |
| | | | | | | 530 | |
| | | | | | | | |
| | | | Canada — 1.6% | |
| | 555 | | | 1011778 B.C. ULC/New Red Finance, Inc., 6.000%, 04/01/22 (e) | | | 572 | |
| | 188 | | | ATS Automation Tooling Systems, Inc., 6.500%, 06/15/23 (e) | | | 189 | |
| | | | Baytex Energy Corp., | | | | |
| | 100 | | | 5.125%, 06/01/21 (e) | | | 85 | |
| | 75 | | | 5.625%, 06/01/24 (e) | | | 63 | |
| | | | Bombardier, Inc., | | | | |
| | 40 | | | 4.750%, 04/15/19 (e) | | | 32 | |
| | 139 | | | 5.500%, 09/15/18 (e) | | | 122 | |
| | 169 | | | 6.125%, 01/15/23 (e) | | | 126 | |
| | 11 | | | Brookfield Residential Properties, Inc., 6.500%, 12/15/20 (e) | | | 11 | |
| | 192 | | | Brookfield Residential Properties, Inc./Brookfield Residential U.S. Corp., 6.125%, 07/01/22 (e) | | | 186 | |
| | 230 | | | Cascades, Inc., 5.500%, 07/15/22 (e) | | | 221 | |
| | 213 | | | Concordia Healthcare Corp., 7.000%, 04/15/23 (e) | | | 220 | |
SEE NOTES TO FINANCIAL STATEMENTS.
| | | | | | |
| | | |
| 10 | | | | J.P. MORGAN INCOME FUNDS | | AUGUST 31, 2015 |
| | | | | | | | |
PRINCIPAL
AMOUNT | | | SECURITY DESCRIPTION | | VALUE | |
| Corporate Bonds — continued | |
| | | | Canada — continued | |
| | | | First Quantum Minerals Ltd., | | | | |
| | 423 | | | 6.750%, 02/15/20 (e) | | | 302 | |
| | 18 | | | 7.000%, 02/15/21 (e) | | | 13 | |
| | 25 | | | Garda World Security Corp., 7.250%, 11/15/21 (e) | | | 23 | |
| | 125 | | | HudBay Minerals, Inc., 9.500%, 10/01/20 | | | 113 | |
| | 325 | | | Lundin Mining Corp., 7.875%, 11/01/22 (e) | | | 320 | |
| | 92 | | | Masonite International Corp., 5.625%, 03/15/23 (e) | | | 93 | |
| | 245 | | | Mattamy Group Corp., 6.500%, 11/15/20 (e) | | | 237 | |
| | 800 | | | MEG Energy Corp., 6.375%, 01/30/23 (e) | | | 644 | |
| | 405 | | | New Gold, Inc., 6.250%, 11/15/22 (e) | | | 342 | |
| | 171 | | | NOVA Chemicals Corp., 5.000%, 05/01/25 (e) | | | 171 | |
| | 330 | | | Novelis, Inc., 8.750%, 12/15/20 | | | 329 | |
| | 227 | | | Open Text Corp., 5.625%, 01/15/23 (e) | | | 227 | |
| | 2,600 | | | Pacific Exploration and Production Corp., Reg. S, 5.125%, 03/28/23 | | | 1,261 | |
| | 350 | | | Precision Drilling Corp., 5.250%, 11/15/24 | | | 275 | |
| | 1,070 | | | Quebecor Media, Inc., 5.750%, 01/15/23 | | | 1,081 | |
| | 115 | | | Taseko Mines Ltd., 7.750%, 04/15/19 | | | 66 | |
| | 1,325 | | | Transcanada Trust, VAR, 5.625%, 05/20/75 | | | 1,268 | |
| | 400 | | | Ultra Petroleum Corp., 6.125%, 10/01/24 (e) | | | 264 | |
| | | | Valeant Pharmaceuticals International, Inc., | | | | |
| | 345 | | | 5.375%, 03/15/20 (e) | | | 351 | |
| | 195 | | | 5.500%, 03/01/23 (e) | | | 198 | |
| | 85 | | | 5.625%, 12/01/21 (e) | | | 86 | |
| | 2,160 | | | 5.875%, 05/15/23 (e) | | | 2,203 | |
| | 395 | | | 6.125%, 04/15/25 (e) | | | 407 | |
| | 205 | | | 6.375%, 10/15/20 (e) | | | 214 | |
| | 175 | | | 6.750%, 08/15/18 (e) | | | 183 | |
| | 100 | | | 6.750%, 08/15/21 (e) | | | 104 | |
| | 2,465 | | | 7.250%, 07/15/22 (e) | | | 2,594 | |
| | 100 | | | 7.500%, 07/15/21 (e) | | | 107 | |
| | EUR 1,925 | | | Reg. S, 4.500%, 05/15/23 | | | 2,079 | |
| | 300 | | | Videotron Ltd., 5.375%, 06/15/24 (e) | | | 305 | |
| | | | | | | | |
| | | | | | | 17,687 | |
| | | | | | | | |
| | | | Cayman Islands — 0.6% | |
| | 3,401 | | | Odebrecht Offshore Drilling Finance Ltd., Reg. S, 6.750%, 10/01/22 | | | 1,887 | |
| | 275 | | | Shelf Drilling Holdings Ltd., 8.625%, 11/01/18 (e) | | | 212 | |
| | | | Transocean, Inc., | | | | |
| | 191 | | | 6.500%, 11/15/20 | | | 157 | |
| | 724 | | | 6.875%, 12/15/21 | | | 578 | |
| | 200 | | | UPCB Finance IV Ltd., 5.375%, 01/15/25 (e) | | | 194 | |
| | | | | | | | |
PRINCIPAL
AMOUNT | | | SECURITY DESCRIPTION | | VALUE | |
| | | | | | | | |
| | | | Cayman Islands — continued | |
| | 900 | | | UPCB Finance V Ltd., 7.250%, 11/15/21 (e) | | | 966 | |
| | 2,800 | | | Vale Overseas Ltd., 6.875%, 11/21/36 | | | 2,383 | |
| | | | | | | | |
| | | | | | | 6,377 | |
| | | | | | | | |
| | | | Chile — 0.3% | |
| | 1,980 | | | Empresa Electrica Angamos S.A., 4.875%, 05/25/29 (e) | | | 1,881 | |
| | 1,720 | | | Empresa Electrica Guacolda S.A., 4.560%, 04/30/25 (e) | | | 1,632 | |
| | | | | | | | |
| | | | | | | 3,513 | |
| | | | | | | | |
| | | | Croatia — 0.2% | |
| | EUR 1,250 | | | Agrokor d.d., Reg. S, 9.125%, 02/01/20 | | | 1,512 | |
| | 400 | | | Hrvatska Elektroprivreda, Reg. S, 6.000%, 11/09/17 | | | 416 | |
| | | | | | | | |
| | | | | | | 1,928 | |
| | | | | | | | |
| | | | Denmark — 0.0% (g) | |
| | GBP 195 | | | Danske Bank A/S, VAR, 5.375%, 09/29/21 | | | 315 | |
| | | | | | | | |
| | | | France — 2.0% | |
| | EUR 1,300 | | | Autodis S.A., Reg. S, 6.500%, 02/01/19 | | | 1,517 | |
| | EUR 2,000 | | | Crown European Holdings S.A., Reg. S, 4.000%, 07/15/22 | | | 2,310 | |
| | EUR 400 | | | Europcar Groupe S.A., Reg. S, 5.750%, 06/15/22 | | | 461 | |
| | EUR 1,650 | | | Holding Medi-Partenaires SAS, Reg. S, 7.000%, 05/15/20 | | | 1,963 | |
| | EUR 1,500 | | | Italcementi Finance S.A., SUB, 6.625%, 03/19/20 | | | 1,952 | |
| | EUR 1,760 | | | Labeyrie Fine Foods SAS, Reg. S, 5.625%, 03/15/21 | | | 2,054 | |
| | EUR 600 | | | Lafarge S.A., Reg. S, 4.750%, 09/30/20 | | | 786 | |
| | EUR 1,259 | | | Novafives SAS, Reg. S, 4.500%, 06/30/21 | | | 1,314 | |
| | | | Numericable-SFR SAS, | | | | |
| | EUR 600 | | | 5.375%, 05/15/22 (e) | | | 693 | |
| | 2,200 | | | 6.000%, 05/15/22 (e) | | | 2,200 | |
| | 250 | | | 6.250%, 05/15/24 (e) | | | 250 | |
| | EUR 2,800 | | | Reg. S, 5.375%, 05/15/22 | | | 3,235 | |
| | | | Rexel S.A., | | | | |
| | EUR 275 | | | 3.250%, 06/15/22 | | | 298 | |
| | EUR 1,300 | | | Reg. S, 5.125%, 06/15/20 | | | 1,540 | |
| | EUR 1,650 | | | SMCP SAS, Reg. S, 8.875%, 06/15/20 | | | 1,981 | |
| | | | | | | | |
| | | | | | | 22,554 | |
| | | | | | | | |
| | | | Germany — 1.9% | |
| | EUR 2,250 | | | Bayer AG, VAR, 3.000%, 07/01/75 | | | 2,589 | |
| | EUR 1,750 | | | CeramTec Group GmbH, Reg. S, 8.250%, 08/15/21 | | | 2,122 | |
SEE NOTES TO FINANCIAL STATEMENTS.
| | | | | | | | |
| | | |
| AUGUST 31, 2015 | | J.P. MORGAN INCOME FUNDS | | | | | 11 | |
JPMorgan Global Bond Opportunities Fund
SCHEDULE OF PORTFOLIO INVESTMENTS
AS OF AUGUST 31, 2015 (continued)
(Amounts in U.S. Dollars, unless otherwise noted)
(Amounts in thousands)
| | | | | | | | |
PRINCIPAL
AMOUNT | | | SECURITY DESCRIPTION | | VALUE | |
| Corporate Bonds — continued | |
| | | | Germany — continued | |
| | EUR 1,350 | | | Deutsche Raststaetten Gruppe IV GmbH, Reg. S, 6.750%, 12/30/20 | | | 1,629 | |
| | EUR 1,800 | | | HP Pelzer Holding GmbH, Reg. S, 7.500%, 07/15/21 | | | 2,111 | |
| | EUR 480 | | | KraussMaffei Group GmbH, Reg. S, 8.750%, 12/15/20 | | | 574 | |
| | EUR 1,575 | | | Pfleiderer GmbH, Reg. S, 7.875%, 08/01/19 | | | 1,785 | |
| | EUR 1,200 | | | ProGroup AG, Reg. S, 5.125%, 05/01/22 | | | 1,384 | |
| | EUR 1,100 | | | Techem Energy Metering Service GmbH & Co. KG, Reg. S, 7.875%, 10/01/20 | | | 1,332 | |
| | EUR 1,825 | | | Trionista TopCo GmbH, Reg. S, 6.875%, 04/30/21 | | | 2,156 | |
| | | | Unitymedia Hessen GmbH & Co. KG/Unitymedia NRW GmbH, | | | | |
| | 200 | | | 5.000%, 01/15/25 (e) | | | 195 | |
| | 200 | | | 5.500%, 01/15/23 (e) | | | 206 | |
| | EUR 3,420 | | | Reg. S, 5.125%, 01/21/23 | | | 4,067 | |
| | EUR 1,300 | | | WEPA Hygieneprodukte GmbH, Reg. S, 6.500%, 05/15/20 | | | 1,531 | |
| | | | | | | | |
| | | | | | | 21,681 | |
| | | | | | | | |
| | | | Hong Kong — 0.3% | |
| | 3,800 | | | Bank of East Asia Ltd. (The), VAR, 4.250%, 11/20/24 | | | 3,793 | |
| | | | | | | | |
| | | | India — 0.3% | |
| | 4,000 | | | JSW Steel Ltd., 4.750%, 11/12/19 | | | 3,495 | |
| | | | | | | | |
| | | | Ireland — 0.9% | |
| | | | AerCap Ireland Capital Ltd./AerCap Global Aviation Trust, | | | | |
| | 217 | | | 4.250%, 07/01/20 | | | 218 | |
| | 642 | | | 4.625%, 07/01/22 | | | 647 | |
| | 2,100 | | | Alfa Bank OJSC Via Alfa Bond Issuance plc, Reg. S, 7.875%, 09/25/17 | | | 2,164 | |
| | | | Ardagh Packaging Finance plc, | | | | |
| | 1,100 | | | 9.125%, 10/15/20 (e) | | | 1,155 | |
| | EUR 1,650 | | | Reg. S, 9.250%, 10/15/20 | | | 1,933 | |
| | 300 | | | Ardagh Packaging Finance plc/Ardagh Holdings USA, Inc., 6.000%, 06/30/21 (e) | | | 298 | |
| | EUR 820 | | | Bank of Ireland, 3.250%, 01/15/19 | | | 979 | |
| | 285 | | | Endo Ltd./Endo Finance LLC/Endo Finco, Inc., 6.000%, 02/01/25 (e) | | | 293 | |
| | EUR 2,200 | | | Smurfit Kappa Acquisitions, Reg. S, 3.250%, 06/01/21 | | | 2,548 | |
| | | | | | | | |
| | | | | | | 10,235 | |
| | | | | | | | |
| | | | | | | | |
PRINCIPAL
AMOUNT | | | SECURITY DESCRIPTION | | VALUE | |
| | | | | | | | |
| | | | Italy — 1.2% | |
| | EUR 700 | | | Assicurazioni Generali S.p.A., VAR, 7.750%, 12/12/42 | | | 959 | |
| | EUR 455 | | | Banco Popolare SC, 3.500%, 03/14/19 | | | 524 | |
| | EUR 1,400 | | | Cerved Group S.p.A., Reg. S, 8.000%, 01/15/21 | | | 1,693 | |
| | | | Enel S.p.A., | | | | |
| | EUR 1,550 | | | VAR, 6.500%, 01/10/74 | | | 1,901 | |
| | GBP 200 | | | VAR, 7.750%, 09/10/75 | | | 334 | |
| | EUR 350 | | | Intesa Sanpaolo S.p.A., 6.625%, 09/13/23 | | | 475 | |
| | EUR 1,300 | | | Rhino Bondco S.p.A, Reg. S, 7.250%, 11/15/20 | | | 1,558 | |
| | EUR 3,250 | | | Telecom Italia S.p.A., 3.250%, 01/16/23 | | | 3,644 | |
| | EUR 1,841 | | | UniCredit S.p.A., Reg. S, 6.950%, 10/31/22 | | | 2,413 | |
| | | | | | | | |
| | | | | | | 13,501 | |
| | | | | | | | |
| | | | Japan — 0.0% (g) | |
| | 200 | | | SoftBank Group Corp., 4.500%, 04/15/20 (e) | | | 200 | |
| | | | | | | | |
| | | | Luxembourg — 4.1% | |
| | 2,735 | | | Actavis Funding SCS, 3.000%, 03/12/20 | | | 2,724 | |
| | | | Altice Luxembourg S.A., | | | | |
| | EUR 850 | | | 7.250%, 05/15/22 (e) | | | 958 | |
| | 700 | | | 7.625%, 02/15/25 (e) | | | 665 | |
| | 250 | | | 7.750%, 05/15/22 (e) | | | 244 | |
| | | | Altice Financing S.A., | | | | |
| | 700 | | | 6.625%, 02/15/23 (e) | | | 697 | |
| | EUR 2,100 | | | Reg. S, 5.250%, 02/15/23 | | | 2,379 | |
| | 200 | | | Altice Finco S.A., 7.625%, 02/15/25 (e) | | | 196 | |
| | EUR 2,100 | | | Altice Luxembourg S.A., Reg. S, 7.250%, 05/15/22 | | | 2,368 | |
| | | | ArcelorMittal, | | | | |
| | EUR 1,700 | | | 2.875%, 07/06/20 | | | 1,862 | |
| | 50 | | | 5.250%, 02/25/17 | | | 51 | |
| | 60 | | | 6.250%, 03/01/21 | | | 59 | |
| | 1,350 | | | 7.000%, 02/25/22 | | | 1,347 | |
| | 50 | | | 10.600%, 06/01/19 | | | 58 | |
| | EUR 2,370 | | | Auris Luxembourg II S.A., Reg. S, 8.000%, 01/15/23 | | | 2,886 | |
| | 45 | | | Beverage Packaging Holdings Luxembourg II S.A./Beverage Packaging Holdings II Is, 5.625%, 12/15/16 (e) | | | 45 | |
| | 100 | | | Capsugel S.A., 7.000% (cash), 05/15/19 (e) (v) | | | 101 | |
| | 600 | | | ConvaTec Healthcare E S.A., 10.500%, 12/15/18 (e) | | | 624 | |
| | EUR 1,950 | | | Fiat Chrysler Finance Europe, 4.750%, 07/15/22 | | | 2,305 | |
SEE NOTES TO FINANCIAL STATEMENTS.
| | | | | | |
| | | |
| 12 | | | | J.P. MORGAN INCOME FUNDS | | AUGUST 31, 2015 |
| | | | | | | | |
PRINCIPAL
AMOUNT | | | SECURITY DESCRIPTION | | VALUE | |
| Corporate Bonds — continued | |
| | | | Luxembourg — continued | |
| | EUR 2,075 | | | Galapagos Holding S.A., Reg. S, 7.000%, 06/15/22 | | | 2,084 | |
| | EUR 600 | | | Geo Debt Finance S.C.A., Reg. S, 7.500%, 08/01/18 | | | 620 | |
| | EUR 1,300 | | | Gestamp Funding Luxembourg S.A., Reg. S, 5.875%, 05/31/20 | | | 1,520 | |
| | 2,250 | | | INEOS Group Holdings S.A., 5.875%, 02/15/19 (e) | | | 2,230 | |
| | | | Intelsat Jackson Holdings S.A., | | | | |
| | 549 | | | 5.500%, 08/01/23 | | | 483 | |
| | 862 | | | 6.625%, 12/15/22 | | | 754 | |
| | 557 | | | 7.250%, 04/01/19 | | | 545 | |
| | 340 | | | 7.250%, 10/15/20 | | | 327 | |
| | 1,945 | | | 7.500%, 04/01/21 | | | 1,884 | |
| | | | Intelsat Luxembourg S.A., | | | | |
| | 5 | | | 6.750%, 06/01/18 | | | 4 | |
| | 360 | | | 7.750%, 06/01/21 | | | 270 | |
| | 200 | | | Mallinckrodt International Finance S.A., 4.750%, 04/15/23 | | | 190 | |
| | | | Mallinckrodt International Finance S.A./Mallinckrodt CB LLC, | | | | |
| | 175 | | | 4.875%, 04/15/20 (e) | | | 177 | |
| | 145 | | | 5.500%, 04/15/25 (e) | | | 144 | |
| | 311 | | | 5.750%, 08/01/22 (e) | | | 317 | |
| | EUR 735 | | | Matterhorn Telecom Holding S.A., Reg. S, 4.875%, 05/01/23 | | | 748 | |
| | EUR 1,050 | | | Monitchem HoldCo 2 S.A., Reg. S, 6.875%, 06/15/22 | | | 1,096 | |
| | EUR 1,750 | | | Play Finance 1 S.A., Reg. S, 6.500%, 08/01/19 | | | 2,035 | |
| | EUR 750 | | | Play Topco S.A., 7.750% (cash), Reg. S, 02/28/20 (v) | | | 855 | |
| | EUR 2,450 | | | SIG Combibloc Holdings S.C.A., Reg. S, 7.750%, 02/15/23 | | | 2,837 | |
| | EUR 1,800 | | | Telenet Finance V Luxembourg S.C.A., Reg. S, 6.250%, 08/15/22 | | | 2,185 | |
| | EUR 1,500 | | | Trinseo Materials Operating SCA/Trinseo Materials Finance, Inc., Reg. S, 6.375%, 05/01/22 | | | 1,692 | |
| | | | Wind Acquisition Finance S.A., | | | | |
| | EUR 550 | | | 7.000%, 04/23/21 (e) | | | 646 | |
| | 600 | | | 7.375%, 04/23/21 (e) | | | 614 | |
| | EUR 1,850 | | | Reg. S, 7.000%, 04/23/21 | | | 2,175 | |
| | | | | | | | |
| | | | | | | 46,001 | |
| | | | | | | | |
| | | | Mexico — 0.4% | |
| | 1,850 | | | Alfa S.A.B. de C.V., Reg. S, 6.875%, 03/25/44 | | | 1,836 | |
| | | | | | | | |
PRINCIPAL
AMOUNT | | | SECURITY DESCRIPTION | | VALUE | |
| | | | | | | | |
| | | | Mexico — continued | |
| | | | Cemex S.A.B. de C.V., | | | | |
| | 1,250 | | | 5.700%, 01/11/25 (e) | | | 1,163 | |
| | 200 | | | 6.125%, 05/05/25 (e) | | | 190 | |
| | 1,940 | | | Elementia S.A.B. de C.V., 5.500%, 01/15/25 (e) | | | 1,872 | |
| | | | | | | | |
| | | | | | | 5,061 | |
| | | | | | | | |
| | | | Netherlands — 1.8% | |
| | 900 | | | Bluewater Holding B.V., Reg. S, 10.000%, 12/10/19 (e) | | | 639 | |
| | 400 | | | EDP Finance B.V., 5.250%, 01/14/21 (e) | | | 422 | |
| | 2,120 | | | Embraer Netherlands Finance B.V., 5.050%, 06/15/25 | | | 1,998 | |
| | | | Fiat Chrysler Automobiles N.V., | | | | |
| | 273 | | | 4.500%, 04/15/20 | | | 273 | |
| | 200 | | | 5.250%, 04/15/23 | | | 198 | |
| | EUR 1,375 | | | Grupo Antolin Dutch B.V., Reg. S, 4.750%, 04/01/21 | | | 1,546 | |
| | EUR 1,100 | | | InterXion Holding N.V., Reg. S, 6.000%, 07/15/20 | | | 1,315 | |
| | | | NXP B.V./NXP Funding LLC, | | | | |
| | 1,000 | | | 5.750%, 02/15/21 (e) | | | 1,044 | |
| | 1,000 | | | 5.750%, 03/15/23 (e) | | | 1,035 | |
| | EUR 800 | | | PortAventura Entertainment Barcelona B.V., Reg. S, 7.250%, 12/01/20 | | | 924 | |
| | | | Schaeffler Finance B.V., | | | | |
| | 600 | | | 4.750%, 05/15/21 (e) | | | 590 | |
| | EUR 2,600 | | | Reg. S, 3.500%, 05/15/22 | | | 2,928 | |
| | | | Sensata Technologies B.V., | | | | |
| | 129 | | | 5.000%, 10/01/25 (e) | | | 125 | |
| | 1,600 | | | 5.625%, 11/01/24 (e) | | | 1,640 | |
| | EUR 2,850 | | | UPC Holding B.V., Reg. S, 6.375%, 09/15/22 | | | 3,448 | |
| | EUR 1,650 | | | Ziggo Bond Finance B.V., Reg. S, 4.625%, 01/15/25 | | | 1,759 | |
| | | | | | | | |
| | | | | | | 19,884 | |
| | | | | | | | |
| | | | Norway — 0.3% | |
| | EUR 2,700 | | | Lock A.S., Reg. S, 7.000%, 08/15/21 | | | 3,218 | |
| | | | | | | | |
| | | | Singapore — 0.0% (g) | |
| | 200 | | | Flextronics International Ltd., 5.000%, 02/15/23 | | | 201 | |
| | | | | | | | |
| | | | South Korea — 0.3% | |
| | | | Woori Bank, | | | | |
| | 3,700 | | | 4.750%, 04/30/24 (e) | | | 3,810 | |
| | | | | | | | |
| | | | | | | 3,810 | |
| | | | | | | | |
SEE NOTES TO FINANCIAL STATEMENTS.
| | | | | | | | |
| | | |
| AUGUST 31, 2015 | | J.P. MORGAN INCOME FUNDS | | | | | 13 | |
JPMorgan Global Bond Opportunities Fund
SCHEDULE OF PORTFOLIO INVESTMENTS
AS OF AUGUST 31, 2015 (continued)
(Amounts in U.S. Dollars, unless otherwise noted)
(Amounts in thousands)
| | | | | | | | |
PRINCIPAL
AMOUNT | | | SECURITY DESCRIPTION | | VALUE | |
| Corporate Bonds — continued | |
| | | | Spain — 0.2% | |
| | EUR 800 | | | CaixaBank S.A., VAR, 5.000%, 11/14/23 | | | 947 | |
| | EUR 1,400 | | | Campofrio Food Group S.A., Reg. S, 3.375%, 03/15/22 | | | 1,555 | |
| | | | | | | | |
| | | | | | | 2,502 | |
| | | | | | | | |
| | | | Sweden — 0.3% | |
| | EUR 750 | | | Dometic Group AB, 9.500% (cash), Reg. S, 06/26/19 (v) | | | 859 | |
| | EUR 1,000 | | | TVN Finance Corp. III AB, Reg. S, 7.375%, 12/15/20 | | | 1,212 | |
| | EUR 1,550 | | | Volvo Treasury AB, VAR, 4.200%, 06/10/75 | | | 1,743 | |
| | | | | | | | |
| | | | | | | 3,814 | |
| | | | | | | | |
| | | | Switzerland — 0.7% | |
| | | | Credit Suisse AG, | | | | |
| | 1,938 | | | 6.500%, 08/08/23 (e) | | | 2,131 | |
| | EUR 1,350 | | | VAR, 5.750%, 09/18/25 | | | 1,703 | |
| | | | UBS AG, | | | | |
| | 1,404 | | | 5.125%, 05/15/24 | | | 1,404 | |
| | 650 | | | Reg. S, VAR, 4.750%, 05/22/23 | | | 662 | |
| | EUR 1,505 | | | VAR, 4.750%, 02/12/26 | | | 1,807 | |
| | | | | | | | |
| | | | | | | 7,707 | |
| | | | | | | | |
| | | | United Kingdom — 5.0% | |
| | EUR 769 | | | Aviva plc, VAR, 6.125%, 07/05/43 | | | 1,016 | |
| | | | Barclays Bank plc, | | | | |
| | 1,550 | | | 7.625%, 11/21/22 | | | 1,767 | |
| | 1,550 | | | VAR, 7.750%, 04/10/23 | | | 1,674 | |
| | GBP 1,950 | | | Boparan Finance plc, Reg. S, 5.250%, 07/15/19 | | | 2,876 | |
| | 915 | | | BP Capital Markets plc, 3.062%, 03/17/22 | | | 908 | |
| | EUR 2,200 | | | EC Finance plc, Reg. S, 5.125%, 07/15/21 | | | 2,530 | |
| | GBP 1,100 | | | Galaxy Bidco Ltd., Reg. S, 6.375%, 11/15/20 | | | 1,706 | |
| | GBP 550 | | | Heathrow Finance plc, 7.125%, 03/01/17 | | | 888 | |
| | EUR 2,150 | | | Ineos Finance plc, Reg. S, 4.000%, 05/01/23 | | | 2,316 | |
| | | | International Game Technology plc, | | | | |
| | 975 | | | 6.250%, 02/15/22 (e) | | | 938 | |
| | EUR 1,500 | | | Reg. S, 4.125%, 02/15/20 | | | 1,675 | |
| | | | Jaguar Land Rover Automotive plc, | | | | |
| | 500 | | | 4.125%, 12/15/18 (e) | | | 501 | |
| | 200 | | | 4.250%, 11/15/19 (e) | | | 199 | |
| | GBP 2,000 | | | Reg. S, 5.000%, 02/15/22 | | | 3,077 | |
| | | | Matalan Finance plc, | | | | |
| | GBP 450 | | | 6.875%, 06/01/19 (e) | | | 649 | |
| | GBP 750 | | | Reg. S, 6.875%, 06/01/19 | | | 1,082 | |
| | GBP 300 | | | Reg. S, 8.875%, 06/01/20 | | | 399 | |
| | | | | | | | |
PRINCIPAL
AMOUNT | | | SECURITY DESCRIPTION | | VALUE | |
| | | | | | | | |
| | | | United Kingdom — continued | |
| EUR | 1,750 | | | Merlin Entertainments plc, Reg. S, 2.750%, 03/15/22 | | | 1,878 | |
| GBP | 1,200 | | | New Look Secured Issuer plc, Reg. S, 6.500%, 07/01/22 | | | 1,777 | |
| GBP | 710 | | | NGG Finance plc, Reg. S, VAR, 5.625%, 06/18/73 | | | 1,155 | |
| GBP | 1,500 | | | Odeon & UCI Finco plc, Reg. S, 9.000%, 08/01/18 | | | 2,382 | |
| EUR | 1,450 | | | OTE plc, 3.500%, 07/09/20 | | | 1,420 | |
| GBP | 975 | | | Pizzaexpress Financing 1 plc, Reg. S, 8.625%, 08/01/22 | | | 1,539 | |
| GBP | 1,450 | | | Pizzaexpress Financing 2 plc, Reg. S, 6.625%, 08/01/21 | | | 2,276 | |
| GBP | 1,500 | | | Priory Group No. 3 plc, Reg. S, 8.875%, 02/15/19 | | | 2,377 | |
| | | | R&R Ice Cream plc, | | | | |
| GBP | 600 | | | 5.500%, 05/15/20 (e) | | | 937 | |
| GBP | 1,250 | | | Reg. S, 5.500%, 05/15/20 | | | 1,952 | |
| | 1,645 | | | Royal Bank of Scotland Group plc, 6.125%, 12/15/22 | | | 1,773 | |
| | 2,256 | | | Santander UK plc, 5.000%, 11/07/23 (e) | | | 2,340 | |
| | 600 | | | Sea Trucks Group Ltd., Reg. S, 9.000%, 03/26/18 (e) | | | 442 | |
| GBP | 2,030 | | | Tesco plc, 5.000%, 03/24/23 | | | 3,110 | |
| | 200 | | | Virgin Media Finance plc, 5.750%, 01/15/25 (e) | | | 201 | |
| GBP | 2,835 | | | Virgin Media Secured Finance plc, Reg. S, 6.000%, 04/15/21 | | | 4,493 | |
| GBP | 1,475 | | | Vougeot Bidco plc, Reg. S, 7.875%, 07/15/20 | | | 2,410 | |
| | | | | | | | |
| | | | | | | 56,663 | |
| | | | | | | | |
| | | | United States — 24.2% | |
| | | | Acadia Healthcare Co., Inc., | | | | |
| | 55 | | | 5.625%, 02/15/23 | | | 56 | |
| | 100 | | | 6.125%, 03/15/21 | | | 103 | |
| | 530 | | | ACCO Brands Corp., 6.750%, 04/30/20 | | | 556 | |
| | 307 | | | ACE Cash Express, Inc., 11.000%, 02/01/19 (e) | | | 120 | |
| | 75 | | | Activision Blizzard, Inc., 5.625%, 09/15/21 (e) | | | 79 | |
| | | | ADT Corp. (The), | | | | |
| | 552 | | | 4.125%, 06/15/23 | | | 506 | |
| | 400 | | | 6.250%, 10/15/21 | | | 413 | |
| | | | Advanced Micro Devices, Inc., | | | | |
| | 225 | | | 6.750%, 03/01/19 | | | 159 | |
| | 369 | | | 7.000%, 07/01/24 | | | 238 | |
| | 11 | | | 7.500%, 08/15/22 | | | 7 | |
SEE NOTES TO FINANCIAL STATEMENTS.
| | | | | | |
| | | |
| 14 | | | | J.P. MORGAN INCOME FUNDS | | AUGUST 31, 2015 |
| | | | | | | | |
PRINCIPAL
AMOUNT | | | SECURITY DESCRIPTION | | VALUE | |
| Corporate Bonds — continued | |
| | | | United States — continued | |
| | | | AECOM, | | | | |
| | 365 | | | 5.750%, 10/15/22 (e) | | | 365 | |
| | 125 | | | 5.875%, 10/15/24 (e) | | | 126 | |
| | 500 | | | AES Corp., 5.500%, 04/15/25 | | | 470 | |
| | 250 | | | AK Steel Corp., 8.750%, 12/01/18 | | | 250 | |
| | 130 | | | Alabama Power Co., 4.150%, 08/15/44 | | | 123 | |
| | 370 | | | Albertson’s Holdings LLC/Safeway, Inc., 7.750%, 10/15/22 (e) | | | 396 | |
| | 15 | | | Alcatel-Lucent USA, Inc., 6.450%, 03/15/29 | | | 16 | |
| | | | Alcoa, Inc., | | | | |
| | 725 | | | 5.125%, 10/01/24 | | | 711 | |
| | 250 | | | 5.400%, 04/15/21 | | | 257 | |
| | 300 | | | 5.900%, 02/01/27 | | | 300 | |
| | 250 | | | Aleris International, Inc., 7.875%, 11/01/20 | | | 242 | |
| | 156 | | | Alliance Data Systems Corp., 5.375%, 08/01/22 (e) | | | 154 | |
| | | | Ally Financial, Inc., | | | | |
| | 1,420 | | | 4.125%, 03/30/20 | | | 1,424 | |
| | 970 | | | 4.625%, 03/30/25 | | | 936 | |
| | 250 | | | 4.750%, 09/10/18 | | | 258 | |
| | 240 | | | 8.000%, 12/31/18 | | | 266 | |
| | 365 | | | 8.000%, 11/01/31 | | | 432 | |
| | 165 | | | Altria Group, Inc., 4.250%, 08/09/42 | | | 147 | |
| | | | AMC Entertainment, Inc., | | | | |
| | 500 | | | 5.750%, 06/15/25 | | | 498 | |
| | 230 | | | 5.875%, 02/15/22 | | | 233 | |
| | 1,105 | | | American Airlines 2015-1 Class B Pass-Through Trust, 3.700%, 05/01/23 | | | 1,086 | |
| | | | American Axle & Manufacturing, Inc., | | | | |
| | 500 | | | 6.250%, 03/15/21 | | | 510 | |
| | 448 | | | 6.625%, 10/15/22 | | | 457 | |
| | 325 | | | American International Group, Inc., 6.250%, 03/15/37 | | | 354 | |
| | 900 | �� | | AmeriGas Partners LP/AmeriGas Finance Corp., 6.250%, 08/20/19 | | | 920 | |
| | | | Amkor Technology, Inc., | | | | |
| | 1,015 | | | 6.375%, 10/01/22 | | | 987 | |
| | 850 | | | 6.625%, 06/01/21 | | | 839 | |
| | 100 | | | Amsurg Corp., 5.625%, 11/30/20 | | | 102 | |
| | 500 | | | Antero Resources Corp., 5.375%, 11/01/21 | | | 460 | |
| | 1,633 | | | Argos Merger Sub, Inc., 7.125%, 03/15/23 (e) | | | 1,711 | |
| | 1,425 | | | Ashland, Inc., 4.750%, 08/15/22 | | | 1,414 | |
| | | | Ashtead Capital, Inc., | | | | |
| | 300 | | | 5.625%, 10/01/24 (e) | | | 298 | |
| | 1,000 | | | 6.500%, 07/15/22 (e) | | | 1,040 | |
| | | | | | | | |
PRINCIPAL
AMOUNT | | | SECURITY DESCRIPTION | | VALUE | |
| | | | | | | | |
| | | | United States — continued | |
| | | | AT&T, Inc., | | | | |
| | 2,630 | | | 3.400%, 05/15/25 | | | 2,506 | |
| | 1,325 | | | 4.300%, 12/15/42 | | | 1,129 | |
| | | | Audatex North America, Inc., | | | | |
| | 714 | | | 6.000%, 06/15/21 (e) | | | 697 | |
| | 520 | | | 6.125%, 11/01/23 (e) | | | 516 | |
| | | | Avaya, Inc., | | | | |
| | 60 | | | 7.000%, 04/01/19 (e) | | | 54 | |
| | 221 | | | 10.500%, 03/01/21 (e) | | | 146 | |
| | | | Avis Budget Car Rental LLC/Avis Budget Finance, Inc., | | | | |
| | 17 | | | 5.125%, 06/01/22 (e) | | | 17 | |
| | 135 | | | 5.250%, 03/15/25 (e) | | | 128 | |
| | 1,795 | | | 5.500%, 04/01/23 | | | 1,780 | |
| EUR | 500 | | | Axalta Coating Systems US Holdings, Inc./Axalta Coating Systems Dutch Holding B B.V., Reg. S, 5.750%, 02/01/21 | | | 584 | |
| | 1,040 | | | Bank of America Corp., 4.250%, 10/22/26 | | | 1,024 | |
| | 25 | | | Basic Energy Services, Inc., 7.750%, 02/15/19 | | | 16 | |
| | 400 | | | Berry Plastics Corp., 5.500%, 05/15/22 | | | 387 | |
| | 279 | | | Blue Racer Midstream LLC/Blue Racer Finance Corp., 6.125%, 11/15/22 (e) | | | 273 | |
| | 235 | | | BlueLine Rental Finance Corp., 7.000%, 02/01/19 (e) | | | 222 | |
| | 82 | | | Boyd Gaming Corp., 6.875%, 05/15/23 | | | 84 | |
| | 500 | | | BreitBurn Energy Partners LP/BreitBurn Finance Corp., 7.875%, 04/15/22 | | | 212 | |
| | 231 | | | Building Materials Corp. of America, 5.375%, 11/15/24 (e) | | | 231 | |
| | 157 | | | Bumble Bee Holdings, Inc., 9.000%, 12/15/17 (e) | | | 161 | |
| | 1,340 | | | Burlington Northern Santa Fe LLC, 4.550%, 09/01/44 | | | 1,294 | |
| | | | Cablevision Systems Corp., | | | | |
| | 233 | | | 7.750%, 04/15/18 | | | 251 | |
| | 848 | | | 8.000%, 04/15/20 | | | 918 | |
| | 250 | | | Caesars Entertainment Operating Co., Inc., 8.500%, 02/15/20 (d) | | | 209 | |
| | | | California Resources Corp., | | | | |
| | 418 | | | 5.500%, 09/15/21 | | | 324 | |
| | 795 | | | 6.000%, 11/15/24 | | | 590 | |
| | 1,500 | | | Calpine Corp., 6.000%, 01/15/22 (e) | | | 1,596 | |
| | 400 | | | Casella Waste Systems, Inc., 7.750%, 02/15/19 | | | 399 | |
| | | | CCO Holdings LLC/CCO Holdings Capital Corp., | | | | |
| | 39 | | | 5.375%, 05/01/25 (e) | | | 38 | |
SEE NOTES TO FINANCIAL STATEMENTS.
| | | | | | | | |
| | | |
| AUGUST 31, 2015 | | J.P. MORGAN INCOME FUNDS | | | | | 15 | |
JPMorgan Global Bond Opportunities Fund
SCHEDULE OF PORTFOLIO INVESTMENTS
AS OF AUGUST 31, 2015 (continued)
(Amounts in U.S. Dollars, unless otherwise noted)
(Amounts in thousands)
| | | | | | | | |
PRINCIPAL
AMOUNT | | | SECURITY DESCRIPTION | | VALUE | |
| Corporate Bonds — continued | |
| | | | United States — continued | |
| | 1,905 | | | 5.750%, 09/01/23 | | | 1,943 | |
| | 831 | | | 6.500%, 04/30/21 | | | 868 | |
| | 1,500 | | | 6.625%, 01/31/22 | | | 1,579 | |
| | 300 | | | 7.375%, 06/01/20 | | | 313 | |
| | | | CCO Safari II LLC, | | | | |
| | 328 | | | 4.464%, 07/23/22 (e) | | | 327 | |
| | 73 | | | 4.908%, 07/23/25 (e) | | | 72 | |
| | 176 | | | 6.384%, 10/23/35 (e) | | | 179 | |
| | 1,085 | | | 6.484%, 10/23/45 (e) | | | 1,104 | |
| | | | CDW LLC/CDW Finance Corp., | | | | |
| | 48 | | | 5.000%, 09/01/23 | | | 48 | |
| | 165 | | | 5.500%, 12/01/24 | | | 163 | |
| | 450 | | | Cemex Finance LLC, 9.375%, 10/12/22 (e) | | | 501 | |
| | 201 | | | Centene Corp., 4.750%, 05/15/22 | | | 204 | |
| | | | CenturyLink, Inc., | | | | |
| | 178 | | | 5.625%, 04/01/25 (e) | | | 159 | |
| | 200 | | | Series T, 5.800%, 03/15/22 | | | 190 | |
| | 1,345 | | | 6.750%, 12/01/23 | | | 1,308 | |
| | | | Cequel Communications Holdings I LLC/Cequel Capital Corp., | | | | |
| | 199 | | | 5.125%, 12/15/21 (e) | | | 182 | |
| | 1,025 | | | Chesapeake Energy Corp., 6.625%, 08/15/20 | | | 817 | |
| | 65 | | | Chinos Intermediate Holdings A, Inc., 7.750% (cash), 05/01/19 (e) (v) | | | 28 | |
| | 204 | | | Chiquita Brands International, Inc./Chiquita Brands LLC, 7.875%, 02/01/21 | | | 220 | |
| | | | CHS/Community Health Systems, Inc., | | | | |
| | 200 | | | 5.125%, 08/01/21 | | | 205 | |
| | 200 | | | 6.875%, 02/01/22 | | | 213 | |
| | 135 | | | Cincinnati Bell, Inc., 8.375%, 10/15/20 | | | 141 | |
| | 90 | | | Cinemark USA, Inc., 5.125%, 12/15/22 | | | 90 | |
| | | | CIT Group, Inc., | | | | |
| | 29 | | | 3.875%, 02/19/19 | | | 29 | |
| | 1,220 | | | 5.000%, 08/15/22 | | | 1,240 | |
| | 491 | | | 5.250%, 03/15/18 | | | 510 | |
| | 400 | | | 5.375%, 05/15/20 | | | 418 | |
| | 1,495 | | | 5.500%, 02/15/19 (e) | | | 1,571 | |
| | 200 | | | Citgo Holding, Inc., 10.750%, 02/15/20 (e) | | | 197 | |
| | 2,690 | | | Citigroup, Inc., 2.400%, 02/18/20 | | | 2,666 | |
| | | | Claire’s Stores, Inc., | | | | |
| | 250 | | | 6.125%, 03/15/20 (e) | | | 195 | |
| | 68 | | | 8.875%, 03/15/19 | | | 29 | |
| | 880 | | | 9.000%, 03/15/19 (e) | | | 746 | |
| | | | Clear Channel Worldwide Holdings, Inc., | | | | |
| | 2,080 | | | Series B, 6.500%, 11/15/22 | | | 2,149 | |
| | 1,675 | | | Series B, 7.625%, 03/15/20 | | | 1,733 | |
| | | | | | | | |
PRINCIPAL
AMOUNT | | | SECURITY DESCRIPTION | | VALUE | |
| | | | | | | | |
| | | | United States — continued | |
| | 100 | | | Clearwater Paper Corp., 4.500%, 02/01/23 | | | 95 | |
| | | | Cloud Peak Energy Resources LLC/Cloud Peak Energy Finance Corp., | | | | |
| | 99 | | | 6.375%, 03/15/24 | | | 57 | |
| | 26 | | | 8.500%, 12/15/19 | | | 18 | |
| | 155 | | | CNG Holdings, Inc., 9.375%, 05/15/20 (e) | | | 89 | |
| | 367 | | | Coeur Mining, Inc., 7.875%, 02/01/21 | | | 234 | |
| | 500 | | | Cogent Communications Finance, Inc., 5.625%, 04/15/21 (e) | | | 469 | |
| | 600 | | | Cogent Communications Group, Inc., 5.375%, 03/01/22 (e) | | | 580 | |
| | 1,750 | | | Comcast Corp., 3.375%, 02/15/25 | | | 1,740 | |
| | | | Commercial Metals Co., | | | | |
| | 200 | | | 4.875%, 05/15/23 | | | 177 | |
| | 75 | | | 7.350%, 08/15/18 | | | 80 | |
| | 1,000 | | | CommScope Technologies Finance LLC, 6.000%, 06/15/25 (e) | | | 972 | |
| | 190 | | | CommScope, Inc., 5.500%, 06/15/24 (e) | | | 185 | |
| | | | Comstock Resources, Inc., | | | | |
| | 150 | | | 9.500%, 06/15/20 | | | 49 | |
| | 562 | | | 10.000%, 03/15/20 (e) | | | 451 | |
| | 530 | | | Concho Resources, Inc., 5.500%, 04/01/23 | | | 524 | |
| | 450 | | | CONSOL Energy, Inc., 5.875%, 04/15/22 | | | 322 | |
| | 175 | | | Consolidated Communications, Inc., 6.500%, 10/01/22 (e) | | | 162 | |
| | 17 | | | Constellation Brands, Inc., 4.750%, 11/15/24 | | | 17 | |
| | 137 | | | Continental Airlines 2007-1 Class A Pass-Through Trust, 5.983%, 04/19/22 | | | 152 | |
| | 1,300 | | | Corrections Corp. of America, 4.625%, 05/01/23 | | | 1,274 | |
| | 733 | | | Cott Beverages, Inc., 6.750%, 01/01/20 | | | 760 | |
| | 261 | | | Crestwood Midstream Partners LP/Crestwood Midstream Finance Corp., 6.125%, 03/01/22 | | | 238 | |
| | 260 | | | Crown Castle International Corp., 5.250%, 01/15/23 | | | 272 | |
| | 365 | | | CSC Holdings LLC, 6.750%, 11/15/21 | | | 383 | |
| | 80 | | | CSI Compressco LP/Compressco Finance, Inc., 7.250%, 08/15/22 | | | 66 | |
| | 1,195 | | | CVS Health Corp., 5.300%, 12/05/43 | | | 1,288 | |
| | | | Dana Holding Corp., | | | | |
| | 1,000 | | | 5.500%, 12/15/24 | | | 983 | |
| | 600 | | | 6.000%, 09/15/23 | | | 604 | |
| | 210 | | | Darling Ingredients, Inc., 5.375%, 01/15/22 | | | 207 | |
| | 151 | | | DCP Midstream Operating LP, 3.875%, 03/15/23 | | | 124 | |
SEE NOTES TO FINANCIAL STATEMENTS.
| | | | | | |
| | | |
| 16 | | | | J.P. MORGAN INCOME FUNDS | | AUGUST 31, 2015 |
| | | | | | | | |
PRINCIPAL
AMOUNT | | | SECURITY DESCRIPTION | | VALUE | |
| Corporate Bonds — continued | |
| | | | United States — continued | |
| | 312 | | | Dean Foods Co., 6.500%, 03/15/23 (e) | | | 315 | |
| | 1,053 | | | Denali Borrower LLC/Denali Finance Corp., 5.625%, 10/15/20 (e) | | | 1,079 | |
| | 835 | | | Denbury Resources, Inc., 4.625%, 07/15/23 | | | 559 | |
| | 455 | | | Diamondback Energy, Inc., 7.625%, 10/01/21 | | | 478 | |
| | | | DISH DBS Corp., | | | | |
| | 1,170 | | | 5.875%, 07/15/22 | | | 1,106 | |
| | 950 | | | 5.875%, 11/15/24 | | | 866 | |
| | 1,766 | | | 6.750%, 06/01/21 | | | 1,773 | |
| | 210 | | | 7.875%, 09/01/19 | | | 228 | |
| | 500 | | | DJO Finco, Inc./DJO Finance LLC/DJO Finance Corp., 8.125%, 06/15/21 (e) | | | 517 | |
| | 1,155 | | | Dominion Resources, Inc., 3.625%, 12/01/24 | | | 1,142 | |
| | 110 | | | DS Services of America, Inc., 10.000%, 09/01/21 (e) | | | 128 | |
| | 4 | | | DuPont Fabros Technology LP, 5.875%, 09/15/21 | | | 4 | |
| | | | Dynegy, Inc., | | | | |
| | 115 | | | 6.750%, 11/01/19 | | | 119 | |
| | 615 | | | 7.375%, 11/01/22 | | | 637 | |
| | 35 | | | 7.625%, 11/01/24 | | | 36 | |
| | 203 | | | E*TRADE Financial Corp., 5.375%, 11/15/22 | | | 212 | |
| | 175 | | | Eagle Spinco, Inc., 4.625%, 02/15/21 | | | 171 | |
| | 1,063 | | | Embarq Corp., 7.995%, 06/01/36 | | | 1,124 | |
| | 565 | | | Emdeon, Inc., 11.000%, 12/31/19 | | | 607 | |
| | 1,294 | | | Energizer Holdings, Inc., 5.500%, 06/15/25 (e) | | | 1,260 | |
| | 75 | | | EnerSys, 5.000%, 04/30/23 (e) | | | 72 | |
| | | | EP Energy LLC/Everest Acquisition Finance, Inc., | | | | |
| | 400 | | | 7.750%, 09/01/22 | | | 368 | |
| | 1,300 | | | 9.375%, 05/01/20 | | | 1,259 | |
| | | | Equinix, Inc., | | | | |
| | 38 | | | 5.375%, 01/01/22 | | | 38 | |
| | 300 | | | 5.375%, 04/01/23 | | | 301 | |
| | 27 | | | 5.750%, 01/01/25 | | | 27 | |
| | | | EXCO Resources, Inc., | | | | |
| | 200 | | | 7.500%, 09/15/18 | | | 71 | |
| | 150 | | | 8.500%, 04/15/22 | | | 42 | |
| | 500 | | | FCA U.S. LLC/CG Co-Issuer, Inc., 8.250%, 06/15/21 | | | 536 | |
| | 151 | | | Fidelity & Guaranty Life Holdings, Inc., 6.375%, 04/01/21 (e) | | | 157 | |
| | | | First Data Corp., | | | | |
| | 391 | | | 6.750%, 11/01/20 (e) | | | 412 | |
| | 410 | | | 7.375%, 06/15/19 (e) | | | 425 | |
| | 2,712 | | | 8.250%, 01/15/21 (e) | | | 2,854 | |
| | | | | | | | |
PRINCIPAL
AMOUNT | | | SECURITY DESCRIPTION | | VALUE | |
| | | | | | | | |
| | | | United States — continued | |
| | 251 | | | 11.750%, 08/15/21 | | | 283 | |
| | 335 | | | 12.625%, 01/15/21 | | | 385 | |
| | 550 | | | 8.750%, 01/15/22 (e) | | | 579 | |
| | 385 | | | FirstEnergy Transmission LLC, 5.450%, 07/15/44 (e) | | | 399 | |
| | 2,000 | | | Ford Motor Credit Co. LLC, 3.664%, 09/08/24 | | | 1,934 | |
| | 2,740 | | | Freeport-McMoRan, Inc., 3.550%, 03/01/22 | | | 2,110 | |
| | 12 | | | Freescale Semiconductor, Inc., 6.000%, 01/15/22 (e) | | | 13 | |
| | | | Fresenius Medical Care U.S. Finance II, Inc., | | | | |
| | 420 | | | 4.125%, 10/15/20 (e) | | | 427 | |
| | 295 | | | 4.750%, 10/15/24 (e) | | | 296 | |
| | 250 | | | 5.875%, 01/31/22 (e) | | | 270 | |
| | | | Frontier Communications Corp., | | | | |
| | 250 | | | 6.250%, 09/15/21 | | | 228 | |
| | 70 | | | 8.125%, 10/01/18 | | | 76 | |
| | 273 | | | 8.500%, 04/15/20 | | | 280 | |
| | 142 | | | 8.750%, 04/15/22 | | | 140 | |
| | 370 | | | 9.250%, 07/01/21 | | | 380 | |
| | 1,000 | | | Gannett Co., Inc., 6.375%, 10/15/23 | | | 1,047 | |
| | | | General Electric Capital Corp., | | | | |
| | 2,610 | | | 3.450%, 05/15/24 | | | 2,662 | |
| | 1,315 | | | VAR, 6.375%, 11/15/67 | | | 1,404 | |
| | 125 | | | GenOn Energy, Inc., 9.875%, 10/15/20 | | | 118 | |
| | 1,000 | | | GEO Group, Inc. (The), 6.625%, 02/15/21 | | | 1,042 | |
| | | | Goldman Sachs Group, Inc. (The), | | | | |
| | 1,850 | | | 3.850%, 07/08/24 | | | 1,869 | |
| | 1,200 | | | 5.150%, 05/22/45 | | | 1,186 | |
| | 35 | | | Goodman Networks, Inc., 12.125%, 07/01/18 | | | 13 | |
| | | | Goodyear Tire & Rubber Co. (The), | | | | |
| | 475 | | | 7.000%, 05/15/22 | | | 505 | |
| | 292 | | | 8.250%, 08/15/20 | | | 304 | |
| | 1,000 | | | 8.750%, 08/15/20 | | | 1,191 | |
| | 575 | | | Gray Television, Inc., 7.500%, 10/01/20 | | | 595 | |
| | 300 | | | Halcon Resources Corp., 9.250%, 02/15/22 | | | 99 | |
| | | | Harland Clarke Holdings Corp., | | | | |
| | 150 | | | 6.875%, 03/01/20 (e) | | | 139 | |
| | 10 | | | 9.250%, 03/01/21 (e) | | | 8 | |
| | | | HCA, Inc., | | | | |
| | 300 | | | 5.000%, 03/15/24 | | | 307 | |
| | 1,125 | | | 5.375%, 02/01/25 | | | 1,142 | |
| | 100 | | | 6.500%, 02/15/20 | | | 110 | |
| | 2,275 | | | 7.500%, 02/15/22 | | | 2,610 | |
| | | | HD Supply, Inc., | | | | |
| | 1,250 | | | 5.250%, 12/15/21 (e) | | | 1,284 | |
SEE NOTES TO FINANCIAL STATEMENTS.
| | | | | | | | |
| | | |
| AUGUST 31, 2015 | | J.P. MORGAN INCOME FUNDS | | | | | 17 | |
JPMorgan Global Bond Opportunities Fund
SCHEDULE OF PORTFOLIO INVESTMENTS
AS OF AUGUST 31, 2015 (continued)
(Amounts in U.S. Dollars, unless otherwise noted)
(Amounts in thousands)
| | | | | | | | |
PRINCIPAL
AMOUNT | | | SECURITY DESCRIPTION | | VALUE | |
| Corporate Bonds — continued | |
| | | | United States — continued | |
| | 200 | | | 7.500%, 07/15/20 | | | 214 | |
| | 600 | | | Headwaters, Inc., 7.250%, 01/15/19 | | | 624 | |
| | | | HealthSouth Corp., | | | | |
| | 250 | | | 5.125%, 03/15/23 | | | 248 | |
| | 174 | | | 5.750%, 11/01/24 | | | 176 | |
| | 375 | | | Hecla Mining Co., 6.875%, 05/01/21 | | | 300 | |
| | | | Hertz Corp. (The), | | | | |
| | 250 | | | 6.250%, 10/15/22 | | | 254 | |
| | 2,367 | | | 7.375%, 01/15/21 | | | 2,468 | |
| | | | Hexion, Inc., | | | | |
| | 2,670 | | | 6.625%, 04/15/20 | | | 2,490 | |
| | 163 | | | 10.000%, 04/15/20 | | | 166 | |
| | | | Hilcorp Energy I LP/Hilcorp Finance Co., | | | | |
| | 675 | | | 5.000%, 12/01/24 (e) | | | 584 | |
| | 125 | | | 7.625%, 04/15/21 (e) | | | 128 | |
| | 250 | | | Huntington Ingalls Industries, Inc., 5.000%, 12/15/21 (e) | | | 258 | |
| | | | Huntsman International LLC, | | | | |
| | 550 | | | 4.875%, 11/15/20 | | | 539 | |
| | 400 | | | 5.125%, 11/15/22 (e) | | | 380 | |
| | 600 | | | IASIS Healthcare LLC/IASIS Capital Corp., 8.375%, 05/15/19 | | | 622 | |
| | 681 | | | Icahn Enterprises LP/Icahn Enterprises Finance Corp., 5.875%, 02/01/22 | | | 688 | |
| | 525 | | | iHeartCommunications, Inc., 9.000%, 12/15/19 | | | 494 | |
| | 30 | | | IHS, Inc., 5.000%, 11/01/22 | | | 30 | |
| | 500 | | | ILFC E-Capital Trust I, VAR, 4.690%, 12/21/65 (e) | | | 470 | |
| | 535 | | | ILFC E-Capital Trust II, VAR, 6.250%, 12/21/65 (e) | | | 505 | |
| | 1,050 | | | IMS Health, Inc., 6.000%, 11/01/20 (e) | | | 1,079 | |
| | 1,500 | | | Infor Software Parent LLC/Infor Software Parent, Inc., 7.125% (cash), 05/01/21 (e) (v) | | | 1,359 | |
| | 400 | | | Infor U.S., Inc., 6.500%, 05/15/22 (e) | | | 375 | |
| | 825 | | | Intel Corp., 4.900%, 07/29/45 | | | 849 | |
| | | | International Lease Finance Corp., | | | | |
| | 1,235 | | | 3.875%, 04/15/18 | | | 1,241 | |
| | 650 | | | 4.625%, 04/15/21 | | | 661 | |
| | 870 | | | 5.875%, 08/15/22 | | | 939 | |
| | 515 | | | 6.250%, 05/15/19 | | | 555 | |
| | 320 | | | International Wire Group Holdings, Inc., 8.500%, 10/15/17 (e) | | | 330 | |
| | 515 | | | Iron Mountain, Inc., 5.750%, 08/15/24 | | | 517 | |
| | | | | | | | |
PRINCIPAL
AMOUNT | | | SECURITY DESCRIPTION | | VALUE | |
| | | | | | | | |
| | | | United States — continued | |
| | | | Isle of Capri Casinos, Inc., | | | | |
| | 135 | | | 5.875%, 03/15/21 | | | 139 | |
| | 100 | | | 8.875%, 06/15/20 | | | 107 | |
| | 15 | | | Jarden Corp., 7.500%, 05/01/17 | | | 16 | |
| | | | JBS USA LLC/JBS USA Finance, Inc., | | | | |
| | 236 | | | 5.750%, 06/15/25 (e) | | | 229 | |
| | 1,137 | | | 5.875%, 07/15/24 (e) | | | 1,135 | |
| | 545 | | | 7.250%, 06/01/21 (e) | | | 568 | |
| | 260 | | | 8.250%, 02/01/20 (e) | | | 273 | |
| | 435 | | | Jones Energy Holdings LLC/Jones Energy Finance Corp., 6.750%, 04/01/22 | | | 370 | |
| | 260 | | | Jurassic Holdings III, Inc., 6.875%, 02/15/21 (e) | | | 183 | |
| | 5 | | | K. Hovnanian Enterprises, Inc., 11.875%, 10/15/15 | | | 5 | |
| | 1,260 | | | Kinder Morgan, Inc., 4.300%, 06/01/25 | | | 1,163 | |
| | 650 | | | Kindred Healthcare, Inc., 8.750%, 01/15/23 (e) | | | 728 | |
| | 1,000 | | | Kinetic Concepts, Inc./KCI USA, Inc., 10.500%, 11/01/18 | | | 1,055 | |
| EUR
950 |
| | Kloeckner Pentaplast of America, Inc., Reg. S, 7.125%, 11/01/20 | | | 1,078 | |
| | | | Kraft Heinz Foods Co., | | | | |
| | 357 | | | 4.875%, 02/15/25 (e) | | | 385 | |
| | 1,035 | | | 5.200%, 07/15/45 (e) | | | 1,088 | |
| | 50 | | | Lamar Media Corp., 5.875%, 02/01/22 | | | 52 | |
| | | | Lennar Corp., | | | | |
| | 125 | | | 4.500%, 06/15/19 | | | 128 | |
| | 225 | | | Series B, 12.250%, 06/01/17 | | | 260 | |
| | | | Level 3 Communications, Inc., | | | | |
| | 1,488 | | | 5.750%, 12/01/22 | | | 1,484 | |
| | | | Level 3 Financing, Inc., | | | | |
| | 103 | | | 5.125%, 05/01/23 (e) | | | 100 | |
| | 188 | | | 5.375%, 08/15/22 | | | 189 | |
| | 362 | | | 5.375%, 05/01/25 (e) | | | 350 | |
| | 48 | | | 5.625%, 02/01/23 | | | 48 | |
| | 800 | | | 7.000%, 06/01/20 | | | 842 | |
| | 5 | | | VAR, 3.914%, 01/15/18 | | | 5 | |
| | 250 | | | LIN Television Corp., 5.875%, 11/15/22 (e) | | | 249 | |
| | 800 | | | Linn Energy LLC/Linn Energy Finance Corp., 7.750%, 02/01/21 | | | 314 | |
| | 230 | | | M/I Homes, Inc., 8.625%, 11/15/18 | | | 238 | |
| | | | MarkWest Energy Partners LP/MarkWest Energy Finance Corp., | | | | |
| | 500 | | | 4.500%, 07/15/23 | | | 462 | |
| | 444 | | | 4.875%, 12/01/24 | | | 412 | |
| | 1,000 | | | 4.875%, 06/01/25 | | | 925 | |
SEE NOTES TO FINANCIAL STATEMENTS.
| | | | | | |
| | | |
| 18 | | | | J.P. MORGAN INCOME FUNDS | | AUGUST 31, 2015 |
| | | | | | | | |
PRINCIPAL
AMOUNT | | | SECURITY DESCRIPTION | | VALUE | |
| Corporate Bonds — continued | |
| | | | United States — continued | |
| | 124 | | | Masco Corp., 4.450%, 04/01/25 | | | 124 | |
| | 550 | | | MasTec, Inc., 4.875%, 03/15/23 | | | 451 | |
| | 75 | | | Memorial Resource Development Corp., 5.875%, 07/01/22 | | | 68 | |
| | 42 | | | Mercer International, Inc., 7.000%, 12/01/19 | | | 43 | |
| | | | Meritage Homes Corp., | | | | |
| | 150 | | | 7.000%, 04/01/22 | | | 160 | |
| | 75 | | | 7.150%, 04/15/20 | | | 81 | |
| | | | MetLife, Inc., | | | | |
| | 1,920 | | | 3.000%, 03/01/25 | | | 1,833 | |
| | 435 | | | 6.400%, 12/15/36 | | | 478 | |
| | | | MGM Resorts International, | | | | |
| | 500 | | | 5.250%, 03/31/20 | | | 503 | |
| | 920 | | | 6.000%, 03/15/23 | | | 934 | |
| | 295 | | | 6.750%, 10/01/20 | | | 314 | |
| | 1,545 | | | 7.750%, 03/15/22 | | | 1,711 | |
| | | | Micron Technology, Inc., | | | | |
| | 492 | | | 5.250%, 08/01/23 (e) | | | 459 | |
| | 35 | | | 5.500%, 02/01/25 | | | 32 | |
| | 1,750 | | | 5.875%, 02/15/22 | | | 1,724 | |
| | 1,390 | | | Microsoft Corp., 4.875%, 12/15/43 | | | 1,485 | |
| | 235 | | | Milacron LLC/Mcron Finance Corp., 7.750%, 02/15/21 (e) | | | 241 | |
| | | | Momentive Performance Materials, Inc., | | | | |
| | 350 | | | 3.880%, 10/24/21 | | | 299 | |
| | 350 | | | 8.875%, 10/15/20 (d) | | | — | |
| | 3,110 | | | Morgan Stanley, 3.700%, 10/23/24 | | | 3,108 | |
| | 846 | | | MPG Holdco I, Inc., 7.375%, 10/15/22 | | | 888 | |
| | 450 | | | MPH Acquisition Holdings LLC, 6.625%, 04/01/22 (e) | | | 462 | |
| | 155 | | | MSCI, Inc., 5.250%, 11/15/24 (e) | | | 158 | |
| | 65 | | | Mustang Merger Corp., 8.500%, 08/15/21 (e) | | | 68 | |
| | 500 | | | National Financial Partners Corp., 9.000%, 07/15/21 (e) | | | 490 | |
| | 530 | | | Nationstar Mortgage LLC/Nationstar Capital Corp., 6.500%, 07/01/21 | | | 467 | |
| | 577 | | | Navient Corp., 8.000%, 03/25/20 | | | 584 | |
| | 90 | | | Navios Maritime Acquisition Corp./Navios Acquisition Finance U.S., Inc., 8.125%, 11/15/21 (e) | | | 86 | |
| | 430 | | | Navios Maritime Holdings, Inc./Navios Maritime Finance II U.S., Inc., 7.375%, 01/15/22 (e) | | | 357 | |
| | 280 | | | Navios South American Logistics, Inc./Navios Logistics Finance U.S., Inc., 7.250%, 05/01/22 (e) | | | 258 | |
| | | | | | | | |
PRINCIPAL
AMOUNT | | | SECURITY DESCRIPTION | | VALUE | |
| | | | | | | | |
| | | | United States — continued | |
| | 29 | | | NCI Building Systems, Inc., 8.250%, 01/15/23 (e) | | | 30 | |
| | 5 | | | NCR Corp., 6.375%, 12/15/23 | | | 5 | |
| | 1,700 | | | Neiman Marcus Group Ltd. LLC, 8.000%, 10/15/21 (e) | | | 1,793 | |
| | | | Netflix, Inc., | | | | |
| | 300 | | | 5.500%, 02/15/22 (e) | | | 307 | |
| | 200 | | | 5.750%, 03/01/24 | | | 209 | |
| | | | New Albertsons, Inc., | | | | |
| | 197 | | | 7.450%, 08/01/29 | | | 191 | |
| | 53 | | | 8.000%, 05/01/31 | | | 53 | |
| | 22 | | | 8.700%, 05/01/30 | | | 23 | |
| | 620 | | | Newfield Exploration Co., 5.375%, 01/01/26 | | | 577 | |
| | | | Nexstar Broadcasting, Inc., | | | | |
| | 230 | | | 6.125%, 02/15/22 (e) | | | 232 | |
| | 665 | | | 6.875%, 11/15/20 | | | 698 | |
| | 1,585 | | | Nielsen Finance LLC/Nielsen Finance Co., 5.000%, 04/15/22 (e) | | | 1,563 | |
| | | | Noble Energy, Inc., | | | | |
| | 1,290 | | | 5.250%, 11/15/43 | | | 1,152 | |
| | 175 | | | 5.625%, 05/01/21 | | | 177 | |
| | 500 | | | 5.875%, 06/01/22 | | | 507 | |
| | 100 | | | 5.875%, 06/01/24 | | | 103 | |
| | | | NRG Energy, Inc., | | | | |
| | 500 | | | 7.875%, 05/15/21 | | | 516 | |
| | 500 | | | 8.250%, 09/01/20 | | | 516 | |
| | 55 | | | Nucor Corp., 5.200%, 08/01/43 | | | 56 | |
| | 5 | | | Oasis Petroleum, Inc., 6.875%, 03/15/22 | | | 4 | |
| | 200 | | | Ocean Rig UDW, Inc., 7.250%, 04/01/19 (e) | | | 104 | |
| | | | Omnicare, Inc., | | | | |
| | 280 | | | 4.750%, 12/01/22 | | | 298 | |
| | 190 | | | 5.000%, 12/01/24 | | | 204 | |
| | 1,455 | | | Oracle Corp., 4.500%, 07/08/44 | | | 1,461 | |
| | 8 | | | Orbital ATK, Inc., 5.250%, 10/01/21 | | | 8 | |
| | 44 | | | Oshkosh Corp., 5.375%, 03/01/25 | | | 44 | |
| | | | Outfront Media Capital LLC/Outfront Media Capital Corp., | | | | |
| | 5 | | | 5.250%, 02/15/22 | | | 5 | |
| | 150 | | | 5.625%, 02/15/24 | | | 154 | |
| | 303 | | | Par Pharmaceutical Cos., Inc., 7.375%, 10/15/20 | | | 322 | |
| | | | Parker Drilling Co., | | | | |
| | 150 | | | 6.750%, 07/15/22 | | | 117 | |
| | 50 | | | 7.500%, 08/01/20 | | | 42 | |
| | 675 | | | Party City Holdings, Inc., 8.875%, 08/01/20 | | | 720 | |
SEE NOTES TO FINANCIAL STATEMENTS.
| | | | | | | | |
| | | |
| AUGUST 31, 2015 | | J.P. MORGAN INCOME FUNDS | | | | | 19 | |
JPMorgan Global Bond Opportunities Fund
SCHEDULE OF PORTFOLIO INVESTMENTS
AS OF AUGUST 31, 2015 (continued)
(Amounts in U.S. Dollars, unless otherwise noted)
(Amounts in thousands)
| | | | | | | | |
PRINCIPAL
AMOUNT | | | SECURITY DESCRIPTION | | VALUE | |
| Corporate Bonds — continued | |
| | | | United States — continued | |
| | 284 | | | Peabody Energy Corp., 10.000%, 03/15/22 (e) | | | 114 | |
| | 300 | | | Penn Virginia Corp., 8.500%, 05/01/20 | | | 78 | |
| | 500 | | | Petco Animal Supplies, Inc., 9.250%, 12/01/18 (e) | | | 517 | |
| | 696 | | | Pilgrim’s Pride Corp., 5.750%, 03/15/25 (e) | | | 712 | |
| | 153 | | | Pittsburgh Glass Works LLC, 8.000%, 11/15/18 (e) | | | 159 | |
| | 1,000 | | | Plantronics, Inc., 5.500%, 05/31/23 (e) | | | 1,005 | |
| | 113 | | | Platform Specialty Products Corp., 6.500%, 02/01/22 (e) | | | 109 | |
| | 175 | | | PolyOne Corp., 5.250%, 03/15/23 | | | 171 | |
| | | | Post Holdings, Inc., | | | | |
| | 1,007 | | | 6.750%, 12/01/21 (e) | | | 1,015 | |
| | 1,500 | | | 7.375%, 02/15/22 | | | 1,537 | |
| | 1,630 | | | PPL Capital Funding, Inc., Series A, VAR, 6.700%, 03/30/67 | | | 1,390 | |
| | 10 | | | Prestige Brands, Inc., 5.375%, 12/15/21 (e) | | | 10 | |
| | 300 | | | Prince Mineral Holding Corp., 11.500%, 12/15/19 (e) | | | 258 | |
| | | | Prudential Financial, Inc., | | | | |
| | 660 | | | 4.600%, 05/15/44 | | | 645 | |
| | 235 | | | VAR, 5.875%, 09/15/42 | | | 248 | |
| | EUR 1,775 | | | PSPC Escrow Corp., Reg. S, 6.000%, 02/01/23 | | | 1,872 | |
| | | | QEP Resources, Inc., | | | | |
| | 75 | | | 5.250%, 05/01/23 | | | 65 | |
| | 515 | | | 5.375%, 10/01/22 | | | 444 | |
| | 15 | | | Quad/Graphics, Inc., 7.000%, 05/01/22 | | | 14 | |
| | 1,067 | | | QUALCOMM, Inc., 4.800%, 05/20/45 | | | 923 | |
| | | | Qwest Capital Funding, Inc., | | | | |
| | 24 | | | 6.875%, 07/15/28 | | | 22 | |
| | 11 | | | 7.750%, 02/15/31 | | | 11 | |
| | 50 | | | R.R. Donnelley & Sons Co., 7.625%, 06/15/20 | | | 53 | |
| | 150 | | | Radio Systems Corp., 8.375%, 11/01/19 (e) | | | 159 | |
| | | | Rain CII Carbon LLC/CII Carbon Corp., | | | | |
| | 250 | | | 8.000%, 12/01/18 (e) | | | 234 | |
| | EUR 700 | | | Reg. S, 8.500%, 01/15/21 | | | 743 | |
| | 144 | | | RCN Telecom Services LLC/RCN Capital Corp., 8.500%, 08/15/20 (e) | | | 152 | |
| | 1,250 | | | Realogy Group LLC/Realogy Co.-Issuer Corp., 5.250%, 12/01/21 (e) | | | 1,273 | |
| | 745 | | | Regal Entertainment Group, 5.750%, 03/15/22 | | | 750 | |
| | | | Regency Energy Partners LP/Regency Energy Finance Corp., | | | | |
| | 3,107 | | | 5.000%, 10/01/22 | | | 3,043 | |
| | 550 | | | 5.500%, 04/15/23 | | | 535 | |
| | | | | | | | |
PRINCIPAL
AMOUNT | | | SECURITY DESCRIPTION | | VALUE | |
| | | | | | | | |
| | | | United States — continued | |
| | 500 | | | Revlon Consumer Products Corp., 5.750%, 02/15/21 | | | 495 | |
| | 1,520 | | | Reynolds American, Inc., 5.850%, 08/15/45 | | | 1,637 | |
| | | | Reynolds Group Issuer, Inc./Reynolds Group Issuer LLC, | | | | |
| | 1,100 | | | 5.750%, 10/15/20 | | | 1,134 | |
| | 1,100 | | | 6.875%, 02/15/21 | | | 1,152 | |
| | 600 | | | 9.000%, 04/15/19 | | | 614 | |
| | 120 | | | 9.875%, 08/15/19 | | | 126 | |
| | 840 | | | RHP Hotel Properties LP/RHP Finance Corp., 5.000%, 04/15/23 (e) | | | 832 | |
| | 250 | | | Rice Energy, Inc., 7.250%, 05/01/23 (e) | | | 232 | |
| | 1,250 | | | Rite Aid Corp., 6.125%, 04/01/23 (e) | | | 1,283 | |
| | 100 | | | Rivers Pittsburgh Borrower LP/Rivers Pittsburgh Finance Corp., 9.500%, 06/15/19 (e) | | | 104 | |
| | 15 | | | RR Donnelley & Sons Co., 6.500%, 11/15/23 | | | 14 | |
| | 31 | | | RSP Permian, Inc., 6.625%, 10/01/22 (e) | | | 30 | |
| | 43 | | | Sabine Oil & Gas Corp., 9.750%, 02/15/17 (d) | | | 5 | |
| | | | Sabine Pass Liquefaction LLC, | | | | |
| | 500 | | | 5.625%, 04/15/23 | | | 486 | |
| | 1,100 | | | 5.625%, 03/01/25 (e) | | | 1,063 | |
| | 604 | | | Sabre GLBL, Inc., 5.375%, 04/15/23 (e) | | | 592 | |
| | 250 | | | SBA Communications Corp., 4.875%, 07/15/22 | | | 248 | |
| | | | Scientific Games International, Inc., | | | | |
| | 165 | | | 7.000%, 01/01/22 (e) | | | 169 | |
| | 460 | | | 10.000%, 12/01/22 | | | 422 | |
| | 225 | | | Seminole Hard Rock Entertainment, Inc./Seminole Hard Rock International LLC, 5.875%, 05/15/21 (e) | | | 223 | |
| | 2,558 | | | Serta Simmons Bedding LLC, 8.125%, 10/01/20 (e) | | | 2,708 | |
| | 1,000 | | | Service Corp. International, 5.375%, 05/15/24 | | | 1,040 | |
| | 25 | | | SESI LLC, 6.375%, 05/01/19 | | | 25 | |
| | 317 | | | Shingle Springs Tribal Gaming Authority, 9.750%, 09/01/21 (e) | | | 334 | |
| | | | Sinclair Television Group, Inc., | | | | |
| | 250 | | | 5.375%, 04/01/21 | | | 249 | |
| | 500 | | | 5.625%, 08/01/24 (e) | | | 476 | |
| | 1,000 | | | 6.125%, 10/01/22 | | | 1,005 | |
| | | | Sirius XM Radio, Inc., | | | | |
| | 76 | | | 4.625%, 05/15/23 (e) | | | 72 | |
| | 580 | | | 5.750%, 08/01/21 (e) | | | 600 | |
| | 800 | | | 5.875%, 10/01/20 (e) | | | 834 | |
| | 2,281 | | | 6.000%, 07/15/24 (e) | | | 2,350 | |
SEE NOTES TO FINANCIAL STATEMENTS.
| | | | | | |
| | | |
| 20 | | | | J.P. MORGAN INCOME FUNDS | | AUGUST 31, 2015 |
| | | | | | | | |
PRINCIPAL
AMOUNT | | | SECURITY DESCRIPTION | | VALUE | |
| Corporate Bonds — continued | |
| | | | United States — continued | |
| | | | SITEL LLC/Sitel Finance Corp., | | | | |
| | 11 | | | 11.000%, 08/01/17 (e) | | | 11 | |
| | 22 | | | 11.500%, 04/01/18 | | | 23 | |
| | 300 | | | Six Flags Entertainment Corp., 5.250%, 01/15/21 (e) | | | 305 | |
| | 750 | | | SM Energy Co., 6.500%, 11/15/21 | | | 728 | |
| | | | Smithfield Foods, Inc., | | | | |
| | 118 | | | 5.250%, 08/01/18 (e) | | | 120 | |
| | 710 | | | 5.875%, 08/01/21 (e) | | | 736 | |
| | 325 | | | 6.625%, 08/15/22 | | | 346 | |
| | 3,970 | | | Southern Copper Corp., 5.875%, 04/23/45 | | | 3,387 | |
| | | | Spectrum Brands, Inc., | | | | |
| | 29 | | | 6.125%, 12/15/24 (e) | | | 30 | |
| | 500 | | | 6.625%, 11/15/22 | | | 537 | |
| | | | Sprint Capital Corp., | | | | |
| | 75 | | | 6.875%, 11/15/28 | | | 64 | |
| | 895 | | | 8.750%, 03/15/32 | | | 847 | |
| | | | Sprint Communications, Inc., | | | | |
| | 1,030 | | | 7.000%, 03/01/20 (e) | | | 1,094 | |
| | 352 | | | 7.000%, 08/15/20 | | | 348 | |
| | | | Sprint Corp., | | | | |
| | 417 | | | 7.125%, 06/15/24 | | | 386 | |
| | 22 | | | 7.250%, 09/15/21 | | | 21 | |
| | 404 | | | 7.625%, 02/15/25 | | | 377 | |
| | 3,939 | | | 7.875%, 09/15/23 | | | 3,786 | |
| | 210 | | | Standard Pacific Corp., 8.375%, 01/15/21 | | | 247 | |
| | 246 | | | Station Casinos LLC, 7.500%, 03/01/21 | | | 260 | |
| | | | Steel Dynamics, Inc., | | | | |
| | 15 | | | 5.125%, 10/01/21 | | | 15 | |
| | 190 | | | 5.500%, 10/01/24 | | | 184 | |
| | 250 | | | 6.375%, 08/15/22 | | | 258 | |
| | 200 | | | Stone Energy Corp., 7.500%, 11/15/22 | | | 133 | |
| | 20 | | | SunGard Data Systems, Inc., 6.625%, 11/01/19 | | | 21 | |
| | 505 | | | Sunoco Logistics Partners Operations LP, 5.350%, 05/15/45 | | | 431 | |
| | 300 | | | SUPERVALU, Inc., 7.750%, 11/15/22 | | | 311 | |
| | 145 | | | Synchrony Financial, 3.750%, 08/15/21 | | | 144 | |
| | 150 | | | Talen Energy Supply LLC, 4.625%, 07/15/19 (e) | | | 142 | |
| | 110 | | | Talos Production LLC/Talos Production Finance, Inc., 9.750%, 02/15/18 (e) | | | 80 | |
| | 500 | | | Targa Resources Partners LP/Targa Resources Partners Finance Corp., 5.250%, 05/01/23 | | | 470 | |
| | 133 | | | Taylor Morrison Communities, Inc./Monarch Communities, Inc., 5.875%, 04/15/23 (e) | | | 133 | |
| | | | | | | | |
PRINCIPAL
AMOUNT | | | SECURITY DESCRIPTION | | VALUE | |
| | | | | | | | |
| | | | United States — continued | |
| | 1,100 | | | Tempur Sealy International, Inc., 6.875%, 12/15/20 | | | 1,177 | |
| | | | Tenet Healthcare Corp., | | | | |
| | 300 | | | 4.500%, 04/01/21 | | | 302 | |
| | 500 | | | 4.750%, 06/01/20 | | | 510 | |
| | 200 | | | 6.000%, 10/01/20 | | | 214 | |
| | 200 | | | 6.750%, 02/01/20 | | | 211 | |
| | 300 | | | 8.000%, 08/01/20 | | | 313 | |
| | 2,700 | | | 8.125%, 04/01/22 | | | 2,990 | |
| | 207 | | | Tenneco, Inc., 5.375%, 12/15/24 | | | 214 | |
| | 2,100 | | | Terex Corp., 6.000%, 05/15/21 | | | 2,121 | |
| | 65 | | | TerraForm Power Operating LLC, 5.875%, 02/01/23 (e) | | | 62 | |
| | | | Tesoro Logistics LP/Tesoro Logistics Finance Corp., | | | | |
| | 156 | | | 5.500%, 10/15/19 (e) | | | 158 | |
| | 150 | | | 6.250%, 10/15/22 (e) | | | 150 | |
| | 149 | | | Time Warner Cable, Inc., 7.300%, 07/01/38 | | | 158 | |
| | 1,335 | | | Time Warner, Inc., 4.650%, 06/01/44 | | | 1,241 | |
| | | | T-Mobile USA, Inc., | | | | |
| | 4 | | | 5.250%, 09/01/18 | | | 4 | |
| | 21 | | | 6.000%, 03/01/23 | | | 21 | |
| | 5 | | | 6.125%, 01/15/22 | | | 5 | |
| | 400 | | | 6.250%, 04/01/21 | | | 413 | |
| | 661 | | | 6.375%, 03/01/25 | | | 676 | |
| | 203 | | | 6.464%, 04/28/19 | | | 209 | |
| | 327 | | | 6.625%, 04/01/23 | | | 341 | |
| | 1,265 | | | 6.633%, 04/28/21 | | | 1,322 | |
| | 798 | | | 6.731%, 04/28/22 | | | 838 | |
| | 203 | | | 6.836%, 04/28/23 | | | 213 | |
| | | | Tronox Finance LLC, | | | | |
| | 50 | | | 6.375%, 08/15/20 | | | 41 | |
| | 466 | | | 7.500%, 03/15/22 (e) | | | 375 | |
| | 725 | | | U.S. Airways 2013-1 Class B Pass-Through Trust, 5.375%, 11/15/21 | | | 751 | |
| | 85 | | | U.S. Concrete, Inc., 8.500%, 12/01/18 | | | 89 | |
| | 200 | | | UCI International, Inc., 8.625%, 02/15/19 | | | 164 | |
| | 225 | | | Unifrax I LLC/Unifrax Holding Co., 7.500%, 02/15/19 (e) | | | 224 | |
| | 350 | | | Unit Corp., 6.625%, 05/15/21 | | | 301 | |
| | | | United Rentals North America, Inc., | | | | |
| | 250 | | | 4.625%, 07/15/23 | | | 246 | |
| | 385 | | | 5.500%, 07/15/25 | | | 371 | |
| | 1,600 | | | 6.125%, 06/15/23 | | | 1,632 | |
| | 1,650 | | | 7.625%, 04/15/22 | | | 1,778 | |
| | 115 | | | 8.250%, 02/01/21 | | | 122 | |
SEE NOTES TO FINANCIAL STATEMENTS.
| | | | | | | | |
| | | |
| AUGUST 31, 2015 | | J.P. MORGAN INCOME FUNDS | | | | | 21 | |
JPMorgan Global Bond Opportunities Fund
SCHEDULE OF PORTFOLIO INVESTMENTS
AS OF AUGUST 31, 2015 (continued)
(Amounts in U.S. Dollars, unless otherwise noted)
(Amounts in thousands)
| | | | | | | | |
PRINCIPAL
AMOUNT | | | SECURITY DESCRIPTION | | VALUE | |
| Corporate Bonds — continued | |
| | | | United States — continued | |
| | 710 | | | UnitedHealth Group, Inc., 4.750%, 07/15/45 | | | 746 | |
| | | | Universal Health Services, Inc., | | | | |
| | 34 | | | 3.750%, 08/01/19 (e) | | | 35 | |
| | 47 | | | 4.750%, 08/01/22 (e) | | | 48 | |
| | | | Univision Communications, Inc., | | | | |
| | 100 | | | 5.125%, 05/15/23 (e) | | | 99 | |
| | 200 | | | 6.750%, 09/15/22 (e) | | | 211 | |
| | 171 | | | USG Corp., 5.500%, 03/01/25 (e) | | | 170 | |
| | 375 | | | USI, Inc., 7.750%, 01/15/21 (e) | | | 364 | |
| | | | VeriSign, Inc., | | | | |
| | 67 | | | 4.625%, 05/01/23 | | | 66 | |
| | 39 | | | 5.250%, 04/01/25 | | | 39 | |
| | | | Verizon Communications, Inc., | | | | |
| | 2,000 | | | 3.500%, 11/01/24 | | | 1,954 | |
| | 438 | | | 4.862%, 08/21/46 | | | 413 | |
| | 153 | | | Vulcan Materials Co., 4.500%, 04/01/25 | | | 150 | |
| | 123 | | | VWR Funding, Inc., 7.250%, 09/15/17 | | | 127 | |
| | | | Walgreens Boots Alliance, Inc., | | | | |
| | 1,000 | | | 2.700%, 11/18/19 | | | 1,001 | |
| | 200 | | | 4.800%, 11/18/44 | | | 185 | |
| | 25 | | | WCI Communities, Inc., 6.875%, 08/15/21 | | | 26 | |
| | 1,225 | | | Wells Fargo & Co., 3.000%, 02/19/25 | | | 1,180 | |
| | 357 | | | Western Refining Logistics LP/WNRL Finance Corp., 7.500%, 02/15/23 | | | 361 | |
| | 250 | | | Whiting Petroleum Corp., 5.750%, 03/15/21 | | | 224 | |
| | | | Williams Partners LP, | | | | |
| | 265 | | | 4.000%, 09/15/25 | | | 237 | |
| | 275 | | | 5.100%, 09/15/45 | | | 225 | |
| | | | Windstream Services LLC, | | | | |
| | 130 | | | 6.375%, 08/01/23 | | | 96 | |
| | 335 | | | 7.500%, 06/01/22 | | | 265 | |
| | 1,419 | | | 7.500%, 04/01/23 | | | 1,110 | |
| | 25 | | | 7.750%, 10/15/20 | | | 22 | |
| | 1,995 | | | 7.750%, 10/01/21 | | | 1,626 | |
| | 165 | | | Wise Metals Group LLC/Wise Alloys Finance Corp., 8.750%, 12/15/18 (e) | | | 156 | |
| | | | WMG Acquisition Corp., | | | | |
| | 390 | | | 5.625%, 04/15/22 (e) | | | 387 | |
| | 200 | | | 6.750%, 04/15/22 (e) | | | 191 | |
| | 605 | | | WPX Energy, Inc., 6.000%, 01/15/22 | | | 511 | |
| | 1,915 | | | Wynn Las Vegas LLC/Wynn Las Vegas Capital Corp., 5.500%, 03/01/25 (e) | | | 1,771 | |
| | | | Zayo Group LLC/Zayo Capital, Inc., | | | | |
| | 1,470 | | | 6.000%, 04/01/23 (e) | | | 1,468 | |
| | 100 | | | 6.375%, 05/15/25 (e) | | | 99 | |
| | | | | | | | |
PRINCIPAL
AMOUNT | | | SECURITY DESCRIPTION | | VALUE | |
| | | | | | | | |
| | | | United States — continued | |
| | 230 | | | 10.125%, 07/01/20 | | | 253 | |
| | 1,170 | | | Zebra Technologies Corp., 7.250%, 10/15/22 (e) | | | 1,252 | |
| | | | ZF North America Capital, Inc., | | | | |
| | EUR 1,700 | | | 2.750%, 04/27/23 | | | 1,798 | |
| | 222 | | | 4.000%, 04/29/20 (e) | | | 222 | |
| | 167 | | | 4.500%, 04/29/22 (e) | | | 162 | |
| | 1,244 | | | 4.750%, 04/29/25 (e) | | | 1,178 | |
| | | | | | | | |
| | | | | | | 274,427 | |
| | | | | | | | |
| | | | Total Corporate Bonds
(Cost $558,570) | | | 532,337 | |
| | | | | | | | |
| Foreign Government Securities — 13.5% | |
| | | | Argentina — 0.8% | |
| | 3,750 | | | Provincia de Buenos Aires, 9.950%, 06/09/21 (e) | | | 3,647 | |
| | 4,800 | | | Republic of Argentina, 7.000%, 10/03/15 | | | 4,796 | |
| | | | | | | | |
| | | | | | | 8,443 | |
| | | | | | | | |
| | | | Ecuador — 0.1% | |
| | 1,350 | | | Republic of Ecuador, 10.500%, 03/24/20 (e) | | | 1,077 | |
| | | | | | | | |
| | | | Hungary — 1.7% | |
| | | | Republic of Hungary, | | | | |
| | HUF 1,895,000 | | | 3.000%, 06/26/24 | | | 6,407 | |
| | HUF 3,126,900 | | | 5.500%, 06/24/25 | | | 12,820 | |
| | | | | | | | |
| | | | | | | 19,227 | |
| | | | | | | | |
| | | | Italy — 1.1% | |
| | | | Italy Buoni Poliennali Del Tesoro, | | | | |
| | EUR 4,200 | | | 4.500%, 03/01/24 | | | 5,696 | |
| | EUR 4,690 | | | 4.750%, 09/01/44 (e) | | | 7,082 | |
| | | | | | | | |
| | | | | | | 12,778 | |
| | | | | | | | |
| | | | Mexico — 1.6% | |
| | MXN 239,014 | | | United Mexican States, 10.000%, 12/05/24 | | | 18,275 | |
| | | | | | | | |
| | | | Morocco — 0.2% | |
| | 1,800 | | | Kingdom of Morocco, Reg. S, 4.250%, 12/11/22 | | | 1,813 | |
| | | | | | | | |
| | | | Pakistan — 0.2% | |
| | 2,300 | | | Republic of Pakistan, Reg. S, 7.250%, 04/15/19 | | | 2,366 | |
| | | | | | | | |
| | | | Portugal — 0.5% | |
| | EUR 4,653 | | | Portugal Obrigacoes do Tesouro OT, 2.875%, 10/15/25 (e) | | | 5,338 | |
| | | | | | | | |
SEE NOTES TO FINANCIAL STATEMENTS.
| | | | | | |
| | | |
| 22 | | | | J.P. MORGAN INCOME FUNDS | | AUGUST 31, 2015 |
| | | | | | | | |
PRINCIPAL
AMOUNT | | | SECURITY DESCRIPTION | | VALUE | |
| Foreign Government Securities — continued | |
| | | | South Africa — 1.6% | |
| | | | Republic of South Africa, | | | | |
| | ZAR 144,475 | | | 10.500%, 12/21/26 | | | 12,586 | |
| | ZAR 77,000 | | | Series 2032, 8.250%, 03/31/32 | | | 5,518 | |
| | | | | | | | |
| | | | | | | 18,104 | |
| | | | | | | | |
| | | | Spain — 2.5% | |
| | | | Spain Government Bond, | | | | |
| | EUR 16,935 | | | 3.800%, 04/30/24 (e) | | | 21,782 | |
| | EUR 4,420 | | | 5.150%, 10/31/44 (e) | | | 6,842 | |
| | | | | | | | |
| | | | | | | 28,624 | |
| | | | | | | | |
| | | | Sri Lanka — 0.2% | |
| | 2,900 | | | Republic of Sri Lanka, 6.125%, 06/03/25 (e) | | | 2,813 | |
| | | | | | | | |
| | | | United Arab Emirates — 0.5% | |
| | 6,000 | | | Government of Dubai, Reg. S, 5.250%, 01/30/43 | | | 5,310 | |
| | | | | | | | |
| | | | United Kingdom — 2.3% | |
| | GBP 17,000 | | | United Kingdom Gilt, 1.750%, 01/22/17 | | | 26,517 | |
| | | | | | | | |
| | | | Zambia — 0.2% | |
| | 2,600 | | | Republic of Zambia, 8.970%, 07/30/27 (e) | | | 2,372 | |
| | | | | | | | |
| | | | Total Foreign Government Securities
(Cost $162,302) | | | 153,057 | |
| | | | | | | | |
| Loan Assignments — 4.5% | |
| | | | Australia — 0.1% | |
| | 843 | | | FMG Resources Pty, Ltd., Term Loan B, VAR, 3.750%, 06/30/19 | | | 680 | |
| | | | | | | | |
| | | | Canada — 0.1% | |
| | 284 | | | Concordia Healthcare Corp., Initial Term Loan, VAR, 4.750%, 04/21/22 | | | 284 | |
| | 41 | | | Garda World Security Corp., Term B Delayed Draw Loan, VAR, 4.003%, 11/06/20 | | | 40 | |
| | 158 | | | Garda World Security Corp., Term B Loan, VAR, 4.003%, 11/06/20 | | | 156 | |
| | 148 | | | MEG Energy Corp., Incremental Term Loan, VAR, 3.750%, 03/31/20 | | | 138 | |
| | 440 | | | Mitel Networks Corp., Term Loan 2015, VAR, 5.000%, 04/29/22 | | | 437 | |
| | 449 | | | Valeant Pharmaceuticals International, Inc., Series F-1 Tranche B Term Loan, VAR, 4.000%, 04/01/22 | | | 448 | |
| | | | | | | | |
| | | | | | | 1,503 | |
| | | | | | | | |
| | | | Luxembourg — 0.1% | |
| | 1,039 | | | Auris Luxembourg III Sarl, Facility B-4, VAR, 4.250%, 01/17/22 ^ | | | 1,039 | |
| | 499 | | | Onex Wizard Acquisition Co. II S.C.A., Initial Dollar Term Loan, VAR, 4.250%, 03/11/22 | | | 498 | |
| | | | | | | | |
| | | | | | | 1,537 | |
| | | | | | | | |
| | | | | | | | |
PRINCIPAL
AMOUNT | | | SECURITY DESCRIPTION | | VALUE | |
| | | | | | | | |
| | | | Marshall Islands — 0.0% (g) | |
| | 437 | | | Navios Maritime Partners LP, Term Loan, VAR, 5.500%, 06/18/20 | | | 433 | |
| | | | | | | | |
| | | | Singapore — 0.1% | |
| | 681 | | | Avago Technologies Ltd., Term Loan, VAR, 3.750%, 05/06/21 | | | 680 | |
| | | | | | | | |
| | | | United Kingdom — 0.1% | |
| | 847 | | | Virgin Media Investments Holdings Ltd., F Faciity, VAR, 3.500%, 06/30/23 | | | 837 | |
| | | | | | | | |
| | | | United States — 4.0% | |
| | 60 | | | Acadia Healthcare, Inc., Tranche B Term Loan, VAR, 4.250%, 02/11/22 | | | 60 | |
| | 248 | | | AdvancePierre Foods, Inc., 1st Lien Term Loan B, VAR, 5.750%, 07/10/17 | | | 248 | |
| | 199 | | | Albertsons LLC, Term B-4 Loan, VAR, 5.500%, 08/25/21 | | | 198 | |
| | 250 | | | Alliant Holdings I, Inc., Initial Term Loan, VAR, 4.500%, 08/12/22 | | | 249 | |
| | 793 | | | Altice Financing S.A., Term Loan, VAR, 5.500%, 07/02/19 | | | 796 | |
| | 450 | | | American Casino & Entertainment Properties LLC, Term Loan, VAR, 5.000%, 07/07/22 | | | 451 | |
| | 30 | | | Amsurg Corp., Initial Term Loan, VAR, 3.750%, 07/16/21 | | | 30 | |
| | 5 | | | Ascensus, Inc., 2nd Lien Initial Term Loan, VAR, 9.000%, 12/02/20 | | | 5 | |
| | 940 | | | Avaya, Inc., Term Loan B-7, VAR, 6.250%, 04/30/20 | | | 806 | |
| | 930 | | | Axalta Coating Systems U.S. Holdings, Inc., Term Loan, VAR, 3.750%, 02/01/20 | | | 926 | |
| | 205 | | | Berry Plastics Corp., Term E Loan, VAR, 3.750%, 01/06/21 | | | 203 | |
| | 380 | | | Blue Coat Systems, Inc., Initial Term Loan, VAR, 4.500%, 05/20/22 | | | 377 | |
| | 1,000 | | | Calpine Corp., Term Loan, VAR, 3.500%, 05/27/22 | | | 986 | |
| | 1,818 | | | CHG Healthcare Services, Inc., Term Loan, VAR, 4.250%, 11/19/19 ^ | | | 1,809 | |
| | 248 | | | Chrysler Group LLC, Term Loan B, VAR, 3.500%, 05/24/17 | | | 248 | |
| | 497 | | | Chrysler Group LLC, Tranche B Term Loan, VAR, 3.250%, 12/31/18 | | | 495 | |
| | 851 | | | CHS/Community Health Systems, Inc., Incremental 2021 Term Loan H, VAR, 4.000%, 01/27/21 | | | 853 | |
| | 197 | | | Cincinnati Bell, Inc., Tranche B Term Loan, VAR, 4.000%, 09/10/20 | | | 197 | |
| | 298 | | | CITGO Petroleum Corp., Term B Loan, VAR, 4.500%, 07/29/21 | | | 297 | |
SEE NOTES TO FINANCIAL STATEMENTS.
| | | | | | | | |
| | | |
| AUGUST 31, 2015 | | J.P. MORGAN INCOME FUNDS | | | | | 23 | |
JPMorgan Global Bond Opportunities Fund
SCHEDULE OF PORTFOLIO INVESTMENTS
AS OF AUGUST 31, 2015 (continued)
(Amounts in U.S. Dollars, unless otherwise noted)
(Amounts in thousands)
| | | | | | | | |
PRINCIPAL
AMOUNT | | | SECURITY DESCRIPTION | | VALUE | |
| Loan Assignments — continued | |
| | | | United States — continued | |
| | 200 | | | Coeur Mining, Inc., Term Loan, VAR, 9.000%, 06/23/20 | | | 196 | |
| | 476 | | | Compass investorsOnex USI Acquisition Corp., Term Loan B, VAR, 4.250%, 12/27/19 | | | 472 | |
| | 208 | | | Continental Building Products, Inc., 1st Lien Term Loan, VAR, 4.000%, 08/28/20 | | | 206 | |
| | 50 | | | DaVita HealthCare Partners, Inc., Tranche B Term Loan, VAR, 3.500%, 06/24/21 | | | 49 | |
| | 1,227 | | | Dell International LLC, Term Loan B-2, VAR, 4.000%, 04/29/20 | | | 1,220 | |
| | 850 | | | Delta 2 Sarl, USD Facility B-3, VAR, 4.750%, 07/30/21 ^ | | | 842 | |
| | 94 | | | Dole Food Co., Inc., Tranche B Term Loan, VAR, 4.500%, 11/01/18 | | | 94 | |
| | 318 | | | Drillships Ocean Ventures, Inc., Term Loan, VAR, 5.500%, 07/25/21 | | | 245 | |
| | 345 | | | Duff & Phelps Corp., Initial Term Loan B-1, VAR, 4.750%, 04/23/20 | | | 345 | |
| | 496 | | | Duff & Phelps Corp., Term Loan, VAR, 4.750%, 04/23/20 | | | 494 | |
| | 18 | | | EFS Cogen Holdings LLC, Term B Advance, VAR, 3.750%, 12/17/20 | | | 18 | |
| | 466 | | | Emdeon, Inc., Term B-3 Loan, VAR, 3.750%, 11/02/18 | | | 464 | |
| | 510 | | | Energy Future Intermediate Holding Co. LLC, Term Loan, VAR, 4.250%, 06/19/16 | | | 510 | |
| | 154 | | | Entegris, Inc., Tranche B Term Loan, VAR, 3.500%, 04/30/21 | | | 153 | |
| | 100 | | | EWT Holdings III Corp., 2nd Lien Term Loan, VAR, 8.500%, 01/15/22 | | | 98 | |
| | 200 | | | Fieldwood Energy LLC, 2nd Lien Closing Date Loan, VAR, 8.375%, 09/30/20 | | | 76 | |
| | 500 | | | First Data Corp., 2021 New Dollar Term Loan, VAR, 4.200%, 03/24/21 | | | 499 | |
| | 300 | | | First Data Corp., Term Loan, VAR, 3.700%, 03/23/18 | | | 298 | |
| | 495 | | | Freescale Semiconductor, Inc., Term Loan B, VAR, 4.250%, 02/28/20 | | | 494 | |
| | 448 | | | Gardner Denver, Inc., Initial Dollar Term Loan, VAR, 4.250%, 07/30/20 | | | 427 | |
| | 367 | | | Go Daddy Operating Co., Initial Term Loan, VAR, 4.250%, 05/13/21 | | | 366 | |
| | 450 | | | Graton Economic Development Authority, Term Loan B, VAR, 4.750%, 09/09/22 ^ | | | 450 | |
| | 87 | | | Halyard Health, Inc., Term Loan, VAR, 4.000%, 11/01/21 | | | 87 | |
| | 248 | | | Hearthside Group Holdings, Term Loan, VAR, 4.500%, 06/02/21 | | | 247 | |
| | 350 | | | Horizon Pharma Financing, Inc., 2015 Term Loan, VAR, 4.500%, 05/07/21 | | | 350 | |
| | | | | | | | |
PRINCIPAL
AMOUNT | | | SECURITY DESCRIPTION | | VALUE | |
| | | | | | | | |
| | | | United States — continued | |
| | 890 | | | HUB International Ltd., Initial Term Loan, VAR, 4.000%, 10/02/20 | | | 879 | |
| | 379 | | | Hudson Products Holdings, Inc., Term Loan, VAR, 5.000%, 03/15/19 | | | 363 | |
| | 1,118 | | | IASIS Healthcare LLC, Term Loan B, VAR, 4.500%, 05/03/18 | | | 1,119 | |
| | 550 | | | iHeartCommunications, Inc., Term Loan D, VAR, 6.948%, 01/30/19 | | | 485 | |
| | 24 | | | iHeartCommunications, Inc., Tranche E Term Loan, VAR, 7.698%, 07/30/19 | | | 21 | |
| | 499 | | | IMS Health, Inc., Term Loan, VAR, 3.500%, 03/17/21 | | | 495 | |
| | 249 | | | Infor US, Inc., Tranche B-5 Term Loan, VAR, 3.750%, 06/03/20 | | | 242 | |
| | 499 | | | Intelligrated, Inc., 1st Lien Term Loan, VAR, 4.503%, 07/30/18 | | | 497 | |
| | 298 | | | Intrawest Operations Group, Initial Term Loan, VAR, 4.750%, 12/09/20 | | | 297 | |
| | 1,143 | | | inVentiv Health, Inc., Term Loan B-4, VAR, 7.750%, 05/15/18 | | | 1,144 | |
| | 495 | | | J.C. Penney Co., Inc., Term Loan, VAR, 6.000%, 05/22/18 | | | 493 | |
| | 500 | | | JELD-WEN, Inc., Term B-1 Loan, VAR, 5.000%, 07/01/22 | | | 498 | |
| | 1,000 | | | Landmark US Member LLC, Term Loan, VAR, 4.750%, 10/25/19 ^ | | | 990 | |
| | 166 | | | Landry’s, Inc., Term Loan, VAR, 4.000%, 04/24/18 | | | 166 | |
| | 40 | | | Mallinckrodt International Finance, Incremental Term B-1 Loan, VAR, 3.500%, 03/19/21 | | | 39 | |
| | 99 | | | Mauser AG (FKA Pertus Sechzehnte GmbH), Initial Dollar 1st Lien Term Loan, VAR, 4.500%, 07/31/21 | | | 99 | |
| | 82 | | | McGraw-Hill Education Holdings LLC, Term Loan, VAR, 4.750%, 03/22/19 | | | 82 | |
| | 600 | | | Media General, Inc., Term B Loan, VAR, 4.000%, 07/31/20 | | | 599 | |
| | 499 | | | MGM Resorts International, Term B Loan, VAR, 3.500%, 12/20/19 | | | 494 | |
| | 341 | | | MPH Acquisition Holdings LLC, Initial Term Loan, VAR, 3.750%, 03/31/21 | | | 337 | |
| | 747 | | | National Financial Partners Corp., 2014 Specified Refinancing Term Loan, VAR, 4.500%, 07/01/20 | | | 738 | |
| | 467 | | | National Mentor Holdings, Inc., Tranche B Term Loan, VAR, 4.250%, 01/31/21 | | | 463 | |
| | 70 | | | New Albertsons, Inc., Term B Loan, VAR, 4.750%, 06/27/21 | | | 70 | |
SEE NOTES TO FINANCIAL STATEMENTS.
| | | | | | |
| | | |
| 24 | | | | J.P. MORGAN INCOME FUNDS | | AUGUST 31, 2015 |
| | | | | | | | |
PRINCIPAL
AMOUNT | | | SECURITY DESCRIPTION | | VALUE | |
| Loan Assignments — continued | |
| | | | United States — continued | |
| | 99 | | | New Albertsons, Inc., Term Loan B-2, VAR, 5.375%, 03/21/19 | | | 99 | |
| | 235 | | | NVA Holdings, Inc., 1st Lien Term Loan, VAR, 4.750%, 08/14/21 | | | 235 | |
| | 31 | | | OCI Beaumont LLC, Term Loan B-3, VAR, 5.500%, 08/20/19 | | | 31 | |
| | 349 | | | On Assignment, Inc., Initial Term B Loan, VAR, 3.750%, 06/03/22 | | | 348 | |
| | 40 | | | Ortho-Clinical Diagnostics, Inc., Initial Term Loan, VAR, 4.750%, 06/30/21 | | | 39 | |
| | 491 | | | Overseas Shipholding Group, Initial Term Loan, VAR, 5.250%, 08/05/19 | | | 487 | |
| | 248 | | | Pacific Drilling S.A., Term Loan, VAR, 4.500%, 06/03/18 | | | 179 | |
| | 291 | | | Packers Holdings LLC, Initial Term Loan, VAR, 5.000%, 12/02/21 | | | 290 | |
| | 397 | | | Peabody Energy Corp., Term Loan, VAR, 4.250%, 09/24/20 | | | 291 | |
| | 257 | | | Petsmart, Inc., Term Loan B, VAR, 4.250%, 03/11/22 | | | 256 | |
| | 335 | | | PGX Holdings, Inc., 1st Lien Initial Term Loan, VAR, 5.750%, 09/29/20 | | | 335 | |
| | 196 | | | Pinnacle Foods Finance LLC, 1st Lien Term Loan G, VAR, 3.000%, 04/29/20 | | | 194 | |
| | 104 | | | Post Holdings, Inc., Series A Incremental Term Loan, VAR, 3.750%, 06/02/21 | | | 103 | |
| | 119 | | | Quikrete Holdings, Inc., 1st Lien Initial Loan, VAR, 4.000%, 09/28/20 | | | 118 | |
| | 22 | | | Quikrete Holdings, Inc., 2nd Lien Initial Loan, VAR, 7.000%, 03/26/21 | | | 22 | |
| | 500 | | | Rite Aid Corp., 2nd Lien Tranche 2 Term Loan, VAR, 4.875%, 06/21/21 | | | 500 | |
| | 249 | | | Riverbed Technology, Inc., Term Loan, VAR, 6.000%, 04/25/22 | | | 249 | |
| | 1,807 | | | ROC Finance LLC, Funded Term B Loan, VAR, 5.000%, 06/20/19 | | | 1,720 | |
| | 742 | | | Sage Products Holdings III LLC, Term Loan, VAR, 4.250%, 12/13/19 | | | 741 | |
| | 1,766 | | | Scientific Games International, Inc., Initial Term Loan, VAR, 6.000%, 10/18/20 | | | 1,745 | |
| | 198 | | | Seadrill Partners LP, Initial Term Loan, VAR, 4.000%, 02/21/21 | | | 135 | |
| | 495 | | | Sears Roebuck Acceptance Corp., Term Loan, VAR, 5.500%, 06/30/18 | | | 488 | |
| | 119 | | | Sedgwick Claims Management Services, Inc., 1st Lien Initial Term Loan, VAR, 3.750%, 03/01/21 | | | 116 | |
| | 435 | | | Sedgwick Claims Management Services, Inc., 2nd Lien Initial Term Loan, VAR, 6.750%, 02/28/22 | | | 425 | |
| | | | | | | | |
PRINCIPAL
AMOUNT | | | SECURITY DESCRIPTION | | VALUE | |
| | | | | | | | |
| | | | United States — continued | |
| | 48 | | | Stallion Oilfield Holdings, Inc., Term Loan B, VAR, 8.000%, 06/19/18 | | | 35 | |
| | 198 | | | Staples, Inc., Term Loan, VAR, 3.500%, 04/21/21 ^ | | | 197 | |
| | 1,771 | | | Stardust Finance, Senior Lien Term Loan, VAR, 6.500%, 03/13/22 | | | 1,757 | |
| | 891 | | | Station Casinos LLC, Term Loan, VAR, 4.250%, 03/02/20 | | | 889 | |
| | 686 | | | Summit Materials Co. I LLC, Term Loan, VAR, 4.250%, 07/15/22 | | | 682 | |
| | 500 | | | SunGard Data Systems, Inc., Tranche E Term Loan, VAR, 4.000%, 03/08/20 | | | 499 | |
| | 297 | | | SUPERVALU, Inc., Term Loan B, VAR, 4.500%, 03/21/19 | | | 298 | |
| | 249 | | | Tempur Sealy International, Inc., Term B Loan, VAR, 3.500%, 03/18/20 | | | 249 | |
| | 250 | | | Texas Competitive Electric Holdings Co. LLC, Extended Term Loan, VAR, 4.674%, 10/10/17 (d) | | | 113 | |
| | 125 | | | Texas Competitive Electric Holdings Co. LLC, Non-Extended Term Loan, VAR, 4.674%, 11/18/15 (d) | | | 55 | |
| | 510 | | | Tribune Media Co., Term Loan B, VAR, 3.750%, 12/28/20 | | | 507 | |
| | 470 | | | Univision Communications, Inc., 2013 Incremental Term Loan, VAR, 4.000%, 03/01/20 | | | 467 | |
| | 795 | | | Univision Communications, Inc., Replacement 1st Lien Term Loan, VAR, 4.000%, 03/01/20 | | | 789 | |
| | 63 | | | UPC Financing Partnership, Facility AH, VAR, 3.250%, 06/30/21 | | | 62 | |
| | 116 | | | Visant Corp., Initial Term Loan, VAR, 7.000%, 09/23/21 | | | 111 | |
| | 49 | | | WMG Acquisition Corp., Tranche B Refinancing Term Loan, VAR, 3.750%, 07/01/20 | | | 48 | |
| | 99 | | | XO Communications LLC, Initial Term Loan, VAR, 4.250%, 03/20/21 | | | 98 | |
| | 376 | | | Zebra Technologies Corp., Initial Term Loan, VAR, 4.750%, 10/27/21 | | | 378 | |
| | | | | | | | |
| | | | | | | 44,924 | |
| | | | | | | | |
| | | | Total Loan Assignments
(Cost 51,617) | | | 50,594 | |
| | | | | | | | |
| Preferred Securities — 5.1% (x) | |
| | | | Belgium — 0.2% | |
| | EUR 2,370 | | | KBC Groep N.V., VAR, 5.625%, 03/19/19 | | | 2,666 | |
| | | | | | | | |
SEE NOTES TO FINANCIAL STATEMENTS.
| | | | | | | | |
| | | |
| AUGUST 31, 2015 | | J.P. MORGAN INCOME FUNDS | | | | | 25 | |
JPMorgan Global Bond Opportunities Fund
SCHEDULE OF PORTFOLIO INVESTMENTS
AS OF AUGUST 31, 2015 (continued)
(Amounts in U.S. Dollars, unless otherwise noted)
(Amounts in thousands, except numbers of Futures contracts)
| | | | | | | | |
PRINCIPAL
AMOUNT | | | SECURITY DESCRIPTION | | VALUE | |
| Preferred Securities — continued | |
| | | | Denmark — 0.1% | |
| | | | Danske Bank A/S, | | | | |
| | EUR 420 | | | VAR, 5.750%, 04/06/20 | | | 478 | |
| | EUR 950 | | | VAR, 5.875%, 04/06/22 | | | 1,081 | |
| | | | | | | | |
| | | | | | | 1,559 | |
| | | | | | | | |
| | | | France — 0.4% | |
| | 1,975 | | | BNP Paribas S.A., VAR, 7.375%, 08/19/25 (e) | | | 2,022 | |
| | EUR 550 | | | BPCE S.A., VAR, 6.117%, 10/30/17 | | | 665 | |
| | GBP 450 | | | Credit Agricole S.A., VAR, 8.125%, 10/26/19 | | | 770 | |
| | | | Orange S.A., | | | | |
| | EUR 700 | | | VAR, 4.250%, 02/07/20 | | | 824 | |
| | EUR 200 | | | VAR, 5.250%, 02/07/24 | | | 241 | |
| | | | | | | | |
| | | | | | | 4,522 | |
| | | | | | | | |
| | | | Germany — 0.0% (g) | |
| | EUR 300 | | | Allianz SE, VAR, 4.750%, 10/24/23 | | | 363 | |
| | | | | | | | |
| | | | Ireland — 0.3% | |
| | EUR 2,770 | | | Bank of Ireland, VAR, 7.375%, 06/18/20 | | | 3,176 | |
| | | | | | | | |
| | | | Italy — 0.2% | |
| | EUR 1,400 | | | Intesa Sanpaolo S.p.A., VAR, 8.375%, 10/14/19 | | | 1,840 | |
| | | | | | | | |
| | | | Netherlands — 0.5% | |
| | EUR 729 | | | Cooperatieve Centrale Raiffeisen-Boerenleenbank BA, VAR, 5.500%, 06/29/20 | | | 836 | |
| | EUR 2,400 | | | Gas Natural Fenosa Finance B.V., VAR, 4.125%, 11/18/22 | | | 2,680 | |
| | | | Telefonica Europe B.V., | | | | |
| | EUR 400 | | | VAR, 4.200%, 12/04/19 | | | 456 | |
| | EUR 100 | | | VAR, 5.875%, 03/31/24 | | | 119 | |
| | EUR 700 | | | VAR, 6.500%, 09/18/18 | | | 851 | |
| | EUR 100 | | | VAR, 7.625%, 09/18/21 | | | 128 | |
| | | | | | | | |
| | | | | | | 5,070 | |
| | | | | | | | |
| | | | Spain — 0.2% | |
| | | | Banco Bilbao Vizcaya Argentaria S.A., | | | | |
| | EUR 800 | | | Reg. S, VAR, 7.000%, 02/19/19 | | | 909 | |
| | 1,400 | | | VAR, 9.000%, 05/09/18 | | | 1,502 | |
| | | | | | | | |
| | | | | | | 2,411 | |
| | | | | | | | |
| | | | Sweden — 0.4% | |
| | | | Skandinaviska Enskilda Banken AB, | | | | |
| | 2,240 | | | VAR, 5.750%, 05/13/20 | | | 2,220 | |
| | EUR 700 | | | VAR, 7.092%, 12/21/17 | | | 877 | |
| | 700 | | | Svenska Handelsbanken AB, VAR, 5.250%, 03/01/21 | | | 690 | |
| | | | | | | | |
PRINCIPAL
AMOUNT | | | SECURITY DESCRIPTION | | VALUE | |
| | | | | | | | |
| | | | Sweden — continued | |
| | 600 | | | Swedbank AB, VAR, 5.500%, 03/17/20 | | | 594 | |
| | | | | | | | |
| | | | | | | 4,381 | |
| | | | | | | | |
| | | | Switzerland — 0.3% | |
| | 1,190 | | | Credit Suisse Group AG, VAR, 6.250%, 12/18/24 (e) | | | 1,143 | |
| | | | UBS Group AG, | | | | |
| | EUR 1,025 | | | VAR, 5.750%, 02/19/22 | | | 1,189 | |
| | 723 | | | VAR, 7.125%, 02/19/20 | | | 754 | |
| | | | | | | | |
| | | | | | | 3,086 | |
| | | | | | | | |
| | | | United Kingdom — 1.0% | |
| | GBP 580 | | | HBOS Capital Funding LP, VAR, 6.461%, 11/30/18 | | | 945 | |
| | 200 | | | HSBC Holdings plc, VAR, 6.375%, 03/30/25 | | | 199 | |
| | GBP 1,000 | | | Legal & General Group plc, VAR, 6.385%, 05/02/17 | | | 1,587 | |
| | 1,762 | | | Lloyds Banking Group plc, VAR, 7.500%, 06/27/24 | | | 1,839 | |
| | GBP 1,980 | | | Nationwide Building Society, VAR, 6.875%, 06/20/19 | | | 3,030 | |
| | GBP 1,940 | | | Santander UK Group Holdings plc, VAR, 7.375%, 06/24/22 | | | 3,029 | |
| | GBP 638 | | | Standard Life plc, VAR, 6.750%, 07/12/27 | | | 1,104 | |
| | | | | | | | |
| | | | | | | 11,733 | |
| | | | | | | | |
| | | | United States — 1.5% | |
| | | | Bank of America Corp., | | | | |
| | 5,355 | | | Series AA, VAR, 6.100%, 03/17/25 | | | 5,228 | |
| | 50 | | | Series K, VAR, 8.000%, 01/30/18 | | | 52 | |
| | 686 | | | Capital One Financial Corp., Series E, VAR, 5.550%, 06/01/20 | | | 682 | |
| | | | Citigroup, Inc., | | | | |
| | 40 | | | VAR, 5.950%, 01/30/23 | | | 39 | |
| | 972 | | | Series M, VAR, 6.300%, 05/15/24 | | | 943 | |
| | 2,773 | | | Series O, VAR, 5.875%, 03/27/20 | | | 2,747 | |
| | | | Goldman Sachs Group, Inc. (The), | | | | |
| | 225 | | | Series L, VAR, 5.700%, 05/10/19 | | | 227 | |
| | 1,630 | | | Series M, VAR, 5.375%, 05/10/20 | | | 1,596 | |
| | 2,574 | | | Morgan Stanley, Series J, VAR, 5.550%, 07/15/20 | | | 2,571 | |
| | 1,350 | | | SunTrust Banks, Inc., VAR, 5.625%, 12/15/19 | | | 1,353 | |
| | 1,265 | | | Wells Fargo & Co., Series U, VAR, 5.875%, 06/15/25 | | | 1,295 | |
| | | | | | | | |
| | | | | | | 16,733 | |
| | | | | | | | |
| | | | Total Preferred Securities
(Cost $58,997) | | | 57,540 | |
| | | | | | | | |
SEE NOTES TO FINANCIAL STATEMENTS.
| | | | | | |
| | | |
| 26 | | | | J.P. MORGAN INCOME FUNDS | | AUGUST 31, 2015 |
| | | | | | | | |
| SHARES | | | SECURITY DESCRIPTION | | VALUE | |
| Preferred Stocks — 0.0% (g) | |
| | | | Cayman Islands — 0.0% (g) | |
| | — | (h) | | XLIT Ltd., Series D, VAR, 3.409%, 09/29/15 ($1,000 par value) @ | | | 50 | |
| | | | | | | | |
| | | | United Kingdom — 0.0% (g) | |
| | — | (h) | | Royal Bank of Scotland Group plc, Series M, VAR, 6.400%, 09/01/15 ($25 par value) @ | | | 9 | |
| | — | (h) | | Royal Bank of Scotland Group plc, Series N, VAR, 6.350%, 09/30/15 ($25 par value) @ | | | 3 | |
| | | | | | | | |
| | | | | | | 12 | |
| | | | | | | | |
| | | | United States — 0.0% (g) | |
| | 1 | | | Ally Financial, Inc., Series G, 7.000%, 10/01/15 (e) @ | | | 547 | |
| | | | | | | | |
| | | | Total Preferred Stocks
(Cost $603) | | | 609 | |
| | | | | | | | |
| | | | | | | | |
| SHARES | | | SECURITY DESCRIPTION | | VALUE | |
| Short-Term Investment — 7.5% | |
| | | | Investment Company — 7.5% | |
| | 85,537 | | | JPMorgan Prime Money Market Fund, Institutional Class Shares, 0.060% (b) (l)
(Cost $85,537) | | | 85,537 | |
| | | | | | | | |
| | | | Total Investments — 98.8%
(Cost $1,160,764) | | | 1,120,906 | |
| | | | Other Assets in Excess of
Liabilities — 1.2% (c) | | | 13,245 | |
| | | | | | | | |
| | | | NET ASSETS — 100.0% | | $ | 1,134,151 | |
| | | | | | | | |
Percentages indicated are based on net assets.
| | | | | | | | | | | | | | | | | | | | |
| Futures Contracts | |
NUMBER OF
CONTRACTS | | | DESCRIPTION | | EXPIRATION
DATE | | | TRADING
CURRENCY | | | NOTIONAL
VALUE AT
AUGUST 31, 2015 | | | NET
UNREALIZED
APPRECIATION
(DEPRECIATION) | |
| | | | Long Futures Outstanding | | | | | | | | | | | | | | | | |
| | 5 | | | Euro Bobl | | | 09/08/15 | | | | EUR | | | | 729 | | | | (3 | ) |
| | 61 | | | Euro-BTP Italian Government Bond | | | 09/08/15 | | | | EUR | | | | 9,252 | | | | 366 | |
| | 154 | | | 10 Year U.S. Treasury Note | | | 12/21/15 | | | | USD | | | | 19,568 | | | | (53 | ) |
| | 35 | | | U.S. Treasury Long Bond | | | 12/21/15 | | | | USD | | | | 5,412 | | | | (57 | ) |
| | 236 | | | U.S. Treasury Ultra Bond | | | 12/21/15 | | | | USD | | | | 37,384 | | | | (296 | ) |
| | | | | |
| | | | Short Futures Outstanding | | | | | | | | | | | | | | | | |
| | (79 | ) | | Euro Bund | | | 09/08/15 | | | | EUR | | | | (13,571 | ) | | | (37 | ) |
| | (13 | ) | | Euro-Buxl 30-Year Bond | | | 09/08/15 | | | | EUR | | | | (2,211 | ) | | | 31 | |
| | (111 | ) | | 2 Year U.S. Treasury Note | | | 12/31/15 | | | | USD | | | | (24,250 | ) | | | 31 | |
| | (727 | ) | | 5 Year U.S. Treasury Note | | | 12/31/15 | | | | USD | | | | (86,831 | ) | | | 300 | |
| | (545 | ) | | 90 Day Eurodollar | | | 03/14/16 | | | | USD | | | | (135,405 | ) | | | (124 | ) |
| | (677 | ) | | 90 Day Sterling | | | 09/21/16 | | | | GBP | | | | (128,598 | ) | | | (10 | ) |
| | | | | | | | | | | | | | | | | | | | |
| | | | | | | | | | | | | | | | | | | 148 | |
| | | | | | | | | | | | | | | | | | | | |
| | | | | | | | | | | | | | | | | | | | | | |
| Forward Foreign Currency Exchange Contracts | |
CONTRACTS
TO BUY | | | CURRENCY | | COUNTERPARTY | | SETTLEMENT
DATE | | | SETTLEMENT
VALUE | | | VALUE AT
AUGUST 31, 2015 | | | NET
UNREALIZED
APPRECIATION
(DEPRECIATION) | |
| | 14,008 | | | BRL | | State Street Corp.† | | | 09/14/15 | | | | 3,834 | | | | 3,845 | | | | 11 | |
| | 11,245,951 | | | COP | | Goldman Sachs International† | | | 09/14/15 | | | | 3,747 | | | | 3,681 | | | | (66 | ) |
| | 398 | | | EUR | | HSBC Bank, N.A. | | | 09/14/15 | | | | 444 | | | | 447 | | | | 3 | |
| | 1,372 | | | EUR | | Merrill Lynch International | | | 09/14/15 | | | | 1,574 | | | | 1,540 | | | | (34 | ) |
| | 532 | | | EUR | | Royal Bank of Canada | | | 09/14/15 | | | | 604 | | | | 597 | | | | (7 | ) |
| | 9,855 | | | EUR | | Standard Chartered Bank | | | 09/14/15 | | | | 10,971 | | | | 11,061 | | | | 90 | |
SEE NOTES TO FINANCIAL STATEMENTS.
| | | | | | | | |
| | | |
| AUGUST 31, 2015 | | J.P. MORGAN INCOME FUNDS | | | | | 27 | |
JPMorgan Global Bond Opportunities Fund
SCHEDULE OF PORTFOLIO INVESTMENTS
AS OF AUGUST 31, 2015 (continued)
(Amounts in U.S. Dollars, unless otherwise noted)
(Amounts in thousands)
| | | | | | | | | | | | | | | | | | | | | | |
CONTRACTS
TO BUY | | | CURRENCY | | COUNTERPARTY | | SETTLEMENT
DATE | | | SETTLEMENT
VALUE | | | VALUE AT
AUGUST 31, 2015 | | | NET
UNREALIZED
APPRECIATION
(DEPRECIATION) | |
| | 1,179 | | | EUR | | State Street Corp. | | | 09/14/15 | | | | 1,306 | | | | 1,324 | | | | 18 | |
| | 164 | | | GBP | | Deutsche Bank AG | | | 09/14/15 | | | | 257 | | | | 252 | | | | (5 | ) |
| | 1,285,661 | | | JPY | | Standard Chartered Bank | | | 09/14/15 | | | | 10,366 | | | | 10,606 | | | | 240 | |
| | 25,901 | | | MXN | | Royal Bank of Canada | | | 09/14/15 | | | | 1,577 | | | | 1,549 | | | | (28 | ) |
| | | | | | | | | | | | | 34,680 | | | | 34,902 | | | | 222 | |
| | |
| | | | | | | | | | | | | | | | | | | | | | |
CONTRACTS
TO SELL | | | CURRENCY | | COUNTERPARTY | | SETTLEMENT
DATE | | | SETTLEMENT
VALUE | | | VALUE AT
AUGUST 31, 2015 | | | NET
UNREALIZED
APPRECIATION
(DEPRECIATION) | |
| | 14,008 | | | BRL | | Standard Chartered Bank† | | | 09/14/15 | | | | 3,947 | | | | 3,845 | | | | 102 | |
| | 11,245,951 | | | COP | | Standard Chartered Bank† | | | 09/14/15 | | | | 3,831 | | | | 3,681 | | | | 150 | |
| | 7,382 | | | EUR | | Credit Suisse International | | | 09/14/15 | | | | 8,103 | | | | 8,286 | | | | (183 | ) |
| | 134,515 | | | EUR | | Deutsche Bank AG | | | 09/14/15 | | | | 148,625 | | | | 150,971 | | | | (2,346 | ) |
| | 56,809 | | | EUR | | Goldman Sachs International | | | 09/14/15 | | | | 61,932 | | | | 63,759 | | | | (1,827 | ) |
| | 646 | | | EUR | | Merrill Lynch International | | | 09/14/15 | | | | 725 | | | | 725 | | | | — | (h) |
| | 658 | | | EUR | | Royal Bank of Canada | | | 09/14/15 | | | | 725 | | | | 738 | | | | (13 | ) |
| | 7,171 | | | GBP | | BNP Paribas | | | 09/14/15 | | | | 11,225 | | | | 11,004 | | | | 221 | |
| | 2,986 | | | GBP | | Credit Suisse International | | | 09/14/15 | | | | 4,658 | | | | 4,582 | | | | 76 | |
| | 27,193 | | | GBP | | Deutsche Bank AG | | | 09/14/15 | | | | 42,386 | | | | 41,725 | | | | 661 | |
| | 10,368 | | | GBP | | Merrill Lynch International | | | 09/14/15 | | | | 16,281 | | | | 15,909 | | | | 372 | |
| | 589 | | | GBP | | State Street Corp. | | | 09/14/15 | | | | 914 | | | | 904 | | | | 10 | |
| | 5,438,778 | | | HUF | | Royal Bank of Canada | | | 09/14/15 | | | | 19,094 | | | | 19,469 | | | | (375 | ) |
| | 1,285,661 | | | JPY | | Goldman Sachs International | | | 09/14/15 | | | | 10,303 | | | | 10,606 | | | | (303 | ) |
| | 251,242 | | | MXN | | Deutsche Bank AG | | | 09/14/15 | | | | 15,042 | | | | 15,024 | | | | 18 | |
| | 87,238 | | | MXN | | Royal Bank of Canada | | | 09/14/15 | | | | 5,414 | | | | 5,217 | | | | 197 | |
| | 253,320 | | | ZAR | | Standard Chartered Bank | | | 09/14/15 | | | | 19,684 | | | | 19,065 | | | | 619 | |
| | | | | | | | | | | | | 372,889 | | | | 375,510 | | | | (2,621 | ) |
| | |
SEE NOTES TO FINANCIAL STATEMENTS.
| | | | | | |
| | | |
| 28 | | | | J.P. MORGAN INCOME FUNDS | | AUGUST 31, 2015 |
JPMorgan Global Bond Opportunities Fund
NOTES TO SCHEDULE OF PORTFOLIO INVESTMENTS
AS OF AUGUST 31, 2015
| | |
| BRL | | — Brazilian Real |
| CDO | | — Collateralized Debt Obligation |
| CLO | | — Collateralized Loan Obligation |
| CMO | | — Collateralized Mortgage Obligation |
| COP | | — Colombian Peso |
| CSMC | | — Credit Suisse Mortgage Trust |
| EUR | | — Euro |
| GBP | | — British Pound |
| GMAC | | — General Motors Acceptance Corp. |
| HUF | | — Hungarian Forint |
| IF | | — Inverse Floaters represent securities that pay interest at a rate that increases (decreases) with a decline (incline) in a specified index. The interest rate shown is the rate in effect as of August 31, 2015. The rate may be subject to a cap and floor. |
| IO | | — Interest Only represents the right to receive the monthly interest payments on an underlying pool of mortgage loans. The principal amount shown represents the par value on the underlying pool. The yields on these securities are subject to accelerated principal paydowns as a result of prepayment or refinancing of the underlying pool of mortgage instruments. As a result, interest income may be reduced considerably. |
| JPY | | — Japanese Yen |
| MXN | | — Mexican Peso |
| Reg. S | | — Security was purchased pursuant to Regulation S under the Securities Act of 1933, which exempts from registration securities offered and sold outside of the United States. Such a security cannot be sold in the United States without either an effective registration statement filed pursuant to the Securities Act of 1933, or pursuant to an exemption from registration. |
| REMIC | | — Real Estate Mortgage Investment Conduit |
| STRIPS | | — Separate Trading of Registered Interest and Principal of Securities. The STRIPS Program lets investors hold and trade individual interest and principal components of eligible notes and bonds as separate securities. |
| SUB | | — Step-Up Bond. The interest rate shown is the rate in effect as of August 31, 2015. |
| USD | | — United States Dollar |
| | |
| VAR | | — Variable Rate Security. The interest rate shown is the rate in effect as of August 31, 2015. |
| ZAR | | — South African Rand |
| |
| @ | | — The date shown reflects the next call date on which the issuer may redeem the security. The coupon rate for this security is currently in effect as of August 31, 2015. |
| (a) | | — Non-income producing security. |
| (b) | | — Investment in affiliate. Money market fund registered under the Investment Company Act of 1940, as amended, and advised by J.P. Morgan Investment Management Inc. |
| (c) | | — Included in this amount is cash segregated as collateral for futures contracts. |
| (d) | | — Defaulted Security. |
| (e) | | — Security is exempt from registration under Rule 144A of the Securities Act of 1933, as amended. Unless otherwise indicated, this security has been determined to be liquid under procedures established by the Board of Trustees and may be resold in transactions exempt from registration, normally to qualified institutional buyers. |
| (g) | | — Amount rounds to less than 0.1%. |
| (h) | | — Amount rounds to less than one thousand (shares or dollars). |
| (l) | | — The rate shown is the current yield as of August 31, 2015. |
| (v) | | — Security has the ability to pay in kind (“PIK”) or pay income in cash. When applicable, separate rates of such payments are disclosed. |
| (x) | | — Securities are perpetual and thus, do not have a predetermined maturity date. The coupon rates for these securities are fixed for a period of time and may be structured to adjust thereafter. The dates shown, if applicable, reflects the next call date. The coupon rates shown are the rates in effect as of August 31, 2015. |
| † | | — Non-deliverable forward. See Note 2.D.(2). in the Notes to Financial Statements. |
| ^ | | — All or a portion of the security is unsettled as of August 31, 2015. Unless otherwise indicated, the coupon rate is undetermined. The coupon rate shown may not be accrued for the entire position. |
SEE NOTES TO FINANCIAL STATEMENTS.
| | | | | | | | |
| | | |
| AUGUST 31, 2015 | | J.P. MORGAN INCOME FUNDS | | | | | 29 | |
STATEMENT OF ASSETS AND LIABILITIES
AS OF AUGUST 31, 2015
(Amounts in thousands, except per share amounts)
| | | | |
| | | Global Bond
Opportunities
Fund | |
ASSETS: | | | | |
Investments in non-affiliates, at value | | $ | 1,035,369 | |
Investments in affiliates, at value | | | 85,537 | |
| | | | |
Total investment securities, at value | | | 1,120,906 | |
Cash | | | 582 | |
Foreign currency, at value | | | 1,328 | |
Deposits at broker for futures contracts | | | 1,843 | |
Receivables: | | | | |
Investment securities sold | | | 3,993 | |
Fund shares sold | | | 9,866 | |
Interest from non-affiliates | | | 13,564 | |
Dividends from affiliates | | | 3 | |
Tax reclaims | | | 56 | |
Variation margin on futures contracts | | | 212 | |
Unrealized appreciation on forward foreign currency exchange contracts | | | 2,788 | |
| | | | |
Total Assets | | | 1,155,141 | |
| | | | |
| |
LIABILITIES: | | | | |
Payables: | | | | |
Investment securities purchased | | | 13,943 | |
Fund shares redeemed | | | 1,131 | |
Unrealized depreciation on forward foreign currency exchange contracts | | | 5,187 | |
Accrued liabilities: | | | | |
Investment advisory fees | | | 391 | |
Administration fees | | | 1 | |
Distribution fees | | | 22 | |
Shareholder servicing fees | | | 112 | |
Custodian and accounting fees | | | 69 | |
Collateral management fees | | | 1 | |
Trustees’ and Chief Compliance Officer’s fees | | | — | (a) |
Other | | | 133 | |
| | | | |
Total Liabilities | | | 20,990 | |
| | | | |
Net Assets | | $ | 1,134,151 | |
| | | | |
| (a) | Amount rounds to less than $1,000. |
SEE NOTES TO FINANCIAL STATEMENTS.
| | | | | | |
| | | |
| 30 | | | | J.P. MORGAN INCOME FUNDS | | AUGUST 31, 2015 |
| | | | |
| | | Global Bond
Opportunities
Fund | |
NET ASSETS: | | | | |
Paid-in-Capital | | $ | 1,173,986 | |
Accumulated undistributed (distributions in excess of) net investment income | | | 10,935 | |
Accumulated net realized gains (losses) | | | (8,600 | ) |
Net unrealized appreciation (depreciation) | | | (42,170 | ) |
| | | | |
Total Net Assets | | $ | 1,134,151 | |
| | | | |
| |
Net Assets: | | | | |
Class A | | $ | 64,383 | |
Class C | | | 13,324 | |
Class R6 | | | 113,977 | |
Select Class | | | 942,467 | |
| | | | |
Total | | $ | 1,134,151 | |
| | | | |
| |
Outstanding units of beneficial interest (shares) ($0.0001 par value; unlimited number of shares authorized): | | | | |
Class A | | | 6,429 | |
Class C | | | 1,334 | |
Class R6 | | | 11,359 | |
Select Class | | | 93,942 | |
| |
Net Asset Value (a): | | | | |
Class A — Redemption price per share | | $ | 10.01 | |
Class C — Offering price per share (b) | | | 9.99 | |
Class R6 — Offering and redemption price per share | | | 10.03 | |
Select Class — Offering and redemption price per share | | | 10.03 | |
Class A maximum sales charge | | | 3.75 | % |
Class A maximum public offering price per share
[net asset value per share/(100% — maximum sales charge)] | | $ | 10.40 | |
| | | | |
| |
Cost of investments in non-affiliates | | $ | 1,075,227 | |
Cost of investments in affiliates | | | 85,537 | |
Cost of foreign currency | | | 1,337 | |
| (a) | Per share amounts may not recalculate due to rounding of net assets and/or shares outstanding. |
| (b) | Redemption price for Class C Shares varies based upon length of time the shares are held. |
SEE NOTES TO FINANCIAL STATEMENTS.
| | | | | | | | |
| | | |
| AUGUST 31, 2015 | | J.P. MORGAN INCOME FUNDS | | | | | 31 | |
STATEMENT OF OPERATIONS
FOR THE YEAR ENDED AUGUST 31, 2015
(Amounts in thousands)
| | | | |
| | | Global Bond
Opportunities
Fund | |
INVESTMENT INCOME: | | | | |
Interest income from non-affiliates | | $ | 35,472 | |
Dividend income from non-affiliates | | | 41 | |
Dividend income from affiliates | | | 15 | |
Foreign taxes withheld | | | (53 | ) |
| | | | |
Total investment income | | | 35,475 | |
| | | | |
| |
EXPENSES: | | | | |
Investment advisory fees | | | 4,134 | |
Administration fees | | | 617 | |
Distribution fees: | | | | |
Class A | | | 111 | |
Class C | | | 64 | |
Shareholder servicing fees: | | | | |
Class A | | | 111 | |
Class C | | | 21 | |
Select Class | | | 1,561 | |
Custodian and accounting fees | | | 211 | |
Interest expense to affiliates | | | 1 | |
Professional fees | | | 131 | |
Collateral management fees | | | 1 | |
Trustees’ and Chief Compliance Officer’s fees | | | 6 | |
Printing and mailing costs | | | 32 | |
Registration and filing fees | | | 151 | |
Transfer agent fees | | | 17 | |
Sub-transfer agent fees (See Note 2.H.) | | | 100 | |
Other | | | 7 | |
| | | | |
Total expenses | | | 7,276 | |
| | | | |
Less fees waived | | | (2,393 | ) |
Less earnings credits | | | — | (a) |
Less expense reimbursements | | | (8 | ) |
| | | | |
Net expenses | | | 4,875 | |
| | | | |
Net investment income (loss) | | | 30,600 | |
| | | | |
| |
REALIZED/UNREALIZED GAINS (LOSSES): | | | | |
Net realized gain (loss) on transactions from: | | | | |
Investments in non-affiliates | | | (14,926 | ) |
Futures | | | (2,928 | ) |
Foreign currency transactions | | | 25,272 | |
Swaps | | | 3 | |
| | | | |
Net realized gain (loss) | | | 7,421 | |
| | | | |
Change in net unrealized appreciation/depreciation on: | | | | |
Investments in non-affiliates | | | (41,167 | ) |
Futures | | | 225 | |
Foreign currency translations | | | (3,318 | ) |
| | | | |
Change in net unrealized appreciation/depreciation | | | (44,260 | ) |
| | | | |
Net realized/unrealized gains (losses) | | | (36,839 | ) |
| | | | |
Change in net assets resulting from operations | | $ | (6,239 | ) |
| | | | |
| (a) | Amount rounds to less than $1,000. |
SEE NOTES TO FINANCIAL STATEMENTS.
| | | | | | |
| | | |
| 32 | | | | J.P. MORGAN INCOME FUNDS | | AUGUST 31, 2015 |
STATEMENTS OF CHANGES IN NET ASSETS
FOR THE PERIODS INDICATED
(Amounts in thousands)
| | | | | | | | |
| | | Global Bond Opportunities Fund | |
| | | Year Ended
August 31, 2015 | | | Year Ended
August 31, 2014 | |
CHANGE IN NET ASSETS RESULTING FROM OPERATIONS: | | | | | | | | |
Net investment income (loss) | | $ | 30,600 | | | $ | 3,864 | |
Net realized gain (loss) | | | 7,421 | | | | 647 | |
Change in net unrealized appreciation/depreciation | | | (44,260 | ) | | | 1,972 | |
| | | | | | | | |
Change in net assets resulting from operations | | | (6,239 | ) | | | 6,483 | |
| | | | | | | | |
| | |
DISTRIBUTIONS TO SHAREHOLDERS: | | | | | | | | |
Class A | | | | | | | | |
From net investment income | | | (2,055 | ) | | | (301 | ) |
From net realized gains | | | (22 | ) | | | (3 | ) |
Class C | | | | | | | | |
From net investment income | | | (380 | ) | | | (45 | ) |
From net realized gains | | | (4 | ) | | | — | (a) |
Class R6 | | | | | | | | |
From net investment income | | | (3,564 | ) | | | (1,350 | ) |
From net realized gains | | | (29 | ) | | | (182 | ) |
Select Class | | | | | | | | |
From net investment income | | | (30,396 | ) | | | (1,792 | ) |
From net realized gains | | | (308 | ) | | | (155 | ) |
| | | | | | | | |
Total distributions to shareholders | | | (36,758 | ) | | | (3,828 | ) |
| | | | | | | | |
| | |
CAPITAL TRANSACTIONS: | | | | | | | | |
Change in net assets resulting from capital transactions | | | 973,190 | | | | 174,263 | |
| | | | | | | | |
| | |
NET ASSETS: | | | | | | | | |
Change in net assets | | | 930,193 | | | | 176,918 | |
Beginning of period | | | 203,958 | | | | 27,040 | |
| | | | | | | | |
End of period | | $ | 1,134,151 | | | $ | 203,958 | |
| | | | | | | | |
Accumulated undistributed (distributions in excess of) net investment income | | $ | 10,935 | | | $ | 876 | |
| | | | | | | | |
| (a) | Amount rounds to less than $1,000. |
SEE NOTES TO FINANCIAL STATEMENTS.
| | | | | | | | |
| | | |
| AUGUST 31, 2015 | | J.P. MORGAN INCOME FUNDS | | | | | 33 | |
STATEMENTS OF CHANGES IN NET ASSETS
FOR THE PERIODS INDICATED (continued)
(Amounts in thousands)
| | | | | | | | |
| | | Global Bond Opportunities Fund | |
| | | Year Ended
August 31, 2015 | | | Year Ended
August 31, 2014 | |
CAPITAL TRANSACTIONS: | | | | | | | | |
Class A | | | | | | | | |
Proceeds from shares issued | | $ | 74,560 | | | $ | 28,400 | |
Distributions reinvested | | | 2,052 | | | | 302 | |
Cost of shares redeemed | | | (28,498 | ) | | | (9,849 | ) |
| | | | | | | | |
Change in net assets resulting from Class A capital transactions | | $ | 48,114 | | | $ | 18,853 | |
| | | | | | | | |
Class C | | | | | | | | |
Proceeds from shares issued | | $ | 11,057 | | | $ | 4,696 | |
Distributions reinvested | | | 348 | | | | 45 | |
Cost of shares redeemed | | | (2,236 | ) | | | (79 | ) |
| | | | | | | | |
Change in net assets resulting from Class C capital transactions | | $ | 9,169 | | | $ | 4,662 | |
| | | | | | | | |
Class R6 | | | | | | | | |
Proceeds from shares issued | | $ | 89,470 | | | $ | 47,058 | |
Distributions reinvested | | | 2,081 | | | | 1,532 | |
Cost of shares redeemed | | | (20,147 | ) | | | (2,594 | ) |
| | | | | | | | |
Change in net assets resulting from Class R6 capital transactions | | $ | 71,404 | | | $ | 45,996 | |
| | | | | | | | |
Select Class | | | | | | | | |
Proceeds from shares issued | | $ | 1,161,770 | | | $ | 137,196 | |
Distributions reinvested | | | 5,132 | | | | 1,437 | |
Cost of shares redeemed | | | (322,399 | ) | | | (33,881 | ) |
| | | | | | | | |
Change in net assets resulting from Select Class capital transactions | | $ | 844,503 | | | $ | 104,752 | |
| | | | | | | | |
Total change in net assets resulting from capital transactions | | $ | 973,190 | | | $ | 174,263 | |
| | | | | | | | |
SHARE TRANSACTIONS: | | | | | | | | |
Class A | | | | | | | | |
Issued | | | 7,218 | | | | 2,695 | |
Reinvested | | | 200 | | | | 29 | |
Redeemed | | | (2,794 | ) | | | (939 | ) |
| | | | | | | | |
Change in Class A Shares | | | 4,624 | | | | 1,785 | |
| | | | | | | | |
Class C | | | | | | | | |
Issued | | | 1,071 | | | | 445 | |
Reinvested | | | 34 | | | | 4 | |
Redeemed | | | (218 | ) | | | (7 | ) |
| | | | | | | | |
Change in Class C Shares | | | 887 | | | | 442 | |
| | | | | | | | |
Class R6 | | | | | | | | |
Issued | | | 8,669 | | | | 4,547 | |
Reinvested | | | 203 | | | | 146 | |
Redeemed | | | (1,968 | ) | | | (243 | ) |
| | | | | | | | |
Change in Class R6 Shares | | | 6,904 | | | | 4,450 | |
| | | | | | | | |
Select Class | | | | | | | | |
Issued | | | 112,226 | | | | 12,949 | |
Reinvested | | | 499 | | | | 137 | |
Redeemed | | | (31,301 | ) | | | (3,186 | ) |
| | | | | | | | |
Change in Select Class Shares | | | 81,424 | | | | 9,900 | |
| | | | | | | | |
SEE NOTES TO FINANCIAL STATEMENTS.
| | | | | | |
| | | |
| 34 | | | | J.P. MORGAN INCOME FUNDS | | AUGUST 31, 2015 |
THIS PAGE IS INTENTIONALLY LEFT BLANK
| | | | | | | | |
| | | |
| AUGUST 31, 2015 | | J.P. MORGAN INCOME FUNDS | | | | | 35 | |
FINANCIAL HIGHLIGHTS
FOR THE PERIODS INDICATED
| | | | | | | | | | | | | | | | | | | | | | | | | | | | |
| | | Per share operating performance | |
| | | | | | Investment operations | | | Distributions | |
| | | Net asset
value,
beginning
of period | | | Net
investment
income
(loss) | | | Net realized
and unrealized
gains
(losses) on
investments | | | Total from
investment
operations | | | Net
investment
income | | | Net
realized
gain | | | Total
distributions | |
Global Bond Opportunities Fund | | | | | | | | | | | | | | | | | | | | | | | | | | | | |
Class A | | | | | | | | | | | | | | | | | | | | | | | | | | | | |
Year Ended August 31, 2015 | | $ | 10.60 | | | $ | 0.40 | (f) | | $ | (0.53 | ) | | $ | (0.13 | ) | | $ | (0.45 | ) | | $ | (0.01 | ) | | $ | (0.46 | ) |
Year Ended August 31, 2014 | | | 10.20 | | | | 0.42 | (f) | | | 0.38 | | | | 0.80 | | | | (0.35 | ) | | | (0.05 | ) | | | (0.40 | ) |
September 4, 2012 (h) through August 31, 2013 | | | 10.00 | | | | 0.45 | | | | 0.16 | | | | 0.61 | | | | (0.41 | ) | | | — | | | | (0.41 | ) |
| | | | | | | |
Class C | | | | | | | | | | | | | | | | | | | | | | | | | | | | |
Year Ended August 31, 2015 | | | 10.59 | | | | 0.35 | (f) | | | (0.51 | ) | | | (0.16 | ) | | | (0.43 | ) | | | (0.01 | ) | | | (0.44 | ) |
Year Ended August 31, 2014 | | | 10.21 | | | | 0.37 | (f) | | | 0.39 | | | | 0.76 | | | | (0.33 | ) | | | (0.05 | ) | | | (0.38 | ) |
September 4, 2012 (h) through August 31, 2013 | | | 10.00 | | | | 0.44 | | | | 0.14 | | | | 0.58 | | | | (0.37 | ) | | | — | | | | (0.37 | ) |
| | | | | | | |
Class R6 | | | | | | | | | | | | | | | | | | | | | | | | | | | | |
Year Ended August 31, 2015 | | | 10.61 | | | | 0.44 | (f) | | | (0.52 | ) | | | (0.08 | ) | | | (0.49 | ) | | | (0.01 | ) | | | (0.50 | ) |
Year Ended August 31, 2014 | | | 10.21 | | | | 0.48 | (f) | | | 0.36 | | | | 0.84 | | | | (0.39 | ) | | | (0.05 | ) | | | (0.44 | ) |
September 4, 2012 (h) through August 31, 2013 | | | 10.00 | | | | 0.52 | | | | 0.14 | | | | 0.66 | | | | (0.45 | ) | | | — | | | | (0.45 | ) |
| | | | | | | |
Select Class | | | | | | | | | | | | | | | | | | | | | | | | | | | | |
Year Ended August 31, 2015 | | | 10.61 | | | | 0.42 | (f) | | | (0.52 | ) | | | (0.10 | ) | | | (0.47 | ) | | | (0.01 | ) | | | (0.48 | ) |
Year Ended August 31, 2014 | | | 10.21 | | | | 0.45 | (f) | | | 0.37 | | | | 0.82 | | | | (0.37 | ) | | | (0.05 | ) | | | (0.42 | ) |
September 4, 2012 (h) through August 31, 2013 | | | 10.00 | | | | 0.50 | | | | 0.14 | | | | 0.64 | | | | (0.43 | ) | | | — | | | | (0.43 | ) |
| (a) | Annualized for periods less than one year, unless otherwise noted. |
| (b) | Not annualized for periods less than one year. |
| (c) | Includes adjustments in accordance with accounting principles generally accepted in the United States of America and as such, the net asset values for financial reporting purposes and the returns based upon those net asset values may differ from the net asset values and returns for shareholder transactions. |
| (d) | Includes earnings credits and interest expense, if applicable, each of which is less than 0.01% unless otherwise noted. |
| (e) | Portfolio turnover is calculated by dividing the lesser of total purchases or sales of portfolio securities for the reporting period by the monthly average value of portfolio securities owned during the reporting period. Excluded from both the numerator and denominator are amounts relating to derivatives and securities whose maturities or expiration dates at the time of acquisition were one year or less. |
| (f) | Calculated based upon average shares outstanding. |
| (g) | Certain non-recurring expenses incurred by the Fund were not annualized for the year ended August 31, 2014 and for the period ended August 31, 2013. |
| (h) | Commencement of operations. |
SEE NOTES TO FINANCIAL STATEMENTS.
| | | | | | |
| | | |
| 36 | | | | J.P. MORGAN INCOME FUNDS | | AUGUST 31, 2015 |
| | | | | | | | | | | | | | | | | | | | | | | | | | |
| | | Ratios/Supplemental data | |
| | | | | | | | | | Ratios to average net assets (a) | | | | |
Net asset
value,
end of
period | | | Total return
(excludes
sales charge) (b)(c) | | | Net assets,
end of
period
(000’s) | | | Net
expenses (d) | | | Net
investment
income
(loss) | | | Expenses
without waivers,
reimbursements and
earnings credits | | | Portfolio
turnover
rate (b)(e) | |
| | | | | | | | | | | | | | | | | | | | | | | | | | |
| | | | | | | | | | | | | | | | | | | | | | | | | | |
| $ | 10.01 | | | | (1.26 | )% | | $ | 64,383 | | | | 0.89 | % | | | 3.85 | % | | | 1.27 | % | | | 90 | % |
| | 10.60 | | | | 8.01 | | | | 19,131 | | | | 0.89 | (g) | | | 4.01 | (g) | | | 1.49 | (g) | | | 77 | |
| | 10.20 | | | | 6.12 | | | | 203 | | | | 0.90 | (g) | | | 4.66 | (g) | | | 2.41 | (g) | | | 117 | |
| | | | | | |
| | | | | | | | | | | | | | | | | | | | | | | | | | |
| | 9.99 | | | | (1.63 | ) | | | 13,324 | | | | 1.29 | | | | 3.44 | | | | 1.79 | | | | 90 | |
| | 10.59 | | | | 7.55 | | | | 4,727 | | | | 1.29 | (g) | | | 3.49 | (g) | | | 1.98 | (g) | | | 77 | |
| | 10.21 | | | | 5.77 | | | | 53 | | | | 1.30 | (g) | | | 4.30 | (g) | | | 2.54 | (g) | | | 117 | |
| | | | | | |
| | | | | | | | | | | | | | | | | | | | | | | | | | |
| | 10.03 | | | | (0.86 | ) | | | 113,977 | | | | 0.49 | | | | 4.22 | | | | 0.71 | | | | 90 | |
| | 10.61 | | | | 8.38 | | | | 47,277 | | | | 0.49 | (g) | | | 4.53 | (g) | | | 1.00 | (g) | | | 77 | |
| | 10.21 | | | | 6.58 | | | | 53 | | | | 0.50 | (g) | | | 5.10 | (g) | | | 1.55 | (g) | | | 117 | |
| | | | | | |
| | | | | | | | | | | | | | | | | | | | | | | | | | |
| | 10.03 | | | | (0.97 | ) | | | 942,467 | | | | 0.64 | | | | 4.08 | | | | 0.97 | | | | 90 | |
| | 10.61 | | | | 8.22 | | | | 132,823 | | | | 0.64 | (g) | | | 4.30 | (g) | | | 1.26 | (g) | | | 77 | |
| | 10.21 | | | | 6.43 | | | | 26,731 | | | | 0.65 | (g) | | | 4.95 | (g) | | | 1.80 | (g) | | | 117 | |
SEE NOTES TO FINANCIAL STATEMENTS.
| | | | | | | | |
| | | |
| AUGUST 31, 2015 | | J.P. MORGAN INCOME FUNDS | | | | | 37 | |
NOTES TO FINANCIAL STATEMENTS
AS OF AUGUST 31, 2015
1. Organization
JPMorgan Trust I (the “Trust”) was formed on November 12, 2004, as a Delaware statutory trust, pursuant to a Declaration of Trust dated November 5, 2004 and is registered under the Investment Company Act of 1940, as amended (the “1940 Act”), as an open-end management investment company.
The following is a separate fund of the Trust (the “Fund”) covered by this report:
| | | | |
| | | Classes Offered | | Diversified/Non-Diversified |
| Global Bond Opportunities Fund | | Class A, Class C, Class R6 and Select Class | | Non-Diversified |
The investment objective of the Fund is to seek to provide total return.
Class A Shares generally provide for a front-end sales charge while Class C Shares provide for a contingent deferred sales charge (“CDSC”). No sales charges are assessed with respect to Class R6 and Select Class Shares. All classes of shares have equal rights as to earnings, assets and voting privileges, except that each class may bear different sub-transfer agency, distribution and shareholder servicing fees and each class has exclusive voting rights with respect to its distribution plan and shareholder servicing agreements. Certain Class A Shares, for which front-end sales charges have been waived, may be subject to a CDSC as described in the Fund’s prospectus.
2. Significant Accounting Policies
The following is a summary of significant accounting policies followed by the Fund in the preparation of its financial statements. The Fund is an investment company and, accordingly, follows the investment company accounting and reporting guidance of the Financial Accounting Standards Board Accounting Standards Codification Topic 946—Investment Companies, which is part of U.S. generally accepted accounting principles (“GAAP”). The preparation of financial statements in conformity with GAAP requires management to make estimates and assumptions that affect the reported amounts of assets and liabilities and disclosure of contingent assets and liabilities at the date of the financial statements and the reported amounts of increases and decreases in net assets from operations during the reporting period. Actual results could differ from those estimates.
A. Valuation of Investments — The valuation of the investments is in accordance with GAAP and the Fund’s valuation policies set forth by and under the supervision and responsibility of the Board of Trustees (the “Board”), which established the following approach to valuation, as described more fully below: (i) investments for which market quotations are readily available shall be valued at such unadjusted quoted prices and (ii) all other investments for which market quotations are not readily available shall be valued at their fair value as determined in good faith by the Board.
JPMorgan Funds Management, Inc. (the “Administrator”) has established the J.P. Morgan Asset Management Americas Valuation Committee (“AVC”) to assist the Board with the oversight and monitoring of the valuation of the Fund’s investments. The Administrator implements the valuation policies of the Fund’s investments, as directed by the Board. The AVC oversees and carries out the policies for the valuation of investments held in the Fund. This includes monitoring the appropriateness of fair values based on results of ongoing valuation oversight, including but not limited to consideration of macro or security specific events, market events and pricing vendor and broker due diligence. The Administrator is responsible for discussing and assessing the potential impacts to the fair values on an ongoing basis, and at least on a quarterly basis with the AVC and the Board.
A market-based approach is primarily used to value the Fund’s investments. Investments for which market quotations are not readily available are fair valued by approved pricing vendors or third party broker-dealers (collectively referred to as “Pricing Services”) or may be internally fair valued using methods set forth by the valuation policies approved by the Board. This may include related or comparable assets or liabilities, recent transactions, market multiples, book values, and other relevant information for the investment to determine the fair value of the investment. An income-based valuation approach may be used in which the anticipated future cash flows of the investment are discounted to calculate the fair value. Discounts may also be applied due to the nature or duration of any restrictions on the disposition of the investments. Valuations may be based upon current market prices of securities that are comparable in coupon, rating, maturity and industry. It is possible that the estimated values may differ significantly from the values that would have been used, had a ready market for the investments existed, and such differences could be material.
Fixed income instruments are valued based on prices received from Pricing Services. The Pricing Services use multiple valuation techniques to determine the valuation of fixed income instruments. In instances where sufficient market activity exists, the Pricing Services may utilize a market-based approach through which trades or quotes from market makers are used to determine the valuation of these instruments. In instances where sufficient market activity may not exist, the Pricing Services also utilize proprietary valuation models which may consider market transactions in comparable securities and the various relationships between securities in determining fair value and/or market characteristics in order to estimate the relevant cash flows, which are then discounted to calculate the fair values.
Equities and other exchange-traded instruments are valued at the last sale price or official market closing price on the primary exchange on which the instrument is traded before the net asset values (“NAV”) of the Fund are calculated on a valuation date.
Investments in open-end investment companies (the “Underlying Funds”) are valued at each Underlying Fund’s NAV per share as of the report date.
Futures are generally valued on the basis of available market quotations. Other derivatives are valued utilizing market quotations from approved Pricing Services.
See the table on “Quantitative Information about Level 3 Fair Value Measurements” for information on the valuation techniques and inputs used to value Level 3 securities held by the Fund at August 31, 2015.
| | | | | | |
| | | |
| 38 | | | | J.P. MORGAN INCOME FUNDS | | AUGUST 31, 2015 |
Valuations reflected in this report are as of the report date. As a result, changes in valuation due to market events and/or issuer related events after the report date and prior to issuance of the report are not reflected herein.
The various inputs that are used in determining the valuation of the Fund’s investments are summarized into the three broad levels listed below.
| • | | Level 1 — Unadjusted inputs using quoted prices in active markets for identical investments. |
| • | | Level 2 — Other significant observable inputs including, but are not limited to, quoted prices for similar investments, inputs other than quoted prices that are observable for investments (such as interest rates, prepayment speeds, credit risk, etc.) or other market corroborated inputs. |
| • | | Level 3 — Significant inputs based on the best information available in the circumstances, to the extent observable inputs are not available (including the Fund’s assumptions in determining the fair value of investments). |
A financial instrument’s level within the fair value hierarchy is based on the lowest level of any input, both individually and in the aggregate, that is significant to the fair value measurement. The inputs or methodology used for valuing instruments are not necessarily an indication of the risk associated with investing in those instruments.
The following table represents each valuation input as presented on the Schedule of Portfolio Investments (“SOI”) (amounts in thousands):
| | | | | | | | | | | | | | | | |
| | | Level 1
Quoted prices | | | Level 2
Other significant
observable inputs | | | Level 3 Significant
unobservable inputs | | | Total | |
Investments in Securities | | | | | | | | | | | | | | | | |
Debt Securities | | | | | | | | | | | | | | | | |
Asset-Backed Securities | | | | | | | | | | | | | | | | |
Cayman Islands | | $ | — | | | $ | 3,643 | | | $ | 250 | | | $ | 3,893 | |
Ireland | | | — | | | | — | | | | 785 | | | | 785 | |
Italy | | | — | | | | 61 | | | | — | | | | 61 | |
United States | | | — | | | | 14,725 | | | | 41,556 | | | | 56,281 | |
| | | | | | | | | | | | | | | | |
Total Asset-Backed Securities | | | — | | | | 18,429 | | | | 42,591 | | | | 61,020 | |
| | | | | | | | | | | | | | | | |
Collateralized Mortgage Obligations | | | | | | | | | | | | | | | | |
Agency CMO | | | | | | | | | | | | | | | | |
United States | | | — | | | | 21,237 | | | | — | | | | 21,237 | |
Non-Agency CMO | | | | | | | | | | | | | | | | |
Italy | | | — | | | | — | | | | 129 | | | | 129 | |
Spain | | | — | | | | 125 | | | | — | | | | 125 | |
United States | | | — | | | | 27,997 | | | | — | | | | 27,997 | |
| | | | | | | | | | | | | | | | |
Total Collateralized Mortgage Obligations | | | — | | | | 49,359 | | | | 129 | | | | 49,488 | |
| | | | | | | | | | | | | | | | |
Commercial Mortgage-Backed Securities | | | | | | | | | | | | | | | | |
Cayman Islands | | | — | | | | 255 | | | | 111 | | | | 366 | |
United States | | | — | | | | 74,504 | | | | 33,667 | | | | 108,171 | |
| | | | | | | | | | | | | | | | |
Total Commercial Mortgage-Backed Securities | | | — | | | | 74,759 | | | | 33,778 | | | | 108,537 | |
| | | | | | | | | | | | | | | | |
Convertible Bonds | | | | | | | | | | | | | | | | |
Netherlands | | | — | | | | 1,699 | | | | — | | | | 1,699 | |
United Kingdom | | | — | | | | 199 | | | | — | | | | 199 | |
United States | | | — | | | | 20,266 | | | | — | | | | 20,266 | |
| | | | | | | | | | | | | | | | |
Total Convertible Bonds | | | — | | | | 22,164 | | | | — | | | | 22,164 | |
| | | | | | | | | | | | | | | | |
Corporate Bonds | | | | | | | | | | | | | | | | |
Australia | | | — | | | | 212 | | | | — | | | | 212 | |
Bahamas | | | — | | | | 441 | | | | — | | | | 441 | |
Belgium | | | — | | | | 2,587 | | | | — | | | | 2,587 | |
Bermuda | | | — | | | | 530 | | | | — | | | | 530 | |
Canada | | | — | | | | 17,687 | | | | — | | | | 17,687 | |
Cayman Islands | | | — | | | | 6,377 | | | | — | | | | 6,377 | |
Chile | | | — | | | | 3,513 | | | | — | | | | 3,513 | |
Croatia | | | — | | | | 1,928 | | | | — | | | | 1,928 | |
Denmark | | | — | | | | 315 | | | | — | | | | 315 | |
France | | | — | | | | 22,554 | | | | — | | | | 22,554 | |
Germany | | | — | | | | 21,681 | | | | — | | | | 21,681 | |
Hong Kong | | | — | | | | 3,793 | | | | — | | | | 3,793 | |
India | | | — | | | | 3,495 | | | | — | | | | 3,495 | |
| | | | | | | | |
| | | |
| AUGUST 31, 2015 | | J.P. MORGAN INCOME FUNDS | | | | | 39 | |
NOTES TO FINANCIAL STATEMENTS
AS OF AUGUST 31, 2015 (continued)
| | | | | | | | | | | | | | | | |
| | | Level 1
Quoted prices | | | Level 2
Other significant
observable inputs | | | Level 3 Significant
unobservable inputs | | | Total | |
Ireland | | $ | — | | | $ | 10,235 | | | $ | — | | | $ | 10,235 | |
Italy | | | — | | | | 13,501 | | | | — | | | | 13,501 | |
Japan | | | — | | | | 200 | | | | — | | | | 200 | |
Luxembourg | | | — | | | | 46,001 | | | | — | | | | 46,001 | |
Mexico | | | — | | | | 5,061 | | | | — | | | | 5,061 | |
Netherlands | | | — | | | | 19,884 | | | | — | | | | 19,884 | |
Norway | | | — | | | | 3,218 | | | | — | | | | 3,218 | |
Singapore | | | — | | | | 201 | | | | — | | | | 201 | |
South Korea | | | — | | | | 3,810 | | | | — | | | | 3,810 | |
Spain | | | — | | | | 2,502 | | | | — | | | | 2,502 | |
Sweden | | | — | | | | 3,814 | | | | — | | | | 3,814 | |
Switzerland | | | — | | | | 7,707 | | | | — | | | | 7,707 | |
United Kingdom | | | — | | | | 56,663 | | | | — | | | | 56,663 | |
United States | | | — | | | | 274,422 | | | | 5 | | | | 274,427 | |
| | | | | | | | | | | | | | | | |
Total Corporate Bonds | | | — | | | | 532,332 | | | | 5 | | | | 532,337 | |
| | | | | | | | | | | | | | | | |
Foreign Government Securities | | | — | | | | 153,057 | | | | — | | | | 153,057 | |
Preferred Securities | | | | | | | | | | | | | | | | |
Belgium | | | — | | | | 2,666 | | | | — | | | | 2,666 | |
Denmark | | | — | | | | 1,559 | | | | — | | | | 1,559 | |
France | | | — | | | | 4,522 | | | | — | | | | 4,522 | |
Germany | | | — | | | | 363 | | | | — | | | | 363 | |
Ireland | | | — | | | | 3,176 | | | | — | | | | 3,176 | |
Italy | | | — | | | | 1,840 | | | | — | | | | 1,840 | |
Netherlands | | | — | | | | 5,070 | | | | — | | | | 5,070 | |
Spain | | | — | | | | 2,411 | | | | — | | | | 2,411 | |
Sweden | | | — | | | | 4,381 | | | | — | | | | 4,381 | |
Switzerland | | | — | | | | 3,086 | | | | — | | | | 3,086 | |
United Kingdom | | | — | | | | 11,733 | | | | — | | | | 11,733 | |
United States | | | — | | | | 16,733 | | | | — | | | | 16,733 | |
| | | | | | | | | | | | | | | | |
Total Preferred Securities | | | — | | | | 57,540 | | | | — | | | | 57,540 | |
| | | | | | | | | | | | | | | | |
Preferred Stocks | | | | | | | | | | | | | | | | |
Cayman Islands | | | — | | | | 50 | | | | — | | | | 50 | |
United Kingdom | | | 12 | | | | — | | | | — | | | | 12 | |
United States | | | 547 | | | | — | | | | — | | | | 547 | |
| | | | | | | | | | | | | | | | |
Total Preferred Stocks | | | 559 | | | | 50 | | | | — | | | | 609 | |
| | | | | | | | | | | | | | | | |
Common Stocks | | | | | | | | | | | | | | | | |
United States | | | 23 | | | | — | | | | — | | | | 23 | |
| | | | | | | | | | | | | | | | |
Loan Assignments | | | | | | | | | | | | | | | | |
Australia | | | — | | | | 680 | | | | — | | | | 680 | |
Canada | | | — | | | | 1,503 | | | | — | | | | 1,503 | |
Luxembourg | | | — | | | | 1,537 | | | | — | | | | 1,537 | |
Marshall Islands | | | — | | | | 433 | | | | — | | | | 433 | |
Singapore | | | — | | | | 680 | | | | — | | | | 680 | |
United Kingdom | | | — | | | | 837 | | | | — | | | | 837 | |
United States | | | — | | | | 44,728 | | | | 196 | | | | 44,924 | |
| | | | | | | | | | | | | | | | |
Total Loan Assignments | | | — | | | | 50,398 | | | | 196 | | | | 50,594 | |
| | | | | | | | | | | | | | | | |
Short-Term Investment | | | | | | | | | | | | | | | | |
Investment Company | | | 85,537 | | | | — | | | | — | | | | 85,537 | |
| | | | | | | | | | | | | | | | |
Total Investments in Securities | | $ | 86,119 | | | $ | 958,088 | | | $ | 76,699 | | | $ | 1,120,906 | |
| | | | | | | | | | | | | | | | |
Appreciation in Other Financial Instruments | | | | | | | | | | | | | | | | |
Forward Foreign Currency Exchange Contracts | | $ | — | | | $ | 2,788 | | | $ | — | | | $ | 2,788 | |
Futures Contracts | | | 728 | | | | — | | | | — | | | | 728 | |
| | | | | | | | | | | | | | | | |
Total Appreciation in Other Financial Instruments | | $ | 728 | | | $ | 2,788 | | | $ | — | | | $ | 3,516 | |
| | | | | | | | | | | | | | | | |
| | | | | | |
| | | |
| 40 | | | | J.P. MORGAN INCOME FUNDS | | AUGUST 31, 2015 |
| | | | | | | | | | | | | | | | |
| | | Level 1
Quoted prices | | | Level 2
Other significant
observable inputs | | | Level 3 Significant
unobservable inputs | | | Total | |
Depreciation in Other Financial Instruments | | | | | | | | | | | | | | | | |
Forward Foreign Currency Exchange Contracts | | $ | — | | | $ | (5,187 | ) | | $ | — | | | $ | (5,187 | ) |
Futures Contracts | | | (580 | ) | | | — | | | | — | | | | (580 | ) |
| | | | | | | | | | | | | | | | |
Total Depreciation in Other Financial Instruments | | $ | (580 | ) | | $ | (5,187 | ) | | $ | — | | | $ | (5,767 | ) |
| | | | | | | | | | | | | | | | |
There were no significant transfers between Levels 1 and 2 during the year ended August 31, 2015.
The following is a summary of investments for which significant unobservable inputs (Level 3) were used in determining fair value (amounts in thousands):
| | | | | | | | | | | | | | | | | | | | | | | | | | | | | | | | | | | | |
| | | Balance
as of
August 31,
2014 | | | Realized
gain (loss) | | | Change in
unrealized
appreciation
(depreciation) | | | Net
accretion
(amortization) | | | Purchases¹ | | | Sales² | | | Transfers
into Level 3 | | | Transfers
out of
Level 3 | | | Balance
as of
August 31,
2015 | |
Investments in Securities | | | | | | | | | | | | | | | | | | | | | | | | | | | | | | | | | | | | |
Asset-Backed Securities — Cayman Islands | | $ | 250 | | | $ | — | | | $ | — | | | $ | — | | | $ | — | | | $ | — | | | $ | — | | | $ | — | | | $ | 250 | |
Asset-Backed Securities — Ireland | | | — | | | | — | | | | — | | | | — | | | | 785 | | | | — | | | | — | | | | — | | | | 785 | |
Asset-Backed Securities — United States | | | 8,916 | | | | 3 | | | | 7 | | | | 35 | | | | 39,013 | | | | (6,418 | ) | | | — | | | | — | | | | 41,556 | |
Collateralized Mortgage Obligations — Non-Agency CMO — Italy | | | 149 | | | | — | | | | (21 | ) | | | 1 | | | | — | | | | — | | | | — | | | | — | | | | 129 | |
Collateralized Mortgage Obligations — Non-Agency CMO — United States | | | 101 | | | | — | | | | (1 | ) | | | — | (a) | | | — | | | | (100 | ) | | | — | | | | — | | | | — | |
Commercial Mortgage-Backed Securities — Cayman Islands | | | 112 | | | | — | | | | (1 | ) | | | — | | | | — | | | | — | | | | — | | | | — | | | | 111 | |
Commercial Mortgage-Backed Securities — United States | | | 1,488 | | | | — | | | | (268 | ) | | | 3 | | | | 32,925 | | | | — | | | | — | | | | (481 | ) | | | 33,667 | |
Corporate Bonds — United States | | | 160 | | | | — | | | | — | (a) | | | (1 | ) | | | — | (b) | | | — | | | | 6 | | | | (160 | ) | | | 5 | |
Loan Assignments — United States | | | — | | | | — | | | | — | (a) | | | — | (a) | | | 196 | | | | — | | | | — | | | | — | | | | 196 | |
| | | | | | | | | | | | | | | | | | | | | | | | | | | | | | | | | | | | |
| | $ | 11,176 | | | $ | 3 | | | $ | (284 | ) | | $ | 38 | | | $ | 72,919 | | | $ | (6,518 | ) | | $ | 6 | | | $ | (641 | ) | | $ | 76,699 | |
| | | | | | | | | | | | | | | | | | | | | | | | | | | | | | | | | | | | |
| (a) | Amount rounds to less than $1,000. |
| (1) | Purchases include all purchases of securities and securities received in corporate actions. |
| (2) | Sales include all sales of securities, maturities, paydowns and securities tendered in corporate actions. |
Transfers into, and out of, Level 3 are valued utilizing values as of the beginning of the year.
Transfers between Level 2 and Level 3 are due to a decline or an increase in market activity (e.g. frequency of trades), respectively, which resulted in a lack of or increase in available market inputs to determine price.
The change in net unrealized appreciation (depreciation) attributable to securities owned at August 31, 2015, which were valued using significant unobservable inputs (Level 3), amounted to approximately $(240,000). This amount is included in Change in net unrealized appreciation/depreciation of investments in non-affiliates on the Statement of Operations.
| | | | | | | | |
| | | |
| AUGUST 31, 2015 | | J.P. MORGAN INCOME FUNDS | | | | | 41 | |
NOTES TO FINANCIAL STATEMENTS
AS OF AUGUST 31, 2015 (continued)
Quantitative Information about Level 3 Fair Value Measurements #
(Amounts in thousands)
| | | | | | | | | | | | |
| | | Fair Value at
August 31, 2015 | | | Valuation Technique(s) | | Unobservable Input | | Range (Weighted Average) | |
| | $ | 33,001 | | | Discounted Cash Flow | | Constant Prepayment Rate | | | 0.00% - 18.00% (1.58%) | |
| | | | | | | | Constant Default Rate | | | 0.00% - 50.00% (19.50%) | |
| | | | | | | | Yield (Discount Rate of Cash Flows) | | | 2.52% - 6.64% (4.25%) | |
| | | | | | | | | | | | |
| Asset-Backed Securities | | | 33,001 | | | | | | | | | |
| | | | | | | | | | | | |
| | | 129 | | | Discounted Cash Flow | | Constant Prepayment Rate | | | 3.20% (3.20%) | |
| | | | | | | | Constant Default Rate | | | 0.50% (0.50%) | |
| | | | | | | | Yield (Discount Rate of Cash Flows) | | | 1.19% (1.19%) | |
| | | | | | | | | | | | |
| Collateralized Mortgage Obligations | | | 129 | | | | | | | | | |
| | | | | | | | | | | | |
| | | 31,603 | | | Discounted Cash Flow | | Yield (Discount Rate of Cash Flows) | | | 3.06% - 20.64% (5.25%) | |
| | | | | | | | | | | | |
| Commercial Mortgage-Backed Securities | | | 31,603 | | | | | | | | | |
| | | | | | | | | | | | |
| Total | | $ | 64,733 | | | | | | | | | |
| | | | | | | | | | | | |
| # | The table above does not include certain Level 3 investments that are valued by brokers and pricing services. At August 31, 2015, the value of these investments was approximately $11,966,000. The inputs for these investments are not readily available or cannot be reasonably estimated and are generally those inputs described in Note 2.A. |
The significant unobservable inputs used in the fair value measurement of the Fund’s investments are listed above. Generally, a change in the assumptions used in any input in isolation may be accompanied by a change in another input. Significant changes in any of the unobservable inputs may significantly impact the fair value measurement. The impact is based on the relationship between each unobservable input and the fair value measurement. Significant increases (decreases) in the yield and default rate may decrease (increase) the fair value measurement. A significant change in the prepayment rate (Constant Prepayment Rate or PSA Prepayment Model) may decrease or increase the fair value measurement.
B. Restricted Securities — Certain securities held by the Fund may be subject to legal or contractual restrictions on resale. Restricted securities generally are resold in transactions exempt from registration under the Securities Act of 1933 (the “Securities Act”). Disposal of these securities may involve time-consuming negotiations and expense. Prompt sale at the current valuation may be difficult and could adversely affect the net assets of the Fund.
As of August 31, 2015, the Fund had no investments in restricted securities other than securities sold to the Fund under Rule 144A or Regulation S under the Securities Act.
C. Loan Assignments — The Funds may invest in debt instruments that are interests in amounts owed to lenders or lending syndicates (a “Lender”) by corporate, governmental, or other borrowers (a “Borrower”). A loan is often administered by a bank or other financial institution (the “Agent”) that acts as Agent for all holders. The Agent administers the terms of the loan, as specified in the loan agreement. The Funds invest in loan assignments of all or a portion of the loans. When a fund purchases a loan assignment, the Fund has direct rights against the Borrower on a loan, provided, however, the Fund’s rights may be more limited than the Lender from which it acquired the assignment and the fund may be able to enforce its rights only through the Agent. As a result, a fund assumes the credit risk of the Borrower as well as any other persons interpositioned between the Fund and the Borrower (“Intermediate Participants”). A fund may incur certain costs and delays in realizing payment on a loan assignment or suffer a loss of principal and/or interest if assets or interests held by the Agent or other Intermediate Participants are determined to be subject to the claims of the Agent’s or other Intermediate Participant’s creditors. In addition, it is unclear whether loan assignments and other forms of direct indebtedness offer securities law protections against fraud and misrepresentation. Also, because J.P. Morgan Investment Management Inc. (the “Adviser” or “JPMIM”), an indirect, wholly-owned subsidiary of JPMorgan Chase & Co. (“JPMorgan”), may wish to invest in publicly traded securities of a Borrower, it may not have access to material non-public information regarding the Borrower to which other investors have access. Although certain loan assignments are secured by collateral, a fund could experience delays or limitations in realizing the value on such collateral or have its interest subordinated to other indebtedness of the Borrower. Loan assignments are vulnerable to market conditions such that economic conditions or other events may reduce the demand for assignments and certain assignments which were liquid, when purchased, may become illiquid and they may be difficult to value. In addition, the settlement period for loans is uncertain as there is no standardized settlement schedule applicable to such investments. Therefore, a fund may not receive the proceeds from a sale of such investments for a period after the sale.
Certain loan assignments are also subject to the risks associated with high yield securities described under Note 7.
D. Derivatives — The Fund used instruments including futures, forward foreign currency exchange contracts, swaps and other derivatives in connection with its investment strategy. Derivative instruments may be used as substitutes for securities in which the Fund can invest, to hedge portfolio investments or to generate income or gain to the Fund. Derivatives are also used to manage duration, sector and yield curve exposures and credit and spread volatility.
| | | | | | |
| | | |
| 42 | | | | J.P. MORGAN INCOME FUNDS | | AUGUST 31, 2015 |
The Fund may be subject to various risks from the use of derivatives including the risk that changes in the value of a derivative may not correlate perfectly with the underlying asset, rate or index; counterparty credit risk related to derivatives counterparties’ failure to perform under contract terms; liquidity risk related to the lack of a liquid market for these contracts allowing the Fund to close out its position(s); and, documentation risk relating to disagreement over contract terms. Investing in certain derivatives also results in a form of leverage and as such, the Fund’s risk of loss associated with these instruments may exceed its value, as recorded on the Statement of Assets and Liabilities.
The Fund is party to various derivative contracts governed by International Swaps and Derivatives Association master agreements (“ISDA agreements”). The Fund’s ISDA agreements, which are separately negotiated with each dealer counterparty, may contain provisions allowing, absent other considerations, a counterparty to exercise rights, to the extent not otherwise waived, against the Fund in the event the Fund’s net assets decline over time by a pre-determined percentage or fall below a pre-determined floor. The ISDA agreements also contain provisions allowing, absent other conditions, the Fund to exercise rights, to the extent not otherwise waived, against the counterparty (i.e. decline in a counterparty’s credit rating below a specified level). Such rights for both the counterparty and the Fund often include the ability to terminate (i.e. close out) open contracts at prices which may favor the counterparty, which could have an adverse effect on the Fund. The ISDA agreements give the Fund and counterparty the right, upon an event of default, to close out all transactions traded under such agreements and to net amounts owed or due across all transactions and offset such net payable or receivable with collateral posted to a segregated account by one party to the other.
Counterparty credit risk may be mitigated to the extent a counterparty posts collateral for mark to market gains to the Fund.
Notes D(1) — D(3) below describe the various derivatives used by the Fund.
(1). Futures Contracts — The Fund used treasury, index or other financial futures contracts to gain or reduce exposure to the stock and bond markets, maintain liquidity and minimize transaction costs. The Fund also bought futures contracts to immediately invest incoming cash in the market or sold futures in response to cash outflows, thereby simulating an invested position in the underlying index while maintaining a cash balance for liquidity.
Futures contracts provide for the delayed delivery of the underlying instrument at a fixed price or are settled for a cash amount based on the change in the value of the underlying instrument at a specific date in the future. Upon entering into a futures contract, the Fund is required to deposit with the broker, cash or securities in an amount equal to a certain percentage of the contract amount, which is referred to as the initial margin deposit. Subsequent payments, referred to as variation margin, are made or received by the Fund periodically and are based on changes in the market value of open futures contracts. Changes in the market value of open futures contracts are recorded as Change in net unrealized appreciation/depreciation on the Statement of Operations. Realized gains or losses, representing the difference between the value of the contract at the time it was opened and the value at the time it was closed, are reported on the Statement of Operations at the closing or expiration of the futures contract. Securities deposited as initial margin are designated on the SOI and cash deposited is recorded on the Statement of Assets and Liabilities. A receivable from and/or a payable to brokers for the daily variation margin is also recorded on the Statement of Assets and Liabilities.
The use of futures contracts exposes the Fund to interest rate risk. The Fund may be subject to the risk that the change in the value of the futures contract may not correlate perfectly with the underlying instrument. Use of long futures contracts subjects the Fund to risk of loss in excess of the amounts shown on the Statement of Assets and Liabilities, up to the notional amount of the futures contracts. Use of short futures contracts subjects the Fund to unlimited risk of loss. The Fund may enter into futures contracts only on exchanges or boards of trade. The exchange or board of trade acts as the counterparty to each futures transaction; therefore, the Fund’s credit risk is limited to failure of the exchange or board of trade. Under some circumstances, futures exchanges may establish daily limits on the amount that the price of a futures contract can vary from the previous day’s settlement price, which could effectively prevent liquidation of positions.
The Fund’s futures contracts are not subject to master netting arrangements (the right to close out all transactions traded with a counterparty and net amounts owed or due across transactions).
(2). Forward Foreign Currency Exchange Contracts — The Fund may be exposed to foreign currency risks associated with portfolio investments and therefore, at times, used forward foreign currency exchange contracts to hedge or manage these exposures. The Fund also bought forward foreign currency exchange contracts to gain exposure to currencies. Forward foreign currency exchange contracts represent obligations to purchase or sell foreign currency on a specified future date at a price fixed at the time the contracts are entered into. Non-deliverable forward foreign currency exchange contracts are settled with the counterparty in cash without the delivery of foreign currency.
The values of the forward foreign currency exchange contracts are adjusted daily based on the applicable exchange rate of the underlying currency. Changes in the value of these contracts are recorded as unrealized appreciation or depreciation until the contract settlement date. When the forward foreign currency exchange contract is closed, the Fund records a realized gain or loss equal to the difference between the value at the time the contract was opened and the value at the time it was closed. The Fund also records a realized gain or loss when a forward foreign currency exchange contract offsets another forward foreign currency exchange contract with the same counterparty upon settlement.
As of August 31, 2015, the Fund did not receive or post collateral for forward foreign currency exchange contracts.
(3). Swaps — The Fund engaged in credit default swaps to manage credit risks within its portfolio. Swap transactions are negotiated contracts (“over the counter “OTC” swaps”) between the Fund and counterparty to exchange investment cash flows, assets or market-linked returns at specified, future intervals.
| | | | | | | | |
| | | |
| AUGUST 31, 2015 | | J.P. MORGAN INCOME FUNDS | | | | | 43 | |
NOTES TO FINANCIAL STATEMENTS
AS OF AUGUST 31, 2015 (continued)
Upfront payments made and/or received by the Fund are recognized as a realized gain or loss when the contract matures or is terminated. The value of an OTC swap agreement is recorded as either an asset or a liability on the Statement of Assets and Liabilities at the beginning of the measurement period. The change in the value of swaps, including accruals of periodic amounts of interest to be paid or received on swaps, is reported as change in net unrealized appreciation/depreciation on the Statement of Operations. A realized gain or loss is recorded upon payment or receipt of a periodic payment or payment made upon termination of a swap agreement.
The Fund may be required to post or receive collateral based on the net value of the Fund’s outstanding OTC swap contracts with the counterparty in the form of cash or securities. Daily movement of collateral is subject to minimum threshold amounts. Collateral posted by the Fund is held in a segregated account at the Fund’s custodian bank. Cash collateral posted by the Fund is invested in an affiliated money market fund (See Note 3.G.) and is reported on the Statement of Assets and Liabilities as Investments in affiliates — restricted. Collateral received by the Fund is held in escrow in segregated accounts maintained by JPMorgan Chase Bank, N.A. (“JPMCB”), an affiliate of the Fund, which provides collateral management services to the Fund (See Note 3.F.).
The Fund’s swap contracts are subject to master netting arrangements.
Credit Default Swaps
The Fund entered into credit default swaps to simulate long and short positions or to take an active long or short position with respect to the likelihood of a default or credit event by the issuer of the underlying reference obligation.
The underlying reference obligation may be a single issuer of corporate or sovereign debt, a basket of issuers or a credit index. A credit index is a list of credit instruments or exposures that reference a fixed number of obligors with shared characteristics that represents some part of the credit market as a whole. Index credit default swaps have standardized terms including a fixed spread and standard maturity dates. The composition of the obligations within a particular index changes periodically.
Credit default swaps involve one party, the protection buyer, making a stream of payments to another party, the protection seller, in exchange for the right to receive a contingent payment if there is a credit event related to the underlying reference obligation. In the event that the reference obligation matures prior to the termination date of the contract, a similar security will be substituted for the duration of the contract term. Credit events are defined under individual swap agreements and generally include bankruptcy, failure to pay, restructuring, repudiation/moratorium, obligation acceleration and obligation default.
If a credit event occurs, the Fund, as protection seller, would be obligated to make a payment, which may be either: (i) a net cash settlement equal to the notional amount of the swap less the auction value of the reference obligation or (ii) the notional amount of the swap in exchange for the delivery of the reference obligation. Selling protection effectively adds leverage to the Fund’s portfolio up to the notional amount of swap agreements. The notional amount represents the maximum potential liability under a contract and is not reflected on the Statement of Assets and Liabilities. Potential liabilities under these contracts may be reduced by: the auction rates of the underlying reference obligations; upfront payments received at the inception of a swap; and net amounts received from credit default swaps purchased with the identical reference obligation.
As of August 31, 2015, the Fund did not have open swap contracts.
(4). Summary of Derivatives Information — The following table presents the value of derivatives held as of August 31, 2015, by their primary underlying risk exposure and respective location on the Statement of Assets and Liabilities (amounts in thousands):
| | | | | | | | | | | | | | |
| Derivative Contracts | | Statement of Assets and Liabilities Location | | | | | | | | | |
| Gross Assets: | | | | Futures
Contracts (a) | | | Forward Foreign
Currency Exchange
Contracts | | | Total | |
Interest rate contracts | | Receivables, Net Assets — Unrealized Appreciation | | $ | 728 | | | $ | — | | | $ | 728 | |
Foreign exchange contracts | | Receivables | | | — | | | | 2,788 | | | | 2,788 | |
| | | | | | | | | | | | | | |
Total | | | | $ | 728 | | | $ | 2,788 | | | $ | 3,516 | |
| | | | | | | | | | | | | | |
| | | | |
Gross Liabilities: | | | | | | | | | | | |
Interest rate contracts | | Payables, Net Assets — Unrealized Depreciation | | $ | (580 | ) | | $ | — | | | $ | (580 | ) |
Foreign exchange contracts | | Payables | | | — | | | | (5,187 | ) | | | (5,187 | ) |
| | | | | | | | | | | | | | |
Total | | | | $ | (580 | ) | | $ | (5,187 | ) | | $ | (5,767 | ) |
| | | | | | | | | | | | | | |
| (a) | This amount represents the cumulative appreciation (depreciation) of futures contracts as reported on the SOI. The Statement of Assets and Liabilities only reflects the current day variation margin receivable/payable from/to brokers. |
| | | | | | |
| | | |
| 44 | | | | J.P. MORGAN INCOME FUNDS | | AUGUST 31, 2015 |
The following table presents the Fund’s gross derivative assets and liabilities by counterparty net of amounts available for offset under netting arrangements and any related collateral received or posted by the Fund as of August 31, 2015 (amounts in thousands):
| | | | | | | | | | | | | | | | |
| Counterparty | | Gross Amount
of Derivative
Assets
Presented on the
Statement of
Assets and
Liabilities (a) | | | Derivatives
Available for
Offset | | | Collateral Received | | | Net Amount Due From
Counterparty (not less
than zero) | |
BNP Paribas | | $ | 221 | | | $ | — | | | $ | — | | | $ | 221 | |
Credit Suisse International | | | 76 | | | | (76 | ) | | | — | | | | — | |
Deutsche Bank AG | | | 679 | | | | (679 | ) | | | — | | | | — | |
HSBC Bank, N.A. | | | 3 | | | | — | | | | — | | | | 3 | |
Merrill Lynch International | | $ | 372 | | | $ | (34 | ) | | $ | — | | | $ | 338 | |
Royal Bank of Canada | | | 197 | | | | (197 | ) | | | — | | | | — | |
Standard Chartered Bank | | | 1,201 | | | | — | | | | — | | | | 1,201 | |
State Street Corp. | | | 39 | | | | — | | | | — | | | | 39 | |
Exchange Traded Futures & Options Contracts (b) | | | 728 | (c) | | | — | | | | — | | | | 728 | |
| | | | | | | | | | | | | | | | |
Total | | $ | 3,516 | | | $ | (986 | ) | | $ | — | | | $ | 2,530 | |
| | | | | | | | | | | | | | | | |
| | | | | | | | | | | | | | | | |
| Counterparty | | Gross Amount
of Derivative
Liabilities
Presented on the
Statement of
Assets and
Liabilities (a) | | | Derivatives
Available for
Offset | | | Collateral Posted | | | Net Amount Due To
Counterparty (not less
than zero) | |
Credit Suisse International | | $ | 183 | | | $ | (76 | ) | | $ | — | | | $ | 107 | |
Deutsche Bank AG | | | 2,351 | | | | (679 | ) | | | — | | | | 1,672 | |
Goldman Sachs International | | | 2,196 | | | | — | | | | — | | | | 2,196 | |
Merrill Lynch International | | | 34 | | | | (34 | ) | | | — | | | | — | |
Royal Bank of Canada | | | 423 | | | | (197 | ) | | | — | | | | 226 | |
Exchange Traded Futures & Options Contracts (b) | | | 580 | (c) | | | — | | | | — | | | | 580 | |
| | | | | | | | | | | | | | | | |
Total | | $ | 5,767 | | | $ | (986 | ) | | $ | — | | | $ | 4,781 | |
| | | | | | | | | | | | | | | | |
| (a) | For financial reporting purposes, the Fund does not offset derivative assets and derivative liabilities subject to master netting arrangements on the Statement of Assets and Liabilities. |
| (b) | These derivatives are not subject to master netting arrangements. |
| (c) | A portion of this amount represents the cumulative appreciation (depreciation) of futures contracts as reported on the SOI. The Statement of Assets and Liabilities only reflects the current day variation margin receivable/payable from/to brokers for futures contracts. |
The following tables present the effect of derivatives on the Statement of Operations for the year ended August 31, 2015, by primary underlying risk exposure (amounts in thousands):
| | | | | | | | | | | | | | | | |
| Amount of Realized Gain (Loss) on Derivatives Recognized on Statement of Operations | | | | |
| Derivative Contracts | | Futures Contracts | | | Forward Foreign
Currency Exchange
Contracts | | | Swaps | | | Total | |
Interest rate contracts | | $ | (2,928 | ) | | $ | — | | | $ | — | | | $ | (2,928 | ) |
Foreign exchange contracts | | | — | | | | 25,957 | | | | — | | | | 25,957 | |
Credit contracts | | | — | | | | — | | | | 3 | | | | 3 | |
| | | | | | | | | | | | | | | | |
Total | | $ | (2,928 | ) | | $ | 25,957 | | | $ | 3 | | | $ | 23,032 | |
| | | | | | | | | | | | | | | | |
| | | | | | | | | | | | |
| Amount of Change in Unrealized Appreciation (Depreciation) on Derivatives Recognized on Statement of Operations | |
| Derivative Contracts | | Futures Contracts | | | Forward Foreign
Currency Exchange
Contracts | | | Total | |
Interest rate contracts | | $ | 225 | | | $ | — | | | $ | 225 | |
Foreign exchange contracts | | | — | | | | (3,274 | ) | | | (3,274 | ) |
| | | | | | | | | | | | |
Total | | $ | 225 | | | $ | (3,274 | ) | | $ | (3,049 | ) |
| | | | | | | | | | | | |
| | | | | | | | |
| | | |
| AUGUST 31, 2015 | | J.P. MORGAN INCOME FUNDS | | | | | 45 | |
NOTES TO FINANCIAL STATEMENTS
AS OF AUGUST 31, 2015 (continued)
The Fund’s derivatives contracts held at August 31, 2015 are not accounted for as hedging instruments under GAAP.
Derivatives Volume — The table below discloses the volume of the Fund’s futures contracts and forward foreign currency exchange contracts activity during the year ended August 31, 2015 (amounts in thousands). Please refer to the tables in the Summary of Derivatives Information for derivative-related gains and losses associated with volume activity.
| | | | |
Futures Contracts: | | | | |
Average Notional Balance Long | | $ | 39,061 | (a) |
Average Notional Balance Short | | | 200,285 | |
Ending Notional Balance Long | | | 72,345 | |
Ending Notional Balance Short | | | 390,866 | |
| |
Forward Foreign Currency Exchange Contracts: | | | | |
Average Settlement Value Purchased | | | 25,086 | |
Average Settlement Value Sold | | | 242,786 | |
Ending Settlement Value Purchased | | | 34,680 | |
Ending Settlement Value Sold | | | 372,889 | |
| (a) | For the period from September 1, 2014 through December 31, 2014 and April 1, 2015 through August 31, 2015. |
E. When Issued Securities and Forward Commitments — The Fund may purchase when issued securities, including To Be Announced (“TBA”) securities, and enter into contracts to purchase or sell securities for a fixed price that may be settled a month or more after the trade date. When issued securities are securities that have been authorized, but not issued in the market. A forward commitment involves entering into a contract to purchase or sell securities for a fixed price at a future date that may be settled a month or more after the trade date. The purchase of securities on a when issued or forward commitment basis involves the risk that the value of the security to be purchased declines before settlement date. The sale of securities on a forward commitment basis involves the risk that the value of the securities sold may increase before the settlement date. The Fund may be exposed to credit risk if the counterparty fails to perform under the terms of the transaction. Interest income for securities purchased on a when issued or forward commitment basis is not accrued until settlement date. It is the Fund’s policy to reserve assets with a current value at least equal to the amount of their when issued or forward commitments. At August 31, 2015, the Fund did not hold when issued securities or TBAs.
F. Foreign Currency Translation — The books and records of the Fund are maintained in U.S. dollars. Foreign currency amounts are translated into U.S. dollars at the prevailing exchange rates of such currencies against the U.S. dollar. The market value of investment securities and other assets and liabilities are translated at the exchange rate as of the valuation date. Purchases and sales of investment securities, income and expenses are translated at the exchange rate prevailing on the respective dates of such transactions.
The Fund does not isolate the effect of changes in foreign exchange rates from changes in market prices on securities held. Accordingly, such changes are included within Change in net unrealized appreciation/depreciation on investments on the Statement of Operations.
Reported realized foreign currency gains and losses arise from the disposition of foreign currency, currency gains or losses realized between the trade and settlement dates on securities transactions, and the difference between the amounts of dividends, interest and foreign withholding taxes recorded on the Fund’s books on the transaction date and the U.S. dollar equivalent of the amounts actually received or paid. These reported realized foreign currency gains and losses are included in Net realized gain (loss) on foreign currency transactions on the Statement of Operations. Unrealized foreign currency gains and losses arise from changes (due to changes in exchange rates) in the value of foreign currency and other assets and liabilities denominated in foreign currencies, which are held at year end and are included in Change in net unrealized appreciation/depreciation on foreign currency translations on the Statement of Operations.
G. Security Transactions and Investment Income — Investment transactions are accounted for on the trade date (the date the order to buy or sell is executed). Securities gains and losses are calculated on a specifically identified cost basis. Interest income is determined on the basis of coupon interest accrued using the effective interest method which adjusts for amortization of premiums and accretion of discounts. Dividend income, net of foreign taxes withheld, if any, is recorded on the ex-dividend date or when the Fund first learns of the dividend.
H. Allocation of Income and Expenses — Expenses directly attributable to a fund are charged directly to that fund, while the expenses attributable to more than one fund of the Trust are allocated among the respective funds. In calculating the NAV of each class, investment income, realized and unrealized gains and losses and expenses, other than class specific expenses, are allocated daily to each class of shares based upon the proportion of net assets of each class at the beginning of each day.
Sub-transfer agent fees are class-specific expenses. The amount of the sub-transfer agent fees charged to each class of the Fund for the year ended August 31, 2015 are as follows (amounts in thousands):
| | | | | | | | | | | | |
| | | Class A | | | Class C | | | Select Class | |
Sub-transfer agent fees | | $ | 28 | | | $ | 6 | | | $ | 66 | |
| | | | | | |
| | | |
| 46 | | | | J.P. MORGAN INCOME FUNDS | | AUGUST 31, 2015 |
I. Federal Income Taxes — The Fund is treated as a separate taxable entity for Federal income tax purposes. The Fund’s policy is to comply with the provisions of the Internal Revenue Code of 1986, as amended (the “Code”), applicable to regulated investment companies and to distribute to shareholders all of its distributable net investment income and net realized capital gains on investments. Accordingly, no provision for Federal income tax is necessary. Management has reviewed the Fund’s tax positions for all open tax years and has determined that as of August 31, 2015, no liability for income tax is required in the Fund’s financial statements for net unrecognized tax benefits. However, management’s conclusions may be subject to future review based on changes in, or the interpretation of, the accounting standards or tax laws and regulations. The Fund’s Federal tax returns for the prior three fiscal years, or since inception if shorter, remain subject to examination by the Internal Revenue Service.
J. Foreign Taxes — The Fund may be subject to foreign taxes on income, gains on investments or currency purchases/repatriation, a portion of which may be recoverable. The Fund will accrue such taxes and recoveries as applicable, based upon its current interpretation of tax rules and regulations that exist in the markets in which it invests.
K. Distributions to Shareholders — Distributions from net investment income are generally declared and paid monthly and are declared separately for each class. No class has preferential dividend rights; differences in per share rates are due to differences in separate class expenses. Net realized capital gains, if any, are distributed by the Fund at least annually. The amount of distributions from net investment income and net realized capital gains is determined in accordance with Federal income tax regulations, which may differ from GAAP. To the extent these “book/tax” differences are permanent in nature (i.e., that they result from other than timing of recognition — “temporary differences”), such amounts are reclassified within the capital accounts based on their Federal tax-basis treatment.
The following amounts were reclassified within the capital accounts (amounts in thousands):
| | | | | | | | | | | | |
| | | Paid-in-Capital | | | Accumulated
undistributed
(distributions in
excess of)
net investment
income | | | Accumulated
net realized
gains (losses) | |
| | $ | 4 | | | $ | 15,854 | | | $ | (15,858 | ) |
The reclassifications for the Fund relate primarily to foreign currency gains or losses.
3. Fees and Other Transactions with Affiliates
A. Investment Advisory Fee — Pursuant to the Investment Advisory Agreement, the Adviser supervises the investments of the Fund and for such services is paid a fee. The fee is accrued daily and paid monthly at an annual rate of 0.55% of the Fund’s average daily net assets.
The Adviser waived Investment Advisory fees and/or reimbursed expenses as outlined in Note 3.F.
B. Administration Fees — Pursuant to an Administration Agreement, the Administrator, an indirect, wholly-owned subsidiary of JPMorgan, provides certain administration services to the Fund. In consideration of these services, the Administrator receives a fee accrued daily and paid monthly at an annual rate of 0.15% of the first $25 billion of the average daily net assets of all funds in the J.P. Morgan Funds Complex covered by the Administration Agreement (excluding certain funds of funds and money market funds) and 0.075% of the average daily net assets in excess of $25 billion of all such funds. For the year ended August 31, 2015, the effective rate was 0.08% of the Fund’s average daily net assets, notwithstanding any fee waivers and/or expense reimbursements.
The Administrator waived Administration fees as outlined in Note 3.F.
JPMorgan Chase Bank, N.A. (“JPMCB”), a wholly-owned subsidiary of JPMorgan, serves as the Fund’s sub-administrator (the “Sub-administrator”). For its services as Sub-administrator, JPMCB receives a portion of the fees payable to the Administrator.
C. Distribution Fees — Pursuant to a Distribution Agreement, JPMorgan Distribution Services, Inc. (the “Distributor”), a wholly-owned subsidiary of JPMorgan, serves as the Trust’s exclusive underwriter and promotes and arranges for the sale of the Fund’s shares. The Board has adopted a Distribution Plan (the “Distribution Plan”) for Class A and Class C Shares of the Fund in accordance with Rule 12b-1 under the 1940 Act. The Distribution Plan provides that the Fund shall pay distribution fees, including payments to the Distributor, at annual rates of 0.25% and 0.75% of the average daily net assets of Class A and Class C Shares, respectively.
In addition, the Distributor is entitled to receive the front-end sales charges from purchases of Class A Shares and the CDSC from redemptions of Class C Shares and certain Class A Shares for which front-end sales charges have been waived. For the year ended August 31, 2015, the Distributor retained the following amounts (in thousands):
| | | | | | | | |
| | | Front-End Sales Charge | | | CDSC | |
| | $ | 17 | | | $ | — | (a) |
| (a) | Amounts rounds to less than $1,000. |
D. Shareholder Servicing Fees — The Trust, on behalf of the Fund, has entered into a Shareholder Servicing Agreement with the Distributor under which the Distributor provides certain support services to the shareholders. The Class R6 Shares do not participate in the Shareholder Servicing Agreement. For performing these services, the Distributor receives a fee that is accrued daily and paid monthly at an annual rate of 0.25% of the average daily net assets of Class A, Class C and Select Class Shares.
| | | | | | | | |
| | | |
| AUGUST 31, 2015 | | J.P. MORGAN INCOME FUNDS | | | | | 47 | |
NOTES TO FINANCIAL STATEMENTS
AS OF AUGUST 31, 2015 (continued)
The Distributor has entered into shareholder services contracts with affiliated and unaffiliated financial intermediaries who provide shareholder services and other related services to their clients or customers who invest in the Fund under which the Distributor will pay all or a portion of such fees earned to financial intermediaries for performing such services.
The Distributor waived Shareholder Servicing fees as outlined in Note 3.F.
E. Custodian and Accounting Fees — JPMCB provides portfolio custody and accounting services to the Fund. For these services, the Fund pays JPMCB transaction and asset-based fees that vary according to the number of transactions and positions, plus out-of-pocket expenses. The amounts paid directly to JPMCB by the Fund for custody and accounting services are included in Custodian and accounting fees on the Statement of Operations. Payments to the custodian may be reduced by credits earned by the Fund, based on uninvested cash balances held by the custodian. Such earnings credits, if any, are presented separately on the Statement of Operations.
Interest income earned on cash balances at the custodian, if any, is included in Interest income from affiliates on the Statement of Operations.
Interest expense paid to the custodian related to cash overdrafts, if any, is included in Interest expense to affiliates on the Statement of Operations.
F. Collateral Management Fees — JPMCB provides derivatives collateral management services for the Fund. The amounts paid directly to JPMCB by the Fund for these services are included in Collateral management fees on the Statements of Operations.
G. Waivers and Reimbursements — The Adviser, Administrator and Distributor have contractually agreed to waive fees and/or reimburse the Fund to the extent that total annual operating expenses (excluding acquired fund fees and expenses, dividend expenses related to short sales, interest, taxes, expenses related to litigation and potential litigation, extraordinary expenses and expenses related to the Board’s deferred compensation plan) exceed the percentages of the Fund’s average daily net assets as shown in the table below:
| | | | | | | | | | | | | | | | |
| | | Class A | | | Class C | | | Class R6 | | | Select Class | |
| | | 0.90 | % | | | 1.30 | % | | | 0.50 | % | | | 0.65 | % |
The expense limitation agreement was in effect for the year ended August 31, 2015 and is in place until at least December 31, 2015. In addition, the Fund’s service providers have voluntarily waived fees during the year ended August 31, 2015. However, the Fund’s service providers are under no obligation to do so and may discontinue such voluntary waivers at any time.
For the year ended August 31, 2015, the Fund’s service providers waived fees and/or reimbursed expenses for the Fund as follows (amounts in thousands). None of these parties expect the Fund to repay any such waived fees and/or reimbursed expenses in future years.
| | | | | | | | | | | | | | | | | | | | |
| | | Contractual Waivers | | | | |
| | | Investment
Advisory | | | Administration | | | Shareholder
Servicing | | | Total | | | Contractual
Reimbursements | |
| | $ | 962 | | | $ | 589 | | | $ | 776 | | | $ | 2,327 | | | $ | 8 | |
| | | | | |
| | | | | | | | | | | | | | | Voluntary Waiver
Administration | |
| | | | | | | | | | | | | | | | | | $ | 1 | |
Additionally, the Fund may invest in one or more money market funds advised by the Adviser or its affiliates. The Adviser, Administrator and Distributor, as shareholder servicing agent, waive fees in an amount sufficient to offset the respective fees each charges to the affiliated money market fund on the Fund’s investment in such affiliated money market fund. A portion of the waiver is voluntary.
The amounts of these waivers/reimbursements resulting from investments in these money market funds for the year ended August 31, 2015 were approximately $65,000.
H. Other — Certain officers of the Trust are affiliated with the Adviser, the Administrator and the Distributor. Such officers, with the exception of the Chief Compliance Officer, receive no compensation from the Fund for serving in their respective roles.
The Board appointed a Chief Compliance Officer to the Fund in accordance with Federal securities regulations. The Fund, along with other affiliated funds, makes reimbursement payments, on a pro-rata basis, to the Administrator for a portion of the fees associated with the Office of the Chief Compliance Officer. Such fees are included in Trustees’ and Chief Compliance Officer’s fees on the Statement of Operations.
The Trust adopted a Trustee Deferred Compensation Plan (the “Plan”) which allows the Independent Trustees to defer the receipt of all or a portion of compensation related to performance of their duties as Trustees. The deferred fees are invested in various J.P. Morgan Funds until distribution in accordance with the Plan.
During the year ended August 31, 2015, the Fund may have purchased securities from an underwriting syndicate in which the principal underwriter or members of the syndicate are affiliated with the Adviser.
The Fund may use related party broker-dealers. For the year ended August 31, 2015, the Fund did not incur any brokerage commissions with broker-dealers affiliated with the Adviser.
| | | | | | |
| | | |
| 48 | | | | J.P. MORGAN INCOME FUNDS | | AUGUST 31, 2015 |
The Securities and Exchange Commission (“SEC”) has granted an exemptive order permitting the Fund to engage in principal transactions with J.P. Morgan Securities, Inc., an affiliated broker, involving taxable money market instruments, subject to certain conditions.
4. Investment Transactions
During the year ended August 31, 2015, purchases and sales of investments (excluding short-term investments) were as follows (amounts in thousands):
| | | | | | | | | | | | | | | | |
| | | Purchases
(excluding
U.S. Government) | | | Sales
(excluding
U.S. Government) | | | Purchases
of U.S.
Government | | | Sales
of U.S.
Government | |
| | $ | 1,538,288 | | | $ | 633,879 | | | $ | 321 | | | $ | 281 | |
5. Federal Income Tax Matters
For Federal income tax purposes, the estimated cost and unrealized appreciation (depreciation) in value of investment securities held at August 31, 2015 were as follows (amounts in thousands):
| | | | | | | | | | | | | | | | |
| | | Aggregate
Cost | | | Gross
Unrealized
Appreciation | | | Gross
Unrealized
Depreciation | | | Net Unrealized
Appreciation
(Depreciation) | |
| | $ | 1,161,625 | | | $ | 4,074 | | | $ | 44,793 | | | $ | (40,719 | ) |
The difference between book and tax basis appreciation (depreciation) on investments is primarily attributed to wash sale loss deferrals.
The tax character of distributions paid during the year ended August 31, 2015 was as follows (amounts in thousands):
| | | | | | | | | | | | |
| | | Ordinary
Income | | | Net
Long-Term
Capital Gains | | | Total
Distributions
Paid | |
| | $ | 36,758 | | | $ | — | | | $ | 36,758 | |
The tax character of distributions paid during the year ended August 31, 2014 was as follows (amounts in thousands):
| | | | | | | | | | | | |
| | | Ordinary
Income | | | Net
Long-Term
Capital Gains | | | Total
Distribution
Paid | |
| | $ | 3,774 | | | $ | 54 | | | $ | 3,828 | |
As of August 31, 2015, the estimated components of net assets (excluding paid-in-capital) on a tax basis were as follows (amounts in thousands):
| | | | | | | | | | | | |
| | | Current
Distributable
Ordinary
Income | | | Current
Distributable
Long-Term
Capital Gain or
(Tax Basis
Loss Carryover) | | | Unrealized
Appreciation
(Depreciation) | |
| | $ | 9,059 | | | $ | (521 | ) | | $ | (40,964 | ) |
The cumulative timing differences primarily consist of post-October capital loss deferrals and mark to market of forward foreign currency contracts.
As of August 31, 2015, the Fund had net capital loss carryforwards as follows (amounts in thousands):
| | | | | | | | |
| | | Capital Loss
Carryforward Character | |
| | | Short-Term | | | Long-
Term | |
| | $ | 178 | | | $ | 343 | |
Net capital losses incurred after October 31 within the taxable year are deemed to arise on the first business day of the Fund’s next taxable year. For the year ended August 31, 2015, the Fund deferred to September 1, 2015 the following post-October net capital losses of (amounts in thousands):
| | | | | | | | |
| | | Net Capital Loss | |
| | | Short-Term | | | Long-Term | |
| | $ | 5,573 | | | $ | 1,833 | |
6. Borrowings
The Fund relies upon an exemptive order granted by the SEC (the “Order”) permitting the establishment and operation of an Interfund Lending Facility (the “Facility”). The Facility allows the Fund to directly lend and borrow money to or from any other fund relying upon the Order at rates
| | | | | | | | |
| | | |
| AUGUST 31, 2015 | | J.P. MORGAN INCOME FUNDS | | | | | 49 | |
NOTES TO FINANCIAL STATEMENTS
AS OF AUGUST 31, 2015 (continued)
beneficial to both the borrowing and lending funds. Advances under the Facility are taken primarily for temporary or emergency purposes, including the meeting of redemption requests that otherwise might require the untimely disposition of securities, and are subject to the Fund’s borrowing restrictions. The Interfund loan rate is determined, as specified in the Order, by averaging the current repurchase agreement rate and the current bank loan rate. The Order was granted to JPMorgan Trust II and may be relied upon by the Fund because the Fund and the series of JPMorgan Trust II are both investment companies in the same “group of investment companies” (as defined in Section 12(d)(1)(G) of the 1940 Act).
In addition, the Trust and JPMCB have entered into a financing arrangement. Under this arrangement, JPMCB provides an unsecured, uncommitted credit facility in the aggregate amount of $100 million to certain of the J.P. Morgan Funds, including the Fund. Advances under the arrangement are taken primarily for temporary or emergency purposes, including the meeting of redemption requests that otherwise might require the untimely disposition of securities, and are subject to the Fund’s borrowing restrictions. Interest on borrowings is payable at a rate determined by JPMCB at the time of borrowing. This agreement has been extended until November 9, 2015.
The Fund had no borrowings outstanding from another fund or from the unsecured, uncommitted credit facility at August 31, 2015, or at any time during the year then ended.
7. Risks, Concentrations and Indemnifications
In the normal course of business, the Fund enters into contracts that contain a variety of representations which provide general indemnifications. The Fund’s maximum exposure under these arrangements is unknown. The amount of exposure would depend on future claims that may be made against the Fund that have not yet occurred. However, based on experience, the Fund expects the risk of loss to be remote.
The Adviser or an affiliate may from time to time exercise discretion on behalf of certain of their clients with respect to the purchase or sale of a significant portion of the Fund’s outstanding shares. Investment activities on behalf of these shareholders could impact the Fund.
Since the Fund is non-diversified, it may invest a greater percentage of its assets in a particular issuer or group of issuers than a diversified fund would. This increased investment in fewer issuers may result in the Fund’s shares being more sensitive to economic results of those issuing the securities.
The Fund may have elements of risk not typically associated with investments in the United States of America due to concentrated investments in a limited number of countries or regions, which may vary throughout the period. Such concentrations may subject the Fund to additional risks resulting from political or economic conditions in such countries or regions and the possible imposition of adverse governmental laws or currency exchange restrictions could cause the securities and their markets to be less liquid and their prices to be more volatile than those of comparable U.S. securities.
As of August 31, 2015, a significant portion of the Fund’s net assets consisted of securities that were denominated in foreign currencies. Changes in currency exchange rates will affect the value of, and investment income from, such securities.
The Fund is subject to interest rate and credit risk. The value of debt securities may decline as interest rates increase. The Fund could lose money if the issuer of a fixed income security is unable to pay interest or repay principal when it is due. The Fund invests in floating rate loans and other floating rate debt securities. Although these investments are generally less sensitive to interest rate changes than other fixed rate instruments, the value of floating rate loans and other floating rate investments may decline if their interest rates do not rise as quickly, or as much, as general interest rates. Many factors can cause interest rates to rise. Some examples include central bank monetary policy, rising inflation rates and general economic conditions. Given the historically low interest rate environment, risks associated with rising rates are heightened. The ability of the issuers of debt to meet their obligations may be affected by the economic and political developments in a specific industry or region.
The Fund is also subject to counterparty credit risk, which is the risk that a counterparty fails to perform on agreements with the Fund such as forward foreign currency exchange contracts and TBA securities.
The Fund is subject to risks associated with securities with contractual cash flows including asset-backed and mortgage-related securities such as collateralized mortgage obligations, mortgage pass-through securities and commercial mortgage-backed securities, including securities backed by sub-prime mortgage loans. The value, liquidity and related income of these securities are sensitive to changes in economic conditions, including real estate value, prepayments, delinquencies and/or defaults, and may be adversely affected by shifts in the market’s perception of the issuers and changes in interest rates.
The Fund invests in high yield securities that are not rated or rated below investment grade (commonly known as “junk bonds.”) These securities are considered to be high risk investments. Investments in lower-rated securities or unrated securities of comparable quality tend to be more sensitive to economic conditions than higher rated securities. Junk bonds involve a greater risk of default by the issuer because such securities are generally unsecured and are often subordinated to other creditors’ claims. The market price of these securities can change suddenly and unexpectedly. As a result, the Fund is intended for investors who are able and willing to assume a high degree of risk.
The Fund’s investments in sovereign and corporate debt obligations within emerging market countries may be subject to potentially higher risks than investments in more developed markets and the prices of such investments may be volatile. The yields of emerging market debt obligations reflect, among other things, perceived credit risk. The consequences of political, social or economic instability in these markets may have disruptive effects on the market prices of the Fund’s investments and the income they generate, as well as the Fund’s ability to repatriate such amounts.
As of August 31, 2015, the Fund had the following country allocations representing greater than 10% of the Fund’s total investments:
| | | | | | |
| | | |
| 50 | | | | J.P. MORGAN INCOME FUNDS | | AUGUST 31, 2015 |
REPORT OF INDEPENDENT REGISTERED PUBLIC ACCOUNTING FIRM
To the Trustees of JPMorgan Trust I and the Shareholders of JPMorgan Global Bond Opportunities Fund:
In our opinion, the accompanying statement of assets and liabilities, including the schedule of portfolio investments, and the related statements of operations and of changes in net assets and the financial highlights present fairly, in all material respects, the financial position of JPMorgan Global Bond Opportunities Fund (a separate fund of JPMorgan Trust I) (the “Fund”) at August 31, 2015, the results of its operations for the year then ended, the changes in its net assets for each of the two years in the period then ended and the financial highlights for each of the periods presented, in conformity with accounting principles generally accepted in the United States of America. These financial statements and financial highlights (hereafter referred to as “financial statements”) are the responsibility of the Fund’s management. Our responsibility is to express an opinion on these financial statements based on our audits. We conducted our audits of these financial statements in accordance with the standards of the Public Company Accounting Oversight Board (United States). Those standards require that we plan and perform the audit to obtain reasonable assurance about whether the financial statements are free of material misstatement. An audit includes examining, on a test basis, evidence supporting the amounts and disclosures in the financial statements, assessing the accounting principles used and significant estimates made by management, and evaluating the overall financial statement presentation. We believe that our audits, which included confirmation of securities at August 31, 2015 by correspondence with the transfer agent, custodian and brokers, provide a reasonable basis for our opinion.
PricewaterhouseCoopers LLP
New York, New York
October 28, 2015
| | | | | | | | |
| | | |
| AUGUST 31, 2015 | | J.P. MORGAN INCOME FUNDS | | | | | 51 | |
TRUSTEES
(Unaudited)
The Fund’s Statement of Additional Information includes additional information about the Fund’s Trustees and is available, without charge, upon request by calling 1-800-480-4111 or on the J.P. Morgan Funds’ website at www.jpmorganfunds.com.
| | | | | | |
Name (Year of Birth); Positions With the Fund (1) | | Principal Occupations During Past 5 Years | | Number of
Portfolios in Fund
Complex Overseen
by Trustee (2) | | Other Directorships Held Outside Fund Complex During Past 5 Years |
Independent Trustees | | |
| | | |
| John F. Finn (1947); Trustee of Trust since 2005; Trustee of heritage One Group Mutual Funds since 1998. | | Chairman (1985-present), President and Chief Executive Officer, Gardner, Inc. (supply chain management company serving industrial and consumer markets) (1974-present). | | 148 | | Director, Greif, Inc. (GEF) (industrial package products and services) (2007-present); Trustee, Columbus Association for the Performing Arts (1988-present); Director, Cardinal Health, Inc. (CAH) (1994-2014). |
| | | |
| Dr. Matthew Goldstein (1941); Chairman since 2013; Trustee of Trust since 2005; Trustee of heritage J.P. Morgan Funds since 2003. | | Chancellor Emeritus, City University of New York (2015-present); Professor, City University of New York (2013-present); Chancellor, City University of New York (1999-2013); President, Adelphi University (New York) (1998-1999). | | 148 | | Trustee, Museum of Jewish Heritage (2011-present). |
| | | |
| Robert J. Higgins (1945); Trustee of Trust since 2005; Trustee of heritage J.P. Morgan Funds since 2002. | | Retired; Director of Administration of the State of Rhode Island (2003-2004); President — Consumer Banking and Investment Services, Fleet Boston Financial (1971-2001). | | 148 | | None |
| | | |
| Frankie D. Hughes (1952), Trustee of Trust since 2008. | | President, Ashland Hughes Properties (property management) (2014-present); President and Chief Investment Officer, Hughes Capital Management, Inc. (fixed income asset management) (1993-2014). | | 148 | | Trustee, The Victory Portfolios
(2000-2008) (Investment companies). |
| | | |
| Peter C. Marshall (1942); Trustee of Trust since 2005; Trustee of heritage One Group Mutual Funds since 1985. | | Self-employed business consultant
(2002-present). | | 148 | | None |
| | | |
| Mary E. Martinez (1960); Trustee of Trust since 2013. | | Associate, Special Properties, a Christie’s International Real Estate Affiliate (2010-present); Managing Director, Bank of America (Asset Management) (2007-2008); Chief Operating Officer, U.S. Trust Asset Management, U.S. Trust Company (asset management) (2003-2007); President, Excelsior Funds (registered investment companies) (2004-2005). | | 148 | | None |
| | | |
| Marilyn McCoy* (1948); Trustee of Trust since 2005; Trustee of heritage One Group Mutual Funds since 1999. | | Vice President of Administration and Planning, Northwestern University (1985-present). | | 148 | | Trustee, Carleton College
(2003-present). |
| | | |
| Mitchell M. Merin (1953); Trustee of Trust since 2013. | | Retired; President and Chief Operating Officer, Morgan Stanley Investment Management, Member Morgan Stanley & Co. Management Committee (registered investment adviser) (1998-2005). | | 148 | | Director, Sun Life Financial (SLF) (2007-2013) (financial services and insurance); Trustee, Trinity College, Hartford, CT (2002-2010). |
| | | |
| William G. Morton, Jr. (1937); Trustee of Trust since 2005; Trustee of heritage J.P. Morgan Funds since 2003. | | Retired; Chairman Emeritus (2001-2002), and Chairman and Chief Executive Officer, Boston Stock Exchange (1985-2001). | | 148 | | Director, Radio Shack Corp. (electronics) (1987-2008); Director, National Organization of Investment Professionals (2010-present); Trustee of the Stratton Mountain School (2001-present). |
| | | | | | |
| | | |
| 52 | | | | J.P. MORGAN INCOME FUNDS | | AUGUST 31, 2015 |
| | | | | | |
Name (Year of Birth); Positions With the Fund (1) | | Principal Occupations During Past 5 Years | | Number of
Portfolios in Fund
Complex Overseen
by Trustee (2) | | Other Directorships Held Outside Fund Complex During Past 5 Years |
Independent Trustees (continued) | | |
| | | |
| Dr. Robert A. Oden, Jr. (1946); Trustee of Trust since 2005; Trustee of heritage One Group Mutual Funds since 1997. | | Retired; President, Carleton College
(2002-2010); President, Kenyon College
(1995-2002). | | 148 | | Chairman, Dartmouth-Hitchcock Medical Center (2011-present); Trustee, American Schools of Oriental Research (2011-present); Trustee, American University in Cairo (1999-2014); Trustee, American Museum of Fly Fishing (2013-present). |
| | | |
| Marian U. Pardo** (1946); Trustee of Trust since 2013. | | Managing Director and Founder, Virtual Capital Management LLC (Investment Consulting) (2007-present); Managing Director, Credit Suisse Asset Management (portfolio manager) (2003-2006). | | 148 | | Member, Board of Governors, Columbus Citizens Foundation (not-for-profit supporting philanthropic and cultural programs) (2006-present). |
| | | |
| Frederick W. Ruebeck (1939); Trustee of Trust since 2005; Trustee of heritage One Group Mutual Funds since 1994. | | Consultant (2000-present); Adviser, JP Greene & Associates, LLC (broker-dealer)
(2000-2009); Chief Investment Officer, Wabash College (2004-present); Director of Investments, Eli Lilly and Company (pharmaceuticals) (1988-1999). | | 148 | | Trustee, Wabash College
(1988-present); Chairman, Indianapolis Symphony Foundation (1994-present). |
| | | |
| James J. Schonbachler (1943); Trustee of Trust since 2005; Trustee of heritage J.P. Morgan Funds since 2001. | | Retired; Managing Director of Bankers Trust Company (financial services) (1968-1998). | | 148 | | None |
| (1) | The Trustees serve for an indefinite term, subject to the Trust’s current retirement policy, which is age 78 for all Trustees. |
| (2) | A Fund Complex means two or more registered investment companies that hold themselves out to investors as related companies for purposes of investment and investor services or have a common investment adviser or have an investment adviser that is an affiliated person of the investment adviser of any of the other registered investment companies. The J.P. Morgan Funds Complex for which the Board of Trustees serves currently includes eleven registered investment companies (148 funds). |
| * | Two members of the Board of Trustees of Northwestern University are executive officers of registered investment advisers (not affiliated with JPMorgan) that are under common control with sub-advisers to certain J.P. Morgan Funds. |
| ** | In connection with prior employment with JPMorgan Chase, Ms. Pardo is the recipient of non-qualified pension plan payments from JPMorgan Chase in the amount of approximately $2,055 per month, which she irrevocably waived effective January 1, 2013, and deferred compensation payments from JPMorgan Chase in the amount of approximately $7,294 per year, which ended in January 2013. In addition, Ms. Pardo receives payments from a fully funded qualified plan, which is not an obligation of JPMorgan Chase. |
The contact address for each of the Trustees is 270 Park Avenue, New York, NY 10017.
| | | | | | | | |
| | | |
| AUGUST 31, 2015 | | J.P. MORGAN INCOME FUNDS | | | | | 53 | |
OFFICERS
(Unaudited)
| | |
Name (Year of Birth), Positions Held with the Trust (Since) | | Principal Occupations During Past 5 Years |
| |
Robert L. Young (1963),
President and Principal Executive Officer (2013)* | | Chief Operating Officer and Director, J.P. Morgan Investment Management Inc. since 2010; Senior Vice President, J.P. Morgan Funds (2005-2010), Chief Operating Officer, J.P. Morgan Funds (2005-2010); Director and various officer positions for JPMorgan Funds Management, Inc. (formerly One Group Administrative Services) and JPMorgan Distribution Services, Inc. (formerly One Group Dealer Services, Inc.) from 1999 to present. Mr. Young has been with JPMorgan Chase & Co. (formerly Bank One Corporation) since 1997. |
| |
Laura M. Del Prato (1964),
Treasurer and Principal Financial Officer (2014) | | Managing Director, JPMorgan Funds Management, Inc. since 2014; Partner, Cohen Fund Audit Services, Ltd. (2012-2013); Partner (2004-2012) and various other titles (1990-2004) at KPMG, LLP. |
| |
Frank J. Nasta (1964),
Secretary (2008) | | Managing Director and Associate General Counsel, JPMorgan Chase since 2008; Previously, Director, Managing Director, General Counsel and Corporate Secretary, J. & W. Seligman & Co. Incorporated; Secretary of each of the investment companies of the Seligman Group of Funds and Seligman Data Corp.; Director and Corporate Secretary, Seligman Advisors, Inc. and Seligman Services, Inc. |
| |
Stephen M. Ungerman (1953),
Chief Compliance Officer (2005) | | Managing Director, JPMorgan Chase & Co.; Mr. Ungerman has been with JPMorgan Chase & Co. since 2000. |
| |
Elizabeth A. Davin (1964), Assistant Secretary (2005)* | | Executive Director and Assistant General Counsel, JPMorgan Chase since February 2012; formerly Vice President and Assistant General Counsel, JPMorgan Chase from 2005 to February 2012; Senior Counsel, JPMorgan Chase (formerly Bank One Corporation) from 2004 to 2005. |
| |
Jessica K. Ditullio (1962),
Assistant Secretary (2005)* | | Executive Director and Assistant General Counsel, JPMorgan Chase since February 2011; Ms. Ditullio has served as an attorney with various titles for JPMorgan Chase (formerly Bank One Corporation) since 1990. |
| |
John T. Fitzgerald (1975),
Assistant Secretary (2008) | | Executive Director and Assistant General Counsel, JPMorgan Chase since February 2011; formerly, Vice President and Assistant General Counsel, JPMorgan Chase from 2005 to February 2011. |
| |
Carmine Lekstutis (1980),
Assistant Secretary (2011) | | Executive Director and Assistant General Counsel, JPMorgan Chase since February 2015; formerly Vice President and Assistant General Counsel, JPMorgan Chase from 2011 to February 2015; Associate, Skadden, Arps, Slate, Meagher & Flom LLP (law firm) from 2006 to 2011. |
| |
Gregory S. Samuels (1980),
Assistant Secretary (2010) | | Executive Director and Assistant General Counsel, JPMorgan Chase since 2014; formerly Vice President and Assistant General Counsel, JPMorgan Chase since 2010; Associate, Ropes & Gray (law firm) from 2008 to 2010; Associate, Clifford Chance LLP (law firm) from 2005 to 2008. |
| |
Pamela L. Woodley (1971),
Assistant Secretary (2012)** | | Vice President and Assistant General Counsel, JPMorgan Chase since November 2004. |
| |
Michael M. D’Ambrosio (1969),
Assistant Treasurer (2012) | | Managing Director, JPMorgan Funds Management, Inc. since May 2014; formerly Executive Director, JPMorgan Funds Management, Inc. from 2012 to May 2014; prior to joining JPMorgan Chase, Mr. D’Ambrosio was a Tax Director at PricewaterhouseCoopers LLP since 2006. |
| |
Joseph Parascondola (1963),
Assistant Treasurer (2011) | | Vice President, JPMorgan Funds Management, Inc. since August 2006. |
| |
Matthew J. Plastina (1970),
Assistant Treasurer (2011) | | Vice President, JPMorgan Funds Management, Inc. since August 2010; prior to August 2010, Vice President and Controller, Legg Mason Global Asset Management. |
| |
Julie A. Roach (1971),
Assistant Treasurer (2012)* | | Vice President, JPMorgan Funds Management, Inc. since August 2012; prior to joining JPMorgan Chase, Ms. Roach was a Senior Manager with Deloitte since 2001. |
| |
Gillian I. Sands (1969),
Assistant Treasurer (2012) | | Vice President, JPMorgan Funds Management, Inc. since September 2012; Assistant Treasurer, Wells Fargo Funds Management (2007-2009). |
The contact address for each of the officers, unless otherwise noted, is 270 Park Avenue, New York, NY 10017.
| * | The contact address for the officer is 460 Polaris Parkway, Westerville, OH 43082. |
| ** | The contact address for the officer is 4 New York Plaza, Floor 21, New York, NY 10004. |
| | | | | | |
| | | |
| 54 | | | | J.P. MORGAN INCOME FUNDS | | AUGUST 31, 2015 |
SCHEDULE OF SHAREHOLDER EXPENSES
(Unaudited)
Hypothetical $1,000 Investment
As a shareholder of the Fund, you incur two types of costs: (1) transaction costs, including sales charges (loads) on purchase payments and (2) ongoing costs, including investment advisory fees, administration fees, distribution fees and other Fund expenses. The examples below are intended to help you understand your ongoing costs (in dollars) of investing in the Fund and to compare these ongoing costs with the ongoing costs of investing in other mutual funds. The examples assume that you had a $1,000 investment in each Class at the beginning of the reporting period, March 1, 2015, and continued to hold your shares at the end of the reporting period, August 31, 2015.
Actual Expenses
For each Class of the Fund in the table below, the first line provides information about actual account values and actual expenses. You may use the information in this line, together with the amount you invested, to estimate the expenses that you paid over the period. Simply divide your account value by $1,000 (for example, an $8,600 account value divided by $1,000 = 8.6), then multiply the result by the number in the first line of each Class under the heading entitled “Expenses Paid During the Period” to estimate the expenses you paid on your account during this period.
Hypothetical Example for Comparison Purposes
The second line of each Class in the table below provides information about hypothetical account values and hypothetical expenses based on the Class’ actual expense ratio and an assumed rate of return of 5% per year before expenses, which is not the Class’ actual return. The hypothetical account values and expenses may not be used to estimate the actual ending account balance or expenses you paid for the period. You may use this information to compare the ongoing costs of investing in the Class of the Fund and other funds. To do so, compare this 5% hypothetical example with the 5% hypothetical examples that appear in the shareholder reports of the other funds. Please note that the expenses shown in the table are meant to highlight your ongoing costs only and do not reflect any transaction costs, such as sales charges (loads) or redemption fees. Therefore, the second line for each Class in the table is useful in comparing ongoing costs only, and will not help you determine the relative total costs of owning different funds. In addition, if these transaction costs were included, your costs would have been higher. The examples also assume all dividends and distributions have been reinvested.
| | | | | | | | | | | | | | | | |
| | | Beginning
Account Value
March 1, 2015 | | | Ending
Account Value
August 31, 2015 | | | Expenses
Paid During
the Period* | | | Annualized
Expense
Ratio | |
Global Bond Opportunities Fund | | | | | | | | | | | | | | | | |
Class A | | | | | | | | | | | | | | | | |
Actual | | $ | 1,000.00 | | | $ | 976.40 | | | $ | 4.43 | | | | 0.89 | % |
Hypothetical | | | 1,000.00 | | | | 1,020.72 | | | | 4.53 | | | | 0.89 | |
Class C | | | | | | | | | | | | | | | | |
Actual | | | 1,000.00 | | | | 974.70 | | | | 6.42 | | | | 1.29 | |
Hypothetical | | | 1,000.00 | | | | 1,018.70 | | | | 6.56 | | | | 1.29 | |
Class R6 | | | | | | | | | | | | | | | | |
Actual | | | 1,000.00 | | | | 978.20 | | | | 2.44 | | | | 0.49 | |
Hypothetical | | | 1,000.00 | | | | 1,022.74 | | | | 2.50 | | | | 0.49 | |
Select Class | | | | | | | | | | | | | | | | |
Actual | | | 1,000.00 | | | | 977.40 | | | | 3.19 | | | | 0.64 | |
Hypothetical | | | 1,000.00 | | | | 1,021.98 | | | | 3.26 | | | | 0.64 | |
| * | Expenses are equal to each Class’ respective annualized expense ratio, multiplied by the average account value over the period, multiplied by 184/365 (to reflect the one-half year period). |
| | | | | | | | |
| | | |
| AUGUST 31, 2015 | | J.P. MORGAN INCOME FUNDS | | | | | 55 | |
BOARD APPROVAL OF INVESTMENT ADVISORY AGREEMENTS
(Unaudited)
The Board of Trustees has established various standing committees composed of Trustees with diverse backgrounds, to which the Board of Trustees has assigned specific subject matter responsibilities to further enhance the effectiveness of the Board’s oversight and decision making. The Board of Trustees and its investment committees (money market and alternative products, equity, and fixed income) meet regularly throughout the year and consider factors that are relevant to their annual consideration of investment advisory agreements at each meeting. They also meet for the specific purpose of considering investment advisory agreement annual renewals. The Board of Trustees held meetings in person in June and August 2015, at which the Trustees considered the continuation of the investment advisory agreement for the Fund whose annual report is contained herein (the “Advisory Agreement”). At the June meeting, the Board’s investment committees met to review and consider performance, expense and related information for the J.P. Morgan Funds. Each investment committee reported to the full Board, which then considered the investment committee’s preliminary findings. At the August meeting, the Trustees continued their review and consideration. The Trustees, including a majority of the Trustees who are not “interested persons” (as defined in the 1940 Act) of any party to the Advisory Agreement or any of their affiliates, approved the continuation of the Advisory Agreement on August 19, 2015.
As part of their review of the Advisory Agreement, the Trustees considered and reviewed performance and other information about the Fund received from the Adviser. This information includes the Fund’s performance as compared to the performance of its peers and benchmarks and analyses by the Adviser of the Fund’s performance. In addition, the Trustees have engaged an independent management consulting firm (“independent consultant”) to report on the performance of certain J.P. Morgan Funds at each of the Trustees’ regular meetings. The Adviser also periodically provides comparative information regarding the Fund’s expense ratios and those of its peer groups. In addition, in preparation for the June and August meetings, the Trustees requested, received and evaluated extensive materials from the Adviser, including performance and expense information compiled by Lipper Inc. (“Lipper”), an independent provider of investment company data. The independent consultant also provided additional analyses of the performance of the Fund in connection with the Trustees’ review of the Advisory Agreement. Before voting on the proposed Advisory Agreement, the Trustees reviewed the proposed Advisory Agreement with representatives of the Adviser, counsel to the Trust and independent legal counsel and received a memorandum from independent legal counsel to the Trustees discussing the legal standards for their consideration of the proposed Advisory Agreement. The Trustees also discussed the proposed Advisory Agreement in executive sessions with independent legal counsel at which no representatives of the Adviser were present. Set forth below is a summary
of the material factors evaluated by the Trustees in determining whether to approve the Advisory Agreement.
The Trustees considered information provided with respect to the Fund over the course of the year. Each Trustee attributed different weights to the various factors and no factor alone was considered determinative. From year to year, the Trustees consider and place emphasis on relevant information in light of changing circumstances in market and economic conditions. The Trustees determined that the compensation to be received by the Adviser from the Fund under the Advisory Agreement was fair and reasonable and that the continuance of the Advisory Agreement was in the best interests of the Fund and its shareholders.
The factors summarized below were considered and discussed by the Trustees in reaching their conclusions:
Nature, Extent and Quality of Services Provided by the Adviser
The Trustees received and considered information regarding the nature, extent and quality of the services provided to the Fund under the Advisory Agreement. The Trustees took into account information furnished throughout the year at Trustee meetings, as well as the materials furnished specifically in connection with this annual review process. The Trustees considered the background and experience of the Adviser’s senior management and the expertise of, and the amount of attention given to the Fund by, investment personnel of the Adviser. In addition, the Trustees reviewed the qualifications, backgrounds and responsibilities of the portfolio management team primarily responsible for the day-to-day management of the Fund and the infrastructure supporting the team. The Trustees also considered information provided by the Adviser and JPMorgan Distribution Services, Inc. (“JPMDS”) about the structure and distribution strategy of the Fund. The Trustees reviewed information relating to the Adviser’s risk governance model and reports showing the Adviser’s compliance structure and ongoing compliance processes. The Trustees also considered the quality of administrative services provided by JPMorgan Funds Management, Inc. (“JPMFM”), an affiliate of the Adviser.
The Trustees also considered their knowledge of the nature and quality of the services provided by the Adviser and its affiliates to the Fund gained from their experience as Trustees of the J.P. Morgan Funds. In addition, they considered the overall reputation and capabilities of the Adviser and its affiliates, the commitment of the Adviser to provide high quality service to the Fund, their overall confidence in the Adviser’s integrity and the Adviser’s responsiveness to questions or concerns raised by them, including the Adviser’s willingness to consider and implement organizational and operational changes designed to improve investment results and the services provided to the Fund.
Based upon these considerations and other factors, the Trustees concluded that they were satisfied with the nature, extent
| | | | | | |
| | | |
| 56 | | | | J.P. MORGAN INCOME FUNDS | | AUGUST 31, 2015 |
and quality of the investment advisory services provided to the Fund by the Adviser.
Costs of Services Provided and Profitability to the Adviser and its Affiliates
The Trustees received and considered information regarding the profitability to the Adviser and its affiliates in providing services to the Fund. The Trustees reviewed and discussed this data. The Trustees recognized that this data is not audited and represents the Adviser’s determination of its and its affiliates’ revenues from the contractual services provided to the Fund, less expenses of providing such services. Expenses include direct and indirect costs and are calculated using an allocation methodology developed by the Adviser. The Trustees also recognized that it is difficult to make comparisons of profitability from fund investment advisory contracts because comparative information is not generally publicly available and is affected by numerous factors, including the structure of the particular adviser, the types of funds it manages, its business mix, numerous assumptions regarding allocations and the fact that publicly-traded fund managers’ operating profits and net income are net of distribution and marketing expenses. Based on their review, the Trustees concluded that the profitability to the Adviser under the Advisory Agreement was not unreasonable in light of the services and benefits provided to the Fund.
Fall-Out Benefits
The Trustees reviewed information regarding potential “fallout” or ancillary benefits received by the Adviser and its affiliates as a result of their relationship with the Fund. The Trustees also reviewed the Adviser’s allocation of fund brokerage for the J.P. Morgan Funds complex, including allocations to brokers who provide research to the Adviser.
The Trustees also considered that JPMFM and JPMDS, affiliates of the Adviser, earn fees from the Fund for providing administrative and shareholder services. These fees were shown separately in the profitability analysis presented to the Trustees. The Trustees also considered the payments of Rule 12b-1 fees to JPMDS, which also acts as the Fund’s distributor. The Trustees also considered the fees paid to JPMorgan Chase Bank, N.A. (“JPMCB”) for custody and fund accounting, and other related services.
Economies of Scale
The Trustees considered the extent to which the Fund may benefit from economies of scale. The Trustees considered that there may not be a direct relationship between economies of scale realized by the Fund and those realized by the Adviser as assets increase. The Trustees noted that the proposed investment advisory fee schedule for the Fund does not contain breakpoints, but that the fees remain competitive with peer funds. The Trustees also considered that the Adviser has
implemented fee waivers and expense limitations (“Fee Caps”) which allows the Fund’s shareholders to share potential economies of scale from the Fund’s inception. The Trustees also considered that the Adviser has shared economies of scale by adding or enhancing services to the Fund over time, noting the Adviser’s substantial investments in its business in support of the Fund, including investments in trading systems and technology (including cybersecurity improvements), retention of key talent, additions to analyst and portfolio management teams, and regulatory support enhancements. The Trustees also considered whether it would be appropriate to add advisory fee breakpoints and the Trustees concluded that the current fee structure was reasonable in light of the Fee Caps that the Adviser has in place that serve to limit the overall net expense ratios of the Fund at competitive levels. The Trustees concluded that the Fund’s shareholders received the benefits of potential economies of scale through the Fee Caps and the Adviser’s reinvestment in its operations to serve the Fund and its shareholders.
Independent Written Evaluation of the Fund’s Chief Compliance Officer
The Trustees noted that, upon their direction, the Chief Compliance Officer for the Fund had prepared an independent written evaluation in order to assist the Trustees in determining the reasonableness of the proposed management fees. The Trustees considered the written evaluation in determining whether to continue the Advisory Agreement.
Fees Relative to Adviser’s Other Clients
The Trustees received and considered information about the nature and extent of investment advisory services and fee rates offered to other clients of the Adviser, including institutional separate accounts and/or funds sub-advised by the Adviser, and for investment management styles substantially similar to that of the Fund. The Trustees considered the complexity of investment management for registered mutual funds relative to the Adviser’s other clients and noted differences in the regulatory, legal and other risks and responsibilities of providing services to the different clients. The Trustees considered that serving as an adviser to a registered mutual fund involves greater responsibilities and risks than acting as a sub-adviser and observed that sub-advisory fees may be lower than those charged by the Adviser to the Fund. The Trustees also noted that the adviser, not the mutual fund, pays the sub-advisory fee and that many responsibilities related to the advisory function are retained by the primary adviser. The Trustees concluded that the fee rates charged to the Fund in comparison to those charged to the Adviser’s other clients were reasonable.
Investment Performance
The Trustees received and considered absolute and/or relative performance for the Fund in a report prepared by Lipper. The
| | | | | | | | |
| | | |
| AUGUST 31, 2015 | | J.P. MORGAN INCOME FUNDS | | | | | 57 | |
BOARD APPROVAL OF INVESTMENT ADVISORY AGREEMENTS
(Unaudited) (continued)
Trustees considered the total return performance information, which included the ranking of the Fund within a performance universe made up of funds with the same Lipper investment classification and objective (the “Universe Group”) by total return for the applicable one-year period. The Trustees reviewed a description of Lipper’s methodology for selecting mutual funds in the Fund’s Universe Group. The Lipper materials provided to the Trustees highlighted information with respect to certain representative classes to assist the Trustees in their review. As part of this review, the Trustees also reviewed the Fund’s performance against its benchmark and considered the performance information provided for the Fund at regular Board meetings by the Adviser and the Trustees’ independent consultant and also considered the special analysis prepared by the Trustees’ independent consultant. The Lipper performance data noted by the Trustees as part of their review and the determinations made by the Trustees with respect to the Fund’s performance for certain representative classes are summarized below:
The Trustees noted that the Fund’s performance was in the second quintile for both Class A and Select Class shares for the one-year period ended December 31, 2014, and that the independent consultant indicated that the Fund’s overall performance was attractive. The Trustees discussed the performance and investment strategy of the Fund with the Adviser and, based upon this discussion and various other factors, concluded that the Fund’s performance was reasonable.
Advisory Fees and Expense Ratios
The Trustees considered the contractual advisory fee rate paid by the Fund to the Adviser and compared that rate to the information prepared by Lipper concerning management fee rates paid by other funds in the same Lipper category as the Fund. The Trustees recognized that Lipper reported the Fund’s management fee rate as the combined contractual advisory fee and administration fee rates. The Trustees also reviewed information about other expenses and the expense ratios for the Fund. The Trustees considered the fee waiver and/or expense reimbursement arrangements currently in place for the Fund and considered the net advisory fee rate after taking into account any waivers and/or reimbursements. The Trustees recognized that it is difficult to make comparisons of advisory fees because there are variations in the services that are included in the fees paid by other funds. The Trustees’ determinations as a result of the review of the Fund’s advisory fees and expense ratios for certain representative classes are summarized below:
The Trustees noted that the Fund’s net advisory fee and the actual total expenses for both Class A and Select Class shares were in the first quintile of the Universe Group. After considering the factors identified above, in light of this information, the Trustees concluded that the advisory fee was reasonable.
| | | | | | |
| | | |
| 58 | | | | J.P. MORGAN INCOME FUNDS | | AUGUST 31, 2015 |

Rev. January 2011
| | |
| FACTS | | WHAT DOES J.P. MORGAN FUNDS DO WITH YOUR PERSONAL INFORMATION? |
| | |
| Why? | | Financial companies choose how they share your personal information. Federal law gives consumers the right to limit some but not all sharing. Federal law also requires us to tell you how we collect, share, and protect your personal information. Please read this notice carefully to understand what we do. |
| | |
| What? | | The types of personal information we collect and share depend on the product or service you have with us. This information can include: ¡ Social Security number and account balances ¡ transaction history and account transactions ¡ checking account information and wire transfer instructions When you are no longer our customer, we continue to share your information as described in this notice. |
| | |
| How? | | All financial companies need to share customers’ personal information to run their everyday business. In the section below, we list the reasons financial companies can share their customers’ personal information; the reasons J.P. Morgan Funds chooses to share; and whether you can limit this sharing. |
| | | | |
| Reasons we can share your personal information | | Does J.P. Morgan
Funds share? | | Can you limit this
sharing? |
For our everyday business purposes — such as to process your transactions, maintain your account(s), respond to court orders and legal investigations, or report to credit bureaus | | Yes | | No |
For marketing purposes — to offer our products and services to you | | Yes | | No |
| For joint marketing with other financial companies | | No | | We don’t share |
For our affiliates’ everyday business purposes — information about your transactions and experiences | | No | | We don’t share |
For our affiliates’ everyday business purposes — information about your creditworthiness | | No | | We don’t share |
| For nonaffiliates to market to you | | No | | We don’t share |
| | |
| | |
| Questions? | | Call 1-800-480-4111 or go to www.jpmorganfunds.com |

| | |
| Who we are |
| Who is providing this notice? | | J.P. Morgan Funds |
| | |
| What we do |
| How does J.P. Morgan Funds protect my personal information? | | To protect your personal information from unauthorized access and use, we use security measures that comply with federal law. These measures include computer safeguards and secured files and buildings. We authorize our employees to access your information only when they need it to do their work and we require companies that work for us to protect your information. |
How does J.P. Morgan Funds collect my personal information? | | We collect your personal information, for example, when you: ¡ open an account or provide contact information ¡ give us your account information or pay us by check ¡ make a wire transfer We also collect your personal information from others, such as credit bureaus, affiliates and other companies. |
| Why can’t I limit all sharing? | | Federal law gives you the right to limit only ¡ sharing for affiliates’ everyday business purposes – information about your creditworthiness ¡ affiliates from using your information to market to you ¡ sharing for nonaffiliates to market to you State laws and individual companies may give you additional rights to limit sharing. |
| | |
| Definitions |
| Affiliates | | Companies related by common ownership or control. They can be financial and nonfinancial companies. ¡ J.P. Morgan Funds does not share with our affiliates. |
| Nonaffiliates | | Companies not related by common ownership or control. They can be financial and nonfinancial companies. ¡ J.P. Morgan Funds does not share with nonaffiliates so they can market to you. |
| Joint Marketing | | A formal agreement between nonaffiliated financial companies that together market financial products or services to you. ¡ J.P. Morgan Funds doesn’t jointly market. |
J.P. Morgan Funds are distributed by JPMorgan Distribution Services, Inc., which is an affiliate of JPMorgan Chase & Co. Affiliates of JPMorgan Chase & Co. receive fees for providing various services to the funds.
Contact JPMorgan Distribution Services, Inc. at 1-800-480-4111 for a fund prospectus. You can also visit us at www.jpmorganfunds.com. Investors should carefully consider the investment objectives and risk as well as charges and expenses of the mutual fund before investing. The prospectus contains this and other information about the mutual fund. Read the prospectus carefully before investing.
Investors may obtain information about the Securities Investor Protection Corporation (SIPC), including the SIPC brochure by visiting www.sipc.org or by calling SIPC at 202-371-8300.
The Fund files a complete schedule of its fund holdings for the first and third quarters of its fiscal year with the SEC on Form N-Q. The Fund’s Forms N-Q are available on the SEC’s website at http://www.sec.gov and may be reviewed and copied at the SEC’s Public Reference Room in Washington, DC. Information on the operation of the SEC’s Public Reference Room may be obtained by calling 1-800-SEC-0330. Shareholders may request the Form N-Q without charge by calling 1-800-480-4111 or by visiting the J.P. Morgan Funds’ website at www.jpmorganfunds.com.
A description of the Fund’s policies and procedures with respect to the disclosure of the Fund’s holdings is available in the prospectus and Statement of Additional Information.
A copy of proxy policies and procedures is available without charge upon request by calling 1-800-480-4111 and on the Fund’s website at www.jpmorganfunds.com. A description of such policies and procedures is on the SEC’s website at www.sec.gov. The Trustees have delegated the authority to vote proxies for securities owned by the Fund to the Adviser. A copy of the Fund’s voting record for the most recent 12-month period ended June 30 is available on the SEC’s website at www.sec.gov or at the Fund’s website at www.jpmorganfunds.com no later than August 31 of each year. The Fund’s proxy voting record will include, among other things, a brief description of the matter voted on for each fund security, and will state how each vote was cast, for example, for or against the proposal.

J.P. Morgan Asset Management is the marketing name for the asset management business of JPMorgan Chase & Co. Those businesses include, but are not limited to, J.P. Morgan Investment Management Inc., Security Capital Research & Management Incorporated and J.P. Morgan Alternative Asset Management, Inc.
| | | | |
| | © JPMorgan Chase & Co., 2015. All rights reserved. August 2015. | | AN-GBO-815 |
Annual Report
J.P. Morgan Income Funds
August 31, 2015
JPMorgan Floating Rate Income Fund

CONTENTS
Investments in the Fund are not bank deposits or obligations of, or guaranteed or endorsed by, any bank and are not insured or guaranteed by the FDIC, the Federal Reserve Board or any other government agency. You could lose money if you sell when the Fund’s share price is lower than when you invested.
Past performance is no guarantee of future performance. The general market views expressed in this report are opinions based on market and other conditions through the end of the reporting period and are subject to change without notice. These views are not intended to predict the future performance of the Fund or the securities markets. References to specific securities and their issuers are for illustrative purposes only and are not intended to be, and should not be interpreted as, recommendations to purchase or sell such securities. Such views are not meant as investment advice and may not be relied on as an indication of trading intent on behalf of the Fund.
Prospective investors should refer to the Fund’s prospectus for a discussion of the Fund’s investment objective, strategies and risks. Call J.P. Morgan Funds Service Center at 1-800-480-4111 for a prospectus containing more complete information about the Fund, including management fees and other expenses. Please read it carefully before investing.
CEO’S LETTER
September 25, 2015 (Unaudited)
Dear Shareholder,
As the U.S. economy continued to strengthen and policy makers moved toward a more normalized monetary policy over the twelve months ended August 31, 2015, central bankers in Europe, Japan and Asia unleashed unprecedented stimulus measures to bolster flagging growth. Over the same period, financial market volatility increased until it truly erupted in mid-August amid acute worries that China’s economy — the world’s second largest economy — was faltering.
| | |
 | | “The U.S. economic recovery remained largely intact amid historically low interest rates, while central banks in the U.S., Europe, Japan and China continued to provide or increase growth stimulus.” |
Though U.S. financial markets largely recovered by the end of August, the shock from the global sell-off in equities, along with other considerations, was apparently enough to convince the U.S. Federal Reserve (the “Fed”) to postpone an interest rate increase in September.
Amid an environment of low interest rates, falling energy prices and global growth, U.S. equity prices rose through the end of 2014 and essentially remained near their closing highs for the first five months of 2015, hitting a peak in mid-May. Meanwhile, U.S. bond markets provided lackluster returns, caught between investor concerns about the timing and impact of a Fed interest rate increase and periodic “flights to safety” as investors reacted to specific market or geopolitical events.
While there was notable weakness in the U.S. economy in the first three months of 2015 — mainly due to severe winter weather and a labor dispute at vital West Coast ports — the upward trajectory of the economy resumed in the second quarter and U.S. gross domestic product rose 3.9%. Unemployment continued its steady decline throughout the twelve months ended August 31, 2015, dropping to 5.1% from 6.1%.
Importantly, inflationary pressure remained subdued in the U.S. amid lower energy prices and nearly stagnant wage growth. Global oil prices dipped below $60 a barrel in March 2015, before rebounding somewhat and then dropping again to below $50 a barrel by August. Global commodities prices also fell sharply through the summer of 2015.
Part of the decline in commodities prices was attributable to signs of slowing growth in China, the world’s leading consumer of raw materials. In response to falling domestic equity prices and weakening economic data, Chinese policy makers enacted a range of stimulus measures, including cutting interest rates and easing bank lending rules in June and July of 2015. Then on
August 11, China’s central bank shocked global markets by devaluing the yuan by nearly 2% and two days later, weaker-than-expected retail sales and industrial production data again shook investor confidence.
On Monday, August 24th, China’s stock market suffered its biggest one-day drop since 2011. The Shanghai Composite Index closed down 8.5% for the day. Chinese regulators suspended trading in hundreds of stocks that had each lost 10% or more. The selloff spread rapidly and key equity indexes in developed markets from Asia to Europe closed down by roughly 5%. Emerging market equities also fell, dragging local currencies lower. In U.S. trading, the Standard & Poor’s 500 Index closed down -3.9% for the day.
Government bonds of developed market nations initially benefitted from the sell-off as investors sought the perceived safety of fixed income securities. But prices for longer-dated U.S. Treasury bonds declined, partly due to massive selling of foreign-exchange reserves (including U.S. Treasuries) by China and partly due to expectations of an imminent Fed interest rate increase.
While the global economic environment at the end of August 2015 was markedly different than it was twelve months earlier, in fundamental ways it remained unchanged. The U.S. economic recovery remained largely intact amid historically low interest rates, while central banks in the U.S., Europe, Japan and China continued to provide or increase growth stimulus. Global energy prices remained under pressure. What appeared to have changed is the intensity of investor concern about both the health of China’s economy and the timing of any increase in U.S. interest rates. This uncertain environment and its effects on financial markets may provide opportunities for those investors who have long-term objectives and a well-diversified portfolio.
On behalf of everyone at J.P. Morgan Asset Management, thank you for your continued support. We look forward to managing your investment needs for years to come. Should you have any questions, please visit www.jpmorganfunds.com or contact the J.P. Morgan Funds Service Center at 1-800-480-4111.
Sincerely yours,

George C.W. Gatch
CEO, Global Funds Management
J.P. Morgan Asset Management
| | | | | | | | |
| | | |
| AUGUST 31, 2015 | | J.P. MORGAN INCOME FUNDS | | | | | 1 | |
JPMorgan Floating Rate Income Fund
FUND COMMENTARY
TWELVE MONTHS ENDED AUGUST 31, 2015 (Unaudited)
| | | | |
| REPORTING PERIOD RETURN: | | | |
| Fund (Select Class Shares)* | | | -0.61% | |
| Credit Suisse Leveraged Loan Index | | | 1.39% | |
| Barclays U.S. Aggregate Index | | | 1.56% | |
| |
| Net Assets as of 8/31/2015 (In Thousands) | | $ | 2,450,685 | |
INVESTMENT OBJECTIVE**
The JPMorgan Floating Rate Income Fund (the “Fund”) seeks to provide current income with a secondary objective of capital appreciation.
HOW DID THE MARKET PERFORM?
U.S. leveraged credit markets struggled throughout the twelve months ended August 31, 2015. Market volatility driven by falling commodities prices, concerns about slowing economic growth in China and expectations of an increase in U.S. interest rates impacted performance in late 2014 and throughout 2015.
The energy sector was in the headlines amid the sharp fall in oil and commodities prices due to a global supply and demand imbalance, and debt default concerns within the sector. Oil producers cut back on capital spending in their 2015 budgets, generally based on the lower oil prices. Supply around the world remained high and the Organization of Petroleum Exporting Countries did not reduce production and geopolitical concerns failed to materially affect producers in riskier areas. Notably, the energy sector accounts for a much smaller percentage of the loan market relative to the market for high yield bonds (also known as “junk bonds”), which helped contribute to the outperformance of loans over the twelve month reporting period.
WHAT WERE THE MAIN DRIVERS OF THE FUND’S PERFORMANCE?
The Fund’s Select Class Shares underperformed the Credit Suisse Leveraged Loan Index (the “Benchmark) for the twelve months ended August 31, 2015. The Fund’s overweight position and security selection in the energy sector and security
selection in the retail sector detracted from performance relative to the Benchmark. The Fund’s exposure to bonds rated B and BB also detracted from relative performance.
The Fund’s overweight position in the food and drug sector and its security selection in the retail sectors were leading contributors to performance relative to the Benchmark. The Fund’s allocation to bonds rated CCC also contributed to relative performance.
HOW WAS THE FUND POSITIONED?
During the reporting period, the Fund held an underweight position in loans rated BBB and CCC and lower, and an overweight position in BB and B rated loans. From the start of 2015, the Fund’s portfolio managers moved the Fund to more defensive posture, generally reducing B and lower rated positions and increasing the weighting in BB rated issues.
| | | | |
PORTFOLIO COMPOSITION*** | |
| Loan Assignments | | | 83.5 | % |
| Corporate Bonds | | | 12.3 | |
| Others (each less than 1.0%) | | | 0.6 | |
| Short-Term Investment | | | 3.6 | |
| * | | The return shown is based on net asset values calculated for shareholder transactions and may differ from the return shown in the financial highlights, which reflects adjustments made to the net asset values in accordance with accounting principles generally accepted in the United States of America. |
| ** | | The adviser seeks to achieve the Fund’s objective. There can be no guarantee it will be achieved. |
| *** | | Percentages indicated are based on total investments as of August 31, 2015. The Fund’s portfolio composition is subject to change. |
| | | | | | |
| | | |
| 2 | | | | J.P. MORGAN INCOME FUNDS | | AUGUST 31, 2015 |
| | | | | | | | | | | | | | |
AVERAGE ANNUAL TOTAL RETURNS AS OF AUGUST 31, 2015 | |
| | | | |
| | | INCEPTION DATE OF
CLASS | | 1 YEAR | | | 3 YEAR | | | SINCE
INCEPTION | |
CLASS A SHARES | | June 1, 2011 | | | | | | | | | | | | |
Without Sales Charge | | | | | (0.92 | )% | | | 3.00 | % | | | 3.03 | % |
With Sales Charge* | | | | | (3.13 | ) | | | 1.68 | | | | 2.10 | |
CLASS C SHARES | | June 1, 2011 | | | | | | | | | | | | |
Without CDSC | | | | | (1.37 | ) | | | 2.53 | | | | 2.54 | |
With CDSC** | | | | | (2.37 | ) | | | 2.53 | | | | 2.54 | |
CLASS R6 SHARES | | October 31, 2013 | | | (0.49 | ) | | | 3.34 | | | | 3.36 | |
SELECT CLASS SHARES | | June 1, 2011 | | | (0.61 | ) | | | 3.27 | | | | 3.31 | |
| * | | Sales Charge for Class A Shares is 2.25%. Prior to January 2, 2014, the sales charge was 3.75%. |
| ** | | Assumes a 1% CDSC (contingent deferred sales charge) for the one year period and 0% CDSC thereafter. |
LIFE OF FUND PERFORMANCE (6/1/11 TO 8/31/15)
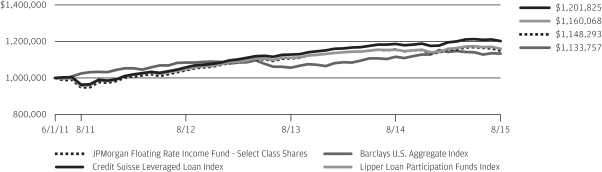
The performance quoted is past performance and is not a guarantee of future results. Mutual funds are subject to certain market risks. Investment returns and principal value of an investment will fluctuate so that an investor’s shares, when redeemed, may be worth more or less than their original cost. Current performance may be higher or lower than the performance data shown. For up-to-date, month-end performance information please call 1-800-480-4111.
The Fund commenced operations on June 1, 2011.
Returns for Class R6 Shares prior to their inception date are based on the performance of Select Class Shares. The actual returns for Class R6 Shares would have been different than those shown because Class R6 Shares have different expenses than Select Class Shares.
The graph illustrates comparative performance for $1,000,000 invested in the Select Class Shares of JPMorgan Floating Rate Income Fund, the Credit Suisse Leveraged Loan Index, the Barclays U.S. Aggregate Index and the Lipper Loan Participation Funds Index from June 1, 2011 to August 31, 2015. The performance of the Lipper Loan Participation Funds Index reflects an initial investment at the end of the month closest to the Fund’s inception. The performance of the Fund assumes reinvestment of all dividends and capital gain distributions, if any. The performance of the Credit Suisse Leveraged Loan Index and the Barclays U.S. Aggregate Index does not reflect the deduction of expenses or a sales charge associated with a mutual fund and has been adjusted to reflect reinvestment of all dividends and capital gain distributions of the securities included in the benchmarks, if applicable. The performance of the Lipper Loan
Participation Funds Index includes expenses associated with a mutual fund, such as investment management fees. These expenses are not identical to the expenses incurred by the Fund. The Credit Suisse Leveraged Loan Index is an unmanaged market value-weighted index designed to represent the investable universe of the U.S. dollar-denominated leveraged loan market. The index reflects reinvestment of all distributions and changes in market prices. The Barclays U.S. Aggregate Index is an unmanaged index that represents securities that are SEC-registered, taxable, and dollar denominated. The index covers the U.S. investment grade fixed rate bond market, with index components for government and corporate securities, mortgage pass-through securities, and asset-backed securities. The Lipper Loan Participation Funds Index is an index based on total returns of certain mutual funds within the Fund’s designated category as determined by Lipper, Inc. Investors cannot invest directly in an index.
Select Class Shares have a $1,000,000 minimum initial investment.
Fund performance may reflect the waiver of the Fund’s fees and reimbursement of expenses for certain periods since the inception date. Without these waivers and reimbursements, performance would have been lower. Also, performance shown in this section does not reflect the deduction of taxes that a shareholder would pay on Fund distributions or redemption of Fund shares.
The returns shown are based on net asset values calculated for shareholder transactions and may differ from the returns shown in the financial highlights, which reflect adjustments made to the net asset values in accordance with accounting principles generally accepted in the United States of America.
| | | | | | | | |
| | | |
| AUGUST 31, 2015 | | J.P. MORGAN INCOME FUNDS | | | | | 3 | |
JPMorgan Floating Rate Income Fund
SCHEDULE OF PORTFOLIO INVESTMENTS
AS OF AUGUST 31, 2015
(Amounts in thousands)
| | | | | | | | |
PRINCIPAL
AMOUNT($) | | | SECURITY DESCRIPTION | | VALUE($) | |
| Corporate Bonds — 12.1% | |
| | | | Consumer Discretionary — 2.6% | |
| | | | Auto Components — 0.1% | |
| | 1,168 | | | Pittsburgh Glass Works LLC, 8.000%, 11/15/18 (e) | | | 1,215 | |
| | | | | | | | |
| | | | Automobiles — 0.3% | | | | |
| | 3,224 | | | Fiat Chrysler Automobiles N.V., (Netherlands), 4.500%, 04/15/20 | | | 3,226 | |
| | 3,417 | | | Jaguar Land Rover Automotive plc, (United Kingdom), 4.125%, 12/15/18 (e) | | | 3,423 | |
| | | | | | | | |
| | | | | | | 6,649 | |
| | | | | | | | |
| | | | Household Durables — 0.9% | | | | |
| | 1,895 | | | Brookfield Residential Properties, Inc., (Canada), 6.500%, 12/15/20 (e) | | | 1,890 | |
| | | | Lennar Corp., | | | | |
| | 1,350 | | | 4.500%, 06/15/19 | | | 1,380 | |
| | 6,323 | | | Series B, 12.250%, 06/01/17 | | | 7,303 | |
| | 4,448 | | | M/I Homes, Inc., 8.625%, 11/15/18 | | | 4,598 | |
| | | | Standard Pacific Corp., | | | | |
| | 3,150 | | | 8.375%, 05/15/18 | | | 3,560 | |
| | 2,702 | | | 10.750%, 09/15/16 | | | 2,945 | |
| | | | | | | | |
| | | | | | | 21,676 | |
| | | | | | | | |
| | | | Media — 1.0% | | | | |
| | | | Cablevision Systems Corp., | | | | |
| | 8,185 | | | 8.000%, 04/15/20 | | | 8,860 | |
| | 5,000 | | | 8.625%, 09/15/17 | | | 5,463 | |
| | 5,000 | | | CCO Safari II LLC, 3.579%, 07/23/20 (e) | | | 4,994 | |
| | 4,946 | | | DISH DBS Corp., 7.875%, 09/01/19 | | | 5,361 | |
| | | | | | | | |
| | | | | | | 24,678 | |
| | | | | | | | |
| | | | Specialty Retail — 0.3% | | | | |
| | | | Claire’s Stores, Inc., | | | | |
| | 1,872 | | | 6.125%, 03/15/20 (e) | | | 1,460 | |
| | 8,128 | | | 9.000%, 03/15/19 (e) | | | 6,888 | |
| | | | | | | | |
| | | | | | | 8,348 | |
| | | | | | | | |
| | | | Total Consumer Discretionary | | | 62,566 | |
| | | | | | | | |
| | | | Consumer Staples — 0.1% | |
| | | | Food Products — 0.1% | |
| | 2,277 | | | Bumble Bee Holdings, Inc., 9.000%, 12/15/17 (e) | | | 2,342 | |
| | | | | | | | |
| | | | Energy — 1.5% | |
| | | | Energy Equipment & Services — 0.7% | |
| | 3,751 | | | FTS International, Inc., VAR, 7.783%, 06/15/20 (e) | | | 2,832 | |
| | 6,070 | | | Ocean Rig UDW, Inc., 7.250%, 04/01/19 (e) | | | 3,157 | |
| | 5,359 | | | PHI, Inc., 5.250%, 03/15/19 | | | 4,595 | |
| | 5,980 | | | SESI LLC, 7.125%, 12/15/21 | | | 5,966 | |
| | | | | | | | |
| | | | | | | 16,550 | |
| | | | | | | | |
| | | | | | | | |
PRINCIPAL
AMOUNT($) | | | SECURITY DESCRIPTION | | VALUE($) | |
| | |
| | | | Oil, Gas & Consumable Fuels — 0.8% | |
| | | | Chesapeake Energy Corp., | | | | |
| | 1,285 | | | 3.250%, 03/15/16 | | | 1,262 | |
| | 7,641 | | | VAR, 3.539%, 04/15/19 | | | 5,693 | |
| | 3,000 | | | EP Energy LLC/Everest Acquisition Finance, Inc., 9.375%, 05/01/20 | | | 2,906 | |
| | 1,700 | | | Hilcorp Energy I LP/Hilcorp Finance Co., 7.625%, 04/15/21 (e) | | | 1,737 | |
| | 1,662 | | | Sabine Oil & Gas Corp., 9.750%, 02/15/17 (d) | | | 191 | |
| | 4,657 | | | Talos Production LLC/Talos Production Finance, Inc., 9.750%, 02/15/18 (e) | | | 3,400 | |
| | 6,018 | | | Ultra Petroleum Corp., (Canada), 5.750%, 12/15/18 (e) | | | 4,844 | |
| | | | | | | | |
| | | | | | | 20,033 | |
| | | | | | | | |
| | | | Total Energy | | | 36,583 | |
| | | | | | | | |
| | | | Health Care — 1.8% | |
| | | | Health Care Equipment & Supplies — 0.6% | |
| | 14,577 | | | ConvaTec Healthcare E S.A., (Luxembourg), 10.500% 12/15/18 (e) | | | 15,160 | |
| | | | | | | | |
| | | | Health Care Providers & Services — 0.6% | | | | |
| | | | Tenet Healthcare Corp., | | | | |
| | 4,383 | | | 6.000%, 10/01/20 | | | 4,690 | |
| | 3,660 | | | 8.000%, 08/01/20 | | | 3,820 | |
| | 5,690 | | | VAR, 3.786%, 06/15/20 (e) | | | 5,721 | |
| | | | | | | | |
| | | | | | | 14,231 | |
| | | | | | | | |
| | | | Pharmaceuticals — 0.6% | |
| | | | Valeant Pharmaceuticals International, Inc., (Canada), | | | | |
| | 10,449 | | | 6.750%, 08/15/18 (e) | | | 10,933 | |
| | 4,000 | | | 7.000%, 10/01/20 (e) | | | 4,140 | |
| | | | | | | | |
| | | | | | | 15,073 | |
| | | | | | | | |
| | | | Total Health Care | | | 44,464 | |
| | | | | | | | |
| | | | Industrials — 2.1% | |
| | | | Aerospace & Defense — 0.2% | |
| | | | Bombardier, Inc., (Canada), | | | | |
| | 2,272 | | | 4.750%, 04/15/19 (e) | | | 1,840 | |
| | 3,500 | | | 7.500%, 03/15/18 (e) | | | 3,273 | |
| | | | | | | | |
| | | | | | | 5,113 | |
| | | | | | | | |
| | | | Airlines — 0.3% | |
| | 533 | | | Continental Airlines 2003-ERJ1 Pass-Through Trust, 7.875%, 07/02/18 | | | 557 | |
| | 2,928 | | | Continental Airlines 2004-ERJ1 Pass-Through Trust, 9.558%, 09/01/19 | | | 3,177 | |
| | 1,136 | | | Continental Airlines 2006-ERJ1 Pass-Through Trust, 9.318%, 11/01/19 (e) | | | 1,250 | |
SEE NOTES TO FINANCIAL STATEMENTS.
| | | | | | |
| | | |
| 4 | | | | J.P. MORGAN INCOME FUNDS | | AUGUST 31, 2015 |
| | | | | | | | |
PRINCIPAL
AMOUNT($) | | | SECURITY DESCRIPTION | | VALUE($) | |
| Corporate Bonds — continued | |
| | | | Airlines — continued | |
| | 3,648 | | | Continental Airlines 2012-3 Class C Pass-Through Certificates, 6.125%, 04/29/18 | | | 3,785 | |
| | | | | | | | |
| | | | | | | 8,769 | |
| | | | | | | | |
| | | | Commercial Services & Supplies — 1.1% | |
| | 8,950 | | | ADT Corp. (The), 4.125%, 04/15/19 | | | 9,084 | |
| | 18,115 | | | ILFC E-Capital Trust I, VAR, 4.690%, 12/21/65 (e) | | | 17,028 | |
| | | | | | | | |
| | | | | | | 26,112 | |
| | | | | | | | |
| | | | Industrial Conglomerates — 0.2% | |
| | 4,230 | | | J.M. Huber Corp., 9.875%, 11/01/19 (e) | | | 4,473 | |
| | | | | | | | |
| | | | Machinery — 0.1% | |
| | 5,700 | | | Bluewater Holding B.V., (Netherlands), Reg. S, 10.000%, 12/10/19 (e) | | | 4,047 | |
| | | | | | | | |
| | | | Marine — 0.1% | |
| | 2,290 | | | Shelf Drilling Holdings Ltd., (Cayman Islands), 8.625%, 11/01/18 (e) | | | 1,763 | |
| | | | | | | | |
| | | | Road & Rail — 0.1% | |
| | | | Avis Budget Car Rental LLC/Avis Budget Finance, Inc., | | | | |
| | 1,250 | | | 4.875%, 11/15/17 | | | 1,273 | |
| | 903 | | | VAR, 3.074%, 12/01/17 | | | 899 | |
| | | | | | | | |
| | | | | | | 2,172 | |
| | | | | | | | |
| | | | Total Industrials | | | 52,449 | |
| | | | | | | | |
| | | | Information Technology — 0.5% | |
| | | | Communications Equipment — 0.4% | |
| | 9,600 | | | Avaya, Inc., 7.000%, 04/01/19 (e) | | | 8,616 | |
| | | | | | | | |
| | | | Semiconductors & Semiconductor Equipment — 0.1% | |
| | 4,355 | | | Advanced Micro Devices, Inc., 6.750%, 03/01/19 | | | 3,070 | |
| | | | | | | | |
| | | | Total Information Technology | | | 11,686 | |
| | | | | | | | |
| | | | Materials — 1.8% | |
| | | | Chemicals — 0.6% | |
| | 3,089 | | | Hexion, Inc., 10.000%, 04/15/20 | | | 3,151 | |
| | | | INEOS Group Holdings S.A., (Luxembourg), | | | | |
| | 1,713 | | | 5.875%, 02/15/19 (e) | | | 1,698 | |
| | 1,295 | | | 6.125%, 08/15/18 (e) | | | 1,296 | |
| | 8,000 | | | PolyOne Corp., 7.375%, 09/15/20 | | | 8,312 | |
| | 1,000 | | | Rain CII Carbon LLC/CII Carbon Corp., 8.000%, 12/01/18 (e) | | | 935 | |
| | | | | | | | |
| | | | | | | 15,392 | |
| | | | | | | | |
| | | | | | | | |
PRINCIPAL
AMOUNT($) | | | SECURITY DESCRIPTION | | VALUE($) | |
| | | | | |
| | | | Construction Materials — 1.2% | |
| | | | Cemex S.A.B. de C.V., (Mexico), | | | | |
| | 4,650 | | | 7.250%, 01/15/21 (e) | | | 4,882 | |
| | 22,365 | | | VAR, 5.039%, 10/15/18 (e) | | | 23,316 | |
| | | | | | | | |
| | | | | | | 28,198 | |
| | | | | | | | |
| | | | Metals & Mining — 0.0% (g) | |
| | 1,000 | | | Aleris International, Inc., 7.625%, 02/15/18 | | | 983 | |
| | | | | | | | |
| | | | Total Materials | | | 44,573 | |
| | | | | | | | |
| | | | Telecommunication Services — 0.9% | |
| | | | Diversified Telecommunication Services — 0.9% | |
| | 1,602 | | | CCO Holdings LLC/CCO Holdings Capital Corp., 7.375%, 06/01/20 | | | 1,670 | |
| | | | Frontier Communications Corp., | | | | |
| | 7,570 | | | 7.125%, 03/15/19 | | | 7,759 | |
| | 1,250 | | | 8.125%, 10/01/18 | | | 1,350 | |
| | | | Intelsat Jackson Holdings S.A., (Luxembourg), | | | | |
| | 4,342 | | | 7.250%, 04/01/19 | | | 4,245 | |
| | 1,000 | | | 7.250%, 10/15/20 | | | 961 | |
| | 3,375 | | | Intelsat Luxembourg S.A., (Luxembourg), 6.750%, 06/01/18 | | | 3,105 | |
| | 3,635 | | | Level 3 Financing, Inc., VAR, 3.914%, 01/15/18 | | | 3,662 | |
| | | | | | | | |
| | | | Total Telecommunication Services | | | 22,752 | |
| | | | | | | | |
| | | | Utilities — 0.8% | |
| | | | Independent Power & Renewable Electricity
Producers — 0.8% | |
| | 13,000 | | | AES Corp., VAR, 3.324%, 06/01/19 | | | 12,870 | |
| | | | GenOn Energy, Inc., | | | | |
| | 4,000 | | | 7.875%, 06/15/17 | | | 3,820 | |
| | 3,000 | | | 9.875%, 10/15/20 | | | 2,835 | |
| | | | | | | | |
| | | | Total Utilities | | | 19,525 | |
| | | | | | | | |
| | | | Total Corporate Bonds
(Cost $313,449) | | | 296,940 | |
| | | | | | | | |
|
| SHARES | |
| Preferred Stock — 0.6% | |
| | | | Financials — 0.6% | |
| | | | Insurance — 0.6% | |
| | 16 | | | XLIT Ltd., (Cayman Islands), Series D, VAR, 3.409%, 09/29/15 ($1,000 par value) @ (Cost $13,587) | | | 13,803 | |
| | | | | | | | |
SEE NOTES TO FINANCIAL STATEMENTS.
| | | | | | | | |
| | | |
| AUGUST 31, 2015 | | J.P. MORGAN INCOME FUNDS | | | | | 5 | |
JPMorgan Floating Rate Income Fund
SCHEDULE OF PORTFOLIO INVESTMENTS
AS OF AUGUST 31, 2015 (continued)
(Amounts in thousands)
| | | | | | | | |
PRINCIPAL
AMOUNT($) | | | SECURITY DESCRIPTION | | VALUE($) | |
| Loan Assignments — 82.3% | |
| | | | Consumer Discretionary — 23.6% | |
| | | | Auto Components — 1.2% | |
| | 24,051 | | | CS Intermediate Holdco 2 LLC, Term Loan, VAR, 4.000%, 04/04/21 | | | 23,937 | |
| | 6,211 | | | Key Safety Systems, Inc., Initial Term Loan, VAR, 4.750%, 08/29/21 | | | 6,180 | |
| | | | | | | | |
| | | | | | | 30,117 | |
| | | | | | | | |
| | | | Automobiles — 1.4% | |
| | 11,448 | | | Chrysler Group LLC, New Term Loan B, VAR, 3.500%, 05/24/17 | | | 11,424 | |
| | 22,362 | | | Chrysler Group LLC, Tranche B Term Loan, VAR, 3.250%, 12/31/18 | | | 22,264 | |
| | | | | | | | |
| | | | | | | 33,688 | |
| | | | | | | | |
| | | | Diversified Consumer Services — 0.7% | |
| | 16,840 | | | Spin Holdco, Inc., Initial Term Loan, VAR, 4.250%, 11/14/19 | | | 16,593 | |
| | | | | | | | |
| | | | Hotels, Restaurants & Leisure — 5.6% | |
| | 13,670 | | | American Casino & Entertainment Properties LLC, Term Loan B, VAR, 5.000%, 07/07/22 | | | 13,704 | |
| | 9,750 | | | CBAC Borrower LLC, Term Loan B, VAR, 8.250%, 07/02/20 | | | 8,994 | |
| | 7,967 | | | Golden Nugget, Inc., Closing Date Facility Term Loan, VAR, 5.500%, 11/21/19 | | | 7,972 | |
| | 3,414 | | | Golden Nugget, Inc., Delayed Draw Term Loan, VAR, 5.500%, 11/21/19 | | | 3,416 | |
| | 6,250 | | | Graton Economic Development Authority, Term Loan B, VAR, 4.750%, 09/09/22 ^ | | | 6,250 | |
| | 8,634 | | | Hilton Worldwide Finance LLC, Initial Term Loan, VAR, 3.500%, 10/26/20 | | | 8,615 | |
| | 21,029 | | | Intrawest Operations Group, Initial Term Loan, VAR, 4.750%, 12/09/20 | | | 20,977 | |
| | 13,090 | | | Landry’s, Inc., Term Loan, VAR, 4.000%, 04/24/18 | | | 13,102 | |
| | 5,196 | | | MGM Resorts International, Term B Loan, VAR, 3.500%, 12/20/19 ^ | | | 5,148 | |
| | 14,012 | | | Scientific Games International, Inc., Initial Term Loan, VAR, 6.000%, 10/18/20 | | | 13,847 | |
| | 18,303 | | | Shingle Springs Tribal Gaming Authority, Term B Loan, VAR, 6.250%, 08/29/19 | | | 18,349 | |
| | 17,003 | | | Station Casinos LLC, Term Loan, VAR, 4.250%, 03/02/20 ^ | | | 16,961 | |
| | | | | | | | |
| | | | | | | 137,335 | |
| | | | | | | | |
| | | | Household Durables — 0.2% | |
| | 3,848 | | | Tempur Sealy International, Inc., Term B Loan, VAR, 3.500%, 03/18/20 | | | 3,842 | |
| | | | | | | | |
| | | | Internet & Catalog Retail — 1.0% | |
| | 21,834 | | | Lands’ End, Inc., Initial Term B Loan, VAR, 4.250%, 04/02/21 | | | 20,551 | |
| | | | | | | | |
PRINCIPAL
AMOUNT($) | | | SECURITY DESCRIPTION | | VALUE($) | |
| | |
| | | | Internet & Catalog Retail — continued | |
| | 4,164 | | | Sitel, Inc., Tranche A Extended U.S. Term Loan, VAR, 7.536%, 01/30/17 | | | 4,123 | |
| | | | | | | | |
| | | | | | | 24,674 | |
| | | | | | | | |
| | | | Leisure Products — 1.4% | |
| | 28,575 | | | Delta 2 (Luxembourg) Sarl, Facility B-3, VAR, 4.750%, 07/30/21 | | | 28,321 | |
| | 7,143 | | | FGI Operating Co. LLC, Term B Loan, VAR, 5.500%, 04/19/19 | | | 6,679 | |
| | | | | | | | |
| | | | | | | 35,000 | |
| | | | | | | | |
| | | | Media — 7.3% | |
| | 5,906 | | | Charter Communications Operating LLC, Term Loan I, VAR, 3.500%, 07/30/22 ^ | | | 5,893 | |
| | 244 | | | DigitalGlobe, Inc., 1st Lien Term Loan B, VAR, 3.750%, 01/31/20 | | | 243 | |
| | 11,625 | | | EMI Group NA Holdings, Term Loan B, VAR, 4.000%, 08/11/22 ^ | | | 11,596 | |
| | 26,461 | | | iHeartCommunications, Inc., Term Loan D, VAR, 6.948%, 01/30/19 | | | 23,319 | |
| | 2,795 | | | iHeartCommunications, Inc., Tranche E Term Loan, VAR, 7.698%, 07/30/19 | | | 2,489 | |
| | 5,527 | | | Interactive Data Corp., Term Loan, VAR, 4.750%, 05/02/21 | | | 5,519 | |
| | 11,053 | | | Media General, Inc., Term B Loan, VAR, 4.000%, 07/31/20 | | | 11,036 | |
| | 3,624 | | | Mission Broadcasting, Inc., Term B-2 Loan, VAR, 3.750%, 10/01/20 | | | 3,599 | |
| | 4,109 | | | Nexstar Broadcasting, Inc., Term B-2 Loan, VAR, 3.750%, 10/01/20 | | | 4,082 | |
| | 7,503 | | | Numericable Group S.A., Dollar Denominated Tranche B-1 Loan, VAR, 4.500%, 05/21/20 | | | 7,495 | |
| | 6,491 | | | Numericable Group S.A., Dollar Denominated Tranche B-2 Loan, VAR, 4.500%, 05/21/20 | | | 6,484 | |
| | 9,031 | | | NVA Holdings, Inc., 1st Lien Term Loan, VAR, 4.750%, 08/14/21 | | | 9,019 | |
| | 2,464 | | | Townsquare Media, Inc., Initial Term Loan, VAR, 4.250%, 04/01/22 | | | 2,456 | |
| | 24,505 | | | Tribune Media Co., Term Loan B, VAR, 3.750%, 12/28/20 | | | 24,375 | |
| | 6,858 | | | Univision Communications, Inc., 2013 Incremental Term Loan, VAR, 4.000%, 03/01/20 | | | 6,805 | |
| | 29,952 | | | Univision Communications, Inc., Replacement 1st Lien Term Loan, VAR, 4.000%, 03/01/20 | | | 29,719 | |
| | 1,968 | | | Vertis, Inc., 1st Lien Term Loan, VAR, 12.000%, 12/21/15 (d) | | | — | (h) |
| | 1,165 | | | Visant Corp., Initial Term Loan, VAR, 7.000%, 09/23/21 | | | 1,112 | |
SEE NOTES TO FINANCIAL STATEMENTS.
| | | | | | |
| | | |
| 6 | | | | J.P. MORGAN INCOME FUNDS | | AUGUST 31, 2015 |
| | | | | | | | |
PRINCIPAL
AMOUNT($) | | | SECURITY DESCRIPTION | | VALUE($) | |
| Loan Assignments — continued | |
| | | | Media — continued | |
| | 24,291 | | | WMG Acquisition Corp., Tranche B Refinancing Term Loan, VAR, 3.750%, 07/01/20 | | | 23,785 | |
| | | | | | | | |
| | | | | | | 179,026 | |
| | | | | | | | |
| | | | Multiline Retail — 2.4% | |
| | 35,592 | | | J.C. Penney Co., Inc., Term Loan, VAR, 6.000%, 05/22/18 | | | 35,492 | |
| | 23,632 | | | Neiman Marcus Group, Inc., Other Term Loan, VAR, 4.250%, 10/25/20 | | | 23,356 | |
| | | | | | | | |
| | | | | | | 58,848 | |
| | | | | | | | |
| | | | Specialty Retail — 2.0% | |
| | 39,901 | | | J. Crew Group, Inc., Initial Loan, VAR, 4.000%, 03/05/21 | | | 30,890 | |
| | 6,092 | | | Petsmart, Inc., Term Loan B, VAR, 4.250%, 03/11/22 | | | 6,079 | |
| | 7,473 | | | Serta Simmons Holdings LLC, 1st Lien Senior Secured Term Loan, VAR, 4.250%, 10/01/19 | | | 7,471 | |
| | 5,556 | | | Staples, Inc., Term Loan, VAR, 3.500%, 04/21/21 ^ | | | 5,528 | |
| | | | | | | | |
| | | | | | | 49,968 | |
| | | | | | | | |
| | | | Textiles, Apparel & Luxury Goods — 0.4% | |
| | 6,472 | | | Cole Haan LLC, Term B-1 Loan, VAR, 5.000%, 01/31/20 | | | 6,170 | |
| | 4,950 | | | Nine West Holdings, Inc., Initial Loan, VAR, 4.750%, 10/08/19 | | | 3,916 | |
| | | | | | | | |
| | | | | | | 10,086 | |
| | | | | | | | |
| | | | Total Consumer Discretionary | | | 579,177 | |
| | | | | | | | |
| | | | Consumer Staples — 10.4% | |
| | | | Food & Staples Retailing — 6.9% | |
| | 5,447 | | | AdvancePierre Foods, Inc., 1st Lien Term Loan B, VAR, 5.750%, 07/10/17 | | | 5,447 | |
| | 17,868 | | | Albertsons LLC, Term B-4 Loan, VAR, 5.500%, 08/25/21 | | | 17,864 | |
| | 50,816 | | | New Albertsons, Inc., Term B Loan, VAR, 4.750%, 06/27/21 | | | 50,641 | |
| | 31,192 | | | New Albertsons, Inc., Term Loan B-2, VAR, 5.375%, 03/21/19 | | | 31,160 | |
| | 16,000 | | | Rite Aid Corp., 2nd Lien Tranche 2 Term Loan, VAR, 4.875%, 06/21/21 ^ | | | 15,993 | |
| | 47,711 | | | SUPERVALU, Inc., Term Loan B, VAR, 4.500%, 03/21/19 ^ | | | 47,823 | |
| | | | | | | | |
| | | | | | | 168,928 | |
| | | | | | | | |
| | | | Food Products — 3.1% | |
| | 21,105 | | | Dole Food Co., Inc., Tranche B Term Loan, VAR, 4.500%, 11/01/18 | | | 21,097 | |
| | | | | | | | |
PRINCIPAL
AMOUNT($) | | | SECURITY DESCRIPTION | | VALUE($) | |
| | |
| | | | Food Products — continued | |
| | 18,211 | | | Hearthside Food Solutions LLC, Term Loan, VAR, 4.500%, 06/02/21 | | | 18,097 | |
| | 22,626 | | | Pinnacle Foods Finance LLC, 1st Lien Term Loan G, VAR, 3.000%, 04/29/20 | | | 22,482 | |
| | 11,213 | | | Pinnacle Foods Finance LLC, Tranche H Term Loan, VAR, 3.000%, 04/29/20 | | | 11,117 | |
| | 3,132 | | | Post Holdings, Inc., Series A Incremental Term Loan, VAR, 3.750%, 06/02/21 | | | 3,126 | |
| | | | | | | | |
| | | | | | | 75,919 | |
| | | | | | | | |
| | | | Household Products — 0.4% | |
| | 10,907 | | | Reynolds Group Holdings Ltd., Incremental U.S. Term Loan, VAR, 4.500%, 12/01/18 | | | 10,897 | |
| | | | | | | | |
| | | | Total Consumer Staples | | | 255,744 | |
| | | | | | | | |
| | | | Energy — 3.7% | |
| | | | Energy Equipment & Services — 0.9% | |
| | 3,441 | | | Drillships Financing Holding, Inc., Tranche B-1 Term Loan, VAR, 6.000%, 03/31/21 | | | 2,443 | |
| | 3,564 | | | Floatel International Ltd., Initial Term Loan, (Bermuda), VAR, 6.000%, 06/27/20 | | | 2,509 | |
| | 6,267 | | | Pacific Drilling S.A., Term Loan, VAR, 4.500%, 06/03/18 | | | 4,518 | |
| | 10,581 | | | Seadrill Partners LP, Initial Term Loan, VAR, 4.000%, 02/21/21 | | | 7,211 | |
| | 5,104 | | | Stallion Oilfield Holdings, Inc., Term Loan B, VAR, 8.000%, 06/19/18 | | | 3,675 | |
| | | | | | | | |
| | | | | | | 20,356 | |
| | | | | | | | |
| | | | Oil, Gas & Consumable Fuels — 2.8% | |
| | 1,300 | | | Alon USA Partners LP, MLP Term Loans, VAR, 9.250%, 11/26/18 | | | 1,300 | |
| | 2,385 | | | CITGO Holding, Inc., Term Loan, VAR, 9.500%, 05/12/18 | | | 2,391 | |
| | 6,152 | | | CITGO Petroleum Corp., Term B Loan, VAR, 4.500%, 07/29/21 | | | 6,130 | |
| | 15,338 | | | Energy Transfer Equity LP, New Term Loan, VAR, 3.250%, 12/02/19 | | | 14,788 | |
| | 8,390 | | | Fieldwood Energy LLC, 2nd Lien Closing Date Loan, VAR, 8.375%, 09/30/20 | | | 3,167 | |
| | 4,497 | | | MEG Energy Corp., Incremental Term Loan, (Canada), VAR, 3.750%, 03/31/20 | | | 4,184 | |
| | 3,815 | | | Navios Maritime Partners LP, Term Loan B-1, (Greece), VAR, 06/18/20 | | | 3,776 | |
| | 11,619 | | | Overseas Shipholding Group, Initial Term Loan, VAR, 5.250%, 08/05/19 ^ | | | 11,542 | |
| | 10,382 | | | Peabody Energy Corp., Term Loan, VAR, 4.250%, 09/24/20 | | | 7,622 | |
| | 9,390 | | | Sabine Oil & Gas (NFR Energy), 2nd Lien Term Loan, VAR, 8.750%, 12/31/18 (d) | | | 1,949 | |
SEE NOTES TO FINANCIAL STATEMENTS.
| | | | | | | | |
| | | |
| AUGUST 31, 2015 | | J.P. MORGAN INCOME FUNDS | | | | | 7 | |
JPMorgan Floating Rate Income Fund
SCHEDULE OF PORTFOLIO INVESTMENTS
AS OF AUGUST 31, 2015 (continued)
(Amounts in thousands)
| | | | | | | | |
PRINCIPAL
AMOUNT($) | | | SECURITY DESCRIPTION | | VALUE($) | |
| Loan Assignments — continued | |
| | | | Oil, Gas & Consumable Fuels — continued | |
| | 9,128 | | | Southcross Holdings LP, 1st LienTerm Loan, VAR, 6.000%, 08/04/21 | | | 7,569 | |
| | 3,491 | | | Veresen Midstream Ltd. Partnership, Initial Term Loan, VAR, 5.250%, 03/31/22 | | | 3,485 | |
| | 1,132 | | | W&T Offshore, Inc., 2nd LienTerm Loan, VAR, 9.000%, 05/15/20 | | | 993 | |
| | | | | | | | |
| | | | | | | 68,896 | |
| | | | | | | | |
| | | | Total Energy | | | 89,252 | |
| | | | | | | | |
| | | | Financials — 3.8% | |
| | | | Capital Markets — 0.2% | |
| | 4,172 | | | Duff & Phelps Corp., Term Loan, VAR, 4.750%, 04/23/20 | | | 4,151 | |
| | | | | | | | |
| | | | Consumer Finance — 0.7% | |
| | 17,774 | | | Sears Roebuck Acceptance Corp., Term Loan, VAR, 5.500%, 06/30/18 | | | 17,525 | |
| | | | | | | | |
| | | | Diversified Financial Services — 1.8% | |
| | 3,270 | | | Ascensus, Inc., 1st Lien Initial Term Loan, VAR, 5.000%, 12/02/19 | | | 3,260 | |
| | 700 | | | Ascensus, Inc., 2nd Lien Initial Term Loan, VAR, 9.000%, 12/02/20 | | | 698 | |
| | 6,178 | | | Onex USI Acquisition Corp., Term Loan B, VAR, 4.250%, 12/27/19 | | | 6,134 | |
| | 22,481 | | | ROC Finance LLC, Funded Term B Loan, VAR, 5.000%, 06/20/19 | | | 21,394 | |
| | 7,133 | | | Sedgwick Claims Management Services, Inc., 1st Lien Initial Term Loan, VAR, 3.750%, 03/01/21 | | | 6,976 | |
| | 1,135 | | | Sedgwick Claims Management Services, Inc., 2nd Lien Initial Term Loan, VAR, 6.750%, 02/28/22 | | | 1,108 | |
| | 5,100 | | | US LBM Holdings LLC, Term Loan, VAR, 7.500%, 08/15/22 ^ | | | 4,998 | |
| | | | | | | | |
| | | | | | | 44,568 | |
| | | | | | | | |
| | | | Insurance — 0.8% | |
| | 6,260 | | | Alliant Holdings I, Inc., Initial Term Loan, VAR, 4.500%, 08/12/22 | | | 6,233 | |
| | 6,972 | | | HUB International Ltd., Initial Term Loan, VAR, 4.000%, 10/02/20 | | | 6,888 | |
| | 6,007 | | | National Financial Partners Corp., 2014 Specified Refinancing Term Loan, VAR, 4.500%, 07/01/20 | | | 5,939 | |
| | | | | | | | |
| | | | | | | 19,060 | |
| | | | | | | | |
| | | | Real Estate Management & Development — 0.3% | |
| | 6,276 | | | CityCenter Holdings LLC, Term B Loan, VAR, 4.250%, 10/16/20 | | | 6,260 | |
| | | | | | | | |
| | | | Total Financials | | | 91,564 | |
| | | | | | | | |
| | | | | | | | |
PRINCIPAL
AMOUNT($) | | | SECURITY DESCRIPTION | | VALUE($) | |
| | |
| | | | Health Care — 8.7% | | | | |
| | | | Biotechnology — 1.3% | | | | |
| | 6,355 | | | AMAG Pharmaceuticals, Inc., Initial Term Loan, VAR, 4.750%, 08/17/21 ^ | | | 6,339 | |
| | 25,321 | | | Sage Products Holdings III LLC, Term Loan, VAR, 4.250%, 12/13/19 | | | 25,274 | |
| | | | | | | | |
| | | | | | | 31,613 | |
| | | | | | | | |
| | | | Health Care Equipment & Supplies — 1.5% | |
| | 8,876 | | | Auris Luxembourg III SARL, Facility B-4, (Luxembourg), VAR, 4.250%, 01/17/22 ^ | | | 8,870 | |
| | 8,236 | | | Mallinckrodt International Finance S.A., Initial Term B Loan, VAR, 3.250%, 03/19/21 | | | 8,169 | |
| | 7,603 | | | Mallinckrodt International Finance, Incremental Term B-1 Loan, VAR, 3.500%, 03/19/21 | | | 7,563 | |
| | 11,315 | | | Ortho-Clinical Diagnostics, Inc., Initial Term Loan, VAR, 4.750%, 06/30/21 | | | 11,135 | |
| | | | | | | | |
| | | | | | | 35,737 | |
| | | | | | | | |
| | | | Health Care Providers & Services — 3.8% | |
| | 1,958 | | | Acadia Healthcare, Inc., Tranche B Term Loan, VAR, 4.250%, 02/11/22 | | | 1,969 | |
| | 7,534 | | | Amsurg Corp., Initial Term Loan, VAR, 3.750%, 07/16/21 | | | 7,526 | |
| | 23,099 | | | CHG Healthcare Services, Inc., 1st Lien Term Loan, VAR, 4.250%, 11/19/19 | | | 22,983 | |
| | 1,506 | | | CHS/Community Health Systems, Inc., Incremental 2018 Term F Loan, VAR, 3.575%, 12/31/18 | | | 1,504 | |
| | 2,239 | | | CHS/Community Health Systems, Inc., Incremental 2021 Term H Loan, VAR, 4.000%, 01/27/21 | | | 2,243 | |
| | 2,344 | | | DaVita HealthCare Partners, Inc., Tranche B Term Loan, VAR, 3.500%, 06/24/21 | | | 2,337 | |
| | 9,162 | | | HCA, Inc., Term Loan B-4, VAR, 3.032%, 05/01/18 | | | 9,143 | |
| | 7,611 | | | IASIS Healthcare LLC, Term Loan B, VAR, 4.500%, 05/03/18 | | | 7,613 | |
| | 17,122 | | | inVentiv Health, Inc., Term Loan B-4, VAR, 7.750%, 05/15/18 | | | 17,136 | |
| | 21,794 | | | National Mentor Holdings, Inc., Tranche B Term Loan, VAR, 4.250%, 01/31/21 | | | 21,631 | |
| | | | | | | | |
| | | | | | | 94,085 | |
| | | | | | | | |
| | | | Pharmaceuticals — 2.1% | |
| | 13,153 | | | Grifols Worldwide Operations Ltd., U.S. Tranche B Term Loan, VAR, 3.198%, 02/27/21 | | | 13,125 | |
| | 5,900 | | | Horizon Pharma Financing, Inc., 2015 Term Loan, VAR, 4.500%, 05/07/21 | | | 5,893 | |
| | 14,485 | | | Par Pharmaceutical Cos., Inc., Term Loan B-2, VAR, 4.000%, 09/30/19 | | | 14,460 | |
SEE NOTES TO FINANCIAL STATEMENTS.
| | | | | | |
| | | |
| 8 | | | | J.P. MORGAN INCOME FUNDS | | AUGUST 31, 2015 |
| | | | | | | | |
PRINCIPAL
AMOUNT($) | | | SECURITY DESCRIPTION | | VALUE($) | |
| Loan Assignments — continued | |
| | | | Pharmaceuticals — continued | |
| | 18,778 | | | Valeant Pharmaceuticals International, Inc., Series F-1 Tranche B Term Loan, (Canada), VAR, 4.000%, 04/01/22 | | | 18,771 | |
| | | | | | | | |
| | | | | | | 52,249 | |
| | | | | | | | |
| | | | Total Health Care | | | 213,684 | |
| | | | | | | | |
| | | | Industrials — 11.1% | |
| | | | Airlines — 2.3% | |
| | 37,257 | | | Delta Air Lines, Inc., Term Loan B-1, VAR, 3.250%, 10/18/18 | | | 37,158 | |
| | 454 | | | Landmark Aviation, Canadian Term Loan, VAR, 4.750%, 10/25/19 | | | 449 | |
| | 11,433 | | | Landmark US Member LLC, Term Loan, VAR, 4.750%, 10/25/19 | | | 11,321 | |
| | 6,760 | | | U.S. Airways, Inc., Term Loan B-1, VAR, 3.500%, 05/23/19 | | | 6,718 | |
| | | | | | | | |
| | | | | | | 55,646 | |
| | | | | | | | |
| | | | Building Products — 1.7% | |
| | 11,325 | | | Continental Building Products, Inc., 1st Lien Term Loan, VAR, 4.000%, 08/28/20 ^ | | | 11,226 | |
| | 7,000 | | | JELD-WEN, Inc., Term B-1 Loan, VAR, 5.000%, 07/01/22 | | | 6,978 | |
| | 12,447 | | | Stardust Finance, Senior Lien Term Loan, VAR, 6.500%, 03/13/22 | | | 12,353 | |
| | 10,176 | | | Summit Materials Co. I LLC, Term Loan, VAR, 4.250%, 07/15/22 | | | 10,116 | |
| | | | | | | | |
| | | | | | | 40,673 | |
| | | | | | | | |
| | | | Commercial Services & Supplies — 2.2% | |
| | 2,856 | | | Garda World Security Corp., Term B Delayed Draw Loan, VAR, 4.003%, 11/06/20 | | | 2,809 | |
| | 9,725 | | | Garda World Security Corp., Term B Loan, VAR, 4.003%, 11/06/20 ^ | | | 9,563 | |
| | 11,349 | | | Harland Clarke Holdings Corp., Extended Tranche B-2 Term Loan, VAR, 5.532%, 06/30/17 | | | 11,318 | |
| | 3,641 | | | Harland Clarke Holdings Corp., Tranche B-4 Term Loan, VAR, 6.000%, 08/04/19 | | | 3,625 | |
| | 6,795 | | | Marine Acquisition Corp., Term Loan, VAR, 5.250%, 01/30/21 | | | 6,786 | |
| | 4,936 | | | Multi Packaging Solutions, Inc., Term Loan B, VAR, 4.250%, 09/30/20 | | | 4,862 | |
| | 4,789 | | | Packers Holdings LLC, Initial Term Loan, VAR, 5.000%, 12/02/21 | | | 4,777 | |
| | 4,816 | | | University Support Services LLC (St. George’s University Scholastic Services LLC), Term Loan, VAR, 5.750%, 08/06/21 | | | 4,828 | |
| | | | | | | | |
PRINCIPAL
AMOUNT($) | | | SECURITY DESCRIPTION | | VALUE($) | |
| | |
| | | | Commercial Services & Supplies — continued | |
| | 5,344 | | | Wand Intermediate I LP, 1st Lien Initial Term Loan, VAR, 4.750%, 09/17/21 | | | 5,333 | |
| | | | | | | | |
| | | | | | | 53,901 | |
| | | | | | | | |
| | | | Construction & Engineering — 0.1% | |
| | 1,741 | | | Stonewall Gas Gathering LLC, Term Loan, VAR, 8.750%, 01/28/22 | | | 1,724 | |
| | | | | | | | |
| | | | Industrial Conglomerates — 0.4% | |
| | 1,751 | | | Autoparts Holdings Ltd., 1st Lien Term Loan, VAR, 7.000%, 07/29/17 | | | 1,542 | |
| | 8,815 | | | Hudson Products Holdings, Inc., Term Loan, VAR, 5.000%, 03/15/19 | | | 8,440 | |
| | | | | | | | |
| | | | | | | 9,982 | |
| | | | | | | | |
| | | | Machinery — 2.8% | |
| | 6,953 | | | Gardner Denver, Inc., Initial Dollar Term Loan, VAR, 4.250%, 07/30/20 | | | 6,626 | |
| | 16,779 | | | Gates Global LLC, Initial Dollar Term Loan, VAR, 4.250%, 07/05/21 | | | 16,045 | |
| | 21,855 | | | Intelligrated, Inc., 1st Lien Term Loan, VAR, 4.503%, 07/30/18 | | | 21,773 | |
| | 7,601 | | | Onex Wizard Acquisition Co. II S.C.A., Initial Dollar Term Loan, (Luxembourg), VAR, 4.250%, 03/11/22 | | | 7,590 | |
| | 17,909 | | | Rexnord LLC/RBS Global Inc., Term B Loan, VAR, 4.000%, 08/21/20 | | | 17,721 | |
| | | | | | | | |
| | | | | | | 69,755 | |
| | | | | | | | |
| | | | Marine — 0.3% | |
| | 1,895 | | | Drillships Ocean Ventures, Inc., Term Loan, VAR, 5.500%, 07/25/21 | | | 1,459 | |
| | 8,800 | | | Shelf Drilling Holdings Ltd., Term Loan, (Cayman Islands), VAR, 10.000%, 10/08/18 | | | 5,632 | |
| | | | | | | | |
| | | | | | | 7,091 | |
| | | | | | | | |
| | | | Professional Services — 0.4% | |
| | 4,968 | | | On Assignment, Inc., Initial Term B Loan, VAR, 3.750%, 06/03/22 | | | 4,956 | |
| | 5,998 | | | PGX Holdings, Inc., 1st Lien Initial Term Loan, VAR, 5.750%, 09/29/20 | | | 6,000 | |
| | | | | | | | |
| | | | | | | 10,956 | |
| | | | | | | | |
| | | | Road & Rail — 0.8% | |
| | 2,826 | | | Hertz Corp. (The), Term Loan, VAR, 3.750%, 03/11/18 | | | 2,810 | |
| | 3,618 | | | Ozburn-Hessey Logistics LLC, Term Loan, VAR, 6.753%, 05/23/19 | | | 3,587 | |
| | 13,075 | | | Quality Distribution, Inc., 1st Lien Term Loan, VAR, 5.750%, 07/29/22 | | | 12,936 | |
| | | | | | | | |
| | | | | | | 19,333 | |
| | | | | | | | |
SEE NOTES TO FINANCIAL STATEMENTS.
| | | | | | | | |
| | | |
| AUGUST 31, 2015 | | J.P. MORGAN INCOME FUNDS | | | | | 9 | |
JPMorgan Floating Rate Income Fund
SCHEDULE OF PORTFOLIO INVESTMENTS
AS OF AUGUST 31, 2015 (continued)
(Amounts in thousands)
| | | | | | | | |
PRINCIPAL
AMOUNT($) | | | SECURITY DESCRIPTION | | VALUE($) | |
| Loan Assignments — continued | |
| | | | Trading Companies & Distributors — 0.1% | |
| | 3,562 | | | McJunkin Red Man Corp., Term Loan, VAR, 4.750%, 11/08/19 | | | 3,475 | |
| | | | | | | | |
| | | | Total Industrials | | | 272,536 | |
| | | | | | | | |
| | | | Information Technology — 9.1% | |
| | | | Communications Equipment — 2.3% | |
| | 45,557 | | | Avaya, Inc., Term Loan B-7, VAR, 6.250%, 04/30/20 | | | 39,049 | |
| | 5,896 | | | Blue Coat Systems, Inc., Initial Term Loan B-1, VAR, 4.500%, 05/20/22 | | | 5,852 | |
| | 7,055 | | | Mitel Networks Corp., Term Loan 2015, (Canada), VAR, 5.000%, 04/29/22 | | | 7,004 | |
| | 4,888 | | | Riverbed Technology, Inc., Term Loan, VAR, 6.000%, 04/25/22 | | | 4,886 | |
| | | | | | | | |
| | | | | | | 56,791 | |
| | | | | | | | |
| | | | Electronic Equipment, Instruments & Components — 1.6% | |
| | 3,502 | | | CDW LLC/CDW Finance Corp., Term Loan, VAR, 3.250%, 04/29/20 | | | 3,472 | |
| | 29,675 | | | Dell International LLC, Term Loan B-2, VAR, 4.000%, 04/29/20 | | | 29,498 | |
| | 4,641 | | | Natel Engineering Co., Inc., Initial Term Loan, VAR, 6.750%, 04/10/20 | | | 4,641 | |
| | 1,129 | | | Zebra Technologies Corp., Initial Term Loan, VAR, 4.750%, 10/27/21 | | | 1,135 | |
| | | | | | | | |
| | | | | | | 38,746 | |
| | | | | | | | |
| | | | Internet Software & Services — 0.4% | |
| | 9,334 | | | Go Daddy Group, Inc. (The), Initial Term Loan, VAR, 4.250%, 05/13/21 ^ | | | 9,325 | |
| | | | | | | | |
| | | | IT Services — 2.0% | |
| | 7,935 | | | First Data Corp., 2021 New Dollar Term Loan, VAR, 4.200%, 03/24/21 | | | 7,914 | |
| | | | First Data Corp., Term Loan, | | | | |
| | 20,500 | | | VAR, 3.700%, 03/23/18 | | | 20,329 | |
| | 13,904 | | | VAR, 3.700%, 09/24/18 | | | 13,790 | |
| | 5,516 | | | Science Applications International Corp., Tranche B Incremental Loan, VAR, 3.750%, 05/04/22 | | | 5,513 | |
| | | | | | | | |
| | | | | | | 47,546 | |
| | | | | | | | |
| | | | Semiconductors & Semiconductor Equipment — 2.0% | |
| | 24,771 | | | Avago Technologies Ltd., Term Loan, (Singapore), VAR, 3.750%, 05/06/21 ^ | | | 24,739 | |
| | 11,427 | | | Freescale Semiconductor, Inc., Term Loan B, VAR, 4.250%, 02/28/20 ^ | | | 11,409 | |
| | 7,359 | | | Freescale Semiconductor, Inc., Term Loan B-5, VAR, 5.000%, 01/15/21 | | | 7,364 | |
| | | | | | | | |
PRINCIPAL
AMOUNT($) | | | SECURITY DESCRIPTION | | VALUE($) | |
| | |
| | | | Semiconductors & Semiconductor Equipment — continued | |
| | 6,188 | | | On Semiconductor Corp., Term Loan, VAR, 1.936%, 01/02/18 | | | 6,033 | |
| | | | | | | | |
| | | | | | | 49,545 | |
| | | | | | | | |
| | | | Software — 0.8% | |
| | 12,131 | | | Emdeon, Inc., Term B-2 Loan, VAR, 3.750%, 11/02/18 | | | 12,079 | |
| | 6,464 | | | SS&C Technologies Holdings, Inc., Term B-1 Loan, VAR, 4.000%, 07/08/22 | | | 6,469 | |
| | 1,047 | | | SS&C Technologies Holdings, Inc., Term B-2 Loan, VAR, 4.000%, 07/08/22 | | | 1,048 | |
| | | | | | | | |
| | | | | | | 19,596 | |
| | | | | | | | |
| | | | Total Information Technology | | | 221,549 | |
| | | | | | | | |
| | | | Materials — 4.0% | |
| | | | Chemicals — 0.8% | |
| | 2,894 | | | Axalta Coating Systems U.S. Holdings, Inc., Term Loan, VAR, 3.750%, 02/01/20 ^ | | | 2,880 | |
| | 4,303 | | | Gemini HDPE LLC, Advance, VAR, 4.750%, 08/06/21 | | | 4,296 | |
| | 5,188 | | | OCI Beaumont LLC, Term Loan B-3, VAR, 5.500%, 08/20/19 | | | 5,278 | |
| | 2,575 | | | Platform Specialty Products Co., Tranche B-2 Term Loan, VAR, 4.750%, 06/07/20 | | | 2,574 | |
| | 4,234 | | | Tronox Ltd., Term Loan, VAR, 4.250%, 03/19/20 | | | 3,988 | |
| | | | | | | | |
| | | | | | | 19,016 | |
| | | | | | | | |
| | | | Construction Materials — 0.7% | |
| | 7,673 | | | Headwaters, Inc., Term B Loan, VAR, 4.500%, 03/24/22 | | | 7,683 | |
| | 10,250 | | | Quikrete Holdings, Inc., 1st Lien Initial Loan, VAR, 4.000%, 09/28/20 ^ | | | 10,185 | |
| | 790 | | | Quikrete Holdings, Inc., 2nd Lien Initial Loan, VAR, 7.000%, 03/26/21 | | | 790 | |
| | | | | | | | |
| | | | | | | 18,658 | |
| | | | | | | | |
| | | | Containers & Packaging — 1.0% | |
| | 4,607 | | | Ardagh Holdings USA, Inc., New Term Loan, VAR, 4.000%, 12/17/19 | | | 4,584 | |
| | 3,226 | | | Berry Plastics Corp., Term E Loan, VAR, 3.750%, 01/06/21 | | | 3,197 | |
| | 2,992 | | | Berry Plastics Corp., Term Loan D, VAR, 3.500%, 02/08/20 | | | 2,945 | |
| | 2,881 | | | Devix Topco S.A., 1st Lien Term Loan B, VAR, 4.250%, 05/03/21 | | | 2,874 | |
| | 8,875 | | | Novolex, 1st Lien Term Loan, VAR, 6.000%, 12/05/21 | | | 8,845 | |
SEE NOTES TO FINANCIAL STATEMENTS.
| | | | | | |
| | | |
| 10 | | | | J.P. MORGAN INCOME FUNDS | | AUGUST 31, 2015 |
| | | | | | | | |
PRINCIPAL
AMOUNT($) | | | SECURITY DESCRIPTION | | VALUE($) | |
| Loan Assignments — continued | |
| | | | Containers & Packaging — continued | |
| | 2,960 | | | Southern Graphics, Inc., New Term Loan, VAR, 4.250%, 10/17/19 | | | 2,925 | |
| | | | | | | | |
| | | | | | | 25,370 | |
| | | | | | | | |
| | | | Metals & Mining — 1.3% | |
| | 5,792 | | | Atkore International, Inc., 1st Lien Initial Term Loan, VAR, 4.500%, 04/09/21 | | | 5,531 | |
| | 4,415 | | | Atkore International, Inc., 2nd Lien Initial Term Loan, VAR, 7.750%, 10/09/21 | | | 4,067 | |
| | 6,750 | | | Coeur Mining, Inc., Term Loan B-2, VAR, 9.000%, 06/23/20 | | | 6,615 | |
| | 18,561 | | | FMG Resources Pty, Ltd. (Fortescue Metals Group), Term Loan B, (Australia), VAR, 3.750%, 06/30/19 | | | 14,962 | |
| | | | | | | | |
| | | | | | | 31,175 | |
| | | | | | | | |
| | | | Paper & Forest Products — 0.2% | |
| | 4,683 | | | Unifrax I LLC/Unifrax Holding Co., Term Loan, VAR, 4.250%, 11/28/18 | | | 4,655 | |
| | | | | | | | |
| | | | Total Materials | | | 98,874 | |
| | | | | | | | |
| | | | Telecommunication Services — 2.6% | |
| | | | Diversified Telecommunication Services — 2.3% | |
| | 27,037 | | | Altice Financing S.A., Term Loan, VAR, 5.500%, 07/02/19 | | | 27,138 | |
| | 5,626 | | | Cincinnati Bell, Inc., Tranche B Term Loan, VAR, 4.000%, 09/10/20 ^ | | | 5,601 | |
| | 9,252 | | | Level 3 Financing, Inc., Term Loan B-3, VAR, 4.000%, 08/01/19 | | | 9,238 | |
| | 6,379 | | | UPC Financing Partnership, Facility AH, VAR, 3.250%, 06/30/21 | | | 6,282 | |
| | 6,692 | | | Virgin Media Investments Holdings Ltd., F Facility, (United Kingdom), VAR, 3.500%, 06/30/23 | | | 6,611 | |
| | 2,559 | | | XO Communications LLC, Initial Term Loan, VAR, 4.250%, 03/20/21 | | | 2,540 | |
| | | | | | | | |
| | | | | | | 57,410 | |
| | | | | | | | |
| | | | Wireless Telecommunication Services — 0.3% | |
| | 1,220 | | | Syniverse Holdings, Inc., Initial Term Loan, VAR, 4.000%, 04/23/19 | | | 1,122 | |
| | 6,207 | | | Syniverse Holdings, Inc., Tranche B Term Loan, VAR, 4.000%, 04/23/19 | | | 5,711 | |
| | | | | | | | |
| | | | | | | 6,833 | |
| | | | | | | | |
| | | | Total Telecommunication Services | | | 64,243 | |
| | | | | | | | |
| | | | | | | | |
PRINCIPAL
AMOUNT($) | | | SECURITY DESCRIPTION | | VALUE($) | |
| | | | Utilities — 5.3% | |
| | | | Electric Utilities — 3.7% | |
| | 31,997 | | | Calpine Construction Finance Co., New Term B-1 Loan, VAR, 3.000%, 05/03/20 | | | 31,245 | |
| | 8,889 | | | Calpine Construction Finance Co., Term B-2 Loan, VAR, 3.250%, 01/31/22 | | | 8,676 | |
| | 8,864 | | | InterGen N.V., Term Advance, VAR, 5.500%, 06/15/20 | | | 8,333 | |
| | 82,050 | | | Texas Competitive Electric Holdings Co. LLC, Extended Term Loan, VAR, 4.674%, 10/10/17 (d) | | | 37,016 | |
| | 11,000 | | | Texas Competitive Electric Holdings Co. LLC, Non-Extended Term Loan, VAR, 4.674%, 11/18/15 (d) | | | 4,848 | |
| | | | | | | | |
| | | | | | | 90,118 | |
| | | | | | | | |
| | | | Independent Power & Renewable Electricity
Producers — 1.6% | |
| | 12,650 | | | Calpine Corp., Term Loan, VAR, 3.500%, 05/27/22 | | | 12,472 | |
| | 6,899 | | | Dynegy, Inc., Tranche B-2 Term Loan, VAR, 4.000%, 04/23/20 | | | 6,879 | |
| | 20,453 | | | NRG Energy, Inc., Incremental Term Loan, VAR, 2.750%, 07/01/18 | | | 20,134 | |
| | | | | | | | |
| | | | | | | 39,485 | |
| | | | | | | | |
| | | | Total Utilities | | | 129,603 | |
| | | | | | | | |
| | | | Total Loan Assignments
(Cost $2,106,773) | | | 2,016,226 | |
| | | | | | | | |
| | |
| SHARES | | | | | | |
| Short-Term Investment — 3.5% | | | | |
| | | | Investment Company — 3.5% | | | | |
| | 86,177 | | | JPMorgan Prime Money Market Fund, Institutional Class Shares, 0.060% (b) (l)
(Cost $86,177) | | | 86,177 | |
| | | | | | | | |
| | | | Total Investments — 98.5%
(Cost $2,519,986) | | | 2,413,146 | |
| | | | Other Assets in Excess of
Liabilities — 1.5% | | | 37,539 | |
| | | | | | | | |
| | | | NET ASSETS — 100.0% | | $ | 2,450,685 | |
| | | | | | | | |
Percentages indicated are based on net assets.
SEE NOTES TO FINANCIAL STATEMENTS.
| | | | | | | | |
| | | |
| AUGUST 31, 2015 | | J.P. MORGAN INCOME FUNDS | | | | | 11 | |
JPMorgan Floating Rate Income Fund
NOTES TO SCHEDULE OF PORTFOLIO INVESTMENTS
AS OF AUGUST 31, 2015
| | |
| Reg. S | | — Security was purchased pursuant to Regulation S under the Securities Act of 1933, which exempts from registration securities offered and sold outside of the United States. Such a security cannot be sold in the United States without either an effective registration statement filed pursuant to the Securities Act of 1933, or pursuant to an exemption from registration. |
| VAR | | — Variable Rate Security. The interest rate shown is the rate in effect as of August 31, 2015. |
| (b) | | — Investment in affiliate. Money market fund registered under the Investment Company Act of 1940, as amended, and advised by J.P. Morgan Investment Management Inc. |
| (d) | | — Defaulted Security. |
| (e) | | — Security is exempt from registration under Rule 144A of the Securities Act of 1933, as amended. Unless otherwise indicated, this security has been determined to be liquid under procedures established by the Board of Trustees and may be resold in transactions exempt from registration, normally to qualified institutional buyers. |
| | |
| (g) | | — Amount rounds to less than 0.1%. |
| (h) | | — Amount rounds to less than one thousand (shares or dollars). |
| (l) | | — The rate shown is the current yield as of August 31, 2015. |
| @ | | — The date shown reflects the next call date on which the issuer may redeem the security. The coupon rate for this security is currently in effect as of August 31, 2015. |
| ^ | | — All or a portion of the security is unsettled as of August 31, 2015. Unless otherwise indicated, the coupon rate is undetermined. The coupon rate shown may not be accrued for the entire position. |
SEE NOTES TO FINANCIAL STATEMENTS.
| | | | | | |
| | | |
| 12 | | | | J.P. MORGAN INCOME FUNDS | | AUGUST 31, 2015 |
STATEMENT OF ASSETS AND LIABILITIES
AS OF AUGUST 31, 2015
(Amounts in thousands, except per share amounts)
| | | | |
| | | Floating Rate
Income Fund | |
ASSETS: | | | | |
Investments in non-affiliates, at value | | $ | 2,326,969 | |
Investments in affiliates, at value | | | 86,177 | |
| | | | |
Total investment securities, at value | | | 2,413,146 | |
Cash | | | 3,020 | |
Foreign currency, at value | | | 2 | |
Receivables: | | | | |
Investment securities sold | | | 66,275 | |
Fund shares sold | | | 545 | |
Interest from non-affiliates | | | 17,521 | |
Dividends from affiliates | | | 8 | |
Tax reclaims | | | 328 | |
| | | | |
Total Assets | | | 2,500,845 | |
| | | | |
| |
LIABILITIES: | | | | |
Payables: | | | | |
Investment securities purchased | | | 42,356 | |
Fund shares redeemed | | | 5,904 | |
Accrued liabilities: | | | | |
Investment advisory fees | | | 1,158 | |
Administration fees | | | 177 | |
Distribution fees | | | 39 | |
Shareholder servicing fees | | | 177 | |
Custodian and accounting fees | | | 101 | |
Trustees’ and Chief Compliance Officer’s fees | | | 1 | |
Other | | | 247 | |
| | | | |
Total Liabilities | | | 50,160 | |
| | | | |
Net Assets | | $ | 2,450,685 | |
| | | | |
SEE NOTES TO FINANCIAL STATEMENTS.
| | | | | | | | |
| | | |
| AUGUST 31, 2015 | | J.P. MORGAN INCOME FUNDS | | | | | 13 | |
STATEMENT OF ASSETS AND LIABILITIES
AS OF AUGUST 31, 2015 (continued)
(Amounts in thousands, except per share amounts)
| | | | |
| | |
Floating Rate
Income Fund | |
NET ASSETS: | | | | |
Paid-in-Capital | | $ | 2,588,488 | |
Accumulated undistributed (distributions in excess of) net investment income | | | 1,538 | |
Accumulated net realized gains (losses) | | | (32,501 | ) |
Net unrealized appreciation (depreciation) | | | (106,840 | ) |
| | | | |
Total Net Assets | | $ | 2,450,685 | |
| | | | |
| |
Net Assets: | | | | |
Class A | | $ | 85,854 | |
Class C | | | 26,637 | |
Class R6 | | | 391,548 | |
Select Class | | | 1,946,646 | |
| | | | |
Total | | $ | 2,450,685 | |
| | | | |
| |
Outstanding units of beneficial interest (shares) ($0.0001 par value; unlimited number of shares authorized): | | | | |
Class A | | | 8,977 | |
Class C | | | 2,793 | |
Class R6 | | | 40,925 | |
Select Class | | | 203,506 | |
| |
Net Asset Value (a): | | | | |
Class A — Redemption price per share | | $ | 9.56 | |
Class C — Offering price per share (b) | | | 9.54 | |
Class R6 — Offering and redemption price per share | | | 9.57 | |
Select Class — Offering and redemption price per share | | | 9.57 | |
Class A maximum sales charge | | | 2.25 | % |
Class A maximum public offering price per share
[net asset value per share/(100% — maximum sales charge)] | | $ | 9.78 | |
| | | | |
| |
Cost of investments in non-affiliates | | $ | 2,433,809 | |
Cost of investments in affiliates | | | 86,177 | |
Cost of foreign currency | | | 2 | |
| (a) | Per share amounts may not recalculate due to rounding of net assets and/or shares outstanding. |
| (b) | Redemption price for Class C Shares varies based upon length of time the shares are held. |
SEE NOTES TO FINANCIAL STATEMENTS.
| | | | | | |
| | | |
| 14 | | | | J.P. MORGAN INCOME FUNDS | | AUGUST 31, 2015 |
STATEMENT OF OPERATIONS
FOR THE YEAR ENDED AUGUST 31, 2015
(Amounts in thousands)
| | | | |
| | |
Floating Rate
Income Fund | |
INVESTMENT INCOME: | | | | |
Interest income from non-affiliates | | $ | 143,350 | |
Dividend income from non-affiliates | | | 619 | |
Dividend income from affiliates | | | 55 | |
| | | | |
Total investment income | | | 144,024 | |
| | | | |
| |
EXPENSES: | | | | |
Investment advisory fees | | | 16,404 | |
Administration fees | | | 2,448 | |
Distribution fees: | | | | |
Class A | | | 266 | |
Class C | | | 200 | |
Shareholder servicing fees: | | | | |
Class A | | | 266 | |
Class C | | | 67 | |
Select Class | | | 5,838 | |
Custodian and accounting fees | | | 366 | |
Interest expense to affiliates | | | 2 | |
Professional fees | | | 181 | |
Trustees’ and Chief Compliance Officer’s fees | | | 31 | |
Printing and mailing costs | | | 55 | |
Registration and filing fees | | | 352 | |
Transfer agent fees | | | 37 | |
Sub-transfer agent fees (See Note 2.G.) | | | 133 | |
Other | | | 37 | |
| | | | |
Total expenses | | | 26,683 | |
| | | | |
Less fees waived | | | (4,607 | ) |
Less earnings credits | | | (2 | ) |
Less expense reimbursements | | | (31 | ) |
| | | | |
Net expenses | | | 22,043 | |
| | | | |
Net investment income (loss) | | | 121,981 | |
| | | | |
| |
REALIZED/UNREALIZED GAINS (LOSSES): | | | | |
Net realized gain (loss) on transactions from: | | | | |
Investments in non-affiliates | | | (34,826 | ) |
Foreign currency transactions | | | 1,686 | |
| | | | |
Net realized gain (loss) | | | (33,140 | ) |
| | | | |
Change in net unrealized appreciation/depreciation on: | | | | |
Investments in non-affiliates | | | (116,995 | ) |
Foreign currency translations | | | (227 | ) |
| | | | |
Change in net unrealized appreciation/depreciation | | | (117,222 | ) |
| | | | |
Net realized/unrealized gains (losses) | | | (150,362 | ) |
| | | | |
Change in net assets resulting from operations | | $ | (28,381 | ) |
| | | | |
SEE NOTES TO FINANCIAL STATEMENTS.
| | | | | | | | |
| | | |
| AUGUST 31, 2015 | | J.P. MORGAN INCOME FUNDS | | | | | 15 | |
STATEMENTS OF CHANGES IN NET ASSETS
FOR THE PERIODS INDICATED
(Amounts in thousands)
| | | | | | | | |
| | | Floating Rate Income Fund | |
| | | Year Ended
August 31, 2015 | | | Year Ended
August 31, 2014 | |
CHANGE IN NET ASSETS RESULTING FROM OPERATIONS: | | | | | | | | |
Net investment income (loss) | | $ | 121,981 | | | $ | 165,391 | |
Net realized gain (loss) | | | (33,140 | ) | | | (2,034 | ) |
Distributions of capital gains received from investment company affiliates | | | — | | | | 3 | |
Change in net unrealized appreciation/depreciation | | | (117,222 | ) | | | 3,305 | |
| | | | | | | | |
Change in net assets resulting from operations | | | (28,381 | ) | | | 166,665 | |
| | | | | | | | |
| | |
DISTRIBUTIONS TO SHAREHOLDERS: | | | | | | | | |
Class A | | | | | | | | |
From net investment income | | | (3,964 | ) | | | (6,852 | ) |
From net realized gains | | | (3 | ) | | | (168 | ) |
Class C | | | | | | | | |
From net investment income | | | (940 | ) | | | (670 | ) |
From net realized gains | | | (1 | ) | | | (17 | ) |
Class R6 (a) | | | | | | | | |
From net investment income | | | (22,014 | ) | | | (21,210 | ) |
From net realized gains | | | (14 | ) | | | (120 | ) |
Select Class | | | | | | | | |
From net investment income | | | (98,585 | ) | | | (133,773 | ) |
From net realized gains | | | (69 | ) | | | (3,120 | ) |
| | | | | | | | |
Total distributions to shareholders | | | (125,590 | ) | | | (165,930 | ) |
| | | | | | | | |
| | |
CAPITAL TRANSACTIONS: | | | | | | | | |
Change in net assets resulting from capital transactions | | | (1,433,176 | ) | | | 704,745 | |
| | | | | | | | |
| | |
NET ASSETS: | | | | | | | | |
Change in net assets | | | (1,587,147 | ) | | | 705,480 | |
Beginning of period | | | 4,037,832 | | | | 3,332,352 | |
| | | | | | | | |
End of period | | $ | 2,450,685 | | | $ | 4,037,832 | |
| | | | | | | | |
Accumulated undistributed (distributions in excess of) net investment income | | $ | 1,538 | | | $ | 5,708 | |
| | | | | | | | |
| (a) | Commencement of offering of class of shares effective October 31, 2013. |
SEE NOTES TO FINANCIAL STATEMENTS.
| | | | | | |
| | | |
| 16 | | | | J.P. MORGAN INCOME FUNDS | | AUGUST 31, 2015 |
| | | | | | | | |
| | | Floating Rate Income Fund | |
| | | Year Ended
August 31, 2015 | | | Year Ended
August 31, 2014 | |
CAPITAL TRANSACTIONS: | | | | | | | | |
Class A | | | | | | | | |
Proceeds from shares issued | | $ | 82,936 | | | $ | 115,883 | |
Distributions reinvested | | | 3,418 | | | | 5,337 | |
Cost of shares redeemed | | | (162,643 | ) | | | (111,386 | ) |
| | | | | | | | |
Change in net assets resulting from Class A capital transactions | | $ | (76,289 | ) | | $ | 9,834 | |
| | | | | | | | |
Class C | | | | | | | | |
Proceeds from shares issued | | $ | 17,467 | | | $ | 16,008 | |
Distributions reinvested | | | 927 | | | | 673 | |
Cost of shares redeemed | | | (13,094 | ) | | | (9,254 | ) |
| | | | | | | | |
Change in net assets resulting from Class C capital transactions | | $ | 5,300 | | | $ | 7,427 | |
| | | | | | | | |
Class R6 (a) | | | | | | | | |
Proceeds from shares issued | | $ | 179,907 | | | $ | 1,144,405 | |
Distributions reinvested | | | 8,751 | | | | 4,409 | |
Cost of shares redeemed | | | (684,679 | ) | | | (225,409 | ) |
| | | | | | | | |
Change in net assets resulting from Class R6 capital transactions | | $ | (496,021 | ) | | $ | 923,405 | |
| | | | | | | | |
Select Class | | | | | | | | |
Proceeds from shares issued | | $ | 516,352 | | | $ | 2,068,552 | |
Distributions reinvested | | | 23,376 | | | | 20,616 | |
Cost of shares redeemed | | | (1,405,894 | ) | | | (2,325,089 | ) |
| | | | | | | | |
Change in net assets resulting from Select Class capital transactions | | $ | (866,166 | ) | | $ | (235,921 | ) |
| | | | | | | | |
Total change in net assets resulting from capital transactions | | $ | (1,433,176 | ) | | $ | 704,745 | |
| | | | | | | | |
| | |
SHARE TRANSACTIONS: | | | | | | | | |
Class A | | | | | | | | |
Issued | | | 8,398 | | | | 11,482 | |
Reinvested | | | 348 | | | | 529 | |
Redeemed | | | (16,557 | ) | | | (11,022 | ) |
| | | | | | | | |
Change in Class A Shares | | | (7,811 | ) | | | 989 | |
| | | | | | | | |
Class C | | | | | | | | |
Issued | | | 1,775 | | | | 1,591 | |
Reinvested | | | 95 | | | | 67 | |
Redeemed | | | (1,347 | ) | | | (919 | ) |
| | | | | | | | |
Change in Class C Shares | | | 523 | | | | 739 | |
| | | | | | | | |
Class R6 (a) | | | | | | | | |
Issued | | | 18,374 | | | | 113,007 | |
Reinvested | | | 894 | | | | 437 | |
Redeemed | | | (69,497 | ) | | | (22,290 | ) |
| | | | | | | | |
Change in Class R6 Shares | | | (50,229 | ) | | | 91,154 | |
| | | | | | | | |
Select Class | | | | | | | | |
Issued | | | 52,490 | | | | 204,520 | |
Reinvested | | | 2,387 | | | | 2,043 | |
Redeemed | | | (142,971 | ) | | | (229,933 | ) |
| | | | | | | | |
Change in Select Class Shares | | | (88,094 | ) | | | (23,370 | ) |
| | | | | | | | |
| (a) | Commencement of offering of class of shares effective October 31, 2013. |
SEE NOTES TO FINANCIAL STATEMENTS.
| | | | | | | | |
| | | |
| AUGUST 31, 2015 | | J.P. MORGAN INCOME FUNDS | | | | | 17 | |
FINANCIAL HIGHLIGHTS
FOR THE PERIODS INDICATED
| | | | | | | | | | | | | | | | | | | | | | | | | | | | |
| | | | | | Per share operating performance | |
| | | | | | Investment operations | | | Distributions | |
| | | Net asset
value,
beginning
of period | | | Net
investment
income
(loss) | | | Net realized
and unrealized
gains
(losses) on
investments | | | Total from
investment
operations | | | Net
investment
income | | | Net
realized
gain | | | Total
distributions | |
Floating Rate Income Fund | | | | | | | | | | | | | | | | | | | | | | | | | | | | |
Class A | | | | | | | | | | | | | | | | | | | | | | | | | | | | |
Year Ended August 31, 2015 | | $ | 10.04 | | | $ | 0.38 | (f) | | $ | (0.47 | ) | | $ | (0.09 | ) | | $ | (0.39 | ) | | $ | — | (g) | | $ | (0.39 | ) |
Year Ended August 31, 2014 | | | 10.02 | | | | 0.39 | (h) | | | 0.02 | | | | 0.41 | | | | (0.38 | ) | | | (0.01 | ) | | | (0.39 | ) |
Year Ended August 31, 2013 | | | 9.89 | | | | 0.43 | | | | 0.14 | | | | 0.57 | | | | (0.43 | ) | | | (0.01 | ) | | | (0.44 | ) |
Year Ended August 31, 2012 | | | 9.41 | | | | 0.47 | (f) | | | 0.44 | | | | 0.91 | | | | (0.43 | ) | | | — | (g) | | | (0.43 | ) |
June 1, 2011(i) through August 31, 2011 | | | 10.00 | | | | 0.09 | (f) | | | (0.63 | ) | | | (0.54 | ) | | | (0.05 | ) | | | — | | | | (0.05 | ) |
| | | | | | | |
Class C | | | | | | | | | | | | | | | | | | | | | | | | | | | | |
Year Ended August 31, 2015 | | | 10.02 | | | | 0.33 | (f) | | | (0.46 | ) | | | (0.13 | ) | | | (0.35 | ) | | | — | (g) | | | (0.35 | ) |
Year Ended August 31, 2014 | | | 10.01 | | | | 0.34 | (h) | | | 0.02 | | | | 0.36 | | | | (0.34 | ) | | | (0.01 | ) | | | (0.35 | ) |
Year Ended August 31, 2013 | | | 9.88 | | | | 0.40 | | | | 0.13 | | | | 0.53 | | | | (0.39 | ) | | | (0.01 | ) | | | (0.40 | ) |
Year Ended August 31, 2012 | | | 9.41 | | | | 0.44 | (f) | | | 0.42 | | | | 0.86 | | | | (0.39 | ) | | | — | (g) | | | (0.39 | ) |
June 1, 2011(i) through August 31, 2011 | | | 10.00 | | | | 0.06 | (f) | | | (0.61 | ) | | | (0.55 | ) | | | (0.04 | ) | | | — | | | | (0.04 | ) |
| | | | | | | |
Class R6 | | | | | | | | | | | | | | | | | | | | | | | | | | | | |
Year Ended August 31, 2015 | | | 10.05 | | | | 0.41 | (f) | | | (0.46 | ) | | | (0.05 | ) | | | (0.43 | ) | | | — | (g) | | | (0.43 | ) |
October 31, 2013(k) through August 31, 2014 | | | 10.10 | | | | 0.34 | (h) | | | (0.03 | )(l) | | | 0.31 | | | | (0.35 | ) | | | (0.01 | ) | | | (0.36 | ) |
| | | | | | | |
Select Class | | | | | | | | | | | | | | | | | | | | | | | | | | | | |
Year Ended August 31, 2015 | | | 10.05 | | | | 0.40 | (f) | | | (0.46 | ) | | | (0.06 | ) | | | (0.42 | ) | | | — | (g) | | | (0.42 | ) |
Year Ended August 31, 2014 | | | 10.03 | | | | 0.42 | (h) | | | 0.02 | | | | 0.44 | | | | (0.41 | ) | | | (0.01 | ) | | | (0.42 | ) |
Year Ended August 31, 2013 | | | 9.89 | | | | 0.46 | | | | 0.15 | | | | 0.61 | | | | (0.46 | ) | | | (0.01 | ) | | | (0.47 | ) |
Year Ended August 31, 2012 | | | 9.41 | | | | 0.50 | (f) | | | 0.43 | | | | 0.93 | | | | (0.45 | ) | | | — | (g) | | | (0.45 | ) |
June 1, 2011(i) through August 31, 2011 | | | 10.00 | | | | 0.08 | (f) | | | (0.62 | ) | | | (0.54 | ) | | | (0.05 | ) | | | — | | | | (0.05 | ) |
| (a) | Annualized for periods less than one year, unless otherwise noted. |
| (b) | Not annualized for periods less than one year. |
| (c) | Includes adjustments in accordance with accounting principles generally accepted in the United States of America and as such, the net asset values for financial reporting purposes and the returns based upon those net asset values may differ from the net asset values and returns for shareholder transactions. |
| (d) | Includes earnings credits and interest expense, if applicable, each of which is less than 0.01% unless otherwise noted. |
| (e) | Portfolio turnover is calculated by dividing the lesser of total purchases or sales of portfolio securities for the reporting period by the monthly average value of portfolio securities owned during the reporting period. Excluded from both the numerator and denominator are amounts relating to derivatives and securities whose maturities or expiration dates at the time of acquisition were one year or less. |
| (f) | Calculated based upon average shares outstanding. |
| (g) | Amount rounds to less than $0.01. |
| (h) | Net investment income (loss) may appear disproportionate among the classes due to the timing of recognition of income and changes in the relative size of the classes. |
| (i) | Commencement of operations. |
| (j) | Certain non-recurring expenses incurred by the Fund were not annualized for the period ended August 31, 2011. |
| (k) | Commencement of offering of class of shares. |
| (l) | Calculation of the net realized and unrealized gains (losses) per share do not correlate with the Fund’s net realized and unrealized gains (losses) presented in the Statement of Operations due to the timing of capital transactions in relation to the fluctuating market values of the Fund’s investments. |
SEE NOTES TO FINANCIAL STATEMENTS.
| | | | | | |
| | | |
| 18 | | | | J.P. MORGAN INCOME FUNDS | | AUGUST 31, 2015 |
| | | | | | | | | | | | | | | | | | | | | | | | | | |
| | | Ratios/Supplemental data | |
| | | | | | | | | | Ratios to average net assets (a) | | | | |
Net asset
value,
end of
period | | | Total return
(excludes
sales charge) (b)(c) | | | Net assets,
end of
period
(000’s) | | | Net
expenses (d) | | | Net
investment
income
(loss) | | |
Expenses
without waivers,
reimbursements and
earnings credits | | | Portfolio
turnover
rate (b)(e) | |
| | | | | | | | | | | | | | | | | | | | | | | | | | |
| | | | | | | | | | | | | | | | | | | | | | | | | | |
| $ | 9.56 | | | | (0.92 | )% | | $ | 85,854 | | | | 0.99 | % | | | 3.85 | % | | | 1.25 | % | | | 16 | % |
| | 10.04 | | | | 4.15 | | | | 168,575 | | | | 0.98 | | | | 3.85 | (h) | | | 1.15 | | | | 61 | |
| | 10.02 | | | | 5.90 | | | | 158,323 | | | | 0.97 | | | | 4.64 | | | | 1.16 | | | | 42 | |
| | 9.89 | | | | 9.82 | | | | 63,811 | | | | 0.97 | | | | 4.80 | | | | 1.20 | | | | 65 | |
| | 9.41 | | | | (5.43 | ) | | | 54,039 | | | | 0.95 | (j) | | | 3.68 | (j) | | | 1.33 | (j) | | | 1 | |
| | | | | | |
| | | | | | | | | | | | | | | | | | | | | | | | | | |
| | 9.54 | | | | (1.37 | ) | | | 26,637 | | | | 1.49 | | | | 3.35 | | | | 1.73 | | | | 16 | |
| | 10.02 | | | | 3.59 | | | | 22,738 | | | | 1.48 | | | | 3.35 | (h) | | | 1.65 | | | | 61 | |
| | 10.01 | | | | 5.50 | | | | 15,323 | | | | 1.47 | | | | 4.07 | | | | 1.65 | | | | 42 | |
| | 9.88 | | | | 9.24 | | | | 2,408 | | | | 1.47 | | | | 4.45 | | | | 1.68 | | | | 65 | |
| | 9.41 | | | | (5.55 | ) | | | 285 | | | | 1.48 | (j) | | | 2.43 | (j) | | | 2.58 | (j) | | | 1 | |
| | | | | | |
| | | | | | | | | | | | | | | | | | | | | | | | | | |
| | 9.57 | | | | (0.49 | ) | | | 391,548 | | | | 0.64 | | | | 4.18 | | | | 0.67 | | | | 16 | |
| | 10.05 | | | | 3.05 | | | | 916,404 | | | | 0.63 | | | | 4.11 | (h) | | | 0.66 | | | | 61 | |
| | | | | | |
| | | | | | | | | | | | | | | | | | | | | | | | | | |
| | 9.57 | | | | (0.61 | ) | | | 1,946,646 | | | | 0.74 | | | | 4.09 | | | | 0.92 | | | | 16 | |
| | 10.05 | | | | 4.40 | | | | 2,930,115 | | | | 0.73 | | | | 4.10 | (h) | | | 0.90 | | | | 61 | |
| | 10.03 | | | | 6.25 | | | | 3,158,706 | | | | 0.72 | | | | 4.85 | | | | 0.91 | | | | 42 | |
| | 9.89 | | | | 10.09 | | | | 781,827 | | | | 0.72 | | | | 5.12 | | | | 0.94 | | | | 65 | |
| | 9.41 | | | | (5.40 | ) | | | 187,051 | | | | 0.72 | (j) | | | 3.37 | (j) | | | 1.55 | (j) | | | 1 | |
SEE NOTES TO FINANCIAL STATEMENTS.
| | | | | | | | |
| | | |
| AUGUST 31, 2015 | | J.P. MORGAN INCOME FUNDS | | | | | 19 | |
NOTES TO FINANCIAL STATEMENTS
AS OF AUGUST 31, 2015
1. Organization
JPMorgan Trust I (the “Trust”) was formed on November 12, 2004, as a Delaware statutory trust, pursuant to a Declaration of Trust dated November 5, 2004 and is registered under the Investment Company Act of 1940, as amended (the “1940 Act”), as an open-end management investment company.
The following is a separate fund of the Trust (the “Fund”) covered by this report:
| | | | |
| | | Classes Offered | | Diversified/Non-Diversified |
| Floating Rate Income Fund | | Class A, Class C, Class R6 and Select Class | | Diversified |
The investment objective of the Fund is to seek to provide current income with a secondary objective of capital appreciation.
Class R6 Shares commenced operations on October 31, 2013.
Class A Shares generally provide for a front-end sales charge while Class C Shares provide for a contingent deferred sales charge (“CDSC”). No sales charges are assessed with respect to Class R6 and Select Class Shares. All classes of shares have equal rights as to earnings, assets and voting privileges, except that each class may bear different sub-transfer agency, distribution and shareholder servicing fees and each class has exclusive voting rights with respect to its distribution plan and shareholder servicing agreements. Certain Class A Shares, for which front-end sales charges have been waived, may be subject to a CDSC as described in the Fund’s prospectus.
2. Significant Accounting Policies
The following is a summary of significant accounting policies followed by the Fund in the preparation of its financial statements. The Fund is an investment company and, accordingly, follows the investment company accounting and reporting guidance of the Financial Accounting Standards Board Accounting Standards Codification Topic 946 — Investment Companies, which is part of U.S. generally accepted accounting principles (“GAAP”). The preparation of financial statements in conformity with GAAP requires management to make estimates and assumptions that affect the reported amounts of assets and liabilities and disclosure of contingent assets and liabilities at the date of the financial statements and the reported amounts of increases and decreases in net assets from operations during the reporting period. Actual results could differ from those estimates.
A. Valuation of Investments — The valuation of the investments is in accordance with GAAP and the Fund’s valuation policies set forth by and under the supervision and responsibility of the Board of Trustees (the “Board”), which established the following approach to valuation, as described more fully below: (i) investments for which market quotations are readily available shall be valued at such unadjusted quoted prices and (ii) all other investments for which market quotations are not readily available shall be valued at their fair value as determined in good faith by the Board.
JPMorgan Funds Management, Inc. (the “Administrator”) has established the J.P. Morgan Asset Management Americas Valuation Committee (“AVC”) to assist the Board with the oversight and monitoring of the valuation of the Fund’s investments. The Administrator implements the valuation policies of the Fund’s investments, as directed by the Board. The AVC oversees and carries out the policies for the valuation of investments held in the Fund. This includes monitoring the appropriateness of fair values based on results of ongoing valuation oversight, including but not limited to consideration of macro or security specific events, market events and pricing vendor and broker due diligence. The Administrator is responsible for discussing and assessing the potential impacts to the fair values on an ongoing basis, and at least on a quarterly basis with the AVC and the Board.
A market-based approach is primarily used to value the Fund’s investments. Investments for which market quotations are not readily available are fair valued by approved pricing vendors or third party broker-dealers (collectively referred to as “Pricing Services”) or may be internally fair valued using methods set forth by the valuation policies approved by the Board. This may include related or comparable assets or liabilities, recent transactions, market multiples, book values, and other relevant information for the investment to determine the fair value of the investment. An income-based valuation approach may be used in which the anticipated future cash flows of the investment are discounted to calculate the fair value. Discounts may also be applied due to the nature or duration of any restrictions on the disposition of the investments. Valuations may be based upon current market prices of securities that are comparable in coupon, rating, maturity and industry. It is possible that the estimated values may differ significantly from the values that would have been used, had a ready market for the investments existed, and such differences could be material.
Fixed income instruments are valued based on prices received from Pricing Services. The Pricing Services use multiple valuation techniques to determine the valuation of fixed income instruments. In instances where sufficient market activity exists, the Pricing Services may utilize a market-based approach through which trades or quotes from market makers are used to determine the valuation of these instruments. In instances where sufficient market activity may not exist, the Pricing Services also utilize proprietary valuation models which may consider market transactions in comparable securities and the various relationships between securities in determining fair value and/or market characteristics in order to estimate the relevant cash flows, which are then discounted to calculate the fair values.
Equities and other exchange-traded instruments are valued at the last sale price or official market closing price on the primary exchange on which the instrument is traded before the net asset values (“NAV”) of the Fund are calculated on a valuation date. Investments in open-end investment companies, including J.P. Morgan Funds (the “Underlying Funds”), are valued at each Underlying Fund’s NAV as of the report date.
Forward Foreign Currency Exchange Contracts are valued utilizing market quotations from approved Pricing Services.
Valuations reflected in this report are as of the report date. As a result, changes in valuation due to market events and/or issuer related events after the report date and prior to issuance of the report are not reflected herein.
| | | | | | |
| | | |
| 20 | | | | J.P. MORGAN INCOME FUNDS | | AUGUST 31, 2015 |
The various inputs that are used in determining the valuation of the Fund’s investments are summarized into the three broad levels listed below.
| • | | Level 1 — Unadjusted inputs using quoted prices in active markets for identical investments. |
| • | | Level 2 — Other significant observable inputs including, but are not limited to, quoted prices for similar investments, inputs other than quoted prices that are observable for investments (such as interest rates, prepayment speeds, credit risk, etc.) or other market corroborated inputs. |
| • | | Level 3 — Significant inputs based on the best information available in the circumstances, to the extent observable inputs are not available (including the Fund’s assumptions in determining the fair value of investments). |
A financial instrument’s level within the fair value hierarchy is based on the lowest level of any input, both individually and in the aggregate, that is significant to the fair value measurement. The inputs or methodology used for valuing instruments are not necessarily an indication of the risk associated with investing in those instruments.
The following table represents each valuation input as presented on the Schedule of Portfolio Investments (amounts in thousands):
| | | | | | | | | | | | | | | | |
| | | Level 1
Quoted prices | | | Level 2
Other significant
observable inputs | | | Level 3
Significant
unobservable inputs | | | Total | |
Investments in Securities | | | | | | | | | | | | | | | | |
Debt Securities | | | | | | | | | | | | | | | | |
Corporate Bonds | | | | | | | | | | | | | | | | |
Consumer Discretionary | | $ | — | | | $ | 62,566 | | | $ | — | | | $ | 62,566 | |
Consumer Staples | | | — | | | | 2,342 | | | | — | | | | 2,342 | |
Energy | | | — | | | | 36,583 | | | | — | | | | 36,583 | |
Health Care | | | — | | | | 44,464 | | | | — | | | | 44,464 | |
Industrials | | | — | | | | 51,199 | | | | 1,250 | | | | 52,449 | |
Information Technology | | | — | | | | 11,686 | | | | — | | | | 11,686 | |
Materials | | | — | | | | 44,573 | | | | — | | | | 44,573 | |
Telecommunication Services | | | — | | | | 22,752 | | | | — | | | | 22,752 | |
Utilities | | | — | | | | 19,525 | | | | — | | | | 19,525 | |
| | | | | | | | | | | | | | | | |
Total Corporate Bonds | | | — | | | | 295,690 | | | | 1,250 | | | | 296,940 | |
| | | | | | | | | | | | | | | | |
Preferred Stock | | | | | | | | | | | | | | | | |
Financials | | | — | | | | 13,803 | | | | — | | | | 13,803 | |
| | | | | | | | | | | | | | | | |
Loan Assignments | | | | | | | | | | | | | | | | |
Consumer Discretionary | | | — | | | | 579,177 | | | | — | (a) | | | 579,177 | |
Consumer Staples | | | — | | | | 255,744 | | | | — | | | | 255,744 | |
Energy | | | — | | | | 89,252 | | | | — | | | | 89,252 | |
Financials | | | — | | | | 91,564 | | | | — | | | | 91,564 | |
Health Care | | | — | | | | 213,684 | | | | — | | | | 213,684 | |
Industrials | | | — | | | | 272,536 | | | | — | | | | 272,536 | |
Information Technology | | | — | | | | 221,549 | | | | — | | | | 221,549 | |
Materials | | | — | | | | 92,259 | | | | 6,615 | | | | 98,874 | |
Telecommunication Services | | | — | | | | 64,243 | | | | — | | | | 64,243 | |
Utilities | | | — | | | | 129,603 | | | | — | | | | 129,603 | |
| | | | | | | | | | | | | | | | |
Total Loan Assignments | | | — | | | | 2,009,611 | | | | 6,615 | | | | 2,016,226 | |
| | | | | | | | | | | | | | | | |
Short-Term Investment | | | | | | | | | | | | | | | | |
Investment Company | | | 86,177 | | | | — | | | | — | | | | 86,177 | |
| | | | | | | | | | | | | | | | |
Total Investments in Securities | | $ | 86,177 | | | $ | 2,319,104 | | | $ | 7,865 | | | $ | 2,413,146 | |
| | | | | | | | | | | | | | | | |
There were no transfers between Levels 1 and 2 during the year ended August 31, 2015. There were no significant transfers in and out of Level 3 during the year ended August 31, 2015.
| (a) | Amount rounds to less than $1,000. |
B. Foreign Currency Translation — The books and records of the Fund are maintained in U.S. dollars. Foreign currency amounts are translated into U.S. dollars at the prevailing exchange rates of such currencies against the U.S. dollar. The market value of investment securities and other assets and liabilities are translated at the exchange rate as of the valuation date. Purchases and sales of investment securities, income and expenses are translated at the exchange rate prevailing on the respective dates of such transactions.
The Fund does not isolate the effect of changes in foreign exchange rates from changes in market prices on securities held. Accordingly, such changes are included within Change in net unrealized appreciation/depreciation on investments on the Statement of Operations.
| | | | | | | | |
| | | |
| AUGUST 31, 2015 | | J.P. MORGAN INCOME FUNDS | | | | | 21 | |
NOTES TO FINANCIAL STATEMENTS
AS OF AUGUST 31, 2015 (continued)
Reported realized foreign currency gains and losses arise from the disposition of foreign currency, currency gains or losses realized between the trade and settlement dates on securities transactions, and the difference between the amounts of dividends, interest and foreign withholding taxes recorded on the Fund’s books on the transaction date and the U.S. dollar equivalent of the amounts actually received or paid. These reported realized foreign currency gains and losses are included in Net realized gain (loss) on foreign currency transactions on the Statement of Operations. Unrealized foreign currency gains and losses arise from changes (due to changes in exchange rates) in the value of foreign currency and other assets and liabilities denominated in foreign currencies, which are held at period end and are included in Change in net unrealized appreciation/depreciation on foreign currency translations on the Statement of Operations.
C. Restricted Securities — Certain securities held by the Fund may be subject to legal or contractual restrictions on resale. Restricted securities generally are resold in transactions exempt from registration under the Securities Act of 1933, (the “Securities Act”). Disposal of these securities may involve time-consuming negotiations and expense. Prompt sale at the current valuation may be difficult and could adversely affect the net assets of the Fund. As of August 31, 2015, the Fund had no investments in restricted securities other than securities sold to the Fund under Rule 144A or Regulation S under the Securities Act.
D. Forward Foreign Currency Exchange Contracts — The Fund used forward foreign currency exchange contracts including non-deliverable forwards mainly as a substitute for securities in which the Fund can invest, to increase income or gain to the Fund and to hedge or manage the Fund’s exposure to foreign currency risks associated with portfolio investments. Forward foreign currency exchange contracts represent obligations to purchase or sell foreign currency on a specified future date at a price fixed at the time the contracts are entered into. Non-deliverable forward foreign currency exchange contracts are settled with the counterparty in cash without the delivery of foreign currency.
The values of the forward foreign currency exchange contracts are adjusted daily based on the applicable exchange rate of the underlying currency. Changes in the value of these contracts are recorded as unrealized appreciation or depreciation until the contract settlement date. When the forward foreign currency exchange contract is closed, the Fund records a realized gain or loss equal to the difference between the value at the time the contract was opened and the value at the time it was closed. The Fund also records a realized gain or loss when a forward currency contract offsets another forward foreign currency contract with the same counterparty upon settlement.
The Fund is party to various derivative contracts governed by International Swaps and Derivatives Association master agreements (“ISDA agreements”). The Fund’s ISDA agreements, which are separately negotiated with each dealer counterparty, may contain provisions allowing, absent other considerations, a counterparty to exercise rights, to the extent not otherwise waived, against the Fund in the event the Fund’s net assets decline over time by a pre-determined percentage or fall below a pre-determined floor. The ISDA agreements may also contain provisions allowing, absent other conditions, the Fund to exercise rights, to the extent not otherwise waived, against the counterparties (i.e. decline in a counterparty’s credit rating below a specified level). Such rights for both the counterparty and Fund often include the ability to terminate (i.e. close out) open contracts at prices which may favor the counterparty, which could have an adverse effect on the Fund. The ISDA agreements give the Fund and counterparty the right, upon an event of default, to close out all transactions traded under such agreements and to net amounts owed or due across all transactions and offset such net payable or receivable with collateral posted to a segregated account by one party to the other.
As of August 31, 2015, the Fund did not receive or post collateral for forward foreign currency exchange contracts.
| | | | |
The table below discloses the volume of the Fund’s forward foreign currency exchange contracts activity during the year ended August 31, 2015
(amounts in thousands): | |
Forward Foreign Currency Exchange Contracts | | | | |
Average Settlement Value Purchased | | | $ 735 (a) | |
Average Settlement Value Sold | | | 11,256 (b) | |
| (a) | For the period September 1, 2014 through October 31, 2014 and March 1, 2015 through March 31, 2015. |
| (b) | For the period September 1, 2014 through March 31, 2015. |
E. Loan Assignments — The Fund may invest in debt instruments that are interests in amounts owed to lenders or lending syndicates (a “Lender”) by corporate, governmental, or other borrowers (a “Borrower”). A loan is often administered by a bank or other financial institution (the “Agent”) that acts as agent for all holders. The Agent administers the terms of the loan, as specified in the loan agreement. The fund invests in loan assignments of all or a portion of the loans. When a fund purchases a loan assignment, the fund has direct rights against the Borrower on a loan, provided, however, the Fund’s rights may be more limited than the Lender from which they acquired the assignment and the fund may be able to enforce its rights only through the Agent. As a result, a fund assumes the credit risk of the Borrower as well as any other persons interpositioned between the Fund and the Borrower (“Intermediate Participants”). A fund may incur certain costs and delays in realizing payment on a loan assignment or suffer a loss of principal and/or interest if assets or interests held by the Agent or other Intermediate Participants are determined to be subject to the claims of the Agent’s or other Intermediate Participant’s creditors. In addition, it is unclear whether loan assignments and other forms of direct indebtedness offer securities law protections against fraud and misrepresentation. Also, because J.P. Morgan Investment Management Inc. (the “Adviser” or “JPMIM”), an indirect, wholly-owned subsidiary of JPMorgan Chase & Co. (“JPMorgan”), may wish to invest in publicly traded securities of a Borrower, it may not have access to material non-public information regarding the Borrower to which other investors have access. Although certain loan assignments are secured by collateral, a fund could experience delays or limitations in realizing the value on such
| | | | | | |
| | | |
| 22 | | | | J.P. MORGAN INCOME FUNDS | | AUGUST 31, 2015 |
collateral or have its interest subordinated to other indebtedness of the Borrower. Loan assignments are vulnerable to market conditions such that economic conditions or other events may reduce the demand for assignments and certain assignments which were liquid, when purchased, may become illiquid and they may be difficult to value. In addition, the settlement period for loans is uncertain as there is no standardized settlement schedule applicable to such investments. Therefore, a fund may not receive the proceeds from a sale of such investments for a period after the sale.
Certain loan assignments are also subject to the risks associated with high yield securities described under Note 7 – Risks, Concentrations and Indemnifications.
At August 31, 2015, the Fund had investments in Loan Assignments that amounted to more than 5% of the Fund’s net assets, by agent bank as follows:
| | | | |
| Agent Bank | | Percentage | |
Deutsche Bank AG | | | 13.1 | % |
Credit Suisse International | | | 13.0 | |
Bank of America, N.A. | | | 12.1 | |
Citibank, N.A | | | 10.5 | |
Barclays Bank plc | | | 10.1 | |
Goldman Sachs International | | | 8.0 | |
F. Security Transactions and Investment Income — Investment transactions are accounted for on the trade date (the date the order to buy or sell is executed). Securities gains and losses are calculated on a specifically identified cost basis. Interest income is determined on the basis of coupon interest accrued using the effective interest method which adjusts for amortization of premiums and accretion of discounts. Dividend income, net of foreign taxes withheld, if any, is recorded on the ex-dividend date or when the Fund first learns of the dividend.
G. Allocation of Income and Expenses — Expenses directly attributable to a fund are charged directly to that fund, while the expenses attributable to more than one fund of the Trust are allocated among the respective funds. In calculating the NAV of each class, investment income, realized and unrealized gains and losses and expenses, other than class specific expenses, are allocated daily to each class of shares based upon the proportion of net assets of each class at the beginning of each day.
Sub-transfer agent fees are class-specific expenses. The amount of the sub-transfer agent fees charged to each class of the Fund for the year ended August 31, 2015 are as follows (amounts in thousands):
| | | | | | | | | | | | |
| | | Class A | | | Class C | | | Select Class | |
| | $ | 83 | | | $ | 13 | | | $ | 37 | |
H. Federal Income Taxes — The Fund is treated as a separate taxable entity for Federal income tax purposes. The Fund’s policy is to comply with the provisions of the Internal Revenue Code of 1986, as amended (the “Code”), applicable to regulated investment companies and to distribute to shareholders all of its distributable net investment income and net realized capital gains on investments. Accordingly, no provision for Federal income tax is necessary. Management has reviewed the Fund’s tax positions for all open tax years and has determined that as of August 31, 2015, no liability for income tax is required in the Fund’s financial statements for net unrecognized tax benefits. However, management’s conclusions may be subject to future review based on changes in, or the interpretation of, the accounting standards or tax laws and regulations. The Fund’s Federal tax returns for the prior three fiscal years remain subject to examination by the Internal Revenue Service.
I. Foreign Taxes — The Fund may be subject to foreign taxes on income, gains on investments or currency purchases/repatriation, a portion of which may be recoverable. The Fund will accrue such taxes and recoveries as applicable, based upon its current interpretation of tax rules and regulations that exist in the markets in which it invests.
J. Distributions to Shareholders — Distributions from net investment income are generally declared and paid monthly and are declared separately for each class. No class has preferential dividend rights; differences in per share rates are due to differences in separate class expenses. Net realized capital gains, if any, are distributed by the Fund at least annually. The amount of distributions from net investment income and net realized capital gains is determined in accordance with Federal income tax regulations, which may differ from GAAP. To the extent these “book/tax” differences are permanent in nature (i.e., that they result from other than timing of recognition — “temporary differences”), such amounts are reclassified within the capital accounts based on their Federal tax-basis treatment.
The following amounts were reclassified within the capital accounts (amounts in thousands):
| | | | | | | | | | |
| | | Paid-in-Capital | | Accumulated undistributed (distributions in excess of) net investment income | | | Accumulated net realized gains (losses) | |
| | $(205) | | $ | (648 | ) | | $ | 853 | |
The reclassifications for the Fund relate primarily to debt modifications.
��
| | | | | | | | |
| | | |
| AUGUST 31, 2015 | | J.P. MORGAN INCOME FUNDS | | | | | 23 | |
NOTES TO FINANCIAL STATEMENTS
AS OF AUGUST 31, 2015 (continued)
3. Fees and Other Transactions with Affiliates
A. Investment Advisory Fee — Pursuant to the Investment Advisory Agreement, the Adviser supervises the investments of the Fund and for such services is paid a fee. The fee is accrued daily and paid monthly at an annual rate of 0.55% of the Fund’s average daily net assets.
The Adviser waived Investment Advisory fees and/or reimbursed expenses as outlined in Note 3.F.
B. Administration Fee — Pursuant to an Administration Agreement, the Administrator, an indirect, wholly-owned subsidiary of JPMorgan, provides certain administration services to the Fund. In consideration of these services, the Administrator receives a fee accrued daily and paid monthly at an annual rate of 0.15% of the first $25 billion of the average daily net assets of all funds in the J.P. Morgan Funds Complex covered by the Administration Agreement (excluding certain funds of funds and money market funds) and 0.075% of the average daily net assets in excess of $25 billion of all such funds. For the year ended August 31, 2015, the effective rate was 0.08% of the Fund’s average daily net assets, notwithstanding any fee waivers and/or expense reimbursements.
The Administrator waived Administration fees as outlined in Note 3.F.
JPMorgan Chase Bank, N.A. (“JPMCB”), a wholly-owned subsidiary of JPMorgan, serves as the Fund’s sub-administrator (the “Sub-administrator”). For its services as Sub-administrator, JPMCB receives a portion of the fees payable to the Administrator.
C. Distribution Fees — Pursuant to a Distribution Agreement, JPMorgan Distribution Services, Inc. (the “Distributor”), a wholly-owned subsidiary of JPMorgan, serves as the Trust’s exclusive underwriter and promotes and arranges for the sale of the Fund’s shares.
The Board has adopted a Distribution Plan (the “Distribution Plan”) for Class A and Class C Shares of the Fund in accordance with Rule 12b-1 under the 1940 Act. The Distribution Plan provides that the Fund shall pay distribution fees, including payments to the Distributor, at annual rates of 0.25% and 0.75% of the average daily net assets of Class A and Class C Shares, respectively.
In addition, the Distributor is entitled to receive the front-end sales charges from purchases of Class A Shares and the CDSC from redemptions of Class C Shares and certain Class A Shares for which front-end sales charges have been waived. For the year ended August 31, 2015, the Distributor retained the following (amounts in thousands):
| | | | | | | | |
| | | Front-End Sales Charge | | | CDSC | |
| | $ | 10 | | | $ | — | (a) |
| (a) | Amount rounds to less than $1,000. |
D. Shareholder Servicing Fees — The Trust, on behalf of the Fund, has entered into a Shareholder Servicing Agreement with the Distributor under which the Distributor provides certain support services to the shareholders. The Class R6 Shares do not participate in the Shareholder Servicing Agreement. For performing these services, the Distributor receives a fee that is accrued daily and paid monthly at an annual rate of 0.25% of the average daily net assets of Class A, Class C and Select Class Shares, respectively.
The Distributor has entered into shareholder services contracts with affiliated and unaffiliated financial intermediaries who provide shareholder services and other related services to their clients or customers who invest in the Fund under which the Distributor will pay all or a portion of such fees earned to financial intermediaries for performing such services.
The Distributor waived Shareholder Servicing fees as outlined in Note 3.F.
E. Custodian and Accounting Fees — JPMCB provides portfolio custody and accounting services to the Fund. For these services, the Fund pays JPMCB transaction and asset-based fees that vary according to the number of transactions and positions, plus out-of-pocket expenses. The amounts paid directly to JPMCB by the Fund for custody and accounting services are included in Custodian and accounting fees on the Statement of Operations. Payments to the custodian may be reduced by credits earned by the Fund, based on uninvested cash balances held by the custodian. Such earnings credits, if any, are presented separately on the Statement of Operations.
Interest income earned on cash balances at the custodian, if any, is included in Interest income from affiliates on the Statement of Operations.
Interest expense paid to the custodian related to cash overdrafts, if any, is included in Interest expense to affiliates on the Statement of Operations.
F. Waivers and Reimbursements — The Adviser, Administrator and Distributor have contractually agreed to waive fees and/or reimburse the Fund to the extent that total annual operating expenses (excluding acquired fund fees and expenses, dividend expenses related to short sales, interest, taxes, expenses related to litigation and potential litigation, extraordinary expenses and expenses related to the Board’s deferred compensation plan) exceed the percentages of the Fund’s respective average daily net assets as shown in the table below:
| | | | | | | | | | | | | | |
| | | Class A | | Class C | | | Class R6 | | | Select Class | |
| | 1.00% | | | 1.50 | % | | | 0.65 | % | | | 0.75 | % |
The expense limitation agreement was in effect for the year ended August 31, 2015 and is in place until at least December 31, 2015.
| | | | | | |
| | | |
| 24 | | | | J.P. MORGAN INCOME FUNDS | | AUGUST 31, 2015 |
For the year ended August 31, 2015, the Fund’s service providers waived fees and/or reimbursed expenses for the Fund as follows (amounts in thousands). None of these parties expect the Fund to repay any such waived fees and/or reimbursed expenses in future years.
| | | | | | | | | | | | | | | | | | | | |
| | | Contractual Waivers | | | | |
| | | Investment Advisory | | | Administration | | | Shareholder
Servicing | | | Total | | | Contractual
Reimbursements | |
| | $ | 330 | | | $ | 254 | | | $ | 3,756 | | | $ | 4,340 | | | $ | 31 | |
Additionally, the Fund may invest in one or more money market funds advised by the Adviser or its affiliates. The Adviser, Administrator and Distributor, as shareholder servicing agent, waive fees in an amount sufficient to offset the respective fees each charges to the affiliated money market fund on the Fund’s investment in such affiliated money market fund. A portion of the waiver is voluntary.
The amounts of these waivers/reimbursements resulting from investments in these money market funds for the year ended August 31, 2015 was approximately $267,000.
G. Other — Certain officers of the Trust are affiliated with the Adviser, the Administrator and the Distributor. Such officers, with the exception of the Chief Compliance Officer, receive no compensation from the Fund for serving in their respective roles.
The Board appointed a Chief Compliance Officer to the Fund in accordance with Federal securities regulations. The Fund, along with other affiliated funds, makes reimbursement payments, on a pro-rata basis, to the Administrator for a portion of the fees associated with the Office of the Chief Compliance Officer. Such fees are included in Trustees’ and Chief Compliance Officer’s fees on the Statement of Operations.
The Trust adopted a Trustee Deferred Compensation Plan (the “Plan”) which allows the Independent Trustees to defer the receipt of all or a portion of compensation related to performance of their duties as Trustees. The deferred fees are invested in various J.P. Morgan Funds until distribution in accordance with the Plan.
During the year ended August 31, 2015, the Fund may have purchased securities from an underwriting syndicate in which the principal underwriter or members of the syndicate are affiliated with the Adviser.
The Fund may use related party broker-dealers. For the year ended August 31, 2015, the Fund did not incur any brokerage commissions with broker-dealers affiliated with the Adviser.
The Securities and Exchange Commission (“SEC”) has granted an exemptive order permitting the Fund to engage in principal transactions with J.P. Morgan Securities, Inc., an affiliated broker, involving taxable money market instruments, subject to certain conditions.
4. Investment Transactions
During the year ended August 31, 2015, purchases and sales of investments (excluding short-term investments) were as follows (amounts in thousands):
| | | | | | | | |
| | | Purchases
(excluding U.S.
Government) | | | Sales (excluding U.S. Government) | |
| | $ | 445,438 | | | $ | 1,781,079 | |
During the year ended August 31, 2015, there were no purchases or sales of U.S. Government securities.
5. Federal Income Tax Matters
For Federal income tax purposes, the estimated cost and unrealized appreciation (depreciation) in value of investment securities held at August 31, 2015 were as follows (amounts in thousands):
| | | | | | | | | | | | | | | | |
| | | Aggregate Cost | | | Gross Unrealized Appreciation | | | Gross Unrealized Depreciation | | | Net Unrealized
Appreciation
(Depreciation) | |
| | $ | 2,519,731 | | | $ | 10,853 | | | $ | 117,438 | | | $ | (106,585 | ) |
The difference between book and tax basis appreciation (depreciation) on investments is primarily attributed to defaulted bonds.
The tax character of distributions paid during the year ended August 31, 2015 was as follows (amounts in thousands):
| | | | | | | | | | | | |
| | | Ordinary Income | | | Net Long-Term Capital Gains | | | Total Distributions
Paid | |
| | $ | 125,504 | | | $ | 86 | | | $ | 125,590 | |
| | | | | | | | |
| | | |
| AUGUST 31, 2015 | | J.P. MORGAN INCOME FUNDS | | | | | 25 | |
NOTES TO FINANCIAL STATEMENTS
AS OF AUGUST 31, 2015 (continued)
The tax character of distributions paid during the year ended August 31, 2014 was as follows (amounts in thousands):
| | | | | | | | | | | | |
| | | Ordinary Income | | | Net
Long-Term
Capital Gains | | | Total
Distributions
Paid | |
| | $ | 164,141 | | | $ | 1,789 | | | $ | 165,930 | |
As of August 31, 2015, the estimated components of net assets (excluding paid-in-capital) on a tax basis were as follows (amounts in thousands):
| | | | | | | | | | | | |
| | | Current Distributable Ordinary Income | | | Current Distributable Long-Term Capital Gain or (Tax Basis Loss Carryover) | | | Unrealized Appreciation (Depreciation) | |
| | $ | 2,451 | | | $ | (7,502 | ) | | $ | (106,585 | ) |
The cumulative timing differences primarily consist of post-October capital loss deferrals.
As of August 31, 2015, the Fund had post-enactment net capital loss carryforwards (amounts in thousands):
| | | | | | | | |
| | | Capital Loss Carryforward Character | |
| | | Short-Term | | | Long-Term | |
| | $ | 6,007 | | | $ | 1,496 | |
Specified ordinary losses and net capital losses and other late year losses incurred after October 31, and within the taxable year are deemed to arise on the first business day of the Fund’s next taxable year. For the year ended August 31, 2015 the Fund deferred to September 1, 2015 the following specified ordinary losses and net capital losses of (amounts in thousands):
| | | | | | | | | | | | |
| | | Net Capital Loss | | | Specified
Ordinary Loss | |
| | | Short-Term | | | Long-Term | | |
| | $ | 12,595 | | | $ | 12,655 | | | $ | 893 | |
6. Borrowings
The Fund relies upon an exemptive order granted by the SEC (the “Order”) permitting the establishment and operation of an Interfund Lending Facility (the “Facility”). The Facility allows the Fund to directly lend and borrow money to or from any other fund relying upon the Order at rates beneficial to both the borrowing and lending funds. Advances under the Facility are taken primarily for temporary or emergency purposes, including the meeting of redemption requests that otherwise might require the untimely disposition of securities, and are subject to the Fund’s borrowing restrictions. The Interfund loan rate is determined, as specified in the Order, by averaging the current repurchase agreement rate and the current bank loan rate. The Order was granted to JPMorgan Trust II and may be relied upon by the Fund because the Fund and the series of JPMorgan Trust II are both investment companies in the same “group of investment companies” (as defined in Section 12(d)(1)(G) of the 1940 Act).
In addition, the Trust and JPMCB have entered into a financing arrangement. Under this arrangement, JPMCB provides an unsecured, uncommitted credit facility in the aggregate amount of $100 million to certain of the J.P. Morgan Funds, including the Fund. Advances under the arrangement are taken primarily for temporary or emergency purposes, including the meeting of redemption requests that otherwise might require the untimely disposition of securities, and are subject to the Fund’s borrowing restrictions. Interest on borrowings is payable at a rate determined by JPMCB at the time of borrowing. This agreement has been extended until November 9, 2015.
The Fund had no borrowings outstanding from another fund or from the unsecured, uncommitted credit facility at August 31, 2015. Average borrowings from the Facility for, or at any time during the year ended August 31, 2015, were as follows (amounts in thousands):
| | | | | | | | | | | | | | | | |
| | | Average Borrowings | | | Average Interest Rate Paid | | | Number of Days Outstanding | | | Interest Paid | |
| | $ | 21,904 | | | | 0.22 | % | | | 16 | | | $ | 2 | |
Interest expense paid as a result of borrowings from another fund or from the unsecured, uncommitted credit facility is included in Interest expense to affiliates on the Statement of Operations.
7. Risks, Concentrations and Indemnifications
In the normal course of business, the Fund enters into contracts that contain a variety of representations which provide general indemnifications. The Fund’s maximum exposure under these arrangements is unknown. The amount of exposure would depend on future claims that may be made against the Fund that have not yet occurred. However, based on experience, the Fund expects the risk of loss to be remote.
One or more affiliates of the Adviser have investment discretion with respect to their clients’ holdings in the Fund, which collectively represent a significant portion of the Fund’s assets. Significant shareholder transactions by these shareholders may impact the Fund’s performance.
| | | | | | |
| | | |
| 26 | | | | J.P. MORGAN INCOME FUNDS | | AUGUST 31, 2015 |
The Fund is subject to interest rate and credit risk. The value of debt securities may decline as interest rates increase. The Fund could lose money if the issuer of a fixed income security is unable to pay interest or repay principal when it is due. The Fund invests in floating rate loans and other floating rate debt securities. Although these investments are generally less sensitive to interest rate changes than other fixed rate instruments, the value of floating rate loans and other floating rate investments may decline if their interest rates do not rise as quickly, or as much, as general interest rates. Many factors can cause interest rates to rise. Some examples include central bank monetary policy, rising inflation rates and general economic conditions. Given the historically low interest rate environment, risks associated with rising rates are heightened. The ability of the issuers of debt to meet their obligations may be affected by the economic and political developments in a specific industry or region.
The Fund invests in high yield securities that are not rated or rated below investment grade (commonly known as “junk bonds.”) These securities are considered to be high risk investments. Investments in lower-rated securities or unrated securities of comparable quality tend to be more sensitive to economic conditions than higher rated securities. Junk bonds involve a greater risk of default by the issuer because such securities are generally unsecured and are often subordinated to other creditors’ claims. The market price of these securities can change suddenly and unexpectedly. As a result, the Fund is intended for investors who are able and willing to assume a high degree of risk.
The Fund is subject to the risk that, should the Fund decide to sell an illiquid investment when a ready buyer is not available at a price the Fund deems to be representative of its value, the value of the Fund’s net assets could be adversely affected.
| | | | | | | | |
| | | |
| AUGUST 31, 2015 | | J.P. MORGAN INCOME FUNDS | | | | | 27 | |
REPORT OF INDEPENDENT REGISTERED PUBLIC ACCOUNTING FIRM
To the Trustees of JPMorgan Trust I and the Shareholders of JPMorgan Floating Rate Income Fund:
In our opinion, the accompanying statement of assets and liabilities, including the schedule of portfolio investments, and the related statements of operations and of changes in net assets and the financial highlights present fairly, in all material respects, the financial position of JPMorgan Floating Rate Income Fund (a separate fund of JPMorgan Trust I) (the “Fund”) at August 31, 2015, the results of its operations for the year then ended, the changes in its net assets for each of the two years in the period then ended and the financial highlights for each of the periods presented, in conformity with accounting principles generally accepted in the United States of America. These financial statements and financial highlights (hereafter referred to as “financial statements”) are the responsibility of the Fund’s management. Our responsibility is to express an opinion on these financial statements based on our audits. We conducted our audits of these financial statements in accordance with the standards of the Public Company Accounting Oversight Board (United States). Those standards require that we plan and perform the audit to obtain reasonable assurance about whether the financial statements are free of material misstatement. An audit includes examining, on a test basis, evidence supporting the amounts and disclosures in the financial statements, assessing the accounting principles used and significant estimates made by management, and evaluating the overall financial statement presentation. We believe that our audits, which included confirmation of securities at August 31, 2015 by correspondence with the transfer agent, custodian and brokers, provide a reasonable basis for our opinion.
PricewaterhouseCoopers LLP
New York, New York
October 28, 2015
| | | | | | |
| | | |
| 28 | | | | J.P. MORGAN INCOME FUNDS | | AUGUST 31, 2015 |
TRUSTEES
(Unaudited)
The Fund’s Statement of Additional Information includes additional information about the Fund’s Trustees and is available, without charge, upon request by calling 1-800-480-4111 or on the J.P. Morgan Funds’ website at www.jpmorganfunds.com.
| | | | | | |
Name (Year of Birth); Positions With the Fund (1) | | Principal Occupations During Past 5 Years | | Number of
Portfolios in Fund
Complex Overseen
by Trustee (2) | | Other Directorships Held Outside Fund Complex During Past 5 Years |
Independent Trustees | | |
| | | |
| John F. Finn (1947); Trustee of Trust since 2005; Trustee of heritage One Group Mutual Funds since 1998. | | Chairman (1985-present), President and Chief Executive Officer, Gardner, Inc. (supply chain management company serving industrial and consumer markets) (1974-present). | | 148 | | Director, Greif, Inc. (GEF) (industrial package products and services) (2007-present); Trustee, Columbus Association for the Performing Arts (1988-present); Director, Cardinal Health, Inc. (CAH) (1994-2014). |
| | | |
| Dr. Matthew Goldstein (1941); Chairman since 2013; Trustee of Trust since 2005; Trustee of heritage J.P. Morgan Funds since 2003. | | Chancellor Emeritus, City University of New York (2015-present); Professor, City University of New York (2013-present); Chancellor, City University of New York (1999-2013); President, Adelphi University (New York) (1998-1999). | | 148 | | Trustee, Museum of Jewish Heritage (2011-present). |
| | | |
| Robert J. Higgins (1945); Trustee of Trust since 2005; Trustee of heritage J.P. Morgan Funds since 2002. | | Retired; Director of Administration of the State of Rhode Island (2003-2004); President — Consumer Banking and Investment Services, Fleet Boston Financial (1971-2001). | | 148 | | None |
| | | |
| Frankie D. Hughes (1952), Trustee of Trust since 2008. | | President, Ashland Hughes Properties (property management) (2014-present); President and Chief Investment Officer, Hughes Capital Management, Inc. (fixed income asset management) (1993-2014). | | 148 | | Trustee, The Victory Portfolios
(2000-2008) (Investment companies). |
| | | |
| Peter C. Marshall (1942); Trustee of Trust since 2005; Trustee of heritage One Group Mutual Funds since 1985. | | Self-employed business consultant
(2002-present). | | 148 | | None |
| | | |
| Mary E. Martinez (1960); Trustee of Trust since 2013. | | Associate, Special Properties, a Christie’s International Real Estate Affiliate (2010-present); Managing Director, Bank of America (Asset Management) (2007-2008); Chief Operating Officer, U.S. Trust Asset Management, U.S. Trust Company (asset management) (2003-2007); President, Excelsior Funds (registered investment companies) (2004-2005). | | 148 | | None |
| | | |
| Marilyn McCoy* (1948); Trustee of Trust since 2005; Trustee of heritage One Group Mutual Funds since 1999. | | Vice President of Administration and Planning, Northwestern University (1985-present). | | 148 | | Trustee, Carleton College
(2003-present). |
| | | |
| Mitchell M. Merin (1953); Trustee of Trust since 2013. | | Retired; President and Chief Operating Officer, Morgan Stanley Investment Management, Member Morgan Stanley & Co. Management Committee (registered investment adviser) (1998-2005). | | 148 | | Director, Sun Life Financial (SLF) (2007-2013) (financial services and insurance); Trustee, Trinity College, Hartford, CT (2002-2010). |
| | | |
| William G. Morton, Jr. (1937); Trustee of Trust since 2005; Trustee of heritage J.P. Morgan Funds since 2003. | | Retired; Chairman Emeritus (2001-2002), and Chairman and Chief Executive Officer, Boston Stock Exchange (1985-2001). | | 148 | | Director, Radio Shack Corp. (electronics) (1987-2008); Director, National Organization of Investment Professionals (2010-present); Trustee of the Stratton Mountain School (2001-present). |
| | | | | | | | |
| | | |
| AUGUST 31, 2015 | | J.P. MORGAN INCOME FUNDS | | | | | 29 | |
| | | | | | |
Name (Year of Birth); Positions With the Fund (1) | | Principal Occupations During Past 5 Years | | Number of
Portfolios in Fund
Complex Overseen
by Trustee (2) | | Other Directorships Held Outside Fund Complex During Past 5 Years |
Independent Trustees (continued) | | |
| | | |
| Dr. Robert A. Oden, Jr. (1946); Trustee of Trust since 2005; Trustee of heritage One Group Mutual Funds since 1997. | | Retired; President, Carleton College
(2002-2010); President, Kenyon College
(1995-2002). | | 148 | | Chairman, Dartmouth-Hitchcock Medical Center (2011-present); Trustee, American Schools of Oriental Research (2011-present); Trustee, American University in Cairo (1999-2014); Trustee, American Museum of Fly Fishing (2013-present). |
| | | |
| Marian U. Pardo** (1946); Trustee of Trust since 2013. | | Managing Director and Founder, Virtual Capital Management LLC (Investment Consulting) (2007-present); Managing Director, Credit Suisse Asset Management (portfolio manager) (2003-2006). | | 148 | | Member, Board of Governors, Columbus Citizens Foundation (not-for-profit supporting philanthropic and cultural programs) (2006-present). |
| | | |
| Frederick W. Ruebeck (1939); Trustee of Trust since 2005; Trustee of heritage One Group Mutual Funds since 1994. | | Consultant (2000-present); Adviser, JP Greene & Associates, LLC (broker-dealer)
(2000-2009); Chief Investment Officer, Wabash College (2004-present); Director of Investments, Eli Lilly and Company (pharmaceuticals) (1988-1999). | | 148 | | Trustee, Wabash College
(1988-present); Chairman, Indianapolis Symphony Foundation (1994-present). |
| | | |
| James J. Schonbachler (1943); Trustee of Trust since 2005; Trustee of heritage J.P. Morgan Funds since 2001. | | Retired; Managing Director of Bankers Trust Company (financial services) (1968-1998). | | 148 | | None |
| (1) | The Trustees serve for an indefinite term, subject to the Trust’s current retirement policy, which is age 78 for all Trustees. |
| (2) | A Fund Complex means two or more registered investment companies that hold themselves out to investors as related companies for purposes of investment and investor services or have a common investment adviser or have an investment adviser that is an affiliated person of the investment adviser of any of the other registered investment companies. The J.P. Morgan Funds Complex for which the Board of Trustees serves currently includes eleven registered investment companies (148 funds). |
| * | Two members of the Board of Trustees of Northwestern University are executive officers of registered investment advisers (not affiliated with JPMorgan) that are under common control with sub-advisers to certain J.P. Morgan Funds. |
| ** | In connection with prior employment with JPMorgan Chase, Ms. Pardo is the recipient of non-qualified pension plan payments from JPMorgan Chase in the amount of approximately $2,055 per month, which she irrevocably waived effective January 1, 2013, and deferred compensation payments from JPMorgan Chase in the amount of approximately $7,294 per year, which ended in January 2013. In addition, Ms. Pardo receives payments from a fully funded qualified plan, which is not an obligation of JPMorgan Chase. |
The contact address for each of the Trustees is 270 Park Avenue, New York, NY 10017.
TRUSTEES
(Unaudited) (continued)
| | | | | | |
| | | |
| 30 | | | | J.P. MORGAN INCOME FUNDS | | AUGUST 31, 2015 |
OFFICERS
(Unaudited)
| | |
Name (Year of Birth), Positions Held with the Trust (Since) | | Principal Occupations During Past 5 Years |
| |
Robert L. Young (1963),
President and Principal Executive Officer (2013)* | | Chief Operating Officer and Director, J.P. Morgan Investment Management Inc. since 2010; Senior Vice President, J.P. Morgan Funds (2005-2010), Chief Operating Officer, J.P. Morgan Funds (2005-2010); Director and various officer positions for JPMorgan Funds Management, Inc. (formerly One Group Administrative Services) and JPMorgan Distribution Services, Inc. (formerly One Group Dealer Services, Inc.) from 1999 to present. Mr. Young has been with JPMorgan Chase & Co. (formerly Bank One Corporation) since 1997. |
| |
Laura M. Del Prato (1964),
Treasurer and Principal Financial Officer (2014) | | Managing Director, JPMorgan Funds Management, Inc. since 2014; Partner, Cohen Fund Audit Services, Ltd. (2012-2013); Partner (2004-2012) and various other titles (1990-2004) at KPMG, LLP. |
| |
Frank J. Nasta (1964),
Secretary (2008) | | Managing Director and Associate General Counsel, JPMorgan Chase since 2008; Previously, Director, Managing Director, General Counsel and Corporate Secretary, J. & W. Seligman & Co. Incorporated; Secretary of each of the investment companies of the Seligman Group of Funds and Seligman Data Corp.; Director and Corporate Secretary, Seligman Advisors, Inc. and Seligman Services, Inc. |
| |
Stephen M. Ungerman (1953),
Chief Compliance Officer (2005) | | Managing Director, JPMorgan Chase & Co.; Mr. Ungerman has been with JPMorgan Chase & Co. since 2000. |
| |
Elizabeth A. Davin (1964), Assistant Secretary (2005)* | | Executive Director and Assistant General Counsel, JPMorgan Chase since February 2012; formerly Vice President and Assistant General Counsel, JPMorgan Chase from 2005 to February 2012; Senior Counsel, JPMorgan Chase (formerly Bank One Corporation) from 2004 to 2005. |
| |
Jessica K. Ditullio (1962),
Assistant Secretary (2005)* | | Executive Director and Assistant General Counsel, JPMorgan Chase since February 2011; Ms. Ditullio has served as an attorney with various titles for JPMorgan Chase (formerly Bank One Corporation) since 1990. |
| |
John T. Fitzgerald (1975),
Assistant Secretary (2008) | | Executive Director and Assistant General Counsel, JPMorgan Chase since February 2011; formerly, Vice President and Assistant General Counsel, JPMorgan Chase from 2005 to February 2011. |
| |
Carmine Lekstutis (1980),
Assistant Secretary (2011) | | Executive Director and Assistant General Counsel, JPMorgan Chase since February 2015; formerly Vice President and Assistant General Counsel, JPMorgan Chase from 2011 to February 2015; Associate, Skadden, Arps, Slate, Meagher & Flom LLP (law firm) from 2006 to 2011. |
| |
Gregory S. Samuels (1980),
Assistant Secretary (2010) | | Executive Director and Assistant General Counsel, JPMorgan Chase since 2014; formerly Vice President and Assistant General Counsel, JPMorgan Chase since 2010; Associate, Ropes & Gray (law firm) from 2008 to 2010; Associate, Clifford Chance LLP (law firm) from 2005 to 2008. |
| |
Pamela L. Woodley (1971),
Assistant Secretary (2012)** | | Vice President and Assistant General Counsel, JPMorgan Chase since November 2004. |
| |
Michael M. D’Ambrosio (1969),
Assistant Treasurer (2012) | | Managing Director, JPMorgan Funds Management, Inc. since May 2014; formerly Executive Director, JPMorgan Funds Management, Inc. from 2012 to May 2014; prior to joining JPMorgan Chase, Mr. D’Ambrosio was a Tax Director at PricewaterhouseCoopers LLP since 2006. |
| |
Joseph Parascondola (1963),
Assistant Treasurer (2011) | | Vice President, JPMorgan Funds Management, Inc. since August 2006. |
| |
Matthew J. Plastina (1970),
Assistant Treasurer (2011) | | Vice President, JPMorgan Funds Management, Inc. since August 2010; prior to August 2010, Vice President and Controller, Legg Mason Global Asset Management. |
| |
Julie A. Roach (1971),
Assistant Treasurer (2012)* | | Vice President, JPMorgan Funds Management, Inc. since August 2012; prior to joining JPMorgan Chase, Ms. Roach was a Senior Manager with Deloitte since 2001. |
| |
Gillian I. Sands (1969),
Assistant Treasurer (2012) | | Vice President, JPMorgan Funds Management, Inc. since September 2012; Assistant Treasurer, Wells Fargo Funds Management (2007-2009). |
The contact address for each of the officers, unless otherwise noted, is 270 Park Avenue, New York, NY 10017.
| * | The contact address for the officer is 460 Polaris Parkway, Westerville, OH 43082. |
| ** | The contact address for the officer is 4 New York Plaza, Floor 21, New York, NY 10004. |
| | | | | | | | |
| | | |
| AUGUST 31, 2015 | | J.P. MORGAN INCOME FUNDS | | | | | 31 | |
SCHEDULE OF SHAREHOLDER EXPENSES
(Unaudited)
Hypothetical $1,000 Investment
As a shareholder of the Fund, you incur two types of costs: (1) transaction costs, including sales charges (loads) on purchase payments and (2) ongoing costs, including investment advisory fees, administration fees, distribution fees and other Fund expenses. The examples below are intended to help you understand your ongoing costs (in dollars) of investing in the Fund and to compare these ongoing costs with the ongoing costs of investing in other mutual funds. The examples assume that you had a $1,000 investment in each Class at the beginning of the reporting period, March 1, 2015, and continued to hold your shares at the end of the reporting period, August 31, 2015.
Actual Expenses
For each Class of the Fund in the table below, the first line provides information about actual account values and actual expenses. You may use the information in this line, together with the amount you invested, to estimate the expenses that you paid over the period. Simply divide your account value by $1,000 (for example, an $8,600 account value divided by $1,000 = 8.6), then multiply the result by the number in the first line of each Class under the heading entitled “Expenses Paid During the Period” to estimate the expenses you paid on your account during this period.
Hypothetical Example for Comparison Purposes
The second line of each Class in the table below provides information about hypothetical account values and hypothetical expenses based on the Class’ actual expense ratio and an assumed rate of return of 5% per year before expenses, which is not the Class’ actual return. The hypothetical account values and expenses may not be used to estimate the actual ending account balance or expenses you paid for the period. You may use this information to compare the ongoing costs of investing in the Class of the Fund and other funds. To do so, compare this 5% hypothetical example with the 5% hypothetical examples that appear in the shareholder reports of the other funds. Please note that the expenses shown in the table are meant to highlight your ongoing costs only and do not reflect any transaction costs, such as sales charges (loads) or redemption fees. Therefore, the second line for each Class in the table is useful in comparing ongoing costs only, and will not help you determine the relative total costs of owning different funds. In addition, if these transaction costs were included, your costs would have been higher. The examples also assume all dividends and distributions have been reinvested.
| | | | | | | | | | | | | | | | |
| | | Beginning
Account Value
March 1, 2015 | | | Ending
Account Value
August 31, 2015 | | | Expenses
Paid During
the Period* | | | Annualized
Expense
Ratio | |
Floating Rate Income Fund | | | | | | | | | | | | | | | | |
Class A | | | | | | | | | | | | | | | | |
Actual | | $ | 1,000.00 | | | $ | 991.40 | | | $ | 4.97 | | | | 0.99 | % |
Hypothetical | | | 1,000.00 | | | | 1,020.21 | | | | 5.04 | | | | 0.99 | |
Class C | | | | | | | | | | | | | | | | |
Actual | | | 1,000.00 | | | | 990.00 | | | | 7.47 | | | | 1.49 | |
Hypothetical | | | 1,000.00 | | | | 1,017.69 | | | | 7.58 | | | | 1.49 | |
Class R6 | | | | | | | | | | | | | | | | |
Actual | | | 1,000.00 | | | | 994.40 | | | | 3.22 | | | | 0.64 | |
Hypothetical | | | 1,000.00 | | | | 1,021.98 | | | | 3.26 | | | | 0.64 | |
Select Class | | | | | | | | | | | | | | | | |
Actual | | | 1,000.00 | | | | 993.80 | | | | 3.72 | | | | 0.74 | |
Hypothetical | | | 1,000.00 | | | | 1,021.48 | | | | 3.77 | | | | 0.74 | |
| * | Expenses are equal to each Class’ respective annualized expense ratio, multiplied by the average account value over the period, multiplied by 184/365 (to reflect the one-half year period). |
| | | | | | |
| | | |
| 32 | | | | J.P. MORGAN INCOME FUNDS | | AUGUST 31, 2015 |
BOARD APPROVAL OF INVESTMENT ADVISORY AGREEMENT
(Unaudited)
The Board of Trustees has established various standing committees composed of Trustees with diverse backgrounds, to which the Board of Trustees has assigned specific subject matter responsibilities to further enhance the effectiveness of the Board’s oversight and decision making. The Board of Trustees and its investment committees (money market and alternative products, equity, and fixed income) meet regularly throughout the year and consider factors that are relevant to their annual consideration of investment advisory agreements at each meeting. They also meet for the specific purpose of considering investment advisory agreement annual renewals. The Board of Trustees held meetings in person in June and August 2015, at which the Trustees considered the continuation of the investment advisory agreement for the Fund whose annual report is contained herein (the “Advisory Agreement”). At the June meeting, the Board’s investment committees met to review and consider performance, expense and related information for the J.P. Morgan Funds. Each investment committee reported to the full Board, which then considered the investment committee’s preliminary findings. At the August meeting, the Trustees continued their review and consideration. The Trustees, including a majority of the Trustees who are not “interested persons” (as defined in the 1940 Act) of any party to the Advisory Agreement or any of their affiliates, approved the continuation of the Advisory Agreement on August 19, 2015.
As part of their review of the Advisory Agreement, the Trustees considered and reviewed performance and other information about the Fund received from the Adviser. This information includes the Fund’s performance compared to the performance of its peers and benchmarks and analyses by the Adviser of the Fund’s performance. In addition, the Trustees have engaged an independent management consulting firm (“independent consultant”) to report on the performance of certain J.P. Morgan Funds at each of the Trustees’ regular meetings. The Adviser also periodically provides comparative information regarding the Fund’s expense ratios and those of its peer groups. In addition, in preparation for the June and August meetings, the Trustees requested, received and evaluated extensive materials from the Adviser, including performance and expense information compiled by Lipper Inc. (“Lipper”), an independent provider of investment company data. The Trustees’ independent consultant also provided additional analyses of the performance of the Fund in connection with the Trustees’ review of the Advisory Agreement. Before voting on the proposed Advisory Agreement, the Trustees reviewed the proposed Advisory Agreement with representatives of the Adviser, counsel to the Trust, and independent legal counsel and received a memorandum from independent legal counsel to the Trustees discussing the legal standards for their consideration of the proposed Advisory Agreement. The Trustees also discussed the proposed Advisory Agreement in executive sessions with independent legal counsel at which no representatives of the Adviser were present. Set forth below is a summary
of the material factors evaluated by the Trustees in determining whether to approve the Advisory Agreement.
The Trustees considered information provided with respect to the Fund over the course of the year. Each Trustee attributed different weights to the various factors and no factor alone was considered determinative. From year to year, the Trustees consider and place emphasis on relevant information in light of changing circumstances in market and economic conditions. The Trustees determined that the compensation to be received by the Adviser from the Fund under the Advisory Agreement was fair and reasonable and that the continuance of the Advisory Agreement was in the best interests of the Fund and its shareholders.
The factors summarized below were considered and discussed by the Trustees in reaching their conclusions:
Nature, Extent and Quality of Services Provided by the Adviser
The Trustees received and considered information regarding the nature, extent and quality of the services provided to the Fund under the Advisory Agreement. The Trustees took into account information furnished throughout the year at Trustee meetings, as well as the materials furnished specifically in connection with this annual review process. The Trustees considered the background and experience of the Adviser’s senior management and the expertise of, and the amount of attention given to the Fund by, investment personnel of the Adviser. In addition, the Trustees reviewed the qualifications, backgrounds and responsibilities of the portfolio management team primarily responsible for the day-to-day management of the Fund and the infrastructure supporting the team. The Trustees also considered information provided by the Adviser and JPMorgan Distribution Services, Inc. (“JPMDS”) about the structure and distribution strategy of the Fund. The Trustees reviewed information relating to the Adviser’s risk governance model and reports showing the Adviser’s compliance structure and ongoing compliance processes. The Trustees also considered the quality of administrative services provided by JPMorgan Funds Management, Inc. (“JPMFM”), an affiliate of the Adviser.
The Trustees also considered their knowledge of the nature and quality of the services provided by the Adviser and its affiliates to the Fund gained from their experience as Trustees of the J.P. Morgan Funds. In addition, they considered the overall reputation and capabilities of the Adviser and its affiliates, the commitment of the Adviser to provide high quality service to the Fund, their overall confidence in the Adviser’s integrity and the Adviser’s responsiveness to questions or concerns raised by them, including the Adviser’s willingness to consider and implement organizational and operational changes designed to improve investment results and the services provided to the Fund.
Based upon these considerations and other factors, the Trustees concluded that they were satisfied with the nature,
| | | | | | | | |
| | | |
| AUGUST 31, 2015 | | J.P. MORGAN INCOME FUNDS | | | | | 33 | |
BOARD APPROVAL OF INVESTMENT ADVISORY AGREEMENT
(Unaudited) (continued)
extent and quality of the investment advisory services provided to the Fund by the Adviser.
Costs of Services Provided and Profitability to the Adviser and its Affiliates
The Trustees received and considered information regarding the profitability to the Adviser and its affiliates in providing services to the Fund. The Trustees reviewed and discussed this data. The Trustees recognized that this data is not audited and represents the Adviser’s determination of its and its affiliates’ revenues from the contractual services provided to the Fund, less expenses of providing such services. Expenses include direct and indirect costs and are calculated using an allocation methodology developed by the Adviser. The Trustees also recognized that it is difficult to make comparisons of profitability from fund investment advisory contracts because comparative information is not generally publicly available and is affected by numerous factors, including the structure of the particular adviser, the types of funds it manages, its business mix, numerous assumptions regarding allocations and the fact that publicly-traded fund managers’ operating profits and net income are net of distribution and marketing expenses. Based on their review, the Trustees concluded that the profitability to the Adviser under the Advisory Agreement was not unreasonable in light of the services and benefits provided to the Fund.
Fall-Out Benefits
The Trustees reviewed information regarding potential “fallout” or ancillary benefits received by the Adviser and its affiliates as a result of their relationship with the Fund. The Trustees also reviewed the Adviser’s allocation of fund brokerage for the J.P. Morgan Funds complex, including allocations to brokers who provide research to the Adviser.
The Trustees also considered that JPMFM and JPMDS, affiliates of the Adviser, earn fees from the Fund for providing administrative and shareholder services. These fees were shown separately in the profitability analysis presented to the Trustees. The Trustees also considered the payments of Rule 12b-1 fees to JPMDS, which also acts as the Fund’s distributor. The Trustees also considered the fees paid to JPMorgan Chase Bank, N.A. (“JPMCB”) for custody and fund accounting, and other related services.
Economies of Scale
The Trustees considered the extent to which the Fund may benefit from economies of scale. The Trustees considered that there may not be a direct relationship between economies of scale realized by the Fund and those realized by the Adviser as assets increase. The Trustees noted that the proposed investment advisory fee schedule for the Fund does not contain breakpoints, but that the fees remain competitive with peer funds. The Trustees also considered that the Adviser has
implemented fee waivers and expense limitations (“Fee Caps”) which allows the Fund’s shareholders to share potential economies of scale from the Fund’s inception. The Trustees also considered that the Adviser has shared economies of scale by adding or enhancing services to the Fund over time, noting the Adviser’s substantial investments in its business in support of the Fund, including investments in trading systems and technology (including cybersecurity improvements), retention of key talent, additions to analyst and portfolio management teams, and regulatory support enhancements. The Trustees also considered whether it would be appropriate to add advisory fee breakpoints and the Trustees concluded that the current fee structure was reasonable in light of the Fee Caps that the Adviser has in place that serve to limit the overall net expense ratios of the Fund at competitive levels. The Trustees concluded that the Fund’s shareholders received the benefits of potential economies of scale through the Fee Caps and the Adviser’s reinvestment in its operations to serve the Fund and its shareholders.
Independent Written Evaluation of the Fund’s Chief Compliance Officer
The Trustees noted that, upon their direction, the Chief Compliance Officer for the Fund had prepared an independent written evaluation in order to assist the Trustees in determining the reasonableness of the proposed management fees. The Trustees considered the written evaluation in determining whether to continue the Advisory Agreement.
Fees Relative to Adviser’s Other Clients
The Trustees received and considered information about the nature and extent of investment advisory services and fee rates offered to other clients of the Adviser, including institutional separate accounts and/or funds sub-advised by the Adviser, and for investment management styles substantially similar to that of the Fund. The Trustees considered the complexity of investment management for registered mutual funds relative to the Adviser’s other clients and noted differences in the regulatory, legal and other risks and responsibilities of providing services to the different clients. The Trustees considered that serving as an adviser to a registered mutual fund involves greater responsibilities and risks than acting as a sub-adviser and observed that sub-advisory fees may be lower than those charged by the Adviser to the Fund. The Trustees also noted that the adviser, not the mutual fund, pays the sub-advisory fee and that many responsibilities related to the advisory function are retained by the primary adviser. The Trustees concluded that the fee rates charged to the Fund in comparison to those charged to the Adviser’s other clients were reasonable.
Investment Performance
The Trustees received and considered absolute and/or relative performance for the Fund in a report prepared by Lipper. The
| | | | | | |
| | | |
| 34 | | | | J.P. MORGAN INCOME FUNDS | | AUGUST 31, 2015 |
Trustees considered the total return performance information, which included the ranking of the Fund within a performance universe made up of funds with the same Lipper investment classification and objective (the “Universe Group”) by total return for the applicable one- and three-year periods. The Trustees reviewed a description of Lipper’s methodology for selecting mutual funds in the Fund’s Universe Group. The Lipper materials provided to the Trustees highlighted information with respect to certain representative classes to assist the Trustees in their review. As part of this review, the Trustees also reviewed the Fund’s performance against its benchmark and considered the performance information provided for the Fund at regular Board meetings by the Adviser and the Trustees’ independent consultant and also considered the special analysis prepared by the Trustees’ independent consultant. The Lipper performance data noted by the Trustees as part of their review and the determinations made by the Trustees with respect to the Fund’s performance for certain representative classes are summarized below:
The Trustees noted that the Fund’s performance was in the fourth and third quintiles for Class A shares and in the fourth and second quintiles for Select Class shares for the one- and three-year periods ended December 31, 2014, respectively, and that the independent consultant indicated that the Fund’s overall performance needed enhancement. The Trustees discussed the performance and investment strategy of the Fund with the Adviser and, based upon this discussion, the Adviser’s and/or independent consultant’s analysis and other factors, concluded that the Fund’s performance was reasonable. The Trustees requested, however, that the Adviser provide additional Fund
performance information to be reviewed with the members of the fixed income committee at each of their regular meetings over the course of next year.
Advisory Fees and Expense Ratios
The Trustees considered the contractual advisory fee rate paid by the Fund to the Adviser and compared that rate to the information prepared by Lipper concerning management fee rates paid by other funds in the same Lipper category as the Fund. The Trustees recognized that Lipper reported the Fund’s management fee rate as the combined contractual advisory fee and administration fee rates. The Trustees also reviewed information about other expenses and the expense ratios for the Fund. The Trustees considered the fee waiver and/or expense reimbursement arrangements currently in place for the Fund and considered the net advisory fee rate after taking into account any waivers and/or reimbursements. The Trustees recognized that it is difficult to make comparisons of advisory fees because there are variations in the services that are included in the fees paid by other funds. The Trustees’ determinations as a result of the review of the Fund’s advisory fees and expense ratios for certain representative classes are summarized below:
The Trustees noted that the Fund’s net advisory fee and actual total expenses for both Class A and Select Class shares were in the fourth and second quintiles of the Universe Group, respectively. After considering the factors identified above, in light of this information, the Trustees concluded that the advisory fee was reasonable.
| | | | | | | | |
| | | |
| AUGUST 31, 2015 | | J.P. MORGAN INCOME FUNDS | | | | | 35 | |
TAX LETTER
(Unaudited)
Certain tax information for the J.P. Morgan Funds is required to be provided to shareholders based upon the Fund’s income and distributions for the taxable year ended August 31, 2015. The information and distributions reported in this letter may differ from the information and taxable distributions reported to the shareholders for the calendar year ending December 31, 2015. The information necessary to complete your income tax returns
for the calendar year ending December 31, 2015 will be provided under separate cover.
Long Term Capital Gain Notice
The Fund distributed approximately $86,000, or maximum allowable amount, of long-term capital gain dividends for the fiscal year ended August 31, 2015.
| | | | | | |
| | | |
| 36 | | | | J.P. MORGAN INCOME FUNDS | | AUGUST 31, 2015 |

Rev. January 2011
| | |
| FACTS | | WHAT DOES J.P. MORGAN FUNDS DO WITH YOUR PERSONAL INFORMATION? |
| | |
| Why? | | Financial companies choose how they share your personal information. Federal law gives consumers the right to limit some but not all sharing. Federal law also requires us to tell you how we collect, share, and protect your personal information. Please read this notice carefully to understand what we do. |
| | |
| What? | | The types of personal information we collect and share depend on the product or service you have with us. This information can include: ¡ Social Security number and account balances ¡ transaction history and account transactions ¡ checking account information and wire transfer instructions When you are no longer our customer, we continue to share your information as described in this notice. |
| | |
| How? | | All financial companies need to share customers’ personal information to run their everyday business. In the section below, we list the reasons financial companies can share their customers’ personal information; the reasons J.P. Morgan Funds chooses to share; and whether you can limit this sharing. |
| | | | |
| Reasons we can share your personal information | | Does J.P. Morgan
Funds share? | | Can you limit this
sharing? |
For our everyday business purposes — such as to process your transactions, maintain your account(s), respond to court orders and legal investigations, or report to credit bureaus | | Yes | | No |
For marketing purposes — to offer our products and services to you | | Yes | | No |
| For joint marketing with other financial companies | | No | | We don’t share |
For our affiliates’ everyday business purposes — information about your transactions and experiences | | No | | We don’t share |
For our affiliates’ everyday business purposes — information about your creditworthiness | | No | | We don’t share |
| For nonaffiliates to market to you | | No | | We don’t share |
| | |
| | |
| Questions? | | Call 1-800-480-4111 or go to www.jpmorganfunds.com |

| | |
| Who we are |
| Who is providing this notice? | | J.P. Morgan Funds |
| | |
| What we do |
| How does J.P. Morgan Funds protect my personal information? | | To protect your personal information from unauthorized access and use, we use security measures that comply with federal law. These measures include computer safeguards and secured files and buildings. We authorize our employees to access your information only when they need it to do their work and we require companies that work for us to protect your information. |
How does J.P. Morgan Funds collect my personal information? | | We collect your personal information, for example, when you: ¡ open an account or provide contact information ¡ give us your account information or pay us by check ¡ make a wire transfer We also collect your personal information from others, such as credit bureaus, affiliates and other companies. |
| Why can’t I limit all sharing? | | Federal law gives you the right to limit only ¡ sharing for affiliates’ everyday business purposes – information about your creditworthiness ¡ affiliates from using your information to market to you ¡ sharing for nonaffiliates to market to you State laws and individual companies may give you additional rights to limit sharing. |
| | |
| Definitions |
| Affiliates | | Companies related by common ownership or control. They can be financial and nonfinancial companies. ¡ J.P. Morgan Funds does not share with our affiliates. |
| Nonaffiliates | | Companies not related by common ownership or control. They can be financial and nonfinancial companies. ¡ J.P. Morgan Funds does not share with nonaffiliates so they can market to you. |
| Joint Marketing | | A formal agreement between nonaffiliated financial companies that together market financial products or services to you. ¡ J.P. Morgan Funds doesn’t jointly market. |
J.P. Morgan Funds are distributed by JPMorgan Distribution Services, Inc., which is an affiliate of JPMorgan Chase & Co. Affiliates of JPMorgan Chase & Co. receive fees for providing various services to the funds.
Contact JPMorgan Distribution Services, Inc. at 1-800-480-4111 for a fund prospectus. You can also visit us at www.jpmorganfunds.com. Investors should carefully consider the investment objectives and risk as well as charges and expenses of the mutual fund before investing. The prospectus contains this and other information about the mutual fund. Read the prospectus carefully before investing.
Investors may obtain information about the Securities Investor Protection Corporation (SIPC), including the SIPC brochure by visiting www.sipc.org or by calling SIPC at 202-371-8300.
The Fund files a complete schedule of its fund holdings for the first and third quarters of its fiscal year with the SEC on Form N-Q. The Fund’s Forms N-Q are available on the SEC’s website at http://www.sec.gov and may be reviewed and copied at the SEC’s Public Reference Room in Washington, DC. Information on the operation of the SEC’s Public Reference Room may be obtained by calling 1-800-SEC-0330. Shareholders may request the Form N-Q without charge by calling 1-800-480-4111 or by visiting the J.P. Morgan Funds’ website at www.jpmorganfunds.com.
A description of the Fund’s policies and procedures with respect to the disclosure of the Fund’s holdings is available in the prospectus and Statement of Additional Information.
A copy of proxy policies and procedures is available without charge upon request by calling 1-800-480-4111 and on the Fund’s website at www.jpmorganfunds.com. A description of such policies and procedures is on the SEC’s website at www.sec.gov. The Trustees have delegated the authority to vote proxies for securities owned by the Fund to the Adviser. A copy of the Fund’s voting record for the most recent 12-month period ended June 30 is available on the SEC’s website at www.sec.gov or at the Fund’s website at www.jpmorganfunds.com no later than August 31 of each year. The Fund’s proxy voting record will include, among other things, a brief description of the matter voted on for each fund security, and will state how each vote was cast, for example, for or against the proposal.

J.P. Morgan Asset Management is the marketing name for the asset management business of JPMorgan Chase & Co. Those businesses include, but are not limited to, J.P. Morgan Investment Management Inc., Security Capital Research & Management Incorporated and J.P. Morgan Alternative Asset Management, Inc.
| | | | |
| | © JPMorgan Chase & Co., 2015. All rights reserved. August 2015. | | AN-FRI-815 |
ITEM 2. CODE OF ETHICS.
Disclose whether, as of the end of the period covered by the report, the registrant has adopted a code of ethics that applies to the registrant’s principal executive officer, principal financial officer, principal accounting officer or controller, or persons performing similar functions, regardless of whether these individuals are employed by the registrant or a third party. If the registrant has not adopted such a code of ethics, explain why it has not done so.
The registrant must briefly describe the nature of any amendment, during the period covered by the report, to a provision of its code of ethics that applies to the registrant’s principal executive officer, principal financial officer, principal accounting officer or controller, or persons performing similar functions, regardless of whether these individuals are employed by the registrant or a third party, and that relates to any element of the code of ethics definition enumerated in paragraph (b) of this Item. The registrant must file a copy of any such amendment as an exhibit pursuant to Item 12(a)(1), unless the registrant has elected to satisfy paragraph (f) of this Item by positing its code of ethics on its website pursuant to paragraph (f)(2) of this Item, or by undertaking to provide its code of ethics to any person without charge, upon request, pursuant to paragraph (f)(3) of this Item.
If the registrant has, during the period covered by the report, granted a waiver, including an implicit waiver, from a provision of the code of ethics that applies to the registrant’s principal executive officer, principal financial officer, principal accounting officer or controller, or persons performing similar functions, regardless of whether these individuals are employed by the registrant or third party, that relates to one or more items set forth in paragraph (b) of this Item, the registrant must briefly describe the nature of the waiver, the name of the person to whom the waiver was granted, and the date of the waiver.
The Registrant has adopted a code of ethics that applies to the Registrant’s principal executive officer and principal financial officer. There were no amendments to the code of ethics or waivers granted with respect to the code of ethics in the period covered by the report.
ITEM 3. AUDIT COMMITTEE FINANCIAL EXPERT.
(a) (1) Disclose that the registrant’s board of directors has determined that the registrant either:
(i) Has at least one audit committee financial expert serving on its audit committee; or
(ii) Does not have an audit committee financial expert serving on its audit committee.
The Registrant’s Board of Trustees has determined that the Registrant has at least one audit committee financial expert serving on its audit committee. The Securities and Exchange Commission has stated that the designation or identification of a person as an audit committee financial expert pursuant to this Item 3 of Form N-CSR does not impose on such person any duties, obligations or liabilities that are greater than the duties, obligations and liabilities imposed on such person as a member of the Audit Committee and the Board of Trustees in the absence of such designation or identification.
(2) If the registrant provides the disclosure required by paragraph (a)(1)(i) of this Item, it must disclose the name of the audit committee financial expert and whether that person is “independent.” In order to be considered “independent” for purposes of this Item, a member of an audit committee may not, other than in his or her capacity as a member of the audit committee, the board of directors, or any other board committee:
(i) Accept directly or indirectly any consulting, advisory, or other compensatory fee from the issuer; or
(ii) Be an “interested person” of the investment company as defined in Section 2(a)(19) of the Act (15 U.S.C. 80a-2(a)(19)).
The audit committee financial expert is Mitchell Merin. He is not an “interested person” of the Registrant and is also “independent” as defined by the U.S. Securities and Exchange Commission for purposes of audit committee financial expert determinations.
(3) If the registrant provides the disclosure required by paragraph (a)(1)(ii) of this Item, it must explain why it does not have an audit committee financial expert.
Not applicable.
ITEM 4. PRINCIPAL ACCOUNTANT FEES AND SERVICES.
(a) Disclose, under the caption Audit Fees, the aggregate fees billed for each of the last two fiscal years for professional services rendered by the principal accountant for the audit of the registrant’s annual financial statements or services that are normally provided by the accountant in connection with statutory and regulatory filings or engagements for those fiscal years.
AUDIT FEES
2015 – $238,600
2014 – $232,400
(b) Disclose, under the caption Audit-Related Fees, the aggregate fees billed in each of the last two fiscal years for assurance and related services by the principal accountant that are reasonably related to the performance of the audit of the registrant’s financial statements and are not reported under paragraph (a) of this Item. Registrants shall describe the nature of the services comprising the fees disclosed under this category.
AUDIT-RELATED FEES
2015 – $30,300
2014 – $49,300
Audit-related fees consists of semi-annual financial statement reviews and security count procedures performed as required under Rule 17f-2 of the Investment Company Act of 1940 during the Registrant’s fiscal year.
(c) Disclose, under the caption Tax Fees, the aggregate fees billed in each of the last two fiscal years for professional services rendered by the principal accountant for tax compliance, tax advice, and tax planning. Registrants shall describe the nature of the services comprising the fees disclosed under this category.
TAX FEES
2015 – $46,700
2014 – $43,800
The tax fees consist of fees billed in connection with preparing the federal regulated investment company income tax returns for the Registrant for the tax years ended August 31, 2015 and 2014, respectively.
For the last fiscal year, no tax fees were required to be approved pursuant to paragraph (c)(7)(ii) of Rule 2-01 of Regulation S-X.
(d) Disclose, under the caption All Other Fees, the aggregate fees billed in each of the last two fiscal years for products and services provided by the principal accountant, other than the services reported in paragraphs (a) through (c) of this Item. Registrants shall describe the nature of the services comprising the fees disclosed under this category.
ALL OTHER FEES
2015 – Not applicable
2014 – Not applicable
(e) (1) Disclose the audit committee’s pre-approval policies and procedures described in paragraph (c)(7) of Rule 2-01 of Regulation S-X.
Pursuant to the Registrant’s Audit Committee Charter and written policies and procedures for the pre-approval of audit and non-audit services (the “Pre-approval Policy”), the Audit Committee pre-approves all audit and non-audit services performed by the Registrant’s independent public registered accounting firm for the Registrant. In addition, the Audit Committee pre-approves the auditor’s engagement for non-audit services with the Registrant’s investment adviser (not including a sub-adviser whose role is primarily portfolio management and is sub-contracted or overseen by another investment adviser) and any Service Affiliate in accordance with paragraph (c)(7)(ii) of Rule 2-01 of Regulation S-X, if the engagement relates directly to the operations and financial reporting of the Registrant. Proposed services may be pre-approved either 1) without consideration of specific case-by-case services or 2) require the specific pre-approval of the Audit Committee. Therefore, initially the Pre-approval Policy listed a number of audit and non-audit services that have been approved by the Audit Committee, or which were not subject to pre-approval under the transition provisions of
Sarbanes-Oxley Act of 2002 (the “Pre-approval List”). The Audit Committee annually reviews and pre-approves the services included on the Pre-approval List that may be provided by the independent public registered accounting firm without obtaining additional specific pre-approval of individual services from the Audit Committee. The Audit Committee adds to, or subtracts from, the list of general pre-approved services from time to time, based on subsequent determinations. All other audit and non-audit services not on the Pre-approval List must be specifically pre-approved by the Audit Committee.
One or more members of the Audit Committee may be appointed as the Committee’s delegate for the purposes of considering whether to approve such services. Any pre-approvals granted by the delegate will be reported, for informational purposes only, to the Audit Committee at its next scheduled meeting. The Audit Committee’s responsibilities to pre-approve services performed by the independent public registered accounting firm are not delegated to management.
(2) Disclose the percentage of services described in each of paragraphs (b) through (d) of this Item that were approved by the audit committee pursuant to paragraph (c)(7)(i)(C) of Rule 2-01 of Regulation S-X.
2015 – 0.0%
2014 – 0.0%
(f) If greater than 50 percent, disclose the percentage of hours expended on the principal accountant’s engagement to audit the registrant’s financial statements for the most recent fiscal year that were attributed to work performed by persons other than the principal accountant’s full-time, permanent employees.
None.
(g) Disclose the aggregate non-audit fees billed by the registrant’s accountant for services rendered to the registrant, and rendered to the registrant’s investment adviser (not including any sub-adviser whose role is primarily portfolio management and is subcontracted with or overseen by another investment adviser), and any entity controlling, controlled by, or under common control with the adviser that provides ongoing services to the registrant for each of the last two fiscal years of the registrant.
The aggregate non-audit fees billed by the independent registered public accounting firm for services rendered to the Registrant, and rendered to Service Affiliates, for the last two calendar year ends were:
2015 – $30.7 million
2014 – $33.8 million
(h) Disclose whether the registrant’s audit committee of the board of directors has considered whether the provision of non-audit services that were rendered to the registrant’s investment adviser (not including any subadviser whose role is primarily portfolio management and is subcontracted with or overseen by another investment adviser), and any entity controlling, controlled by, or under common control with the investment adviser that provides ongoing services to the registrant that were not pre-approved pursuant to paragraph (c)(7)(ii) of Rule 2-01 of Regulation S-X is compatible with maintaining the principal accountant’s independence.
The Registrant’s Audit Committee has considered whether the provision of the non-audit services that were rendered to Service Affiliates that were not pre-approved (not requiring pre-approval) is compatible with maintaining the independent public registered accounting firm’s independence. All services provided by the independent public registered accounting firm to the Registrant or to Service Affiliates that were required to be pre-approved were pre-approved as required.
ITEM 5. AUDIT COMMITTEE OF LISTED REGISTRANTS.
(a) If the registrant is a listed issuer as defined in Rule 10A-3 under the Exchange Act (17CFR 240.10A-3), state whether or not the registrant has a separately-designated standing audit committee established in accordance with Section 3(a)(58)(A) of the Exchange Act (15 U.S.C. 78c(a)(58)(A)). If the registrant has such a committee, however designated, identify each committee member. If the entire board of directors is acting as the registrant’s audit committee as specified in Section 3(a)(58)(B) of the Exchange Act (15 U.S.C. 78c(a)(58)(B)), so state.
(b) If applicable, provide the disclosure required by Rule 10A-3(d) under the Exchange Act (17CFR 240.10A-3(d)) regarding an exemption from the listing standards for all audit committees.
Not applicable.
ITEM 6. SCHEDULE OF INVESTMENTS.
File Schedule I – Investments in securities of unaffiliated issuers as of the close of the reporting period as set forth in Section 210.12-12 of Regulation S-X, unless the schedule is included as part of the report to shareholders filed under Item 1 of this Form.
Included in Item 1.
ITEM 7. DISCLOSURE OF PROXY VOTING POLICIES AND PROCEDURES FOR CLOSED-END MANAGEMENT INVESTMENT COMPANIES.
A closed-end management investment company that is filing an annual report on this Form N-CSR must, unless it invests exclusively in non-voting securities, describe the policies and procedures that it uses to determine how to vote proxies relating to portfolio securities, including the procedures that the company uses when a vote presents a conflict between the interests of its shareholders, on the one hand, and those of the company’s investment adviser; principal underwriter; or any affiliated person (as defined in Section 2(a)(3) of the Investment Company Act of 1940 (15 U.S.C. 80a-2(a)(3)) and the rules thereunder) of the company, its investment adviser, or its principal underwriter, on the other. Include any policies and procedures of the company’s investment adviser, or any other third party, that the company uses, or that are used on the company’s behalf, to determine how to vote proxies relating to portfolio securities.
Not applicable.
ITEM 8. PORTFOLIO MANAGERS OF CLOSED-END MANAGEMENT INVESTMENT COMPANIES.
Not applicable.
ITEM 9. PURCHASE OF EQUITY SECURITIES BY CLOSED-END MANAGEMENT INVESTMENT COMPANY AND AFFILIATED PURCHASERS.
(a) If the registrant is a closed-end management investment company, provide the information specified in paragraph (b) of this Item with respect to any purchase made by or on behalf of the registrant or any “affiliated purchaser,” as defined in Rule 10b-18(a)(3) under the Exchange Act (17 CFR 240.10b-18(a)(3)), of shares or other units of any class of the registrant’s equity securities that is registered by the registrant pursuant to Section 12 of the Exchange Act (15 U.S.C. 781).
Not applicable.
ITEM 10. SUBMISSION OF MATTERS TO A VOTE OF SECURITY HOLDERS.
Describe any material changes to the procedures by which shareholders may recommend nominees to the registrant’s board of directors, where those changes were implemented after the registrant last provided disclosure in response to the requirements of Item 7(d)(2)(ii)(G) of Schedule 14A (17 CFR 240.14a-101), or this Item.
No material changes to report.
ITEM 11. CONTROLS AND PROCEDURES.
(a) Disclose the conclusions of the registrant’s principal executive and principal financial officers, or persons performing similar functions, regarding the effectiveness of the registrant’s disclosure controls and procedures (as defined in Rule 30a-3(c) under the Act (17 CFR 270.30a-3(c))) as of a date within 90 days of the filing date of the report that includes the disclosure required by this paragraph, based on the evaluation of these controls and procedures required by Rule 30a-3(b) under the Act (17 CFR 270.30a-3(b)) and Rules 13a-15(b) or 15d-15(b) under the Exchange Act (17 CFR 240.13a-15(b) or 240.15d-15(b)).
The Registrant’s principal executive and principal financial officers have concluded, based on their evaluation of the Registrant’s disclosure controls and procedures as of a date within 90 days of the filing date of this report, that the Registrant’s disclosure controls and procedures are reasonably designed to ensure that information required to be disclosed by the Registrant on Form N-CSR is recorded, processed, summarized and reported within the required time
periods and that information required to be disclosed by the Registrant in the reports that it files or submits on Form N-CSR is accumulated and communicated to the Registrant’s management, including its principal executive and principal financial officers, as appropriate to allow timely decisions regarding required disclosure.
(b) Disclose any change in the registrant’s internal control over financial reporting (as defined in Rule 30a-3(d) under the Act (17 CFR 270.30a-3(d)) that occurred during the registrant’s second fiscal quarter of the period covered by this report that has materially affected, or is reasonably likely to materially affect, the registrant’s internal control over financial reporting.
There were no changes in the Registrant’s internal control over financial reporting that occurred during the last fiscal quarter covered by this report that have materially affected, or are reasonably likely to materially affect, the Registrant’s internal control over financial reporting.
ITEM 12. EXHIBITS.
(a) File the exhibits listed below as part of this Form. Letter or number the exhibits in the sequence indicated.
(a)(1) Any code of ethics, or amendment thereto, that is the subject of the disclosure required by Item 2, to the extent that the registrant intends to satisfy the Item 2 requirements through filing of an exhibit.
Code of Ethics applicable to its Principal Executive and Principal Financial Officers pursuant to Section 406 of the Sarbanes-Oxley Act of 2002 attached hereto.
(a)(2) A separate certification for each principal executive officer and principal financial officer of the registrant as required by Rule 30a-2(a) under the Act (17 CFR 270.30a-2).
Certifications pursuant to Rule 30a-2(a) under the Investment Company Act of 1940 are attached hereto.
(a)(3) Any written solicitation to purchase securities under Rule 23c-1 under the Act (17 CFR 270.23c-1) sent or given during the period covered by the report by or on behalf of the registrant to 10 or more persons.
Not applicable.
(b) A separate or combined certification for each principal executive officer and principal officer of the registrant as required by Rule 30a-2(b) under the Act of 1940.
Certifications pursuant to Rule 30a-2(b) under the Investment Company Act of 1940 are attached hereto.
SIGNATURES
Pursuant to the requirements of the Securities Exchange Act of 1934 and the Investment Company Act of 1940, the registrant has duly caused this report to be signed on its behalf by the undersigned, thereunto duly authorized.
| | |
| JPMorgan Trust I |
| |
| By: | | /s/ Robert L. Young |
| | Robert L. Young |
| | President and Principal Executive Officer |
| | November 5, 2015 |
Pursuant to the requirements of the Securities Exchange Act of 1934 and the Investment Company Act of 1940, this report has been signed below by the following persons on behalf of the registrant and in the capacities and on the dates indicated.
| | |
| |
| By: | | /s/ Robert L. Young |
| | Robert L. Young |
| | President and Principal Executive Officer |
| | November 5, 2015 |
| |
| By: | | /s/ Laura M. Del Prato |
| | Laura M. Del Prato |
| | Treasurer and Principal Financial Officer |
| | November 5, 2015 |