UNITED STATES
SECURITIES AND EXCHANGE COMMISSION
Washington, D.C. 20549
FORM N-CSR
CERTIFIED SHAREHOLDER REPORT OF REGISTERED
MANAGEMENT INVESTMENT COMPANIES
Investment Company Act file number: 811-21295
JPMorgan Trust I
(Exact name of registrant as specified in charter)
270 Park Avenue
New York, NY 10017
(Address of principal executive offices) (Zip code)
Frank J. Nasta
270 Park Avenue
New York, NY 10017
(Name and Address of Agent for Service)
Registrant’s telephone number, including area code: (800) 480-4111
Date of fiscal year end: December 31
Date of reporting period: January 1, 2016 through December 31, 2016
Form N-CSR is to be used by management investment companies to file reports with the Commission not later than 10 days after the transmission to stockholders of any report that is required to be transmitted to stockholders under Rule 30e-1 under the Investment Company Act of 1940 (17 CFR 270.30e-1). The Commission may use the information provided on Form N-CSR in its regulatory, disclosure review, inspection, and policymaking roles.
A registrant is required to disclose the information specified by Form N-CSR, and the Commission will make this information public. A registrant is not required to respond to the collection of information contained in Form N-CSR unless the Form displays a currently valid Office of Management and Budget (“OMB”) control number. Please direct comments concerning the accuracy of the information collection burden estimate and any suggestions for reducing the burden to Secretary, Securities and Exchange Commission, 450 Fifth Street, NW, Washington, DC 20549-0609. The OMB has reviewed this collection of information under the clearance requirements of 44 U.S.C. Section 3507.
ITEM 1. REPORTS TO STOCKHOLDERS.
The following is a copy of the report transmitted to shareholders pursuant to Rule 30e-1 under the Investment Company Act of 1940 (17 CFR 270.30e-1).
Annual Report
J.P. Morgan Specialty Funds
December 31, 2016
Security Capital U.S. Core Real Estate Securities Fund

CONTENTS
Investments in the Fund are not deposits or obligations of, or guaranteed or endorsed by, any bank and are not insured or guaranteed by the FDIC, the Federal Reserve Board or any other government agency. You could lose money if you sell when the Fund’s share price is lower than when you invested.
Past performance is no guarantee of future performance. The general market views expressed in this report are opinions based on market and other conditions through the end of the reporting period and are subject to change without notice. These views are not intended to predict the future performance of the Fund or the securities markets. References to specific securities and their issuers are for illustrative purposes only and are not intended to be, and should not be interpreted as, recommendations to purchase or sell such securities. Such views are not meant as investment advice and may not be relied on as an indication of trading intent on behalf of the Fund.
Prospective investors should refer to the Fund’s prospectus for a discussion of the Fund’s investment objective, strategies and risks. Call J.P. Morgan Funds Service Center at 1-800-480-4111 for a prospectus containing more complete information about the Fund, including management fees and other expenses. Please read it carefully before investing.
CEO’S LETTER
January 20, 2017 (Unaudited)
Dear Shareholder,
The U.S. economy retained its position as the global growth leader among developed nations throughout 2016, which helped drive U.S. asset prices higher and pushed the U.S. Federal Reserve (the “Fed”) to raise interest rates at the end of the year. While the year generally produced positive returns in global financial markets, the path was not necessarily smooth.
| | |
 | | “Investors who withstood the sporadic sell-offs in financial markets were generally rewarded with solid returns on a range of asset classes.” |
The start to 2016 was marked by a sell-off in global financial markets, mainly in response to worrisome economic data from China, continued weakness in oil prices and concerns about tightening U.S. fiscal policy. By mid-February, the Standard & Poor’s 500 Index (the “S&P 500”) had declined 10% from the start of the year and the price of West Texas Intermediate crude oil dropped by 30% to near $26 a barrel. However, U.S. equity prices and global oil prices had mostly rebounded by the end of March to levels slightly above where they ended in 2015.
During the first quarter of 2016, central banks in China, Japan and the European Union swung into action once again with further accommodative policies. In the U.S., the Fed held off raising interest rates but continued to signal that it would tighten fiscal policy in the months ahead. First quarter gross domestic product in the U.S. increased by 0.8% from the previous quarter and U.S. unemployment rose slightly to 5.0% in March and April but fell back below that level for the remainder of 2016.
The S&P 500 reached record highs in May and remained buoyant for most of June. However, British voters surprised financial markets by choosing to leave the U.K. in a June 23rd referendum. The result stunned many investors and sparked a two-day sell-off that drained an estimated $3.01 trillion from global
financial markets. Financial markets quickly recovered in the following days and by July and August, the S&P 500 was again reaching fresh highs. Overall U.S. corporate earnings also rebounded in the third quarter of 2016 and posted the first positive growth in six quarters.
The November 8th victory of Republican Party presidential candidate Donald Trump surprised many investors and led to brief declines in global equities. However, within 24 hours global share prices had largely recovered. U.S. equity prices rallied through the end of the year. The U.S. economy also showed signs for further strength. Following 74 consecutive months of job growth, the U.S. jobless rate in November 2016 stood at its lowest level since 2007.
Against this backdrop, the Fed raised interest rates by a quarter of a point on December 14th. “Economic growth has picked up since the middle of the year,” said Fed Chairwoman Janet Yellen. “We expect the economy will continue to perform well.”
In many ways, 2016 ended in a very different place than it began. Investors who withstood the sporadic sell-offs in financial markets were generally rewarded with solid returns on a range of asset classes. We believe the market performance over the past year has further validated both patience and diversification as fundamental components of a sound investment strategy.
We look forward to managing your investment needs for years to come. Should you have any questions, please visit www.jpmorganfunds.com or contact the J.P. Morgan Funds Service Center at 1-800-480-4111.
Sincerely yours,

George C.W. Gatch
CEO, Investment Funds Management,
J.P. Morgan Asset Management
| | | | | | | | |
| | | |
| DECEMBER 31, 2016 | | J.P. MORGAN SPECIALTY FUNDS | | | | | 1 | |
J.P. Morgan Specialty Funds
MARKET OVERVIEW
TWELVE MONTHS ENDED DECEMBER 31, 2016 (Unaudited)
After largely retracing a mid-year pricing surge, real estate investment trust (“REIT”) common equities still generated an attractive total return for 2016 in a highly volatile market period characterized by widely shifting investor expectations regarding the path for long-term interest rates and economic growth centered mainly on the U.S. national elections. For the twelve months ended December 31, 2016, the Wilshire U.S. Real Estate Securities Index posted a gain of 7.62%, compared with an 11.96% return for the Standard & Poor’s 500 Index.
Similar pricing patterns were evident in total returns for REIT senior fixed income securities during 2016, with year-end interest rate moves weighing most heavily on the pricing of longer duration perpetual preferred securities. Duration measures the price sensitivity of a bond or a portfolio of bonds to relative changes in interest rates. Generally, bonds with longer duration experience larger changes in price when interest rates rise or fall than bonds with shorter duration. For the twelve months ended December 31, 2016, the Wells Fargo Hybrid and Preferred Securities REIT Index posted a gain of 3.65%, and the Barclays Investment Grade REIT Index generated a gain of 4.74%.
We believe that we have seen similar patterns: Interest rates move up and REIT equity prices increase as a result. We believe that REIT equity investors have been rewarded for staying the course and focusing more on fundamental valuations and less on top-down market conventions.
Now more than ever, we believe REITs are most often priced on the margin not by real estate investors, but instead by a diverse universe of generalist stock investors, including large and small cap stock funds, hedge funds, closed end funds, etc. We believe that these are intelligent investors, but their perspective is oriented toward macro considerations — some might say more emotional — embracing a shorter term, dividend orientation to investing in REIT common equity. We believe that within the portfolios of these investors, REITs are aligned with a group of income-oriented investments that become significantly more appealing as interest rates fall and vice versa. We believe this market dynamic creates opportunity for investors to a degree that is truly unique to REITs. We believe that no other equity market sector has a “big brother”, a vast multi-trillion dollar, fully functioning private equity market providing a window to an alternative view on valuation and a massive arsenal of capital to arbitrage pricing differences where they occur.
As markets entered 2017 and investors pondered economic policy implications, we believe that it’s been reasonable to question the potential for shifts in the appetite and pricing of private real estate capital, a key factor in gauging REIT pricing vis- à-vis net asset value. We believe real estate investors will continue to focus on a number of factors that together characterize a highly favorable fundamental and financial positioning for real estate, in terms of cash flow growth and valuations. These factors include low borrowing costs, accommodative debt markets, manageable levels of new construction, healthy tenant demand and stable-to-improving rent/occupancy levels. We believe it’s likely that investors will also see real value in the inflation hedge offered through real estate ownership due to escalating replacement cost, entitlement, materials, labor, etc. In this context, we believe that U.S. and global institutional demand for U.S. real estate investments will remain healthy, with stable pricing, and with private capital ready to take advantage of public market overreactions where they occur.
At the end of the day, real estate stocks are not a homogenous group and we believe investors can expect to see a dispersed pattern of performance moving forward, with absolute winners and losers under a broad range of economic scenarios. We believe that successful investing in this environment requires the resources to analyze and fully understand the underlying real estate markets, capital structures, cash flow growth opportunities, and risks under alternative economic scenarios. We believe that successful investing also requires patience and conviction to move against the market’s momentum, which is often so keenly focused on shorter-term earnings targets and events. These qualities are fundamental to our investment approach and we believe they will enable us to produce attractive risk-adjusted investment returns over the longer term.
| | | | | | |
| | | |
| 2 | | | | J.P. MORGAN SPECIALTY FUNDS | | DECEMBER 31, 2016 |
Security Capital U.S. Core Real Estate Securities Fund
FUND COMMENTARY
TWELVE MONTHS ENDED DECEMBER 31, 2016 (Unaudited)
| | | | |
| REPORTING PERIOD RETURN: | | | |
| Fund (Select Class Shares)* | | | 4.92% | |
| Wilshire U.S. Real Estate Securities Index | | | 7.62% | |
| Bloomberg Barclays Investment Grade REIT Index | | | 4.74% | |
| U.S. Core Real Estate Composite Benchmark | | | 6.62% | |
| |
| Net Assets as of 12/31/2016 (In Thousands) | | $ | 113,888 | |
INVESTMENT OBJECTIVE**
The Security Capital U.S. Core Real Estate Securities Fund (the “Fund”) seeks a risk-adjusted total return over the long term by investing primarily in real estate securities.
WHAT WERE THE MAIN DRIVERS OF THE FUND’S PERFORMANCE?
The Fund (Select Class Shares) generated a positive return for the twelve months ended December 31, 2016, outperforming the Bloomberg Barclays Investment Grade REIT Index, yet underperforming relative to the U.S. Core Real Estate Securities Composite Benchmark and the all-common equity Wilshire U.S. Real Estate Securities Index (“WILRESI”). The Fund invests in equity and fixed income securities and, therefore, its performance is compared with multiple benchmarks, including broad-based equity and fixed income benchmarks as well as a blended composite benchmark.
The Fund’s real estate investment trust (“REIT”) common equity holdings represented 62.6% of the portfolio and generated positive returns for the twelve month reporting period. Among the Fund’s common stock holdings, the Fund’s near-absence of investment in data center companies was the largest single
factor for the performance shortfall relative to the WILRESI for the period. The Fund’s holdings in the regional malls and apartment sectors also detracted from performance relative to the WILRESI. The Fund’s holdings in the industrial-warehouse and office sectors and in health care companies contributed to performance relative to the WILRESI.
In absolute terms, the Fund’s investments in preferred equity and debt, representing 20.9% and 11.7% of the portfolio, respectively, generated positive returns for the twelve month reporting period. This reflected wide yield spreads among preferred equity and the Fund’s positioning in debt holdings with shorter maturities.
HOW WAS THE FUND POSITIONED?
The Fund’s portfolio managers utilized a bottom-up process to inform both security selection and security type (common equity, preferred equity or debt). They relied on proprietary cash flow models, extensive field work and internal real estate market research to target what they believed to be attractive long-term investment opportunities, emphasizing quality real estate portfolios, flexible balance sheets and transparent business models.
| | | | | | | | |
| | | |
| DECEMBER 31, 2016 | | J.P. MORGAN SPECIALTY FUNDS | | | | | 3 | |
Security Capital U.S. Core Real Estate Securities Fund
FUND COMMENTARY
TWELVE MONTHS ENDED DECEMBER 31, 2016 (Unaudited) (continued)
| | | | | | | | |
| TOP TEN HOLDINGS OF THE PORTFOLIO*** | |
| | 1. | | | Simon Property Group, Inc. | | | 5.5 | % |
| | 2. | | | Prologis, Inc. | | | 3.9 | |
| | 3. | | | Equity Residential | | | 3.6 | |
| | 4. | | | Public Storage | | | 3.6 | |
| | 5. | | | AvalonBay Communities, Inc. | | | 3.3 | |
| | 6. | | | Vornado Realty Trust | | | 2.9 | |
| | 7. | | | Equinix, Inc. | | | 2.4 | |
| | 8. | | | Senior Housing Properties Trust, 6.750%, 04/15/20 | | | 2.3 | |
| | 9. | | | Senior Housing Properties Trust | | | 2.3 | |
| | 10. | | | General Growth Properties, Inc., Series A, 6.375%, 02/13/18 | | | 2.3 | |
| | | | |
PORTFOLIO COMPOSITION BY SECURITY TYPE*** | |
| Common Stocks | | | 62.9 | % |
| Preferred Securities | | | 23.6 | |
| Corporate Bonds | | | 9.4 | |
| Short-Term Investment | | | 4.1 | |
| * | | The return shown is based on net asset values calculated for shareholder transactions and may differ from the return shown in the financial highlights, which reflects adjustments made to the net asset values in accordance with accounting principles generally accepted in the United States of America. |
| ** | | The adviser seeks to achieve the Fund’s objective. There can be no guarantee it will be achieved. |
| *** | | Percentages indicated are based on total investments as of December 31, 2016. The Fund’s portfolio composition is subject to change. |
| | | | | | | | |
GEOGRAPHIC DIVERSIFICATION | |
| | | Security Capital U.S.
Core Real Estate
Securities Fund (a) | | | NCREIF (b) | |
East | | | 37.1 | % | | | 33.3 | % |
Northeast | | | 19.8 | % | | | 12.0 | % |
Mideast | | | 17.3 | % | | | 21.3 | % |
West | | | 30.7 | % | | | 37.8 | % |
Pacific | | | 25.8 | % | | | 32.0 | % |
Mountain | | | 4.9 | % | | | 5.8 | % |
South | | | 20.5 | % | | | 19.9 | % |
Southeast | | | 12.0 | % | | | 9.4 | % |
Southwest | | | 8.5 | % | | | 10.5 | % |
Midwest | | | 10.2 | % | | | 9.0 | % |
East North Central | | | 7.7 | % | | | 7.6 | % |
West North Central | | | 2.5 | % | | | 1.4 | % |
Non-U.S. | | | 1.5 | % | | | 0.0 | % |
| (a) | | Percentages indicated are based on total investments as of December 31, 2016. The Fund’s portfolio composition is subject to change. |
| (b) | | Reflects the industry average of institutions belonging to the National Council of Real Estate Investment Fiduciaries. |
| | | | | | |
| | | |
| 4 | | | | J.P. MORGAN SPECIALTY FUNDS | | DECEMBER 31, 2016 |
| | | | | | | | | | | | | | | | |
AVERAGE ANNUAL TOTAL RETURNS AS OF DECEMBER 31, 2016 | |
| | | | |
| | | INCEPTION DATE OF
CLASS | | | 1 YEAR | | | 5 YEAR | | | SINCE
INCEPTION | |
CLASS A SHARES | | | August 31, 2011 | | | | | | | | | | | | | |
With Sales Charge* | | | | | | | (0.79 | )% | | | 7.41 | % | | | 7.10 | % |
Without Sales Charge | | | | | | | 4.69 | | | | 8.57 | | | | 8.18 | |
CLASS C SHARES | | | August 31, 2011 | | | | | | | | | | | | | |
With CDSC** | | | | | | | 3.14 | | | | 8.03 | | | | 7.64 | |
Without CDSC | | | | | | | 4.14 | | | | 8.03 | | | | 7.64 | |
CLASS R5 SHARES | | | August 31, 2011 | | | | 5.11 | | | | 9.05 | | | | 8.67 | |
CLASS R6 SHARES | | | August 31, 2011 | | | | 5.16 | | | | 9.12 | | | | 8.73 | |
SELECT CLASS SHARES | | | August 31, 2011 | | | | 4.92 | | | | 8.84 | | | | 8.46 | |
| * | | Sales Charge for Class A Shares is 5.25%. |
| ** | | Assumes a 1% CDSC (contingent deferred sales charge) for the one year period and 0% CDSC thereafter. |
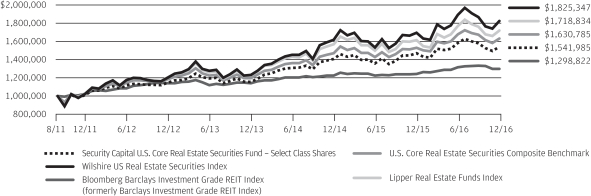
LIFE OF FUND PERFORMANCE (8/31/11 TO 12/31/2016)
The performance quoted is past performance and is not a guarantee of future results. Mutual funds are subject to certain market risks. Investment returns and principal value of an investment will fluctuate so that an investor’s shares, when redeemed, may be worth more or less than their original cost. Current performance may be higher or lower than the performance data shown. For up-to-date month-end performance information please call 1-800-480-4111.
The Fund commenced operations on August 31, 2011.
The graph illustrates comparative performance for $1,000,000 invested in Select Class Shares of the Security Capital U.S. Core Real Estate Securities Fund, the Wilshire US Real Estate Securities Index, Bloomberg Barclays Investment Grade REIT Index, U.S. Core Real Estate Securities Composite Benchmark and the Lipper Real Estate Funds Index from August 31, 2011 to December 31, 2016. The performance of the Fund assumes reinvestment of all dividends and capital gain distributions, if any, and does not include a sales charge. The performance of the indices, other than the Lipper Real Estate Funds Index, does not reflect the deduction of expenses or a sales charge associated with a mutual fund and has been adjusted to reflect reinvestment of all dividends and capital gain distributions of the securities included in the benchmark, if applicable. The performance of the Lipper Real Estate Funds Index includes expenses associated with a mutual fund, such as investment management fees. These expenses are not identical to the expenses incurred by the Fund. The Wilshire US Real Estate Securities Index is an unmanaged, float-adjusted market capitalization-weighted index comprising publicly traded REITs and real estate operating companies, not including special purpose REITs. It is comprised of major
companies engaged in the equity ownership and operation of commercial real estate. The Bloomberg Barclays Investment Grade REIT Index publicly includes issued U.S. corporate and secured notes that meet the specified maturity, liquidity, and quality requirements. To qualify, bonds must be SEC-registered or 144a securities with registration rights and only includes the portion of the Bloomberg Barclays U.S. Corporate Index deemed to be a Real Estate Investment Trust. The U.S. Core Real Estate Securities Composite Benchmark is a composite benchmark comprised of unmanaged indices that includes 60% Wilshire US Real Estate Securities Index, 10% Wells Fargo Hybrid and Preferred Securities REIT Index and 30% Bloomberg Barclays Investment Grade REIT Index. The Lipper Real Estate Funds Index represents the total returns of the funds in the indicated category as defined by Lipper, Inc. Investors cannot invest directly in an index.
Select Class Shares have a $1,000,000 minimum initial investment.
Fund performance may reflect the waiver of the Fund’s fees and reimbursement of expenses for certain periods since the inception date. Without these waivers and reimbursements, performance would have been lower. Also, performance shown in this section does not reflect the deduction of taxes that a shareholder would pay on Fund distributions or redemptions of Fund shares.
The returns shown are based on net asset values calculated for shareholder transactions and may differ from the returns shown in the financial highlights, which reflect adjustments made to the net asset values in accordance with accounting principles generally accepted in the United States of America.
| | | | | | | | |
| | | |
| DECEMBER 31, 2016 | | J.P. MORGAN SPECIALTY FUNDS | | | | | 5 | |
Security Capital U.S. Core Real Estate Securities Fund
SCHEDULE OF PORTFOLIO INVESTMENTS
AS OF DECEMBER 31, 2016
(Amounts in thousands)
| | | | | | | | |
SHARES | | | SECURITY DESCRIPTION | | VALUE($) | |
| Common Stocks — 62.6% | |
| | | | Apartments — 10.6% | |
| | 25 | | | Apartment Investment & Management Co., Class A | | | 1,158 | |
| | 21 | | | AvalonBay Communities, Inc. | | | 3,757 | |
| | 64 | | | Equity Residential | | | 4,106 | |
| | 8 | | | Essex Property Trust, Inc. | | | 1,962 | |
| | 11 | | | Mid-America Apartment Communities, Inc. | | | 1,109 | |
| | | | | | | | |
| | | | | | | 12,092 | |
| | | | | | | | |
| | | | Health Care — 6.9% | |
| | 60 | | | HCP, Inc. | | | 1,787 | |
| | 135 | | | Senior Housing Properties Trust | | | 2,559 | |
| | 24 | | | Ventas, Inc. | | | 1,514 | |
| | 30 | | | Welltower, Inc. | | | 2,026 | |
| | | | | | | | |
| | | | | | | 7,886 | |
| | | | | | | | |
| | | | Hotels — 3.8% | |
| | 25 | | | Chesapeake Lodging Trust | | | 641 | |
| | 31 | | | Hospitality Properties Trust | | | 997 | |
| | 75 | | | Host Hotels & Resorts, Inc. | | | 1,417 | |
| | 19 | | | LaSalle Hotel Properties | | | 577 | |
| | 25 | | | Pebblebrook Hotel Trust | | | 735 | |
| | | | | | | | |
| | | | | | | 4,367 | |
| | | | | | | | |
| | | | Industrial — 9.6% | |
| | 12 | | | CoreSite Realty Corp. | | | 958 | |
| | 23 | | | CyrusOne, Inc. | | | 1,048 | |
| | 8 | | | Equinix, Inc. | | | 2,690 | |
| | 46 | | | Liberty Property Trust | | | 1,813 | |
| | 83 | | | Prologis, Inc. | | | 4,407 | |
| | | | | | | | |
| | | | | | | 10,916 | |
| | | | | | | | |
| | | | Office — 8.5% | |
| | 18 | | | Alexandria Real Estate Equities, Inc. | | | 2,033 | |
| | 14 | | | Digital Realty Trust, Inc. | | | 1,408 | |
| | 42 | | | Douglas Emmett, Inc. | | | 1,530 | |
| | 40 | | | Hudson Pacific Properties, Inc. | | | 1,375 | |
| | 31 | | | Vornado Realty Trust | | | 3,268 | |
| | | | | | | | |
| | | | | | | 9,614 | |
| | | | | | | | |
| | | | Regional Malls — 8.3% | |
| | 59 | | | CBL & Associates Properties, Inc. | | | 679 | |
| | 50 | | | General Growth Properties, Inc. | | | 1,256 | |
| | 12 | | | Macerich Co. (The) | | | 855 | |
| | 35 | | | Simon Property Group, Inc. | | | 6,246 | |
| | 6 | | | Taubman Centers, Inc. | | | 422 | |
| | | | | | | | |
| | | | | | | 9,458 | |
| | | | | | | | |
| | | | | | | | |
SHARES | | | SECURITY DESCRIPTION | | VALUE($) | |
| | | | | | | | |
| | | | Shopping Centers — 6.6% | |
| | 136 | | | DDR Corp. | | | 2,070 | |
| | 7 | | | Federal Realty Investment Trust | | | 1,059 | |
| | 41 | | | Kimco Realty Corp. | | | 1,030 | |
| | 19 | | | Regency Centers Corp. | | | 1,306 | |
| | 58 | | | Weingarten Realty Investors | | | 2,091 | |
| | | | | | | | |
| | | | | | | 7,556 | |
| | | | | | | | |
| | | | Single Tenant — 1.1% | |
| | 61 | | | American Homes 4 Rent, Class A | | | 1,281 | |
| | | | | | | | |
| | | | Storage — 7.2% | |
| | 58 | | | CubeSmart | | | 1,548 | |
| | 14 | | | Extra Space Storage, Inc. | | | 1,052 | |
| | 18 | | | Life Storage, Inc. | | | 1,531 | |
| | 18 | | | Public Storage | | | 4,045 | |
| | | | | | | | |
| | | | | | | 8,176 | |
| | | | | | | | |
| | | | Total Common Stocks
(Cost $62,242) | | | 71,346 | |
| | | | | | | | |
| | | | | | | | |
| | |
PRINCIPAL
AMOUNT($) | | | | | | |
| Corporate Bonds — 9.4% | |
| | | | Apartments — 0.2% | |
| | 197 | | | Post Apartment Homes LP, 3.375%, 12/01/22 | | | 196 | |
| | | | | | | | |
| | | | Health Care — 4.8% | |
| | 298 | | | HCP, Inc., 4.000%, 12/01/22 | | | 307 | |
| | | | Senior Housing Properties Trust, | | | | |
| | 1,502 | | | 3.250%, 05/01/19 | | | 1,506 | |
| | 2,428 | | | 6.750%, 04/15/20 | | | 2,626 | |
| | 879 | | | 6.750%, 12/15/21 | | | 983 | |
| | | | | | | | |
| | | | | | | 5,422 | |
| | | | | | | | |
| | | | Industrial — 0.2% | |
| | 252 | | | DCT Industrial Operating Partnership LP, 4.500%, 10/15/23 | | | 256 | |
| | | | | | | | |
| | | | Office — 3.7% | |
| | 232 | | | Alexandria Real Estate Equities, Inc.,
4.600%, 04/01/22 | | | 245 | |
| | | | Corporate Office Properties LP, | | | | |
| | 2,305 | | | 3.600%, 05/15/23 | | | 2,216 | |
| | 805 | | | 3.700%, 06/15/21 | | | 821 | |
| | 140 | | | Equity Commonwealth, 5.875%, 09/15/20 | | | 149 | |
| | 701 | | | Government Properties Income Trust,
3.750%, 08/15/19 | | | 708 | |
| | 67 | | | SL Green Realty Corp., 4.500%, 12/01/22 | | | 68 | |
| | | | | | | | |
| | | | | | | 4,207 | |
| | | | | | | | |
SEE NOTES TO FINANCIAL STATEMENTS.
| | | | | | |
| | | |
| 6 | | | | J.P. MORGAN SPECIALTY FUNDS | | DECEMBER 31, 2016 |
| | | | | | | | |
PRINCIPAL
AMOUNT($) | | | SECURITY DESCRIPTION | | VALUE($) | |
| Corporate Bonds — continued | |
| | | | Regional Malls — 0.4% | |
| | 480 | | | CBL & Associates LP, 5.250%, 12/01/23 | | | 471 | |
| | | | | | | | |
| | | | Shopping Centers — 0.1% | |
| | 117 | | | Equity One, Inc., 3.750%, 11/15/22 | | | 119 | |
| | | | | | | | |
| | | | Total Corporate Bonds
(Cost $10,661) | | | 10,671 | |
| | | | | | | | |
| | |
| SHARES | | | | | | |
| Preferred Stocks — 23.5% | |
| | | | Apartments — 0.7% | |
| | 26 | | | Apartment Investment & Management Co., 6.875%, 05/16/19 ($25 par value) @ | | | 680 | |
| | 3 | | | Equity LifeStyle Properties, Inc., Series C, 6.750%, 09/07/17 ($– par value) @ | | | 82 | |
| | 3 | | | Sun Communities, Inc., Series A,
7.125%, 11/14/17 ($25 par value) @ | | | 77 | |
| | | | | | | | |
| | | | | | | 839 | |
| | | | | | | | |
| | | | Health Care — 0.3% | |
| | 10 | | | Sabra Health Care REIT, Inc., Series A,
7.125%, 03/21/18 ($25 par value) @ | | | 249 | |
| | 5 | | | Senior Housing Properties Trust,
6.250%, 02/18/21($25 par value) @ | | | 111 | |
| | | | | | | | |
| | | | | | | 360 | |
| | | | | | | | |
| | | | Hotels — 3.5% | |
| | 27 | | | Ashford Hospitality Trust, Inc., Series D,
8.450%, 02/13/17 ($25 par value) @ | | | 663 | |
| | 5 | | | Hospitality Properties Trust, Series D,
7.125%, 02/10/17 ($25 par value) @ | | | 117 | |
| | 26 | | | LaSalle Hotel Properties, Series J,
6.300%, 05/25/21 ($25 par value) @ | | | 608 | |
| | 91 | | | Sunstone Hotel Investors, Inc., Series E,
6.950%, 03/11/21 ($25 par value) @ | | | 2,316 | |
| | 10 | | | Sunstone Hotel Investors, Inc., Series F,
6.450%, 05/17/21($25 par value) @ | | | 248 | |
| | | | | | | | |
| | | | | | | 3,952 | |
| | | | | | | | |
| | | | Industrial — 0.2% | |
| | 8 | | | Terreno Realty Corp., Series A,
7.750%, 07/19/17 ($25 par value) @ | | | 198 | |
| | | | | | | | |
| | | | Leasing — 0.3% | |
| | 13 | | | National Retail Properties, Inc., Series D, 6.625%, 02/23/17 ($25 par value) @ | | | 337 | |
| | | | | | | | |
| | | | Office — 6.9% | |
| | 8 | | | Alexandria Real Estate Equities, Inc., Series E, 6.450%, 03/15/17 ($25 par value) @ | | | 207 | |
| | 4 | | | Brandywine Realty Trust,
6.900%, 04/11/17 ($25 par value) @ | | | 97 | |
| | | | | | | | |
SHARES | | | SECURITY DESCRIPTION | | VALUE($) | |
| | | | | | | | |
| | | | Office — continued | |
| | 76 | | | Corporate Office Properties Trust, Series L, 7.375%, 06/27/17 ($25 par value) @ | | | 1,902 | |
| | 5 | | | Digital Realty Trust, Inc., Series F,
6.625%, 04/05/17 ($25 par value) @ | | | 113 | |
| | 29 | | | Digital Realty Trust, Inc., Series H,
7.375%, 03/26/19 ($25 par value) @ | | | 799 | |
| | 25 | | | Kilroy Realty Corp., Series G,
6.875%, 03/27/17 ($25 par value) @ | | | 634 | |
| | 25 | | | Kilroy Realty Corp., Series H,
6.375%, 08/15/17 ($25 par value) @ | | | 631 | |
| | 15 | | | PS Business Parks, Inc., Series S,
6.450%, 01/18/17 ($25 par value) @ | | | 382 | |
| | 96 | | | SL Green Realty Corp., Series I,
6.500%, 08/10/17 ($25 par value) @ | | | 2,382 | |
| | 20 | | | Vornado Realty Trust, Series G,
6.625%, 02/13/17 ($25 par value) @ | | | 509 | |
| | 8 | | | Vornado Realty Trust, Series K,
5.700%, 07/18/17 ($25 par value) @ | | | 184 | |
| | | | | | | | |
| | | | | | | 7,840 | |
| | | | | | | | |
| | | | Regional Malls — 4.5% | |
| | 40 | | | CBL & Associates Properties, Inc., Series D, 7.375%, 02/13/17 ($25 par value) @ | | | 987 | |
| | 103 | | | General Growth Properties, Inc., Series A, 6.375%, 02/13/18 ($25 par value) @ | | | 2,553 | |
| | 16 | | | Pennsylvania REIT, Series A,
8.250%, 04/20/17 ($25 par value) @ | | | 397 | |
| | 1 | | | Pennsylvania REIT, Series B,
7.375%, 10/11/17 ($25 par value) @ | | | 22 | |
| | 2 | | | Taubman Centers, Inc., Series J,
6.500%, 08/14/17 ($25 par value) @ | | | 45 | |
| | 23 | | | Taubman Centers, Inc., Series K,
6.250%, 03/15/18 ($25 par value) @ | | | 564 | |
| | 23 | | | Washington Prime Group, Inc., Series H,
7.500%, 08/10/17 ($25 par value) @ | | | 600 | |
| | | | | | | | |
| | | | | | | 5,168 | |
| | | | | | | | |
| | | | Shopping Centers — 3.9% | |
| | 8 | | | DDR Corp., Series J,
6.500%, 08/01/17 ($25 par value) @ | | | 188 | |
| | 21 | | | DDR Corp., Series K,
6.250%, 04/09/18 ($25 par value) @ | | | 503 | |
| | 54 | | | Regency Centers Corp., Series 6,
6.625%, 02/16/17 ($25 par value) @ | | | 1,344 | |
| | 1 | | | Regency Centers Corp., Series 7,
6.000%, 08/23/17 ($25 par value) @ | | | 12 | |
| | 24 | | | Retail Properties of America, Inc., Series A, 7.000%, 12/20/17 ($25 par value) @ | | | 607 | |
SEE NOTES TO FINANCIAL STATEMENTS.
| | | | | | | | |
| | | |
| DECEMBER 31, 2016 | | J.P. MORGAN SPECIALTY FUNDS | | | | | 7 | |
Security Capital U.S. Core Real Estate Securities Fund
SCHEDULE OF PORTFOLIO INVESTMENTS
AS OF DECEMBER 31, 2016 (continued)
(Amounts in thousands)
| | | | | | | | |
SHARES | | | SECURITY DESCRIPTION | | VALUE($) | |
| Preferred Stocks — continued | |
| | | | Shopping Centers — continued | |
| | 24 | | | Saul Centers, Inc., Series C,
6.875%, 02/12/18 ($25 par value) @ | | | 608 | |
| | 42 | | | Urstadt Biddle Properties, Inc., Series F, 7.125%, 10/24/17 ($25 par value) @ | | | 1,063 | |
| | 2 | | | Urstadt Biddle Properties, Inc., Series G, 6.750%, 10/28/19 ($25 par value) @ | | | 54 | |
| | | | | | | | |
| | | | | | | 4,379 | |
| | | | | | | | |
| | | | Single Tenant — 2.7% | |
| | 91 | | | American Homes 4 Rent, Series D,
6.500%, 05/24/21 ($25 par value) @ | | | 2,284 | |
| | 34 | | | American Homes 4 Rent, Series E,
6.350%, 06/29/21 ($25 par value) @ | | | 825 | |
| | | | | | | | |
| | | | | | | 3,109 | |
| | | | | | | | |
| | | | Storage — 0.5% | |
| | 7 | | | Public Storage, Series D,
4.950%, 07/20/21 ($25 par value) @ | | | 149 | |
| | 6 | | | Public Storage, Series E,
4.900%, 10/14/21 ($25 par value) @ | | | 116 | |
| | 13 | | | Public Storage, Series V,
5.375%, 09/20/17 ($25 par value) @ | | | 285 | |
| | 1 | | | Public Storage, Series Y,
6.375%, 03/17/19 ($25 par value) @ | | | 37 | |
| | | | | | | | |
| | | | | | | 587 | |
| | | | | | | | |
| | | | Total Preferred Stocks
(Cost $27,142) | | | 26,769 | |
| | | | | | | | |
| Short-Term Investment — 4.1% | |
| | | | Investment Company — 4.1% | |
| | 4,678 | | | JPMorgan U.S. Government Money Market Fund, Institutional Class Shares, 0.410% (b) (l) (Cost $4,678) | | | 4,678 | |
| | | | | | | | |
| | | | Total Investments — 99.6%
(Cost $104,723) | | | 113,464 | |
| | | | Other Assets in Excess
of Liabilities — 0.4% | | | 424 | |
| | | | | | | | |
| | | | NET ASSETS — 100.0% | | $ | 113,888 | |
| | | | | | | | |
Percentages indicated are based on net assets.
NOTES TO SCHEDULE OF PORTFOLIO INVESTMENTS:
| | |
| REIT | | — Real Estate Investment Trust |
| (b) | | – Investment in affiliate. Money market fund is registered under the Investment Company Act of 1940, as amended, and advised by J.P. Morgan Investment Management Inc. |
| (l) | | – The rate shown is the current yield as of December 31, 2016. |
| @ | | – The date shown reflects the next call date on which the issuer may redeem the security. The coupon rate for this security is currently in effect as of December 31, 2016 and is based upon the stated par value. |
SEE NOTES TO FINANCIAL STATEMENTS.
| | | | | | |
| | | |
| 8 | | | | J.P. MORGAN SPECIALTY FUNDS | | DECEMBER 31, 2016 |
STATEMENT OF ASSETS AND LIABILITIES
AS OF DECEMBER 31, 2016
(Amounts in thousands, except per share amounts)
| | | | |
| | | Security Capital U.S. Core Real Estate Securities Fund | |
ASSETS: | | | | |
Investments in non-affiliates, at value | | $ | 108,786 | |
Investments in affiliates, at value | | | 4,678 | |
| | | | |
Total investment securities, at value | | | 113,464 | |
Cash | | | 7 | |
Receivables: | | | | |
Fund shares sold | | | 17 | |
Interest and dividends from non-affiliates | | | 615 | |
Dividends from affiliates | | | 3 | |
| | | | |
Total Assets | | | 114,106 | |
| | | | |
| |
LIABILITIES: | | | | |
Payables: | | | | |
Investment securities purchased | | | 74 | |
Fund shares redeemed | | | 22 | |
Accrued liabilities: | | | | |
Investment advisory fees | | | 37 | |
Distribution fees | | | 1 | |
Shareholder servicing fees | | | 11 | |
Custodian and accounting fees | | | 6 | |
Trustees’ and Chief Compliance Officer’s fees | | | — | (a) |
Audit fees | | | 50 | |
Other | | | 17 | |
| | | | |
Total Liabilities | | | 218 | |
| | | | |
Net Assets | | $ | 113,888 | |
| | | | |
| (a) | Amount rounds to less than 500. |
SEE NOTES TO FINANCIAL STATEMENTS.
| | | | | | | | |
| | | |
| DECEMBER 31, 2016 | | J.P. MORGAN SPECIALTY FUNDS | | | | | 9 | |
STATEMENT OF ASSETS AND LIABILITIES
AS OF DECEMBER 31, 2016 (continued)
(Amounts in thousands, except per share amounts)
| | | | |
| | | Security Capital
U.S. Core Real Estate
Securities Fund | |
NET ASSETS: | | | | |
Paid-in-Capital | | $ | 108,007 | |
Accumulated undistributed (distributions in excess of) net investment income | | | 167 | |
Accumulated net realized gains (losses) | | | (3,027 | ) |
Net unrealized appreciation (depreciation) | | | 8,741 | |
| | | | |
Total Net Assets | | $ | 113,888 | |
| | | | |
| |
Net Assets: | | | | |
Class A | | $ | 1,826 | |
Class C | | | 527 | |
Class R5 | | | 28 | |
Class R6 | | | 54,012 | |
Select | | | 57,495 | |
| | | | |
Total | | $ | 113,888 | |
| | | | |
| |
Outstanding units of beneficial interest (shares)
($0.0001 par value; unlimited number of shares authorized): | | | | |
Class A | | | 104 | |
Class C | | | 31 | |
Class R5 | | | 1 | |
Class R6 | | | 3,078 | |
Select | | | 3,282 | |
| |
Net Asset Value (a): | | | | |
Class A — Redemption price per share | | $ | 17.48 | |
Class C — Offering price per share (b) | | | 17.45 | |
Class R5 — Offering and redemption price per share | | | 17.54 | |
Class R6 — Offering and redemption price per share | | | 17.55 | |
Select — Offering and redemption price per share | | | 17.52 | |
Class A maximum sales charge | | | 5.25 | % |
Class A maximum public offering price per share
[net asset value per share/(100% – maximum sales charge)] | | $ | 18.45 | |
| | | | |
| |
Cost of investments in non-affiliates | | $ | 100,045 | |
Cost of investments in affiliates | | | 4,678 | |
| (a) | Per share amounts may not recalculate due to rounding of net assets and/or shares outstanding. |
| (b) | Redemption price for Class C Shares varies based upon length of time the shares are held. |
SEE NOTES TO FINANCIAL STATEMENTS.
| | | | | | |
| | | |
| 10 | | | | J.P. MORGAN SPECIALTY FUNDS | | DECEMBER 31, 2016 |
STATEMENT OF OPERATIONS
FOR THE YEAR ENDED DECEMBER 31, 2016
(Amounts in thousands)
| | | | |
| | | Security Capital
U.S. Core Real Estate
Securities Fund | |
INVESTMENT INCOME: | | | | |
Interest income from non-affiliates | | $ | 483 | |
Interest income from affiliates | | | — | (a) |
Dividend income from non-affiliates | | | 3,291 | |
Dividend income from affiliates | | | 23 | |
| | | | |
Total investment income | | | 3,797 | |
| | | | |
| |
EXPENSES: | | | | |
Investment advisory fees | | | 709 | |
Administration fees | | | 97 | |
Distribution fees: | | | | |
Class A | | | 5 | |
Class C | | | 4 | |
Shareholder servicing fees: | | | | |
Class A | | | 5 | |
Class C | | | 1 | |
Class R5 | | | — | (a) |
Select | | | 147 | |
Custodian and accounting fees | | | 39 | |
Professional fees | | | 75 | |
Trustees’ and Chief Compliance Officer’s fees | | | 19 | |
Printing and mailing costs | | | 26 | |
Registration and filing fees | | | 68 | |
Transfer agency fees (See Note 2.C.) | | | 5 | |
Sub-transfer agency fees (See Note 2.C.) | | | 10 | |
Other | | | 7 | |
| | | | |
Total expenses | | | 1,217 | |
| | | | |
Less fees waived | | | (122 | ) |
Less expense reimbursements | | | (142 | ) |
| | | | |
Net expenses | | | 953 | |
| | | | |
Net investment income (loss) | | | 2,844 | |
| | | | |
| |
REALIZED/UNREALIZED GAINS (LOSSES): | | | | |
Net realized gain (loss) on transactions from investments in non-affiliates | | | 4,519 | |
Change in net unrealized appreciation/depreciation on investments in non-affiliates | | | (720 | ) |
| | | | |
Net realized/unrealized gains (losses) | | | 3,799 | |
| | | | |
Change in net assets resulting from operations | | $ | 6,643 | |
| | | | |
| (a) | Amount rounds to less than 500. |
SEE NOTES TO FINANCIAL STATEMENTS.
| | | | | | | | |
| | | |
| DECEMBER 31, 2016 | | J.P. MORGAN SPECIALTY FUNDS | | | | | 11 | |
STATEMENT OF CHANGES IN NET ASSETS
FOR THE PERIODS INDICATED
(Amounts in thousands)
| | | | | | | | |
| | | Security Capital U.S. Core Real Estate
Securities Fund | |
| | | Year Ended
December 31, 2016 | | | Year Ended
December 31, 2015 | |
CHANGE IN NET ASSETS RESULTING FROM OPERATIONS: | | | | | | | | |
Net investment income (loss) | | $ | 2,844 | | | $ | 1,687 | |
Net realized gain (loss) | | | 4,519 | | | | 1,572 | |
Change in net unrealized appreciation/depreciation | | | (720 | ) | | | (780 | ) |
| | | | | | | | |
Change in net assets resulting from operations | | | 6,643 | | | | 2,479 | |
| | | | | | | | |
| | |
DISTRIBUTIONS TO SHAREHOLDERS: | | | | | | | | |
Class A | | | | | | | | |
From net investment income | | | (33 | ) | | | (122 | ) |
From net realized gains | | | (107 | ) | | | (210 | ) |
Return of capital | | | (5 | ) | | | — | |
Class C | | | | | | | | |
From net investment income | | | (8 | ) | | | (7 | ) |
From net realized gains | | | (31 | ) | | | (15 | ) |
Return of capital | | | (1 | ) | | | — | |
Class R5 | | | | | | | | |
From net investment income | | | (1 | ) | | | (1 | ) |
From net realized gains | | | (2 | ) | | | (1 | ) |
Return of capital | | | — | (a) | | | — | |
Class R6 | | | | | | | | |
From net investment income | | | (1,516 | ) | | | (568 | ) |
From net realized gains | | | (3,385 | ) | | | (593 | ) |
Return of capital | | | (146 | ) | | | — | |
Select | | | | | | | | |
From net investment income | | | (1,193 | ) | | | (1,062 | ) |
From net realized gains | | | (3,336 | ) | | | (1,815 | ) |
Return of capital | | | (153 | ) | | | — | |
| | | | | | | | |
Total distributions to shareholders | | | (9,917 | ) | | | (4,394 | ) |
| | | | | | | | |
| | |
CAPITAL TRANSACTIONS: | | | | | | | | |
Change in net assets resulting from capital transactions | | | 42,715 | | | | (18,812 | ) |
| | | | | | | | |
| | |
NET ASSETS: | | | | | | | | |
Change in net assets | | | 39,441 | | | | (20,727 | ) |
Beginning of period | | | 74,447 | | | | 95,174 | |
| | | | | | | | |
End of period | | $ | 113,888 | | | $ | 74,447 | |
| | | | | | | | |
Accumulated undistributed (distributions in excess of) net investment income | | $ | 167 | | | $ | 60 | |
| | | | | | | | |
| (a) | Amount rounds to less than 500. |
SEE NOTES TO FINANCIAL STATEMENTS.
| | | | | | |
| | | |
| 12 | | | | J.P. MORGAN SPECIALTY FUNDS | | DECEMBER 31, 2016 |
| | | | | | | | |
| | | Security Capital U.S. Core Real Estate
Securities Fund | |
| | | Year Ended
December 31, 2016 | | | Year Ended
December 31, 2015 | |
CAPITAL TRANSACTIONS: | | | | | | | | |
Class A | | | | | | | | |
Proceeds from shares issued | | $ | 1,598 | | | $ | 3,633 | |
Distributions reinvested | | | 145 | | | | 332 | |
Cost of shares redeemed | | | (5,852 | ) | | | (3,718 | ) |
| | | | | | | | |
Change in net assets resulting from Class A capital transactions | | $ | (4,109 | ) | | $ | 247 | |
| | | | | | | | |
Class C | | | | | | | | |
Proceeds from shares issued | | $ | 423 | | | $ | 159 | |
Distributions reinvested | | | 40 | | | | 20 | |
Cost of shares redeemed | | | (355 | ) | | | (86 | ) |
| | | | | | | | |
Change in net assets resulting from Class C capital transactions | | $ | 108 | | | $ | 93 | |
| | | | | | | | |
Class R5 | | | | | | | | |
Proceeds from shares issued | | $ | 3 | | | $ | 1 | |
Distributions reinvested | | | 3 | | | | 2 | |
Cost of shares redeemed | | | — | (a) | | | (48 | ) |
| | | | | | | | |
Change in net assets resulting from Class R5 capital transactions | | $ | 6 | | | $ | (45 | ) |
| | | | | | | | |
Class R6 | | | | | | | | |
Proceeds from shares issued | | $ | 53,293 | | | $ | 5,253 | |
Distributions reinvested | | | 5,048 | | | | 1,161 | |
Cost of shares redeemed | | | (19,266 | ) | | | (14,892 | ) |
| | | | | | | | |
Change in net assets resulting from Class R6 capital transactions | | $ | 39,075 | | | $ | (8,478 | ) |
| | | | | | | | |
Select | | | | | | | | |
Proceeds from shares issued | | $ | 13,253 | | | $ | 13,642 | |
Distributions reinvested | | | 4,415 | | | | 2,638 | |
Cost of shares redeemed | | | (10,033 | ) | | | (26,909 | ) |
| | | | | | | | |
Change in net assets resulting from Select capital transactions | | $ | 7,635 | | | $ | (10,629 | ) |
| | | | | | | | |
Total change in net assets resulting from capital transactions | | $ | 42,715 | | | $ | (18,812 | ) |
| | | | | | | | |
SEE NOTES TO FINANCIAL STATEMENTS.
| | | | | | | | |
| | | |
| DECEMBER 31, 2016 | | J.P. MORGAN SPECIALTY FUNDS | | | | | 13 | |
STATEMENT OF CHANGES IN NET ASSETS
FOR THE PERIODS INDICATED (continued)
(Amounts in thousands)
| | | | | | | | |
| | | Security Capital U.S. Core Real Estate
Securities Fund | |
| | | Year Ended
December 31, 2016 | | | Year Ended
December 31, 2015 | |
SHARE TRANSACTIONS: | | | | | | | | |
Class A | | | | | | | | |
Issued | | | 84 | | | | 193 | |
Reinvested | | | 8 | | | | 19 | |
Redeemed | | | (333 | ) | | | (204 | ) |
| | | | | | | | |
Change in Class A Shares | | | (241 | ) | | | 8 | |
| | | | | | | | |
Class C | | | | | | | | |
Issued | | | 23 | | | | 10 | |
Reinvested | | | 2 | | | | 1 | |
Redeemed | | | (19 | ) | | | (5 | ) |
| | | | | | | | |
Change in Class C Shares | | | 6 | | | | 6 | |
| | | | | | | | |
Class R5 | | | | | | | | |
Issued | | | — | (a) | | | — | (a) |
Reinvested | | | — | (a) | | | — | (a) |
Redeemed | | | — | (a) | | | (3 | ) |
| | | | | | | | |
Change in Class R5 Shares | | | — | (a) | | | (3 | ) |
| | | | | | | | |
Class R6 | | | | | | | | |
Issued | | | 2,937 | | | | 282 | |
Reinvested | | | 284 | | | | 65 | |
Redeemed | | | (1,042 | ) | | | (837 | ) |
| | | | | | | | |
Change in Class R6 Shares | | | 2,179 | | | | (490 | ) |
| | | | | | | | |
Select | | | | | | | | |
Issued | | | 744 | | | | 735 | |
Reinvested | | | 250 | | | | 148 | |
Redeemed | | | (547 | ) | | | (1,482 | ) |
| | | | | | | | |
Change in Select Shares | | | 447 | | | | (599 | ) |
| | | | | | | | |
| (a) | Amount rounds to less than 500. |
SEE NOTES TO FINANCIAL STATEMENTS.
| | | | | | |
| | | |
| 14 | | | | J.P. MORGAN SPECIALTY FUNDS | | DECEMBER 31, 2016 |
THIS PAGE IS INTENTIONALLY LEFT BLANK
| | | | | | | | |
| | | |
| DECEMBER 31, 2016 | | J.P. MORGAN SPECIALTY FUNDS | | | | | 15 | |
FINANCIAL HIGHLIGHTS
FOR THE PERIODS INDICATED
| | | | | | | | | | | | | | | | | | | | | | | | | | | | | | | | |
| | | Per share operating performance | |
| | | | | | Investment operations | | | Distributions | |
| | | Net asset
value,
beginning
of period | | | Net
investment
income
(loss) (a) | | | Net realized
and unrealized
gains (losses) on
investments | | | Total from
investment
operations | | | Net
investment
income | | | Net
realized
gain | | | Return of
capital | | | Total
distributions | |
Security Capital U.S. Core Real Estate Securities Fund | |
Class A | |
Year Ended December 31, 2016 | | $ | 18.10 | | | $ | 0.33 | | | $ | 0.50 | | | $ | 0.83 | | | $ | (0.33 | ) | | $ | (1.07 | ) | | $ | (0.05 | ) | | $ | (1.45 | ) |
Year Ended December 31, 2015 | | | 18.32 | | | | 0.30 | | | | 0.47 | (e) | | | 0.77 | | | | (0.35 | ) | | | (0.64 | ) | | | — | | | | (0.99 | ) |
Year Ended December 31, 2014 | | | 15.70 | | | | 0.31 | | | | 3.05 | | | | 3.36 | | | | (0.29 | ) | | | (0.45 | ) | | | — | | | | (0.74 | ) |
Year Ended December 31, 2013 | | | 16.36 | | | | 0.29 | | | | (0.21 | ) | | | 0.08 | | | | (0.28 | ) | | | (0.44 | ) | | | (0.02 | ) | | | (0.74 | ) |
Year Ended December 31, 2012 | | | 14.98 | | | | 0.34 | | | | 1.62 | | | | 1.96 | | | | (0.29 | ) | | | (0.29 | ) | | | — | | | | (0.58 | ) |
Class C | |
Year Ended December 31, 2016 | | | 18.08 | | | | 0.29 | | | | 0.45 | | | | 0.74 | | | | (0.25 | ) | | | (1.07 | ) | | | (0.05 | ) | | | (1.37 | ) |
Year Ended December 31, 2015 | | | 18.32 | | | | 0.22 | | | | 0.44 | (e) | | | 0.66 | | | | (0.26 | ) | | | (0.64 | ) | | | — | | | | (0.90 | ) |
Year Ended December 31, 2014 | | | 15.70 | | | | 0.24 | | | | 3.04 | | | | 3.28 | | | | (0.21 | ) | | | (0.45 | ) | | | — | | | | (0.66 | ) |
Year Ended December 31, 2013 | | | 16.37 | | | | 0.22 | | | | (0.22 | ) | | | — | (f) | | | (0.21 | ) | | | (0.44 | ) | | | (0.02 | ) | | | (0.67 | ) |
Year Ended December 31, 2012 | | | 15.00 | | | | 0.25 | | | | 1.62 | | | | 1.87 | | | | (0.21 | ) | | | (0.29 | ) | | | — | | | | (0.50 | ) |
Class R5 | |
Year Ended December 31, 2016 | | | 18.15 | | | | 0.46 | | | | 0.46 | | | | 0.92 | | | | (0.41 | ) | | | (1.07 | ) | | | (0.05 | ) | | | (1.53 | ) |
Year Ended December 31, 2015 | | | 18.38 | | | | 0.38 | | | | 0.46 | (e) | | | 0.84 | | | | (0.43 | ) | | | (0.64 | ) | | | — | | | | (1.07 | ) |
Year Ended December 31, 2014 | | | 15.73 | | | | 0.38 | | | | 3.08 | | | | 3.46 | | | | (0.36 | ) | | | (0.45 | ) | | | — | | | | (0.81 | ) |
Year Ended December 31, 2013 | | | 16.39 | | | | 0.37 | | | | (0.22 | ) | | | 0.15 | | | | (0.35 | ) | | | (0.44 | ) | | | (0.02 | ) | | | (0.81 | ) |
Year Ended December 31, 2012 | | | 15.00 | | | | 0.41 | | | | 1.62 | | | | 2.03 | | | | (0.35 | ) | | | (0.29 | ) | | | — | | | | (0.64 | ) |
Class R6 | |
Year Ended December 31, 2016 | | | 18.16 | | | | 0.48 | | | | 0.45 | | | | 0.93 | | | | (0.42 | ) | | | (1.07 | ) | | | (0.05 | ) | | | (1.54 | ) |
Year Ended December 31, 2015 | | | 18.38 | | | | 0.39 | | | | 0.47 | (e) | | | 0.86 | | | | (0.44 | ) | | | (0.64 | ) | | | — | | | | (1.08 | ) |
Year Ended December 31, 2014 | | | 15.74 | | | | 0.40 | | | | 3.05 | | | | 3.45 | | | | (0.36 | ) | | | (0.45 | ) | | | — | | | | (0.81 | ) |
Year Ended December 31, 2013 | | | 16.39 | | | | 0.43 | | | | (0.26 | ) | | | 0.17 | | | | (0.36 | ) | | | (0.44 | ) | | | (0.02 | ) | | | (0.82 | ) |
Year Ended December 31, 2012 | | | 15.00 | | | | 0.42 | | | | 1.62 | | | | 2.04 | | | | (0.36 | ) | | | (0.29 | ) | | | — | | | | (0.65 | ) |
Select | |
Year Ended December 31, 2016 | | | 18.14 | | | | 0.43 | | | | 0.44 | | | | 0.87 | | | | (0.37 | ) | | | (1.07 | ) | | | (0.05 | ) | | | (1.49 | ) |
Year Ended December 31, 2015 | | | 18.36 | | | | 0.34 | | | | 0.47 | (e) | | | 0.81 | | | | (0.39 | ) | | | (0.64 | ) | | | — | | | | (1.03 | ) |
Year Ended December 31, 2014 | | | 15.72 | | | | 0.35 | | | | 3.07 | | | | 3.42 | | | | (0.33 | ) | | | (0.45 | ) | | | — | | | | (0.78 | ) |
Year Ended December 31, 2013 | | | 16.38 | | | | 0.33 | | | | (0.21 | ) | | | 0.12 | | | | (0.32 | ) | | | (0.44 | ) | | | (0.02 | ) | | | (0.78 | ) |
Year Ended December 31, 2012 | | | 15.00 | | | | 0.41 | | | | 1.59 | | | | 2.00 | | | | (0.33 | ) | | | (0.29 | ) | | | — | | | | (0.62 | ) |
| (a) | Calculated based upon average shares outstanding. |
| (b) | Includes adjustments in accordance with accounting principles generally accepted in the United States of America and as such, the net asset values for financial reporting purposes and the returns based upon those net asset values may differ from the net asset values and returns for shareholder transactions. |
| (c) | Includes earnings credits and interest expense, if applicable, each of which is less than 0.005% unless otherwise noted. |
| (d) | Portfolio turnover is calculated by dividing the lesser of total purchases or sales of portfolio securities for the reporting period by the monthly average value of portfolio securities owned during the reporting period. Excluded from both the numerator and denominator are amounts relating to derivatives and securities whose maturities or expiration dates at the time of acquisition were one year or less. |
| (e) | Calculation of net realized and unrealized gains (losses) per share do not correlate with the Fund’s net realized and unrealized gains (losses) presented on the Statement of Operations due to the timing of capital transactions in relation to the fluctuating market values of the Fund’s investments. |
| (f) | Amount rounds to less than $0.005. |
SEE NOTES TO FINANCIAL STATEMENTS.
| | | | | | |
| | | |
| 16 | | | | J.P. MORGAN SPECIALTY FUNDS | | DECEMBER 31, 2016 |
| | | | | | | | | | | | | | | | | | | | | | | | | | |
| | | Ratios/Supplemental data | |
| | | | | | | | | | Ratios to average net assets | | | | |
Net asset
value,
end of
period | | | Total return
(excludes
sales charge) (b) | | | Net assets,
end of
period
(000's) | | | Net
expenses (c) | | | Net
investment
income
(loss) | | | Expenses without
waivers,
reimbursements and
earnings credits | | | Portfolio
turnover
rate (d) | |
| | |
| | |
| $ | 17.48 | | | | 4.63 | % | | $ | 1,826 | | | | 1.17 | % | | | 1.76 | % | | | 1.56 | % | | | 147 | % |
| | 18.10 | | | | 4.38 | | | | 6,232 | | | | 1.17 | | | | 1.66 | | | | 1.47 | | | | 85 | |
| | 18.32 | | | | 21.54 | | | | 6,177 | | | | 1.16 | | | | 1.75 | | | | 1.45 | | | | 76 | |
| | 15.70 | | | | 0.46 | | | | 4,270 | | | | 1.17 | | | | 1.75 | | | | 1.56 | | | | 106 | |
| | 16.36 | | | | 13.14 | | | | 3,867 | | | | 1.17 | | | | 2.11 | | | | 2.33 | | | | 74 | |
| | |
| | 17.45 | | | | 4.14 | | | | 527 | | | | 1.67 | | | | 1.57 | | | | 2.06 | | | | 147 | |
| | 18.08 | | | | 3.79 | | | | 448 | | | | 1.67 | | | | 1.23 | | | | 2.12 | | | | 85 | |
| | 18.32 | | | | 21.00 | | | | 356 | | | | 1.66 | | | | 1.38 | | | | 1.96 | | | | 76 | |
| | 15.70 | | | | (0.04 | ) | | | 88 | | | | 1.67 | | | | 1.30 | | | | 2.05 | | | | 106 | |
| | 16.37 | | | | 12.53 | | | | 57 | | | | 1.67 | | | | 1.56 | | | | 2.90 | | | | 74 | |
| | |
| | 17.54 | | | | 5.11 | | | | 28 | | | | 0.72 | | | | 2.49 | | | | 1.78 | | | | 147 | |
| | 18.15 | | | | 4.77 | | | | 23 | | | | 0.72 | | | | 2.03 | | | | 1.79 | | | | 85 | |
| | 18.38 | | | | 22.17 | | | | 71 | | | | 0.71 | | | | 2.17 | | | | 1.00 | | | | 76 | |
| | 15.73 | | | | 0.87 | | | | 58 | | | | 0.72 | | | | 2.18 | | | | 1.11 | | | | 106 | |
| | 16.39 | | | | 13.65 | | | | 57 | | | | 0.72 | | | | 2.52 | | | | 1.94 | | | | 74 | |
| | |
| | 17.55 | | | | 5.16 | | | | 54,012 | | | | 0.67 | | | | 2.54 | | | | 0.88 | | | | 147 | |
| | 18.16 | | | | 4.89 | | | | 16,332 | | | | 0.67 | | | | 2.14 | | | | 0.92 | | | | 85 | |
| | 18.38 | | | | 22.15 | | | | 25,542 | | | | 0.66 | | | | 2.27 | | | | 0.95 | | | | 76 | |
| | 15.74 | | | | 0.98 | | | | 7,630 | | | | 0.67 | | | | 2.60 | | | | 1.04 | | | | 106 | |
| | 16.39 | | | | 13.70 | | | | 57 | | | | 0.67 | | | | 2.57 | | | | 1.89 | | | | 74 | |
| | |
| | 17.52 | | | | 4.86 | | | | 57,495 | | | | 0.92 | | | | 2.30 | | | | 1.15 | | | | 147 | |
| | 18.14 | | | | 4.61 | | | | 51,412 | | | | 0.92 | | | | 1.86 | | | | 1.19 | | | | 85 | |
| | 18.36 | | | | 21.91 | | | | 63,028 | | | | 0.91 | | | | 1.99 | | | | 1.20 | | | | 76 | |
| | 15.72 | | | | 0.69 | | | | 44,340 | | | | 0.92 | | | | 1.98 | | | | 1.31 | | | | 106 | |
| | 16.38 | | | | 13.42 | | | | 41,370 | | | | 0.92 | | | | 2.53 | | | | 1.91 | | | | 74 | |
SEE NOTES TO FINANCIAL STATEMENTS.
| | | | | | | | |
| | | |
| DECEMBER 31, 2016 | | J.P. MORGAN SPECIALTY FUNDS | | | | | 17 | |
NOTES TO FINANCIAL STATEMENTS
AS OF DECEMBER 31, 2016
1. Organization
JPMorgan Trust I (the “Trust”) was formed on November 12, 2004, as Delaware statutory trust, pursuant to a Declaration of Trust dated November 5, 2004 and is registered under the Investment Company Act of 1940, as amended (the “1940 Act”), as an open-end management investment company.
The following is a separate fund of the Trust (the “Fund”) covered by this report:
| | | | |
| Fund | | Classes Offered | | Diversified/Non-Diversified |
| Security Capital U.S. Core Real Estate Securities Fund | | Class A, Class C, Class R5, Class R6 and Select Class | | Non-Diversified* |
| * | Effective February 15, 2017, the Fund changed its designation to diversified. |
The investment objective of the Fund is to seek a risk-adjusted total return over the long-term by investing primarily in real estate securities.
Class A Shares generally provide for a front-end sales charge while Class C Shares provide for a contingent deferred sales charge (“CDSC”). No sales charges are assessed with respect to Class R5, Class R6 and Select Class Shares. All classes of shares have equal rights as to earnings, assets and voting privileges, except that each class may bear different transfer agency, sub-transfer agency, distribution and shareholder servicing fees and each class has exclusive voting rights with respect to its distribution plan and shareholder servicing agreements. Certain Class A Shares, for which front-end sales charges have been waived, may be subject to a CDSC as described in the Fund’s prospectus.
Security Capital Research & Management Incorporated (the “Adviser”) an indirect, wholly-owned subsidiary of JPMorgan Asset Management Holdings Inc. acts as investment adviser to the Fund. J.P. Morgan Investment Management Inc. (“JPMIM”) (the “Administrator”) an indirect, wholly-owned subsidiary of JPMorgan Chase & Co. (“JPMorgan”) acts as Administrator to the Fund. Prior to April 1, 2016, JPMorgan Funds Management, Inc. (“JPMFM”) served as the Fund’s administrator. Effective April 1, 2016, JPMFM merged into JPMIM and JPMIM became the Fund’s Administrator under the Administration Agreement.
2. Significant Accounting Policies
The following is a summary of significant accounting policies followed by the Fund in the preparation of its financial statements. The Fund is an investment company and, accordingly, follows the investment company accounting and reporting guidance of the Financial Accounting Standards Board Accounting Standards Codification Topic 946 — Investment Companies, which is part of U.S. generally accepted accounting principles (“GAAP”). The preparation of financial statements in conformity with GAAP requires management to make estimates and assumptions that affect the reported amounts of assets and liabilities and disclosure of contingent assets and liabilities at the date of the financial statements and the reported amounts of increases and decreases in net assets from operations during the reporting period. Actual results could differ from those estimates.
A. Valuation of Investments — The valuation of investments is in accordance with GAAP and the Fund’s valuation policies set forth by and under the supervision and responsibility of the Board of Trustees (the “Board”), which established the following approach to valuation, as described more fully below: (i) investments for which market quotations are readily available shall be valued at such unadjusted quoted prices and (ii) all other investments for which market quotations are not readily available shall be valued at their fair value as determined in good faith by the Board.
The Administrator has established the J.P. Morgan Asset Management Americas Valuation Committee (“AVC”) to assist the Board with the oversight and monitoring of the valuation of the Fund’s investments. The Administrator implements the valuation policies of the Fund’s investments, as directed by the Board. The AVC oversees and carries out the policies for the valuation of investments held in the Fund. This includes monitoring the appropriateness of fair values based on results of ongoing valuation oversight, including but not limited to consideration of macro or security specific events, market events and pricing vendor and broker due diligence. The Administrator is responsible for discussing and assessing the potential impacts to the fair values on an ongoing basis, and at least on a quarterly basis with the AVC and the Board.
Fixed-income instruments are valued based on prices received from approved affiliated and unaffiliated pricing vendors or third party broker-dealers (collectively referred to as “Pricing Services”). The Pricing Services use multiple valuation techniques to determine the valuation of fixed-income instruments. In instances where sufficient market activity exists, the Pricing Services may utilize a market-based approach through which trades or quotes from market makers are used to determine the valuation of these instruments. In instances where sufficient market activity may not exist, the Pricing Services also utilize proprietary valuation models which may consider market transactions in comparable securities and the various relationships between securities in determining fair value and/or market characteristics in order to estimate the relevant cash flows, which are then discounted to calculate the fair values.
Equities and other exchange-traded instruments are valued at the last sale price or official market closing price on the primary exchange on which the instrument is traded before the net asset values (“NAV”) of the Fund are calculated on a valuation date. Investments in open-end investment companies (the “Underlying Funds”) are valued at each Underlying Fund’s NAV per share as of the report date.
Valuations reflected in this report are as of the report date. As a result, changes in valuation due to market events and/or issuer related events after the report date and prior to issuance of the report are not reflected herein.
| | | | | | |
| | | |
| 18 | | | | J.P. MORGAN SPECIALTY FUNDS | | DECEMBER 31, 2016 |
The various inputs that are used in determining the valuation of the Fund’s investments are summarized into the three broad levels listed below.
| • | | Level 1 — Unadjusted inputs using quoted prices in active markets for identical investments. |
| • | | Level 2 — Other significant observable inputs including, but not limited to, quoted prices for similar investments, inputs other than quoted prices that are observable for investments (such as interest rates, prepayment speeds, credit risk, etc.) or other market corroborated inputs. |
| • | | Level 3 — Significant inputs based on the best information available in the circumstances, to the extent observable inputs are not available (including the Fund’s assumptions in determining the fair value of investments). |
A financial instrument’s level within the fair value hierarchy is based on the lowest level of any input, both individually and in the aggregate, that is significant to the fair value measurement. The inputs or methodology used for valuing instruments are not necessarily an indication of the risk associated with investing in those instruments.
The following table represents each valuation input as presented on the Schedule of Portfolio Investments (“SOI”) (amounts in thousands):
| | | | | | | | | | | | | | | | |
| | | Level 1
Quoted prices | | | Level 2
Other significant
observable inputs | | | Level 3
Significant
unobservable inputs | | | Total | |
Total Investments in Securities (a) | | $ | 102,793 | | | $ | 10,671 | | | $ | — | | | $ | 113,464 | |
| | | | | | | | | | | | | | | | |
| (a) | All portfolio holdings designated as level 1 and level 2 are disclosed individually on the SOI. Level 2 consists of corporate bonds. Please refer to the SOI for industry specifics of portfolio holdings. |
There were no transfers among any levels for the year ended December 31, 2016.
B. Security Transactions and Investment Income — Investment transactions are accounted for on the trade date (the date the order to buy or sell is executed). Securities gains and losses are calculated on a specifically identified cost basis. Interest income is determined on the basis of coupon interest accrued using the effective interest method which adjusts for amortization of premiums and accretion of discounts. Dividend income, net of foreign taxes withheld, if any, is recorded on the ex-dividend date or when the Fund first learns of the dividend.
To the extent such information is publicly available, the Fund records distributions received in excess of income earned from underlying investments as a reduction of cost of investments and/or realized gain. Such amounts are based on estimates if actual amounts are not available and actual amounts of income, realized gain and return of capital may differ from the estimated amounts. The Fund adjusts the estimated amounts of the components of distributions (and consequently its net investment income) as necessary once the issuers provide information about the actual composition of the distributions.
C. Allocation of Income and Expenses — Expenses directly attributable to a fund are charged directly to that fund, while the expenses attributable to more than one fund of the Trust are allocated among the respective funds. In calculating the NAV of each class, investment income, realized and unrealized gains and losses and expenses, other than class specific expenses, are allocated daily to each class of shares based upon the proportion of net assets of each class at the beginning of each day.
Transfer agency fees and sub-transfer agency fees are class-specific expenses. The amount of the transfer agency fees and sub-transfer agency fees charged to each class of the Fund for the year ended December 31, 2016 are as follows (amounts in thousands):
| | | | | | | | | | | | | | | | | | | | | | | | |
| | | Class A | | | Class C | | | Class R5 | | | Class R6 | | | Select Class | | | Total | |
Transfer agency fees | | $ | 2 | | | $ | — | (a) | | $ | — | (a) | | $ | 1 | | | $ | 2 | | | $ | 5 | |
Sub-transfer agency fees | | | 1 | | | | 1 | | | | — | (a) | | | — | | | | 8 | | | | 10 | |
| (a) | Amount rounds to less than 500. |
D. Federal Income Taxes — The Fund is treated as a separate taxable entity for Federal income tax purposes. The Fund’s policy is to comply with the provisions of the Internal Revenue Code of 1986, as amended (the “Code”), applicable to regulated investment companies and to distribute to shareholders all of its distributable net investment income and net realized capital gains on investments. Accordingly, no provision for Federal income tax is necessary. Management has reviewed the Fund’s tax positions for all open tax years and has determined that as of December 31, 2016, no liability for income tax is required in the Fund’s financial statements for net unrecognized tax benefits. However, management’s conclusions may be subject to future review based on changes in, or the interpretation of, the accounting standards or tax laws and regulations. The Fund’s Federal tax returns for the prior three fiscal years remains subject to examination by the Internal Revenue Service.
E. Distributions to Shareholders — Distributions from net investment income are generally declared and paid quarterly and are declared separately for each class. No class has preferential dividend rights; differences in per share rates are due to differences in separate class expenses. Net realized capital gains, if any, are distributed at least annually. The amount of distributions from net investment income and net realized capital gains is determined in accordance with Federal income tax regulations, which may differ from GAAP. To the extent these “book/tax” differences are permanent in nature (i.e., that they result from other than timing of recognition — “temporary differences”), such amounts are reclassified within the capital accounts based on their Federal tax-basis treatment.
| | | | | | | | |
| | | |
| DECEMBER 31, 2016 | | J.P. MORGAN SPECIALTY FUNDS | | | | | 19 | |
NOTES TO FINANCIAL STATEMENTS
AS OF DECEMBER 31, 2016 (continued)
The following amounts were reclassified within the capital accounts (amounts in thousands):
| | | | | | | | | | | | |
| | | Paid-in-Capital | | | Accumulated undistributed (distributions in excess of) net investment income | | | Accumulated net realized gains (losses) | |
| | $ | — | | | $ | 14 | | | $ | (14 | ) |
The reclassifications for the Fund relate primarily to investments in real estate investment trusts.
3. Fees and Other Transactions with Affiliates
A. Investment Advisory Fee — Pursuant to an Investment Advisory Agreement, the Adviser acts as the investment adviser to the Fund. The Adviser supervises the investments of the Fund and for such services is paid a fee. The fee is accrued daily and paid monthly based on the Fund’s average daily net assets at an annual rate of 0.60%.
B. Administration Fee — Pursuant to an Administration Agreement, the Administrator provides certain administration services to the Fund. In consideration of these services, the Administrator receives a fee accrued daily and paid monthly at an annual rate of 0.15% of the first $25 billion of the average daily net assets of all funds in the J.P. Morgan Funds Complex covered by the Administration Agreement (excluding certain funds of funds and money market funds) and 0.075% of the average daily net assets in excess of $25 billion of all such funds. For the year ended December 31, 2016, the effective rate was 0.08% of the Fund’s average daily net assets, notwithstanding any fee waivers and/or expense reimbursements.
JPMorgan Chase Bank, N.A. (“JPMCB”), a wholly-owned subsidiary of JPMorgan, serves as the Fund’s sub-administrator (the “Sub-administrator”). For its services as Sub-administrator, JPMCB receives a portion of the fees payable to the Administrator.
C. Distribution Fees — Pursuant to a Distribution Agreement, JPMorgan Distribution Services, Inc. (the “Distributor”), a wholly-owned subsidiary of JPMorgan, serves as the Trust’s principal underwriter and promotes and arranges for the sale of the Fund’s shares.
The Board has adopted a Distribution Plan (the “Distribution Plan”) for Class A and Class C Shares of the Fund in accordance with Rule 12b-1 under the 1940 Act. Class R5, Class R6 and Select Class Shares do not charge a distribution fee. The Distribution Plan provides that the Fund shall pay distribution fees, including payments to the Distributor, at annual rates of 0.25% and 0.75% of the average daily net assets of Class A and Class C Shares, respectively.
In addition, the Distributor is entitled to receive the front-end sales charges from purchases of Class A Shares and the CDSC from the redemptions of Class C Shares and certain Class A Shares for which front-end sales charges have been waived. For the year ended December 31, 2016, the Distributor retained the following amounts (in thousands):
| | | | | | | | |
| | | Front-End Sales Charge | | | CDSC | |
| | $ | 1 | | | $ | — | (a) |
| (a) | Amount rounds to less than 500. |
D. Shareholder Servicing Fees — The Trust, on behalf of the Fund, has entered into a Shareholder Servicing Agreement with the Distributor under which the Distributor provides certain support services to the shareholders. The Class R6 Shares do not charge a shareholder servicing fee. For performing these services, the Distributor receives a fee that is accrued daily and paid monthly equal to a percentage of the average daily net assets as shown in the table below:
| | | | | | | | | | | | | | | | |
| | | Class A | | | Class C | | | Class R5 | | | Select Class | |
| | | 0.25 | % | | | 0.25 | % | | | 0.05 | % | | | 0.25 | % |
The Distributor has entered into shareholder services contracts with affiliated and unaffiliated financial intermediaries who provide shareholder services and other related services to their clients or customers who invest in the Fund under which the Distributor will pay all or a portion of such fees earned to financial intermediaries for performing such services.
E. Custodian and Accounting Fees — JPMCB provides portfolio custody and accounting services to the Fund. For performing these services, the Fund pays JPMCB transaction and asset-based fees that vary according to the number of transactions and positions, plus out-of-pocket expenses. The amounts paid directly to JPMCB by the Fund for custody and accounting services are included in Custodian and accounting fees on the Statement of Operations. Payments to the custodian may be reduced by credits earned by the Fund, based on uninvested cash balances held by the custodian. Such earnings credits, if any, are presented separately on the Statement of Operations.
Interest expense paid to the custodian related to cash overdrafts, if any, is included in Interest expense to affiliates on the Statement of Operations.
F. Waivers and Reimbursements — The Administrator and Distributor have contractually agreed to waive fees and/or reimburse the Fund to the extent that total annual operating expenses (excluding acquired fund fees and expenses, dividend and interest expenses related to short sales,
| | | | | | |
| | | |
| 20 | | | | J.P. MORGAN SPECIALTY FUNDS | | DECEMBER 31, 2016 |
interest, taxes, expenses related to litigation and potential litigation, and extraordinary expenses) exceed the percentages of the Fund’s average daily net assets as shown in the table below:
| | | | | | | | | | | | | | | | | | | | |
| | | Class A | | | Class C | | | Class R5 | | | Class R6 | | | Select Class | |
| | | 1.18 | % | | | 1.68 | % | | | 0.73 | % | | | 0.68 | % | | | 0.93 | % |
The expense limitation agreements were in effect for the year ended December 31, 2016 and are in place until at least April 30, 2017.
For the year ended December 31, 2016, the Administrator and Distributor waived fees and/or reimbursed expenses for the Fund as follows (amounts in thousands). None of these parties expect the Fund to repay any such waived fees and reimbursed expenses in future years.
| | | | | | | | | | | | | | | | |
| | | Contractual Waivers | |
| | | Administration | | | Shareholder
Servicing | | | Total | | | Contractual
Reimbursements | |
| | $ | 97 | | | $ | 14 | | | $ | 111 | | | $ | 142 | |
Additionally, the Fund may invest in one or more money market funds advised by the Adviser or its affiliates (affiliated money market funds). The Administrator and/or the Distributor, as shareholder servicing agent, have contractually agreed to waive fees and/or reimburse expenses in an amount sufficient to offset the respective net fees each collects from the affiliated money market fund on the Fund’s investment in such affiliated money market fund. A portion of the waiver and/or reimbursement was voluntary.
The amount of waivers resulting from investments in these money market funds for the year ended December 31, 2016 was approximately $11.
G. Other — Certain officers of the Trust are affiliated with the Adviser, the Administrator and the Distributor. Such officers, with the exception of the Chief Compliance Officer, receive no compensation from the Fund for serving in their respective roles.
The Board appointed a Chief Compliance Officer to the Fund in accordance with Federal securities regulations. The Fund, along with other affiliated funds, makes reimbursement payments, on a pro-rata basis, to the Administrator for a portion of the fees associated with the Office of the Chief Compliance Officer. Such fees are included in Trustees’ and Chief Compliance Officer’s fees on the Statement of Operations.
The Trust adopted a Trustee Deferred Compensation Plan (the “Plan”) which allows the Independent Trustees to defer the receipt of all or a portion of compensation related to performance of their duties as Trustees. The deferred fees are invested in various J.P. Morgan Funds until distribution in accordance with the Plan.
During the year ended December 31, 2016, the Fund purchased securities from an underwriting syndicate in which the principal underwriter or members of the syndicate were affiliated with the Adviser.
The Fund may use related party broker-dealers. For the year ended December 31, 2016, the Fund did not incur any brokerage commissions with broker-dealers affiliated with the Adviser.
The Securities and Exchange Commission (“SEC”) has granted an exemptive order permitting the Fund to engage in principal transactions with J.P. Morgan Securities, Inc., an affiliated broker, involving taxable money market instruments, subject to certain conditions.
4. Investment Transactions
During the year ended December 31, 2016, purchases and sales of investments (excluding short-term investments) were as follows (amounts in thousands):
| | | | | | | | |
| | | Purchases
(excluding
U.S. Government) | | | Sales
(excluding
U.S. Government) | |
| | $ | 197,998 | | | $ | 160,701 | |
During the year ended December 31, 2016, there were no purchases or sales of U.S. Government securities.
5. Federal Income Tax Matters
For Federal income tax purposes, the cost and unrealized appreciation (depreciation) in value of investment securities held at December 31, 2016 were as follows (amounts in thousands):
| | | | | | | | | | | | | | | | |
| | | Aggregate Cost | | | Gross Unrealized Appreciation | | | Gross Unrealized Depreciation | | | Net Unrealized Appreciation (Depreciation) | |
| | $ | 107,658 | | | $ | 7,576 | | | $ | 1,770 | | | $ | 5,806 | |
The difference between book and tax basis appreciation (depreciation) on investments is primarily attributed to wash sale loss deferrals.
| | | | | | | | |
| | | |
| DECEMBER 31, 2016 | | J.P. MORGAN SPECIALTY FUNDS | | | | | 21 | |
NOTES TO FINANCIAL STATEMENTS
AS OF DECEMBER 31, 2016 (continued)
The tax character of distributions paid during the year ended December 31, 2016 was as follows (amounts in thousands):
| | | | | | | | | | | | | | | | |
| | | Ordinary Income* | | | Net Long-Term Capital Gains | | | Return of
Capital | | | Total Distributions Paid | |
| | $ | 5,768 | | | $ | 3,844 | | | $ | 305 | | | $ | 9,917 | |
| | | | | | | | | | | | | | | | |
| * | Short-term gains are treated as ordinary income for income tax purposes |
The tax character of distributions paid during the year ended December 31, 2015 was as follows (amounts in thousands):
| | | | | | | | | | | | |
| | | Ordinary Income* | | | Net
Long-Term
Capital Gains | | | Total Distributions Paid | |
| | $ | 1,760 | | | $ | 2,634 | | | $ | 4,394 | |
| * | Short-term gains are treated as ordinary income for income tax purposes. |
As of December 31, 2016, the estimated components of net assets (excluding paid-in-capital) on a tax basis were as follows (amounts in thousands):
| | | | |
| | | Unrealized
Appreciation
(Depreciation) | |
| | $ | 5,806 | |
The cumulative timing differences primarily consist of post-October capital loss deferrals, wash sale loss deferrals and investments in real estate investment trusts.
Net capital losses incurred after October 31 and within the taxable year are deemed to arise on the first business day of the Fund’s next taxable year. For the year ended December 31, 2016, the Fund deferred to January 1, 2017 the following net capital losses of (amounts in thousands):
| | | | | | | | |
| | | Net Capital Losses | |
| | | Short-Term | | | Long-Term | |
| | $ | 186 | | | $ | (95 | ) |
6. Borrowings
The Fund relies upon an exemptive order granted by the SEC (the “Order”) permitting the establishment and operation of an Interfund Lending Facility (the “Facility”). The Facility allows the Fund to directly lend and borrow money to or from any other fund relying upon the Order at rates beneficial to both the borrowing and lending funds. Advances under the Facility are taken primarily for temporary or emergency purposes, including the meeting of redemption requests that otherwise might require the untimely disposition of securities, and are subject to the Fund’s borrowing restrictions. The Interfund loan rate is determined, as specified in the Order, by averaging the current repurchase agreement rate and the current bank loan rate. The Order was granted to JPMorgan Trust II and may be relied upon by the Fund because the Fund and the series of JPMorgan Trust II are both investment companies in the same “group of investment companies” (as defined in Section 12 (d)(1)(G) of the 1940 Act).
The Trust and JPMCB have entered into a financing arrangement. Under this arrangement, JPMCB provides an unsecured, uncommitted credit facility in the aggregate amount of $100 million to certain of the J.P. Morgan Funds, including the Fund. Advances under the arrangement are taken primarily for temporary or emergency purposes, including the meeting of redemption requests that otherwise might require the untimely disposition of securities, and are subject to the Fund’s borrowing restrictions. Interest on borrowings is payable at a rate determined by JPMCB at the time of borrowing. This agreement has been extended until November 6, 2017.
The Fund had no borrowings outstanding from another fund or from the unsecured, uncommitted credit facility during the year ended December 31, 2016.
In addition, effective August 16, 2016, the Trust along with certain other trusts (“Borrowers”) entered into a joint syndicated senior unsecured revolving credit facility totaling $1.5 billion (“Credit Facility”) with various lenders and The Bank of New York Mellon, as administrative agent for the lenders. This Credit Facility provides a source of funds to the Borrowers for temporary and emergency purposes, including the meeting of redemption requests that otherwise might require the untimely disposition of securities. Under the terms of the Credit Facility, a borrowing fund must have a minimum of $25,000,000 in adjusted net asset value and not exceed certain adjusted net asset coverage ratios prior to and during the time in which any borrowings are outstanding. If a fund does not comply with the aforementioned requirements, the fund must remediate within three business days with respect to the $25,000,000 minimum adjusted net asset value or within one business day with respect to certain asset coverage ratios or the administrative agent at the request of, or with the consent of, the lenders may terminate the Credit Facility and declare any outstanding borrowings to be due and payable immediately.
Interest associated with any borrowing under the Credit Facility is charged to the borrowing fund at a rate of interest equal to 1.00% plus the greater of the federal funds effective rate or one month LIBOR. The annual commitment fee to maintain the Credit Facility is 0.15% and is incurred
| | | | | | |
| | | |
| 22 | | | | J.P. MORGAN SPECIALTY FUNDS | | DECEMBER 31, 2016 |
on the unused portion of the Credit Facility and is allocated to all participating funds pro rata based on their respective net assets. The initial term of the Credit Facility is 364 days, unless extended. The Fund did not utilize the Credit Facility during the year ended December 31, 2016.
7. Risks, Concentrations and Indemnifications
In the normal course of business, the Fund enters into contracts that contain a variety of representations which provide general indemnifications. The Fund’s maximum exposure under these arrangements is unknown. The amount of exposure would depend on future claims that may be made against the Fund that have not yet occurred. However, based on experience, the Fund expects the risk of loss to be remote.
As of December 31, 2016 the Fund had three shareholders who collectively owned shares representing 64.7% of the Fund’s net assets. Significant shareholder transactions by these shareholders may impact the Fund’s performance.
Because the Fund may invest a substantial portion of their assets in REITs, the Fund may be subject to certain risks similar to those associated with direct investments in real estate. REITs may be affected by changes in the value of their underlying properties and by defaults by tenants. REITs depend generally on their ability to generate cash flow to make distributions to shareholders, and certain REITs have self-liquidation provisions by which mortgages held may be paid in full and distributions of capital returns may be made at any time.
The Fund is subject to interest rate and credit risk. The value of debt securities may decline as interest rates increase. The Fund could lose money if the issuer of a fixed-income security is unable to pay interest or repay principal when it is due. The ability of the issuers of debt to meet their obligations may be affected by the economic and political developments in a specific industry or region.
| | | | | | | | |
| | | |
| DECEMBER 31, 2016 | | J.P. MORGAN SPECIALTY FUNDS | | | | | 23 | |
REPORT OF INDEPENDENT REGISTERED PUBLIC ACCOUNTING FIRM
To the Trustees of JPMorgan Trust I and the Shareholders of Security Capital U.S. Core Real Estate Securities Fund:
In our opinion, the accompanying statement of assets and liabilities, including the schedule of portfolio investments, and the related statements of operations and of changes in net assets and the financial highlights present fairly, in all material respects, the financial position of Security Capital U.S. Core Real Estate Securities Fund (a separate Fund of JPMorgan Trust I) (the “Fund”) as of December 31, 2016, the results of its operations for the year then ended, the changes in its net assets for each of the two years in the period then ended and the financial highlights for each of the five years in the period then ended, in conformity with accounting principles generally accepted in the United States of America. These financial statements and financial highlights (hereafter referred to as “financial statements”) are the responsibility of the Fund’s management. Our responsibility is to express an opinion on these financial statements based on our audits. We conducted our audits of these financial statements in accordance with the standards of the Public Company Accounting Oversight Board (United States). Those standards require that we plan and perform the audit to obtain reasonable assurance about whether the financial statements are free of material misstatement. An audit includes examining, on a test basis, evidence supporting the amounts and disclosures in the financial statements, assessing the accounting principles used and significant estimates made by management, and evaluating the overall financial statement presentation. We believe that our audits, which included confirmation of securities as of December 31, 2016 by correspondence with the transfer agent, custodian and brokers, provide a reasonable basis for our opinion.
PricewaterhouseCoopers LLP
New York, New York
February 24, 2017
| | | | | | |
| | | |
| 24 | | | | J.P. MORGAN SPECIALTY FUNDS | | DECEMBER 31, 2016 |
TRUSTEES
(Unaudited)
The Fund’s Statement of Additional Information includes additional information about the Fund’s Trustees and is available, without charge, upon request by calling 1-800-480-4111 or on the J.P. Morgan Funds’ website at www.jpmorganfunds.com.
| | | | | | |
Name (Year of Birth); Positions With the Fund (1) | | Principal Occupations During Past 5 Years | | Number of
Portfolios in Fund
Complex Overseen
by Trustee (2) | | Other Directorships Held Outside Fund Complex During Past 5 Years |
Independent Trustees | | |
| | | |
| John F. Finn (1947); Trustee of Trust since 2005; Trustee of heritage One Group Mutual Funds since 1998. | | Chairman (1985-present), President and Chief Executive Officer, Gardner, Inc. (supply chain management company serving industrial and consumer markets) (1974-present). | | 151 | | Director, Greif, Inc. (GEF) (industrial package products and services) (2007-present); Trustee, Columbus Association for the Performing Arts (1988-present); Director, Cardinal Health, Inc. (CAH) (1994-2014). |
| | | |
| Dr. Matthew Goldstein (1941); Chairman since 2013; Trustee of Trust since 2005; Trustee of heritage J.P. Morgan Funds since 2003. | | Chancellor Emeritus, City University of New York (2015-present); Professor, City University of New York (2013-present); Chancellor, City University of New York (1999-2013); President, Adelphi University (New York) (1998-1999). | | 151 | | Trustee, Museum of Jewish Heritage (2011-present); Trustee, National Museum of Mathematics (present); Chair, Association of College and University Administrators (present). |
| | | |
| Dennis P. Harrington (1950); Trustee of Trust since 2017. | | Retired; Partner, Deloitte LLP (1984-2012). | | 150 | | None |
| | | |
| Frankie D. Hughes (1952); Trustee of Trust since 2008. | | President, Ashland Hughes Properties (property management) (2014-present); President and Chief Investment Officer, Hughes Capital Management, Inc. (fixed income asset management) (1993-2014). | | 151 | | Trustee, The Victory Portfolios
(2000-2008) (Investment companies). |
| | | |
| Peter C. Marshall (1942); Trustee of Trust since 2005; Trustee of heritage One Group Mutual Funds since 1985. | | Self-employed business consultant
(2002-present). | | 151 | | None |
| | | |
| Mary E. Martinez (1960); Trustee of Trust since 2013. | | Associate, Special Properties, a Christie’s International Real Estate Affiliate (2010-present); Managing Director, Bank of America (Asset Management) (2007-2008); Chief Operating Officer, U.S. Trust Asset Management, U.S. Trust Company (asset management) (2003-2007); President, Excelsior Funds (registered investment companies) (2004-2005). | | 151 | | None |
| | | |
| Marilyn McCoy* (1948); Trustee of Trust since 2005; Trustee of heritage One Group Mutual Funds since 1999. | | Vice President of Administration and Planning, Northwestern University (1985-present). | | 151 | | None |
| | | |
| Mitchell M. Merin (1953); Trustee of Trust since 2013. | | Retired; President and Chief Operating Officer, Morgan Stanley Investment Management, Member Morgan Stanley & Co. Management Committee (registered investment adviser) (1998-2005). | | 151 | | Director, Sun Life Financial (SLF) (2007-2013) (financial services and insurance); Trustee, Trinity College, Hartford, CT (2002-2010). |
| | | |
| Dr. Robert A. Oden, Jr. (1946); Trustee of Trust since 2005; Trustee of heritage One Group Mutual Funds since 1997. | | Retired; President, Carleton College
(2002-2010); President, Kenyon College
(1995-2002). | | 151 | | Chairman, Dartmouth-Hitchcock Medical Center (2011-present); Trustee, American Schools of Oriental Research (2011-present); Trustee, American University in Cairo (1999-2014); Trustee, American Museum of Fly Fishing (2013-present). |
| | | | | | | | |
| | | |
| DECEMBER 31, 2016 | | J.P. MORGAN SPECIALTY FUNDS | | | | | 25 | |
TRUSTEES
(Unaudited) (continued)
| | | | | | |
Name (Year of Birth); Positions With the Fund (1) | | Principal Occupations During Past 5 Years | | Number of
Portfolios in Fund
Complex Overseen
by Trustee (2) | | Other Directorships Held Outside Fund Complex During Past 5 Years |
Independent Trustees (continued) | | |
| | | |
| Marian U. Pardo** (1946); Trustee of Trust since 2013. | | Managing Director and Founder, Virtual Capital Management LLC (Investment Consulting) (2007-present); Managing Director, Credit Suisse Asset Management (portfolio manager) (2003-2006). | | 151 | | Member, Board of Governors, Columbus Citizens Foundation (not-for-profit supporting philanthropic and cultural programs) (2006-present). |
| | | |
| Frederick W. Ruebeck (1939); Trustee of Trust since 2005; Trustee of heritage One Group Mutual Funds since 1994. | | Consultant (2000-present); Adviser, JP Greene & Associates, LLC (broker-dealer)
(2000-2009); Chief Investment Officer, Wabash College (2004-present); Director of Investments, Eli Lilly and Company (pharmaceuticals) (1988-1999). | | 151 | | None |
| | | |
| James J. Schonbachler (1943); Trustee of Trust since 2005; Trustee of heritage J.P. Morgan Funds since 2001. | | Retired; Managing Director of Bankers Trust Company (financial services) (1968-1998). | | 151 | | None |
| (1) | The Trustees serve for an indefinite term, subject to the Trust’s current retirement policy, which is age 78 for all Trustees. |
| (2) | A Fund Complex means two or more registered investment companies that hold themselves out to investors as related companies for purposes of investment and investor services or have a common investment adviser or have an investment adviser that is an affiliated person of the investment adviser of any of the other registered investment companies. The J.P. Morgan Funds Complex for which the Board of Trustees serves currently includes twelve registered investment companies (151 funds). |
| * | Two members of the Board of Trustees of Northwestern University are executive officers of registered investment advisers (not affiliated with JPMorgan) that are under common control with sub-advisers to certain J.P. Morgan Funds. |
| ** | In connection with prior employment with JPMorgan Chase, Ms. Pardo was the recipient of non-qualified pension plan payments from JPMorgan Chase in the amount of approximately $2,055 per month, which she irrevocably waived effective January 1, 2013, and deferred compensation payments from JPMorgan Chase in the amount of approximately $7,294 per year, which ended in January 2013. In addition, Ms. Pardo receives payments from a fully-funded qualified plan, which is not an obligation of JPMorgan Chase. |
The contact address for each of the Trustees is 270 Park Avenue, New York, NY 10017.
| | | | | | |
| | | |
| 26 | | | | J.P. MORGAN SPECIALTY FUNDS | | DECEMBER 31, 2016 |
OFFICERS
(Unaudited)
| | |
Name (Year of Birth), Positions Held with the Trust (Since) | | Principal Occupations During Past 5 Years |
| |
Brian S. Shlissel (1964),
President and Principal Executive Officer (2016) | | Managing Director and Chief Administrative Officer for J.P. Morgan pooled vehicles, J.P. Morgan Investment Management Inc. (formerly JPMorgan Funds Management, Inc.) (2014 – present); Managing Director and Head of Mutual Fund Services, Allianz Global Investors; President and Chief Executive Officer, Allianz Global Investors Mutual Funds and PIMCO Closed-End Funds (1999-2014) |
| |
Laura M. Del Prato (1964),
Treasurer and Principal Financial Officer (2014)* | | Managing Director, J.P. Morgan Investment Management Inc. (formerly JPMorgan Funds Management, Inc.) since 2014; Partner, Cohen Fund Audit Services, Ltd. (2012-2013); Partner (2004-2012) and various other titles (1990-2004) at KPMG, LLP. |
| |
Frank J. Nasta (1964),
Secretary (2008) | | Managing Director and Associate General Counsel, JPMorgan Chase since 2008. |
| |
Stephen M. Ungerman (1953),
Chief Compliance Officer (2005) | | Managing Director, JPMorgan Chase & Co.; Mr. Ungerman has been with JPMorgan Chase & Co. since 2000. |
| |
Elizabeth A. Davin (1964), Assistant Secretary (2005)* | | Executive Director and Assistant General Counsel, JPMorgan Chase since February 2012; formerly Vice President and Assistant General Counsel, JPMorgan Chase from 2005 to February 2012; Senior Counsel, JPMorgan Chase (formerly Bank One Corporation) from 2004 to 2005. |
| |
Jessica K. Ditullio (1962),
Assistant Secretary (2005)* | | Executive Director and Assistant General Counsel, JPMorgan Chase. Ms. Ditullio has been with JPMorgan Chase (formerly Bank One Corporation) since 1990. |
| |
John T. Fitzgerald (1975),
Assistant Secretary (2008) | | Executive Director and Assistant General Counsel, JPMorgan Chase. Mr. Fitzgerald has been with JPMorgan Chase since 2005. |
| |
Carmine Lekstutis (1980),
Assistant Secretary (2011) | | Executive Director and Assistant General Counsel, JPMorgan Chase since February 2015; formerly Vice President and Assistant General Counsel, JPMorgan Chase from 2011 to February 2015. |
| |
Gregory S. Samuels (1980),
Assistant Secretary (2010) | | Executive Director and Assistant General Counsel, JPMorgan Chase since 2014; formerly Vice President and Assistant General Counsel, JPMorgan Chase since 2010. |
| |
Pamela L. Woodley (1971),
Assistant Secretary (2012)** | | Vice President and Assistant General Counsel, JPMorgan Chase since November 2004. |
| |
Michael M. D’Ambrosio (1969),
Assistant Treasurer (2012) | | Managing Director, J.P. Morgan Investment Management Inc. (formerly JPMorgan Funds Management, Inc.) since May 2014; formerly Executive Director, JPMorgan Funds Management, Inc. from 2012 to May 2014; prior to joining JPMorgan Chase, Mr. D’Ambrosio was a Tax Director at PricewaterhouseCoopers LLP since 2006. |
| |
Lauren A. Paino (1973),
Assistant Treasurer (2014)** | | Executive Director, J.P. Morgan Investment Management Inc. (formerly JPMorgan Funds Management, Inc.) since August 2013; formerly Director, Credit Suisse Asset Management from 2000-2013. |
| |
Joseph Parascondola (1963),
Assistant Treasurer (2011)** | | Vice President, J.P. Morgan Investment Management Inc. (formerly JPMorgan Funds Management, Inc.) since August 2006. |
| |
Matthew J. Plastina (1970),
Assistant Treasurer (2011)** | | Executive Director, J.P. Morgan Investment Management Inc. (formerly JPMorgan Funds Management, Inc.) since February 2016; Vice President, JPMorgan Funds Management, Inc. from 2010 to January 2016. |
| |
Julie A. Roach (1971),
Assistant Treasurer (2012)* | | Vice President, J.P. Morgan Investment Management Inc. (formerly JPMorgan Funds Management, Inc.) since August 2012; prior to joining JPMorgan Chase, Ms. Roach was a Senior Manager with Deloitte since 2001. |
| |
Gillian I. Sands (1969),
Assistant Treasurer (2012)** | | Vice President, J.P. Morgan Investment Management Inc. (formerly JPMorgan Funds Management, Inc.) since September 2012; Assistant Treasurer, Wells Fargo Funds Management (2007-2009). |
The contact address for each of the officers, unless otherwise noted, is 270 Park Avenue, New York, NY 10017.
| * | The contact address for the officer is 1111 Polaris Parkway, Columbus, OH 43240. |
| ** | The contact address for the officer is 4 New York Plaza, New York, NY 10004. |
| | | | | | | | |
| | | |
| DECEMBER 31, 2016 | | J.P. MORGAN SPECIALTY FUNDS | | | | | 27 | |
SCHEDULE OF SHAREHOLDER EXPENSES
(Unaudited)
Hypothetical $1,000 Investment
As a shareholder of the Fund, you incur two types of costs: (1) transaction costs, including sales charges (loads) on purchase payments and (2) ongoing costs, including investment advisory fees, administration fees, distribution fees and other Fund expenses. The examples below are intended to help you understand your ongoing costs (in dollars) of investing in the Fund and to compare these ongoing costs with the ongoing costs of investing in other mutual funds. The examples assume that you had a $1,000 investment in each Class at the beginning of the reporting period, July 1, 2016, and continued to hold your shares at the end of the reporting period, December 31, 2016.
Actual Expenses
For each Class of the Fund in the table below, the first line provides information about actual account values and actual expenses. You may use the information in this line, together with the amount you invested, to estimate the expenses that you paid over the period. Simply divide your account value by $1,000 (for example, an $8,600 account value divided by
$1,000 = 8.6), then multiply the result by the number in the first line of each Class under the heading entitled “Expenses Paid During the Period” to estimate the expenses you paid on your account during this period.
Hypothetical Example for Comparison Purposes
The second line of each Class in the table below provides information about hypothetical account values and hypothetical expenses based on the Class’ actual expense ratio and an assumed rate of return of 5% per year before expenses, which is not the Class’ actual return. The hypothetical account values and expenses may not be used to estimate the actual ending account balance or expenses you paid for the period. You may use this information to compare the ongoing costs of investing in the Class of the Fund and other funds. To do so, compare this 5% hypothetical example with the 5% hypothetical examples that appear in the shareholder reports of the other funds. Please note that the expenses shown in the table are meant to highlight your ongoing costs only and do not reflect any transaction costs, such as sales charges (loads) or redemption fees. Therefore, the second line for each Class in the table is useful in comparing ongoing costs only, and will not help you determine the relative total costs of owning different funds. In addition, if these transaction costs were included, your costs would have been higher. The examples also assume all dividends and distributions have been reinvested.
| | | | | | | | | | | | | | | | |
| | | Beginning
Account Value
July 1, 2016 | | | Ending
Account Value
December 31, 2016 | | | Expenses
Paid During
the Period* | | | Annualized
Expense
Ratio | |
Security Capital U.S. Core Real Estate Securities Fund | | | | | | | | | | | | | | | | |
Class A | | | | | | | | | | | | | | | | |
Actual | | $ | 1,000.00 | | | $ | 973.30 | | | $ | 5.85 | | | | 1.18 | % |
Hypothetical | | | 1,000.00 | | | | 1,019.20 | | | | 5.99 | | | | 1.18 | |
Class C | | | | | | | | | | | | | | | | |
Actual | | | 1,000.00 | | | | 971.00 | | | | 8.32 | | | | 1.68 | |
Hypothetical | | | 1,000.00 | | | | 1,016.69 | | | | 8.52 | | | | 1.68 | |
Class R5 | | | | | | | | | | | | | | | | |
Actual | | | 1,000.00 | | | | 975.60 | | | | 3.63 | | | | 0.73 | |
Hypothetical | | | 1,000.00 | | | | 1,021.47 | | | | 3.71 | | | | 0.73 | |
Class R6 | | | | | | | | | | | | | | | | |
Actual | | | 1,000.00 | | | | 975.90 | | | | 3.38 | | | | 0.68 | |
Hypothetical | | | 1,000.00 | | | | 1,021.72 | | | | 3.46 | | | | 0.68 | |
Select | | | | | | | | | | | | | | | | |
Actual | | | 1,000.00 | | | | 974.60 | | | | 4.62 | | | | 0.93 | |
Hypothetical | | | 1,000.00 | | | | 1,020.46 | | | | 4.72 | | | | 0.93 | |
| * | Expenses are equal to each Class’ respective annualized expense ratio, multiplied by the average account value over the period, multiplied by 184/366 (to reflect the one-half year period). |
| | | | | | |
| | | |
| 28 | | | | J.P. MORGAN SPECIALTY FUNDS | | DECEMBER 31, 2016 |
BOARD APPROVAL OF INVESTMENT ADVISORY AGREEMENT
(Unaudited)
The Board of Trustees has established various standing committees composed of Trustees with diverse backgrounds, to which the Board of Trustees has assigned specific subject matter responsibilities to further enhance the effectiveness of the Board’s oversight and decision making. The Board of Trustees and its investment committees (money market and alternative products, equity, and fixed income) meet regularly throughout the year and consider factors that are relevant to their annual consideration of investment advisory agreements at each meeting. They also meet for the specific purpose of considering investment advisory contract annual renewals. The Board of Trustees held meetings in person in June and August 2016, at which the Trustees considered the continuation of the investment advisory agreement for the Fund whose annual report is contained herein (the “Advisory Agreement”). At the June meeting, the Board’s investment committees met to review and consider performance, expense and related information for the J.P. Morgan Funds. Each investment committee reported to the full Board, which then considered the investment committee’s preliminary findings. At the August meeting, the Trustees continued their review and consideration. The Trustees, including a majority of the Trustees who are not “interested persons” (as defined in the 1940 Act) of any party to the Advisory Agreement or any of their affiliates, approved the continuation of the Advisory Agreement on August 17, 2016.
As part of their review of the Advisory Agreement, the Trustees considered and reviewed performance and other information about the Fund received from the Adviser. This information included the Fund’s performance as compared to the performance of its peers and benchmarks and analyses by the Adviser of the Fund’s performance. In addition, the Trustees have engaged an independent management consulting firm (“independent consultant”) to report on the performance of certain J.P. Morgan Funds at each of the Trustees’ regular meetings. The Adviser also periodically provides comparative information regarding the Fund’s expense ratios and those of its peer group. In addition, in preparation for the June and August meetings, the Trustees requested, received and evaluated extensive materials from the Adviser, including, with respect to the Fund, performance and expense information compiled by Broadridge, using data from Lipper Inc., independent providers of investment company data (together, “Broadridge/Lipper”). The independent consultant also provided additional analyses of the performance of the Fund in connection with the Trustees’ review of the Advisory Agreement, as well as a risk/return assessment as compared the Fund’s objectives and peers. Before voting on the proposed Advisory Agreement, the Trustees reviewed the proposed Advisory Agreement with representatives of the Adviser, counsel to the Trust and independent legal counsel and received a memorandum from independent legal counsel to the Trustees discussing the legal standards for their consideration of the proposed Advisory Agreement. The Trustees also discussed the proposed
Advisory Agreement in executive sessions with independent legal counsel at which no representatives of the Adviser were present. Set forth below is a summary of the material factors evaluated by the Trustees in determining whether to approve the Advisory Agreement.
The Trustees considered information provided with respect to the Fund over the course of the year. Each Trustee attributed different weights to the various factors and no factor alone was considered determinative. From year to year, the Trustees consider and place emphasis on relevant information in light of changing circumstances in market and economic conditions. The Trustees determined that the compensation to be received by the Adviser from the Fund under the Advisory Agreement was fair and reasonable and that the continuance of the Advisory Agreement was in the best interests of the Fund and its shareholders.
The factors summarized below were considered and discussed by the Trustees in reaching their conclusions:
Nature, Extent and Quality of Services Provided by the Adviser
The Trustees received and considered information regarding the nature, extent and quality of the services provided to the Fund under the Advisory Agreement. The Trustees took into account information furnished throughout the year at Trustee meetings, as well as the materials furnished specifically in connection with this annual review process. The Trustees considered the background and experience of the Adviser’s senior management and the expertise of, and the amount of attention given to the Fund by, investment personnel of the Adviser. In addition, the Trustees reviewed the qualifications, backgrounds and responsibilities of the portfolio management team primarily responsible for the day-to-day management of the Fund and the infrastructure supporting the team. The Trustees also considered information provided by the Adviser and JPMorgan Distribution Services, Inc. (“JPMDS”) about the structure and distribution strategy of the Fund. The Trustees reviewed information relating to the Adviser’s risk governance model and reports showing the Adviser’s compliance structure and ongoing compliance processes. The Trustees also considered the quality of the administrative services provided by J.P. Morgan Investment Management Inc. in its role as administrator (“JPMIM”).
The Trustees also considered their knowledge of the nature and quality of the services provided by the Adviser and its affiliates to the Fund gained from their experience as Trustees of the J.P. Morgan Funds. In addition, they considered the overall reputation and capabilities of the Adviser and its affiliates, the commitment of the Adviser to provide high quality service to the Fund, their overall confidence in the Adviser’s integrity and the Adviser’s responsiveness to questions or concerns raised by them, including the Adviser’s willingness to consider and implement organizational and operational changes designed to
| | | | | | | | |
| | | |
| DECEMBER 31, 2016 | | J.P. MORGAN SPECIALTY FUNDS | | | | | 29 | |
BOARD APPROVAL OF INVESTMENT ADVISORY AGREEMENT
(Unaudited) (continued)
improve investment results and the services provided to the Fund.
Based upon these considerations and other factors, the Trustees concluded that they were satisfied with the nature, extent and quality of the investment advisory services provided to the Fund by the Adviser.
Costs of Services Provided and Profitability to the Adviser and its Affiliates
The Trustees received and considered information regarding the profitability to the Adviser and its affiliates in providing services to the Fund. The Trustees reviewed and discussed this data. The Trustees recognized that this data is not audited and represents the Adviser’s determination of its and its affiliates’ revenues from the contractual services provided to the Fund, less expenses of providing such services. Expenses include direct and indirect costs and are calculated using an allocation methodology developed by the Adviser. The Trustees also recognized that it is difficult to make comparisons of profitability from fund investment advisory contracts because comparative information is not generally publicly available and is affected by numerous factors, including the structure of the particular adviser, the types of funds it manages, its business mix, numerous assumptions regarding allocations and the fact that publicly-traded fund managers’ operating profits and net income are net of distribution and marketing expenses. Based upon their review, the Trustees concluded that the profitability to the Adviser under the Advisory Agreement was not unreasonable in light of the services and benefits provided to the Fund.
Fall-Out Benefits
The Trustees reviewed information regarding potential “fallout” or ancillary benefits received by the Adviser and its affiliates as a result of their relationship with the Fund. The Board also reviewed the Adviser’s allocation of fund brokerage for the J.P. Morgan Funds complex, including allocations to brokers who provide research to the Adviser.
The Trustees also considered that JPMDS, an affiliate of the Adviser, and JPMIM earn fees from the Fund for providing shareholder and administrative services, respectively. These fees were shown separately in the profitability analysis presented to the Trustees. The Trustees also considered the payments of Rule 12b-1 fees to JPMDS, which also acts as the Fund’s distributor and that these fees are in turn generally paid to financial intermediaries that sell the Fund, including financial intermediaries that are affiliates of the Adviser. The Trustees also considered the fees paid to JPMorgan Chase Bank, N.A. (“JPMCB”) for custody and fund accounting and other related services.
Economies of Scale
The Trustees considered the extent to which the Fund may benefit from economies of scale. The Trustees considered that
there may not be a direct relationship between economies of scale realized by the Fund and those realized by the Adviser as assets increase. The Trustees noted that the proposed investment advisory fee schedule for the Fund does not contain breakpoints, but that the fees remain competitive with peer funds. The Trustees also considered that JPMIM, as administrator, and JPMDS, as distributor, have implemented fee waivers and expense limitations (“Fee Caps”) which allows the Fund’s shareholders to share potential economies of scale from the Fund’s inception. The Trustees also considered that the Adviser has shared economies of scale by adding or enhancing services to the Fund over time, noting the Adviser’s substantial investments in its business in support of the Fund, including investments in trading systems and technology (including cybersecurity improvements), retention of key talent, additions to analyst and portfolio management teams, and regulatory support enhancements. The Trustees also considered whether it would be appropriate to add advisory fee breakpoints and the Trustees concluded that the current fee structure was reasonable in light of the Fee Caps in place that serve to limit the overall net expense ratios of the Fund at competitive levels. The Trustees concluded that the Fund’s shareholders received the benefits of potential economies of scale through the Fee Caps and the Adviser’s reinvestment in its operations to serve the Fund and its shareholders.
Independent Written Evaluation of the Fund’s Chief Compliance Officer
The Trustees noted that, upon their direction, the Chief Compliance Officer for the Fund had prepared an independent written evaluation in order to assist the Trustees in determining the reasonableness of the proposed management fees. The Trustees considered the written evaluation in determining whether to continue the Advisory Agreement.
Fees Relative to Adviser’s Other Clients
The Trustees received and considered information about the nature and extent of investment advisory services and fee rates offered to other clients of the Adviser, including institutional separate accounts and/or funds sub-advised by the Adviser, and for investment management styles substantially similar to that of the Fund. The Trustees considered the complexity of investment management for registered mutual funds relative to the Adviser’s other clients and noted differences in the regulatory, legal and other risks and responsibilities of providing services to the different clients. The Trustees considered that serving as an adviser to a registered mutual fund involves greater responsibilities and risks than acting as a sub-adviser and observed that sub-advisory fees may be lower than those charged by the Adviser to the Fund. The Trustees also noted that the adviser, not the mutual fund, pays the sub-advisory fee and that many responsibilities related to the advisory function are retained by the primary adviser. The Trustees concluded
| | | | | | |
| | | |
| 30 | | | | J.P. MORGAN SPECIALTY FUNDS | | DECEMBER 31, 2016 |
that the fee rates charged to the Fund in comparison to those charged to the Adviser’s other clients were reasonable.
Investment Performance
The Trustees received and considered absolute and/or relative performance for the Fund in a report prepared by Broadridge/Lipper. The Trustees considered the total return performance information, which included the ranking of the Fund within a performance universe made up of funds with the same Broadridge/Lipper investment classification and objective (the “Universe”), as well as a sub-set of funds within the Universe (the “Peer Group”), by total return for the applicable one- and three-year periods. The Trustees reviewed a description of Broadridge/Lipper’s methodology for selecting mutual funds in the Fund’s Peer Group and Universe. The Broadridge/Lipper materials provided to the Trustees highlighted information with respect to certain representative classes to assist the Trustees in their review. As part of this review, the Trustees also reviewed the Fund’s performance against its benchmark and considered the performance information provided for the Fund at regular Board meetings by the Adviser and the Trustees’ independent consultant and also considered the special analysis prepared by the Trustees’ independent consultant. The Trustees and Adviser determined that the Peer Group and/or Universe for the Fund were less meaningful and the independent consultant prepared an analysis of the Fund across various risk and return metrics including performance, volatility and risk-adjusted return measures and a customized peer group of funds with similar portfolio objectives (as selected by the independent consultant). The Broadridge/Lipper performance data noted by the Trustees as part of their review and the determinations made by the Trustees with respect to the Fund’s performance for certain representative classes are summarized below:
The Trustees noted that the Fund’s performance for Class A shares was in the first and fifth quintiles for for the one- and three-year periods, respectively, ended December 31, 2015 based upon the Peer Group and Universe. The Trustees noted that the Fund’s performance for the Select Class shares was in
the first and fifth quintiles based upon the Peer Group and in the first and fourth quintiles based upon the Universe, for the one- and three-year periods, respectively, ended December 31, 2015. The Trustees discussed the performance and investment strategy of the Fund with the Adviser and reviewed the performance analysis and evaluation prepared by the independent consultant. Based upon these discussions and various other factors, the Trustees concluded that the Fund’s performance was reasonable.
Advisory Fees and Expense Ratios
The Trustees considered the contractual advisory fee rate paid by the Fund to the Adviser and compared that rate to the information prepared by Broadridge/Lipper concerning management fee rates paid by other funds in the same Broadridge/Lipper category as the Fund. The Trustees recognized that Broadridge/Lipper reported the Fund’s management fee rate as the combined contractual advisory fee and administration fee rates. The Trustees also reviewed information about other expenses and the expense ratios for the Fund. The Trustees considered the fee waiver and/or expense reimbursement arrangements currently in place for the Fund and considered the net advisory fee rate after taking into account any waivers and/or reimbursements. The Trustees recognized that it is difficult to make comparisons of advisory fees because there are variations in the services that are included in the fees paid by other funds. The Trustees’ determinations as a result of the review of the Fund’s advisory fees and expense ratios for certain representative classes are summarized below:
The Trustees noted that the Fund’s net advisory fee and actual total expenses for both Class A and Select Class shares were in the first quintile based upon the Peer Group and Universe. The Trustees noted that the Fund’s net advisory fee and actual total expenses for Select Class shares was in the second and first quintiles respectively based upon the Peer Group and in the second and second quintiles based upon the Universe. After considering the factors identified above, in light of this information, the Trustees concluded that the advisory fee was reasonable.
| | | | | | | | |
| | | |
| DECEMBER 31, 2016 | | J.P. MORGAN SPECIALTY FUNDS | | | | | 31 | |
Tax Letter
(Unaudited)
Certain tax information for the J.P. Morgan Funds is required to be provided to shareholders based upon the Fund’s income and distributions for the taxable year ended December 31, 2016. The information and distributions reported in this letter may differ from the information and taxable distributions reported to the shareholders for the calendar year ending December 31, 2016. The information necessary to complete your income tax
returns for the calendar year ending December 31, 2016 will be provided under separate cover.
Long Term Capital Gain
The Fund distributed approximately $3,844,000, or maximum allowable amount, of long-term capital gain dividends for the fiscal year ended December 31, 2016.
| | | | | | |
| | | |
| 32 | | | | J.P. MORGAN SPECIALTY FUNDS | | DECEMBER 31, 2016 |

Rev. January 2011
| | |
| FACTS | | WHAT DOES J.P. MORGAN FUNDS DO WITH YOUR PERSONAL INFORMATION? |
| | |
| Why? | | Financial companies choose how they share your personal information. Federal law gives consumers the right to limit some but not all sharing. Federal law also requires us to tell you how we collect, share, and protect your personal information. Please read this notice carefully to understand what we do. |
| | |
| What? | | The types of personal information we collect and share depend on the product or service you have with us. This information can include: ◾ Social Security number and account balances ◾ transaction history and account transactions ◾ checking account information and wire transfer instructions When you are no longer our customer, we continue to share your information as described in this notice. |
| | |
| How? | | All financial companies need to share customers’ personal information to run their everyday business. In the section below, we list the reasons financial companies can share their customers’ personal information; the reasons J.P. Morgan Funds chooses to share; and whether you can limit this sharing. |
| | | | |
| Reasons we can share your personal information | | Does J.P. Morgan
Funds share? | | Can you limit this
sharing? |
For our everyday business purposes — such as to process your transactions, maintain your account(s), respond to court orders and legal investigations, or report to credit bureaus | | Yes | | No |
For marketing purposes — to offer our products and services to you | | Yes | | No |
| For joint marketing with other financial companies | | No | | We don’t share |
For our affiliates’ everyday business purposes — information about your transactions and experiences | | No | | We don’t share |
For our affiliates’ everyday business purposes — information about your creditworthiness | | No | | We don’t share |
| For nonaffiliates to market to you | | No | | We don’t share |
| | |
| | |
| Questions? | | Call 1-800-480-4111 or go to www.jpmorganfunds.com |

| | |
| Who we are |
| Who is providing this notice? | | J.P. Morgan Funds |
| | |
| What we do |
| How does J.P. Morgan Funds protect my personal information? | | To protect your personal information from unauthorized access and use, we use security measures that comply with federal law. These measures include computer safeguards and secured files and buildings. We authorize our employees to access your information only when they need it to do their work and we require companies that work for us to protect your information. |
How does J.P. Morgan Funds collect my personal information? | | We collect your personal information, for example, when you: ◾ open an account or provide contact information ◾ give us your account information or pay us by check ◾ make a wire transfer We also collect your personal information from others, such as credit bureaus, affiliates and other companies. |
| Why can’t I limit all sharing? | | Federal law gives you the right to limit only ◾ sharing for affiliates’ everyday business purposes – information about your creditworthiness ◾ affiliates from using your information to market to you ◾ sharing for nonaffiliates to market to you State laws and individual companies may give you additional rights to limit sharing. |
| | |
| Definitions |
| Affiliates | | Companies related by common ownership or control. They can be financial and nonfinancial companies. ◾ J.P. Morgan Funds does not share with our affiliates. |
| Nonaffiliates | | Companies not related by common ownership or control. They can be financial and nonfinancial companies. ◾ J.P. Morgan Funds does not share with nonaffiliates so they can market to you. |
| Joint Marketing | | A formal agreement between nonaffiliated financial companies that together market financial products or services to you. ◾ J.P. Morgan Funds doesn’t jointly market. |
J.P. Morgan Funds are distributed by JPMorgan Distribution Services, Inc., which is an affiliate of JPMorgan Chase & Co. Affiliates of JPMorgan Chase & Co. receive fees for providing various services to the funds.
Contact JPMorgan Distribution Services, Inc. at 1-800-480-4111 for a fund prospectus. You can also visit us at www.jpmorganfunds.com. Investors should carefully consider the investment objectives and risk as well as charges and expenses of the mutual fund before investing. The prospectus contains this and other information about the mutual fund. Read the prospectus carefully before investing.
Investors may obtain information about the Securities Investor Protection Corporation (SIPC), including the SIPC brochure by visiting www.sipc.org or by calling SIPC at 202-371-8300.
The Fund files a complete schedule of its fund holdings for the first and third quarters of its fiscal year with the SEC on Form N-Q. The Fund’s Forms N-Q are available on the SEC’s website at http://www.sec.gov and may be reviewed and copied at the SEC’s Public Reference Room in Washington, DC. Information on the operation of the SEC’s Public Reference Room may be obtained by calling 1-800-SEC-0330. Shareholders may request the Form N-Q without charge by calling 1-800-480-4111 or by visiting the J.P. Morgan Funds’ website at www.jpmorganfunds.com.
A description of the Fund’s policies and procedures with respect to the disclosure of the Fund’s holdings is available in the prospectus and Statement of Additional Information.
A copy of proxy policies and procedures is available without charge upon request by calling 1-800-480-4111 and on the Fund’s website at www.jpmorganfunds.com. A description of such policies and procedures is on the SEC’s website at www.sec.gov. The Trustees have delegated the authority to vote proxies for securities owned by the Fund to the Adviser. A copy of the Fund’s voting record for the most recent 12-month period ended June 30 is available on the SEC’s website at www.sec.gov or at the Fund’s website at www.jpmorganfunds.com no later than August 31 of each year. The Fund’s proxy voting record will include, among other things, a brief description of the matter voted on for each fund security, and will state how each vote was cast, for example, for or against the proposal.


J.P. Morgan Asset Management is the marketing name for the asset management businesses of JPMorgan Chase & Co. Those businesses include, but are not limited to, J.P. Morgan Investment Management Inc., Security Capital Research & Management Incorporated and J.P. Morgan Alternative Asset Management, Inc.
| | | | |
| | © JPMorgan Chase & Co., 2017. All rights reserved. December 2016. | | AN-USRE-1216 |
ITEM 2. CODE OF ETHICS.
Disclose whether, as of the end of the period covered by the report, the registrant has adopted a code of ethics that applies to the registrant’s principal executive officer, principal financial officer, principal accounting officer or controller, or persons performing similar functions, regardless of whether these individuals are employed by the registrant or a third party. If the registrant has not adopted such a code of ethics, explain why it has not done so.
The registrant must briefly describe the nature of any amendment, during the period covered by the report, to a provision of its code of ethics that applies to the registrant’s principal executive officer, principal financial officer, principal accounting officer or controller, or persons performing similar functions, regardless of whether these individuals are employed by the registrant or a third party, and that relates to any element of the code of ethics definition enumerated in paragraph (b) of this Item. The registrant must file a copy of any such amendment as an exhibit pursuant to Item 12(a)(1), unless the registrant has elected to satisfy paragraph (f) of this Item by positing its code of ethics on its website pursuant to paragraph (f)(2) of this Item, or by undertaking to provide its code of ethics to any person without charge, upon request, pursuant to paragraph (f)(3) of this Item.
If the registrant has, during the period covered by the report, granted a waiver, including an implicit waiver, from a provision of the code of ethics that applies to the registrant’s principal executive officer, principal financial officer, principal accounting officer or controller, or persons performing similar functions, regardless of whether these individuals are employed by the registrant or third party, that relates to one or more items set forth in paragraph (b) of this Item, the registrant must briefly describe the nature of the waiver, the name of the person to whom the waiver was granted, and the date of the waiver.
The Registrant has adopted a code of ethics that applies to the Registrant’s principal executive officer and principal financial officer. There were no amendments to the code of ethics or waivers granted with respect to the code of ethics in the period covered by the report.
ITEM 3. AUDIT COMMITTEE FINANCIAL EXPERT.
(a) (1) Disclose that the registrant’s board of directors has determined that the registrant either:
(i) Has at least one audit committee financial expert serving on its audit committee; or
(ii) Does not have an audit committee financial expert serving on its audit committee.
The Registrant’s Board of Trustees has determined that the Registrant has at least one audit committee financial expert serving on its audit committee. The Securities and Exchange Commission has stated that the designation or identification of a person as an audit committee financial expert pursuant to this Item 3 of Form N-CSR does not impose on such person any duties, obligations or liabilities that are greater than the duties, obligations and liabilities imposed on such person as a member of the Audit Committee and the Board of Trustees in the absence of such designation or identification.
(2) If the registrant provides the disclosure required by paragraph (a)(1)(i) of this Item, it must disclose the name of the audit committee financial expert and whether that person is “independent.” In order to be considered “independent” for purposes of this Item, a member of an audit committee may not, other than in his or her capacity as a member of the audit committee, the board of directors, or any other board committee:
(i) Accept directly or indirectly any consulting, advisory, or other compensatory fee from the issuer; or
(ii) Be an “interested person” of the investment company as defined in Section 2(a)(19) of the Act (15 U.S.C. 80a-2(a)(19)).
Effective January 1, 2016, James Schonbachler replaced Mitchell Merin as the audit committee financial expert. He is not an “interested person” of the Registrant and is also “independent” as defined by the U.S. Securities and Exchange Commission for purposes of audit committee financial expert determinations.
(3) If the registrant provides the disclosure required by paragraph (a)(1)(ii) of this Item, it must explain why it does not have an audit committee financial expert.
Not applicable.
ITEM 4. PRINCIPAL ACCOUNTANT FEES AND SERVICES.
(a) Disclose, under the caption Audit Fees, the aggregate fees billed for each of the last two fiscal years for professional services rendered by the principal accountant for the audit of the registrant’s annual financial statements or services that are normally provided by the accountant in connection with statutory and regulatory filings or engagements for those fiscal years.
AUDIT FEES
2016 – $53,628
2015 – $45,128
(b) Disclose, under the caption Audit-Related Fees, the aggregate fees billed in each of the last two fiscal years for assurance and related services by the principal accountant that are reasonably related to the performance of the audit of the registrant’s financial statements and are not reported under paragraph (a) of this Item. Registrants shall describe the nature of the services comprising the fees disclosed under this category.
AUDIT-RELATED FEES
2016 – $5,780
2015 – $5,500
Audit-related fees consists of semi-annual financial statement reviews and security count procedures performed as required under Rule 17f-2 of the Investment Company Act of 1940 during the Registrant’s fiscal year.
(c) Disclose, under the caption Tax Fees, the aggregate fees billed in each of the last two fiscal years for professional services rendered by the principal accountant for tax compliance, tax advice, and tax planning. Registrants shall describe the nature of the services comprising the fees disclosed under this category.
TAX FEES
2016 – $13,722
2015 – $12,950
The tax fees consist of fees billed in connection with preparing the federal regulated investment company income tax returns for the Registrant for the tax years ended December 31, 2016 and 2015, respectively.
For the last fiscal year, no tax fees were required to be approved pursuant to paragraph (c)(7)(ii) of Rule 2-01 of Regulation S-X.
(d) Disclose, under the caption All Other Fees, the aggregate fees billed in each of the last two fiscal years for products and services provided by the principal accountant, other than the services reported in paragraphs (a) through (c) of this Item. Registrants shall describe the nature of the services comprising the fees disclosed under this category.
ALL OTHER FEES
2016 – Not applicable
2015 – Not applicable
(e) (1) Disclose the audit committee’s pre-approval policies and procedures described in paragraph (c)(7) of Rule 2-01 of Regulation S-X.
Pursuant to the Registrant’s Audit Committee Charter and written policies and procedures for the pre-approval of audit and non-audit services (the “Pre-approval Policy”), the Audit Committee pre-approves all audit and non-audit services performed by the Registrant’s independent public registered accounting firm for the Registrant. In addition, the Audit Committee pre-approves the auditor’s engagement for non-audit services with the Registrant’s investment adviser (not including a sub-adviser whose role is primarily portfolio management and is sub-contracted or overseen by another investment adviser) and any Service Affiliate in accordance with paragraph (c)(7)(ii) of Rule 2-01 of Regulation S-X, if the engagement relates directly to the operations and financial reporting of the Registrant. Proposed services may be pre-approved either 1) without consideration of specific case-by-case services or 2) require the specific pre-approval of the Audit Committee. Therefore, initially the Pre-approval Policy listed a number of audit and non-audit services that have
been approved by the Audit Committee, or which were not subject to pre-approval under the transition provisions of Sarbanes-Oxley Act of 2002 (the “Pre-approval List”). The Audit Committee annually reviews and pre-approves the services included on the Pre-approval List that may be provided by the independent public registered accounting firm without obtaining additional specific pre-approval of individual services from the Audit Committee. The Audit Committee adds to, or subtracts from, the list of general pre-approved services from time to time, based on subsequent determinations. All other audit and non-audit services not on the Pre-approval List must be specifically pre-approved by the Audit Committee.
One or more members of the Audit Committee may be appointed as the Committee’s delegate for the purposes of considering whether to approve such services. Any pre-approvals granted by the delegate will be reported, for informational purposes only, to the Audit Committee at its next scheduled meeting. The Audit Committee’s responsibilities to pre-approve services performed by the independent public registered accounting firm are not delegated to management.
(2) Disclose the percentage of services described in each of paragraphs (b) through (d) of this Item that were approved by the audit committee pursuant to paragraph (c)(7)(i)(C) of Rule 2-01 of Regulation S-X.
2016 – 0.0%
2015 – 0.0%
(f) If greater than 50 percent, disclose the percentage of hours expended on the principal accountant’s engagement to audit the registrant’s financial statements for the most recent fiscal year that were attributed to work performed by persons other than the principal accountant’s full-time, permanent employees.
Not applicable – Less than 50%.
(g) Disclose the aggregate non-audit fees billed by the registrant’s accountant for services rendered to the registrant, and rendered to the registrant’s investment adviser (not including any sub-adviser whose role is primarily portfolio management and is subcontracted with or overseen by another investment adviser), and any entity controlling, controlled by, or under common control with the adviser that provides ongoing services to the registrant for each of the last two fiscal years of the registrant.
The aggregate non-audit fees billed by the independent registered public accounting firm for services rendered to the Registrant, and rendered to Service Affiliates, for the last two calendar year ends were:
2016 – $29.2 million
2015 – $31.8 million
(h) Disclose whether the registrant’s audit committee of the board of directors has considered whether the provision of non-audit services that were rendered to the registrant’s investment adviser (not including any subadviser whose role is primarily portfolio management and is subcontracted with or overseen by another investment adviser), and any entity controlling, controlled by, or under common control with the investment adviser that provides ongoing services to the registrant that were not pre-approved pursuant to paragraph (c)(7)(ii) of Rule 2-01 of Regulation S-X is compatible with maintaining the principal accountant’s independence.
The Registrant’s Audit Committee has considered whether the provision of the non-audit services that were rendered to Service Affiliates that were not pre-approved (not requiring pre-approval) is compatible with maintaining the independent public registered accounting firm’s independence. All services provided by the independent public registered accounting firm to the Registrant or to Service Affiliates that were required to be pre-approved were pre-approved as required.
ITEM 5. AUDIT COMMITTEE OF LISTED REGISTRANTS.
(a) If the registrant is a listed issuer as defined in Rule 10A-3 under the Exchange Act (17CFR 240.10A-3), state whether or not the registrant has a separately-designated standing audit committee established in accordance with Section 3(a)(58)(A) of the Exchange Act (15 U.S.C. 78c(a)(58)(A)). If the registrant has such a committee, however designated, identify each committee member. If the entire board of directors is acting as the registrant’s audit committee as specified in Section 3(a)(58)(B) of the Exchange Act (15 U.S.C. 78c(a)(58)(B)), so state.
(b) If applicable, provide the disclosure required by Rule 10A-3(d) under the Exchange Act (17CFR 240.10A-3(d)) regarding an exemption from the listing standards for all audit committees.
Not applicable.
ITEM 6. SCHEDULE OF INVESTMENTS.
File Schedule I – Investments in securities of unaffiliated issuers as of the close of the reporting period as set forth in Section 210.12-12 of Regulation S-X, unless the schedule is included as part of the report to shareholders filed under Item 1 of this Form.
Included in Item 1.
ITEM 7. DISCLOSURE OF PROXY VOTING POLICIES AND PROCEDURES FOR CLOSED-END MANAGEMENT INVESTMENT COMPANIES.
A closed-end management investment company that is filing an annual report on this Form N-CSR must, unless it invests exclusively in non-voting securities, describe the policies and procedures that it uses to determine how to vote proxies relating to portfolio securities, including the procedures that the company uses when a vote presents a conflict between the interests of its shareholders, on the one hand, and those of the company’s investment adviser; principal underwriter; or any affiliated person (as defined in Section 2(a)(3) of the Investment Company Act of 1940 (15 U.S.C. 80a-2(a)(3)) and the rules thereunder) of the company, its investment adviser, or its principal underwriter, on the other. Include any policies and procedures of the company’s investment adviser, or any other third party, that the company uses, or that are used on the company’s behalf, to determine how to vote proxies relating to portfolio securities.
Not applicable.
ITEM 8. PORTFOLIO MANAGERS OF CLOSED-END MANAGEMENT INVESTMENT COMPANIES.
Not applicable.
ITEM 9. PURCHASE OF EQUITY SECURITIES BY CLOSED-END MANAGEMENT INVESTMENT COMPANY AND AFFILIATED PURCHASERS.
(a) If the registrant is a closed-end management investment company, provide the information specified in paragraph (b) of this Item with respect to any purchase made by or on behalf of the registrant or any “affiliated purchaser,” as defined in Rule 10b-18(a)(3) under the Exchange Act (17 CFR 240.10b-18(a)(3)), of shares or other units of any class of the registrant’s equity securities that is registered by the registrant pursuant to Section 12 of the Exchange Act (15 U.S.C. 781).
Not applicable.
ITEM 10. SUBMISSION OF MATTERS TO A VOTE OF SECURITY HOLDERS.
Describe any material changes to the procedures by which shareholders may recommend nominees to the registrant’s board of directors, where those changes were implemented after the registrant last provided disclosure in response to the requirements of Item 7(d)(2)(ii)(G) of Schedule 14A (17 CFR 240.14a-101), or this Item.
No material changes to report.
ITEM 11. CONTROLS AND PROCEDURES.
(a) Disclose the conclusions of the registrant’s principal executive and principal financial officers, or persons performing similar functions, regarding the effectiveness of the registrant’s disclosure controls and procedures (as defined in Rule 30a-3(c) under the Act (17 CFR 270.30a-3(c))) as of a date within 90 days of the filing date of the report that includes the disclosure required by this paragraph, based on the evaluation of these controls and procedures required by Rule 30a-3(b) under the Act (17 CFR 270.30a-3(b)) and Rules 13a-15(b) or 15d-15(b) under the Exchange Act (17 CFR 240.13a-15(b) or 240.15d-15(b)).
The Registrant’s principal executive and principal financial officers have concluded, based on their evaluation of the Registrant’s disclosure controls and procedures as of a date within 90 days of the filing date of this report, that the Registrant’s disclosure controls and procedures are reasonably designed to ensure that information required to be disclosed by the Registrant on Form N-CSR is recorded, processed, summarized and reported within the required time
periods and that information required to be disclosed by the Registrant in the reports that it files or submits on Form N-CSR is accumulated and communicated to the Registrant’s management, including its principal executive and principal financial officers, as appropriate to allow timely decisions regarding required disclosure.
(b) Disclose any change in the registrant’s internal control over financial reporting (as defined in Rule 30a-3(d) under the Act (17 CFR 270.30a-3(d)) that occurred during the registrant’s second fiscal quarter of the period covered by this report that has materially affected, or is reasonably likely to materially affect, the registrant’s internal control over financial reporting.
There were no changes in the Registrant’s internal control over financial reporting that occurred during the last fiscal quarter covered by this report that have materially affected, or are reasonably likely to materially affect, the Registrant’s internal control over financial reporting.
ITEM 12. EXHIBITS.
(a) File the exhibits listed below as part of this Form. Letter or number the exhibits in the sequence indicated.
(a)(1) Any code of ethics, or amendment thereto, that is the subject of the disclosure required by Item 2, to the extent that the registrant intends to satisfy the Item 2 requirements through filing of an exhibit.
Code of Ethics applicable to its Principal Executive and Principal Financial Officers pursuant to Section 406 of the Sarbanes-Oxley Act of 2002 attached hereto.
(a)(2) A separate certification for each principal executive officer and principal financial officer of the registrant as required by Rule 30a-2(a) under the Act (17 CFR 270.30a-2).
Certifications pursuant to Rule 30a-2(a) under the Investment Company Act of 1940 are attached hereto.
(a)(3) Any written solicitation to purchase securities under Rule 23c-1 under the Act (17 CFR 270.23c-1) sent or given during the period covered by the report by or on behalf of the registrant to 10 or more persons.
Not applicable.
(b) A separate or combined certification for each principal executive officer and principal officer of the registrant as required by Rule 30a-2(b) under the Act of 1940.
Certifications pursuant to Rule 30a-2(b) under the Investment Company Act of 1940 are attached hereto.
SIGNATURES
Pursuant to the requirements of the Securities Exchange Act of 1934 and the Investment Company Act of 1940, the registrant has duly caused this report to be signed on its behalf by the undersigned, thereunto duly authorized.
| | |
| JPMorgan Trust I |
| |
| By: | | /s/ Brian S. Shlissel |
| | Brian S. Shlissel |
| | President and Principal Executive Officer |
| | March 3, 2017 |
Pursuant to the requirements of the Securities Exchange Act of 1934 and the Investment Company Act of 1940, this report has been signed below by the following persons on behalf of the registrant and in the capacities and on the dates indicated.
| | |
| |
| By: | | /s/ Brian S. Shlissel |
| | Brian S. Shlissel |
| | President and Principal Executive Officer |
| | March 3, 2017 |
| |
| By: | | /s/ Laura M. Del Prato |
| | Laura M. Del Prato |
| | Treasurer and Principal Financial Officer |
| | March 3, 2017 |