UNITED STATES
SECURITIES AND EXCHANGE COMMISSION
Washington, D.C. 20549
FORM N-CSR
CERTIFIED SHAREHOLDER REPORT OF REGISTERED
MANAGEMENT INVESTMENT COMPANIES
Investment Company Act file number: 811-21295
JPMorgan Trust I
(Exact name of registrant as specified in charter)
277 Park Avenue
New York, NY 10172
(Address of principal executive offices) (Zip code)
Gregory S. Samuels
277 Park Avenue
New York, NY 10172
(Name and Address of Agent for Service)
Registrant’s telephone number, including area code: (800) 480-4111
Date of fiscal year end: October 31
Date of reporting period: November 1, 2021 through April 30, 2022
Form N-CSR is to be used by management investment companies to file reports with the Commission not later than 10 days after the transmission to stockholders of any report that is required to be transmitted to stockholders under Rule 30e-1 under the Investment Company Act of 1940 (17 CFR 270.30e-1). The Commission may use the information provided on Form N-CSR in its regulatory, disclosure review, inspection, and policymaking roles.
A registrant is required to disclose the information specified by Form N-CSR, and the Commission will make this information public. A registrant is not required to respond to the collection of information contained in Form N-CSR unless the Form displays a currently valid Office of Management and Budget (“OMB”) control number. Please direct comments concerning the accuracy of the information collection burden estimate and any suggestions for reducing the burden to Secretary, Securities and Exchange Commission, 450 Fifth Street, NW, Washington, DC 20549-0609. The OMB has reviewed this collection of information under the clearance requirements of 44 U.S.C. Section 3507.
ITEM 1. REPORTS TO STOCKHOLDERS.
a.) The following is a copy of the report transmitted to shareholders pursuant to Rule 30e-1 under the Investment Company Act of 1940 (17 CFR 270.30e-1).
b.) A copy of the notice transmitted to shareholders in reliance on Rule 30e-3 under the 1940 Act that contains disclosures specified by paragraph (c)(3) of that rule is included in the Annual Report. Not Applicable. Notices do not incorporate disclosures from the shareholder reports.
| JPMorgan Macro Opportunities Fund |
| JPMorgan Opportunistic Equity Long/Short Fund |
| JPMorgan Research Market Neutral Fund |

| 1 | |
| 2 | |
| Fund Commentaries: | |
| 3 | |
| 6 | |
| 9 | |
| 12 | |
| 26 | |
| 34 | |
| 42 | |
| 58 | |
| 60 |
 | “The market environment remains challenging; investors should recognize the risks in trying to time market movements, as well as the potential long-term benefits of portfolio diversification.” — Andrea L. Lisher |

Head of Americas, Client
J.P. Morgan Asset Management
| April 30, 2022 | J.P. Morgan Specialty Funds | 1 |
| 2 | J.P. Morgan Specialty Funds | April 30, 2022 |
| REPORTING PERIOD RETURN: | |
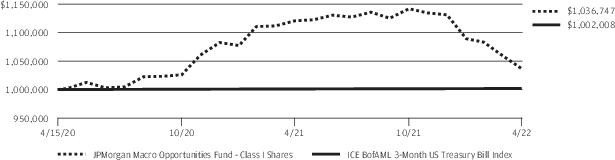
Fund (Class I Shares) * | (9.22)% |
ICE BofAML 3-Month US Treasury Bill Index | 0.07% |
Net Assets as of 4/30/2022 (In Thousands) | $18,222 |
| April 30, 2022 | J.P. Morgan Specialty Funds | 3 |
| TOP TEN HOLDINGS OF THE PORTFOLIO AS OF April 30, 2022 | PERCENT OF TOTAL INVESTMENTS | ||
| 1. | HDFC Bank Ltd.,ADR (India) | 3.0% | |
| 2. | Thermo Fisher Scientific, Inc. | 2.8 | |
| 3. | Microsoft Corp. | 2.7 | |
| 4. | Alphabet, Inc., Class A | 2.3 | |
| 5. | Amazon.com, Inc. | 2.2 | |
| 6. | Mastercard, Inc., Class A | 2.0 | |
| 7. | LVMH Moet Hennessy Louis Vuitton SE (France) | 1.7 | |
| 8. | ServiceNow, Inc. | 1.7 | |
| 9. | Lululemon Athletica, Inc. | 1.7 | |
| 10. | NIKE, Inc., Class B | 1.7 | |
| PORTFOLIO COMPOSTION BY SECTOR AS OF April 30, 2022 | PERCENT OF TOTAL INVESTMENTS | |
Information Technology | 12.9% | |
Financials | 11.0 | |
Consumer Discretionary | 7.4 | |
Health Care | 6.3 | |
Communication Services | 2.3 | |
Consumer Staples | 1.4 | |
Industrials | 1.3 | |
Utilities | 1.1 | |
Others | 1.3 | |
Short-Term Investments | 55.0 |
| * | The return shown is based on net asset values calculated for shareholder transactions and may differ from the return shown in the financial highlights, which reflects adjustments made to the net asset values in accordance with accounting principles generally accepted in the United States of America. |
| ** | The adviser seeks to achieve the Fund’s objective. There can be no guarantee it will be achieved. |
| 4 | J.P. Morgan Specialty Funds | April 30, 2022 |
| INCEPTION DATE OF CLASS | 6 MONTH* | 1 YEAR | SINCE INCEPTION | ||||
| CLASS A SHARES | April 15, 2020 | ||||||
| With Sales Charge ** | (14.13)% | (12.58)% | (1.14)% | ||||
| Without Sales Charge | (9.35) | (7.73) | 1.51 | ||||
| CLASS C SHARES | April 15, 2020 | ||||||
| With CDSC *** | (10.56) | (9.20) | 1.01 | ||||
| Without CDSC | (9.56) | (8.20) | 1.01 | ||||
| Class I SHARES | April 15, 2020 | (9.22) | (7.49) | 1.78 | |||
| Class R6 SHARES | September 30, 2020 | (9.15) | (7.26) | 1.96 |
| * | Not annualized. |
| ** | Sales Charge for Class A Shares is 5.25%. |
| *** | Assumes a 1% CDSC (contingent deferred sales charge) for the 6 month and one year periods and 0% CDSC thereafter. |
| April 30, 2022 | J.P. Morgan Specialty Funds | 5 |
| REPORTING PERIOD RETURN: | |
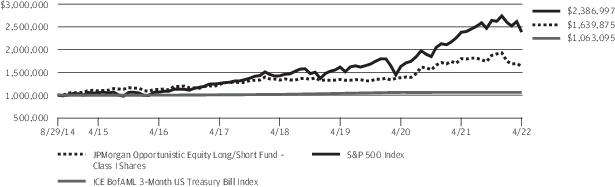
Fund (Class I Shares) * | (12.51)% |
S&P 500 Index | (9.65)% |
ICE BofAML 3-Month US Treasury Bill Index | 0.07% |
Net Assets as of 4/30/2022 (In Thousands) | $615,906 |
| 6 | J.P. Morgan Specialty Funds | April 30, 2022 |
| TOP TEN LONG POSITIONS OF THE PORTFOLIO AS OF April 30, 2022 | PERCENT OF TOTAL INVESTMENTS | ||
| 1. | Target Corp. | 6.7% | |
| 2. | Zimmer Biomet Holdings, Inc. | 5.7 | |
| 3. | Tesla, Inc. | 5.4 | |
| 4. | NXP Semiconductors NV (China) | 4.7 | |
| 5. | PACCAR, Inc. | 4.4 | |
| 6. | Centene Corp. | 4.4 | |
| 7. | Old Dominion Freight Line, Inc. | 4.1 | |
| 8. | UnitedHealth Group, Inc. | 4.0 | |
| 9. | Dollar General Corp. | 3.2 | |
| 10. | Advanced Micro Devices, Inc. | 3.2 | |
| TOP TEN SHORT POSITIONS OF THE PORTFOLIO AS OF April 30, 2022 | PERCENT OF TOTAL INVESTMENTS | ||
| 1. | Kimberly-Clark Corp. | 26.8% | |
| 2. | 3M Co. | 16.2 | |
| 3. | SPDR S&P 500 ETF Trust | 13.5 | |
| 4. | SoFi Technologies, Inc. | 7.8 | |
| 5. | Apple, Inc. | 7.5 | |
| 6. | Johnson Controls International plc | 7.2 | |
| 7. | Altria Group, Inc. | 7.1 | |
| 8. | Wynn Resorts Ltd. | 7.0 | |
| 9. | Conagra Brands, Inc. | 2.9 | |
| 10. | ManpowerGroup, Inc. | 2.1 | |
| LONG POSITION PORTFOLIO COMPOSITION BY SECTOR AS OF April 30, 2022 | PERCENT OF TOTAL INVESTMENTS | |
Consumer Discretionary | 19.0% | |
Health Care | 14.0 | |
Information Technology | 10.3 | |
Industrials | 9.8 | |
Financials | 1.9 | |
Utilities | 1.6 | |
Real Estate | 1.4 | |
Exchange-Traded Fund | 1.0 | |
Communication Services | 0.6 | |
Short-Term Investments | 40.4 |
| SHORT POSITION PORTFOLIO COMPOSITION BY SECTOR AS OF April 30, 2022 | PERCENT OF TOTAL INVESTMENTS | |
Consumer Staples | 38.2% | |
Industrials | 25.5 | |
Exchange-Traded Fund | 13.5 | |
Financials | 8.2 | |
Information Technology | 7.5 | |
Consumer Discretionary | 7.1 |
| * | The return shown is based on net asset values calculated for shareholder transactions and may differ from the return shown in the financial highlights, which reflects adjustments made to the net asset values in accordance with accounting principles generally accepted in the United States of America. |
| ** | The adviser seeks to achieve the Fund’s objective. There can be no guarantee it will be achieved. |
| April 30, 2022 | J.P. Morgan Specialty Funds | 7 |
| INCEPTION DATE OF CLASS | 6 MONTH* | 1 YEAR | 5 YEAR | SINCE INCEPTION | |||||
| CLASS A SHARES | August 29, 2014 | ||||||||
| With Sales Charge ** | (17.21)% | (14.00)% | 4.40% | 5.65% | |||||
| Without Sales Charge | (12.62) | (9.24) | 5.53 | 6.40 | |||||
| CLASS C SHARES | August 29, 2014 | ||||||||
| With CDSC *** | (13.83) | (10.69) | 5.01 | 5.87 | |||||
| Without CDSC | (12.83) | (9.69) | 5.01 | 5.87 | |||||
| Class I SHARES | August 29, 2014 | (12.51) | (9.03) | 5.80 | 6.66 | ||||
| Class R6 SHARES | August 29, 2014 | (12.38) | (8.80) | 6.07 | 6.93 |
| * | Not annualized. |
| ** | Sales Charge for Class A Shares is 5.25%. |
| *** | Assumes a 1% CDSC (contingent deferred sales charge) for the 6 month and one year periods and 0% CDSC thereafter. |
| 8 | J.P. Morgan Specialty Funds | April 30, 2022 |
| REPORTING PERIOD RETURN: | |
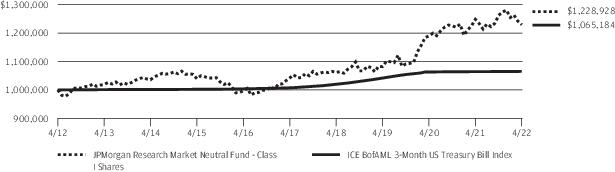
Fund (Class I Shares) * | (2.64)% |
ICE BofAML 3-Month US Treasury Bill Index | 0.07% |
Net Assets as of 4/30/2022 (In Thousands) | $124,347 |
| April 30, 2022 | J.P. Morgan Specialty Funds | 9 |
| TOP TEN LONG POSITIONS OF THE PORTFOLIO AS OF April 30, 2022 | PERCENT OF TOTAL INVESTMENTS | ||
| 1. | Mastercard, Inc., Class A | 2.5% | |
| 2. | NXP Semiconductors NV (China) | 2.0 | |
| 3. | Amazon.com, Inc. | 1.4 | |
| 4. | Diamondback Energy, Inc. | 1.4 | |
| 5. | Deere & Co. | 1.2 | |
| 6. | AbbVie, Inc. | 1.2 | |
| 7. | Exelon Corp. | 1.1 | |
| 8. | Wells Fargo & Co. | 1.0 | |
| 9. | Advanced Micro Devices, Inc. | 1.0 | |
| 10. | FleetCor Technologies, Inc. | 1.0 | |
| TOP TEN SHORT POSITIONS OF THE PORTFOLIO AS OF April 30, 2022 | PERCENT OF TOTAL INVESTMENTS | ||
| 1. | Kroger Co. (The) | 3.3% | |
| 2. | Omnicom Group, Inc. | 3.1 | |
| 3. | 3M Co. | 2.3 | |
| 4. | Enbridge, Inc. | 2.2 | |
| 5. | Paramount Global, Class B | 2.1 | |
| 6. | Intel Corp. | 1.9 | |
| 7. | Walmart, Inc. | 1.8 | |
| 8. | Apple, Inc. | 1.8 | |
| 9. | NetApp, Inc. | 1.6 | |
| 10. | Cisco Systems, Inc. | 1.6 | |
| LONG POSITION PORTFOLIO COMPOSITION BY SECTOR AS OF April 30, 2022 | PERCENT OF TOTAL INVESTMENTS | |
Information Technology | 13.4% | |
Industrials | 11.7 | |
Health Care | 9.9 | |
Consumer Discretionary | 8.0 | |
Financials | 6.2 | |
Energy | 4.7 | |
Communication Services | 4.5 | |
Utilities | 3.8 | |
Real Estate | 2.3 | |
Consumer Staples | 2.2 | |
Materials | 1.9 | |
Short-Term Investments | 31.4 |
| SHORT POSITION PORTFOLIO COMPOSITION BY SECTOR AS OF April 30, 2022 | PERCENT OF TOTAL INVESTMENTS | |
Information Technology | 16.8% | |
Industrials | 16.4 | |
Health Care | 11.3 | |
Financials | 10.9 | |
Consumer Staples | 10.2 | |
Communication Services | 9.9 | |
Energy | 5.9 | |
Utilities | 5.8 | |
Consumer Discretionary | 5.7 | |
Real Estate | 4.4 | |
Materials | 2.7 |
| * | The return shown is based on net asset values calculated for shareholder transactions and may differ from the return shown in the financial highlights, which reflects adjustments made to the net asset values in accordance with accounting principles generally accepted in the United States of America. |
| ** | The adviser seeks to achieve the Fund’s objective. There can be no guarantee it will be achieved. |
| 10 | J.P. Morgan Specialty Funds | April 30, 2022 |
| INCEPTION DATE OF CLASS | 6 MONTH* | 1 YEAR | 5 YEAR | 10 YEAR | |||||
| CLASS A SHARES | February 28, 2002 | ||||||||
| With Sales Charge ** | (7.86)% | (6.94)% | 1.97% | 1.27% | |||||
| Without Sales Charge | (2.74) | (1.79) | 3.08 | 1.82 | |||||
| CLASS C SHARES | November 2, 2009 | ||||||||
| With CDSC *** | (3.98) | (3.18) | 2.58 | 1.41 | |||||
| Without CDSC | (2.98) | (2.18) | 2.58 | 1.41 | |||||
| Class I SHARES | November 2, 2009 | (2.64) | (1.52) | 3.35 | 2.08 |
| * | Not annualized. |
| ** | Sales Charge for Class A Shares is 5.25%. |
| *** | Assumes a 1% CDSC (contingent deferred sales charge) for the 6 month and one year periods and 0% CDSC thereafter. |
| April 30, 2022 | J.P. Morgan Specialty Funds | 11 |
| INVESTMENTS | SHARES (000) | VALUE ($000) |
| Common Stocks — 34.3% | ||
| Banks — 6.4% | ||
| Bank Central Asia Tbk. PT (Indonesia) | 102 | 58 |
| Bank Mandiri Persero Tbk. PT (Indonesia) | 139 | 85 |
| Bank Negara Indonesia Persero Tbk. PT (Indonesia) | 68 | 43 |
| Bank Rakyat Indonesia Persero Tbk. PT (Indonesia) | 519 | 173 |
| East West Bancorp, Inc. | 1 | 88 |
| First Republic Bank | 1 | 104 |
| HDFC Bank Ltd., ADR (India) | 8 | 435 |
| Signature Bank | 1 | 172 |
| 1,158 | ||
| Building Products — 1.0% | ||
| Allegion plc | 2 | 191 |
| Electric Utilities — 0.9% | ||
| Orsted A/S (Denmark) (a) | 1 | 163 |
| Electronic Equipment, Instruments & Components — 1.1% | ||
| Keyence Corp. (Japan) | 1 | 201 |
| Insurance — 2.3% | ||
| AIA Group Ltd. (Hong Kong) | 24 | 236 |
| Arthur J Gallagher & Co. | 1 | 175 |
| 411 | ||
| Interactive Media & Services — 1.8% | ||
| Alphabet, Inc., Class A * | — | 335 |
| Internet & Direct Marketing Retail — 1.7% | ||
| Amazon.com, Inc. * | — | 316 |
| IT Services — 2.0% | ||
| Mastercard, Inc., Class A | 1 | 280 |
| PayPal Holdings, Inc. * | 1 | 86 |
| 366 | ||
| Life Sciences Tools & Services — 2.2% | ||
| Thermo Fisher Scientific, Inc. | 1 | 396 |
| Personal Products — 1.1% | ||
| Estee Lauder Cos., Inc. (The), Class A | 1 | 193 |
| Pharmaceuticals — 2.8% | ||
| AstraZeneca plc (United Kingdom) | 1 | 132 |
| Eli Lilly & Co. | 1 | 230 |
| Novo Nordisk A/S, Class B (Denmark) | 1 | 147 |
| 509 | ||
| Semiconductors & Semiconductor Equipment — 0.4% | ||
| NVIDIA Corp. | — | 74 |
| INVESTMENTS | SHARES (000) | VALUE ($000) |
| Software — 6.6% | ||
| Adobe, Inc. * | 1 | 219 |
| Atlassian Corp. plc, Class A* | — | 136 |
| Microsoft Corp. | 1 | 386 |
| Salesforce, Inc. * | 1 | 221 |
| ServiceNow, Inc. * | 1 | 244 |
| 1,206 | ||
| Textiles, Apparel & Luxury Goods — 4.0% | ||
| Lululemon Athletica, Inc. * | 1 | 244 |
| LVMH Moet Hennessy Louis Vuitton SE (France) | — | 248 |
| NIKE, Inc., Class B | 2 | 242 |
| 734 | ||
| Total Common Stocks (Cost $5,724) | 6,253 | |
| PRINCIPAL AMOUNT ($000) | ||
| Foreign Government Securities — 0.6% | ||
| Romania Government Bond | ||
| 2.75%, 2/26/2026 (a) | EUR 60 | 63 |
| 3.62%, 5/26/2030 (a) | EUR 58 | 55 |
| Total Foreign Government Securities (Cost $149) | 118 | |
| NO. OF CONTRACTS | ||
| Options Purchased — 0.4% | ||
| Call Options Purchased — 0.1% | ||
| Banks — 0.1% | ||
| Standard Chartered plc (United Kingdom) | ||
| 5/20/2022 at GBP 520.00, American Style | ||
| Notional Amount: GBP 60 | ||
| Counterparty: Exchange-Traded * | GBP 11 | 5 |
| Wells Fargo & Co. | ||
| 6/17/2022 at USD 52.50, American Style | ||
| Notional Amount: USD 96 | ||
| Counterparty: Exchange-Traded * | 22 | 1 |
| 6 | ||
| 12 | J.P. Morgan Specialty Funds | April 30, 2022 |
| INVESTMENTS | NO. OF CONTRACTS | VALUE ($000) |
| Call Options Purchased — continued | ||
| Foreign Exchange Currency Options — 0.0% ^ | ||
| Foreign Exchange EUR / USD (European Union) | ||
| 5/5/2022 at EUR 1.15, Vanilla, European Style | ||
| Notional Amount: EUR 1,149 | ||
| Counterparty: Barclays Bank plc * | EUR 1,149,000 | — |
| 5/5/2022 at EUR 1.19, Vanilla, European Style | ||
| Notional Amount: EUR 575 | ||
| Counterparty: Barclays Bank plc * | EUR 575,000 | —(b) |
| 5/5/2022 at EUR 1.19, Vanilla, European Style | ||
| Notional Amount: EUR 574 | ||
| Counterparty: Barclays Bank plc * | EUR 574,000 | —(b) |
| 5/5/2022 at EUR 1.19, Vanilla, European Style | ||
| Notional Amount: EUR 575 | ||
| Counterparty: Barclays Bank plc * | EUR 575,000 | —(b) |
| — | ||
| Total Call Options Purchased | 6 | |
| Put Options Purchased — 0.3% | ||
| Foreign Exchange Currency Options — 0.1% | ||
| Foreign Exchange USD / JPY | ||
| 10/26/2022 at USD 123.00, Vanilla, European Style | ||
| Notional Amount: USD 1,841 | ||
| Counterparty: Goldman Sachs International * | 1,841,000 | 25 |
| Index Funds — 0.2% | ||
| S&P 500 Index | ||
| 5/6/2022 at USD 4,150.00, European Style | ||
| Notional Amount: USD 1,653 | ||
| Counterparty: Exchange-Traded * | 4 | 33 |
| Total Put Options Purchased | 58 | |
| Total Options Purchased (Cost $93) | 64 | |
| PRINCIPAL AMOUNT ($000) | ||
| Short Term Investments — 43.1% | ||
| Foreign Government Treasury Bills — 23.1% | ||
| German Treasury Bills (Germany) | ||
| (0.74)%, 5/18/2022 (a) (c) | EUR 254 | 269 |
| INVESTMENTS | PRINCIPAL AMOUNT ($000) | VALUE ($000) |
| Foreign Government Treasury Bills — continued | ||
| (0.67)%, 6/22/2022 (a) (c) | EUR 841 | 888 |
| (0.68)%, 7/20/2022 (a) (c) | EUR 831 | 878 |
| Japan Treasury Bills (Japan) | ||
| (0.08)%, 6/6/2022 (c) | JPY 107,700 | 830 |
| (0.14)%, 7/25/2022 (c) | JPY 115,400 | 889 |
| (0.25)%, 8/1/2022 (c) | JPY 59,050 | 455 |
| Total Foreign Government Treasury Bills (Cost $4,438) | 4,209 | |
| SHARES (000) | ||
| Investment Companies — 20.0% | ||
| JPMorgan Prime Money Market Fund Class IM Shares, 0.42% (d) (e) (Cost $3,640) | 3,639 | 3,639 |
| Total Short Term Investments (Cost $8,078) | 7,848 | |
| Total Investments — 78.4% (Cost $14,044) | 14,283 | |
| Other Assets Less Liabilities — 21.6% | 3,939 | |
| NET ASSETS — 100.0% | 18,222 | |
Percentages indicated are based on net assets. | ||
Amounts presented as a dash (“-“) represent amounts that round to less than a thousand. | ||
| Abbreviations | |
| ADR | American Depositary Receipt |
| EUR | Euro |
| GBP | British Pound |
| JPY | Japanese Yen |
| PT | Limited liability company |
| USD | United States Dollar |
| ^ | Amount rounds to less than 0.1% of net assets. | |
| * | Non-income producing security. | |
| (a) | Security exempt from registration pursuant to Regulation S under the Securities Act of 1933, as amended. Regulation S applies to securities offerings that are made outside of the United States and do not involve direct selling efforts in the United States and as such may have restrictions on resale. | |
| (b) | Value is zero. | |
| (c) | The rate shown is the effective yield as of April 30, 2022. | |
| April 30, 2022 | J.P. Morgan Specialty Funds | 13 |
| (d) | Investment in an affiliated fund, which is registered under the Investment Company Act of 1940, as amended, and is advised by J.P. Morgan Investment Management Inc. | |
| (e) | The rate shown is the current yield as of April 30, 2022. |
| DESCRIPTION | NUMBER OF CONTRACTS | EXPIRATION DATE | TRADING CURRENCY | NOTIONAL AMOUNT ($) | VALUE AND UNREALIZED APPRECIATION (DEPRECIATION) ($) |
| Long Contracts | |||||
| Euro-Bund | 6 | 06/08/2022 | EUR | 973 | (29) |
| NASDAQ 100 E-Mini Index | 2 | 06/17/2022 | USD | 514 | (54) |
| STOXX Europe 600 Health Care Index | 6 | 06/17/2022 | EUR | 339 | 13 |
| STOXX 600 Insurance Index | 11 | 06/17/2022 | EUR | 179 | (1) |
| STOXX Europe 600 Utilities Equity Index | 13 | 06/17/2022 | EUR | 271 | 11 |
| XAU Utilities Index | 2 | 06/17/2022 | USD | 143 | 3 |
| XAV Health Care Index | 2 | 06/17/2022 | USD | 263 | 2 |
| (55) | |||||
| Short Contracts | |||||
| Euro-Bobl | (14) | 06/08/2022 | EUR | (1,879) | 22 |
| EURO STOXX 50 Index | (23) | 06/17/2022 | EUR | (893) | 37 |
| MSCI Emerging Markets E-Mini Index | (3) | 06/17/2022 | USD | (158) | 9 |
| S&P 500 E-Mini Index | (6) | 06/17/2022 | USD | (1,239) | 92 |
| STOXX 600 Banks Index | (63) | 06/17/2022 | EUR | (428) | 5 |
| U.S. Treasury 10 Year Note | (1) | 06/21/2022 | USD | (119) | 8 |
| 173 | |||||
| 118 |
| Abbreviations | |
| EUR | Euro |
| MSCI | Morgan Stanley Capital International |
| NASDAQ | National Assosiation of Securities Dealers Automate Quotation |
| USD | United States Dollar |
| 14 | J.P. Morgan Specialty Funds | April 30, 2022 |
| CURRENCY PURCHASED | CURRENCY SOLD | COUNTERPARTY | SETTLEMENT DATE | UNREALIZED APPRECIATION (DEPRECIATION ($) | ||
| USD | 727 | CNY | 4,799 | HSBC Bank, NA** | 5/24/2022 | 3 |
| USD | 177 | COP | 703,288 | BNP Paribas** | 5/24/2022 | —(a) |
| USD | 484 | DKK | 3,296 | BNP Paribas | 5/24/2022 | 16 |
| USD | 262 | HKD | 2,055 | Barclays Bank plc | 5/24/2022 | —(a) |
| USD | 45 | IDR | 650,899 | Bank of America NA** | 5/24/2022 | —(a) |
| USD | 1,099 | INR | 84,043 | BNP Paribas** | 5/24/2022 | 4 |
| USD | 729 | TWD | 21,082 | BNP Paribas** | 5/24/2022 | 12 |
| USD | 1,278 | ZAR | 18,843 | Goldman Sachs International | 5/24/2022 | 88 |
| GBP | 77 | USD | 96 | Goldman Sachs International | 7/25/2022 | 1 |
| USD | 1,452 | AUD | 1,965 | Goldman Sachs International | 7/25/2022 | 61 |
| USD | 3,460 | EUR | 3,160 | Goldman Sachs International | 7/25/2022 | 112 |
| USD | 251 | GBP | 191 | Goldman Sachs International | 7/25/2022 | 11 |
| USD | 2,434 | JPY | 307,559 | Goldman Sachs International | 7/25/2022 | 56 |
| Total unrealized appreciation | 364 | |||||
| CNY | 4,732 | USD | 739 | Citibank, NA** | 5/24/2022 | (26) |
| DKK | 300 | USD | 44 | BNP Paribas | 5/24/2022 | (1) |
| DKK | 430 | USD | 64 | Merrill Lynch International | 5/24/2022 | (2) |
| DKK | 250 | USD | 36 | State Street Corp. | 5/24/2022 | (1) |
| IDR | 3,383,574 | USD | 235 | Standard Chartered Bank** | 5/24/2022 | (3) |
| INR | 5,509 | USD | 72 | Bank of America NA** | 5/24/2022 | —(a) |
| INR | 4,059 | USD | 53 | Citibank, NA** | 5/24/2022 | —(a) |
| KRW | 32,676 | USD | 27 | Barclays Bank plc** | 5/24/2022 | (1) |
| MXN | 3,739 | USD | 183 | Goldman Sachs International | 5/24/2022 | (1) |
| TWD | 21,522 | USD | 736 | HSBC Bank, NA** | 5/24/2022 | (4) |
| ZAR | 1,433 | USD | 93 | Goldman Sachs International | 5/24/2022 | (3) |
| ZAR | 2,688 | USD | 185 | HSBC Bank, NA | 5/24/2022 | (15) |
| ZAR | 3,392 | USD | 229 | Merrill Lynch International | 5/24/2022 | (16) |
| EUR | 756 | USD | 823 | Goldman Sachs International | 7/25/2022 | (21) |
| JPY | 175,822 | USD | 1,379 | Goldman Sachs International | 7/25/2022 | (19) |
| USD | 1,379 | JPY | 179,429 | Goldman Sachs International | 7/25/2022 | (8) |
| Total unrealized depreciation | (121) | |||||
| Net unrealized appreciation | 243 | |||||
| Abbreviations | |
| AUD | Australian Dollar |
| CNY | China Yuan |
| COP | Columbian Peso |
| DKK | Danish Krone |
| EUR | Euro |
| GBP | British Pound |
| HKD | Hong Kong Dollar |
| IDR | Indonesian Rupiah |
| INR | Indian Rupee |
| JPY | Japanese Yen |
| KRW | Korean Republic Won |
| MXN | Mexican Peso |
| TWD | Taiwan Dollar |
| April 30, 2022 | J.P. Morgan Specialty Funds | 15 |
| USD | United States Dollar |
| ZAR | South African Rand |
| (a) | Amount rounds to less than one thousand. |
| ** | Non-deliverable forward. |
| Written Call Options Contracts as of April 30, 2022 (amounts in thousands, except number of contracts): | ||||||
| DESCRIPTION | COUNTERPARTY | NUMBER OF CONTRACTS | NOTIONAL AMOUNT | EXERCISE PRICE | EXPIRATION DATE | VALUE ($) |
| Foreign Exchange EUR / USD | Barclays Bank plc | 1,724,000 | EUR 1,724 | EUR 1.19 | 5/05/2022 | —(a) |
| Foreign Exchange EUR / USD | Barclays Bank plc | 1,149,000 | EUR 1,149 | EUR 1.15 | 5/05/2022 | —(a) |
| Total Written Options Contracts | —(a) | |||||
| Written Put Options Contracts as of April 30, 2022 (amounts in thousands, except number of contracts): | ||||||
| DESCRIPTION | COUNTERPARTY | NUMBER OF CONTRACTS | NOTIONAL AMOUNT | EXERCISE PRICE | EXPIRATION DATE | VALUE ($) |
| Foreign Exchange USD / JPY | Goldman Sachs International | 1,841,000 | USD 1,841 | USD 120.00 | 10/26/2022 | (16) |
| Total Written Options Contracts (Premiums Received $32) | (16) | |||||
| (a) | Amount rounds to less than one thousand. |
| Abbreviations | |
| EUR | Euro |
| JPY | Japanese Yen |
| USD | United States Dollar |
| 16 | J.P. Morgan Specialty Funds | April 30, 2022 |
| INVESTMENTS | SHARES (000) | VALUE ($000) |
| Long Positions — 102.1% | ||
| Common Stocks — 59.9% | ||
| Automobiles — 6.0% | ||
| Ferrari NV (Italy) | 15 | 3,150 |
| Tesla, Inc. * (a) | 39 | 33,988 |
| 37,138 | ||
| Diversified Financial Services — 2.0% | ||
| Berkshire Hathaway, Inc., Class B * (a) | 37 | 12,091 |
| Electric Utilities — 1.6% | ||
| Exelon Corp. | 215 | 10,079 |
| Equity Real Estate Investment Trusts (REITs) — 1.4% | ||
| Welltower, Inc. | 95 | 8,584 |
| Health Care Equipment & Supplies — 5.8% | ||
| Zimmer Biomet Holdings, Inc. (a) | 297 | 35,836 |
| Health Care Providers & Services — 8.5% | ||
| Centene Corp. * (a) | 342 | 27,530 |
| UnitedHealth Group, Inc. (a) | 49 | 24,942 |
| 52,472 | ||
| Interactive Media & Services — 0.7% | ||
| Alphabet, Inc., Class A * | 2 | 4,062 |
| Machinery — 4.5% | ||
| PACCAR, Inc. (a) | 335 | 27,790 |
| Multiline Retail — 10.1% | ||
| Dollar General Corp. | 85 | 20,129 |
| Target Corp. | 185 | 42,279 |
| 62,408 | ||
| Road & Rail — 5.5% | ||
| Old Dominion Freight Line, Inc. (a) | 93 | 25,862 |
| Union Pacific Corp. (a) | 33 | 7,793 |
| 33,655 | ||
| Semiconductors & Semiconductor Equipment — 8.1% | ||
| Advanced Micro Devices, Inc. * | 233 | 19,899 |
| NXP Semiconductors NV (China) | 173 | 29,654 |
| 49,553 | ||
| Software — 2.4% | ||
| Microsoft Corp. (a) | 53 | 14,829 |
| Specialty Retail — 3.2% | ||
| O'Reilly Automotive, Inc. * (a) | 33 | 19,809 |
| INVESTMENTS | SHARES (000) | VALUE ($000) |
| Technology Hardware, Storage & Peripherals — 0.1% | ||
| Seagate Technology Holdings plc | 7 | 617 |
| Total Common Stocks (Cost $368,112) | 368,923 | |
| Exchange-Traded Funds — 1.0% | ||
| U.S. Equity — 1.0% | ||
| Invesco Trust (Cost $6,126) | 19 | 5,981 |
| Short-Term Investments — 41.2% | ||
| Investment Companies — 41.2% | ||
| JPMorgan Prime Money Market Fund Class Institutional Shares, 0.36% (b) (c)(Cost $253,878) | 253,821 | 253,872 |
| Total Long Positions (Cost $628,116) | 628,776 | |
| Short Positions — (21.8)% | ||
| Common Stocks — (18.8)% | ||
| Automobiles — (0.0)% ^ | ||
| Rivian Automotive, Inc., Class A * | (2) | (62) |
| Building Products — (1.6)% | ||
| Johnson Controls International plc | (161) | (9,649) |
| Consumer Finance — (1.8)% | ||
| SoFi Technologies, Inc. * | (1,702) | (10,416) |
| Upstart Holdings, Inc. * | (7) | (543) |
| (10,959) | ||
| Food Products — (0.9)% | ||
| Conagra Brands, Inc. | (110) | (3,856) |
| Kellogg Co. | (27) | (1,826) |
| (5,682) | ||
| Hotels, Restaurants & Leisure — (1.5)% | ||
| Wynn Resorts Ltd. * | (134) | (9,437) |
| Household Products — (5.8)% | ||
| Kimberly-Clark Corp. | (259) | (35,957) |
| Industrial Conglomerates — (3.5)% | ||
| 3M Co. | (150) | (21,643) |
| Internet & Direct Marketing Retail — (0.0)% ^ | ||
| Wayfair, Inc., Class A * | (1) | (58) |
| Professional Services — (0.5)% | ||
| ManpowerGroup, Inc. | (32) | (2,849) |
| Technology Hardware, Storage & Peripherals — (1.6)% | ||
| Apple, Inc. | (64) | (10,071) |
| April 30, 2022 | J.P. Morgan Specialty Funds | 17 |
| INVESTMENTS | SHARES (000) | VALUE ($000) |
| Short Positions — continued | ||
| Common Stocks — continued | ||
| Tobacco — (1.6)% | ||
| Altria Group, Inc. | (172) | (9,568) |
| Total Common Stocks (Proceeds $(118,017)) | (115,935) | |
| Exchange-Traded Funds — (3.0)% | ||
| U.S. Equity — (3.0)% | ||
| SPDR S&P 500 ETF Trust (Proceeds $(18,095)) | (44) | (18,124) |
| Total Short Positions (Proceeds $(136,112)) | (134,059) | |
| Total Investments — 80.3% (Cost $492,004) | 494,717 | |
| Other Assets Less Liabilities — 19.7% | 121,189 | |
| Net Assets — 100.0% | 615,906 | |
Percentages indicated are based on net assets. | ||
| Abbreviations | |
| ETF | Exchange Traded Fund |
| SPDR | Standard & Poor's Depositary Receipt |
| ^ | Amount rounds to less than 0.1% of net assets. | |
| * | Non-income producing security. | |
| (a) | All or a portion of this security is segregated as collateral for short sales. The total value of securities and cash segregated as collateral is $70,910 and $154,144, respectively. | |
| (b) | Investment in an affiliated fund, which is registered under the Investment Company Act of 1940, as amended, and is advised by J.P. Morgan Investment Management Inc. | |
| (c) | The rate shown is the current yield as of April 30, 2022. |
| 18 | J.P. Morgan Specialty Funds | April 30, 2022 |
| INVESTMENTS | SHARES (000) | VALUE ($000) |
| Long Positions — 98.4% | ||
| Common Stocks — 67.5% | ||
| Aerospace & Defense — 1.6% | ||
| Howmet Aerospace, Inc. | 12 | 417 |
| Northrop Grumman Corp. | 2 | 719 |
| Raytheon Technologies Corp. | 6 | 562 |
| Textron, Inc. | 3 | 243 |
| TransDigm Group, Inc. * | — | 97 |
| 2,038 | ||
| Air Freight & Logistics — 0.5% | ||
| FedEx Corp. | — | 70 |
| United Parcel Service, Inc., Class B | 3 | 500 |
| 570 | ||
| Auto Components — 0.7% | ||
| Aptiv plc * | 2 | 237 |
| Lear Corp. | 1 | 137 |
| Magna International, Inc. (Canada) | 9 | 498 |
| 872 | ||
| Automobiles — 0.1% | ||
| Rivian Automotive, Inc., Class A * | 4 | 133 |
| Banks — 2.4% | ||
| Fifth Third Bancorp | 18 | 657 |
| M&T Bank Corp. | 2 | 345 |
| SVB Financial Group * | 1 | 359 |
| Truist Financial Corp. | 6 | 293 |
| Wells Fargo & Co. (a) | 29 | 1,278 |
| 2,932 | ||
| Beverages — 1.2% | ||
| Coca-Cola Co. (The) | 6 | 362 |
| Constellation Brands, Inc., Class A | 1 | 280 |
| Monster Beverage Corp. * | 4 | 341 |
| PepsiCo, Inc. | 3 | 529 |
| 1,512 | ||
| Biotechnology — 3.9% | ||
| AbbVie, Inc. (a) | 10 | 1,423 |
| Biogen, Inc. * | 3 | 610 |
| BioMarin Pharmaceutical, Inc. * | 4 | 373 |
| Neurocrine Biosciences, Inc. * | 3 | 272 |
| Regeneron Pharmaceuticals, Inc. * | 1 | 674 |
| Sarepta Therapeutics, Inc. * | 5 | 335 |
| Vertex Pharmaceuticals, Inc. * | 4 | 1,217 |
| 4,904 | ||
| INVESTMENTS | SHARES (000) | VALUE ($000) |
| Building Products — 0.8% | ||
| Fortune Brands Home & Security, Inc. | — | 23 |
| Trane Technologies plc | 7 | 952 |
| 975 | ||
| Capital Markets — 1.4% | ||
| Charles Schwab Corp. (The) | 9 | 590 |
| CME Group, Inc. | 1 | 188 |
| Morgan Stanley | 1 | 68 |
| S&P Global, Inc. | 2 | 744 |
| State Street Corp. | 1 | 120 |
| 1,710 | ||
| Chemicals — 1.0% | ||
| Air Products and Chemicals, Inc. (a) | 1 | 157 |
| DuPont de Nemours, Inc. (a) | 5 | 368 |
| Eastman Chemical Co. (a) | 2 | 182 |
| Linde plc (United Kingdom) | 1 | 389 |
| PPG Industries, Inc. | 1 | 102 |
| 1,198 | ||
| Commercial Services & Supplies — 0.8% | ||
| Republic Services, Inc. | 4 | 561 |
| Waste Connections, Inc. | 4 | 483 |
| 1,044 | ||
| Communications Equipment — 0.1% | ||
| Juniper Networks, Inc. | 5 | 154 |
| Construction Materials — 0.5% | ||
| Martin Marietta Materials, Inc. | 1 | 445 |
| Vulcan Materials Co. | 1 | 190 |
| 635 | ||
| Consumer Finance — 0.8% | ||
| American Express Co. | 5 | 962 |
| Electric Utilities — 1.9% | ||
| Alliant Energy Corp. | 1 | 72 |
| Exelon Corp. | 29 | 1,376 |
| FirstEnergy Corp. | 14 | 593 |
| Xcel Energy, Inc. | 5 | 366 |
| 2,407 | ||
| Electrical Equipment — 0.6% | ||
| Eaton Corp. plc | 5 | 706 |
| April 30, 2022 | J.P. Morgan Specialty Funds | 19 |
| INVESTMENTS | SHARES (000) | VALUE ($000) |
| Long Positions — continued | ||
| Common Stocks — continued | ||
| Electronic Equipment, Instruments & Components — 0.6% | ||
| Corning, Inc. | 10 | 371 |
| Keysight Technologies, Inc. * | 3 | 410 |
| 781 | ||
| Energy Equipment & Services — 0.5% | ||
| Baker Hughes Co. | 18 | 565 |
| Entertainment — 0.7% | ||
| Endeavor Group Holdings, Inc., Class A * | 40 | 914 |
| Equity Real Estate Investment Trusts (REITs) — 2.3% | ||
| American Homes 4 Rent, Class A | 6 | 250 |
| Camden Property Trust | 2 | 373 |
| Equinix, Inc. | — | 136 |
| Host Hotels & Resorts, Inc. | 3 | 63 |
| Invitation Homes, Inc. | 9 | 334 |
| Kimco Realty Corp. | 12 | 288 |
| Prologis, Inc. | 2 | 355 |
| Sun Communities, Inc. | 2 | 341 |
| UDR, Inc. | 5 | 271 |
| Ventas, Inc. | 1 | 69 |
| WP Carey, Inc. | 1 | 88 |
| Cousins Properties, Inc. | 9 | 306 |
| 2,874 | ||
| Food Products — 0.7% | ||
| Hershey Co. (The) | 3 | 679 |
| Mondelez International, Inc., Class A | 3 | 196 |
| 875 | ||
| Health Care Equipment & Supplies — 1.3% | ||
| Becton Dickinson and Co. | 1 | 215 |
| Boston Scientific Corp. * | 16 | 685 |
| Intuitive Surgical, Inc. * | 2 | 433 |
| Zimmer Biomet Holdings, Inc. | 2 | 238 |
| 1,571 | ||
| Health Care Providers & Services — 2.4% | ||
| Centene Corp. * | 8 | 643 |
| CVS Health Corp. (a) | 9 | 927 |
| Humana, Inc. | 1 | 365 |
| UnitedHealth Group, Inc. (a) | 2 | 1,005 |
| 2,940 | ||
| Hotels, Restaurants & Leisure — 2.7% | ||
| Booking Holdings, Inc. * | — | 170 |
| INVESTMENTS | SHARES (000) | VALUE ($000) |
| Hotels, Restaurants & Leisure — continued | ||
| Chipotle Mexican Grill, Inc. * | 1 | 672 |
| Domino's Pizza, Inc. | 1 | 315 |
| Expedia Group, Inc. * | 2 | 361 |
| Hilton Worldwide Holdings, Inc. * | — | 47 |
| Marriott International, Inc., Class A * | 2 | 397 |
| McDonald's Corp. | 4 | 901 |
| Yum! Brands, Inc. (a) | 4 | 501 |
| 3,364 | ||
| Household Durables — 0.3% | ||
| Toll Brothers, Inc. | 7 | 333 |
| Household Products — 0.2% | ||
| Procter & Gamble Co. (The) | 1 | 207 |
| Industrial Conglomerates — 0.0% ^ | ||
| Roper Technologies, Inc. | — | 47 |
| Insurance — 1.5% | ||
| Arthur J Gallagher & Co. | 3 | 487 |
| Hartford Financial Services Group, Inc. (The) | 5 | 318 |
| Progressive Corp. (The) (a) | 10 | 1,118 |
| 1,923 | ||
| Interactive Media & Services — 1.9% | ||
| Alphabet, Inc., Class C * | — | 561 |
| Alphabet, Inc., Class A * | — | 301 |
| Meta Platforms, Inc., Class A * | 3 | 624 |
| Snap, Inc., Class A * | 31 | 861 |
| 2,347 | ||
| Internet & Direct Marketing Retail — 1.4% | ||
| Amazon.com, Inc. * (a) | — | 1,748 |
| DoorDash, Inc., Class A * | 1 | 57 |
| 1,805 | ||
| IT Services — 4.9% | ||
| Affirm Holdings, Inc. * | 9 | 273 |
| Automatic Data Processing, Inc. | 1 | 185 |
| Fidelity National Information Services, Inc. | 1 | 129 |
| FleetCor Technologies, Inc. * | 5 | 1,233 |
| Mastercard, Inc., Class A (a) | 9 | 3,097 |
| Shopify, Inc., Class A (Canada) * (a) | 1 | 542 |
| Visa, Inc., Class A | 1 | 171 |
| WEX, Inc. * | 3 | 446 |
| 6,076 | ||
| 20 | J.P. Morgan Specialty Funds | April 30, 2022 |
| INVESTMENTS | SHARES (000) | VALUE ($000) |
| Long Positions — continued | ||
| Common Stocks — continued | ||
| Life Sciences Tools & Services — 1.2% | ||
| Danaher Corp. | 2 | 413 |
| PerkinElmer, Inc. | 3 | 383 |
| Thermo Fisher Scientific, Inc. (a) | 1 | 709 |
| 1,505 | ||
| Machinery — 3.2% | ||
| Deere & Co. (a) | 4 | 1,464 |
| Dover Corp. | 8 | 1,067 |
| Ingersoll Rand, Inc. | 5 | 225 |
| Otis Worldwide Corp. | 11 | 819 |
| Parker-Hannifin Corp. | 2 | 363 |
| 3,938 | ||
| Media — 1.1% | ||
| Charter Communications, Inc., Class A * | 1 | 401 |
| Comcast Corp., Class A | 7 | 262 |
| Liberty Media Corp.-Liberty SiriusXM, Class A * | 17 | 723 |
| 1,386 | ||
| Metals & Mining — 0.4% | ||
| Freeport-McMoRan, Inc. | 11 | 448 |
| Multiline Retail — 0.4% | ||
| Dollar General Corp. | 2 | 446 |
| Multi-Utilities — 1.8% | ||
| Ameren Corp. (a) | 13 | 1,218 |
| CenterPoint Energy, Inc. | 16 | 478 |
| NiSource, Inc. | 9 | 274 |
| Sempra Energy | 2 | 232 |
| 2,202 | ||
| Oil, Gas & Consumable Fuels — 4.2% | ||
| Cheniere Energy, Inc. | 3 | 466 |
| ConocoPhillips (a) | 11 | 1,014 |
| Coterra Energy, Inc. | 5 | 146 |
| Diamondback Energy, Inc. (a) | 13 | 1,686 |
| EOG Resources, Inc. | 5 | 565 |
| ONEOK, Inc. | 5 | 290 |
| Phillips 66 | 8 | 703 |
| Pioneer Natural Resources Co. (a) | 1 | 318 |
| 5,188 | ||
| Personal Products — 0.1% | ||
| Estee Lauder Cos., Inc. (The), Class A | — | 123 |
| INVESTMENTS | SHARES (000) | VALUE ($000) |
| Pharmaceuticals — 1.0% | ||
| Bristol-Myers Squibb Co. | 12 | 892 |
| Eli Lilly & Co. | 1 | 316 |
| 1,208 | ||
| Professional Services — 0.9% | ||
| Booz Allen Hamilton Holding Corp. | 5 | 406 |
| Leidos Holdings, Inc. (a) | 7 | 697 |
| 1,103 | ||
| Road & Rail — 3.1% | ||
| Canadian National Railway Co. (Canada) | 2 | 235 |
| CSX Corp. | 9 | 303 |
| Knight-Swift Transportation Holdings, Inc. | 5 | 243 |
| Lyft, Inc., Class A * (a) | 35 | 1,146 |
| Norfolk Southern Corp. (a) | 3 | 825 |
| Old Dominion Freight Line, Inc. | 2 | 620 |
| Uber Technologies, Inc. * (a) | 12 | 379 |
| Union Pacific Corp. | 1 | 55 |
| XPO Logistics, Inc. * | 2 | 100 |
| 3,906 | ||
| Semiconductors & Semiconductor Equipment — 5.5% | ||
| Advanced Micro Devices, Inc. * (a) | 15 | 1,261 |
| Analog Devices, Inc. | 3 | 519 |
| Lam Research Corp. (a) | 1 | 525 |
| Marvell Technology, Inc. | 3 | 150 |
| Microchip Technology, Inc. | 5 | 293 |
| NXP Semiconductors NV (China) | 14 | 2,418 |
| ON Semiconductor Corp. * | 7 | 346 |
| Taiwan Semiconductor Manufacturing Co. Ltd., ADR (Taiwan) | 3 | 270 |
| Teradyne, Inc. | 4 | 449 |
| Texas Instruments, Inc. | 3 | 554 |
| 6,785 | ||
| Software — 1.1% | ||
| Autodesk, Inc. * | 1 | 250 |
| Coupa Software, Inc. * | 4 | 299 |
| DocuSign, Inc. * | 3 | 213 |
| Intuit, Inc. | — | 140 |
| Microsoft Corp. | 1 | 326 |
| Workday, Inc., Class A * | 1 | 183 |
| 1,411 | ||
| April 30, 2022 | J.P. Morgan Specialty Funds | 21 |
| INVESTMENTS | SHARES (000) | VALUE ($000) |
| Long Positions — continued | ||
| Common Stocks — continued | ||
| Specialty Retail — 2.3% | ||
| AutoZone, Inc. * | — | 430 |
| Best Buy Co., Inc. | 4 | 325 |
| Burlington Stores, Inc. * | 3 | 597 |
| Lowe's Cos., Inc. (a) | 4 | 797 |
| O'Reilly Automotive, Inc. * (a) | 1 | 745 |
| 2,894 | ||
| Technology Hardware, Storage & Peripherals — 0.9% | ||
| Hewlett Packard Enterprise Co. | 22 | 339 |
| Seagate Technology Holdings plc | 10 | 836 |
| 1,175 | ||
| Wireless Telecommunication Services — 0.6% | ||
| T-Mobile US, Inc. * | 7 | 812 |
| Total Common Stocks (Cost $73,623) | 83,904 | |
| Short-Term Investments — 30.9% | ||
| Investment Companies — 30.9% | ||
| JPMorgan Prime Money Market Fund Class Institutional Shares, 0.36% (b) (c)(Cost $38,464) | 38,460 | 38,468 |
| Total Long Positions (Cost $112,087) | 122,372 | |
| Short Positions — (63.5)% | ||
| Common Stocks — (63.5)% | ||
| Aerospace & Defense — (0.9)% | ||
| Hexcel Corp. | (3) | (152) |
| Huntington Ingalls Industries, Inc. | (4) | (795) |
| L3Harris Technologies, Inc. | — | (142) |
| (1,089) | ||
| Air Freight & Logistics — (1.0)% | ||
| CH Robinson Worldwide, Inc. | (7) | (737) |
| Expeditors International of Washington, Inc. | (5) | (542) |
| (1,279) | ||
| Auto Components — (0.8)% | ||
| Autoliv, Inc. (Sweden) | (6) | (438) |
| BorgWarner, Inc. | (16) | (575) |
| (1,013) | ||
| Automobiles — (0.1)% | ||
| Harley-Davidson, Inc. | (2) | (81) |
| INVESTMENTS | SHARES (000) | VALUE ($000) |
| Banks — (2.1)% | ||
| First Republic Bank | (4) | (623) |
| Huntington Bancshares, Inc. | (56) | (734) |
| KeyCorp | (38) | (727) |
| PNC Financial Services Group, Inc. (The) | (3) | (493) |
| (2,577) | ||
| Beverages — (0.1)% | ||
| Brown-Forman Corp., Class B | (2) | (125) |
| Biotechnology — (2.0)% | ||
| Amgen, Inc. | (2) | (448) |
| Gilead Sciences, Inc. | (15) | (888) |
| Moderna, Inc. * | (9) | (1,197) |
| (2,533) | ||
| Building Products — (1.3)% | ||
| Allegion plc | (3) | (359) |
| Carrier Global Corp. | (15) | (557) |
| Johnson Controls International plc | (10) | (614) |
| Masco Corp. | (2) | (130) |
| (1,660) | ||
| Capital Markets — (2.3)% | ||
| BlackRock, Inc. | (1) | (443) |
| Franklin Resources, Inc. | (24) | (602) |
| Goldman Sachs Group, Inc. (The) | (1) | (351) |
| Moody's Corp. | (2) | (672) |
| MSCI, Inc. | (1) | (311) |
| Northern Trust Corp. | (5) | (527) |
| (2,906) | ||
| Chemicals — (0.5)% | ||
| Dow, Inc. | (7) | (432) |
| Ecolab, Inc. | (1) | (150) |
| Sherwin-Williams Co. (The) | — | (65) |
| (647) | ||
| Commercial Services & Supplies — (0.2)% | ||
| Waste Management, Inc. | (1) | (224) |
| Communications Equipment — (1.0)% | ||
| Cisco Systems, Inc. | (26) | (1,266) |
| Consumer Finance — (1.0)% | ||
| Capital One Financial Corp. | (9) | (1,073) |
| Discover Financial Services | (1) | (172) |
| (1,245) | ||
| 22 | J.P. Morgan Specialty Funds | April 30, 2022 |
| INVESTMENTS | SHARES (000) | VALUE ($000) |
| Short Positions — continued | ||
| Common Stocks — continued | ||
| Containers & Packaging — (1.2)% | ||
| AptarGroup, Inc. | (3) | (386) |
| Ball Corp. | (4) | (311) |
| International Paper Co. | (7) | (307) |
| Packaging Corp. of America | (1) | (112) |
| Silgan Holdings, Inc. | (8) | (376) |
| (1,492) | ||
| Diversified Telecommunication Services — (1.6)% | ||
| AT&T, Inc. | (36) | (684) |
| Lumen Technologies, Inc. | (60) | (599) |
| Verizon Communications, Inc. | (16) | (741) |
| (2,024) | ||
| Electric Utilities — (3.1)% | ||
| American Electric Power Co., Inc. | (12) | (1,140) |
| Duke Energy Corp. | (7) | (739) |
| Eversource Energy | (5) | (416) |
| Pinnacle West Capital Corp. | (6) | (461) |
| PPL Corp. | (13) | (361) |
| Southern Co. (The) | (10) | (758) |
| (3,875) | ||
| Electrical Equipment �� (1.4)% | ||
| Acuity Brands, Inc. | (3) | (478) |
| Emerson Electric Co. | (5) | (464) |
| Hubbell, Inc. | (3) | (677) |
| Sensata Technologies Holding plc * | (2) | (93) |
| (1,712) | ||
| Electronic Equipment, Instruments & Components — (0.1)% | ||
| Cognex Corp. | (3) | (176) |
| Energy Equipment & Services — (0.5)% | ||
| Schlumberger NV | (17) | (651) |
| Entertainment — (0.3)% | ||
| AMC Entertainment Holdings, Inc., Class A * | (22) | (339) |
| Warner Bros Discovery, Inc. * | — | — |
| (339) | ||
| Equity Real Estate Investment Trusts (REITs) — (2.8)% | ||
| AvalonBay Communities, Inc. | — | (101) |
| Duke Realty Corp. | (6) | (331) |
| Equity Residential | (1) | (98) |
| Iron Mountain, Inc. | (19) | (996) |
| National Retail Properties, Inc. | (14) | (592) |
| INVESTMENTS | SHARES (000) | VALUE ($000) |
| Equity Real Estate Investment Trusts (REITs) — continued | ||
| Orion Office REIT, Inc. | — | — |
| Realty Income Corp. | (3) | (221) |
| Simon Property Group, Inc. | (6) | (735) |
| SL Green Realty Corp. | (4) | (239) |
| Vornado Realty Trust | (5) | (200) |
| (3,513) | ||
| Food & Staples Retailing — (4.1)% | ||
| Costco Wholesale Corp. | — | (100) |
| Kroger Co. (The) | (48) | (2,574) |
| Walgreens Boots Alliance, Inc. | (23) | (987) |
| Walmart, Inc. | (10) | (1,448) |
| (5,109) | ||
| Food Products — (1.3)% | ||
| Campbell Soup Co. | (9) | (429) |
| Conagra Brands, Inc. | (6) | (226) |
| General Mills, Inc. | (6) | (401) |
| Kellogg Co. | (9) | (585) |
| (1,641) | ||
| Gas Utilities — (0.4)% | ||
| National Fuel Gas Co. | (6) | (438) |
| Health Care Equipment & Supplies — (1.2)% | ||
| Baxter International, Inc. | (9) | (652) |
| Stryker Corp. | (3) | (774) |
| (1,426) | ||
| Health Care Providers & Services — (1.0)% | ||
| Henry Schein, Inc. * | (5) | (390) |
| Quest Diagnostics, Inc. | (5) | (630) |
| Universal Health Services, Inc., Class B | (1) | (198) |
| (1,218) | ||
| Hotels, Restaurants & Leisure — (0.9)% | ||
| Starbucks Corp. | (15) | (1,132) |
| Household Durables — (0.3)% | ||
| Mohawk Industries, Inc. * | (1) | (106) |
| NVR, Inc. * | — | (171) |
| PulteGroup, Inc. | (3) | (137) |
| (414) | ||
| Household Products — (1.0)% | ||
| Church & Dwight Co., Inc. | (2) | (233) |
| April 30, 2022 | J.P. Morgan Specialty Funds | 23 |
| INVESTMENTS | SHARES (000) | VALUE ($000) |
| Short Positions — continued | ||
| Common Stocks — continued | ||
| Household Products — continued | ||
| Clorox Co. (The) | (4) | (587) |
| Kimberly-Clark Corp. | (3) | (377) |
| (1,197) | ||
| Industrial Conglomerates — (2.1)% | ||
| 3M Co. | (13) | (1,829) |
| General Electric Co. | (11) | (830) |
| (2,659) | ||
| Insurance — (1.5)% | ||
| Allstate Corp. (The) | (4) | (500) |
| Aon plc, Class A | — | (119) |
| Chubb Ltd. | (3) | (639) |
| Ryan Specialty Group Holdings, Inc., Class A * | (7) | (273) |
| W R Berkley Corp. | (3) | (188) |
| Willis Towers Watson plc | (1) | (138) |
| (1,857) | ||
| Internet & Direct Marketing Retail — (0.6)% | ||
| eBay, Inc. | (15) | (796) |
| IT Services — (2.5)% | ||
| Cognizant Technology Solutions Corp., Class A | (7) | (531) |
| DXC Technology Co. * | (4) | (107) |
| Global Payments, Inc. | (3) | (385) |
| Jack Henry & Associates, Inc. | (1) | (207) |
| Paychex, Inc. | (5) | (607) |
| PayPal Holdings, Inc. * | (1) | (100) |
| Western Union Co. (The) | (70) | (1,179) |
| (3,116) | ||
| Life Sciences Tools & Services — (0.8)% | ||
| Agilent Technologies, Inc. | (3) | (438) |
| Waters Corp. * | (2) | (533) |
| (971) | ||
| Machinery — (1.6)% | ||
| Caterpillar, Inc. | (2) | (451) |
| Donaldson Co., Inc. | (4) | (206) |
| IDEX Corp. | (1) | (210) |
| Illinois Tool Works, Inc. | (4) | (674) |
| PACCAR, Inc. | (5) | (406) |
| (1,947) | ||
| Media — (4.4)% | ||
| Interpublic Group of Cos., Inc. (The) | (27) | (888) |
| INVESTMENTS | SHARES (000) | VALUE ($000) |
| Media — continued | ||
| Omnicom Group, Inc. | (32) | (2,426) |
| Paramount Global, Class B | (57) | (1,650) |
| Sirius XM Holdings, Inc. | (83) | (499) |
| (5,463) | ||
| Multiline Retail — (0.3)% | ||
| Macy's, Inc. | (6) | (151) |
| Target Corp. | (1) | (215) |
| (366) | ||
| Multi-Utilities — (0.2)% | ||
| Dominion Energy, Inc. | (3) | (231) |
| Oil, Gas & Consumable Fuels — (3.2)% | ||
| Enbridge, Inc. (Canada) | (40) | (1,733) |
| Exxon Mobil Corp. | (11) | (948) |
| Hess Corp. | (10) | (1,037) |
| Marathon Oil Corp. | (11) | (269) |
| (3,987) | ||
| Pharmaceuticals — (2.2)% | ||
| Johnson & Johnson | (3) | (571) |
| Merck & Co., Inc. | (10) | (845) |
| Pfizer, Inc. | (16) | (806) |
| Zoetis, Inc. | (3) | (526) |
| (2,748) | ||
| Professional Services — (0.5)% | ||
| Equifax, Inc. | — | (48) |
| TransUnion | (4) | (349) |
| Verisk Analytics, Inc. | (1) | (211) |
| (608) | ||
| Road & Rail — (1.0)% | ||
| Canadian Pacific Railway Ltd. (Canada) | (2) | (162) |
| Heartland Express, Inc. | (19) | (257) |
| JB Hunt Transport Services, Inc. | (2) | (289) |
| Werner Enterprises, Inc. | (13) | (515) |
| (1,223) | ||
| Semiconductors & Semiconductor Equipment — (3.0)% | ||
| Broadcom, Inc. | (3) | (1,244) |
| Intel Corp. | (34) | (1,491) |
| QUALCOMM, Inc. | (6) | (847) |
| Universal Display Corp. | (1) | (135) |
| (3,717) | ||
| 24 | J.P. Morgan Specialty Funds | April 30, 2022 |
| INVESTMENTS | SHARES (000) | VALUE ($000) |
| Short Positions — continued | ||
| Common Stocks — continued | ||
| Software — (1.4)% | ||
| Ceridian HCM Holding, Inc. * | (10) | (558) |
| Oracle Corp. | (1) | (46) |
| Palantir Technologies, Inc., Class A * | (13) | (135) |
| Paycom Software, Inc. * | (2) | (504) |
| Salesforce, Inc. * | (1) | (270) |
| VMware, Inc., Class A | (2) | (231) |
| (1,744) | ||
| Specialty Retail — (0.4)% | ||
| CarMax, Inc. * | (3) | (268) |
| Williams-Sonoma, Inc. | (1) | (162) |
| (430) | ||
| Technology Hardware, Storage & Peripherals — (2.6)% | ||
| Apple, Inc. | (9) | (1,410) |
| HP, Inc. | (13) | (488) |
| NetApp, Inc. | (17) | (1,275) |
| Xerox Holdings Corp. | (5) | (79) |
| (3,252) | ||
| Textiles, Apparel & Luxury Goods — (0.2)% | ||
| VF Corp. | (5) | (280) |
| Trading Companies & Distributors — (0.5)% | ||
| Fastenal Co. | (10) | (566) |
| Total Common Stocks (Proceeds $(84,734)) | (78,963) | |
| Total Short Positions (Proceeds $(84,734)) | (78,963) | |
| Total Investments — 34.9% (Cost $27,353) | 43,409 | |
| Other Assets Less Liabilities — 65.1% | 80,938 | |
| Net Assets — 100.0% | 124,347 | |
Percentages indicated are based on net assets. | ||
Amounts presented as a dash (“-“) represent amounts that round to less than a thousand. | ||
| Abbreviations | |
| ADR | American Depositary Receipt |
| ^ | Amount rounds to less than 0.1% of net assets. | |
| * | Non-income producing security. | |
| (a) | All or a portion of this security is segregated as collateral for short sales. The total value of securities and cash segregated as collateral is $14,707 and $80,921, respectively. | |
| (b) | Investment in an affiliated fund, which is registered under the Investment Company Act of 1940, as amended, and is advised by J.P. Morgan Investment Management Inc. | |
| (c) | The rate shown is the current yield as of April 30, 2022. |
| April 30, 2022 | J.P. Morgan Specialty Funds | 25 |
| JPMorgan Macro Opportunities Fund | JPMorgan Opportunistic Equity Long/Short Fund | JPMorgan Research Market Neutral Fund | |||
| ASSETS: | |||||
| Investments in non-affiliates, at value | $10,580 | $374,904 | $ 83,904 | ||
| Investments in affiliates, at value | 3,639 | 253,872 | 38,468 | ||
| Options purchased, at value | 64 | — | — | ||
| Restricted cash for exchange-traded options | 813 | — | — | ||
| Cash | 2,503 | — | — | ||
| Foreign currency, at value | 88 | — | — | ||
| Deposits at broker for futures contracts | — | — | 72 | ||
| Deposits at broker for securities sold short | — | 154,144 | 80,921 | ||
| Receivables: | |||||
| Due from custodian | — | 9,881 | — | ||
| Investment securities sold | — | 67,190 | 3,524 | ||
| Fund shares sold | — | 597 | 271 | ||
| Interest from non-affiliates | 2 | — | 5 | ||
| Dividends from non-affiliates | 2 | 68 | 54 | ||
| Dividends from affiliates | —(a) | 78 | 10 | ||
| Tax reclaims | 4 | — | — | ||
| Variation margin on futures contracts | 425 | — | — | ||
| Unrealized appreciation on forward foreign currency exchange contracts | 364 | — | — | ||
| Due from adviser | 15 | — | — | ||
| Total Assets | 18,499 | 860,734 | 207,229 | ||
| LIABILITIES: | |||||
| Payables: | |||||
| Due to custodian | — | — | 9 | ||
| Securities sold short, at value | — | 134,059 | 78,963 | ||
| Dividend expense to non-affiliates on securities sold short | — | 34 | 72 | ||
| Investment securities purchased | — | 108,906 | 3,634 | ||
| Interest expense to non-affiliates on securities sold short | — | 2 | — | ||
| Fund shares redeemed | — | 1,062 | 54 | ||
| Variation margin on futures contracts | — | — | 2 | ||
| Unrealized depreciation on forward foreign currency exchange contracts | 121 | — | — | ||
| Outstanding options written, at fair value | 16 | — | — | ||
| Accrued liabilities: | |||||
| Investment advisory fees | — | 612 | 26 | ||
| Administration fees | — | 40 | 3 | ||
| Distribution fees | —(a) | 9 | 5 | ||
| Service fees | 4 | 77 | 25 | ||
| Custodian and accounting fees | 7 | 3 | 8 | ||
| Trustees’ and Chief Compliance Officer’s fees | — | — | 1 | ||
| Other | 129 | 24 | 80 | ||
| Total Liabilities | 277 | 244,828 | 82,882 | ||
| Net Assets | $18,222 | $615,906 | $124,347 (a) Amount rounds to less than one thousand. |
| 26 | J.P. Morgan Specialty Funds | April 30, 2022 |
| JPMorgan Macro Opportunities Fund | JPMorgan Opportunistic Equity Long/Short Fund | JPMorgan Research Market Neutral Fund | |||
| NET ASSETS: | |||||
| Paid-in-Capital | $17,857 | $626,090 | $144,805 | ||
| Total distributable earnings (loss) | 365 | (10,184) | (20,458) | ||
| Total Net Assets: | $18,222 | $615,906 | $124,347 | ||
| Net Assets: | |||||
| Class A | $ 338 | $ 25,474 | $ 19,566 | ||
| Class C | 293 | 5,566 | 1,128 | ||
| Class I | 17,571 | 327,760 | 103,653 | ||
| Class R6 | 20 | 257,106 | — | ||
| Total | $18,222 | $615,906 | $124,347 | ||
| Outstanding units of beneficial interest (shares) ($0.0001 par value; unlimited number of shares authorized): | |||||
| Class A | 22 | 1,369 | 1,621 | ||
| Class C | 19 | 313 | 105 | ||
| Class I | 1,146 | 17,239 | 8,015 | ||
| Class R6 | 1 | 13,257 | — | ||
| Net Asset Value (a): | |||||
| Class A — Redemption price per share | $ 15.25 | $ 18.61 | $ 12.07 | ||
| Class C — Offering price per share (b) | 15.16 | 17.78 | 10.76 | ||
| Class I — Offering and redemption price per share | 15.34 | 19.01 | 12.93 | ||
| Class R6 — Offering and redemption price per share | 15.37 | 19.39 | — | ||
| Class A maximum sales charge | 5.25% | 5.25% | 5.25% | ||
| Class A maximum public offering price per share [net asset value per share/(100% – maximum sales charge)] | $ 16.09 | $ 19.64 | $ 12.74 | ||
| Cost of investments in non-affiliates | $10,311 | $374,238 | $ 73,623 | ||
| Cost of investments in affiliates | 3,640 | 253,878 | 38,464 | ||
| Cost of options purchased | 93 | — | — | ||
| Cost of foreign currency | 88 | — | — | ||
| Premiums received from options written | 32 | — | — | ||
| Proceeds from securities sold short | — | 136,112 | 84,734 |
| (a) | Per share amounts may not recalculate due to rounding of net assets and/or shares outstanding. |
| (b) | Redemption price for Class C Shares varies based upon length of time the shares are held. |
| April 30, 2022 | J.P. Morgan Specialty Funds | 27 |
| JPMorgan Macro Opportunities Fund | JPMorgan Opportunistic Equity Long/Short Fund | JPMorgan Research Market Neutral Fund | |||
| INVESTMENT INCOME: | |||||
| Interest income from non-affiliates | $ 3 | $ — | $ — | ||
| Interest income from affiliates | 5 | — | — | ||
| Dividend income from non-affiliates | 30 | 1,978 | 606 | ||
| Dividend income from affiliates | 3 | 145 | 17 | ||
| Foreign taxes withheld (net) | (3) | — | — | ||
| Total investment income | 38 | 2,123 | 623 | ||
| EXPENSES: | |||||
| Investment advisory fees | 56 | 4,215 | 195 | ||
| Administration fees | 7 | 264 | 42 | ||
| Distribution fees: | |||||
| Class A | —(a) | 36 | 23 | ||
| Class C | 1 | 24 | 5 | ||
| Service fees: | |||||
| Class A | —(a) | 36 | 23 | ||
| Class C | —(a) | 8 | 2 | ||
| Class I | 23 | 474 | 115 | ||
| Custodian and accounting fees | 21 | 18 | 21 | ||
| Interest expense to affiliates | 5 | — | — | ||
| Professional fees | 82 | 45 | 35 | ||
| Trustees’ and Chief Compliance Officer’s fees | 12 | 13 | 13 | ||
| Printing and mailing costs | 9 | 23 | 3 | ||
| Registration and filing fees | 31 | 45 | 34 | ||
| Transfer agency fees (See Note 2.I) | —(a) | 10 | 3 | ||
| Dividend expense to non-affiliates on securities sold short | — | 2,194 | 1,110 | ||
| Interest expense to non-affiliates on securities sold short | — | 374 | 49 | ||
| Other | 5 | 16 | 6 | ||
| Total expenses | 252 | 7,795 | 1,679 | ||
| Less fees waived | (64) | (120) | (115) | ||
| Less expense reimbursements | (95) | — | — | ||
| Net expenses | 93 | 7,675 | 1,564 | ||
| Net investment income (loss) | $ (55) | $ (5,552) | $ (941) (a) Amount rounds to less than one thousand. |
| 28 | J.P. Morgan Specialty Funds | April 30, 2022 |
| JPMorgan Macro Opportunities Fund | JPMorgan Opportunistic Equity Long/Short Fund | JPMorgan Research Market Neutral Fund | |||
| REALIZED/UNREALIZED GAINS (LOSSES): | |||||
| Net realized gain (loss) on transactions from: | |||||
| Investments in non-affiliates | $ (493) | $ 34,101 | $ 5,115 | ||
| Investments in affiliates | —(a) | (75) | (7) | ||
| Options purchased | (127) | (72) | — | ||
| Futures contracts | 189 | — | (485) | ||
| Securities sold short | — | (18,960) | (3,669) | ||
| Foreign currency transactions | (6) | —(a) | — | ||
| Forward foreign currency exchange contracts | 353 | — | — | ||
| Options written | 31 | — | — | ||
| Net realized gain (loss) | (53) | 14,994 | 954 | ||
| Change in net unrealized appreciation/depreciation on: | |||||
| Investments in non-affiliates | (2,093) | (105,657) | (12,965) | ||
| Investments in affiliates | (1) | (6) | 1 | ||
| Options purchased | 4 | (21) | — | ||
| Futures contracts | 207 | — | 7 | ||
| Securities sold short | — | 1,934 | 9,626 | ||
| Foreign currency translations | (2) | — | — | ||
| Forward foreign currency exchange contracts | 170 | — | — | ||
| Options written | 16 | — | — | ||
| Change in net unrealized appreciation/depreciation | (1,699) | (103,750) | (3,331) | ||
| Net realized/unrealized gains (losses) | (1,752) | (88,756) | (2,377) | ||
| Change in net assets resulting from operations | $(1,807) | $ (94,308) | $ (3,318) |
| (a) | Amount rounds to less than one thousand. |
| April 30, 2022 | J.P. Morgan Specialty Funds | 29 |
| JPMorgan Macro Opportunities Fund | JPMorgan Opportunistic Equity Long/Short Fund | ||||||
| Six Months Ended April 30, 2022 (Unaudited) | Year Ended October 31, 2021 | Six Months Ended April 30, 2022 (Unaudited) | Year Ended October 31, 2021 | ||||
| CHANGE IN NET ASSETS RESULTING FROM OPERATIONS: | |||||||
| Net investment income (loss) | $ (55) | $ (5) | $ (5,552) | $ (11,007) | |||
| Net realized gain (loss) | (53) | 762 | 14,994 | 78,034 | |||
| Change in net unrealized appreciation/depreciation | (1,699) | 1,024 | (103,750) | 42,356 | |||
| Change in net assets resulting from operations | (1,807) | 1,781 | (94,308) | 109,383 | |||
| DISTRIBUTIONS TO SHAREHOLDERS: | |||||||
| Class A | (5) | — | (3,030) | (918) | |||
| Class C | (1) | — | (702) | (222) | |||
| Class I | (243) | — | (38,675) | (10,347) | |||
| Class R6 | (1) | — | (29,311) | (9,883) | |||
| Total distributions to shareholders | (250) | — | (71,718) | (21,370) | |||
| CAPITAL TRANSACTIONS: | |||||||
| Change in net assets resulting from capital transactions | 1,092 | 1,974 | 36,278 | 172,125 | |||
| NET ASSETS: | |||||||
| Change in net assets | (965) | 3,755 | (129,748) | 260,138 | |||
| Beginning of period | 19,187 | 15,432 | 745,654 | 485,516 | |||
| End of period | $18,222 | $19,187 | $ 615,906 | $745,654 | |||
| 30 | J.P. Morgan Specialty Funds | April 30, 2022 |
| JPMorgan Research Market Neutral Fund | |||
| Six Months Ended April 30, 2022 (Unaudited) | Year Ended October 31, 2021 | ||
| CHANGE IN NET ASSETS RESULTING FROM OPERATIONS: | |||
| Net investment income (loss) | $ (941) | $ (1,566) | |
| Net realized gain (loss) | 954 | 5,737 | |
| Change in net unrealized appreciation/depreciation | (3,331) | (2,033) | |
| Change in net assets resulting from operations | (3,318) | 2,138 | |
| DISTRIBUTIONS TO SHAREHOLDERS: | |||
| Class A | — | (1,124) | |
| Class C | — | (159) | |
| Class I | — | (6,901) | |
| Total distributions to shareholders | — | (8,184) | |
| CAPITAL TRANSACTIONS: | |||
| Change in net assets resulting from capital transactions | 35,475 | (43,203) | |
| NET ASSETS: | |||
| Change in net assets | 32,157 | (49,249) | |
| Beginning of period | 92,190 | 141,439 | |
| End of period | $124,347 | $ 92,190 | |
| April 30, 2022 | J.P. Morgan Specialty Funds | 31 |
| JPMorgan Macro Opportunities Fund | JPMorgan Opportunistic Equity Long/Short Fund | ||||||
| Six Months Ended April 30, 2022 (Unaudited) | Year Ended October 31, 2021 | Six Months Ended April 30, 2022 (Unaudited) | Year Ended October 31, 2021 | ||||
| CAPITAL TRANSACTIONS: | |||||||
| Class A | |||||||
| Proceeds from shares issued | $ 98 | $ 337 | $ 3,227 | $ 16,519 | |||
| Distributions reinvested | 5 | — | 2,956 | 913 | |||
| Cost of shares redeemed | (16) | (80) | (4,264) | (11,337) | |||
| Change in net assets resulting from Class A capital transactions | 87 | 257 | 1,919 | 6,095 | |||
| Class C | |||||||
| Proceeds from shares issued | 225 | 54 | 493 | 2,019 | |||
| Distributions reinvested | 1 | — | 692 | 218 | |||
| Cost of shares redeemed | — | — | (1,135) | (537) | |||
| Change in net assets resulting from Class C capital transactions | 226 | 54 | 50 | 1,700 | |||
| Class I | |||||||
| Proceeds from shares issued | 1,501 | 1,682 | 109,246 | 242,796 | |||
| Distributions reinvested | 243 | — | 38,027 | 10,199 | |||
| Cost of shares redeemed | (965) | (19) | (127,958) | (124,700) | |||
| Change in net assets resulting from Class I capital transactions | 779 | 1,663 | 19,315 | 128,295 | |||
| Class R6 | |||||||
| Proceeds from shares issued | — | — | 53,852 | 76,310 | |||
| Distributions reinvested | — | — | 6,999 | 2,265 | |||
| Cost of shares redeemed | — | — | (45,857) | (42,540) | |||
| Change in net assets resulting from Class R6 capital transactions | — | — | 14,994 | 36,035 | |||
| Total change in net assets resulting from capital transactions | $1,092 | $1,974 | $ 36,278 | $ 172,125 | |||
| SHARE TRANSACTIONS: | |||||||
| Class A | |||||||
| Issued | 6 | 20 | 151 | 742 | |||
| Reinvested | — | — | 139 | 43 | |||
| Redeemed | (1) | (5) | (212) | (512) | |||
| Change in Class A Shares | 5 | 15 | 78 | 273 | |||
| Class C | |||||||
| Issued | 14 | 4 | 25 | 94 | |||
| Reinvested | — | — | 34 | 11 | |||
| Redeemed | — | — | (57) | (25) | |||
| Change in Class C Shares | 14 | 4 | 2 | 80 | |||
| Class I | |||||||
| Issued | 94 | 101 | 5,156 | 10,786 | |||
| Reinvested | 15 | — | 1,747 | 471 | |||
| Redeemed | (61) | (1) | (6,228) | (5,539) | |||
| Change in Class I Shares | 48 | 100 | 675 | 5,718 | |||
| Class R6 | |||||||
| Issued | — | — | 2,517 | 3,324 | |||
| Reinvested | — | — | 315 | 103 | |||
| Redeemed | (—) | (—) | (2,208) | (1,866) | |||
| Change in Class R6 Shares | — | — | 624 | 1,561 | |||
| 32 | J.P. Morgan Specialty Funds | April 30, 2022 |
| JPMorgan Research Market Neutral Fund | |||
| Six Months Ended April 30, 2022 (Unaudited) | Year Ended October 31, 2021 | ||
| CAPITAL TRANSACTIONS: | |||
| Class A | |||
| Proceeds from shares issued | $ 5,623 | $ 6,793 | |
| Distributions reinvested | — | 1,075 | |
| Cost of shares redeemed | (2,357) | (8,506) | |
| Change in net assets resulting from Class A capital transactions | 3,266 | (638) | |
| Class C | |||
| Proceeds from shares issued | 132 | 417 | |
| Distributions reinvested | — | 159 | |
| Cost of shares redeemed | (180) | (1,175) | |
| Change in net assets resulting from Class C capital transactions | (48) | (599) | |
| Class I | |||
| Proceeds from shares issued | 62,710 | 41,158 | |
| Distributions reinvested | — | 6,758 | |
| Cost of shares redeemed | (30,453) | (89,882) | |
| Change in net assets resulting from Class I capital transactions | 32,257 | (41,966) | |
| Total change in net assets resulting from capital transactions | $ 35,475 | $(43,203) | |
| SHARE TRANSACTIONS: | |||
| Class A | |||
| Issued | 453 | 559 | |
| Reinvested | — | 90 | |
| Redeemed | (191) | (689) | |
| Change in Class A Shares | 262 | (40) | |
| Class C | |||
| Issued | 12 | 37 | |
| Reinvested | — | 15 | |
| Redeemed | (16) | (109) | |
| Change in Class C Shares | (4) | (57) | |
| Class I | |||
| Issued | 4,740 | 3,149 | |
| Reinvested | — | 532 | |
| Redeemed | (2,306) | (6,877) | |
| Change in Class I Shares | 2,434 | (3,196) | |
| April 30, 2022 | J.P. Morgan Specialty Funds | 33 |
| Per share operating performance | ||||
| Investment operations | ||||
| Net asset value, beginning of period | Net investment income (loss)(b) | Net realized and unrealized gains (losses) on investments | Total from investment operations | |
| JPMorgan Macro Opportunities Fund | ||||
| Class A | ||||
| Six Months Ended April 30, 2022(Unaudited) | $17.05 | $(0.07) | $(1.50) | $(1.57) |
| Year Ended October 31, 2021 | 15.38 | (0.08) | 1.75 | 1.67 |
| April 15, 2020(g) through October 31, 2020 | 15.00 | (0.01) | 0.39 | 0.38 |
| Class C | ||||
| Six Months Ended April 30, 2022(Unaudited) | 16.93 | (0.10) | (1.51) | (1.61) |
| Year Ended October 31, 2021 | 15.34 | (0.15) | 1.74 | 1.59 |
| April 15, 2020(g) through October 31, 2020 | 15.00 | (0.06) | 0.40 | 0.34 |
| Class I | ||||
| Six Months Ended April 30, 2022(Unaudited) | 17.12 | (0.05) | (1.51) | (1.56) |
| Year Ended October 31, 2021 | 15.40 | (0.01) | 1.73 | 1.72 |
| April 15, 2020(g) through October 31, 2020 | 15.00 | —(h) | 0.40 | 0.40 |
| Class R6 | ||||
| Six Months Ended April 30, 2022(Unaudited) | 17.17 | (0.03) | (1.51) | (1.54) |
| Year Ended October 31, 2021 | 15.41 | 0.04 | 1.72 | 1.76 |
| September 30, 2020(i) through October 31, 2020 | 15.35 | 0.01 | 0.05 | 0.06 |
| (a) | Annualized for periods less than one year, unless otherwise noted. |
| (b) | Calculated based upon average shares outstanding. |
| (c) | Includes adjustments in accordance with accounting principles generally accepted in the United States of America and as such, the net asset values for financial reporting purposes and the returns based upon those net asset values may differ from the net asset values and returns for shareholder transactions. |
| (d) | Not annualized for periods less than one year. |
| (e) | Includes earnings credits and interest expense, if applicable, each of which is less than 0.005% unless otherwise noted. |
| (f) | Certain non-recurring expenses incurred by the Fund were not annualized for the period indicated. |
| (g) | Commencement of operations. |
| (h) | Amount rounds to less than $0.005. |
| (i) | Commencement of offering of class of shares. |
| 34 | J.P. Morgan Specialty Funds | April 30, 2022 |
| Ratios/Supplemental data | |||||||
| Distributions | Ratios to average net assets(a) | ||||||
| Net investment income | Net asset value, end of period | Total return (excludes sales charge)(c)(d) | Net assets, end of period (000's) | Net expenses(e) | Net investment income (loss) | Expenses without waivers and reimbursements(e) | Portfolio turnover rate(d) |
| $(0.23) | $15.25 | (9.30)% | $ 338 | 1.23(f)% | (0.84)(f)% | 2.96(f)% | 48% |
| — | 17.05 | 10.86 | 290 | 1.21 | (0.48) | 3.28 | 99 |
| — | 15.38 | 2.53 | 27 | 1.20(f) | (0.18)(f) | 5.12(f) | 49 |
| (0.16) | 15.16 | (9.56) | 293 | 1.73(f) | (1.30)(f) | 3.45(f) | 48 |
| — | 16.93 | 10.37 | 77 | 1.71 | (0.89) | 3.83 | 99 |
| — | 15.34 | 2.27 | 20 | 1.70(f) | (0.70)(f) | 5.76(f) | 49 |
| (0.22) | 15.34 | (9.16) | 17,571 | 0.98(f) | (0.59)(f) | 2.70(f) | 48 |
| — | 17.12 | 11.17 | 18,798 | 0.96 | (0.04) | 3.11 | 99 |
| — | 15.40 | 2.67 | 15,365 | 0.95(f) | 0.05(f) | 4.24(f) | 49 |
| (0.26) | 15.37 | (9.10) | 20 | 0.73(f) | (0.35)(f) | 2.52(f) | 48 |
| — | 17.17 | 11.42 | 22 | 0.71 | 0.22 | 2.93 | 99 |
| — | 15.41 | 0.39 | 20 | 0.77(f) | 0.84(f) | 7.24(f) | 49 |
| April 30, 2022 | J.P. Morgan Specialty Funds | 35 |
| Per share operating performance | ||||||||
| Investment operations | Distributions | |||||||
| Net asset value, beginning of period | Net investment income (loss)(b) | Net realized and unrealized gains (losses) on investments | Total from investment operations | Net investment income | Net realized gain | Total distributions | ||
| JPMorgan Opportunistic Equity Long/Short Fund | ||||||||
| Class A | ||||||||
| Six Months Ended April 30, 2022(Unaudited) | $23.65 | $(0.20) | $(2.52) | $(2.72) | $ — | $(2.32) | $(2.32) | |
| Year Ended October 31, 2021 | 20.54 | (0.46) | 4.46 | 4.00 | — | (0.89) | (0.89) | |
| Year Ended October 31, 2020 | 17.34 | (0.29) | 3.49 | 3.20 | — | — | — | |
| Year Ended October 31, 2019 | 18.22 | —(j) | (0.55) | (0.55) | — | (0.33) | (0.33) | |
| Year Ended October 31, 2018 | 18.13 | (0.21) | 0.53 | 0.32 | — | (0.23) | (0.23) | |
| Year Ended October 31, 2017 | 17.12 | (0.19) | 2.46 | 2.27 | — | (1.26) | (1.26) | |
| Class C | ||||||||
| Six Months Ended April 30, 2022(Unaudited) | 22.75 | (0.24) | (2.41) | (2.65) | — | (2.32) | (2.32) | |
| Year Ended October 31, 2021 | 19.88 | (0.56) | 4.32 | 3.76 | — | (0.89) | (0.89) | |
| Year Ended October 31, 2020 | 16.87 | (0.39) | 3.40 | 3.01 | — | — | — | |
| Year Ended October 31, 2019 | 17.83 | (0.08) | (0.55) | (0.63) | — | (0.33) | (0.33) | |
| Year Ended October 31, 2018 | 17.83 | (0.29) | 0.52 | 0.23 | — | (0.23) | (0.23) | |
| Year Ended October 31, 2017 | 16.94 | (0.27) | 2.42 | 2.15 | — | (1.26) | (1.26) | |
| Class I | ||||||||
| Six Months Ended April 30, 2022(Unaudited) | 24.08 | (0.18) | (2.57) | (2.75) | — | (2.32) | (2.32) | |
| Year Ended October 31, 2021 | 20.84 | (0.42) | 4.55 | 4.13 | — | (0.89) | (0.89) | |
| Year Ended October 31, 2020 | 17.58 | (0.27) | 3.56 | 3.29 | (0.03) | — | (0.03) | |
| Year Ended October 31, 2019 | 18.43 | 0.07 | (0.59) | (0.52) | — | (0.33) | (0.33) | |
| Year Ended October 31, 2018 | 18.28 | (0.16) | 0.54 | 0.38 | — | (0.23) | (0.23) | |
| Year Ended October 31, 2017 | 17.21 | (0.14) | 2.47 | 2.33 | — | (1.26) | (1.26) | |
| 36 | J.P. Morgan Specialty Funds | April 30, 2022 |
| Ratios/Supplemental data | ||||||||
| Ratios to average net assets(a) | ||||||||
| Net asset value, end of period | Total return (excludes sales charge)(c)(d) | Net assets, end of period (000's) | Net expenses (including dividend and interest expense for securities sold short)(e)(f) | Net investment income (loss) | Expenses without waivers (including dividend and interest expense for securities sold short)(f) | Portfolio turnover rate (excluding securities sold short)(d) | Portfolio turnover rate (including securities sold short)(d) | |
| $18.61 | (12.76)% | $ 25,474 | 2.51(g)(h)% | (1.91)(h)% | 2.55(h)% | 457% | 914% | |
| 23.65 | 19.94 | 30,516 | 2.66(i) | (2.08) | 2.67 | 548 | 1,013 | |
| 20.54 | 18.45 | 20,914 | 2.28 | (1.54) | 2.33 | 511 | 1,058 | |
| 17.34 | (3.10) | 19,352 | 2.25 | —(k) | 2.36 | 636 | 1,232 | |
| 18.22 | 1.80 | 50,803 | 2.55 | (1.11) | 2.63 | 548 | 995 | |
| 18.13 | 13.58 | 49,338 | 2.42 | (1.05) | 2.61 | 493 | 795 | |
| 17.78 | (12.97) | 5,566 | 3.02(g)(h) | (2.41)(h) | 3.05(h) | 457 | 914 | |
| 22.75 | 19.37 | 7,079 | 3.15(i) | (2.57) | 3.16 | 548 | 1,013 | |
| 19.88 | 17.84 | 4,596 | 2.79 | (2.12) | 2.85 | 511 | 1,058 | |
| 16.87 | (3.62) | 2,599 | 2.74 | (0.45) | 2.85 | 636 | 1,232 | |
| 17.83 | 1.32 | 3,544 | 3.05 | (1.61) | 3.13 | 548 | 995 | |
| 17.83 | 13.00 | 2,594 | 2.90 | (1.53) | 3.11 | 493 | 795 | |
| 19.01 | (12.65) | 327,760 | 2.27(g)(h) | (1.67)(h) | 2.31(h) | 457 | 914 | |
| 24.08 | 20.28 | 398,771 | 2.41(i) | (1.84) | 2.42 | 548 | 1,013 | |
| 20.84 | 18.71 | 226,048 | 2.04 | (1.38) | 2.08 | 511 | 1,058 | |
| 17.58 | (2.89) | 132,665 | 1.99 | 0.40 | 2.10 | 636 | 1,232 | |
| 18.43 | 2.12 | 151,261 | 2.30 | (0.87) | 2.38 | 548 | 995 | |
| 18.28 | 13.86 | 103,091 | 2.15 | (0.81) | 2.32 | 493 | 795 | |
| April 30, 2022 | J.P. Morgan Specialty Funds | 37 |
| Per share operating performance | ||||||||
| Investment operations | Distributions | |||||||
| Net asset value, beginning of period | Net investment income (loss)(b) | Net realized and unrealized gains (losses) on investments | Total from investment operations | Net investment income | Net realized gain | Total distributions | ||
| Class R6 | ||||||||
| Six Months Ended April 30, 2022(Unaudited) | $24.48 | $(0.15) | $(2.62) | $(2.77) | $ — | $(2.32) | $(2.32) | |
| Year Ended October 31, 2021 | 21.13 | (0.37) | 4.61 | 4.24 | — | (0.89) | (0.89) | |
| Year Ended October 31, 2020 | 17.83 | (0.21) | 3.59 | 3.38 | (0.08) | — | (0.08) | |
| Year Ended October 31, 2019 | 18.63 | 0.17 | (0.64) | (0.47) | — | (0.33) | (0.33) | |
| Year Ended October 31, 2018 | 18.44 | (0.12) | 0.54 | 0.42 | — | (0.23) | (0.23) | |
| Year Ended October 31, 2017 | 17.31 | (0.10) | 2.49 | 2.39 | — | (1.26) | (1.26) | |
| (a) | Annualized for periods less than one year, unless otherwise noted. |
| (b) | Calculated based upon average shares outstanding. |
| (c) | Includes adjustments in accordance with accounting principles generally accepted in the United States of America and as such, the net asset values for financial reporting purposes and the returns based upon those net asset values may differ from the net asset values and returns for shareholder transactions. |
| (d) | Not annualized for periods less than one year. |
| (e) | Includes earnings credits and interest expense, if applicable, each of which is less than 0.005% unless otherwise noted. |
| (f) | |
| April 30, 2022 | October 31, 2021 | October 31, 2020 | October 31, 2019 | October 31, 2018 | October 31, 2017 | |
| Net expenses (excluding dividend and interest expense for securities sold short) | ||||||
| Class A | 1.78% | 1.82% | 1.81% | 1.79% | 1.82% | 1.83% |
| Class C | 2.29% | 2.31% | 2.32% | 2.28% | 2.32% | 2.31% |
| Class I | 1.53% | 1.57% | 1.57% | 1.53% | 1.57% | 1.56% |
| Class R6 | 1.29% | 1.31% | 1.31% | 1.29% | 1.32% | 1.31% |
| Expenses without waivers (excluding dividend and interest expense for securities sold short) | ||||||
| Class A | 1.82% | 1.83% | 1.86% | 1.90% | 1.90% | 2.02% |
| Class C | 2.32% | 2.32% | 2.38% | 2.39% | 2.40% | 2.52% |
| Class I | 1.57% | 1.58% | 1.61% | 1.64% | 1.65% | 1.73% |
| Class R6 | 1.32% | 1.32% | 1.35% | 1.39% | 1.38% | 1.47% |
| (g) | Interest expense on securities sold short is 0.11%. |
| (h) | Certain non-recurring expenses incurred by the Fund were not annualized for the period indicated. |
| (i) | Interest expense on securities sold short is 0.21%. |
| (j) | Amount rounds to less than $0.005. |
| (k) | Amount rounds to less than 0.005%. |
| 38 | J.P. Morgan Specialty Funds | April 30, 2022 |
| Ratios/Supplemental data | ||||||||
| Ratios to average net assets(a) | ||||||||
| Net asset value, end of period | Total return (excludes sales charge)(c)(d) | Net assets, end of period (000's) | Net expenses (including dividend and interest expense for securities sold short)(e)(f) | Net investment income (loss) | Expenses without waivers (including dividend and interest expense for securities sold short)(f) | Portfolio turnover rate (excluding securities sold short)(d) | Portfolio turnover rate (including securities sold short)(d) | |
| $19.39 | (12.52)% | $257,106 | 2.02(g)(h)% | (1.41)(h)% | 2.05(h)% | 457% | 914% | |
| 24.48 | 20.54 | 309,288 | 2.15(i) | (1.57) | 2.16 | 548 | 1,013 | |
| 21.13 | 19.01 | 233,958 | 1.78 | (1.09) | 1.82 | 511 | 1,058 | |
| 17.83 | (2.59) | 164,419 | 1.75 | 0.91 | 1.85 | 636 | 1,232 | |
| 18.63 | 2.32 | 56,436 | 2.05 | (0.66) | 2.11 | 548 | 995 | |
| 18.44 | 14.13 | 6,350 | 1.90 | (0.56) | 2.06 | 493 | 795 | |
| April 30, 2022 | J.P. Morgan Specialty Funds | 39 |
| Per share operating performance | ||||||
| Investment operations | Distributions | |||||
| Net asset value, beginning of period | Net investment income (loss)(b) | Net realized and unrealized gains (losses) on investments | Total from investment operations | Net realized gain | ||
| JPMorgan Research Market Neutral Fund | ||||||
| Class A | ||||||
| Six Months Ended April 30, 2022(Unaudited) | $12.41 | $(0.12) | $(0.22) | $(0.34) | $ — | |
| Year Ended October 31, 2021 | 13.01 | (0.21) | 0.52 | 0.31 | (0.91) | |
| Year Ended October 31, 2020 | 13.11 | (0.20) | 1.59 | 1.39 | (1.49) | |
| Year Ended October 31, 2019 | 14.29 | (0.04) | 0.31 | 0.27 | (1.45) | |
| Year Ended October 31, 2018 | 14.69 | (0.11) | 0.10 | (0.01) | (0.39) | |
| Year Ended October 31, 2017 | 13.84 | (0.22) | 1.07 | 0.85 | — | |
| Class C | ||||||
| Six Months Ended April 30, 2022(Unaudited) | 11.09 | (0.13) | (0.20) | (0.33) | — | |
| Year Ended October 31, 2021 | 11.77 | (0.25) | 0.48 | 0.23 | (0.91) | |
| Year Ended October 31, 2020 | 12.06 | (0.23) | 1.43 | 1.20 | (1.49) | |
| Year Ended October 31, 2019 | 13.32 | (0.10) | 0.29 | 0.19 | (1.45) | |
| Year Ended October 31, 2018 | 13.79 | (0.17) | 0.09 | (0.08) | (0.39) | |
| Year Ended October 31, 2017 | 13.06 | (0.27) | 1.00 | 0.73 | — | |
| Class I | ||||||
| Six Months Ended April 30, 2022(Unaudited) | 13.28 | (0.11) | (0.24) | (0.35) | — | |
| Year Ended October 31, 2021 | 13.82 | (0.20) | 0.57 | 0.37 | (0.91) | |
| Year Ended October 31, 2020 | 13.80 | (0.19) | 1.70 | 1.51 | (1.49) | |
| Year Ended October 31, 2019 | 14.93 | —(j) | 0.32 | 0.32 | (1.45) | |
| Year Ended October 31, 2018 | 15.30 | (0.07) | 0.09 | 0.02 | (0.39) | |
| Year Ended October 31, 2017 | 14.37 | (0.18) | 1.11 | 0.93 | — | |
| (a) | Annualized for periods less than one year, unless otherwise noted. |
| (b) | Calculated based upon average shares outstanding. |
| (c) | Includes adjustments in accordance with accounting principles generally accepted in the United States of America and as such, the net asset values for financial reporting purposes and the returns based upon those net asset values may differ from the net asset values and returns for shareholder transactions. |
| (d) | Not annualized for periods less than one year. |
| (e) | Includes earnings credits and interest expense, if applicable, each of which is less than 0.005% unless otherwise noted. |
| (f) | |
| April 30, 2022 | October 31, 2021 | October 31, 2020 | October 31, 2019 | October 31, 2018 | October 31, 2017 | |
| Net expenses (excluding dividend and interest expense for securities sold short) | ||||||
| Class A | 0.93% | 0.93% | 1.08% | 1.22% | 1.22% | 1.24% |
| Class C | 1.44% | 1.43% | 1.60% | 1.73% | 1.73% | 1.72% |
| Class I | 0.67% | 0.68% | 0.76% | 0.96% | 0.96% | 0.96% |
| Expenses without waivers (excluding dividend and interest expense for securities sold short) | ||||||
| Class A | 1.14% | 1.16% | 1.46% | 1.62% | 1.55% | 1.53% |
| Class C | 1.65% | 1.67% | 1.95% | 2.09% | 2.02% | 2.07% |
| Class I | 0.87% | 0.89% | 1.13% | 1.32% | 1.25% | 1.25% |
| (g) | Interest expense on securities sold short is 0.09%. |
| (h) | Certain non-recurring expenses incurred by the Fund were not annualized for the period indicated. |
| (i) | Interest expense on securities sold short is 0.16%. |
| (j) | Amount rounds to less than $0.005. |
| 40 | J.P. Morgan Specialty Funds | April 30, 2022 |
| Ratios/Supplemental data | ||||||||
| Ratios to average net assets(a) | ||||||||
| Net asset value, end of period | Total return (excludes sales charge)(c)(d) | Net assets, end of period (000's) | Net expenses (including dividend and interest expense for securities sold short)(e)(f) | Net investment income (loss) | Expenses without waivers (including dividend and interest expense for securities sold short)(f) | Portfolio turnover rate (excluding securities sold short)(d) | Portfolio turnover rate (including securities sold short)(d) | |
| $12.07 | (2.74)% | $ 19,566 | 3.01(g)(h)% | (1.89)(h)% | 3.22(h)% | 58% | 130% | |
| 12.41 | 2.72 | 16,867 | 2.99(i) | (1.77) | 3.22 | 119 | 307 | |
| 13.01 | 11.97 | 18,205 | 3.23 | (1.57) | 3.61 | 224 | 531 | |
| 13.11 | 2.01 | 14,276 | 3.69 | (0.26) | 4.09 | 125 | 356 | |
| 14.29 | (0.01) | 14,973 | 3.50 | (0.73) | 3.83 | 131 | 252 | |
| 14.69 | 6.14 | 17,932 | 3.66 | (1.51) | 3.95 | 109 | 278 | |
| 10.76 | (2.98) | 1,128 | 3.55(g)(h) | (2.42)(h) | 3.76(h) | 58 | 130 | |
| 11.09 | 2.29 | 1,211 | 3.49(i) | (2.25) | 3.73 | 119 | 307 | |
| 11.77 | 11.36 | 1,949 | 3.75 | (2.00) | 4.10 | 224 | 531 | |
| 12.06 | 1.52 | 3,731 | 4.20 | (0.74) | 4.56 | 125 | 356 | |
| 13.32 | (0.53) | 6,155 | 4.01 | (1.26) | 4.30 | 131 | 252 | |
| 13.79 | 5.59 | 10,920 | 4.14 | (2.01) | 4.49 | 109 | 278 | |
| 12.93 | (2.64) | 103,653 | 2.75(g)(h) | (1.63)(h) | 2.95(h) | 58 | 130 | |
| 13.28 | 3.01 | 74,112 | 2.74(i) | (1.50) | 2.95 | 119 | 307 | |
| 13.82 | 12.26 | 121,285 | 2.91 | (1.42) | 3.28 | 224 | 531 | |
| 13.80 | 2.27 | 27,694 | 3.43 | 0.01 | 3.79 | 125 | 356 | |
| 14.93 | 0.20 | 34,927 | 3.24 | (0.47) | 3.53 | 131 | 252 | |
| 15.30 | 6.47 | 44,219 | 3.37 | (1.24) | 3.68 | 109 | 278 | |
| April 30, 2022 | J.P. Morgan Specialty Funds | 41 |
| Classes Offered | Trust | Diversification Classification | |
| JPMorgan Macro Opportunities Fund | Class A, Class C, Class I and Class R6 | JPM IV | Diversified |
| JPMorgan Opportunistic Equity Long/Short Fund | Class A, Class C, Class I and Class R6 | JPM I | Non-Diversified |
| JPMorgan Research Market Neutral Fund | Class A, Class C and Class I | JPM I | Diversified |
| 42 | J.P. Morgan Specialty Funds | April 30, 2022 |
| • | Level 1 — Unadjusted inputs using quoted prices in active markets for identical investments. |
| • | Level 2 — Other significant observable inputs including, but not limited to, quoted prices for similar investments, inputs other than quoted prices that are observable for investments (such as interest rates, prepayment speeds, credit risk, etc.) or other market corroborated inputs. |
| • | Level 3 — Significant inputs based on the best information available in the circumstances, to the extent observable inputs are not available (including the Funds' assumptions in determining the fair value of investments). |
| Macro Opportunities Fund | |||||||
| Level 1 Quoted prices | Level 2 Other significant observable inputs | Level 3 Significant unobservable inputs | Total | ||||
| Investments in Securities | |||||||
| Common Stocks | |||||||
| Banks | $ 799 | $ 359 | $— | $ 1,158 | |||
| Building Products | 191 | — | — | 191 | |||
| Electric Utilities | — | 163 | — | 163 | |||
| Electronic Equipment, Instruments & Components | — | 201 | — | 201 | |||
| Insurance | 175 | 236 | — | 411 | |||
| Interactive Media & Services | 335 | — | — | 335 | |||
| Internet & Direct Marketing Retail | 316 | — | — | 316 | |||
| IT Services | 366 | — | — | 366 | |||
| Life Sciences Tools & Services | 396 | — | — | 396 | |||
| Personal Products | 193 | — | — | 193 | |||
| Pharmaceuticals | 230 | 279 | — | 509 | |||
| Semiconductors & Semiconductor Equipment | 74 | — | — | 74 | |||
| Software | 1,206 | — | — | 1,206 | |||
| Textiles, Apparel & Luxury Goods | 486 | 248 | — | 734 | |||
| Total Common Stocks | 4,767 | 1,486 | — | 6,253 | |||
| Foreign Government Securities | — | 118 | — | 118 | |||
| Options Purchased | |||||||
| Call Options Purchased | 1 | 5 | — | 6 | |||
| Put Options Purchased | 33 | 25 | — | 58 | |||
| Total Options Purchased | 34 | 30 | — | 64 | |||
| Short-Term Investments | |||||||
| Foreign Government Treasury Bills | — | 4,209 | — | 4,209 | |||
| Investment Companies | 3,639 | — | — | 3,639 | |||
| Total Short-Term Investments | 3,639 | 4,209 | — | 7,848 | |||
| Total Investments in Securities | $8,440 | $5,843 | $— | $14,283 |
| April 30, 2022 | J.P. Morgan Specialty Funds | 43 |
| Macro Opportunities Fund (continued) | |||||||
| Level 1 Quoted prices | Level 2 Other significant observable inputs | Level 3 Significant unobservable inputs | Total | ||||
| Appreciation in Other Financial Instruments | |||||||
| Forward Foreign Currency Exchange Contracts | $ — | $ 364 | $— | $ 364 | |||
| Futures Contracts | 202 | — | — | 202 | |||
| Depreciation in Other Financial Instruments | |||||||
| Forward Foreign Currency Exchange Contracts | — | (121) | — | (121) | |||
| Futures Contracts | (84) | — | — | (84) | |||
| Options Written | |||||||
| Call Options Written | — | — | — | — | |||
| Put Options Written | — | (16) | — | (16) | |||
| Total Net Appreciation/ Depreciation in Other Financial Instruments | $ 118 | $ 227 | $— | $ 345 |
| Opportunistic Equity Long/Short Fund | |||||||
| Level 1 Quoted prices | Level 2 Other significant observable inputs | Level 3 Significant unobservable inputs | Total | ||||
| Total Investments in Securities (a) | $ 628,776 | $— | $— | $ 628,776 | |||
| Total Liabilities for Securities Sold Short (a) | $(134,059) | $— | $— | $(134,059) |
| (a) | Please refer to the SOI for specific of portfolio holdings. |
| Research Market Neutral Fund | |||||||
| Level 1 Quoted prices | Level 2 Other significant observable inputs | Level 3 Significant unobservable inputs | Total | ||||
| Total Investments in Securities (a) | $122,372 | $— | $— | $122,372 | |||
| Total Liabilities for Securities Sold Short (a) | $ (78,963) | $— | $— | $ (78,963) |
| (a) | Please refer to the SOI for specific of portfolio holdings. |
| 44 | J.P. Morgan Specialty Funds | April 30, 2022 |
| Macro Opportunities Fund | |||||||||||||||
| For the six months ended April 30, 2022 | |||||||||||||||
| Security Description | Value at October 31, 2021 | Purchases at Cost | Proceeds from Sales | Net Realized Gain (Loss) | Change in Unrealized Appreciation/ (Depreciation) | Value at April 30, 2022 | Shares at April 30, 2022 | Dividend Income | Capital Gain Distributions | ||||||
| JPMorgan Prime Money Market Fund Class IM Shares, 0.42% (a) (b) | $2,529 | $1,768 | $657 | $—(c) | $(1) | $3,639 | 3,639 | $3 | $— | ||||||
| (a) | Investment in an affiliated fund, which is registered under the Investment Company Act of 1940, as amended, and is advised by J.P. Morgan Investment Management Inc. |
| (b) | The rate shown is the current yield as of April 30, 2022. |
| (c) | Amount rounds to less than one thousand. |
| Opportunistic Equity Long/Short Fund | |||||||||||||||
| For the six months ended April 30, 2022 | |||||||||||||||
| Security Description | Value at October 31, 2021 | Purchases at Cost | Proceeds from Sales | Net Realized Gain (Loss) | Change in Unrealized Appreciation/ (Depreciation) | Value at April 30, 2022 | Shares at April 30, 2022 | Dividend Income | Capital Gain Distributions | ||||||
| JPMorgan Prime Money Market Fund Class Institutional Shares, 0.36% (a) (b) | $119,946 | $1,475,991 | $1,341,984 | $(75) | $(6) | $253,872 | 253,821 | $145 | $— | ||||||
| (a) | Investment in an affiliated fund, which is registered under the Investment Company Act of 1940, as amended, and is advised by J.P. Morgan Investment Management Inc. |
| (b) | The rate shown is the current yield as of April 30, 2022. |
| April 30, 2022 | J.P. Morgan Specialty Funds | 45 |
| Research Market Neutral Fund | |||||||||||||||
| For the six months ended April 30, 2022 | |||||||||||||||
| Security Description | Value at October 31, 2021 | Purchases at Cost | Proceeds from Sales | Net Realized Gain (Loss) | Change in Unrealized Appreciation/ (Depreciation) | Value at April 30, 2022 | Shares at April 30, 2022 | Dividend Income | Capital Gain Distributions | ||||||
| JPMorgan Prime Money Market Fund Class Institutional Shares, 0.36% (a) (b) | $9,752 | $98,675 | $69,953 | $(7) | $1 | $38,468 | 38,460 | $17 | $— | ||||||
| (a) | Investment in an affiliated fund, which is registered under the Investment Company Act of 1940, as amended, and is advised by J.P. Morgan Investment Management Inc. |
| (b) | The rate shown is the current yield as of April 30, 2022. |
| 46 | J.P. Morgan Specialty Funds | April 30, 2022 |
| April 30, 2022 | J.P. Morgan Specialty Funds | 47 |
| Macro Opportunities Fund | |
| Equity Risk Exposure: | |
| Unrealized Appreciation on Futures Contracts * | $ 172 |
| Purchased Options at Market Value | 39 |
| Unrealized Depreciation on Futures Contracts * | (55) |
| Foreign Exchange Rate Risk Exposure: | |
| Unrealized Appreciation on Forward Foreign Currency Exchange Contracts | 364 |
| Purchased Options at Market Value | 25 |
| Unrealized Depreciation on Forward Foreign Currency Exchange Contracts | (121) |
| Written Options at Market Value | (16) |
| Interest Rate Risk Exposure: | |
| Unrealized Appreciation on Futures Contracts * | 30 |
| Unrealized Depreciation on Futures Contracts * | (29) |
| Net Fair Value of Derivative Contracts: | |
| Unrealized Appreciation (Depreciation) on Futures Contracts * | 118 |
| Unrealized Appreciation (Depreciation) on Forward Foreign Currency Exchange Contracts | 243 |
| Purchased Options at Market Value | 64 |
| Written Options at Market Value | (16) |
| * | Includes cumulative appreciation/(depreciation) on futures contracts, if any, as reported on the SOIs. Only current day’s variation margin is reported within the Statements of Assets and Liabilities. |
| 48 | J.P. Morgan Specialty Funds | April 30, 2022 |
| Counterparty | Gross Amount of Derivative Assets Subject to Netting Arrangements Presented on the Statement of Assets and Liabilities (a) | Derivatives Available for offset | Collateral Received | Net Amount Due From Counterparty (Not less than zero) | |||
| BNP Paribas | $ 32 | $ (1) | $— | $ 31 | |||
| Goldman Sachs International | 354 | (68) | — | 286 | |||
| HSBC Bank, NA | 3 | (3) | — | — | |||
| $389 | $(72) | $— | $317 |
| Counterparty | Gross Amount of Derivative Liabilities Subject to Netting Arrangements Presented on the Statement of Assets and Liabilities (a) | Derivative Available for Offset | Collateral Posted | Net Amount Due to Counterparty (Not less than zero) | |||
| Barclays Bank plc | $ 1 | $ — | $— | $ 1 | |||
| BNP Paribas | 1 | (1) | — | — | |||
| Citibank, NA | 26 | — | — | 26 | |||
| Goldman Sachs International | 68 | (68) | — | — | |||
| HSBC Bank, NA | 19 | (3) | — | 16 | |||
| Merrill Lynch International | 18 | — | — | 18 | |||
| Standard Chartered Bank | 3 | — | — | 3 | |||
| State Street Corp. | 1 | — | — | 1 | |||
| $137 | $(72) | $— | $65 |
| (a) | For financial reporting purposes the Fund does not offset derivative assets and derivative liabilities subject to master netting arrangements on the Statement of Assets and Liabilities. |
| Macro Opportunities Fund | Opportunistic Equity Long/ Short Fund | Research Market Neutral Fund | |
| Realized Gain (Loss) on Derivatives Recognized as a Result From Operations: | |||
| Equity Risk Exposure: | |||
| Futures Contracts | $ 289 | $ — | $(485) |
| Purchased Options | (100) | (72) | — |
| Written Options | 16 | — | — |
| Foreign Exchange Rate Risk Exposure: | |||
| Forward Foreign Currency Exchange Contracts | 353 | — | — |
| Purchased Options | (27) | — | — |
| Written Options | 15 | — | — |
| Interest Rate Risk Exposure: | |||
| Futures Contracts | (100) | — | — |
| Net Change in Unrealized Appreciation (Depreciation) on Derivatives Recognized as a Result of Operations: | |||
| Equity Risk Exposure: | |||
| Futures Contracts | 198 | — | 7 |
| Purchased Options | 32 | (21) | — |
| April 30, 2022 | J.P. Morgan Specialty Funds | 49 |
| Macro Opportunities Fund | Opportunistic Equity Long/ Short Fund | Research Market Neutral Fund | |
| Foreign Exchange Rate Risk Exposure: | |||
| Forward Foreign Currency Exchange Contracts | $ 170 | $ — | $ — |
| Purchased Options | (28) | — | — |
| Written Options | 16 | — | — |
| Interest Rate Risk Exposure: | |||
| Futures Contracts | 9 | — | — |
| Macro Opportunities Fund | Opportunistic Equity Long/ Short Fund | Research Market Neutral Fund | |
| Futures Contracts: | |||
| Average Notional Balance Long | $ 3,711 | $ — | $4,574 |
| Average Notional Balance Short | (4,819) | — | (131) |
| Ending Notional Balance Long | 2,682 | — | — |
| Ending Notional Balance Short | (4,716) | — | — |
| Forward Foreign Currency Exchange Contracts: | |||
| Average Settlement Value Purchased | (4,952) | — | — |
| Average Settlement Value Sold | 12,435 | — | — |
| Ending Settlement Value Purchased | (4,994) | — | — |
| Ending Settlement Value Sold | 13,777 | — | — |
| Exchange-Traded Options: | |||
| Average Number of Contracts Purchased | 128 | 82 | — |
| Average Number of Contracts Written | (2) | — | — |
| Ending Number of Contracts Purchased | 37 | — | — |
| OTC Options: | |||
| Average Number of Contracts Purchased | 2,111,429 | — | — |
| Average Number of Contracts Written | (1,469,429) | — | — |
| Ending Number of Contracts Purchased | 4,714,000 | — | — |
| Ending Number of Contracts Written | (4,714,000) | — | — |
| 50 | J.P. Morgan Specialty Funds | April 30, 2022 |
| Class A | Class C | Class I | Class R6 | Total | |
| Macro Opportunities Fund | |||||
| Transfer agency fees | $—(a) | $—(a) | $—(a) | $ —(a) | $ —(a) |
| Opportunistic Equity Long/Short Fund | |||||
| Transfer agency fees | 1 | —(a) | 9 | —(a) | 10 |
| Research Market Neutral Fund | |||||
| Transfer agency fees | 1 | —(a) | 2 | n/a | 3 |
| (a) | Amount rounds to less than one thousand. |
| April 30, 2022 | J.P. Morgan Specialty Funds | 51 |
| Macro Opportunities Fund | 0.60% |
| Opportunistic Equity Long/Short Fund | 1.20 |
| Research Market Neutral Fund | 0.35 |
| Class A | Class C | |
| Macro Opportunities Fund | 0.25% | 0.75% |
| Opportunistic Equity Long/Short Fund | 0.25 | 0.75 |
| Research Market Neutral Fund | 0.25 | 0.75 |
| 52 | J.P. Morgan Specialty Funds | April 30, 2022 |
| Front-End Sales Charge | CDSC | |
| Macro Opportunities Fund | $—(a) | $— |
| Opportunistic Equity Long/Short Fund | 2 | — |
| Research Market Neutral Fund | —(a) | — |
| (a) | Amount rounds to less than one thousand. |
| Class A | Class C | Class I | |
| Macro Opportunities Fund | 0.25% | 0.25% | 0.25% |
| Opportunistic Equity Long/Short Fund | 0.25 | 0.25 | 0.25 |
| Research Market Neutral Fund | 0.25 | 0.25 | 0.25 |
| Class A | Class C | Class I | Class R6 | |
| Macro Opportunities Fund | 1.20% | 1.70% | 0.95% | 0.70% |
| Opportunistic Equity Long/Short Fund | 1.85 | 2.35 | 1.60 | 1.35 |
| Research Market Neutral Fund | 0.95 | 1.45 | 0.69 | n/a |
| April 30, 2022 | J.P. Morgan Specialty Funds | 53 |
| Contractual Waivers | |||||
| Investment Advisory Fees | Administration Fees | Service Fees | Total | Contractual Reimbursements | |
| Macro Opportunities Fund | $56 | $ 7 | $—(a) | $ 63 | $95 |
| Research Market Neutral Fund | 63 | 37 | 3 | 103 | — |
| (a) | Amount rounds to less than one thousand. |
| Macro Opportunities Fund | $ 1 |
| Opportunistic Equity Long/Short Fund | 119 |
| Research Market Neutral Fund | 11 |
| Opportunistic Equity Long/Short Fund | 1 |
| Research Market Neutral Fund | 1 |
| Purchases (excluding U.S. Government) | Sales (excluding U.S. Government) | Securities Sold Short | Covers on Securities Sold Short | |
| Macro Opportunities Fund | $ 4,290 | $ 5,642 | $ — | $ — |
| Opportunistic Equity Long/Short Fund | 2,298,155 | 2,459,635 | 2,323,122 | 2,300,548 |
| Research Market Neutral Fund | 60,833 | 50,642 | 66,945 | 53,812 |
| 54 | J.P. Morgan Specialty Funds | April 30, 2022 |
| Aggregate Cost | Gross Unrealized Appreciation | Gross Unrealized Depreciation | Net Unrealized Appreciation (Depreciation) | |
| Macro Opportunities Fund | $ 14,012 | $ 1,431 | $ 815 | $ 616 |
| Opportunistic Equity Long/Short Fund * | 492,004 | 18,252 | 15,539 | 2,713 |
| Research Market Neutral Fund * | 27,353 | 23,556 | 7,500 | 16,056 |
| * | The tax cost includes the proceeds from short sales which may result in a net negative cost. |
| Capital Loss Carryforward Character | ||
| Short-Term | Long-Term | |
| Macro Opportunities Fund | $ — | $132 |
| Research Market Neutral Fund | 29,216* | — |
| * | Amount includes capital loss carryforwards which are limited in future years under Internal Revenue Code sections 381-384. |
| Late Year Ordinary Loss Deferral | |
| Research Market Neutral Fund | $1,186 |
| Capital Loss Utilized | ||
| Short-Term | Long-Term | |
| Macro Opportunities Fund | $ — | $274 |
| Research Market Neutral Fund | 2,164 | — |
| April 30, 2022 | J.P. Morgan Specialty Funds | 55 |
| Number of Individual Shareholder and/or Affiliated Omnibus Accounts | % of the Fund | Number of Individual Shareholder and/or Non-Affiliated Omnibus Accounts | % of the Fund | |
| Macro Opportunities Fund | 1 | 85.4% | — | —% |
| Opportunistic Equity Long/Short Fund | — | — | 4 | 70.9 |
| Research Market Neutral Fund | — | — | 3 | 47.1 |
| Macro Opportunities Fund | |
| Germany | 14.2% |
| Japan | 16.6 |
| 56 | J.P. Morgan Specialty Funds | April 30, 2022 |
| April 30, 2022 | J.P. Morgan Specialty Funds | 57 |
| Beginning Account Value November 1, 2021 | Ending Account Value April 30, 2022 | Expenses Paid During the Period* | Annualized Expense Ratio | |
| JPMorgan Macro Opportunities Fund | ||||
| Class A | ||||
| Actual | $1,000.00 | $ 907.00 | $ 5.82 | 1.23% |
| Hypothetical | 1,000.00 | 1,018.70 | 6.16 | 1.23 |
| Class C | ||||
| Actual | 1,000.00 | 904.40 | 8.17 | 1.73 |
| Hypothetical | 1,000.00 | 1,016.22 | 8.65 | 1.73 |
| Class I | ||||
| Actual | 1,000.00 | 908.40 | 4.64 | 0.98 |
| Hypothetical | 1,000.00 | 1,019.94 | 4.91 | 0.98 |
| Class R6 | ||||
| Actual | 1,000.00 | 909.00 | 3.46 | 0.73 |
| Hypothetical | 1,000.00 | 1,021.18 | 3.66 | 0.73 |
| JPMorgan Opportunistic Equity Long/Short Fund | ||||
| Class A | ||||
| Actual | 1,000.00 | 872.40 | 11.65 | 2.51 |
| Hypothetical | 1,000.00 | 1,012.35 | 12.52 | 2.51 |
| Class C | ||||
| Actual | 1,000.00 | 870.30 | 14.00 | 3.02 |
| Hypothetical | 1,000.00 | 1,009.82 | 15.05 | 3.02 |
| Class I | ||||
| Actual | 1,000.00 | 873.50 | 10.54 | 2.27 |
| Hypothetical | 1,000.00 | 1,013.54 | 11.33 | 2.27 |
| Class R6 | ||||
| Actual | 1,000.00 | 874.80 | 9.39 | 2.02 |
| Hypothetical | 1,000.00 | 1,014.78 | 10.09 | 2.02 |
| 58 | J.P. Morgan Specialty Funds | April 30, 2022 |
| Beginning Account Value November 1, 2021 | Ending Account Value April 30, 2022 | Expenses Paid During the Period* | Annualized Expense Ratio | |
| JPMorgan Research Market Neutral Fund | ||||
| Class A | ||||
| Actual | $1,000.00 | $ 972.60 | $14.72 | 3.01% |
| Hypothetical | 1,000.00 | 1,009.87 | 15.00 | 3.01 |
| Class C | ||||
| Actual | 1,000.00 | 970.20 | 17.34 | 3.55 |
| Hypothetical | 1,000.00 | 1,007.19 | 17.67 | 3.55 |
| Class I | ||||
| Actual | 1,000.00 | 973.60 | 13.46 | 2.75 |
| Hypothetical | 1,000.00 | 1,011.16 | 13.71 | 2.75 |
| * | Expenses are equal to each Class’ respective annualized expense ratio, multiplied by the average account value over the period, multiplied by 181/365 (to reflect the one-half year period). |
| April 30, 2022 | J.P. Morgan Specialty Funds | 59 |
| 60 | J.P. Morgan Specialty Funds | April 30, 2022 |


| © JPMorgan Chase & Co., 2022. All rights reserved. April 2022. | SAN-SPEC-422 |
| JPMorgan Emerging Markets Equity Fund |
| JPMorgan Emerging Markets Research Enhanced Equity Fund |
| JPMorgan Europe Dynamic Fund |
| JPMorgan International Equity Fund |
| JPMorgan International Focus Fund |
| JPMorgan International Hedged Equity Fund |
| JPMorgan International Research Enhanced Equity Fund |
| JPMorgan International Value Fund |

| 1 | |
| 2 | |
| Fund Commentaries: | |
| 3 | |
| 7 | |
| 10 | |
| 13 | |
| 16 | |
| 19 | |
| 23 | |
| 25 | |
| 28 | |
| 60 | |
| 86 | |
| 110 | |
| 134 | |
| 138 |
 | “The market environment remains challenging; investors should recognize the risks in trying to time market movements, as well as the potential long-term benefits of portfolio diversification.” — Andrea L. Lisher |

Head of Americas, Client
J.P. Morgan Asset Management
| April 30, 2022 | J.P. Morgan International Equity Funds | 1 |
| 2 | J.P. Morgan International Equity Funds | April 30, 2022 |
| REPORTING PERIOD RETURN: | |
Fund (Class L Shares) * | (26.17)% |
MSCI Emerging Markets Index (net total return) | (14.15)% |
Net Assets as of 4/30/2022 (In Thousands) | $9,678,228 |
| April 30, 2022 | J.P. Morgan International Equity Funds | 3 |
| TOP TEN POSITIONS OF THE PORTFOLIO AS OF April 30, 2022 | PERCENT OF TOTAL INVESTMENTS | ||
| 1. | Taiwan Semiconductor Manufacturing Co. Ltd., ADR (Taiwan) | 8.0% | |
| 2. | Samsung Electronics Co. Ltd. (South Korea) | 6.4 | |
| 3. | Tencent Holdings Ltd. (China) | 4.8 | |
| 4. | Tata Consultancy Services Ltd. (India) | 3.3 | |
| 5. | MercadoLibre, Inc. (Brazil) | 3.0 | |
| 6. | Housing Development Finance Corp. Ltd. (India) | 3.0 | |
| 7. | Reliance Industries Ltd. (India) | 2.8 | |
| 8. | JD.com, Inc., Class A (China) | 2.6 | |
| 9. | AIA Group Ltd. (Hong Kong) | 2.6 | |
| 10. | NetEase, Inc. (China) | 2.5 | |
| PORTFOLIO COMPOSTION BY COUNTRY AS OF April 30, 2022 | PERCENT OF TOTAL INVESTMENTS | |
China | 30.5% | |
India | 21.9 | |
Taiwan | 11.5 | |
South Korea | 8.1 | |
Brazil | 5.7 | |
Hong Kong | 4.9 | |
Indonesia | 4.4 | |
Mexico | 3.1 | |
United States | 2.0 | |
South Africa | 1.5 | |
United Kingdom | 1.1 | |
Others (each less than 1.0%) | 2.5 | |
Short-Term Investments | 2.8 |
| * | The return shown is based on net asset values calculated for shareholder transactions and may differ from the return shown in the financial highlights, which reflects adjustments made to the net asset values in accordance with accounting principles generally accepted in the United States of America. |
| ** | The adviser seeks to achieve the Fund’s objective. There can be no guarantee it will be achieved. |
| 4 | J.P. Morgan International Equity Funds | April 30, 2022 |
| INCEPTION DATE OF CLASS | 6 MONTH* | 1 YEAR | 5 YEAR | 10 YEAR | |||||
| CLASS A SHARES | September 28, 2001 | ||||||||
| With Sales Charge ** | (30.18)% | (33.58)% | 3.75% | 2.85% | |||||
| Without Sales Charge | (26.30) | (29.90) | 4.87 | 3.40 | |||||
| CLASS C SHARES | February 28, 2006 | ||||||||
| With CDSC *** | (27.47) | (31.25) | 4.36 | 2.99 | |||||
| Without CDSC | (26.47) | (30.25) | 4.36 | 2.99 | |||||
| Class I SHARES | September 10, 2001 | (26.18) | (29.71) | 5.15 | 3.66 | ||||
| Class L SHARES | November 15, 1993 | (26.17) | (29.65) | 5.26 | 3.79 | ||||
| Class R2 SHARES | July 31, 2017 | (26.41) | (30.12) | 4.57 | 3.22 | ||||
| Class R3 SHARES | July 31, 2017 | (26.29) | (29.91) | 4.84 | 3.38 | ||||
| Class R4 SHARES | July 31, 2017 | (26.22) | (29.76) | 5.09 | 3.63 | ||||
| Class R5 SHARES | September 9, 2016 | (26.15) | (29.63) | 5.26 | 3.80 | ||||
| Class R6 SHARES | December 23, 2013 | (26.14) | (29.58) | 5.36 | 3.88 |
| * | Not annualized. |
| ** | Sales Charge for Class A Shares is 5.25%. |
| *** | Assumes a 1% CDSC (contingent deferred sales charge) for the 6 month and one year periods and 0% CDSC thereafter. |
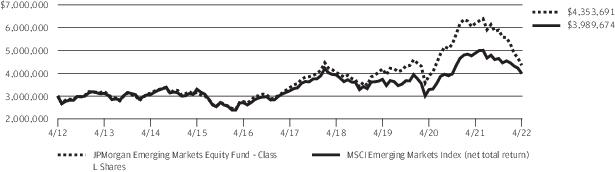
| April 30, 2022 | J.P. Morgan International Equity Funds | 5 |
| 6 | J.P. Morgan International Equity Funds | April 30, 2022 |
| REPORTING PERIOD RETURN: | |
Fund (Class R6 Shares) * | (15.89)% |
MSCI Emerging Markets Index (net total return) | (14.15)% |
Net Assets as of 4/30/2022 (In Thousands) | $2,946,092 |
| April 30, 2022 | J.P. Morgan International Equity Funds | 7 |
| TOP TEN POSITIONS OF THE PORTFOLIO AS OF April 30, 2022 | PERCENT OF TOTAL INVESTMENTS | ||
| 1. | Taiwan Semiconductor Manufacturing Co. Ltd. (Taiwan) | 5.8 % | |
| 2. | Samsung Electronics Co. Ltd. (South Korea) | 4.5 | |
| 3. | Tencent Holdings Ltd. (China) | 4.2 | |
| 4. | Alibaba Group Holding Ltd. (China) | 2.9 | |
| 5. | Reliance Industries Ltd. (India) | 1.8 | |
| 6. | Meituan (China)(a) | 1.4 | |
| 7. | China Construction Bank Corp., Class H (China) | 1.2 | |
| 8. | Infosys Ltd., ADR (India) | 1.2 | |
| 9. | JD.com, Inc., Class A (China) | 1.2 | |
| 10. | Vale SA, ADR (Brazil) | 1.2 | |
| PORTFOLIO COMPOSTION BY COUNTRY AS OF April 30, 2022 | PERCENT OF TOTAL INVESTMENTS | |
China | 30.2% | |
Taiwan | 14.6 | |
South Korea | 13.2 | |
India | 12.7 | |
Brazil | 6.1 | |
Saudi Arabia | 4.2 | |
South Africa | 4.2 | |
Mexico | 2.9 | |
Thailand | 2.1 | |
Indonesia | 1.8 | |
Malaysia | 1.2 | |
Others (each less than 1.0%) | 4.8 | |
Short-Term Investments | 2.0 |
| * | The return shown is based on net asset values calculated for shareholder transactions and may differ from the return shown in the financial highlights, which reflects adjustments made to the net asset values in accordance with accounting principles generally accepted in the United States of America. |
| ** | The adviser seeks to achieve the Fund’s objective. There can be no guarantee it will be achieved. |
| 8 | J.P. Morgan International Equity Funds | April 30, 2022 |
| INCEPTION DATE OF CLASS | 6 MONTH* | 1 YEAR | SINCE INCEPTION | ||||
| Class I SHARES | January 30, 2019 | (15.95)% | (20.37)% | 5.42% | |||
| Class R6 SHARES | December 11, 2018 | (15.89) | (20.26) | 5.54 |
| * | Not annualized. |
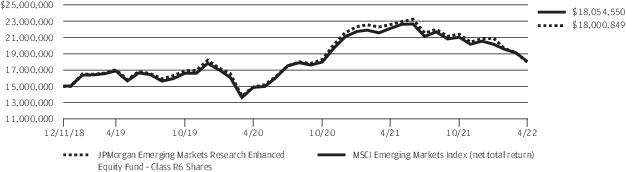
| April 30, 2022 | J.P. Morgan International Equity Funds | 9 |
| REPORTING PERIOD RETURN: | |
Fund (Class A Shares, without a sales charge) * | (14.34)% |
MSCI Europe Index (net total return) | (11.73)% |
Net Assets as of 4/30/2022 (In Thousands) | $606,542 |
| TOP TEN POSITIONS OF THE PORTFOLIO AS OF April 30, 2022 | PERCENT OF TOTAL INVESTMENTS | ||
| 1. | Nestle SA (Registered) (Switzerland) | 4.7 % | |
| 2. | Novo Nordisk A/S, Class B (Denmark) | 3.7 | |
| 3. | Roche Holding AG (Switzerland) | 3.7 | |
| 4. | TotalEnergies SE (France) | 2.9 | |
| 5. | BP plc (United Kingdom) | 2.8 | |
| 6. | Novartis AG (Registered) (Switzerland) | 2.8 | |
| 7. | LVMH Moet Hennessy Louis Vuitton SE (France) | 2.4 | |
| 8. | Koninklijke Ahold Delhaize NV (Netherlands) | 2.2 | |
| 9. | Allianz SE (Registered) (Germany) | 2.1 | |
| 10. | Diageo plc (United Kingdom) | 2.0 | |
| PORTFOLIO COMPOSTION BY COUNTRY AS OF April 30, 2022 | PERCENT OF TOTAL INVESTMENTS | |
United Kingdom | 18.2% | |
Switzerland | 16.1 | |
France | 15.0 | |
Germany | 14.2 | |
Denmark | 7.2 | |
Netherlands | 5.8 | |
Finland | 3.2 | |
United States | 2.2 | |
Australia | 2.0 | |
Ireland | 1.4 | |
Norway | 1.3 | |
Spain | 1.2 | |
Italy | 1.1 | |
Austria | 1.0 | |
Luxembourg | 0.9 | |
Short-Term Investments | 9.2 |
| * | The return shown is based on net asset values calculated for shareholder transactions and may differ from the return shown in the financial highlights, which reflects adjustments made to the net asset values in accordance with accounting principles generally accepted in the United States of America. |
| 10 | J.P. Morgan International Equity Funds | April 30, 2022 |
| ** | The adviser seeks to achieve the Fund’s objective. There can be no guarantee it will be achieved. |
| April 30, 2022 | J.P. Morgan International Equity Funds | 11 |
| INCEPTION DATE OF CLASS | 6 MONTH* | 1 YEAR | 5 YEAR | 10 YEAR | |||||
| CLASS A SHARES | November 2, 1995 | ||||||||
| With Sales Charge ** | (18.83)% | (15.94)% | 1.75% | 5.31% | |||||
| Without Sales Charge | (14.34) | (11.29) | 2.85 | 5.88 | |||||
| CLASS C SHARES | November 1, 1998 | ||||||||
| With CDSC *** | (15.58) | (12.73) | 2.34 | 5.45 | |||||
| Without CDSC | (14.58) | (11.73) | 2.34 | 5.45 | |||||
| Class I SHARES | September 10, 2001 | (14.22) | (11.03) | 3.12 | 6.16 | ||||
| Class L SHARES | September 10, 2001 | (14.19) | (10.93) | 3.24 | 6.34 | ||||
| Class R6 SHARES | October 1, 2018 | (14.13) | (10.83) | 3.32 | 6.38 |
| * | Not annualized. |
| ** | Sales Charge for Class A Shares is 5.25%. |
| *** | Assumes a 1% CDSC (contingent deferred sales charge) for the 6 month and one year periods and 0% CDSC thereafter. |
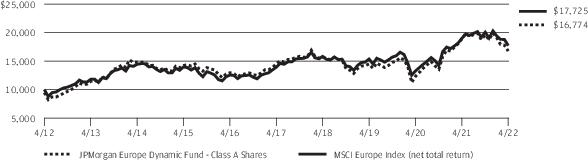
| 12 | J.P. Morgan International Equity Funds | April 30, 2022 |
| REPORTING PERIOD RETURN: | |
Fund (Class I Shares) * | (16.85)% |
MSCI EAFE Index (net total return) | (11.80)% |
Net Assets as of 4/30/2022 (In Thousands) | $4,483,386 |
| April 30, 2022 | J.P. Morgan International Equity Funds | 13 |
| TOP TEN POSITIONS OF THE PORTFOLIO AS OF April 30, 2022 | PERCENT OF TOTAL INVESTMENTS | ||
| 1. | Nestle SA (Registered) (Switzerland) | 4.0 % | |
| 2. | Roche Holding AG (Switzerland) | 3.3 | |
| 3. | TotalEnergies SE (France) | 3.3 | |
| 4. | Novo Nordisk A/S, Class B (Denmark) | 2.7 | |
| 5. | BHP Group Ltd. (Australia) | 2.5 | |
| 6. | Diageo plc (United Kingdom) | 2.4 | |
| 7. | ASML Holding NV (Netherlands) | 2.3 | |
| 8. | LVMH Moet Hennessy Louis Vuitton SE (France) | 2.2 | |
| 9. | DBS Group Holdings Ltd. (Singapore) | 2.0 | |
| 10. | Shell plc (Netherlands) | 1.9 | |
| PORTFOLIO COMPOSTION BY COUNTRY AS OF April 30, 2022 | PERCENT OF TOTAL INVESTMENTS | |
France | 14.9% | |
Japan | 11.8 | |
Switzerland | 10.1 | |
United Kingdom | 9.9 | |
Germany | 8.3 | |
Denmark | 5.7 | |
Netherlands | 5.6 | |
United States | 4.1 | |
Sweden | 3.6 | |
Hong Kong | 3.4 | |
Australia | 2.5 | |
Spain | 2.0 | |
Singapore | 2.0 | |
South Korea | 1.7 |
| PORTFOLIO COMPOSTION BY COUNTRY AS OF April 30, 2022 | PERCENT OF TOTAL INVESTMENTS | |
South Africa | 1.5% | |
Taiwan | 1.3 | |
Belgium | 1.3 | |
Others (each less than 1.0%) | 3.1 | |
Short-Term Investments | 7.2 |
| * | The return shown is based on net asset values calculated for shareholder transactions and may differ from the return shown in the financial highlights, which reflects adjustments made to the net asset values in accordance with accounting principles generally accepted in the United States of America. |
| ** | The adviser seeks to achieve the Fund’s objective. There can be no guarantee it will be achieved. |
| 14 | J.P. Morgan International Equity Funds | April 30, 2022 |
| INCEPTION DATE OF CLASS | 6 MONTH* | 1 YEAR | 5 YEAR | 10 YEAR | |||||
| CLASS A SHARES | February 28, 2002 | ||||||||
| With Sales Charge ** | (21.34)% | (17.40)% | 3.32% | 4.21% | |||||
| Without Sales Charge | (16.98) | (12.83) | 4.43 | 4.78 | |||||
| CLASS C SHARES | January 31, 2003 | ||||||||
| With CDSC *** | (18.16) | (14.25) | 3.92 | 4.35 | |||||
| Without CDSC | (17.16) | (13.25) | 3.92 | 4.35 | |||||
| Class I SHARES | January 1, 1997 | (16.85) | (12.60) | 4.72 | 5.04 | ||||
| Class R2 SHARES | November 3, 2008 | (17.06) | (13.06) | 4.14 | 4.49 | ||||
| Class R5 SHARES | May 15, 2006 | (16.83) | (12.52) | 4.82 | 5.20 | ||||
| Class R6 SHARES | November 30, 2010 | (16.77) | (12.41) | 4.93 | 5.28 |
| * | Not annualized. |
| ** | Sales Charge for Class A Shares is 5.25%. |
| *** | Assumes a 1% CDSC (contingent deferred sales charge) for the 6 month and one year periods and 0% CDSC thereafter. |
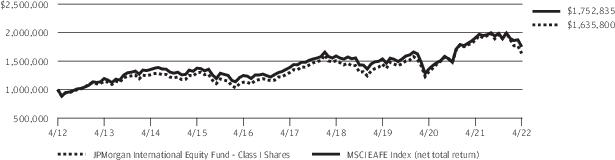
| April 30, 2022 | J.P. Morgan International Equity Funds | 15 |
| REPORTING PERIOD RETURN: | |
Fund (Class I Shares) * | (16.59)% |
MSCI ACWI ex USA Index (net total return) | (11.87)% |
Net Assets as of 4/30/2022 (In Thousands) | $1,406,947 |
| 16 | J.P. Morgan International Equity Funds | April 30, 2022 |
| TOP TEN POSITIONS OF THE PORTFOLIO AS OF April 30, 2022 | PERCENT OF TOTAL INVESTMENTS | ||
| 1. | Nestle SA (Registered) (Switzerland) | 4.8 % | |
| 2. | Shell plc (Netherlands) | 4.0 | |
| 3. | Novo Nordisk A/S, Class B (Denmark) | 3.9 | |
| 4. | Samsung Electronics Co. Ltd. (South Korea) | 3.8 | |
| 5. | Diageo plc (United Kingdom) | 3.6 | |
| 6. | BHP Group Ltd. (Australia) | 3.5 | |
| 7. | Roche Holding AG (Switzerland) | 3.2 | |
| 8. | Anglo American plc (South Africa) | 3.2 | |
| 9. | Toronto-Dominion Bank (The) (Canada) | 3.1 | |
| 10. | AIA Group Ltd. (Hong Kong) | 2.9 | |
| PORTFOLIO COMPOSTION BY COUNTRY AS OF April 30, 2022 | PERCENT OF TOTAL INVESTMENTS | |
Switzerland | 11.2% | |
United Kingdom | 9.9 | |
France | 9.8 | |
Netherlands | 7.4 | |
Canada | 5.7 | |
Germany | 5.4 | |
Denmark | 5.3 | |
Hong Kong | 4.9 | |
Japan | 4.7 | |
South Korea | 4.5 | |
Australia | 3.5 | |
United States | 3.3 | |
Taiwan | 3.3 | |
South Africa | 3.2 |
| PORTFOLIO COMPOSTION BY COUNTRY AS OF April 30, 2022 | PERCENT OF TOTAL INVESTMENTS | |
Singapore | 2.7% | |
China | 2.4 | |
India | 2.4 | |
Spain | 2.2 | |
Belgium | 2.1 | |
Indonesia | 1.9 | |
Sweden | 1.4 | |
Short-Term Investments | 2.8 |
| * | The return shown is based on net asset values calculated for shareholder transactions and may differ from the return shown in the financial highlights, which reflects adjustments made to the net asset values in accordance with accounting principles generally accepted in the United States of America. |
| ** | The adviser seeks to achieve the Fund’s objective. There can be no guarantee it will be achieved. |
| April 30, 2022 | J.P. Morgan International Equity Funds | 17 |
| INCEPTION DATE OF CLASS | 6 MONTH* | 1 YEAR | 5 YEAR | 10 YEAR | |||||
| CLASS A SHARES | November 30, 2011 | ||||||||
| With Sales Charge ** | (21.10)% | (19.86)% | 3.62% | 5.06% | |||||
| Without Sales Charge | (16.72) | (15.43) | 4.74 | 5.63 | |||||
| CLASS C SHARES | November 30, 2011 | ||||||||
| With CDSC *** | (17.91) | (16.82) | 4.22 | 5.20 | |||||
| Without CDSC | (16.91) | (15.82) | 4.22 | 5.20 | |||||
| Class I SHARES | November 30, 2011 | (16.59) | (15.20) | 5.02 | 5.92 | ||||
| Class R2 SHARES | November 30, 2011 | (16.83) | (15.68) | 4.43 | 5.34 | ||||
| Class R5 SHARES | November 30, 2011 | (16.57) | (15.11) | 5.12 | 6.06 | ||||
| Class R6 SHARES | November 30, 2011 | (16.50) | (15.01) | 5.22 | 6.14 |
| * | Not annualized. |
| ** | Sales Charge for Class A Shares is 5.25%. |
| *** | Assumes a 1% CDSC (contingent deferred sales charge) for the 6 month and one year periods and 0% CDSC thereafter. |
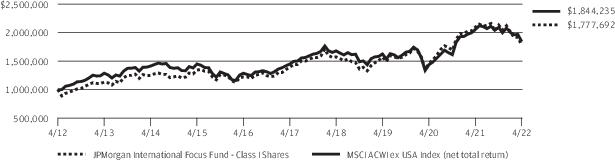
| 18 | J.P. Morgan International Equity Funds | April 30, 2022 |
| REPORTING PERIOD RETURN: | |
Fund (Class I Shares) * | (10.08)% |
MSCI EAFE Index (net total return) | (11.80)% |
ICE BofAML 3-Month US Treasury Bill Index | 0.07% |
Net Assets as of 4/30/2022 (In Thousands) | $171,223 |
| April 30, 2022 | J.P. Morgan International Equity Funds | 19 |
| TOP TEN POSITIONS OF THE PORTFOLIO AS OF April 30, 2022 | PERCENT OF TOTAL INVESTMENTS | ||
| 1. | MSCI EAFE E-Mini Index 6/17/2022 at USD 2,015.00, European Style | 3.6 % | |
| 2. | Nestle SA (Registered) (Switzerland) | 2.8 | |
| 3. | Roche Holding AG (Switzerland) | 2.4 | |
| 4. | ASML Holding NV (Netherlands) | 2.0 | |
| 5. | Novo Nordisk A/S, Class B (Denmark) | 1.9 | |
| 6. | LVMH Moet Hennessy Louis Vuitton SE (France) | 1.7 | |
| 7. | Novartis AG (Registered) (Switzerland) | 1.7 | |
| 8. | AstraZeneca plc (United Kingdom) | 1.6 | |
| 9. | Diageo plc (United Kingdom) | 1.4 | |
| 10. | Allianz SE (Registered) (Germany) | 1.3 | |
| PORTFOLIO COMPOSTION BY COUNTRY AS OF April 30, 2022 | PERCENT OF TOTAL INVESTMENTS | |
Japan | 20.9% | |
United Kingdom | 12.8 | |
Switzerland | 10.9 | |
France | 10.7 | |
Germany | 8.7 | |
Australia | 6.1 | |
Netherlands | 5.9 | |
United States | 5.4 | |
Denmark | 3.2 | |
Spain | 2.7 | |
Hong Kong | 2.4 | |
Sweden | 1.9 | |
Others (each less than 1.0%) | 3.9 | |
Short-Term Investments | 4.5 |
| * | The return shown is based on net asset values calculated for shareholder transactions and may differ from the return shown in the financial highlights, which reflects adjustments made to the net asset values in accordance with accounting principles generally accepted in the United States of America. |
| ** | The adviser seeks to achieve the Fund’s objective. There can be no guarantee it will be achieved. |
| 20 | J.P. Morgan International Equity Funds | April 30, 2022 |
| INCEPTION DATE OF CLASS | 6 MONTH* | 1 YEAR | SINCE INCEPTION | ||||
| CLASS A SHARES | March 15, 2019 | ||||||
| With Sales Charge ** | (14.88)% | (10.37)% | (0.61)% | ||||
| Without Sales Charge | (10.15) | (5.40) | 1.11 | ||||
| CLASS C SHARES | March 15, 2019 | ||||||
| With CDSC *** | (11.38) | (6.87) | 0.60 | ||||
| Without CDSC | (10.38) | (5.87) | 0.60 | ||||
| Class I SHARES | March 15, 2019 | (10.08) | (5.18) | 1.36 | |||
| Class R5 SHARES | March 15, 2019 | (9.97) | (5.01) | 1.52 | |||
| Class R6 SHARES | March 15, 2019 | (9.99) | (4.98) | 1.61 |
| * | Not annualized. |
| ** | Sales Charge for Class A Shares is 5.25%. |
| *** | Assumes a 1% CDSC (contingent deferred sales charge) for the 6 month and one year periods and 0% CDSC thereafter. |
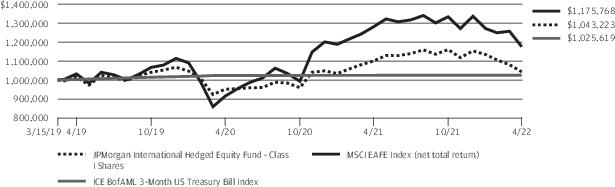
| April 30, 2022 | J.P. Morgan International Equity Funds | 21 |
| 22 | J.P. Morgan International Equity Funds | April 30, 2022 |
| REPORTING PERIOD RETURN: | |
Fund (Class I Shares) * | (12.16)% |
MSCI EAFE Index (net total return) | (11.80)% |
Net Assets as of 4/30/2022 (In Thousands) | $5,523,040 |
| TOP TEN POSITIONS OF THE PORTFOLIO AS OF April 30, 2022 | PERCENT OF TOTAL INVESTMENTS | ||
| 1. | Nestle SA (Registered) (Switzerland) | 2.9 % | |
| 2. | Roche Holding AG (Switzerland) | 2.5 | |
| 3. | ASML Holding NV (Netherlands) | 2.0 | |
| 4. | Novo Nordisk A/S, Class B (Denmark) | 2.0 | |
| 5. | LVMH Moet Hennessy Louis Vuitton SE (France) | 1.8 | |
| 6. | Novartis AG (Registered) (Switzerland) | 1.7 | |
| 7. | AstraZeneca plc (United Kingdom) | 1.6 | |
| 8. | Diageo plc (United Kingdom) | 1.4 | |
| 9. | BP plc (United Kingdom) | 1.3 | |
| 10. | Allianz SE (Registered) (Germany) | 1.3 | |
| PORTFOLIO COMPOSTION BY COUNTRY AS OF April 30, 2022 | PERCENT OF TOTAL INVESTMENTS | |
Japan | 19.0% | |
United Kingdom | 13.6 | |
Switzerland | 11.4 | |
France | 11.4 | |
Germany | 9.1 | |
Netherlands | 6.3 | |
Australia | 5.8 | |
Denmark | 3.4 | |
Spain | 2.7 | |
Hong Kong | 2.2 | |
Sweden | 1.9 | |
United States | 1.9 | |
Others (each less than 1.0%) | 4.0 | |
Short-Term Investments | 7.3 |
| * | The return shown is based on net asset values calculated for shareholder transactions and may differ from the return shown in the financial highlights, which reflects adjustments made to the net asset values in accordance with accounting principles generally accepted in the United States of America. |
| ** | The adviser seeks to achieve the Fund’s objective. There can be no guarantee it will be achieved. |
| April 30, 2022 | J.P. Morgan International Equity Funds | 23 |
| INCEPTION DATE OF CLASS | 6 MONTH* | 1 YEAR | 5 YEAR | 10 YEAR | |||||
| CLASS A SHARES | April 23, 1993 | ||||||||
| With Sales Charge ** | (16.83)% | (12.46)% | 2.48% | 4.74% | |||||
| Without Sales Charge | (12.21) | (7.61) | 3.60 | 5.31 | |||||
| Class I SHARES | October 28, 1992 | (12.16) | (7.45) | 3.83 | 5.57 | ||||
| Class R6 SHARES | November 1, 2017 | (12.14) | (7.36) | 3.93 | 5.62 |
| * | Not annualized. |
| ** | Sales Charge for Class A Shares is 5.25%. |
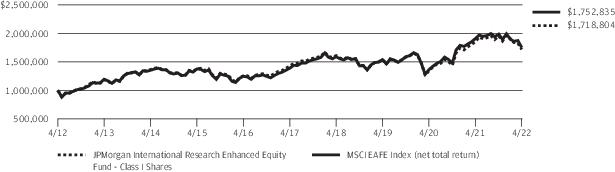
| 24 | J.P. Morgan International Equity Funds | April 30, 2022 |
| REPORTING PERIOD RETURN: | |
Fund (Class L Shares) * | (7.92)% |
MSCI EAFE Value Index (net total return) | (5.14)% |
Net Assets as of 4/30/2022 (In Thousands) | $387,700 |
| April 30, 2022 | J.P. Morgan International Equity Funds | 25 |
| TOP TEN POSITIONS OF THE PORTFOLIO AS OF April 30, 2022 | PERCENT OF TOTAL INVESTMENTS | ||
| 1. | Shell plc (Netherlands) | 2.8 % | |
| 2. | Novartis AG (Registered) (Switzerland) | 2.4 | |
| 3. | Toyota Motor Corp. (Japan) | 2.3 | |
| 4. | BHP Group Ltd. (Australia) | 2.2 | |
| 5. | TotalEnergies SE (France) | 1.7 | |
| 6. | HSBC Holdings plc (United Kingdom) | 1.6 | |
| 7. | GlaxoSmithKline plc | 1.5 | |
| 8. | BP plc (United Kingdom) | 1.4 | |
| 9. | Siemens AG (Registered) (Germany) | 1.2 | |
| 10. | Allianz SE (Registered) (Germany) | 1.2 | |
| PORTFOLIO COMPOSTION BY COUNTRY AS OF April 30, 2022 | PERCENT OF TOTAL INVESTMENTS | |
Japan | 20.1% | |
United Kingdom | 13.6 | |
Germany | 9.4 | |
Australia | 8.1 | |
France | 7.7 | |
Switzerland | 5.9 | |
Netherlands | 5.8 | |
Italy | 3.2 | |
Spain | 3.1 | |
Sweden | 2.6 | |
Norway | 2.4 | |
United States | 2.3 | |
Denmark | 1.6 | |
Finland | 1.5 |
| PORTFOLIO COMPOSTION BY COUNTRY AS OF April 30, 2022 | PERCENT OF TOTAL INVESTMENTS | |
Singapore | 1.4% | |
Austria | 1.3 | |
Hong Kong | 1.0 | |
Others (each less than 1.0%) | 2.7 | |
Short-Term Investments | 6.3 |
| * | The return shown is based on net asset values calculated for shareholder transactions and may differ from the return shown in the financial highlights, which reflects adjustments made to the net asset values in accordance with accounting principles generally accepted in the United States of America. |
| ** | The adviser seeks to achieve the Fund’s objective. There can be no guarantee it will be achieved. |
| 26 | J.P. Morgan International Equity Funds | April 30, 2022 |
| INCEPTION DATE OF CLASS | 6 MONTH* | 1 YEAR | 5 YEAR | 10 YEAR | |||||
| CLASS A SHARES | September 28, 2001 | ||||||||
| With Sales Charge ** | (12.90)% | (9.86)% | 0.46% | 2.46% | |||||
| Without Sales Charge | (8.05) | (4.87) | 1.55 | 3.02 | |||||
| CLASS C SHARES | July 11, 2006 | ||||||||
| With CDSC *** | (9.34) | (6.36) | 1.03 | 2.61 | |||||
| Without CDSC | (8.34) | (5.36) | 1.03 | 2.61 | |||||
| Class I SHARES | September 10, 2001 | (7.97) | (4.66) | 1.81 | 3.29 | ||||
| Class L SHARES | November 4, 1993 | (7.92) | (4.53) | 1.92 | 3.42 | ||||
| Class R2 SHARES | November 3, 2008 | (8.22) | (5.13) | 1.25 | 2.74 | ||||
| Class R5 SHARES | September 9, 2016 | (7.85) | (4.50) | 1.92 | 3.42 | ||||
| Class R6 SHARES | November 30, 2010 | (7.93) | (4.44) | 2.02 | 3.53 |
| * | Not annualized. |
| ** | Sales Charge for Class A Shares is 5.25%. |
| *** | Assumes a 1% CDSC (contingent deferred sales charge) for the 6 month and one year periods and 0% CDSC thereafter. |
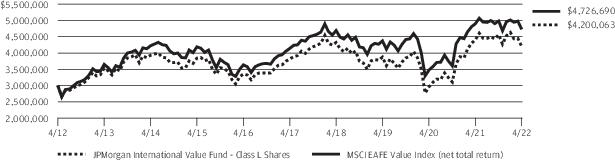
| April 30, 2022 | J.P. Morgan International Equity Funds | 27 |
| INVESTMENTS | SHARES (000) | VALUE ($000) |
| Common Stocks — 97.3% | ||
| Brazil — 5.7% | ||
| B3 SA - Brasil Bolsa Balcao | 36,160 | 97,275 |
| Magazine Luiza SA * | 35,416 | 35,388 |
| MercadoLibre, Inc. * | 290 | 282,412 |
| Raia Drogasil SA | 12,592 | 53,284 |
| XP, Inc., Class A * | 3,372 | 82,972 |
| 551,331 | ||
| China — 30.5% | ||
| Alibaba Group Holding Ltd. * | 2,185 | 26,658 |
| Beijing Oriental Yuhong Waterproof Technology Co. Ltd., Class A | 14,621 | 99,270 |
| Budweiser Brewing Co. APAC Ltd. (a) | 36,765 | 91,478 |
| Dada Nexus Ltd., ADR * | 3,482 | 26,570 |
| Foshan Haitian Flavouring & Food Co. Ltd., Class A | 10,770 | 131,311 |
| JD.com, Inc., ADR * | 1,020 | 62,922 |
| JD.com, Inc., Class A * | 7,921 | 246,959 |
| Jiangsu Hengli Hydraulic Co. Ltd., Class A | 14,368 | 98,604 |
| KE Holdings, Inc., ADR * | 3,440 | 48,775 |
| Kingdee International Software Group Co. Ltd. * | 33,349 | 68,052 |
| Meituan * (a) | 7,797 | 167,056 |
| Midea Group Co. Ltd., Class A | 3,256 | 27,705 |
| NetEase, Inc. | 12,341 | 236,401 |
| Pharmaron Beijing Co. Ltd., Class A | 5,886 | 110,397 |
| Ping An Bank Co. Ltd., Class A | 24,427 | 55,982 |
| Shenzhen Mindray Bio-Medical Electronics Co. Ltd., Class A | 1,917 | 89,874 |
| Shenzhou International Group Holdings Ltd. | 8,462 | 114,817 |
| Sichuan Swellfun Co. Ltd., Class A | 1,990 | 20,973 |
| Silergy Corp. | 1,455 | 129,542 |
| Sunny Optical Technology Group Co. Ltd. | 6,003 | 87,494 |
| Tencent Holdings Ltd. | 9,578 | 451,358 |
| Wanhua Chemical Group Co. Ltd., Class A | 8,751 | 101,801 |
| Wuliangye Yibin Co. Ltd., Class A | 2,814 | 68,187 |
| Wuxi Biologics Cayman, Inc. * (a) | 19,748 | 145,760 |
| Xinyi Solar Holdings Ltd. | 90,630 | 134,715 |
| Yum China Holdings, Inc. | 2,605 | 108,882 |
| 2,951,543 | ||
| Hong Kong — 4.9% | ||
| AIA Group Ltd. | 24,585 | 241,514 |
| Hong Kong Exchanges & Clearing Ltd. | 1,598 | 67,802 |
| Techtronic Industries Co. Ltd. | 1,220 | 16,254 |
| Techtronic Industries Co. Ltd. | 11,206 | 149,579 |
| 475,149 | ||
| INVESTMENTS | SHARES (000) | VALUE ($000) |
| India — 21.9% | ||
| Apollo Hospitals Enterprise Ltd. | 1,562 | 90,468 |
| Asian Paints Ltd. | 2,104 | 88,691 |
| Britannia Industries Ltd. | 1,516 | 64,701 |
| HDFC Bank Ltd. | 13,065 | 234,234 |
| HDFC Bank Ltd., ADR | 2,799 | 154,522 |
| HDFC Life Insurance Co. Ltd. (a) | 16,679 | 126,468 |
| Hindustan Unilever Ltd. | 5,256 | 152,715 |
| Housing Development Finance Corp. Ltd. | 9,711 | 280,190 |
| Infosys Ltd. | 3,073 | 62,281 |
| Infosys Ltd., ADR | 6,857 | 136,239 |
| Kotak Mahindra Bank Ltd. | 6,895 | 159,883 |
| Reliance Industries Ltd. | 7,350 | 266,303 |
| Tata Consultancy Services Ltd. | 6,652 | 306,584 |
| 2,123,279 | ||
| Indonesia — 4.4% | ||
| Bank Central Asia Tbk. PT | 366,933 | 205,802 |
| Bank Rakyat Indonesia Persero Tbk. PT | 655,689 | 218,467 |
| 424,269 | ||
| Macau — 0.5% | ||
| Sands China Ltd. * | 22,195 | 48,921 |
| Mexico — 3.1% | ||
| Grupo Financiero Banorte SAB de CV, Class O | 17,815 | 117,418 |
| Wal-Mart de Mexico SAB de CV | 52,447 | 185,898 |
| 303,316 | ||
| Panama — 0.7% | ||
| Copa Holdings SA, Class A * | 879 | 66,264 |
| Poland — 0.4% | ||
| Allegro.eu SA * (a) | 6,701 | 34,466 |
| Portugal — 0.9% | ||
| Jeronimo Martins SGPS SA | 4,290 | 89,295 |
| South Africa — 1.5% | ||
| Bid Corp. Ltd. | 3,452 | 72,233 |
| Capitec Bank Holdings Ltd. | 525 | 73,285 |
| 145,518 | ||
| South Korea — 8.2% | ||
| Delivery Hero SE * (a) (b) | 1,063 | 37,355 |
| LG Chem Ltd. | 225 | 92,259 |
| NCSoft Corp. | 162 | 53,683 |
| Samsung Electronics Co. Ltd. | 11,386 | 606,785 |
| 790,082 | ||
| 28 | J.P. Morgan International Equity Funds | April 30, 2022 |
| INVESTMENTS | SHARES (000) | VALUE ($000) |
| Common Stocks — continued | ||
| Taiwan — 11.5% | ||
| Chailease Holding Co. Ltd. | 16,230 | 128,975 |
| Delta Electronics, Inc. | 9,230 | 77,048 |
| Realtek Semiconductor Corp. | 3,104 | 42,120 |
| Taiwan Semiconductor Manufacturing Co. Ltd. | 6,120 | 110,666 |
| Taiwan Semiconductor Manufacturing Co. Ltd., ADR | 8,142 | 756,695 |
| 1,115,504 | ||
| United Kingdom — 1.1% | ||
| Prudential plc | 8,808 | 109,652 |
| United States — 2.0% | ||
| EPAM Systems, Inc. * | 544 | 144,031 |
| JS Global Lifestyle Co. Ltd. (a) | 41,166 | 48,836 |
| 192,867 | ||
| Total Common Stocks (Cost $8,504,575) | 9,421,456 | |
| Short-Term Investments — 2.8% | ||
| Investment Companies — 2.8% | ||
| JPMorgan Prime Money Market Fund Class Institutional Shares, 0.36% (c) (d)(Cost $267,802) | 267,753 | 267,806 |
| Investment of Cash Collateral from Securities Loaned — 0.0% ^ | ||
| JPMorgan Securities Lending Money Market Fund Agency SL Class Shares, 0.37% (c) (d) | 8 | 8 |
| JPMorgan U.S. Government Money Market Fund Class IM Shares, 0.37% (c) (d) | 99 | 99 |
| Total Investment of Cash Collateral from Securities Loaned (Cost $107) | 107 | |
| Total Short-Term Investments (Cost $267,909) | 267,913 | |
| Total Investments — 100.1% (Cost $8,772,484) | 9,689,369 | |
| Liabilities in Excess of Other Assets — (0.1)% | (11,141) | |
| NET ASSETS — 100.0% | 9,678,228 | |
Percentages indicated are based on net assets. | ||
| Abbreviations | |
| ADR | American Depositary Receipt |
| APAC | Asia Pacific |
| PT | Limited liability company |
| SGPS | Holding company |
| ^ | Amount rounds to less than 0.1% of net assets. | |
| * | Non-income producing security. | |
| (a) | Security exempt from registration pursuant to Regulation S under the Securities Act of 1933, as amended. Regulation S applies to securities offerings that are made outside of the United States and do not involve direct selling efforts in the United States and as such may have restrictions on resale. | |
| (b) | The security or a portion of this security is on loan at April 30, 2022. The total value of securities on loan at April 30, 2022 is $106. | |
| (c) | Investment in an affiliated fund, which is registered under the Investment Company Act of 1940, as amended, and is advised by J.P. Morgan Investment Management Inc. | |
| (d) | The rate shown is the current yield as of April 30, 2022. |
| INDUSTRY | PERCENT OF TOTAL INVESTMENTS |
| Banks | 12.7% |
| Semiconductors & Semiconductor Equipment | 12.1 |
| Internet & Direct Marketing Retail | 9.3 |
| IT Services | 6.7 |
| Technology Hardware, Storage & Peripherals | 6.3 |
| Insurance | 4.9 |
| Interactive Media & Services | 4.7 |
| Food & Staples Retailing | 4.0 |
| Entertainment | 2.9 |
| Chemicals | 2.9 |
| Thrifts & Mortgage Finance | 2.9 |
| Oil, Gas & Consumable Fuels | 2.7 |
| Machinery | 2.7 |
| Life Sciences Tools & Services | 2.6 |
| Capital Markets | 2.6 |
| Food Products | 2.1 |
| Beverages | 1.8 |
| Electronic Equipment, Instruments & Components | 1.7 |
| Hotels, Restaurants & Leisure | 1.6 |
| Personal Products | 1.6 |
| Diversified Financial Services | 1.3 |
| Textiles, Apparel & Luxury Goods | 1.2 |
| Construction Materials | 1.0 |
| Others (each less than 1.0%) | 4.9 |
| Short-Term Investments | 2.8 |
| April 30, 2022 | J.P. Morgan International Equity Funds | 29 |
| INVESTMENTS | SHARES (000) | VALUE ($000) |
| Common Stocks — 98.7% | ||
| Brazil — 6.2% | ||
| Atacadao SA | 1,245 | 5,192 |
| B3 SA - Brasil Bolsa Balcao | 1,593 | 4,285 |
| Cia Energetica de Minas Gerais (Preference) | 959 | 2,918 |
| EDP - Energias do Brasil SA | 936 | 4,026 |
| Gerdau SA (Preference) | 2,097 | 11,972 |
| Itau Unibanco Holding SA (Preference) * | 3,198 | 15,485 |
| Itausa SA (Preference) | 6,219 | 11,610 |
| Localiza Rent a Car SA | 436 | 4,701 |
| Lojas Renner SA * | 1,656 | 7,992 |
| Magazine Luiza SA * | 3,785 | 3,782 |
| MercadoLibre, Inc. * | 4 | 4,281 |
| Petroleo Brasileiro SA (Preference) | 4,981 | 30,721 |
| Porto Seguro SA | 470 | 1,950 |
| Raia Drogasil SA | 2,012 | 8,511 |
| Suzano SA | 975 | 9,858 |
| TIM SA, ADR * | 466 | 6,360 |
| Vale SA, ADR | 2,078 | 35,104 |
| WEG SA | 1,854 | 11,365 |
| XP, Inc., Receipts * | 85 | 2,096 |
| 182,209 | ||
| Chile — 0.4% | ||
| Banco Santander Chile, ADR | 383 | 7,452 |
| Cencosud SA | 1,448 | 2,317 |
| Cia Cervecerias Unidas SA, ADR | 118 | 1,578 |
| 11,347 | ||
| China — 30.4% | ||
| Alibaba Group Holding Ltd. * | 7,028 | 85,726 |
| Amoy Diagnostics Co. Ltd., Class A | 204 | 1,393 |
| Anhui Conch Cement Co. Ltd., Class H | 903 | 4,910 |
| Anjoy Foods Group Co. Ltd., Class A | 136 | 2,635 |
| ANTA Sports Products Ltd. | 718 | 8,247 |
| Baidu, Inc., ADR * | 92 | 11,375 |
| Baoshan Iron & Steel Co. Ltd., Class A | 6,679 | 6,444 |
| BeiGene Ltd., ADR * (a) | 17 | 2,677 |
| Beijing Oriental Yuhong Waterproof Technology Co. Ltd., Class A | 589 | 3,999 |
| BOE Technology Group Co. Ltd., Class A | 10,123 | 5,750 |
| BYD Co. Ltd., Class H | 159 | 4,642 |
| Chacha Food Co. Ltd., Class A | 651 | 5,179 |
| China Conch Environment Protection Holdings Ltd. * | 1,321 | 1,131 |
| China Conch Venture Holdings Ltd. | 1,321 | 3,430 |
| China Construction Bank Corp., Class H | 51,389 | 36,609 |
| China International Capital Corp. Ltd., Class H (b) | 3,397 | 6,809 |
| INVESTMENTS | SHARES (000) | VALUE ($000) |
| China — continued | ||
| China Lesso Group Holdings Ltd. | 3,062 | 3,829 |
| China Life Insurance Co. Ltd., Class H | 6,444 | 9,364 |
| China Merchants Bank Co. Ltd., Class H | 3,374 | 20,336 |
| China Molybdenum Co. Ltd., Class H | 12,579 | 6,256 |
| China Oilfield Services Ltd., Class H | 8,198 | 8,393 |
| China Pacific Insurance Group Co. Ltd., Class H | 3,075 | 6,818 |
| China Petroleum & Chemical Corp., Class H | 12,884 | 6,306 |
| China Resources Land Ltd. | 2,594 | 11,585 |
| China Resources Mixc Lifestyle Services Ltd. (b) | 644 | 3,096 |
| China Vanke Co. Ltd., Class H | 4,356 | 10,272 |
| China Yangtze Power Co. Ltd., Class A | 2,446 | 8,336 |
| Chongqing Brewery Co. Ltd., Class A * | 192 | 3,590 |
| Chongqing Fuling Zhacai Group Co. Ltd., Class A | 602 | 3,142 |
| Contemporary Amperex Technology Co. Ltd., Class A | 117 | 7,085 |
| COSCO SHIPPING Holdings Co. Ltd., Class H * | 1,890 | 2,941 |
| Country Garden Services Holdings Co. Ltd. | 1,560 | 6,575 |
| CSPC Pharmaceutical Group Ltd. | 5,804 | 5,934 |
| ENN Energy Holdings Ltd. | 681 | 9,118 |
| Foshan Haitian Flavouring & Food Co. Ltd., Class A | 712 | 8,681 |
| Fuyao Glass Industry Group Co. Ltd., Class H (b) | 965 | 3,942 |
| Ganfeng Lithium Co. Ltd., Class H (b) | 221 | 2,648 |
| Guangzhou Automobile Group Co. Ltd., Class H | 11,024 | 9,347 |
| Guangzhou Kingmed Diagnostics Group Co. Ltd., Class A | 282 | 3,452 |
| Haier Smart Home Co. Ltd., Class H | 3,563 | 12,586 |
| Hangzhou Tigermed Consulting Co. Ltd., Class H (b) | 271 | 2,625 |
| Han's Laser Technology Industry Group Co. Ltd., Class A | 605 | 2,497 |
| Hefei Meiya Optoelectronic Technology, Inc., Class A | 535 | 1,814 |
| Huatai Securities Co. Ltd., Class H (b) | 2,480 | 3,408 |
| Huayu Automotive Systems Co. Ltd., Class A | 978 | 2,861 |
| Huazhu Group Ltd. | 1,647 | 5,183 |
| Hundsun Technologies, Inc., Class A | 327 | 1,862 |
| Hutchmed China Ltd., ADR * (a) | 64 | 972 |
| Industrial & Commercial Bank of China Ltd., Class H | 27,366 | 16,496 |
| Inner Mongolia Yili Industrial Group Co. Ltd., Class A | 1,589 | 9,157 |
| JD.com, Inc., Class A * | 1,127 | 35,144 |
| Jiangsu Hengli Hydraulic Co. Ltd., Class A | 273 | 1,873 |
| Jiangsu Hengrui Medicine Co. Ltd., Class A | 949 | 4,191 |
| Kuaishou Technology * (b) | 315 | 2,576 |
| Kunlun Energy Co. Ltd. | 7,742 | 6,425 |
| Kweichow Moutai Co. Ltd., Class A | 31 | 8,375 |
| Laobaixing Pharmacy Chain JSC, Class A | 670 | 3,232 |
| Lenovo Group Ltd. | 3,448 | 3,348 |
| 30 | J.P. Morgan International Equity Funds | April 30, 2022 |
| INVESTMENTS | SHARES (000) | VALUE ($000) |
| Common Stocks — continued | ||
| China — continued | ||
| Longfor Group Holdings Ltd. (b) | 2,086 | 10,331 |
| Maxscend Microelectronics Co. Ltd., Class A * | 66 | 1,805 |
| Meituan * (b) | 1,866 | 39,984 |
| Minth Group Ltd. | 1,506 | 3,548 |
| NetEase, Inc. | 1,352 | 25,906 |
| NIO, Inc., ADR * (a) | 437 | 7,302 |
| Nongfu Spring Co. Ltd., Class H (b) | 740 | 3,917 |
| Oppein Home Group, Inc., Class A | 348 | 6,074 |
| Pharmaron Beijing Co. Ltd., Class H (b) | 572 | 7,190 |
| PICC Property & Casualty Co. Ltd., Class H | 10,226 | 10,459 |
| Pinduoduo, Inc., ADR * | 222 | 9,573 |
| Ping An Bank Co. Ltd., Class A | 3,403 | 7,798 |
| Ping An Insurance Group Co. of China Ltd., Class H | 3,821 | 24,155 |
| Poly Developments and Holdings Group Co. Ltd., Class A | 1,188 | 3,243 |
| Postal Savings Bank of China Co. Ltd., Class H (b) | 8,595 | 6,517 |
| Qingdao Haier Biomedical Co. Ltd., Class A | 387 | 3,744 |
| Shanghai Baosight Software Co. Ltd., Class A | 513 | 3,641 |
| Shenzhen Mindray Bio-Medical Electronics Co. Ltd., Class A | 128 | 6,009 |
| Silergy Corp. | 77 | 6,856 |
| Skshu Paint Co. Ltd., Class A | 323 | 3,589 |
| Sunny Optical Technology Group Co. Ltd. | 533 | 7,771 |
| Tencent Holdings Ltd. | 2,663 | 125,503 |
| Tongwei Co. Ltd., Class A | 792 | 4,842 |
| Trip.com Group Ltd., ADR * | 152 | 3,606 |
| Wanhua Chemical Group Co. Ltd., Class A | 562 | 6,534 |
| Wuliangye Yibin Co. Ltd., Class A | 101 | 2,437 |
| WuXi AppTec Co. Ltd., Class H (b) | 534 | 7,259 |
| Wuxi Biologics Cayman, Inc. * (b) | 1,988 | 14,677 |
| Xiaomi Corp., Class B * (b) | 3,225 | 4,910 |
| Xinyi Solar Holdings Ltd. | 6,168 | 9,168 |
| XPeng, Inc., Class A * (a) | 485 | 6,024 |
| Yum China Holdings, Inc. | 71 | 2,925 |
| Yum China Holdings, Inc. | 167 | 6,962 |
| Yunnan Energy New Material Co. Ltd. * | 94 | 2,837 |
| Zai Lab Ltd., ADR * | 24 | 966 |
| Zhejiang Dingli Machinery Co. Ltd., Class A | 355 | 1,975 |
| Zhejiang Weixing New Building Materials Co. Ltd., Class A | 1,651 | 4,693 |
| Zhongji Innolight Co. Ltd., Class A | 507 | 2,323 |
| Zijin Mining Group Co. Ltd., Class H | 8,426 | 12,269 |
| 895,949 | ||
| INVESTMENTS | SHARES (000) | VALUE ($000) |
| Colombia — 0.2% | ||
| Ecopetrol SA, ADR (a) | 330 | 5,352 |
| Greece — 0.5% | ||
| Hellenic Telecommunications Organization SA | 384 | 7,388 |
| OPAP SA | 465 | 6,886 |
| 14,274 | ||
| Hong Kong — 0.2% | ||
| Techtronic Industries Co. Ltd. | 418 | 5,579 |
| Hungary — 0.4% | ||
| OTP Bank Nyrt. * | 252 | 7,514 |
| Richter Gedeon Nyrt. | 185 | 3,684 |
| 11,198 | ||
| India — 12.8% | ||
| ACC Ltd. | 153 | 4,626 |
| Apollo Hospitals Enterprise Ltd. | 187 | 10,818 |
| Axis Bank Ltd. * | 994 | 9,375 |
| Bharat Petroleum Corp. Ltd. | 1,760 | 8,285 |
| Biocon Ltd. * | 913 | 4,381 |
| Britannia Industries Ltd. | 233 | 9,936 |
| Dabur India Ltd. | 643 | 4,652 |
| Dr. Reddy's Laboratories Ltd. | 53 | 2,880 |
| Eicher Motors Ltd. | 124 | 4,220 |
| GAIL India Ltd. | 1,461 | 3,020 |
| HDFC Bank Ltd., ADR | 128 | 7,076 |
| HDFC Life Insurance Co. Ltd. (b) | 1,385 | 10,501 |
| Hindalco Industries Ltd. | 1,589 | 9,891 |
| Hindustan Unilever Ltd. | 657 | 19,080 |
| Housing Development Finance Corp. Ltd. | 987 | 28,464 |
| ICICI Bank Ltd. | 3,010 | 28,932 |
| Infosys Ltd., ADR | 1,773 | 35,227 |
| Kotak Mahindra Bank Ltd. | 577 | 13,383 |
| Larsen & Toubro Ltd. | 552 | 12,122 |
| Maruti Suzuki India Ltd. | 135 | 13,556 |
| NTPC Ltd. | 4,763 | 9,668 |
| Oil & Natural Gas Corp. Ltd. | 3,278 | 6,793 |
| Petronet LNG Ltd. | 2,227 | 5,903 |
| Power Grid Corp. of India Ltd. | 2,429 | 7,198 |
| Reliance Industries Ltd. | 1,486 | 53,838 |
| Shriram Transport Finance Co. Ltd. | 446 | 6,927 |
| Tata Consultancy Services Ltd. | 573 | 26,392 |
| Tata Consumer Products Ltd. | 325 | 3,487 |
| Tata Steel Ltd. | 375 | 6,162 |
| April 30, 2022 | J.P. Morgan International Equity Funds | 31 |
| INVESTMENTS | SHARES (000) | VALUE ($000) |
| Common Stocks — continued | ||
| India — continued | ||
| UltraTech Cement Ltd. | 89 | 7,709 |
| Wipro Ltd. | 474 | 3,113 |
| 377,615 | ||
| Indonesia — 1.8% | ||
| Bank Central Asia Tbk. PT | 36,002 | 20,192 |
| Bank Rakyat Indonesia Persero Tbk. PT | 53,968 | 17,982 |
| Telkom Indonesia Persero Tbk. PT | 50,760 | 16,177 |
| 54,351 | ||
| Malaysia — 1.2% | ||
| CIMB Group Holdings Bhd. | 3,823 | 4,557 |
| Malayan Banking Bhd. | 1,818 | 3,781 |
| Petronas Chemicals Group Bhd. | 3,999 | 9,388 |
| Public Bank Bhd. | 11,430 | 12,286 |
| Tenaga Nasional Bhd. | 2,208 | 4,584 |
| 34,596 | ||
| Mexico — 2.9% | ||
| America Movil SAB de CV | 18,099 | 17,650 |
| Fomento Economico Mexicano SAB de CV, ADR | 91 | 6,823 |
| Grupo Aeroportuario del Pacifico SAB de CV, Class B * | 628 | 9,670 |
| Grupo Aeroportuario del Sureste SAB de CV, Class B | 426 | 9,284 |
| Grupo Financiero Banorte SAB de CV, Class O | 1,963 | 12,942 |
| Grupo Mexico SAB de CV | 2,202 | 10,313 |
| Kimberly-Clark de Mexico SAB de CV, Class A | 2,133 | 2,969 |
| Wal-Mart de Mexico SAB de CV | 4,209 | 14,919 |
| 84,570 | ||
| Peru — 0.4% | ||
| Credicorp Ltd. | 80 | 11,094 |
| Philippines — 0.5% | ||
| Ayala Corp. | 253 | 3,554 |
| Ayala Land, Inc. | 5,924 | 3,616 |
| International Container Terminal Services, Inc. | 1,500 | 6,160 |
| 13,330 | ||
| Poland — 0.4% | ||
| Dino Polska SA * (b) | 119 | 7,666 |
| Powszechny Zaklad Ubezpieczen SA | 809 | 5,596 |
| 13,262 | ||
| INVESTMENTS | SHARES (000) | VALUE ($000) |
| Qatar — 0.6% | ||
| Industries Qatar QSC | 1,191 | 6,142 |
| Qatar National Bank QPSC | 1,977 | 12,624 |
| 18,766 | ||
| Russia — 0.0% ^ | ||
| Gazprom PJSC, ADR ‡ | 2,290 | 256 |
| Magnitogorsk Iron & Steel Works PJSC ‡ | 3,146 | 36 |
| MMC Norilsk Nickel PJSC, ADR ‡ | 410 | 197 |
| Novatek PJSC ‡ | 165 | 50 |
| Rosneft Oil Co. PJSC, GDR ‡ (b) | 833 | 78 |
| Sberbank of Russia PJSC, ADR ‡ | 793 | 70 |
| Severstal PAO, GDR ‡ (b) | 329 | 105 |
| TCS Group Holding plc, GDR ‡ * (b) | 69 | 50 |
| X5 Retail Group NV, GDR ‡ (b) | 207 | 50 |
| 892 | ||
| Saudi Arabia — 4.2% | ||
| Al Rajhi Bank | 703 | 32,930 |
| Alinma Bank | 1,338 | 14,673 |
| Almarai Co. JSC | 380 | 5,234 |
| BinDawood Holding Co. | 132 | 3,596 |
| Etihad Etisalat Co. | 368 | 4,249 |
| SABIC Agri-Nutrients Co. | 148 | 6,359 |
| Saudi Arabian Oil Co. (b) | 478 | 5,716 |
| Saudi Basic Industries Corp. | 431 | 14,944 |
| Saudi National Bank (The) | 1,380 | 28,935 |
| Saudi Telecom Co. | 271 | 8,327 |
| 124,963 | ||
| Singapore — 0.1% | ||
| BOC Aviation Ltd. (b) | 347 | 2,718 |
| South Africa — 4.2% | ||
| Bid Corp. Ltd. | 537 | 11,244 |
| Bidvest Group Ltd. (The) | 233 | 3,196 |
| Capitec Bank Holdings Ltd. | 76 | 10,660 |
| Clicks Group Ltd. | 385 | 7,572 |
| FirstRand Ltd. | 4,291 | 18,479 |
| Foschini Group Ltd. (The) | 366 | 3,218 |
| Gold Fields Ltd. | 206 | 2,783 |
| Impala Platinum Holdings Ltd. | 375 | 4,856 |
| MTN Group Ltd. | 359 | 3,809 |
| Naspers Ltd., Class N | 112 | 11,315 |
| Nedbank Group Ltd. | 599 | 8,360 |
| Sanlam Ltd. | 2,676 | 11,085 |
| Sasol Ltd. * | 226 | 5,522 |
| 32 | J.P. Morgan International Equity Funds | April 30, 2022 |
| INVESTMENTS | SHARES (000) | VALUE ($000) |
| Common Stocks — continued | ||
| South Africa — continued | ||
| SPAR Group Ltd. (The) | 620 | 6,500 |
| Standard Bank Group Ltd. | 791 | 8,380 |
| Vodacom Group Ltd. | 644 | 6,201 |
| 123,180 | ||
| South Korea — 13.3% | ||
| BGF retail Co. Ltd. | 18 | 2,506 |
| Hana Financial Group, Inc. | 218 | 8,087 |
| Hankook Tire & Technology Co. Ltd. | 127 | 3,476 |
| Hyundai Glovis Co. Ltd. | 56 | 9,235 |
| Hyundai Mobis Co. Ltd. | 30 | 4,870 |
| Hyundai Motor Co. | 40 | 5,736 |
| JYP Entertainment Corp. | 101 | 4,695 |
| Kakao Corp. | 168 | 11,763 |
| KB Financial Group, Inc. | 370 | 17,204 |
| Kia Corp. | 244 | 16,007 |
| KIWOOM Securities Co. Ltd. | 41 | 3,057 |
| LG Chem Ltd. | 37 | 15,001 |
| LG Household & Health Care Ltd. | 10 | 7,057 |
| Mando Corp. | 73 | 3,119 |
| NAVER Corp. | 81 | 18,023 |
| NCSoft Corp. | 22 | 7,358 |
| POSCO Holdings, Inc. | 63 | 14,461 |
| Samsung Biologics Co. Ltd. * (b) | 11 | 7,480 |
| Samsung Electro-Mechanics Co. Ltd. | 51 | 6,605 |
| Samsung Electronics Co. Ltd. | 2,482 | 132,276 |
| Samsung Fire & Marine Insurance Co. Ltd. | 46 | 7,548 |
| Samsung SDI Co. Ltd. | 12 | 5,813 |
| Shinhan Financial Group Co. Ltd. | 461 | 15,312 |
| SK Hynix, Inc. | 326 | 28,580 |
| SK Innovation Co. Ltd. * | 58 | 9,290 |
| SK Telecom Co. Ltd. | 137 | 6,169 |
| SK, Inc. | 22 | 4,716 |
| SKC Co. Ltd. | 60 | 6,956 |
| S-Oil Corp. | 125 | 10,200 |
| 392,600 | ||
| Taiwan — 14.7% | ||
| Accton Technology Corp. | 686 | 5,351 |
| Advantech Co. Ltd. | 860 | 10,698 |
| ASE Technology Holding Co. Ltd. | 3,092 | 9,865 |
| AU Optronics Corp. | 9,025 | 5,155 |
| Cathay Financial Holding Co. Ltd. | 2,757 | 5,797 |
| Chailease Holding Co. Ltd. | 1,731 | 13,754 |
| CTBC Financial Holding Co. Ltd. | 9,129 | 8,979 |
| INVESTMENTS | SHARES (000) | VALUE ($000) |
| Taiwan — continued | ||
| Delta Electronics, Inc. | 1,908 | 15,927 |
| Eclat Textile Co. Ltd. | 404 | 6,629 |
| Evergreen Marine Corp. Taiwan Ltd. | 786 | 3,778 |
| Fubon Financial Holding Co. Ltd. | 5,983 | 15,022 |
| Giant Manufacturing Co. Ltd. | 457 | 3,821 |
| Hon Hai Precision Industry Co. Ltd. | 3,760 | 12,882 |
| MediaTek, Inc. | 352 | 9,704 |
| Nan Ya Plastics Corp. | 3,282 | 9,589 |
| Nanya Technology Corp. | 3,229 | 7,066 |
| Nien Made Enterprise Co. Ltd. | 368 | 3,876 |
| Novatek Microelectronics Corp. | 744 | 9,842 |
| Powertech Technology, Inc. | 914 | 2,872 |
| Quanta Computer, Inc. | 2,491 | 7,016 |
| Realtek Semiconductor Corp. | 642 | 8,712 |
| Sea Ltd., ADR * | 19 | 1,558 |
| Taiwan Semiconductor Manufacturing Co. Ltd. | 9,455 | 170,970 |
| Taiwan Semiconductor Manufacturing Co. Ltd., ADR | 290 | 26,934 |
| Taiwan Union Technology Corp. | 1,420 | 3,667 |
| Uni-President Enterprises Corp. | 4,552 | 10,531 |
| United Microelectronics Corp. | 2,699 | 4,287 |
| Vanguard International Semiconductor Corp. | 1,277 | 4,493 |
| Wiwynn Corp. | 229 | 7,831 |
| Yageo Corp. | 616 | 8,314 |
| Yang Ming Marine Transport Corp. * | 1,354 | 5,649 |
| Yuanta Financial Holding Co. Ltd. | 13,913 | 12,246 |
| 432,815 | ||
| Thailand — 2.1% | ||
| Airports of Thailand PCL * | 3,921 | 7,578 |
| Airports of Thailand PCL, NVDR * | 104 | 201 |
| Indorama Ventures PCL | 2,247 | 2,942 |
| Minor International PCL * | 5,464 | 5,522 |
| Minor International PCL, NVDR * | 145 | 147 |
| PTT Exploration & Production PCL, NVDR | 85 | 371 |
| PTT Exploration & Production PCL | 2,319 | 10,145 |
| PTT Global Chemical PCL | 4,788 | 6,942 |
| PTT Global Chemical PCL, NVDR | 127 | 185 |
| PTT PCL | 5,171 | 5,621 |
| PTT PCL, NVDR | 138 | 149 |
| SCB X PCL | 2,933 | 9,849 |
| Siam Cement PCL (The), NVDR | 18 | 192 |
| Siam Cement PCL (The) (Registered) | 674 | 7,243 |
| April 30, 2022 | J.P. Morgan International Equity Funds | 33 |
| INVESTMENTS | SHARES (000) | VALUE ($000) |
| Common Stocks — continued | ||
| Thailand — continued | ||
| Thai Oil PCL, NVDR | 76 | 124 |
| Thai Oil PCL | 2,864 | 4,686 |
| 61,897 | ||
| Turkey — 0.2% | ||
| Ford Otomotiv Sanayi A/S | 330 | 6,651 |
| United Arab Emirates — 1.0% | ||
| Dubai Islamic Bank PJSC | 3,613 | 6,320 |
| Emaar Properties PJSC | 4,464 | 7,699 |
| Emirates Telecommunications Group Co. PJSC | 767 | 7,335 |
| First Abu Dhabi Bank PJSC | 1,100 | 6,720 |
| 28,074 | ||
| United States — 0.0% ^ | ||
| JS Global Lifestyle Co. Ltd. (b) | 1,179 | 1,399 |
| Total Common Stocks (Cost $2,859,310) | 2,908,681 | |
| Short-Term Investments — 2.0% | ||
| Investment Companies — 1.5% | ||
| JPMorgan Prime Money Market Fund Class Institutional Shares, 0.36% (c) (d)(Cost $43,823) | 43,814 | 43,823 |
| Investment of Cash Collateral from Securities Loaned — 0.5% | ||
| JPMorgan Securities Lending Money Market Fund Agency SL Class Shares, 0.37% (c) (d) | 6,491 | 6,486 |
| JPMorgan U.S. Government Money Market Fund Class IM Shares, 0.37% (c) (d) | 7,576 | 7,576 |
| Total Investment of Cash Collateral from Securities Loaned (Cost $14,061) | 14,062 | |
| Total Short-Term Investments (Cost $57,884) | 57,885 | |
| Total Investments — 100.7% (Cost $2,917,194) | 2,966,566 | |
| Liabilities in Excess of Other Assets — (0.7)% | (20,474) | |
| NET ASSETS — 100.0% | 2,946,092 | |
Percentages indicated are based on net assets. | ||
| Abbreviations | |
| ADR | American Depositary Receipt |
| GDR | Global Depositary Receipt |
| JSC | Joint Stock Company |
| NVDR | Non-Voting Depositary Receipt |
| PJSC | Public Joint Stock Company |
| Preference | A special type of equity investment that shares in the earnings of the company, has limited voting rights, and may have a dividend preference. Preference shares may also have liquidation preference. |
| PT | Limited liability company |
| ^ | Amount rounds to less than 0.1% of net assets. | |
| ‡ | Value determined using significant unobservable inputs. | |
| * | Non-income producing security. | |
| (a) | The security or a portion of this security is on loan at April 30, 2022. The total value of securities on loan at April 30, 2022 is $13,480. | |
| (b) | Security exempt from registration pursuant to Regulation S under the Securities Act of 1933, as amended. Regulation S applies to securities offerings that are made outside of the United States and do not involve direct selling efforts in the United States and as such may have restrictions on resale. | |
| (c) | Investment in an affiliated fund, which is registered under the Investment Company Act of 1940, as amended, and is advised by J.P. Morgan Investment Management Inc. | |
| (d) | The rate shown is the current yield as of April 30, 2022. | |
| 34 | J.P. Morgan International Equity Funds | April 30, 2022 |
| INDUSTRY | PERCENT OF TOTAL INVESTMENTS |
| Banks | 15.5% |
| Semiconductors & Semiconductor Equipment | 10.1 |
| Internet & Direct Marketing Retail | 6.3 |
| Interactive Media & Services | 5.7 |
| Technology Hardware, Storage & Peripherals | 5.6 |
| Oil, Gas & Consumable Fuels | 5.5 |
| Metals & Mining | 4.2 |
| Insurance | 3.6 |
| Chemicals | 3.1 |
| Electronic Equipment, Instruments & Components | 2.5 |
| Automobiles | 2.5 |
| Food & Staples Retailing | 2.5 |
| IT Services | 2.2 |
| Food Products | 2.1 |
| Real Estate Management & Development | 1.9 |
| Diversified Financial Services | 1.5 |
| Wireless Telecommunication Services | 1.5 |
| Entertainment | 1.3 |
| Life Sciences Tools & Services | 1.3 |
| Diversified Telecommunication Services | 1.3 |
| Transportation Infrastructure | 1.1 |
| Hotels, Restaurants & Leisure | 1.1 |
| Personal Products | 1.0 |
| Construction Materials | 1.0 |
| Thrifts & Mortgage Finance | 1.0 |
| Others (each less than 1.0%) | 12.6 |
| Short-Term Investments | 2.0 |
| DESCRIPTION | NUMBER OF CONTRACTS | EXPIRATION DATE | TRADING CURRENCY | NOTIONAL AMOUNT ($) | VALUE AND UNREALIZED APPRECIATION (DEPRECIATION) ($) |
| Long Contracts | |||||
| MSCI Emerging Markets E-Mini Index | 78 | 06/17/2022 | USD | 4,119 | 77 |
| Abbreviations | |
| MSCI | Morgan Stanley Capital International |
| USD | United States Dollar |
| April 30, 2022 | J.P. Morgan International Equity Funds | 35 |
| INVESTMENTS | SHARES (000) | VALUE ($000) |
| Common Stocks — 97.8% | ||
| Australia — 2.1% | ||
| Glencore plc * | 2,081 | 12,823 |
| Austria — 1.1% | ||
| Erste Group Bank AG | 125 | 3,879 |
| Wienerberger AG | 97 | 2,738 |
| 6,617 | ||
| Denmark — 7.8% | ||
| Carlsberg A/S, Class B | 39 | 4,924 |
| Genmab A/S * | 20 | 7,172 |
| Jyske Bank A/S (Registered) * | 93 | 5,161 |
| Novo Nordisk A/S, Class B | 213 | 24,325 |
| Pandora A/S (a) | 36 | 3,164 |
| Royal Unibrew A/S | 28 | 2,381 |
| 47,127 | ||
| Finland — 3.5% | ||
| Neste OYJ | 105 | 4,527 |
| Nokia OYJ * | 1,783 | 9,038 |
| Nordea Bank Abp | 742 | 7,394 |
| 20,959 | ||
| France — 16.1% | ||
| Airbus SE | 81 | 8,872 |
| Arkema SA | 56 | 6,404 |
| BNP Paribas SA | 136 | 7,066 |
| Capgemini SE | 50 | 10,114 |
| LVMH Moet Hennessy Louis Vuitton SE | 24 | 15,446 |
| Pernod Ricard SA | 43 | 8,818 |
| Teleperformance | 15 | 5,339 |
| Thales SA | 31 | 3,967 |
| TotalEnergies SE (a) | 386 | 18,952 |
| Veolia Environnement SA | 180 | 5,266 |
| Vinci SA (a) | 78 | 7,559 |
| 97,803 | ||
| Germany — 15.2% | ||
| Allianz SE (Registered) | 62 | 13,987 |
| Bayer AG (Registered) * | 106 | 6,974 |
| Brenntag SE | 84 | 6,461 |
| Deutsche Boerse AG | 56 | 9,739 |
| Deutsche Telekom AG (Registered) | 567 | 10,446 |
| DWS Group GmbH & Co. KGaA (b) | 68 | 2,257 |
| Mercedes-Benz Group AG * | 133 | 9,309 |
| Muenchener Rueckversicherungs-Gesellschaft AG (Registered) | 31 | 7,392 |
| INVESTMENTS | SHARES (000) | VALUE ($000) |
| Germany — continued | ||
| RWE AG | 267 | 11,073 |
| Siemens AG (Registered) | 81 | 9,938 |
| Volkswagen AG (Preference) | 31 | 4,809 |
| 92,385 | ||
| Ireland — 1.5% | ||
| AIB Group plc | 1,699 | 3,705 |
| AIB Group plc | 10 | 21 |
| Bank of Ireland Group plc * | 883 | 5,463 |
| Bank of Ireland Group plc * | 14 | 87 |
| 9,276 | ||
| Italy — 1.2% | ||
| UniCredit SpA | 762 | 7,051 |
| Luxembourg — 1.0% | ||
| ArcelorMittal SA | 210 | 6,134 |
| Netherlands — 6.3% | ||
| Adyen NV * (b) | 3 | 4,653 |
| ASM International NV | 20 | 6,075 |
| ASML Holding NV (a) | 8 | 4,670 |
| Koninklijke Ahold Delhaize NV | 496 | 14,618 |
| NN Group NV | 163 | 8,014 |
| 38,030 | ||
| Norway — 1.4% | ||
| Equinor ASA | 257 | 8,688 |
| Spain — 1.3% | ||
| Corp. ACCIONA Energias Renovables SA | 133 | 4,917 |
| Fluidra SA | 105 | 2,836 |
| 7,753 | ||
| Switzerland — 17.3% | ||
| Cie Financiere Richemont SA (Registered) | 73 | 8,448 |
| Nestle SA (Registered) | 236 | 30,416 |
| Novartis AG (Registered) | 206 | 18,206 |
| Roche Holding AG | 65 | 24,249 |
| Schindler Holding AG | 20 | 3,890 |
| Sika AG (Registered) | 23 | 7,124 |
| Zurich Insurance Group AG | 28 | 12,730 |
| 105,063 | ||
| United Kingdom — 19.6% | ||
| 3i Group plc | 304 | 4,973 |
| Ashtead Group plc | 111 | 5,737 |
| Auto Trader Group plc (b) | 643 | 5,075 |
| 36 | J.P. Morgan International Equity Funds | April 30, 2022 |
| INVESTMENTS | SHARES (000) | VALUE ($000) |
| Common Stocks — continued | ||
| United Kingdom — continued | ||
| Barclays plc | 4,715 | 8,666 |
| BP plc | 3,787 | 18,283 |
| Centrica plc * | 6,057 | 6,002 |
| Computacenter plc | 92 | 3,110 |
| Diageo plc | 260 | 12,950 |
| Future plc | 108 | 2,969 |
| Intermediate Capital Group plc | 145 | 2,770 |
| JD Sports Fashion plc | 2,102 | 3,463 |
| Linde plc (a) | 40 | 12,406 |
| Lloyds Banking Group plc | 14,092 | 8,004 |
| Marks & Spencer Group plc * | 2,091 | 3,570 |
| Petershill Partners plc * (b) | 582 | 1,867 |
| RELX plc | 298 | 8,865 |
| Segro plc, REIT | 384 | 6,425 |
| Taylor Wimpey plc | 2,410 | 3,791 |
| 118,926 | ||
| United States — 2.4% | ||
| Schneider Electric SE (a) | 61 | 8,829 |
| Stellantis NV | 413 | 5,552 |
| 14,381 | ||
| Total Common Stocks (Cost $575,629) | 593,016 | |
| Short-Term Investments — 9.9% | ||
| Investment Companies — 2.0% | ||
| JPMorgan Prime Money Market Fund Class Institutional Shares, 0.36% (c) (d)(Cost $12,092) | 12,089 | 12,091 |
| Investment of Cash Collateral from Securities Loaned — 7.9% | ||
| JPMorgan Securities Lending Money Market Fund Agency SL Class Shares, 0.37% (c) (d) | 34,025 | 34,001 |
| JPMorgan U.S. Government Money Market Fund Class IM Shares, 0.37% (c) (d) | 14,177 | 14,177 |
| Total Investment of Cash Collateral from Securities Loaned (Cost $48,178) | 48,178 | |
| Total Short-Term Investments (Cost $60,270) | 60,269 | |
| INVESTMENTS | SHARES (000) | VALUE ($000) |
| Total Investments — 107.7% (Cost $635,899) | 653,285 | |
| Liabilities in Excess of Other Assets — (7.7)% | (46,743) | |
| NET ASSETS — 100.0% | 606,542 | |
Percentages indicated are based on net assets. | ||
| Abbreviations | |
| OYJ | Public Limited Company |
| Preference | A special type of equity investment that shares in the earnings of the company, has limited voting rights, and may have a dividend preference. Preference shares may also have liquidation preference. |
| REIT | Real Estate Investment Trust |
| * | Non-income producing security. |
| (a) | The security or a portion of this security is on loan at April 30, 2022. The total value of securities on loan at April 30, 2022 is $44,177. |
| (b) | Security exempt from registration pursuant to Regulation S under the Securities Act of 1933, as amended. Regulation S applies to securities offerings that are made outside of the United States and do not involve direct selling efforts in the United States and as such may have restrictions on resale. |
| (c) | Investment in an affiliated fund, which is registered under the Investment Company Act of 1940, as amended, and is advised by J.P. Morgan Investment Management Inc. |
| (d) | The rate shown is the current yield as of April 30, 2022. |
| April 30, 2022 | J.P. Morgan International Equity Funds | 37 |
| INDUSTRY | PERCENT OF TOTAL INVESTMENTS |
| Pharmaceuticals | 11.3% |
| Banks | 8.6 |
| Oil, Gas & Consumable Fuels | 7.7 |
| Insurance | 6.4 |
| Food Products | 4.7 |
| Beverages | 4.4 |
| Textiles, Apparel & Luxury Goods | 4.2 |
| Chemicals | 4.0 |
| Multi-Utilities | 3.4 |
| Capital Markets | 3.4 |
| Automobiles | 2.9 |
| Metals & Mining | 2.9 |
| Food & Staples Retailing | 2.8 |
| IT Services | 2.7 |
| Professional Services | 2.2 |
| Aerospace & Defense | 2.0 |
| Trading Companies & Distributors | 1.9 |
| Semiconductors & Semiconductor Equipment | 1.6 |
| Diversified Telecommunication Services | 1.6 |
| Industrial Conglomerates | 1.5 |
| Communications Equipment | 1.4 |
| Electrical Equipment | 1.4 |
| Construction & Engineering | 1.2 |
| Biotechnology | 1.1 |
| Machinery | 1.0 |
| Equity Real Estate Investment Trusts (REITs) | 1.0 |
| Others (each less than 1.0%) | 3.5 |
| Short-Term Investments | 9.2 |
| 38 | J.P. Morgan International Equity Funds | April 30, 2022 |
| DESCRIPTION | NUMBER OF CONTRACTS | EXPIRATION DATE | TRADING CURRENCY | NOTIONAL AMOUNT ($) | VALUE AND UNREALIZED APPRECIATION (DEPRECIATION) ($) |
| Long Contracts | |||||
| EURO STOXX 50 Index | 128 | 06/17/2022 | EUR | 4,971 | (200) |
| FTSE 100 Index | 29 | 06/17/2022 | GBP | 2,704 | (64) |
| (264) |
| Abbreviations | |
| EUR | Euro |
| FTSE | Financial Times and the London Stock Exchange |
| GBP | British Pound |
| April 30, 2022 | J.P. Morgan International Equity Funds | 39 |
| INVESTMENTS | SHARES (000) | VALUE ($000) |
| Common Stocks — 94.4% | ||
| Australia — 2.5% | ||
| BHP Group Ltd. | 1,060 | 35,532 |
| BHP Group Ltd. | 2,303 | 76,945 |
| 112,477 | ||
| Austria — 0.8% | ||
| Erste Group Bank AG | 1,184 | 36,856 |
| Belgium — 1.3% | ||
| KBC Group NV | 877 | 59,685 |
| China — 0.8% | ||
| Tencent Holdings Ltd. | 736 | 34,693 |
| Denmark — 5.8% | ||
| Carlsberg A/S, Class B | 347 | 44,053 |
| Coloplast A/S, Class B | 247 | 33,286 |
| Genmab A/S * | 92 | 32,495 |
| Novo Nordisk A/S, Class B | 1,070 | 122,268 |
| Orsted A/S (a) | 256 | 28,261 |
| 260,363 | ||
| Finland — 0.7% | ||
| Kone OYJ, Class B | 609 | 29,279 |
| France — 15.1% | ||
| AXA SA (b) | 2,268 | 60,007 |
| BNP Paribas SA (b) | 836 | 43,352 |
| Capgemini SE | 288 | 58,640 |
| Kering SA | 87 | 46,403 |
| L'Oreal SA | 202 | 73,510 |
| LVMH Moet Hennessy Louis Vuitton SE | 158 | 101,950 |
| Pernod Ricard SA | 245 | 50,532 |
| Safran SA | 398 | 42,710 |
| TotalEnergies SE | 3,029 | 148,725 |
| Vinci SA (b) | 550 | 53,374 |
| 679,203 | ||
| Germany — 8.4% | ||
| adidas AG | 173 | 34,829 |
| Allianz SE (Registered) | 363 | 81,953 |
| Deutsche Boerse AG | 363 | 63,267 |
| Muenchener Rueckversicherungs-Gesellschaft AG (Registered) | 198 | 47,179 |
| RWE AG | 1,171 | 48,636 |
| Symrise AG | 454 | 53,977 |
| Volkswagen AG (Preference) | 314 | 48,622 |
| 378,463 | ||
| INVESTMENTS | SHARES (000) | VALUE ($000) |
| Hong Kong — 3.5% | ||
| AIA Group Ltd. | 8,860 | 87,043 |
| Hong Kong Exchanges & Clearing Ltd. | 1,054 | 44,705 |
| Techtronic Industries Co. Ltd. | 1,922 | 25,655 |
| 157,403 | ||
| India — 0.9% | ||
| HDFC Bank Ltd., ADR | 745 | 41,122 |
| Japan — 12.0% | ||
| Daikin Industries Ltd. | 270 | 41,200 |
| Hoya Corp. | 490 | 48,589 |
| Keyence Corp. | 174 | 70,109 |
| Kubota Corp. | 2,272 | 38,597 |
| Kyowa Kirin Co. Ltd. | 1,486 | 31,331 |
| Makita Corp. | 962 | 28,425 |
| Nidec Corp. | 514 | 33,262 |
| Recruit Holdings Co. Ltd. | 949 | 34,438 |
| Shin-Etsu Chemical Co. Ltd. | 428 | 58,849 |
| SMC Corp. | 79 | 38,253 |
| Sony Group Corp. | 826 | 71,250 |
| Tokyo Electron Ltd. | 102 | 42,828 |
| 537,131 | ||
| Netherlands — 5.7% | ||
| Adyen NV * (a) | 18 | 30,916 |
| ASML Holding NV | 185 | 104,758 |
| ING Groep NV (b) | 3,197 | 30,290 |
| Shell plc | 3,256 | 87,406 |
| 253,370 | ||
| Singapore — 2.1% | ||
| DBS Group Holdings Ltd. | 3,797 | 92,118 |
| South Africa — 1.5% | ||
| Anglo American plc | 1,554 | 68,826 |
| South Korea — 1.7% | ||
| Delivery Hero SE * (a) (b) | 396 | 13,936 |
| Samsung Electronics Co. Ltd., GDR (a) | 25 | 32,765 |
| Samsung Electronics Co. Ltd., GDR (a) | 23 | 29,669 |
| 76,370 | ||
| Spain — 2.1% | ||
| Iberdrola SA | 6,265 | 71,993 |
| Industria de Diseno Textil SA (b) | 992 | 20,788 |
| 92,781 | ||
| 40 | J.P. Morgan International Equity Funds | April 30, 2022 |
| INVESTMENTS | SHARES (000) | VALUE ($000) |
| Common Stocks — continued | ||
| Sweden — 3.6% | ||
| Assa Abloy AB, Class B | 1,591 | 40,208 |
| Atlas Copco AB, Class A | 930 | 42,144 |
| Svenska Handelsbanken AB, Class A | 5,071 | 51,153 |
| Volvo AB, Class B | 1,854 | 29,581 |
| 163,086 | ||
| Switzerland — 10.3% | ||
| Lonza Group AG (Registered) | 95 | 56,105 |
| Nestle SA (Registered) | 1,420 | 183,305 |
| Roche Holding AG | 412 | 152,801 |
| SGS SA (Registered) | 18 | 45,352 |
| Straumann Holding AG (Registered) | 196 | 23,128 |
| 460,691 | ||
| Taiwan — 1.3% | ||
| Sea Ltd., ADR * | 246 | 20,331 |
| Taiwan Semiconductor Manufacturing Co. Ltd., ADR | 430 | 39,958 |
| 60,289 | ||
| United Kingdom — 10.1% | ||
| Diageo plc | 2,236 | 111,562 |
| Legal & General Group plc | 10,911 | 34,011 |
| Linde plc (b) | 231 | 72,341 |
| London Stock Exchange Group plc | 545 | 53,750 |
| Persimmon plc | 1,277 | 33,264 |
| Prudential plc | 3,233 | 40,249 |
| RELX plc | 2,401 | 71,562 |
| Smith & Nephew plc | 2,147 | 34,799 |
| 451,538 | ||
| United States — 4.2% | ||
| Ferguson plc | 362 | 45,438 |
| GlaxoSmithKline plc | 3,571 | 80,497 |
| Schneider Electric SE (b) | 440 | 63,049 |
| 188,984 | ||
| Total Common Stocks (Cost $3,767,366) | 4,234,728 | |
| Short-Term Investments — 7.4% | ||
| Investment Companies — 2.9% | ||
| JPMorgan Prime Money Market Fund Class Institutional Shares, 0.36% (c) (d)(Cost $127,784) | 127,777 | 127,803 |
| Investment of Cash Collateral from Securities Loaned — 4.5% | ||
| JPMorgan Securities Lending Money Market Fund Agency SL Class Shares, 0.37% (c) (d) | 136,104 | 136,009 |
| INVESTMENTS | SHARES (000) | VALUE ($000) |
| Investment of Cash Collateral from Securities Loaned — continued | ||
| JPMorgan U.S. Government Money Market Fund Class IM Shares, 0.37% (c) (d) | 66,362 | 66,362 |
| Total Investment of Cash Collateral from Securities Loaned (Cost $202,371) | 202,371 | |
| Total Short-Term Investments (Cost $330,155) | 330,174 | |
| Total Investments — 101.8% (Cost $4,097,521) | 4,564,902 | |
| Liabilities in Excess of Other Assets — (1.8)% | (81,516) | |
| NET ASSETS — 100.0% | 4,483,386 | |
Percentages indicated are based on net assets. | ||
| Abbreviations | |
| ADR | American Depositary Receipt |
| GDR | Global Depositary Receipt |
| OYJ | Public Limited Company |
| Preference | A special type of equity investment that shares in the earnings of the company, has limited voting rights, and may have a dividend preference. Preference shares may also have liquidation preference. |
| * | Non-income producing security. |
| (a) | Security exempt from registration pursuant to Regulation S under the Securities Act of 1933, as amended. Regulation S applies to securities offerings that are made outside of the United States and do not involve direct selling efforts in the United States and as such may have restrictions on resale. |
| (b) | The security or a portion of this security is on loan at April 30, 2022. The total value of securities on loan at April 30, 2022 is $169,016. |
| (c) | Investment in an affiliated fund, which is registered under the Investment Company Act of 1940, as amended, and is advised by J.P. Morgan Investment Management Inc. |
| (d) | The rate shown is the current yield as of April 30, 2022. |
| April 30, 2022 | J.P. Morgan International Equity Funds | 41 |
| INDUSTRY | PERCENT OF TOTAL INVESTMENTS |
| Pharmaceuticals | 8.5% |
| Banks | 7.8 |
| Insurance | 7.6 |
| Oil, Gas & Consumable Fuels | 5.2 |
| Machinery | 5.0 |
| Beverages | 4.5 |
| Semiconductors & Semiconductor Equipment | 4.1 |
| Chemicals | 4.1 |
| Food Products | 4.0 |
| Textiles, Apparel & Luxury Goods | 4.0 |
| Metals & Mining | 3.9 |
| Capital Markets | 3.6 |
| Professional Services | 3.4 |
| Health Care Equipment & Supplies | 3.1 |
| Household Durables | 2.3 |
| Electric Utilities | 2.2 |
| Electrical Equipment | 2.1 |
| IT Services | 2.0 |
| Building Products | 1.8 |
| Personal Products | 1.6 |
| Electronic Equipment, Instruments & Components | 1.5 |
| Technology Hardware, Storage & Peripherals | 1.4 |
| Life Sciences Tools & Services | 1.2 |
| Construction & Engineering | 1.2 |
| Multi-Utilities | 1.1 |
| Automobiles | 1.1 |
| Trading Companies & Distributors | 1.0 |
| Others (each less than 1.0%) | 3.5 |
| Short-Term Investments | 7.2 |
| 42 | J.P. Morgan International Equity Funds | April 30, 2022 |
| INVESTMENTS | SHARES (000) | VALUE ($000) |
| Common Stocks — 96.9% | ||
| Australia — 3.5% | ||
| BHP Group Ltd. | 1,474 | 49,409 |
| Belgium — 2.1% | ||
| KBC Group NV | 426 | 28,987 |
| Canada — 5.7% | ||
| Canadian National Railway Co. | 312 | 36,711 |
| Toronto-Dominion Bank (The) | 608 | 43,874 |
| 80,585 | ||
| China — 2.4% | ||
| Tencent Holdings Ltd. | 714 | 33,657 |
| Denmark — 5.3% | ||
| Coloplast A/S, Class B | 147 | 19,794 |
| Novo Nordisk A/S, Class B | 475 | 54,270 |
| 74,064 | ||
| France — 9.8% | ||
| Capgemini SE | 114 | 23,256 |
| L'Oreal SA | 80 | 29,111 |
| LVMH Moet Hennessy Louis Vuitton SE | 55 | 35,515 |
| TotalEnergies SE | 412 | 20,205 |
| Vinci SA | 310 | 30,091 |
| 138,178 | ||
| Germany — 5.4% | ||
| adidas AG | 83 | 16,655 |
| Allianz SE (Registered) | 171 | 38,640 |
| Volkswagen AG (Preference) | 131 | 20,265 |
| 75,560 | ||
| Hong Kong — 4.8% | ||
| AIA Group Ltd. | 4,197 | 41,227 |
| Hong Kong Exchanges & Clearing Ltd. | 638 | 27,063 |
| 68,290 | ||
| India — 2.4% | ||
| HDFC Bank Ltd., ADR | 605 | 33,384 |
| Indonesia — 1.9% | ||
| Bank Central Asia Tbk. PT | 47,320 | 26,541 |
| Japan — 4.7% | ||
| Hoya Corp. | 154 | 15,293 |
| Keyence Corp. | 54 | 21,548 |
| Sony Group Corp. | 337 | 29,066 |
| 65,907 | ||
| INVESTMENTS | SHARES (000) | VALUE ($000) |
| Netherlands — 7.4% | ||
| Adyen NV * (a) | 8 | 14,007 |
| ASML Holding NV | 60 | 34,215 |
| Shell plc | 2,100 | 56,372 |
| 104,594 | ||
| Singapore — 2.6% | ||
| DBS Group Holdings Ltd. | 1,538 | 37,318 |
| South Africa — 3.2% | ||
| Anglo American plc | 1,004 | 44,450 |
| South Korea — 4.5% | ||
| Delivery Hero SE * (a) | 269 | 9,472 |
| Samsung Electronics Co. Ltd. | 1,003 | 53,456 |
| 62,928 | ||
| Spain — 2.1% | ||
| Iberdrola SA | 2,638 | 30,314 |
| Sweden — 1.4% | ||
| Atlas Copco AB, Class A | 439 | 19,881 |
| Switzerland — 11.2% | ||
| Lonza Group AG (Registered) | 39 | 23,191 |
| Nestle SA (Registered) | 519 | 67,010 |
| Roche Holding AG | 123 | 45,449 |
| SGS SA (Registered) | 8 | 21,499 |
| 157,149 | ||
| Taiwan — 3.3% | ||
| Sea Ltd., ADR * | 119 | 9,817 |
| Taiwan Semiconductor Manufacturing Co. Ltd., ADR | 388 | 36,074 |
| 45,891 | ||
| United Kingdom — 9.9% | ||
| Diageo plc | 1,000 | 49,915 |
| Linde plc | 117 | 36,728 |
| Persimmon plc | 641 | 16,686 |
| RELX plc | 1,187 | 35,377 |
| 138,706 | ||
| United States — 3.3% | ||
| Ferguson plc | 189 | 23,702 |
| Schneider Electric SE | 159 | 22,866 |
| 46,568 | ||
| Total Common Stocks (Cost $1,191,605) | 1,362,361 | |
| April 30, 2022 | J.P. Morgan International Equity Funds | 43 |
| INVESTMENTS | SHARES (000) | VALUE ($000) |
| Short-Term Investments — 2.8% | ||
| Investment Companies — 2.8% | ||
| JPMorgan Prime Money Market Fund Class Institutional Shares, 0.36% (b) (c)(Cost $39,692) | 39,681 | 39,689 |
| Total Investments — 99.7% (Cost $1,231,297) | 1,402,050 | |
| Other Assets Less Liabilities — 0.3% | 4,897 | |
| NET ASSETS — 100.0% | 1,406,947 | |
Percentages indicated are based on net assets. | ||
| Abbreviations | |
| ADR | American Depositary Receipt |
| Preference | A special type of equity investment that shares in the earnings of the company, has limited voting rights, and may have a dividend preference. Preference shares may also have liquidation preference. |
| PT | Limited liability company |
| * | Non-income producing security. |
| (a) | Security exempt from registration pursuant to Regulation S under the Securities Act of 1933, as amended. Regulation S applies to securities offerings that are made outside of the United States and do not involve direct selling efforts in the United States and as such may have restrictions on resale. |
| (b) | Investment in an affiliated fund, which is registered under the Investment Company Act of 1940, as amended, and is advised by J.P. Morgan Investment Management Inc. |
| (c) | The rate shown is the current yield as of April 30, 2022. |
| INDUSTRY | PERCENT OF TOTAL INVESTMENTS |
| Banks | 12.2% |
| Pharmaceuticals | 7.1 |
| Metals & Mining | 6.7 |
| Insurance | 5.8 |
| Oil, Gas & Consumable Fuels | 5.4 |
| Semiconductors & Semiconductor Equipment | 5.0 |
| Food Products | 4.8 |
| Professional Services | 4.0 |
| Technology Hardware, Storage & Peripherals | 3.8 |
| Textiles, Apparel & Luxury Goods | 3.7 |
| Beverages | 3.6 |
| Household Durables | 3.3 |
| IT Services | 2.7 |
| Chemicals | 2.6 |
| Road & Rail | 2.6 |
| Health Care Equipment & Supplies | 2.5 |
| Interactive Media & Services | 2.4 |
| Electric Utilities | 2.2 |
| Construction & Engineering | 2.1 |
| Personal Products | 2.1 |
| Capital Markets | 1.9 |
| Trading Companies & Distributors | 1.7 |
| Life Sciences Tools & Services | 1.7 |
| Electrical Equipment | 1.6 |
| Electronic Equipment, Instruments & Components | 1.5 |
| Automobiles | 1.4 |
| Machinery | 1.4 |
| Others (each less than 1.0%) | 1.4 |
| Short-Term Investments | 2.8 |
| 44 | J.P. Morgan International Equity Funds | April 30, 2022 |
| INVESTMENTS | SHARES (000) | VALUE ($000) |
| Common Stocks — 91.2% | ||
| Australia — 6.0% | ||
| Aurizon Holdings Ltd. | 61 | 172 |
| Australia & New Zealand Banking Group Ltd. | 13 | 253 |
| BHP Group Ltd. | 43 | 1,444 |
| Commonwealth Bank of Australia | 12 | 885 |
| CSL Ltd. | 5 | 958 |
| Dexus, REIT | 63 | 490 |
| Goodman Group, REIT | 48 | 800 |
| GPT Group (The), REIT | 41 | 147 |
| Insurance Australia Group Ltd. | 47 | 150 |
| Macquarie Group Ltd. | 3 | 411 |
| Mirvac Group, REIT | 145 | 244 |
| National Australia Bank Ltd. | 19 | 434 |
| Newcrest Mining Ltd. | 8 | 155 |
| Rio Tinto Ltd. | 19 | 1,528 |
| Rio Tinto plc | 9 | 632 |
| Wesfarmers Ltd. | 10 | 360 |
| Westpac Banking Corp. | 55 | 914 |
| Woolworths Group Ltd. | 12 | 327 |
| 10,304 | ||
| Belgium — 0.4% | ||
| KBC Group NV | 10 | 689 |
| China — 0.5% | ||
| BOC Hong Kong Holdings Ltd. | 117 | 423 |
| Prosus NV * | 9 | 406 |
| 829 | ||
| Denmark — 3.2% | ||
| Carlsberg A/S, Class B | 7 | 858 |
| Genmab A/S * | — | 189 |
| Novo Nordisk A/S, Class B | 28 | 3,161 |
| Orsted A/S (a) | 10 | 1,085 |
| Vestas Wind Systems A/S | 7 | 174 |
| 5,467 | ||
| Finland — 0.8% | ||
| Kone OYJ, Class B | 4 | 216 |
| Nokia OYJ * | 60 | 302 |
| Nordea Bank Abp | 77 | 763 |
| 1,281 | ||
| France — 10.7% | ||
| Air Liquide SA | 11 | 1,890 |
| Airbus SE | 4 | 433 |
| Alstom SA | 14 | 316 |
| INVESTMENTS | SHARES (000) | VALUE ($000) |
| France — continued | ||
| AXA SA | 8 | 220 |
| BNP Paribas SA | 28 | 1,474 |
| Capgemini SE | 7 | 1,474 |
| Kering SA | 1 | 633 |
| L'Oreal SA | 6 | 2,116 |
| LVMH Moet Hennessy Louis Vuitton SE | 5 | 2,922 |
| Pernod Ricard SA | 2 | 409 |
| Safran SA | 7 | 708 |
| Sanofi | 5 | 580 |
| Societe Generale SA | 18 | 421 |
| TotalEnergies SE | 42 | 2,055 |
| Veolia Environnement SA | 38 | 1,096 |
| Vinci SA | 15 | 1,488 |
| 18,235 | ||
| Germany — 8.6% | ||
| adidas AG | 4 | 870 |
| Allianz SE (Registered) | 10 | 2,143 |
| BASF SE * | 2 | 86 |
| Bayer AG (Registered) * | 7 | 479 |
| Brenntag SE | 2 | 152 |
| Deutsche Boerse AG | 1 | 153 |
| Deutsche Post AG (Registered) | 23 | 964 |
| Deutsche Telekom AG (Registered) | 92 | 1,686 |
| Infineon Technologies AG | 36 | 1,028 |
| Mercedes-Benz Group AG * | 2 | 163 |
| Merck KGaA | 3 | 518 |
| Muenchener Rueckversicherungs-Gesellschaft AG (Registered) | 4 | 1,014 |
| RWE AG | 34 | 1,417 |
| SAP SE | 11 | 1,124 |
| Siemens AG (Registered) | 8 | 985 |
| Volkswagen AG (Preference) | 5 | 827 |
| Vonovia SE * | 20 | 812 |
| Zalando SE * (a) | 7 | 282 |
| 14,703 | ||
| Hong Kong — 2.4% | ||
| AIA Group Ltd. | 171 | 1,682 |
| CK Asset Holdings Ltd. | 51 | 349 |
| CLP Holdings Ltd. | 20 | 195 |
| Hong Kong Exchanges & Clearing Ltd. | 18 | 742 |
| Link, REIT | 20 | 173 |
| Sun Hung Kai Properties Ltd. | 22 | 253 |
| April 30, 2022 | J.P. Morgan International Equity Funds | 45 |
| INVESTMENTS | SHARES (000) | VALUE ($000) |
| Common Stocks — continued | ||
| Hong Kong — continued | ||
| Techtronic Industries Co. Ltd. | 29 | 387 |
| Xinyi Glass Holdings Ltd. | 143 | 317 |
| 4,098 | ||
| Ireland — 0.5% | ||
| Kingspan Group plc | 3 | 294 |
| Kingspan Group plc | 5 | 467 |
| 761 | ||
| Italy — 0.6% | ||
| Enel SpA | 27 | 174 |
| FinecoBank Banca Fineco SpA | 48 | 672 |
| UniCredit SpA | 26 | 243 |
| 1,089 | ||
| Japan — 20.8% | ||
| AGC, Inc. | 11 | 397 |
| Asahi Group Holdings Ltd. | 23 | 878 |
| Asahi Kasei Corp. | 69 | 566 |
| Bridgestone Corp. | 22 | 817 |
| Capcom Co. Ltd. | 13 | 333 |
| Central Japan Railway Co. | 5 | 655 |
| Daiichi Sankyo Co. Ltd. | 35 | 894 |
| Daikin Industries Ltd. | 3 | 504 |
| Daito Trust Construction Co. Ltd. | 1 | 87 |
| Daiwa House Industry Co. Ltd. | 27 | 661 |
| Dentsu Group, Inc. | 24 | 872 |
| Fast Retailing Co. Ltd. | — | 92 |
| Hitachi Ltd. | 24 | 1,143 |
| Honda Motor Co. Ltd. | 38 | 1,000 |
| Hoya Corp. | 11 | 1,042 |
| ITOCHU Corp. | 29 | 884 |
| Japan Airlines Co. Ltd. * | 12 | 205 |
| Kao Corp. | 11 | 425 |
| Keyence Corp. | 4 | 1,407 |
| Konami Holdings Corp. | 7 | 449 |
| Kubota Corp. | 30 | 517 |
| Kyowa Kirin Co. Ltd. | 18 | 390 |
| Mitsubishi Corp. | 26 | 876 |
| Mitsubishi Electric Corp. | 15 | 159 |
| Mitsubishi UFJ Financial Group, Inc. | 88 | 510 |
| Mitsui Fudosan Co. Ltd. | 24 | 517 |
| Murata Manufacturing Co. Ltd. | 12 | 715 |
| Nidec Corp. | 5 | 304 |
| Nintendo Co. Ltd. | 1 | 320 |
| INVESTMENTS | SHARES (000) | VALUE ($000) |
| Japan — continued | ||
| NIPPON EXPRESS HOLDINGS, Inc. | 7 | 428 |
| Nippon Steel Corp. | 11 | 175 |
| Nippon Telegraph & Telephone Corp. | 33 | 975 |
| Nitori Holdings Co. Ltd. | 4 | 401 |
| Nomura Research Institute Ltd. | 18 | 495 |
| Ono Pharmaceutical Co. Ltd. | 21 | 529 |
| ORIX Corp. | 37 | 673 |
| Otsuka Corp. | 13 | 416 |
| Recruit Holdings Co. Ltd. | 16 | 573 |
| Rohm Co. Ltd. | 6 | 391 |
| Ryohin Keikaku Co. Ltd. | 49 | 440 |
| Seven & i Holdings Co. Ltd. | 13 | 593 |
| Shimadzu Corp. | 2 | 62 |
| Shin-Etsu Chemical Co. Ltd. | 7 | 948 |
| Shionogi & Co. Ltd. | 10 | 528 |
| SoftBank Group Corp. | 10 | 399 |
| Sony Group Corp. | 19 | 1,683 |
| Sumitomo Electric Industries Ltd. | 41 | 441 |
| Sumitomo Metal Mining Co. Ltd. | 12 | 531 |
| Sumitomo Mitsui Financial Group, Inc. | 34 | 1,027 |
| Suzuki Motor Corp. | 12 | 374 |
| T&D Holdings, Inc. | 36 | 464 |
| Takeda Pharmaceutical Co. Ltd. | 10 | 290 |
| Terumo Corp. | 22 | 649 |
| Tokio Marine Holdings, Inc. | 22 | 1,190 |
| Tokyo Electron Ltd. | 3 | 1,266 |
| Toyota Motor Corp. | 111 | 1,898 |
| Yamato Holdings Co. Ltd. | 6 | 107 |
| 35,565 | ||
| Luxembourg — 0.1% | ||
| ArcelorMittal SA | 7 | 216 |
| Netherlands — 5.9% | ||
| Adyen NV * (a) | — | 431 |
| Akzo Nobel NV | 8 | 689 |
| ASML Holding NV | 6 | 3,389 |
| ING Groep NV | 21 | 202 |
| Koninklijke Ahold Delhaize NV | 18 | 516 |
| Koninklijke DSM NV | 4 | 734 |
| Koninklijke KPN NV | 234 | 808 |
| Koninklijke Philips NV | 6 | 149 |
| NN Group NV | 19 | 915 |
| 46 | J.P. Morgan International Equity Funds | April 30, 2022 |
| INVESTMENTS | SHARES (000) | VALUE ($000) |
| Common Stocks — continued | ||
| Netherlands — continued | ||
| Shell plc | 62 | 1,674 |
| Wolters Kluwer NV | 6 | 547 |
| 10,054 | ||
| Singapore — 0.9% | ||
| DBS Group Holdings Ltd. | 45 | 1,087 |
| Oversea-Chinese Banking Corp. Ltd. | 39 | 345 |
| United Overseas Bank Ltd. | 8 | 171 |
| 1,603 | ||
| Spain — 2.6% | ||
| Banco Bilbao Vizcaya Argentaria SA | 239 | 1,256 |
| Banco Santander SA | 72 | 211 |
| Endesa SA | 23 | 486 |
| Iberdrola SA | 179 | 2,051 |
| Industria de Diseno Textil SA | 24 | 507 |
| 4,511 | ||
| Sweden — 1.8% | ||
| Atlas Copco AB, Class A | 19 | 869 |
| Lundin Energy AB | 18 | 754 |
| SKF AB, Class B | 35 | 567 |
| Volvo AB, Class B | 61 | 965 |
| 3,155 | ||
| Switzerland — 10.8% | ||
| Cie Financiere Richemont SA (Registered) | 3 | 344 |
| Givaudan SA (Registered) | — | 1,220 |
| Julius Baer Group Ltd. | 3 | 129 |
| Lonza Group AG (Registered) | 2 | 1,325 |
| Nestle SA (Registered) | 37 | 4,758 |
| Novartis AG (Registered) | 32 | 2,844 |
| Roche Holding AG | 11 | 4,002 |
| SGS SA (Registered) | — | 750 |
| Sika AG (Registered) | 4 | 1,211 |
| UBS Group AG (Registered) | 37 | 630 |
| Zurich Insurance Group AG | 3 | 1,313 |
| 18,526 | ||
| Taiwan — 0.1% | ||
| Sea Ltd., ADR * | 2 | 119 |
| United Kingdom — 12.7% | ||
| 3i Group plc | 79 | 1,288 |
| AstraZeneca plc | 21 | 2,763 |
| Barclays plc | 619 | 1,137 |
| Berkeley Group Holdings plc * | 15 | 759 |
| INVESTMENTS | SHARES (000) | VALUE ($000) |
| United Kingdom — continued | ||
| BP plc | 422 | 2,039 |
| British American Tobacco plc | 16 | 660 |
| CK Hutchison Holdings Ltd. | 17 | 123 |
| DCC plc | 4 | 339 |
| Diageo plc | 47 | 2,340 |
| HSBC Holdings plc | 131 | 819 |
| InterContinental Hotels Group plc | 15 | 955 |
| Intertek Group plc | 2 | 126 |
| Lloyds Banking Group plc | 2,027 | 1,151 |
| London Stock Exchange Group plc | 1 | 131 |
| Prudential plc | 41 | 510 |
| Reckitt Benckiser Group plc | 16 | 1,250 |
| RELX plc | 53 | 1,572 |
| SSE plc | 34 | 785 |
| Standard Chartered plc | 141 | 965 |
| Taylor Wimpey plc | 132 | 208 |
| Tesco plc | 239 | 811 |
| Unilever plc | 23 | 1,069 |
| 21,800 | ||
| United States — 1.8% | ||
| Ferguson plc | 1 | 118 |
| GlaxoSmithKline plc | 17 | 378 |
| Schneider Electric SE | 12 | 1,760 |
| Stellantis NV | 64 | 861 |
| 3,117 | ||
| Total Common Stocks (Cost $147,593) | 156,122 | |
| INVESTMENTS | NO. OF CONTRACTS | |
| Options Purchased — 3.5% | ||
| Put Options Purchased — 3.5% | ||
| United States — 3.5% | ||
| MSCI EAFE E-Mini Index | ||
| 6/17/2022 at USD 2,015.00, European Style | ||
| Notional Amount: USD 166,560 | ||
| Counterparty: Exchange-Traded * (Cost $4,108) | 819 | 6,077 |
| April 30, 2022 | J.P. Morgan International Equity Funds | 47 |
| INVESTMENTS | SHARES (000) | VALUE ($000) |
| Short-Term Investments — 4.5% | ||
| Investment Companies — 4.5% | ||
| JPMorgan U.S. Government Money Market Fund Class Institutional Shares, 0.29% (b) (c)(Cost $7,724) | 7,724 | 7,724 |
| Total Investments — 99.2% (Cost $159,425) | 169,923 | |
| Other Assets Less Liabilities — 0.8% | 1,300 | |
| NET ASSETS — 100.0% | 171,223 | |
Percentages indicated are based on net assets. | ||
Amounts presented as a dash (“-“) represent amounts that round to less than a thousand. | ||
| Abbreviations | |
| ADR | American Depositary Receipt |
| EAFE | Europe, Australasia, and Far East |
| MSCI | Morgan Stanley Capital International |
| OYJ | Public Limited Company |
| Preference | A special type of equity investment that shares in the earnings of the company, has limited voting rights, and may have a dividend preference. Preference shares may also have liquidation preference. |
| REIT | Real Estate Investment Trust |
| USD | United States Dollar |
| * | Non-income producing security. |
| (a) | Security exempt from registration pursuant to Regulation S under the Securities Act of 1933, as amended. Regulation S applies to securities offerings that are made outside of the United States and do not involve direct selling efforts in the United States and as such may have restrictions on resale. |
| (b) | Investment in an affiliated fund, which is registered under the Investment Company Act of 1940, as amended, and is advised by J.P. Morgan Investment Management Inc. |
| (c) | The rate shown is the current yield as of April 30, 2022. |
| INDUSTRY | PERCENT OF TOTAL INVESTMENTS |
| Pharmaceuticals | 10.2% |
| Banks | 9.5 |
| Insurance | 5.6 |
| Chemicals | 4.3 |
| Oil, Gas & Consumable Fuels | 3.8 |
| Index Funds | 3.6 |
| Semiconductors & Semiconductor Equipment | 3.6 |
| Automobiles | 3 |
| Electric Utilities | 2.8 |
| Textiles, Apparel & Luxury Goods | 2.8 |
| Food Products | 2.8 |
| Metals & Mining | 2.7 |
| Beverages | 2.6 |
| Machinery | 2.3 |
| Personal Products | 2.1 |
| Professional Services | 2.1 |
| Capital Markets | 2.1 |
| Diversified Telecommunication Services | 2 |
| IT Services | 1.7 |
| Real Estate Management & Development | 1.6 |
| Household Durables | 1.6 |
| Industrial Conglomerates | 1.5 |
| Multi-Utilities | 1.5 |
| Electrical Equipment | 1.4 |
| Food & Staples Retailing | 1.3 |
| Electronic Equipment, Instruments & Components | 1.3 |
| Trading Companies & Distributors | 1.2 |
| Building Products | 1.2 |
| Equity Real Estate Investment Trusts (REITs) | 1.1 |
| Health Care Equipment & Supplies | 1.1 |
| Others (each less than 1.0%) | 11.1 |
| Short-Term Investments | 4.5 |
| 48 | J.P. Morgan International Equity Funds | April 30, 2022 |
| DESCRIPTION | NUMBER OF CONTRACTS | EXPIRATION DATE | TRADING CURRENCY | NOTIONAL AMOUNT ($) | VALUE AND UNREALIZED APPRECIATION (DEPRECIATION) ($) |
| Long Contracts | |||||
| SPI 200 Index | 27 | 06/16/2022 | AUD | 3,484 | 100 |
| MSCI EAFE E-Mini Index | 52 | 06/17/2022 | USD | 5,188 | (323) |
| (223) |
| Abbreviations | |
| AUD | Australian Dollar |
| EAFE | Europe, Australasia, and Far East |
| MSCI | Morgan Stanley Capital International |
| SPI | Australian Securities Exchange |
| USD | United States Dollar |
| Written Call Options Contracts as of April 30, 2022 (amounts in thousands, except number of contracts): | ||||||
| DESCRIPTION | COUNTERPARTY | NUMBER OF CONTRACTS | NOTIONAL AMOUNT | EXERCISE PRICE | EXPIRATION DATE | VALUE ($) |
| MSCI EAFE E-Mini Index | Exchange-Traded | 819 | USD 166,560 | USD 2,240.00 | 6/17/2022 | (156) |
| Written Put Options Contracts as of April 30, 2022 (amounts in thousands, except number of contracts): | ||||||
| DESCRIPTION | COUNTERPARTY | NUMBER OF CONTRACTS | NOTIONAL AMOUNT | EXERCISE PRICE | EXPIRATION DATE | VALUE ($) |
| MSCI EAFE E-Mini Index | Exchange-Traded | 819 | USD 166,560 | USD 1,700.00 | 6/17/2022 | (880) |
| Total Written Options Contracts (Premiums Received $3,954) | (1,036) | |||||
| Abbreviations | |
| EAFE | Europe, Australasia, and Far East |
| MSCI | Morgan Stanley Capital International |
| USD | United States Dollar |
| April 30, 2022 | J.P. Morgan International Equity Funds | 49 |
| INVESTMENTS | SHARES (000) | VALUE ($000) |
| Common Stocks — 93.0% | ||
| Australia — 5.8% | ||
| Aurizon Holdings Ltd. | 1,806 | 5,100 |
| Australia & New Zealand Banking Group Ltd. | 473 | 8,996 |
| BHP Group Ltd. | 1,252 | 41,822 |
| Commonwealth Bank of Australia (a) | 378 | 27,468 |
| CSL Ltd. (a) | 156 | 29,779 |
| Dexus, REIT | 2,082 | 16,277 |
| Goodman Group, REIT | 1,551 | 25,816 |
| GPT Group (The), REIT | 1,310 | 4,657 |
| Insurance Australia Group Ltd. | 1,434 | 4,579 |
| Macquarie Group Ltd. | 92 | 13,239 |
| Mirvac Group, REIT | 4,262 | 7,203 |
| National Australia Bank Ltd. | 610 | 13,915 |
| Newcrest Mining Ltd. (a) | 254 | 4,775 |
| Rio Tinto Ltd. | 563 | 44,554 |
| Rio Tinto plc | 321 | 22,717 |
| Wesfarmers Ltd. | 322 | 11,149 |
| Westpac Banking Corp. | 1,724 | 28,856 |
| Woolworths Group Ltd. | 370 | 10,019 |
| 320,921 | ||
| Belgium — 0.4% | ||
| KBC Group NV | 345 | 23,440 |
| China — 0.5% | ||
| BOC Hong Kong Holdings Ltd. | 3,436 | 12,438 |
| Prosus NV * | 295 | 14,253 |
| 26,691 | ||
| Denmark — 3.4% | ||
| Carlsberg A/S, Class B | 238 | 30,226 |
| Genmab A/S * | 18 | 6,300 |
| Novo Nordisk A/S, Class B | 947 | 108,177 |
| Orsted A/S (b) | 334 | 36,979 |
| Vestas Wind Systems A/S (a) | 228 | 5,808 |
| 187,490 | ||
| Finland — 0.8% | ||
| Kone OYJ, Class B | 154 | 7,422 |
| Nokia OYJ * | 2,127 | 10,783 |
| Nordea Bank Abp | 2,605 | 25,967 |
| 44,172 | ||
| France — 11.4% | ||
| Air Liquide SA | 376 | 64,981 |
| Airbus SE | 156 | 17,120 |
| Alstom SA | 509 | 11,199 |
| INVESTMENTS | SHARES (000) | VALUE ($000) |
| France — continued | ||
| AXA SA (a) | 322 | 8,524 |
| BNP Paribas SA (a) | 961 | 49,812 |
| Capgemini SE | 253 | 51,500 |
| Kering SA | 42 | 22,324 |
| L'Oreal SA | 195 | 70,811 |
| LVMH Moet Hennessy Louis Vuitton SE | 153 | 98,992 |
| Pernod Ricard SA | 69 | 14,212 |
| Safran SA | 234 | 25,190 |
| Sanofi (a) | 188 | 19,901 |
| Societe Generale SA | 601 | 14,446 |
| TotalEnergies SE (a) | 1,445 | 70,937 |
| Veolia Environnement SA | 1,299 | 37,914 |
| Vinci SA (a) | 537 | 52,073 |
| 629,936 | ||
| Germany — 9.2% | ||
| adidas AG | 150 | 30,244 |
| Allianz SE (Registered) | 315 | 71,064 |
| BASF SE * | 67 | 3,506 |
| Bayer AG (Registered) * | 266 | 17,549 |
| Brenntag SE | 84 | 6,465 |
| Deutsche Boerse AG | 34 | 5,976 |
| Deutsche Post AG (Registered) | 803 | 34,324 |
| Deutsche Telekom AG (Registered) | 3,203 | 59,011 |
| Infineon Technologies AG | 1,184 | 33,593 |
| Mercedes-Benz Group AG * | 76 | 5,298 |
| Merck KGaA | 98 | 18,147 |
| Muenchener Rueckversicherungs-Gesellschaft AG (Registered) | 147 | 34,965 |
| RWE AG | 1,158 | 48,082 |
| SAP SE | 372 | 37,723 |
| Siemens AG (Registered) | 271 | 33,291 |
| Volkswagen AG (Preference) | 191 | 29,548 |
| Vonovia SE * | 708 | 28,201 |
| Zalando SE * (a) (b) | 242 | 9,538 |
| 506,525 | ||
| Hong Kong — 2.2% | ||
| AIA Group Ltd. | 4,937 | 48,498 |
| CK Asset Holdings Ltd. | 1,527 | 10,353 |
| CLP Holdings Ltd. | 589 | 5,748 |
| Hong Kong Exchanges & Clearing Ltd. | 533 | 22,622 |
| Link, REIT | 597 | 5,158 |
| Sun Hung Kai Properties Ltd. | 658 | 7,572 |
| 50 | J.P. Morgan International Equity Funds | April 30, 2022 |
| INVESTMENTS | SHARES (000) | VALUE ($000) |
| Common Stocks — continued | ||
| Hong Kong — continued | ||
| Techtronic Industries Co. Ltd. | 812 | 10,839 |
| Xinyi Glass Holdings Ltd. | 4,214 | 9,325 |
| 120,115 | ||
| Ireland — 0.5% | ||
| Kingspan Group plc | 119 | 10,938 |
| Kingspan Group plc | 163 | 15,188 |
| 26,126 | ||
| Italy — 0.7% | ||
| Enel SpA | 1,060 | 6,894 |
| FinecoBank Banca Fineco SpA | 1,750 | 24,323 |
| UniCredit SpA | 890 | 8,236 |
| 39,453 | ||
| Japan — 19.1% | ||
| AGC, Inc. | 309 | 11,603 |
| Asahi Group Holdings Ltd. | 677 | 25,537 |
| Asahi Kasei Corp. | 2,082 | 17,083 |
| Bridgestone Corp. | 657 | 24,089 |
| Capcom Co. Ltd. | 382 | 10,082 |
| Central Japan Railway Co. | 140 | 17,611 |
| Daiichi Sankyo Co. Ltd. | 1,032 | 25,987 |
| Daikin Industries Ltd. | 89 | 13,613 |
| Daito Trust Construction Co. Ltd. | 21 | 1,974 |
| Daiwa House Industry Co. Ltd. | 831 | 19,973 |
| Dentsu Group, Inc. | 690 | 24,876 |
| Fast Retailing Co. Ltd. | 10 | 4,558 |
| Hitachi Ltd. | 744 | 35,271 |
| Honda Motor Co. Ltd. | 1,113 | 29,270 |
| Hoya Corp. | 297 | 29,524 |
| ITOCHU Corp. | 888 | 26,804 |
| Japan Airlines Co. Ltd. * | 380 | 6,277 |
| Kao Corp. | 331 | 13,266 |
| Keyence Corp. | 87 | 34,934 |
| Konami Holdings Corp. | 219 | 13,436 |
| Kubota Corp. | 928 | 15,762 |
| Kyowa Kirin Co. Ltd. | 560 | 11,797 |
| Mitsubishi Corp. | 782 | 26,263 |
| Mitsubishi Electric Corp. | 459 | 4,808 |
| Mitsubishi UFJ Financial Group, Inc. | 2,758 | 16,033 |
| Mitsui Fudosan Co. Ltd. | 748 | 15,847 |
| Murata Manufacturing Co. Ltd. | 362 | 21,578 |
| Nidec Corp. | 151 | 9,743 |
| Nintendo Co. Ltd. | 22 | 10,086 |
| INVESTMENTS | SHARES (000) | VALUE ($000) |
| Japan — continued | ||
| NIPPON EXPRESS HOLDINGS, Inc. | 217 | 12,723 |
| Nippon Steel Corp. | 289 | 4,597 |
| Nippon Telegraph & Telephone Corp. | 1,259 | 37,093 |
| Nitori Holdings Co. Ltd. | 115 | 11,852 |
| Nomura Research Institute Ltd. | 526 | 14,862 |
| Ono Pharmaceutical Co. Ltd. | 629 | 16,167 |
| ORIX Corp. | 1,122 | 20,460 |
| Otsuka Corp. | 465 | 15,242 |
| Recruit Holdings Co. Ltd. | 455 | 16,504 |
| Rohm Co. Ltd. | 161 | 11,276 |
| Ryohin Keikaku Co. Ltd. | 1,423 | 12,790 |
| Seven & i Holdings Co. Ltd. | 401 | 17,722 |
| Shimadzu Corp. | 88 | 2,864 |
| Shin-Etsu Chemical Co. Ltd. | 205 | 28,119 |
| Shionogi & Co. Ltd. | 271 | 15,063 |
| SoftBank Group Corp. | 278 | 11,438 |
| Sony Group Corp. | 552 | 47,657 |
| Sumitomo Electric Industries Ltd. | 1,231 | 13,232 |
| Sumitomo Metal Mining Co. Ltd. | 355 | 15,565 |
| Sumitomo Mitsui Financial Group, Inc. | 1,008 | 30,447 |
| Suzuki Motor Corp. | 373 | 11,253 |
| T&D Holdings, Inc. | 1,084 | 13,929 |
| Takeda Pharmaceutical Co. Ltd. | 297 | 8,627 |
| Terumo Corp. | 639 | 19,029 |
| Tokio Marine Holdings, Inc. | 650 | 35,161 |
| Tokyo Electron Ltd. | 84 | 35,317 |
| Toyota Motor Corp. | 3,162 | 54,180 |
| Yamato Holdings Co. Ltd. | 160 | 2,990 |
| 1,053,844 | ||
| Luxembourg — 0.1% | ||
| ArcelorMittal SA | 290 | 8,453 |
| Malta — 0.0% ^ | ||
| BGP Holdings plc ‡ * | 449 | 2 |
| Netherlands — 6.3% | ||
| Adyen NV * (b) | 9 | 14,794 |
| Akzo Nobel NV (a) | 273 | 23,721 |
| ASML Holding NV | 199 | 112,793 |
| ING Groep NV (a) | 877 | 8,309 |
| Koninklijke Ahold Delhaize NV | 619 | 18,252 |
| Koninklijke DSM NV | 147 | 24,723 |
| Koninklijke KPN NV | 8,306 | 28,659 |
| Koninklijke Philips NV | 206 | 5,380 |
| April 30, 2022 | J.P. Morgan International Equity Funds | 51 |
| INVESTMENTS | SHARES (000) | VALUE ($000) |
| Common Stocks — continued | ||
| Netherlands — continued | ||
| NN Group NV | 659 | 32,293 |
| Shell plc | 2,241 | 60,167 |
| Wolters Kluwer NV | 189 | 19,088 |
| 348,179 | ||
| Singapore — 0.9% | ||
| DBS Group Holdings Ltd. | 1,397 | 33,884 |
| Oversea-Chinese Banking Corp. Ltd. | 1,225 | 10,880 |
| United Overseas Bank Ltd. | 250 | 5,356 |
| 50,120 | ||
| Spain — 2.8% | ||
| Banco Bilbao Vizcaya Argentaria SA | 8,143 | 42,731 |
| Banco Santander SA (a) | 2,814 | 8,224 |
| Endesa SA | 778 | 16,303 |
| Iberdrola SA | 5,930 | 68,136 |
| Industria de Diseno Textil SA (a) | 814 | 17,073 |
| 152,467 | ||
| Sweden — 1.9% | ||
| Atlas Copco AB, Class A | 669 | 30,337 |
| Lundin Energy AB (a) | 578 | 23,917 |
| SKF AB, Class B | 1,240 | 20,244 |
| Volvo AB, Class B | 2,103 | 33,550 |
| 108,048 | ||
| Switzerland — 11.4% | ||
| Cie Financiere Richemont SA (Registered) | 107 | 12,489 |
| Givaudan SA (Registered) | 10 | 41,518 |
| Julius Baer Group Ltd. | 90 | 4,313 |
| Lonza Group AG (Registered) | 77 | 45,174 |
| Nestle SA (Registered) | 1,260 | 162,612 |
| Novartis AG (Registered) | 1,075 | 94,988 |
| Roche Holding AG | 367 | 136,056 |
| SGS SA (Registered) | 10 | 25,973 |
| Sika AG (Registered) | 133 | 40,771 |
| UBS Group AG (Registered) | 1,302 | 22,099 |
| Zurich Insurance Group AG | 100 | 45,432 |
| 631,425 | ||
| Taiwan — 0.1% | ||
| Sea Ltd., ADR * | 48 | 3,953 |
| United Kingdom — 13.6% | ||
| 3i Group plc | 2,813 | 46,037 |
| AstraZeneca plc | 662 | 88,261 |
| Barclays plc | 21,163 | 38,900 |
| INVESTMENTS | SHARES (000) | VALUE ($000) |
| United Kingdom — continued | ||
| Berkeley Group Holdings plc * | 504 | 25,577 |
| BP plc | 14,904 | 71,951 |
| British American Tobacco plc | 611 | 25,623 |
| CK Hutchison Holdings Ltd. | 535 | 3,752 |
| DCC plc | 149 | 11,282 |
| Diageo plc | 1,581 | 78,866 |
| HSBC Holdings plc | 4,651 | 29,061 |
| InterContinental Hotels Group plc | 517 | 33,011 |
| Intertek Group plc | 71 | 4,443 |
| Lloyds Banking Group plc | 67,039 | 38,076 |
| London Stock Exchange Group plc | 50 | 4,967 |
| Prudential plc | 1,474 | 18,350 |
| Reckitt Benckiser Group plc | 554 | 43,232 |
| RELX plc | 1,858 | 55,359 |
| SSE plc | 1,153 | 26,774 |
| Standard Chartered plc | 5,017 | 34,300 |
| Taylor Wimpey plc | 5,072 | 7,977 |
| Tesco plc | 8,523 | 28,956 |
| Unilever plc | 813 | 37,750 |
| 752,505 | ||
| United States — 1.9% | ||
| Ferguson plc | 42 | 5,303 |
| GlaxoSmithKline plc | 528 | 11,898 |
| Schneider Electric SE (a) | 411 | 59,012 |
| Stellantis NV | 2,140 | 28,726 |
| 104,939 | ||
| Total Common Stocks (Cost $4,625,226) | 5,138,804 | |
| Short-Term Investments — 7.4% | ||
| Investment Companies — 3.7% | ||
| JPMorgan Prime Money Market Fund Class Institutional Shares, 0.36% (c) (d)(Cost $204,860) | 204,821 | 204,862 |
| Investment of Cash Collateral from Securities Loaned — 3.7% | ||
| JPMorgan Securities Lending Money Market Fund Agency SL Class Shares, 0.37% (c) (d) | 127,422 | 127,333 |
| JPMorgan U.S. Government Money Market Fund Class IM Shares, 0.37% (c) (d) | 73,567 | 73,567 |
| Total Investment of Cash Collateral from Securities Loaned (Cost $200,904) | 200,900 | |
| Total Short-Term Investments (Cost $405,764) | 405,762 | |
| 52 | J.P. Morgan International Equity Funds | April 30, 2022 |
| INVESTMENTS | SHARES (000) | VALUE ($000) |
| Total Investments — 100.4% (Cost $5,030,990) | 5,544,566 | |
| Liabilities in Excess of Other Assets — (0.4)% | (21,526) | |
| NET ASSETS — 100.0% | 5,523,040 | |
Percentages indicated are based on net assets. | ||
| Abbreviations | |
| ADR | American Depositary Receipt |
| OYJ | Public Limited Company |
| Preference | A special type of equity investment that shares in the earnings of the company, has limited voting rights, and may have a dividend preference. Preference shares may also have liquidation preference. |
| REIT | Real Estate Investment Trust |
| ^ | Amount rounds to less than 0.1% of net assets. | |
| ‡ | Value determined using significant unobservable inputs. | |
| * | Non-income producing security. | |
| (a) | The security or a portion of this security is on loan at April 30, 2022. The total value of securities on loan at April 30, 2022 is $177,073. | |
| (b) | Security exempt from registration pursuant to Regulation S under the Securities Act of 1933, as amended. Regulation S applies to securities offerings that are made outside of the United States and do not involve direct selling efforts in the United States and as such may have restrictions on resale. | |
| (c) | Investment in an affiliated fund, which is registered under the Investment Company Act of 1940, as amended, and is advised by J.P. Morgan Investment Management Inc. | |
| (d) | The rate shown is the current yield as of April 30, 2022. | |
| INDUSTRY | PERCENT OF TOTAL INVESTMENTS |
| Pharmaceuticals | 10.5% |
| Banks | 9.6 |
| Insurance | 5.6 |
| Chemicals | 4.5 |
| Oil, Gas & Consumable Fuels | 4.1 |
| Semiconductors & Semiconductor Equipment | 3.4 |
| Textiles, Apparel & Luxury Goods | 2.9 |
| Food Products | 2.9 |
| Electric Utilities | 2.9 |
| Automobiles | 2.8 |
| Beverages | 2.7 |
| Metals & Mining | 2.6 |
| Machinery | 2.3 |
| Diversified Telecommunication Services | 2.3 |
| Personal Products | 2.2 |
| Professional Services | 2.2 |
| Capital Markets | 2.1 |
| IT Services | 1.8 |
| Multi-Utilities | 1.6 |
| Real Estate Management & Development | 1.5 |
| Industrial Conglomerates | 1.5 |
| Household Durables | 1.5 |
| Electrical Equipment | 1.5 |
| Food & Staples Retailing | 1.3 |
| Trading Companies & Distributors | 1.2 |
| Building Products | 1.1 |
| Electronic Equipment, Instruments & Components | 1.1 |
| Equity Real Estate Investment Trusts (REITs) | 1.1 |
| Others (each less than 1.0%) | 11.9 |
| Short-Term Investments | 7.3 |
| April 30, 2022 | J.P. Morgan International Equity Funds | 53 |
| DESCRIPTION | NUMBER OF CONTRACTS | EXPIRATION DATE | TRADING CURRENCY | NOTIONAL AMOUNT ($) | VALUE AND UNREALIZED APPRECIATION (DEPRECIATION) ($) |
| Long Contracts | |||||
| SPI 200 Index | 607 | 06/16/2022 | AUD | 78,334 | 2,036 |
| MSCI EAFE E-Mini Index | 826 | 06/17/2022 | USD | 82,402 | (1,379) |
| 657 |
| Abbreviations | |
| AUD | Australian Dollar |
| EAFE | Europe, Australasia, and Far East |
| MSCI | Morgan Stanley Capital International |
| SPI | Australian Securities Exchange |
| USD | United States Dollar |
| 54 | J.P. Morgan International Equity Funds | April 30, 2022 |
| INVESTMENTS | SHARES (000) | VALUE ($000) |
| Common Stocks — 98.2% | ||
| Australia — 8.5% | ||
| Australia & New Zealand Banking Group Ltd. | 177 | 3,371 |
| BHP Group Ltd. | 266 | 8,877 |
| BlueScope Steel Ltd. | 29 | 416 |
| Glencore plc * | 695 | 4,283 |
| Harvey Norman Holdings Ltd. | 141 | 502 |
| JB Hi-Fi Ltd. | 11 | 419 |
| Metcash Ltd. | 136 | 455 |
| National Australia Bank Ltd. | 200 | 4,557 |
| Rio Tinto Ltd. | 24 | 1,923 |
| Rio Tinto plc | 54 | 3,797 |
| South32 Ltd. | 291 | 969 |
| Super Retail Group Ltd. | 62 | 456 |
| Westpac Banking Corp. | 113 | 1,897 |
| Worley Ltd. | 109 | 1,062 |
| 32,984 | ||
| Austria — 1.3% | ||
| ANDRITZ AG | 12 | 520 |
| BAWAG Group AG * (a) | 14 | 680 |
| Erste Group Bank AG | 25 | 768 |
| OMV AG | 32 | 1,608 |
| Telekom Austria AG * | 59 | 419 |
| voestalpine AG | 34 | 886 |
| Wienerberger AG | 13 | 376 |
| 5,257 | ||
| Belgium — 0.5% | ||
| Ageas SA | 18 | 885 |
| Bekaert SA | 19 | 703 |
| Telenet Group Holding NV | 9 | 266 |
| 1,854 | ||
| China — 0.5% | ||
| BOC Hong Kong Holdings Ltd. | 316 | 1,142 |
| Yangzijiang Shipbuilding Holdings Ltd. | 1,259 | 822 |
| 1,964 | ||
| Denmark — 1.7% | ||
| AP Moller - Maersk A/S, Class B | — | 776 |
| D/S Norden A/S | 6 | 210 |
| Drilling Co. of 1972 A/S (The) * | 18 | 910 |
| H+H International A/S, Class B * | 24 | 582 |
| Jyske Bank A/S (Registered) * | 11 | 609 |
| Matas A/S | 38 | 532 |
| Solar A/S, Class B | 9 | 1,043 |
| INVESTMENTS | SHARES (000) | VALUE ($000) |
| Denmark — continued | ||
| Spar Nord Bank A/S | 83 | 1,055 |
| Sydbank A/S | 23 | 784 |
| 6,501 | ||
| Egypt — 0.3% | ||
| Energean plc * | 74 | 1,100 |
| Finland — 1.6% | ||
| Cargotec OYJ, Class B | 12 | 421 |
| Konecranes OYJ | 13 | 374 |
| Nokia OYJ * | 370 | 1,878 |
| Nordea Bank Abp | 202 | 2,007 |
| Outokumpu OYJ (b) | 132 | 647 |
| TietoEVRY OYJ (b) | 10 | 257 |
| Valmet OYJ | 18 | 486 |
| 6,070 | ||
| France — 8.1% | ||
| AXA SA (b) | 117 | 3,096 |
| BNP Paribas SA | 62 | 3,221 |
| Carrefour SA | 81 | 1,723 |
| Cie de Saint-Gobain | 25 | 1,436 |
| Coface SA | 41 | 495 |
| Credit Agricole SA | 91 | 985 |
| Eiffage SA | 11 | 1,131 |
| Eutelsat Communications SA | 84 | 928 |
| IPSOS | 18 | 870 |
| Metropole Television SA | 32 | 594 |
| Orange SA | 177 | 2,102 |
| Publicis Groupe SA | 20 | 1,205 |
| Renault SA * | 35 | 846 |
| Rothschild & Co. | 28 | 1,102 |
| SCOR SE | 18 | 516 |
| Societe Generale SA | 70 | 1,677 |
| Sopra Steria Group SACA | 3 | 496 |
| SPIE SA | 25 | 596 |
| Technip Energies NV * | 79 | 955 |
| Television Francaise 1 (b) | 56 | 473 |
| TotalEnergies SE (b) | 138 | 6,797 |
| 31,244 | ||
| Germany — 9.8% | ||
| Allianz SE (Registered) | 21 | 4,730 |
| Aurubis AG | 7 | 819 |
| Bayer AG (Registered) * | 64 | 4,214 |
| Bayerische Motoren Werke AG | 19 | 1,505 |
| April 30, 2022 | J.P. Morgan International Equity Funds | 55 |
| INVESTMENTS | SHARES (000) | VALUE ($000) |
| Common Stocks — continued | ||
| Germany — continued | ||
| Continental AG * | 7 | 471 |
| Covestro AG (a) | 18 | 786 |
| Daimler Truck Holding AG * | 26 | 684 |
| Deutsche Bank AG (Registered) * | 148 | 1,484 |
| Deutsche Pfandbriefbank AG (a) | 77 | 974 |
| Deutsche Post AG (Registered) | 60 | 2,561 |
| Deutsche Telekom AG (Registered) | 152 | 2,805 |
| DWS Group GmbH & Co. KGaA (a) | 10 | 324 |
| E.ON SE | 127 | 1,324 |
| Freenet AG | 21 | 580 |
| HeidelbergCement AG | 12 | 697 |
| HOCHTIEF AG | 4 | 267 |
| Kloeckner & Co. SE * | 71 | 914 |
| Mercedes-Benz Group AG * | 51 | 3,553 |
| Muenchener Rueckversicherungs-Gesellschaft AG (Registered) | 7 | 1,599 |
| ProSiebenSat.1 Media SE | 27 | 308 |
| Siemens AG (Registered) | 40 | 4,942 |
| Talanx AG | 10 | 405 |
| Volkswagen AG (Preference) | 14 | 2,097 |
| 38,043 | ||
| Hong Kong — 1.0% | ||
| Hongkong Land Holdings Ltd. | 287 | 1,341 |
| Kerry Properties Ltd. | 420 | 1,136 |
| Pacific Basin Shipping Ltd. | 2,195 | 1,007 |
| VTech Holdings Ltd. | 57 | 402 |
| 3,886 | ||
| Italy — 3.4% | ||
| Anima Holding SpA (a) | 104 | 508 |
| Assicurazioni Generali SpA | 84 | 1,593 |
| Azimut Holding SpA | 22 | 460 |
| Credito Emiliano SpA | 68 | 417 |
| Eni SpA | 209 | 2,923 |
| Intesa Sanpaolo SpA | 935 | 1,904 |
| Maire Tecnimont SpA (b) | 252 | 737 |
| Mediobanca Banca di Credito Finanziario SpA | 73 | 735 |
| Pirelli & C SpA (a) | 196 | 971 |
| Poste Italiane SpA (a) | 50 | 488 |
| UniCredit SpA | 137 | 1,267 |
| Unipol Gruppo SpA | 214 | 1,169 |
| 13,172 | ||
| INVESTMENTS | SHARES (000) | VALUE ($000) |
| Japan — 21.0% | ||
| Acom Co. Ltd. | 98 | 251 |
| AGC, Inc. | 26 | 978 |
| Aiful Corp. | 138 | 394 |
| Aozora Bank Ltd. | 23 | 450 |
| Arcs Co. Ltd. | 17 | 269 |
| Bridgestone Corp. | 36 | 1,301 |
| Brother Industries Ltd. | 40 | 690 |
| Chiba Bank Ltd. (The) | 98 | 567 |
| Concordia Financial Group Ltd. | 147 | 537 |
| Cosmo Energy Holdings Co. Ltd. | 58 | 1,438 |
| Credit Saison Co. Ltd. (b) | 92 | 1,034 |
| Dai-ichi Life Holdings, Inc. | 102 | 2,048 |
| Daiwa Securities Group, Inc. | 125 | 613 |
| Fuyo General Lease Co. Ltd. | 16 | 866 |
| Hachijuni Bank Ltd. (The) | 96 | 316 |
| Hitachi Ltd. | 43 | 2,020 |
| Honda Motor Co. Ltd. | 105 | 2,767 |
| Isuzu Motors Ltd. | 115 | 1,340 |
| ITOCHU Corp. | 49 | 1,482 |
| Japan Post Holdings Co. Ltd. | 193 | 1,355 |
| Japan Post Insurance Co. Ltd. | 74 | 1,195 |
| Kamigumi Co. Ltd. | 23 | 389 |
| Kandenko Co. Ltd. | 41 | 261 |
| KDDI Corp. | 105 | 3,474 |
| Kinden Corp. | 22 | 265 |
| Mitsubishi Chemical Holdings Corp. | 137 | 837 |
| Mitsubishi Corp. | 68 | 2,266 |
| Mitsubishi Gas Chemical Co., Inc. | 22 | 314 |
| Mitsubishi UFJ Financial Group, Inc. | 731 | 4,250 |
| Mitsui & Co. Ltd. | 95 | 2,288 |
| Mitsui Fudosan Co. Ltd. | 74 | 1,575 |
| Mizuho Financial Group, Inc. | 178 | 2,159 |
| MS&AD Insurance Group Holdings, Inc. | 44 | 1,319 |
| Nichias Corp. | 14 | 253 |
| Nippon Telegraph & Telephone Corp. | 98 | 2,900 |
| Nippon Television Holdings, Inc. | 33 | 314 |
| Nomura Holdings, Inc. | 274 | 1,055 |
| Nomura Real Estate Holdings, Inc. | 54 | 1,318 |
| ORIX Corp. | 119 | 2,174 |
| Rengo Co. Ltd. | 36 | 215 |
| Resona Holdings, Inc. | 190 | 827 |
| Sanwa Holdings Corp. | 37 | 333 |
| SBI Holdings, Inc. | 23 | 521 |
| Sekisui House Ltd. | 64 | 1,105 |
| 56 | J.P. Morgan International Equity Funds | April 30, 2022 |
| INVESTMENTS | SHARES (000) | VALUE ($000) |
| Common Stocks — continued | ||
| Japan — continued | ||
| Shizuoka Bank Ltd. (The) | 91 | 587 |
| SoftBank Corp. | 211 | 2,452 |
| Sojitz Corp. | 71 | 1,075 |
| Sompo Holdings, Inc. | 23 | 949 |
| Sumitomo Corp. | 94 | 1,486 |
| Sumitomo Forestry Co. Ltd. | 66 | 1,007 |
| Sumitomo Mitsui Financial Group, Inc. | 93 | 2,807 |
| Sumitomo Mitsui Trust Holdings, Inc. | 50 | 1,558 |
| T&D Holdings, Inc. | 92 | 1,182 |
| Takeda Pharmaceutical Co. Ltd. | 115 | 3,349 |
| Tokyo Steel Manufacturing Co. Ltd. | 53 | 551 |
| Tokyo Tatemono Co. Ltd. | 35 | 495 |
| Tosoh Corp. | 38 | 518 |
| Toyota Motor Corp. | 535 | 9,175 |
| Toyota Tsusho Corp. | 19 | 672 |
| UBE Corp. | 16 | 253 |
| Yamaha Motor Co. Ltd. | 55 | 1,144 |
| 81,583 | ||
| Luxembourg — 0.5% | ||
| ArcelorMittal SA | 57 | 1,658 |
| RTL Group SA | 7 | 387 |
| 2,045 | ||
| Malta — 0.1% | ||
| Kindred Group plc, SDR | 57 | 504 |
| Netherlands — 6.1% | ||
| ABN AMRO Bank NV, CVA (a) (b) | 91 | 1,133 |
| Aegon NV | 337 | 1,747 |
| ASR Nederland NV | 27 | 1,218 |
| Flow Traders (a) (b) | 21 | 692 |
| Heijmans NV, CVA | 56 | 764 |
| ING Groep NV | 211 | 2,002 |
| Koninklijke Ahold Delhaize NV | 63 | 1,870 |
| NN Group NV | 26 | 1,288 |
| PostNL NV (b) | 116 | 381 |
| Randstad NV | 13 | 667 |
| Shell plc | 420 | 11,262 |
| Signify NV (a) | 14 | 601 |
| 23,625 | ||
| Norway — 2.5% | ||
| DNB Bank ASA (b) | 70 | 1,354 |
| Elkem ASA (a) | 230 | 953 |
| Equinor ASA | 80 | 2,707 |
| INVESTMENTS | SHARES (000) | VALUE ($000) |
| Norway — continued | ||
| Europris ASA (a) | 59 | 300 |
| Norsk Hydro ASA | 170 | 1,427 |
| Olav Thon Eiendomsselskap ASA | 24 | 493 |
| Selvaag Bolig ASA | 12 | 56 |
| SpareBank 1 Nord Norge | 80 | 854 |
| SpareBank 1 SMN | 42 | 597 |
| SpareBank 1 SR-Bank ASA | 46 | 588 |
| Storebrand ASA | 60 | 518 |
| 9,847 | ||
| Singapore — 1.5% | ||
| DBS Group Holdings Ltd. | 64 | 1,560 |
| Oversea-Chinese Banking Corp. Ltd. | 207 | 1,836 |
| StarHub Ltd. | 378 | 343 |
| United Overseas Bank Ltd. | 68 | 1,449 |
| Yangzijiang Financial Holding Pte. Ltd. * | 1,260 | 497 |
| 5,685 | ||
| South Africa — 0.9% | ||
| Anglo American plc | 76 | 3,373 |
| Spain — 3.3% | ||
| Acerinox SA | 40 | 427 |
| Atresmedia Corp. de Medios de Comunicacion SA | 190 | 726 |
| Banco Bilbao Vizcaya Argentaria SA | 518 | 2,718 |
| Banco Santander SA (b) | 944 | 2,758 |
| CaixaBank SA (b) | 293 | 945 |
| Mediaset Espana Comunicacion SA * | 96 | 431 |
| Repsol SA | 148 | 2,209 |
| Telefonica SA | 401 | 1,950 |
| Unicaja Banco SA (a) | 541 | 510 |
| 12,674 | ||
| Sweden — 2.7% | ||
| Bilia AB, Class A | 24 | 330 |
| Boliden AB (b) | 25 | 1,092 |
| Bonava AB, Class B | 42 | 204 |
| Humana AB * | 52 | 274 |
| Intrum AB * (b) | 24 | 574 |
| Inwido AB | 42 | 573 |
| Loomis AB | 31 | 777 |
| Lundin Energy AB (b) | 27 | 1,124 |
| Mekonomen AB * | 34 | 392 |
| Securitas AB, Class B | 60 | 709 |
| Skandinaviska Enskilda Banken AB, Class A | 125 | 1,402 |
| Skanska AB, Class B | 29 | 544 |
| April 30, 2022 | J.P. Morgan International Equity Funds | 57 |
| INVESTMENTS | SHARES (000) | VALUE ($000) |
| Common Stocks — continued | ||
| Sweden — continued | ||
| SSAB AB, Class B (b) | 189 | 1,110 |
| Svenska Handelsbanken AB, Class A | 105 | 1,061 |
| Volvo AB, Class B | 14 | 230 |
| 10,396 | ||
| Switzerland — 6.2% | ||
| Adecco Group AG (Registered) | 16 | 604 |
| Julius Baer Group Ltd. | 15 | 734 |
| Mobilezone Holding AG (Registered) | 51 | 824 |
| Novartis AG (Registered) | 108 | 9,584 |
| Roche Holding AG | 3 | 1,144 |
| Swiss Life Holding AG (Registered) | 2 | 1,479 |
| Swisscom AG (Registered) (b) | 2 | 1,153 |
| UBS Group AG (Registered) | 237 | 4,024 |
| Vontobel Holding AG (Registered) | 8 | 555 |
| Zurich Insurance Group AG | 9 | 4,063 |
| 24,164 | ||
| United Kingdom — 14.2% | ||
| 3i Group plc | 59 | 969 |
| Aviva plc | 276 | 1,481 |
| Balfour Beatty plc | 249 | 753 |
| Barclays plc | 969 | 1,782 |
| Barratt Developments plc | 139 | 852 |
| Bellway plc | 9 | 267 |
| Berkeley Group Holdings plc * | 10 | 513 |
| BP plc | 1,192 | 5,755 |
| BT Group plc | 575 | 1,276 |
| Centrica plc * | 1,490 | 1,476 |
| CK Hutchison Holdings Ltd. | 276 | 1,937 |
| Crest Nicholson Holdings plc | 84 | 265 |
| Drax Group plc | 122 | 1,237 |
| easyJet plc * | 111 | 766 |
| Halfords Group plc | 239 | 681 |
| HSBC Holdings plc | 1,071 | 6,693 |
| IG Group Holdings plc | 56 | 569 |
| Inchcape plc | 43 | 387 |
| Investec plc | 278 | 1,639 |
| ITV plc | 437 | 404 |
| J Sainsbury plc | 236 | 689 |
| JET2 plc * | 55 | 835 |
| Johnson Matthey plc | 50 | 1,366 |
| Keller Group plc | 44 | 468 |
| Kier Group plc * | 253 | 252 |
| Land Securities Group plc, REIT | 157 | 1,471 |
| INVESTMENTS | SHARES (000) | VALUE ($000) |
| United Kingdom — continued | ||
| Legal & General Group plc | 427 | 1,331 |
| Lloyds Banking Group plc | 4,177 | 2,372 |
| Man Group plc | 271 | 788 |
| Marks & Spencer Group plc * | 530 | 905 |
| Morgan Sindall Group plc | 20 | 531 |
| NatWest Group plc | 399 | 1,071 |
| OSB Group plc | 172 | 1,203 |
| Paragon Banking Group plc | 75 | 462 |
| Premier Foods plc | 451 | 630 |
| Rathbones Group plc | 16 | 412 |
| Reach plc | 208 | 426 |
| Redrow plc | 48 | 314 |
| Royal Mail plc | 263 | 1,125 |
| Standard Chartered plc | 163 | 1,114 |
| Taylor Wimpey plc | 325 | 511 |
| Tesco plc | 599 | 2,034 |
| Vistry Group plc | 77 | 801 |
| Vodafone Group plc | 1,914 | 2,898 |
| WPP plc | 106 | 1,322 |
| 55,033 | ||
| United States — 2.5% | ||
| GlaxoSmithKline plc | 278 | 6,276 |
| Stellantis NV | 97 | 1,303 |
| Stellantis NV | 62 | 836 |
| Tenaris SA | 74 | 1,124 |
| 9,539 | ||
| Total Common Stocks (Cost $361,439) | 380,543 | |
| Short-Term Investments — 6.6% | ||
| Investment Companies — 1.5% | ||
| JPMorgan Prime Money Market Fund Class Institutional Shares, 0.36% (c) (d)(Cost $5,752) | 5,751 | 5,753 |
| Investment of Cash Collateral from Securities Loaned — 5.1% | ||
| JPMorgan Securities Lending Money Market Fund Agency SL Class Shares, 0.37% (c) (d) | 14,709 | 14,699 |
| JPMorgan U.S. Government Money Market Fund Class IM Shares, 0.37% (c) (d) | 5,183 | 5,183 |
| Total Investment of Cash Collateral from Securities Loaned (Cost $19,881) | 19,882 | |
| Total Short-Term Investments (Cost $25,633) | 25,635 | |
| 58 | J.P. Morgan International Equity Funds | April 30, 2022 |
| INVESTMENTS | SHARES (000) | VALUE ($000) |
| Total Investments — 104.8% (Cost $387,072) | 406,178 | |
| Liabilities in Excess of Other Assets — (4.8)% | (18,478) | |
| NET ASSETS — 100.0% | 387,700 | |
Percentages indicated are based on net assets. | ||
Amounts presented as a dash (“-“) represent amounts that round to less than a thousand. | ||
| Abbreviations | |
| CVA | Dutch Certification |
| OYJ | Public Limited Company |
| Preference | A special type of equity investment that shares in the earnings of the company, has limited voting rights, and may have a dividend preference. Preference shares may also have liquidation preference. |
| REIT | Real Estate Investment Trust |
| SDR | Swedish Depositary Receipt |
| * | Non-income producing security. |
| (a) | Security exempt from registration pursuant to Regulation S under the Securities Act of 1933, as amended. Regulation S applies to securities offerings that are made outside of the United States and do not involve direct selling efforts in the United States and as such may have restrictions on resale. |
| (b) | The security or a portion of this security is on loan at April 30, 2022. The total value of securities on loan at April 30, 2022 is $18,772. |
| (c) | Investment in an affiliated fund, which is registered under the Investment Company Act of 1940, as amended, and is advised by J.P. Morgan Investment Management Inc. |
| (d) | The rate shown is the current yield as of April 30, 2022. |
| INDUSTRY | PERCENT OF TOTAL INVESTMENTS |
| Banks | 18.4% |
| Oil, Gas & Consumable Fuels | 9.1 |
| Insurance | 8.9 |
| Metals & Mining | 8.1 |
| Pharmaceuticals | 6 |
| Automobiles | 6 |
| Capital Markets | 4.2 |
| Diversified Telecommunication Services | 3.1 |
| Trading Companies & Distributors | 2.8 |
| Wireless Telecommunication Services | 2.4 |
| Industrial Conglomerates | 2.2 |
| Media | 2.1 |
| Food & Staples Retailing | 2 |
| Real Estate Management & Development | 1.6 |
| Construction & Engineering | 1.5 |
| Household Durables | 1.4 |
| Chemicals | 1.2 |
| Air Freight & Logistics | 1 |
| Energy Equipment & Services | 1 |
| Others (each less than 1.0%) | 10.7 |
| Short-Term Investments | 6.3 |
| April 30, 2022 | J.P. Morgan International Equity Funds | 59 |
| JPMorgan Emerging Markets Equity Fund | JPMorgan Emerging Markets Research Enhanced Equity Fund | JPMorgan Europe Dynamic Fund | |||
| ASSETS: | |||||
| Investments in non-affiliates, at value | $9,421,456 | $2,908,681 | $ 593,016 | ||
| Investments in affiliates, at value | 267,806 | 43,823 | 12,091 | ||
| Investments of cash collateral received from securities loaned, at value (See Note 2.C) | 107 | 14,062 | 48,178 | ||
| Cash | — | 4,238 | 98 | ||
| Foreign currency, at value | 4,775 | 1,131 | — | ||
| Deposits at broker for futures contracts | — | 12,043 | 834 | ||
| Receivables: | |||||
| Investment securities sold | 10,291 | 155,227 | 931 | ||
| Fund shares sold | 131,113 | 137,432 | 59 | ||
| Dividends from non-affiliates | 4,182 | 6,028 | 2,369 | ||
| Dividends from affiliates | 59 | 10 | 2 | ||
| Tax reclaims | 230 | 122 | 3,350 | ||
| Securities lending income (See Note 2.C) | —(a) | 3 | 8 | ||
| Variation margin on futures contracts | — | 3,769 | 34 | ||
| Total Assets | 9,840,019 | 3,286,569 | 660,970 | ||
| LIABILITIES: | |||||
| Payables: | |||||
| Due to custodian | 10,241 | — | — | ||
| Foreign currency due to custodian, at value | — | — | 460 | ||
| Investment securities purchased | — | — | 5,093 | ||
| Collateral received on securities loaned (See Note 2.C) | 107 | 14,063 | 48,178 | ||
| Fund shares redeemed | 94,084 | 317,760 | 250 | ||
| Accrued liabilities: | |||||
| Investment advisory fees | 5,472 | 569 | 312 | ||
| Administration fees | 523 | 140 | 39 | ||
| Distribution fees | 138 | — | 21 | ||
| Service fees | 746 | 19 | 40 | ||
| Custodian and accounting fees | 143 | 180 | 14 | ||
| Trustees’ and Chief Compliance Officer’s fees | — | — | —(a) | ||
| Deferred foreign capital gains tax | 49,934 | 7,716 | — | ||
| Other | 403 | 30 | 21 | ||
| Total Liabilities | 161,791 | 340,477 | 54,428 | ||
| Net Assets | $9,678,228 | $2,946,092 | $ 606,542 (a) Amount rounds to less than one thousand. |
| 60 | J.P. Morgan International Equity Funds | April 30, 2022 |
| JPMorgan Emerging Markets Equity Fund | JPMorgan Emerging Markets Research Enhanced Equity Fund | JPMorgan Europe Dynamic Fund | |||
| NET ASSETS: | |||||
| Paid-in-Capital | $8,828,888 | $3,082,344 | $ 712,608 | ||
| Total distributable earnings (loss) | 849,340 | (136,252) | (106,066) | ||
| Total Net Assets: | $9,678,228 | $2,946,092 | $ 606,542 | ||
| Net Assets: | |||||
| Class A | $ 476,166 | $ — | $ 73,397 | ||
| Class C | 51,142 | — | 7,015 | ||
| Class I | 2,901,502 | 236,318 | 69,744 | ||
| Class L | 1,804,078 | — | 75,636 | ||
| Class R2 | 465 | — | — | ||
| Class R3 | 12,570 | — | — | ||
| Class R4 | 2,908 | — | — | ||
| Class R5 | 15,147 | — | — | ||
| Class R6 | 4,414,250 | 2,709,774 | 380,750 | ||
| Total | $9,678,228 | $2,946,092 | $ 606,542 | ||
| Outstanding units of beneficial interest (shares) ($0.0001 par value; unlimited number of shares authorized): | |||||
| Class A | 16,507 | — | 2,832 | ||
| Class C | 1,848 | — | 307 | ||
| Class I | 98,095 | 14,208 | 2,638 | ||
| Class L | 60,492 | — | 2,823 | ||
| Class R2 | 16 | — | — | ||
| Class R3 | 439 | — | — | ||
| Class R4 | 99 | — | — | ||
| Class R5 | 508 | — | — | ||
| Class R6 | 148,159 | 163,851 | 14,277 | ||
| Net Asset Value (a): | |||||
| Class A — Redemption price per share | $ 28.85 | $ — | $ 25.92 | ||
| Class C — Offering price per share (b) | 27.67 | — | 22.86 | ||
| Class I — Offering and redemption price per share | 29.58 | 16.63 | 26.43 | ||
| Class L — Offering and redemption price per share | 29.82 | — | 26.79 | ||
| Class R2 — Offering and redemption price per share | 28.45 | — | — | ||
| Class R3 — Offering and redemption price per share | 28.64 | — | — | ||
| Class R4 — Offering and redemption price per share | 29.47 | — | — | ||
| Class R5 — Offering and redemption price per share | 29.82 | — | — | ||
| Class R6 — Offering and redemption price per share | 29.79 | 16.54 | 26.67 | ||
| Class A maximum sales charge | 5.25% | —% | 5.25% | ||
| Class A maximum public offering price per share [net asset value per share/(100% – maximum sales charge)] | $ 30.45 | $ — | $ 27.36 | ||
| Cost of investments in non-affiliates | $8,504,575 | $2,859,310 | $ 575,629 | ||
| Cost of investments in affiliates | 267,802 | 43,823 | 12,092 | ||
| Cost of foreign currency | 3,472 | 1,131 | — | ||
| Investment securities on loan, at value (See Note 2.C) | 106 | 13,480 | 44,177 | ||
| Cost of investment of cash collateral (See Note 2.C) | 107 | 14,061 | 48,178 |
| (a) | Per share amounts may not recalculate due to rounding of net assets and/or shares outstanding. |
| (b) | Redemption price for Class C Shares varies based upon length of time the shares are held. |
| April 30, 2022 | J.P. Morgan International Equity Funds | 61 |
| JPMorgan International Equity Fund | JPMorgan International Focus Fund | JPMorgan International Hedged Equity Fund | |||
| ASSETS: | |||||
| Investments in non-affiliates, at value | $4,234,728 | $1,362,361 | $156,122 | ||
| Investments in affiliates, at value | 127,803 | 39,689 | 7,724 | ||
| Investments of cash collateral received from securities loaned, at value (See Note 2.C) | 202,371 | — | — | ||
| Options purchased, at value | — | — | 6,077 | ||
| Cash | 51 | 50 | 751 | ||
| Foreign currency, at value | 2,745 | 967 | 204 | ||
| Deposits at broker for futures contracts | — | — | 642 | ||
| Receivables: | |||||
| Investment securities sold | — | — | 995 | ||
| Fund shares sold | 312,065 | 1,544 | 635 | ||
| Dividends from non-affiliates | 12,176 | 1,739 | 636 | ||
| Dividends from affiliates | 39 | 20 | 1 | ||
| Tax reclaims | 7,971 | 5,603 | 424 | ||
| Securities lending income (See Note 2.C) | 126 | 5 | — | ||
| Other assets | — | 69 | — | ||
| Total Assets | 4,900,075 | 1,412,047 | 174,211 | ||
| LIABILITIES: | |||||
| Payables: | |||||
| Investment securities purchased | 95,972 | 2,937 | 1,215 | ||
| Collateral received on securities loaned (See Note 2.C) | 202,371 | — | — | ||
| Fund shares redeemed | 116,207 | 848 | 615 | ||
| Variation margin on futures contracts | — | — | 39 | ||
| Outstanding options written, at fair value | — | — | 1,036 | ||
| Accrued liabilities: | |||||
| Investment advisory fees | 1,610 | 959 | 16 | ||
| Administration fees | 123 | 9 | — | ||
| Distribution fees | 93 | 71 | 1 | ||
| Service fees | 173 | 161 | 36 | ||
| Custodian and accounting fees | 85 | 73 | 12 | ||
| Trustees’ and Chief Compliance Officer’s fees | — | — | 1 | ||
| Other | 55 | 42 | 17 | ||
| Total Liabilities | 416,689 | 5,100 | 2,988 | ||
| Net Assets | $4,483,386 | $1,406,947 | $171,223 |
| 62 | J.P. Morgan International Equity Funds | April 30, 2022 |
| JPMorgan International Equity Fund | JPMorgan International Focus Fund | JPMorgan International Hedged Equity Fund | |||
| NET ASSETS: | |||||
| Paid-in-Capital | $4,036,997 | $1,118,469 | $179,991 | ||
| Total distributable earnings (loss) | 446,389 | 288,478 | (8,768) | ||
| Total Net Assets: | $4,483,386 | $1,406,947 | $171,223 | ||
| Net Assets: | |||||
| Class A | $ 365,217 | $ 268,558 | $ 5,203 | ||
| Class C | 8,331 | 18,734 | 284 | ||
| Class I | 623,210 | 654,222 | 165,497 | ||
| Class R2 | 20,627 | 1,783 | — | ||
| Class R5 | 9,074 | 2,216 | 21 | ||
| Class R6 | 3,456,927 | 461,434 | 218 | ||
| Total | $4,483,386 | $1,406,947 | $171,223 | ||
| Outstanding units of beneficial interest (shares) ($0.0001 par value; unlimited number of shares authorized): | |||||
| Class A | 21,721 | 11,896 | 354 | ||
| Class C | 526 | 843 | 19 | ||
| Class I | 36,411 | 28,583 | 11,216 | ||
| Class R2 | 1,244 | 79 | — | ||
| Class R5 | 527 | 97 | 2 | ||
| Class R6 | 201,358 | 20,152 | 15 | ||
| Net Asset Value (a): | |||||
| Class A — Redemption price per share | $ 16.81 | $ 22.57 | $ 14.68 | ||
| Class C — Offering price per share (b) | 15.85 | 22.23 | 14.65 | ||
| Class I — Offering and redemption price per share | 17.12 | 22.89 | 14.76 | ||
| Class R2 — Offering and redemption price per share | 16.59 | 22.40 | — | ||
| Class R5 — Offering and redemption price per share | 17.21 | 22.89 | 14.78 | ||
| Class R6 — Offering and redemption price per share | 17.17 | 22.90 | 14.79 | ||
| Class A maximum sales charge | 5.25% | 5.25% | 5.25% | ||
| Class A maximum public offering price per share [net asset value per share/(100% – maximum sales charge)] | $ 17.74 | $ 23.82 | $ 15.49 | ||
| Cost of investments in non-affiliates | $3,767,366 | $1,191,605 | $147,593 | ||
| Cost of investments in affiliates | 127,784 | 39,692 | 7,724 | ||
| Cost of options purchased | — | — | 4,108 | ||
| Cost of foreign currency | 2,748 | 967 | 206 | ||
| Investment securities on loan, at value (See Note 2.C) | 169,016 | — | — | ||
| Cost of investment of cash collateral (See Note 2.C) | 202,371 | — | — | ||
| Premiums received from options written | — | — | 3,954 |
| (a) | Per share amounts may not recalculate due to rounding of net assets and/or shares outstanding. |
| (b) | Redemption price for Class C Shares varies based upon length of time the shares are held. |
| April 30, 2022 | J.P. Morgan International Equity Funds | 63 |
| JPMorgan International Research Enhanced Equity Fund | JPMorgan International Value Fund | ||
| ASSETS: | |||
| Investments in non-affiliates, at value | $5,138,804 | $380,543 | |
| Investments in affiliates, at value | 204,862 | 5,753 | |
| Investments of cash collateral received from securities loaned, at value (See Note 2.C) | 200,900 | 19,882 | |
| Cash | 4,433 | — | |
| Foreign currency, at value | 606 | — | |
| Deposits at broker for futures contracts | 11,765 | — | |
| Receivables: | |||
| Investment securities sold | 29,816 | 658 | |
| Fund shares sold | 567,563 | 818 | |
| Dividends from non-affiliates | 18,416 | 2,851 | |
| Dividends from affiliates | 57 | 3 | |
| Tax reclaims | 10,118 | 2,232 | |
| Securities lending income (See Note 2.C) | 187 | 20 | |
| Total Assets | 6,187,527 | 412,760 | |
| LIABILITIES: | |||
| Payables: | |||
| Due to custodian | — | 266 | |
| Foreign currency due to custodian, at value | — | 289 | |
| Investment securities purchased | 461,303 | 2,647 | |
| Collateral received on securities loaned (See Note 2.C) | 200,899 | 19,882 | |
| Fund shares redeemed | 309 | 587 | |
| Variation margin on futures contracts | 382 | — | |
| Accrued liabilities: | |||
| Investment advisory fees | 714 | 148 | |
| Administration fees | 240 | 3 | |
| Distribution fees | 8 | 40 | |
| Service fees | 27 | 37 | |
| Custodian and accounting fees | 132 | 24 | |
| Trustees’ and Chief Compliance Officer’s fees | —(a) | —(a) | |
| Other | 473 | 1,137 | |
| Total Liabilities | 664,487 | 25,060 | |
| Net Assets | $5,523,040 | $387,700 (a) Amount rounds to less than one thousand. |
| 64 | J.P. Morgan International Equity Funds | April 30, 2022 |
| JPMorgan International Research Enhanced Equity Fund | JPMorgan International Value Fund | ||
| NET ASSETS: | |||
| Paid-in-Capital | $5,318,902 | $451,151 | |
| Total distributable earnings (loss) | 204,138 | (63,451) | |
| Total Net Assets: | $5,523,040 | $387,700 | |
| Net Assets: | |||
| Class A | $ 37,317 | $177,422 | |
| Class C | — | 2,490 | |
| Class I | 313,629 | 37,651 | |
| Class L | — | 6,285 | |
| Class R2 | — | 500 | |
| Class R5 | — | 33 | |
| Class R6 | 5,172,094 | 163,319 | |
| Total | $5,523,040 | $387,700 | |
| Outstanding units of beneficial interest (shares) ($0.0001 par value; unlimited number of shares authorized): | |||
| Class A | 2,080 | 15,053 | |
| Class C | — | 217 | |
| Class I | 17,407 | 3,106 | |
| Class L | — | 521 | |
| Class R2 | — | 43 | |
| Class R5 | — | 3 | |
| Class R6 | 288,141 | 13,630 | |
| Net Asset Value (a): | |||
| Class A — Redemption price per share | $ 17.94 | $ 11.79 | |
| Class C — Offering price per share (b) | — | 11.44 | |
| Class I — Offering and redemption price per share | 18.02 | 12.12 | |
| Class L — Offering and redemption price per share | — | 12.05 | |
| Class R2 — Offering and redemption price per share | — | 11.59 | |
| Class R5 — Offering and redemption price per share | — | 11.97 | |
| Class R6 — Offering and redemption price per share | 17.95 | 11.98 | |
| Class A maximum sales charge | 5.25% | 5.25% | |
| Class A maximum public offering price per share [net asset value per share/(100% – maximum sales charge)] | $ 18.93 | $ 12.44 | |
| Cost of investments in non-affiliates | $4,625,226 | $361,439 | |
| Cost of investments in affiliates | 204,860 | 5,752 | |
| Cost of foreign currency | 631 | — | |
| Investment securities on loan, at value | 177,073 | 18,772 | |
| Cost of investment of cash collateral (See Note 2.C) | 200,904 | 19,881 |
| (a) | Per share amounts may not recalculate due to rounding of net assets and/or shares outstanding. |
| (b) | Redemption price for Class C Shares varies based upon length of time the shares are held. |
| April 30, 2022 | J.P. Morgan International Equity Funds | 65 |
| JPMorgan Emerging Markets Equity Fund | JPMorgan Emerging Markets Research Enhanced Equity Fund | JPMorgan Europe Dynamic Fund | |||
| INVESTMENT INCOME: | |||||
| Interest income from non-affiliates | $ — | $ 3 | $ 1 | ||
| Dividend income from non-affiliates | 49,549 | 46,566 | 11,865 | ||
| Dividend income from affiliates | 90 | 34 | 10 | ||
| Non-cash dividend income from non-affiliates | 13,536 | 4,198 | 2,368 | ||
| Income from securities lending (net) (See Note 2.C) | 85 | 20 | 86 | ||
| Foreign taxes withheld (net) | (5,770) | (3,902) | (1,485) | ||
| Total investment income | 57,490 | 46,919 | 12,845 | ||
| EXPENSES: | |||||
| Investment advisory fees | 40,116 | 4,495 | 2,764 | ||
| Administration fees | 4,115 | 1,348 | 346 | ||
| Distribution fees: | |||||
| Class A | 729 | — | 103 | ||
| Class C | 250 | — | 36 | ||
| Class R2 | 2 | — | — | ||
| Class R3 | 17 | — | — | ||
| Service fees: | |||||
| Class A | 729 | — | 103 | ||
| Class C | 83 | — | 12 | ||
| Class I | 4,859 | 137 | 397 | ||
| Class L | 1,103 | — | 41 | ||
| Class R3 | 17 | — | — | ||
| Class R4 | 4 | — | — | ||
| Class R5 | 9 | — | — | ||
| Custodian and accounting fees | 2,119 | 959 | 76 | ||
| Interest expense to affiliates | 14 | — | 9 | ||
| Professional fees | 143 | 49 | 46 | ||
| Trustees’ and Chief Compliance Officer’s fees | 31 | 18 | 14 | ||
| Printing and mailing costs | 358 | 15 | 30 | ||
| Registration and filing fees | 222 | 46 | 35 | ||
| Transfer agency fees (See Note 2.I) | 130 | 13 | 20 | ||
| Other | 333 | 39 | 27 | ||
| Total expenses | 55,383 | 7,119 | 4,059 | ||
| Less fees waived | (1,804) | (796) | (20) | ||
| Less expense reimbursements | (55) | — | — | ||
| Net expenses | 53,524 | 6,323 | 4,039 | ||
| Net investment income (loss) | $ 3,966 | $ 40,596 | $ 8,806 |
| 66 | J.P. Morgan International Equity Funds | April 30, 2022 |
| JPMorgan Emerging Markets Equity Fund | JPMorgan Emerging Markets Research Enhanced Equity Fund | JPMorgan Europe Dynamic Fund | |||
| REALIZED/UNREALIZED GAINS (LOSSES): | |||||
| Net realized gain (loss) on transactions from: | |||||
| Investments in non-affiliates | $ 58,730(a) | $(144,648)(b) | $ (51,787) | ||
| Investments in affiliates | (21) | (14) | (7) | ||
| Futures contracts | — | (420) | 2,066 | ||
| Foreign currency transactions | (3,457) | (1,113) | (2,159) | ||
| Forward foreign currency exchange contracts | — | — | — | ||
| Net realized gain (loss) | 55,252 | (146,195) | (51,887) | ||
| Distribution of capital gain received from investment company affiliates | — | — | — | ||
| Change in net unrealized appreciation/depreciation on: | |||||
| Investments in non-affiliates | (3,600,687)(c) | (502,838)(d) | (112,693) | ||
| Investments in affiliates | 4 | 1 | (1) | ||
| Futures contracts | — | 77 | (1,615) | ||
| Foreign currency translations | 1,104 | 119 | (314) | ||
| Change in net unrealized appreciation/depreciation | (3,599,579) | (502,641) | (114,623) | ||
| Net realized/unrealized gains (losses) | (3,544,327) | (648,836) | (166,510) | ||
| Change in net assets resulting from operations | $(3,540,361) | $(608,240) | $(157,704) |
| (a) | Net of foreign capital gains tax of $(250). |
| (b) | Net of foreign capital gains tax of $(2,160). |
| (c) | Net of change in foreign capital gains tax of $(89). |
| (d) | Net of change in foreign capital gains tax of $5,322. |
| April 30, 2022 | J.P. Morgan International Equity Funds | 67 |
| JPMorgan International Equity Fund | JPMorgan International Focus Fund | JPMorgan International Hedged Equity Fund | |||
| INVESTMENT INCOME: | |||||
| Interest income from non-affiliates | $ — | $ — | $ — | ||
| Interest income from affiliates | — | —(a) | — | ||
| Dividend income from non-affiliates | 65,897 | 36,677 | 2,708 | ||
| Dividend income from affiliates | 69 | 34 | 2 | ||
| Non-cash dividend income from non-affiliates | — | 3,517 | — | ||
| Income from securities lending (net) (See Note 2.C) | 347 | 84 | — | ||
| Foreign taxes withheld (net) | (6,505) | (3,253) | (270) | ||
| Total investment income | 59,808 | 37,059 | 2,440 | ||
| EXPENSES: | |||||
| Investment advisory fees | 11,777 | 9,993 | 210 | ||
| Administration fees | 1,766 | 1,249 | 63 | ||
| Distribution fees: | |||||
| Class A | 515 | 394 | 6 | ||
| Class C | 37 | 82 | 1 | ||
| Class R2 | 57 | 5 | — | ||
| Service fees: | |||||
| Class A | 515 | 394 | 6 | ||
| Class C | 12 | 28 | — | ||
| Class I | 776 | 970 | 204 | ||
| Class R2 | 28 | 2 | — | ||
| Class R5 | 5 | 1 | — | ||
| Custodian and accounting fees | 307 | 290 | 41 | ||
| Interest expense to affiliates | 8 | 5 | — | ||
| Professional fees | 67 | 52 | 46 | ||
| Trustees’ and Chief Compliance Officer’s fees | 20 | 17 | 13 | ||
| Printing and mailing costs | 60 | 49 | 13 | ||
| Registration and filing fees | 88 | 92 | 55 | ||
| Transfer agency fees (See Note 2.I) | 56 | 33 | 1 | ||
| Other | 62 | 44 | 9 | ||
| Total expenses | 16,156 | 13,700 | 668 | ||
| Less fees waived | (2,706) | (2,941) | (158) | ||
| Less expense reimbursements | — | — | —(a) | ||
| Net expenses | 13,450 | 10,759 | 510 | ||
| Net investment income (loss) | $ 46,358 | $ 26,300 | $ 1,930 (a) Amount rounds to less than one thousand. |
| 68 | J.P. Morgan International Equity Funds | April 30, 2022 |
| JPMorgan International Equity Fund | JPMorgan International Focus Fund | JPMorgan International Hedged Equity Fund | |||
| REALIZED/UNREALIZED GAINS (LOSSES): | |||||
| Net realized gain (loss) on transactions from: | |||||
| Investments in non-affiliates | $ (36,377) | $ 224,853 | $ 879 | ||
| Investments in affiliates | (44) | (5) | — | ||
| Options purchased | — | — | (6,076) | ||
| Futures contracts | — | 71 | (604) | ||
| Foreign currency transactions | (859) | (345) | (40) | ||
| Options written | — | — | 5,505 | ||
| Net realized gain (loss) | (37,280) | 224,574 | (336) | ||
| Change in net unrealized appreciation/depreciation on: | |||||
| Investments in non-affiliates | (884,227) | (803,012) | (24,366) | ||
| Investments in affiliates | 19 | (3) | — | ||
| Options purchased | — | — | 3,612 | ||
| Futures contracts | — | — | (233) | ||
| Foreign currency translations | (1,171) | (384) | (57) | ||
| Options written | — | — | 1,199 | ||
| Change in net unrealized appreciation/depreciation | (885,379) | (803,399) | (19,845) | ||
| Net realized/unrealized gains (losses) | (922,659) | (578,825) | (20,181) | ||
| Change in net assets resulting from operations | $(876,301) | $(552,525) | $(18,251) |
| April 30, 2022 | J.P. Morgan International Equity Funds | 69 |
| JPMorgan International Research Enhanced Equity Fund | JPMorgan International Value Fund | ||
| INVESTMENT INCOME: | |||
| Interest income from non-affiliates | $ 2 | $ — | |
| Interest income from affiliates | —(a) | — | |
| Dividend income from non-affiliates | 80,992 | 8,938 | |
| Dividend income from affiliates | 96 | 5 | |
| Non-cash dividend income from non-affiliates | — | 871 | |
| Income from securities lending (net) (See Note 2.C) | 526 | 48 | |
| Foreign taxes withheld (net) | (7,756) | (805) | |
| Total investment income | 73,860 | 9,057 | |
| EXPENSES: | |||
| Investment advisory fees | 4,904 | 1,088 | |
| Administration fees | 1,839 | 148 | |
| Distribution fees: | |||
| Class A | 53 | 231 | |
| Class C | — | 12 | |
| Class R2 | — | 1 | |
| Service fees: | |||
| Class A | 53 | 231 | |
| Class C | — | 4 | |
| Class I | 453 | 48 | |
| Class L | — | 3 | |
| Class R2 | — | 1 | |
| Custodian and accounting fees | 330 | 49 | |
| Interest expense to affiliates | 36 | 1 | |
| Professional fees | 82 | 49 | |
| Trustees’ and Chief Compliance Officer’s fees | 20 | 13 | |
| Printing and mailing costs | 13 | 8 | |
| Registration and filing fees | 65 | 67 | |
| Transfer agency fees (See Note 2.I) | 33 | 9 | |
| Other | 78 | 25 | |
| Total expenses | 7,959 | 1,988 | |
| Less fees waived | (1,570) | (409) | |
| Less expense reimbursements | — | (1) | |
| Net expenses | 6,389 | 1,578 | |
| Net investment income (loss) | $ 67,471 | $ 7,479 (a) Amount rounds to less than one thousand. |
| 70 | J.P. Morgan International Equity Funds | April 30, 2022 |
| JPMorgan International Research Enhanced Equity Fund | JPMorgan International Value Fund | ||
| REALIZED/UNREALIZED GAINS (LOSSES): | |||
| Net realized gain (loss) on transactions from: | |||
| Investments in non-affiliates | $ 40,943 | $ (76) | |
| Investments in affiliates | (36) | (1) | |
| Futures contracts | (2,412) | (367) | |
| Foreign currency transactions | (1,473) | 109 | |
| Net realized gain (loss) | 37,022 | (335) | |
| Change in net unrealized appreciation/depreciation on: | |||
| Investments in non-affiliates | (745,853) | (40,325) | |
| Investments in affiliates | (3) | 1 | |
| Futures contracts | 501 | (50) | |
| Foreign currency translations | (1,597) | (266) | |
| Change in net unrealized appreciation/depreciation | (746,952) | (40,640) | |
| Net realized/unrealized gains (losses) | (709,930) | (40,975) | |
| Change in net assets resulting from operations | $(642,459) | $(33,496) |
| April 30, 2022 | J.P. Morgan International Equity Funds | 71 |
| JPMorgan Emerging Markets Equity Fund | JPMorgan Emerging Markets Research Enhanced Equity Fund | ||||||
| Six Months Ended April 30, 2022 (Unaudited) | Year Ended October 31, 2021 | �� | Six Months Ended April 30, 2022 (Unaudited) | Year Ended October 31, 2021 | |||
| CHANGE IN NET ASSETS RESULTING FROM OPERATIONS: | |||||||
| Net investment income (loss) | $ 3,966 | $ (660) | $ 40,596 | $ 70,642 | |||
| Net realized gain (loss) | 55,252 | 570,100 | (146,195) | 184,068 | |||
| Distributions of capital gains received from investment company affiliates | — | — | — | — | |||
| Change in net unrealized appreciation/depreciation | (3,599,579) | 749,583 | (502,641) | 221,738 | |||
| Change in net assets resulting from operations | (3,540,361) | 1,319,023 | (608,240) | 476,448 | |||
| DISTRIBUTIONS TO SHAREHOLDERS: | |||||||
| Class A | (22,535) | — | — | — | |||
| Class C | (2,610) | — | — | — | |||
| Class I | (162,208) | (4,875) | (231) | (1) | |||
| Class L | (91,277) | (3,336) | — | — | |||
| Class R2 | (19) | — | — | — | |||
| Class R3 | (504) | — | — | — | |||
| Class R4 | (135) | (1) | — | — | |||
| Class R5 | (704) | (80) | — | — | |||
| Class R6 | (206,914) | (10,851) | (199,236) | (50,836) | |||
| Total distributions to shareholders | (486,906) | (19,143) | (199,467) | (50,837) | |||
| CAPITAL TRANSACTIONS: | |||||||
| Change in net assets resulting from capital transactions | (130,289) | 1,315,679 | (39,589) | 527,435 | |||
| NET ASSETS: | |||||||
| Change in net assets | (4,157,556) | 2,615,559 | (847,296) | 953,046 | |||
| Beginning of period | 13,835,784 | 11,220,225 | 3,793,388 | 2,840,342 | |||
| End of period | $ 9,678,228 | $13,835,784 | $2,946,092 | $3,793,388 | |||
| 72 | J.P. Morgan International Equity Funds | April 30, 2022 |
| JPMorgan Europe Dynamic Fund | JPMorgan International Equity Fund | ||||||
| Six Months Ended April 30, 2022 (Unaudited) | Year Ended October 31, 2021 | Six Months Ended April 30, 2022 (Unaudited) | Year Ended October 31, 2021 | ||||
| CHANGE IN NET ASSETS RESULTING FROM OPERATIONS: | |||||||
| Net investment income (loss) | $ 8,806 | $ 12,685 | $ 46,358 | $ 80,677 | |||
| Net realized gain (loss) | (51,887) | 65,264 | (37,280) | 332,125 | |||
| Change in net unrealized appreciation/depreciation | (114,623) | 119,032 | (885,379) | 630,933 | |||
| Change in net assets resulting from operations | (157,704) | 196,981 | (876,301) | 1,043,735 | |||
| DISTRIBUTIONS TO SHAREHOLDERS: | |||||||
| Class A | (1,773) | (839) | (27,845) | (3,040) | |||
| Class C | (188) | (80) | (669) | (42) | |||
| Class I | (9,923) | (772) | (38,399) | (4,786) | |||
| Class L | (2,043) | (920) | — | — | |||
| Class R2 | — | — | (1,477) | (292) | |||
| Class R5 | — | — | (678) | (99) | |||
| Class R6 | (11,157) | (4,405) | (256,785) | (33,732) | |||
| Total distributions to shareholders | (25,084) | (7,016) | (325,853) | (41,991) | |||
| CAPITAL TRANSACTIONS: | |||||||
| Change in net assets resulting from capital transactions | (285,188) | 445,725 | 839,823 | 913,051 | |||
| NET ASSETS: | |||||||
| Change in net assets | (467,976) | 635,690 | (362,331) | 1,914,795 | |||
| Beginning of period | 1,074,518 | 438,828 | 4,845,717 | 2,930,922 | |||
| End of period | $ 606,542 | $1,074,518 | $4,483,386 | $4,845,717 | |||
| April 30, 2022 | J.P. Morgan International Equity Funds | 73 |
| International Focus Fund | JPMorgan International Hedged Equity Fund | ||||||
| Six Months Ended April 30, 2022 (Unaudited) | Year Ended October 31, 2021 | Six Months Ended April 30, 2022 (Unaudited) | Year Ended October 31, 2021 | ||||
| CHANGE IN NET ASSETS RESULTING FROM OPERATIONS: | |||||||
| Net investment income (loss) | $ 26,300 | $ 58,536 | $ 1,930 | $ 2,600 | |||
| Net realized gain (loss) | 224,574 | 75,956 | (336) | (5,465) | |||
| Change in net unrealized appreciation/depreciation | (803,399) | 610,179 | (19,845) | 26,744 | |||
| Change in net assets resulting from operations | (552,525) | 744,671 | (18,251) | 23,879 | |||
| DISTRIBUTIONS TO SHAREHOLDERS: | |||||||
| Class A | (5,362) | (1,160) | (77) | (29) | |||
| Class C | (261) | (42) | (6) | (1) | |||
| Class I | (14,693) | (4,486) | (4,049) | (2,175) | |||
| Class R2 | (21) | (9) | — | — | |||
| Class R5 | (56) | (32) | (1) | (1) | |||
| Class R6 | (50,762) | (28,297) | (4) | (1) | |||
| Total distributions to shareholders | (71,155) | (34,026) | (4,137) | (2,207) | |||
| CAPITAL TRANSACTIONS: | |||||||
| Change in net assets resulting from capital transactions | (1,889,661) | 407,973 | 40,835 | (6,164) | |||
| NET ASSETS: | |||||||
| Change in net assets | (2,513,341) | 1,118,618 | 18,447 | 15,508 | |||
| Beginning of period | 3,920,288 | 2,801,670 | 152,776 | 137,268 | |||
| End of period | $ 1,406,947 | $3,920,288 | $171,223 | $152,776 | |||
| 74 | J.P. Morgan International Equity Funds | April 30, 2022 |
| JPMorgan International Research Enhanced Equity Fund | JPMorgan International Value Fund | ||||||
| Six Months Ended April 30, 2022 (Unaudited) | Year Ended October 31, 2021 | Six Months Ended April 30, 2022 (Unaudited) | Year Ended October 31, 2021 | ||||
| CHANGE IN NET ASSETS RESULTING FROM OPERATIONS: | |||||||
| Net investment income (loss) | $ 67,471 | $ 126,966 | $ 7,479 | $ 13,022 | |||
| Net realized gain (loss) | 37,022 | 283,157 | (335) | 4,345 | |||
| Change in net unrealized appreciation/depreciation | (746,952) | 1,196,412 | (40,640) | 104,838 | |||
| Change in net assets resulting from operations | (642,459) | 1,606,535 | (33,496) | 122,205 | |||
| DISTRIBUTIONS TO SHAREHOLDERS: | |||||||
| Class A | (1,695) | (402) | (8,496) | (4,156) | |||
| Class C | — | — | (136) | (106) | |||
| Class I | (15,314) | (10,216) | (1,804) | (914) | |||
| Class L | — | — | (331) | (192) | |||
| Class R2 | — | — | (22) | (11) | |||
| Class R5 | — | — | (2) | (3) | |||
| Class R6 | (182,288) | (95,880) | (7,825) | (3,877) | |||
| Total distributions to shareholders | (199,297) | (106,498) | (18,616) | (9,259) | |||
| CAPITAL TRANSACTIONS: | |||||||
| Change in net assets resulting from capital transactions | 1,368,954 | (1,366,544) | 43,113 | 15,889 | |||
| NET ASSETS: | |||||||
| Change in net assets | 527,198 | 133,493 | (8,999) | 128,835 | |||
| Beginning of period | 4,995,842 | 4,862,349 | 396,699 | 267,864 | |||
| End of period | $5,523,040 | $ 4,995,842 | $387,700 | $396,699 | |||
| April 30, 2022 | J.P. Morgan International Equity Funds | 75 |
| JPMorgan Emerging Markets Equity Fund | JPMorgan Emerging Markets Research Enhanced Equity Fund | ||||||
| Six Months Ended April 30, 2022 (Unaudited) | Year Ended October 31, 2021 | Six Months Ended April 30, 2022 (Unaudited) | Year Ended October 31, 2021 | ||||
| CAPITAL TRANSACTIONS: | |||||||
| Class A | |||||||
| Proceeds from shares issued | $ 72,542 | $ 254,285 | $ — | $ — | |||
| Distributions reinvested | 21,957 | — | — | — | |||
| Cost of shares redeemed | (124,291) | (192,488) | — | — | |||
| Change in net assets resulting from Class A capital transactions | (29,792) | 61,797 | — | — | |||
| Class C | |||||||
| Proceeds from shares issued | 1,419 | 21,002 | — | — | |||
| Distributions reinvested | 2,464 | — | — | — | |||
| Cost of shares redeemed | (12,578) | (18,983) | — | — | |||
| Change in net assets resulting from Class C capital transactions | (8,695) | 2,019 | — | — | |||
| Class I | |||||||
| Proceeds from shares issued | 737,549 | 2,529,253 | 289,005 | 6,294 | |||
| Distributions reinvested | 152,054 | 4,534 | 232 | 1 | |||
| Cost of shares redeemed | (1,413,676) | (2,287,926) | (28,388) | (466) | |||
| Change in net assets resulting from Class I capital transactions | (524,073) | 245,861 | 260,849 | 5,829 | |||
| Class L | |||||||
| Proceeds from shares issued | 375,238 | 1,202,345 | — | — | |||
| Distributions reinvested | 90,633 | 3,299 | — | — | |||
| Cost of shares redeemed | (510,665) | (693,103) | — | — | |||
| Change in net assets resulting from Class L capital transactions | (44,794) | 512,541 | — | — | |||
| Class R2 | �� | ||||||
| Proceeds from shares issued | 80 | 415 | — | — | |||
| Distributions reinvested | 19 | — | — | — | |||
| Cost of shares redeemed | (36) | (288) | — | — | |||
| Change in net assets resulting from Class R2 capital transactions | 63 | 127 | — | — | |||
| Class R3 | |||||||
| Proceeds from shares issued | 3,296 | 13,765 | — | — | |||
| Distributions reinvested | 227 | — | — | — | |||
| Cost of shares redeemed | (1,233) | (5,183) | — | — | |||
| Change in net assets resulting from Class R3 capital transactions | 2,290 | 8,582 | — | — | |||
| Class R4 | |||||||
| Proceeds from shares issued | 574 | 2,383 | — | — | |||
| Distributions reinvested | 135 | 1 | — | — | |||
| Cost of shares redeemed | (464) | (1,833) | — | — | |||
| Change in net assets resulting from Class R4 capital transactions | 245 | 551 | — | — | |||
| 76 | J.P. Morgan International Equity Funds | April 30, 2022 |
| JPMorgan Emerging Markets Equity Fund | JPMorgan Emerging Markets Research Enhanced Equity Fund | ||||||
| Six Months Ended April 30, 2022 (Unaudited) | Year Ended October 31, 2021 | Six Months Ended April 30, 2022 (Unaudited) | Year Ended October 31, 2021 | ||||
| CAPITAL TRANSACTIONS: (continued) | |||||||
| Class R5 | |||||||
| Proceeds from shares issued | $ 2,496 | $ 18,329 | $ — | $ — | |||
| Distributions reinvested | 651 | 79 | — | — | |||
| Cost of shares redeemed | (2,589) | (63,474) | — | — | |||
| Change in net assets resulting from Class R5 capital transactions | 558 | (45,066) | — | — | |||
| Class R6 | |||||||
| Proceeds from shares issued | 1,170,304 | 2,782,507 | 626,445 | 1,383,412 | |||
| Distributions reinvested | 189,279 | 9,925 | 199,236 | 50,835 | |||
| Cost of shares redeemed | (885,674) | (2,263,165) | (1,126,119) | (912,641) | |||
| Change in net assets resulting from Class R6 capital transactions | 473,909 | 529,267 | (300,438) | 521,606 | |||
| Total change in net assets resulting from capital transactions | $ (130,289) | $ 1,315,679 | $ (39,589) | $ 527,435 | |||
| SHARE TRANSACTIONS: | |||||||
| Class A | |||||||
| Issued | 2,151 | 6,043 | — | — | |||
| Reinvested | 591 | — | — | — | |||
| Redeemed | (3,559) | (4,582) | — | — | |||
| Change in Class A Shares | (817) | 1,461 | — | — | |||
| Class C | |||||||
| Issued | 44 | 523 | — | — | |||
| Reinvested | 69 | — | — | — | |||
| Redeemed | (380) | (464) | — | — | |||
| Change in Class C Shares | (267) | 59 | — | — | |||
| Class I | |||||||
| Issued | 20,934 | 58,966 | 15,500 | 281 | |||
| Reinvested | 3,999 | 106 | 12 | — | |||
| Redeemed | (41,117) | (52,366) | (1,565) | (22) | |||
| Change in Class I Shares | (16,184) | 6,706 | 13,947 | 259 | |||
| Class L | |||||||
| Issued | 10,537 | 27,731 | — | — | |||
| Reinvested | 2,366 | 77 | — | — | |||
| Redeemed | (14,334) | (15,762) | — | — | |||
| Change in Class L Shares | (1,431) | 12,046 | — | — | |||
| Class R2 | |||||||
| Issued | 2 | 10 | — | — | |||
| Reinvested | 1 | — | — | — | |||
| Redeemed | (1) | (7) | — | — | |||
| Change in Class R2 Shares | 2 | 3 | — | — | |||
| April 30, 2022 | J.P. Morgan International Equity Funds | 77 |
| JPMorgan Emerging Markets Equity Fund | JPMorgan Emerging Markets Research Enhanced Equity Fund | ||||||
| Six Months Ended April 30, 2022 (Unaudited) | Year Ended October 31, 2021 | Six Months Ended April 30, 2022 (Unaudited) | Year Ended October 31, 2021 | ||||
| SHARE TRANSACTIONS: (continued) | |||||||
| Class R3 | |||||||
| Issued | 98 | 334 | — | — | |||
| Reinvested | 6 | — | — | — | |||
| Redeemed | (35) | (124) | — | — | |||
| Change in Class R3 Shares | 69 | 210 | — | — | |||
| Class R4 | |||||||
| Issued | 16 | 54 | — | — | |||
| Reinvested | 4 | — | — | — | |||
| Redeemed | (13) | (42) | — | — | |||
| Change in Class R4 Shares | 7 | 12 | — | — | |||
| Class R5 | |||||||
| Issued | 70 | 416 | — | — | |||
| Reinvested | 17 | 2 | — | — | |||
| Redeemed | (73) | (1,466) | — | — | |||
| Change in Class R5 Shares | 14 | (1,048) | — | — | |||
| Class R6 | |||||||
| Issued | 34,215 | 63,838 | 35,237 | 64,804 | |||
| Reinvested | 4,950 | 232 | 10,435 | 2,474 | |||
| Redeemed | (25,924) | (51,699) | (64,205) | (42,567) | |||
| Change in Class R6 Shares | 13,241 | 12,371 | (18,533) | 24,711 | |||
| 78 | J.P. Morgan International Equity Funds | April 30, 2022 |
| JPMorgan Europe Dynamic Fund | JPMorgan International Equity Fund | ||||||
| Six Months Ended April 30, 2022 (Unaudited) | Year Ended October 31, 2021 | Six Months Ended April 30, 2022 (Unaudited) | Year Ended October 31, 2021 | ||||
| CAPITAL TRANSACTIONS: | |||||||
| Class A | |||||||
| Proceeds from shares issued | $ 3,798 | $ 6,061 | $ 45,611 | $ 128,373 | |||
| Distributions reinvested | 1,698 | 805 | 27,642 | 3,017 | |||
| Cost of shares redeemed | (6,159) | (15,952) | (37,996) | (50,637) | |||
| Change in net assets resulting from Class A capital transactions | (663) | (9,086) | 35,257 | 80,753 | |||
| Class C | |||||||
| Proceeds from shares issued | 65 | 543 | 817 | 2,112 | |||
| Distributions reinvested | 183 | 79 | 669 | 42 | |||
| Cost of shares redeemed | (2,942) | (4,769) | (1,587) | (3,467) | |||
| Change in net assets resulting from Class C capital transactions | (2,694) | (4,147) | (101) | (1,313) | |||
| Class I | |||||||
| Proceeds from shares issued | 51,229 | 412,233 | 265,574 | 217,953 | |||
| Distributions reinvested | 9,021 | 721 | 38,299 | 4,774 | |||
| Cost of shares redeemed | (358,634) | (48,189) | (110,519) | (91,184) | |||
| Change in net assets resulting from Class I capital transactions | (298,384) | 364,765 | 193,354 | 131,543 | |||
| Class L | |||||||
| Proceeds from shares issued | 7,945 | 11,606 | — | — | |||
| Distributions reinvested | 2,037 | 917 | — | — | |||
| Cost of shares redeemed | (5,871) | (6,155) | — | — | |||
| Change in net assets resulting from Class L capital transactions | 4,111 | 6,368 | — | — | |||
| Class R2 | |||||||
| Proceeds from shares issued | — | — | 3,053 | 5,946 | |||
| Distributions reinvested | — | — | 1,474 | 289 | |||
| Cost of shares redeemed | — | — | (2,833) | (9,508) | |||
| Change in net assets resulting from Class R2 capital transactions | — | — | 1,694 | (3,273) | |||
| Class R5 | |||||||
| Proceeds from shares issued | — | — | 1,886 | 4,537 | |||
| Distributions reinvested | — | — | 650 | 95 | |||
| Cost of shares redeemed | — | — | (1,596) | (3,471) | |||
| Change in net assets resulting from Class R5 capital transactions | — | — | 940 | 1,161 | |||
| Class R6 | |||||||
| Proceeds from shares issued | 38,473 | 135,760 | 1,034,724 | 1,637,397 | |||
| Distributions reinvested | 10,393 | 4,405 | 256,061 | 33,605 | |||
| Cost of shares redeemed | (36,424) | (52,340) | (682,106) | (966,822) | |||
| Change in net assets resulting from Class R6 capital transactions | 12,442 | 87,825 | 608,679 | 704,180 | |||
| Total change in net assets resulting from capital transactions | $(285,188) | $445,725 | $ 839,823 | $ 913,051 | |||
| April 30, 2022 | J.P. Morgan International Equity Funds | 79 |
| JPMorgan Europe Dynamic Fund | JPMorgan International Equity Fund | ||||||
| Six Months Ended April 30, 2022 (Unaudited) | Year Ended October 31, 2021 | Six Months Ended April 30, 2022 (Unaudited) | Year Ended October 31, 2021 | ||||
| SHARE TRANSACTIONS: | |||||||
| Class A | |||||||
| Issued | 131 | 204 | 2,323 | 6,338 | |||
| Reinvested | 58 | 31 | 1,370 | 155 | |||
| Redeemed | (215) | (561) | (1,993) | (2,491) | |||
| Change in Class A Shares | (26) | (326) | 1,700 | 4,002 | |||
| Class C | |||||||
| Issued | 2 | 21 | 44 | 108 | |||
| Reinvested | 7 | 3 | 35 | 2 | |||
| Redeemed | (118) | (189) | (87) | (179) | |||
| Change in Class C Shares | (109) | (165) | (8) | (69) | |||
| Class I | |||||||
| Issued | 1,685 | 13,177 | 13,925 | 10,466 | |||
| Reinvested | 301 | 27 | 1,865 | 242 | |||
| Redeemed | (13,380) | (1,563) | (5,912) | (4,423) | |||
| Change in Class I Shares | (11,394) | 11,641 | 9,878 | 6,285 | |||
| Class L | |||||||
| Issued | 264 | 384 | — | — | |||
| Reinvested | 67 | 34 | — | — | |||
| Redeemed | (198) | (212) | — | — | |||
| Change in Class L Shares | 133 | 206 | — | — | |||
| Class R2 | |||||||
| Issued | — | — | 164 | 296 | |||
| Reinvested | — | — | 74 | 15 | |||
| Redeemed | — | — | (148) | (468) | |||
| Change in Class R2 Shares | — | — | 90 | (157) | |||
| Class R5 | |||||||
| Issued | — | — | 101 | 219 | |||
| Reinvested | — | — | 31 | 5 | |||
| Redeemed | — | — | (78) | (165) | |||
| Change in Class R5 Shares | — | — | 54 | 59 | |||
| Class R6 | |||||||
| Issued | 1,288 | 4,263 | 55,539 | 79,648 | |||
| Reinvested | 344 | 163 | 12,433 | 1,702 | |||
| Redeemed | (1,348) | (1,668) | (37,798) | (46,388) | |||
| Change in Class R6 Shares | 284 | 2,758 | 30,174 | 34,962 | |||
| 80 | J.P. Morgan International Equity Funds | April 30, 2022 |
| International Focus Fund | JPMorgan International Hedged Equity Fund | ||||||
| Six Months Ended April 30, 2022 (Unaudited) | Year Ended October 31, 2021 | Six Months Ended April 30, 2022 (Unaudited) | Year Ended October 31, 2021 | ||||
| CAPITAL TRANSACTIONS: | |||||||
| Class A | |||||||
| Proceeds from shares issued | $ 55,948 | $ 195,801 | $ 3,689 | $ 3,079 | |||
| Distributions reinvested | 5,307 | 1,132 | 77 | 29 | |||
| Cost of shares redeemed | (67,045) | (32,379) | (1,511) | (1,473) | |||
| Change in net assets resulting from Class A capital transactions | (5,790) | 164,554 | 2,255 | 1,635 | |||
| Class C | |||||||
| Proceeds from shares issued | 1,461 | 8,415 | 131 | 184 | |||
| Distributions reinvested | 260 | 42 | 6 | 1 | |||
| Cost of shares redeemed | (3,033) | (3,542) | (132) | (7) | |||
| Change in net assets resulting from Class C capital transactions | (1,312) | 4,915 | 5 | 178 | |||
| Class I | |||||||
| Proceeds from shares issued | 190,812 | 534,780 | 89,078 | 57,032 | |||
| Distributions reinvested | 14,119 | 4,249 | 3,842 | 2,032 | |||
| Cost of shares redeemed | (224,640) | (182,797) | (54,423) | (67,180) | |||
| Change in net assets resulting from Class I capital transactions | (19,709) | 356,232 | 38,497 | (8,116) | |||
| Class R2 | |||||||
| Proceeds from shares issued | 417 | 947 | — | — | |||
| Distributions reinvested | 21 | 9 | — | — | |||
| Cost of shares redeemed | (363) | (716) | — | — | |||
| Change in net assets resulting from Class R2 capital transactions | 75 | 240 | — | — | |||
| Class R5 | |||||||
| Proceeds from shares issued | 217 | 424 | — | — | |||
| Distributions reinvested | 56 | 32 | 1 | — | |||
| Cost of shares redeemed | (691) | (749) | — | — | |||
| Change in net assets resulting from Class R5 capital transactions | (418) | (293) | 1 | — | |||
| Class R6 | |||||||
| Proceeds from shares issued | 85,526 | 452,976 | 112 | 151 | |||
| Distributions reinvested | 50,271 | 28,297 | 5 | 1 | |||
| Cost of shares redeemed | (566,706) | (598,948) | (40) | (13) | |||
| Redemptions in-kind | (1,431,598) | — | — | — | |||
| Change in net assets resulting from Class R6 capital transactions | (1,862,507) | (117,675) | 77 | 139 | |||
| Total change in net assets resulting from capital transactions | $(1,889,661) | $ 407,973 | $ 40,835 | $ (6,164) | |||
| SHARE TRANSACTIONS: | |||||||
| Class A | |||||||
| Issued | 2,189 | 7,283 | 232 | 192 | |||
| Reinvested | 205 | 45 | 5 | 2 | |||
| Redeemed | (2,748) | (1,217) | (96) | (92) | |||
| Change in Class A Shares | (354) | 6,111 | 141 | 102 | |||
| April 30, 2022 | J.P. Morgan International Equity Funds | 81 |
| International Focus Fund | JPMorgan International Hedged Equity Fund | ||||||
| Six Months Ended April 30, 2022 (Unaudited) | Year Ended October 31, 2021 | Six Months Ended April 30, 2022 (Unaudited) | Year Ended October 31, 2021 | ||||
| SHARE TRANSACTIONS: (continued) | |||||||
| Class C | |||||||
| Issued | 57 | 316 | 8 | 11 | |||
| Reinvested | 10 | 2 | — | — | |||
| Redeemed | (122) | (134) | (8) | — | |||
| Change in Class C Shares | (55) | 184 | — | 11 | |||
| Class I | |||||||
| Issued | 7,441 | 19,663 | 5,596 | 3,560 | |||
| Reinvested | 538 | 165 | 241 | 135 | |||
| Redeemed | (9,166) | (6,676) | (3,457) | (4,418) | |||
| Change in Class I Shares | (1,187) | 13,152 | 2,380 | (723) | |||
| Class R2 | |||||||
| Issued | 17 | 36 | — | — | |||
| Reinvested | 1 | — | — | — | |||
| Redeemed | (14) | (26) | — | — | |||
| Change in Class R2 Shares | 4 | 10 | — | — | |||
| Class R5 | |||||||
| Issued | 8 | 15 | — | — | |||
| Reinvested | 2 | 1 | — | — | |||
| Redeemed | (27) | (27) | — | — | |||
| Change in Class R5 Shares | (17) | (11) | — | — | |||
| Class R6 | |||||||
| Issued | 3,340 | 16,687 | 7 | 9 | |||
| Reinvested | 1,917 | 1,099 | — | — | |||
| Redeemed | (21,797) | (22,086) | (2) | (1) | |||
| Redemptions in-kind | (60,558) | — | — | — | |||
| Change in Class R6 Shares | (77,098) | (4,300) | 5 | 8 | |||
| 82 | J.P. Morgan International Equity Funds | April 30, 2022 |
| JPMorgan International Research Enhanced Equity Fund | JPMorgan International Value Fund | ||||||
| Six Months Ended April 30, 2022 (Unaudited) | Year Ended October 31, 2021 | Six Months Ended April 30, 2022 (Unaudited) | Year Ended October 31, 2021 | ||||
| CAPITAL TRANSACTIONS: | |||||||
| Class A | |||||||
| Proceeds from shares issued | $ 712 | $ 1,989 | $ 21,599 | $ 39,262 | |||
| Distributions reinvested | 1,642 | 389 | 8,400 | 4,095 | |||
| Cost of shares redeemed | (4,775) | (22,274) | (16,228) | (34,717) | |||
| Change in net assets resulting from Class A capital transactions | (2,421) | (19,896) | 13,771 | 8,640 | |||
| Class C | |||||||
| Proceeds from shares issued | — | — | 127 | 165 | |||
| Distributions reinvested | — | — | 135 | 104 | |||
| Cost of shares redeemed | — | — | (1,309) | (2,175) | |||
| Change in net assets resulting from Class C capital transactions | — | — | (1,047) | (1,906) | |||
| Class I | |||||||
| Proceeds from shares issued | 75,161 | 105,581 | 7,674 | 12,348 | |||
| Distributions reinvested | 15,288 | 10,212 | 1,784 | 829 | |||
| Cost of shares redeemed | (103,229) | (342,012) | (5,847) | (11,848) | |||
| Change in net assets resulting from Class I capital transactions | (12,780) | (226,219) | 3,611 | 1,329 | |||
| Class L | |||||||
| Proceeds from shares issued | — | — | 349 | 2,881 | |||
| Distributions reinvested | — | — | 310 | 179 | |||
| Cost of shares redeemed | — | — | (554) | (3,956) | |||
| Change in net assets resulting from Class L capital transactions | — | — | 105 | (896) | |||
| Class R2 | |||||||
| Proceeds from shares issued | — | — | 32 | 175 | |||
| Distributions reinvested | — | — | 22 | 11 | |||
| Cost of shares redeemed | — | — | (2) | (252) | |||
| Change in net assets resulting from Class R2 capital transactions | — | — | 52 | (66) | |||
| Class R5 | |||||||
| Proceeds from shares issued | — | — | 24 | 21 | |||
| Distributions reinvested | — | — | 2 | 3 | |||
| Cost of shares redeemed | — | — | (52) | (64) | |||
| Change in net assets resulting from Class R5 capital transactions | — | — | (26) | (40) | |||
| Class R6 | |||||||
| Proceeds from shares issued | 1,424,432 | 359,932 | 37,644 | 52,793 | |||
| Distributions reinvested | 181,166 | 95,880 | 7,790 | 3,621 | |||
| Cost of shares redeemed | (221,443) | (1,576,241) | (18,787) | (47,586) | |||
| Change in net assets resulting from Class R6 capital transactions | 1,384,155 | (1,120,429) | 26,647 | 8,828 | |||
| Total change in net assets resulting from capital transactions | $1,368,954 | $(1,366,544) | $ 43,113 | $ 15,889 | |||
| April 30, 2022 | J.P. Morgan International Equity Funds | 83 |
| JPMorgan International Research Enhanced Equity Fund | JPMorgan International Value Fund | ||||||
| Six Months Ended April 30, 2022 (Unaudited) | Year Ended October 31, 2021 | Six Months Ended April 30, 2022 (Unaudited) | Year Ended October 31, 2021 | ||||
| SHARE TRANSACTIONS: | |||||||
| Class A | |||||||
| Issued | 36 | 100 | 1,690 | 3,054 | |||
| Reinvested | 83 | 21 | 685 | 356 | |||
| Redeemed | (238) | (1,211) | (1,270) | (2,757) | |||
| Change in Class A Shares | (119) | (1,090) | 1,105 | 653 | |||
| Class C | |||||||
| Issued | — | — | 10 | 12 | |||
| Reinvested | — | — | 11 | 10 | |||
| Redeemed | — | — | (105) | (181) | |||
| Change in Class C Shares | — | — | (84) | (159) | |||
| Class I | |||||||
| Issued | 3,788 | 5,301 | 582 | 923 | |||
| Reinvested | 765 | 540 | 141 | 70 | |||
| Redeemed | (5,228) | (17,195) | (449) | (921) | |||
| Change in Class I Shares | (675) | (11,354) | 274 | 72 | |||
| Class L | |||||||
| Issued | — | — | 28 | 219 | |||
| Reinvested | — | — | 25 | 15 | |||
| Redeemed | — | — | (43) | (301) | |||
| Change in Class L Shares | — | — | 10 | (67) | |||
| Class R2 | |||||||
| Issued | — | — | 3 | 14 | |||
| Reinvested | — | — | 2 | 1 | |||
| Redeemed | — | — | (—)(a) | (20) | |||
| Change in Class R2 Shares | — | — | 5 | (5) | |||
| Class R5 | |||||||
| Issued | — | — | 2 | 2 | |||
| Redeemed | — | — | (4) | (5) | |||
| Change in Class R5 Shares | — | — | (2) | (3) | |||
| Class R6 | |||||||
| Issued | 76,037 | 17,749 | 2,914 | 4,060 | |||
| Reinvested | 9,108 | 5,089 | 626 | 310 | |||
| Redeemed | (10,933) | (80,049) | (1,451) | (3,744) | |||
| Change in Class R6 Shares | 74,212 | (57,211) | 2,089 | 626 | |||
| (a) | Amount rounds to less than one thousand. |
| 84 | J.P. Morgan International Equity Funds | April 30, 2022 |
| Per share operating performance | ||||||||
| Investment operations | Distributions | |||||||
| Net asset value, beginning of period | Net investment income (loss)(b) | Net realized and unrealized gains (losses) on investments | Total from investment operations | Net investment income | Net realized gain | Total distributions | ||
| JPMorgan Emerging Markets Equity Fund | ||||||||
| Class A | ||||||||
| Six Months Ended April 30, 2022(Unaudited) | $40.54 | $(0.04) | $(10.32) | $(10.36) | $(0.07) | $(1.26) | $(1.33) | |
| Year Ended October 31, 2021 | 36.44 | (0.14) | 4.24 | 4.10 | — | — | — | |
| Year Ended October 31, 2020 | 30.07 | (0.02) | 6.56 | 6.54 | (0.17) | — | (0.17) | |
| Year Ended October 31, 2019 | 23.84 | 0.19 | 6.16 | 6.35 | (0.12) | — | (0.12) | |
| Year Ended October 31, 2018 | 27.58 | 0.14 | (3.84) | (3.70) | (0.04) | — | (0.04) | |
| Year Ended October 31, 2017 | 21.79 | 0.09 | 5.80 | 5.89 | (0.10) | — | (0.10) | |
| Class C | ||||||||
| Six Months Ended April 30, 2022(Unaudited) | 38.96 | (0.13) | (9.90) | (10.03) | — | (1.26) | (1.26) | |
| Year Ended October 31, 2021 | 35.20 | (0.34) | 4.10 | 3.76 | — | — | — | |
| Year Ended October 31, 2020 | 29.07 | (0.18) | 6.35 | 6.17 | (0.04) | — | (0.04) | |
| Year Ended October 31, 2019 | 23.08 | 0.04 | 5.98 | 6.02 | (0.03) | — | (0.03) | |
| Year Ended October 31, 2018 | 26.80 | 0.02 | (3.74) | (3.72) | —(g) | — | — | |
| Year Ended October 31, 2017 | 21.18 | (0.04) | 5.67 | 5.63 | (0.01) | — | (0.01) | |
| Class I | ||||||||
| Six Months Ended April 30, 2022(Unaudited) | 41.60 | (0.01) | (10.58) | (10.59) | (0.17) | (1.26) | (1.43) | |
| Year Ended October 31, 2021 | 37.34 | (0.04) | 4.34 | 4.30 | (0.04) | — | (0.04) | |
| Year Ended October 31, 2020 | 30.79 | 0.05 | 6.75 | 6.80 | (0.25) | — | (0.25) | |
| Year Ended October 31, 2019 | 24.45 | 0.27 | 6.29 | 6.56 | (0.22) | — | (0.22) | |
| Year Ended October 31, 2018 | 28.29 | 0.24 | (3.96) | (3.72) | (0.12) | — | (0.12) | |
| Year Ended October 31, 2017 | 22.33 | 0.16 | 5.94 | 6.10 | (0.14) | — | (0.14) | |
| Class L | ||||||||
| Six Months Ended April 30, 2022(Unaudited) | 41.96 | 0.02 | (10.68) | (10.66) | (0.22) | (1.26) | (1.48) | |
| Year Ended October 31, 2021 | 37.64 | 0.01 | 4.37 | 4.38 | (0.06) | — | (0.06) | |
| Year Ended October 31, 2020 | 31.03 | 0.08 | 6.80 | 6.88 | (0.27) | — | (0.27) | |
| Year Ended October 31, 2019 | 24.63 | 0.29 | 6.35 | 6.64 | (0.24) | — | (0.24) | |
| Year Ended October 31, 2018 | 28.49 | 0.26 | (3.99) | (3.73) | (0.13) | — | (0.13) | |
| Year Ended October 31, 2017 | 22.49 | 0.21 | 5.96 | 6.17 | (0.17) | — | (0.17) | |
| Class R2 | ||||||||
| Six Months Ended April 30, 2022(Unaudited) | 39.99 | (0.09) | (10.19) | (10.28) | — | (1.26) | (1.26) | |
| Year Ended October 31, 2021 | 36.06 | (0.26) | 4.19 | 3.93 | — | — | — | |
| Year Ended October 31, 2020 | 29.78 | (0.13) | 6.52 | 6.39 | (0.11) | — | (0.11) | |
| Year Ended October 31, 2019 | 23.73 | 0.08 | 6.13 | 6.21 | (0.16) | — | (0.16) | |
| Year Ended October 31, 2018 | 27.57 | 0.07 | (3.83) | (3.76) | (0.08) | — | (0.08) | |
| July 31, 2017(h) through October 31, 2017 | 26.40 | (0.01) | 1.18 | 1.17 | — | — | — | |
| Class R3 | ||||||||
| Six Months Ended April 30, 2022(Unaudited) | 40.30 | (0.05) | (10.24) | (10.29) | (0.11) | (1.26) | (1.37) | |
| Year Ended October 31, 2021 | 36.25 | (0.15) | 4.20 | 4.05 | — | — | — | |
| Year Ended October 31, 2020 | 29.96 | (0.05) | 6.55 | 6.50 | (0.21) | — | (0.21) | |
| Year Ended October 31, 2019 | 23.78 | 0.25 | 6.06 | 6.31 | (0.13) | — | (0.13) | |
| Year Ended October 31, 2018 | 27.59 | 0.22 | (3.92) | (3.70) | (0.11) | — | (0.11) | |
| July 31, 2017(h) through October 31, 2017 | 26.40 | 0.01 | 1.18 | 1.19 | — | — | — | |
| 86 | J.P. Morgan International Equity Funds | April 30, 2022 |
| Ratios/Supplemental data | |||||||
| Ratios to average net assets(a) | |||||||
| Net asset value, end of period | Total return (excludes sales charge)(c)(d) | Net assets, end of period (000's) | Net expenses(e) | Net investment income (loss) | Expenses without waivers and reimbursements | Portfolio turnover rate(d) | |
| $28.85 | (26.28)% | $ 476,166 | 1.24(f)% | (0.26)(f)% | 1.31(f)% | 11% | |
| 40.54 | 11.25 | 702,288 | 1.24 | (0.33) | 1.30 | 25 | |
| 36.44 | 21.84 | 578,112 | 1.24 | (0.06) | 1.33 | 15 | |
| 30.07 | 26.77 | 524,357 | 1.24 | 0.69 | 1.47 | 34 | |
| 23.84 | (13.44) | 369,490 | 1.24 | 0.51 | 1.52 | 13 | |
| 27.58 | 27.22 | 525,451 | 1.35 | 0.36 | 1.58 | 22 | |
| 27.67 | (26.47) | 51,142 | 1.74(f) | (0.78)(f) | 1.81(f) | 11 | |
| 38.96 | 10.68 | 82,409 | 1.74 | (0.83) | 1.80 | 25 | |
| 35.20 | 21.24 | 72,364 | 1.74 | (0.58) | 1.83 | 15 | |
| 29.07 | 26.12 | 56,830 | 1.74 | 0.15 | 1.98 | 34 | |
| 23.08 | (13.87) | 43,612 | 1.74 | 0.06 | 2.02 | 13 | |
| 26.80 | 26.58 | 48,497 | 1.85 | (0.15) | 2.09 | 22 | |
| 29.58 | (26.20) | 2,901,502 | 0.99(f) | (0.04)(f) | 1.05(f) | 11 | |
| 41.60 | 11.51 | 4,753,438 | 0.99 | (0.09) | 1.05 | 25 | |
| 37.34 | 22.19 | 4,016,180 | 0.99 | 0.15 | 1.07 | 15 | |
| 30.79 | 27.04 | 1,725,882 | 0.99 | 0.94 | 1.21 | 34 | |
| 24.45 | (13.23) | 773,142 | 0.99 | 0.84 | 1.26 | 13 | |
| 28.29 | 27.54 | 629,451 | 1.10 | 0.62 | 1.30 | 22 | |
| 29.82 | (26.17) | 1,804,078 | 0.89(f) | 0.09(f) | 0.90(f) | 11 | |
| 41.96 | 11.63 | 2,598,326 | 0.89 | 0.02 | 0.90 | 25 | |
| 37.64 | 22.29 | 1,877,489 | 0.89 | 0.25 | 0.92 | 15 | |
| 31.03 | 27.20 | 926,781 | 0.89 | 1.00 | 1.06 | 34 | |
| 24.63 | (13.16) | 475,997 | 0.89 | 0.91 | 1.11 | 13 | |
| 28.49 | 27.72 | 430,860 | 0.95 | 0.84 | 1.14 | 22 | |
| 28.45 | (26.41) | 465 | 1.54(f) | (0.54)(f) | 1.81(f) | 11 | |
| 39.99 | 10.90 | 585 | 1.54 | (0.63) | 1.78 | 25 | |
| 36.06 | 21.51 | 414 | 1.54 | (0.41) | 2.00 | 15 | |
| 29.78 | 26.35 | 145 | 1.54 | 0.31 | 2.26 | 34 | |
| 23.73 | (13.69) | 95 | 1.54 | 0.26 | 2.04 | 13 | |
| 27.57 | 4.43 | 21 | 1.60 | (0.17) | 1.80 | 22 | |
| 28.64 | (26.29) | 12,570 | 1.29(f) | (0.29)(f) | 1.31(f) | 11 | |
| 40.30 | 11.17 | 14,918 | 1.29 | (0.36) | 1.30 | 25 | |
| 36.25 | 21.80 | 5,797 | 1.29 | (0.15) | 1.33 | 15 | |
| 29.96 | 26.67 | 2,151 | 1.29 | 0.90 | 1.49 | 34 | |
| 23.78 | (13.49) | 341 | 1.29 | 0.81 | 1.59 | 13 | |
| 27.59 | 4.51 | 21 | 1.35 | 0.08 | 1.55 | 22 | |
| April 30, 2022 | J.P. Morgan International Equity Funds | 87 |
| Per share operating performance | ||||||||
| Investment operations | Distributions | |||||||
| Net asset value, beginning of period | Net investment income (loss)(b) | Net realized and unrealized gains (losses) on investments | Total from investment operations | Net investment income | Net realized gain | Total distributions | ||
| Class R4 | ||||||||
| Six Months Ended April 30, 2022(Unaudited) | $41.45 | $(0.01) | $(10.55) | $(10.56) | $(0.16) | $(1.26) | $(1.42) | |
| Year Ended October 31, 2021 | 37.20 | (0.05) | 4.32 | 4.27 | (0.02) | — | (0.02) | |
| Year Ended October 31, 2020 | 30.68 | 0.04 | 6.70 | 6.74 | (0.22) | — | (0.22) | |
| Year Ended October 31, 2019 | 24.42 | 0.27 | 6.25 | 6.52 | (0.26) | — | (0.26) | |
| Year Ended October 31, 2018 | 28.28 | 0.18 | (3.91) | (3.73) | (0.13) | — | (0.13) | |
| July 31, 2017(h) through October 31, 2017 | 27.05 | 0.02 | 1.21 | 1.23 | — | — | — | |
| Class R5 | ||||||||
| Six Months Ended April 30, 2022(Unaudited) | 41.88 | 0.02 | (10.67) | (10.65) | (0.15) | (1.26) | (1.41) | |
| Year Ended October 31, 2021 | 37.56 | 0.01 | 4.36 | 4.37 | (0.05) | — | (0.05) | |
| Year Ended October 31, 2020 | 30.96 | 0.08 | 6.78 | 6.86 | (0.26) | — | (0.26) | |
| Year Ended October 31, 2019 | 24.60 | 0.31 | 6.31 | 6.62 | (0.26) | — | (0.26) | |
| Year Ended October 31, 2018 | 28.47 | 0.39 | (4.11) | (3.72) | (0.15) | — | (0.15) | |
| Year Ended October 31, 2017 | 22.49 | 0.15 | 6.01 | 6.16 | (0.18) | — | (0.18) | |
| Class R6 | ||||||||
| Six Months Ended April 30, 2022(Unaudited) | 41.95 | 0.04 | (10.68) | (10.64) | (0.26) | (1.26) | (1.52) | |
| Year Ended October 31, 2021 | 37.61 | 0.05 | 4.37 | 4.42 | (0.08) | — | (0.08) | |
| Year Ended October 31, 2020 | 31.00 | 0.12 | 6.78 | 6.90 | (0.29) | — | (0.29) | |
| Year Ended October 31, 2019 | 24.60 | 0.31 | 6.35 | 6.66 | (0.26) | — | (0.26) | |
| Year Ended October 31, 2018 | 28.46 | 0.29 | (3.99) | (3.70) | (0.16) | — | (0.16) | |
| Year Ended October 31, 2017 | 22.46 | 0.21 | 5.98 | 6.19 | (0.19) | — | (0.19) | |
| (a) | Annualized for periods less than one year, unless otherwise noted. |
| (b) | Calculated based upon average shares outstanding. |
| (c) | Includes adjustments in accordance with accounting principles generally accepted in the United States of America and as such, the net asset values for financial reporting purposes and the returns based upon those net asset values may differ from the net asset values and returns for shareholder transactions. |
| (d) | Not annualized for periods less than one year. |
| (e) | Includes interest expense, if applicable, which is less than 0.005% unless otherwise noted. |
| (f) | Certain non-recurring expenses incurred by the Fund were not annualized for the period indicated. |
| (g) | Amount rounds to less than $0.005. |
| (h) | Commencement of offering of class of shares. |
| 88 | J.P. Morgan International Equity Funds | April 30, 2022 |
| Ratios/Supplemental data | |||||||
| Ratios to average net assets(a) | |||||||
| Net asset value, end of period | Total return (excludes sales charge)(c)(d) | Net assets, end of period (000's) | Net expenses(e) | Net investment income (loss) | Expenses without waivers and reimbursements | Portfolio turnover rate(d) | |
| $29.47 | (26.22)% | $ 2,908 | 1.04(f)% | (0.03)(f)% | 1.06(f)% | 11% | |
| 41.45 | 11.48 | 3,810 | 1.04 | (0.12) | 1.06 | 25 | |
| 37.20 | 22.09 | 2,962 | 1.04 | 0.12 | 1.08 | 15 | |
| 30.68 | 26.98 | 1,300 | 1.04 | 0.94 | 1.23 | 34 | |
| 24.42 | (13.25) | 26 | 1.04 | 0.63 | 1.62 | 13 | |
| 28.28 | 4.55 | 21 | 1.10 | 0.33 | 1.30 | 22 | |
| 29.82 | (26.15) | 15,147 | 0.89(f) | 0.10(f) | 0.92(f) | 11 | |
| 41.88 | 11.64 | 20,676 | 0.89 | 0.02 | 0.91 | 25 | |
| 37.56 | 22.29 | 57,909 | 0.89 | 0.26 | 0.93 | 15 | |
| 30.96 | 27.19 | 41,872 | 0.89 | 1.08 | 1.08 | 34 | |
| 24.60 | (13.14) | 1,672 | 0.89 | 1.37 | 1.11 | 13 | |
| 28.47 | 27.72 | 217 | 0.95 | 0.58 | 3.36 | 22 | |
| 29.79 | (26.14) | 4,414,250 | 0.79(f) | 0.20(f) | 0.80(f) | 11 | |
| 41.95 | 11.75 | 5,659,334 | 0.79 | 0.11 | 0.80 | 25 | |
| 37.61 | 22.39 | 4,608,998 | 0.79 | 0.37 | 0.82 | 15 | |
| 31.00 | 27.36 | 3,034,359 | 0.79 | 1.09 | 0.96 | 34 | |
| 24.60 | (13.08) | 2,936,830 | 0.79 | 1.00 | 1.01 | 13 | |
| 28.46 | 27.87 | 2,813,349 | 0.85 | 0.85 | 1.01 | 22 | |
| April 30, 2022 | J.P. Morgan International Equity Funds | 89 |
| Per share operating performance | ||||||||
| Investment operations | Distributions | |||||||
| Net asset value, beginning of period | Net investment income (loss)(b) | Net realized and unrealized gains (losses) on investments | Total from investment operations | Net investment income | Net realized gain | Total distributions | ||
| JPMorgan Emerging Markets Research Enhanced Equity Fund | ||||||||
| Class I | ||||||||
| Six Months Ended April 30, 2022(Unaudited) | $20.87 | $0.19 | $(3.38) | $(3.19) | $(0.52) | $(0.53) | $(1.05) | |
| Year Ended October 31, 2021 | 18.11 | 0.51 | 2.56 | 3.07 | (0.31) | — | (0.31) | |
| Year Ended October 31, 2020 | 16.78 | 0.33 | 1.04 | 1.37 | — | (0.04) | (0.04) | |
| January 30, 2019(g) through October 31, 2019 | 16.22 | 0.31 | 0.25 | 0.56 | — | — | — | |
| Class R6 | ||||||||
| Six Months Ended April 30, 2022(Unaudited) | 20.77 | 0.21 | (3.37) | (3.16) | (0.54) | (0.53) | (1.07) | |
| Year Ended October 31, 2021 | 18.01 | 0.42 | 2.65 | 3.07 | (0.31) | — | (0.31) | |
| Year Ended October 31, 2020 | 16.80 | 0.31 | 1.07 | 1.38 | (0.13) | (0.04) | (0.17) | |
| December 11, 2018(h) through October 31, 2019 | 15.00 | 0.42 | 1.46 | 1.88 | (0.08) | — | (0.08) | |
| (a) | Annualized for periods less than one year, unless otherwise noted. |
| (b) | Calculated based upon average shares outstanding. |
| (c) | Includes adjustments in accordance with accounting principles generally accepted in the United States of America and as such, the net asset values for financial reporting purposes and the returns based upon those net asset values may differ from the net asset values and returns for shareholder transactions. |
| (d) | Not annualized for periods less than one year. |
| (e) | Includes interest expense, if applicable, which is less than 0.005% unless otherwise noted. |
| (f) | Certain non-recurring expenses incurred by the Fund were not annualized for the period indicated. |
| (g) | Commencement of offering of class of shares. |
| (h) | Commencement of operations. |
| 90 | J.P. Morgan International Equity Funds | April 30, 2022 |
| Ratios/Supplemental data | |||||||
| Ratios to average net assets(a) | |||||||
| Net asset value, end of period | Total return(c)(d) | Net assets, end of period (000's) | Net expenses(e) | Net investment income (loss) | Expenses without waivers | Portfolio turnover rate(d) | |
| $16.63 | (15.90)% | $ 236,318 | 0.45(f)% | 2.21(f)% | 0.64(f)% | 16% | |
| 20.87 | 16.95 | 5,435 | 0.45 | 2.36 | 0.69 | 53 | |
| 18.11 | 8.15 | 33 | 0.45 | 1.98 | 1.39 | 47 | |
| 16.78 | 3.45 | 5 | 0.44(f) | 2.52(f) | 0.70(f) | 28 | |
| 16.54 | (15.84) | 2,709,774 | 0.35(f) | 2.26(f) | 0.39(f) | 16 | |
| 20.77 | 17.09 | 3,787,953 | 0.35 | 1.97 | 0.40 | 53 | |
| 18.01 | 8.22 | 2,840,309 | 0.35 | 1.87 | 0.41 | 47 | |
| 16.80 | 12.60 | 2,090,569 | 0.34(f) | 2.90(f) | 0.46(f) | 28 | |
| April 30, 2022 | J.P. Morgan International Equity Funds | 91 |
| Per share operating performance | ||||||
| Investment operations | Distributions | |||||
| Net asset value, beginning of period | Net investment income (loss)(b) | Net realized and unrealized gains (losses) on investments | Total from investment operations | Net investment income | ||
| JPMorgan Europe Dynamic Fund | ||||||
| Class A | ||||||
| Six Months Ended April 30, 2022(Unaudited) | $30.91 | $0.28 | $(4.65) | $(4.37) | $(0.62) | |
| Year Ended October 31, 2021 | 21.64 | 0.40(g) | 9.14 | 9.54 | (0.27) | |
| Year Ended October 31, 2020 | 24.25 | 0.25 | (2.16) | (1.91) | (0.70) | |
| Year Ended October 31, 2019 | 23.01 | 0.61 | 1.18 | 1.79 | (0.55) | |
| Year Ended October 31, 2018 | 27.04 | 0.42 | (4.08) | (3.66) | (0.37) | |
| Year Ended October 31, 2017 | 21.94 | 0.37 | 5.15 | 5.52 | (0.42) | |
| Class C | ||||||
| Six Months Ended April 30, 2022(Unaudited) | 27.25 | 0.16 | (4.08) | (3.92) | (0.47) | |
| Year Ended October 31, 2021 | 19.10 | 0.22(g) | 8.08 | 8.30 | (0.15) | |
| Year Ended October 31, 2020 | 21.47 | 0.12 | (1.91) | (1.79) | (0.58) | |
| Year Ended October 31, 2019 | 20.39 | 0.44 | 1.06 | 1.50 | (0.42) | |
| Year Ended October 31, 2018 | 24.00 | 0.25 | (3.62) | (3.37) | (0.24) | |
| Year Ended October 31, 2017 | 19.52 | 0.23 | 4.58 | 4.81 | (0.33) | |
| Class I | ||||||
| Six Months Ended April 30, 2022(Unaudited) | 31.57 | 0.16 | (4.57) | (4.41) | (0.73) | |
| Year Ended October 31, 2021 | 22.10 | 0.47(g) | 9.33 | 9.80 | (0.33) | |
| Year Ended October 31, 2020 | 24.75 | 0.31 | (2.19) | (1.88) | (0.77) | |
| Year Ended October 31, 2019 | 23.48 | 0.67 | 1.21 | 1.88 | (0.61) | |
| Year Ended October 31, 2018 | 27.60 | 0.49 | (4.17) | (3.68) | (0.44) | |
| Year Ended October 31, 2017 | 22.37 | 0.46 | 5.25 | 5.71 | (0.48) | |
| Class L | ||||||
| Six Months Ended April 30, 2022(Unaudited) | 31.99 | 0.36 | (4.81) | (4.45) | (0.75) | |
| Year Ended October 31, 2021 | 22.38 | 0.54(g) | 9.44 | 9.98 | (0.37) | |
| Year Ended October 31, 2020 | 25.05 | 0.35 | (2.23) | (1.88) | (0.79) | |
| Year Ended October 31, 2019 | 23.70 | 0.65 | 1.27 | 1.92 | (0.57) | |
| Year Ended October 31, 2018 | 27.85 | 0.51 | (4.18) | (3.67) | (0.48) | |
| Year Ended October 31, 2017 | 22.61 | 0.52 | 5.27 | 5.79 | (0.55) | |
| Class R6 | ||||||
| Six Months Ended April 30, 2022(Unaudited) | 31.86 | 0.36 | (4.77) | (4.41) | (0.78) | |
| Year Ended October 31, 2021 | 22.29 | 0.55(g) | 9.41 | 9.96 | (0.39) | |
| Year Ended October 31, 2020 | 24.96 | 0.37 | (2.22) | (1.85) | (0.82) | |
| Year Ended October 31, 2019 | 23.70 | 0.75 | 1.19 | 1.94 | (0.68) | |
| October 1, 2018(h) through October 31, 2018 | 26.32 | 0.01 | (2.63) | (2.62) | — | |
| (a) | Annualized for periods less than one year, unless otherwise noted. |
| (b) | Calculated based upon average shares outstanding. |
| (c) | Includes adjustments in accordance with accounting principles generally accepted in the United States of America and as such, the net asset values for financial reporting purposes and the returns based upon those net asset values may differ from the net asset values and returns for shareholder transactions. |
| (d) | Not annualized for periods less than one year. |
| (e) | Includes interest expense, if applicable, which is less than 0.005% unless otherwise noted. |
| (f) | Certain non-recurring expenses incurred by the Fund were not annualized for the period indicated. |
| (g) | Reflects income from foreign withholding tax claims, including related interest income. Had the Fund not received these proceeds, the net investment income (loss) per share would have been $0.38, $0.20, $0.45, $0.52 and $0.53 for Class A, Class C, Class I, Class L and Class R6, respectively, and the net investment income (loss) ratios would have been 1.29%, 0.78%, 1.44%, 1.70% and 1.75% for Class A, Class C, Class I, Class L and Class R6, respectively. |
| (h) | Commencement of offering of class of shares. |
| 92 | J.P. Morgan International Equity Funds | April 30, 2022 |
| Ratios/Supplemental data | |||||||
| Ratios to average net assets(a) | |||||||
| Net asset value, end of period | Total return (excludes sales charge)(c)(d) | Net assets, end of period (000's) | Net expenses(e) | Net investment income (loss) | Expenses without waivers | Portfolio turnover rate(d) | |
| $25.92 | (14.36)% | $ 73,397 | 1.24(f)% | 1.98(f)% | 1.24(f)% | 43% | |
| 30.91 | 44.30 | 88,315 | 1.24 | 1.37(g) | 1.26 | 92 | |
| 21.64 | (8.21) | 68,882 | 1.24 | 1.09 | 1.28 | 159 | |
| 24.25 | 8.14 | 98,294 | 1.24 | 2.67 | 1.31 | 83 | |
| 23.01 | (13.72) | 124,681 | 1.24 | 1.58 | 1.29 | 149 | |
| 27.04 | 25.65 | 165,020 | 1.36 | 1.52 | 1.36 | 189 | |
| 22.86 | (14.58) | 7,015 | 1.74(f) | 1.27(f) | 1.75(f) | 43 | |
| 27.25 | 43.56 | 11,313 | 1.74 | 0.86(g) | 1.77 | 92 | |
| 19.10 | (8.68) | 11,082 | 1.74 | 0.59 | 1.77 | 159 | |
| 21.47 | 7.64 | 19,798 | 1.74 | 2.15 | 1.80 | 83 | |
| 20.39 | (14.18) | 31,125 | 1.74 | 1.08 | 1.79 | 149 | |
| 24.00 | 25.02 | 46,615 | 1.85 | 1.07 | 1.86 | 189 | |
| 26.43 | (14.25) | 69,744 | 0.98(f) | 1.07(f) | 0.98(f) | 43 | |
| 31.57 | 44.61 | 443,053 | 0.98 | 1.52(g) | 0.99 | 92 | |
| 22.10 | (7.98) | 52,841 | 0.99 | 1.33 | 1.01 | 159 | |
| 24.75 | 8.44 | 86,582 | 0.99 | 2.86 | 1.05 | 83 | |
| 23.48 | (13.53) | 139,858 | 0.99 | 1.84 | 1.04 | 149 | |
| 27.60 | 26.06 | 187,678 | 1.06 | 1.85 | 1.07 | 189 | |
| 26.79 | (14.19) | 75,636 | 0.82(f) | 2.43(f) | 0.83(f) | 43 | |
| 31.99 | 44.88 | 86,054 | 0.84 | 1.78(g) | 0.85 | 92 | |
| 22.38 | (7.86) | 55,597 | 0.85 | 1.49 | 0.86 | 159 | |
| 25.05 | 8.49 | 65,686 | 0.89 | 2.77 | 0.90 | 83 | |
| 23.70 | (13.41) | 389,665 | 0.88 | 1.88 | 0.89 | 149 | |
| 27.85 | 26.22 | 578,183 | 0.90 | 2.07 | 0.91 | 189 | |
| 26.67 | (14.13) | 380,750 | 0.72(f) | 2.45(f) | 0.73(f) | 43 | |
| 31.86 | 45.01 | 445,783 | 0.74 | 1.83(g) | 0.75 | 92 | |
| 22.29 | (7.79) | 250,426 | 0.75 | 1.61 | 0.76 | 159 | |
| 24.96 | 8.65 | 271,885 | 0.79 | 3.17 | 0.79 | 83 | |
| 23.70 | (9.95) | 18 | 0.82 | 0.67 | 0.83 | 149 | |
| April 30, 2022 | J.P. Morgan International Equity Funds | 93 |
| Per share operating performance | ||||||||
| Investment operations | Distributions | |||||||
| Net asset value, beginning of period | Net investment income (loss)(b) | Net realized and unrealized gains (losses) on investments | Total from investment operations | Net investment income | Net realized gain | Total distributions | ||
| JPMorgan International Equity Fund | ||||||||
| Class A | ||||||||
| Six Months Ended April 30, 2022(Unaudited) | $21.63 | $0.15 | $(3.61) | $(3.46) | $(0.37) | $(0.99) | $(1.36) | |
| Year Ended October 31, 2021 | 16.47 | 0.30(g) | 5.04 | 5.34 | (0.18) | — | (0.18) | |
| Year Ended October 31, 2020 | 17.27 | 0.19 | (0.49) | (0.30) | (0.50) | — | (0.50) | |
| Year Ended October 31, 2019 | 15.56 | 0.33 | 1.89 | 2.22 | (0.33) | (0.18) | (0.51) | |
| Year Ended October 31, 2018 | 17.81 | 0.33 | (2.33) | (2.00) | (0.25) | — | (0.25) | |
| Year Ended October 31, 2017 | 14.24 | 0.22 | 3.39 | 3.61 | (0.04) | — | (0.04) | |
| Class C | ||||||||
| Six Months Ended April 30, 2022(Unaudited) | 20.41 | 0.09 | (3.39) | (3.30) | (0.27) | (0.99) | (1.26) | |
| Year Ended October 31, 2021 | 15.53 | 0.18(g) | 4.77 | 4.95 | (0.07) | — | (0.07) | |
| Year Ended October 31, 2020 | 16.29 | 0.09 | (0.45) | (0.36) | (0.40) | — | (0.40) | |
| Year Ended October 31, 2019 | 14.68 | 0.23 | 1.80 | 2.03 | (0.24) | (0.18) | (0.42) | |
| Year Ended October 31, 2018 | 16.83 | 0.25 | (2.23) | (1.98) | (0.17) | — | (0.17) | |
| Year Ended October 31, 2017 | 13.50 | 0.12 | 3.22 | 3.34 | (0.01) | — | (0.01) | |
| Class I | ||||||||
| Six Months Ended April 30, 2022(Unaudited) | 22.02 | 0.20 | (3.69) | (3.49) | (0.42) | (0.99) | (1.41) | |
| Year Ended October 31, 2021 | 16.76 | 0.36(g) | 5.13 | 5.49 | (0.23) | — | (0.23) | |
| Year Ended October 31, 2020 | 17.56 | 0.21 | (0.47) | (0.26) | (0.54) | — | (0.54) | |
| Year Ended October 31, 2019 | 15.82 | 0.36 | 1.93 | 2.29 | (0.37) | (0.18) | (0.55) | |
| Year Ended October 31, 2018 | 18.09 | 0.41 | (2.40) | (1.99) | (0.28) | — | (0.28) | |
| Year Ended October 31, 2017 | 14.45 | 0.26 | 3.44 | 3.70 | (0.06) | — | (0.06) | |
| Class R2 | ||||||||
| Six Months Ended April 30, 2022(Unaudited) | 21.31 | 0.12 | (3.55) | (3.43) | (0.30) | (0.99) | (1.29) | |
| Year Ended October 31, 2021 | 16.31 | 0.23(g) | 4.99 | 5.22 | (0.22) | — | (0.22) | |
| Year Ended October 31, 2020 | 17.14 | 0.13 | (0.48) | (0.35) | (0.48) | — | (0.48) | |
| Year Ended October 31, 2019 | 15.44 | 0.28 | 1.88 | 2.16 | (0.28) | (0.18) | (0.46) | |
| Year Ended October 31, 2018 | 17.70 | 0.29 | (2.33) | (2.04) | (0.22) | — | (0.22) | |
| Year Ended October 31, 2017 | 14.17 | 0.17 | 3.38 | 3.55 | (0.02) | — | (0.02) | |
| Class R5 | ||||||||
| Six Months Ended April 30, 2022(Unaudited) | 22.14 | 0.19 | (3.69) | (3.50) | (0.44) | (0.99) | (1.43) | |
| Year Ended October 31, 2021 | 16.85 | 0.39(g) | 5.15 | 5.54 | (0.25) | — | (0.25) | |
| Year Ended October 31, 2020 | 17.60 | 0.24 | (0.48) | (0.24) | (0.51) | — | (0.51) | |
| Year Ended October 31, 2019 | 15.85 | 0.38 | 1.94 | 2.32 | (0.39) | (0.18) | (0.57) | |
| Year Ended October 31, 2018 | 18.13 | 0.41 | (2.40) | (1.99) | (0.29) | — | (0.29) | |
| Year Ended October 31, 2017 | 14.47 | 0.21 | 3.52 | 3.73 | (0.07) | — | (0.07) | |
| 94 | J.P. Morgan International Equity Funds | April 30, 2022 |
| Ratios/Supplemental data | |||||||
| Ratios to average net assets(a) | |||||||
| Net asset value, end of period | Total return (excludes sales charge)(c)(d) | Net assets, end of period (000's) | Net expenses(e) | Net investment income (loss) | Expenses without waivers | Portfolio turnover rate(d) | |
| $16.81 | (16.98)% | $365,217 | 0.95(f)% | 1.58(f)% | 1.11(f)% | 18% | |
| 21.63 | 32.56 | 433,033 | 0.95 | 1.47(g) | 1.11 | 35 | |
| 16.47 | (1.88) | 263,791 | 0.95 | 1.17 | 1.12 | 28 | |
| 17.27 | 14.93 | 328,312 | 0.95 | 2.03 | 1.22 | 25 | |
| 15.56 | (11.42) | 240,394 | 0.95 | 1.88 | 1.32 | 33 | |
| 17.81 | 25.43 | 302,130 | 1.23 | 1.39 | 1.35 | 17 | |
| 15.85 | (17.16) | 8,331 | 1.45(f) | 1.02(f) | 1.62(f) | 18 | |
| 20.41 | 31.94 | 10,899 | 1.45 | 0.91(g) | 1.62 | 35 | |
| 15.53 | (2.38) | 9,358 | 1.45 | 0.61 | 1.62 | 28 | |
| 16.29 | 14.39 | 14,549 | 1.45 | 1.51 | 1.74 | 25 | |
| 14.68 | (11.89) | 18,899 | 1.45 | 1.48 | 1.83 | 33 | |
| 16.83 | 24.79 | 24,281 | 1.74 | 0.83 | 1.88 | 17 | |
| 17.12 | (16.85) | 623,210 | 0.70(f) | 2.03(f) | 0.85(f) | 18 | |
| 22.02 | 32.94 | 584,191 | 0.70 | 1.71(g) | 0.86 | 35 | |
| 16.76 | (1.64) | 339,416 | 0.70 | 1.26 | 0.86 | 28 | |
| 17.56 | 15.20 | 190,885 | 0.70 | 2.22 | 0.96 | 25 | |
| 15.82 | (11.20) | 179,831 | 0.70 | 2.30 | 1.06 | 33 | |
| 18.09 | 25.69 | 139,715 | 0.99 | 1.59 | 1.10 | 17 | |
| 16.59 | (17.06) | 20,627 | 1.25(f) | 1.27(f) | 1.46(f) | 18 | |
| 21.31 | 32.18 | 24,598 | 1.25 | 1.13(g) | 1.47 | 35 | |
| 16.31 | (2.21) | 21,379 | 1.25 | 0.79 | 1.37 | 28 | |
| 17.14 | 14.58 | 2,099 | 1.25 | 1.75 | 1.57 | 25 | |
| 15.44 | (11.68) | 1,833 | 1.25 | 1.64 | 1.60 | 33 | |
| 17.70 | 25.12 | 2,096 | 1.49 | 1.07 | 1.71 | 17 | |
| 17.21 | (16.83) | 9,074 | 0.60(f) | 1.97(f) | 0.71(f) | 18 | |
| 22.14 | 33.04 | 10,463 | 0.60 | 1.85(g) | 0.71 | 35 | |
| 16.85 | (1.52) | 6,970 | 0.60 | 1.41 | 0.72 | 28 | |
| 17.60 | 15.38 | 3,778 | 0.60 | 2.31 | 0.83 | 25 | |
| 15.85 | (11.16) | 19,516 | 0.60 | 2.31 | 0.91 | 33 | |
| 18.13 | 25.88 | 21,891 | 0.84 | 1.36 | 0.93 | 17 | |
| April 30, 2022 | J.P. Morgan International Equity Funds | 95 |
| Per share operating performance | ||||||||
| Investment operations | Distributions | |||||||
| Net asset value, beginning of period | Net investment income (loss)(b) | Net realized and unrealized gains (losses) on investments | Total from investment operations | Net investment income | Net realized gain | Total distributions | ||
| Class R6 | ||||||||
| Six Months Ended April 30, 2022(Unaudited) | $22.10 | $0.20 | $(3.68) | $(3.48) | $(0.46) | $(0.99) | $(1.45) | |
| Year Ended October 31, 2021 | 16.81 | 0.42(g) | 5.13 | 5.55 | (0.26) | — | (0.26) | |
| Year Ended October 31, 2020 | 17.61 | 0.26 | (0.49) | (0.23) | (0.57) | — | (0.57) | |
| Year Ended October 31, 2019 | 15.86 | 0.40 | 1.93 | 2.33 | (0.40) | (0.18) | (0.58) | |
| Year Ended October 31, 2018 | 18.13 | 0.43 | (2.39) | (1.96) | (0.31) | — | (0.31) | |
| Year Ended October 31, 2017 | 14.46 | 0.29 | 3.46 | 3.75 | (0.08) | — | (0.08) | |
| (a) | Annualized for periods less than one year, unless otherwise noted. |
| (b) | Calculated based upon average shares outstanding. |
| (c) | Includes adjustments in accordance with accounting principles generally accepted in the United States of America and as such, the net asset values for financial reporting purposes and the returns based upon those net asset values may differ from the net asset values and returns for shareholder transactions. |
| (d) | Not annualized for periods less than one year. |
| (e) | Includes interest expense, if applicable, which is less than 0.005% unless otherwise noted. |
| (f) | Certain non-recurring expenses incurred by the Fund were not annualized for the period indicated. |
| (g) | Reflects income from foreign withholding tax claims. Had the Fund not received these proceeds, the net investment income (loss) per share and the net investment income (loss) ratios for each share class would have remained the same. |
| 96 | J.P. Morgan International Equity Funds | April 30, 2022 |
| Ratios/Supplemental data | |||||||
| Ratios to average net assets(a) | |||||||
| Net asset value, end of period | Total return (excludes sales charge)(c)(d) | Net assets, end of period (000's) | Net expenses(e) | Net investment income (loss) | Expenses without waivers | Portfolio turnover rate(d) | |
| $17.17 | (16.77)% | $3,456,927 | 0.50(f)% | 2.01(f)% | 0.60(f)% | 18% | |
| 22.10 | 33.20 | 3,782,533 | 0.50 | 1.98(g) | 0.60 | 35 | |
| 16.81 | (1.46) | 2,290,008 | 0.50 | 1.56 | 0.61 | 28 | |
| 17.61 | 15.50 | 2,457,383 | 0.50 | 2.46 | 0.72 | 25 | |
| 15.86 | (11.04) | 3,808,621 | 0.50 | 2.42 | 0.81 | 33 | |
| 18.13 | 26.04 | 3,516,978 | 0.74 | 1.84 | 0.81 | 17 | |
| April 30, 2022 | J.P. Morgan International Equity Funds | 97 |
| Per share operating performance | ||||||
| Investment operations | Distributions | |||||
| Net asset value, beginning of period | Net investment income (loss)(b) | Net realized and unrealized gains (losses) on investments | Total from investment operations | Net investment income | ||
| JPMorgan International Focus Fund | ||||||
| Class A | ||||||
| Six Months Ended April 30, 2022(Unaudited) | $27.55 | $0.18 | $(4.73) | $(4.55) | $(0.43) | |
| Year Ended October 31, 2021 | 22.07 | 0.35(g) | 5.32 | 5.67 | (0.19) | |
| Year Ended October 31, 2020 | 21.15 | 0.18 | 0.75 | 0.93 | (0.01) | |
| Year Ended October 31, 2019 | 18.24 | 0.26 | 3.02 | 3.28 | (0.37) | |
| Year Ended October 31, 2018 | 21.14 | 0.36 | (3.13) | (2.77) | (0.13) | |
| Year Ended October 31, 2017 | 17.24 | 0.16 | 4.09 | 4.25 | (0.35) | |
| Class C | ||||||
| Six Months Ended April 30, 2022(Unaudited) | 27.06 | 0.11 | (4.65) | (4.54) | (0.29) | |
| Year Ended October 31, 2021 | 21.68 | 0.20(g) | 5.24 | 5.44 | (0.06) | |
| Year Ended October 31, 2020 | 20.86 | 0.07 | 0.75 | 0.82 | — | |
| Year Ended October 31, 2019 | 17.98 | 0.16 | 2.97 | 3.13 | (0.25) | |
| Year Ended October 31, 2018 | 20.90 | 0.26 | (3.09) | (2.83) | (0.09) | |
| Year Ended October 31, 2017 | 17.04 | 0.05 | 4.06 | 4.11 | (0.25) | |
| Class I | ||||||
| Six Months Ended April 30, 2022(Unaudited) | 27.95 | 0.21 | (4.79) | (4.58) | (0.48) | |
| Year Ended October 31, 2021 | 22.39 | 0.42(g) | 5.39 | 5.81 | (0.25) | |
| Year Ended October 31, 2020 | 21.43 | 0.23 | 0.78 | 1.01 | (0.05) | |
| Year Ended October 31, 2019 | 18.49 | 0.31 | 3.04 | 3.35 | (0.41) | |
| Year Ended October 31, 2018 | 21.41 | 0.44 | (3.19) | (2.75) | (0.17) | |
| Year Ended October 31, 2017 | 17.45 | 0.23 | 4.13 | 4.36 | (0.40) | |
| Class R2 | ||||||
| Six Months Ended April 30, 2022(Unaudited) | 27.25 | 0.14 | (4.69) | (4.55) | (0.30) | |
| Year Ended October 31, 2021 | 21.85 | 0.27(g) | 5.26 | 5.53 | (0.13) | |
| Year Ended October 31, 2020 | 20.99 | 0.13 | 0.73 | 0.86 | — | |
| Year Ended October 31, 2019 | 18.14 | 0.21 | 2.98 | 3.19 | (0.34) | |
| Year Ended October 31, 2018 | 21.11 | 0.35 | (3.17) | (2.82) | (0.15) | |
| Year Ended October 31, 2017 | 17.21 | 0.06 | 4.14 | 4.20 | (0.30) | |
| Class R5 | ||||||
| Six Months Ended April 30, 2022(Unaudited) | 27.96 | 0.22 | (4.79) | (4.57) | (0.50) | |
| Year Ended October 31, 2021 | 22.38 | 0.44(g) | 5.40 | 5.84 | (0.26) | |
| Year Ended October 31, 2020 | 21.42 | 0.25 | 0.78 | 1.03 | (0.07) | |
| Year Ended October 31, 2019 | 18.49 | 0.34 | 3.03 | 3.37 | (0.44) | |
| Year Ended October 31, 2018 | 21.39 | 0.53 | (3.25) | (2.72) | (0.18) | |
| Year Ended October 31, 2017 | 17.44 | 0.20 | 4.17 | 4.37 | (0.42) | |
| 98 | J.P. Morgan International Equity Funds | April 30, 2022 |
| Ratios/Supplemental data | |||||||
| Ratios to average net assets(a) | |||||||
| Net asset value, end of period | Total return (excludes sales charge)(c)(d) | Net assets, end of period (000's) | Net expenses(e) | Net investment income (loss) | Expenses without waivers | Portfolio turnover rate(d) | |
| $22.57 | (16.72)% | $268,558 | 1.00(f)% | 1.39(f)% | 1.21(f)% | 16% | |
| 27.55 | 25.74 | 337,503 | 1.00 | 1.31(g) | 1.21 | 32 | |
| 22.07 | 4.39 | 135,527 | 1.00 | 0.86 | 1.22 | 38 | |
| 21.15 | 18.41 | 114,629 | 1.00 | 1.33 | 1.32 | 34 | |
| 18.24 | (13.20) | 84,325 | 1.00 | 1.75 | 1.38 | 63 | |
| 21.14 | 25.16 | 67,684 | 1.24 | 0.83 | 1.46 | 38 | |
| 22.23 | (16.91) | 18,734 | 1.50(f) | 0.89(f) | 1.73(f) | 16 | |
| 27.06 | 25.11 | 24,272 | 1.50 | 0.77(g) | 1.72 | 32 | |
| 21.68 | 3.93 | 15,463 | 1.50 | 0.32 | 1.73 | 38 | |
| 20.86 | 17.73 | 18,447 | 1.50 | 0.83 | 1.84 | 34 | |
| 17.98 | (13.60) | 22,532 | 1.50 | 1.29 | 1.89 | 63 | |
| 20.90 | 24.51 | 14,534 | 1.74 | 0.27 | 2.00 | 38 | |
| 22.89 | (16.59) | 654,222 | 0.75(f) | 1.63(f) | 0.96(f) | 16 | |
| 27.95 | 26.04 | 832,039 | 0.75 | 1.54(g) | 0.96 | 32 | |
| 22.39 | 4.71 | 372,068 | 0.75 | 1.05 | 0.96 | 38 | |
| 21.43 | 18.62 | 177,764 | 0.75 | 1.57 | 1.08 | 34 | |
| 18.49 | (12.96) | 189,061 | 0.75 | 2.09 | 1.13 | 63 | |
| 21.41 | 25.60 | 131,356 | 0.89 | 1.14 | 1.19 | 38 | |
| 22.40 | (16.83) | 1,783 | 1.30(f) | 1.13(f) | 1.50(f) | 16 | |
| 27.25 | 25.35 | 2,078 | 1.30 | 1.00(g) | 1.48 | 32 | |
| 21.85 | 4.10 | 1,441 | 1.30 | 0.61 | 1.51 | 38 | |
| 20.99 | 18.01 | 1,049 | 1.30 | 1.05 | 1.74 | 34 | |
| 18.14 | (13.46) | 773 | 1.30 | 1.70 | 1.72 | 63 | |
| 21.11 | 24.85 | 97 | 1.49 | 0.31 | 2.79 | 38 | |
| 22.89 | (16.57) | 2,216 | 0.65(f) | 1.69(f) | 0.87(f) | 16 | |
| 27.96 | 26.19 | 3,172 | 0.65 | 1.61(g) | 0.87 | 32 | |
| 22.38 | 4.79 | 2,772 | 0.65 | 1.16 | 0.88 | 38 | |
| 21.42 | 18.76 | 3,082 | 0.65 | 1.71 | 1.04 | 34 | |
| 18.49 | (12.84) | 3,341 | 0.65 | 2.56 | 1.07 | 63 | |
| 21.39 | 25.67 | 90 | 0.79 | 1.01 | 2.44 | 38 | |
| April 30, 2022 | J.P. Morgan International Equity Funds | 99 |
| Per share operating performance | ||||||
| Investment operations | Distributions | |||||
| Net asset value, beginning of period | Net investment income (loss)(b) | Net realized and unrealized gains (losses) on investments | Total from investment operations | Net investment income | ||
| Class R6 | ||||||
| Six Months Ended April 30, 2022(Unaudited) | $27.98 | $0.21 | $(4.76) | $(4.55) | $(0.53) | |
| Year Ended October 31, 2021 | 22.40 | 0.46(g) | 5.40 | 5.86 | (0.28) | |
| Year Ended October 31, 2020 | 21.44 | 0.28 | 0.77 | 1.05 | (0.09) | |
| Year Ended October 31, 2019 | 18.50 | 0.27 | 3.13 | 3.40 | (0.46) | |
| Year Ended October 31, 2018 | 21.40 | 0.44 | (3.16) | (2.72) | (0.18) | |
| Year Ended October 31, 2017 | 17.45 | 0.26 | 4.12 | 4.38 | (0.43) | |
| (a) | Annualized for periods less than one year, unless otherwise noted. |
| (b) | Calculated based upon average shares outstanding. |
| (c) | Includes adjustments in accordance with accounting principles generally accepted in the United States of America and as such, the net asset values for financial reporting purposes and the returns based upon those net asset values may differ from the net asset values and returns for shareholder transactions. |
| (d) | Not annualized for periods less than one year. |
| (e) | Includes interest expense, if applicable, which is less than 0.005% unless otherwise noted. |
| (f) | Certain non-recurring expenses incurred by the Fund were not annualized for the period indicated. |
| (g) | Reflects income from foreign withholding tax claims. Had the Fund not received these proceeds, the net investment income (loss) per share and the net investment income (loss) ratios for each share class would have remained the same. |
| 100 | J.P. Morgan International Equity Funds | April 30, 2022 |
| Ratios/Supplemental data | |||||||
| Ratios to average net assets(a) | |||||||
| Net asset value, end of period | Total return (excludes sales charge)(c)(d) | Net assets, end of period (000's) | Net expenses(e) | Net investment income (loss) | Expenses without waivers | Portfolio turnover rate(d) | |
| $22.90 | (16.50)% | $ 461,434 | 0.55(f)% | 1.60(f)% | 0.71(f)% | 16% | |
| 27.98 | 26.28 | 2,721,224 | 0.55 | 1.68(g) | 0.71 | 32 | |
| 22.40 | 4.89 | 2,274,399 | 0.55 | 1.31 | 0.71 | 38 | |
| 21.44 | 18.95 | 2,284,670 | 0.55 | 1.32 | 0.77 | 34 | |
| 18.50 | (12.81) | 175,198 | 0.55 | 2.12 | 0.87 | 63 | |
| 21.40 | 25.72 | 143,868 | 0.74 | 1.37 | 0.95 | 38 | |
| April 30, 2022 | J.P. Morgan International Equity Funds | 101 |
| Per share operating performance | ||||||
| Investment operations | Distributions | |||||
| Net asset value, beginning of period | Net investment income (loss)(b) | Net realized and unrealized gains (losses) on investments | Total from investment operations | Net investment income | ||
| JPMorgan International Hedged Equity Fund | ||||||
| Class A | ||||||
| Six Months Ended April 30, 2022(Unaudited) | $16.73 | $0.18 | $(1.85) | $(1.67) | $(0.38) | |
| Year Ended October 31, 2021 | 14.12 | 0.30 | 2.58 | 2.88 | (0.27) | |
| Year Ended October 31, 2020 | 15.58 | 0.27 | (1.49) | (1.22) | (0.24) | |
| March 15, 2019(g) through October 31, 2019 | 15.00 | 0.19 | 0.39 | 0.58 | — | |
| Class C | ||||||
| Six Months Ended April 30, 2022(Unaudited) | 16.68 | 0.10 | (1.81) | (1.71) | (0.32) | |
| Year Ended October 31, 2021 | 14.06 | 0.22 | 2.57 | 2.79 | (0.17) | |
| Year Ended October 31, 2020 | 15.53 | 0.20 | (1.50) | (1.30) | (0.17) | |
| March 15, 2019(g) through October 31, 2019 | 15.00 | 0.16 | 0.37 | 0.53 | — | |
| Class I | ||||||
| Six Months Ended April 30, 2022(Unaudited) | 16.83 | 0.18 | (1.84) | (1.66) | (0.41) | |
| Year Ended October 31, 2021 | 14.18 | 0.32 | 2.61 | 2.93 | (0.28) | |
| Year Ended October 31, 2020 | 15.61 | 0.31 | (1.50) | (1.19) | (0.24) | |
| March 15, 2019(g) through October 31, 2019 | 15.00 | 0.32 | 0.29 | 0.61 | — | |
| Class R5 | ||||||
| Six Months Ended April 30, 2022(Unaudited) | 16.86 | 0.19 | (1.84) | (1.65) | (0.43) | |
| Year Ended October 31, 2021 | 14.20 | 0.35 | 2.61 | 2.96 | (0.30) | |
| Year Ended October 31, 2020 | 15.62 | 0.31 | (1.48) | (1.17) | (0.25) | |
| March 15, 2019(g) through October 31, 2019 | 15.00 | 0.34 | 0.28 | 0.62 | — | |
| Class R6 | ||||||
| Six Months Ended April 30, 2022(Unaudited) | 16.88 | 0.21 | (1.85) | (1.64) | (0.45) | |
| Year Ended October 31, 2021 | 14.22 | 0.39 | 2.59 | 2.98 | (0.32) | |
| Year Ended October 31, 2020 | 15.63 | 0.34 | (1.49) | (1.15) | (0.26) | |
| March 15, 2019(g) through October 31, 2019 | 15.00 | 0.35 | 0.28 | 0.63 | — | |
| (a) | Annualized for periods less than one year, unless otherwise noted. |
| (b) | Calculated based upon average shares outstanding. |
| (c) | Includes adjustments in accordance with accounting principles generally accepted in the United States of America and as such, the net asset values for financial reporting purposes and the returns based upon those net asset values may differ from the net asset values and returns for shareholder transactions. |
| (d) | Not annualized for periods less than one year. |
| (e) | Includes interest expense, if applicable, which is less than 0.005% unless otherwise noted. |
| (f) | Certain non-recurring expenses incurred by the Fund were not annualized for the period indicated. |
| (g) | Commencement of offering of class of shares. |
| 102 | J.P. Morgan International Equity Funds | April 30, 2022 |
| Ratios/Supplemental data | |||||||
| Ratios to average net assets(a) | |||||||
| Net asset value, end of period | Total return (excludes sales charge)(c)(d) | Net assets, end of period (000's) | Net expenses(e) | Net investment income (loss) | Expenses without waivers | Portfolio turnover rate(d) | |
| $14.68 | (10.15)% | $ 5,203 | 0.85(f)% | 2.33(f)% | 1.04(f)% | 9% | |
| 16.73 | 20.60 | 3,561 | 0.85 | 1.85 | 1.05 | 50 | |
| 14.12 | (8.02) | 1,573 | 0.85 | 1.84 | 1.30 | 85 | |
| 15.58 | 3.87 | 330 | 0.85(f) | 1.95(f) | 1.31(f) | 9 | |
| 14.65 | (10.38) | 284 | 1.35(f) | 1.33(f) | 1.55(f) | 9 | |
| 16.68 | 19.97 | 320 | 1.35 | 1.35 | 1.55 | 50 | |
| 14.06 | (8.47) | 115 | 1.35 | 1.34 | 1.81 | 85 | |
| 15.53 | 3.53 | 119 | 1.35(f) | 1.73(f) | 1.92(f) | 9 | |
| 14.76 | (10.02) | 165,497 | 0.60(f) | 2.30(f) | 0.79(f) | 9 | |
| 16.83 | 20.90 | 148,703 | 0.60 | 2.02 | 0.79 | 50 | |
| 14.18 | (7.78) | 135,542 | 0.60 | 2.12 | 1.03 | 85 | |
| 15.61 | 4.07 | 59,751 | 0.60(f) | 3.38(f) | 1.19(f) | 9 | |
| 14.78 | (9.97) | 21 | 0.45(f) | 2.35(f) | 0.70(f) | 9 | |
| 16.86 | 21.10 | 23 | 0.45 | 2.19 | 0.71 | 50 | |
| 14.20 | (7.68) | 19 | 0.45 | 2.08 | 1.04 | 85 | |
| 15.62 | 4.13 | 21 | 0.45(f) | 3.59(f) | 1.03(f) | 9 | |
| 14.79 | (9.92) | 218 | 0.35(f) | 2.66(f) | 0.56(f) | 9 | |
| 16.88 | 21.19 | 169 | 0.35 | 2.42 | 0.58 | 50 | |
| 14.22 | (7.53) | 19 | 0.35 | 2.33 | 0.94 | 85 | |
| 15.63 | 4.20 | 21 | 0.35(f) | 3.69(f) | 0.93(f) | 9 | |
| April 30, 2022 | J.P. Morgan International Equity Funds | 103 |
| Per share operating performance | ||||||||
| Investment operations | Distributions | |||||||
| Net asset value, beginning of period | Net investment income (loss)(b) | Net realized and unrealized gains (losses) on investments | Total from investment operations | Net investment income | Net realized gain | Total distributions | ||
| JPMorgan International Research Enhanced Equity Fund | ||||||||
| Class A | ||||||||
| Six Months Ended April 30, 2022(Unaudited) | $21.26 | $0.24 | $(2.78) | $(2.54) | $(0.78) | $ — | $(0.78) | |
| Year Ended October 31, 2021 | 15.84 | 0.43(g) | 5.16 | 5.59 | (0.17) | — | (0.17) | |
| Year Ended October 31, 2020 | 17.93 | 0.36 | (1.96) | (1.60) | (0.49) | — | (0.49) | |
| Year Ended October 31, 2019 | 16.79 | 0.51 | 1.15 | 1.66 | (0.52) | — | (0.52) | |
| Year Ended October 31, 2018 | 18.76 | 0.45 | (2.04) | (1.59) | (0.19) | (0.19) | (0.38) | |
| Year Ended October 31, 2017 | 15.54 | 0.34 | 3.23 | 3.57 | (0.35) | — | (0.35) | |
| Class I | ||||||||
| Six Months Ended April 30, 2022(Unaudited) | 21.39 | 0.25 | (2.79) | (2.54) | (0.83) | — | (0.83) | |
| Year Ended October 31, 2021 | 16.05 | 0.47(g) | 5.23 | 5.70 | (0.36) | — | (0.36) | |
| Year Ended October 31, 2020 | 18.17 | 0.36 | (1.94) | (1.58) | (0.54) | — | (0.54) | |
| Year Ended October 31, 2019 | 17.01 | 0.56 | 1.16 | 1.72 | (0.56) | — | (0.56) | |
| Year Ended October 31, 2018 | 18.92 | 0.35 | (1.91) | (1.56) | (0.16) | (0.19) | (0.35) | |
| Year Ended October 31, 2017 | 15.68 | 0.41 | 3.23 | 3.64 | (0.40) | — | (0.40) | |
| Class R6 | ||||||||
| Six Months Ended April 30, 2022(Unaudited) | 21.33 | 0.27 | (2.80) | (2.53) | (0.85) | — | (0.85) | |
| Year Ended October 31, 2021 | 16.00 | 0.49(g) | 5.21 | 5.70 | (0.37) | — | (0.37) | |
| Year Ended October 31, 2020 | 18.11 | 0.39 | (1.94) | (1.55) | (0.56) | — | (0.56) | |
| Year Ended October 31, 2019 | 16.97 | 0.57 | 1.16 | 1.73 | (0.59) | — | (0.59) | |
| November 1, 2017(h) through October 31, 2018 | 18.98 | 0.56 | (2.16) | (1.60) | (0.22) | (0.19) | (0.41) | |
| (a) | Annualized for periods less than one year, unless otherwise noted. |
| (b) | Calculated based upon average shares outstanding. |
| (c) | Includes adjustments in accordance with accounting principles generally accepted in the United States of America and as such, the net asset values for financial reporting purposes and the returns based upon those net asset values may differ from the net asset values and returns for shareholder transactions. |
| (d) | Not annualized for periods less than one year. |
| (e) | Includes interest expense, if applicable, which is less than 0.005% unless otherwise noted. |
| (f) | Certain non-recurring expenses incurred by the Fund were not annualized for the period indicated. |
| (g) | Reflects income from foreign withholding tax claims, including related interest income. Had the Fund not received these proceeds, the net investment income (loss) per share for each share class would have remained the same and the net investment income (loss) ratios would have been 2.13%, 2.33%, and 2.44% for Class A, Class I and Class R6, respectively. |
| (h) | Commencement of offering of class of shares. |
| 104 | J.P. Morgan International Equity Funds | April 30, 2022 |
| Ratios/Supplemental data | |||||||
| Ratios to average net assets(a) | |||||||
| Net asset value, end of period | Total return (excludes sales charge)(c)(d) | Net assets, end of period (000's) | Net expenses(e) | Net investment income (loss) | Expenses without waivers | Portfolio turnover rate(d) | |
| $17.94 | (12.31)% | $ 37,317 | 0.47(f)% | 2.38(f)% | 0.84(f)% | 9% | |
| 21.26 | 35.44 | 46,779 | 0.60 | 2.15(g) | 0.88 | 20 | |
| 15.84 | (9.26) | 52,118 | 0.60 | 2.21 | 0.83 | 52 | |
| 17.93 | 10.39 | 213,256 | 0.60 | 3.00 | 0.83 | 22 | |
| 16.79 | (8.66) | 203,437 | 0.60 | 2.40 | 0.84 | 42 | |
| 18.76 | 23.41 | 298,112 | 0.59 | 1.98 | 0.90 | 33 | |
| 18.02 | (12.26) | 313,629 | 0.35(f) | 2.48(f) | 0.56(f) | 9 | |
| 21.39 | 35.78 | 386,797 | 0.35 | 2.35(g) | 0.56 | 20 | |
| 16.05 | (9.05) | 472,455 | 0.34 | 2.15 | 0.56 | 52 | |
| 18.17 | 10.65 | 185,680 | 0.35 | 3.28 | 0.56 | 22 | |
| 17.01 | (8.42) | 152,610 | 0.35 | 1.85 | 0.56 | 42 | |
| 18.92 | 23.71 | 4,740,590 | 0.34 | 2.37 | 0.58 | 33 | |
| 17.95 | (12.24) | 5,172,094 | 0.25(f) | 2.78(f) | 0.30(f) | 9 | |
| 21.33 | 35.93 | 4,562,266 | 0.25 | 2.46(g) | 0.31 | 20 | |
| 16.00 | (8.96) | 4,337,776 | 0.24 | 2.35 | 0.30 | 52 | |
| 18.11 | 10.78 | 4,435,538 | 0.25 | 3.37 | 0.31 | 22 | |
| 16.97 | (8.60) | 4,344,571 | 0.25 | 3.00 | 0.32 | 42 | |
| April 30, 2022 | J.P. Morgan International Equity Funds | 105 |
| Per share operating performance | ||||||
| Investment operations | Distributions | |||||
| Net asset value, beginning of period | Net investment income (loss)(b) | Net realized and unrealized gains (losses) on investments | Total from investment operations | Net investment income | ||
| JPMorgan International Value Fund | ||||||
| Class A | ||||||
| Six Months Ended April 30, 2022(Unaudited) | $13.46 | $0.23 | $(1.29) | $(1.06) | $(0.61) | |
| Year Ended October 31, 2021 | 9.46 | 0.43(g) | 3.89 | 4.32 | (0.32) | |
| Year Ended October 31, 2020 | 12.22 | 0.28 | (2.55) | (2.27) | (0.49) | |
| Year Ended October 31, 2019 | 12.44 | 0.44 | (0.20) | 0.24 | (0.46) | |
| Year Ended October 31, 2018 | 14.26 | 0.36 | (1.87) | (1.51) | (0.31) | |
| Year Ended October 31, 2017 | 12.23 | 0.22 | 2.50 | 2.72 | (0.69) | |
| Class C | ||||||
| Six Months Ended April 30, 2022(Unaudited) | 13.02 | 0.17 | (1.23) | (1.06) | (0.52) | |
| Year Ended October 31, 2021 | 9.14 | 0.33(g) | 3.79 | 4.12 | (0.24) | |
| Year Ended October 31, 2020 | 11.81 | 0.21 | (2.47) | (2.26) | (0.41) | |
| Year Ended October 31, 2019 | 12.02 | 0.36 | (0.18) | 0.18 | (0.39) | |
| Year Ended October 31, 2018 | 13.78 | 0.28 | (1.82) | (1.54) | (0.22) | |
| Year Ended October 31, 2017 | 11.88 | 0.15 | 2.42 | 2.57 | (0.67) | |
| Class I | ||||||
| Six Months Ended April 30, 2022(Unaudited) | 13.84 | 0.25 | (1.33) | (1.08) | (0.64) | |
| Year Ended October 31, 2021 | 9.72 | 0.47(g) | 3.99 | 4.46 | (0.34) | |
| Year Ended October 31, 2020 | 12.54 | 0.31 | (2.61) | (2.30) | (0.52) | |
| Year Ended October 31, 2019 | 12.76 | 0.48 | (0.20) | 0.28 | (0.50) | |
| Year Ended October 31, 2018 | 14.62 | 0.41 | (1.92) | (1.51) | (0.35) | |
| Year Ended October 31, 2017 | 12.57 | 0.28 | 2.55 | 2.83 | (0.78) | |
| Class L | ||||||
| Six Months Ended April 30, 2022(Unaudited) | 13.78 | 0.25 | (1.33) | (1.08) | (0.65) | |
| Year Ended October 31, 2021 | 9.66 | 0.47(g) | 3.99 | 4.46 | (0.34) | |
| Year Ended October 31, 2020 | 12.47 | 0.30 | (2.58) | (2.28) | (0.53) | |
| Year Ended October 31, 2019 | 12.70 | 0.46 | (0.17) | 0.29 | (0.52) | |
| Year Ended October 31, 2018 | 14.55 | 0.41 | (1.90) | (1.49) | (0.36) | |
| Year Ended October 31, 2017 | 12.50 | 0.27 | 2.57 | 2.84 | (0.79) | |
| Class R2 | ||||||
| Six Months Ended April 30, 2022(Unaudited) | 13.22 | 0.20 | (1.26) | (1.06) | (0.57) | |
| Year Ended October 31, 2021 | 9.29 | 0.39(g) | 3.82 | 4.21 | (0.28) | |
| Year Ended October 31, 2020 | 11.96 | 0.24 | (2.51) | (2.27) | (0.40) | |
| Year Ended October 31, 2019 | 12.20 | 0.40 | (0.20) | 0.20 | (0.44) | |
| Year Ended October 31, 2018 | 14.01 | 0.31 | (1.84) | (1.53) | (0.28) | |
| Year Ended October 31, 2017 | 12.04 | 0.19 | 2.46 | 2.65 | (0.68) | |
| Class R5 | ||||||
| Six Months Ended April 30, 2022(Unaudited) | 13.67 | 0.28 | (1.34) | (1.06) | (0.64) | |
| Year Ended October 31, 2021 | 9.60 | 0.41(g) | 4.02 | 4.43 | (0.36) | |
| Year Ended October 31, 2020 | 12.40 | 0.33 | (2.59) | (2.26) | (0.54) | |
| Year Ended October 31, 2019 | 12.65 | 0.49 | (0.21) | 0.28 | (0.53) | |
| Year Ended October 31, 2018 | 14.51 | 0.42 | (1.91) | (1.49) | (0.37) | |
| Year Ended October 31, 2017 | 12.51 | 0.23 | 2.59 | 2.82 | (0.82) | |
| 106 | J.P. Morgan International Equity Funds | April 30, 2022 |
| Ratios/Supplemental data | |||||||
| Ratios to average net assets(a) | |||||||
| Net asset value, end of period | Total return (excludes sales charge)(c)(d) | Net assets, end of period (000's) | Net expenses(e) | Net investment income (loss) | Expenses without waivers and reimbursements(f) | Portfolio turnover rate(d) | |
| $11.79 | (8.05)% | $177,422 | 1.00(f)% | 3.55(f)% | 1.23(f)% | 11% | |
| 13.46 | 46.20 | 187,774 | 1.00 | 3.39(g) | 1.24 | 33 | |
| 9.46 | (19.51) | 125,744 | 1.00 | 2.66 | 1.26 | 59 | |
| 12.22 | 2.30 | 181,458 | 1.00 | 3.69 | 1.28 | 61 | |
| 12.44 | (10.88) | 242,231 | 1.00 | 2.59 | 1.27 | 90 | |
| 14.26 | 23.30 | 316,510 | 1.35 | 1.71 | 1.35 | 31 | |
| 11.44 | (8.34) | 2,490 | 1.50(f) | 2.79(f) | 1.76(f) | 11 | |
| 13.02 | 45.54 | 3,923 | 1.50 | 2.70(g) | 1.77 | 33 | |
| 9.14 | (19.94) | 4,202 | 1.50 | 2.07 | 1.78 | 59 | |
| 11.81 | 1.82 | 9,358 | 1.50 | 3.15 | 1.80 | 61 | |
| 12.02 | (11.37) | 14,055 | 1.50 | 2.06 | 1.78 | 90 | |
| 13.78 | 22.67 | 20,997 | 1.85 | 1.21 | 1.87 | 31 | |
| 12.12 | (7.97) | 37,651 | 0.75(f) | 3.86(f) | 0.98(f) | 11 | |
| 13.84 | 46.51 | 39,188 | 0.75 | 3.58(g) | 0.99 | 33 | |
| 9.72 | (19.31) | 26,805 | 0.75 | 2.88 | 1.02 | 59 | |
| 12.54 | 2.56 | 45,503 | 0.75 | 3.91 | 1.03 | 61 | |
| 12.76 | (10.62) | 66,291 | 0.75 | 2.84 | 1.02 | 90 | |
| 14.62 | 23.66 | 144,875 | 1.04 | 2.07 | 1.04 | 31 | |
| 12.05 | (8.00) | 6,285 | 0.66(f) | 3.88(f) | 0.84(f) | 11 | |
| 13.78 | 46.77 | 7,042 | 0.66 | 3.66(g) | 0.84 | 33 | |
| 9.66 | (19.25) | 5,585 | 0.65 | 2.72 | 0.85 | 59 | |
| 12.47 | 2.69 | 30,256 | 0.65 | 3.81 | 0.87 | 61 | |
| 12.70 | (10.57) | 73,651 | 0.65 | 2.84 | 0.87 | 90 | |
| 14.55 | 23.88 | 201,672 | 0.87 | 2.03 | 0.88 | 31 | |
| 11.59 | (8.22) | 500 | 1.30(f) | 3.25(f) | 1.59(f) | 11 | |
| 13.22 | 45.84 | 514 | 1.30 | 3.14(g) | 1.59 | 33 | |
| 9.29 | (19.74) | 412 | 1.30 | 2.27 | 1.61 | 59 | |
| 11.96 | 2.00 | 722 | 1.30 | 3.47 | 1.69 | 61 | |
| 12.20 | (11.19) | 1,025 | 1.30 | 2.27 | 1.59 | 90 | |
| 14.01 | 23.02 | 1,369 | 1.58 | 1.52 | 1.73 | 31 | |
| 11.97 | (7.93) | 33 | 0.65(f) | 4.35(f) | 0.84(f) | 11 | |
| 13.67 | 46.74 | 67 | 0.65 | 3.24(g) | 0.85 | 33 | |
| 9.60 | (19.26) | 77 | 0.65 | 3.13 | 0.86 | 59 | |
| 12.40 | 2.64 | 88 | 0.65 | 4.08 | 0.87 | 61 | |
| 12.65 | (10.58) | 70 | 0.65 | 2.97 | 0.91 | 90 | |
| 14.51 | 23.81 | 62 | 0.93 | 1.69 | 4.00 | 31 | |
| April 30, 2022 | J.P. Morgan International Equity Funds | 107 |
| Per share operating performance | ||||||
| Investment operations | Distributions | |||||
| Net asset value, beginning of period | Net investment income (loss)(b) | Net realized and unrealized gains (losses) on investments | Total from investment operations | Net investment income | ||
| Class R6 | ||||||
| Six Months Ended April 30, 2022(Unaudited) | $13.71 | $0.26 | $(1.32) | $(1.06) | $(0.67) | |
| Year Ended October 31, 2021 | 9.62 | 0.49(g) | 3.97 | 4.46 | (0.37) | |
| Year Ended October 31, 2020 | 12.43 | 0.34 | (2.60) | (2.26) | (0.55) | |
| Year Ended October 31, 2019 | 12.67 | 0.51 | (0.21) | 0.30 | (0.54) | |
| Year Ended October 31, 2018 | 14.53 | 0.43 | (1.91) | (1.48) | (0.38) | |
| Year Ended October 31, 2017 | 12.51 | 0.31 | 2.53 | 2.84 | (0.82) | |
| (a) | Annualized for periods less than one year, unless otherwise noted. |
| (b) | Calculated based upon average shares outstanding. |
| (c) | Includes adjustments in accordance with accounting principles generally accepted in the United States of America and as such, the net asset values for financial reporting purposes and the returns based upon those net asset values may differ from the net asset values and returns for shareholder transactions. |
| (d) | Not annualized for periods less than one year. |
| (e) | Includes interest expense, if applicable, which is less than 0.005% unless otherwise noted. |
| (f) | Certain non-recurring expenses incurred by the Fund were not annualized for the period indicated. |
| (g) | Reflects income from foreign withholding tax claims, including related interest income, less IRS compliance fees. Without these proceeds, the net investment income (loss) per share would have been $0.38, $0.28, $0.42, $0.41, $0.34, $0.35 and $0.44 for Class A, Class C, Class I, Class L, Class R2, Class R5, and Class R6,respectively, and the net investment income (loss) ratios would have been 3.00%, 2.26%, 3.19%, 3.23%, 2.72%, 2.80% and 3.44% for Class A, Class C, Class I, Class L, Class R2, Class R5, and Class R6, respectively. |
| 108 | J.P. Morgan International Equity Funds | April 30, 2022 |
| Ratios/Supplemental data | |||||||
| Ratios to average net assets(a) | |||||||
| Net asset value, end of period | Total return (excludes sales charge)(c)(d) | Net assets, end of period (000's) | Net expenses(e) | Net investment income (loss) | Expenses without waivers and reimbursements(f) | Portfolio turnover rate(d) | |
| $11.98 | (7.93)% | $163,319 | 0.55(f)% | 4.07(f)% | 0.73(f)% | 11% | |
| 13.71 | 46.99 | 158,191 | 0.55 | 3.83(g) | 0.73 | 33 | |
| 9.62 | (19.22) | 105,039 | 0.55 | 3.18 | 0.76 | 59 | |
| 12.43 | 2.83 | 125,887 | 0.55 | 4.22 | 0.77 | 61 | |
| 12.67 | (10.49) | 124,246 | 0.55 | 3.06 | 0.77 | 90 | |
| 14.53 | 23.99 | 108,302 | 0.80 | 2.28 | 0.82 | 31 | |
| April 30, 2022 | J.P. Morgan International Equity Funds | 109 |
| Classes Offered | Trust | Diversification Classification | |
| JPMorgan Emerging Markets Equity Fund | Class A, Class C, Class I, Class L, Class R2, Class R3, Class R4, Class R5 and Class R6 | JPM I | Diversified |
| JPMorgan Emerging Markets Research Enhanced Equity Fund | Class I and Class R6 | JPM IV | Diversified |
| JPMorgan Europe Dynamic Fund | Class A, Class C, Class I, Class L and Class R6 | JPM I | Diversified |
| JPMorgan International Equity Fund | Class A, Class C, Class I, Class R2, Class R5 and Class R6 | JPM I | Diversified |
| JPMorgan International Focus Fund | Class A, Class C, Class I, Class R2, Class R5 and Class R6 | JPM I | Diversified |
| JPMorgan International Hedged Equity Fund | Class A, Class C, Class I, Class R5 and Class R6 | JPM IV | Diversified |
| JPMorgan International Research Enhanced Equity Fund | Class A, Class I and Class R6 | JPM II | Diversified |
| JPMorgan International Value Fund | Class A, Class C, Class I, Class L, Class R2, Class R5 and Class R6 | JPM I | Diversified |
| 110 | J.P. Morgan International Equity Funds | April 30, 2022 |
| • | Level 1 — Unadjusted inputs using quoted prices in active markets for identical investments. |
| • | Level 2 — Other significant observable inputs including, but not limited to, quoted prices for similar investments, inputs other than quoted prices that are observable for investments (such as interest rates, prepayment speeds, credit risk, etc.) or other market corroborated inputs. |
| • | Level 3 — Significant inputs based on the best information available in the circumstances, to the extent observable inputs are not available (including the Funds' assumptions in determining the fair value of investments). |
| April 30, 2022 | J.P. Morgan International Equity Funds | 111 |
| Emerging Markets Equity Fund | |||||||
| Level 1 Quoted prices | Level 2 Other significant observable inputs | Level 3 Significant unobservable inputs | Total | ||||
| Investments in Securities | |||||||
| Common Stocks | |||||||
| Brazil | $ 551,331 | $ — | $— | $ 551,331 | |||
| China | 247,149 | 2,704,394 | — | 2,951,543 | |||
| Hong Kong | — | 475,149 | — | 475,149 | |||
| India | 290,761 | 1,832,518 | — | 2,123,279 | |||
| Indonesia | — | 424,269 | — | 424,269 | |||
| Macau | — | 48,921 | — | 48,921 | |||
| Mexico | 303,316 | — | — | 303,316 | |||
| Panama | 66,264 | — | — | 66,264 | |||
| Poland | — | 34,466 | — | 34,466 | |||
| Portugal | — | 89,295 | — | 89,295 | |||
| South Africa | 72,233 | 73,285 | — | 145,518 | |||
| South Korea | — | 790,082 | — | 790,082 | |||
| Taiwan | 756,695 | 358,809 | — | 1,115,504 | |||
| United Kingdom | — | 109,652 | — | 109,652 | |||
| United States | 144,031 | 48,836 | — | 192,867 | |||
| Total Common Stocks | 2,431,780 | 6,989,676 | — | 9,421,456 | |||
| Short-Term Investments | |||||||
| Investment Companies | 267,806 | — | — | 267,806 | |||
| Investment of Cash Collateral from Securities Loaned | 107 | — | — | 107 | |||
| Total Short-Term Investments | 267,913 | — | — | 267,913 | |||
| Total Investments in Securities | $2,699,693 | $6,989,676 | $— | $9,689,369 | |||
| Emerging Markets Research Enhanced Equity Fund | ||||
| Level 1 Quoted prices | Level 2 Other significant observable inputs | Level 3 Significant unobservable inputs | Total | |
| Investments in Securities | ||||
| Common Stocks | ||||
| Brazil | $182,209 | $ — | $ — | $ 182,209 |
| Chile | 11,347 | — | — | 11,347 |
| China | 48,016 | 847,933 | — | 895,949 |
| Colombia | 5,352 | — | — | 5,352 |
| Greece | — | 14,274 | — | 14,274 |
| Hong Kong | — | 5,579 | — | 5,579 |
| Hungary | — | 11,198 | — | 11,198 |
| India | 42,303 | 335,312 | — | 377,615 |
| Indonesia | 16,177 | 38,174 | — | 54,351 |
| Malaysia | 13,972 | 20,624 | — | 34,596 |
| Mexico | 84,570 | — | — | 84,570 |
| Peru | 11,094 | — | — | 11,094 |
| Philippines | — | 13,330 | — | 13,330 |
| Poland | — | 13,262 | — | 13,262 |
| Qatar | 12,624 | 6,142 | — | 18,766 |
| Russia | — | — | 892 | 892 |
| Saudi Arabia | 4,249 | 120,714 | — | 124,963 |
| Singapore | — | 2,718 | — | 2,718 |
| 112 | J.P. Morgan International Equity Funds | April 30, 2022 |
| Emerging Markets Research Enhanced Equity Fund (continued) | |||||||
| Level 1 Quoted prices | Level 2 Other significant observable inputs | Level 3 Significant unobservable inputs | Total | ||||
| South Africa | $ 34,735 | $ 88,445 | $ — | $ 123,180 | |||
| South Korea | — | 392,600 | — | 392,600 | |||
| Taiwan | 28,492 | 404,323 | — | 432,815 | |||
| Thailand | 54,907 | 6,990 | — | 61,897 | |||
| Turkey | 6,651 | — | — | 6,651 | |||
| United Arab Emirates | 6,720 | 21,354 | — | 28,074 | |||
| United States | — | 1,399 | — | 1,399 | |||
| Total Common Stocks | 563,418 | 2,344,371 | 892 | 2,908,681 | |||
| Short-Term Investments | |||||||
| Investment Companies | 43,823 | — | — | 43,823 | |||
| Investment of Cash Collateral from Securities Loaned | 14,062 | — | — | 14,062 | |||
| Total Short-Term Investments | 57,885 | — | — | 57,885 | |||
| Total Investments in Securities | $621,303 | $2,344,371 | $892 | $2,966,566 | |||
| Appreciation in Other Financial Instruments | |||||||
| Futures Contracts | $ 77 | $ — | $ — | $ 77 | |||
| Europe Dynamic Fund | |||||||
| Level 1 Quoted prices | Level 2 Other significant observable inputs | Level 3 Significant unobservable inputs | Total | ||||
| Investments in Securities | |||||||
| Common Stocks | |||||||
| Australia | $ — | $ 12,823 | $— | $ 12,823 | |||
| Austria | — | 6,617 | — | 6,617 | |||
| Denmark | — | 47,127 | — | 47,127 | |||
| Finland | — | 20,959 | — | 20,959 | |||
| France | — | 97,803 | — | 97,803 | |||
| Germany | — | 92,385 | — | 92,385 | |||
| Ireland | 9,168 | 108 | — | 9,276 | |||
| Italy | — | 7,051 | — | 7,051 | |||
| Luxembourg | — | 6,134 | — | 6,134 | |||
| Netherlands | — | 38,030 | — | 38,030 | |||
| Norway | — | 8,688 | — | 8,688 | |||
| Spain | — | 7,753 | — | 7,753 | |||
| Switzerland | — | 105,063 | — | 105,063 | |||
| United Kingdom | 1,867 | 117,059 | — | 118,926 | |||
| United States | — | 14,381 | — | 14,381 | |||
| Total Common Stocks | 11,035 | 581,981 | — | 593,016 | |||
| Short-Term Investments | |||||||
| Investment Companies | 12,091 | — | — | 12,091 | |||
| Investment of Cash Collateral from Securities Loaned | 48,178 | — | — | 48,178 | |||
| Total Short-Term Investments | 60,269 | — | — | 60,269 | |||
| April 30, 2022 | J.P. Morgan International Equity Funds | 113 |
| Europe Dynamic Fund (continued) | |||||||
| Level 1 Quoted prices | Level 2 Other significant observable inputs | Level 3 Significant unobservable inputs | Total | ||||
| Total Investments in Securities | $71,304 | $581,981 | $— | $653,285 | |||
| Depreciation in Other Financial Instruments | |||||||
| Futures Contracts | $ (264) | $ — | $— | $ (264) | |||
| International Equity Fund | |||||||
| Level 1 Quoted prices | Level 2 Other significant observable inputs | Level 3 Significant unobservable inputs | Total | ||||
| Investments in Securities | |||||||
| Common Stocks | |||||||
| Australia | $ — | $ 112,477 | $— | $ 112,477 | |||
| Austria | — | 36,856 | — | 36,856 | |||
| Belgium | — | 59,685 | — | 59,685 | |||
| China | — | 34,693 | — | 34,693 | |||
| Denmark | — | 260,363 | — | 260,363 | |||
| Finland | — | 29,279 | — | 29,279 | |||
| France | — | 679,203 | — | 679,203 | |||
| Germany | — | 378,463 | — | 378,463 | |||
| Hong Kong | — | 157,403 | — | 157,403 | |||
| India | 41,122 | — | — | 41,122 | |||
| Japan | — | 537,131 | — | 537,131 | |||
| Netherlands | — | 253,370 | — | 253,370 | |||
| Singapore | — | 92,118 | — | 92,118 | |||
| South Africa | — | 68,826 | — | 68,826 | |||
| South Korea | — | 76,370 | — | 76,370 | |||
| Spain | — | 92,781 | — | 92,781 | |||
| Sweden | — | 163,086 | — | 163,086 | |||
| Switzerland | — | 460,691 | — | 460,691 | |||
| Taiwan | 60,289 | — | — | 60,289 | |||
| United Kingdom | — | 451,538 | — | 451,538 | |||
| United States | — | 188,984 | — | 188,984 | |||
| Total Common Stocks | 101,411 | 4,133,317 | — | 4,234,728 | |||
| Short-Term Investments | |||||||
| Investment Companies | 127,803 | — | — | 127,803 | |||
| Investment of Cash Collateral from Securities Loaned | 202,371 | — | — | 202,371 | |||
| Total Short-Term Investments | 330,174 | — | — | 330,174 | |||
| Total Investments in Securities | $431,585 | $4,133,317 | $— | $4,564,902 | |||
| International Focus Fund | ||||
| Level 1 Quoted prices | Level 2 Other significant observable inputs | Level 3 Significant unobservable inputs | Total | |
| Investments in Securities | ||||
| Common Stocks | ||||
| Australia | $ — | $ 49,409 | $— | $ 49,409 |
| Belgium | — | 28,987 | — | 28,987 |
| Canada | 80,585 | — | — | 80,585 |
| 114 | J.P. Morgan International Equity Funds | April 30, 2022 |
| International Focus Fund (continued) | |||||||
| Level 1 Quoted prices | Level 2 Other significant observable inputs | Level 3 Significant unobservable inputs | Total | ||||
| China | $ — | $ 33,657 | $— | $ 33,657 | |||
| Denmark | — | 74,064 | — | 74,064 | |||
| France | — | 138,178 | — | 138,178 | |||
| Germany | — | 75,560 | — | 75,560 | |||
| Hong Kong | — | 68,290 | — | 68,290 | |||
| India | 33,384 | — | — | 33,384 | |||
| Indonesia | — | 26,541 | — | 26,541 | |||
| Japan | — | 65,907 | — | 65,907 | |||
| Netherlands | — | 104,594 | — | 104,594 | |||
| Singapore | — | 37,318 | — | 37,318 | |||
| South Africa | — | 44,450 | — | 44,450 | |||
| South Korea | — | 62,928 | — | 62,928 | |||
| Spain | — | 30,314 | — | 30,314 | |||
| Sweden | — | 19,881 | — | 19,881 | |||
| Switzerland | — | 157,149 | — | 157,149 | |||
| Taiwan | 45,891 | — | — | 45,891 | |||
| United Kingdom | — | 138,706 | — | 138,706 | |||
| United States | — | 46,568 | — | 46,568 | |||
| Total Common Stocks | 159,860 | 1,202,501 | — | 1,362,361 | |||
| Short-Term Investments | |||||||
| Investment Companies | 39,689 | — | — | 39,689 | |||
| Total Investments in Securities | $199,549 | $1,202,501 | $— | $1,402,050 | |||
| International Hedged Equity Fund | ||||
| Level 1 Quoted prices | Level 2 Other significant observable inputs | Level 3 Significant unobservable inputs | Total | |
| Investments in Securities | ||||
| Common Stocks | ||||
| Australia | $ — | $ 10,304 | $— | $ 10,304 |
| Belgium | — | 689 | — | 689 |
| China | — | 829 | — | 829 |
| Denmark | — | 5,467 | — | 5,467 |
| Finland | — | 1,281 | — | 1,281 |
| France | — | 18,235 | — | 18,235 |
| Germany | — | 14,703 | — | 14,703 |
| Hong Kong | — | 4,098 | — | 4,098 |
| Ireland | — | 761 | — | 761 |
| Italy | — | 1,089 | — | 1,089 |
| Japan | — | 35,565 | — | 35,565 |
| Luxembourg | — | 216 | — | 216 |
| Netherlands | — | 10,054 | — | 10,054 |
| Singapore | — | 1,603 | — | 1,603 |
| Spain | — | 4,511 | — | 4,511 |
| Sweden | — | 3,155 | — | 3,155 |
| Switzerland | — | 18,526 | — | 18,526 |
| Taiwan | 119 | — | — | 119 |
| United Kingdom | — | 21,800 | — | 21,800 |
| April 30, 2022 | J.P. Morgan International Equity Funds | 115 |
| International Hedged Equity Fund (continued) | |||||||
| Level 1 Quoted prices | Level 2 Other significant observable inputs | Level 3 Significant unobservable inputs | Total | ||||
| United States | $ — | $ 3,117 | $— | $ 3,117 | |||
| Total Common Stocks | 119 | 156,003 | — | 156,122 | |||
| Options Purchased | |||||||
| Put Options Purchased | 6,077 | — | — | 6,077 | |||
| Short-Term Investments | |||||||
| Investment Companies | 7,724 | — | — | 7,724 | |||
| Total Investments in Securities | $13,920 | $156,003 | $— | $169,923 | |||
| Appreciation in Other Financial Instruments | |||||||
| Futures Contracts | $ 100 | $ — | $— | $ 100 | |||
| Depreciation in Other Financial Instruments | |||||||
| Futures Contracts | (323) | — | — | (323) | |||
| Options Written | |||||||
| Call Options Written | (156) | — | — | (156) | |||
| Put Options Written | (880) | — | — | (880) | |||
| Total Net Appreciation/ Depreciation in Other Financial Instruments | $ (1,259) | $ — | $— | $ (1,259) | |||
| International Research Enhanced Equity Fund | |||||||
| Level 1 Quoted prices | Level 2 Other significant observable inputs | Level 3 Significant unobservable inputs | Total | ||||
| Investments in Securities | |||||||
| Common Stocks | |||||||
| Australia | $ — | $ 320,921 | $— | $ 320,921 | |||
| Belgium | — | 23,440 | — | 23,440 | |||
| China | — | 26,691 | — | 26,691 | |||
| Denmark | — | 187,490 | — | 187,490 | |||
| Finland | — | 44,172 | — | 44,172 | |||
| France | — | 629,936 | — | 629,936 | |||
| Germany | — | 506,525 | — | 506,525 | |||
| Hong Kong | — | 120,115 | — | 120,115 | |||
| Ireland | — | 26,126 | — | 26,126 | |||
| Italy | — | 39,453 | — | 39,453 | |||
| Japan | — | 1,053,844 | — | 1,053,844 | |||
| Luxembourg | — | 8,453 | — | 8,453 | |||
| Malta | — | — | 2 | 2 | |||
| Netherlands | — | 348,179 | — | 348,179 | |||
| Singapore | — | 50,120 | — | 50,120 | |||
| Spain | — | 152,467 | — | 152,467 | |||
| Sweden | — | 108,048 | — | 108,048 | |||
| Switzerland | — | 631,425 | — | 631,425 | |||
| Taiwan | 3,953 | — | — | 3,953 | |||
| United Kingdom | — | 752,505 | — | 752,505 | |||
| United States | — | 104,939 | — | 104,939 | |||
| Total Common Stocks | 3,953 | 5,134,849 | 2 | 5,138,804 | |||
| Short-Term Investments | |||||||
| Investment Companies | 204,862 | — | — | 204,862 | |||
| 116 | J.P. Morgan International Equity Funds | April 30, 2022 |
| International Research Enhanced Equity Fund (continued) | |||||||
| Level 1 Quoted prices | Level 2 Other significant observable inputs | Level 3 Significant unobservable inputs | Total | ||||
| Investment of Cash Collateral from Securities Loaned | $200,900 | $ — | $— | $ 200,900 | |||
| Total Short-Term Investments | 405,762 | — | — | 405,762 | |||
| Total Investments in Securities | $409,715 | $5,134,849 | $ 2 | $5,544,566 | |||
| Appreciation in Other Financial Instruments | |||||||
| Futures Contracts | $ 2,036 | $ — | $— | $ 2,036 | |||
| Depreciation in Other Financial Instruments | |||||||
| Futures Contracts | (1,379) | — | — | (1,379) | |||
| Total Net Appreciation/ Depreciation in Other Financial Instruments | $ 657 | $ — | $— | $ 657 | |||
| International Value Fund | |||||||
| Level 1 Quoted prices | Level 2 Other significant observable inputs | Level 3 Significant unobservable inputs | Total | ||||
| Investments in Securities | |||||||
| Common Stocks | |||||||
| Australia | $ — | $ 32,984 | $— | $ 32,984 | |||
| Austria | — | 5,257 | — | 5,257 | |||
| Belgium | — | 1,854 | — | 1,854 | |||
| China | — | 1,964 | — | 1,964 | |||
| Denmark | 532 | 5,969 | — | 6,501 | |||
| Egypt | 1,100 | — | — | 1,100 | |||
| Finland | — | 6,070 | — | 6,070 | |||
| France | — | 31,244 | — | 31,244 | |||
| Germany | — | 38,043 | — | 38,043 | |||
| Hong Kong | — | 3,886 | — | 3,886 | |||
| Italy | — | 13,172 | — | 13,172 | |||
| Japan | — | 81,583 | — | 81,583 | |||
| Luxembourg | — | 2,045 | — | 2,045 | |||
| Malta | — | 504 | — | 504 | |||
| Netherlands | — | 23,625 | — | 23,625 | |||
| Norway | 1,403 | 8,444 | — | 9,847 | |||
| Singapore | 497 | 5,188 | — | 5,685 | |||
| South Africa | — | 3,373 | — | 3,373 | |||
| Spain | — | 12,674 | — | 12,674 | |||
| Sweden | 274 | 10,122 | — | 10,396 | |||
| Switzerland | — | 24,164 | — | 24,164 | |||
| United Kingdom | 2,401 | 52,632 | — | 55,033 | |||
| United States | — | 9,539 | — | 9,539 | |||
| Total Common Stocks | 6,207 | 374,336 | — | 380,543 | |||
| Short-Term Investments | |||||||
| Investment Companies | 5,753 | — | — | 5,753 | |||
| Investment of Cash Collateral from Securities Loaned | 19,882 | — | — | 19,882 | |||
| Total Short-Term Investments | 25,635 | — | — | 25,635 | |||
| Total Investments in Securities | $31,842 | $374,336 | $— | $406,178 | |||
| April 30, 2022 | J.P. Morgan International Equity Funds | 117 |
| Investment Securities on Loan, at value, Presented on the Statements of Assets and Liabilities | Cash Collateral Posted by Borrower* | Net Amount Due to Counterparty (not less than zero) | |
| Emerging Markets Equity Fund | $ 106 | $ (106) | $— |
| Emerging Markets Research Enhanced Equity Fund | 13,480 | (13,480) | — |
| Europe Dynamic Fund | 44,177 | (44,177) | — |
| International Equity Fund | 169,016 | (169,016) | — |
| International Research Enhanced Equity Fund | 177,073 | (177,073) | — |
| International Value Fund | 18,772 | (18,772) | — |
| * | Collateral posted reflects the value of securities on loan and does not include any additional amounts received from the borrower. |
| 118 | J.P. Morgan International Equity Funds | April 30, 2022 |
| Emerging Markets Equity Fund | $6 |
| Emerging Markets Research Enhanced Equity Fund | 2 |
| Europe Dynamic Fund | 2 |
| International Equity Fund | 8 |
| International Focus Fund | 3 |
| International Research Enhanced Equity Fund | 4 |
| International Value Fund | 1 |
| Emerging Markets Equity Fund | |||||||||||||||
| For the six months ended April 30, 2022 | |||||||||||||||
| Security Description | Value at October 31, 2021 | Purchases at Cost | Proceeds from Sales | Net Realized Gain (Loss) | Change in Unrealized Appreciation/ (Depreciation) | Value at April 30, 2022 | Shares at April 30, 2022 | Dividend Income | Capital Gain Distributions | ||||||
| JPMorgan Prime Money Market Fund Class Institutional Shares, 0.36% (a) (b) | $ 24,800 | $1,675,531 | $1,432,508 | $(21) | $ 4 | $267,806 | 267,753 | $ 90 | $— | ||||||
| JPMorgan Securities Lending Money Market Fund Agency SL Class Shares, 0.37% (a) (b) | 222,040 | 150,500 | 372,500 | (32)* | —(c) | 8 | 8 | 26* | — | ||||||
| JPMorgan U.S. Government Money Market Fund Class IM Shares, 0.37% (a) (b) | 25,886 | 319,665 | 345,452 | — | — | 99 | 99 | 2* | — | ||||||
| Total | $272,726 | $2,145,696 | $2,150,460 | $(53) | $ 4 | $267,913 | $118 | $— | |||||||
| (a) | Investment in an affiliated fund, which is registered under the Investment Company Act of 1940, as amended, and is advised by J.P. Morgan Investment Management Inc. |
| (b) | The rate shown is the current yield as of April 30, 2022. |
| (c) | Amount rounds to less than one thousand. |
| * | Amount is included on the Statements of Operations as Income from securities lending (net) (after payments of rebates and Citibank’s fee). |
| April 30, 2022 | J.P. Morgan International Equity Funds | 119 |
| Emerging Markets Research Enhanced Equity Fund | |||||||||||||||
| For the six months ended April 30, 2022 | |||||||||||||||
| Security Description | Value at October 31, 2021 | Purchases at Cost | Proceeds from Sales | Net Realized Gain (Loss) | Change in Unrealized Appreciation/ (Depreciation) | Value at April 30, 2022 | Shares at April 30, 2022 | Dividend Income | Capital Gain Distributions | ||||||
| JPMorgan Prime Money Market Fund Class Institutional Shares, 0.36% (a) (b) | $ 3,718 | $745,224 | $705,105 | $(14) | $—(c) | $43,823 | 43,814 | $34 | $— | ||||||
| JPMorgan Securities Lending Money Market Fund Agency SL Class Shares, 0.37% (a) (b) | 22,493 | 48,000 | 64,000 | (8)* | 1 | 6,486 | 6,491 | 7* | — | ||||||
| JPMorgan U.S. Government Money Market Fund Class IM Shares, 0.37% (a) (b) | 2,859 | 98,486 | 93,769 | — | — | 7,576 | 7,576 | 2* | — | ||||||
| Total | $29,070 | $891,710 | $862,874 | $(22) | $ 1 | $57,885 | $43 | $— | |||||||
| (a) | Investment in an affiliated fund, which is registered under the Investment Company Act of 1940, as amended, and is advised by J.P. Morgan Investment Management Inc. |
| (b) | The rate shown is the current yield as of April 30, 2022. |
| (c) | Amount rounds to less than one thousand. |
| * | Amount is included on the Statements of Operations as Income from securities lending (net) (after payments of rebates and Citibank’s fee). |
| Europe Dynamic Fund | |||||||||||||||
| For the six months ended April 30, 2022 | |||||||||||||||
| Security Description | Value at October 31, 2021 | Purchases at Cost | Proceeds from Sales | Net Realized Gain (Loss) | Change in Unrealized Appreciation/ (Depreciation) | Value at April 30, 2022 | Shares at April 30, 2022 | Dividend Income | Capital Gain Distributions | ||||||
| JPMorgan Prime Money Market Fund Class Institutional Shares, 0.36% (a) (b) | $46,060 | $253,946 | $287,907 | $(7) | $(1) | $12,091 | 12,089 | $10 | $— | ||||||
| JPMorgan Securities Lending Money Market Fund Agency SL Class Shares, 0.37% (a) (b) | — | 73,000 | 39,000 | 1* | —(c) | 34,001 | 34,025 | 8* | — | ||||||
| JPMorgan U.S. Government Money Market Fund Class IM Shares, 0.37% (a) (b) | 7,173 | 129,488 | 122,484 | — | — | 14,177 | 14,177 | 4* | — | ||||||
| Total | $53,233 | $456,434 | $449,391 | $(6) | $(1) | $60,269 | $22 | $— | |||||||
| (a) | Investment in an affiliated fund, which is registered under the Investment Company Act of 1940, as amended, and is advised by J.P. Morgan Investment Management Inc. |
| (b) | The rate shown is the current yield as of April 30, 2022. |
| (c) | Amount rounds to less than one thousand. |
| * | Amount is included on the Statements of Operations as Income from securities lending (net) (after payments of rebates and Citibank’s fee). |
| 120 | J.P. Morgan International Equity Funds | April 30, 2022 |
| International Equity Fund | |||||||||||||||
| For the six months ended April 30, 2022 | |||||||||||||||
| Security Description | Value at October 31, 2021 | Purchases at Cost | Proceeds from Sales | Net Realized Gain (Loss) | Change in Unrealized Appreciation/ (Depreciation) | Value at April 30, 2022 | Shares at April 30, 2022 | Dividend Income | Capital Gain Distributions | ||||||
| JPMorgan Prime Money Market Fund Class Institutional Shares, 0.36% (a) (b) | $123,785 | $ 968,511 | $ 964,468 | $(44) | $19 | $127,803 | 127,777 | $ 69 | $— | ||||||
| JPMorgan Securities Lending Money Market Fund Agency SL Class Shares, 0.37% (a) (b) | 111,000 | 561,000 | 535,975 | (16)* | —(c) | 136,009 | 136,104 | 59* | — | ||||||
| JPMorgan U.S. Government Money Market Fund Class IM Shares, 0.37% (a) (b) | 13,466 | 609,509 | 556,613 | — | — | 66,362 | 66,362 | 16* | — | ||||||
| Total | $248,251 | $2,139,020 | $2,057,056 | $(60) | $19 | $330,174 | $144 | $— | |||||||
| (a) | Investment in an affiliated fund, which is registered under the Investment Company Act of 1940, as amended, and is advised by J.P. Morgan Investment Management Inc. |
| (b) | The rate shown is the current yield as of April 30, 2022. |
| (c) | Amount rounds to less than one thousand. |
| * | Amount is included on the Statements of Operations as Income from securities lending (net) (after payments of rebates and Citibank’s fee). |
| International Focus Fund | |||||||||||||||
| For the six months ended April 30, 2022 | |||||||||||||||
| Security Description | Value at October 31, 2021 | Purchases at Cost | Proceeds from Sales | Net Realized Gain (Loss) | Change in Unrealized Appreciation/ (Depreciation) | Value at April 30, 2022 | Shares at April 30, 2022 | Dividend Income | Capital Gain Distributions | ||||||
| JPMorgan Prime Money Market Fund Class Institutional Shares, 0.36% (a) (b) | $47,837 | $595,620 | $ 603,760 | $ (5) | $(3) | $39,689 | 39,681 | $34 | $— | ||||||
| JPMorgan Securities Lending Money Market Fund Agency SL Class Shares, 0.37% (a) (b) | 33,000 | 234,000 | 266,986 | (14)* | — | — | — | 8* | — | ||||||
| JPMorgan U.S. Government Money Market Fund Class IM Shares, 0.37% (a) (b) | 3,469 | 160,401 | 163,870 | — | — | — | — | 5* | — | ||||||
| Total | $84,306 | $990,021 | $1,034,616 | $(19) | $(3) | $39,689 | $47 | $— | |||||||
| (a) | Investment in an affiliated fund, which is registered under the Investment Company Act of 1940, as amended, and is advised by J.P. Morgan Investment Management Inc. |
| (b) | The rate shown is the current yield as of April 30, 2022. |
| * | Amount is included on the Statements of Operations as Income from securities lending (net) (after payments of rebates and Citibank’s fee). |
| International Hedged Equity Fund | |||||||||||||||
| For the six months ended April 30, 2022 | |||||||||||||||
| Security Description | Value at October 31, 2021 | Purchases at Cost | Proceeds from Sales | Net Realized Gain (Loss) | Change in Unrealized Appreciation/ (Depreciation) | Value at April 30, 2022 | Shares at April 30, 2022 | Dividend Income | Capital Gain Distributions | ||||||
| JPMorgan U.S. Government Money Market Fund Class Institutional Shares, 0.29% (a) (b) | $3,536 | $54,734 | $50,546 | $— | $— | $7,724 | 7,724 | $2 | $— | ||||||
| (a) | Investment in an affiliated fund, which is registered under the Investment Company Act of 1940, as amended, and is advised by J.P. Morgan Investment Management Inc. |
| (b) | The rate shown is the current yield as of April 30, 2022. |
| April 30, 2022 | J.P. Morgan International Equity Funds | 121 |
| International Research Enhanced Equity Fund | |||||||||||||||
| For the six months ended April 30, 2022 | |||||||||||||||
| Security Description | Value at October 31, 2021 | Purchases at Cost | Proceeds from Sales | Net Realized Gain (Loss) | Change in Unrealized Appreciation/ (Depreciation) | Value at April 30, 2022 | Shares at April 30, 2022 | Dividend Income | Capital Gain Distributions | ||||||
| JPMorgan Prime Money Market Fund Class Institutional Shares, 0.36% (a) (b) | $ 93,239 | $ 936,459 | $ 824,801 | $(36) | $ 1 | $204,862 | 204,821 | $ 96 | $— | ||||||
| JPMorgan Securities Lending Money Market Fund Agency SL Class Shares, 0.37% (a) (b) | 82,347 | 399,000 | 354,000 | (10)* | (4) | 127,333 | 127,422 | 47* | — | ||||||
| JPMorgan U.S. Government Money Market Fund Class IM Shares, 0.37% (a) (b) | 10,123 | 411,295 | 347,851 | — | — | 73,567 | 73,567 | 18* | — | ||||||
| Total | $185,709 | $1,746,754 | $1,526,652 | $(46) | $(3) | $405,762 | $161 | $— | |||||||
| (a) | Investment in an affiliated fund, which is registered under the Investment Company Act of 1940, as amended, and is advised by J.P. Morgan Investment Management Inc. |
| (b) | The rate shown is the current yield as of April 30, 2022. |
| * | Amount is included on the Statements of Operations as Income from securities lending (net) (after payments of rebates and Citibank’s fee). |
| International Value Fund | |||||||||||||||
| For the six months ended April 30, 2022 | |||||||||||||||
| Security Description | Value at October 31, 2021 | Purchases at Cost | Proceeds from Sales | Net Realized Gain (Loss) | Change in Unrealized Appreciation/ (Depreciation) | Value at April 30, 2022 | Shares at April 30, 2022 | Dividend Income | Capital Gain Distributions | ||||||
| JPMorgan Prime Money Market Fund Class Institutional Shares, 0.36% (a) (b) | $2,400 | $ 40,191 | $ 36,838 | $(1) | $ 1 | $ 5,753 | 5,751 | $ 5 | $— | ||||||
| JPMorgan Securities Lending Money Market Fund Agency SL Class Shares, 0.37% (a) (b) | 3,199 | 41,501 | 30,000 | (1)* | — | 14,699 | 14,709 | 6* | — | ||||||
| JPMorgan U.S. Government Money Market Fund Class IM Shares, 0.37% (a) (b) | 945 | 52,091 | 47,853 | — | — | 5,183 | 5,183 | 2* | — | ||||||
| Total | $6,544 | $133,783 | $114,691 | $(2) | $ 1 | $25,635 | $13 | $— | |||||||
| (a) | Investment in an affiliated fund, which is registered under the Investment Company Act of 1940, as amended, and is advised by J.P. Morgan Investment Management Inc. |
| (b) | The rate shown is the current yield as of April 30, 2022. |
| * | Amount is included on the Statements of Operations as Income from securities lending (net) (after payments of rebates and Citibank’s fee). |
| 122 | J.P. Morgan International Equity Funds | April 30, 2022 |
| April 30, 2022 | J.P. Morgan International Equity Funds | 123 |
| Emerging Markets Research Enhanced Equity Fund | Europe Dynamic Fund | International Focus Fund | International Hedged Equity Fund | International Research Enhanced Equity Fund | International Value Fund | |
| Futures Contracts: | ||||||
| Average Notional Balance Long | $82,512 | $20,389 | $ 14,652 | $ 7,409 | $108,795 | $3,581 |
| Average Notional Balance Short | — | — | (14,662) | — | — | — |
| Ending Notional Balance Long | 4,119 | 7,675 | — | 8,672 | 160,736 | — |
| Exchange-Traded Options: | ||||||
| Average Number of Contracts Purchased | — | — | — | 747 | — | — |
| Average Number of Contracts Written | — | — | — | (1,494) | — | — |
| Ending Number of Contracts Purchased | — | — | — | 819 | — | — |
| Ending Number of Contracts Written | — | — | — | (1,638) | — | — |
| Class A | Class C | Class I | Class L | Class R2 | Class R3 | Class R4 | Class R5 | Class R6 | Total | |
| Emerging Markets Equity Fund | ||||||||||
| Transfer agency fees | $ 16 | $ 2 | $42 | $ 12 | $ 1 | $ —(a) | $ —(a) | $ 2 | $55 | $130 |
| Emerging Markets Research Enhanced Equity Fund | ||||||||||
| Transfer agency fees | n/a | n/a | 2 | n/a | n/a | n/a | n/a | n/a | 11 | 13 |
| Europe Dynamic Fund | ||||||||||
| Transfer agency fees | 6 | 1 | 11 | 1 | n/a | n/a | n/a | n/a | 1 | 20 |
| International Equity Fund | ||||||||||
| Transfer agency fees | 11 | 1 | 14 | n/a | 12 | n/a | n/a | —(a) | 18 | 56 |
| International Focus Fund | ||||||||||
| Transfer agency fees | 4 | 2 | 16 | n/a | —(a) | n/a | n/a | 1 | 10 | 33 |
| International Hedged Equity Fund | ||||||||||
| Transfer agency fees | —(a) | —(a) | 1 | n/a | n/a | n/a | n/a | —(a) | —(a) | 1 |
| 124 | J.P. Morgan International Equity Funds | April 30, 2022 |
| Class A | Class C | Class I | Class L | Class R2 | Class R3 | Class R4 | Class R5 | Class R6 | Total | |
| International Research Enhanced Equity Fund | ||||||||||
| Transfer agency fees | $ 9 | n/a | $12 | n/a | n/a | n/a | n/a | n/a | $12 | $ 33 |
| International Value Fund | ||||||||||
| Transfer agency fees | 6 | $ 1 | 1 | $ —(a) | $ —(a) | n/a | n/a | $ —(a) | 1 | 9 |
| (a) | Amount rounds to less than one thousand. |
| Emerging Markets Equity Fund | 0.68% |
| Emerging Markets Research Enhanced Equity Fund | 0.25 |
| Europe Dynamic Fund | 0.60 |
| International Equity Fund | 0.50 |
| International Focus Fund | 0.60 |
| International Hedged Equity Fund | 0.25 |
| International Research Enhanced Equity Fund | 0.20 |
| International Value Fund | 0.55 |
| April 30, 2022 | J.P. Morgan International Equity Funds | 125 |
| Class A | Class C | Class R2 | Class R3 | |
| Emerging Markets Equity Fund | 0.25% | 0.75% | 0.50% | 0.25% |
| Europe Dynamic Fund | 0.25 | 0.75 | n/a | n/a |
| International Equity Fund | 0.25 | 0.75 | 0.50 | n/a |
| International Focus Fund | 0.25 | 0.75 | 0.50 | n/a |
| International Hedged Equity Fund | 0.25 | 0.75 | n/a | n/a |
| International Research Enhanced Equity Fund | 0.25 | n/a | n/a | n/a |
| International Value Fund | 0.25 | 0.75 | 0.50 | n/a |
| Front-End Sales Charge | CDSC | |
| Emerging Markets Equity Fund | $ 7 | $—(a) |
| Europe Dynamic Fund | 1 | — |
| International Equity Fund | 26 | 1 |
| International Focus Fund | 39 | —(a) |
| International Hedged Equity Fund | 1 | — |
| International Research Enhanced Equity Fund | —(a) | — |
| International Value Fund | 19 | — |
| (a) | Amount rounds to less than one thousand. |
| Class A | Class C | Class I | Class L | Class R2 | Class R3 | Class R4 | Class R5 | |
| Emerging Markets Equity Fund | 0.25% | 0.25% | 0.25% | 0.10% | 0.25% | 0.25% | 0.25% | 0.10% |
| Emerging Markets Research Enhanced Equity Fund | n/a | n/a | 0.25 | n/a | n/a | n/a | n/a | n/a |
| Europe Dynamic Fund | 0.25 | 0.25 | 0.25 | 0.10 | n/a | n/a | n/a | n/a |
| International Equity Fund | 0.25 | 0.25 | 0.25 | n/a | 0.25 | n/a | n/a | 0.10 |
| 126 | J.P. Morgan International Equity Funds | April 30, 2022 |
| Class A | Class C | Class I | Class L | Class R2 | Class R3 | Class R4 | Class R5 | |
| International Focus Fund | 0.25% | 0.25% | 0.25% | n/a% | 0.25% | n/a% | n/a% | 0.10% |
| International Hedged Equity Fund | 0.25 | 0.25 | 0.25 | n/a | n/a | n/a | n/a | 0.10 |
| International Research Enhanced Equity Fund | 0.25 | n/a | 0.25 | n/a | n/a | n/a | n/a | n/a |
| International Value Fund | 0.25 | 0.25 | 0.25 | 0.10 | 0.25 | n/a | n/a | 0.10 |
| Class A | Class C | Class I | Class R2 | Class R3 | Class R4 | Class R5 | Class R6 | |
| Emerging Markets Equity Fund | 1.24% | 1.74% | 0.99% | 1.54% | 1.29% | 1.04% | 0.89% | 0.79% |
| Emerging Markets Research Enhanced Equity Fund | n/a | n/a | 0.45 | n/a | n/a | n/a | n/a | 0.35 |
| Europe Dynamic Fund | 1.24 | 1.74 | 0.99 | n/a | n/a | n/a | n/a | n/a |
| International Equity Fund | 0.95 | 1.45 | 0.70 | 1.25 | n/a | n/a | 0.60 | 0.50 |
| International Focus Fund | 1.00 | 1.50 | 0.75 | 1.30 | n/a | n/a | 0.65 | 0.55 |
| International Hedged Equity Fund | 0.85 | 1.35 | 0.60 | n/a | n/a | n/a | 0.45 | 0.35 |
| International Research Enhanced Equity Fund | 0.60 | n/a | 0.35 | n/a | n/a | n/a | n/a | 0.25 |
| International Value Fund | 1.00 | 1.50 | 0.75 | 1.30 | n/a | n/a | 0.65 | 0.55 |
| April 30, 2022 | J.P. Morgan International Equity Funds | 127 |
| Contractual Waivers | Voluntary Waivers | |||||
| Investment Advisory Fees | Administration Fees | Service Fees | Total | Contractual Reimbursements | 12b-1 | |
| Emerging Markets Equity Fund | $ 326 | $ 219 | $1,197 | $1,742 | $55 | $ — |
| Emerging Markets Research Enhanced Equity Fund | 402 | 268 | 84 | 754 | — | — |
| International Equity Fund | 1,412 | 941 | 293 | 2,646 | — | — |
| International Focus Fund | 1,568 | 1,045 | 297 | 2,910 | — | — |
| International Hedged Equity Fund | 95 | 60 | —(a) | 155 | — | — |
| International Research Enhanced Equity Fund | 691 | 459 | 324 | 1,474 | — | 29 |
| International Value Fund | 205 | 137 | 64 | 406 | 1 | — |
| (a) | Amount rounds to less than one thousand. |
| Emerging Markets Equity Fund | $61 |
| Emerging Markets Research Enhanced Equity Fund | 42 |
| Europe Dynamic Fund | 19 |
| International Equity Fund | 59 |
| International Focus Fund | 30 |
| International Hedged Equity Fund | 2 |
| International Research Enhanced Equity Fund | 66 |
| International Value Fund | 3 |
| Emerging Markets Equity Fund | 1 |
| Emerging Markets Research Enhanced Equity Fund | 1 |
| Europe Dynamic Fund | 1 |
| International Equity Fund | 1 |
| International Focus Fund | 1 |
| International Hedged Equity Fund | 1 |
| International Research Enhanced Equity Fund | 1 |
| 128 | J.P. Morgan International Equity Funds | April 30, 2022 |
| Purchases (excluding U.S. Government) | Sales (excluding U.S. Government) | |
| Emerging Markets Equity Fund | $1,308,784 | $2,177,166 |
| Emerging Markets Research Enhanced Equity Fund | 571,098 | 737,155 |
| Europe Dynamic Fund | 385,041 | 642,085 |
| International Equity Fund | 1,248,185 | 836,829 |
| International Focus Fund | 512,049 | 1,301,728 |
| International Hedged Equity Fund | 46,086 | 13,376 |
| International Research Enhanced Equity Fund | 1,412,392 | 422,408 |
| International Value Fund | 69,376 | 44,096 |
| Aggregate Cost | Gross Unrealized Appreciation | Gross Unrealized Depreciation | Net Unrealized Appreciation (Depreciation) | |
| Emerging Markets Equity Fund | $8,772,484 | $2,384,515 | $1,467,630 | $916,885 |
| Emerging Markets Research Enhanced Equity Fund | 2,917,194 | 408,925 | 359,476 | 49,449 |
| Europe Dynamic Fund | 635,899 | 55,515 | 38,393 | 17,122 |
| International Equity Fund | 4,097,521 | 741,897 | 274,516 | 467,381 |
| International Focus Fund | 1,231,297 | 257,687 | 86,934 | 170,753 |
| International Hedged Equity Fund | 155,471 | 23,579 | 10,386 | 13,193 |
| International Research Enhanced Equity Fund | 5,030,990 | 808,857 | 294,624 | 514,233 |
| International Value Fund | 387,072 | 45,483 | 26,377 | 19,106 |
| Capital Loss Carryforward Character | ||
| Short-Term | Long-Term | |
| Europe Dynamic Fund | $ 60,459 | $ — |
| International Focus Fund | 113,809 | — |
| International Hedged Equity Fund | 4,593* | 13,223* |
| International Research Enhanced Equity Fund | — | 285,015 |
| International Value Fund | 48,944 | 31,961 |
| * | Amount includes capital loss carryforwards which are limited in future years under Internal Revenue Code sections 381-384. |
| April 30, 2022 | J.P. Morgan International Equity Funds | 129 |
| Capital Loss Utilized | ||
| Short-Term | Long-Term | |
| Emerging Markets Equity Fund | $ — | $151,019 |
| Emerging Markets Research Enhanced Equity Fund | 64,286 | 18,842 |
| Europe Dynamic Fund | 58,188 | — |
| International Equity Fund | 56,023 | 54,962 |
| International Focus Fund | 51,636 | 21,707 |
| International Research Enhanced Equity Fund | 33,296 | 211,502 |
| International Value Fund | 4,721 | — |
| Average Borrowings | Average Interest Rate paid | Number of Days Outstanding | Interest Paid | |
| Emerging Markets Equity Fund | $45,389 | 0.83% | 20 | $14 |
| Emerging Markets Research Enhanced Equity Fund | 12,242 | 0.81 | 2 | 1 |
| Europe Dynamic Fund | 45,914 | 0.81 | 5 | 5 |
| International Equity Fund | 90,091 | 0.81 | 2 | 4 |
| International Focus Fund | 23,839 | 0.80 | 3 | 2 |
| International Value Fund | 1,651 | 0.82 | 2 | —(a) |
| (a) | Amount rounds to less than one thousand. |
| 130 | J.P. Morgan International Equity Funds | April 30, 2022 |
| Number of Individual Shareholder and/or Affiliated Omnibus Accounts | % of the Fund | Number of Individual Shareholder and/or Non-Affiliated Omnibus Accounts | % of the Fund | |
| Emerging Markets Equity Fund | — | —% | 3 | 43.4% |
| Europe Dynamic Fund | 3 | 45.3 | 1 | 11.6 |
| International Focus Fund | — | — | 2 | 35.5 |
| International Hedged Equity Fund | 1 | 13.9 | 3 | 57.7 |
| International Research Enhanced Equity Fund | 1 | 10.4 | 1 | 10.4 |
| International Value Fund | — | — | 1 | 80.8 |
| J.P. Morgan Investor Funds | JPMorgan SmartRetirement Funds | JPMorgan SmartRetirement Blend Funds | |
| Emerging Markets Research Enhanced Equity Fund | 10.5% | 31.5% | 39.9% |
| Europe Dynamic Fund | 50.5 | — | — |
| International Equity Fund | — | 49.8 | — |
| International Focus Fund | 11.6 | — | — |
| International Research Enhanced Equity Fund | 19.3 | 60.5 | — |
| April 30, 2022 | J.P. Morgan International Equity Funds | 131 |
| Emerging Markets Equity Fund | Emerging Markets Research Enhanced Equity Fund | Europe Dynamic Fund | International Equity Fund | International Focus Fund | International Hedged Equity Fund | International Research Enhanced Equity Fund | International Value Fund | |
| China | 30.5% | 30.3% | —% | —% | —% | —% | —% | —% |
| France | — | — | 16.2 | 15.6 | — | 10.7 | 11.8 | — |
| Germany | — | — | 15.3 | — | — | — | — | — |
| India | 21.9 | 12.8 | — | — | — | — | — | — |
| Japan | — | — | — | 12.3 | — | 20.9 | 19.7 | 21.1 |
| South Korea | — | 13.3 | — | — | — | — | — | — |
| Switzerland | — | — | 17.4 | 10.6 | 11.2 | 10.9 | 11.8 | — |
| Taiwan | 11.5 | 14.7 | — | — | — | — | — | — |
| United Kingdom | — | — | 19.7 | 10.4 | — | 12.8 | 14.1 | 14.2 |
| 132 | J.P. Morgan International Equity Funds | April 30, 2022 |
| Fund | Value | Type |
| International Focus Fund | $1,236,430(a) | Redemption in-kind |
| (a) | This amount includes cash of $99,867 associated with the redemption in-kind. |
| April 30, 2022 | J.P. Morgan International Equity Funds | 133 |
| Beginning Account Value November 1, 2021 | Ending Account Value April 30, 2022 | Expenses Paid During the Period* | Annualized Expense Ratio | |
| JPMorgan Emerging Markets Equity Fund | ||||
| Class A | ||||
| Actual | $1,000.00 | $ 737.20 | $5.34 | 1.24% |
| Hypothetical | 1,000.00 | 1,018.65 | 6.21 | 1.24 |
| Class C | ||||
| Actual | 1,000.00 | 735.30 | 7.49 | 1.74 |
| Hypothetical | 1,000.00 | 1,016.17 | 8.70 | 1.74 |
| Class I | ||||
| Actual | 1,000.00 | 738.00 | 4.27 | 0.99 |
| Hypothetical | 1,000.00 | 1,019.89 | 4.96 | 0.99 |
| Class R2 | ||||
| Actual | 1,000.00 | 735.90 | 6.63 | 1.54 |
| Hypothetical | 1,000.00 | 1,017.16 | 7.70 | 1.54 |
| Class R3 | ||||
| Actual | 1,000.00 | 737.10 | 5.56 | 1.29 |
| Hypothetical | 1,000.00 | 1,018.40 | 6.46 | 1.29 |
| Class R4 | ||||
| Actual | 1,000.00 | 737.80 | 4.48 | 1.04 |
| Hypothetical | 1,000.00 | 1,019.64 | 5.21 | 1.04 |
| Class R5 | ||||
| Actual | 1,000.00 | 738.50 | 3.84 | 0.89 |
| Hypothetical | 1,000.00 | 1,020.38 | 4.46 | 0.89 |
| Class R6 | ||||
| Actual | 1,000.00 | 738.60 | 3.41 | 0.79 |
| Hypothetical | 1,000.00 | 1,020.88 | 3.96 | 0.79 |
| 134 | J.P. Morgan International Equity Funds | April 30, 2022 |
| Beginning Account Value November 1, 2021 | Ending Account Value April 30, 2022 | Expenses Paid During the Period* | Annualized Expense Ratio | |
| JPMorgan Emerging Markets Research Enhanced Equity Fund | ||||
| Class I | ||||
| Actual | $1,000.00 | $ 841.00 | $2.05 | 0.45% |
| Hypothetical | 1,000.00 | 1,022.56 | 2.26 | 0.45 |
| Class R6 | ||||
| Actual | 1,000.00 | 841.60 | 1.60 | 0.35 |
| Hypothetical | 1,000.00 | 1,023.06 | 1.76 | 0.35 |
| JPMorgan Europe Dynamic Fund | ||||
| Class A | ||||
| Actual | 1,000.00 | 856.40 | 5.71 | 1.24 |
| Hypothetical | 1,000.00 | 1,018.65 | 6.21 | 1.24 |
| Class C | ||||
| Actual | 1,000.00 | 854.20 | 8.00 | 1.74 |
| Hypothetical | 1,000.00 | 1,016.17 | 8.70 | 1.74 |
| Class I | ||||
| Actual | 1,000.00 | 857.50 | 4.51 | 0.98 |
| Hypothetical | 1,000.00 | 1,019.94 | 4.91 | 0.98 |
| Class R6 | ||||
| Actual | 1,000.00 | 858.70 | 3.32 | 0.72 |
| Hypothetical | 1,000.00 | 1,021.22 | 3.61 | 0.72 |
| JPMorgan International Equity Fund | ||||
| Class A | ||||
| Actual | 1,000.00 | 830.20 | 4.31 | 0.95 |
| Hypothetical | 1,000.00 | 1,020.08 | 4.76 | 0.95 |
| Class C | ||||
| Actual | 1,000.00 | 828.40 | 6.57 | 1.45 |
| Hypothetical | 1,000.00 | 1,017.60 | 7.25 | 1.45 |
| Class I | ||||
| Actual | 1,000.00 | 831.50 | 3.18 | 0.70 |
| Hypothetical | 1,000.00 | 1,021.32 | 3.51 | 0.70 |
| Class R2 | ||||
| Actual | 1,000.00 | 829.40 | 5.67 | 1.25 |
| Hypothetical | 1,000.00 | 1,018.60 | 6.26 | 1.25 |
| Class R5 | ||||
| Actual | 1,000.00 | 831.70 | 2.72 | 0.60 |
| Hypothetical | 1,000.00 | 1,021.82 | 3.01 | 0.60 |
| Class R6 | ||||
| Actual | 1,000.00 | 832.30 | 2.27 | 0.50 |
| Hypothetical | 1,000.00 | 1,022.32 | 2.51 | 0.50 |
| JPMorgan International Focus Fund | ||||
| Class A | ||||
| Actual | 1,000.00 | 832.80 | 4.54 | 1.00 |
| Hypothetical | 1,000.00 | 1,019.84 | 5.01 | 1.00 |
| Class C | ||||
| Actual | 1,000.00 | 830.90 | 6.81 | 1.50 |
| Hypothetical | 1,000.00 | 1,017.36 | 7.50 | 1.50 |
| Class I | ||||
| Actual | 1,000.00 | 834.10 | 3.41 | 0.75 |
| Hypothetical | 1,000.00 | 1,021.08 | 3.76 | 0.75 |
| Class R2 | ||||
| Actual | 1,000.00 | 831.70 | 5.90 | 1.30 |
| Hypothetical | 1,000.00 | 1,018.35 | 6.51 | 1.30 |
| April 30, 2022 | J.P. Morgan International Equity Funds | 135 |
| Beginning Account Value November 1, 2021 | Ending Account Value April 30, 2022 | Expenses Paid During the Period* | Annualized Expense Ratio | |
| JPMorgan International Focus Fund (continued) | ||||
| Class R5 | ||||
| Actual | $1,000.00 | $ 834.30 | $2.96 | 0.65% |
| Hypothetical | 1,000.00 | 1,021.57 | 3.26 | 0.65 |
| Class R6 | ||||
| Actual | 1,000.00 | 835.00 | 2.50 | 0.55 |
| Hypothetical | 1,000.00 | 1,022.07 | 2.76 | 0.55 |
| JPMorgan International Hedged Equity Fund | ||||
| Class A | ||||
| Actual | 1,000.00 | 898.50 | 4.00 | 0.85 |
| Hypothetical | 1,000.00 | 1,020.58 | 4.26 | 0.85 |
| Class C | ||||
| Actual | 1,000.00 | 896.20 | 6.35 | 1.35 |
| Hypothetical | 1,000.00 | 1,018.10 | 6.76 | 1.35 |
| Class I | ||||
| Actual | 1,000.00 | 899.80 | 2.83 | 0.60 |
| Hypothetical | 1,000.00 | 1,021.82 | 3.01 | 0.60 |
| Class R5 | ||||
| Actual | 1,000.00 | 900.30 | 2.12 | 0.45 |
| Hypothetical | 1,000.00 | 1,022.56 | 2.26 | 0.45 |
| Class R6 | ||||
| Actual | 1,000.00 | 900.80 | 1.65 | 0.35 |
| Hypothetical | 1,000.00 | 1,023.06 | 1.76 | 0.35 |
| JPMorgan International Research Enhanced Equity Fund | ||||
| Class A | ||||
| Actual | 1,000.00 | 876.90 | 2.19 | 0.47 |
| Hypothetical | 1,000.00 | 1,022.46 | 2.36 | 0.47 |
| Class I | ||||
| Actual | 1,000.00 | 877.40 | 1.63 | 0.35 |
| Hypothetical | 1,000.00 | 1,023.06 | 1.76 | 0.35 |
| Class R6 | ||||
| Actual | 1,000.00 | 877.60 | 1.16 | 0.25 |
| Hypothetical | 1,000.00 | 1,023.56 | 1.25 | 0.25 |
| JPMorgan International Value Fund | ||||
| Class A | ||||
| Actual | 1,000.00 | 919.50 | 4.76 | 1.00 |
| Hypothetical | 1,000.00 | 1,019.84 | 5.01 | 1.00 |
| Class C | ||||
| Actual | 1,000.00 | 916.60 | 7.13 | 1.50 |
| Hypothetical | 1,000.00 | 1,017.36 | 7.50 | 1.50 |
| Class I | ||||
| Actual | 1,000.00 | 920.30 | 3.57 | 0.75 |
| Hypothetical | 1,000.00 | 1,021.08 | 3.76 | 0.75 |
| Class R2 | ||||
| Actual | 1,000.00 | 917.80 | 6.18 | 1.30 |
| Hypothetical | 1,000.00 | 1,018.35 | 6.51 | 1.30 |
| Class R5 | ||||
| Actual | 1,000.00 | 920.70 | 3.10 | 0.65 |
| Hypothetical | 1,000.00 | 1,021.57 | 3.26 | 0.65 |
| 136 | J.P. Morgan International Equity Funds | April 30, 2022 |
| Beginning Account Value November 1, 2021 | Ending Account Value April 30, 2022 | Expenses Paid During the Period* | Annualized Expense Ratio | |
| JPMorgan International Value Fund (continued) | ||||
| Class R6 | ||||
| Actual | $1,000.00 | $ 920.70 | $2.62 | 0.55% |
| Hypothetical | 1,000.00 | 1,022.07 | 2.76 | 0.55 |
| * | Expenses are equal to each Class’ respective annualized expense ratio, multiplied by the average account value over the period, multiplied by 181/365 (to reflect the one-half year period). |
| April 30, 2022 | J.P. Morgan International Equity Funds | 137 |
| 138 | J.P. Morgan International Equity Funds | April 30, 2022 |


| © JPMorgan Chase & Co., 2022. All rights reserved. April 2022. | SAN-INTEQ-422 |
| JPMorgan Tax Aware Equity Fund |
| JPMorgan Tax Aware Real Return Fund |

| 1 | |
| 2 | |
| Fund Commentaries: | |
| 3 | |
| 5 | |
| 8 | |
| 24 | |
| 32 | |
| 36 | |
| 46 | |
| 48 |
 | “The market environment remains challenging; investors should recognize the risks in trying to time market movements, as well as the potential long-term benefits of portfolio diversification.” — Andrea L. Lisher |

Head of Americas, Client
J.P. Morgan Asset Management
| April 30, 2022 | J.P. Morgan Tax Aware Funds | 1 |
| 2 | J.P. Morgan Tax Aware Funds | April 30, 2022 |
| REPORTING PERIOD RETURN: | |
Fund Class I Shares * | (12.03)% |
S&P 500 Index | (9.65)% |
Net Assets as of 4/30/2022 (In Thousands) | $1,171,616 |
| TOP TEN HOLDINGS OF THE PORTFOLIO AS OF April 30, 2022 | PERCENT OF TOTAL INVESTMENTS | ||
| 1. | Microsoft Corp. | 9.8 % | |
| 2. | Apple, Inc. | 5.8 | |
| 3. | Amazon.com, Inc. | 5.3 | |
| 4. | UnitedHealth Group, Inc. | 4.5 | |
| 5. | Alphabet, Inc., Class A | 4.4 | |
| 6. | Alphabet, Inc., Class C | 4.0 | |
| 7. | AbbVie, Inc. | 2.9 | |
| 8. | Mastercard, Inc., Class A | 2.9 | |
| 9. | Texas Instruments, Inc. | 2.7 | |
| 10. | NXP Semiconductors NV (China) | 2.7 | |
| PORTFOLIO COMPOSTION BY SECTOR AS OF April 30, 2022 | PERCENT OF TOTAL INVESTMENTS | |
Information Technology | 28.5% | |
Health Care | 15.5 | |
Industrials | 11.9 | |
Consumer Discretionary | 11.5 | |
Communication Services | 10.9 | |
Financials | 9.1 | |
Consumer Staples | 4.9 | |
Energy | 3.7 | |
Utilities | 2.0 | |
Materials | 1.7 | |
Short-Term Investments | 0.3 |
| * | The return shown is based on net asset values calculated for shareholder transactions and may differ from the return shown in the financial highlights, which reflects adjustments made to the net asset values in accordance with accounting principles generally accepted in the United States of America. |
| ** | The adviser seeks to achieve the Fund’s objective. There can be no guarantee it will be achieved. |
| April 30, 2022 | J.P. Morgan Tax Aware Funds | 3 |
| 6 MONTH | 1 YEAR | 5 YEAR | 10 YEAR | ||||||||||||||||||||||
| Inception Date of Class | Before Taxes* | After Taxes on Distributions* | After Taxes on Distributions and Sale of Fund Shares* | Before Taxes | After Taxes on Distributions | After Taxes on Distributions and Sale of Fund Shares | Before Taxes | After Taxes on Distributions | After Taxes on Distributions and Sale of Fund Shares | Before Taxes | After Taxes on Distributions | After Taxes on Distributions and Sale of Fund Shares | |||||||||||||
| CLASS A SHARES | March 22, 2011 | ||||||||||||||||||||||||
| With Sales Charge ** | (16.81)% | (19.37)% | (7.58)% | (8.66)% | (11.47)% | (2.52)% | 12.25% | 9.97% | 9.56% | 12.99% | 11.44% | 10.61% | |||||||||||||
| Without Sales Charge | (12.20) | (14.90) | (4.72) | (3.60) | (6.57) | 0.61 | 13.47 | 11.16 | 10.57 | 13.60 | 12.04 | 11.16 | |||||||||||||
| CLASS C SHARES | March 22, 2011 | ||||||||||||||||||||||||
| With CDSC *** | (13.40) | (16.15) | (5.39) | (5.05) | (8.06) | (0.20) | 12.91 | 10.67 | 10.14 | 13.16 | 11.68 | 10.80 | |||||||||||||
| Without CDSC | (12.40) | (15.15) | (4.79) | (4.05) | (7.06) | 0.39 | 12.91 | 10.67 | 10.14 | 13.16 | 11.68 | 10.80 | |||||||||||||
| Class I SHARES | January 30, 1997 | (12.03) | (14.75) | (4.61) | (3.22) | (6.25) | 0.90 | 13.93 | 11.53 | 10.93 | 14.08 | 12.42 | 11.54 | ||||||||||||
| Class R6 SHARES | October 01, 2018 | (11.96) | (14.69) | (4.56) | (3.09) | (6.15) | 0.99 | 14.02 | 11.60 | 11.00 | 14.13 | 12.46 | 11.58 | ||||||||||||
| * | Not annualized. |
| ** | Sales Charge for Class A Shares is 5.25%. |
| *** | Assumes a 1% CDSC (contingent deferred sales charge) for the 6 month and one year periods and 0% CDSC thereafter. |
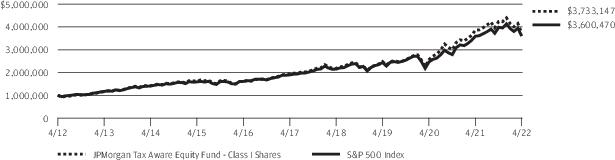
| 4 | J.P. Morgan Tax Aware Funds | April 30, 2022 |
| REPORTING PERIOD RETURN: | |
Fund (Class I Shares) * | (3.54)% |
Bloomberg U.S. 1-15 Year Blend (1-17) Municipal Bond Index | (6.69)% |
Tax Aware Real Return Composite Benchmark ** | (1.20)% |
Net Assets as of 4/30/2022 (In Thousands) | $607,253 |
| PORTFOLIO COMPOSITION AS OF April 30, 2022 | PERCENT OF TOTAL INVESTMENTS | |
Municipal Bonds | 87.7% | |
Short-Term Investments | 12.3 |
| * | The return shown is based on net asset values calculated for shareholder transactions and may differ from the return shown in the financial highlights, which reflects adjustments made to the net asset values in accordance with accounting principles generally accepted in the United States of America. |
| ** | The Fund’s Composite Benchmark is determined by adding the return of the Bloomberg U.S. 1-15 Year Blend (1-17) Municipal Bond Index (formerly known as Bloomberg Barclays U.S. 1-15 Year Blend (1-17) Municipal Bond Index) and the Bloomberg Inflation Swap 5 Year Zero Coupon Index (formerly known as Bloomberg Barclays Inflation Swap 5 Year Zero Coupon Index). |
| April 30, 2022 | J.P. Morgan Tax Aware Funds | 5 |
| *** | The adviser seeks to achieve the Fund’s objective. There can be no guarantee it will be achieved. |
| 6 | J.P. Morgan Tax Aware Funds | April 30, 2022 |
| 6 MONTH | 1 YEAR | 5 YEAR | 10 YEAR | ||||||||||||||||||||||
| Inception Date of Class | Before Taxes* | After Taxes on Distributions* | After Taxes on Distributions and Sale of Fund Shares* | Before Taxes | After Taxes on Distributions | After Taxes on Distributions and Sale of Fund Shares | Before Taxes | After Taxes on Distributions | After Taxes on Distributions and Sale of Fund Shares | Before Taxes | After Taxes on Distributions | After Taxes on Distributions and Sale of Fund Shares | |||||||||||||
| CLASS A SHARES | August 31, 2005 | ||||||||||||||||||||||||
| With Sales Charge ** | (7.22)% | (7.22)% | (4.05)% | (4.26)% | (4.27)% | (2.07)% | 1.36% | 1.31% | 1.45% | 0.96% | 0.93% | 1.20% | |||||||||||||
| Without Sales Charge | (3.58) | (3.58) | (1.89) | (0.50) | (0.52) | 0.17 | 2.14 | 2.09 | 2.06 | 1.35 | 1.32 | 1.51 | |||||||||||||
| CLASS C SHARES | August 31, 2005 | ||||||||||||||||||||||||
| With CDSC *** | (4.82) | (4.82) | (2.73) | (1.90) | (1.91) | (0.86) | 1.62 | 1.59 | 1.57 | 0.87 | 0.86 | 1.05 | |||||||||||||
| Without CDSC | (3.82) | (3.82) | (2.13) | (0.90) | (0.91) | (0.26) | 1.62 | 1.59 | 1.57 | 0.87 | 0.86 | 1.05 | |||||||||||||
| Class I SHARES | August 31, 2005 | (3.54) | (3.55) | (1.82) | (0.26) | (0.28) | 0.41 | 2.38 | 2.33 | 2.30 | 1.60 | 1.57 | 1.76 | ||||||||||||
| Class R6 SHARES | August 16, 2013 | (3.40) | (3.40) | (1.71) | (0.05) | (0.07) | 0.57 | 2.49 | 2.47 | 2.45 | 1.69 | 1.68 | 1.86 | ||||||||||||
| * | Not annualized. |
| ** | Sales Charge for Class A Shares is 3.75%. |
| *** | Assumes a 1% CDSC (contingent deferred sales charge) for the 6 month and one year periods and 0% CDSC thereafter. |
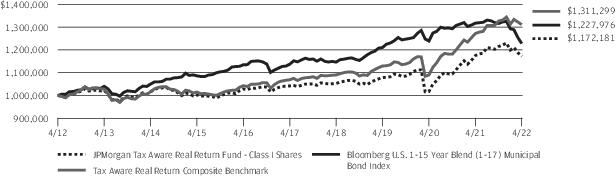
| April 30, 2022 | J.P. Morgan Tax Aware Funds | 7 |
| INVESTMENTS | SHARES (000) | VALUE ($000) |
| Common Stocks — 99.7% | ||
| Aerospace & Defense — 0.5% | ||
| Raytheon Technologies Corp. | 60 | 5,685 |
| Banks — 3.7% | ||
| Bank of America Corp. | 653 | 23,311 |
| First Republic Bank | 19 | 2,826 |
| Wells Fargo & Co. | 406 | 17,706 |
| 43,843 | ||
| Beverages — 2.2% | ||
| Monster Beverage Corp. * | 72 | 6,135 |
| PepsiCo, Inc. | 115 | 19,763 |
| 25,898 | ||
| Biotechnology — 3.6% | ||
| AbbVie, Inc. | 230 | 33,797 |
| Regeneron Pharmaceuticals, Inc. * | 13 | 8,569 |
| 42,366 | ||
| Building Products — 0.4% | ||
| Trane Technologies plc | 35 | 4,882 |
| Capital Markets — 2.6% | ||
| Charles Schwab Corp. (The) | 138 | 9,160 |
| Morgan Stanley | 200 | 16,132 |
| S&P Global, Inc. | 15 | 5,572 |
| 30,864 | ||
| Chemicals — 1.7% | ||
| Linde plc (United Kingdom) | 62 | 19,424 |
| Commercial Services & Supplies — 1.4% | ||
| Waste Connections, Inc. | 122 | 16,777 |
| Consumer Finance — 1.8% | ||
| American Express Co. | 118 | 20,563 |
| Electric Utilities — 2.0% | ||
| NextEra Energy, Inc. | 323 | 22,973 |
| Energy Equipment & Services — 1.4% | ||
| Baker Hughes Co. | 538 | 16,704 |
| Food & Staples Retailing — 1.1% | ||
| Costco Wholesale Corp. | 25 | 13,080 |
| Food Products — 1.6% | ||
| Mondelez International, Inc., Class A | 281 | 18,109 |
| Health Care Equipment & Supplies — 1.6% | ||
| Boston Scientific Corp. * | 252 | 10,619 |
| Intuitive Surgical, Inc. * | 32 | 7,562 |
| 18,181 | ||
| INVESTMENTS | SHARES (000) | VALUE ($000) |
| Health Care Providers & Services — 4.5% | ||
| UnitedHealth Group, Inc. | 105 | 53,223 |
| Hotels, Restaurants & Leisure — 1.8% | ||
| Booking Holdings, Inc. * | 4 | 8,289 |
| Hilton Worldwide Holdings, Inc. * | 82 | 12,842 |
| 21,131 | ||
| Industrial Conglomerates — 1.4% | ||
| Honeywell International, Inc. | 81 | 15,761 |
| Insurance — 1.0% | ||
| Arthur J Gallagher & Co. | 29 | 4,920 |
| Progressive Corp. (The) | 65 | 6,914 |
| 11,834 | ||
| Interactive Media & Services — 10.1% | ||
| Alphabet, Inc., Class A * | 23 | 51,717 |
| Alphabet, Inc., Class C * | 20 | 47,265 |
| Meta Platforms, Inc., Class A * | 73 | 14,646 |
| Snap, Inc., Class A * | 167 | 4,750 |
| 118,378 | ||
| Internet & Direct Marketing Retail — 5.3% | ||
| Amazon.com, Inc. * | 25 | 62,215 |
| IT Services — 3.9% | ||
| Fiserv, Inc. * | 89 | 8,676 |
| Mastercard, Inc., Class A | 92 | 33,518 |
| PayPal Holdings, Inc. * | 42 | 3,679 |
| 45,873 | ||
| Life Sciences Tools & Services — 2.3% | ||
| Danaher Corp. | 80 | 20,166 |
| Thermo Fisher Scientific, Inc. | 13 | 6,911 |
| 27,077 | ||
| Machinery — 2.3% | ||
| Deere & Co. | 57 | 21,502 |
| Dover Corp. | 42 | 5,612 |
| 27,114 | ||
| Media — 0.8% | ||
| Charter Communications, Inc., Class A * | 21 | 9,142 |
| Multiline Retail — 0.7% | ||
| Dollar General Corp. | 32 | 7,625 |
| Oil, Gas & Consumable Fuels — 2.3% | ||
| ConocoPhillips | 280 | 26,755 |
| 8 | J.P. Morgan Tax Aware Funds | April 30, 2022 |
| INVESTMENTS | SHARES (000) | VALUE ($000) |
| Common Stocks — continued | ||
| Pharmaceuticals — 3.5% | ||
| Bristol-Myers Squibb Co. | 149 | 11,261 |
| Eli Lilly & Co. | 103 | 30,047 |
| 41,308 | ||
| Road & Rail — 5.9% | ||
| Norfolk Southern Corp. | 118 | 30,469 |
| Old Dominion Freight Line, Inc. | 39 | 10,925 |
| Union Pacific Corp. | 120 | 28,045 |
| 69,439 | ||
| Semiconductors & Semiconductor Equipment — 9.0% | ||
| Advanced Micro Devices, Inc. * | 102 | 8,740 |
| Analog Devices, Inc. | 71 | 10,977 |
| ASML Holding NV (Registered), NYRS (Netherlands) | 11 | 5,891 |
| NVIDIA Corp. | 91 | 16,859 |
| NXP Semiconductors NV (China) | 182 | 31,087 |
| Texas Instruments, Inc. | 187 | 31,888 |
| 105,442 | ||
| Software — 9.7% | ||
| Microsoft Corp. | 411 | 114,175 |
| Specialty Retail — 3.8% | ||
| AutoZone, Inc. * | 10 | 19,107 |
| Burlington Stores, Inc. * | 38 | 7,817 |
| Lowe's Cos., Inc. | 87 | 17,144 |
| 44,068 | ||
| INVESTMENTS | SHARES (000) | VALUE ($000) |
| Technology Hardware, Storage & Peripherals — 5.8% | ||
| Apple, Inc. | 432 | 68,081 |
| Total Common Stocks (Cost $491,275) | 1,167,990 | |
| Short Term Investments — 0.3% | ||
| Investment Companies — 0.3% | ||
| JPMorgan Prime Money Market Fund Class IM Shares, 0.42% (a) (b) (Cost $3,537) | 3,536 | 3,537 |
| Total Investments — 100.0% (Cost $494,812) | 1,171,527 | |
| Other Assets Less Liabilities — 0.0% ^ | 89 | |
| NET ASSETS — 100.0% | 1,171,616 | |
Percentages indicated are based on net assets. | ||
| Abbreviations | |
| NYRS | New York Registry Shares |
| ^ | Amount rounds to less than 0.1% of net assets. |
| * | Non-income producing security. |
| (a) | Investment in an affiliated fund, which is registered under the Investment Company Act of 1940, as amended, and is advised by J.P. Morgan Investment Management Inc. |
| (b) | The rate shown is the current yield as of April 30, 2022. |
| April 30, 2022 | J.P. Morgan Tax Aware Funds | 9 |
| INVESTMENTS | PRINCIPAL AMOUNT ($000) | VALUE ($000) |
| Municipal Bonds — 86.0% (a) | ||
| Alabama — 1.8% | ||
| Alabama Public School and College Authority Series 2016-A, Rev., 4.00%, 6/1/2031 | 35 | 36 |
| Black Belt Energy Gas District, Gas Project No. 8 Series 2022A, Rev., VRDO, 4.00%, 12/1/2029 (b) | 1,615 | 1,664 |
| Black Belt Energy Gas District, Gas Supply | ||
| Series 2021C-1, Rev., VRDO, 4.00%, 12/1/2026 (b) | 450 | 457 |
| Series 2021A, Rev., VRDO, LIQ : Royal Bank of Canada, 4.00%, 12/1/2031 (b) | 3,000 | 3,084 |
| Southeast Energy Authority A Cooperative District, Project No. 2 Series 2021B, Rev., VRDO, 4.00%, 12/1/2031 (b) | 5,745 | 5,821 |
| Total Alabama | 11,062 | |
| Alaska — 1.0% | ||
| Borough of Matanuska-Susitna, Goose Creek Correctional Center Project | ||
| Series 2016, Rev., 5.00%, 9/1/2024 | 15 | 16 |
| Rev., 5.25%, 9/1/2029 | 3,490 | 3,726 |
| City and Borough of Juneau | ||
| GO, 4.00%, 6/1/2029 | 800 | 859 |
| GO, 4.00%, 6/1/2030 | 380 | 411 |
| GO, 4.00%, 6/1/2031 | 250 | 271 |
| GO, 4.00%, 6/1/2032 | 855 | 924 |
| Total Alaska | 6,207 | |
| Arizona — 1.2% | ||
| Arizona Board of Regents Series 2022A, Rev., 5.00%, 7/1/2034 | 350 | 405 |
| Arizona Industrial Development Authority, Doral Academy of Northern Nevada Project Series 2021A, Rev., 4.00%, 7/15/2036 (c) | 275 | 257 |
| Arizona Industrial Development Authority, Macombs Facility Project Series 2021A, Rev., 4.00%, 7/1/2041 | 135 | 123 |
| Arizona Industrial Development Authority, Pinecrest Academy of Northern Nevada Project Series 2022A, Rev., 4.50%, 7/15/2029 (c) | 150 | 146 |
| City of Phoenix, GO, 5.00%, 7/1/2031 (d) | 1,500 | 1,754 |
| City of Phoenix Civic Improvement Corp., Junior Lien Series 2021A, Rev., 5.00%, 7/1/2035 | 1,200 | 1,397 |
| City of San Luis Series A, Rev., AGM, 5.00%, 7/1/2025 | 50 | 54 |
| City of Sedona, Excise Tax | ||
| Rev., 5.00%, 7/1/2028 | 200 | 225 |
| Rev., 5.00%, 7/1/2029 | 200 | 227 |
| INVESTMENTS | PRINCIPAL AMOUNT ($000) | VALUE ($000) |
| Arizona — continued | ||
| Rev., 5.00%, 7/1/2030 | 100 | 115 |
| Rev., 5.00%, 7/1/2031 | 175 | 203 |
| Rev., 5.00%, 7/1/2032 | 100 | 117 |
| Rev., 5.00%, 7/1/2033 | 300 | 349 |
| County of Pima, Rev., 3.00%, 7/1/2023 | 5 | 5 |
| Maricopa County Industrial Development Authority, Honorhealth | ||
| Series 2021A, Rev., 5.00%, 9/1/2036 | 750 | 838 |
| Series 2021A, Rev., 4.00%, 9/1/2037 | 695 | 701 |
| Pima County Regional Transportation Authority, Excise Tax Series 2014, Rev., 5.00%, 6/1/2025 | 20 | 21 |
| Pima County Unified School District No. 16 Catalina Foothills, School Improvement Projects Series 2018-B, GO, 5.00%, 7/1/2028 | 10 | 11 |
| Pinal County Electric District No. 3, Rev., 5.00%, 7/1/2029 | 200 | 226 |
| Salt River Project Agricultural Improvement & Power District, Electric System Series A, Rev., 5.00%, 1/1/2028 | 185 | 208 |
| Town of Queen Creek, Excise Tax | ||
| Series 2016, Rev., 4.00%, 8/1/2026 | 25 | 26 |
| Rev., 5.00%, 8/1/2029 | 10 | 11 |
| Total Arizona | 7,419 | |
| Arkansas — 0.3% | ||
| City of Cabot | ||
| Series 2021B, Rev., 5.00%, 12/1/2026 | 300 | 331 |
| Series 2021B, Rev., 5.00%, 12/1/2027 | 325 | 362 |
| City of Fort Smith, Water and Sewer, Rev., 5.00%, 10/1/2027 | 1,305 | 1,432 |
| City of Springdale Public Facilities Board Hospital, Arkansas Children's Northwest Project Series 2016, Rev., 5.00%, 3/1/2030 | 10 | 11 |
| Total Arkansas | 2,136 | |
| California — 8.6% | ||
| Briggs Elementary School District, Election of 2014 Series B, GO, 4.00%, 8/1/2030 | 5 | 5 |
| California Enterprise Development Authority, Rocketship Public Schools | ||
| Series 2022A, Rev., 4.00%, 6/1/2031 (c) | 250 | 241 |
| Series 2022A, Rev., 4.00%, 6/1/2042 (c) | 550 | 497 |
| California Health Facilities Financing Authority, Kaiser Permanente Series 2017A, Subseries 2017A-2, Rev., 4.00%, 11/1/2038 | 1,000 | 1,008 |
| 10 | J.P. Morgan Tax Aware Funds | April 30, 2022 |
| INVESTMENTS | PRINCIPAL AMOUNT ($000) | VALUE ($000) |
| Municipal Bonds — continued | ||
| California — continued | ||
| California Infrastructure and Economic Development Bank, Bay Area Toll Bridges, First Lien Series 2003A, Rev., AGM, 5.00%, 7/1/2022 (e) | 340 | 342 |
| California Municipal Finance Authority, Lutheran University | ||
| Rev., 5.00%, 10/1/2029 | 225 | 246 |
| Rev., 5.00%, 10/1/2030 | 225 | 245 |
| Rev., 5.00%, 10/1/2031 | 225 | 244 |
| California Municipal Finance Authority, Mount San Antonio Garden Series 2022B1, Rev., 2.75%, 11/15/2027 | 100 | 93 |
| California Public Finance Authority, Enso Village Project | ||
| Series 2021B-3, Rev., 2.13%, 11/15/2027 (c) | 150 | 142 |
| Series 2021B-2, Rev., 2.38%, 11/15/2028 (c) | 260 | 244 |
| Series 2021B-1, Rev., 3.13%, 5/15/2029 (c) | 100 | 94 |
| Series 2021A, Rev., 5.00%, 11/15/2036 (c) | 100 | 102 |
| Series 2021A, Rev., 5.00%, 11/15/2046 (c) | 100 | 100 |
| California Statewide Communities Development Authority, San Francisco Campus for Jewish Living Project | ||
| Rev., 4.00%, 11/1/2031 | 100 | 107 |
| Rev., 4.00%, 11/1/2032 | 160 | 170 |
| City of Culver City, Wastewater Facilities Series A, Rev., 4.00%, 9/1/2035 | 25 | 26 |
| City of Los Angeles, Department of Water and Power, Power System | ||
| Series B, Rev., 5.00%, 7/1/2031 | 2,100 | 2,180 |
| Series A, Rev., 5.00%, 7/1/2032 | 2,550 | 2,779 |
| Series B, Rev., 5.00%, 7/1/2032 | 1,925 | 1,998 |
| Series D, Rev., 5.00%, 7/1/2032 | 3,300 | 3,453 |
| Series 2019-C, Rev., 5.00%, 7/1/2034 | 5 | 6 |
| Series A, Rev., 5.00%, 7/1/2034 | 710 | 771 |
| City of Santa Rosa, Wastewater Series B, Rev., AGM-CR, AMBAC, Zero Coupon, 9/1/2023 | 4,750 | 4,598 |
| County of San Bernardino, Arrowhead Project Series 2019 A, COP, 5.00%, 10/1/2026 | 200 | 220 |
| CSCDA Community Improvement Authority, Essential Housing, Orange Portfolio Series 2021A-1, Rev., 2.80%, 3/1/2047 (c) | 1,510 | 1,200 |
| CSCDA Community Improvement Authority, Essential Housing, Pasadena Portfolio Series 2021A-1, Rev., 2.65%, 12/1/2046 (c) | 200 | 161 |
| CSCDA Community Improvement Authority, Essential Housing, Senior Lien Series 2021A-1, Rev., 2.45%, 2/1/2047 (c) | 1,420 | 1,093 |
| INVESTMENTS | PRINCIPAL AMOUNT ($000) | VALUE ($000) |
| California — continued | ||
| Golden State Tobacco Securitization Corp., Tobacco Settlement Series 2015A, Rev., 5.00%, 6/1/2025 (e) | 4,950 | 5,321 |
| Lompoc Valley Medical Center, GO, 5.00%, 8/1/2024 | 15 | 16 |
| Los Angeles Community College District, Election of 2008 Series G, GO, 4.00%, 8/1/2024 (e) | 145 | 150 |
| Los Angeles Department of Water and Power Power System | ||
| Series 2017B, Rev., 5.00%, 7/1/2029 | 3,580 | 3,935 |
| Series 2017A, Rev., 5.00%, 7/1/2033 | 5,000 | 5,437 |
| Los Angeles Unified School District, Headquarters Building Projects Series B, COP, 5.00%, 10/1/2031 | 80 | 81 |
| Sacramento Municipal Utility District, Financing Authority, Cosumnes Project, Rev., 5.00%, 7/1/2028 | 1,290 | 1,386 |
| San Francisco Bay Area Rapid Transit District, Sales Tax | ||
| Series A, Rev., 5.00%, 7/1/2025 | 395 | 425 |
| Series A, Rev., 5.00%, 7/1/2026 | 225 | 242 |
| San Francisco City and County, Airport Commission, San Francisco International Airport Series 2019A, Rev., AMT, 5.00%, 5/1/2034 | 25 | 27 |
| San Joaquin County Transportation Authority, Measure K Sales Tax, Rev., 5.00%, 3/1/2030 | 2,000 | 2,204 |
| Sanger Unified School District, Capital Projects | ||
| COP, AGM, 5.00%, 6/1/2033 | 145 | 167 |
| COP, AGM, 5.00%, 6/1/2034 | 400 | 458 |
| COP, AGM, 5.00%, 6/1/2035 | 425 | 485 |
| South Placer Wastewater Authority, Rev., 5.00%, 11/1/2024 | 10 | 11 |
| State of California, Various Purpose | ||
| GO, 5.00%, 8/1/2030 | 5,370 | 5,699 |
| GO, 5.00%, 12/1/2035 | 3,250 | 3,705 |
| Westminster School District Series 2016, GO, 5.00%, 8/1/2030 | 5 | 5 |
| Total California | 52,119 | |
| Colorado — 1.5% | ||
| City of Aurora, COP, 5.00%, 12/1/2031 | 15 | 17 |
| City of Greeley, COP, 4.00%, 12/1/2034 | 10 | 10 |
| Colorado Educational and Cultural Facilities Authority, Aspen View Academy Project | ||
| Rev., 4.00%, 5/1/2026 | 30 | 30 |
| Rev., 4.00%, 5/1/2028 | 35 | 35 |
| Rev., 4.00%, 5/1/2030 | 35 | 34 |
| April 30, 2022 | J.P. Morgan Tax Aware Funds | 11 |
| INVESTMENTS | PRINCIPAL AMOUNT ($000) | VALUE ($000) |
| Municipal Bonds — continued | ||
| Colorado — continued | ||
| Rev., 4.00%, 5/1/2036 | 85 | 81 |
| Colorado Higher Education, Lease Purchase Financing Program, COP, 5.00%, 9/1/2031 | 500 | 581 |
| Denver Health and Hospital Authority, Healthcare | ||
| Series 2019-A, Rev., 4.00%, 12/1/2038 | 1,250 | 1,231 |
| Series 2019-A, Rev., 4.00%, 12/1/2039 | 1,000 | 981 |
| El Paso County School District No. 49 Falcon | ||
| COP, 5.00%, 12/15/2026 | 75 | 83 |
| COP, 5.00%, 12/15/2027 | 110 | 123 |
| COP, 5.00%, 12/15/2028 | 170 | 192 |
| Rampart Range Metropolitan District No. 5, Rev., 4.00%, 12/1/2036 | 500 | 443 |
| Reunion Metropolitan District Series 2021A, Rev., 3.63%, 12/1/2044 | 500 | 390 |
| State of Colorado Series 2021A, COP, 5.00%, 12/15/2028 | 1,800 | 2,035 |
| Third Creek Metropolitan District No. 1 Series 2022A-1, GO, 4.50%, 12/1/2037 | 825 | 728 |
| University of Colorado, Enterprise System Series 2021C-3B, Rev., VRDO, 2.00%, 10/15/2026 (b) | 475 | 453 |
| Waterview II Metropolitan District Series 2022A, GO, 4.50%, 12/1/2031 | 525 | 488 |
| Windler Public Improvement Authority, Limited Tax | ||
| Series 2021 A-1, Rev., 4.00%, 12/1/2036 | 885 | 760 |
| Series 2021 A-1, Rev., 4.00%, 12/1/2041 | 750 | 602 |
| Total Colorado | 9,297 | |
| Connecticut — 0.5% | ||
| Connecticut State Health and Educational Facilities Authority Series 2020A, Rev., 5.00%, 7/1/2029 | 100 | 111 |
| State of Connecticut Special Tax Series 2021A, Rev., 5.00%, 5/1/2030 | 2,400 | 2,751 |
| Town of Southington Series 2020C, GO, 5.00%, 6/1/2028 | 5 | 6 |
| Town of Stafford, GO, 3.00%, 8/1/2026 | 10 | 10 |
| Total Connecticut | 2,878 | |
| District of Columbia — 0.7% | ||
| District of Columbia | ||
| Series 2017A, GO, 5.00%, 6/1/2029 | 290 | 319 |
| Series 2017A, GO, 5.00%, 6/1/2030 | 400 | 440 |
| Series 2017A, GO, 5.00%, 6/1/2031 | 600 | 657 |
| Series 2017A, GO, 5.00%, 6/1/2032 | 665 | 727 |
| District of Columbia, Gallaudet University Project | ||
| Series 2021A, Rev., 4.00%, 4/1/2033 | 160 | 168 |
| INVESTMENTS | PRINCIPAL AMOUNT ($000) | VALUE ($000) |
| District of Columbia — continued | ||
| Series 2021A, Rev., 4.00%, 4/1/2034 | 165 | 172 |
| Series 2021A, Rev., 4.00%, 4/1/2035 | 200 | 208 |
| Series 2021A, Rev., 4.00%, 4/1/2036 | 200 | 208 |
| District of Columbia, Income Tax Secured Series 2020C, Rev., 5.00%, 5/1/2037 | 1,000 | 1,131 |
| Total District of Columbia | 4,030 | |
| Florida — 4.5% | ||
| Broward County, Water and Sewer Utility Series 2015B, Rev., 5.00%, 10/1/2030 | 5,000 | 5,376 |
| Capital Trust Agency, Inc., Legends Academy Project Series 2021A, Rev., 5.00%, 12/1/2045 (c) | 175 | 154 |
| Capital Trust Agency, Inc., The Marie Selby Botanical Gardens, Inc. Project, Rev., 4.00%, 6/15/2031 (c) | 100 | 92 |
| City of Jacksonville | ||
| Series 2022A, Rev., 5.00%, 10/1/2029 (d) | 205 | 228 |
| Series 2022A, Rev., 5.00%, 10/1/2030 (d) | 225 | 253 |
| City of Pompano Beach, John Knox Village Project | ||
| Rev., 3.50%, 9/1/2030 | 1,900 | 1,809 |
| Rev., 3.50%, 9/1/2035 | 2,250 | 2,039 |
| Series 2021A, Rev., 4.00%, 9/1/2036 | 115 | 110 |
| Florida Atlantic University Finance Corp., Student Housing Project Series 2019B, Rev., 5.00%, 7/1/2029 | 250 | 281 |
| Florida Development Finance Corp., Mater Academy Project | ||
| Series 2022A, Rev., 5.00%, 6/15/2028 | 180 | 190 |
| Series 2022A, Rev., 5.00%, 6/15/2031 | 260 | 271 |
| Florida Development Finance Corp., River city Science Academy Series 2022B, Rev., 5.00%, 7/1/2031 (d) | 165 | 169 |
| Florida Development Finance Corp., The Mayflower Retirement Community Project | ||
| Series 2021B-2, Rev., 1.75%, 6/1/2026 (c) | 100 | 93 |
| Series 2021B-1, Rev., 2.38%, 6/1/2027 (c) | 100 | 92 |
| Series 2021A, Rev., 4.00%, 6/1/2029 (c) | 1,375 | 1,329 |
| Series 2021A, Rev., 4.00%, 6/1/2030 (c) | 1,435 | 1,369 |
| Series 2021A, Rev., 4.00%, 6/1/2031 (c) | 1,395 | 1,316 |
| Series 2021A, Rev., 4.00%, 6/1/2036 (c) | 2,105 | 1,900 |
| Florida Gulf Coast University Financing Corp., Housing Project | ||
| Series 2017A, Rev., 5.00%, 8/1/2032 | 500 | 544 |
| Series 2020A, Rev., 4.00%, 2/1/2037 | 200 | 203 |
| 12 | J.P. Morgan Tax Aware Funds | April 30, 2022 |
| INVESTMENTS | PRINCIPAL AMOUNT ($000) | VALUE ($000) |
| Municipal Bonds — continued | ||
| Florida — continued | ||
| Florida Higher Educational Facilities Financial Authority, Rollins College Project Series 2020A, Rev., 4.00%, 12/1/2037 | 1,590 | 1,625 |
| Florida Municipal Power Agency, St. Lucie Project Series 2021A, Rev., 5.00%, 10/1/2031 | 1,000 | 1,156 |
| Hillsborough County Industrial Development Authority, Baycare Health System Series 2020B, Rev., VRDO, LOC : TD Bank NA, 0.28%, 5/2/2022 (b) | 300 | 300 |
| JEA Electric System Series 2017B, Rev., 5.00%, 10/1/2033 | 4,000 | 4,405 |
| Lee County Industrial Development Authority, Cypress Cove at Healthpark Florida, Inc., Project Series 2022B2, Rev., 3.25%, 10/1/2026 | 1,500 | 1,485 |
| Palm Beach County Health Facilities Authority, Toby and Leon Cooperman Sinai, Rev., 4.00%, 6/1/2041 | 500 | 459 |
| St. Johns County Industrial Development Authority, Vicar's Landing Project Series 2021A, Rev., 4.00%, 12/15/2029 | 225 | 219 |
| University of Central Florida Housing Facility Series 2021A, Rev., 5.00%, 10/1/2024 | 50 | 53 |
| Wildwood Utility Dependent District, Rev., 5.00%, 10/1/2030 | 125 | 142 |
| Total Florida | 27,662 | |
| Georgia — 2.6% | ||
| Albany-Dougherty Inner City Authority, Albany State University Projects, Rev., 5.00%, 7/1/2032 | 2,000 | 2,232 |
| City of Bainbridge, Utilities, Rev., 4.00%, 12/1/2033 | 435 | 463 |
| Clayton County Development Authority, Clayton State University Project | ||
| Rev., 5.00%, 7/1/2026 | 50 | 54 |
| Rev., 5.00%, 7/1/2027 | 100 | 111 |
| Rev., 5.00%, 7/1/2028 | 125 | 140 |
| Main Street Natural Gas, Inc. Series 2021C, Rev., VRDO, 4.00%, 12/1/2028 (b) | 5,000 | 5,093 |
| Milledgeville and Baldwin County Development Authority, College and State University Projects | ||
| Rev., 5.00%, 6/15/2026 | 450 | 489 |
| Rev., 5.00%, 6/15/2027 | 415 | 458 |
| Rev., 5.00%, 6/15/2030 | 1,075 | 1,217 |
| Rev., 5.00%, 6/15/2034 | 1,600 | 1,790 |
| Rev., 5.00%, 6/15/2035 | 1,000 | 1,117 |
| Oconee County School District | ||
| GO, 5.00%, 3/1/2030 | 360 | 416 |
| INVESTMENTS | PRINCIPAL AMOUNT ($000) | VALUE ($000) |
| Georgia — continued | ||
| GO, 5.00%, 3/1/2031 | 175 | 205 |
| Polk School District, Sales Tax, GO, 5.00%, 3/1/2025 | 325 | 347 |
| Savannah Economic Development Authority, University Project | ||
| Series 2021B, Rev., 5.00%, 6/15/2027 | 295 | 326 |
| Series 2021B, Rev., 5.00%, 6/15/2028 | 205 | 229 |
| Series 2021B, Rev., 5.00%, 6/15/2029 | 320 | 360 |
| Series 2021B, Rev., 5.00%, 6/15/2030 | 340 | 385 |
| State of Georgia Series 2015A, GO, 5.00%, 2/1/2025 | 130 | 139 |
| Total Georgia | 15,571 | |
| Idaho — 0.1% | ||
| Idaho Housing and Finance Association Series 2021A, Rev., 5.00%, 7/15/2035 | 750 | 851 |
| Illinois — 3.2% | ||
| City of Chicago, Second Lien Waterworks Project | ||
| Rev., 5.00%, 11/1/2022 | 400 | 406 |
| Rev., 5.00%, 11/1/2029 | 1,000 | 1,048 |
| County of Cook Series 2021A, GO, 5.00%, 11/15/2028 | 2,300 | 2,567 |
| Illinois Finance Authority, Smith Crossing | ||
| Rev., 4.00%, 10/15/2025 | 295 | 297 |
| Rev., 4.00%, 10/15/2029 | 150 | 148 |
| Rev., 4.00%, 10/15/2030 | 100 | 98 |
| Rev., 4.00%, 10/15/2031 | 135 | 132 |
| Illinois State Toll Highway Authority Series 2014A, Rev., 5.00%, 12/1/2022 | 3,000 | 3,057 |
| Northern Illinois University, Auxiliary Facilities System | ||
| Rev., 5.00%, 10/1/2026 | 250 | 270 |
| Rev., 5.00%, 10/1/2027 | 325 | 356 |
| Rev., 5.00%, 10/1/2028 | 325 | 360 |
| Regional Transportation Authority Series A, Rev., NATL -RE, 6.00%, 7/1/2024 | 750 | 808 |
| State of Illinois | ||
| Series 2017D, GO, 5.00%, 11/1/2028 | 1,350 | 1,450 |
| Series 2021 A, GO, 5.00%, 3/1/2030 | 1,260 | 1,372 |
| Series 2018-A, GO, 5.00%, 10/1/2030 | 2,000 | 2,152 |
| Series 2021B, GO, 5.00%, 12/1/2033 | 1,000 | 1,077 |
| Series 2021A, GO, 4.00%, 3/1/2038 | 1,000 | 943 |
| Series 2021A, GO, 4.00%, 3/1/2039 | 3,000 | 2,814 |
| Total Illinois | 19,355 | |
| April 30, 2022 | J.P. Morgan Tax Aware Funds | 13 |
| INVESTMENTS | PRINCIPAL AMOUNT ($000) | VALUE ($000) |
| Municipal Bonds — continued | ||
| Indiana — 1.4% | ||
| City of Valparaiso, Green Oaks of Valparaiso LLC, Rev., 5.38%, 12/1/2041 (c) | 200 | 161 |
| Crown Point Multi School Building Corp., Ad Valorem Property Tax, First Mortgage, Rev., 5.00%, 7/15/2033 | 2,035 | 2,319 |
| Fort Wayne Redevelopment Authority, Harrison Square Project, Rev., 5.00%, 2/1/2026 | 1,110 | 1,157 |
| Indiana Finance Authority, Rose-Hulman Institute of Technology Project | ||
| Rev., 5.00%, 6/1/2029 | 125 | 139 |
| Rev., 5.00%, 6/1/2031 | 100 | 111 |
| Rev., 4.00%, 6/1/2033 | 115 | 117 |
| Indianapolis Local Public Improvement Bond Bank, Stormwater Project Series 2013D, Rev., 5.00%, 1/1/2026 | 4,050 | 4,138 |
| Lake Ridge School Building Corp., First Mortgage, Rev., 4.00%, 7/15/2028 | 125 | 129 |
| Lawrence Township School Building Corp., Ad Valorem Property Tax, Rev., 5.00%, 1/15/2030 | 100 | 114 |
| Total Indiana | 8,385 | |
| Iowa — 0.0% ^ | ||
| Iowa Finance Authority, State Revolving Fund, Rev., 5.00%, 8/1/2032 | 20 | 22 |
| Kentucky — 1.8% | ||
| City of Hazard, Appalachian Regional Healthcare, Inc., Rev., 4.00%, 7/1/2036 | 805 | 803 |
| City of Henderson, Pratt Paper LLC Project | ||
| Series 2022B, Rev., AMT, 3.70%, 1/1/2032 (c) | 440 | 430 |
| Series 2022B, Rev., AMT, 4.45%, 1/1/2042 (c) | 500 | 482 |
| County of Carroll, Kentucky Environmental Facilities | ||
| Series 2008A, Rev., AMT, 2.00%, 2/1/2032 | 1,225 | 1,023 |
| Series 2006B, Rev., AMT, 2.13%, 10/1/2034 | 1,000 | 812 |
| County of Trimble, Louisville Gas And Electric Co. Project Series 2001A, Rev., 0.63%, 9/1/2026 | 3,250 | 2,832 |
| Kentucky Bond Development Corp., Centre College | ||
| Rev., 4.00%, 6/1/2027 | 235 | 246 |
| Rev., 4.00%, 6/1/2028 | 125 | 131 |
| Rev., 4.00%, 6/1/2029 | 160 | 169 |
| Rev., 4.00%, 6/1/2030 | 165 | 174 |
| Kentucky Public Energy Authority Series 2022A-1, Rev., VRDO, 4.00%, 8/1/2030 (b) | 3,825 | 3,895 |
| Total Kentucky | 10,997 | |
| Louisiana — 0.6% | ||
| City of Alexandria, Utilities Series 2013A, Rev., 5.00%, 5/1/2023 (e) | 1,250 | 1,287 |
| INVESTMENTS | PRINCIPAL AMOUNT ($000) | VALUE ($000) |
| Louisiana — continued | ||
| Lafayette Public Power Authority, Rev., 5.00%, 11/1/2025 | 15 | 16 |
| Louisiana Local Government Environmental Facilities and Community Development Authority, Bossier City Project, Rev., 5.00%, 10/1/2027 | 25 | 28 |
| Louisiana Public Facilities Authority, Ochsner Clinic Foundation Project | ||
| Series 2020A, Rev., 5.00%, 5/15/2035 | 650 | 724 |
| Series 2020A, Rev., 5.00%, 5/15/2036 | 775 | 862 |
| Series 2020A, Rev., 5.00%, 5/15/2037 | 500 | 555 |
| Louisiana Public Facilities Authority, School Master Project Series 2021A, Rev., 4.00%, 6/1/2031 (c) | 290 | 275 |
| St. Tammany Parish Hospital Service District No. 1 Series 2018-A, Rev., 5.00%, 7/1/2032 | 15 | 17 |
| State of Louisiana, State Highway Improvement Series 2013-A, Rev., 5.00%, 6/15/2023 | 40 | 41 |
| Terrebonne Parish Recreation District No. 5, GO, 5.00%, 3/1/2027 | 20 | 22 |
| Total Louisiana | 3,827 | |
| Maine — 0.3% | ||
| Maine Municipal Bond Bank | ||
| Series 2022A, Rev., 5.00%, 11/1/2033 (d) | 800 | 940 |
| Series 2022A, Rev., 5.00%, 11/1/2034 (d) | 700 | 819 |
| Total Maine | 1,759 | |
| Maryland — 1.6% | ||
| City of Baltimore, Water Project Series 2020A, Rev., 4.00%, 7/1/2038 | 1,000 | 1,028 |
| County of Baltimore, GO, 5.00%, 3/1/2029 | 2,000 | 2,296 |
| County of Baltimore, Public Improvement, GO, 5.00%, 3/1/2036 | 3,560 | 4,135 |
| County of Howard Series 2019-B, GO, 5.00%, 8/15/2027 | 15 | 17 |
| County of Montgomery, Consolidated Public Improvements Series A, GO, 4.00%, 12/1/2033 | 5 | 5 |
| Maryland Health and Higher Educational Facilities Authority, Stevenson University Issue | ||
| Series 2021A, Rev., 5.00%, 6/1/2030 | 395 | 431 |
| Series 2021A, Rev., 5.00%, 6/1/2032 | 450 | 490 |
| Series 2021A, Rev., 4.00%, 6/1/2038 | 790 | 773 |
| Washington Suburban Sanitary Commission, Rev., 5.00%, 6/15/2029 | 395 | 441 |
| Total Maryland | 9,616 | |
| 14 | J.P. Morgan Tax Aware Funds | April 30, 2022 |
| INVESTMENTS | PRINCIPAL AMOUNT ($000) | VALUE ($000) |
| Municipal Bonds — continued | ||
| Massachusetts — 3.0% | ||
| Commonwealth of Massachusetts Series 2004C, GO, AGM, 5.50%, 12/1/2022 | 200 | 205 |
| Massachusetts Bay Transportation Authority Assessment Series 2006-A, Rev., 5.25%, 7/1/2031 | 1,500 | 1,783 |
| Massachusetts Development Finance Agency, Bentley University | ||
| Series 2021A, Rev., 5.00%, 7/1/2028 | 225 | 248 |
| Series 2021A, Rev., 5.00%, 7/1/2030 | 2,000 | 2,242 |
| Series 2021A, Rev., 5.00%, 7/1/2033 | 1,265 | 1,430 |
| Massachusetts Development Finance Agency, Boston University Project Series 2008 -U6E, Rev., VRDO, LOC : TD Bank NA, 0.25%, 5/2/2022 (b) | 10,000 | 10,000 |
| Massachusetts Development Finance Agency, Salem Community Corp. | ||
| Rev., 5.00%, 1/1/2026 (d) | 290 | 297 |
| Rev., 5.00%, 1/1/2027 (d) | 300 | 309 |
| Rev., 5.00%, 1/1/2028 (d) | 265 | 273 |
| Rev., 5.00%, 1/1/2029 (d) | 500 | 513 |
| Rev., 5.00%, 1/1/2030 (d) | 230 | 236 |
| Rev., 5.00%, 1/1/2031 (d) | 245 | 250 |
| Rev., 5.13%, 1/1/2040 (d) | 100 | 101 |
| Massachusetts Development Finance Agency, Southcoast Health System Obligated Group Issue Series 2021G, Rev., 5.00%, 7/1/2036 | 200 | 221 |
| Total Massachusetts | 18,108 | |
| Michigan — 0.7% | ||
| Avondale School District, GO, Q-SBLF, 5.00%, 11/1/2027 | 15 | 16 |
| Eastern Michigan University, Board of Regents Series 2017A, Rev., 5.00%, 3/1/2033 | 1,000 | 1,091 |
| Grand Rapids Public Schools, Unlimited Tax, GO, AGM, 5.00%, 11/1/2029 | 5 | 6 |
| Lakeview School District, School Building & Site, GO, Q-SBLF, 5.00%, 5/1/2028 | 10 | 11 |
| Michigan Finance Authority, Lawrence Technological University Obligated Group | ||
| Rev., 4.00%, 2/1/2027 | 45 | 46 |
| Rev., 4.00%, 2/1/2032 | 95 | 95 |
| Michigan Strategic Fund, Graphic Packaging International LLC, Coated Recycled Board Machine Project, Rev., AMT, VRDO, 4.00%, 10/1/2026 (b) | 125 | 128 |
| Northern Michigan University | ||
| Rev., 5.00%, 6/1/2027 | 110 | 122 |
| INVESTMENTS | PRINCIPAL AMOUNT ($000) | VALUE ($000) |
| Michigan — continued | ||
| Rev., 5.00%, 6/1/2028 | 100 | 112 |
| Rev., 5.00%, 6/1/2029 | 325 | 368 |
| Rev., 5.00%, 6/1/2030 | 415 | 474 |
| Rev., 5.00%, 6/1/2031 | 190 | 219 |
| Rev., 5.00%, 6/1/2032 | 300 | 345 |
| Onekama Consolidated Schools, GO, AGM, 4.00%, 5/1/2025 | 15 | 15 |
| Watervliet Public Schools, School Building and Site, GO, Q-SBLF, 5.00%, 5/1/2025 | 10 | 10 |
| Wayne-Westland Community Schools Series 2019, GO, Q-SBLF, 4.00%, 11/1/2031 | 10 | 11 |
| Western Michigan University, Tax Exempt | ||
| Series 2021A, Rev., AGM, 5.00%, 11/15/2034 | 200 | 230 |
| Series 2021A, Rev., AGM, 5.00%, 11/15/2035 | 200 | 230 |
| Series 2021A, Rev., AGM, 5.00%, 11/15/2036 | 200 | 229 |
| Series 2021A, Rev., AGM, 5.00%, 11/15/2037 | 350 | 400 |
| Total Michigan | 4,158 | |
| Minnesota — 0.3% | ||
| City of Victoria Series 2021A, GO, 4.00%, 2/1/2029 | 100 | 108 |
| Duluth Economic Development Authority, Benedictine Health System | ||
| Series 2021A, Rev., 3.00%, 7/1/2025 | 100 | 98 |
| Series 2021A, Rev., 3.00%, 7/1/2026 | 180 | 174 |
| Minnesota Municipal Gas Agency Series 2022A, Rev., 4.00%, 12/1/2027 | 1,435 | 1,502 |
| Total Minnesota | 1,882 | |
| Mississippi — 0.9% | ||
| Mississippi Business Finance Corp., Gulf Opportunity Zone Industrial Development, Chevron USA, Inc., Project | ||
| Series 2009G, Rev., VRDO, 0.29%, 5/2/2022 (b) | 300 | 300 |
| Series 2011 B, Rev., VRDO, 0.29%, 5/2/2022 (b) | 250 | 250 |
| Series 2011D, Rev., VRDO, 0.29%, 5/2/2022 (b) | 5,000 | 5,000 |
| Total Mississippi | 5,550 | |
| Missouri — 1.0% | ||
| City of Springfield, Public Utility, Rev., 5.00%, 8/1/2022 | 100 | 101 |
| Health and Educational Facilities Authority of the State of Missouri | ||
| Rev., 5.00%, 2/15/2030 | 670 | 760 |
| April 30, 2022 | J.P. Morgan Tax Aware Funds | 15 |
| INVESTMENTS | PRINCIPAL AMOUNT ($000) | VALUE ($000) |
| Municipal Bonds — continued | ||
| Missouri — continued | ||
| Rev., 5.00%, 2/15/2031 | 705 | 806 |
| Rev., 5.00%, 2/15/2032 | 500 | 575 |
| Rev., 5.00%, 2/15/2033 | 500 | 573 |
| Rev., 4.00%, 2/15/2034 | 400 | 402 |
| Health and Educational Facilities Authority of the State of Missouri, St. Luke's Health System, Inc. | ||
| Rev., 5.00%, 11/15/2026 | 750 | 821 |
| Rev., 5.00%, 11/15/2027 | 175 | 194 |
| Rev., 5.00%, 11/15/2028 | 500 | 560 |
| Rev., 5.00%, 11/15/2029 | 1,000 | 1,131 |
| Total Missouri | 5,923 | |
| Montana — 0.0% ^ | ||
| Silver Bow County School District No. 1, GO, 5.00%, 7/1/2029 | 5 | 6 |
| Nebraska — 0.5% | ||
| Central Plains Energy Project, Gas Project No. 3 Series 2017A, Rev., 5.00%, 9/1/2042 | 2,550 | 2,793 |
| Nevada — 0.2% | ||
| County of Clark, Nevada Improvement District No. 158, 5.00%, 8/1/2034 | 10 | 11 |
| County of Clark, Southern California Edison Co., Rev., 2.10%, 6/1/2031 | 1,215 | 1,050 |
| Total Nevada | 1,061 | |
| New Hampshire — 0.4% | ||
| New Hampshire Business Finance Authority, St. Luke's Hospital Obligated Group | ||
| Series 2021B, Rev., 5.00%, 8/15/2032 | 1,475 | 1,676 |
| Series 2021B, Rev., 5.00%, 8/15/2035 | 650 | 732 |
| Total New Hampshire | 2,408 | |
| New Jersey — 3.8% | ||
| Burlington County Bridge Commission, Government Leasing Program, Rev., 5.00%, 4/1/2030 | 435 | 499 |
| Camden County Improvement Authority (The), Camden Prep High School Project | ||
| Rev., 4.00%, 7/15/2027 (c) | 215 | 214 |
| Rev., 5.00%, 7/15/2032 (c) | 285 | 296 |
| Rev., 5.00%, 7/15/2042 (c) | 585 | 597 |
| County of Morris, GO, 3.00%, 2/1/2030 | 20 | 20 |
| New Jersey Economic Development Authority, School Facilities Construction Series PP, Rev., 5.00%, 6/15/2024 (e) | 5,000 | 5,269 |
| INVESTMENTS | PRINCIPAL AMOUNT ($000) | VALUE ($000) |
| New Jersey — continued | ||
| New Jersey Transportation Trust Fund Authority, Federal Highway Reimbursement Series A, Rev., 5.00%, 6/15/2028 | 3,000 | 3,233 |
| New Jersey Transportation Trust Fund Authority, Transportation Program | ||
| Series 2013AA, Rev., 5.00%, 6/15/2036 | 2,500 | 2,551 |
| Series 2020AA, Rev., 4.00%, 6/15/2050 | 1,125 | 1,046 |
| Series 2020AA, Rev., 5.00%, 6/15/2050 | 1,000 | 1,054 |
| New Jersey Turnpike Authority Series 2017B, Rev., 4.00%, 1/1/2035 | 5 | 5 |
| State of New Jersey, COVID-19 Emergency Bonds Series 2020A, GO, 5.00%, 6/1/2029 | 5,000 | 5,588 |
| Tobacco Settlement Financing Corp. Series 2018A, Rev., 5.00%, 6/1/2027 | 2,800 | 3,013 |
| Township of Branchburg, GO, 3.00%, 9/1/2028 | 40 | 40 |
| Total New Jersey | 23,425 | |
| New Mexico — 0.0% ^ | ||
| State of New Mexico, Severance Tax Permanent Fund Series 2018A, Rev., 5.00%, 7/1/2022 | 25 | 25 |
| New York — 14.2% | ||
| Broome County Local Development Corp., Good Shepherd Village at Endwell, Inc. | ||
| Rev., 4.00%, 7/1/2031 | 100 | 100 |
| Rev., 4.00%, 7/1/2036 | 160 | 159 |
| Build NYC Resource Corp., New World Preparatory Charter School Project | ||
| Series 2021A, Rev., 4.00%, 6/15/2031 | 150 | 145 |
| Series 2021A, Rev., 4.00%, 6/15/2056 | 225 | 188 |
| City of New York, Fiscal Year 2018 | ||
| Series B, Subseries B-4, GO, VRDO, LIQ : Barclays Bank plc, 0.28%, 5/2/2022 (b) | 5,000 | 5,000 |
| Subseries B-5, GO, VRDO, LIQ : Barclays Bank plc, 0.28%, 5/2/2022 (b) | 8,900 | 8,900 |
| Series 2018-1, GO, 5.00%, 8/1/2030 | 20 | 22 |
| City of New York, Fiscal Year 2021 Subseries F-1, GO, 4.00%, 3/1/2040 | 1,020 | 1,023 |
| County of St. Lawrence, GO, AGM, 3.00%, 5/15/2034 | 10 | 10 |
| Erie County Industrial Development Agency (The), School District Buffalo Project Series 2015A, Rev., 5.00%, 5/1/2024 | 40 | 42 |
| Hudson Yards Infrastructure Corp., Second Indenture, Fiscal Year 2017 | ||
| Series A, Rev., 5.00%, 2/15/2033 | 1,500 | 1,642 |
| Series A, Rev., 5.00%, 2/15/2034 | 40 | 44 |
| 16 | J.P. Morgan Tax Aware Funds | April 30, 2022 |
| INVESTMENTS | PRINCIPAL AMOUNT ($000) | VALUE ($000) |
| Municipal Bonds — continued | ||
| New York — continued | ||
| Island Park Union Free School District Series 2019, GO, 4.00%, 7/15/2033 | 40 | 42 |
| Long Island Power Authority Series 2019-A, Rev., 3.00%, 9/1/2036 | 10 | 9 |
| Metropolitan Transportation Authority | ||
| Series 2012 G-1, Rev., VRDO, LOC : Barclays Bank plc, 0.28%, 5/2/2022 (b) | 475 | 475 |
| Series 2015F, Rev., 5.00%, 11/15/2025 | 15 | 16 |
| Subseries C-1, Rev., 5.25%, 11/15/2028 | 5,000 | 5,345 |
| Nassau County Interim Finance Authority Series 2021A, Rev., 5.00%, 11/15/2034 | 1,275 | 1,490 |
| New York City Transitional Finance Authority, Building Aid, Fiscal Year 2019 Series S-2A, Rev., 5.00%, 7/15/2032 | 40 | 44 |
| New York City Transitional Finance Authority, Future Tax Secured, Fiscal Year 2010 Subseries 2010G-6, Rev., VRDO, LIQ : Barclays Bank plc, 0.28%, 5/2/2022 (b) | 2,900 | 2,900 |
| New York City Transitional Finance Authority, Future Tax Secured, Fiscal Year 2013 Series I, Rev., 3.00%, 5/1/2022 | 150 | 150 |
| New York City Transitional Finance Authority, Future Tax Secured, Fiscal Year 2021 Series 2021D, Subseries D-1, Rev., 4.00%, 11/1/2042 | 3,000 | 2,987 |
| New York City Transitional Finance Authority, Future Tax Secured, Fiscal Year 2022 Series 2022F, Subseries F-1, Rev., 5.00%, 2/1/2036 | 1,005 | 1,138 |
| New York City Water and Sewer System, Second General Resolution, Fiscal Year 2015 Series FF, Rev., 5.00%, 6/15/2031 | 3,000 | 3,203 |
| New York Convention Center Development Corp., Subordinate Lien, Hotel Unit Fee Secured Series 2016B, Rev., AGM-CR, Zero Coupon, 11/15/2052 | 10,000 | 2,187 |
| New York Liberty Development Corp. | ||
| Rev., 2.25%, 2/15/2041 | 500 | 364 |
| Rev., 2.75%, 2/15/2044 | 1,000 | 781 |
| New York State Dormitory Authority Series 2018A, Rev., 5.00%, 7/1/2038 | 3,500 | 3,932 |
| New York State Dormitory Authority, School Districts Financing Program Series 2018A, Rev., 5.00%, 10/1/2030 | 875 | 958 |
| New York State Dormitory Authority, State Personal Income Tax, General Purpose | ||
| Series 2021E, Rev., 5.00%, 3/15/2032 | 165 | 191 |
| Series D, Rev., 4.00%, 2/15/2037 | 5,500 | 5,562 |
| Series 2020 A, Rev., 4.00%, 3/15/2044 | 1,000 | 997 |
| INVESTMENTS | PRINCIPAL AMOUNT ($000) | VALUE ($000) |
| New York — continued | ||
| New York State Dormitory Authority, State Sales Tax | ||
| Series 2017-A, Rev., 5.00%, 3/15/2028 | 5 | 5 |
| Series 2014A, Rev., 5.00%, 3/15/2033 | 1,000 | 1,043 |
| New York State Environmental Facilities Corp., State Clean Water and Drinking Water Revolving Funds, New York City Municipal Water Finance Authority | ||
| Series 2017A, Rev., 5.00%, 6/15/2027 | 3,500 | 3,918 |
| Series 2017A, Rev., 5.00%, 6/15/2028 | 2,000 | 2,228 |
| New York State Thruway Authority, Junior Lien | ||
| Series 2016-A, Rev., 5.00%, 1/1/2025 | 25 | 27 |
| Series J, Rev., 5.00%, 1/1/2025 | 5 | 5 |
| Series 2016A, Rev., 5.00%, 1/1/2027 | 125 | 135 |
| New York State Urban Development Corp., Sales Tax Series 2021 A, Rev., 4.00%, 3/15/2046 | 1,000 | 992 |
| New York State Urban Development Corp., State Personal Income Tax, General Purpose Series 2017C, Rev., 5.00%, 3/15/2027 | 5,475 | 6,062 |
| Port Authority of New York & New Jersey, Consolidated Series 194, Rev., 5.00%, 10/15/2041 | 6,500 | 6,926 |
| Sales Tax Asset Receivable Corp., Fiscal Year 2015 Series A, Rev., 5.00%, 10/15/2024 (e) | 1,890 | 2,008 |
| Syracuse Industrial Development Agency, School District Series 2019-A, Rev., 4.00%, 5/1/2034 | 10 | 10 |
| Utility Debt Securitization Authority Series 2013TE, Rev., 5.00%, 12/15/2028 | 4,000 | 4,172 |
| Utility Debt Securitization Authority, Federally Tax-Exempt Series 2013TE, Rev., 5.00%, 12/15/2041 | 4,250 | 4,421 |
| Village of Stewart Manor, Public Improvement | ||
| GO, 5.00%, 8/1/2026 | 20 | 22 |
| GO, 4.00%, 8/1/2028 | 20 | 21 |
| Wellsville Central School District, GO, AGM, 5.00%, 6/15/2023 | 20 | 21 |
| Westchester County Local Development Corp., Purchase Senior Learning Community, Inc., Project | ||
| Series 2021D, Rev., 2.88%, 7/1/2026 (c) | 465 | 445 |
| Series 2021C, Rev., 3.20%, 7/1/2028 (c) | 3,025 | 2,843 |
| Series 2021A, Rev., 5.00%, 7/1/2046 (c) | 1,000 | 933 |
| Total New York | 86,283 | |
| North Carolina — 1.9% | ||
| City of Sanford, Enterprise System, Rev., 5.00%, 6/1/2031 | 570 | 645 |
| April 30, 2022 | J.P. Morgan Tax Aware Funds | 17 |
| INVESTMENTS | PRINCIPAL AMOUNT ($000) | VALUE ($000) |
| Municipal Bonds — continued | ||
| North Carolina — continued | ||
| County of Chatham | ||
| Series 2021A, Rev., 5.00%, 11/1/2032 | 150 | 176 |
| Series 2021A, Rev., 5.00%, 11/1/2033 | 275 | 322 |
| Series 2021A, Rev., 5.00%, 11/1/2034 | 225 | 262 |
| County of Duplin | ||
| Rev., 5.00%, 6/1/2029 | 140 | 157 |
| Rev., 5.00%, 6/1/2031 | 135 | 155 |
| County of Wake, Rev., 5.00%, 3/1/2032 | 1,000 | 1,163 |
| Mecklenburg County Public Facilities Corp., Rev., 5.00%, 2/1/2026 | 10 | 11 |
| North Carolina Capital Facilities Finance Agency, High Point University | ||
| Rev., 5.00%, 5/1/2029 | 525 | 582 |
| Rev., 5.00%, 5/1/2030 | 560 | 623 |
| Rev., 4.00%, 5/1/2032 | 1,000 | 1,031 |
| North Carolina Medical Care Commission, The Forest at Duke Project, Rev., 4.00%, 9/1/2034 | 190 | 193 |
| North Carolina Medical Care Commission, Moses Cone Health System Series 2001B, Rev., VRDO, LIQ : Bank of Montreal, 0.29%, 5/2/2022 (b) | 5,000 | 5,000 |
| North Carolina Turnpike Authority, Triangle Expressway System, Senior Lien, Rev., AGM, 5.00%, 1/1/2029 | 700 | 767 |
| University of North Carolina at Chapel Hill Series B, Rev., VRDO, LIQ : TD Bank NA, 0.28%, 5/2/2022 (b) | 575 | 575 |
| University of North Carolina at Greensboro, Rev., 4.00%, 4/1/2035 | 10 | 10 |
| Total North Carolina | 11,672 | |
| North Dakota — 0.2% | ||
| City of Grand Forks, Rev., 4.00%, 12/1/2038 | 1,200 | 1,192 |
| Ohio — 1.8% | ||
| Akron Bath Copley Joint Township Hospital District, Children's Hospital Medical Center of Akron Series 2022A, Rev., 5.00%, 11/15/2029 (d) | 650 | 727 |
| American Municipal Power, Inc., Fremont Energy Center Project Series 2021A, Rev., 5.00%, 2/15/2033 | 1,250 | 1,412 |
| Butler County Port Authority, Community First Solutions | ||
| Series 2021A, Rev., 4.00%, 5/15/2038 | 110 | 115 |
| Series 2021A, Rev., 4.00%, 5/15/2039 | 110 | 114 |
| Series 2021A, Rev., 4.00%, 5/15/2040 | 120 | 125 |
| Series 2021A, Rev., 4.00%, 5/15/2041 | 125 | 130 |
| INVESTMENTS | PRINCIPAL AMOUNT ($000) | VALUE ($000) |
| Ohio — continued | ||
| City of Lakewood, Limited Tax, Various Purpose, GO, 5.00%, 12/1/2027 | 250 | 281 |
| County of Hamilton Series 2021A, GO, 5.00%, 12/1/2031 | 1,190 | 1,398 |
| Miami University, General Receipts Series 2021A, Rev., 5.00%, 9/1/2035 | 760 | 862 |
| Northeast Ohio Medical University | ||
| Series 2021A, Rev., 5.00%, 12/1/2030 | 70 | 76 |
| Series 2021A, Rev., 4.00%, 12/1/2035 | 150 | 151 |
| Ohio Higher Educational Facility Commission, John Carroll University | ||
| Rev., 5.00%, 10/1/2028 | 370 | 402 |
| Rev., 5.00%, 10/1/2029 | 445 | 485 |
| Rev., 5.00%, 10/1/2030 | 425 | 465 |
| Rev., 5.00%, 10/1/2031 | 645 | 706 |
| Rev., 5.00%, 10/1/2032 | 700 | 762 |
| Ohio Turnpike and Infrastructure Commission, Junior Lien Series 2022A, Rev., 5.00%, 2/15/2031 (d) | 1,000 | 1,130 |
| State of Ohio Series 2016A, GO, 5.00%, 9/1/2025 | 385 | 416 |
| State of Ohio, Capital Facilities Lease Appropriation Series 2018A, Rev., 5.00%, 4/1/2028 | 1,020 | 1,149 |
| Total Ohio | 10,906 | |
| Oklahoma — 0.6% | ||
| Oklahoma County Finance Authority, Educational Facilities, Lease Midwest City-Del City Public Schools Project | ||
| Rev., 5.00%, 10/1/2022 | 250 | 253 |
| Rev., 5.00%, 10/1/2023 | 180 | 187 |
| Rev., 5.00%, 10/1/2025 | 500 | 535 |
| Rev., 5.00%, 10/1/2026 | 500 | 543 |
| Oklahoma Turnpike Authority, Turnpike System, Second Senior Series 2017A, Rev., 5.00%, 1/1/2038 | 2,000 | 2,149 |
| Total Oklahoma | 3,667 | |
| Oregon — 2.1% | ||
| City of Portland, Second Lien Sewer System Series B, Rev., 4.00%, 10/1/2036 | 2,180 | 2,237 |
| County of Marion, GO, AMBAC, 5.50%, 6/1/2023 | 100 | 104 |
| Hospital Facilities Authority of Multnomah County Oregon | ||
| Series 2021B-2, Rev., 0.95%, 6/1/2027 | 5,800 | 5,097 |
| Series 2021B-1, Rev., 1.20%, 6/1/2028 | 2,000 | 1,717 |
| Linn & Benton Counties, School District No. 8J, Greater Albany, GO, 5.00%, 6/15/2030 | 500 | 555 |
| 18 | J.P. Morgan Tax Aware Funds | April 30, 2022 |
| INVESTMENTS | PRINCIPAL AMOUNT ($000) | VALUE ($000) |
| Municipal Bonds — continued | ||
| Oregon — continued | ||
| Oregon State Facilities Authority, Peacehealth Series 2018 B, Rev., VRDO, LOC : TD Bank NA, 0.28%, 5/2/2022 (b) | 1,100 | 1,100 |
| Salem Hospital Facility Authority, Capital Manor Project | ||
| Rev., 5.00%, 5/15/2028 | 155 | 163 |
| Rev., 4.00%, 5/15/2029 | 130 | 130 |
| Rev., 4.00%, 5/15/2030 | 190 | 188 |
| Rev., 4.00%, 5/15/2031 | 200 | 197 |
| Rev., 4.00%, 5/15/2032 | 185 | 182 |
| Tri-County Metropolitan Transportation District of Oregon Series 2017A, Rev., 5.00%, 10/1/2023 | 50 | 52 |
| Washington Counties, Hillsborough School District No. 1J, GO, 5.00%, 6/15/2027 | 570 | 635 |
| Yamhill County Hospital Authority Series 2021A, Rev., 5.00%, 11/15/2056 | 240 | 218 |
| Total Oregon | 12,575 | |
| Pennsylvania — 1.6% | ||
| Berks County Industrial Development Authority, Tower Health Project | ||
| Rev., 5.00%, 11/1/2027 | 350 | 366 |
| Rev., 5.00%, 11/1/2028 | 450 | 468 |
| Rev., 5.00%, 11/1/2029 | 150 | 155 |
| Rev., 5.00%, 11/1/2030 | 150 | 154 |
| Bucks County Industrial Development Authority, Grand View Hospital Project, Rev., 5.00%, 7/1/2036 | 1,225 | 1,296 |
| Commonwealth Financing Authority, Tobacco Master Settlement Payment | ||
| Rev., 5.00%, 6/1/2024 | 500 | 522 |
| Rev., 5.00%, 6/1/2025 | 630 | 668 |
| Rev., 5.00%, 6/1/2026 | 380 | 409 |
| Rev., 5.00%, 6/1/2027 | 500 | 544 |
| Rev., 5.00%, 6/1/2028 | 880 | 966 |
| Rev., 5.00%, 6/1/2029 | 380 | 415 |
| County of Lancaster Series 2016-A, GO, 4.00%, 5/1/2026 | 15 | 16 |
| County of Montgomery Higher Education and Health Authority, Thomas Jefferson University Series 2018A, Rev., 4.00%, 9/1/2043 | 2,000 | 1,984 |
| Fairview School District Series A, GO, 4.00%, 2/1/2028 | 10 | 10 |
| Pennsylvania Economic Development Financing Authority, Presbyterian Senior Living, Rev., 4.00%, 7/1/2030 | 335 | 347 |
| INVESTMENTS | PRINCIPAL AMOUNT ($000) | VALUE ($000) |
| Pennsylvania — continued | ||
| Pennsylvania Turnpike Commission Series 2021 B, Rev., 5.00%, 12/1/2025 | 165 | 178 |
| Sayre Health Care Facilities Authority, Guthrie Health Issue, Rev., (ICE LIBOR USD 3 Month + 0.78%), 1.13%, 6/1/2022 (f) | 1,475 | 1,473 |
| Township of Lower Paxton Series 2020A, GO, 4.00%, 4/1/2032 | 15 | 16 |
| Total Pennsylvania | 9,987 | |
| Rhode Island — 0.0% ^ | ||
| Rhode Island Turnpike and Bridge Authority, Motor Fuel Tax Series 2016A, Rev., 5.00%, 10/1/2029 | 10 | 11 |
| South Carolina — 0.0% ^ | ||
| City of Charleston, Waterworks & Sewer System, Rev., 5.00%, 1/1/2028 | 15 | 16 |
| Spartanburg County Tourist Public Facilities Corp., COP, 4.00%, 4/1/2028 | 10 | 11 |
| Total South Carolina | 27 | |
| Tennessee — 3.7% | ||
| City of Memphis, Electric System, Rev., 5.00%, 12/1/2026 | 345 | 382 |
| County of Coffee | ||
| Series 2021A, GO, 5.00%, 6/1/2025 | 105 | 113 |
| Series 2021C, GO, 5.00%, 6/1/2025 | 110 | 118 |
| Series 2021B, GO, 5.00%, 6/1/2026 | 150 | 165 |
| Series 2021A, GO, 5.00%, 6/1/2027 | 120 | 134 |
| Series 2021B, GO, 5.00%, 6/1/2027 | 160 | 178 |
| Series 2021A, GO, 5.00%, 6/1/2028 | 125 | 141 |
| Series 2021B, GO, 5.00%, 6/1/2028 | 165 | 186 |
| Series 2021C, GO, 5.00%, 6/1/2028 | 460 | 519 |
| Series 2021A, GO, 5.00%, 6/1/2029 | 135 | 155 |
| Series 2021B, GO, 5.00%, 6/1/2029 | 175 | 200 |
| Series 2021C, GO, 5.00%, 6/1/2029 | 490 | 561 |
| Series 2021B, GO, 5.00%, 6/1/2030 | 180 | 208 |
| Series 2021C, GO, 5.00%, 6/1/2030 | 215 | 248 |
| Series 2021A, GO, 5.00%, 6/1/2031 | 100 | 117 |
| Metropolitan Government Nashville and Davidson County Health and Educational Facilities, The Blakeford at Green Hills Corp. Series 2020A, Rev., 4.00%, 11/1/2038 | 1,305 | 1,241 |
| Metropolitan Government Nashville and Davidson County Health and Educational Facilities, Trevecca Nazarene University Project | ||
| Series 2021B, Rev., 4.00%, 10/1/2026 | 150 | 150 |
| Series 2021B, Rev., 4.00%, 10/1/2027 | 195 | 194 |
| April 30, 2022 | J.P. Morgan Tax Aware Funds | 19 |
| INVESTMENTS | PRINCIPAL AMOUNT ($000) | VALUE ($000) |
| Municipal Bonds — continued | ||
| Tennessee — continued | ||
| Series 2021B, Rev., 4.00%, 10/1/2028 | 200 | 198 |
| Series 2021B, Rev., 4.00%, 10/1/2029 | 200 | 196 |
| Series 2021B, Rev., 4.00%, 10/1/2030 | 105 | 102 |
| Metropolitan Nashville Airport Authority (The), Subordinate Airport Series 2019A, Rev., 5.00%, 7/1/2034 | 130 | 144 |
| Tennessee Energy Acquisition Corp., Commodity Project Series 2021A, Rev., VRDO, 5.00%, 11/1/2031 (b) | 7,755 | 8,433 |
| Tennessee Energy Acquisition Corp., Gas Project, Rev., VRDO, 4.00%, 11/1/2025 (b) | 8,000 | 8,155 |
| Total Tennessee | 22,238 | |
| Texas — 10.3% | ||
| Baytown Municipal Development District, Third-Lien Hotel | ||
| Series 2021C, Rev., 5.00%, 10/1/2028 | 890 | 995 |
| Series 2021C, Rev., 5.00%, 10/1/2029 | 465 | 524 |
| Series 2021C, Rev., 5.00%, 10/1/2030 | 485 | 551 |
| Series 2021C, Rev., 5.00%, 10/1/2031 | 515 | 590 |
| Series 2021C, Rev., 5.00%, 10/1/2032 | 535 | 610 |
| Bexar County Hospital District, GO, 4.00%, 2/15/2035 | 10 | 10 |
| Board of Regents of the University of Texas System Financing System Series 2014B, Rev., 5.00%, 8/15/2026 | 5,000 | 5,497 |
| Central Texas Regional Mobility Authority, Senior Lien Series 2021D, Rev., 4.00%, 1/1/2044 | 2,000 | 1,976 |
| City of Austin, Airport System, Rev., AMT, 5.00%, 11/15/2034 (d) | 1,500 | 1,664 |
| City of Cibolo, GO, 4.00%, 2/1/2026 | 410 | 431 |
| City of Edinburg Series 2021A, GO, AGM, 5.00%, 3/1/2030 | 500 | 573 |
| City of El Paso, Water and Sewer, Rev., 5.00%, 3/1/2031 | 1,250 | 1,446 |
| City of Ennis, GO, 4.00%, 2/1/2031 | 225 | 240 |
| City of Houston, Airport System Series 2021A, Rev., AMT, 5.00%, 7/1/2032 | 950 | 1,049 |
| City of Houston, Airport System, United Airlines, Inc., Terminal Improvements Projects Series 2021B-1, Rev., AMT, 4.00%, 7/15/2041 | 400 | 363 |
| City of Houston, Combined Utility System, Junior Lien Series A, Rev., AGM, 5.75%, 12/1/2032 (e) | 5,550 | 7,021 |
| City of Houston, Public Improvement Series 2014A, GO, 5.00%, 3/1/2024 (e) | 4,000 | 4,189 |
| City of Portland, GO, 3.00%, 8/15/2029 | 100 | 101 |
| INVESTMENTS | PRINCIPAL AMOUNT ($000) | VALUE ($000) |
| Texas — continued | ||
| Clifton Higher Education Finance Corp., Idea Public Schools, Rev., PSF-GTD, 5.00%, 8/15/2030 | 460 | 523 |
| Collin County Community College District, Limited Tax, GO, 5.00%, 8/15/2026 | 1,000 | 1,102 |
| Conroe Local Government Corp., Conroe Convention Center Hotel Series 2021A, Rev., 2.50%, 10/1/2031 | 100 | 85 |
| County of El Paso, GO, 5.00%, 2/15/2032 | 1,490 | 1,655 |
| Fort Bend County Municipal Utility District No. 169 | ||
| Series 2021A, GO, AGM, 4.00%, 12/1/2025 | 50 | 52 |
| Series 2021A, GO, AGM, 4.00%, 12/1/2026 | 250 | 263 |
| Lower Colorado River Authority, Rev., 5.00%, 5/15/2031 | 2,760 | 3,142 |
| Lower Colorado River Authority, LCRA Transmission Services Corp. Project | ||
| Rev., 5.00%, 5/15/2034 | 220 | 245 |
| Series 2020A, Rev., 5.00%, 5/15/2035 | 1,000 | 1,112 |
| Rev., 5.00%, 5/15/2036 | 1,495 | 1,648 |
| Series 2020A, Rev., 5.00%, 5/15/2036 | 1,000 | 1,109 |
| Rev., 5.00%, 5/15/2037 | 1,250 | 1,385 |
| Rev., 5.00%, 5/15/2038 | 1,500 | 1,646 |
| Lower Neches Valley Authority Industrial Development Corp., ExxonMobil Project, Rev., VRDO, 0.27%, 5/2/2022 (b) | 8,000 | 8,000 |
| New Hope Cultural Education Facilities Finance Corp., Jubilee Academic Center, Inc., Rev., 4.00%, 8/15/2031 (c) | 485 | 464 |
| New Hope Cultural Education Facilities Finance Corp., Morningside Ministries Project, Rev., 4.00%, 1/1/2037 (d) | 100 | 87 |
| New Hope Cultural Education Facilities Finance Corp., Westminster Project, Rev., 4.00%, 11/1/2055 | 100 | 90 |
| North Texas Tollway Authority System, First Tier | ||
| Series A, Rev., 5.00%, 1/1/2026 | 200 | 203 |
| Series 2017A, Rev., 5.00%, 1/1/2027 | 550 | 594 |
| Series 2017A, Rev., 5.00%, 1/1/2030 | 360 | 385 |
| Series 2017A, Rev., 5.00%, 1/1/2035 | 600 | 647 |
| North Texas Tollway Authority System, Second Tier | ||
| Series 2017B, Rev., 5.00%, 1/1/2026 | 150 | 153 |
| Series 2017B, Rev., 5.00%, 1/1/2027 | 300 | 323 |
| Series 2017B, Rev., 5.00%, 1/1/2030 | 400 | 428 |
| Northwest Independent School District, GO, PSF-GTD, 5.00%, 2/15/2031 (d) | 3,635 | 4,230 |
| 20 | J.P. Morgan Tax Aware Funds | April 30, 2022 |
| INVESTMENTS | PRINCIPAL AMOUNT ($000) | VALUE ($000) |
| Municipal Bonds — continued | ||
| Texas — continued | ||
| San Antonio Education Facilities Corp., Hallmark University Project Series 2021A, Rev., 5.00%, 10/1/2041 | 200 | 187 |
| San Antonio Education Facilities Corp., University of the Incarnate Word Series 2021A, Rev., 4.00%, 4/1/2037 | 600 | 593 |
| San Antonio Water System, Junior Lien Series 2020C, Rev., 5.00%, 5/15/2029 | 1,500 | 1,713 |
| San Jacinto Community College District, Limited Tax Series 2019-A, GO, 5.00%, 2/15/2029 | 120 | 137 |
| Trinity River Authority, Walker-Calloway System | ||
| Rev., 5.00%, 2/1/2026 | 275 | 296 |
| Rev., 5.00%, 2/1/2027 | 290 | 317 |
| Rev., 5.00%, 2/1/2028 | 305 | 338 |
| Rev., 5.00%, 2/1/2029 | 320 | 356 |
| Rev., 5.00%, 2/1/2030 | 340 | 379 |
| Rev., 5.00%, 2/1/2031 | 355 | 392 |
| Tyler Independent School District, GO, PSF-GTD, 5.00%, 2/15/2028 | 175 | 194 |
| Total Texas | 62,303 | |
| Utah — 0.6% | ||
| Mida Golf and Equestrian Center Public Infrastructure District, Limited Tax, GO, 4.13%, 6/1/2036 (c) | 895 | 762 |
| Military Installation Development Authority, Tax Allocation and Hotel Tax | ||
| Series 2021A-1, Rev., 4.00%, 6/1/2036 | 100 | 87 |
| Series 2021A-2, Rev., 4.00%, 6/1/2036 | 100 | 87 |
| Series 2021A-1, Rev., 4.00%, 6/1/2041 | 100 | 83 |
| University of Utah (The) Series 2019-A, Rev., 5.00%, 8/1/2035 | 250 | 281 |
| Utah Infrastructure Agency Telecommunications and Franchise Tax, Rev., 4.00%, 10/15/2025 (e) | 250 | 263 |
| Utah Infrastructure Agency, Tax-Exempt Telecommunications | ||
| Rev., 5.00%, 10/15/2027 (d) | 100 | 105 |
| Rev., 4.00%, 10/15/2031 | 500 | 475 |
| Rev., 5.00%, 10/15/2032 (d) | 100 | 102 |
| Rev., 4.00%, 10/15/2033 | 525 | 487 |
| Weber Basin Water Conservancy District | ||
| Series 2017B, Rev., 5.00%, 10/1/2030 | 250 | 279 |
| Series 2017B, Rev., 5.00%, 10/1/2031 | 470 | 523 |
| Total Utah | 3,534 | |
| INVESTMENTS | PRINCIPAL AMOUNT ($000) | VALUE ($000) |
| Virginia — 0.8% | ||
| Fairfax County Economic Development Authority Series 2021 A, Rev., 5.00%, 10/1/2034 | 1,520 | 1,759 |
| Henrico County Economic Development Authority, Westminster Canterbury Richmond, Rev., 4.00%, 10/1/2040 | 330 | 321 |
| Lynchburg Economic Development Authority, Central Health, Inc., Rev., 4.00%, 1/1/2037 | 825 | 827 |
| Virginia Public School Authority Series 2017C, Rev., 5.00%, 8/1/2028 | 500 | 556 |
| Virginia Small Business Financing Authority, The Obligated Group of National Senior Campuses, Inc. Series 2020A, Rev., 5.00%, 1/1/2034 | 1,200 | 1,293 |
| Total Virginia | 4,756 | |
| Washington — 3.9% | ||
| Energy Northwest, Rev., 5.00%, 7/1/2026 | 10 | 11 |
| Port of Seattle, Intermediate Lien | ||
| Series 2015B, Rev., 5.00%, 3/1/2033 | 3,750 | 3,934 |
| Series 2015B, Rev., 5.00%, 3/1/2034 | 1,000 | 1,049 |
| State of Washington, Various Purpose | ||
| Series R-2018C, GO, 5.00%, 8/1/2034 | 900 | 993 |
| Series 2021C, GO, 5.00%, 2/1/2037 | 5,170 | 5,908 |
| University of Washington | ||
| Series 2020C, Rev., 5.00%, 4/1/2034 | 3,495 | 3,972 |
| Series 2020C, Rev., 5.00%, 4/1/2035 | 500 | 567 |
| Washington Health Care Facilities Authority, Providence St. Joseph Health | ||
| Series 2018B, Rev., 5.00%, 10/1/2025 | 1,250 | 1,341 |
| Series 2018B, Rev., 5.00%, 10/1/2026 | 1,500 | 1,634 |
| Series 2018B, Rev., 5.00%, 10/1/2027 | 2,500 | 2,760 |
| Washington State Housing Finance Commission, Rockwood Retirement Communities Project Series 2020A, Rev., 5.00%, 1/1/2041 (c) | 1,415 | 1,265 |
| Total Washington | 23,434 | |
| West Virginia — 0.5% | ||
| State of West Virginia Series 2021A, GO, 5.00%, 6/1/2032 | 2,600 | 3,018 |
| Wisconsin — 1.3% | ||
| City of Milwaukee, Sewerage System | ||
| Series 2021-S2, Rev., 5.00%, 6/1/2029 | 580 | 664 |
| Series 2021-S2, Rev., 5.00%, 6/1/2030 | 750 | 866 |
| Public Finance Authority, Ascend Leadership Academy Project Series 2021A, Rev., 5.00%, 6/15/2041 (c) | 130 | 114 |
| April 30, 2022 | J.P. Morgan Tax Aware Funds | 21 |
| INVESTMENTS | PRINCIPAL AMOUNT ($000) | VALUE ($000) |
| Municipal Bonds — continued | ||
| Wisconsin — continued | ||
| Public Finance Authority, Coral Academy of Science | ||
| Series 2021A, Rev., 4.00%, 7/1/2030 | 305 | 297 |
| Series 2021A, Rev., 4.00%, 7/1/2041 | 500 | 454 |
| Public Finance Authority, Entrance Fee Principal Redemption, Searstone CCRC Project Series 2021B2, Rev., 2.25%, 6/1/2027 | 215 | 198 |
| Public Finance Authority, Roseman University of Health Sciences Project, Rev., 4.00%, 4/1/2032 (c) | 100 | 99 |
| Public Finance Authority, Scotland Healthcare System | ||
| Series 2021A, Rev., 5.00%, 10/1/2025 | 695 | 744 |
| Series 2021A, Rev., 5.00%, 10/1/2026 | 730 | 793 |
| Public Finance Authority, The Carmelite System, Inc., Obligated Group, Rev., 3.25%, 1/1/2029 | 860 | 860 |
| Public Finance Authority, The Franklin School of Innovation, Rev., 5.00%, 1/1/2042 (c) | 105 | 101 |
| Public Finance Authority, Triad Math and Science Academy Co. | ||
| Series 2021A, Rev., 4.00%, 6/15/2024 | 340 | 342 |
| Series 2021A, Rev., 4.00%, 6/15/2026 | 370 | 370 |
| Series 2021A, Rev., 4.00%, 6/15/2028 | 400 | 396 |
| Series 2021A, Rev., 4.00%, 6/15/2030 | 435 | 424 |
| Series 2021A, Rev., 4.00%, 6/15/2041 | 280 | 255 |
| Public Finance Authority, Viticus Group Project | ||
| Series 2022A, Rev., 4.00%, 12/1/2031 (c) | 100 | 94 |
| Series 2022A, Rev., 4.00%, 12/1/2041 (c) | 290 | 253 |
| Wisconsin Health and Educational Facilities Authority, Hope Christian Schools, Rev., 4.00%, 12/1/2041 | 160 | 143 |
| Wisconsin Health and Educational Facilities Authority, Oakwood Lutheran Senior Ministries, Rev., 4.00%, 1/1/2037 | 325 | 293 |
| Total Wisconsin | 7,760 | |
| Total Municipal Bonds (Cost $552,690) | 521,895 | |
| SHARES (000) | ||
| Short Term Investments — 12.0% | ||
| Investment Companies — 12.0% | ||
| JPMorgan Institutional Tax Free Money Market Fund Class IM Shares, 0.34% (g) (h) (Cost $73,113) | 73,091 | 73,113 |
| INVESTMENTS | SHARES (000) | VALUE ($000) |
| Total Investments — 98.0% (Cost $625,803) | 595,008 | |
| Other Assets Less Liabilities — 2.0% | 12,245 | |
| NET ASSETS — 100.0% | 607,253 | |
Percentages indicated are based on net assets. | ||
| Abbreviations | |
| AGM | Insured by Assured Guaranty Municipal Corp. |
| AMBAC | Insured by American Municipal Bond Assurance Corp. |
| AMT | Alternative Minimum Tax |
| CCRC | Congregate Care Retirement Center |
| COP | Certificate of Participation |
| CR | Custodial Receipts |
| GO | General Obligation |
| GTD | Guaranteed |
| ICE | Intercontinental Exchange |
| LIBOR | London Interbank Offered Rate |
| LIQ | Liquidity Agreement |
| LOC | Letter of Credit |
| NATL | Insured by National Public Finance Guarantee Corp. |
| PSF-GTD | Permanent School Fund Guaranteed |
| Q-SBLF | Qualified School Bond Loan Fund |
| RE | Reinsured |
| Rev. | Revenue |
| USD | United States Dollar |
| VRDO | Variable Rate Demand Obligation |
| ^ | Amount rounds to less than 0.1% of net assets. | |
| (a) | The date shown represents the earliest of the prerefunded date, next put date or final maturity date. | |
| (b) | Variable or floating rate security, the interest rate of which adjusts periodically based on changes in current interest rates and prepayments on the underlying pool of assets. The interest rate shown is the current rate as of April 30, 2022. | |
| (c) | Securities exempt from registration under Rule 144A or section 4(a)(2), of the Securities Act of 1933, as amended. | |
| (d) | All or a portion of the security is a when-issued security, delayed delivery security, or forward commitment. | |
| (e) | Security is prerefunded or escrowed to maturity. | |
| (f) | Variable or floating rate security, linked to the referenced benchmark. The interest rate shown is the current rate as of April 30, 2022. | |
| (g) | Investment in an affiliated fund, which is registered under the Investment Company Act of 1940, as amended, and is advised by J.P. Morgan Investment Management Inc. | |
| (h) | The rate shown is the current yield as of April 30, 2022. | |
| 22 | J.P. Morgan Tax Aware Funds | April 30, 2022 |
| FLOATING RATE INDEX(a) | FIXED RATE | PAY/ RECEIVE FLOATING RATE | MATURITY DATE | NOTIONAL AMOUNT | UPFRONT PAYMENTS (RECEIPTS) $ | UNREALIZED APPRECIATION (DEPRECIATION) ($) | VALUE ($) | ||
| CPI-U at termination | 2.74% at termination | Receive | 10/1/2026 | USD 14,803 | — | 1,019 | 1,019 | ||
| CPI-U at termination | 2.95% at termination | Receive | 1/28/2027 | USD 14,096 | — | 611 | 611 | ||
| CPI-U at termination | 3.15% at termination | Receive | 3/29/2032 | USD 45,079 | 83 | 130 | 213 | ||
| CPI-U at termination | 3.21% at termination | Receive | 2/15/2025 | USD 7,148 | — | 252 | 252 | ||
| CPI-U at termination | 3.21% at termination | Receive | 3/2/2027 | USD 14,288 | — | 386 | 386 | ||
| CPI-U at termination | 3.36% at termination | Receive | 11/18/2026 | USD 5,985 | — | 222 | 222 | ||
| CPI-U at termination | 3.36% at termination | Receive | 3/4/2027 | USD 48,446 | (399) | 1,324 | 925 | ||
| CPI-U at termination | 3.38% at termination | Receive | 11/18/2026 | USD 2,797 | — | 101 | 101 | ||
| CPI-U at termination | 3.41% at termination | Receive | 4/12/2027 | USD 8,872 | — | 88 | 88 | ||
| CPI-U at termination | 3.44% at termination | Receive | 3/14/2027 | USD 98,258 | (200) | 1,516 | 1,316 | ||
| CPI-U at termination | 3.45% at termination | Receive | 3/14/2027 | USD 51,874 | (138) | 795 | 657 | ||
| CPI-U at termination | 3.46% at termination | Receive | 4/13/2027 | USD 14,788 | — | 108 | 108 | ||
| CPI-U at termination | 3.57% at termination | Receive | 5/3/2027 | USD 30,773 | (83) | 41 | (42) | ||
| CPI-U at termination | 4.45% at termination | Receive | 4/22/2024 | USD 7,548 | — | 16 | 16 | ||
| CPI-U at termination | 4.48% at termination | Receive | 3/21/2024 | USD 3,962 | — | 24 | 24 | ||
| CPI-U at termination | 5.30% at termination | Receive | 4/4/2023 | USD 17,297 | — | 71 | 71 | ||
| (737) | 6,704 | 5,967 | |||||||
| CPI-U at termination | 3.68% at termination | Receive | 3/29/2027 | USD 5,538 | (2) | (5) | (7) | ||
| CPI-U at termination | 3.69% at termination | Receive | 3/29/2027 | USD 125,074 | (99) | (125) | (224) | ||
| CPI-U at termination | 5.43% at termination | Receive | 5/3/2023 | USD 6,070 | — | (10) | (10) | ||
| CPI-U at termination | 5.98% at termination | Receive | 3/29/2023 | USD 2,909 | — | (5) | (5) | ||
| (101) | (145) | (246) | |||||||
| (838) | 6,559 | 5,721 |
| Abbreviations | |
| CPI-U | Consumer Price Index for All Urban Consumers |
| USD | United States Dollar |
| (a) Value of floating rate index at April 30, 2022 was as follows: |
| FLOATING RATE INDEX | VALUE | |
| CPI-U | 2.89% |
| April 30, 2022 | J.P. Morgan Tax Aware Funds | 23 |
| JPMorgan Tax Aware Equity Fund | JPMorgan Tax Aware Real Return Fund | ||
| ASSETS: | |||
| Investments in non-affiliates, at value | $1,167,990 | $ 521,895 | |
| Investments in affiliates, at value | 3,537 | 73,113 | |
| Cash | 2 | 3,007 | |
| Deposits at broker for centrally cleared swaps | — | 18,365 | |
| Receivables: | |||
| Investment securities sold | 1,572 | 3,070 | |
| Investment securities sold — delayed delivery securities | — | 100 | |
| Fund shares sold | 734 | 729 | |
| Interest from non-affiliates | — | 5,991 | |
| Dividends from non-affiliates | 795 | — | |
| Dividends from affiliates | —(a) | 18 | |
| Total Assets | 1,174,630 | 626,288 | |
| LIABILITIES: | |||
| Payables: | |||
| Investment securities purchased | 1,209 | — | |
| Investment securities purchased — delayed delivery securities | — | 14,386 | |
| Fund shares redeemed | 1,239 | 2,766 | |
| Variation margin on centrally cleared swaps (net upfront receipts of $0 and $838, respectively) | — | 1,585 | |
| Accrued liabilities: | |||
| Investment advisory fees | 355 | 135 | |
| Administration fees | 72 | 17 | |
| Distribution fees | 20 | 23 | |
| Service fees | 79 | 44 | |
| Custodian and accounting fees | 7 | 18 | |
| Trustees’ and Chief Compliance Officer’s fees | — | —(a) | |
| Other | 33 | 61 | |
| Total Liabilities | 3,014 | 19,035 | |
| Net Assets | $1,171,616 | $ 607,253 (a) Amount rounds to less than one thousand. |
| 24 | J.P. Morgan Tax Aware Funds | April 30, 2022 |
| JPMorgan Tax Aware Equity Fund | JPMorgan Tax Aware Real Return Fund | ||
| NET ASSETS: | |||
| Paid-in-Capital | $ 396,875 | $ 711,838 | |
| Total distributable earnings (loss) | 774,741 | (104,585) | |
| Total Net Assets: | $1,171,616 | $ 607,253 | |
| Net Assets: | |||
| Class A | $ 39,105 | $ 90,091 | |
| Class C | 16,838 | 6,697 | |
| Class I | 688,449 | 457,639 | |
| Class R6 | 427,224 | 52,826 | |
| Total | $1,171,616 | $ 607,253 | |
| Outstanding units of beneficial interest (shares) ($0.0001 par value; unlimited number of shares authorized): | |||
| Class A | 1,028 | 9,456 | |
| Class C | 453 | 704 | |
| Class I | 17,931 | 47,918 | |
| Class R6 | 11,123 | 5,534 | |
| Net Asset Value (a): | |||
| Class A — Redemption price per share | $ 38.05 | $ 9.53 | |
| Class C — Offering price per share (b) | 37.15 | 9.51 | |
| Class I — Offering and redemption price per share | 38.40 | 9.55 | |
| Class R6 — Offering and redemption price per share | 38.41 | 9.55 | |
| Class A maximum sales charge | 5.25% | 3.75% | |
| Class A maximum public offering price per share [net asset value per share/(100% – maximum sales charge)] | $ 40.16 | $ 9.90 | |
| Cost of investments in non-affiliates | $ 491,275 | $ 552,690 | |
| Cost of investments in affiliates | 3,537 | 73,113 |
| (a) | Per share amounts may not recalculate due to rounding of net assets and/or shares outstanding. |
| (b) | Redemption price for Class C Shares varies based upon length of time the shares are held. |
| April 30, 2022 | J.P. Morgan Tax Aware Funds | 25 |
| JPMorgan Tax Aware Equity Fund | JPMorgan Tax Aware Real Return Fund | ||
| INVESTMENT INCOME: | |||
| Interest income from non-affiliates | $ — | $ 5,555 | |
| Dividend income from non-affiliates | 6,125 | — | |
| Dividend income from affiliates | 4 | 35 | |
| Total investment income | 6,129 | 5,590 | |
| EXPENSES: | |||
| Investment advisory fees | 2,316 | 1,033 | |
| Administration fees | 496 | 221 | |
| Distribution fees: | |||
| Class A | 53 | 124 | |
| Class C | 69 | 30 | |
| Service fees: | |||
| Class A | 53 | 124 | |
| Class C | 23 | 10 | |
| Class I | 960 | 550 | |
| Custodian and accounting fees | 22 | 73 | |
| Interest expense to affiliates | —(a) | — | |
| Professional fees | 30 | 47 | |
| Trustees’ and Chief Compliance Officer’s fees | 14 | 13 | |
| Printing and mailing costs | 31 | 5 | |
| Registration and filing fees | 49 | 48 | |
| Transfer agency fees (See Note 2.I) | 10 | 4 | |
| Other | 35 | 10 | |
| Total expenses | 4,161 | 2,292 | |
| Less fees waived | (603) | (704) | |
| Less expense reimbursements | (3) | — | |
| Net expenses | 3,555 | 1,588 | |
| Net investment income (loss) | $ 2,574 | $ 4,002 (a) Amount rounds to less than one thousand. |
| 26 | J.P. Morgan Tax Aware Funds | April 30, 2022 |
| JPMorgan Tax Aware Equity Fund | JPMorgan Tax Aware Real Return Fund | ||
| REALIZED/UNREALIZED GAINS (LOSSES): | |||
| Net realized gain (loss) on transactions from: | |||
| Investments in non-affiliates | $ 98,856 | $ (5,335) | |
| Investments in affiliates | (2) | (14) | |
| Futures contracts | — | (82) | |
| Foreign currency transactions | —(a) | — | |
| Swaps | — | 27,840 | |
| Net realized gain (loss) | 98,854 | 22,409 | |
| Distribution of capital gain received from investment company affiliates | — | 1 | |
| Change in net unrealized appreciation/depreciation on: | |||
| Investments in non-affiliates | (261,574) | (47,921) | |
| Investments in affiliates | —(a) | (1) | |
| Swaps | — | (870) | |
| Change in net unrealized appreciation/depreciation | (261,574) | (48,792) | |
| Net realized/unrealized gains (losses) | (162,720) | (26,382) | |
| Change in net assets resulting from operations | $(160,146) | $(22,380) |
| (a) | Amount rounds to less than one thousand. |
| April 30, 2022 | J.P. Morgan Tax Aware Funds | 27 |
| JPMorgan Tax Aware Equity Fund | JPMorgan Tax Aware Real Return Fund | ||||||
| Six Months Ended April 30, 2022 (Unaudited) | Year Ended October 31, 2021 | Six Months Ended April 30, 2022 (Unaudited) | Year Ended October 31, 2021 | ||||
| CHANGE IN NET ASSETS RESULTING FROM OPERATIONS: | |||||||
| Net investment income (loss) | $ 2,574 | $ 6,211 | $ 4,002 | $ 6,491 | |||
| Net realized gain (loss) | 98,854 | 216,878 | 22,409 | 33,316 | |||
| Distributions of capital gains received from investment company affiliates | — | — | 1 | —(a) | |||
| Change in net unrealized appreciation/depreciation | (261,574) | 223,729 | (48,792) | (779) | |||
| Change in net assets resulting from operations | (160,146) | 446,818 | (22,380) | 39,028 | |||
| DISTRIBUTIONS TO SHAREHOLDERS: | |||||||
| Class A | (5,822) | (4,005) | (560) | (795) | |||
| Class C | (2,555) | (1,733) | (25) | (39) | |||
| Class I | (105,929) | (88,662) | (3,088) | (5,235) | |||
| Class R6 | (71,509) | (69,665) | (335) | (444) | |||
| Total distributions to shareholders | (185,815) | (164,065) | (4,008) | (6,513) | |||
| CAPITAL TRANSACTIONS: | |||||||
| Change in net assets resulting from capital transactions | 78,264 | (17,513) | 67,807 | 258,426 | |||
| NET ASSETS: | |||||||
| Change in net assets | (267,697) | 265,240 | 41,419 | 290,941 | |||
| Beginning of period | 1,439,313 | 1,174,073 | 565,834 | 274,893 | |||
| End of period | $1,171,616 | $1,439,313 | $607,253 | $565,834 | |||
| (a) | Amount rounds to less than one thousand. |
| 28 | J.P. Morgan Tax Aware Funds | April 30, 2022 |
| JPMorgan Tax Aware Equity Fund | JPMorgan Tax Aware Real Return Fund | ||||||
| Six Months Ended April 30, 2022 (Unaudited) | Year Ended October 31, 2021 | Six Months Ended April 30, 2022 (Unaudited) | Year Ended October 31, 2021 | ||||
| CAPITAL TRANSACTIONS: | |||||||
| Class A | |||||||
| Proceeds from shares issued | $ 6,227 | $ 6,213 | $ 32,651 | $ 65,111 | |||
| Distributions reinvested | 5,735 | 3,935 | 486 | 693 | |||
| Cost of shares redeemed | (4,141) | (5,023) | (36,536) | (7,320) | |||
| Change in net assets resulting from Class A capital transactions | 7,821 | 5,125 | (3,399) | 58,484 | |||
| Class C | |||||||
| Proceeds from shares issued | 2,573 | 4,381 | 2,607 | 5,286 | |||
| Distributions reinvested | 2,496 | 1,683 | 23 | 36 | |||
| Cost of shares redeemed | (2,491) | (2,848) | (2,695) | (1,439) | |||
| Change in net assets resulting from Class C capital transactions | 2,578 | 3,216 | (65) | 3,883 | |||
| Class I | |||||||
| Proceeds from shares issued | 83,714 | 155,474 | 154,707 | 237,630 | |||
| Distributions reinvested | 103,917 | 86,764 | 1,703 | 2,990 | |||
| Cost of shares redeemed | (138,075) | (203,733) | (108,454) | (51,812) | |||
| Change in net assets resulting from Class I capital transactions | 49,556 | 38,505 | 47,956 | 188,808 | |||
| Class R6 | |||||||
| Proceeds from shares issued | 27,926 | 61,647 | 27,824 | 12,045 | |||
| Distributions reinvested | 71,177 | 69,432 | 273 | 440 | |||
| Cost of shares redeemed | (80,794) | (195,438) | (4,782) | (5,234) | |||
| Change in net assets resulting from Class R6 capital transactions | 18,309 | (64,359) | 23,315 | 7,251 | |||
| Total change in net assets resulting from capital transactions | $ 78,264 | $ (17,513) | $ 67,807 | $258,426 | |||
| SHARE TRANSACTIONS: | |||||||
| Class A | |||||||
| Issued | 139 | 136 | 3,309 | 6,679 | |||
| Reinvested | 130 | 101 | 50 | 72 | |||
| Redeemed | (95) | (114) | (3,743) | (762) | |||
| Change in Class A Shares | 174 | 123 | (384) | 5,989 | |||
| Class C | |||||||
| Issued | 60 | 99 | 262 | 544 | |||
| Reinvested | 58 | 44 | 2 | 4 | |||
| Redeemed | (58) | (64) | (275) | (148) | |||
| Change in Class C Shares | 60 | 79 | (11) | 400 | |||
| Class I | |||||||
| Issued | 1,887 | 3,388 | 15,752 | 24,612 | |||
| Reinvested | 2,328 | 2,193 | 173 | 309 | |||
| Redeemed | (3,009) | (4,477) | (11,078) | (5,359) | |||
| Change in Class I Shares | 1,206 | 1,104 | 4,847 | 19,562 | |||
| April 30, 2022 | J.P. Morgan Tax Aware Funds | 29 |
| JPMorgan Tax Aware Equity Fund | JPMorgan Tax Aware Real Return Fund | ||||||
| Six Months Ended April 30, 2022 (Unaudited) | Year Ended October 31, 2021 | Six Months Ended April 30, 2022 (Unaudited) | Year Ended October 31, 2021 | ||||
| SHARE TRANSACTIONS: (continued) | |||||||
| Class R6 | |||||||
| Issued | 625 | 1,381 | 2,826 | 1,230 | |||
| Reinvested | 1,594 | 1,754 | 28 | 45 | |||
| Redeemed | (1,838) | (4,628) | (490) | (540) | |||
| Change in Class R6 Shares | 381 | (1,493) | 2,364 | 735 | |||
| 30 | J.P. Morgan Tax Aware Funds | April 30, 2022 |
| Per share operating performance | ||||||||
| Investment operations | Distributions | |||||||
| Net asset value, beginning of period | Net investment income (loss)(b) | Net realized and unrealized gains (losses) on investments | Total from investment operations | Net investment income | Net realized gain | Total distributions | ||
| JPMorgan Tax Aware Equity Fund | ||||||||
| Class A | ||||||||
| Six Months Ended April 30, 2022(Unaudited) | $49.77 | $ —(f) | $ (5.15) | $ (5.15) | $(0.01) | $(6.56) | $(6.57) | |
| Year Ended October 31, 2021 | 40.37 | 0.02 | 14.90 | 14.92 | (0.04) | (5.48) | (5.52) | |
| Year Ended October 31, 2020 | 36.83 | 0.17 | 5.79 | 5.96 | (0.18) | (2.24) | (2.42) | |
| Year Ended October 31, 2019 | 33.50 | 0.23 | 4.28 | 4.51 | (0.25) | (0.93) | (1.18) | |
| Year Ended October 31, 2018 | 34.41 | 0.17 | 1.46 | 1.63 | (0.18) | (2.36) | (2.54) | |
| Year Ended October 31, 2017 | 28.82 | 0.17 | 6.87 | 7.04 | (0.19) | (1.26) | (1.45) | |
| Class C | ||||||||
| Six Months Ended April 30, 2022(Unaudited) | 48.84 | (0.11) | (5.02) | (5.13) | — | (6.56) | (6.56) | |
| Year Ended October 31, 2021 | 39.86 | (0.20) | 14.66 | 14.46 | — | (5.48) | (5.48) | |
| Year Ended October 31, 2020 | 36.42 | (0.02) | 5.74 | 5.72 | (0.04) | (2.24) | (2.28) | |
| Year Ended October 31, 2019 | 33.17 | 0.07 | 4.22 | 4.29 | (0.11) | (0.93) | (1.04) | |
| Year Ended October 31, 2018 | 34.13 | —(f) | 1.44 | 1.44 | (0.04) | (2.36) | (2.40) | |
| Year Ended October 31, 2017 | 28.62 | 0.01 | 6.83 | 6.84 | (0.07) | (1.26) | (1.33) | |
| Class I | ||||||||
| Six Months Ended April 30, 2022(Unaudited) | 50.15 | 0.08 | (5.18) | (5.10) | (0.09) | (6.56) | (6.65) | |
| Year Ended October 31, 2021 | 40.64 | 0.20 | 15.00 | 15.20 | (0.21) | (5.48) | (5.69) | |
| Year Ended October 31, 2020 | 37.05 | 0.32 | 5.84 | 6.16 | (0.33) | (2.24) | (2.57) | |
| Year Ended October 31, 2019 | 33.67 | 0.40 | 4.28 | 4.68 | (0.37) | (0.93) | (1.30) | |
| Year Ended October 31, 2018 | 34.57 | 0.32 | 1.45 | 1.77 | (0.31) | (2.36) | (2.67) | |
| Year Ended October 31, 2017 | 28.94 | 0.31 | 6.91 | 7.22 | (0.33) | (1.26) | (1.59) | |
| Class R6 | ||||||||
| Six Months Ended April 30, 2022(Unaudited) | 50.16 | 0.11 | (5.19) | (5.08) | (0.11) | (6.56) | (6.67) | |
| Year Ended October 31, 2021 | 40.64 | 0.25 | 15.00 | 15.25 | (0.25) | (5.48) | (5.73) | |
| Year Ended October 31, 2020 | 37.06 | 0.37 | 5.82 | 6.19 | (0.37) | (2.24) | (2.61) | |
| Year Ended October 31, 2019 | 33.68 | 0.38 | 4.33 | 4.71 | (0.40) | (0.93) | (1.33) | |
| October 1, 2018(h) through October 31, 2018 | 37.04 | 0.01 | (3.37) | (3.36) | — | — | — | |
| (a) | Annualized for periods less than one year, unless otherwise noted. |
| (b) | Calculated based upon average shares outstanding. |
| (c) | Includes adjustments in accordance with accounting principles generally accepted in the United States of America and as such, the net asset values for financial reporting purposes and the returns based upon those net asset values may differ from the net asset values and returns for shareholder transactions. |
| (d) | Not annualized for periods less than one year. |
| (e) | Includes earnings credits and interest expense, if applicable, each of which is less than 0.005% unless otherwise noted. |
| (f) | Amount rounds to less than $0.005. |
| (g) | Certain non-recurring expenses incurred by the Fund were not annualized for the period indicated. |
| (h) | Commencement of offering of class of shares. |
| 32 | J.P. Morgan Tax Aware Funds | April 30, 2022 |
| Ratios/Supplemental data | |||||||
| Ratios to average net assets(a) | |||||||
| Net asset value, end of period | Total return (excludes sales charge)(c)(d) | Net assets, end of period (000's) | Net expenses(e) | Net investment income (loss) | Expenses without waivers and reimbursements | Portfolio turnover rate(d) | |
| $38.05 | (12.20)% | $ 39,105 | 0.94(g)% | (0.02)(g)% | 0.95(g)% | 20% | |
| 49.77 | 40.69 | 42,525 | 0.94 | 0.05 | 0.95 | 21 | |
| 40.37 | 16.96 | 29,515 | 0.95 | 0.45 | 0.96 | 19 | |
| 36.83 | 13.99 | 25,640 | 0.96 | 0.67 | 0.98 | 14 | |
| 33.50 | 4.83 | 25,594 | 0.96 | 0.50 | 0.96 | 38 | |
| 34.41 | 25.25 | 20,140 | 0.99 | 0.53 | 0.99 | 28 | |
| 37.15 | (12.40) | 16,838 | 1.45(g) | (0.52)(g) | 1.46(g) | 20 | |
| 48.84 | 39.96 | 19,177 | 1.44 | (0.45) | 1.45 | 21 | |
| 39.86 | 16.40 | 12,499 | 1.45 | (0.05) | 1.46 | 19 | |
| 36.42 | 13.42 | 11,345 | 1.44 | 0.19 | 1.46 | 14 | |
| 33.17 | 4.31 | 12,197 | 1.46 | (0.01) | 1.47 | 38 | |
| 34.13 | 24.65 | 8,988 | 1.48 | 0.04 | 1.48 | 28 | |
| 38.40 | (12.01) | 688,449 | 0.55(g) | 0.38(g) | 0.70(g) | 20 | |
| 50.15 | 41.22 | 838,765 | 0.55 | 0.45 | 0.70 | 21 | |
| 40.64 | 17.47 | 634,799 | 0.55 | 0.85 | 0.71 | 19 | |
| 37.05 | 14.45 | 586,825 | 0.55 | 1.16 | 0.71 | 14 | |
| 33.67 | 5.26 | 1,364,073 | 0.55 | 0.91 | 0.70 | 38 | |
| 34.57 | 25.82 | 1,244,869 | 0.55 | 0.99 | 0.65 | 28 | |
| 38.41 | (11.96) | 427,224 | 0.44(g) | 0.49(g) | 0.45(g) | 20 | |
| 50.16 | 41.39 | 538,846 | 0.44 | 0.56 | 0.45 | 21 | |
| 40.64 | 17.57 | 497,260 | 0.44 | 0.98 | 0.45 | 19 | |
| 37.06 | 14.55 | 650,680 | 0.44 | 1.08 | 0.46 | 14 | |
| 33.68 | (9.07) | 18 | 0.44 | 0.31 | 0.48 | 38 | |
| April 30, 2022 | J.P. Morgan Tax Aware Funds | 33 |
| Per share operating performance | ||||||
| Investment operations | Distributions | |||||
| Net asset value, beginning of period | Net investment income (loss)(b) | Net realized and unrealized gains (losses) on investments | Total from investment operations | Net investment income | ||
| JPMorgan Tax Aware Real Return Fund | ||||||
| Class A | ||||||
| Six Months Ended April 30, 2022(Unaudited) | $9.94 | $0.06 | $(0.41) | $(0.35) | $(0.06) | |
| Year Ended October 31, 2021 | 9.11 | 0.13 | 0.84 | 0.97 | (0.14) | |
| Year Ended October 31, 2020 | 9.25 | 0.18 | (0.13) | 0.05 | (0.19) | |
| Year Ended October 31, 2019 | 9.19 | 0.22 | 0.07 | 0.29 | (0.23) | |
| Year Ended October 31, 2018 | 9.46 | 0.23 | (0.26) | (0.03) | (0.24) | |
| Year Ended October 31, 2017 | 9.59 | 0.23 | (0.13) | 0.10 | (0.23) | |
| Class C | ||||||
| Six Months Ended April 30, 2022(Unaudited) | 9.92 | 0.03 | (0.41) | (0.38) | (0.03) | |
| Year Ended October 31, 2021 | 9.09 | 0.08 | 0.84 | 0.92 | (0.09) | |
| Year Ended October 31, 2020 | 9.23 | 0.14 | (0.14) | —(g) | (0.14) | |
| Year Ended October 31, 2019 | 9.17 | 0.17 | 0.07 | 0.24 | (0.18) | |
| Year Ended October 31, 2018 | 9.43 | 0.18 | (0.25) | (0.07) | (0.19) | |
| Year Ended October 31, 2017 | 9.57 | 0.19 | (0.14) | 0.05 | (0.19) | |
| Class I | ||||||
| Six Months Ended April 30, 2022(Unaudited) | 9.97 | 0.07 | (0.42) | (0.35) | (0.07) | |
| Year Ended October 31, 2021 | 9.13 | 0.16 | 0.84 | 1.00 | (0.16) | |
| Year Ended October 31, 2020 | 9.27 | 0.20 | (0.13) | 0.07 | (0.21) | |
| Year Ended October 31, 2019 | 9.21 | 0.24 | 0.07 | 0.31 | (0.25) | |
| Year Ended October 31, 2018 | 9.48 | 0.26 | (0.27) | (0.01) | (0.26) | |
| Year Ended October 31, 2017 | 9.61 | 0.26 | (0.13) | 0.13 | (0.26) | |
| Class R6 | ||||||
| Six Months Ended April 30, 2022(Unaudited) | 9.96 | 0.07 | (0.41) | (0.34) | (0.07) | |
| Year Ended October 31, 2021 | 9.13 | 0.17 | 0.83 | 1.00 | (0.17) | |
| Year Ended October 31, 2020 | 9.27 | 0.23 | (0.15) | 0.08 | (0.22) | |
| Year Ended October 31, 2019 | 9.21 | 0.25 | 0.07 | 0.32 | (0.26) | |
| Year Ended October 31, 2018 | 9.48 | 0.27 | (0.27) | —(g) | (0.27) | |
| Year Ended October 31, 2017 | 9.61 | 0.26 | (0.12) | 0.14 | (0.27) | |
| (a) | Annualized for periods less than one year, unless otherwise noted. |
| (b) | Calculated based upon average shares outstanding. |
| (c) | Includes adjustments in accordance with accounting principles generally accepted in the United States of America and as such, the net asset values for financial reporting purposes and the returns based upon those net asset values may differ from the net asset values and returns for shareholder transactions. |
| (d) | Not annualized for periods less than one year. |
| (e) | Includes earnings credits and interest expense, if applicable, each of which is less than 0.005% unless otherwise noted. |
| (f) | Certain non-recurring expenses incurred by the Fund were not annualized for the period indicated. |
| (g) | Amount rounds to less than $0.005. |
| (h) | Amount rounds to less than 0.005%. |
| 34 | J.P. Morgan Tax Aware Funds | April 30, 2022 |
| Ratios/Supplemental data | |||||||
| Ratios to average net assets(a) | |||||||
| Net asset value, end of period | Total return (excludes sales charge)(c)(d) | Net assets, end of period (000's) | Net expenses(e) | Net investment income (loss) | Expenses without waivers | Portfolio turnover rate(d) | |
| $9.53 | (3.58)% | $ 90,091 | 0.74(f)% | 1.15(f)% | 0.99(f)% | 18% | |
| 9.94 | 10.68 | 97,845 | 0.75 | 1.33 | 1.01 | 7 | |
| 9.11 | 0.57 | 35,094 | 0.75 | 1.96 | 1.01 | 12 | |
| 9.25 | 3.14 | 39,846 | 0.76 | 2.32 | 0.99 | 4 | |
| 9.19 | (0.36) | 33,051 | 0.74 | 2.47 | 0.98 | 30 | |
| 9.46 | 1.12 | 56,720 | 0.73 | 2.47 | 0.97 | 20 | |
| 9.51 | (3.82) | 6,697 | 1.24(f) | 0.64(f) | 1.50(f) | 18 | |
| 9.92 | 10.17 | 7,095 | 1.25 | 0.84 | 1.51 | 7 | |
| 9.09 | 0.04 | 2,859 | 1.25 | 1.50 | 1.51 | 12 | |
| 9.23 | 2.60 | 8,353 | 1.26 | 1.85 | 1.48 | 4 | |
| 9.17 | (0.76) | 18,315 | 1.24 | 1.97 | 1.48 | 30 | |
| 9.43 | 0.50 | 26,545 | 1.23 | 1.98 | 1.49 | 20 | |
| 9.55 | (3.54) | 457,639 | 0.49(f) | 1.40(f) | 0.74(f) | 18 | |
| 9.97 | 11.04 | 429,314 | 0.50 | 1.61 | 0.76 | 7 | |
| 9.13 | 0.82 | 214,709 | 0.50 | 2.24 | 0.75 | 12 | |
| 9.27 | 3.38 | 384,626 | 0.51 | 2.58 | 0.73 | 4 | |
| 9.21 | (0.10) | 411,760 | 0.49 | 2.72 | 0.73 | 30 | |
| 9.48 | 1.35 | 323,320 | 0.48 | 2.74 | 0.65 | 20 | |
| 9.55 | (3.40) | 52,826 | 0.39(f) | 1.53(f) | 0.49(f) | 18 | |
| 9.96 | 11.04 | 31,580 | 0.40 | 1.76 | 0.51 | 7 | |
| 9.13 | 0.92 | 22,231 | 0.40 | 2.48 | 0.49 | 12 | |
| 9.27 | 3.49 | 316,009 | 0.41 | 2.70 | 0.48 | 4 | |
| 9.21 | —(h) | 588,549 | 0.39 | 2.82 | 0.48 | 30 | |
| 9.48 | 1.47 | 1,112,857 | 0.38 | 2.75 | 0.47 | 20 | |
| April 30, 2022 | J.P. Morgan Tax Aware Funds | 35 |
| Classes Offered | Diversification Classification | |
| JPMorgan Tax Aware Equity Fund | Class A, Class C, Class I and Class R6 | Diversified |
| JPMorgan Tax Aware Real Return Fund | Class A, Class C, Class I and Class R6 | Diversified |
| 36 | J.P. Morgan Tax Aware Funds | April 30, 2022 |
| • | Level 1 — Unadjusted inputs using quoted prices in active markets for identical investments. |
| • | Level 2 — Other significant observable inputs including, but not limited to, quoted prices for similar investments, inputs other than quoted prices that are observable for investments (such as interest rates, prepayment speeds, credit risk, etc.) or other market corroborated inputs. |
| • | Level 3 — Significant inputs based on the best information available in the circumstances, to the extent observable inputs are not available (including the Funds' assumptions in determining the fair value of investments). |
| Tax Aware Equity Fund | |||||||
| Level 1 Quoted prices | Level 2 Other significant observable inputs | Level 3 Significant unobservable inputs | Total | ||||
| Total Investments in Securities (a) | $1,171,527 | $— | $— | $1,171,527 |
| (a) | Please refer to the SOI for specific of portfolio holdings. |
| Tax Aware Real Return Fund | |||||||
| Level 1 Quoted prices | Level 2 Other significant observable inputs | Level 3 Significant unobservable inputs | Total | ||||
| Investments in Securities | |||||||
| Municipal Bonds | $ — | $521,895 | $— | $521,895 | |||
| Short-Term Investments | |||||||
| Investment Companies | 73,113 | — | — | 73,113 | |||
| Total Investments in Securities | $73,113 | $521,895 | $— | $595,008 | |||
| Appreciation in Other Financial Instruments | |||||||
| Swaps | $ — | $ 6,704 | $— | $ 6,704 | |||
| Depreciation in Other Financial Instruments | |||||||
| Swaps | — | (145) | — | (145) | |||
| Total Net Appreciation/ Depreciation in Other Financial Instruments | $ — | $ 6,559 | $— | $ 6,559 |
| April 30, 2022 | J.P. Morgan Tax Aware Funds | 37 |
| 38 | J.P. Morgan Tax Aware Funds | April 30, 2022 |
| Tax Aware Equity Fund | |||||||||||||||
| For the six months ended April 30, 2022 | |||||||||||||||
| Security Description | Value at October 31, 2021 | Purchases at Cost | Proceeds from Sales | Net Realized Gain (Loss) | Change in Unrealized Appreciation/ (Depreciation) | Value at April 30, 2022 | Shares at April 30, 2022 | Dividend Income | Capital Gain Distributions | ||||||
| JPMorgan Prime Money Market Fund Class IM Shares, 0.42% (a) (b) | $14,898 | $83,600 | $94,960 | $(2) | $—(c) | $3,537 | 3,536 | $4 | $— | ||||||
| (a) | Investment in an affiliated fund, which is registered under the Investment Company Act of 1940, as amended, and is advised by J.P. Morgan Investment Management Inc. |
| (b) | The rate shown is the current yield as of April 30, 2022. |
| (c) | Amount rounds to less than one thousand. |
| Tax Aware Real Return Fund | |||||||||||||||
| For the six months ended April 30, 2022 | |||||||||||||||
| Security Description | Value at October 31, 2021 | Purchases at Cost | Proceeds from Sales | Net Realized Gain (Loss) | Change in Unrealized Appreciation/ (Depreciation) | Value at April 30, 2022 | Shares at April 30, 2022 | Dividend Income | Capital Gain Distributions | ||||||
| JPMorgan Institutional Tax Free Money Market Fund Class IM Shares, 0.34% (a) (b) | $56,696 | $176,174 | $159,742 | $(14) | $(1) | $73,113 | 73,091 | $35 | $1 | ||||||
| (a) | Investment in an affiliated fund, which is registered under the Investment Company Act of 1940, as amended, and is advised by J.P. Morgan Investment Management Inc. |
| (b) | The rate shown is the current yield as of April 30, 2022. |
| April 30, 2022 | J.P. Morgan Tax Aware Funds | 39 |
| Tax Aware Real Return Fund | |
| Futures Contracts: | |
| Average Notional Balance Long | $ 3,819 |
| Average Notional Balance Short | (3,817) |
| Interest Rate Related Swaps : | |
| Average Notional Balance - Pays Fixed Rate | 474,431 |
| Ending Notional Balance - Pays Fixed Rate | 525,605 |
| Class A | Class C | Class I | Class R6 | Total | |
| Tax Aware Equity Fund | |||||
| Transfer agency fees | $1 | $—(a) | $6 | $3 | $10 |
| 40 | J.P. Morgan Tax Aware Funds | April 30, 2022 |
| Class A | Class C | Class I | Class R6 | Total | |
| Tax Aware Real Return Fund | |||||
| Transfer agency fees | $1 | $—(a) | $2 | $1 | $ 4 |
| (a) | Amount rounds to less than one thousand. |
| Class A | Class C | |
| Tax Aware Equity Fund | 0.25% | 0.75% |
| Tax Aware Real Return Fund | 0.25 | 0.75 |
| April 30, 2022 | J.P. Morgan Tax Aware Funds | 41 |
| Front-End Sales Charge | CDSC | |
| Tax Aware Equity Fund | $6 | $— |
| Tax Aware Real Return Fund | 2 | — |
| Class A | Class C | Class I | |
| Tax Aware Equity Fund | 0.25% | 0.25% | 0.25% |
| Tax Aware Real Return Fund | 0.25 | 0.25 | 0.25 |
| Class A | Class C | Class I | Class R6 | |
| Tax Aware Equity Fund | n/a% | n/a% | 0.55% | 0.44% |
| Tax Aware Real Return Fund | 0.75 | 1.25 | 0.50 | 0.40 |
| Contractual Waivers | |||||
| Investment Advisory Fees | Administration Fees | Service Fees | Total | Contractual Reimbursements | |
| Tax Aware Equity Fund | $ 33 | $ 22 | $544 | $599 | $ 3 |
| Tax Aware Real Return Fund | 163 | 108 | 410 | 681 | — |
| 42 | J.P. Morgan Tax Aware Funds | April 30, 2022 |
| Tax Aware Equity Fund | $ 3 |
| Tax Aware Real Return Fund | 23 |
| Tax Aware Equity Fund | 1 |
| Purchases (excluding U.S. Government) | Sales (excluding U.S. Government) | |
| Tax Aware Equity Fund | $270,061 | $358,980 |
| Tax Aware Real Return Fund | 177,376 | 90,809 |
| Aggregate Cost | Gross Unrealized Appreciation | Gross Unrealized Depreciation | Net Unrealized Appreciation (Depreciation) | |
| Tax Aware Equity Fund | $494,812 | $685,605 | $ 8,890 | $676,715 |
| Tax Aware Real Return Fund | 624,965 | 8,898 | 33,134 | (24,236) |
| Capital Loss Carryforward Character | ||
| Short-Term | Long-Term | |
| Tax Aware Real Return Fund | $102,720 | $— |
| Capital Loss Utilized | ||
| Short-Term | Long-Term | |
| Tax Aware Real Return Fund | $33,349 | $— |
| April 30, 2022 | J.P. Morgan Tax Aware Funds | 43 |
| Average Borrowings | Average Interest Rate paid | Number of Days Outstanding | Interest Paid | |
| Tax Aware Equity Fund | $2,698 | 0.82% | 1 | $—(a) |
| (a) | Amount rounds to less than one thousand. |
| 44 | J.P. Morgan Tax Aware Funds | April 30, 2022 |
| Number of Individual Shareholder and/or Affiliated Omnibus Accounts | % of the Fund | Number of Individual Shareholder and/or Non-Affiliated Omnibus Accounts | % of the Fund | |
| Tax Aware Equity Fund | 1 | 46.3% | 1 | 31.2% |
| Tax Aware Real Return Fund | 1 | 12.7 | 2 | 47.8 |
| April 30, 2022 | J.P. Morgan Tax Aware Funds | 45 |
| Beginning Account Value November 1, 2021 | Ending Account Value April 30, 2022 | Expenses Paid During the Period* | Annualized Expense Ratio | |
| JPMorgan Tax Aware Equity Fund | ||||
| Class A | ||||
| Actual | $1,000.00 | $ 878.00 | $4.38 | 0.94% |
| Hypothetical | 1,000.00 | 1,020.13 | 4.71 | 0.94 |
| Class C | ||||
| Actual | 1,000.00 | 876.00 | 6.74 | 1.45 |
| Hypothetical | 1,000.00 | 1,017.60 | 7.25 | 1.45 |
| Class I | ||||
| Actual | 1,000.00 | 879.90 | 2.56 | 0.55 |
| Hypothetical | 1,000.00 | 1,022.07 | 2.76 | 0.55 |
| Class R6 | ||||
| Actual | 1,000.00 | 880.40 | 2.05 | 0.44 |
| Hypothetical | 1,000.00 | 1,022.61 | 2.21 | 0.44 |
| JPMorgan Tax Aware Real Return Fund | ||||
| Class A | ||||
| Actual | 1,000.00 | 964.20 | 3.60 | 0.74 |
| Hypothetical | 1,000.00 | 1,021.13 | 3.71 | 0.74 |
| Class C | ||||
| Actual | 1,000.00 | 961.80 | 6.03 | 1.24 |
| Hypothetical | 1,000.00 | 1,018.65 | 6.21 | 1.24 |
| Class I | ||||
| Actual | 1,000.00 | 964.60 | 2.39 | 0.49 |
| Hypothetical | 1,000.00 | 1,022.37 | 2.46 | 0.49 |
| 46 | J.P. Morgan Tax Aware Funds | April 30, 2022 |
| Beginning Account Value November 1, 2021 | Ending Account Value April 30, 2022 | Expenses Paid During the Period* | Annualized Expense Ratio | |
| JPMorgan Tax Aware Real Return Fund (continued) | ||||
| Class R6 | ||||
| Actual | $1,000.00 | $ 966.00 | $1.90 | 0.39% |
| Hypothetical | 1,000.00 | 1,022.86 | 1.96 | 0.39 |
| * | Expenses are equal to each Class’ respective annualized expense ratio, multiplied by the average account value over the period, multiplied by 181/365 (to reflect the one-half year period). |
| April 30, 2022 | J.P. Morgan Tax Aware Funds | 47 |
| 48 | J.P. Morgan Tax Aware Funds | April 30, 2022 |


| © JPMorgan Chase & Co., 2022. All rights reserved. April 2022. | SAN-TA-422 |
| JPMorgan Global Allocation Fund |
| JPMorgan Income Builder Fund |

| 1 | |
| 2 | |
| Fund Commentaries: | |
| 3 | |
| 6 | |
| 10 | |
| 123 | |
| 132 | |
| 138 | |
| 163 | |
| 165 |
 | “The market environment remains challenging; investors should recognize the risks in trying to time market movements, as well as the potential long-term benefits of portfolio diversification.” — Andrea L. Lisher |

Head of Americas, Client
J.P. Morgan Asset Management
| April 30, 2022 | J.P. Morgan Funds | 1 |
| 2 | J.P. Morgan Funds | April 30, 2022 |
| REPORTING PERIOD RETURN: | |
Fund Class I Shares * | (12.15)% |
MSCI All Country World Index (net of foreign withholding taxes) | (11.63)% |
Bloomberg Global Aggregate Index (Unhedged USD) | (11.69)% |
60% MSCI All Country World Index (net of foreign withholding taxes) / 40% Bloomberg Global Aggregate Index (Unhedged) (formerly known as Global Allocation Composite Benchmark) | (11.37)% |
Net Assets as of 4/30/2022 (In Thousands) | $4,213,255 |
| TOP TEN POSITIONS OF THE PORTFOLIO AS OF April 30, 2022 | PERCENT OF TOTAL INVESTMENTS | ||
| 1. | JPMorgan Income Fund, Class R6 Shares | 4.4% | |
| 2. | Microsoft Corp. | 1.7 | |
| 3. | U.S. Treasury Notes, 0.13%, 1/31/2023 | 1.5 | |
| 4. | Amazon.com, Inc. | 1.4 | |
| 5. | Apple, Inc. | 1.2 | |
| 6. | UnitedHealth Group, Inc. | 0.8 | |
| 7. | Bristol-Myers Squibb Co. | 0.8 | |
| 8. | LVMH Moet Hennessy Louis Vuitton SE (France) | 0.8 | |
| 9. | AbbVie, Inc. | 0.7 | |
| 10. | Japan Government Bond | 0.7 | |
| PORTFOLIO COMPOSITION AS OF April 30, 2022 | PERCENT OF TOTAL INVESTMENTS | |
Common Stocks | 54.7% | |
Corporate Bonds | 15.6 | |
Foreign Government Securities | 14.7 | |
Investment Companies | 4.4 | |
U.S. Treasury Obligations | 1.5 | |
Options Purchased | 1.1 | |
Others (each less than 1.0%) | 1.0 | |
Short-Term Investments | 7.0 |
| * | The return shown is based on net asset values calculated for shareholder transactions and may differ from the return shown in the financial highlights, which reflects adjustments made to the net asset values in accordance with accounting principles generally accepted in the United States of America. |
| ** | The adviser seeks to achieve the Fund’s objective. There can be no guarantee it will be achieved. |
| April 30, 2022 | J.P. Morgan Funds | 3 |
| INCEPTION DATE OF CLASS | 6 MONTH* | 1 YEAR | 5 YEAR | 10 YEAR | |||||
| CLASS A SHARES | May 31, 2011 | ||||||||
| With Sales Charge ** | (16.19)% | (13.74)% | 4.55% | 5.85% | |||||
| Without Sales Charge | (12.25) | (9.69) | 5.52 | 6.34 | |||||
| CLASS C SHARES | May 31, 2011 | ||||||||
| With CDSC *** | (13.42) | (11.10) | 5.00 | 5.92 | |||||
| Without CDSC | (12.42) | (10.10) | 5.00 | 5.92 | |||||
| Class I SHARES | May 31, 2011 | (12.15) | (9.46) | 5.79 | 6.61 | ||||
| Class R2 SHARES | May 31, 2011 | (12.39) | (10.03) | 5.15 | 6.02 | ||||
| Class R3 SHARES | October 1, 2018 | (12.32) | (9.79) | 5.42 | 6.29 | ||||
| Class R4 SHARES | October 1, 2018 | (12.14) | (9.54) | 5.71 | 6.57 | ||||
| Class R5 SHARES | October 1, 2018 | (12.13) | (9.42) | 5.82 | 6.62 | ||||
| Class R6 SHARES | November 1, 2017 | (12.10) | (9.34) | 5.91 | 6.67 |
| * | Not annualized. |
| ** | Sales Charge for Class A Shares is 4.50%. |
| *** | Assumes a 1% CDSC (contingent deferred sales charge) for the 6 month and one year periods and 0% CDSC thereafter. |
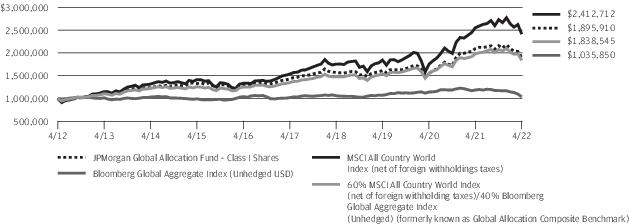
| 4 | J.P. Morgan Funds | April 30, 2022 |
| April 30, 2022 | J.P. Morgan Funds | 5 |
| REPORTING PERIOD RETURN: | |
Fund (Class A Shares, without a sales charge) * | (7.56)% |
MSCI World Index (net of foreign withholding taxes) | (11.30)% |
Bloomberg U.S. Aggregate Index | (9.47)% |
60% MSCI World Index (net of foreign withholding taxes) / 40% Bloomberg U.S. Aggregate Index (formerly known as Income Builder Composite Benchmark) | (10.47)% |
Net Assets as of 4/30/2022 (In Thousands) | $12,053,776 |
| TOP TEN POSITIONS OF THE PORTFOLIO AS OF April 30, 2022 | PERCENT OF TOTAL INVESTMENTS | ||
| 1. | JPMorgan Equity Premium Income ETF | 2.5% | |
| 2. | Royal Bank of Canada, ELN, 7.50%, 5/11/2022, (linked to Russell 2000 Index) | 1.0 | |
| 3. | BNP Paribas SA, ELN, 7.00%, 5/18/2022, (linked to Russell 2000 Index) | 1.0 | |
| 4. | Societe Generale SA, ELN, 7.50%, 8/10/2022, (linked to Russell 2000 Index) | 1.0 | |
| 5. | Barclays Bank plc, ELN, 7.00%, 8/3/2022, (linked to Russell 2000 Index) | 1.0 | |
| 6. | BNP Paribas SA, ELN, 7.00%, 7/27/2022, (linked to Russell 2000 Index) | 1.0 | |
| 7. | Barclays Bank plc, ELN, 7.00%, 7/20/2022, (linked to Russell 2000 Index) | 1.0 | |
| 8. | Societe Generale SA, ELN, 7.00%, 5/25/2022, (linked to Russell 2000 Index) | 1.0 | |
| 9. | Johnson & Johnson | 0.6 | |
| 10. | U.S. Treasury Notes, 0.13%, 1/31/2023 | 0.5 | |
| PORTFOLIO COMPOSITION AS OF April 30, 2022 | PERCENT OF TOTAL INVESTMENTS | |
Common Stocks | 37.0% | |
Corporate Bonds | 33.3 | |
Equity Linked Notes | 6.8 | |
Commercial Mortgage-Backed Securities | 3.9 | |
Collateralized Mortgage Obligations | 3.7 | |
Exchange-Traded Funds | 2.5 | |
Loan Assignments | 2.3 | |
Asset-Backed Securities | 1.3 | |
Foreign Government Securities | 1.1 | |
Others (each less than 1.0%) | 1.8 | |
Short-Term Investments | 6.3 |
| * | The return shown is based on net asset values calculated for shareholder transactions and may differ from the return shown in the financial highlights, which reflects adjustments made to the net asset values in accordance with accounting principles generally accepted in the United States of America. |
| 6 | J.P. Morgan Funds | April 30, 2022 |
| ** | The adviser seeks to achieve the Fund’s objective. There can be no guarantee it will be achieved. |
| April 30, 2022 | J.P. Morgan Funds | 7 |
| INCEPTION DATE OF CLASS | 6 MONTH* | 1 YEAR | 5 YEAR | 10 YEAR | |||||
| CLASS A SHARES | May 31, 2007 | ||||||||
| With Sales Charge ** | (11.74)% | (9.14)% | 3.53% | 4.97% | |||||
| Without Sales Charge | (7.56) | (4.87) | 4.48 | 5.45 | |||||
| CLASS C SHARES | May 31, 2007 | ||||||||
| With CDSC *** | (8.74) | (6.37) | 3.94 | 5.03 | |||||
| Without CDSC | (7.74) | (5.37) | 3.94 | 5.03 | |||||
| Class I SHARES | May 31, 2007 | (7.48) | (4.72) | 4.63 | 5.62 | ||||
| Class R6 SHARES | November 1, 2017 | (7.44) | (4.63) | 4.71 | 5.66 |
| * | Not annualized. |
| ** | Sales Charge for Class A Shares is 4.50%. |
| *** | Assumes a 1% CDSC (contingent deferred sales charge) for the 6 month and one year periods and 0% CDSC thereafter. |
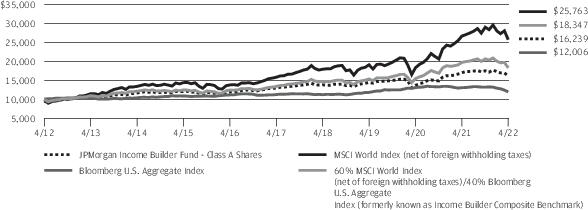
| 8 | J.P. Morgan Funds | April 30, 2022 |
| April 30, 2022 | J.P. Morgan Funds | 9 |
| INVESTMENTS | SHARES (000) | VALUE ($000) |
| Common Stocks — 55.4% | ||
| Australia — 0.5% | ||
| Ampol Ltd. | 2 | 44 |
| APA Group | 9 | 75 |
| Aristocrat Leisure Ltd. | 5 | 111 |
| ASX Ltd. | 2 | 93 |
| Aurizon Holdings Ltd. | 15 | 41 |
| Australia & New Zealand Banking Group Ltd. | 22 | 425 |
| BHP Group Ltd. | 259 | 8,686 |
| BHP Group Ltd. | 18 | 615 |
| BlueScope Steel Ltd. | 4 | 56 |
| Brambles Ltd. | 11 | 84 |
| Cochlear Ltd. | 1 | 84 |
| Coles Group Ltd. | 11 | 139 |
| Commonwealth Bank of Australia | 13 | 981 |
| Computershare Ltd. | 4 | 76 |
| Crown Resorts Ltd. * | 3 | 27 |
| CSL Ltd. | 4 | 723 |
| Dexus, REIT | 9 | 67 |
| Domino's Pizza Enterprises Ltd. | — | 25 |
| Endeavour Group Ltd. | 11 | 58 |
| Evolution Mining Ltd. | 14 | 41 |
| Fortescue Metals Group Ltd. | 13 | 203 |
| Glencore plc * | 78 | 484 |
| Goodman Group, REIT | 13 | 221 |
| GPT Group (The), REIT | 15 | 54 |
| IDP Education Ltd. | 2 | 31 |
| Insurance Australia Group Ltd. | 20 | 62 |
| LendLease Corp. Ltd. | 5 | 47 |
| Macquarie Group Ltd. | 3 | 386 |
| Medibank Pvt Ltd. | 22 | 49 |
| Mineral Resources Ltd. | 1 | 55 |
| Mirvac Group, REIT | 31 | 53 |
| National Australia Bank Ltd. | 26 | 591 |
| Newcrest Mining Ltd. | 7 | 132 |
| Northern Star Resources Ltd. | 9 | 60 |
| Orica Ltd. | 3 | 37 |
| Origin Energy Ltd. | 14 | 67 |
| Qantas Airways Ltd. * | 7 | 28 |
| QBE Insurance Group Ltd. | 12 | 101 |
| Ramsay Health Care Ltd. | 1 | 82 |
| REA Group Ltd. | — | 37 |
| Reece Ltd. | 2 | 28 |
| Rio Tinto Ltd. | 3 | 232 |
| Rio Tinto plc | 9 | 628 |
| INVESTMENTS | SHARES (000) | VALUE ($000) |
| Australia — continued | ||
| Santos Ltd. | 25 | 142 |
| Scentre Group, REIT | 41 | 86 |
| SEEK Ltd. | 3 | 52 |
| Sonic Healthcare Ltd. | 4 | 93 |
| South32 Ltd. | 37 | 123 |
| Stockland, REIT | 19 | 55 |
| Suncorp Group Ltd. | 10 | 80 |
| Tabcorp Holdings Ltd. | 18 | 67 |
| Telstra Corp. Ltd. | 33 | 93 |
| Transurban Group | 24 | 244 |
| Treasury Wine Estates Ltd. | 6 | 45 |
| Vicinity Centres, REIT | 31 | 40 |
| Washington H Soul Pattinson & Co. Ltd. | 2 | 33 |
| Wesfarmers Ltd. | 9 | 310 |
| Westpac Banking Corp. | 29 | 486 |
| WiseTech Global Ltd. | 1 | 36 |
| Woodside Petroleum Ltd. | 8 | 167 |
| Woolworths Group Ltd. | 10 | 259 |
| 18,530 | ||
| Austria — 0.0% ^ | ||
| Erste Group Bank AG | 3 | 85 |
| Mondi plc | 4 | 72 |
| OMV AG | 1 | 59 |
| Raiffeisen Bank International AG (a) | 1 | 13 |
| Verbund AG * | — | 58 |
| voestalpine AG | 1 | 24 |
| 311 | ||
| Belgium — 0.4% | ||
| Ageas SA | 1 | 65 |
| Anheuser-Busch InBev SA | 7 | 395 |
| Elia Group SA/NV (a) | — | 39 |
| Etablissements Franz Colruyt NV | — | 16 |
| Groupe Bruxelles Lambert SA | 1 | 82 |
| KBC Group NV | 253 | 17,179 |
| Proximus SADP | 1 | 21 |
| Sofina SA | — | 37 |
| Solvay SA | 1 | 55 |
| UCB SA | 1 | 114 |
| Umicore SA | 2 | 60 |
| 18,063 | ||
| Brazil — 0.4% | ||
| Itau Unibanco Holding SA (Preference) * | 329 | 1,594 |
| 10 | J.P. Morgan Funds | April 30, 2022 |
| INVESTMENTS | SHARES (000) | VALUE ($000) |
| Common Stocks — continued | ||
| Brazil — continued | ||
| Localiza Rent a Car SA | 134 | 1,439 |
| Lojas Renner SA * | 286 | 1,381 |
| Magazine Luiza SA * | 496 | 495 |
| NU Holdings Ltd., Class A * (a) | 77 | 459 |
| Petroleo Brasileiro SA (Preference) | 694 | 4,282 |
| Porto Seguro SA | 398 | 1,652 |
| Raia Drogasil SA | 267 | 1,131 |
| Suzano SA | 142 | 1,439 |
| Vale SA | 79 | 1,338 |
| XP, Inc., Class A * | 48 | 1,168 |
| Yara International ASA | 1 | 67 |
| 16,445 | ||
| Canada — 0.3% | ||
| Canadian National Railway Co. | 48 | 5,627 |
| Fairfax Financial Holdings Ltd. | 3 | 1,740 |
| Toronto-Dominion Bank (The) | 86 | 6,186 |
| 13,553 | ||
| Chile — 0.0% ^ | ||
| Antofagasta plc | 3 | 60 |
| Banco Santander Chile | 20,347 | 979 |
| 1,039 | ||
| China — 4.4% | ||
| Advanced Micro-Fabrication Equipment, Inc., Class A * | 53 | 831 |
| Aier Eye Hospital Group Co. Ltd., Class A | 197 | 1,052 |
| Alibaba Group Holding Ltd. * | 532 | 6,488 |
| Amoy Diagnostics Co. Ltd., Class A | 23 | 157 |
| Angel Yeast Co. Ltd., Class A | 110 | 631 |
| Anjoy Foods Group Co. Ltd., Class A | 28 | 539 |
| ANTA Sports Products Ltd. | 87 | 995 |
| Asymchem Laboratories Tianjin Co. Ltd., Class H * (b) | 40 | 853 |
| Bank of Ningbo Co. Ltd., Class A | 294 | 1,593 |
| Baoshan Iron & Steel Co. Ltd., Class A | 1,050 | 1,013 |
| Beijing Kingsoft Office Software, Inc., Class A | 2 | 45 |
| Beijing Kingsoft Office Software, Inc., Class A | 18 | 495 |
| BOC Hong Kong Holdings Ltd. | 29 | 105 |
| BOE Technology Group Co. Ltd., Class A | 1,637 | 930 |
| Budweiser Brewing Co. APAC Ltd. (b) | 610 | 1,518 |
| Chacha Food Co. Ltd., Class A | 72 | 576 |
| INVESTMENTS | SHARES (000) | VALUE ($000) |
| China — continued | ||
| Changzhou Xingyu Automotive Lighting Systems Co. Ltd., Class A | 41 | 779 |
| China Construction Bank Corp., Class H | 7,300 | 5,201 |
| China Longyuan Power Group Corp. Ltd., Class H | 960 | 1,852 |
| China Merchants Bank Co. Ltd., Class A | 496 | 2,961 |
| China Merchants Bank Co. Ltd., Class H | 549 | 3,312 |
| China Resources Land Ltd. | 304 | 1,358 |
| China State Construction Engineering Corp. Ltd., Class A | 960 | 903 |
| China Vanke Co. Ltd., Class A | 672 | 1,958 |
| China Yangtze Power Co. Ltd., Class A | 305 | 1,038 |
| Chongqing Brewery Co. Ltd., Class A * | 115 | 2,150 |
| Chongqing Fuling Zhacai Group Co. Ltd., Class A | 376 | 1,960 |
| Chow Tai Fook Jewellery Group Ltd. * | 15 | 25 |
| Contemporary Amperex Technology Co. Ltd., Class A | 58 | 3,521 |
| Country Garden Services Holdings Co. Ltd. | 271 | 1,142 |
| ESR Cayman Ltd. * (b) | 16 | 48 |
| Flat Glass Group Co. Ltd., Class H | 143 | 511 |
| Foshan Haitian Flavouring & Food Co. Ltd., Class A | 260 | 3,176 |
| Futu Holdings Ltd., ADR * (a) | — | 13 |
| Fuyao Glass Industry Group Co. Ltd., Class A | 43 | 229 |
| Fuyao Glass Industry Group Co. Ltd., Class H (b) | 153 | 626 |
| Glodon Co. Ltd., Class A | 92 | 635 |
| Guangdong Haid Group Co. Ltd., Class A | 87 | 805 |
| Guangzhou Automobile Group Co. Ltd., Class H | 1,964 | 1,665 |
| Guangzhou Kingmed Diagnostics Group Co. Ltd., Class A | 63 | 770 |
| Haier Smart Home Co. Ltd., Class H | 1,154 | 4,078 |
| Hangzhou Tigermed Consulting Co. Ltd., Class A | 59 | 789 |
| Han's Laser Technology Industry Group Co. Ltd., Class A | 453 | 1,869 |
| Hefei Meiya Optoelectronic Technology, Inc., Class A | 146 | 493 |
| Hongfa Technology Co. Ltd., Class A * | 102 | 735 |
| Huazhu Group Ltd. | 366 | 1,154 |
| Hundsun Technologies, Inc., Class A | 170 | 967 |
| Inner Mongolia Yili Industrial Group Co. Ltd., Class A | 689 | 3,973 |
| April 30, 2022 | J.P. Morgan Funds | 11 |
| INVESTMENTS | SHARES (000) | VALUE ($000) |
| Common Stocks — continued | ||
| China — continued | ||
| Jade Bird Fire Co. Ltd., Class A | 271 | 1,330 |
| JD.com, Inc., Class A * | 131 | 4,081 |
| Jiangsu Hengli Hydraulic Co. Ltd., Class A | 98 | 671 |
| Jiangsu Hengrui Medicine Co. Ltd., Class A | 134 | 593 |
| Kingdee International Software Group Co. Ltd. * | 577 | 1,177 |
| Kunlun Energy Co. Ltd. | 1,650 | 1,369 |
| Kweichow Moutai Co. Ltd., Class A | 5 | 1,353 |
| Laobaixing Pharmacy Chain JSC, Class A | 96 | 463 |
| LONGi Green Energy Technology Co. Ltd., Class A | 173 | 1,743 |
| Maxscend Microelectronics Co. Ltd., Class A * | 26 | 715 |
| Meituan * (b) | 242 | 5,190 |
| Midea Group Co. Ltd., Class A | 140 | 1,188 |
| Minth Group Ltd. | 394 | 928 |
| Montage Technology Co. Ltd., Class A | 69 | 603 |
| NARI Technology Co. Ltd., Class A | 311 | 1,481 |
| NetEase, Inc. | 160 | 3,063 |
| NXP Semiconductors NV | 131 | 22,451 |
| Oppein Home Group, Inc., Class A | 113 | 1,974 |
| Pharmaron Beijing Co. Ltd., Class H (b) | 159 | 1,994 |
| Ping An Bank Co. Ltd., Class A | 1,376 | 3,153 |
| Ping An Insurance Group Co. of China Ltd., Class A | 278 | 1,851 |
| Ping An Insurance Group Co. of China Ltd., Class H | 443 | 2,800 |
| Poly Developments and Holdings Group Co. Ltd., Class A | 832 | 2,271 |
| Prosus NV * | 7 | 356 |
| Proya Cosmetics Co. Ltd., Class A | 25 | 772 |
| Qingdao Haier Biomedical Co. Ltd., Class A | 22 | 210 |
| Sangfor Technologies, Inc., Class A | 31 | 408 |
| Shanghai Baosight Software Co. Ltd., Class A | 267 | 1,896 |
| Shanghai Liangxin Electrical Co. Ltd., Class A * | 367 | 585 |
| Shanghai M&G Stationery, Inc., Class A | 65 | 465 |
| Shanghai Putailai New Energy Technology Co. Ltd., Class A * | 34 | 602 |
| Shenzhen Inovance Technology Co. Ltd., Class A | 161 | 1,383 |
| Shenzhen Mindray Bio-Medical Electronics Co. Ltd., Class A | 63 | 2,939 |
| INVESTMENTS | SHARES (000) | VALUE ($000) |
| China — continued | ||
| Shenzhou International Group Holdings Ltd. | 70 | 953 |
| Silergy Corp. | 10 | 890 |
| SITC International Holdings Co. Ltd. | 11 | 37 |
| Skshu Paint Co. Ltd., Class A | 122 | 1,354 |
| StarPower Semiconductor Ltd., Class A | 8 | 398 |
| StarPower Semiconductor Ltd., Class A | 5 | 271 |
| Sungrow Power Supply Co. Ltd., Class A | 71 | 662 |
| Sunny Optical Technology Group Co. Ltd. | 75 | 1,097 |
| Suzhou Maxwell Technologies Co. Ltd., Class A | 17 | 842 |
| Tencent Holdings Ltd. | 386 | 18,204 |
| Tongwei Co. Ltd., Class A | 642 | 3,925 |
| Wanhua Chemical Group Co. Ltd., Class A | 209 | 2,429 |
| Will Semiconductor Co. Ltd., Class A | 23 | 512 |
| Wilmar International Ltd. | 15 | 48 |
| Wuliangye Yibin Co. Ltd., Class A | 116 | 2,821 |
| Wuxi Biologics Cayman, Inc. * (b) | 313 | 2,310 |
| Xinyi Solar Holdings Ltd. | 1,010 | 1,501 |
| XPeng, Inc., Class A * | 45 | 557 |
| Yangzhou Yangjie Electronic Technology Co. Ltd., Class A | 78 | 803 |
| Yonyou Network Technology Co. Ltd., Class A | 148 | 422 |
| Yunnan Energy New Material Co. Ltd. * | 73 | 2,193 |
| Zhejiang Dingli Machinery Co. Ltd., Class A | 75 | 419 |
| Zijin Mining Group Co. Ltd., Class H | 1,086 | 1,581 |
| 184,804 | ||
| Denmark — 1.1% | ||
| Ambu A/S, Class B (a) | 1 | 17 |
| AP Moller - Maersk A/S, Class A | — | 71 |
| AP Moller - Maersk A/S, Class B | — | 130 |
| Carlsberg A/S, Class B | 106 | 13,509 |
| Chr Hansen Holding A/S | 1 | 65 |
| Coloplast A/S, Class B | 24 | 3,207 |
| Danske Bank A/S | 5 | 84 |
| Demant A/S * | 1 | 38 |
| DSV A/S | 2 | 265 |
| Genmab A/S * | 1 | 183 |
| GN Store Nord A/S | 1 | 37 |
| Novo Nordisk A/S, Class B | 246 | 28,151 |
| Novozymes A/S, Class B | 2 | 113 |
| Orsted A/S (b) | 1 | 166 |
| 12 | J.P. Morgan Funds | April 30, 2022 |
| INVESTMENTS | SHARES (000) | VALUE ($000) |
| Common Stocks — continued | ||
| Denmark — continued | ||
| Pandora A/S | 1 | 69 |
| ROCKWOOL A/S, Class B | — | 18 |
| Tryg A/S | 3 | 68 |
| Vestas Wind Systems A/S | 8 | 204 |
| 46,395 | ||
| Finland — 0.0% ^ | ||
| Elisa OYJ | 1 | 66 |
| Fortum OYJ | 3 | 58 |
| Kesko OYJ, Class B | 2 | 54 |
| Kone OYJ, Class B | 3 | 129 |
| Neste OYJ | 3 | 144 |
| Nokia OYJ * | 43 | 216 |
| Nordea Bank Abp | 25 | 253 |
| Orion OYJ, Class B | 1 | 33 |
| Sampo OYJ, Class A | 4 | 192 |
| Stora Enso OYJ, Class R | 5 | 91 |
| UPM-Kymmene OYJ | 4 | 146 |
| Wartsila OYJ Abp | 4 | 30 |
| 1,412 | ||
| France — 2.8% | ||
| Accor SA * | 1 | 44 |
| Adevinta ASA * | 2 | 18 |
| Aeroports de Paris * | — | 33 |
| Air Liquide SA | 4 | 649 |
| Airbus SE | 137 | 15,024 |
| Alstom SA | 3 | 55 |
| Amundi SA (b) | 1 | 29 |
| Arkema SA | 1 | 55 |
| AXA SA (a) | 15 | 408 |
| BioMerieux | — | 31 |
| BNP Paribas SA | 9 | 462 |
| Bollore SE | 7 | 33 |
| Bouygues SA (a) | 2 | 62 |
| Bureau Veritas SA | 2 | 67 |
| Capgemini SE | 77 | 15,734 |
| Carrefour SA | 5 | 104 |
| Cie de Saint-Gobain | 4 | 234 |
| Cie Generale des Etablissements Michelin SCA | 1 | 166 |
| CNP Assurances (a) | 1 | 30 |
| Covivio, REIT (a) | — | 29 |
| Credit Agricole SA | 655 | 7,077 |
| Danone SA | 5 | 313 |
| INVESTMENTS | SHARES (000) | VALUE ($000) |
| France — continued | ||
| Dassault Aviation SA | — | 33 |
| Dassault Systemes SE | 5 | 233 |
| Edenred | 2 | 99 |
| Eiffage SA | 1 | 65 |
| Electricite de France SA | 4 | 39 |
| Engie SA | 15 | 171 |
| EssilorLuxottica SA | 2 | 387 |
| Eurazeo SE * | — | 24 |
| Faurecia SE | 1 | 21 |
| Gecina SA, REIT | — | 41 |
| Getlink SE | 4 | 64 |
| Hermes International | — | 309 |
| Ipsen SA | — | 31 |
| Kering SA | 1 | 316 |
| Klepierre SA, REIT * | 2 | 38 |
| La Francaise des Jeux SAEM (b) | 1 | 28 |
| Legrand SA | 2 | 187 |
| L'Oreal SA | 14 | 5,180 |
| LVMH Moet Hennessy Louis Vuitton SE | 50 | 32,146 |
| Orange SA | 16 | 188 |
| Orpea SA | — | 15 |
| Pernod Ricard SA | 2 | 342 |
| Publicis Groupe SA | 2 | 108 |
| Remy Cointreau SA | — | 36 |
| Renault SA * | 2 | 37 |
| Safran SA | 88 | 9,432 |
| Sanofi (a) | 9 | 951 |
| Sartorius Stedim Biotech | — | 71 |
| SEB SA | — | 26 |
| Societe Generale SA | 6 | 154 |
| Sodexo SA | 1 | 53 |
| Teleperformance | 1 | 167 |
| Thales SA | 1 | 108 |
| TotalEnergies SE (a) | 87 | 4,264 |
| Ubisoft Entertainment SA * | 1 | 34 |
| Unibail-Rodamco-Westfield, REIT * | 1 | 70 |
| Valeo | 2 | 33 |
| Veolia Environnement SA | 5 | 151 |
| Vinci SA (a) | 221 | 21,393 |
| Vivendi SE (a) | 6 | 71 |
| Wendel SE | — | 21 |
| Worldline SA * (b) | 2 | 74 |
| 117,868 | ||
| April 30, 2022 | J.P. Morgan Funds | 13 |
| INVESTMENTS | SHARES (000) | VALUE ($000) |
| Common Stocks — continued | ||
| Germany — 1.3% | ||
| adidas AG | 32 | 6,543 |
| Allianz SE (Registered) | 29 | 6,645 |
| Aroundtown SA | 8 | 40 |
| BASF SE * | 7 | 383 |
| Bayer AG (Registered) * | 8 | 512 |
| Bayerische Motoren Werke AG | 3 | 214 |
| Bayerische Motoren Werke AG (Preference) | — | 34 |
| Bechtle AG | 1 | 30 |
| Beiersdorf AG | 1 | 80 |
| Brenntag SE | 1 | 94 |
| Carl Zeiss Meditec AG | — | 40 |
| Commerzbank AG * | 8 | 52 |
| Continental AG * | 1 | 60 |
| Covestro AG (b) | 2 | 66 |
| Daimler Truck Holding AG * | 3 | 88 |
| Deutsche Bank AG (Registered) * | 16 | 164 |
| Deutsche Boerse AG | 2 | 262 |
| Deutsche Lufthansa AG (Registered) * | 5 | 35 |
| Deutsche Post AG (Registered) | 178 | 7,585 |
| Deutsche Telekom AG (Registered) | 26 | 472 |
| E.ON SE | 18 | 185 |
| Evonik Industries AG | 2 | 44 |
| Fresenius Medical Care AG & Co. KGaA | 2 | 101 |
| Fresenius SE & Co. KGaA | 3 | 117 |
| FUCHS PETROLUB SE (Preference) | 1 | 17 |
| GEA Group AG | 1 | 47 |
| Hannover Rueck SE | — | 74 |
| HeidelbergCement AG | 1 | 68 |
| HelloFresh SE * | 1 | 55 |
| Henkel AG & Co. KGaA | 1 | 52 |
| Henkel AG & Co. KGaA (Preference) | 1 | 91 |
| Infineon Technologies AG | 10 | 293 |
| KION Group AG | 1 | 32 |
| Knorr-Bremse AG | 1 | 41 |
| LANXESS AG | 1 | 25 |
| LEG Immobilien SE | 1 | 59 |
| Mercedes-Benz Group AG * | 7 | 473 |
| Merck KGaA | 1 | 190 |
| MTU Aero Engines AG * | — | 85 |
| Muenchener Rueckversicherungs-Gesellschaft AG (Registered) | 1 | 264 |
| Nemetschek SE | — | 36 |
| INVESTMENTS | SHARES (000) | VALUE ($000) |
| Germany — continued | ||
| Porsche Automobil Holding SE (Preference) | 1 | 100 |
| Puma SE | 1 | 61 |
| Rational AG | — | 24 |
| RWE AG | 413 | 17,153 |
| SAP SE | 8 | 838 |
| Sartorius AG (Preference) | — | 78 |
| Scout24 SE (b) | 1 | 42 |
| Siemens AG (Registered) | 6 | 744 |
| Siemens Energy AG | 3 | 61 |
| Siemens Healthineers AG (b) | 2 | 119 |
| Symrise AG | 1 | 125 |
| Telefonica Deutschland Holding AG | 8 | 25 |
| Uniper SE | 1 | 19 |
| United Internet AG (Registered) | 1 | 25 |
| Volkswagen AG | — | 56 |
| Volkswagen AG (Preference) | 51 | 7,945 |
| Vonovia SE * | 6 | 233 |
| Zalando SE * (b) | 2 | 68 |
| 53,464 | ||
| Greece — 0.0% ^ | ||
| Hellenic Telecommunications Organization SA | 76 | 1,461 |
| Hong Kong — 0.4% | ||
| AIA Group Ltd. | 989 | 9,714 |
| CK Asset Holdings Ltd. | 16 | 108 |
| CK Infrastructure Holdings Ltd. | 5 | 34 |
| CLP Holdings Ltd. | 13 | 127 |
| Hang Lung Properties Ltd. | 16 | 31 |
| Hang Seng Bank Ltd. | 6 | 108 |
| Henderson Land Development Co. Ltd. | 12 | 48 |
| HK Electric Investments & HK Electric Investments Ltd. (b) | 20 | 20 |
| HKT Trust & HKT Ltd. | 29 | 42 |
| Hong Kong & China Gas Co. Ltd. | 89 | 99 |
| Hong Kong Exchanges & Clearing Ltd. | 108 | 4,568 |
| Hongkong Land Holdings Ltd. | 9 | 43 |
| Jardine Matheson Holdings Ltd. | 2 | 90 |
| Link, REIT | 16 | 142 |
| Melco Resorts & Entertainment Ltd., ADR * | 2 | 9 |
| MTR Corp. Ltd. | 12 | 64 |
| New World Development Co. Ltd. | 13 | 48 |
| 14 | J.P. Morgan Funds | April 30, 2022 |
| INVESTMENTS | SHARES (000) | VALUE ($000) |
| Common Stocks — continued | ||
| Hong Kong — continued | ||
| Power Assets Holdings Ltd. | 11 | 74 |
| Sino Land Co. Ltd. | 26 | 34 |
| Sun Hung Kai Properties Ltd. | 11 | 121 |
| Swire Pacific Ltd., Class A | 4 | 23 |
| Swire Properties Ltd. | 9 | 22 |
| Techtronic Industries Co. Ltd. | 108 | 1,441 |
| WH Group Ltd. (b) | 66 | 46 |
| Wharf Real Estate Investment Co. Ltd. | 14 | 66 |
| Xinyi Glass Holdings Ltd. | 14 | 31 |
| 17,153 | ||
| India — 0.6% | ||
| HDFC Bank Ltd., ADR | 301 | 16,638 |
| ICICI Bank Ltd., ADR | 126 | 2,397 |
| Infosys Ltd., ADR | 223 | 4,430 |
| 23,465 | ||
| Indonesia — 0.3% | ||
| Bank Central Asia Tbk. PT | 17,420 | 9,770 |
| Bank Rakyat Indonesia Persero Tbk. PT | 11,624 | 3,873 |
| 13,643 | ||
| Ireland — 0.0% ^ | ||
| AerCap Holdings NV * | 1 | 50 |
| CRH plc | 6 | 242 |
| Flutter Entertainment plc * | 2 | 133 |
| Kerry Group plc, Class A | 1 | 123 |
| Kerry Group plc, Class A | — | 16 |
| Kingspan Group plc | — | 13 |
| Kingspan Group plc | 1 | 100 |
| Smurfit Kappa Group plc | 2 | 82 |
| 759 | ||
| Israel — 0.0% ^ | ||
| Azrieli Group Ltd. | — | 29 |
| Bank Hapoalim BM | 9 | 83 |
| Bank Leumi Le-Israel BM | 11 | 121 |
| Check Point Software Technologies Ltd. * | 1 | 106 |
| Elbit Systems Ltd. | — | 45 |
| ICL Group Ltd. | 6 | 61 |
| Israel Discount Bank Ltd., Class A | 10 | 58 |
| Kornit Digital Ltd. * | — | 24 |
| Mizrahi Tefahot Bank Ltd. | 1 | 42 |
| Nice Ltd. * | 1 | 104 |
| INVESTMENTS | SHARES (000) | VALUE ($000) |
| Israel — continued | ||
| Teva Pharmaceutical Industries Ltd., ADR * | 9 | 76 |
| Wix.com Ltd. * | — | 34 |
| 783 | ||
| Italy — 0.1% | ||
| Amplifon SpA | 1 | 39 |
| Assicurazioni Generali SpA | 9 | 166 |
| Atlantia SpA * | 4 | 93 |
| Coca-Cola HBC AG * | 1 | 32 |
| Davide Campari-Milano NV | 4 | 47 |
| DiaSorin SpA | — | 26 |
| Enel SpA | 64 | 419 |
| Eni SpA | 20 | 279 |
| Ferrari NV | 1 | 210 |
| FinecoBank Banca Fineco SpA | 5 | 67 |
| Infrastrutture Wireless Italiane SpA (b) | 3 | 28 |
| Intesa Sanpaolo SpA (a) | 131 | 266 |
| Mediobanca Banca di Credito Finanziario SpA | 5 | 49 |
| Moncler SpA | 1 | 85 |
| Nexi SpA * (b) | 4 | 41 |
| Poste Italiane SpA (b) | 4 | 41 |
| Prysmian SpA | 2 | 66 |
| Recordati Industria Chimica e Farmaceutica SpA | 1 | 40 |
| Snam SpA | 16 | 87 |
| Telecom Italia SpA | 79 | 23 |
| Terna - Rete Elettrica Nazionale | 11 | 91 |
| UniCredit SpA | 17 | 155 |
| 2,350 | ||
| Japan — 2.1% | ||
| Advantest Corp. | 2 | 109 |
| Aeon Co. Ltd. | 5 | 97 |
| AGC, Inc. | 1 | 56 |
| Aisin Corp. | 1 | 35 |
| Ajinomoto Co., Inc. | 3 | 91 |
| ANA Holdings, Inc. * | 1 | 25 |
| Asahi Group Holdings Ltd. | 4 | 136 |
| Asahi Intecc Co. Ltd. | 2 | 33 |
| Asahi Kasei Corp. | 10 | 82 |
| Astellas Pharma, Inc. | 15 | 224 |
| Azbil Corp. | 1 | 30 |
| Bandai Namco Holdings, Inc. | 2 | 108 |
| April 30, 2022 | J.P. Morgan Funds | 15 |
| INVESTMENTS | SHARES (000) | VALUE ($000) |
| Common Stocks — continued | ||
| Japan — continued | ||
| Benefit One, Inc. | 1 | 9 |
| Bridgestone Corp. | 234 | 8,577 |
| Brother Industries Ltd. | 2 | 33 |
| Canon, Inc. | 8 | 184 |
| Capcom Co. Ltd. | 1 | 37 |
| Central Japan Railway Co. | 1 | 151 |
| Chiba Bank Ltd. (The) | 4 | 24 |
| Chubu Electric Power Co., Inc. | 5 | 51 |
| Chugai Pharmaceutical Co. Ltd. | 5 | 159 |
| Concordia Financial Group Ltd. | 9 | 32 |
| Cosmos Pharmaceutical Corp. | — | 18 |
| CyberAgent, Inc. | 3 | 33 |
| Dai Nippon Printing Co. Ltd. | 2 | 38 |
| Daifuku Co. Ltd. | 1 | 49 |
| Dai-ichi Life Holdings, Inc. | 8 | 158 |
| Daiichi Sankyo Co. Ltd. | 14 | 347 |
| Daikin Industries Ltd. | 2 | 290 |
| Daito Trust Construction Co. Ltd. | 1 | 48 |
| Daiwa House Industry Co. Ltd. | 4 | 108 |
| Daiwa House REIT Investment Corp., REIT | — | 41 |
| Daiwa Securities Group, Inc. | 11 | 56 |
| Denso Corp. | 3 | 207 |
| Dentsu Group, Inc. | 2 | 61 |
| Disco Corp. | — | 49 |
| East Japan Railway Co. | 2 | 120 |
| Eisai Co. Ltd. | 2 | 83 |
| ENEOS Holdings, Inc. | 24 | 84 |
| FANUC Corp. | 38 | 5,823 |
| Fast Retailing Co. Ltd. | 1 | 230 |
| Fuji Electric Co. Ltd. | 1 | 44 |
| FUJIFILM Holdings Corp. | 3 | 159 |
| Fujitsu Ltd. | 2 | 242 |
| GLP J-REIT, REIT | — | 45 |
| GMO Payment Gateway, Inc. | — | 25 |
| Hakuhodo DY Holdings, Inc. | 2 | 21 |
| Hamamatsu Photonics KK | 1 | 49 |
| Hankyu Hanshin Holdings, Inc. | 2 | 50 |
| Hikari Tsushin, Inc. | — | 23 |
| Hino Motors Ltd. | 2 | 11 |
| Hirose Electric Co. Ltd. | — | 38 |
| Hitachi Construction Machinery Co. Ltd. | 1 | 20 |
| Hitachi Ltd. | 8 | 365 |
| Hitachi Metals Ltd. * | 2 | 27 |
| Honda Motor Co. Ltd. | 320 | 8,425 |
| INVESTMENTS | SHARES (000) | VALUE ($000) |
| Japan — continued | ||
| Hoshizaki Corp. | 1 | 32 |
| Hoya Corp. | 86 | 8,584 |
| Hulic Co. Ltd. | 3 | 25 |
| Ibiden Co. Ltd. | 1 | 30 |
| Idemitsu Kosan Co. Ltd. | 2 | 45 |
| Iida Group Holdings Co. Ltd. | 1 | 17 |
| Inpex Corp. | 8 | 96 |
| Isuzu Motors Ltd. | 5 | 55 |
| Ito En Ltd. | 1 | 21 |
| ITOCHU Corp. | 9 | 287 |
| Itochu Techno-Solutions Corp. | 1 | 21 |
| Japan Airlines Co. Ltd. * | 1 | 20 |
| Japan Exchange Group, Inc. | 4 | 57 |
| Japan Metropolitan Fund Invest, REIT | — | 44 |
| Japan Post Bank Co. Ltd. | 3 | 25 |
| Japan Post Holdings Co. Ltd. | 19 | 136 |
| Japan Post Insurance Co. Ltd. | 2 | 26 |
| Japan Real Estate Investment Corp., REIT | — | 48 |
| Japan Tobacco, Inc. | 9 | 160 |
| JFE Holdings, Inc. | 4 | 46 |
| JSR Corp. | 2 | 43 |
| Kajima Corp. | 4 | 40 |
| Kakaku.com, Inc. | 1 | 23 |
| Kansai Electric Power Co., Inc. (The) | 6 | 49 |
| Kansai Paint Co. Ltd. | 1 | 21 |
| Kao Corp. | 4 | 148 |
| KDDI Corp. | 13 | 421 |
| Keio Corp. | 1 | 31 |
| Keisei Electric Railway Co. Ltd. | 1 | 25 |
| Keyence Corp. | 10 | 3,980 |
| Kikkoman Corp. | 1 | 62 |
| Kintetsu Group Holdings Co. Ltd. | 1 | 40 |
| Kirin Holdings Co. Ltd. | 7 | 96 |
| Kobayashi Pharmaceutical Co. Ltd. | — | 27 |
| Kobe Bussan Co. Ltd. | 1 | 24 |
| Koei Tecmo Holdings Co. Ltd. | 1 | 15 |
| Koito Manufacturing Co. Ltd. | 1 | 33 |
| Komatsu Ltd. | 7 | 158 |
| Konami Holdings Corp. | 1 | 43 |
| Kose Corp. | — | 31 |
| Kubota Corp. | 8 | 138 |
| Kurita Water Industries Ltd. | 1 | 27 |
| Kyocera Corp. | 2 | 126 |
| Kyowa Kirin Co. Ltd. | 2 | 44 |
| 16 | J.P. Morgan Funds | April 30, 2022 |
| INVESTMENTS | SHARES (000) | VALUE ($000) |
| Common Stocks — continued | ||
| Japan — continued | ||
| Lasertec Corp. | 1 | 80 |
| Lawson, Inc. | 1 | 22 |
| Lion Corp. | 2 | 19 |
| Lixil Corp. | 2 | 37 |
| M3, Inc. | 3 | 109 |
| Makita Corp. | 2 | 50 |
| Marubeni Corp. | 12 | 134 |
| Mazda Motor Corp. | 4 | 31 |
| McDonald's Holdings Co. Japan Ltd. | 1 | 24 |
| Medipal Holdings Corp. | 2 | 25 |
| MEIJI Holdings Co. Ltd. | 1 | 50 |
| Mercari, Inc. * | 1 | 13 |
| MINEBEA MITSUMI, Inc. | 3 | 56 |
| MISUMI Group, Inc. | 2 | 55 |
| Mitsubishi Chemical Holdings Corp. | 10 | 62 |
| Mitsubishi Corp. | 10 | 336 |
| Mitsubishi Electric Corp. | 14 | 152 |
| Mitsubishi Estate Co. Ltd. | 9 | 137 |
| Mitsubishi Gas Chemical Co., Inc. | 1 | 19 |
| Mitsubishi HC Capital, Inc. | 5 | 24 |
| Mitsubishi Heavy Industries Ltd. | 2 | 85 |
| Mitsubishi UFJ Financial Group, Inc. | 94 | 549 |
| Mitsui & Co. Ltd. | 12 | 300 |
| Mitsui Chemicals, Inc. | 2 | 34 |
| Mitsui Fudosan Co. Ltd. | 7 | 155 |
| Mitsui OSK Lines Ltd. | 3 | 63 |
| Miura Co. Ltd. | 1 | 17 |
| Mizuho Financial Group, Inc. | 19 | 231 |
| MonotaRO Co. Ltd. | 2 | 33 |
| MS&AD Insurance Group Holdings, Inc. | 3 | 104 |
| Murata Manufacturing Co. Ltd. | 5 | 274 |
| NEC Corp. | 2 | 78 |
| Nexon Co. Ltd. | 4 | 89 |
| NGK Insulators Ltd. | 2 | 28 |
| Nidec Corp. | 3 | 220 |
| Nihon M&A Center Holdings, Inc. | 2 | 28 |
| Nintendo Co. Ltd. | 1 | 411 |
| Nippon Building Fund, Inc., REIT | — | 62 |
| NIPPON EXPRESS HOLDINGS, Inc. | 1 | 35 |
| Nippon Paint Holdings Co. Ltd. | 6 | 51 |
| Nippon Prologis REIT, Inc., REIT | — | 44 |
| Nippon Sanso Holdings Corp. | 1 | 22 |
| Nippon Shinyaku Co. Ltd. | — | 27 |
| Nippon Steel Corp. | 7 | 108 |
| INVESTMENTS | SHARES (000) | VALUE ($000) |
| Japan — continued | ||
| Nippon Telegraph & Telephone Corp. | 9 | 280 |
| Nippon Yusen KK | 1 | 87 |
| Nissan Chemical Corp. | 1 | 53 |
| Nissan Motor Co. Ltd. * | 18 | 74 |
| Nisshin Seifun Group, Inc. | 2 | 20 |
| Nissin Foods Holdings Co. Ltd. | 1 | 35 |
| Nitori Holdings Co. Ltd. | 1 | 62 |
| Nitto Denko Corp. | 1 | 81 |
| Nomura Holdings, Inc. | 24 | 94 |
| Nomura Real Estate Holdings, Inc. | 1 | 22 |
| Nomura Real Estate Master Fund, Inc., REIT | — | 43 |
| Nomura Research Institute Ltd. | 3 | 74 |
| NTT Data Corp. | 5 | 90 |
| Obayashi Corp. | 5 | 36 |
| Obic Co. Ltd. | 1 | 74 |
| Odakyu Electric Railway Co. Ltd. | 2 | 36 |
| Oji Holdings Corp. | 6 | 31 |
| Olympus Corp. | 9 | 153 |
| Omron Corp. | 2 | 88 |
| Ono Pharmaceutical Co. Ltd. | 3 | 75 |
| Open House Group Co. Ltd. | 1 | 27 |
| Oracle Corp., Japan | — | 19 |
| Oriental Land Co. Ltd. | 2 | 242 |
| ORIX Corp. | 10 | 177 |
| Orix JREIT, Inc., REIT | — | 28 |
| Osaka Gas Co. Ltd. | 3 | 54 |
| Otsuka Corp. | 1 | 29 |
| Otsuka Holdings Co. Ltd. | 3 | 101 |
| Pan Pacific International Holdings Corp. | 3 | 46 |
| Panasonic Holdings Corp. | 17 | 156 |
| Persol Holdings Co. Ltd. | 1 | 28 |
| Pola Orbis Holdings, Inc. | 1 | 9 |
| Rakuten Group, Inc. | 6 | 45 |
| Recruit Holdings Co. Ltd. | 11 | 392 |
| Renesas Electronics Corp. * | 10 | 103 |
| Resona Holdings, Inc. | 16 | 71 |
| Ricoh Co. Ltd. | 5 | 39 |
| Rinnai Corp. | — | 19 |
| Rohm Co. Ltd. | 1 | 49 |
| Ryohin Keikaku Co. Ltd. | 2 | 17 |
| Santen Pharmaceutical Co. Ltd. | 3 | 23 |
| SBI Holdings, Inc. | 2 | 45 |
| SCSK Corp. | 1 | 19 |
| April 30, 2022 | J.P. Morgan Funds | 17 |
| INVESTMENTS | SHARES (000) | VALUE ($000) |
| Common Stocks — continued | ||
| Japan — continued | ||
| Secom Co. Ltd. | 2 | 113 |
| Seiko Epson Corp. | 2 | 31 |
| Sekisui Chemical Co. Ltd. | 3 | 39 |
| Sekisui House Ltd. | 5 | 83 |
| Seven & i Holdings Co. Ltd. | 6 | 261 |
| SG Holdings Co. Ltd. | 2 | 41 |
| Sharp Corp. | 2 | 14 |
| Shimadzu Corp. | 2 | 62 |
| Shimano, Inc. | 1 | 106 |
| Shimizu Corp. | 4 | 23 |
| Shin-Etsu Chemical Co. Ltd. | 78 | 10,761 |
| Shionogi & Co. Ltd. | 2 | 111 |
| Shiseido Co. Ltd. | 3 | 147 |
| Shizuoka Bank Ltd. (The) | 3 | 23 |
| SMC Corp. | 1 | 242 |
| SoftBank Corp. | 23 | 265 |
| SoftBank Group Corp. | 10 | 395 |
| Sohgo Security Services Co. Ltd. | 1 | 19 |
| Sompo Holdings, Inc. | 2 | 98 |
| Sony Group Corp. | 62 | 5,368 |
| Square Enix Holdings Co. Ltd. | 1 | 28 |
| Stanley Electric Co. Ltd. | 1 | 19 |
| Subaru Corp. | 5 | 74 |
| SUMCO Corp. | 3 | 37 |
| Sumitomo Chemical Co. Ltd. | 12 | 50 |
| Sumitomo Corp. | 9 | 141 |
| Sumitomo Electric Industries Ltd. | 6 | 63 |
| Sumitomo Metal Mining Co. Ltd. | 2 | 88 |
| Sumitomo Mitsui Financial Group, Inc. | 10 | 311 |
| Sumitomo Mitsui Trust Holdings, Inc. | 3 | 81 |
| Sumitomo Pharma Co. Ltd. | 1 | 13 |
| Sumitomo Realty & Development Co. Ltd. | 2 | 64 |
| Suntory Beverage & Food Ltd. | 1 | 39 |
| Suzuki Motor Corp. | 3 | 87 |
| Sysmex Corp. | 1 | 92 |
| T&D Holdings, Inc. | 4 | 53 |
| Taisei Corp. | 2 | 41 |
| Taisho Pharmaceutical Holdings Co. Ltd. | — | 16 |
| Takeda Pharmaceutical Co. Ltd. | 12 | 363 |
| TDK Corp. | 3 | 93 |
| Terumo Corp. | 5 | 146 |
| TIS, Inc. | 2 | 36 |
| Tobu Railway Co. Ltd. | 1 | 31 |
| Toho Co. Ltd. | 1 | 33 |
| INVESTMENTS | SHARES (000) | VALUE ($000) |
| Japan — continued | ||
| Tokio Marine Holdings, Inc. | 118 | 6,380 |
| Tokyo Century Corp. | — | 12 |
| Tokyo Electric Power Co. Holdings, Inc. * | 12 | 41 |
| Tokyo Electron Ltd. | 15 | 6,329 |
| Tokyo Gas Co. Ltd. | 3 | 57 |
| Tokyu Corp. | 4 | 48 |
| TOPPAN, Inc. | 2 | 33 |
| Toray Industries, Inc. | 11 | 52 |
| Toshiba Corp. | 3 | 125 |
| Tosoh Corp. | 2 | 29 |
| TOTO Ltd. | 1 | 37 |
| Toyo Suisan Kaisha Ltd. | 1 | 22 |
| Toyota Industries Corp. | 1 | 66 |
| Toyota Motor Corp. | 84 | 1,438 |
| Toyota Tsusho Corp. | 2 | 61 |
| Trend Micro, Inc. | 1 | 56 |
| Tsuruha Holdings, Inc. | — | 15 |
| Unicharm Corp. | 3 | 108 |
| USS Co. Ltd. | 1 | 25 |
| Welcia Holdings Co. Ltd. | 1 | 12 |
| West Japan Railway Co. | 2 | 63 |
| Yakult Honsha Co. Ltd. | 1 | 52 |
| Yamaha Corp. | 1 | 38 |
| Yamaha Motor Co. Ltd. | 2 | 47 |
| Yamato Holdings Co. Ltd. | 2 | 41 |
| Yaskawa Electric Corp. | 2 | 61 |
| Yokogawa Electric Corp. | 2 | 29 |
| Z Holdings Corp. | 21 | 82 |
| ZOZO, Inc. | 1 | 19 |
| 86,398 | ||
| Jordan — 0.0% ^ | ||
| Hikma Pharmaceuticals plc | 1 | 32 |
| Luxembourg — 0.0% ^ | ||
| ArcelorMittal SA | 5 | 147 |
| Eurofins Scientific SE | 1 | 99 |
| 246 | ||
| Macau — 0.0% ^ | ||
| Galaxy Entertainment Group Ltd. | 17 | 97 |
| Sands China Ltd. * | 338 | 745 |
| 842 | ||
| 18 | J.P. Morgan Funds | April 30, 2022 |
| INVESTMENTS | SHARES (000) | VALUE ($000) |
| Common Stocks — continued | ||
| Mexico — 0.3% | ||
| Grupo Aeroportuario del Pacifico SAB de CV, Class B * | 179 | 2,759 |
| Grupo Aeroportuario del Sureste SAB de CV, ADR (a) | 11 | 2,413 |
| Grupo Financiero Banorte SAB de CV, Class O | 628 | 4,135 |
| Wal-Mart de Mexico SAB de CV | 803 | 2,847 |
| 12,154 | ||
| Netherlands — 0.5% | ||
| ABN AMRO Bank NV, CVA (a) (b) | 3 | 42 |
| Adyen NV * (b) | 1 | 2,422 |
| Aegon NV | 14 | 73 |
| Akzo Nobel NV | 2 | 129 |
| Argenx SE * | — | 80 |
| Argenx SE * | — | 25 |
| ASM International NV | — | 111 |
| ASML Holding NV | 13 | 7,088 |
| Euronext NV (b) | 1 | 54 |
| EXOR NV | 1 | 59 |
| Heineken Holding NV | 1 | 71 |
| Heineken NV | 2 | 200 |
| IMCD NV | 1 | 72 |
| ING Groep NV (a) | 31 | 293 |
| JDE Peet's NV | 1 | 23 |
| Koninklijke Ahold Delhaize NV | 8 | 244 |
| Koninklijke DSM NV | 1 | 233 |
| Koninklijke KPN NV | 27 | 92 |
| Koninklijke Philips NV | 7 | 190 |
| NN Group NV | 2 | 105 |
| Randstad NV | 1 | 50 |
| Shell plc | 389 | 10,451 |
| Universal Music Group NV | 6 | 133 |
| Wolters Kluwer NV | 2 | 210 |
| 22,450 | ||
| New Zealand — 0.0% ^ | ||
| Auckland International Airport Ltd. * | 10 | 49 |
| Fisher & Paykel Healthcare Corp. Ltd. | 5 | 63 |
| Mercury NZ Ltd. | 5 | 21 |
| Meridian Energy Ltd. | 10 | 31 |
| Ryman Healthcare Ltd. | 3 | 20 |
| Spark New Zealand Ltd. | 15 | 47 |
| Xero Ltd. * | 1 | 70 |
| 301 | ||
| INVESTMENTS | SHARES (000) | VALUE ($000) |
| Norway — 0.0% ^ | ||
| Aker BP ASA | 1 | 36 |
| DNB Bank ASA | 7 | 143 |
| Equinor ASA | 8 | 261 |
| Gjensidige Forsikring ASA (a) | 2 | 34 |
| Mowi ASA | 3 | 98 |
| Norsk Hydro ASA | 11 | 90 |
| Orkla ASA | 6 | 48 |
| Schibsted ASA, Class A (a) | 1 | 12 |
| Schibsted ASA, Class B | 1 | 15 |
| Telenor ASA | 5 | 78 |
| 815 | ||
| Peru — 0.1% | ||
| Credicorp Ltd. | 14 | 1,981 |
| Poland — 0.0% ^ | ||
| Dino Polska SA * (b) | 20 | 1,287 |
| InPost SA * (a) | 1 | 9 |
| 1,296 | ||
| Portugal — 0.0% ^ | ||
| EDP - Energias de Portugal SA | 22 | 102 |
| Galp Energia SGPS SA | 4 | 48 |
| Jeronimo Martins SGPS SA | 2 | 47 |
| 197 | ||
| Qatar — 0.0% ^ | ||
| Qatar National Bank QPSC | 244 | 1,556 |
| Russia — 0.0% ^ | ||
| Severstal PAO, GDR ‡ (b) | 58 | 19 |
| TCS Group Holding plc, GDR ‡ * (b) | 17 | 12 |
| 31 | ||
| Singapore — 0.2% | ||
| Ascendas, REIT | 27 | 55 |
| CapitaLand Integrated Commercial Trust, REIT | 38 | 64 |
| Capitaland Investment Ltd. * | 21 | 63 |
| City Developments Ltd. | 3 | 20 |
| DBS Group Holdings Ltd. | 251 | 6,099 |
| Genting Singapore Ltd. * | 47 | 27 |
| Grab Holdings Ltd., Class A * | 9 | 25 |
| Keppel Corp. Ltd. | 12 | 57 |
| Mapletree Commercial Trust, REIT | 17 | 23 |
| Mapletree Logistics Trust, REIT | 25 | 32 |
| Oversea-Chinese Banking Corp. Ltd. | 27 | 237 |
| April 30, 2022 | J.P. Morgan Funds | 19 |
| INVESTMENTS | SHARES (000) | VALUE ($000) |
| Common Stocks — continued | ||
| Singapore — continued | ||
| Singapore Airlines Ltd. * | 11 | 42 |
| Singapore Exchange Ltd. | 6 | 45 |
| Singapore Technologies Engineering Ltd. | 12 | 37 |
| Singapore Telecommunications Ltd. | 65 | 131 |
| STMicroelectronics NV | 6 | 200 |
| United Overseas Bank Ltd. | 9 | 199 |
| UOL Group Ltd. * | 4 | 19 |
| Venture Corp. Ltd. | 2 | 28 |
| 7,403 | ||
| South Africa — 0.5% | ||
| Anglo American plc | 191 | 8,452 |
| Bid Corp. Ltd. | 79 | 1,661 |
| Capitec Bank Holdings Ltd. | 12 | 1,747 |
| Clicks Group Ltd. | 104 | 2,039 |
| FirstRand Ltd. | 699 | 3,009 |
| Naspers Ltd., Class N | 9 | 891 |
| Sanlam Ltd. | 421 | 1,744 |
| Vodacom Group Ltd. | 124 | 1,198 |
| 20,741 | ||
| South Korea — 1.1% | ||
| Delivery Hero SE * (b) | 43 | 1,511 |
| JYP Entertainment Corp. | 31 | 1,443 |
| KB Financial Group, Inc. | 57 | 2,643 |
| Kia Corp. | 37 | 2,450 |
| KIWOOM Securities Co. Ltd. | 12 | 899 |
| LG Chem Ltd. | 7 | 2,915 |
| LG Household & Health Care Ltd. | 2 | 1,155 |
| NAVER Corp. | 7 | 1,605 |
| NCSoft Corp. | 3 | 796 |
| Samsung Electronics Co. Ltd. | 422 | 22,468 |
| SK Hynix, Inc. | 46 | 4,064 |
| S-Oil Corp. | 31 | 2,528 |
| 44,477 | ||
| Spain — 0.3% | ||
| ACS Actividades de Construccion y Servicios SA | 2 | 47 |
| Aena SME SA * (b) | 1 | 84 |
| Amadeus IT Group SA * | 4 | 223 |
| Banco Bilbao Vizcaya Argentaria SA | 53 | 277 |
| Banco Santander SA (a) | 137 | 401 |
| CaixaBank SA | 35 | 113 |
| Cellnex Telecom SA (b) | 4 | 188 |
| INVESTMENTS | SHARES (000) | VALUE ($000) |
| Spain — continued | ||
| EDP Renovaveis SA (a) | 2 | 54 |
| Enagas SA | 2 | 43 |
| Endesa SA | 2 | 53 |
| Ferrovial SA | 4 | 98 |
| Grifols SA | 2 | 40 |
| Iberdrola SA | 741 | 8,516 |
| Industria de Diseno Textil SA | 9 | 181 |
| Naturgy Energy Group SA | 2 | 46 |
| Red Electrica Corp. SA | 3 | 69 |
| Repsol SA | 11 | 171 |
| Siemens Gamesa Renewable Energy SA * | 2 | 30 |
| Telefonica SA | 42 | 203 |
| 10,837 | ||
| Sweden — 0.4% | ||
| Alfa Laval AB (a) | 3 | 69 |
| Assa Abloy AB, Class B | 8 | 201 |
| Atlas Copco AB, Class A | 76 | 3,441 |
| Atlas Copco AB, Class B | 3 | 122 |
| Boliden AB | 2 | 94 |
| Electrolux AB, Class B (a) | 2 | 27 |
| Embracer Group AB * (a) | 4 | 30 |
| Epiroc AB, Class A (a) | 5 | 106 |
| Epiroc AB, Class B | 3 | 54 |
| EQT AB | 2 | 66 |
| Essity AB, Class B (a) | 5 | 127 |
| Evolution AB (b) | 1 | 140 |
| Fastighets AB Balder, Class B * | 1 | 41 |
| Getinge AB, Class B | 2 | 52 |
| H & M Hennes & Mauritz AB, Class B (a) | 6 | 73 |
| Hexagon AB, Class B * | 15 | 199 |
| Husqvarna AB, Class B (a) | 3 | 32 |
| Industrivarden AB, Class A | 1 | 26 |
| Industrivarden AB, Class C (a) | 1 | 32 |
| Investment AB Latour, Class B | 1 | 31 |
| Investor AB, Class A (a) | 4 | 82 |
| Investor AB, Class B | 14 | 277 |
| Kinnevik AB, Class B * (a) | 2 | 38 |
| L E Lundbergforetagen AB, Class B | 1 | 28 |
| Lifco AB, Class B * | 2 | 39 |
| Lundin Energy AB (a) | 2 | 66 |
| Nibe Industrier AB, Class B | 11 | 111 |
| Sagax AB, Class B | 1 | 33 |
| Sandvik AB | 9 | 169 |
| 20 | J.P. Morgan Funds | April 30, 2022 |
| INVESTMENTS | SHARES (000) | VALUE ($000) |
| Common Stocks — continued | ||
| Sweden — continued | ||
| Securitas AB, Class B | 2 | 29 |
| Sinch AB * (a) (b) | 4 | 18 |
| Skandinaviska Enskilda Banken AB, Class A | 13 | 144 |
| Skanska AB, Class B | 3 | 51 |
| SKF AB, Class B | 3 | 49 |
| Svenska Cellulosa AB SCA, Class B | 5 | 93 |
| Svenska Handelsbanken AB, Class A | 12 | 116 |
| Swedbank AB, Class A | 7 | 113 |
| Swedish Match AB | 13 | 100 |
| Tele2 AB, Class B (a) | 4 | 53 |
| Telefonaktiebolaget LM Ericsson, Class B | 23 | 184 |
| Telia Co. AB | 21 | 87 |
| Volvo AB, Class A | 2 | 26 |
| Volvo AB, Class B | 708 | 11,296 |
| 18,165 | ||
| Switzerland — 0.9% | ||
| ABB Ltd. (Registered) | 13 | 390 |
| Adecco Group AG (Registered) | 1 | 49 |
| Alcon, Inc. | 4 | 282 |
| Bachem Holding AG (Registered), Class B * | — | 20 |
| Baloise Holding AG (Registered) | — | 63 |
| Barry Callebaut AG (Registered) | — | 67 |
| Chocoladefabriken Lindt & Spruengli AG | — | 90 |
| Chocoladefabriken Lindt & Spruengli AG (Registered) | — | 119 |
| Cie Financiere Richemont SA (Registered) | 4 | 480 |
| Clariant AG (Registered) * | 2 | 29 |
| Credit Suisse Group AG (Registered) | 21 | 142 |
| EMS-Chemie Holding AG (Registered) | — | 49 |
| Geberit AG (Registered) | — | 162 |
| Givaudan SA (Registered) (a) | — | 294 |
| Holcim AG * | 4 | 203 |
| Julius Baer Group Ltd. | 2 | 84 |
| Kuehne + Nagel International AG (Registered) | 1 | 120 |
| Logitech International SA (Registered) | 1 | 89 |
| Lonza Group AG (Registered) | 7 | 3,956 |
| Nestle SA (Registered) | 102 | 13,148 |
| Novartis AG (Registered) | 17 | 1,532 |
| Partners Group Holding AG | — | 190 |
| Roche Holding AG | 25 | 9,134 |
| Roche Holding AG | — | 98 |
| INVESTMENTS | SHARES (000) | VALUE ($000) |
| Switzerland — continued | ||
| Schindler Holding AG | — | 59 |
| Schindler Holding AG (Registered) | — | 30 |
| SGS SA (Registered) | 1 | 3,430 |
| Sika AG (Registered) | 1 | 343 |
| Sonova Holding AG (Registered) | 1 | 153 |
| Straumann Holding AG (Registered) | 1 | 96 |
| Swatch Group AG (The) (a) | — | 54 |
| Swatch Group AG (The) (Registered) | 1 | 20 |
| Swiss Life Holding AG (Registered) | — | 146 |
| Swiss Prime Site AG (Registered) | 1 | 59 |
| Swisscom AG (Registered) | — | 121 |
| Temenos AG (Registered) | 1 | 54 |
| UBS Group AG (Registered) | 28 | 472 |
| VAT Group AG (b) | — | 66 |
| Vifor Pharma AG | — | 68 |
| Wizz Air Holdings plc * (b) | 24 | 928 |
| Zurich Insurance Group AG | 1 | 542 |
| 37,431 | ||
| Taiwan — 1.3% | ||
| Accton Technology Corp. | 159 | 1,240 |
| Advantech Co. Ltd. | 166 | 2,067 |
| Chailease Holding Co. Ltd. | 189 | 1,500 |
| Eclat Textile Co. Ltd. | 85 | 1,395 |
| Global Unichip Corp. | 78 | 1,068 |
| Novatek Microelectronics Corp. | 73 | 966 |
| Realtek Semiconductor Corp. | 107 | 1,452 |
| Sea Ltd., ADR * | 21 | 1,720 |
| Taiwan Semiconductor Manufacturing Co. Ltd. | 879 | 15,895 |
| Taiwan Semiconductor Manufacturing Co. Ltd., ADR | 269 | 25,023 |
| Wiwynn Corp. | 49 | 1,675 |
| 54,001 | ||
| Tanzania, United Republic of — 0.0% ^ | ||
| AngloGold Ashanti Ltd. | 35 | 725 |
| Thailand — 0.1% | ||
| PTT Exploration & Production PCL | 343 | 1,500 |
| SCB X PCL | 381 | 1,279 |
| Thai Oil PCL | 1,306 | 2,138 |
| 4,917 | ||
| United Arab Emirates — 0.0% ^ | ||
| NMC Health plc ‡ * | 3 | —(c) |
| April 30, 2022 | J.P. Morgan Funds | 21 |
| INVESTMENTS | SHARES (000) | VALUE ($000) |
| Common Stocks — continued | ||
| United Kingdom — 1.1% | ||
| 3i Group plc | 8 | 126 |
| abrdn plc | 17 | 41 |
| Admiral Group plc | 2 | 48 |
| Ashtead Group plc | 3 | 183 |
| Associated British Foods plc | 3 | 56 |
| AstraZeneca plc | 12 | 1,636 |
| Auto Trader Group plc (b) | 7 | 59 |
| AVEVA Group plc | 1 | 26 |
| Aviva plc | 30 | 161 |
| BAE Systems plc | 25 | 232 |
| Barclays plc | 133 | 244 |
| Barratt Developments plc | 8 | 49 |
| Berkeley Group Holdings plc * | 1 | 45 |
| BP plc | 2,076 | 10,021 |
| British American Tobacco plc | 17 | 723 |
| British Land Co. plc (The), REIT | 7 | 45 |
| BT Group plc | 71 | 157 |
| Bunzl plc | 3 | 103 |
| Burberry Group plc | 3 | 63 |
| CK Hutchison Holdings Ltd. | 7 | 48 |
| CK Hutchison Holdings Ltd. | 14 | 102 |
| CNH Industrial NV | 8 | 115 |
| Coca-Cola Europacific Partners plc | 2 | 81 |
| Compass Group plc | 14 | 298 |
| Croda International plc | 1 | 107 |
| DCC plc | 1 | 59 |
| Diageo plc | 172 | 8,602 |
| Entain plc * | 5 | 87 |
| Experian plc | 7 | 252 |
| Halma plc | 3 | 92 |
| Hargreaves Lansdown plc | 3 | 32 |
| HSBC Holdings plc | 161 | 1,006 |
| Imperial Brands plc | 7 | 156 |
| Informa plc * | 12 | 84 |
| InterContinental Hotels Group plc | 1 | 93 |
| Intertek Group plc | 1 | 80 |
| J Sainsbury plc | 14 | 40 |
| JD Sports Fashion plc | 20 | 34 |
| Johnson Matthey plc | 2 | 42 |
| Just Eat Takeaway.com NV * (b) | 1 | 39 |
| Kingfisher plc | 16 | 52 |
| Land Securities Group plc, REIT | 6 | 52 |
| Legal & General Group plc | 47 | 147 |
| Linde plc (a) | 18 | 5,624 |
| INVESTMENTS | SHARES (000) | VALUE ($000) |
| United Kingdom — continued | ||
| Lloyds Banking Group plc | 562 | 319 |
| London Stock Exchange Group plc | 3 | 257 |
| M&G plc | 21 | 55 |
| Melrose Industries plc | 35 | 50 |
| National Grid plc | 29 | 425 |
| NatWest Group plc | 45 | 120 |
| Next plc | 1 | 79 |
| Ocado Group plc * | 4 | 44 |
| Pearson plc | 6 | 58 |
| Pepco Group NV * (b) | 121 | 1,133 |
| Persimmon plc | 105 | 2,727 |
| Phoenix Group Holdings plc | 6 | 42 |
| Prudential plc | 134 | 1,668 |
| Reckitt Benckiser Group plc | 6 | 441 |
| RELX plc | 15 | 456 |
| RELX plc | 182 | 5,417 |
| Rentokil Initial plc | 15 | 101 |
| Rolls-Royce Holdings plc * | 66 | 68 |
| Sage Group plc (The) | 8 | 74 |
| Schroders plc | 1 | 35 |
| Segro plc, REIT | 9 | 159 |
| Severn Trent plc | 2 | 78 |
| Smith & Nephew plc | 7 | 113 |
| Smiths Group plc | 3 | 57 |
| Spirax-Sarco Engineering plc | 1 | 88 |
| SSE plc | 8 | 196 |
| St James's Place plc | 4 | 69 |
| Standard Chartered plc | 21 | 142 |
| Taylor Wimpey plc | 29 | 45 |
| Tesco plc | 61 | 207 |
| Unilever plc | 20 | 945 |
| United Utilities Group plc | 5 | 78 |
| Vodafone Group plc | 216 | 327 |
| Whitbread plc * | 2 | 56 |
| WPP plc | 9 | 115 |
| 47,586 | ||
| United States — 33.9% | ||
| AbbVie, Inc. | 211 | 30,975 |
| Advanced Micro Devices, Inc. * | 113 | 9,704 |
| Airbnb, Inc., Class A * | 7 | 1,024 |
| Alleghany Corp. * | 2 | 1,612 |
| Alliant Energy Corp. (a) | 23 | 1,353 |
| Allstate Corp. (The) | 9 | 1,076 |
| 22 | J.P. Morgan Funds | April 30, 2022 |
| INVESTMENTS | SHARES (000) | VALUE ($000) |
| Common Stocks — continued | ||
| United States — continued | ||
| Alnylam Pharmaceuticals, Inc. * | 16 | 2,089 |
| Alphabet, Inc., Class C * (d) | 8 | 19,432 |
| Amazon.com, Inc. * (d) | 24 | 59,809 |
| American Electric Power Co., Inc. | 12 | 1,234 |
| American Express Co. | 113 | 19,669 |
| American Homes 4 Rent, REIT, Class A | 36 | 1,409 |
| American International Group, Inc. | 44 | 2,559 |
| AmerisourceBergen Corp. | 17 | 2,556 |
| AMETEK, Inc. | 29 | 3,658 |
| Analog Devices, Inc. | 52 | 8,082 |
| Apple Hospitality REIT, Inc., REIT | 48 | 857 |
| Apple, Inc. (d) | 335 | 52,886 |
| Arista Networks, Inc. * | 27 | 3,085 |
| Arthur J Gallagher & Co. | 51 | 8,603 |
| AutoZone, Inc. * | 2 | 3,227 |
| Axalta Coating Systems Ltd. * | 28 | 712 |
| Baker Hughes Co. | 372 | 11,536 |
| Bank of America Corp. | 850 | 30,326 |
| BellRing Brands, Inc. * | 33 | 697 |
| Berkshire Hathaway, Inc., Class B * | 24 | 7,655 |
| Best Buy Co., Inc. | 14 | 1,265 |
| Biogen, Inc. * | 5 | 1,016 |
| BioMarin Pharmaceutical, Inc. * | 9 | 724 |
| BJ's Wholesale Club Holdings, Inc. * | 28 | 1,789 |
| BlackRock, Inc. | 4 | 2,386 |
| Blackstone, Inc. | 44 | 4,438 |
| Boeing Co. (The) * | 12 | 1,816 |
| Booking Holdings, Inc. * | 8 | 17,901 |
| Boston Scientific Corp. * | 452 | 19,044 |
| Bright Horizons Family Solutions, Inc. * | 21 | 2,372 |
| Bristol-Myers Squibb Co. | 440 | 33,116 |
| Brixmor Property Group, Inc., REIT | 70 | 1,775 |
| Bumble, Inc., Class A * | 91 | 2,184 |
| Bunge Ltd. | 6 | 724 |
| Burlington Stores, Inc. * | 15 | 3,113 |
| Capital One Financial Corp. | 31 | 3,802 |
| Cardinal Health, Inc. | 31 | 1,770 |
| Carlisle Cos., Inc. | 6 | 1,477 |
| CarMax, Inc. * | 17 | 1,467 |
| Catalent, Inc. * | 33 | 2,994 |
| CBRE Group, Inc., Class A * | 18 | 1,494 |
| Celanese Corp. | 4 | 524 |
| Centene Corp. * | 83 | 6,687 |
| CenterPoint Energy, Inc. | 46 | 1,423 |
| INVESTMENTS | SHARES (000) | VALUE ($000) |
| United States — continued | ||
| Charles Schwab Corp. (The) | 91 | 6,049 |
| Charter Communications, Inc., Class A * | 25 | 10,785 |
| Cheniere Energy, Inc. | 18 | 2,418 |
| Chevron Corp. | 114 | 17,797 |
| Chubb Ltd. | 10 | 2,015 |
| Cigna Corp. | 18 | 4,516 |
| Cisco Systems, Inc. | 24 | 1,155 |
| Citigroup, Inc. | 151 | 7,264 |
| Citizens Financial Group, Inc. | 62 | 2,461 |
| Claire's Stores, Inc. ‡ * | — | 110 |
| CNA Financial Corp. | 17 | 786 |
| Coca-Cola Co. (The) | 151 | 9,744 |
| Columbia Sportswear Co. | 14 | 1,120 |
| Comcast Corp., Class A | 111 | 4,409 |
| CommScope Holding Co., Inc. * | 57 | 342 |
| Confluent, Inc., Class A * (a) | 40 | 1,264 |
| ConocoPhillips | 155 | 14,794 |
| Constellation Brands, Inc., Class A | 58 | 14,271 |
| Cooper Cos., Inc. (The) | 9 | 3,323 |
| Copart, Inc. * | 33 | 3,775 |
| Coterra Energy, Inc. | 79 | 2,264 |
| Cracker Barrel Old Country Store, Inc. (a) | 6 | 687 |
| Crowdstrike Holdings, Inc., Class A * | 8 | 1,604 |
| CVS Health Corp. | 30 | 2,859 |
| CyberArk Software Ltd. * | — | 49 |
| Deere & Co. | 17 | 6,461 |
| Delta Air Lines, Inc. * | 92 | 3,941 |
| Dexcom, Inc. * | 7 | 2,700 |
| Diamondback Energy, Inc. | 34 | 4,287 |
| Dick's Sporting Goods, Inc. (a) | 16 | 1,544 |
| DISH Network Corp., Class A * | 36 | 1,015 |
| Dollar General Corp. | 8 | 1,797 |
| Dover Corp. | 16 | 2,105 |
| Dow, Inc. | 14 | 938 |
| DuPont de Nemours, Inc. | 17 | 1,141 |
| Eastman Chemical Co. | 65 | 6,691 |
| Eaton Corp. plc | 94 | 13,701 |
| Edison International | 19 | 1,284 |
| Energizer Holdings, Inc. | 36 | 1,090 |
| Entegris, Inc. | 26 | 2,879 |
| Entergy Corp. | 11 | 1,359 |
| EOG Resources, Inc. | 38 | 4,472 |
| EP Energy Corp. * | 5 | 38 |
| EPAM Systems, Inc. * | 7 | 1,861 |
| April 30, 2022 | J.P. Morgan Funds | 23 |
| INVESTMENTS | SHARES (000) | VALUE ($000) |
| Common Stocks — continued | ||
| United States — continued | ||
| Equifax, Inc. | 12 | 2,484 |
| Equity LifeStyle Properties, Inc., REIT | 28 | 2,172 |
| Estee Lauder Cos., Inc. (The), Class A | 11 | 2,858 |
| Exact Sciences Corp. * (a) | 25 | 1,384 |
| Exelixis, Inc. * | 83 | 1,860 |
| Exelon Corp. | 40 | 1,852 |
| Exxon Mobil Corp. | 47 | 3,973 |
| Federal Realty Investment Trust, REIT | 11 | 1,258 |
| FedEx Corp. | ��� 9 | 1,787 |
| Ferguson plc | 31 | 3,909 |
| Fidelity National Information Services, Inc. | 34 | 3,411 |
| First Republic Bank | 20 | 2,989 |
| Fiverr International Ltd. * | — | 11 |
| FleetCor Technologies, Inc. * | 6 | 1,379 |
| Flowserve Corp. | 19 | 635 |
| FMC Corp. | 14 | 1,808 |
| Fortune Brands Home & Security, Inc. | 14 | 983 |
| Freeport-McMoRan, Inc. | 165 | 6,677 |
| Gap, Inc. (The) | 96 | 1,195 |
| Garmin Ltd. | 20 | 2,152 |
| Generac Holdings, Inc. * | 7 | 1,592 |
| General Dynamics Corp. | 7 | 1,740 |
| General Motors Co. * | 21 | 804 |
| GlaxoSmithKline plc | 40 | 898 |
| Global Payments, Inc. | 22 | 2,972 |
| Goodman Networks, Inc. ‡ * | 2 | —(c) |
| Hartford Financial Services Group, Inc. (The) | 34 | 2,379 |
| HCA Healthcare, Inc. | 4 | 869 |
| Hess Corp. | 52 | 5,318 |
| Hilton Worldwide Holdings, Inc. * | 27 | 4,198 |
| Home Depot, Inc. (The) | 21 | 6,328 |
| Honeywell International, Inc. | 18 | 3,446 |
| Horizon Therapeutics plc * | 39 | 3,885 |
| Host Hotels & Resorts, Inc., REIT | 87 | 1,781 |
| HubSpot, Inc. * | 6 | 2,266 |
| Humana, Inc. | 6 | 2,578 |
| Ingersoll Rand, Inc. | 358 | 15,758 |
| Inmode Ltd. * | — | 9 |
| Insulet Corp. * | 9 | 2,082 |
| InterActiveCorp. * | 11 | 899 |
| Intercontinental Exchange, Inc. | 9 | 984 |
| International Business Machines Corp. | 13 | 1,708 |
| INVESTMENTS | SHARES (000) | VALUE ($000) |
| United States — continued | ||
| Intuit, Inc. | 21 | 8,730 |
| Intuitive Surgical, Inc. * | 15 | 3,548 |
| Invesco Ltd. | 53 | 982 |
| ITT, Inc. | 14 | 955 |
| James Hardie Industries plc, CHDI | 4 | 101 |
| Jazz Pharmaceuticals plc * | 19 | 3,034 |
| JBG SMITH Properties, REIT | 34 | 886 |
| Johnson & Johnson | 26 | 4,698 |
| Keurig Dr Pepper, Inc. | 65 | 2,449 |
| Keysight Technologies, Inc. * | 16 | 2,187 |
| Kilroy Realty Corp., REIT | 7 | 476 |
| Kimco Realty Corp., REIT | 90 | 2,291 |
| Kinder Morgan, Inc. | 102 | 1,853 |
| Kite Realty Group Trust, REIT | 27 | 611 |
| Kohl's Corp. | 41 | 2,364 |
| Kontoor Brands, Inc. | 18 | 708 |
| Kraft Heinz Co. (The) | 53 | 2,254 |
| Kyndryl Holdings, Inc. * | 36 | 432 |
| Laboratory Corp. of America Holdings * | 4 | 970 |
| Lam Research Corp. | 19 | 8,890 |
| Lamar Advertising Co., REIT, Class A | 6 | 706 |
| Lamb Weston Holdings, Inc. | 32 | 2,093 |
| Leidos Holdings, Inc. | 22 | 2,245 |
| Liberty Broadband Corp., Class C * | 14 | 1,550 |
| Liberty Media Corp.-Liberty SiriusXM, Class C * | 38 | 1,584 |
| Lincoln National Corp. | 19 | 1,131 |
| Lockheed Martin Corp. | 2 | 660 |
| Loews Corp. | 66 | 4,117 |
| Lowe's Cos., Inc. | 10 | 1,987 |
| Lyft, Inc., Class A * | 495 | 16,130 |
| M&T Bank Corp. | 44 | 7,308 |
| Marathon Petroleum Corp. | 13 | 1,110 |
| Marriott International, Inc., Class A * | 108 | 19,175 |
| Marsh & McLennan Cos., Inc. | 6 | 1,044 |
| Martin Marietta Materials, Inc. | 5 | 1,922 |
| Mastercard, Inc., Class A | 81 | 29,604 |
| McDonald's Corp. | 100 | 24,993 |
| McKesson Corp. | 16 | 5,019 |
| Medtronic plc | 28 | 2,943 |
| Merck & Co., Inc. | 16 | 1,433 |
| Meta Platforms, Inc., Class A * | 139 | 27,906 |
| Mettler-Toledo International, Inc. * | 1 | 1,782 |
| Microsoft Corp. | 269 | 74,684 |
| 24 | J.P. Morgan Funds | April 30, 2022 |
| INVESTMENTS | SHARES (000) | VALUE ($000) |
| Common Stocks — continued | ||
| United States — continued | ||
| Mid-America Apartment Communities, Inc., REIT | 7 | 1,464 |
| Middleby Corp. (The) * | 5 | 787 |
| Mohawk Industries, Inc. * | 12 | 1,726 |
| MongoDB, Inc. * | 6 | 2,205 |
| Moran Foods Backstop Equity ‡ * | 24 | 14 |
| Morgan Stanley | 18 | 1,452 |
| Murphy USA, Inc. | 7 | 1,686 |
| MYT Holding Co. ‡ * | 23 | 23 |
| Natera, Inc. * | 28 | 973 |
| National Vision Holdings, Inc. * | 35 | 1,313 |
| Neurocrine Biosciences, Inc. * | 7 | 645 |
| Newell Brands, Inc. | 69 | 1,608 |
| Nexstar Media Group, Inc., Class A | 7 | 1,047 |
| NextEra Energy, Inc. | 192 | 13,629 |
| NIKE, Inc., Class B | 32 | 4,037 |
| NMG, Inc. * | 1 | 208 |
| Norfolk Southern Corp. | 33 | 8,510 |
| Northern Trust Corp. | 16 | 1,600 |
| Northrop Grumman Corp. | 4 | 1,798 |
| NVIDIA Corp. | 34 | 6,393 |
| Old Dominion Freight Line, Inc. | 5 | 1,529 |
| Organon & Co. | 17 | 548 |
| Packaging Corp. of America | 15 | 2,433 |
| Palo Alto Networks, Inc. * | 9 | 5,132 |
| Parker-Hannifin Corp. | 11 | 3,087 |
| PG&E Corp. * | 92 | 1,158 |
| Philip Morris International, Inc. | 17 | 1,672 |
| Phillips 66 | 20 | 1,725 |
| Pioneer Natural Resources Co. | 6 | 1,279 |
| PNC Financial Services Group, Inc. (The) | 17 | 2,757 |
| Post Holdings, Inc. * | 25 | 1,842 |
| Procter & Gamble Co. (The) | 16 | 2,512 |
| Progressive Corp. (The) | 204 | 21,900 |
| Prologis, Inc., REIT | 60 | 9,662 |
| Public Storage, REIT | 2 | 716 |
| QIAGEN NV * | 2 | 84 |
| QUALCOMM, Inc. | 38 | 5,338 |
| Quanta Services, Inc. | 50 | 5,837 |
| Ralph Lauren Corp. | 11 | 1,166 |
| Rayonier, Inc., REIT | 43 | 1,870 |
| Raytheon Technologies Corp. | 77 | 7,333 |
| Regeneron Pharmaceuticals, Inc. * | 35 | 23,330 |
| Regions Financial Corp. | 36 | 754 |
| INVESTMENTS | SHARES (000) | VALUE ($000) |
| United States — continued | ||
| ROBLOX Corp., Class A * | 18 | 553 |
| Ross Stores, Inc. | 103 | 10,312 |
| Royal Caribbean Cruises Ltd. * (a) | 86 | 6,679 |
| Royalty Pharma plc, Class A | 40 | 1,716 |
| S&P Global, Inc. | 14 | 5,126 |
| Schneider Electric SE (a) | 29 | 4,110 |
| Seagate Technology Holdings plc | 88 | 7,236 |
| ServiceNow, Inc. * | 7 | 3,288 |
| Signature Bank | 9 | 2,067 |
| Snap, Inc., Class A * | 372 | 10,573 |
| SolarEdge Technologies, Inc. * | 13 | 3,130 |
| Southwest Airlines Co. * | 120 | 5,613 |
| Stanley Black & Decker, Inc. | 8 | 969 |
| State Street Corp. | 145 | 9,696 |
| Stellantis NV (a) | 340 | 4,570 |
| Sun Communities, Inc., REIT | 45 | 7,884 |
| SVB Financial Group * | 4 | 2,192 |
| Swiss Re AG | 2 | 196 |
| Synopsys, Inc. * | 11 | 3,131 |
| Sysco Corp. | 18 | 1,550 |
| T. Rowe Price Group, Inc. | 11 | 1,381 |
| Tapestry, Inc. | 39 | 1,292 |
| TD SYNNEX Corp. | 18 | 1,821 |
| Tenaris SA | 4 | 57 |
| Teradyne, Inc. | 18 | 1,931 |
| Terex Corp. | 15 | 501 |
| Tesla, Inc. * | 25 | 22,116 |
| Texas Instruments, Inc. (d) | 112 | 19,015 |
| Texas Roadhouse, Inc. | 7 | 607 |
| Textron, Inc. | 12 | 810 |
| Thermo Fisher Scientific, Inc. | 6 | 3,360 |
| Timken Co. (The) | 11 | 629 |
| T-Mobile US, Inc. * | 128 | 15,779 |
| Trade Desk, Inc. (The), Class A * | 28 | 1,673 |
| Trane Technologies plc | 135 | 18,896 |
| Travelers Cos., Inc. (The) | 31 | 5,386 |
| Truist Financial Corp. | 278 | 13,458 |
| UDR, Inc., REIT | 12 | 628 |
| UnitedHealth Group, Inc. (d) | 65 | 33,121 |
| US Bancorp | 77 | 3,723 |
| US Foods Holding Corp. * | 49 | 1,836 |
| Ventas, Inc., REIT | 16 | 881 |
| Verizon Communications, Inc. (d) | 77 | 3,543 |
| Vertex Pharmaceuticals, Inc. * | 16 | 4,401 |
| April 30, 2022 | J.P. Morgan Funds | 25 |
| INVESTMENTS | SHARES (000) | VALUE ($000) |
| Common Stocks — continued | ||
| United States — continued | ||
| Viatris, Inc. | 48 | 499 |
| Walt Disney Co. (The) * | 6 | 626 |
| Wells Fargo & Co. | 419 | 18,260 |
| Welltower, Inc., REIT | 8 | 739 |
| Westrock Co. | 29 | 1,442 |
| Weyerhaeuser Co., REIT | 97 | 4,011 |
| Whiting Petroleum Corp. | 2 | 130 |
| Williams Cos., Inc. (The) | 59 | 2,009 |
| Wolfspeed, Inc. * (a) | 21 | 1,954 |
| Xcel Energy, Inc. | 38 | 2,798 |
| Zebra Technologies Corp., Class A * | 5 | 1,967 |
| Zimmer Biomet Holdings, Inc. | 212 | 25,616 |
| Zoom Video Communications, Inc., Class A * | 24 | 2,374 |
| Zscaler, Inc. * | 7 | 1,465 |
| 1,429,215 | ||
| Total Common Stocks (Cost $1,974,236) | 2,335,295 | |
| INVESTMENTS | PRINCIPAL AMOUNT ($000) | |
| Corporate Bonds — 15.8% | ||
| Australia — 0.1% | ||
| FMG Resources August 2006 Pty. Ltd. | ||
| 5.13%, 5/15/2024 (e) | 1,041 | 1,051 |
| 4.50%, 9/15/2027 (e) | 1,620 | 1,535 |
| 4.38%, 4/1/2031 (e) | 3,611 | 3,196 |
| 5,782 | ||
| Canada — 0.9% | ||
| 1011778 BC ULC | ||
| 5.75%, 4/15/2025 (a) (e) | 798 | 815 |
| 4.38%, 1/15/2028 (e) | 4 | 4 |
| Algonquin Power & Utilities Corp. (US Treasury Yield Curve Rate T Note Constant Maturity 5 Year + 3.25%), 4.75%, 1/18/2082 (f) | 90 | 82 |
| Baffinland Iron Mines Corp. 8.75%, 7/15/2026 (e) | 490 | 498 |
| Baytex Energy Corp. 8.75%, 4/1/2027 (e) | 140 | 148 |
| Bombardier, Inc. | ||
| 7.50%, 12/1/2024 (e) | 2,069 | 2,059 |
| 7.13%, 6/15/2026 (e) | 1,583 | 1,456 |
| 7.88%, 4/15/2027 (e) | 60 | 56 |
| INVESTMENTS | PRINCIPAL AMOUNT ($000) | VALUE ($000) |
| Canada — continued | ||
| 6.00%, 2/15/2028 (e) | 1 | 1 |
| Garda World Security Corp. | ||
| 4.63%, 2/15/2027 (e) | 435 | 392 |
| 9.50%, 11/1/2027 (e) | 160 | 157 |
| 6.00%, 6/1/2029 (e) | 20 | 17 |
| GFL Environmental, Inc. | ||
| 3.75%, 8/1/2025 (e) | 255 | 242 |
| 5.13%, 12/15/2026 (e) | 1,402 | 1,378 |
| 4.00%, 8/1/2028 (e) | 7 | 6 |
| 3.50%, 9/1/2028 (e) | 5,893 | 5,245 |
| MEG Energy Corp. 7.13%, 2/1/2027 (e) | 1,442 | 1,464 |
| Methanex Corp. | ||
| 5.25%, 12/15/2029 | 4,644 | 4,412 |
| 5.65%, 12/1/2044 | 3,092 | 2,705 |
| NOVA Chemicals Corp. 4.88%, 6/1/2024 (e) | 3 | 3 |
| Ontario Teachers' Finance Trust | ||
| 1.10%, 10/19/2027 (e) | CAD 773 | 533 |
| 0.10%, 5/19/2028 (b) | EUR 2,955 | 2,838 |
| 0.05%, 11/25/2030 (b) | EUR 5,225 | 4,731 |
| Open Text Corp. 3.88%, 12/1/2029 (e) | 2,371 | 2,107 |
| Parkland Corp. | ||
| 5.88%, 7/15/2027 (e) | 20 | 19 |
| 4.50%, 10/1/2029 (e) | 3,582 | 3,135 |
| 4.63%, 5/1/2030 (e) | 451 | 395 |
| Titan Acquisition Ltd. 7.75%, 4/15/2026 (e) | 939 | 906 |
| TransAlta Corp. 6.50%, 3/15/2040 | 802 | 803 |
| Videotron Ltd. 5.13%, 4/15/2027 (e) | 155 | 152 |
| 36,759 | ||
| Cayman Islands — 0.0% ^ | ||
| Global Aircraft Leasing Co. Ltd. 6.50% (Cash), 9/15/2024 (e) (g) | 1,630 | 1,406 |
| Chile — 0.0% ^ | ||
| Celulosa Arauco y Constitucion SA 5.50%, 11/2/2047 | 355 | 325 |
| Finland — 0.0% ^ | ||
| Nokia OYJ 6.63%, 5/15/2039 (a) | 493 | 569 |
| France — 0.4% | ||
| Altice France SA 8.13%, 2/1/2027 (e) | 1,340 | 1,350 |
| Dexia Credit Local SA | ||
| 0.75%, 1/25/2023 (b) | EUR 3,500 | 3,712 |
| 0.50%, 7/22/2023 (b) | GBP 3,500 | 4,324 |
| 26 | J.P. Morgan Funds | April 30, 2022 |
| INVESTMENTS | PRINCIPAL AMOUNT ($000) | VALUE ($000) |
| Corporate Bonds — continued | ||
| France — continued | ||
| 1.63%, 12/8/2023 (b) | GBP 2,800 | 3,496 |
| 1.25%, 11/26/2024 (b) | EUR 2,100 | 2,226 |
| 15,108 | ||
| Germany — 0.1% | ||
| Kreditanstalt fuer Wiederaufbau 0.00%, 12/15/2022 | EUR 3,000 | 3,170 |
| Hong Kong — 0.0% ^ | ||
| Seaspan Corp. 5.50%, 8/1/2029 (e) | 20 | 18 |
| Italy — 0.3% | ||
| Telecom Italia Capital SA | ||
| 6.38%, 11/15/2033 | 1,524 | 1,332 |
| 6.00%, 9/30/2034 | 808 | 691 |
| 7.20%, 7/18/2036 | 4,103 | 3,701 |
| 7.72%, 6/4/2038 | 5,205 | 4,886 |
| 10,610 | ||
| Japan — 0.0% ^ | ||
| Development Bank of Japan, Inc. 3.13%, 9/6/2023 (e) | 1,850 | 1,862 |
| Luxembourg — 0.1% | ||
| Altice Financing SA 5.00%, 1/15/2028 (e) | 253 | 211 |
| Altice France Holding SA | ||
| 10.50%, 5/15/2027 (a) (e) | 3 | 3 |
| 6.00%, 2/15/2028 (a) (e) | 580 | 479 |
| ArcelorMittal SA | ||
| 7.00%, 10/15/2039 (h) | 476 | 523 |
| 6.75%, 3/1/2041 (h) | 507 | 544 |
| ARD Finance SA 6.50% (Cash), 6/30/2027 (e) (g) | 2,048 | 1,721 |
| Intelsat Jackson Holdings SA 6.50%, 3/15/2030 (e) | 321 | 302 |
| 3,783 | ||
| Macau — 0.1% | ||
| MGM China Holdings Ltd. 4.75%, 2/1/2027 (a) (e) | 3,148 | 2,644 |
| Studio City Finance Ltd. | ||
| 6.00%, 7/15/2025 (e) | 340 | 288 |
| 5.00%, 1/15/2029 (e) | 604 | 412 |
| Wynn Macau Ltd. 4.88%, 10/1/2024 (e) | 2,862 | 2,558 |
| 5,902 | ||
| Netherlands — 0.2% | ||
| BNG Bank NV 4.75%, 3/6/2023 (b) | AUD 602 | 434 |
| INVESTMENTS | PRINCIPAL AMOUNT ($000) | VALUE ($000) |
| Netherlands — continued | ||
| Nederlandse Waterschapsbank NV 3.50%, 7/20/2027 | AUD 3,120 | 2,179 |
| Trivium Packaging Finance BV 5.50%, 8/15/2026 (e) (h) | 1,111 | 1,073 |
| UPC Broadband Finco BV 4.88%, 7/15/2031 (e) | 5,882 | 5,169 |
| 8,855 | ||
| Saudi Arabia — 0.0% ^ | ||
| Saudi Arabian Oil Co. 1.25%, 11/24/2023 (e) | 400 | 388 |
| Singapore — 0.2% | ||
| Temasek Financial I Ltd. | ||
| 3.63%, 8/1/2028 (e) | 6,158 | 6,202 |
| 1.63%, 8/2/2031 (e) | 2,593 | 2,186 |
| 2.38%, 8/2/2041 (a) (e) | 1,558 | 1,246 |
| 9,634 | ||
| South Korea — 0.2% | ||
| Korea Development Bank (The) | ||
| 1.75%, 12/15/2022 (b) | GBP 2,450 | 3,080 |
| 2.13%, 10/1/2024 | 1,826 | 1,781 |
| Korea Southern Power Co. Ltd. 0.75%, 1/27/2026 (e) | 2,155 | 1,934 |
| 6,795 | ||
| Switzerland — 0.0% ^ | ||
| VistaJet Malta Finance plc 6.38%, 2/1/2030 (e) | 80 | 70 |
| United Kingdom — 0.3% | ||
| eG Global Finance plc 6.75%, 2/7/2025 (e) | 1,199 | 1,165 |
| INEOS Quattro Finance 2 plc 3.38%, 1/15/2026 (e) | 468 | 427 |
| Marks & Spencer plc 7.13%, 12/1/2037 (e) | 2,475 | 2,502 |
| Petrofac Ltd. 9.75%, 11/15/2026 (a) (e) | 200 | 187 |
| Rolls-Royce plc 5.75%, 10/15/2027 (e) | 961 | 926 |
| Virgin Media Secured Finance plc | ||
| 5.50%, 5/15/2029 (e) | 5 | 5 |
| 4.50%, 8/15/2030 (e) | 846 | 734 |
| Vmed O2 UK Financing I plc | ||
| 4.25%, 1/31/2031 (e) | 7,106 | 6,007 |
| 4.75%, 7/15/2031 (e) | 1,188 | 1,019 |
| 12,972 | ||
| April 30, 2022 | J.P. Morgan Funds | 27 |
| INVESTMENTS | PRINCIPAL AMOUNT ($000) | VALUE ($000) |
| Corporate Bonds — continued | ||
| United States — 12.9% | ||
| Acadia Healthcare Co., Inc. 5.50%, 7/1/2028 (e) | 4 | 4 |
| ACCO Brands Corp. 4.25%, 3/15/2029 (e) | 2,747 | 2,390 |
| Acrisure LLC | ||
| 7.00%, 11/15/2025 (e) | 1,131 | 1,101 |
| 4.25%, 2/15/2029 (e) | 10 | 9 |
| Adtalem Global Education, Inc. 5.50%, 3/1/2028 (e) | 2 | 2 |
| Advantage Sales & Marketing, Inc. 6.50%, 11/15/2028 (e) | 326 | 296 |
| AECOM 5.13%, 3/15/2027 | 97 | 96 |
| Aethon United BR LP 8.25%, 2/15/2026 (e) | 1,036 | 1,068 |
| Air Methods Corp. 8.00%, 5/15/2025 (a) (e) | 666 | 544 |
| Albertsons Cos., Inc. | ||
| 3.25%, 3/15/2026 (e) | 1,528 | 1,394 |
| 7.50%, 3/15/2026 (e) | 734 | 771 |
| 5.88%, 2/15/2028 (e) | 614 | 596 |
| 3.50%, 3/15/2029 (e) | 6 | 5 |
| 4.88%, 2/15/2030 (e) | 982 | 889 |
| Alcoa Nederland Holding BV 5.50%, 12/15/2027 (e) | 214 | 213 |
| Allegheny Technologies, Inc. 5.88%, 12/1/2027 | 5 | 5 |
| Alliant Holdings Intermediate LLC 6.75%, 10/15/2027 (e) | 4 | 4 |
| Allied Universal Holdco LLC | ||
| 6.63%, 7/15/2026 (e) | 2,147 | 2,075 |
| 9.75%, 7/15/2027 (e) | 9 | 9 |
| Allison Transmission, Inc. | ||
| 4.75%, 10/1/2027 (e) | 8 | 8 |
| 5.88%, 6/1/2029 (e) | 5 | 5 |
| 3.75%, 1/30/2031 (e) | 2 | 2 |
| AMC Entertainment Holdings, Inc. | ||
| 10.00% (Cash), 6/15/2026 (a) (e) (g) | 1,291 | 1,081 |
| 7.50%, 2/15/2029 (e) | 40 | 37 |
| AMC Networks, Inc. 4.75%, 8/1/2025 | 1,079 | 1,042 |
| American Airlines Group, Inc. 3.75%, 3/1/2025 (a) (e) | 1,089 | 972 |
| American Airlines, Inc. | ||
| 11.75%, 7/15/2025 (e) | 320 | 368 |
| 5.50%, 4/20/2026 (e) | 5,032 | 4,988 |
| INVESTMENTS | PRINCIPAL AMOUNT ($000) | VALUE ($000) |
| United States — continued | ||
| 5.75%, 4/20/2029 (e) | 6,727 | 6,482 |
| American Axle & Manufacturing, Inc. | ||
| 6.25%, 3/15/2026 | 28 | 27 |
| 6.50%, 4/1/2027 (a) | 7 | 7 |
| 5.00%, 10/1/2029 (a) | 5 | 4 |
| AmeriGas Partners LP 5.50%, 5/20/2025 | 90 | 89 |
| AMN Healthcare, Inc. 4.63%, 10/1/2027 (e) | 225 | 216 |
| AmWINS Group, Inc. 4.88%, 6/30/2029 (e) | 332 | 304 |
| ANGI Group LLC 3.88%, 8/15/2028 (e) | 40 | 32 |
| Antero Midstream Partners LP 7.88%, 5/15/2026 (e) | 1,295 | 1,355 |
| Antero Resources Corp. | ||
| 8.38%, 7/15/2026 (e) | 95 | 102 |
| 7.63%, 2/1/2029 (e) | 109 | 115 |
| Apollo Commercial Real Estate Finance, Inc. REIT, 4.63%, 6/15/2029 (e) | 2 | 2 |
| APX Group, Inc. 6.75%, 2/15/2027 (e) | 903 | 895 |
| Aramark Services, Inc. | ||
| 5.00%, 4/1/2025 (e) | 3 | 3 |
| 6.38%, 5/1/2025 (e) | 1,303 | 1,327 |
| Arches Buyer, Inc. 4.25%, 6/1/2028 (e) | 5 | 4 |
| Archrock Partners LP 6.88%, 4/1/2027 (e) | 786 | 787 |
| Arconic Corp. | ||
| 6.00%, 5/15/2025 (e) | 1,320 | 1,324 |
| 6.13%, 2/15/2028 (e) | 5 | 5 |
| Ardagh Packaging Finance plc 5.25%, 4/30/2025 (e) | 1,506 | 1,496 |
| Artera Services LLC 9.03%, 12/4/2025 (e) | 270 | 256 |
| Ascent Resources Utica Holdings LLC 7.00%, 11/1/2026 (e) | 649 | 654 |
| ASGN, Inc. 4.63%, 5/15/2028 (e) | 326 | 303 |
| Ashland LLC 6.88%, 5/15/2043 | 340 | 377 |
| AssuredPartners, Inc. 7.00%, 8/15/2025 (e) | 200 | 197 |
| At Home Group, Inc. 7.13%, 7/15/2029 (a) (e) | 180 | 134 |
| Avantor Funding, Inc. 4.63%, 7/15/2028 (e) | 2 | 2 |
| Avaya, Inc. 6.13%, 9/15/2028 (e) | 4 | 4 |
| Avient Corp. 5.75%, 5/15/2025 (e) | 1,031 | 1,041 |
| B&G Foods, Inc. 5.25%, 4/1/2025 | 326 | 310 |
| 28 | J.P. Morgan Funds | April 30, 2022 |
| INVESTMENTS | PRINCIPAL AMOUNT ($000) | VALUE ($000) |
| Corporate Bonds — continued | ||
| United States — continued | ||
| Ball Corp. | ||
| 4.88%, 3/15/2026 | 1,049 | 1,049 |
| 3.13%, 9/15/2031 | 2,595 | 2,171 |
| Bath & Body Works, Inc. | ||
| 5.25%, 2/1/2028 | 150 | 144 |
| 7.50%, 6/15/2029 | 5 | 5 |
| 6.63%, 10/1/2030 (e) | 10 | 10 |
| 6.88%, 11/1/2035 | 4,621 | 4,515 |
| 6.75%, 7/1/2036 | 5,109 | 4,956 |
| Bausch Health Americas, Inc. | ||
| 9.25%, 4/1/2026 (e) | 3,994 | 3,965 |
| 8.50%, 1/31/2027 (e) | 26 | 25 |
| Bausch Health Cos., Inc. | ||
| 5.50%, 11/1/2025 (e) | 2,115 | 2,046 |
| 9.00%, 12/15/2025 (e) | 220 | 221 |
| 6.13%, 2/1/2027 (e) | 10 | 10 |
| 5.00%, 1/30/2028 (e) | 3 | 2 |
| 5.00%, 2/15/2029 (e) | 2 | 1 |
| 5.25%, 1/30/2030 (e) | 2 | 1 |
| 5.25%, 2/15/2031 (e) | 3 | 2 |
| BCPE Empire Holdings, Inc. 7.63%, 5/1/2027 (e) | 317 | 297 |
| Block, Inc. | ||
| 2.75%, 6/1/2026 (e) | 1,249 | 1,139 |
| 3.50%, 6/1/2031 (e) | 5 | 4 |
| Booz Allen Hamilton, Inc. 3.88%, 9/1/2028 (e) | 234 | 216 |
| Boxer Parent Co., Inc. 7.13%, 10/2/2025 (e) | 430 | 439 |
| Boyd Gaming Corp. 4.75%, 12/1/2027 | 1 | 1 |
| Brand Industrial Services, Inc. 8.50%, 7/15/2025 (e) | 2,411 | 2,152 |
| Brink's Co. (The) 4.63%, 10/15/2027 (e) | 150 | 142 |
| Brookfield Property REIT, Inc. | ||
| REIT, 5.75%, 5/15/2026 (e) | 877 | 849 |
| REIT, 4.50%, 4/1/2027 (e) | 3 | 3 |
| Buckeye Partners LP | ||
| 4.13%, 3/1/2025 (e) | 289 | 277 |
| 4.50%, 3/1/2028 (e) | 1,377 | 1,256 |
| 5.85%, 11/15/2043 | 2,126 | 1,695 |
| Builders FirstSource, Inc. 4.25%, 2/1/2032 (e) | 1,245 | 1,063 |
| Caesars Entertainment, Inc. | ||
| 6.25%, 7/1/2025 (e) | 3,625 | 3,664 |
| INVESTMENTS | PRINCIPAL AMOUNT ($000) | VALUE ($000) |
| United States — continued | ||
| 8.13%, 7/1/2027 (e) | 1 | 1 |
| Caesars Resort Collection LLC 5.75%, 7/1/2025 (e) | 1,253 | 1,280 |
| Calpine Corp. | ||
| 4.50%, 2/15/2028 (e) | 226 | 209 |
| 5.13%, 3/15/2028 (e) | 5 | 5 |
| 3.75%, 3/1/2031 (e) | 6,267 | 5,280 |
| Calumet Specialty Products Partners LP 11.00%, 4/15/2025 (e) | 852 | 852 |
| Camelot Finance SA 4.50%, 11/1/2026 (e) | 50 | 47 |
| Cargo Aircraft Management, Inc. 4.75%, 2/1/2028 (e) | 230 | 216 |
| Carnival Corp. | ||
| 10.50%, 2/1/2026 (e) | 1,632 | 1,795 |
| 7.63%, 3/1/2026 (e) | 3,527 | 3,452 |
| 9.88%, 8/1/2027 (e) | 5 | 5 |
| 6.00%, 5/1/2029 (e) | 6 | 5 |
| Carvana Co. 5.63%, 10/1/2025 (a) (e) | 1,354 | 1,173 |
| CCO Holdings LLC | ||
| 5.00%, 2/1/2028 (e) | 7 | 7 |
| 4.75%, 3/1/2030 (e) | 7 | 6 |
| 4.25%, 2/1/2031 (e) | 6 | 5 |
| 4.50%, 6/1/2033 (e) | 1,280 | 1,047 |
| 4.25%, 1/15/2034 (e) | 1,443 | 1,147 |
| CD&R Smokey Buyer, Inc. 6.75%, 7/15/2025 (e) | 992 | 1,010 |
| CDK Global, Inc. 5.25%, 5/15/2029 (e) | 3 | 3 |
| CEC Entertainment LLC 6.75%, 5/1/2026 (e) | 959 | 901 |
| Cedar Fair LP 5.50%, 5/1/2025 (e) | 1,385 | 1,392 |
| Centene Corp. | ||
| 4.25%, 12/15/2027 | 6 | 6 |
| 2.45%, 7/15/2028 | 33 | 29 |
| 4.63%, 12/15/2029 | 8 | 8 |
| Central Garden & Pet Co. 4.13%, 10/15/2030 | 5,871 | 5,075 |
| Century Communities, Inc. 6.75%, 6/1/2027 | 300 | 303 |
| CF Industries, Inc. 5.38%, 3/15/2044 | 866 | 878 |
| Charter Communications Operating LLC 3.85%, 4/1/2061 | 62 | 42 |
| Chemours Co. (The) 5.38%, 5/15/2027 (a) | 5 | 5 |
| April 30, 2022 | J.P. Morgan Funds | 29 |
| INVESTMENTS | PRINCIPAL AMOUNT ($000) | VALUE ($000) |
| Corporate Bonds — continued | ||
| United States — continued | ||
| Cheniere Energy Partners LP 4.00%, 3/1/2031 | 5 | 5 |
| Cheniere Energy, Inc. 4.63%, 10/15/2028 | 4 | 4 |
| Chesapeake Energy Corp. | ||
| 5.50%, 2/1/2026 (e) | 781 | 774 |
| 5.88%, 2/1/2029 (e) | 5 | 5 |
| Chobani LLC 7.50%, 4/15/2025 (a) (e) | 337 | 316 |
| Churchill Downs, Inc. 5.50%, 4/1/2027 (e) | 886 | 870 |
| Cinemark USA, Inc. 8.75%, 5/1/2025 (e) | 150 | 156 |
| Clarios Global LP | ||
| 6.75%, 5/15/2025 (e) | 4 | 4 |
| 6.25%, 5/15/2026 (e) | 1,161 | 1,173 |
| 8.50%, 5/15/2027 (e) | 20 | 20 |
| Clarivate Science Holdings Corp. 3.88%, 7/1/2028 (e) | 5 | 4 |
| Clear Channel Outdoor Holdings, Inc. | ||
| 7.75%, 4/15/2028 (e) | 8 | 8 |
| 7.50%, 6/1/2029 (e) | 307 | 290 |
| Cleveland-Cliffs, Inc. | ||
| 6.75%, 3/15/2026 (e) | 572 | 600 |
| 5.88%, 6/1/2027 | 9 | 9 |
| 4.63%, 3/1/2029 (e) | 3 | 3 |
| CNX Resources Corp. 7.25%, 3/14/2027 (e) | 990 | 1,012 |
| Coinbase Global, Inc. 3.63%, 10/1/2031 (a) (e) | 490 | 362 |
| Colgate Energy Partners III LLC 5.88%, 7/1/2029 (e) | 6 | 6 |
| CommScope, Inc. | ||
| 6.00%, 3/1/2026 (e) | 1,246 | 1,175 |
| 8.25%, 3/1/2027 (e) | 1,158 | 984 |
| 7.13%, 7/1/2028 (a) (e) | 615 | 490 |
| Community Health Systems, Inc. | ||
| 8.00%, 3/15/2026 (e) | 4,112 | 4,251 |
| 5.63%, 3/15/2027 (e) | 6 | 6 |
| 6.13%, 4/1/2030 (a) (e) | 5 | 4 |
| Compass Minerals International, Inc. 6.75%, 12/1/2027 (e) | 298 | 302 |
| Conduent Business Services LLC 6.00%, 11/1/2029 (e) | 2 | 2 |
| Consolidated Communications, Inc. 6.50%, 10/1/2028 (e) | 140 | 122 |
| INVESTMENTS | PRINCIPAL AMOUNT ($000) | VALUE ($000) |
| United States — continued | ||
| Continental Resources, Inc. 5.75%, 1/15/2031 (e) | 3 | 3 |
| CoreCivic, Inc. 8.25%, 4/15/2026 | 1,300 | 1,335 |
| Cornerstone Building Brands, Inc. 6.13%, 1/15/2029 (e) | 4 | 3 |
| Coty, Inc. 5.00%, 4/15/2026 (e) | 1,241 | 1,179 |
| Crescent Energy Finance LLC 7.25%, 5/1/2026 (e) | 706 | 695 |
| Crestwood Midstream Partners LP | ||
| 5.75%, 4/1/2025 | 156 | 154 |
| 5.63%, 5/1/2027 (e) | 62 | 60 |
| Crown Americas LLC 4.75%, 2/1/2026 | 1,216 | 1,211 |
| CrownRock LP 5.63%, 10/15/2025 (e) | 1,475 | 1,475 |
| CSC Holdings LLC | ||
| 5.50%, 4/15/2027 (e) | 5 | 5 |
| 6.50%, 2/1/2029 (e) | 215 | 204 |
| 4.13%, 12/1/2030 (e) | 3,190 | 2,632 |
| 3.38%, 2/15/2031 (e) | 3,477 | 2,715 |
| 4.50%, 11/15/2031 (e) | 6,597 | 5,419 |
| Curo Group Holdings Corp. 7.50%, 8/1/2028 (e) | 90 | 75 |
| CVR Energy, Inc. 5.25%, 2/15/2025 (e) | 1,342 | 1,298 |
| CWT Travel Group, Inc. 8.50%, 11/19/2026 (a) (e) | 10 | 10 |
| Dana, Inc. 5.38%, 11/15/2027 | 4 | 4 |
| Darling Ingredients, Inc. 5.25%, 4/15/2027 (e) | 807 | 807 |
| DaVita, Inc. 4.63%, 6/1/2030 (e) | 5 | 4 |
| DCP Midstream Operating LP 5.38%, 7/15/2025 | 1,116 | 1,122 |
| Dell, Inc. 6.50%, 4/15/2038 | 480 | 492 |
| Delta Air Lines, Inc. | ||
| 2.90%, 10/28/2024 | 1,246 | 1,188 |
| 4.50%, 10/20/2025 (e) | 1 | 1 |
| 7.38%, 1/15/2026 | 1,121 | 1,194 |
| 4.75%, 10/20/2028 (e) | — | — |
| 3.75%, 10/28/2029 | 10 | 9 |
| Diamond Sports Group LLC | ||
| 5.38%, 8/15/2026 (b) | 207 | 77 |
| 5.38%, 8/15/2026 (e) | 255 | 94 |
| Diebold Nixdorf, Inc. 9.38%, 7/15/2025 (a) (e) | 1,066 | 943 |
| Directv Financing LLC 5.88%, 8/15/2027 (e) | 5 | 5 |
| 30 | J.P. Morgan Funds | April 30, 2022 |
| INVESTMENTS | PRINCIPAL AMOUNT ($000) | VALUE ($000) |
| Corporate Bonds — continued | ||
| United States — continued | ||
| DISH DBS Corp. | ||
| 7.75%, 7/1/2026 | 489 | 460 |
| 5.25%, 12/1/2026 (e) | 1,785 | 1,639 |
| 7.38%, 7/1/2028 | 662 | 579 |
| Diversified Healthcare Trust | ||
| REIT, 9.75%, 6/15/2025 | 811 | 850 |
| REIT, 4.38%, 3/1/2031 | 2,253 | 1,749 |
| DT Midstream, Inc. 4.38%, 6/15/2031 (e) | 5 | 4 |
| Dycom Industries, Inc. 4.50%, 4/15/2029 (e) | 870 | 794 |
| Eco Material Technologies, Inc. 7.88%, 1/31/2027 (e) | 120 | 116 |
| Edgewell Personal Care Co. 5.50%, 6/1/2028 (e) | 223 | 216 |
| Elanco Animal Health, Inc. 6.40%, 8/28/2028 (h) | 1,166 | 1,197 |
| Element Solutions, Inc. 3.88%, 9/1/2028 (e) | 5 | 4 |
| Embarq Corp. 8.00%, 6/1/2036 | 2,228 | 2,005 |
| Emergent BioSolutions, Inc. 3.88%, 8/15/2028 (a) (e) | 6,556 | 5,564 |
| Encompass Health Corp. 4.50%, 2/1/2028 | 5 | 5 |
| Endeavor Energy Resources LP 6.63%, 7/15/2025 (e) | 892 | 917 |
| Endo Dac 6.00%, 6/30/2028 (a) (e) | 100 | 43 |
| EnerSys 4.38%, 12/15/2027 (e) | 845 | 784 |
| EnLink Midstream LLC | ||
| 5.63%, 1/15/2028 (e) | 3,766 | 3,732 |
| 5.38%, 6/1/2029 | 6,570 | 6,395 |
| EnLink Midstream Partners LP | ||
| 4.40%, 4/1/2024 | 95 | 94 |
| 5.05%, 4/1/2045 | 3,414 | 2,628 |
| 5.45%, 6/1/2047 | 7,331 | 5,938 |
| Envision Healthcare Corp. 8.75%, 10/15/2026 (e) | 924 | 385 |
| Enviva Partners LP 6.50%, 1/15/2026 (e) | 138 | 141 |
| EQM Midstream Partners LP | ||
| 6.00%, 7/1/2025 (e) | 270 | 268 |
| 6.50%, 7/1/2027 (e) | 29 | 29 |
| 5.50%, 7/15/2028 | 8 | 8 |
| 4.50%, 1/15/2029 (e) | 2 | 2 |
| 4.75%, 1/15/2031 (e) | 2 | 2 |
| INVESTMENTS | PRINCIPAL AMOUNT ($000) | VALUE ($000) |
| United States — continued | ||
| Exela Intermediate LLC 11.50%, 7/15/2026 (e) | 768 | 280 |
| Ferrellgas LP 5.38%, 4/1/2026 (e) | 490 | 443 |
| First Student Bidco, Inc. 4.00%, 7/31/2029 (e) | 347 | 311 |
| FirstEnergy Corp. SeriesC, 5.35%, 7/15/2047 (h) | 1,606 | 1,501 |
| FirstEnergy Transmission LLC 5.45%, 7/15/2044 (e) | 1,472 | 1,446 |
| Fluor Corp. 4.25%, 9/15/2028 (a) | 1,743 | 1,653 |
| Ford Motor Credit Co. LLC | ||
| 3.37%, 11/17/2023 | 4,291 | 4,216 |
| 5.58%, 3/18/2024 | 4,350 | 4,399 |
| 5.13%, 6/16/2025 | 5 | 5 |
| Fortress Transportation and Infrastructure Investors LLC 6.50%, 10/1/2025 (e) | 1,132 | 1,078 |
| Freedom Mortgage Corp. | ||
| 8.25%, 4/15/2025 (e) | 1,870 | 1,795 |
| 6.63%, 1/15/2027 (e) | 960 | 831 |
| Freeport-McMoRan, Inc. | ||
| 4.38%, 8/1/2028 | 5 | 5 |
| 4.25%, 3/1/2030 | 5 | 5 |
| Frontier Communications Holdings LLC | ||
| 5.88%, 10/15/2027 (e) | 2 | 2 |
| 6.75%, 5/1/2029 (e) | 2 | 2 |
| FXI Holdings, Inc. 12.25%, 11/15/2026 (e) | 1,476 | 1,572 |
| Gartner, Inc. 4.50%, 7/1/2028 (e) | 5 | 5 |
| Gates Global LLC 6.25%, 1/15/2026 (e) | 852 | 831 |
| Genesis Energy LP | ||
| 6.50%, 10/1/2025 | 1,295 | 1,230 |
| 8.00%, 1/15/2027 | 633 | 621 |
| 7.75%, 2/1/2028 | 4 | 4 |
| Global Medical Response, Inc. 6.50%, 10/1/2025 (e) | 892 | 864 |
| Global Net Lease, Inc. REIT, 3.75%, 12/15/2027 (e) | 346 | 311 |
| Goodyear Tire & Rubber Co. (The) | ||
| 5.00%, 7/15/2029 | 1,146 | 1,022 |
| 5.25%, 4/30/2031 (a) | 1,050 | 913 |
| 5.25%, 7/15/2031 | 3,507 | 3,025 |
| 5.63%, 4/30/2033 | 5,593 | 4,817 |
| Graphic Packaging International LLC 3.75%, 2/1/2030 (e) | 3,886 | 3,407 |
| April 30, 2022 | J.P. Morgan Funds | 31 |
| INVESTMENTS | PRINCIPAL AMOUNT ($000) | VALUE ($000) |
| Corporate Bonds — continued | ||
| United States — continued | ||
| Gray Television, Inc. 7.00%, 5/15/2027 (e) | 209 | 216 |
| Griffon Corp. 5.75%, 3/1/2028 | 100 | 89 |
| GrubHub Holdings, Inc. 5.50%, 7/1/2027 (e) | 4 | 3 |
| Guitar Center, Inc. 8.50%, 1/15/2026 (e) | 849 | 851 |
| Gulfport Energy Corp. 8.00%, 5/17/2026 (a) | 773 | 795 |
| HAT Holdings I LLC REIT, 3.38%, 6/15/2026 (e) | 929 | 853 |
| Hawaiian Brand Intellectual Property Ltd. 5.75%, 1/20/2026 (e) | 1,561 | 1,522 |
| HCA, Inc. | ||
| 5.38%, 9/1/2026 | 1,316 | 1,347 |
| 5.63%, 9/1/2028 | 5 | 5 |
| 5.88%, 2/1/2029 | 5 | 5 |
| 7.50%, 11/15/2095 | 2,000 | 2,317 |
| HealthEquity, Inc. 4.50%, 10/1/2029 (e) | 291 | 266 |
| Herbalife Nutrition Ltd. 7.88%, 9/1/2025 (e) | 886 | 872 |
| Hertz Corp. (The) 4.63%, 12/1/2026 (e) | 1,457 | 1,328 |
| Hess Midstream Operations LP 5.63%, 2/15/2026 (e) | 1,091 | 1,091 |
| Hilton Domestic Operating Co., Inc. | ||
| 5.38%, 5/1/2025 (e) | 782 | 798 |
| 3.75%, 5/1/2029 (e) | 5 | 5 |
| 4.88%, 1/15/2030 | 2 | 2 |
| Hilton Worldwide Finance LLC 4.88%, 4/1/2027 | 7 | 7 |
| HLF Financing SARL LLC 4.88%, 6/1/2029 (e) | 20 | 16 |
| Holly Energy Partners LP 5.00%, 2/1/2028 (e) | 326 | 310 |
| Hologic, Inc. 3.25%, 2/15/2029 (e) | 5 | 4 |
| Home Point Capital, Inc. 5.00%, 2/1/2026 (e) | 737 | 582 |
| Horizon Therapeutics USA, Inc. 5.50%, 8/1/2027 (e) | 219 | 219 |
| Howard Hughes Corp. (The) 4.38%, 2/1/2031 (e) | 170 | 151 |
| Howmet Aerospace, Inc. | ||
| 6.88%, 5/1/2025 (a) | 877 | 927 |
| 5.90%, 2/1/2027 | 3 | 3 |
| 3.00%, 1/15/2029 | 2,101 | 1,833 |
| 5.95%, 2/1/2037 (a) | 4,374 | 4,420 |
| INVESTMENTS | PRINCIPAL AMOUNT ($000) | VALUE ($000) |
| United States — continued | ||
| HUB International Ltd. | ||
| 7.00%, 5/1/2026 (e) | 1,935 | 1,918 |
| 5.63%, 12/1/2029 (e) | 8 | 7 |
| Hughes Satellite Systems Corp. 6.63%, 8/1/2026 | 85 | 85 |
| Icahn Enterprises LP | ||
| 4.75%, 9/15/2024 | 1,257 | 1,226 |
| 6.38%, 12/15/2025 | 756 | 750 |
| 6.25%, 5/15/2026 | 2,475 | 2,454 |
| 5.25%, 5/15/2027 | 4 | 4 |
| 4.38%, 2/1/2029 | 1,777 | 1,533 |
| iHeartCommunications, Inc. | ||
| 6.38%, 5/1/2026 | 1,216 | 1,219 |
| 8.38%, 5/1/2027 | 9 | 8 |
| II-VI, Inc. 5.00%, 12/15/2029 (e) | 3 | 3 |
| International Game Technology plc 4.13%, 4/15/2026 (e) | 1,295 | 1,221 |
| Intrado Corp. 8.50%, 10/15/2025 (a) (e) | 160 | 142 |
| IQVIA, Inc. 5.00%, 5/15/2027 (e) | 7 | 7 |
| IRB Holding Corp. 7.00%, 6/15/2025 (e) | 1,060 | 1,091 |
| Iron Mountain, Inc. | ||
| REIT, 4.88%, 9/15/2027 (e) | 5 | 5 |
| REIT, 5.25%, 7/15/2030 (e) | 3,490 | 3,199 |
| REIT, 4.50%, 2/15/2031 (e) | 2,425 | 2,078 |
| REIT, 5.63%, 7/15/2032 (e) | 6,194 | 5,601 |
| iStar, Inc. | ||
| REIT, 4.75%, 10/1/2024 | 40 | 39 |
| REIT, 4.25%, 8/1/2025 | 1,125 | 1,072 |
| ITT Holdings LLC 6.50%, 8/1/2029 (e) | 170 | 150 |
| Jazz Securities DAC 4.38%, 1/15/2029 (e) | 5 | 5 |
| JBS USA LUX SA 6.75%, 2/15/2028 (e) | 9 | 9 |
| Kaiser Aluminum Corp. 4.50%, 6/1/2031 (a) (e) | 6,096 | 5,258 |
| KAR Auction Services, Inc. 5.13%, 6/1/2025 (e) | 1,210 | 1,224 |
| Kennedy-Wilson, Inc. | ||
| 4.75%, 3/1/2029 | 240 | 221 |
| 4.75%, 2/1/2030 | 93 | 84 |
| LABL, Inc. | ||
| 6.75%, 7/15/2026 (e) | 490 | 471 |
| 10.50%, 7/15/2027 (e) | 5 | 5 |
| Ladder Capital Finance Holdings LLLP REIT, 4.25%, 2/1/2027 (e) | 686 | 631 |
| 32 | J.P. Morgan Funds | April 30, 2022 |
| INVESTMENTS | PRINCIPAL AMOUNT ($000) | VALUE ($000) |
| Corporate Bonds — continued | ||
| United States — continued | ||
| Lamb Weston Holdings, Inc. | ||
| 4.13%, 1/31/2030 (e) | 2,373 | 2,118 |
| 4.38%, 1/31/2032 (e) | 5,986 | 5,347 |
| Laredo Petroleum, Inc. 9.50%, 1/15/2025 | 890 | 912 |
| LBM Acquisition LLC 6.25%, 1/15/2029 (e) | 170 | 138 |
| LCPR Senior Secured Financing DAC 6.75%, 10/15/2027 (e) | 214 | 213 |
| LD Holdings Group LLC | ||
| 6.50%, 11/1/2025 (e) | 561 | 465 |
| 6.13%, 4/1/2028 (e) | 340 | 257 |
| Legacy LifePoint Health LLC 6.75%, 4/15/2025 (e) | 1,460 | 1,489 |
| Level 3 Financing, Inc. | ||
| 4.25%, 7/1/2028 (e) | 60 | 51 |
| 3.63%, 1/15/2029 (e) | 7,177 | 5,825 |
| 3.75%, 7/15/2029 (e) | 1,737 | 1,411 |
| Life Time, Inc. 5.75%, 1/15/2026 (e) | 1,223 | 1,187 |
| Lions Gate Capital Holdings LLC 5.50%, 4/15/2029 (e) | 73 | 65 |
| Live Nation Entertainment, Inc. | ||
| 6.50%, 5/15/2027 (e) | 208 | 216 |
| 4.75%, 10/15/2027 (e) | 96 | 90 |
| LPL Holdings, Inc. 4.00%, 3/15/2029 (e) | 10 | 9 |
| LSF9 Atlantis Holdings LLC 7.75%, 2/15/2026 (e) | 550 | 496 |
| Lumen Technologies, Inc. | ||
| Series Y, 7.50%, 4/1/2024 | 5 | 5 |
| 5.63%, 4/1/2025 | 5 | 5 |
| 5.13%, 12/15/2026 (e) | 2,280 | 2,052 |
| 4.00%, 2/15/2027 (e) | 428 | 381 |
| Series G, 6.88%, 1/15/2028 (a) | 884 | 842 |
| 4.50%, 1/15/2029 (e) | 774 | 612 |
| 5.38%, 6/15/2029 (e) | 159 | 129 |
| Series P, 7.60%, 9/15/2039 | 4,187 | 3,654 |
| Series U, 7.65%, 3/15/2042 | 3,819 | 3,418 |
| Macy's Retail Holdings LLC 6.13%, 3/15/2032 (e) | 38 | 35 |
| Masonite International Corp. 5.38%, 2/1/2028 (e) | 320 | 306 |
| MasTec, Inc. 4.50%, 8/15/2028 (a) (e) | 5 | 5 |
| Matador Resources Co. 5.88%, 9/15/2026 | 1,278 | 1,255 |
| INVESTMENTS | PRINCIPAL AMOUNT ($000) | VALUE ($000) |
| United States — continued | ||
| Mattel, Inc. 3.38%, 4/1/2026 (e) | 1,312 | 1,276 |
| Mauser Packaging Solutions Holding Co. | ||
| 5.50%, 4/15/2024 (e) | 1 | 1 |
| 7.25%, 4/15/2025 (e) | 332 | 315 |
| McGraw-Hill Education, Inc. | ||
| 5.75%, 8/1/2028 (e) | 104 | 93 |
| 8.00%, 8/1/2029 (e) | 234 | 209 |
| MGIC Investment Corp. 5.25%, 8/15/2028 | 225 | 211 |
| MGM Resorts International | ||
| 6.75%, 5/1/2025 | 2,375 | 2,431 |
| 5.75%, 6/15/2025 | 4 | 4 |
| 5.50%, 4/15/2027 | 10 | 10 |
| Michaels Cos., Inc. (The) 7.88%, 5/1/2029 (e) | 180 | 142 |
| MicroStrategy, Inc. 6.13%, 6/15/2028 (a) (e) | 3 | 3 |
| Midwest Gaming Borrower LLC 4.88%, 5/1/2029 (e) | 338 | 297 |
| Millennium Escrow Corp. 6.63%, 8/1/2026 (e) | 2,299 | 2,124 |
| Mohegan Gaming & Entertainment 8.00%, 2/1/2026 (e) | 1,044 | 927 |
| Molina Healthcare, Inc. 4.38%, 6/15/2028 (e) | 94 | 88 |
| Moss Creek Resources Holdings, Inc. 7.50%, 1/15/2026 (e) | 2,302 | 2,111 |
| MPT Operating Partnership LP | ||
| REIT, 5.00%, 10/15/2027 | 5 | 5 |
| REIT, 4.63%, 8/1/2029 | 222 | 205 |
| Murphy Oil Corp. | ||
| 5.75%, 8/15/2025 | 570 | 570 |
| 6.37%, 12/1/2042 (h) | 830 | 749 |
| Nabors Industries, Inc. | ||
| 5.75%, 2/1/2025 | 745 | 712 |
| 7.38%, 5/15/2027 (e) | 1 | 1 |
| Nationstar Mortgage Holdings, Inc. | ||
| 6.00%, 1/15/2027 (e) | 1,220 | 1,183 |
| 5.50%, 8/15/2028 (e) | 5 | 5 |
| 5.13%, 12/15/2030 (e) | 69 | 60 |
| 5.75%, 11/15/2031 (e) | 670 | 595 |
| Navient Corp. | ||
| 6.75%, 6/15/2026 | 930 | 914 |
| 5.00%, 3/15/2027 | 2 | 2 |
| 4.88%, 3/15/2028 (a) | 6,135 | 5,383 |
| April 30, 2022 | J.P. Morgan Funds | 33 |
| INVESTMENTS | PRINCIPAL AMOUNT ($000) | VALUE ($000) |
| Corporate Bonds — continued | ||
| United States — continued | ||
| 5.50%, 3/15/2029 | 6,177 | 5,432 |
| NCL Corp. Ltd. | ||
| 3.63%, 12/15/2024 (a) (e) | 989 | 920 |
| 5.88%, 3/15/2026 (e) | 425 | 393 |
| 5.88%, 2/15/2027 (e) | 1,939 | 1,848 |
| NCR Corp. | ||
| 5.75%, 9/1/2027 (e) | 306 | 295 |
| 5.13%, 4/15/2029 (e) | 8 | 8 |
| Netflix, Inc. | ||
| 3.63%, 6/15/2025 (e) | 270 | 264 |
| 5.38%, 11/15/2029 (e) | 7 | 7 |
| New Fortress Energy, Inc. | ||
| 6.75%, 9/15/2025 (e) | 2,870 | 2,822 |
| 6.50%, 9/30/2026 (e) | 50 | 48 |
| New Residential Investment Corp. REIT, 6.25%, 10/15/2025 (e) | 691 | 658 |
| Newell Brands, Inc. | ||
| 4.88%, 6/1/2025 | 579 | 586 |
| 4.45%, 4/1/2026 (h) | 230 | 228 |
| 5.63%, 4/1/2036 (h) | 1,000 | 956 |
| 5.75%, 4/1/2046 (h) | 4,621 | 4,303 |
| Newmark Group, Inc. 6.13%, 11/15/2023 | 560 | 571 |
| News Corp. 3.88%, 5/15/2029 (e) | 5 | 5 |
| Nexstar Media, Inc. | ||
| 5.63%, 7/15/2027 (e) | 9 | 9 |
| 4.75%, 11/1/2028 (e) | 5 | 5 |
| NextEra Energy Operating Partners LP 4.25%, 7/15/2024 (e) | 1,468 | 1,457 |
| NGL Energy Operating LLC 7.50%, 2/1/2026 (e) | 2,321 | 2,187 |
| NGL Energy Partners LP 7.50%, 11/1/2023 (a) | 10 | 9 |
| Nielsen Finance LLC 5.63%, 10/1/2028 (e) | 4 | 4 |
| NMG Holding Co., Inc. 7.13%, 4/1/2026 (e) | 1,360 | 1,350 |
| Nordstrom, Inc. | ||
| 4.38%, 4/1/2030 (a) | 2,890 | 2,515 |
| 4.25%, 8/1/2031 (a) | 5,749 | 4,873 |
| 5.00%, 1/15/2044 (a) | 2,750 | 2,279 |
| Northern Oil and Gas, Inc. 8.13%, 3/1/2028 (e) | 50 | 50 |
| Novelis Corp. | ||
| 3.25%, 11/15/2026 (e) | 730 | 666 |
| INVESTMENTS | PRINCIPAL AMOUNT ($000) | VALUE ($000) |
| United States — continued | ||
| 4.75%, 1/30/2030 (e) | 5 | 5 |
| NRG Energy, Inc. | ||
| 5.75%, 1/15/2028 | 221 | 216 |
| 3.63%, 2/15/2031 (e) | 7,157 | 5,958 |
| 3.88%, 2/15/2032 (e) | 5,333 | 4,452 |
| NuStar Logistics LP | ||
| 5.75%, 10/1/2025 | 116 | 115 |
| 6.38%, 10/1/2030 | 6,514 | 6,413 |
| Occidental Petroleum Corp. | ||
| 6.95%, 7/1/2024 | 2,601 | 2,728 |
| 8.00%, 7/15/2025 | 2,410 | 2,597 |
| 5.88%, 9/1/2025 | 7 | 7 |
| 6.38%, 9/1/2028 | 7 | 7 |
| 8.88%, 7/15/2030 | 9 | 11 |
| 6.63%, 9/1/2030 | 2 | 2 |
| OneMain Finance Corp. | ||
| 6.13%, 3/15/2024 | 5,661 | 5,683 |
| 6.88%, 3/15/2025 | 5 | 5 |
| 7.13%, 3/15/2026 | 7 | 7 |
| 4.00%, 9/15/2030 (a) | 3 | 2 |
| Outfront Media Capital LLC 5.00%, 8/15/2027 (e) | 2 | 2 |
| Owens-Brockway Glass Container, Inc. 6.63%, 5/13/2027 (e) | 9 | 9 |
| Pacific Gas and Electric Co. | ||
| 4.50%, 7/1/2040 | 270 | 221 |
| 4.60%, 6/15/2043 | 392 | 317 |
| 4.75%, 2/15/2044 | 386 | 317 |
| 4.30%, 3/15/2045 | 400 | 310 |
| 3.95%, 12/1/2047 | 911 | 666 |
| 4.95%, 7/1/2050 | 350 | 292 |
| Par Pharmaceutical, Inc. 7.50%, 4/1/2027 (e) | 1,461 | 1,333 |
| Paramount Global (US Treasury Yield Curve Rate T Note Constant Maturity 5 Year + 4.00%), 6.37%, 3/30/2062 (f) | 224 | 217 |
| Party City Holdings, Inc. 8.75%, 2/15/2026 (e) | 1,069 | 982 |
| Patterson-UTI Energy, Inc. 3.95%, 2/1/2028 | 1,511 | 1,392 |
| PBF Holding Co. LLC | ||
| 9.25%, 5/15/2025 (e) | 2,215 | 2,296 |
| 6.00%, 2/15/2028 (a) | 5 | 4 |
| PDC Energy, Inc. 5.75%, 5/15/2026 | 1,045 | 1,017 |
| 34 | J.P. Morgan Funds | April 30, 2022 |
| INVESTMENTS | PRINCIPAL AMOUNT ($000) | VALUE ($000) |
| Corporate Bonds — continued | ||
| United States — continued | ||
| PennyMac Financial Services, Inc. | ||
| 5.38%, 10/15/2025 (e) | 460 | 435 |
| 5.75%, 9/15/2031 (e) | 1,292 | 1,059 |
| Penske Automotive Group, Inc. | ||
| 3.50%, 9/1/2025 | 602 | 581 |
| 3.75%, 6/15/2029 | 5 | 4 |
| Performance Food Group, Inc. 5.50%, 10/15/2027 (e) | 3 | 3 |
| Perrigo Finance Unlimited Co. | ||
| 3.90%, 6/15/2030 (a) (h) | 5,879 | 5,273 |
| 4.90%, 12/15/2044 | 2,476 | 1,978 |
| PG&E Corp. 5.00%, 7/1/2028 (a) | 5 | 5 |
| Photo Holdings Merger Sub, Inc. 8.50%, 10/1/2026 (a) (e) | 1,103 | 1,020 |
| Pilgrim's Pride Corp. | ||
| 5.88%, 9/30/2027 (e) | 150 | 151 |
| 4.25%, 4/15/2031 (e) | 1,843 | 1,682 |
| Plantronics, Inc. 4.75%, 3/1/2029 (e) | 306 | 310 |
| Post Holdings, Inc. | ||
| 5.63%, 1/15/2028 (e) | 5 | 5 |
| 5.50%, 12/15/2029 (e) | 5 | 5 |
| Premier Entertainment Sub LLC 5.88%, 9/1/2031 (e) | 50 | 39 |
| Presidio Holdings, Inc. 4.88%, 2/1/2027 (e) | 834 | 791 |
| Prestige Brands, Inc. 5.13%, 1/15/2028 (e) | 5 | 5 |
| Prime Healthcare Services, Inc. 7.25%, 11/1/2025 (e) | 70 | 70 |
| Prime Security Services Borrower LLC | ||
| 5.25%, 4/15/2024 (e) | 1,645 | 1,643 |
| 5.75%, 4/15/2026 (e) | 641 | 615 |
| 6.25%, 1/15/2028 (e) | 8 | 7 |
| PTC, Inc. 3.63%, 2/15/2025 (e) | 20 | 19 |
| QVC, Inc. | ||
| 4.75%, 2/15/2027 (a) | 2,752 | 2,463 |
| 4.38%, 9/1/2028 (a) | 5,083 | 4,319 |
| 5.45%, 8/15/2034 | 4,000 | 3,205 |
| 5.95%, 3/15/2043 (a) | 2,770 | 2,157 |
| Rackspace Technology Global, Inc. 5.38%, 12/1/2028 (a) (e) | 120 | 98 |
| Radian Group, Inc. 6.63%, 3/15/2025 | 559 | 569 |
| Radiate Holdco LLC 4.50%, 9/15/2026 (e) | 922 | 849 |
| INVESTMENTS | PRINCIPAL AMOUNT ($000) | VALUE ($000) |
| United States — continued | ||
| Realogy Group LLC 5.75%, 1/15/2029 (e) | 10 | 8 |
| RegionalCare Hospital Partners Holdings, Inc. 9.75%, 12/1/2026 (e) | 1,370 | 1,408 |
| Renewable Energy Group, Inc. 5.88%, 6/1/2028 (e) | 289 | 306 |
| Resorts World Las Vegas LLC 4.63%, 4/16/2029 (a) (e) | 200 | 175 |
| RHP Hotel Properties LP REIT, 4.75%, 10/15/2027 | 217 | 202 |
| Rite Aid Corp. | ||
| 7.50%, 7/1/2025 (e) | 1,571 | 1,345 |
| 8.00%, 11/15/2026 (e) | 48 | 40 |
| RLJ Lodging Trust LP REIT, 3.75%, 7/1/2026 (e) | 808 | 747 |
| Rocket Mortgage LLC 2.88%, 10/15/2026 (e) | 979 | 866 |
| Royal Caribbean Cruises Ltd. | ||
| 9.13%, 6/15/2023 (e) | 94 | 97 |
| 11.50%, 6/1/2025 (e) | 213 | 232 |
| 4.25%, 7/1/2026 (e) | 1,063 | 962 |
| 5.50%, 8/31/2026 (e) | 2,980 | 2,777 |
| RP Escrow Issuer LLC 5.25%, 12/15/2025 (e) | 1,109 | 1,031 |
| Sabre GLBL, Inc. 7.38%, 9/1/2025 (e) | 2,023 | 2,046 |
| SBA Communications Corp. | ||
| REIT, 3.88%, 2/15/2027 | 531 | 504 |
| REIT, 3.13%, 2/1/2029 | 7 | 6 |
| Scientific Games Holdings LP 6.63%, 3/1/2030 (e) | 100 | 95 |
| Scientific Games International, Inc. | ||
| 7.00%, 5/15/2028 (e) | 120 | 123 |
| 7.25%, 11/15/2029 (e) | 1 | 1 |
| SCIL IV LLC 5.38%, 11/1/2026 (e) | 530 | 484 |
| Scripps Escrow II, Inc. 3.88%, 1/15/2029 (e) | 5 | 4 |
| Scripps Escrow, Inc. 5.88%, 7/15/2027 (e) | 309 | 295 |
| Seagate HDD Cayman | ||
| 4.13%, 1/15/2031 | 3,185 | 2,795 |
| 5.75%, 12/1/2034 | 3,832 | 3,602 |
| Select Medical Corp. 6.25%, 8/15/2026 (e) | 1,512 | 1,501 |
| Sensata Technologies, Inc. | ||
| 4.38%, 2/15/2030 (e) | 24 | 22 |
| 3.75%, 2/15/2031 (e) | 5 | 4 |
| April 30, 2022 | J.P. Morgan Funds | 35 |
| INVESTMENTS | PRINCIPAL AMOUNT ($000) | VALUE ($000) |
| Corporate Bonds — continued | ||
| United States — continued | ||
| Service Corp. International 4.63%, 12/15/2027 | 220 | 213 |
| Service Properties Trust | ||
| REIT, 4.35%, 10/1/2024 | 626 | 580 |
| REIT, 7.50%, 9/15/2025 | 1,210 | 1,208 |
| Silgan Holdings, Inc. 4.13%, 2/1/2028 | 55 | 51 |
| Sirius XM Radio, Inc. | ||
| 3.13%, 9/1/2026 (e) | 250 | 230 |
| 5.00%, 8/1/2027 (e) | 974 | 940 |
| 5.50%, 7/1/2029 (e) | 5 | 5 |
| 4.13%, 7/1/2030 (e) | 5 | 4 |
| Six Flags Theme Parks, Inc. 7.00%, 7/1/2025 (e) | 1,018 | 1,057 |
| SLM Corp. 4.20%, 10/29/2025 | 620 | 606 |
| Sonic Automotive, Inc. | ||
| 4.63%, 11/15/2029 (e) | 10 | 9 |
| 4.88%, 11/15/2031 (e) | 1,404 | 1,198 |
| Sotheby's 7.38%, 10/15/2027 (a) (e) | 217 | 214 |
| Southwestern Energy Co. 5.95%, 1/23/2025 (h) | 8 | 8 |
| Specialty Building Products Holdings LLC 6.38%, 9/30/2026 (e) | 500 | 487 |
| Spectrum Brands, Inc. 5.00%, 10/1/2029 (e) | 9 | 8 |
| Spirit AeroSystems, Inc. | ||
| 7.50%, 4/15/2025 (e) | 1,420 | 1,438 |
| 4.60%, 6/15/2028 | 4 | 3 |
| Spirit Loyalty Cayman Ltd. 8.00%, 9/20/2025 (e) | 563 | 595 |
| Sprint Capital Corp. 8.75%, 3/15/2032 | 7 | 9 |
| Sprint Corp. 7.63%, 3/1/2026 | 1,812 | 1,968 |
| SPX FLOW, Inc. 8.75%, 4/1/2030 (a) (e) | 246 | 222 |
| SRS Distribution, Inc. | ||
| 4.63%, 7/1/2028 (e) | 10 | 9 |
| 6.00%, 12/1/2029 (e) | 170 | 149 |
| SS&C Technologies, Inc. 5.50%, 9/30/2027 (e) | 6 | 6 |
| Stagwell Global LLC 5.63%, 8/15/2029 (e) | 347 | 306 |
| Standard Industries, Inc. 4.75%, 1/15/2028 (e) | 5 | 5 |
| Staples, Inc. | ||
| 7.50%, 4/15/2026 (e) | 1,220 | 1,165 |
| 10.75%, 4/15/2027 (e) | 2,108 | 1,868 |
| INVESTMENTS | PRINCIPAL AMOUNT ($000) | VALUE ($000) |
| United States — continued | ||
| Starwood Property Trust, Inc. REIT, 4.38%, 1/15/2027 (e) | 400 | 373 |
| Station Casinos LLC 4.50%, 2/15/2028 (e) | 9 | 8 |
| Stericycle, Inc. 5.38%, 7/15/2024 (e) | 636 | 634 |
| Summit Midstream Holdings LLC 8.50%, 10/15/2026 (e) | 1,370 | 1,279 |
| Sunoco LP | ||
| 6.00%, 4/15/2027 | 936 | 943 |
| 4.50%, 4/30/2030 (e) | 502 | 453 |
| Surgery Center Holdings, Inc. 10.00%, 4/15/2027 (e) | 272 | 284 |
| SWF Escrow Issuer Corp. 6.50%, 10/1/2029 (e) | 19 | 15 |
| Talen Energy Supply LLC | ||
| 10.50%, 1/15/2026 (e) | 492 | 182 |
| 7.25%, 5/15/2027 (a) (e) | 17 | 16 |
| Tallgrass Energy Partners LP 7.50%, 10/1/2025 (e) | 1,240 | 1,265 |
| Talos Production, Inc. 12.00%, 1/15/2026 | 650 | 699 |
| Targa Resources Partners LP | ||
| 4.88%, 2/1/2031 | 5 | 5 |
| 4.00%, 1/15/2032 | 1 | 1 |
| TEGNA, Inc. 4.75%, 3/15/2026 (e) | 839 | 832 |
| Tempur Sealy International, Inc. | ||
| 4.00%, 4/15/2029 (e) | 1,013 | 878 |
| 3.88%, 10/15/2031 (e) | 3,888 | 3,222 |
| Tenet Healthcare Corp. | ||
| 4.63%, 7/15/2024 | 2,550 | 2,543 |
| 4.88%, 1/1/2026 (e) | 300 | 294 |
| 6.25%, 2/1/2027 (e) | 1,050 | 1,042 |
| 5.13%, 11/1/2027 (e) | 4 | 4 |
| 6.13%, 10/1/2028 (e) | 317 | 304 |
| Tenneco, Inc. 7.88%, 1/15/2029 (e) | 150 | 152 |
| TerraForm Power Operating LLC 5.00%, 1/31/2028 (e) | 5,652 | 5,278 |
| Terrier Media Buyer, Inc. 8.88%, 12/15/2027 (e) | 100 | 98 |
| T-Mobile USA, Inc. | ||
| 2.25%, 2/15/2026 (a) | 1,421 | 1,307 |
| 2.25%, 2/15/2026 (e) | 624 | 574 |
| 2.63%, 4/15/2026 | 90 | 83 |
| 4.75%, 2/1/2028 | 7 | 7 |
| 3.38%, 4/15/2029 | 10 | 9 |
| 36 | J.P. Morgan Funds | April 30, 2022 |
| INVESTMENTS | PRINCIPAL AMOUNT ($000) | VALUE ($000) |
| Corporate Bonds — continued | ||
| United States — continued | ||
| Topaz Solar Farms LLC 5.75%, 9/30/2039 (e) | 696 | 706 |
| TPC Group, Inc. 10.50%, 8/1/2024 (e) | 957 | 311 |
| TransDigm, Inc. | ||
| 8.00%, 12/15/2025 (e) | 4,285 | 4,460 |
| 6.25%, 3/15/2026 (e) | 1,857 | 1,848 |
| 7.50%, 3/15/2027 | 30 | 30 |
| 5.50%, 11/15/2027 | 1 | 1 |
| Transocean Poseidon Ltd. 6.88%, 2/1/2027 (a) (e) | 895 | 861 |
| Transocean, Inc. | ||
| 7.50%, 1/15/2026 (e) | 500 | 409 |
| 11.50%, 1/30/2027 (a) (e) | 857 | 852 |
| 8.00%, 2/1/2027 (e) | 1,224 | 967 |
| Travel + Leisure Co. | ||
| 6.63%, 7/31/2026 (e) | 657 | 673 |
| 6.00%, 4/1/2027 (h) | 7 | 7 |
| 4.50%, 12/1/2029 (e) | 4,062 | 3,595 |
| TripAdvisor, Inc. 7.00%, 7/15/2025 (e) | 795 | 815 |
| Triton Water Holdings, Inc. 6.25%, 4/1/2029 (e) | 151 | 125 |
| Triumph Group, Inc. 8.88%, 6/1/2024 (e) | 999 | 1,034 |
| Tutor Perini Corp. 6.88%, 5/1/2025 (a) (e) | 325 | 304 |
| Twilio, Inc. 3.63%, 3/15/2029 | 9 | 8 |
| Uber Technologies, Inc. | ||
| 7.50%, 5/15/2025 (e) | 245 | 253 |
| 8.00%, 11/1/2026 (e) | 2,420 | 2,535 |
| 7.50%, 9/15/2027 (e) | 50 | 51 |
| 4.50%, 8/15/2029 (e) | 8 | 7 |
| United Airlines, Inc. 4.38%, 4/15/2026 (e) | 1,189 | 1,148 |
| United Natural Foods, Inc. 6.75%, 10/15/2028 (e) | 312 | 312 |
| United Rentals North America, Inc. | ||
| 5.50%, 5/15/2027 | 5 | 5 |
| 3.88%, 2/15/2031 | 4 | 4 |
| United States Cellular Corp. 6.70%, 12/15/2033 | 1,832 | 1,892 |
| United States Steel Corp. 6.88%, 3/1/2029 (a) | 54 | 55 |
| United Wholesale Mortgage LLC 5.50%, 11/15/2025 (a) (e) | 1,092 | 1,003 |
| INVESTMENTS | PRINCIPAL AMOUNT ($000) | VALUE ($000) |
| United States — continued | ||
| Uniti Group LP REIT, 7.88%, 2/15/2025 (e) | 2,505 | 2,549 |
| Univision Communications, Inc. 4.50%, 5/1/2029 (e) | 5 | 4 |
| US Acute Care Solutions LLC 6.38%, 3/1/2026 (e) | 210 | 204 |
| US Foods, Inc. 6.25%, 4/15/2025 (e) | 1,355 | 1,392 |
| USA Compression Partners LP 6.88%, 4/1/2026 | 1,031 | 1,010 |
| Vail Resorts, Inc. 6.25%, 5/15/2025 (e) | 430 | 440 |
| Valvoline, Inc. | ||
| 4.25%, 2/15/2030 (e) | 1,000 | 867 |
| 3.63%, 6/15/2031 (e) | 500 | 406 |
| Vector Group Ltd. | ||
| 10.50%, 11/1/2026 (e) | 822 | 839 |
| 5.75%, 2/1/2029 (e) | 20 | 18 |
| Venture Global Calcasieu Pass LLC 3.88%, 11/1/2033 (e) | 3 | 3 |
| Vericast Corp. 11.00%, 9/15/2026 (e) | 1,088 | 1,034 |
| Veritas US, Inc. 7.50%, 9/1/2025 (a) (e) | 2,163 | 1,906 |
| Verscend Escrow Corp. 9.75%, 8/15/2026 (e) | 90 | 93 |
| Viasat, Inc. 5.63%, 9/15/2025 (e) | 1,563 | 1,434 |
| VICI Properties LP | ||
| REIT, 4.25%, 12/1/2026 (e) | 6 | 6 |
| REIT, 5.75%, 2/1/2027 (e) | 978 | 978 |
| REIT, 4.50%, 1/15/2028 (e) | 350 | 345 |
| REIT, 4.63%, 12/1/2029 (e) | 6 | 6 |
| REIT, 4.13%, 8/15/2030 (e) | 5 | 4 |
| Victoria's Secret & Co. 4.63%, 7/15/2029 (e) | 50 | 41 |
| Vistra Operations Co. LLC | ||
| 5.50%, 9/1/2026 (e) | 662 | 660 |
| 5.63%, 2/15/2027 (e) | 1,870 | 1,842 |
| 5.00%, 7/31/2027 (e) | 5 | 5 |
| 4.38%, 5/1/2029 (e) | 5,280 | 4,791 |
| VOC Escrow Ltd. 5.00%, 2/15/2028 (e) | 90 | 81 |
| W&T Offshore, Inc. 9.75%, 11/1/2023 (e) | 148 | 147 |
| Waste Pro USA, Inc. 5.50%, 2/15/2026 (e) | 1,330 | 1,183 |
| Watco Cos. LLC 6.50%, 6/15/2027 (e) | 15 | 14 |
| Weatherford International Ltd. 8.63%, 4/30/2030 (e) | 110 | 109 |
| April 30, 2022 | J.P. Morgan Funds | 37 |
| INVESTMENTS | PRINCIPAL AMOUNT ($000) | VALUE ($000) |
| Corporate Bonds — continued | ||
| United States — continued | ||
| Wesco Aircraft Holdings, Inc. 9.00%, 11/15/2026 (a) (e) | 230 | 143 |
| WESCO Distribution, Inc. | ||
| 7.13%, 6/15/2025 (e) | 237 | 246 |
| 7.25%, 6/15/2028 (e) | 7 | 7 |
| Western Digital Corp. 4.75%, 2/15/2026 | 3 | 3 |
| Western Midstream Operating LP | ||
| 3.60%, 2/1/2025 (h) | 1,046 | 1,000 |
| 5.30%, 3/1/2048 | 875 | 759 |
| 5.75%, 2/1/2050 (h) | 6,066 | 5,345 |
| White Cap Buyer LLC 6.88%, 10/15/2028 (e) | 160 | 147 |
| William Carter Co. (The) 5.63%, 3/15/2027 (e) | 1,280 | 1,275 |
| Windstream Escrow LLC 7.75%, 8/15/2028 (e) | 314 | 299 |
| WMG Acquisition Corp. 3.88%, 7/15/2030 (e) | 5 | 4 |
| WR Grace Holdings LLC 5.63%, 8/15/2029 (e) | 8 | 7 |
| WW International, Inc. 4.50%, 4/15/2029 (a) (e) | 190 | 150 |
| Wyndham Hotels & Resorts, Inc. 4.38%, 8/15/2028 (e) | 330 | 308 |
| Wynn Las Vegas LLC 5.50%, 3/1/2025 (e) | 8 | 8 |
| Wynn Resorts Finance LLC 7.75%, 4/15/2025 (e) | 897 | 924 |
| Xerox Holdings Corp. | ||
| 5.00%, 8/15/2025 (e) | 1,098 | 1,054 |
| 5.50%, 8/15/2028 (a) (e) | 6,856 | 6,170 |
| XHR LP REIT, 6.38%, 8/15/2025 (e) | 799 | 809 |
| XPO Logistics, Inc. 6.25%, 5/1/2025 (e) | 1,036 | 1,059 |
| Yum! Brands, Inc. | ||
| 4.75%, 1/15/2030 (e) | 5 | 5 |
| 4.63%, 1/31/2032 | 667 | 606 |
| Zayo Group Holdings, Inc. | ||
| 4.00%, 3/1/2027 (e) | 1,626 | 1,415 |
| 6.13%, 3/1/2028 (e) | 10 | 8 |
| Ziff Davis, Inc. 4.63%, 10/15/2030 (e) | 510 | 455 |
| 542,617 | ||
| Total Corporate Bonds (Cost $730,748) | 666,625 | |
| INVESTMENTS | PRINCIPAL AMOUNT ($000) | VALUE ($000) |
| Foreign Government Securities — 14.9% | ||
| Australia — 0.2% | ||
| Commonwealth of Australia | ||
| 2.75%, 4/21/2024 (b) | AUD 1,785 | 1,269 |
| 3.25%, 4/21/2025 (b) | AUD 1,191 | 854 |
| 2.75%, 11/21/2029 (b) | AUD 2,795 | 1,935 |
| 2.75%, 6/21/2035 (b) | AUD 1,676 | 1,123 |
| 2.75%, 5/21/2041 (b) | AUD 720 | 461 |
| 3.00%, 3/21/2047 (b) | AUD 614 | 400 |
| 1.75%, 6/21/2051 (b) | AUD 710 | 345 |
| 6,387 | ||
| Belgium — 0.3% | ||
| Kingdom of Belgium | ||
| 0.80%, 6/22/2027 (b) | EUR 3,755 | 3,942 |
| 0.10%, 6/22/2030 (b) | EUR 1,187 | 1,141 |
| 1.00%, 6/22/2031 (b) | EUR 2,150 | 2,202 |
| 1.45%, 6/22/2037 (b) | EUR 1,620 | 1,636 |
| 1.90%, 6/22/2038 (b) | EUR 1,835 | 1,972 |
| 3.75%, 6/22/2045 (b) | EUR 705 | 994 |
| 1.60%, 6/22/2047 (b) | EUR 267 | 262 |
| 1.70%, 6/22/2050 (b) | EUR 886 | 879 |
| 2.15%, 6/22/2066 (b) | EUR 942 | 1,028 |
| 14,056 | ||
| Canada — 0.4% | ||
| Canada Government Bond | ||
| 2.50%, 6/1/2024 | CAD 3,280 | 2,545 |
| 2.25%, 6/1/2029 | CAD 595 | 447 |
| 2.75%, 12/1/2048 | CAD 1,083 | 831 |
| 2.00%, 12/1/2051 | CAD 3,264 | 2,128 |
| 2.75%, 12/1/2064 | CAD 350 | 265 |
| Province of Alberta 2.90%, 12/1/2028 | CAD 410 | 310 |
| Province of British Columbia | ||
| 4.70%, 6/18/2037 | CAD 880 | 757 |
| 2.95%, 6/18/2050 | CAD 505 | 338 |
| Province of Ontario | ||
| 2.30%, 9/8/2024 | CAD 3,210 | 2,462 |
| 0.01%, 11/25/2030 (b) | EUR 5,800 | 5,244 |
| 15,327 | ||
| China — 0.1% | ||
| Export-Import Bank of China (The) 0.75%, 5/28/2023 (b) | EUR 3,800 | 4,005 |
| Denmark — 0.1% | ||
| Kingdom of Denmark | ||
| 0.25%, 11/15/2022 | DKK 1,704 | 242 |
| 38 | J.P. Morgan Funds | April 30, 2022 |
| INVESTMENTS | PRINCIPAL AMOUNT ($000) | VALUE ($000) |
| Foreign Government Securities — continued | ||
| Denmark — continued | ||
| 1.75%, 11/15/2025 | DKK 2,373 | 347 |
| 0.50%, 11/15/2027 | DKK 3,009 | 416 |
| 0.50%, 11/15/2029 | DKK 10,080 | 1,361 |
| 4.50%, 11/15/2039 | DKK 5,082 | 1,073 |
| 0.25%, 11/15/2052 | DKK 2,400 | 247 |
| 3,686 | ||
| France — 0.9% | ||
| French Republic | ||
| 0.75%, 5/25/2028 (b) | EUR 11,870 | 12,331 |
| 1.50%, 5/25/2031 (b) | EUR 2,455 | 2,633 |
| 1.25%, 5/25/2036 (b) | EUR 9,315 | 9,315 |
| 1.75%, 6/25/2039 (b) | EUR 3,048 | 3,254 |
| 3.25%, 5/25/2045 (b) | EUR 1,829 | 2,449 |
| 2.00%, 5/25/2048 (b) | EUR 312 | 339 |
| 1.50%, 5/25/2050 (b) | EUR 5,832 | 5,664 |
| 0.75%, 5/25/2053 (b) | EUR 1,089 | 832 |
| 1.75%, 5/25/2066 (b) | EUR 1,746 | 1,743 |
| 38,560 | ||
| Germany — 0.3% | ||
| Bundesrepublik Deutschland | ||
| 4.00%, 1/4/2037 (b) | EUR 4,030 | 5,977 |
| 2.50%, 7/4/2044 (b) | EUR 2,325 | 3,175 |
| 1.25%, 8/15/2048 (b) | EUR 1,440 | 1,594 |
| 0.00%, 8/15/2050 (b) | EUR 1,871 | 1,474 |
| 12,220 | ||
| Hungary — 0.0% ^ | ||
| Hungary Government Bond | ||
| 0.13%, 9/21/2028 (e) | EUR 893 | 786 |
| 2.13%, 9/22/2031 (e) | 1,158 | 929 |
| 1,715 | ||
| Indonesia — 0.1% | ||
| Republic of Indonesia | ||
| 2.15%, 7/18/2024 (b) | EUR 1,120 | 1,190 |
| 1.30%, 3/23/2034 | EUR 902 | 778 |
| 1,968 | ||
| Italy — 2.6% | ||
| Buoni Poliennali del Tesoro | ||
| 1.00%, 7/15/2022 (b) | EUR 17,773 | 18,803 |
| 0.90%, 8/1/2022 (b) | EUR 18,050 | 19,105 |
| 0.95%, 3/1/2023 (b) | EUR 2,161 | 2,298 |
| 2.45%, 10/1/2023 (b) | EUR 1,738 | 1,887 |
| INVESTMENTS | PRINCIPAL AMOUNT ($000) | VALUE ($000) |
| Italy — continued | ||
| 0.65%, 10/15/2023 (b) | EUR 2,220 | 2,349 |
| 0.00%, 1/15/2024 (b) | EUR 6,940 | 7,231 |
| 0.35%, 2/1/2025 (b) | EUR 4,181 | 4,296 |
| 1.85%, 7/1/2025 (b) | EUR 1,037 | 1,105 |
| 0.00%, 4/1/2026 (b) | EUR 16,565 | 16,343 |
| 0.25%, 3/15/2028 (b) | EUR 12,340 | 11,689 |
| 0.95%, 12/1/2031 (b) | EUR 1,541 | 1,384 |
| 1.65%, 3/1/2032 (b) | EUR 721 | 694 |
| 2.25%, 9/1/2036 (b) | EUR 2,982 | 2,914 |
| 0.95%, 3/1/2037 (b) | EUR 7,530 | 6,080 |
| 1.80%, 3/1/2041 (b) | EUR 553 | 479 |
| 4.75%, 9/1/2044 (b) | EUR 122 | 164 |
| 1.50%, 4/30/2045 (b) | EUR 5,008 | 3,929 |
| 2.70%, 3/1/2047 (b) | EUR 207 | 204 |
| 3.45%, 3/1/2048 (b) | EUR 211 | 235 |
| 2.15%, 9/1/2052 (b) | EUR 1,296 | 1,089 |
| 2.80%, 3/1/2067 (b) | EUR 612 | 574 |
| Italian Republic Government Bond 2.38%, 10/17/2024 | 5,381 | 5,242 |
| 108,094 | ||
| Japan — 6.7% | ||
| Japan Bank for International Cooperation 1.63%, 1/20/2027 | 974 | 908 |
| Japan Finance Organization for Municipalities 3.25%, 4/24/2023 (e) | 1,890 | 1,901 |
| Japan Government Bond | ||
| 0.10%, 6/20/2022 | JPY 1,772,850 | 13,665 |
| 0.10%, 12/20/2022 | JPY 3,399,300 | 26,224 |
| 0.01%, 6/1/2023 | JPY 4,005,500 | 30,894 |
| 0.80%, 9/20/2023 | JPY 1,154,500 | 9,004 |
| 0.10%, 9/20/2024 | JPY 1,835,600 | 14,193 |
| 0.50%, 9/20/2024 | JPY 393,150 | 3,069 |
| 0.10%, 12/20/2024 | JPY 405,400 | 3,136 |
| 0.10%, 6/20/2026 | JPY 1,192,000 | 9,232 |
| 0.10%, 9/20/2026 | JPY 2,308,150 | 17,872 |
| 0.01%, 12/20/2026 | JPY 2,094,400 | 16,148 |
| 0.10%, 9/20/2027 | JPY 2,713,100 | 20,986 |
| 0.10%, 12/20/2029 | JPY 756,650 | 5,806 |
| 0.10%, 3/20/2030 | JPY 1,256,450 | 9,631 |
| 1.60%, 3/20/2032 | JPY 1,031,450 | 9,014 |
| 1.50%, 6/20/2034 | JPY 642,250 | 5,616 |
| 1.40%, 9/20/2034 | JPY 1,944,050 | 16,834 |
| 0.70%, 3/20/2037 | JPY 721,800 | 5,722 |
| 0.60%, 9/20/2037 | JPY 842,050 | 6,560 |
| April 30, 2022 | J.P. Morgan Funds | 39 |
| INVESTMENTS | PRINCIPAL AMOUNT ($000) | VALUE ($000) |
| Foreign Government Securities — continued | ||
| Japan — continued | ||
| 0.30%, 12/20/2039 | JPY 1,574,650 | 11,427 |
| 0.40%, 6/20/2040 | JPY 2,072,200 | 15,236 |
| 1.50%, 3/20/2045 | JPY 667,700 | 5,866 |
| 1.40%, 12/20/2045 | JPY 145,750 | 1,258 |
| 0.80%, 12/20/2047 | JPY 628,950 | 4,747 |
| 0.40%, 9/20/2049 | JPY 42,550 | 286 |
| 0.40%, 12/20/2049 | JPY 1,030,350 | 6,911 |
| 0.40%, 3/20/2050 | JPY 1,020,550 | 6,836 |
| 0.90%, 3/20/2057 | JPY 269,150 | 2,019 |
| 0.50%, 3/20/2060 | JPY 279,900 | 1,816 |
| 282,817 | ||
| Netherlands — 0.2% | ||
| Kingdom of Netherlands | ||
| 2.50%, 1/15/2033 (b) | EUR 2,310 | 2,745 |
| 4.00%, 1/15/2037 (b) | EUR 1,110 | 1,586 |
| 3.75%, 1/15/2042 (b) | EUR 917 | 1,372 |
| 2.75%, 1/15/2047 (b) | EUR 1,160 | 1,618 |
| 0.00%, 1/15/2052 (b) | EUR 520 | 379 |
| 7,700 | ||
| Peru — 0.0% ^ | ||
| Republic of Peru 1.86%, 12/1/2032 | 487 | 378 |
| Philippines — 0.0% ^ | ||
| Republic of Philippines 0.25%, 4/28/2025 | EUR 1,303 | 1,307 |
| Qatar — 0.0% ^ | ||
| State of Qatar 3.88%, 4/23/2023 (e) | 860 | 870 |
| Romania — 0.0% ^ | ||
| Romania Government Bond 2.00%, 4/14/2033 (e) | EUR 1,470 | 1,129 |
| Saudi Arabia — 0.0% ^ | ||
| Kingdom of Saudi Arabia 2.25%, 2/2/2033 (e) | 914 | 793 |
| South Korea — 0.4% | ||
| Export-Import Bank of Korea | ||
| 0.00%, 10/19/2024 (b) | EUR 10,060 | 10,314 |
| 0.75%, 9/21/2025 | 4,217 | 3,856 |
| Republic of Korea 0.00%, 9/16/2025 | EUR 1,276 | 1,291 |
| 15,461 | ||
| Spain — 0.7% | ||
| Bonos and Obligaciones del Estado | ||
| 1.60%, 4/30/2025 (b) | EUR 680 | 733 |
| INVESTMENTS | PRINCIPAL AMOUNT ($000) | VALUE ($000) |
| Spain — continued | ||
| 1.50%, 4/30/2027 (b) | EUR 6,575 | 6,999 |
| 1.40%, 7/30/2028 (b) | EUR 8,252 | 8,683 |
| 2.35%, 7/30/2033 (b) | EUR 1,078 | 1,175 |
| 4.70%, 7/30/2041 (b) | EUR 3,538 | 5,139 |
| 1.00%, 7/30/2042 (b) | EUR 637 | 529 |
| 2.90%, 10/31/2046 (b) | EUR 2,012 | 2,316 |
| 2.70%, 10/31/2048 (b) | EUR 771 | 853 |
| 1.00%, 10/31/2050 (b) | EUR 1,606 | 1,182 |
| 3.45%, 7/30/2066 (b) | EUR 771 | 933 |
| 28,542 | ||
| Sweden — 0.1% | ||
| Kingdom of Sweden | ||
| 1.50%, 11/13/2023 (b) | SEK 4,690 | 480 |
| 1.00%, 11/12/2026 (b) | SEK 5,010 | 497 |
| 0.75%, 5/12/2028 | SEK 1,985 | 192 |
| 0.75%, 11/12/2029 (b) | SEK 13,515 | 1,285 |
| 3.50%, 3/30/2039 | SEK 1,370 | 174 |
| 0.50%, 11/24/2045 | SEK 470 | 35 |
| Svensk Exportkredit AB 2.88%, 3/14/2023 | 3,300 | 3,317 |
| 5,980 | ||
| United Arab Emirates — 0.0% ^ | ||
| United Arab Emirates Government Bond 0.75%, 9/2/2023 (e) | 1,569 | 1,526 |
| United Kingdom — 1.8% | ||
| United Kingdom of Great Britain and Northern Ireland | ||
| 1.00%, 4/22/2024 (b) | GBP 4,360 | 5,421 |
| 0.25%, 1/31/2025 (b) | GBP 870 | 1,051 |
| 0.63%, 6/7/2025 (b) | GBP 12,632 | 15,413 |
| 1.25%, 7/22/2027 (b) | GBP 7,537 | 9,282 |
| 4.25%, 3/7/2036 (b) | GBP 2,922 | 4,640 |
| 1.75%, 9/7/2037 (b) | GBP 5,378 | 6,448 |
| 4.75%, 12/7/2038 (b) | GBP 1,018 | 1,760 |
| 1.25%, 10/22/2041 (b) | GBP 1,150 | 1,247 |
| 0.88%, 1/31/2046 (b) | GBP 5,755 | 5,587 |
| 4.25%, 12/7/2046 (b) | GBP 5,625 | 9,976 |
| 1.50%, 7/22/2047 (b) | GBP 4,357 | 4,855 |
| 1.75%, 7/22/2057 (b) | GBP 4,109 | 4,903 |
| 40 | J.P. Morgan Funds | April 30, 2022 |
| INVESTMENTS | PRINCIPAL AMOUNT ($000) | VALUE ($000) |
| Foreign Government Securities — continued | ||
| United Kingdom — continued | ||
| 2.50%, 7/22/2065 (b) | GBP 2,317 | 3,458 |
| 1.63%, 10/22/2071 (b) | GBP 290 | 344 |
| 74,385 | ||
| Total Foreign Government Securities (Cost $734,117) | 626,906 | |
| INVESTMENTS | SHARES (000) | |
| Investment Companies — 4.4% | ||
| United States — 4.4% | ||
| JPMorgan Income Fund, Class R6 Shares (i)(Cost $190,192) | 20,994 | 186,217 |
| INVESTMENTS | PRINCIPAL AMOUNT ($000) | |
| U.S. Treasury Obligations — 1.5% | ||
| U.S. Treasury Notes 0.13%, 1/31/2023 (j)(Cost $64,591) | USD 64,812 | 63,977 |
| NO. OF CONTRACTS | VALUE ($000) | |
| Options Purchased — 1.1% | ||
| Put Options Purchased — 1.1% | ||
| United States — 1.1% | ||
| S&P 500 Index | ||
| 9/16/2022 at USD 4,250.00, European Style | ||
| Notional Amount: USD 246,676 | ||
| Counterparty: Exchange-Traded * | 597 | 18,746 |
| S&P 500 Index | ||
| 9/16/2022 at USD 4,350.00, European Style | ||
| Notional Amount: USD 160,732 | ||
| Counterparty: Exchange-Traded * | 389 | 14,006 |
| S&P 500 Index | ||
| 9/16/2022 at USD 4,025.00, European Style | ||
| Notional Amount: USD 257,006 | ||
| Counterparty: Exchange-Traded * | 622 | 13,730 |
| Total Put Options Purchased | 46,482 | |
| Total Options Purchased (Cost $26,377) | 46,482 | |
| INVESTMENTS | SHARES (000) | VALUE ($000) |
| Exchange-Traded Funds — 0.4% | ||
| United States — 0.4% | ||
| iShares MSCI India ETF (a)(Cost $10,007) | 372 | 16,222 |
| INVESTMENTS | NO. OF WARRANTS (000) | |
| Warrants — 0.2% | ||
| Netherlands — 0.0% ^ | ||
| BNP Paribas Issuance BV | ||
| expiring 9/26/2022 * | 34 | 169 |
| expiring 9/26/2022 * | 5 | 111 |
| expiring 9/26/2022 * | 7 | 69 |
| expiring 9/30/2022 * | 2 | 66 |
| expiring 9/30/2022 * | 33 | 107 |
| expiring 9/30/2022 * | 187 | 302 |
| expiring 10/21/2022 * | 4 | 47 |
| 871 | ||
| Switzerland — 0.2% | ||
| UBS AG | ||
| expiring 7/8/2022 * | 13 | 255 |
| expiring 7/20/2022 * | 27 | 136 |
| expiring 8/9/2022 * | 5 | 155 |
| expiring 8/9/2022 * | 5 | 157 |
| expiring 8/16/2022 * | 55 | 379 |
| expiring 10/3/2022 * | 63 | 549 |
| expiring 12/12/2022 * | 13 | 112 |
| expiring 12/15/2022 * | 88 | 608 |
| expiring 12/23/2022 * | 12 | 340 |
| expiring 12/23/2022 * | 21 | 256 |
| expiring 1/16/2023, price 1.00 USD * | 17 | 291 |
| expiring 1/30/2023 * | 14 | 711 |
| expiring 2/27/2023 * | 1 | 13 |
| expiring 2/27/2023 * | 39 | 398 |
| expiring 2/27/2023 * | 309 | 1,022 |
| expiring 3/17/2023 * | 21 | 425 |
| expiring 4/17/2023, price 1.00 USD * | 253 | 408 |
| expiring 4/25/2023 * | 53 | 370 |
| expiring 5/18/2023 * | 36 | 357 |
| expiring 6/19/2023 * | 77 | 731 |
| 7,673 | ||
| United Kingdom — 0.0% ^ | ||
| Nmg Research Ltd., expiring 9/24/2027, price 1.00 USD ‡ * | 1 | 51 |
| April 30, 2022 | J.P. Morgan Funds | 41 |
| INVESTMENTS | NO. OF WARRANTS (000) | VALUE ($000) |
| Warrants — continued | ||
| United Kingdom — continued | ||
| UBS AG | ||
| expiring 8/26/2022, price 1.00 USD * | 17 | 390 |
| expiring 4/17/2023, price 1.00 USD * | 44 | 351 |
| 792 | ||
| United States — 0.0% ^ | ||
| Windstream Holdings, Inc., expiring 12/31/2049, price 11.00 USD ‡ * | 1 | 8 |
| Total Warrants (Cost $13,288) | 9,344 | |
| INVESTMENTS | PRINCIPAL AMOUNT ($000) | |
| Commercial Mortgage-Backed Securities — 0.2% | ||
| United States — 0.2% | ||
| FHLMC, Multi-Family Structured Pass-Through Certificates | ||
| Series K033, Class X1, IO, 0.40%, 7/25/2023 (k) | 101,027 | 314 |
| Series KC03, Class X1, IO, 0.63%, 11/25/2024 (k) | 29,679 | 362 |
| Series K078, Class X1, IO, 0.23%, 6/25/2028 (k) | 63,277 | 450 |
| Series K082, Class X1, IO, 0.15%, 9/25/2028 (k) | 419,560 | 1,535 |
| Series K083, Class X1, IO, 0.18%, 9/25/2028 (k) | 133,664 | 620 |
| FNMA ACES Series 2019-M21, Class X2, IO, 1.43%, 2/25/2031 (k) | 3,289 | 280 |
| FREMF Series 2018-KF46, Class B, 2.40%, 3/25/2028 (e) (k) | 220 | 214 |
| FREMF Mortgage Trust | ||
| Series 2017-KF31, Class B, 3.35%, 4/25/2024 (e) (k) | 141 | 140 |
| Series 2017-KF32, Class B, 3.00%, 5/25/2024 (e) (k) | 298 | 297 |
| Series 2017-KF36, Class B, 3.10%, 8/25/2024 (e) (k) | 258 | 257 |
| Series 2017-KF38, Class B, 2.95%, 9/25/2024 (e) (k) | 194 | 194 |
| Series 2018-KF45, Class B, 2.40%, 3/25/2025 (e) (k) | 398 | 387 |
| Series 2018-KF47, Class B, 2.45%, 5/25/2025 (e) (k) | 226 | 223 |
| Series 2018-KF49, Class B, 2.35%, 6/25/2025 (e) (k) | 198 | 191 |
| INVESTMENTS | PRINCIPAL AMOUNT ($000) | VALUE ($000) |
| United States — continued | ||
| Series 2019-KF63, Class B, 2.80%, 5/25/2029 (e) (k) | 1,215 | 1,204 |
| LB-UBS Commercial Mortgage Trust Series 2006-C6, Class AJ, 5.45%, 9/15/2039 (k) | 923 | 384 |
| Velocity Commercial Capital Loan Trust | ||
| Series 2018-2, Class M2, 4.51%, 10/26/2048 ‡ (e) (k) | 231 | 225 |
| Series 2018-2, Class M3, 4.72%, 10/26/2048 ‡ (e) (k) | 340 | 326 |
| Wells Fargo Commercial Mortgage Trust Series 2019-C52, Class XA, IO, 1.75%, 8/15/2052 (k) | 3,765 | 311 |
| Total Commercial Mortgage-Backed Securities (Cost $8,399) | 7,914 | |
| Supranational — 0.2% | ||
| Asian Development Bank, 3.40%, 9/10/2027 (b) | AUD 3,030 | 2,119 |
| European Investment Bank, 0.50%, 6/21/2023 | AUD 1,210 | 836 |
| Inter-American Development Bank | ||
| 0.50%, 5/23/2023 | CAD 3,650 | 2,777 |
| 1.70%, 10/10/2024 | CAD 800 | 605 |
| 4.40%, 1/26/2026 | CAD 614 | 500 |
| Total Supranational (Cost $7,165) | 6,837 | |
| Asset-Backed Securities — 0.1% | ||
| United States — 0.1% | ||
| OneMain Financial Issuance Trust | ||
| Series 2015-3A, Class C, 5.82%, 11/20/2028 ‡ (e) | 829 | 830 |
| Series 2019-1A, Class B, 3.79%, 2/14/2031 ‡ (e) | 1,045 | 1,046 |
| Total Asset-Backed Securities (Cost $1,874) | 1,876 | |
| Loan Assignments — 0.0% (l) ^ | ||
| United States — 0.0% ^ | ||
| FGI Operating Co. LLC, 1st Lien Term Loan (ICE LIBOR USD 3 Month + 11.00%), 12.00%, 5/16/2022 ‡ (f) (m) | 16 | 2 |
| Moran Foods LLC, Tranche A Second Lien Term Loan (ICE LIBOR USD 3 Month + 7.00%), 8.01%, 10/1/2024 (f) | 413 | 289 |
| 42 | J.P. Morgan Funds | April 30, 2022 |
| INVESTMENTS | PRINCIPAL AMOUNT ($000) | VALUE ($000) |
| Loan Assignments — continued | ||
| United States — continued | ||
| Moran Foods LLC, 1st Lien Term Loan B (ICE LIBOR USD 3 Month + 7.00%), 8.01%, 4/1/2024 ‡ (f) | 603 | 543 |
| Moran Foods LLC, 1st Lien Term Loan (ICE LIBOR USD 3 Month + 7.00%), 7.00%, 12/31/2038 (f) | 80 | 72 |
| Total Loan Assignments (Cost $867) | 906 | |
| Collateralized Mortgage Obligations — 0.0% ^ | ||
| United States — 0.0% ^ | ||
| CHL GMSR Issuer Trust Series 2018-GT1, Class B, 4.17%, 5/25/2023 ‡ (e) (k) | 840 | 830 |
| CHL Mortgage Pass-Through Trust | ||
| Series 2005-31, Class 2A1, 2.44%, 1/25/2036 (k) | — | — |
| Series 2006-21, Class A14, 6.00%, 2/25/2037 | — | — |
| Series 2007-10, Class A4, 5.50%, 7/25/2037 | — | — |
| Deutsche Alt-A Securities Mortgage Loan Trust | ||
| Series 2006-AF1, Class A4, 0.97%, 4/25/2036 (k) | — | — |
| Series 2007-3, Class 2A1, 1.42%, 10/25/2047 (k) | — | — |
| HarborView Mortgage Loan Trust Series 2006-14, Class 1A1A, 0.91%, 1/25/2047 (k) | — | — |
| JPMorgan Mortgage Trust Series 2005-A8, Class 2A3, 2.66%, 11/25/2035 (k) | — | — |
| Total Collateralized Mortgage Obligations (Cost $840) | 830 | |
| INVESTMENTS | SHARES (000) | |
| Convertible Preferred Stocks — 0.0% ^ | ||
| United States — 0.0% ^ | ||
| Claire's Stores, Inc. ‡ *(Cost $72) | — | 590 |
| Preferred Stocks — 0.0% ^ | ||
| United States — 0.0% ^ | ||
| Goodman Networks, Inc. ‡ * | 3 | — |
| MYT Holding LLC Series A, 10.00%, 6/6/2029 ‡ * | 40 | 44 |
| Total Preferred Stocks (Cost $49) | 44 | |
| INVESTMENTS | NO. OF RIGHTS (000) | VALUE ($000) |
| Rights — 0.0% ^ | ||
| United States — 0.0% ^ | ||
| Vistra Corp., expiring 12/31/2049 ‡ *(Cost $—) (n) | 17 | 22 |
| INVESTMENTS | PRINCIPAL AMOUNT ($000) | |
| Short-Term Investments — 7.1% | ||
| Foreign Government Treasury Bills — 1.1% | ||
| Canadian Treasury Bills | ||
| 1.58%, 1/5/2023 (o) | CAD 19,513 | 14,969 |
| 1.69%, 2/2/2023 (o) | CAD 19,551 | 14,965 |
| 1.79%, 3/2/2023 (o) | CAD 19,598 | 14,961 |
| Total Foreign Government Treasury Bills (Cost $46,331) | 44,895 | |
| INVESTMENTS | SHARES (000) | |
| Investment Companies — 3.9% | ||
| JPMorgan Prime Money Market Fund Class Institutional Shares, 0.36% (i) (p) (Cost $165,429) | 165,414 | 165,446 |
| Investment of Cash Collateral from Securities Loaned — 2.1% | ||
| JPMorgan Securities Lending Money Market Fund Agency SL Class Shares, 0.37% (i) (p) | 78,788 | 78,733 |
| JPMorgan U.S. Government Money Market Fund Class IM Shares, 0.37% (i) (p) | 10,897 | 10,897 |
| Total Investment of Cash Collateral from Securities Loaned (Cost $89,632) | 89,630 | |
| Total Short-Term Investments (Cost $301,392) | 299,971 | |
| Total Investments — 101.3% (Cost $4,064,214) | 4,270,058 | |
| Liabilities in Excess of Other Assets — (1.3)% | (56,803) | |
| NET ASSETS — 100.0% | 4,213,255 | |
Percentages indicated are based on net assets. | ||
Amounts presented as a dash (“-“) represent amounts that round to less than a thousand. | ||
| Abbreviations | |
| ACES | Alternative Credit Enhancement Securities |
| ADR | American Depositary Receipt |
| APAC | Asia Pacific |
| April 30, 2022 | J.P. Morgan Funds | 43 |
| AUD | Australian Dollar |
| CAD | Canadian Dollar |
| CHDI | Clearing House Electronic Subregister System (CHESS) Depository Interest |
| CVA | Dutch Certification |
| DKK | Danish Krone |
| ETF | Exchange Traded Fund |
| EUR | Euro |
| FHLMC | Federal Home Loan Mortgage Corp. |
| FNMA | Federal National Mortgage Association |
| GBP | British Pound |
| GDR | Global Depositary Receipt |
| ICE | Intercontinental Exchange |
| IO | Interest Only represents the right to receive the monthly interest payments on an underlying pool of mortgage loans. The principal amount shown represents the par value on the underlying pool. The yields on these securities are subject to accelerated principal paydowns as a result of prepayment or refinancing of the underlying pool of mortgage instruments. As a result, interest income may be reduced considerably. |
| JPY | Japanese Yen |
| JSC | Joint Stock Company |
| LIBOR | London Interbank Offered Rate |
| OYJ | Public Limited Company |
| Preference | A special type of equity investment that shares in the earnings of the company, has limited voting rights, and may have a dividend preference. Preference shares may also have liquidation preference. |
| PT | Limited liability company |
| REIT | Real Estate Investment Trust |
| SCA | Limited partnership with share capital |
| SEK | Swedish Krona |
| SGPS | Holding company |
| USD | United States Dollar |
| ^ | Amount rounds to less than 0.1% of net assets. | |
| ‡ | Value determined using significant unobservable inputs. | |
| * | Non-income producing security. | |
| (a) | The security or a portion of this security is on loan at April 30, 2022. The total value of securities on loan at April 30, 2022 is $83,512. | |
| (b) | Security exempt from registration pursuant to Regulation S under the Securities Act of 1933, as amended. Regulation S applies to securities offerings that are made outside of the United States and do not involve direct selling efforts in the United States and as such may have restrictions on resale. | |
| (c) | Value is zero. | |
| (d) | All or a portion of this security is segregated as collateral for short sales. The total value of securities segregated as collateral is $5,762. | |
| (e) | Securities exempt from registration under Rule 144A or section 4(a)(2), of the Securities Act of 1933, as amended. | |
| (f) | Variable or floating rate security, linked to the referenced benchmark. The interest rate shown is the current rate as of April 30, 2022. | |
| (g) | Security has the ability to pay in kind (“PIK”) or pay income in cash. When applicable, separate rates of such payments are disclosed. | |
| (h) | Step bond. Interest rate is a fixed rate for an initial period that either resets at a specific date or may reset in the future contingent upon a predetermined trigger. The interest rate shown is the current rate as of April 30, 2022. | |
| (i) | Investment in an affiliated fund, which is registered under the Investment Company Act of 1940, as amended, and is advised by J.P. Morgan Investment Management Inc. | |
| (j) | All or a portion of this security is deposited with the broker as initial margin for futures contracts. | |
| (k) | Variable or floating rate security, the interest rate of which adjusts periodically based on changes in current interest rates and prepayments on the underlying pool of assets. The interest rate shown is the current rate as of April 30, 2022. | |
| (l) | Loan assignments are presented by obligor. Each series or loan tranche underlying each obligor may have varying terms. | |
| (m) | Defaulted security. | |
| (n) | Value is zero. | |
| (o) | The rate shown is the effective yield as of April 30, 2022. | |
| (p) | The rate shown is the current yield as of April 30, 2022. |
| 44 | J.P. Morgan Funds | April 30, 2022 |
| INDUSTRY | PERCENT OF TOTAL INVESTMENTS |
| Foreign Government Securities | 14.7% |
| Banks | 5.4 |
| Oil, Gas & Consumable Fuels | 4.4 |
| Fixed Income Funds | 4.4 |
| Semiconductors & Semiconductor Equipment | 3.8 |
| Software | 2.9 |
| Hotels, Restaurants & Leisure | 2.8 |
| Pharmaceuticals | 2.6 |
| Technology Hardware, Storage & Peripherals | 2.4 |
| Insurance | 2.2 |
| Internet & Direct Marketing Retail | 2.2 |
| Health Care Providers & Services | 2.0 |
| Interactive Media & Services | 1.9 |
| Biotechnology | 1.8 |
| Health Care Equipment & Supplies | 1.8 |
| IT Services | 1.6 |
| Equity Real Estate Investment Trusts (REITs) | 1.6 |
| U.S. Treasury Notes | 1.5 |
| Machinery | 1.5 |
| Capital Markets | 1.4 |
| Electric Utilities | 1.4 |
| Aerospace & Defense | 1.4 |
| Beverages | 1.4 |
| Chemicals | 1.3 |
| Specialty Retail | 1.3 |
| Textiles, Apparel & Luxury Goods | 1.2 |
| Consumer Finance | 1.2 |
| Automobiles | 1.2 |
| Media | 1.1 |
| Food Products | 1.1 |
| Metals & Mining | 1.1 |
| Index Funds | 1.1 |
| Diversified Telecommunication Services | 1.1 |
| Others (each less than 1.0%) | 14.2 |
| Short-Term Investments | 7.0 |
| April 30, 2022 | J.P. Morgan Funds | 45 |
| DESCRIPTION | NUMBER OF CONTRACTS | EXPIRATION DATE | TRADING CURRENCY | NOTIONAL AMOUNT ($) | VALUE AND UNREALIZED APPRECIATION (DEPRECIATION) ($) |
| Long Contracts | |||||
| Euro-Bobl | 203 | 06/08/2022 | EUR | 27,241 | (237) |
| Euro-BTP | 17 | 06/08/2022 | EUR | 2,338 | (260) |
| Euro-Bund | 173 | 06/08/2022 | EUR | 28,060 | (798) |
| Euro-Buxl | 12 | 06/08/2022 | EUR | 2,169 | (232) |
| Euro-OAT | 76 | 06/08/2022 | EUR | 11,709 | (1,028) |
| Japan 10 Year Bond Mini | 93 | 06/10/2022 | JPY | 10,715 | (91) |
| Foreign Exchange AUD / USD | 834 | 06/13/2022 | USD | 58,960 | (2,177) |
| Foreign Exchange EUR / USD | 2,510 | 06/13/2022 | USD | 331,555 | (13,022) |
| Foreign Exchange GBP / USD | 1,183 | 06/13/2022 | USD | 92,984 | (4,183) |
| Foreign Exchange JPY / USD | 2,511 | 06/13/2022 | USD | 242,186 | (29,412) |
| Japan 10 Year Bond | 2 | 06/13/2022 | JPY | 2,304 | (19) |
| Foreign Exchange CAD / USD | 1,536 | 06/14/2022 | USD | 119,539 | (256) |
| Australia 10 Year Bond | 153 | 06/15/2022 | AUD | 13,420 | (379) |
| S&P / TSX 60 Index | 729 | 06/16/2022 | CAD | 142,038 | (3,029) |
| EURO STOXX 50 Index | 403 | 06/17/2022 | EUR | 15,650 | (720) |
| MSCI EAFE E-Mini Index | 8 | 06/17/2022 | USD | 798 | (12) |
| MSCI Emerging Markets E-Mini Index | 110 | 06/17/2022 | USD | 5,808 | 122 |
| S&P 500 E-Mini Index | 1,955 | 06/17/2022 | USD | 403,781 | (12,665) |
| Canada 5 Year Bond | 42 | 06/21/2022 | CAD | 3,777 | (152) |
| Canada 10 Year Bond | 65 | 06/21/2022 | CAD | 6,377 | (72) |
| U.S. Treasury Ultra Bond | 5 | 06/21/2022 | USD | 798 | (62) |
| Long Gilt | 88 | 06/28/2022 | GBP | 13,106 | (493) |
| (69,177) | |||||
| Short Contracts | |||||
| Euro-Bobl | (1,685) | 06/08/2022 | EUR | (226,110) | 2,042 |
| Euro-Bund | (752) | 06/08/2022 | EUR | (121,973) | 2,597 |
| Euro-Schatz | (121) | 06/08/2022 | EUR | (14,060) | 29 |
| TOPIX Index | (56) | 06/09/2022 | JPY | (8,346) | (819) |
| Japan 10 Year Bond | (263) | 06/13/2022 | JPY | (303,015) | (288) |
| MSCI Emerging Markets E-Mini Index | (2,464) | 06/17/2022 | USD | (130,112) | (3,753) |
| Russell 2000 E-mini Index | (905) | 06/17/2022 | USD | (84,251) | 5,607 |
| U.S. Treasury 10 Year Note | (164) | 06/21/2022 | USD | (19,524) | 846 |
| U.S. Treasury 10 Year Ultra Note | (33) | 06/21/2022 | USD | (4,253) | 359 |
| U.S. Treasury Long Bond | (350) | 06/21/2022 | USD | (49,175) | 1,348 |
| U.S. Treasury 2 Year Note | (142) | 06/30/2022 | USD | (29,925) | 541 |
| U.S. Treasury 5 Year Note | (59) | 06/30/2022 | USD | (6,641) | 31 |
| 8,540 | |||||
| (60,637) |
| Abbreviations | |
| AUD | Australian Dollar |
| CAD | Canadian Dollar |
| EAFE | Europe, Australasia, and Far East |
| EUR | Euro |
| GBP | British Pound |
| JPY | Japanese Yen |
| MSCI | Morgan Stanley Capital International |
| TOPIX | Tokyo Stock Price Index |
| 46 | J.P. Morgan Funds | April 30, 2022 |
| TSX | Toronto Stock Exchange |
| USD | United States Dollar |
| April 30, 2022 | J.P. Morgan Funds | 47 |
| CURRENCY PURCHASED | CURRENCY SOLD | COUNTERPARTY | SETTLEMENT DATE | UNREALIZED APPRECIATION (DEPRECIATION ($) | ||
| USD | 15,868 | AUD | 21,216 | HSBC Bank, NA | 5/4/2022 | 878 |
| USD | 14,611 | CAD | 18,291 | Royal Bank of Canada | 5/4/2022 | 373 |
| USD | 1,179 | CAD | 1,474 | State Street Corp. | 5/4/2022 | 31 |
| USD | 4,097 | DKK | 27,356 | State Street Corp. | 5/4/2022 | 217 |
| USD | 283,387 | EUR | 254,201 | BNP Paribas | 5/4/2022 | 15,207 |
| USD | 733 | EUR | 674 | Royal Bank of Canada | 5/4/2022 | 22 |
| USD | 1,315 | EUR | 1,208 | State Street Corp. | 5/4/2022 | 40 |
| USD | 84,261 | GBP | 64,279 | Barclays Bank plc | 5/4/2022 | 3,434 |
| USD | 996 | GBP | 760 | Standard Chartered Bank | 5/4/2022 | 40 |
| USD | 2,356 | SEK | 21,927 | BNP Paribas | 5/4/2022 | 123 |
| USD | 4,220 | CNY | 26,995 | State Street Corp.** | 5/5/2022 | 153 |
| USD | 7,722 | JPY | 939,738 | Barclays Bank plc | 5/6/2022 | 480 |
| USD | 259,347 | JPY | 31,608,977 | BNP Paribas | 5/6/2022 | 15,757 |
| USD | 1,535 | JPY | 187,923 | Merrill Lynch International | 5/6/2022 | 87 |
| USD | 34,334 | JPY | 4,210,732 | State Street Corp. | 5/6/2022 | 1,884 |
| USD | 46,000 | CAD | 57,813 | Citibank, NA | 5/18/2022 | 999 |
| EUR | 2,514 | USD | 2,648 | Merrill Lynch International | 6/3/2022 | 7 |
| USD | 13,989 | AUD | 19,528 | Merrill Lynch International | 6/3/2022 | 183 |
| USD | 15,507 | CAD | 19,765 | BNP Paribas | 6/3/2022 | 122 |
| USD | 3,888 | DKK | 27,356 | Citibank, NA | 6/3/2022 | 3 |
| USD | 237,678 | EUR | 224,490 | HSBC Bank, NA | 6/3/2022 | 530 |
| USD | 1,697 | EUR | 1,600 | State Street Corp. | 6/3/2022 | 7 |
| USD | 2,245 | SEK | 21,927 | State Street Corp. | 6/3/2022 | 10 |
| USD | 1,485 | GBP | 1,181 | HSBC Bank, NA | 6/6/2022 | 1 |
| EUR | 837 | GBP | 700 | Royal Bank of Canada | 6/29/2022 | 5 |
| EUR | 5,013 | SEK | 51,655 | Goldman Sachs International | 6/29/2022 | 34 |
| GBP | 33 | EUR | 40 | Merrill Lynch International | 6/29/2022 | —(a) |
| USD | 6 | CHF | 6 | Merrill Lynch International | 6/29/2022 | —(a) |
| USD | 1,602 | CHF | 1,489 | Royal Bank of Canada | 6/29/2022 | 66 |
| USD | 1,357 | DKK | 9,151 | BNP Paribas | 6/29/2022 | 55 |
| USD | 544 | DKK | 3,709 | Merrill Lynch International | 6/29/2022 | 17 |
| USD | 82,844 | EUR | 75,109 | Barclays Bank plc | 6/29/2022 | 3,378 |
| USD | 7,948 | EUR | 7,193 | Royal Bank of Canada | 6/29/2022 | 338 |
| USD | 503 | NOK | 4,409 | BNP Paribas | 6/29/2022 | 32 |
| USD | 1,124 | NOK | 10,062 | Goldman Sachs International | 6/29/2022 | 51 |
| USD | 233 | SEK | 2,227 | Merrill Lynch International | 6/29/2022 | 6 |
| USD | 549 | SEK | 5,170 | Royal Bank of Canada | 6/29/2022 | 21 |
| Total unrealized appreciation | 44,591 | |||||
| AUD | 19,528 | USD | 13,981 | Merrill Lynch International | 5/4/2022 | (183) |
| AUD | 1,688 | USD | 1,263 | Royal Bank of Canada | 5/4/2022 | (70) |
| CAD | 19,765 | USD | 15,507 | BNP Paribas | 5/4/2022 | (121) |
| DKK | 27,356 | USD | 3,883 | Citibank, NA | 5/4/2022 | (3) |
| EUR | 1,776 | USD | 1,933 | BNP Paribas | 5/4/2022 | (59) |
| EUR | 2,171 | USD | 2,424 | Citibank, NA | 5/4/2022 | (134) |
| EUR | 11,271 | USD | 12,540 | Goldman Sachs International | 5/4/2022 | (649) |
| EUR | 224,490 | USD | 237,375 | HSBC Bank, NA | 5/4/2022 | (541) |
| EUR | 1,031 | USD | 1,125 | Royal Bank of Canada | 5/4/2022 | (37) |
| EUR | 2,873 | USD | 3,199 | Standard Chartered Bank | 5/4/2022 | (168) |
| EUR | 10,158 | USD | 11,181 | State Street Corp. | 5/4/2022 | (464) |
| EUR | 2,313 | USD | 2,506 | TD Bank Financial Group | 5/4/2022 | (66) |
| GBP | 864 | USD | 1,125 | Citibank, NA | 5/4/2022 | (39) |
| 48 | J.P. Morgan Funds | April 30, 2022 |
| CURRENCY PURCHASED | CURRENCY SOLD | COUNTERPARTY | SETTLEMENT DATE | UNREALIZED APPRECIATION (DEPRECIATION ($) | ||
| GBP | 1,010 | USD | 1,314 | Royal Bank of Canada | 5/4/2022 | (44) |
| SEK | 21,927 | USD | 2,244 | State Street Corp. | 5/4/2022 | (11) |
| JPY | 302,173 | USD | 2,473 | Barclays Bank plc | 5/6/2022 | (144) |
| JPY | 156,724 | USD | 1,265 | BNP Paribas | 5/6/2022 | (57) |
| JPY | 199,775 | USD | 1,629 | Citibank, NA | 5/6/2022 | (90) |
| CAD | 1,415 | USD | 1,115 | Merrill Lynch International | 6/3/2022 | (14) |
| EUR | 1,219 | USD | 1,321 | State Street Corp. | 6/3/2022 | (33) |
| USD | 278,331 | JPY | 36,288,698 | BNP Paribas | 6/3/2022 | (1,586) |
| CNY | 26,953 | USD | 4,079 | HSBC Bank, NA** | 6/6/2022 | (22) |
| CNY | 42 | USD | 6 | State Street Corp.** | 6/6/2022 | —(a) |
| USD | 4,054 | CNY | 26,995 | TD Bank Financial Group** | 6/6/2022 | (10) |
| USD | 79,335 | GBP | 63,166 | Barclays Bank plc | 6/6/2022 | (94) |
| CHF | 8 | USD | 8 | Merrill Lynch International | 6/29/2022 | —(a) |
| CHF | 15,668 | USD | 16,403 | State Street Corp. | 6/29/2022 | (245) |
| DKK | 38,623 | USD | 5,614 | Barclays Bank plc | 6/29/2022 | (120) |
| EUR | 13,286 | CHF | 13,709 | Goldman Sachs International | 6/29/2022 | (82) |
| EUR | 457 | CHF | 471 | Royal Bank of Canada | 6/29/2022 | (3) |
| EUR | 3,462 | DKK | 25,763 | Goldman Sachs International | 6/29/2022 | (1) |
| EUR | 19,966 | GBP | 16,802 | Goldman Sachs International | 6/29/2022 | (6) |
| EUR | 38,773 | USD | 41,915 | Standard Chartered Bank | 6/29/2022 | (893) |
| GBP | 15,463 | USD | 20,361 | Barclays Bank plc | 6/29/2022 | (915) |
| GBP | 752 | USD | 961 | Royal Bank of Canada | 6/29/2022 | (15) |
| GBP | 1,163 | USD | 1,527 | Standard Chartered Bank | 6/29/2022 | (64) |
| NOK | 14,072 | USD | 1,580 | BNP Paribas | 6/29/2022 | (80) |
| NOK | 398 | USD | 45 | Royal Bank of Canada | 6/29/2022 | (2) |
| SEK | 58,533 | USD | 6,201 | BNP Paribas | 6/29/2022 | (230) |
| SEK | 112 | USD | 12 | Goldman Sachs International | 6/29/2022 | —(a) |
| SEK | 406 | USD | 43 | Royal Bank of Canada | 6/29/2022 | (1) |
| Total unrealized depreciation | (7,296) | |||||
| Net unrealized appreciation | 37,295 | |||||
| Abbreviations | |
| AUD | Australian Dollar |
| CAD | Canadian Dollar |
| CHF | Swiss Franc |
| CNY | China Yuan |
| DKK | Danish Krone |
| EUR | Euro |
| GBP | British Pound |
| JPY | Japanese Yen |
| NOK | Norwegian Krone |
| SEK | Swedish Krona |
| USD | United States Dollar |
| (a) | Amount rounds to less than one thousand. |
| ** | Non-deliverable forward. |
| April 30, 2022 | J.P. Morgan Funds | 49 |
| COUNTERPARTY | DESCRIPTION | TERMINATION DATE | NOTIONAL VALUE(1) | NET UNREALIZED APPRECIATION (DEPRECIATION)(2) | NET CASH AND OTHER RECEIVABLES (PAYABLES) | VALUE |
| Bank of America, NA | The Fund receives the total return on a portfolio of long equity positions and pays or receives the net of one day ESTR on long positions, plus or minus a specified spread (rates range from 0.00% to 0.19% ), which is denominated in EUR based on the local currencies of the positions within the swaps. | 04/28/2023 | $— | $— | $436 | $436 |
| COUNTERPARTY | DESCRIPTION | TERMINATION DATE | NOTIONAL VALUE(1) | NET UNREALIZED APPRECIATION (DEPRECIATION)(2) | NET CASH AND OTHER RECEIVABLES (PAYABLES) | VALUE |
| Bank of America, NA | The Fund receives the total return on a portfolio of long equity positions and pays or receives the net of one day SONIA on long positions, plus or minus a specified spread (rates range from 0.00% to 0.15% ), which is denominated in GBP based on the local currencies of the positions within the swaps. | 04/28/2023 | $— | $— | $108 | $108 |
| The following reference rates, and their values as of period-end, are used for security descriptions: | Value |
| ESTR | (0.59) |
| SONIA | 0.69 |
| Abbreviations | |
| ESTR | Euro Short-Term Rate |
| EUR | Euro |
| GBP | British Pound |
| SONIA | Sterling Overnight Index Average |
| (1) | Notional value represents market value as of April 30, 2022 of these positions based on the securities’ last sale or closing price on the principal exchange on which the securities are traded. |
| (2) | Unrealized appreciation (depreciation) represents the unrealized gain (loss) of the positions subsequent to the swap reset. |
| NET UPFRONT PAYMENTS RECEIPTS ($) | VALUE ($) | ||
| Assets | |||
| OTC Total return basket swap contracts outstanding | — | 544 |
| 50 | J.P. Morgan Funds | April 30, 2022 |
| INVESTMENTS | SHARES (000) | VALUE ($000) |
| Common Stocks — 38.7% | ||
| Australia — 0.9% | ||
| Adbri Ltd. | 743 | 1,517 |
| AGL Energy Ltd. | 1,711 | 10,401 |
| Alumina Ltd. | 2,568 | 3,233 |
| APA Group | 386 | 3,103 |
| Atlas Arteria Ltd. | 246 | 1,195 |
| Bendigo & Adelaide Bank Ltd. | 481 | 3,589 |
| BHP Group Ltd. | 589 | 19,745 |
| Charter Hall Long Wale, REIT | 1,011 | 3,793 |
| CSR Ltd. | 860 | 3,682 |
| Dexus, REIT | 676 | 5,285 |
| Glencore plc * | 1,269 | 7,818 |
| Goodman Group, REIT | 352 | 5,865 |
| Insignia Financial Ltd. | 1,675 | 4,026 |
| Mirvac Group, REIT | 2,217 | 3,747 |
| Rio Tinto plc | 244 | 17,219 |
| Sonic Healthcare Ltd. | 142 | 3,658 |
| Telstra Corp. Ltd. | 1,009 | 2,865 |
| Woodside Petroleum Ltd. | 217 | 4,717 |
| 105,458 | ||
| Austria — 0.1% | ||
| ANDRITZ AG | 40 | 1,716 |
| Erste Group Bank AG | 66 | 2,045 |
| Mondi plc | 158 | 2,971 |
| OMV AG | 66 | 3,362 |
| 10,094 | ||
| Belgium — 0.2% | ||
| Ageas SA | 62 | 2,968 |
| Cofinimmo SA, REIT | 30 | 4,004 |
| Euronav NV | 120 | 1,383 |
| KBC Group NV | 35 | 2,385 |
| Proximus SADP | 142 | 2,482 |
| Shurgard Self Storage SA | 50 | 2,911 |
| Telenet Group Holding NV | 54 | 1,611 |
| Warehouses De Pauw CVA | 107 | 4,134 |
| 21,878 | ||
| Brazil — 0.2% | ||
| B3 SA - Brasil Bolsa Balcao | 5,057 | 13,603 |
| BB Seguridade Participacoes SA | 705 | 3,602 |
| Itau Unibanco Holding SA (Preference) * | 1,127 | 5,456 |
| Yara International ASA | 78 | 3,971 |
| 26,632 | ||
| INVESTMENTS | SHARES (000) | VALUE ($000) |
| Canada — 2.3% | ||
| Algonquin Power & Utilities Corp. (a) | 217 | 3,143 |
| Allied Properties, REIT | 149 | 4,836 |
| Atco Ltd., Class I | 80 | 2,838 |
| Bank of Nova Scotia (The) | 94 | 5,925 |
| Barrick Gold Corp. | 361 | 8,058 |
| BCE, Inc. | 219 | 11,637 |
| Canadian Apartment Properties, REIT | 115 | 4,491 |
| Canadian Imperial Bank of Commerce | 71 | 7,872 |
| Canadian National Railway Co. | 131 | 15,444 |
| Canadian Tire Corp. Ltd., Class A | 27 | 3,690 |
| Canadian Utilities Ltd., Class A | 373 | 11,203 |
| Capital Power Corp. (a) | 87 | 2,866 |
| Chartwell Retirement Residences | 186 | 1,769 |
| Emera, Inc. | 69 | 3,335 |
| Enbridge, Inc. | 273 | 11,938 |
| Fortis, Inc. | 243 | 11,833 |
| Gibson Energy, Inc. (a) | 147 | 2,800 |
| Great-West Lifeco, Inc. (a) | 279 | 7,686 |
| Hydro One Ltd. (a) (b) | 431 | 11,656 |
| IGM Financial, Inc. (a) | 194 | 6,143 |
| Keyera Corp. | 137 | 3,388 |
| Manulife Financial Corp. | 409 | 7,999 |
| Northland Power, Inc. | 88 | 2,644 |
| Nutrien Ltd. | 93 | 9,143 |
| Pembina Pipeline Corp. | 343 | 12,988 |
| Power Corp. of Canada (a) | 262 | 7,704 |
| Restaurant Brands International, Inc. (a) | 136 | 7,744 |
| Rogers Communications, Inc., Class B | 162 | 8,849 |
| Shaw Communications, Inc., Class B | 296 | 8,821 |
| Sienna Senior Living, Inc. | 225 | 2,429 |
| Superior Plus Corp. | 287 | 2,530 |
| TC Energy Corp. | 587 | 31,064 |
| TELUS Corp. | 475 | 11,895 |
| Thomson Reuters Corp. | 19 | 1,955 |
| Toronto-Dominion Bank (The) | 206 | 14,877 |
| TransAlta Renewables, Inc. | 182 | 2,527 |
| 275,720 | ||
| Cayman Islands — 0.0% ^ | ||
| Telford Offshore Holdings Ltd. ‡ * | 58 | — |
| Chile — 0.0% ^ | ||
| Banco Santander Chile, ADR | 233 | 4,539 |
| April 30, 2022 | J.P. Morgan Funds | 51 |
| INVESTMENTS | SHARES (000) | VALUE ($000) |
| Common Stocks — continued | ||
| China — 1.6% | ||
| China Construction Bank Corp., Class H | 30,576 | 21,782 |
| China Merchants Bank Co. Ltd., Class H | 2,481 | 14,954 |
| China Pacific Insurance Group Co. Ltd., Class H | 4,012 | 8,894 |
| China Petroleum & Chemical Corp., Class H | 15,844 | 7,755 |
| China Resources Land Ltd. | 2,362 | 10,549 |
| Fuyao Glass Industry Group Co. Ltd., Class A | 379 | 2,009 |
| Fuyao Glass Industry Group Co. Ltd., Class H (b) | 684 | 2,795 |
| Guangdong Investment Ltd. | 3,818 | 4,888 |
| Haier Smart Home Co. Ltd., Class H | 4,464 | 15,770 |
| Huayu Automotive Systems Co. Ltd., Class A | 2,327 | 6,805 |
| Inner Mongolia Yili Industrial Group Co. Ltd., Class A | 2,682 | 15,453 |
| Jiangsu Yanghe Brewery Joint-Stock Co. Ltd., Class A | 31 | 731 |
| Joyoung Co. Ltd., Class A | 1,049 | 2,364 |
| Midea Group Co. Ltd., Class A | 1,287 | 10,951 |
| NetEase, Inc. | 782 | 14,981 |
| Ping An Insurance Group Co. of China Ltd., Class H | 1,688 | 10,673 |
| Postal Savings Bank of China Co. Ltd., Class H (b) | 13,148 | 9,969 |
| Tingyi Cayman Islands Holding Corp. | 6,470 | 11,809 |
| Topsports International Holdings Ltd. (b) | 4,359 | 3,334 |
| Wilmar International Ltd. | 1,444 | 4,602 |
| Xinyi Solar Holdings Ltd. | 3,256 | 4,840 |
| Yum China Holdings, Inc. | 94 | 3,914 |
| Zhejiang Supor Co. Ltd., Class A | 791 | 6,527 |
| 196,349 | ||
| Denmark — 0.5% | ||
| AP Moller - Maersk A/S, Class B | 1 | 3,160 |
| Carlsberg A/S, Class B | 119 | 15,139 |
| D/S Norden A/S | 19 | 709 |
| Novo Nordisk A/S, Class B | 313 | 35,705 |
| Topdanmark A/S | 34 | 1,931 |
| 56,644 | ||
| Finland — 0.3% | ||
| Elisa OYJ | 119 | 6,966 |
| Fortum OYJ | 130 | 2,166 |
| Nordea Bank Abp | 1,748 | 17,425 |
| Orion OYJ, Class B | 172 | 6,769 |
| INVESTMENTS | SHARES (000) | VALUE ($000) |
| Finland — continued | ||
| Sampo OYJ, Class A | 69 | 3,359 |
| Wartsila OYJ Abp | 492 | 3,948 |
| 40,633 | ||
| France — 1.4% | ||
| Amundi SA (b) | 30 | 1,806 |
| Atos SE | 46 | 1,123 |
| AXA SA | 204 | 5,388 |
| BNP Paribas SA | 86 | 4,475 |
| Capgemini SE | 41 | 8,411 |
| Carrefour SA | 120 | 2,543 |
| Cie de Saint-Gobain | 81 | 4,703 |
| Covivio, REIT | 45 | 3,200 |
| Credit Agricole SA | 731 | 7,895 |
| Danone SA | 126 | 7,594 |
| Electricite de France SA | 264 | 2,403 |
| Engie SA | 540 | 6,377 |
| Eutelsat Communications SA | 231 | 2,562 |
| Gaztransport Et Technigaz SA | 30 | 3,567 |
| Klepierre SA, REIT * | 376 | 8,990 |
| L'Oreal SA | 24 | 8,737 |
| LVMH Moet Hennessy Louis Vuitton SE | 31 | 20,174 |
| Orange SA | 661 | 7,872 |
| Publicis Groupe SA | 75 | 4,507 |
| Rexel SA * | 132 | 2,702 |
| Rubis SCA | 90 | 2,382 |
| Sanofi | 43 | 4,551 |
| Societe Generale SA | 137 | 3,296 |
| TotalEnergies SE | 329 | 16,140 |
| Vinci SA | 250 | 24,274 |
| Vivendi SE | 385 | 4,428 |
| 170,100 | ||
| Germany — 1.4% | ||
| Allianz SE (Registered) | 147 | 33,271 |
| Aroundtown SA | 741 | 3,728 |
| BASF SE * | 197 | 10,359 |
| Bayerische Motoren Werke AG | 58 | 4,742 |
| Daimler Truck Holding AG * | 44 | 1,170 |
| Deutsche Post AG (Registered) | 438 | 18,732 |
| Deutsche Telekom AG (Registered) | 782 | 14,407 |
| E.ON SE | 263 | 2,739 |
| Evonik Industries AG | 88 | 2,307 |
| Freenet AG | 245 | 6,776 |
| LEG Immobilien SE | 34 | 3,451 |
| 52 | J.P. Morgan Funds | April 30, 2022 |
| INVESTMENTS | SHARES (000) | VALUE ($000) |
| Common Stocks — continued | ||
| Germany — continued | ||
| Mercedes-Benz Group AG * | 97 | 6,804 |
| Muenchener Rueckversicherungs-Gesellschaft AG (Registered) | 75 | 17,741 |
| RWE AG | 68 | 2,808 |
| Siemens AG (Registered) | 69 | 8,442 |
| Telefonica Deutschland Holding AG | 4,056 | 12,198 |
| Uniper SE | 95 | 2,438 |
| Vonovia SE * | 302 | 12,034 |
| 164,147 | ||
| Hong Kong — 0.5% | ||
| CK Asset Holdings Ltd. | 559 | 3,790 |
| CK Infrastructure Holdings Ltd. | 440 | 2,958 |
| CLP Holdings Ltd. | 323 | 3,152 |
| Hang Seng Bank Ltd. | 395 | 6,994 |
| HK Electric Investments & HK Electric Investments Ltd. (b) | 782 | 772 |
| HKBN Ltd. | 2,050 | 2,395 |
| HKT Trust & HKT Ltd. | 5,366 | 7,700 |
| Hong Kong Exchanges & Clearing Ltd. | 274 | 11,614 |
| New World Development Co. Ltd. | 980 | 3,748 |
| PCCW Ltd. | 5,003 | 2,834 |
| Power Assets Holdings Ltd. | 511 | 3,442 |
| VTech Holdings Ltd. | 454 | 3,210 |
| WH Group Ltd. (b) | 3,477 | 2,401 |
| Xinyi Glass Holdings Ltd. | 3,100 | 6,860 |
| Yue Yuen Industrial Holdings Ltd. * | 1,739 | 2,558 |
| 64,428 | ||
| India — 0.4% | ||
| Embassy Office Parks, REIT | 952 | 4,780 |
| HCL Technologies Ltd. | 308 | 4,308 |
| Infosys Ltd., ADR | 1,435 | 28,516 |
| Tata Consultancy Services Ltd. | 318 | 14,675 |
| 52,279 | ||
| Indonesia — 0.3% | ||
| Bank Rakyat Indonesia Persero Tbk. PT | 56,053 | 18,676 |
| Telkom Indonesia Persero Tbk. PT | 57,052 | 18,182 |
| 36,858 | ||
| Ireland — 0.0% ^ | ||
| Smurfit Kappa Group plc | 72 | 3,039 |
| Italy — 0.6% | ||
| A2A SpA | 4,512 | 7,710 |
| ACEA SpA | 86 | 1,478 |
| INVESTMENTS | SHARES (000) | VALUE ($000) |
| Italy — continued | ||
| Assicurazioni Generali SpA | 401 | 7,603 |
| Banca Generali SpA | 79 | 2,600 |
| Banca Mediolanum SpA | 744 | 5,398 |
| Enel SpA | 1,204 | 7,828 |
| Eni SpA | 395 | 5,517 |
| ERG SpA | 32 | 1,098 |
| Hera SpA | 557 | 2,077 |
| Intesa Sanpaolo SpA | 5,132 | 10,458 |
| Iren SpA | 1,040 | 2,689 |
| Italgas SpA | 431 | 2,794 |
| Mediobanca Banca di Credito Finanziario SpA | 259 | 2,596 |
| Poste Italiane SpA (b) | 263 | 2,580 |
| Snam SpA | 562 | 3,081 |
| Terna - Rete Elettrica Nazionale | 424 | 3,457 |
| UniCredit SpA | 316 | 2,926 |
| Unipol Gruppo SpA | 264 | 1,438 |
| 73,328 | ||
| Japan — 1.9% | ||
| Aozora Bank Ltd. | 260 | 5,201 |
| ARTERIA Networks Corp. | 160 | 1,643 |
| Bridgestone Corp. | 397 | 14,548 |
| Chubu Electric Power Co., Inc. | 282 | 2,844 |
| Chugoku Electric Power Co., Inc. (The) | 351 | 2,313 |
| Dai Nippon Printing Co. Ltd. | 183 | 3,822 |
| Daiwa House Industry Co. Ltd. | 101 | 2,426 |
| Daiwa House REIT Investment Corp., REIT | 1 | 3,215 |
| Electric Power Development Co. Ltd. | 486 | 6,664 |
| ENEOS Holdings, Inc. | 1,009 | 3,551 |
| FANUC Corp. | 67 | 10,205 |
| Frontier Real Estate Investment Corp., REIT | 1 | 2,464 |
| Hokkaido Electric Power Co., Inc. | 545 | 2,023 |
| Honda Motor Co. Ltd. | 371 | 9,772 |
| Idemitsu Kosan Co. Ltd. | 163 | 4,291 |
| Japan Metropolitan Fund Invest, REIT | 12 | 9,481 |
| Japan Post Holdings Co. Ltd. | 865 | 6,069 |
| Japan Tobacco, Inc. | 277 | 4,714 |
| Kansai Electric Power Co., Inc. (The) | 780 | 6,840 |
| KDDI Corp. | 169 | 5,596 |
| Konica Minolta, Inc. | 1,255 | 4,367 |
| Kyushu Railway Co. | 217 | 4,253 |
| Mitsubishi Chemical Holdings Corp. | 1,177 | 7,176 |
| Mitsui Fudosan Logistics Park, Inc., REIT | 1 | 2,637 |
| Nippon Accommodations Fund, Inc., REIT | 1 | 4,067 |
| April 30, 2022 | J.P. Morgan Funds | 53 |
| INVESTMENTS | SHARES (000) | VALUE ($000) |
| Common Stocks — continued | ||
| Japan — continued | ||
| Nippon Building Fund, Inc., REIT | 1 | 4,423 |
| Nippon Prologis REIT, Inc., REIT | 2 | 4,736 |
| Nippon Telegraph & Telephone Corp. | 281 | 8,290 |
| Okinawa Electric Power Co., Inc. (The) | 131 | 1,303 |
| Osaka Gas Co. Ltd. | 43 | 770 |
| Shikoku Electric Power Co., Inc. | 111 | 641 |
| Shin-Etsu Chemical Co. Ltd. | 95 | 13,015 |
| SoftBank Corp. | 845 | 9,833 |
| Sumitomo Forestry Co. Ltd. | 104 | 1,597 |
| Takeda Pharmaceutical Co. Ltd. | 224 | 6,508 |
| Tohoku Electric Power Co., Inc. | 1,072 | 5,964 |
| Tokio Marine Holdings, Inc. | 200 | 10,814 |
| Tokyo Electron Ltd. | 20 | 8,312 |
| Tokyo Gas Co. Ltd. | 100 | 1,910 |
| Toyota Motor Corp. | 664 | 11,372 |
| United Urban Investment Corp., REIT | 2 | 2,078 |
| 221,748 | ||
| Luxembourg — 0.1% | ||
| APERAM SA | 39 | 1,496 |
| Intelsat SA ‡ * | 270 | 8,430 |
| 9,926 | ||
| Mexico — 0.4% | ||
| Bolsa Mexicana de Valores SAB de CV | 552 | 1,106 |
| Grupo Financiero Banorte SAB de CV, Class O | 3,034 | 19,999 |
| Kimberly-Clark de Mexico SAB de CV, Class A | 2,171 | 3,021 |
| Wal-Mart de Mexico SAB de CV | 6,447 | 22,850 |
| 46,976 | ||
| Netherlands — 0.5% | ||
| ASML Holding NV | 22 | 12,655 |
| ASR Nederland NV | 56 | 2,536 |
| BE Semiconductor Industries NV | 39 | 2,387 |
| CTP NV (b) | 279 | 3,951 |
| Eurocommercial Properties NV, REIT | 34 | 823 |
| Flow Traders (b) | 39 | 1,262 |
| ING Groep NV | 370 | 3,503 |
| Koninklijke Ahold Delhaize NV | 152 | 4,477 |
| Koninklijke KPN NV | 1,649 | 5,689 |
| NN Group NV | 59 | 2,878 |
| OCI NV * | 75 | 2,847 |
| PostNL NV | 747 | 2,449 |
| Randstad NV | 56 | 2,989 |
| INVESTMENTS | SHARES (000) | VALUE ($000) |
| Netherlands — continued | ||
| Shell plc | 260 | 6,978 |
| Signify NV (b) | 48 | 2,023 |
| 57,447 | ||
| New Zealand — 0.1% | ||
| Contact Energy Ltd. | 1,046 | 5,499 |
| Spark New Zealand Ltd. | 2,549 | 8,061 |
| 13,560 | ||
| Norway — 0.3% | ||
| Aker BP ASA | 105 | 3,768 |
| DNB Bank ASA | 315 | 6,095 |
| Elmera Group ASA (b) | 408 | 921 |
| Equinor ASA | 157 | 5,318 |
| FLEX LNG Ltd. | 34 | 968 |
| Gjensidige Forsikring ASA | 138 | 2,944 |
| Norsk Hydro ASA | 510 | 4,279 |
| SFL Corp. Ltd. | 313 | 3,109 |
| Telenor ASA | 676 | 9,536 |
| 36,938 | ||
| Poland — 0.1% | ||
| Powszechny Zaklad Ubezpieczen SA | 848 | 5,863 |
| Portugal — 0.1% | ||
| EDP - Energias de Portugal SA | 535 | 2,494 |
| Galp Energia SGPS SA | 311 | 3,777 |
| Jeronimo Martins SGPS SA | 175 | 3,646 |
| NOS SGPS SA | 676 | 2,857 |
| REN - Redes Energeticas Nacionais SGPS SA | 445 | 1,358 |
| 14,132 | ||
| Russia — 0.0% ^ | ||
| Moscow Exchange MICEX-RTS PJSC ‡ | 2,552 | 61 |
| Severstal PAO, GDR ‡ (b) | 10 | 3 |
| Severstal PAO, GDR ‡ (b) | 132 | 42 |
| 106 | ||
| Saudi Arabia — 0.1% | ||
| Al Rajhi Bank | 243 | 11,387 |
| Singapore — 0.3% | ||
| Ascendas, REIT | 1,524 | 3,135 |
| BW LPG Ltd. (b) | 536 | 3,373 |
| CapitaLand Integrated Commercial Trust, REIT | 4,859 | 8,142 |
| DBS Group Holdings Ltd. | 474 | 11,492 |
| 54 | J.P. Morgan Funds | April 30, 2022 |
| INVESTMENTS | SHARES (000) | VALUE ($000) |
| Common Stocks — continued | ||
| Singapore — continued | ||
| Digital Core REIT Management Pte. Ltd., REIT * | 2,781 | 2,757 |
| Keppel Infrastructure Trust | 4,647 | 1,856 |
| NetLink NBN Trust (b) | 3,677 | 2,659 |
| Singapore Telecommunications Ltd. | 1,563 | 3,120 |
| StarHub Ltd. | 1,690 | 1,533 |
| 38,067 | ||
| South Africa — 0.2% | ||
| Anglo American plc | 207 | 9,145 |
| AVI Ltd. | 272 | 1,183 |
| Bid Corp. Ltd. | 159 | 3,324 |
| Sanlam Ltd. | 685 | 2,839 |
| SPAR Group Ltd. (The) | 101 | 1,061 |
| Vodacom Group Ltd. | 663 | 6,384 |
| 23,936 | ||
| South Korea — 0.5% | ||
| ESR Kendall Square REIT Co. Ltd., REIT | 791 | 4,614 |
| Korea Electric Power Corp. * | 139 | 2,542 |
| Korea Gas Corp. | 80 | 2,625 |
| LG Uplus Corp. | 236 | 2,602 |
| NCSoft Corp. | 9 | 3,107 |
| Samsung Electronics Co. Ltd. | 876 | 46,681 |
| SK Telecom Co. Ltd., ADR | 110 | 2,752 |
| 64,923 | ||
| Spain — 1.1% | ||
| Acerinox SA | 192 | 2,024 |
| Atlantica Sustainable Infrastructure plc | 76 | 2,351 |
| Banco Bilbao Vizcaya Argentaria SA | 1,113 | 5,840 |
| Banco Santander SA | 1,685 | 4,924 |
| Cellnex Telecom SA (b) | 117 | 5,451 |
| Cia de Distribucion Integral Logista Holdings SA | 120 | 2,204 |
| Enagas SA | 514 | 11,123 |
| Endesa SA | 512 | 10,739 |
| Iberdrola SA | 2,366 | 27,188 |
| Mapfre SA | 886 | 1,617 |
| Merlin Properties Socimi SA, REIT | 247 | 2,682 |
| Naturgy Energy Group SA (a) | 512 | 15,398 |
| Red Electrica Corp. SA | 365 | 7,350 |
| Repsol SA | 1,014 | 15,120 |
| Telefonica SA | 3,009 | 14,639 |
| 128,650 | ||
| INVESTMENTS | SHARES (000) | VALUE ($000) |
| Sweden — 0.5% | ||
| Boliden AB | 127 | 5,505 |
| Lundin Energy AB | 90 | 3,723 |
| Skandinaviska Enskilda Banken AB, Class A | 293 | 3,291 |
| SSAB AB, Class B | 452 | 2,655 |
| Svenska Handelsbanken AB, Class A | 313 | 3,157 |
| Tele2 AB, Class B | 957 | 12,679 |
| Telia Co. AB | 1,976 | 8,200 |
| Thule Group AB (b) | 38 | 1,330 |
| Volvo AB, Class B (a) | 1,409 | 22,483 |
| 63,023 | ||
| Switzerland — 1.5% | ||
| ABB Ltd. (Registered) | 221 | 6,640 |
| Nestle SA (Registered) | 443 | 57,267 |
| Novartis AG (Registered) | 230 | 20,319 |
| OC Oerlikon Corp. AG (Registered) | 615 | 4,383 |
| Roche Holding AG | 166 | 61,428 |
| Swiss Life Holding AG (Registered) | 3 | 1,902 |
| Swisscom AG (Registered) | 5 | 2,915 |
| UBS Group AG (Registered) | 369 | 6,258 |
| Zurich Insurance Group AG | 54 | 24,410 |
| 185,522 | ||
| Taiwan — 1.0% | ||
| Accton Technology Corp. | 369 | 2,878 |
| ASE Technology Holding Co. Ltd. | 1,977 | 6,307 |
| Chailease Holding Co. Ltd. | 548 | 4,353 |
| Chicony Electronics Co. Ltd. * | 342 | 950 |
| Delta Electronics, Inc. | 506 | 4,226 |
| MediaTek, Inc. | 205 | 5,651 |
| Mega Financial Holding Co. Ltd. | 4,172 | 5,865 |
| Novatek Microelectronics Corp. | 705 | 9,326 |
| President Chain Store Corp. | 808 | 7,476 |
| Quanta Computer, Inc. | 2,441 | 6,875 |
| Realtek Semiconductor Corp. | 468 | 6,351 |
| Taiwan Semiconductor Manufacturing Co. Ltd. | 2,686 | 48,570 |
| Taiwan Semiconductor Manufacturing Co. Ltd., ADR | 53 | 5,006 |
| Vanguard International Semiconductor Corp. | 1,342 | 4,722 |
| Wiwynn Corp. | 141 | 4,822 |
| 123,378 | ||
| Thailand — 0.1% | ||
| Siam Cement PCL (The) (Registered) | 500 | 5,373 |
| April 30, 2022 | J.P. Morgan Funds | 55 |
| INVESTMENTS | SHARES (000) | VALUE ($000) |
| Common Stocks — continued | ||
| United Kingdom — 2.2% | ||
| 3i Group plc | 239 | 3,915 |
| Admiral Group plc | 73 | 2,312 |
| Aviva plc | 767 | 4,113 |
| Barclays plc | 2,970 | 5,460 |
| Barratt Developments plc | 1,234 | 7,550 |
| Berkeley Group Holdings plc * | 66 | 3,345 |
| BP plc | 3,506 | 16,926 |
| Centrica plc * | 2,867 | 2,840 |
| Coca-Cola Europacific Partners plc | 88 | 4,387 |
| Diageo plc | 223 | 11,104 |
| Direct Line Insurance Group plc | 2,231 | 7,080 |
| Drax Group plc | 258 | 2,612 |
| Dunelm Group plc | 122 | 1,489 |
| Grafton Group plc | 94 | 1,145 |
| Hays plc | 1,574 | 2,418 |
| Howden Joinery Group plc | 304 | 2,882 |
| HSBC Holdings plc | 1,623 | 10,140 |
| IG Group Holdings plc | 90 | 924 |
| Imperial Brands plc | 375 | 7,805 |
| InterContinental Hotels Group plc | 160 | 10,205 |
| Intermediate Capital Group plc | 118 | 2,266 |
| J Sainsbury plc | 220 | 641 |
| Johnson Matthey plc | 42 | 1,156 |
| Legal & General Group plc | 1,160 | 3,615 |
| Lloyds Banking Group plc | 8,887 | 5,048 |
| LondonMetric Property plc, REIT | 1,024 | 3,460 |
| Man Group plc | 1,358 | 3,957 |
| National Grid plc | 705 | 10,473 |
| NatWest Group plc | 1,178 | 3,161 |
| OSB Group plc | 330 | 2,307 |
| Pagegroup plc | 273 | 1,668 |
| Pennon Group plc | 160 | 2,225 |
| Persimmon plc | 320 | 8,346 |
| QinetiQ Group plc | 496 | 2,103 |
| RELX plc | 740 | 22,038 |
| Safestore Holdings plc, REIT | 250 | 3,933 |
| Sage Group plc (The) | 1,126 | 10,334 |
| Schroders plc | 15 | 546 |
| Severn Trent plc | 85 | 3,336 |
| SSE plc | 727 | 16,886 |
| St James's Place plc | 207 | 3,320 |
| Taylor Wimpey plc | 3,299 | 5,188 |
| Tesco plc | 1,069 | 3,631 |
| Tritax EuroBox plc (b) | 1,566 | 1,999 |
| INVESTMENTS | SHARES (000) | VALUE ($000) |
| United Kingdom — continued | ||
| Unilever plc | 124 | 5,750 |
| UNITE Group plc (The), REIT | 211 | 2,991 |
| United Utilities Group plc | 391 | 5,621 |
| Vodafone Group plc | 5,495 | 8,319 |
| WPP plc | 643 | 8,012 |
| 260,982 | ||
| United States — 17.0% | ||
| 3M Co. | 53 | 7,689 |
| Abbott Laboratories | 12 | 1,329 |
| AbbVie, Inc. | 385 | 56,594 |
| Accenture plc, Class A | 6 | 1,646 |
| AGNC Investment Corp., REIT | 599 | 6,572 |
| Air Products and Chemicals, Inc. | 12 | 2,731 |
| Alexandria Real Estate Equities, Inc., REIT | 66 | 12,071 |
| Alliant Energy Corp. | 55 | 3,243 |
| American Electric Power Co., Inc. | 76 | 7,561 |
| American Express Co. | 16 | 2,745 |
| American Tower Corp., REIT | 46 | 11,132 |
| Americold Realty Trust, REIT | 228 | 6,023 |
| Amgen, Inc. | 31 | 7,196 |
| Analog Devices, Inc. | 154 | 23,711 |
| Annaly Capital Management, Inc., REIT | 1,094 | 7,021 |
| Apple, Inc. | 7 | 1,087 |
| Arthur J Gallagher & Co. | 16 | 2,615 |
| AT&T, Inc. | 431 | 8,134 |
| AvalonBay Communities, Inc. | 41 | 9,266 |
| Avangrid, Inc. | 103 | 4,556 |
| Avast plc (b) | 385 | 2,728 |
| Avista Corp. | 69 | 2,801 |
| Baker Hughes Co. | 246 | 7,645 |
| Bank of America Corp. | 559 | 19,944 |
| Battalion Oil Corp. * | 5 | 100 |
| Boston Properties, Inc., REIT | 68 | 7,947 |
| Brandywine Realty Trust, REIT | 480 | 5,598 |
| Bristol-Myers Squibb Co. | 676 | 50,893 |
| Brixmor Property Group, Inc., REIT | 297 | 7,540 |
| Bunge Ltd. | 88 | 9,951 |
| Camden Property Trust, REIT | 55 | 8,567 |
| Campbell Soup Co. | 186 | 8,801 |
| Cardinal Health, Inc. | 158 | 9,178 |
| CenterPoint Energy, Inc. | 533 | 16,300 |
| CF Industries Holdings, Inc. | 97 | 9,382 |
| Chesapeake Energy Corp. (a) | 16 | 1,329 |
| 56 | J.P. Morgan Funds | April 30, 2022 |
| INVESTMENTS | SHARES (000) | VALUE ($000) |
| Common Stocks — continued | ||
| United States — continued | ||
| Chevron Corp. | 150 | 23,455 |
| Chubb Ltd. | 22 | 4,624 |
| Cisco Systems, Inc. | 146 | 7,147 |
| Citigroup, Inc. | 42 | 2,040 |
| Claire's Stores, Inc. ‡ * | 4 | 1,413 |
| Clear Channel Outdoor Holdings, Inc. * | 287 | 706 |
| Clearway Energy, Inc., Class C | 71 | 2,162 |
| Clorox Co. (The) | 56 | 8,049 |
| CME Group, Inc. | 94 | 20,649 |
| CMS Energy Corp. | 38 | 2,577 |
| Coca-Cola Co. (The) | 946 | 61,142 |
| Cogent Communications Holdings, Inc. | 41 | 2,383 |
| Comcast Corp., Class A | 680 | 27,036 |
| Comerica, Inc. | 97 | 7,944 |
| Conagra Brands, Inc. | 249 | 8,703 |
| ConocoPhillips | 55 | 5,256 |
| Consolidated Edison, Inc. | 104 | 9,636 |
| Crown Castle International Corp., REIT | 16 | 2,931 |
| Cummins, Inc. | 18 | 3,489 |
| CVS Health Corp. | 37 | 3,508 |
| Deere & Co. | 7 | 2,456 |
| Digital Realty Trust, Inc., REIT | 57 | 8,314 |
| Douglas Emmett, Inc., REIT | 219 | 6,443 |
| Dover Corp. | 23 | 3,027 |
| Dow, Inc. | 140 | 9,315 |
| Duke Energy Corp. | 112 | 12,328 |
| Eastman Chemical Co. | 216 | 22,182 |
| Eaton Corp. plc | 122 | 17,687 |
| Edison International | 130 | 8,958 |
| Eli Lilly & Co. | 8 | 2,318 |
| Emerson Electric Co. | 84 | 7,596 |
| Entergy Corp. | 75 | 8,910 |
| EOG Resources, Inc. | 69 | 8,097 |
| EP Energy Corp. * | 141 | 1,164 |
| Equinix, Inc., REIT | 44 | 31,693 |
| Equitrans Midstream Corp. | 337 | 2,650 |
| Equity LifeStyle Properties, Inc. | 101 | 7,781 |
| Essex Property Trust, Inc., REIT | 25 | 8,377 |
| Evergy, Inc. | 174 | 11,780 |
| Exelon Corp. | 136 | 6,381 |
| Exxon Mobil Corp. | 148 | 12,616 |
| Fastenal Co. | 135 | 7,482 |
| Federal Realty Investment Trust, REIT | 125 | 14,654 |
| Fidelity National Information Services, Inc. | 15 | 1,436 |
| INVESTMENTS | SHARES (000) | VALUE ($000) |
| United States — continued | ||
| FirstEnergy Corp. | 77 | 3,317 |
| Frontier Communications Parent, Inc. * | 218 | 5,754 |
| General Dynamics Corp. | 57 | 13,382 |
| General Mills, Inc. | 128 | 9,027 |
| Genuine Parts Co. | 66 | 8,582 |
| Gilead Sciences, Inc. | 116 | 6,875 |
| GlaxoSmithKline plc | 916 | 20,646 |
| Goodman Networks, Inc. ‡ * | 54 | — |
| Gulfport Energy Corp. * | 124 | 11,669 |
| Hasbro, Inc. | 75 | 6,588 |
| Hawaiian Electric Industries, Inc. | 78 | 3,207 |
| Healthpeak Properties, Inc., REIT | 239 | 7,825 |
| Hewlett Packard Enterprise Co. | 540 | 8,328 |
| Home Depot, Inc. (The) | 15 | 4,368 |
| Host Hotels & Resorts, Inc., REIT | 709 | 14,427 |
| HP, Inc. | 231 | 8,461 |
| iHeartMedia, Inc., Class A * | 122 | 1,952 |
| Intel Corp. | 77 | 3,355 |
| International Business Machines Corp. | 81 | 10,712 |
| International Paper Co. | 176 | 8,131 |
| Interpublic Group of Cos., Inc. (The) | 176 | 5,737 |
| Invitation Homes, Inc. | 318 | 12,676 |
| Iron Mountain, Inc., REIT | 185 | 9,917 |
| J M Smucker Co. (The) | 39 | 5,401 |
| Johnson & Johnson | 390 | 70,462 |
| Juniper Networks, Inc. | 261 | 8,221 |
| Kellogg Co. | 130 | 8,916 |
| Kilroy Realty Corp., REIT | 95 | 6,615 |
| Kimberly-Clark Corp. | 65 | 9,085 |
| Kimco Realty Corp., REIT | 559 | 14,155 |
| Kinder Morgan, Inc. | 639 | 11,590 |
| Kraft Heinz Co. (The) | 221 | 9,439 |
| Lumen Technologies, Inc. | 855 | 8,601 |
| LyondellBasell Industries NV, Class A | 85 | 9,021 |
| Marathon Petroleum Corp. | 115 | 10,058 |
| McDonald's Corp. | 169 | 42,216 |
| Medtronic plc | 35 | 3,688 |
| Merck & Co., Inc. | 467 | 41,411 |
| Microsoft Corp. | 11 | 3,181 |
| Mondelez International, Inc., Class A | 62 | 3,976 |
| Moran Foods Backstop Equity ‡ * | 148 | 83 |
| Motorola Solutions, Inc. | 7 | 1,486 |
| MYT Holding Co. ‡ * | 1,342 | 1,331 |
| National HealthCare Corp. | 25 | 1,675 |
| April 30, 2022 | J.P. Morgan Funds | 57 |
| INVESTMENTS | SHARES (000) | VALUE ($000) |
| Common Stocks — continued | ||
| United States — continued | ||
| National Retail Properties, Inc., REIT | 118 | 5,162 |
| Neiman Marcus Group Restricted Equity * | 4 | 855 |
| NetApp, Inc. | 96 | 7,067 |
| Newell Brands, Inc. | 353 | 8,176 |
| Newmont Corp. | 40 | 2,920 |
| NextEra Energy, Inc. | 308 | 21,867 |
| NiSource, Inc. | 63 | 1,825 |
| NMG, Inc. * (a) | 41 | 8,061 |
| Norfolk Southern Corp. | 49 | 12,710 |
| Northern Trust Corp. | 18 | 1,849 |
| Northrop Grumman Corp. | 6 | 2,677 |
| NorthWestern Corp. | 54 | 3,067 |
| NortonLifeLock, Inc. | 218 | 5,452 |
| NRG Energy, Inc. | 73 | 2,619 |
| Oasis Petroleum, Inc. | 96 | 12,746 |
| Omnicom Group, Inc. | 109 | 8,325 |
| ONEOK, Inc. | 179 | 11,341 |
| PACCAR, Inc. | 89 | 7,406 |
| Park Hotels & Resorts, Inc., REIT | 271 | 5,349 |
| Parker-Hannifin Corp. | 9 | 2,509 |
| PepsiCo, Inc. | 128 | 21,909 |
| Pfizer, Inc. | 27 | 1,348 |
| Philip Morris International, Inc. | 162 | 16,241 |
| Phillips 66 | 115 | 9,958 |
| Pinnacle West Capital Corp. | 156 | 11,121 |
| Pioneer Natural Resources Co. | 33 | 7,665 |
| PNC Financial Services Group, Inc. (The) | 26 | 4,312 |
| PPG Industries, Inc. | 21 | 2,746 |
| PPL Corp. | 373 | 10,556 |
| Procter & Gamble Co. (The) | 323 | 51,831 |
| Progressive Corp. (The) | 250 | 26,797 |
| Prologis, Inc., REIT | 256 | 41,089 |
| Public Service Enterprise Group, Inc. | 49 | 3,446 |
| Public Storage, REIT | 52 | 19,252 |
| Raytheon Technologies Corp. | 138 | 13,107 |
| Realty Income Corp. | 118 | 8,201 |
| Regency Centers Corp., REIT | 117 | 8,063 |
| Republic Services, Inc. | 12 | 1,658 |
| Rexford Industrial Realty, Inc., REIT | 74 | 5,798 |
| Schneider Electric SE | 36 | 5,122 |
| Seagate Technology Holdings plc | 275 | 22,561 |
| Shenandoah Telecommunications Co. | 120 | 2,428 |
| Simon Property Group, Inc., REIT | 60 | 7,131 |
| Sirius XM Holdings, Inc. | 1,249 | 7,496 |
| INVESTMENTS | SHARES (000) | VALUE ($000) |
| United States — continued | ||
| Southern Co. (The) | 171 | 12,565 |
| State Street Corp. | 121 | 8,079 |
| Steel Dynamics, Inc. | 109 | 9,378 |
| Stellantis NV (a) | 762 | 10,234 |
| Stellantis NV | 141 | 1,893 |
| Sun Communities, Inc., REIT | 102 | 17,952 |
| Sysco Corp. | 36 | 3,089 |
| T. Rowe Price Group, Inc. | 76 | 9,340 |
| Texas Instruments, Inc. | 218 | 37,064 |
| TJX Cos., Inc. (The) | 383 | 23,469 |
| Trane Technologies plc | 111 | 15,529 |
| Truist Financial Corp. | 332 | 16,067 |
| UGI Corp. | 69 | 2,353 |
| United Parcel Service, Inc., Class B | 16 | 2,941 |
| UnitedHealth Group, Inc. | 33 | 16,762 |
| US Bancorp | 76 | 3,698 |
| Valero Energy Corp. | 102 | 11,377 |
| Ventas, Inc., REIT | 371 | 20,603 |
| Verizon Communications, Inc. | 566 | 26,209 |
| VICI Properties, Inc., REIT | 925 | 27,566 |
| Vistra Corp. | 67 | 1,672 |
| VMware, Inc., Class A | 69 | 7,409 |
| Walgreens Boots Alliance, Inc. | 167 | 7,079 |
| Walmart, Inc. | 20 | 3,063 |
| Warner Bros Discovery, Inc. * | 77 | 1,388 |
| Wells Fargo & Co. | 230 | 10,020 |
| Welltower, Inc., REIT | 202 | 18,338 |
| Western Union Co. (The) | 439 | 7,363 |
| Weyerhaeuser Co., REIT | 198 | 8,151 |
| Whiting Petroleum Corp. | 30 | 2,165 |
| Williams Cos., Inc. (The) | 395 | 13,556 |
| WP Carey, Inc., REIT | 100 | 8,089 |
| Xcel Energy, Inc. | 39 | 2,879 |
| 2,044,827 | ||
| Total Common Stocks (Cost $4,024,900) | 4,658,890 | |
| 58 | J.P. Morgan Funds | April 30, 2022 |
| INVESTMENTS | PRINCIPAL AMOUNT ($000) | VALUE ($000) |
| Corporate Bonds — 34.8% | ||
| Australia — 0.2% | ||
| Australia & New Zealand Banking Group Ltd. (USD ICE Swap Rate 5 Year + 5.17%), 6.75%, 6/15/2026 (c) (d) (e) (f) | 10,853 | 11,368 |
| FMG Resources August 2006 Pty. Ltd. | ||
| 5.13%, 5/15/2024 (c) | 1,958 | 1,978 |
| 4.50%, 9/15/2027 (c) | 1,982 | 1,878 |
| 4.38%, 4/1/2031 (c) | 2,442 | 2,161 |
| Glencore Funding LLC | ||
| 2.50%, 9/1/2030 (c) | 180 | 151 |
| 2.63%, 9/23/2031 (c) | 63 | 53 |
| Mineral Resources Ltd. 8.13%, 5/1/2027 (c) | 724 | 735 |
| 18,324 | ||
| Austria — 0.0% ^ | ||
| ams-OSRAM AG 7.00%, 7/31/2025 (a) (c) | 1,280 | 1,296 |
| Azerbaijan — 0.0% ^ | ||
| Southern Gas Corridor CJSC 6.88%, 3/24/2026 (b) | 950 | 1,006 |
| State Oil Co. of the Azerbaijan Republic | ||
| 4.75%, 3/13/2023 (b) | 686 | 682 |
| 6.95%, 3/18/2030 (b) | 2,180 | 2,354 |
| 4,042 | ||
| Bahrain — 0.0% ^ | ||
| Oil and Gas Holding Co. BSCC (The) 7.50%, 10/25/2027 (b) | 1,150 | 1,206 |
| Belgium — 0.0% ^ | ||
| Anheuser-Busch InBev Worldwide, Inc. | ||
| 3.50%, 6/1/2030 | 174 | 165 |
| 4.38%, 4/15/2038 | 420 | 401 |
| KBC Group NV (EUR Swap Annual 5 Year + 4.69%), 4.75%, 3/5/2024 (b) (d) (e) (f) | EUR 1,800 | 1,880 |
| 2,446 | ||
| Brazil — 0.0% ^ | ||
| Guara Norte SARL 5.20%, 6/15/2034 (c) | 332 | 294 |
| Klabin Austria GmbH 7.00%, 4/3/2049 (b) | 1,150 | 1,109 |
| MV24 Capital BV 6.75%, 6/1/2034 (c) | 614 | 584 |
| Nexa Resources SA 5.38%, 5/4/2027 (b) | 580 | 557 |
| Petrobras Global Finance BV | ||
| 5.50%, 6/10/2051 | 319 | 261 |
| 6.85%, 6/5/2115 | 300 | 263 |
| Suzano Austria GmbH | ||
| 6.00%, 1/15/2029 | 900 | 907 |
| 7.00%, 3/16/2047 (b) | 220 | 221 |
| INVESTMENTS | PRINCIPAL AMOUNT ($000) | VALUE ($000) |
| Brazil — continued | ||
| Vale Overseas Ltd. 3.75%, 7/8/2030 | 57 | 51 |
| Votorantim Cimentos International SA 7.25%, 4/5/2041 (b) | 440 | 498 |
| 4,745 | ||
| Canada — 1.4% | ||
| 1011778 BC ULC | ||
| 3.88%, 1/15/2028 (c) | 2,030 | 1,868 |
| 3.50%, 2/15/2029 (c) | 1,546 | 1,365 |
| 4.00%, 10/15/2030 (c) | 4,185 | 3,578 |
| Athabasca Oil Corp. 9.75%, 11/1/2026 (a) (c) | 359 | 381 |
| ATS Automation Tooling Systems, Inc. 4.13%, 12/15/2028 (c) | 1,373 | 1,239 |
| Bank of Montreal (SOFRINDX + 0.68%), 0.92%, 3/10/2023 (f) | 195 | 195 |
| Bank of Nova Scotia (The) | ||
| (ICE LIBOR USD 3 Month + 2.65%), 4.65%, 10/12/2022 (d) (e) (f) | 1,551 | 1,462 |
| (US Treasury Yield Curve Rate T Note Constant Maturity 5 Year + 4.55%), 4.90%, 6/4/2025 (d) (e) (f) | 2,497 | 2,450 |
| 1.30%, 9/15/2026 | 280 | 251 |
| Series 2, (US Treasury Yield Curve Rate T Note Constant Maturity 5 Year + 2.61%), 3.62%, 10/27/2081 (f) | 2,670 | 2,132 |
| Baytex Energy Corp. 8.75%, 4/1/2027 (c) | 6,070 | 6,417 |
| Bell Canada (The) Series US-5, 2.15%, 2/15/2032 | 159 | 132 |
| Bombardier, Inc. | ||
| 7.50%, 12/1/2024 (c) | 40 | 40 |
| 7.50%, 3/15/2025 (c) | 1,906 | 1,849 |
| 6.00%, 2/15/2028 (a) (c) | 970 | 839 |
| Brookfield Residential Properties, Inc. | ||
| 6.25%, 9/15/2027 (c) | 1,000 | 938 |
| 4.88%, 2/15/2030 (c) | 467 | 390 |
| Canadian Pacific Railway Co. 2.45%, 12/2/2031 | 105 | 91 |
| Emera US Finance LP 2.64%, 6/15/2031 | 75 | 64 |
| Emera, Inc. Series 16-A, (ICE LIBOR USD 3 Month + 5.44%), 6.75%, 6/15/2076 (f) | 29,134 | 29,535 |
| Enbridge, Inc. | ||
| Series 16-A, (ICE LIBOR USD 3 Month + 3.89%), 6.00%, 1/15/2077 (f) | 2,730 | 2,742 |
| (ICE LIBOR USD 3 Month + 3.64%), 6.25%, 3/1/2078 (f) | 5,351 | 5,396 |
| April 30, 2022 | J.P. Morgan Funds | 59 |
| INVESTMENTS | PRINCIPAL AMOUNT ($000) | VALUE ($000) |
| Corporate Bonds — continued | ||
| Canada — continued | ||
| Series 20-A, (US Treasury Yield Curve Rate T Note Constant Maturity 5 Year + 5.31%), 5.75%, 7/15/2080 (f) | 13,544 | 13,442 |
| Garda World Security Corp. 4.63%, 2/15/2027 (c) | 2,596 | 2,336 |
| GFL Environmental, Inc. | ||
| 4.25%, 6/1/2025 (c) | 2,670 | 2,590 |
| 3.75%, 8/1/2025 (c) | 3,858 | 3,655 |
| 4.00%, 8/1/2028 (a) (c) | 3,309 | 2,912 |
| 4.75%, 6/15/2029 (a) (c) | 2,895 | 2,627 |
| 4.38%, 8/15/2029 (c) | 2,244 | 1,991 |
| goeasy Ltd. 5.38%, 12/1/2024 (c) | 879 | 861 |
| MEG Energy Corp. 7.13%, 2/1/2027 (c) | 6,109 | 6,204 |
| NOVA Chemicals Corp. | ||
| 4.88%, 6/1/2024 (c) | 6,055 | 5,972 |
| 5.00%, 5/1/2025 (c) | 3,790 | 3,752 |
| 5.25%, 6/1/2027 (c) | 4,811 | 4,558 |
| 4.25%, 5/15/2029 (c) | 3,479 | 3,009 |
| Open Text Corp. 3.88%, 2/15/2028 (c) | 2,165 | 1,972 |
| Open Text Holdings, Inc. 4.13%, 2/15/2030 (c) | 1,000 | 888 |
| Precision Drilling Corp. | ||
| 7.13%, 1/15/2026 (c) | 4,508 | 4,520 |
| 6.88%, 1/15/2029 (c) | 518 | 503 |
| Primo Water Holdings, Inc. 4.38%, 4/30/2029 (c) | 764 | 665 |
| Quebecor Media, Inc. 5.75%, 1/15/2023 | 5,516 | 5,577 |
| Ritchie Bros Auctioneers, Inc. 5.38%, 1/15/2025 (c) | 1,282 | 1,285 |
| Ritchie Bros Holdings, Inc. 4.75%, 12/15/2031 (c) | 1,630 | 1,630 |
| Rogers Communications, Inc. | ||
| 3.80%, 3/15/2032 (c) | 135 | 124 |
| (US Treasury Yield Curve Rate T Note Constant Maturity 5 Year + 3.59%), 5.25%, 3/15/2082 (c) (f) | 5,065 | 4,754 |
| Royal Bank of Canada (ICE LIBOR USD 3 Month + 0.36%), 1.40%, 1/17/2023 (f) | 100 | 100 |
| Superior Plus LP 4.50%, 3/15/2029 (c) | 3,770 | 3,445 |
| Taseko Mines Ltd. 7.00%, 2/15/2026 (c) | 410 | 407 |
| Tervita Corp. 11.00%, 12/1/2025 (c) | 579 | 646 |
| TransAlta Corp. 6.50%, 3/15/2040 | 305 | 305 |
| TransCanada PipeLines Ltd. 4.75%, 5/15/2038 (a) | 119 | 117 |
| INVESTMENTS | PRINCIPAL AMOUNT ($000) | VALUE ($000) |
| Canada — continued | ||
| Transcanada Trust | ||
| Series 16-A, (ICE LIBOR USD 3 Month + 4.64%), 5.87%, 8/15/2076 (f) | 5,204 | 5,216 |
| (SOFR + 4.42%), 5.50%, 9/15/2079 (f) | 9,787 | 9,420 |
| Videotron Ltd. | ||
| 5.38%, 6/15/2024 (c) | 5,053 | 5,104 |
| 5.13%, 4/15/2027 (c) | 4,520 | 4,430 |
| 3.63%, 6/15/2029 (c) | 3,423 | 2,978 |
| 171,349 | ||
| Cayman Islands — 0.0% ^ | ||
| Global Aircraft Leasing Co. Ltd. 6.50% (Cash), 9/15/2024 (c) (g) | 943 | 814 |
| Chile — 0.0% ^ | ||
| Corp. Nacional del Cobre de Chile | ||
| 4.88%, 11/4/2044 (b) | 400 | 379 |
| 3.70%, 1/30/2050 (c) | 1,400 | 1,113 |
| Empresa Nacional del Petroleo 3.75%, 8/5/2026 (b) | 1,000 | 953 |
| 2,445 | ||
| China — 0.4% | ||
| Agile Group Holdings Ltd. (US Treasury Yield Curve Rate T Note Constant Maturity 5 Year + 9.22%), 6.87%, 3/7/2023 (b) (d) (e) (f) | 2,800 | 630 |
| Central Plaza Development Ltd. | ||
| (US Treasury Yield Curve Rate T Note Constant Maturity 5 Year + 8.07%), 5.75%, 11/14/2024 (b) (d) (e) (f) | 300 | 254 |
| 4.65%, 1/19/2026 (b) | 3,400 | 2,994 |
| China Oil & Gas Group Ltd. 4.70%, 6/30/2026 (b) | 600 | 572 |
| Chong Hing Bank Ltd. (US Treasury Yield Curve Rate T Note Constant Maturity 5 Year + 3.86%), 5.70%, 7/15/2024 (b) (d) (e) (f) | 1,250 | 1,249 |
| CIFI Holdings Group Co. Ltd. 5.50%, 1/23/2023 (b) | 2,700 | 2,501 |
| Country Garden Holdings Co. Ltd. | ||
| 5.13%, 1/14/2027 (b) | 900 | 585 |
| 3.30%, 1/12/2031 (b) | 1,000 | 600 |
| ENN Clean Energy International Investment Ltd. 3.38%, 5/12/2026 (b) | 400 | 369 |
| Fortune Star BVI Ltd. | ||
| 6.75%, 7/2/2023 (b) | 1,700 | 1,663 |
| 60 | J.P. Morgan Funds | April 30, 2022 |
| INVESTMENTS | PRINCIPAL AMOUNT ($000) | VALUE ($000) |
| Corporate Bonds — continued | ||
| China — continued | ||
| 5.00%, 5/18/2026 (b) | 1,800 | 1,557 |
| Gemdale Ever Prosperity Investment Ltd. 4.95%, 7/26/2022 (b) | 1,400 | 1,378 |
| Gemstones International Ltd. 12.00%, 3/10/2023 (b) | 1,500 | 825 |
| Golden Eagle Retail Group Ltd. 4.63%, 5/21/2023 (b) | 2,500 | 2,440 |
| Greenland Global Investment Ltd. 6.75%, 6/25/2022 (b) | 1,500 | 1,400 |
| HBIS Group Hong Kong Co. Ltd. 3.75%, 12/18/2022 (b) | 700 | 692 |
| Hong Kong Red Star Macalline Universal Home Furnishings Ltd. 3.38%, 9/21/2022 (b) | 2,100 | 1,760 |
| Hopson Development Holdings Ltd. 7.00%, 5/18/2024 (b) | 2,300 | 1,833 |
| Huarong Finance 2017 Co. Ltd. (US Treasury Yield Curve Rate T Note Constant Maturity 5 Year + 6.98%), 4.00%, 11/7/2022 (b) (d) (e) (f) | 300 | 299 |
| Huarong Finance 2019 Co. Ltd. 2.50%, 2/24/2023 (b) | 1,600 | 1,574 |
| Huarong Finance II Co. Ltd. 4.63%, 6/3/2026 (b) | 500 | 474 |
| Kunming Traffic Investment Co. Ltd. 6.20%, 6/27/2022 (b) | 1,200 | 1,166 |
| KWG Group Holdings Ltd. 7.88%, 9/1/2023 (b) | 3,000 | 1,395 |
| New Metro Global Ltd. | ||
| 6.50%, 5/20/2022 (b) | 2,000 | 1,960 |
| 4.80%, 12/15/2024 (b) | 1,100 | 731 |
| NXP BV 3.25%, 5/11/2041 (c) | 75 | 59 |
| RKPF Overseas Ltd. | ||
| 6.70%, 9/30/2024 (b) | 2,700 | 2,214 |
| 5.20%, 1/12/2026 (b) | 1,200 | 864 |
| Shandong Iron And Steel Xinheng International Co. Ltd. | ||
| 6.50%, 11/5/2023 (b) | 600 | 617 |
| 4.80%, 7/28/2024 (b) | 700 | 694 |
| Shui On Development Holding Ltd. | ||
| (US Treasury Yield Curve Rate T Note Constant Maturity 5 Year + 7.63%), 6.40%, 6/20/2022 (b) (d) (e) (f) | 2,000 | 1,930 |
| 5.50%, 3/3/2025 (b) | 1,200 | 1,080 |
| INVESTMENTS | PRINCIPAL AMOUNT ($000) | VALUE ($000) |
| China — continued | ||
| West China Cement Ltd. 4.95%, 7/8/2026 (b) | 1,200 | 1,074 |
| Yanlord Land HK Co. Ltd. 6.80%, 2/27/2024 (b) | 3,000 | 2,887 |
| 42,320 | ||
| Colombia — 0.0% ^ | ||
| Ecopetrol SA | ||
| 5.88%, 9/18/2023 | 950 | 960 |
| 5.38%, 6/26/2026 (a) | 529 | 521 |
| 5.38%, 6/26/2026 | 631 | 622 |
| 7.38%, 9/18/2043 | 412 | 374 |
| 5.88%, 5/28/2045 | 730 | 577 |
| 3,054 | ||
| Finland — 0.1% | ||
| Nokia OYJ | ||
| 4.38%, 6/12/2027 | 1,203 | 1,167 |
| 6.63%, 5/15/2039 (a) | 673 | 777 |
| Nordea Bank Abp | ||
| (US Treasury Yield Curve Rate T Note Constant Maturity 5 Year + 4.11%), 6.63%, 3/26/2026 (c) (d) (e) (f) | 7,250 | 7,341 |
| 1.50%, 9/30/2026 (c) | 200 | 179 |
| 9,464 | ||
| France — 0.7% | ||
| Altice France SA | ||
| 8.13%, 2/1/2027 (c) | 6,089 | 6,135 |
| 5.13%, 7/15/2029 (c) | 7,415 | 6,277 |
| 5.50%, 10/15/2029 (c) | 3,732 | 3,172 |
| CGG SA 8.75%, 4/1/2027 (a) (c) | 500 | 496 |
| Credit Agricole SA | ||
| (USD Swap Semi 5 Year + 6.19%), 8.12%, 12/23/2025 (c) (d) (e) (f) | 19,545 | 21,011 |
| (GBP Swap Semi 5 Year + 4.81%), 7.50%, 6/23/2026 (c) (d) (e) (f) | GBP 3,130 | 4,074 |
| (EUR Swap Annual 5 Year + 4.37%), 4.00%, 12/23/2027 (b) (d) (e) (f) | EUR 1,000 | 988 |
| (US Treasury Yield Curve Rate T Note Constant Maturity 5 Year + 3.24%), 4.75%, 3/23/2029 (c) (d) (e) (f) | 7,870 | 6,778 |
| Societe Generale SA | ||
| 4.25%, 4/14/2025 (c) | 450 | 445 |
| April 30, 2022 | J.P. Morgan Funds | 61 |
| INVESTMENTS | PRINCIPAL AMOUNT ($000) | VALUE ($000) |
| Corporate Bonds — continued | ||
| France — continued | ||
| (USD ICE Swap Rate 5 Year + 5.87%), 8.00%, 9/29/2025 (c) (d) (e) (f) | 19,644 | 20,475 |
| (US Treasury Yield Curve Rate T Note Constant Maturity 5 Year + 4.51%), 5.38%, 11/18/2030 (c) (d) (e) (f) | 10,487 | 9,208 |
| 79,059 | ||
| Germany — 0.0% ^ | ||
| Bayer US Finance II LLC 4.63%, 6/25/2038 (c) | 200 | 192 |
| Deutsche Telekom International Finance BV 8.75%, 6/15/2030 (h) | 286 | 363 |
| TK Elevator US Newco, Inc. 5.25%, 7/15/2027 (c) | 3,920 | 3,672 |
| Volkswagen Group of America Finance LLC 3.13%, 5/12/2023 (c) | 230 | 230 |
| 4,457 | ||
| Greece — 0.0% ^ | ||
| Danaos Corp. 8.50%, 3/1/2028 (a) (c) | 305 | 315 |
| Guatemala — 0.0% ^ | ||
| Energuate Trust 5.88%, 5/3/2027 (b) | 1,147 | 1,094 |
| Hong Kong — 0.1% | ||
| Bank of East Asia Ltd. (The) (US Treasury Yield Curve Rate T Note Constant Maturity 5 Year + 5.53%), 5.83%, 10/21/2025 (b) (d) (e) (f) | 1,750 | 1,745 |
| CAS Capital No. 1 Ltd. (US Treasury Yield Curve Rate T Note Constant Maturity 5 Year + 3.64%), 4.00%, 7/12/2026 (b) (d) (e) (f) | 2,500 | 2,334 |
| Elect Global Investments Ltd. (US Treasury Yield Curve Rate T Note Constant Maturity 5 Year + 2.89%), 4.10%, 6/3/2025 (b) (d) (e) (f) | 300 | 289 |
| FWD Group Ltd. (US Treasury Yield Curve Rate T Note Constant Maturity 5 Year + 4.87%), 0.00%, 6/15/2022 (b) (d) (e) (f) | 1,300 | 1,278 |
| FWD Ltd. (US Treasury Yield Curve Rate T Note Constant Maturity 5 Year + 3.08%), 5.50%, 2/1/2023 (b) (d) (e) (f) | 1,800 | 1,764 |
| Melco Resorts Finance Ltd. 5.63%, 7/17/2027 (b) | 2,300 | 1,963 |
| NWD MTN Ltd. 4.13%, 7/18/2029 (b) | 1,400 | 1,243 |
| 10,616 | ||
| INVESTMENTS | PRINCIPAL AMOUNT ($000) | VALUE ($000) |
| India — 0.3% | ||
| ABJA Investment Co. Pte. Ltd. 5.45%, 1/24/2028 (b) | 2,400 | 2,364 |
| Azure Power Energy Ltd. 3.58%, 8/19/2026 (c) | 193 | 172 |
| Azure Power Solar Energy Pvt Ltd. 5.65%, 12/24/2024 (b) | 1,700 | 1,700 |
| Continuum Energy Levanter Pte. Ltd. 4.50%, 2/9/2027 (b) | 1,677 | 1,526 |
| Greenko Dutch BV 3.85%, 3/29/2026 (b) | 1,503 | 1,368 |
| Greenko Power II Ltd. | ||
| 4.30%, 12/13/2028 (c) | 924 | 813 |
| 4.30%, 12/13/2028 (b) | 200 | 176 |
| Greenko Wind Projects Mauritius Ltd. 5.50%, 4/6/2025 (c) | 1,000 | 976 |
| HDFC Bank Ltd. (US Treasury Yield Curve Rate T Note Constant Maturity 5 Year + 2.93%), 3.70%, 8/25/2026 (c) (d) (e) (f) | 2,000 | 1,829 |
| HPCL-Mittal Energy Ltd. 5.25%, 4/28/2027 (b) | 2,100 | 1,982 |
| India Green Energy Holdings 5.38%, 4/29/2024 (b) | 2,650 | 2,597 |
| India Green Power Holdings 4.00%, 2/22/2027 (b) | 2,900 | 2,511 |
| JSW Infrastructure Ltd. | ||
| 4.95%, 1/21/2029 (c) | 800 | 716 |
| 4.95%, 1/21/2029 (b) | 900 | 805 |
| JSW Steel Ltd. | ||
| 5.38%, 4/4/2025 (b) | 2,500 | 2,462 |
| 3.95%, 4/5/2027 (c) | 600 | 533 |
| 3.95%, 4/5/2027 (b) | 200 | 178 |
| Network i2i Ltd. (US Treasury Yield Curve Rate T Note Constant Maturity 5 Year + 4.27%), 5.65%, 1/15/2025 (b) (d) (e) (f) | 2,100 | 2,072 |
| ReNew Power Synthetic 6.67%, 3/12/2024 (b) | 2,200 | 2,228 |
| TML Holdings Pte. Ltd. 4.35%, 6/9/2026 (b) | 1,000 | 914 |
| Vedanta Resources Ltd. 6.38%, 7/30/2022 (b) | 2,900 | 2,887 |
| 30,809 | ||
| Indonesia — 0.2% | ||
| Adaro Indonesia PT 4.25%, 10/31/2024 (b) | 3,300 | 3,257 |
| 62 | J.P. Morgan Funds | April 30, 2022 |
| INVESTMENTS | PRINCIPAL AMOUNT ($000) | VALUE ($000) |
| Corporate Bonds — continued | ||
| Indonesia — continued | ||
| Bank Negara Indonesia Persero Tbk. PT (US Treasury Yield Curve Rate T Note Constant Maturity 5 Year + 3.47%), 4.30%, 3/24/2027 (b) (d) (e) (f) | 1,300 | 1,196 |
| Bank Tabungan Negara Persero Tbk. PT 4.20%, 1/23/2025 (b) | 2,200 | 2,123 |
| Indika Energy Capital III Pte. Ltd. 5.88%, 11/9/2024 (b) | 900 | 882 |
| Indika Energy Capital IV Pte. Ltd. 8.25%, 10/22/2025 (b) | 2,250 | 2,242 |
| Indonesia Asahan Aluminium Persero PT | ||
| 5.71%, 11/15/2023 (c) | 990 | 1,020 |
| 6.53%, 11/15/2028 (c) | 2,380 | 2,577 |
| 6.76%, 11/15/2048 (b) | 200 | 210 |
| 6.76%, 11/15/2048 (c) | 250 | 262 |
| Medco Bell Pte. Ltd. 6.38%, 1/30/2027 (b) | 800 | 748 |
| Medco Oak Tree Pte. Ltd. 7.38%, 5/14/2026 (b) | 200 | 198 |
| Medco Platinum Road Pte. Ltd. 6.75%, 1/30/2025 (b) | 2,400 | 2,380 |
| Minejesa Capital BV | ||
| 4.63%, 8/10/2030 (c) | 824 | 742 |
| 5.63%, 8/10/2037 (b) | 1,200 | 1,006 |
| Pertamina Persero PT | ||
| 4.30%, 5/20/2023 (b) | 260 | 262 |
| 3.10%, 1/21/2030 (c) | 450 | 405 |
| 6.00%, 5/3/2042 (b) | 880 | 889 |
| Perusahaan Perseroan Persero PT Perusahaan Listrik Negara | ||
| 4.13%, 5/15/2027 (b) | 680 | 665 |
| 6.25%, 1/25/2049 (b) | 810 | 816 |
| 4.88%, 7/17/2049 (b) | 500 | 422 |
| 4.00%, 6/30/2050 (b) | 870 | 666 |
| 22,968 | ||
| Ireland — 0.1% | ||
| AerCap Global Aviation Trust (ICE LIBOR USD 3 Month + 4.30%), 6.50%, 6/15/2045 (c) (f) | 7,463 | 7,239 |
| AerCap Holdings NV (US Treasury Yield Curve Rate T Note Constant Maturity 5 Year + 4.54%), 5.87%, 10/10/2079 (f) | 7,459 | 6,993 |
| INVESTMENTS | PRINCIPAL AMOUNT ($000) | VALUE ($000) |
| Ireland — continued | ||
| Bank of Ireland Group plc (US Treasury Yield Curve Rate T Note Constant Maturity 1 Year + 1.10%), 2.03%, 9/30/2027 (c) (f) | 200 | 176 |
| Cimpress plc 7.00%, 6/15/2026 (c) | 545 | 508 |
| 14,916 | ||
| Israel — 0.0% ^ | ||
| Energean Israel Finance Ltd. | ||
| 4.88%, 3/30/2026 (b) | 210 | 194 |
| 5.38%, 3/30/2028 (b) | 220 | 202 |
| Leviathan Bond Ltd. 6.50%, 6/30/2027 (b) | 720 | 706 |
| 1,102 | ||
| Italy — 0.2% | ||
| Enel SpA (USD Swap Semi 5 Year + 5.88%), 8.75%, 9/24/2073 (c) (f) | 2,430 | 2,570 |
| Intesa Sanpaolo SpA | ||
| 3.13%, 7/14/2022 (c) | 250 | 250 |
| (EUR Swap Annual 5 Year + 7.19%), 7.75%, 1/11/2027 (b) (d) (e) (f) | EUR 2,660 | 2,971 |
| Telecom Italia Capital SA | ||
| 6.38%, 11/15/2033 | 3,907 | 3,414 |
| 6.00%, 9/30/2034 | 4,901 | 4,192 |
| 7.72%, 6/4/2038 | 2,620 | 2,460 |
| Telecom Italia SpA 5.30%, 5/30/2024 (c) | 1,925 | 1,889 |
| UniCredit SpA | ||
| (EURIBOR ICE Swap Rate 5 Year + 7.33%), 7.50%, 6/3/2026 (b) (d) (e) (f) | EUR 1,200 | 1,294 |
| (US Treasury Yield Curve Rate T Note Constant Maturity 1 Year + 1.20%), 1.98%, 6/3/2027 (c) (f) | 200 | 176 |
| (EURIBOR ICE Swap Rate 5 Year + 4.08%), 3.88%, 6/3/2027 (b) (d) (e) (f) | EUR 202 | 171 |
| 19,387 | ||
| Japan — 0.1% | ||
| Nippon Life Insurance Co. | ||
| (USD Swap Semi 5 Year + 3.65%), 5.10%, 10/16/2044 (c) (f) | 2,887 | 2,902 |
| (US Treasury Yield Curve Rate T Note Constant Maturity 5 Year + 2.65%), 2.75%, 1/21/2051 (c) (f) | 3,620 | 3,113 |
| Sumitomo Life Insurance Co. (US Treasury Yield Curve Rate T Note Constant Maturity 5 Year + 2.75%), 3.38%, 4/15/2081 (c) (f) | 2,620 | 2,410 |
| April 30, 2022 | J.P. Morgan Funds | 63 |
| INVESTMENTS | PRINCIPAL AMOUNT ($000) | VALUE ($000) |
| Corporate Bonds — continued | ||
| Japan — continued | ||
| Takeda Pharmaceutical Co. Ltd. 2.05%, 3/31/2030 | 200 | 168 |
| Universal Entertainment Corp. 8.50%, 12/11/2024 (c) | 824 | 830 |
| 9,423 | ||
| Kazakhstan — 0.1% | ||
| Fund of National Welfare Samruk-Kazyna JSC 2.00%, 10/28/2026 (c) | 478 | 418 |
| Kazakhstan Temir Zholy Finance BV 6.95%, 7/10/2042 (b) | 1,545 | 1,572 |
| KazMunayGas National Co. JSC | ||
| 4.75%, 4/24/2025 (c) | 550 | 535 |
| 4.75%, 4/19/2027 (b) | 500 | 475 |
| 5.75%, 4/19/2047 (b) | 1,380 | 1,248 |
| 6.38%, 10/24/2048 (b) | 1,040 | 994 |
| Tengizchevroil Finance Co. International Ltd. 4.00%, 8/15/2026 (b) | 800 | 722 |
| 5,964 | ||
| Luxembourg — 0.3% | ||
| Altice Financing SA 5.75%, 8/15/2029 (c) | 4,556 | 3,838 |
| Altice France Holding SA | ||
| 10.50%, 5/15/2027 (a) (c) | 8,469 | 8,585 |
| 6.00%, 2/15/2028 (c) | 1,845 | 1,524 |
| Intelsat Jackson Holdings SA 6.50%, 3/15/2030 (a) (c) | 19,096 | 17,979 |
| 31,926 | ||
| Macau — 0.0% ^ | ||
| Champion Path Holdings Ltd. 4.85%, 1/27/2028 (b) | 700 | 500 |
| Studio City Finance Ltd. 6.00%, 7/15/2025 (b) | 1,200 | 1,016 |
| 1,516 | ||
| Mexico — 0.1% | ||
| Alfa SAB de CV 6.88%, 3/25/2044 (c) | 712 | 742 |
| Alpek SAB de CV 4.25%, 9/18/2029 (b) | 1,000 | 929 |
| BBVA Bancomer SA 6.75%, 9/30/2022 (b) | 900 | 909 |
| Cemex SAB de CV (US Treasury Yield Curve Rate T Note Constant Maturity 5 Year + 4.53%), 5.12%, 6/8/2026 (c) (d) (e) (f) | 1,052 | 955 |
| Comision Federal de Electricidad 4.68%, 2/9/2051 (b) | 300 | 213 |
| Petroleos Mexicanos | ||
| 6.88%, 8/4/2026 | 1,605 | 1,599 |
| INVESTMENTS | PRINCIPAL AMOUNT ($000) | VALUE ($000) |
| Mexico — continued | ||
| 5.35%, 2/12/2028 | 1,900 | 1,681 |
| 6.50%, 1/23/2029 (a) | 420 | 384 |
| 6.70%, 2/16/2032 | 167 | 144 |
| 5.63%, 1/23/2046 | 1,999 | 1,368 |
| 6.75%, 9/21/2047 | 850 | 614 |
| 6.35%, 2/12/2048 | 500 | 348 |
| 7.69%, 1/23/2050 | 2,102 | 1,641 |
| 6.95%, 1/28/2060 (a) | 2,100 | 1,533 |
| 13,060 | ||
| Morocco — 0.0% ^ | ||
| OCP SA 6.88%, 4/25/2044 (b) | 1,030 | 988 |
| Netherlands — 0.2% | ||
| ABN AMRO Bank NV (EUR Swap Annual 5 Year + 4.67%), 4.37%, 9/22/2025 (b) (d) (e) (f) | EUR 6,700 | 6,785 |
| Cooperatieve Rabobank UA (EUR Swap Annual 5 Year + 4.68%), 4.37%, 6/29/2027 (b) (d) (e) (f) | EUR 7,200 | 7,292 |
| ING Groep NV | ||
| (USD Swap Semi 5 Year + 4.45%), 6.50%, 4/16/2025 (d) (e) (f) | 600 | 598 |
| (US Treasury Yield Curve Rate T Note Constant Maturity 5 Year + 4.34%), 5.75%, 11/16/2026 (d) (e) (f) | 2,360 | 2,266 |
| (US Treasury Yield Curve Rate T Note Constant Maturity 5 Year + 2.86%), 3.88%, 5/16/2027 (d) (e) (f) | 5,500 | 4,455 |
| Shell International Finance BV 2.75%, 4/6/2030 | 85 | 78 |
| Trivium Packaging Finance BV | ||
| 5.50%, 8/15/2026 (c) (h) | 2,741 | 2,648 |
| 8.50%, 8/15/2027 (a) (c) (h) | 2,181 | 2,154 |
| UPC Broadband Finco BV 4.88%, 7/15/2031 (c) | 808 | 710 |
| VZ Secured Financing BV 5.00%, 1/15/2032 (c) | 1,586 | 1,369 |
| 28,355 | ||
| Norway — 0.0% ^ | ||
| DNB Bank ASA (US Treasury Yield Curve Rate T Note Constant Maturity 1 Year + 0.68%), 1.60%, 3/30/2028 (c) (f) | 200 | 176 |
| 64 | J.P. Morgan Funds | April 30, 2022 |
| INVESTMENTS | PRINCIPAL AMOUNT ($000) | VALUE ($000) |
| Corporate Bonds — continued | ||
| Panama — 0.0% ^ | ||
| AES Panama Generation Holdings SRL 4.38%, 5/31/2030 (c) | 960 | 855 |
| Empresa de Transmision Electrica SA 5.13%, 5/2/2049 (c) | 580 | 537 |
| 1,392 | ||
| Paraguay — 0.0% ^ | ||
| Bioceanico Sovereign Certificate Ltd. Zero Coupon, 6/5/2034 (c) | 402 | 269 |
| Peru — 0.0% ^ | ||
| Petroleos del Peru SA | ||
| 4.75%, 6/19/2032 (c) | 900 | 728 |
| 5.63%, 6/19/2047 (b) | 600 | 436 |
| Southern Copper Corp. 5.88%, 4/23/2045 | 185 | 203 |
| 1,367 | ||
| Philippines — 0.1% | ||
| Globe Telecom, Inc. (US Treasury Yield Curve Rate T Note Constant Maturity 5 Year + 5.53%), 4.20%, 8/2/2026 (b) (d) (e) (f) | 800 | 768 |
| Petron Corp. (US Treasury Yield Curve Rate T Note Constant Maturity 5 Year + 4.77%), 4.60%, 7/19/2023 (b) (d) (e) (f) | 2,400 | 2,304 |
| Rizal Commercial Banking Corp. (US Treasury Yield Curve Rate T Note Constant Maturity 5 Year + 6.24%), 6.50%, 8/27/2025 (b) (d) (e) (f) | 2,700 | 2,628 |
| SMC Global Power Holdings Corp. | ||
| (US Treasury Yield Curve Rate T Note Constant Maturity 5 Year + 6.61%), 6.50%, 4/25/2024 (b) (d) (e) (f) | 1,200 | 1,164 |
| (US Treasury Yield Curve Rate T Note Constant Maturity 5 Year + 9.20%), 7.00%, 10/21/2025 (b) (d) (e) (f) | 1,700 | 1,646 |
| 8,510 | ||
| Saudi Arabia — 0.0% ^ | ||
| Saudi Arabian Oil Co. | ||
| 1.63%, 11/24/2025 (c) | 200 | 186 |
| 2.25%, 11/24/2030 (c) | 397 | 344 |
| 3.25%, 11/24/2050 (c) | 350 | 274 |
| 3.50%, 11/24/2070 (c) | 1,104 | 842 |
| 1,646 | ||
| INVESTMENTS | PRINCIPAL AMOUNT ($000) | VALUE ($000) |
| South Africa — 0.0% ^ | ||
| Eskom Holdings SOC Ltd. | ||
| 6.75%, 8/6/2023 (b) | 430 | 417 |
| 7.13%, 2/11/2025 (b) | 650 | 619 |
| 1,036 | ||
| South Korea — 0.0% ^ | ||
| Hana Bank (US Treasury Yield Curve Rate T Note Constant Maturity 5 Year + 2.41%), 3.50%, 10/19/2026 (c) (d) (e) (f) | 500 | 466 |
| Heungkuk Life Insurance Co. Ltd. (US Treasury Yield Curve Rate T Note Constant Maturity 5 Year + 2.47%), 4.48%, 11/9/2022 (b) (d) (e) (f) | 1,150 | 1,143 |
| Kia Corp. 3.00%, 4/25/2023 (c) | 200 | 200 |
| 1,809 | ||
| Spain — 0.1% | ||
| Banco Bilbao Vizcaya Argentaria SA | ||
| (EUR Swap Annual 5 Year + 6.04%), 6.00%, 3/29/2024 (b) (d) (e) (f) | EUR 2,000 | 2,108 |
| (EUR Swap Annual 5 Year + 6.46%), 6.00%, 1/15/2026 (b) (d) (e) (f) | EUR 4,000 | 4,212 |
| Banco Santander SA | ||
| (USD ICE Swap Rate 5 Year + 4.99%), 7.50%, 2/8/2024 (b) (d) (e) (f) | 1,800 | 1,814 |
| (US Treasury Yield Curve Rate T Note Constant Maturity 5 Year + 3.75%), 4.75%, 11/12/2026 (d) (e) (f) | 2,200 | 1,943 |
| Grifols Escrow Issuer SA 4.75%, 10/15/2028 (c) | 1,634 | 1,491 |
| Telefonica Emisiones SA 4.67%, 3/6/2038 | 308 | 286 |
| 11,854 | ||
| Sweden — 0.0% ^ | ||
| Svenska Handelsbanken AB (US Treasury Yield Curve Rate T Note Constant Maturity 5 Year + 4.05%), 4.75%, 3/1/2031 (b) (d) (e) (f) | 3,200 | 2,964 |
| Switzerland — 0.7% | ||
| Cloverie plc for Zurich Insurance Co. Ltd. (ICE LIBOR USD 3 Month + 4.92%), 5.63%, 6/24/2046 (b) (f) | 2,700 | 2,753 |
| Credit Suisse Group AG | ||
| (USD Swap Semi 5 Year + 5.11%), 7.13%, 7/29/2022 (b) (d) (e) (f) | 4,465 | 4,455 |
| (USD Swap Semi 5 Year + 4.60%), 7.50%, 12/11/2023 (c) (d) (e) (f) | 11,691 | 11,699 |
| April 30, 2022 | J.P. Morgan Funds | 65 |
| INVESTMENTS | PRINCIPAL AMOUNT ($000) | VALUE ($000) |
| Corporate Bonds — continued | ||
| Switzerland — continued | ||
| (USD Swap Semi 5 Year + 3.46%), 6.25%, 12/18/2024 (c) (d) (e) (f) | 19,875 | 19,274 |
| (US Treasury Yield Curve Rate T Note Constant Maturity 5 Year + 4.82%), 6.37%, 8/21/2026 (c) (d) (e) (f) | 6,039 | 5,685 |
| (SOFR + 0.98%), 1.31%, 2/2/2027 (c) (f) | 250 | ��� 219 |
| (US Treasury Yield Curve Rate T Note Constant Maturity 5 Year + 4.89%), 5.25%, 2/11/2027 (c) (d) (e) (f) | 9,486 | 8,336 |
| UBS Group AG | ||
| (USD Swap Semi 5 Year + 4.34%), 7.00%, 1/31/2024 (c) (d) (e) (f) | 13,904 | 14,130 |
| (USD Swap Semi 5 Year + 4.87%), 7.00%, 2/19/2025 (b) (d) (e) (f) | 8,000 | 8,150 |
| (USD Swap Semi 5 Year + 4.59%), 6.87%, 8/7/2025 (b) (d) (e) (f) | 7,015 | 7,101 |
| (US Treasury Yield Curve Rate T Note Constant Maturity 5 Year + 4.86%), 5.12%, 7/29/2026 (b) (d) (e) (f) | 1,577 | 1,514 |
| (US Treasury Yield Curve Rate T Note Constant Maturity 5 Year + 3.40%), 4.88%, 2/12/2027 (c) (d) (e) (f) | 5,225 | 4,781 |
| 88,097 | ||
| Thailand — 0.1% | ||
| Bangkok Bank PCL (US Treasury Yield Curve Rate T Note Constant Maturity 5 Year + 4.73%), 5.00%, 9/23/2025 (b) (d) (e) (f) | 2,200 | 2,140 |
| Krung Thai Bank PCL (US Treasury Yield Curve Rate T Note Constant Maturity 5 Year + 3.53%), 4.40%, 3/25/2026 (b) (d) (e) (f) | 2,700 | 2,481 |
| Thaioil Treasury Center Co. Ltd. | ||
| 4.88%, 1/23/2043 (b) | 500 | 441 |
| 3.50%, 10/17/2049 (b) | 300 | 205 |
| 5,267 | ||
| Trinidad And Tobago — 0.0% ^ | ||
| Trinidad Petroleum Holdings Ltd. 9.75%, 6/15/2026 (c) | 1,565 | 1,575 |
| INVESTMENTS | PRINCIPAL AMOUNT ($000) | VALUE ($000) |
| Turkey — 0.0% ^ | ||
| Turkcell Iletisim Hizmetleri A/S 5.80%, 4/11/2028 (b) | 660 | 590 |
| Ukraine — 0.0% ^ | ||
| NPC Ukrenergo 6.88%, 11/9/2026 (c) | 628 | 195 |
| United Arab Emirates — 0.0% ^ | ||
| MDGH GMTN RSC Ltd. 3.70%, 11/7/2049 (b) | 600 | 547 |
| Telford Offshore Ltd. 12.00% (PIK), 12/31/2164 (d) (e) (g) | 1,550 | 11 |
| 558 | ||
| United Kingdom — 0.9% | ||
| 180 Medical, Inc. 3.88%, 10/15/2029 (c) | 3,079 | 2,740 |
| Ashtead Capital, Inc. 4.38%, 8/15/2027 (c) | 300 | 295 |
| Barclays plc | ||
| (U.K. Government Bonds 5 Year Note Generic Bid Yield + 6.02%), 6.37%, 12/15/2025 (b) (d) (e) (f) | GBP 400 | 505 |
| (US Treasury Yield Curve Rate T Note Constant Maturity 1 Year + 1.30%), 2.89%, 11/24/2032 (f) | 200 | 167 |
| BAT Capital Corp. 4.39%, 8/15/2037 | 232 | 198 |
| BP Capital Markets plc | ||
| (US Treasury Yield Curve Rate T Note Constant Maturity 5 Year + 4.04%), 4.38%, 6/22/2025 (d) (e) (f) | 4,196 | 4,078 |
| (U.K. Government Bonds 5 Year Note Generic Bid Yield + 4.17%), 4.25%, 3/22/2027 (b) (d) (e) (f) | GBP 2,300 | 2,767 |
| (EUR Swap Annual 5 Year + 4.12%), 3.63%, 3/22/2029 (b) (d) (e) (f) | EUR 7,400 | 7,260 |
| (US Treasury Yield Curve Rate T Note Constant Maturity 5 Year + 4.40%), 4.88%, 3/22/2030 (d) (e) (f) | 16,634 | 15,947 |
| HSBC Holdings plc | ||
| (EUR Swap Annual 5 Year + 5.34%), 6.00%, 9/29/2023 (b) (d) (e) (f) | EUR 3,970 | 4,256 |
| (USD ICE Swap Rate 5 Year + 4.37%), 6.37%, 3/30/2025 (d) (e) (f) | 6,827 | 6,856 |
| (USD ICE Swap Rate 5 Year + 3.75%), 6.00%, 5/22/2027 (d) (e) (f) | 3,310 | 3,177 |
| (USD ICE Swap Rate 5 Year + 3.61%), 6.50%, 3/23/2028 (d) (e) (f) | 7,250 | 7,073 |
| (EUR Swap Annual 5 Year + 3.84%), 4.75%, 7/4/2029 (b) (d) (e) (f) | EUR 1,918 | 1,905 |
| (SOFR + 1.29%), 2.21%, 8/17/2029 (f) | 200 | 172 |
| 66 | J.P. Morgan Funds | April 30, 2022 |
| INVESTMENTS | PRINCIPAL AMOUNT ($000) | VALUE ($000) |
| Corporate Bonds — continued | ||
| United Kingdom — continued | ||
| (US Treasury Yield Curve Rate T Note Constant Maturity 5 Year + 3.65%), 4.60%, 12/17/2030 (d) (e) (f) | 3,820 | 3,238 |
| INEOS Quattro Finance 2 plc 3.38%, 1/15/2026 (c) | 1,685 | 1,538 |
| Ithaca Energy North Sea plc 9.00%, 7/15/2026 (c) | 636 | 649 |
| Jaguar Land Rover Automotive plc | ||
| 7.75%, 10/15/2025 (c) | 1,194 | 1,196 |
| 5.88%, 1/15/2028 (c) | 1,616 | 1,418 |
| Marks & Spencer plc 7.13%, 12/1/2037 (c) | 206 | 208 |
| Nationwide Building Society | ||
| (U.K. Government Bonds 5 Year Note Generic Bid Yield + 5.39%), 5.87%, 12/20/2024 (b) (d) (e) (f) | GBP 200 | 250 |
| (U.K. Government Bonds 5 Year Note Generic Bid Yield + 5.63%), 5.75%, 6/20/2027 (b) (d) (e) (f) | GBP 4,470 | 5,550 |
| (SOFR + 1.29%), 2.97%, 2/16/2028 (a) (c) (f) | 200 | 186 |
| NatWest Group plc (US Treasury Yield Curve Rate T Note Constant Maturity 5 Year + 5.63%), 6.00%, 12/29/2025 (d) (e) (f) | 2,641 | 2,603 |
| NatWest Markets plc 1.60%, 9/29/2026 (c) | 200 | 179 |
| Rolls-Royce plc 5.75%, 10/15/2027 (c) | 2,232 | 2,151 |
| Standard Chartered plc (US Treasury Yield Curve Rate T Note Constant Maturity 5 Year + 5.66%), 6.00%, 7/26/2025 (c) (d) (e) (f) | 3,525 | 3,503 |
| Virgin Media Finance plc 5.00%, 7/15/2030 (c) | 435 | 378 |
| Virgin Media Secured Finance plc | ||
| 5.50%, 5/15/2029 (c) | 6,525 | 6,036 |
| 4.50%, 8/15/2030 (c) | 1,000 | 868 |
| Vodafone Group plc | ||
| 5.00%, 5/30/2038 | 188 | 187 |
| (USD Swap Semi 5 Year + 4.87%), 7.00%, 4/4/2079 (f) | 7,333 | 7,744 |
| (US Treasury Yield Curve Rate T Note Constant Maturity 5 Year + 2.77%), 4.12%, 6/4/2081 (f) | 7,100 | 6,135 |
| 101,413 | ||
| United States — 28.4% | ||
| 7-Eleven, Inc. 1.80%, 2/10/2031 (c) | 174 | 141 |
| INVESTMENTS | PRINCIPAL AMOUNT ($000) | VALUE ($000) |
| United States — continued | ||
| AbbVie, Inc. | ||
| 3.20%, 11/21/2029 | 457 | 425 |
| 4.05%, 11/21/2039 | 166 | 152 |
| Abercrombie & Fitch Management Co. 8.75%, 7/15/2025 (c) | 450 | 470 |
| Acadia Healthcare Co., Inc. | ||
| 5.50%, 7/1/2028 (c) | 2,824 | 2,750 |
| 5.00%, 4/15/2029 (c) | 2,490 | 2,359 |
| ACCO Brands Corp. 4.25%, 3/15/2029 (c) | 5,180 | 4,507 |
| ACI Worldwide, Inc. 5.75%, 8/15/2026 (c) | 3,105 | 3,136 |
| Activision Blizzard, Inc. 1.35%, 9/15/2030 | 292 | 238 |
| Adient Global Holdings Ltd. 4.88%, 8/15/2026 (c) | 1,876 | 1,673 |
| ADT Security Corp. (The) | ||
| 4.13%, 8/1/2029 (c) | 4,300 | 3,651 |
| 4.88%, 7/15/2032 (c) | 6,428 | 5,440 |
| Adtalem Global Education, Inc. 5.50%, 3/1/2028 (c) | 1,137 | 1,044 |
| Advanced Drainage Systems, Inc. 5.00%, 9/30/2027 (c) | 515 | 498 |
| AECOM 5.13%, 3/15/2027 | 1,977 | 1,955 |
| Aetna, Inc. | ||
| 2.75%, 11/15/2022 | 96 | 96 |
| 3.88%, 8/15/2047 | 257 | 222 |
| Air Lease Corp. 3.75%, 6/1/2026 | 70 | 68 |
| Albertsons Cos., Inc. | ||
| 3.25%, 3/15/2026 (c) | 4,739 | 4,324 |
| 7.50%, 3/15/2026 (c) | 3,170 | 3,332 |
| 4.63%, 1/15/2027 (c) | 8,552 | 8,010 |
| 5.88%, 2/15/2028 (c) | 3,316 | 3,221 |
| 3.50%, 3/15/2029 (c) | 7,608 | 6,409 |
| 4.88%, 2/15/2030 (c) | 2,359 | 2,135 |
| Alcoa Nederland Holding BV | ||
| 5.50%, 12/15/2027 (c) | 6,325 | 6,293 |
| 6.13%, 5/15/2028 (c) | 1,000 | 1,018 |
| 4.13%, 3/31/2029 (c) | 809 | 757 |
| Alexandria Real Estate Equities, Inc. | ||
| 2.75%, 12/15/2029 (a) | 80 | 72 |
| 2.95%, 3/15/2034 | 30 | 26 |
| Allegheny Technologies, Inc. | ||
| 5.88%, 12/1/2027 (a) | 1,861 | 1,796 |
| 4.88%, 10/1/2029 (a) | 1,655 | 1,506 |
| 5.13%, 10/1/2031 | 1,240 | 1,120 |
| April 30, 2022 | J.P. Morgan Funds | 67 |
| INVESTMENTS | PRINCIPAL AMOUNT ($000) | VALUE ($000) |
| Corporate Bonds — continued | ||
| United States — continued | ||
| Alliance Resource Operating Partners LP 7.50%, 5/1/2025 (c) | 407 | 408 |
| Allied Universal Holdco LLC | ||
| 6.63%, 7/15/2026 (c) | 1,996 | 1,929 |
| 9.75%, 7/15/2027 (c) | 907 | 880 |
| 4.63%, 6/1/2028 (c) | 3,840 | 3,386 |
| Allison Transmission, Inc. | ||
| 4.75%, 10/1/2027 (a) (c) | 2,545 | 2,452 |
| 5.88%, 6/1/2029 (c) | 7,583 | 7,486 |
| 3.75%, 1/30/2031 (c) | 5,472 | 4,733 |
| Ally Financial, Inc. | ||
| 5.75%, 11/20/2025 | 4,161 | 4,275 |
| Series C, (US Treasury Yield Curve Rate T Note Constant Maturity 7 Year + 3.48%), 4.70%, 5/15/2028 (d) (e) (f) | 6,324 | 5,444 |
| Altria Group, Inc. | ||
| 4.80%, 2/14/2029 | 83 | 82 |
| 3.40%, 2/4/2041 | 85 | 62 |
| AMC Entertainment Holdings, Inc. 10.00% (Cash), 6/15/2026 (a) (c) (g) | 2,941 | 2,463 |
| AMC Networks, Inc. | ||
| 4.75%, 8/1/2025 | 2,836 | 2,739 |
| 4.25%, 2/15/2029 | 257 | 224 |
| Ameren Corp. 3.50%, 1/15/2031 | 140 | 131 |
| American Airlines Group, Inc. 3.75%, 3/1/2025 (a) (c) | 182 | 162 |
| American Airlines, Inc. | ||
| 11.75%, 7/15/2025 (c) | 126 | 145 |
| 5.50%, 4/20/2026 (c) | 6,867 | 6,807 |
| 5.75%, 4/20/2029 (c) | 6,285 | 6,056 |
| American Axle & Manufacturing, Inc. | ||
| 6.25%, 3/15/2026 | 3,979 | 3,785 |
| 6.50%, 4/1/2027 (a) | 5,200 | 4,846 |
| 6.88%, 7/1/2028 (a) | 1,349 | 1,271 |
| 5.00%, 10/1/2029 (a) | 2,629 | 2,264 |
| American Builders & Contractors Supply Co., Inc. 4.00%, 1/15/2028 (c) | 4,195 | 3,912 |
| American Electric Power Co., Inc. (US Treasury Yield Curve Rate T Note Constant Maturity 5 Year + 2.68%), 3.88%, 2/15/2062 (f) | 5,173 | 4,635 |
| American Honda Finance Corp. (ICE LIBOR USD 3 Month + 0.47%), 0.93%, 11/16/2022 (f) | 28 | 28 |
| INVESTMENTS | PRINCIPAL AMOUNT ($000) | VALUE ($000) |
| United States — continued | ||
| American International Group, Inc. Series A-9, (ICE LIBOR USD 3 Month + 2.87%), 5.75%, 4/1/2048 (f) | 1,908 | 1,845 |
| American Tower Corp. | ||
| 1.45%, 9/15/2026 | 100 | 89 |
| 1.50%, 1/31/2028 | 337 | 285 |
| 2.10%, 6/15/2030 | 125 | 103 |
| American Transmission Systems, Inc. 2.65%, 1/15/2032 (c) | 20 | 17 |
| AmeriGas Partners LP | ||
| 5.63%, 5/20/2024 | 2,121 | 2,118 |
| 5.50%, 5/20/2025 | 5,898 | 5,809 |
| 5.88%, 8/20/2026 | 2,714 | 2,680 |
| 5.75%, 5/20/2027 | 1,424 | 1,399 |
| Amgen, Inc. 2.00%, 1/15/2032 | 298 | 246 |
| Amkor Technology, Inc. 6.63%, 9/15/2027 (c) | 3,941 | 4,010 |
| AMN Healthcare, Inc. 4.63%, 10/1/2027 (c) | 858 | 824 |
| ANGI Group LLC 3.88%, 8/15/2028 (c) | 528 | 418 |
| Antero Midstream Partners LP | ||
| 7.88%, 5/15/2026 (c) | 4,139 | 4,329 |
| 5.75%, 3/1/2027 (c) | 490 | 477 |
| 5.75%, 1/15/2028 (c) | 3,115 | 3,029 |
| 5.38%, 6/15/2029 (c) | 4,467 | 4,187 |
| Antero Resources Corp. | ||
| 8.38%, 7/15/2026 (c) | 2,242 | 2,416 |
| 7.63%, 2/1/2029 (c) | 739 | 783 |
| 5.38%, 3/1/2030 (c) | 1,447 | 1,414 |
| Anthem, Inc. 2.88%, 9/15/2029 | 190 | 174 |
| APi Escrow Corp. 4.75%, 10/15/2029 (c) | 2,037 | 1,833 |
| APi Group DE, Inc. 4.13%, 7/15/2029 (c) | 3,278 | 2,926 |
| Aramark Services, Inc. 5.00%, 2/1/2028 (a) (c) | 7,840 | 7,311 |
| Arches Buyer, Inc. | ||
| 4.25%, 6/1/2028 (c) | 1,780 | 1,582 |
| 6.13%, 12/1/2028 (c) | 634 | 552 |
| Archrock Partners LP | ||
| 6.88%, 4/1/2027 (c) | 472 | 473 |
| 6.25%, 4/1/2028 (c) | 2,420 | 2,347 |
| Arconic Corp. | ||
| 6.00%, 5/15/2025 (c) | 2,269 | 2,277 |
| 6.13%, 2/15/2028 (c) | 7,067 | 6,846 |
| Arcosa, Inc. 4.38%, 4/15/2029 (c) | 408 | 372 |
| 68 | J.P. Morgan Funds | April 30, 2022 |
| INVESTMENTS | PRINCIPAL AMOUNT ($000) | VALUE ($000) |
| Corporate Bonds — continued | ||
| United States — continued | ||
| Ardagh Packaging Finance plc | ||
| 4.13%, 8/15/2026 (c) | 1,385 | 1,281 |
| 5.25%, 8/15/2027 (c) | 5,299 | 4,551 |
| 5.25%, 8/15/2027 (a) (c) | 7,346 | 6,308 |
| Asbury Automotive Group, Inc. | ||
| 4.50%, 3/1/2028 (a) | 1,390 | 1,296 |
| 4.63%, 11/15/2029 (c) | 1,924 | 1,732 |
| 4.75%, 3/1/2030 | 385 | 345 |
| 5.00%, 2/15/2032 (c) | 1,343 | 1,192 |
| ASGN, Inc. 4.63%, 5/15/2028 (c) | 500 | 465 |
| Ashland LLC | ||
| 3.38%, 9/1/2031 (c) | 281 | 243 |
| 6.88%, 5/15/2043 | 426 | 473 |
| AT&T, Inc. | ||
| Series B, (EURIBOR ICE Swap Rate 5 Year + 3.14%), 2.87%, 3/2/2025 (d) (e) (f) | EUR 700 | 696 |
| 2.25%, 2/1/2032 | 408 | 340 |
| 3.50%, 6/1/2041 | 124 | 103 |
| Atkore, Inc. 4.25%, 6/1/2031 (c) | 407 | 360 |
| Audacy Capital Corp. 6.50%, 5/1/2027 (a) (c) | 4,439 | 3,818 |
| Avantor Funding, Inc. 4.63%, 7/15/2028 (c) | 6,866 | 6,532 |
| Aviation Capital Group LLC 1.95%, 9/20/2026 (c) | 210 | 184 |
| Avis Budget Car Rental LLC | ||
| 5.75%, 7/15/2027 (a) (c) | 2,503 | 2,453 |
| 5.75%, 7/15/2027 (c) | 2,855 | 2,791 |
| 4.75%, 4/1/2028 (c) | 5,455 | 5,060 |
| 5.38%, 3/1/2029 (a) (c) | 2,711 | 2,542 |
| Axalta Coating Systems LLC | ||
| 4.75%, 6/15/2027 (a) (c) | 4,423 | 4,202 |
| 3.38%, 2/15/2029 (c) | 3,894 | 3,369 |
| B&G Foods, Inc. 5.25%, 4/1/2025 | 5,294 | 5,041 |
| Baker Hughes Holdings LLC 3.14%, 11/7/2029 | 165 | 153 |
| Bank of America Corp. | ||
| Series U, (ICE LIBOR USD 3 Month + 3.14%), 5.20%, 6/1/2023 (d) (e) (f) | 6,649 | 6,549 |
| Series JJ, (ICE LIBOR USD 3 Month + 3.29%), 5.12%, 6/20/2024 (d) (e) (f) | 2,314 | 2,256 |
| Series X, (ICE LIBOR USD 3 Month + 3.71%), 6.25%, 9/5/2024 (d) (e) (f) | 15,732 | 15,926 |
| INVESTMENTS | PRINCIPAL AMOUNT ($000) | VALUE ($000) |
| United States — continued | ||
| Series Z, (ICE LIBOR USD 3 Month + 4.17%), 6.50%, 10/23/2024 (d) (e) (f) | 7,182 | 7,321 |
| Series AA, (ICE LIBOR USD 3 Month + 3.90%), 6.10%, 3/17/2025 (d) (e) (f) | 7,783 | 7,865 |
| Series AA, (ICE LIBOR USD 3 Month + 3.90%), 6.10%, 3/17/2025 (d) (e) (f) | 1,250 | 1,263 |
| Series DD, (ICE LIBOR USD 3 Month + 4.55%), 6.30%, 3/10/2026 (d) (e) (f) | 21,045 | 21,519 |
| Series RR, (US Treasury Yield Curve Rate T Note Constant Maturity 5 Year + 2.76%), 4.38%, 1/27/2027 (d) (e) (f) | 1,305 | 1,155 |
| Series TT, (US Treasury Yield Curve Rate T Note Constant Maturity 5 Year + 3.23%), 6.13%, 4/27/2027 (d) (e) (f) | 7,865 | 7,865 |
| (SOFR + 0.96%), 1.73%, 7/22/2027 (f) | 778 | 698 |
| Series FF, (ICE LIBOR USD 3 Month + 2.93%), 5.87%, 3/15/2028 (d) (e) (f) | 9,756 | 9,339 |
| (SOFR + 1.21%), 2.57%, 10/20/2032 (f) | 320 | 270 |
| Bank of New York Mellon Corp. (The) | ||
| Series D, (ICE LIBOR USD 3 Month + 2.46%), 4.50%, 6/20/2023 (d) (e) (f) | 3,007 | 2,909 |
| Series G, (US Treasury Yield Curve Rate T Note Constant Maturity 5 Year + 4.36%), 4.70%, 9/20/2025 (d) (e) (f) | 2,095 | 2,090 |
| Series H, (US Treasury Yield Curve Rate T Note Constant Maturity 5 Year + 3.35%), 3.70%, 3/20/2026 (d) (e) (f) | 2,910 | 2,692 |
| Series F, (ICE LIBOR USD 3 Month + 3.13%), 4.62%, 9/20/2026 (d) (e) (f) | 11,948 | 11,171 |
| Bath & Body Works, Inc. | ||
| 9.38%, 7/1/2025 (c) | 264 | 297 |
| 7.50%, 6/15/2029 | 2,347 | 2,426 |
| 6.88%, 11/1/2035 | 1,032 | 1,008 |
| 6.75%, 7/1/2036 | 2,350 | 2,280 |
| Bausch Health Americas, Inc. | ||
| 9.25%, 4/1/2026 (c) | 4,876 | 4,840 |
| 8.50%, 1/31/2027 (a) (c) | 5,791 | 5,480 |
| Bausch Health Cos., Inc. | ||
| 6.13%, 4/15/2025 (a) (c) | 18,991 | 19,047 |
| 5.50%, 11/1/2025 (c) | 12,156 | 11,761 |
| 9.00%, 12/15/2025 (c) | 23,732 | 23,821 |
| 5.75%, 8/15/2027 (c) | 965 | 902 |
| 7.00%, 1/15/2028 (c) | 3,489 | 2,878 |
| 4.88%, 6/1/2028 (c) | 5,057 | 4,487 |
| 5.00%, 2/15/2029 (c) | 4,668 | 3,283 |
| April 30, 2022 | J.P. Morgan Funds | 69 |
| INVESTMENTS | PRINCIPAL AMOUNT ($000) | VALUE ($000) |
| Corporate Bonds — continued | ||
| United States — continued | ||
| 6.25%, 2/15/2029 (c) | 2,065 | 1,503 |
| 7.25%, 5/30/2029 (c) | 1,679 | 1,270 |
| 5.25%, 1/30/2030 (c) | 3,476 | 2,413 |
| 5.25%, 2/15/2031 (a) (c) | 3,262 | 2,267 |
| Beacon Roofing Supply, Inc. 4.50%, 11/15/2026 (c) | 656 | 639 |
| Becton Dickinson and Co. 2.82%, 5/20/2030 | 356 | 319 |
| Bed Bath & Beyond, Inc. 5.17%, 8/1/2044 | 338 | 187 |
| Berry Global, Inc. 4.88%, 7/15/2026 (c) | 6,914 | 6,871 |
| Berry Petroleum Co. LLC 7.00%, 2/15/2026 (c) | 407 | 395 |
| Big River Steel LLC 6.63%, 1/31/2029 (c) | 1,672 | 1,710 |
| Biogen, Inc. 2.25%, 5/1/2030 | 107 | 89 |
| Black Knight InfoServ LLC 3.63%, 9/1/2028 (c) | 2,862 | 2,654 |
| Bloomin' Brands, Inc. 5.13%, 4/15/2029 (a) (c) | 1,113 | 1,035 |
| Blue Racer Midstream LLC | ||
| 7.63%, 12/15/2025 (c) | 1,522 | 1,568 |
| 6.63%, 7/15/2026 (c) | 1,510 | 1,512 |
| BlueLinx Holdings, Inc. 6.00%, 11/15/2029 (c) | 308 | 279 |
| Boise Cascade Co. 4.88%, 7/1/2030 (c) | 852 | 801 |
| Booz Allen Hamilton, Inc. | ||
| 3.88%, 9/1/2028 (a) (c) | 2,882 | 2,655 |
| 4.00%, 7/1/2029 (a) (c) | 3,568 | 3,291 |
| Boston Properties LP, REIT 2.45%, 10/1/2033 | 160 | 130 |
| Boyd Gaming Corp. | ||
| 4.75%, 12/1/2027 | 1,164 | 1,100 |
| 4.75%, 6/15/2031 (c) | 1,209 | 1,093 |
| Boyne USA, Inc. 4.75%, 5/15/2029 (c) | 2,786 | 2,584 |
| BP Capital Markets America, Inc. 3.63%, 4/6/2030 (a) | 176 | 170 |
| Brightsphere Investment Group, Inc. 4.80%, 7/27/2026 | 289 | 269 |
| Brink's Co. (The) | ||
| 5.50%, 7/15/2025 (c) | 1,890 | 1,895 |
| 4.63%, 10/15/2027 (c) | 5,525 | 5,235 |
| Bristol-Myers Squibb Co. 2.35%, 11/13/2040 | 70 | 53 |
| Bristow Group, Inc. 6.88%, 3/1/2028 (c) | 408 | 400 |
| Broadcom, Inc. 4.30%, 11/15/2032 | 145 | 136 |
| INVESTMENTS | PRINCIPAL AMOUNT ($000) | VALUE ($000) |
| United States — continued | ||
| Brookfield Property REIT, Inc., REIT 5.75%, 5/15/2026 (c) | 1,609 | 1,558 |
| Brundage-Bone Concrete Pumping Holdings, Inc. 6.00%, 2/1/2026 (c) | 382 | 357 |
| Buckeye Partners LP | ||
| 4.13%, 3/1/2025 (c) | 3,620 | 3,470 |
| 3.95%, 12/1/2026 | 200 | 189 |
| 4.13%, 12/1/2027 | 2,207 | 2,036 |
| 4.50%, 3/1/2028 (c) | 4,360 | 3,979 |
| Builders FirstSource, Inc. | ||
| 5.00%, 3/1/2030 (c) | 3,130 | 2,895 |
| 4.25%, 2/1/2032 (c) | 3,999 | 3,414 |
| Burlington Northern Santa Fe LLC 3.30%, 9/15/2051 | 35 | 29 |
| BWX Technologies, Inc. | ||
| 4.13%, 6/30/2028 (c) | 2,674 | 2,480 |
| 4.13%, 4/15/2029 (c) | 4,624 | 4,277 |
| Cable One, Inc. 4.00%, 11/15/2030 (c) | 2,214 | 1,900 |
| Caesars Entertainment, Inc. 4.63%, 10/15/2029 (a) (c) | 2,530 | 2,169 |
| California Resources Corp. 7.13%, 2/1/2026 (c) | 5,668 | 5,765 |
| Callon Petroleum Co. 8.00%, 8/1/2028 (a) (c) | 204 | 211 |
| Calpine Corp. | ||
| 5.25%, 6/1/2026 (c) | 2,595 | 2,563 |
| 4.63%, 2/1/2029 (c) | 1,622 | 1,418 |
| 5.00%, 2/1/2031 (c) | 2,214 | 1,888 |
| 3.75%, 3/1/2031 (c) | 50 | 42 |
| Calumet Specialty Products Partners LP 11.00%, 4/15/2025 (c) | 576 | 576 |
| Capital One Financial Corp. Series M, (US Treasury Yield Curve Rate T Note Constant Maturity 5 Year + 3.16%), 3.95%, 9/1/2026 (d) (e) (f) | 7,699 | 6,679 |
| Carnival Corp. | ||
| 10.50%, 2/1/2026 (c) | 742 | 816 |
| 5.75%, 3/1/2027 (c) | 2,270 | 2,056 |
| 4.00%, 8/1/2028 (c) | 3,156 | 2,841 |
| 6.00%, 5/1/2029 (c) | 3,326 | 2,985 |
| Carpenter Technology Corp. | ||
| 6.38%, 7/15/2028 | 1,466 | 1,461 |
| 7.63%, 3/15/2030 | 870 | 886 |
| Carriage Services, Inc. 4.25%, 5/15/2029 (c) | 408 | 355 |
| 70 | J.P. Morgan Funds | April 30, 2022 |
| INVESTMENTS | PRINCIPAL AMOUNT ($000) | VALUE ($000) |
| Corporate Bonds — continued | ||
| United States — continued | ||
| Cars.com, Inc. 6.38%, 11/1/2028 (c) | 407 | 381 |
| Catalent Pharma Solutions, Inc. | ||
| 5.00%, 7/15/2027 (c) | 2,038 | 1,974 |
| 3.13%, 2/15/2029 (c) | 940 | 816 |
| CCO Holdings LLC | ||
| 5.50%, 5/1/2026 (c) | 4,668 | 4,680 |
| 5.13%, 5/1/2027 (c) | 36,915 | 35,984 |
| 5.00%, 2/1/2028 (c) | 17,749 | 16,906 |
| 5.38%, 6/1/2029 (a) (c) | 10,053 | 9,525 |
| 4.75%, 3/1/2030 (a) (c) | 11,296 | 10,096 |
| 4.50%, 8/15/2030 (c) | 6,415 | 5,597 |
| 4.25%, 2/1/2031 (c) | 10,261 | 8,648 |
| 4.75%, 2/1/2032 (c) | 1,610 | 1,384 |
| 4.25%, 1/15/2034 (c) | 5,030 | 3,999 |
| CD&R Smokey Buyer, Inc. 6.75%, 7/15/2025 (c) | 4,976 | 5,064 |
| CDK Global, Inc. 5.25%, 5/15/2029 (c) | 7,151 | 7,207 |
| CDW LLC | ||
| 5.50%, 12/1/2024 | 635 | 650 |
| 4.25%, 4/1/2028 | 7,836 | 7,301 |
| 3.25%, 2/15/2029 | 1,372 | 1,207 |
| Cedar Fair LP | ||
| 5.50%, 5/1/2025 (c) | 1,455 | 1,462 |
| 5.38%, 4/15/2027 | 160 | 156 |
| 5.25%, 7/15/2029 (a) | 1,395 | 1,320 |
| Cengage Learning, Inc. 9.50%, 6/15/2024 (c) | 2,132 | 2,089 |
| Centene Corp. | ||
| 4.25%, 12/15/2027 | 10,139 | 9,835 |
| 4.63%, 12/15/2029 (a) | 19,757 | 19,135 |
| 3.38%, 2/15/2030 | 5,040 | 4,503 |
| Centennial Resource Production LLC 5.38%, 1/15/2026 (a) (c) | 540 | 527 |
| CenterPoint Energy Resources Corp. (ICE LIBOR USD 3 Month + 0.50%), 1.00%, 3/2/2023 (f) | 50 | 50 |
| CenterPoint Energy, Inc. (ICE LIBOR USD 3 Month + 3.27%), 6.13%, 9/1/2023 (d) (e) (f) | 5,558 | 5,348 |
| Central Garden & Pet Co. | ||
| 5.13%, 2/1/2028 | 6,555 | 6,326 |
| 4.13%, 10/15/2030 | 2,842 | 2,457 |
| Charles River Laboratories International, Inc. | ||
| 3.75%, 3/15/2029 (c) | 1,604 | 1,452 |
| 4.00%, 3/15/2031 (c) | 580 | 518 |
| INVESTMENTS | PRINCIPAL AMOUNT ($000) | VALUE ($000) |
| United States — continued | ||
| Charles Schwab Corp. (The) | ||
| Series G, (US Treasury Yield Curve Rate T Note Constant Maturity 5 Year + 4.97%), 5.38%, 6/1/2025 (d) (e) (f) | 16,951 | 17,079 |
| Series H, (US Treasury Yield Curve Rate T Note Constant Maturity 10 Year + 3.08%), 4.00%, 12/1/2030 (d) (e) (f) | 25,078 | 21,257 |
| Chemours Co. (The) | ||
| 5.38%, 5/15/2027 (a) | 1,500 | 1,448 |
| 5.75%, 11/15/2028 (c) | 8,862 | 8,308 |
| Cheniere Corpus Christi Holdings LLC 2.74%, 12/31/2039 | 50 | 41 |
| Cheniere Energy Partners LP | ||
| 4.50%, 10/1/2029 | 4,325 | 4,141 |
| 4.00%, 3/1/2031 | 2,666 | 2,413 |
| 3.25%, 1/31/2032 (c) | 2,253 | 1,926 |
| Cheniere Energy, Inc. 4.63%, 10/15/2028 | 7,525 | 7,280 |
| Chesapeake Energy Corp. | ||
| 5.50%, 2/1/2026 (c) | 1,916 | 1,900 |
| 5.88%, 2/1/2029 (c) | 941 | 930 |
| 6.75%, 4/15/2029 (c) | 8,910 | 8,966 |
| Chevron Corp. 2.24%, 5/11/2030 | 80 | 71 |
| Chubb INA Holdings, Inc. 2.88%, 11/3/2022 | 52 | 52 |
| Churchill Downs, Inc. | ||
| 5.50%, 4/1/2027 (c) | 325 | 319 |
| 4.75%, 1/15/2028 (c) | 1,000 | 936 |
| Ciena Corp. 4.00%, 1/31/2030 (c) | 4,011 | 3,658 |
| Cigna Corp. 4.38%, 10/15/2028 | 387 | 388 |
| Cinemark USA, Inc. | ||
| 8.75%, 5/1/2025 (c) | 1,000 | 1,039 |
| 5.25%, 7/15/2028 (a) (c) | 2,165 | 1,924 |
| Citigroup, Inc. | ||
| (ICE LIBOR USD 3 Month + 4.07%), 5.95%, 1/30/2023 (a) (d) (e) (f) | 5,183 | 5,183 |
| (ICE LIBOR USD 3 Month + 4.07%), 5.95%, 1/30/2023 (d) (e) (f) | 4,000 | 4,000 |
| (ICE LIBOR USD 3 Month + 4.23%), 5.90%, 2/15/2023 (d) (e) (f) | 1,548 | 1,574 |
| Series M, (ICE LIBOR USD 3 Month + 3.42%), 6.30%, 5/15/2024 (d) (e) (f) | 20,542 | 20,311 |
| Series U, (SOFR + 3.81%), 5.00%, 9/12/2024 (d) (e) (f) | 15,165 | 14,350 |
| Series V, (SOFR + 3.23%), 4.70%, 1/30/2025 (d) (e) (f) | 2,596 | 2,357 |
| Series P, (ICE LIBOR USD 3 Month + 3.91%), 5.95%, 5/15/2025 (d) (e) (f) | 9,333 | 9,123 |
| April 30, 2022 | J.P. Morgan Funds | 71 |
| INVESTMENTS | PRINCIPAL AMOUNT ($000) | VALUE ($000) |
| Corporate Bonds — continued | ||
| United States — continued | ||
| Series W, (US Treasury Yield Curve Rate T Note Constant Maturity 5 Year + 3.60%), 4.00%, 12/10/2025 (d) (e) (f) | 12,954 | 11,756 |
| (US Treasury Yield Curve Rate T Note Constant Maturity 5 Year + 3.42%), 3.88%, 2/18/2026 (d) (e) (f) | 8,855 | 7,999 |
| Series T, (ICE LIBOR USD 3 Month + 4.52%), 6.25%, 8/15/2026 (d) (e) (f) | 9,744 | 9,738 |
| (SOFR + 0.77%), 1.46%, 6/9/2027 (a) (f) | 815 | 725 |
| (SOFR + 1.18%), 2.52%, 11/3/2032 (f) | 55 | 46 |
| Citizens Bank NA (ICE LIBOR USD 3 Month + 0.95%), 1.93%, 3/29/2023 (f) | 250 | 251 |
| Citizens Financial Group, Inc. | ||
| Series B, (ICE LIBOR USD 3 Month + 3.00%), 6.00%, 7/6/2023 (d) (e) (f) | 3,001 | 2,862 |
| Series C, (ICE LIBOR USD 3 Month + 3.16%), 6.37%, 4/6/2024 (d) (e) (f) | 5,409 | 5,233 |
| Series G, (US Treasury Yield Curve Rate T Note Constant Maturity 5 Year + 3.22%), 4.00%, 10/6/2026 (d) (e) (f) | 6,650 | 5,902 |
| Civitas Resources, Inc. 5.00%, 10/15/2026 (c) | 407 | 387 |
| Clarios Global LP | ||
| 6.75%, 5/15/2025 (c) | 1,595 | 1,627 |
| 6.25%, 5/15/2026 (a) (c) | 3,670 | 3,707 |
| Clarivate Science Holdings Corp. | ||
| 3.88%, 7/1/2028 (c) | 2,626 | 2,337 |
| 4.88%, 7/1/2029 (c) | 2,958 | 2,607 |
| Clean Harbors, Inc. 4.88%, 7/15/2027 (c) | 785 | 769 |
| Clear Channel Outdoor Holdings, Inc. | ||
| 5.13%, 8/15/2027 (a) (c) | 9,798 | 9,207 |
| 7.75%, 4/15/2028 (c) | 4,638 | 4,371 |
| 7.50%, 6/1/2029 (c) | 8,147 | 7,688 |
| Cleveland-Cliffs, Inc. | ||
| 4.63%, 3/1/2029 (a) (c) | 3,158 | 2,960 |
| 4.88%, 3/1/2031 (a) (c) | 2,257 | 2,088 |
| Clorox Co. (The) 3.05%, 9/15/2022 | 62 | 62 |
| CMS Energy Corp. (US Treasury Yield Curve Rate T Note Constant Maturity 5 Year + 4.12%), 4.75%, 6/1/2050 (f) | 4,749 | 4,559 |
| CNX Midstream Partners LP 4.75%, 4/15/2030 (c) | 1,242 | 1,143 |
| CNX Resources Corp. | ||
| 7.25%, 3/14/2027 (c) | 1,217 | 1,244 |
| INVESTMENTS | PRINCIPAL AMOUNT ($000) | VALUE ($000) |
| United States — continued | ||
| 6.00%, 1/15/2029 (c) | 1,670 | 1,648 |
| Cogent Communications Group, Inc. 3.50%, 5/1/2026 (c) | 700 | 661 |
| Coinbase Global, Inc. | ||
| 3.38%, 10/1/2028 (a) (c) | 1,942 | 1,508 |
| 3.63%, 10/1/2031 (a) (c) | 2,645 | 1,954 |
| Comcast Corp. | ||
| 4.15%, 10/15/2028 | 205 | 206 |
| 1.50%, 2/15/2031 (a) | 240 | 195 |
| CommScope Technologies LLC | ||
| 6.00%, 6/15/2025 (c) | 7,185 | 6,287 |
| 5.00%, 3/15/2027 (c) | 2,405 | 1,888 |
| CommScope, Inc. | ||
| 6.00%, 3/1/2026 (c) | 9,090 | 8,574 |
| 8.25%, 3/1/2027 (a) (c) | 10,160 | 8,636 |
| 4.75%, 9/1/2029 (c) | 4,740 | 3,963 |
| Community Health Systems, Inc. | ||
| 8.00%, 3/15/2026 (c) | 3,292 | 3,403 |
| 5.63%, 3/15/2027 (c) | 3,918 | 3,735 |
| 8.00%, 12/15/2027 (c) | 150 | 155 |
| 6.88%, 4/1/2028 (c) | 649 | 509 |
| 6.00%, 1/15/2029 (c) | 2,684 | 2,537 |
| 6.13%, 4/1/2030 (a) (c) | 342 | 281 |
| 5.25%, 5/15/2030 (c) | 4,389 | 3,848 |
| 4.75%, 2/15/2031 (c) | 2,890 | 2,449 |
| Compass Group Diversified Holdings LLC 5.25%, 4/15/2029 (c) | 2,112 | 1,896 |
| Comstock Resources, Inc. | ||
| 7.50%, 5/15/2025 (c) | 1,478 | 1,508 |
| 6.75%, 3/1/2029 (c) | 8,241 | 8,333 |
| 5.88%, 1/15/2030 (c) | 2,222 | 2,138 |
| Conduent Business Services LLC 6.00%, 11/1/2029 (c) | 4,650 | 4,278 |
| Consensus Cloud Solutions, Inc. 6.50%, 10/15/2028 (c) | 844 | 793 |
| Constellation Brands, Inc. 2.25%, 8/1/2031 | 333 | 276 |
| Constellation Merger Sub, Inc. 8.50%, 9/15/2025 (c) | 1,592 | 1,481 |
| Cooper-Standard Automotive, Inc. | ||
| 13.00%, 6/1/2024 (a) (c) | 6,658 | 6,725 |
| 5.63%, 11/15/2026 (a) (c) | 7,311 | 3,441 |
| CoreCivic, Inc. | ||
| 8.25%, 4/15/2026 | 4,988 | 5,124 |
| 4.75%, 10/15/2027 | 662 | 589 |
| 72 | J.P. Morgan Funds | April 30, 2022 |
| INVESTMENTS | PRINCIPAL AMOUNT ($000) | VALUE ($000) |
| Corporate Bonds — continued | ||
| United States — continued | ||
| CoreLogic, Inc. 4.50%, 5/1/2028 (c) | 776 | 688 |
| Coty, Inc. | ||
| 5.00%, 4/15/2026 (c) | 4,278 | 4,063 |
| 6.50%, 4/15/2026 (a) (c) | 1,332 | 1,295 |
| 4.75%, 1/15/2029 (c) | 2,340 | 2,083 |
| Cox Communications, Inc. 4.80%, 2/1/2035 (c) | 190 | 186 |
| CPI CG, Inc. 8.63%, 3/15/2026 (c) | 295 | 285 |
| CQP Holdco LP 5.50%, 6/15/2031 (c) | 1,052 | 970 |
| Credit Acceptance Corp. 6.63%, 3/15/2026 (a) | 810 | 818 |
| Crestwood Midstream Partners LP | ||
| 5.75%, 4/1/2025 | 5,514 | 5,448 |
| 5.63%, 5/1/2027 (c) | 2,355 | 2,293 |
| 8.00%, 4/1/2029 (c) | 4,797 | 5,001 |
| Crocs, Inc. | ||
| 4.25%, 3/15/2029 (c) | 516 | 439 |
| 4.13%, 8/15/2031 (c) | 197 | 157 |
| Crown Americas LLC 4.75%, 2/1/2026 | 681 | 678 |
| Crown Castle International Corp. | ||
| 3.65%, 9/1/2027 | 250 | 240 |
| 2.10%, 4/1/2031 | 170 | 138 |
| CSC Holdings LLC | ||
| 5.88%, 9/15/2022 | 1,585 | 1,593 |
| 5.25%, 6/1/2024 | 1,349 | 1,318 |
| 5.50%, 4/15/2027 (c) | 5,420 | 5,233 |
| 5.38%, 2/1/2028 (c) | 2,010 | 1,845 |
| 7.50%, 4/1/2028 (c) | 2,260 | 2,083 |
| 6.50%, 2/1/2029 (c) | 8,969 | 8,521 |
| 4.50%, 11/15/2031 (c) | 4,903 | 4,027 |
| CSX Corp. 2.40%, 2/15/2030 (a) | 75 | 67 |
| CTR Partnership LP, REIT 3.88%, 6/30/2028 (c) | 420 | 380 |
| Curo Group Holdings Corp. 7.50%, 8/1/2028 (c) | 1,028 | 856 |
| CVR Partners LP 6.13%, 6/15/2028 (c) | 3,401 | 3,333 |
| CVS Health Corp. | ||
| 4.30%, 3/25/2028 | 100 | 100 |
| 2.13%, 9/15/2031 | 174 | 145 |
| 4.78%, 3/25/2038 | 255 | 252 |
| 5.30%, 12/5/2043 | 86 | 89 |
| Dana, Inc. | ||
| 5.38%, 11/15/2027 | 895 | 846 |
| 5.63%, 6/15/2028 | 3,421 | 3,263 |
| INVESTMENTS | PRINCIPAL AMOUNT ($000) | VALUE ($000) |
| United States — continued | ||
| Dave & Buster's, Inc. 7.63%, 11/1/2025 (c) | 170 | 176 |
| DaVita, Inc. | ||
| 4.63%, 6/1/2030 (c) | 9,180 | 7,987 |
| 3.75%, 2/15/2031 (c) | 7,626 | 6,215 |
| DCP Midstream Operating LP | ||
| 3.88%, 3/15/2023 | 2,613 | 2,604 |
| 5.38%, 7/15/2025 | 1,919 | 1,929 |
| 5.63%, 7/15/2027 | 2,481 | 2,517 |
| 6.75%, 9/15/2037 (c) | 1,740 | 1,954 |
| 5.60%, 4/1/2044 | 525 | 502 |
| Del Monte Foods, Inc. 11.88%, 5/15/2025 (c) | 1,926 | 2,103 |
| Delek Logistics Partners LP 7.13%, 6/1/2028 (c) | 647 | 618 |
| Dell International LLC 4.90%, 10/1/2026 | 65 | 66 |
| Deluxe Corp. 8.00%, 6/1/2029���(c) | 2,100 | 1,993 |
| Diamond Sports Group LLC 5.38%, 8/15/2026 (a) (c) | 5,398 | 1,997 |
| Directv Financing LLC 5.88%, 8/15/2027 (c) | 4,658 | 4,384 |
| Discovery Communications LLC 3.63%, 5/15/2030 (a) | 190 | 174 |
| DISH DBS Corp. | ||
| 5.88%, 7/15/2022 | 2,197 | 2,200 |
| 5.00%, 3/15/2023 | 12,579 | 12,462 |
| 5.88%, 11/15/2024 | 30,567 | 29,650 |
| 7.75%, 7/1/2026 | 12,076 | 11,359 |
| 5.25%, 12/1/2026 (c) | 14,585 | 13,391 |
| 7.38%, 7/1/2028 | 573 | 501 |
| 5.75%, 12/1/2028 (c) | 2,915 | 2,607 |
| 5.13%, 6/1/2029 | 750 | 586 |
| Dominion Energy, Inc. | ||
| Series B, (US Treasury Yield Curve Rate T Note Constant Maturity 5 Year + 2.99%), 4.65%, 12/15/2024 (d) (e) (f) | 3,636 | 3,472 |
| Series C, (US Treasury Yield Curve Rate T Note Constant Maturity 5 Year + 3.20%), 4.35%, 1/15/2027 (d) (e) (f) | 5,175 | 4,726 |
| Series C, 2.25%, 8/15/2031 | 54 | 45 |
| Dornoch Debt Merger Sub, Inc. 6.63%, 10/15/2029 (a) (c) | 3,736 | 3,064 |
| DT Midstream, Inc. | ||
| 4.13%, 6/15/2029 (c) | 4,356 | 3,964 |
| 4.38%, 6/15/2031 (c) | 2,677 | 2,398 |
| April 30, 2022 | J.P. Morgan Funds | 73 |
| INVESTMENTS | PRINCIPAL AMOUNT ($000) | VALUE ($000) |
| Corporate Bonds — continued | ||
| United States — continued | ||
| Duke Energy Corp. | ||
| 3.05%, 8/15/2022 | 84 | 84 |
| 3.75%, 9/1/2046 | 112 | 93 |
| (US Treasury Yield Curve Rate T Note Constant Maturity 5 Year + 2.32%), 3.25%, 1/15/2082 (f) | 5,838 | 4,966 |
| Dun & Bradstreet Corp. (The) 5.00%, 12/15/2029 (c) | 1,250 | 1,163 |
| Dycom Industries, Inc. 4.50%, 4/15/2029 (c) | 5,624 | 5,132 |
| Edgewell Personal Care Co. | ||
| 5.50%, 6/1/2028 (c) | 1,815 | 1,756 |
| 4.13%, 4/1/2029 (c) | 3,338 | 2,962 |
| Edison International Series B, (US Treasury Yield Curve Rate T Note Constant Maturity 5 Year + 3.90%), 5.00%, 12/15/2026 (d) (e) (f) | 4,770 | 4,317 |
| Elastic NV 4.13%, 7/15/2029 (c) | 585 | 524 |
| Element Solutions, Inc. 3.88%, 9/1/2028 (c) | 2,883 | 2,577 |
| Embarq Corp. 8.00%, 6/1/2036 | 5,823 | 5,241 |
| Emergent BioSolutions, Inc. 3.88%, 8/15/2028 (a) (c) | 4,324 | 3,670 |
| Enact Holdings, Inc. 6.50%, 8/15/2025 (c) | 1,620 | 1,612 |
| Encino Acquisition Partners Holdings LLC 8.50%, 5/1/2028 (c) | 5,594 | 5,608 |
| Encompass Health Corp. | ||
| 5.75%, 9/15/2025 | 4,690 | 4,772 |
| 4.50%, 2/1/2028 | 5,822 | 5,383 |
| 4.75%, 2/1/2030 | 2,675 | 2,418 |
| 4.63%, 4/1/2031 | 3,400 | 3,001 |
| Endeavor Energy Resources LP 6.63%, 7/15/2025 (c) | 1,197 | 1,230 |
| Endo Dac | ||
| 5.88%, 10/15/2024 (c) | 1,925 | 1,776 |
| 9.50%, 7/31/2027 (a) (c) | 4,357 | 3,438 |
| 6.00%, 6/30/2028 (a) (c) | 2,563 | 1,102 |
| Endo Luxembourg Finance Co. I SARL 6.13%, 4/1/2029 (c) | 2,305 | 2,005 |
| Energizer Holdings, Inc. | ||
| 6.50%, 12/31/2027 (c) | 1,978 | 1,899 |
| 4.75%, 6/15/2028 (c) | 3,222 | 2,833 |
| 4.38%, 3/31/2029 (c) | 4,611 | 3,840 |
| Energy Transfer LP | ||
| Series A, (ICE LIBOR USD 3 Month + 4.03%), 6.25%, 2/15/2023 (d) (e) (f) | 1,328 | 1,129 |
| INVESTMENTS | PRINCIPAL AMOUNT ($000) | VALUE ($000) |
| United States — continued | ||
| 4.20%, 4/15/2027 | 115 | 113 |
| Series B, (ICE LIBOR USD 3 Month + 4.16%), 6.63%, 2/15/2028 (d) (e) (f) | 8,894 | 7,693 |
| Series G, (US Treasury Yield Curve Rate T Note Constant Maturity 5 Year + 5.31%), 7.13%, 5/15/2030 (d) (e) (f) | 4,455 | 4,204 |
| EnerSys 4.38%, 12/15/2027 (c) | 200 | 186 |
| EnLink Midstream LLC 5.38%, 6/1/2029 (a) | 803 | 782 |
| EnLink Midstream Partners LP | ||
| Series C, (ICE LIBOR USD 3 Month + 4.11%), 6.00%, 12/15/2022 (d) (e) (f) | 210 | 155 |
| 4.40%, 4/1/2024 | 4,495 | 4,438 |
| 4.15%, 6/1/2025 | 1,600 | 1,556 |
| 4.85%, 7/15/2026 | 2,940 | 2,859 |
| 5.60%, 4/1/2044 | 522 | 431 |
| Enova International, Inc. | ||
| 8.50%, 9/1/2024 (c) | 135 | 135 |
| 8.50%, 9/15/2025 (c) | 500 | 498 |
| EnPro Industries, Inc. 5.75%, 10/15/2026 | 162 | 162 |
| Entegris Escrow Corp. 4.75%, 4/15/2029 (c) | 3,813 | 3,675 |
| Entegris, Inc. | ||
| 4.38%, 4/15/2028 (c) | 2,891 | 2,681 |
| 3.63%, 5/1/2029 (a) (c) | 2,434 | 2,141 |
| Entergy Corp. 4.00%, 7/15/2022 | 98 | 98 |
| Entergy Texas, Inc. 1.75%, 3/15/2031 | 200 | 165 |
| Enterprise Products Operating LLC Series E, (ICE LIBOR USD 3 Month + 3.03%), 5.25%, 8/16/2077 (f) | 4,380 | 4,002 |
| Envision Healthcare Corp. 8.75%, 10/15/2026 (c) | 7,419 | 3,090 |
| Enviva Partners LP 6.50%, 1/15/2026 (c) | 764 | 778 |
| EOG Resources, Inc. 5.10%, 1/15/2036 | 180 | 183 |
| EQM Midstream Partners LP | ||
| 6.00%, 7/1/2025 (c) | 2,170 | 2,151 |
| 6.50%, 7/1/2027 (c) | 2,550 | 2,576 |
| 4.50%, 1/15/2029 (c) | 4,301 | 3,872 |
| 4.75%, 1/15/2031 (c) | 5,576 | 4,972 |
| EQT Corp. | ||
| 6.63%, 2/1/2025 (h) | 895 | 932 |
| 3.13%, 5/15/2026 (c) | 1,789 | 1,687 |
| 5.00%, 1/15/2029 | 1,855 | 1,849 |
| 7.50%, 2/1/2030 (h) | 1,165 | 1,290 |
| 3.63%, 5/15/2031 (c) | 1,382 | 1,251 |
| 74 | J.P. Morgan Funds | April 30, 2022 |
| INVESTMENTS | PRINCIPAL AMOUNT ($000) | VALUE ($000) |
| Corporate Bonds — continued | ||
| United States — continued | ||
| Equitable Holdings, Inc. Series B, (US Treasury Yield Curve Rate T Note Constant Maturity 5 Year + 4.74%), 4.95%, 9/15/2025 (d) (e) (f) | 786 | 784 |
| ESC Co., Intelsat Jackson Holdings, Ltd. | ||
| 5.50%, 8/1/2023 ‡ (i) | 10,554 | 1 |
| 8.50%, 10/15/2024 ‡ (i) | 16,148 | 2 |
| 9.75%, 7/15/2025 ‡ (i) | 1,585 | — |
| ESC GCBREGS EXIDE TECH | ||
| 7.13%, 8/1/2026 (i) | 5,505 | ��� 303 |
| 6.00%, 1/15/2028 (i) | 5,450 | 300 |
| Escrow Texas Competit | ||
| 8.50%, 12/1/2021 ‡ (i) | 12,478 | 12 |
| 8.50%, 10/1/2022 ‡ (i) | 16,772 | 25 |
| Evergy, Inc. 2.90%, 9/15/2029 | 152 | 139 |
| Exela Intermediate LLC 11.50%, 7/15/2026 (c) | 3,525 | 1,287 |
| Exxon Mobil Corp. 4.23%, 3/19/2040 | 219 | 214 |
| Ferrellgas LP | ||
| 5.38%, 4/1/2026 (c) | 449 | 406 |
| 5.88%, 4/1/2029 (c) | 1,000 | 873 |
| Fertitta Entertainment LLC 4.63%, 1/15/2029 (c) | 1,159 | 1,051 |
| Fidelity National Information Services, Inc. 2.25%, 3/1/2031 | 200 | 168 |
| Fiserv, Inc. 3.50%, 7/1/2029 | 193 | 180 |
| Fluor Corp. 3.50%, 12/15/2024 (a) | 161 | 158 |
| Foot Locker, Inc. 4.00%, 10/1/2029 (c) | 407 | 339 |
| Ford Motor Credit Co. LLC | ||
| 4.06%, 11/1/2024 | 5,620 | 5,497 |
| 4.69%, 6/9/2025 | 7,630 | 7,481 |
| 5.13%, 6/16/2025 | 6,000 | 5,985 |
| 4.13%, 8/4/2025 | 4,442 | 4,264 |
| 3.38%, 11/13/2025 | 6,405 | 6,150 |
| 4.39%, 1/8/2026 | 6,475 | 6,248 |
| 4.54%, 8/1/2026 | 2,252 | 2,153 |
| 2.70%, 8/10/2026 | 1,714 | 1,528 |
| 4.27%, 1/9/2027 | 9,413 | 8,872 |
| 4.13%, 8/17/2027 | 5,525 | 5,122 |
| 3.82%, 11/2/2027 | 1,935 | 1,761 |
| 4.00%, 11/13/2030 | 5,909 | 5,111 |
| Foundation Building Materials, Inc. 6.00%, 3/1/2029 (c) | 407 | 331 |
| Freeport-McMoRan, Inc. | ||
| 5.00%, 9/1/2027 | 1,000 | 1,012 |
| INVESTMENTS | PRINCIPAL AMOUNT ($000) | VALUE ($000) |
| United States — continued | ||
| 4.13%, 3/1/2028 | 5,265 | 5,091 |
| 4.38%, 8/1/2028 | 3,530 | 3,418 |
| 5.45%, 3/15/2043 | 120 | 120 |
| Frontier Communications Holdings LLC | ||
| 5.88%, 10/15/2027 (c) | 3,844 | 3,681 |
| 5.00%, 5/1/2028 (c) | 11,290 | 10,303 |
| 6.75%, 5/1/2029 (c) | 2,468 | 2,224 |
| 5.88%, 11/1/2029 | 1,149 | 997 |
| 6.00%, 1/15/2030 (a) (c) | 1,380 | 1,201 |
| Gannett Holdings LLC 6.00%, 11/1/2026 (a) (c) | 1,624 | 1,478 |
| Gap, Inc. (The) | ||
| 3.63%, 10/1/2029 (c) | 1,220 | 992 |
| 3.88%, 10/1/2031 (c) | 975 | 777 |
| Gartner, Inc. | ||
| 4.50%, 7/1/2028 (c) | 3,884 | 3,722 |
| 3.63%, 6/15/2029 (c) | 1,937 | 1,734 |
| 3.75%, 10/1/2030 (c) | 869 | 775 |
| Gates Global LLC 6.25%, 1/15/2026 (c) | 2,064 | 2,012 |
| GCI LLC 4.75%, 10/15/2028 (c) | 7,965 | 7,388 |
| GCP Applied Technologies, Inc. 5.50%, 4/15/2026 (c) | 6,986 | 7,047 |
| General Electric Co. Series D, (ICE LIBOR USD 3 Month + 3.33%), 4.16%, 6/15/2022 (d) (e) (f) | 38,293 | 36,182 |
| General Motors Financial Co., Inc. 4.30%, 4/6/2029 | 70 | 67 |
| Genesis Energy LP | ||
| 6.50%, 10/1/2025 | 180 | 171 |
| 6.25%, 5/15/2026 | 1,933 | 1,803 |
| 8.00%, 1/15/2027 | 1,353 | 1,327 |
| 7.75%, 2/1/2028 | 3,721 | 3,581 |
| Genting New York LLC 3.30%, 2/15/2026 (c) | 535 | 489 |
| GEO Group, Inc. (The) | ||
| 5.88%, 10/15/2024 | 2,215 | 1,971 |
| 6.00%, 4/15/2026 | 899 | 725 |
| Gilead Sciences, Inc. | ||
| 3.25%, 9/1/2022 (a) | 91 | 91 |
| 1.65%, 10/1/2030 | 491 | 407 |
| Glatfelter Corp. 4.75%, 11/15/2029 (c) | 2,320 | 1,856 |
| Global Infrastructure Solutions, Inc. | ||
| 5.63%, 6/1/2029 (c) | 3,370 | 3,071 |
| 7.50%, 4/15/2032 (c) | 2,580 | 2,403 |
| April 30, 2022 | J.P. Morgan Funds | 75 |
| INVESTMENTS | PRINCIPAL AMOUNT ($000) | VALUE ($000) |
| Corporate Bonds — continued | ||
| United States — continued | ||
| Global Medical Response, Inc. 6.50%, 10/1/2025 (c) | 2,285 | 2,214 |
| Global Payments, Inc. | ||
| 3.20%, 8/15/2029 | 195 | 177 |
| 2.90%, 11/15/2031 | 55 | 47 |
| GLP Capital LP, REIT 5.25%, 6/1/2025 | 618 | 629 |
| Go Daddy Operating Co. LLC | ||
| 5.25%, 12/1/2027 (c) | 1,581 | 1,564 |
| 3.50%, 3/1/2029 (c) | 1,500 | 1,331 |
| Golden Entertainment, Inc. 7.63%, 4/15/2026 (c) | 394 | 403 |
| Goldman Sachs Capital II (ICE LIBOR USD 3 Month + 0.77%), 4.00%, 5/31/2022 (d) (e) (f) | 2,351 | 1,809 |
| Goldman Sachs Group, Inc. (The) | ||
| (ICE LIBOR USD 3 Month + 0.75%), 1.21%, 2/23/2023 (f) | 100 | 100 |
| Series S, (US Treasury Yield Curve Rate T Note Constant Maturity 5 Year + 2.85%), 4.40%, 2/10/2025 (d) (e) (f) | 1,733 | 1,620 |
| Series R, (US Treasury Yield Curve Rate T Note Constant Maturity 5 Year + 3.22%), 4.95%, 2/10/2025 (d) (e) (f) | 931 | 896 |
| Series T, (US Treasury Yield Curve Rate T Note Constant Maturity 5 Year + 2.97%), 3.80%, 5/10/2026 (d) (e) (f) | 6,520 | 5,737 |
| Series U, (US Treasury Yield Curve Rate T Note Constant Maturity 5 Year + 2.92%), 3.65%, 8/10/2026 (d) (e) (f) | 5,383 | 4,670 |
| Series V, (US Treasury Yield Curve Rate T Note Constant Maturity 5 Year + 2.95%), 4.12%, 11/10/2026 (d) (e) (f) | 2,770 | 2,484 |
| Series O, (ICE LIBOR USD 3 Month + 3.83%), 5.30%, 11/10/2026 (d) (e) (f) | 2,755 | 2,719 |
| (SOFR + 0.82%), 1.54%, 9/10/2027 (f) | 298 | 263 |
| (SOFR + 0.91%), 1.95%, 10/21/2027 (f) | 85 | 76 |
| (SOFR + 1.11%), 2.64%, 2/24/2028 (f) | 70 | 64 |
| (SOFR + 1.26%), 2.65%, 10/21/2032 (f) | 75 | 63 |
| Goodyear Tire & Rubber Co. (The) | ||
| 5.00%, 5/31/2026 (a) | 4,195 | 4,043 |
| 5.00%, 7/15/2029 | 2,982 | 2,659 |
| 5.25%, 4/30/2031 (a) | 2,965 | 2,578 |
| 5.25%, 7/15/2031 | 999 | 862 |
| GrafTech Finance, Inc. 4.63%, 12/15/2028 (c) | 2,127 | 1,941 |
| INVESTMENTS | PRINCIPAL AMOUNT ($000) | VALUE ($000) |
| United States — continued | ||
| Graham Holdings Co. 5.75%, 6/1/2026 (c) | 450 | 453 |
| Graham Packaging Co., Inc. 7.13%, 8/15/2028 (c) | 676 | 610 |
| Gray Escrow II, Inc. 5.38%, 11/15/2031 (a) (c) | 3,066 | 2,643 |
| Gray Television, Inc. | ||
| 5.88%, 7/15/2026 (c) | 2,102 | 2,115 |
| 7.00%, 5/15/2027 (c) | 6,085 | 6,290 |
| 4.75%, 10/15/2030 (a) (c) | 2,335 | 2,031 |
| Great Lakes Dredge & Dock Corp. 5.25%, 6/1/2029 (c) | 331 | 309 |
| Griffon Corp. 5.75%, 3/1/2028 | 3,475 | 3,101 |
| Gulfport Energy Corp. | ||
| 8.00%, 5/17/2026 (a) | 703 | 723 |
| 8.00%, 5/17/2026 (c) | 3,215 | 3,307 |
| Gulfport Energy Operating Corp. | ||
| 6.63%, 5/1/2023 ‡ (i) | 745 | — |
| 6.00%, 10/15/2024 ‡ (i) | 4,620 | — |
| 6.38%, 5/15/2025 ‡ (i) | 1,458 | — |
| 6.38%, 1/15/2026 ‡ (i) | 4,130 | — |
| GYP Holdings III Corp. 4.63%, 5/1/2029 (c) | 356 | 316 |
| H&E Equipment Services, Inc. 3.88%, 12/15/2028 (c) | 1,000 | 871 |
| Hanesbrands, Inc. 4.88%, 5/15/2026 (c) | 2,359 | 2,306 |
| Harsco Corp. 5.75%, 7/31/2027 (c) | 757 | 681 |
| HAT Holdings I LLC | ||
| 6.00%, 4/15/2025 (a) (c) | 788 | 800 |
| 3.38%, 6/15/2026 (c) | 1,000 | 919 |
| HCA, Inc. | ||
| 5.38%, 2/1/2025 | 31,659 | 32,569 |
| 5.88%, 2/15/2026 | 24,150 | 25,007 |
| 5.38%, 9/1/2026 | 7,986 | 8,174 |
| 5.63%, 9/1/2028 | 10,285 | 10,629 |
| 3.50%, 9/1/2030 | 7,926 | 7,100 |
| 2.38%, 7/15/2031 | 329 | 271 |
| HealthEquity, Inc. 4.50%, 10/1/2029 (c) | 1,316 | 1,202 |
| Hecla Mining Co. 7.25%, 2/15/2028 (a) | 484 | 489 |
| Herbalife Nutrition Ltd. 7.88%, 9/1/2025 (c) | 970 | 954 |
| Herc Holdings, Inc. 5.50%, 7/15/2027 (a) (c) | 10,623 | 10,407 |
| Hertz Corp. (The) | ||
| 6.25%, 10/15/2022 (i) | 1,106 | 6 |
| 5.50%, 10/15/2024 (i) | 11,828 | 59 |
| 4.63%, 12/1/2026 (c) | 4,630 | 4,220 |
| 76 | J.P. Morgan Funds | April 30, 2022 |
| INVESTMENTS | PRINCIPAL AMOUNT ($000) | VALUE ($000) |
| Corporate Bonds — continued | ||
| United States — continued | ||
| 5.00%, 12/1/2029 (c) | 2,195 | 1,921 |
| Hess Midstream Operations LP | ||
| 5.63%, 2/15/2026 (c) | 4,115 | 4,115 |
| 4.25%, 2/15/2030 (c) | 2,718 | 2,493 |
| H-Food Holdings LLC 8.50%, 6/1/2026 (c) | 450 | 422 |
| Hilcorp Energy I LP | ||
| 6.25%, 11/1/2028 (c) | 640 | 637 |
| 6.00%, 4/15/2030 (c) | 1,506 | 1,495 |
| 6.25%, 4/15/2032 (c) | 1,255 | 1,223 |
| Hilton Domestic Operating Co., Inc. | ||
| 5.38%, 5/1/2025 (c) | 584 | 596 |
| 5.75%, 5/1/2028 (c) | 1,536 | 1,558 |
| 3.75%, 5/1/2029 (c) | 2,650 | 2,401 |
| 4.88%, 1/15/2030 | 1,923 | 1,855 |
| 4.00%, 5/1/2031 (c) | 1,990 | 1,780 |
| 3.63%, 2/15/2032 (c) | 856 | 725 |
| Hilton Grand Vacations Borrower Escrow LLC | ||
| 5.00%, 6/1/2029 (c) | 696 | 628 |
| 4.88%, 7/1/2031 (c) | 1,000 | 873 |
| Hilton Worldwide Finance LLC 4.88%, 4/1/2027 | 4,204 | 4,162 |
| HLF Financing SARL LLC 4.88%, 6/1/2029 (c) | 1,000 | 805 |
| Holly Energy Partners LP | ||
| 6.38%, 4/15/2027 (c) | 1,720 | 1,754 |
| 5.00%, 2/1/2028 (c) | 2,795 | 2,659 |
| Hologic, Inc. | ||
| 4.63%, 2/1/2028 (c) | 1,638 | 1,602 |
| 3.25%, 2/15/2029 (c) | 5,498 | 4,898 |
| Home Point Capital, Inc. 5.00%, 2/1/2026 (c) | 500 | 395 |
| Horizon Therapeutics USA, Inc. 5.50%, 8/1/2027 (c) | 612 | 612 |
| Howard Hughes Corp. (The) 4.38%, 2/1/2031 (c) | 368 | 327 |
| Howmet Aerospace, Inc. | ||
| 5.13%, 10/1/2024 | 3,601 | 3,664 |
| 5.90%, 2/1/2027 | 4,185 | 4,295 |
| 6.75%, 1/15/2028 | 145 | 154 |
| Hughes Satellite Systems Corp. | ||
| 5.25%, 8/1/2026 | 1,126 | 1,095 |
| 6.63%, 8/1/2026 (a) | 4,459 | 4,437 |
| Huntington Bancshares, Inc. Series E, (ICE LIBOR USD 3 Month + 2.88%), 5.70%, 4/15/2023 (d) (e) (f) | 3,742 | 3,526 |
| INVESTMENTS | PRINCIPAL AMOUNT ($000) | VALUE ($000) |
| United States — continued | ||
| Hyundai Capital America | ||
| 0.80%, 4/3/2023 (c) | 80 | 78 |
| 1.65%, 9/17/2026 (c) | 165 | 147 |
| 2.10%, 9/15/2028 (c) | 83 | 71 |
| IAA, Inc. 5.50%, 6/15/2027 (c) | 450 | 440 |
| Icahn Enterprises LP | ||
| 6.25%, 5/15/2026 | 1,427 | 1,415 |
| 5.25%, 5/15/2027 | 1,000 | 934 |
| 4.38%, 2/1/2029 | 2,383 | 2,056 |
| IEA Energy Services LLC 6.63%, 8/15/2029 (c) | 305 | 279 |
| iHeartCommunications, Inc. | ||
| 6.38%, 5/1/2026 | 2,920 | 2,928 |
| 8.38%, 5/1/2027 | 6,548 | 6,482 |
| 5.25%, 8/15/2027 (c) | 5,555 | 5,194 |
| II-VI, Inc. 5.00%, 12/15/2029 (c) | 2,599 | 2,437 |
| ILFC E-Capital Trust I 4.05%, 12/21/2065 (a) (c) (j) | 7,148 | 5,575 |
| ILFC E-Capital Trust II 4.30%, 12/21/2065 (c) (j) | 2,205 | 1,764 |
| Imola Merger Corp. 4.75%, 5/15/2029 (c) | 11,541 | 10,733 |
| Ingles Markets, Inc. 4.00%, 6/15/2031 (a) (c) | 356 | 320 |
| Installed Building Products, Inc. 5.75%, 2/1/2028 (c) | 306 | 290 |
| Intel Corp. 2.00%, 8/12/2031 (a) | 64 | 54 |
| International Game Technology plc | ||
| 6.50%, 2/15/2025 (c) | 9,488 | 9,654 |
| 6.25%, 1/15/2027 (c) | 4,104 | 4,167 |
| 5.25%, 1/15/2029 (c) | 442 | 419 |
| IQVIA, Inc. | ||
| 5.00%, 10/15/2026 (c) | 7,463 | 7,426 |
| 5.00%, 5/15/2027 (c) | 2,790 | 2,764 |
| IRB Holding Corp. 7.00%, 6/15/2025 (c) | 1,040 | 1,070 |
| Iron Mountain, Inc. | ||
| 4.88%, 9/15/2027 (c) | 4,756 | 4,542 |
| 5.25%, 3/15/2028 (c) | 2,013 | 1,917 |
| 4.50%, 2/15/2031 (c) | 2,140 | 1,834 |
| ITC Holdings Corp. 2.95%, 5/14/2030 (c) | 155 | 140 |
| ITT Holdings LLC 6.50%, 8/1/2029 (c) | 474 | 419 |
| James Hardie International Finance DAC 5.00%, 1/15/2028 (c) | 450 | 434 |
| Jazz Securities DAC 4.38%, 1/15/2029 (c) | 4,875 | 4,491 |
| JB Poindexter & Co., Inc. 7.13%, 4/15/2026 (c) | 1,631 | 1,634 |
| April 30, 2022 | J.P. Morgan Funds | 77 |
| INVESTMENTS | PRINCIPAL AMOUNT ($000) | VALUE ($000) |
| Corporate Bonds — continued | ||
| United States — continued | ||
| JBS USA LUX SA 6.75%, 2/15/2028 (c) | 1,722 | 1,778 |
| JELD-WEN, Inc. | ||
| 6.25%, 5/15/2025 (c) | 1,197 | 1,222 |
| 4.63%, 12/15/2025 (c) | 2,505 | 2,361 |
| 4.88%, 12/15/2027 (c) | 1,760 | 1,596 |
| Joseph T Ryerson & Son, Inc. 8.50%, 8/1/2028 (c) | 100 | 108 |
| Kaiser Aluminum Corp. | ||
| 4.63%, 3/1/2028 (c) | 1,500 | 1,376 |
| 4.50%, 6/1/2031 (a) (c) | 2,065 | 1,781 |
| Kansas City Southern 3.50%, 5/1/2050 | 35 | 28 |
| Kennedy-Wilson, Inc. | ||
| 4.75%, 3/1/2029 | 1,545 | 1,425 |
| 5.00%, 3/1/2031 | 3,674 | 3,316 |
| Keurig Dr Pepper, Inc. | ||
| 3.20%, 5/1/2030 | 253 | 231 |
| 4.50%, 4/15/2052 | 35 | 33 |
| KFC Holding Co. 4.75%, 6/1/2027 (c) | 1,000 | 998 |
| Kimco Realty Corp., REIT 2.25%, 12/1/2031 | 46 | 39 |
| Kinder Morgan Energy Partners LP 4.70%, 11/1/2042 | 80 | 72 |
| Kontoor Brands, Inc. 4.13%, 11/15/2029 (c) | 410 | 356 |
| Korn Ferry 4.63%, 12/15/2027 (c) | 450 | 426 |
| Kraft Heinz Foods Co. 3.75%, 4/1/2030 (a) | 155 | 147 |
| Kroger Co. (The) 1.70%, 1/15/2031 (a) | 176 | 144 |
| L3Harris Technologies, Inc. 1.80%, 1/15/2031 | 185 | 152 |
| LABL, Inc. | ||
| 6.75%, 7/15/2026 (c) | 8,760 | 8,429 |
| 10.50%, 7/15/2027 (c) | 2,020 | 1,949 |
| Lamar Media Corp. | ||
| 3.75%, 2/15/2028 | 1,215 | 1,112 |
| 4.00%, 2/15/2030 | 630 | 565 |
| 3.63%, 1/15/2031 | 361 | 314 |
| Lamb Weston Holdings, Inc. | ||
| 4.88%, 5/15/2028 (a) (c) | 1,115 | 1,084 |
| 4.13%, 1/31/2030 (c) | 8,032 | 7,168 |
| 4.38%, 1/31/2032 (c) | 1,728 | 1,544 |
| Laredo Petroleum, Inc. 9.50%, 1/15/2025 | 2,212 | 2,267 |
| LD Holdings Group LLC 6.50%, 11/1/2025 (c) | 1,101 | 912 |
| Lear Corp. 2.60%, 1/15/2032 | 25 | 21 |
| INVESTMENTS | PRINCIPAL AMOUNT ($000) | VALUE ($000) |
| United States — continued | ||
| Level 3 Financing, Inc. | ||
| 5.38%, 5/1/2025 | 10,443 | 10,352 |
| 5.25%, 3/15/2026 | 1,599 | 1,555 |
| 4.63%, 9/15/2027 (c) | 4,657 | 4,185 |
| 3.63%, 1/15/2029 (c) | 1,404 | 1,139 |
| Levi Strauss & Co. 3.50%, 3/1/2031 (a) (c) | 509 | 440 |
| LGI Homes, Inc. 4.00%, 7/15/2029 (c) | 305 | 252 |
| Liberty Interactive LLC 8.25%, 2/1/2030 (a) | 2,370 | 2,093 |
| Lions Gate Capital Holdings LLC 5.50%, 4/15/2029 (c) | 2,113 | 1,873 |
| Lithia Motors, Inc. 4.38%, 1/15/2031 (c) | 1,668 | 1,530 |
| Live Nation Entertainment, Inc. | ||
| 4.88%, 11/1/2024 (c) | 2,560 | 2,528 |
| 5.63%, 3/15/2026 (c) | 5,302 | 5,236 |
| 6.50%, 5/15/2027 (c) | 6,460 | 6,701 |
| 4.75%, 10/15/2027 (a) (c) | 6,631 | 6,230 |
| 3.75%, 1/15/2028 (c) | 903 | 817 |
| Louisiana-Pacific Corp. 3.63%, 3/15/2029 (c) | 520 | 447 |
| Lowe's Cos., Inc. | ||
| 1.70%, 9/15/2028 | 75 | 66 |
| 2.63%, 4/1/2031 | 166 | 146 |
| 3.70%, 4/15/2046 (a) | 122 | 102 |
| LPL Holdings, Inc. | ||
| 4.63%, 11/15/2027 (c) | 1,900 | 1,803 |
| 4.00%, 3/15/2029 (c) | 1,681 | 1,530 |
| Lumen Technologies, Inc. | ||
| Series Y, 7.50%, 4/1/2024 | 6,646 | 6,825 |
| 5.63%, 4/1/2025 | 3,267 | 3,185 |
| 5.13%, 12/15/2026 (a) (c) | 12,528 | 11,275 |
| 4.00%, 2/15/2027 (a) (c) | 6,160 | 5,478 |
| Series G, 6.88%, 1/15/2028 | 799 | 761 |
| 4.50%, 1/15/2029 (c) | 1,780 | 1,406 |
| 5.38%, 6/15/2029 (c) | 5,016 | 4,085 |
| Series P, 7.60%, 9/15/2039 | 100 | 87 |
| Series U, 7.65%, 3/15/2042 (a) | 772 | 691 |
| Macy's Retail Holdings LLC | ||
| 5.88%, 4/1/2029 (c) | 157 | 149 |
| 5.88%, 3/15/2030 (a) (c) | 771 | 723 |
| 5.13%, 1/15/2042 (a) | 2,150 | 1,596 |
| 4.30%, 2/15/2043 | 819 | 563 |
| Madison IAQ LLC | ||
| 4.13%, 6/30/2028 (c) | 750 | 658 |
| 5.88%, 6/30/2029 (c) | 4,290 | 3,496 |
| 78 | J.P. Morgan Funds | April 30, 2022 |
| INVESTMENTS | PRINCIPAL AMOUNT ($000) | VALUE ($000) |
| Corporate Bonds — continued | ||
| United States — continued | ||
| Magallanes, Inc. | ||
| 3.76%, 3/15/2027 (c) | 60 | 58 |
| 4.28%, 3/15/2032 (c) | 135 | 125 |
| Magnolia Oil & Gas Operating LLC 6.00%, 8/1/2026 (c) | 500 | 500 |
| Mallinckrodt International Finance SA | ||
| 5.63%, 10/15/2023 (c) (i) | 2,615 | 1,373 |
| 5.50%, 4/15/2025 (c) (i) | 5,555 | 2,889 |
| Marriott Ownership Resorts, Inc. | ||
| 6.13%, 9/15/2025 (c) | 973 | 996 |
| 4.75%, 1/15/2028 | 36 | 33 |
| 4.50%, 6/15/2029 (c) | 656 | 577 |
| Masonite International Corp. | ||
| 5.38%, 2/1/2028 (c) | 1,582 | 1,515 |
| 3.50%, 2/15/2030 (c) | 935 | 788 |
| MasTec, Inc. 4.50%, 8/15/2028 (a) (c) | 5,891 | 5,648 |
| Matador Resources Co. 5.88%, 9/15/2026 | 3,555 | 3,490 |
| Match Group Holdings II LLC | ||
| 5.00%, 12/15/2027 (c) | 545 | 531 |
| 4.63%, 6/1/2028 (c) | 200 | 186 |
| 4.13%, 8/1/2030 (c) | 1,397 | 1,249 |
| Mattel, Inc. | ||
| 3.15%, 3/15/2023 | 1,000 | 995 |
| 3.38%, 4/1/2026 (c) | 1,297 | 1,261 |
| 5.88%, 12/15/2027 (c) | 1,034 | 1,058 |
| 3.75%, 4/1/2029 (c) | 1,624 | 1,547 |
| Mauser Packaging Solutions Holding Co. | ||
| 5.50%, 4/15/2024 (c) | 7,447 | 7,270 |
| 7.25%, 4/15/2025 (c) | 2,610 | 2,473 |
| McDonald's Corp. 3.70%, 2/15/2042 | 137 | 120 |
| McGraw-Hill Education, Inc. 5.75%, 8/1/2028 (c) | 4,120 | 3,677 |
| MDC Holdings, Inc. 2.50%, 1/15/2031 | 190 | 153 |
| Mellon Capital IV Series 1, (ICE LIBOR USD 3 Month + 0.57%), 4.00%, 5/31/2022 (d) (e) (f) | 2,027 | 1,707 |
| Meritage Homes Corp. 3.88%, 4/15/2029 (c) | 1,226 | 1,097 |
| Meritor, Inc. 6.25%, 6/1/2025 (a) (c) | 571 | 591 |
| MetLife Capital Trust IV 7.88%, 12/15/2037 (c) | 7,703 | 8,743 |
| MetLife, Inc. | ||
| Series G, (US Treasury Yield Curve Rate T Note Constant Maturity 5 Year + 3.58%), 3.85%, 9/15/2025 (d) (e) (f) | 11,895 | 11,328 |
| INVESTMENTS | PRINCIPAL AMOUNT ($000) | VALUE ($000) |
| United States — continued | ||
| Series D, (ICE LIBOR USD 3 Month + 2.96%), 5.87%, 3/15/2028 (d) (e) (f) | 4,741 | 4,688 |
| 6.40%, 12/15/2036 | 14,937 | 15,493 |
| 9.25%, 4/8/2038 (c) | 3,109 | 3,842 |
| MGM Resorts International | ||
| 6.00%, 3/15/2023 | 6,330 | 6,401 |
| 6.75%, 5/1/2025 | 1,495 | 1,530 |
| 5.75%, 6/15/2025 | 6,942 | 6,897 |
| 4.63%, 9/1/2026 | 2,640 | 2,486 |
| 5.50%, 4/15/2027 | 1,468 | 1,430 |
| Microchip Technology, Inc. 4.25%, 9/1/2025 (a) | 1,091 | 1,082 |
| Midcontinent Communications 5.38%, 8/15/2027 (c) | 2,488 | 2,432 |
| Midwest Gaming Borrower LLC 4.88%, 5/1/2029 (c) | 764 | 670 |
| Mileage Plus Holdings LLC 6.50%, 6/20/2027 (c) | 4,455 | 4,544 |
| Minerals Technologies, Inc. 5.00%, 7/1/2028 (c) | 450 | 420 |
| Mississippi Power Co. Series 12-A, 4.25%, 3/15/2042 (a) | 128 | 115 |
| MIWD Holdco II LLC 5.50%, 2/1/2030 (c) | 1,208 | 1,045 |
| Mohegan Gaming & Entertainment 8.00%, 2/1/2026 (c) | 1,717 | 1,524 |
| Molina Healthcare, Inc. | ||
| 4.38%, 6/15/2028 (c) | 2,202 | 2,058 |
| 3.88%, 11/15/2030 (c) | 3,655 | 3,297 |
| Mondelez International, Inc. 1.50%, 2/4/2031 | 174 | 141 |
| Moog, Inc. 4.25%, 12/15/2027 (c) | 450 | 419 |
| Morgan Stanley | ||
| Series N, (ICE LIBOR USD 3 Month + 3.16%), 5.30%, 12/15/2025 (d) (e) (f) | 914 | 879 |
| Series M, (ICE LIBOR USD 3 Month + 4.44%), 5.87%, 9/15/2026 (d) (e) (f) | 1,997 | 2,035 |
| (SOFR + 0.86%), 1.51%, 7/20/2027 (f) | 182 | 162 |
| (SOFR + 1.61%), 4.21%, 4/20/2028 (f) | 90 | 89 |
| (SOFR + 1.02%), 1.93%, 4/28/2032 (f) | 80 | 64 |
| (SOFR + 1.20%), 2.51%, 10/20/2032 (f) | 30 | 25 |
| (SOFR + 1.49%), 3.22%, 4/22/2042 (f) | 25 | 21 |
| Moss Creek Resources Holdings, Inc. | ||
| 7.50%, 1/15/2026 (c) | 2,234 | 2,049 |
| 10.50%, 5/15/2027 (c) | 168 | 164 |
| April 30, 2022 | J.P. Morgan Funds | 79 |
| INVESTMENTS | PRINCIPAL AMOUNT ($000) | VALUE ($000) |
| Corporate Bonds — continued | ||
| United States — continued | ||
| Mozart Debt Merger Sub, Inc. | ||
| 3.88%, 4/1/2029 (c) | 6,809 | 5,949 |
| 5.25%, 10/1/2029 (a) (c) | 5,302 | 4,613 |
| MPH Acquisition Holdings LLC 5.50%, 9/1/2028 (c) | 100 | 93 |
| MPLX LP 4.50%, 4/15/2038 | 141 | 130 |
| MSCI, Inc. | ||
| 4.00%, 11/15/2029 (c) | 2,662 | 2,452 |
| 3.63%, 9/1/2030 (c) | 145 | 128 |
| 3.63%, 11/1/2031 (c) | 389 | 341 |
| Mueller Water Products, Inc. 4.00%, 6/15/2029 (c) | 458 | 410 |
| Murphy Oil Corp. 6.37%, 12/1/2042 (h) | 1,325 | 1,196 |
| Murphy Oil USA, Inc. 3.75%, 2/15/2031 (c) | 2,234 | 1,962 |
| Nabors Industries Ltd. 7.25%, 1/15/2026 (c) | 1,376 | 1,345 |
| Nabors Industries, Inc. 5.75%, 2/1/2025 | 4,145 | 3,962 |
| National CineMedia LLC 5.88%, 4/15/2028 (a) (c) | 1,745 | 1,500 |
| National Rural Utilities Cooperative Finance Corp. (ICE LIBOR USD 3 Month + 3.63%), 5.25%, 4/20/2046 (f) | 3,053 | 2,958 |
| Nationstar Mortgage Holdings, Inc. | ||
| 6.00%, 1/15/2027 (c) | 450 | 437 |
| 5.50%, 8/15/2028 (c) | 5,136 | 4,674 |
| 5.13%, 12/15/2030 (c) | 2,280 | 1,983 |
| 5.75%, 11/15/2031 (c) | 4,085 | 3,625 |
| Natural Resource Partners LP 9.13%, 6/30/2025 (c) | 283 | 288 |
| Navient Corp. 5.00%, 3/15/2027 (a) | 1,330 | 1,211 |
| NCR Corp. | ||
| 5.75%, 9/1/2027 (c) | 6,319 | 6,082 |
| 5.00%, 10/1/2028 (c) | 2,390 | 2,282 |
| 5.13%, 4/15/2029 (c) | 4,509 | 4,295 |
| 6.13%, 9/1/2029 (c) | 5,370 | 5,142 |
| NESCO Holdings II, Inc. 5.50%, 4/15/2029 (c) | 1,187 | 1,119 |
| Netflix, Inc. | ||
| 5.88%, 2/15/2025 | 969 | 1,005 |
| 4.88%, 4/15/2028 | 140 | 137 |
| 5.88%, 11/15/2028 | 7,453 | 7,677 |
| 5.38%, 11/15/2029 (c) | 1,238 | 1,239 |
| 4.88%, 6/15/2030 (a) (c) | 1,885 | 1,838 |
| New Albertsons LP | ||
| 7.75%, 6/15/2026 | 1,535 | 1,621 |
| INVESTMENTS | PRINCIPAL AMOUNT ($000) | VALUE ($000) |
| United States — continued | ||
| 6.63%, 6/1/2028 | 613 | 651 |
| 7.45%, 8/1/2029 | 392 | 412 |
| 8.00%, 5/1/2031 | 2,108 | 2,269 |
| Newell Brands, Inc. | ||
| 4.45%, 4/1/2026 (h) | 8,050 | 7,981 |
| 5.63%, 4/1/2036 (h) | 4,455 | 4,258 |
| News Corp. | ||
| 3.88%, 5/15/2029 (c) | 5,359 | 4,846 |
| 5.13%, 2/15/2032 (c) | 2,090 | 1,996 |
| Nexstar Media, Inc. | ||
| 5.63%, 7/15/2027 (c) | 13,007 | 12,658 |
| 4.75%, 11/1/2028 (c) | 4,557 | 4,135 |
| NextEra Energy Capital Holdings, Inc. | ||
| (ICE LIBOR USD 3 Month + 2.07%), 3.03%, 10/1/2066 (f) | 5,650 | 4,803 |
| (ICE LIBOR USD 3 Month + 2.13%), 2.95%, 6/15/2067 (f) | 2,514 | 2,190 |
| (ICE LIBOR USD 3 Month + 3.16%), 5.65%, 5/1/2079 (f) | 4,282 | 4,210 |
| (US Treasury Yield Curve Rate T Note Constant Maturity 5 Year + 2.55%), 3.80%, 3/15/2082 (f) | 3,938 | 3,427 |
| NextEra Energy Operating Partners LP | ||
| 4.25%, 7/15/2024 (c) | 1,811 | 1,798 |
| 4.25%, 9/15/2024 (c) | 57 | 56 |
| 4.50%, 9/15/2027 (c) | 986 | 934 |
| NGL Energy Operating LLC 7.50%, 2/1/2026 (c) | 2,272 | 2,140 |
| Nielsen Co. Luxembourg SARL (The) 5.00%, 2/1/2025 (c) | 914 | 915 |
| Nielsen Finance LLC | ||
| 5.63%, 10/1/2028 (c) | 2,818 | 2,731 |
| 4.75%, 7/15/2031 (c) | 280 | 265 |
| NiSource, Inc. | ||
| (US Treasury Yield Curve Rate T Note Constant Maturity 5 Year + 2.84%), 5.65%, 6/15/2023 (d) (e) (f) | 8,367 | 8,074 |
| 1.70%, 2/15/2031 | 190 | 150 |
| Nissan Motor Acceptance Co. LLC | ||
| 1.85%, 9/16/2026 (c) | 260 | 225 |
| 2.45%, 9/15/2028 (c) | 122 | 104 |
| NMG Holding Co., Inc. 7.13%, 4/1/2026 (c) | 8,290 | 8,230 |
| NMI Holdings, Inc. 7.38%, 6/1/2025 (c) | 411 | 428 |
| Norfolk Southern Corp. 2.30%, 5/15/2031 | 132 | 114 |
| 80 | J.P. Morgan Funds | April 30, 2022 |
| INVESTMENTS | PRINCIPAL AMOUNT ($000) | VALUE ($000) |
| Corporate Bonds — continued | ||
| United States — continued | ||
| Northern Oil and Gas, Inc. 8.13%, 3/1/2028 (c) | 764 | 760 |
| NortonLifeLock, Inc. 5.00%, 4/15/2025 (c) | 1,378 | 1,376 |
| Novelis Corp. | ||
| 3.25%, 11/15/2026 (c) | 2,573 | 2,348 |
| 4.75%, 1/30/2030 (c) | 4,705 | 4,327 |
| 3.88%, 8/15/2031 (c) | 1,286 | 1,103 |
| NRG Energy, Inc. | ||
| 6.63%, 1/15/2027 | 2,341 | 2,370 |
| 5.75%, 1/15/2028 | 805 | 787 |
| 3.38%, 2/15/2029 (c) | 1,950 | 1,653 |
| 5.25%, 6/15/2029 (c) | 3,187 | 3,002 |
| 3.63%, 2/15/2031 (c) | 3,605 | 3,001 |
| 3.88%, 2/15/2032 (c) | 3,504 | 2,925 |
| NuStar Logistics LP | ||
| 5.75%, 10/1/2025 | 1,615 | 1,607 |
| 6.00%, 6/1/2026 | 2,167 | 2,162 |
| 5.63%, 4/28/2027 | 3,035 | 2,910 |
| 6.38%, 10/1/2030 | 2,025 | 1,994 |
| Oasis Petroleum, Inc. 6.38%, 6/1/2026 (c) | 2,095 | 2,105 |
| Occidental Petroleum Corp. | ||
| 8.00%, 7/15/2025 | 5,030 | 5,420 |
| 5.88%, 9/1/2025 | 2,940 | 3,020 |
| 5.50%, 12/1/2025 | 2,313 | 2,353 |
| 8.50%, 7/15/2027 | 6,264 | 7,063 |
| 6.38%, 9/1/2028 | 2,425 | 2,546 |
| 8.88%, 7/15/2030 | 6,661 | 8,000 |
| 6.63%, 9/1/2030 | 2,425 | 2,628 |
| 6.13%, 1/1/2031 (a) | 3,981 | 4,184 |
| Oceaneering International, Inc. | ||
| 4.65%, 11/15/2024 | 2,194 | 2,123 |
| 6.00%, 2/1/2028 | 1,175 | 1,093 |
| ON Semiconductor Corp. 3.88%, 9/1/2028 (c) | 3,751 | 3,480 |
| ONE Gas, Inc. (ICE LIBOR USD 3 Month + 0.61%), 1.36%, 3/11/2023 (f) | 38 | 38 |
| OneMain Finance Corp. | ||
| 5.63%, 3/15/2023 | 3,088 | 3,119 |
| 6.88%, 3/15/2025 | 2,110 | 2,121 |
| 7.13%, 3/15/2026 | 502 | 508 |
| 3.50%, 1/15/2027 | 1,267 | 1,113 |
| 6.63%, 1/15/2028 | 4,188 | 4,136 |
| 5.38%, 11/15/2029 | 1,405 | 1,261 |
| 4.00%, 9/15/2030 (a) | 1,550 | 1,269 |
| INVESTMENTS | PRINCIPAL AMOUNT ($000) | VALUE ($000) |
| United States — continued | ||
| Option Care Health, Inc. 4.38%, 10/31/2029 (c) | 513 | 461 |
| Oracle Corp. 3.80%, 11/15/2037 | 279 | 229 |
| Organon & Co. | ||
| 4.13%, 4/30/2028 (c) | 10,125 | 9,419 |
| 5.13%, 4/30/2031 (c) | 5,943 | 5,371 |
| Outfront Media Capital LLC 5.00%, 8/15/2027 (c) | 2,492 | 2,371 |
| Ovintiv, Inc. 8.13%, 9/15/2030 | 250 | 298 |
| Owens & Minor, Inc. | ||
| 4.50%, 3/31/2029 (c) | 4,018 | 3,614 |
| 6.63%, 4/1/2030 (c) | 1,716 | 1,680 |
| Owens-Brockway Glass Container, Inc. | ||
| 6.38%, 8/15/2025 (a) (c) | 1,084 | 1,081 |
| 6.63%, 5/13/2027 (a) (c) | 2,358 | 2,323 |
| Pactiv Evergreen Group Issuer, Inc. 4.00%, 10/15/2027 (c) | 4,802 | 4,190 |
| Papa John's International, Inc. 3.88%, 9/15/2029 (c) | 407 | 356 |
| Par Pharmaceutical, Inc. 7.50%, 4/1/2027 (c) | 8,148 | 7,434 |
| Paramount Global | ||
| 4.20%, 5/19/2032 | 145 | 134 |
| (ICE LIBOR USD 3 Month + 3.90%), 6.25%, 2/28/2057 (f) | 12,291 | 11,863 |
| (US Treasury Yield Curve Rate T Note Constant Maturity 5 Year + 4.00%), 6.37%, 3/30/2062 (f) | 8,290 | 8,034 |
| Patrick Industries, Inc. 4.75%, 5/1/2029 (c) | 247 | 212 |
| Patterson-UTI Energy, Inc. | ||
| 3.95%, 2/1/2028 | 1,984 | 1,827 |
| 5.15%, 11/15/2029 | 200 | 190 |
| PBF Holding Co. LLC 9.25%, 5/15/2025 (c) | 2,871 | 2,976 |
| PBF Logistics LP 6.88%, 5/15/2023 | 770 | 768 |
| Penske Truck Leasing Co. LP 4.88%, 7/11/2022 (c) | 45 | 45 |
| Performance Food Group, Inc. | ||
| 6.88%, 5/1/2025 (c) | 400 | 410 |
| 5.50%, 10/15/2027 (c) | 4,211 | 4,086 |
| 4.25%, 8/1/2029 (c) | 6,332 | 5,627 |
| PetSmart, Inc. | ||
| 4.75%, 2/15/2028 (c) | 2,606 | 2,424 |
| 7.75%, 2/15/2029 (c) | 2,226 | 2,215 |
| PG&E Corp. | ||
| 5.00%, 7/1/2028 (a) | 6,052 | 5,569 |
| April 30, 2022 | J.P. Morgan Funds | 81 |
| INVESTMENTS | PRINCIPAL AMOUNT ($000) | VALUE ($000) |
| Corporate Bonds — continued | ||
| United States — continued | ||
| 5.25%, 7/1/2030 | 503 | 457 |
| PGT Innovations, Inc. 4.38%, 10/1/2029 (c) | 2,099 | 1,842 |
| Philip Morris International, Inc. 3.38%, 8/15/2029 | 195 | 183 |
| Photo Holdings Merger Sub, Inc. 8.50%, 10/1/2026 (a) (c) | 10,815 | 10,004 |
| Physicians Realty LP | ||
| 3.95%, 1/15/2028 | 60 | 58 |
| 2.63%, 11/1/2031 | 20 | 17 |
| Pike Corp. 5.50%, 9/1/2028 (c) | 2,448 | 2,222 |
| Pilgrim's Pride Corp. 5.88%, 9/30/2027 (c) | 2,410 | 2,428 |
| Plains All American Pipeline LP Series B, (ICE LIBOR USD 3 Month + 4.11%), 6.13%, 11/15/2022 (d) (e) (f) | 3,773 | 3,141 |
| Plantronics, Inc. 4.75%, 3/1/2029 (c) | 2,758 | 2,795 |
| Playtika Holding Corp. 4.25%, 3/15/2029 (c) | 499 | 450 |
| PM General Purchaser LLC 9.50%, 10/1/2028 (c) | 2,098 | 2,025 |
| PNC Financial Services Group, Inc. (The) | ||
| Series O, (ICE LIBOR USD 3 Month + 3.68%), 3.99%, 8/1/2022 (d) (e) (f) | 10,102 | 10,014 |
| Series R, (ICE LIBOR USD 3 Month + 3.04%), 4.85%, 6/1/2023 (d) (e) (f) | 8,712 | 8,527 |
| Series T, (US Treasury Yield Curve Rate T Note Constant Maturity 5 Year + 2.60%), 3.40%, 9/15/2026 (d) (e) (f) | 12,810 | 11,017 |
| Series S, (ICE LIBOR USD 3 Month + 3.30%), 5.00%, 11/1/2026 (d) (e) (f) | 3,591 | 3,447 |
| Series U, (US Treasury Yield Curve Rate T Note Constant Maturity 5 Year + 3.00%), 6.00%, 5/15/2027 (d) (e) (f) | 3,530 | 3,521 |
| Post Holdings, Inc. | ||
| 5.75%, 3/1/2027 (c) | 1,886 | 1,860 |
| 5.63%, 1/15/2028 (a) (c) | 4,711 | 4,454 |
| 5.50%, 12/15/2029 (c) | 7,221 | 6,571 |
| 4.63%, 4/15/2030 (c) | 3,100 | 2,651 |
| PPL Capital Funding, Inc. Series A, (ICE LIBOR USD 3 Month + 2.67%), 3.66%, 3/30/2067 (f) | 12,547 | 10,941 |
| PRA Group, Inc. 5.00%, 10/1/2029 (c) | 689 | 637 |
| Presidio Holdings, Inc. 4.88%, 2/1/2027 (c) | 2,415 | 2,292 |
| Prestige Brands, Inc. | ||
| 5.13%, 1/15/2028 (c) | 900 | 855 |
| 3.75%, 4/1/2031 (c) | 2,119 | 1,796 |
| INVESTMENTS | PRINCIPAL AMOUNT ($000) | VALUE ($000) |
| United States — continued | ||
| Prime Security Services Borrower LLC | ||
| 5.75%, 4/15/2026 (c) | 9,707 | 9,307 |
| 3.38%, 8/31/2027 (c) | 3,986 | 3,402 |
| PROG Holdings, Inc. 6.00%, 11/15/2029 (c) | 616 | 544 |
| Progressive Corp. (The) Series B, (ICE LIBOR USD 3 Month + 2.54%), 5.38%, 3/15/2023 (d) (e) (f) | 7,704 | 7,357 |
| Prudential Financial, Inc. | ||
| (ICE LIBOR USD 3 Month + 4.18%), 5.87%, 9/15/2042 (f) | 4,231 | 4,220 |
| (ICE LIBOR USD 3 Month + 3.92%), 5.63%, 6/15/2043 (f) | 19,489 | 19,486 |
| (US Treasury Yield Curve Rate T Note Constant Maturity 5 Year + 3.16%), 5.12%, 3/1/2052 (f) | 3,685 | 3,584 |
| PTC, Inc. | ||
| 3.63%, 2/15/2025 (c) | 434 | 420 |
| 4.00%, 2/15/2028 (c) | 820 | 760 |
| Public Service Co. of Oklahoma Series J, 2.20%, 8/15/2031 | 248 | 209 |
| QVC, Inc. 4.38%, 3/15/2023 | 587 | 587 |
| Qwest Corp. 7.25%, 9/15/2025 | 325 | 353 |
| Rain CII Carbon LLC 7.25%, 4/1/2025 (c) | 4,785 | 4,606 |
| Range Resources Corp. | ||
| 4.88%, 5/15/2025 | 3,485 | 3,450 |
| 8.25%, 1/15/2029 | 2,764 | 2,964 |
| 4.75%, 2/15/2030 (a) (c) | 1,227 | 1,170 |
| Raytheon Technologies Corp. | ||
| 1.90%, 9/1/2031 | 329 | 270 |
| 4.15%, 5/15/2045 | 236 | 220 |
| Realogy Group LLC | ||
| 5.75%, 1/15/2029 (c) | 1,500 | 1,257 |
| 5.25%, 4/15/2030 (c) | 5,768 | 4,673 |
| Regeneron Pharmaceuticals, Inc. 1.75%, 9/15/2030 | 385 | 313 |
| Renewable Energy Group, Inc. 5.88%, 6/1/2028 (c) | 560 | 593 |
| Rent-A-Center, Inc. 6.38%, 2/15/2029 (a) (c) | 474 | 409 |
| Resolute Forest Products, Inc. 4.88%, 3/1/2026 (a) (c) | 245 | 234 |
| RHP Hotel Properties LP | ||
| 4.75%, 10/15/2027 | 12,200 | 11,376 |
| 4.50%, 2/15/2029 (c) | 2,463 | 2,225 |
| 82 | J.P. Morgan Funds | April 30, 2022 |
| INVESTMENTS | PRINCIPAL AMOUNT ($000) | VALUE ($000) |
| Corporate Bonds — continued | ||
| United States — continued | ||
| Rite Aid Corp. | ||
| 7.50%, 7/1/2025 (c) | 5,077 | 4,347 |
| 8.00%, 11/15/2026 (a) (c) | 8,786 | 7,384 |
| Rockcliff Energy II LLC 5.50%, 10/15/2029 (c) | 1,475 | 1,431 |
| Rocket Mortgage LLC | ||
| 2.88%, 10/15/2026 (c) | 2,844 | 2,517 |
| 3.63%, 3/1/2029 (c) | 3,148 | 2,692 |
| 4.00%, 10/15/2033 (c) | 486 | 389 |
| Roper Technologies, Inc. 3.13%, 11/15/2022 | 93 | 93 |
| Royal Caribbean Cruises Ltd. | ||
| 10.88%, 6/1/2023 (c) | 2,590 | 2,710 |
| 9.13%, 6/15/2023 (c) | 447 | 461 |
| 11.50%, 6/1/2025 (c) | 4,466 | 4,855 |
| Royalty Pharma plc 2.15%, 9/2/2031 | 86 | 69 |
| RP Escrow Issuer LLC 5.25%, 12/15/2025 (c) | 1,927 | 1,792 |
| RR Donnelley & Sons Co. 8.25%, 7/1/2027 (a) | 450 | 502 |
| Ryder System, Inc. 2.50%, 9/1/2022 | 100 | 100 |
| S&P Global, Inc. 2.90%, 3/1/2032 (c) | 130 | 117 |
| Sabre GLBL, Inc. | ||
| 9.25%, 4/15/2025 (c) | 1,432 | 1,527 |
| 7.38%, 9/1/2025 (c) | 2,875 | 2,908 |
| Sagicor Financial Co. Ltd. 5.30%, 5/13/2028 (c) | 569 | 555 |
| Sally Holdings LLC 5.63%, 12/1/2025 | 1,047 | 1,051 |
| SBA Communications Corp., REIT 3.13%, 2/1/2029 | 1,050 | 901 |
| Scotts Miracle-Gro Co. (The) | ||
| 5.25%, 12/15/2026 (a) | 2,180 | 2,158 |
| 4.50%, 10/15/2029 (a) | 1,140 | 1,000 |
| 4.00%, 4/1/2031 (a) | 2,754 | 2,265 |
| 4.38%, 2/1/2032 | 3,297 | 2,753 |
| Scripps Escrow II, Inc. | ||
| 3.88%, 1/15/2029 (c) | 1,359 | 1,208 |
| 5.38%, 1/15/2031 (a) (c) | 1,315 | 1,171 |
| Scripps Escrow, Inc. 5.88%, 7/15/2027 (c) | 880 | 840 |
| Sealed Air Corp. 5.13%, 12/1/2024 (c) | 155 | 158 |
| SeaWorld Parks & Entertainment, Inc. 5.25%, 8/15/2029 (c) | 905 | 823 |
| SEG Holding LLC 5.63%, 10/15/2028 (c) | 331 | 323 |
| INVESTMENTS | PRINCIPAL AMOUNT ($000) | VALUE ($000) |
| United States — continued | ||
| Sempra Energy | ||
| (US Treasury Yield Curve Rate T Note Constant Maturity 5 Year + 4.55%), 4.88%, 10/15/2025 (d) (e) (f) | 12,275 | 12,091 |
| (US Treasury Yield Curve Rate T Note Constant Maturity 5 Year + 2.87%), 4.12%, 4/1/2052 (f) | 8,262 | 7,261 |
| Sensata Technologies BV | ||
| 4.88%, 10/15/2023 (c) | 4,531 | 4,543 |
| 5.63%, 11/1/2024 (c) | 731 | 739 |
| 5.00%, 10/1/2025 (c) | 172 | 171 |
| 4.00%, 4/15/2029 (c) | 5,290 | 4,716 |
| Sensata Technologies, Inc. 3.75%, 2/15/2031 (c) | 878 | 742 |
| Service Corp. International | ||
| 7.50%, 4/1/2027 | 2,735 | 2,974 |
| 4.63%, 12/15/2027 | 825 | 800 |
| 5.13%, 6/1/2029 | 3,005 | 2,964 |
| 3.38%, 8/15/2030 | 1,412 | 1,214 |
| 4.00%, 5/15/2031 | 2,700 | 2,430 |
| Shire Acquisitions Investments Ireland DAC 3.20%, 9/23/2026 | 300 | 289 |
| Silgan Holdings, Inc. 4.13%, 2/1/2028 | 928 | 865 |
| Sinclair Television Group, Inc. | ||
| 5.13%, 2/15/2027 (a) (c) | 2,890 | 2,532 |
| 5.50%, 3/1/2030 (c) | 2,164 | 1,769 |
| 4.13%, 12/1/2030 (c) | 2,735 | 2,269 |
| Sirius XM Radio, Inc. | ||
| 3.13%, 9/1/2026 (c) | 744 | 685 |
| 5.00%, 8/1/2027 (c) | 23,245 | 22,431 |
| 4.00%, 7/15/2028 (c) | 4,395 | 3,972 |
| 5.50%, 7/1/2029 (c) | 4,617 | 4,440 |
| 4.13%, 7/1/2030 (c) | 680 | 597 |
| Six Flags Entertainment Corp. | ||
| 4.88%, 7/31/2024 (c) | 9,141 | 9,104 |
| 5.50%, 4/15/2027 (a) (c) | 2,114 | 2,072 |
| Six Flags Theme Parks, Inc. 7.00%, 7/1/2025 (c) | 1,390 | 1,444 |
| SM Energy Co. | ||
| 5.63%, 6/1/2025 | 3,980 | 3,890 |
| 6.75%, 9/15/2026 | 968 | 963 |
| 6.50%, 7/15/2028 (a) | 1,006 | 992 |
| Sonic Automotive, Inc. 4.63%, 11/15/2029 (c) | 2,821 | 2,427 |
| April 30, 2022 | J.P. Morgan Funds | 83 |
| INVESTMENTS | PRINCIPAL AMOUNT ($000) | VALUE ($000) |
| Corporate Bonds — continued | ||
| United States — continued | ||
| Southern California Edison Co. Series E, (ICE LIBOR USD 3 Month + 4.20%), 4.52%, 5/31/2022 (d) (e) (f) | 2,040 | 2,009 |
| Southern Co. Gas Capital Corp. Series 20-A, 1.75%, 1/15/2031 | 60 | 48 |
| Southwestern Energy Co. | ||
| 7.75%, 10/1/2027 | 1,705 | 1,779 |
| 5.38%, 3/15/2030 | 4,399 | 4,343 |
| 4.75%, 2/1/2032 | 928 | 878 |
| Spanish Broadcasting System, Inc. 9.75%, 3/1/2026 (c) | 315 | 308 |
| Spectrum Brands, Inc. | ||
| 5.75%, 7/15/2025 | 91 | 92 |
| 5.00%, 10/1/2029 (c) | 2,486 | 2,312 |
| 5.50%, 7/15/2030 (c) | 5,413 | 5,037 |
| 3.88%, 3/15/2031 (c) | 1,561 | 1,307 |
| Spirit AeroSystems, Inc. | ||
| 5.50%, 1/15/2025 (c) | 1,147 | 1,136 |
| 7.50%, 4/15/2025 (c) | 4,150 | 4,202 |
| Sprint Capital Corp. | ||
| 6.88%, 11/15/2028 | 6,265 | 6,876 |
| 8.75%, 3/15/2032 | 18,554 | 23,579 |
| Sprint Corp. | ||
| 7.88%, 9/15/2023 | 10,601 | 11,131 |
| 7.13%, 6/15/2024 | 6,327 | 6,659 |
| 7.63%, 2/15/2025 | 22,072 | 23,479 |
| 7.63%, 3/1/2026 | 29,453 | 31,991 |
| SRS Distribution, Inc. 4.63%, 7/1/2028 (c) | 5,500 | 5,035 |
| SS&C Technologies, Inc. 5.50%, 9/30/2027 (c) | 10,123 | 9,921 |
| Stagwell Global LLC 5.63%, 8/15/2029 (c) | 3,411 | 3,011 |
| Standard Industries, Inc. | ||
| 5.00%, 2/15/2027 (c) | 1,647 | 1,561 |
| 4.75%, 1/15/2028 (c) | 9,295 | 8,551 |
| 4.38%, 7/15/2030 (c) | 225 | 188 |
| 3.38%, 1/15/2031 (c) | 1,408 | 1,125 |
| Stanley Black & Decker, Inc. (US Treasury Yield Curve Rate T Note Constant Maturity 5 Year + 2.66%), 4.00%, 3/15/2060 (f) | 670 | 640 |
| Staples, Inc. | ||
| 7.50%, 4/15/2026 (c) | 15,693 | 14,987 |
| 10.75%, 4/15/2027 (c) | 7,739 | 6,857 |
| State Street Corp. | ||
| Series F, (ICE LIBOR USD 3 Month + 3.60%), 4.42%, 6/15/2022 (d) (e) (f) | 1,960 | 1,950 |
| INVESTMENTS | PRINCIPAL AMOUNT ($000) | VALUE ($000) |
| United States — continued | ||
| Series H, (ICE LIBOR USD 3 Month + 2.54%), 5.63%, 12/15/2023 (d) (e) (f) | 4,393 | 4,198 |
| (SOFR + 0.73%), 2.20%, 2/7/2028 (f) | 290 | 269 |
| Station Casinos LLC 4.50%, 2/15/2028 (c) | 6,494 | 5,894 |
| Stericycle, Inc. 3.88%, 1/15/2029 (c) | 1,821 | 1,606 |
| Stevens Holding Co., Inc. 6.13%, 10/1/2026 (c) | 1,940 | 1,945 |
| Summit Materials LLC 5.25%, 1/15/2029 (c) | 952 | 893 |
| Summit Midstream Holdings LLC 8.50%, 10/15/2026 (c) | 2,093 | 1,954 |
| Sunoco LP | ||
| 5.88%, 3/15/2028 | 423 | 417 |
| 4.50%, 5/15/2029 | 2,780 | 2,500 |
| 4.50%, 4/30/2030 (c) | 4,242 | 3,828 |
| SVB Financial Group | ||
| Series C, (US Treasury Yield Curve Rate T Note Constant Maturity 5 Year + 3.20%), 4.00%, 5/15/2026 (d) (e) (f) | 11,860 | 10,315 |
| Series D, (US Treasury Yield Curve Rate T Note Constant Maturity 5 Year + 3.07%), 4.25%, 11/15/2026 (d) (e) (f) | 4,135 | 3,579 |
| Switch Ltd. | ||
| 3.75%, 9/15/2028 (c) | 845 | 792 |
| 4.13%, 6/15/2029 (c) | 1,447 | 1,382 |
| Synaptics, Inc. 4.00%, 6/15/2029 (c) | 1,991 | 1,755 |
| Syneos Health, Inc. 3.63%, 1/15/2029 (a) (c) | 911 | 806 |
| Sysco Corp. | ||
| 3.25%, 7/15/2027 | 265 | 255 |
| 2.40%, 2/15/2030 | 186 | 163 |
| Take-Two Interactive Software, Inc. | ||
| 3.70%, 4/14/2027 | 100 | 98 |
| 4.00%, 4/14/2032 | 30 | 29 |
| Tallgrass Energy Partners LP | ||
| 7.50%, 10/1/2025 (c) | 7,631 | 7,788 |
| 6.00%, 3/1/2027 (c) | 1,000 | 960 |
| 5.50%, 1/15/2028 (c) | 710 | 662 |
| 6.00%, 12/31/2030 (c) | 2,053 | 1,899 |
| 6.00%, 9/1/2031 (c) | 4,277 | 3,903 |
| Targa Resources Partners LP | ||
| 6.50%, 7/15/2027 | 3,538 | 3,645 |
| 5.00%, 1/15/2028 | 1,745 | 1,716 |
| 84 | J.P. Morgan Funds | April 30, 2022 |
| INVESTMENTS | PRINCIPAL AMOUNT ($000) | VALUE ($000) |
| Corporate Bonds — continued | ||
| United States — continued | ||
| 6.88%, 1/15/2029 | 1,906 | 2,010 |
| 4.88%, 2/1/2031 | 4,010 | 3,855 |
| 4.00%, 1/15/2032 | 3,301 | 2,993 |
| TEGNA, Inc. | ||
| 4.75%, 3/15/2026 (c) | 1,547 | 1,533 |
| 4.63%, 3/15/2028 | 3,389 | 3,261 |
| Teleflex, Inc. 4.63%, 11/15/2027 | 1,031 | 1,010 |
| Tempur Sealy International, Inc. | ||
| 4.00%, 4/15/2029 (c) | 8,623 | 7,470 |
| 3.88%, 10/15/2031 (c) | 1,890 | 1,566 |
| Tenet Healthcare Corp. | ||
| 4.63%, 7/15/2024 | 2,244 | 2,238 |
| 4.63%, 9/1/2024 (c) | 1,018 | 1,009 |
| 4.88%, 1/1/2026 (c) | 22,644 | 22,172 |
| 6.25%, 2/1/2027 (c) | 17,904 | 17,770 |
| 5.13%, 11/1/2027 (c) | 11,231 | 10,905 |
| 4.63%, 6/15/2028 (c) | 450 | 424 |
| 4.25%, 6/1/2029 (c) | 3,354 | 3,030 |
| Tenneco, Inc. | ||
| 5.00%, 7/15/2026 (a) | 4,090 | 3,921 |
| 7.88%, 1/15/2029 (c) | 2,336 | 2,360 |
| 5.13%, 4/15/2029 (c) | 2,780 | 2,710 |
| Terex Corp. 5.00%, 5/15/2029 (c) | 6,511 | 5,983 |
| TerraForm Power Operating LLC 4.25%, 1/31/2023 (c) | 1,671 | 1,673 |
| Thermo Fisher Scientific, Inc. 2.00%, 10/15/2031 | 230 | 193 |
| Thor Industries, Inc. 4.00%, 10/15/2029 (c) | 510 | 431 |
| Titan International, Inc. 7.00%, 4/30/2028 | 419 | 411 |
| T-Mobile USA, Inc. | ||
| 4.75%, 2/1/2028 | 21,452 | 21,166 |
| 2.25%, 11/15/2031 | 542 | 443 |
| 3.00%, 2/15/2041 | 170 | 130 |
| Topaz Solar Farms LLC 5.75%, 9/30/2039 (c) | 374 | 379 |
| TopBuild Corp. 3.63%, 3/15/2029 (c) | 920 | 802 |
| TransDigm, Inc. 6.25%, 3/15/2026 (c) | 9,380 | 9,333 |
| Transocean Guardian Ltd. 5.88%, 1/15/2024 (c) | 2,104 | 2,013 |
| Transocean Pontus Ltd. 6.13%, 8/1/2025 (a) (c) | 3,570 | 3,507 |
| Transocean Poseidon Ltd. 6.88%, 2/1/2027 (a) (c) | 2,633 | 2,534 |
| INVESTMENTS | PRINCIPAL AMOUNT ($000) | VALUE ($000) |
| United States — continued | ||
| Transocean Proteus Ltd. 6.25%, 12/1/2024 (c) | 308 | 303 |
| Transocean, Inc. 11.50%, 1/30/2027 (a) (c) | 500 | 497 |
| TreeHouse Foods, Inc. 4.00%, 9/1/2028 (a) | 742 | 605 |
| Tri Pointe Homes, Inc. | ||
| 5.25%, 6/1/2027 | 1,000 | 966 |
| 5.70%, 6/15/2028 | 128 | 123 |
| TriMas Corp. 4.13%, 4/15/2029 (c) | 4,555 | 4,065 |
| TriNet Group, Inc. 3.50%, 3/1/2029 (c) | 882 | 799 |
| Trinseo Materials Operating SCA | ||
| 5.38%, 9/1/2025 (c) | 9,060 | 8,743 |
| 5.13%, 4/1/2029 (c) | 2,568 | 2,264 |
| TripAdvisor, Inc. 7.00%, 7/15/2025 (c) | 1,640 | 1,681 |
| Triton Water Holdings, Inc. 6.25%, 4/1/2029 (c) | 2,758 | 2,283 |
| Triumph Group, Inc. | ||
| 8.88%, 6/1/2024 (c) | 221 | 229 |
| 6.25%, 9/15/2024 (c) | 1,545 | 1,487 |
| 7.75%, 8/15/2025 (a) | 2,337 | 2,273 |
| Truist Financial Corp. | ||
| Series P, (US Treasury Yield Curve Rate T Note Constant Maturity 5 Year + 4.61%), 4.95%, 9/1/2025 (d) (e) (f) | 2,005 | 2,002 |
| Series M, (ICE LIBOR USD 3 Month + 2.79%), 5.12%, 12/15/2027 (d) (e) (f) | 2,346 | 2,159 |
| Series Q, (US Treasury Yield Curve Rate T Note Constant Maturity 10 Year + 4.35%), 5.10%, 3/1/2030 (d) (e) (f) | 15,904 | 15,844 |
| TTM Technologies, Inc. 4.00%, 3/1/2029 (a) (c) | 725 | 634 |
| Twilio, Inc. | ||
| 3.63%, 3/15/2029 (a) | 1,586 | 1,400 |
| 3.88%, 3/15/2031 (a) | 1,586 | 1,363 |
| Uber Technologies, Inc. 4.50%, 8/15/2029 (c) | 3,800 | 3,273 |
| UDR, Inc. | ||
| 3.20%, 1/15/2030 | 160 | 148 |
| 3.00%, 8/15/2031 | 41 | 36 |
| Under Armour, Inc. 3.25%, 6/15/2026 | 2,136 | 1,966 |
| Unisys Corp. 6.88%, 11/1/2027 (c) | 222 | 223 |
| United Airlines Holdings, Inc. | ||
| 5.00%, 2/1/2024 | 2,404 | 2,386 |
| 4.88%, 1/15/2025 (a) | 2,345 | 2,263 |
| United Airlines, Inc. 4.38%, 4/15/2026 (c) | 4,662 | 4,501 |
| April 30, 2022 | J.P. Morgan Funds | 85 |
| INVESTMENTS | PRINCIPAL AMOUNT ($000) | VALUE ($000) |
| Corporate Bonds — continued | ||
| United States — continued | ||
| United Natural Foods, Inc. 6.75%, 10/15/2028 (c) | 509 | 509 |
| United Rentals North America, Inc. | ||
| 5.50%, 5/15/2027 | 10,010 | 10,185 |
| 4.88%, 1/15/2028 | 3,315 | 3,226 |
| 5.25%, 1/15/2030 | 2,500 | 2,425 |
| 3.88%, 2/15/2031 | 5,089 | 4,487 |
| United States Cellular Corp. 6.70%, 12/15/2033 | 4,296 | 4,438 |
| United States Steel Corp. | ||
| 6.88%, 3/1/2029 (a) | 2,747 | 2,795 |
| 6.65%, 6/1/2037 | 341 | 334 |
| UnitedHealth Group, Inc. 3.05%, 5/15/2041 | 75 | 62 |
| Uniti Group LP | ||
| 7.88%, 2/15/2025 (c) | 1,000 | 1,018 |
| 4.75%, 4/15/2028 (c) | 1,000 | 893 |
| 6.50%, 2/15/2029 (c) | 328 | 283 |
| 6.00%, 1/15/2030 (c) | 1,000 | 834 |
| Universal Health Services, Inc. 2.65%, 1/15/2032 (a) (c) | 166 | 136 |
| Univision Communications, Inc. 4.50%, 5/1/2029 (c) | 1,489 | 1,336 |
| Urban One, Inc. 7.38%, 2/1/2028 (c) | 444 | 430 |
| US Bancorp | ||
| (US Treasury Yield Curve Rate T Note Constant Maturity 5 Year + 2.54%), 3.70%, 1/15/2027 (d) (e) (f) | 6,765 | 5,779 |
| Series J, (ICE LIBOR USD 3 Month + 2.91%), 5.30%, 4/15/2027 (d) (e) (f) | 1,414 | 1,372 |
| US Foods, Inc. 4.63%, 6/1/2030 (c) | 2,017 | 1,805 |
| Vail Resorts, Inc. 6.25%, 5/15/2025 (c) | 1,642 | 1,679 |
| Valvoline, Inc. | ||
| 4.25%, 2/15/2030 (c) | 3,267 | 2,834 |
| 3.63%, 6/15/2031 (c) | 300 | 244 |
| Varex Imaging Corp. 7.88%, 10/15/2027 (c) | 247 | 254 |
| Vector Group Ltd. | ||
| 10.50%, 11/1/2026 (c) | 464 | 474 |
| 5.75%, 2/1/2029 (c) | 1,662 | 1,458 |
| Venator Finance SARL 5.75%, 7/15/2025 (a) (c) | 3,375 | 2,768 |
| Ventas Realty LP, REIT 4.00%, 3/1/2028 | 100 | 98 |
| Verizon Communications, Inc. | ||
| 4.40%, 11/1/2034 | 246 | 242 |
| 4.27%, 1/15/2036 | 150 | 145 |
| INVESTMENTS | PRINCIPAL AMOUNT ($000) | VALUE ($000) |
| United States — continued | ||
| 3.40%, 3/22/2041 | 112 | 94 |
| Viavi Solutions, Inc. 3.75%, 10/1/2029 (c) | 1,738 | 1,564 |
| VICI Properties LP | ||
| 5.63%, 5/1/2024 (c) | 1,490 | 1,502 |
| 3.50%, 2/15/2025 (c) | 527 | 506 |
| 4.63%, 6/15/2025 (c) | 2,251 | 2,210 |
| 4.50%, 9/1/2026 (c) | 995 | 956 |
| 4.25%, 12/1/2026 (c) | 8,012 | 7,592 |
| 5.75%, 2/1/2027 (c) | 4,882 | 4,882 |
| 3.75%, 2/15/2027 (c) | 1,875 | 1,729 |
| 4.50%, 1/15/2028 (c) | 555 | 547 |
| 3.88%, 2/15/2029 (c) | 3,853 | 3,503 |
| 4.63%, 12/1/2029 (c) | 4,688 | 4,402 |
| 4.13%, 8/15/2030 (c) | 1,620 | 1,455 |
| Victoria's Secret & Co. 4.63%, 7/15/2029 (c) | 630 | 517 |
| Victors Merger Corp. 6.38%, 5/15/2029 (c) | 569 | 341 |
| Viper Energy Partners LP 5.38%, 11/1/2027 (c) | 489 | 487 |
| Virtusa Corp. 7.13%, 12/15/2028 (a) (c) | 310 | 279 |
| Vista Outdoor, Inc. 4.50%, 3/15/2029 (c) | 8,140 | 7,285 |
| Vistra Corp. (US Treasury Yield Curve Rate T Note Constant Maturity 5 Year + 5.74%), 7.00%, 12/15/2026 (c) (d) (e) (f) | 1,712 | 1,665 |
| Vistra Operations Co. LLC | ||
| 5.50%, 9/1/2026 (c) | 1,952 | 1,945 |
| 5.63%, 2/15/2027 (c) | 6,875 | 6,772 |
| 5.00%, 7/31/2027 (c) | 1,266 | 1,206 |
| 4.38%, 5/1/2029 (c) | 1,498 | 1,359 |
| VM Consolidated, Inc. 5.50%, 4/15/2029 (c) | 357 | 319 |
| VMware, Inc. 2.20%, 8/15/2031 | 286 | 233 |
| W&T Offshore, Inc. 9.75%, 11/1/2023 (c) | 571 | 567 |
| Wabash National Corp. 4.50%, 10/15/2028 (c) | 3,221 | 2,696 |
| Warrior Met Coal, Inc. 7.88%, 12/1/2028 (c) | 362 | 379 |
| Weatherford International Ltd. 11.00%, 12/1/2024 (c) | 996 | 1,026 |
| WEC Energy Group, Inc. 1.80%, 10/15/2030 | 100 | 82 |
| Weekley Homes LLC 4.88%, 9/15/2028 (c) | 599 | 529 |
| Welbilt, Inc. 9.50%, 2/15/2024 | 940 | 944 |
| 86 | J.P. Morgan Funds | April 30, 2022 |
| INVESTMENTS | PRINCIPAL AMOUNT ($000) | VALUE ($000) |
| Corporate Bonds — continued | ||
| United States — continued | ||
| Wells Fargo & Co. | ||
| Series S, (ICE LIBOR USD 3 Month + 3.11%), 5.90%, 6/15/2024 (d) (e) (f) | 7,127 | 6,976 |
| Series U, (ICE LIBOR USD 3 Month + 3.99%), 5.87%, 6/15/2025 (d) (e) (f) | 2,207 | 2,224 |
| Series BB, (US Treasury Yield Curve Rate T Note Constant Maturity 5 Year + 3.45%), 3.90%, 3/15/2026 (d) (e) (f) | 25,317 | 23,100 |
| Wesco Aircraft Holdings, Inc. | ||
| 8.50%, 11/15/2024 (c) | 1,046 | 582 |
| 9.00%, 11/15/2026 (a) (c) | 10,989 | 6,825 |
| 13.13%, 11/15/2027 (c) | 444 | 167 |
| WESCO Distribution, Inc. | ||
| 7.13%, 6/15/2025 (c) | 5,708 | 5,929 |
| 7.25%, 6/15/2028 (c) | 5,708 | 5,894 |
| William Carter Co. (The) 5.63%, 3/15/2027 (c) | 9,312 | 9,279 |
| Windstream Escrow LLC 7.75%, 8/15/2028 (a) (c) | 2,115 | 2,015 |
| Winnebago Industries, Inc. 6.25%, 7/15/2028 (c) | 305 | 303 |
| WMG Acquisition Corp. | ||
| 3.75%, 12/1/2029 (c) | 5,431 | 4,868 |
| 3.00%, 2/15/2031 (c) | 3,119 | 2,602 |
| Wolverine World Wide, Inc. 4.00%, 8/15/2029 (a) (c) | 560 | 476 |
| World Acceptance Corp. 7.00%, 11/1/2026 (c) | 305 | 265 |
| WP Carey, Inc. | ||
| 2.40%, 2/1/2031 | 150 | 127 |
| 2.45%, 2/1/2032 | 30 | 25 |
| WR Grace Holdings LLC | ||
| 5.63%, 10/1/2024 (c) | 1,010 | 1,013 |
| 4.88%, 6/15/2027 (c) | 250 | 235 |
| 5.63%, 8/15/2029 (c) | 1,596 | 1,360 |
| WW International, Inc. 4.50%, 4/15/2029 (a) (c) | 509 | 403 |
| Wyndham Hotels & Resorts, Inc. 4.38%, 8/15/2028 (c) | 525 | 489 |
| Wynn Las Vegas LLC 5.50%, 3/1/2025 (c) | 11,657 | 11,278 |
| Wynn Resorts Finance LLC 5.13%, 10/1/2029 (c) | 6,555 | 5,740 |
| Xerox Holdings Corp. 5.00%, 8/15/2025 (c) | 1,412 | 1,356 |
| Yum! Brands, Inc. | ||
| 4.75%, 1/15/2030 (c) | 1,834 | 1,745 |
| 3.63%, 3/15/2031 | 4,332 | 3,722 |
| INVESTMENTS | PRINCIPAL AMOUNT ($000) | VALUE ($000) |
| United States — continued | ||
| 4.63%, 1/31/2032 | 3,567 | 3,242 |
| Zayo Group Holdings, Inc. 4.00%, 3/1/2027 (c) | 4,071 | 3,542 |
| Ziff Davis, Inc. 4.63%, 10/15/2030 (c) | 1,870 | 1,667 |
| Zimmer Biomet Holdings, Inc. 2.60%, 11/24/2031 | 95 | 81 |
| ZipRecruiter, Inc. 5.00%, 1/15/2030 (c) | 578 | 540 |
| Zoetis, Inc. 2.00%, 5/15/2030 | 182 | 157 |
| ZoomInfo Technologies LLC 3.88%, 2/1/2029 (c) | 1,242 | 1,099 |
| 3,428,183 | ||
| Uzbekistan — 0.0% ^ | ||
| Uzbekneftegaz JSC 4.75%, 11/16/2028 (c) | 1,350 | 1,100 |
| Total Corporate Bonds (Cost $4,480,787) | 4,195,461 | |
| Equity Linked Notes — 7.1% | ||
| Canada — 1.1% | ||
| Royal Bank of Canada, ELN, 7.50%, 5/11/2022, (linked to Russell 2000 Index) (b) | 68 | 126,519 |
| France — 4.0% | ||
| BNP Paribas SA, ELN, 7.00%, 5/18/2022, (linked to Russell 2000 Index) (c) | 66 | 122,386 |
| BNP Paribas SA, ELN, 7.00%, 7/27/2022, (linked to Russell 2000 Index) (c) | 64 | 120,568 |
| Societe Generale SA, ELN, 7.00%, 5/25/2022, (linked to Russell 2000 Index) (b) | 64 | 119,827 |
| Societe Generale SA, ELN, 7.50%, 8/10/2022, (linked to Russell 2000 Index) (b) | 64 | 121,356 |
| 484,137 | ||
| United Kingdom — 2.0% | ||
| Barclays Bank plc, ELN, 7.00%, 7/20/2022, (linked to Russell 2000 Index) (b) | 64 | 120,498 |
| Barclays Bank plc, ELN, 7.00%, 8/3/2022, (linked to Russell 2000 Index) (b) | 64 | 120,631 |
| 241,129 | ||
| Total Equity Linked Notes (Cost $881,500) | 851,785 | |
| April 30, 2022 | J.P. Morgan Funds | 87 |
| INVESTMENTS | PRINCIPAL AMOUNT ($000) | VALUE ($000) |
| Commercial Mortgage-Backed Securities — 4.0% | ||
| United States — 4.0% | ||
| BANK | ||
| Series 2019-BN16, Class D, 3.00%, 2/15/2052 ‡ (c) | 2,500 | 2,006 |
| Series 2019-BN16, Class F, 3.85%, 2/15/2052 ‡ (c) (j) | 2,000 | 1,358 |
| Series 2019-BN21, Class F, 2.68%, 10/17/2052 ‡ (c) | 4,000 | 2,551 |
| Series 2019-BN23, Class D, 2.50%, 12/15/2052 ‡ (c) | 4,000 | 3,099 |
| Series 2020-BN30, Class F, 2.00%, 12/15/2053 ‡ (c) (j) | 3,000 | 1,747 |
| Series 2021-BN31, Class E, 2.50%, 2/15/2054 ‡ (c) (j) | 2,500 | 1,793 |
| Series 2017-BNK5, Class D, 3.08%, 6/15/2060 ‡ (c) (j) | 8,500 | 6,951 |
| Series 2018-BN14, Class F, 3.94%, 9/15/2060 ‡ (c) | 1,534 | 929 |
| Series 2018-BN15, Class E, 3.00%, 11/15/2061 ‡ (c) | 1,000 | 721 |
| Series 2019-BN18, Class F, 3.33%, 5/15/2062 ‡ (c) | 9,699 | 6,498 |
| Series 2019-BN24, Class D, 2.50%, 11/15/2062 ‡ (c) | 1,000 | 730 |
| Series 2020-BN25, Class D, 2.50%, 1/15/2063 ‡ (c) | 1,000 | 753 |
| Series 2020-BN26, Class D, 2.50%, 3/15/2063 ‡ (c) | 1,350 | 1,027 |
| Series 2020-BN28, Class E, 2.50%, 3/15/2063 ‡ (c) | 3,000 | 2,135 |
| BBCMS MORTGAGE TRUST Series 2017-C1, Class D, 3.66%, 2/15/2050 ‡ (c) (j) | 2,887 | 2,438 |
| Benchmark Mortgage Trust | ||
| Series 2018-B1, Class D, 2.75%, 1/15/2051 ‡ (c) | 975 | 753 |
| Series 2019-B9, Class F, 3.92%, 3/15/2052 ‡ (c) (j) | 6,590 | 4,520 |
| Series 2019-B11, Class D, 3.00%, 5/15/2052 ‡ (c) | 4,000 | 3,159 |
| Series 2020-B21, Class E, 2.00%, 12/17/2053 ‡ (c) | 2,500 | 1,653 |
| Series 2020-B21, Class F, 2.00%, 12/17/2053 ‡ (c) | 3,000 | 1,734 |
| Series 2021-B26, Class F, 1.98%, 6/15/2054 ‡ (c) (j) | 10,000 | 5,577 |
| Series 2019-B14, Class E, 2.50%, 12/15/2062 ‡ (c) | 1,415 | 1,009 |
| INVESTMENTS | PRINCIPAL AMOUNT ($000) | VALUE ($000) |
| United States — continued | ||
| Series 2019-B15, Class E, 2.75%, 12/15/2072 ‡ (c) | 4,391 | 3,308 |
| Series 2019-B15, Class F, 2.75%, 12/15/2072 ‡ (c) (j) | 5,000 | 3,168 |
| BX Series 2021-MFM1, Class G, 4.45%, 1/15/2034 ‡ (c) (j) | 750 | 722 |
| BX Commercial Mortgage Trust Series 2020-VIV2, Class C, 3.66%, 3/9/2044 ‡ (c) (j) | 30,590 | 27,097 |
| CAMB Commercial Mortgage Trust Series 2019-LIFE, Class E, 2.70%, 12/15/2037 ‡ (c) (j) | 2,690 | 2,637 |
| CD Mortgage Trust | ||
| Series 2016-CD2, Class C, 4.11%, 11/10/2049 (j) | 750 | 673 |
| Series 2017-CD4, Class D, 3.30%, 5/10/2050 ‡ (c) | 1,000 | 834 |
| Series 2017-CD5, Class D, 3.35%, 8/15/2050 ‡ (c) | 1,831 | 1,472 |
| Series 2017-CD6, Class C, 4.41%, 11/13/2050 ‡ (j) | 1,371 | 1,289 |
| Series 2018-CD7, Class D, 3.26%, 8/15/2051 ‡ (c) (j) | 2,000 | 1,641 |
| Series 2019-CD8, Class E, 3.00%, 8/15/2057 ‡ (c) | 2,000 | 1,423 |
| Series 2019-CD8, Class F, 3.00%, 8/15/2057 ‡ (c) | 1,500 | 891 |
| CFCRE Commercial Mortgage Trust Series 2016-C6, Class D, 4.34%, 11/10/2049 ‡ (c) (j) | 1,000 | 832 |
| CGMS Commercial Mortgage Trust Series 2017-B1, Class E, 3.30%, 8/15/2050 ‡ (c) (j) | 3,000 | 2,058 |
| Citigroup Commercial Mortgage Trust | ||
| Series 2019-PRM, Class E, 4.89%, 5/10/2036 ‡ (c) (j) | 2,750 | 2,813 |
| Series 2015-GC27, Class D, 4.57%, 2/10/2048 ‡ (c) (j) | 3,756 | 3,424 |
| Series 2015-P1, Class D, 3.23%, 9/15/2048 ‡ (c) | 2,500 | 2,176 |
| Series 2016-C1, Class D, 5.11%, 5/10/2049 ‡ (c) (j) | 2,225 | 2,045 |
| Series 2016-C2, Class D, 3.25%, 8/10/2049 ‡ (c) (j) | 1,000 | 832 |
| Series 2016-P6, Class D, 3.25%, 12/10/2049 ‡ (c) | 1,325 | 1,080 |
| Series 2017-P7, Class D, 3.25%, 4/14/2050 ‡ (c) | 3,000 | 2,299 |
| 88 | J.P. Morgan Funds | April 30, 2022 |
| INVESTMENTS | PRINCIPAL AMOUNT ($000) | VALUE ($000) |
| Commercial Mortgage-Backed Securities — continued | ||
| United States — continued | ||
| Series 2017-P7, Class B, 4.14%, 4/14/2050 ‡ (j) | 910 | 866 |
| Series 2020-GC46, Class E, 2.60%, 2/15/2053 ‡ (c) | 4,500 | 3,204 |
| Commercial Mortgage Trust | ||
| Series 2020-CBM, Class F, 3.75%, 2/10/2037 ‡ (c) (j) | 2,750 | 2,456 |
| Series 2014-CR15, Class C, 4.82%, 2/10/2047 (j) | 3,375 | 3,387 |
| Series 2014-LC15, Class D, 5.17%, 4/10/2047 ‡ (c) (j) | 1,500 | 1,431 |
| Series 2014-CR19, Class D, 4.85%, 8/10/2047 ‡ (c) (j) | 400 | 372 |
| Series 2014-UBS5, Class D, 3.50%, 9/10/2047 ‡ (c) | 5,100 | 4,391 |
| Series 2014-LC17, Class D, 3.69%, 10/10/2047 ‡ (c) | 3,250 | 3,015 |
| Series 2014-CR20, Class D, 3.22%, 11/10/2047 ‡ (c) | 3,275 | 2,754 |
| Series 2015-CR22, Class E, 3.00%, 3/10/2048 ‡ (c) | 2,500 | 2,092 |
| Series 2015-CR22, Class D, 4.21%, 3/10/2048 ‡ (c) (j) | 1,000 | 927 |
| Series 2015-LC21, Class D, 4.48%, 7/10/2048 ‡ (j) | 450 | 409 |
| Series 2015-CR24, Class D, 3.46%, 8/10/2048 ‡ (j) | 2,134 | 1,888 |
| Series 2015-CR25, Class D, 3.93%, 8/10/2048 ‡ (j) | 2,000 | 1,727 |
| Series 2015-CR27, Class D, 3.60%, 10/10/2048 ‡ (c) (j) | 500 | 441 |
| Series 2015-CR26, Class D, 3.63%, 10/10/2048 ‡ (j) | 2,500 | 2,206 |
| Series 2015-LC23, Class D, 3.76%, 10/10/2048 ‡ (c) (j) | 2,750 | 2,512 |
| Series 2015-LC23, Class E, 3.76%, 10/10/2048 ‡ (c) (j) | 1,500 | 1,289 |
| Series 2016-CR28, Class D, 4.02%, 2/10/2049 ‡ (j) | 1,350 | 1,245 |
| Credit Suisse Commercial Mortgage Trust Series 2007-C1, Class AM, 5.42%, 2/15/2040 | 25 | 26 |
| CSAIL Commercial Mortgage Trust | ||
| Series 2019-C15, Class C, 5.15%, 3/15/2052 ‡ (j) | 3,835 | 3,684 |
| Series 2015-C2, Class B, 4.21%, 6/15/2057 ‡ (j) | 1,000 | 958 |
| INVESTMENTS | PRINCIPAL AMOUNT ($000) | VALUE ($000) |
| United States — continued | ||
| DBJPM Mortgage Trust | ||
| Series 2016-C3, Class D, 3.62%, 8/10/2049 ‡ (c) (j) | 1,170 | 931 |
| Series 2016-C3, Class E, 4.37%, 8/10/2049 ‡ (c) (j) | 1,250 | 940 |
| FHLMC, Multiclass Certificates Series 2020-RR05, Class X, IO, 2.01%, 1/27/2029 | 17,110 | 1,938 |
| FHLMC, Multi-Family Structured Credit Risk Series 2021-MN1, Class M1, 2.29%, 1/25/2051 (c) (j) | 546 | 531 |
| FHLMC, Multi-Family Structured Pass-Through Certificates | ||
| Series K033, Class X1, IO, 0.40%, 7/25/2023 (j) | 103,480 | 321 |
| Series KC03, Class X1, IO, 0.63%, 11/25/2024 (j) | 64,737 | 790 |
| Series K734, Class X3, IO, 2.24%, 7/25/2026 (j) | 13,025 | 967 |
| Series KC04, Class X1, IO, 1.41%, 12/25/2026 (j) | 14,949 | 551 |
| Series K084, Class X3, IO, 2.31%, 11/25/2028 (j) | 6,000 | 713 |
| Series K090, Class X3, IO, 2.39%, 10/25/2029 (j) | 1,750 | 232 |
| Series K723, Class X3, IO, 1.97%, 10/25/2034 (j) | 6,544 | 172 |
| Series Q012, Class X, IO, 4.16%, 9/25/2035 (j) | 24,349 | 5,207 |
| Series 2021-MN2, Class B1, 5.79%, 7/25/2041 (c) (j) | 2,000 | 1,917 |
| Series K054, Class X3, IO, 1.65%, 4/25/2043 (j) | 17,000 | 883 |
| Series K067, Class X3, IO, 2.19%, 9/25/2044 (j) | 34,106 | 3,199 |
| Series K727, Class X3, IO, 2.07%, 10/25/2044 (j) | 33,818 | 1,399 |
| Series K068, Class X3, IO, 2.13%, 10/25/2044 (j) | 11,050 | 1,019 |
| Series K059, Class X3, IO, 1.98%, 11/25/2044 (j) | 24,693 | 1,828 |
| Series K729, Class X3, IO, 2.03%, 11/25/2044 (j) | 37,637 | 1,620 |
| Series K060, Class X3, IO, 1.96%, 12/25/2044 (j) | 1,000 | 73 |
| Series K061, Class X3, IO, 2.04%, 12/25/2044 (j) | 1,544 | 121 |
| April 30, 2022 | J.P. Morgan Funds | 89 |
| INVESTMENTS | PRINCIPAL AMOUNT ($000) | VALUE ($000) |
| Commercial Mortgage-Backed Securities — continued | ||
| United States — continued | ||
| Series K066, Class X3, IO, 2.24%, 8/25/2045 (j) | 20,000 | 1,900 |
| Series K728, Class X3, IO, 2.02%, 11/25/2045 (j) | 8,120 | 372 |
| Series K071, Class X3, IO, 2.08%, 11/25/2045 (j) | 5,000 | 477 |
| Series K089, Class X3, IO, 2.37%, 1/25/2046 (j) | 22,283 | 2,863 |
| Series K087, Class X3, IO, 2.40%, 1/25/2046 (j) | 18,300 | 2,291 |
| Series K082, Class X3, IO, 2.29%, 10/25/2046 (j) | 11,750 | 1,354 |
| Series K102, Class X3, IO, 1.96%, 12/25/2046 (j) | 1,180 | 135 |
| Series K088, Class X3, IO, 2.43%, 2/25/2047 (j) | 11,130 | 1,467 |
| Series K093, Class X3, IO, 2.28%, 5/25/2047 (j) | 15,000 | 1,899 |
| Series K116, Class X3, IO, 3.12%, 9/25/2047 (j) | 10,500 | 2,050 |
| Series K108, Class X3, IO, 3.61%, 4/25/2048 (j) | 19,600 | 4,228 |
| Series 2021-MN1, Class M2, 4.04%, 1/25/2051 (c) (j) | 11,750 | 11,154 |
| Series 2021-MN1, Class B1, 8.04%, 1/25/2051 (c) (j) | 2,650 | 2,833 |
| FNMA ACES | ||
| Series 2019-M21, Class X2, IO, 1.43%, 2/25/2031 (j) | 5,769 | 491 |
| Series 2016-M4, Class X2, IO, 2.69%, 1/25/2039 (j) | 10,664 | 135 |
| FNMA, Multi-Family REMIC Trust Series 2020-M37, Class X, IO, 1.19%, 4/25/2032 (j) | 27,617 | 1,846 |
| FREMF Mortgage Trust | ||
| Series 2017-KF31, Class B, 3.35%, 4/25/2024 (c) (j) | 1,322 | 1,310 |
| Series 2017-KF32, Class B, 3.00%, 5/25/2024 (c) (j) | 1,581 | 1,576 |
| Series 2017-KF38, Class B, 2.95%, 9/25/2024 (c) (j) | 632 | 629 |
| Series 2018-KF47, Class B, 2.45%, 5/25/2025 (c) (j) | 1,348 | 1,327 |
| Series 2018-KF49, Class B, 2.35%, 6/25/2025 (c) (j) | 188 | 181 |
| Series 2018-KF51, Class C, 6.45%, 8/25/2025 (c) (j) | 2,802 | 2,798 |
| INVESTMENTS | PRINCIPAL AMOUNT ($000) | VALUE ($000) |
| United States — continued | ||
| Series 2019-KF58, Class B, 2.60%, 1/25/2026 (c) (j) | 906 | 900 |
| Series 2019-KC03, Class B, 4.51%, 1/25/2026 (c) (j) | 2,304 | 2,256 |
| Series 2019-KF62, Class B, 2.50%, 4/25/2026 (c) (j) | 964 | 941 |
| Series 2017-KL1E, Class BE, 4.04%, 2/25/2027 (c) (j) | 186 | 155 |
| Series 2017-KF33, Class B, 3.00%, 6/25/2027 (c) (j) | 566 | 557 |
| Series 2017-KF40, Class B, 3.15%, 11/25/2027 (c) (j) | 978 | 968 |
| Series 2018-KF43, Class B, 2.60%, 1/25/2028 (c) (j) | 1,623 | 1,567 |
| Series 21K-F116, Class CS, 6.56%, 6/25/2028 (c) (j) | 10,890 | 11,018 |
| Series 2018-KF50, Class B, 2.35%, 7/25/2028 (c) (j) | 326 | 320 |
| Series 2018-K82, Class B, 4.27%, 9/25/2028 (c) (j) | 1,460 | 1,447 |
| Series 2018-KSW4, Class C, 5.45%, 10/25/2028 (j) | 4,525 | 4,358 |
| Series 2019-KF59, Class B, 2.80%, 2/25/2029 (c) (j) | 2,716 | 2,669 |
| Series 2019-KG01, Class B, 4.31%, 4/25/2029 (c) (j) | 3,090 | 2,894 |
| Series 2019-KW09, Class X2A, IO, 0.10%, 5/25/2029 (c) | 283,727 | 1,338 |
| Series 2019-KF63, Class B, 2.80%, 5/25/2029 (c) (j) | 3,019 | 2,993 |
| Series 2019-KW09, Class C, PO, 6/25/2029 (c) | 24,011 | 14,856 |
| Series 2019-KW09, Class X2B, IO, 0.10%, 6/25/2029 (c) | 32,681 | 173 |
| Series 21K-F102, Class CS, 6.16%, 1/25/2031 (c) (j) | 11,408 | 11,618 |
| Series 2017-K153, Class B, PO, 4/25/2032 (c) | 10,281 | 5,233 |
| Series 2017-K729, Class B, 3.80%, 11/25/2049 (c) (j) | 1,400 | 1,387 |
| Series 2017-K724, Class D, PO, 12/25/2049 (c) | 20,000 | 17,671 |
| Series 2017-K724, Class X2A, IO, 0.10%, 12/25/2049 (c) | 165,879 | 165 |
| Series 2017-K724, Class X2B, IO, 0.10%, 12/25/2049 (c) | 52,000 | 62 |
| Series 2019-K103, Class B, 3.57%, 12/25/2051 (c) (j) | 970 | 893 |
| 90 | J.P. Morgan Funds | April 30, 2022 |
| INVESTMENTS | PRINCIPAL AMOUNT ($000) | VALUE ($000) |
| Commercial Mortgage-Backed Securities — continued | ||
| United States — continued | ||
| GNMA | ||
| Series 2012-44, IO, 0.03%, 3/16/2049 (j) | 4,756 | 2 |
| Series 2015-86, IO, 0.40%, 5/16/2052 (j) | 8,181 | 166 |
| Series 2013-7, IO, 0.29%, 5/16/2053 (j) | 40,762 | 374 |
| Series 2012-89, IO, 0.19%, 12/16/2053 (j) | 7,557 | 17 |
| Series 2014-186, IO, 0.39%, 8/16/2054 (j) | 4,258 | 59 |
| Series 2015-33, IO, 0.66%, 2/16/2056 (j) | 5,610 | 111 |
| Series 2015-59, IO, 0.90%, 6/16/2056 (j) | 3,745 | 121 |
| Series 2016-40, IO, 0.62%, 7/16/2057 (j) | 8,393 | 227 |
| Series 2016-157, IO, 0.91%, 11/16/2057 (j) | 12,829 | 624 |
| Series 2016-71, Class QI, IO, 0.92%, 11/16/2057 (j) | 48,928 | 2,215 |
| Series 2016-151, IO, 0.89%, 6/16/2058 (j) | 41,494 | 1,844 |
| Series 2017-54, IO, 0.65%, 12/16/2058 (j) | 6,871 | 301 |
| Series 2017-86, IO, 0.73%, 5/16/2059 (j) | 2,037 | 89 |
| Series 2017-148, IO, 0.57%, 7/16/2059 (j) | 9,771 | 389 |
| Series 2019-53, Class IA, IO, 0.78%, 6/16/2061 (j) | 6,141 | 381 |
| Series 2020-145, IO, 0.73%, 3/16/2063 (j) | 56,437 | 3,476 |
| GS Mortgage Securities Trust | ||
| Series 2012-GCJ9, Class D, 4.90%, 11/10/2045 ‡ (c) (j) | 500 | 495 |
| Series 2013-GC12, Class E, 3.25%, 6/10/2046 ‡ (c) | 800 | 730 |
| Series 2013-GC12, Class D, 4.59%, 6/10/2046 ‡ (c) (j) | 750 | 724 |
| Series 2015-GC28, Class D, 4.46%, 2/10/2048 ‡ (c) (j) | 2,500 | 2,310 |
| Series 2015-GC32, Class E, 4.57%, 7/10/2048 ‡ (c) (j) | 2,500 | 1,900 |
| Series 2015-GC34, Class D, 2.98%, 10/10/2048 ‡ | 1,380 | 1,146 |
| Series 2017-GS5, Class D, 3.51%, 3/10/2050 ‡ (c) (j) | 2,900 | 2,435 |
| INVESTMENTS | PRINCIPAL AMOUNT ($000) | VALUE ($000) |
| United States — continued | ||
| Series 2017-GS6, Class D, 3.24%, 5/10/2050 ‡ (c) | 1,750 | 1,499 |
| Series 2015-GC30, Class D, 3.38%, 5/10/2050 ‡ | 1,250 | 1,124 |
| Series 2019-GC40, Class E, 3.00%, 7/10/2052 ‡ (c) | 2,250 | 1,660 |
| Series 2019-GC42, Class D, 2.80%, 9/1/2052 ‡ (c) | 2,000 | 1,555 |
| Jackson Park Trust | ||
| Series 2019-LIC, Class E, 3.35%, 10/14/2039 ‡ (c) (j) | 3,625 | 2,845 |
| Series 2019-LIC, Class F, 3.35%, 10/14/2039 ‡ (c) (j) | 4,170 | 3,152 |
| JPMBB Commercial Mortgage Securities Trust | ||
| Series 2013-C15, Class E, 3.50%, 11/15/2045 ‡ (c) | 2,000 | 1,843 |
| Series 2013-C17, Class D, 5.05%, 1/15/2047 ‡ (c) (j) | 1,250 | 1,176 |
| Series 2014-C21, Class D, 4.80%, 8/15/2047 ‡ (c) (j) | 2,049 | 1,911 |
| Series 2014-C26, Class D, 4.02%, 1/15/2048 ‡ (c) (j) | 1,000 | 911 |
| Series 2016-C1, Class D2, 4.39%, 3/17/2049 ‡ (c) (j) | 1,465 | 1,300 |
| JPMCC Commercial Mortgage Securities Trust Series 2017-JP5, Class D, 4.69%, 3/15/2050 (c) (j) | 7,577 | 6,660 |
| JPMDB Commercial Mortgage Securities Trust Series 2016-C4, Class D, 3.20%, 12/15/2049 ‡ (c) (j) | 2,514 | 2,095 |
| JPMorgan Chase Commercial Mortgage Securities Trust Series 2016-JP3, Class D, 3.57%, 8/15/2049 ‡ (c) (j) | 4,500 | 3,590 |
| KNDL Mortgage Trust Series 2019-KNSQ, Class E, 2.35%, 5/15/2036 ‡ (c) (j) | 2,040 | 2,004 |
| LB-UBS Commercial Mortgage Trust Series 2006-C6, Class AJ, 5.45%, 9/15/2039 (j) | 3,353 | 1,395 |
| MHC Commercial Mortgage Trust Series 2021-MHC, Class G, 3.75%, 4/15/2038 ‡ (c) (j) | 14,400 | 13,874 |
| Morgan Stanley Bank of America Merrill Lynch Trust | ||
| Series 2012-C5, Class G, 4.50%, 8/15/2045 ‡ (c) | 1,500 | 1,470 |
| Series 2012-C5, Class E, 4.84%, 8/15/2045 ‡ (c) (j) | 2,500 | 2,495 |
| Series 2014-C14, Class D, 5.22%, 2/15/2047 ‡ (c) (j) | 3,750 | 3,736 |
| April 30, 2022 | J.P. Morgan Funds | 91 |
| INVESTMENTS | PRINCIPAL AMOUNT ($000) | VALUE ($000) |
| Commercial Mortgage-Backed Securities — continued | ||
| United States — continued | ||
| Series 2014-C15, Class D, 5.06%, 4/15/2047 ‡ (c) (j) | 365 | 356 |
| Series 2014-C16, Class C, 4.91%, 6/15/2047 ‡ (j) | 2,000 | 1,878 |
| Series 2015-C24, Class D, 3.26%, 5/15/2048 ‡ (c) | 6,000 | 5,302 |
| Morgan Stanley Capital I Trust | ||
| Series 2018-MP, Class D, 4.42%, 7/11/2040 ‡ (c) (j) | 730 | 643 |
| Series 2018-L1, Class E, 3.00%, 10/15/2051 ‡ (c) | 5,486 | 4,172 |
| Series 2019-L2, Class D, 3.00%, 3/15/2052 ‡ (c) | 7,075 | 5,494 |
| Series 2019-L2, Class E, 3.00%, 3/15/2052 ‡ (c) | 2,575 | 1,886 |
| Series 2021-L5, Class E, 2.50%, 5/15/2054 ‡ (c) | 2,885 | 2,012 |
| MRCD MARK Mortgage Trust | ||
| Series 2019-PARK, Class F, 2.72%, 12/15/2036 ‡ (c) | 10,000 | 8,971 |
| Series 2019-PARK, Class G, 2.72%, 12/15/2036 ‡ (c) | 4,000 | 3,523 |
| Series 2019-PARK, Class J, 4.25%, 12/15/2036 ‡ (c) | 17,000 | 15,316 |
| Multi-Family Connecticut Avenue Securities Trust | ||
| Series 2019-01, Class M7, 2.37%, 10/15/2049 ‡ (c) (j) | 142 | 140 |
| Series 2019-01, Class M10, 3.92%, 10/15/2049 (c) (j) | 4,900 | 4,659 |
| Series 2020-01, Class M10, 4.42%, 3/25/2050 (c) (j) | 7,836 | 7,501 |
| NYC Commercial Mortgage Trust Series 2021-909, Class E, 3.31%, 4/10/2043 ‡ (c) (j) | 5,000 | 3,649 |
| VASA Trust Series 2021-VASA, Class G, 5.55%, 7/15/2039 ‡ (c) (j) | 1,360 | 1,330 |
| Velocity Commercial Capital Loan Trust | ||
| Series 2018-2, Class A, 4.05%, 10/26/2048 (c) (j) | 3,060 | 3,042 |
| Series 2018-2, Class M2, 4.51%, 10/26/2048 ‡ (c) (j) | 218 | 213 |
| Series 2018-2, Class M3, 4.72%, 10/26/2048 ‡ (c) (j) | 320 | 307 |
| Wells Fargo Commercial Mortgage Trust | ||
| Series 2021-SAVE, Class E, 4.20%, 2/15/2040 ‡ (c) (j) | 1,818 | 1,778 |
| INVESTMENTS | PRINCIPAL AMOUNT ($000) | VALUE ($000) |
| United States — continued | ||
| Series 2015-NXS1, Class E, 2.88%, 5/15/2048 ‡ (c) (j) | 1,500 | 1,237 |
| Series 2015-C28, Class D, 4.22%, 5/15/2048 ‡ (j) | 7,740 | 7,029 |
| Series 2016-C35, Class D, 3.14%, 7/15/2048 ‡ (c) | 5,000 | 3,885 |
| Series 2018-C43, Class D, 3.00%, 3/15/2051 ‡ (c) | 1,250 | 996 |
| Series 2018-C44, Class D, 3.00%, 5/15/2051 ‡ (c) | 1,517 | 1,185 |
| Series 2019-C52, Class XA, IO, 1.75%, 8/15/2052 (j) | 3,765 | 311 |
| Series 2022-C62, Class C, 4.35%, 4/15/2055 (j) | 4,074 | 3,688 |
| Series 2015-NXS3, Class D, 3.15%, 9/15/2057 ‡ (c) | 1,000 | 896 |
| WFRBS Commercial Mortgage Trust | ||
| Series 2014-C19, Class D, 4.23%, 3/15/2047 ‡ (c) | 1,500 | 1,406 |
| Series 2014-C22, Class D, 4.05%, 9/15/2057 ‡ (c) (j) | 5,505 | 4,919 |
| Total Commercial Mortgage-Backed Securities (Cost $527,799) | 486,397 | |
| Collateralized Mortgage Obligations — 3.9% | ||
| Bermuda — 0.0% ^ | ||
| Bellemeade Re Ltd. Series 2019-1A, Class M2, 3.37%, 3/25/2029 ‡ (c) (j) | 1,000 | 990 |
| Eagle RE Ltd. Series 2019-1, Class M2, 3.97%, 4/25/2029 ‡ (c) (j) | 1,980 | 1,982 |
| 2,972 | ||
| United States — 3.9% | ||
| Adjustable Rate Mortgage Trust | ||
| Series 2004-2, Class 6A1, 2.55%, 2/25/2035 (j) | 830 | 846 |
| Series 2005-2, Class 3A1, 2.76%, 6/25/2035 (j) | 678 | 671 |
| Alternative Loan Trust | ||
| Series 2004-28CB, Class 4A1, 5.00%, 1/25/2020 | 6 | 5 |
| Series 2005-50CB, Class 4A1, 5.00%, 11/25/2020 | 2 | 2 |
| Series 2005-85CB, Class 3A2, 5.25%, 2/25/2021 | 78 | 73 |
| Series 2005-J6, Class 2A1, 5.50%, 7/25/2025 | 47 | 44 |
| 92 | J.P. Morgan Funds | April 30, 2022 |
| INVESTMENTS | PRINCIPAL AMOUNT ($000) | VALUE ($000) |
| Collateralized Mortgage Obligations — continued | ||
| United States — continued | ||
| Series 2006-J3, Class 4A1, 5.75%, 5/25/2026 | 348 | 333 |
| Series 2005-J1, Class 3A1, 6.50%, 8/25/2032 | 12 | 12 |
| Series 2004-12CB, Class 2A1, 6.00%, 6/25/2034 | 150 | 150 |
| Series 2004-25CB, Class A1, 6.00%, 12/25/2034 | 3,269 | 3,100 |
| Series 2004-28CB, Class 2A4, 5.75%, 1/25/2035 | 319 | 303 |
| Series 2004-28CB, Class 6A1, 6.00%, 1/25/2035 | 466 | 448 |
| Series 2004-32CB, Class 2A5, 5.50%, 2/25/2035 | 1,975 | 1,877 |
| Series 2005-3CB, Class 1A13, 5.50%, 3/25/2035 | 6,182 | 5,756 |
| Series 2005-J2, Class 1A5, 1.17%, 4/25/2035 (j) | 4,063 | 3,381 |
| Series 2005-6CB, Class 1A4, 5.50%, 4/25/2035 | 2,495 | 2,325 |
| Series 2005-6CB, Class 1A6, 5.50%, 4/25/2035 | 299 | 279 |
| Series 2005-10CB, Class 1A5, 5.50%, 5/25/2035 | 2,581 | 2,279 |
| Series 2005-10CB, Class 1A8, 5.50%, 5/25/2035 | 1,493 | 1,349 |
| Series 2005-13CB, Class A4, 5.50%, 5/25/2035 | 1,008 | 947 |
| Series 2005-21CB, Class A4, 5.25%, 6/25/2035 | 546 | 477 |
| Series 2005-21CB, Class A17, 6.00%, 6/25/2035 | 2,429 | 2,191 |
| Series 2005-20CB, Class 1A1, 5.50%, 7/25/2035 | 106 | 92 |
| Series 2005-23CB, Class A15, 5.50%, 7/25/2035 | 1,193 | 1,061 |
| Series 2005-64CB, Class 1A1, 5.50%, 12/25/2035 | 436 | 413 |
| Series 2005-64CB, Class 1A15, 5.50%, 12/25/2035 | 1,104 | 1,045 |
| Series 2005-J14, Class A3, 5.50%, 12/25/2035 | 235 | 176 |
| Series 2005-J14, Class A7, 5.50%, 12/25/2035 | 1,242 | 930 |
| Series 2005-J14, Class A8, 5.50%, 12/25/2035 | 1,038 | 777 |
| Series 2005-86CB, Class A4, 5.50%, 2/25/2036 | 308 | 223 |
| INVESTMENTS | PRINCIPAL AMOUNT ($000) | VALUE ($000) |
| United States — continued | ||
| Series 2006-J1, Class 1A13, 5.50%, 2/25/2036 | 105 | 85 |
| Series 2005-80CB, Class 5A1, 6.00%, 2/25/2036 | 3,026 | 2,974 |
| Series 2006-4CB, Class 2A5, 5.50%, 4/25/2036 | 567 | 499 |
| Series 2006-14CB, Class A1, 6.00%, 6/25/2036 | 1,222 | 829 |
| Series 2006-19CB, Class A15, 6.00%, 8/25/2036 | 444 | 314 |
| Series 2006-25CB, Class A2, 6.00%, 10/25/2036 | 213 | 137 |
| Series 2006-41CB, Class 2A13, 5.75%, 1/25/2037 | 2,304 | 1,491 |
| Series 2007-8CB, Class A9, 6.00%, 5/25/2037 | 152 | 105 |
| Series 2007-19, Class 1A8, 6.00%, 8/25/2037 | 140 | 89 |
| American Home Mortgage Investment Trust Series 2007-2, Class 12A1, 1.21%, 3/25/2037 (j) | 4,376 | 1,929 |
| Angel Oak Mortgage Trust | ||
| Series 2019-5, Class B1, 3.96%, 10/25/2049 ‡ (c) (j) | 2,250 | 2,149 |
| Series 2019-6, Class B1, 3.94%, 11/25/2059 (c) (j) | 4,000 | 3,974 |
| Series 2019-6, Class B3, 5.98%, 11/25/2059 ‡ (c) (j) | 1,285 | 1,272 |
| Angel Oak Mortgage Trust I LLC | ||
| Series 2019-2, Class B1, 5.02%, 3/25/2049 ‡ (c) (j) | 4,000 | 3,852 |
| Series 2019-4, Class B1, 4.41%, 7/26/2049 (c) (j) | 5,000 | 4,706 |
| Banc of America Alternative Loan Trust | ||
| Series 2006-4, Class 2A1, 6.00%, 5/25/2021 | 2 | 2 |
| Series 2005-11, Class 4A5, 5.75%, 12/25/2035 | 356 | 326 |
| Series 2006-4, Class 3CB4, 6.00%, 5/25/2046 | 485 | 447 |
| Series 2006-4, Class 4CB1, 6.50%, 5/25/2046 | 1,073 | 1,001 |
| Series 2006-5, Class CB7, 6.00%, 6/25/2046 | 285 | 265 |
| Banc of America Funding Trust | ||
| Series 2007-4, Class 8A1, 5.50%, 11/25/2034 | 53 | 42 |
| April 30, 2022 | J.P. Morgan Funds | 93 |
| INVESTMENTS | PRINCIPAL AMOUNT ($000) | VALUE ($000) |
| Collateralized Mortgage Obligations — continued | ||
| United States — continued | ||
| Series 2005-6, Class 1A2, 5.50%, 10/25/2035 | 1,460 | 1,296 |
| Series 2005-7, Class 4A7, 6.00%, 11/25/2035 | 86 | 83 |
| Series 2006-A, Class 1A1, 2.61%, 2/20/2036 (j) | 415 | 412 |
| Series 2006-2, Class 2A20, 5.75%, 3/25/2036 | 213 | 191 |
| Series 2007-5, Class 4A1, 1.04%, 7/25/2037 (j) | 2,674 | 1,941 |
| Banc of America Mortgage Trust | ||
| Series 2004-A, Class 2A2, 2.63%, 2/25/2034 (j) | 248 | 251 |
| Series 2007-3, Class 1A1, 6.00%, 9/25/2037 | 152 | 142 |
| Bear Stearns ALT-A Trust Series 2006-8, Class 3A1, 0.99%, 2/25/2034 (j) | 214 | 205 |
| Bear Stearns Asset-Backed Securities I Trust Series 2004-AC5, Class M1, 1.67%, 10/25/2034 ‡ (j) | 318 | 234 |
| Chase Mortgage Finance Trust | ||
| Series 2007-A2, Class 3A1, 2.43%, 6/25/2035 (j) | — | — |
| Series 2006-S3, Class 1A2, 6.00%, 11/25/2036 | 1,093 | 613 |
| Series 2006-S4, Class A5, 6.00%, 12/25/2036 | 819 | 473 |
| Series 2007-S2, Class 1A8, 6.00%, 3/25/2037 | 198 | 121 |
| CHL GMSR Issuer Trust | ||
| Series 2018-GT1, Class A, 3.42%, 5/25/2023 (c) (j) | 4,530 | 4,492 |
| Series 2018-GT1, Class B, 4.17%, 5/25/2023 ‡ (c) (j) | 795 | 786 |
| CHL Mortgage Pass-Through Trust | ||
| Series 2005-20, Class A7, 5.25%, 12/25/2027 | 89 | 67 |
| Series 2004-25, Class 2A1, 1.35%, 2/25/2035 (j) | 2,012 | 1,835 |
| Series 2005-26, Class 1A11, 5.50%, 11/25/2035 | 1,321 | 937 |
| Series 2005-31, Class 2A1, 2.44%, 1/25/2036 (j) | 579 | 530 |
| Series 2005-30, Class A5, 5.50%, 1/25/2036 | 127 | 95 |
| Series 2006-HYB1, Class 2A2C, 2.68%, 3/20/2036 (j) | 1,881 | 1,796 |
| INVESTMENTS | PRINCIPAL AMOUNT ($000) | VALUE ($000) |
| United States — continued | ||
| Series 2006-HYB2, Class 2A1B, 2.92%, 4/20/2036 (j) | 544 | 519 |
| Series 2006-J2, Class 1A1, 6.00%, 4/25/2036 | 92 | 64 |
| Series 2006-10, Class 1A16, 6.00%, 5/25/2036 | 1,035 | 602 |
| Series 2006-17, Class A2, 6.00%, 12/25/2036 | 303 | 164 |
| Series 2006-18, Class 2A4, 6.00%, 12/25/2036 | 1,784 | 1,223 |
| Series 2007-2, Class A2, 6.00%, 3/25/2037 | 106 | 62 |
| Series 2007-3, Class A18, 6.00%, 4/25/2037 | 831 | 512 |
| Series 2007-10, Class A4, 5.50%, 7/25/2037 | 106 | 61 |
| Series 2007-13, Class A4, 6.00%, 8/25/2037 | 211 | 132 |
| Series 2007-16, Class A1, 6.50%, 10/25/2037 | 2,001 | 1,161 |
| Series 2007-18, Class 2A1, 6.50%, 11/25/2037 | 429 | 205 |
| Citicorp Mortgage Securities Trust Series 2007-4, Class 1A9, 6.00%, 5/25/2037 | 339 | 319 |
| Citigroup Mortgage Loan Trust | ||
| Series 2006-AR3, Class 1A1A, 3.16%, 6/25/2036 (j) | 976 | 968 |
| Series 2006-AR5, Class 1A5A, 2.92%, 7/25/2036 (j) | 400 | 383 |
| Citigroup Mortgage Loan Trust, Inc. | ||
| Series 2005-6, Class A1, 2.19%, 9/25/2035 (j) | 276 | 282 |
| Series 2006-8, Class A3, 1.02%, 10/25/2035 (c) (j) | 524 | 297 |
| Series 2005-9, Class 2A2, 5.50%, 11/25/2035 | 74 | 57 |
| COLT Mortgage Loan Trust | ||
| Series 2021-3, Class B1, 3.06%, 9/27/2066 ‡ (c) (j) | 2,500 | 2,134 |
| Series 2021-5, Class B1, 4.16%, 11/26/2066 ‡ (c) (j) | 3,903 | 3,423 |
| Series 2021-5, Class B2, 4.16%, 11/26/2066 ‡ (c) (j) | 2,247 | 1,898 |
| Series 2022-1, Class B1, 4.10%, 12/27/2066 ‡ (c) (j) | 2,038 | 1,777 |
| Series 2022-1, Class B2, 4.10%, 12/27/2066 ‡ (c) (j) | 2,581 | 2,165 |
| 94 | J.P. Morgan Funds | April 30, 2022 |
| INVESTMENTS | PRINCIPAL AMOUNT ($000) | VALUE ($000) |
| Collateralized Mortgage Obligations — continued | ||
| United States — continued | ||
| Connecticut Avenue Securities Trust | ||
| Series 2019-R05, Class 1B1, 4.77%, 7/25/2039 ‡ (c) (j) | 2,545 | 2,545 |
| Series 2019-R07, Class 1B1, 4.07%, 10/25/2039 ‡ (c) (j) | 8,500 | 8,232 |
| Series 2020-R02, Class 2B1, 3.67%, 1/25/2040 ‡ (c) (j) | 19,158 | 17,578 |
| Series 2021-R01, Class 1B1, 3.39%, 10/25/2041 ‡ (c) (j) | 5,200 | 4,871 |
| Series 2021-R03, Class 1B1, 3.04%, 12/25/2041 ‡ (c) (j) | 2,000 | 1,810 |
| Series 2021-R03, Class 1B2, 5.79%, 12/25/2041 ‡ (c) (j) | 9,100 | 8,148 |
| Series 2022-R01, Class 1B2, 6.29%, 12/25/2041 ‡ (c) (j) | 11,437 | 10,368 |
| CSFB Mortgage-Backed Pass-Through Certificates | ||
| Series 2005-10, Class 11A1, 5.50%, 11/25/2020 | 572 | 93 |
| Series 2003-29, Class 3A1, 5.50%, 12/25/2033 | 191 | 187 |
| Series 2004-AR4, Class 4A1, 2.64%, 5/25/2034 (j) | 926 | 949 |
| Series 2004-AR4, Class 2A1, 3.08%, 5/25/2034 (j) | 158 | 162 |
| Series 2004-AR5, Class 6A1, 2.41%, 6/25/2034 (j) | 264 | 273 |
| Series 2004-4, Class 4A1, 5.50%, 8/25/2034 | 1,278 | 1,278 |
| Series 2004-8, Class 4A3, 5.50%, 12/25/2034 | 91 | 87 |
| Series 2005-4, Class 2A5, 1.22%, 6/25/2035 (j) | 2,467 | 1,804 |
| Series 2005-10, Class 5A3, 5.50%, 11/25/2035 | 288 | 244 |
| CSFB Mortgage-Backed Trust Series 2004-AR6, Class 7A1, 2.55%, 10/25/2034 (j) | 574 | 580 |
| CSMC Mortgage-Backed Trust | ||
| Series 2006-8, Class 5A1, 5.54%, 10/25/2026 (j) | 37 | 35 |
| Series 2007-2, Class 3A13, 5.50%, 3/25/2037 | 360 | 234 |
| Deephaven Residential Mortgage Trust | ||
| Series 2021-3, Class B1, 3.27%, 8/25/2066 ‡ (c) (j) | 5,000 | 4,244 |
| INVESTMENTS | PRINCIPAL AMOUNT ($000) | VALUE ($000) |
| United States — continued | ||
| Series 2021-3, Class B2, 4.13%, 8/25/2066 ‡ (c) (j) | 4,502 | 3,815 |
| Series 2021-4, Class B1, 4.16%, 11/25/2066 ‡ (c) (j) | 6,000 | 5,272 |
| Series 2021-4, Class B2, 4.51%, 11/25/2066 ‡ (c) (j) | 6,508 | 5,578 |
| Series 2022-1, Class B1, 4.32%, 1/25/2067 ‡ (c) (j) | 3,000 | 2,638 |
| Series 2022-1, Class B2, 4.32%, 1/25/2067 ‡ (c) (j) | 5,640 | 4,773 |
| Series 2022-2, Class A3, 4.30%, 3/25/2067 (c) (j) | 4,880 | 4,798 |
| Deutsche Alt-A Securities, Inc., Mortgage Loan Trust | ||
| Series 2005-1, Class 2A1, 4.36%, 2/25/2020 (j) | 20 | 20 |
| Series 2005-2, Class 2A1, 0.97%, 3/25/2020 (j) | 4 | 4 |
| DSLA Mortgage Loan Trust Series 2005-AR4, Class 2A1A, 1.07%, 8/19/2045 (j) | 1,290 | 1,222 |
| FHLMC STACR Series 2019-HQA3, Class B1, 3.67%, 9/25/2049 (c) (j) | 3,000 | 2,899 |
| FHLMC STACR REMIC Trust | ||
| Series 2021-DNA5, Class B2, 5.79%, 1/25/2034 (c) (j) | 3,400 | 3,226 |
| Series 2021-DNA6, Class B1, 3.69%, 10/25/2041 (c) (j) | 8,500 | 7,973 |
| Series 2020-HQA1, Class B2, 5.77%, 1/25/2050 (c) (j) | 4,000 | 3,714 |
| Series 2021-DNA1, Class B2, 5.04%, 1/25/2051 ‡ (c) (j) | 8,000 | 7,121 |
| FHLMC Structured Agency Credit Risk Debt Notes | ||
| Series 2015-HQ1, Class B, 11.42%, 3/25/2025 (j) | 2,905 | 2,939 |
| Series 2017-DNA3, Class B1, 5.12%, 3/25/2030 (j) | 3,000 | 3,120 |
| Series 2021-DNA2, Class B2, 6.29%, 8/25/2033 (c) (j) | 18,050 | 17,164 |
| FHLMC, REMIC | ||
| Series 4068, Class DS, IF, IO, 5.45%, 6/15/2042 (j) | 1,999 | 314 |
| Series 4097, Class ES, IF, IO, 5.55%, 8/15/2042 (j) | 2,954 | 453 |
| Series 4103, Class SB, IF, IO, 5.50%, 9/15/2042 (j) | 3,286 | 633 |
| April 30, 2022 | J.P. Morgan Funds | 95 |
| INVESTMENTS | PRINCIPAL AMOUNT ($000) | VALUE ($000) |
| Collateralized Mortgage Obligations — continued | ||
| United States — continued | ||
| Series 4425, Class SA, IF, IO, 5.50%, 1/15/2045 (j) | 3,475 | 481 |
| Series 4594, Class SG, IF, IO, 5.45%, 6/15/2046 (j) | 3,493 | 597 |
| Series 4606, Class SB, IF, IO, 5.45%, 8/15/2046 (j) | 6,606 | 1,041 |
| Series 4614, Class SK, IF, IO, 5.45%, 9/15/2046 (j) | 11,511 | 1,941 |
| Series 4616, Class HS, IF, IO, 5.45%, 9/15/2046 (j) | 3,886 | 607 |
| Series 4703, Class SA, IF, IO, 5.60%, 7/15/2047 (j) | 5,993 | 977 |
| Series 4718, Class SD, IF, IO, 5.60%, 9/15/2047 (j) | 3,108 | 414 |
| Series 4768, Class SG, IF, IO, 5.65%, 3/15/2048 (j) | 2,407 | 402 |
| Series 4820, Class ES, IF, IO, 5.65%, 3/15/2048 (j) | 1,393 | 195 |
| Series 4834, Class SA, IF, IO, 5.60%, 10/15/2048 (j) | 3,696 | 515 |
| Series 4937, Class MS, IF, IO, 5.38%, 12/25/2049 (j) | 5,886 | 832 |
| Series 4839, Class WS, IF, IO, 5.55%, 8/15/2056 (j) | 7,335 | 1,276 |
| FHLMC, STRIPS | ||
| Series 264, Class S1, IF, IO, 5.40%, 7/15/2042 (j) | 1,920 | 293 |
| Series 274, Class S1, IF, IO, 5.45%, 8/15/2042 (j) | 2,607 | 396 |
| Series 278, Class S1, IF, IO, 5.50%, 9/15/2042 (j) | 2,243 | 361 |
| Series 279, Class S6, IF, IO, 5.50%, 9/15/2042 (j) | 1,716 | 266 |
| Series 300, Class S1, IF, IO, 5.55%, 1/15/2043 (j) | 2,290 | 447 |
| Series 311, Class S1, IF, IO, 5.40%, 8/15/2043 (j) | 1,389 | 215 |
| Series 316, Class S7, IF, IO, 5.55%, 11/15/2043 (j) | 2,218 | 283 |
| Series 326, Class S2, IF, IO, 5.40%, 3/15/2044 (j) | 2,627 | 429 |
| Series 336, Class S1, IF, IO, 5.50%, 8/15/2044 (j) | 1,855 | 285 |
| Series 337, Class S1, IF, IO, 5.50%, 9/15/2044 (j) | 1,464 | 232 |
| Series 356, Class S5, IF, IO, 5.45%, 9/15/2047 (j) | 8,850 | 1,474 |
| INVESTMENTS | PRINCIPAL AMOUNT ($000) | VALUE ($000) |
| United States — continued | ||
| First Horizon Alternative Mortgage Securities Trust Series 2006-FA6, Class 3A1, 5.75%, 11/25/2021 | 14 | 11 |
| FNMA, Connecticut Avenue Securities | ||
| Series 2017-C01, Class 1B1, 6.42%, 7/25/2029 (j) | 1,820 | 2,012 |
| Series 2021-R02, Class 2B1, 3.59%, 11/25/2041 (c) (j) | 3,153 | 2,936 |
| Series 2021-R02, Class 2B2, 6.49%, 11/25/2041 (c) (j) | 5,142 | 4,805 |
| FNMA, REMIC | ||
| Series 2011-126, Class SM, IF, IO, 5.28%, 12/25/2041 (j) | 2,139 | 279 |
| Series 2012-20, Class SL, IF, IO, 5.78%, 3/25/2042 (j) | 2,679 | 465 |
| Series 2012-35, Class SN, IF, IO, 5.78%, 4/25/2042 (j) | 2,967 | 493 |
| Series 2012-75, Class DS, IF, IO, 5.28%, 7/25/2042 (j) | 3,056 | 432 |
| Series 2012-128, Class MS, IF, IO, 5.48%, 11/25/2042 (j) | 1,403 | 227 |
| Series 2013-124, Class SB, IF, IO, 5.28%, 12/25/2043 (j) | 3,401 | 473 |
| Series 2013-136, Class SB, IF, IO, 5.23%, 1/25/2044 (j) | 3,103 | 480 |
| Series 2015-35, Class SA, IF, IO, 4.93%, 6/25/2045 (j) | 3,323 | 344 |
| Series 2015-37, Class ST, IF, IO, 4.95%, 6/25/2045 (j) | 3,224 | 427 |
| Series 2016-1, Class SJ, IF, IO, 5.48%, 2/25/2046 (j) | 6,992 | 1,306 |
| Series 2016-77, Class SA, IF, IO, 5.33%, 10/25/2046 (j) | 2,690 | 429 |
| Series 2017-1, Class SA, IF, IO, 5.38%, 2/25/2047 (j) | 3,163 | 491 |
| Series 2017-16, Class SM, IF, IO, 5.38%, 3/25/2047 (j) | 1,812 | 298 |
| Series 2017-37, Class AS, IF, IO, 5.43%, 5/25/2047 (j) | 8,450 | 1,286 |
| Series 2018-14, Class SA, IF, IO, 5.53%, 3/25/2048 (j) | 5,278 | 1,019 |
| Series 2018-15, Class JS, IF, IO, 5.53%, 3/25/2048 (j) | 3,299 | 565 |
| Series 2018-16, Class SN, IF, IO, 5.58%, 3/25/2048 (j) | 1,272 | 243 |
| Series 2018-27, Class SE, IF, IO, 5.53%, 5/25/2048 (j) | 2,536 | 437 |
| 96 | J.P. Morgan Funds | April 30, 2022 |
| INVESTMENTS | PRINCIPAL AMOUNT ($000) | VALUE ($000) |
| Collateralized Mortgage Obligations — continued | ||
| United States — continued | ||
| Series 2018-60, Class SK, IF, IO, 5.03%, 8/25/2048 (j) | 2,295 | 228 |
| Series 2018-73, Class SC, IF, IO, 5.53%, 10/25/2048 (j) | 5,335 | 788 |
| Series 2019-9, Class SM, IF, IO, 5.38%, 3/25/2049 (j) | 2,850 | 424 |
| Series 2019-20, Class BS, IF, IO, 5.38%, 5/25/2049 (j) | 917 | 128 |
| GCAT Trust Series 2020-NQM1, Class B1, 3.64%, 1/25/2060 ‡ (c) (j) | 3,000 | 2,774 |
| GMACM Mortgage Loan Trust | ||
| Series 2004-AR2, Class 3A, 3.14%, 8/19/2034 (j) | 302 | 286 |
| Series 2005-AR1, Class 3A, 3.22%, 3/18/2035 (j) | 54 | 51 |
| GNMA | ||
| Series 2014-25, Class HS, IF, IO, 5.51%, 2/20/2044 (j) | 2,338 | 420 |
| Series 2015-124, Class SB, IF, IO, 5.66%, 9/20/2045 (j) | 4,089 | 560 |
| Series 2015-149, Class GS, IF, IO, 5.66%, 10/20/2045 (j) | 4,115 | 788 |
| Series 2016-111, Class SA, IF, IO, 5.51%, 8/20/2046 (j) | 2,008 | 300 |
| Series 2016-120, Class NS, IF, IO, 5.51%, 9/20/2046 (j) | 5,741 | 911 |
| Series 2017-11, Class AS, IF, IO, 5.51%, 1/20/2047 (j) | 2,271 | 311 |
| Series 2017-55, Class AS, IF, IO, 5.56%, 4/20/2047 (j) | 1,391 | 185 |
| Series 2017-56, Class SC, IF, IO, 5.56%, 4/20/2047 (j) | 3,099 | 402 |
| Series 2017-68, Class SA, IF, IO, 5.56%, 5/20/2047 (j) | 3,183 | 447 |
| Series 2017-67, Class ST, IF, IO, 5.61%, 5/20/2047 (j) | 6,046 | 979 |
| Series 2017-75, Class SD, IF, IO, 5.61%, 5/20/2047 (j) | 1,210 | 161 |
| Series 2017-80, Class AS, IF, IO, 5.61%, 5/20/2047 (j) | 3,074 | 423 |
| Series 2017-93, Class SE, IF, IO, 5.61%, 6/20/2047 (j) | 2,187 | 296 |
| Series 2017-107, Class SL, IF, IO, 5.61%, 7/20/2047 (j) | 6,688 | 941 |
| Series 2017-112, Class S, IF, IO, 5.61%, 7/20/2047 (j) | 4,585 | 627 |
| INVESTMENTS | PRINCIPAL AMOUNT ($000) | VALUE ($000) |
| United States — continued | ||
| Series 2017-120, Class QS, IF, IO, 5.61%, 8/20/2047 (j) | 2,553 | 346 |
| Series 2017-134, Class SB, IF, IO, 5.61%, 9/20/2047 (j) | 2,557 | 319 |
| Series 2017-141, Class QS, IF, IO, 5.61%, 9/20/2047 (j) | 5,687 | 697 |
| Series 2017-149, Class QS, IF, IO, 5.61%, 10/20/2047 (j) | 2,826 | 389 |
| Series 2018-1, Class ST, IF, IO, 5.61%, 1/20/2048 (j) | 6,466 | 911 |
| Series 2018-11, Class SA, IF, IO, 5.61%, 1/20/2048 (j) | 2,470 | 327 |
| Series 2018-6, Class CS, IF, IO, 5.61%, 1/20/2048 (j) | 2,155 | 306 |
| Series 2018-36, Class SG, IF, IO, 5.61%, 3/20/2048 (j) | 6,240 | 894 |
| Series 2018-63, Class SB, IF, IO, 5.61%, 4/20/2048 (j) | 1,107 | 148 |
| Series 2018-64, Class GS, IF, IO, 5.61%, 5/20/2048 (j) | 3,655 | 435 |
| Series 2018-65, Class SE, IF, IO, 5.61%, 5/20/2048 (j) | 4,494 | 606 |
| Series 2018-92, Class SH, IF, IO, 5.61%, 7/20/2048 (j) | 2,373 | 299 |
| Series 2018-115, Class DS, IF, IO, 5.61%, 8/20/2048 (j) | 5,753 | 702 |
| Series 2018-126, Class CS, IF, IO, 5.61%, 9/20/2048 (j) | 3,549 | 435 |
| Series 2018-146, Class S, IF, IO, 5.56%, 10/20/2048 (j) | 2,469 | 287 |
| Series 2018-147, Class SD, IF, IO, 5.56%, 10/20/2048 (j) | 6,983 | 841 |
| Series 2018-168, Class SA, IF, IO, 5.51%, 12/20/2048 (j) | 2,901 | 365 |
| Series 2019-16, Class SB, IF, IO, 5.46%, 2/20/2049 (j) | 4,137 | 494 |
| Series 2019-22, Class SM, IF, IO, 5.46%, 2/20/2049 (j) | 12,332 | 1,566 |
| Series 2019-23, Class JS, IF, IO, 5.46%, 2/20/2049 (j) | 3,452 | 460 |
| Series 2019-30, Class SA, IF, IO, 5.46%, 3/20/2049 (j) | 4,924 | 594 |
| Series 2019-38, Class SN, IF, IO, 5.46%, 3/20/2049 (j) | 6,087 | 823 |
| Series 2019-41, Class CS, IF, IO, 5.46%, 3/20/2049 (j) | 4,046 | 472 |
| Series 2019-42, Class SJ, IF, IO, 5.46%, 4/20/2049 (j) | 4,444 | 535 |
| April 30, 2022 | J.P. Morgan Funds | 97 |
| INVESTMENTS | PRINCIPAL AMOUNT ($000) | VALUE ($000) |
| Collateralized Mortgage Obligations — continued | ||
| United States — continued | ||
| Series 2019-56, Class GS, IF, IO, 5.56%, 5/20/2049 (j) | 2,431 | 288 |
| Series 2019-69, Class DS, IF, IO, 5.51%, 6/20/2049 (j) | 2,601 | 301 |
| Series 2019-70, Class SM, IF, IO, 5.51%, 6/20/2049 (j) | 2,498 | 294 |
| Series 2020-76, Class SL, IF, IO, 5.56%, 5/20/2050 (j) | 5,718 | 798 |
| GSMSC Pass-Through Trust Series 2008-2R, Class 2A1, 7.50%, 10/25/2036 (c) (j) | 1,265 | 428 |
| GSR Mortgage Loan Trust | ||
| Series 2004-15F, Class 1A2, 5.50%, 12/25/2034 | 195 | 171 |
| Series 2005-1F, Class 2A3, 6.00%, 2/25/2035 | 146 | 123 |
| Series 2005-AR3, Class 6A1, 3.00%, 5/25/2035 (j) | 66 | 60 |
| Series 2005-AR4, Class 3A5, 2.76%, 7/25/2035 (j) | 1,238 | 1,019 |
| Series 2005-6F, Class 3A18, 5.50%, 7/25/2035 | 712 | 698 |
| Series 2005-AR7, Class 6A1, 2.67%, 11/25/2035 (j) | 631 | 621 |
| Series 2006-1F, Class 2A16, 6.00%, 2/25/2036 | 547 | 332 |
| Series 2006-1F, Class 2A9, 6.00%, 2/25/2036 | 886 | 537 |
| Series 2006-9F, Class 3A1, 6.25%, 10/25/2036 | 453 | 430 |
| Series 2007-1F, Class 3A13, 6.00%, 1/25/2037 | 228 | 178 |
| HarborView Mortgage Loan Trust Series 2005-11, Class 2A1A, 1.17%, 8/19/2045 (j) | 146 | 142 |
| Impac CMB Trust | ||
| Series 2004-5, Class 1A1, 1.39%, 10/25/2034 (j) | 271 | 269 |
| Series 2004-6, Class 1A2, 1.45%, 10/25/2034 (j) | — | — |
| Series 2004-5, Class 1M2, 1.54%, 10/25/2034 ‡ (j) | 99 | 95 |
| Series 2004-7, Class 1A2, 1.59%, 11/25/2034 (j) | 304 | 307 |
| Series 2004-9, Class 1A1, 1.43%, 1/25/2035 (j) | — | — |
| Series 2004-10, Class 2A, 1.31%, 3/25/2035 (j) | 460 | 436 |
| INVESTMENTS | PRINCIPAL AMOUNT ($000) | VALUE ($000) |
| United States — continued | ||
| Series 2004-10, Class 3A1, 1.37%, 3/25/2035 (j) | — | — |
| Series 2005-1, Class 1A1, 1.19%, 4/25/2035 (j) | 261 | 253 |
| Series 2005-1, Class 1A2, 1.29%, 4/25/2035 (j) | 319 | 309 |
| Series 2005-2, Class 1A2, 1.29%, 4/25/2035 (j) | 316 | 310 |
| Impac Secured Assets CMN Owner Trust Series 2003-2, Class A4, 3.75%, 8/25/2033 | 182 | 157 |
| Impac Secured Assets Trust | ||
| Series 2007-3, Class A1B, 1.15%, 9/25/2037 (j) | 1,787 | 1,552 |
| Series 2007-3, Class A1C, 1.39%, 9/25/2037 (j) | 2,994 | 2,552 |
| IndyMac INDX Mortgage Loan Trust | ||
| Series 2005-AR3, Class 3A1, 2.55%, 4/25/2035 (j) | 184 | 184 |
| Series 2005-AR14, Class 2A1A, 1.27%, 7/25/2035 (j) | 746 | 665 |
| Series 2007-AR21, Class 6A1, 2.66%, 9/25/2037 (j) | 4,601 | 3,775 |
| JPMorgan Alternative Loan Trust Series 2006-A2, Class 1A1, 1.03%, 5/25/2036 (j) | 2,582 | 2,401 |
| JPMorgan Mortgage Trust | ||
| Series 2006-S3, Class 2A4, 5.50%, 8/25/2021 | 8 | 7 |
| Series 2004-A6, Class 1A1, 2.59%, 12/25/2034 (j) | 67 | 65 |
| Series 2005-A3, Class 6A6, 2.90%, 6/25/2035 (j) | 154 | 156 |
| Series 2005-A6, Class 1A2, 2.60%, 9/25/2035 (j) | 168 | 166 |
| Series 2005-A8, Class 1A1, 2.74%, 11/25/2035 (j) | 91 | 81 |
| Series 2005-A8, Class 4A1, 2.82%, 11/25/2035 (j) | 1,378 | 1,259 |
| Series 2006-A7, Class 2A4, 3.10%, 1/25/2037 (j) | 424 | 390 |
| Series 2007-S1, Class 2A17, 1.00%, 3/25/2037 (j) | 3,709 | 1,090 |
| Legacy Mortgage Asset Trust | ||
| Series 2021-GS3, Class A2, 3.25%, 7/25/2061 (c) (h) | 2,800 | 2,597 |
| 98 | J.P. Morgan Funds | April 30, 2022 |
| INVESTMENTS | PRINCIPAL AMOUNT ($000) | VALUE ($000) |
| Collateralized Mortgage Obligations — continued | ||
| United States — continued | ||
| Series 2021-GS1, Class A2, 3.84%, 10/25/2066 (c) (h) | 2,000 | 1,924 |
| Lehman Mortgage Trust | ||
| Series 2005-2, Class 2A5, 5.50%, 12/25/2035 | 708 | 513 |
| Series 2007-7, Class 5A7, 6.50%, 8/25/2037 | 7,067 | 4,311 |
| MASTR Alternative Loan Trust | ||
| Series 2004-8, Class 1A1, 6.50%, 9/25/2034 | 162 | 162 |
| Series 2004-12, Class 3A1, 6.00%, 12/25/2034 | 586 | 579 |
| Series 2005-3, Class 1A1, 5.50%, 4/25/2035 | 164 | 155 |
| Series 2005-5, Class 3A1, 5.75%, 8/25/2035 | 212 | 135 |
| Series 2005-6, Class 1A2, 5.50%, 12/25/2035 | 429 | 346 |
| Merrill Lynch Mortgage Investors Trust | ||
| Series 2005-1, Class 2A2, 2.01%, 4/25/2035 (j) | 144 | 137 |
| Series 2006-1, Class 2A1, 1.98%, 2/25/2036 (j) | 811 | 826 |
| Series 2006-AF2, Class AF2, 6.25%, 10/25/2036 | 180 | 99 |
| METLIFE SECURITIZATION TRUST Series 2017-1A, Class A, 3.00%, 4/25/2055 (c) (j) | 2,817 | 2,772 |
| Morgan Stanley Mortgage Loan Trust | ||
| Series 2006-2, Class 1A, 5.25%, 2/25/2021 | 273 | 253 |
| Series 2004-8AR, Class 4A1, 2.47%, 10/25/2034 (j) | 409 | 414 |
| Series 2004-9, Class 1A, 5.36%, 11/25/2034 (j) | 443 | 455 |
| Series 2005-4, Class 1A, 5.00%, 8/25/2035 | 20 | 19 |
| MortgageIT Trust Series 2005-3, Class A1, 1.27%, 8/25/2035 (j) | — | — |
| New Residential Mortgage Loan Trust | ||
| Series 2019-NQM4, Class B1, 3.74%, 9/25/2059 ‡ (c) (j) | 2,500 | 2,336 |
| Series 2019-NQM4, Class B2, 4.96%, 9/25/2059 ‡ (c) (j) | 4,000 | 3,707 |
| Series 2019-NQM5, Class B1, 4.04%, 11/25/2059 ‡ (c) (j) | 2,041 | 1,908 |
| INVESTMENTS | PRINCIPAL AMOUNT ($000) | VALUE ($000) |
| United States — continued | ||
| Nomura Asset Acceptance Corp. Alternative Loan Trust Series 2005-WF1, Class 2A5, 5.66%, 3/25/2035 (h) | 4 | 4 |
| PNMAC GMSR ISSUER TRUST Series 2018-GT1, Class A, 3.52%, 2/25/2023 (c) (j) | 3,715 | 3,700 |
| PRPM FRN 3.77% 03/26 3.77%, 3/25/2026 | 4,987 | 4,711 |
| PRPM LLC | ||
| Series 2020-4, Class A2, 3.44%, 10/25/2025 ‡ (c) (h) | 7,000 | 6,764 |
| Series 2020-6, Class A2, 4.70%, 11/25/2025 (c) (h) | 2,350 | 2,275 |
| Series 2021-1, Class A2, 3.72%, 1/25/2026 (c) (j) | 5,000 | 4,700 |
| Series 2021-3, Class A2, 3.72%, 4/25/2026 (c) (h) | 5,500 | 5,142 |
| Series 2021-5, Class A2, 3.72%, 6/25/2026 (c) (h) | 4,000 | 3,728 |
| Series 2021-6, Class A2, 3.47%, 7/25/2026 (c) (h) | 3,447 | 3,204 |
| Series 2021-7, Class A2, 3.67%, 8/25/2026 (c) (h) | 5,030 | 4,618 |
| Series 2021-8, Class A2, 3.60%, 9/25/2026 (c) (j) | 5,000 | 4,640 |
| Series 2021-10, Class A2, 4.83%, 10/25/2026 (c) (h) | 9,000 | 8,501 |
| Series 2021-11, Class A2, 4.58%, 11/25/2026 (c) (h) | 5,269 | 4,922 |
| RALI Trust | ||
| Series 2003-QS20, Class CB, 5.00%, 11/25/2018 | 3 | 2 |
| Series 2005-QA5, Class A2, 4.34%, 4/25/2035 (j) | 830 | 788 |
| Series 2005-QS17, Class A3, 6.00%, 12/25/2035 | 622 | 583 |
| Series 2006-QS3, Class 1A10, 6.00%, 3/25/2036 | 988 | 910 |
| Series 2006-QS4, Class A2, 6.00%, 4/25/2036 | 1,110 | 1,018 |
| Series 2006-QS17, Class A5, 6.00%, 12/25/2036 | 1,644 | 1,490 |
| Residential Asset Securitization Trust | ||
| Series 2005-A3, Class A2, 5.50%, 4/25/2035 | — | — |
| Series 2005-A8CB, Class A11, 6.00%, 7/25/2035 | 1,538 | 1,156 |
| April 30, 2022 | J.P. Morgan Funds | 99 |
| INVESTMENTS | PRINCIPAL AMOUNT ($000) | VALUE ($000) |
| Collateralized Mortgage Obligations — continued | ||
| United States — continued | ||
| Series 2005-A14, Class A1, 5.50%, 12/25/2035 | 132 | 81 |
| Series 2006-A8, Class 3A1, 6.00%, 8/25/2036 | 2,594 | 1,586 |
| Series 2007-A5, Class 2A2, 6.00%, 5/25/2037 | 6,465 | 4,496 |
| RFMSI Trust | ||
| Series 2004-S9, Class 2A1, 4.75%, 12/25/2019 | — | — |
| Series 2005-S7, Class A6, 5.50%, 11/25/2035 | 61 | 54 |
| Series 2006-S10, Class 1A1, 6.00%, 10/25/2036 | 1,260 | 1,163 |
| Series 2006-SA4, Class 2A1, 4.75%, 11/25/2036 (j) | 1,006 | 950 |
| Seasoned Credit Risk Transfer Trust Series 2017-3, Class AIO, IO, 0.00%, 7/25/2056 (j) | 202,722 | 120 |
| Sequoia Mortgage Trust Series 2007-3, Class 1A1, 0.99%, 7/20/2036 (j) | 422 | 385 |
| Starwood Mortgage Residential Trust | ||
| Series 2020-1, Class B1, 3.73%, 2/25/2050 ‡ (c) (j) | 5,410 | 5,131 |
| Series 2020-INV1, Class B2, 4.26%, 11/25/2055 ‡ (c) | 1,600 | 1,553 |
| Structured Adjustable Rate Mortgage Loan Trust Series 2005-1, Class 1A1, 2.81%, 2/25/2035 (j) | 266 | 263 |
| Structured Asset Mortgage Investments II Trust | ||
| Series 2005-AR3, Class 1A1, 1.21%, 8/25/2035 (j) | 2,126 | 1,998 |
| Series 2007-AR7, Class 1A1, 1.52%, 5/25/2047 (j) | 2,838 | 2,473 |
| Verus Securitization Trust | ||
| Series 2019-INV2, Class B1, 4.45%, 7/25/2059 ‡ (c) (j) | 2,000 | 2,001 |
| Series 2019-INV3, Class B1, 3.73%, 11/25/2059 ‡ (c) (j) | 5,000 | 4,928 |
| Series 2021-R1, Class B1, 3.20%, 10/25/2063 ‡ (c) (j) | 2,000 | 1,943 |
| Series 2021-R1, Class B2, 4.20%, 10/25/2063 ‡ (c) (j) | 1,322 | 1,224 |
| Series 2021-R3, Class B1, 3.07%, 4/25/2064 ‡ (c) (j) | 2,500 | 2,388 |
| Series 2021-R3, Class B2, 4.07%, 4/25/2064 ‡ (c) (j) | 1,776 | 1,709 |
| INVESTMENTS | PRINCIPAL AMOUNT ($000) | VALUE ($000) |
| United States — continued | ||
| Series 2020-5, Class B1, 3.71%, 5/25/2065 ‡ (c) (j) | 2,400 | 2,256 |
| Series 2020-5, Class B2, 4.71%, 5/25/2065 ‡ (c) (j) | 1,400 | 1,317 |
| Series 2021-1, Class B1, 2.98%, 1/25/2066 ‡ (c) (j) | 3,150 | 2,878 |
| Series 2021-4, Class M1, 2.19%, 7/25/2066 (c) (j) | 1,121 | 972 |
| Series 2021-5, Class B1, 3.04%, 9/25/2066 ‡ (c) (j) | 3,826 | 3,343 |
| Series 2021-5, Class B2, 3.94%, 9/25/2066 ‡ (c) (j) | 3,750 | 3,262 |
| WaMu Mortgage Pass-Through Certificates Trust | ||
| Series 2004-AR11, Class A, 2.40%, 10/25/2034 (j) | 564 | 549 |
| Series 2005-AR5, Class A6, 2.93%, 5/25/2035 (j) | 1,262 | 1,255 |
| Series 2005-AR16, Class 1A1, 2.69%, 12/25/2035 (j) | 413 | 414 |
| Series 2005-AR14, Class 1A3, 2.86%, 12/25/2035 (j) | 945 | 944 |
| Series 2005-AR14, Class 1A4, 2.86%, 12/25/2035 (j) | 631 | 629 |
| Series 2005-AR18, Class 1A3A, 2.82%, 1/25/2036 (j) | 44 | 45 |
| Series 2006-AR2, Class 1A1, 3.08%, 3/25/2036 (j) | 150 | 149 |
| Series 2004-AR10, Class A1B, 1.51%, 7/25/2044 (j) | 517 | 503 |
| Series 2005-AR15, Class A1A1, 1.19%, 11/25/2045 (j) | 28 | 27 |
| Washington Mutual Mortgage Pass-Through Certificates WMALT Trust | ||
| Series 2005-1, Class 1A3, 5.50%, 3/25/2035 | 516 | 483 |
| Series 2005-4, Class CB7, 5.50%, 6/25/2035 | 357 | 342 |
| Series 2005-10, Class 2A5, 5.75%, 11/25/2035 | 1,861 | 1,801 |
| Series 2005-10, Class 4CB1, 5.75%, 12/25/2035 | 573 | 554 |
| Series 2006-5, Class 2CB5, 6.50%, 7/25/2036 | 160 | 136 |
| Series 2007-1, Class 1A7, 1.27%, 2/25/2037 (j) | 2,584 | 1,845 |
| 100 | J.P. Morgan Funds | April 30, 2022 |
| INVESTMENTS | PRINCIPAL AMOUNT ($000) | VALUE ($000) |
| Collateralized Mortgage Obligations — continued | ||
| United States — continued | ||
| Wells Fargo Mortgage-Backed Securities Trust | ||
| Series 2006-AR19, Class A3, 2.74%, 12/25/2036 (j) | 122 | 116 |
| Series 2007-15, Class A1, 6.00%, 11/25/2037 | 147 | 135 |
| 461,261 | ||
| Total Collateralized Mortgage Obligations (Cost $511,211) | 464,233 | |
| INVESTMENTS | SHARES (000) | |
| Exchange-Traded Funds — 2.6% | ||
| United States — 2.6% | ||
| JPMorgan Equity Premium Income ETF, (k)(Cost $332,142) | 5,366 | 314,304 |
| INVESTMENTS | PRINCIPAL AMOUNT ($000) | |
| Loan Assignments — 2.4% (l) | ||
| Canada — 0.0% ^ | ||
| 1011778 BC ULC, 1st Lien Term Loan B (ICE LIBOR USD 1 Month + 1.75%), 2.51%, 11/19/2026 (f) (l) | 660 | 646 |
| West Jet, 1st Lien Term Loan (ICE LIBOR USD 3 Month + 3.00%), 4.00%, 12/11/2026 (f) (l) | 645 | 623 |
| 1,269 | ||
| France — 0.0% ^ | ||
| Altice France, 1st Lien Term Loan B-13 (ICE LIBOR USD 3 Month + 4.00%), 4.51%, 8/14/2026 (f) (l) | 2,661 | 2,638 |
| Numericable US LLC, 1st Lien Term Loan B (ICE LIBOR USD 3 Month + 3.69%), 4.73%, 1/31/2026 (f) (l) | 544 | 538 |
| 3,176 | ||
| Ireland — 0.0% ^ | ||
| ICON, 1st Lien Term Loan B (ICE LIBOR USD 3 Month + 2.25%), 3.31%, 7/3/2028 (f) (l) | 119 | 118 |
| INVESTMENTS | PRINCIPAL AMOUNT ($000) | VALUE ($000) |
| Luxembourg — 0.1% | ||
| ICON, 1st Lien Term Loan B (ICE LIBOR USD 3 Month + 2.25%), 3.31%, 7/3/2028 (f) (l) | 478 | 475 |
| Nestle Skin Health, Term Loan B (ICE LIBOR USD 3 Month + 3.75%), 4.76%, 10/1/2026 (f) (l) | 9,809 | 9,713 |
| 10,188 | ||
| Netherlands — 0.0% ^ | ||
| Commscope, Inc., 1st Lien Term Loan B-2 (ICE LIBOR USD 1 Month + 3.25%), 4.01%, 4/6/2026 (f) (l) | 1,221 | 1,173 |
| United Kingdom — 0.0% ^ | ||
| Cineworld Finance US, Inc., 1st Lien Term Loan B (ICE LIBOR USD 3 Month + 2.50%), 4.00%, 2/28/2025 (f) (l) | 432 | 329 |
| Delta 2 Lux SARL, 1st Lien Term Loan B (ICE LIBOR USD 1 Month + 2.50%), 3.50%, 2/1/2024 (f) (l) | 467 | 464 |
| 793 | ||
| United States — 2.3% | ||
| Adient US LLC, Term Loan B (ICE LIBOR USD 1 Month + 3.25%), 4.01%, 4/10/2028 (f) (l) | 5,320 | 5,274 |
| Advanced Drainage Systems, Inc., 1st Lien Term Loan B (ICE LIBOR USD 1 Month + 2.25%), 2.75%, 7/31/2026 (f) (l) | 310 | 309 |
| Air Medical Group, 1st Lien Term Loan (ICE LIBOR USD 3 Month + 4.25%), 5.25%, 10/2/2025 (f) (l) | 449 | 445 |
| Albany Molecular Research, Inc., 1st Lien Term Loan (ICE LIBOR USD 3 Month + 3.75%), 4.99%, 8/30/2026 (f) (l) | 1,072 | 1,065 |
| Alliance Laundry Systems LLC, 1st Lien Term Loan B (ICE LIBOR USD 1 Month + 3.50%; ICE LIBOR USD 3 Month + 3.50%), 4.52%, 10/8/2027 (f) (l) | 1,043 | 1,036 |
| Allied Universal Holdco LLC, 1st Lien Term Loan B (ICE LIBOR USD 1 Month + 3.75%), 4.51%, 5/12/2028 (f) (l) | 816 | 794 |
| Altice Financing SA, 1st Lien Term Loan (ICE LIBOR USD 3 Month + 2.75%), 3.79%, 7/15/2025 (f) (l) | 884 | 867 |
| Altium Packaging LLC, 1st Lien Term Loan (ICE LIBOR USD 1 Month + 2.75%), 3.52%, 2/3/2028 (f) (l) | 707 | 680 |
| April 30, 2022 | J.P. Morgan Funds | 101 |
| INVESTMENTS | PRINCIPAL AMOUNT ($000) | VALUE ($000) |
| Loan Assignments — continued | ||
| United States — continued | ||
| American Axle & Manufacturing, Inc., 1st Lien Term Loan B (ICE LIBOR USD 1 Month + 2.25%), 3.00%, 4/6/2024 (f) (l) | 1,047 | 1,041 |
| Ancestry.com, 1st Lien Term Loan B (ICE LIBOR USD 1 Month + 3.25%), 4.01%, 12/6/2027 (f) (l) | 1,010 | 985 |
| API Group DE, 1st Lien Term Loan (ICE LIBOR USD 1 Month + 2.50%), 3.26%, 10/1/2026 (f) (l) | 819 | 813 |
| AppleCaramel Buyer LLC, 1st Lien Term Loan B (3-MONTH PRIME + 3.75%), 4.45%, 10/19/2027 (f) (l) | 8,052 | 7,853 |
| Asplundh Tree Expert LLC, 1st Lien Term Loan B (ICE LIBOR USD 1 Month + 1.75%), 2.51%, 9/7/2027 (f) (l) | 808 | 799 |
| Astoria Energy LLC, 1st Lien Term Loan B (ICE LIBOR USD 3 Month + 3.50%), 4.51%, 12/10/2027 (f) (l) (m) | 494 | 486 |
| Asurion LLC, 1st Lien Term Loan B (ICE LIBOR USD 1 Month + 3.25%), 4.01%, 7/31/2027 (f) (l) | 268 | 261 |
| Asurion LLC, 1st Lien Term Loan B-3 (ICE LIBOR USD 1 Month + 5.25%), 6.01%, 1/31/2028 (f) (l) | 325 | 315 |
| Asurion LLC, Term Loan B-6 (ICE LIBOR USD 1 Month + 3.13%), 3.89%, 11/3/2023 (f) (l) | 541 | 539 |
| Asurion LLC, Term Loan B-7 (ICE LIBOR USD 1 Month + 3.00%), 3.76%, 11/3/2024 (f) (l) | 242 | 239 |
| Atkins Nutritionals, Inc., 1st Lien Term Loan B (ICE LIBOR USD 1 Month + 3.25%), 3.90%, 7/7/2024 (f) (l) | 323 | 322 |
| Avantor Funding, Inc., 1st Lien Term Loan B (ICE LIBOR USD 1 Month + 2.25%), 3.01%, 11/8/2027 (f) (l) | 916 | 910 |
| Axalta Coating Systems US Holdings, Inc., Term Loan B (ICE LIBOR USD 3 Month + 1.75%), 2.76%, 6/1/2024 (f) (l) | 348 | 345 |
| B&G Foods, Inc., 1st Lien Term Loan B (ICE LIBOR USD 1 Month + 2.50%), 3.26%, 10/10/2026 (f) (l) | 476 | 466 |
| Banijay Entertainment, 1st Lien Term Loan B (ICE LIBOR USD 1 Month + 3.75%), 4.20%, 3/1/2025 (f) (l) | 542 | 538 |
| Bausch Health Cos., Inc., 1st Lien Term Loan (ICE LIBOR USD 3 Month + 5.25%), 5.75%, 1/27/2027 (f) (l) (m) | 710 | 686 |
| INVESTMENTS | PRINCIPAL AMOUNT ($000) | VALUE ($000) |
| United States — continued | ||
| Birkenstock, 1st Lien Term Loan B (ICE LIBOR USD 6 Month + 3.25%), 5.10%, 4/28/2028 (f) (l) | 730 | 707 |
| BJ's Wholesale Club, Inc., 1st Lien Term Loan (ICE LIBOR USD 1 Month + 2.00%), 2.52%, 2/3/2024 (f) (l) | 361 | 361 |
| Bombardier Recreational Products, Inc., 1st Lien Term Loan B (ICE LIBOR USD 1 Month + 2.00%), 2.49%, 5/24/2027 (f) (l) | 503 | 494 |
| Brookfield WEC Holdings, Inc., 1st Lien Term Loan (ICE LIBOR USD 1 Month + 2.75%), 3.51%, 8/1/2025 (f) (l) | 1,384 | 1,358 |
| Brooks Automation, 1st Lien Term Loan B (ICE LIBOR USD 3 Month + 3.35%), 3.85%, 2/1/2029 (f) (l) (m) | 851 | 839 |
| Brooks Automation, 2nd Lien Term Loan (ICE LIBOR USD 3 Month + 5.60%), 6.10%, 2/1/2030 (f) (l) | 169 | 166 |
| Buckeye Partners, 1st Lien Term Loan B1 (ICE LIBOR USD 1 Month + 2.25%), 2.71%, 11/1/2026 (f) (l) | 558 | 553 |
| Bway Holding Co., 1st Lien Term Loan (ICE LIBOR USD 1 Month + 3.25%), 3.71%, 4/3/2024 (f) (l) | 7,152 | 7,004 |
| Cabinetworks, 1st Lien Term Loan B (ICE LIBOR USD 3 Month + 4.25%), 4.75%, 5/17/2028 (f) (l) | 5,806 | 4,819 |
| Caesars Resort Collection, 1st Lien Term Loan B (ICE LIBOR USD 1 Month + 2.75%), 3.51%, 12/23/2024 (f) (l) (m) | 1,246 | 1,240 |
| Calpine Construction Finance Co. LP, 1st Lien Term Loan (ICE LIBOR USD 1 Month + 2.00%), 2.76%, 1/15/2025 (f) (l) | 985 | 972 |
| Camelot Finance LP, 1st Lien Term Loan B (ICE LIBOR USD 1 Month + 3.00%), 4.00%, 10/30/2026 (f) (l) | 691 | 685 |
| Carroll County Energy LLC, 1st Lien Term Loan B (ICE LIBOR USD 3 Month + 3.50%), 4.51%, 2/16/2026 (f) (l) | 738 | 711 |
| CBS Radio, Inc., 1st Lien Term Loan B (ICE LIBOR USD 1 Month + 2.50%), 3.25%, 11/18/2024 (f) (l) | 244 | 238 |
| CenturyLink, Inc., 1st Lien Term Loan B (ICE LIBOR USD 1 Month + 2.25%), 3.01%, 3/15/2027 (f) (l) | 832 | 795 |
| Chamberlain Group, 1st Lien Term Loan B (ICE LIBOR USD 3 Month + 3.50%), 4.51%, 11/3/2028 (f) (l) | 655 | 642 |
| 102 | J.P. Morgan Funds | April 30, 2022 |
| INVESTMENTS | PRINCIPAL AMOUNT ($000) | VALUE ($000) |
| Loan Assignments — continued | ||
| United States — continued | ||
| Charter Communications Operating LLC, 1st Lien Term Loan B-2 (ICE LIBOR USD 1 Month + 1.75%), 2.52%, 2/1/2027 (f) (l) | 1,728 | 1,705 |
| Cincinnati Bell, 1st Lien Term Loan B-2 (ICE LIBOR USD 3 Month + 3.25%), 4.05%, 11/22/2028 (f) (l) | 2,250 | 2,237 |
| Cineworld Finance US, Inc., 1st Lien Term Loan B (3-MONTH FIXED + 7.00%), 15.25%, 5/23/2024 (f) (l) | 57 | 65 |
| CITGO Holding, 1st Lien Term Loan B (ICE LIBOR USD 1 Month + 7.00%), 7.76%, 8/1/2023 (f) (l) | 326 | 322 |
| Claire's Stores, Inc., 1st Lien Term Loan B (ICE LIBOR USD 1 Month + 6.50%), 7.26%, 12/18/2026 (f) (l) (n) | 1,814 | 1,775 |
| Clear Channel Outdoor Holdings, Inc., 1st Lien Term Loan B (ICE LIBOR USD 3 Month + 3.50%), 4.74%, 8/21/2026 (f) (l) | 2,492 | 2,429 |
| Club Car, 1st Lien Term Loan (ICE LIBOR USD 3 Month + 4.00%), 4.56%, 6/1/2028 (f) (l) | 485 | 476 |
| Conair Holdings LLC, 1st Lien Term Loan B (ICE LIBOR USD 3 Month + 3.75%), 4.76%, 5/17/2028 (f) (l) | 1,071 | 1,047 |
| Conservice, 1st Lien Term Loan (ICE LIBOR USD 1 Month + 4.25%), 5.01%, 5/13/2027 (f) (l) | 660 | 653 |
| Consilio, 1st Lien Term Loan B (ICE LIBOR USD 1 Month + 4.00%), 4.76%, 5/12/2028 (f) (l) | 786 | 773 |
| Cortes NP Acquisition Corp., 1st Lien Term Loan B (ICE LIBOR USD 1 Month + 2.75%), 3.20%, 3/2/2027 (f) (l) | 1,015 | 986 |
| CSC Holdings LLC, 1st Lien Term Loan (ICE LIBOR USD 1 Month + 2.25%), 2.80%, 7/17/2025 (f) (l) | 1,340 | 1,312 |
| CSC Holdings LLC, 1st Lien Term Loan B (ICE LIBOR USD 1 Month + 2.25%), 2.80%, 1/15/2026 (f) (l) | 946 | 927 |
| CVS Holdings I LP, 1st Lien Term Loan (ICE LIBOR USD 1 Month + 4.25%), 5.01%, 8/31/2026 (f) (l) | 587 | 575 |
| DaVita, Inc., 1st Lien Term Loan B (ICE LIBOR USD 1 Month + 1.75%), 2.51%, 8/12/2026 (f) (l) | 637 | 627 |
| DexKo Global, Inc., 1st Lien Term Loan B (ICE LIBOR USD 3 Month + 3.75%), 4.72%, 10/4/2028 (f) (l) | 4,957 | 4,829 |
| INVESTMENTS | PRINCIPAL AMOUNT ($000) | VALUE ($000) |
| United States — continued | ||
| DexKo Global, Inc., Delayed Draw Term Loan B-1 (3-MONTH UNFND + 3.75%), 4.76%, 10/4/2028 (f) (l) | 944 | 920 |
| Diamond Sports Group LLC, 2nd Lien Term Loan (1-MONTH SOFR + 3.25%), 4.09%, 8/24/2026 (f) (l) | 338 | 112 |
| DigiCert, 1st Lien Term Loan | ||
| (ICE LIBOR USD 1 Month + 4.00%), 4.76%, 10/16/2026 (f) (l) | 480 | 477 |
| (ICE LIBOR USD 1 Month + 7.00%), 7.76%, 2/19/2029 (f) (l) | 145 | 143 |
| Directv Financing LLC, 1st Lien Term Loan (ICE LIBOR USD 1 Month + 5.00%), 5.76%, 8/2/2027 (f) (l) | 7,443 | 7,405 |
| Duff & Phelps Corp., 1st Lien Term Loan B (ICE LIBOR USD 1 Month + 3.75%), 4.75%, 4/9/2027 (f) (l) | 535 | 533 |
| E.W. Scripps Co., 1st Lien Term Loan B-3 (ICE LIBOR USD 1 Month + 2.75%), 3.51%, 1/7/2028 (f) (l) | 565 | 562 |
| EIF Channelview Cogeneration LLC, Term Loan (ICE LIBOR USD 1 Month + 4.25%), 5.25%, 5/3/2025 (f) (l) | 123 | 122 |
| Elanco Animal Health, Inc., 1st Lien Term Loan B (ICE LIBOR USD 1 Month + 1.75%), 2.21%, 8/1/2027 (f) (l) | 369 | 361 |
| Endo Pharmaceutical, 1st Lien Term Loan B (ICE LIBOR USD 1 Month + 5.00%), 5.81%, 3/27/2028 (f) (l) | 197 | 183 |
| Ensemble RCM LLC, 1st Lien Term Loan (ICE LIBOR USD 3 Month + 3.75%), 4.99%, 8/3/2026 (f) (l) (m) | 355 | 354 |
| Entegris, Inc., 1st Lien Term Loan B (3-MONTH SOFR + 2.75%), 2.75%, 3/2/2029 (f) (l) (m) | 250 | 250 |
| Enterprise Development Authority (The), 1st lien Term Loan B (ICE LIBOR USD 1 Month + 4.25%), 5.01%, 2/28/2028 (f) (l) | 571 | 568 |
| Envision, 1st Lien Term Loan (ICE LIBOR USD 1 Month + 3.75%), 4.51%, 10/10/2025 (f) (l) | 883 | 536 |
| EPIC Crude Services LP, 1st Lien Term Loan B (ICE LIBOR USD 3 Month + 5.00%), 5.51%, 3/2/2026 (f) (l) | 10,016 | 8,617 |
| Exelon Corp., 1st Lien Term Loan B (ICE LIBOR USD 3 Month + 2.50%), 3.50%, 12/15/2027 (f) (l) | 772 | 769 |
| April 30, 2022 | J.P. Morgan Funds | 103 |
| INVESTMENTS | PRINCIPAL AMOUNT ($000) | VALUE ($000) |
| Loan Assignments — continued | ||
| United States — continued | ||
| FGI Operating Co. LLC, 1st Lien Term Loan (ICE LIBOR USD 3 Month + 11.00%), 12.00%, 5/16/2022 ‡ (f) (i) (l) | 151 | 16 |
| First Student Bidco, 1st Lien Term Loan B (ICE LIBOR USD 3 Month + 3.00%), 3.98%, 7/21/2028 (f) (l) | 4,620 | 4,528 |
| First Student Bidco, 1st Lien Term Loan C (ICE LIBOR USD 3 Month + 3.00%), 3.98%, 7/21/2028 (f) (l) | 1,710 | 1,675 |
| Garda World Security, 1st Lien Term Loan B (ICE LIBOR USD 1 Month + 4.25%), 4.92%, 10/30/2026 (f) (l) | 500 | 495 |
| Gates Global LLC, 1st Lien Term Loan (ICE LIBOR USD 1 Month + 2.50%), 3.26%, 3/31/2027 (f) (l) | 1,055 | 1,034 |
| Gemini HDPE LLC, 1st Lien Term Loan B (ICE LIBOR USD 3 Month + 3.00%), 3.50%, 12/31/2027 (f) (l) | 608 | 605 |
| Genesee & Wyoming, 1st Lien Term Loan (ICE LIBOR USD 3 Month + 2.00%), 3.01%, 12/30/2026 (f) (l) | 1,022 | 1,012 |
| Geneys Telecom Holdings, 1st Lien Term Loan B (ICE LIBOR USD 1 Month + 4.00%), 4.76%, 12/1/2027 (f) (l) (m) | 6,173 | 6,150 |
| Getty Images, 1st Lien Term Loan B (ICE LIBOR USD 3 Month + 4.50%), 5.06%, 2/19/2026 (f) (l) | 570 | 567 |
| Go Daddy Group, Inc. (The), 1st Lien Term Loan B (ICE LIBOR USD 1 Month + 1.75%), 2.51%, 2/15/2024 (f) (l) | 331 | 328 |
| GoodRx, Inc., 1st Lien Term Loan (ICE LIBOR USD 1 Month + 2.75%), 3.51%, 10/10/2025 (f) (l) | 946 | 936 |
| Graham Packaging, 1st Lien Term Loan (ICE LIBOR USD 1 Month + 3.00%), 3.76%, 8/4/2027 (f) (l) | 3,738 | 3,657 |
| Gray Television, Inc., 1st Lien Term Loan B (ICE LIBOR USD 1 Month + 2.50%), 2.96%, 1/2/2026 (f) (l) | 862 | 855 |
| Gray TV, 1st Lien Term Loan D (ICE LIBOR USD 1 Month + 3.00%), 3.46%, 12/1/2028 (f) (l) | 214 | 212 |
| Griffon Corp., 1st Lien Term Loan B (ICE LIBOR USD 3 Month + 2.75%), 3.27%, 1/24/2029 (f) (l) (m) | 866 | 857 |
| Grizzly Acquisitions, Inc., 1st Lien Term Loan B (ICE LIBOR USD 3 Month + 3.25%), 4.22%, 10/1/2025 (f) (l) | 312 | 310 |
| INVESTMENTS | PRINCIPAL AMOUNT ($000) | VALUE ($000) |
| United States — continued | ||
| Harsco Corp., Term Loan B-3 (ICE LIBOR USD 1 Month + 2.25%), 3.13%, 3/10/2028 (f) (l) | 531 | 517 |
| Hearthside Group Holdings LLC, 1st Lien Term Loan (ICE LIBOR USD 1 Month + 3.69%), 4.45%, 5/23/2025 (f) (l) | 348 | 332 |
| Hertz Corp. (The), 1st Lien Term Loan B (ICE LIBOR USD 1 Month + 3.25%), 4.01%, 6/30/2028 (f) (l) | 886 | 882 |
| Hertz Corp. (The), 1st Lien Term Loan C (ICE LIBOR USD 1 Month + 3.25%), 4.01%, 6/30/2028 (f) (l) | 168 | 167 |
| Holley, Inc., 1st Lien Term Loan B (ICE LIBOR USD 3 Month + 3.75%), 4.50%, 11/17/2028 (f) (l) | 425 | 416 |
| Holley, Inc., Delayed Draw Term Loan B (ICE LIBOR USD 3 Month + 3.75%), 4.58%, 11/17/2028 (f) (l) (m) | 21 | 21 |
| Hostess Brands LLC, 1st Lien Term Loan (ICE LIBOR USD 1 Month + 2.25%; ICE LIBOR USD 3 Month + 2.25%), 3.36%, 8/3/2025 (f) (l) | 682 | 672 |
| HUB International, 1st Lien Term Loan B (ICE LIBOR USD 3 Month + 2.75%), 4.21%, 4/25/2025 (f) (l) | 613 | 604 |
| Hyland Software, Inc., 1st Lien Term Loan (ICE LIBOR USD 1 Month + 3.50%), 4.26%, 7/1/2024 (f) (l) | 478 | 476 |
| iHeartCommunications, Inc., 1st Lien Term Loan (ICE LIBOR USD 1 Month + 3.00%), 3.76%, 5/1/2026 (f) (l) (m) | 4,297 | 4,257 |
| iHeartCommunications, Inc., Term Loan B (ICE LIBOR USD 1 Month + 3.25%), 4.01%, 5/1/2026 (f) (l) | 150 | 149 |
| INEOS Enterprises, 1st Lien Term Loan B (ICE LIBOR USD 3 Month + 3.50%), 4.50%, 8/28/2026 (f) (l) | 530 | 526 |
| Ineos US Finance LLC, 1st Lien Term Loan B (ICE LIBOR USD 1 Month + 2.50%), 3.00%, 11/8/2028 (f) (l) (m) | 500 | 496 |
| INEOS US Petrochem LLC, 1st Lien Term Loan B (ICE LIBOR USD 1 Month + 2.75%), 3.51%, 1/29/2026 (f) (l) | 347 | 343 |
| Ingram Micro, 1st Lien Term Loan B (ICE LIBOR USD 3 Month + 3.50%), 4.51%, 6/30/2028 (f) (l) | 570 | 568 |
| Insulet, 1st Lien Term Loan B (ICE LIBOR USD 1 Month + 3.25%), 4.01%, 5/4/2028 (f) (l) (m) | 1,188 | 1,186 |
| 104 | J.P. Morgan Funds | April 30, 2022 |
| INVESTMENTS | PRINCIPAL AMOUNT ($000) | VALUE ($000) |
| Loan Assignments — continued | ||
| United States — continued | ||
| Intelsat Jackson Holding, 1st Lien Term Loan (ICE LIBOR USD 3 Month + 4.25%), 4.92%, 2/1/2029 (f) (l) (m) | 933 | 905 |
| Interior Logic Group, 1st Lien Term Loan B (ICE LIBOR USD 1 Month + 3.50%), 4.26%, 4/3/2028 (f) (l) | 705 | 601 |
| Invenergy, Term Loan (1-MONTH SOFR + 3.75%), 4.56%, 8/28/2025 (f) (l) | 282 | 275 |
| ION Corporates, 1st Lien Term Loan B (3-MONTH SOFR + 3.75%), 4.62%, 3/11/2028 (f) (l) | 389 | 386 |
| IRB Holding Corp., 1st Lien Term Loan B (ICE LIBOR USD 3 Month + 2.75%), 3.76%, 2/5/2025 (f) (l) | 1,115 | 1,104 |
| Jazz Pharmaceuticals plc, 1st Lien Term Loan B (ICE LIBOR USD 1 Month + 3.50%), 4.26%, 5/5/2028 (f) (l) | 844 | 843 |
| JBS USA LUX SA, 1st Lien Term Loan B (ICE LIBOR USD 3 Month + 2.00%), 2.80%, 5/1/2026 (f) (l) | 3,601 | 3,586 |
| KDC US Holdings, Inc., 1st Lien Term Loan B (ICE LIBOR USD 1 Month + 3.75%), 4.51%, 12/22/2025 (f) (l) | 1,027 | 1,012 |
| LABL, Inc., 1st Lien Term Loan B (ICE LIBOR USD 1 Month + 5.00%), 5.76%, 10/29/2028 (f) (l) | 4,976 | 4,880 |
| LegalShield, 1st Lien Term Loan (ICE LIBOR USD 1 Month + 3.75%), 4.25%, 12/15/2028 (f) (l) | 330 | 326 |
| Leslie's Poolmart, Inc., 1st Lien Term Loan B (ICE LIBOR USD 3 Month + 2.50%), 3.02%, 3/9/2028 (f) (l) | 1,230 | 1,213 |
| LifePoint Health, Inc., 1st Lien Term Loan B (ICE LIBOR USD 1 Month + 3.75%), 4.50%, 11/16/2025 (f) (l) | 590 | 582 |
| LogMeIn, Inc., 1st Lien Term Loan B (ICE LIBOR USD 1 Month + 4.75%), 5.30%, 8/31/2027 (f) (l) | 696 | 668 |
| Madison IAQ LLC, 1st Lien Term Loan (ICE LIBOR USD 3 Month + 3.25%), 4.52%, 6/21/2028 (f) (l) | 5,076 | 4,917 |
| Medallion Midland Acquisition LLC, 1st Lien Term Loan B (ICE LIBOR USD 1 Month + 3.75%), 4.51%, 10/18/2028 (f) (l) | 448 | 447 |
| Medline, 1st Lien Term Loan B (ICE LIBOR USD 1 Month + 3.25%), 4.01%, 10/23/2028 (f) (l) (m) | 3,743 | 3,677 |
| INVESTMENTS | PRINCIPAL AMOUNT ($000) | VALUE ($000) |
| United States — continued | ||
| MetroNet Systems Holdings LLC, 1st Lien Term Loan B (1-MONTH SOFR + 3.75%), 4.50%, 6/2/2028 (f) (l) | 471 | 467 |
| MH Sub I LLC, 1st Lien Term Loan (ICE LIBOR USD 1 Month + 3.75%), 4.75%, 9/13/2024 (f) (l) | 723 | 719 |
| MI Windows & Doors, Inc., 1st Lien Term Loan B (1-MONTH SOFR + 3.50%), 4.20%, 12/18/2027 (f) (l) | 302 | 299 |
| Mirion Technologies, Inc., 1st Lien Term Loan (ICE LIBOR USD 3 Month + 2.75%), 3.25%, 10/20/2028 (f) (l) | 499 | 492 |
| Moran Foods LLC, 1st Lien Term Loan (ICE LIBOR USD 3 Month + 7.00%), 7.00%, 12/31/2038 (f) (l) | 449 | 404 |
| Moran Foods LLC, 1st Lien Term Loan B (ICE LIBOR USD 3 Month + 7.00%), 8.01%, 4/1/2024 ‡ (f) (l) | 3,373 | 3,036 |
| Moran Foods LLC, Tranche A Second Lien Term Loan (ICE LIBOR USD 3 Month + 7.00%), 8.01%, 10/1/2024 (f) (l) | 2,639 | 1,848 |
| NAI Entertainment Holdings, 1st Lien Term Loan B (ICE LIBOR USD 1 Month + 2.50%), 3.50%, 5/8/2025 (f) (l) | 292 | 287 |
| Naked Juice LLC, Delayed Draw 1st Liend Term Loan 0.00%, 1/24/2029 (f) (l) | 16 | 15 |
| Netsmart Technologies, Inc., 1st Lien Term Loan B (ICE LIBOR USD 1 Month + 4.00%), 4.76%, 10/1/2027 (f) (l) | 451 | 449 |
| Nexstar Broadcasting, Inc., 1st Lien Term Loan B (ICE LIBOR USD 1 Month + 2.50%), 2.96%, 9/18/2026 (f) (l) | 943 | 934 |
| Nielsen Finance LLC, 1st Lien Term Loan B-4 (ICE LIBOR USD 1 Month + 2.00%), 2.49%, 10/4/2023 (f) (l) | 282 | 282 |
| Nielsen Holdings plc, Term Loan B3 (ICE LIBOR USD 1 Month + 3.75%), 4.51%, 3/6/2028 (f) (l) | 465 | 462 |
| Option Care Health, Inc., 1st Lien Term Loan B (ICE LIBOR USD 1 Month + 2.75%), 3.51%, 10/27/2028 (f) (l) | 608 | 606 |
| Osmose Holdings, Inc., 1st Lien Term Loan (ICE LIBOR USD 1 Month + 3.25%), 4.01%, 6/23/2028 (f) (l) | 562 | 553 |
| Pactiv Evergreen Group Holdings, Inc., 1st Lien Term Loan B (ICE LIBOR USD 1 Month + 3.50%), 4.26%, 9/24/2028 (f) (l) | 2,375 | 2,314 |
| April 30, 2022 | J.P. Morgan Funds | 105 |
| INVESTMENTS | PRINCIPAL AMOUNT ($000) | VALUE ($000) |
| Loan Assignments — continued | ||
| United States — continued | ||
| Parexel International Corp., 1st Lien Term Loan (ICE LIBOR USD 1 Month + 3.50%), 4.26%, 11/15/2028 (f) (l) (m) | 5,180 | 5,140 |
| Pathway Vet Alliance LLC, 1st Lien Term Loan (ICE LIBOR USD 3 Month + 3.75%), 4.76%, 3/31/2027 (f) (l) | 735 | 728 |
| PCI Pharma, 1st Lien Term Loan (ICE LIBOR USD 3 Month + 3.75%), 4.76%, 11/30/2027 (f) (l) | 833 | 827 |
| Pearl Intermediate Parent LLC, 1st Lien Term Loan B-3 (ICE LIBOR USD 1 Month + 3.50%), 4.26%, 2/14/2025 (f) (l) | 786 | 781 |
| Petco Health & Wellness Co., Inc., Term Loan B (ICE LIBOR USD 3 Month + 3.25%), 4.26%, 3/3/2028 (f) (l) | 6,624 | 6,553 |
| PetVet Care Centers, 1st Lien Term Loan (ICE LIBOR USD 1 Month + 3.25%), 4.01%, 2/14/2025 (f) (l) | 545 | 539 |
| PG&E Corp., Exit Term Loan (ICE LIBOR USD 1 Month + 3.00%), 3.81%, 6/23/2025 (f) (l) | 806 | 795 |
| Pike Corp., Delayed Draw Term Loan B (ICE LIBOR USD 1 Month + 3.00%), 3.77%, 1/21/2028 (f) (l) (m) | 881 | 875 |
| Plantronics, Inc., 1st Lien Term Loan (ICE LIBOR USD 1 Month + 2.50%), 3.26%, 7/2/2025 (f) (l) | 1,749 | 1,733 |
| PQ Corp., 1st Lien Term Loan B (ICE LIBOR USD 3 Month + 2.50%), 3.74%, 6/9/2028 (f) (l) | 486 | 480 |
| Prime Security Services Borrower LLC, 1st Lien Term Loan B (ICE LIBOR USD 3 Month + 2.75%), 3.50%, 9/23/2026 (f) (l) | 1,238 | 1,222 |
| PrimeSource, 1st Lien Term Loan B (ICE LIBOR USD 3 Month + 3.25%), 4.22%, 12/28/2027 (f) (l) | 2,595 | 2,458 |
| Project Boost Purchaser LLC, 1st Lien Term Loan B (ICE LIBOR USD 1 Month + 3.50%), 4.26%, 6/1/2026 (f) (l) | 400 | 393 |
| Proofpoint, Inc., 1st Lien Term Loan B (ICE LIBOR USD 3 Month + 3.25%), 3.76%, 8/31/2028 (f) (l) | 489 | 480 |
| Pure Fishing, 1st Lien Term Loan (ICE LIBOR USD 1 Month + 4.50%), 5.26%, 12/22/2025 (f) (l) | 11,570 | 10,789 |
| Qlik Technologies, 1st Lien Term Loan B (ICE LIBOR USD 1 Month + 4.00%), 4.77%, 4/26/2024 (f) (l) | 400 | 398 |
| INVESTMENTS | PRINCIPAL AMOUNT ($000) | VALUE ($000) |
| United States — continued | ||
| Quest Software US Holdings, Inc., 1st Lien Term Loan B (3-MONTH SOFR + 4.25%), 4.75%, 2/1/2029 (f) (l) | 795 | 780 |
| Quidditch Acquisition, Inc., 1st Lien Cov-Lite Term Loan (ICE LIBOR USD 1 Month + 7.00%), 8.00%, 3/21/2025 (f) (l) | 144 | 138 |
| Quikrete Holdings, Inc., 1st Lien Term Loan B (ICE LIBOR USD 1 Month + 3.00%), 3.76%, 6/11/2028 (f) (l) | 674 | 656 |
| Radiology Partners, Inc., 1st Lien Term Loan B (ICE LIBOR USD 1 Month + 4.25%), 4.85%, 7/9/2025 (f) (l) | 550 | 541 |
| RealPage, Inc., 1st Lien Term Loan B (ICE LIBOR USD 1 Month + 3.25%), 3.75%, 4/24/2028 (f) (l) | 542 | 533 |
| Red Ventures LLC, 1st Lien Term Loan B (ICE LIBOR USD 1 Month + 2.50%), 3.26%, 11/8/2024 (f) (l) | 329 | 324 |
| Reynolds Consumer Products, 1st Lien Term Loan (ICE LIBOR USD 1 Month + 1.75%), 2.51%, 2/4/2027 (f) (l) | 816 | 802 |
| Reynolds Group Holdings, 1st Lien Term Loan (ICE LIBOR USD 1 Month + 3.25%), 4.01%, 2/5/2026 (f) (l) | 671 | 652 |
| Ring Container Technologies LLC, 1st Lien Term Loan B (ICE LIBOR USD 1 Month + 3.75%; ICE LIBOR USD 3 Month + 3.75%), 4.27%, 8/12/2028 (f) (l) | 429 | 426 |
| Sabre Holdings Corp., 1st Lien Term Loan B | ||
| (ICE LIBOR USD 1 Month + 3.50%), 4.26%, 12/17/2027 (f) (l) | 2,140 | 2,119 |
| (ICE LIBOR USD 1 Month + 3.50%), 4.26%, 12/17/2027 (f) (l) | 1,343 | 1,330 |
| Samsonite International SA, 1st Lien Term Loan B (ICE LIBOR USD 1 Month + 1.75%), 2.51%, 4/25/2025 (f) (l) | 400 | 392 |
| Shearer's Foods LLC, 1st Lien Term Loan (ICE LIBOR USD 1 Month + 3.50%), 4.26%, 9/23/2027 (f) (l) | 325 | 314 |
| Shutterfly, Inc., 1st Lien Term Loan B (ICE LIBOR USD 1 Month + 5.00%), 5.76%, 9/25/2026 (f) (l) | 3,505 | 3,237 |
| Solenis International LP, 1st Lien Term Loan B (ICE LIBOR USD 3 Month + 3.75%), 4.81%, 11/9/2028 (f) (l) | 2,956 | 2,894 |
| Spin Holdco, Inc., Term Loan B (ICE LIBOR USD 3 Month + 4.00%), 4.75%, 3/4/2028 (f) (l) | 544 | 542 |
| 106 | J.P. Morgan Funds | April 30, 2022 |
| INVESTMENTS | PRINCIPAL AMOUNT ($000) | VALUE ($000) |
| Loan Assignments — continued | ||
| United States — continued | ||
| Spirit AeroSystems, Inc., 1st Lien Term Loan B (ICE LIBOR USD 1 Month + 3.75%), 4.51%, 1/15/2025 (f) (l) | 1,520 | 1,515 |
| SPX Flow, Inc., 1st Lien Term Loan B (1-MONTH SOFR + 4.50%), 5.30%, 4/5/2029 (f) (l) (m) | 3,485 | 3,392 |
| SRS Distribution, 1st Lien Term Loan B (ICE LIBOR USD 3 Month + 3.50%; 3 Month SOFR + 3.50%), 4.00%, 6/2/2028 (f) (l) | 476 | 458 |
| SS&C Technologies Holdings, Inc., 1st Lien Term Loan B-3 (ICE LIBOR USD 1 Month + 1.75%), 2.51%, 4/16/2025 (f) (l) | 316 | 311 |
| SS&C Technologies Holdings, Inc., 1st Lien Term Loan B-4 (ICE LIBOR USD 1 Month + 1.75%), 2.51%, 4/16/2025 (f) (l) | 257 | 253 |
| St. George's University Scholastic Services LLC, 1st Lien Term Loan B (ICE LIBOR USD 1 Month + 3.25%), 4.01%, 2/10/2029 (f) (l) | 717 | 708 |
| Staples, Inc., 1st Lien Term Loan (ICE LIBOR USD 3 Month + 5.00%), 5.32%, 4/16/2026 (f) (l) | 1,167 | 1,117 |
| Star Merger Sub, Inc., 1st Lien Term Loan B (ICE LIBOR USD 1 Month + 3.25%), 3.92%, 2/6/2026 (f) (l) | 722 | 716 |
| Summer BC Holdco B SARL, 1st Lien Term Loan B (ICE LIBOR USD 3 Month + 4.50%), 5.51%, 12/4/2026 (f) (l) (m) | 1,906 | 1,897 |
| Summit Materials LLC, Term Loan (ICE LIBOR USD 1 Month + 2.00%), 2.76%, 11/21/2024 (f) (l) | 459 | 459 |
| Sundyne, 1st Lien Term Loan B (ICE LIBOR USD 1 Month + 4.25%), 5.25%, 3/17/2027 (f) (l) | 712 | 705 |
| Synaptics, Inc., 1st Lien Term Loan B (ICE LIBOR USD 3 Month + 2.25%), 2.75%, 12/2/2028 (f) (l) | 703 | 699 |
| Team Health Holdings, 1st Lien Term Loan B (1-MONTH SOFR + 5.25%), 3.75%, 2/6/2024 (f) (l) | 416 | 386 |
| Tekni-Plex, Inc., 1st Lien Term Loan (ICE LIBOR USD 1 Month + 4.00%), 4.76%, 9/15/2028 (f) (l) | 415 | 410 |
| Tekni-Plex, Inc., Delayed Draw Term Loan B (ICE LIBOR USD 1 Month + 4.00%), 4.76%, 9/15/2028 (f) (l) (m) | 37 | 37 |
| Tenneco, Inc., 1st Lien Term Loan B (ICE LIBOR USD 1 Month + 3.00%), 3.76%, 10/1/2025 (f) (l) | 663 | 653 |
| INVESTMENTS | PRINCIPAL AMOUNT ($000) | VALUE ($000) |
| United States — continued | ||
| ThoughtWorks, Inc., 1st Lien Term Loan (ICE LIBOR USD 1 Month + 2.75%), 3.51%, 3/24/2028 (f) (l) | 284 | 281 |
| Thyssenkrupp Elevator, 1st Lien Term Loan B-1 (ICE LIBOR USD 6 Month + 3.50%), 4.02%, 7/30/2027 (f) (l) | 2,893 | 2,863 |
| Titan Acquisition Ltd., 1st Lien Term Loan B (ICE LIBOR USD 3 Month + 3.00%), 3.35%, 3/28/2025 (f) (l) | 7,095 | 6,925 |
| Traeger Grills, 1st Lien Term Loan (ICE LIBOR USD 1 Month + 3.25%), 4.01%, 6/29/2028 (f) (l) | 619 | 586 |
| Traeger Grills, Delayed Draw Term Loan (3-MONTH UNFND + 3.25%), 4.24%, 6/29/2028 (f) (l) (m) | 20 | 19 |
| Trans Union LLC, Term Loan B6 (ICE LIBOR USD 1 Month + 2.25%), 3.01%, 12/1/2028 (f) (l) | 737 | 729 |
| TransDigm Group, Inc., 1st Lien Term Loan E (ICE LIBOR USD 1 Month + 2.25%), 3.01%, 5/30/2025 (f) (l) | 1,066 | 1,046 |
| TransDigm Group, Inc., 1st Lien Term Loan F (ICE LIBOR USD 1 Month + 2.25%), 3.01%, 12/9/2025 (f) (l) | 1,742 | 1,707 |
| Trinseo Materials Operating SCA, 1st Lien Term Loan B (ICE LIBOR USD 1 Month + 2.00%), 2.76%, 9/6/2024 (f) (l) | 336 | 332 |
| Triton Water Holdings, 1st Lien Term Loan B (ICE LIBOR USD 3 Month + 3.50%), 4.51%, 3/31/2028 (f) (l) | 4,349 | 4,218 |
| Tropicana, Inc., 1st Lien Term Loan (ICE LIBOR USD 3 Month + 3.25%), 4.00%, 1/24/2029 (f) (l) | 298 | 292 |
| Truck Hero, Inc., 1st Lien Term Loan (ICE LIBOR USD 1 Month + 3.25%), 4.01%, 1/31/2028 (f) (l) | 1,849 | 1,723 |
| U.S. Renal Care, 1st Lien Term Loan B (ICE LIBOR USD 1 Month + 5.00%), 5.50%, 6/26/2026 (f) (l) | 4,085 | 3,605 |
| UFC Holdings LLC, 1st Lien Term Loan B-3 (ICE LIBOR USD 3 Month + 2.75%), 3.50%, 4/29/2026 (f) (l) | 2,760 | 2,717 |
| Ultimate Software Group, 1st Lien Term Loan (ICE LIBOR USD 3 Month + 3.25%), 4.21%, 5/4/2026 (f) (l) | 1,147 | 1,134 |
| Ultra Resources, Inc., 1st Lien Term Loan B (ICE LIBOR USD 3 Month + 3.75%), 3.75%, 11/17/2028 (f) (l) (m) | 596 | 591 |
| April 30, 2022 | J.P. Morgan Funds | 107 |
| INVESTMENTS | PRINCIPAL AMOUNT ($000) | VALUE ($000) |
| Loan Assignments — continued | ||
| United States — continued | ||
| United Natural Foods, Inc., 1st Lien Term Loan B (ICE LIBOR USD 1 Month + 3.25%), 4.01%, 10/22/2025 (f) (l) | 1,351 | 1,341 |
| Univision Communications Inc., 1st Lien Term Loan B (ICE LIBOR USD 1 Month + 3.25%), 4.01%, 3/15/2026 (f) (l) (m) | 788 | 780 |
| USI, Inc., Term Loan (ICE LIBOR USD 3 Month + 3.00%), 4.01%, 5/16/2024 (f) (l) | 537 | 532 |
| Utz Quality Foods LLC, 1st Lien Term Loan B (ICE LIBOR USD 1 Month + 3.00%), 3.76%, 1/20/2028 (f) (l) | 405 | 401 |
| Valeant Pharmaceuticals International, Inc., 1st Lien Term Loan B (ICE LIBOR USD 1 Month + 3.00%), 3.76%, 6/2/2025 (f) (l) | 9,633 | 9,575 |
| Vertex Aerospace, 1st Lien Term Loan B (ICE LIBOR USD 1 Month + 4.00%), 4.76%, 12/6/2028 (f) (l) | 474 | 472 |
| Virtusa Corp., 1st Lien Term Loan B | ||
| (ICE LIBOR USD 1 Month + 3.75%), 4.51%, 2/11/2028 (f) (l) | 144 | 142 |
| (3-MONTH SOFR + 3.75%), 4.55%, 2/15/2029 (f) (l) | 323 | 319 |
| Whataburger, 1st Lien Term Loan B (ICE LIBOR USD 1 Month + 3.25%), 4.01%, 8/3/2028 (f) (l) (m) | 898 | 888 |
| Wheel Pros, Inc., 1st Lien Term Loan (ICE LIBOR USD 1 Month + 4.50%), 5.25%, 5/11/2028 (f) (l) | 636 | 592 |
| WIRB Copernicus Group, Inc., 1st Lien Term Loan B (ICE LIBOR USD 3 Month + 4.00%), 5.01%, 1/8/2027 (f) (l) | 1,417 | 1,413 |
| WMG Acquisition Corp., 1st Lien Term Loan G (ICE LIBOR USD 1 Month + 2.13%), 2.89%, 1/20/2028 (f) (l) | 1,249 | 1,237 |
| Zayo Group, 1st Lien Term Loan B (ICE LIBOR USD 1 Month + 3.00%), 3.76%, 3/9/2027 (f) (l) | 421 | 399 |
| Zekelman Industries, Inc., 1st Lien Term Loan (ICE LIBOR USD 1 Month + 2.00%), 2.63%, 1/24/2027 (f) (l) | 662 | 651 |
| 275,837 | ||
| Total Loan Assignments (Cost $299,036) | 292,554 | |
| INVESTMENTS | PRINCIPAL AMOUNT ($000) | VALUE ($000) |
| Asset-Backed Securities — 1.3% | ||
| Cayman Islands — 0.0% ^ | ||
| BlueMountain CLO Ltd. Series 2018-3A, Class D, 4.43%, 10/25/2030 ‡ (c) (j) | 685 | 670 |
| Voya CLO Ltd. Series 2016-3A, Class CR, 4.29%, 10/18/2031 ‡ (c) (j) | 550 | 514 |
| 1,184 | ||
| United States — 1.3% | ||
| ABFC Trust | ||
| Series 2003-OPT1, Class A1A, 1.49%, 4/25/2033 ‡ (j) | 154 | 150 |
| Series 2004-OPT3, Class M1, 1.42%, 9/25/2033 ‡ (j) | 511 | 506 |
| Series 2004-HE1, Class M1, 1.57%, 3/25/2034 (j) | 734 | 718 |
| ACC Trust Series 2019-1, Class C, 6.41%, 2/20/2024 (c) | 1,448 | 1,454 |
| Accredited Mortgage Loan Trust Series 2004-4, Class M1, 1.54%, 1/25/2035 ‡ (j) | 487 | 459 |
| ACE Securities Corp. Home Equity Loan Trust | ||
| Series 2003-FM1, Class M1, 1.96%, 11/25/2032 ‡ (j) | 483 | 496 |
| Series 2004-OP1, Class M2, 2.24%, 4/25/2034 ‡ (j) | 1,921 | 1,900 |
| American Credit Acceptance Receivables Trust | ||
| Series 2019-1, Class F, 6.06%, 12/12/2025 (c) | 1,630 | 1,656 |
| Series 2019-3, Class F, 5.42%, 5/12/2026 (c) | 1,210 | 1,215 |
| Series 2020-2, Class D, 5.65%, 5/13/2026 (c) | 900 | 918 |
| Series 2019-2, Class F, 5.81%, 6/12/2026 (c) | 510 | 515 |
| Series 2021-2, Class E, 2.54%, 7/13/2027 (c) | 1,400 | 1,325 |
| Series 2021-3, Class D, 1.34%, 11/15/2027 (c) | 700 | 658 |
| Series 2022-1, Class E, 3.64%, 3/13/2028 (c) | 1,473 | 1,363 |
| Ameriquest Mortgage Securities, Inc. Series 2004-R1, Class A2, 1.27%, 2/25/2034 ‡ (j) | 571 | 551 |
| Ameriquest Mortgage Securities, Inc. Asset-Backed Pass-Through Certificates Series 2002-AR1, Class M1, 1.73%, 9/25/2032 ‡ (j) | 196 | 204 |
| 108 | J.P. Morgan Funds | April 30, 2022 |
| INVESTMENTS | PRINCIPAL AMOUNT ($000) | VALUE ($000) |
| Asset-Backed Securities — continued | ||
| United States — continued | ||
| Asset-Backed Securities Corp. Home Equity Loan Trust | ||
| Series 2004-HE2, Class M2, 2.54%, 4/25/2034 ‡ (j) | 752 | 730 |
| Series 2004-HE7, Class M2, 2.24%, 10/25/2034 ‡ (j) | 694 | 719 |
| Series 2005-HE6, Class M4, 1.63%, 7/25/2035 ‡ (j) | 158 | 158 |
| Bear Stearns Asset-Backed Securities I Trust Series 2004-HE11, Class M2, 2.24%, 12/25/2034 ‡ (j) | — | — |
| Bear Stearns Asset-Backed Securities Trust | ||
| Series 2003-SD1, Class M1, 1.94%, 12/25/2033 ‡ (j) | 388 | 385 |
| Series 2004-HE2, Class M2, 2.47%, 3/25/2034 ‡ (j) | 129 | 143 |
| Series 2003-1, Class M1, 2.32%, 11/25/2042 ‡ (j) | 126 | 137 |
| Series 2004-SD4, Class A1, 1.57%, 8/25/2044 ‡ (j) | 671 | 668 |
| Centex Home Equity Loan Trust | ||
| Series 2004-C, Class M2, 1.46%, 6/25/2034 ‡ (j) | 398 | 379 |
| Series 2004-D, Class MV2, 1.70%, 9/25/2034 ‡ (j) | 134 | 136 |
| Series 2004-D, Class MF2, 6.06%, 9/25/2034 ‡ (h) | 603 | 588 |
| Series 2004-D, Class MF3, 6.26%, 9/25/2034 ‡ (h) | 1,640 | 1,550 |
| Chase Funding Trust | ||
| Series 2003-5, Class 1M2, 5.64%, 9/25/2032 ‡ (j) | 116 | 102 |
| Series 2004-1, Class 1M1, 4.73%, 5/25/2033 ‡ | 841 | 816 |
| Series 2003-4, Class 1A5, 4.96%, 5/25/2033 ‡ (h) | 619 | 582 |
| Series 2004-1, Class 2M1, 1.42%, 9/25/2033 ‡ (j) | 30 | 30 |
| Series 2004-2, Class 1M1, 5.70%, 2/26/2035 ‡ (j) | 1,803 | 1,695 |
| CHEC Loan Trust Series 2004-1, Class M1, 1.57%, 7/25/2034 ‡ (c) (j) | 632 | 622 |
| Citigroup Mortgage Loan Trust, Inc. | ||
| Series 2005-OPT1, Class M4, 1.72%, 2/25/2035 ‡ (j) | 147 | 145 |
| Series 2005-WF2, Class AF7, 5.75%, 8/25/2035 ‡ (h) | 27 | 25 |
| INVESTMENTS | PRINCIPAL AMOUNT ($000) | VALUE ($000) |
| United States — continued | ||
| Consumer Loan Underlying Bond Club Certificate Issuer Trust I Series 2020-9, Class PT, 8.37%, 4/15/2045 (c) (j) | 2,116 | 2,065 |
| Countrywide Asset-Backed Certificates | ||
| Series 2004-3, Class M1, 1.42%, 6/25/2034 (j) | 427 | 416 |
| Series 2004-3, Class M2, 1.49%, 6/25/2034 ‡ (j) | 397 | 393 |
| Series 2004-BC4, Class M1, 1.72%, 11/25/2034 ‡ (j) | 67 | 67 |
| Series 2004-ECC2, Class M2, 1.64%, 12/25/2034 ‡ (j) | 247 | 243 |
| Series 2005-AB4, Class 2A1, 1.21%, 3/25/2036 ‡ (j) | 1,241 | 1,158 |
| Countrywide Partnership Trust Series 2004-EC1, Class M2, 1.61%, 1/25/2035 ‡ (j) | 290 | 288 |
| CWABS Asset-Backed Certificates Trust Series 2005-11, Class AF6, 5.05%, 2/25/2036 ‡ (j) | 101 | 100 |
| CWABS, Inc., Asset-Backed Certificates | ||
| Series 2004-1, Class M3, 1.64%, 2/25/2034 ‡ (j) | 513 | 512 |
| Series 2004-1, Class M2, 1.49%, 3/25/2034 ‡ (j) | 404 | 401 |
| Series 2004-5, Class M2, 1.67%, 7/25/2034 ‡ (j) | 852 | 850 |
| Drive Auto Receivables Trust Series 2021-2, Class A2, 0.36%, 5/15/2024 | 44 | 44 |
| DT Auto Owner Trust | ||
| Series 2019-1A, Class E, 4.94%, 2/17/2026 (c) | 3,690 | 3,741 |
| Series 2019-2A, Class E, 4.46%, 5/15/2026 (c) | 4,167 | 4,169 |
| Series 2019-3A, Class E, 3.85%, 8/17/2026 (c) | 3,900 | 3,904 |
| Series 2021-3A, Class D, 1.31%, 5/17/2027 (c) | 600 | 549 |
| Series 2021-2A, Class E, 2.97%, 7/17/2028 (c) | 1,235 | 1,145 |
| Exeter Automobile Receivables Trust | ||
| Series 2019-1A, Class E, 5.20%, 1/15/2026 (c) | 4,340 | 4,412 |
| Series 2019-3A, Class E, 4.00%, 8/17/2026 (c) | 2,333 | 2,323 |
| Series 2020-1A, Class E, 3.74%, 1/15/2027 (c) | 2,690 | 2,644 |
| April 30, 2022 | J.P. Morgan Funds | 109 |
| INVESTMENTS | PRINCIPAL AMOUNT ($000) | VALUE ($000) |
| Asset-Backed Securities — continued | ||
| United States — continued | ||
| Series 2021-4A, Class E, 4.02%, 1/17/2028 (c) | 1,070 | 999 |
| Finance America Mortgage Loan Trust Series 2004-3, Class M2, 1.61%, 11/25/2034 ‡ (j) | 139 | 135 |
| First Franklin Mortgage Loan Asset-Backed Certificates Series 2004-FF3, Class M1, 1.49%, 5/25/2034 ‡ (j) | 406 | 397 |
| Ford Credit Auto Owner Trust | ||
| Series 2020-C, Class A2, 0.25%, 9/15/2023 | 16 | 16 |
| Series 2019-B, Class A3, 2.23%, 10/15/2023 | 24 | 24 |
| FREED ABS Trust Series 2019-1, Class C, 5.39%, 6/18/2026 ‡ (c) | 862 | 862 |
| Fremont Home Loan Trust | ||
| Series 2002-1, Class M1, 1.92%, 8/25/2033 ‡ (j) | 765 | 772 |
| Series 2004-B, Class M2, 1.61%, 5/25/2034 ‡ (j) | 319 | 318 |
| Series 2004-C, Class M1, 1.64%, 8/25/2034 ‡ (j) | 523 | 509 |
| Series 2004-D, Class M1, 1.54%, 11/25/2034 (j) | 1,356 | 1,257 |
| Series 2004-D, Class M2, 1.57%, 11/25/2034 (j) | 226 | 211 |
| GLS Auto Receivables Issuer Trust | ||
| Series 2019-1A, Class D, 4.94%, 12/15/2025 (c) | 540 | 546 |
| Series 2019-2A, Class D, 4.52%, 2/17/2026 (c) | 1,000 | 1,002 |
| GM Financial Consumer Automobile Receivables Trust Series 2019-3, Class A3, 2.18%, 4/16/2024 | 19 | 19 |
| GSAMP Trust | ||
| Series 2003-SEA, Class A1, 1.47%, 2/25/2033 ‡ (j) | 532 | 515 |
| Series 2003-HE1, Class M1, 1.84%, 6/20/2033 ‡ (j) | 1,070 | 1,054 |
| Series 2005-NC1, Class M1, 1.34%, 2/25/2035 ‡ (j) | 232 | 237 |
| Series 2006-FM1, Class A2C, 0.99%, 4/25/2036 ‡ (j) | 2,126 | 1,632 |
| Home Equity Mortgage Loan Asset-Backed Trust SPMD | ||
| Series 2004-B, Class M2, 1.79%, 11/25/2034 ‡ (j) | 353 | 350 |
| INVESTMENTS | PRINCIPAL AMOUNT ($000) | VALUE ($000) |
| United States — continued | ||
| Series 2004-C, Class M2, 1.57%, 3/25/2035 ‡ (j) | 636 | 581 |
| Hyundai Auto Receivables Trust Series 2020-C, Class A2, 0.26%, 9/15/2023 | 18 | 18 |
| LendingClub Loan Certificate Issuer Trust | ||
| Series 2022-NP3, Class CERT, 0.00%, 5/15/2037 ‡ (c) | 125 | 4,178 |
| Series 2022-P3, Class CERT, 0.00%, 5/15/2037 ‡ (c) | 125 | 3,359 |
| Lendingpoint Asset Securitization Trust Series 2021-B, Class B, 1.68%, 2/15/2029 (c) | 750 | 706 |
| Lendmark Funding Trust Series 2021-1A, Class D, 5.05%, 11/20/2031 (c) | 1,100 | 966 |
| Long Beach Mortgage Loan Trust Series 2003-4, Class M1, 1.69%, 8/25/2033 ‡ (j) | 48 | 47 |
| Marlette Funding Trust Series 2017-3A, Class D, 5.03%, 12/15/2024 ‡ (c) | 72 | 72 |
| Mastr Asset-Backed Securities Trust | ||
| Series 2003-OPT1, Class M3, 4.79%, 12/25/2032 ‡ (j) | 1,632 | 1,608 |
| Series 2004-OPT2, Class M2, 1.64%, 9/25/2034 ‡ (j) | 554 | 538 |
| Series 2005-NC1, Class M4, 1.81%, 12/25/2034 ‡ (j) | 554 | 560 |
| ME Funding LLC Series 2019-1, Class A2, 6.45%, 7/30/2049 (c) | 2,395 | 2,405 |
| Merrill Lynch Mortgage Investors Trust | ||
| Series 2003-OPT1, Class M1, 1.64%, 7/25/2034 (j) | 185 | 180 |
| Series 2004-HE2, Class M1, 1.87%, 8/25/2035 ‡ (j) | 85 | 83 |
| Morgan Stanley ABS Capital I, Inc. Trust | ||
| Series 2003-NC10, Class M1, 1.69%, 10/25/2033 (j) | 354 | 350 |
| Series 2004-HE1, Class M1, 1.52%, 1/25/2034 (j) | 321 | 319 |
| Series 2004-NC3, Class M1, 1.46%, 3/25/2034 ‡ (j) | 1,308 | 1,281 |
| Series 2004-NC5, Class M1, 1.57%, 5/25/2034 ‡ (j) | 3,100 | 2,971 |
| Series 2004-WMC2, Class M1, 1.58%, 7/25/2034 ‡ (j) | 977 | 959 |
| Series 2004-WMC2, Class M2, 2.47%, 7/25/2034 ‡ (j) | 186 | 190 |
| Series 2004-HE6, Class M2, 1.57%, 8/25/2034 (j) | 631 | 607 |
| 110 | J.P. Morgan Funds | April 30, 2022 |
| INVESTMENTS | PRINCIPAL AMOUNT ($000) | VALUE ($000) |
| Asset-Backed Securities — continued | ||
| United States — continued | ||
| Series 2004-HE7, Class M2, 1.61%, 8/25/2034 ‡ (j) | 168 | 164 |
| Series 2004-HE6, Class M3, 1.64%, 8/25/2034 (j) | 417 | 398 |
| Series 2004-HE7, Class M3, 1.69%, 8/25/2034 ‡ (j) | 35 | 34 |
| Series 2004-HE8, Class M2, 1.69%, 9/25/2034 ‡ (j) | 236 | 229 |
| Series 2004-NC8, Class M3, 1.78%, 9/25/2034 ‡ (j) | 315 | 312 |
| Series 2004-HE8, Class M3, 1.79%, 9/25/2034 ‡ (j) | 415 | 401 |
| Series 2005-HE1, Class M2, 1.37%, 12/25/2034 ‡ (j) | 256 | 245 |
| Series 2005-NC1, Class M3, 1.43%, 1/25/2035 ‡ (j) | 263 | 254 |
| Morgan Stanley Mortgage Loan Trust Series 2007-5AX, Class 2A2, 0.97%, 2/25/2037 ‡ (j) | 3,075 | 988 |
| New Century Home Equity Loan Trust | ||
| Series 2004-1, Class M1, 1.55%, 5/25/2034 (j) | 1,462 | 1,432 |
| Series 2004-2, Class M2, 1.60%, 8/25/2034 ‡ (j) | 102 | 101 |
| Series 2004-2, Class M4, 2.47%, 8/25/2034 ‡ (j) | 180 | 179 |
| Series 2004-3, Class M2, 1.64%, 11/25/2034 ‡ (j) | 320 | 317 |
| Series 2004-3, Class M3, 1.73%, 11/25/2034 ‡ (j) | 201 | 202 |
| Series 2004-4, Class M2, 1.46%, 2/25/2035 ‡ (j) | 286 | 281 |
| NovaStar Mortgage Funding Trust Series 2003-2, Class M2, 3.44%, 9/25/2033 ‡ (j) | 1,127 | 1,149 |
| Oak Street Investment Grade Net Lease Fund | ||
| Series 2021-1A, Class A3, 2.80%, 1/20/2051 (c) | 2,500 | 2,351 |
| Series 2021-1A, Class B1, 4.23%, 1/20/2051 ‡ (c) | 1,250 | 1,187 |
| OneMain Financial Issuance Trust | ||
| Series 2015-3A, Class C, 5.82%, 11/20/2028 ‡ (c) | 786 | 787 |
| Series 2019-1A, Class B, 3.79%, 2/14/2031 ‡ (c) | 990 | 991 |
| INVESTMENTS | PRINCIPAL AMOUNT ($000) | VALUE ($000) |
| United States — continued | ||
| Option One Mortgage Accept Corp. Asset-Backed Certificates | ||
| Series 2003-5, Class A2, 1.31%, 8/25/2033 ‡ (j) | 277 | 268 |
| Series 2003-5, Class M2, 2.99%, 8/25/2033 ‡ (j) | 33 | 39 |
| Option One Mortgage Loan Trust Series 2004-3, Class M2, 1.52%, 11/25/2034 ‡ (j) | 366 | 356 |
| People's Choice Home Loan Securities Trust Series 2004-2, Class M3, 2.39%, 10/25/2034 ‡ (j) | 1,910 | 1,868 |
| PNMAC FMSR ISSUER TRUST Series 2018-FT1, Class A, 3.02%, 4/25/2023 (c) (j) | 2,878 | 2,843 |
| PRET LLC | ||
| Series 2021-NPL6, Class A1, 2.49%, 7/25/2051 (c) (h) | 3,234 | 3,068 |
| Series 2021-NPL3, Class A2, 3.72%, 7/25/2051 (c) (h) | 3,333 | 3,067 |
| Series 2021-NPL6, Class A2, 5.07%, 7/25/2051 ‡ (c) (h) | 6,250 | 5,879 |
| Series 2021-RN4, Class A2, 5.19%, 10/25/2051 (c) (j) | 5,000 | 4,820 |
| Pretium Mortgage Credit Partners I LLC Series 2021-NPL1, Class A2, 4.21%, 9/27/2060 (c) (h) | 4,000 | 3,803 |
| Pretium Mortgage Credit Partners LLC Series 2021-RN1, Class A2, 3.60%, 2/25/2061 (c) (h) | 5,000 | 4,684 |
| Progress Residential Trust | ||
| Series 2021-SFR8, Class G, 4.01%, 10/17/2038 ‡ (c) | 6,080 | 5,376 |
| Series 2022-SFR3, Class D, 4.45%, 4/17/2039 (c) | 1,250 | 1,213 |
| RAMP Trust Series 2002-RS2, Class AI5, 6.03%, 3/25/2032 ‡ (j) | 227 | 216 |
| RASC Trust Series 2005-KS2, Class M1, 1.31%, 3/25/2035 ‡ (j) | 185 | 184 |
| RCO VII Mortgage LLC Series 2021-1, Class A1, 1.87%, 5/26/2026 (c) (h) | 2,387 | 2,266 |
| Renaissance Home Equity Loan Trust | ||
| Series 2002-3, Class M1, 2.17%, 12/25/2032 ‡ (j) | 356 | 342 |
| Series 2003-1, Class M1, 2.17%, 6/25/2033 ‡ (j) | 155 | 151 |
| Series 2003-4, Class M1, 1.94%, 3/25/2034 ‡ (j) | 1,185 | 1,146 |
| April 30, 2022 | J.P. Morgan Funds | 111 |
| INVESTMENTS | PRINCIPAL AMOUNT ($000) | VALUE ($000) |
| Asset-Backed Securities — continued | ||
| United States — continued | ||
| Series 2003-4, Class M2F, 6.24%, 3/25/2034 ‡ (h) | 637 | 631 |
| Santander Drive Auto Receivables Trust Series 2021-2, Class A3, 0.34%, 2/18/2025 | 158 | 158 |
| Santander Prime Auto Issuance Notes Trust | ||
| Series 2018-A, Class E, 5.04%, 9/15/2025 (c) | 291 | 293 |
| Series 2018-A, Class F, 6.80%, 9/15/2025 (c) | 441 | 442 |
| SASCO Mortgage Loan Trust Series 2004-GEL3, Class M1, 2.24%, 8/25/2034 (j) | 649 | 641 |
| Saxon Asset Securities Trust Series 2004-2, Class MV2, 2.47%, 8/25/2035 ‡ (j) | 260 | 254 |
| Securitized Asset-Backed Receivables LLC Trust | ||
| Series 2004-NC1, Class M1, 1.45%, 2/25/2034 ‡ (j) | 1,202 | 1,181 |
| Series 2005-OP1, Class M2, 1.34%, 1/25/2035 ‡ (j) | 397 | 376 |
| Stanwich Mortgage Loan Co. LLC Series 2021-NPB1, Class A2, 4.38%, 10/16/2026 (c) (h) | 5,500 | 5,158 |
| Structured Asset Investment Loan Trust Series 2004-5, Class M3, 1.60%, 5/25/2034 ‡ (j) | 2 | 2 |
| Structured Asset Securities Corp. Pass-Through Certificates Series 2002-AL1, Class A3, 3.45%, 2/25/2032 ‡ | 1,151 | 749 |
| Upstart Pass-Through Trust | ||
| Series 2022-PT3, Class A, HB, 20.27%, 4/20/2030 (c) (j) | 2,922 | 2,958 |
| Series 2022-PT4, Class A, 19.72%, 5/20/2030 (c) (j) | 5,000 | 5,080 |
| Upstart Securitization Trust Series 2022-1, Class C, 5.71%, 3/20/2032 (c) | 1,200 | 1,132 |
| Wells Fargo Home Equity Asset-Backed Securities Trust | ||
| Series 2004-2, Class M1, 1.57%, 10/25/2034 ‡ (j) | 390 | 384 |
| Series 2004-2, Class M8B, 5.00%, 10/25/2034 ‡ (c) (j) | 290 | 275 |
| Series 2004-2, Class M8A, 5.17%, 10/25/2034 ‡ (c) (j) | 290 | 296 |
| INVESTMENTS | PRINCIPAL AMOUNT ($000) | VALUE ($000) |
| United States — continued | ||
| Wells Fargo Home Equity Trust Mortgage Pass-Through Certificates Series 2004-1, Class M2, 1.61%, 4/25/2034 ‡ (j) | 74 | 74 |
| Westlake Automobile Receivables Trust Series 2019-2A, Class F, 5.00%, 3/16/2026 (c) | 1,880 | 1,888 |
| 161,518 | ||
| Total Asset-Backed Securities (Cost $163,719) | 162,702 | |
| Foreign Government Securities — 1.2% | ||
| Angola — 0.1% | ||
| Republic of Angola | ||
| 9.50%, 11/12/2025 (b) | 970 | 1,032 |
| 8.00%, 11/26/2029 (b) | 780 | 727 |
| 8.00%, 11/26/2029 (c) | 1,550 | 1,445 |
| 9.13%, 11/26/2049 (b) | 1,840 | 1,625 |
| 4,829 | ||
| Argentina — 0.0% ^ | ||
| Argentine Republic | ||
| 1.00%, 7/9/2029 | 354 | 113 |
| 0.50%, 7/9/2030 (h) | 1,853 | 582 |
| 1.13%, 7/09/2035 (h) | 5,116 | 1,450 |
| 2.00%, 1/9/2038 (h) | 1,486 | 531 |
| 2.50%, 7/9/2041 (h) | 450 | 150 |
| 2,826 | ||
| Bahrain — 0.1% | ||
| Kingdom of Bahrain | ||
| 7.00%, 1/26/2026 (b) | 970 | 1,032 |
| 7.00%, 10/12/2028 (b) | 1,400 | 1,469 |
| 6.75%, 9/20/2029 (b) | 200 | 202 |
| 5.45%, 9/16/2032 (c) | 481 | 431 |
| 6.00%, 9/19/2044 (b) | 1,500 | 1,241 |
| 7.50%, 9/20/2047 (b) | 970 | 899 |
| 5,274 | ||
| Brazil — 0.0% ^ | ||
| Federative Republic of Brazil | ||
| 4.25%, 1/07/2025 | 880 | 889 |
| 4.50%, 5/30/2029 | 1,130 | 1,066 |
| 8.25%, 1/20/2034 | 585 | 680 |
| 5.63%, 1/7/2041 | 950 | 846 |
| 5.00%, 1/27/2045 | 1,230 | 991 |
| 4,472 | ||
| 112 | J.P. Morgan Funds | April 30, 2022 |
| INVESTMENTS | PRINCIPAL AMOUNT ($000) | VALUE ($000) |
| Foreign Government Securities — continued | ||
| Colombia — 0.0% ^ | ||
| Republic of Colombia | ||
| 4.50%, 1/28/2026 | 350 | 336 |
| 3.88%, 4/25/2027 | 690 | 630 |
| 7.38%, 9/18/2037 | 1,000 | 1,037 |
| 6.13%, 1/18/2041 | 950 | 844 |
| 5.00%, 6/15/2045 | 1,370 | 1,023 |
| 5.20%, 5/15/2049 | 420 | 319 |
| 4,189 | ||
| Costa Rica — 0.0% ^ | ||
| Republic of Costa Rica | ||
| 4.38%, 4/30/2025 (b) | 200 | 200 |
| 7.00%, 4/4/2044 (b) | 1,100 | 1,044 |
| 1,244 | ||
| Cote D'Ivoire — 0.0% ^ | ||
| Republic of Cote d'Ivoire | ||
| 5.75%, 12/31/2032 (b) (h) | 854 | 806 |
| 6.13%, 6/15/2033 (b) | 3,430 | 3,130 |
| 3,936 | ||
| Croatia — 0.0% ^ | ||
| Republic of Croatia 6.00%, 1/26/2024 (b) | 1,290 | 1,337 |
| Dominican Republic — 0.1% | ||
| Dominican Republic Government Bond | ||
| 5.50%, 1/27/2025 (b) | 510 | 523 |
| 6.88%, 1/29/2026 (b) | 1,200 | 1,264 |
| 5.95%, 1/25/2027 (b) | 1,020 | 1,024 |
| 4.50%, 1/30/2030 (c) | 790 | 679 |
| 4.88%, 9/23/2032 (c) | 1,090 | 915 |
| 5.30%, 1/21/2041 (c) | 285 | 225 |
| 7.45%, 4/30/2044 (b) | 1,580 | 1,528 |
| 6.85%, 1/27/2045 (b) | 500 | 448 |
| 6.50%, 2/15/2048 (b) | 1,250 | 1,075 |
| 5.88%, 1/30/2060 (c) | 880 | 667 |
| 8,348 | ||
| Ecuador — 0.1% | ||
| Republic of Ecuador | ||
| 5.00%, 7/31/2030 (b) (h) | 2,570 | 2,080 |
| 5.00%, 7/31/2030 (c) (h) | 650 | 526 |
| 1.00%, 7/31/2035 (b) (h) | 3,110 | 1,943 |
| 0.50%, 7/31/2040 (b) (h) | 1,200 | 649 |
| 5,198 | ||
| INVESTMENTS | PRINCIPAL AMOUNT ($000) | VALUE ($000) |
| Egypt — 0.1% | ||
| Arab Republic of Egypt | ||
| 3.88%, 2/16/2026 (c) | 665 | 540 |
| 7.50%, 1/31/2027 (b) | 1,720 | 1,531 |
| 5.88%, 2/16/2031 (a) (c) | 482 | 352 |
| 7.05%, 1/15/2032 (a) (c) | 880 | 678 |
| 7.63%, 5/29/2032 (c) | 750 | 584 |
| 8.50%, 1/31/2047 (b) | 1,049 | 758 |
| 8.70%, 3/01/2049 (c) | 1,520 | 1,106 |
| 8.88%, 5/29/2050 (b) | 250 | 183 |
| 8.15%, 11/20/2059 (c) | 1,050 | 725 |
| 6,457 | ||
| El Salvador — 0.0% ^ | ||
| Republic of El Salvador | ||
| 5.88%, 1/30/2025 (b) | 650 | 309 |
| 6.38%, 1/18/2027 (b) | 950 | 389 |
| 7.12%, 1/20/2050 (b) | 1,437 | 532 |
| 1,230 | ||
| Ethiopia — 0.0% ^ | ||
| Federal Democratic Republic of Ethiopia 6.63%, 12/11/2024 (b) | 437 | 300 |
| Gabon — 0.0% ^ | ||
| Gabonese Republic 6.95%, 6/16/2025 (b) | 300 | 298 |
| Ghana — 0.0% ^ | ||
| Republic of Ghana | ||
| 7.88%, 3/26/2027 (b) | 360 | 251 |
| 7.63%, 5/16/2029 (b) | 1,310 | 819 |
| 10.75%, 10/14/2030 (b) | 1,120 | 1,103 |
| 8.63%, 6/16/2049 (b) | 1,890 | 1,081 |
| 3,254 | ||
| Guatemala — 0.0% ^ | ||
| Republic of Guatemala | ||
| 4.50%, 5/3/2026 (b) | 655 | 650 |
| 6.13%, 6/1/2050 (c) | 720 | 689 |
| 1,339 | ||
| Hungary — 0.0% ^ | ||
| Hungary Government Bond 7.63%, 3/29/2041 | 952 | 1,200 |
| April 30, 2022 | J.P. Morgan Funds | 113 |
| INVESTMENTS | PRINCIPAL AMOUNT ($000) | VALUE ($000) |
| Foreign Government Securities — continued | ||
| Indonesia — 0.0% ^ | ||
| Republic of Indonesia | ||
| 3.50%, 1/11/2028 | 670 | 654 |
| 6.75%, 1/15/2044 (b) | 650 | 774 |
| 1,428 | ||
| Iraq — 0.0% ^ | ||
| Republic of Iraq | ||
| 6.75%, 3/9/2023 (b) | 950 | 949 |
| 5.80%, 1/15/2028 (b) | 1,852 | 1,776 |
| 2,725 | ||
| Israel — 0.0% ^ | ||
| Israel Government AID Bond | ||
| 4.50%, 1/30/2043 | 873 | 911 |
| 4.13%, 1/17/2048 | 1,966 | 1,934 |
| 2,845 | ||
| Jamaica — 0.0% ^ | ||
| Jamaica Government Bond | ||
| 8.00%, 3/15/2039 | 1,243 | 1,541 |
| 7.88%, 7/28/2045 | 550 | 674 |
| 2,215 | ||
| Jordan — 0.0% ^ | ||
| Hashemite Kingdom of Jordan 5.85%, 7/7/2030 (c) | 1,810 | 1,587 |
| Kazakhstan — 0.0% ^ | ||
| Republic of Kazakhstan 6.50%, 7/21/2045 (b) | 560 | 633 |
| Kenya — 0.0% ^ | ||
| Republic of Kenya | ||
| 6.88%, 6/24/2024 (b) | 2,663 | 2,557 |
| 8.00%, 5/22/2032 (c) | 1,360 | 1,163 |
| 6.30%, 1/23/2034 (a) (c) | 483 | 362 |
| 4,082 | ||
| Lebanon — 0.0% ^ | ||
| Lebanese Republic | ||
| 6.00%, 1/27/2023 (b) (i) | 1,250 | 147 |
| 6.65%, 4/22/2024 (b) (i) | 625 | 74 |
| 6.85%, 3/23/2027 (b) (i) | 2,639 | 297 |
| 6.65%, 11/3/2028 (b) (i) | 2,215 | 250 |
| 7.25%, 3/23/2037 (b) (i) | 492 | 55 |
| 823 | ||
| INVESTMENTS | PRINCIPAL AMOUNT ($000) | VALUE ($000) |
| Mexico — 0.0% ^ | ||
| United Mexican States | ||
| 5.55%, 1/21/2045 | 650 | 633 |
| 4.60%, 1/23/2046 | 610 | 517 |
| 4.50%, 1/31/2050 | 500 | 414 |
| 3.77%, 5/24/2061 | 1,198 | 829 |
| 2,393 | ||
| Morocco — 0.0% ^ | ||
| Kingdom of Morocco | ||
| 3.00%, 12/15/2032 (c) | 690 | 545 |
| 4.00%, 12/15/2050 (c) | 650 | 449 |
| 994 | ||
| Nigeria — 0.1% | ||
| Federal Republic of Nigeria | ||
| 7.63%, 11/21/2025 (b) | 1,000 | 990 |
| 6.50%, 11/28/2027 (c) | 1,220 | 1,080 |
| 6.50%, 11/28/2027 (b) | 920 | 814 |
| 8.75%, 1/21/2031 (b) | 780 | 707 |
| 7.88%, 2/16/2032 (b) | 710 | 595 |
| 7.63%, 11/28/2047 (b) | 600 | 424 |
| 7.63%, 11/28/2047 (c) | 1,290 | 913 |
| 5,523 | ||
| Oman — 0.1% | ||
| Sultanate of Oman Government Bond | ||
| 4.88%, 2/1/2025 (c) | 320 | 322 |
| 4.75%, 6/15/2026 (b) | 1,550 | 1,519 |
| 5.38%, 3/08/2027 (b) | 1,320 | 1,323 |
| 6.00%, 8/1/2029 (b) | 1,180 | 1,192 |
| 6.25%, 1/25/2031 (c) | 264 | 268 |
| 7.38%, 10/28/2032 (c) | 625 | 685 |
| 6.50%, 3/08/2047 (b) | 340 | 310 |
| 6.75%, 1/17/2048 (b) | 1,170 | 1,091 |
| 7.00%, 1/25/2051 (c) | 301 | 289 |
| 6,999 | ||
| Pakistan — 0.0% ^ | ||
| Islamic Republic of Pakistan | ||
| 8.25%, 4/15/2024 (b) | 730 | 652 |
| 8.25%, 9/30/2025 (b) | 550 | 465 |
| 6.00%, 4/8/2026 (c) | 471 | 384 |
| 7.38%, 4/8/2031 (c) | 554 | 424 |
| 8.88%, 4/8/2051 (b) | 767 | 548 |
| 2,473 | ||
| 114 | J.P. Morgan Funds | April 30, 2022 |
| INVESTMENTS | PRINCIPAL AMOUNT ($000) | VALUE ($000) |
| Foreign Government Securities — continued | ||
| Panama — 0.1% | ||
| Republic of Panama | ||
| 3.75%, 3/16/2025 | 1,050 | 1,046 |
| 3.88%, 3/17/2028 | 1,750 | 1,694 |
| 6.70%, 1/26/2036 | 1,150 | 1,294 |
| 4.50%, 4/1/2056 | 810 | 688 |
| 3.87%, 7/23/2060 | 380 | 284 |
| 5,006 | ||
| Paraguay — 0.1% | ||
| Republic of Paraguay | ||
| 4.70%, 3/27/2027 (b) | 2,020 | 2,003 |
| 6.10%, 8/11/2044 (b) | 2,130 | 2,089 |
| 5.60%, 3/13/2048 (b) | 350 | 313 |
| 5.40%, 3/30/2050 (c) | 950 | 839 |
| 5,244 | ||
| Peru — 0.0% ^ | ||
| Republic of Peru | ||
| 4.13%, 8/25/2027 | 760 | 753 |
| 5.63%, 11/18/2050 | 750 | 823 |
| 1,576 | ||
| Philippines — 0.0% ^ | ||
| Republic of Philippines | ||
| 3.00%, 2/1/2028 | 1,100 | 1,052 |
| 3.70%, 2/2/2042 | 1,430 | 1,237 |
| 2,289 | ||
| Qatar — 0.0% ^ | ||
| State of Qatar | ||
| 4.00%, 3/14/2029 (c) | 540 | 553 |
| 5.10%, 4/23/2048 (b) | 1,200 | 1,335 |
| 4.82%, 3/14/2049 (b) | 1,570 | 1,686 |
| 4.82%, 3/14/2049 (c) | 430 | 461 |
| 4,035 | ||
| Romania — 0.0% ^ | ||
| Romania Government Bond | ||
| 4.38%, 8/22/2023 (b) | 1,010 | 1,023 |
| 6.13%, 1/22/2044 (b) | 810 | 836 |
| 5.13%, 6/15/2048 (b) | 730 | 662 |
| 2,521 | ||
| Saudi Arabia — 0.1% | ||
| Kingdom of Saudi Arabia | ||
| 3.25%, 10/26/2026 (b) | 1,000 | 995 |
| INVESTMENTS | PRINCIPAL AMOUNT ($000) | VALUE ($000) |
| Saudi Arabia—continued | ||
| 3.63%, 3/4/2028 (b) | 1,980 | 1,967 |
| 2.25%, 2/2/2033 (c) | 480 | 416 |
| 4.63%, 10/4/2047 (b) | 1,050 | 1,024 |
| 5.00%, 4/17/2049 (b) | 650 | 673 |
| 3.45%, 2/2/2061 (c) | 468 | 374 |
| 5,449 | ||
| Senegal — 0.0% ^ | ||
| Republic of Senegal | ||
| 6.75%, 3/13/2048 (b) | 650 | 514 |
| 6.75%, 3/13/2048 (c) | 460 | 364 |
| 878 | ||
| Serbia, Republic Of — 0.0% ^ | ||
| Republic of Serbia 2.13%, 12/1/2030 (c) | 797 | 590 |
| South Africa — 0.1% | ||
| Republic of South Africa | ||
| 4.88%, 4/14/2026 (a) | 220 | 217 |
| 4.30%, 10/12/2028 | 2,380 | 2,169 |
| 6.25%, 3/08/2041 | 2,500 | 2,264 |
| 5.00%, 10/12/2046 (a) | 700 | 526 |
| 5.75%, 9/30/2049 | 1,550 | 1,225 |
| 6,401 | ||
| Sri Lanka — 0.0% ^ | ||
| Democratic Socialist Republic of Sri Lanka | ||
| 5.75%, 4/18/2023 (b) | 850 | 366 |
| 6.85%, 11/3/2025 (b) | 596 | 259 |
| 6.20%, 5/11/2027 (b) | 1,050 | 446 |
| 6.75%, 4/18/2028 (b) | 1,540 | 655 |
| 7.55%, 3/28/2030 (c) | 660 | 279 |
| 2,005 | ||
| Tajikistan — 0.0% ^ | ||
| Republic of Tajikistan 7.13%, 9/14/2027 (b) | 600 | 432 |
| Tunisia — 0.0% ^ | ||
| Tunisian Republic 5.75%, 1/30/2025 (b) | 330 | 224 |
| Turkey — 0.0% ^ | ||
| Republic of Turkey | ||
| 5.60%, 11/14/2024 | 950 | 909 |
| 4.88%, 10/9/2026 | 900 | 791 |
| 5.13%, 2/17/2028 | 940 | 803 |
| April 30, 2022 | J.P. Morgan Funds | 115 |
| INVESTMENTS | PRINCIPAL AMOUNT ($000) | VALUE ($000) |
| Foreign Government Securities — continued | ||
| Turkey—continued | ||
| 6.00%, 1/14/2041 | 1,040 | 777 |
| 4.88%, 4/16/2043 | 510 | 345 |
| 3,625 | ||
| Ukraine — 0.0% ^ | ||
| Ukraine Government Bond | ||
| 7.75%, 9/1/2023 (b) | 1,413 | 558 |
| 7.75%, 9/1/2024 (b) | 700 | 236 |
| 7.75%, 9/1/2025 (b) | 970 | 316 |
| 7.75%, 9/1/2026 (b) | 500 | 164 |
| 7.75%, 9/1/2027 (b) | 1,080 | 354 |
| 9.75%, 11/1/2028 (b) | 840 | 275 |
| 7.38%, 9/25/2032 (b) | 1,560 | 484 |
| 7.25%, 3/15/2033 (b) | 1,530 | 474 |
| 2,861 | ||
| United Arab Emirates — 0.0% ^ | ||
| United Arab Emirates Government Bond | ||
| 2.88%, 10/19/2041 (c) | 840 | 702 |
| 4.13%, 10/11/2047 (b) | 1,900 | 1,860 |
| 3.13%, 9/30/2049 (b) | 930 | 764 |
| 3,326 | ||
| Uruguay — 0.1% | ||
| Oriental Republic of Uruguay | ||
| 7.88%, 1/15/2033 | 440 | 567 |
| 7.63%, 3/21/2036 | 790 | 1,033 |
| 5.10%, 6/18/2050 | 2,420 | 2,541 |
| 4.98%, 4/20/2055 | 440 | 454 |
| 4,595 | ||
| Zambia — 0.0% ^ | ||
| Republic of Zambia 8.97%, 7/30/2027 (b) | 1,050 | 777 |
| Total Foreign Government Securities (Cost $176,786) | 142,285 | |
| INVESTMENTS | SHARES (000) | |
| Preferred Stocks — 0.6% | ||
| United States — 0.6% | ||
| Allstate Corp. (The) Series H, 5.10%, 10/15/2024 ($25 par value) (o) | 49 | 1,100 |
| Bank of America Corp., | ||
| Series GG, 6.00%, 5/16/2023 ($25 par value) (o) | 145 | 3,628 |
| INVESTMENTS | SHARES (000) | VALUE ($000) |
| United States — continued | ||
| Series HH, 5.88%, 7/24/2023 ($25 par value) (o) | 121 | 2,970 |
| Series KK, 5.38%, 6/25/2024 ($25 par value) (o) | 92 | 2,074 |
| Series LL, 5.00%, 9/17/2024 ($25 par value) (o) | 35 | 744 |
| Energy Transfer LP Series E, (ICE LIBOR USD 3 Month + 5.16%), 7.60%, 5/15/2024 (f) (o) | 255 | 6,179 |
| Goodman Networks, Inc. ‡ * | 64 | 1 |
| MetLife, Inc. Series F, 4.75%, 3/15/2025 ($25 par value) (o) | 99 | 2,235 |
| Morgan Stanley, | ||
| Series I, (ICE LIBOR USD 3 Month + 3.71%), 6.38%, 10/15/2024 ($25 par value) (f) (o) | 72 | 1,868 |
| Series L, 4.88%, 1/15/2025 ($25 par value) (o) | 25 | 524 |
| Series K, (ICE LIBOR USD 3 Month + 3.49%), 5.85%, 4/15/2027 ($25 par value) (f) (o) | 419 | 10,564 |
| MYT Holding LLC Series A, 10.00%, 6/6/2029 ‡ * | 2,316 | 2,536 |
| NextEra Energy Capital Holdings, Inc. Series N, 5.65%, 3/1/2079 ($25 par value) | 115 | 2,880 |
| Northern Trust Corp. Series E, 4.70%, 1/1/2025 ($25 par value) (o) | 62 | 1,416 |
| Public Storage Series L, REIT, 4.63%, 6/17/2025 ($25 par value) (o) | 77 | 1,692 |
| SCE Trust VI 5.00%, 6/26/2022 ($25 par value) (o) | 453 | 9,125 |
| Sempra Energy 5.75%, 7/1/2079 ($25 par value) | 18 | 427 |
| Southern Co. (The) Series 2020, 4.95%, 1/30/2080 ($25 par value) | 160 | 3,379 |
| State Street Corp. Series G, (ICE LIBOR USD 3 Month + 3.71%), 5.35%, 3/15/2026 ($25 par value) (f) (o) | 43 | 1,099 |
| Truist Financial Corp. Series R, 4.75%, 9/1/2025 ($25 par value) (o) | 104 | 2,112 |
| US Bancorp Series K, 5.50%, 10/15/2023 ($25 par value) (o) | 58 | 1,398 |
| Wells Fargo & Co., | ||
| Series Y, 5.63%, 6/15/2022 ($25 par value) (o) | 152 | 3,600 |
| 116 | J.P. Morgan Funds | April 30, 2022 |
| INVESTMENTS | SHARES (000) | VALUE ($000) |
| Preferred Stocks — continued | ||
| United States — continued | ||
| Series Z, 4.75%, 3/15/2025 ($25 par value) (o) | 776 | 15,086 |
| Series AA, 4.70%, 12/15/2025 ($25 par value) (o) | 19 | 361 |
| Total Preferred Stocks (Cost $85,237) | 76,998 | |
| INVESTMENTS | PRINCIPAL AMOUNT ($000) | |
| U.S. Treasury Obligations — 0.6% | ||
| United States — 0.6% | ||
| U.S. Treasury Notes , 0.13%, 1/31/2023 (p)(Cost $68,022) | 68,308 | 67,428 |
| Convertible Bonds — 0.4% | ||
| Australia — 0.0% ^ | ||
| DEXUS Finance Pty. Ltd. REIT, 2.30%, 6/19/2026 (b) | AUD 1,600 | 1,126 |
| Glencore Funding LLC Zero Coupon, 3/27/2025 (b) | 1,000 | 1,149 |
| 2,275 | ||
| Canada — 0.0% ^ | ||
| Shopify, Inc. 0.13%, 11/1/2025 | 681 | 591 |
| China — 0.1% | ||
| Hansoh Pharmaceutical Group Co. Ltd. Zero Coupon, 1/22/2026 (b) | 600 | 539 |
| Hello Group, Inc. 1.25%, 7/1/2025 | 1,149 | 1,046 |
| Meituan Zero Coupon, 4/27/2028 (b) | 1,000 | 821 |
| Pharmaron Beijing Co. Ltd. Zero Coupon,6/18/2026 (b) | 1,000 | 860 |
| Pinduoduo, Inc. Zero Coupon, 12/1/2025 | 1,120 | 986 |
| Smart Insight International Ltd. 4.50%, 12/5/2023 (b) | HKD 4,000 | 426 |
| Weibo Corp. 1.25%, 11/15/2022 | 1,124 | 1,096 |
| 5,774 | ||
| Germany — 0.0% ^ | ||
| MTU Aero Engines AG Series MTX, 0.05%, 3/18/2027 (b) | EUR 800 | 819 |
| Israel — 0.0% ^ | ||
| Wix.com Ltd. Zero Coupon, 8/15/2025 | 1,673 | 1,447 |
| New Zealand — 0.0% ^ | ||
| Xero Investments Ltd. Zero Coupon, 12/2/2025 (b) | 916 | 782 |
| INVESTMENTS | PRINCIPAL AMOUNT ($000) | VALUE ($000) |
| South Korea — 0.0% ^ | ||
| Delivery Hero SE Series A, 1.00%, 4/30/2026 (b) | EUR 300 | 229 |
| Spain — 0.0% ^ | ||
| Cellnex Telecom SA 0.75%, 11/20/2031 (b) | EUR 1,200 | 1,063 |
| Taiwan — 0.0% ^ | ||
| Sea Ltd. 0.25%, 9/15/2026 | 1,027 | 773 |
| United Kingdom — 0.0% ^ | ||
| Barclays Bank plc | ||
| Zero Coupon, 2/4/2025 | 490 | 713 |
| Series VUN, Zero Coupon, 2/18/2025 | 508 | 558 |
| Capital & Counties Properties plc REIT, 2.00%, 3/30/2026 | GBP 500 | 635 |
| Cornwall Jersey Ltd. 0.75%, 4/16/2026 (b) | GBP 500 | 491 |
| Just Eat Takeaway.com NV Series B, 0.63%, 2/9/2028 (b) | EUR 600 | 472 |
| Ocado Group plc 0.75%, 1/18/2027 (b) | GBP 300 | 281 |
| Trainline plc 1.00%, 1/14/2026 (b) | GBP 600 | 647 |
| WH Smith plc 1.63%, 5/7/2026 (b) | GBP 500 | 586 |
| 4,383 | ||
| United States — 0.3% | ||
| Affirm Holdings, Inc. Zero Coupon, 11/15/2026 (c) | 1,508 | 997 |
| Airbnb, Inc. Zero Coupon, 3/15/2026 | 693 | 635 |
| Alteryx, Inc. 1.00%, 8/1/2026 | 1,137 | 968 |
| Avalara, Inc. 0.25%, 8/1/2026 (c) | 687 | 549 |
| Beyond Meat, Inc. Zero Coupon, 3/15/2027 | 473 | 247 |
| BigCommerce Holdings, Inc. 0.25%, 10/1/2026 (c) | 389 | 288 |
| BofA Finance LLC 0.25%, 5/1/2023 | 615 | 641 |
| Cheesecake Factory, Inc. (The) 0.38%, 6/15/2026 | 366 | 312 |
| Chegg, Inc. Zero Coupon, 9/1/2026 | 1,646 | 1,277 |
| Confluent, Inc. Zero Coupon, 1/15/2027 (c) | 395 | 303 |
| DigitalBridge Group, Inc. REIT, 5.00%, 4/15/2023 | 853 | 852 |
| DISH Network Corp. | ||
| 2.38%,3/15/2024 | 2,092 | 1,945 |
| 3.38%, 8/15/2026 | 4,533 | 3,887 |
| DocuSign, Inc. Zero Coupon, 1/15/2024 | 970 | 901 |
| Dropbox, Inc. Zero Coupon, 3/1/2026 | 999 | 904 |
| Gulfport Energy Corp. 15.00% (PIK), 5/31/2022 ‡ (g) | — | 2,141 |
| Halozyme Therapeutics, Inc. 0.25%, 3/1/2027 | 469 | 402 |
| April 30, 2022 | J.P. Morgan Funds | 117 |
| INVESTMENTS | PRINCIPAL AMOUNT ($000) | VALUE ($000) |
| Convertible Bonds — continued | ||
| United States — continued | ||
| LendingTree, Inc. 0.50%, 7/15/2025 | 1,331 | 1,065 |
| Liberty Interactive LLC | ||
| 4.00%, 11/15/2029 | 3,709 | 2,504 |
| 3.75%, 2/15/2030 | 320 | 220 |
| Meritor, Inc. 3.25%, 10/15/2037 | 564 | 618 |
| MFA Financial, Inc. REIT, 6.25%, 6/15/2024 | 882 | 869 |
| Peloton Interactive, Inc. Zero Coupon, 2/15/2026 | 1,133 | 922 |
| Redwood Trust, Inc. REIT, 4.75%, 8/15/2023 | 716 | 707 |
| Repay Holdings Corp. Zero Coupon, 2/1/2026 (c) | 855 | 693 |
| RingCentral, Inc. | ||
| Zero Coupon, 3/1/2025 | 1,093 | 916 |
| Zero Coupon, 3/15/2026 | 1,704 | 1,350 |
| RWT Holdings, Inc. 5.75%, 10/1/2025 | 313 | 290 |
| Shift4 Payments, Inc. 0.50%, 8/1/2027 (c) | 544 | 443 |
| Snap, Inc. Zero Coupon, 5/1/2027 (c) | 919 | 729 |
| Splunk, Inc. 1.13%, 6/15/2027 | 657 | 589 |
| Spotify USA, Inc. Zero Coupon, 3/15/2026 | 654 | 532 |
| Supernus Pharmaceuticals, Inc. 0.63%, 4/1/2023 | 636 | 616 |
| TripAdvisor, Inc. 0.25%, 4/1/2026 | 672 | 554 |
| Twitter, Inc. Zero Coupon, 3/15/2026 | 1,630 | 1,539 |
| Uber Technologies, Inc. Zero Coupon, 12/15/2025 | 1,071 | 925 |
| Unity Software, Inc. Zero Coupon, 11/15/2026 (c) | 384 | 297 |
| Vishay Intertechnology, Inc. 2.25%, 6/15/2025 | 756 | 738 |
| 34,365 | ||
| Vietnam — 0.0% ^ | ||
| No. Va Land Investment Group Corp. 5.25%, 7/16/2026 (b) | 1,200 | 1,212 |
| Total Convertible Bonds (Cost $57,156) | 53,713 | |
| INVESTMENTS | SHARES (000) | |
| Convertible Preferred Stocks — 0.2% | ||
| United States — 0.2% | ||
| AMG Capital Trust II 5.15%, 10/15/2037 ($50 par value) | 20 | 1,089 |
| Bank of America Corp. Series L, 7.25% ($1,000 par value) | 2 | 2,621 |
| INVESTMENTS | SHARES (000) | VALUE ($000) |
| United States — continued | ||
| Broadcom, Inc. Series A, 8.00%, 9/30/2022 ($1,000 par value) | 1 | 2,467 |
| Claire's Stores, Inc. ‡ * | 3 | 7,506 |
| Danaher Corp. Series B, 5.00%, 4/15/2023 ($1,000 par value) | — | 670 |
| Dominion Energy, Inc. Series A, 7.25%, 6/1/2022 ($100 par value) | 10 | 963 |
| KKR & Co., Inc., Series C, 6.00%, 9/15/2023 ($50 par value) | 26 | 1,705 |
| NextEra Energy, Inc. 6.22%, 9/1/2023 ($50 par value) | 30 | 1,425 |
| Stanley Black & Decker, Inc. 5.25%, 11/15/2022 ($100 par value) | 9 | 711 |
| Wells Fargo & Co. Series L, 7.50% ($1,000 par value) | 2 | 2,341 |
| Total Convertible Preferred Stocks (Cost $13,628) | 21,498 | |
| INVESTMENTS | NO. OF WARRANTS (000) | |
| Warrants — 0.0% ^ | ||
| United Kingdom — 0.0% ^ | ||
| Cineworld Group expiring 12/31/2049, price 4,149.00 GBP * | 17 | — |
| Nmg Research Ltd. expiring 9/24/2027, price 1.00 USD ‡ * | 47 | 2,614 |
| 2,614 | ||
| United States — 0.0% ^ | ||
| Chesapeake Energy Corp. | ||
| expiring 2/9/2026, price 35.00 USD * | 10 | 552 |
| expiring 2/9/2026, price 26.00 USD * | 17 | 997 |
| expiring 2/9/2026, price 31.00 USD * | 19 | 1,027 |
| Windstream Holdings, Inc. expiring 12/31/2049, price 11.00 USD ‡ * | 4 | 67 |
| 2,643 | ||
| Total Warrants (Cost $—) | 5,257 | |
| INVESTMENTS | PRINCIPAL AMOUNT ($000) | |
| Mortgage-Backed Securities — 0.0% ^ | ||
| United States — 0.0% ^ | ||
| FNMA UMBS, 20 Year Pool # CA1231, 3.50%, 2/1/2038 | 274 | 275 |
| 118 | J.P. Morgan Funds | April 30, 2022 |
| INVESTMENTS | PRINCIPAL AMOUNT ($000) | VALUE ($000) |
| Mortgage-Backed Securities — continued | ||
| United States — continued | ||
| FNMA UMBS, 30 Year | ||
| Pool # MA4398, 2.00%, 8/1/2051 | 602 | 532 |
| Pool # MA4465, 2.00%, 11/1/2051 | 53 | 47 |
| Pool # MA4548, 2.50%, 2/1/2052 | 20 | 18 |
| Pool # MA4563, 2.50%, 3/1/2052 | 59 | 54 |
| Pool # MA4564, 3.00%, 3/1/2052 | 18 | 17 |
| Total Mortgage-Backed Securities (Cost $1,036) | 943 | |
| INVESTMENTS | NO. OF RIGHTS (000) | |
| Rights — 0.0% ^ | ||
| Luxembourg — 0.0% ^ | ||
| Intelsat Jackson Holdings SA, expiring 12/5/2025‡ * | 56 | — |
| United States — 0.0% ^ | ||
| Vistra Corp., expiring 12/31/2049 ‡ * | 488 | 622 |
| Total Rights (Cost $1) | 622 | |
| INVESTMENTS | PRINCIPAL AMOUNT ($000) | |
| Short-Term Investments — 6.6% | ||
| Certificates of Deposits — 0.0% ^ | ||
| Bank of Nova Scotia (The), (SOFR + 0.87%), 0.86%, 3/24/2023 (f) | 325 | 325 |
| Lloyds Bank Corporate Markets plc, (SOFR + 0.96%), 0.95%, 3/22/2023 (f) | 249 | 250 |
| Shinhan Bank, 0.80%, 8/12/2022 | 58 | 58 |
| Total Certificates of Deposits (Cost $632) | 633 | |
| Commercial Paper — 0.0% ^ | ||
| CDP Financial, Inc., 0.61%, 8/1/2022 (c) (q) | 178 | 177 |
| Enel Finance America LLC, 1.01%, 1/20/2023 (c) (q) | 250 | 245 |
| Toronto-Dominion Bank (The), 0.40%, 11/22/2022 (c) (q) | 250 | 247 |
| Volvo Group Treasury U.S., Inc., 1.36%, 9/1/2022 (c) (q) | 250 | 249 |
| Waste Management, Inc., 0.31%, 9/8/2022 (c) (q) | 250 | 249 |
| INVESTMENTS | PRINCIPAL AMOUNT ($000) | VALUE ($000) |
| Commercial Paper — continued | ||
| Westpac Securities NZ Ltd., 0.52%, 11/25/2022 (c) (q) | 250 | 247 |
| Total Commercial Paper (Cost $1,423) | 1,414 | |
| INVESTMENTS | SHARES (000) | |
| Investment Companies — 4.7% | ||
| JPMorgan Prime Money Market Fund Class IM Shares, 0.42% (k) (r) | 80,057 | 80,081 |
| JPMorgan Prime Money Market Fund Class Institutional Shares, 0.36% (k) (r) | 486,793 | 486,890 |
| Total Investment Companies (Cost $566,950) | 566,971 | |
| Investment of Cash Collateral from Securities Loaned — 1.9% | ||
| JPMorgan Securities Lending Money Market Fund Agency SL Class Shares, 0.37% (k) (r) | 197,993 | 197,855 |
| JPMorgan U.S. Government Money Market Fund Class IM Shares, 0.37% (k) (r) | 24,748 | 24,748 |
| Total Investment of Cash Collateral from Securities Loaned (Cost $222,643) | 222,603 | |
| Total Short-Term Investments (Cost $791,648) | 791,621 | |
| Total Investments — 104.4% (Cost $12,414,608) | 12,586,691 | |
| Liabilities in Excess of Other Assets — (4.4)% | (532,915) | |
| NET ASSETS — 100.0% | 12,053,776 | |
Percentages indicated are based on net assets. | ||
Amounts presented as a dash (“-“) represent amounts that round to less than a thousand. | ||
| Abbreviations | |
| ABS | Asset-Backed Securities |
| ACES | Alternative Credit Enhancement Securities |
| ADR | American Depositary Receipt |
| AUD | Australian Dollar |
| CJSC | Closed Joint Stock Company |
| CLO | Collateralized Loan Obligations |
| CSMC | Credit Suisse Mortgage Trust |
| CVA | Dutch Certification |
| ELN | Equity-Linked Note |
| ETF | Exchange Traded Fund |
| EUR | Euro |
| April 30, 2022 | J.P. Morgan Funds | 119 |
| EURIBOR | Euro Interbank Offered Rate |
| FHLMC | Federal Home Loan Mortgage Corp. |
| FNMA | Federal National Mortgage Association |
| GBP | British Pound |
| GDR | Global Depositary Receipt |
| GMTN | Global Medium Term Note |
| GNMA | Government National Mortgage Association |
| HB | High Coupon Bonds (a.k.a. "IOettes") represent the right to receive interest payments on an underlying pool of mortgages with similar features as those associated with IO securities. Unlike IO's the owner also has a right to receive a very small portion of principal. The high interest rates result from taking interest payments from other classes in the Real Estate Mortgage Investment Conduit trust and allocating them to the small principal of the HB class. |
| HKD | Hong Kong Dollar |
| ICE | Intercontinental Exchange |
| IF | Inverse Floaters represent securities that pay interest at a rate that increases (decreases) with a decline (incline) in a specified index or have an interest rate that adjusts periodically based on changes in current interest rates and prepayments on the underlying pool of assets. The interest rate shown is the rate in effect as of April 30, 2022. The rate may be subject to a cap and floor. |
| IO | Interest Only represents the right to receive the monthly interest payments on an underlying pool of mortgage loans. The principal amount shown represents the par value on the underlying pool. The yields on these securities are subject to accelerated principal paydowns as a result of prepayment or refinancing of the underlying pool of mortgage instruments. As a result, interest income may be reduced considerably. |
| JSC | Joint Stock Company |
| LIBOR | London Interbank Offered Rate |
| OYJ | Public Limited Company |
| PJSC | Public Joint Stock Company |
| PO | Principal Only represents the right to receive the principal portion only on an underlying pool of mortgage loans. The market value of these securities is extremely volatile in response to changes in market interest rates. As prepayments on the underlying mortgages of these securities increase, the yield on these securities increases. |
| Preference | A special type of equity investment that shares in the earnings of the company, has limited voting rights, and may have a dividend preference. Preference shares may also have liquidation preference. |
| PT | Limited liability company |
| REIT | Real Estate Investment Trust |
| REMIC | Real Estate Mortgage Investment Conduit |
| RTS | Russian Trading System |
| SCA | Limited partnership with share capital |
| SGPS | Holding company |
| SOFR | Secured Overnight Financing Rate |
| SOFRINDX | Compounding index of the Secured Overnight Financing Rate |
| STRIPS | Separate Trading of Registered Interest and Principal of Securities. The STRIPS Program lets investors hold and trade individual interest and principal components of eligible notes and bonds as separate securities. |
| UMBS | Uniform Mortgage-Backed Securities |
| UNFND | Unfunded |
| USD | United States Dollar |
| ^ | Amount rounds to less than 0.1% of net assets. | |
| ‡ | Value determined using significant unobservable inputs. | |
| * | Non-income producing security. | |
| (a) | The security or a portion of this security is on loan at April 30, 2022. The total value of securities on loan at April 30, 2022 is $211,753. | |
| (b) | Security exempt from registration pursuant to Regulation S under the Securities Act of 1933, as amended. Regulation S applies to securities offerings that are made outside of the United States and do not involve direct selling efforts in the United States and as such may have restrictions on resale. | |
| (c) | Securities exempt from registration under Rule 144A or section 4(a)(2), of the Securities Act of 1933, as amended. | |
| (d) | Security is an interest bearing note with preferred security characteristics. | |
| (e) | Security is perpetual and thus, does not have a predetermined maturity date. The coupon rate for this security is fixed for a period of time and may be structured to adjust thereafter. The date shown, if applicable, reflects the next call date. The coupon rate shown is the rate in effect as of April 30, 2022. | |
| (f) | Variable or floating rate security, linked to the referenced benchmark. The interest rate shown is the current rate as of April 30, 2022. | |
| (g) | Security has the ability to pay in kind (“PIK”) or pay income in cash. When applicable, separate rates of such payments are disclosed. | |
| (h) | Step bond. Interest rate is a fixed rate for an initial period that either resets at a specific date or may reset in the future contingent upon a predetermined trigger. The interest rate shown is the current rate as of April 30, 2022. | |
| (i) | Defaulted security. | |
| (j) | Variable or floating rate security, the interest rate of which adjusts periodically based on changes in current interest rates and prepayments on the underlying pool of assets. The interest rate shown is the current rate as of April 30, 2022. | |
| (k) | Investment in an affiliated fund, which is registered under the Investment Company Act of 1940, as amended, and is advised by J.P. Morgan Investment Management Inc. | |
| (l) | Loan assignments are presented by obligor. Each series or loan tranche underlying each obligor may have varying terms. | |
| (m) | All or a portion of this security is unsettled as of April 30, 2022. Unless otherwise indicated, the coupon rate is undetermined. The coupon rate shown may not be accrued for the entire position. | |
| (n) | Fund is subject to legal or contractual restrictions on the resale of the security. | |
| (o) | The date shown reflects the next call date on which the issuer may redeem the security at par value. The coupon rate for this security is based on par value and is in effect as of reporting date (e.g. March 31, 2021.) |
| 120 | J.P. Morgan Funds | April 30, 2022 |
| (p) | All or a portion of this security is deposited with the broker as initial margin for futures contracts. | |
| (q) | The rate shown is the effective yield as of April 30, 2022. | |
| (r) | The rate shown is the current yield as of April 30, 2022. |
| INDUSTRY | PERCENT OF TOTAL INVESTMENTS |
| Banks | 6.8% |
| Convertible Bonds | 6.8 |
| Oil, Gas & Consumable Fuels | 6.5 |
| Equity Real Estate Investment Trusts (REITs) | 4.8 |
| Diversified Telecommunication Services | 4.2 |
| Commercial Mortgage-Backed Securities | 3.9 |
| Collateralized Mortgage Obligations | 3.7 |
| Pharmaceuticals | 3.7 |
| Electric Utilities | 3.3 |
| Media | 3.3 |
| Insurance | 2.7 |
| Exchange-Traded Fund | 2.5 |
| Capital Markets | 2.5 |
| Health Care Providers & Services | 2.4 |
| Hotels, Restaurants & Leisure | 1.7 |
| Food Products | 1.7 |
| Semiconductors & Semiconductor Equipment | 1.6 |
| Wireless Telecommunication Services | 1.6 |
| Chemicals | 1.6 |
| Metals & Mining | 1.4 |
| Asset-Backed Securities | 1.3 |
| Multi-Utilities | 1.2 |
| Foreign Government Securities | 1.1 |
| Specialty Retail | 1.0 |
| Food & Staples Retailing | 1.0 |
| Beverages | 1.0 |
| Others (each less than 1.0%) | 20.4 |
| Short-Term Investments | 6.3 |
| April 30, 2022 | J.P. Morgan Funds | 121 |
| DESCRIPTION | NUMBER OF CONTRACTS | EXPIRATION DATE | TRADING CURRENCY | NOTIONAL AMOUNT ($) | VALUE AND UNREALIZED APPRECIATION (DEPRECIATION) ($) |
| Long Contracts | |||||
| EURO STOXX 50 Index | 65 | 06/17/2022 | EUR | 2,524 | (61) |
| FTSE 100 Index | 15 | 06/17/2022 | GBP | 1,399 | 38 |
| S&P 500 E-Mini Index | 3,059 | 06/17/2022 | USD | 631,798 | (21,156) |
| U.S. Treasury 10 Year Note | 14,709 | 06/21/2022 | USD | 1,751,061 | (110,693) |
| (131,872) | |||||
| Short Contracts | |||||
| EURO STOXX 50 Index | (4,085) | 06/17/2022 | EUR | (158,632) | (2,504) |
| Russell 2000 E-mini Index | (5,021) | 06/17/2022 | USD | (467,430) | 24,760 |
| 22,256 | |||||
| (109,616) |
| Abbreviations | |
| EUR | Euro |
| FTSE | Financial Times and the London Stock Exchange |
| GBP | British Pound |
| USD | United States Dollar |
| 122 | J.P. Morgan Funds | April 30, 2022 |
| JPMorgan Global Allocation Fund | JPMorgan Income Builder Fund | ||
| ASSETS: | |||
| Investments in non-affiliates, at value | $3,782,283 | $11,482,813 | |
| Investments in affiliates, at value | 351,663 | 881,275 | |
| Investments of cash collateral received from securities loaned, at value (See Note 2.F) | 89,630 | 222,603 | |
| Options purchased, at value | 46,482 | — | |
| Cash | 2,301 | 2,355 | |
| Foreign currency, at value | 3,450 | 705 | |
| Deposits at broker for futures contracts | 3,526 | 426 | |
| Receivables: | |||
| Investment securities sold | 31,897 | 125,248 | |
| Fund shares sold | 1,965 | 7,978 | |
| Interest from non-affiliates | 11,442 | 70,394 | |
| Dividends from non-affiliates | 3,384 | 13,010 | |
| Dividends from affiliates | 684 | 105 | |
| Tax reclaims | 2,479 | 8,723 | |
| Securities lending income (See Note 2.F) | 69 | 174 | |
| Unrealized appreciation on forward foreign currency exchange contracts | 44,591 | — | |
| Outstanding OTC swap contracts, at value | 544 | — | |
| Total Assets | 4,376,390 | 12,815,809 | |
| LIABILITIES: | |||
| Payables: | |||
| Investment securities purchased | 54,540 | 507,312 | |
| Collateral received on securities loaned (See Note 2.F) | 89,630 | 222,603 | |
| Fund shares redeemed | 3,602 | 15,811 | |
| Variation margin on futures contracts | 4,775 | 7,033 | |
| Unrealized depreciation on forward foreign currency exchange contracts | 7,296 | — | |
| Unrealized depreciation on unfunded commitments | — | 6 | |
| Accrued liabilities: | |||
| Investment advisory fees | 1,924 | 4,172 | |
| Administration fees | 264 | 717 | |
| Distribution fees | 421 | 2,139 | |
| Service fees | 370 | 347 | |
| Custodian and accounting fees | 117 | 290 | |
| Deferred foreign capital gains tax | — | 1,039 | |
| Other | 196 | 564 | |
| Total Liabilities | 163,135 | 762,033 | |
| Net Assets | $4,213,255 | $12,053,776 |
| April 30, 2022 | J.P. Morgan Funds | 123 |
| JPMorgan Global Allocation Fund | JPMorgan Income Builder Fund | ||
| NET ASSETS: | |||
| Paid-in-Capital | $4,118,834 | $12,102,124 | |
| Total distributable earnings (loss) | 94,421 | (48,348) | |
| Total Net Assets: | $4,213,255 | $12,053,776 | |
| Net Assets: | |||
| Class A | $ 690,735 | $ 4,901,476 | |
| Class C | 416,076 | 1,701,969 | |
| Class I | 2,210,640 | 5,012,509 | |
| Class R2 | 5,883 | — | |
| Class R3 | 893 | — | |
| Class R4 | 1,316 | — | |
| Class R5 | 69 | — | |
| Class R6 | 887,643 | 437,822 | |
| Total | $4,213,255 | $12,053,776 | |
| Outstanding units of beneficial interest (shares) ($0.0001 par value; unlimited number of shares authorized): | |||
| Class A | 36,602 | 487,104 | |
| Class C | 22,494 | 169,644 | |
| Class I | 116,341 | 497,272 | |
| Class R2 | 314 | — | |
| Class R3 | 47 | — | |
| Class R4 | 70 | — | |
| Class R5 | 4 | — | |
| Class R6 | 46,734 | 43,430 | |
| Net Asset Value (a): | |||
| Class A — Redemption price per share | $ 18.87 | $ 10.06 | |
| Class C — Offering price per share (b) | 18.50 | 10.03 | |
| Class I — Offering and redemption price per share | 19.00 | 10.08 | |
| Class R2 — Offering and redemption price per share | 18.72 | — | |
| Class R3 — Offering and redemption price per share | 18.94 | — | |
| Class R4 — Offering and redemption price per share | 18.87 | — | |
| Class R5 — Offering and redemption price per share | 19.01 | — | |
| Class R6 — Offering and redemption price per share | 18.99 | 10.08 | |
| Class A maximum sales charge | 4.50% | 4.50% | |
| Class A maximum public offering price per share [net asset value per share/(100% – maximum sales charge)] | $ 19.76 | $ 10.53 | |
| Cost of investments in non-affiliates | $3,592,584 | $11,292,873 | |
| Cost of investments in affiliates | 355,621 | 899,092 | |
| Cost of options purchased | 26,377 | — | |
| Cost of foreign currency | 2,216 | 776 | |
| Investment securities on loan, at value (See Note 2.F) | 83,512 | 211,753 | |
| Cost of investment of cash collateral (See Note 2.F) | 89,632 | 222,643 |
| (a) | Per share amounts may not recalculate due to rounding of net assets and/or shares outstanding. |
| (b) | Redemption price for Class C Shares varies based upon length of time the shares are held. |
| 124 | J.P. Morgan Funds | April 30, 2022 |
| JPMorgan Global Allocation Fund | JPMorgan Income Builder Fund | ||
| INVESTMENT INCOME: | |||
| Interest income from non-affiliates | $ 16,805 | $ 192,577 | |
| Interest income from affiliates | —(a) | — | |
| Dividend income from non-affiliates | 28,216 | 87,465 | |
| Dividend income from affiliates | 826 | 7,783 | |
| Income from securities lending (net) (See Note 2.F) | 209 | 594 | |
| Foreign taxes withheld (net) | (1,686) | (5,970) | |
| Total investment income | 44,370 | 282,449 | |
| EXPENSES: | |||
| Investment advisory fees | 13,230 | 27,351 | |
| Administration fees | 1,804 | 4,476 | |
| Distribution fees: | |||
| Class A | 942 | 6,468 | |
| Class C | 1,791 | 7,291 | |
| Class R2 | 16 | — | |
| Class R3 | 2 | — | |
| Service fees: | |||
| Class A | 942 | 6,468 | |
| Class C | 597 | 2,430 | |
| Class I | 3,198 | 6,809 | |
| Class R2 | 8 | — | |
| Class R3 | 2 | — | |
| Class R4 | 2 | — | |
| Class R5 | —(a) | — | |
| Custodian and accounting fees | 417 | 857 | |
| Interest expense to affiliates | 13 | 3 | |
| Professional fees | 92 | 119 | |
| Trustees’ and Chief Compliance Officer’s fees | 20 | 32 | |
| Printing and mailing costs | 79 | 260 | |
| Registration and filing fees | 128 | 159 | |
| Transfer agency fees (See Note 2.M) | 43 | 135 | |
| Dividend expense to non-affiliates on securities sold short | 271 | — | |
| Interest expense to non-affiliates on securities sold short | 47 | — | |
| Other | 240 | 314 | |
| Total expenses | 23,884 | 63,172 | |
| Less fees waived | (2,677) | (13,564) | |
| Less expense reimbursements | (3) | (460) | |
| Net expenses | 21,204 | 49,148 | |
| Net investment income (loss) | $ 23,166 | $ 233,301 (a) Amount rounds to less than one thousand. |
| April 30, 2022 | J.P. Morgan Funds | 125 |
| JPMorgan Global Allocation Fund | JPMorgan Income Builder Fund | ||
| REALIZED/UNREALIZED GAINS (LOSSES): | |||
| Net realized gain (loss) on transactions from: | |||
| Investments in non-affiliates | $ 95,251 | $ 119,793(a) | |
| Investments in affiliates | (103) | (102) | |
| Options purchased | 4,112 | — | |
| Futures contracts | (77,926) | (113,348) | |
| Securities sold short | (2,812) | — | |
| Foreign currency transactions | (3,173) | (800) | |
| Forward foreign currency exchange contracts | 50,056 | — | |
| Swaps | 2,206 | — | |
| Net realized gain (loss) | 67,611 | 5,543 | |
| Change in net unrealized appreciation/depreciation on: | |||
| Investments in non-affiliates | (686,179) | (1,141,985)(b) | |
| Investments in affiliates | (4,008) | (17,895) | |
| Options purchased | 17,688 | — | |
| Futures contracts | (49,529) | (72,831) | |
| Securities sold short | (10) | — | |
| Foreign currency translations | 1,737 | (1,110) | |
| Forward foreign currency exchange contracts | 30,171 | — | |
| Swaps | (1,706) | — | |
| Unfunded commitments | — | (10) | |
| Change in net unrealized appreciation/depreciation | (691,836) | (1,233,831) | |
| Net realized/unrealized gains (losses) | (624,225) | (1,228,288) | |
| Change in net assets resulting from operations | $(601,059) | $ (994,987) |
| (a) | Net of foreign capital gains tax of $(792). |
| (b) | Net of change in foreign capital gains tax of $840. |
| 126 | J.P. Morgan Funds | April 30, 2022 |
| JPMorgan Global Allocation Fund | JPMorgan Income Builder Fund | ||||||
| Six Months Ended April 30, 2022 (Unaudited) | Year Ended October 31, 2021 | Six Months Ended April 30, 2022 (Unaudited) | Year Ended October 31, 2021 | ||||
| CHANGE IN NET ASSETS RESULTING FROM OPERATIONS: | |||||||
| Net investment income (loss) | $ 23,166 | $ 53,504 | $ 233,301 | $ 458,527 | |||
| Net realized gain (loss) | 67,611 | 371,128 | 5,543 | 691,837 | |||
| Change in net unrealized appreciation/depreciation | (691,836) | 508,200 | (1,233,831) | 962,131 | |||
| Change in net assets resulting from operations | (601,059) | 932,832 | (994,987) | 2,112,495 | |||
| DISTRIBUTIONS TO SHAREHOLDERS: | |||||||
| Class A | (69,829) | (11,389) | (340,225) | (175,523) | |||
| Class C | (44,839) | (7,511) | (126,592) | (72,722) | |||
| Class I | (241,983) | (52,958) | (365,002) | (205,129) | |||
| Class R2 | (579) | (100) | — | — | |||
| Class R3 | (116) | (15) | — | — | |||
| Class R4 | (127) | (20) | — | — | |||
| Class R5 | (7) | (4) | — | — | |||
| Class R6 | (95,366) | (18,956) | (30,650) | (18,942) | |||
| Total distributions to shareholders | (452,846) | (90,953) | (862,469) | (472,316) | |||
| CAPITAL TRANSACTIONS: | |||||||
| Change in net assets resulting from capital transactions | 144,563 | 651,552 | 232,268 | (30,633) | |||
| NET ASSETS: | |||||||
| Change in net assets | (909,342) | 1,493,431 | (1,625,188) | 1,609,546 | |||
| Beginning of period | 5,122,597 | 3,629,166 | 13,678,964 | 12,069,418 | |||
| End of period | $4,213,255 | $5,122,597 | $12,053,776 | $13,678,964 | |||
| April 30, 2022 | J.P. Morgan Funds | 127 |
| JPMorgan Global Allocation Fund | JPMorgan Income Builder Fund | ||||||
| Six Months Ended April 30, 2022 (Unaudited) | Year Ended October 31, 2021 | Six Months Ended April 30, 2022 (Unaudited) | Year Ended October 31, 2021 | ||||
| CAPITAL TRANSACTIONS: | |||||||
| Class A | |||||||
| Proceeds from shares issued | $ 132,972 | $ 343,717 | $ 610,966 | $ 1,470,545 | |||
| Distributions reinvested | 64,220 | 10,397 | 312,321 | 160,549 | |||
| Cost of shares redeemed | (113,624) | (165,771) | (611,053) | (1,007,091) | |||
| Change in net assets resulting from Class A capital transactions | 83,568 | 188,343 | 312,234 | 624,003 | |||
| Class C | |||||||
| Proceeds from shares issued | 22,448 | 58,369 | 72,788 | 192,408 | |||
| Distributions reinvested | 40,451 | 6,657 | 120,824 | 69,488 | |||
| Cost of shares redeemed | (59,819) | (110,453) | (361,443) | (941,440) | |||
| Change in net assets resulting from Class C capital transactions | 3,080 | (45,427) | (167,831) | (679,544) | |||
| Class I | |||||||
| Proceeds from shares issued | 259,209 | 596,114 | 441,227 | 991,794 | |||
| Distributions reinvested | 204,489 | 43,953 | 328,487 | 183,235 | |||
| Cost of shares redeemed | (455,032) | (447,625) | (709,222) | (1,052,204) | |||
| Change in net assets resulting from Class I capital transactions | 8,666 | 192,442 | 60,492 | 122,825 | |||
| Class R2 | |||||||
| Proceeds from shares issued | 409 | 741 | — | — | |||
| Distributions reinvested | 579 | 100 | — | — | |||
| Cost of shares redeemed | (640) | (886) | — | — | |||
| Change in net assets resulting from Class R2 capital transactions | 348 | (45) | — | — | |||
| Class R3 | |||||||
| Proceeds from shares issued | 690 | 95 | — | — | |||
| Distributions reinvested | 4 | 1 | — | — | |||
| Cost of shares redeemed | (450) | (47) | — | — | |||
| Change in net assets resulting from Class R3 capital transactions | 244 | 49 | — | — | |||
| Class R4 | |||||||
| Proceeds from shares issued | 203 | 920 | — | — | |||
| Distributions reinvested | 127 | 20 | — | — | |||
| Cost of shares redeemed | (81) | (449) | — | — | |||
| Change in net assets resulting from Class R4 capital transactions | 249 | 491 | — | — | |||
| Class R5 | |||||||
| Proceeds from shares issued | 3 | 707 | — | — | |||
| Distributions reinvested | 7 | 4 | — | — | |||
| Cost of shares redeemed | (13) | (680) | — | — | |||
| Change in net assets resulting from Class R5 capital transactions | (3) | 31 | — | — | |||
| 128 | J.P. Morgan Funds | April 30, 2022 |
| JPMorgan Global Allocation Fund | JPMorgan Income Builder Fund | ||||||
| Six Months Ended April 30, 2022 (Unaudited) | Year Ended October 31, 2021 | Six Months Ended April 30, 2022 (Unaudited) | Year Ended October 31, 2021 | ||||
| CAPITAL TRANSACTIONS: (continued) | |||||||
| Class R6 | |||||||
| Proceeds from shares issued | $ 31,004 | $ 353,812 | $ 40,254 | $ 83,057 | |||
| Distributions reinvested | 90,836 | 18,024 | 30,225 | 18,708 | |||
| Cost of shares redeemed | (73,429) | (56,168) | (43,106) | (199,682) | |||
| Change in net assets resulting from Class R6 capital transactions | 48,411 | 315,668 | 27,373 | (97,917) | |||
| Total change in net assets resulting from capital transactions | $ 144,563 | $ 651,552 | $ 232,268 | $ (30,633) | |||
| SHARE TRANSACTIONS: | |||||||
| Class A | |||||||
| Issued | 6,208 | 15,139 | 56,020 | 128,767 | |||
| Reinvested | 2,958 | 469 | 28,542 | 14,043 | |||
| Redeemed | (5,386) | (7,316) | (56,138) | (88,675) | |||
| Change in Class A Shares | 3,780 | 8,292 | 28,424 | 54,135 | |||
| Class C | |||||||
| Issued | 1,064 | 2,621 | 6,654 | 16,903 | |||
| Reinvested | 1,900 | 309 | 11,057 | 6,110 | |||
| Redeemed | (2,886) | (4,969) | (33,340) | (82,929) | |||
| Change in Class C Shares | 78 | (2,039) | (15,629) | (59,916) | |||
| Class I | |||||||
| Issued | 12,093 | 26,172 | 40,285 | 86,981 | |||
| Reinvested | 9,359 | 1,971 | 29,962 | 16,013 | |||
| Redeemed | (21,492) | (19,623) | (65,255) | (92,705) | |||
| Change in Class I Shares | (40) | 8,520 | 4,992 | 10,289 | |||
| Class R2 | |||||||
| Issued | 19 | 33 | — | — | |||
| Reinvested | 27 | 5 | — | — | |||
| Redeemed | (29) | (40) | — | — | |||
| Change in Class R2 Shares | 17 | (2) | — | — | |||
| Class R3 | |||||||
| Issued | 30 | 4 | — | — | |||
| Redeemed | (22) | (2) | — | — | |||
| Change in Class R3 Shares | 8 | 2 | — | — | |||
| Class R4 | |||||||
| Issued | 10 | 40 | — | — | |||
| Reinvested | 6 | 1 | — | — | |||
| Redeemed | (4) | (19) | — | — | |||
| Change in Class R4 Shares | 12 | 22 | — | — | |||
| April 30, 2022 | J.P. Morgan Funds | 129 |
| JPMorgan Global Allocation Fund | JPMorgan Income Builder Fund | ||||||
| Six Months Ended April 30, 2022 (Unaudited) | Year Ended October 31, 2021 | Six Months Ended April 30, 2022 (Unaudited) | Year Ended October 31, 2021 | ||||
| SHARE TRANSACTIONS: (continued) | |||||||
| Class R5 | |||||||
| Issued | —(a) | 32 | — | — | |||
| Reinvested | 1 | —(a) | — | — | |||
| Redeemed | (1) | (29) | — | — | |||
| Change in Class R5 Shares | —(a) | 3 | — | — | |||
| Class R6 | |||||||
| Issued | 1,448 | 15,695 | 3,717 | 7,264 | |||
| Reinvested | 4,159 | 807 | 2,758 | 1,635 | |||
| Redeemed | (3,615) | (2,448) | (3,952) | (17,707) | |||
| Change in Class R6 Shares | 1,992 | 14,054 | 2,523 | (8,808) | |||
| (a) | Amount rounds to less than one thousand. |
| 130 | J.P. Morgan Funds | April 30, 2022 |
| Per share operating performance | ||||||||
| Investment operations | Distributions | |||||||
| Net asset value, beginning of period | Net investment income (loss)(b)(c) | Net realized and unrealized gains (losses) on investments | Total from investment operations | Net investment income | Net realized gain | Total distributions | ||
| JPMorgan Global Allocation Fund | ||||||||
| Class A | ||||||||
| Six Months Ended April 30, 2022(Unaudited) | $23.57 | $0.08 | $(2.72) | $(2.64) | $(0.26) | $(1.80) | $(2.06) | |
| Year Ended October 31, 2021 | 19.27 | 0.22 | 4.50 | 4.72 | (0.28) | (0.14) | (0.42) | |
| Year Ended October 31, 2020 | 18.82 | 0.27 | 0.46 | 0.73 | (0.28) | — | (0.28) | |
| Year Ended October 31, 2019 | 17.71 | 0.36 | 1.22 | 1.58 | (0.47) | — | (0.47) | |
| Year Ended October 31, 2018 | 18.63 | 0.31 | (0.63) | (0.32) | (0.31) | (0.29) | (0.60) | |
| Year Ended October 31, 2017 | 16.38 | 0.34 | 2.23 | 2.57 | (0.32) | — | (0.32) | |
| Class C | ||||||||
| Six Months Ended April 30, 2022(Unaudited) | 23.15 | 0.03 | (2.66) | (2.63) | (0.22) | (1.80) | (2.02) | |
| Year Ended October 31, 2021 | 18.94 | 0.11 | 4.41 | 4.52 | (0.17) | (0.14) | (0.31) | |
| Year Ended October 31, 2020 | 18.54 | 0.18 | 0.46 | 0.64 | (0.24) | — | (0.24) | |
| Year Ended October 31, 2019 | 17.47 | 0.27 | 1.19 | 1.46 | (0.39) | — | (0.39) | |
| Year Ended October 31, 2018 | 18.39 | 0.22 | (0.63) | (0.41) | (0.22) | (0.29) | (0.51) | |
| Year Ended October 31, 2017 | 16.20 | 0.25 | 2.20 | 2.45 | (0.26) | — | (0.26) | |
| Class I | ||||||||
| Six Months Ended April 30, 2022(Unaudited) | 23.72 | 0.11 | (2.74) | (2.63) | (0.29) | (1.80) | (2.09) | |
| Year Ended October 31, 2021 | 19.39 | 0.28 | 4.52 | 4.80 | (0.33) | (0.14) | (0.47) | |
| Year Ended October 31, 2020 | 18.91 | 0.32 | 0.47 | 0.79 | (0.31) | — | (0.31) | |
| Year Ended October 31, 2019 | 17.79 | 0.41 | 1.22 | 1.63 | (0.51) | — | (0.51) | |
| Year Ended October 31, 2018 | 18.71 | 0.37 | (0.65) | (0.28) | (0.35) | (0.29) | (0.64) | |
| Year Ended October 31, 2017 | 16.45 | 0.38 | 2.23 | 2.61 | (0.35) | — | (0.35) | |
| Class R2 | ||||||||
| Six Months Ended April 30, 2022(Unaudited) | 23.40 | 0.05 | (2.70) | (2.65) | (0.23) | (1.80) | (2.03) | |
| Year Ended October 31, 2021 | 19.14 | 0.14 | 4.45 | 4.59 | (0.19) | (0.14) | (0.33) | |
| Year Ended October 31, 2020 | 18.73 | 0.20 | 0.46 | 0.66 | (0.25) | — | (0.25) | |
| Year Ended October 31, 2019 | 17.64 | 0.30 | 1.20 | 1.50 | (0.41) | — | (0.41) | |
| Year Ended October 31, 2018 | 18.57 | 0.25 | (0.62) | (0.37) | (0.27) | (0.29) | (0.56) | |
| Year Ended October 31, 2017 | 16.36 | 0.28 | 2.22 | 2.50 | (0.29) | — | (0.29) | |
| Class R3 | ||||||||
| Six Months Ended April 30, 2022(Unaudited) | 23.65 | 0.07 | (2.73) | (2.66) | (0.25) | (1.80) | (2.05) | |
| Year Ended October 31, 2021 | 19.34 | 0.20 | 4.50 | 4.70 | (0.25) | (0.14) | (0.39) | |
| Year Ended October 31, 2020 | 18.90 | 0.24 | 0.48 | 0.72 | (0.28) | — | (0.28) | |
| Year Ended October 31, 2019 | 17.79 | 0.34 | 1.22 | 1.56 | (0.45) | — | (0.45) | |
| October 1, 2018(k) through October 31, 2018 | 18.65 | 0.02 | (0.88) | (0.86) | — | — | — | |
| Class R4 | ||||||||
| Six Months Ended April 30, 2022(Unaudited) | 23.57 | 0.10 | (2.72) | (2.62) | (0.28) | (1.80) | (2.08) | |
| Year Ended October 31, 2021 | 19.28 | 0.26 | 4.48 | 4.74 | (0.31) | (0.14) | (0.45) | |
| Year Ended October 31, 2020 | 18.81 | 0.30 | 0.47 | 0.77 | (0.30) | — | (0.30) | |
| Year Ended October 31, 2019 | 17.71 | 0.42 | 1.17 | 1.59 | (0.49) | — | (0.49) | |
| October 1, 2018(k) through October 31, 2018 | 18.56 | 0.02 | (0.87) | (0.85) | — | — | — | |
| Class R5 | ||||||||
| Six Months Ended April 30, 2022(Unaudited) | 23.73 | 0.12 | (2.75) | (2.63) | (0.29) | (1.80) | (2.09) | |
| Year Ended October 31, 2021 | 19.39 | 0.33 | 4.48 | 4.81 | (0.33) | (0.14) | (0.47) | |
| Year Ended October 31, 2020 | 18.92 | 0.33 | 0.46 | 0.79 | (0.32) | — | (0.32) | |
| Year Ended October 31, 2019 | 17.80 | 0.42 | 1.22 | 1.64 | (0.52) | — | (0.52) | |
| October 1, 2018(k) through October 31, 2018 | 18.65 | 0.02 | (0.87) | (0.85) | — | — | — | |
| 132 | J.P. Morgan Funds | April 30, 2022 |
| Ratios/Supplemental data | ||||||||
| Ratios to average net assets(a) | ||||||||
| Net asset value, end of period | Total return (excludes sales charge)(d)(e) | Net assets, end of period (000's) | Net expenses (including dividend and interest expense for securities sold short)(f)(g)(h) | Net investment income (loss)(c) | Expenses without waivers and reimbursements (including dividend and interest expense for securities sold short)(g)(h) | Portfolio turnover rate (excluding securities sold short)(e)(i) | Portfolio turnover rate (including securities sold short)(e)(i) | |
| $18.87 | (12.25)% | $ 690,735 | 1.03(j)% | 0.81(j)% | 1.18(j)% | 57% | 64% | |
| 23.57 | 24.67 | 773,563 | 1.04 | 0.97 | 1.18 | 101 | 110 | |
| 19.27 | 3.94 | 472,779 | 1.03 | 1.45 | 1.19 | 105 | 116 | |
| 18.82 | 9.08 | 443,776 | 1.05 | 2.00 | 1.26 | 111 | 139 | |
| 17.71 | (1.81) | 344,414 | 1.06 | 1.67 | 1.28 | 108 | 131 | |
| 18.63 | 15.88 | 305,300 | 1.04 | 1.96 | 1.29 | 83 | 95 | |
| 18.50 | (12.42) | 416,076 | 1.53(j) | 0.30(j) | 1.68(j) | 57 | 64 | |
| 23.15 | 24.02 | 519,020 | 1.54 | 0.49 | 1.68 | 101 | 110 | |
| 18.94 | 3.44 | 463,256 | 1.54 | 0.95 | 1.69 | 105 | 116 | |
| 18.54 | 8.54 | 526,390 | 1.55 | 1.49 | 1.76 | 111 | 139 | |
| 17.47 | (2.32) | 511,863 | 1.56 | 1.18 | 1.78 | 108 | 131 | |
| 18.39 | 15.29 | 406,887 | 1.54 | 1.45 | 1.79 | 83 | 95 | |
| 19.00 | (12.15) | 2,210,640 | 0.78(j) | 1.05(j) | 0.93(j) | 57 | 64 | |
| 23.72 | 24.96 | 2,760,026 | 0.79 | 1.23 | 0.93 | 101 | 110 | |
| 19.39 | 4.25 | 2,091,223 | 0.78 | 1.71 | 0.93 | 105 | 116 | |
| 18.91 | 9.36 | 2,170,359 | 0.80 | 2.25 | 1.00 | 111 | 139 | |
| 17.79 | (1.58) | 1,855,964 | 0.82 | 1.95 | 1.03 | 108 | 131 | |
| 18.71 | 16.12 | 1,611,736 | 0.79 | 2.14 | 1.02 | 83 | 95 | |
| 18.72 | (12.39) | 5,883 | 1.40(j) | 0.44(j) | 1.45(j) | 57 | 64 | |
| 23.40 | 24.16 | 6,946 | 1.41 | 0.61 | 1.45 | 101 | 110 | |
| 19.14 | 3.55 | 5,724 | 1.40 | 1.09 | 1.46 | 105 | 116 | |
| 18.73 | 8.69 | 5,394 | 1.42 | 1.64 | 1.56 | 111 | 139 | |
| 17.64 | (2.09) | 3,658 | 1.39 | 1.35 | 1.56 | 108 | 131 | |
| 18.57 | 15.50 | 2,441 | 1.29 | 1.58 | 1.62 | 83 | 95 | |
| 18.94 | (12.32) | 893 | 1.15(j) | 0.67(j) | 1.18(j) | 57 | 64 | |
| 23.65 | 24.47 | 932 | 1.16 | 0.86 | 1.18 | 101 | 110 | |
| 19.34 | 3.85 | 720 | 1.15 | 1.22 | 1.26 | 105 | 116 | |
| 18.90 | 8.97 | 50 | 1.17 | 1.83 | 1.44 | 111 | 139 | |
| 17.79 | (4.61) | 19 | 1.23 | 1.08 | 1.38 | 108 | 131 | |
| 18.87 | (12.19) | 1,316 | 0.90(j) | 0.94(j) | 0.93(j) | 57 | 64 | |
| 23.57 | 24.77 | 1,377 | 0.91 | 1.12 | 0.93 | 101 | 110 | |
| 19.28 | 4.13 | 688 | 0.90 | 1.59 | 0.95 | 105 | 116 | |
| 18.81 | 9.20 | 631 | 0.92 | 2.29 | 1.02 | 111 | 139 | |
| 17.71 | (4.58) | 19 | 0.98 | 1.33 | 1.13 | 108 | 131 | |
| 19.01 | (12.13) | 69 | 0.75(j) | 1.09(j) | 0.80(j) | 57 | 64 | |
| 23.73 | 25.00 | 89 | 0.76 | 1.43 | 0.81 | 101 | 110 | |
| 19.39 | 4.23 | 22 | 0.75 | 1.73 | 0.97 | 105 | 116 | |
| 18.92 | 9.39 | 21 | 0.78 | 2.27 | 1.00 | 111 | 139 | |
| 17.80 | (4.56) | 19 | 0.73 | 1.58 | 0.88 | 108 | 131 | |
| April 30, 2022 | J.P. Morgan Funds | 133 |
| Per share operating performance | ||||||||
| Investment operations | Distributions | |||||||
| Net asset value, beginning of period | Net investment income (loss)(b)(c) | Net realized and unrealized gains (losses) on investments | Total from investment operations | Net investment income | Net realized gain | Total distributions | ||
| Class R6 | ||||||||
| Six Months Ended April 30, 2022(Unaudited) | $23.71 | $0.13 | $(2.75) | $(2.62) | $(0.30) | $(1.80) | $(2.10) | |
| Year Ended October 31, 2021 | 19.38 | 0.31 | 4.52 | 4.83 | (0.36) | (0.14) | (0.50) | |
| Year Ended October 31, 2020 | 18.91 | 0.35 | 0.46 | 0.81 | (0.34) | — | (0.34) | |
| Year Ended October 31, 2019 | 17.79 | 0.43 | 1.22 | 1.65 | (0.53) | — | (0.53) | |
| November 1, 2017(k) through October 31, 2018 | 18.74 | 0.37 | (0.65) | (0.28) | (0.38) | (0.29) | (0.67) | |
| (a) | Annualized for periods less than one year, unless otherwise noted. |
| (b) | Calculated based upon average shares outstanding. |
| (c) | Net investment income (loss) is affected by the timing of distributions from Underlying Funds. |
| (d) | Includes adjustments in accordance with accounting principles generally accepted in the United States of America and as such, the net asset values for financial reporting purposes and the returns based upon those net asset values may differ from the net asset values and returns for shareholder transactions. |
| (e) | Not annualized for periods less than one year. |
| (f) | Includes interest expense, if applicable, which is less than 0.005% unless otherwise noted. |
| (g) | |
| April 30, 2022 | October 31, 2021 | October 31, 2020 | October 31, 2019 | October 31, 2018 | October 31, 2017 | |
| Net expenses (excluding dividend and interest expense for securities sold short) | ||||||
| Class A | 1.02% | 1.03% | 1.02% | 1.02% | 1.02% | 1.02% |
| Class C | 1.52% | 1.53% | 1.53% | 1.52% | 1.52% | 1.52% |
| Class I | 0.77% | 0.78% | 0.77% | 0.77% | 0.78% | 0.77% |
| Class R2 | 1.39% | 1.40% | 1.39% | 1.39% | 1.35% | 1.27% |
| Class R3 | 1.14% | 1.15% | 1.14% | 1.14% | 1.19% | —% |
| Class R4 | 0.89% | 0.90% | 0.89% | 0.89% | 0.94% | —% |
| Class R5 | 0.74% | 0.75% | 0.74% | 0.75% | 0.69% | —% |
| Class R6 | 0.64% | 0.65% | 0.64% | 0.64% | 0.64% | —% |
| Expenses without waivers (excluding dividend and interest expense for securities sold short) | ||||||
| Class A | 1.17% | 1.17% | 1.18% | 1.23% | 1.24% | 1.27% |
| Class C | 1.67% | 1.67% | 1.68% | 1.73% | 1.74% | 1.77% |
| Class I | 0.92% | 0.92% | 0.92% | 0.97% | 0.99% | 1.00% |
| Class R2 | 1.44% | 1.44% | 1.45% | 1.53% | 1.52% | 1.60% |
| Class R3 | 1.17% | 1.17% | 1.25% | 1.41% | 1.34% | —% |
| Class R4 | 0.92% | 0.92% | 0.94% | 0.99% | 1.09% | —% |
| Class R5 | 0.79% | 0.80% | 0.96% | 0.97% | 0.84% | —% |
| Class R6 | 0.67% | 0.67% | 0.67% | 0.72% | 0.74% | —% |
| (h) | Does not include expenses of underlying funds. |
| (i) | The Fund presents portfolio turnover in two ways, one including securities sold short and the other excluding securities sold short. |
| (j) | Certain non-recurring expenses incurred by the Fund were not annualized for the period indicated. |
| (k) | Commencement of offering of class of shares. |
| 134 | J.P. Morgan Funds | April 30, 2022 |
| Ratios/Supplemental data | ||||||||
| Ratios to average net assets(a) | ||||||||
| Net asset value, end of period | Total return (excludes sales charge)(d)(e) | Net assets, end of period (000's) | Net expenses (including dividend and interest expense for securities sold short)(f)(g)(h) | Net investment income (loss)(c) | Expenses without waivers and reimbursements (including dividend and interest expense for securities sold short)(g)(h) | Portfolio turnover rate (excluding securities sold short)(e)(i) | Portfolio turnover rate (including securities sold short)(e)(i) | |
| $18.99 | (12.10)% | $ 887,643 | 0.65(j)% | 1.19(j)% | 0.68(j)% | 57% | 64% | |
| 23.71 | 25.13 | 1,060,644 | 0.66 | 1.36 | 0.68 | 101 | 110 | |
| 19.38 | 4.34 | 594,754 | 0.65 | 1.83 | 0.68 | 105 | 116 | |
| 18.91 | 9.50 | 528,192 | 0.67 | 2.35 | 0.75 | 111 | 139 | |
| 17.79 | (1.58) | 841,967 | 0.68 | 2.02 | 0.78 | 108 | 131 | |
| April 30, 2022 | J.P. Morgan Funds | 135 |
| Per share operating performance | ||||||||
| Investment operations | Distributions | |||||||
| Net asset value, beginning of period | Net investment income (loss)(b) | Net realized and unrealized gains (losses) on investments | Total from investment operations | Net investment income | Net realized gain | Total distributions | ||
| JPMorgan Income Builder Fund | ||||||||
| Class A | ||||||||
| Six Months Ended April 30, 2022(Unaudited) | $11.62 | $0.19 | $(1.02) | $(0.83) | $(0.23) | $(0.50) | $(0.73) | |
| Year Ended October 31, 2021 | 10.21 | 0.40 | 1.42 | 1.82 | (0.41) | — | (0.41) | |
| Year Ended October 31, 2020 | 10.73 | 0.38 | (0.49) | (0.11) | (0.39) | (0.02) | (0.41) | |
| Year Ended October 31, 2019 | 10.13 | 0.41 | 0.60 | 1.01 | (0.41) | — | (0.41) | |
| Year Ended October 31, 2018 | 10.62 | 0.42 | (0.48) | (0.06) | (0.43) | — | (0.43) | |
| Year Ended October 31, 2017 | 9.95 | 0.41 | 0.67 | 1.08 | (0.41) | — | (0.41) | |
| Class C | ||||||||
| Six Months Ended April 30, 2022(Unaudited) | 11.58 | 0.17 | (1.02) | (0.85) | (0.20) | (0.50) | (0.70) | |
| Year Ended October 31, 2021 | 10.19 | 0.34 | 1.40 | 1.74 | (0.35) | — | (0.35) | |
| Year Ended October 31, 2020 | 10.70 | 0.32 | (0.47) | (0.15) | (0.34) | (0.02) | (0.36) | |
| Year Ended October 31, 2019 | 10.10 | 0.36 | 0.60 | 0.96 | (0.36) | — | (0.36) | |
| Year Ended October 31, 2018 | 10.59 | 0.37 | (0.49) | (0.12) | (0.37) | — | (0.37) | |
| Year Ended October 31, 2017 | 9.92 | 0.36 | 0.67 | 1.03 | (0.36) | — | (0.36) | |
| Class I | ||||||||
| Six Months Ended April 30, 2022(Unaudited) | 11.64 | 0.20 | (1.02) | (0.82) | (0.24) | (0.50) | (0.74) | |
| Year Ended October 31, 2021 | 10.23 | 0.41 | 1.42 | 1.83 | (0.42) | — | (0.42) | |
| Year Ended October 31, 2020 | 10.74 | 0.39 | (0.48) | (0.09) | (0.40) | (0.02) | (0.42) | |
| Year Ended October 31, 2019 | 10.14 | 0.43 | 0.60 | 1.03 | (0.43) | — | (0.43) | |
| Year Ended October 31, 2018 | 10.63 | 0.44 | (0.49) | (0.05) | (0.44) | — | (0.44) | |
| Year Ended October 31, 2017 | 9.96 | 0.43 | 0.67 | 1.10 | (0.43) | — | (0.43) | |
| Class R6 | ||||||||
| Six Months Ended April 30, 2022(Unaudited) | 11.64 | 0.21 | (1.02) | (0.81) | (0.25) | (0.50) | (0.75) | |
| Year Ended October 31, 2021 | 10.23 | 0.42 | 1.42 | 1.84 | (0.43) | — | (0.43) | |
| Year Ended October 31, 2020 | 10.74 | 0.40 | (0.48) | (0.08) | (0.41) | (0.02) | (0.43) | |
| Year Ended October 31, 2019 | 10.14 | 0.43 | 0.61 | 1.04 | (0.44) | — | (0.44) | |
| November 1, 2017(g) through October 31, 2018 | 10.64 | 0.46 | (0.51) | (0.05) | (0.45) | — | (0.45) | |
| (a) | Annualized for periods less than one year, unless otherwise noted. |
| (b) | Calculated based upon average shares outstanding. |
| (c) | Includes adjustments in accordance with accounting principles generally accepted in the United States of America and as such, the net asset values for financial reporting purposes and the returns based upon those net asset values may differ from the net asset values and returns for shareholder transactions. |
| (d) | Not annualized for periods less than one year. |
| (e) | Includes earnings credits and interest expense, if applicable, each of which is less than 0.005% unless otherwise noted. |
| (f) | Certain non-recurring expenses incurred by the Fund were not annualized for the period indicated. |
| (g) | Commencement of offering of class of shares. |
| 136 | J.P. Morgan Funds | April 30, 2022 |
| Ratios/Supplemental data | |||||||
| Ratios to average net assets(a) | |||||||
| Net asset value, end of period | Total return (excludes sales charge)(c)(d) | Net assets, end of period (000's) | Net expenses(e) | Net investment income (loss) | Expenses without waivers and reimbursements | Portfolio turnover rate(d) | |
| $10.06 | (7.56)% | $4,901,476 | 0.75(f)% | 3.60(f)% | 1.02(f)% | 32% | |
| 11.62 | 17.94 | 5,328,533 | 0.75 | 3.47 | 1.02 | 72 | |
| 10.21 | (1.01) | 4,132,310 | 0.74 | 3.65 | 1.02 | 64 | |
| 10.73 | 10.20 | 3,678,891 | 0.74 | 3.90 | 1.05 | 48 | |
| 10.13 | (0.67) | 3,386,949 | 0.75 | 4.02 | 1.07 | 59 | |
| 10.62 | 11.11 | 3,731,312 | 0.75 | 4.02 | 1.08 | 52 | |
| 10.03 | (7.74) | 1,701,969 | 1.25(f) | 3.07(f) | 1.52(f) | 32 | |
| 11.58 | 17.18 | 2,146,228 | 1.25 | 2.95 | 1.52 | 72 | |
| 10.19 | (1.42) | 2,497,469 | 1.24 | 3.16 | 1.52 | 64 | |
| 10.70 | 9.67 | 3,814,158 | 1.24 | 3.43 | 1.55 | 48 | |
| 10.10 | (1.17) | 4,114,927 | 1.25 | 3.52 | 1.57 | 59 | |
| 10.59 | 10.58 | 4,609,784 | 1.25 | 3.53 | 1.59 | 52 | |
| 10.08 | (7.48) | 5,012,509 | 0.60(f) | 3.74(f) | 0.76(f) | 32 | |
| 11.64 | 18.08 | 5,728,166 | 0.60 | 3.61 | 0.76 | 72 | |
| 10.23 | (0.76) | 4,930,991 | 0.59 | 3.80 | 0.77 | 64 | |
| 10.74 | 10.35 | 5,672,266 | 0.59 | 4.08 | 0.80 | 48 | |
| 10.14 | (0.52) | 4,445,260 | 0.60 | 4.17 | 0.81 | 59 | |
| 10.63 | 11.26 | 4,448,619 | 0.60 | 4.15 | 0.83 | 52 | |
| 10.08 | (7.44) | 437,822 | 0.51(f) | 3.84(f) | 0.51(f) | 32 | |
| 11.64 | 18.18 | 476,037 | 0.51 | 3.69 | 0.51 | 72 | |
| 10.23 | (0.68) | 508,648 | 0.51 | 3.90 | 0.52 | 64 | |
| 10.74 | 10.44 | 354,830 | 0.51 | 4.15 | 0.55 | 48 | |
| 10.14 | (0.51) | 212,657 | 0.50 | 4.37 | 0.57 | 59 | |
| April 30, 2022 | J.P. Morgan Funds | 137 |
| Classes Offered | Diversification Classification | |
| JPMorgan Global Allocation Fund | Class A, Class C, Class I, Class R2, Class R3, Class R4, Class R5 and Class R6 | Diversified |
| JPMorgan Income Builder Fund | Class A, Class C, Class I and Class R6 | Diversified |
| 138 | J.P. Morgan Funds | April 30, 2022 |
| • | Level 1 — Unadjusted inputs using quoted prices in active markets for identical investments. |
| • | Level 2 — Other significant observable inputs including, but not limited to, quoted prices for similar investments, inputs other than quoted prices that are observable for investments (such as interest rates, prepayment speeds, credit risk, etc.) or other market corroborated inputs. |
| • | Level 3 — Significant inputs based on the best information available in the circumstances, to the extent observable inputs are not available (including the Funds' assumptions in determining the fair value of investments). |
| Global Allocation Fund | ||||
| Level 1 Quoted prices | Level 2 Other significant observable inputs | Level 3 Significant unobservable inputs | Total | |
| Investments in Securities | ||||
| Asset-Backed Securities | $ — | $ — | $1,876 | $ 1,876 |
| Collateralized Mortgage Obligations | — | — | 830 | 830 |
| Commercial Mortgage-Backed Securities | ||||
| United States | — | 7,363 | 551 | 7,914 |
| Common Stocks | ||||
| Australia | — | 18,530 | — | 18,530 |
| Austria | — | 311 | — | 311 |
| Belgium | — | 18,063 | — | 18,063 |
| Brazil | 16,378 | 67 | — | 16,445 |
| Canada | 13,553 | — | — | 13,553 |
| Chile | 979 | 60 | — | 1,039 |
| China | 23,234 | 161,570 | — | 184,804 |
| Denmark | — | 46,395 | — | 46,395 |
| Finland | — | 1,412 | — | 1,412 |
| France | — | 117,868 | — | 117,868 |
| Germany | — | 53,464 | — | 53,464 |
| Greece | — | 1,461 | — | 1,461 |
| Hong Kong | 235 | 16,918 | — | 17,153 |
| India | 23,465 | — | — | 23,465 |
| Indonesia | — | 13,643 | — | 13,643 |
| Ireland | 173 | 586 | — | 759 |
| April 30, 2022 | J.P. Morgan Funds | 139 |
| Global Allocation Fund (continued) | |||||||
| Level 1 Quoted prices | Level 2 Other significant observable inputs | Level 3 Significant unobservable inputs | Total | ||||
| Israel | $ 240 | $ 543 | $ — | $ 783 | |||
| Italy | — | 2,350 | — | 2,350 | |||
| Japan | — | 86,398 | — | 86,398 | |||
| Jordan | — | 32 | — | 32 | |||
| Luxembourg | — | 246 | — | 246 | |||
| Macau | — | 842 | — | 842 | |||
| Mexico | 12,154 | — | — | 12,154 | |||
| Netherlands | 25 | 22,425 | — | 22,450 | |||
| New Zealand | — | 301 | — | 301 | |||
| Norway | 15 | 800 | — | 815 | |||
| Peru | 1,981 | — | — | 1,981 | |||
| Poland | — | 1,296 | — | 1,296 | |||
| Portugal | — | 197 | — | 197 | |||
| Qatar | 1,556 | — | — | 1,556 | |||
| Russia | — | — | 31 | 31 | |||
| Singapore | 25 | 7,378 | — | 7,403 | |||
| South Africa | 4,898 | 15,843 | — | 20,741 | |||
| South Korea | — | 44,477 | — | 44,477 | |||
| Spain | — | 10,837 | — | 10,837 | |||
| Sweden | — | 18,165 | — | 18,165 | |||
| Switzerland | 187 | 37,244 | — | 37,431 | |||
| Taiwan | 26,743 | 27,258 | — | 54,001 | |||
| Tanzania, United Republic of | — | 725 | — | 725 | |||
| Thailand | 4,917 | — | — | 4,917 | |||
| United Arab Emirates | — | — | — | — | |||
| United Kingdom | 81 | 47,505 | — | 47,586 | |||
| United States | 1,414,897 | 14,171 | 147 | 1,429,215 | |||
| Total Common Stocks | 1,545,736 | 789,381 | 178 | 2,335,295 | |||
| Convertible Preferred Stocks | — | — | 590 | 590 | |||
| Corporate Bonds | — | 666,625 | — | 666,625 | |||
| Exchange-Traded Funds | 16,222 | — | — | 16,222 | |||
| Foreign Government Securities | — | 626,906 | — | 626,906 | |||
| Investment Companies | 186,217 | — | — | 186,217 | |||
| Loan Assignments | |||||||
| United States | — | 361 | 545 | 906 | |||
| Options Purchased | |||||||
| Put Options Purchased | 46,482 | — | — | 46,482 | |||
| Preferred Stocks | — | — | 44 | 44 | |||
| Rights | — | — | 22 | 22 | |||
| Supranational | — | 6,837 | — | 6,837 | |||
| U.S. Treasury Obligations | — | 63,977 | — | 63,977 | |||
| Warrants | |||||||
| Netherlands | — | 871 | — | 871 | |||
| Switzerland | — | 7,673 | — | 7,673 | |||
| United Kingdom | — | 741 | 51 | 792 | |||
| United States | — | — | 8 | 8 | |||
| Total Warrants | — | 9,285 | 59 | 9,344 | |||
| 140 | J.P. Morgan Funds | April 30, 2022 |
| Global Allocation Fund (continued) | |||||||
| Level 1 Quoted prices | Level 2 Other significant observable inputs | Level 3 Significant unobservable inputs | Total | ||||
| Short-Term Investments | |||||||
| Foreign Government Treasury Bills | $ — | $ 44,895 | $ — | $ 44,895 | |||
| Investment Companies | 165,446 | — | — | 165,446 | |||
| Investment of Cash Collateral from Securities Loaned | 89,630 | — | — | 89,630 | |||
| Total Short-Term Investments | 255,076 | 44,895 | — | 299,971 | |||
| Total Investments in Securities | $2,049,733 | $2,215,630 | $4,695 | $4,270,058 | |||
| Appreciation in Other Financial Instruments | |||||||
| Forward Foreign Currency Exchange Contracts | $ — | $ 44,591 | $ — | $ 44,591 | |||
| Futures Contracts | 13,522 | — | — | 13,522 | |||
| Depreciation in Other Financial Instruments | |||||||
| Forward Foreign Currency Exchange Contracts | — | (7,296) | — | (7,296) | |||
| Futures Contracts | (74,159) | — | — | (74,159) | |||
| Total Net Appreciation/ Depreciation in Other Financial Instruments | $ (60,637) | $ 37,295 | $ — | $ (23,342) | |||
| Income Builder Fund | |||||||
| Level 1 Quoted prices | Level 2 Other significant observable inputs | Level 3 Significant unobservable inputs | Total | ||||
| Investments in Securities | |||||||
| Asset-Backed Securities | |||||||
| Cayman Islands | $ — | $ — | $ 1,184 | $ 1,184 | |||
| United States | — | 92,554 | 68,964 | 161,518 | |||
| Total Asset-Backed Securities | — | 92,554 | 70,148 | 162,702 | |||
| Collateralized Mortgage Obligations | |||||||
| Bermuda | — | — | 2,972 | 2,972 | |||
| United States | — | 303,061 | 158,200 | 461,261 | |||
| Total Collateralized Mortgage Obligations | — | 303,061 | 161,172 | 464,233 | |||
| Commercial Mortgage-Backed Securities | |||||||
| United States | — | 194,974 | 291,423 | 486,397 | |||
| Common Stocks | |||||||
| Australia | — | 105,458 | — | 105,458 | |||
| Austria | — | 10,094 | — | 10,094 | |||
| Belgium | — | 21,878 | — | 21,878 | |||
| Brazil | 22,661 | 3,971 | — | 26,632 | |||
| Canada | 275,720 | — | — | 275,720 | |||
| Cayman Islands | — | — | — | — | |||
| Chile | 4,539 | — | — | 4,539 | |||
| China | — | 196,349 | — | 196,349 | |||
| Denmark | 1,931 | 54,713 | — | 56,644 | |||
| Finland | — | 40,633 | — | 40,633 | |||
| France | — | 170,100 | — | 170,100 | |||
| Germany | — | 164,147 | — | 164,147 | |||
| Hong Kong | 11,914 | 52,514 | — | 64,428 | |||
| India | 28,516 | 23,763 | — | 52,279 | |||
| April 30, 2022 | J.P. Morgan Funds | 141 |
| Income Builder Fund (continued) | |||||||
| Level 1 Quoted prices | Level 2 Other significant observable inputs | Level 3 Significant unobservable inputs | Total | ||||
| Indonesia | $ 18,182 | $ 18,676 | $ — | $ 36,858 | |||
| Ireland | — | 3,039 | — | 3,039 | |||
| Italy | — | 73,328 | — | 73,328 | |||
| Japan | 4,067 | 217,681 | — | 221,748 | |||
| Luxembourg | — | 1,496 | 8,430 | 9,926 | |||
| Mexico | 46,976 | — | — | 46,976 | |||
| Netherlands | — | 57,447 | — | 57,447 | |||
| New Zealand | — | 13,560 | — | 13,560 | |||
| Norway | 3,109 | 33,829 | — | 36,938 | |||
| Poland | — | 5,863 | — | 5,863 | |||
| Portugal | 1,358 | 12,774 | — | 14,132 | |||
| Russia | — | — | 106 | 106 | |||
| Saudi Arabia | — | 11,387 | — | 11,387 | |||
| Singapore | 2,659 | 35,408 | — | 38,067 | |||
| South Africa | 11,952 | 11,984 | — | 23,936 | |||
| South Korea | 7,366 | 57,557 | — | 64,923 | |||
| Spain | 2,351 | 126,299 | — | 128,650 | |||
| Sweden | — | 63,023 | — | 63,023 | |||
| Switzerland | — | 185,522 | — | 185,522 | |||
| Taiwan | 5,006 | 118,372 | — | 123,378 | |||
| Thailand | 5,373 | — | — | 5,373 | |||
| United Kingdom | 4,387 | 256,595 | — | 260,982 | |||
| United States | 1,994,025 | 47,975 | 2,827 | 2,044,827 | |||
| Total Common Stocks | 2,452,092 | 2,195,435 | 11,363 | 4,658,890 | |||
| Convertible Bonds | |||||||
| Australia | — | 2,275 | — | 2,275 | |||
| Canada | — | 591 | — | 591 | |||
| China | — | 5,774 | — | 5,774 | |||
| Germany | — | 819 | — | 819 | |||
| Israel | — | 1,447 | — | 1,447 | |||
| New Zealand | — | 782 | — | 782 | |||
| South Korea | — | 229 | — | 229 | |||
| Spain | — | 1,063 | — | 1,063 | |||
| Taiwan | — | 773 | — | 773 | |||
| United Kingdom | — | 4,383 | — | 4,383 | |||
| United States | — | 32,224 | 2,141 | 34,365 | |||
| Vietnam | — | 1,212 | — | 1,212 | |||
| Total Convertible Bonds | — | 51,572 | 2,141 | 53,713 | |||
| Convertible Preferred Stocks | |||||||
| United States | 13,992 | — | 7,506 | 21,498 | |||
| Corporate Bonds | |||||||
| Australia | — | 18,324 | — | 18,324 | |||
| Austria | — | 1,296 | — | 1,296 | |||
| Azerbaijan | — | 4,042 | — | 4,042 | |||
| Bahrain | — | 1,206 | — | 1,206 | |||
| Belgium | — | 2,446 | — | 2,446 | |||
| Brazil | — | 4,745 | — | 4,745 | |||
| Canada | — | 171,349 | — | 171,349 | |||
| 142 | J.P. Morgan Funds | April 30, 2022 |
| Income Builder Fund (continued) | |||||||
| Level 1 Quoted prices | Level 2 Other significant observable inputs | Level 3 Significant unobservable inputs | Total | ||||
| Cayman Islands | $ — | $ 814 | $ — | $ 814 | |||
| Chile | — | 2,445 | — | 2,445 | |||
| China | — | 42,320 | — | 42,320 | |||
| Colombia | — | 3,054 | — | 3,054 | |||
| Finland | — | 9,464 | — | 9,464 | |||
| France | — | 79,059 | — | 79,059 | |||
| Germany | — | 4,457 | — | 4,457 | |||
| Greece | — | 315 | — | 315 | |||
| Guatemala | — | 1,094 | — | 1,094 | |||
| Hong Kong | — | 10,616 | — | 10,616 | |||
| India | — | 30,809 | — | 30,809 | |||
| Indonesia | — | 22,968 | — | 22,968 | |||
| Ireland | — | 14,916 | — | 14,916 | |||
| Israel | — | 1,102 | — | 1,102 | |||
| Italy | — | 19,387 | — | 19,387 | |||
| Japan | — | 9,423 | — | 9,423 | |||
| Kazakhstan | — | 5,964 | — | 5,964 | |||
| Luxembourg | — | 31,926 | — | 31,926 | |||
| Macau | — | 1,516 | — | 1,516 | |||
| Mexico | — | 13,060 | — | 13,060 | |||
| Morocco | — | 988 | — | 988 | |||
| Netherlands | — | 28,355 | — | 28,355 | |||
| Norway | — | 176 | — | 176 | |||
| Panama | — | 1,392 | — | 1,392 | |||
| Paraguay | — | 269 | — | 269 | |||
| Peru | — | 1,367 | — | 1,367 | |||
| Philippines | — | 8,510 | — | 8,510 | |||
| Saudi Arabia | — | 1,646 | — | 1,646 | |||
| South Africa | — | 1,036 | — | 1,036 | |||
| South Korea | — | 1,809 | — | 1,809 | |||
| Spain | — | 11,854 | — | 11,854 | |||
| Sweden | — | 2,964 | — | 2,964 | |||
| Switzerland | — | 88,097 | — | 88,097 | |||
| Thailand | — | 5,267 | — | 5,267 | |||
| Trinidad And Tobago | — | 1,575 | — | 1,575 | |||
| Turkey | — | 590 | — | 590 | |||
| Ukraine | — | 195 | — | 195 | |||
| United Arab Emirates | — | 558 | — | 558 | |||
| United Kingdom | — | 101,413 | — | 101,413 | |||
| United States | — | 3,428,143 | 40 | 3,428,183 | |||
| Uzbekistan | — | 1,100 | — | 1,100 | |||
| Total Corporate Bonds | — | 4,195,421 | 40 | 4,195,461 | |||
| Equity Linked Notes | — | 851,785 | — | 851,785 | |||
| Exchange-Traded Funds | 314,304 | — | — | 314,304 | |||
| Foreign Government Securities | — | 142,285 | — | 142,285 | |||
| Loan Assignments | |||||||
| Canada | — | 1,269 | — | 1,269 | |||
| France | — | 3,176 | — | 3,176 | |||
| April 30, 2022 | J.P. Morgan Funds | 143 |
| Income Builder Fund (continued) | |||||||
| Level 1 Quoted prices | Level 2 Other significant observable inputs | Level 3 Significant unobservable inputs | Total | ||||
| Ireland | $ — | $ 118 | $ — | $ 118 | |||
| Luxembourg | — | 10,188 | — | 10,188 | |||
| Netherlands | — | 1,173 | — | 1,173 | |||
| United Kingdom | — | 793 | — | 793 | |||
| United States | — | 272,785 | 3,052 | 275,837 | |||
| Total Loan Assignments | — | 289,502 | 3,052 | 292,554 | |||
| Mortgage-Backed Securities | — | 943 | — | 943 | |||
| Preferred Stocks | |||||||
| United States | 74,461 | — | 2,537 | 76,998 | |||
| Rights | |||||||
| Luxembourg | — | — | — | — | |||
| United States | — | — | 622 | 622 | |||
| Total Rights | — | — | 622 | 622 | |||
| U.S. Treasury Obligations | — | 67,428 | — | 67,428 | |||
| Warrants | |||||||
| United Kingdom | — | — | 2,614 | 2,614 | |||
| United States | 2,576 | — | 67 | 2,643 | |||
| Total Warrants | 2,576 | — | 2,681 | 5,257 | |||
| Short-Term Investments | |||||||
| Certificates of Deposits | — | 633 | — | 633 | |||
| Commercial Paper | — | 1,414 | — | 1,414 | |||
| Investment Companies | 566,971 | — | — | 566,971 | |||
| Investment of Cash Collateral from Securities Loaned | 222,603 | — | — | 222,603 | |||
| Total Short-Term Investments | 789,574 | 2,047 | — | 791,621 | |||
| Total Investments in Securities | $3,646,999 | $8,387,007 | $552,685 | $12,586,691 | |||
| Appreciation in Other Financial Instruments | |||||||
| Futures Contracts | $ 24,798 | $ — | $ — | $ 24,798 | |||
| Depreciation in Other Financial Instruments | |||||||
| Futures Contracts | (134,414) | — | — | (134,414) | |||
| Total Net Appreciation/ Depreciation in Other Financial Instruments | $ (109,616) | $ — | $ — | $ (109,616) | |||
| Income Builder Fund | Balance as of October 31, 2021 | Realized gain (loss) | Change in net unrealized appreciation (depreciation) | Net accretion (amortization) | Purchases 1 | Sales 2 | Transfers into Level 3 | Transfers out of Level 3 | Other(a) | Balance as of April 30, 2022 |
| Investments in securities: | ||||||||||
| Asset-Backed Securities | $111,362 | $1,601 | $ (5,409) | $ 64 | $ 13,787 | $(41,598) | $ 1,486 | $ (4,134) | $(7,011) | $ 70,148 |
| Collateralized Mortgage Obligations | 91,751 | (65) | (14,747) | 4 | 59,452 | (38,320) | 56,086 | — | 7011 | 161,172 |
| 144 | J.P. Morgan Funds | April 30, 2022 |
| Income Builder Fund | Balance as of October 31, 2021 | Realized gain (loss) | Change in net unrealized appreciation (depreciation) | Net accretion (amortization) | Purchases 1 | Sales 2 | Transfers into Level 3 | Transfers out of Level 3 | Other(a) | Balance as of April 30, 2022 | |||||||||
| Commercial Mortgage-Backed Securities | $270,236 | $ 86 | $(29,642) | $381 | $ 34,309 | $ (2,819) | $ 37,783 | $(18,911) | $ — | $291,423 | |||||||||
| Common Stocks | 8,968 | 112 | (20,790) | — | 9,010 | (8,592) | 22,655 | — | — | 11,363 | |||||||||
| Convertible Bonds | 1,869 | — | 272 | — | — | — | — | — | — | 2,141 | |||||||||
| Convertible Preferred Stocks | 7,671 | 541 | 1 | — | — | (707) | — | — | — | 7,506 | |||||||||
| Corporate Bonds | 640 | 6 | (882) | — | 283 | (7) | — | — | — | 40 | |||||||||
| Loan Assignments | 3,411 | (2) | (444) | 38 | 3,207 | (3,158) | — | — | — | 3,052 | |||||||||
| Preferred Stocks | 2,648 | — | (111) | — | — | — | — | — | — | 2,537 | |||||||||
| Rights | 678 | — | (57) | — | 1 | — | — | — | — | 622 | |||||||||
| Warrants | 992 | — | 1689 | — | — | — | — | — | — | 2,681 | |||||||||
| Total | 500,226 | 2,279 | (70,120) | 487 | 120,049 | (95,201) | 118,010 | (23,045) | — | 552,685 |
| 1 | Purchases include all purchases of securities and securities received in corporate actions. | ||||||||
| 2 | Sales include all sales of securities, maturities, paydowns and securities tendered in corporate actions. | ||||||||
| (a) | Certain Level 3 investments were re-classified between Asset-Backed Securities and Collateralized Mortgage Obligations. |
| Fair Value at April 30, 2022 | Valuation Technique(s) | Unobservable Input | Range (Weighted Average) (a) | |
| $ -(b) | Market Comparable Companies | EBITDA Multiple (c) | 5.0x(5.0x) | |
| Liquidity Discount | 30.00%(30.00%) | |||
| Common Stocks | -(b) | |||
| 1 | Market Comparable Companies | EBITDA Multiple (c) | 5.0x(5.0x) |
| April 30, 2022 | J.P. Morgan Funds | 145 |
| Fair Value at April 30, 2022 | Valuation Technique(s) | Unobservable Input | Range (Weighted Average) (a) | |
| Liquidity Discount | 30.00%(30.00%) | |||
| Preferred Stocks | 1 | |||
| 61,430 | Discounted Cash Flow | Constant Prepayment Rate | 0.00% - 35.00% (9.48%) | |
| Constant Default Rate | 0.00% - 9.39% (2.29%) | |||
| Yield (Discount Rate of Cash Flows) | 2.34% - 10.78% (5.28%) | |||
| Asset-Backed Securities | 61,430 | |||
| 161,172 | Discounted Cash Flow | Constant Prepayment Rate | 0.00% - 45.00% (18.56%) | |
| Constant Default Rate | 0.00% - 1.89% (0.02%) | |||
| Yield (Discount Rate of Cash Flows) | 3.05% - 14.48% (6.92%) | |||
| Collateralized Mortgage Obligations | 161,172 | |||
| 291,422 | Discounted Cash Flow | Constant Prepayment Rate | 0.00% - 100.00% (0.18%) | |
| Constant Default Rate | 0.00% - 5.00% (0.01%) | |||
| Yield (Discount Rate of Cash Flows) | 3.22% - 14.16% (7.74%) | |||
| Collateralized Mortgage-Backed Securities | 291,422 | |||
| 17 | Terms of Restructuring | Expected Recovery | 10.90% (10.90%) | |
| Loan Assignments | 17 | |||
| Total | $514,041 |
| # | The table above does not include certain level 3 investments that are valued by brokers and Pricing Services. At April 30 2022, the value of these investments was $38,664. The inputs for these investments are not readily available or cannot be reasonably estimated and are generally those inputs described in Note 2.A. |
| (a) | Unobservable inputs were weighted by the relative fair value of the instruments. |
| (b) | Amount rounds to less than one thousand. |
| (c) | Represents amounts used when the reporting entity has determined that market participants would take into account such multiples when pricing the investments. |
| 146 | J.P. Morgan Funds | April 30, 2022 |
| Unfunded Commitment | Funded Commitment | Total Commitment | |||||||
| Security Description | Maturity Date | Commitment Fee Rate | Rate if Funded | Par Amount | Value | Par Amount | Value | Par Amount | Value |
| Income Builder Fund | |||||||||
| Holley, Inc., Delayed Draw Term Loan B | 11/17/2028 | 3.750% | 4.576% | $ 50 | $ 49 | $21 | $21 | $ 71 | $ 70 |
| Moran Foods LLC, Delayed Draw 1st Lien Term Loan B ‡ | 04/01/2023 | 0.000 | 1.115 | 483 | 482 | — | — | 483 | 482 |
| Tekni-Plex, Inc., Delayed Draw Term Loan B | 09/15/2028 | 4.000 | 4.764 | 22 | 22 | 37 | 37 | 59 | 59 |
| Traeger Grills, Delayed Draw Term Loan | 06/29/2028 | 3.250 | 4.239 | 61 | 58 | 20 | 19 | 81 | 77 |
| April 30, 2022 | J.P. Morgan Funds | 147 |
| Investment Securities on Loan, at value, Presented on the Statements of Assets and Liabilities | Cash Collateral Posted by Borrower* | Net Amount Due to Counterparty (not less than zero) | |
| Global Allocation Fund | $ 83,512 | $ (83,512) | $— |
| 148 | J.P. Morgan Funds | April 30, 2022 |
| Investment Securities on Loan, at value, Presented on the Statements of Assets and Liabilities | Cash Collateral Posted by Borrower* | Net Amount Due to Counterparty (not less than zero) | |
| Income Builder Fund | $211,753 | $(211,753) | $— |
| * | Collateral posted reflects the value of securities on loan and does not include any additional amounts received from the borrower. |
| Global Allocation Fund | $3 |
| Income Builder Fund | 9 |
| Global Allocation Fund | |||||||||||||||
| For the six months ended April 30, 2022 | |||||||||||||||
| Security Description | Value at October 31, 2021 | Purchases at Cost | Proceeds from Sales | Net Realized Gain (Loss) | Change in Unrealized Appreciation/ (Depreciation) | Value at April 30, 2022 | Shares at April 30, 2022 | Dividend Income | Capital Gain Distributions | ||||||
| JPMorgan Income Fund Class R6 Shares (a) | $ — | $ 190,193 | $ — | $ — | $(3,976) | $186,217 | 20,994 | $622 | $— | ||||||
| JPMorgan Prime Money Market Fund Class Institutional Shares, 0.36% (a) (b) | 207,109 | 1,896,343 | 1,937,874 | (103) | (29) | 165,446 | 165,414 | 204 | — | ||||||
| JPMorgan Securities Lending Money Market Fund Agency SL Class Shares, 0.37% (a) (b) | 68,262 | 220,500 | 210,000 | (26)* | (3) | 78,733 | 78,788 | 33* | — | ||||||
| JPMorgan U.S. Government Money Market Fund Class IM Shares, 0.37% (a) (b) | 9,037 | 133,183 | 131,323 | — | — | 10,897 | 10,897 | 4* | — | ||||||
| Total | $284,408 | $2,440,219 | $2,279,197 | $(129) | $(4,008) | $441,293 | $863 | $— | |||||||
| (a) | Investment in an affiliated fund, which is registered under the Investment Company Act of 1940, as amended, and is advised by J.P. Morgan Investment Management Inc. |
| (b) | The rate shown is the current yield as of April 30, 2022. |
| * | Amount is included on the Statements of Operations as Income from securities lending (net) (after payments of rebates and Citibank’s fee). |
| April 30, 2022 | J.P. Morgan Funds | 149 |
| Income Builder Fund | |||||||||||||||
| For the six months ended April 30, 2022 | |||||||||||||||
| Security Description | Value at October 31, 2021 | Purchases at Cost | Proceeds from Sales | Net Realized Gain (Loss) | Change in Unrealized Appreciation/ (Depreciation) | Value at April 30, 2022 | Shares at April 30, 2022 | Dividend Income | Capital Gain Distributions | ||||||
| JPMorgan Equity Premium Income ETF Class (a) | $ — | $ 332,143 | $ — | $ — | $(17,839) | $ 314,304 | 5,366 | $7,579 | $— | ||||||
| JPMorgan Prime Money Market Fund Class IM Shares, 0.42% (a) (b) | 55,261 | 331,342 | 306,516 | (12) | 6 | 80,081 | 80,057 | 45 | — | ||||||
| JPMorgan Prime Money Market Fund Class Institutional Shares, 0.36% (a) (b) | 209,276 | 3,712,676 | 3,434,950 | (90) | (22) | 486,890 | 486,793 | 159 | — | ||||||
| JPMorgan Securities Lending Money Market Fund Agency SL Class Shares, 0.37% (a) (b) | 213,987 | 284,999 | 301,000 | (91)* | (40) | 197,855 | 197,993 | 142* | — | ||||||
| JPMorgan U.S. Government Money Market Fund Class IM Shares, 0.37% (a) (b) | 24,954 | 239,607 | 239,813 | — | — | 24,748 | 24,748 | 15* | — | ||||||
| Total | $503,478 | $4,900,767 | $4,282,279 | $(193) | $(17,895) | $1,103,878 | $7,940 | $— | |||||||
| (a) | Investment in an affiliated fund, which is registered under the Investment Company Act of 1940, as amended, and is advised by J.P. Morgan Investment Management Inc. |
| (b) | The rate shown is the current yield as of April 30, 2022. |
| * | Amount is included on the Statements of Operations as Income from securities lending (net) (after payments of rebates and Citibank’s fee). |
| 150 | J.P. Morgan Funds | April 30, 2022 |
| April 30, 2022 | J.P. Morgan Funds | 151 |
| 152 | J.P. Morgan Funds | April 30, 2022 |
| Global Allocation Fund | Income Builder Fund | |
| Equity Risk Exposure: | ||
| Unrealized Appreciation on Futures Contracts * | $ 5,729 | $ 24,798 |
| Swaps at Value (Assets) | 544 | — |
| Purchased Options at Market Value | 46,482 | — |
| Unrealized Depreciation on Futures Contracts * | (20,998) | (23,721) |
| Foreign Exchange Rate Risk Exposure: | ||
| Unrealized Appreciation on Forward Foreign Currency Exchange Contracts | 44,591 | — |
| Unrealized Depreciation on Futures Contracts * | (49,050) | — |
| Unrealized Depreciation on Forward Foreign Currency Exchange Contracts | (7,296) | — |
| Interest Rate Risk Exposure: | ||
| Unrealized Appreciation on Futures Contracts * | 7,793 | — |
| Unrealized Depreciation on Futures Contracts * | (4,111) | (110,693) |
| Net Fair Value of Derivative Contracts: | ||
| Unrealized Appreciation (Depreciation) on Futures Contracts * | (60,637) | (109,616) |
| Swaps at Value | 544 | — |
| Unrealized Appreciation (Depreciation) on Forward Foreign Currency Exchange Contracts | 37,295 | — |
| Purchased Options at Market Value | 46,482 | — |
| * | Includes cumulative appreciation/(depreciation) on futures contracts, if any, as reported on the SOIs. Only current day’s variation margin is reported within the Statements of Assets and Liabilities. |
| Counterparty | Gross Amount of Derivative Assets Subject to Netting Arrangements Presented on the Statement of Assets and Liabilities (a) | Derivatives Available for offset | Collateral Received | Net Amount Due From Counterparty (Not less than zero) | |||
| Bank of America, NA | $ 544 | $ — | $(544)(b) | $ — | |||
| Barclays Bank plc | 7,292 | (1,273) | — | 6,019 | |||
| BNP Paribas | 31,296 | (2,133) | — | 29,163 | |||
| Citibank, NA | 1,002 | (266) | — | 736 | |||
| Goldman Sachs International | 85 | (85) | — | — | |||
| HSBC Bank, NA | 1,409 | (563) | — | 846 | |||
| Merrill Lynch International | 300 | (197) | — | 103 | |||
| Royal Bank of Canada | 825 | (172) | — | 653 | |||
| Standard Chartered Bank | 40 | (40) | — | — | |||
| State Street Corp. | 2,342 | (753) | — | 1,589 | |||
| $45,135 | $(5,482) | $(544) | $39,109 |
| April 30, 2022 | J.P. Morgan Funds | 153 |
| Counterparty | Gross Amount of Derivative Liabilities Subject to Netting Arrangements Presented on the Statement of Assets and Liabilities (a) | Derivative Available for Offset | Collateral Posted | Net Amount Due to Counterparty (Not less than zero) | |||
| Barclays Bank plc | $1,273 | $(1,273) | $— | $ — | |||
| BNP Paribas | 2,133 | (2,133) | — | — | |||
| Citibank, NA | 266 | (266) | — | — | |||
| Goldman Sachs International | 738 | (85) | — | 653 | |||
| HSBC Bank, NA | 563 | (563) | — | — | |||
| Merrill Lynch International | 197 | (197) | — | — | |||
| Royal Bank of Canada | 172 | (172) | — | — | |||
| Standard Chartered Bank | 1,125 | (40) | — | 1,085 | |||
| State Street Corp. | 753 | (753) | — | — | |||
| TD Bank Financial Group | 76 | — | — | 76 | |||
| $7,296 | $(5,482) | $— | $1,814 |
| (a) | For financial reporting purposes the Fund does not offset derivative assets and derivative liabilities subject to master netting arrangements on the Statement of Assets and Liabilities. |
| (b) | Collateral received or posted is limited to the net derivative asset or net derivative liability amounts. |
| Global Allocation Fund | Income Builder Fund | |
| Realized Gain (Loss) on Derivatives Recognized as a Result From Operations: | ||
| Equity Risk Exposure: | ||
| Futures Contracts | $(19,402) | $(30,464) |
| Swap Contracts | 2,206 | — |
| Purchased Options | 4,112 | — |
| Foreign Exchange Rate Risk Exposure: | ||
| Futures Contracts | (57,333) | — |
| Forward Foreign Currency Exchange Contracts | 50,056 | — |
| Interest Rate Risk Exposure: | ||
| Futures Contracts | (1,191) | (82,884) |
| Net Change in Unrealized Appreciation (Depreciation) on Derivatives Recognized as a Result of Operations: | ||
| Equity Risk Exposure: | ||
| Futures Contracts | (22,971) | 4,502 |
| Swap Contracts | (1,706) | — |
| Purchased Options | 17,688 | — |
| Foreign Exchange Rate Risk Exposure: | ||
| Futures Contracts | (33,786) | — |
| Forward Foreign Currency Exchange Contracts | 30,171 | — |
| Interest Rate Risk Exposure: | ||
| Futures Contracts | 7,228 | (77,333) |
| 154 | J.P. Morgan Funds | April 30, 2022 |
| Global Allocation Fund | Income Builder Fund | |
| Futures Contracts: | ||
| Average Notional Balance Long | $1,621,390 | $2,110,448 |
| Average Notional Balance Short | (742,655) | (414,306) |
| Ending Notional Balance Long | 1,535,313 | 2,386,782 |
| Ending Notional Balance Short | (997,385) | (626,062) |
| Forward Foreign Currency Exchange Contracts: | ||
| Average Settlement Value Purchased | (392,945) | — |
| Average Settlement Value Sold | 1,220,718 | — |
| Ending Settlement Value Purchased | (466,416) | — |
| Ending Settlement Value Sold | 1,496,880 | — |
| Exchange-Traded Options: | ||
| Average Number of Contracts Purchased | 305 | — |
| Ending Number of Contracts Purchased | 1,608 | — |
| Total Return Basket Swaps: | ||
| Average Notional Balance Long | 59,560 | — |
| Fund | Fund Counterparty | Value of swap contracts | Collateral amount | |
| Global Allocation Fund | Collateral Received | Bank of America, NA | $544 | $(560) |
| April 30, 2022 | J.P. Morgan Funds | 155 |
| Class A | Class C | Class I | Class R2 | Class R3 | Class R4 | Class R5 | Class R6 | Total | |
| Global Allocation Fund | |||||||||
| Transfer agency fees | $13 | $11 | $13 | $ 1 | $ —(a) | $ —(a) | $ —(a) | $5 | $ 43 |
| Income Builder Fund | |||||||||
| Transfer agency fees | 67 | 33 | 31 | n/a | n/a | n/a | n/a | 4 | 135 |
| (a) | Amount rounds to less than one thousand. |
| 156 | J.P. Morgan Funds | April 30, 2022 |
| Global Allocation Fund | 0.55% |
| Income Builder Fund | 0.42 |
| Class A | Class C | Class R2 | Class R3 | |
| Global Allocation Fund | 0.25% | 0.75% | 0.50% | 0.25% |
| Income Builder Fund | 0.25 | 0.75 | n/a | n/a |
| Front-End Sales Charge | CDSC | |
| Global Allocation Fund | $ 25 | $—(a) |
| April 30, 2022 | J.P. Morgan Funds | 157 |
| Front-End Sales Charge | CDSC | |
| Income Builder Fund | $117 | $ 1 |
| (a) | Amount rounds to less than one thousand. |
| Class A | Class C | Class I | Class R2 | Class R3 | Class R4 | Class R5 | |
| Global Allocation Fund | 0.25% | 0.25% | 0.25% | 0.25% | 0.25% | 0.25% | 0.10% |
| Income Builder Fund | 0.25 | 0.25 | 0.25 | n/a | n/a | n/a | n/a |
| Class A | Class C | Class I | Class R2 | Class R3 | Class R4 | Class R5 | Class R6 | |
| Global Allocation Fund | 1.03% | 1.53% | 0.78% | 1.40% | 1.15% | 0.90% | 0.75% | 0.65% |
| Income Builder Fund | 0.75 | 1.25 | 0.60 | n/a | n/a | n/a | n/a | 0.52 |
| Contractual Waivers | |||||
| Investment Advisory Fees | Administration Fees | Service Fees | Total | Contractual Reimbursements | |
| Global Allocation Fund | $100 | $67 | $ 2,306 | $ 2,473 | $ 3 |
| Income Builder Fund | 143 | — | 13,289 | 13,432 | 460 |
| Global Allocation Fund | $203 |
| Income Builder Fund | 131 |
| 158 | J.P. Morgan Funds | April 30, 2022 |
| Global Allocation Fund | 1 |
| Income Builder Fund | 1 |
| Purchases (excluding U.S. Government) | Sales (excluding U.S. Government) | Purchases of U.S. Government | Sales of U.S. Government | Securities Sold Short | Covers on Securities Sold Short | |
| Global Allocation Fund | $2,400,617 | $2,762,186 | $86,461 | $58,778 | $278,568 | $293,366 |
| Income Builder Fund | 4,020,199 | 4,285,433 | 56,019 | 19,514 | — | — |
| Aggregate Cost | Gross Unrealized Appreciation | Gross Unrealized Depreciation | Net Unrealized Appreciation (Depreciation) | |
| Global Allocation Fund * | $ 4,064,214 | $552,301 | $369,255 | $183,046 |
| Income Builder Fund | 12,414,608 | 929,347 | 866,880 | 62,467 |
| * | The tax cost includes the proceeds from short sales which may result in a net negative cost. |
| Capital Loss Utilized | ||
| Short-Term | Long-Term | |
| Income Builder Fund | $53,583 | $16,732 |
| April 30, 2022 | J.P. Morgan Funds | 159 |
| Number of Individual Shareholder and/or Affiliated Omnibus Accounts | % of the Fund | Number of Individual Shareholder and/or Non-Affiliated Omnibus Accounts | % of the Fund | |
| Global Allocation Fund | — | —% | 2 | 22.1% |
| Income Builder Fund | 1 | 16.5 | 3 | 33.4 |
| 160 | J.P. Morgan Funds | April 30, 2022 |
| April 30, 2022 | J.P. Morgan Funds | 161 |
| 162 | J.P. Morgan Funds | April 30, 2022 |
| Beginning Account Value November 1, 2021 | Ending Account Value April 30, 2022 | Expenses Paid During the Period* | Annualized Expense Ratio | |
| JPMorgan Global Allocation Fund | ||||
| Class A | ||||
| Actual | $1,000.00 | $ 877.50 | $4.79 | 1.03% |
| Hypothetical | 1,000.00 | 1,019.69 | 5.16 | 1.03 |
| Class C | ||||
| Actual | 1,000.00 | 875.80 | 7.12 | 1.53 |
| Hypothetical | 1,000.00 | 1,017.21 | 7.65 | 1.53 |
| Class I | ||||
| Actual | 1,000.00 | 878.50 | 3.63 | 0.78 |
| Hypothetical | 1,000.00 | 1,020.93 | 3.91 | 0.78 |
| Class R2 | ||||
| Actual | 1,000.00 | 876.10 | 6.51 | 1.40 |
| Hypothetical | 1,000.00 | 1,017.85 | 7.00 | 1.40 |
| Class R3 | ||||
| Actual | 1,000.00 | 876.80 | 5.35 | 1.15 |
| Hypothetical | 1,000.00 | 1,019.09 | 5.76 | 1.15 |
| Class R4 | ||||
| Actual | 1,000.00 | 878.10 | 4.19 | 0.90 |
| Hypothetical | 1,000.00 | 1,020.33 | 4.51 | 0.90 |
| Class R5 | ||||
| Actual | 1,000.00 | 878.70 | 3.49 | 0.75 |
| Hypothetical | 1,000.00 | 1,021.08 | 3.76 | 0.75 |
| Class R6 | ||||
| Actual | 1,000.00 | 879.00 | 3.03 | 0.65 |
| Hypothetical | 1,000.00 | 1,021.57 | 3.26 | 0.65 |
| April 30, 2022 | J.P. Morgan Funds | 163 |
| Beginning Account Value November 1, 2021 | Ending Account Value April 30, 2022 | Expenses Paid During the Period* | Annualized Expense Ratio | |
| JPMorgan Income Builder Fund | ||||
| Class A | ||||
| Actual | $1,000.00 | $ 924.40 | $3.58 | 0.75% |
| Hypothetical | 1,000.00 | 1,021.08 | 3.76 | 0.75 |
| Class C | ||||
| Actual | 1,000.00 | 922.60 | 5.96 | 1.25 |
| Hypothetical | 1,000.00 | 1,018.60 | 6.26 | 1.25 |
| Class I | ||||
| Actual | 1,000.00 | 925.20 | 2.86 | 0.60 |
| Hypothetical | 1,000.00 | 1,021.82 | 3.01 | 0.60 |
| Class R6 | ||||
| Actual | 1,000.00 | 925.60 | 2.43 | 0.51 |
| Hypothetical | 1,000.00 | 1,022.27 | 2.56 | 0.51 |
| * | Expenses are equal to each Class’ respective annualized expense ratio, multiplied by the average account value over the period, multiplied by 181/365 (to reflect the one-half year period). |
| 164 | J.P. Morgan Funds | April 30, 2022 |
| April 30, 2022 | J.P. Morgan Funds | 165 |

| © JPMorgan Chase & Co., 2022. All rights reserved. April 2022. | SAN-IB-GAL-422 |
ITEM 2. CODE OF ETHICS.
Disclose whether, as of the end of the period covered by the report, the registrant has adopted a code of ethics that applies to the registrant’s principal executive officer, principal financial officer, principal accounting officer or controller, or persons performing similar functions, regardless of whether these individuals are employed by the registrant or a third party. If the registrant has not adopted such a code of ethics, explain why it has not done so.
The registrant must briefly describe the nature of any amendment, during the period covered by the report, to a provision of its code of ethics that applies to the registrant’s principal executive officer, principal financial officer, principal accounting officer or controller, or persons performing similar functions, regardless of whether these individuals are employed by the registrant or a third party, and that relates to any element of the code of ethics definition enumerated in paragraph (b) of this Item. The registrant must file a copy of any such amendment as an exhibit pursuant to Item 13(a)(1), unless the registrant has elected to satisfy paragraph (f) of this Item by positing its code of ethics on its website pursuant to paragraph (f)(2) of this Item, or by undertaking to provide its code of ethics to any person without charge, upon request, pursuant to paragraph (f)(3) of this Item.
If the registrant has, during the period covered by the report, granted a waiver, including an implicit waiver, from a provision of the code of ethics that applies to the registrant’s principal executive officer, principal financial officer, principal accounting officer or controller, or persons performing similar functions, regardless of whether these individuals are employed by the registrant or third party, that relates to one or more items set forth in paragraph (b) of this Item, the registrant must briefly describe the nature of the waiver, the name of the person to whom the waiver was granted, and the date of the waiver.
Not applicable to a semi-annual report.
ITEM 3. AUDIT COMMITTEE FINANCIAL EXPERT.
(a) (1) Disclose that the registrant’s board of directors has determined that the registrant either:
(i) Has at least one audit committee financial expert serving on its audit committee; or
(ii) Does not have an audit committee financial expert serving on its audit committee.
(2) If the registrant provides the disclosure required by paragraph (a)(1)(i) of this Item, it must disclose the name of the audit committee financial expert and whether that person is “independent.” In order to be considered “independent” for purposes of this Item, a member of an audit committee may not, other than in his or her capacity as a member of the audit committee, the board of directors, or any other board committee:
(i) Accept directly or indirectly any consulting, advisory, or other compensatory fee from the issuer; or
(ii) Be an “interested person” of the investment company as defined in Section 2(a)(19) of the Act (15 U.S.C. 80a-2(a)(19)).
(3) If the registrant provides the disclosure required by paragraph (a)(1)(ii) of this Item, it must explain why it does not have an audit committee financial expert.
Not applicable to a semi-annual report.
ITEM 4. PRINCIPAL ACCOUNTANT FEES AND SERVICES.
(a) Disclose, under the caption Audit Fees, the aggregate fees billed for each of the last two fiscal years for professional
services rendered by the principal accountant for the audit of the registrant’s annual financial statements or services that are normally provided by the accountant in connection with statutory and regulatory filings or engagements for those fiscal years.
(b) Disclose, under the caption Audit-Related Fees, the aggregate fees billed in each of the last two fiscal years for assurance and related services by the principal accountant that are reasonably related to the performance of the audit of the registrant’s financial statements and are not reported under paragraph (a) of this Item. Registrants shall describe the nature of the services comprising the fees disclosed under this category.
(c) Disclose, under the caption Tax Fees, the aggregate fees billed in each of the last two fiscal years for professional services rendered by the principal accountant for tax compliance, tax advice, and tax planning. Registrants shall describe the nature of the services comprising the fees disclosed under this category.
(d) Disclose, under the caption All Other Fees, the aggregate fees billed in each of the last two fiscal years for products and services provided by the principal accountant, other than the services reported in paragraphs (a) through (c) of this Item. Registrants shall describe the nature of the services comprising the fees disclosed under this category.
(e) (1) Disclose the audit committee’s pre-approval policies and procedures described in paragraph (c)(7) of Rule 2-01 of Regulation S-X.
(2) Disclose the percentage of services described in each of paragraphs (b) through (d) of this Item that were approved by the audit committee pursuant to paragraph (c)(7)(i)(C) of Rule 2-01 of Regulation S-X.
(f) If greater than 50 percent, disclose the percentage of hours expended on the principal accountant’s engagement to audit the registrant’s financial statements for the most recent fiscal year that were attributed to work performed by persons other than the principal accountant’s full-time, permanent employees.
(g) Disclose the aggregate non-audit fees billed by the registrant’s accountant for services rendered to the registrant, and rendered to the registrant’s investment adviser (not including any sub-adviser whose role is primarily portfolio management and is subcontracted with or overseen by another investment adviser), and any entity controlling, controlled by, or under common control with the adviser that provides ongoing services to the registrant for each of the last two fiscal years of the registrant.
(h) Disclose whether the registrant’s audit committee of the board of directors has considered whether the provision of non-audit services that were rendered to the registrant’s investment adviser (not including any subadviser whose role is primarily portfolio management and is subcontracted with or overseen by another investment adviser), and any entity controlling, controlled by, or under common control with the investment adviser that provides ongoing services to the registrant that were not pre-approved pursuant to paragraph (c)(7)(ii) of Rule 2-01 of Regulation S-X is compatible with maintaining the principal accountant’s independence.
Not applicable to a semi-annual report.
ITEM 5. AUDIT COMMITTEE OF LISTED REGISTRANTS.
(a) If the registrant is a listed issuer as defined in Rule 10A-3 under the Exchange Act (17CFR 240.10A-3), state whether or not the registrant has a separately-designated standing audit committee established in accordance with Section 3(a)(58)(A) of the Exchange Act (15 U.S.C. 78c(a)(58)(A)). If the registrant has such a committee, however designated, identify each committee member. If the entire board of directors is acting as the registrant’s audit committee as specified in Section 3(a)(58)(B) of the Exchange Act (15 U.S.C. 78c(a)(58)(B)), so state.
(b) If applicable, provide the disclosure required by Rule 10A-3(d) under the Exchange Act (17CFR 240.10A-3(d)) regarding an exemption from the listing standards for all audit committees.
Not applicable to a semi-annual report.
ITEM 6. INVESTMENTS.
File Schedule I – Investments in securities of unaffiliated issuers as of the close of the reporting period as set forth in Section 210.12-12 of Regulation S-X, unless the schedule is included as part of the report to shareholders filed under Item 1 of this Form.
Included in Item 1.
ITEM 7. DISCLOSURE OF PROXY VOTING POLICIES AND PROCEDURES FOR CLOSED-END MANAGEMENT INVESTMENT COMPANIES.
Not applicable.
ITEM 8. PORTFOLIO MANAGERS OF CLOSED-END MANAGEMENT INVESTMENT COMPANIES.
Not applicable.
ITEM 9. PURCHASE OF EQUITY SECURITIES BY CLOSED-END MANAGEMENT INVESTMENT COMPANY AND AFFILIATED PURCHASERS.
Not applicable.
ITEM 10. SUBMISSION OF MATTERS TO A VOTE OF SECURITY HOLDERS.
Describe any material changes to the procedures by which shareholders may recommend nominees to the registrant’s board of directors, where those changes were implemented after the registrant last provided disclosure in response to the requirements of Item 7(d)(2)(ii)(G) of Schedule 14A (17 CFR 240.14a-101), or this Item.
No material changes to report.
ITEM 11. CONTROLS AND PROCEDURES.
(a) Disclose the conclusions of the registrant’s principal executive and principal financial officers, or persons performing similar functions, regarding the effectiveness of the registrant’s disclosure controls and procedures (as defined in Rule 30a-3(c) under the Act (17 CFR 270.30a-3(c))) as of a date within 90 days of the filing date of the report that includes the disclosure required by this paragraph, based on the evaluation of these controls and procedures required by Rule 30a-3(b) under the Act (17 CFR 270.30a-3(b)) and Rules 13a-15(b) or 15d-15(b) under the Exchange Act (17 CFR 240.13a-15(b) or 240.15d-15(b)).
The Registrant’s principal executive and principal financial officers have concluded, based on their evaluation of the Registrant’s disclosure controls and procedures as of a date within 90 days of the filing date of this report, that the Registrant’s disclosure controls and procedures are reasonably designed to ensure that information required to be disclosed by the Registrant on Form N-CSR is recorded, processed, summarized and reported within the required time periods and that information required to be disclosed by the Registrant in the reports that it files or submits on Form N-CSR is accumulated and communicated to the Registrant’s management, including its principal executive and principal financial officers, as appropriate to allow timely decisions regarding required disclosure.
(b) Disclose any change in the registrant’s internal control over financial reporting (as defined in Rule 30a-3(d) under the Act (17 CFR 270.30a-3(d)) that occurred during the registrant’s second fiscal quarter of the period covered by this report that has materially affected, or is reasonably likely to materially affect, the registrant’s internal control over financial reporting.
There were no changes in the Registrant’s internal control over financial reporting that occurred during the last fiscal quarter covered by this report that have materially affected, or are reasonably likely to materially affect, the Registrant’s internal control over financial reporting.
ITEM 12. DISCLOSURE OF SECURITIES LENDING ACTIVITIES FOR CLOSED-END MANAGEMENT INVESTMENT COMPANIES.
Not applicable.
ITEM 13. EXHIBITS.
| (a) | File the exhibits listed below as part of this Form. Letter or number the exhibits in the sequence indicated. |
(1) Any code of ethics, or amendment thereto, that is the subject of the disclosure required by Item 2, to the extent that the registrant intends to satisfy the Item 2 requirements through filing of an exhibit.
Not applicable.
(2) A separate certification for each principal executive officer and principal financial officer of the registrant as required by Rule 30a-2(a) under the Act (17 CFR 270.30a-2).
(3) Any written solicitation to purchase securities under Rule 23c-1 under the Act (17 CFR 270.23c-1) sent or given during the period covered by the report by or on behalf of the registrant to 10 or more persons.
Not applicable.
| (b) | A separate or combined certification for each principal executive officer and principal officer of the registrant as required by Rule 30a-2(b) under the Act of 1940. |
SIGNATURES
Pursuant to the requirements of the Securities Exchange Act of 1934 and the Investment Company Act of 1940, the registrant has duly caused this report to be signed on its behalf by the undersigned, thereunto duly authorized.
| JPMorgan Trust I | ||
| By: | /s/ Brian S. Shlissel | |
| Brian S. Shlissel | ||
| President and Principal Executive Officer | ||
| July 5, 2022 | ||
Pursuant to the requirements of the Securities Exchange Act of 1934 and the Investment Company Act of 1940, this report has been signed below by the following persons on behalf of the registrant and in the capacities and on the dates indicated.
| By: | /s/ Brian S. Shlissel | |
| Brian S. Shlissel | ||
| President and Principal Executive Officer | ||
| July 5, 2022 | ||
| By: | /s/ Timothy J. Clemens | |
| Timothy J. Clemens | ||
| Treasurer and Principal Financial Officer | ||
| July 5, 2022 | ||