UNITED STATES
SECURITIES AND EXCHANGE COMMISSION
Washington, D.C. 20549
FORM N-CSR
CERTIFIED SHAREHOLDER REPORT OF REGISTERED
MANAGEMENT INVESTMENT COMPANIES
Investment Company Act file number: 811-21295
JPMorgan Trust I
(Exact name of registrant as specified in charter)
277 Park Avenue
New York, NY 10172
(Address of principal executive offices) (Zip code)
Gregory S. Samuels
277 Park Avenue
New York, NY 10172
(Name and Address of Agent for Service)
Registrant’s telephone number, including area code: (800) 480-4111
Date of fiscal year end: October 31
Date of reporting period: November 1, 2021 through October 31, 2022
Form N-CSR is to be used by management investment companies to file reports with the Commission not later than 10 days after the transmission to stockholders of any report that is required to be transmitted to stockholders under Rule 30e-1 under the Investment Company Act of 1940 (17 CFR 270.30e-1). The Commission may use the information provided on Form N-CSR in its regulatory, disclosure review, inspection, and policymaking roles.
A registrant is required to disclose the information specified by Form N-CSR, and the Commission will make this information public. A registrant is not required to respond to the collection of information contained in Form N-CSR unless the Form displays a currently valid Office of Management and Budget (“OMB”) control number. Please direct comments concerning the accuracy of the information collection burden estimate and any suggestions for reducing the burden to Secretary, Securities and Exchange Commission, 450 Fifth Street, NW, Washington, DC 20549-0609. The OMB has reviewed this collection of information under the clearance requirements of 44 U.S.C. Section 3507.
ITEM 1. REPORTS TO STOCKHOLDERS.
a.) The following is a copy of the report transmitted to shareholders pursuant to Rule 30e-1 under the Investment Company Act of 1940 (17 CFR 270.30e-1).
b.) A copy of the notice transmitted to shareholders in reliance on Rule 30e-3 under the 1940 Act that contains disclosures specified by paragraph (c)(3) of that rule is included in the Annual Reports. Not Applicable. Notices do not incorporate disclosures from the
shareholder report.
Annual Report
J.P. Morgan Specialty Funds
October 31, 2022
JPMorgan Opportunistic Equity Long/Short Fund |
JPMorgan Research Market Neutral Fund |
CONTENTS
Investments in a Fund are not deposits or obligations of, or guaranteed or endorsed by, any bank and are not insured or guaranteed by the FDIC, the Federal Reserve Board or any other government agency. You could lose money if you sell when a Fund’s share price is lower than when you invested.
Past performance is no guarantee of future performance. The general market views expressed in this report are opinions based on market and other conditions through the end of the reporting period and are subject to change without notice. These views are not intended to predict the future performance of a Fund or the securities markets.
Prospective investors should refer to the Funds’ prospectuses for a discussion of the Funds’ investment objectives, strategies and risks. Call J.P. Morgan Funds Service Center at 1-800-480-4111 for a prospectus containing more complete information about a Fund, including management fees and other expenses. Please read it carefully before investing.
Letter to Shareholders
December 15, 2022 (Unaudited)
Dear Shareholder,
Global financial markets reflected turmoil in the global economy in 2022, stirred by sharply higher inflation, rising interest rates, sporadic pandemic disruptions and the widening impact of the Russia-Ukraine conflict. Prices for both equities and bonds tumbled during the first half of the year and remained under pressure through the end of October.
|
“While investors seek to adapt to the current market environment, we believe a well-diversified portfolio and a patient outlook remain crucial components of a successful invest- ment approach.” — Brian S. Shlissel
|
Emerging market equities underperformed both the U.S. and other developed equity markets amid economic weakness in China and slowing global demand during the period. Across Europe, the war in Ukraine set off an energy crisis as a result of reduced imports of natural gas from Russia. U.S. equity markets also fell in 2022, but surprisingly strong corporate earnings and consumer spending helped leading U.S. indexes to rebound from their lowest levels. For the twelve month period ended October 31, 2022, the MSCI Emerging Markets Index returned -31.0%, the MSCI EAFE Index returned -23.0% and the S&P 500 Index returned -14.6%.
Notably, some recent U.S. inflationary data has indicated signs of easing price pressures and U.S. economic output as measured by gross domestic product turned positive in the third quarter of 2022, following two consecutive quarters of negative growth. Though the U.S. economy has lost momentum in 2022, it has not yet fallen into recession. Meanwhile, as the potential for a rapid resolution to the war in Ukraine appears to have faded, the European Union and its largest constituent
nations have moved to secure sufficient winter energy supplies while decreasing their dependence on imports of natural gas from Russia. In the U.K., a year-long political crisis was resolved with the accession of Rishi Sunak to prime minister in October 2022, which helped shore up the value of British pound and stabilize U.K. financial markets. China has eased some of the social restrictions under its “Zero Covid” policy and domestic equity indexes recently rose amid investor expectations that China’s economy may fully reopen in the coming months.
As 2022 comes to a close, financial markets are likely to remain volatile due to investor uncertainty regarding the outlook for inflation, interest rates and economic momentum. Increased geo-political tensions between Russia and Ukraine’s Western allies also remains a headwind for global financial markets.
Investors this year have confronted economic and financial market conditions not experienced in many years. While investors seek to adapt to the current market environment, we believe a well-diversified portfolio and a patient outlook remain crucial components of a successful investment approach. Our broad array of investment solutions seeks to provide investors with ability to build durable portfolios that can help them meet their financial goals.
Sincerely yours,
Brian S. Shlissel
President, J.P. Morgan Funds
J.P. Morgan Asset Management
1-800-480-4111 or www.jpmorganfunds.com for more information
| J.P. Morgan Specialty Funds | |
J.P. Morgan Specialty Funds
MARKET OVERVIEW
TWELVE MONTHS ENDED October 31, 2022 (Unaudited)
While developed market equities largely ended 2021 with positive returns, global prices for equities and bonds plummeted in 2022 amid accelerating inflation, rising interest rates, pandemic disruptions in China and the outbreak of conflict in Ukraine. Returns for both equity and bond markets broadly declined during the first half of 2022 and remained in negative territory through the end of October. Notably, global energy prices rose sharply in the first half of 2022 before receding somewhat in the third quarter.
In the U.S., investors largely kept their focus on inflation data as indicators of short-term policy of the U.S. Federal Reserve. In mid-March 2022, the central bank initiated its first interest rate increase since late 2018, and then followed with four more rate raises by the end of September 2022.
U.S. gross domestic product fell by 1.6% in the first quarter of 2022 and dropped 0.6% in the second quarter before rebounding to a 2.6% increase in the third quarter. Consumer spending declined but remained somewhat better than investors expected. By the end of June 2022, U.S. equity prices had tumbled more than 20% from the start of the year, which is generally considered a bear market. However, prices rebounded somewhat by the end of October 2022.
Within U.S. equities, growth stocks generally underperformed value stocks and small cap and mid cap stocks slightly underperformed large cap stocks. For the twelve months ended October 31, 2022, the S&P 500 Index returned -14.6%, the MSCI EAFE Index returned -23.0% and the MSCI Emerging Markets Index returned -31.0%.
| J.P. Morgan Specialty Funds | |
JPMorgan Opportunistic Equity Long/Short Fund
FUND COMMENTARY
TWELVE MONTHS ENDED October 31, 2022 (Unaudited)
| |
| |
| |
ICE BofAML 3-Month US Treasury Bill Index | |
Net Assets as of 10/31/2022 (In Thousands) | |
INVESTMENT OBJECTIVE**
The JPMorgan Opportunistic Equity Long/Short Fund (the “Fund”) seeks capital appreciation.
WHAT WERE THE MAIN DRIVERS OF THE FUND’S PERFORMANCE?
The Fund’s Class I Shares underperformed the S&P 500 Index (the “Benchmark”) for the twelve months ended October 31, 2022.
The Fund’s long positions in the industrials and information technology sectors were leading detractors from performance relative to the Benchmark. The Fund’s long positions in the health care and utilities sectors were leading contributors to relative performance.
Leading individual detractors from absolute performance included the Fund’s underweight position in Apple Inc. and its overweight positions in Tempur Sealy International Inc. and Zscaler Inc. Shares of Apple, a maker of computers, mobile devices and related product and services, rose as investors sought large capitalization stocks amid a broad sell-off in equities during the period. Shares of Tempur Sealy International, a beds and bedding products maker, fell after the company reported lower-than-expected earnings and revenue for the second quarter of 2022. Shares of Zscaler, a cloud internet security platform provider, fell after the company issued a lower-than-expected earnings forecast in late February
2022 and after the company’s chief executive left the company in October 2022.
Leading individual contributors to absolute performance included the Fund’s long positions in Constellation Energy Corp., O’Reilly Automotive Inc. and UnitedHealth Group Inc. Shares of Constellation Energy, an electric utility, rose amid investor expectations that the company would benefit from increased federal funding on so-called clean energy projects under the Inflation Reduction Act of 2022. Shares of O’Reilly Automotive, an auto parts retail chain, rose after the company reported better-than-expected earnings for the third quarter of 2022. Shares of UnitedHealth Group, a health insurance provider, rose amid consecutive quarters of better-than-expected earnings and revenue growth in 2022
HOW WAS THE FUND POSITIONED?
During the twelve months ended October 31, 2022, the Fund invested the majority of its assets in long and short positions in equity securities, selecting from a universe of equity securities with market capitalizations similar to those included in the S&P 500 Index. The Fund’s portfolio managers sought to achieve lower volatility than the Benchmark through a disciplined research process, security selection and risk management. For the twelve-month period, the Fund’s average gross exposure was 89% and its average net exposure was 28%.
| J.P. Morgan Specialty Funds | |
JPMorgan Opportunistic Equity Long/Short Fund
FUND COMMENTARY
TWELVE MONTHS ENDED October 31, 2022 (Unaudited) (continued)
TOP TEN LONG POSITIONS OF THE
PORTFOLIO AS OF October 31, 2022 | PERCENT OF
TOTAL
INVESTMENTS |
| | |
| | |
| NXP Semiconductors NV (China) | |
| | |
| | |
| | |
| Constellation Energy Corp. | |
| Canadian Pacific Railway Ltd. | |
| | |
| | |
TOP TEN SHORT POSITIONS OF THE
PORTFOLIO AS OF October 31, 2022 | PERCENT OF
TOTAL
INVESTMENTS |
| | |
| Old Dominion Freight Line, Inc. | |
| iShares Semiconductor ETF | |
| | |
| | |
| | |
| | |
| | |
| | |
| | |
LONG POSITION PORTFOLIO COMPOSITION
BY SECTOR AS OF October 31, 2022 | PERCENT OF
TOTAL
INVESTMENTS |
| |
| |
| |
| |
| |
| |
| |
| |
SHORT POSITION PORTFOLIO COMPOSITION
BY SECTOR AS OF October 31, 2022 | PERCENT OF
TOTAL
INVESTMENTS |
| |
| |
| |
| |
| |
| |
| |
| |
| |
*
The return shown is based on net asset values calculated for shareholder transactions and may differ from the return shown in the financial highlights, which reflects adjustments made to the net asset values in accordance with accounting principles generally accepted in the United States of America.
**
The adviser seeks to achieve the Fund’s objective. There can be no guarantee it will be achieved.
| J.P. Morgan Specialty Funds | |
AVERAGE ANNUAL TOTAL RETURNS AS OF October 31, 2022
|
| Sales Charge for Class A Shares is 5.25%. |
| Assumes a 1% CDSC (contingent deferred sales charge) for the one year period and 0% CDSC thereafter. |
LIFE OF FUND PERFORMANCE (8/29/14 TO 10/31/22)
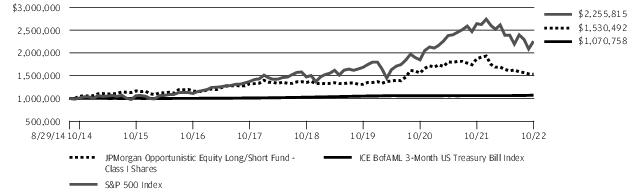
The performance quoted is past performance and is not a guarantee of future results. Mutual funds are subject to certain market risks. Investment returns and principal value of an investment will fluctuate so that an investor’s shares, when redeemed, may be worth more or less than their original cost. Current performance may be higher or lower than the performance data shown. For up-to-date month-end performance information, please call 1-800-480-4111.
The Fund commenced operations on August 29, 2014.
The graph illustrates comparative performance for $1,000,000 invested in Class I Shares of the JPMorgan Opportunistic Equity Long/Short Fund, the S&P 500 Index and the ICE BofAML 3-Month US Treasury Bill Index from August 29, 2014 to October 31, 2022. The performance of the Fund assumes reinvestment of all dividends and capital gain distributions, if any, and does not include a sales charge. The performance of the S&P 500 Index and ICE BofAML 3-Month US Treasury Bill Index does not reflect the deduction of expenses or a sales charge associated with a mutual fund and has been adjusted to reflect reinvestment of all dividends and capital gain distributions of securities included in the benchmarks, if applicable. The S&P 500 Index is an unmanaged index generally representative of the performance of large companies in the U.S. stock market. The ICE BofAML 3-Month US Treasury Bill Index is comprised of a single issue purchased at the beginning of the month and held for a full month. Each month the index is rebalanced and the issue selected is the
outstanding Treasury Bill that matures closest to, but not beyond, 3 months from the rebalancing date. Investors cannot invest directly in an index.
From the inception of the Fund through January 23, 2015, the Fund did not experience any shareholder activity. If such activity had occurred, the Fund’s performance may have been impacted.
Class I Shares have a $1,000,000 minimum initial investment.
Fund performance may reflect the waiver of the Fund’s fees and reimbursement of expenses for certain periods since the inception date. Without these waivers and reimbursements, performance would have been lower. Also, performance shown in this section does not reflect the deduction of taxes that a shareholder would pay on Fund distributions or on gains resulting from redemptions of Fund shares.
Because Class C Shares automatically convert to Class A Shares after 8 years, the since inception annual total return shown above for Class C reflects Class A performance for the period after conversion.
The returns shown are based on net asset values calculated for shareholder transactions and may differ from the returns shown in the financial highlights, which reflect adjustments made to the net asset values in accordance with accounting principles generally accepted in the United States of America.
| J.P. Morgan Specialty Funds | |
JPMorgan Research Market Neutral Fund
FUND COMMENTARY
TWELVE MONTHS ENDED October 31, 2022 (Unaudited)
| |
| |
ICE BofAML 3-Month US Treasury Bill Index | |
Net Assets as of 10/31/2022 (In Thousands) | |
INVESTMENT OBJECTIVE**
The JPMorgan Research Market Neutral Fund (the “Fund”) seeks to provide long-term capital appreciation from a broadly diversified portfolio of U.S. stocks while neutralizing the general risks associated with stock market investing.
WHAT WERE THE MAIN DRIVERS OF THE FUND’S PERFORMANCE?
The Fund’s Class I Shares underperformed the ICE BofAML 3-Month US Treasury Bill Index (the “Benchmark”) for the twelve months ended October 31, 2022.
The Fund’s security selection in the media sector and the software & hardware sector was a leading detractor from performance relative to the Benchmark, while the Fund’s security selection in the pharmaceuticals & health care sector and the industrial cyclical sector was a leading contributor to relative performance.
The Fund’s security selection in the media sector and the software & hardware sector was a leading detractor from performance relative to the Benchmark, while the Fund’s security selection in the pharmaceuticals & health care sector and the industrial cyclical sector was a leading contributor to relative performance.
Leading individual detractors from relative performance included the Fund’s short positions in Omnicom Group Inc., Ceridian HCM Holding Inc. and Apple Inc. Shares of Omnicom Group, an advertising and marketing provider, rose after the company reported better-than-expected earnings and revenue
for the third quarter of 2022. Shares of Ceridian HCM Holding, a payroll and management software provider, rose after the company reported better-than-expected earnings and revenue for the third quarter of 2022. Shares of Apple, a maker of personal computers, mobile devices and related product and services, rose as investors sought large capitalization stocks amid a broad sell-off in equities during the period.
Leading individual contributors to relative performance included the Fund’s short position in Moderna Inc. and Intel Corp., and its long position in Mastercard Inc. Shares of Moderna, a pharmaceuticals maker, fell amid investor concerns about slowing demand for its COVID-19 vaccines. Shares of Intel, a semiconductor manufacturer, fell amid broad weakness in the semiconductor sector. Shares of Mastercard, a payment processing provider, rose amid consecutive quarters of better-than-expected earnings and revenue during the period.
HOW WAS THE FUND POSITIONED?
The Fund’s portfolio managers aimed to construct a portfolio of long and short positions with a low correlation to the broader market for stocks and bonds. The Fund’s portfolio managers used fundamental research to estimate companies’ long-term earnings forecasts, ranking approximately 600 large and mid-cap stocks into five quintiles. The Fund’s portfolio managers looked to the top two quintiles for potential long positions in stocks that they believed were undervalued and the bottom two quintiles for potential short positions in stocks that they believed were overvalued.
| J.P. Morgan Specialty Funds | |
TOP TEN LONG POSITIONS OF THE
PORTFOLIO AS OF October 31, 2022 | PERCENT OF
TOTAL
INVESTMENTS |
| Mastercard, Inc., Class A | |
| NXP Semiconductors NV (China) | |
| | |
| | |
| | |
| | |
| | |
| Honeywell International, Inc. | |
| | |
| | |
TOP TEN SHORT POSITIONS OF THE
PORTFOLIO AS OF October 31, 2022 | PERCENT OF
TOTAL
INVESTMENTS |
| | |
| | |
| | |
| | |
| | |
| | |
| | |
| | |
| | |
| Johnson Controls International plc | |
LONG POSITION PORTFOLIO COMPOSITION
BY SECTOR AS OF October 31, 2022 | PERCENT OF
TOTAL
INVESTMENTS |
| |
| |
| |
| |
| |
| |
| |
| |
| |
| |
| |
| |
SHORT POSITION PORTFOLIO COMPOSITION
BY SECTOR AS OF October 31, 2022 | PERCENT OF
TOTAL
INVESTMENTS |
| |
| |
| |
| |
| |
| |
| |
| |
| |
| |
| |
*
The return shown is based on net asset values calculated for shareholder transactions and may differ from the return shown in the financial highlights, which reflects adjustments made to the net asset values in accordance with accounting principles generally accepted in the United States of America.
**
The adviser seeks to achieve the Fund’s objective. There can be no guarantee it will be achieved.
| J.P. Morgan Specialty Funds | |
JPMorgan Research Market Neutral Fund
FUND COMMENTARY
TWELVE MONTHS ENDED October 31, 2022 (Unaudited) (continued)
AVERAGE ANNUAL TOTAL RETURNS AS OF October 31, 2022
|
| Sales Charge for Class A Shares is 5.25%. |
| Assumes a 1% CDSC (contingent deferred sales charge) for the one year period and 0% CDSC thereafter. |
TEN YEAR FUND PERFORMANCE (10/31/12 TO 10/31/22)
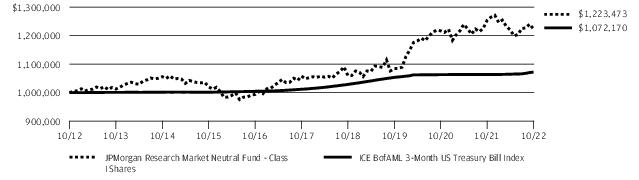
The performance quoted is past performance and is not a guarantee of future results. Mutual funds are subject to certain market risks. Investment returns and principal value of an investment will fluctuate so that an investor’s shares, when redeemed, may be worth more or less than their original cost. Current performance may be higher or lower than the performance data shown. For up-to-date month-end performance information, please call 1-800-480-4111.
The graph illustrates comparative performance for $1,000,000 invested in Class I Shares of the JPMorgan Research Market Neutral Fund and ICE BofAML 3-Month US Treasury Bill Index from October 31, 2012 to October 31, 2022. The performance of the Fund assumes reinvestment of all dividends and capital gain distributions, if any, and does not include a sales charge. The performance of the ICE BofAML 3-Month US Treasury Bill Index does not reflect the deduction of expenses or a sales charge associated with a mutual fund and has been adjusted to reflect reinvestment of all dividends and capital gain distributions of the securities included in the benchmark, if applicable. The ICE BofAML 3-Month US Treasury Bill Index is comprised of a single issue purchased at the beginning of the month and held for a full month. Each month the index
is rebalanced and the issue selected is the outstanding Treasury Bill that matures closest to, but not beyond, 3 months from the rebalancing date. Investors cannot invest directly in an index.
Class I Shares have a $1,000,000 minimum initial investment.
Fund performance may reflect the waiver of the Fund’s fees and reimbursement of expenses for certain periods. Without these waivers and reimbursements, performance would have been lower. Also, performance shown in this section does not reflect the deduction of taxes that a shareholder would pay on Fund distributions or on gains resulting from redemptions of Fund shares.
Because Class C Shares automatically convert to Class A Shares after 8 years, the 10 year average annual total return shown above for Class C reflects Class A performance for the period after conversion.
The returns shown are based on net asset values calculated for shareholder transactions and may differ from the returns shown in the financial highlights, which reflect adjustments made to the net asset values in accordance with accounting principles generally accepted in the United States of America.
| J.P. Morgan Specialty Funds | |
JPMorgan Opportunistic Equity Long/Short Fund
SCHEDULE OF PORTFOLIO INVESTMENTS
AS OF October 31, 2022
| | |
|
|
|
| | |
| | |
| | |
Communications Equipment — 0.5% |
| | |
Electric Utilities — 10.7% |
Constellation Energy Corp. (a) | | |
| | |
| | |
Health Care Providers & Services — 6.0% |
| | |
UnitedHealth Group, Inc. (a) | | |
| | |
Hotels, Restaurants & Leisure — 2.0% |
Royal Caribbean Cruises Ltd. * | | |
Industrial Conglomerates — 2.0% |
Honeywell International, Inc. | | |
Internet & Direct Marketing Retail — 4.2% |
| | |
|
| | |
Life Sciences Tools & Services — 1.7% |
Thermo Fisher Scientific, Inc. | | |
|
| | |
Oil, Gas & Consumable Fuels — 1.7% |
| | |
|
Canadian Pacific Railway Ltd. (Canada) | | |
| | |
| | |
Semiconductors & Semiconductor Equipment — 4.9% |
NXP Semiconductors NV (China) | | |
|
| | |
| | |
| | |
| | |
|
|
|
| | |
O'Reilly Automotive, Inc. * | | |
| | |
Total Common Stocks
(Cost $252,284) | | |
Exchange-Traded Funds — 4.7% |
|
SPDR S&P 500 ETF Trust(Cost $22,132) | | |
Short-Term Investments — 36.6% |
Investment Companies — 36.6% |
JPMorgan Prime Money Market Fund Class Institutional Shares, 3.12% (b) (c)(Cost $176,262) | | |
Total Long Positions
(Cost $450,678) | | |
Short Positions — (31.1)% |
|
Air Freight & Logistics — (0.8)% |
| | |
|
| | |
| | |
| | |
| | |
Building Products — (0.7)% |
| | |
|
| | |
| | |
| | |
| | |
Communications Equipment — (1.0)% |
| | |
Consumer Finance — (1.8)% |
| | |
Capital One Financial Corp. | | |
| | |
| | |
|
| | |
SEE NOTES TO FINANCIAL STATEMENTS.
| J.P. Morgan Specialty Funds | |
JPMorgan Opportunistic Equity Long/Short Fund
SCHEDULE OF PORTFOLIO INVESTMENTS
AS OF October 31, 2022 (continued)
| | |
Short Positions — continued |
Common Stocks — continued |
|
Mondelez International, Inc., Class A | | |
Health Care Providers & Services — (0.7)% |
| | |
| | |
| | |
Household Products — (1.2)% |
| | |
Procter & Gamble Co. (The) | | |
| | |
|
| | |
Professional Services — (0.3)% |
| | |
|
JB Hunt Transport Services, Inc. | | |
Knight-Swift Transportation Holdings, Inc. | | |
Old Dominion Freight Line, Inc. | | |
| | |
| | |
| | |
Semiconductors & Semiconductor Equipment — (1.0)% |
| | |
Specialty Retail — (1.5)% |
| | |
Technology Hardware, Storage & Peripherals — (6.6)% |
| | |
| | |
| | |
| | |
|
|
Textiles, Apparel & Luxury Goods — (0.5)% |
| | |
Total Common Stocks
(Proceeds $(129,779)) | | |
Exchange-Traded Funds — (3.2)% |
|
iShares Semiconductor ETF
(Proceeds $(15,586)) | | |
Total Short Positions
(Proceeds $(145,365)) | | |
Total Investments — 66.2%
(Cost $305,313) | | |
Other Assets Less Liabilities — 33.8% | | |
| | |
Percentages indicated are based on net assets. |
| |
| |
| Standard & Poor's Depositary Receipt |
| Non-income producing security. |
| All or a portion of this security is segregated as collateral for short sales. The total value of securities and cash segregated as collateral is $64,171 and $146,489, respectively. |
| Investment in an affiliated fund, which is registered under the Investment Company Act of 1940, as amended, and is advised by J.P. Morgan Investment Management Inc. |
| The rate shown is the current yield as of October 31, 2022. |
SEE NOTES TO FINANCIAL STATEMENTS.
| J.P. Morgan Specialty Funds | |
JPMorgan Research Market Neutral Fund
SCHEDULE OF PORTFOLIO INVESTMENTS
AS OF October 31, 2022
| | |
|
|
Aerospace & Defense — 3.1% |
| | |
| | |
Raytheon Technologies Corp. | | |
| | |
| | |
| | |
Air Freight & Logistics — 0.3% |
| | |
United Parcel Service, Inc., Class B | | |
| | |
|
| | |
| | |
Magna International, Inc. (Canada) | | |
| | |
|
Rivian Automotive, Inc., Class A * | | |
|
| | |
| | |
| | |
| | |
| | |
|
| | |
Constellation Brands, Inc., Class A | | |
| | |
| | |
| | |
| | |
|
| | |
| | |
BioMarin Pharmaceutical, Inc. * | | |
Neurocrine Biosciences, Inc. * | | |
Regeneron Pharmaceuticals, Inc. * | | |
Sarepta Therapeutics, Inc. * | | |
Vertex Pharmaceuticals, Inc. * (a) | | |
| | |
| | |
|
|
|
| | |
|
Ameriprise Financial, Inc. | | |
Charles Schwab Corp. (The) | | |
| | |
| | |
Raymond James Financial, Inc. | | |
| | |
| | |
| | |
|
Air Products and Chemicals, Inc. (a) | | |
DuPont de Nemours, Inc. (a) | | |
| | |
Linde plc (United Kingdom) | | |
| | |
Sherwin-Williams Co. (The) | | |
| | |
Commercial Services & Supplies — 1.0% |
| | |
| | |
| | |
Construction Materials — 0.4% |
Martin Marietta Materials, Inc. | | |
| | |
| | |
|
| | |
Electric Utilities — 1.7% |
| | |
| | |
| | |
| | |
Electrical Equipment — 0.5% |
| | |
Electronic Equipment, Instruments & Components — 1.1% |
| | |
SEE NOTES TO FINANCIAL STATEMENTS.
| J.P. Morgan Specialty Funds | |
JPMorgan Research Market Neutral Fund
SCHEDULE OF PORTFOLIO INVESTMENTS
AS OF October 31, 2022 (continued)
| | |
Long Positions — continued |
Common Stocks — continued |
Electronic Equipment, Instruments & Components — continued |
Keysight Technologies, Inc. * | | |
Mobileye Global, Inc., Class A (Israel) * | | |
| | |
Energy Equipment & Services — 0.5% |
| | |
|
Endeavor Group Holdings, Inc., Class A * (a) | | |
| | |
Take-Two Interactive Software, Inc. * | | |
Warner Music Group Corp., Class A | | |
| | |
Equity Real Estate Investment Trusts (REITs) — 1.8% |
American Homes 4 Rent, Class A | | |
Host Hotels & Resorts, Inc. | | |
| | |
| | |
| | |
| | |
| | |
| | |
| | |
| | |
Food & Staples Retailing — 0.2% |
| | |
|
| | |
Mondelez International, Inc., Class A | | |
| | |
Health Care Equipment & Supplies — 0.8% |
Boston Scientific Corp. * | | |
Intuitive Surgical, Inc. * | | |
Zimmer Biomet Holdings, Inc. | | |
| | |
Health Care Providers & Services — 2.0% |
| | |
| | |
| | |
UnitedHealth Group, Inc. (a) | | |
| | |
| | |
|
|
Hotels, Restaurants & Leisure — 2.2% |
| | |
Chipotle Mexican Grill, Inc. * | | |
Hilton Worldwide Holdings, Inc. | | |
Marriott International, Inc., Class A | | |
| | |
| | |
| | |
Household Products — 0.2% |
| | |
Industrial Conglomerates — 1.2% |
Honeywell International, Inc. (a) | | |
|
| | |
Progressive Corp. (The) (a) | | |
| | |
Interactive Media & Services — 0.7% |
Meta Platforms, Inc., Class A * (a) | | |
Internet & Direct Marketing Retail — 1.4% |
| | |
DoorDash, Inc., Class A * | | |
| | |
|
| | |
Automatic Data Processing, Inc. | | |
| | |
FleetCor Technologies, Inc. * | | |
Mastercard, Inc., Class A (a) | | |
| | |
| | |
Life Sciences Tools & Services — 1.0% |
| | |
Thermo Fisher Scientific, Inc. (a) | | |
| | |
|
| | |
| | |
| | |
| | |
SEE NOTES TO FINANCIAL STATEMENTS.
| J.P. Morgan Specialty Funds | |
| | |
Long Positions — continued |
Common Stocks — continued |
|
Charter Communications, Inc., Class A * | | |
| | |
Liberty Media Corp.-Liberty SiriusXM, Class A * | | |
| | |
|
| | |
|
| | |
|
| | |
| | |
| | |
| | |
Oil, Gas & Consumable Fuels — 2.7% |
| | |
| | |
| | |
| | |
| | |
| | |
| | |
| | |
|
Bristol-Myers Squibb Co. (a) | | |
Elanco Animal Health, Inc. * | | |
| | |
Professional Services — 1.1% |
Booz Allen Hamilton Holding Corp. | | |
Leidos Holdings, Inc. (a) | | |
| | |
|
Canadian National Railway Co. (Canada) | | |
| | |
Knight-Swift Transportation Holdings, Inc. | | |
| | |
Uber Technologies, Inc. * (a) | | |
| | |
| | |
| | |
|
|
Semiconductors & Semiconductor Equipment — 6.4% |
Advanced Micro Devices, Inc. * (a) | | |
| | |
ASML Holding NV (Registered), NYRS (Netherlands) | | |
| | |
| | |
NXP Semiconductors NV (China) | | |
Taiwan Semiconductor Manufacturing Co. Ltd., ADR (Taiwan) | | |
| | |
| | |
|
| | |
| | |
| | |
| | |
| | |
| | |
| | |
|
| | |
| | |
Burlington Stores, Inc. * | | |
| | |
O'Reilly Automotive, Inc. * (a) | | |
| | |
Technology Hardware, Storage & Peripherals — 1.0% |
Seagate Technology Holdings plc | | |
Wireless Telecommunication Services — 1.0% |
| | |
Total Common Stocks
(Cost $98,884) | | |
Short-Term Investments — 30.3% |
Investment Companies — 19.6% |
JPMorgan Prime Money Market Fund Class Institutional Shares, 3.12% (b) (c)(Cost $30,959) | | |
SEE NOTES TO FINANCIAL STATEMENTS.
| J.P. Morgan Specialty Funds | |
JPMorgan Research Market Neutral Fund
SCHEDULE OF PORTFOLIO INVESTMENTS
AS OF October 31, 2022 (continued)
| | |
U.S. Treasury Obligations—10.7% |
| | |
| | |
| | |
| | |
Total U.S. Treasury Obligations
(Cost $17,009) | | |
Total Short-Term Investments
(Cost $47,968) | | |
Total Long Positions
(Cost $146,852) | | |
| | |
Short Positions — (66.1)% |
|
Aerospace & Defense — (2.5)% |
| | |
| | |
| | |
Huntington Ingalls Industries, Inc. | | |
| | |
| | |
Air Freight & Logistics — (0.8)% |
CH Robinson Worldwide, Inc. | | |
Expeditors International of Washington, Inc. | | |
| | |
|
| | |
| | |
| | |
|
| | |
|
Citizens Financial Group, Inc. | | |
| | |
| | |
Huntington Bancshares, Inc. | | |
| | |
PNC Financial Services Group, Inc. (The) | | |
| | |
| | |
|
|
|
Brown-Forman Corp., Class B | | |
Molson Coors Beverage Co., Class B | | |
| | |
|
| | |
| | |
| | |
| | |
Building Products — (1.7)% |
| | |
Johnson Controls International plc | | |
Lennox International, Inc. | | |
| | |
| | |
|
| | |
Goldman Sachs Group, Inc. (The) | | |
| | |
| | |
| | |
T. Rowe Price Group, Inc. | | |
| | |
|
| | |
| | |
| | |
LyondellBasell Industries NV, Class A | | |
| | |
| | |
Commercial Services & Supplies — (0.1)% |
| | |
Communications Equipment — (1.1)% |
| | |
| | |
| | |
Consumer Finance — (0.9)% |
Capital One Financial Corp. | | |
| | |
| | |
SEE NOTES TO FINANCIAL STATEMENTS.
| J.P. Morgan Specialty Funds | |
| | |
Short Positions — continued |
Common Stocks — continued |
Containers & Packaging — (0.7)% |
| | |
| | |
Packaging Corp. of America | | |
| | |
| | |
Diversified Financial Services — (0.3)% |
| | |
Diversified Telecommunication Services — (0.8)% |
| | |
| | |
Verizon Communications, Inc. | | |
| | |
Electric Utilities — (2.8)% |
American Electric Power Co., Inc. | | |
| | |
| | |
| | |
| | |
Pinnacle West Capital Corp. | | |
| | |
| | |
| | |
Electrical Equipment — (0.7)% |
| | |
| | |
Sensata Technologies Holding plc | | |
| | |
Energy Equipment & Services — (0.2)% |
| | |
|
AMC Entertainment Holdings, Inc., Class A * | | |
| | |
| | |
Warner Bros Discovery, Inc. * | | |
| | |
Equity Real Estate Investment Trusts (REITs) — (2.3)% |
AvalonBay Communities, Inc. | | |
Digital Realty Trust, Inc. | | |
Extra Space Storage, Inc. | | |
| | |
|
|
Equity Real Estate Investment Trusts (REITs) — continued |
| | |
National Retail Properties, Inc. | | |
| | |
| | |
Simon Property Group, Inc. | | |
| | |
| | |
| | |
Food & Staples Retailing — (4.1)% |
| | |
| | |
Walgreens Boots Alliance, Inc. | | |
| | |
| | |
|
| | |
| | |
| | |
| | |
| | |
| | |
|
| | |
Health Care Equipment & Supplies — (0.7)% |
| | |
Health Care Providers & Services — (0.7)% |
| | |
| | |
| | |
Household Durables — (0.4)% |
Mohawk Industries, Inc. * | | |
| | |
| | |
| | |
Household Products — (0.4)% |
| | |
SEE NOTES TO FINANCIAL STATEMENTS.
| J.P. Morgan Specialty Funds | |
JPMorgan Research Market Neutral Fund
SCHEDULE OF PORTFOLIO INVESTMENTS
AS OF October 31, 2022 (continued)
| | |
Short Positions — continued |
Common Stocks — continued |
Industrial Conglomerates — (2.4)% |
| | |
| | |
| | |
|
| | |
| | |
Hartford Financial Services Group, Inc. (The) | | |
Marsh & McLennan Cos., Inc. | | |
Principal Financial Group, Inc. | | |
Ryan Specialty Holdings, Inc., Class A * | | |
| | |
| | |
Interactive Media & Services — (0.3)% |
Alphabet, Inc., Class A * | | |
Alphabet, Inc., Class C * | | |
| | |
Internet & Direct Marketing Retail — (0.5)% |
| | |
|
Cognizant Technology Solutions Corp., Class A | | |
| | |
| | |
Jack Henry & Associates, Inc. | | |
| | |
Shopify, Inc. (Canada), Class A * | | |
| | |
| | |
Life Sciences Tools & Services — (0.8)% |
Agilent Technologies, Inc. | | |
| | |
| | |
| | |
|
| | |
| | |
| | |
Illinois Tool Works, Inc. | | |
| | |
|
|
|
| | |
Stanley Black & Decker, Inc. | | |
| | |
|
Interpublic Group of Cos., Inc. (The) | | |
| | |
Paramount Global, Class B | | |
| | |
| | |
|
Consolidated Edison, Inc. | | |
| | |
| | |
Oil, Gas & Consumable Fuels — (1.8)% |
| | |
| | |
| | |
Pioneer Natural Resources Co. | | |
| | |
|
| | |
| | |
| | |
| | |
| | |
| | |
| | |
Professional Services — (1.1)% |
| | |
| | |
| | |
| | |
|
Canadian Pacific Railway Ltd. (Canada) | | |
| | |
JB Hunt Transport Services, Inc. | | |
| | |
| | |
SEE NOTES TO FINANCIAL STATEMENTS.
| J.P. Morgan Specialty Funds | |
| | |
Short Positions — continued |
Common Stocks — continued |
Semiconductors & Semiconductor Equipment — (2.5)% |
| | |
Microchip Technology, Inc. | | |
| | |
| | |
| | |
|
Ceridian HCM Holding, Inc. * | | |
| | |
| | |
| | |
| | |
Specialty Retail — (0.3)% |
| | |
| | |
| | |
Technology Hardware, Storage & Peripherals — (4.3)% |
| | |
Dell Technologies, Inc., Class C | | |
Hewlett Packard Enterprise Co. | | |
| | |
| | |
| | |
| | |
Textiles, Apparel & Luxury Goods — (0.2)% |
| | |
| | |
|
|
Trading Companies & Distributors — (0.4)% |
| | |
Total Common Stocks
(Proceeds $(110,785)) | | |
Total Short Positions
(Proceeds $(110,785)) | | |
Total Investments — 32.8%
(Cost $36,067) | | |
Other Assets Less Liabilities — 67.2% | | |
| | |
Percentages indicated are based on net assets. |
Amounts presented as a dash ("-") represent amounts that round to less than a thousand. |
| |
| American Depositary Receipt |
| |
| Non-income producing security. |
| All or a portion of this security is segregated as collateral for short sales. The total value of securities and cash segregated as collateral is $19,759 and $105,856, respectively. |
| Investment in an affiliated fund, which is registered under the Investment Company Act of 1940, as amended, and is advised by J.P. Morgan Investment Management Inc. |
| The rate shown is the current yield as of October 31, 2022. |
| The rate shown is the effective yield as of October 31, 2022. |
Futures contracts outstanding as of October 31, 2022 (amounts in thousands, except number of contracts):
| | | | | VALUE AND
UNREALIZED
APPRECIATION
(DEPRECIATION) ($) |
| | | | | |
| | | | | |
SEE NOTES TO FINANCIAL STATEMENTS.
| J.P. Morgan Specialty Funds | |
STATEMENTS OF ASSETS AND LIABILITIES
AS OF October 31, 2022
(Amounts in thousands, except per share amounts)
| JPMorgan
Opportunistic
Equity
Long/Short Fund | |
| | |
Investments in non-affiliates, at value | | |
Investments in affiliates, at value | | |
| | |
Deposits at broker for futures contracts | | |
Deposits at broker for securities sold short | | |
| | |
Investment securities sold | | |
| | |
Interest from non-affiliates | | |
Dividends from non-affiliates | | |
Dividends from affiliates | | |
Variation margin on futures contracts | | |
| | |
| | |
| | |
Securities sold short, at value | | |
Dividend expense to non-affiliates on securities sold short | | |
Investment securities purchased | | |
| | |
| | |
| | |
| | |
| | |
| | |
Custodian and accounting fees | | |
| | |
| | |
| | |
SEE NOTES TO FINANCIAL STATEMENTS.
| J.P. Morgan Specialty Funds | |
| JPMorgan Opportunistic Equity Long/Short Fund | |
| | |
| | |
Total distributable earnings (loss) | | |
| | |
| | |
| | |
| | |
| | |
| | |
| | |
Outstanding units of beneficial interest (shares)
($0.0001 par value; unlimited number of shares authorized): | | |
| | |
| | |
| | |
| | |
| | |
Class A — Redemption price per share | | |
Class C — Offering price per share (b) | | |
Class I — Offering and redemption price per share | | |
Class R6 — Offering and redemption price per share | | |
Class A maximum sales charge | | |
Class A maximum public offering price per share
[net asset value per share/(100% – maximum sales charge)] | | |
Cost of investments in non-affiliates | | |
Cost of investments in affiliates | | |
Proceeds from securities sold short | | |
(a)
Per share amounts may not recalculate due to rounding of net assets and/or shares outstanding.
(b)
Redemption price for Class C Shares varies based upon length of time the shares are held.
SEE NOTES TO FINANCIAL STATEMENTS.
| J.P. Morgan Specialty Funds | |
STATEMENTS OF OPERATIONS
FOR THE YEAR ENDED October 31, 2022
(Amounts in thousands)
| JPMorgan
Opportunistic
Equity
Long/Short Fund | |
| | |
Interest income from non-affiliates | | |
Interest income from affiliates | | |
Interest income from non-affiliates on securities sold short | | |
Dividend income from non-affiliates | | |
Dividend income from affiliates | | |
| | |
| | |
| | |
| | |
| | |
| | |
| | |
| | |
| | |
| | |
| | |
Custodian and accounting fees | | |
Interest expense to affiliates | | |
| | |
Trustees’ and Chief Compliance Officer’s fees | | |
Printing and mailing costs | | |
Registration and filing fees | | |
Transfer agency fees (See Note 2.I.) | | |
Dividend expense to non-affiliates on securities sold short | | |
| | |
| | |
| | |
| | |
Net investment income (loss) | | |
(a)
Amount rounds to less than one thousand.
SEE NOTES TO FINANCIAL STATEMENTS.
| J.P. Morgan Specialty Funds | |
| JPMorgan Opportunistic Equity Long/Short Fund | |
REALIZED/UNREALIZED GAINS (LOSSES): | | |
Net realized gain (loss) on transactions from: | | |
Investments in non-affiliates | | |
Investments in affiliates | | |
| | |
| | |
| | |
| | |
Change in net unrealized appreciation/depreciation on: | | |
Investments in non-affiliates | | |
Investments in affiliates | | |
| | |
| | |
| | |
Change in net unrealized appreciation/depreciation | | |
Net realized/unrealized gains (losses) | | |
Change in net assets resulting from operations | | |
(a)
Amount rounds to less than one thousand.
SEE NOTES TO FINANCIAL STATEMENTS.
| J.P. Morgan Specialty Funds | |
STATEMENTS OF CHANGES IN NET ASSETS
FOR THE PERIODS INDICATED
(Amounts in thousands)
| JPMorgan Opportunistic
Equity Long/Short Fund | JPMorgan
Research Market
Neutral Fund |
| Year Ended
October 31, 2022 | Year Ended
October 31, 2021 | Year Ended
October 31, 2022 | Year Ended
October 31, 2021 |
CHANGE IN NET ASSETS RESULTING FROM OPERATIONS: | | | | |
Net investment income (loss) | | | | |
| | | | |
Change in net unrealized appreciation/depreciation | | | | |
Change in net assets resulting from operations | | | | |
DISTRIBUTIONS TO SHAREHOLDERS: | | | | |
| | | | |
| | | | |
| | | | |
| | | | |
Total distributions to shareholders | | | | |
| | | | |
Change in net assets resulting from capital transactions | | | | |
| | | | |
| | | | |
| | | | |
| | | | |
SEE NOTES TO FINANCIAL STATEMENTS.
| J.P. Morgan Specialty Funds | |
| JPMorgan Opportunistic
Equity Long/Short Fund | JPMorgan
Research Market
Neutral Fund |
| Year Ended October 31, 2022 | Year Ended October 31, 2021 | Year Ended October 31, 2022 | Year Ended October 31, 2021 |
| | | | |
| | | | |
Proceeds from shares issued | | | | |
| | | | |
| | | | |
Change in net assets resulting from Class A capital transactions | | | | |
| | | | |
Proceeds from shares issued | | | | |
| | | | |
| | | | |
Change in net assets resulting from Class C capital transactions | | | | |
| | | | |
Proceeds from shares issued | | | | |
| | | | |
| | | | |
Change in net assets resulting from Class I capital transactions | | | | |
| | | | |
Proceeds from shares issued | | | | |
| | | | |
| | | | |
Change in net assets resulting from Class R6 capital transactions | | | | |
Total change in net assets resulting from capital transactions | | | | |
| | | | |
| | | | |
| | | | |
| | | | |
| | | | |
| | | | |
| | | | |
| | | | |
| | | | |
| | | | |
| | | | |
| | | | |
| | | | |
| | | | |
| | | | |
| | | | |
SEE NOTES TO FINANCIAL STATEMENTS.
| J.P. Morgan Specialty Funds | |
STATEMENTS OF CHANGES IN NET ASSETS
FOR THE PERIODS INDICATED (continued)
(Amounts in thousands)
| JPMorgan Opportunistic Equity Long/Short Fund | JPMorgan Research Market Neutral Fund |
| Year Ended October 31, 2022 | Year Ended October 31, 2021 | Year Ended October 31, 2022 | Year Ended October 31, 2021 |
SHARE TRANSACTIONS: (continued) | | | | |
| | | | |
| | | | |
| | | | |
| | | | |
Change in Class R6 Shares | | | | |
SEE NOTES TO FINANCIAL STATEMENTS.
| J.P. Morgan Specialty Funds | |
THIS PAGE IS INTENTIONALLY LEFT BLANK
FINANCIAL HIGHLIGHTS
FOR THE PERIODS INDICATED
| Per share operating performance |
| | | |
| Net asset
value,
beginning
of period | Net
investment
income
(loss)(a) | Net realized
and unrealized
gains
(losses) on
investments | Total from
investment
operations | | | |
JPMorgan Opportunistic Equity Long/Short Fund | | | | | | | |
| | | | | | | |
Year Ended October 31, 2022 | | | | | | | |
Year Ended October 31, 2021 | | | | | | | |
Year Ended October 31, 2020 | | | | | | | |
Year Ended October 31, 2019 | | | | | | | |
Year Ended October 31, 2018 | | | | | | | |
| | | | | | | |
Year Ended October 31, 2022 | | | | | | | |
Year Ended October 31, 2021 | | | | | | | |
Year Ended October 31, 2020 | | | | | | | |
Year Ended October 31, 2019 | | | | | | | |
Year Ended October 31, 2018 | | | | | | | |
| | | | | | | |
Year Ended October 31, 2022 | | | | | | | |
Year Ended October 31, 2021 | | | | | | | |
Year Ended October 31, 2020 | | | | | | | |
Year Ended October 31, 2019 | | | | | | | |
Year Ended October 31, 2018 | | | | | | | |
| | | | | | | |
Year Ended October 31, 2022 | | | | | | | |
Year Ended October 31, 2021 | | | | | | | |
Year Ended October 31, 2020 | | | | | | | |
Year Ended October 31, 2019 | | | | | | | |
Year Ended October 31, 2018 | | | | | | | |
|
| Calculated based upon average shares outstanding. |
| Includes adjustments in accordance with accounting principles generally accepted in the United States of America and as such, the net asset values for financial reporting purposes and the returns based upon those net asset values may differ from the net asset values and returns for shareholder transactions. |
| Includes earnings credits and interest expense, if applicable, each of which is less than 0.005% unless otherwise noted. |
| |
| | | | | |
Net expenses (excluding dividend and interest expense for securities sold short) | | | | | |
| | | | | |
| | | | | |
| | | | | |
| | | | | |
Expenses without waivers and reimbursements (excluding dividend and interest expense for securities sold short) | | | | | |
| | | | | |
| | | | | |
| | | | | |
| | | | | |
|
| Interest expense on securities sold short is 0.21%. |
| Amount rounds to less than $0.005. |
| Amount rounds to less than 0.005%. |
SEE NOTES TO FINANCIAL STATEMENTS.
| J.P. Morgan Specialty Funds | |
| |
| | | Ratios to average net assets |
Net asset
value,
end of
period | Total return
(excludes
sales charge)(b) | Net assets,
end of
period
(000's) | Net
expenses
(including dividend
and interest expense
for securities sold
short)(c)(d) | Net
investment
income
(loss) | Expenses without
waivers,
reimbursements,
and earnings
credits
(including dividend
and interest expense
for securities sold
short)(d) | Portfolio
turnover rate
(excluding securities
sold short) | Portfolio
turnover rate
(including securities
sold short) |
| | | | | | | |
| | | | | | | |
| | | | | | | |
| | | | | | | |
| | | | | | | |
| | | | | | | |
| | | | | | | |
| | | | | | | |
| | | | | | | |
| | | | | | | |
| | | | | | | |
| | | | | | | |
| | | | | | | |
| | | | | | | |
| | | | | | | |
| | | | | | | |
| | | | | | | |
| | | | | | | |
| | | | | | | |
| | | | | | | |
| | | | | | | |
| | | | | | | |
| | | | | | | |
| | | | | | | |
| | | | | | | |
SEE NOTES TO FINANCIAL STATEMENTS.
| J.P. Morgan Specialty Funds | |
FINANCIAL HIGHLIGHTS
FOR THE PERIODS INDICATED
| Per share operating performance |
| | | |
| Net asset
value,
beginning
of period | Net
investment
income
(loss)(a) | Net realized
and unrealized
gains
(losses) on
investments | Total from
investment
operations | |
JPMorgan Research Market Neutral Fund | | | | | |
| | | | | |
Year Ended October 31, 2022 | | | | | |
Year Ended October 31, 2021 | | | | | |
Year Ended October 31, 2020 | | | | | |
Year Ended October 31, 2019 | | | | | |
Year Ended October 31, 2018 | | | | | |
| | | | | |
Year Ended October 31, 2022 | | | | | |
Year Ended October 31, 2021 | | | | | |
Year Ended October 31, 2020 | | | | | |
Year Ended October 31, 2019 | | | | | |
Year Ended October 31, 2018 | | | | | |
| | | | | |
Year Ended October 31, 2022 | | | | | |
Year Ended October 31, 2021 | | | | | |
Year Ended October 31, 2020 | | | | | |
Year Ended October 31, 2019 | | | | | |
Year Ended October 31, 2018 | | | | | |
|
| Calculated based upon average shares outstanding. |
| Includes adjustments in accordance with accounting principles generally accepted in the United States of America and as such, the net asset values for financial reporting purposes and the returns based upon those net asset values may differ from the net asset values and returns for shareholder transactions. |
| Includes earnings credits and interest expense, if applicable, each of which is less than 0.005% unless otherwise noted. |
| |
| | | | | |
Net expenses (excluding dividend and interest expense for securities sold short) | | | | | |
| | | | | |
| | | | | |
| | | | | |
Expenses without waivers and reimbursements (excluding dividend and interest expense for securities sold short) | | | | | |
| | | | | |
| | | | | |
| | | | | |
|
| Interest expense on securities sold short is 0.16%. |
| Amount rounds to less than $0.005. |
SEE NOTES TO FINANCIAL STATEMENTS.
| J.P. Morgan Specialty Funds | |
| |
| | | Ratios to average net assets |
Net asset
value,
end of
period | Total return
(excludes
sales charge)(b) | Net assets,
end of
period
(000's) | Net
expenses
(including dividend
expense for
securities sold
short)(c)(d) | Net
investment
income
(loss) | Expenses without
waivers,
reimbursements,
and earnings
credits
(including dividend
expense for
securities sold
short)(d) | Portfolio
turnover rate
(excluding securities
sold short) | Portfolio
turnover rate
(including securities
sold short) |
| | | | | | | |
| | | | | | | |
| | | | | | | |
| | | | | | | |
| | | | | | | |
| | | | | | | |
| | | | | | | |
| | | | | | | |
| | | | | | | |
| | | | | | | |
| | | | | | | |
| | | | | | | |
| | | | | | | |
| | | | | | | |
| | | | | | | |
| | | | | | | |
| | | | | | | |
| | | | | | | |
| | | | | | | |
SEE NOTES TO FINANCIAL STATEMENTS.
| J.P. Morgan Specialty Funds | |
NOTES TO FINANCIAL STATEMENTS
AS OF October 31, 2022
(Dollar values in thousands)
1. Organization
JPMorgan Trust I (the “Trust”) was formed on November 12, 2004, as a Delaware statutory trust, pursuant to a Declaration of Trust dated November 5, 2004 and is registered under the Investment Company Act of 1940, as amended (the “1940 Act”), as an open-end management investment company.
The following are 2 separate funds of the Trust (each, a "Fund" and collectively, the "Funds") covered by this report:
| | Diversification Classification |
JPMorgan Opportunistic Equity Long/Short Fund | Class A, Class C, Class I and Class R6 | |
JPMorgan Research Market Neutral Fund | Class A, Class C and Class I | |
The investment objective of JPMorgan Opportunistic Equity Long/Short Fund (“Opportunistic Equity Long/Short Fund”) is to seek capital appreciation.
The investment objective of JPMorgan Research Market Neutral Fund (“Research Market Neutral Fund”) is to seek to provide long-term capital appreciation from a broadly diversified portfolio of U.S. stocks while neutralizing the general risks associated with stock market investing.
Class A Shares generally provide for a front-end sales charge while Class C Shares provide for a contingent deferred sales charge ("CDSC"). No sales charges are assessed with respect to Class I and Class R6 Shares. Certain Class A Shares, for which front-end sales charges have been waived, may be subject to a CDSC as described in the Funds' prospectus. Effective October 1, 2020, Class C Shares automatically convert to Class A Shares after eight years. Prior to October 1, 2020, Class C Shares automatically converted to Class A Shares after ten years. All classes of shares have equal rights as to earnings, assets and voting privileges, except that each class may bear different transfer agency, distribution and service fees and each class has exclusive voting rights with respect to its distribution plan and shareholder servicing agreements.
J.P. Morgan Investment Management Inc. (“JPMIM”), an indirect, wholly-owned subsidiary of JPMorgan Chase & Co. (“JPMorgan”), acts as Adviser (the “Adviser”) and Administrator (the “Administrator”) to the Funds.
2. Significant Accounting Policies
The following is a summary of significant accounting policies followed by the Funds in the preparation of their financial statements. The Funds are investment companies and, accordingly, follow the investment company accounting and reporting guidance of the Financial Accounting Standards Board (“FASB”) Accounting Standards Codification Topic 946 — Investment Companies, which is part of U.S. generally accepted accounting principles (“GAAP”). The preparation of financial statements in conformity with GAAP requires management to make estimates and assumptions that affect (i) the reported amounts of assets and liabilities, (ii) disclosure of contingent assets and liabilities at the date of the financial statements, and (iii) the reported amounts of increases and decreases in net assets from operations during the reporting period. Actual results could differ from those estimates.
A. Valuation of Investments — Investments are valued in accordance with GAAP and the Funds' valuation policies set forth by, and under the supervision and responsibility of, the Board of Trustees of the Trust (the "Board"), which established the following approach to valuation, as described more fully below: (i) investments for which market quotations are readily available shall be valued at their market value and (ii) all other investments for which market quotations are not readily available shall be valued at their fair value as determined in good faith by the Board.
Under Section 2(a)(41) of the Investment Company Act of 1940, the Board are required to determine fair value for securities that do not have readily available market quotations. Under SEC Rule 2a-5 (Good Faith Determinations of Fair Value), the Board may designate the performance of these fair valuation determinations to a valuation designee. The Board has designated the Adviser as the “Valuation Designee” to perform fair valuation determinations for the Funds on behalf of the Board subject to appropriate oversight by the Board. The Adviser, as Valuation Designee, leverages the J.P. Morgan Asset Management Americas Valuation Committee (“AVC”) to help oversee and carry out the policies for the valuation of Investments held in the Funds. The Adviser, as Valuation Designee, remains responsible for the valuation determinations.
This oversight by the AVC includes monitoring the appropriateness of fair values based on results of ongoing valuation oversight including, but not limited to, consideration of macro or security specific events, market events, and pricing vendor and broker due diligence. The Administrator is responsible for discussing and assessing the potential impacts to the fair values on an ongoing basis, and, at least on a quarterly basis, with the AVC and the Board.
Fixed income instruments are valued based on prices received from approved affiliated and unaffiliated pricing vendors or third party broker-dealers (collectively referred to as “Pricing Services”). The Pricing Services use multiple valuation techniques to determine the valuation of fixed income instruments. In instances where sufficient market activity exists, the Pricing Services may utilize a market-based approach through which trades or quotes from market makers are used to determine the valuation of these instruments. In instances where sufficient market activity may not exist, the Pricing Services also utilize proprietary valuation models which may consider market transactions in comparable securities and the various relationships between securities in determining fair value and/or market characteristics in order to estimate the relevant cash flows, which are then discounted to calculate the fair values.
| J.P. Morgan Specialty Funds | |
Equities and other exchange-traded instruments are valued at the last sale price or official market closing price on the primary exchange on which the instrument is traded before the net asset values ("NAV") of the Funds are calculated on a valuation date.
Certain foreign equity instruments are valued by applying international fair value factors provided by approved Pricing Services. The factors seek to adjust the local closing price for movements of local markets post-closing, but prior to the time the NAVs are calculated.
Investments in open-end investment companies, excluding exchange-traded funds (“ETFs”) (“Underlying Funds”), are valued at each Underlying Fund’s NAV per share as of the report date.
Futures contracts and options are generally valued on the basis of available market quotations. Forward foreign currency exchange contracts are valued utilizing market quotations from approved Pricing Services.
Valuations reflected in this report are as of the report date. As a result, changes in valuation due to market events and/or issuer-related events after the report date and prior to issuance of the report are not reflected herein.
The various inputs that are used in determining the valuation of the Funds' investments are summarized into the three broad levels listed below.
•
Level 1 — Unadjusted inputs using quoted prices in active markets for identical investments.
•
Level 2 — Other significant observable inputs including, but not limited to, quoted prices for similar investments, inputs other than quoted prices that are observable for investments (such as interest rates, prepayment speeds, credit risk, etc.) or other market corroborated inputs.
•
Level 3 — Significant inputs based on the best information available in the circumstances, to the extent observable inputs are not available (including the Funds' assumptions in determining the fair value of investments).
A financial instrument’s level within the fair value hierarchy is based on the lowest level of any input, both individually and in the aggregate, that is significant to the fair value measurement. The inputs or methodology used for valuing instruments are not necessarily an indication of the risk associated with investing in those instruments.
The following tables represent each valuation input as presented on the Schedules of Portfolio Investments ("SOIs"):
Opportunistic Equity Long/Short Fund | | | | |
| | Level 2
Other significant
observable inputs | Level 3
Significant
unobservable inputs | |
Total Investments in Securities (a) | | | | |
Total Liabilities for Securities Sold Short (a) | | | | |
|
| Please refer to the SOI for specifics of portfolio holdings. |
Research Market Neutral Fund | | | | |
| | Level 2
Other significant
observable inputs | Level 3
Significant
unobservable inputs | |
Investments in Securities | | | | |
| | | | |
| | | | |
| | | | |
U.S. Treasury Obligations | | | | |
Total Short-Term Investments | | | | |
Total Investments in Securities | | | | |
| | | | |
| | | | |
Total Liabilities for Securities Sold Short | | | | |
Depreciation in Other Financial Instruments | | | | |
| | | | |
| J.P. Morgan Specialty Funds | |
NOTES TO FINANCIAL STATEMENTS
AS OF October 31, 2022 (continued)
(Dollar values in thousands)
B. Restricted Securities — Certain securities held by the Funds may be subject to legal or contractual restrictions on resale. Restricted securities generally are resold in transactions exempt from registration under the Securities Act of 1933, as amended (the “Securities Act”). Disposal of these securities may involve time-consuming negotiations and expense. Prompt sale at the current valuation may be difficult and could adversely affect the NAVs of the Funds.
As of October 31, 2022, the Funds had no investments in restricted securities other than securities sold to the Funds under Rule 144A and/or Regulation S under the Securities Act.
C. Securities Lending — The Funds are authorized to engage in securities lending in order to generate additional income. The Funds are able to lend to approved borrowers. Citibank N.A. (“Citibank”) serves as lending agent for the Funds, pursuant to a Securities Lending Agency Agreement (the “Securities Lending Agency Agreement”). Securities loaned are collateralized by cash equal to at least 100% of the market value plus accrued interest on the securities lent, which is invested in an affiliated money market fund. The Funds retain the interest earned on cash collateral investments but are required to pay the borrower a rebate for the use of the cash collateral. In cases where the lent security is of high value to borrowers, there may be a negative rebate (i.e., a net payment from the borrower to the Funds). Upon termination of a loan, the Funds are required to return to the borrower an amount equal to the cash collateral, plus any rebate owed to the borrowers. The remaining maturities of the securities lending transactions are considered overnight and continuous. Loans are subject to termination by the Funds or the borrower at any time.
The net income earned on the securities lending (after payment of rebates and Citibank’s fee) is included on the Statements of Operations as Income from securities lending (net). The Funds also receive payments from the borrower during the period of the loan, equivalent to dividends and interest earned on the securities loaned, which are recorded as Dividend or Interest income, respectively, on the Statements of Operations.
Under the Securities Lending Agency Agreement, Citibank marks to market the loaned securities on a daily basis. In the event the cash received from the borrower is less than 102% of the value of the loaned securities (105% for loans of non-U.S. securities), Citibank requests additional cash from the borrower so as to maintain a collateralization level of at least 102% of the value of the loaned securities plus accrued interest (105% for loans of non-U.S. securities), subject to certain de minimis amounts.
The value of securities out on loan is recorded as an asset on the Statements of Assets and Liabilities. The value of the cash collateral received is recorded as a liability on the Statements of Assets and Liabilities and details of collateral investments are disclosed on the SOIs.
The Funds bear the risk of loss associated with the collateral investments and are not entitled to additional collateral from the borrower to cover any such losses. To the extent that the value of the collateral investments declines below the amount owed to a borrower, the Funds may incur losses that exceed the amount they earned on lending the security. Upon termination of a loan, the Funds may use leverage (borrow money) to repay the borrower for cash collateral posted if the Adviser does not believe that it is prudent to sell the collateral investments to fund the payment of this liability. Securities lending activity is subject to master netting arrangements.
Securities lending also involves counterparty risks, including the risk that the loaned securities may not be returned in a timely manner or at all. Subject to certain conditions, Citibank has agreed to indemnify the Funds from losses resulting from a borrower’s failure to return a loaned security.
The Funds did not lend out any securities during the year ended October 31, 2022.
D. Investment Transactions with Affiliates — The Funds invested in Underlying Funds and ETFs, which are advised by the Adviser. An issuer which is under common control with a Fund may be considered an affiliate. For the purposes of the financial statements, the Funds assume the issuers listed in the tables below to be affiliated issuers. The Underlying Funds’ and ETFs' distributions may be reinvested into such Underlying Funds and ETFs. Reinvestment amounts are included in the purchases at cost amounts in the tables below.
Opportunistic Equity Long/Short Fund |
For the year ended October 31, 2022 |
| | | | | Change in
Unrealized
Appreciation/
(Depreciation) | | | | Capital Gain
Distributions |
JPMorgan Prime Money Market Fund Class Institutional Shares, 3.12% (a) (b) | | | | | | | | | |
|
| Investment in an affiliated fund, which is registered under the Investment Company Act of 1940, as amended, and is advised by J.P. Morgan Investment Management Inc. |
| The rate shown is the current yield as of October 31, 2022. |
| Amount rounds to less than one thousand. |
| J.P. Morgan Specialty Funds | |
Research Market Neutral Fund |
For the year ended October 31, 2022 |
| | | | | Change in
Unrealized
Appreciation/
(Depreciation) | | | | Capital Gain
Distributions |
JPMorgan Prime Money Market Fund Class Institutional Shares, 3.12% (a) (b) | | | | | | | | | |
|
| Investment in an affiliated fund, which is registered under the Investment Company Act of 1940, as amended, and is advised by J.P. Morgan Investment Management Inc. |
| The rate shown is the current yield as of October 31, 2022. |
E. Foreign Currency Translation — The books and records of the Funds are maintained in U.S. dollars. Foreign currency amounts are translated into U.S. dollars at the prevailing exchange rates of such currencies against the U.S. dollar. The market value of investment securities and other assets and liabilities are translated at the exchange rate as of the valuation date. Purchases and sales of investment securities, income and expenses are translated at the exchange rate prevailing on the respective dates of such transactions.
The Funds do not isolate the effect of changes in foreign exchange rates from changes in market prices on securities held. Accordingly, such changes are included within Change in net unrealized appreciation/depreciation on investments in non-affiliates on the Statements of Operations.
Reported realized foreign currency gains and losses arise from the disposition of foreign currency, currency gains or losses realized between the trade and settlement dates on securities transactions, and the difference between the amounts of dividends, interest and foreign withholding taxes recorded on each Fund's books on the transaction date and the U.S. dollar equivalent of the amounts actually received or paid. These reported realized foreign currency gains and losses are included in Net realized gain (loss) on foreign currency transactions on the Statements of Operations. Unrealized foreign currency gains and losses arise from changes (due to changes in exchange rates) in the value of foreign currency and other assets and liabilities denominated in foreign currencies, which are held at year end and are included in Change in net unrealized appreciation/depreciation on foreign currency translations on the Statements of Operations.
F. Derivatives — The Funds used derivative instruments including options and futures contracts in connection with their respective investment strategies. Derivative instruments may be used as substitutes for securities in which the Funds can invest, to hedge portfolio investments or to generate income or gain to the Funds. Derivatives may also be used to effectively manage the long and short equity exposures in the portfolio, manage duration, sector and yield curve exposures and credit and spread volatility.
The Funds may be subject to various risks from the use of derivatives, including the risk that changes in the value of a derivative may not correlate perfectly with the underlying asset, rate or index; counterparty credit risk related to derivatives counterparties’ failure to perform under contract terms; liquidity risk related to the potential lack of a liquid market for these contracts allowing a Fund to close out its position(s); and documentation risk relating to disagreement over contract terms. Investing in certain derivatives also results in a form of leverage and as such, the Funds’ risk of loss associated with these instruments may exceed their value, as recorded on the Statements of Assets and Liabilities.
The Funds are party to various derivative contracts governed by International Swaps and Derivatives Association master agreements (“ISDA agreements”). The Funds’ ISDA agreements, which are separately negotiated with each dealer counterparty, may contain provisions allowing, absent other considerations, a counterparty to exercise rights, to the extent not otherwise waived, against the Funds in the event the Funds’ net assets decline over time by a pre-determined percentage or fall below a pre-determined floor. The ISDA agreements may also contain provisions allowing, absent other conditions, the Funds to exercise rights, to the extent not otherwise waived, against a counterparty (e.g., decline in a counterparty’s credit rating below a specified level). Such rights for both a counterparty and the Funds often include the ability to terminate (i.e., close out) open contracts at prices which may favor a counterparty, which could have an adverse effect on the Funds. The ISDA agreements give the Funds and a counterparty the right, upon an event of default, to close out all transactions traded under such agreements and to net amounts owed or due across all transactions and offset such net payable or receivable against collateral posted to a segregated account by one party for the benefit of the other.
Counterparty credit risk may be mitigated to the extent a counterparty posts additional collateral for mark-to-market gains to the Funds.
| J.P. Morgan Specialty Funds | |
NOTES TO FINANCIAL STATEMENTS
AS OF October 31, 2022 (continued)
(Dollar values in thousands)
Notes F(1) - F(2) below describe the various derivatives used by the Funds.
(1) Options — Opportunistic Equity Long/Short Fund purchased and/or sold ("wrote") put and call options on various instruments including currencies, futures, securities, options on indices and interest rate swaps ("swaptions") to manage and hedge interest rate risks within its portfolio and also to gain long or short exposure to the underlying instrument, index, currency or rate. A purchaser of a put option has the right, but not the obligation, to sell the underlying instrument at an agreed upon price (“strike price”) to the option seller. A purchaser of a call option has the right, but not the obligation, to purchase the underlying instrument at the strike price from the option seller.
Options Purchased — Premiums paid by the Fund for options purchased are included on the Statements of Assets and Liabilities as Options purchased. The option is adjusted daily to reflect the current market value of the option and the change is recorded as Change in net unrealized appreciation/depreciation on options purchased on the Statements of Operations. If the option is allowed to expire, the Fund will lose the entire premium it paid and record a realized loss for the premium amount. Premiums paid for options purchased which are exercised or closed are added to the amounts paid or offset against the proceeds on the underlying investment transaction to determine the realized gain (loss) or cost basis of the underlying investment.
Options Written — Premiums received by the Fund for options written are included on the Statements of Assets and Liabilities as a liability. The amount of the liability is adjusted daily to reflect the current market value of the option written and the change in market value is recorded as Change in net unrealized appreciation/depreciation of options written on the Statements of Operations. Premiums received from options written that expire are treated as realized gains. If a written option is closed, the Fund records a realized gain or loss on options written based on whether the cost of the closing transaction exceeds the premium received. If a call option is exercised by the option buyer, the premium received by the Fund is added to the proceeds from the sale of the underlying security to the option buyer and compared to the cost of the closing transaction to determine whether there has been a realized gain or loss. If a put option is exercised by an option buyer, the premium received by the option seller reduces the cost basis of the purchased security.
Written uncovered call options subject the Fund to unlimited risk of loss. Written covered call options limit the upside potential of a security above the strike price. Written put options subject the Fund to risk of loss if the value of the security declines below the exercise price minus the put premium.
The Fund is not subject to credit risk on options written as the counterparty has already performed its obligation by paying the premium at the inception of the contract.
The Fund's exchange-traded option contracts are not subject to master netting arrangements (the right to close out all transactions traded with a counterparty and net amounts owed or due across transactions). The Fund's over-the-counter ("OTC") options are subject to master netting agreements.
As of October 31, 2022, there were no exchange-traded options held by the Fund.
The Fund may be required to post or receive collateral for OTC options. Cash collateral posted by the Fund is considered restricted.
(2) Futures Contracts — Research Market Neutral Fund used index futures contracts to gain or reduce exposure to the stock market, or maintain liquidity or minimize transaction costs. The Fund also used index futures contracts to more effectively manage the long and short equity exposures in the portfolio. The Fund also purchased futures contracts to invest incoming cash in the market or sold futures in response to cash outflows, thereby simulating an invested position in the underlying index while maintaining a cash balance for liquidity.
Futures contracts provide for the delayed delivery of the underlying instrument at a fixed price or are settled for a cash amount based on the change in the value of the underlying instrument at a specific date in the future. Upon entering into a futures contract, the Fund is required to deposit with the broker, cash or securities in an amount equal to a certain percentage of the contract amount, which is referred to as the initial margin deposit. Subsequent payments, referred to as variation margin, are made or received by the Fund periodically and are based on changes in the market value of open futures contracts. Changes in the market value of open futures contracts are recorded as Change in net unrealized appreciation/depreciation on futures contracts on the Statements of Operations. Realized gains or losses, representing the difference between the value of the contract at the time it was opened and the value at the time it was closed, are reported on the Statements of Operations at the closing or expiration of the futures contract. Securities deposited as initial margin are designated on the SOIs, while cash deposited, which is considered restricted, is recorded on the Statements of Assets and Liabilities. A receivable from and/or a payable to brokers for the daily variation margin is also recorded on the Statements of Assets and Liabilities.
The use of futures contracts exposes the Fund to equity price risk. The Fund may be subject to the risk that the change in the value of the futures contract may not correlate perfectly with the underlying instrument. Use of long futures contracts subjects the Fund to risk of loss in excess of the amounts shown on the Statements of Assets and Liabilities, up to the notional amount of the futures contracts. Use of short futures contracts subjects the Fund to unlimited risk of loss. The Fund may enter into futures contracts only on exchanges or boards of trade. The exchange or board of trade acts as the counterparty to each futures transaction; therefore, the Fund's credit risk is limited to failure of the exchange or board of trade. Under some circumstances, futures exchanges may establish daily limits on the amount that the price of a futures contract can vary from the previous day’s settlement price, which could effectively prevent liquidation of positions.
| J.P. Morgan Specialty Funds | |
The Fund's futures contracts are not subject to master netting arrangements (the right to close out all transactions traded with a counterparty and net amounts owed or due across transactions).
Derivatives Volume
The table below discloses the volume of the Funds’ options and futures contracts activity during the year ended October 31, 2022. Please refer to the tables in the Summary of Derivatives Information for derivative-related gains and losses associated with volume activity:
| Opportunistic
Equity Long/
Short Fund | Research
Market Neutral
Fund |
| | |
Average Notional Balance Long | | |
Average Notional Balance Short | | |
Ending Notional Balance Short | | |
| | |
Average Number of Contracts Purchased | | |
The Funds may be required to post or receive collateral based on the net value of the Funds’ outstanding OTC options with the counterparty in the form of cash or securities. Daily movement of cash collateral is subject to minimum threshold amounts. Collateral posted by the Funds is held in a segregated account at the Funds’ custodian bank. For certain counterparties cash collateral posted by the Funds is invested in an affiliated money market fund (See Note 3.F.), otherwise the cash collateral is included on the Statements of Assets and Liabilities as Restricted cash for OTC derivatives. Collateral received by the Funds is held in a separate segregated account maintained by JPMorgan Chase Bank, N.A. (“JPMCB”), an affiliate of the Funds.
The Funds' derivatives contracts held at October 31, 2022 are not accounted for as hedging instruments under GAAP.
G. Short Sales — Opportunistic Equity Long/Short Fund and Research Market Neutral Fund engaged in short sales as part of their normal investment activities. In a short sale, the Funds sell securities they do not own in anticipation of a decline in the market value of those securities. In order to deliver securities to the purchaser, the Funds borrow securities from a broker. To close out a short position, the Funds deliver the same securities to the broker.
The Funds are required to pledge cash or securities to the broker as collateral for the securities sold short. Collateral requirements are calculated daily based on the current market value of the short positions. Cash collateral deposited with the broker is recorded as Deposits at broker for securities sold short, while cash collateral deposited at the Funds' custodian for the benefit of the broker is recorded as Restricted cash for securities sold short on the Statements of Assets and Liabilities. Securities segregated as collateral are denoted on the SOIs. The Funds may receive or pay the net of the following amounts: (i) a portion of the income from the investment of cash collateral; (ii) the broker’s fee on the borrowed securities (calculated daily based upon the market value of each borrowed security and a variable rate that is dependent on availability of the security); and (iii) a financing charge for the difference between the market value of the short position and cash collateral deposited with the broker. The net amounts of income or fees are included as interest income or interest expense on securities sold short on the Statements of Operations.
The Funds are obligated to pay the broker dividends declared on short positions when a position is open on the record date. Dividends on short positions are reported on ex-dividend date on the Statements of Operations as Dividend expense on securities sold short. The Funds are obligated to pay the broker interest accrued on short positions while the position is outstanding. Interest expense on short positions is reported as Interest expense to non-affiliates on securities sold short on the Statements of Operations. Liabilities for securities sold short are reported at market value on the Statements of Assets and Liabilities and the change in market value is recorded as Change in net unrealized appreciation/depreciation on the Statements of Operations. Short sale transactions may result in unlimited losses as the security’s price increases and the short position loses value. There is no upward limit on the price a borrowed security could attain. The Funds are also subject to risk of loss if the broker were to fail to perform its obligations under the contractual terms.
The Funds will record a realized loss if the price of the borrowed security increases between the date of the short sale and the date on which the Funds replace the borrowed security. The Funds will record a realized gain if the price of the borrowed security declines between those dates.
As of October 31, 2022, Opportunistic Equity Long/Short Fund and Research Market Neutral Fund had outstanding short sales as listed on their SOIs.
H. Security Transactions and Investment Income — Investment transactions are accounted for on the trade date (the date the order to buy or sell is executed). Securities gains and losses are calculated on a specifically identified cost basis. Interest income and interest expense on securities sold short, if any, is determined on the basis of coupon interest accrued using the effective interest method, which adjusts for amortization of premiums and accretion of discounts. Dividend income, net of foreign taxes withheld, if any, and dividend expense on securities sold short are recorded on the ex-dividend date or when a Fund first learns of the dividend.
To the extent such information is publicly available, the Funds record distributions received in excess of income earned from underlying investments as a reduction of cost of investments and/or realized gain. Such amounts are based on estimates if actual amounts are not available and actual amounts of income, realized gain and return of capital may differ from the estimated amounts. The Funds adjust the estimated amounts of the
| J.P. Morgan Specialty Funds | |
NOTES TO FINANCIAL STATEMENTS
AS OF October 31, 2022 (continued)
(Dollar values in thousands)
components of distributions (and consequently their net investment income) as necessary, once the issuers provide information about the actual composition of the distributions.
I. Allocation of Income and Expenses— Expenses directly attributable to a Fund are charged directly to that Fund, while the expenses attributable to more than one fund of the Trust are allocated among the applicable funds. Investment income, realized and unrealized gains and losses and expenses, other than class-specific expenses, are allocated daily to each class of shares based upon the proportion of net assets of each class at the beginning of each day.
Transfer agency fees are class-specific expenses. The amount of the transfer agency fees charged to each share class of the Funds for the year ended October 31, 2022 are as follows:
| | | | | |
Opportunistic Equity Long/Short Fund | | | | | |
| | | | | |
Research Market Neutral Fund | | | | | |
| | | | | |
|
| Amount rounds to less than one thousand. |
J. Federal Income Taxes — Each Fund is treated as a separate taxable entity for Federal income tax purposes. Each Fund's policy is to comply with the provisions of the Internal Revenue Code (the “Code”) applicable to regulated investment companies and to distribute to shareholders all of its distributable net investment income and net realized capital gains on investments. Accordingly, no provision for Federal income tax is necessary. Management has reviewed the Funds' tax positions for all open tax years and has determined that as of October 31, 2022, no liability for Federal income tax is required in the Funds' financial statements for net unrecognized tax benefits. However, management’s conclusions may be subject to future review based on changes in, or the interpretation of, the accounting standards or tax laws and regulations. Opportunistic Equity Long/Short Fund's and Research Market Neutral Fund's Federal tax returns for the prior three fiscal years remain subject to examination by the Internal Revenue Service.
K. Foreign Taxes —The Funds may be subject to foreign taxes on income, gains on investments or currency purchases/repatriation, a portion of which may be recoverable. The Funds will accrue such taxes and recoveries as applicable, based upon their current interpretation of tax rules and regulations that exist in the markets in which they invest. When a capital gains tax is determined to apply, the Funds record an estimated deferred tax liability in an amount that would be payable if the securities were disposed of on the valuation date.
L. Distributions to Shareholders — Distributions from net investment income, if any, are generally declared and paid at least annually and are declared separately for each class. No class has preferential dividend rights; differences in per share rates are due to differences in separate class expenses. Net realized capital gains, if any, are distributed by each Fund at least annually. The amount of distributions from net investment income and net realized capital gains is determined in accordance with Federal income tax regulations, which may differ from GAAP. To the extent these “book/tax” differences are permanent in nature (i.e., that they result from other than timing of recognition — “temporary differences”), such amounts are reclassified within the capital accounts based on their Federal tax basis treatment.
The following amounts were reclassified within the capital accounts:
| | Accumulated
undistributed
(distributions in
excess of)
net investment
income | Accumulated
net realized
gains (losses) |
Opportunistic Equity Long/Short Fund | | | |
Research Market Neutral Fund | | | |
The reclassifications for the Funds relate primarily to tax reclassifications on certain investments.
| J.P. Morgan Specialty Funds | |
3. Fees and Other Transactions with Affiliates
A. Investment Advisory Fee — Pursuant to an Investment Advisory Agreement, the Adviser manages the investments of each Fund and for such services is paid a fee. The investment advisory fee is accrued daily and paid monthly at an annual rate based on each Fund's respective average daily net assets. The annual rate for each Fund is as follows:
| |
Opportunistic Equity Long/Short Fund | |
Research Market Neutral Fund | |
|
| Effective November 1, 2022, the investment advisory fees changed to 1.05%. |
The Adviser waived investment advisory fees and/or reimbursed expenses as outlined in Note 3.F.
B. Administration Fee — Pursuant to an Administration Agreement, the Administrator provides certain administration services to each Fund. In consideration of these services, the Administrator receives a fee accrued daily and paid monthly at an annual rate of 0.075% of the first $10 billion of each Fund’s respective average daily net assets, plus 0.050% of each Fund’s respective average daily net assets between $10 billion and $20 billion, plus 0.025% of each Fund’s respective average daily net assets between $20 billion and $25 billion, plus 0.01% of each Fund’s respective average daily net assets in excess of $25 billion. For the year ended October 31, 2022, the effective annualized rate for the Funds was 0.075% of each Fund's average daily net assets, notwithstanding any fee waivers and/or expense reimbursements.
The Administrator waived administration fees as outlined in Note 3.F.
JPMCB, a wholly-owned subsidiary of JPMorgan, serves as the Funds' sub-administrator (the “Sub-administrator”). For its services as Sub-administrator, JPMCB receives a portion of the fees payable to the Administrator.
C. Distribution Fees — Pursuant to a Distribution Agreement, JPMorgan Distribution Services, Inc. (“JPMDS”), an indirect, wholly-owned subsidiary of JPMorgan, serves as each Fund's principal underwriter and promotes and arranges for the sale of each Fund's shares.
The Board has adopted a Distribution Plan (the “Distribution Plan”) for Class A and Class C Shares of the Funds pursuant to Rule 12b-1 under the 1940 Act. Class I and Class R6 Shares of the Funds do not charge a distribution fee. The Distribution Plan provides that each Fund shall pay, with respect to the applicable share classes, distribution fees, including payments to JPMDS, at annual rates of the average daily net assets as shown in the table below:
| | |
Opportunistic Equity Long/Short Fund | | |
Research Market Neutral Fund | | |
In addition, JPMDS is entitled to receive the front-end sales charges from purchases of Class A Shares and the CDSC from redemptions of Class C Shares and certain Class A Shares for which front-end sales charges have been waived. For the year ended October 31, 2022, JPMDS retained the following:
| | |
Opportunistic Equity Long/Short Fund | | |
Research Market Neutral Fund | | |
|
| Amount rounds to less than one thousand. |
D. Service Fees — The Trust, on behalf of the Funds, have entered into a Shareholder Servicing Agreement with JPMDS under which JPMDS provides certain support services to fund shareholders. For performing these services, JPMDS receives a fee with respect to all share classes, except Class R6 Shares which do not charge a service fee, that is accrued daily and paid monthly equal to a percentage of the average daily net assets as shown in the table below:
| | | |
Opportunistic Equity Long/Short Fund | | | |
Research Market Neutral Fund | | | |
JPMDS has entered into shareholder services contracts with affiliated and unaffiliated financial intermediaries who provide shareholder services and other related services to their clients or customers who invest in the Funds. Pursuant to such contracts, JPMDS will pay all or a portion of such fees earned to financial intermediaries for performing such services.
JPMDS waived service fees as outlined in Note 3.F.
| J.P. Morgan Specialty Funds | |
NOTES TO FINANCIAL STATEMENTS
AS OF October 31, 2022 (continued)
(Dollar values in thousands)
E. Custodian and Accounting Fees — JPMCB provides portfolio custody and accounting services to the Funds. For performing these services, the Funds pay JPMCB transaction and asset-based fees that vary according to the number of transactions and positions, plus out-of-pocket expenses. The amounts paid directly to JPMCB by the Funds for custody and accounting services are included in Custodian and accounting fees on the Statements of Operations.
Interest income earned on cash balances at the custodian, if any, is included in Interest income from affiliates on the Statements of Operations.
Interest expense paid to the custodian related to cash overdrafts, if any, is included in Interest expense to affiliates on the Statements of Operations.
F. Waivers and Reimbursements— The Adviser, Administrator and/or JPMDS have contractually agreed to waive fees and/or reimburse the Funds to the extent that total annual operating expenses (excluding acquired fund fees and expenses other than certain money market fund fees as described below, dividend and interest expenses related to short sales, interest, taxes, expenses related to litigation and potential litigation, expenses related to trustee elections and extraordinary expenses) exceed the percentages of the Funds’ respective average daily net assets as shown in the table below:
| | | | |
Opportunistic Equity Long/Short Fund | | | | |
Research Market Neutral Fund | | | | |
|
| Effective November 1, 2022, the contractual expense limitation changed to 1.35%, 1.85%, 1.10% and 1.05% for Class A, Class C, Class I, and Class R6, respectively. |
The expense limitation agreements were in effect for the year ended October 31, 2022 and the contractual expense limitation percentages in the table above are in place until at least February 28, 2023.
For the year ended October 31, 2022, the Funds' service providers waived fees and/or reimbursed expenses for each of the Funds as follows. None of these parties expect the Funds to repay any such waived fees and/or reimbursed expenses in future years.
| |
| | | | |
Opportunistic Equity Long/Short Fund | | | | |
Research Market Neutral Fund | | | | |
Additionally, the Funds may invest in one or more money market funds advised by the Adviser (affiliated money market funds). The Adviser, Administrator and/or JPMDS, as shareholder servicing agent, have contractually agreed to waive fees and/or reimburse expenses in an amount sufficient to offset the respective net fees each collects from the affiliated money market fund on the applicable Fund’s investment in such affiliated money market fund, except for investments of securities lending cash collateral. None of these parties expect the Funds to repay any such waived fees and/ or reimbursed expenses in future years.
The amounts of these waivers resulting from investments in these money market funds for the year ended October 31, 2022 were as follows:
| |
Opportunistic Equity Long/Short Fund | |
Research Market Neutral Fund | |
Effective January 1, 2022, JPMIM voluntarily agreed to reimburse the Funds for the Trustee Fees paid to one of the interested Trustees. For the period January 1, 2022 through October 31, 2022 the amount of these waivers were as follows:
| |
Opportunistic Equity Long/Short Fund | |
Research Market Neutral Fund | |
G. Other — Certain officers of the Trust are affiliated with the Adviser, the Administrator and JPMDS. Such officers, with the exception of the Chief Compliance Officer, receive no compensation from the Funds for serving in their respective roles.
The Board designated and appointed a Chief Compliance Officer to the Funds pursuant to Rule 38a-1 under the 1940 Act. Each Fund, along with affiliated funds, makes reimbursement payments, on a pro-rata basis, to the Administrator for a portion of the fees associated with the office of the Chief Compliance Officer. Such fees are included in Trustees’ and Chief Compliance Officer’s fees on the Statements of Operations.
| J.P. Morgan Specialty Funds | |
The Trust adopted a Trustee Deferred Compensation Plan (the “Plan”) which allows the independent Trustees to defer the receipt of all or a portion of compensation related to performance of their duties as Trustees. The deferred fees are invested in various J.P. Morgan Funds until distribution in accordance with the Plan.
During the year ended October 31, 2022, Research Market Neutral Fund purchased securities from an underwriting syndicate in which the principal underwriter or members of the syndicate were affiliated with the Adviser.
The Securities and Exchange Commission ("SEC") has granted an exemptive order permitting the Funds to engage in principal transactions with J.P. Morgan Securities LLC, an affiliated broker, involving taxable money market instruments, subject to certain conditions.
4. Investment Transactions
During the year ended October 31, 2022, purchases and sales of investments (excluding short-term investments) were as follows:
| Purchases
(excluding
U.S. Government) | Sales
(excluding
U.S. Government) | | Covers on
Securities
Sold Short |
Opportunistic Equity Long/Short Fund | | | | |
Research Market Neutral Fund | | | | |
5. Federal Income Tax Matters
For Federal income tax purposes, the estimated cost and unrealized appreciation (depreciation) in value of investments held at October 31, 2022 were as follows:
| | Gross
Unrealized
Appreciation | Gross
Unrealized
Depreciation | Net Unrealized
Appreciation
(Depreciation) |
Opportunistic Equity Long/Short Fund * | | | | |
Research Market Neutral Fund * | | | | |
|
| The tax cost includes the proceeds from short sales which may result in a net negative cost. |
The difference between book and tax basis appreciation (depreciation) on investments is primarily attributed to wash sale loss deferrals.
The tax character of distributions paid during the year ended October 31, 2022 was as follows:
| | Net
Long-Term
Capital Gains | |
Opportunistic Equity Long/Short Fund | | | |
| | | |
|
| Short-term gain distributions are treated as ordinary income for income tax purposes. |
The tax character of distributions paid during the year ended October 31, 2021 was as follows:
| | Net
Long-Term
Capital Gains | |
Opportunistic Equity Long/Short Fund | | | |
Research Market Neutral Fund | | | |
|
| Short-term gain distributions are treated as ordinary income for income tax purposes. |
| J.P. Morgan Specialty Funds | |
NOTES TO FINANCIAL STATEMENTS
AS OF October 31, 2022 (continued)
(Dollar values in thousands)
As of October 31, 2022, the estimated components of net assets (excluding paid-in-capital) on a tax basis were as follows:
| Current
Distributable
Long-Term
Capital Gain
(Tax Basis Capital
Loss Carryover) | Unrealized
Appreciation
(Depreciation) |
Opportunistic Equity Long/Short Fund | | |
Research Market Neutral Fund | | |
The cumulative timing differences primarily consist of tax adjustments on certain investments, late year loss deferrals and wash sale loss deferrals.
At October 31, 2022, the following Funds had net capital loss carryforwards which are available to offset future realized gains:
| Capital Loss Carryforward Character |
| |
Opportunistic Equity Long/Short Fund | |
Research Market Neutral Fund | |
|
| Amount includes capital loss carryforwards which are limited in future years under Internal Revenue Code sections 381-384. |
Late year ordinary losses incurred after December 31 and within the taxable year are deemed to arise on the first business day of the Funds’ next taxable year. For the year ended October 31, 2022, the following Fund deferred to November 1, 2022 late year ordinary losses of:
| Late Year Ordinary Loss Deferral |
|
Opportunistic Equity Long/Short Fund | |
Research Market Neutral Fund | |
During the year ended October 31, 2022, the following Fund utilized capital loss carryforwards as follows:
| |
| |
Research Market Neutral Fund | |
6. Borrowings
The Funds rely upon an exemptive order granted by the SEC (the “Order”) permitting the establishment and operation of an Interfund Lending Facility (the “Facility”). The Facility allows the Funds to directly lend and borrow money to or from any other fund relying upon the Order at rates beneficial to both the borrowing and lending funds. Advances under the Facility are taken primarily for temporary or emergency purposes, including the meeting of redemption requests that otherwise might require the untimely disposition of securities, and are subject to each Fund's borrowing restrictions. The Interfund loan rate is determined, as specified in the Order, by averaging the current repurchase agreement rate and the current bank loan rate. The Order was granted to JPMorgan Trust II ("JPM II") and may be relied upon by the Funds because the Funds and the series of JPM II are all investment companies in the same “group of investment companies” (as defined in Section 12(d)(1)(G) of the 1940 Act).
The Funds had no borrowings outstanding from another fund, or loans outstanding to another fund, during the year ended October 31, 2022.
The Trust and JPMCB have entered into a financing arrangement. Under this arrangement, JPMCB provides an unsecured, uncommitted credit facility in the aggregate amount of $100 million to certain of the J.P. Morgan Funds, including the Funds. Advances under the arrangement are taken primarily for temporary or emergency purposes, including the meeting of redemption requests that otherwise might require the untimely disposition of securities, and are subject to each Fund's borrowing restrictions. Interest on borrowings is payable at a rate determined by JPMCB at the time of borrowing. This agreement has been extended until October 30, 2023.
The Funds had no borrowings outstanding from the unsecured, uncommitted credit facility during the year ended October 31, 2022.
The Trust, along with certain other trusts for J.P. Morgan Funds (“Borrowers”), has entered into a joint syndicated senior unsecured revolving credit facility totaling $1.5 billion (“Credit Facility”) with various lenders and The Bank of New York Mellon, as administrative agent for the lenders. This
| J.P. Morgan Specialty Funds | |
Credit Facility provides a source of funds to the Borrowers for temporary and emergency purposes, including the meeting of redemption requests that otherwise might require the untimely disposition of securities. Under the terms of the Credit Facility, a borrowing fund must have a minimum of $25 million in adjusted net asset value and not exceed certain adjusted net asset coverage ratios prior to and during the time in which any borrowings are outstanding. If a fund does not comply with the aforementioned requirements, the fund must remediate within three business days with respect to the $25 million minimum adjusted net asset value or within one business day with respect to certain asset coverage ratios or the administrative agent at the request of, or with the consent of, the lenders may terminate the Credit Facility and declare any outstanding borrowings to be due and payable immediately.
Interest associated with any borrowing under the Credit Facility is charged to the borrowing fund at a rate of interest equal to 1.00% (the “Applicable Margin”), plus the greater of the federal funds effective rate or one month LIBOR. The annual commitment fee to maintain the Credit Facility is 0.15% and is incurred on the unused portion of the Credit Facility and is allocated to all participating funds pro rata based on their respective net assets. Effective August 9, 2022, the Credit Facility has been amended and restated for a term of 364 days, unless extended, and to include a change in the interest associated with any borrowing to the higher, on the day of the borrowing, of (a) the federal funds effective rate, or (b) the one-month Adjusted SOFR Rate plus reduction of the Applicable Margin charged for borrowing under the Credit Facility from 1.25% to 1.00%.
The Funds did not utilize the Credit Facility during the year ended October 31, 2022.
7. Risks, Concentrations and Indemnifications
In the normal course of business, the Funds enter into contracts that contain a variety of representations which provide general indemnifications. Each Fund's maximum exposure under these arrangements is unknown. The amount of exposure would depend on future claims that may be brought against each Fund. However, based on experience, the Funds expect the risk of loss to be remote.
As of October 31, 2022, the Funds had individual shareholder and/or omnibus accounts each owning more than 10% of the respective Fund's outstanding shares as follows:
| Number of
Individual Shareholder
and/or Non-Affiliated
Omnibus Accounts | |
Opportunistic Equity Long/Short Fund | | |
Research Market Neutral Fund | | |
Significant shareholder transactions by these shareholders may impact the Funds' performance and liquidity.
Derivatives may be riskier than other types of investments because they may be more sensitive to changes in economic and market conditions and could result in losses that significantly exceed the Funds’ original investment. Many derivatives create leverage thereby causing the Funds to be more volatile than they would have been if they had not used derivatives. Derivatives also expose the Funds to counterparty risk (the risk that the derivative counterparty will not fulfill its contractual obligations), including credit risk of the derivative counterparty. The possible lack of a liquid secondary market for derivatives and the resulting inability of the Funds to sell or otherwise close a derivatives position could expose the Funds to losses.
The Funds are also subject to counterparty credit risk, which is the risk that a counterparty fails to perform on agreements with the Funds.
Since Opportunistic Equity Long/Short Fund is non-diversified, it may invest a greater percentage of its assets in a particular issuer or group of issuers than a diversified fund would. This increased investment in fewer issuers may result in the Fund's shares being more sensitive to economic results of those issuing the securities.
As of October 31, 2022, Opportunistic Equity Long/Short Fund and Research Market Neutral Fund pledged substantially all of their assets to Citigroup Global Markets, Inc. for securities sold short. For the Funds, deposits at broker for securities sold short, as noted on the Statements of Assets and Liabilities, are held at Citigroup Global Markets, Inc.
LIBOR is intended to represent the rate at which contributing banks may obtain short-term borrowings from each other in the London interbank market. On March 5, 2021, the U.K. Financial Conduct Authority ("FCA") publicly announced that (i) immediately after December 31, 2021, publication of the 1-week and 2-month U.S. Dollar LIBOR settings will permanently cease; (ii) immediately after June 30, 2023, publication of the overnight and 12-month U.S. Dollar LIBOR settings will permanently cease; and (iii) immediately after June 30, 2023, the 1-month, 3-month and 6-month U.S. Dollar LIBOR settings will cease to be provided or, subject to the FCA's consideration of the case, be provided on a synthetic basis and no longer be representative of the underlying market and economic reality they are intended to measure and that representativeness will not be restored. There is no assurance that the dates announced by the FCA will not change or that the administrator of LIBOR and/or regulators will not take further action that could impact the availability, composition or characteristics of LIBOR or the currencies and/or tenors for which LIBOR is published. In addition, certain regulated entities ceased entering into most new LIBOR contracts in connection with regulatory guidance or prohibitions. Public and private
| J.P. Morgan Specialty Funds | |
NOTES TO FINANCIAL STATEMENTS
AS OF October 31, 2022 (continued)
(Dollar values in thousands)
sector industry initiatives are currently underway to implement new or alternative reference rates to be used in place of LIBOR. There is no assurance that any such alternative reference rate will be similar to or produce the same value or economic equivalence as LIBOR or that it will have the same volume or liquidity as did LIBOR prior to its discontinuance, unavailability or replacement, all of which may affect the value, volatility, liquidity or return on certain of a Fund's loans, notes, derivatives and other instruments or investments comprising some or all of a Fund's investments and result in costs incurred in connection with changing reference rates used for positions, closing out positions and entering into new trades. Certain of a Fund's investments may transition from LIBOR prior to the dates announced by the FCA. The transition from LIBOR to alternative reference rates may result in operational issues for a Fund or its investments. No assurances can be given as to the impact of the LIBOR transition (and the timing of any such impact) on a Fund and its investments.
The Funds are subject to infectious disease epidemics/pandemics risk. The worldwide outbreak of COVID-19 has negatively affected economies, markets and individual companies throughout the world. The effects of this COVID-19 pandemic to public health, and business and market conditions, including among other things, reduced consumer demand and economic output, supply chain disruptions and increased government spending may continue to have a significant negative impact on the performance of a Fund's investments, increase a Fund's volatility, exacerbate other pre-existing political, social and economic risks to the Funds and negatively impact broad segments of businesses and populations. In addition, governments, their regulatory agencies, or self-regulatory organizations have taken or may take actions in response to the pandemic that affect the instruments in which the Funds invest, or the issuers of such instruments, in ways that could also have a significant negative impact on a Fund’s investment performance. The duration and extent of COVID-19 and associated economic and market conditions and uncertainty over the long-term cannot be reasonably estimated at this time. The ultimate impact of COVID-19 and the extent to which the associated conditions impact a Fund will also depend on future developments, which are highly uncertain, difficult to accurately predict and subject to frequent changes.
| J.P. Morgan Specialty Funds | |
REPORT OF INDEPENDENT REGISTERED PUBLIC ACCOUNTING FIRM
To the Board of Trustees of JPMorgan Trust I and Shareholders of JPMorgan Opportunistic Equity Long/Short Fund and JPMorgan Research Market Neutral Fund
Opinions on the Financial Statements
We have audited the accompanying statements of assets and liabilities, including the schedules of portfolio investments, of JPMorgan Opportunistic Equity Long/Short Fund and JPMorgan Research Market Neutral Fund (two of the funds constituting JPMorgan Trust I, hereafter collectively referred to as the "Funds") as of October 31, 2022, the related statements of operations for the year ended October 31, 2022, the statements of changes in net assets for each of the two years in the period ended October 31, 2022, including the related notes,and the financial highlights for each of the periods indicated therein (collectively referred to as the “financial statements”). In our opinion, the financial statements present fairly, in all material respects, the financial position of each of the Funds as of October 31, 2022, the results of each of their operations for the year then ended, the changes in each of their net assets for each of the two years in the period ended October 31, 2022 and each of the financial highlights for each of the periods indicated therein in conformity with accounting principles generally accepted in the United States of America.
Basis for Opinions
These financial statements are the responsibility of the Funds’ management. Our responsibility is to express an opinion on the Funds’ financial statements based on our audits. We are a public accounting firm registered with the Public Company Accounting Oversight Board (United States) (PCAOB) and are required to be independent with respect to the Funds in accordance with the U.S. federal securities laws and the applicable rules and regulations of the Securities and Exchange Commission and the PCAOB.
We conducted our audits of these financial statements in accordance with the standards of the PCAOB. Those standards require that we plan and perform the audit to obtain reasonable assurance about whether the financial statements are free of material misstatement, whether due to error or fraud.
Our audits included performing procedures to assess the risks of material misstatement of the financial statements, whether due to error or fraud, and performing procedures that respond to those risks. Such procedures included examining, on a test basis, evidence regarding the amounts and disclosures in the financial statements. Our audits also included evaluating the accounting principles used and significant estimates made by management, as well as evaluating the overall presentation of the financial statements. Our procedures included confirmation of securities owned as of October 31, 2022 by correspondence with the custodian, transfer agent and brokers; when replies were not received from brokers, we performed other auditing procedures. We believe that our audits provide a reasonable basis for our opinions.
/s/ PricewaterhouseCoopers LLP
New York, New York
December 22, 2022
We have served as the auditor of one or more investment companies in the JPMorgan Funds complex since 1993.
| J.P. Morgan Specialty Funds | |
The Funds’ Statement of Additional Information includes additional information about the Funds’ Trustees and is available, without charge, upon request by calling 1-800-480-4111 or on the J.P. Morgan Funds’ website at www.jpmorganfunds.com.
Name (Year of Birth);
Positions With
the Funds (1) | Principal Occupation
During Past 5 Years | Number of
Funds in Fund
Complex Overseen
by Trustee (2) | Other Directorships Held
During the Past 5 Years |
| | | |
John F. Finn (1947); Chair
since 2020; Trustee since 1998. | Chairman, Gardner, Inc. (supply chain management company serving industrial and consumer markets) (serving in various roles 1974-present). | | Director, Greif, Inc. (GEF) (industrial package products and services) (2007-present); Trustee, Columbus Association for the Performing Arts (1988-present). |
Stephen P. Fisher (1959);
Trustee since 2018. | Retired; Chairman and Chief Executive Officer, NYLIFE Distributors LLC (registered broker-dealer) (serving in various roles 2008-2013); Chairman, NYLIM Service Company LLC (transfer agent) (2008-2017); New York Life Investment Management LLC (registered investment adviser) (serving in various roles 2005-2017); Chairman, IndexIQ Advisors LLC (registered investment adviser for ETFs) (2014-2017); President, MainStay VP Funds Trust (2007-2017), MainStay DefinedTerm Municipal Opportunities Fund (2011-2017) and MainStay Funds Trust (2007-2017) (registered investment companies). | | Honors Program Advisory Board Member, The Zicklin School of Business, Baruch College, The City University of New York (2017-present). |
Gary L. French (1951);
Trustee since 2014. | Real Estate Investor (2011-2020); Investment management industry Consultant and Expert Witness (2011-present); Senior Consultant for The Regulatory Fundamentals Group LLC (2011-2017). | | Independent Trustee, The China Fund, Inc. (2013-2019); Exchange Traded Concepts Trust II (2012-2014); Exchange Traded Concepts Trust I (2011-2014). |
Kathleen M. Gallagher (1958);
Trustee since 2018. | Retired; Chief Investment Officer — Benefit Plans, Ford Motor Company (serving in various roles 1985-2016). | | Non- Executive Director, Legal & General Investment Management (Holdings) (2018-present); Non-Executive Director, Legal & General Investment Management America (U.S. Holdings) (financial services and insurance) (2017-present); Advisory Board Member, State Street Global Advisors Total Portfolio Solutions (2017-present); Member, Client Advisory Council, Financial Engines, LLC (registered investment adviser) (2011-2016); Director, Ford Pension Funds Investment Management Ltd. (2007-2016). |
Robert J. Grassi (1957);
Trustee since 2014. | Sole Proprietor, Academy Hills Advisors LLC (2012-present); Pension Director, Corning Incorporated (2002-2012). | | |
| J.P. Morgan Specialty Funds | |
Name (Year of Birth); Positions With the Funds (1) | Principal Occupation During Past 5 Years | Number of Funds in Fund Complex Overseen by Trustee (2) | Other Directorships Held During the Past 5 Years |
Frankie D. Hughes (1952);
Trustee since 2008. | President, Ashland Hughes Properties (property management) (2014-present); President and Chief Investment Officer, Hughes Capital Management, Inc. (fixed income asset management) (1993-2014). | | |
Raymond Kanner (1953);
Trustee since 2017. | Retired; Managing Director and Chief Investment Officer, IBM Retirement Funds (2007-2016). | | Advisory Board Member, Penso Advisors, LLC (2020-present); Advisory Board Member, Los Angeles Capital (2018-present); Advisory Board Member, State Street Global Advisors Total Portfolio Solutions (2017- present); Acting Executive Director, Committee on Investment of Employee Benefit Assets (CIEBA) (2016-2017); Advisory Board Member, Betterment for Business (robo advisor) (2016- 2017); Advisory Board Member, BlueStar Indexes (index creator) (2013-2017); Director, Emerging Markets Growth Fund (registered investment company) (1997-2016); Member, Russell Index Client Advisory Board (2001-2015). |
Thomas P. Lemke (1954);
Trustee since 2014. | | | (1) Independent Trustee of Advisors’ Inner Circle III fund platform, consisting of the following: (i) the Advisors’ Inner Circle Fund III, (ii) the Gallery Trust, (iii) the Schroder Series Trust, (iv) the Delaware Wilshire Private Markets Fund (since 2020), (v) Chiron Capital Allocation Fund Ltd., and (vi) formerly the Winton Diversified Opportunities Fund (2014-2018); and (2) Independent Trustee of the Symmetry Panoramic Trust (since 2018). |
Lawrence R. Maffia (1950);
Trustee since 2014 | Retired; Director and President, ICI Mutual Insurance Company (2006-2013). | | Director, ICI Mutual Insurance Company (1999-2013). |
Mary E. Martinez (1960); Vice
Chair since 2021; Trustee since 2013. | Associate, Special Properties, a Christie’s International Real Estate Affiliate (2010-present); Managing Director, Bank of America (asset management) (2007-2008); Chief Operating Officer, U.S. Trust Asset Management, U.S. Trust Company (asset management) (2003-2007); President, Excelsior Funds (registered investment companies) (2004-2005). | | |
Marilyn McCoy (1948);
Trustee since 2005. | Vice President of Administration and Planning, Northwestern University (1985-present). | | |
| J.P. Morgan Specialty Funds | |
TRUSTEES
(Unaudited) (continued)
Name (Year of Birth); Positions With the Funds (1) | Principal Occupation During Past 5 Years | Number of Funds in Fund Complex Overseen by Trustee (2) | Other Directorships Held During the Past 5 Years |
Dr. Robert A. Oden, Jr. (1946); Trustee
since 2005. | Retired; President, Carleton College (2002-2010); President, Kenyon College (1995-2002). | | Trustee, The Coldwater Conservation Fund (2017-present); Trustee, American Museum of Fly Fishing (2013-present); Trustee and Vice Chair, Trout Unlimited (2017-2021);Trustee, Dartmouth- Hitchcock MedicalCenter (2011-2020). |
Marian U. Pardo* (1946);
Trustee since 2013. | Managing Director and Founder, Virtual Capital Management LLC (investment consulting) (2007-present); Managing Director, Credit Suisse Asset Management (portfolio manager) (2003-2006). | | Board Chair and Member, Board of Governors, Columbus Citizens Foundation (not-for-profit supporting philanthropic and cultural programs) (2006-present). |
Emily A. Youssouf (1951);
Trustee since 2022. | Adjunct Professor (2011-present) and Clinical Professor (2009-2011), NYU Schack Institute of Real Estate; Board Member and Member of the Audit Committee (2013–present), Chair of Finance Committee (2019-present), Member of Related Parties Committee (2013-2018) and Member of the Enterprise Risk Committee (2015-2018), PennyMac Financial Services, Inc.; Board Member (2005-2018), Chair of Capital Committee (2006-2016), Chair of Audit Committee (2005-2018), Member of Finance Committee (2005-2018) and Chair of IT Committee (2016-2018), NYC Health and Hospitals Corporation. | | Trustee, NYC School Construction Authority (2009-present); Board Member, NYS Job Development Authority (2008-present); Trustee and Chair of the Audit Committee of the Transit Center Foundation (2015-2019). |
| | | |
Robert F. Deutsch** (1957);
Trustee since 2014. | Retired; Head of ETF Business for JPMorgan Asset Management (2013-2017); Head of Global Liquidity Business for JPMorgan Asset Management (2003-2013). | | Treasurer and Director of the JUST Capital Foundation (2017-present). |
Nina O. Shenker** (1957);
Trustee since 2022. | Vice Chair (2017-2021), General Counsel and Managing Director (2008-2016), Associate General Counsel and Managing Director (2004-2008), J.P. Morgan Asset & Wealth Management. | | Director and Member of Legal and Human Resources Subcommittees, American Jewish Joint Distribution Committee (2018-present). |
|
| The year shown is the first year in which a Trustee became a member of any of the following: the Mutual Fund Board, the ETF Board, the heritage J.P. Morgan Funds or the heritage One Group Mutual Funds. Trustees serve an indefinite term, until resignation, retirement, removal or death. The Board’s current retirement policy sets retirement at the end of the calendar year in which the Trustee attains the age of 75, provided that any Board member who was a member of the Mutual Fund Board prior to January 1, 2022 and was born prior to January 1, 1950 shall retire from the Board at the end of the calendar year in which the Trustee attains the age of 78. |
| A Fund Complex means two or more registered investment companies that hold themselves out to investors as related companies for purposes of investment and investor services or have a common investment adviser or have an investment adviser that is an affiliated person of the investment adviser of any of the other registered investment companies. The J.P. Morgan Funds Complex for which the Board of Trustees serves currently includes nine registered investment companies (166 J.P. Morgan Funds). |
| In connection with prior employment with JPMorgan Chase, Ms. Pardo was the recipient of non-qualified pension plan payments from JPMorgan Chase in the amount of approximately $2,055 per month, which she irrevocably waived effective January 1, 2013, and deferred compensation payments from JPMorgan Chase in the amount of approximately $7,294 per year, which ended in January 2013. In addition, Ms. Pardo receives payments from a fully-funded qualified plan, which is not an obligation of JPMorgan Chase. |
| Designation as an “Interested Trustee” is based on prior employment by the Adviser or an affiliate of the Adviser or interests in a control person of the Adviser. |
| J.P. Morgan Specialty Funds | |
| The contact address for each of the Trustees is 277 Park Avenue, New York, NY 10172. |
| J.P. Morgan Specialty Funds | |
Name (Year of Birth),
Positions Held with
the Trust (Since) | Principal Occupations During Past 5 Years |
Brian S. Shlissel (1964),
President and Principal Executive
Officer (2016)* | Managing Director and Chief Administrative Officer for J.P. Morgan pooled vehicles, J.P. Morgan Investment Management Inc. since 2014. |
Timothy J. Clemens (1975),
Treasurer and Principal Financial
Officer (2018) | Executive Director, J.P. Morgan Investment Management Inc. since February 2016. Mr. Clemens has been with J.P. Morgan Investment Management Inc. since 2013. |
Gregory S. Samuels (1980),
Secretary (2019) (formerly Assistant
Secretary 2010-2019)** | Managing Director and Assistant General Counsel, JPMorgan Chase & Co. Mr. Samuels has been with JPMorgan Chase & Co. since 2010. |
Stephen M. Ungerman (1953),
Chief Compliance Officer (2005) | Managing Director, JPMorgan Chase & Co. Mr. Ungerman has been with JPMorgan Chase & Co. since 2000. |
Kiesha Astwood-Smith (1973),
Assistant Secretary (2021)** | Vice President and Assistant General Counsel, JPMorgan Chase & Co. since June 2021; Senior Director and Counsel, Equitable Financial Life Insurance Company (formerly, AXA Equitable Life Insurance Company) from September 2015 through June 2021. |
Matthew Beck (1988),
Assistant Secretary (2021)*** | Vice President and Assistant General Counsel, JPMorgan Chase & Co. since May 2021; Senior Legal Counsel, Ultimus Fund Solutions from May 2018 through May 2021; General Counsel, The Nottingham Company from April 2014 through May 2018. |
Elizabeth A. Davin (1964),
Assistant Secretary (2005)*** | Executive Director and Assistant General Counsel, JPMorgan Chase & Co. Ms. Davin has been with JPMorgan Chase & Co. (formerly Bank One Corporation) since 2004. |
Jessica K. Ditullio (1962)
Assistant Secretary (2005)*** | Executive Director and Assistant General Counsel, JPMorgan Chase & Co. Ms. Ditullio has been with JPMorgan Chase & Co. (formerly Bank One Corporation) since 1990. |
Anthony Geron (1971),
Assistant Secretary (2018)** | Vice President and Assistant General Counsel, JPMorgan Chase & Co. since September 2018; Lead Director and Counsel, AXA Equitable Life Insurance Company from 2015 to 2018 and Senior Director and Counsel, AXA Equitable Life Insurance Company from 2014 to 2015. |
Carmine Lekstutis (1980),
Assistant Secretary (2011)** | Executive Director and Assistant General Counsel, JPMorgan Chase & Co. Mr. Lekstutis has been with JPMorgan Chase & Co. since 2011. |
Max Vogel (1990),
Assistant Secretary (2021)** | Vice President and Assistant General Counsel, JPMorgan Chase & Co. since June 2021; Associate, Proskauer Rose LLP (law firm) from March 2017 to June 2021. |
Zachary E. Vonnegut-Gabovitch
(1986),
Assistant Secretary (2017)** | Vice President and Assistant General Counsel, JPMorgan Chase & Co. since September 2016. |
Michael M. D’Ambrosio (1969),
Assistant Treasurer (2012) | Managing Director, J.P. Morgan Investment Management Inc. Mr. D’Ambrosio has been with J.P. Morgan Investment Management Inc. since 2012. |
Aleksandr Fleytekh (1972),
Assistant Treasurer (2019) | Vice President, J.P. Morgan Investment Management Inc. since February 2012. |
Shannon Gaines (1977),
Assistant Treasurer (2018)*** | Vice President, J.P. Morgan Investment Management Inc. since January 2014. |
Jeffrey D. House (1972),
Assistant Treasurer (2017)*** | Vice President, J.P. Morgan Investment Management Inc. since July 2006. |
Michael Mannarino (1985),
Assistant Treasurer (2020) | Vice President, J.P. Morgan Investment Management Inc. since 2014. |
Joseph Parascondola (1963),
Assistant Treasurer (2011)* | Executive Director, J.P. Morgan Investment Management, Inc. Mr. Parascondola has been with J.P. Morgan Investment Management Inc. since 2006. |
Gillian I. Sands (1969),
Assistant Treasurer (2012) | Executive Director, J.P. Morgan Investment Management Inc. Ms. Sands has been with J.P. Morgan Investment Management Inc. since 2012. |
|
The contact address for each of the officers, unless otherwise noted, is 277 Park Avenue, New York, NY 10172. |
| J.P. Morgan Specialty Funds | |
| The contact address for the officer is 575 Washington Boulevard, Jersey City, NJ 07310. |
| The contact address for the officer is 4 New York Plaza, New York, NY 10004. |
| The contact address for the officer is 1111 Polaris Parkway, Columbus, OH 43240. |
| J.P. Morgan Specialty Funds | |
SCHEDULE OF SHAREHOLDER EXPENSES
(Unaudited)
Hypothetical $1,000 Investment
As a shareholder of the Funds, you incur two types of costs: (1) transaction costs, including sales charges (loads) on purchase payments and (2) ongoing costs, including investment advisory fees, administration fees, distribution fees and other Fund expenses. The examples below are intended to help you understand your ongoing costs (in dollars) of investing in the Funds (not including expenses of the Underlying Funds and ETFs) and to compare these ongoing costs with the ongoing costs of investing in other mutual funds. The examples assume that you had a $1,000 investment in each Class at the beginning of the reporting period, May 1, 2022, and continued to hold your shares at the end of the reporting period, October 31, 2022.
Actual Expenses
For each Class of each Fund in the table below, the first line provides information about actual account values and actual expenses. You may use the information in this line, together with the amount you invested, to estimate the expenses that you paid over the period. Simply divide your account value by $1,000 (for example, an $8,600 account value divided by $1,000 = 8.6), then multiply the result by the number in the first line of each Class under the heading titled “Expenses Paid During the Period” to estimate the expenses you paid on your account during this period.
Hypothetical Example for Comparison Purposes
The second line of each Class in the table below provides information about hypothetical account values and hypothetical expenses based on the Class’ actual expense ratio and an assumed rate of return of 5% per year before expenses, which is not the Class’ actual return. The hypothetical account values and expenses may not be used to estimate the actual ending account balance or expenses you paid for the period. You may use this information to compare the ongoing costs of investing in the Class of the Funds and other funds. To do so, compare this 5% hypothetical example with the 5% hypothetical examples that appear in the shareholder reports of the other funds. Please note that the expenses shown in the table are meant to highlight your ongoing costs only and do not reflect any transaction costs, such as sales charges (loads), or redemption fees, and expenses of the Underlying Funds and ETFs. Therefore, the second line for each Class in the table is useful in comparing ongoing costs only, and will not help you determine the relative total costs of owning different funds. In addition, if these transaction costs were included, your costs would have been higher. The examples also assume all dividends and distributions have been reinvested.
| Beginning
Account Value
May 1, 2022 | Ending
Account Value
October 31, 2022 | Expenses
Paid During
the Period* | |
JPMorgan Opportunistic Equity Long/Short Fund | | | | |
| | | | |
| | | | |
| | | | |
| | | | |
| | | | |
| | | | |
| | | | |
| | | | |
| | | | |
| | | | |
| | | | |
| | | | |
JPMorgan Research Market Neutral Fund | | | | |
| | | | |
| | | | |
| | | | |
| | | | |
| | | | |
| | | | |
| | | | |
| | | | |
| | | | |
|
| Expenses are equal to each Class’ respective annualized expense ratio, multiplied by the average account value over the period, multiplied by 184/365 (to reflect the one-half year period). |
| J.P. Morgan Specialty Funds | |
BOARD APPROVAL OF INVESTMENT ADVISORY AGREEMENTS
(Unaudited)
The Board of Trustees (the “Board” or the “Trustees”) has established various standing committees composed of Trustees with diverse backgrounds, to which the Board has assigned specific subject matter responsibilities to further enhance the effectiveness of the Board’s oversight and decision making. Effective January 2022, the Board consolidated with the J.P. Morgan Exchange-Traded Fund Trust Board and now consists of Trustees from both Boards. The Board and its investment committees (money market and alternative products, equity, and fixed income) met regularly throughout the year and at each meeting considered factors that are relevant to their annual consideration of the continuation of the investment advisory agreements. The Board also met for the specific purpose of considering annual renewals for investment advisory agreements. The Board held meetings on June 21-22, 2022 and August 9-11, 2022, at which the Trustees considered the continuation of the investment advisory agreements for each Fund, whose annual report is contained herein (each an “Advisory Agreement” and collectively, the “Advisory Agreements”). At the June meeting, the Board’s investment committees met to review and consider performance, expense and related information for the J.P. Morgan Funds. Each investment committee reported to the full Board, which then considered each investment committee’s preliminary findings. At the August meeting, the Trustees continued their review and consideration. The Trustees, including a majority of the Trustees who are not parties to an Advisory Agreement or “interested persons” (as defined in the Investment Company Act of 1940) of any party to an Advisory Agreement or any of their affiliates, approved the continuation of each Advisory Agreement on August 11, 2022.
As part of their review of the Advisory Agreements, the Trustees considered and reviewed performance and other information about the Funds received from the Adviser. This information includes the Funds’ performance as compared to the performance of their peers and benchmarks and analyses by the Adviser of the Funds’ performance. In addition, at each of their regular meetings throughout the year, the Trustees considered reports on the performance of certain J.P. Morgan Funds (including certain ETFs, beginning in February 2022) provided by an independent investment consulting firm (“independent consultant”). In addition, in preparation for the June and August meetings, the Trustees requested, received, and evaluated extensive materials from the Adviser, including performance and expense information compiled by Broadridge, using data from Lipper Inc. and/or Morningstar Inc., independent providers of investment company data (together, “Broadridge”). The Trustees’ independent consultant also provided additional quantitative and statistical analyses of certain Funds, including risk and performance return assessments as compared to the Funds’ objectives, benchmarks, and peers. Before voting on the Advisory Agreements, the Trustees reviewed the Advisory Agreements with representatives of the
Adviser, counsel to the Trust, and independent legal counsel and received a memorandum from independent legal counsel to the Trustees discussing the legal standards for their consideration of the Advisory Agreements. The Trustees also discussed the Advisory Agreements with independent legal counsel in executive sessions at which no representatives of the Adviser were present.
A summary of the material factors evaluated by the Trustees in determining whether to approve each Advisory Agreement is provided below. Each Trustee attributed different weights to the various factors and no factor alone was considered determinative. The Trustees considered information provided with respect to the Funds throughout the year, including additional reporting and information provided in connection with the COVID-19 pandemic, as well as materials furnished specifically in connection with the annual review process. From year to year, the Trustees consider and place emphasis on relevant information in light of changing circumstances in market and economic conditions.
After considering and weighing the factors and information they had received, the Trustees found that the compensation to be received by the Adviser from each Fund under the applicable Advisory Agreement was fair and reasonable under the circumstances and determined that the continuance of each Advisory Agreement was in the best interests of each Fund and its shareholders.
Nature, Extent and Quality of Services Provided by the Adviser
The Trustees received and considered information regarding the nature, extent and quality of services provided to each Fund under the applicable Advisory Agreement. The Trustees took into account information furnished throughout the year at Trustee meetings, as well as the materials furnished specifically in connection with this annual review process. Among other things, the Trustees considered:
(i)
The background and experience of the Adviser’s senior management and investment personnel, including personnel changes, if any;
(ii)
The qualifications, backgrounds and responsibilities of the portfolio management team primarily responsible for the day-to-day management each of the Funds, including personnel changes, if any;
(iii)
The investment strategy for each Fund, and the infrastructure supporting the portfolio management teams;
(iv)
Information about the structure and distribution strategy for each Fund and how it fits with the Trusts’ other fund offerings;
(v)
The administration services provided by the Adviser in its role as Administrator;
BOARD APPROVAL OF INVESTMENT ADVISORY AGREEMENTS
(Unaudited)
(vi)
Their knowledge of the nature and quality of the services provided by the Adviser and its affiliates gained from their experience as Trustees of the Trusts and in the financial industry generally;
(vii)
The overall reputation and capabilities of the Adviser and its affiliates;
(viii)
The commitment of the Adviser to provide high quality service to the Funds;
(ix)
Their overall confidence in the Adviser’s integrity;
(x)
The Adviser’s responsiveness to requests for additional information, questions or concerns raised by them, including the Adviser’s willingness to consider and implement organizational and operational changes designed to improve investment results and the services provided to each Fund; and
(xi)
The Adviser’s business continuity plan and steps the Adviser and its affiliates have taken to provide ongoing services to the Funds during the COVID-19 pandemic, and the Adviser’s and its affiliates’ success in continuing to provide services to the Funds and their shareholders throughout this period.
Based upon these considerations and other factors, the Trustees concluded that they were satisfied with the nature, extent and quality of the services provided to the Funds by the Adviser.
Costs of Services Provided and Profitability to the Adviser and its Affiliates
The Trustees received and considered information regarding the profitability to the Adviser and its affiliates from providing services to each Fund. The Trustees reviewed and discussed this information. The Trustees recognized that this information is not audited and represents the Adviser’s determination of its and its affiliates’ revenues from the contractual services provided to the Funds, less expenses of providing such services. Expenses include direct and indirect costs and are calculated using an allocation methodology developed by the Adviser and reviewed with the Board. The Trustees also recognized that it is difficult to make comparisons of profitability from fund investment advisory contracts because comparative information is not generally publicly available and is affected by numerous factors, including the structure of the particular adviser, the types of funds it manages, its business mix, numerous assumptions regarding allocations and the fact that publicly-traded fund managers’ operating profits and net income are net of distribution and marketing expenses. Based upon their review, and taking into consideration the factors noted above, the Trustees concluded that the profitability to the Adviser under each Advisory Agreement was not unreasonable in light of the services and benefits provided to each Fund.
The Trustees also considered that JPMDS, an affiliate of the Adviser, and the Adviser earn fees from the Funds for providing shareholder and administration services, respectively. These fees were shown separately in the profitability analysis presented to the Trustees. The Trustees also considered the payments of Rule 12b-1 fees to JPMDS, which also acts as the Funds’ distributor and that these fees are in turn generally paid to financial intermediaries that sell the Funds, including financial intermediaries that are affiliates of the Adviser (although they are retained by JPMDS in certain instances). The Trustees also considered the fees earned by JPMorgan Chase Bank, N.A. (“JPMCB”), an affiliate of the Adviser, for custody and fund accounting, and other related services for each Fund, and the profitability of the arrangements to JPMCB.
Fall-Out Benefits
The Trustees reviewed information regarding potential “fall-out” or ancillary benefits received by the Adviser and its affiliates as a result of their relationship with the Funds. The Trustees considered that the J.P. Morgan Funds' operating accounts are held at JPMCB, which, as a result, will receive float benefits for certain J.P. Morgan Funds, as applicable. The Trustees also noted that the Adviser supports a diverse set of products and services, which benefits the Adviser by allowing it to leverage its infrastructure to serve additional clients. The Trustees also reviewed the Adviser’s allocation of fund brokerage for the J.P. Morgan Funds complex, including allocations to brokers who provide research to the Adviser, as well as the Adviser’s use of affiliates to provide other services and the benefits to such affiliates of doing so.
Economies of Scale
The Trustees considered the extent to which the Funds may benefit from potential economies of scale. The Trustees considered that there may not be a direct relationship between economies of scale realized by the Funds and those realized by the Adviser as assets increase. The Trustees considered the extent to which the Funds were priced to scale and whether it would be appropriate to add advisory fee breakpoints. The Trustees noted certain Funds with contractual expense limitations and fee waivers (“Fee Caps”), which allow a Fund’s shareholders to share potential economies of scale from a Fund’s inception, prior to reaching scale. The Trustees also noted that certain other Funds that had achieved scale as asset levels had increased, no longer had Fee Caps in place for some or all of their share classes, but shared economies of scale through lower average expenses. The Trustees noted that the fees remain satisfactory relative to peer funds. The Trustees considered the benefits to the Funds of the use of an affiliated distributor and custodian, including the ability to rely on existing infrastructure supporting distribution, custodial and transfer agent services and the ability to negotiate competitive fees for the Funds. The Trustees further considered the
Adviser's and JPMDS's ongoing investments in their business in support of the Funds, including the Adviser's and/or JPMDS's investments in trading systems, technology (including improvements to the J.P. Morgan Funds’ website, and cybersecurity improvements), retention of key talent, and regulatory support enhancements. The Trustees concluded that the current fee structure for each Fund, including any Fee Caps the Adviser has in place that serve to limit the overall net expense ratios of each Fund at competitive levels, was reasonable. The Trustees concluded that, for Funds with Fee Caps in place for some or all of their share classes, the relevant Fund’s shareholders received the benefits of potential economies of scale through the Fee Caps and, for Funds that achieved scale and no longer had Fee Caps in place for some or all of their share classes, the relevant Fund’s shareholders benefited from lower average expenses resulting from increased assets. The Trustees also concluded that all Funds benefited from the Adviser’s reinvestment in its operations to serve the Funds and their shareholders. The Trustees noted that the Adviser’s reinvestment ensures sufficient resources in terms of personnel and infrastructure to support the Funds.
Fees Relative to Adviser’s Other Clients
The Trustees received and considered information about the nature and extent of investment advisory services and fee rates offered to other clients of the Adviser, including, to the extent applicable, institutional separate accounts, collective investment trusts, other registered investment companies and/or private funds sub-advised by the Adviser, for investment management styles substantially similar to that of each Fund. The Trustees considered the complexity of investment management for registered investment companies relative to the Adviser’s other clients and noted differences, as applicable, in the fee structure and the regulatory, legal and other risks and responsibilities of providing services to the different clients. The Trustees considered that serving as an adviser to a registered investment company involves greater responsibilities and risks than acting as a sub-adviser and observed that sub-advisory fees may be lower than those charged by the Adviser to each Fund. The Trustees also noted that the adviser, not the applicable registered investment company, typically bears the sub-advisory fee and that many responsibilities related to the advisory function are typically retained by the primary adviser. The Trustees concluded that the fee rates charged to each Fund in comparison to those charged to the Adviser’s other clients were reasonable.
Investment Performance
The Trustees receive and consider information about the Funds’ performance throughout the year. In addition, the Trustees received and considered absolute and/or relative performance information for the Funds in a report prepared by Broadridge. The Trustees considered the total return performance
information, which included the ranking of the Funds within a performance universe comprised of funds with the same Broadridge investment classification and objective (the “Universe”), as well as a subset of funds within the Universe (the “Peer Group”), by total return for the applicable one-, three- and five-year periods. The Trustees reviewed a description of Broadridge methodology for selecting mutual funds in each Fund’s Universe and Peer Group and noted that Universe and Peer Group quintile rankings were not calculated if the number of funds in the Universe and/or Peer Group did not meet a predetermined minimum. The Broadridge materials provided to the Trustees highlighted information with respect to certain representative classes to assist the Trustees in their review. As part of this review, the Trustees also reviewed each Fund’s performance against its benchmark and considered the performance information provided for the Funds at regular Board meetings by the Adviser and the Trustees’ independent consultant, and also considered the special analysis prepared for certain Funds by the Trustees’ independent consultant. The Trustees also engaged with the Adviser to consider what steps might be taken to improve performance, as applicable. The Broadridge performance data noted by the Trustees as part of their review and the determinations made by the Trustees with respect to each Fund’s performance for certain representative classes are summarized below:
The Trustees noted that the Opportunistic Equity Long/Short Fund’s performance for Class A shares was in the third, second and second quintiles of the Peer Group, and in the third, second and first quintiles of the Universe, for the one-, three- and five-year periods ended December 31, 2021, respectively. The Trustees noted that the performance for Class I shares was in the fourth, third and first quintiles of the Peer Group, and in the third, second and first quintiles of the Universe, for the one-, three- and five-year periods ended December 31, 2021, respectively. The Trustees noted that the performance for Class R6 shares was in the fourth, first and first quintiles of the Peer Group, and in the third, second and first quintiles of the Universe, for the one-, three- and five-year periods ended December 31, 2021, respectively. The Trustees discussed the performance and investment strategy of the Fund with the Adviser and reviewed the performance analysis and evaluation prepared by the independent consultant. Based upon these discussions and various other factors, the Trustees concluded that the Fund’s performance was satisfactory under the circumstances.
The Trustees noted that the Research Market Neutral Fund’s performance for Class A shares was in the third, first and first quintiles of the Universe, for the one-, three- and five-year periods ended December 31, 2021, respectively. Broadridge did not calculate quintile rankings for the Peer Group for Class A shares of this Fund due to the limited number of funds in the Peer Groups. The Trustees noted that the performance for
BOARD APPROVAL OF INVESTMENT ADVISORY AGREEMENTS
(Unaudited)
Class I shares was in the fifth, second and first quintiles of the Peer Group, and in the third, first and first quintiles of the Universe, for the one-, three- and five-year periods ended December 31, 2021, respectively. The Trustees discussed the performance and investment strategy of the Fund with the Adviser and reviewed the performance analysis and evaluation prepared by the independent consultant. Based upon these discussions and various other factors, the Trustees concluded that the Fund’s performance was satisfactory under the circumstances.
Advisory Fees and Expense Ratios
The Trustees considered the contractual advisory fee rate and administration fee rate paid by each Fund to the Adviser and compared the combined rate to the information prepared by Broadridge concerning management fee rates paid by other funds in the same Broadridge category as each Fund. The Trustees recognized that Broadridge reported each Fund’s management fee rate as the combined contractual advisory fee and administration fee rates. The Trustees also reviewed information about other expenses and the expense ratios for each Fund and noted that Universe and Peer Group quintile rankings were not calculated if the number of funds in the Universe and/or Peer Groups did not meet a predetermined minimum. For each Fund that had a Fee Cap in place, the Trustees considered the net advisory fee rate and net expense ratio for each class, as applicable, taking into account any waivers and/or reimbursements. The Trustees also considered any proposed changes to a Fee Cap, and, where deemed appropriate by the Trustees, additional waivers and/or reimbursements. The Trustees recognized that it can be difficult to make comparisons of advisory fees because there
are variations in the services that are included in the fees paid by other funds. The Trustees’ determinations as a result of the review of each Fund’s advisory fees and expense ratios for certain representative classes are summarized below:
The Trustees noted that the Opportunistic Equity Long/Short Fund’s net advisory fee and actual total expenses for Class A shares were in the fourth and third quintiles, respectively, of both the Peer Group and Universe. The Trustees noted that the net advisory fee for Class I shares was in the third and fourth quintiles of the Peer Group and Universe, respectively, and that the actual total expenses for Class I shares were in the fourth quintile of both the Peer Group and Universe. The Trustees noted that the net advisory fee for Class R6 shares was in the third and fourth quintiles of the Peer Group and Universe, respectively, and that the actual total expenses for Class R6 shares were in the first and second quintiles of the Peer Group and Universe, respectively. After considering the factors identified above, in light of this information, the Trustees concluded that the advisory fee was satisfactory in light of the services provided to the Fund.
The Trustees noted that the Research Market Neutral Fund’s net advisory fee and actual total expenses for Class A shares were both in the first quintile of the Universe. Broadridge did not calculate quintile rankings for the Peer Group for Class A shares of this Fund due to the limited number of funds in the Peer Groups. The Trustees noted that the net advisory fee and actual total expenses for Class I shares were both in the first quintile of both the Peer Group and Universe. After considering the factors identified above, in light of this information, the Trustees concluded that the advisory fee was satisfactory in light of the services provided to the Fund.
TAX LETTER
(Unaudited)
(Dollar values in thousands)
Certain tax information for the J.P. Morgan Funds is required to be provided to shareholders based upon the Funds’ income and distributions for the taxable year ended October 31, 2022. The information and distributions reported in this letter may differ from the information and taxable distributions reported to the shareholders for the calendar year ending December 31, 2022. The information necessary to complete your income tax returns for the calendar year ending December 31, 2022 will be provided under separate cover.
Long Term Capital Gain
The Fund listed below distributed the following amount, or maximum allowable amount, of long-term capital gain dividends for the fiscal year ended October 31, 2022:
| Long-Term
Capital Gain
Distribution |
JPMorgan Opportunistic Equity Long/Short Fund | |
| J.P. Morgan Specialty Funds | |
| WHAT DOES J.P. MORGAN FUNDS DO WITH YOUR PERSONAL INFORMATION? |
| Financial companies choose how they share your personal information. Federal law gives consumers the right to limit some but not all sharing. Federal law also requires us to tell you how we collect, share, and protect your personal information. Please read this notice carefully to understand what we do. |
| The types of personal information we collect and share depend on the product or service you have with us. This information can include: |
| ○Social Security number and account balances |
| ○transaction history and account transactions |
| ○checking account information and wire transfer instructions |
| When you are no longer our customer, we continue to share your information as described in this notice. |
| All financial companies need to share customers’ personal information to run their everyday business. In the section below, we list the reasons financial companies can share their customers’ personal information; the reasons J.P. Morgan Funds chooses to share; and whether you can limit this sharing. |
Reasons we can share your personal information | Does J.P. Morgan
Funds share? | Can you limit this
sharing? |
For our everyday business purposes — such as to process your transactions, maintain your account(s), respond to court orders and legal investigations, or report to credit bureaus | | |
For marketing purposes — to offer our products and services to you | | |
For joint marketing with other financial companies | | |
For our affiliates’ everyday business purposes — information about your transactions and experiences | | |
For our affiliates’ everyday business purposes — information about your creditworthiness | | |
For nonaffiliates to market to you | | |
Questions? Call 1-800-480-4111 or go to www.jpmorganfunds.com | |
|
Who is providing this notice? | |
|
How does J.P. Morgan Funds protect my personal information? | To protect your personal information from unauthorized access and use, we use security measures that comply with federal law. These measures include computer safeguards and secured files and buildings. We authorize our employees to access your information only when they need it to do their work and we require companies that work for us to protect your information. |
|
How does J.P. Morgan Funds protect my personal information? | We collect your personal information, for example, when you: |
○open an account or provide contact information |
○give us your account information or pay us by check |
|
We also collect your personal information from others, such as credit bureaus, affiliates and other companies. |
|
Why can’t I limit all sharing? | Federal law gives you the right to limit only: |
○sharing for affiliates’ everyday business purposes – information about your creditworthiness |
○affiliates from using your information to market to you |
○sharing for nonaffiliates to market to you |
State laws and individual companies may give you additional rights to limit sharing. |
|
| Companies related by common ownership or control. They can be financial and nonfinancial companies. |
| ○J.P. Morgan Funds does not share with our affiliates. |
|
| Companies not related by common ownership or control. They can be financial and nonfinancial companies. |
| ○J.P. Morgan Funds does not share with nonaffiliates so they can market to you. |
|
| A formal agreement between nonaffiliated financial companies that together market financial products or services to you. |
| ○J.P. Morgan Funds doesn’t jointly market. |
THIS PAGE IS INTENTIONALLY LEFT BLANK
THIS PAGE IS INTENTIONALLY LEFT BLANK
J.P. Morgan Funds are distributed by JPMorgan Distribution Services, Inc., which is an affiliate of JPMorgan Chase & Co. Affiliates of JPMorgan Chase & Co. receive fees for providing various services to the funds.
Contact JPMorgan Distribution Services, Inc. at 1-800-480-4111 for a fund prospectus. You can also visit us at www.jpmorganfunds.com. Investors should carefully consider the investment objectives and risk as well as charges and expenses of the mutual fund before investing. The prospectus contains this and other information about the mutual fund. Read the prospectus carefully before investing.
Investors may obtain information about the Securities Investor Protection Corporation (SIPC), including the SIPC brochure, by visiting www.sipc.org or by calling SIPC at 202-371-8300.
Each Fund files a complete schedule of its fund holdings for the first and third quarters of its fiscal year with the SEC as an exhibit to its report on Form N-PORT. The Funds' Form N-PORT reports are available on the SEC’s website at http://www.sec.gov. Each Fund's quarterly holdings can be found by visiting the J.P. Morgan Funds’ website at www.jpmorganfunds.com.
A description of the Fund's policies and procedures with respect to the disclosure of each Fund's holdings is available in the prospectuses and Statement of Additional Information.
A copy of proxy policies and procedures is available without charge upon request by calling 1-800-480-4111 and on the Fund’s website at www.jpmorganfunds.com. A description of such policies and procedures is on the SEC’s website at www.sec.gov. The Trustees have delegated the authority to vote proxies for securities owned by the Funds to the Adviser. A copy of the Fund’s voting record for the most recent 12-month period ended June 30 is available on the SEC’s website at www.sec.gov or at the Fund’s website at www.jpmorganfunds.com no later than August 31 of each year. The Fund’s proxy voting record will include, among other things, a brief description of the matter voted on for each fund security, and will state how each vote was cast, for example, for or against the proposal.
J.P. Morgan Asset Management is the brand name for the asset management business of JPMorgan Chase & Co. and its affiliates worldwide.
© JPMorgan Chase & Co., 2022. All rights reserved. October 2022.
AN-SPEC-1022
Annual Report
J.P. Morgan International Equity Funds
October 31, 2022
JPMorgan Emerging Markets Equity Fund |
JPMorgan Emerging Markets Research Enhanced Equity Fund |
JPMorgan Europe Dynamic Fund |
JPMorgan International Equity Fund |
JPMorgan International Focus Fund |
JPMorgan International Hedged Equity Fund |
JPMorgan International Value Fund |
CONTENTS
Investments in a Fund are not deposits or obligations of, or guaranteed or endorsed by, any bank and are not insured or guaranteed by the FDIC, the Federal Reserve Board or any other government agency. You could lose money if you sell when a Fund’s share price is lower than when you invested.
Past performance is no guarantee of future performance. The general market views expressed in this report are opinions based on market and other conditions through the end of the reporting period and are subject to change without notice. These views are not intended to predict the future performance of a Fund or the securities markets.
Prospective investors should refer to the Funds’ prospectuses for a discussion of the Funds’ investment objectives, strategies and risks. Call J.P. Morgan Funds Service Center at 1-800-480-4111 for a prospectus containing more complete information about a Fund, including management fees and other expenses. Please read it carefully before investing.
Letter to Shareholders
December 15, 2022 (Unaudited)
Dear Shareholder,
Global financial markets reflected turmoil in the global economy in 2022, stirred by sharply higher inflation, rising interest rates, sporadic pandemic disruptions and the widening impact of the Russia-Ukraine conflict. Prices for both equities and bonds tumbled during the first half of the year and remained under pressure through the end of October.
|
“While investors seek to adapt to the current market environment, we believe a well-diversified portfolio and a patient outlook remain crucial components of a successful invest- ment approach.” — Brian S. Shlissel
|
Emerging market equities underperformed both the U.S. and other developed equity markets amid economic weakness in China and slowing global demand during the period. Across Europe, the war in Ukraine set off an energy crisis as a result of reduced imports of natural gas from Russia. U.S. equity markets also fell in 2022, but surprisingly strong corporate earnings and consumer spending helped leading U.S. indexes to rebound from their lowest levels. For the twelve month period ended October 31, 2022, the MSCI Emerging Markets Index returned -31.0%, the MSCI EAFE Index returned -23.0% and the S&P 500 Index returned -14.6%.
Notably, some recent U.S. inflationary data has indicated signs of easing price pressures and U.S. economic output as measured by gross domestic product turned positive in the third quarter of 2022, following two consecutive quarters of negative growth. Though the U.S. economy has lost momentum in 2022, it has not yet fallen into recession. Meanwhile, as the potential for a rapid resolution to the war in Ukraine appears to have faded, the European Union and its largest constituent
nations have moved to secure sufficient winter energy supplies while decreasing their dependence on imports of natural gas from Russia. In the U.K., a year-long political crisis was resolved with the accession of Rishi Sunak to prime minister in October 2022, which helped shore up the value of British pound and stabilize U.K. financial markets. China has eased some of the social restrictions under its “Zero Covid” policy and domestic equity indexes recently rose amid investor expectations that China’s economy may fully reopen in the coming months.
As 2022 comes to a close, financial markets are likely to remain volatile due to investor uncertainty regarding the outlook for inflation, interest rates and economic momentum. Increased geo-political tensions between Russia and Ukraine’s Western allies also remains a headwind for global financial markets.
Investors this year have confronted economic and financial market conditions not experienced in many years. While investors seek to adapt to the current market environment, we believe a well-diversified portfolio and a patient outlook remain crucial components of a successful investment approach. Our broad array of investment solutions seeks to provide investors with ability to build durable portfolios that can help them meet their financial goals.
Sincerely yours,
Brian S. Shlissel
President, J.P. Morgan Funds
J.P. Morgan Asset Management
1-800-480-4111 or www.jpmorganfunds.com for more information
| J.P. Morgan International Equity Funds | |
J.P. Morgan International Equity Funds
MARKET OVERVIEW
TWELVE MONTHS ENDED October 31, 2022 (Unaudited)
While developed market equities largely ended 2021 with positive returns, global prices for equities and bonds plummeted in 2022 amid accelerating inflation, rising interest rates, pandemic disruptions in China and the outbreak of conflict in Ukraine. Returns for both equity and bond markets broadly declined during the first half of 2022 and remained in negative territory through the end of October. Notably, global energy prices rose sharply in the first half of 2022 before receding somewhat in the third quarter.
In the EU, the war in Ukraine remained the focus of investors’ attention as energy supplies from Russia were constrained and the potential for a rapid resolution to the conflict receded. Both the EU and its individual constituent nations moved to build up reserves of natural gas and petroleum ahead of the winter months. By the end of October 2022, several European governments had sought to confront soaring inflation with spending plans to help households manage rising food and energy costs. The European Central Bank responded to the highest inflation rates in 40 years by sharply raising its policy interest rates in September 2022 and again in October. During the twelve month period, equity markets in Europe largely outperformed emerging markets equities but underperformed U.S. equity markets.
Political turmoil in the U.K. added to a weakening economic outlook that rattled financial markets and pushed the British pound to a 37-year low against the U.S. dollar. By late October 2022, the accession of Rishi Sunak to prime minister provided some support for both the pound and U.K. financial markets. The Bank of England was among the earliest developed market central banks to move to curb inflationary pressures, with an initial interest rate increase in December 2021, and seven more increases during the period.
Developed markets in the Asia-Pacific region also slumped during the period amid rising inflation, particularly soaring energy prices, and broad weakness in the semiconductors sector. Despite inflationary pressures, the Bank of Japan maintained its ultra-low interest rate policy. Meanwhile, equities in Hong Kong and Singapore largely underperformed other developed markets.
In the U.S., investors largely kept their focus on inflation data as indicators of short-term policy of the U.S. Federal Reserve. In mid-March 2022, the central bank initiated its first interest rate increase since late 2018, and then followed with four more rate raises by the end of September 2022. U.S. gross domestic product fell by 1.6% in the first quarter of 2022 and dropped 0.6% in the second quarter before rebounding to a 2.6% increase in the third quarter. Consumer spending declined but remained somewhat better than investors expected. By the end of June 2022, U.S. equity prices had tumbled more than 20% from the start of the year, which is generally considered a bear market. However, prices rebounded somewhat by the end of October 2022.
Meanwhile, emerging markets equities and bonds slumped throughout the twelve months ended in October 2022. China was among the worst performers as the government’s “zero covid” policy led to strict lockdowns in several large cities, which weighed on the services sector in particular and on economic growth in general. China’s technology sector remained under pressure amid increased scrutiny of large technology companies by government regulators. Across emerging markets rising interest rates weighed on government spending and higher energy prices hurt markets of regions dependent on petroleum imports.
For the twelve months ended October 31, 2022, the S&P 500 Index returned -14.6%, the MSCI EAFE Index returned -23.0% and the MSCI Emerging Markets Index returned -31.0%.
| J.P. Morgan International Equity Funds | |
JPMorgan Emerging Markets Equity Fund
FUND COMMENTARY
TWELVE MONTHS ENDED October 31, 2022 (Unaudited)
| |
| |
MSCI Emerging Markets Index (net total return) | |
Net Assets as of 10/31/2022 (In Thousands) | |
INVESTMENT OBJECTIVE**
The JPMorgan Emerging Markets Equity Fund (the “Fund”) seeks to provide high total return.
WHAT WERE THE MAIN DRIVERS OF THE FUND’S PERFORMANCE?
The Fund’s Class L Shares underperformed the MSCI Emerging Markets Index (the “Benchmark”) for the twelve months ended October 31, 2022.
The Fund’s security selection in the information technology and communication services sectors was a leading detractor from performance relative to the Benchmark. The Fund’s overweight position and security selection in the consumer staples sector and its security selection in the energy sector were leading contributors to relative performance.
By country, the Fund’s security selection in China and Taiwan were leading detractors from relative performance, while the Fund’s underweight position in Russia and overweight position in Indonesia were leading contributors to relative performance. The Fund liquidated its holdings in Russia following the imposition of multilateral economic sanctions in response to Russia’s invasion of Ukraine in late February 2022.
Leading individual detractors from relative performance included the Fund’s out-of-Benchmark position in Sea Ltd. and its overweight positions in Silergy Corp. and Taiwan Semiconductor Manufacturing Co. Shares of Sea, a Singapore-based internet and mobile platform provider, fell after Tencent Holdings Ltd. reduced its stake in the company. Shares of Silergy, a China-based semiconductor manufacturer, fell later in the period after the U.S. imposed tighter controls on technology exports to China’s semiconductor sector. Shares of Taiwan Semiconductor Manufacturing fell amid investor concerns that the company’s business could be hurt by tighter controls on U.S. technology exports to China.
Leading individual contributors to relative performance included the Fund’s overweight positions in HDFC Bank Ltd. and Walmart Inc. and its underweight position in Alibaba Group Holding Ltd. Shares of HDFC Bank, an Indian financial services company, rose amid consecutive quarters of earnings and revenue growth during the period. Shares of Walmart, a U.S. retail stores operator, rose amid investor expectations that company could better withstand a potential slowdown in consumer spending compare with some of its retail sector peers. Shares of Alibaba, a China-based online retail market platform operator, fell amid tighter regulations on Chinese technology companies and slower growth in China’s economy.
HOW WAS THE FUND POSITIONED?
The Fund’s portfolio managers employed an active strategy in which portfolio construction was focused on the highest-conviction ideas found at the security level. The Fund’s portfolio managers used bottom-up fundamental research to determine the Fund’s security weightings, researching companies in an attempt to determine their underlying value and potential for future earnings growth.
As a result of this process, the Fund’s largest sector overweight allocations relative to the Benchmark during the period were in the information technology and financials sectors and its largest relative underweight allocations were in the materials and communication services sectors.
The Fund’s largest country overweight allocations relative to the Benchmark during the period were in India and Argentina and its largest relative underweight allocations were in Saudi
Arabia and South Korea.
| J.P. Morgan International Equity Funds | |
JPMorgan Emerging Markets Equity Fund
FUND COMMENTARY
TWELVE MONTHS ENDED October 31, 2022 (Unaudited) (continued)
*
The return shown is based on net asset values calculated for shareholder transactions and may differ from the return shown in the financial highlights, which reflects adjustments made to the net asset values in accordance with accounting principles generally accepted in the United States of America.
**
The adviser seeks to achieve the Fund’s objective. There can be no guarantee it will be achieved.
TOP TEN POSITIONS OF THE
PORTFOLIO AS OF October 31, 2022 | PERCENT OF
TOTAL
INVESTMENTS |
| Taiwan Semiconductor Manufacturing Co. Ltd., ADR (Taiwan) | |
| Samsung Electronics Co. Ltd. (South Korea) | |
| Housing Development Finance Corp. Ltd. (India) | |
| MercadoLibre, Inc. (Brazil) | |
| | |
| Tata Consultancy Services Ltd. (India) | |
| | |
| Bank Rakyat Indonesia Persero Tbk. PT (Indonesia) | |
| Kotak Mahindra Bank Ltd. (India) | |
| Tencent Holdings Ltd. (China) | |
PORTFOLIO COMPOSITION BY COUNTRY
AS OF October 31, 2022 | PERCENT OF
TOTAL
INVESTMENTS |
| |
| |
| |
| |
| |
| |
| |
| |
| |
| |
| |
Others (each less than 1.0%) | |
| |
| J.P. Morgan International Equity Funds | |
AVERAGE ANNUAL TOTAL RETURNS AS OF October 31, 2022
|
| Sales Charge for Class A Shares is 5.25%. |
| Assumes a 1% CDSC (contingent deferred sales charge) for the one year period and 0% CDSC thereafter. |
TEN YEAR FUND PERFORMANCE (10/31/12 TO 10/31/22)
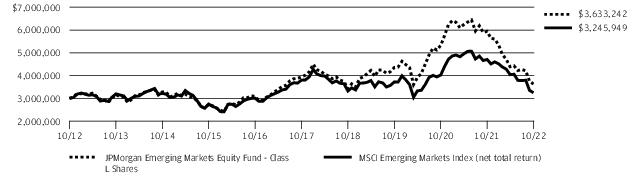
The performance quoted is past performance and is not a guarantee of future results. Mutual funds are subject to certain market risks. Investment returns and principal value of an investment will fluctuate so that an investor’s shares, when redeemed, may be worth more or less than their original cost. Current performance may be higher or lower than the performance data shown. For up-to-date month-end performance information, please call 1-800-480-4111.
Returns for Class R5 Shares and Class R6 Shares prior to their inception dates are based on the performance of Class L Shares. The actual returns of Class R5 Shares and Class R6 Shares would have been different than those shown because Class R5 Shares and Class R6 Shares have different expenses than Class L Shares.
Returns shown for Class R2 Shares and Class R3 Shares prior to their inception dates are based on the performance of Class A Shares. The actual returns of Class R2 Shares and Class R3 Shares would have been lower than those shown because Class R2 Shares and Class R3 Shares have higher expenses than Class A Shares.
Returns for Class R4 Shares prior to its inception date are based on the performance of Class I Shares. The actual returns of Class R4 Shares would have been lower than those shown because Class R4 Shares have higher expenses than Class I Shares.
The graph illustrates comparative performance for $3,000,000 invested in Class L Shares of the JPMorgan Emerging Markets Equity Fund and the MSCI Emerging Markets Index (net total return) from October 31, 2012 to October 31, 2022. The performance of the Fund assumes reinvestment of all dividends and capital gain distributions, if any, and does not include a sales charge. The performance of the MSCI Emerging Markets Index (net total return) does not reflect the deduction of expenses or a sales charge associated with a mutual fund and approximates the minimum possible dividend reinvestment of the securities included in the benchmark, if applicable. The MSCI Emerging Markets Index (net total return) is a free float-adjusted market capitalization weighted index that is designed to measure the performance of large- and mid- cap stocks in emerging markets. Net total return figures assume the reinvestment of dividends after deduction of withholding tax, applying the maximum rate to nonresident individual investors who do not benefit from double taxation treaties. Investors cannot invest directly in an index.
Class L Shares have a $3,000,000 minimum initial investment.
Fund performance may reflect the waiver of the Fund’s fees and reimbursement of expenses for certain periods since the applicable inception date. Without these waivers and reimbursements, performance would have been lower. Also, performance shown in this section does not reflect the deduction of taxes that a shareholder would pay on Fund distributions or on gains resulting from redemptions of Fund shares.
| J.P. Morgan International Equity Funds | |
JPMorgan Emerging Markets Equity Fund
FUND COMMENTARY
TWELVE MONTHS ENDED October 31, 2022 (Unaudited) (continued)
International investing involves a greater degree of risk and increased volatility. Changes in currency exchange rates and differences in accounting and taxation policies outside the U.S. can raise or lower returns. Also, some overseas markets may not be as politically and economically stable as the U.S. and other nations.
Because Class C Shares automatically convert to Class A Shares after 8 years, the 10 year average annual total return shown above for Class C reflects Class A performance for the period after conversion.
The returns shown are based on net asset values calculated for shareholder transactions and may differ from the returns shown in the financial highlights, which reflect adjustments made to the net asset values in accordance with accounting principles generally accepted in the United States of America.
| J.P. Morgan International Equity Funds | |
JPMorgan Emerging Markets Research Enhanced Equity Fund
FUND COMMENTARY
TWELVE MONTHS ENDED October 31, 2022 (Unaudited)
| |
| |
MSCI Emerging Markets Index (net total return) | |
Net Assets as of 10/31/2022 (In Thousands) | |
INVESTMENT OBJECTIVE**
The JPMorgan Emerging Markets Research Enhanced Equity Fund (the “Fund”) seeks to provide long-term capital appreciation.
WHAT WERE THE MAIN DRIVERS OF THE FUND’S PERFORMANCE?
The Fund’s Class R6 Shares underperformed the MSCI Emerging Markets Index (the “Benchmark”) for the twelve months ended October 31, 2022.
By sector, the Fund’s security selection in the financials and health care sectors was a leading detractor form performance relative to the Benchmark. The Fund’s security selection in the communication services sector and its overweight position in the energy sector were leading contributors to relative performance.
By country, the Fund’s security selections in China and Taiwan were leading detractors from relative performance, while the Fund’s overweight positions in Brazil and Mexico were leading contributors to relative performance.
Leading individual detractors from relative performance included the Fund’s underweight positions in Saudi Arabian Mining Co. and Banco Bradesco S/A, and its overweight position in Sberbank. Shares of Saudi Arabian Mining, a metals and minerals producer not held in the Fund, rose amid general increase in global prices for commodities. Shares of Banco Bradesco, a Brazilian financial services company not held in the Fund, rose as investors sought value following a sell-off in the company’s shares in mid-July 2022. Shares of Sberbank, a Russian bank and financial services provider no longer held in the Fund, fell after the imposition of multilateral economic
sanctions in response to Russia’s invasion of Ukraine in late February 2022.
Leading individual contributors to relative performance included the Fund’s underweight position in Yandex NV and its overweight positions in Petroleo Brasileiro SA (Petrobras) and
Alinma Bank. Shares of Yandex, a Dutch e-commerce and taxi service provider not held in the Fund, fell amid investor concerns about its large exposure to Russia and the potential impact of multilateral sanctions on its business. Shares of Petrobras, Brazil’s state-controlled oil and gas producer, rose amid higher global energy prices. Shares of Alinma, a Saudi Arabian bank, rose amid investor expectations that rising global energy prices would benefit the broader Saudi Arabian economy.
HOW WAS THE FUND POSITIONED?
The Fund’s portfolio managers employed a combination of a disciplined portfolio construction process with in-depth fundamental research into individual securities conducted by a global network of research analysts to identify what they believed to be their relative value.
As a result of this process, by sector, the Fund’s largest overweight allocations relative to the Benchmark during the period were in the consumer staples and energy sectors and its largest underweight allocations were in the health care and materials sectors.
By country, the Fund’s largest overweight allocations relative to the Benchmark during the period were in Mexico and Hong Kong and its largest relative underweight allocations were in Saudi Arabia and Kuwait.
| J.P. Morgan International Equity Funds | |
JPMorgan Emerging Markets Research Enhanced Equity Fund
FUND COMMENTARY
TWELVE MONTHS ENDED October 31, 2022 (Unaudited) (continued)
*
The return shown is based on net asset values calculated for shareholder transactions and may differ from the return shown in the financial highlights, which reflects adjustments made to the net asset values in accordance with accounting principles generally accepted in the United States of America.
**
The adviser seeks to achieve the Fund’s objective. There can be no guarantee it will be achieved.
TOP TEN POSITIONS OF THE
PORTFOLIO AS OF October 31, 2022 | PERCENT OF
TOTAL
INVESTMENTS |
| Taiwan Semiconductor Manufacturing Co. Ltd. (Taiwan) | |
| Samsung Electronics Co. Ltd. (South Korea) | |
| Tencent Holdings Ltd. (China) | |
| Alibaba Group Holding Ltd. (China) | |
| Reliance Industries Ltd. (India) | |
| | |
| Infosys Ltd., ADR (India) | |
| | |
| Housing Development Finance Corp. Ltd. (India) | |
| Petroleo Brasileiro SA (Preference) (Brazil) | |
PORTFOLIO COMPOSITION BY COUNTRY
AS OF October 31, 2022 | PERCENT OF
TOTAL
INVESTMENTS |
| |
| |
| |
| |
| |
| |
| |
| |
| |
| |
| |
| |
| |
Others (each less than 1.0%) | |
| |
| J.P. Morgan International Equity Funds | |
AVERAGE ANNUAL TOTAL RETURNS AS OF October 31, 2022
LIFE OF FUND PERFORMANCE (12/11/18 TO 10/31/22)
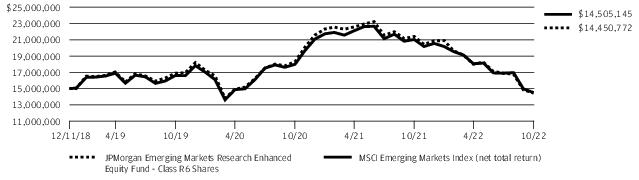
The performance quoted is past performance and is not a guarantee of future results. Mutual funds are subject to certain market risks. Investment returns and principal value of an investment will fluctuate so that an investor’s shares, when redeemed, may be worth more or less than their original cost. Current performance may be higher or lower than the performance data shown. For up-to-date month-end performance information, please call 1-800-480-4111.
The Fund commenced operations on December 11, 2018.
Returns for Class I Shares prior to its inception date are based on the performance of Class R6 Shares. The actual returns of Class I Shares would have been lower than those shown because Class I Shares have higher expenses than Class R6 Shares.
The graph illustrates comparative performance for $15,000,000 invested in Class R6 Shares of the JPMorgan Emerging Markets Research Enhanced Equity Fund and the MSCI Emerging Markets Index (net total return) from December 11, 2018 to October 31, 2022. The performance of the Fund assumes reinvestment of all dividends and capital gain distributions, if any, and does not include a sales charge. The performance of the MSCI Emerging Markets Index (net total return) does not reflect the deduction of expenses or a sales charge associated with a mutual fund and approximates the minimum possible dividend reinvestment of the securities included in the benchmark, if applicable. The MSCI Emerging Markets Index (net total return) is a free float-adjusted market capitalization weighted index that is designed to measure the performance of large- and mid- cap stocks in emerging markets. Net total return figures assume the reinvestment of dividends after deduction of withholding tax, applying the maximum rate to nonresident individual investors who do not benefit from double taxation treaties. Investors cannot invest directly in an index.
Class R6 Shares have a $15,000,000 minimum initial investment.
Fund performance may reflect the waiver of the Fund’s fees and reimbursement of expenses for certain periods since the applicable inception date.
Without these waivers and reimbursements, performance would have been lower. Also, performance shown in this section does not reflect the deduction of taxes that a shareholder would pay on Fund distributions or on gains resulting from redemptions of Fund shares.
International investing involves a greater degree of risk and increased volatility. Changes in currency exchange rates and differences in accounting and taxation policies outside the U.S. can raise or lower returns. Also, some overseas markets may not be as politically and economically stable as the U.S. and other nations.
The returns shown are based on net asset values calculated for shareholder transactions and may differ from the returns shown in the financial highlights, which reflect adjustments made to the net asset values in accordance with accounting principles generally accepted in the United States of America.
The MSCI information may only be used for your internal use, may not be reproduced or redisseminated in any form and may not be used as a basis for or a component of any financial instruments or products or indices. None of the MSCI information is intended to constitute investment advice or a recommendation to make (or refrain from making) any kind of investment decision and may not be relied on as such. Historical data and analysis should not be taken as an indication or guarantee of any future performance analysis, forecast or prediction. The MSCI information is provided on an “as is” basis and the user of this information assumes the entire risk of any use made of this information. MSCI, each of its affiliates and each other person involved in or related to compiling, computing or creating any MSCI information (collectively, the “MSCI Parties”) expressly disclaims all warranties (including, without limitation, any warranties of originality, accuracy, completeness, timeliness, noninfringement, merchantability and fitness for a particular purpose) with respect to this information. Without limiting any of the foregoing, in no event shall any MSCI Party have any liability for any direct, indirect, special, incidental, punitive, consequential (including, without limitation, lost profits) or any other damages. (www.msci.com)
| J.P. Morgan International Equity Funds | |
JPMorgan Europe Dynamic Fund
FUND COMMENTARY
TWELVE MONTHS ENDED October 31, 2022 (Unaudited)
| |
Fund (Class A Shares, without a sales charge) * | |
MSCI Europe Index (net total return) | |
Net Assets as of 10/31/2022 (In Thousands) | |
INVESTMENT OBJECTIVE**
The JPMorgan Europe Dynamic Fund (the “Fund”) seeks total return from long-term capital growth. Total return consists of capital growth and current income.
WHAT WERE THE MAIN DRIVERS OF THE FUND’S PERFORMANCE?
The Fund’s Class A Shares, without a sales charge, outperformed the MSCI Europe Index (net total return) (the “Benchmark”) for the twelve months ended October 31, 2022.
Relative to the Benchmark, the Fund’s overweight position in the energy sector and its security selection in the financials sector were leading contributors to performance, while the Fund’s overweight position in the consumer discretionary sector and its security selection in the industrials sector were leading detractors from relative performance.
.Leading individual contributors to relative performance included the Fund’s overweight positions in TotalEnergies SE, UniCredit SpA and Bank of Ireland Group PLC. Shares of TotalEnergies, a French integrated petroleum and natural gas company, rose amid higher global energy prices during the period. Shares of UniCredit, an Italian banking and financial services company, rose after the company forecast improving financial results for the second half of 2022. Shares of Bank of Ireland, a financial services provider, rose amid continued growth in earnings during the period.
Leading individual detractors from relative performance included the Fund’s underweight positions in Shell PLC, U.K. and Cie. Financiere Richemont SA, and its overweight position in Sanofi SA. Shares of Shell, a U.K. integrated petroleum and natural gas company not held in the Fund, rose amid higher global energy prices. Shares of Financiere Richemont, a Swiss luxury goods maker, rose amid investor expectations that the company could be an acquisition target. Shares of Sanofi SA, a French pharmaceutical company, fell amid investor concerns about potential U.S. legislation to lower prices on a range of consumer drugs.
HOW WAS THE FUND POSITIONED?
The Fund’s portfolio managers believe that attractively valued, high quality securities with positive momentum have the potential to outperform the market. During the reporting
period, the Fund’s portfolio managers invested in securities that they believed had these style characteristics. Portfolio positions were based on bottom-up security selection rather
than top-down asset allocation decisions.
TOP TEN HOLDINGS OF THE
PORTFOLIO AS OF October 31, 2022 | PERCENT OF
TOTAL
INVESTMENTS |
| | |
| TotalEnergies SE (France) | |
| | |
| Novo Nordisk A/S, Class B (Denmark) | |
| | |
| Novartis AG (Registered) (Switzerland) | |
| LVMH Moet Hennessy Louis Vuitton SE (France) | |
| Koninklijke Ahold Delhaize NV (Netherlands) | |
| | |
| Zurich Insurance Group AG (Switzerland) | |
PORTFOLIO COMPOSITION BY COUNTRY
AS OF October 31, 2022 | PERCENT OF
TOTAL
INVESTMENTS |
| |
| |
| |
| |
| |
| |
| |
| |
| |
| |
| |
| |
| |
Others (each less than 1.0%) | |
| |
*
The return shown is based on net asset values calculated for shareholder transactions and may differ from the return shown in
| J.P. Morgan International Equity Funds | |
the financial highlights, which reflects adjustments made to the net asset values in accordance with accounting principles generally accepted in the United States of America.
**
The adviser seeks to achieve the Fund’s objective. There can be no guarantee it will be achieved.
| J.P. Morgan International Equity Funds | |
JPMorgan Europe Dynamic Fund
FUND COMMENTARY
TWELVE MONTHS ENDED October 31, 2022 (Unaudited) (continued)
AVERAGE ANNUAL TOTAL RETURNS AS OF October 31, 2022
|
| Sales Charge for Class A Shares is 5.25%. |
| Assumes a 1% CDSC (contingent deferred sales charge) for the one year period and 0% CDSC thereafter. |
TEN YEAR FUND PERFORMANCE (10/31/12 TO 10/31/22)
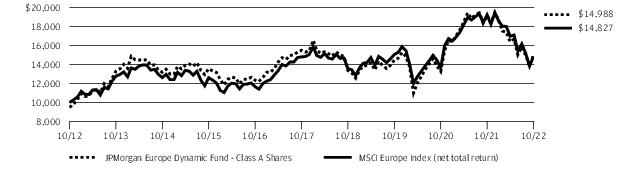
The performance quoted is past performance and is not a guarantee of future results. Mutual funds are subject to certain market risks. Investment returns and principal value of an investment will fluctuate so that an investor’s shares, when redeemed, may be worth more or less than their original cost. Current performance may be higher or lower than the performance data shown. For up-to-date month-end performance information, please call 1-800-480-4111.
Returns for Class R6 Shares prior to its inception date are based on the performance of Class L Shares. The actual returns of Class R6 Shares would have been different than those shown because Class R6 Shares have different expenses than Class L Shares.
The graph illustrates comparative performance for $10,000 invested in Class A Shares of the JPMorgan Europe Dynamic Fund and the MSCI Europe Index (net total return) from October 31, 2012 to October 31, 2022. The performance of the Fund assumes reinvestment of all dividends and capital gain distributions, if any, and includes a sales charge. The performance of the MSCI Europe Index (net total return) does not reflect the deduction of expenses or a sales charge associated with a mutual fund and approximates the minimum possible dividend reinvestment of the securities included in the benchmark, if applicable. The MSCI Europe Index (net total return) is a free float-adjusted market capitalization weighted index that is designed to measure the performance of large- and mid- cap stocks in the developed markets countries in Europe. Net total return figures assume the reinvestment of dividends after deduction of withholding tax, applying the maximum rate to nonresident
individual investors who do not benefit from double taxation treaties. Investors cannot invest directly in an index.
Class A Shares have a $1,000 minimum initial investment and carry a 5.25% sales charge.
Fund performance may reflect the waiver of the Fund’s fees and reimbursement of expenses for certain periods since the applicable inception date. Without these waivers and reimbursements, performance would have been lower. Also, performance shown in this section does not reflect the deduction of taxes that a shareholder would pay on Fund distributions or on gains resulting from redemptions of Fund shares.
International investing involves a greater degree of risk and increased volatility. Changes in currency exchange rates and differences in accounting and taxation policies outside the U.S. can raise or lower returns. Also, some overseas markets may not be as politically and economically stable as the U.S. and other nations.
Because Class C Shares automatically convert to Class A Shares after 8 years, the 10 year average annual total return shown above for Class C reflects Class A performance for the period after conversion.
The returns shown are based on net asset values calculated for shareholder transactions and may differ from the returns shown in the financial highlights, which reflect adjustments made to the net asset values in accordance with accounting principles generally accepted in the United States of America.
| J.P. Morgan International Equity Funds | |
JPMorgan International Equity Fund
FUND COMMENTARY
TWELVE MONTHS ENDED October 31, 2022 (Unaudited)
| |
| |
MSCI EAFE Index (net total return) | |
Net Assets as of 10/31/2022 (In Thousands) | |
INVESTMENT OBJECTIVE**
The JPMorgan International Equity Fund (the “Fund”) seeks total return from long-term capital growth and income. Total return consists of capital growth and current income.
WHAT WERE THE MAIN DRIVERS OF THE FUND’S PERFORMANCE?
The Fund’s Class I Shares underperformed the MSCI EAFE Index (net of total return) (the “Benchmark”) for the twelve months ended October 31, 2022.
The Fund’s security selections in the consumer discretionary and communication services sectors were leading detractors from relative performance, while the Fund’s security selection in the materials sector and its underweight position in the real estate sector, where the Fund had no holdings, were leading contributors to relative performance.
By region, the Fund’s security selections in Japan and the U.K. were leading detractors from relative performance, while the Fund’s security selection in Europe, excluding the U.K., was the leading contributor to relative performance.
Leading individual detractors from relative performance included the Fund’s overweight positions in Sea Ltd., Adidas AG and Delivery Hero SE. Shares of Sea, a Singapore-based internet and mobile platform provider, fell after Tencent Holdings Ltd. reduced its stake in the company. Shares of
Adidas, a German maker of footwear and sports apparel, fell amid supply-chain constraints and consumer backlash to the company’s former partnership with Kanye West. Shares of Delivery Hero, a German food ordering service, fell as the company made several acquisitions to expand during the period.
Leading individual contributors to relative performance included the Fund’s overweight positions in TotalEnergies SE, DBS Group Holdings Ltd. and Novo Nordisk A/S.
Shares of TotalEnergies, a French integrated petroleum and natural gas company, rose amid higher global energy prices during the period. Shares of DBS Group Holdings, a Singapore financial services provider, rose after the company reported earnings and revenue growth during the period. Shares of Novo Nordisk, a Danish pharmaceuticals and health care products company, rose after legislative efforts to cap insulin prices failed in the U.S. Congress.
HOW WAS THE FUND POSITIONED?
The Fund’s portfolio managers continued to focus on security selection to build a portfolio of international equities. They used bottom-up fundamental research to identify what they believed were attractively priced securities of companies with solid financial positions that possessed the potential to increase their earnings faster than their industry peers.
| J.P. Morgan International Equity Funds | |
JPMorgan International Equity Fund
FUND COMMENTARY
TWELVE MONTHS ENDED October 31, 2022 (Unaudited) (continued)
TOP TEN HOLDINGS OF THE
PORTFOLIO AS OF October 31, 2022 | PERCENT OF
TOTAL
INVESTMENTS |
| TotalEnergies SE (France) | |
| | |
| | |
| LVMH Moet Hennessy Louis Vuitton SE (France) | |
| Novo Nordisk A/S, Class B (Denmark) | |
| AstraZeneca plc (United Kingdom) | |
| | |
| DBS Group Holdings Ltd. (Singapore) | |
| Diageo plc (United Kingdom) | |
| ASML Holding NV (Netherlands) | |
PORTFOLIO COMPOSITION BY COUNTRY
AS OF October 31, 2022 | PERCENT OF
TOTAL
INVESTMENTS |
| |
| |
| |
| |
| |
| |
| |
| |
| |
| |
| |
| |
| |
| |
PORTFOLIO COMPOSITION BY COUNTRY AS OF October 31, 2022 | PERCENT OF TOTAL INVESTMENTS |
| |
| |
| |
Others (each less than 1.0%) | |
| |
*
The return shown is based on net asset values calculated for shareholder transactions and may differ from the return shown in the financial highlights, which reflects adjustments made to the net asset values in accordance with accounting principles generally accepted in the United States of America.
**
The adviser seeks to achieve the Fund’s objective. There can be no guarantee it will be achieved.
| J.P. Morgan International Equity Funds | |
AVERAGE ANNUAL TOTAL RETURNS AS OF October 31, 2022
|
| Sales Charge for Class A Shares is 5.25%. |
| Assumes a 1% CDSC (contingent deferred sales charge) for the one year period and 0% CDSC thereafter. |
TEN YEAR FUND PERFORMANCE (10/31/12 TO 10/31/22)
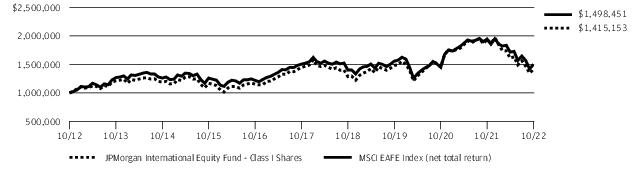
The performance quoted is past performance and is not a guarantee of future results. Mutual funds are subject to certain market risks. Investment returns and principal value of an investment will fluctuate so that an investor’s shares, when redeemed, may be worth more or less than their original cost. Current performance may be higher or lower than the performance data shown. For up-to-date month-end performance information, please call 1-800-480-4111.
The graph illustrates comparative performance for $1,000,000 invested in Class I Shares of the JPMorgan International Equity Fund and the MSCI EAFE Index (net total return) from October 31, 2012 to October 31, 2022. The performance of the Fund assumes reinvestment of all dividends and capital gain distributions, if any, and does not include a sales charge. The performance of the MSCI EAFE Index (net total return) does not reflect the deduction of expenses or a sales charge associated with a mutual fund and approximates the minimum possible dividend reinvestment of the securities included in the benchmark, if applicable. The MSCI EAFE Index (net total return) is a free float-adjusted market capitalization weighted index that is designed to measure the performance of large- and mid- cap stocks in developed markets, excluding the U.S. and Canada. Net total return figures assume the reinvestment of dividends after deduction of withholding tax, applying the maximum rate to nonresident individual investors who do not benefit from double taxation treaties. Investors cannot invest directly in an index.
Class I Shares have a $1,000,000 minimum initial investment.
Fund performance may reflect the waiver of the Fund’s fees and reimbursement of expenses for certain periods since the applicable inception date. Without these waivers and reimbursements, performance would have been lower. Also, performance shown in this section does not reflect the deduction of taxes that a shareholder would pay on Fund distributions or on gains resulting from redemptions of Fund shares.
International investing involves a greater degree of risk and increased volatility. Changes in currency exchange rates and differences in accounting and taxation policies outside the U.S. can raise or lower returns. Also, some overseas markets may not be as politically and economically stable as the U.S. and other nations.
Because Class C Shares automatically convert to Class A Shares after 8 years, the 10 year average annual total return shown above for Class C reflects Class A performance for the period after conversion.
The returns shown are based on net asset values calculated for shareholder transactions and may differ from the returns shown in the financial highlights, which reflect adjustments made to the net asset values in accordance with accounting principles generally accepted in the United States of America.
| J.P. Morgan International Equity Funds | |
JPMorgan International Focus Fund
FUND COMMENTARY
TWELVE MONTHS ENDED October 31, 2022 (Unaudited)
| |
| |
MSCI ACWI ex USA Index (net total return) | |
Net Assets as of 10/31/2022 (In Thousands) | |
INVESTMENT OBJECTIVE**
The JPMorgan International Focus Fund (the “Fund”) seeks to provide long-term capital appreciation.
WHAT WERE THE MAIN DRIVERS OF THE FUND’S PERFORMANCE?
The Fund’s Class I Shares underperformed the MSCI ACWI ex USA Index (net total return) (the “Benchmark”) for the twelve months ended October 31, 2022.
The Fund’s security selection in the communication services and consumer discretionary sectors was a leading detractor from performance relative to the Benchmark, while the Fund’s security selection in the materials and energy sectors was a leading contributor to relative performance.
By region, the Fund’s security selections in the Pacific, excluding Japan, and in Japan were leading detractors from relative performance, while the Fund’s overweight position in the U.K. and Canada were leading contributors to relative performance.
Leading individual detractors from relative performance included the Fund’s overweight positions in Sea Ltd., Adidas and Sberbank. Shares of Sea, a Singapore-based internet and mobile platform provider, fell after Tencent Holdings Ltd. reduced its stake in the company. Shares of Adidas, a German maker of footwear and sports apparel, fell amid supply-chain
constraints and consumer backlash to the company’s former partnership with Kanye West. Shares of Sberbank, a Russian financial services provider no longer held by the Fund, fell after the imposition of multilateral economic sanctions in response to Russia’s invasion of Ukraine in late February 2022.
Leading individual contributors to relative performance included the Fund’s overweight positions in Shell PLC, DBS Group Holdings Ltd. and Novo Nordisk A/S. Shares of Shell, a U.K. integrated petroleum and natural gas company not held in the Fund, rose amid higher global energy prices. Shares of DBS Group Holdings, a Singapore financial services provider, rose after the company reported earnings and revenue growth during the period. Shares of Novo Nordisk, a Danish pharmaceuticals and health care products company, rose after legislative efforts to cap insulin prices failed in the U.S. Congress.
HOW WAS THE FUND POSITIONED?
By harnessing their team’s global sector specialists, the Fund’s portfolio managers sought to build a high-conviction, benchmark-agnostic portfolio of growth, value and unique companies, whose future prospects, the portfolio managers believed, were under-appreciated by the market and thus possessed the potential to deliver higher-than-expected earnings that could have a positive effect on their share prices.
| J.P. Morgan International Equity Funds | |
TOP TEN HOLDINGS OF THE
PORTFOLIO AS OF October 31, 2022 | PERCENT OF
TOTAL
INVESTMENTS |
| | |
| | |
| Samsung Electronics Co. Ltd. (South Korea) | |
| Toronto-Dominion Bank (The) (Canada) | |
| Canadian National Railway Co. (Canada) | |
| Novo Nordisk A/S, Class B (Denmark) | |
| Diageo plc (United Kingdom) | |
| HDFC Bank Ltd., ADR (India) | |
| | |
| DBS Group Holdings Ltd. (Singapore) | |
PORTFOLIO COMPOSITION BY COUNTRY
AS OF October 31, 2022 | PERCENT OF
TOTAL
INVESTMENTS |
| |
| |
| |
| |
| |
| |
| |
| |
| |
| |
| |
| |
| |
| |
PORTFOLIO COMPOSITION BY COUNTRY AS OF October 31, 2022 | PERCENT OF TOTAL INVESTMENTS |
| |
| |
| |
| |
| |
| |
| |
| |
| |
*
The return shown is based on net asset values calculated for shareholder transactions and may differ from the return shown in the financial highlights, which reflects adjustments made to the net asset values in accordance with accounting principles generally accepted in the United States of America.
**
The adviser seeks to achieve the Fund’s objective. There can be no guarantee it will be achieved.
| J.P. Morgan International Equity Funds | |
JPMorgan International Focus Fund
FUND COMMENTARY
TWELVE MONTHS ENDED October 31, 2022 (Unaudited) (continued)
AVERAGE ANNUAL TOTAL RETURNS AS OF October 31, 2022
|
| Sales Charge for Class A Shares is 5.25%. |
| Assumes a 1% CDSC (contingent deferred sales charge) for the one year period and 0% CDSC thereafter. |
TEN YEAR FUND PERFORMANCE (10/31/12 TO 10/31/22)
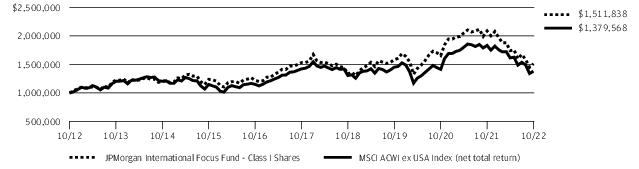
The performance quoted is past performance and is not a guarantee of future results. Mutual funds are subject to certain market risks. Investment returns and principal value of an investment will fluctuate so that an investor’s shares, when redeemed, may be worth more or less than their original cost. Current performance may be higher or lower than the performance data shown. For up-to-date month-end performance information, please call 1-800-480-4111.
The Fund commenced operations on November 30, 2011.
The graph illustrates comparative performance for $1,000,000 invested in Class I Shares of the JPMorgan International Focus Fund and the MSCI ACWI ex USA Index (net total return) from October 31, 2012 to October 31, 2022. The performance of the Fund assumes reinvestment of all dividends and capital gain distributions, if any, and does not include a sales charge. The performance of the MSCI ACWI ex USA Index (net total return) does not reflect the deduction of expenses or a sales charge associated with a mutual fund and approximates the minimum possible dividend reinvestment of the securities included in the benchmark, if applicable. The MSCI ACWI ex USA Index (net total return) is a free float-adjusted market capitalization weighted index that is designed to measure the performance of large- and mid- cap stocks in developed and emerging markets, excluding the U.S.. Net total return figures assume the reinvestment of dividends after deduction of withholding tax, applying the maximum rate to nonresident individual investors who do not benefit from double taxation treaties. Investors cannot invest directly in an index.
Class I Shares have a $1,000,000 minimum initial investment.
Subsequent to the inception date of the Fund and through May 30, 2013, the Fund did not experience any shareholder activity. If such shareholder activity had occurred, the Fund’s performance may have been impacted.
Fund performance may reflect the waiver of the Fund’s fees and reimbursement of expenses for certain periods since the applicable inception date. Without these waivers and reimbursements, performance would have been lower. Also, performance shown in this section does not reflect the deduction of taxes that a shareholder would pay on Fund distributions or on gains resulting from redemptions of Fund shares.
International investing involves a greater degree of risk and increased volatility. Changes in currency exchange rates and differences in accounting and taxation policies outside the U.S. can raise or lower returns. Also, some overseas markets may not be as politically and economically stable as the U.S. and other nations.
Because Class C Shares automatically convert to Class A Shares after 8 years, the 10 year average annual total return shown above for Class C reflects Class A performance for the period after conversion.
The returns shown are based on net asset values calculated for shareholder transactions and may differ from the returns shown in the financial highlights, which reflect adjustments made to the net asset values in accordance with accounting principles generally accepted in the United States of America.
| J.P. Morgan International Equity Funds | |
JPMorgan International Hedged Equity Fund
FUND COMMENTARY
TWELVE MONTHS ENDED October 31, 2022 (Unaudited)
| |
| |
MSCI EAFE Index (net total return) | |
ICE BofAML 3-Month US Treasury Bill Index | |
Net Assets as of 10/31/2022 (In Thousands) | |
INVESTMENT OBJECTIVE**
The JPMorgan International Hedged Equity Fund (the “Fund”) seeks to provide capital appreciation.
WHAT WERE THE MAIN DRIVERS OF THE FUND’S PERFORMANCE?
The Fund’s Class I Shares outperformed the MSCI EAFE Index (net total return) (the “Benchmark”) and underperformed the ICE BofAML 3-Month U.S. Treasury Bill Index for the twelve months ended October 31, 2022. The Fund’s options hedge allowed the Fund to generally perform as designed during the reporting period with about 56% of the Benchmark’s volatility.
The Fund’s security selection in the health care and communication services sectors was a leading contributor to performance relative to the Benchmark, while the Fund’s security selection in the materials and information technology sectors were leading detractors from relative performance.
By country, the Fund’s security selection in Sweden and Singapore was a leading contributor to performance relative to the Benchmark, while the Fund’s security selection in Australia and the U.K. was a leading detractor from relative performance.
Leading individual contributors to relative performance included the Fund’s overweight positions in BP PLC and Novo Nordisk A/S and its underweight position in Sea Ltd. Shares of BP, a U.K. integrated petroleum and natural gas producer, rose amid higher global energy prices during the period. Shares of Novo Nordisk, a Danish pharmaceuticals and health care products company, rose after legislative efforts to cap insulin prices failed in the U.S. Congress.
Shares of Sea, a Singapore-based internet and mobile platform provider, fell after Tencent Holdings Ltd. reduced its stake in the company.
Leading individual detractors from relative performance included the Fund’s overweight positions in Adidas AG,
Kingspan Group PLC and Infineon Technologies AG. Shares of Adidas, a German maker of footwear and sports apparel, fell amid supply-chain constraints and consumer backlash to the company’s former partnership with Kanye West. Shares of Kingspan Group, an Irish manufacturer of insulated building materials, fell after the company reported a decline in new orders during the period. Shares of Infineon Technologies, a German semiconductor manufacturer, fell amid broad weakness in the semiconductor sector during the period.
HOW WAS THE FUND POSITIONED?
The Fund’s portfolio managers continued to focus on security selection to build a portfolio of international equities. They used bottom-up fundamental research to identify what they believed were attractively priced securities of companies with solid financial positions that possessed the potential to increase
their earnings faster than their industry peers.
TOP TEN HOLDINGS OF THE
PORTFOLIO AS OF October 31, 2022 | PERCENT OF
TOTAL
INVESTMENTS |
| | |
| | |
| LVMH Moet Hennessy Louis Vuitton SE (France) | |
| ASML Holding NV (Netherlands) | |
| Novo Nordisk A/S, Class B (Denmark) | |
| | |
| Novartis AG (Registered) (Switzerland) | |
| AstraZeneca plc (United Kingdom) | |
| | |
| TotalEnergies SE (France) | |
| J.P. Morgan International Equity Funds | |
JPMorgan International Hedged Equity Fund
FUND COMMENTARY
TWELVE MONTHS ENDED October 31, 2022 (Unaudited) (continued)
*
The return shown is based on net asset values calculated for shareholder transactions and may differ from the return shown in the financial highlights, which reflects adjustments made to the net asset values in accordance with accounting principles generally accepted in the United States of America.
**
The adviser seeks to achieve the Fund’s objective. There can be no guarantee it will be achieved.
PORTFOLIO COMPOSITION BY COUNTRY
AS OF October 31, 2022 | PERCENT OF
TOTAL
INVESTMENTS |
| |
| |
| |
| |
| |
| |
| |
| |
| |
| |
| |
| |
| |
Others (each less than 1.0%) | |
| |
| J.P. Morgan International Equity Funds | |
AVERAGE ANNUAL TOTAL RETURNS AS OF October 31, 2022
|
| Sales Charge for Class A Shares is 5.25%. |
| Assumes a 1% CDSC (contingent deferred sales charge) for the one year period and 0% CDSC thereafter. |
LIFE OF FUND PERFORMANCE (2/22/19 TO 10/31/22)
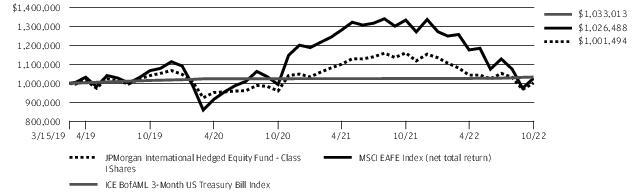
The performance quoted is past performance and is not a guarantee of future results. Mutual funds are subject to certain market risks. Investment returns and principal value of an investment will fluctuate so that an investor’s shares, when redeemed, may be worth more or less than their original cost. Current performance may be higher or lower than the performance data shown. For up-to-date month-end performance information, please call 1-800-480-4111.
The Fund commenced operations on March 15, 2019.
The graph illustrates comparative performance for $1,000,000 invested in Class I Shares of the JPMorgan International Hedged Equity Fund, the MSCI EAFE Index (net total return) and the ICE BofAML 3-Month US Treasury Bill Index from March 15, 2019 to October 31, 2022. The performance of the Fund assumes reinvestment of all dividends and capital gain distributions, if any, and does not include a sales charge. The performance of the MSCI EAFE Index (net total return) does not reflect the deduction of expenses or a sales charge associated with a mutual fund and approximates the minimum possible dividend reinvestment of the securities included in the benchmark, if applicable. The performance of the ICE BofAML 3-Month US Treasury Bill Index does not reflect the deduction of expenses or a sales charge associated with a mutual fund and has been adjusted to reflect reinvestment of all dividends and capital gain distributions of securities included in the benchmarks, if applicable. The MSCI EAFE Index (net total return) is a free float-adjusted market capitalization weighted index that is designed to measure the performance of large- and mid- cap stocks in developed markets, excluding the U.S. and Canada. Net total return figures assume the reinvestment of dividends after deduction of withholding tax, applying the maximum rate to nonresident individual investors who do not benefit from double taxation treaties. The ICE BofAML 3-Month US Treasury Bill Index is comprised of a single issue purchased
at the beginning of the month and held for a full month. Each month the index is rebalanced and the issue selected is the outstanding Treasury Bill that matures closest to, but not beyond, 3 months from the rebalancing date. Investors cannot invest directly in an index.
Class I Shares have a $1,000,000 minimum initial investment.
Fund performance may reflect the waiver of the Fund’s fees and reimbursement of expenses for certain periods since the applicable inception date. Without these waivers and reimbursements, performance would have been lower. Also, performance shown in this section does not reflect the deduction of taxes that a shareholder would pay on Fund distributions or on gains resulting from redemptions of Fund shares.
International investing involves a greater degree of risk and increased volatility. Changes in currency exchange rates and differences in accounting and taxation policies outside the U.S. can raise or lower returns. Also, some overseas markets may not be as politically and economically stable as the U.S. and other nations.
The returns shown are based on net asset values calculated for shareholder transactions and may differ from the returns shown in the financial highlights, which reflect adjustments made to the net asset values in accordance with accounting principles generally accepted in the United States of America.
The MSCI information may only be used for your internal use, may not be reproduced or redisseminated in any form and may not be used as a basis for or a component of any financial instruments or products or indices. None of the MSCI information is intended to constitute investment advice or a recommendation to make (or refrain from making) any kind of investment decision and may not be relied on as such. Historical data and analysis should
| J.P. Morgan International Equity Funds | |
JPMorgan International Hedged Equity Fund
FUND COMMENTARY
TWELVE MONTHS ENDED October 31, 2022 (Unaudited) (continued)
not be taken as an indication or guarantee of any future performance analysis, forecast or prediction. The MSCI information is provided on an “as is” basis and the user of this information assumes the entire risk of any use made of this information. MSCI, each of its affiliates and each other person involved in or related to compiling, computing or creating any MSCI information (collectively, the “MSCI Parties”) expressly disclaims all warranties (including, without
limitation, any warranties of originality, accuracy, completeness, timeliness, noninfringement, merchantability and fitness for a particular purpose) with respect to this information. Without limiting any of the foregoing, in no event shall any MSCI Party have any liability for any direct, indirect, special, incidental, punitive, consequential (including, without limitation, lost profits) or any other damages. (www.msci.com)
| J.P. Morgan International Equity Funds | |
JPMorgan International Value Fund
FUND COMMENTARY
TWELVE MONTHS ENDED October 31, 2022 (Unaudited)
| |
| |
MSCI EAFE Value Index (net total return) | |
Net Assets as of 10/31/2022 (In Thousands) | |
INVESTMENT OBJECTIVE**
The JPMorgan International Value Fund (the “Fund”) seeks to provide long-term capital appreciation.
WHAT WERE THE MAIN DRIVERS OF THE FUND’S PERFORMANCE?
The Fund’s Class L Shares underperformed the MSCI EAFE Value Index (net total return) (the “Benchmark”) for the twelve months ended October 31, 2022.
The Fund’s security selection in the industrials and consumer discretionary sectors was a leading detractor from performance relative to the Benchmark, while the Fund’s underweight position in the real estate sector and its security selection in the utilities sector were leading contributors to relative performance.
By region, the Fund’s overweight allocations to both Europe, excluding the U.K., and to the U.K. detracted from performance relative to the Benchmark, while its security selection in both Japan and in the Pacific, excluding Japan, were leading contributors to relative performance.
Leading individual detractors from relative performance included the Fund’s underweight positions in Shell PLC, British American Tobacco PLC and AstraZeneca PLC. Shares of Shell, a U.K. integrated petroleum and natural gas company, rose amid higher global energy prices during the period. Shares of British American Tobacco, a U.K. tobacco products maker not held in the Fund, rose amid the company’s efforts to enter the retail market for cannabis products. Shares of AstraZeneca, a U.K. pharmaceuticals company not held in the Fund, rose amid investor expectations of regulatory approvals of the company’s treatment for COVID-19 and its variants.
Leading individual contributors to relative performance included the Fund’s underweight positions in Enel SpA and Vonovia SE and its overweight position in Equinor ASA. Shares of Enel, an Italian electricity and natural gas utility, fell amid rising fuel costs. Shares of Vonovia, a German owner/manager of real estate, fell after the company reported weaker-than-expected results during the period. Shares of Equinor, a Norwegian oil and gas producer, rose amid higher global energy prices during the period.
HOW WAS THE FUND POSITIONED?
The Fund’s portfolio managers employed behavioral-based and quantitative screens in addition to conducting fundamental
analysis to seek out companies that they believed had attractive valuations. As a result of this process, the Fund’s largest overweight positions relative to the Benchmark during the period were in the financials and consumer discretionary sectors, while the largest underweight positions were in the consumer staples and utilities sectors.
TOP TEN HOLDINGS OF THE
PORTFOLIO AS OF October 31, 2022 | PERCENT OF
TOTAL
INVESTMENTS |
| | |
| Novartis AG (Registered) (Switzerland) | |
| Toyota Motor Corp. (Japan) | |
| TotalEnergies SE (France) | |
| | |
| BHP Group Ltd. (Australia) | |
| HSBC Holdings plc (United Kingdom) | |
| | |
| Siemens AG (Registered) (Germany) | |
| | |
PORTFOLIO COMPOSITION BY COUNTRY
AS OF October 31, 2022 | PERCENT OF
TOTAL
INVESTMENTS |
| |
| |
| |
| |
| |
| |
| |
| |
| |
| |
| |
| |
| |
| |
| |
| |
Others (each less than 1.0%) | |
| |
| J.P. Morgan International Equity Funds | |
JPMorgan International Value Fund
FUND COMMENTARY
TWELVE MONTHS ENDED October 31, 2022 (Unaudited) (continued)
*
The return shown is based on net asset values calculated for shareholder transactions and may differ from the return shown in the financial highlights, which reflects adjustments made to the net asset values in accordance with accounting principles generally accepted in the United States of America.
**
The adviser seeks to achieve the Fund’s objective. There can be no guarantee it will be achieved.
| J.P. Morgan International Equity Funds | |
AVERAGE ANNUAL TOTAL RETURNS AS OF October 31, 2022
|
| Sales Charge for Class A Shares is 5.25%. |
| Assumes a 1% CDSC (contingent deferred sales charge) for the one year period and 0% CDSC thereafter. |
TEN YEAR FUND PERFORMANCE (10/31/12 TO 10/31/22)
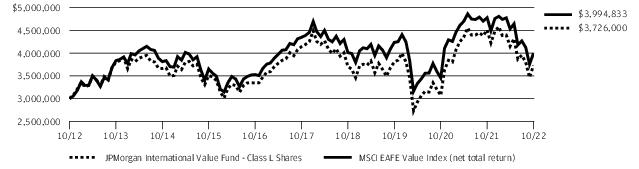
The performance quoted is past performance and is not a guarantee of future results. Mutual funds are subject to certain market risks. Investment returns and principal value of an investment will fluctuate so that an investor’s shares, when redeemed, may be worth more or less than their original cost. Current performance may be higher or lower than the performance data shown. For up-to-date month-end performance information please call 1-800-480-4111. Effective May 2018, some of the Fund’s investment strategies changed. The Fund’s past performance would have been different if the Fund was managed under the current strategies.
Returns for Class R5 Shares prior to its inception date are based on the performance of Class L Shares. The actual returns of Class R5 Shares would have been different than those shown because Class R5 Shares have different expenses than Class L Shares.
The graph illustrates comparative performance for $3,000,000 invested in Class L Shares of the JPMorgan International Value Fund and the MSCI EAFE Value Index (net total return) from October 31, 2012 to October 31, 2022. The performance of the Fund assumes reinvestment of all dividends and capital gain distributions, if any, and does not include a sales charge. The performance of the MSCI EAFE Value Index (net total return) does not reflect the deduction of expenses or a sales charge associated with a mutual fund and approximates the minimum possible dividend reinvestment of the securities included in the benchmark, if applicable. The MSCI EAFE Value Index (net total return) is a free float-adjusted market capitalization weighted index that is designed to measure the performance of value-oriented large- and mid- cap stocks in developed markets, excluding the U.S. and Canada. Net total return figures
assume the reinvestment of dividends after deduction of withholding tax, applying the maximum rate to nonresident individual investors who do not benefit from double taxation treaties. Investors cannot invest directly in an index.
Class L Shares have a $3,000,000 minimum initial investment.
Fund performance may reflect the waiver of the Fund’s fees and reimbursement of expenses for certain periods since the applicable inception date. Without these waivers and reimbursements, performance would have been lower. Also, performance shown in this section does not reflect the deduction of taxes that a shareholder would pay on Fund distributions or on gains resulting from redemptions of Fund shares.
International investing involves a greater degree of risk and increased volatility. Changes in currency exchange rates and differences in accounting and taxation policies outside the U.S. can raise or lower returns. Also, some overseas markets may not be as politically and economically stable as the U.S. and other nations.
Because Class C Shares automatically convert to Class A Shares after 8 years, the 10 year average annual total return shown above for Class C reflects Class A performance for the period after conversion.
The returns shown are based on net asset values calculated for shareholder transactions and may differ from the returns shown in the financial highlights, which reflect adjustments made to the net asset values in accordance with accounting principles generally accepted in the United States of America.
| J.P. Morgan International Equity Funds | |
JPMorgan Emerging Markets Equity Fund
SCHEDULE OF PORTFOLIO INVESTMENTS
AS OF October 31, 2022
| | |
|
|
B3 SA - Brasil Bolsa Balcao | | |
| | |
NU Holdings Ltd., Class A * | | |
Petroleo Brasileiro SA (Preference) | | |
| | |
| | |
| | |
|
Beijing Oriental Yuhong Waterproof Technology Co. Ltd., Class A | | |
Budweiser Brewing Co. APAC Ltd. (a) | | |
| | |
Foshan Haitian Flavouring & Food Co. Ltd., Class A | | |
| | |
| | |
Jiangsu Hengli Hydraulic Co. Ltd., Class A | | |
Kingdee International Software Group Co. Ltd. * | | |
| | |
Midea Group Co. Ltd., Class A | | |
| | |
Pharmaron Beijing Co. Ltd., Class A | | |
Shenzhen Mindray Bio-Medical Electronics Co. Ltd., Class A | | |
Shenzhou International Group Holdings Ltd. | | |
| | |
| | |
Wanhua Chemical Group Co. Ltd., Class A | | |
Wuliangye Yibin Co. Ltd., Class A | | |
WuXi AppTec Co. Ltd., Class A | | |
Wuxi Biologics Cayman, Inc. * (a) | | |
| | |
| | |
|
| | |
| | |
Hong Kong Exchanges & Clearing Ltd. | | |
| | |
Techtronic Industries Co. Ltd. | | |
Techtronic Industries Co. Ltd. | | |
| | |
|
Apollo Hospitals Enterprise Ltd. | | |
| | |
|
|
| | |
Britannia Industries Ltd. | | |
| | |
| | |
HDFC Life Insurance Co. Ltd. (a) | | |
| | |
Housing Development Finance Corp. Ltd. | | |
| | |
| | |
| | |
| | |
Tata Consultancy Services Ltd. | | |
| | |
|
Bank Central Asia Tbk. PT | | |
Bank Rakyat Indonesia Persero Tbk. PT | | |
| | |
|
| | |
|
Grupo Financiero Banorte SAB de CV, Class O | | |
Wal-Mart de Mexico SAB de CV | | |
| | |
|
Copa Holdings SA, Class A * | | |
|
| | |
|
| | |
|
| | |
Capitec Bank Holdings Ltd. | | |
| | |
| | |
|
Delivery Hero SE * (a) (b) | | |
| | |
| | |
Samsung Electronics Co. Ltd. | | |
| | |
SEE NOTES TO FINANCIAL STATEMENTS.
| J.P. Morgan International Equity Funds | |
| | |
Common Stocks — continued |
|
Chailease Holding Co. Ltd. | | |
| | |
Realtek Semiconductor Corp. | | |
Taiwan Semiconductor Manufacturing Co. Ltd., ADR | | |
Taiwan Semiconductor Manufacturing Co. Ltd. | | |
| | |
|
| | |
| | |
JS Global Lifestyle Co. Ltd. (a) | | |
| | |
Total Common Stocks
(Cost $7,368,331) | | |
Short-Term Investments — 1.7% |
Investment Companies — 1.6% |
JPMorgan Prime Money Market Fund Class Institutional Shares, 3.12% (c) (d)(Cost $113,774) | | |
Investment of Cash Collateral from Securities Loaned — 0.1% |
JPMorgan Securities Lending Money Market Fund Agency SL Class Shares, 3.23% (c) (d) | | |
JPMorgan U.S. Government Money Market Fund Class IM Shares, 2.85% (c) (d) | | |
Total Investment of Cash Collateral from Securities Loaned
(Cost $4,791) | | |
Total Short-Term Investments
(Cost $118,565) | | |
Total Investments — 100.1%
(Cost $7,486,896) | | |
Liabilities in Excess of Other Assets — (0.1)% | | |
| | |
Percentages indicated are based on net assets. |
| |
| American Depositary Receipt |
| |
| A special type of equity investment that shares in the earnings of the company, has limited voting rights, and may have a dividend preference. Preference shares may also have liquidation preference. |
| Limited liability company |
| |
| Non-income producing security. |
| Security exempt from registration pursuant to Regulation S under the Securities Act of 1933, as amended. Regulation S applies to securities offerings that are made outside of the United States and do not involve direct selling efforts in the United States and as such may have restrictions on resale. |
| The security or a portion of this security is on loan at October 31, 2022. The total value of securities on loan at October 31, 2022 is $4,595. |
| Investment in an affiliated fund, which is registered under the Investment Company Act of 1940, as amended, and is advised by J.P. Morgan Investment Management Inc. |
| The rate shown is the current yield as of October 31, 2022. |
Summary of Investments by Industry, October 31, 2022
The following table represents the portfolio investments of the Fund by industry classifications as a percentage of total investments:
PORTFOLIO COMPOSITION BY ASSET CLASS
AS OF October 31, 2022 | PERCENT OF
TOTAL
INVESTMENTS |
| |
Semiconductors & Semiconductor Equipment | |
| |
Internet & Direct Marketing Retail | |
Technology Hardware, Storage & Peripherals | |
| |
Diversified Financial Services | |
| |
| |
Oil, Gas & Consumable Fuels | |
| |
Interactive Media & Services | |
Life Sciences Tools & Services | |
Hotels, Restaurants & Leisure | |
| |
| |
| |
| |
| |
Electronic Equipment, Instruments & Components | |
Health Care Providers & Services | |
Health Care Equipment & Supplies | |
Textiles, Apparel & Luxury Goods | |
Others (each less than 1.0%) | |
| |
SEE NOTES TO FINANCIAL STATEMENTS.
| J.P. Morgan International Equity Funds | |
JPMorgan Emerging Markets Research Enhanced Equity Fund
SCHEDULE OF PORTFOLIO INVESTMENTS
AS OF October 31, 2022
| | |
|
|
B3 SA - Brasil Bolsa Balcao | | |
Centrais Eletricas Brasileiras SA | | |
Cia Energetica de Minas Gerais (Preference) | | |
EDP - Energias do Brasil SA | | |
| | |
Itau Unibanco Holding SA (Preference) * | | |
| | |
| | |
| | |
| | |
| | |
NU Holdings Ltd., Class A * | | |
Petroleo Brasileiro SA (Preference) | | |
| | |
| | |
| | |
| | |
| | |
| | |
| | |
| | |
|
Banco Santander Chile, ADR | | |
| | |
| | |
|
Alibaba Group Holding Ltd. * | | |
Amoy Diagnostics Co. Ltd., Class A | | |
Angel Yeast Co. Ltd., Class A | | |
Anhui Conch Cement Co. Ltd., Class H | | |
ANTA Sports Products Ltd. | | |
| | |
Baoshan Iron & Steel Co. Ltd., Class A | | |
| | |
Beijing Oriental Yuhong Waterproof Technology Co. Ltd., Class A | | |
BOE Technology Group Co. Ltd., Class A | | |
| | |
CGN Power Co. Ltd., Class H (a) | | |
Chacha Food Co. Ltd., Class A | | |
China Conch Environment Protection Holdings Ltd. * | | |
China Construction Bank Corp., Class H | | |
China International Capital Corp. Ltd., Class H (a) | | |
| | |
|
|
China Lesso Group Holdings Ltd. | | |
China Life Insurance Co. Ltd., Class H | | |
China Longyuan Power Group Corp. Ltd., Class H | | |
China Merchants Bank Co. Ltd., Class H | | |
China Oilfield Services Ltd., Class H | | |
China Overseas Land & Investment Ltd. | | |
China Pacific Insurance Group Co. Ltd., Class H | | |
China Petroleum & Chemical Corp., Class H | | |
China Resources Land Ltd. | | |
China Resources Mixc Lifestyle Services Ltd. (a) | | |
China Vanke Co. Ltd., Class H | | |
China Yangtze Power Co. Ltd., Class A | | |
Chongqing Brewery Co. Ltd., Class A | | |
Chongqing Fuling Zhacai Group Co. Ltd., Class A | | |
| | |
COSCO SHIPPING Holdings Co. Ltd., Class H | | |
Country Garden Services Holdings Co. Ltd. | | |
CSPC Pharmaceutical Group Ltd. | | |
Dongguan Yiheda Automation Co. Ltd., Class A | | |
Dongguan Yiheda Automation Co. Ltd., Class A | | |
| | |
Foshan Haitian Flavouring & Food Co. Ltd., Class A | | |
Fuyao Glass Industry Group Co. Ltd., Class H (a) | | |
Ganfeng Lithium Group Co. Ltd., Class H (a) | | |
Guangzhou Automobile Group Co. Ltd., Class H | | |
Guangzhou Kingmed Diagnostics Group Co. Ltd., Class A | | |
| | |
Haier Smart Home Co. Ltd., Class H | | |
Han's Laser Technology Industry Group Co. Ltd., Class A | | |
Hefei Meiya Optoelectronic Technology, Inc., Class A | | |
Huatai Securities Co. Ltd., Class H (a) | | |
Huayu Automotive Systems Co. Ltd., Class A | | |
Hundsun Technologies, Inc., Class A | | |
HUTCHMED China Ltd., ADR * (b) | | |
Industrial & Commercial Bank of China Ltd., Class H | | |
Inner Mongolia Yili Industrial Group Co. Ltd., Class A | | |
Jade Bird Fire Co. Ltd., Class A | | |
| | |
| | |
Jiangsu Hengli Hydraulic Co. Ltd., Class A | | |
Joinn Laboratories China Co. Ltd., Class H (a) | | |
Kingdee International Software Group Co. Ltd. * | | |
SEE NOTES TO FINANCIAL STATEMENTS.
| J.P. Morgan International Equity Funds | |
| | |
Common Stocks — continued |
|
Kuaishou Technology * (a) | | |
| | |
Kweichow Moutai Co. Ltd., Class A | | |
Laobaixing Pharmacy Chain JSC, Class A | | |
Longfor Group Holdings Ltd. (c) | | |
| | |
Midea Group Co. Ltd., Class A | | |
| | |
Montage Technology Co. Ltd., Class A | | |
NARI Technology Co. Ltd., Class A | | |
| | |
| | |
| | |
Oppein Home Group, Inc., Class A | | |
Pharmaron Beijing Co. Ltd., Class H (a) | | |
PICC Property & Casualty Co. Ltd., Class H | | |
| | |
Ping An Bank Co. Ltd., Class A | | |
Ping An Insurance Group Co. of China Ltd., Class H | | |
Postal Savings Bank of China Co. Ltd., Class H (a) | | |
Qingdao Haier Biomedical Co. Ltd., Class A | | |
Sany Heavy Industry Co. Ltd., Class A | | |
Shanghai Baosight Software Co. Ltd., Class A | | |
Shanghai Liangxin Electrical Co. Ltd., Class A | | |
Shanghai Putailai New Energy Technology Co. Ltd., Class A | | |
Shenzhen Mindray Bio-Medical Electronics Co. Ltd., Class A | | |
| | |
Skshu Paint Co. Ltd., Class A * | | |
Sunny Optical Technology Group Co. Ltd. | | |
| | |
Tingyi Cayman Islands Holding Corp. | | |
Tongwei Co. Ltd., Class A | | |
Trip.com Group Ltd., ADR * | | |
Wanhua Chemical Group Co. Ltd., Class A | | |
Wuliangye Yibin Co. Ltd., Class A | | |
WuXi AppTec Co. Ltd., Class H (a) | | |
Wuxi Biologics Cayman, Inc. * (a) | | |
Xinyi Solar Holdings Ltd. | | |
| | |
| | |
| | |
Yunnan Energy New Material Co. Ltd. | | |
| | |
|
|
Zhejiang Dingli Machinery Co. Ltd., Class A | | |
Zhejiang Weixing New Building Materials Co. Ltd., Class A | | |
Zijin Mining Group Co. Ltd., Class H | | |
| | |
|
| | |
|
Hellenic Telecommunications Organization SA | | |
| | |
| | |
|
Orient Overseas International Ltd. | | |
Techtronic Industries Co. Ltd. | | |
| | |
|
| | |
| | |
| | |
|
| | |
Apollo Hospitals Enterprise Ltd. | | |
| | |
| | |
| | |
Bharat Petroleum Corp. Ltd. | | |
| | |
Britannia Industries Ltd. | | |
| | |
Dr Reddy's Laboratories Ltd. | | |
| | |
| | |
| | |
| | |
| | |
HDFC Life Insurance Co. Ltd. (a) | | |
| | |
Housing Development Finance Corp. Ltd. | | |
| | |
ICICI Prudential Life Insurance Co. Ltd. (a) | | |
| | |
SEE NOTES TO FINANCIAL STATEMENTS.
| J.P. Morgan International Equity Funds | |
JPMorgan Emerging Markets Research Enhanced Equity Fund
SCHEDULE OF PORTFOLIO INVESTMENTS
AS OF October 31, 2022 (continued)
| | |
Common Stocks — continued |
|
| | |
| | |
| | |
| | |
Oil & Natural Gas Corp. Ltd. | | |
| | |
Power Grid Corp. of India Ltd. | | |
| | |
Shriram Transport Finance Co. Ltd. | | |
Tata Consultancy Services Ltd. | | |
Tata Consumer Products Ltd. | | |
| | |
| | |
| | |
|
Bank Central Asia Tbk. PT | | |
Bank Mandiri Persero Tbk. PT | | |
Bank Rakyat Indonesia Persero Tbk. PT | | |
Telkom Indonesia Persero Tbk. PT | | |
| | |
|
| | |
| | |
Petronas Chemicals Group Bhd. | | |
| | |
| | |
| | |
|
| | |
| | |
Grupo Aeroportuario del Pacifico SAB de CV, Class B | | |
Grupo Aeroportuario del Sureste SAB de CV, Class B | | |
Grupo Financiero Banorte SAB de CV, Class O | | |
| | |
Kimberly-Clark de Mexico SAB de CV, Class A | | |
Sitios Latinoamerica SAB de CV * | | |
Wal-Mart de Mexico SAB de CV | | |
| | |
|
| | |
| | |
|
|
| | |
| | |
| | |
| | |
|
| | |
Powszechny Zaklad Ubezpieczen SA (b) | | |
| | |
|
| | |
| | |
| | |
|
| | |
Magnitogorsk Iron & Steel Works PJSC ‡ | | |
MMC Norilsk Nickel PJSC, ADR ‡ | | |
MMC Norilsk Nickel PJSC ‡ | | |
| | |
| | |
Sberbank of Russia PJSC ‡ * | | |
| | |
TCS Group Holding plc, GDR ‡ * (a) | | |
X5 Retail Group NV, GDR ‡ (a) | | |
| | |
|
| | |
| | |
| | |
| | |
| | |
Saudi Arabian Oil Co. (a) | | |
Saudi Basic Industries Corp. | | |
Saudi National Bank (The) | | |
| | |
| | |
|
| | |
|
| | |
| | |
Capitec Bank Holdings Ltd. | | |
SEE NOTES TO FINANCIAL STATEMENTS.
| J.P. Morgan International Equity Funds | |
| | |
Common Stocks — continued |
|
| | |
| | |
| | |
Foschini Group Ltd. (The) | | |
| | |
| | |
| | |
| | |
SPAR Group Ltd. (The) (b) | | |
| | |
| | |
| | |
|
| | |
Hana Financial Group, Inc. | | |
Hankook Tire & Technology Co. Ltd. | | |
| | |
| | |
| | |
| | |
| | |
| | |
| | |
| | |
KIWOOM Securities Co. Ltd. | | |
| | |
| | |
| | |
| | |
| | |
Samsung Biologics Co. Ltd. * (a) | | |
Samsung Electro-Mechanics Co. Ltd. | | |
Samsung Electronics Co. Ltd. | | |
Samsung Fire & Marine Insurance Co. Ltd. | | |
| | |
Shinhan Financial Group Co. Ltd. | | |
| | |
| | |
| | |
| | |
| | |
| | |
| | |
| | |
|
|
| | |
| | |
ASE Technology Holding Co. Ltd. | | |
Chailease Holding Co. Ltd. | | |
CTBC Financial Holding Co. Ltd. | | |
| | |
E.Sun Financial Holding Co. Ltd. | | |
| | |
| | |
Evergreen Marine Corp. Taiwan Ltd. | | |
Fubon Financial Holding Co. Ltd. | | |
Giant Manufacturing Co. Ltd. | | |
Hon Hai Precision Industry Co. Ltd. | | |
Largan Precision Co. Ltd. | | |
| | |
| | |
Nan Ya Printed Circuit Board Corp. | | |
Nien Made Enterprise Co. Ltd. | | |
Novatek Microelectronics Corp. | | |
Powertech Technology, Inc. | | |
President Chain Store Corp. | | |
Realtek Semiconductor Corp. | | |
| | |
Taiwan Semiconductor Manufacturing Co. Ltd., ADR | | |
Taiwan Semiconductor Manufacturing Co. Ltd. | | |
Uni-President Enterprises Corp. | | |
United Microelectronics Corp. * | | |
Vanguard International Semiconductor Corp. | | |
| | |
Yang Ming Marine Transport Corp. | | |
Yuanta Financial Holding Co. Ltd. | | |
| | |
|
Airports of Thailand PCL * | | |
| | |
| | |
Minor International PCL * | | |
PTT Exploration & Production PCL, NVDR | | |
PTT Exploration & Production PCL | | |
| | |
PTT Global Chemical PCL, NVDR | | |
| | |
| | |
SEE NOTES TO FINANCIAL STATEMENTS.
| J.P. Morgan International Equity Funds | |
JPMorgan Emerging Markets Research Enhanced Equity Fund
SCHEDULE OF PORTFOLIO INVESTMENTS
AS OF October 31, 2022 (continued)
| | |
Common Stocks — continued |
|
| | |
| | |
Siam Cement PCL (The), NVDR | | |
Siam Cement PCL (The) (Registered) | | |
| | |
| | |
Thai Union Group PCL, Class F | | |
| | |
United Arab Emirates — 0.9% |
| | |
| | |
Emirates Telecommunications Group Co. PJSC | | |
First Abu Dhabi Bank PJSC | | |
| | |
|
| | |
| | |
JS Global Lifestyle Co. Ltd. (a) | | |
| | |
| | |
Total Common Stocks
(Cost $3,011,874) | | |
| | |
|
|
Thai Union Group PCL, expiring 12/31/2022(Cost $—) (d) | | |
| | |
Short-Term Investments — 2.1% |
Investment Companies — 1.8% |
JPMorgan Prime Money Market Fund Class Institutional Shares, 3.12% (e) (f)(Cost $47,042) | | |
Investment of Cash Collateral from Securities Loaned — 0.3% |
JPMorgan Securities Lending Money Market Fund Agency SL Class Shares, 3.23% (e) (f) | | |
| | |
|
Investment of Cash Collateral from Securities Loaned — continued |
JPMorgan U.S. Government Money Market Fund Class IM Shares, 2.85% (e) (f) | | |
Total Investment of Cash Collateral from Securities Loaned
(Cost $6,925) | | |
Total Short-Term Investments
(Cost $53,967) | | |
Total Investments — 95.6%
(Cost $3,065,841) | | |
Other Assets Less Liabilities — 4.4% | | |
| | |
Percentages indicated are based on net assets. |
Amounts presented as a dash ("-") represent amounts that round to less than a thousand. |
| |
| American Depositary Receipt |
| Brazilian Depositary Receipt |
| Global Depositary Receipt |
| |
| Non-Voting Depositary Receipt |
| Public Joint Stock Company |
| A special type of equity investment that shares in the earnings of the company, has limited voting rights, and may have a dividend preference. Preference shares may also have liquidation preference. |
| Limited liability company |
| Amount rounds to less than 0.1% of net assets. |
| Value determined using significant unobservable inputs. | |
| Non-income producing security. | |
| Security exempt from registration pursuant to Regulation S under the Securities Act of 1933, as amended. Regulation S applies to securities offerings that are made outside of the United States and do not involve direct selling efforts in the United States and as such may have restrictions on resale. | |
| The security or a portion of this security is on loan at October 31, 2022. The total value of securities on loan at October 31, 2022 is $6,699. | |
| Securities exempt from registration under Rule 144A or section 4(a)(2), of the Securities Act of 1933, as amended. | |
| | |
SEE NOTES TO FINANCIAL STATEMENTS.
| J.P. Morgan International Equity Funds | |
| Investment in an affiliated fund, which is registered under the Investment Company Act of 1940, as amended, and is advised by J.P. Morgan Investment Management Inc. | |
| The rate shown is the current yield as of October 31, 2022. | |
Summary of Investments by Industry, October 31, 2022
The following table represents the portfolio investments of the Fund by industry classifications as a percentage of total investments:
PORTFOLIO COMPOSITION BY ASSET CLASS
AS OF October 31, 2022 | PERCENT OF
TOTAL
INVESTMENTS |
| |
Semiconductors & Semiconductor Equipment | |
Oil, Gas & Consumable Fuels | |
Internet & Direct Marketing Retail | |
Technology Hardware, Storage & Peripherals | |
Interactive Media & Services | |
| |
| |
| |
| |
| |
| |
Diversified Financial Services | |
Electronic Equipment, Instruments & Components | |
| |
Wireless Telecommunication Services | |
Real Estate Management & Development | |
Diversified Telecommunication Services | |
| |
Hotels, Restaurants & Leisure | |
Life Sciences Tools & Services | |
Transportation Infrastructure | |
| |
| |
| |
| |
| |
Others (each less than 1.0%) | |
| |
SEE NOTES TO FINANCIAL STATEMENTS.
| J.P. Morgan International Equity Funds | |
JPMorgan Emerging Markets Research Enhanced Equity Fund
SCHEDULE OF PORTFOLIO INVESTMENTS
AS OF October 31, 2022 (continued)
Futures contracts outstanding as of October 31, 2022 (amounts in thousands, except number of contracts):
| | | | | VALUE AND
UNREALIZED
APPRECIATION
(DEPRECIATION) ($) |
| | | | | |
MSCI Emerging Markets E-Mini Index | | | | | |
| |
| Morgan Stanley Capital International |
| |
SEE NOTES TO FINANCIAL STATEMENTS.
| J.P. Morgan International Equity Funds | |
JPMorgan Europe Dynamic Fund
SCHEDULE OF PORTFOLIO INVESTMENTS
AS OF October 31, 2022
| | |
|
|
| | |
|
| | |
|
| | |
| | |
Jyske Bank A/S (Registered) * | | |
Novo Nordisk A/S, Class B | | |
| | |
|
| | |
| | |
| | |
| | |
|
| | |
| | |
| | |
| | |
LVMH Moet Hennessy Louis Vuitton SE | | |
| | |
| | |
| | |
| | |
| | |
| | |
| | |
|
| | |
| | |
| | |
| | |
| | |
Deutsche Lufthansa AG (Registered) * | | |
Deutsche Telekom AG (Registered) | | |
Dr Ing hc F Porsche AG (Preference) * | | |
| | |
| | |
Muenchener Rueckversicherungs-Gesellschaft AG (Registered) | | |
| | |
|
|
| | |
VERBIO Vereinigte BioEnergie AG | | |
| | |
|
| | |
Bank of Ireland Group plc | | |
Bank of Ireland Group plc | | |
| | |
| | |
|
| | |
|
| | |
Koninklijke Ahold Delhaize NV | | |
| | |
| | |
|
| | |
|
Corp. ACCIONA Energias Renovables SA | | |
|
| | |
| | |
New Wave Group AB, Class B | | |
| | |
|
| | |
Zurich Insurance Group AG | | |
| | |
|
| | |
| | |
| | |
| | |
| | |
| | |
| | |
| | |
| | |
Reckitt Benckiser Group plc | | |
SEE NOTES TO FINANCIAL STATEMENTS.
| J.P. Morgan International Equity Funds | |
JPMorgan Europe Dynamic Fund
SCHEDULE OF PORTFOLIO INVESTMENTS
AS OF October 31, 2022 (continued)
| | |
Common Stocks — continued |
United Kingdom — continued |
| | |
| | |
| | |
|
| | |
| | |
| | |
| | |
| | |
Total Common Stocks
(Cost $527,921) | | |
Short-Term Investments — 1.2% |
Investment Companies — 1.2% |
JPMorgan Prime Money Market Fund Class Institutional Shares, 3.12% (b) (c)(Cost $6,343) | | |
Total Investments — 98.1%
(Cost $534,264) | | |
Other Assets Less Liabilities — 1.9% | | |
| | |
Percentages indicated are based on net assets. |
| |
| |
| A special type of equity investment that shares in the earnings of the company, has limited voting rights, and may have a dividend preference. Preference shares may also have liquidation preference. |
| Non-income producing security. |
| Security exempt from registration pursuant to Regulation S under the Securities Act of 1933, as amended. Regulation S applies to securities offerings that are made outside of the United States and do not involve direct selling efforts in the United States and as such may have restrictions on resale. |
| Investment in an affiliated fund, which is registered under the Investment Company Act of 1940, as amended, and is advised by J.P. Morgan Investment Management Inc. |
| The rate shown is the current yield as of October 31, 2022. |
Summary of Investments by Industry, October 31, 2022
The following table represents the portfolio investments of the Fund by industry classifications as a percentage of total investments:
PORTFOLIO COMPOSITION BY ASSET CLASS
AS OF October 31, 2022 | PERCENT OF
TOTAL
INVESTMENTS |
| |
| |
Oil, Gas & Consumable Fuels | |
| |
| |
Textiles, Apparel & Luxury Goods | |
| |
| |
| |
| |
Independent Power and Renewable Electricity Producers | |
| |
| |
| |
Trading Companies & Distributors | |
| |
Diversified Telecommunication Services | |
| |
| |
| |
| |
Construction & Engineering | |
| |
| |
Others (each less than 1.0%) | |
| |
SEE NOTES TO FINANCIAL STATEMENTS.
| J.P. Morgan International Equity Funds | |
Futures contracts outstanding as of October 31, 2022 (amounts in thousands, except number of contracts):
| | | | | VALUE AND
UNREALIZED
APPRECIATION
(DEPRECIATION) ($) |
| | | | | |
| | | | | |
| | | | | |
| | | | | |
| |
| |
| Financial Times and the London Stock Exchange |
| |
SEE NOTES TO FINANCIAL STATEMENTS.
| J.P. Morgan International Equity Funds | |
JPMorgan International Equity Fund
SCHEDULE OF PORTFOLIO INVESTMENTS
AS OF October 31, 2022
| | |
|
|
| | |
| | |
Woodside Energy Group Ltd. | | |
Woodside Energy Group Ltd. | | |
| | |
|
| | |
|
| | |
|
| | |
| | |
| | |
Novo Nordisk A/S, Class B | | |
| | |
| | |
|
| | |
|
| | |
| | |
| | |
| | |
| | |
LVMH Moet Hennessy Louis Vuitton SE | | |
| | |
| | |
| | |
| | |
| | |
|
| | |
| | |
| | |
Deutsche Telekom AG (Registered) | | |
Muenchener Rueckversicherungs-Gesellschaft AG (Registered) (b) | | |
| | |
| | |
Volkswagen AG (Preference) | | |
| | |
| | |
|
|
| | |
Hong Kong Exchanges & Clearing Ltd. | | |
| | |
Techtronic Industries Co. Ltd. | | |
| | |
|
| | |
|
| | |
| | |
| | |
| | |
| | |
| | |
| | |
| | |
Nippon Telegraph & Telephone Corp. | | |
Recruit Holdings Co. Ltd. | | |
Shin-Etsu Chemical Co. Ltd. | | |
| | |
| | |
Tokio Marine Holdings, Inc. | | |
| | |
| | |
|
| | |
| | |
| | |
| | |
|
| | |
|
| | |
|
Delivery Hero SE * (a) (b) | | |
Samsung Electronics Co. Ltd., GDR (a) | | |
Samsung Electronics Co. Ltd., GDR (a) | | |
| | |
|
| | |
SEE NOTES TO FINANCIAL STATEMENTS.
| J.P. Morgan International Equity Funds | |
| | |
Common Stocks — continued |
|
| | |
| | |
Svenska Handelsbanken AB, Class A | | |
| | |
| | |
|
Lonza Group AG (Registered) | | |
| | |
Straumann Holding AG (Registered) | | |
| | |
|
Taiwan Semiconductor Manufacturing Co. Ltd., ADR | | |
|
| | |
| | |
| | |
| | |
London Stock Exchange Group plc | | |
| | |
| | |
| | |
|
| | |
| | |
| | |
| | |
| | |
| | |
Total Common Stocks
(Cost $3,666,547) | | |
Short-Term Investments — 4.2% |
Investment Companies — 1.5% |
JPMorgan Prime Money Market Fund Class Institutional Shares, 3.12% (c) (d)(Cost $57,919) | | |
Investment of Cash Collateral from Securities Loaned — 2.7% |
JPMorgan Securities Lending Money Market Fund Agency SL Class Shares, 3.23% (c) (d) | | |
| | |
|
Investment of Cash Collateral from Securities Loaned — continued |
JPMorgan U.S. Government Money Market Fund Class IM Shares, 2.85% (c) (d) | | |
Total Investment of Cash Collateral from Securities Loaned
(Cost $103,567) | | |
Total Short-Term Investments
(Cost $161,486) | | |
Total Investments — 102.5%
(Cost $3,828,033) | | |
Liabilities in Excess of Other Assets — (2.5)% | | |
| | |
Percentages indicated are based on net assets. |
| |
| American Depositary Receipt |
| Global Depositary Receipt |
| |
| A special type of equity investment that shares in the earnings of the company, has limited voting rights, and may have a dividend preference. Preference shares may also have liquidation preference. |
| Non-income producing security. |
| Security exempt from registration pursuant to Regulation S under the Securities Act of 1933, as amended. Regulation S applies to securities offerings that are made outside of the United States and do not involve direct selling efforts in the United States and as such may have restrictions on resale. |
| The security or a portion of this security is on loan at October 31, 2022. The total value of securities on loan at October 31, 2022 is $97,049. |
| Investment in an affiliated fund, which is registered under the Investment Company Act of 1940, as amended, and is advised by J.P. Morgan Investment Management Inc. |
| The rate shown is the current yield as of October 31, 2022. |
SEE NOTES TO FINANCIAL STATEMENTS.
| J.P. Morgan International Equity Funds | |
JPMorgan International Equity Fund
SCHEDULE OF PORTFOLIO INVESTMENTS
AS OF October 31, 2022 (continued)
Summary of Investments by Industry, October 31, 2022
The following table represents the portfolio investments of the Fund by industry classifications as a percentage of total investments:
PORTFOLIO COMPOSITION BY ASSET CLASS
AS OF October 31, 2022 | PERCENT OF
TOTAL
INVESTMENTS |
| |
| |
| |
Oil, Gas & Consumable Fuels | |
| |
| |
Textiles, Apparel & Luxury Goods | |
| |
Semiconductors & Semiconductor Equipment | |
| |
| |
| |
| |
Health Care Equipment & Supplies | |
| |
| |
| |
| |
Diversified Telecommunication Services | |
Electronic Equipment, Instruments & Components | |
| |
Construction & Engineering | |
Independent Power and Renewable Electricity Producers | |
Technology Hardware, Storage & Peripherals | |
| |
Life Sciences Tools & Services | |
| |
| |
Trading Companies & Distributors | |
Others (each less than 1.0%) | |
| |
SEE NOTES TO FINANCIAL STATEMENTS.
| J.P. Morgan International Equity Funds | |
JPMorgan International Focus Fund
SCHEDULE OF PORTFOLIO INVESTMENTS
AS OF October 31, 2022
| | |
|
|
| | |
Woodside Energy Group Ltd. | | |
Woodside Energy Group Ltd. | | |
| | |
|
| | |
|
Alimentation Couche-Tard, Inc. | | |
Canadian National Railway Co. | | |
Toronto-Dominion Bank (The) | | |
| | |
|
| | |
|
| | |
Novo Nordisk A/S, Class B | | |
| | |
|
| | |
| | |
LVMH Moet Hennessy Louis Vuitton SE | | |
| | |
| | |
| | |
|
| | |
| | |
| | |
| | |
| | |
|
| | |
Hong Kong Exchanges & Clearing Ltd. | | |
| | |
|
| | |
|
Bank Central Asia Tbk. PT | | |
| | |
|
|
| | |
| | |
Shin-Etsu Chemical Co. Ltd. | | |
| | |
Tokio Marine Holdings, Inc. | | |
| | |
|
Wal-Mart de Mexico SAB de CV | | |
|
| | |
| | |
| | |
|
| | |
|
| | |
|
Delivery Hero SE * (a) (b) | | |
Samsung Electronics Co. Ltd. | | |
| | |
|
| | |
|
| | |
|
Lonza Group AG (Registered) | | |
|
Taiwan Semiconductor Manufacturing Co. Ltd., ADR | | |
|
| | |
| | |
| | |
| | |
| | |
| | |
|
| | |
| | |
SEE NOTES TO FINANCIAL STATEMENTS.
| J.P. Morgan International Equity Funds | |
JPMorgan International Focus Fund
SCHEDULE OF PORTFOLIO INVESTMENTS
AS OF October 31, 2022 (continued)
| | |
Common Stocks — continued |
United States — continued |
| | |
| | |
| | |
Total Common Stocks
(Cost $1,046,890) | | |
Short-Term Investments — 7.0% |
Investment Companies — 1.8% |
JPMorgan Prime Money Market Fund Class Institutional Shares, 3.12% (c) (d)(Cost $19,898) | | |
Investment of Cash Collateral from Securities Loaned — 5.2% |
JPMorgan Securities Lending Money Market Fund Agency SL Class Shares, 3.23% (c) (d) | | |
JPMorgan U.S. Government Money Market Fund Class IM Shares, 2.85% (c) (d) | | |
Total Investment of Cash Collateral from Securities Loaned
(Cost $56,412) | | |
Total Short-Term Investments
(Cost $76,310) | | |
Total Investments — 104.1%
(Cost $1,123,200) | | |
Liabilities in Excess of Other Assets — (4.1)% | | |
| | |
Percentages indicated are based on net assets. |
| |
| American Depositary Receipt |
| Limited liability company |
| Non-income producing security. |
| The security or a portion of this security is on loan at October 31, 2022. The total value of securities on loan at October 31, 2022 is $26,619. |
| Security exempt from registration pursuant to Regulation S under the Securities Act of 1933, as amended. Regulation S applies to securities offerings that are made outside of the United States and do not involve direct selling efforts in the United States and as such may have restrictions on resale. |
| Investment in an affiliated fund, which is registered under the Investment Company Act of 1940, as amended, and is advised by J.P. Morgan Investment Management Inc. |
| The rate shown is the current yield as of October 31, 2022. |
Summary of Investments by Industry, October 31, 2022
The following table represents the portfolio investments of the Fund by industry classifications as a percentage of total investments:
INDUSTRY October 31, 2022 | PERCENT OF
TOTAL
INVESTMENTS |
| |
Oil, Gas & Consumable Fuels | |
| |
| |
Semiconductors & Semiconductor Equipment | |
| |
| |
Technology Hardware, Storage & Peripherals | |
Textiles, Apparel & Luxury Goods | |
| |
| |
| |
| |
Construction & Engineering | |
| |
Health Care Equipment & Supplies | |
| |
| |
| |
| |
Trading Companies & Distributors | |
Electronic Equipment, Instruments & Components | |
Interactive Media & Services | |
| |
| |
| |
Life Sciences Tools & Services | |
Independent Power and Renewable Electricity Producers | |
Internet & Direct Marketing Retail | |
| |
SEE NOTES TO FINANCIAL STATEMENTS.
| J.P. Morgan International Equity Funds | |
JPMorgan International Hedged Equity Fund
SCHEDULE OF PORTFOLIO INVESTMENTS
AS OF October 31, 2022
| | |
|
|
| | |
| | |
Commonwealth Bank of Australia | | |
| | |
| | |
| | |
| | |
Insurance Australia Group Ltd. | | |
| | |
| | |
| | |
National Australia Bank Ltd. | | |
| | |
| | |
| | |
| | |
| | |
| | |
| | |
Woodside Energy Group Ltd. | | |
| | |
| | |
|
| | |
|
BOC Hong Kong Holdings Ltd. | | |
| | |
Xinyi Glass Holdings Ltd. | | |
| | |
|
| | |
| | |
Novo Nordisk A/S, Class B | | |
| | |
| | |
| | |
|
| | |
| | |
| | |
| | |
| | |
|
|
| | |
| | |
| | |
| | |
| | |
| | |
| | |
LVMH Moet Hennessy Louis Vuitton SE | | |
| | |
| | |
| | |
| | |
| | |
| | |
| | |
| | |
|
| | |
| | |
| | |
| | |
| | |
Deutsche Post AG (Registered) | | |
Deutsche Telekom AG (Registered) | | |
| | |
| | |
| | |
Muenchener Rueckversicherungs-Gesellschaft AG (Registered) | | |
| | |
| | |
| | |
| | |
Volkswagen AG (Preference) | | |
| | |
| | |
|
| | |
| | |
| | |
Hong Kong Exchanges & Clearing Ltd. | | |
| | |
| | |
SEE NOTES TO FINANCIAL STATEMENTS.
| J.P. Morgan International Equity Funds | |
JPMorgan International Hedged Equity Fund
SCHEDULE OF PORTFOLIO INVESTMENTS
AS OF October 31, 2022 (continued)
| | |
Common Stocks — continued |
|
Sun Hung Kai Properties Ltd. | | |
Techtronic Industries Co. Ltd. | | |
| | |
|
| | |
| | |
| | |
|
| | |
FinecoBank Banca Fineco SpA | | |
| | |
| | |
|
| | |
Asahi Group Holdings Ltd. | | |
| | |
| | |
| | |
Central Japan Railway Co. | | |
| | |
| | |
Daito Trust Construction Co. Ltd. | | |
Daiwa House Industry Co. Ltd. | | |
| | |
| | |
| | |
| | |
| | |
| | |
| | |
Japan Airlines Co. Ltd. * | | |
| | |
| | |
| | |
| | |
| | |
| | |
Mitsubishi UFJ Financial Group, Inc. | | |
| | |
Murata Manufacturing Co. Ltd. | | |
| | |
| | |
| | |
|
|
NIPPON EXPRESS HOLDINGS, Inc. | | |
Nippon Paint Holdings Co. Ltd. | | |
| | |
Nippon Telegraph & Telephone Corp. | | |
Nomura Research Institute Ltd. | | |
Ono Pharmaceutical Co. Ltd. | | |
| | |
| | |
Recruit Holdings Co. Ltd. | | |
| | |
Seven & i Holdings Co. Ltd. | | |
| | |
Shin-Etsu Chemical Co. Ltd. | | |
| | |
| | |
| | |
Sumitomo Electric Industries Ltd. | | |
Sumitomo Metal Mining Co. Ltd. | | |
Sumitomo Mitsui Financial Group, Inc. | | |
| | |
| | |
Takeda Pharmaceutical Co. Ltd. | | |
| | |
Tokio Marine Holdings, Inc. | | |
| | |
| | |
| | |
|
| | |
|
| | |
| | |
| | |
Koninklijke Ahold Delhaize NV | | |
| | |
| | |
| | |
| | |
| | |
| | |
|
| | |
SEE NOTES TO FINANCIAL STATEMENTS.
| J.P. Morgan International Equity Funds | |
| | |
Common Stocks — continued |
|
Oversea-Chinese Banking Corp. Ltd. | | |
| | |
United Overseas Bank Ltd. | | |
| | |
|
| | |
|
Banco Bilbao Vizcaya Argentaria SA | | |
| | |
| | |
Industria de Diseno Textil SA | | |
| | |
|
| | |
| | |
| | |
| | |
| | |
|
Cie Financiere Richemont SA (Registered) | | |
| | |
| | |
Lonza Group AG (Registered) | | |
| | |
| | |
| | |
UBS Group AG (Registered) | | |
Zurich Insurance Group AG | | |
| | |
|
| | |
| | |
| | |
Berkeley Group Holdings plc | | |
| | |
British American Tobacco plc | | |
CK Hutchison Holdings Ltd. | | |
| | |
| | |
| | |
InterContinental Hotels Group plc | | |
| | |
|
United Kingdom — continued |
| | |
| | |
London Stock Exchange Group plc | | |
Reckitt Benckiser Group plc | | |
| | |
| | |
| | |
| | |
| | |
| | |
| | |
|
| | |
| | |
| | |
| | |
| | |
| | |
| | |
| | |
Total Common Stocks
(Cost $160,682) | | |
| | |
|
Put Options Purchased — 1.1% |
|
| | |
12/30/2022 at USD 1,575.00, European Style | | |
Notional Amount: USD 159,600 | | |
Counterparty: Exchange-Traded * (Cost $4,516) | | |
| | |
Short-Term Investments — 3.8% |
Investment Companies — 3.8% |
JPMorgan U.S. Government Money Market Fund Class Institutional Shares, 2.79% (b) (c)(Cost $6,096) | | |
Total Investments — 99.0%
(Cost $171,294) | | |
Other Assets Less Liabilities — 1.0% | | |
| | |
SEE NOTES TO FINANCIAL STATEMENTS.
| J.P. Morgan International Equity Funds | |
JPMorgan International Hedged Equity Fund
SCHEDULE OF PORTFOLIO INVESTMENTS
AS OF October 31, 2022 (continued)
Percentages indicated are based on net assets. |
Amounts presented as a dash ("-") represent amounts that round to less than a thousand. |
| |
| American Depositary Receipt |
| Europe, Australasia and Far East |
| Morgan Stanley Capital International |
| |
| A special type of equity investment that shares in the earnings of the company, has limited voting rights, and may have a dividend preference. Preference shares may also have liquidation preference. |
| Real Estate Investment Trust |
| |
| Non-income producing security. |
| Security exempt from registration pursuant to Regulation S under the Securities Act of 1933, as amended. Regulation S applies to securities offerings that are made outside of the United States and do not involve direct selling efforts in the United States and as such may have restrictions on resale. |
| Investment in an affiliated fund, which is registered under the Investment Company Act of 1940, as amended, and is advised by J.P. Morgan Investment Management Inc. |
| The rate shown is the current yield as of October 31, 2022. |
Summary of Investments by Industry, October 31, 2022
The following table represents the portfolio investments of the Fund by industry classifications as a percentage of total investments:
INDUSTRY October 31, 2022 | PERCENT OF
TOTAL
INVESTMENTS |
| |
| |
| |
Oil, Gas & Consumable Fuels | |
| |
Semiconductors & Semiconductor Equipment | |
| |
Textiles, Apparel & Luxury Goods | |
| |
| |
| |
| |
| |
Diversified Telecommunication Services | |
| |
| |
| |
| |
| |
| |
| |
Electronic Equipment, Instruments & Components | |
| |
Real Estate Management & Development | |
| |
Trading Companies & Distributors | |
| |
Health Care Equipment & Supplies | |
| |
Equity Real Estate Investment Trusts (REITs) | |
Construction & Engineering | |
Others (each less than 1.0%) | |
| |
SEE NOTES TO FINANCIAL STATEMENTS.
| J.P. Morgan International Equity Funds | |
Futures contracts outstanding as of October 31, 2022 (amounts in thousands, except number of contracts):
| | | | | VALUE AND
UNREALIZED
APPRECIATION
(DEPRECIATION) ($) |
| | | | | |
| | | | | |
| | | | | |
| | | | | |
| |
| |
| Europe, Australasia and Far East |
| Morgan Stanley Capital International |
| Australian Securities Exchange |
| |
Written Call Options Contracts as of October 31, 2022 (amounts in thousands, except number of contracts):
|
| | | | | | |
| | | | | | |
Written Put Options Contracts as of October 31, 2022
|
| | | | | | |
| | | | | | |
Total Written Options Contracts (Premiums Received $4,555) | |
| |
| Europe, Australasia and Far East |
| Morgan Stanley Capital International |
| |
SEE NOTES TO FINANCIAL STATEMENTS.
| J.P. Morgan International Equity Funds | |
JPMorgan International Value Fund
SCHEDULE OF PORTFOLIO INVESTMENTS
AS OF October 31, 2022
| | |
|
|
Australia & New Zealand Banking Group Ltd. | | |
| | |
| | |
Coronado Global Resources, Inc., CDI (a) | | |
| | |
| | |
| | |
National Australia Bank Ltd. | | |
| | |
| | |
| | |
| | |
| | |
Woodside Energy Group Ltd. | | |
| | |
|
| | |
| | |
| | |
| | |
| | |
| | |
|
| | |
| | |
| | |
|
BOC Hong Kong Holdings Ltd. | | |
Yangzijiang Shipbuilding Holdings Ltd. | | |
| | |
|
| | |
Drilling Co. of 1972 A/S (The) * | | |
| | |
Jyske Bank A/S (Registered) * | | |
| | |
| | |
| | |
| | |
|
| | |
| | |
|
|
| | |
| | |
| | |
| | |
| | |
|
| | |
| | |
| | |
| | |
| | |
| | |
| | |
| | |
| | |
| | |
| | |
| | |
| | |
| | |
| | |
| | |
| | |
| | |
| | |
| | |
|
| | |
| | |
| | |
Bayerische Motoren Werke AG | | |
Daimler Truck Holding AG * | | |
Deutsche Bank AG (Registered) | | |
Deutsche Pfandbriefbank AG (a) | | |
Deutsche Post AG (Registered) | | |
Deutsche Telekom AG (Registered) | | |
| | |
| | |
| | |
| | |
| | |
| | |
SEE NOTES TO FINANCIAL STATEMENTS.
| J.P. Morgan International Equity Funds | |
| | |
Common Stocks — continued |
|
Muenchener Rueckversicherungs-Gesellschaft AG (Registered) | | |
| | |
| | |
Volkswagen AG (Preference) | | |
| | |
|
Hongkong Land Holdings Ltd. | | |
| | |
Pacific Basin Shipping Ltd. | | |
| | |
|
Bank of Ireland Group plc | | |
|
| | |
Assicurazioni Generali SpA | | |
| | |
| | |
| | |
| | |
Mediobanca Banca di Credito Finanziario SpA | | |
| | |
| | |
| | |
| | |
| | |
| | |
|
| | |
| | |
| | |
| | |
| | |
Concordia Financial Group Ltd. | | |
Cosmo Energy Holdings Co. Ltd. | | |
| | |
Dai-ichi Life Holdings, Inc. | | |
| | |
Fuyo General Lease Co. Ltd. | | |
Hachijuni Bank Ltd. (The) | | |
| | |
| | |
| | |
|
|
| | |
| | |
| | |
Japan Post Holdings Co. Ltd. | | |
Japan Post Insurance Co. Ltd. | | |
| | |
| | |
| | |
| | |
| | |
Mitsubishi UFJ Financial Group, Inc. | | |
| | |
| | |
Mizuho Financial Group, Inc. | | |
MS&AD Insurance Group Holdings, Inc. | | |
| | |
Nippon Telegraph & Telephone Corp. | | |
Nomura Real Estate Holdings, Inc. | | |
| | |
| | |
| | |
Shizuoka Financial Group, Inc. | | |
| | |
| | |
| | |
| | |
| | |
Sumitomo Forestry Co. Ltd. | | |
Sumitomo Mitsui Financial Group, Inc. | | |
Sumitomo Mitsui Trust Holdings, Inc. | | |
Sumitomo Warehouse Co. Ltd. (The) | | |
Takeda Pharmaceutical Co. Ltd. | | |
Tokyo Steel Manufacturing Co. Ltd. | | |
| | |
Tokyu Fudosan Holdings Corp. | | |
| | |
| | |
| | |
| | |
|
| | |
|
ABN AMRO Bank NV, CVA (a) | | |
SEE NOTES TO FINANCIAL STATEMENTS.
| J.P. Morgan International Equity Funds | |
JPMorgan International Value Fund
SCHEDULE OF PORTFOLIO INVESTMENTS
AS OF October 31, 2022 (continued)
| | |
Common Stocks — continued |
|
| | |
| | |
| | |
Koninklijke Ahold Delhaize NV | | |
Koninklijke BAM Groep NV * | | |
| | |
| | |
| | |
| | |
|
| | |
| | |
| | |
| | |
| | |
| | |
| | |
Olav Thon Eiendomsselskap ASA | | |
| | |
| | |
| | |
| | |
| | |
|
| | |
Oversea-Chinese Banking Corp. Ltd. | | |
| | |
United Overseas Bank Ltd. | | |
| | |
|
| | |
|
Banco Bilbao Vizcaya Argentaria SA | | |
| | |
| | |
| | |
| | |
| | |
|
| | |
| | |
| | |
|
|
| | |
| | |
Securitas AB, Class B (b) | | |
Skandinaviska Enskilda Banken AB, Class A | | |
| | |
Svenska Handelsbanken AB, Class A | | |
| | |
|
| | |
Mobilezone Holding AG (Registered) | | |
| | |
Swiss Life Holding AG (Registered) | | |
UBS Group AG (Registered) | | |
Zurich Insurance Group AG | | |
| | |
|
| | |
| | |
| | |
| | |
| | |
Berkeley Group Holdings plc | | |
| | |
| | |
| | |
CK Hutchison Holdings Ltd. | | |
Crest Nicholson Holdings plc | | |
| | |
| | |
| | |
| | |
| | |
| | |
| | |
| | |
Land Securities Group plc, REIT | | |
Legal & General Group plc | | |
| | |
| | |
Marks & Spencer Group plc * | | |
| | |
| | |
| | |
SEE NOTES TO FINANCIAL STATEMENTS.
| J.P. Morgan International Equity Funds | |
| | |
Common Stocks — continued |
United Kingdom — continued |
| | |
Paragon Banking Group plc | | |
| | |
| | |
| | |
| | |
| | |
| | |
| | |
| | |
| | |
|
| | |
| | |
| | |
| | |
| | |
| | |
Total Common Stocks
(Cost $360,347) | | |
Short-Term Investments — 5.4% |
Investment Companies — 4.3% |
JPMorgan Prime Money Market Fund Class Institutional Shares, 3.12% (c) (d)(Cost $15,394) | | |
Investment of Cash Collateral from Securities Loaned — 1.1% |
JPMorgan Securities Lending Money Market Fund Agency SL Class Shares, 3.23% (c) (d) | | |
JPMorgan U.S. Government Money Market Fund Class IM Shares, 2.85% (c) (d) | | |
Total Investment of Cash Collateral from Securities Loaned
(Cost $3,995) | | |
Total Short-Term Investments
(Cost $19,389) | | |
Total Investments — 100.7%
(Cost $379,736) | | |
Liabilities in Excess of Other Assets — (0.7)% | | |
| | |
Percentages indicated are based on net assets. |
| |
| Certificate of interbank deposits |
| |
| |
| A special type of equity investment that shares in the earnings of the company, has limited voting rights, and may have a dividend preference. Preference shares may also have liquidation preference. |
| Real Estate Investment Trust |
| Swedish Depositary Receipt |
| Non-income producing security. |
| Security exempt from registration pursuant to Regulation S under the Securities Act of 1933, as amended. Regulation S applies to securities offerings that are made outside of the United States and do not involve direct selling efforts in the United States and as such may have restrictions on resale. |
| The security or a portion of this security is on loan at October 31, 2022. The total value of securities on loan at October 31, 2022 is $3,806. |
| Investment in an affiliated fund, which is registered under the Investment Company Act of 1940, as amended, and is advised by J.P. Morgan Investment Management Inc. |
| The rate shown is the current yield as of October 31, 2022. |
SEE NOTES TO FINANCIAL STATEMENTS.
| J.P. Morgan International Equity Funds | |
JPMorgan International Value Fund
SCHEDULE OF PORTFOLIO INVESTMENTS
AS OF October 31, 2022 (continued)
Summary of Investments by Industry, October 31, 2022
The following table represents the portfolio investments of the Fund by industry classifications as a percentage of total investments:
PORTFOLIO COMPOSITION BY ASSET CLASS
AS OF October 31, 2022 | PERCENT OF
TOTAL
INVESTMENTS |
| |
Oil, Gas & Consumable Fuels | |
| |
| |
| |
| |
Trading Companies & Distributors | |
| |
Diversified Telecommunication Services | |
Wireless Telecommunication Services | |
| |
Real Estate Management & Development | |
| |
Construction & Engineering | |
| |
Commercial Services & Supplies | |
| |
| |
Others (each less than 1.0%) | |
| |
SEE NOTES TO FINANCIAL STATEMENTS.
| J.P. Morgan International Equity Funds | |
STATEMENTS OF ASSETS AND LIABILITIES
AS OF October 31, 2022
(Amounts in thousands, except per share amounts)
| JPMorgan
Emerging
Markets
Equity Fund | JPMorgan
Emerging
Markets
Research
Enhanced
Equity Fund | |
| | | |
Investments in non-affiliates, at value | | | |
Investments in affiliates, at value | | | |
Investments of cash collateral received from securities loaned, at value (See Note 2.C.) | | | |
| | | |
Foreign currency, at value | | | |
Deposits at broker for futures contracts | | | |
| | | |
Investment securities sold | | | |
| | | |
Dividends from non-affiliates | | | |
Dividends from affiliates | | | |
| | | |
Securities lending income (See Note 2.C.) | | | |
Variation margin on futures contracts | | | |
| | | |
| | | |
| | | |
Investment securities purchased | | | |
Collateral received on securities loaned (See Note 2.C.) | | | |
| | | |
Variation margin on futures contracts | | | |
| | | |
| | | |
| | | |
| | | |
| | | |
Custodian and accounting fees | | | |
Deferred foreign capital gains tax | | | |
| | | |
| | | |
| | | |
(a)
Amount rounds to less than one thousand.
SEE NOTES TO FINANCIAL STATEMENTS.
| J.P. Morgan International Equity Funds | |
STATEMENTS OF ASSETS AND LIABILITIES
AS OF October 31, 2022 (continued)
(Amounts in thousands, except per share amounts)
| JPMorgan Emerging Markets Equity Fund | JPMorgan Emerging Markets Research Enhanced Equity Fund | |
| | | |
| | | |
Total distributable earnings (loss) | | | |
| | | |
| | | |
| | | |
| | | |
| | | |
| | | |
| | | |
| | | |
| | | |
| | | |
| | | |
| | | |
Outstanding units of beneficial interest (shares)
($0.0001 par value; unlimited number of shares authorized): | | | |
| | | |
| | | |
| | | |
| | | |
| | | |
| | | |
| | | |
| | | |
| | | |
| | | |
Class A — Redemption price per share | | | |
Class C — Offering price per share (b) | | | |
Class I — Offering and redemption price per share | | | |
Class L — Offering and redemption price per share | | | |
Class R2 — Offering and redemption price per share | | | |
Class R3 — Offering and redemption price per share | | | |
Class R4 — Offering and redemption price per share | | | |
Class R5 — Offering and redemption price per share | | | |
Class R6 — Offering and redemption price per share | | | |
Class A maximum sales charge | | | |
Class A maximum public offering price per share
[net asset value per share/(100% – maximum sales charge)] | | | |
Cost of investments in non-affiliates | | | |
Cost of investments in affiliates | | | |
| | | |
Investment securities on loan, at value (See Note 2.C.) | | | |
Cost of investment of cash collateral (See Note 2.C.) | | | |
(a)
Per share amounts may not recalculate due to rounding of net assets and/or shares outstanding.
(b)
Redemption price for Class C Shares varies based upon length of time the shares are held.
SEE NOTES TO FINANCIAL STATEMENTS.
| J.P. Morgan International Equity Funds | |
| JPMorgan
International
Equity Fund | JPMorgan
International
Focus Fund | JPMorgan
International
Hedged
|
| | | |
Investments in non-affiliates, at value | | | |
Investments in affiliates, at value | | | |
Investments of cash collateral received from securities loaned, at value (See Note 2.C.) | | | |
Options purchased, at value | | | |
| | | |
Foreign currency, at value | | | |
Deposits at broker for futures contracts | | | |
| | | |
Investment securities sold | | | |
| | | |
Dividends from non-affiliates | | | |
Dividends from affiliates | | | |
| | | |
Securities lending income (See Note 2.C.) | | | |
| | | |
| | | |
| | | |
Investment securities purchased | | | |
Collateral received on securities loaned (See Note 2.C.) | | | |
| | | |
Variation margin on futures contracts | | | |
Outstanding options written, at fair value | | | |
| | | |
| | | |
| | | |
| | | |
| | | |
Custodian and accounting fees | | | |
| | | |
| | | |
| | | |
SEE NOTES TO FINANCIAL STATEMENTS.
| J.P. Morgan International Equity Funds | |
STATEMENTS OF ASSETS AND LIABILITIES
AS OF October 31, 2022 (continued)
(Amounts in thousands, except per share amounts)
| JPMorgan International Equity Fund | JPMorgan International Focus Fund | JPMorgan International Hedged |
| | | |
| | | |
Total distributable earnings (loss) | | | |
| | | |
| | | |
| | | |
| | | |
| | | |
| | | |
| | | |
| | | |
| | | |
Outstanding units of beneficial interest (shares)
($0.0001 par value; unlimited number of shares authorized): | | | |
| | | |
| | | |
| | | |
| | | |
| | | |
| | | |
| | | |
Class A — Redemption price per share | | | |
Class C — Offering price per share (b) | | | |
Class I — Offering and redemption price per share | | | |
Class R2 — Offering and redemption price per share | | | |
Class R5 — Offering and redemption price per share | | | |
Class R6 — Offering and redemption price per share | | | |
Class A maximum sales charge | | | |
Class A maximum public offering price per share
[net asset value per share/(100% – maximum sales charge)] | | | |
Cost of investments in non-affiliates | | | |
Cost of investments in affiliates | | | |
Cost of options purchased | | | |
| | | |
Investment securities on loan, at value (See Note 2.C.) | | | |
Cost of investment of cash collateral (See Note 2.C.) | | | |
Premiums received from options written | | | |
(a)
Per share amounts may not recalculate due to rounding of net assets and/or shares outstanding.
(b)
Redemption price for Class C Shares varies based upon length of time the shares are held.
SEE NOTES TO FINANCIAL STATEMENTS.
| J.P. Morgan International Equity Funds | |
| |
| |
Investments in non-affiliates, at value | |
Investments in affiliates, at value | |
Investments of cash collateral received from securities loaned, at value (See Note 2.C.) | |
| |
Foreign currency, at value | |
| |
Investment securities sold | |
| |
Dividends from non-affiliates | |
Dividends from affiliates | |
| |
Securities lending income (See Note 2.C.) | |
| |
| |
| |
Investment securities purchased | |
Collateral received on securities loaned (See Note 2.C.) | |
| |
| |
| |
| |
| |
Custodian and accounting fees | |
| |
| |
| |
SEE NOTES TO FINANCIAL STATEMENTS.
| J.P. Morgan International Equity Funds | |
STATEMENTS OF ASSETS AND LIABILITIES
AS OF October 31, 2022 (continued)
(Amounts in thousands, except per share amounts)
| |
| |
| |
Total distributable earnings (loss) | |
| |
| |
| |
| |
| |
| |
| |
| |
| |
| |
Outstanding units of beneficial interest (shares)
($0.0001 par value; unlimited number of shares authorized): | |
| |
| |
| |
| |
| |
| |
| |
| |
Class A — Redemption price per share | |
Class C — Offering price per share (b) | |
Class I — Offering and redemption price per share | |
Class L — Offering and redemption price per share | |
Class R2 — Offering and redemption price per share | |
Class R5 — Offering and redemption price per share | |
Class R6 — Offering and redemption price per share | |
Class A maximum sales charge | |
Class A maximum public offering price per share
[net asset value per share/(100% – maximum sales charge)] | |
Cost of investments in non-affiliates | |
Cost of investments in affiliates | |
| |
Investment securities on loan, at value (See Note 2.C.) | |
Cost of investment of cash collateral (See Note 2.C.) | |
(a)
Per share amounts may not recalculate due to rounding of net assets and/or shares outstanding.
(b)
Redemption price for Class C Shares varies based upon length of time the shares are held.
SEE NOTES TO FINANCIAL STATEMENTS.
| J.P. Morgan International Equity Funds | |
STATEMENTS OF OPERATIONS
FOR THE YEAR ENDED October 31, 2022
(Amounts in thousands)
| JPMorgan
Emerging
Markets
Equity Fund | JPMorgan
Emerging
Markets
Research
Enhanced
Equity Fund | |
| | | |
Interest income from non-affiliates | | | |
Interest income from affiliates | | | |
Dividend income from non-affiliates | | | |
Dividend income from affiliates | | | |
Income from securities lending (net) (See Note 2.C.) | | | |
Foreign taxes withheld (net) | | | |
| | | |
| | | |
| | | |
| | | |
| | | |
| | | |
| | | |
| | | |
| | | |
| | | |
| | | |
| | | |
| | | |
| | | |
| | | |
| | | |
| | | |
| | | |
Custodian and accounting fees | | | |
Interest expense to affiliates | | | |
| | | |
Trustees’ and Chief Compliance Officer’s fees | | | |
Printing and mailing costs | | | |
Registration and filing fees | | | |
Transfer agency fees (See Note 2.I.) | | | |
| | | |
| | | |
| | | |
Less expense reimbursements | | | |
| | | |
Net investment income (loss) | | | |
(a)
Amount rounds to less than one thousand.
SEE NOTES TO FINANCIAL STATEMENTS.
| J.P. Morgan International Equity Funds | |
STATEMENTS OF OPERATIONS
FOR THE YEAR ENDED October 31, 2022 (continued)
(Amounts in thousands)
| JPMorgan Emerging Markets Equity Fund | JPMorgan Emerging Markets Research Enhanced Equity Fund | |
REALIZED/UNREALIZED GAINS (LOSSES): | | | |
Net realized gain (loss) on transactions from: | | | |
Investments in non-affiliates | | | |
Investments in affiliates | | | |
| | | |
Foreign currency transactions | | | |
| | | |
Distribution of capital gains received from investment company affiliates | | | |
Change in net unrealized appreciation/depreciation on: | | | |
Investments in non-affiliates | | | |
Investments in affiliates | | | |
| | | |
Foreign currency translations | | | |
Change in net unrealized appreciation/depreciation | | | |
Net realized/unrealized gains (losses) | | | |
Change in net assets resulting from operations | | | |
(a)
Net of foreign capital gains tax of $(17,795).
(b)
Net of foreign capital gains tax of $(3,891).
(c)
Amount rounds to less than one thousand.
(d)
Net of change in foreign capital gains tax of $47,297.
(e)
Net of change in foreign capital gains tax of $6,557.
SEE NOTES TO FINANCIAL STATEMENTS.
| J.P. Morgan International Equity Funds | |
| JPMorgan
International
Equity Fund | JPMorgan
International
Focus Fund | JPMorgan
International
Hedged
|
| | | |
Interest income from non-affiliates | | | |
Interest income from affiliates | | | |
Dividend income from non-affiliates | | | |
Dividend income from affiliates | | | |
Income from securities lending (net) (See Note 2.C.) | | | |
Foreign taxes withheld (net) | | | |
| | | |
| | | |
| | | |
| | | |
| | | |
| | | |
| | | |
| | | |
| | | |
| | | |
| | | |
| | | |
| | | |
| | | |
Custodian and accounting fees | | | |
Interest expense to affiliates | | | |
| | | |
Trustees’ and Chief Compliance Officer’s fees | | | |
Printing and mailing costs | | | |
Registration and filing fees | | | |
Transfer agency fees (See Note 2.I.) | | | |
| | | |
| | | |
| | | |
Less expense reimbursements | | | |
| | | |
Net investment income (loss) | | | |
(a)
Amount rounds to less than one thousand.
SEE NOTES TO FINANCIAL STATEMENTS.
| J.P. Morgan International Equity Funds | |
STATEMENTS OF OPERATIONS
FOR THE YEAR ENDED October 31, 2022 (continued)
(Amounts in thousands)
| JPMorgan International Equity Fund | JPMorgan International Focus Fund | JPMorgan International Hedged |
REALIZED/UNREALIZED GAINS (LOSSES): | | | |
Net realized gain (loss) on transactions from: | | | |
Investments in non-affiliates | | | |
Investments in affiliates | | | |
| | | |
| | | |
Foreign currency transactions | | | |
| | | |
| | | |
Change in net unrealized appreciation/depreciation on: | | | |
Investments in non-affiliates | | | |
Investments in affiliates | | | |
| | | |
| | | |
Foreign currency translations | | | |
| | | |
Change in net unrealized appreciation/depreciation | | | |
Net realized/unrealized gains (losses) | | | |
Change in net assets resulting from operations | | | |
SEE NOTES TO FINANCIAL STATEMENTS.
| J.P. Morgan International Equity Funds | |
| |
| |
Interest income from non-affiliates | |
Interest income from affiliates | |
Dividend income from non-affiliates | |
Dividend income from affiliates | |
Income from securities lending (net) (See Note 2.C.) | |
Foreign taxes withheld (net) | |
| |
| |
| |
| |
| |
| |
| |
| |
| |
| |
| |
| |
| |
| |
| |
Custodian and accounting fees | |
Interest expense to affiliates | |
| |
Trustees’ and Chief Compliance Officer’s fees | |
Printing and mailing costs | |
Registration and filing fees | |
Transfer agency fees (See Note 2.I.) | |
| |
| |
| |
Less expense reimbursements | |
| |
Net investment income (loss) | |
(a)
Amount rounds to less than one thousand.
SEE NOTES TO FINANCIAL STATEMENTS.
| J.P. Morgan International Equity Funds | |
STATEMENTS OF OPERATIONS
FOR THE YEAR ENDED October 31, 2022 (continued)
(Amounts in thousands)
| |
REALIZED/UNREALIZED GAINS (LOSSES): | |
Net realized gain (loss) on transactions from: | |
Investments in non-affiliates | |
Investments in affiliates | |
| |
Foreign currency transactions | |
| |
Change in net unrealized appreciation/depreciation on: | |
Investments in non-affiliates | |
Investments in affiliates | |
| |
Foreign currency translations | |
Change in net unrealized appreciation/depreciation | |
Net realized/unrealized gains (losses) | |
Change in net assets resulting from operations | |
(a)
Amount rounds to less than one thousand.
SEE NOTES TO FINANCIAL STATEMENTS.
| J.P. Morgan International Equity Funds | |
STATEMENTS OF CHANGES IN NET ASSETS
FOR THE PERIODS INDICATED
(Amounts in thousands)
| JPMorgan Emerging Markets
Equity Fund | JPMorgan Emerging Markets Research
Enhanced Equity Fund |
| Year Ended
October 31, 2022 | Year Ended
October 31, 2021 | Year Ended
October 31, 2022 | Year Ended
October 31, 2021 |
CHANGE IN NET ASSETS RESULTING FROM OPERATIONS: | | | | |
Net investment income (loss) | | | | |
| | | | |
Change in net unrealized appreciation/depreciation | | | | |
Change in net assets resulting from operations | | | | |
DISTRIBUTIONS TO SHAREHOLDERS: | | | | |
| | | | |
| | | | |
| | | | |
| | | | |
| | | | |
| | | | |
| | | | |
| | | | |
| | | | |
Total distributions to shareholders | | | | |
| | | | |
Change in net assets resulting from capital transactions | | | | |
| | | | |
| | | | |
| | | | |
| | | | |
SEE NOTES TO FINANCIAL STATEMENTS.
| J.P. Morgan International Equity Funds | |
STATEMENTS OF CHANGES IN NET ASSETS
FOR THE PERIODS INDICATED (continued)
(Amounts in thousands)
| JPMorgan Europe Dynamic Fund | JPMorgan International Equity Fund |
| Year Ended
October 31, 2022 | Year Ended
October 31, 2021 | Year Ended
October 31, 2022 | Year Ended
October 31, 2021 |
CHANGE IN NET ASSETS RESULTING FROM OPERATIONS: | | | | |
Net investment income (loss) | | | | |
| | | | |
Change in net unrealized appreciation/depreciation | | | | |
Change in net assets resulting from operations | | | | |
DISTRIBUTIONS TO SHAREHOLDERS: | | | | |
| | | | |
| | | | |
| | | | |
| | | | |
| | | | |
| | | | |
| | | | |
Total distributions to shareholders | | | | |
| | | | |
Change in net assets resulting from capital transactions | | | | |
| | | | |
| | | | |
| | | | |
| | | | |
SEE NOTES TO FINANCIAL STATEMENTS.
| J.P. Morgan International Equity Funds | |
| JPMorgan International Focus Fund | JPMorgan International Hedged Equity Fund |
| Year Ended
October 31, 2022 | Year Ended
October 31, 2021 | Year Ended
October 31, 2022 | Year Ended
October 31, 2021 |
CHANGE IN NET ASSETS RESULTING FROM OPERATIONS: | | | | |
Net investment income (loss) | | | | |
| | | | |
Change in net unrealized appreciation/depreciation | | | | |
Change in net assets resulting from operations | | | | |
DISTRIBUTIONS TO SHAREHOLDERS: | | | | |
| | | | |
| | | | |
| | | | |
| | | | |
| | | | |
| | | | |
Total distributions to shareholders | | | | |
| | | | |
Change in net assets resulting from capital transactions | | | | |
| | | | |
| | | | |
| | | | |
| | | | |
SEE NOTES TO FINANCIAL STATEMENTS.
| J.P. Morgan International Equity Funds | |
STATEMENTS OF CHANGES IN NET ASSETS
FOR THE PERIODS INDICATED (continued)
(Amounts in thousands)
| JPMorgan International Value Fund |
| Year Ended
October 31, 2022 | Year Ended
October 31, 2021 |
CHANGE IN NET ASSETS RESULTING FROM OPERATIONS: | | |
Net investment income (loss) | | |
| | |
Change in net unrealized appreciation/depreciation | | |
Change in net assets resulting from operations | | |
DISTRIBUTIONS TO SHAREHOLDERS: | | |
| | |
| | |
| | |
| | |
| | |
| | |
| | |
Total distributions to shareholders | | |
| | |
Change in net assets resulting from capital transactions | | |
| | |
| | |
| | |
| | |
SEE NOTES TO FINANCIAL STATEMENTS.
| J.P. Morgan International Equity Funds | |
| JPMorgan Emerging Markets
Equity Fund | JPMorgan Emerging Markets Research
Enhanced Equity Fund |
| Year Ended October 31, 2022 | Year Ended October 31, 2021 | Year Ended October 31, 2022 | |
| | | | |
| | | | |
Proceeds from shares issued | | | | |
| | | | |
| | | | |
Change in net assets resulting from Class A capital transactions | | | | |
| | | | |
Proceeds from shares issued | | | | |
| | | | |
| | | | |
Change in net assets resulting from Class C capital transactions | | | | |
| | | | |
Proceeds from shares issued | | | | |
| | | | |
| | | | |
Change in net assets resulting from Class I capital transactions | | | | |
| | | | |
Proceeds from shares issued | | | | |
| | | | |
| | | | |
Change in net assets resulting from Class L capital transactions | | | | |
| | | | |
Proceeds from shares issued | | | | |
| | | | |
| | | | |
Change in net assets resulting from Class R2 capital transactions | | | | |
| | | | |
Proceeds from shares issued | | | | |
| | | | |
| | | | |
Change in net assets resulting from Class R3 capital transactions | | | | |
| | | | |
Proceeds from shares issued | | | | |
| | | | |
| | | | |
Change in net assets resulting from Class R4 capital transactions | | | | |
SEE NOTES TO FINANCIAL STATEMENTS.
| J.P. Morgan International Equity Funds | |
STATEMENTS OF CHANGES IN NET ASSETS
FOR THE PERIODS INDICATED (continued)
(Amounts in thousands)
| JPMorgan Emerging Markets Equity Fund | JPMorgan Emerging Markets Research Enhanced Equity Fund |
| Year Ended October 31, 2022 | Year Ended October 31, 2021 | Year Ended October 31, 2022 | |
CAPITAL TRANSACTIONS: (continued) | | | | |
| | | | |
Proceeds from shares issued | | | | |
| | | | |
| | | | |
Change in net assets resulting from Class R5 capital transactions | | | | |
| | | | |
Proceeds from shares issued | | | | |
| | | | |
| | | | |
Change in net assets resulting from Class R6 capital transactions | | | | |
Total change in net assets resulting from capital transactions | | | | |
| | | | |
| | | | |
| | | | |
| | | | |
| | | | |
| | | | |
| | | | |
| | | | |
| | | | |
| | | | |
| | | | |
| | | | |
| | | | |
| | | | |
| | | | |
| | | | |
| | | | |
| | | | |
| | | | |
| | | | |
| | | | |
| | | | |
| | | | |
| | | | |
| | | | |
Change in Class R2 Shares | | | | |
(a)
Amount rounds to less than one thousand.
SEE NOTES TO FINANCIAL STATEMENTS.
| J.P. Morgan International Equity Funds | |
| JPMorgan Emerging Markets Equity Fund | JPMorgan Emerging Markets Research Enhanced Equity Fund |
| Year Ended October 31, 2022 | Year Ended October 31, 2021 | Year Ended October 31, 2022 | |
SHARE TRANSACTIONS: (continued) | | | | |
| | | | |
| | | | |
| | | | |
| | | | |
Change in Class R3 Shares | | | | |
| | | | |
| | | | |
| | | | |
| | | | |
Change in Class R4 Shares | | | | |
| | | | |
| | | | |
| | | | |
| | | | |
Change in Class R5 Shares | | | | |
| | | | |
| | | | |
| | | | |
| | | | |
Change in Class R6 Shares | | | | |
(a)
Amount rounds to less than one thousand.
SEE NOTES TO FINANCIAL STATEMENTS.
| J.P. Morgan International Equity Funds | |
STATEMENTS OF CHANGES IN NET ASSETS
FOR THE PERIODS INDICATED (continued)
(Amounts in thousands)
| JPMorgan Europe Dynamic Fund | JPMorgan International Equity Fund |
| Year Ended October 31, 2022 | Year Ended October 31, 2021 | Year Ended October 31, 2022 | Year Ended October 31, 2021 |
| | | | |
| | | | |
Proceeds from shares issued | | | | |
| | | | |
| | | | |
Change in net assets resulting from Class A capital transactions | | | | |
| | | | |
Proceeds from shares issued | | | | |
| | | | |
| | | | |
Change in net assets resulting from Class C capital transactions | | | | |
| | | | |
Proceeds from shares issued | | | | |
| | | | |
| | | | |
Change in net assets resulting from Class I capital transactions | | | | |
| | | | |
Proceeds from shares issued | | | | |
| | | | |
| | | | |
Change in net assets resulting from Class L capital transactions | | | | |
| | | | |
Proceeds from shares issued | | | | |
| | | | |
| | | | |
Change in net assets resulting from Class R2 capital transactions | | | | |
| | | | |
Proceeds from shares issued | | | | |
| | | | |
| | | | |
Change in net assets resulting from Class R5 capital transactions | | | | |
| | | | |
Proceeds from shares issued | | | | |
| | | | |
| | | | |
Change in net assets resulting from Class R6 capital transactions | | | | |
Total change in net assets resulting from capital transactions | | | | |
SEE NOTES TO FINANCIAL STATEMENTS.
| J.P. Morgan International Equity Funds | |
| JPMorgan Europe Dynamic Fund | JPMorgan International Equity Fund |
| Year Ended October 31, 2022 | Year Ended October 31, 2021 | Year Ended October 31, 2022 | Year Ended October 31, 2021 |
| | | | |
| | | | |
| | | | |
| | | | |
| | | | |
| | | | |
| | | | |
| | | | |
| | | | |
| | | | |
| | | | |
| | | | |
| | | | |
| | | | |
| | | | |
| | | | |
| | | | |
| | | | |
| | | | |
| | | | |
| | | | |
| | | | |
| | | | |
| | | | |
| | | | |
Change in Class R2 Shares | | | | |
| | | | |
| | | | |
| | | | |
| | | | |
Change in Class R5 Shares | | | | |
| | | | |
| | | | |
| | | | |
| | | | |
Change in Class R6 Shares | | | | |
SEE NOTES TO FINANCIAL STATEMENTS.
| J.P. Morgan International Equity Funds | |
STATEMENTS OF CHANGES IN NET ASSETS
FOR THE PERIODS INDICATED (continued)
(Amounts in thousands)
| JPMorgan International Focus Fund | JPMorgan International Hedged Equity Fund |
| Year Ended October 31, 2022 | Year Ended October 31, 2021 | Year Ended October 31, 2022 | |
| | | | |
| | | | |
Proceeds from shares issued | | | | |
| | | | |
| | | | |
Change in net assets resulting from Class A capital transactions | | | | |
| | | | |
Proceeds from shares issued | | | | |
| | | | |
| | | | |
Change in net assets resulting from Class C capital transactions | | | | |
| | | | |
Proceeds from shares issued | | | | |
| | | | |
| | | | |
Change in net assets resulting from Class I capital transactions | | | | |
| | | | |
Proceeds from shares issued | | | | |
| | | | |
| | | | |
Change in net assets resulting from Class R2 capital transactions | | | | |
| | | | |
Proceeds from shares issued | | | | |
| | | | |
| | | | |
Change in net assets resulting from Class R5 capital transactions | | | | |
| | | | |
Proceeds from shares issued | | | | |
| | | | |
| | | | |
| | | | |
Change in net assets resulting from Class R6 capital transactions | | | | |
Total change in net assets resulting from capital transactions | | | | |
(a)
Amount rounds to less than one thousand.
SEE NOTES TO FINANCIAL STATEMENTS.
| J.P. Morgan International Equity Funds | |
| JPMorgan International Focus Fund | JPMorgan International Hedged Equity Fund |
| Year Ended October 31, 2022 | Year Ended October 31, 2021 | Year Ended October 31, 2022 | |
| | | | |
| | | | |
| | | | |
| | | | |
| | | | |
| | | | |
| | | | |
| | | | |
| | | | |
| | | | |
| | | | |
| | | | |
| | | | |
| | | | |
| | | | |
| | | | |
| | | | |
| | | | |
| | | | |
| | | | |
Change in Class R2 Shares | | | | |
| | | | |
| | | | |
| | | | |
| | | | |
Change in Class R5 Shares | | | | |
| | | | |
| | | | |
| | | | |
| | | | |
| | | | |
Change in Class R6 Shares | | | | |
(a)
Amount rounds to less than one thousand.
SEE NOTES TO FINANCIAL STATEMENTS.
| J.P. Morgan International Equity Funds | |
STATEMENTS OF CHANGES IN NET ASSETS
FOR THE PERIODS INDICATED (continued)
(Amounts in thousands)
| JPMorgan International Value Fund |
| Year Ended October 31, 2022 | |
| | |
| | |
Proceeds from shares issued | | |
| | |
| | |
Change in net assets resulting from Class A capital transactions | | |
| | |
Proceeds from shares issued | | |
| | |
| | |
Change in net assets resulting from Class C capital transactions | | |
| | |
Proceeds from shares issued | | |
| | |
| | |
Change in net assets resulting from Class I capital transactions | | |
| | |
Proceeds from shares issued | | |
| | |
| | |
Change in net assets resulting from Class L capital transactions | | |
| | |
Proceeds from shares issued | | |
| | |
| | |
Change in net assets resulting from Class R2 capital transactions | | |
| | |
Proceeds from shares issued | | |
| | |
| | |
Change in net assets resulting from Class R5 capital transactions | | |
| | |
Proceeds from shares issued | | |
| | |
| | |
Change in net assets resulting from Class R6 capital transactions | | |
Total change in net assets resulting from capital transactions | | |
SEE NOTES TO FINANCIAL STATEMENTS.
| J.P. Morgan International Equity Funds | |
| JPMorgan International Value Fund |
| Year Ended October 31, 2022 | |
| | |
| | |
| | |
| | |
| | |
| | |
| | |
| | |
| | |
| | |
| | |
| | |
| | |
| | |
| | |
| | |
| | |
| | |
| | |
| | |
| | |
| | |
| | |
| | |
| | |
Change in Class R2 Shares | | |
| | |
| | |
| | |
| | |
Change in Class R5 Shares | | |
| | |
| | |
| | |
| | |
Change in Class R6 Shares | | |
(a)
Amount rounds to less than one thousand.
SEE NOTES TO FINANCIAL STATEMENTS.
| J.P. Morgan International Equity Funds | |
FINANCIAL HIGHLIGHTS
FOR THE PERIODS INDICATED
| Per share operating performance |
| | | |
| Net asset
value,
beginning
of period | Net
investment
income
(loss)(a) | Net realized
and unrealized
gains
(losses) on
investments | Total from
investment
operations | | | |
JPMorgan Emerging Markets Equity Fund | | | | | | | |
| | | | | | | |
Year Ended October 31, 2022 | | | | | | | |
Year Ended October 31, 2021 | | | | | | | |
Year Ended October 31, 2020 | | | | | | | |
Year Ended October 31, 2019 | | | | | | | |
Year Ended October 31, 2018 | | | | | | | |
| | | | | | | |
Year Ended October 31, 2022 | | | | | | | |
Year Ended October 31, 2021 | | | | | | | |
Year Ended October 31, 2020 | | | | | | | |
Year Ended October 31, 2019 | | | | | | | |
Year Ended October 31, 2018 | | | | | | | |
| | | | | | | |
Year Ended October 31, 2022 | | | | | | | |
Year Ended October 31, 2021 | | | | | | | |
Year Ended October 31, 2020 | | | | | | | |
Year Ended October 31, 2019 | | | | | | | |
Year Ended October 31, 2018 | | | | | | | |
| | | | | | | |
Year Ended October 31, 2022 | | | | | | | |
Year Ended October 31, 2021 | | | | | | | |
Year Ended October 31, 2020 | | | | | | | |
Year Ended October 31, 2019 | | | | | | | |
Year Ended October 31, 2018 | | | | | | | |
| | | | | | | |
Year Ended October 31, 2022 | | | | | | | |
Year Ended October 31, 2021 | | | | | | | |
Year Ended October 31, 2020 | | | | | | | |
Year Ended October 31, 2019 | | | | | | | |
Year Ended October 31, 2018 | | | | | | | |
| | | | | | | |
Year Ended October 31, 2022 | | | | | | | |
Year Ended October 31, 2021 | | | | | | | |
Year Ended October 31, 2020 | | | | | | | |
Year Ended October 31, 2019 | | | | | | | |
Year Ended October 31, 2018 | | | | | | | |
| | | | | | | |
Year Ended October 31, 2022 | | | | | | | |
Year Ended October 31, 2021 | | | | | | | |
Year Ended October 31, 2020 | | | | | | | |
Year Ended October 31, 2019 | | | | | | | |
Year Ended October 31, 2018 | | | | | | | |
SEE NOTES TO FINANCIAL STATEMENTS.
| J.P. Morgan International Equity Funds | |
| |
| | | Ratios to average net assets |
Net asset
value,
end of
period | Total return
(excludes
sales charge)(b) | Net assets,
end of
period
(000's) | | Net
investment
income
(loss) | Expenses without
waivers and reimbursements | |
| | | | | | |
| | | | | | |
| | | | | | |
| | | | | | |
| | | | | | |
| | | | | | |
| | | | | | |
| | | | | | |
| | | | | | |
| | | | | | |
| | | | | | |
| | | | | | |
| | | | | | |
| | | | | | |
| | | | | | |
| | | | | | |
| | | | | | |
| | | | | | |
| | | | | | |
| | | | | | |
| | | | | | |
| | | | | | |
| | | | | | |
| | | | | | |
| | | | | | |
| | | | | | |
| | | | | | |
| | | | | | |
| | | | | | |
| | | | | | |
| | | | | | |
| | | | | | |
| | | | | | |
| | | | | | |
| | | | | | |
| | | | | | |
| | | | | | |
| | | | | | |
| | | | | | |
| | | | | | |
| | | | | | |
| | | | | | |
| | | | | | |
SEE NOTES TO FINANCIAL STATEMENTS.
| J.P. Morgan International Equity Funds | |
FINANCIAL HIGHLIGHTS
FOR THE PERIODS INDICATED (continued)
| Per share operating performance |
| | | |
| Net asset
value,
beginning
of period | Net
investment
income
(loss)(a) | Net realized
and unrealized
gains
(losses) on
investments | Total from
investment
operations | | | |
JPMorgan Emerging Markets Equity Fund (continued) | | | | | | | |
| | | | | | | |
Year Ended October 31, 2022 | | | | | | | |
Year Ended October 31, 2021 | | | | | | | |
Year Ended October 31, 2020 | | | | | | | |
Year Ended October 31, 2019 | | | | | | | |
Year Ended October 31, 2018 | | | | | | | |
| | | | | | | |
Year Ended October 31, 2022 | | | | | | | |
Year Ended October 31, 2021 | | | | | | | |
Year Ended October 31, 2020 | | | | | | | |
Year Ended October 31, 2019 | | | | | | | |
Year Ended October 31, 2018 | | | | | | | |
|
| Calculated based upon average shares outstanding. |
| Includes adjustments in accordance with accounting principles generally accepted in the United States of America and as such, the net asset values for financial reporting purposes and the returns based upon those net asset values may differ from the net asset values and returns for shareholder transactions. |
| Includes interest expense, if applicable, which is less than 0.005% unless otherwise noted. |
| Amount rounds to less than $0.005. |
SEE NOTES TO FINANCIAL STATEMENTS.
| J.P. Morgan International Equity Funds | |
| |
| | | Ratios to average net assets |
Net asset
value,
end of
period | Total return
(excludes
sales charge)(b) | Net assets,
end of
period
(000's) | | Net
investment
income
(loss) | Expenses without
waivers and reimbursements | |
|
| | | | | | |
| | | | | | |
| | | | | | |
| | | | | | |
| | | | | | |
| | | | | | |
| | | | | | |
| | | | | | |
| | | | | | |
| | | | | | |
| | | | | | |
| | | | | | |
SEE NOTES TO FINANCIAL STATEMENTS.
| J.P. Morgan International Equity Funds | |
FINANCIAL HIGHLIGHTS
FOR THE PERIODS INDICATED
| Per share operating performance |
| | | |
| Net asset
value,
beginning
of period | Net
investment
income
(loss)(b) | Net realized
and unrealized
gains
(losses) on
investments | Total from
investment
operations | | | |
JPMorgan Emerging Markets Research Enhanced Equity Fund | | | | | | | |
| | | | | | | |
Year Ended October 31, 2022 | | | | | | | |
Year Ended October 31, 2021 | | | | | | | |
Year Ended October 31, 2020 | | | | | | | |
January 30, 2019 (f) through October 31, 2019 | | | | | | | |
| | | | | | | |
Year Ended October 31, 2022 | | | | | | | |
Year Ended October 31, 2021 | | | | | | | |
Year Ended October 31, 2020 | | | | | | | |
December 11, 2018 (h) through October 31, 2019 | | | | | | | |
|
| Annualized for periods less than one year, unless otherwise noted. |
| Calculated based upon average shares outstanding. |
| Not annualized for periods less than one year. |
| Includes adjustments in accordance with accounting principles generally accepted in the United States of America and as such, the net asset values for financial reporting purposes and the returns based upon those net asset values may differ from the net asset values and returns for shareholder transactions. |
| Includes interest expense, if applicable, which is less than 0.005% unless otherwise noted. |
| Commencement of offering of class of shares. |
| Certain non-recurring expenses incurred by the Fund were not annualized for the period indicated. |
| Commencement of operations. |
SEE NOTES TO FINANCIAL STATEMENTS.
| J.P. Morgan International Equity Funds | |
| |
| | | Ratios to average net assets(a) |
Net asset
value,
end of
period | | Net assets,
end of
period
(000's) | | Net
investment
income
(loss) | Expenses without
waivers and reimbursements | |
| | | | | | |
| | | | | | |
| | | | | | |
| | | | | | |
| | | | | | |
| | | | | | |
| | | | | | |
| | | | | | |
| | | | | | |
| | | | | | |
| | | | | | |
SEE NOTES TO FINANCIAL STATEMENTS.
| J.P. Morgan International Equity Funds | |
FINANCIAL HIGHLIGHTS
FOR THE PERIODS INDICATED
| Per share operating performance |
| | | |
| Net asset
value,
beginning
of period | Net
investment
income
(loss)(b) | Net realized
and unrealized
gains
(losses) on
investments | Total from
investment
operations | |
JPMorgan Europe Dynamic Fund | | | | | |
| | | | | |
Year Ended October 31, 2022 | | | | | |
Year Ended October 31, 2021 | | | | | |
Year Ended October 31, 2020 | | | | | |
Year Ended October 31, 2019 | | | | | |
Year Ended October 31, 2018 | | | | | |
| | | | | |
Year Ended October 31, 2022 | | | | | |
Year Ended October 31, 2021 | | | | | |
Year Ended October 31, 2020 | | | | | |
Year Ended October 31, 2019 | | | | | |
Year Ended October 31, 2018 | | | | | |
| | | | | |
Year Ended October 31, 2022 | | | | | |
Year Ended October 31, 2021 | | | | | |
Year Ended October 31, 2020 | | | | | |
Year Ended October 31, 2019 | | | | | |
Year Ended October 31, 2018 | | | | | |
| | | | | |
Year Ended October 31, 2022 | | | | | |
Year Ended October 31, 2021 | | | | | |
Year Ended October 31, 2020 | | | | | |
Year Ended October 31, 2019 | | | | | |
Year Ended October 31, 2018 | | | | | |
| | | | | |
Year Ended October 31, 2022 | | | | | |
Year Ended October 31, 2021 | | | | | |
Year Ended October 31, 2020 | | | | | |
Year Ended October 31, 2019 | | | | | |
October 1, 2018 (g) through October 31, 2018 | | | | | |
|
| Annualized for periods less than one year, unless otherwise noted. |
| Calculated based upon average shares outstanding. |
| Not annualized for periods less than one year. |
| Includes adjustments in accordance with accounting principles generally accepted in the United States of America and as such, the net asset values for financial reporting purposes and the returns based upon those net asset values may differ from the net asset values and returns for shareholder transactions. |
| Includes interest expense, if applicable, which is less than 0.005% unless otherwise noted. |
| Reflects income from foreign withholding tax claims, including related interest income. Had the Fund not received these proceeds, the net investment income (loss) per share would have been $0.38, $0.20, $0.45, $0.52 and $0.53 for Class A, Class C, Class I, Class L and Class R6, respectively, and the net investment income (loss) ratios would have been 1.29%, 0.78%, 1.44%, 1.70% and 1.75% for Class A, Class C, Class I, Class L and Class R6, respectively. |
| Commencement of offering of class of shares. |
SEE NOTES TO FINANCIAL STATEMENTS.
| J.P. Morgan International Equity Funds | |
| |
| | | Ratios to average net assets(a) |
Net asset
value,
end of
period | Total return
(excludes
sales charge)(c)(d) | Net assets,
end of
period
(000's) | | Net
investment
income
(loss) | Expenses without
waivers and reimbursements | |
| | | | | | |
| | | | | | |
| | | | | | |
| | | | | | |
| | | | | | |
| | | | | | |
| | | | | | |
| | | | | | |
| | | | | | |
| | | | | | |
| | | | | | |
| | | | | | |
| | | | | | |
| | | | | | |
| | | | | | |
| | | | | | |
| | | | | | |
| | | | | | |
| | | | | | |
| | | | | | |
| | | | | | |
| | | | | | |
| | | | | | |
| | | | | | |
| | | | | | |
| | | | | | |
| | | | | | |
| | | | | | |
| | | | | | |
| | | | | | |
| | | | | | |
SEE NOTES TO FINANCIAL STATEMENTS.
| J.P. Morgan International Equity Funds | |
FINANCIAL HIGHLIGHTS
FOR THE PERIODS INDICATED
| Per share operating performance |
| | | |
| Net asset
value,
beginning
of period | Net
investment
income
(loss)(a) | Net realized
and unrealized
gains
(losses) on
investments | Total from
investment
operations | | | |
JPMorgan International Equity Fund | | | | | | | |
| | | | | | | |
Year Ended October 31, 2022 | | | | | | | |
Year Ended October 31, 2021 | | | | | | | |
Year Ended October 31, 2020 | | | | | | | |
Year Ended October 31, 2019 | | | | | | | |
Year Ended October 31, 2018 | | | | | | | |
| | | | | | | |
Year Ended October 31, 2022 | | | | | | | |
Year Ended October 31, 2021 | | | | | | | |
Year Ended October 31, 2020 | | | | | | | |
Year Ended October 31, 2019 | | | | | | | |
Year Ended October 31, 2018 | | | | | | | |
| | | | | | | |
Year Ended October 31, 2022 | | | | | | | |
Year Ended October 31, 2021 | | | | | | | |
Year Ended October 31, 2020 | | | | | | | |
Year Ended October 31, 2019 | | | | | | | |
Year Ended October 31, 2018 | | | | | | | |
| | | | | | | |
Year Ended October 31, 2022 | | | | | | | |
Year Ended October 31, 2021 | | | | | | | |
Year Ended October 31, 2020 | | | | | | | |
Year Ended October 31, 2019 | | | | | | | |
Year Ended October 31, 2018 | | | | | | | |
| | | | | | | |
Year Ended October 31, 2022 | | | | | | | |
Year Ended October 31, 2021 | | | | | | | |
Year Ended October 31, 2020 | | | | | | | |
Year Ended October 31, 2019 | | | | | | | |
Year Ended October 31, 2018 | | | | | | | |
| | | | | | | |
Year Ended October 31, 2022 | | | | | | | |
Year Ended October 31, 2021 | | | | | | | |
Year Ended October 31, 2020 | | | | | | | |
Year Ended October 31, 2019 | | | | | | | |
Year Ended October 31, 2018 | | | | | | | |
|
| Calculated based upon average shares outstanding. |
| Includes adjustments in accordance with accounting principles generally accepted in the United States of America and as such, the net asset values for financial reporting purposes and the returns based upon those net asset values may differ from the net asset values and returns for shareholder transactions. |
| Includes interest expense, if applicable, which is less than 0.005% unless otherwise noted. |
| Reflects income from foreign withholding tax claims. Had the Fund not received these proceeds, the net investment income (loss) per share and the net investment income (loss) ratios for each share class would have remained the same. |
SEE NOTES TO FINANCIAL STATEMENTS.
| J.P. Morgan International Equity Funds | |
| |
| | | Ratios to average net assets |
Net asset
value,
end of
period | Total return
(excludes
sales charge)(b) | Net assets,
end of
period
(000's) | | Net
investment
income
(loss) | Expenses without
waivers and reimbursements | |
| | | | | | |
| | | | | | |
| | | | | | |
| | | | | | |
| | | | | | |
| | | | | | |
| | | | | | |
| | | | | | |
| | | | | | |
| | | | | | |
| | | | | | |
| | | | | | |
| | | | | | |
| | | | | | |
| | | | | | |
| | | | | | |
| | | | | | |
| | | | | | |
| | | | | | |
| | | | | | |
| | | | | | |
| | | | | | |
| | | | | | |
| | | | | | |
| | | | | | |
| | | | | | |
| | | | | | |
| | | | | | |
| | | | | | |
| | | | | | |
| | | | | | |
| | | | | | |
| | | | | | |
| | | | | | |
| | | | | | |
| | | | | | |
| | | | | | |
SEE NOTES TO FINANCIAL STATEMENTS.
| J.P. Morgan International Equity Funds | |
FINANCIAL HIGHLIGHTS
FOR THE PERIODS INDICATED
| Per share operating performance |
| | | |
| Net asset
value,
beginning
of period | Net
investment
income
(loss)(a) | Net realized
and unrealized
gains
(losses) on
investments | Total from
investment
operations | |
JPMorgan International Focus Fund | | | | | |
| | | | | |
Year Ended October 31, 2022 | | | | | |
Year Ended October 31, 2021 | | | | | |
Year Ended October 31, 2020 | | | | | |
Year Ended October 31, 2019 | | | | | |
Year Ended October 31, 2018 | | | | | |
| | | | | |
Year Ended October 31, 2022 | | | | | |
Year Ended October 31, 2021 | | | | | |
Year Ended October 31, 2020 | | | | | |
Year Ended October 31, 2019 | | | | | |
Year Ended October 31, 2018 | | | | | |
| | | | | |
Year Ended October 31, 2022 | | | | | |
Year Ended October 31, 2021 | | | | | |
Year Ended October 31, 2020 | | | | | |
Year Ended October 31, 2019 | | | | | |
Year Ended October 31, 2018 | | | | | |
| | | | | |
Year Ended October 31, 2022 | | | | | |
Year Ended October 31, 2021 | | | | | |
Year Ended October 31, 2020 | | | | | |
Year Ended October 31, 2019 | | | | | |
Year Ended October 31, 2018 | | | | | |
| | | | | |
Year Ended October 31, 2022 | | | | | |
Year Ended October 31, 2021 | | | | | |
Year Ended October 31, 2020 | | | | | |
Year Ended October 31, 2019 | | | | | |
Year Ended October 31, 2018 | | | | | |
| | | | | |
Year Ended October 31, 2022 | | | | | |
Year Ended October 31, 2021 | | | | | |
Year Ended October 31, 2020 | | | | | |
Year Ended October 31, 2019 | | | | | |
Year Ended October 31, 2018 | | | | | |
|
| Calculated based upon average shares outstanding. |
| Includes adjustments in accordance with accounting principles generally accepted in the United States of America and as such, the net asset values for financial reporting purposes and the returns based upon those net asset values may differ from the net asset values and returns for shareholder transactions. |
| Includes interest expense, if applicable, which is less than 0.005% unless otherwise noted. |
| Reflects income from foreign withholding tax claims. Had the Fund not received these proceeds, the net investment income (loss) per share and the net investment income (loss) ratios for each share class would have remained the same. |
SEE NOTES TO FINANCIAL STATEMENTS.
| J.P. Morgan International Equity Funds | |
| |
| | | Ratios to average net assets |
Net asset
value,
end of
period | Total return
(excludes
sales charge)(b) | Net assets,
end of
period
(000's) | | Net
investment
income
(loss) | Expenses without
waivers and reimbursements | |
| | | | | | |
| | | | | | |
| | | | | | |
| | | | | | |
| | | | | | |
| | | | | | |
| | | | | | |
| | | | | | |
| | | | | | |
| | | | | | |
| | | | | | |
| | | | | | |
| | | | | | |
| | | | | | |
| | | | | | |
| | | | | | |
| | | | | | |
| | | | | | |
| | | | | | |
| | | | | | |
| | | | | | |
| | | | | | |
| | | | | | |
| | | | | | |
| | | | | | |
| | | | | | |
| | | | | | |
| | | | | | |
| | | | | | |
| | | | | | |
| | | | | | |
| | | | | | |
| | | | | | |
| | | | | | |
| | | | | | |
| | | | | | |
| | | | | | |
SEE NOTES TO FINANCIAL STATEMENTS.
| J.P. Morgan International Equity Funds | |
FINANCIAL HIGHLIGHTS
FOR THE PERIODS INDICATED
| Per share operating performance |
| | | |
| Net asset
value,
beginning
of period | Net
investment
income
(loss)(b) | Net realized
and unrealized
gains
(losses) on
investments | Total from
investment
operations | |
JPMorgan International Hedged Equity Fund | | | | | |
| | | | | |
Year Ended October 31, 2022 | | | | | |
Year Ended October 31, 2021 | | | | | |
Year Ended October 31, 2020 | | | | | |
March 15, 2019 (f) through October 31, 2019 | | | | | |
| | | | | |
Year Ended October 31, 2022 | | | | | |
Year Ended October 31, 2021 | | | | | |
Year Ended October 31, 2020 | | | | | |
March 15, 2019 (f) through October 31, 2019 | | | | | |
| | | | | |
Year Ended October 31, 2022 | | | | | |
Year Ended October 31, 2021 | | | | | |
Year Ended October 31, 2020 | | | | | |
March 15, 2019 (f) through October 31, 2019 | | | | | |
| | | | | |
Year Ended October 31, 2022 | | | | | |
Year Ended October 31, 2021 | | | | | |
Year Ended October 31, 2020 | | | | | |
March 15, 2019 (f) through October 31, 2019 | | | | | |
| | | | | |
Year Ended October 31, 2022 | | | | | |
Year Ended October 31, 2021 | | | | | |
Year Ended October 31, 2020 | | | | | |
March 15, 2019 (f) through October 31, 2019 | | | | | |
|
| Annualized for periods less than one year, unless otherwise noted. |
| Calculated based upon average shares outstanding. |
| Not annualized for periods less than one year. |
| Includes adjustments in accordance with accounting principles generally accepted in the United States of America and as such, the net asset values for financial reporting purposes and the returns based upon those net asset values may differ from the net asset values and returns for shareholder transactions. |
| Includes interest expense, if applicable, which is less than 0.005% unless otherwise noted. |
| Commencement of operations. |
| Certain non-recurring expenses incurred by the Fund were not annualized for the period indicated. |
SEE NOTES TO FINANCIAL STATEMENTS.
| J.P. Morgan International Equity Funds | |
| |
| | | Ratios to average net assets(a) |
Net asset
value,
end of
period | Total return
(excludes
sales charge)(c)(d) | Net assets,
end of
period
(000's) | | Net
investment
income
(loss) | Expenses without
waivers and reimbursements | |
| | | | | | |
| | | | | | |
| | | | | | |
| | | | | | |
| | | | | | |
| | | | | | |
| | | | | | |
| | | | | | |
| | | | | | |
| | | | | | |
| | | | | | |
| | | | | | |
| | | | | | |
| | | | | | |
| | | | | | |
| | | | | | |
| | | | | | |
| | | | | | |
| | | | | | |
| | | | | | |
| | | | | | |
| | | | | | |
| | | | | | |
| | | | | | |
| | | | | | |
| | | | | | |
SEE NOTES TO FINANCIAL STATEMENTS.
| J.P. Morgan International Equity Funds | |
FINANCIAL HIGHLIGHTS
FOR THE PERIODS INDICATED
| Per share operating performance |
| | | |
| Net asset
value,
beginning
of period | Net
investment
income
(loss)(a) | Net realized
and unrealized
gains
(losses) on
investments | Total from
investment
operations | |
JPMorgan International Value Fund | | | | | |
| | | | | |
Year Ended October 31, 2022 | | | | | |
Year Ended October 31, 2021 | | | | | |
Year Ended October 31, 2020 | | | | | |
Year Ended October 31, 2019 | | | | | |
Year Ended October 31, 2018 | | | | | |
| | | | | |
Year Ended October 31, 2022 | | | | | |
Year Ended October 31, 2021 | | | | | |
Year Ended October 31, 2020 | | | | | |
Year Ended October 31, 2019 | | | | | |
Year Ended October 31, 2018 | | | | | |
| | | | | |
Year Ended October 31, 2022 | | | | | |
Year Ended October 31, 2021 | | | | | |
Year Ended October 31, 2020 | | | | | |
Year Ended October 31, 2019 | | | | | |
Year Ended October 31, 2018 | | | | | |
| | | | | |
Year Ended October 31, 2022 | | | | | |
Year Ended October 31, 2021 | | | | | |
Year Ended October 31, 2020 | | | | | |
Year Ended October 31, 2019 | | | | | |
Year Ended October 31, 2018 | | | | | |
| | | | | |
Year Ended October 31, 2022 | | | | | |
Year Ended October 31, 2021 | | | | | |
Year Ended October 31, 2020 | | | | | |
Year Ended October 31, 2019 | | | | | |
Year Ended October 31, 2018 | | | | | |
| | | | | |
Year Ended October 31, 2022 | | | | | |
Year Ended October 31, 2021 | | | | | |
Year Ended October 31, 2020 | | | | | |
Year Ended October 31, 2019 | | | | | |
Year Ended October 31, 2018 | | | | | |
SEE NOTES TO FINANCIAL STATEMENTS.
| J.P. Morgan International Equity Funds | |
| |
| | | Ratios to average net assets |
Net asset
value,
end of
period | Total return
(excludes
sales charge)(b) | Net assets,
end of
period
(000's) | | Net
investment
income
(loss) | Expenses without
waivers and reimbursements | |
| | | | | | |
| | | | | | |
| | | | | | |
| | | | | | |
| | | | | | |
| | | | | | |
| | | | | | |
| | | | | | |
| | | | | | |
| | | | | | |
| | | | | | |
| | | | | | |
| | | | | | |
| | | | | | |
| | | | | | |
| | | | | | |
| | | | | | |
| | | | | | |
| | | | | | |
| | | | | | |
| | | | | | |
| | | | | | |
| | | | | | |
| | | | | | |
| | | | | | |
| | | | | | |
| | | | | | |
| | | | | | |
| | | | | | |
| | | | | | |
| | | | | | |
| | | | | | |
| | | | | | |
| | | | | | |
| | | | | | |
| | | | | | |
| | | | | | |
SEE NOTES TO FINANCIAL STATEMENTS.
| J.P. Morgan International Equity Funds | |
FINANCIAL HIGHLIGHTS
FOR THE PERIODS INDICATED (continued)
| Per share operating performance |
| | | |
| Net asset
value,
beginning
of period | Net
investment
income
(loss)(a) | Net realized
and unrealized
gains
(losses) on
investments | Total from
investment
operations | |
JPMorgan International Value Fund (continued) | | | | | |
| | | | | |
Year Ended October 31, 2022 | | | | | |
Year Ended October 31, 2021 | | | | | |
Year Ended October 31, 2020 | | | | | |
Year Ended October 31, 2019 | | | | | |
Year Ended October 31, 2018 | | | | | |
|
| Calculated based upon average shares outstanding. |
| Includes adjustments in accordance with accounting principles generally accepted in the United States of America and as such, the net asset values for financial reporting purposes and the returns based upon those net asset values may differ from the net asset values and returns for shareholder transactions. |
| Includes interest expense, if applicable, which is less than 0.005% unless otherwise noted. |
| Reflects income from foreign withholding tax claims, including related interest income, less IRS compliance fees. Without these proceeds, the net investment income (loss) per share would have been $0.38, $0.28, $0.42, $0.41, $0.34, $0.35 and $0.44 for Class A, Class C, Class I, Class L, Class R2, Class R5, and Class R6,respectively, and the net investment income (loss) ratios would have been 3.00%, 2.26%, 3.19%, 3.23%, 2.72%, 2.80% and 3.44% for Class A, Class C, Class I, Class L, Class R2, Class R5, and Class R6, respectively. |
SEE NOTES TO FINANCIAL STATEMENTS.
| J.P. Morgan International Equity Funds | |
| |
| | | Ratios to average net assets |
Net asset
value,
end of
period | Total return
(excludes
sales charge)(b) | Net assets,
end of
period
(000's) | | Net
investment
income
(loss) | Expenses without
waivers and reimbursements | |
|
| | | | | | |
| | | | | | |
| | | | | | |
| | | | | | |
| | | | | | |
| | | | | | |
SEE NOTES TO FINANCIAL STATEMENTS.
| J.P. Morgan International Equity Funds | |
NOTES TO FINANCIAL STATEMENTS
AS OF October 31, 2022
(Dollar values in thousands)
1. Organization
JPMorgan Trust I (“JPM I") and JPMorgan Trust IV (“JPM IV") (collectively, the “Trusts”) were formed on November 12, 2004 and November 11, 2015, respectively, as Delaware statutory trusts, pursuant to Declarations of Trust dated November 5, 2004 and November 11, 2015, respectively, and are registered under the Investment Company Act of 1940, as amended (the “1940 Act”), as open-end management investment companies.
The following are 7 separate funds of the Trusts (each, a "Fund" and collectively, the "Funds") covered by this report:
| | | Diversification Classification |
JPMorgan Emerging Markets Equity Fund | Class A, Class C, Class I, Class L, Class R2, Class R3, Class R4, Class R5 and Class R6 | | |
JPMorgan Emerging Markets Research Enhanced Equity Fund | | | |
JPMorgan Europe Dynamic Fund | Class A, Class C, Class I, Class L and Class R6 | | |
JPMorgan International Equity Fund | Class A, Class C, Class I, Class R2, Class R5 and Class R6 | | |
JPMorgan International Focus Fund | Class A, Class C, Class I, Class R2, Class R5 and Class R6 | | |
JPMorgan International Hedged Equity Fund | Class A, Class C, Class I, Class R5 and Class R6 | | |
JPMorgan International Value Fund | Class A, Class C, Class I, Class L, Class R2, Class R5 and Class R6 | | |
The investment objective of JPMorgan Emerging Markets Equity Fund (“Emerging Markets Equity Fund”) is to seek to provide high total return.
The investment objective of JPMorgan Emerging Markets Research Enhanced Equity Fund (“Emerging Markets Research Enhanced Equity Fund”),
JPMorgan International Focus Fund (“International Focus Fund”) and JPMorgan International Value Fund (“International Value Fund”) is to seek to provide long-term capital appreciation.
The investment objective of JPMorgan Europe Dynamic Fund (“Europe Dynamic Fund”) is to seek total return from long-term capital growth. Total return consists of capital growth and current income.
The investment objective of JPMorgan International Equity Fund (“International Equity Fund”) is to seek total return from long-term capital growth and income. Total return consists of capital growth and current income.
The investment objective of JPMorgan International Hedged Equity Fund (“International Hedged Equity Fund”) is to seek to provide capital appreciation.
Class L Shares of Europe Dynamic Fund and International Value Fund are publicly offered on a limited basis. Investors are not eligible to purchase Class L Shares of Europe Dynamic Fund and International Value Fund unless they meet certain requirements as described in the Funds' prospectuses.
Effective as of the close of business on December 31, 2020, all share classes of Emerging Markets Equity Fund are publicly offered on a limited basis. Investors are not eligible to purchase shares of the Fund unless they meet certain requirements as described in the Fund's prospectuses.
Class A Shares generally provide for a front-end sales charge while Class C Shares provide for a contingent deferred sales charge ("CDSC"). No sales charges are assessed with respect to Class I, Class L, Class R2, Class R3, Class R4, Class R5 and Class R6 Shares. Certain Class A Shares, for which front-end sales charges have been waived, may be subject to a CDSC as described in the Funds' prospectus. Effective October 1, 2020, Class C Shares automatically convert to Class A Shares after eight years. Prior to October 1, 2020, Class C Shares automatically converted to Class A Shares after ten years. All classes of shares have equal rights as to earnings, assets and voting privileges, except that each class may bear different transfer agency, distribution and service fees and each class has exclusive voting rights with respect to its distribution plan and shareholder servicing agreements.
J.P. Morgan Investment Management Inc. ("JPMIM"), an indirect, wholly-owned subsidiary of JPMorgan Chase & Co. ("JPMorgan"), acts as Adviser (the "Adviser") and Administrator (the "Administrator") to the Funds.
2. Significant Accounting Policies
The following is a summary of significant accounting policies followed by the Funds in the preparation of their financial statements. The Funds are investment companies and, accordingly, follow the investment company accounting and reporting guidance of the Financial Accounting Standards Board (“FASB”) Accounting Standards Codification Topic 946 — Investment Companies, which is part of U.S. generally accepted accounting principles (“GAAP”). The preparation of financial statements in conformity with GAAP requires management to make estimates and assumptions that affect (i)
| J.P. Morgan International Equity Funds | |
the reported amounts of assets and liabilities, (ii) disclosure of contingent assets and liabilities at the date of the financial statements, and (iii) the reported amounts of increases and decreases in net assets from operations during the reporting period. Actual results could differ from those estimates.
A. Valuation of Investments — Investments are valued in accordance with GAAP and the Funds' valuation policies set forth by, and under the supervision and responsibility of, the Boards of Trustees of the Trusts (the "Boards"), which established the following approach to valuation, as described more fully below: (i) investments for which market quotations are readily available shall be valued at their market value and (ii) all other investments for which market quotations are not readily available shall be valued at their fair value as determined in good faith by the Boards.
Under Section 2(a)(41) of the Investment Company Act of 1940, the Boards are required to determine fair value for securities that do not have readily available market quotations. Under SEC Rule 2a-5 (Good Faith Determinations of Fair Value), the Boards may designate the performance of these fair valuation determinations to a valuation designee. The Boards have designated the Adviser as the “Valuation Designee” to perform fair valuation determinations for the Funds on behalf of the Boards subject to appropriate oversight by the Boards. The Adviser, as Valuation Designee, leverages the J.P. Morgan Asset Management Americas Valuation Committee (“AVC”) to help oversee and carry out the policies for the valuation of Investments held in the Funds. The Adviser, as Valuation Designee, remains responsible for the valuation determinations.
This oversight by the AVC includes monitoring the appropriateness of fair values based on results of ongoing valuation oversight including, but not limited to, consideration of macro or security specific events, market events, and pricing vendor and broker due diligence. The Administrator is responsible for discussing and assessing the potential impacts to the fair values on an ongoing basis, and, at least on a quarterly basis, with the AVC and the Boards.
A market-based approach is primarily used to value the Funds' investments. Investments for which market quotations are not readily available are fair valued using prices supplied by approved affiliated and/or unaffiliated pricing vendors or third party broker-dealers (collectively referred to as “Pricing Services”) or may be internally fair valued using methods set forth by the valuation policies approved by the Boards. This may include the use of related or comparable assets or liabilities, recent transactions, market multiples, book values and other relevant information for the investment. An income-based valuation approach may be used in which the anticipated future cash flows of the investment are discounted to calculate the fair value. Discounts may also be applied due to the nature or duration of any restrictions on the disposition of the investments. Valuations may be based upon current market prices of securities that are comparable in coupon, rating, maturity and industry. It is possible that the estimated values may differ significantly from the values that would have been used had a ready market for the investments existed, and such differences could be material.
Equities and other exchange-traded instruments are valued at the last sale price or official market closing price on the primary exchange on which the instrument is traded before the net asset values ("NAV") of the Funds are calculated on a valuation date. Certain foreign equity instruments are valued by applying international fair value factors provided by approved Pricing Services. The factors seek to adjust the local closing price for movements of local markets post-closing, but prior to the time the NAV is calculated.
Investments in open-end investment companies (“Underlying Funds”) are valued at each Underlying Fund’s NAV per share as of the report date.
Futures contracts and options are generally valued on the basis of available market quotations.
Valuations reflected in this report are as of the report date. As a result, changes in valuation due to market events and/or issuer-related events after the report date and prior to issuance of the report are not reflected herein.
The various inputs that are used in determining the valuation of the Funds' investments are summarized into the three broad levels listed below.
•
Level 1 — Unadjusted inputs using quoted prices in active markets for identical investments.
•
Level 2 — Other significant observable inputs including, but not limited to, quoted prices for similar investments, inputs other than quoted prices that are observable for investments (such as interest rates, prepayment speeds, credit risk, etc.) or other market corroborated inputs.
•
Level 3 — Significant inputs based on the best information available in the circumstances, to the extent observable inputs are not available (including the Funds' assumptions in determining the fair value of investments).
A financial instrument’s level within the fair value hierarchy is based on the lowest level of any input, both individually and in the aggregate, that is significant to the fair value measurement. The inputs or methodology used for valuing instruments are not necessarily an indication of the risk associated with investing in those instruments.
| J.P. Morgan International Equity Funds | |
NOTES TO FINANCIAL STATEMENTS
AS OF October 31, 2022 (continued)
(Dollar values in thousands)
The following tables represent each valuation input as presented on the Schedules of Portfolio Investments ("SOIs"):
Emerging Markets Equity Fund | | |
| | Level 2
Other significant
observable inputs | Level 3
Significant
unobservable inputs | |
Investments in Securities | | | | |
| | | | |
| | | | |
| | | | |
| | | | |
| | | | |
| | | | |
| | | | |
| | | | |
| | | | |
| | | | |
| | | | |
| | | | |
| | | | |
| | | | |
| | | | |
| | | | |
| | | | |
| | | | |
Investment of Cash Collateral from Securities Loaned | | | | |
Total Short-Term Investments | | | | |
Total Investments in Securities | | | | |
Emerging Markets Research Enhanced Equity Fund | | |
| | Level 2
Other significant
observable inputs | Level 3
Significant
unobservable inputs | |
Investments in Securities | | | | |
| | | | |
| | | | |
| | | | |
| | | | |
| | | | |
| | | | |
| | | | |
| | | | |
| | | | |
| | | | |
| | | | |
| | | | |
| | | | |
| | | | |
| | | | |
| | | | |
| | | | |
| | | | |
| J.P. Morgan International Equity Funds | |
Emerging Markets Research Enhanced Equity Fund (continued) | | |
| | Level 2 Other significant observable inputs | Level 3 Significant unobservable inputs | |
| | | | |
| | | | |
| | | | |
| | | | |
| | | | |
| | | | |
| | | | |
| | | | |
| | | | |
| | | | |
| | | | |
| | | | |
Investment of Cash Collateral from Securities Loaned | | | | |
Total Short-Term Investments | | | | |
Total Investments in Securities | | | | |
Depreciation in Other Financial Instruments | | | | |
| | | | |
Transfers between level 2 and level 3 are due to a decline or an increase in market activity (e.g. frequency of trades), which resulted in a lack or increase of available market inputs to determine the price for the year ended October 31, 2022.
| | |
| | Level 2
Other significant
observable inputs | Level 3
Significant
unobservable inputs | |
Investments in Securities | | | | |
| | | | |
| | | | |
| | | | |
| | | | |
| | | | |
| | | | |
| | | | |
| | | | |
| | | | |
| | | | |
| | | | |
| | | | |
| | | | |
| | | | |
| | | | |
| | | | |
| | | | |
| | | | |
| | | | |
Total Investments in Securities | | | | |
| J.P. Morgan International Equity Funds | |
NOTES TO FINANCIAL STATEMENTS
AS OF October 31, 2022 (continued)
(Dollar values in thousands)
Europe Dynamic Fund (continued) | | |
| | Level 2 Other significant observable inputs | Level 3 Significant unobservable inputs | |
Appreciation in Other Financial Instruments | | | | |
| | | | |
International Equity Fund | | |
| | Level 2
Other significant
observable inputs | Level 3
Significant
unobservable inputs | |
Investments in Securities | | | | |
| | | | |
| | | | |
| | | | |
| | | | |
| | | | |
| | | | |
| | | | |
| | | | |
| | | | |
| | | | |
| | | | |
| | | | |
| | | | |
| | | | |
| | | | |
| | | | |
| | | | |
| | | | |
| | | | |
| | | | |
| | | | |
| | | | |
| | | | |
| | | | |
Investment of Cash Collateral from Securities Loaned | | | | |
Total Short-Term Investments | | | | |
Total Investments in Securities | | | | |
| | |
| | Level 2
Other significant
observable inputs | Level 3
Significant
unobservable inputs | |
Investments in Securities | | | | |
| | | | |
| | | | |
| | | | |
| | | | |
| | | | |
| | | | |
| | | | |
| J.P. Morgan International Equity Funds | |
International Focus Fund (continued) | | |
| | Level 2 Other significant observable inputs | Level 3 Significant unobservable inputs | |
| | | | |
| | | | |
| | | | |
| | | | |
| | | | |
| | | | |
| | | | |
| | | | |
| | | | |
| | | | |
| | | | |
| | | | |
| | | | |
| | | | |
| | | | |
| | | | |
| | | | |
| | | | |
| | | | |
Investment of Cash Collateral from Securities Loaned | | | | |
Total Short-Term Investments | | | | |
Total Investments in Securities | | | | |
International Hedged Equity Fund | | |
| | Level 2
Other significant
observable inputs | Level 3
Significant
unobservable inputs | |
Investments in Securities | | | | |
| | | | |
| | | | |
| | | | |
| | | | |
| | | | |
| | | | |
| | | | |
| | | | |
| | | | |
| | | | |
| | | | |
| | | | |
| | | | |
| | | | |
| | | | |
| | | | |
| | | | |
| | | | |
| | | | |
| | | | |
| J.P. Morgan International Equity Funds | |
NOTES TO FINANCIAL STATEMENTS
AS OF October 31, 2022 (continued)
(Dollar values in thousands)
International Hedged Equity Fund (continued) | | |
| | Level 2 Other significant observable inputs | Level 3 Significant unobservable inputs | |
| | | | |
| | | | |
| | | | |
| | | | |
| | | | |
Total Investments in Securities | | | | |
Appreciation in Other Financial Instruments | | | | |
| | | | |
Depreciation in Other Financial Instruments | | | | |
| | | | |
| | | | |
| | | | |
| | | | |
Total Net Appreciation/ Depreciation in Other Financial Instruments | | | | |
| | |
| | Level 2
Other significant
observable inputs | Level 3
Significant
unobservable inputs | |
Investments in Securities | | | | |
| | | | |
| | | | |
| | | | |
| | | | |
| | | | |
| | | | |
| | | | |
| | | | |
| | | | |
| | | | |
| | | | |
| | | | |
| | | | |
| | | | |
| | | | |
| | | | |
| | | | |
| | | | |
| | | | |
| | | | |
| | | | |
| | | | |
| | | | |
| | | | |
| | | | |
| J.P. Morgan International Equity Funds | |
International Value Fund (continued) | | |
| | Level 2 Other significant observable inputs | Level 3 Significant unobservable inputs | |
| | | | |
| | | | |
Investment of Cash Collateral from Securities Loaned | | | | |
Total Short-Term Investments | | | | |
Total Investments in Securities | | | | |
B. Restricted Securities — Certain securities held by the Funds may be subject to legal or contractual restrictions on resale. Restricted securities generally are resold in transactions exempt from registration under the Securities Act of 1933, as amended (the “Securities Act”). Disposal of these securities may involve time-consuming negotiations and expense. Prompt sale at the current valuation may be difficult and could adversely affect the NAVs of the Funds.
As of October 31, 2022, the Funds had no investments in restricted securities other than securities sold to the Funds under Rule 144A and/or Regulation S under the Securities Act.
C. Securities Lending — The Funds are authorized to engage in securities lending in order to generate additional income. The Funds are able to lend to approved borrowers. Citibank N.A. (“Citibank”) serves as lending agent for the Funds, pursuant to a Securities Lending Agency Agreement (the “Securities Lending Agency Agreement”). Securities loaned are collateralized by cash equal to at least 100% of the market value plus accrued interest on the securities lent, which is invested in the Class IM Shares of the JPMorgan U.S. Government Money Market Fund and the Agency SL Class Shares of the JPMorgan Securities Lending Money Market Fund. The Funds retain the interest earned on cash collateral investments but are required to pay the borrower a rebate for the use of the cash collateral. In cases where the lent security is of high value to borrowers, there may be a negative rebate (i.e., a net payment from the borrower to the Funds). Upon termination of a loan, the Funds are required to return to the borrower an amount equal to the cash collateral, plus any rebate owed to the borrowers. The remaining maturities of the securities lending transactions are considered overnight and continuous. Loans are subject to termination by the Funds or the borrower at any time.
The net income earned on the securities lending (after payment of rebates and Citibank’s fee) is included on the Statements of Operations as Income from securities lending (net). The Funds also receive payments from the borrower during the period of the loan, equivalent to dividends and interest earned on the securities loaned, which are recorded as Dividend or Interest income, respectively, on the Statements of Operations.
Under the Securities Lending Agency Agreement, Citibank marks to market the loaned securities on a daily basis. In the event the cash received from the borrower is less than 102% of the value of the loaned securities (105% for loans of non-U.S. securities), Citibank requests additional cash from the borrower so as to maintain a collateralization level of at least 102% of the value of the loaned securities plus accrued interest (105% for loans of non-U.S. securities), subject to certain de minimis amounts.
The value of securities out on loan is recorded as an asset on the Statements of Assets and Liabilities. The value of the cash collateral received is recorded as a liability on the Statements of Assets and Liabilities and details of collateral investments are disclosed on the SOIs.
The Funds bear the risk of loss associated with the collateral investments and are not entitled to additional collateral from the borrower to cover any such losses. To the extent that the value of the collateral investments declines below the amount owed to a borrower, the Funds may incur losses that exceed the amount they earned on lending the security. Upon termination of a loan, the Funds may use leverage (borrow money) to repay the borrower for cash collateral posted if the Adviser does not believe that it is prudent to sell the collateral investments to fund the payment of this liability. Securities lending activity is subject to master netting arrangements.
The following table presents for each lending Fund, the value of the securities on loan with Citibank, net of amounts available for offset under the master netting arrangements and any related collateral received or posted by the Funds as of October 31, 2022.
| Investment Securities
on Loan, at value,
Presented on the
Statements of Assets
and Liabilities | Cash Collateral
Posted by Borrower* | Net Amount Due
to Counterparty
(not less than zero) |
Emerging Markets Equity Fund | | | |
Emerging Markets Research Enhanced Equity Fund | | | |
International Equity Fund | | | |
| | | |
| J.P. Morgan International Equity Funds | |
NOTES TO FINANCIAL STATEMENTS
AS OF October 31, 2022 (continued)
(Dollar values in thousands)
| Investment Securities on Loan, at value, Presented on the Statements of Assets and Liabilities | Cash Collateral Posted by Borrower* | Net Amount Due to Counterparty (not less than zero) |
| | | |
|
| Collateral posted reflects the value of securities on loan and does not include any additional amounts received from the borrower. |
Securities lending also involves counterparty risks, including the risk that the loaned securities may not be returned in a timely manner or at all. Subject to certain conditions, Citibank has agreed to indemnify the Funds from losses resulting from a borrower’s failure to return a loaned security.
JPMIM voluntarily waived investment advisory fees charged to the Funds to reduce the impact of the cash collateral investment in the JPMorgan U.S. Government Money Market Fund from 0.13% to 0.06%. For the year ended October 31, 2022, JPMIM waived fees associated with the Funds' investment in the JPMorgan U.S. Government Money Market Fund as follows:
Emerging Markets Equity Fund | |
Emerging Markets Research Enhanced Equity Fund | |
| |
International Equity Fund | |
| |
| |
The above waiver is included in the determination of earnings on cash collateral investment and in the calculation of Citibank’s compensation and is included on the Statements of Operations as Income from securities lending (net).
D. Investment Transactions with Affiliates — The Funds invested in Underlying Funds which are advised by the Adviser. An issuer which is under common control with a Fund may be considered an affiliate. For the purposes of the financial statements, the Funds assume the issuers listed in the tables below to be affiliated issuers. The Underlying Funds’ distributions may be reinvested into such Underlying Funds. Reinvestment amounts are included in the purchases at cost amounts in the tables below.
Emerging Markets Equity Fund |
For the year ended October 31, 2022 |
| | | | | Change in
Unrealized
Appreciation/
(Depreciation) | | | | Capital Gain
Distributions |
JPMorgan Prime Money Market Fund Class Institutional Shares, 3.12% (a) (b) | | | | | | | | | |
JPMorgan Securities Lending Money Market Fund Agency SL Class Shares, 3.23% (a) (b) | | | | | | | | | |
JPMorgan U.S. Government Money Market Fund Class IM Shares, 2.85% (a) (b) | | | | | | | | | |
| | | | | | | | | |
|
| Investment in an affiliated fund, which is registered under the Investment Company Act of 1940, as amended, and is advised by J.P. Morgan Investment Management Inc. |
| The rate shown is the current yield as of October 31, 2022. |
| Amount rounds to less than one thousand. |
| Amount is included on the Statements of Operations as Income from securities lending (net) (after payments of rebates and Citibank’s fee). |
| J.P. Morgan International Equity Funds | |
Emerging Markets Research Enhanced Equity Fund |
For the year ended October 31, 2022 |
| | | | | Change in
Unrealized
Appreciation/
(Depreciation) | | | | Capital Gain
Distributions |
JPMorgan Prime Money Market Fund Class Institutional Shares, 3.12% (a) (b) | | | | | | | | | |
JPMorgan Securities Lending Money Market Fund Agency SL Class Shares, 3.23% (a) (b) | | | | | | | | | |
JPMorgan U.S. Government Money Market Fund Class IM Shares, 2.85% (a) (b) | | | | | | | | | |
| | | | | | | | | |
|
| Investment in an affiliated fund, which is registered under the Investment Company Act of 1940, as amended, and is advised by J.P. Morgan Investment Management Inc. |
| The rate shown is the current yield as of October 31, 2022. |
| Amount rounds to less than one thousand. |
| Amount is included on the Statements of Operations as Income from securities lending (net) (after payments of rebates and Citibank’s fee). |
|
For the year ended October 31, 2022 |
| | | | | Change in
Unrealized
Appreciation/
(Depreciation) | | | | Capital Gain
Distributions |
JPMorgan Prime Money Market Fund Class Institutional Shares, 3.12% (a) (b) | | | | | | | | | |
JPMorgan Securities Lending Money Market Fund Agency SL Class Shares, 3.23% (a) (b) | | | | | | | | | |
JPMorgan U.S. Government Money Market Fund Class IM Shares, 2.85% (a) (b) | | | | | | | | | |
| | | | | | | | | |
|
| Investment in an affiliated fund, which is registered under the Investment Company Act of 1940, as amended, and is advised by J.P. Morgan Investment Management Inc. |
| The rate shown is the current yield as of October 31, 2022. |
| Amount is included on the Statements of Operations as Income from securities lending (net) (after payments of rebates and Citibank’s fee). |
International Equity Fund |
For the year ended October 31, 2022 |
| | | | | Change in
Unrealized
Appreciation/
(Depreciation) | | | | Capital Gain
Distributions |
JPMorgan Prime Money Market Fund Class Institutional Shares, 3.12% (a) (b) | | | | | | | | | |
JPMorgan Securities Lending Money Market Fund Agency SL Class Shares, 3.23% (a) (b) | | | | | | | | | |
JPMorgan U.S. Government Money Market Fund Class IM Shares, 2.85% (a) (b) | | | | | | | | | |
| | | | | | | | | |
|
| Investment in an affiliated fund, which is registered under the Investment Company Act of 1940, as amended, and is advised by J.P. Morgan Investment Management Inc. |
| J.P. Morgan International Equity Funds | |
NOTES TO FINANCIAL STATEMENTS
AS OF October 31, 2022 (continued)
(Dollar values in thousands)
| The rate shown is the current yield as of October 31, 2022. |
| Amount is included on the Statements of Operations as Income from securities lending (net) (after payments of rebates and Citibank’s fee). |
|
For the year ended October 31, 2022 |
| | | | | Change in
Unrealized
Appreciation/
(Depreciation) | | | | Capital Gain
Distributions |
JPMorgan Prime Money Market Fund Class Institutional Shares, 3.12% (a) (b) | | | | | | | | | |
JPMorgan Securities Lending Money Market Fund Agency SL Class Shares, 3.23% (a) (b) | | | | | | | | | |
JPMorgan U.S. Government Money Market Fund Class IM Shares, 2.85% (a) (b) | | | | | | | | | |
| | | | | | | | | |
|
| Investment in an affiliated fund, which is registered under the Investment Company Act of 1940, as amended, and is advised by J.P. Morgan Investment Management Inc. |
| The rate shown is the current yield as of October 31, 2022. |
| Amount is included on the Statements of Operations as Income from securities lending (net) (after payments of rebates and Citibank’s fee). |
International Hedged Equity Fund |
For the year ended October 31, 2022 |
| | | | | Change in
Unrealized
Appreciation/
(Depreciation) | | | | Capital Gain
Distributions |
JPMorgan U.S. Government Money Market Fund Class Institutional Shares, 2.79% (a) (b) | | | | | | | | | |
|
| Investment in an affiliated fund, which is registered under the Investment Company Act of 1940, as amended, and is advised by J.P. Morgan Investment Management Inc. |
| The rate shown is the current yield as of October 31, 2022. |
|
For the year ended October 31, 2022 |
| | | | | Change in
Unrealized
Appreciation/
(Depreciation) | | | | Capital Gain
Distributions |
JPMorgan Prime Money Market Fund Class Institutional Shares, 3.12% (a) (b) | | | | | | | | | |
JPMorgan Securities Lending Money Market Fund Agency SL Class Shares, 3.23% (a) (b) | | | | | | | | | |
JPMorgan U.S. Government Money Market Fund Class IM Shares, 2.85% (a) (b) | | | | | | | | | |
| | | | | | | | | |
|
| Investment in an affiliated fund, which is registered under the Investment Company Act of 1940, as amended, and is advised by J.P. Morgan Investment Management Inc. |
| The rate shown is the current yield as of October 31, 2022. |
| Amount rounds to less than one thousand. |
| Amount is included on the Statements of Operations as Income from securities lending (net) (after payments of rebates and Citibank’s fee). |
| J.P. Morgan International Equity Funds | |
E. Foreign Currency Translation — The books and records of the Funds are maintained in U.S. dollars. Foreign currency amounts are translated into U.S. dollars at the prevailing exchange rates of such currencies against the U.S. dollar. The market value of investment securities and other assets and liabilities are translated at the exchange rate as of the valuation date. Purchases and sales of investment securities, income and expenses are translated at the exchange rate prevailing on the respective dates of such transactions.
The Funds do not isolate the effect of changes in foreign exchange rates from changes in market prices on securities held. Accordingly, such changes are included within Change in net unrealized appreciation/depreciation on investments in non-affiliates on the Statements of Operations.
Reported realized foreign currency gains and losses arise from the disposition of foreign currency, currency gains or losses realized between the trade and settlement dates on securities transactions, and the difference between the amounts of dividends, interest and foreign withholding taxes recorded on each Fund's books on the transaction date and the U.S. dollar equivalent of the amounts actually received or paid. These reported realized foreign currency gains and losses are included in Net realized gain (loss) on foreign currency transactions on the Statements of Operations. Unrealized foreign currency gains and losses arise from changes (due to changes in exchange rates) in the value of foreign currency and other assets and liabilities denominated in foreign currencies, which are held at year end and are included in Change in net unrealized appreciation/depreciation on foreign currency translations on the Statements of Operations.
F. Options — International Hedged Equity Fund purchased put and call options on securities to gain long or short exposure to the underlying instrument. A purchaser of a put option has the right, but not the obligation, to sell the underlying instrument at an agreed upon price (“strike price”) to the option seller. A purchaser of a call option has the right, but not the obligation, to purchase the underlying instrument at the strike price from the option seller.
Options Purchased — Premiums paid by the Fund for options purchased are included on the Statements of Assets and Liabilities as Options purchased. The option is adjusted daily to reflect the current market value of the option and the change is recorded as Change in net unrealized appreciation/depreciation on options purchased on the Statements of Operations. If the option is allowed to expire, the Fund will lose the entire premium it paid and record a realized loss for the premium amount. Premiums paid for options purchased which are exercised or closed are added to the amounts paid or offset against the proceeds on the underlying investment transaction to determine the realized gain (loss) or cost basis of the underlying investment.
Options Written — Premiums received by the Fund for options written are included on the Statement of Assets and Liabilities as a liability. The amount of the liability is adjusted daily to reflect the current market value of the option written and the change in market value is recorded as Change in net unrealized appreciation/depreciation of options written on the Statement of Operations. Premiums received from options written that expire are treated as realized gains. If a written option is closed, the Fund records a realized gain or loss on options written based on whether the cost of the closing transaction exceeds the premium received. If a call option is exercised by the option buyer, the premium received by the Fund is added to the proceeds from the sale of the underlying security to the option buyer and compared to the cost of the closing transaction to determine whether there has been a realized gain or loss. If a put option is exercised by an option buyer, the premium received by the option seller reduces the cost basis of the purchased security.
Written uncovered call options subject the Fund to unlimited risk of loss. Written covered call options limit the upside potential of a security above the strike price. Written put options subject the Fund to risk of loss if the value of the security declines below the exercise price minus the put premium.
The Fund is not subject to credit risk on options written as the counterparty has already performed its obligation by paying the premium at the inception of the contract.
The Fund's exchange-traded option contracts are not subject to master netting arrangements (the right to close out all transactions traded with a counterparty and net amounts owed or due across transactions).
G. Futures Contracts — Emerging Markets Research Enhanced Equity Fund, Europe Dynamic Fund, International Focus Fund, International Hedged Equity Fund and International Value Fund used index futures contracts to gain or reduce exposure to the stock market, or maintain liquidity or minimize transaction costs. The Funds also purchased futures contracts to invest incoming cash in the market or sold futures in response to cash outflows, thereby simulating an invested position in the underlying index while maintaining a cash balance for liquidity.
Futures contracts provide for the delayed delivery of the underlying instrument at a fixed price or are settled for a cash amount based on the change in the value of the underlying instrument at a specific date in the future. Upon entering into a futures contract, the Funds are required to deposit with the broker, cash or securities in an amount equal to a certain percentage of the contract amount, which is referred to as the initial margin deposit. Subsequent payments, referred to as variation margin, are made or received by the Funds periodically and are based on changes in the market value of open futures contracts. Changes in the market value of open futures contracts are recorded as Change in net unrealized appreciation/depreciation on futures contracts on the Statements of Operations. Realized gains or losses, representing the difference between the value of the contract at the time it was opened and the value at the time it was closed, are reported on the Statements of Operations at the closing or expiration of the futures contract. Securities deposited as initial margin are designated on the SOIs, while cash deposited, which is considered restricted, is recorded on the Statements of Assets and Liabilities. A receivable from and/or a payable to brokers for the daily variation margin is also recorded on the Statements of Assets and Liabilities.
| J.P. Morgan International Equity Funds | |
NOTES TO FINANCIAL STATEMENTS
AS OF October 31, 2022 (continued)
(Dollar values in thousands)
The use of futures contracts exposes the Funds to equity price risk. The Funds may be subject to the risk that the change in the value of the futures contract may not correlate perfectly with the underlying instrument. Use of long futures contracts subjects the Funds to risk of loss in excess of the amounts shown on the Statements of Assets and Liabilities, up to the notional amount of the futures contracts. Use of short futures contracts subjects the Funds to unlimited risk of loss. The Funds may enter into futures contracts only on exchanges or boards of trade. The exchange or board of trade acts as the counterparty to each futures transaction; therefore, the Funds' credit risk is limited to failure of the exchange or board of trade. Under some circumstances, futures exchanges may establish daily limits on the amount that the price of a futures contract can vary from the previous day’s settlement price, which could effectively prevent liquidation of positions.
The Funds' futures contracts are not subject to master netting arrangements (the right to close out all transactions traded with a counterparty and net amounts owed or due across transactions).
Derivatives Volume
The table below discloses the volume of the Funds' options and futures contracts activity during the year ended October 31, 2022.
| Emerging
Markets
Research
Enhanced
Equity Fund | | | International
Hedged
Equity Fund | |
| | | | | |
Average Notional Balance Long | | | | | |
Ending Notional Balance Long | | | | | |
| | | | | |
Average Number of Contracts Purchased | | | | | |
Average Number of Contracts Written | | | | | |
Ending Number of Contracts Purchased | | | | | |
Ending Number of Contracts Written | | | | | |
The Funds' derivatives contracts held at October 31, 2022 are not accounted for as hedging instruments under GAAP.
H. Security Transactions and Investment Income — Investment transactions are accounted for on the trade date (the date the order to buy or sell is executed). Securities gains and losses are calculated on a specifically identified cost basis.
Interest income and interest expense on securities sold short, if any, is determined on the basis of coupon interest accrued using the effective interest method, which adjusts for amortization of premiums and accretion of discounts.
Dividend income, net of foreign taxes withheld, if any, is recorded on the ex-dividend date or when the Fund first learns of the dividend.
To the extent such information is publicly available, the Funds record distributions received in excess of income earned from underlying investments as a reduction of cost of investments and/or realized gain. Such amounts are based on estimates if actual amounts are not available and actual amounts of income, realized gain and return of capital may differ from the estimated amounts. The Funds adjust the estimated amounts of the components of distributions (and consequently their net investment income) as necessary, once the issuers provide information about the actual composition of the distributions.
I. Allocation of Income and Expenses— Expenses directly attributable to a Fund are charged directly to that Fund, while the expenses attributable to more than one fund of the Trusts are allocated among the applicable funds. Investment income, realized and unrealized gains and losses and expenses, other than class-specific expenses, are allocated daily to each class of shares based upon the proportion of net assets of each class at the beginning of each day.
Transfer agency fees are class-specific expenses. The amount of the transfer agency fees charged to each share class of the Funds for the year ended October 31, 2022 are as follows:
| | | | | | | | | | |
Emerging Markets Equity Fund | | | | | | | | | | |
| | | | | | | | | | |
Emerging Markets Research Enhanced Equity Fund | | | | | | | | | | |
| | | | | | | | | | |
| | | | | | | | | | |
| | | | | | | | | | |
International Equity Fund | | | | | | | | | | |
| | | | | | | | | | |
| J.P. Morgan International Equity Funds | |
| | | | | | | | | | |
| | | | | | | | | | |
| | | | | | | | | | |
International Hedged Equity Fund | | | | | | | | | | |
| | | | | | | | | | |
| | | | | | | | | | |
| | | | | | | | | | |
|
| Amount rounds to less than one thousand. |
J. Federal Income Taxes — Each Fund is treated as a separate taxable entity for Federal income tax purposes. Each Fund's policy is to comply with the provisions of the Internal Revenue Code (the “Code”) applicable to regulated investment companies and to distribute to shareholders all of its distributable net investment income and net realized capital gains on investments. Accordingly, no provision for Federal income tax is necessary. Management has reviewed the Funds' tax positions for all open tax years and has determined that as of October 31, 2022, no liability for Federal income tax is required in the Funds' financial statements for net unrecognized tax benefits. However, management’s conclusions may be subject to future review based on changes in, or the interpretation of, the accounting standards or tax laws and regulations. Each Fund's Federal tax returns for the prior three fiscal years remain subject to examination by the Internal Revenue Service.
K. Foreign Taxes —The Funds may be subject to foreign taxes on income, gains on investments or currency purchases/repatriation, a portion of which may be recoverable. The Funds will accrue such taxes and recoveries as applicable, based upon their current interpretation of tax rules and regulations that exist in the markets in which they invest. When a capital gains tax is determined to apply, the Funds record an estimated deferred tax liability in an amount that would be payable if the securities were disposed of on the valuation date.
L. Distributions to Shareholders — Distributions from net investment income, if any, are generally declared and paid at least annually and are declared separately for each class. No class has preferential dividend rights; differences in per share rates are due to differences in separate class expenses. Net realized capital gains, if any, are distributed by each Fund at least annually. The amount of distributions from net investment income and net realized capital gains is determined in accordance with Federal income tax regulations, which may differ from GAAP. To the extent these “book/tax” differences are permanent in nature (i.e., that they result from other than timing of recognition — “temporary differences”), such amounts are reclassified within the capital accounts based on their Federal tax basis treatment.
The following amounts were reclassified within the capital accounts:
| | Accumulated
undistributed
(distributions in
excess of)
net investment
income | Accumulated
net realized
gains (losses) |
Emerging Markets Equity Fund | | | |
Emerging Markets Research Enhanced Equity Fund | | | |
| | | |
International Equity Fund | | | |
| | | |
International Hedged Equity Fund | | | |
| | | |
The reclassifications for the Funds relate primarily to tax adjustments on certain investments, foreign currency gains or losses, foreign taxes and redemptions in-kind.
3. Fees and Other Transactions with Affiliates
A. Investment Advisory Fee — Pursuant to an Investment Advisory Agreement, the Adviser manages the investments of each Fund and for such services is paid a fee. The investment advisory fee is accrued daily and paid monthly at an annual rate based on each Fund's respective average daily net assets. The annual rate for each Fund is as follows:
| |
Emerging Markets Equity Fund | |
Emerging Markets Research Enhanced Equity Fund | |
| J.P. Morgan International Equity Funds | |
NOTES TO FINANCIAL STATEMENTS
AS OF October 31, 2022 (continued)
(Dollar values in thousands)
| |
| |
International Equity Fund | |
| |
International Hedged Equity Fund | |
| |
The Adviser waived investment advisory fees and/or reimbursed expenses as outlined in Note 3.F.
B. Administration Fee — Pursuant to an Administration Agreement, the Administrator provides certain administration services to each Fund. In consideration of these services, the Administrator receives a fee accrued daily and paid monthly at an annual rate of 0.075% of the first $10 billion of each Fund’s respective average daily net assets, plus 0.050% of each Fund’s respective average daily net assets between $10 billion and $20 billion, plus 0.025% of each Fund’s respective average daily net assets between $20 billion and $25 billion, plus 0.01% of each Fund’s respective average daily net assets in excess of $25 billion. For the year ended October 31, 2022, the effective rate for Emerging Markets Equity Fund, Emerging Markets Research Enhanced Equity Fund, Europe Dynamic Fund, International Equity Fund, International Focus Fund, International Hedged Equity Fund and International Value Fund was 0.07%, 0.075%, 0.075%, 0.075%, 0.075%, 0.075% and 0.075%, respectively of each Fund's average daily net assets, notwithstanding any fee waivers and/or expense reimbursements.
The Administrator waived administration fees as outlined in Note 3.F.
JPMorgan Chase Bank, N.A. ("JPMCB"), a wholly-owned subsidiary of JPMorgan, serves as the Funds' sub-administrator (the “Sub-administrator”). For its services as Sub-administrator, JPMCB receives a portion of the fees payable to the Administrator.
C. Distribution Fees — Pursuant to a Distribution Agreement, JPMorgan Distribution Services, Inc. (“JPMDS”), an indirect, wholly-owned subsidiary of JPMorgan, serves as each Fund's principal underwriter and promotes and arranges for the sale of each Fund's shares.
The Boards have adopted a Distribution Plan (the “Distribution Plan”) for Class A, Class C, Class R2 and Class R3 Shares of the Funds, as applicable, pursuant to Rule 12b-1 under the 1940 Act. Class I, Class L, Class R4, Class R5 and Class R6 Shares of the Funds do not charge a distribution fee. The Distribution Plan provides that the following Funds shall pay, with respect to the applicable share classes, distribution fees, including payments to JPMDS, at annual rates of the average daily net assets as shown in the table below:
| | | | |
Emerging Markets Equity Fund | | | | |
| | | | |
International Equity Fund | | | | |
| | | | |
International Hedged Equity Fund | | | | |
| | | | |
In addition, JPMDS is entitled to receive the front-end sales charges from purchases of Class A Shares and the CDSC from redemptions of Class C Shares and certain Class A Shares for which front-end sales charges have been waived. For the year ended October 31, 2022, JPMDS retained the following:
| | |
Emerging Markets Equity Fund | | |
| | |
International Equity Fund | | |
| | |
International Hedged Equity Fund | | |
| | |
|
| Amount rounds to less than one thousand. |
| J.P. Morgan International Equity Funds | |
D. Service Fees — The Trusts, on behalf of the Funds, have entered into a Shareholder Servicing Agreement with JPMDS under which JPMDS provides certain support services to fund shareholders. For performing these services, JPMDS receives a fee with respect to all share classes, except Class R6 Shares which do not charge a service fee, that is accrued daily and paid monthly equal to a percentage of the average daily net assets as shown in the table below:
| | | | | | | | |
Emerging Markets Equity Fund | | | | | | | | |
Emerging Markets Research Enhanced Equity Fund | | | | | | | | |
| | | | | | | | |
International Equity Fund | | | | | | | | |
| | | | | | | | |
International Hedged Equity Fund | | | | | | | | |
| | | | | | | | |
JPMDS has entered into shareholder services contracts with affiliated and unaffiliated financial intermediaries who provide shareholder services and other related services to their clients or customers who invest in the Funds. Pursuant to such contracts, JPMDS will pay all or a portion of such fees earned to financial intermediaries for performing such services.
JPMDS waived service fees as outlined in Note 3.F.
E. Custodian and Accounting Fees — JPMCB provides portfolio custody and accounting services to the Funds. For performing these services, the Funds pay JPMCB transaction and asset-based fees that vary according to the number of transactions and positions, plus out-of-pocket expenses. The amounts paid directly to JPMCB by the Funds for custody and accounting services are included in Custodian and accounting fees on the Statements of Operations.
Interest income earned on cash balances at the custodian, if any, is included in Interest income from affiliates on the Statements of Operations.
Interest expense paid to the custodian related to cash overdrafts, if any, is included in Interest expense to affiliates on the Statements of Operations.
F. Waivers and Reimbursements — The Adviser, Administrator and/or JPMDS have contractually agreed to waive fees and/or reimburse the Funds to the extent that total annual operating expenses (excluding acquired fund fees and expenses other than certain money market fund fees as described below, dividend and interest expenses related to short sales, interest, taxes, expenses related to litigation and potential litigation, expenses related to trustee elections and extraordinary expenses) exceed the percentages of the Funds' respective average daily net assets as shown in the table below:
| | | | | | | | | |
Emerging Markets Equity Fund | | | | | | | | | |
Emerging Markets Research Enhanced Equity Fund | | | | | | | | | |
| | | | | | | | | |
International Equity Fund | | | | | | | | | |
| | | | | | | | | |
International Hedged Equity Fund | | | | | | | | | |
| | | | | | | | | |
The expense limitation agreements were in effect for the year ended October 31, 2022 and the contractual expense limitation percentages in the table above are in place until at least February 28, 2023.
| J.P. Morgan International Equity Funds | |
NOTES TO FINANCIAL STATEMENTS
AS OF October 31, 2022 (continued)
(Dollar values in thousands)
For the year ended October 31, 2022, the Funds' service providers waived fees and/or reimbursed expenses for each of the Funds as follows. None of these parties expect the Funds to repay any such waived fees and/or reimbursed expenses in future years.
| | |
| | | | | Contractual
Reimbursements |
Emerging Markets Equity Fund | | | | | |
Emerging Markets Research Enhanced Equity Fund | | | | | |
| | | | | |
International Equity Fund | | | | | |
| | | | | |
International Hedged Equity Fund | | | | | |
| | | | | |
|
| Amount rounds to less than one thousand. |
Additionally, the Funds may invest in one or more money market funds advised by the Adviser (affiliated money market funds). The Adviser, Administrator and/or JPMDS, as shareholder servicing agent, have contractually agreed to waive fees and/or reimburse expenses in an amount sufficient to offset the respective net fees each collects from the affiliated money market fund on the applicable Fund's investment in such affiliated money market fund, except for investments of securities lending cash collateral. None of these parties expect the Funds to repay any such waived fees and/or reimbursed expenses in future years.
The amounts of these waivers resulting from investments in these money market funds for the year ended October 31, 2022 were as follows:
| |
Emerging Markets Equity Fund | |
Emerging Markets Research Enhanced Equity Fund | |
| |
International Equity Fund | |
| |
International Hedged Equity Fund | |
| |
Effective January 1, 2022, JPMIM voluntarily agreed to reimburse the Funds for the Trustee Fees paid to one of the interested Trustees. For the period January 1, 2022 through October 31, 2022 the amount of these waivers were as follows:
| |
Emerging Markets Equity Fund | |
Emerging Markets Research Enhanced Equity Fund | |
| |
International Equity Fund | |
| |
International Hedged Equity Fund | |
| |
G. Other — Certain officers of the Trusts are affiliated with the Adviser, the Administrator and JPMDS. Such officers, with the exception of the Chief Compliance Officer, receive no compensation from the Funds for serving in their respective roles.
The Boards designated and appointed a Chief Compliance Officer to the Funds pursuant to Rule 38a-1 under the 1940 Act. Each Fund, along with affiliated funds, makes reimbursement payments, on a pro-rata basis, to the Administrator for a portion of the fees associated with the office of the Chief Compliance Officer. Such fees are included in Trustees’ and Chief Compliance Officer’s fees on the Statements of Operations.
The Trusts adopted a Trustee Deferred Compensation Plan (the “Plan”) which allows the independent Trustees to defer the receipt of all or a portion of compensation related to performance of their duties as Trustees. The deferred fees are invested in various J.P. Morgan Funds until distribution in accordance with the Plan.
During the year ended October 31, 2022, Europe Dynamic Fund and International Value Fund purchased securities from an underwriting syndicate in which the principal underwriter or members of the syndicate were affiliated with the Adviser.
| J.P. Morgan International Equity Funds | |
The Securities and Exchange Commission ("SEC") has granted an exemptive order permitting the Funds to engage in principal transactions with J.P. Morgan Securities LLC, an affiliated broker, involving taxable money market instruments, subject to certain conditions.
4. Investment Transactions
During the year ended October 31, 2022, purchases and sales of investments (excluding short-term investments) were as follows:
| Purchases
(excluding
U.S. Government) | Sales
(excluding
U.S. Government) |
Emerging Markets Equity Fund | | |
Emerging Markets Research Enhanced Equity Fund | | |
| | |
International Equity Fund | | |
| | |
International Hedged Equity Fund | | |
| | |
During the year ended October 31, 2022, there were no purchases or sales of U.S. Government securities.
5. Federal Income Tax Matters
For Federal income tax purposes, the estimated cost and unrealized appreciation (depreciation) in value of investments held at October 31, 2022 were as follows:
| | Gross
Unrealized
Appreciation | Gross
Unrealized
Depreciation | Net Unrealized
Appreciation
(Depreciation) |
Emerging Markets Equity Fund | | | | |
Emerging Markets Research Enhanced Equity Fund | | | | |
| | | | |
International Equity Fund | | | | |
| | | | |
International Hedged Equity Fund | | | | |
| | | | |
The difference between book and tax basis appreciation (depreciation) on investments is primarily attributed to tax adjustments on certain investments and wash sale loss deferrals.
The tax character of distributions paid during the year ended October 31, 2022 was as follows:
| | Net
Long-Term
Capital Gains | |
Emerging Markets Equity Fund | | | |
Emerging Markets Research Enhanced Equity Fund | | | |
| | | |
International Equity Fund | | | |
| | | |
International Hedged Equity Fund | | | |
| | | |
|
| Short-term gain distributions are treated as ordinary income for income tax purposes. |
| J.P. Morgan International Equity Funds | |
NOTES TO FINANCIAL STATEMENTS
AS OF October 31, 2022 (continued)
(Dollar values in thousands)
The tax character of distributions paid during the year ended October 31, 2021 was as follows:
| | |
Emerging Markets Equity Fund | | |
Emerging Markets Research Enhanced Equity Fund | | |
| | |
International Equity Fund | | |
| | |
International Hedged Equity Fund | | |
| | |
|
| Short-term gain distributions are treated as ordinary income for income tax purposes. |
As of October 31, 2022, the estimated components of net assets (excluding paid-in-capital) on a tax basis were as follows:
| Current
Distributable
Ordinary
Income | Current
Distributable
Long-Term
Capital Gain
(Tax Basis Capital
Loss Carryover) | Unrealized
Appreciation
(Depreciation) |
Emerging Markets Equity Fund | | | |
Emerging Markets Research Enhanced Equity Fund | | | |
| | | |
International Equity Fund | | | |
| | | |
International Hedged Equity Fund | | | |
| | | |
The cumulative timing differences primarily consist of tax adjustments on certain investments and wash sale loss deferrals.
At October 31, 2022, the following Funds had net capital loss carryforwards which are available to offset future realized gains:
| Capital Loss Carryforward Character |
| | |
Emerging Markets Equity Fund | | |
Emerging Markets Research Enhanced Equity Fund | | |
| | |
International Equity Fund | | |
| | |
International Hedged Equity Fund | | |
| | |
|
| Amount includes capital loss carryforwards which are limited in future years under Internal Revenue Code sections 381-384. |
During the year ended October 31, 2022, the following Fund utilized capital loss carryforwards as follows:
| |
| | |
International Hedged Equity Fund | | |
| J.P. Morgan International Equity Funds | |
6. Borrowings
The Funds rely upon an exemptive order granted by the SEC (the “Order”) permitting the establishment and operation of an Interfund Lending Facility (the “Facility”). The Facility allows the Funds to directly lend and borrow money to or from any other fund relying upon the Order at rates beneficial to both the borrowing and lending funds. Advances under the Facility are taken primarily for temporary or emergency purposes, including the meeting of redemption requests that otherwise might require the untimely disposition of securities, and are subject to each Fund's borrowing restrictions. The Interfund loan rate is determined, as specified in the Order, by averaging the current repurchase agreement rate and the current bank loan rate. The Order was granted to JPMorgan Trust II (“JPM II”) and may be relied upon by the Funds because the Funds and the series of JPM II are all investment companies in the same “group of investment companies” (as defined in Section 12(d)(1)(G) of the 1940 Act).
The Funds had no borrowings outstanding from another fund, or loans outstanding to another fund, during the year ended October 31, 2022. Average borrowings from the Facility during the year ended October 31, 2022 were as follows:
| | | | |
Emerging Markets Equity Fund | | | | |
Emerging Markets Research Enhanced Equity Fund | | | | |
| | | | |
International Equity Fund | | | | |
| | | | |
| | | | |
|
| Amount rounds to less than one thousand. |
The Trusts and JPMCB have entered into a financing arrangement. Under this arrangement, JPMCB provides an unsecured, uncommitted credit facility in the aggregate amount of $100 million to certain of the J.P. Morgan Funds, including the Funds. Advances under the arrangement are taken primarily for temporary or emergency purposes, including the meeting of redemption requests that otherwise might require the untimely disposition of securities, and are subject to each Fund’s borrowing restrictions. Interest on borrowings is payable at a rate determined by JPMCB at the time of borrowing. This agreement has been extended until October 30, 2023.
The Funds had no borrowings outstanding from the unsecured, uncommitted credit facility during the year ended October 31, 2022.
The Trusts, along with certain other trusts for J.P. Morgan Funds (“Borrowers”), have entered into a joint syndicated senior unsecured revolving credit facility totaling $1.5 billion (“Credit Facility”) with various lenders and The Bank of New York Mellon, as administrative agent for the lenders. This Credit Facility provides a source of funds to the Borrowers for temporary and emergency purposes, including the meeting of redemption requests that otherwise might require the untimely disposition of securities. Under the terms of the Credit Facility, a borrowing fund must have a minimum of $25 million in adjusted net asset value and not exceed certain adjusted net asset coverage ratios prior to and during the time in which any borrowings are outstanding. If a fund does not comply with the aforementioned requirements, the fund must remediate within three business days with respect to the $25 million minimum adjusted net asset value or within one business day with respect to certain asset coverage ratios or the administrative agent at the request of, or with the consent of, the lenders may terminate the Credit Facility and declare any outstanding borrowings to be due and payable immediately.
Interest associated with any borrowing under the Credit Facility is charged to the borrowing fund at a rate of interest equal to 1.00% (the "Applicable Margin"), plus the greater of the federal funds effective rate or one month London Interbank Offered Rate ("LIBOR"). The annual commitment fee to maintain the Credit Facility is 0.15% and is incurred on the unused portion of the Credit Facility and is allocated to all participating funds pro rata based on their respective net assets. Effective August 9, 2022, the Credit Facility has been amended and restated for a term of 364 days, unless extended, and to include a change in the interest associated with any borrowing to the higher, on the day of the borrowing, of (a) the federal funds effective rate, or (b) the one-month Adjusted SOFR Rate plus of the Applicable Margin.
The Fund did not utilize the Credit Facility during the year ended October 31, 2022.
7. Risks, Concentrations and Indemnifications
In the normal course of business, the Funds enter into contracts that contain a variety of representations which provide general indemnifications. Each Fund's maximum exposure under these arrangements is unknown. The amount of exposure would depend on future claims that may be brought against each Fund. However, based on experience, the Funds expect the risk of loss to be remote.
| J.P. Morgan International Equity Funds | |
NOTES TO FINANCIAL STATEMENTS
AS OF October 31, 2022 (continued)
(Dollar values in thousands)
As of October 31, 2022, the Funds had individual shareholder and/or omnibus accounts each owning more than 10% of the respective Fund's outstanding shares as follows:
| Number of
Individual Shareholder
and/or Affiliated
Omnibus Accounts | | Number of
Individual Shareholder
and/or Non-Affiliated
Omnibus Accounts | |
Emerging Markets Equity Fund | | | | |
Emerging Markets Research Enhanced Equity Fund | | | | |
| | | | |
| | | | |
International Hedged Equity Fund | | | | |
| | | | |
As of October 31, 2022, J.P. Morgan Investor Funds, JPMorgan SmartRetirement Funds and JPMorgan SmartRetirement Blend Funds, which are affiliated fund of funds, each owned in the aggregate, shares representing more than 10% of the net assets of the Funds as follows:
| | JPMorgan
SmartRetirement
Funds | JPMorgan
SmartRetirement
Blend Funds |
Emerging Markets Research Enhanced Equity Fund | | | |
| | | |
International Equity Fund | | | |
| | | |
Significant shareholder transactions by these shareholders may impact the Funds' performance and liquidity.
The Funds may have elements of risk not typically associated with investments in the United States of America due to concentrated investments in a limited number of foreign countries or regions, which may vary throughout the period. Such concentrations may subject each of these Funds to additional risks resulting from political or economic conditions in such countries or regions and the possible imposition of adverse governmental laws or currency exchange restrictions could cause the securities and their markets to be less liquid and their prices to be more volatile than those of comparable U.S. securities.
As of October 31, 2022, the following Funds had non-U.S. country allocations representing greater than 10% of total investments (excluding investment of cash collateral from securities loaned) as follows:
| Emerging
Markets
Equity Fund | Emerging
Markets
Research
Enhanced
Equity Fund | | | | International
Hedged
Equity Fund | |
| | | | | | | |
| | | | | | | |
| | | | | | | |
| | | | | | | |
| | | | | | | |
| | | | | | | |
| | | | | | | |
| | | | | | | |
As of October 31, 2022, a significant portion of each Fund's investments consisted of securities that were denominated in foreign currencies. Changes in currency exchange rates will affect the value of, and investment income from, such securities.
Derivatives may be riskier than other types of investments because they may be more sensitive to changes in economic and market conditions and could result in losses that significantly exceed the Funds' original investment. Many derivatives create leverage thereby causing the Funds to be more volatile than they would have been if they had not used derivatives. Derivatives also expose the Funds to counterparty risk (the risk that the derivative counterparty will not fulfill its contractual obligations), including credit risk of the derivative counterparty. The possible lack of a liquid secondary market for derivatives and the resulting inability of the Funds to sell or otherwise close a derivatives position could expose the Funds to losses.
| J.P. Morgan International Equity Funds | |
The Funds invest in foreign issuers and foreign securities (including depositary receipts) are subject to additional risks, including political and economic risks, civil conflicts and war, greater volatility, expropriation and nationalization risks, sanctions or other measures by the United States or other governments, currency fluctuations, higher transaction costs, delayed settlement, possible foreign controls on investment, liquidity risks and less stringent investor protection and disclosure standards of foreign markets. In certain markets where securities and other instruments are not traded “delivery versus payment,” a Fund may not receive timely payment for securities or other instruments it has delivered or receive delivery of securities paid for and may be subject to increased risk that the counterparty will fail to make payments or delivery when due or default completely.
Events and evolving conditions in certain economies or markets may alter the risks associated with investments tied to countries or regions that historically were perceived as comparatively stable becoming riskier and more volatile. Emerging Markets Equity Fund and Emerging Markets Research Enhanced Equity Fund each invests a substantial portion of their assets in emerging market countries. These risks are magnified in countries in emerging markets. Emerging market countries typically have less established market economies than developed countries and may face greater social, economic, regulatory and political uncertainties. In addition, emerging markets typically present greater illiquidity and price volatility concerns due to smaller or limited local capital markets and greater difficulty in determining market valuations of securities due to limited public information on issuers. Certain emerging market countries may be subject to less stringent requirements regarding accounting, auditing, financial reporting and record keeping and therefore, material information related to an investment may not be available or reliable.
In addition, a Fund is limited in its ability to exercise its legal rights or enforce a counterparty’s legal obligations in certain jurisdictions outside of the United States, in particular, in emerging market countries.
LIBOR is intended to represent the rate at which contributing banks may obtain short-term borrowings from each other in the London interbank market. On March 5, 2021, the U.K. Financial Conduct Authority ("FCA") publicly announced that (i) immediately after December 31, 2021, publication of the 1-week and 2-month U.S. Dollar LIBOR settings will permanently cease; (ii) immediately after June 30, 2023, publication of the overnight and 12-month U.S. Dollar LIBOR settings will permanently cease; and (iii) immediately after June 30, 2023, the 1-month, 3-month and 6-month U.S. Dollar LIBOR settings will cease to be provided or, subject to the FCA's consideration of the case, be provided on a synthetic basis and no longer be representative of the underlying market and economic reality they are intended to measure and that representativeness will not be restored. There is no assurance that the dates announced by the FCA will not change or that the administrator of LIBOR and/or regulators will not take further action that could impact the availability, composition or characteristics of LIBOR or the currencies and/or tenors for which LIBOR is published. In addition, certain regulated entities ceased entering into most new LIBOR contracts in connection with regulatory guidance or prohibitions. Public and private sector industry initiatives are currently underway to implement new or alternative reference rates to be used in place of LIBOR. There is no assurance that any such alternative reference rate will be similar to or produce the same value or economic equivalence as LIBOR or that it will have the same volume or liquidity as did LIBOR prior to its discontinuance, unavailability or replacement, all of which may affect the value, volatility, liquidity or return on certain of a Fund's loans, notes, derivatives and other instruments or investments comprising some or all of a Fund's investments and result in costs incurred in connection with changing reference rates used for positions, closing out positions and entering into new trades. Certain of a Fund's investments may transition from LIBOR prior to the dates announced by the FCA. The transition from LIBOR to alternative reference rates may result in operational issues for a Fund or its investments. No assurances can be given as to the impact of the LIBOR transition (and the timing of any such impact) on a Fund and its investments. These risks may also apply with respect to changes in connection with other interbank offering rates (e.g., Euribor) and a wide range of other index levels, rates and values that are treated as “benchmarks” and are the subject of recent regulatory reform.
The Funds are subject to infectious disease epidemics/pandemics risk. The worldwide outbreak of COVID-19 has negatively affected economies, markets and individual companies throughout the world. The effects of this COVID-19 pandemic to public health, and business and market conditions, including among other things, reduced consumer demand and economic output, supply chain disruptions and increased government spending may continue to have a significant negative impact on the performance of a Fund’s investments, increase a Fund’s volatility, exacerbate other pre-existing political, social and economic risks to the Funds and negatively impact broad segments of businesses and populations. In addition, governments, their regulatory agencies, or self-regulatory organizations have taken or may take actions in response to the pandemic that affect the instruments in which the Funds invest, or the issuers of such instruments, in ways that could also have a significant negative impact on a Fund’s investment performance. The duration and extent of COVID-19 and associated economic and market conditions and uncertainty over the long-term cannot be reasonably estimated at this time. The ultimate impact of COVID-19 and the extent to which the associated conditions impact a Fund will also depend on future developments, which are highly uncertain, difficult to accurately predict and subject to frequent changes.
8. Redemptions in-kind
On April 21, 2022, certain shareholders sold Class R6 Shares of International Focus Fund. The portfolio securities were delivered primarily by means of a redemption in-kind in exchange for shares of the Fund. Cash and portfolio securities were transferred as detailed below:
|
| This amount includes cash of $99,867 associated with the redemption in-kind. |
| J.P. Morgan International Equity Funds | |
REPORT OF INDEPENDENT REGISTERED PUBLIC ACCOUNTING FIRM
To the Board of Trustees of JPMorgan Trust I and JPMorgan Trust IV and Shareholders of JPMorgan Emerging Markets Equity Fund, JPMorgan Emerging Markets Research Enhanced Equity Fund, JPMorgan Europe Dynamic Fund, JPMorgan International Equity Fund, JPMorgan International Focus Fund, JPMorgan International Hedged Equity Fund and JPMorgan International Value Fund.
Opinions on the Financial Statements
We have audited the accompanying statements of assets and liabilities, including the schedules of portfolio investments, of JPMorgan Emerging Markets Equity Fund, JPMorgan International Value Fund, JPMorgan Europe Dynamic Fund, JPMorgan International Equity Fund and JPMorgan International Focus Fund (five of the funds constituting JPMorgan Trust I) and JPMorgan Emerging Markets Research Enhanced Equity Fund and JPMorgan International Hedged Equity Fund (two of the funds constituting JPMorgan Trust IV) (hereafter collectively referred to as the "Funds") as of October 31, 2022, the related statements of operations for the year ended October 31, 2022, the statements of changes in net assets for each of the two years in the period ended October 31, 2022, including the related notes, and the financial highlights for each of the periods indicated therein (collectively referred to as the “financial statements”). In our opinion, the financial statements present fairly, in all material respects, the financial position of each of the Funds as of October 31, 2022, the results of each of their operations for the year then ended, the changes in each of their net assets for each of the two years in the period ended October 31, 2022 and each of the financial highlights for each of the periods indicated therein in conformity with accounting principles generally accepted in the United States of America.
Basis for Opinions
These financial statements are the responsibility of the Funds’ management. Our responsibility is to express an opinion on the Funds’ financial statements based on our audits. We are a public accounting firm registered with the Public Company Accounting Oversight Board (United States) (PCAOB) and are required to be independent with respect to the Funds in accordance with the U.S. federal securities laws and the applicable rules and regulations of the Securities and Exchange Commission and the PCAOB.
We conducted our audits of these financial statements in accordance with the standards of the PCAOB. Those standards require that we plan and perform the audit to obtain reasonable assurance about whether the financial statements are free of material misstatement, whether due to error or fraud.
Our audits included performing procedures to assess the risks of material misstatement of the financial statements, whether due to error or fraud, and performing procedures that respond to those risks. Such procedures included examining, on a test basis, evidence regarding the amounts and disclosures in the financial statements. Our audits also included evaluating the accounting principles used and significant estimates made by management, as well as evaluating the overall presentation of the financial statements. Our procedures included confirmation of securities owned as of October 31, 2022 by correspondence with the custodian, transfer agent and brokers; when replies were not received from brokers, we performed other auditing procedures. We believe that our audits provide a reasonable basis for our opinions.
/s/ PricewaterhouseCoopers LLP
New York, New York
December 22, 2022
We have served as the auditor of one or more investment companies in the JPMorgan Funds complex since 1993.
| J.P. Morgan International Equity Funds | |
The Funds’ Statement of Additional Information includes additional information about the Funds’ Trustees and is available, without charge, upon request by calling 1-800-480-4111 or on the J.P. Morgan Funds’ website at www.jpmorganfunds.com.
Name (Year of Birth);
Positions With
the Funds (1) | Principal Occupation
During Past 5 Years | Number of
Funds in Fund
Complex Overseen
by Trustee (2) | Other Directorships Held
During the Past 5 Years |
| | | |
John F. Finn (1947); Chair
since 2020; Trustee since 1998. | Chairman, Gardner, Inc. (supply chain management company serving industrial and consumer markets) (serving in various roles 1974-present). | | Director, Greif, Inc. (GEF) (industrial package products and services) (2007-present); Trustee, Columbus Association for the Performing Arts (1988-present). |
Stephen P. Fisher (1959);
Trustee since 2018. | Retired; Chairman and Chief Executive Officer, NYLIFE Distributors LLC (registered broker-dealer) (serving in various roles 2008-2013); Chairman, NYLIM Service Company LLC (transfer agent) (2008-2017); New York Life Investment Management LLC (registered investment adviser) (serving in various roles 2005-2017); Chairman, IndexIQ Advisors LLC (registered investment adviser for ETFs) (2014-2017); President, MainStay VP Funds Trust (2007-2017), MainStay DefinedTerm Municipal Opportunities Fund (2011-2017) and MainStay Funds Trust (2007-2017) (registered investment companies). | | Honors Program Advisory Board Member, The Zicklin School of Business, Baruch College, The City University of New York (2017-present). |
Gary L. French (1951);
Trustee since 2014. | Real Estate Investor (2011-2020); Investment management industry Consultant and Expert Witness (2011-present); Senior Consultant for The Regulatory Fundamentals Group LLC (2011-2017). | | Independent Trustee, The China Fund, Inc. (2013-2019); Exchange Traded Concepts Trust II (2012-2014); Exchange Traded Concepts Trust I (2011-2014). |
Kathleen M. Gallagher (1958);
Trustee since 2018. | Retired; Chief Investment Officer — Benefit Plans, Ford Motor Company (serving in various roles 1985-2016). | | Non- Executive Director, Legal & General Investment Management (Holdings) (2018-present); Non-Executive Director, Legal & General Investment Management America (U.S. Holdings) (financial services and insurance) (2017-present); Advisory Board Member, State Street Global Advisors Total Portfolio Solutions (2017-present); Member, Client Advisory Council, Financial Engines, LLC (registered investment adviser) (2011-2016); Director, Ford Pension Funds Investment Management Ltd. (2007-2016). |
Robert J. Grassi (1957);
Trustee since 2014. | Sole Proprietor, Academy Hills Advisors LLC (2012-present); Pension Director, Corning Incorporated (2002-2012). | | |
| J.P. Morgan International Equity Funds | |
TRUSTEES
(Unaudited) (continued)
Name (Year of Birth); Positions With the Funds (1) | Principal Occupation During Past 5 Years | Number of Funds in Fund Complex Overseen by Trustee (2) | Other Directorships Held During the Past 5 Years |
Frankie D. Hughes (1952);
Trustee since 2008. | President, Ashland Hughes Properties (property management) (2014-present); President and Chief Investment Officer, Hughes Capital Management, Inc. (fixed income asset management) (1993-2014). | | |
Raymond Kanner (1953);
Trustee since 2017. | Retired; Managing Director and Chief Investment Officer, IBM Retirement Funds (2007-2016). | | Advisory Board Member, Penso Advisors, LLC (2020-present); Advisory Board Member, Los Angeles Capital (2018-present); Advisory Board Member, State Street Global Advisors Total Portfolio Solutions (2017- present); Acting Executive Director, Committee on Investment of Employee Benefit Assets (CIEBA) (2016-2017); Advisory Board Member, Betterment for Business (robo advisor) (2016- 2017); Advisory Board Member, BlueStar Indexes (index creator) (2013-2017); Director, Emerging Markets Growth Fund (registered investment company) (1997-2016); Member, Russell Index Client Advisory Board (2001-2015). |
Thomas P. Lemke (1954);
Trustee since 2014. | | | (1) Independent Trustee of Advisors’ Inner Circle III fund platform, consisting of the following: (i) the Advisors’ Inner Circle Fund III, (ii) the Gallery Trust, (iii) the Schroder Series Trust, (iv) the Delaware Wilshire Private Markets Fund (since 2020), (v) Chiron Capital Allocation Fund Ltd., and (vi) formerly the Winton Diversified Opportunities Fund (2014-2018); and (2) Independent Trustee of the Symmetry Panoramic Trust (since 2018). |
Lawrence R. Maffia (1950);
Trustee since 2014 | Retired; Director and President, ICI Mutual Insurance Company (2006-2013). | | Director, ICI Mutual Insurance Company (1999-2013). |
Mary E. Martinez (1960); Vice
Chair since 2021; Trustee since 2013. | Associate, Special Properties, a Christie’s International Real Estate Affiliate (2010-present); Managing Director, Bank of America (asset management) (2007-2008); Chief Operating Officer, U.S. Trust Asset Management, U.S. Trust Company (asset management) (2003-2007); President, Excelsior Funds (registered investment companies) (2004-2005). | | |
Marilyn McCoy (1948);
Trustee since 2005. | Vice President of Administration and Planning, Northwestern University (1985-present). | | |
| J.P. Morgan International Equity Funds | |
Name (Year of Birth); Positions With the Funds (1) | Principal Occupation During Past 5 Years | Number of Funds in Fund Complex Overseen by Trustee (2) | Other Directorships Held During the Past 5 Years |
Dr. Robert A. Oden, Jr. (1946); Trustee
since 2005. | Retired; President, Carleton College (2002-2010); President, Kenyon College (1995-2002). | | Trustee, The Coldwater Conservation Fund (2017-present); Trustee, American Museum of Fly Fishing (2013-present); Trustee and Vice Chair, Trout Unlimited (2017-2021);Trustee, Dartmouth- Hitchcock MedicalCenter (2011-2020). |
Marian U. Pardo* (1946);
Trustee since 2013. | Managing Director and Founder, Virtual Capital Management LLC (investment consulting) (2007-present); Managing Director, Credit Suisse Asset Management (portfolio manager) (2003-2006). | | Board Chair and Member, Board of Governors, Columbus Citizens Foundation (not-for-profit supporting philanthropic and cultural programs) (2006-present). |
Emily A. Youssouf (1951);
Trustee since 2022. | Adjunct Professor (2011-present) and Clinical Professor (2009-2011), NYU Schack Institute of Real Estate; Board Member and Member of the Audit Committee (2013–present), Chair of Finance Committee (2019-present), Member of Related Parties Committee (2013-2018) and Member of the Enterprise Risk Committee (2015-2018), PennyMac Financial Services, Inc.; Board Member (2005-2018), Chair of Capital Committee (2006-2016), Chair of Audit Committee (2005-2018), Member of Finance Committee (2005-2018) and Chair of IT Committee (2016-2018), NYC Health and Hospitals Corporation. | | Trustee, NYC School Construction Authority (2009-present); Board Member, NYS Job Development Authority (2008-present); Trustee and Chair of the Audit Committee of the Transit Center Foundation (2015-2019). |
| | | |
Robert F. Deutsch** (1957);
Trustee since 2014. | Retired; Head of ETF Business for JPMorgan Asset Management (2013-2017); Head of Global Liquidity Business for JPMorgan Asset Management (2003-2013). | | Treasurer and Director of the JUST Capital Foundation (2017-present). |
Nina O. Shenker** (1957);
Trustee since 2022. | Vice Chair (2017-2021), General Counsel and Managing Director (2008-2016), Associate General Counsel and Managing Director (2004-2008), J.P. Morgan Asset & Wealth Management. | | Director and Member of Legal and Human Resources Subcommittees, American Jewish Joint Distribution Committee (2018-present). |
|
| The year shown is the first year in which a Trustee became a member of any of the following: the Mutual Fund Board, the ETF Board, the heritage J.P. Morgan Funds or the heritage One Group Mutual Funds. Trustees serve an indefinite term, until resignation, retirement, removal or death. The Board’s current retirement policy sets retirement at the end of the calendar year in which the Trustee attains the age of 75, provided that any Board member who was a member of the Mutual Fund Board prior to January 1, 2022 and was born prior to January 1, 1950 shall retire from the Board at the end of the calendar year in which the Trustee attains the age of 78. |
| A Fund Complex means two or more registered investment companies that hold themselves out to investors as related companies for purposes of investment and investor services or have a common investment adviser or have an investment adviser that is an affiliated person of the investment adviser of any of the other registered investment companies. The J.P. Morgan Funds Complex for which the Board of Trustees serves currently includes nine registered investment companies (166 J.P. Morgan Funds). |
| In connection with prior employment with JPMorgan Chase, Ms. Pardo was the recipient of non-qualified pension plan payments from JPMorgan Chase in the amount of approximately $2,055 per month, which she irrevocably waived effective January 1, 2013, and deferred compensation payments from JPMorgan Chase in the amount of approximately $7,294 per year, which ended in January 2013. In addition, Ms. Pardo receives payments from a fully-funded qualified plan, which is not an obligation of JPMorgan Chase. |
| Designation as an “Interested Trustee” is based on prior employment by the Adviser or an affiliate of the Adviser or interests in a control person of the Adviser. |
| J.P. Morgan International Equity Funds | |
TRUSTEES
(Unaudited) (continued)
| The contact address for each of the Trustees is 277 Park Avenue, New York, NY 10172. |
| J.P. Morgan International Equity Funds | |
Name (Year of Birth),
Positions Held with
the Trust (Since) | Principal Occupations During Past 5 Years |
Brian S. Shlissel (1964),
President and Principal Executive
Officer (2016)* | Managing Director and Chief Administrative Officer for J.P. Morgan pooled vehicles, J.P. Morgan Investment Management Inc. since 2014. |
Timothy J. Clemens (1975),
Treasurer and Principal Financial
Officer (2018) | Executive Director, J.P. Morgan Investment Management Inc. since February 2016. Mr. Clemens has been with J.P. Morgan Investment Management Inc. since 2013. |
Gregory S. Samuels (1980),
Secretary (2019) (formerly Assistant
Secretary 2010-2019)** | Managing Director and Assistant General Counsel, JPMorgan Chase & Co. Mr. Samuels has been with JPMorgan Chase & Co. since 2010. |
Stephen M. Ungerman (1953),
Chief Compliance Officer (2005) | Managing Director, JPMorgan Chase & Co. Mr. Ungerman has been with JPMorgan Chase & Co. since 2000. |
Kiesha Astwood-Smith (1973),
Assistant Secretary (2021)** | Vice President and Assistant General Counsel, JPMorgan Chase & Co. since June 2021; Senior Director and Counsel, Equitable Financial Life Insurance Company (formerly, AXA Equitable Life Insurance Company) from September 2015 through June 2021. |
Matthew Beck (1988),
Assistant Secretary (2021)*** | Vice President and Assistant General Counsel, JPMorgan Chase & Co. since May 2021; Senior Legal Counsel, Ultimus Fund Solutions from May 2018 through May 2021; General Counsel, The Nottingham Company from April 2014 through May 2018. |
Elizabeth A. Davin (1964),
Assistant Secretary (2005)*** | Executive Director and Assistant General Counsel, JPMorgan Chase & Co. Ms. Davin has been with JPMorgan Chase & Co. (formerly Bank One Corporation) since 2004. |
Jessica K. Ditullio (1962)
Assistant Secretary (2005)*** | Executive Director and Assistant General Counsel, JPMorgan Chase & Co. Ms. Ditullio has been with JPMorgan Chase & Co. (formerly Bank One Corporation) since 1990. |
Anthony Geron (1971),
Assistant Secretary (2018)** | Vice President and Assistant General Counsel, JPMorgan Chase & Co. since September 2018; Lead Director and Counsel, AXA Equitable Life Insurance Company from 2015 to 2018 and Senior Director and Counsel, AXA Equitable Life Insurance Company from 2014 to 2015. |
Carmine Lekstutis (1980),
Assistant Secretary (2011)** | Executive Director and Assistant General Counsel, JPMorgan Chase & Co. Mr. Lekstutis has been with JPMorgan Chase & Co. since 2011. |
Max Vogel (1990),
Assistant Secretary (2021)** | Vice President and Assistant General Counsel, JPMorgan Chase & Co. since June 2021; Associate, Proskauer Rose LLP (law firm) from March 2017 to June 2021. |
Zachary E. Vonnegut-Gabovitch
(1986),
Assistant Secretary (2017)** | Vice President and Assistant General Counsel, JPMorgan Chase & Co. since September 2016. |
Michael M. D’Ambrosio (1969),
Assistant Treasurer (2012) | Managing Director, J.P. Morgan Investment Management Inc. Mr. D’Ambrosio has been with J.P. Morgan Investment Management Inc. since 2012. |
Aleksandr Fleytekh (1972),
Assistant Treasurer (2019) | Vice President, J.P. Morgan Investment Management Inc. since February 2012. |
Shannon Gaines (1977),
Assistant Treasurer (2018)*** | Vice President, J.P. Morgan Investment Management Inc. since January 2014. |
Jeffrey D. House (1972),
Assistant Treasurer (2017)*** | Vice President, J.P. Morgan Investment Management Inc. since July 2006. |
Michael Mannarino (1985),
Assistant Treasurer (2020) | Vice President, J.P. Morgan Investment Management Inc. since 2014. |
Joseph Parascondola (1963),
Assistant Treasurer (2011)* | Executive Director, J.P. Morgan Investment Management, Inc. Mr. Parascondola has been with J.P. Morgan Investment Management Inc. since 2006. |
Gillian I. Sands (1969),
Assistant Treasurer (2012) | Executive Director, J.P. Morgan Investment Management Inc. Ms. Sands has been with J.P. Morgan Investment Management Inc. since 2012. |
|
The contact address for each of the officers, unless otherwise noted, is 277 Park Avenue, New York, NY 10172. |
| J.P. Morgan International Equity Funds | |
OFFICERS
(Unaudited) (continued)
| The contact address for the officer is 575 Washington Boulevard, Jersey City, NJ 07310. |
| The contact address for the officer is 4 New York Plaza, New York, NY 10004. |
| The contact address for the officer is 1111 Polaris Parkway, Columbus, OH 43240. |
| J.P. Morgan International Equity Funds | |
SCHEDULE OF SHAREHOLDER EXPENSES
(Unaudited)
Hypothetical $1,000 Investment
As a shareholder of the Funds, you incur two types of costs: (1) transaction costs, including sales charges (loads) on purchase payments and (2) ongoing costs, including investment advisory fees, administration fees, distribution fees and other Fund expenses. The examples below are intended to help you understand your ongoing costs (in dollars) of investing in the Funds (not including expenses of the Underlying Funds and ETFs) and to compare these ongoing costs with the ongoing costs of investing in other mutual funds. The examples assume that you had a $1,000 investment in each Class at the beginning of the reporting period, May 1, 2022, and continued to hold your shares at the end of the reporting period, October 31, 2022.
Actual Expenses
For each Class of each Fund in the table below, the first line provides information about actual account values and actual expenses. You may use the information in this line, together with the amount you invested, to estimate the expenses that you paid over the period. Simply divide your account value by $1,000 (for example, an $8,600 account value divided by $1,000 = 8.6), then multiply the result by the number in the first line of each Class under the heading titled “Expenses Paid During the Period” to estimate the expenses you paid on your account during this period.
Hypothetical Example for Comparison Purposes
The second line of each Class in the table below provides information about hypothetical account values and hypothetical expenses based on the Class’ actual expense ratio and an assumed rate of return of 5% per year before expenses, which is not the Class’ actual return. The hypothetical account values and expenses may not be used to estimate the actual ending account balance or expenses you paid for the period. You may use this information to compare the ongoing costs of investing in the Class of the Funds and other funds. To do so, compare this 5% hypothetical example with the 5% hypothetical examples that appear in the shareholder reports of the other funds. Please note that the expenses shown in the table are meant to highlight your ongoing costs only and do not reflect any transaction costs, such as sales charges (loads), or redemption fees, and expenses of the Underlying Funds and ETFs. Therefore, the second line for each Class in the table is useful in comparing ongoing costs only, and will not help you determine the relative total costs of owning different funds. In addition, if these transaction costs were included, your costs would have been higher. The examples also assume all dividends and distributions have been reinvested.
| Beginning
Account Value
May 1, 2022 | Ending
Account Value
October 31, 2022 | Expenses
Paid During
the Period* | |
JPMorgan Emerging Markets Equity Fund | | | | |
| | | | |
| | | | |
| | | | |
| | | | |
| | | | |
| | | | |
| | | | |
| | | | |
| | | | |
| | | | |
| | | | |
| | | | |
| | | | |
| | | | |
| | | | |
| | | | |
| | | | |
| | | | |
| | | | |
| | | | |
| | | | |
| | | | |
| | | | |
| | | | |
| J.P. Morgan International Equity Funds | |
SCHEDULE OF SHAREHOLDER EXPENSES
(Unaudited) (continued)
Hypothetical $1,000 Investment
| Beginning Account Value May 1, 2022 | Ending Account Value October 31, 2022 | Expenses Paid During the Period* | |
JPMorgan Emerging Markets Equity Fund (continued) | | | | |
| | | | |
| | | | |
| | | | |
JPMorgan Emerging Markets Research Enhanced Equity Fund | | | | |
| | | | |
| | | | |
| | | | |
| | | | |
| | | | |
| | | | |
JPMorgan Europe Dynamic Fund | | | | |
| | | | |
| | | | |
| | | | |
| | | | |
| | | | |
| | | | |
| | | | |
| | | | |
| | | | |
| | | | |
| | | | |
| | | | |
| | | | |
| | | | |
| | | | |
JPMorgan International Equity Fund | | | | |
| | | | |
| | | | |
| | | | |
| | | | |
| | | | |
| | | | |
| | | | |
| | | | |
| | | | |
| | | | |
| | | | |
| | | | |
| | | | |
| | | | |
| | | | |
| | | | |
| | | | |
| | | | |
JPMorgan International Focus Fund | | | | |
| | | | |
| | | | |
| | | | |
| J.P. Morgan International Equity Funds | |
| Beginning Account Value May 1, 2022 | Ending Account Value October 31, 2022 | Expenses Paid During the Period* | |
JPMorgan International Focus Fund (continued) | | | | |
| | | | |
| | | | |
| | | | |
| | | | |
| | | | |
| | | | |
| | | | |
| | | | |
| | | | |
| | | | |
| | | | |
| | | | |
| | | | |
| | | | |
| | | | |
JPMorgan International Hedged Equity Fund | | | | |
| | | | |
| | | | |
| | | | |
| | | | |
| | | | |
| | | | |
| | | | |
| | | | |
| | | | |
| | | | |
| | | | |
| | | | |
| | | | |
| | | | |
| | | | |
JPMorgan International Value Fund | | | | |
| | | | |
| | | | |
| | | | |
| | | | |
| | | | |
| | | | |
| | | | |
| | | | |
| | | | |
| | | | |
| | | | |
| | | | |
| | | | |
| | | | |
| | | | |
| | | | |
| | | | |
| | | | |
| J.P. Morgan International Equity Funds | |
SCHEDULE OF SHAREHOLDER EXPENSES
(Unaudited) (continued)
Hypothetical $1,000 Investment
| Beginning Account Value May 1, 2022 | Ending Account Value October 31, 2022 | Expenses Paid During the Period* | |
JPMorgan International Value Fund (continued) | | | | |
| | | | |
| | | | |
| | | | |
|
| Expenses are equal to each Class’ respective annualized expense ratio, multiplied by the average account value over the period, multiplied by 184/365 (to reflect the one-half year period). |
| J.P. Morgan International Equity Funds | |
BOARD APPROVAL OF INVESTMENT ADVISORY AGREEMENTS
(Unaudited)
The Board of Trustees (the “Board” or the “Trustees”) has established various standing committees composed of Trustees with diverse backgrounds, to which the Board has assigned specific subject matter responsibilities to further enhance the effectiveness of the Board’s oversight and decision making. Effective January 2022, the Board consolidated with the J.P. Morgan Exchange-Traded Fund Trust Board and now consists of Trustees from both Boards. The Board and its investment committees (money market and alternative products, equity, and fixed income) met regularly throughout the year and, at each meeting, considered factors that are relevant to their annual consideration of the continuation of the investment advisory agreements. The Board also met for the specific purpose of considering investment advisory agreement annual renewals. The Board held meetings on June 21-22, 2022 and August 9-11, 2022, at which the Trustees considered the continuation of the investment advisory agreements for each Fund whose annual report is contained herein (each an “Advisory Agreement” and collectively, the “Advisory Agreements”). At the June meeting, the Board’s investment committees met to review and consider performance, expense and related information for the J.P. Morgan Funds. Each investment committee reported to the full Board, which then considered each investment committee’s preliminary findings. At the August meeting, the Trustees continued their review and consideration. The Trustees, including a majority of the Trustees who are not parties to an Advisory Agreement or “interested persons” (as defined in the Investment Company Act of 1940) of any party to an Advisory Agreement or any of their affiliates, approved the continuation of each Advisory Agreement on August 11, 2022.
As part of their review of the Advisory Agreements, the Trustees considered and reviewed performance and other information about the Funds received from the Adviser. This information includes the Funds’ performance as compared to the performance of their peers and benchmarks, and analyses by the Adviser of the Funds’ performance. In addition, at each of their regular meetings throughout the year, the Trustees considered reports on the performance of certain J.P. Morgan Funds (including certain ETFs, beginning in February 2022) provided by an independent investment consulting firm (“independent consultant”). In addition, in preparation for the June and August meetings, the Trustees requested, received and evaluated extensive materials from the Adviser, including performance and expense information compiled by Broadridge, using data from Lipper Inc. and/or Morningstar Inc., independent providers of investment company data (together, “Broadridge”). The Trustees’ independent consultant also provided additional quantitative and statistical analyses of certain Funds, including risk and performance return assessments as compared to the Funds’ objectives, benchmarks, and peers. Before voting on the Advisory Agreements, the Trustees reviewed the Advisory Agreements with representatives of the
Adviser, counsel to the Trusts, and independent legal counsel, and received a memorandum from independent legal counsel to the Trustees discussing the legal standards for their consideration of the Advisory Agreements. The Trustees also discussed the Advisory Agreements with independent legal counsel in executive sessions at which no representatives of the Adviser were present.
A summary of the material factors evaluated by the Trustees in determining whether to approve each Advisory Agreement is provided below. Each Trustee attributed different weights to the various factors and no factor alone was considered determinative. The Trustees considered information provided with respect to the Funds throughout the year, including additional reporting and information provided in connection with the COVID-19 pandemic, as well as materials furnished specifically in connection with the annual review process. From year to year, the Trustees consider and place emphasis on relevant information in light of changing circumstances in market and economic conditions.
After considering and weighing the factors and information they had received, the Trustees found that the compensation to be received by the Adviser from each Fund under the applicable Advisory Agreement was fair and reasonable under the circumstances, and determined that the continuance of each Advisory Agreement was in the best interests of each Fund and its shareholders.
Nature, Extent and Quality of Services Provided by the Adviser
The Trustees received and considered information regarding the nature, extent and quality of services provided to each Fund under the applicable Advisory Agreement. The Trustees took into account information furnished throughout the year at Trustee meetings, as well as the materials furnished specifically in connection with this annual review process. Among other things, the Trustees considered:
(i)
The background and experience of the Adviser’s senior management and investment personnel, including personnel changes, if any;
(ii)
The qualifications, backgrounds and responsibilities of the portfolio management team primarily responsible for the day-to-day management each of the Funds, including personnel changes, if any;
(iii)
The investment strategy for each Fund, and the infrastructure supporting the portfolio management teams;
(iv)
Information about the structure and distribution strategy for each Fund and how it fits with the Trusts’ other fund offerings;
(v)
The administration services provided by the Adviser in its role as Administrator;
BOARD APPROVAL OF INVESTMENT ADVISORY AGREEMENTS
(Unaudited)
(vi)
Their knowledge of the nature and quality of the services provided by the Adviser and its affiliates gained from their experience as Trustees of the Trusts and in the financial industry generally;
(vii)
The overall reputation and capabilities of the Adviser and its affiliates;
(viii)
The commitment of the Adviser to provide high quality service to the Funds;
(ix)
Their overall confidence in the Adviser’s integrity;
(x)
The Adviser’s responsiveness to requests for additional information, questions or concerns raised by them, including the Adviser’s willingness to consider and implement organizational and operational changes designed to improve investment results and the services provided to each Fund; and
(xi)
The Adviser’s business continuity plan and steps the Adviser and its affiliates have taken to provide ongoing services to the Funds during the COVID-19 pandemic, and the Adviser’s and its affiliates’ success in continuing to provide services to the Funds and their shareholders throughout this period.
Based upon these considerations and other factors, the Trustees concluded that they were satisfied with the nature, extent and quality of the services provided to the Funds by the Adviser.
Costs of Services Provided and Profitability to the Adviser and its Affiliates
The Trustees received and considered information regarding the profitability to the Adviser and its affiliates from providing services to each Fund. The Trustees reviewed and discussed this information. The Trustees recognized that this information is not audited and represents the Adviser’s determination of its and its affiliates’ revenues from the contractual services provided to the Funds, less expenses of providing such services. Expenses include direct and indirect costs and are calculated using an allocation methodology developed by the Adviser and reviewed with the Board. The Trustees also recognized that it is difficult to make comparisons of profitability from fund investment advisory contracts because comparative information is not generally publicly available and is affected by numerous factors, including the structure of the particular adviser, the types of funds it manages, its business mix, numerous assumptions regarding allocations and the fact that publicly-traded fund managers’ operating profits and net income are net of distribution and marketing expenses. Based upon their review, and taking into consideration the factors noted above, the Trustees concluded that the profitability to the Adviser under each Advisory Agreement was not unreasonable in light of the services and benefits provided to each Fund.
The Trustees also considered that JPMDS, an affiliate of the Adviser, and the Adviser earn fees from the Funds for providing shareholder and administration services, respectively. These fees were shown separately in the profitability analysis presented to the Trustees. The Trustees also considered the payments of Rule 12b-1 fees to JPMDS, which also acts as the Funds’ distributor, and that these fees are in turn generally paid to financial intermediaries that sell the Funds, including financial intermediaries that are affiliates of the Adviser (although they are retained by JPMDS in certain instances). The Trustees also considered the fees earned by JPMorgan Chase Bank, N.A. (“JPMCB”) , an affiliate of the Adviser, for custody, fund accounting and other related services for each Fund, and the profitability of the arrangements to JPMCB.
Fall-Out Benefits
The Trustees reviewed information regarding potential “fall-out” or ancillary benefits received by the Adviser and its affiliates as a result of their relationship with the Funds. The Trustees considered that the J.P. Morgan Funds' operating accounts are held at JPMCB, which, as a result, will receive float benefits for certain J.P. Morgan Funds, as applicable. The Trustees also noted that the Adviser supports a diverse set of products and services, which benefits the Adviser by allowing it to leverage its infrastructure to serve additional clients, including benefits that may be received by the Adviser and its affiliates in connection with the Funds’ potential investments in other funds advised by the Adviser. The Trustees also reviewed the Adviser’s allocation of fund brokerage for the J.P. Morgan Funds complex, including allocations to brokers who provide research to the Adviser, as well as the Adviser’s use of affiliates to provide other services and the benefits to such affiliates of doing so.
Economies of Scale
The Trustees considered the extent to which the Funds may benefit from potential economies of scale. The Trustees considered that there may not be a direct relationship between economies of scale realized by the Funds and those realized by the Adviser as assets increase. The Trustees considered the extent to which the Funds were priced to scale and whether it would be appropriate to add advisory fee breakpoints. The Trustees noted certain Funds with contractual expense limitations and fee waivers (“Fee Caps”) which allow a Fund’s shareholders to share potential economies of scale from a Fund’s inception, prior to reaching scale. The Trustees also noted that certain other Funds that had achieved scale as asset levels had increased no longer had Fee Caps in place for some or all of their share classes, but shared economies of scale through lower average expenses. The Trustees noted that the fees remain satisfactory relative to peer funds. The Trustees considered the benefits to the Funds of the use of an affiliated distributor and custodian, including the ability to rely on
existing infrastructure supporting distribution, custodial and transfer agent services and the ability to negotiate competitive fees for the Funds. The Trustees further considered the Adviser's and JPMDS's ongoing investments in their business in support of the Funds, including the Adviser's and/or JPMDS's investments in trading systems, technology (including improvements to the J.P. Morgan Funds’ website, and cybersecurity improvements), retention of key talent, and regulatory support enhancements. The Trustees concluded that the current fee structure for each Fund, including any Fee Caps the Adviser has in place that serve to limit the overall net expense ratios of each Fund at competitive levels, was reasonable. The Trustees concluded that, for Funds with Fee Caps in place for some or all of their share classes, the relevant Fund’s shareholders received the benefits of potential economies of scale through the Fee Caps and, for Funds that achieved scale and no longer had Fee Caps in place for some or all of their share classes, the relevant Fund’s shareholders benefited from lower average expenses resulting from increased assets. The Trustees also concluded that all Funds benefited from the Adviser’s reinvestment in its operations to serve the Funds and their shareholders. The Trustees noted that the Adviser’s reinvestment ensures sufficient resources in terms of personnel and infrastructure to support the Funds.
Independent Written Evaluation of the Funds’ Senior Officer
The Trustees noted that, upon their direction, the Senior Officer for the International Equity Fund had prepared an independent written evaluation in order to assist the Trustees in determining the reasonableness of the proposed management fees. In determining whether to continue the Advisory Agreements, the Trustees considered the Senior Officer’s report.
Fees Relative to Adviser’s Other Clients
The Trustees received and considered information about the nature and extent of investment advisory services and fee rates offered to other clients of the Adviser, including, to the extent applicable, institutional separate accounts, collective investment trusts, other registered investment companies and/or private funds sub-advised by the Adviser, for investment management styles substantially similar to that of each Fund. The Trustees considered the complexity of investment management for registered investment companies relative to the Adviser’s other clients and noted differences, as applicable, in the fee structure and the regulatory, legal and other risks and responsibilities of providing services to the different clients. The Trustees considered that serving as an adviser to a registered investment company involves greater responsibilities and risks than acting as a sub-adviser and observed that sub-advisory fees may be lower than those charged by the Adviser to each Fund. The Trustees also noted that the adviser, not the applicable registered investment company, typically bears the sub-advisory fee and that many responsibilities
related to the advisory function are typically retained by the primary adviser. The Trustees concluded that the fee rates charged to each Fund in comparison to those charged to the Adviser’s other clients were reasonable.
Investment Performance
The Trustees receive and consider information about the Funds’ performance throughout the year. In addition, the Trustees received and considered absolute and/or relative performance information for the Funds in a report prepared by Broadridge. The Trustees considered the total return performance information, which included the ranking of the Funds within a performance universe comprised of funds with the same Broadridge investment classification and objective (the “Universe”), as well as a subset of funds within the Universe (the “Peer Group”), by total return for the applicable one-, three- and five-year periods. The Trustees reviewed a description of Broadridge’s methodology for selecting mutual funds in each Fund’s Universe and Peer Group and noted that Universe and Peer Group quintile rankings were not calculated if the number of funds in the Universe and/or Peer Group did not meet a predetermined minimum. The Broadridge materials provided to the Trustees highlighted information with respect to certain representative classes to assist the Trustees in their review. As part of this review, the Trustees also reviewed each Fund’s performance against its benchmark and considered the performance information provided for the Funds at regular Board meetings by the Adviser and the Trustees’ independent consultant and also considered the special analysis prepared for certain Funds by the Trustees’ independent consultant. The Trustees also engaged with the Adviser to consider what steps might be taken to improve performance, as applicable. The Broadridge performance data noted by the Trustees as part of their review and the determinations made by the Trustees with respect to each Fund’s performance for certain representative classes are summarized below:
The Trustees noted that the Emerging Markets Equity Fund’s performance for Class A, Class I and Class R6 shares was in the fifth, first and first quintiles of both the Peer Group and Universe, for the one-, three- and five-year periods ended December 31, 2021, respectively. The Trustees discussed the performance and investment strategy of the Fund with the Adviser and reviewed the performance analysis and evaluation prepared by the independent consultant. Based upon these discussions and various other factors, the Trustees concluded that the Fund’s performance was satisfactory under the circumstances.
The Trustees noted that the Emerging Markets Research Enhanced Equity Fund’s performance for both Class I and Class R6 shares was in the third and fourth quintiles of the Peer Group, and in the fourth and third quintiles of the Universe, for the one- and three-year periods ended December 31, 2021,
BOARD APPROVAL OF INVESTMENT ADVISORY AGREEMENTS
(Unaudited)
respectively. The Trustees discussed the performance and investment strategy of the Fund with the Adviser and reviewed the performance analysis and evaluation prepared by the independent consultant. Based upon these discussions and various other factors, the Trustees concluded that the Fund’s performance was satisfactory under the circumstances.
The Trustees noted that the Europe Dynamic Fund’s performance for Class A shares was in the third, fourth and fourth quintiles of the Peer Group, and in the third, third and fifth quintiles of the Universe, for the one-, three- and five-year periods ended December 31, 2021, respectively. The Trustees noted that performance for Class I shares was in the third, third and fourth quintiles of the Universe, for the one-, three- and five-year periods ended December 31, 2021, respectively. Broadridge did not calculate quintile rankings for the Peer Group for Class I shares of this Fund due to the limited number of funds in the Peer Groups. The Trustees noted that performance for Class R6 shares was in the second and fourth quintiles of the Peer Group, and in the second and third quintiles of the Universe, for the one- and three-year periods ended December 31,2021, respectively. The Trustees discussed the performance and investment strategy of the Fund with the Adviser and reviewed the performance analysis and evaluation prepared by the independent consultant. Based upon these discussions and various other factors, the Trustees concluded that the Fund’s performance was satisfactory under the circumstances. They requested, however, that the Fund’s Adviser provide additional Fund performance information to be reviewed with members of the equity committee at each of their regular meetings over the course of the next year.
The Trustees noted that the International Equity Fund’s performance Class A shares was in the second, second and first quintiles of the Peer Group, and in the second, first and first quintiles of the Universe, for the one-, three- and five-year periods ended December 31, 2021, respectively. The Trustees notes that performance for Class I shares was in the first, second and first quintiles of the Peer Group, and in the second, first and first quintiles of the Universe, for the one-, three- and five-year periods ended December 31, 2021, respectively. The Trustees noted that the performance for Class R6 shares was in the second, second and first quintiles of the Peer Group, and in the second, first and first quintiles of the Universe, for the one-, three- and five-year periods ended December 31, 2021, respectively. The Trustees discussed the performance and investment strategy of the Fund with the Adviser and reviewed the performance analysis and evaluation prepared by the independent consultant. Based upon these discussions and various other factors, the Trustees concluded that the Fund’s performance was satisfactory.
The Trustees noted that the International Focus Fund’s performance for both Class A and Class I shares was in the fifth, second and first quintiles of the Peer Group, and in the fifth,
first and first quintiles of the Universe, for the one-, three- and five-year periods ended December 31, 2021, respectively. The Trustees noted that the performance for Class R6 shares was in the fourth, third and second quintiles of the Peer Group, and in the fourth, first and first quintiles of the Universe, for the one-, three- and five-year periods ended December 31, 2021, respectively. The Trustees discussed the performance and investment strategy of the Fund with the Adviser and reviewed the performance analysis and evaluation prepared by the independent consultant. Based upon these discussions, and various other factors, the Trustees concluded that the Fund’s performance was satisfactory under the circumstances.
The Trustees noted that the International Hedged Equity Fund’s performance for Class A shares was in the third quintile of both the Peer Group and Universe, for the one-year period ended December 31,2021. The Trustees noted that the performance for Class I shares was in the third quintile of the Universe, for the one-year period ended December 31, 2021. Broadridge did not calculate quintile rankings for the Peer Group for Class I shares of this Fund due to the limited number of funds in the Peer Groups. The Trustees noted that performance for Class R6 shares was in the fourth quintile of the Peer Group, and in the third quintile of the Universe, for the one-year period ended December 31, 2021. The Trustees discussed the performance and investment strategy of the Fund with the Adviser and reviewed the performance analysis and evaluation prepared by the independent consultant. Based upon these discussions, and various other factors, the Trustees concluded that the Fund’s performance was satisfactory under the circumstances.
The Trustees noted that the International Value Fund’s performance for Class A shares was in the first, fourth and fifth quintiles of the Peer Group, and in the first, fifth and fifth quintiles of the Universe, for the one-, three- and five-year periods ended December 31, 2021, respectively. The Trustees noted that performance for Class I shares was in the first, fourth and fourth quintiles of the Peer Group, and in the first, fourth and fifth quintiles of the Universe, for the one-, three- and five-year periods ended December, 31, 2021, respectively. The Trustees notes that performance for Class R6 shares was in the first, fourth and fifth quintiles of both the Peer Group and Universe, for the one-, three- and five-year periods ended December 31, 2021, respectively. The Trustees discussed the performance and investment strategy of the Fund with the Adviser and reviewed the performance analysis and evaluation prepared by the independent consultant. Based upon these discussions, and various other factors, the Trustees concluded that the Fund’s performance was satisfactory under the circumstances. They requested, however, that the Fund’s Adviser provide additional Fund performance information to be reviewed with members of the equity committee at each of their regular meetings over the course of the next year.
Advisory Fees and Expense Ratios
The Trustees considered the contractual advisory fee rate and administration fee rate paid by each Fund to the Adviser and compared the combined rate to the information prepared by Broadridge concerning management fee rates paid by other funds in the same Broadridge category as each Fund. The Trustees recognized that Broadridge reported each Fund’s management fee rate as the combined contractual advisory fee and administration fee rates. The Trustees also reviewed information about other expenses and the expense ratios for each Fund and noted that Universe and Peer Group quintile rankings were not calculated if the number of funds in the Universe and/or Peer Group did not meet a predetermined minimum. For each Fund that had a Fee Cap in place, the Trustees considered the net advisory fee rate and net expense ratio for each share class, as applicable, taking into account any waivers and/or reimbursements. The Trustees also considered any proposed changes to a Fee Cap, and, where deemed appropriate by the Trustees, additional waivers and/or reimbursements. The Trustees recognized that it can be difficult to make comparisons of advisory fees because there are variations in the services that are included in the fees paid by other funds. The Trustees’ determinations as a result of the review of each Fund’s advisory fees and expense ratios for certain representative classes are summarized below:
The Trustees noted that the Emerging Markets Equity Fund’s net advisory fee for Class A shares was in the second quintile of both the Peer Group and Universe, and that the actual total expenses for Class A shares were in the second and first quintiles of the Peer Group and Universe, respectively. The Trustees noted that the net advisory fee and actual total expenses for Class I shares were both in the second quintile of both the Peer Group and Universe. The Trustees noted that the net advisory fee for Class R6 shares was in the first and second quintiles of the Peer Group and Universe, respectively, and that the actual total expenses for Class R6 shares were in the first quintile of both the Peer Group and Universe. After considering the factors identified above, in light of this information, the Trustees concluded that the advisory fee was satisfactory in light of the services provided to the Fund.
The Trustees noted that the Emerging Markets Research Enhanced Equity Fund’s net advisory fee and actual total expenses for both the Class I and Class R6 shares were both in the first quintile of both the Peer Group and Universe. After considering the factors identified above, in light of this information, the Trustees concluded that the advisory fee was satisfactory in light of the services provided to the Fund.
The Trustees noted that the Europe Dynamic Fund’s net advisory fee and actual total expenses for the Class A and Class R6 shares were both in the first quintile of both the Peer Group and Universe. The Trustees noted that the net advisory fee for Class I shares was in the first quintile of the Universe,
and that the actual total expenses for Class I shares were in the second quintile of the Universe. Broadridge did not calculate quintile rankings for the Peer Group for Class I shares of this Fund due to the limited number of funds in the Peer Groups. After considering the factors identified above, in light of this information, the Trustees concluded that the advisory fee was satisfactory in light of the services provided to the Fund.
The Trustees noted that the International Equity Fund’s net advisory fee and actual total expenses for the Class A shares were both in the first quintile of both the Peer Group and Universe. The Trustees noted that the net advisory fee for both Class I and Class R6 shares was in the first and second quintiles of the Peer Group and Universe, respectively, and that the actual total expenses for Class I and Class R6 shares were in the first quintile of the both the Peer Group and Universe. After considering the factors identified above, in light of this information, the Trustees concluded that the advisory fee was satisfactory in light of the services provided to the Fund.
The Trustees noted that the International Focus Fund’s net advisory fee and actual total expenses for Class A shares were in the first quintile of both the Peer Group and Universe. The Trustees noted that the net advisory fee and actual total expenses for Class I shares were both in the first and second quintiles of the Peer Group and Universe, respectively. The Trustees noted that the net advisory fee for Class R6 shares was in the first and second quintiles of the Peer Group and Universe, respectively, and that the actual total expenses for Class R6 shares were in the first quintile of both the Peer Group and Universe. After considering the factors identified above, in light of this information, the Trustees concluded that the advisory fee was satisfactory in light of the services provided to the Fund.
The Trustees noted that the International Hedged Equity Fund’s net advisory fee and actual total expenses for the Class A and Class R6 shares were both in the first quintile of both the Peer Group and Universe. The Trustees noted that the net advisory fee and actual total expenses for Class I shares were both in the first quintile of the Universe. Broadridge did not calculate quintile rankings for the Peer Group for Class I shares of this Fund due to the limited number of funds in the Peer Group. After considering the factors identified above, in light of this information, the Trustees concluded that the advisory fee was satisfactory in light of the services provided to the Fund.
The Trustees noted that the International Value Fund’s net advisory fee and actual total expenses for each of the Class A, Class I, and Class R6 shares were both in the first quintile of both the Peer Group and Universe. After considering the factors identified above, in light of this information, the Trustees concluded that the advisory fee was satisfactory in light of the services provided to the Fund.
TAX LETTER
(Unaudited)
(Dollar values in thousands)
Certain tax information for the J.P. Morgan Funds is required to be provided to shareholders based upon the Funds’ income and distributions for the taxable year ended October 31, 2022. The information and distributions reported in this letter may differ from the information and taxable distributions reported to the shareholders for the calendar year ending December 31, 2022. The information necessary to complete your income tax returns for the calendar year ending December 31, 2022 will be provided under separate cover.
Long Term Capital Gain
Each Fund listed below distributed the following amount, or maximum allowable amount, of long-term capital gain dividends for the fiscal year ended October 31, 2022:
| Long-Term
Capital Gain
Distribution |
JPMorgan Emerging Markets Equity Fund | |
JPMorgan Emerging Markets Research Enhanced Equity Fund | |
JPMorgan International Equity Fund | |
Qualified Dividend Income (QDI)
Each Fund listed below had the following amount, or maximum allowable amount, of ordinary income distributions treated as qualified dividends for the fiscal year ended October 31, 2022:
| |
JPMorgan Emerging Markets Equity Fund | |
JPMorgan Emerging Markets Research Enhanced Equity Fund | |
JPMorgan Europe Dynamic Fund | |
JPMorgan International Equity Fund | |
JPMorgan International Focus Fund | |
JPMorgan International Hedged Equity Fund | |
JPMorgan International Value Fund | |
Foreign Source Income and Foreign Tax Credit Pass Through
For the fiscal year ended October 31, 2022, the following Funds intend to elect to pass through to shareholders taxes paid to foreign countries. Gross income and foreign tax expenses are as follows or amounts as finally determined:
| Total Foreign
Source Income | |
JPMorgan Emerging Markets Equity Fund | | |
JPMorgan Emerging Markets Research Enhanced Equity Fund | | |
JPMorgan Europe Dynamic Fund | | |
JPMorgan International Equity Fund | | |
JPMorgan International Focus Fund | | |
JPMorgan International Hedged Equity Fund | | |
JPMorgan International Value Fund | | |
| J.P. Morgan International Equity Funds | |
| WHAT DOES J.P. MORGAN FUNDS DO WITH YOUR PERSONAL INFORMATION? |
| Financial companies choose how they share your personal information. Federal law gives consumers the right to limit some but not all sharing. Federal law also requires us to tell you how we collect, share, and protect your personal information. Please read this notice carefully to understand what we do. |
| The types of personal information we collect and share depend on the product or service you have with us. This information can include: |
| ○Social Security number and account balances |
| ○transaction history and account transactions |
| ○checking account information and wire transfer instructions |
| When you are no longer our customer, we continue to share your information as described in this notice. |
| All financial companies need to share customers’ personal information to run their everyday business. In the section below, we list the reasons financial companies can share their customers’ personal information; the reasons J.P. Morgan Funds chooses to share; and whether you can limit this sharing. |
Reasons we can share your personal information | Does J.P. Morgan
Funds share? | Can you limit this
sharing? |
For our everyday business purposes — such as to process your transactions, maintain your account(s), respond to court orders and legal investigations, or report to credit bureaus | | |
For marketing purposes — to offer our products and services to you | | |
For joint marketing with other financial companies | | |
For our affiliates’ everyday business purposes — information about your transactions and experiences | | |
For our affiliates’ everyday business purposes — information about your creditworthiness | | |
For nonaffiliates to market to you | | |
Questions? Call 1-800-480-4111 or go to www.jpmorganfunds.com | |
|
Who is providing this notice? | |
|
How does J.P. Morgan Funds protect my personal information? | To protect your personal information from unauthorized access and use, we use security measures that comply with federal law. These measures include computer safeguards and secured files and buildings. We authorize our employees to access your information only when they need it to do their work and we require companies that work for us to protect your information. |
|
How does J.P. Morgan Funds protect my personal information? | We collect your personal information, for example, when you: |
○open an account or provide contact information |
○give us your account information or pay us by check |
|
We also collect your personal information from others, such as credit bureaus, affiliates and other companies. |
|
Why can’t I limit all sharing? | Federal law gives you the right to limit only: |
○sharing for affiliates’ everyday business purposes – information about your creditworthiness |
○affiliates from using your information to market to you |
○sharing for nonaffiliates to market to you |
State laws and individual companies may give you additional rights to limit sharing. |
|
| Companies related by common ownership or control. They can be financial and nonfinancial companies. |
| ○J.P. Morgan Funds does not share with our affiliates. |
|
| Companies not related by common ownership or control. They can be financial and nonfinancial companies. |
| ○J.P. Morgan Funds does not share with nonaffiliates so they can market to you. |
|
| A formal agreement between nonaffiliated financial companies that together market financial products or services to you. |
| ○J.P. Morgan Funds doesn’t jointly market. |
J.P. Morgan Funds are distributed by JPMorgan Distribution Services, Inc., which is an affiliate of JPMorgan Chase & Co. Affiliates of JPMorgan Chase & Co. receive fees for providing various services to the funds.
Contact JPMorgan Distribution Services, Inc. at 1-800-480-4111 for a fund prospectus. You can also visit us at www.jpmorganfunds.com. Investors should carefully consider the investment objectives and risk as well as charges and expenses of the mutual fund before investing. The prospectus contains this and other information about the mutual fund. Read the prospectus carefully before investing.
Investors may obtain information about the Securities Investor Protection Corporation (SIPC), including the SIPC brochure, by visiting www.sipc.org or by calling SIPC at 202-371-8300.
Each Fund files a complete schedule of its fund holdings for the first and third quarters of its fiscal year with the SEC as an exhibit to its report on Form N-PORT. The Funds' Form N-PORT reports are available on the SEC’s website at http://www.sec.gov. Each Fund's quarterly holdings can be found by visiting the J.P. Morgan Funds’ website at www.jpmorganfunds.com.
A description of the Fund's policies and procedures with respect to the disclosure of each Fund's holdings is available in the prospectuses and Statement of Additional Information.
A copy of proxy policies and procedures is available without charge upon request by calling 1-800-480-4111 and on the Fund’s website at www.jpmorganfunds.com. A description of such policies and procedures is on the SEC’s website at www.sec.gov. The Trustees have delegated the authority to vote proxies for securities owned by the Funds to the Adviser. A copy of the Fund’s voting record for the most recent 12-month period ended June 30 is available on the SEC’s website at www.sec.gov or at the Fund’s website at www.jpmorganfunds.com no later than August 31 of each year. The Fund’s proxy voting record will include, among other things, a brief description of the matter voted on for each fund security, and will state how each vote was cast, for example, for or against the proposal.
J.P. Morgan Asset Management is the brand name for the asset management business of JPMorgan Chase & Co. and its affiliates worldwide.
© JPMorgan Chase & Co., 2022. All rights reserved. October 2022.
AN-INTEQ-1022
Annual Report
J.P. Morgan Tax Aware Funds
October 31, 2022
JPMorgan Tax Aware Equity Fund |
JPMorgan Tax Aware Real Return Fund |
CONTENTS
Investments in a Fund are not deposits or obligations of, or guaranteed or endorsed by, any bank and are not insured or guaranteed by the FDIC, the Federal Reserve Board or any other government agency. You could lose money if you sell when a Fund’s share price is lower than when you invested.
Past performance is no guarantee of future performance. The general market views expressed in this report are opinions based on market and other conditions through the end of the reporting period and are subject to change without notice. These views are not intended to predict the future performance of a Fund or the securities markets.
Prospective investors should refer to the Funds’ prospectuses for a discussion of the Funds’ investment objectives, strategies and risks. Call J.P. Morgan Funds Service Center at 1-800-480-4111 for a prospectus containing more complete information about a Fund, including management fees and other expenses. Please read it carefully before investing.
Letter to Shareholders
December 15, 2022 (Unaudited)
Dear Shareholder,
Global financial markets reflected turmoil in the global economy in 2022, stirred by sharply higher inflation, rising interest rates, sporadic pandemic disruptions and the widening impact of the Russia-Ukraine conflict. Prices for both equities and bonds tumbled during the first half of the year and remained under pressure through the end of October.
|
“While investors seek to adapt to the current market environment, we believe a well-diversified portfolio and a patient outlook remain crucial components of a successful invest- ment approach.” — Brian S. Shlissel
|
Emerging market equities underperformed both the U.S. and other developed equity markets amid economic weakness in China and slowing global demand during the period. Across Europe, the war in Ukraine set off an energy crisis as a result of reduced imports of natural gas from Russia. U.S. equity markets also fell in 2022, but surprisingly strong corporate earnings and consumer spending helped leading U.S. indexes to rebound from their lowest levels. For the twelve month period ended October 31, 2022, the MSCI Emerging Markets Index returned -31.0%, the MSCI EAFE Index returned -23.0% and the S&P 500 Index returned -14.6%.
Notably, some recent U.S. inflationary data has indicated signs of easing price pressures and U.S. economic output as measured by gross domestic product turned positive in the third quarter of 2022, following two consecutive quarters of negative growth. Though the U.S. economy has lost momentum in 2022, it has not yet fallen into recession. Meanwhile, as the potential for a rapid resolution to the war in Ukraine appears to have faded, the European Union and its largest constituent
nations have moved to secure sufficient winter energy supplies while decreasing their dependence on imports of natural gas from Russia. In the U.K., a year-long political crisis was resolved with the accession of Rishi Sunak to prime minister in October 2022, which helped shore up the value of British pound and stabilize U.K. financial markets. China has eased some of the social restrictions under its “Zero Covid” policy and domestic equity indexes recently rose amid investor expectations that China’s economy may fully reopen in the coming months.
As 2022 comes to a close, financial markets are likely to remain volatile due to investor uncertainty regarding the outlook for inflation, interest rates and economic momentum. Increased geo-political tensions between Russia and Ukraine’s Western allies also remains a headwind for global financial markets.
Investors this year have confronted economic and financial market conditions not experienced in many years. While investors seek to adapt to the current market environment, we believe a well-diversified portfolio and a patient outlook remain crucial components of a successful investment approach. Our broad array of investment solutions seeks to provide investors with ability to build durable portfolios that can help them meet their financial goals.
Sincerely yours,
Brian S. Shlissel
President, J.P. Morgan Funds
J.P. Morgan Asset Management
1-800-480-4111 or www.jpmorganfunds.com for more information
| J.P. Morgan Tax Aware Funds | |
J.P. Morgan Tax Aware Funds
MARKET OVERVIEW
TWELVE MONTHS ENDED October 31, 2022 (Unaudited)
While developed market equities largely ended 2021 with positive returns, global prices for equities and bonds plummeted in 2022 amid accelerating inflation, rising interest rates, pandemic disruptions in China and the outbreak of conflict in Ukraine. Returns for both equity and bond markets broadly declined during the first half of 2022 and remained in negative territory through the end of October. Notably, global energy prices rose sharply in the first half of 2022 before receding somewhat in the third quarter.
In the U.S., investors largely kept their focus on inflation data as indicators of short-term policy of the U.S. Federal Reserve. In mid-March 2022, the central bank initiated its first interest rate increase since late 2018, and then followed with four more rate raises by the end of September 2022.
U.S. gross domestic product fell by 1.6% in the first quarter of 2022 and dropped 0.6% in the second quarter before rebounding to a 2.6% increase in the third quarter. Consumer spending declined but remained somewhat better than investors expected. By the end of June 2022, U.S. equity prices had tumbled more than 20% from the start of the year, which is generally considered a bear market. However, equity prices rebounded somewhat by the end of October 2022.
Within U.S. equities, growth stocks generally underperformed value stocks and small cap and mid cap stocks slightly underperformed large cap stocks. For the twelve months ended October 31, 2022, the S&P 500 Index returned -14.6%.
| J.P. Morgan Tax Aware Funds | |
JPMorgan Tax Aware Equity Fund
FUNDS COMMENTARY
TWELVE MONTHS ENDED October 31, 2022 (Unaudited)
| |
| |
| |
Net Assets as of 10/31/2022 (In Thousands) | |
INVESTMENT OBJECTIVE**
The JPMorgan Tax Aware Equity Fund (the “Fund”) seeks to provide high after-tax total return from a portfolio of selected equity securities.
WHAT WERE THE MAIN DRIVERS OF THE FUND’S PERFORMANCE?
The Fund’s Class I Shares underperformed the S&P 500 Index (the “Benchmark”) for the twelve months ended October 31, 2022.
The Fund’s overweight position in the media sector and its underweight position in the energy sector were leading detractors from performance relative to the Benchmark, while the Fund’s security selection in the pharmaceutical/medical technology sector and in the auto & transportation sector were leading contributors to relative performance.
Leading individual detractors from relative performance included the Fund’s overweight positions in NXP Semiconductors Inc., Snap Inc. and Charter Communications Inc. Shares of NXP Semiconductors, a semiconductor manufacturer based in the Netherlands, fell amid investor concerns about slowing demand for semiconductors. Shares of Snap, an online photography and images platform provider, fell after the company reported lower-than-expected revenue during the period. Shares of Charter Communications, a broadband services provider, fell amid weakness in broadband demand and after the company reported weaker-than-expected results for the third quarter of 2022.
Leading individual contributors to relative performance included the Fund’s overweight positions in Eli Lilly & Co., AutoZone Inc. and AbbVie Inc. Shares of Eli Lilly, a pharmaceuticals maker, rose as the company launched several new drugs during the period. Shares of AutoZone, an automotive parts retail chain, rose amid consistent growth in earnings and revenue during the period. Shares of AbbVie, a biopharmaceutical company, rose after the company reported better-than-expected earnings for the third quarter of 2022 and increased its quarterly dividend.
HOW WAS THE FUND POSITIONED?
During the reporting period, the Fund’s portfolio managers employed a bottom-up fundamental approach to security
selection, researching companies to determine what the portfolio managers believed to be the companies’ underlying
value and potential for future earnings growth.
TOP TEN HOLDINGS OF THE
PORTFOLIO AS OF October 31, 2022 | PERCENT OF
TOTAL
INVESTMENTS |
| | |
| | |
| | |
| | |
| | |
| | |
| | |
| | |
| Mastercard, Inc., Class A | |
| | |
PORTFOLIO COMPOSITION BY SECTOR
AS OF October 31, 2022 | PERCENT OF
TOTAL
INVESTMENTS |
| |
| |
| |
| |
| |
| |
| |
| |
| |
| |
| |
*
The return shown is based on net asset values calculated for shareholder transactions and may differ from the return shown in the financial highlights, which reflects adjustments made to the net asset values in accordance with accounting principles generally accepted in the United States of America.
**
The adviser seeks to achieve the Fund’s objective. There can be no guarantee it will be achieved.
| J.P. Morgan Tax Aware Funds | |
JPMorgan Tax Aware Equity Fund
FUNDS COMMENTARY
TWELVE MONTHS ENDED October 31, 2022 (Unaudited) (continued)
AVERAGE ANNUAL TOTAL RETURNS AS OF October 31, 2022
| | | | |
| | | After Taxes
on
Distributions | After Taxes
on
Distributions
and Sale of
Fund Shares | | After Taxes
on
Distributions | After Taxes
on
Distributions
and Sale of
Fund Shares | | After Taxes
on
Distributions | After Taxes
on
Distributions
and Sale of
Fund Shares |
| | | | | | | | | | |
| | | | | | | | | | |
| | | | | | | | | | |
| | | | | | | | | | |
| | | | | | | | | | |
| | | | | | | | | | |
| | | | | | | | | | |
| | | | | | | | | | |
|
| Sales Charge for Class A Shares is 5.25%. |
| Assumes a 1% CDSC (contingent deferred sales charge) for the one year period and 0% CDSC thereafter. |
TEN YEAR FUND PERFORMANCE (10/31/12 TO 10/31/22)
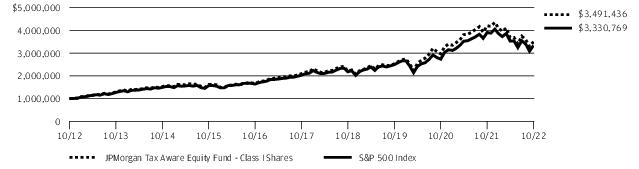
The performance quoted is past performance and is not a guarantee of future results. Mutual funds are subject to certain market risks. Investment returns and principal value of an investment will fluctuate so that an investor’s shares, when redeemed, may be worth more or less than their original cost. Current performance may be higher or lower than the performance data shown. For up-to-date month-end performance information, please call 1-800-480-4111.
Returns for Class R6 Shares prior to their inception date are based on the performance of Class I Shares. The actual returns of Class R6 Shares would have been different than those shown because Class R6 Shares have different expenses than Class I Shares.
The graph illustrates comparative performance for $1,000,000 invested in Class I Shares of the JPMorgan Tax Aware Equity Fund and the S&P 500 Index from October 31, 2012 to October 31, 2022. The performance of the Fund assumes reinvestment of all dividends and capital gain distributions, if any, and does not include a sales charge. The performance of the S&P 500 Index does not reflect the deduction of expenses or a sales charge associated with a mutual fund and has been adjusted to reflect reinvestment of all dividends and capital gain distributions of the securities included in the benchmark, if applicable. The S&P 500 Index is an unmanaged index generally representative of the performance of large companies in the U.S. stock market. Investors cannot invest directly in an index.
Class I Shares have a $1,000,000 minimum initial investment.
The Tax Aware strategy seeks to minimize shareholders’ tax liability in connection with the Fund’s distribution of realized capital gains. There can be no guarantee the strategy will minimize or eliminate such tax liability.
Fund performance may reflect the waiver of the Fund’s fees and reimbursement of expenses for certain periods since the applicable inception date. Without these waivers and reimbursements, performance would have been lower. Also, performance shown in this section does not reflect the deduction of taxes that a shareholder would pay on Fund distributions or on gains resulting from redemptions of Fund shares, with the exception of returns noted above as returns after taxes.
Because Class C Shares automatically convert to Class A Shares after 8 years, the 10 year average annual total return shown above for Class C reflects Class A performance for the period after conversion.
The returns shown are based on net asset values calculated for shareholder transactions and may differ from the returns shown in the financial highlights, which reflect adjustments made to the net asset values in accordance with accounting principles generally accepted in the United States of America.
| J.P. Morgan Tax Aware Funds | |
JPMorgan Tax Aware Real Return Fund
FUNDS COMMENTARY
TWELVE MONTHS ENDED October 31, 2022 (Unaudited)
| |
| |
Bloomberg U.S. 1-15 Year Blend (1-17) Municipal Bond Index | |
Tax Aware Real Return Composite Benchmark ** | |
Net Assets as of 10/31/2022 (In Thousands) | |
INVESTMENT OBJECTIVE***
The JPMorgan Tax Aware Real Return Fund (the “Fund”) seeks to maximize after-tax inflation protected return.
WHAT WERE THE MAIN DRIVERS OF THE FUND’S PERFORMANCE?
The Fund’s Class I Shares had a negative absolute return and outperformed the Bloomberg U.S. 1-15 Year Blend (1-17) Municipal Bond Index (the “Benchmark”) and underperformed the Tax Aware Real Return Composite Benchmark for the twelve months ended October 31, 2022. The Bloomberg Inflation Swap 5-Year Zero Coupon Index returned 5.85% for the period.
The Fund’s hedge against inflation, which was implemented through the use of swaps contracts, was a leading contributor to absolute performance as U.S. inflation reached its highest levels in 40 years amid continued supply chain disruptions, volatile energy prices and the ongoing Russia-Ukraine conflict.
Relative to the Benchmark, the Fund’s underweight position in local general obligation bonds and transportation sector bonds were leading contributors to performance. The Fund’s longer overall duration was a leading detractor from relative performance as interest rates rose during the period. Generally, bonds of longer duration will experience a larger decline in price compared with shorter duration bonds when interest rates rise. The Fund’s overweight allocations to bonds rated single-A and BBB also detracted from relative performance.
HOW WAS THE FUND POSITIONED?
Among the Fund’s tax-exempt fixed income investments, the Fund employed a bottom-up, security-selection-based investment approach and sought to take advantage of opportunities stemming from increased volatility, supply pressures and headline credit risk. The Fund maintained its bias to high quality debt securities, as the Fund’s portfolio managers preferred higher quality issuances. The Fund’s portfolio managers also maintained an inflation-overlay hedging strategy, using zero coupon inflation linked swaps (“inflation swaps”) to purchase protection against inflation along the yield curve. The yield curve shows the relationship between yields and maturity dates for a set of similar bonds at a given point in time.
During the period, the Fund’s portfolio managers increased the aggregate amount of hedged positions to 83% from 100% at the start of the period.
INVESTMENT APPROACH
The Fund uses inflation swaps in combination with tax-exempt municipal bonds to seek to replicate a portfolio of inflation protected securities. The Fund is designed to protect the total return generated by its tax-exempt fixed income holdings from inflation risk. The inflation swaps used by the Fund are based on cumulative percentage movements in the Consumer Price Index for All Urban Consumers (“CPI-U”). The inflation swaps are structured so that one counterparty agrees to pay the cumulative percentage change in the CPI-U over the duration of the swap. The other counterparty (the Fund) pays a compounded fixed rate (zero coupon inflation-swap rate), which is based on the “breakeven inflation rate,” calculated as the yield difference between a nominal U.S. Treasury security and a U.S. Treasury Inflation Protected Security of equal maturity
The Fund’s portfolio managers aim to protect the portfolio from inflation risk across maturities. Therefore, the yield curve positioning of the underlying bonds is used as the general basis for the Fund’s inflation swap positioning. The Fund’s portfolio managers believe that matching the duration of the inflation protection to the duration of the underlying bonds is the most effective and efficient way to protect the portfolio from both actual realized inflation as well as the loss of value that results from an increase in inflation expectations. Duration measures the price sensitivity of a bond or a portfolio of bonds to relative changes in interest rates. However, the inflation protection is actively managed, and the Fund’s portfolio managers may elect to deviate from the curve positioning of the underlying bonds as a result of opportunities that may result from macroeconomic or technical factors.
PORTFOLIO COMPOSITION
AS OF October 31, 2022 | PERCENT OF
TOTAL
INVESTMENTS |
| |
| |
*
The return shown is based on net asset values calculated for shareholder transactions and may differ from the return shown in
| J.P. Morgan Tax Aware Funds | |
JPMorgan Tax Aware Real Return Fund
FUNDS COMMENTARY
TWELVE MONTHS ENDED October 31, 2022 (Unaudited) (continued)
the financial highlights, which reflects adjustments made to the net asset values in accordance with accounting principles generally accepted in the United States of America.
**
The Fund’s Composite Benchmark is determined by adding the return of the Bloomberg U.S. 1-15 Year Blend (1-17) Municipal Bond Index (formerly known as Bloomberg Barclays U.S. 1-15 Year Blend (1-17) Municipal Bond Index) and the Bloomberg Inflation Swap 5 Year Zero Coupon Index (formerly known as
Bloomberg Barclays Inflation Swap 5 Year Zero Coupon Index).
***
The adviser seeks to achieve the Fund’s objective. There can be no guarantee it will be achieved.
| J.P. Morgan Tax Aware Funds | |
AVERAGE ANNUAL TOTAL RETURNS AS OF October 31, 2022
| | | | |
| | | After Taxes
on
Distributions | After Taxes
on
Distributions
and Sale of
Fund Shares | | After Taxes
on
Distributions | After Taxes
on
Distributions
and Sale of
Fund Shares | | After Taxes
on
Distributions | After Taxes
on
Distributions
and Sale of
Fund Shares |
| | | | | | | | | | |
| | | | | | | | | | |
| | | | | | | | | | |
| | | | | | | | | | |
| | | | | | | | | | |
| | | | | | | | | | |
| | | | | | | | | | |
| | | | | | | | | | |
|
| Sales Charge for Class A Shares is 3.75%. |
| Assumes a 1% CDSC (contingent deferred sales charge) for the one year period and 0% CDSC thereafter. |
TEN YEAR FUND PERFORMANCE (10/31/12 TO 10/31/22)
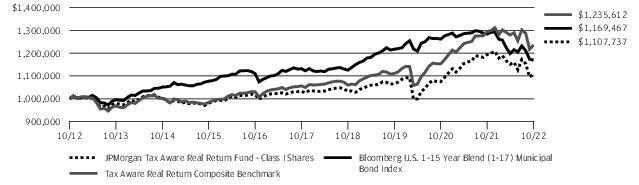
The performance quoted is past performance and is not a guarantee of future results. Mutual funds are subject to certain market risks. Investment returns and principal value of an investment will fluctuate so that an investor’s shares, when redeemed, may be worth more or less than their original cost. Current performance may be higher or lower than the performance data shown. For up-to-date month-end performance information, please call 1-800-480-4111.
Returns for Class R6 Shares prior to its inception date are based on the performance of Class I Shares. The actual returns of Class R6 Shares would have been different than those shown because Class R6 Shares have different expenses than Class I Shares.
The graph illustrates comparative performance for $1,000,000 invested in Class I Shares of the JPMorgan Tax Aware Real Return Fund, the Bloomberg U.S. 1-15 Year Blend (1-17) Municipal Bond Index and the Tax Aware Real Return Composite Benchmark from October 31, 2012 to October 31, 2022. The performance of the Fund assumes reinvestment of all dividends and capital gain distributions, if any, and does not include a sales charge. The performance of the Bloomberg U.S. 1-15 Year Blend (1-17) Municipal Bond Index and the Tax Aware Real Return Composite Benchmark does not reflect the deduction of expenses or a sales charge associated with a mutual fund and has been adjusted to reflect reinvestment of all dividends and capital gain distributions of the securities included in the benchmarks, if applicable.
The Bloomberg U.S. 1-15 Year Blend (1-17) Municipal Bond Index represents the performance of municipal bonds with maturities from 1 to 17 years. The Tax Aware Real Return Composite Benchmark is determined by adding the return of
the Bloomberg U.S. 1-15 Year Blend (1-17) Municipal Bond Index and the Bloomberg Inflation Swap 5 Year Zero Coupon Index. Investors cannot invest directly in an index.
Class I Shares have a $1,000,000 minimum initial investment.
For some investors, income from municipal bonds may be subject to the Alternative Minimum Tax. Capital gains, if any, are federally taxable. Income may be subject to state and local taxes.
The Tax Aware strategy seeks to minimize shareholders’ tax liability in connection with the Fund’s distribution of realized capital gains. There can be no guarantee the strategy will minimize or eliminate such tax liability.
Fund performance may reflect the waiver of the Fund’s fees and reimbursement of expenses for certain periods since the applicable inception date. Without these waivers and reimbursements, performance would have been lower.
Also, performance shown in this section does not reflect the deduction of taxes that a shareholder would pay on Fund distributions or on gains resulting from redemptions of Fund shares, with the exception of returns noted above as returns after taxes.
Because Class C Shares automatically convert to Class A Shares after 8 years, the 10 year average annual total return shown above for Class C reflects Class A performance for the period after conversion.
The returns shown are based on net asset values calculated for shareholder transactions and may differ from the returns shown in the financial highlights, which reflect adjustments made to the net asset values in accordance with accounting principles generally accepted in the United States of America.
| J.P. Morgan Tax Aware Funds | |
JPMorgan Tax Aware Equity Fund
SCHEDULE OF PORTFOLIO INVESTMENTS
AS OF October 31, 2022
| | |
|
|
| | |
| | |
| | |
| | |
|
| | |
| | |
| | |
|
| | |
| | |
Regeneron Pharmaceuticals, Inc. * | | |
| | |
|
| | |
|
Linde plc (United Kingdom) | | |
Commercial Services & Supplies — 1.5% |
| | |
|
| | |
Electric Utilities — 2.4% |
| | |
Food & Staples Retailing — 1.9% |
| | |
|
Mondelez International, Inc., Class A | | |
Health Care Equipment & Supplies — 1.0% |
Boston Scientific Corp. * | | |
Health Care Providers & Services — 5.5% |
| | |
Hotels, Restaurants & Leisure — 2.1% |
| | |
Hilton Worldwide Holdings, Inc. | | |
| | |
| | |
Industrial Conglomerates — 1.6% |
Honeywell International, Inc. | | |
| | |
|
|
| | |
| | |
| | |
Interactive Media & Services — 8.1% |
Alphabet, Inc., Class A * | | |
Alphabet, Inc., Class C * | | |
Meta Platforms, Inc., Class A * | | |
| | |
Internet & Direct Marketing Retail — 4.8% |
| | |
|
| | |
Mastercard, Inc., Class A | | |
| | |
Life Sciences Tools & Services — 2.2% |
| | |
|
| | |
|
Charter Communications, Inc., Class A * | | |
Oil, Gas & Consumable Fuels — 5.5% |
| | |
| | |
| | |
| | |
|
| | |
| | |
| | |
|
| | |
Old Dominion Freight Line, Inc. | | |
| | |
| | |
Semiconductors & Semiconductor Equipment — 7.4% |
| | |
ASML Holding NV (Registered), NYRS (Netherlands) | | |
| | |
SEE NOTES TO FINANCIAL STATEMENTS.
| J.P. Morgan Tax Aware Funds | |
| | |
Common Stocks — continued |
Semiconductors & Semiconductor Equipment — continued |
NXP Semiconductors NV (China) | | |
| | |
| | |
|
| | |
|
| | |
| | |
| | |
Technology Hardware, Storage & Peripherals — 5.8% |
| | |
Wireless Telecommunication Services — 1.1% |
| | |
Total Common Stocks
(Cost $424,390) | | |
Short-Term Investments — 2.8% |
Investment Companies — 2.8% |
JPMorgan Prime Money Market Fund Class IM Shares, 3.18% (a) (b)
(Cost $29,647) | | |
Total Investments — 100.5%
(Cost $454,037) | | |
Liabilities in Excess of Other Assets — (0.5)% | | |
| | |
Percentages indicated are based on net assets. |
| Non-income producing security. |
| Investment in an affiliated fund, which is registered under the Investment Company Act of 1940, as amended, and is advised by J.P. Morgan Investment Management Inc. |
| The rate shown is the current yield as of October 31, 2022. |
SEE NOTES TO FINANCIAL STATEMENTS.
| J.P. Morgan Tax Aware Funds | |
JPMorgan Tax Aware Real Return Fund
SCHEDULE OF PORTFOLIO INVESTMENTS
AS OF October 31, 2022
| | |
Municipal Bonds — 78.1% (a) |
|
Alabama Public School and College Authority Series 2016-A, Rev., 4.00%, 6/1/2031 | | |
Black Belt Energy Gas District, Gas Project No. 8 Series 2022A, Rev., 4.00%, 12/1/2029 (b) | | |
Southeast Energy Authority A Cooperative District | | |
Series 2022B-1, Rev., 5.00%, 8/1/2028 (b) | | |
Series 2022A-1, Rev., 5.50%, 12/1/2029 (b) (c) | | |
Southeast Energy Authority A Cooperative District, Project No. 2 Series 2021B, Rev., 4.00%, 12/1/2031 (b) | | |
| | |
|
Borough of Matanuska-Susitna, Goose Creek Correctional Center Project | | |
Series 2016, Rev., 5.00%, 9/1/2024 | | |
| | |
| | |
|
Arizona Board of Regents Series 2022A, Rev., 5.00%, 7/1/2034 | | |
Arizona Industrial Development Authority, Doral Academy of Northern Nevada Project Series 2021A, Rev., 4.00%, 7/15/2036 (d) | | |
Arizona Industrial Development Authority, Macombs Facility Project Series 2021A, Rev., 4.00%, 7/1/2041 | | |
Arizona Industrial Development Authority, Pinecrest Academy of Northern Nevada Project Series 2022A, Rev., 4.50%, 7/15/2029 (d) | | |
City of Phoenix Series 2018 A, GO, 5.00%, 7/1/2031 | | |
City of San Luis Series 2017A, Rev., AGM, 5.00%, 7/1/2025 | | |
City of Sedona, Excise Tax | | |
| | |
| | |
County of Pima Rev., 3.00%, 7/1/2023 | | |
Industrial Development Authority of the County of Pima (The) Series 2022B-3, Rev., 5.13%, 11/15/2029 (d) | | |
Pima County Unified School District No. 16 Catalina Foothills, School Improvement Projects Series 2018 B, GO, 5.00%, 7/1/2028 | | |
Pinal County Electric District No. 3 Rev., 4.00%, 7/1/2034 | | |
| | |
|
|
Salt River Project Agricultural Improvement & Power District, Electric System Series 2017A, Rev., 5.00%, 1/1/2028 | | |
Town of Queen Creek, Excise Tax Series 2022A, Rev., 5.00%, 8/1/2029 | | |
| | |
|
City of Fort Smith, Water and Sewer Series 2019A, Rev., 5.00%, 10/1/2027 | | |
City of Springdale Public Facilities Board Hospital, Arkansas Children's Northwest Project Series 2016, Rev., 5.00%, 3/1/2030 | | |
| | |
|
Briggs Elementary School District, Election of 2014 Series B, GO, 4.00%, 8/1/2030 | | |
California Community Choice Financing Authority, Clean Energy Project Series 2021B-1, Rev., 4.00%, 8/1/2031 (b) | | |
California Enterprise Development Authority, Rocketship Public Schools | | |
Series 2022A, Rev., 4.00%, 6/1/2031 (d) | | |
Series 2022A, Rev., 4.00%, 6/1/2042 (d) | | |
California Health Facilities Financing Authority, Kaiser Permanente Series 2017A, Subseries 2017A-2, Rev., 4.00%, 11/1/2038 | | |
California Health Facilities Financing Authority, Sutter Health Series 2016B, Rev., 4.00%, 11/15/2038 | | |
California Municipal Finance Authority, Lutheran University | | |
| | |
Series 2022B1, Rev., 5.00%, 10/1/2030 | | |
| | |
California Municipal Finance Authority, Mount San Antonio Garden Series 2022B1, Rev., 2.75%, 11/15/2027 | | |
California Municipal Finance Authority, Recovery Zone Facility, Chevron USA, Inc., Project Series 2010A, Rev., VRDO, 1.00%, 11/9/2022 (b) | | |
California Public Finance Authority, Enso Village Project | | |
Series 2021B-3, Rev., 2.13%, 11/15/2027 (d) | | |
Series 2021B-2, Rev., 2.38%, 11/15/2028 (d) | | |
Series 2021B-1, Rev., 3.13%, 5/15/2029 (d) | | |
Series 2021A, Rev., 5.00%, 11/15/2036 (d) | | |
Series 2021A, Rev., 5.00%, 11/15/2046 (d) | | |
SEE NOTES TO FINANCIAL STATEMENTS.
| J.P. Morgan Tax Aware Funds | |
| | |
Municipal Bonds — continued |
|
California Statewide Communities Development Authority, San Francisco Campus for Jewish Living Project | | |
Series 2021B-2, Rev., 4.00%, 11/1/2031 | | |
Series 2021B-3, Rev., 4.00%, 11/1/2032 | | |
City of Culver City, Wastewater Facilities Series 2019 A, Rev., 4.00%, 9/1/2035 | | |
City of Los Angeles Department of Airports Series 2022A, Rev., 5.00%, 5/15/2025 | | |
City of Los Angeles, Department of Water and Power, Power System | | |
Series 2014B, Rev., 5.00%, 7/1/2031 | | |
Series 2014B, Rev., 5.00%, 7/1/2032 | | |
Series 2014D, Rev., 5.00%, 7/1/2032 | | |
Series 2017A, Rev., 5.00%, 7/1/2032 | | |
Series 2017A, Rev., 5.00%, 7/1/2033 | | |
Series 2017A, Rev., 5.00%, 7/1/2034 | | |
Series 2019 C, Rev., 5.00%, 7/1/2034 | | |
City of Santa Rosa, Wastewater Series 2002B, Rev., AGM-CR, AMBAC, Zero Coupon, 9/1/2023 | | |
Clovis Unified School District COP, 4.00%, 6/1/2026 | | |
Contra Costa County Public Financing Authority Series 2021B, Rev., 5.00%, 6/1/2036 | | |
County of San Bernardino, Arrowhead Project Series 2019 A, COP, 5.00%, 10/1/2026 | | |
CSCDA Community Improvement Authority, Essential Housing, Orange Portfolio Series 2021A-1, Rev., 2.80%, 3/1/2047 (d) | | |
CSCDA Community Improvement Authority, Essential Housing, Pasadena Portfolio Series 2021A-1, Rev., 2.65%, 12/1/2046 (d) | | |
CSCDA Community Improvement Authority, Essential Housing, Senior Lien Series 2021A-1, Rev., 2.45%, 2/1/2047 (d) | | |
Golden State Tobacco Securitization Corp., Tobacco Settlement Series 2015A, Rev., 5.00%, 6/1/2025 (e) | | |
Lompoc Valley Medical Center GO, 5.00%, 8/1/2024 | | |
Los Angeles Community College District, Election of 2008 Series G, GO, 4.00%, 8/1/2024 (e) | | |
Los Angeles County Public Works Financing Authority Series 2020A, Rev., 5.00%, 12/1/2034 | | |
Los Angeles Department of Water and Power System Series 2017B, Rev., 5.00%, 7/1/2029 | | |
Mission Viejo Community Development Financing Authority Series 2022B, Rev., 4.00%, 5/1/2026 | | |
| | |
|
|
Ontario Public Financing Authority, Civic Center Improvements | | |
Series 2022A, Rev., AGM, 5.00%, 11/1/2027 | | |
Series 2022A, Rev., AGM, 5.00%, 11/1/2029 | | |
Series 2022A, Rev., AGM, 5.00%, 11/1/2030 | | |
Orange County Community Facilities District | | |
Series A, 5.00%, 8/15/2037 | | |
Series A, 5.00%, 8/15/2042 | | |
River Islands Public Financing Authority,Community of Facilities District No. 2003-1 Series 2022A-1, AGM, 4.00%, 9/1/2037 | | |
Sacramento Municipal Utility District, Financing Authority, Cosumnes Project Series 2022A, Rev., 5.00%, 7/1/2028 | | |
San Francisco Bay Area Rapid Transit District, Sales Tax Series 2015A, Rev., 5.00%, 7/1/2026 | | |
San Francisco City and County, Airport Commission, San Francisco International Airport Series 2019A, Rev., AMT, 5.00%, 5/1/2034 | | |
San Joaquin County Transportation Authority, Measure K Sales Tax Series 2015A, Rev., 5.00%, 3/1/2030 | | |
San Marcos Redevelopment Agency Successor Agency Series 2019 A, 5.00%, 10/1/2026 | | |
Sanger Unified School District | | |
COP, AGM, 5.00%, 6/1/2033 | | |
COP, AGM, 5.00%, 6/1/2034 | | |
COP, AGM, 5.00%, 6/1/2035 | | |
South Placer Wastewater Authority Rev., 5.00%, 11/1/2024 | | |
South San Francisco Public Facilities Financing Authority | | |
| | |
| | |
State of California Series 2021A, GO, 4.00%, 10/1/2027 | | |
State of California, Various Purpose Series 2018 A, GO, 5.00%, 8/1/2030 | | |
Vista Unified School District | | |
| | |
Series 2022B, GO, 5.00%, 8/1/2034 | | |
Series 2022B, GO, 5.00%, 8/1/2035 | | |
Westminster School District Series 2016, GO, 5.00%, 8/1/2030 | | |
| | |
SEE NOTES TO FINANCIAL STATEMENTS.
| J.P. Morgan Tax Aware Funds | |
JPMorgan Tax Aware Real Return Fund
SCHEDULE OF PORTFOLIO INVESTMENTS
AS OF October 31, 2022 (continued)
| | |
Municipal Bonds — continued |
|
Arapahoe County School District No. 5 Cherry Creek GO, 5.00%, 12/15/2037 | | |
Arapahoe County Water & Wastewater Authority Rev., 4.00%, 12/1/2039 | | |
City and County of Denver, Airport System Series 2022A, Rev., AMT, 5.50%, 11/15/2040 | | |
City of Greeley COP, 4.00%, 12/1/2034 | | |
Colorado Educational and Cultural Facilities Authority, Aspen View Academy Project | | |
| | |
| | |
| | |
| | |
Denver Health and Hospital Authority Series 2019A, Rev., 4.00%, 12/1/2037 | | |
Dominion Water & Sanitation District Rev., 5.25%, 12/1/2032 | | |
Jefferson County School District R-1 GO, 5.00%, 12/15/2035 | | |
Rampart Range Metropolitan District No. 5 Rev., 4.00%, 12/1/2036 | | |
Reunion Metropolitan District Series 2021A, Rev., 3.63%, 12/1/2044 | | |
State of Colorado Series 2021A, COP, 5.00%, 12/15/2028 | | |
Third Creek Metropolitan District No. 1 Series 2022A-1, GO, 4.50%, 12/1/2037 | | |
University of Colorado, Enterprise System Series 2021C-3B, Rev., 2.00%, 10/15/2026 (b) | | |
Waterview II Metropolitan District Series 2022A, GO, 4.50%, 12/1/2031 | | |
Windler Public Improvement Authority, Limited Tax | | |
Series 2021A-1, Rev., 4.00%, 12/1/2036 | | |
Series 2021A-1, Rev., 4.00%, 12/1/2041 | | |
| | |
|
State of Connecticut Special Tax | | |
Series 2022A, Rev., 5.00%, 7/1/2031 (c) | | |
Series 2022B, Rev., 5.00%, 7/1/2031 (c) | | |
Town of Southington Series 2020C, GO, 5.00%, 6/1/2028 | | |
Town of Stafford GO, 3.00%, 8/1/2026 | | |
| | |
| | |
|
District of Columbia — 1.8% |
| | |
Series 2017A, GO, 5.00%, 6/1/2029 | | |
Series 2017A, GO, 5.00%, 6/1/2030 | | |
Series 2017A, GO, 5.00%, 6/1/2031 | | |
District of Columbia, Gallaudet University Project | | |
Series 2021A, Rev., 4.00%, 4/1/2033 | | |
Series 2021A, Rev., 4.00%, 4/1/2034 | | |
Series 2021A, Rev., 4.00%, 4/1/2035 | | |
Series 2021A, Rev., 4.00%, 4/1/2036 | | |
Metropolitan Washington Airports Authority Aviation | | |
Series 2021A, Rev., AMT, 5.00%, 10/1/2028 | | |
Series 2020 A, Rev., AMT, 5.00%, 10/1/2032 | | |
Series 2021A, Rev., AMT, 4.00%, 10/1/2039 | | |
Metropolitan Washington Airports Authority Dulles Toll Road Series 2019A, Rev., 5.00%, 10/1/2036 | | |
Total District of Columbia | | |
|
Broward County, Water and Sewer Utility Series B, Rev., 5.00%, 10/1/2030 | | |
Capital Trust Agency, Inc., Legends Academy Project Series 2021A, Rev., 5.00%, 12/1/2045 (d) | | |
Capital Trust Agency, Inc., The Marie Selby Botanical Gardens, Inc., Project Rev., 4.00%, 6/15/2031 (d) | | |
City of Jacksonville Series 2022A, Rev., 5.00%, 10/1/2029 | | |
City of Pompano Beach, John Knox Village Project | | |
| | |
Series 2020, Rev., 3.50%, 9/1/2035 | | |
Series 2021A, Rev., 4.00%, 9/1/2036 | | |
County of St. Lucie, Power and Light Co. Project Rev., VRDO, 1.40%, 11/9/2022 (b) | | |
Florida Atlantic University Finance Corp., Student Housing Project Series 2019B, Rev., 5.00%, 7/1/2029 | | |
Florida Development Finance Corp., IPS Florida LLC Rev., 5.25%, 6/15/2029 (d) | | |
Florida Development Finance Corp., Mater Academy Project | | |
Series 2022A, Rev., 5.00%, 6/15/2028 | | |
Series 2022A, Rev., 5.00%, 6/15/2031 | | |
Florida Development Finance Corp., River city Science Academy Series 2022B, Rev., 5.00%, 7/1/2031 (c) | | |
SEE NOTES TO FINANCIAL STATEMENTS.
| J.P. Morgan Tax Aware Funds | |
| | |
Municipal Bonds — continued |
|
Florida Development Finance Corp., The Mayflower Retirement Community Project | | |
Series 2021B2, Rev., 1.75%, 6/1/2026 (d) | | |
Series 2021B-1, Rev., 2.38%, 6/1/2027 (d) | | |
Series 2021A, Rev., 4.00%, 6/1/2029 (d) | | |
Series 2021A, Rev., 4.00%, 6/1/2030 (d) | | |
Series 2021A, Rev., 4.00%, 6/1/2031 (d) | | |
Series 2021A, Rev., 4.00%, 6/1/2036 (d) | | |
Florida Gulf Coast University Financing Corp., Housing Project Series 2017A, Rev., 5.00%, 8/1/2032 | | |
Florida Higher Educational Facilities Financial Authority, Rollins College Project Series 2020A, Rev., 4.00%, 12/1/2037 | | |
Hillsborough County Industrial Development Authority, Baycare Health System Series 2020B, Rev., VRDO, LOC : TD Bank NA, 1.20%, 11/9/2022 (b) | | |
JEA Electric System Series 2017B, Rev., 5.00%, 10/1/2033 | | |
Lee County Industrial Development Authority, Cypress Cove at Healthpark Florida, Inc., Project Series 2022B2, Rev., 3.25%, 10/1/2026 | | |
Middleton Community Development District A 5.20%, 5/1/2027 | | |
Palm Beach County Health Facilities Authority, Jupiter Medical Center Projects Series 2022A, Rev., 5.00%, 11/1/2028 | | |
Palm Beach County Health Facilities Authority, Toby and Leon Cooperman Sinai Rev., 4.00%, 6/1/2041 | | |
St. Johns County Industrial Development Authority, Vicar's Landing Project Series 2021A, Rev., 4.00%, 12/15/2029 | | |
University of Central Florida Housing Facility Series 2021A, Rev., 5.00%, 10/1/2024 | | |
Wildwood Utility Dependent District Series 2021A, Rev., 5.00%, 10/1/2030 | | |
| | |
|
Albany-Dougherty Inner City Authority, Albany State University Projects Series 2022A, Rev., 5.00%, 7/1/2032 | | |
Clayton County Development Authority, Clayton State University Project | | |
| | |
| | |
Georgia Ports Authority Rev., 4.00%, 7/1/2052 | | |
| | |
|
|
Lee County School District GO, 5.00%, 2/1/2030 | | |
Main Street Natural Gas, Inc., Gas Supply Series 2021A, Rev., 4.00%, 9/1/2027 (b) | | |
Polk School District, Sales Tax Series 2018, GO, 5.00%, 3/1/2025 | | |
Savannah Economic Development Authority, University Project | | |
Series 2021B, Rev., 5.00%, 6/15/2027 | | |
Series 2021B, Rev., 5.00%, 6/15/2030 | | |
State of Georgia Series 2015A, GO, 5.00%, 2/1/2025 | | |
| | |
|
Idaho Housing and Finance Association Series 2021A, Rev., 5.00%, 7/15/2035 | | |
|
City of Chicago, Second Lien Waterworks Project | | |
| | |
| | |
Illinois Finance Authority | | |
Series 2022B-3, Rev., 4.75%, 11/15/2027 (c) | | |
Series 2022B-2, Rev., 5.25%, 11/15/2027 (c) | | |
Series 2022B-1, Rev., 6.00%, 11/15/2027 (c) | | |
Illinois Finance Authority, Northwestern Memorial Healthcare Series 2021B, Rev., VRDO, LIQ : Royal Bank of Canada, 1.15%, 11/9/2022 (b) | | |
Illinois Finance Authority, Smith Crossing | | |
Series 2017 A, Rev., 4.00%, 10/15/2025 | | |
| | |
| | |
| | |
Northern Illinois University, Auxiliary Facilities System | | |
Series 2021A, Rev., 5.00%, 10/1/2026 | | |
Series 2021A, Rev., 5.00%, 10/1/2027 | | |
| | |
Regional Transportation Authority Series 2002A, Rev., NATL -RE, 6.00%, 7/1/2024 | | |
| | |
Series 2017D, GO, 5.00%, 11/1/2025 | | |
Series 2017D, GO, 5.00%, 11/1/2028 | | |
Series 2021A, GO, 5.00%, 3/1/2030 | | |
Series 2018A, GO, 5.00%, 10/1/2030 | | |
Series 2021A, GO, 5.00%, 3/1/2033 | | |
Series 2021B, GO, 5.00%, 12/1/2033 | | |
SEE NOTES TO FINANCIAL STATEMENTS.
| J.P. Morgan Tax Aware Funds | |
JPMorgan Tax Aware Real Return Fund
SCHEDULE OF PORTFOLIO INVESTMENTS
AS OF October 31, 2022 (continued)
| | |
Municipal Bonds — continued |
|
Series 2021A, GO, 4.00%, 3/1/2038 | | |
Series 2021A, GO, 4.00%, 3/1/2039 | | |
| | |
|
City of Valparaiso, Green Oaks of Valparaiso LLC Rev., 5.38%, 12/1/2041 (d) | | |
Fort Wayne Community School Building Corp. Series 2020 A, Rev., 5.00%, 7/15/2038 | | |
Fort Wayne Redevelopment Authority, Harrison Square Project Series 2020 A, Rev., 5.00%, 2/1/2026 | | |
Indiana Finance Authority, DEPAUW University Projects | | |
Series 2022A, Rev., 5.00%, 7/1/2027 | | |
Series 2022A, Rev., 5.00%, 7/1/2029 | | |
Series 2022A, Rev., 5.00%, 7/1/2030 | | |
Series 2022A, Rev., 5.00%, 10/1/2030 | | |
Series 2022A, Rev., 5.00%, 7/1/2031 | | |
Series 2022A, Rev., 5.00%, 7/1/2032 | | |
Indiana Finance Authority, Rose-Hulman Institute of Technology Project Series 2008-J, Rev., 5.00%, 6/1/2029 | | |
Indianapolis Local Public Improvement Bond Bank, Stormwater Project Series 2013D, Rev., 5.00%, 1/1/2026 | | |
Lake Ridge School Building Corp., First Mortgage Rev., 4.00%, 7/15/2028 | | |
| | |
|
Iowa Finance Authority, State Revolving Fund Series 2013D, Rev., 5.00%, 8/1/2032 | | |
|
City of Hazard, Appalachian Regional Healthcare, Inc. Rev., 4.00%, 7/1/2036 | | |
City of Henderson, Pratt Paper LLC Project | | |
Series 2022B, Rev., AMT, 3.70%, 1/1/2032 (d) | | |
Series 2022B, Rev., AMT, 4.45%, 1/1/2042 (d) | | |
County of Boone, Duke Energy Kentucky, Inc. Series 2008A, Rev., 3.70%, 8/1/2027 | | |
County of Carroll, Kentucky Environmental Facilities | | |
Series 2008A, Rev., AMT, 2.00%, 2/1/2032 | | |
Series 2006 B, Rev., AMT, 2.13%, 10/1/2034 | | |
Kentucky Bond Development Corp., Centre College | | |
| | |
| | |
|
|
| | |
Kentucky Public Energy Authority, Gas Supply Series 2022A-1, Rev., 4.00%, 8/1/2030 (b) | | |
| | |
|
City of Alexandria, Utilities Series 2013A, Rev., 5.00%, 5/1/2023 (e) | | |
Lafayette Public Power Authority Rev., 5.00%, 11/1/2025 | | |
Louisiana Local Government Environmental Facilities and Community Development Authority, Bossier City Project Series 2017A, Rev., 5.00%, 10/1/2027 | | |
Louisiana Public Facilities Authority, Ochsner Clinic Foundation Project | | |
Series 2020A, Rev., 5.00%, 5/15/2036 | | |
Series 2020A, Rev., 5.00%, 5/15/2037 | | |
Louisiana Public Facilities Authority, School Master Project Series 2021A, Rev., 4.00%, 6/1/2031 (d) | | |
St. Tammany Parish Hospital Service District No. 1 Series 2018 A, Rev., 5.00%, 7/1/2032 | | |
State of Louisiana, State Highway Improvement Series 2013-A, Rev., 5.00%, 6/15/2023 | | |
Terrebonne Parish Recreation District No. 5 Series 2021A, GO, 5.00%, 3/1/2027 | | |
| | |
|
Maine Municipal Bond Bank | | |
Series 2022A, Rev., 5.00%, 11/1/2033 | | |
Series 2022A, Rev., 5.00%, 11/1/2034 | | |
| | |
|
County of Howard Series 2019 B, GO, 5.00%, 8/15/2027 | | |
County of Montgomery, Consolidated Public Improvements Series 2016 A, GO, 4.00%, 12/1/2033 | | |
Maryland Economic Development Corp. | | |
Series 2022A, Rev., 5.25%, 7/1/2029 (c) | | |
Series 2022A, Rev., 5.25%, 7/1/2030 (c) | | |
Maryland Health and Higher Educational Facilities Authority, Stevenson University Issue | | |
Series 2021A, Rev., 5.00%, 6/1/2030 | | |
Series 2021A, Rev., 5.00%, 6/1/2032 | | |
Series 2021A, Rev., 4.00%, 6/1/2038 | | |
SEE NOTES TO FINANCIAL STATEMENTS.
| J.P. Morgan Tax Aware Funds | |
| | |
Municipal Bonds — continued |
|
| | |
Series 2021-A, GO, 5.00%, 8/1/2034 | | |
Series 2013A, GO, 4.00%, 8/1/2036 | | |
State of Maryland Department of Transportation Series 2021-A, Rev., 5.00%, 10/1/2027 | | |
Washington Suburban Sanitary Commission Rev., GTD, 5.00%, 6/15/2029 | | |
| | |
|
Commonwealth of Massachusetts Series 2004C, GO, AGM, 5.50%, 12/1/2022 | | |
Massachusetts Development Finance Agency, Salem Community Corp. | | |
| | |
| | |
| | |
| | |
| | |
| | |
| | |
Massachusetts Development Finance Agency, Southcoast Health System Obligated Group Issue Series 2021G, Rev., 5.00%, 7/1/2036 | | |
Massachusetts Health and Educational Facilities Authority, Baystate Medical Centre Series 2009K-1, Rev., VRDO, LOC : TD Bank NA, 1.15%, 11/9/2022 (b) | | |
| | |
|
Avondale School District Series 2022A, GO, Q-SBLF, 5.00%, 11/1/2027 | | |
Eastern Michigan University, Board of Regents Series 2017A, Rev., 5.00%, 3/1/2033 | | |
Lakeview School District, School Building and Site GO, Q-SBLF, 5.00%, 5/1/2028 | | |
Michigan Finance Authority, Lawrence Technological University Obligated Group | | |
| | |
| | |
Michigan Strategic Fund, Graphic Packaging International LLC, Coated Recycled Board Machine Project Rev., AMT, 4.00%, 10/1/2026 (b) | | |
Northern Michigan University Rev., 5.00%, 6/1/2031 | | |
| | |
|
|
Onekama Consolidated Schools GO, AGM, 4.00%, 5/1/2025 | | |
University of Michigan Series 2012D-1, Rev., VRDO, 1.20%, 11/9/2022 (b) | | |
Watervliet Public Schools, School Building and Site GO, Q-SBLF, 5.00%, 5/1/2025 | | |
Wayne-Westland Community Schools Series 2019, GO, Q-SBLF, 4.00%, 11/1/2031 | | |
Western Michigan University, Tax Exempt Series 2021A, Rev., AGM, 5.00%, 11/15/2036 | | |
| | |
|
County of Hennepin GO, 5.00%, 12/15/2029 | | |
Duluth Economic Development Authority, Benedictine Health System | | |
Series 2021A, Rev., 3.00%, 7/1/2025 | | |
Series 2021A, Rev., 3.00%, 7/1/2026 | | |
Minnesota Higher Education Facilities Authority | | |
| | |
| | |
Series 2022A, Rev., 5.00%, 10/1/2027 | | |
Series 2022A, Rev., 5.00%, 10/1/2028 | | |
Series 2022B, Rev., 5.00%, 10/1/2028 | | |
Series 2022A, Rev., 5.00%, 10/1/2029 | | |
Series 2022A, Rev., 5.00%, 10/1/2030 | | |
Series 2022A, Rev., 5.00%, 10/1/2031 | | |
Series 2022A, Rev., 5.00%, 10/1/2032 | | |
Minnesota Municipal Gas Agency Series 2022A, Rev., LIQ : Royal Bank of Canada, 4.00%, 12/1/2027 | | |
Moorhead Independent School District No. 152 Series 2020A, GO, 4.00%, 2/1/2028 | | |
| | |
|
Health and Educational Facilities Authority of the State of Missouri | | |
| | |
Series 2015A, Rev., 5.00%, 2/15/2031 | | |
| | |
| | |
| | |
SEE NOTES TO FINANCIAL STATEMENTS.
| J.P. Morgan Tax Aware Funds | |
JPMorgan Tax Aware Real Return Fund
SCHEDULE OF PORTFOLIO INVESTMENTS
AS OF October 31, 2022 (continued)
| | |
Municipal Bonds — continued |
|
Health and Educational Facilities Authority of the State of Missouri, St. Luke's Health System, Inc. Rev., 5.00%, 11/15/2029 | | |
Industrial Development Authority of the City of St Louis Missouri (The), St. Louis Innovation District Rev., 5.00%, 5/15/2041 | | |
| | |
|
Montana State Board of Regents,The University of Montana Series 2019B, Rev., 5.00%, 11/15/2028 | | |
Silver Bow County School District No. 1 Series 2021B, GO, 5.00%, 7/1/2029 | | |
| | |
|
Central Plains Energy Project, Gas Project No. 3 Series 2017A, Rev., 5.00%, 9/1/2042 | | |
|
County of Clark, Nevada Improvement District No. 158 Series 2006 B, 5.00%, 8/1/2034 | | |
County of Clark, Southern California Edison Co. Series 2008A, Rev., 2.10%, 6/1/2031 | | |
| | |
|
New Hampshire Business Finance Authority, St. Luke's Hospital Obligated Group | | |
Series 2021B, Rev., 5.00%, 8/15/2032 | | |
Series 2021B, Rev., 5.00%, 8/15/2035 | | |
| | |
|
Borough of Bergenfield GO, 4.00%, 8/1/2036 | | |
Camden County Improvement Authority (The), Camden Prep High School Project | | |
Rev., 4.00%, 7/15/2027 (d) | | |
Rev., 5.00%, 7/15/2032 (d) | | |
Rev., 5.00%, 7/15/2042 (d) | | |
County of Morris GO, 3.00%, 2/1/2030 | | |
New Jersey Economic Development Authority, School Facilities Construction Series 2014PP, Rev., 5.00%, 6/15/2024 (e) | | |
New Jersey Transportation Trust Fund Authority, Federal Highway Reimbursement Series 2018 A, Rev., 5.00%, 6/15/2028 | | |
| | |
|
|
New Jersey Transportation Trust Fund Authority, Transportation Program | | |
Series 2013AA, Rev., 5.00%, 6/15/2036 | | |
Series 2020 AA, Rev., 4.00%, 6/15/2050 | | |
Series 2020 AA, Rev., 5.00%, 6/15/2050 | | |
New Jersey Turnpike Authority Series 2017B, Rev., 4.00%, 1/1/2035 | | |
Tobacco Settlement Financing Corp. Series 2018A, Rev., 5.00%, 6/1/2027 | | |
| | |
|
Loving Municipal School District No. 10 | | |
Series 2020 A, GO, 5.00%, 9/15/2023 | | |
Series 2020 A, GO, 5.00%, 9/15/2024 | | |
| | |
| | |
| | |
| | |
State of New Mexico GO, 5.00%, 3/1/2031 | | |
| | |
|
Broome County Local Development Corp., Good Shepherd Village at Endwell, Inc. | | |
| | |
| | |
Build NYC Resource Corp., New World Preparatory Charter School Project | | |
Series 2021A, Rev., 4.00%, 6/15/2031 | | |
Series 2021A, Rev., 4.00%, 6/15/2056 | | |
| | |
Series 2021A-1, GO, 4.00%, 8/1/2034 | | |
Series 2021F, Subseries F-1, GO, 5.00%, 3/1/2036 | | |
Series F, Subseries F-1, GO, 5.00%, 3/1/2037 | | |
City of New York, Fiscal Year 2018 Series 2018-1, GO, 5.00%, 8/1/2030 | | |
County of St. Lawrence GO, AGM, 3.00%, 5/15/2034 | | |
Hudson Yards Infrastructure Corp., Second Indenture, Fiscal Year 2017 Series 2017 A, Rev., 5.00%, 2/15/2033 | | |
Long Island Power Authority Series 2019 A, Rev., 3.00%, 9/1/2036 | | |
Metropolitan Transportation Authority | | |
Series 2015F, Rev., 5.00%, 11/15/2025 | | |
SEE NOTES TO FINANCIAL STATEMENTS.
| J.P. Morgan Tax Aware Funds | |
| | |
Municipal Bonds — continued |
|
Series C-1, Rev., 5.25%, 11/15/2028 | | |
New York City Transitional Finance Authority, Future Tax Secured, Fiscal Year 2021 Series 2021D, Rev., 4.00%, 11/1/2042 | | |
New York City Transitional Finance Authority, Future Tax Secured, Fiscal Year 2022 Series 2022F, Rev., 5.00%, 2/1/2036 | | |
New York City Water and Sewer System, Second General Resolution, Fiscal Year 2015 Series 2015 FF, Rev., 5.00%, 6/15/2031 | | |
New York Convention Center Development Corp., Subordinate Lien, Hotel Unit Fee Secured Series B, Rev., AGM-CR, Zero Coupon, 11/15/2052 | | |
New York Liberty Development Corp. | | |
Series 1WTC-2021, Rev., 2.25%, 2/15/2041 | | |
| | |
New York State Dormitory Authority | | |
| | |
Series 2018A, Rev., 5.00%, 7/1/2038 | | |
New York State Dormitory Authority, School Districts Financing Program Series 2018A, Rev., 5.00%, 10/1/2030 | | |
New York State Dormitory Authority, State Personal Income Tax, General Purpose Series 2020 A, Rev., 4.00%, 3/15/2044 | | |
New York State Dormitory Authority, State Sales Tax Series A, Rev., 5.00%, 3/15/2033 | | |
New York State Environmental Facilities Corp., State Clean Water and Drinking Water Revolving Funds, New York City Municipal Water Finance Authority Series 2017A, Rev., 5.00%, 6/15/2028 | | |
New York State Thruway Authority, Junior Lien | | |
Series 2016-A, Rev., 5.00%, 1/1/2025 | | |
Series J, Rev., 5.00%, 1/1/2025 | | |
New York State Urban Development Corp., Sales Tax Series 2021A, Rev., 4.00%, 3/15/2046 | | |
New York State Urban Development Corp., State Personal Income Tax, General Purpose Series 2017C, Rev., 5.00%, 3/15/2027 | | |
Port Authority of New York & New Jersey, Consolidated Series 194, Rev., 5.00%, 10/15/2041 | | |
Port Washington Union Free School District GO, 4.00%, 8/1/2035 | | |
Sales Tax Asset Receivable Corp., Fiscal Year 2015 Series 2015A, Rev., 5.00%, 10/15/2024 (e) | | |
Syracuse Industrial Development Agency, School District Series 2019 A, Rev., 4.00%, 5/1/2034 | | |
| | |
|
|
Utility Debt Securitization Authority | | |
Series 2013TE, Rev., 5.00%, 12/15/2028 | | |
Series 2013TE, Rev., 5.00%, 12/15/2041 | | |
Village of Stewart Manor, Public Improvement | | |
Series 2013TE, GO, 5.00%, 8/1/2026 | | |
Series 2013TE, GO, 4.00%, 8/1/2028 | | |
Wellsville Central School District Series 2017 B, GO, AGM, 5.00%, 6/15/2023 | | |
Westchester County Local Development Corp., Purchase Senior Learning Community, Inc., Project | | |
Series 2021D, Rev., 2.88%, 7/1/2026 (d) | | |
Series 2021C, Rev., 3.20%, 7/1/2028 (d) | | |
Series 2021A, Rev., 5.00%, 7/1/2041 (d) | | |
| | |
|
County of Cabarrus Series 2022A, Rev., 5.00%, 6/1/2028 | | |
County of Duplin Series 2021B, Rev., 5.00%, 6/1/2029 | | |
County of New Hanover Series 2016 A, Rev., 5.00%, 6/1/2026 | | |
North Carolina Capital Facilities Finance Agency, High Point University | | |
Series 2017C, Rev., 5.00%, 5/1/2030 | | |
| | |
North Carolina Medical Care Commission, The Forest at Duke Project Rev., 4.00%, 9/1/2034 | | |
North Carolina Turnpike Authority, Triangle Expressway System, Senior Lien Rev., AGM, 5.00%, 1/1/2029 | | |
University of North Carolina at Chapel Hill Series B, Rev., VRDO, LIQ : TD Bank NA, 1.20%, 11/9/2022 (b) | | |
University of North Carolina at Greensboro Series 2021A, Rev., 4.00%, 4/1/2035 | | |
| | |
|
City of Grand Forks Rev., 4.00%, 12/1/2038 | | |
North Dakota Building Authority Series 2020A, Rev., 5.00%, 12/1/2035 | | |
| | |
|
Akron Bath Copley Joint Township Hospital District, Children's Hospital Medical Center of Akron Series 2022A, Rev., 5.00%, 11/15/2029 | | |
SEE NOTES TO FINANCIAL STATEMENTS.
| J.P. Morgan Tax Aware Funds | |
JPMorgan Tax Aware Real Return Fund
SCHEDULE OF PORTFOLIO INVESTMENTS
AS OF October 31, 2022 (continued)
| | |
Municipal Bonds — continued |
|
American Municipal Power, Inc., Fremont Energy Center Project Series 2021A, Rev., 5.00%, 2/15/2033 | | |
Butler County Port Authority, Community First Solutions | | |
Series 2021A, Rev., 4.00%, 5/15/2038 | | |
Series 2021A, Rev., 4.00%, 5/15/2039 | | |
Series 2021A, Rev., 4.00%, 5/15/2040 | | |
Series 2021A, Rev., 4.00%, 5/15/2041 | | |
County of Cuyahoga, Eliza Jennings Senior Care Network Series 2022-A, Rev., 5.00%, 5/15/2032 | | |
County of Summit Series 2019 A, GO, 5.00%, 12/1/2029 | | |
Northeast Ohio Medical University | | |
Series 2021A, Rev., 5.00%, 12/1/2030 | | |
Series 2021A, Rev., 4.00%, 12/1/2035 | | |
Ohio Higher Educational Facility Commission | | |
| | |
| | |
Ohio Higher Educational Facility Commission, Cleveland Institute of Music 2 | | |
| | |
| | |
Ohio Higher Educational Facility Commission, John Carroll University | | |
| | |
| | |
| | |
| | |
| | |
Ohio Water Development Authority | | |
| | |
Series 2021A, Rev., 5.00%, 12/1/2039 | | |
State of Ohio Series 2016A, GO, 5.00%, 9/1/2025 | | |
State of Ohio, Capital Facilities Lease Appropriation Series 2018A, Rev., 5.00%, 4/1/2028 | | |
| | |
|
Oklahoma County Finance Authority, Educational Facilities, Lease Midwest City-Del City Public Schools Project | | |
| | |
| | |
| | |
|
|
| | |
Oklahoma Turnpike Authority, Turnpike System, Second Senior Series 2017A, Rev., 5.00%, 1/1/2038 | | |
| | |
|
City of Portland, Second Lien Sewer System Series 2014B, Rev., 4.00%, 10/1/2036 | | |
County of Marion Series 2022B, GO, AMBAC, 5.50%, 6/1/2023 | | |
Hospital Facilities Authority of Multnomah County Oregon | | |
Series 2021B-2, Rev., 0.95%, 6/1/2027 | | |
Series 2021B-1, Rev., 1.20%, 6/1/2028 | | |
Linn & Benton Counties, School District No. 8J, Greater Albany Series 2022B2, GO, 5.00%, 6/15/2030 | | |
Salem Hospital Facility Authority, Capital Manor Project | | |
| | |
| | |
| | |
| | |
| | |
State of Oregon Series 2017O, GO, VRDO, LIQ : US Bank NA, 1.24%, 11/9/2022 (b) | | |
Tri-County Metropolitan Transportation District of Oregon Series 2017A, Rev., 5.00%, 10/1/2023 | | |
Umatilla County School District No. 61R Stanfield GO, 4.00%, 6/15/2039 | | |
Washington & Multnomah Counties School District No. 48J Beaverton Series 2022B, GO, 5.00%, 6/15/2025 | | |
Washington Counties, Hillsborough School District No. 1J Series 2017, GO, 5.00%, 6/15/2027 | | |
Yamhill County Hospital Authority, Friendsview Manor Series 2021A, Rev., 5.00%, 11/15/2056 | | |
| | |
|
Allegheny County Higher Education Building Authority, Chatham University | | |
Series 2016A, Rev., 5.00%, 9/1/2028 | | |
| | |
| | |
| | |
SEE NOTES TO FINANCIAL STATEMENTS.
| J.P. Morgan Tax Aware Funds | |
| | |
Municipal Bonds — continued |
|
| | |
Berks County Industrial Development Authority, Tower Health Project | | |
Series 2021C, Rev., 5.00%, 11/1/2027 | | |
| | |
| | |
| | |
Bucks County Industrial Development Authority, Grand View Hospital Project Rev., 5.00%, 7/1/2036 | | |
Commonwealth Financing Authority, Tobacco Master Settlement Payment | | |
| | |
| | |
| | |
| | |
| | |
| | |
County of Lancaster Series A, GO, 4.00%, 5/1/2026 | | |
County of Montgomery Higher Education and Health Authority, Thomas Jefferson University Series 2018A, Rev., 4.00%, 9/1/2043 | | |
Fairview School District Series A, GO, 4.00%, 2/1/2028 | | |
Pennsylvania Economic Development Financing Authority, Presbyterian Senior Living Rev., 4.00%, 7/1/2030 | | |
Pennsylvania Turnpike Commission Series 2021B, Rev., 5.00%, 12/1/2025 | | |
Philadelphia Authority for Industrial Development, Holy Family University Project Rev., 5.00%, 9/1/2029 (c) | | |
Sayre Health Care Facilities Authority, Guthrie Health Issue Series 2021B, Rev., (ICE LIBOR USD 3 Month + 0.78%), 2.84%, 12/1/2022 (f) | | |
Township of Hampton GO, 5.00%, 1/1/2030 | | |
| | |
|
Rhode Island Turnpike and Bridge Authority, Motor Fuel Tax Series 2016A, Rev., 5.00%, 10/1/2029 | | |
| | |
|
|
City of Charleston, Waterworks & Sewer System Rev., 5.00%, 1/1/2028 | | |
Spartanburg County Tourist Public Facilities Corp. Series 2021B, COP, 4.00%, 4/1/2028 | | |
| | |
|
City of Memphis, Electric System Series 2022A, Rev., 5.00%, 12/1/2026 | | |
City of Murfreesboro GO, 5.00%, 6/1/2029 | | |
Metropolitan Government Nashville and Davidson County Health and Educational Facilities, The Blakeford at Green Hills Corp. Series 2020A, Rev., 4.00%, 11/1/2038 | | |
Metropolitan Nashville Airport Authority (The), Subordinate Airport Series 2019A, Rev., 5.00%, 7/1/2034 | | |
Tennessee Energy Acquisition Corp., Gas Project Series 2018, Rev., 4.00%, 11/1/2025 (b) | | |
| | |
|
Baytown Municipal Development District, Third-Lien Hotel Series 2021C, Rev., 5.00%, 10/1/2032 | | |
Bexar County Hospital District GO, 4.00%, 2/15/2035 | | |
Board of Regents of the University of Texas System Financing System Series 2014B, Rev., 5.00%, 8/15/2026 | | |
Central Texas Regional Mobility Authority, Senior Lien Series 2021D, Rev., 4.00%, 1/1/2044 | | |
City of Austin, Airport System Series 2022A, Rev., AMT, 5.00%, 11/15/2034 | | |
City of El Paso, Water and Sewer Rev., 5.00%, 3/1/2031 | | |
City of Houston, Airport System Series 2021A, Rev., AMT, 5.00%, 7/1/2032 | | |
City of Houston, Airport System, United Airlines, Inc., Terminal Improvements Projects Series 2021B-1, Rev., AMT, 4.00%, 7/15/2041 | | |
City of Houston, Combined Utility System, Junior Lien Series 2002A, Rev., AGM, 5.75%, 12/1/2032 (e) | | |
City of Houston, Public Improvement Series 2014A, GO, 5.00%, 3/1/2024 (e) | | |
City of Mesquite, Waterworks and Sewer System | | |
Series 2020 A, Rev., 5.00%, 3/1/2026 | | |
| | |
| | |
SEE NOTES TO FINANCIAL STATEMENTS.
| J.P. Morgan Tax Aware Funds | |
JPMorgan Tax Aware Real Return Fund
SCHEDULE OF PORTFOLIO INVESTMENTS
AS OF October 31, 2022 (continued)
| | |
Municipal Bonds — continued |
|
Clifton Higher Education Finance Corp., IDEA Public Schools Rev., PSF-GTD, 5.00%, 8/15/2030 | | |
Conroe Local Government Corp., Conroe Convention Center Hotel Series 2021A, Rev., 2.50%, 10/1/2031 | | |
County of El Paso GO, 5.00%, 2/15/2032 | | |
County of Tarrant GO, 5.00%, 7/15/2033 | | |
Denton Independent School District Series 2021A, GO, PSF-GTD, 5.00%, 8/15/2030 | | |
Lower Neches Valley Authority Industrial Development Corp. Rev., VRDO, 1.20%, 11/9/2022 (b) | | |
Lower Neches Valley Authority Industrial Development Corp., ExxonMobil Project Series 2002A, Rev., VRDO, 1.20%, 11/9/2022 (b) | | |
New Hope Cultural Education Facilities Finance Corp. Series 2022B-3, Rev., 4.25%, 10/1/2026 | | |
New Hope Cultural Education Facilities Finance Corp., Jubilee Academic Center, Inc. Series 2021B, Rev., 4.00%, 8/15/2031 (d) | | |
New Hope Cultural Education Facilities Finance Corp., Morningside Ministries Project Rev., 4.00%, 1/1/2037 | | |
New Hope Cultural Education Facilities Finance Corp., Westminster Project Rev., 4.00%, 11/1/2055 | | |
North Texas Tollway Authority System, First Tier | | |
Series A, Rev., 5.00%, 1/1/2026 | | |
Series A, Rev., 5.00%, 1/1/2027 | | |
Series A, Rev., 5.00%, 1/1/2030 | | |
Series A, Rev., 5.00%, 1/1/2035 | | |
North Texas Tollway Authority System, Second Tier | | |
Series B, Rev., 5.00%, 1/1/2027 | | |
Series B, Rev., 5.00%, 1/1/2030 | | |
Northwest Independent School District GO, PSF-GTD, 5.00%, 2/15/2031 | | |
Round Rock Independent School District Series 2016A, GO, 5.00%, 8/1/2029 | | |
San Antonio Education Facilities Corp., Hallmark University Project Series 2021A, Rev., 5.00%, 10/1/2041 | | |
San Antonio Education Facilities Corp., University of the Incarnate Word Series 2021A, Rev., 4.00%, 4/1/2037 | | |
Trinity River Authority, Walker-Calloway System | | |
| | |
Series 2017 A, Rev., 5.00%, 2/1/2027 | | |
| | |
| | |
|
|
| | |
| | |
| | |
Tyler Independent School District GO, PSF-GTD, 5.00%, 2/15/2028 | | |
| | |
|
Mida Golf and Equestrian Center Public Infrastructure District, Limited Tax GO, 4.13%, 6/1/2036 (d) | | |
Military Installation Development Authority, Tax Allocation and Hotel Tax | | |
Series 2021A-1, Rev., 4.00%, 6/1/2036 | | |
Series 2021A-2, Rev., 4.00%, 6/1/2036 | | |
Series 2021A-1, Rev., 4.00%, 6/1/2041 | | |
Utah Charter School Finance Authority, Wallace Stegner Academy | | |
Series 2022A, Rev., 5.25%, 6/15/2032 (d) | | |
Series 2022A, Rev., 5.63%, 6/15/2042 (d) | | |
Utah Infrastructure Agency Telecommunications and Franchise Tax Rev., 4.00%, 10/15/2025 (e) | | |
Utah Infrastructure Agency, Tax-Exempt Telecommunications | | |
| | |
| | |
| | |
| | |
Weber Basin Water Conservancy District Series 2017B, Rev., 5.00%, 10/1/2031 | | |
| | |
|
Henrico County Economic Development Authority, Westminster Canterbury Richmond Rev., 4.00%, 10/1/2040 | | |
Lynchburg Economic Development Authority, Central Health, Inc. Rev., 4.00%, 1/1/2037 | | |
Virginia Small Business Financing Authority, The Obligated Group of National Senior Campuses, Inc. Series 2020A, Rev., 5.00%, 1/1/2034 | | |
| | |
|
County of Kitsap Series 2022B, GO, 5.00%, 12/1/2034 | | |
Energy Northwest Series 2021A, Rev., 5.00%, 7/1/2026 | | |
SEE NOTES TO FINANCIAL STATEMENTS.
| J.P. Morgan Tax Aware Funds | |
| | |
Municipal Bonds — continued |
|
Port of Seattle Series 2022B, Rev., AMT, 4.00%, 8/1/2047 | | |
Port of Seattle, Intermediate Lien | | |
Series B, Rev., 5.00%, 3/1/2033 | | |
Series 2022B, Rev., AMT, 5.00%, 8/1/2033 | | |
Series B, Rev., 5.00%, 3/1/2034 | | |
Washington Health Care Facilities Authority, Providence St. Joseph Health | | |
Series 2018B, Rev., 5.00%, 10/1/2025 | | |
Series 2018B, Rev., 5.00%, 10/1/2026 | | |
Series 2018B, Rev., 5.00%, 10/1/2027 | | |
Washington State Housing Finance Commission, New Haven Apartments Series 2018 B, Rev., VRDO, LOC : Federal National Mortgage Association, 2.33%, 11/10/2022 (b) | | |
Washington State Housing Finance Commission, Rockwood Retirement Communities Project Series 2020A, Rev., 5.00%, 1/1/2041 (d) | | |
| | |
|
Public Finance Authority, Ascend Leadership Academy Project Series 2021A, Rev., 5.00%, 6/15/2041 (d) | | |
Public Finance Authority, Coral Academy of Science | | |
Series 2021A, Rev., 4.00%, 7/1/2030 | | |
Series 2021A, Rev., 4.00%, 7/1/2041 | | |
Public Finance Authority, Entrance Fee Principal Redemption, Searstone CCRC Project Series 2021B2, Rev., 2.25%, 6/1/2027 (d) | | |
Public Finance Authority, Roseman University of Health Sciences Project Rev., 4.00%, 4/1/2032 (d) | | |
Public Finance Authority, Scotland Healthcare System | | |
Series 2021A, Rev., 5.00%, 10/1/2025 | | |
Series 2021A, Rev., 5.00%, 10/1/2026 | | |
Public Finance Authority, The Carmelite System, Inc., Obligated Group Series 2021A, Rev., 3.25%, 1/1/2029 | | |
Public Finance Authority, The Franklin School of Innovation Rev., 5.00%, 1/1/2042 (d) | | |
Public Finance Authority, Triad Math and Science Academy Co. | | |
Series 2021A, Rev., 4.00%, 6/15/2024 | | |
Series 2021A, Rev., 4.00%, 6/15/2026 | | |
Series 2021A, Rev., 4.00%, 6/15/2028 | | |
Series 2021A, Rev., 4.00%, 6/15/2030 | | |
| | |
|
|
Series 2021A, Rev., 4.00%, 6/15/2041 | | |
Public Finance Authority, Viticus Group Project | | |
Series 2022A, Rev., 4.00%, 12/1/2031 (d) | | |
Series 2022A, Rev., 4.00%, 12/1/2041 (d) | | |
Wisconsin Health and Educational Facilities Authority, Hope Christian Schools Rev., 4.00%, 12/1/2041 | | |
Wisconsin Health and Educational Facilities Authority, Marquette University Series 2021A-1, Rev., 5.00%, 10/1/2032 | | |
Wisconsin Health and Educational Facilities Authority, Oakwood Lutheran Senior Ministries Rev., 4.00%, 1/1/2037 | | |
| | |
Total Municipal Bonds
(Cost $476,079) | | |
| | |
Short-Term Investments — 8.2% |
Investment Companies — 8.2% |
JPMorgan Institutional Tax Free Money Market Fund Class IM Shares, 2.04% (g) (h)
(Cost $46,359) | | |
Total Investments — 86.3%
(Cost $522,438) | | |
Other Assets Less Liabilities — 13.7% | | |
| | |
Percentages indicated are based on net assets. |
| |
| Insured by Assured Guaranty Municipal Corp. |
| Insured by American Municipal Bond Assurance Corp. |
| |
| Congregate Care Retirement Center |
| Certificate of Participation |
| |
| |
| |
| Intercontinental Exchange |
| London Interbank Offered Rate |
| |
| |
| Insured by National Public Finance Guarantee Corp. |
| Permanent School Fund Guaranteed |
| Qualified School Bond Loan Fund |
SEE NOTES TO FINANCIAL STATEMENTS.
| J.P. Morgan Tax Aware Funds | |
JPMorgan Tax Aware Real Return Fund
SCHEDULE OF PORTFOLIO INVESTMENTS
AS OF October 31, 2022 (continued)
| |
| |
| |
| Variable Rate Demand Obligation |
| Amount rounds to less than 0.1% of net assets. |
| The date shown represents the earliest of the prerefunded date, next put date or final maturity date. | |
| Variable or floating rate security, the interest rate of which adjusts periodically based on changes in current interest rates and prepayments on the underlying pool of assets. The interest rate shown is the current rate as of October 31, 2022. | |
| All or a portion of the security is a when-issued security, delayed delivery security, or forward commitment. | |
| Securities exempt from registration under Rule 144A or section 4(a)(2), of the Securities Act of 1933, as amended. | |
| Security is prerefunded or escrowed to maturity. | |
| Variable or floating rate security, linked to the referenced benchmark. The interest rate shown is the current rate as of October 31, 2022. | |
| Investment in an affiliated fund, which is registered under the Investment Company Act of 1940, as amended, and is advised by J.P. Morgan Investment Management Inc. | |
| The rate shown is the current yield as of October 31, 2022. | |
Centrally Cleared Inflation-linked swap contracts outstanding as of October 31, 2022 (amounts in thousands):
| | | | | UPFRONT
PAYMENTS
(RECEIPTS)
$ | UNREALIZED
APPRECIATION
(DEPRECIATION) ($) | |
| | | | | | | |
| | | | | | | |
| | | | | | | |
| | | | | | | |
| | | | | | | |
| | | | | | | |
| | | | | | | |
| | | | | | | |
| | | | | | | |
| | | | | | | |
| | | | | | | |
| | | | | | | |
| | | | | | | |
| | | | | | | |
| | | | | | | |
| |
| Consumer Price Index for All Urban Consumers |
| |
(a) Value of floating rate index at October 31, 2022 was as follows: |
SEE NOTES TO FINANCIAL STATEMENTS.
| J.P. Morgan Tax Aware Funds | |
Centrally Cleared Credit default swap contracts outstanding - buy protection(*) as of October 31, 2022 (amounts in thousands):
REFERENCE
OBLIGATION/INDEX | FINANCING
RATE PAID
BY THE FUND
(%) | | | | | UPFRONT
PAYMENTS
(RECEIPTS)
| UNREALIZED
APPRECIATION
(DEPRECIATION)
($) | |
| | | | | | | | |
| The Fund, as a buyer of credit protection, is generally obligated to make periodic payments and may also pay or receive an upfront premium to or from the protection seller, in exchange for the right to receive a contingent payment, upon occurrence of a credit event with respect to an underlying reference obligation, as defined under the terms of individual swap contracts. |
| Implied credit spreads are an indication of the seller's performance risk, related to the likelihood of a credit event occurring that would require a seller to make payment to a buyer. Implied credit spreads are used to determine the value of swap contracts and reflect the cost of buying/selling protection, which may include upfront payments made to enter into the contract. Therefore, higher spreads would indicate a greater likelihood that a seller will be obligated to perform (i.e. make payment) under the swap contract.Increasing values, in absolute terms and relative to notional amounts, are also indicative of greater performance risk. Implied credit spreads for credit default swaps on credit indices are linked to the weighted average spread across the underlying reference obligations included in a particular index. |
| The notional amount is the maximum amount that a seller of credit protection would be obligated to pay and a buyer of credit protection would receive, upon occurrence of a credit event. |
| Upfront payments and receipts generally represent premiums paid or received at the initiation of the agreement to compensate the differences between the stated terms of the swap agreement and current market conditions (credit spreads, interest rates and other relevant factors). |
| |
| Credit Default Swap Index |
| |
SEE NOTES TO FINANCIAL STATEMENTS.
| J.P. Morgan Tax Aware Funds | |
STATEMENTS OF ASSETS AND LIABILITIES
AS OF October 31, 2022
(Amounts in thousands, except per share amounts)
| JPMorgan
Tax Aware
Equity Fund | |
| | |
Investments in non-affiliates, at value | | |
Investments in affiliates, at value | | |
| | |
Deposits at broker for centrally cleared swaps | | |
| | |
Investment securities sold | | |
Investment securities sold — delayed delivery securities | | |
| | |
Interest from non-affiliates | | |
Dividends from non-affiliates | | |
Dividends from affiliates | | |
Variation margin on centrally cleared swaps | | |
| | |
| | |
| | |
Investment securities purchased | | |
Investment securities purchased — delayed delivery securities | | |
| | |
| | |
| | |
| | |
| | |
| | |
Custodian and accounting fees | | |
| | |
| | |
| | |
SEE NOTES TO FINANCIAL STATEMENTS.
| J.P. Morgan Tax Aware Funds | |
| JPMorgan Tax Aware Equity Fund | |
| | |
| | |
Total distributable earnings (loss) | | |
| | |
| | |
| | |
| | |
| | |
| | |
| | |
Outstanding units of beneficial interest (shares)
($0.0001 par value; unlimited number of shares authorized): | | |
| | |
| | |
| | |
| | |
| | |
Class A — Redemption price per share | | |
Class C — Offering price per share (b) | | |
Class I — Offering and redemption price per share | | |
Class R6 — Offering and redemption price per share | | |
Class A maximum sales charge | | |
Class A maximum public offering price per share
[net asset value per share/(100% – maximum sales charge)] | | |
Cost of investments in non-affiliates | | |
Cost of investments in affiliates | | |
Net upfront payments on centrally cleared swaps | | |
(a)
Per share amounts may not recalculate due to rounding of net assets and/or shares outstanding.
(b)
Redemption price for Class C Shares varies based upon length of time the shares are held.
SEE NOTES TO FINANCIAL STATEMENTS.
| J.P. Morgan Tax Aware Funds | |
STATEMENTS OF OPERATIONS
FOR THE YEAR ENDED October 31, 2022
(Amounts in thousands)
| JPMorgan
Tax Aware
Equity Fund | |
| | |
Interest income from non-affiliates | | |
Dividend income from non-affiliates | | |
Dividend income from affiliates | | |
| | |
| | |
| | |
| | |
| | |
| | |
| | |
| | |
| | |
| | |
| | |
Custodian and accounting fees | | |
Interest expense to affiliates | | |
| | |
Trustees’ and Chief Compliance Officer’s fees | | |
Printing and mailing costs | | |
Registration and filing fees | | |
Transfer agency fees (See Note 2.I.) | | |
| | |
| | |
| | |
Less expense reimbursements | | |
| | |
Net investment income (loss) | | |
REALIZED/UNREALIZED GAINS (LOSSES): | | |
Net realized gain (loss) on transactions from: | | |
Investments in non-affiliates | | |
Investments in affiliates | | |
| | |
| | |
| | |
Distribution of capital gains received from investment company affiliates | | |
Change in net unrealized appreciation/depreciation on: | | |
Investments in non-affiliates | | |
Investments in affiliates | | |
| | |
Change in net unrealized appreciation/depreciation | | |
Net realized/unrealized gains (losses) | | |
Change in net assets resulting from operations | | |
(a)
Amount rounds to less than one thousand.
SEE NOTES TO FINANCIAL STATEMENTS.
| J.P. Morgan Tax Aware Funds | |
STATEMENTS OF CHANGES IN NET ASSETS
FOR THE PERIODS INDICATED
(Amounts in thousands)
| JPMorgan Tax Aware Equity Fund | JPMorgan Tax Aware Real Return Fund |
| Year Ended
October 31, 2022 | Year Ended
October 31, 2021 | Year Ended
October 31, 2022 | |
CHANGE IN NET ASSETS RESULTING FROM OPERATIONS: | | | | |
Net investment income (loss) | | | | |
| | | | |
Distributions of capital gains received from investment company affiliates | | | | |
Change in net unrealized appreciation/depreciation | | | | |
Change in net assets resulting from operations | | | | |
DISTRIBUTIONS TO SHAREHOLDERS: | | | | |
| | | | |
| | | | |
| | | | |
| | | | |
Total distributions to shareholders | | | | |
| | | | |
Change in net assets resulting from capital transactions | | | | |
| | | | |
| | | | |
| | | | |
| | | | |
(a)
Amount rounds to less than one thousand.
SEE NOTES TO FINANCIAL STATEMENTS.
| J.P. Morgan Tax Aware Funds | |
STATEMENTS OF CHANGES IN NET ASSETS
FOR THE PERIODS INDICATED (continued)
(Amounts in thousands)
| JPMorgan Tax Aware Equity Fund | JPMorgan Tax Aware Real Return Fund |
| Year Ended October 31, 2022 | Year Ended October 31, 2021 | Year Ended October 31, 2022 | Year Ended October 31, 2021 |
| | | | |
| | | | |
Proceeds from shares issued | | | | |
| | | | |
| | | | |
Change in net assets resulting from Class A capital transactions | | | | |
| | | | |
Proceeds from shares issued | | | | |
| | | | |
| | | | |
Change in net assets resulting from Class C capital transactions | | | | |
| | | | |
Proceeds from shares issued | | | | |
| | | | |
| | | | |
Change in net assets resulting from Class I capital transactions | | | | |
| | | | |
Proceeds from shares issued | | | | |
| | | | |
| | | | |
Change in net assets resulting from Class R6 capital transactions | | | | |
Total change in net assets resulting from capital transactions | | | | |
| | | | |
| | | | |
| | | | |
| | | | |
| | | | |
| | | | |
| | | | |
| | | | |
| | | | |
| | | | |
| | | | |
| | | | |
| | | | |
| | | | |
| | | | |
| | | | |
SEE NOTES TO FINANCIAL STATEMENTS.
| J.P. Morgan Tax Aware Funds | |
| JPMorgan Tax Aware Equity Fund | JPMorgan Tax Aware Real Return Fund |
| Year Ended October 31, 2022 | Year Ended October 31, 2021 | Year Ended October 31, 2022 | Year Ended October 31, 2021 |
SHARE TRANSACTIONS: (continued) | | | | |
| | | | |
| | | | |
| | | | |
| | | | |
Change in Class R6 Shares | | | | |
SEE NOTES TO FINANCIAL STATEMENTS.
| J.P. Morgan Tax Aware Funds | |
FINANCIAL HIGHLIGHTS
FOR THE PERIODS INDICATED
| Per share operating performance |
| | | |
| Net asset
value,
beginning
of period | Net
investment
income
(loss)(b) | Net realized
and unrealized
gains
(losses) on
investments | Total from
investment
operations | | | |
JPMorgan Tax Aware Equity Fund | | | | | | | |
| | | | | | | |
Year Ended October 31, 2022 | | | | | | | |
Year Ended October 31, 2021 | | | | | | | |
Year Ended October 31, 2020 | | | | | | | |
Year Ended October 31, 2019 | | | | | | | |
Year Ended October 31, 2018 | | | | | | | |
| | | | | | | |
Year Ended October 31, 2022 | | | | | | | |
Year Ended October 31, 2021 | | | | | | | |
Year Ended October 31, 2020 | | | | | | | |
Year Ended October 31, 2019 | | | | | | | |
Year Ended October 31, 2018 | | | | | | | |
| | | | | | | |
Year Ended October 31, 2022 | | | | | | | |
Year Ended October 31, 2021 | | | | | | | |
Year Ended October 31, 2020 | | | | | | | |
Year Ended October 31, 2019 | | | | | | | |
Year Ended October 31, 2018 | | | | | | | |
| | | | | | | |
Year Ended October 31, 2022 | | | | | | | |
Year Ended October 31, 2021 | | | | | | | |
Year Ended October 31, 2020 | | | | | | | |
Year Ended October 31, 2019 | | | | | | | |
October 1, 2018 (g) through October 31, 2018 | | | | | | | |
|
| Annualized for periods less than one year, unless otherwise noted. |
| Calculated based upon average shares outstanding. |
| Not annualized for periods less than one year. |
| Includes adjustments in accordance with accounting principles generally accepted in the United States of America and as such, the net asset values for financial reporting purposes and the returns based upon those net asset values may differ from the net asset values and returns for shareholder transactions. |
| Includes earnings credits and interest expense, if applicable, each of which is less than 0.005% unless otherwise noted. |
| Amount rounds to less than $0.005. |
| Commencement of offering of class of shares. |
SEE NOTES TO FINANCIAL STATEMENTS.
| J.P. Morgan Tax Aware Funds | |
| |
| | | Ratios to average net assets(a) |
Net asset
value,
end of
period | Total return
(excludes
sales charge)(c)(d) | Net assets,
end of
period
(000's) | | Net
investment
income
(loss) | Expenses without
waivers and reimbursements | |
| | | | | | |
| | | | | | |
| | | | | | |
| | | | | | |
| | | | | | |
| | | | | | |
| | | | | | |
| | | | | | |
| | | | | | |
| | | | | | |
| | | | | | |
| | | | | | |
| | | | | | |
| | | | | | |
| | | | | | |
| | | | | | |
| | | | | | |
| | | | | | |
| | | | | | |
| | | | | | |
| | | | | | |
| | | | | | |
| | | | | | |
| | | | | | |
| | | | | | |
SEE NOTES TO FINANCIAL STATEMENTS.
| J.P. Morgan Tax Aware Funds | |
FINANCIAL HIGHLIGHTS
FOR THE PERIODS INDICATED
| Per share operating performance |
| | | |
| Net asset
value,
beginning
of period | Net
investment
income
(loss)(a) | Net realized
and unrealized
gains
(losses) on
investments | Total from
investment
operations | |
JPMorgan Tax Aware Real Return Fund | | | | | |
| | | | | |
Year Ended October 31, 2022 | | | | | |
Year Ended October 31, 2021 | | | | | |
Year Ended October 31, 2020 | | | | | |
Year Ended October 31, 2019 | | | | | |
Year Ended October 31, 2018 | | | | | |
| | | | | |
Year Ended October 31, 2022 | | | | | |
Year Ended October 31, 2021 | | | | | |
Year Ended October 31, 2020 | | | | | |
Year Ended October 31, 2019 | | | | | |
Year Ended October 31, 2018 | | | | | |
| | | | | |
Year Ended October 31, 2022 | | | | | |
Year Ended October 31, 2021 | | | | | |
Year Ended October 31, 2020 | | | | | |
Year Ended October 31, 2019 | | | | | |
Year Ended October 31, 2018 | | | | | |
| | | | | |
Year Ended October 31, 2022 | | | | | |
Year Ended October 31, 2021 | | | | | |
Year Ended October 31, 2020 | | | | | |
Year Ended October 31, 2019 | | | | | |
Year Ended October 31, 2018 | | | | | |
|
| Calculated based upon average shares outstanding. |
| Includes adjustments in accordance with accounting principles generally accepted in the United States of America and as such, the net asset values for financial reporting purposes and the returns based upon those net asset values may differ from the net asset values and returns for shareholder transactions. |
| Includes earnings credits and interest expense, if applicable, each of which is less than 0.005% unless otherwise noted. |
| Amount rounds to less than $0.005. |
| Amount rounds to less than 0.005%. |
SEE NOTES TO FINANCIAL STATEMENTS.
| J.P. Morgan Tax Aware Funds | |
| |
| | | Ratios to average net assets |
Net asset
value,
end of
period | Total return
(excludes
sales charge)(b) | Net assets,
end of
period
(000's) | | Net
investment
income
(loss) | | |
| | | | | | |
| | | | | | |
| | | | | | |
| | | | | | |
| | | | | | |
| | | | | | |
| | | | | | |
| | | | | | |
| | | | | | |
| | | | | | |
| | | | | | |
| | | | | | |
| | | | | | |
| | | | | | |
| | | | | | |
| | | | | | |
| | | | | | |
| | | | | | |
| | | | | | |
| | | | | | |
| | | | | | |
| | | | | | |
| | | | | | |
| | | | | | |
| | | | | | |
SEE NOTES TO FINANCIAL STATEMENTS.
| J.P. Morgan Tax Aware Funds | |
NOTES TO FINANCIAL STATEMENTS
AS OF October 31, 2022
(Dollar values in thousands)
1. Organization
JPMorgan Trust I (the “Trust”) was formed on November 12, 2004, as a Delaware statutory trust, pursuant to a Declaration of Trust dated November 5, 2004 and is registered under the Investment Company Act of 1940, as amended (the “1940 Act”), as an open-end management investment company.
The following are 2 separate funds of the Trust (each, a "Fund" and collectively, the "Funds") covered by this report:
| | Diversification Classification |
JPMorgan Tax Aware Equity Fund | Class A, Class C, Class I and Class R6 | |
JPMorgan Tax Aware Real Return Fund | Class A, Class C, Class I and Class R6 | |
The investment objective of JPMorgan Tax Aware Equity Fund (“Tax Aware Equity Fund”) is to seek to provide high after-tax total return from a portfolio of selected equity securities.
The investment objective of JPMorgan Tax Aware Real Return Fund (“Tax Aware Real Return Fund”) is to seek to maximize after-tax inflation protected return.
Class A Shares generally provide for a front-end sales charge while Class C Shares provide for a contingent deferred sales charge ("CDSC"). No sales charges are assessed with respect to Class I and Class R6 Shares. Certain Class A Shares, for which front-end sales charges have been waived, may be subject to a CDSC as described in the Funds' prospectus. Effective October 1, 2020, Class C Shares automatically convert to Class A Shares after eight years. Prior to October 1, 2020, Class C Shares automatically converted to Class A Shares after ten years. All classes of shares have equal rights as to earnings, assets and voting privileges, except that each class may bear different transfer agency, distribution and service fees and each class has exclusive voting rights with respect to its distribution plan and shareholder servicing agreements.
J.P. Morgan Investment Management Inc. (“JPMIM”), an indirect, wholly-owned subsidiary of JPMorgan Chase & Co. (“JPMorgan”), acts as Adviser (the “Adviser”) and Administrator (the “Administrator”) to the Funds.
2. Significant Accounting Policies
The following is a summary of significant accounting policies followed by the Funds in the preparation of their financial statements. The Funds are investment companies and, accordingly, follow the investment company accounting and reporting guidance of the Financial Accounting Standards Board (“FASB”) Accounting Standards Codification Topic 946 — Investment Companies, which is part of U.S. generally accepted accounting principles (“GAAP”). The preparation of financial statements in conformity with GAAP requires management to make estimates and assumptions that affect (i) the reported amounts of assets and liabilities, (ii) disclosure of contingent assets and liabilities at the date of the financial statements, and (iii) the reported amounts of increases and decreases in net assets from operations during the reporting period. Actual results could differ from those estimates.
A. Valuation of Investments — Investments are valued in accordance with GAAP and the Funds' valuation policies set forth by, and under the supervision and responsibility of, the Board of Trustees of the Trust (the "Board"), which established the following approach to valuation, as described more fully below: (i) investments for which market quotations are readily available shall be valued at their market value and (ii) all other investments for which market quotations are not readily available shall be valued at their fair value as determined in good faith by the Board.
Under Section 2(a)(41) of the Investment Company Act of 1940, the Board are required to determine fair value for securities that do not have readily available market quotations. Under SEC Rule 2a-5 (Good Faith Determinations of Fair Value), the Board may designate the performance of these fair valuation determinations to a valuation designee. The Board has designated the Adviser as the “Valuation Designee” to perform fair valuation determinations for the Funds on behalf of the Board subject to appropriate oversight by the Board. The Adviser, as Valuation Designee, leverages the J.P. Morgan Asset Management Americas Valuation Committee (“AVC”) to help oversee and carry out the policies for the valuation of Investments held in the Funds. The Adviser, as Valuation Designee, remains responsible for the valuation determinations.
This oversight by the AVC includes monitoring the appropriateness of fair values based on results of ongoing valuation oversight including, but not limited to, consideration of macro or security specific events, market events, and pricing vendor and broker due diligence. The Administrator is responsible for discussing and assessing the potential impacts to the fair values on an ongoing basis, and, at least on a quarterly basis, with the AVC and the Board.
Fixed income instruments are valued based on prices received from approved affiliated and unaffiliated pricing vendors or third party broker-dealers (collectively referred to as “Pricing Services”). The Pricing Services use multiple valuation techniques to determine the valuation of fixed income instruments. In instances where sufficient market activity exists, the Pricing Services may utilize a market-based approach through which trades or quotes from market makers are used to determine the valuation of these instruments. In instances where sufficient market activity may not exist, the Pricing Services also utilize proprietary valuation models which may consider market transactions in comparable securities and the various relationships between securities in determining fair value and/or market characteristics in order to estimate the relevant cash flows, which are then discounted to calculate the fair values.
| J.P. Morgan Tax Aware Funds | |
Equities and other exchange-traded instruments are valued at the last sale price or official market closing price on the primary exchange on which the instrument is traded before the net asset values (“NAV”) of the Funds are calculated on a valuation date.
Investments in open-end investment companies (“Underlying Funds”) are valued at each Underlying Fund’s NAV per share as of the report date.
Futures contracts are generally valued on the basis of available market quotations.
Swaps are valued utilizing market quotations from approved Pricing Services.
Valuations reflected in this report are as of the report date. As a result, changes in valuation due to market events and/or issuer-related events after the report date and prior to issuance of the report are not reflected herein.
The various inputs that are used in determining the valuation of the Funds' investments are summarized into the three broad levels listed below.
•
Level 1 — Unadjusted inputs using quoted prices in active markets for identical investments.
•
Level 2 — Other significant observable inputs including, but not limited to, quoted prices for similar investments, inputs other than quoted prices that are observable for investments (such as interest rates, prepayment speeds, credit risk, etc.) or other market corroborated inputs.
•
Level 3 — Significant inputs based on the best information available in the circumstances, to the extent observable inputs are not available (including the Funds' assumptions in determining the fair value of investments).
A financial instrument’s level within the fair value hierarchy is based on the lowest level of any input, both individually and in the aggregate, that is significant to the fair value measurement. The inputs or methodology used for valuing instruments are not necessarily an indication of the risk associated with investing in those instruments.
The following tables represent each valuation input as presented on the Schedules of Portfolio Investments ("SOIs"):
| | | | |
| | Level 2
Other significant
observable inputs | Level 3
Significant
unobservable inputs | |
Total Investments in Securities (a) | | | | |
|
| Please refer to the SOI for specifics of portfolio holdings. |
Tax Aware Real Return Fund | | | | |
| | Level 2
Other significant
observable inputs | Level 3
Significant
unobservable inputs | |
Investments in Securities | | | | |
| | | | |
| | | | |
| | | | |
Total Investments in Securities | | | | |
Appreciation in Other Financial Instruments | | | | |
| | | | |
Depreciation in Other Financial Instruments | | | | |
| | | | |
Total Net Appreciation/ Depreciation in Other Financial Instruments | | | | |
B. Restricted Securities — Certain securities held by the Funds may be subject to legal or contractual restrictions on resale. Restricted securities generally are resold in transactions exempt from registration under the Securities Act of 1933, as amended (the “Securities Act”). Disposal of these securities may involve time-consuming negotiations and expense. Prompt sale at the current valuation may be difficult and could adversely affect the NAVs of the Funds.
As of October 31, 2022, the Funds had no investments in restricted securities other than securities sold to the Funds under Rule 144A and/or Regulation S under the Securities Act.
| J.P. Morgan Tax Aware Funds | |
NOTES TO FINANCIAL STATEMENTS
AS OF October 31, 2022 (continued)
(Dollar values in thousands)
C. When-Issued Securities, Delayed Delivery Securities and Forward Commitments — Tax Aware Real Return Fund purchased when-issued securities, including To Be Announced (“TBA”) securities, and entered into contracts to purchase or sell securities for a fixed price that may be settled a month or more after the trade date, or purchased delayed delivery securities which generally settle seven days after the trade date. When-issued securities are securities that have been authorized, but not issued in the market. A forward commitment involves entering into a contract to purchase or sell securities for a fixed price at a future date that may be settled a month or more after the trade date. A delayed delivery security is agreed upon in advance between the buyer and the seller of the security and is generally delivered beyond seven days of the agreed upon date. The purchase of securities on a when-issued, delayed delivery or forward commitment basis involves the risk that the value of the security to be purchased declines before the settlement date. The sale of securities on a forward commitment basis involves the risk that the value of the securities sold may increase before the settlement date. The Funds may be exposed to credit risk if the counterparty fails to perform under the terms of the transaction. Interest income for securities purchased on a when-issued, delayed delivery or forward commitment basis is not accrued until the settlement date.
Tax Aware Real Return Fund had when-issued securities, delayed delivery securities or forward commitments outstanding as of October 31, 2022, which are shown as a Receivable for Investment securities sold - delayed delivery securities and a Payable for Investment securities purchased - delayed delivery securities, respectively, on the Statements of Assets and Liabilities. The values of these securities held at October 31, 2022 are detailed on the SOIs.
D. Securities Lending — The Funds are authorized to engage in securities lending in order to generate additional income. The Funds are able to lend to approved borrowers. Citibank N.A. (“Citibank”) serves as lending agent for the Funds, pursuant to a Securities Lending Agency Agreement (the “Securities Lending Agency Agreement”). Securities loaned are collateralized by cash equal to at least 100% of the market value plus accrued interest on the securities lent, which is invested in an affiliated money market fund. The Funds retain the interest earned on cash collateral investments but are required to pay the borrower a rebate for the use of the cash collateral. In cases where the lent security is of high value to borrowers, there may be a negative rebate (i.e., a net payment from the borrower to the Funds). Upon termination of a loan, the Funds are required to return to the borrower an amount equal to the cash collateral, plus any rebate owed to the borrowers. The remaining maturities of the securities lending transactions are considered overnight and continuous. Loans are subject to termination by the Funds or the borrower at any time.
The net income earned on the securities lending (after payment of rebates and Citibank’s fee) is included on the Statements of Operations as Income from securities lending (net). The Funds also receive payments from the borrower during the period of the loan, equivalent to dividends and interest earned on the securities loaned, which are recorded as Dividend or Interest income, respectively, on the Statements of Operations.
Under the Securities Lending Agency Agreement, Citibank marks to market the loaned securities on a daily basis. In the event the cash received from the borrower is less than 102% of the value of the loaned securities (105% for loans of non-U.S. securities), Citibank requests additional cash from the borrower so as to maintain a collateralization level of at least 102% of the value of the loaned securities plus accrued interest (105% for loans of non-U.S. securities), subject to certain de minimis amounts.
The value of securities out on loan is recorded as an asset on the Statements of Assets and Liabilities. The value of the cash collateral received is recorded as a liability on the Statements of Assets and Liabilities and details of collateral investments are disclosed on the SOIs.
The Funds bear the risk of loss associated with the collateral investments and are not entitled to additional collateral from the borrower to cover any such losses. To the extent that the value of the collateral investments declines below the amount owed to a borrower, the Funds may incur losses that exceed the amount they earned on lending the security. Upon termination of a loan, the Funds may use leverage (borrow money) to repay the borrower for cash collateral posted if the Adviser does not believe that it is prudent to sell the collateral investments to fund the payment of this liability. Securities lending activity is subject to master netting arrangements.
Securities lending also involves counterparty risks, including the risk that the loaned securities may not be returned in a timely manner or at all. Subject to certain conditions, Citibank has agreed to indemnify the Funds from losses resulting from a borrower’s failure to return a loaned security.
The Funds did not lend out any securities during the year ended October 31, 2022.
| J.P. Morgan Tax Aware Funds | |
E. Investment Transactions with Affiliates — The Funds invested in Underlying Funds, which are advised by the Adviser. An issuer which is under common control with a Fund may be considered an affiliate. For the purposes of the financial statements, the Funds assume the issuers listed in the tables below to be affiliated issuers. The Underlying Funds’ distributions may be reinvested into such Underlying Funds. Reinvestment amounts are included in the purchases at cost amounts in the tables below.
|
For the year ended October 31, 2022 |
| | | | | Change in
Unrealized
Appreciation/
(Depreciation) | | | | Capital Gain
Distributions |
JPMorgan Prime Money Market Fund Class IM Shares, 3.18% (a) (b) | | | | | | | | | |
|
| Investment in an affiliated fund, which is registered under the Investment Company Act of 1940, as amended, and is advised by J.P. Morgan Investment Management Inc. |
| The rate shown is the current yield as of October 31, 2022. |
| Amount rounds to less than one thousand. |
Tax Aware Real Return Fund |
For the year ended October 31, 2022 |
| | | | | Change in
Unrealized
Appreciation/
(Depreciation) | | | | Capital Gain
Distributions |
JPMorgan Institutional Tax Free Money Market Fund Class IM Shares, 2.04% (a) (b) | | | | | | | | | |
|
| Investment in an affiliated fund, which is registered under the Investment Company Act of 1940, as amended, and is advised by J.P. Morgan Investment Management Inc. |
| The rate shown is the current yield as of October 31, 2022. |
F. Futures Contracts — Tax Aware Real Return Fund used treasury futures contracts to manage and hedge interest rate risk associated with portfolio investments. The Fund also used futures contracts to lengthen or shorten the duration of the overall investment portfolio.
Futures contracts provide for the delayed delivery of the underlying instrument at a fixed price or are settled for a cash amount based on the change in the value of the underlying instrument at a specific date in the future. Upon entering into a futures contract, the Fund is required to deposit with the broker, cash or securities in an amount equal to a certain percentage of the contract amount, which is referred to as the initial margin deposit. Subsequent payments, referred to as variation margin, are made or received by the Fund periodically and are based on changes in the market value of open futures contracts. Changes in the market value of open futures contracts are recorded as Change in net unrealized appreciation/depreciation on futures contracts on the Statements of Operations. Realized gains or losses, representing the difference between the value of the contract at the time it was opened and the value at the time it was closed, are reported on the Statements of Operations at the closing or expiration of the futures contract. Securities deposited as initial margin are designated on the SOIs, while cash deposited, which is considered restricted, is recorded on the Statements of Assets and Liabilities. A receivable from and/or a payable to brokers for the daily variation margin is also recorded on the Statements of Assets and Liabilities.
The use of futures contracts exposes the Fund to interest rate risk. The Fund may be subject to the risk that the change in the value of the futures contract may not correlate perfectly with the underlying instrument. Use of long futures contracts subjects the Fund to risk of loss in excess of the amounts shown on the Statements of Assets and Liabilities, up to the notional amount of the futures contracts. Use of short futures contracts subjects the Fund to unlimited risk of loss. The Fund may enter into futures contracts only on exchanges or boards of trade. The exchange or board of trade acts as the counterparty to each futures transaction; therefore, the Fund's credit risk is limited to failure of the exchange or board of trade. Under some circumstances, futures exchanges may establish daily limits on the amount that the price of a futures contract can vary from the previous day’s settlement price, which could effectively prevent liquidation of positions.
The Fund's futures contracts are not subject to master netting arrangements (the right to close out all transactions traded with a counterparty and net amounts owed or due across transactions).
| J.P. Morgan Tax Aware Funds | |
NOTES TO FINANCIAL STATEMENTS
AS OF October 31, 2022 (continued)
(Dollar values in thousands)
G. Swaps — Tax Aware Real Return Fund engaged in various swap transactions to manage interest rate (e.g., duration, yield curve) and inflation risks within its portfolio. The Fund also used swaps as alternatives to direct investments. Swap transactions are contracts negotiated over-the-counter (“OTC swaps”) between the fund and a counterparty or are centrally cleared (“centrally cleared swaps”) through a central clearinghouse managed by a Futures Commission Merchant (“FCM”) that exchange investment cash flows, assets, foreign currencies or market-linked returns at specified, future intervals.
Upfront payments made and/or received by the Fund are recorded as assets or liabilities, respectively, on the Statements of Assets and Liabilities and amortized over the term of the swap. The value of an OTC swap agreement is recorded as either an asset or a liability on the Statements of Assets and Liabilities at the beginning of the measurement period. Upon entering into a centrally cleared swap, the Fund is required to deposit with the FCM cash or securities, which is referred to as initial margin deposit. Securities deposited as initial margin are designated on the SOIs, while cash deposited, which is considered restricted, is recorded on the Statements of Assets and Liabilities. Daily changes in valuation of centrally cleared swaps, if any, are recorded as a variation margin receivable or payable on the Statements of Assets and Liabilities. The change in the value of swaps, including accruals of periodic amounts of interest to be paid or received on swaps, is reported as Change in net unrealized appreciation/ depreciation on swaps on the Statements of Operations. A realized gain or loss is recorded upon payment or receipt of a periodic payment or payment made upon termination of a swap agreement.
The central clearinghouse acts as the counterparty to each centrally cleared swap transaction; therefore credit risk is limited to the failure of the clearinghouse.
Inflation-Linked Swaps
Tax Aware Real Return Fund used inflation-linked swaps to provide inflation protection within its portfolio. These are agreements between counterparties to exchange interest payments based on interest rates over the life of the swap. One cash flow stream will typically be a floating rate payment based upon the Consumer Price Index upon while the other is a pre-determined fixed interest rate. The use of swaps exposes the Fund to interest rate risk.
(1) Summary of Derivatives Information —The following tables present the value of derivatives held as of October 31, 2022, by their primary underlying risk exposure and respective location on the Statements of Assets and Liabilities:
| Tax Aware
Real Return Fund |
Interest Rate Risk Exposure: | |
Swaps at Value (Assets) * | |
Swaps at Value (Liabilities) * | |
| |
Swaps at Value (Assets) * | |
Net Fair Value of Derivative Contracts: | |
| |
|
| Includes the fair value of centrally cleared swap contracts as reported on the SOIs. Only current day’s variation margin is reported within the Statements of Assets and Liabilities. |
The following tables present the effect of derivatives on the Statements of Operations for the year ended October 31, 2022, by primary underlying risk exposure:
| Tax Aware
Real Return Fund |
Realized Gain (Loss) on Derivatives Recognized as a Result From Operations: | |
Interest Rate Risk Exposure: | |
| |
| |
| |
| |
Net Change in Unrealized Appreciation (Depreciation) on Derivatives Recognized as a Result of Operations: | |
Interest Rate Risk Exposure: | |
| |
| J.P. Morgan Tax Aware Funds | |
| Tax Aware Real Return Fund |
| |
| |
Derivatives Volume
The table below discloses the volume of the Fund’s futures contracts and swaps activity during the year ended October 31, 2022.
| Tax Aware
Real Return Fund |
| |
Average Notional Balance Long | |
Average Notional Balance Short | |
Interest Rate-Related Swaps : | |
Average Notional Balance - Pays Fixed Rate | |
Ending Notional Balance - Pays Fixed Rate | |
| |
Average Notional Balance - Buy Protection | |
Ending Notional Balance - Buy Protection | |
H. Security Transactions and Investment Income — Investment transactions are accounted for on the trade date (the date the order to buy or sell is executed). Securities gains and losses are calculated on a specifically identified cost basis. Interest income is determined on the basis of coupon interest accrued using the effective interest method, which adjusts for amortization of premiums and accretion of discounts. Dividend income and distributions of net investment income and realized capital gains from the Underlying Funds, if any, are recorded on the ex-dividend date or when a Fund first learns of the dividend.
I. Allocation of Income and Expenses— Expenses directly attributable to a Fund are charged directly to that Fund, while the expenses attributable to more than one fund of the Trust are allocated among the applicable funds. Investment income, realized and unrealized gains and losses and expenses, other than class-specific expenses, are allocated daily to each class of shares based upon the proportion of net assets of each class at the beginning of each day.
Transfer agency fees are class-specific expenses. The amount of the transfer agency fees charged to each share class of the Funds for the year ended October 31, 2022 are as follows:
| | | | | |
| | | | | |
| | | | | |
Tax Aware Real Return Fund | | | | | |
| | | | | |
|
| Amount rounds to less than one thousand. |
| J.P. Morgan Tax Aware Funds | |
NOTES TO FINANCIAL STATEMENTS
AS OF October 31, 2022 (continued)
(Dollar values in thousands)
J. Federal Income Taxes — Each Fund is treated as a separate taxable entity for Federal income tax purposes. Each Fund's policy is to comply with the provisions of the Internal Revenue Code (the “Code”) applicable to regulated investment companies and to distribute to shareholders all of its distributable net investment income and net realized capital gains on investments. Accordingly, no provision for Federal income tax is necessary. Management has reviewed the Funds' tax positions for all open tax years and has determined that as of October 31, 2022, no liability for Federal income tax is required in the Funds' financial statements for net unrecognized tax benefits. However, management’s conclusions may be subject to future review based on changes in, or the interpretation of, the accounting standards or tax laws and regulations. Each Fund's Federal tax returns for the prior three fiscal years, remain subject to examination by the Internal Revenue Service.
K. Distributions to Shareholders — Distributions from net investment income, if any, are generally declared and paid at least quarterly for Tax Aware Equity Fund and declared and paid at least monthly for Tax Aware Real Return Fund. Distributions are declared separately for each class. No class has preferential dividend rights; differences in per share rates are due to differences in separate class expenses. No class has preferential dividend rights; differences in per share rates are due to differences in separate class expenses. Net realized capital gains, if any, are distributed by each Fund at least annually. The amount of distributions from net investment income and net realized capital gains is determined in accordance with Federal income tax regulations, which may differ from GAAP. To the extent these “book/tax” differences are permanent in nature (i.e., that they result from other than timing of recognition — “temporary differences”), such amounts are reclassified within the capital accounts based on their Federal tax basis treatment.
The following amounts were reclassified within the capital accounts:
| | Accumulated
undistributed
(distributions in
excess of)
net investment
income | Accumulated
net realized
gains (losses) |
| | | |
Tax Aware Real Return Fund | | | |
|
| Amount rounds to less than one thousand. |
The reclassifications for the Funds relate primarily to investments and tax equalization.
3. Fees and Other Transactions with Affiliates
A. Investment Advisory Fee — Pursuant to an Investment Advisory Agreement, the Adviser manages the investments of each Fund and for such services is paid a fee. The investment advisory fee is accrued daily and paid monthly at an annual rate of 0.35% of each Fund’s respective average daily net assets.
The Adviser waived investment advisory fees and/or reimbursed expenses as outlined in Note 3.F.
B. Administration Fee — Pursuant to an Administration Agreement, the Administrator provides certain administration services to each Fund. In consideration of these services, the Administrator receives a fee accrued daily and paid monthly at an annual rate of 0.075% of the first $10 billion of each Fund's respective average daily net assets, plus 0.050% of each Fund's respective average daily net assets between $10 billion and $20 billion, plus 0.025% of each Fund's respective average daily net assets between $20 billion and $25 billion, plus 0.010% of each Fund's respective average daily net assets in excess of $25 billion. For the year ended October 31, 2022, the effective rate was 0.075% of each Fund's average daily net assets, notwithstanding any fee waivers and/or expense reimbursements.
The Administrator waived administration fees as outlined in Note 3.F.
JPMorgan Chase Bank, N.A. ("JPMCB"), a wholly-owned subsidiary of JPMorgan, serves as the Funds' sub-administrator (the “Sub-administrator”). For its services as Sub-administrator, JPMCB receives a portion of the fees payable to the Administrator.
C. Distribution Fees — Pursuant to a Distribution Agreement, JPMorgan Distribution Services, Inc. (“JPMDS”), an indirect, wholly-owned subsidiary of JPMorgan, serves as each Fund's principal underwriter and promotes and arranges for the sale of each Fund's shares.
The Board has adopted a Distribution Plan (the “Distribution Plan”) for Class A and Class C Shares of the Funds pursuant to Rule 12b-1 under the 1940 Act. Class I and Class R6 Shares of each Fund do not charge a distribution fee. The Distribution Plan provides that each Fund shall pay, with respect to the applicable share classes, distribution fees, including payments to JPMDS, at annual rates of the average daily net assets as shown in the table below:
| J.P. Morgan Tax Aware Funds | |
| | |
Tax Aware Real Return Fund | | |
JPMDS waived distribution fees as outlined in Note 3.F.
In addition, JPMDS is entitled to receive the front-end sales charges from purchases of Class A Shares and the CDSC from redemptions of Class C Shares and certain Class A Shares for which front-end sales charges have been waived. For the year ended October 31, 2022, JPMDS retained the following:
| | |
| | |
Tax Aware Real Return Fund | | |
D. Service Fees — The Trust, on behalf of the Funds, has entered into a Shareholder Servicing Agreement with JPMDS under which JPMDS provides certain support services to fund shareholders. For performing these services, JPMDS receives a fee with respect to all share classes, except Class R6 Shares which do not charge a service fee, that is accrued daily and paid monthly equal to a percentage of the average daily net assets as shown in the table below:
| | | |
| | | |
Tax Aware Real Return Fund | | | |
JPMDS has entered into shareholder services contracts with affiliated and unaffiliated financial intermediaries who provide shareholder services and other related services to their clients or customers who invest in the Funds. Pursuant to such contracts, JPMDS will pay all or a portion of such fees earned to financial intermediaries for performing such services.
JPMDS waived service fees as outlined in Note 3.F.
E. Custodian and Accounting Fees — JPMCB provides portfolio custody and accounting services to the Funds. For performing these services, the Funds pay JPMCB transaction and asset-based fees that vary according to the number of transactions and positions, plus out-of-pocket expenses. The amounts paid directly to JPMCB by the Funds for custody and accounting services are included in Custodian and accounting fees on the Statements of Operations.
Interest income earned on cash balances at the custodian, if any, is included in Interest income from affiliates on the Statements of Operations.
Interest expense paid to the custodian related to cash overdrafts, if any, is included in Interest expense to affiliates on the Statements of Operations.
F. Waivers and Reimbursements — The Adviser, Administrator and/or JPMDS have contractually agreed to waive fees and/or reimburse the Funds to the extent that total annual operating expenses (excluding acquired fund fees and expenses other than certain money market fund fees as described below, dividend and interest expenses related to short sales, interest, taxes, expenses related to litigation and potential litigation, expenses related to trustee elections and extraordinary expenses) exceed the percentages of the Funds' respective average daily net assets as shown in the table below:
| | | | |
| | | | |
Tax Aware Real Return Fund | | | | |
|
| Effective November 1, 2022, the contractual expense limitation changed to 0.70%, 1.20%, 0.45% and 0.35%, for Class A, Class C, Class I, and Class R6, respectively. |
The expense limitation agreements were in effect for the year ended October 31, 2022 and the contractual expense limitation percentages in the table above are in place until at least February 28, 2023.
| J.P. Morgan Tax Aware Funds | |
NOTES TO FINANCIAL STATEMENTS
AS OF October 31, 2022 (continued)
(Dollar values in thousands)
For the year ended October 31, 2022, the Funds' service providers waived fees and/or reimbursed expenses for each of the Funds as follows. None of these parties expect the Funds to repay any such waived fees and/or reimbursed expenses in future years.
| | |
| | | | | Contractual
Reimbursements |
| | | | | |
Tax Aware Real Return Fund | | | | | |
Additionally, the Funds may invest in one or more money market funds advised by the Adviser (affiliated money market funds). The Adviser, Administrator and/or JPMDS, as shareholder servicing agent, have contractually agreed to waive fees and/or reimburse expenses in an amount sufficient to offset the respective net fees each collects from the affiliated money market fund on the applicable Fund's investment in such affiliated money market fund, except for investments of securities lending cash collateral. None of these parties expect the Funds to repay any such waived fees and/or reimbursed expenses in future years.
The amounts of these waivers resulting from investments in these money market funds for the year ended October 31, 2022 were as follows:
| |
| |
Tax Aware Real Return Fund | |
Effective January 1, 2022, JPMIM voluntarily agreed to reimburse the Funds for the Trustee Fees paid to one of the interested Trustees. For the period January 1, 2022 through October 31, 2022 the amount of these waivers were as follows:
| |
| |
Tax Aware Real Return Fund | |
G. Other — Certain officers of the Trust are affiliated with the Adviser, the Administrator and JPMDS. Such officers, with the exception of the Chief Compliance Officer, receive no compensation from the Funds for serving in their respective roles.
The Board designated and appointed a Chief Compliance Officer to the Funds pursuant to Rule 38a-1 under the 1940 Act. Each Fund, along with affiliated funds, makes reimbursement payments, on a pro-rata basis, to the Administrator for a portion of the fees associated with the office of the Chief Compliance Officer. Such fees are included in Trustees’ and Chief Compliance Officer’s fees on the Statements of Operations.
The Trust adopted a Trustee Deferred Compensation Plan (the “Plan”) which allows the independent Trustees to defer the receipt of all or a portion of compensation related to performance of their duties as Trustees. The deferred fees are invested in various J.P. Morgan Funds until distribution in accordance with the Plan.
During the year ended October 31, 2022, the Funds purchased securities from an underwriting syndicate in which the principal underwriter or members of the syndicate were affiliated with the Adviser.
The Securities and Exchange Commission ("SEC") has granted an exemptive order permitting the Funds to engage in principal transactions with J.P. Morgan Securities LLC, an affiliated broker, involving taxable money market instruments, subject to certain conditions.
4. Investment Transactions
During the year ended October 31, 2022, purchases and sales of investments (excluding short-term investments) were as follows:
| Purchases
(excluding
U.S. Government) | Sales
(excluding
U.S. Government) |
| | |
Tax Aware Real Return Fund | | |
During the year ended October 31, 2022, there were no purchases or sales of U.S. Government securities.
| J.P. Morgan Tax Aware Funds | |
5. Federal Income Tax Matters
For Federal income tax purposes, the estimated cost and unrealized appreciation (depreciation) in value of investments held at October 31, 2022 were as follows:
| | Gross
Unrealized
Appreciation | Gross
Unrealized
Depreciation | Net Unrealized
Appreciation
(Depreciation) |
| | | | |
Tax Aware Real Return Fund | | | | |
The difference between book and tax basis appreciation (depreciation) on investments is primarily attributed to wash sale loss deferrals.
The tax character of distributions paid during the year ended October 31, 2022 was as follows:
| | | Net
Long-Term
Capital Gains | |
| | | | |
Tax Aware Real Return Fund | | | | |
| | | | |
|
| Short-term gain distributions are treated as ordinary income for income tax purposes. |
The tax character of distributions paid during the year ended October 31, 2021 was as follows:
| | | Net
Long-Term
Capital Gains | |
| | | | |
Tax Aware Real Return Fund | | | | |
|
| Short-term gain distributions are treated as ordinary income for income tax purposes. |
As of October 31, 2022, the estimated components of net assets (excluding paid-in-capital) on a tax basis were as follows:
| Current
Distributable
Ordinary
Income | Current
Distributable
Long-Term
Capital Gain
(Tax Basis Capital
Loss Carryover) | Unrealized
Appreciation
(Depreciation) |
| | | |
Tax Aware Real Return Fund | | | |
The cumulative timing differences primarily consist of wash sale loss deferrals and trustee deferred compensation.
At October 31, 2022, the following Fund had net capital loss carryforwards which are available to offset future realized gains:
| Capital Loss Carryforward Character |
| | |
Tax Aware Real Return Fund | | |
| J.P. Morgan Tax Aware Funds | |
NOTES TO FINANCIAL STATEMENTS
AS OF October 31, 2022 (continued)
(Dollar values in thousands)
During the year ended October 31, 2022, the following Fund utilized capital loss carryforwards as follows:
| |
| | |
Tax Aware Real Return Fund | | |
6. Borrowings
The Funds rely upon an exemptive order granted by the SEC (the “Order”) permitting the establishment and operation of an Interfund Lending Facility (the “Facility”). The Facility allows the Funds to directly lend and borrow money to or from any other fund relying upon the Order at rates beneficial to both the borrowing and lending funds. Advances under the Facility are taken primarily for temporary or emergency purposes, including the meeting of redemption requests that otherwise might require the untimely disposition of securities, and are subject to each Fund's borrowing restrictions. The Interfund loan rate is determined, as specified in the Order, by averaging the current repurchase agreement rate and the current bank loan rate. The Order was granted to JPMorgan Trust II ("JPM") and may be relied upon by the Funds because the Funds and the series of JPM II are all investment companies in the same “group of investment companies” (as defined in Section 12(d)(1)(G) of the 1940 Act).
The Funds had no borrowings outstanding from another fund, or loans outstanding to another fund, during the year ended October 31, 2022. Average borrowings from the Facility during the year ended October 31, 2022 were as follows:
|
| Amount rounds to less than one thousand. |
The Trust and JPMCB have entered into a financing arrangement. Under this arrangement, JPMCB provides an unsecured, uncommitted credit facility in the aggregate amount of $100 million to certain of the J.P. Morgan Funds, including the Funds. Advances under the arrangement are taken primarily for temporary or emergency purposes, including the meeting of redemption requests that otherwise might require the untimely disposition of securities, and are subject to each Fund's borrowing restrictions. Interest on borrowings is payable at a rate determined by JPMCB at the time of borrowing. This agreement has been extended until October 30, 2023.
The Funds had no borrowings outstanding from the unsecured, uncommitted credit facility during the year ended October 31, 2022.
The Trust, along with certain other trusts for J.P. Morgan Funds (“Borrowers”), has entered into a joint syndicated senior unsecured revolving credit facility totaling $1.5 billion (“Credit Facility”) with various lenders and The Bank of New York Mellon, as administrative agent for the lenders. This Credit Facility provides a source of funds to the Borrowers for temporary and emergency purposes, including the meeting of redemption requests that otherwise might require the untimely disposition of securities. Under the terms of the Credit Facility, a borrowing fund must have a minimum of $25 million in adjusted net asset value and not exceed certain adjusted net asset coverage ratios prior to and during the time in which any borrowings are outstanding. If a fund does not comply with the aforementioned requirements, the fund must remediate within three business days with respect to the $25 million minimum adjusted net asset value or within one business day with respect to certain asset coverage ratios or the administrative agent at the request of, or with the consent of, the lenders may terminate the Credit Facility and declare any outstanding borrowings to be due and payable immediately.
Interest associated with any borrowing under the Credit Facility is charged to the borrowing fund at a rate of interest equal to 1.00% (the “Applicable Margin”), plus the greater of the federal funds effective rate or one month LIBOR. The annual commitment fee to maintain the Credit Facility is 0.15% and is incurred on the unused portion of the Credit Facility and is allocated to all participating funds pro rata based on their respective net assets. Effective August 9, 2022, the Credit Facility has been amended and restated for a term of 364 days, unless extended, and to include a change in the interest associated with any borrowing to the higher, on the day of the borrowing, of (a) the federal funds effective rate, or (b) the one-month Adjusted SOFR Rate plus reduction of the Applicable Margin charged for borrowing under the Credit Facility from 1.25% to 1.00%.
The Funds did not utilize the Credit Facility during the year ended October 31, 2022.
7. Risks, Concentrations and Indemnifications
In the normal course of business, the Funds enter into contracts that contain a variety of representations which provide general indemnifications. Each Fund's maximum exposure under these arrangements is unknown. The amount of exposure would depend on future claims that may be brought against each Fund. However, based on experience, the Funds expect the risk of loss to be remote.
| J.P. Morgan Tax Aware Funds | |
As of October 31, 2022, the Funds had individual shareholder and/or affiliated omnibus accounts each owning more than 10% of the respective Fund's outstanding shares as follows:
| Number of
Individual Shareholder
and/or Affiliated
Omnibus Accounts | | Number of
Individual Shareholder
and/or Non-Affiliated
Omnibus Accounts | |
| | | | |
Tax Aware Real Return Fund | | | | |
Significant shareholder transactions by these shareholders may impact the Funds' performance and liquidity.
The Funds are subject to interest rate risk. Investments in bonds and other debt securities will change in value based on changes in interest rates. If rates increase, the value of these investments generally declines. Securities with greater interest rate sensitivity and longer maturities generally are subject to greater fluctuations in value. The Funds invest in variable and floating rate loans and other variable and floating rate securities. Although these investments are generally less sensitive to interest rate changes than fixed rate instruments, the value of floating rate loans and other securities may decline if their interest rates do not rise as quickly, or as much, as general interest rates. The Funds may face a heightened level of interest rate risk due to certain changes in monetary policy. It is difficult to predict the pace at which central banks or monetary authorities may increase interest rates or the timing, frequency, or magnitude of such increases. Any such changes could be sudden and could expose debt markets to significant volatility and reduced liquidity for Fund investments.
The Funds are subject to credit risk. The Fund’s investments are subject to the risk that an issuer and/or a counterparty will fail to make payments when due or default completely. Prices of the Funds’ investments may be adversely affected if any of the issuers or counterparties it is invested in are subject to an actual or perceived deterioration in their credit quality. Credit spreads may increase, which may reduce the market values of the Fund’s securities. Credit spread risk is the risk that economic and market conditions or any actual or perceived credit deterioration may lead to an increase in the credit spreads (i.e. the difference in yield between two securities of similar maturity but different credit quality) and a decline in price of the issuer’s securities.
Tax Aware Real Return Fund invests primarily in a portfolio of debt obligations issued by states, territories and possessions of the United States and by the District of Columbia, and by their political subdivisions and duly constituted authorities. An issuer's ability to meet its payment obligations may be affected by economic or political developments in a specific state or region. These debt obligations may be insured by private insurers who guarantee the payment of principal and interest in the event of issuer default. The value of these investments may be impacted by changes to bond insurers' ratings and the Fund's ability to collect principal and interest, in the event of an issuer's default, may be limited if the private insurer does not have the wherewithal to satisfy its obligation.
LIBOR is intended to represent the rate at which contributing banks may obtain short-term borrowings from each other in the London interbank market. On March 5, 2021, the U.K. Financial Conduct Authority ("FCA") publicly announced that (i) immediately after December 31, 2021, publication of the 1-week and 2-month U.S. Dollar LIBOR settings will permanently cease; (ii) immediately after June 30, 2023, publication of the overnight and 12-month U.S. Dollar LIBOR settings will permanently cease; and (iii) immediately after June 30, 2023, the 1-month, 3-month and 6-month U.S. Dollar LIBOR settings will cease to be provided or, subject to the FCA's consideration of the case, be provided on a synthetic basis and no longer be representative of the underlying market and economic reality they are intended to measure and that representativeness will not be restored. There is no assurance that the dates announced by the FCA will not change or that the administrator of LIBOR and/or regulators will not take further action that could impact the availability, composition or characteristics of LIBOR or the currencies and/or tenors for which LIBOR is published. In addition, certain regulated entities ceased entering into most new LIBOR contracts in connection with regulatory guidance or prohibitions. Public and private sector industry initiatives are currently underway to implement new or alternative reference rates to be used in place of LIBOR. There is no assurance that any such alternative reference rate will be similar to or produce the same value or economic equivalence as LIBOR or that it will have the same volume or liquidity as did LIBOR prior to its discontinuance, unavailability or replacement, all of which may affect the value, volatility, liquidity or return on certain of a Fund's loans, notes, derivatives and other instruments or investments comprising some or all of a Fund's investments and result in costs incurred in connection with changing reference rates used for positions, closing out positions and entering into new trades. Certain of a Fund's investments may transition from LIBOR prior to the dates announced by the FCA. The transition from LIBOR to alternative reference rates may result in operational issues for a Fund or its investments. No assurances can be given as to the impact of the LIBOR transition (and the timing of any such impact) on a Fund and its investments.
The Funds are subject to infectious disease epidemics/pandemics risk. The worldwide outbreak of COVID-19 has negatively affected economies, markets and individual companies throughout the world. The effects of this COVID-19 pandemic to public health, and business and market conditions, including among other things, reduced consumer demand and economic output, supply chain disruptions and increased government spending may continue to have a significant negative impact on the performance of a Fund’s investments, increase a Fund’s volatility, exacerbate other pre-existing political, social and economic risks to the Funds and negatively impact broad segments of businesses and populations. In addition, governments, their regulatory agencies, or self-regulatory organizations have taken or may take actions in response to the pandemic that affect the instruments in which the Funds invest, or the issuers of such instruments, in ways that could also have a significant negative impact on a Fund’s
| J.P. Morgan Tax Aware Funds | |
NOTES TO FINANCIAL STATEMENTS
AS OF October 31, 2022 (continued)
(Dollar values in thousands)
investment performance. The duration and extent of COVID-19 and associated economic and market conditions and uncertainty over the long-term cannot be reasonably estimated at this time. The ultimate impact of COVID-19 and the extent to which the associated conditions impact a Fund will also depend on future developments, which are highly uncertain, difficult to accurately predict and subject to frequent changes.
| J.P. Morgan Tax Aware Funds | |
REPORT OF INDEPENDENT REGISTERED PUBLIC ACCOUNTING FIRM
To the Board of Trustees of JPMorgan Trust I and Shareholders of JPMorgan Tax Aware Equity Fund and JPMorgan Tax Aware Real Return Fund
Opinions on the Financial Statements
We have audited the accompanying statements of assets and liabilities, including the schedules of portfolio investments, of JPMorgan Tax Aware Equity Fund and JPMorgan Tax Aware Real Return Fund (two of the funds constituting JPMorgan Trust I, hereafter collectively referred to as the “Funds”) as of October 31, 2022, the related statements of operations for the year ended October 31, 2022, the statements of changes in net assets for each of the two years in the period ended October 31, 2022, including the related notes, and the financial highlights for each of the periods indicated therein (collectively referred to as the “financial statements”). In our opinion, the financial statements present fairly, in all material respects, the financial position of each of the Funds as of October 31, 2022, the results of each of their operations for the year then ended, the changes in each of their net assets for each of the two years in the period ended October 31, 2022 and each of the financial highlights for each of the periods indicated therein in conformity with accounting principles generally accepted in the United States of America.
Basis for Opinions
These financial statements are the responsibility of the Funds’ management. Our responsibility is to express an opinion on the Funds’ financial statements based on our audits. We are a public accounting firm registered with the Public Company Accounting Oversight Board (United States) (PCAOB) and are required to be independent with respect to the Funds in accordance with the U.S. federal securities laws and the applicable rules and regulations of the Securities and Exchange Commission and the PCAOB.
We conducted our audits of these financial statements in accordance with the standards of the PCAOB. Those standards require that we plan and perform the audit to obtain reasonable assurance about whether the financial statements are free of material misstatement, whether due to error or fraud.
Our audits included performing procedures to assess the risks of material misstatement of the financial statements, whether due to error or fraud, and performing procedures that respond to those risks. Such procedures included examining, on a test basis, evidence regarding the amounts and disclosures in the financial statements. Our audits also included evaluating the accounting principles used and significant estimates made by management, as well as evaluating the overall presentation of the financial statements. Our procedures included confirmation of securities owned as of October 31, 2022 by correspondence with the custodian, transfer agent and brokers; when replies were not received from brokers, we performed other auditing procedures. We believe that our audits provide a reasonable basis for our opinions.
/s/ PricewaterhouseCoopers LLP
New York, New York
December 22, 2022
We have served as the auditor of one or more investment companies in the JPMorgan Funds complex since 1993.
| J.P. Morgan Tax Aware Funds | |
The Funds’ Statement of Additional Information includes additional information about the Funds’ Trustees and is available, without charge, upon request by calling 1-800-480-4111 or on the J.P. Morgan Funds’ website at www.jpmorganfunds.com.
Name (Year of Birth);
Positions With
the Funds (1) | Principal Occupation
During Past 5 Years | Number of
Funds in Fund
Complex Overseen
by Trustee (2) | Other Directorships Held
During the Past 5 Years |
| | | |
John F. Finn (1947); Chair
since 2020; Trustee since 1998. | Chairman, Gardner, Inc. (supply chain management company serving industrial and consumer markets) (serving in various roles 1974-present). | | Director, Greif, Inc. (GEF) (industrial package products and services) (2007-present); Trustee, Columbus Association for the Performing Arts (1988-present). |
Stephen P. Fisher (1959);
Trustee since 2018. | Retired; Chairman and Chief Executive Officer, NYLIFE Distributors LLC (registered broker-dealer) (serving in various roles 2008-2013); Chairman, NYLIM Service Company LLC (transfer agent) (2008-2017); New York Life Investment Management LLC (registered investment adviser) (serving in various roles 2005-2017); Chairman, IndexIQ Advisors LLC (registered investment adviser for ETFs) (2014-2017); President, MainStay VP Funds Trust (2007-2017), MainStay DefinedTerm Municipal Opportunities Fund (2011-2017) and MainStay Funds Trust (2007-2017) (registered investment companies). | | Honors Program Advisory Board Member, The Zicklin School of Business, Baruch College, The City University of New York (2017-present). |
Gary L. French (1951);
Trustee since 2014. | Real Estate Investor (2011-2020); Investment management industry Consultant and Expert Witness (2011-present); Senior Consultant for The Regulatory Fundamentals Group LLC (2011-2017). | | Independent Trustee, The China Fund, Inc. (2013-2019); Exchange Traded Concepts Trust II (2012-2014); Exchange Traded Concepts Trust I (2011-2014). |
Kathleen M. Gallagher (1958);
Trustee since 2018. | Retired; Chief Investment Officer — Benefit Plans, Ford Motor Company (serving in various roles 1985-2016). | | Non- Executive Director, Legal & General Investment Management (Holdings) (2018-present); Non-Executive Director, Legal & General Investment Management America (U.S. Holdings) (financial services and insurance) (2017-present); Advisory Board Member, State Street Global Advisors Total Portfolio Solutions (2017-present); Member, Client Advisory Council, Financial Engines, LLC (registered investment adviser) (2011-2016); Director, Ford Pension Funds Investment Management Ltd. (2007-2016). |
Robert J. Grassi (1957);
Trustee since 2014. | Sole Proprietor, Academy Hills Advisors LLC (2012-present); Pension Director, Corning Incorporated (2002-2012). | | |
| J.P. Morgan Tax Aware Funds | |
Name (Year of Birth); Positions With the Funds (1) | Principal Occupation During Past 5 Years | Number of Funds in Fund Complex Overseen by Trustee (2) | Other Directorships Held During the Past 5 Years |
Frankie D. Hughes (1952);
Trustee since 2008. | President, Ashland Hughes Properties (property management) (2014-present); President and Chief Investment Officer, Hughes Capital Management, Inc. (fixed income asset management) (1993-2014). | | |
Raymond Kanner (1953);
Trustee since 2017. | Retired; Managing Director and Chief Investment Officer, IBM Retirement Funds (2007-2016). | | Advisory Board Member, Penso Advisors, LLC (2020-present); Advisory Board Member, Los Angeles Capital (2018-present); Advisory Board Member, State Street Global Advisors Total Portfolio Solutions (2017- present); Acting Executive Director, Committee on Investment of Employee Benefit Assets (CIEBA) (2016-2017); Advisory Board Member, Betterment for Business (robo advisor) (2016- 2017); Advisory Board Member, BlueStar Indexes (index creator) (2013-2017); Director, Emerging Markets Growth Fund (registered investment company) (1997-2016); Member, Russell Index Client Advisory Board (2001-2015). |
Thomas P. Lemke (1954);
Trustee since 2014. | | | (1) Independent Trustee of Advisors’ Inner Circle III fund platform, consisting of the following: (i) the Advisors’ Inner Circle Fund III, (ii) the Gallery Trust, (iii) the Schroder Series Trust, (iv) the Delaware Wilshire Private Markets Fund (since 2020), (v) Chiron Capital Allocation Fund Ltd., and (vi) formerly the Winton Diversified Opportunities Fund (2014-2018); and (2) Independent Trustee of the Symmetry Panoramic Trust (since 2018). |
Lawrence R. Maffia (1950);
Trustee since 2014 | Retired; Director and President, ICI Mutual Insurance Company (2006-2013). | | Director, ICI Mutual Insurance Company (1999-2013). |
Mary E. Martinez (1960); Vice
Chair since 2021; Trustee since 2013. | Associate, Special Properties, a Christie’s International Real Estate Affiliate (2010-present); Managing Director, Bank of America (asset management) (2007-2008); Chief Operating Officer, U.S. Trust Asset Management, U.S. Trust Company (asset management) (2003-2007); President, Excelsior Funds (registered investment companies) (2004-2005). | | |
Marilyn McCoy (1948);
Trustee since 2005. | Vice President of Administration and Planning, Northwestern University (1985-present). | | |
| J.P. Morgan Tax Aware Funds | |
TRUSTEES
(Unaudited) (continued)
Name (Year of Birth); Positions With the Funds (1) | Principal Occupation During Past 5 Years | Number of Funds in Fund Complex Overseen by Trustee (2) | Other Directorships Held During the Past 5 Years |
Dr. Robert A. Oden, Jr. (1946); Trustee
since 2005. | Retired; President, Carleton College (2002-2010); President, Kenyon College (1995-2002). | | Trustee, The Coldwater Conservation Fund (2017-present); Trustee, American Museum of Fly Fishing (2013-present); Trustee and Vice Chair, Trout Unlimited (2017-2021);Trustee, Dartmouth- Hitchcock MedicalCenter (2011-2020). |
Marian U. Pardo* (1946);
Trustee since 2013. | Managing Director and Founder, Virtual Capital Management LLC (investment consulting) (2007-present); Managing Director, Credit Suisse Asset Management (portfolio manager) (2003-2006). | | Board Chair and Member, Board of Governors, Columbus Citizens Foundation (not-for-profit supporting philanthropic and cultural programs) (2006-present). |
Emily A. Youssouf (1951);
Trustee since 2022. | Adjunct Professor (2011-present) and Clinical Professor (2009-2011), NYU Schack Institute of Real Estate; Board Member and Member of the Audit Committee (2013–present), Chair of Finance Committee (2019-present), Member of Related Parties Committee (2013-2018) and Member of the Enterprise Risk Committee (2015-2018), PennyMac Financial Services, Inc.; Board Member (2005-2018), Chair of Capital Committee (2006-2016), Chair of Audit Committee (2005-2018), Member of Finance Committee (2005-2018) and Chair of IT Committee (2016-2018), NYC Health and Hospitals Corporation. | | Trustee, NYC School Construction Authority (2009-present); Board Member, NYS Job Development Authority (2008-present); Trustee and Chair of the Audit Committee of the Transit Center Foundation (2015-2019). |
| | | |
Robert F. Deutsch** (1957);
Trustee since 2014. | Retired; Head of ETF Business for JPMorgan Asset Management (2013-2017); Head of Global Liquidity Business for JPMorgan Asset Management (2003-2013). | | Treasurer and Director of the JUST Capital Foundation (2017-present). |
Nina O. Shenker** (1957);
Trustee since 2022. | Vice Chair (2017-2021), General Counsel and Managing Director (2008-2016), Associate General Counsel and Managing Director (2004-2008), J.P. Morgan Asset & Wealth Management. | | Director and Member of Legal and Human Resources Subcommittees, American Jewish Joint Distribution Committee (2018-present). |
|
| The year shown is the first year in which a Trustee became a member of any of the following: the Mutual Fund Board, the ETF Board, the heritage J.P. Morgan Funds or the heritage One Group Mutual Funds. Trustees serve an indefinite term, until resignation, retirement, removal or death. The Board’s current retirement policy sets retirement at the end of the calendar year in which the Trustee attains the age of 75, provided that any Board member who was a member of the Mutual Fund Board prior to January 1, 2022 and was born prior to January 1, 1950 shall retire from the Board at the end of the calendar year in which the Trustee attains the age of 78. |
| A Fund Complex means two or more registered investment companies that hold themselves out to investors as related companies for purposes of investment and investor services or have a common investment adviser or have an investment adviser that is an affiliated person of the investment adviser of any of the other registered investment companies. The J.P. Morgan Funds Complex for which the Board of Trustees serves currently includes nine registered investment companies (166 J.P. Morgan Funds). |
| In connection with prior employment with JPMorgan Chase, Ms. Pardo was the recipient of non-qualified pension plan payments from JPMorgan Chase in the amount of approximately $2,055 per month, which she irrevocably waived effective January 1, 2013, and deferred compensation payments from JPMorgan Chase in the amount of approximately $7,294 per year, which ended in January 2013. In addition, Ms. Pardo receives payments from a fully-funded qualified plan, which is not an obligation of JPMorgan Chase. |
| Designation as an “Interested Trustee” is based on prior employment by the Adviser or an affiliate of the Adviser or interests in a control person of the Adviser. |
| J.P. Morgan Tax Aware Funds | |
| The contact address for each of the Trustees is 277 Park Avenue, New York, NY 10172. |
| J.P. Morgan Tax Aware Funds | |
Name (Year of Birth),
Positions Held with
the Trust (Since) | Principal Occupations During Past 5 Years |
Brian S. Shlissel (1964),
President and Principal Executive
Officer (2016)* | Managing Director and Chief Administrative Officer for J.P. Morgan pooled vehicles, J.P. Morgan Investment Management Inc. since 2014. |
Timothy J. Clemens (1975),
Treasurer and Principal Financial
Officer (2018) | Executive Director, J.P. Morgan Investment Management Inc. since February 2016. Mr. Clemens has been with J.P. Morgan Investment Management Inc. since 2013. |
Gregory S. Samuels (1980),
Secretary (2019) (formerly Assistant
Secretary 2010-2019)** | Managing Director and Assistant General Counsel, JPMorgan Chase & Co. Mr. Samuels has been with JPMorgan Chase & Co. since 2010. |
Stephen M. Ungerman (1953),
Chief Compliance Officer (2005) | Managing Director, JPMorgan Chase & Co. Mr. Ungerman has been with JPMorgan Chase & Co. since 2000. |
Kiesha Astwood-Smith (1973),
Assistant Secretary (2021)** | Vice President and Assistant General Counsel, JPMorgan Chase & Co. since June 2021; Senior Director and Counsel, Equitable Financial Life Insurance Company (formerly, AXA Equitable Life Insurance Company) from September 2015 through June 2021. |
Matthew Beck (1988),
Assistant Secretary (2021)*** | Vice President and Assistant General Counsel, JPMorgan Chase & Co. since May 2021; Senior Legal Counsel, Ultimus Fund Solutions from May 2018 through May 2021; General Counsel, The Nottingham Company from April 2014 through May 2018. |
Elizabeth A. Davin (1964),
Assistant Secretary (2005)*** | Executive Director and Assistant General Counsel, JPMorgan Chase & Co. Ms. Davin has been with JPMorgan Chase & Co. (formerly Bank One Corporation) since 2004. |
Jessica K. Ditullio (1962)
Assistant Secretary (2005)*** | Executive Director and Assistant General Counsel, JPMorgan Chase & Co. Ms. Ditullio has been with JPMorgan Chase & Co. (formerly Bank One Corporation) since 1990. |
Anthony Geron (1971),
Assistant Secretary (2018)** | Vice President and Assistant General Counsel, JPMorgan Chase & Co. since September 2018; Lead Director and Counsel, AXA Equitable Life Insurance Company from 2015 to 2018 and Senior Director and Counsel, AXA Equitable Life Insurance Company from 2014 to 2015. |
Carmine Lekstutis (1980),
Assistant Secretary (2011)** | Executive Director and Assistant General Counsel, JPMorgan Chase & Co. Mr. Lekstutis has been with JPMorgan Chase & Co. since 2011. |
Max Vogel (1990),
Assistant Secretary (2021)** | Vice President and Assistant General Counsel, JPMorgan Chase & Co. since June 2021; Associate, Proskauer Rose LLP (law firm) from March 2017 to June 2021. |
Zachary E. Vonnegut-Gabovitch
(1986),
Assistant Secretary (2017)** | Vice President and Assistant General Counsel, JPMorgan Chase & Co. since September 2016. |
Michael M. D’Ambrosio (1969),
Assistant Treasurer (2012) | Managing Director, J.P. Morgan Investment Management Inc. Mr. D’Ambrosio has been with J.P. Morgan Investment Management Inc. since 2012. |
Aleksandr Fleytekh (1972),
Assistant Treasurer (2019) | Vice President, J.P. Morgan Investment Management Inc. since February 2012. |
Shannon Gaines (1977),
Assistant Treasurer (2018)*** | Vice President, J.P. Morgan Investment Management Inc. since January 2014. |
Jeffrey D. House (1972),
Assistant Treasurer (2017)*** | Vice President, J.P. Morgan Investment Management Inc. since July 2006. |
Michael Mannarino (1985),
Assistant Treasurer (2020) | Vice President, J.P. Morgan Investment Management Inc. since 2014. |
Joseph Parascondola (1963),
Assistant Treasurer (2011)* | Executive Director, J.P. Morgan Investment Management, Inc. Mr. Parascondola has been with J.P. Morgan Investment Management Inc. since 2006. |
Gillian I. Sands (1969),
Assistant Treasurer (2012) | Executive Director, J.P. Morgan Investment Management Inc. Ms. Sands has been with J.P. Morgan Investment Management Inc. since 2012. |
|
The contact address for each of the officers, unless otherwise noted, is 277 Park Avenue, New York, NY 10172. |
| J.P. Morgan Tax Aware Funds | |
| The contact address for the officer is 575 Washington Boulevard, Jersey City, NJ 07310. |
| The contact address for the officer is 4 New York Plaza, New York, NY 10004. |
| The contact address for the officer is 1111 Polaris Parkway, Columbus, OH 43240. |
| J.P. Morgan Tax Aware Funds | |
SCHEDULE OF SHAREHOLDER EXPENSES
(Unaudited)
Hypothetical $1,000 Investment
As a shareholder of the Funds, you incur two types of costs: (1) transaction costs, including sales charges (loads) on purchase payments and (2) ongoing costs, including investment advisory fees, administration fees, distribution fees and other Fund expenses. The examples below are intended to help you understand your ongoing costs (in dollars) of investing in the Funds (not including expenses of the Underlying Funds and ETFs) and to compare these ongoing costs with the ongoing costs of investing in other mutual funds. The examples assume that you had a $1,000 investment in each Class at the beginning of the reporting period, May 1, 2022, and continued to hold your shares at the end of the reporting period, October 31, 2022.
Actual Expenses
For each Class of each Fund in the table below, the first line provides information about actual account values and actual expenses. You may use the information in this line, together with the amount you invested, to estimate the expenses that you paid over the period. Simply divide your account value by $1,000 (for example, an $8,600 account value divided by $1,000 = 8.6), then multiply the result by the number in the first line of each Class under the heading titled “Expenses Paid During the Period” to estimate the expenses you paid on your account during this period.
Hypothetical Example for Comparison Purposes
The second line of each Class in the table below provides information about hypothetical account values and hypothetical expenses based on the Class’ actual expense ratio and an assumed rate of return of 5% per year before expenses, which is not the Class’ actual return. The hypothetical account values and expenses may not be used to estimate the actual ending account balance or expenses you paid for the period. You may use this information to compare the ongoing costs of investing in the Class of the Funds and other funds. To do so, compare this 5% hypothetical example with the 5% hypothetical examples that appear in the shareholder reports of the other funds. Please note that the expenses shown in the table are meant to highlight your ongoing costs only and do not reflect any transaction costs, such as sales charges (loads), or redemption fees, and expenses of the Underlying Funds and ETFs. Therefore, the second line for each Class in the table is useful in comparing ongoing costs only, and will not help you determine the relative total costs of owning different funds. In addition, if these transaction costs were included, your costs would have been higher. The examples also assume all dividends and distributions have been reinvested.
| Beginning
Account Value
May 1, 2022 | Ending
Account Value
October 31, 2022 | Expenses
Paid During
the Period* | |
JPMorgan Tax Aware Equity Fund | | | | |
| | | | |
| | | | |
| | | | |
| | | | |
| | | | |
| | | | |
| | | | |
| | | | |
| | | | |
| | | | |
| | | | |
| | | | |
JPMorgan Tax Aware Real Return Fund | | | | |
| | | | |
| | | | |
| | | | |
| | | | |
| | | | |
| | | | |
| | | | |
| | | | |
| | | | |
| J.P. Morgan Tax Aware Funds | |
| Beginning Account Value May 1, 2022 | Ending Account Value October 31, 2022 | Expenses Paid During the Period* | |
JPMorgan Tax Aware Real Return Fund (continued) | | | | |
| | | | |
| | | | |
| | | | |
|
| Expenses are equal to each Class’ respective annualized expense ratio, multiplied by the average account value over the period, multiplied by 184/365 (to reflect the one-half year period). |
| J.P. Morgan Tax Aware Funds | |
BOARD APPROVAL OF INVESTMENT ADVISORY AGREEMENTS
(Unaudited)
The Board of Trustees (the “Board” or the “Trustees”) has established various standing committees composed of Trustees with diverse backgrounds, to which the Board has assigned specific subject matter responsibilities to further enhance the effectiveness of the Board’s oversight and decision making. Effective January 2022, the Board consolidated with the J.P. Morgan Exchange-Traded Fund Trust Board and now consists of Trustees from both Boards. The Board and its investment committees (money market and alternative products, equity, and fixed income) met regularly throughout the year and at each meeting, considered factors that are relevant to their annual consideration of the continuation of the investment advisory agreements. The Board also met for the specific purpose of considering investment advisory agreement annual renewals. The Board held meetings on June 21-22, 2022 and August 9-11, 2022, at which the Trustees considered the continuation of the investment advisory agreements for each Fund whose annual report is contained herein (each an “Advisory Agreement” and collectively, the “Advisory Agreements”). At the June meeting, the Board’s investment committees met to review and consider performance, expense and related information for the J.P. Morgan Funds. Each investment committee reported to the full Board, which then considered each investment committee’s preliminary findings. At the August meeting, the Trustees continued their review and consideration. The Trustees, including a majority of the Trustees who are not parties to an Advisory Agreement or “interested persons” (as defined in the Investment Company Act of 1940) of any party to an Advisory Agreement or any of their affiliates, approved the continuation of each Advisory Agreement on August 11, 2022.
As part of their review of the Advisory Agreements, the Trustees considered and reviewed performance and other information about the Funds received from the Adviser. This information includes the Funds’ performance as compared to the performance of their peers and benchmarks, and analyses by the Adviser of the Funds’ performance. In addition, at each of their regular meetings throughout the year, the Trustees considered reports on the performance of certain J.P. Morgan Funds (including certain ETFs, beginning in February 2022) provided by an independent investment consulting firm (“independent consultant”). In addition, in preparation for the June and August meetings, the Trustees requested, received and evaluated extensive materials from the Adviser, including performance and expense information compiled by Broadridge, using data from Lipper Inc. and/or Morningstar Inc. , independent providers of investment company data (together, “Broadridge”). The Trustees’ independent consultant also provided additional quantitative and statistical analyses of certain Funds, including risk and performance return assessments as compared to the Funds’ objectives, benchmarks, and peers. Before voting on the Advisory Agreements, the Trustees reviewed the Advisory Agreements with representatives of the
Adviser, counsel to the Trusts, and independent legal counsel and received a memorandum from independent legal counsel to the Trustees discussing the legal standards for their consideration of the Advisory Agreements. The Trustees also discussed the Advisory Agreements with independent legal counsel in executive sessions at which no representatives of the Adviser were present.
A summary of the material factors evaluated by the Trustees in determining whether to approve each Advisory Agreement is provided below. Each Trustee attributed different weights to the various factors and no factor alone was considered determinative. The Trustees considered information provided with respect to the Funds throughout the year including additional reporting and information provided in connection with the COVID-19 pandemic, as well as materials furnished specifically in connection with the annual review process. From year to year, the Trustees consider and place emphasis on relevant information in light of changing circumstances in market and economic conditions.
After considering and weighing the factors and information they had received, the Trustees found that the compensation to be received by the Adviser from each Fund under the applicable Advisory Agreement was fair and reasonable under the circumstances, and determined that the continuance of the Advisory Agreement was in the best interests of each Fund and its shareholders.
Nature, Extent and Quality of Services Provided by the Adviser
The Trustees received and considered information regarding the nature, extent and quality of services provided to each Fund under the applicable Advisory Agreement. The Trustees took into account information furnished throughout the year at Trustee meetings, as well as the materials furnished specifically in connection with this annual review process. Among other things, the Trustees considered:
(i)
The background and experience of the Adviser’s senior management and investment personnel, including personnel changes, if any;
(ii)
The qualifications, backgrounds and responsibilities of the portfolio management team primarily responsible for the day-to-day management each of the Funds, including personnel changes, if any;
(iii)
The investment strategy for each Fund, and the infrastructure supporting the portfolio management teams;
(iv)
Information about the structure and distribution strategy for each Fund and how it fits with the Trusts’ other fund offerings;
(v)
The administration services provided by the Adviser in its role as Administrator;
(vi)
Their knowledge of the nature and quality of the services provided by the Adviser and its affiliates gained from their experience as Trustees of the Trusts and in the financial industry generally;
(vii)
The overall reputation and capabilities of the Adviser and its affiliates;
(viii)
The commitment of the Adviser to provide high quality service to the Funds;
(ix)
Their overall confidence in the Adviser’s integrity;
(x)
The Adviser’s responsiveness to requests for additional information, questions or concerns raised by them, including the Adviser’s willingness to consider and implement organizational and operational changes designed to improve investment results and the services provided to each Fund; and
(xi)
The Adviser’s business continuity plan and steps the Adviser and its affiliates have taken to provide ongoing services to the Funds during the COVID-19 pandemic, and the Adviser’s and its affiliates’ success in continuing to provide services to the Funds and their shareholders throughout this period.
Based upon these considerations and other factors, the Trustees concluded that they were satisfied with the nature, extent and quality of the services provided to the Funds by the Adviser.
Costs of Services Provided and Profitability to the Adviser and its Affiliates
The Trustees received and considered information regarding the profitability to the Adviser and its affiliates from providing services to each Fund. The Trustees reviewed and discussed this information. The Trustees recognized that this information is not audited and represents the Adviser’s determination of its and its affiliates’ revenues from the contractual services provided to the Funds, less expenses of providing such services. Expenses include direct and indirect costs and are calculated using an allocation methodology developed by the Adviser and reviewed with the Board. The Trustees also recognized that it is difficult to make comparisons of profitability from fund investment advisory contracts because comparative information is not generally publicly available and is affected by numerous factors, including the structure of the particular adviser, the types of funds it manages, its business mix, numerous assumptions regarding allocations and the fact that publicly-traded fund managers’ operating profits and net income are net of distribution and marketing expenses. Based upon their review, and taking into consideration the factors noted above, the Trustees concluded that the profitability to the Adviser under each Advisory Agreement was not unreasonable in light of the services and benefits provided to each Fund.
The Trustees also considered that JPMDS, an affiliate of the Adviser, and the Adviser earn fees from the Funds for providing shareholder and administration services, respectively. These fees were shown separately in the profitability analysis presented to the Trustees. The Trustees also considered the payments of Rule 12b-1 fees to JPMDS, which also acts as the Funds’ distributor, and that these fees are in turn generally paid to financial intermediaries that sell the Funds, including financial intermediaries that are affiliates of the Adviser (although they are retained by JPMDS in certain instances). The Trustees also considered the fees earned by JPMorgan Chase Bank, N.A. (“JPMCB”), an affiliate of the Adviser, for custody, fund accounting and other related services for each Fund, and the profitability of the arrangements to JPMCB.
Fall-Out Benefits
The Trustees reviewed information regarding potential “fall-out” or ancillary benefits received by the Adviser and its affiliates as a result of their relationship with the Funds. The Trustees considered that the J.P. Morgan Funds' operating accounts are held at JPMCB, which, as a result, will receive float benefits for certain J.P. Morgan Funds, as applicable. The Trustees also noted that the Adviser supports a diverse set of products and services, which benefits the Adviser by allowing it to leverage its infrastructure to serve additional clients, including benefits that may be received by the Adviser and its affiliates in connection with the Funds’ potential investments in other funds advised by the Adviser. The Trustees also reviewed the Adviser’s allocation of fund brokerage for the J.P. Morgan Funds complex, including allocations to brokers who provide research to the Adviser, as well as the Adviser’s use of affiliates to provide other services and the benefits to such affiliates of doing so.
Economies of Scale
The Trustees considered the extent to which the Funds may benefit from potential economies of scale. The Trustees considered that there may not be a direct relationship between economies of scale realized by the Funds and those realized by the Adviser as assets increase. The Trustees considered the extent to which the Funds were priced to scale and whether it would be appropriate to add advisory fee breakpoints. The Trustees noted certain Funds with contractual expense limitations and fee waivers (“Fee Caps”) which allow a Fund’s shareholders to share potential economies of scale from a Fund’s inception, prior to reaching scale. The Trustees also noted that certain other Funds that had achieved scale as asset levels had increased no longer had Fee Caps in place for some or all of their share classes, but shared economies of scale through lower average expenses. The Trustees noted that the fees remain satisfactory relative to peer funds. The Trustees considered the benefits to the Funds of the use of an affiliated distributor and custodian, including the ability to rely on
BOARD APPROVAL OF INVESTMENT ADVISORY AGREEMENTS
(Unaudited)
existing infrastructure supporting distribution, custodial and transfer agent services and the ability to negotiate competitive fees for the Funds. The Trustees further considered the Adviser's and JPMDS's ongoing investments in their business in support of the Funds, including the Adviser's and/or JPMDS's investments in trading systems, technology (including improvements to the J.P. Morgan Funds’ website, and cybersecurity improvements), retention of key talent, and regulatory support enhancements. The Trustees concluded that the current fee structure for each Fund, including any Fee Caps the Adviser has in place that serve to limit the overall net expense ratios of each Fund at competitive levels, was reasonable. The Trustees concluded that, for Funds with Fee Caps in place for some or all of their share classes, the relevant Fund’s shareholders received the benefits of potential economies of scale through the Fee Caps and, for Funds that achieved scale and no longer had Fee Caps in place for some or all of their share classes, the relevant Fund’s shareholders benefited from lower average expenses resulting from increased assets. The Trustees also concluded that all Funds benefited from the Adviser’s reinvestment in its operations to serve the Funds and their shareholders. The Trustees noted that the Adviser’s reinvestment ensures sufficient resources in terms of personnel and infrastructure to support the Funds.
Fees Relative to Adviser’s Other Clients
The Trustees received and considered information about the nature and extent of investment advisory services and fee rates offered to other clients of the Adviser, including, to the extent applicable, institutional separate accounts, collective investment trusts, other registered investment companies and/or private funds sub-advised by the Adviser, for investment management styles substantially similar to that of each Fund. The Trustees considered the complexity of investment management for registered investment companies relative to the Adviser’s other clients and noted differences, as applicable, in the fee structure and the regulatory, legal and other risks and responsibilities of providing services to the different clients. The Trustees considered that serving as an adviser to a registered investment company involves greater responsibilities and risks than acting as a sub-adviser and observed that sub-advisory fees may be lower than those charged by the Adviser to each Fund. The Trustees also noted that the adviser, not the applicable registered investment company, typically bears the sub-advisory fee and that many responsibilities related to the advisory function are typically retained by the primary adviser. The Trustees concluded that the fee rates charged to each Fund in comparison to those charged to the Adviser’s other clients were reasonable.
Investment Performance
The Trustees receive and consider information about the Funds’ performance throughout the year. In addition, the Trustees received and considered absolute and/or relative performance information for the Funds in a report prepared by Broadridge. The Trustees considered the total return performance information, which included the ranking of the Funds within a performance universe comprised of funds with the same Broadridge investment classification and objective (the “Universe”), as well as a subset of funds within the Universe (the “Peer Group”), by total return for the applicable one-, three- and five-year periods. The Trustees reviewed a description of Broadridge methodology for selecting mutual funds in each Fund’s Universe and Peer Group and noted that Universe and Peer Group quintile rankings were not calculated if the number of funds in the Universe and/or Peer Group did not meet a predetermined minimum. The Broadridge materials provided to the Trustees highlighted information with respect to certain representative classes to assist the Trustees in their review. As part of this review, the Trustees also reviewed each Fund’s performance against its benchmark and considered the performance information provided for the Funds at regular Board meetings by the Adviser and the Trustees’ independent consultant and also considered the special analysis prepared for certain Funds by the Trustees’ independent consultant. The Trustees also engaged with the Adviser to consider what steps might be taken to improve performance, as applicable. The Broadridge performance data noted by the Trustees as part of their review and the determinations made by the Trustees with respect to each Fund’s performance for certain representative classes are summarized below:
The Trustees noted that the Tax Aware Equity Fund’s performance for Class A shares was in the third, first and second quintiles of the Peer Group, and in the third, first and first quintiles of the Universe, for the one-, three- and five-year periods ended December 31, 2021, respectively. The Trustees noted that performance for Class I shares was in the third, first and first quintiles of the Peer Group, and in the second, first and first quintiles of the Universe, for the one-, three- and five-year periods ended December 31, 2021, respectively. The Trustees noted that performance for Class R6 shares was in the third and second quintiles of the Peer Group, and in the second and first quintiles of the Universe, for the one- and three-year periods ended December 31, 2021, respectively. The Trustees discussed the performance and investment strategy of the Fund with the Adviser and reviewed the performance analyses and evaluation prepared by the independent consultant. Based upon these discussions and various other factors, the Trustees concluded that the Fund’s performance was satisfactory.
The Trustees noted that the Tax Aware Real Return Fund’s performance for Class A shares was in the first, first and third quintiles of the Peer Group, and in the first, first and fourth
quintiles of the Universe, for the one-, three- and five-year periods ended December 31, 2021, respectively. The Trustees noted that performance for Class I shares was in the first, first and second quintiles of the Peer Group, and in the first, first and third quintiles of the Universe, for the one-, three- and five-year periods ended December 31, 2021, respectively. The Trustees noted that performance for Class R6 shares was in the first quintile of the Peer Group for both the one- and three-year periods ended December 31, 2021, and in the first, first and second quintiles of the Universe for the one-, three- and five-year periods ended December 31, 2021, respectively. Broadridge did not calculate a quintile ranking for the Peer Group for Class R6 shares for the five-year period due to the limited number of funds in the Peer Groups. The Trustees discussed the performance and investment strategy of the Fund with the Adviser and reviewed the analysis and evaluation prepared by the independent consultant. Based upon these discussions and various other factors, the Trustees concluded that the Fund’s performance was satisfactory under the circumstances.
Advisory Fees and Expense Ratios
The Trustees considered the contractual advisory fee rate and administration fee rate paid by each Fund to the Adviser and compared the combined rate to the information prepared by Broadridge concerning management fee rates paid by other funds in the same Broadridge category as each Fund. The Trustees recognized that Broadridge reported each Fund’s management fee rate as the combined contractual advisory fee and administration fee rates. The Trustees also reviewed information about other expenses and the expense ratios for each Fund and noted that Universe and Peer Group quintile rankings were not calculated if the number of funds in the Universe and/or Peer Groups did not meet a predetermined minimum. For each Fund that had a Fee Cap in place, the Trustees considered the net advisory fee rate and net expense ratio for each class, as applicable, taking into account any waivers and/or reimbursements. The Trustees also considered any proposed changes to a Fee Cap, and, where deemed appropriate by the Trustees, additional waivers and/or
reimbursements. The Trustees recognized that it can be difficult to make comparisons of advisory fees because there are variations in the services that are included in the fees paid by other funds. The Trustees’ determinations as a result of the review of each Fund’s advisory fees and expense ratios for certain representative classes are summarized below:
The Trustees noted that the Tax Aware Equity Fund’s net advisory fee for Class A shares was in the second quintile of both the Peer Group and Universe, and that the actual total expenses for Class A shares were in the fourth and third quintiles of the Peer Group and Universe, respectively. The Trustees noted that the net advisory fee and actual total expenses for Class I shares were both in the first and second quintiles of the Peer Group and Universe, respectively. The Trustees noted that the net advisory fee for Class R6 shares was in the second quintile of both the Peer Group and Universe, and that the actual total expenses for Class R6 shares were in the second and first quintiles of the Peer Group and Universe, respectively. After considering the factors identified above, in light of this information, the Trustees concluded that the advisory fee was satisfactory in light of the services provided to the Fund.
The Trustees noted that the Tax Aware Real Return Fund’s net advisory fee for Class A shares was in the first and second quintiles of the Peer Group and Universe, respectively, and that the actual total expenses for Class A shares were in the second and fourth quintiles of the Peer Group and Universe, respectively. The Trustees noted that the net advisory fee for Class I shares was in the third quintile of both the Peer Group and Universe, and that the actual total expenses for Class I shares were in the first and fourth quintiles of the Peer Group and Universe, respectively. The Trustees noted that the net advisory fee for Class R6 shares was in the second and third quintiles of the Peer Group and Universe, respectively, and that the actual total expenses for Class R6 shares were in the second quintile of both the Peer Group and Universe. After considering the factors identified above, in light of this information, the Trustees concluded that the advisory fee was satisfactory in light of the services provided to the Fund.
TAX LETTER
(Unaudited)
(Dollar values in thousands)
Certain tax information for the J.P. Morgan Funds is required to be provided to shareholders based upon the Funds’ income and distributions for the taxable year ended October 31, 2022. The information and distributions reported in this letter may differ from the information and taxable distributions reported to the shareholders for the calendar year ending December 31, 2022. The information necessary to complete your income tax returns for the calendar year ending December 31, 2022 will be provided under separate cover.
Dividends Received Deduction (DRD)
The Fund listed below had the following percentage, or maximum allowable percentage, of ordinary income distributions eligible for the dividends received deduction for corporate shareholders for the fiscal year ended October 31, 2022:
| Dividends
Received
Deduction |
JPMorgan Tax Aware Equity Fund | |
Long Term Capital Gain
The Fund listed below distributed the following amount, or maximum allowable amount, of long-term capital gain dividends for the fiscal year ended October 31, 2022:
| Long-Term
Capital Gain
Distribution |
JPMorgan Tax Aware Equity Fund | |
Qualified Dividend Income (QDI)
The Fund listed below had the following amount, or maximum allowable amount, of ordinary income distributions treated as qualified dividends for the fiscal year ended October 31, 2022:
| |
JPMorgan Tax Aware Equity Fund | |
Tax Exempt Income
The Fund listed below had the following percentage, or maximum allowable percentage, of dividends paid from investment income that are exempt from federal income tax for the fiscal year ended October 31, 2022:
| |
JPMorgan Tax Aware Real Return Fund | |
| J.P. Morgan Tax Aware Funds | |
| WHAT DOES J.P. MORGAN FUNDS DO WITH YOUR PERSONAL INFORMATION? |
| Financial companies choose how they share your personal information. Federal law gives consumers the right to limit some but not all sharing. Federal law also requires us to tell you how we collect, share, and protect your personal information. Please read this notice carefully to understand what we do. |
| The types of personal information we collect and share depend on the product or service you have with us. This information can include: |
| ○Social Security number and account balances |
| ○transaction history and account transactions |
| ○checking account information and wire transfer instructions |
| When you are no longer our customer, we continue to share your information as described in this notice. |
| All financial companies need to share customers’ personal information to run their everyday business. In the section below, we list the reasons financial companies can share their customers’ personal information; the reasons J.P. Morgan Funds chooses to share; and whether you can limit this sharing. |
Reasons we can share your personal information | Does J.P. Morgan
Funds share? | Can you limit this
sharing? |
For our everyday business purposes — such as to process your transactions, maintain your account(s), respond to court orders and legal investigations, or report to credit bureaus | | |
For marketing purposes — to offer our products and services to you | | |
For joint marketing with other financial companies | | |
For our affiliates’ everyday business purposes — information about your transactions and experiences | | |
For our affiliates’ everyday business purposes — information about your creditworthiness | | |
For nonaffiliates to market to you | | |
Questions? Call 1-800-480-4111 or go to www.jpmorganfunds.com | |
|
Who is providing this notice? | |
|
How does J.P. Morgan Funds protect my personal information? | To protect your personal information from unauthorized access and use, we use security measures that comply with federal law. These measures include computer safeguards and secured files and buildings. We authorize our employees to access your information only when they need it to do their work and we require companies that work for us to protect your information. |
|
How does J.P. Morgan Funds protect my personal information? | We collect your personal information, for example, when you: |
○open an account or provide contact information |
○give us your account information or pay us by check |
|
We also collect your personal information from others, such as credit bureaus, affiliates and other companies. |
|
Why can’t I limit all sharing? | Federal law gives you the right to limit only: |
○sharing for affiliates’ everyday business purposes – information about your creditworthiness |
○affiliates from using your information to market to you |
○sharing for nonaffiliates to market to you |
State laws and individual companies may give you additional rights to limit sharing. |
|
| Companies related by common ownership or control. They can be financial and nonfinancial companies. |
| ○J.P. Morgan Funds does not share with our affiliates. |
|
| Companies not related by common ownership or control. They can be financial and nonfinancial companies. |
| ○J.P. Morgan Funds does not share with nonaffiliates so they can market to you. |
|
| A formal agreement between nonaffiliated financial companies that together market financial products or services to you. |
| ○J.P. Morgan Funds doesn’t jointly market. |
THIS PAGE IS INTENTIONALLY LEFT BLANK
THIS PAGE IS INTENTIONALLY LEFT BLANK
J.P. Morgan Funds are distributed by JPMorgan Distribution Services, Inc., which is an affiliate of JPMorgan Chase & Co. Affiliates of JPMorgan Chase & Co. receive fees for providing various services to the funds.
Contact JPMorgan Distribution Services, Inc. at 1-800-480-4111 for a fund prospectus. You can also visit us at www.jpmorganfunds.com. Investors should carefully consider the investment objectives and risk as well as charges and expenses of the mutual fund before investing. The prospectus contains this and other information about the mutual fund. Read the prospectus carefully before investing.
Investors may obtain information about the Securities Investor Protection Corporation (SIPC), including the SIPC brochure, by visiting www.sipc.org or by calling SIPC at 202-371-8300.
Each Fund files a complete schedule of its fund holdings for the first and third quarters of its fiscal year with the SEC as an exhibit to its report on Form N-PORT. The Funds' Form N-PORT reports are available on the SEC’s website at http://www.sec.gov. Each Fund's quarterly holdings can be found by visiting the J.P. Morgan Funds’ website at www.jpmorganfunds.com.
A description of the Fund's policies and procedures with respect to the disclosure of each Fund's holdings is available in the prospectuses and Statement of Additional Information.
A copy of proxy policies and procedures is available without charge upon request by calling 1-800-480-4111 and on the Fund’s website at www.jpmorganfunds.com. A description of such policies and procedures is on the SEC’s website at www.sec.gov. The Trustees have delegated the authority to vote proxies for securities owned by the Funds to the Adviser. A copy of the Fund’s voting record for the most recent 12-month period ended June 30 is available on the SEC’s website at www.sec.gov or at the Fund’s website at www.jpmorganfunds.com no later than August 31 of each year. The Fund’s proxy voting record will include, among other things, a brief description of the matter voted on for each fund security, and will state how each vote was cast, for example, for or against the proposal.
J.P. Morgan Asset Management is the brand name for the asset management business of JPMorgan Chase & Co. and its affiliates worldwide.
© JPMorgan Chase & Co., 2022. All rights reserved. October 2022.
AN-TA-1022
Annual Report
J.P. Morgan Funds
October 31, 2022
JPMorgan Global Allocation Fund |
JPMorgan Income Builder Fund |
CONTENTS
Investments in a Fund are not deposits or obligations of, or guaranteed or endorsed by, any bank and are not insured or guaranteed by the FDIC, the Federal Reserve Board or any other government agency. You could lose money if you sell when a Fund’s share price is lower than when you invested.
Past performance is no guarantee of future performance. The general market views expressed in this report are opinions based on market and other conditions through the end of the reporting period and are subject to change without notice. These views are not intended to predict the future performance of a Fund or the securities markets.
Prospective investors should refer to the Funds’ prospectuses for a discussion of the Funds’ investment objectives, strategies and risks. Call J.P. Morgan Funds Service Center at 1-800-480-4111 for a prospectus containing more complete information about a Fund, including management fees and other expenses. Please read it carefully before investing.
Letter to Shareholders
December 15, 2022 (Unaudited)
Dear Shareholder,
Global financial markets reflected turmoil in the global economy in 2022, stirred by sharply higher inflation, rising interest rates, sporadic pandemic disruptions and the widening impact of the Russia-Ukraine conflict. Prices for both equities and bonds tumbled during the first half of the year and remained under pressure through the end of October.
|
“While investors seek to adapt to the current market environment, we believe a well-diversified portfolio and a patient outlook remain crucial components of a successful invest- ment approach.” — Brian S. Shlissel
|
Emerging market equities underperformed both the U.S. and other developed equity markets amid economic weakness in China and slowing global demand during the period. Across Europe, the war in Ukraine set off an energy crisis as a result of reduced imports of natural gas from Russia. U.S. equity markets also fell in 2022, but surprisingly strong corporate earnings and consumer spending helped leading U.S. indexes to rebound from their lowest levels. For the twelve month period ended October 31, 2022, the MSCI Emerging Markets Index returned -31.0%, the MSCI EAFE Index returned -23.0% and the S&P 500 Index returned -14.6%.
Notably, some recent U.S. inflationary data has indicated signs of easing price pressures and U.S. economic output as measured by gross domestic product turned positive in the third quarter of 2022, following two consecutive quarters of negative growth. Though the U.S. economy has lost momentum in 2022, it has not yet fallen into recession. Meanwhile, as the potential for a rapid resolution to the war in Ukraine appears to have faded, the European Union and its largest constituent
nations have moved to secure sufficient winter energy supplies while decreasing their dependence on imports of natural gas from Russia. In the U.K., a year-long political crisis was resolved with the accession of Rishi Sunak to prime minister in October 2022, which helped shore up the value of British pound and stabilize U.K. financial markets. China has eased some of the social restrictions under its “Zero Covid” policy and domestic equity indexes recently rose amid investor expectations that China’s economy may fully reopen in the coming months.
As 2022 comes to a close, financial markets are likely to remain volatile due to investor uncertainty regarding the outlook for inflation, interest rates and economic momentum. Increased geo-political tensions between Russia and Ukraine’s Western allies also remains a headwind for global financial markets.
Investors this year have confronted economic and financial market conditions not experienced in many years. While investors seek to adapt to the current market environment, we believe a well-diversified portfolio and a patient outlook remain crucial components of a successful investment approach. Our broad array of investment solutions seeks to provide investors with ability to build durable portfolios that can help them meet their financial goals.
Sincerely yours,
Brian S. Shlissel
President, J.P. Morgan Funds
J.P. Morgan Asset Management
1-800-480-4111 or www.jpmorganfunds.com for more information
MARKET OVERVIEW
TWELVE MONTHS ENDED October 31, 2022 (Unaudited)
While developed market equities largely ended 2021 with positive returns, global prices for equities and bonds plummeted in 2022 amid accelerating inflation, rising interest rates, pandemic disruptions in China and the outbreak of conflict in Ukraine. Returns for both equity and bond markets broadly declined during the first half of 2022 and remained in negative territory through the end of October. Notably, global energy prices rose sharply in the first half of 2022 before receding somewhat in the third quarter.
In the EU, the war in Ukraine remained the focus of investors’ attention as energy supplies from Russia were constrained and the potential for a rapid resolution to the conflict receded. Both the EU and its individual constituent nations moved to build up reserves of natural gas and petroleum ahead of the winter months. By the end of October 2022, several European governments had sought to confront soaring inflation with spending plans to help households manage rising food and energy costs. The European Central Bank responded to the highest inflation rates in 40 years by sharply raising its policy interest rates in September 2022 and again in October. During the twelve month period, equity markets in Europe largely outperformed emerging markets equities but underperformed U.S. equity markets.
Political turmoil in the U.K. added to a weakening economic outlook that rattled financial markets and pushed the British pound to a 37-year low against the U.S. dollar. By late October 2022, the accession of Rishi Sunak to prime minister provided some support for both the pound and U.K. financial markets. The Bank of England was among the earliest developed market central banks to move to curb inflationary pressures, with an initial interest rate increase in December 2021, and seven more increases during the period.
Developed markets in the Asia-Pacific region also slumped during the period amid rising inflation, particularly soaring energy prices, and broad weakness in the semiconductors sector. Despite inflationary pressures, the Bank of Japan maintained its ultra-low interest rate policy. Meanwhile, equities in Hong Kong and Singapore largely underperformed other developed markets.
In the U.S., investors largely kept their focus on inflation data as indicators of short-term policy of the U.S. Federal Reserve. In mid-March 2022, the central bank initiated its first interest rate increase since late 2018, and then followed with four more rate raises by the end of September 2022. U.S. gross domestic product fell by 1.6% in the first quarter of 2022 and dropped 0.6% in the second quarter before rebounding to a 2.6% increase in the third quarter. Consumer spending declined but remained somewhat better than investors expected. By the end of June 2022, U.S. equity prices had tumbled more than 20% from the start of the year, which is generally considered a bear market. However, prices rebounded somewhat by the end of October 2022.
Meanwhile, emerging markets equities and bonds slumped throughout the twelve months ended in October 2022. China was among the worst performers as the government’s “zero covid” policy led to strict lockdowns in several large cities, which weighed on the services sector in particular and on economic growth in general. China’s technology sector remained under pressure amid increased scrutiny of large technology companies by government regulators. Across emerging markets rising interest rates weighed on government spending and higher energy prices hurt markets of regions dependent on petroleum imports.
For the twelve months ended October 31, 2022, the S&P 500 Index returned -14.6%, the MSCI EAFE Index returned -23.0% and the MSCI Emerging Markets Index returned -31.0%.
JPMorgan Global Allocation Fund
FUNDS COMMENTARY
TWELVE MONTHS ENDED October 31, 2022 (Unaudited)
| |
| |
MSCI All Country World Index (net of foreign withholding taxes) | |
Bloomberg Global Aggregate Index (Unhedged USD) | |
60% MSCI All Country World Index (net of foreign withholding taxes) / 40% Bloomberg Global Aggregate Index (Unhedged) (formerly known as Global Allocation Composite Benchmark) | |
Net Assets as of 10/31/2022 (In Thousands) | |
INVESTMENT OBJECTIVE**
The JPMorgan Global Allocation Fund (the “Fund”) seeks to maximize long-term total return.
WHAT WERE THE MAIN DRIVERS OF THE FUND’S PERFORMANCE?
For the twelve months ended October 31, 2022, the Fund’s Class I Shares underperformed the MSCI All Country World Index (net of foreign withholding taxes) (the “Benchmark”), outperformed the Bloomberg Global Aggregate Index (Unhedged USD) and underperformed the 60% MSCI All Country World Index (net of foreign withholding taxes) / 40% Bloomberg Global Aggregate Index.
Relative to the Benchmark, which is an all-equity index, the Fund’s overweight allocation to equity, particularly non-U.S. developed markets equity, was a leading detractor from performance.
Relative to 60% MSCI All Country World Index / 40% Bloomberg Global Aggregate Index, the Fund’s initial overweight allocation to equity was a leading detractor from performance, while the Fund’s allocation to shorter duration corporate credit was a leading contributor to relative performance. Generally, bonds with shorter duration will experience a smaller decline in price compared with longer duration bonds when interest rates rise.
HOW WAS THE FUND POSITIONED?
During the reporting period, the Fund’s portfolio managers decreased the overall equity allocation, particularly in European equities. The portfolio managers maintained the Fund’s allocation to shorter duration and higher quality corporate credit and continued to hold non-U.S. government
bonds and U.S. Treasury futures.
TOP TEN POSITIONS OF THE
PORTFOLIO AS OF October 31, 2022 | PERCENT OF
TOTAL
INVESTMENTS |
| JPMorgan Income Fund, Class R6 | |
| | |
| U.S. Treasury Notes 0.13, 1/31/2023 | |
| | |
| | |
| | |
| | |
| | |
| LVMH Moet Hennessy Louis Vuitton SE (France) | |
| Japan Government Bond 0.10, 12/20/2022 (Japan) | |
PORTFOLIO COMPOSITION
AS OF October 31, 2022 | PERCENT OF
TOTAL
INVESTMENTS |
| |
Foreign Government Securities | |
| |
| |
U.S. Treasury Obligations | |
Others (each less than 1.0%) | |
| |
*
The return shown is based on net asset values calculated for shareholder transactions and may differ from the return shown in the financial highlights, which reflects adjustments made to the net asset values in accordance with accounting principles generally accepted in the United States of America.
**
The adviser seeks to achieve the Fund’s objective. There can be no guarantee it will be achieved.
JPMorgan Global Allocation Fund
FUNDS COMMENTARY
TWELVE MONTHS ENDED October 31, 2022 (Unaudited) (continued)
AVERAGE ANNUAL TOTAL RETURNS AS OF October 31, 2022
|
| Sales Charge for Class A Shares is 4.50%. |
| Assumes a 1% CDSC (contingent deferred sales charge) for the one year period and 0% CDSC thereafter. |
TEN YEAR FUND PERFORMANCE (10/31/12 TO 10/31/22)
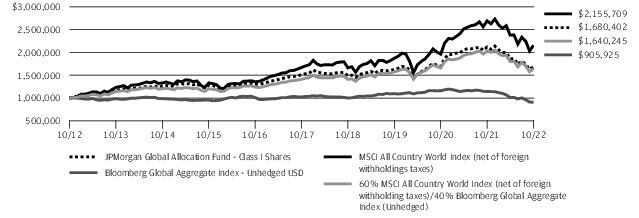
The performance quoted is past performance and is not a guarantee of future results. Mutual funds are subject to certain market risks. Investment returns and principal value of an investment will fluctuate so that an investor’s shares, when redeemed, may be worth more or less than their original cost. Current performance may be higher or lower than the performance data shown. For up-to-date month-end performance information, please call 1-800-480-4111.
Returns for Class R5 and Class R6 Shares prior to their inception date are based on the performance of Class I Shares. The actual returns for Class R5 and Class R6 Shares would have been different than those shown because Class R5 and Class R6 Shares have different expenses than Class I Shares.
Returns for Class R3 Shares prior to its inception date are based on the performance of Class A Shares. The actual returns for Class R3 Shares would have been lower than those shown because Class R3 Shares have higher expenses than Class A Shares.
Returns for Class R4 Shares prior to its inception date are based on the performance of Class I Shares. The actual returns for Class R4 Shares would have been lower than those shown because Class R4 Shares have higher expenses than Class I Shares.
The graph illustrates comparative performance for $1,000,000 invested in Class I Shares of the JPMorgan Global Allocation Fund, the MSCI All Country
World Index (net of foreign withholding taxes), the Bloomberg Global Aggregate Index – (Unhedged USD) and 60% MSCI All Country World Index (net of foreign withholding taxes) / 40% Bloomberg Global Aggregate Index (Unhedged) (formerly known as Global Allocation Composite Benchmark) from April 30, 2012 to April 30, 2022. The performance of the Fund assumes reinvestment of all dividends and capital gain distributions, if any, and does not include a sales charge. The performance of the MSCI All Country World Index (net of foreign withholding taxes), the Bloomberg Global Aggregate Index – (Unhedged USD) and 60% MSCI All Country World Index (net of foreign withholding taxes) / 40% Bloomberg Global Aggregate Index (Unhedged) (formerly known as Global Allocation Composite Benchmark) do not reflect the deduction of expenses or a sales charge associated with a mutual fund and approximates the minimum possible dividend reinvestment of the securities included in the benchmark, if applicable. The dividend is reinvested after deduction of withholding tax, applying the maximum rate to non-resident individual investors who do not benefit from double taxation treaties. The performance of 60% MSCI All Country World Index (net of foreign withholding taxes) / 40% Bloomberg Global Aggregate Index (Unhedged) (formerly known as Global Allocation Composite Benchmark) does not reflect the deduction of expenses associated with a mutual fund, such as investment management fees and has been adjusted to reflect reinvestment of all dividends and capital gain distributions of securities included in the benchmark, if applicable. The MSCI All Country World Index (net of foreign withholding taxes) is a free float-adjusted market capitalization
weighted index that is designed to measure the equity market performance of developed and emerging markets. The Bloomberg Barclays Global Aggregate Index – (Unhedged USD) provides a broad-based measure of the global investment-grade fixed income markets. Investors cannot invest directly in an index.
Subsequent to the inception date of the Fund through May 30, 2013, the Fund did not experience any shareholder activity. If such shareholder activity had occurred, the Fund’s performance may have been impacted.
Class I Shares have a $1,000,000 minimum initial investment. Fund performance may reflect the waiver of the Fund’s fees and reimbursement of expenses for certain periods. Without these waivers and reimbursements, performance would have been lower. Also, performance shown in this section
does not reflect the deduction of taxes that a shareholder would pay on Fund distributions or on gains resulting from redemptions of Fund shares.
International investing involves a greater degree of risk and increased volatility. Changes in currency exchange rates and differences in accounting and taxation policies outside the U.S. can raise or lower returns. Also, some overseas markets may not be as politically and economically stable as the U.S. and other nations.
The returns shown are based on net asset values calculated for shareholder transactions and may differ from the returns shown in the financial highlights, which reflect adjustments made to the net asset values in accordance with accounting principles generally accepted in the United States of America.
JPMorgan Income Builder Fund
FUND COMMENTARY
TWELVE MONTHS ENDED October 31, 2022 (Unaudited)
| |
Fund (Class A Shares, without a sales charge) * | |
MSCI World Index (net total return) | |
Bloomberg U.S. Aggregate Index | |
60% MSCI World Index (net of foreign withholding taxes) / 40% Bloomberg U.S. Aggregate Index (formerly known as Income Builder Composite Benchmark) | |
Net Assets as of 10/31/2022 (In Thousands) | |
INVESTMENT OBJECTIVE**
The JPMorgan Income Builder Fund (the “Fund”) seeks to maximize income while maintaining prospects for capital appreciation.
WHAT WERE THE MAIN DRIVERS OF THE FUND’S PERFORMANCE?
For the twelve months ended October 31, 2022, the Fund’s Class A Shares, without a sales charge, outperformed the MSCI World Index (net of foreign withholding taxes), the Bloomberg U.S. Aggregate Index and the 60% MSCI World Index (net of foreign withholding taxes) / 40% Bloomberg U.S. Aggregate Index.
Relative to the MSCI World Index, which is an all-equity index, the Fund’s underweight allocation to equity was a leading contributor to performance as equity prices fell during the period.
Relative to the Bloomberg U.S. Aggregate Index, which primarily contains U.S. government bonds, the Fund’s allocation to a more diversified set of corporate bonds contributed to performance.
Relative to the Composite Benchmark, the Fund’s allocation to corporate credit, which outperformed government bonds amid rising interest rates during the period, was a leading contributor to performance. The Fund’s allocation to U.S. equity also helped relative performance, though the Fund’s overall allocation to developed markets equity was a leading detractor from relative performance.
HOW WAS THE FUND POSITIONED?
During the period, the Fund’s portfolio managers decreased the Fund’s overall equities exposure but maintained its positioning in credit. The portfolio managers sought to take advantage of periodic market volatility by adding to covered call options in the form of equity-linked notes. The portfolio managers also sought to balance credit allocations with more conservative exposures through U.S. Treasury futures.
TOP TEN POSITIONS OF THE
PORTFOLIO AS OF October 31, 2022 | PERCENT OF
TOTAL
INVESTMENTS |
| JPMorgan Equity Premium Income ETF | |
| National Bank of Canada, ELN, 8.00%, 12/28/2022, (linked to NASDAQ - 100 Index) | |
| Royal Bank of Canada, ELN, 8.00%, 12/21/2022, (linked to NASDAQ - 100 Index) | |
| Societe Generale SA, ELN, 8.00%, 12/15/2022, (linked to NASDAQ - 100 Index) | |
| Barclays Bank plc, ELN, 8.00%, 12/12/2022, (linked to NASDAQ - 100 Index) | |
| Citigroup Global Markets Holdings, Inc., ELN, 9.00%, 12/30/2022, (linked to NASDAQ - 100 Index) | |
| Citigroup Global Markets Holdings, Inc., ELN, 8.00%, 12/5/2022, (linked to NASDAQ - 100 Index) | |
| BNP Paribas, ELN, 8.00%, 11/23/2022, (linked to NASDAQ - 100 Index) | |
| U.S. Treasury Notes0.13,1/31/2023 | |
| | |
PORTFOLIO COMPOSITION
AS OF October 31, 2022 | PERCENT OF
TOTAL
INVESTMENTS |
| |
| |
| |
Commercial Mortgage-Backed Securities | |
Collateralized Mortgage Obligations | |
| |
| |
| |
Others (each less than 1.0%) | |
| |
*
The return shown is based on net asset values calculated for shareholder transactions and may differ from the return shown in the financial highlights, which reflects adjustments made to the net asset values in accordance with accounting principles generally accepted in the United States of America.
**
The adviser seeks to achieve the Fund’s objective. There can be no guarantee it will be achieved.
AVERAGE ANNUAL TOTAL RETURNS AS OF October 31, 2022
|
| Sales Charge for Class A Shares is 4.50%. |
| Assumes a 1% CDSC (contingent deferred sales charge) for the one year period and 0% CDSC thereafter. |
TEN YEAR FUND PERFORMANCE (10/31/12 TO 10/31/22)
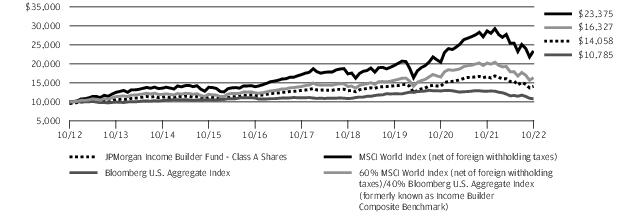
The performance quoted is past performance and is not a guarantee of future results. Mutual funds are subject to certain market risks. Investment returns and principal value of an investment will fluctuate so that an investor’s shares, when redeemed, may be worth more or less than their original cost. Current performance may be higher or lower than the performance data shown. For up-to-date month-end performance information, please call 1-800-480-4111.
Returns for Class R6 Shares prior to its inception date are based on the performance of Class I Shares. The actual returns for Class R6 Shares would have been different than those shown because Class R6 Shares have different expenses than Class I Shares.
The graph illustrates comparative performance for $10,000 invested in Class A Shares of the JPMorgan Income Builder Fund, the MSCI World Index (net of foreign withholding taxes), the Bloomberg U.S. Aggregate Index and 60% MSCI All Country World Index (net of foreign withholding taxes) / 40% Bloomberg U.S. Aggregate Index (formerly known as Income Builder Composite Benchmark) from April 30, 2012 to April 30, 2022. The performance of the Fund assumes reinvestment of all dividends and capital gain distributions, if any, and includes a sales charge. The performance of the MSCI World Index (net of foreign withholding taxes), the Bloomberg U.S. Aggregate Index and 60% MSCI All Country World Index (net of foreign withholding taxes) / 40% Bloomberg U.S. Aggregate Index (formerly known as Income Builder Composite Benchmark) do not reflect the deduction of expenses or a sales charge associated with a mutual fund and have been adjusted to reflect reinvestment of all dividends and capital gain distributions of securities included in the benchmarks, if applicable. The MSCI World Index (net of foreign withholding taxes) assumes the dividend is reinvested after deduction of withholding tax, applying the maximum rate to non-resident individual investors who do not
benefit from double taxation treaties. The MSCI World Index (net of foreign withholding taxes) is a free float-adjusted market capitalization weighted index that is designed to measure the equity market performance of developed markets. The Bloomberg U.S. Aggregate Index is an unmanaged index that represents securities that are SEC-registered, taxable, and dollar denominated. The index covers the U.S. investment grade fixed rate bond market, with index components for government and corporate securities, mortgage pass-through securities, and asset-backed securities. Investors cannot invest directly in an index.
Fund performance may reflect the waiver of the Fund’s fees and reimbursement of expenses for certain periods. Without these waivers and reimbursements, performance would have been lower. Also, performance shown in this section does not reflect the deduction of taxes that a shareholder would pay on Fund distributions or on gains resulting from redemptions of Fund shares.
International investing involves a greater degree of risk and increased volatility. Changes in currency exchange rates and differences in accounting and taxation policies outside the U.S. can raise or lower returns. Also, some overseas markets may not be as politically and economically stable as the U.S. and other nations.
Because Class C Shares automatically convert to Class A Shares after 8 years, the 10 year average annual total return shown above for Class C reflects Class A performance for the period after conversion.
The returns shown are based on net asset values calculated for shareholder transactions and may differ from the returns shown in the financial highlights, which reflect adjustments made to the net asset values in accordance with accounting principles generally accepted in the United States of America.
JPMorgan Global Allocation Fund
SCHEDULE OF PORTFOLIO INVESTMENTS
AS OF October 31, 2022
| | |
|
|
| | |
| | |
| | |
| | |
| | |
Australia & New Zealand Banking Group Ltd. | | |
| | |
| | |
| | |
| | |
| | |
| | |
Commonwealth Bank of Australia | | |
| | |
Domino's Pizza Enterprises Ltd. | | |
| | |
| | |
Flutter Entertainment plc * | | |
Fortescue Metals Group Ltd. | | |
| | |
| | |
| | |
| | |
Insurance Australia Group Ltd. | | |
| | |
Lottery Corp. Ltd. (The) * | | |
| | |
| | |
| | |
| | |
National Australia Bank Ltd. | | |
| | |
Northern Star Resources Ltd. | | |
| | |
| | |
| | |
| | |
| | |
| | |
| | |
| | |
| | |
| | |
| | |
|
|
| | |
| | |
| | |
| | |
| | |
| | |
| | |
| | |
Treasury Wine Estates Ltd. | | |
| | |
Washington H Soul Pattinson & Co. Ltd. | | |
| | |
| | |
| | |
Woodside Energy Group Ltd. | | |
Woodside Energy Group Ltd. | | |
| | |
| | |
|
| | |
| | |
| | |
| | |
| | |
| | |
|
| | |
| | |
| | |
| | |
Groupe Bruxelles Lambert NV | | |
| | |
| | |
| | |
| | |
| | |
| | |
Warehouses De Pauw CVA, REIT | | |
| | |
|
EDP - Energias do Brasil SA | | |
| | |
SEE NOTES TO FINANCIAL STATEMENTS.
| | |
Common Stocks — continued |
|
Itau Unibanco Holding SA (Preference) * | | |
| | |
| | |
NU Holdings Ltd., Class A * | | |
Petroleo Brasileiro SA (Preference) | | |
| | |
| | |
| | |
| | |
| | |
|
Alimentation Couche-Tard, Inc. | | |
Canadian National Railway Co. | | |
Fairfax Financial Holdings Ltd. | | |
Toronto-Dominion Bank (The) | | |
| | |
|
| | |
| | |
| | |
|
Acrobiosystems Co. Ltd., Class A | | |
Acrobiosystems Co. Ltd., Class A | | |
Advanced Micro-Fabrication Equipment, Inc., Class A * | | |
Aier Eye Hospital Group Co. Ltd., Class A | | |
Alibaba Group Holding Ltd. * | | |
Amoy Diagnostics Co. Ltd., Class A | | |
Angel Yeast Co. Ltd., Class A | | |
Anjoy Foods Group Co. Ltd., Class A | | |
Asymchem Laboratories Tianjin Co. Ltd., Class A | | |
Asymchem Laboratories Tianjin Co. Ltd., Class H (b) | | |
Bank of Ningbo Co. Ltd., Class A | | |
Baoshan Iron & Steel Co. Ltd., Class A | | |
Beijing Huafeng Test & Control Technology Co. Ltd., Class A | | |
Beijing Kingsoft Office Software, Inc., Class A | | |
BOC Hong Kong Holdings Ltd. | | |
BOE Technology Group Co. Ltd., Class A | | |
| | |
|
|
Budweiser Brewing Co. APAC Ltd. (b) | | |
Chacha Food Co. Ltd., Class A | | |
Changzhou Xingyu Automotive Lighting Systems Co. Ltd., Class A | | |
China Construction Bank Corp., Class H | | |
China Longyuan Power Group Corp. Ltd., Class H | | |
China Merchants Bank Co. Ltd., Class A | | |
China Merchants Bank Co. Ltd., Class H | | |
China Resources Land Ltd. | | |
China State Construction Engineering Corp. Ltd., Class A | | |
China Vanke Co. Ltd., Class A | | |
China Yangtze Power Co. Ltd., Class A | | |
Chongqing Brewery Co. Ltd., Class A | | |
Chongqing Fuling Zhacai Group Co. Ltd., Class A | | |
Chow Tai Fook Jewellery Group Ltd. | | |
Contemporary Amperex Technology Co. Ltd., Class A | | |
Dongguan Yiheda Automation Co. Ltd., Class A | | |
Dongguan Yiheda Automation Co. Ltd., Class A | | |
| | |
Flat Glass Group Co. Ltd., Class H | | |
Foshan Haitian Flavouring & Food Co. Ltd., Class A | | |
Futu Holdings Ltd., ADR * (a) | | |
Fuyao Glass Industry Group Co. Ltd., Class A | | |
Fuyao Glass Industry Group Co. Ltd., Class H (b) | | |
| | |
Guangdong Haid Group Co. Ltd., Class A | | |
Guangzhou Kingmed Diagnostics Group Co. Ltd., Class A | | |
| | |
Haier Smart Home Co. Ltd., Class H | | |
Hangzhou Tigermed Consulting Co. Ltd., Class A | | |
Han's Laser Technology Industry Group Co. Ltd., Class A | | |
Hefei Meiya Optoelectronic Technology, Inc., Class A | | |
Hongfa Technology Co. Ltd., Class A | | |
SEE NOTES TO FINANCIAL STATEMENTS.
JPMorgan Global Allocation Fund
SCHEDULE OF PORTFOLIO INVESTMENTS
AS OF October 31, 2022 (continued)
| | |
Common Stocks — continued |
|
Hundsun Technologies, Inc., Class A | | |
Inner Mongolia Yili Industrial Group Co. Ltd., Class A | | |
Jade Bird Fire Co. Ltd., Class A | | |
| | |
Jiangsu Hengli Hydraulic Co. Ltd., Class A | | |
| | |
Kingdee International Software Group Co. Ltd. * | | |
| | |
Kweichow Moutai Co. Ltd., Class A | | |
Laobaixing Pharmacy Chain JSC, Class A | | |
LONGi Green Energy Technology Co. Ltd., Class A | | |
Maxscend Microelectronics Co. Ltd., Class A | | |
| | |
Midea Group Co. Ltd., Class A | | |
Montage Technology Co. Ltd., Class A | | |
NARI Technology Co. Ltd., Class A | | |
| | |
| | |
| | |
Oppein Home Group, Inc., Class A | | |
Pharmaron Beijing Co. Ltd., Class H (b) | | |
Ping An Bank Co. Ltd., Class A | | |
Ping An Insurance Group Co. of China Ltd., Class A | | |
Ping An Insurance Group Co. of China Ltd., Class H | | |
Poly Developments and Holdings Group Co. Ltd., Class A | | |
| | |
Proya Cosmetics Co. Ltd., Class A | | |
Qingdao Haier Biomedical Co. Ltd., Class A | | |
Shandong Sinocera Functional Material Co. Ltd., Class A | | |
Shanghai Baosight Software Co. Ltd., Class A | | |
Shanghai Liangxin Electrical Co. Ltd., Class A | | |
Shanghai M&G Stationery, Inc., Class A | | |
Shanghai Putailai New Energy Technology Co. Ltd., Class A | | |
| | |
|
|
Shenzhen Inovance Technology Co. Ltd., Class A | | |
Shenzhen Mindray Bio-Medical Electronics Co. Ltd., Class A | | |
Shenzhou International Group Holdings Ltd. | | |
| | |
SITC International Holdings Co. Ltd. | | |
Skshu Paint Co. Ltd., Class A * | | |
StarPower Semiconductor Ltd., Class A | | |
Sungrow Power Supply Co. Ltd., Class A | | |
Suzhou Maxwell Technologies Co. Ltd., Class A | | |
| | |
Tongwei Co. Ltd., Class A | | |
Wanhua Chemical Group Co. Ltd., Class A | | |
Wilmar International Ltd. | | |
Wuliangye Yibin Co. Ltd., Class A | | |
WuXi AppTec Co. Ltd., Class H (b) | | |
Wuxi Biologics Cayman, Inc. * (b) | | |
Xinyi Glass Holdings Ltd. | | |
Xinyi Solar Holdings Ltd. | | |
| | |
Yangzhou Yangjie Electronic Technology Co. Ltd., Class A | | |
Yonyou Network Technology Co. Ltd., Class A | | |
Yunnan Energy New Material Co. Ltd. | | |
Zhejiang Dingli Machinery Co. Ltd., Class A | | |
Zhejiang Supcon Technology Co. Ltd., Class A | | |
Zhejiang Supcon Technology Co. Ltd., Class A | | |
Zhuzhou CRRC Times Electric Co. Ltd. | | |
Zhuzhou CRRC Times Electric Co. Ltd., Class A | | |
Zijin Mining Group Co. Ltd., Class H | | |
ZWSOFT Co. Ltd. Guangzhou, Class A | | |
| | |
|
AP Moller - Maersk A/S, Class A | | |
AP Moller - Maersk A/S, Class B | | |
| | |
SEE NOTES TO FINANCIAL STATEMENTS.
| | |
Common Stocks — continued |
|
| | |
| | |
| | |
| | |
| | |
| | |
| | |
Novo Nordisk A/S, Class B | | |
| | |
| | |
| | |
| | |
| | |
| | |
| | |
|
| | |
| | |
| | |
| | |
| | |
| | |
| | |
| | |
| | |
| | |
| | |
| | |
| | |
|
| | |
| | |
| | |
| | |
| | |
| | |
| | |
| | |
| | |
| | |
| | |
| | |
| | |
| | |
|
|
| | |
| | |
| | |
| | |
Cie Generale des Etablissements Michelin SCA | | |
| | |
| | |
| | |
| | |
| | |
| | |
| | |
| | |
| | |
| | |
| | |
| | |
| | |
| | |
| | |
| | |
| | |
La Francaise des Jeux SAEM (b) | | |
| | |
| | |
LVMH Moet Hennessy Louis Vuitton SE | | |
| | |
| | |
| | |
| | |
| | |
| | |
| | |
| | |
| | |
| | |
| | |
| | |
| | |
| | |
Ubisoft Entertainment SA * | | |
Unibail-Rodamco-Westfield, REIT * | | |
| | |
SEE NOTES TO FINANCIAL STATEMENTS.
JPMorgan Global Allocation Fund
SCHEDULE OF PORTFOLIO INVESTMENTS
AS OF October 31, 2022 (continued)
| | |
Common Stocks — continued |
|
| | |
| | |
| | |
| | |
| | |
| | |
|
| | |
| | |
| | |
| | |
| | |
Bayerische Motoren Werke AG | | |
Bayerische Motoren Werke AG (Preference) | | |
| | |
| | |
| | |
| | |
| | |
| | |
| | |
Daimler Truck Holding AG * | | |
Deutsche Bank AG (Registered) | | |
| | |
Deutsche Lufthansa AG (Registered) * | | |
Deutsche Post AG (Registered) | | |
Deutsche Telekom AG (Registered) | | |
Dr Ing hc F Porsche AG (Preference) * | | |
| | |
| | |
Fresenius Medical Care AG & Co. KGaA | | |
| | |
| | |
| | |
| | |
| | |
| | |
Henkel AG & Co. KGaA (Preference) | | |
| | |
| | |
| | |
| | |
| | |
|
|
| | |
| | |
| | |
Muenchener Rueckversicherungs- Gesellschaft AG (Registered) | | |
| | |
Porsche Automobil Holding SE (Preference) | | |
| | |
| | |
| | |
| | |
| | |
Sartorius AG (Preference) | | |
| | |
| | |
| | |
Siemens Healthineers AG (b) | | |
| | |
Telefonica Deutschland Holding AG | | |
| | |
United Internet AG (Registered) | | |
| | |
Volkswagen AG (Preference) | | |
| | |
| | |
| | |
|
Hellenic Telecommunications Organization SA | | |
|
| | |
| | |
CK Infrastructure Holdings Ltd. | | |
| | |
Hang Lung Properties Ltd. | | |
| | |
Henderson Land Development Co. Ltd. | | |
HK Electric Investments & HK Electric Investments Ltd. (b) | | |
| | |
Hong Kong & China Gas Co. Ltd. | | |
Hong Kong Exchanges & Clearing Ltd. | | |
SEE NOTES TO FINANCIAL STATEMENTS.
| | |
Common Stocks — continued |
|
Hongkong Land Holdings Ltd. | | |
Jardine Matheson Holdings Ltd. | | |
| | |
| | |
New World Development Co. Ltd. | | |
Power Assets Holdings Ltd. | | |
| | |
| | |
Sun Hung Kai Properties Ltd. | | |
Swire Pacific Ltd., Class A | | |
| | |
Techtronic Industries Co. Ltd. | | |
| | |
Wharf Real Estate Investment Co. Ltd. | | |
| | |
|
| | |
| | |
| | |
| | |
|
Bank Central Asia Tbk. PT | | |
Bank Rakyat Indonesia Persero Tbk. PT | | |
Telkom Indonesia Persero Tbk. PT | | |
| | |
|
| | |
| | |
| | |
| | |
| | |
| | |
| | |
| | |
|
| | |
| | |
| | |
Bezeq The Israeli Telecommunication Corp. Ltd. | | |
Check Point Software Technologies Ltd. * | | |
| | |
|
|
| | |
| | |
Israel Discount Bank Ltd., Class A | | |
Mizrahi Tefahot Bank Ltd. | | |
| | |
Teva Pharmaceutical Industries Ltd., ADR * | | |
Tower Semiconductor Ltd. * | | |
| | |
ZIM Integrated Shipping Services Ltd. (a) | | |
| | |
|
| | |
Assicurazioni Generali SpA | | |
| | |
| | |
| | |
| | |
| | |
| | |
| | |
FinecoBank Banca Fineco SpA | | |
Infrastrutture Wireless Italiane SpA (b) | | |
| | |
Mediobanca Banca di Credito Finanziario SpA | | |
| | |
| | |
| | |
| | |
Recordati Industria Chimica e Farmaceutica SpA | | |
| | |
| | |
Terna - Rete Elettrica Nazionale | | |
| | |
| | |
|
| | |
| | |
| | |
| | |
SEE NOTES TO FINANCIAL STATEMENTS.
JPMorgan Global Allocation Fund
SCHEDULE OF PORTFOLIO INVESTMENTS
AS OF October 31, 2022 (continued)
| | |
Common Stocks — continued |
|
| | |
| | |
Asahi Group Holdings Ltd. | | |
| | |
| | |
| | |
| | |
Bandai Namco Holdings, Inc. | | |
| | |
| | |
| | |
| | |
Central Japan Railway Co. | | |
| | |
Chubu Electric Power Co., Inc. | | |
Chugai Pharmaceutical Co. Ltd. | | |
Concordia Financial Group Ltd. | | |
| | |
Dai Nippon Printing Co. Ltd. | | |
| | |
Dai-ichi Life Holdings, Inc. | | |
| | |
| | |
Daito Trust Construction Co. Ltd. | | |
Daiwa House Industry Co. Ltd. | | |
Daiwa House REIT Investment Corp., REIT | | |
Daiwa Securities Group, Inc. | | |
| | |
| | |
| | |
| | |
| | |
| | |
| | |
| | |
| | |
| | |
| | |
| | |
GMO Payment Gateway, Inc. | | |
Hakuhodo DY Holdings, Inc. | | |
| | |
Hankyu Hanshin Holdings, Inc. | | |
| | |
|
|
| | |
| | |
Hitachi Construction Machinery Co. Ltd. | | |
| | |
| | |
| | |
| | |
| | |
| | |
| | |
Iida Group Holdings Co. Ltd. | | |
| | |
| | |
| | |
| | |
Itochu Techno-Solutions Corp. | | |
Japan Airlines Co. Ltd. * | | |
Japan Exchange Group, Inc. | | |
Japan Metropolitan Fund Invest, REIT | | |
| | |
Japan Post Holdings Co. Ltd. | | |
Japan Post Insurance Co. Ltd. | | |
Japan Real Estate Investment Corp., REIT | | |
| | |
| | |
| | |
| | |
| | |
Kansai Electric Power Co., Inc. (The) | | |
| | |
| | |
| | |
Keisei Electric Railway Co. Ltd. | | |
| | |
| | |
Kintetsu Group Holdings Co. Ltd. | | |
| | |
Kobayashi Pharmaceutical Co. Ltd. | | |
| | |
Koei Tecmo Holdings Co. Ltd. | | |
Koito Manufacturing Co. Ltd. | | |
| | |
| | |
SEE NOTES TO FINANCIAL STATEMENTS.
| | |
Common Stocks — continued |
|
| | |
| | |
Kurita Water Industries Ltd. | | |
| | |
| | |
| | |
| | |
| | |
| | |
| | |
| | |
McDonald's Holdings Co. Japan Ltd. | | |
| | |
| | |
| | |
Mitsubishi Chemical Group Corp. | | |
| | |
Mitsubishi Electric Corp. | | |
Mitsubishi Estate Co. Ltd. | | |
Mitsubishi HC Capital, Inc. | | |
Mitsubishi Heavy Industries Ltd. | | |
Mitsubishi UFJ Financial Group, Inc. | | |
| | |
| | |
| | |
| | |
Mizuho Financial Group, Inc. | | |
| | |
MS&AD Insurance Group Holdings, Inc. | | |
Murata Manufacturing Co. Ltd. | | |
| | |
| | |
| | |
| | |
Nihon M&A Center Holdings, Inc. | | |
| | |
Nippon Building Fund, Inc., REIT | | |
NIPPON EXPRESS HOLDINGS, Inc. | | |
Nippon Paint Holdings Co. Ltd. | | |
Nippon Prologis REIT, Inc., REIT | | |
Nippon Sanso Holdings Corp. | | |
| | |
| | |
Nippon Telegraph & Telephone Corp. | | |
| | |
|
|
| | |
| | |
| | |
Nisshin Seifun Group, Inc. | | |
Nissin Foods Holdings Co. Ltd. | | |
| | |
| | |
| | |
Nomura Real Estate Holdings, Inc. | | |
Nomura Real Estate Master Fund, Inc., REIT | | |
Nomura Research Institute Ltd. | | |
| | |
| | |
| | |
Odakyu Electric Railway Co. Ltd. | | |
| | |
| | |
| | |
Ono Pharmaceutical Co. Ltd. | | |
Open House Group Co. Ltd. | | |
| | |
| | |
| | |
| | |
| | |
| | |
Pan Pacific International Holdings Corp. | | |
| | |
| | |
| | |
Recruit Holdings Co. Ltd. | | |
Renesas Electronics Corp. * | | |
| | |
| | |
| | |
| | |
| | |
| | |
| | |
Sekisui Chemical Co. Ltd. | | |
| | |
Seven & i Holdings Co. Ltd. | | |
| | |
SEE NOTES TO FINANCIAL STATEMENTS.
JPMorgan Global Allocation Fund
SCHEDULE OF PORTFOLIO INVESTMENTS
AS OF October 31, 2022 (continued)
| | |
Common Stocks — continued |
|
| | |
| | |
| | |
| | |
Shin-Etsu Chemical Co. Ltd. | | |
| | |
| | |
Shizuoka Financial Group, Inc. | | |
| | |
| | |
| | |
| | |
| | |
Square Enix Holdings Co. Ltd. | | |
| | |
| | |
Sumitomo Chemical Co. Ltd. | | |
| | |
Sumitomo Electric Industries Ltd. | | |
Sumitomo Metal Mining Co. Ltd. | | |
Sumitomo Mitsui Financial Group, Inc. | | |
Sumitomo Mitsui Trust Holdings, Inc. | | |
Sumitomo Realty & Development Co. Ltd. | | |
Suntory Beverage & Food Ltd. | | |
| | |
| | |
| | |
| | |
Takeda Pharmaceutical Co. Ltd. | | |
| | |
| | |
| | |
| | |
| | |
Tokio Marine Holdings, Inc. | | |
Tokyo Electric Power Co. Holdings, Inc. * | | |
| | |
| | |
| | |
| | |
| | |
| | |
| | |
|
|
| | |
| | |
| | |
| | |
| | |
| | |
| | |
| | |
| | |
| | |
| | |
| | |
| | |
| | |
| | |
| | |
| | |
| | |
| | |
|
Hikma Pharmaceuticals plc | | |
|
| | |
| | |
| | |
|
Galaxy Entertainment Group Ltd. | | |
| | |
| | |
|
Grupo Aeroportuario del Pacifico SAB de CV, Class B | | |
Grupo Aeroportuario del Sureste SAB de CV, ADR | | |
Grupo Financiero Banorte SAB de CV, Class O | | |
Wal-Mart de Mexico SAB de CV | | |
| | |
|
ABN AMRO Bank NV, CVA (b) | | |
| | |
| | |
SEE NOTES TO FINANCIAL STATEMENTS.
| | |
Common Stocks — continued |
|
| | |
| | |
| | |
| | |
| | |
| | |
| | |
| | |
| | |
| | |
| | |
| | |
Koninklijke Ahold Delhaize NV | | |
| | |
| | |
| | |
| | |
| | |
| | |
| | |
| | |
| | |
| | |
|
Auckland International Airport Ltd. * | | |
Fisher & Paykel Healthcare Corp. Ltd. | | |
| | |
| | |
| | |
| | |
| | |
|
| | |
| | |
| | |
Gjensidige Forsikring ASA | | |
| | |
| | |
| | |
| | |
| | |
|
|
| | |
| | |
| | |
|
| | |
|
| | |
|
EDP - Energias de Portugal SA | | |
| | |
| | |
| | |
|
| | |
|
| | |
TCS Group Holding plc, GDR ‡ * (b) | | |
| | |
|
Saudi National Bank (The) | | |
|
CapitaLand Ascendas REIT, REIT | | |
CapitaLand Integrated Commercial Trust, REIT | | |
Capitaland Investment Ltd. | | |
| | |
| | |
| | |
Grab Holdings Ltd., Class A * | | |
| | |
Mapletree Logistics Trust, REIT | | |
Mapletree Pan Asia Commercial Trust, REIT | | |
Oversea-Chinese Banking Corp. Ltd. | | |
| | |
Singapore Airlines Ltd. * | | |
| | |
Singapore Technologies Engineering Ltd. | | |
Singapore Telecommunications Ltd. | | |
| | |
SEE NOTES TO FINANCIAL STATEMENTS.
JPMorgan Global Allocation Fund
SCHEDULE OF PORTFOLIO INVESTMENTS
AS OF October 31, 2022 (continued)
| | |
Common Stocks — continued |
|
United Overseas Bank Ltd. | | |
| | |
| | |
| | |
|
| | |
| | |
Capitec Bank Holdings Ltd. | | |
| | |
| | |
| | |
| | |
| | |
|
| | |
| | |
| | |
| | |
| | |
KIWOOM Securities Co. Ltd. | | |
| | |
| | |
| | |
| | |
Samsung Electronics Co. Ltd. | | |
| | |
| | |
| | |
|
| | |
ACS Actividades de Construccion y Servicios SA | | |
| | |
| | |
Banco Bilbao Vizcaya Argentaria SA (a) | | |
| | |
| | |
| | |
| | |
| | |
| | |
| | |
| | |
|
|
| | |
| | |
Industria de Diseno Textil SA | | |
| | |
| | |
| | |
Siemens Gamesa Renewable Energy SA * | | |
| | |
| | |
|
| | |
| | |
| | |
| | |
| | |
Electrolux AB, Class B (a) | | |
| | |
| | |
| | |
| | |
| | |
| | |
Fastighets AB Balder, Class B * | | |
| | |
H & M Hennes & Mauritz AB, Class B (a) | | |
| | |
| | |
| | |
Industrivarden AB, Class A | | |
Industrivarden AB, Class C | | |
| | |
Investment AB Latour, Class B | | |
| | |
| | |
| | |
L E Lundbergforetagen AB, Class B | | |
| | |
Nibe Industrier AB, Class B | | |
| | |
| | |
Securitas AB, Class B (a) | | |
SEE NOTES TO FINANCIAL STATEMENTS.
| | |
Common Stocks — continued |
|
Skandinaviska Enskilda Banken AB, Class A | | |
| | |
| | |
Svenska Cellulosa AB SCA, Class B | | |
Svenska Handelsbanken AB, Class A | | |
| | |
| | |
Swedish Orphan Biovitrum AB * | | |
| | |
Telefonaktiebolaget LM Ericsson, Class B | | |
| | |
| | |
| | |
Volvo Car AB, Class B * (a) | | |
| | |
|
| | |
Adecco Group AG (Registered) | | |
| | |
Bachem Holding AG, Class B | | |
Baloise Holding AG (Registered) | | |
Barry Callebaut AG (Registered) | | |
Chocoladefabriken Lindt & Spruengli AG | | |
Chocoladefabriken Lindt & Spruengli AG (Registered) | | |
Cie Financiere Richemont SA (Registered) | | |
Clariant AG (Registered) * | | |
Credit Suisse Group AG (Registered) | | |
EMS-Chemie Holding AG (Registered) | | |
| | |
| | |
| | |
| | |
Kuehne + Nagel International AG (Registered) | | |
Logitech International SA (Registered) | | |
Lonza Group AG (Registered) | | |
| | |
Partners Group Holding AG | | |
| | |
Schindler Holding AG (Registered) | | |
| | |
|
|
| | |
| | |
| | |
Sonova Holding AG (Registered) | | |
Straumann Holding AG (Registered) | | |
| | |
Swatch Group AG (The) (Registered) | | |
Swiss Life Holding AG (Registered) | | |
Swiss Prime Site AG (Registered) | | |
| | |
| | |
UBS Group AG (Registered) | | |
| | |
Wizz Air Holdings plc * (b) | | |
Zurich Insurance Group AG | | |
| | |
|
| | |
| | |
| | |
Chailease Holding Co. Ltd. | | |
| | |
| | |
Largan Precision Co. Ltd. | | |
Realtek Semiconductor Corp. | | |
Taiwan Semiconductor Manufacturing Co. Ltd. | | |
Taiwan Semiconductor Manufacturing Co. Ltd., ADR | | |
| | |
Tanzania, United Republic of — 0.0% ^ |
| | |
|
PTT Exploration & Production PCL | | |
| | |
| | |
| | |
United Arab Emirates — 0.0% ^ |
| | |
|
| | |
| | |
SEE NOTES TO FINANCIAL STATEMENTS.
JPMorgan Global Allocation Fund
SCHEDULE OF PORTFOLIO INVESTMENTS
AS OF October 31, 2022 (continued)
| | |
Common Stocks — continued |
United Kingdom — continued |
| | |
| | |
Associated British Foods plc | | |
| | |
Auto Trader Group plc (b) | | |
| | |
| | |
| | |
| | |
| | |
Berkeley Group Holdings plc | | |
| | |
British American Tobacco plc | | |
British Land Co. plc (The), REIT | | |
| | |
| | |
| | |
CK Hutchison Holdings Ltd. | | |
CK Hutchison Holdings Ltd. | | |
| | |
Coca-Cola Europacific Partners plc | | |
| | |
| | |
| | |
| | |
| | |
| | |
| | |
| | |
| | |
| | |
| | |
| | |
InterContinental Hotels Group plc | | |
| | |
| | |
| | |
| | |
Just Eat Takeaway.com NV * (b) | | |
| | |
Land Securities Group plc, REIT | | |
Legal & General Group plc | | |
| | |
| | |
| | |
|
United Kingdom — continued |
London Stock Exchange Group plc | | |
| | |
| | |
| | |
| | |
| | |
| | |
| | |
| | |
Phoenix Group Holdings plc | | |
Reckitt Benckiser Group plc | | |
| | |
| | |
| | |
Rolls-Royce Holdings plc * | | |
| | |
| | |
| | |
| | |
| | |
| | |
Spirax-Sarco Engineering plc | | |
| | |
| | |
| | |
| | |
| | |
| | |
United Utilities Group plc | | |
| | |
| | |
| | |
| | |
|
| | |
Advanced Micro Devices, Inc. * | | |
| | |
Albertsons Cos., Inc., Class A | | |
| | |
Alnylam Pharmaceuticals, Inc. * | | |
Alphabet, Inc., Class C * | | |
| | |
| | |
SEE NOTES TO FINANCIAL STATEMENTS.
| | |
Common Stocks — continued |
United States — continued |
American Electric Power Co., Inc. | | |
| | |
American Homes 4 Rent, Class A, REIT | | |
American International Group, Inc. | | |
| | |
| | |
| | |
Apple Hospitality REIT, Inc., REIT | | |
| | |
| | |
| | |
| | |
Atlassian Corp., Class A * | | |
| | |
Axalta Coating Systems Ltd. * | | |
| | |
| | |
| | |
Baxter International, Inc. | | |
| | |
Berkshire Hathaway, Inc., Class B * | | |
| | |
BioMarin Pharmaceutical, Inc. * | | |
BJ's Wholesale Club Holdings, Inc. * | | |
| | |
| | |
| | |
Boston Scientific Corp. * | | |
| | |
Brixmor Property Group, Inc., REIT | | |
Bumble, Inc., Class A * (a) | | |
| | |
Burlington Stores, Inc. * | | |
Capital One Financial Corp. | | |
| | |
| | |
| | |
| | |
| | |
CBRE Group, Inc., Class A * | | |
| | |
| | |
Charles Schwab Corp. (The) | | |
Charter Communications, Inc., Class A * | | |
| | |
|
United States — continued |
| | |
| | |
| | |
| | |
| | |
| | |
| | |
| | |
Citizens Financial Group, Inc. | | |
Claire's Stores, Inc. ‡ * | | |
| | |
| | |
| | |
| | |
| | |
CommScope Holding Co., Inc. * | | |
| | |
Confluent, Inc., Class A * (a) | | |
| | |
Constellation Brands, Inc., Class A | | |
| | |
| | |
| | |
| | |
Crowdstrike Holdings, Inc., Class A * | | |
| | |
| | |
| | |
| | |
| | |
| | |
| | |
| | |
| | |
Dick's Sporting Goods, Inc. (a) | | |
| | |
| | |
EastGroup Properties, Inc., REIT | | |
| | |
| | |
| | |
Elanco Animal Health, Inc. * | | |
| | |
| | |
SEE NOTES TO FINANCIAL STATEMENTS.
JPMorgan Global Allocation Fund
SCHEDULE OF PORTFOLIO INVESTMENTS
AS OF October 31, 2022 (continued)
| | |
Common Stocks — continued |
United States — continued |
| | |
| | |
| | |
| | |
| | |
| | |
Equity LifeStyle Properties, Inc., REIT | | |
Estee Lauder Cos., Inc. (The), Class A | | |
| | |
| | |
| | |
Federal Realty Investment Trust, REIT (a) | | |
| | |
| | |
Fidelity National Information Services, Inc. | | |
| | |
| | |
| | |
FleetCor Technologies, Inc. * | | |
Fortune Brands Home & Security, Inc. | | |
| | |
| | |
| | |
| | |
| | |
| | |
| | |
Goodman Networks, Inc. ‡ * | | |
| | |
Hartford Financial Services Group, Inc. (The) | | |
| | |
| | |
Hilton Worldwide Holdings, Inc. | | |
| | |
Honeywell International, Inc. | | |
Horizon Therapeutics plc * | | |
| | |
| | |
| | |
| | |
| | |
| | |
|
United States — continued |
| | |
| | |
Intercontinental Exchange, Inc. | | |
International Business Machines Corp. | | |
| | |
Intuitive Surgical, Inc. * | | |
| | |
| | |
James Hardie Industries plc, CHDI | | |
Jazz Pharmaceuticals plc * | | |
JBG SMITH Properties, REIT | | |
| | |
| | |
| | |
Keysight Technologies, Inc. * | | |
| | |
| | |
Kite Realty Group Trust, REIT | | |
Knight-Swift Transportation Holdings, Inc. | | |
| | |
| | |
| | |
Laboratory Corp. of America Holdings | | |
| | |
Lamar Advertising Co., Class A, REIT | | |
Lamb Weston Holdings, Inc. | | |
| | |
Liberty Broadband Corp., Class C * | | |
Liberty Media Corp.-Liberty SiriusXM, Class C * | | |
| | |
| | |
| | |
Marriott International, Inc., Class A | | |
Marsh & McLennan Cos., Inc. | | |
Martin Marietta Materials, Inc. | | |
| | |
Mastercard, Inc., Class A | | |
| | |
| | |
| | |
| | |
Meta Platforms, Inc., Class A * | | |
SEE NOTES TO FINANCIAL STATEMENTS.
| | |
Common Stocks — continued |
United States — continued |
Mettler-Toledo International, Inc. * | | |
| | |
Mid-America Apartment Communities, Inc., REIT | | |
| | |
Mohawk Industries, Inc. * | | |
| | |
Moran Foods Backstop Equity ‡ * | | |
| | |
| | |
| | |
| | |
National Vision Holdings, Inc. * | | |
| | |
| | |
Nexstar Media Group, Inc., Class A | | |
| | |
| | |
| | |
| | |
| | |
| | |
| | |
Old Dominion Freight Line, Inc. | | |
Packaging Corp. of America | | |
Palo Alto Networks, Inc. * | | |
| | |
Performance Food Group Co. * | | |
| | |
Philip Morris International, Inc. | | |
| | |
PNC Financial Services Group, Inc. (The) | | |
| | |
| | |
Procter & Gamble Co. (The) | | |
| | |
| | |
Public Service Enterprise Group, Inc. | | |
| | |
| | |
| | |
| | |
| | |
Raymond James Financial, Inc. | | |
| | |
|
United States — continued |
| | |
Raytheon Technologies Corp. | | |
Regeneron Pharmaceuticals, Inc. * | | |
| | |
| | |
Rockwell Automation, Inc. | | |
| | |
Royal Caribbean Cruises Ltd. * (a) | | |
Royalty Pharma plc, Class A | | |
| | |
SBA Communications Corp., REIT | | |
| | |
Seagate Technology Holdings plc | | |
| | |
Sherwin-Williams Co. (The) | | |
SolarEdge Technologies, Inc. * | | |
| | |
Sun Communities, Inc., REIT | | |
| | |
| | |
| | |
| | |
T. Rowe Price Group, Inc. | | |
Take-Two Interactive Software, Inc. * | | |
| | |
| | |
| | |
| | |
| | |
Texas Instruments, Inc. (d) | | |
| | |
Thermo Fisher Scientific, Inc. | | |
| | |
| | |
| | |
| | |
Trade Desk, Inc. (The), Class A * (a) | | |
| | |
Travelers Cos., Inc. (The) | | |
| | |
Uber Technologies, Inc. * | | |
| | |
UnitedHealth Group, Inc. (d) | | |
| | |
SEE NOTES TO FINANCIAL STATEMENTS.
JPMorgan Global Allocation Fund
SCHEDULE OF PORTFOLIO INVESTMENTS
AS OF October 31, 2022 (continued)
| | |
Common Stocks — continued |
United States — continued |
| | |
| | |
Verizon Communications, Inc. (d) | | |
Vertex Pharmaceuticals, Inc. * | | |
| | |
| | |
| | |
| | |
| | |
| | |
Williams Cos., Inc. (The) | | |
| | |
| | |
Zebra Technologies Corp., Class A * | | |
Zimmer Biomet Holdings, Inc. | | |
Zoom Video Communications, Inc., Class A * | | |
| | |
| | |
Total Common Stocks
(Cost $1,678,031) | | |
| | |
Foreign Government Securities — 17.7% |
|
Commonwealth of Australia | | |
| | |
| | |
| | |
| | |
| | |
| | |
| | |
| | |
| | |
|
| | |
| | |
| | |
| | |
| | |
| | |
| | |
|
|
| | |
| | |
| | |
| | |
| | |
| | |
|
| | |
| | |
| | |
| | |
| | |
| | |
| | |
| | |
| | |
| | |
Province of Alberta 2.90%, 12/1/2028 | | |
Province of British Columbia | | |
| | |
| | |
| | |
| | |
| | |
| | |
|
Export-Import Bank of China (The) 0.75%, 5/28/2023 (b) | | |
People's Republic of China 2.69%, 8/15/2032 | | |
| | |
|
| | |
| | |
| | |
| | |
| | |
| | |
| | |
SEE NOTES TO FINANCIAL STATEMENTS.
| | |
Foreign Government Securities — continued |
|
| | |
| | |
| | |
| | |
| | |
| | |
| | |
| | |
| | |
| | |
|
Bundesrepublik Deutschland | | |
| | |
| | |
| | |
| | |
| | |
|
| | |
| | |
| | |
| | |
|
| | |
| | |
| | |
| | |
|
Buoni Poliennali del Tesoro | | |
| | |
| | |
| | |
| | |
| | |
| | |
| | |
| | |
| | |
| | |
| | |
| | |
| | |
| | |
|
|
| | |
| | |
| | |
| | |
| | |
| | |
| | |
| | |
Italian Republic Government Bond 2.38%, 10/17/2024 | | |
| | |
|
Japan Bank for International Cooperation 1.63%, 1/20/2027 | | |
Japan Finance Organization for Municipalities 3.25%, 4/24/2023 (e) | | |
| | |
| | |
| | |
| | |
| | |
| | |
| | |
| | |
| | |
| | |
| | |
| | |
| | |
| | |
| | |
| | |
| | |
| | |
| | |
| | |
| | |
| | |
| | |
| | |
| | |
| | |
SEE NOTES TO FINANCIAL STATEMENTS.
JPMorgan Global Allocation Fund
SCHEDULE OF PORTFOLIO INVESTMENTS
AS OF October 31, 2022 (continued)
| | |
Foreign Government Securities — continued |
|
| | |
| | |
| | |
|
| | |
| | |
| | |
| | |
| | |
| | |
| | |
|
Republic of Peru 1.86%, 12/1/2032 | | |
|
Republic of Philippines 0.25%, 4/28/2025 | | |
|
State of Qatar 3.88%, 4/23/2023 (e) | | |
|
Romania Government Bond 2.00%, 4/14/2033 (e) | | |
|
Kingdom of Saudi Arabia 2.25%, 2/2/2033 (e) | | |
|
Export-Import Bank of Korea | | |
| | |
| | |
Republic of Korea 0.00%, 9/16/2025 | | |
| | |
|
Bonos and Obligaciones del Estado | | |
| | |
| | |
| | |
| | |
| | |
| | |
| | |
| | |
| | |
| | |
|
|
| | |
| | |
| | |
|
| | |
| | |
| | |
| | |
| | |
| | |
| | |
Svensk Exportkredit AB 2.88%, 3/14/2023 | | |
| | |
United Arab Emirates — 0.0% ^ |
United Arab Emirates Government Bond 0.75%, 9/2/2023 (e) | | |
|
United Kingdom of Great Britain and Northern Ireland | | |
| | |
| | |
| | |
| | |
| | |
| | |
| | |
| | |
| | |
| | |
| | |
| | |
| | |
| | |
| | |
| | |
| | |
| | |
| | |
| | |
| | |
| | |
| | |
SEE NOTES TO FINANCIAL STATEMENTS.
| | |
Foreign Government Securities — continued |
United Kingdom — continued |
| | |
| | |
| | |
| | |
| | |
| | |
| | |
| | |
| | |
| | |
| | |
| | |
| | |
Total Foreign Government Securities
(Cost $724,606) | | |
|
|
FMG Resources August 2006 Pty. Ltd. 4.50%, 9/15/2027 (e) | | |
Glencore Funding LLC 4.13%, 5/30/2023 (e) | | |
Mineral Resources Ltd. 8.13%, 5/1/2027 (e) | | |
| | |
| | |
| | |
| | |
|
1011778 BC ULC 4.38%, 1/15/2028 (e) | | |
Baffinland Iron Mines Corp. 8.75%, 7/15/2026 (e) | | |
Bank of Nova Scotia (The) | | |
| | |
| | |
Baytex Energy Corp. 8.75%, 4/1/2027 (e) | | |
| | |
| | |
| | |
Canadian Imperial Bank of Commerce 0.45%, 6/22/2023 | | |
Garda World Security Corp. 4.63%, 2/15/2027 (e) | | |
| | |
|
|
GFL Environmental, Inc. 5.13%, 12/15/2026 (e) | | |
MEG Energy Corp. 7.13%, 2/1/2027 (e) | | |
Ontario Teachers' Finance Trust | | |
| | |
| | |
| | |
Parkland Corp. 5.88%, 7/15/2027 (e) | | |
Province of Ontario 1.13%, 5/15/2026 (b) | | |
Titan Acquisition Ltd. 7.75%, 4/15/2026 (e) | | |
Videotron Ltd. 5.13%, 4/15/2027 (e) | | |
| | |
|
Global Aircraft Leasing Co. Ltd. 6.50% (Cash), 9/15/2024 (e) (f) | | |
|
BNP Paribas SA 3.50%, 3/1/2023 (e) | | |
| | |
| | |
| | |
| | |
| | |
| | |
Iliad Holding SASU 6.50%, 10/15/2026 (e) | | |
| | |
|
Kreditanstalt fuer Wiederaufbau 0.00%, 12/15/2022 | | |
Mercedes-Benz Finance North America LLC 3.35%, 2/22/2023 (e) | | |
TK Elevator US Newco, Inc. 5.25%, 7/15/2027 (e) | | |
Volkswagen Group of America Finance LLC 3.13%, 5/12/2023 (e) | | |
| | |
|
Cimpress plc 7.00%, 6/15/2026 (e) | | |
SEE NOTES TO FINANCIAL STATEMENTS.
JPMorgan Global Allocation Fund
SCHEDULE OF PORTFOLIO INVESTMENTS
AS OF October 31, 2022 (continued)
| | |
Corporate Bonds — continued |
|
Development Bank of Japan, Inc. 3.13%, 9/6/2023 (e) | | |
Mizuho Financial Group, Inc. | | |
| | |
(SOFR + 0.87%), 0.85%, 9/8/2024 (g) | | |
NTT Finance Corp. 0.37%, 3/3/2023 (a) (e) | | |
| | |
|
Altice France Holding SA 10.50%, 5/15/2027 (e) | | |
|
MGM China Holdings Ltd. 4.75%, 2/1/2027 (e) | | |
| | |
| | |
| | |
| | |
|
BNG Bank NV 4.75%, 3/6/2023 (b) | | |
Nederlandse Waterschapsbank NV | | |
| | |
| | |
Trivium Packaging Finance BV | | |
| | |
| | |
| | |
|
ASB Bank Ltd. 3.75%, 6/14/2023 (e) | | |
|
Saudi Arabian Oil Co. 1.25%, 11/24/2023 (e) | | |
|
| | |
| | |
| | |
| | |
| | |
|
Korea Development Bank (The) | | |
| | |
| | |
|
|
| | |
Korea Southern Power Co. Ltd. 0.75%, 1/27/2026 (e) | | |
| | |
|
VistaJet Malta Finance plc 7.88%, 5/1/2027 (e) | | |
|
Connect Finco SARL 6.75%, 10/1/2026 (e) | | |
eG Global Finance plc 6.75%, 2/7/2025 (e) | | |
INEOS Quattro Finance 2 plc 3.38%, 1/15/2026 (a) (e) | | |
Petrofac Ltd. 9.75%, 11/15/2026 (e) | | |
Virgin Media Secured Finance plc 5.50%, 5/15/2029 (e) | | |
| | |
|
| | |
| | |
| | |
Acrisure LLC 7.00%, 11/15/2025 (e) | | |
Adtalem Global Education, Inc. 5.50%, 3/1/2028 (e) | | |
| | |
Aethon United BR LP 8.25%, 2/15/2026 (e) | | |
AIG Global Funding 0.80%, 7/7/2023 (a) (e) | | |
Albertsons Cos., Inc. 3.25%, 3/15/2026 (e) | | |
Alliant Holdings Intermediate LLC | | |
| | |
| | |
Allied Universal Holdco LLC 6.63%, 7/15/2026 (e) | | |
Allison Transmission, Inc. 4.75%, 10/1/2027 (e) | | |
AMC Entertainment Holdings, Inc. 10.00% (Cash), 6/15/2026 (a) (e) (f) | | |
AMC Networks, Inc. 4.75%, 8/1/2025 | | |
American Airlines Group, Inc. 3.75%, 3/1/2025 (a) (e) | | |
SEE NOTES TO FINANCIAL STATEMENTS.
| | |
Corporate Bonds — continued |
United States — continued |
| | |
| | |
| | |
| | |
American Axle & Manufacturing, Inc. | | |
| | |
| | |
AmeriGas Partners LP 5.50%, 5/20/2025 | | |
AMN Healthcare, Inc. 4.63%, 10/1/2027 (e) | | |
Antero Midstream Partners LP | | |
| | |
| | |
APX Group, Inc. 6.75%, 2/15/2027 (e) | | |
Aramark Services, Inc. 6.38%, 5/1/2025 (e) | | |
Archrock Partners LP 6.88%, 4/1/2027 (e) | | |
| | |
| | |
| | |
Ardagh Packaging Finance plc | | |
| | |
| | |
Artera Services LLC 9.03%, 12/4/2025 (e) | | |
Ascent Resources Utica Holdings LLC 7.00%, 11/1/2026 (e) | | |
ASGN, Inc. 4.63%, 5/15/2028 (e) | | |
AT&T, Inc. (ICE LIBOR USD 3 Month + 0.89%), 3.80%, 2/15/2023 (g) | | |
ATI, Inc. 5.88%, 12/1/2027 | | |
Avient Corp. 5.75%, 5/15/2025 (e) | | |
Axalta Coating Systems LLC 4.75%, 6/15/2027 (a) (e) | | |
B&G Foods, Inc. 5.25%, 9/15/2027 (a) | | |
Ball Corp. 4.88%, 3/15/2026 (a) | | |
Bath & Body Works, Inc. 5.25%, 2/1/2028 | | |
Bausch Health Americas, Inc. | | |
| | |
| | |
| | |
|
United States — continued |
Bausch Health Cos., Inc. 5.50%, 11/1/2025 (e) | | |
BCPE Empire Holdings, Inc. 7.63%, 5/1/2027 (a) (e) | | |
Block, Inc. 2.75%, 6/1/2026 | | |
Booz Allen Hamilton, Inc. 3.88%, 9/1/2028 (e) | | |
Boyd Gaming Corp. 4.75%, 12/1/2027 | | |
Brink's Co. (The) 4.63%, 10/15/2027 (e) | | |
Brookfield Property REIT, Inc. REIT, 5.75%, 5/15/2026 (e) | | |
Caesars Entertainment, Inc. | | |
| | |
| | |
Caesars Resort Collection LLC 5.75%, 7/1/2025 (e) | | |
| | |
| | |
| | |
Calumet Specialty Products Partners LP 11.00%, 4/15/2025 (a) (e) | | |
Camelot Finance SA 4.50%, 11/1/2026 (e) | | |
Capital One Financial Corp. (ICE LIBOR USD 3 Month + 0.72%), 5.13%, 1/30/2023 (g) | | |
| | |
| | |
| | |
| | |
Carvana Co. 5.63%, 10/1/2025 (a) (e) | | |
Catalent Pharma Solutions, Inc. 5.00%, 7/15/2027 (e) | | |
CCO Holdings LLC 5.00%, 2/1/2028 (e) | | |
CD&R Smokey Buyer, Inc. 6.75%, 7/15/2025 (e) | | |
CEC Entertainment LLC 6.75%, 5/1/2026 (e) | | |
Cedar Fair LP 5.50%, 5/1/2025 (e) | | |
CenterPoint Energy Resources Corp. (ICE LIBOR USD 3 Month + 0.50%), 3.60%, 3/2/2023 (g) | | |
Century Communities, Inc. 6.75%, 6/1/2027 | | |
SEE NOTES TO FINANCIAL STATEMENTS.
JPMorgan Global Allocation Fund
SCHEDULE OF PORTFOLIO INVESTMENTS
AS OF October 31, 2022 (continued)
| | |
Corporate Bonds — continued |
United States — continued |
Chemours Co. (The) 5.38%, 5/15/2027 | | |
Chesapeake Energy Corp. 5.50%, 2/1/2026 (e) | | |
Chevron Phillips Chemical Co. LLC 3.30%, 5/1/2023 (e) | | |
Chubb INA Holdings, Inc. 2.70%, 3/13/2023 | | |
Churchill Downs, Inc. 5.50%, 4/1/2027 (e) | | |
Cigna Corp. 3.00%, 7/15/2023 | | |
Cinemark USA, Inc. 8.75%, 5/1/2025 (e) | | |
| | |
| | |
| | |
Clarivate Science Holdings Corp. 3.88%, 7/1/2028 (e) | | |
Clear Channel Outdoor Holdings, Inc. | | |
| | |
| | |
| | |
| | |
| | |
CMG Media Corp. 8.88%, 12/15/2027 (e) | | |
CNX Resources Corp. 7.25%, 3/14/2027 (e) | | |
| | |
| | |
| | |
Community Health Systems, Inc. | | |
| | |
| | |
Compass Minerals International, Inc. 6.75%, 12/1/2027 (e) | | |
Consolidated Communications, Inc. 6.50%, 10/1/2028 (e) | | |
CoreCivic, Inc. 8.25%, 4/15/2026 (a) | | |
Coty, Inc. 5.00%, 4/15/2026 (e) | | |
Crescent Energy Finance LLC 7.25%, 5/1/2026 (e) | | |
Crestwood Midstream Partners LP | | |
| | |
| | |
Crown Americas LLC 4.75%, 2/1/2026 | | |
| | |
|
United States — continued |
CrownRock LP 5.63%, 10/15/2025 (e) | | |
CSC Holdings LLC 5.50%, 4/15/2027 (e) | | |
CVR Energy, Inc. 5.25%, 2/15/2025 (e) | | |
CWT Travel Group, Inc. 8.50%, 11/19/2026 (a) (e) | | |
Dana, Inc. 5.38%, 11/15/2027 | | |
| | |
| | |
| | |
| | |
| | |
| | |
| | |
Diebold Nixdorf, Inc. 9.38%, 7/15/2025 (a) (e) | | |
Directv Financing LLC 5.88%, 8/15/2027 (e) | | |
DISH DBS Corp. 5.25%, 12/1/2026 (e) | | |
Dominion Energy, Inc. 2.45%, 1/15/2023 (e) | | |
Eco Material Technologies, Inc. 7.88%, 1/31/2027 (e) | | |
Elevance Health, Inc. 0.45%, 3/15/2023 (a) | | |
Encompass Health Corp. 4.50%, 2/1/2028 | | |
EQM Midstream Partners LP | | |
| | |
| | |
Eversource Energy 2.80%, 5/1/2023 | | |
Ferrellgas LP 5.38%, 4/1/2026 (e) | | |
Fifth Third Bancorp 1.63%, 5/5/2023 | | |
Ford Motor Credit Co. LLC | | |
| | |
| | |
Fortress Transportation & Infrastructure Investors LLC 6.50%, 10/1/2025 (e) | | |
Freedom Mortgage Corp. 6.63%, 1/15/2027 (e) | | |
Frontier Communications Holdings LLC 5.88%, 10/15/2027 (e) | | |
FXI Holdings, Inc. 12.25%, 11/15/2026 (a) (e) | | |
SEE NOTES TO FINANCIAL STATEMENTS.
| | |
Corporate Bonds — continued |
United States — continued |
Gartner, Inc. 4.50%, 7/1/2028 (e) | | |
Gates Global LLC 6.25%, 1/15/2026 (e) | | |
| | |
| | |
| | |
| | |
Global Medical Response, Inc. 6.50%, 10/1/2025 (e) | | |
Global Net Lease, Inc. REIT, 3.75%, 12/15/2027 (e) | | |
Goldman Sachs Group, Inc. (The) | | |
| | |
(SOFR + 0.58%), 0.67%, 3/8/2024 (a) (g) | | |
GoTo Group, Inc. 5.50%, 9/1/2027 (e) | | |
Gray Television, Inc. 7.00%, 5/15/2027 (e) | | |
Griffon Corp. 5.75%, 3/1/2028 | | |
GrubHub Holdings, Inc. 5.50%, 7/1/2027 (e) | | |
Guitar Center, Inc. 8.50%, 1/15/2026 (e) | | |
Gulfport Energy Corp. 8.00%, 5/17/2026 (a) | | |
HAT Holdings I LLC REIT, 3.38%, 6/15/2026 (e) | | |
Hawaiian Brand Intellectual Property Ltd. 5.75%, 1/20/2026 (e) | | |
Herbalife Nutrition Ltd. 7.88%, 9/1/2025 (e) | | |
Herc Holdings, Inc. 5.50%, 7/15/2027 (e) | | |
Hertz Corp. (The) 4.63%, 12/1/2026 (e) | | |
Hess Midstream Operations LP 5.63%, 2/15/2026 (e) | | |
Hilton Worldwide Finance LLC 4.88%, 4/1/2027 | | |
Holly Energy Partners LP 5.00%, 2/1/2028 (e) | | |
Home Point Capital, Inc. 5.00%, 2/1/2026 (e) | | |
Howmet Aerospace, Inc. 6.88%, 5/1/2025 | | |
HUB International Ltd. 7.00%, 5/1/2026 (e) | | |
| | |
|
United States — continued |
Hughes Satellite Systems Corp. 6.63%, 8/1/2026 | | |
Icahn Enterprises LP 5.25%, 5/15/2027 | | |
iHeartCommunications, Inc. | | |
| | |
| | |
International Game Technology plc 4.13%, 4/15/2026 (e) | | |
Intrado Corp. 8.50%, 10/15/2025 (e) | | |
IQVIA, Inc. 5.00%, 5/15/2027 (e) | | |
IRB Holding Corp. 7.00%, 6/15/2025 (e) | | |
Iron Mountain, Inc. REIT, 4.88%, 9/15/2027 (e) | | |
iStar, Inc. REIT, 4.25%, 8/1/2025 | | |
Jazz Securities DAC 4.38%, 1/15/2029 (e) | | |
John Deere Capital Corp. (SOFR + 0.12%), 3.15%, 7/10/2023 (g) | | |
KAR Auction Services, Inc. 5.13%, 6/1/2025 (e) | | |
Kennedy-Wilson, Inc. 4.75%, 3/1/2029 | | |
Kinder Morgan, Inc. (ICE LIBOR USD 3 Month + 1.28%), 5.36%, 1/15/2023 (g) | | |
| | |
| | |
10.50%, 7/15/2027 (a) (e) | | |
Ladder Capital Finance Holdings LLLP REIT, 4.25%, 2/1/2027 (e) | | |
Las Vegas Sands Corp. 3.50%, 8/18/2026 | | |
LD Holdings Group LLC 6.50%, 11/1/2025 (e) | | |
Level 3 Financing, Inc. 4.63%, 9/15/2027 (e) | | |
Life Time, Inc. 5.75%, 1/15/2026 (e) | | |
Live Nation Entertainment, Inc. | | |
| | |
| | |
LSF9 Atlantis Holdings LLC 7.75%, 2/15/2026 (e) | | |
Lumen Technologies, Inc. 4.00%, 2/15/2027 (a) (e) | | |
SEE NOTES TO FINANCIAL STATEMENTS.
JPMorgan Global Allocation Fund
SCHEDULE OF PORTFOLIO INVESTMENTS
AS OF October 31, 2022 (continued)
| | |
Corporate Bonds — continued |
United States — continued |
Masonite International Corp. 5.38%, 2/1/2028 (e) | | |
Matador Resources Co. 5.88%, 9/15/2026 | | |
Mattel, Inc. 3.38%, 4/1/2026 (e) | | |
Maxar Technologies, Inc. 7.75%, 6/15/2027 (e) | | |
McGraw-Hill Education, Inc. 5.75%, 8/1/2028 (e) | | |
Metropolitan Edison Co. 3.50%, 3/15/2023 (e) | | |
MGM Resorts International | | |
| | |
| | |
| | |
MicroStrategy, Inc. 6.13%, 6/15/2028 (e) | | |
Millennium Escrow Corp. 6.63%, 8/1/2026 (e) | | |
Mohegan Gaming & Entertainment 8.00%, 2/1/2026 (e) | | |
Morgan Stanley 3.13%, 1/23/2023 | | |
Moss Creek Resources Holdings, Inc. 7.50%, 1/15/2026 (e) | | |
MPT Operating Partnership LP REIT, 5.00%, 10/15/2027 | | |
Nabors Industries Ltd. 7.25%, 1/15/2026 (e) | | |
Nabors Industries, Inc. 5.75%, 2/1/2025 | | |
Nationstar Mortgage Holdings, Inc. 6.00%, 1/15/2027 (e) | | |
| | |
| | |
| | |
NCL Corp. Ltd. 5.88%, 2/15/2027 (e) | | |
NCR Corp. 5.75%, 9/1/2027 (e) | | |
Netflix, Inc. 3.63%, 6/15/2025 (e) | | |
New Fortress Energy, Inc. | | |
| | |
| | |
Newell Brands, Inc. 4.45%, 4/1/2026 (h) | | |
Nexstar Media, Inc. 5.63%, 7/15/2027 (e) | | |
| | |
|
United States — continued |
NextEra Energy Capital Holdings, Inc. 0.65%, 3/1/2023 | | |
NextEra Energy Operating Partners LP 4.25%, 7/15/2024 (e) | | |
NGL Energy Operating LLC 7.50%, 2/1/2026 (e) | | |
NMG Holding Co., Inc. 7.13%, 4/1/2026 (e) | | |
Northern Oil and Gas, Inc. 8.13%, 3/1/2028 (e) | | |
Novelis Corp. 3.25%, 11/15/2026 (e) | | |
NRG Energy, Inc. 5.75%, 1/15/2028 | | |
| | |
| | |
| | |
Occidental Petroleum Corp. 8.00%, 7/15/2025 | | |
OGE Energy Corp. 0.70%, 5/26/2023 | | |
| | |
| | |
| | |
| | |
| | |
Outfront Media Capital LLC 5.00%, 8/15/2027 (e) | | |
Owens-Brockway Glass Container, Inc. 6.63%, 5/13/2027 (e) | | |
Party City Holdings, Inc. 8.75%, 2/15/2026 (a) (e) | | |
PBF Holding Co. LLC 6.00%, 2/15/2028 (a) | | |
PDC Energy, Inc. 5.75%, 5/15/2026 | | |
PennyMac Financial Services, Inc. 5.38%, 10/15/2025 (e) | | |
Penske Truck Leasing Co. LP 2.70%, 3/14/2023 (e) | | |
Performance Food Group, Inc. 5.50%, 10/15/2027 (e) | | |
PG&E Corp. 5.00%, 7/1/2028 | | |
Photo Holdings Merger Sub, Inc. 8.50%, 10/1/2026 (e) | | |
Post Holdings, Inc. 5.63%, 1/15/2028 (e) | | |
Presidio Holdings, Inc. 4.88%, 2/1/2027 (e) | | |
SEE NOTES TO FINANCIAL STATEMENTS.
| | |
Corporate Bonds — continued |
United States — continued |
Prestige Brands, Inc. 5.13%, 1/15/2028 (e) | | |
Prime Security Services Borrower LLC | | |
| | |
| | |
QVC, Inc. 4.75%, 2/15/2027 | | |
Radiate Holdco LLC 4.50%, 9/15/2026 (e) | | |
RegionalCare Hospital Partners Holdings, Inc. 9.75%, 12/1/2026 (e) | | |
RHP Hotel Properties LP REIT, 4.75%, 10/15/2027 | | |
Rite Aid Corp. 8.00%, 11/15/2026 (a) (e) | | |
Rithm Capital Corp. REIT, 6.25%, 10/15/2025 (e) | | |
RLJ Lodging Trust LP REIT, 3.75%, 7/1/2026 (a) (e) | | |
Rocket Mortgage LLC 2.88%, 10/15/2026 (e) | | |
Royal Caribbean Cruises Ltd. | | |
| | |
| | |
RP Escrow Issuer LLC 5.25%, 12/15/2025 (e) | | |
Sabre GLBL, Inc. 7.38%, 9/1/2025 (e) | | |
SBA Communications Corp. REIT, 3.88%, 2/15/2027 | | |
Scientific Games International, Inc. | | |
| | |
| | |
SCIL IV LLC 5.38%, 11/1/2026 (e) | | |
Scripps Escrow, Inc. 5.88%, 7/15/2027 (e) | | |
Select Medical Corp. 6.25%, 8/15/2026 (e) | | |
Service Corp. International 4.63%, 12/15/2027 | | |
Service Properties Trust REIT, 7.50%, 9/15/2025 | | |
Silgan Holdings, Inc. 4.13%, 2/1/2028 | | |
Simon Property Group LP REIT, 2.75%, 6/1/2023 | | |
| | |
| | |
| | |
|
United States — continued |
| | |
| | |
| | |
| | |
Specialty Building Products Holdings LLC 6.38%, 9/30/2026 (e) | | |
Spirit AeroSystems, Inc. 7.50%, 4/15/2025 (e) | | |
Sprint Corp. 7.63%, 3/1/2026 | | |
SRS Distribution, Inc. 4.63%, 7/1/2028 (e) | | |
SS&C Technologies, Inc. 5.50%, 9/30/2027 (e) | | |
Standard Industries, Inc. 4.75%, 1/15/2028 (e) | | |
| | |
| | |
| | |
Starwood Property Trust, Inc. REIT, 4.38%, 1/15/2027 (e) | | |
Station Casinos LLC 4.50%, 2/15/2028 (a) (e) | | |
Summit Midstream Holdings LLC 8.50%, 10/15/2026 (e) | | |
Sunoco LP 6.00%, 4/15/2027 | | |
Surgery Center Holdings, Inc. 10.00%, 4/15/2027 (e) | | |
Tallgrass Energy Partners LP 7.50%, 10/1/2025 (e) | | |
Targa Resources Partners LP 4.00%, 1/15/2032 | | |
Taylor Morrison Communities, Inc. 5.88%, 6/15/2027 (e) | | |
TEGNA, Inc. 4.75%, 3/15/2026 (a) (e) | | |
| | |
| | |
| | |
| | |
| | |
Tenneco, Inc. 7.88%, 1/15/2029 (e) | | |
| | |
| | |
| | |
| | |
| | |
| | |
SEE NOTES TO FINANCIAL STATEMENTS.
JPMorgan Global Allocation Fund
SCHEDULE OF PORTFOLIO INVESTMENTS
AS OF October 31, 2022 (continued)
| | |
Corporate Bonds — continued |
United States — continued |
| | |
| | |
| | |
| | |
TripAdvisor, Inc. 7.00%, 7/15/2025 (e) | | |
Triumph Group, Inc. 8.88%, 6/1/2024 (e) | | |
| | |
| | |
| | |
United Airlines, Inc. 4.38%, 4/15/2026 (e) | | |
United Wholesale Mortgage LLC 5.50%, 11/15/2025 (e) | | |
Uniti Group LP REIT, 7.88%, 2/15/2025 (e) | | |
Univision Communications, Inc. | | |
| | |
| | |
US Acute Care Solutions LLC 6.38%, 3/1/2026 (e) | | |
US Foods, Inc. 6.25%, 4/15/2025 (e) | | |
USA Compression Partners LP 6.88%, 4/1/2026 | | |
Vail Resorts, Inc. 6.25%, 5/15/2025 (e) | | |
Vector Group Ltd. 10.50%, 11/1/2026 (a) (e) | | |
Vericast Corp. 11.00%, 9/15/2026 (e) | | |
Veritas US, Inc. 7.50%, 9/1/2025 (e) | | |
Verscend Escrow Corp. 9.75%, 8/15/2026 (e) | | |
Viasat, Inc. 5.63%, 9/15/2025 (e) | | |
Vistra Operations Co. LLC | | |
| | |
| | |
VOC Escrow Ltd. 5.00%, 2/15/2028 (e) | | |
WASH Multifamily Acquisition, Inc. 5.75%, 4/15/2026 (e) | | |
Waste Pro USA, Inc. 5.50%, 2/15/2026 (e) | | |
Watco Cos. LLC 6.50%, 6/15/2027 (e) | | |
Wesco Aircraft Holdings, Inc. 9.00%, 11/15/2026 (a) (e) | | |
| | |
|
United States — continued |
| | |
| | |
| | |
Western Midstream Operating LP 3.35%, 2/1/2025 (h) | | |
William Carter Co. (The) 5.63%, 3/15/2027 (e) | | |
Windstream Escrow LLC 7.75%, 8/15/2028 (a) (e) | | |
Wynn Resorts Finance LLC 7.75%, 4/15/2025 (e) | | |
Xerox Holdings Corp. 5.00%, 8/15/2025 (e) | | |
XHR LP REIT, 6.38%, 8/15/2025 (e) | | |
XPO Logistics, Inc. 6.25%, 5/1/2025 (e) | | |
Yum! Brands, Inc. 4.63%, 1/31/2032 | | |
Zayo Group Holdings, Inc. 4.00%, 3/1/2027 (e) | | |
| | |
Total Corporate Bonds
(Cost $185,266) | | |
| | |
Investment Companies — 4.5% |
| | |
JPMorgan Income Fund, Class R6 Shares (i)(Cost $162,342) | | |
| | |
U.S. Treasury Obligations — 1.9% |
U.S. Treasury Notes 0.13%, 1/31/2023 (j)(Cost $63,630) | | |
| | |
Exchange-Traded Funds — 0.6% |
|
iShares MSCI India ETF * (a)(Cost $11,771) | | |
SEE NOTES TO FINANCIAL STATEMENTS.
| | |
Commercial Mortgage-Backed Securities — 0.2% |
|
FHLMC, Multi-Family Structured Pass-Through Certificates | | |
Series K033, Class X1, IO, 0.28%, 7/25/2023 (k) | | |
Series KC03, Class X1, IO, 0.48%, 11/25/2024 (k) | | |
Series K078, Class X1, IO, 0.09%, 6/25/2028 (k) | | |
Series K082, Class X1, IO, 0.01%, 9/25/2028 (k) | | |
Series K083, Class X1, IO, 0.04%, 9/25/2028 (k) | | |
FNMA ACES Series 2019-M21, Class X2, IO, 1.30%, 2/25/2031 (k) | | |
FREMF Series 2018-KF46, Class B, 5.09%, 3/25/2028 (e) (k) | | |
| | |
Series 2017-KF31, Class B, 6.04%, 4/25/2024 (e) (k) | | |
Series 2017-KF32, Class B, 5.69%, 5/25/2024 (e) (k) | | |
Series 2017-KF36, Class B, 5.79%, 8/25/2024 (e) (k) | | |
Series 2017-KF38, Class B, 5.64%, 9/25/2024 (e) (k) | | |
Series 2018-KF45, Class B, 5.09%, 3/25/2025 (e) (k) | | |
Series 2018-KF47, Class B, 5.14%, 5/25/2025 (e) (k) | | |
Series 2018-KF49, Class B, 5.04%, 6/25/2025 (e) (k) | | |
Series 2019-KF63, Class B, 5.49%, 5/25/2029 (e) (k) | | |
GNMA Series 2021-170, IO, 0.99%, 5/16/2063 (k) | | |
LB-UBS Commercial Mortgage Trust Series 2006-C6, Class AJ, 5.45%, 9/15/2039 ‡ (k) | | |
Velocity Commercial Capital Loan Trust | | |
Series 2018-2, Class M2, 4.51%, 10/26/2048 ‡ (e) (k) | | |
Series 2018-2, Class M3, 4.72%, 10/26/2048 ‡ (e) (k) | | |
| | |
|
United States — continued |
Wells Fargo Commercial Mortgage Trust Series 2019-C52, Class XA, IO, 1.60%, 8/15/2052 (k) | | |
Total Commercial Mortgage-Backed Securities
(Cost $7,758) | | |
|
Asian Development Bank, 3.40%, 9/10/2027 (b) | | |
European Investment Bank, 0.50%, 6/21/2023 | | |
Inter-American Development Bank | | |
| | |
| | |
| | |
Total Supranational
(Cost $7,186) | | |
| | |
|
|
| | |
| | |
| | |
| | |
| | |
| | |
| | |
|
| | |
expiring 1/16/2023, price 1.00 USD * | | |
| | |
| | |
| | |
| | |
| | |
expiring 4/17/2023, price 1.00 USD | | |
| | |
| | |
| | |
SEE NOTES TO FINANCIAL STATEMENTS.
JPMorgan Global Allocation Fund
SCHEDULE OF PORTFOLIO INVESTMENTS
AS OF October 31, 2022 (continued)
| | |
|
|
| | |
| | |
| | |
|
Nmg Research Ltd., expiring 9/24/2027, price 1.00 USD ‡ * | | |
|
Windstream Holdings, Inc., expiring 12/31/2049, price 11.00 USD ‡ * | | |
Total Warrants
(Cost $2,783) | | |
| | |
Asset-Backed Securities — 0.1% |
|
AmeriCredit Automobile Receivables Trust Series 2021-2, Class A3, 0.34%, 12/18/2026 | | |
Hyundai Auto Receivables Trust Series 2021-B, Class A3, 0.38%, 1/15/2026 | | |
Total Asset-Backed Securities
(Cost $2,319) | | |
Collateralized Mortgage Obligations — 0.0% ^ |
|
CHL GMSR Issuer Trust Series 2018-GT1, Class B, 7.09%, 5/25/2023 ‡ (e) (k) | | |
CHL Mortgage Pass-Through Trust | | |
Series 2005-31, Class 2A1, 2.45%, 1/25/2036 (k) | | |
Series 2006-21, Class A14, 6.00%, 2/25/2037 | | |
Series 2007-10, Class A4, 5.50%, 7/25/2037 | | |
Deutsche Alt-A Securities Mortgage Loan Trust | | |
Series 2006-AF1, Class A4, 3.89%, 4/25/2036 (k) | | |
Series 2007-3, Class 2A1, 4.34%, 10/25/2047 (k) | | |
HarborView Mortgage Loan Trust Series 2006-14, Class 1A1A, 3.84%, 1/25/2047 (k) | | |
| | |
|
United States — continued |
JPMorgan Mortgage Trust Series 2005-A8, Class 2A3, 3.85%, 11/25/2035 (k) | | |
Total Collateralized Mortgage Obligations
(Cost $840) | | |
Loan Assignments — 0.0% (g) (l) ^ |
|
FGI Operating Co. LLC, 1st Lien Term Loan (ICE LIBOR USD 3 Month + 11.00%), 12.00%, 5/16/2023 ‡ (m) | | |
Moran Foods LLC, Tranche A Second Lien Term Loan (ICE LIBOR USD 3 Month + 10.75%), 14.42%, 10/1/2024 | | |
Moran Foods LLC, 1st Lien Term Loan (ICE LIBOR USD 3 Month + 7.00%), 10.67%, 4/1/2024 ‡ | | |
Moran Foods LLC, 1st Lien PIK Tranche (ICE LIBOR USD 3 Month + 7.00%), Zero Coupon, 12/31/2038 | | |
Total Loan Assignments
(Cost $893) | | |
| | |
Convertible Preferred Stocks — 0.0% ^ |
|
Claire's Stores, Inc. ‡ *(Cost $72) | | |
Total Convertible Preferred Stocks
(Cost $72) | | |
Preferred Stocks — 0.0% ^ |
|
Goodman Networks, Inc. ‡ * | | |
MYT Holding LLC Series A, 10.00%, 6/6/2029 ‡ | | |
Total Preferred Stocks
(Cost $49) | | |
| | |
|
|
Vistra Corp., expiring 12/31/2049 ‡(Cost $—) (c) | | |
SEE NOTES TO FINANCIAL STATEMENTS.
| | |
Short-Term Investments — 12.3% |
Certificates of Deposits — 0.1% |
Norinchukin Bank, (SOFR + 3.65%), 3.60%, 2/27/2023 (g) | | |
Royal Bank of Canada, 2.50%, 2/24/2023 | | |
Sumitomo Mitsui Banking Corp., 5.00%, 10/6/2023 | | |
Toronto-Dominion Bank (The), 4.02%, 8/22/2023 | | |
Total Certificates of Deposits
(Cost $5,129) | | |
|
Amazon.com Inc., 3.57%, 12/28/2022 (n) | | |
Ameren Corp., 3.51%, 11/1/2022 (n) | | |
American Electric Power Co. Inc., 3.82%, 11/15/2022 (n) | | |
Australia & New Zealand Banking Group Ltd., 3.63%, 12/28/2022 (n) | | |
BofA Securities Inc., 4.76%, 6/20/2023 (n) | | |
CAFCO LLC, 3.89%, 1/9/2023 (n) | | |
Caisse des Depots et Consignations, 3.72%, 1/6/2023 (e) (n) | | |
| | |
| | |
| | |
Church & Dwight Co., Inc., 3.88%, 12/7/2022 (n) | | |
| | |
| | |
| | |
Evergy Missouri West, Inc., 3.66%, 11/3/2022 (n) | | |
Export Development Canada, 3.97%, 3/2/2023 (n) | | |
Federation des caisses Desjardins du Quebec (The), 3.61%, 12/19/2022 (n) | | |
First Abu Dhabi Bank PJSC, 3.36%, 11/29/2022 (n) | | |
GTA Funding LLC, 4.04%, 1/25/2023 (n) | | |
HSBC USA Inc., 3.63%, 12/15/2022 (n) | | |
LMA-Americas LLC, 3.47%, 11/21/2022 (n) | | |
| | |
|
Commercial Paper — continued |
Mitsubishi UFJ Trust & Banking Corp., 3.49%, 12/1/2022 (n) | | |
Pacific Life Short Term Funding LLC, 3.53%, 12/29/2022 (n) | | |
| | |
3.61%, 12/14/2022 (e) (n) | | |
| | |
Skandinaviska Enskilda Banken AB, 4.07%, 2/6/2023 (n) | | |
Suncor Energy, Inc., 3.84%, 11/29/2022 (n) | | |
Svenska Handelsbanken AB, 4.39%, 1/3/2023 (n) | | |
TELUS Corp., 4.35%, 1/10/2023 (n) | | |
TransCanada PipeLines Ltd., 3.98%, 12/15/2022 (n) | | |
United Overseas Bank Ltd., 4.44%, 1/27/2023 (n) | | |
VF Corp., 4.08%, 12/12/2022 (n) | | |
Victory Receivables Corp., 3.83%, 12/19/2022 (n) | | |
Westpac Banking Corp., 4.90%, 7/10/2023 (n) | | |
Total Commercial Paper
(Cost $49,739) | | |
| | |
Investment Companies — 8.6% |
JPMorgan Prime Money Market Fund Class Institutional Shares, 3.12% (i) (o) (Cost $282,814) | | |
Investment of Cash Collateral from Securities Loaned — 1.6% |
JPMorgan Securities Lending Money Market Fund Agency SL Class Shares, 3.23% (i) (o) | | |
JPMorgan U.S. Government Money Market Fund Class IM Shares, 2.85% (i) (o) | | |
Total Investment of Cash Collateral from Securities Loaned
(Cost $51,149) | | |
SEE NOTES TO FINANCIAL STATEMENTS.
JPMorgan Global Allocation Fund
SCHEDULE OF PORTFOLIO INVESTMENTS
AS OF October 31, 2022 (continued)
| | |
U.S. Treasury Obligations — 0.5% |
| | |
| | |
| | |
Total U.S. Treasury Obligations
(Cost $15,918) | | |
Total Short-Term Investments
(Cost $404,749) | | |
Total Investments — 101.0%
(Cost $3,252,295) | | |
Liabilities in Excess of Other Assets — (1.0)% | | |
| | |
Percentages indicated are based on net assets. |
Amounts presented as a dash ("-") represent amounts that round to less than a thousand. |
| |
| Alternative Credit Enhancement Securities |
| American Depositary Receipt |
| |
| |
| |
| Clearing House Electronic Subregister System (CHESS) Depository Interest |
| |
| |
| |
| |
| |
| Federal Home Loan Mortgage Corp. |
| Federal National Mortgage Association |
| |
| Global Depositary Receipt |
| Government National Mortgage Association |
| Intercontinental Exchange |
| Interest Only represents the right to receive the monthly interest payments on an underlying pool of mortgage loans. The principal amount shown represents the par value on the underlying pool. The yields on these securities are subject to accelerated principal paydowns as a result of prepayment or refinancing of the underlying pool of mortgage instruments. As a result, interest income may be reduced considerably. |
| |
| |
| London Interbank Offered Rate |
| |
| |
| Public Joint Stock Company |
| A special type of equity investment that shares in the earnings of the company, has limited voting rights, and may have a dividend preference. Preference shares may also have liquidation preference. |
| Limited liability company |
| Real Estate Investment Trust |
| Limited partnership with share capital |
| |
| |
| Secured Overnight Financing Rate |
| |
| Amount rounds to less than 0.1% of net assets. |
| Value determined using significant unobservable inputs. | |
| Non-income producing security. | |
| The security or a portion of this security is on loan at October 31, 2022. The total value of securities on loan at October 31, 2022 is $48,471. | |
| Security exempt from registration pursuant to Regulation S under the Securities Act of 1933, as amended. Regulation S applies to securities offerings that are made outside of the United States and do not involve direct selling efforts in the United States and as such may have restrictions on resale. | |
| | |
| All or a portion of this security is segregated as collateral for short sales. The total value of securities segregated as collateral is $2,508. | |
| Securities exempt from registration under Rule 144A or section 4(a)(2), of the Securities Act of 1933, as amended. | |
| Security has the ability to pay in kind (“PIK”) or pay income in cash. When applicable, separate rates of such payments are disclosed. | |
| Variable or floating rate security, linked to the referenced benchmark. The interest rate shown is the current rate as of October 31, 2022. | |
| Step bond. Interest rate is a fixed rate for an initial period that either resets at a specific date or may reset in the future contingent upon a predetermined trigger. The interest rate shown is the current rate as of October 31, 2022. | |
| Investment in an affiliated fund, which is registered under the Investment Company Act of 1940, as amended, and is advised by J.P. Morgan Investment Management Inc. | |
| All or a portion of this security is deposited with the broker as initial margin for futures contracts. | |
| Variable or floating rate security, the interest rate of which adjusts periodically based on changes in current interest rates and prepayments on the underlying pool of assets. The interest rate shown is the current rate as of October 31, 2022. | |
SEE NOTES TO FINANCIAL STATEMENTS.
| Loan assignments are presented by obligor. Each series or loan tranche underlying each obligor may have varying terms. | |
| | |
| The rate shown is the effective yield as of October 31, 2022. | |
| The rate shown is the current yield as of October 31, 2022. | |
Summary of Investments by Industry, October 31, 2022
The following table represents the portfolio investments of the Fund by industry classifications as a percentage of total investments:
| PERCENT OF
TOTAL
INVESTMENTS |
Foreign Government Securities | |
| |
| |
Semiconductors & Semiconductor Equipment | |
Oil, Gas & Consumable Fuels | |
| |
| |
| |
| |
Hotels, Restaurants & Leisure | |
| |
| |
Internet & Direct Marketing Retail | |
| |
Health Care Providers & Services | |
Health Care Equipment & Supplies | |
| |
Technology Hardware, Storage & Peripherals | |
Textiles, Apparel & Luxury Goods | |
Interactive Media & Services | |
Equity Real Estate Investment Trusts (REITs) | |
| |
| |
| |
| |
| |
Others (each less than 1.0%) | |
| |
Detailed information about investment portfolios of the underlying funds and ETFs can be found in shareholder reports filed with the Securities and Exchange Commission (SEC) by each such underlying fund semi-annually on Form N-CSR and in portfolio holdings filed quarterly on Form N-PORT, and are available for download from both the SEC’s as well as each respective underlying fund’s website. Detailed information about underlying J.P. Morgan Funds can also be found at www.jpmorganfunds.com or by calling 1-800-480-4111.
SEE NOTES TO FINANCIAL STATEMENTS.
JPMorgan Global Allocation Fund
SCHEDULE OF PORTFOLIO INVESTMENTS
AS OF October 31, 2022 (continued)
Futures contracts outstanding as of October 31, 2022 (amounts in thousands, except number of contracts):
| | | | | VALUE AND
UNREALIZED
APPRECIATION
(DEPRECIATION) ($) |
| | | | | |
| | | | | |
| | | | | |
| | | | | |
| | | | | |
| | | | | |
| | | | | |
| | | | | |
| | | | | |
| | | | | |
| | | | | |
Foreign Exchange AUD / USD | | | | | |
Foreign Exchange EUR / USD | | | | | |
Foreign Exchange GBP / USD | | | | | |
Foreign Exchange JPY / USD | | | | | |
Foreign Exchange CAD / USD | | | | | |
U.S. Treasury 10 Year Note | | | | | |
U.S. Treasury 10 Year Ultra Note | | | | | |
| | | | | |
U.S. Treasury 5 Year Note | | | | | |
| | | | | |
| | | | | |
| | | | | |
| | | | | |
| | | | | |
| | | | | |
MSCI Emerging Markets E-Mini Index | | | | | |
Russell 2000 E-Mini Index | | | | | |
| | | | | |
U.S. Treasury 10 Year Note | | | | | |
| | | | | |
U.S. Treasury 2 Year Note | | | | | |
| | | | | |
| | | | | |
| |
| |
| |
| Europe, Australasia and Far East |
| |
| |
| |
| Morgan Stanley Capital International |
| Sterling Overnight Index Average |
| |
| |
SEE NOTES TO FINANCIAL STATEMENTS.
Forward foreign currency exchange contracts outstanding as of October 31, 2022 (amounts in thousands):
| | | | UNREALIZED
APPRECIATION
(DEPRECIATION) ($) |
| | | | | | |
| | | | | | |
| | | | | | |
| | | | | | |
| | | | Merrill Lynch International | | |
| | | | | | |
| | | | | | |
| | | | | | |
| | | | Goldman Sachs International | | |
| | | | | | |
| | | | | | |
| | | | | | |
| | | | Goldman Sachs International | | |
| | | | | | |
| | | | | | |
| | | | | | |
| | | | | | |
| | | | | | |
| | | | Merrill Lynch International | | |
| | | | Merrill Lynch International | | |
| | | | | | |
| | | | | | |
| | | | | | |
| | | | | | |
| | | | Merrill Lynch International | | |
| | | | | | |
| | | | | | |
| | | | | | |
| | | | | | |
| | | | | | |
Total unrealized appreciation | |
| | | | | | |
| | | | | | |
| | | | Goldman Sachs International** | | |
| | | | | | |
| | | | | | |
| | | | | | |
| | | | | | |
| | | | | | |
| | | | Merrill Lynch International | | |
| | | | | | |
| | | | | | |
| | | | | | |
| | | | | | |
| | | | Goldman Sachs International | | |
| | | | | | |
| | | | | | |
| | | | | | |
| | | | | | |
| | | | Merrill Lynch International | | |
| | | | | | |
SEE NOTES TO FINANCIAL STATEMENTS.
JPMorgan Global Allocation Fund
SCHEDULE OF PORTFOLIO INVESTMENTS
AS OF October 31, 2022 (continued)
| | | | UNREALIZED APPRECIATION (DEPRECIATION) ($) |
| | | | | | |
| | | | | | |
| | | | Merrill Lynch International | | |
| | | | | | |
| | | | | | |
| | | | Goldman Sachs International | | |
| | | | | | |
| | | | | | |
| | | | | | |
| | | | | | |
| | | | Goldman Sachs International** | | |
| | | | | | |
| | | | | | |
Total unrealized depreciation | |
Net unrealized appreciation | |
SEE NOTES TO FINANCIAL STATEMENTS.
JPMorgan Income Builder Fund
SCHEDULE OF PORTFOLIO INVESTMENTS
AS OF October 31, 2022
| | |
|
|
| | |
| | |
Bendigo & Adelaide Bank Ltd. | | |
| | |
Charter Hall Long Wale, REIT | | |
| | |
| | |
| | |
| | |
| | |
| | |
| | |
| | |
| | |
Woodside Energy Group Ltd. | | |
| | |
| | |
|
| | |
| | |
| | |
| | |
| | |
| | |
|
| | |
| | |
| | |
| | |
| | |
| | |
| | |
| | |
|
B3 SA - Brasil Bolsa Balcao | | |
BB Seguridade Participacoes SA | | |
EDP - Energias do Brasil SA | | |
Itau Unibanco Holding SA (Preference) * | | |
| | |
| | |
|
Algonquin Power & Utilities Corp. (b) | | |
| | |
|
|
| | |
| | |
| | |
Bank of Nova Scotia (The) | | |
| | |
| | |
Canadian Apartment Properties, REIT | | |
Canadian Imperial Bank of Commerce | | |
Canadian Natural Resources Ltd. | | |
Canadian Tire Corp. Ltd., Class A | | |
Canadian Utilities Ltd., Class A | | |
| | |
Chartwell Retirement Residences | | |
| | |
| | |
| | |
| | |
| | |
| | |
| | |
| | |
| | |
| | |
| | |
Pembina Pipeline Corp. (b) | | |
| | |
Restaurant Brands International, Inc. | | |
Rogers Communications, Inc., Class B | | |
Shaw Communications, Inc., Class B | | |
Sienna Senior Living, Inc. | | |
| | |
| | |
| | |
Toronto-Dominion Bank (The) | | |
TransAlta Renewables, Inc. | | |
| | |
|
Telford Offshore Holdings Ltd. ‡ * | | |
|
Banco Santander Chile, ADR | | |
|
China Construction Bank Corp., Class H | | |
SEE NOTES TO FINANCIAL STATEMENTS.
JPMorgan Income Builder Fund
SCHEDULE OF PORTFOLIO INVESTMENTS
AS OF October 31, 2022 (continued)
| | |
Common Stocks — continued |
|
China Merchants Bank Co. Ltd., Class H | | |
China Petroleum & Chemical Corp., Class H | | |
China Resources Gas Group Ltd. | | |
China Resources Land Ltd. | | |
Fuyao Glass Industry Group Co. Ltd., Class A | | |
Fuyao Glass Industry Group Co. Ltd., Class H (a) | | |
Guangdong Investment Ltd. | | |
Haier Smart Home Co. Ltd., Class H | | |
Huayu Automotive Systems Co. Ltd., Class A | | |
Inner Mongolia Yili Industrial Group Co. Ltd., Class A | | |
Joyoung Co. Ltd., Class A | | |
Midea Group Co. Ltd., Class A | | |
| | |
| | |
Ping An Insurance Group Co. of China Ltd., Class H | | |
Postal Savings Bank of China Co. Ltd., Class H (a) | | |
Tingyi Cayman Islands Holding Corp. | | |
Topsports International Holdings Ltd. (a) | | |
Wuliangye Yibin Co. Ltd., Class A | | |
Xinyi Glass Holdings Ltd. | | |
| | |
Zhejiang Supor Co. Ltd., Class A | | |
| | |
|
AP Moller - Maersk A/S, Class B | | |
| | |
| | |
Novo Nordisk A/S, Class B | | |
| | |
| | |
|
| | |
|
| | |
| | |
| | |
| | |
| | |
| | |
|
|
| | |
| | |
| | |
|
| | |
| | |
| | |
Cie Generale des Etablissements Michelin SCA | | |
| | |
| | |
| | |
| | |
Gaztransport Et Technigaz SA | | |
| | |
| | |
LVMH Moet Hennessy Louis Vuitton SE | | |
| | |
| | |
| | |
| | |
| | |
| | |
| | |
| | |
| | |
| | |
| | |
|
| | |
| | |
| | |
Bayerische Motoren Werke AG | | |
| | |
Deutsche Post AG (Registered) | | |
Deutsche Telekom AG (Registered) | | |
| | |
| | |
| | |
| | |
Muenchener Rueckversicherungs- Gesellschaft AG (Registered) | | |
SEE NOTES TO FINANCIAL STATEMENTS.
| | |
Common Stocks — continued |
|
Telefonica Deutschland Holding AG | | |
| | |
| | |
|
| | |
CK Infrastructure Holdings Ltd. | | |
| | |
| | |
HK Electric Investments & HK Electric Investments Ltd. (a) | | |
| | |
| | |
Hong Kong Exchanges & Clearing Ltd. | | |
New World Development Co. Ltd. | | |
| | |
Power Assets Holdings Ltd. | | |
| | |
| | |
Yue Yuen Industrial Holdings Ltd. | | |
| | |
|
Embassy Office Parks, REIT | | |
| | |
| | |
Tata Consultancy Services Ltd. | | |
| | |
|
Bank Rakyat Indonesia Persero Tbk. PT | | |
Telkom Indonesia Persero Tbk. PT | | |
| | |
|
| | |
| | |
Assicurazioni Generali SpA | | |
| | |
| | |
| | |
| | |
| | |
| | |
| | |
| | |
|
|
Mediobanca Banca di Credito Finanziario SpA | | |
| | |
| | |
Terna - Rete Elettrica Nazionale | | |
| | |
| | |
| | |
|
| | |
| | |
| | |
| | |
Chubu Electric Power Co., Inc. | | |
Chugoku Electric Power Co., Inc. (The) | | |
Comforia Residential REIT, Inc., REIT | | |
Dai Nippon Printing Co. Ltd. | | |
Daiwa House Industry Co. Ltd. | | |
Daiwa House REIT Investment Corp., REIT | | |
Electric Power Development Co. Ltd. | | |
| | |
| | |
Frontier Real Estate Investment Corp., REIT | | |
Hokkaido Electric Power Co., Inc. | | |
| | |
Japan Metropolitan Fund Invest, REIT | | |
Japan Post Holdings Co. Ltd. | | |
| | |
| | |
Kansai Electric Power Co., Inc. (The) | | |
| | |
Kenedix Office Investment Corp., REIT | | |
| | |
Mitsubishi Chemical Group Corp. | | |
Mitsui Fudosan Logistics Park, Inc., REIT | | |
Nippon Accommodations Fund, Inc., REIT | | |
Nippon Prologis REIT, Inc., REIT | | |
Nippon Telegraph & Telephone Corp. | | |
Okinawa Electric Power Co., Inc. (The) | | |
| | |
| | |
Shin-Etsu Chemical Co. Ltd. | | |
| | |
SEE NOTES TO FINANCIAL STATEMENTS.
JPMorgan Income Builder Fund
SCHEDULE OF PORTFOLIO INVESTMENTS
AS OF October 31, 2022 (continued)
| | |
Common Stocks — continued |
|
Sumitomo Forestry Co. Ltd. | | |
Takeda Pharmaceutical Co. Ltd. | | |
Tohoku Electric Power Co., Inc. | | |
Tokio Marine Holdings, Inc. | | |
| | |
| | |
| | |
United Urban Investment Corp., REIT | | |
| | |
|
| | |
| | |
| | |
|
Bolsa Mexicana de Valores SAB de CV | | |
Grupo Financiero Banorte SAB de CV, Class O | | |
| | |
Kimberly-Clark de Mexico SAB de CV, Class A | | |
Wal-Mart de Mexico SAB de CV | | |
| | |
|
ABN AMRO Bank NV, CVA (a) | | |
| | |
| | |
| | |
Koninklijke Ahold Delhaize NV | | |
| | |
| | |
| | |
| | |
| | |
| | |
| | |
|
| | |
| | |
| | |
|
| | |
| | |
|
|
| | |
| | |
| | |
| | |
Gjensidige Forsikring ASA | | |
| | |
| | |
| | |
| | |
| | |
|
| | |
|
Powszechny Zaklad Ubezpieczen SA | | |
|
EDP - Energias de Portugal SA | | |
| | |
| | |
| | |
| | |
Redes Energeticas Nacionais SGPS SA | | |
| | |
|
Moscow Exchange MICEX-RTS PJSC ‡ * | | |
| | |
| | |
| | |
|
| | |
|
| | |
CapitaLand Ascendas REIT, REIT | | |
CapitaLand Integrated Commercial Trust, REIT | | |
| | |
Digital Core REIT Management Pte. Ltd., REIT | | |
Keppel Infrastructure Trust | | |
| | |
SEE NOTES TO FINANCIAL STATEMENTS.
| | |
Common Stocks — continued |
|
Singapore Telecommunications Ltd. | | |
| | |
| | |
|
| | |
| | |
| | |
| | |
| | |
| | |
| | |
| | |
| | |
| | |
|
ESR Kendall Square REIT Co. Ltd., REIT | | |
Hana Financial Group, Inc. | | |
| | |
| | |
| | |
| | |
Samsung Electronics Co. Ltd. | | |
Shinhan Financial Group Co. Ltd. | | |
| | |
| | |
| | |
|
ACS Actividades de Construccion y Servicios SA | | |
Atlantica Sustainable Infrastructure plc | | |
Banco Bilbao Vizcaya Argentaria SA | | |
| | |
| | |
| | |
Cia de Distribucion Integral Logista Holdings SA | | |
| | |
| | |
| | |
Industria de Diseno Textil SA | | |
| | |
Merlin Properties Socimi SA, REIT | | |
| | |
|
|
| | |
| | |
| | |
| | |
| | |
|
| | |
| | |
| | |
Samhallsbyggnadsbolaget i Norden AB | | |
Skandinaviska Enskilda Banken AB, Class A | | |
| | |
Svenska Handelsbanken AB, Class A | | |
| | |
| | |
| | |
| | |
|
| | |
Accelleron Industries AG * | | |
Cie Financiere Richemont SA (Registered) | | |
| | |
| | |
UBS Group AG (Registered) | | |
Zurich Insurance Group AG | | |
| | |
|
| | |
ASE Technology Holding Co. Ltd. | | |
Chailease Holding Co. Ltd. | | |
| | |
| | |
Mega Financial Holding Co. Ltd. | | |
Novatek Microelectronics Corp. | | |
President Chain Store Corp. | | |
| | |
Realtek Semiconductor Corp. | | |
Taiwan Semiconductor Manufacturing Co. Ltd., ADR | | |
Taiwan Semiconductor Manufacturing Co. Ltd. | | |
SEE NOTES TO FINANCIAL STATEMENTS.
JPMorgan Income Builder Fund
SCHEDULE OF PORTFOLIO INVESTMENTS
AS OF October 31, 2022 (continued)
| | |
Common Stocks — continued |
|
Vanguard International Semiconductor Corp. | | |
| | |
| | |
|
| | |
Siam Cement PCL (The) (Registered) | | |
| | |
|
| | |
| | |
| | |
| | |
| | |
Berkeley Group Holdings plc | | |
Big Yellow Group plc, REIT | | |
| | |
| | |
| | |
Coca-Cola Europacific Partners plc | | |
| | |
| | |
Direct Line Insurance Group plc | | |
| | |
| | |
| | |
| | |
| | |
InterContinental Hotels Group plc | | |
Legal & General Group plc | | |
| | |
LondonMetric Property plc, REIT | | |
| | |
| | |
| | |
| | |
| | |
| | |
| | |
Reckitt Benckiser Group plc | | |
| | |
Safestore Holdings plc, REIT | | |
| | |
| | |
|
United Kingdom — continued |
| | |
| | |
| | |
| | |
| | |
| | |
| | |
UNITE Group plc (The), REIT | | |
United Utilities Group plc | | |
| | |
| | |
| | |
| | |
|
| | |
| | |
| | |
| | |
AGNC Investment Corp., REIT | | |
Air Products and Chemicals, Inc. | | |
Alexandria Real Estate Equities, Inc., REIT | | |
| | |
American Electric Power Co., Inc. | | |
| | |
American Tower Corp., REIT | | |
Americold Realty Trust, Inc., REIT | | |
| | |
| | |
Annaly Capital Management, Inc., REIT | | |
| | |
| | |
| | |
| | |
| | |
| | |
| | |
| | |
| | |
Boston Properties, Inc., REIT | | |
Brandywine Realty Trust, REIT | | |
| | |
Camden Property Trust, REIT | | |
| | |
SEE NOTES TO FINANCIAL STATEMENTS.
| | |
Common Stocks — continued |
United States — continued |
| | |
| | |
CF Industries Holdings, Inc. | | |
| | |
| | |
| | |
| | |
| | |
| | |
Claire's Stores, Inc. ‡ * | | |
Clear Channel Outdoor Holdings, Inc. * | | |
Clearway Energy, Inc., Class C | | |
| | |
| | |
| | |
| | |
Cogent Communications Holdings, Inc. | | |
| | |
| | |
| | |
Consolidated Edison, Inc. | | |
| | |
| | |
| | |
| | |
| | |
| | |
Digital Realty Trust, Inc., REIT | | |
Douglas Emmett, Inc., REIT | | |
| | |
| | |
| | |
| | |
| | |
| | |
| | |
| | |
| | |
| | |
| | |
| | |
Equitrans Midstream Corp. | | |
Equity LifeStyle Properties, Inc. | | |
| | |
| | |
|
United States — continued |
| | |
| | |
Federal Realty Investment Trust, REIT | | |
| | |
Fidelity National Information Services, Inc. | | |
| | |
Frontier Communications Parent, Inc. * (b) | | |
| | |
| | |
| | |
| | |
Goodman Networks, Inc. ‡ * | | |
| | |
| | |
| | |
Hawaiian Electric Industries, Inc. | | |
Healthpeak Properties, Inc., REIT | | |
Hewlett Packard Enterprise Co. | | |
| | |
Host Hotels & Resorts, Inc., REIT | | |
| | |
iHeartMedia, Inc., Class A * (b) | | |
| | |
International Business Machines Corp. | | |
| | |
Interpublic Group of Cos., Inc. (The) | | |
| | |
Iron Mountain, Inc., REIT | | |
| | |
| | |
| | |
| | |
| | |
Kilroy Realty Corp., REIT | | |
| | |
| | |
| | |
Kite Realty Group Trust, REIT | | |
| | |
Laureate Education, Inc., Class A | | |
| | |
LyondellBasell Industries NV, Class A | | |
| | |
| | |
SEE NOTES TO FINANCIAL STATEMENTS.
JPMorgan Income Builder Fund
SCHEDULE OF PORTFOLIO INVESTMENTS
AS OF October 31, 2022 (continued)
| | |
Common Stocks — continued |
United States — continued |
| | |
| | |
| | |
| | |
Mondelez International, Inc., Class A | | |
Moran Foods Backstop Equity ‡ * | | |
| | |
| | |
National Retail Properties, Inc., REIT | | |
Neiman Marcus Group Restricted Equity * | | |
| | |
| | |
| | |
| | |
| | |
| | |
Nordic American Tankers Ltd. | | |
| | |
| | |
| | |
| | |
| | |
| | |
| | |
| | |
Park Hotels & Resorts, Inc., REIT | | |
| | |
| | |
| | |
Philip Morris International, Inc. | | |
| | |
Pinnacle West Capital Corp. | | |
Pioneer Natural Resources Co. | | |
PNC Financial Services Group, Inc. (The) | | |
| | |
| | |
Procter & Gamble Co. (The) | | |
| | |
| | |
Prudential Financial, Inc. | | |
Public Service Enterprise Group, Inc. | | |
| | |
Raytheon Technologies Corp. | | |
| | |
| | |
|
United States — continued |
Regency Centers Corp., REIT | | |
| | |
Rexford Industrial Realty, Inc., REIT | | |
| | |
Seagate Technology Holdings plc | | |
Shenandoah Telecommunications Co. | | |
Simon Property Group, Inc., REIT | | |
| | |
| | |
| | |
| | |
| | |
Sun Communities, Inc., REIT | | |
| | |
T. Rowe Price Group, Inc. (b) | | |
| | |
| | |
| | |
| | |
| | |
| | |
| | |
| | |
United Parcel Service, Inc., Class B | | |
| | |
| | |
| | |
| | |
Verizon Communications, Inc. | | |
| | |
VICI Properties, Inc., REIT | | |
| | |
| | |
Walgreens Boots Alliance, Inc. | | |
| | |
| | |
| | |
| | |
| | |
Williams Cos., Inc. (The) | | |
SEE NOTES TO FINANCIAL STATEMENTS.
| | |
Common Stocks — continued |
United States — continued |
| | |
| | |
| | |
Total Common Stocks
(Cost $3,522,528) | | |
| | |
|
|
Australia & New Zealand Banking Group Ltd. (USD ICE Swap Rate 5 Year + 5.17%), 6.75%, 6/15/2026 (c) (d) (e) (f) | | |
FMG Resources August 2006 Pty. Ltd. | | |
| | |
| | |
| | |
| | |
| | |
| | |
| | |
| | |
| | |
| | |
| | |
|
ams-OSRAM AG 7.00%, 7/31/2025 (b) (c) | | |
|
Southern Gas Corridor CJSC 6.88%, 3/24/2026 (a) | | |
State Oil Co. of the Azerbaijan Republic | | |
| | |
| | |
| | |
|
Oil and Gas Holding Co. BSCC (The) | | |
| | |
| | |
| | |
| | |
|
|
Anheuser-Busch InBev Worldwide, Inc. | | |
| | |
| | |
KBC Group NV (EUR Swap Annual 5 Year + 4.69%), 4.75%, 3/5/2024 (a) (d) (e) (f) | | |
| | |
|
CSN Resources SA 4.63%, 6/10/2031 (c) | | |
Guara Norte SARL 5.20%, 6/15/2034 (c) | | |
Klabin Austria GmbH 7.00%, 4/3/2049 (a) | | |
MARB BondCo plc 3.95%, 1/29/2031 (a) | | |
MV24 Capital BV 6.75%, 6/1/2034 (c) | | |
Nexa Resources SA 5.38%, 5/4/2027 (a) | | |
Petrobras Global Finance BV 6.85%, 6/5/2115 | | |
| | |
| | |
| | |
Vale Overseas Ltd. 3.75%, 7/8/2030 | | |
| | |
|
| | |
| | |
| | |
| | |
Athabasca Oil Corp. 9.75%, 11/1/2026 (c) | | |
ATS Automation Tooling Systems, Inc. 4.13%, 12/15/2028 (c) | | |
| | |
(SOFRINDX + 0.68%), 3.73%, 3/10/2023 (f) | | |
Series H, 4.70%, 9/14/2027 | | |
Bank of Nova Scotia (The) | | |
(ICE LIBOR USD 3 Month + 2.65%), 6.57%, 1/12/2023 (d) (e) (f) | | |
(US Treasury Yield Curve Rate T Note Constant Maturity 5 Year + 4.55%), 4.90%, 6/4/2025 (d) (e) (f) | | |
| | |
Series 2, (US Treasury Yield Curve Rate T Note Constant Maturity 5 Year + 2.61%), 3.62%, 10/27/2081 (f) | | |
SEE NOTES TO FINANCIAL STATEMENTS.
JPMorgan Income Builder Fund
SCHEDULE OF PORTFOLIO INVESTMENTS
AS OF October 31, 2022 (continued)
| | |
Corporate Bonds — continued |
|
Baytex Energy Corp. 8.75%, 4/1/2027 (c) | | |
Bell Canada (The) Series US-5, 2.15%, 2/15/2032 | | |
Canadian Pacific Railway Co. 2.45%, 12/2/2031 | | |
Emera US Finance LP 2.64%, 6/15/2031 | | |
Emera, Inc. Series 16-A, (ICE LIBOR USD 3 Month + 5.44%), 6.75%, 6/15/2076 (f) | | |
| | |
Series 16-A, (ICE LIBOR USD 3 Month + 3.89%), 6.00%, 1/15/2077 (f) | | |
Series 20-A, (US Treasury Yield Curve Rate T Note Constant Maturity 5 Year + 5.31%), 5.75%, 7/15/2080 (f) | | |
(US Treasury Yield Curve Rate T Note Constant Maturity 5 Year + 4.42%), 7.63%, 1/15/2083 (f) | | |
Garda World Security Corp. 4.63%, 2/15/2027 (c) | | |
| | |
| | |
| | |
| | |
| | |
| | |
goeasy Ltd. 5.38%, 12/1/2024 (c) | | |
| | |
| | |
| | |
| | |
| | |
Open Text Holdings, Inc. 4.13%, 2/15/2030 (c) | | |
| | |
| | |
| | |
Quebecor Media, Inc. 5.75%, 1/15/2023 | | |
Ritchie Bros Auctioneers, Inc. 5.38%, 1/15/2025 (c) | | |
Rogers Communications, Inc. | | |
| | |
(US Treasury Yield Curve Rate T Note Constant Maturity 5 Year + 3.59%), 5.25%, 3/15/2082 (c) (f) | | |
| | |
|
|
Royal Bank of Canada (ICE LIBOR USD 3 Month + 0.36%), 4.44%, 1/17/2023 (f) | | |
Superior Plus LP 4.50%, 3/15/2029 (c) | | |
Toronto-Dominion Bank (The) | | |
| | |
(US Treasury Yield Curve Rate T Note Constant Maturity 5 Year + 4.08%), 8.12%, 10/31/2082 (f) | | |
TransAlta Corp. 6.50%, 3/15/2040 | | |
TransCanada PipeLines Ltd. 4.75%, 5/15/2038 | | |
| | |
Series 16-A, (ICE LIBOR USD 3 Month + 4.64%), 5.87%, 8/15/2076 (f) | | |
(SOFR + 4.42%), 5.50%, 9/15/2079 (f) | | |
Vermilion Energy, Inc. 6.88%, 5/1/2030 (c) | | |
| | |
| | |
| | |
| | |
| | |
|
Global Aircraft Leasing Co. Ltd. 6.50% (Cash), 9/15/2024 (c) (g) | | |
|
Empresa Nacional del Petroleo 3.75%, 8/5/2026 (a) | | |
|
Bluestar Finance Holdings Ltd. | | |
(US Treasury Yield Curve Rate T Note Constant Maturity 3 Year + 6.65%), 3.88%, 6/24/2023 (a) (d) (e) (f) | | |
(US Treasury Yield Curve Rate T Note Constant Maturity 3 Year + 5.63%), 3.10%, 7/12/2024 (a) (d) (e) (f) | | |
Central Plaza Development Ltd. 4.65%, 1/19/2026 (a) | | |
China Oil & Gas Group Ltd. 4.70%, 6/30/2026 (a) | | |
SEE NOTES TO FINANCIAL STATEMENTS.
| | |
Corporate Bonds — continued |
|
Chong Hing Bank Ltd. (US Treasury Yield Curve Rate T Note Constant Maturity 5 Year + 3.86%), 5.70%, 7/15/2024 (a) (d) (e) (f) | | |
CMHI Finance BVI Co. Ltd. (US Treasury Yield Curve Rate T Note Constant Maturity 3 Year + 6.35%), 3.50%, 10/9/2023 (a) (d) (e) (f) | | |
CNOOC Petroleum North America ULC 6.40%, 5/15/2037 | | |
Country Garden Holdings Co. Ltd. | | |
| | |
| | |
ENN Clean Energy International Investment Ltd. 3.38%, 5/12/2026 (a) | | |
Golden Eagle Retail Group Ltd. 4.63%, 5/21/2023 (a) | | |
HBIS Group Hong Kong Co. Ltd. 3.75%, 12/18/2022 (a) | | |
Hopson Development Holdings Ltd. 7.00%, 5/18/2024 (a) | | |
Huarong Finance 2017 Co. Ltd. (US Treasury Yield Curve Rate T Note Constant Maturity 5 Year + 6.98%), 4.00%, 11/7/2022 (a) (d) (e) (f) | | |
Huarong Finance 2019 Co. Ltd. | | |
| | |
| | |
Huarong Finance II Co. Ltd. 4.63%, 6/3/2026 (a) | | |
| | |
| | |
| | |
New Metro Global Ltd. 4.80%, 12/15/2024 (a) | | |
| | |
Poly Real Estate Finance Ltd. 3.95%, 2/5/2023 (a) | | |
| | |
| | |
| | |
SF Holding Investment Ltd. 4.13%, 7/26/2023 (a) | | |
Shandong Iron And Steel Xinheng International Co. Ltd. | | |
| | |
| | |
|
|
| | |
Shui On Development Holding Ltd. 5.50%, 3/3/2025 (a) | | |
Sinochem Offshore Capital Co. Ltd. 2.38%, 9/23/2031 (a) | | |
Vanke Real Estate Hong Kong Co. Ltd. 4.15%, 4/18/2023 (a) | | |
West China Cement Ltd. 4.95%, 7/8/2026 (a) | | |
Yancoal International Resources Development Co. Ltd. 3.50%, 11/4/2023 (a) | | |
Yankuang Group Cayman Ltd. 4.00%, 7/16/2023 (a) | | |
Yanlord Land HK Co. Ltd. 6.80%, 2/27/2024 (a) | | |
Yunda Holding Investment Ltd. 2.25%, 8/19/2025 (a) | | |
Zhongsheng Group Holdings Ltd. 3.00%, 1/13/2026 (a) | | |
| | |
|
| | |
| | |
| | |
| | |
| | |
| | |
|
| | |
| | |
| | |
| | |
(US Treasury Yield Curve Rate T Note Constant Maturity 5 Year + 4.11%), 6.63%, 3/26/2026 (c) (d) (e) (f) | | |
| | |
| | |
|
| | |
| | |
| | |
| | |
SEE NOTES TO FINANCIAL STATEMENTS.
JPMorgan Income Builder Fund
SCHEDULE OF PORTFOLIO INVESTMENTS
AS OF October 31, 2022 (continued)
| | |
Corporate Bonds — continued |
|
BNP Paribas SA (US Treasury Yield Curve Rate T Note Constant Maturity 5 Year + 4.90%), 7.75%, 8/16/2029 (c) (d) (e) (f) | | |
BPCE SA 4.00%, 9/12/2023 (c) | | |
CGG SA 8.75%, 4/1/2027 (b) (c) | | |
| | |
(USD Swap Semi 5 Year + 6.19%), 8.12%, 12/23/2025 (c) (d) (e) (f) | | |
(GBP Swap Semi 5 Year + 4.81%), 7.50%, 6/23/2026 (c) (d) (e) (f) | | |
(EUR Swap Annual 5 Year + 4.37%), 4.00%, 12/23/2027 (a) (d) (e) (f) | | |
(US Treasury Yield Curve Rate T Note Constant Maturity 5 Year + 3.24%), 4.75%, 3/23/2029 (c) (d) (e) (f) | | |
| | |
| | |
(USD ICE Swap Rate 5 Year + 5.87%), 8.00%, 9/29/2025 (c) (d) (e) (f) | | |
(US Treasury Yield Curve Rate T Note Constant Maturity 5 Year + 4.51%), 5.38%, 11/18/2030 (c) (d) (e) (f) | | |
| | |
|
Bayer US Finance II LLC 4.63%, 6/25/2038 (c) | | |
Deutsche Telekom International Finance BV 8.75%, 6/15/2030 (h) | | |
TK Elevator US Newco, Inc. 5.25%, 7/15/2027 (c) | | |
Volkswagen Group of America Finance LLC 3.13%, 5/12/2023 (c) | | |
| | |
|
Energuate Trust 5.88%, 5/3/2027 (a) | | |
|
Bank of East Asia Ltd. (The) (US Treasury Yield Curve Rate T Note Constant Maturity 5 Year + 5.53%), 5.83%, 10/21/2025 (a) (d) (e) (f) | | |
| | |
|
|
CAS Capital No. 1 Ltd. (US Treasury Yield Curve Rate T Note Constant Maturity 5 Year + 3.64%), 4.00%, 7/12/2026 (a) (d) (e) (f) | | |
Elect Global Investments Ltd. (US Treasury Yield Curve Rate T Note Constant Maturity 5 Year + 2.89%), 4.10%, 6/3/2025 (a) (d) (e) (f) | | |
| | |
(US Treasury Yield Curve Rate T Note Constant Maturity 5 Year + 4.87%), 8.05%, 12/15/2022 (a) (d) (e) (f) | | |
(US Treasury Yield Curve Rate T Note Constant Maturity 5 Year + 4.88%), 6.37%, 9/13/2024 (a) (d) (e) (f) | | |
FWD Ltd. (US Treasury Yield Curve Rate T Note Constant Maturity 5 Year + 3.08%), 5.50%, 2/1/2023 (a) (d) (e) (f) | | |
Melco Resorts Finance Ltd. 5.63%, 7/17/2027 (a) | | |
NWD Finance BVI Ltd. (US Treasury Yield Curve Rate T Note Constant Maturity 3 Year + 6.20%), 6.15%, 3/16/2025 (a) (d) (e) (f) | | |
NWD MTN Ltd. 4.13%, 7/18/2029 (a) | | |
| | |
|
ABJA Investment Co. Pte. Ltd. 5.45%, 1/24/2028 (a) | | |
Adani Transmission Step-One Ltd. 4.25%, 5/21/2036 (a) | | |
Continuum Energy Levanter Pte. Ltd. 4.50%, 2/9/2027 (a) | | |
Greenko Dutch BV 3.85%, 3/29/2026 (a) | | |
| | |
| | |
| | |
Greenko Solar Mauritius Ltd. 5.95%, 7/29/2026 (a) | | |
Greenko Wind Projects Mauritius Ltd. 5.50%, 4/6/2025 (c) | | |
HDFC Bank Ltd. (US Treasury Yield Curve Rate T Note Constant Maturity 5 Year + 2.93%), 3.70%, 8/25/2026 (c) (d) (e) (f) | | |
SEE NOTES TO FINANCIAL STATEMENTS.
| | |
Corporate Bonds — continued |
|
| | |
| | |
| | |
India Green Energy Holdings 5.38%, 4/29/2024 (a) | | |
India Green Power Holdings 4.00%, 2/22/2027 (a) | | |
| | |
| | |
| | |
| | |
| | |
| | |
| | |
Network i2i Ltd. (US Treasury Yield Curve Rate T Note Constant Maturity 5 Year + 4.27%), 5.65%, 1/15/2025 (a) (d) (e) (f) | | |
ReNew Power Pvt Ltd. 5.88%, 3/5/2027 (a) | | |
ReNew Wind Energy AP2 4.50%, 7/14/2028 (a) | | |
TML Holdings Pte. Ltd. 4.35%, 6/9/2026 (a) | | |
Vedanta Resources Ltd. 7.13%, 5/31/2023 (a) | | |
| | |
|
Adaro Indonesia PT 4.25%, 10/31/2024 (a) | | |
Bank Negara Indonesia Persero Tbk. PT (US Treasury Yield Curve Rate T Note Constant Maturity 5 Year + 3.47%), 4.30%, 3/24/2027 (a) (d) (e) (f) | | |
Bank Tabungan Negara Persero Tbk. PT 4.20%, 1/23/2025 (a) | | |
Cikarang Listrindo Tbk. PT 4.95%, 9/14/2026 (a) | | |
Indika Energy Capital III Pte. Ltd. 5.88%, 11/9/2024 (a) | | |
Indika Energy Capital IV Pte. Ltd. 8.25%, 10/22/2025 (a) | | |
Indonesia Asahan Aluminium Persero PT | | |
| | |
| | |
| | |
|
|
| | |
Medco Bell Pte. Ltd. 6.38%, 1/30/2027 (a) | | |
Medco Platinum Road Pte. Ltd. 6.75%, 1/30/2025 (a) | | |
| | |
| | |
| | |
Perusahaan Perseroan Persero PT Perusahaan Listrik Negara 4.00%, 6/30/2050 (a) | | |
| | |
|
AerCap Global Aviation Trust (ICE LIBOR USD 3 Month + 4.30%), 6.50%, 6/15/2045 (c) (f) | | |
AerCap Holdings NV (US Treasury Yield Curve Rate T Note Constant Maturity 5 Year + 4.54%), 5.87%, 10/10/2079 (f) | | |
Bank of Ireland Group plc (US Treasury Yield Curve Rate T Note Constant Maturity 1 Year + 1.10%), 2.03%, 9/30/2027 (c) (f) | | |
| | |
|
Energean Israel Finance Ltd. | | |
| | |
| | |
Leviathan Bond Ltd. 6.50%, 6/30/2027 (a) | | |
| | |
|
Enel SpA (USD Swap Semi 5 Year + 5.88%), 8.75%, 9/24/2073 (c) (f) | | |
Telecom Italia Capital SA | | |
| | |
| | |
| | |
| | |
(EURIBOR ICE Swap Rate 5 Year + 7.33%), 7.50%, 6/3/2026 (a) (d) (e) (f) | | |
SEE NOTES TO FINANCIAL STATEMENTS.
JPMorgan Income Builder Fund
SCHEDULE OF PORTFOLIO INVESTMENTS
AS OF October 31, 2022 (continued)
| | |
Corporate Bonds — continued |
|
(US Treasury Yield Curve Rate T Note Constant Maturity 1 Year + 1.20%), 1.98%, 6/3/2027 (c) (f) | | |
(EURIBOR ICE Swap Rate 5 Year + 4.08%), 3.88%, 6/3/2027 (a) (d) (e) (f) | | |
| | |
|
Nippon Life Insurance Co. | | |
(USD Swap Semi 5 Year + 3.65%), 5.10%, 10/16/2044 (c) (f) | | |
(US Treasury Yield Curve Rate T Note Constant Maturity 5 Year + 2.65%), 2.75%, 1/21/2051 (c) (f) | | |
Sumitomo Life Insurance Co. (US Treasury Yield Curve Rate T Note Constant Maturity 5 Year + 2.75%), 3.38%, 4/15/2081 (c) (f) | | |
Takeda Pharmaceutical Co. Ltd. 2.05%, 3/31/2030 | | |
Toyota Industries Corp. 3.24%, 3/16/2023 (c) | | |
Universal Entertainment Corp. 8.50%, 12/11/2024 (c) | | |
| | |
|
KazMunayGas National Co. JSC | | |
| | |
| | |
Tengizchevroil Finance Co. International Ltd. 4.00%, 8/15/2026 (a) | | |
| | |
|
Altice Financing SA 5.75%, 8/15/2029 (b) (c) | | |
| | |
| | |
| | |
FAGE International SA 5.63%, 8/15/2026 (c) | | |
Intelsat Jackson Holdings SA 6.50%, 3/15/2030 (c) | | |
| | |
| | |
|
|
Champion Path Holdings Ltd. 4.85%, 1/27/2028 (a) | | |
Studio City Finance Ltd. 6.00%, 7/15/2025 (a) | | |
| | |
|
Alfa SAB de CV 6.88%, 3/25/2044 (c) | | |
Cemex SAB de CV (US Treasury Yield Curve Rate T Note Constant Maturity 5 Year + 4.53%), 5.12%, 6/8/2026 (c) (d) (e) (f) | | |
Comision Federal de Electricidad 4.68%, 2/9/2051 (a) | | |
| | |
| | |
| | |
| | |
| | |
| | |
| | |
| | |
| | |
| | |
| | |
| | |
| | |
| | |
| | |
| | |
| | |
|
OCP SA 6.88%, 4/25/2044 (a) | | |
|
ABN AMRO Bank NV (EUR Swap Annual 5 Year + 4.67%), 4.37%, 9/22/2025 (a) (d) (e) (f) | | |
Cooperatieve Rabobank UA (EUR Swap Annual 5 Year + 4.68%), 4.37%, 6/29/2027 (a) (d) (e) (f) | | |
| | |
(USD Swap Semi 5 Year + 4.45%), 6.50%, 4/16/2025 (d) (e) (f) | | |
SEE NOTES TO FINANCIAL STATEMENTS.
| | |
Corporate Bonds — continued |
|
(US Treasury Yield Curve Rate T Note Constant Maturity 5 Year + 4.34%), 5.75%, 11/16/2026 (d) (e) (f) | | |
(US Treasury Yield Curve Rate T Note Constant Maturity 5 Year + 2.86%), 3.88%, 5/16/2027 (d) (e) (f) | | |
Shell International Finance BV 2.75%, 4/6/2030 | | |
Trivium Packaging Finance BV | | |
| | |
| | |
UPC Broadband Finco BV 4.88%, 7/15/2031 (c) | | |
VZ Secured Financing BV 5.00%, 1/15/2032 (c) | | |
| | |
|
AES Panama Generation Holdings SRL 4.38%, 5/31/2030 (c) | | |
|
Bioceanico Sovereign Certificate Ltd. Zero Coupon, 6/5/2034 (c) | | |
|
| | |
| | |
| | |
| | |
|
Globe Telecom, Inc. (US Treasury Yield Curve Rate T Note Constant Maturity 5 Year + 5.53%), 4.20%, 8/2/2026 (a) (d) (e) (f) | | |
Petron Corp. (US Treasury Yield Curve Rate T Note Constant Maturity 5 Year + 4.77%), 4.60%, 7/19/2023 (a) (d) (e) (f) | | |
Rizal Commercial Banking Corp. (US Treasury Yield Curve Rate T Note Constant Maturity 5 Year + 6.24%), 6.50%, 8/27/2025 (a) (d) (e) (f) | | |
| | |
|
|
SMC Global Power Holdings Corp. | | |
(US Treasury Yield Curve Rate T Note Constant Maturity 5 Year + 6.61%), 6.50%, 4/25/2024 (a) (d) (e) (f) | | |
(US Treasury Yield Curve Rate T Note Constant Maturity 5 Year + 9.20%), 7.00%, 10/21/2025 (a) (d) (e) (f) | | |
| | |
|
BOC Aviation Ltd. 4.38%, 5/2/2023 (a) | | |
DBS Group Holdings Ltd. (US Treasury Yield Curve Rate T Note Constant Maturity 5 Year + 1.92%), 3.30%, 2/27/2025 (a) (d) (e) (f) | | |
GLP Pte. Ltd. (US Treasury Yield Curve Rate T Note Constant Maturity 5 Year + 3.74%), 4.50%, 5/17/2026 (a) (d) (e) (f) | | |
| | |
|
| | |
| | |
| | |
| | |
|
Hana Bank (US Treasury Yield Curve Rate T Note Constant Maturity 5 Year + 2.41%), 3.50%, 10/19/2026 (c) (d) (e) (f) | | |
Heungkuk Life Insurance Co. Ltd. (US Treasury Yield Curve Rate T Note Constant Maturity 5 Year + 2.47%), 4.48%, 11/9/2022 (a) (d) (e) (f) | | |
Hyundai Capital Services, Inc. 2.13%, 4/24/2025 (a) | | |
Hyundai Motor Manufacturing Indonesia PT 1.75%, 5/6/2026 (a) | | |
Kia Corp. 3.00%, 4/25/2023 (c) | | |
Korea Investment & Securities Co. Ltd. 1.38%, 7/19/2024 (a) | | |
Shinhan Bank Co. Ltd. 4.50%, 3/26/2028 (a) | | |
SEE NOTES TO FINANCIAL STATEMENTS.
JPMorgan Income Builder Fund
SCHEDULE OF PORTFOLIO INVESTMENTS
AS OF October 31, 2022 (continued)
| | |
Corporate Bonds — continued |
|
Shinhan Card Co. Ltd. 1.38%, 10/19/2025 (a) | | |
SK Hynix, Inc. 1.50%, 1/19/2026 (a) | | |
SK Innovation Co. Ltd. 4.13%, 7/13/2023 (a) | | |
| | |
|
Banco Bilbao Vizcaya Argentaria SA | | |
(EUR Swap Annual 5 Year + 6.04%), 6.00%, 3/29/2024 (a) (d) (e) (f) | | |
(EUR Swap Annual 5 Year + 6.46%), 6.00%, 1/15/2026 (a) (d) (e) (f) | | |
Banco Santander SA (US Treasury Yield Curve Rate T Note Constant Maturity 5 Year + 3.75%), 4.75%, 11/12/2026 (d) (e) (f) | | |
Grifols Escrow Issuer SA 4.75%, 10/15/2028 (b) (c) | | |
Telefonica Emisiones SA 4.67%, 3/6/2038 | | |
| | |
|
Svenska Handelsbanken AB (US Treasury Yield Curve Rate T Note Constant Maturity 5 Year + 4.05%), 4.75%, 3/1/2031 (a) (d) (e) (f) | | |
|
Cloverie plc for Zurich Insurance Co. Ltd. (ICE LIBOR USD 3 Month + 4.92%), 5.63%, 6/24/2046 (a) (f) | | |
| | |
(USD Swap Semi 5 Year + 3.46%), 6.25%, 12/18/2024 (c) (d) (e) (f) | | |
(SOFR + 0.98%), 1.31%, 2/2/2027 (c) (f) | | |
| | |
(USD Swap Semi 5 Year + 4.34%), 7.00%, 1/31/2024 (c) (d) (e) (f) | | |
(USD Swap Semi 5 Year + 4.87%), 7.00%, 2/19/2025 (a) (d) (e) (f) | | |
(USD Swap Semi 5 Year + 4.59%), 6.87%, 8/7/2025 (a) (d) (e) (f) | | |
| | |
|
|
(US Treasury Yield Curve Rate T Note Constant Maturity 5 Year + 4.86%), 5.12%, 7/29/2026 (a) (d) (e) (f) | | |
(US Treasury Yield Curve Rate T Note Constant Maturity 5 Year + 3.40%), 4.88%, 2/12/2027 (c) (d) (e) (f) | | |
| | |
|
Bangkok Bank PCL (US Treasury Yield Curve Rate T Note Constant Maturity 5 Year + 4.73%), 5.00%, 9/23/2025 (a) (d) (e) (f) | | |
Krung Thai Bank PCL (US Treasury Yield Curve Rate T Note Constant Maturity 5 Year + 3.53%), 4.40%, 3/25/2026 (a) (d) (e) (f) | | |
Thaioil Treasury Center Co. Ltd. | | |
| | |
| | |
TMBThanachart Bank PCL (US Treasury Yield Curve Rate T Note Constant Maturity 5 Year + 3.26%), 4.90%, 12/2/2024 (a) (d) (e) (f) | | |
| | |
United Arab Emirates — 0.0% ^ |
Telford Offshore Ltd. 12.00% (PIK), 12/31/2164 (d) (e) (g) | | |
|
180 Medical, Inc. 3.88%, 10/15/2029 (c) | | |
| | |
| | |
| | |
| | |
(U.K. Government Bonds 5 Year Note Generic Bid Yield + 6.02%), 6.37%, 12/15/2025 (a) (d) (e) (f) | | |
(US Treasury Yield Curve Rate T Note Constant Maturity 5 Year + 5.43%), 8.00%, 3/15/2029 (d) (e) (f) | | |
BAT Capital Corp. 4.39%, 8/15/2037 | | |
SEE NOTES TO FINANCIAL STATEMENTS.
| | |
Corporate Bonds — continued |
United Kingdom — continued |
| | |
(US Treasury Yield Curve Rate T Note Constant Maturity 5 Year + 4.04%), 4.38%, 6/22/2025 (d) (e) (f) | | |
(U.K. Government Bonds 5 Year Note Generic Bid Yield + 4.17%), 4.25%, 3/22/2027 (a) (d) (e) (f) | | |
(EUR Swap Annual 5 Year + 4.12%), 3.63%, 3/22/2029 (a) (d) (e) (f) | | |
(US Treasury Yield Curve Rate T Note Constant Maturity 5 Year + 4.40%), 4.88%, 3/22/2030 (d) (e) (f) | | |
| | |
(USD ICE Swap Rate 5 Year + 3.61%), 6.50%, 3/23/2028 (d) (e) (f) | | |
(EUR Swap Annual 5 Year + 3.84%), 4.75%, 7/4/2029 (a) (d) (e) (f) | | |
(US Treasury Yield Curve Rate T Note Constant Maturity 5 Year + 3.65%), 4.60%, 12/17/2030 (d) (e) (f) | | |
INEOS Quattro Finance 2 plc 3.38%, 1/15/2026 (c) | | |
Ithaca Energy North Sea plc 9.00%, 7/15/2026 (c) | | |
Jaguar Land Rover Automotive plc 5.88%, 1/15/2028 (c) | | |
Marks & Spencer plc 7.13%, 12/1/2037 (c) | | |
Nationwide Building Society | | |
(U.K. Government Bonds 5 Year Note Generic Bid Yield + 5.39%), 5.87%, 12/20/2024 (a) (d) (e) (f) | | |
(U.K. Government Bonds 5 Year Note Generic Bid Yield + 5.63%), 5.75%, 6/20/2027 (a) (d) (e) (f) | | |
NatWest Group plc (US Treasury Yield Curve Rate T Note Constant Maturity 5 Year + 5.63%), 6.00%, 12/29/2025 (d) (e) (f) | | |
Rolls-Royce plc 5.75%, 10/15/2027 (c) | | |
Standard Chartered plc (US Treasury Yield Curve Rate T Note Constant Maturity 5 Year + 4.98%), 7.75%, 8/15/2027 (c) (d) (e) (f) | | |
| | |
|
United Kingdom — continued |
Virgin Media Finance plc 5.00%, 7/15/2030 (c) | | |
Virgin Media Secured Finance plc 5.50%, 5/15/2029 (c) | | |
| | |
| | |
(USD Swap Semi 5 Year + 4.87%), 7.00%, 4/4/2079 (f) | | |
(US Treasury Yield Curve Rate T Note Constant Maturity 5 Year + 2.77%), 4.12%, 6/4/2081 (f) | | |
| | |
|
7-Eleven, Inc. 1.80%, 2/10/2031 (c) | | |
| | |
| | |
| | |
Acadia Healthcare Co., Inc. | | |
| | |
| | |
ACCO Brands Corp. 4.25%, 3/15/2029 (b) (c) | | |
ACI Worldwide, Inc. 5.75%, 8/15/2026 (c) | | |
Activision Blizzard, Inc. 1.35%, 9/15/2030 | | |
Adient Global Holdings Ltd. 4.88%, 8/15/2026 (c) | | |
| | |
| | |
| | |
Adtalem Global Education, Inc. 5.50%, 3/1/2028 (c) | | |
Advanced Drainage Systems, Inc. | | |
| | |
| | |
Advanced Micro Devices, Inc. 3.92%, 6/1/2032 | | |
Aetna, Inc. 3.88%, 8/15/2047 | | |
Air Lease Corp. 3.75%, 6/1/2026 | | |
| | |
| | |
| | |
| | |
| | |
| | |
SEE NOTES TO FINANCIAL STATEMENTS.
JPMorgan Income Builder Fund
SCHEDULE OF PORTFOLIO INVESTMENTS
AS OF October 31, 2022 (continued)
| | |
Corporate Bonds — continued |
United States — continued |
| | |
Alcoa Nederland Holding BV 5.50%, 12/15/2027 (c) | | |
Alexandria Real Estate Equities, Inc. | | |
| | |
| | |
Alliance Resource Operating Partners LP 7.50%, 5/1/2025 (c) | | |
Allied Universal Holdco LLC | | |
| | |
| | |
| | |
Allison Transmission, Inc. | | |
| | |
| | |
| | |
| | |
| | |
Series C, (US Treasury Yield Curve Rate T Note Constant Maturity 7 Year + 3.48%), 4.70%, 5/15/2028 (d) (e) (f) | | |
| | |
| | |
| | |
AMC Entertainment Holdings, Inc. 10.00% (Cash), 6/15/2026 (b) (c) (g) | | |
| | |
| | |
| | |
Ameren Corp. 3.50%, 1/15/2031 | | |
| | |
| | |
| | |
American Axle & Manufacturing, Inc. | | |
| | |
| | |
| | |
| | |
American Builders & Contractors Supply Co., Inc. 4.00%, 1/15/2028 (c) | | |
American Electric Power Co., Inc. | | |
| | |
| | |
| | |
|
United States — continued |
(US Treasury Yield Curve Rate T Note Constant Maturity 5 Year + 2.68%), 3.88%, 2/15/2062 (f) | | |
American Honda Finance Corp. (ICE LIBOR USD 3 Month + 0.47%), 3.39%, 11/16/2022 (f) | | |
American International Group, Inc. Series A-9, (ICE LIBOR USD 3 Month + 2.87%), 5.75%, 4/1/2048 (f) | | |
| | |
| | |
| | |
| | |
American Transmission Systems, Inc. 2.65%, 1/15/2032 (c) | | |
| | |
| | |
| | |
| | |
| | |
Amgen, Inc. 2.00%, 1/15/2032 | | |
Amkor Technology, Inc. 6.63%, 9/15/2027 (c) | | |
AMN Healthcare, Inc. 4.63%, 10/1/2027 (c) | | |
ANGI Group LLC 3.88%, 8/15/2028 (b) (c) | | |
Antero Midstream Partners LP | | |
| | |
| | |
| | |
| | |
| | |
| | |
| | |
| | |
| | |
| | |
| | |
Aramark Services, Inc. 5.00%, 2/1/2028 (b) (c) | | |
| | |
| | |
| | |
SEE NOTES TO FINANCIAL STATEMENTS.
| | |
Corporate Bonds — continued |
United States — continued |
| | |
| | |
| | |
| | |
| | |
| | |
Arcosa, Inc. 4.38%, 4/15/2029 (c) | | |
Ardagh Metal Packaging Finance USA LLC 6.00%, 6/15/2027 (c) | | |
Ardagh Packaging Finance plc | | |
| | |
| | |
| | |
Asbury Automotive Group, Inc. | | |
| | |
| | |
| | |
| | |
ASGN, Inc. 4.63%, 5/15/2028 (c) | | |
| | |
Series B, (EURIBOR ICE Swap Rate 5 Year + 3.14%), 2.87%, 3/2/2025 (d) (e) (f) | | |
| | |
| | |
| | |
| | |
| | |
| | |
Audacy Capital Corp. 6.50%, 5/1/2027 (c) | | |
Avantor Funding, Inc. 4.63%, 7/15/2028 (c) | | |
Aviation Capital Group LLC 1.95%, 9/20/2026 (c) | | |
Avient Corp. 7.13%, 8/1/2030 (c) | | |
Avis Budget Car Rental LLC | | |
| | |
| | |
| | |
| | |
Axalta Coating Systems LLC | | |
| | |
| | |
B&G Foods, Inc. 5.25%, 4/1/2025 | | |
| | |
|
United States — continued |
Baker Hughes Holdings LLC 3.14%, 11/7/2029 | | |
| | |
Series X, (ICE LIBOR USD 3 Month + 3.71%), 6.25%, 9/5/2024 (d) (e) (f) | | |
Series Z, (ICE LIBOR USD 3 Month + 4.17%), 6.50%, 10/23/2024 (d) (e) (f) | | |
Series AA, (ICE LIBOR USD 3 Month + 3.90%), 6.10%, 3/17/2025 (d) (e) (f) | | |
Series DD, (ICE LIBOR USD 3 Month + 4.55%), 6.30%, 3/10/2026 (d) (e) (f) | | |
Series RR, (US Treasury Yield Curve Rate T Note Constant Maturity 5 Year + 2.76%), 4.38%, 1/27/2027 (d) (e) (f) | | |
Series TT, (US Treasury Yield Curve Rate T Note Constant Maturity 5 Year + 3.23%), 6.13%, 4/27/2027 (d) (e) (f) | | |
(SOFR + 0.96%), 1.73%, 7/22/2027 (f) | | |
Series FF, (ICE LIBOR USD 3 Month + 2.93%), 5.87%, 3/15/2028 (d) (e) (f) | | |
(SOFR + 1.21%), 2.57%, 10/20/2032 (f) | | |
Bank of New York Mellon Corp. (The) | | |
Series F, (ICE LIBOR USD 3 Month + 3.13%), 4.62%, 9/20/2026 (d) (e) (f) | | |
(SOFRINDX + 2.07%), 5.83%, 10/25/2033 (f) | | |
| | |
| | |
| | |
| | |
| | |
Bausch Health Americas, Inc. | | |
| | |
| | |
| | |
| | |
| | |
SEE NOTES TO FINANCIAL STATEMENTS.
JPMorgan Income Builder Fund
SCHEDULE OF PORTFOLIO INVESTMENTS
AS OF October 31, 2022 (continued)
| | |
Corporate Bonds — continued |
United States — continued |
| | |
| | |
| | |
| | |
| | |
| | |
| | |
Becton Dickinson and Co. 2.82%, 5/20/2030 | | |
Berry Global, Inc. 4.88%, 7/15/2026 (c) | | |
Berry Petroleum Co. LLC 7.00%, 2/15/2026 (c) | | |
Big River Steel LLC 6.63%, 1/31/2029 (c) | | |
Biogen, Inc. 2.25%, 5/1/2030 | | |
Black Knight InfoServ LLC 3.63%, 9/1/2028 (c) | | |
Block, Inc. 3.50%, 6/1/2031 (b) | | |
| | |
| | |
| | |
BlueLinx Holdings, Inc. 6.00%, 11/15/2029 (c) | | |
Boise Cascade Co. 4.88%, 7/1/2030 (c) | | |
Booz Allen Hamilton, Inc. | | |
| | |
| | |
Boston Properties LP, REIT 2.45%, 10/1/2033 | | |
Boyd Gaming Corp. 4.75%, 6/15/2031 (b) (c) | | |
Boyne USA, Inc. 4.75%, 5/15/2029 (c) | | |
BP Capital Markets America, Inc. 3.63%, 4/6/2030 | | |
Brightsphere Investment Group, Inc. 4.80%, 7/27/2026 | | |
| | |
| | |
| | |
Bristol-Myers Squibb Co. 2.35%, 11/13/2040 | | |
Broadcom, Inc. 4.30%, 11/15/2032 | | |
Brundage-Bone Concrete Pumping Holdings, Inc. 6.00%, 2/1/2026 (c) | | |
| | |
| | |
| | |
|
United States — continued |
| | |
| | |
| | |
Builders FirstSource, Inc. | | |
| | |
| | |
| | |
Burlington Northern Santa Fe LLC 3.30%, 9/15/2051 | | |
| | |
| | |
| | |
Cable One, Inc. 4.00%, 11/15/2030 (c) | | |
Caesars Entertainment, Inc. | | |
| | |
4.63%, 10/15/2029 (b) (c) | | |
Caesars Resort Collection LLC 5.75%, 7/1/2025 (c) | | |
California Resources Corp. 7.13%, 2/1/2026 (c) | | |
| | |
| | |
| | |
| | |
Capital One Financial Corp. Series M, (US Treasury Yield Curve Rate T Note Constant Maturity 5 Year + 3.16%), 3.95%, 9/1/2026 (d) (e) (f) | | |
| | |
| | |
| | |
| | |
| | |
Carnival Holdings Bermuda Ltd. 10.38%, 5/1/2028 (c) | | |
Carpenter Technology Corp. | | |
| | |
| | |
Cars.com, Inc. 6.38%, 11/1/2028 (c) | | |
Catalent Pharma Solutions, Inc. | | |
| | |
| | |
| | |
| | |
| | |
SEE NOTES TO FINANCIAL STATEMENTS.
| | |
Corporate Bonds — continued |
United States — continued |
| | |
| | |
| | |
| | |
| | |
| | |
CD&R Smokey Buyer, Inc. 6.75%, 7/15/2025 (c) | | |
| | |
| | |
| | |
| | |
| | |
| | |
| | |
Cengage Learning, Inc. 9.50%, 6/15/2024 (b) (c) | | |
| | |
| | |
| | |
| | |
CenterPoint Energy Resources Corp. (ICE LIBOR USD 3 Month + 0.50%), 3.60%, 3/2/2023 (f) | | |
CenterPoint Energy, Inc. (ICE LIBOR USD 3 Month + 3.27%), 6.13%, 9/1/2023 (d) (e) (f) | | |
| | |
| | |
| | |
Charles Schwab Corp. (The) | | |
Series G, (US Treasury Yield Curve Rate T Note Constant Maturity 5 Year + 4.97%), 5.38%, 6/1/2025 (d) (e) (f) | | |
Series H, (US Treasury Yield Curve Rate T Note Constant Maturity 10 Year + 3.08%), 4.00%, 12/1/2030 (d) (e) (f) | | |
Chemours Co. (The) 5.75%, 11/15/2028 (c) | | |
Cheniere Energy Partners LP | | |
| | |
| | |
| | |
Cheniere Energy, Inc. 4.63%, 10/15/2028 | | |
| | |
|
United States — continued |
| | |
| | |
| | |
| | |
Chevron Corp. 2.24%, 5/11/2030 | | |
Chord Energy Corp. 6.38%, 6/1/2026 (c) | | |
Chubb INA Holdings, Inc. 2.88%, 11/3/2022 | | |
Churchill Downs, Inc. 4.75%, 1/15/2028 (c) | | |
Ciena Corp. 4.00%, 1/31/2030 (c) | | |
Cigna Corp. 4.38%, 10/15/2028 | | |
| | |
| | |
| | |
| | |
(ICE LIBOR USD 3 Month + 4.07%), 5.95%, 1/30/2023 (b) (d) (e) (f) | | |
Series M, (ICE LIBOR USD 3 Month + 3.42%), 6.30%, 5/15/2024 (d) (e) (f) | | |
Series U, (SOFR + 3.81%), 5.00%, 9/12/2024 (d) (e) (f) | | |
Series V, (SOFR + 3.23%), 4.70%, 1/30/2025 (d) (e) (f) | | |
Series P, (ICE LIBOR USD 3 Month + 3.91%), 5.95%, 5/15/2025 (d) (e) (f) | | |
Series W, (US Treasury Yield Curve Rate T Note Constant Maturity 5 Year + 3.60%), 4.00%, 12/10/2025 (d) (e) (f) | | |
(US Treasury Yield Curve Rate T Note Constant Maturity 5 Year + 3.42%), 3.88%, 2/18/2026 (d) (e) (f) | | |
Series T, (ICE LIBOR USD 3 Month + 4.52%), 6.25%, 8/15/2026 (b) (d) (e) (f) | | |
(SOFR + 0.77%), 1.46%, 6/9/2027 (f) | | |
(SOFR + 1.18%), 2.52%, 11/3/2032 (f) | | |
Citizens Bank NA (ICE LIBOR USD 3 Month + 0.95%), 4.59%, 3/29/2023 (f) | | |
SEE NOTES TO FINANCIAL STATEMENTS.
JPMorgan Income Builder Fund
SCHEDULE OF PORTFOLIO INVESTMENTS
AS OF October 31, 2022 (continued)
| | |
Corporate Bonds — continued |
United States — continued |
Citizens Financial Group, Inc. | | |
Series B, (ICE LIBOR USD 3 Month + 3.00%), 6.00%, 7/6/2023 (d) (e) (f) | | |
Series C, (ICE LIBOR USD 3 Month + 3.16%), 6.37%, 4/6/2024 (d) (e) (f) | | |
Series G, (US Treasury Yield Curve Rate T Note Constant Maturity 5 Year + 3.22%), 4.00%, 10/6/2026 (d) (e) (f) | | |
Civitas Resources, Inc. 5.00%, 10/15/2026 (c) | | |
| | |
| | |
| | |
| | |
Clarivate Science Holdings Corp. | | |
| | |
| | |
Clear Channel Outdoor Holdings, Inc. | | |
| | |
| | |
| | |
| | |
| | |
| | |
CMS Energy Corp. (US Treasury Yield Curve Rate T Note Constant Maturity 5 Year + 4.12%), 4.75%, 6/1/2050 (f) | | |
CNX Midstream Partners LP 4.75%, 4/15/2030 (c) | | |
| | |
| | |
| | |
Cogent Communications Group, Inc. 3.50%, 5/1/2026 (c) | | |
Coherent Corp. 5.00%, 12/15/2029 (c) | | |
| | |
| | |
| | |
| | |
| | |
| | |
| | |
| | |
|
United States — continued |
CommScope Technologies LLC | | |
| | |
| | |
| | |
| | |
| | |
| | |
Community Health Systems, Inc. | | |
| | |
| | |
| | |
| | |
| | |
Compass Group Diversified Holdings LLC 5.25%, 4/15/2029 (c) | | |
| | |
| | |
| | |
Conduent Business Services LLC 6.00%, 11/1/2029 (c) | | |
Consensus Cloud Solutions, Inc. 6.50%, 10/15/2028 (c) | | |
Constellation Brands, Inc. 2.25%, 8/1/2031 | | |
Cooper-Standard Automotive, Inc. | | |
| | |
| | |
Corebridge Financial, Inc. (US Treasury Yield Curve Rate T Note Constant Maturity 5 Year + 3.85%), 6.87%, 12/15/2052 (c) (f) | | |
CoreCivic, Inc. 8.25%, 4/15/2026 (b) | | |
CoreLogic, Inc. 4.50%, 5/1/2028 (b) (c) | | |
| | |
| | |
| | |
| | |
Cox Communications, Inc. 4.80%, 2/1/2035 (c) | | |
CQP Holdco LP 5.50%, 6/15/2031 (c) | | |
Crestwood Midstream Partners LP | | |
| | |
| | |
| | |
Crown Americas LLC 4.75%, 2/1/2026 | | |
SEE NOTES TO FINANCIAL STATEMENTS.
| | |
Corporate Bonds — continued |
United States — continued |
| | |
| | |
| | |
| | |
| | |
| | |
| | |
| | |
| | |
| | |
| | |
| | |
| | |
| | |
CTR Partnership LP, REIT 3.88%, 6/30/2028 (c) | | |
CVR Partners LP 6.13%, 6/15/2028 (c) | | |
| | |
| | |
| | |
| | |
| | |
| | |
| | |
| | |
| | |
| | |
| | |
DCP Midstream Operating LP | | |
| | |
| | |
| | |
| | |
Delek Logistics Partners LP 7.13%, 6/1/2028 (c) | | |
Dell International LLC 4.90%, 10/1/2026 | | |
Deluxe Corp. 8.00%, 6/1/2029 (c) | | |
Diamond Sports Group LLC 5.38%, 8/15/2026 (b) (c) | | |
Directv Financing LLC 5.88%, 8/15/2027 (c) | | |
Discovery Communications LLC 3.63%, 5/15/2030 | | |
| | |
|
United States — continued |
| | |
| | |
| | |
| | |
| | |
| | |
| | |
| | |
| | |
Series B, (US Treasury Yield Curve Rate T Note Constant Maturity 5 Year + 2.99%), 4.65%, 12/15/2024 (d) (e) (f) | | |
Series C, (US Treasury Yield Curve Rate T Note Constant Maturity 5 Year + 3.20%), 4.35%, 1/15/2027 (d) (e) (f) | | |
Series C, 2.25%, 8/15/2031 | | |
Dornoch Debt Merger Sub, Inc. 6.63%, 10/15/2029 (c) | | |
| | |
| | |
| | |
| | |
| | |
(US Treasury Yield Curve Rate T Note Constant Maturity 5 Year + 2.32%), 3.25%, 1/15/2082 (f) | | |
Dun & Bradstreet Corp. (The) 5.00%, 12/15/2029 (c) | | |
Dycom Industries, Inc. 4.50%, 4/15/2029 (c) | | |
Edgewell Personal Care Co. | | |
| | |
| | |
Edison International Series B, (US Treasury Yield Curve Rate T Note Constant Maturity 5 Year + 3.90%), 5.00%, 12/15/2026 (d) (e) (f) | | |
Elanco Animal Health, Inc. 6.40%, 8/28/2028 (h) | | |
Element Solutions, Inc. 3.88%, 9/1/2028 (c) | | |
| | |
| | |
| | |
SEE NOTES TO FINANCIAL STATEMENTS.
JPMorgan Income Builder Fund
SCHEDULE OF PORTFOLIO INVESTMENTS
AS OF October 31, 2022 (continued)
| | |
Corporate Bonds — continued |
United States — continued |
Embarq Corp. 8.00%, 6/1/2036 | | |
Emergent BioSolutions, Inc. 3.88%, 8/15/2028 (c) | | |
Enact Holdings, Inc. 6.50%, 8/15/2025 (c) | | |
Encino Acquisition Partners Holdings LLC 8.50%, 5/1/2028 (c) | | |
| | |
| | |
| | |
| | |
| | |
| | |
5.88%, 10/15/2024 (c) (h) | | |
9.50%, 7/31/2027 (b) (c) (j) | | |
| | |
Endo Luxembourg Finance Co. I Sarl 6.13%, 4/1/2029 (c) (h) | | |
| | |
| | |
| | |
| | |
| | |
Series A, (ICE LIBOR USD 3 Month + 4.03%), 6.25%, 2/15/2023 (d) (e) (f) | | |
| | |
Series B, (ICE LIBOR USD 3 Month + 4.16%), 6.63%, 2/15/2028 (d) (e) (f) | | |
Series G, (US Treasury Yield Curve Rate T Note Constant Maturity 5 Year + 5.31%), 7.13%, 5/15/2030 (d) (e) (f) | | |
| | |
| | |
| | |
EnLink Midstream Partners LP | | |
Series C, (ICE LIBOR USD 3 Month + 4.11%), 6.00%, 12/15/2022 (d) (e) (f) | | |
| | |
| | |
| | |
Enova International, Inc. | | |
| | |
| | |
|
United States — continued |
| | |
| | |
| | |
| | |
| | |
| | |
| | |
| | |
| | |
| | |
Enterprise Products Operating LLC Series E, (ICE LIBOR USD 3 Month + 3.03%), 5.25%, 8/16/2077 (f) | | |
Envision Healthcare Corp. 8.75%, 10/15/2026 (c) | | |
EOG Resources, Inc. 5.10%, 1/15/2036 | | |
EQM Midstream Partners LP | | |
| | |
| | |
| | |
| | |
| | |
| | |
| | |
| | |
| | |
| | |
| | |
| | |
Equitable Holdings, Inc. Series B, (US Treasury Yield Curve Rate T Note Constant Maturity 5 Year + 4.74%), 4.95%, 9/15/2025 (d) (e) (f) | | |
ESC Co., Intelsat Jackson Holdings, Ltd. | | |
| | |
| | |
| | |
| | |
| | |
| | |
Evergy, Inc. 2.90%, 9/15/2029 | | |
Exela Intermediate LLC 11.50%, 7/15/2026 (c) | | |
Exxon Mobil Corp. 4.23%, 3/19/2040 | | |
Fair Isaac Corp. 4.00%, 6/15/2028 (c) | | |
SEE NOTES TO FINANCIAL STATEMENTS.
| | |
Corporate Bonds — continued |
United States — continued |
Ferrellgas LP 5.88%, 4/1/2029 (c) | | |
Fertitta Entertainment LLC | | |
| | |
| | |
Fidelity National Information Services, Inc. 2.25%, 3/1/2031 | | |
Fiserv, Inc. 3.50%, 7/1/2029 | | |
Foot Locker, Inc. 4.00%, 10/1/2029 (c) | | |
Ford Motor Credit Co. LLC | | |
| | |
| | |
| | |
| | |
| | |
| | |
| | |
| | |
| | |
| | |
| | |
| | |
| | |
| | |
| | |
| | |
| | |
Frontier Communications Holdings LLC | | |
| | |
| | |
| | |
| | |
| | |
| | |
Gannett Holdings LLC 6.00%, 11/1/2026 (b) (c) | | |
| | |
| | |
| | |
| | |
| | |
| | |
| | |
GCI LLC 4.75%, 10/15/2028 (c) | | |
| | |
|
United States — continued |
General Electric Co. Series D, (ICE LIBOR USD 3 Month + 3.33%), 6.62%, 12/15/2022 (d) (e) (f) | | |
General Motors Financial Co., Inc. 4.30%, 4/6/2029 | | |
| | |
| | |
| | |
| | |
| | |
Genting New York LLC 3.30%, 2/15/2026 (c) | | |
GEO Group, Inc. (The) 10.50%, 6/30/2028 | | |
G-III Apparel Group Ltd. 7.88%, 8/15/2025 (c) | | |
Gilead Sciences, Inc. 1.65%, 10/1/2030 | | |
Glatfelter Corp. 4.75%, 11/15/2029 (b) (c) | | |
Global Infrastructure Solutions, Inc. | | |
| | |
| | |
Global Medical Response, Inc. 6.50%, 10/1/2025 (c) | | |
Global Net Lease, Inc., REIT 3.75%, 12/15/2027 (c) | | |
| | |
| | |
| | |
GLP Capital LP, REIT 5.25%, 6/1/2025 (b) | | |
Go Daddy Operating Co. LLC | | |
| | |
| | |
Goldman Sachs Capital II (ICE LIBOR USD 3 Month + 0.77%), 4.00%, 11/28/2022 (d) (e) (f) | | |
Goldman Sachs Group, Inc. (The) | | |
(ICE LIBOR USD 3 Month + 0.75%), 3.71%, 2/23/2023 (f) | | |
Series S, (US Treasury Yield Curve Rate T Note Constant Maturity 5 Year + 2.85%), 4.40%, 2/10/2025 (d) (e) (f) | | |
Series R, (US Treasury Yield Curve Rate T Note Constant Maturity 5 Year + 3.22%), 4.95%, 2/10/2025 (d) (e) (f) | | |
SEE NOTES TO FINANCIAL STATEMENTS.
JPMorgan Income Builder Fund
SCHEDULE OF PORTFOLIO INVESTMENTS
AS OF October 31, 2022 (continued)
| | |
Corporate Bonds — continued |
United States — continued |
Series T, (US Treasury Yield Curve Rate T Note Constant Maturity 5 Year + 2.97%), 3.80%, 5/10/2026 (d) (e) (f) | | |
Series U, (US Treasury Yield Curve Rate T Note Constant Maturity 5 Year + 2.92%), 3.65%, 8/10/2026 (d) (e) (f) | | |
Series O, (ICE LIBOR USD 3 Month + 3.83%), 5.30%, 11/10/2026 (d) (e) (f) | | |
(SOFR + 0.82%), 1.54%, 9/10/2027 (f) | | |
(SOFR + 0.91%), 1.95%, 10/21/2027 (f) | | |
(SOFR + 1.11%), 2.64%, 2/24/2028 (f) | | |
(SOFR + 1.26%), 2.65%, 10/21/2032 (f) | | |
Goodyear Tire & Rubber Co. (The) | | |
| | |
| | |
| | |
| | |
GrafTech Finance, Inc. 4.63%, 12/15/2028 (c) | | |
Graham Holdings Co. 5.75%, 6/1/2026 (c) | | |
Graham Packaging Co., Inc. 7.13%, 8/15/2028 (c) | | |
Gray Escrow II, Inc. 5.38%, 11/15/2031 (b) (c) | | |
| | |
| | |
| | |
| | |
Griffon Corp. 5.75%, 3/1/2028 | | |
Group 1 Automotive, Inc. 4.00%, 8/15/2028 (c) | | |
| | |
| | |
| | |
Gulfport Energy Operating Corp. | | |
| | |
| | |
| | |
| | |
|
United States — continued |
Gulfport Energy Operating Corp., Escrow 6.38%, 5/15/2025 ‡ (j) | | |
GYP Holdings III Corp. 4.63%, 5/1/2029 (c) | | |
Hanesbrands, Inc. 4.88%, 5/15/2026 (b) (c) | | |
Harsco Corp. 5.75%, 7/31/2027 (c) | | |
| | |
| | |
| | |
| | |
| | |
| | |
| | |
Herbalife Nutrition Ltd. 7.88%, 9/1/2025 (c) | | |
Herc Holdings, Inc. 5.50%, 7/15/2027 (b) (c) | | |
| | |
| | |
| | |
| | |
| | |
Hess Midstream Operations LP | | |
| | |
| | |
| | |
| | |
| | |
| | |
Hilton Domestic Operating Co., Inc. | | |
| | |
| | |
| | |
| | |
Hilton Worldwide Finance LLC 4.88%, 4/1/2027 | | |
HLF Financing SARL LLC 4.88%, 6/1/2029 (c) | | |
| | |
| | |
| | |
| | |
| | |
| | |
SEE NOTES TO FINANCIAL STATEMENTS.
| | |
Corporate Bonds — continued |
United States — continued |
Home Depot, Inc. (The) 4.95%, 9/15/2052 | | |
Honeywell International, Inc. 5.00%, 2/15/2033 | | |
| | |
| | |
| | |
| | |
HP, Inc. 4.75%, 3/1/2029 (b) (c) | | |
Hughes Satellite Systems Corp. 6.63%, 8/1/2026 | | |
Huntington Bancshares, Inc. Series E, (ICE LIBOR USD 3 Month + 2.88%), 5.70%, 4/15/2023 (d) (e) (f) | | |
| | |
| | |
| | |
| | |
IAA, Inc. 5.50%, 6/15/2027 (c) | | |
| | |
| | |
| | |
iHeartCommunications, Inc. | | |
| | |
| | |
| | |
ILFC E-Capital Trust I 5.12%, 12/21/2065 (c) (k) | | |
ILFC E-Capital Trust II 5.37%, 12/21/2065 (c) (k) | | |
Imola Merger Corp. 4.75%, 5/15/2029 (c) | | |
Ingevity Corp. 3.88%, 11/1/2028 (c) | | |
Ingles Markets, Inc. 4.00%, 6/15/2031 (c) | | |
Installed Building Products, Inc. 5.75%, 2/1/2028 (c) | | |
Intel Corp. 2.00%, 8/12/2031 | | |
International Game Technology plc | | |
| | |
| | |
| | |
| | |
| | |
| | |
| | |
| | |
| | |
|
United States — continued |
| | |
| | |
ITC Holdings Corp. 2.95%, 5/14/2030 (c) | | |
James Hardie International Finance DAC 5.00%, 1/15/2028 (c) | | |
Jazz Securities DAC 4.38%, 1/15/2029 (c) | | |
JB Poindexter & Co., Inc. 7.13%, 4/15/2026 (c) | | |
| | |
| | |
| | |
| | |
John Deere Capital Corp. 4.35%, 9/15/2032 | | |
| | |
| | |
| | |
Kansas City Southern 3.50%, 5/1/2050 | | |
| | |
| | |
| | |
Keurig Dr Pepper, Inc. 3.20%, 5/1/2030 | | |
KeyCorp (SOFRINDX + 2.06%), 4.79%, 6/1/2033 (f) | | |
KFC Holding Co. 4.75%, 6/1/2027 (c) | | |
Kimco Realty Corp., REIT 2.25%, 12/1/2031 | | |
Kinder Morgan Energy Partners LP 4.70%, 11/1/2042 | | |
Kinetik Holdings LP 5.88%, 6/15/2030 (c) | | |
| | |
| | |
| | |
Kontoor Brands, Inc. 4.13%, 11/15/2029 (c) | | |
Korn Ferry 4.63%, 12/15/2027 (c) | | |
Kraft Heinz Foods Co. 3.75%, 4/1/2030 | | |
Kroger Co. (The) 1.70%, 1/15/2031 | | |
L3Harris Technologies, Inc. 1.80%, 1/15/2031 | | |
| | |
| | |
10.50%, 7/15/2027 (b) (c) | | |
Lamb Weston Holdings, Inc. | | |
| | |
SEE NOTES TO FINANCIAL STATEMENTS.
JPMorgan Income Builder Fund
SCHEDULE OF PORTFOLIO INVESTMENTS
AS OF October 31, 2022 (continued)
| | |
Corporate Bonds — continued |
United States — continued |
| | |
| | |
Lear Corp. 2.60%, 1/15/2032 | | |
| | |
| | |
| | |
LGI Homes, Inc. 4.00%, 7/15/2029 (c) | | |
Liberty Interactive LLC 8.25%, 2/1/2030 (b) | | |
Lithia Motors, Inc. 4.38%, 1/15/2031 (b) (c) | | |
Live Nation Entertainment, Inc. | | |
| | |
| | |
| | |
| | |
| | |
| | |
| | |
| | |
| | |
Louisiana-Pacific Corp. 3.63%, 3/15/2029 (c) | | |
| | |
| | |
| | |
| | |
| | |
| | |
| | |
| | |
5.13%, 12/15/2026 (b) (c) | | |
| | |
Series G, 6.88%, 1/15/2028 (b) | | |
| | |
| | |
Series P, 7.60%, 9/15/2039 | | |
Series U, 7.65%, 3/15/2042 (b) | | |
M/I Homes, Inc. 3.95%, 2/15/2030 | | |
Macy's Retail Holdings LLC 5.88%, 3/15/2030 (c) | | |
| | |
| | |
| | |
| | |
|
United States — continued |
Magnolia Oil & Gas Operating LLC 6.00%, 8/1/2026 (c) | | |
Mallinckrodt International Finance SA | | |
11.50%, 12/15/2028 (b) (c) | | |
10.00%, 6/15/2029 (b) (c) | | |
Marriott Ownership Resorts, Inc. | | |
| | |
| | |
| | |
Masonite International Corp. 5.38%, 2/1/2028 (c) | | |
| | |
| | |
| | |
Matador Resources Co. 5.88%, 9/15/2026 | | |
| | |
| | |
| | |
| | |
| | |
Mauser Packaging Solutions Holding Co. | | |
| | |
| | |
McDonald's Corp. 3.70%, 2/15/2042 | | |
McGraw-Hill Education, Inc. 5.75%, 8/1/2028 (c) | | |
MDC Holdings, Inc. 2.50%, 1/15/2031 | | |
| | |
| | |
| | |
Mellon Capital IV Series 1, (ICE LIBOR USD 3 Month + 0.57%), 4.09%, 11/28/2022 (d) (e) (f) | | |
Meritage Homes Corp. 3.88%, 4/15/2029 (c) | | |
MetLife Capital Trust IV 7.88%, 12/15/2037 (c) | | |
| | |
Series G, (US Treasury Yield Curve Rate T Note Constant Maturity 5 Year + 3.58%), 3.85%, 9/15/2025 (d) (e) (f) | | |
Series D, (ICE LIBOR USD 3 Month + 2.96%), 5.87%, 3/15/2028 (d) (e) (f) | | |
| | |
SEE NOTES TO FINANCIAL STATEMENTS.
| | |
Corporate Bonds — continued |
United States — continued |
| | |
| | |
MGIC Investment Corp. 5.25%, 8/15/2028 | | |
MGM Resorts International | | |
| | |
| | |
| | |
| | |
| | |
Midcontinent Communications 5.38%, 8/15/2027 (c) | | |
Midwest Gaming Borrower LLC 4.88%, 5/1/2029 (c) | | |
Mileage Plus Holdings LLC 6.50%, 6/20/2027 (c) | | |
Minerals Technologies, Inc. 5.00%, 7/1/2028 (c) | | |
Mississippi Power Co. Series 12-A, 4.25%, 3/15/2042 | | |
MIWD Holdco II LLC 5.50%, 2/1/2030 (c) | | |
| | |
| | |
| | |
Mondelez International, Inc. 1.50%, 2/4/2031 | | |
Moog, Inc. 4.25%, 12/15/2027 (c) | | |
| | |
Series M, (ICE LIBOR USD 3 Month + 4.44%), 5.87%, 9/15/2026 (d) (e) (f) | | |
(SOFR + 0.86%), 1.51%, 7/20/2027 (f) | | |
(SOFR + 1.61%), 4.21%, 4/20/2028 (f) | | |
(SOFR + 1.02%), 1.93%, 4/28/2032 (f) | | |
(SOFR + 1.20%), 2.51%, 10/20/2032 (f) | | |
(SOFR + 1.49%), 3.22%, 4/22/2042 (f) | | |
Moss Creek Resources Holdings, Inc. | | |
| | |
| | |
| | |
MSCI, Inc. 4.00%, 11/15/2029 (c) | | |
| | |
|
United States — continued |
Mueller Water Products, Inc. 4.00%, 6/15/2029 (c) | | |
Murphy Oil USA, Inc. 3.75%, 2/15/2031 (c) | | |
Nabors Industries Ltd. 7.25%, 1/15/2026 (c) | | |
Nabors Industries, Inc. 5.75%, 2/1/2025 (b) | | |
National CineMedia LLC 5.88%, 4/15/2028 (c) | | |
National Rural Utilities Cooperative Finance Corp. (ICE LIBOR USD 3 Month + 3.63%), 5.25%, 4/20/2046 (f) | | |
Nationstar Mortgage Holdings, Inc. | | |
| | |
| | |
| | |
| | |
Navient Corp. 5.00%, 3/15/2027 | | |
| | |
| | |
| | |
| | |
| | |
NESCO Holdings II, Inc. 5.50%, 4/15/2029 (c) | | |
| | |
| | |
| | |
| | |
| | |
| | |
| | |
| | |
| | |
| | |
| | |
| | |
| | |
| | |
| | |
| | |
| | |
| | |
SEE NOTES TO FINANCIAL STATEMENTS.
JPMorgan Income Builder Fund
SCHEDULE OF PORTFOLIO INVESTMENTS
AS OF October 31, 2022 (continued)
| | |
Corporate Bonds — continued |
United States — continued |
| | |
| | |
| | |
NextEra Energy Capital Holdings, Inc. | | |
| | |
(ICE LIBOR USD 3 Month + 2.07%), 5.81%, 10/1/2066 (f) | | |
(ICE LIBOR USD 3 Month + 2.13%), 5.42%, 6/15/2067 (f) | | |
(ICE LIBOR USD 3 Month + 3.16%), 5.65%, 5/1/2079 (f) | | |
(US Treasury Yield Curve Rate T Note Constant Maturity 5 Year + 2.55%), 3.80%, 3/15/2082 (f) | | |
NextEra Energy Operating Partners LP | | |
| | |
| | |
| | |
NGL Energy Operating LLC 7.50%, 2/1/2026 (c) | | |
| | |
(US Treasury Yield Curve Rate T Note Constant Maturity 5 Year + 2.84%), 5.65%, 6/15/2023 (d) (e) (f) | | |
| | |
Nissan Motor Acceptance Co. LLC 2.45%, 9/15/2028 (c) | | |
NMG Holding Co., Inc. 7.13%, 4/1/2026 (c) | | |
NMI Holdings, Inc. 7.38%, 6/1/2025 (c) | | |
Norfolk Southern Corp. 2.30%, 5/15/2031 | | |
Northern Oil and Gas, Inc. 8.13%, 3/1/2028 (c) | | |
| | |
| | |
| | |
| | |
| | |
| | |
| | |
| | |
| | |
| | |
| | |
| | |
|
United States — continued |
| | |
| | |
| | |
| | |
| | |
Occidental Petroleum Corp. | | |
| | |
| | |
| | |
| | |
| | |
| | |
Oceaneering International, Inc. 6.00%, 2/1/2028 | | |
ON Semiconductor Corp. 3.88%, 9/1/2028 (c) | | |
Oncor Electric Delivery Co. LLC 4.55%, 9/15/2032 (c) | | |
| | |
| | |
| | |
| | |
| | |
| | |
| | |
Option Care Health, Inc. 4.38%, 10/31/2029 (c) | | |
Oracle Corp. 3.80%, 11/15/2037 | | |
O'Reilly Automotive, Inc. 4.70%, 6/15/2032 | | |
| | |
| | |
| | |
Outfront Media Capital LLC 5.00%, 8/15/2027 (b) (c) | | |
Ovintiv, Inc. 8.13%, 9/15/2030 | | |
| | |
| | |
| | |
Owens-Brockway Glass Container, Inc. | | |
| | |
| | |
Pactiv Evergreen Group Issuer, Inc. 4.00%, 10/15/2027 (c) | | |
SEE NOTES TO FINANCIAL STATEMENTS.
| | |
Corporate Bonds — continued |
United States — continued |
Papa John's International, Inc. 3.88%, 9/15/2029 (c) | | |
Par Pharmaceutical, Inc. 7.50%, 4/1/2027 (c) (h) | | |
| | |
| | |
(ICE LIBOR USD 3 Month + 3.90%), 6.25%, 2/28/2057 (f) | | |
(US Treasury Yield Curve Rate T Note Constant Maturity 5 Year + 4.00%), 6.37%, 3/30/2062 (f) | | |
PennyMac Financial Services, Inc. | | |
| | |
| | |
Performance Food Group, Inc. | | |
| | |
| | |
| | |
Permian Resources Operating LLC 5.38%, 1/15/2026 (c) | | |
| | |
| | |
| | |
| | |
| | |
| | |
PGT Innovations, Inc. 4.38%, 10/1/2029 (c) | | |
Philip Morris International, Inc. 3.38%, 8/15/2029 | | |
Photo Holdings Merger Sub, Inc. 8.50%, 10/1/2026 (c) | | |
| | |
| | |
| | |
Pike Corp. 5.50%, 9/1/2028 (c) | | |
Plains All American Pipeline LP Series B, (ICE LIBOR USD 3 Month + 4.11%), 6.13%, 11/28/2022 (d) (e) (f) | | |
Playtika Holding Corp. 4.25%, 3/15/2029 (c) | | |
PM General Purchaser LLC 9.50%, 10/1/2028 (c) | | |
| | |
|
United States — continued |
PNC Financial Services Group, Inc. (The) | | |
Series R, (ICE LIBOR USD 3 Month + 3.04%), 4.85%, 6/1/2023 (d) (e) (f) | | |
Series T, (US Treasury Yield Curve Rate T Note Constant Maturity 5 Year + 2.60%), 3.40%, 9/15/2026 (d) (e) (f) | | |
Series S, (ICE LIBOR USD 3 Month + 3.30%), 5.00%, 11/1/2026 (d) (e) (f) | | |
Series V, (US Treasury Yield Curve Rate T Note Constant Maturity 5 Year + 3.24%), 6.20%, 9/15/2027 (d) (e) (f) | | |
| | |
| | |
| | |
| | |
| | |
PPL Capital Funding, Inc. Series A, (ICE LIBOR USD 3 Month + 2.67%), 6.34%, 3/30/2067 (f) | | |
PRA Group, Inc. 5.00%, 10/1/2029 (c) | | |
Presidio Holdings, Inc. 4.88%, 2/1/2027 (c) | | |
| | |
| | |
| | |
Prime Security Services Borrower LLC | | |
| | |
| | |
Progressive Corp. (The) Series B, (ICE LIBOR USD 3 Month + 2.54%), 5.38%, 3/15/2023 (d) (e) (f) | | |
Prudential Financial, Inc. | | |
(ICE LIBOR USD 3 Month + 3.92%), 5.63%, 6/15/2043 (f) | | |
(US Treasury Yield Curve Rate T Note Constant Maturity 5 Year + 3.16%), 5.12%, 3/1/2052 (f) | | |
(US Treasury Yield Curve Rate T Note Constant Maturity 5 Year + 3.23%), 6.00%, 9/1/2052 (f) | | |
Public Service Co. of Oklahoma Series J, 2.20%, 8/15/2031 | | |
Qwest Corp. 7.25%, 9/15/2025 | | |
SEE NOTES TO FINANCIAL STATEMENTS.
JPMorgan Income Builder Fund
SCHEDULE OF PORTFOLIO INVESTMENTS
AS OF October 31, 2022 (continued)
| | |
Corporate Bonds — continued |
United States — continued |
Rain CII Carbon LLC 7.25%, 4/1/2025 (c) | | |
| | |
| | |
| | |
| | |
Raytheon Technologies Corp. | | |
| | |
| | |
| | |
| | |
| | |
Regeneron Pharmaceuticals, Inc. 1.75%, 9/15/2030 | | |
Rent-A-Center, Inc. 6.38%, 2/15/2029 (b) (c) | | |
Resolute Forest Products, Inc. 4.88%, 3/1/2026 (c) | | |
| | |
| | |
| | |
| | |
| | |
| | |
ROCC Holdings LLC 9.25%, 8/15/2026 (c) | | |
Rockcliff Energy II LLC 5.50%, 10/15/2029 (c) | | |
| | |
| | |
| | |
| | |
Rockies Express Pipeline LLC 4.80%, 5/15/2030 (c) | | |
Royal Caribbean Cruises Ltd. | | |
| | |
11.63%, 8/15/2027 (b) (c) | | |
| | |
| | |
Royalty Pharma plc 2.15%, 9/2/2031 | | |
RP Escrow Issuer LLC 5.25%, 12/15/2025 (c) | | |
RR Donnelley & Sons Co. 8.25%, 7/1/2027 (b) | | |
S&P Global, Inc. 2.90%, 3/1/2032 (c) | | |
| | |
| | |
| | |
|
United States — continued |
| | |
SBA Communications Corp., REIT 3.13%, 2/1/2029 | | |
Scotts Miracle-Gro Co. (The) | | |
| | |
| | |
| | |
| | |
Scripps Escrow II, Inc. 5.38%, 1/15/2031 (b) (c) | | |
Scripps Escrow, Inc. 5.88%, 7/15/2027 (c) | | |
| | |
(US Treasury Yield Curve Rate T Note Constant Maturity 5 Year + 4.55%), 4.88%, 10/15/2025 (d) (e) (f) | | |
(US Treasury Yield Curve Rate T Note Constant Maturity 5 Year + 2.87%), 4.12%, 4/1/2052 (f) | | |
| | |
| | |
| | |
| | |
| | |
Sensata Technologies, Inc. 3.75%, 2/15/2031 (c) | | |
Service Corp. International | | |
| | |
| | |
| | |
| | |
| | |
Shire Acquisitions Investments Ireland DAC 3.20%, 9/23/2026 | | |
Sinclair Television Group, Inc. | | |
| | |
| | |
| | |
| | |
| | |
| | |
| | |
| | |
SEE NOTES TO FINANCIAL STATEMENTS.
| | |
Corporate Bonds — continued |
United States — continued |
Six Flags Entertainment Corp. | | |
| | |
| | |
Six Flags Theme Parks, Inc. 7.00%, 7/1/2025 (c) | | |
| | |
| | |
| | |
| | |
Sonic Automotive, Inc. 4.63%, 11/15/2029 (c) | | |
Southern California Edison Co. Series E, (ICE LIBOR USD 3 Month + 4.20%), 6.98%, 11/28/2022 (d) (e) (f) | | |
Southern Co. Gas Capital Corp. | | |
Series 20-A, 1.75%, 1/15/2031 | | |
| | |
| | |
| | |
| | |
| | |
| | |
| | |
| | |
| | |
| | |
| | |
| | |
| | |
| | |
| | |
| | |
| | |
| | |
| | |
| | |
SRS Distribution, Inc. 4.63%, 7/1/2028 (c) | | |
SS&C Technologies, Inc. 5.50%, 9/30/2027 (c) | | |
Stagwell Global LLC 5.63%, 8/15/2029 (c) | | |
Standard Industries, Inc. | | |
| | |
| | |
| | |
|
United States — continued |
| | |
| | |
| | |
| | |
| | |
| | |
Series H, (ICE LIBOR USD 3 Month + 2.54%), 5.63%, 12/15/2023 (d) (e) (f) | | |
(SOFR + 0.73%), 2.20%, 2/7/2028 (f) | | |
Station Casinos LLC 4.50%, 2/15/2028 (b) (c) | | |
Stericycle, Inc. 3.88%, 1/15/2029 (c) | | |
Stevens Holding Co., Inc. 6.13%, 10/1/2026 (c) | | |
StoneX Group, Inc. 8.63%, 6/15/2025 (c) | | |
Summit Materials LLC 5.25%, 1/15/2029 (c) | | |
Summit Midstream Holdings LLC 8.50%, 10/15/2026 (c) | | |
| | |
| | |
| | |
| | |
| | |
Series C, (US Treasury Yield Curve Rate T Note Constant Maturity 5 Year + 3.20%), 4.00%, 5/15/2026 (d) (e) (f) | | |
Series D, (US Treasury Yield Curve Rate T Note Constant Maturity 5 Year + 3.07%), 4.25%, 11/15/2026 (d) (e) (f) | | |
| | |
| | |
| | |
Sylvamo Corp. 7.00%, 9/1/2029 (c) | | |
Synaptics, Inc. 4.00%, 6/15/2029 (b) (c) | | |
Syneos Health, Inc. 3.63%, 1/15/2029 (c) | | |
| | |
| | |
| | |
Take-Two Interactive Software, Inc. | | |
| | |
| | |
SEE NOTES TO FINANCIAL STATEMENTS.
JPMorgan Income Builder Fund
SCHEDULE OF PORTFOLIO INVESTMENTS
AS OF October 31, 2022 (continued)
| | |
Corporate Bonds — continued |
United States — continued |
Tallgrass Energy Partners LP | | |
| | |
| | |
| | |
| | |
| | |
Targa Resources Partners LP | | |
| | |
| | |
| | |
| | |
| | |
Target Corp. 4.50%, 9/15/2032 | | |
| | |
| | |
| | |
Tempur Sealy International, Inc. | | |
| | |
3.88%, 10/15/2031 (b) (c) | | |
| | |
| | |
| | |
| | |
| | |
| | |
| | |
| | |
| | |
| | |
| | |
Terex Corp. 5.00%, 5/15/2029 (c) | | |
Thor Industries, Inc. 4.00%, 10/15/2029 (c) | | |
| | |
| | |
| | |
Topaz Solar Farms LLC 5.75%, 9/30/2039 (c) | | |
TopBuild Corp. 3.63%, 3/15/2029 (c) | | |
TransDigm, Inc. 6.25%, 3/15/2026 (c) | | |
Transocean Guardian Ltd. 5.88%, 1/15/2024 (c) | | |
Transocean Pontus Ltd. 6.13%, 8/1/2025 (c) | | |
| | |
|
United States — continued |
Transocean Poseidon Ltd. 6.88%, 2/1/2027 (c) | | |
Transocean Proteus Ltd. 6.25%, 12/1/2024 (b) (c) | | |
TreeHouse Foods, Inc. 4.00%, 9/1/2028 | | |
| | |
| | |
| | |
TriMas Corp. 4.13%, 4/15/2029 (c) | | |
TriNet Group, Inc. 3.50%, 3/1/2029 (c) | | |
Trinseo Materials Operating SCA | | |
| | |
| | |
Triton Water Holdings, Inc. 6.25%, 4/1/2029 (c) | | |
| | |
| | |
| | |
| | |
| | |
Series M, (ICE LIBOR USD 3 Month + 2.79%), 5.12%, 12/15/2027 (d) (e) (f) | | |
Series Q, (US Treasury Yield Curve Rate T Note Constant Maturity 10 Year + 4.35%), 5.10%, 3/1/2030 (d) (e) (f) | | |
TTM Technologies, Inc. 4.00%, 3/1/2029 (c) | | |
Tucson Electric Power Co. 1.50%, 8/1/2030 | | |
Uber Technologies, Inc. 4.50%, 8/15/2029 (c) | | |
| | |
| | |
| | |
United Airlines Holdings, Inc. | | |
| | |
| | |
United Airlines, Inc. 4.38%, 4/15/2026 (c) | | |
United Rentals North America, Inc. | | |
| | |
| | |
| | |
| | |
SEE NOTES TO FINANCIAL STATEMENTS.
| | |
Corporate Bonds — continued |
United States — continued |
United States Cellular Corp. 6.70%, 12/15/2033 | | |
United States Steel Corp. 6.88%, 3/1/2029 (b) | | |
| | |
| | |
| | |
| | |
| | |
| | |
Univision Communications, Inc. | | |
| | |
| | |
| | |
| | |
(US Treasury Yield Curve Rate T Note Constant Maturity 5 Year + 2.54%), 3.70%, 1/15/2027 (d) (e) (f) | | |
Series J, (ICE LIBOR USD 3 Month + 2.91%), 5.30%, 4/15/2027 (d) (e) (f) | | |
(SOFR + 1.66%), 4.55%, 7/22/2028 (f) | | |
US Foods, Inc. 4.63%, 6/1/2030 (c) | | |
Vail Resorts, Inc. 6.25%, 5/15/2025 (c) | | |
Valvoline, Inc. 4.25%, 2/15/2030 (c) | | |
Varex Imaging Corp. 7.88%, 10/15/2027 (c) | | |
Vector Group Ltd. 5.75%, 2/1/2029 (c) | | |
Venator Finance SARL 5.75%, 7/15/2025 (b) (c) | | |
Ventas Realty LP, REIT 4.00%, 3/1/2028 | | |
Verizon Communications, Inc. | | |
| | |
| | |
| | |
Viavi Solutions, Inc. 3.75%, 10/1/2029 (c) | | |
| | |
| | |
| | |
| | |
| | |
| | |
| | |
|
United States — continued |
| | |
| | |
| | |
| | |
| | |
| | |
Victors Merger Corp. 6.38%, 5/15/2029 (b) (c) | | |
Virtusa Corp. 7.13%, 12/15/2028 (c) | | |
Vista Outdoor, Inc. 4.50%, 3/15/2029 (c) | | |
Vistra Corp. (US Treasury Yield Curve Rate T Note Constant Maturity 5 Year + 5.74%), 7.00%, 12/15/2026 (c) (d) (e) (f) | | |
Vistra Operations Co. LLC | | |
| | |
| | |
| | |
| | |
VM Consolidated, Inc. 5.50%, 4/15/2029 (c) | | |
VMware, Inc. 2.20%, 8/15/2031 | | |
Wabash National Corp. 4.50%, 10/15/2028 (c) | | |
Warnermedia Holdings, Inc. | | |
| | |
| | |
| | |
Warrior Met Coal, Inc. 7.88%, 12/1/2028 (c) | | |
WEC Energy Group, Inc. 1.80%, 10/15/2030 | | |
Weekley Homes LLC 4.88%, 9/15/2028 (c) | | |
| | |
Series S, (ICE LIBOR USD 3 Month + 3.11%), 5.90%, 6/15/2024 (d) (e) (f) | | |
Series U, (ICE LIBOR USD 3 Month + 3.99%), 5.87%, 6/15/2025 (d) (e) (f) | | |
Series BB, (US Treasury Yield Curve Rate T Note Constant Maturity 5 Year + 3.45%), 3.90%, 3/15/2026 (d) (e) (f) | | |
SEE NOTES TO FINANCIAL STATEMENTS.
JPMorgan Income Builder Fund
SCHEDULE OF PORTFOLIO INVESTMENTS
AS OF October 31, 2022 (continued)
| | |
Corporate Bonds — continued |
United States — continued |
(SOFR + 2.10%), 4.90%, 7/25/2033 (f) | | |
Wesco Aircraft Holdings, Inc. | | |
| | |
9.00%, 11/15/2026 (b) (c) | | |
| | |
| | |
| | |
| | |
William Carter Co. (The) 5.63%, 3/15/2027 (c) | | |
Williams Cos., Inc. (The) 2.60%, 3/15/2031 | | |
Winnebago Industries, Inc. 6.25%, 7/15/2028 (c) | | |
| | |
| | |
| | |
| | |
| | |
| | |
| | |
| | |
| | |
| | |
Wynn Las Vegas LLC 5.50%, 3/1/2025 (c) | | |
Wynn Resorts Finance LLC 5.13%, 10/1/2029 (c) | | |
XPO Escrow Sub LLC 7.50%, 11/15/2027 (c) | | |
| | |
| | |
| | |
| | |
| | |
Zayo Group Holdings, Inc. 4.00%, 3/1/2027 (b) (c) | | |
Ziff Davis, Inc. 4.63%, 10/15/2030 (c) | | |
Zimmer Biomet Holdings, Inc. 2.60%, 11/24/2031 | | |
Zoetis, Inc. 2.00%, 5/15/2030 | | |
ZoomInfo Technologies LLC 3.88%, 2/1/2029 (c) | | |
| | |
| | |
|
|
Uzbekneftegaz JSC 4.75%, 11/16/2028 (c) | | |
Total Corporate Bonds
(Cost $3,902,266) | | |
Equity Linked Notes — 7.1% |
|
National Bank of Canada, ELN, 8.00%, 12/28/2022, (linked to NASDAQ - 100 Index) (c) | | |
Royal Bank of Canada, ELN, 8.00%, 12/21/2022, (linked to NASDAQ - 100 Index) (c) | | |
| | |
|
BNP Paribas, ELN, 8.00%, 11/23/2022, (linked to NASDAQ - 100 Index) (c) | | |
Societe Generale SA, ELN, 8.00%, 12/15/2022, (linked to NASDAQ - 100 Index) (c) | | |
| | |
|
Barclays Bank plc, ELN, 8.00%, 12/12/2022, (linked to NASDAQ - 100 Index) (a) | | |
|
Citigroup Global Markets Holdings, Inc., ELN, 8.00%, 12/5/2022, (linked to NASDAQ - 100 Index) (a) | | |
Citigroup Global Markets Holdings, Inc., ELN, 9.00%, 12/30/2022, (linked to NASDAQ - 100 Index) (a) | | |
| | |
Total Equity Linked Notes
(Cost $759,242) | | |
Commercial Mortgage-Backed Securities — 4.3% |
|
| | |
Series 2019-BN16, Class D, 3.00%, 2/15/2052 ‡ (c) | | |
Series 2019-BN16, Class F, 3.69%, 2/15/2052 ‡ (c) (k) | | |
Series 2019-BN21, Class F, 2.68%, 10/17/2052 ‡ (c) | | |
SEE NOTES TO FINANCIAL STATEMENTS.
| | |
Commercial Mortgage-Backed Securities — continued |
United States — continued |
Series 2019-BN23, Class D, 2.50%, 12/15/2052 ‡ (c) | | |
Series 2020-BN30, Class F, 2.00%, 12/15/2053 ‡ (c) (k) | | |
Series 2021-BN31, Class E, 2.50%, 2/15/2054 ‡ (c) (k) | | |
Series 2017-BNK5, Class D, 3.08%, 6/15/2060 ‡ (c) (k) | | |
Series 2018-BN14, Class F, 3.94%, 9/15/2060 ‡ (c) | | |
Series 2018-BN15, Class E, 3.00%, 11/15/2061 ‡ (c) | | |
Series 2019-BN18, Class F, 3.33%, 5/15/2062 ‡ (c) | | |
Series 2019-BN24, Class D, 2.50%, 11/15/2062 ‡ (c) | | |
Series 2020-BN26, Class D, 2.50%, 3/15/2063 ‡ (c) | | |
Series 2020-BN28, Class E, 2.50%, 3/15/2063 ‡ (c) | | |
BBCMS MORTGAGE TRUST Series 2017-C1, Class D, 3.49%, 2/15/2050 ‡ (c) (k) | | |
| | |
Series 2018-B1, Class D, 2.75%, 1/15/2051 ‡ (c) | | |
Series 2019-B9, Class F, 3.75%, 3/15/2052 ‡ (c) (k) | | |
Series 2019-B11, Class D, 3.00%, 5/15/2052 ‡ (c) | | |
Series 2020-B21, Class E, 2.00%, 12/17/2053 ‡ (c) | | |
Series 2020-B21, Class F, 2.00%, 12/17/2053 ‡ (c) | | |
Series 2021-B26, Class F, 1.87%, 6/15/2054 ‡ (c) (k) | | |
Series 2019-B14, Class E, 2.50%, 12/15/2062 ‡ (c) | | |
Series 2019-B15, Class E, 2.75%, 12/15/2072 ‡ (c) | | |
BX Series 2021-MFM1, Class G, 7.31%, 1/15/2034 ‡ (c) (k) | | |
BX Commercial Mortgage Trust | | |
Series 2020-VIV2, Class C, 3.54%, 3/9/2044 ‡ (c) (k) | | |
Series 2020-VIV3, Class B, 3.54%, 3/9/2044 (c) (k) | | |
| | |
|
United States — continued |
CAMB Commercial Mortgage Trust Series 2019-LIFE, Class E, 5.56%, 12/15/2037 ‡ (c) (k) | | |
| | |
Series 2016-CD2, Class C, 3.98%, 11/10/2049 ‡ (k) | | |
Series 2017-CD4, Class D, 3.30%, 5/10/2050 ‡ (c) | | |
Series 2017-CD5, Class D, 3.35%, 8/15/2050 ‡ (c) | | |
Series 2017-CD6, Class C, 4.23%, 11/13/2050 ‡ (k) | | |
Series 2018-CD7, Class D, 3.10%, 8/15/2051 ‡ (c) (k) | | |
CFCRE Commercial Mortgage Trust Series 2016-C6, Class D, 4.19%, 11/10/2049 ‡ (c) (k) | | |
CGMS Commercial Mortgage Trust Series 2017-B1, Class E, 3.30%, 8/15/2050 ‡ (c) (k) | | |
Citigroup Commercial Mortgage Trust | | |
Series 2019-PRM, Class E, 4.73%, 5/10/2036 ‡ (c) (k) | | |
Series 2015-GC27, Class D, 4.42%, 2/10/2048 ‡ (c) (k) | | |
Series 2015-GC29, Class C, 4.14%, 4/10/2048 ‡ (k) | | |
Series 2015-P1, Class D, 3.23%, 9/15/2048 ‡ (c) | | |
Series 2016-C1, Class D, 4.94%, 5/10/2049 (c) (k) | | |
Series 2016-C2, Class D, 3.25%, 8/10/2049 ‡ (c) (k) | | |
Series 2016-P6, Class D, 3.25%, 12/10/2049 ‡ (c) | | |
Series 2017-P7, Class D, 3.25%, 4/14/2050 ‡ (c) | | |
Series 2017-P7, Class B, 4.14%, 4/14/2050 ‡ (k) | | |
Series 2017-P7, Class C, 4.41%, 4/14/2050 ‡ (k) | | |
Series 2020-GC46, Class E, 2.60%, 2/15/2053 ‡ (c) | | |
Commercial Mortgage Trust | | |
Series 2020-CBM, Class F, 3.63%, 2/10/2037 ‡ (c) (k) | | |
Series 2014-CR15, Class C, 4.67%, 2/10/2047 ‡ (k) | | |
SEE NOTES TO FINANCIAL STATEMENTS.
JPMorgan Income Builder Fund
SCHEDULE OF PORTFOLIO INVESTMENTS
AS OF October 31, 2022 (continued)
| | |
Commercial Mortgage-Backed Securities — continued |
United States — continued |
Series 2014-LC15, Class D, 5.00%, 4/10/2047 ‡ (c) (k) | | |
Series 2014-CR19, Class D, 4.70%, 8/10/2047 ‡ (c) (k) | | |
Series 2014-UBS5, Class D, 3.50%, 9/10/2047 ‡ (c) | | |
Series 2014-LC17, Class D, 3.69%, 10/10/2047 (c) | | |
Series 2015-CR22, Class E, 3.00%, 3/10/2048 ‡ (c) | | |
Series 2015-CR22, Class D, 4.07%, 3/10/2048 ‡ (c) (k) | | |
Series 2015-LC21, Class D, 4.33%, 7/10/2048 ‡ (k) | | |
Series 2015-CR24, Class D, 3.46%, 8/10/2048 ‡ (k) | | |
Series 2015-CR25, Class D, 3.77%, 8/10/2048 ‡ (k) | | |
Series 2015-CR27, Class D, 3.45%, 10/10/2048 ‡ (c) (k) | | |
Series 2015-CR26, Class D, 3.47%, 10/10/2048 ‡ (k) | | |
Series 2015-LC23, Class D, 3.57%, 10/10/2048 ‡ (c) (k) | | |
Series 2015-LC23, Class E, 3.57%, 10/10/2048 ‡ (c) (k) | | |
Series 2016-CR28, Class D, 3.85%, 2/10/2049 ‡ (k) | | |
Series 2016-CR28, Class C, 4.60%, 2/10/2049 ‡ (k) | | |
Series 2018-COR3, Class D, 2.81%, 5/10/2051 ‡ (c) (k) | | |
CSAIL Commercial Mortgage Trust | | |
Series 2015-C4, Class C, 4.56%, 11/15/2048 ‡ (k) | | |
Series 2019-C15, Class C, 4.99%, 3/15/2052 ‡ (k) | | |
Series 2015-C2, Class B, 4.21%, 6/15/2057 ‡ (k) | | |
| | |
Series 2016-C3, Class D, 3.48%, 8/10/2049 ‡ (c) (k) | | |
Series 2016-C3, Class E, 4.23%, 8/10/2049 ‡ (c) (k) | | |
FHLMC Multiclass Certificates Series 2020-RR05, Class X, IO, 2.01%, 1/27/2029 | | |
| | |
|
United States — continued |
FHLMC, Multi-Family Structured Credit Risk | | |
Series MN2, Class B1, 8.50%, 7/25/2041 (c) (k) | | |
Series 2021-MN1, Class M1, 5.00%, 1/25/2051 (c) (k) | | |
Series MN1, Class M2, 6.75%, 1/25/2051 (c) (k) | | |
Series 2021-MN1, Class B1, 10.75%, 1/25/2051 (c) (k) | | |
FHLMC, Multi-Family Structured Pass-Through Certificates | | |
Series K033, Class X1, IO, 0.28%, 7/25/2023 (k) | | |
Series KC03, Class X1, IO, 0.48%, 11/25/2024 (k) | | |
Series K734, Class X3, IO, 2.17%, 7/25/2026 (k) | | |
Series KC04, Class X1, IO, 1.25%, 12/25/2026 (k) | | |
Series K084, Class X3, IO, 2.24%, 11/25/2028 (k) | | |
Series K090, Class X3, IO, 2.31%, 10/25/2029 (k) | | |
Series K723, Class X3, IO, 1.91%, 10/25/2034 (k) | | |
Series Q012, Class X, IO, 4.12%, 9/25/2035 (k) | | |
Series K054, Class X3, IO, 1.60%, 4/25/2043 (k) | | |
Series K067, Class X3, IO, 2.11%, 9/25/2044 (k) | | |
Series K727, Class X3, IO, 2.00%, 10/25/2044 (k) | | |
Series K068, Class X3, IO, 2.06%, 10/25/2044 (k) | | |
Series K059, Class X3, IO, 1.92%, 11/25/2044 (k) | | |
Series K729, Class X3, IO, 1.97%, 11/25/2044 (k) | | |
Series K060, Class X3, IO, 1.90%, 12/25/2044 (k) | | |
Series K061, Class X3, IO, 1.98%, 12/25/2044 (k) | | |
Series K066, Class X3, IO, 2.16%, 8/25/2045 (k) | | |
Series K728, Class X3, IO, 1.96%, 11/25/2045 (k) | | |
SEE NOTES TO FINANCIAL STATEMENTS.
| | |
Commercial Mortgage-Backed Securities — continued |
United States — continued |
Series K071, Class X3, IO, 2.01%, 11/25/2045 (k) | | |
Series K089, Class X3, IO, 2.30%, 1/25/2046 (k) | | |
Series K087, Class X3, IO, 2.32%, 1/25/2046 (k) | | |
Series K082, Class X3, IO, 2.21%, 10/25/2046 (k) | | |
Series K102, Class X3, IO, 1.89%, 12/25/2046 (k) | | |
Series K088, Class X3, IO, 2.35%, 2/25/2047 (k) | | |
Series K093, Class X3, IO, 2.21%, 5/25/2047 (k) | | |
Series K116, Class X3, IO, 3.02%, 9/25/2047 (k) | | |
Series K108, Class X3, IO, 3.49%, 4/25/2048 (k) | | |
Series 2022-MN4, Class B1, 12.50%, 5/25/2052 (c) (k) | | |
| | |
Series 2019-M21, Class X2, IO, 1.30%, 2/25/2031 (k) | | |
Series 2016-M4, Class X2, IO, 2.67%, 1/25/2039 (k) | | |
FNMA, Multi-Family REMIC Trust Series 2020-M37, Class X, IO, 1.05%, 4/25/2032 (k) | | |
| | |
Series 2017-KF31, Class B, 6.04%, 4/25/2024 (c) (k) | | |
Series 2017-KF32, Class B, 5.69%, 5/25/2024 (c) (k) | | |
Series 2017-KF38, Class B, 5.64%, 9/25/2024 (c) (k) | | |
Series 2018-KF47, Class B, 5.14%, 5/25/2025 (c) (k) | | |
Series 2018-KF49, Class B, 5.04%, 6/25/2025 (c) (k) | | |
Series 2018-KF51, Class C, 9.14%, 8/25/2025 (c) (k) | | |
Series 2019-KC03, Class B, 4.38%, 1/25/2026 (c) (k) | | |
Series 2019-KF58, Class B, 5.29%, 1/25/2026 (c) (k) | | |
Series 2019-KF62, Class B, 5.19%, 4/25/2026 (c) (k) | | |
| | |
|
United States — continued |
Series 2017-KL1E, Class BE, 3.91%, 2/25/2027 (c) (k) | | |
Series 2017-KF33, Class B, 5.69%, 6/25/2027 (c) (k) | | |
Series 2017-KF40, Class B, 5.84%, 11/25/2027 (c) (k) | | |
Series 2018-KF43, Class B, 5.29%, 1/25/2028 (c) (k) | | |
Series 21K-F116, Class CS, 8.87%, 6/25/2028 (c) (k) | | |
Series 2018-KF50, Class B, 5.04%, 7/25/2028 (c) (k) | | |
Series 2018-K82, Class B, 4.13%, 9/25/2028 (c) (k) | | |
Series 2018-KSW4, Class C, 8.14%, 10/25/2028 (k) | | |
Series 2019-KF59, Class B, 5.49%, 2/25/2029 (c) (k) | | |
Series 2019-KG01, Class B, 4.17%, 4/25/2029 (c) (k) | | |
Series 2019-KW09, Class X2A, IO, 0.10%, 5/25/2029 (c) | | |
Series 2019-KF63, Class B, 5.49%, 5/25/2029 (c) (k) | | |
Series 2019-KW09, Class C, PO, 6/25/2029 (c) | | |
Series 2019-KW09, Class X2B, IO, 0.10%, 6/25/2029 (c) | | |
Series 2017-K153, Class B, PO, 4/25/2032 (c) | | |
Series 2017-K729, Class B, 3.67%, 11/25/2049 (c) (k) | | |
Series 2017-K724, Class D, PO, 12/25/2049 (c) | | |
Series 2017-K724, Class X2A, IO, 0.10%, 12/25/2049 (c) | | |
Series 2017-K724, Class X2B, IO, 0.10%, 12/25/2049 (c) | | |
Series 2019-K103, Class B, 3.46%, 12/25/2051 (c) (k) | | |
| | |
Series 2012-44, IO, 0.03%, 3/16/2049 (k) | | |
Series 2015-86, IO, 0.42%, 5/16/2052 (k) | | |
Series 2013-7, IO, 0.30%, 5/16/2053 (k) | | |
SEE NOTES TO FINANCIAL STATEMENTS.
JPMorgan Income Builder Fund
SCHEDULE OF PORTFOLIO INVESTMENTS
AS OF October 31, 2022 (continued)
| | |
Commercial Mortgage-Backed Securities — continued |
United States — continued |
Series 2012-89, IO, 0.16%, 12/16/2053 (k) | | |
Series 2014-186, IO, 0.38%, 8/16/2054 (k) | | |
Series 2015-33, IO, 0.26%, 2/16/2056 (k) | | |
Series 2015-59, IO, 0.89%, 6/16/2056 (k) | | |
Series 2016-40, IO, 0.61%, 7/16/2057 (k) | | |
Series 2016-157, IO, 0.90%, 11/16/2057 (k) | | |
Series 2016-71, Class QI, IO, 0.93%, 11/16/2057 (k) | | |
Series 2016-151, IO, 0.85%, 6/16/2058 (k) | | |
Series 2017-54, IO, 0.68%, 12/16/2058 (k) | | |
Series 2017-86, IO, 0.69%, 5/16/2059 (k) | | |
Series 2017-148, IO, 0.56%, 7/16/2059 (k) | | |
Series 2019-53, Class IA, IO, 0.78%, 6/16/2061 (k) | | |
Series 2020-145, IO, 0.73%, 3/16/2063 (k) | | |
GS Mortgage Securities Trust | | |
Series 2012-GCJ9, Class D, 4.63%, 11/10/2045 ‡ (c) (k) | | |
Series 2013-GC12, Class E, 3.25%, 6/10/2046 ‡ (c) | | |
Series 2013-GC12, Class D, 4.45%, 6/10/2046 ‡ (c) (k) | | |
Series 2015-GC28, Class D, 4.31%, 2/10/2048 ‡ (c) (k) | | |
Series 2017-GS5, Class D, 3.51%, 3/10/2050 ‡ (c) (k) | | |
Series 2017-GS6, Class D, 3.24%, 5/10/2050 ‡ (c) | | |
Series 2015-GC30, Class D, 3.38%, 5/10/2050 ‡ | | |
Series 2019-GC40, Class E, 3.00%, 7/10/2052 ‡ (c) | | |
| | |
Series 2019-LIC, Class E, 3.24%, 10/14/2039 ‡ (c) (k) | | |
| | |
|
United States — continued |
Series 2019-LIC, Class F, 3.24%, 10/14/2039 ‡ (c) (k) | | |
JPMBB Commercial Mortgage Securities Trust | | |
Series 2013-C15, Class E, 3.50%, 11/15/2045 ‡ (c) | | |
Series 2013-C17, Class D, 4.88%, 1/15/2047 ‡ (c) (k) | | |
Series 2014-C21, Class D, 4.64%, 8/15/2047 ‡ (c) (k) | | |
Series 2014-C26, Class D, 3.88%, 1/15/2048 ‡ (c) (k) | | |
Series 2015-C33, Class C, 4.62%, 12/15/2048 (k) | | |
Series 2016-C1, Class D2, 4.24%, 3/17/2049 ‡ (c) (k) | | |
Series 2016-C1, Class C, 4.74%, 3/17/2049 ‡ (k) | | |
JPMCC Commercial Mortgage Securities Trust Series 2017-JP5, Class D, 4.53%, 3/15/2050 (c) (k) | | |
JPMDB Commercial Mortgage Securities Trust Series 2016-C4, Class D, 3.07%, 12/15/2049 ‡ (c) (k) | | |
JPMorgan Chase Commercial Mortgage Securities Trust Series 2016-JP3, Class D, 3.43%, 8/15/2049 ‡ (c) (k) | | |
KNDL Mortgage Trust Series 2019-KNSQ, Class E, 5.21%, 5/15/2036 ‡ (c) (k) | | |
LB-UBS Commercial Mortgage Trust Series 2006-C6, Class AJ, 5.45%, 9/15/2039 ‡ (k) | | |
MHC Commercial Mortgage Trust Series 2021-MHC, Class G, 6.61%, 4/15/2038 ‡ (c) (k) | | |
Morgan Stanley Bank of America Merrill Lynch Trust | | |
Series 2012-C5, Class G, 4.50%, 8/15/2045 ‡ (c) | | |
Series 2014-C14, Class D, 5.06%, 2/15/2047 ‡ (c) (k) | | |
Series 2014-C15, Class D, 4.89%, 4/15/2047 ‡ (c) (k) | | |
Series 2014-C16, Class C, 4.75%, 6/15/2047 ‡ (k) | | |
Series 2014-C19, Class D, 3.25%, 12/15/2047 ‡ (c) | | |
SEE NOTES TO FINANCIAL STATEMENTS.
| | |
Commercial Mortgage-Backed Securities — continued |
United States — continued |
Series 2015-C20, Class C, 4.45%, 2/15/2048 ‡ (k) | | |
Series 2015-C24, Class D, 3.26%, 5/15/2048 (c) | | |
Series 2015-C25, Class C, 4.53%, 10/15/2048 ‡ (k) | | |
Series 2016-C31, Class C, 4.27%, 11/15/2049 ‡ (k) | | |
Morgan Stanley Capital I Trust | | |
Series 2018-MP, Class D, 4.28%, 7/11/2040 ‡ (c) (k) | | |
Series 2018-L1, Class E, 3.00%, 10/15/2051 ‡ (c) | | |
Series 2019-L2, Class D, 3.00%, 3/15/2052 ‡ (c) | | |
Series 2019-L2, Class E, 3.00%, 3/15/2052 ‡ (c) | | |
| | |
Series 2019-PARK, Class F, 2.72%, 12/15/2036 ‡ (c) | | |
Series 2019-PARK, Class G, 2.72%, 12/15/2036 ‡ (c) | | |
Series 2019-PARK, Class J, 4.25%, 12/15/2036 ‡ (c) | | |
Multi-Family Connecticut Avenue Securities Trust | | |
Series 2019-01, Class M10, 6.84%, 10/25/2049 ‡ (c) (k) | | |
Series 2020-01, Class M10, 7.34%, 3/25/2050 ‡ (c) (k) | | |
NYC Commercial Mortgage Trust Series 2021-909, Class E, 3.21%, 4/10/2043 ‡ (c) (k) | | |
VASA Trust Series 2021-VASA, Class G, 8.41%, 7/15/2039 ‡ (c) (k) | | |
Velocity Commercial Capital Loan Trust | | |
Series 2018-2, Class A, 4.05%, 10/26/2048 (c) (k) | | |
Series 2018-2, Class M2, 4.51%, 10/26/2048 ‡ (c) (k) | | |
Series 2018-2, Class M3, 4.72%, 10/26/2048 ‡ (c) (k) | | |
Wells Fargo Commercial Mortgage Trust | | |
Series 2021-SAVE, Class E, 7.06%, 2/15/2040 ‡ (c) (k) | | |
Series 2015-NXS1, Class E, 2.88%, 5/15/2048 ‡ (c) (k) | | |
| | |
|
United States — continued |
Series 2015-C28, Class D, 4.08%, 5/15/2048 ‡ (k) | | |
Series 2016-C35, Class D, 3.14%, 7/15/2048 ‡ (c) | | |
Series 2018-C43, Class D, 3.00%, 3/15/2051 ‡ (c) | | |
Series 2018-C44, Class D, 3.00%, 5/15/2051 ‡ (c) | | |
Series 2019-C52, Class XA, IO, 1.60%, 8/15/2052 (k) | | |
Series 2022-C62, Class C, 4.35%, 4/15/2055 ‡ (k) | | |
Series 2015-NXS3, Class D, 3.15%, 9/15/2057 ‡ (c) | | |
WFRBS Commercial Mortgage Trust | | |
Series 2014-C19, Class D, 4.23%, 3/15/2047 ‡ (c) | | |
Series 2014-C22, Class D, 3.91%, 9/15/2057 ‡ (c) (k) | | |
Total Commercial Mortgage-Backed Securities
(Cost $514,791) | | |
Collateralized Mortgage Obligations — 3.9% |
|
Bellemeade Re Ltd. Series 2019-1A, Class M2, 6.29%, 3/25/2029 ‡ (c) (k) | | |
Eagle RE Ltd. Series 2019-1, Class M2, 6.89%, 4/25/2029 ‡ (c) (k) | | |
| | |
|
Adjustable Rate Mortgage Trust | | |
Series 2004-2, Class 6A1, 3.82%, 2/25/2035 (k) | | |
Series 2005-2, Class 3A1, 3.38%, 6/25/2035 (k) | | |
| | |
Series 2004-28CB, Class 4A1, 5.00%, 1/25/2020 | | |
Series 2005-50CB, Class 4A1, 5.00%, 11/25/2020 | | |
Series 2005-85CB, Class 3A2, 5.25%, 2/25/2021 | | |
Series 2005-J6, Class 2A1, 5.50%, 7/25/2025 | | |
Series 2006-J3, Class 4A1, 5.75%, 5/25/2026 | | |
SEE NOTES TO FINANCIAL STATEMENTS.
JPMorgan Income Builder Fund
SCHEDULE OF PORTFOLIO INVESTMENTS
AS OF October 31, 2022 (continued)
| | |
Collateralized Mortgage Obligations — continued |
United States — continued |
Series 2005-J1, Class 3A1, 6.50%, 8/25/2032 | | |
Series 2004-12CB, Class 2A1, 6.00%, 6/25/2034 | | |
Series 2004-25CB, Class A1, 6.00%, 12/25/2034 | | |
Series 2004-28CB, Class 2A4, 5.75%, 1/25/2035 | | |
Series 2004-28CB, Class 6A1, 6.00%, 1/25/2035 | | |
Series 2004-32CB, Class 2A5, 5.50%, 2/25/2035 | | |
Series 2005-3CB, Class 1A13, 5.50%, 3/25/2035 | | |
Series 2005-J2, Class 1A5, 4.09%, 4/25/2035 (k) | | |
Series 2005-6CB, Class 1A4, 5.50%, 4/25/2035 | | |
Series 2005-6CB, Class 1A6, 5.50%, 4/25/2035 | | |
Series 2005-10CB, Class 1A5, 5.50%, 5/25/2035 | | |
Series 2005-10CB, Class 1A8, 5.50%, 5/25/2035 | | |
Series 2005-13CB, Class A4, 5.50%, 5/25/2035 | | |
Series 2005-21CB, Class A4, 5.25%, 6/25/2035 | | |
Series 2005-21CB, Class A17, 6.00%, 6/25/2035 | | |
Series 2005-20CB, Class 1A1, 5.50%, 7/25/2035 | | |
Series 2005-23CB, Class A15, 5.50%, 7/25/2035 | | |
Series 2005-64CB, Class 1A1, 5.50%, 12/25/2035 | | |
Series 2005-64CB, Class 1A15, 5.50%, 12/25/2035 | | |
Series 2005-J14, Class A3, 5.50%, 12/25/2035 | | |
Series 2005-J14, Class A7, 5.50%, 12/25/2035 | | |
Series 2005-J14, Class A8, 5.50%, 12/25/2035 | | |
Series 2005-86CB, Class A4, 5.50%, 2/25/2036 | | |
Series 2006-J1, Class 1A13, 5.50%, 2/25/2036 | | |
| | |
|
United States — continued |
Series 2005-80CB, Class 5A1, 6.00%, 2/25/2036 | | |
Series 2006-4CB, Class 2A5, 5.50%, 4/25/2036 | | |
Series 2006-14CB, Class A1, 6.00%, 6/25/2036 | | |
Series 2006-19CB, Class A15, 6.00%, 8/25/2036 | | |
Series 2006-25CB, Class A2, 6.00%, 10/25/2036 | | |
Series 2006-41CB, Class 2A13, 5.75%, 1/25/2037 | | |
Series 2007-8CB, Class A9, 6.00%, 5/25/2037 | | |
Series 2007-19, Class 1A8, 6.00%, 8/25/2037 | | |
American Home Mortgage Investment Trust Series 2007-2, Class 12A1, 4.13%, 3/25/2037 (k) | | |
| | |
Series 2019-5, Class B1, 3.96%, 10/25/2049 ‡ (c) (k) | | |
Series 2019-6, Class B1, 3.94%, 11/25/2059 (c) (k) | | |
Series 2019-6, Class B3, 5.95%, 11/25/2059 ‡ (c) (k) | | |
Angel Oak Mortgage Trust I LLC | | |
Series 2019-2, Class B1, 5.02%, 3/25/2049 ‡ (c) (k) | | |
Series 2019-2, Class B2, 6.29%, 3/25/2049 ‡ (c) (k) | | |
Series 2019-4, Class B1, 4.41%, 7/26/2049 (c) (k) | | |
Banc of America Alternative Loan Trust | | |
Series 2006-4, Class 2A1, 6.00%, 5/25/2021 | | |
Series 2005-11, Class 4A5, 5.75%, 12/25/2035 | | |
Series 2006-4, Class 3CB4, 6.00%, 5/25/2046 | | |
Series 2006-4, Class 4CB1, 6.50%, 5/25/2046 | | |
Series 2006-5, Class CB7, 6.00%, 6/25/2046 | | |
Banc of America Funding Trust | | |
Series 2007-4, Class 8A1, 5.50%, 11/25/2034 | | |
SEE NOTES TO FINANCIAL STATEMENTS.
| | |
Collateralized Mortgage Obligations — continued |
United States — continued |
Series 2005-6, Class 1A2, 5.50%, 10/25/2035 | | |
Series 2005-7, Class 4A7, 6.00%, 11/25/2035 | | |
Series 2006-A, Class 1A1, 3.93%, 2/20/2036 (k) | | |
Series 2006-2, Class 2A20, 5.75%, 3/25/2036 | | |
Series 2007-5, Class 4A1, 3.96%, 7/25/2037 (k) | | |
Banc of America Mortgage Trust | | |
Series 2004-A, Class 2A2, 2.63%, 2/25/2034 (k) | | |
Series 2007-3, Class 1A1, 6.00%, 9/25/2037 | | |
Bear Stearns ALT-A Trust Series 2006-8, Class 3A1, 3.91%, 2/25/2034 (k) | | |
Bear Stearns Asset-Backed Securities I Trust Series 2004-AC5, Class M1, 4.59%, 10/25/2034 ‡ (k) | | |
Chase Mortgage Finance Trust | | |
Series 2007-A2, Class 3A1, 3.06%, 6/25/2035 (k) | | |
Series 2006-S3, Class 1A2, 6.00%, 11/25/2036 | | |
Series 2006-S4, Class A5, 6.00%, 12/25/2036 | | |
Series 2007-S2, Class 1A8, 6.00%, 3/25/2037 | | |
| | |
Series 2018-GT1, Class A, 6.34%, 5/25/2023 (c) (k) | | |
Series 2018-GT1, Class B, 7.09%, 5/25/2023 ‡ (c) (k) | | |
CHL Mortgage Pass-Through Trust | | |
Series 2005-20, Class A7, 5.25%, 12/25/2027 | | |
Series 2004-25, Class 2A1, 4.27%, 2/25/2035 (k) | | |
Series 2005-26, Class 1A11, 5.50%, 11/25/2035 | | |
Series 2005-31, Class 2A1, 2.45%, 1/25/2036 (k) | | |
Series 2005-30, Class A5, 5.50%, 1/25/2036 | | |
Series 2006-HYB1, Class 2A2C, 2.90%, 3/20/2036 (k) | | |
| | |
|
United States — continued |
Series 2006-HYB2, Class 2A1B, 3.10%, 4/20/2036 (k) | | |
Series 2006-J2, Class 1A1, 6.00%, 4/25/2036 | | |
Series 2006-10, Class 1A16, 6.00%, 5/25/2036 | | |
Series 2006-17, Class A2, 6.00%, 12/25/2036 | | |
Series 2006-18, Class 2A4, 6.00%, 12/25/2036 | | |
Series 2007-2, Class A2, 6.00%, 3/25/2037 | | |
Series 2007-3, Class A18, 6.00%, 4/25/2037 | | |
Series 2007-10, Class A4, 5.50%, 7/25/2037 | | |
Series 2007-13, Class A4, 6.00%, 8/25/2037 | | |
Series 2007-16, Class A1, 6.50%, 10/25/2037 | | |
Series 2007-18, Class 2A1, 6.50%, 11/25/2037 | | |
Series 2006-OA5, Class 2A1, 3.99%, 4/25/2046 (k) | | |
Citicorp Mortgage Securities Trust Series 2007-4, Class 1A9, 6.00%, 5/25/2037 | | |
Citigroup Mortgage Loan Trust | | |
Series 2006-AR3, Class 1A1A, 3.26%, 6/25/2036 (k) | | |
Series 2006-AR5, Class 1A5A, 3.24%, 7/25/2036 (k) | | |
Citigroup Mortgage Loan Trust, Inc. | | |
Series 2005-6, Class A1, 6.08%, 9/25/2035 (k) | | |
Series 2006-8, Class A3, 3.94%, 10/25/2035 (c) (k) | | |
Series 2005-9, Class 2A2, 5.50%, 11/25/2035 | | |
| | |
Series 2021-3, Class B1, 3.06%, 9/27/2066 ‡ (c) (k) | | |
Series 2021-5, Class B1, 4.12%, 11/26/2066 ‡ (c) (k) | | |
Series 2021-5, Class B2, 4.12%, 11/26/2066 ‡ (c) (k) | | |
Series 2022-1, Class B1, 4.15%, 12/27/2066 ‡ (c) (k) | | |
SEE NOTES TO FINANCIAL STATEMENTS.
JPMorgan Income Builder Fund
SCHEDULE OF PORTFOLIO INVESTMENTS
AS OF October 31, 2022 (continued)
| | |
Collateralized Mortgage Obligations — continued |
United States — continued |
Series 2022-1, Class B2, 4.15%, 12/27/2066 ‡ (c) (k) | | |
Connecticut Avenue Securities Trust | | |
Series 2019-R05, Class 1B1, 7.69%, 7/25/2039 ‡ (c) (k) | | |
Series 2019-R07, Class 1B1, 6.99%, 10/25/2039 ‡ (c) (k) | | |
Series 2020-R02, Class 2B1, 6.59%, 1/25/2040 ‡ (c) (k) | | |
Series 2021-R01, Class 1B1, 6.10%, 10/25/2041 ‡ (c) (k) | | |
Series 2021-R03, Class 1B1, 5.75%, 12/25/2041 ‡ (c) (k) | | |
Series 2021-R03, Class 1B2, 8.50%, 12/25/2041 ‡ (c) (k) | | |
Series 2022-R01, Class 1B2, 9.00%, 12/25/2041 ‡ (c) (k) | | |
Series 2022-R06, Class 1M1, 5.75%, 5/25/2042 (c) (k) | | |
Series 2022-R08, Class 1M1, 5.55%, 7/25/2042 ‡ (c) (k) | | |
CSFB Mortgage-Backed Pass-Through Certificates | | |
Series 2005-10, Class 11A1, 5.50%, 11/25/2020 | | |
Series 2003-29, Class 3A1, 5.50%, 12/25/2033 | | |
Series 2004-AR4, Class 4A1, 3.47%, 5/25/2034 (k) | | |
Series 2004-AR4, Class 2A1, 3.65%, 5/25/2034 (k) | | |
Series 2004-AR5, Class 6A1, 2.92%, 6/25/2034 (k) | | |
Series 2004-4, Class 4A1, 5.50%, 8/25/2034 | | |
Series 2004-8, Class 4A3, 5.50%, 12/25/2034 | | |
Series 2005-4, Class 2A5, 4.14%, 6/25/2035 (k) | | |
Series 2005-10, Class 5A3, 5.50%, 11/25/2035 | | |
CSFB Mortgage-Backed Trust Series 2004-AR6, Class 7A1, 3.21%, 10/25/2034 (k) | | |
CSMC Mortgage-Backed Trust | | |
Series 2006-8, Class 5A1, 5.53%, 10/25/2026 (k) | | |
| | |
|
United States — continued |
Series 2007-2, Class 3A13, 5.50%, 3/25/2037 | | |
Deephaven Residential Mortgage Trust | | |
Series 2021-3, Class B1, 3.27%, 8/25/2066 ‡ (c) (k) | | |
Series 2021-3, Class B2, 4.13%, 8/25/2066 ‡ (c) (k) | | |
Series 2021-4, Class B1, 4.16%, 11/25/2066 ‡ (c) (k) | | |
Series 2021-4, Class B2, 4.48%, 11/25/2066 ‡ (c) (k) | | |
Series 2022-1, Class B1, 4.30%, 1/25/2067 ‡ (c) (k) | | |
Series 2022-1, Class B2, 4.30%, 1/25/2067 ‡ (c) (k) | | |
Series 2022-2, Class A3, 4.30%, 3/25/2067 (c) (k) | | |
Deutsche Alt-A Securities, Inc. Mortgage Loan Trust Series 2005-1, Class 2A1, 4.29%, 2/25/2020 (k) | | |
Deutsche Alt-A Securities, Inc., Mortgage Loan Trust Series 2005-2, Class 2A1, 3.89%, 3/25/2020 (k) | | |
DSLA Mortgage Loan Trust Series 2005-AR4, Class 2A1A, 4.00%, 8/19/2045 (k) | | |
FHLMC STACR Series 2019-HQA3, Class B1, 6.59%, 9/25/2049 (c) (k) | | |
| | |
Series 2021-DNA5, Class B2, 8.50%, 1/25/2034 (c) (k) | | |
Series 2021-DNA6, Class B1, 6.40%, 10/25/2041 (c) (k) | | |
Series 2020-HQA1, Class B2, 8.69%, 1/25/2050 (c) (k) | | |
Series 2021-DNA1, Class B2, 7.75%, 1/25/2051 ‡ (c) (k) | | |
FHLMC Structured Agency Credit Risk Debt Notes | | |
Series 2015-HQ1, Class B, 14.34%, 3/25/2025 (k) | | |
Series 2017-DNA3, Class B1, 8.04%, 3/25/2030 (k) | | |
Series 2021-DNA2, Class B2, 9.00%, 8/25/2033 (c) (k) | | |
| | |
Series 4068, Class DS, IF, IO, 2.59%, 6/15/2042 (k) | | |
SEE NOTES TO FINANCIAL STATEMENTS.
| | |
Collateralized Mortgage Obligations — continued |
United States — continued |
Series 4097, Class ES, IF, IO, 2.69%, 8/15/2042 (k) | | |
Series 4103, Class SB, IF, IO, 2.64%, 9/15/2042 (k) | | |
Series 4425, Class SA, IF, IO, 2.64%, 1/15/2045 (k) | | |
Series 4594, Class SG, IF, IO, 2.59%, 6/15/2046 (k) | | |
Series 4606, Class SB, IF, IO, 2.59%, 8/15/2046 (k) | | |
Series 4614, Class SK, IF, IO, 2.59%, 9/15/2046 (k) | | |
Series 4616, Class HS, IF, IO, 2.59%, 9/15/2046 (k) | | |
Series 4703, Class SA, IF, IO, 2.74%, 7/15/2047 (k) | | |
Series 4718, Class SD, IF, IO, 2.74%, 9/15/2047 (k) | | |
Series 4768, Class SG, IF, IO, 2.79%, 3/15/2048 (k) | | |
Series 4820, Class ES, IF, IO, 2.79%, 3/15/2048 (k) | | |
Series 4834, Class SA, IF, IO, 2.74%, 10/15/2048 (k) | | |
Series 4937, Class MS, IF, IO, 2.46%, 12/25/2049 (k) | | |
Series 4839, Class WS, IF, IO, 2.69%, 8/15/2056 (k) | | |
| | |
Series 264, Class S1, IF, IO, 2.54%, 7/15/2042 (k) | | |
Series 274, Class S1, IF, IO, 2.59%, 8/15/2042 (k) | | |
Series 278, Class S1, IF, IO, 2.64%, 9/15/2042 (k) | | |
Series 279, Class S6, IF, IO, 2.64%, 9/15/2042 (k) | | |
Series 300, Class S1, IF, IO, 2.69%, 1/15/2043 (k) | | |
Series 316, Class S7, IF, IO, 2.69%, 11/15/2043 (k) | | |
Series 326, Class S2, IF, IO, 2.54%, 3/15/2044 (k) | | |
Series 336, Class S1, IF, IO, 2.64%, 8/15/2044 (k) | | |
Series 337, Class S1, IF, IO, 2.64%, 9/15/2044 (k) | | |
| | |
|
United States — continued |
Series 356, Class S5, IF, IO, 2.59%, 9/15/2047 (k) | | |
First Horizon Alternative Mortgage Securities Trust Series 2006-FA6, Class 3A1, 5.75%, 11/25/2021 | | |
FNMA, Connecticut Avenue Securities | | |
Series 2017-C01, Class 1B1, 9.34%, 7/25/2029 (k) | | |
Series 2021-R02, Class 2B1, 6.30%, 11/25/2041 (c) (k) | | |
Series 2021-R02, Class 2B2, 9.20%, 11/25/2041 (c) (k) | | |
| | |
Series 2011-126, Class SM, IF, IO, 2.36%, 12/25/2041 (k) | | |
Series 2012-20, Class SL, IF, IO, 2.86%, 3/25/2042 (k) | | |
Series 2012-35, Class SN, IF, IO, 2.86%, 4/25/2042 (k) | | |
Series 2012-75, Class DS, IF, IO, 2.36%, 7/25/2042 (k) | | |
Series 2012-128, Class MS, IF, IO, 2.56%, 11/25/2042 (k) | | |
Series 2013-124, Class SB, IF, IO, 2.36%, 12/25/2043 (k) | | |
Series 2013-136, Class SB, IF, IO, 2.31%, 1/25/2044 (k) | | |
Series 2015-35, Class SA, IF, IO, 2.01%, 6/25/2045 (k) | | |
Series 2015-37, Class ST, IF, IO, 2.03%, 6/25/2045 (k) | | |
Series 2016-1, Class SJ, IF, IO, 2.56%, 2/25/2046 (k) | | |
Series 2016-77, Class SA, IF, IO, 2.41%, 10/25/2046 (k) | | |
Series 2017-1, Class SA, IF, IO, 2.46%, 2/25/2047 (k) | | |
Series 2017-16, Class SM, IF, IO, 2.46%, 3/25/2047 (k) | | |
Series 2017-37, Class AS, IF, IO, 2.51%, 5/25/2047 (k) | | |
Series 2018-14, Class SA, IF, IO, 2.61%, 3/25/2048 (k) | | |
Series 2018-15, Class JS, IF, IO, 2.61%, 3/25/2048 (k) | | |
Series 2018-16, Class SN, IF, IO, 2.66%, 3/25/2048 (k) | | |
SEE NOTES TO FINANCIAL STATEMENTS.
JPMorgan Income Builder Fund
SCHEDULE OF PORTFOLIO INVESTMENTS
AS OF October 31, 2022 (continued)
| | |
Collateralized Mortgage Obligations — continued |
United States — continued |
Series 2018-27, Class SE, IF, IO, 2.61%, 5/25/2048 (k) | | |
Series 2018-60, Class SK, IF, IO, 2.11%, 8/25/2048 (k) | | |
Series 2018-73, Class SC, IF, IO, 2.61%, 10/25/2048 (k) | | |
Series 2019-9, Class SM, IF, IO, 2.46%, 3/25/2049 (k) | | |
Series 2019-20, Class BS, IF, IO, 2.46%, 5/25/2049 (k) | | |
GCAT Trust Series 2020-NQM1, Class B1, 3.64%, 1/25/2060 ‡ (c) (k) | | |
GMACM Mortgage Loan Trust | | |
Series 2004-AR2, Class 3A, 3.97%, 8/19/2034 (k) | | |
Series 2005-AR1, Class 3A, 3.22%, 3/18/2035 (k) | | |
| | |
Series 2014-25, Class HS, IF, IO, 2.61%, 2/20/2044 (k) | | |
Series 2015-124, Class SB, IF, IO, 2.76%, 9/20/2045 (k) | | |
Series 2015-149, Class GS, IF, IO, 2.76%, 10/20/2045 (k) | | |
Series 2016-111, Class SA, IF, IO, 2.61%, 8/20/2046 (k) | | |
Series 2016-120, Class NS, IF, IO, 2.61%, 9/20/2046 (k) | | |
Series 2017-11, Class AS, IF, IO, 2.61%, 1/20/2047 (k) | | |
Series 2017-55, Class AS, IF, IO, 2.66%, 4/20/2047 (k) | | |
Series 2017-56, Class SC, IF, IO, 2.66%, 4/20/2047 (k) | | |
Series 2017-68, Class SA, IF, IO, 2.66%, 5/20/2047 (k) | | |
Series 2017-67, Class ST, IF, IO, 2.71%, 5/20/2047 (k) | | |
Series 2017-75, Class SD, IF, IO, 2.71%, 5/20/2047 (k) | | |
Series 2017-80, Class AS, IF, IO, 2.71%, 5/20/2047 (k) | | |
Series 2017-93, Class SE, IF, IO, 2.71%, 6/20/2047 (k) | | |
Series 2017-107, Class SL, IF, IO, 2.71%, 7/20/2047 (k) | | |
| | |
|
United States — continued |
Series 2017-112, Class S, IF, IO, 2.71%, 7/20/2047 (k) | | |
Series 2017-120, Class QS, IF, IO, 2.71%, 8/20/2047 (k) | | |
Series 2017-134, Class SB, IF, IO, 2.71%, 9/20/2047 (k) | | |
Series 2017-141, Class QS, IF, IO, 2.71%, 9/20/2047 (k) | | |
Series 2017-149, Class QS, IF, IO, 2.71%, 10/20/2047 (k) | | |
Series 2018-1, Class ST, IF, IO, 2.71%, 1/20/2048 (k) | | |
Series 2018-11, Class SA, IF, IO, 2.71%, 1/20/2048 (k) | | |
Series 2018-6, Class CS, IF, IO, 2.71%, 1/20/2048 (k) | | |
Series 2018-36, Class SG, IF, IO, 2.71%, 3/20/2048 (k) | | |
Series 2018-63, Class SB, IF, IO, 2.71%, 4/20/2048 (k) | | |
Series 2018-64, Class GS, IF, IO, 2.71%, 5/20/2048 (k) | | |
Series 2018-65, Class SE, IF, IO, 2.71%, 5/20/2048 (k) | | |
Series 2018-92, Class SH, IF, IO, 2.71%, 7/20/2048 (k) | | |
Series 2018-115, Class DS, IF, IO, 2.71%, 8/20/2048 (k) | | |
Series 2018-126, Class CS, IF, IO, 2.71%, 9/20/2048 (k) | | |
Series 2018-146, Class S, IF, IO, 2.66%, 10/20/2048 (k) | | |
Series 2018-147, Class SD, IF, IO, 2.66%, 10/20/2048 (k) | | |
Series 2018-168, Class SA, IF, IO, 2.61%, 12/20/2048 (k) | | |
Series 2019-16, Class SB, IF, IO, 2.56%, 2/20/2049 (k) | | |
Series 2019-22, Class SM, IF, IO, 2.56%, 2/20/2049 (k) | | |
Series 2019-23, Class JS, IF, IO, 2.56%, 2/20/2049 (k) | | |
Series 2019-30, Class SA, IF, IO, 2.56%, 3/20/2049 (k) | | |
Series 2019-38, Class SN, IF, IO, 2.56%, 3/20/2049 (k) | | |
Series 2019-41, Class CS, IF, IO, 2.56%, 3/20/2049 (k) | | |
SEE NOTES TO FINANCIAL STATEMENTS.
| | |
Collateralized Mortgage Obligations — continued |
United States — continued |
Series 2019-42, Class SJ, IF, IO, 2.56%, 4/20/2049 (k) | | |
Series 2019-56, Class GS, IF, IO, 2.66%, 5/20/2049 (k) | | |
Series 2019-69, Class DS, IF, IO, 2.61%, 6/20/2049 (k) | | |
Series 2019-70, Class SM, IF, IO, 2.61%, 6/20/2049 (k) | | |
Series 2020-76, Class SL, IF, IO, 2.66%, 5/20/2050 (k) | | |
GSMSC Pass-Through Trust Series 2008-2R, Class 2A1, 7.50%, 10/25/2036 (c) (k) | | |
| | |
Series 2004-15F, Class 1A2, 5.50%, 12/25/2034 | | |
Series 2005-1F, Class 2A3, 6.00%, 2/25/2035 | | |
Series 2005-AR3, Class 6A1, 3.17%, 5/25/2035 (k) | | |
Series 2005-AR4, Class 3A5, 3.08%, 7/25/2035 (k) | | |
Series 2005-6F, Class 3A18, 5.50%, 7/25/2035 | | |
Series 2005-AR7, Class 6A1, 3.69%, 11/25/2035 (k) | | |
Series 2006-1F, Class 2A16, 6.00%, 2/25/2036 | | |
Series 2006-1F, Class 2A9, 6.00%, 2/25/2036 | | |
Series 2006-9F, Class 3A1, 6.25%, 10/25/2036 | | |
Series 2007-1F, Class 3A13, 6.00%, 1/25/2037 | | |
HarborView Mortgage Loan Trust Series 2005-11, Class 2A1A, 4.10%, 8/19/2045 (k) | | |
| | |
Series 2004-5, Class 1A1, 4.31%, 10/25/2034 (k) | | |
Series 2004-6, Class 1A2, 4.37%, 10/25/2034 (k) | | |
Series 2004-5, Class 1M2, 4.46%, 10/25/2034 ‡ (k) | | |
Series 2004-7, Class 1A2, 4.51%, 11/25/2034 (k) | | |
Series 2004-9, Class 1A1, 4.35%, 1/25/2035 (k) | | |
| | |
|
United States — continued |
Series 2004-10, Class 2A, 4.23%, 3/25/2035 (k) | | |
Series 2004-10, Class 3A1, 4.29%, 3/25/2035 (k) | | |
Series 2005-1, Class 1A1, 4.11%, 4/25/2035 (k) | | |
Series 2005-1, Class 1A2, 4.21%, 4/25/2035 (k) | | |
Series 2005-2, Class 1A2, 4.21%, 4/25/2035 (k) | | |
Impac Secured Assets CMN Owner Trust Series 2003-2, Class A4, 3.75%, 8/25/2033 | | |
Impac Secured Assets Trust | | |
Series 2007-3, Class A1B, 4.07%, 9/25/2037 (k) | | |
Series 2007-3, Class A1C, 4.31%, 9/25/2037 (k) | | |
IndyMac INDX Mortgage Loan Trust | | |
Series 2005-AR3, Class 3A1, 2.76%, 4/25/2035 (k) | | |
Series 2005-AR14, Class 2A1A, 4.19%, 7/25/2035 (k) | | |
Series 2007-AR21, Class 6A1, 3.05%, 9/25/2037 (k) | | |
JPMorgan Alternative Loan Trust Series 2006-A2, Class 1A1, 3.95%, 5/25/2036 (k) | | |
| | |
Series 2006-S3, Class 2A4, 5.50%, 8/25/2021 | | |
Series 2004-A6, Class 1A1, 2.79%, 12/25/2034 (k) | | |
Series 2005-A3, Class 6A6, 3.02%, 6/25/2035 (k) | | |
Series 2005-A6, Class 1A2, 4.11%, 9/25/2035 (k) | | |
Series 2005-A8, Class 1A1, 3.77%, 11/25/2035 (k) | | |
Series 2005-A8, Class 4A1, 3.84%, 11/25/2035 (k) | | |
Series 2006-A7, Class 2A4, 3.39%, 1/25/2037 (k) | | |
Series 2007-S1, Class 2A17, 3.92%, 3/25/2037 (k) | | |
SEE NOTES TO FINANCIAL STATEMENTS.
JPMorgan Income Builder Fund
SCHEDULE OF PORTFOLIO INVESTMENTS
AS OF October 31, 2022 (continued)
| | |
Collateralized Mortgage Obligations — continued |
United States — continued |
Legacy Mortgage Asset Trust | | |
Series 2021-GS3, Class A2, 3.25%, 7/25/2061 (c) (h) | | |
Series 2021-GS1, Class A2, 3.84%, 10/25/2066 (c) (h) | | |
| | |
Series 2005-2, Class 2A5, 5.50%, 12/25/2035 | | |
Series 2007-7, Class 5A7, 6.50%, 8/25/2037 | | |
MASTR Alternative Loan Trust | | |
Series 2004-8, Class 1A1, 6.50%, 9/25/2034 | | |
Series 2004-12, Class 3A1, 6.00%, 12/25/2034 | | |
Series 2005-3, Class 1A1, 5.50%, 4/25/2035 | | |
Series 2005-5, Class 3A1, 5.75%, 8/25/2035 | | |
Series 2005-6, Class 1A2, 5.50%, 12/25/2035 | | |
Merrill Lynch Mortgage Investors Trust | | |
Series 2005-1, Class 2A2, 2.75%, 4/25/2035 (k) | | |
Series 2006-1, Class 2A1, 2.82%, 2/25/2036 (k) | | |
Series 2006-AF2, Class AF2, 6.25%, 10/25/2036 | | |
Metlife Securitization Trust Series 2017-1A, Class A, 3.00%, 4/25/2055 (c) (k) | | |
Morgan Stanley Mortgage Loan Trust | | |
Series 2006-2, Class 1A, 5.25%, 2/25/2021 | | |
Series 2004-8AR, Class 4A1, 3.61%, 10/25/2034 (k) | | |
Series 2004-9, Class 1A, 5.36%, 11/25/2034 (k) | | |
Series 2005-4, Class 1A, 5.00%, 8/25/2035 | | |
MortgageIT Trust Series 2005-3, Class A1, 4.19%, 8/25/2035 (k) | | |
New Residential Mortgage Loan Trust | | |
Series 2019-NQM4, Class B1, 3.74%, 9/25/2059 ‡ (c) (k) | | |
Series 2019-NQM4, Class B2, 4.89%, 9/25/2059 ‡ (c) (k) | | |
| | |
|
United States — continued |
Series 2019-NQM5, Class B1, 4.04%, 11/25/2059 ‡ (c) (k) | | |
Nomura Asset Acceptance Corp. Alternative Loan Trust Series 2005-WF1, Class 2A5, 5.66%, 3/25/2035 (h) | | |
PNMAC FMSR ISSUER TRUST Series 2018-GT1, Class A, 6.44%, 2/25/2023 (c) (k) | | |
PRET LLC Series 2022-NPL4, Class A1, 6.56%, 8/25/2052 (c) (h) | | |
| | |
| | |
Series 2020-4, Class A2, 3.44%, 10/25/2025 ‡ (c) (h) | | |
Series 2020-6, Class A2, 4.70%, 11/25/2025 (c) (h) | | |
Series 2021-1, Class A2, 3.72%, 1/25/2026 (c) (k) | | |
Series 2021-3, Class A2, 3.72%, 4/25/2026 (c) (h) | | |
Series 2021-5, Class A2, 3.72%, 6/25/2026 (c) (h) | | |
Series 2021-6, Class A1, 1.79%, 7/25/2026 (c) (h) | | |
Series 2021-6, Class A2, 3.47%, 7/25/2026 (c) (h) | | |
Series 2021-7, Class A2, 3.67%, 8/25/2026 (c) (h) | | |
Series 2021-8, Class A2, 3.60%, 9/25/2026 (c) (k) | | |
Series 2021-10, Class A2, 4.83%, 10/25/2026 (c) (h) | | |
Series 2021-11, Class A2, 4.58%, 11/25/2026 (c) (h) | | |
| | |
Series 2003-QS20, Class CB, 5.00%, 11/25/2018 | | |
Series 2005-QA5, Class A2, 4.01%, 4/25/2035 (k) | | |
Series 2005-QS17, Class A3, 6.00%, 12/25/2035 | | |
Series 2006-QS3, Class 1A10, 6.00%, 3/25/2036 | | |
Series 2006-QS4, Class A2, 6.00%, 4/25/2036 | | |
Series 2006-QS17, Class A5, 6.00%, 12/25/2036 | | |
SEE NOTES TO FINANCIAL STATEMENTS.
| | |
Collateralized Mortgage Obligations — continued |
United States — continued |
Residential Asset Securitization Trust | | |
Series 2005-A8CB, Class A11, 6.00%, 7/25/2035 | | |
Series 2005-A14, Class A1, 5.50%, 12/25/2035 | | |
Series 2006-A8, Class 3A1, 6.00%, 8/25/2036 | | |
Series 2007-A5, Class 2A2, 6.00%, 5/25/2037 | | |
| | |
Series 2004-S9, Class 2A1, 4.75%, 12/25/2019 | | |
Series 2005-S7, Class A6, 5.50%, 11/25/2035 | | |
Series 2006-S10, Class 1A1, 6.00%, 10/25/2036 | | |
Series 2006-SA4, Class 2A1, 5.14%, 11/25/2036 (k) | | |
Seasoned Credit Risk Transfer Trust Series 2017-3, Class AIO, IO, 0.00%, 7/25/2056 (k) | | |
Sequoia Mortgage Trust Series 2007-3, Class 1A1, 3.89%, 7/20/2036 (k) | | |
Starwood Mortgage Residential Trust | | |
Series 2020-1, Class B1, 3.73%, 2/25/2050 ‡ (c) (k) | | |
Series 2020-INV1, Class B2, 4.26%, 11/25/2055 ‡ (c) | | |
Structured Adjustable Rate Mortgage Loan Trust Series 2005-1, Class 1A1, 3.50%, 2/25/2035 (k) | | |
Structured Asset Mortgage Investments II Trust | | |
Series 2005-AR3, Class 1A1, 4.13%, 8/25/2035 (k) | | |
Series 2007-AR7, Class 1A1, 4.44%, 5/25/2047 (k) | | |
Verus Securitization Trust | | |
Series 2019-INV2, Class B1, 4.45%, 7/25/2059 ‡ (c) (k) | | |
Series 2019-INV3, Class B1, 3.73%, 11/25/2059 ‡ (c) (k) | | |
Series 2021-R1, Class B1, 3.20%, 10/25/2063 ‡ (c) (k) | | |
Series 2021-R1, Class B2, 4.20%, 10/25/2063 ‡ (c) (k) | | |
| | |
|
United States — continued |
Series 2021-R3, Class B1, 3.07%, 4/25/2064 ‡ (c) (k) | | |
Series 2021-R3, Class B2, 4.07%, 4/25/2064 ‡ (c) (k) | | |
Series 2020-5, Class B1, 3.71%, 5/25/2065 ‡ (c) (k) | | |
Series 2020-5, Class B2, 4.71%, 5/25/2065 ‡ (c) (k) | | |
Series 2021-1, Class B1, 2.98%, 1/25/2066 ‡ (c) (k) | | |
Series 2021-4, Class M1, 2.19%, 7/25/2066 (c) (k) | | |
Series 2021-5, Class B1, 3.04%, 9/25/2066 ‡ (c) (k) | | |
Series 2021-5, Class B2, 3.94%, 9/25/2066 ‡ (c) (k) | | |
WaMu Mortgage Pass-Through Certificates Trust | | |
Series 2004-AR11, Class A, 4.14%, 10/25/2034 (k) | | |
Series 2005-AR5, Class A6, 3.31%, 5/25/2035 (k) | | |
Series 2005-AR16, Class 1A1, 2.79%, 12/25/2035 (k) | | |
Series 2005-AR14, Class 1A3, 3.32%, 12/25/2035 (k) | | |
Series 2005-AR14, Class 1A4, 3.32%, 12/25/2035 (k) | | |
Series 2005-AR18, Class 1A3A, 2.99%, 1/25/2036 (k) | | |
Series 2006-AR2, Class 1A1, 3.09%, 3/25/2036 (k) | | |
Series 2004-AR10, Class A1B, 4.43%, 7/25/2044 (k) | | |
Series 2005-AR15, Class A1A1, 4.11%, 11/25/2045 (k) | | |
Washington Mutual Mortgage Pass-Through Certificates WMALT Trust | | |
Series 2005-1, Class 1A3, 5.50%, 3/25/2035 | | |
Series 2005-4, Class CB7, 5.50%, 6/25/2035 | | |
Series 2005-10, Class 2A5, 5.75%, 11/25/2035 | | |
Series 2005-10, Class 4CB1, 5.75%, 12/25/2035 | | |
Series 2006-5, Class 2CB5, 6.50%, 7/25/2036 | | |
SEE NOTES TO FINANCIAL STATEMENTS.
JPMorgan Income Builder Fund
SCHEDULE OF PORTFOLIO INVESTMENTS
AS OF October 31, 2022 (continued)
| | |
Collateralized Mortgage Obligations — continued |
United States — continued |
Series 2007-1, Class 1A7, 4.19%, 2/25/2037 (k) | | |
Wells Fargo Mortgage-Backed Securities Trust | | |
Series 2006-AR19, Class A3, 3.69%, 12/25/2036 (k) | | |
Series 2007-15, Class A1, 6.00%, 11/25/2037 | | |
| | |
Total Collateralized Mortgage Obligations
(Cost $504,103) | | |
| | |
Exchange-Traded Funds — 2.9% |
|
JPMorgan Equity Premium Income ETF (l)(Cost $332,143) | | |
| | |
Loan Assignments — 2.2% (f) (m) |
|
Flutter Entertainment plc, Term Loan (ICE LIBOR USD + 2.25%), 7.01%, 7/21/2026 (n) | | |
West Jet, 1st Lien Term Loan (ICE LIBOR USD 1 Month + 3.00%), 5.99%, 12/11/2026 | | |
| | |
|
Altice France, 1st Lien Term Loan B-13 (ICE LIBOR USD 3 Month + 4.00%), 6.91%, 8/14/2026 | | |
Numericable US LLC, 1st Lien Term Loan B (ICE LIBOR USD 3 Month + 3.69%), 7.77%, 1/31/2026 | | |
| | |
|
Flutter Entertainment plc, 1st Lien Term Loan B (3-MONTH SOFR + 3.25%), 6.78%, 7/22/2028 | | |
ICON, 1st Lien Term Loan B (ICE LIBOR USD 3 Month + 2.25%), 5.94%, 7/3/2028 | | |
| | |
| | |
|
|
ICON, 1st Lien Term Loan B (ICE LIBOR USD 3 Month + 2.25%), 5.94%, 7/3/2028 | | |
Nestle Skin Health, Term Loan B (ICE LIBOR USD 3 Month + 3.75%), 7.42%, 10/1/2026 | | |
| | |
|
Commscope, Inc., 1st Lien Term Loan B-2 (ICE LIBOR USD 1 Month + 3.25%), 7.00%, 4/6/2026 | | |
|
Delta 2 (Lux) SARL, 1st Lien Term Loan B (ICE LIBOR USD 1 Month + 2.50%), 6.25%, 2/1/2024 | | |
|
Adient US LLC, Term Loan B (ICE LIBOR USD 1 Month + 3.25%), 7.00%, 4/10/2028 | | |
Advanced Drainage Systems, Inc., 1st Lien Term Loan B (1-MONTH CME TERM SOFR + 2.25%), 5.37%, 7/31/2026 | | |
Albany Molecular Research, Inc., 1st Lien Term Loan (ICE LIBOR USD 3 Month + 3.75%), 6.56%, 8/30/2026 (n) | | |
Alliance Laundry Systems LLC, 1st Lien Term Loan B (ICE LIBOR USD 3 Month + 3.50%), 7.41%, 10/8/2027 (n) | | |
Allied Universal Holdco LLC, 1st Lien Term Loan B (ICE LIBOR USD 1 Month + 3.75%), 7.50%, 5/12/2028 | | |
Altice Financing SA, 1st Lien Term Loan (ICE LIBOR USD 3 Month + 2.75%), 6.83%, 7/15/2025 | | |
American Axle & Manufacturing, Inc., 1st Lien Term Loan B (ICE LIBOR USD 1 Month + 2.25%), 5.84%, 4/6/2024 | | |
Ancestry.com, 1st Lien Term Loan B (ICE LIBOR USD 1 Month + 3.25%), 7.00%, 12/6/2027 | | |
API Group DE, 1st Lien Term Loan (ICE LIBOR USD 1 Month + 2.50%), 3.75%, 10/1/2026 | | |
AppleCaramel Buyer LLC, 1st Lien Term Loan B (1-MONTH CME TERM SOFR + 3.75%), 7.48%, 10/19/2027 | | |
Astoria Energy LLC, 1st Lien Term Loan B (ICE LIBOR USD 1 Month + 3.50%), 7.26%, 12/10/2027 | | |
SEE NOTES TO FINANCIAL STATEMENTS.
| | |
Loan Assignments — continued |
United States — continued |
Asurion LLC, 1st Lien Term Loan B (ICE LIBOR USD 1 Month + 3.25%), 7.00%, 7/31/2027 (n) | | |
Asurion LLC, 1st Lien Term Loan B-3 (ICE LIBOR USD 1 Month + 5.25%), 9.00%, 1/31/2028 | | |
Asurion LLC, Term Loan B-10 (1-MONTH CME TERM SOFR + 4.00%), 7.65%, 8/19/2028 | | |
Asurion LLC, Term Loan B-6 (ICE LIBOR USD + 3.13%), 5.50%, 11/3/2023 | | |
Asurion LLC, Term Loan B-7 (ICE LIBOR USD 1 Month + 3.00%), 6.75%, 11/3/2024 (n) | | |
Avantor Funding, Inc., 1st Lien Term Loan B (ICE LIBOR USD 1 Month + 2.25%), 6.00%, 11/8/2027 | | |
Axalta Coating Systems US Holdings, Inc., Term Loan B (ICE LIBOR USD 3 Month + 1.75%), 5.42%, 6/1/2024 | | |
AZZ Inc., 1st Lien Term Loan B (1-MONTH CME TERM SOFR + 4.25%; 3-MONTH SOFR + 4.25%), 8.08%, 5/13/2029 | | |
B&G Foods, Inc., 1st Lien Term Loan B (ICE LIBOR USD 1 Month + 2.50%), 6.25%, 10/10/2026 | | |
Banijay Entertainment, 1st Lien Term Loan B (ICE LIBOR USD 1 Month + 3.75%), 6.88%, 3/1/2025 | | |
Bausch Health Cos., Inc., 1st Lien Term Loan (1-MONTH CME TERM SOFR + 5.25%), 8.62%, 2/1/2027 | | |
Birkenstock, 1st Lien Term Loan B (ICE LIBOR USD 3 Month + 3.25%), 5.10%, 4/28/2028 | | |
Brookfield WEC Holdings, Inc., 1st Lien Term Loan (ICE LIBOR USD 1 Month + 2.75%), 6.50%, 8/1/2025 (n) | | |
Brooks Automation, 1st Lien Term Loan B (1-MONTH SOFR + 3.10%; 6-MONTH SOFR + 3.10%), 5.26%, 2/1/2029 | | |
Brooks Automation, 2nd Lien Term Loan (1-MONTH SOFR + 5.60%), 7.35%, 2/1/2030 | | |
Buckeye Partners LP, 1st Lien Term Loan B-1 (ICE LIBOR USD 1 Month + 2.25%), 5.37%, 11/1/2026 (n) | | |
| | |
|
United States — continued |
Bway Holding Co., 1st Lien Term Loan (ICE LIBOR USD 1 Month + 3.25%), 6.38%, 4/3/2024 | | |
Cabinetworks, 1st Lien Term Loan B (ICE LIBOR USD 3 Month + 4.25%), 7.92%, 5/17/2028 | | |
Caesars Resort Collection, 1st Lien Term Loan B (ICE LIBOR USD 1 Month + 2.75%), 6.50%, 12/23/2024 (n) | | |
Calpine Construction Finance Co. LP, 1st Lien Term Loan (ICE LIBOR USD 1 Month + 2.00%), 5.75%, 1/15/2025 | | |
Camelot Finance LP, 1st Lien Term Loan B (ICE LIBOR USD 1 Month + 3.00%), 6.75%, 10/30/2026 (n) | | |
Carroll County Energy LLC, 1st Lien Term Loan B (ICE LIBOR USD 3 Month + 3.50%), 7.17%, 2/16/2026 | | |
CenturyLink, Inc., 1st Lien Term Loan B (ICE LIBOR USD 1 Month + 2.25%), 6.00%, 3/15/2027 | | |
Chamberlain Group, 1st Lien Term Loan B (ICE LIBOR USD 1 Month + 3.50%), 6.62%, 11/3/2028 | | |
Charter Communications Operating LLC, 1st Lien Term Loan B-2 (ICE LIBOR USD 1 Month + 1.75%), 5.51%, 2/1/2027 (n) | | |
Cincinnati Bell, 1st Lien Term Loan B-2 (1-MONTH CME TERM SOFR + 3.25%), 7.01%, 11/22/2028 | | |
Claire's Stores, Inc., 1st Lien Term Loan B (ICE LIBOR USD 1 Month + 6.50%), 10.25%, 12/18/2026 (o) | | |
Clear Channel Outdoor Holdings, Inc., 1st Lien Term Loan B (ICE LIBOR USD 3 Month + 3.50%), 6.31%, 8/21/2026 | | |
Conair Holdings LLC, 1st Lien Term Loan B (ICE LIBOR USD 3 Month + 3.75%), 7.42%, 5/17/2028 | | |
Conservice LLC, 1st Lien Term Loan (ICE LIBOR USD 1 Month + 4.25%), 8.00%, 5/13/2027 | | |
Consilio, 1st Lien Term Loan B (ICE LIBOR USD 1 Month + 4.00%), 7.75%, 5/12/2028 | | |
Cortes NP Acquisition Corp., 1st Lien Term Loan B (ICE LIBOR USD 1 Month + 2.75%), 5.88%, 3/2/2027 | | |
SEE NOTES TO FINANCIAL STATEMENTS.
JPMorgan Income Builder Fund
SCHEDULE OF PORTFOLIO INVESTMENTS
AS OF October 31, 2022 (continued)
| | |
Loan Assignments — continued |
United States — continued |
CSC Holdings LLC, 1st Lien Term Loan (ICE LIBOR USD 1 Month + 2.25%), 5.66%, 7/17/2025 | | |
CSC Holdings LLC, 1st Lien Term Loan B (ICE LIBOR USD 1 Month + 2.25%), 5.66%, 1/15/2026 | | |
CVS Holdings I LP, 1st Lien Term Loan (ICE LIBOR USD 1 Month + 4.25%), 7.37%, 8/31/2026 | | |
DaVita, Inc., 1st Lien Term Loan B (ICE LIBOR USD 1 Month + 1.75%), 5.50%, 8/12/2026 | | |
DexKo Global, Inc., 1st Lien Term Loan B (1-MONTH SOFR + 7.50%; 3-MONTH SOFR + 7.50%), 7.06%, 10/4/2028 | | |
Diamond Sports Group LLC, 2nd Lien Term Loan (1-MONTH CME TERM SOFR + 3.25%), 6.46%, 8/24/2026 | | |
DigiCert Buyer, Inc., 1st Lien Term Loan | | |
(ICE LIBOR USD 1 Month + 4.00%), 6.90%, 10/16/2026 | | |
(ICE LIBOR USD 3 Month + 7.00%), 9.90%, 2/19/2029 | | |
DIRECTV Financing LLC, 1st Lien Term Loan (ICE LIBOR USD 1 Month + 5.00%), 8.75%, 8/2/2027 | | |
Duff & Phelps Corp., 1st Lien Term Loan B (1-MONTH CME TERM SOFR + 3.75%), 6.78%, 4/9/2027 | | |
E.W. Scripps Co. (The), 1st Lien Term Loan B-3 (ICE LIBOR USD 1 Month + 2.75%), 5.87%, 1/7/2028 | | |
Elanco Animal Health, Inc., 1st Lien Term Loan B (ICE LIBOR USD 1 Month + 1.75%), 5.52%, 8/1/2027 (n) | | |
Endo Pharmaceutical, 1st Lien Term Loan B (3-MONTH PRIME + 6.00%), 12.25%, 3/27/2028 | | |
Ensemble RCM LLC, 1st Lien Term Loan (ICE LIBOR USD 3 Month + 3.75%), 6.56%, 8/3/2026 | | |
Entegris, Inc., 1st Lien Term Loan B (1-MONTH CME TERM SOFR + 3.00%; 3-MONTH SOFR + 3.00%), 5.82%, 7/6/2029 | | |
Envision Healthcare Corp., Term Loan (ICE LIBOR USD + 3.75%), 6.12%, 10/10/2025 | | |
| | |
|
United States — continued |
EPIC Crude Services LP, 1st Lien Term Loan B (ICE LIBOR USD 3 Month + 5.00%), 7.08%, 3/2/2026 | | |
Exelon Corp., 1st Lien Term Loan B (ICE LIBOR USD 3 Month + 2.50%), 5.57%, 12/15/2027 | | |
FGI Operating Co. LLC, 1st Lien Term Loan (ICE LIBOR USD 3 Month + 11.00%), 12.00%, 5/16/2023 ‡ (j) | | |
First Student Bidco, 1st Lien Term Loan B (ICE LIBOR USD 3 Month + 3.00%), 6.64%, 7/21/2028 | | |
First Student Bidco, 1st Lien Term Loan C | | |
(ICE LIBOR USD 3 Month + 3.00%), 6.64%, 7/21/2028 | | |
(3-MONTH SOFR + 4.00%), 7.65%, 7/21/2028 | | |
First Student Bidco, Term Loan B (3-MONTH SOFR + 4.00%), 7.65%, 7/21/2028 | | |
Garda World Security, 1st Lien Term Loan B (ICE LIBOR USD 3 Month + 4.25%), 7.24%, 10/30/2026 | | |
Gates Global LLC, 1st Lien Term Loan (ICE LIBOR USD 1 Month + 2.50%), 6.25%, 3/31/2027 | | |
Gemini HDPE LLC, 1st Lien Term Loan B (ICE LIBOR USD 3 Month + 3.00%), 5.81%, 12/31/2027 | | |
Genesee & Wyoming, 1st Lien Term Loan (ICE LIBOR USD 3 Month + 2.00%), 5.67%, 12/30/2026 | | |
Geneys Telecom Holdings, 1st Lien Term Loan B (ICE LIBOR USD 1 Month + 4.00%), 7.75%, 12/1/2027 (n) | | |
Getty Images, 1st Lien Term Loan B (ICE LIBOR USD 3 Month + 4.50%), 7.63%, 2/19/2026 | | |
GoodRx, Inc., 1st Lien Term Loan (ICE LIBOR USD 1 Month + 2.75%), 6.50%, 10/10/2025 | | |
Graham Packaging, 1st Lien Term Loan (ICE LIBOR USD 1 Month + 3.00%), 6.75%, 8/4/2027 | | |
Gray Television, Inc., 1st Lien Term Loan B (ICE LIBOR USD 1 Month + 2.50%), 5.63%, 1/2/2026 | | |
Gray TV, 1st Lien Term Loan D (ICE LIBOR USD 1 Month + 3.00%), 6.13%, 12/1/2028 | | |
SEE NOTES TO FINANCIAL STATEMENTS.
| | |
Loan Assignments — continued |
United States — continued |
Griffon Corp., 1st Lien Term Loan B (1-MONTH CME TERM SOFR + 2.50%), 5.49%, 1/24/2029 | | |
Grizzly Acquisitions, Inc., 1st Lien Term Loan B (ICE LIBOR USD 3 Month + 3.25%), 6.99%, 10/1/2025 (n) | | |
Harsco Corp., Term Loan B-3 (ICE LIBOR USD 1 Month + 2.25%), 6.06%, 6/9/2028 | | |
Hercules Achievement, Inc., 1st Lien Term Loan (ICE LIBOR USD 1 Month + 3.50%), 7.25%, 12/16/2024 | | |
Hertz Corp. (The), 1st Lien Term Loan B (ICE LIBOR USD 1 Month + 3.25%), 6.37%, 6/30/2028 | | |
Hertz Corp. (The), 1st Lien Term Loan C (ICE LIBOR USD 1 Month + 3.25%), 6.37%, 6/30/2028 | | |
Holley, Inc., 1st Lien Term Loan B (ICE LIBOR USD 3 Month + 3.75%), 7.42%, 11/17/2028 | | |
HUB International, 1st Lien Term Loan B (ICE LIBOR USD 3 Month + 3.00%), 7.33%, 4/25/2025 | | |
Hyland Software, Inc., 1st Lien Term Loan (ICE LIBOR USD 1 Month + 3.50%), 7.25%, 7/1/2024 | | |
iHeartCommunications, Inc., Term Loan B | | |
(ICE LIBOR USD 1 Month + 3.00%), 6.75%, 5/1/2026 | | |
(ICE LIBOR USD 1 Month + 3.25%), 7.00%, 5/1/2026 | | |
INEOS Enterprises, 1st Lien Term Loan B (ICE LIBOR USD 3 Month + 3.50%), 6.57%, 8/28/2026 | | |
INEOS US Finance LLC, 1st Lien Term Loan B (ICE LIBOR USD 1 Month + 2.50%), 5.62%, 11/8/2028 | | |
INEOS US Petrochem LLC, 1st Lien Term Loan B (ICE LIBOR USD 1 Month + 2.75%), 6.50%, 1/29/2026 | | |
Ingram Micro, 1st Lien Term Loan B (ICE LIBOR USD 3 Month + 3.50%), 7.17%, 6/30/2028 | | |
Insulet, 1st Lien Term Loan B (ICE LIBOR USD 1 Month + 3.25%), 7.00%, 5/4/2028 | | |
| | |
|
United States — continued |
Intelsat Jackson Holding, 1st Lien Term Loan (6-MONTH SOFR + 4.25%), 7.44%, 2/1/2029 | | |
Interior Logic Group, 1st Lien Term Loan B (ICE LIBOR USD 1 Month + 3.50%), 7.25%, 4/3/2028 | | |
Invenergy LLC, Term Loan (1-MONTH CME TERM SOFR + 3.75%), 7.59%, 8/28/2025 | | |
ION Corporates, 1st Lien Term Loan B (1-MONTH SOFR + 3.75%), 7.45%, 3/11/2028 | | |
IRB Holding Corp., 1st Lien Term Loan B (ICE LIBOR USD 1 Month + 2.75%), 5.87%, 2/5/2025 | | |
Jazz Pharmaceuticals plc, 1st Lien Term Loan B (ICE LIBOR USD 1 Month + 3.50%), 7.25%, 5/5/2028 | | |
KDC US Holdings, Inc., 1st Lien Term Loan B (ICE LIBOR USD 1 Month + 3.75%), 7.50%, 12/22/2025 | | |
LABL, Inc., 1st Lien Term Loan B (ICE LIBOR USD 1 Month + 5.00%), 8.12%, 10/29/2028 | | |
LegalShield, 1st Lien Term Loan (ICE LIBOR USD 3 Month + 3.75%), 6.82%, 12/15/2028 | | |
Leslie's Poolmart, Inc., 1st Lien Term Loan B (ICE LIBOR USD 1 Month + 2.50%), 6.25%, 3/9/2028 (n) | | |
LifePoint Health, Inc., 1st Lien Term Loan B (ICE LIBOR USD 3 Month + 3.75%), 8.16%, 11/16/2025 | | |
LogMeIn, Inc., 1st Lien Term Loan B (ICE LIBOR USD 1 Month + 4.75%), 8.32%, 8/31/2027 | | |
Madison IAQ LLC, 1st Lien Term Loan (ICE LIBOR USD 3 Month + 3.25%), 6.82%, 6/21/2028 | | |
Medallion Midland Acquisition LLC, 1st Lien Term Loan B (ICE LIBOR USD 3 Month + 3.75%), 7.42%, 10/18/2028 | | |
Medline, 1st Lien Term Loan B (ICE LIBOR USD 1 Month + 3.25%), 6.37%, 10/23/2028 | | |
MetroNet Systems Holdings LLC, 1st Lien Term Loan B (1-MONTH CME TERM SOFR + 3.75%), 7.14%, 6/2/2028 | | |
SEE NOTES TO FINANCIAL STATEMENTS.
JPMorgan Income Builder Fund
SCHEDULE OF PORTFOLIO INVESTMENTS
AS OF October 31, 2022 (continued)
| | |
Loan Assignments — continued |
United States — continued |
MH Sub I LLC, 1st Lien Term Loan (ICE LIBOR USD 1 Month + 3.75%), 7.50%, 9/13/2024 | | |
MI Windows & Doors, Inc., 1st Lien Term Loan B (1-MONTH CME TERM SOFR + 3.50%), 7.33%, 12/18/2027 | | |
Mirion Technologies, Inc., 1st Lien Term Loan (ICE LIBOR USD 3 Month + 2.75%), 5.63%, 10/20/2028 | | |
Moran Foods LLC, 1st Lien PIK Tranche (ICE LIBOR USD 3 Month + 7.00%), 0.00%, 12/31/2038 | | |
Moran Foods LLC, 1st Lien Term Loan (ICE LIBOR USD 3 Month + 7.00%), 10.67%, 4/1/2024 ‡ | | |
Moran Foods LLC, Tranche A Second Lien Term Loan (ICE LIBOR USD 3 Month + 10.75%), 14.42%, 10/1/2024 | | |
NAI Entertainment Holdings, 1st Lien Term Loan B (ICE LIBOR USD 1 Month + 2.50%), 6.26%, 5/8/2025 | | |
Netsmart Technologies, Inc., 1st Lien Term Loan B (ICE LIBOR USD 1 Month + 4.00%), 7.75%, 10/1/2027 | | |
Nielsen Holdings plc, Term Loan B-3 (ICE LIBOR USD 1 Month + 3.75%), 7.50%, 3/6/2028 (n) | | |
Option Care Health, Inc., 1st Lien Term Loan B (ICE LIBOR USD 1 Month + 2.75%), 6.50%, 10/27/2028 | | |
Osmose Holdings, Inc., 1st Lien Term Loan (ICE LIBOR USD 1 Month + 3.25%), 6.88%, 6/23/2028 | | |
Pactiv Evergreen Group Holdings, Inc., 1st Lien Term Loan B (ICE LIBOR USD 1 Month + 3.50%), 7.25%, 9/24/2028 | | |
PAREXEL International Corp., 1st Lien Term Loan (ICE LIBOR USD 1 Month + 3.25%), 6.37%, 11/15/2028 (n) | | |
Pathway Vet Alliance LLC, 1st Lien Term Loan (ICE LIBOR USD 3 Month + 3.75%), 7.42%, 3/31/2027 | | |
PCI Pharma, 1st Lien Term Loan (ICE LIBOR USD 3 Month + 3.75%), 7.42%, 11/30/2027 | | |
Pearl Intermediate Parent LLC, 1st Lien Term Loan B-3 (ICE LIBOR USD 1 Month + 3.50%), 7.25%, 2/14/2025 | | |
| | |
|
United States — continued |
Petco Health & Wellness Co., Inc., Term Loan B (ICE LIBOR USD 3 Month + 3.25%), 6.92%, 3/3/2028 | | |
PetVet Care Centers, 1st Lien Term Loan (ICE LIBOR USD 1 Month + 3.25%), 7.00%, 2/14/2025 | | |
PG&E Corp., Exit Term Loan (ICE LIBOR USD 1 Month + 3.00%), 6.81%, 6/23/2025 | | |
Pike Corp., 1st Lien Term Loan B (1-MONTH CME TERM SOFR + 3.50%), 7.23%, 1/21/2028 | | |
Pike Corp., Delayed Draw Term Loan B (ICE LIBOR USD 1 Month + 3.00%), 6.76%, 1/21/2028 (n) | | |
PQ Corp., 1st Lien Term Loan B (ICE LIBOR USD 3 Month + 2.50%), 5.31%, 6/9/2028 | | |
Prime Security Services Borrower LLC, 1st Lien Term Loan B (ICE LIBOR USD 3 Month + 2.75%), 6.50%, 9/23/2026 | | |
PrimeSource, 1st Lien Term Loan B (ICE LIBOR USD 3 Month + 3.25%), 6.99%, 12/28/2027 | | |
Project Boost Purchaser LLC, 1st Lien Term Loan B (ICE LIBOR USD 1 Month + 3.50%), 7.25%, 6/1/2026 | | |
Proofpoint, Inc., 1st Lien Term Loan B (ICE LIBOR USD 3 Month + 3.25%), 6.32%, 8/31/2028 | | |
Pure Fishing, 1st Lien Term Loan (ICE LIBOR USD 1 Month + 4.50%), 8.25%, 12/22/2025 | | |
Quest Software US Holdings, Inc., 1st Lien Term Loan B (3-MONTH SOFR + 4.25%), 8.49%, 2/1/2029 (n) | | |
Quikrete Holdings, Inc., 1st Lien Term Loan B (ICE LIBOR USD 1 Month + 3.00%), 6.12%, 6/11/2028 | | |
Radiology Partners, Inc., 1st Lien Term Loan B (ICE LIBOR USD 1 Month + 4.25%), 7.82%, 7/9/2025 | | |
RealPage, Inc., 1st Lien Term Loan B (ICE LIBOR USD 1 Month + 3.00%), 6.75%, 4/24/2028 | | |
Red Ventures LLC, 1st Lien Term Loan B (ICE LIBOR USD 1 Month + 2.50%), 5.62%, 11/8/2024 | | |
SEE NOTES TO FINANCIAL STATEMENTS.
| | |
Loan Assignments — continued |
United States — continued |
Reynolds Group Holdings, 1st Lien Term Loan (ICE LIBOR USD 1 Month + 3.25%), 7.00%, 2/5/2026 | | |
Ring Container Technologies LLC, 1st Lien Term Loan B (ICE LIBOR USD 1 Month + 3.75%), 6.61%, 8/12/2028 | | |
Sabre Holdings Corp., 1st Lien Term Loan B | | |
(ICE LIBOR USD 1 Month + 3.50%), 7.25%, 12/17/2027 | | |
(ICE LIBOR USD 1 Month + 3.50%), 7.25%, 12/17/2027 | | |
Samsonite International SA, 1st Lien Term Loan B (ICE LIBOR USD 1 Month + 1.75%), 5.50%, 4/25/2025 | | |
Shearer's Foods LLC, 1st Lien Term Loan (ICE LIBOR USD 1 Month + 3.50%), 7.25%, 9/23/2027 | | |
Shutterfly, Inc., 1st Lien Term Loan B (ICE LIBOR USD 1 Month + 5.00%), 8.12%, 9/25/2026 | | |
Solenis International LP, 1st Lien Term Loan B (ICE LIBOR USD 3 Month + 3.75%), 7.44%, 11/9/2028 | | |
Spin Holdco, Inc., Term Loan B (ICE LIBOR USD 3 Month + 4.00%), 7.14%, 3/4/2028 | | |
Spirit AeroSystems, Inc., 1st Lien Term Loan B (ICE LIBOR USD 1 Month + 3.75%), 7.50%, 1/15/2025 | | |
SPX Flow, Inc., 1st Lien Term Loan B (1-MONTH CME TERM SOFR + 4.50%), 8.33%, 4/5/2029 | | |
SRS Distribution, 1st Lien Term Loan B (1-MONTH CME TERM SOFR + 3.50%), 7.33%, 6/2/2028 | | |
SS&C Technologies Holdings, Inc., 1st Lien Term Loan B-3 (ICE LIBOR USD 1 Month + 1.75%), 5.50%, 4/16/2025 | | |
SS&C Technologies Holdings, Inc., 1st Lien Term Loan B-4 (ICE LIBOR USD 1 Month + 1.75%), 5.50%, 4/16/2025 | | |
St. George's University Scholastic Services LLC, 1st Lien Term Loan B (ICE LIBOR USD 1 Month + 3.25%), 7.00%, 2/10/2029 | | |
Staples, Inc., 1st Lien Term Loan (ICE LIBOR USD 3 Month + 5.00%), 7.78%, 4/16/2026 | | |
| | |
|
United States — continued |
Star Merger Sub, Inc., 1st Lien Term Loan B (ICE LIBOR USD 1 Month + 3.25%), 6.85%, 2/6/2026 | | |
Summer BC Holdco B SARL, 1st Lien Term Loan B (ICE LIBOR USD 3 Month + 4.50%), 8.17%, 12/4/2026 (n) | | |
Sundyne, 1st Lien Term Loan B (ICE LIBOR USD 1 Month + 4.25%), 8.00%, 3/17/2027 | | |
Synaptics, Inc., 1st Lien Term Loan B (ICE LIBOR USD 3 Month + 2.25%), 4.36%, 12/2/2028 (n) | | |
Team Health Holdings, 1st Lien Term Loan B (1-MONTH CME TERM SOFR + 5.25%), 8.98%, 3/2/2027 | | |
Tekni-Plex, Inc., 1st Lien Term Loan (ICE LIBOR USD 3 Month + 4.00%), 7.67%, 9/15/2028 | | |
Tekni-Plex, Inc., Delayed Draw Term Loan B (ICE LIBOR USD 3 Month + 4.00%), 7.67%, 9/15/2028 | | |
Tenneco, Inc., 1st Lien Term Loan B (1 Week LIBOR + 3.00%), 6.21%, 10/1/2025 | | |
ThoughtWorks, Inc., 1st Lien Term Loan (ICE LIBOR USD 1 Month + 2.75%), 6.50%, 3/24/2028 | | |
Thyssenkrupp Elevator, 1st Lien Term Loan B-1 (ICE LIBOR USD 6 Month + 3.50%), 6.87%, 7/30/2027 | | |
Titan Acquisition Ltd., 1st Lien Term Loan B (ICE LIBOR USD 3 Month + 3.00%), 5.88%, 3/28/2025 (n) | | |
Traeger Grills, 1st Lien Term Loan (ICE LIBOR USD 1 Month + 3.25%), 7.00%, 6/29/2028 | | |
Traeger Grills, Delayed Draw Term Loan (ICE LIBOR USD 1 Month + 3.25%), 7.00%, 6/29/2028 (n) | | |
Trans Union LLC, Term Loan B-6 (ICE LIBOR USD 1 Month + 2.25%), 6.00%, 12/1/2028 | | |
TransDigm Group, Inc., 1st Lien Term Loan E (ICE LIBOR USD 3 Month + 2.25%), 5.92%, 5/30/2025 | | |
TransDigm Group, Inc., 1st Lien Term Loan F (ICE LIBOR USD 3 Month + 2.25%), 5.92%, 12/9/2025 | | |
SEE NOTES TO FINANCIAL STATEMENTS.
JPMorgan Income Builder Fund
SCHEDULE OF PORTFOLIO INVESTMENTS
AS OF October 31, 2022 (continued)
| | |
Loan Assignments — continued |
United States — continued |
Trinseo Materials Operating SCA, 1st Lien Term Loan B (ICE LIBOR USD 1 Month + 2.00%), 5.75%, 9/6/2024 | | |
Triton Water Holdings, 1st Lien Term Loan B (ICE LIBOR USD 3 Month + 3.50%), 7.17%, 3/31/2028 | | |
Tropicana, Inc., 1st Lien Term Loan (ICE LIBOR USD 3 Month + 3.25%), 6.90%, 1/24/2029 | | |
Truck Hero, Inc., 1st Lien Term Loan (ICE LIBOR USD 1 Month + 3.50%), 7.25%, 1/31/2028 | | |
U.S. Renal Care, 1st Lien Term Loan B (ICE LIBOR USD 1 Month + 5.00%), 8.12%, 6/26/2026 | | |
UFC Holdings LLC, 1st Lien Term Loan B-3 (ICE LIBOR USD 3 Month + 2.75%), 7.11%, 4/29/2026 | | |
Ultimate Software Group, Inc. (The), 1st Lien Term Loan (ICE LIBOR USD 1 Month + 3.75%), 7.50%, 5/4/2026 | | |
Ultimate Software Group, Inc., 1st Lien Term Loan (ICE LIBOR USD 3 Month + 3.25%), 7.00%, 5/4/2026 | | |
Ultra Resources, Inc., 1st Lien Term Loan B (ICE LIBOR USD 3 Month + 3.75%), 7.06%, 8/3/2029 | | |
United Airlines, Inc., 1st Lien Term Loan B (ICE LIBOR USD 3 Month + 5.25%), 8.78%, 6/21/2027 (n) | | |
United Natural Foods, Inc., 1st Lien Term Loan B (1-MONTH CME TERM SOFR + 3.25%), 7.09%, 10/22/2025 | | |
Univision Communications Inc., 1st Lien Term Loan B (ICE LIBOR USD 1 Month + 3.25%), 6.37%, 3/15/2026 | | |
USI, Inc., Term Loan (ICE LIBOR USD 3 Month + 2.75%), 6.42%, 5/16/2024 | | |
Utz Quality Foods LLC, 1st Lien Term Loan B (1-MONTH CME TERM SOFR + 3.00%), 6.84%, 1/20/2028 | | |
Vertex Aerospace, 1st Lien Term Loan B (ICE LIBOR USD 1 Month + 3.75%), 7.50%, 12/6/2028 | | |
Virtusa Corp., 1st Lien Term Loan B | | |
(ICE LIBOR USD 1 Month + 3.75%), 7.50%, 2/11/2028 | | |
(1-MONTH CME TERM SOFR + 3.75%), 7.58%, 2/15/2029 | | |
| | |
|
United States — continued |
Whataburger, 1st Lien Term Loan B (ICE LIBOR USD 1 Month + 3.25%), 7.00%, 8/3/2028 | | |
Wheel Pros, Inc., 1st Lien Term Loan (ICE LIBOR USD 3 Month + 4.50%), 8.82%, 5/11/2028 | | |
WIRB Copernicus Group, Inc., 1st Lien Term Loan B (1-MONTH SOFR + 4.00%; 3-MONTH SOFR + 4.00%), 7.46%, 1/8/2027 (n) | | |
WMG Acquisition Corp., 1st Lien Term Loan G (ICE LIBOR USD 1 Month + 2.13%), 5.88%, 1/20/2028 | | |
Zekelman Industries, Inc., 1st Lien Term Loan (ICE LIBOR USD 3 Month + 2.00%), 5.60%, 1/24/2027 | | |
| | |
Total Loan Assignments
(Cost $243,582) | | |
Asset-Backed Securities — 1.5% |
|
BlueMountain CLO Ltd. Series 2018-3A, Class D, 7.61%, 10/25/2030 ‡ (c) (k) | | |
Voya CLO Ltd. Series 2016-3A, Class CR, 7.44%, 10/18/2031 ‡ (c) (k) | | |
| | |
|
| | |
Series 2003-OPT1, Class A1A, 4.41%, 4/25/2033 ‡ (k) | | |
Series 2004-OPT3, Class M1, 4.34%, 9/25/2033 ‡ (k) | | |
Series 2004-HE1, Class M1, 4.49%, 3/25/2034 ‡ (k) | | |
Accredited Mortgage Loan Trust Series 2004-4, Class M1, 4.46%, 1/25/2035 ‡ (k) | | |
ACE Securities Corp. Home Equity Loan Trust | | |
Series 2003-FM1, Class M1, 4.88%, 11/25/2032 ‡ (k) | | |
Series 2004-OP1, Class M2, 5.16%, 4/25/2034 ‡ (k) | | |
Affirm Asset Securitization Trust | | |
Series 2021-Z2, Class A, 1.17%, 11/16/2026 (c) | | |
SEE NOTES TO FINANCIAL STATEMENTS.
| | |
Asset-Backed Securities — continued |
United States — continued |
Series 2022-A, Class 1E, 8.04%, 5/17/2027 ‡ (c) | | |
American Credit Acceptance Receivables Trust | | |
Series 2019-1, Class F, 6.06%, 12/12/2025 (c) | | |
Series 2019-3, Class F, 5.42%, 5/12/2026 (c) | | |
Series 2019-2, Class F, 5.81%, 6/12/2026 (c) | | |
Series 2021-2, Class E, 2.54%, 7/13/2027 (c) | | |
Series 2021-3, Class D, 1.34%, 11/15/2027 (c) | | |
Series 2022-1, Class E, 3.64%, 3/13/2028 (c) | | |
Ameriquest Mortgage Securities, Inc. Asset-Backed Pass-Through Certificates Series 2002-AR1, Class M1, 4.65%, 9/25/2032 ‡ (k) | | |
Asset-Backed Securities Corp. Home Equity Loan Trust | | |
Series 2004-HE2, Class M2, 5.46%, 4/25/2034 ‡ (k) | | |
Series 2004-HE7, Class M2, 5.16%, 10/25/2034 ‡ (k) | | |
Series 2005-HE6, Class M4, 4.55%, 7/25/2035 ‡ (k) | | |
Bear Stearns Asset-Backed Securities Trust | | |
Series 2003-SD1, Class M1, 4.86%, 12/25/2033 ‡ (k) | | |
Series 2004-HE2, Class M2, 5.39%, 3/25/2034 ‡ (k) | | |
Series 2003-1, Class M1, 5.24%, 11/25/2042 ‡ (k) | | |
Series 2004-SD4, Class A1, 4.49%, 8/25/2044 ‡ (k) | | |
Centex Home Equity Loan Trust | | |
Series 2004-C, Class M2, 4.38%, 6/25/2034 ‡ (k) | | |
Series 2004-D, Class MV2, 4.62%, 9/25/2034 ‡ (k) | | |
Series 2004-D, Class MF2, 6.06%, 9/25/2034 ‡ (h) | | |
Series 2004-D, Class MF3, 6.26%, 9/25/2034 ‡ (h) | | |
| | |
|
United States — continued |
| | |
Series 2003-5, Class 1M2, 5.64%, 9/25/2032 ‡ (k) | | |
Series 2004-1, Class 1M1, 4.73%, 5/25/2033 ‡ | | |
Series 2003-4, Class 1A5, 4.89%, 5/25/2033 ‡ (h) | | |
Series 2004-1, Class 2M1, 4.34%, 9/25/2033 ‡ (k) | | |
Series 2004-2, Class 1M1, 5.70%, 2/26/2035 ‡ (k) | | |
CHEC Loan Trust Series 2004-1, Class M1, 4.49%, 7/25/2034 ‡ (c) (k) | | |
Citigroup Mortgage Loan Trust, Inc. | | |
Series 2005-OPT1, Class M4, 4.64%, 2/25/2035 ‡ (k) | | |
Series 2005-WF2, Class AF7, 5.75%, 8/25/2035 ‡ (h) | | |
Conn's Receivables Funding LLC Series 2022-A, Class B, 9.52%, 12/15/2026 ‡ (c) | | |
Consumer Loan Underlying Bond Certificate Issuer Trust I Series 2020-9, Class PT, 8.65%, 4/15/2045 (c) (k) | | |
Countrywide Asset-Backed Certificates | | |
Series 2004-3, Class M1, 4.34%, 6/25/2034 ‡ (k) | | |
Series 2004-3, Class M2, 4.41%, 6/25/2034 ‡ (k) | | |
Series 2004-ECC2, Class M2, 4.56%, 12/25/2034 ‡ (k) | | |
Countrywide Partnership Trust Series 2004-EC1, Class M2, 4.53%, 1/25/2035 ‡ (k) | | |
Credit Acceptance Auto Loan Trust | | |
Series 2022-3A, Class A, 6.57%, 10/15/2032 (c) | | |
Series 2022-3A, Class D, 9.00%, 4/18/2033 (c) | | |
CWABS Asset-Backed Certificates Trust Series 2005-11, Class AF6, 5.05%, 2/25/2036 ‡ (k) | | |
CWABS Asset-Backed Certificates Trust, Series 2004-BC4, Class M1, 4.64%, 11/25/2034 ‡ (k) | | |
SEE NOTES TO FINANCIAL STATEMENTS.
JPMorgan Income Builder Fund
SCHEDULE OF PORTFOLIO INVESTMENTS
AS OF October 31, 2022 (continued)
| | |
Asset-Backed Securities — continued |
United States — continued |
CWABS Asset-Backed Certificates Trust, Series 2005-AB4, Class 2A1 Series 2005-AB4, Class 2A1, 4.13%, 3/25/2036 ‡ (k) | | |
CWABS, Inc. Asset-Backed Certificates Series 2004-1, Class M2, 4.41%, 3/25/2034 ‡ (k) | | |
CWABS, Inc. Asset-Backed Certificates Trust Series 2004-5, Class M2, 4.59%, 7/25/2034 ‡ (k) | | |
CWABS, Inc., Asset-Backed Certificates Series 2004-1, Class M3, 4.56%, 2/25/2034 ‡ (k) | | |
| | |
Series 2019-2A, Class E, 4.46%, 5/15/2026 (c) | | |
Series 2021-3A, Class D, 1.31%, 5/17/2027 (c) | | |
Series 2021-2A, Class E, 2.97%, 7/17/2028 (c) | | |
Series 2022-3A, Class C, 7.69%, 7/17/2028 (c) | | |
Exeter Automobile Receivables Trust | | |
Series 2019-3A, Class E, 4.00%, 8/17/2026 (c) | | |
Series 2020-1A, Class E, 3.74%, 1/15/2027 (c) | | |
Series 2021-4A, Class E, 4.02%, 1/17/2028 (c) | | |
Series 2021-2A, Class E, 2.90%, 7/17/2028 (c) | | |
Finance America Mortgage Loan Trust Series 2004-3, Class M2, 4.53%, 11/25/2034 ‡ (k) | | |
First Franklin Mortgage Loan Asset-Backed Certificates Series 2004-FF3, Class M1, 4.41%, 5/25/2034 ‡ (k) | | |
| | |
Series 2019-1, Class C, 5.39%, 6/18/2026 ‡ (c) | | |
Series 2022-4FP, Class B, 7.58%, 12/18/2029 (c) | | |
| | |
Series 2002-1, Class M1, 4.84%, 8/25/2033 ‡ (k) | | |
Series 2004-B, Class M2, 4.53%, 5/25/2034 ‡ (k) | | |
| | |
|
United States — continued |
Series 2004-C, Class M1, 4.56%, 8/25/2034 ‡ (k) | | |
Series 2004-D, Class M1, 4.46%, 11/25/2034 (k) | | |
Series 2004-D, Class M2, 4.49%, 11/25/2034 (k) | | |
GLS Auto Receivables Issuer Trust Series 2019-2A, Class D, 4.52%, 2/17/2026 (c) | | |
GM Financial Consumer Automobile Receivables Trust Series 2019-3, Class A3, 2.18%, 4/16/2024 | | |
| | |
Series 2003-SEA, Class A1, 4.39%, 2/25/2033 ‡ (k) | | |
Series 2003-HE1, Class M1, 4.73%, 6/20/2033 ‡ (k) | | |
Series 2006-FM1, Class A2C, 3.91%, 4/25/2036 ‡ (k) | | |
Home Equity Mortgage Loan Asset-Backed Trust | | |
Series 2004-B, Class M2, 4.71%, 11/25/2034 ‡ (k) | | |
Series 2004-C, Class M2, 4.49%, 3/25/2035 ‡ (k) | | |
LendingClub Loan Certificate Issuer Trust | | |
Series 2022-P3, Class CERT, 11.88%, 5/15/2037 ‡ (c) | | |
Series 2022-NP3, Class CERT, HB, 25.22%, 5/15/2037 ‡ (c) | | |
Series 2022-NP5, Class CERT, 0.00%, 6/15/2037 ‡ (c) | | |
Series 2022-P4, Class CERT, 0.00%, 6/15/2037 ‡ (c) | | |
Series 2022-NP6, Class CERT, HB, 25.46%, 7/15/2037 ‡ (c) | | |
Lendingpoint Asset Securitization Trust Series 2021-B, Class B, 1.68%, 2/15/2029 ‡ (c) | | |
| | |
Series 2021-1A, Class B, 2.47%, 11/20/2031 (c) | | |
Series 2021-1A, Class D, 5.05%, 11/20/2031 ‡ (c) | | |
Series 2021-2A, Class B, 2.37%, 4/20/2032 (c) | | |
SEE NOTES TO FINANCIAL STATEMENTS.
| | |
Asset-Backed Securities — continued |
United States — continued |
Long Beach Mortgage Loan Trust Series 2003-4, Class M1, 4.61%, 8/25/2033 ‡ (k) | | |
MASTR Asset-Backed Securities Trust | | |
Series 2004-OPT2, Class M2, 4.56%, 9/25/2034 ‡ (k) | | |
Series 2005-NC1, Class M4, 4.73%, 12/25/2034 ‡ (k) | | |
ME Funding LLC Series 2019-1, Class A2, 6.45%, 7/30/2049 (c) | | |
Merrill Lynch Mortgage Investors Trust | | |
Series 2003-OPT1, Class M1, 4.56%, 7/25/2034 (k) | | |
Series 2004-HE2, Class M1, 4.79%, 8/25/2035 ‡ (k) | | |
Morgan Stanley ABS Capital I, Inc. Trust | | |
Series 2003-NC10, Class M1, 4.61%, 10/25/2033 ‡ (k) | | |
Series 2004-HE1, Class M1, 4.44%, 1/25/2034 ‡ (k) | | |
Series 2004-NC3, Class M1, 4.38%, 3/25/2034 ‡ (k) | | |
Series 2004-WMC2, Class M1, 4.50%, 7/25/2034 ‡ (k) | | |
Series 2004-WMC2, Class M2, 5.39%, 7/25/2034 ‡ (k) | | |
Series 2004-HE6, Class M2, 4.49%, 8/25/2034 ‡ (k) | | |
Series 2004-HE7, Class M2, 4.53%, 8/25/2034 ‡ (k) | | |
Series 2004-HE6, Class M3, 4.56%, 8/25/2034 ‡ (k) | | |
Series 2004-HE7, Class M3, 4.61%, 8/25/2034 ‡ (k) | | |
Series 2004-HE8, Class M2, 4.61%, 9/25/2034 ‡ (k) | | |
Series 2004-NC8, Class M3, 4.70%, 9/25/2034 ‡ (k) | | |
Series 2004-HE8, Class M3, 4.71%, 9/25/2034 ‡ (k) | | |
Series 2005-HE1, Class M2, 4.29%, 12/25/2034 ‡ (k) | | |
Series 2005-NC1, Class M3, 4.35%, 1/25/2035 ‡ (k) | | |
Morgan Stanley Mortgage Loan Trust Series 2007-5AX, Class 2A2, 3.89%, 2/25/2037 ‡ (k) | | |
| | |
|
United States — continued |
New Century Home Equity Loan Trust | | |
Series 2004-2, Class M2, 4.52%, 8/25/2034 ‡ (k) | | |
Series 2004-2, Class M4, 5.39%, 8/25/2034 ‡ (k) | | |
Series 2004-3, Class M2, 4.56%, 11/25/2034 ‡ (k) | | |
Series 2004-3, Class M3, 4.65%, 11/25/2034 ‡ (k) | | |
Series 2004-4, Class M2, 4.38%, 2/25/2035 ‡ (k) | | |
NovaStar Mortgage Funding Trust Series 2003-2, Class M2, 6.36%, 9/25/2033 ‡ (k) | | |
Oak Street Investment Grade Net Lease Fund | | |
Series 2021-1A, Class A3, 2.80%, 1/20/2051 (c) | | |
Series 2021-1A, Class B1, 4.23%, 1/20/2051 ‡ (c) | | |
Oportun Issuance Trust Series 2022-3, Class B, 8.53%, 1/8/2030 (c) | | |
Option One Mortgage Accept Corp. Asset-Backed Certificates | | |
Series 2003-5, Class A2, 4.23%, 8/25/2033 ‡ (k) | | |
Series 2003-5, Class M2, 5.91%, 8/25/2033 ‡ (k) | | |
Option One Mortgage Loan Trust Series 2004-3, Class M2, 4.44%, 11/25/2034 ‡ (k) | | |
Pagaya AI Debt Selection Trust Series 2021-3, Class C, 3.27%, 5/15/2029 ‡ (c) | | |
People's Choice Home Loan Securities Trust Series 2004-2, Class M3, 5.31%, 10/25/2034 ‡ (k) | | |
PNMAC FMSR ISSUER TRUST Series 2018-FT1, Class A, 5.94%, 4/25/2023 (c) (k) | | |
| | |
Series 2021-NPL6, Class A1, 2.49%, 7/25/2051 ‡ (c) (h) | | |
Series 2021-NPL3, Class A2, 3.72%, 7/25/2051 (c) (h) | | |
Series 2021-NPL6, Class A2, 5.07%, 7/25/2051 ‡ (c) (h) | | |
SEE NOTES TO FINANCIAL STATEMENTS.
JPMorgan Income Builder Fund
SCHEDULE OF PORTFOLIO INVESTMENTS
AS OF October 31, 2022 (continued)
| | |
Asset-Backed Securities — continued |
United States — continued |
Series 2021-RN4, Class A2, 5.19%, 10/25/2051 (c) (k) | | |
Series 2022-NPL2, Class A1, 5.24%, 4/25/2052 ‡ (c) (h) | | |
Pretium Mortgage Credit Partners I LLC Series 2021-NPL1, Class A2, 4.21%, 9/27/2060 (c) (h) | | |
Pretium Mortgage Credit Partners LLC Series 2021-RN1, Class A2, 3.60%, 2/25/2061 (c) (h) | | |
Progress Residential Trust | | |
Series 2021-SFR8, Class G, 4.01%, 10/17/2038 ‡ (c) | | |
Series 2022-SFR3, Class D, 4.45%, 4/17/2039 ‡ (c) | | |
RAMP Trust Series 2002-RS2, Class AI5, 5.06%, 3/25/2032 ‡ (k) | | |
RASC Trust Series 2005-KS2, Class M1, 4.23%, 3/25/2035 ‡ (k) | | |
Renaissance Home Equity Loan Trust | | |
Series 2002-3, Class M1, 5.09%, 12/25/2032 ‡ (k) | | |
Series 2003-1, Class M1, 5.09%, 6/25/2033 ‡ (k) | | |
Series 2003-4, Class M1, 4.86%, 3/25/2034 ‡ (k) | | |
Series 2003-4, Class M2F, 6.24%, 3/25/2034 ‡ (h) | | |
Santander Prime Auto Issuance Notes Trust | | |
Series 2018-A, Class E, 5.04%, 9/15/2025 (c) | | |
Series 2018-A, Class F, 6.80%, 9/15/2025 (c) | | |
SASCO Mortgage Loan Trust Series 2004-GEL3, Class M1, 5.16%, 8/25/2034 ‡ (k) | | |
Saxon Asset Securities Trust Series 2004-2, Class MV2, 4.17%, 8/25/2035 ‡ (k) | | |
Securitized Asset-Backed Receivables LLC Trust Series 2005-OP1, Class M2, 4.26%, 1/25/2035 ‡ (k) | | |
Stanwich Mortgage Loan Co. LLC Series 2021-NPB1, Class A2, 4.38%, 10/16/2026 (c) (h) | | |
Structured Asset Securities Corp. Pass-Through Certificates Series 2002-AL1, Class A3, 3.45%, 2/25/2032 ‡ | | |
| | |
|
United States — continued |
Theorem Funding Trust Series 2022-3A, Class A, 7.60%, 4/15/2029 (c) (i) | | |
Upstart Pass-Through Trust | | |
Series 2022-PT3, Class A, 17.31%, 4/20/2030 (c) (k) | | |
Series 2022-PT4, Class A, 17.63%, 5/20/2030 (c) (k) | | |
Upstart Securitization Trust | | |
Series 2021-5, Class C, 4.15%, 11/20/2031 (c) | | |
Series 2022-1, Class C, 5.71%, 3/20/2032 ‡ (c) | | |
Series 2022-4, Class A, 5.98%, 8/20/2032 (c) | | |
Wells Fargo Home Equity Asset-Backed Securities Trust | | |
Series 2004-2, Class M1, 4.49%, 10/25/2034 ‡ (k) | | |
Series 2004-2, Class M8B, 5.00%, 10/25/2034 ‡ (c) (k) | | |
Series 2004-2, Class M8A, 8.09%, 10/25/2034 ‡ (c) (k) | | |
Wells Fargo Home Equity Trust Mortgage Pass-Through Certificates Series 2004-1, Class M2, 4.53%, 4/25/2034 ‡ (k) | | |
Westlake Automobile Receivables Trust Series 2019-2A, Class F, 5.00%, 3/16/2026 (c) | | |
| | |
Total Asset-Backed Securities
(Cost $165,554) | | |
Foreign Government Securities — 0.8% |
|
| | |
| | |
| | |
| | |
| | |
| | |
|
| | |
| | |
| | |
SEE NOTES TO FINANCIAL STATEMENTS.
| | |
Foreign Government Securities — continued |
|
| | |
| | |
| | |
| | |
|
| | |
| | |
| | |
| | |
| | |
| | |
| | |
| | |
|
Federative Republic of Brazil | | |
| | |
| | |
| | |
| | |
| | |
|
| | |
| | |
| | |
| | |
| | |
| | |
| | |
| | |
| | |
| | |
|
| | |
| | |
| | |
| | |
|
Republic of Cote d'Ivoire | | |
5.75%, 12/31/2032 (a) (h) | | |
| | |
| | |
| | |
|
Dominican Republic — 0.1% |
Dominican Republic Government Bond | | |
| | |
| | |
| | |
| | |
| | |
| | |
| | |
| | |
| | |
|
| | |
| | |
| | |
| | |
| | |
|
| | |
| | |
| | |
| | |
| | |
| | |
| | |
| | |
| | |
| | |
| | |
| | |
|
| | |
| | |
| | |
| | |
|
Gabonese Republic 6.95%, 6/16/2025 (a) | | |
|
| | |
| | |
SEE NOTES TO FINANCIAL STATEMENTS.
JPMorgan Income Builder Fund
SCHEDULE OF PORTFOLIO INVESTMENTS
AS OF October 31, 2022 (continued)
| | |
Foreign Government Securities — continued |
|
| | |
| | |
| | |
|
| | |
| | |
| | |
| | |
| | |
|
| | |
| | |
| | |
| | |
|
| | |
| | |
| | |
| | |
|
Hashemite Kingdom of Jordan 5.85%, 7/7/2030 (c) | | |
|
| | |
| | |
| | |
| | |
|
| | |
| | |
| | |
| | |
| | |
|
| | |
| | |
| | |
| | |
| | |
| | |
| | |
|
|
State of Mongolia 4.45%, 7/7/2031 (a) | | |
|
| | |
| | |
| | |
| | |
|
Republic of Namibia 5.25%, 10/29/2025 (a) | | |
|
Federal Republic of Nigeria | | |
| | |
| | |
| | |
| | |
| | |
| | |
| | |
| | |
|
Sultanate of Oman Government Bond | | |
| | |
| | |
| | |
| | |
| | |
| | |
| | |
| | |
| | |
|
Islamic Republic of Pakistan | | |
| | |
| | |
| | |
| | |
| | |
| | |
|
| | |
| | |
SEE NOTES TO FINANCIAL STATEMENTS.
| | |
Foreign Government Securities — continued |
|
| | |
| | |
| | |
| | |
|
| | |
| | |
| | |
| | |
| | |
|
| | |
| | |
| | |
| | |
| | |
| | |
| | |
|
| | |
| | |
| | |
| | |
| | |
| | |
| | |
| | |
|
Ukraine Government Bond 7.75%, 9/1/2028 (a) | | |
|
Republic of Zambia 8.97%, 7/30/2027 (a) | | |
Total Foreign Government Securities
(Cost $121,871) | | |
U.S. Treasury Obligations — 0.8% |
|
| | |
| | |
| | |
Total U.S. Treasury Obligations
(Cost $77,331) | | |
| | |
|
|
Allstate Corp. (The) Series H, 5.10%, 10/15/2024 ($25 par value) (q) | | |
| | |
Series KK, 5.38%, 6/25/2024 ($25 par value) (q) | | |
Series LL, 5.00%, 9/17/2024 ($25 par value) (q) | | |
Energy Transfer LP Series E, 7.60%, 5/15/2024 (q) | | |
Goodman Networks, Inc. ‡ * | | |
MetLife, Inc. Series F, 4.75%, 3/15/2025 ($25 par value) (q) | | |
| | |
Series I, 6.38%, 10/15/2024 ($25 par value) (q) | | |
Series K, 5.85%, 4/15/2027 ($25 par value) (q) | | |
Series P, 6.50%, 10/15/2027 ($25 par value) (q) | | |
MYT Holding LLC Series A, 10.00%, 6/6/2029 ‡ | | |
Northern Trust Corp. Series E, 4.70%, 1/1/2025 ($25 par value) (q) | | |
Public Storage Series L, REIT, 4.63%, 6/17/2025 ($25 par value) (q) | | |
SCE Trust VI 5.00%, 6/26/2022 ($25 par value) (q) | | |
Sempra Energy 5.75%, 7/1/2079 ($25 par value) | | |
Southern Co. (The) Series 2020, 4.95%, 1/30/2080 ($25 par value) | | |
State Street Corp. Series G, 5.35%, 3/15/2026 ($25 par value) (q) | | |
Truist Financial Corp. Series R, 4.75%, 9/1/2025 ($25 par value) (q) | | |
| | |
Series Y, 5.63%, 12/15/2022 ($25 par value) (q) | | |
Series Z, 4.75%, 3/15/2025 ($25 par value) (q) | | |
Series AA, 4.70%, 12/15/2025 ($25 par value) (q) | | |
Total Preferred Stocks
(Cost $73,057) | | |
SEE NOTES TO FINANCIAL STATEMENTS.
JPMorgan Income Builder Fund
SCHEDULE OF PORTFOLIO INVESTMENTS
AS OF October 31, 2022 (continued)
| | |
|
|
DEXUS Finance Pty. Ltd. REIT, 2.30%, 6/19/2026 (a) | | |
Glencore Funding LLC Zero Coupon, 3/27/2025 (a) | | |
| | |
|
Shopify, Inc. 0.13%, 11/1/2025 | | |
|
Hansoh Pharmaceutical Group Co. Ltd. Zero Coupon, 1/22/2026 (a) | | |
Hello Group, Inc. 1.25%, 7/1/2025 | | |
Meituan Zero Coupon, 4/27/2028 (a) | | |
Pharmaron Beijing Co. Ltd. Zero Coupon,6/18/2026 (a) | | |
Pinduoduo, Inc. Zero Coupon, 12/1/2025 | | |
Smart Insight International Ltd. 4.50%, 12/5/2023 (a) | | |
Weibo Corp. 1.25%, 11/15/2022 | | |
| | |
|
Worldline SA Zero Coupon, 7/30/2026 (a) | | |
|
MTU Aero Engines AG Series MTX, 0.05%, 3/18/2027 (a) | | |
Zalando SE Series B, 0.63%, 8/6/2027 (a) | | |
| | |
|
Wix.com Ltd. Zero Coupon, 8/15/2025 | | |
|
Xero Investments Ltd. Zero Coupon, 12/2/2025 (a) | | |
|
Sea Ltd. 0.25%, 9/15/2026 | | |
|
Delivery Hero SE Series A, 1.00%, 4/30/2026 (a) | | |
|
Cellnex Telecom SA 0.75%, 11/20/2031 (a) | | |
| | |
|
|
| | |
| | |
Series VUN, Zero Coupon, 2/18/2025 | | |
Capital & Counties Properties plc REIT, 2.00%, 3/30/2026 | | |
Cornwall Jersey Ltd. 0.75%, 4/16/2026 (a) | | |
Just Eat Takeaway.com NV Series B, 0.63%, 2/9/2028 (a) | | |
Ocado Group plc 0.75%, 1/18/2027 (a) | | |
Trainline plc 1.00%, 1/14/2026 (a) | | |
WH Smith plc 1.63%, 5/7/2026 (a) | | |
| | |
|
Affirm Holdings, Inc. Zero Coupon, 11/15/2026 (c) | | |
Airbnb, Inc. Zero Coupon, 3/15/2026 | | |
Alteryx, Inc. 1.00%, 8/1/2026 | | |
Avalara, Inc. 0.25%, 8/1/2026 | | |
BigCommerce Holdings, Inc. 0.25%, 10/1/2026 | | |
Block, Inc. 0.25%, 11/1/2027 | | |
BofA Finance LLC 0.25%, 5/1/2023 | | |
Cheesecake Factory, Inc. (The) 0.38%, 6/15/2026 | | |
Chegg, Inc. Zero Coupon, 9/1/2026 | | |
Cloudflare, Inc. Zero Coupon, 8/15/2026 | | |
Coinbase Global, Inc. 0.50%, 6/1/2026 | | |
Confluent, Inc. Zero Coupon, 1/15/2027 (c) | | |
Coupa Software, Inc. 0.38%, 6/15/2026 | | |
DigitalBridge Group, Inc. REIT, 5.00%, 4/15/2023 | | |
| | |
| | |
| | |
DocuSign, Inc. Zero Coupon, 1/15/2024 | | |
Dropbox, Inc. Zero Coupon, 3/1/2026 | | |
Gulfport Energy Corp. 10.00% (Cash), 11/28/2022 ‡ * (d) (e) (g) | | |
Halozyme Therapeutics, Inc. 0.25%, 3/1/2027 | | |
| | |
| | |
| | |
SEE NOTES TO FINANCIAL STATEMENTS.
| | |
Convertible Bonds — continued |
United States — continued |
Okta, Inc. 0.13%, 9/1/2025 | | |
Peloton Interactive, Inc. Zero Coupon, 2/15/2026 | | |
Redwood Trust, Inc. REIT, 4.75%, 8/15/2023 | | |
Repay Holdings Corp. Zero Coupon, 2/1/2026 (c) | | |
| | |
| | |
| | |
RWT Holdings, Inc. 5.75%, 10/1/2025 | | |
Shift4 Payments, Inc. 0.50%, 8/1/2027 | | |
Snap, Inc. Zero Coupon, 5/1/2027 | | |
Splunk, Inc. 1.13%, 6/15/2027 | | |
Spotify USA, Inc. Zero Coupon, 3/15/2026 | | |
Supernus Pharmaceuticals, Inc. 0.63%, 4/1/2023 | | |
TripAdvisor, Inc. 0.25%, 4/1/2026 | | |
Twitter, Inc. Zero Coupon, 3/15/2026 | | |
Uber Technologies, Inc. Zero Coupon, 12/15/2025 | | |
Unity Software, Inc. Zero Coupon, 11/15/2026 (c) | | |
Vishay Intertechnology, Inc. 2.25%, 6/15/2025 | | |
| | |
|
No. Va Land Investment Group Corp. 5.25%, 7/16/2026 (a) | | |
Total Convertible Bonds
(Cost $60,225) | | |
| | |
Convertible Preferred Stocks — 0.2% |
|
AMG Capital Trust II 5.15%, 10/15/2037 ($50 par value) | | |
Bank of America Corp. Series L, 7.25% ($1,000 par value) | | |
Claire's Stores, Inc. ‡ * | | |
Danaher Corp. Series B, 5.00%, 4/15/2023 ($1,000 par value) | | |
KKR Group Co., Inc., Series C, 6.00%, 9/15/2023 ($50 par value) | | |
| | |
|
United States — continued |
NextEra Energy, Inc. 6.93%, 9/1/2025 ($49 par value) * | | |
Wells Fargo & Co. Series L, 7.50% ($1,000 par value) | | |
Total Convertible Preferred Stocks
(Cost $10,230) | | |
| | |
|
|
Cineworld Group expiring 12/31/2049, price 4,149.00 GBP * | | |
Nmg Research Ltd. expiring 9/24/2027, price 1.00 USD ‡ * | | |
| | |
|
Windstream Holdings, Inc. expiring 12/31/2049, price 11.00 USD ‡ * | | |
| | |
| | |
Mortgage-Backed Securities — 0.0% ^ |
|
FNMA UMBS, 20 Year Pool # CA1231, 3.50%, 2/1/2038 | | |
| | |
Pool # MA4398, 2.00%, 8/1/2051 | | |
Pool # MA4465, 2.00%, 11/1/2051 | | |
Pool # MA4548, 2.50%, 2/1/2052 | | |
Pool # MA4563, 2.50%, 3/1/2052 | | |
Pool # MA4564, 3.00%, 3/1/2052 | | |
Total Mortgage-Backed Securities
(Cost $986) | | |
| | |
|
|
Intelsat Jackson Holdings SA, expiring 12/5/2025‡ * | | |
SEE NOTES TO FINANCIAL STATEMENTS.
JPMorgan Income Builder Fund
SCHEDULE OF PORTFOLIO INVESTMENTS
AS OF October 31, 2022 (continued)
| | |
|
|
Vistra Corp., expiring 12/31/2049‡ | | |
| | |
| | |
Short-Term Investments — 7.0% |
Certificates of Deposits — 0.0% ^ |
Bank of Nova Scotia (The), (SOFR + 3.68%), 3.63%, 3/24/2023 (f) | | |
Lloyds Bank Corporate Markets plc, (SOFR + 8.99%), 3.72%, 3/22/2023 (f) | | |
Svenska Handelsbanken AB, 3.46%, 6/13/2023 | | |
Total Certificates of Deposits
(Cost $824) | | |
|
Allianz Fin Corp., 4.40%, 1/31/2023 (s) | | |
Ameren Illinois Co., 4.16%, 11/22/2022 (s) | | |
American Electric Power Co. Inc., 4.32%, 12/12/2022 (s) | | |
American Honda Finance Corp., 4.49%, 1/9/2023 (s) | | |
Brookfield US Holdings Inc., 4.15%, 11/7/2022 (s) | | |
Canadian Pacific Railway Co., 3.65%, 11/3/2022 (s) | | |
CDP Financial, Inc., 4.28%, 1/30/2023 (c) (s) | | |
CenterPoint Energy Resources Corp., 4.14%, 11/17/2022 (s) | | |
Church & Dwight Co., Inc., 3.60%, 11/3/2022 (s) | | |
Citigroup Global Markets, Inc., 4.12%, 8/9/2023 (s) | | |
Consolidated Edison Co., Inc., 4.16%, 11/9/2022 (s) | | |
Credit Industriel et Commercial, 3.69%, 2/9/2023 (s) | | |
DNB Bank ASA, 3.75%, 5/17/2023 (s) | | |
DTE Energy Co., 4.28%, 11/17/2022 (s) | | |
Enbridge (US) Inc., 4.31%, 11/23/2022 (s) | | |
Enel Finance America LLC, 1.01%, 1/20/2023 (s) | | |
| | |
|
Commercial Paper — continued |
Export Development Corp., 4.30%, 1/27/2023 (s) | | |
General Mills, Inc., 4.18%, 11/16/2022 (s) | | |
Gta Funding Corporate Commercial Paper Discount, 4.60%, 1/18/2023 (s) | | |
Henkel US Operations Corp., 4.31%, 9/7/2023 (s) | | |
John Deere Limited, 4.24%, 1/13/2023 (s) | | |
KEB Hana Bank USA, 3.77%, 1/17/2023 (s) | | |
National Rural Utilities Cooperative Finance Corp., 4.11%, 11/21/2022 (s) | | |
Nederlandse Waterschapsbank NV, 4.50%, 3/2/2023 (s) | | |
NextEra Energy Capital Holdings, Inc., 4.11%, 11/14/2022 (s) | | |
NiSource Inc., 4.16%, 11/16/2022 (s) | | |
ONE Gas, Inc., 4.15%, 11/7/2022 (s) | | |
Ontario Teachers' Finance Trust, 4.15%, 3/9/2023 (c) (s) | | |
PPL Capital Funding, Inc., 4.16%, 11/10/2022 (s) | | |
Procter & Gamble Co. (The), 4.41%, 2/21/2023 (s) | | |
| | |
| | |
| | |
Suncor Energy, Inc., 4.98%, 1/30/2023 (s) | | |
| | |
| | |
| | |
Toronto-Dominion Bank (The) | | |
| | |
| | |
Toyota Industries Commercial Finance, Inc., 4.02%, 6/9/2023 (c) (s) | | |
TransCanada PipeLines Ltd., 4.43%, 12/15/2022 (s) | | |
Ventas Realty LP, 3.95%, 11/7/2022 (s) | | |
VF Corp., 4.26%, 11/28/2022 (s) | | |
Westpac Securities NZ Ltd., 0.52%, 11/25/2022 (s) | | |
SEE NOTES TO FINANCIAL STATEMENTS.
| | |
Short-Term Investments — continued |
Commercial Paper — continued |
Xcel Energy, Inc., 3.85%, 11/4/2022 (s) | | |
Total Commercial Paper
(Cost $81,842) | | |
| | |
Investment Companies — 4.5% |
JPMorgan Prime Money Market Fund Class IM Shares, 3.18% (l) (t) | | |
JPMorgan Prime Money Market Fund Class Institutional Shares, 3.12% (l) (t) | | |
Total Investment Companies
(Cost $455,489) | | |
Investment of Cash Collateral from Securities Loaned — 1.7% |
JPMorgan Securities Lending Money Market Fund Agency SL Class Shares, 3.23% (l) (t) | | |
JPMorgan U.S. Government Money Market Fund Class IM Shares, 2.85% (l) (t) | | |
Total Investment of Cash Collateral from Securities Loaned
(Cost $177,390) | | |
Total Short-Term Investments
(Cost $715,545) | | |
Total Investments — 101.2%
(Cost $11,003,454) | | |
Liabilities in Excess of Other Assets — (1.2)% | | |
| | |
Percentages indicated are based on net assets. |
Amounts presented as a dash ("-") represent amounts that round to less than a thousand. |
| |
| |
| Alternative Credit Enhancement Securities |
| American Depositary Receipt |
| |
| Closed Joint Stock Company |
| Collateralized Loan Obligations |
| Chicago Mercantile Exchange |
| Credit Suisse Mortgage Trust |
| |
| |
| |
| |
| Euro Interbank Offered Rate |
| Federal Home Loan Mortgage Corp. |
| Federal National Mortgage Association |
| |
| Global Depositary Receipt |
| Government National Mortgage Association |
| High Coupon Bonds (a.k.a. "IOettes") represent the right to receive interest payments on an underlying pool of mortgages with similar features as those associated with IO securities. Unlike IO's the owner also has a right to receive a very small portion of principal. The high interest rates result from taking interest payments from other classes in the Real Estate Mortgage Investment Conduit trust and allocating them to the small principal of the HB class. |
| |
| Intercontinental Exchange |
| Inverse Floaters represent securities that pay interest at a rate that increases (decreases) with a decline (incline) in a specified index or have an interest rate that adjusts periodically based on changes in current interest rates and prepayments on the underlying pool of assets. The interest rate shown is the rate in effect as of October 31, 2022. The rate may be subject to a cap and floor. |
| Interest Only represents the right to receive the monthly interest payments on an underlying pool of mortgage loans. The principal amount shown represents the par value on the underlying pool. The yields on these securities are subject to accelerated principal paydowns as a result of prepayment or refinancing of the underlying pool of mortgage instruments. As a result, interest income may be reduced considerably. |
| |
| London Interbank Offered Rate |
| National Association of Securities Dealers Automate Quotation |
| |
| |
| Public Joint Stock Company |
| Principal Only represents the right to receive the principal portion only on an underlying pool of mortgage loans. The market value of these securities is extremely volatile in response to changes in market interest rates. As prepayments on the underlying mortgages of these securities increase, the yield on these securities increases. |
| A special type of equity investment that shares in the earnings of the company, has limited voting rights, and may have a dividend preference. Preference shares may also have liquidation preference. |
| Limited liability company |
| Real Estate Investment Trust |
| Real Estate Mortgage Investment Conduit |
| |
| Limited partnership with share capital |
| |
| Secured Overnight Financing Rate |
| Compounding index of the Secured Overnight Financing Rate |
SEE NOTES TO FINANCIAL STATEMENTS.
JPMorgan Income Builder Fund
SCHEDULE OF PORTFOLIO INVESTMENTS
AS OF October 31, 2022 (continued)
| Separate Trading of Registered Interest and Principal of Securities. The STRIPS Program lets investors hold and trade individual interest and principal components of eligible notes and bonds as separate securities. |
| Uniform Mortgage-Backed Securities |
| |
| Amount rounds to less than 0.1% of net assets. |
| Value determined using significant unobservable inputs. | |
| Non-income producing security. | |
| Security exempt from registration pursuant to Regulation S under the Securities Act of 1933, as amended. Regulation S applies to securities offerings that are made outside of the United States and do not involve direct selling efforts in the United States and as such may have restrictions on resale. | |
| The security or a portion of this security is on loan at October 31, 2022. The total value of securities on loan at October 31, 2022 is $168,289. | |
| Securities exempt from registration under Rule 144A or section 4(a)(2), of the Securities Act of 1933, as amended. | |
| Security is an interest bearing note with preferred security characteristics. | |
| Security is perpetual and thus, does not have a predetermined maturity date. The coupon rate for this security is fixed for a period of time and may be structured to adjust thereafter. The date shown, if applicable, reflects the next call date. The coupon rate shown is the rate in effect as of October 31, 2022. | |
| Variable or floating rate security, linked to the referenced benchmark. The interest rate shown is the current rate as of October 31, 2022. | |
| Security has the ability to pay in kind (“PIK”) or pay income in cash. When applicable, separate rates of such payments are disclosed. | |
| Step bond. Interest rate is a fixed rate for an initial period that either resets at a specific date or may reset in the future contingent upon a predetermined trigger. The interest rate shown is the current rate as of October 31, 2022. | |
| All or a portion of the security is a when-issued security, delayed delivery security, or forward commitment. | |
| | |
| Variable or floating rate security, the interest rate of which adjusts periodically based on changes in current interest rates and prepayments on the underlying pool of assets. The interest rate shown is the current rate as of October 31, 2022. | |
| Investment in an affiliated fund, which is registered under the Investment Company Act of 1940, as amended, and is advised by J.P. Morgan Investment Management Inc. | |
| Loan assignments are presented by obligor. Each series or loan tranche underlying each obligor may have varying terms. | |
| All or a portion of this security is unsettled as of October 31, 2022. Unless otherwise indicated, the coupon rate is undetermined. The coupon rate shown may not be accrued for the entire position. | |
| Fund is subject to legal or contractual restrictions on the resale of the security. | |
| All or a portion of this security is deposited with the broker as initial margin for futures contracts. | |
| The date shown reflects the next call date on which the issuer may redeem the security at par value. The coupon rate for this security is based on par value and is in effect as of October 31, 2022. | |
| | |
| The rate shown is the effective yield as of October 31, 2022. | |
| The rate shown is the current yield as of October 31, 2022. | |
SEE NOTES TO FINANCIAL STATEMENTS.
Summary of Investments by Industry, October 31, 2022
The following table represents the portfolio investments of the Fund by industry classifications as a percentage of total investments:
| PERCENT OF
TOTAL
INVESTMENTS |
| |
Oil, Gas & Consumable Fuels | |
| |
Equity Real Estate Investment Trusts (REITs) | |
Commercial Mortgage-Backed Securities | |
Diversified Telecommunication Services | |
Collateralized Mortgage Obligations | |
| |
| |
| |
| |
Health Care Providers & Services | |
| |
| |
Hotels, Restaurants & Leisure | |
Wireless Telecommunication Services | |
| |
| |
| |
Semiconductors & Semiconductor Equipment | |
| |
| |
| |
| |
| |
| |
| |
Others (each less than 1.0%) | |
| |
Detailed information about investment portfolios of the underlying funds and ETFs can be found in shareholder reports filed with the Securities and Exchange Commission (SEC) by each such underlying fund semi-annually on Form N-CSR and in portfolio holdings filed quarterly on Form N-PORT, and are available for download from both the SEC’s as well as each respective underlying fund’s website. Detailed information about underlying J.P. Morgan Funds can also be found at www.jpmorganfunds.com or by calling 1-800-480-4111.
SEE NOTES TO FINANCIAL STATEMENTS.
JPMorgan Income Builder Fund
SCHEDULE OF PORTFOLIO INVESTMENTS
AS OF October 31, 2022 (continued)
Futures contracts outstanding as of October 31, 2022 (amounts in thousands, except number of contracts):
| | | | | VALUE AND
UNREALIZED
APPRECIATION
(DEPRECIATION) ($) |
| | | | | |
| | | | | |
| | | | | |
| | | | | |
U.S. Treasury 10 Year Note | | | | | |
| | | | | |
| | | | | |
| | | | | |
| | | | | |
| | | | | |
| | | | | |
| |
| |
| Financial Times and the London Stock Exchange |
| |
| National Association of Securities Dealers Automate Quotation |
| |
SEE NOTES TO FINANCIAL STATEMENTS.
STATEMENTS OF ASSETS AND LIABILITIES
AS OF October 31, 2022
(Amounts in thousands, except per share amounts)
| JPMorgan
Global
Allocation Fund | |
| | |
Investments in non-affiliates, at value | | |
Investments in affiliates, at value | | |
Investments of cash collateral received from securities loaned, at value (See Note 2.F.) | | |
| | |
Foreign currency, at value | | |
Deposits at broker for futures contracts | | |
| | |
Investment securities sold | | |
| | |
Interest from non-affiliates | | |
Dividends from non-affiliates | | |
Dividends from affiliates | | |
| | |
Securities lending income (See Note 2.F.) | | |
Variation margin on futures contracts | | |
Unrealized appreciation on forward foreign currency exchange contracts | | |
| | |
| | |
| | |
Investment securities purchased | | |
Investment securities purchased — delayed delivery securities | | |
Collateral received on securities loaned (See Note 2.F.) | | |
| | |
Unrealized depreciation on forward foreign currency exchange contracts | | |
Unrealized depreciation on unfunded commitments | | |
| | |
| | |
| | |
| | |
| | |
Custodian and accounting fees | | |
Deferred foreign capital gains tax | | |
| | |
| | |
| | |
SEE NOTES TO FINANCIAL STATEMENTS.
STATEMENTS OF ASSETS AND LIABILITIES
AS OF October 31, 2022 (continued)
(Amounts in thousands, except per share amounts)
| JPMorgan Global Allocation Fund | |
| | |
| | |
Total distributable earnings (loss) | | |
| | |
| | |
| | |
| | |
| | |
| | |
| | |
| | |
| | |
| | |
| | |
Outstanding units of beneficial interest (shares)
($0.0001 par value; unlimited number of shares authorized): | | |
| | |
| | |
| | |
| | |
| | |
| | |
| | |
| | |
| | |
Class A — Redemption price per share | | |
Class C — Offering price per share (b) | | |
Class I — Offering and redemption price per share | | |
Class R2 — Offering and redemption price per share | | |
Class R3 — Offering and redemption price per share | | |
Class R4 — Offering and redemption price per share | | |
Class R5 — Offering and redemption price per share | | |
Class R6 — Offering and redemption price per share | | |
Class A maximum sales charge | | |
Class A maximum public offering price per share
[net asset value per share/(100% – maximum sales charge)] | | |
Cost of investments in non-affiliates | | |
Cost of investments in affiliates | | |
| | |
Investment securities on loan, at value (See Note 2.F.) | | |
Cost of investment of cash collateral (See Note 2.F.) | | |
(a)
Per share amounts may not recalculate due to rounding of net assets and/or shares outstanding.
(b)
Redemption price for Class C Shares varies based upon length of time the shares are held.
SEE NOTES TO FINANCIAL STATEMENTS.
STATEMENTS OF OPERATIONS
FOR THE YEAR ENDED October 31, 2022
(Amounts in thousands)
| JPMorgan
Global
Allocation Fund | |
| | |
Interest income from non-affiliates | | |
Interest income from affiliates | | |
Dividend income from non-affiliates | | |
Dividend income from affiliates | | |
Income from securities lending (net) (See Note 2.F.) | | |
Foreign taxes withheld (net) | | |
| | |
| | |
| | |
| | |
| | |
| | |
| | |
| | |
| | |
| | |
| | |
| | |
| | |
| | |
| | |
| | |
| | |
Custodian and accounting fees | | |
Interest expense to affiliates | | |
| | |
Trustees’ and Chief Compliance Officer’s fees | | |
Printing and mailing costs | | |
Registration and filing fees | | |
Transfer agency fees (See Note 2.M.) | | |
Dividend expense to non-affiliates on securities sold short | | |
| | |
| | |
| | |
Less expense reimbursements | | |
| | |
Net investment income (loss) | | |
(a)
Amount rounds to less than one thousand.
SEE NOTES TO FINANCIAL STATEMENTS.
STATEMENTS OF OPERATIONS
FOR THE YEAR ENDED October 31, 2022 (continued)
(Amounts in thousands)
| JPMorgan Global Allocation Fund | |
REALIZED/UNREALIZED GAINS (LOSSES): | | |
Net realized gain (loss) on transactions from: | | |
Investments in non-affiliates | | |
Investments in affiliates | | |
| | |
| | |
| | |
Foreign currency transactions | | |
Forward foreign currency exchange contracts | | |
| | |
| | |
| | |
Change in net unrealized appreciation/depreciation on: | | |
Investments in non-affiliates | | |
Investments in affiliates | | |
| | |
| | |
| | |
Foreign currency translations | | |
Forward foreign currency exchange contracts | | |
| | |
| | |
Change in net unrealized appreciation/depreciation | | |
Net realized/unrealized gains (losses) | | |
Change in net assets resulting from operations | | |
(a)
Net of foreign capital gains tax of $(1,222).
(b)
Net of change in foreign capital gains tax of $1,616.
SEE NOTES TO FINANCIAL STATEMENTS.
STATEMENTS OF CHANGES IN NET ASSETS
FOR THE PERIODS INDICATED
(Amounts in thousands)
| JPMorgan Global Allocation Fund | JPMorgan Income Builder Fund |
| Year Ended
October 31, 2022 | Year Ended
October 31, 2021 | Year Ended
October 31, 2022 | Year Ended
October 31, 2021 |
CHANGE IN NET ASSETS RESULTING FROM OPERATIONS: | | | | |
Net investment income (loss) | | | | |
| | | | |
Change in net unrealized appreciation/depreciation | | | | |
Change in net assets resulting from operations | | | | |
DISTRIBUTIONS TO SHAREHOLDERS: | | | | |
| | | | |
| | | | |
| | | | |
| | | | |
| | | | |
| | | | |
| | | | |
| | | | |
Total distributions to shareholders | | | | |
| | | | |
Change in net assets resulting from capital transactions | | | | |
| | | | |
| | | | |
| | | | |
| | | | |
SEE NOTES TO FINANCIAL STATEMENTS.
STATEMENTS OF CHANGES IN NET ASSETS
FOR THE PERIODS INDICATED (continued)
(Amounts in thousands)
| JPMorgan Global Allocation Fund | JPMorgan Income Builder Fund |
| Year Ended October 31, 2022 | Year Ended October 31, 2021 | Year Ended October 31, 2022 | |
| | | | |
| | | | |
Proceeds from shares issued | | | | |
| | | | |
| | | | |
Change in net assets resulting from Class A capital transactions | | | | |
| | | | |
Proceeds from shares issued | | | | |
| | | | |
| | | | |
Change in net assets resulting from Class C capital transactions | | | | |
| | | | |
Proceeds from shares issued | | | | |
| | | | |
| | | | |
Change in net assets resulting from Class I capital transactions | | | | |
| | | | |
Proceeds from shares issued | | | | |
| | | | |
| | | | |
Change in net assets resulting from Class R2 capital transactions | | | | |
| | | | |
Proceeds from shares issued | | | | |
| | | | |
| | | | |
Change in net assets resulting from Class R3 capital transactions | | | | |
| | | | |
Proceeds from shares issued | | | | |
| | | | |
| | | | |
Change in net assets resulting from Class R4 capital transactions | | | | |
| | | | |
Proceeds from shares issued | | | | |
| | | | |
| | | | |
Change in net assets resulting from Class R5 capital transactions | | | | |
SEE NOTES TO FINANCIAL STATEMENTS.
| JPMorgan Global Allocation Fund | JPMorgan Income Builder Fund |
| Year Ended October 31, 2022 | Year Ended October 31, 2021 | Year Ended October 31, 2022 | |
CAPITAL TRANSACTIONS: (continued) | | | | |
| | | | |
Proceeds from shares issued | | | | |
| | | | |
| | | | |
Change in net assets resulting from Class R6 capital transactions | | | | |
Total change in net assets resulting from capital transactions | | | | |
| | | | |
| | | | |
| | | | |
| | | | |
| | | | |
| | | | |
| | | | |
| | | | |
| | | | |
| | | | |
| | | | |
| | | | |
| | | | |
| | | | |
| | | | |
| | | | |
| | | | |
| | | | |
| | | | |
| | | | |
Change in Class R2 Shares | | | | |
| | | | |
| | | | |
| | | | |
| | | | |
Change in Class R3 Shares | | | | |
| | | | |
| | | | |
| | | | |
| | | | |
Change in Class R4 Shares | | | | |
(a)
Amount rounds to less than one thousand.
SEE NOTES TO FINANCIAL STATEMENTS.
STATEMENTS OF CHANGES IN NET ASSETS
FOR THE PERIODS INDICATED (continued)
(Amounts in thousands)
| JPMorgan Global Allocation Fund | JPMorgan Income Builder Fund |
| Year Ended October 31, 2022 | Year Ended October 31, 2021 | Year Ended October 31, 2022 | |
SHARE TRANSACTIONS: (continued) | | | | |
| | | | |
| | | | |
| | | | |
| | | | |
Change in Class R5 Shares | | | | |
| | | | |
| | | | |
| | | | |
| | | | |
Change in Class R6 Shares | | | | |
(a)
Amount rounds to less than one thousand.
SEE NOTES TO FINANCIAL STATEMENTS.
THIS PAGE IS INTENTIONALLY LEFT BLANK
FINANCIAL HIGHLIGHTS
FOR THE PERIODS INDICATED
| Per share operating performance |
| | | |
| Net asset
value,
beginning
of period | Net
investment
income
(loss)(b)(c) | Net realized
and unrealized
gains
(losses) on
investments | Total from
investment
operations | | | |
JPMorgan Global Allocation Fund | | | | | | | |
| | | | | | | |
Year Ended October 31, 2022 | | | | | | | |
Year Ended October 31, 2021 | | | | | | | |
Year Ended October 31, 2020 | | | | | | | |
Year Ended October 31, 2019 | | | | | | | |
Year Ended October 31, 2018 | | | | | | | |
| | | | | | | |
Year Ended October 31, 2022 | | | | | | | |
Year Ended October 31, 2021 | | | | | | | |
Year Ended October 31, 2020 | | | | | | | |
Year Ended October 31, 2019 | | | | | | | |
Year Ended October 31, 2018 | | | | | | | |
| | | | | | | |
Year Ended October 31, 2022 | | | | | | | |
Year Ended October 31, 2021 | | | | | | | |
Year Ended October 31, 2020 | | | | | | | |
Year Ended October 31, 2019 | | | | | | | |
Year Ended October 31, 2018 | | | | | | | |
| | | | | | | |
Year Ended October 31, 2022 | | | | | | | |
Year Ended October 31, 2021 | | | | | | | |
Year Ended October 31, 2020 | | | | | | | |
Year Ended October 31, 2019 | | | | | | | |
Year Ended October 31, 2018 | | | | | | | |
| | | | | | | |
Year Ended October 31, 2022 | | | | | | | |
Year Ended October 31, 2021 | | | | | | | |
Year Ended October 31, 2020 | | | | | | | |
Year Ended October 31, 2019 | | | | | | | |
October 1, 2018 (j) through October 31, 2018 | | | | | | | |
| | | | | | | |
Year Ended October 31, 2022 | | | | | | | |
Year Ended October 31, 2021 | | | | | | | |
Year Ended October 31, 2020 | | | | | | | |
Year Ended October 31, 2019 | | | | | | | |
October 1, 2018 (j) through October 31, 2018 | | | | | | | |
| | | | | | | |
Year Ended October 31, 2022 | | | | | | | |
Year Ended October 31, 2021 | | | | | | | |
Year Ended October 31, 2020 | | | | | | | |
Year Ended October 31, 2019 | | | | | | | |
October 1, 2018 (j) through October 31, 2018 | | | | | | | |
SEE NOTES TO FINANCIAL STATEMENTS.
| |
| | | Ratios to average net assets(a) |
Net asset
value,
end of
period | Total return
(excludes
sales charge)(d)(e) | Net assets,
end of
period
(000's) | Net
expenses
(including dividend
and interest expense
for securities sold
short)(f)(g) | Net
investment
income
(loss)(b) | Expenses without
waivers and reimbursements
(including dividend
and interest expense
for securities sold
short)(f) | Portfolio
turnover rate
(excluding securities
sold short)(d)(h) | Portfolio
turnover rate
(including securities
sold short)(d)(h) |
| | | | | | | |
| | | | | | | |
| | | | | | | |
| | | | | | | |
| | | | | | | |
| | | | | | | |
| | | | | | | |
| | | | | | | |
| | | | | | | |
| | | | | | | |
| | | | | | | |
| | | | | | | |
| | | | | | | |
| | | | | | | |
| | | | | | | |
| | | | | | | |
| | | | | | | |
| | | | | | | |
| | | | | | | |
| | | | | | | |
| | | | | | | |
| | | | | | | |
| | | | | | | |
| | | | | | | |
| | | | | | | |
| | | | | | | |
| | | | | | | |
| | | | | | | |
| | | | | | | |
| | | | | | | |
| | | | | | | |
| | | | | | | |
| | | | | | | |
| | | | | | | |
| | | | | | | |
| | | | | | | |
| | | | | | | |
| | | | | | | |
| | | | | | | |
| | | | | | | |
| | | | | | | |
| | | | | | | |
| | | | | | | |
SEE NOTES TO FINANCIAL STATEMENTS.
FINANCIAL HIGHLIGHTS
FOR THE PERIODS INDICATED (continued)
| Per share operating performance |
| | | |
| Net asset
value,
beginning
of period | Net
investment
income
(loss)(b)(c) | Net realized
and unrealized
gains
(losses) on
investments | Total from
investment
operations | | | |
JPMorgan Global Allocation Fund (continued) | | | | | | | |
| | | | | | | |
Year Ended October 31, 2022 | | | | | | | |
Year Ended October 31, 2021 | | | | | | | |
Year Ended October 31, 2020 | | | | | | | |
Year Ended October 31, 2019 | | | | | | | |
November 1, 2017 (j) through October 31, 2018 | | | | | | | |
|
| Annualized for periods less than one year, unless otherwise noted. |
| Net investment income (loss) is affected by the timing of distributions from Underlying Funds. |
| Calculated based upon average shares outstanding. |
| Not annualized for periods less than one year. |
| Includes adjustments in accordance with accounting principles generally accepted in the United States of America and as such, the net asset values for financial reporting purposes and the returns based upon those net asset values may differ from the net asset values and returns for shareholder transactions. |
| Does not include expenses of underlying funds. |
| Includes interest expense, if applicable, which is less than 0.005% unless otherwise noted. |
| The Fund presents portfolio turnover in two ways, one including securities sold short and the other excluding securities sold short. |
| |
| | | | | |
Net expenses (excluding dividend and interest expense for securities sold short) | | | | | |
| | | | | |
| | | | | |
| | | | | |
| | | | | |
| | | | | |
| | | | | |
| | | | | |
| | | | | |
Expenses without waivers and reimbursements (excluding dividend and interest expense for securities sold short) | | | | | |
| | | | | |
| | | | | |
| | | | | |
| | | | | |
| | | | | |
| | | | | |
| | | | | |
| | | | | |
|
| Commencement of offering of class of shares. |
SEE NOTES TO FINANCIAL STATEMENTS.
| |
| | | Ratios to average net assets(a) |
Net asset
value,
end of
period | Total return
(excludes
sales charge)(d)(e) | Net assets,
end of
period
(000's) | Net
expenses
(including dividend
and interest expense
for securities sold
short)(f)(g) | Net
investment
income
(loss)(b) | Expenses without
waivers and reimbursements
(including dividend
and interest expense
for securities sold
short)(f) | Portfolio
turnover rate
(excluding securities
sold short)(d)(h) | Portfolio
turnover rate
(including securities
sold short)(d)(h) |
|
| | | | | | | |
| | | | | | | |
| | | | | | | |
| | | | | | | |
| | | | | | | |
| | | | | | | |
SEE NOTES TO FINANCIAL STATEMENTS.
FINANCIAL HIGHLIGHTS
FOR THE PERIODS INDICATED
| Per share operating performance |
| | | |
| Net asset
value,
beginning
of period | Net
investment
income
(loss)(b) | Net realized
and unrealized
gains
(losses) on
investments | Total from
investment
operations | | | |
JPMorgan Income Builder Fund | | | | | | | |
| | | | | | | |
Year Ended October 31, 2022 | | | | | | | |
Year Ended October 31, 2021 | | | | | | | |
Year Ended October 31, 2020 | | | | | | | |
Year Ended October 31, 2019 | | | | | | | |
Year Ended October 31, 2018 | | | | | | | |
| | | | | | | |
Year Ended October 31, 2022 | | | | | | | |
Year Ended October 31, 2021 | | | | | | | |
Year Ended October 31, 2020 | | | | | | | |
Year Ended October 31, 2019 | | | | | | | |
Year Ended October 31, 2018 | | | | | | | |
| | | | | | | |
Year Ended October 31, 2022 | | | | | | | |
Year Ended October 31, 2021 | | | | | | | |
Year Ended October 31, 2020 | | | | | | | |
Year Ended October 31, 2019 | | | | | | | |
Year Ended October 31, 2018 | | | | | | | |
| | | | | | | |
Year Ended October 31, 2022 | | | | | | | |
Year Ended October 31, 2021 | | | | | | | |
Year Ended October 31, 2020 | | | | | | | |
Year Ended October 31, 2019 | | | | | | | |
November 1, 2017 (f) through October 31, 2018 | | | | | | | |
|
| Annualized for periods less than one year, unless otherwise noted. |
| Calculated based upon average shares outstanding. |
| Not annualized for periods less than one year. |
| Includes adjustments in accordance with accounting principles generally accepted in the United States of America and as such, the net asset values for financial reporting purposes and the returns based upon those net asset values may differ from the net asset values and returns for shareholder transactions. |
| Includes earnings credits and interest expense, if applicable, each of which is less than 0.005% unless otherwise noted. |
| Commencement of offering of class of shares. |
SEE NOTES TO FINANCIAL STATEMENTS.
| |
| | | Ratios to average net assets(a) |
Net asset
value,
end of
period | Total return
(excludes
sales charge)(c)(d) | Net assets,
end of
period
(000's) | | Net
investment
income
(loss) | Expenses without
waivers,
reimbursements,
and earnings
credits | |
| | | | | | |
| | | | | | |
| | | | | | |
| | | | | | |
| | | | | | |
| | | | | | |
| | | | | | |
| | | | | | |
| | | | | | |
| | | | | | |
| | | | | | |
| | | | | | |
| | | | | | |
| | | | | | |
| | | | | | |
| | | | | | |
| | | | | | |
| | | | | | |
| | | | | | |
| | | | | | |
| | | | | | |
| | | | | | |
| | | | | | |
| | | | | | |
| | | | | | |
SEE NOTES TO FINANCIAL STATEMENTS.
NOTES TO FINANCIAL STATEMENTS
AS OF October 31, 2022
(Dollar values in thousands)
1. Organization
JPMorgan Trust I (the “Trust”) was formed on November 12, 2004, as a Delaware statutory trust, pursuant to a Declaration of Trust dated November 5, 2004 and is registered under the Investment Company Act of 1940, as amended (the “1940 Act”), as an open-end management investment company.
The following are 2 separate funds of the Trust (each, a "Fund" and collectively, the "Funds") covered by this report:
| | Diversification Classification |
JPMorgan Global Allocation Fund | Class A, Class C, Class I, Class R2, Class R3, Class R4, Class R5 and Class R6 | |
JPMorgan Income Builder Fund | Class A, Class C, Class I and Class R6 | |
The investment objective of JPMorgan Global Allocation Fund (“Global Allocation Fund”) is to seek to maximize long-term total return.
The investment objective of JPMorgan Income Builder Fund (“Income Builder Fund”) is to seek to maximize income while maintaining prospects for capital appreciation.
Class A Shares generally provide for a front-end sales charge while Class C Shares provide for a contingent deferred sales charge ("CDSC"). No sales charges are assessed with respect to Class I, Class R2, Class R3, Class R4, Class R5 and Class R6 Shares. Certain Class A Shares, for which front-end sales charges have been waived, may be subject to a CDSC as described in the Funds' prospectus. Effective October 1, 2020, Class C Shares automatically convert to Class A Shares after eight years. Prior to October 1, 2020, Class C Shares automatically converted to Class A Shares after ten years. All classes of shares have equal rights as to earnings, assets and voting privileges, except that each class may bear different transfer agency, distribution and service fees and each class has exclusive voting rights with respect to its distribution plan and shareholder servicing agreements.
J.P. Morgan Investment Management Inc. (“JPMIM”), an indirect, wholly-owned subsidiary of JPMorgan Chase & Co. (“JPMorgan”), acts as Adviser (the “Adviser”) and Administrator (the “Administrator”) to the Funds.
2. Significant Accounting Policies
The following is a summary of significant accounting policies followed by the Funds in the preparation of their financial statements. The Funds are investment companies and, accordingly, follow the investment company accounting and reporting guidance of the Financial Accounting Standards Board (“FASB”) Accounting Standards Codification Topic 946 — Investment Companies, which is part of U.S. generally accepted accounting principles (“GAAP”). The preparation of financial statements in conformity with GAAP requires management to make estimates and assumptions that affect (i) the reported amounts of assets and liabilities, (ii) disclosure of contingent assets and liabilities at the date of the financial statements, and (iii) the reported amounts of increases and decreases in net assets from operations during the reporting period. Actual results could differ from those estimates.
A. Valuation of Investments — Investments are valued in accordance with GAAP and the Funds' valuation policies set forth by, and under the supervision and responsibility of, the Board of Trustees of the Trust (the "Board"), which established the following approach to valuation, as described more fully below: (i) investments for which market quotations are readily available shall be valued at their market value and (ii) all other investments for which market quotations are not readily available shall be valued at their fair value as determined in good faith by the Board.
Under the Section 2(a)(41) of the 1940 Act, the Board is required to determine fair value for securities that do not have readily available market quotations. Under the SEC Rule 2a-5 (Good Faith Determinations of Fair Value), the Board may designate the performance of these fair valuation determinations to a valuation designee. The Board has designated the Adviser as the “Valuation Designee” to perform fair valuation determinations for the Funds on behalf of the Board subject to appropriate oversight by the Board. The Adviser, as Valuation Designee, leverages the J.P. Morgan Asset Management Americas Valuation Committee (“AVC”) to help oversee and carry out the policies for the valuation of Investments held in the Funds. The Adviser, as Valuation Designee, remains responsible for the valuation determinations.
This oversight by the AVC includes monitoring the appropriateness of fair values based on results of ongoing valuation oversight including, but not limited to, consideration of macro or security specific events, market events, and pricing vendor and broker due diligence. The Administrator is responsible for discussing and assessing the potential impacts to the fair values on an ongoing basis, and, at least on a quarterly basis, with the AVC and the Board.
A market-based approach is primarily used to value the Funds' investments. Investments for which market quotations are not readily available are fair valued using prices supplied by approved affiliated and/or unaffiliated pricing vendors or third party broker-dealers (collectively referred to as “Pricing Services”) or may be internally fair valued using methods set forth by the valuation policies approved by the Boards. This may include the use of related or comparable assets or liabilities, recent transactions, market multiples, book values and other relevant information for the investment. An income-based valuation approach may be used in which the anticipated future cash flows of the investment are discounted to calculate the fair value. Discounts may also be applied due to the nature or duration of any restrictions on the disposition of the investments. Valuations may be based upon current market prices of securities that are comparable in coupon, rating, maturity and industry. It is possible that the estimated values may differ significantly from the values that would have been used had a ready market for the investments existed, and such differences could be material.
Fixed income instruments are valued based on prices received from Pricing Services. The Pricing Services use multiple valuation techniques to determine the valuation of fixed income instruments. In instances where sufficient market activity exists, the Pricing Services may utilize a market-based approach through which trades or quotes from market makers are used to determine the valuation of these instruments. In instances where sufficient market activity may not exist, the Pricing Services also utilize proprietary valuation models which may consider market transactions in comparable securities and the various relationships between securities in determining fair value and/or market characteristics in order to estimate the relevant cash flows, which are then discounted to calculate the fair values.
Equities and other exchange-traded instruments are valued at the last sale price or official market closing price on the primary exchange on which the instrument is traded before the net asset values ("NAV") of the Funds are calculated on a valuation date. Certain foreign equity instruments are valued by applying international fair value factors provided by approved Pricing Services. The factors seek to adjust the local closing price for movements of local markets post-closing, but prior to the time the NAV is calculated.
Investments in open-end investment companies, excluding exchange-traded funds (“ETFs”) (“Underlying Funds”), are valued at each Underlying Fund’s NAV per share as of the report date.
Futures contracts and options are generally valued on the basis of available market quotations. Swaps and forward foreign currency exchange contracts are valued utilizing market quotations from approved Pricing Services.
See the tables on “Quantitative Information about Level 3 Fair Value Measurements” for information on the valuation techniques and inputs used to value level 3 securities held by at October 31, 2022.
Valuations reflected in this report are as of the report date. As a result, changes in valuation due to market events and/or issuer-related events after the report date and prior to issuance of the report are not reflected herein.
The various inputs that are used in determining the valuation of the Funds' investments are summarized into the three broad levels listed below.
•
Level 1 — Unadjusted inputs using quoted prices in active markets for identical investments.
•
Level 2 — Other significant observable inputs including, but not limited to, quoted prices for similar investments, inputs other than quoted prices that are observable for investments (such as interest rates, prepayment speeds, credit risk, etc.) or other market corroborated inputs.
•
Level 3 — Significant inputs based on the best information available in the circumstances, to the extent observable inputs are not available (including the Funds' assumptions in determining the fair value of investments).
A financial instrument’s level within the fair value hierarchy is based on the lowest level of any input, both individually and in the aggregate, that is significant to the fair value measurement. The inputs or methodology used for valuing instruments are not necessarily an indication of the risk associated with investing in those instruments.
The following tables represent each valuation input as presented on the Schedules of Portfolio Investments ("SOIs"):
| | |
| | Level 2
Other significant
observable inputs | Level 3
Significant
unobservable inputs | |
Investments in Securities | | | | |
| | | | |
Collateralized Mortgage Obligations | | | | |
Commercial Mortgage-Backed Securities | | | | |
| | | | |
| | | | |
| | | | |
| | | | |
| | | | |
| | | | |
| | | | |
| | | | |
| | | | |
| | | | |
| | | | |
| | | | |
| | | | |
| | | | |
NOTES TO FINANCIAL STATEMENTS
AS OF October 31, 2022 (continued)
(Dollar values in thousands)
Global Allocation Fund (continued) | | |
| | Level 2 Other significant observable inputs | Level 3 Significant unobservable inputs | |
| | | | |
| | | | |
| | | | |
| | | | |
| | | | |
| | | | |
| | | | |
| | | | |
| | | | |
| | | | |
| | | | |
| | | | |
| | | | |
| | | | |
| | | | |
| | | | |
| | | | |
| | | | |
| | | | |
| | | | |
| | | | |
| | | | |
| | | | |
| | | | |
| | | | |
| | | | |
| | | | |
Tanzania, United Republic of | | | | |
| | | | |
| | | | |
| | | | |
| | | | |
| | | | |
Convertible Preferred Stocks | | | | |
| | | | |
| | | | |
Foreign Government Securities | | | | |
| | | | |
| | | | |
| | | | |
| | | | |
| | | | |
| | | | |
U.S. Treasury Obligations | | | | |
| | | | |
| | | | |
| | | | |
| | | | |
Global Allocation Fund (continued) | | |
| | Level 2 Other significant observable inputs | Level 3 Significant unobservable inputs | |
| | | | |
| | | | |
| | | | |
| | | | |
| | | | |
| | | | |
Investment of Cash Collateral from Securities Loaned | | | | |
U.S. Treasury Obligations | | | | |
Total Short-Term Investments | | | | |
Total Investments in Securities | | | | |
Appreciation in Other Financial Instruments | | | | |
Forward Foreign Currency Exchange Contracts | | | | |
| | | | |
Depreciation in Other Financial Instruments | | | | |
Forward Foreign Currency Exchange Contracts | | | | |
| | | | |
Total Net Appreciation/ Depreciation in Other Financial Instruments | | | | |
|
| Amount rounds to less than one thousand. |
There were no significant transfers into or out of level 3 for the year ended October 31, 2022.
| | |
| | Level 2
Other significant
observable inputs | Level 3
Significant
unobservable inputs | |
Investments in Securities | | | | |
| | | | |
| | | | |
| | | | |
Total Asset-Backed Securities | | | | |
Collateralized Mortgage Obligations | | | | |
| | | | |
| | | | |
Total Collateralized Mortgage Obligations | | | | |
Commercial Mortgage-Backed Securities | | | | |
| | | | |
| | | | |
| | | | |
| | | | |
| | | | |
| | | | |
| | | | |
| | | | |
| | | | |
| | | | |
NOTES TO FINANCIAL STATEMENTS
AS OF October 31, 2022 (continued)
(Dollar values in thousands)
Income Builder Fund (continued) | | |
| | Level 2 Other significant observable inputs | Level 3 Significant unobservable inputs | |
| | | | |
| | | | |
| | | | |
| | | | |
| | | | |
| | | | |
| | | | |
| | | | |
| | | | |
| | | | |
| | | | |
| | | | |
| | | | |
| | | | |
| | | | |
| | | | |
| | | | |
| | | | |
| | | | |
| | | | |
| | | | |
| | | | |
| | | | |
| | | | |
| | | | |
| | | | |
| | | | |
| | | | |
| | | | |
| | | | |
| | | | |
| | | | |
| | | | |
| | | | |
| | | | |
| | | | |
| | | | |
| | | | |
| | | | |
| | | | |
| | | | |
| | | | |
| | | | |
| | | | |
| | | | |
| | | | |
Convertible Preferred Stocks | | | | |
| | | | |
Income Builder Fund (continued) | | |
| | Level 2 Other significant observable inputs | Level 3 Significant unobservable inputs | |
| | | | |
| | | | |
| | | | |
| | | | |
| | | | |
| | | | |
| | | | |
| | | | |
| | | | |
| | | | |
| | | | |
| | | | |
| | | | |
| | | | |
| | | | |
| | | | |
| | | | |
| | | | |
| | | | |
| | | | |
| | | | |
| | | | |
| | | | |
| | | | |
| | | | |
| | | | |
| | | | |
| | | | |
| | | | |
| | | | |
| | | | |
| | | | |
| | | | |
| | | | |
| | | | |
| | | | |
| | | | |
| | | | |
| | | | |
| | | | |
| | | | |
| | | | |
| | | | |
| | | | |
| | | | |
| | | | |
| | | | |
Foreign Government Securities | | | | |
NOTES TO FINANCIAL STATEMENTS
AS OF October 31, 2022 (continued)
(Dollar values in thousands)
Income Builder Fund (continued) | | |
| | Level 2 Other significant observable inputs | Level 3 Significant unobservable inputs | |
| | | | |
| | | | |
| | | | |
| | | | |
| | | | |
| | | | |
| | | | |
| | | | |
| | | | |
Mortgage-Backed Securities | | | | |
| | | | |
| | | | |
| | | | |
U.S. Treasury Obligations | | | | |
| | | | |
| | | | |
| | | | |
| | | | |
| | | | |
| | | | |
| | | | |
| | | | |
Investment of Cash Collateral from Securities Loaned | | | | |
Total Short-Term Investments | | | | |
Total Investments in Securities | | | | |
Appreciation in Other Financial Instruments | | | | |
| | | | |
Depreciation in Other Financial Instruments | | | | |
| | | | |
Total Net Appreciation/ Depreciation in Other Financial Instruments | | | | |
|
| Amount rounds to less than one thousand. |
The following is a summary of investments for which significant unobservable inputs (level 3) were used in determining fair value:
| Balance as of
October 31,
2021(a) | | Change in net
unrealized
appreciation
(depreciation) | Net
accretion
(amortization) | | | | | | Balance as of
October 31,
2022 |
Investments in Securities: | | | | | | | | | | |
| | | | | | | | | | |
Collateralized Mortgage Obligations | | | | | | | | | | |
Commercial Mortgage-Backed Securities | | | | | | | | | | |
| | | | | | | | | | |
| | | | | | | | | | |
Convertible Preferred Stocks | | | | | | | | | | |
| Balance as of October 31, 2021(a) | | Change in net unrealized appreciation (depreciation) | Net accretion (amortization) | | | | | | Balance as of October 31, 2022 |
| | | | | | | | | | |
| | | | | | | | | | |
| | | | | | | | | | |
| | | | | | | | | | |
| | | | | | | | | | |
| | | | | | | | | | |
|
| Purchases include all purchases of securities and securities received in corporate actions. |
| Sales include all sales of securities, maturities, paydowns and securities tendered in corporate actions. |
| Certain Level 3 investments were re-classified between Asset-Backed Securities and Collateralized Mortgage Obligations. |
The changes in net unrealized appreciation (depreciation) attributable to securities owned at October 31, 2022, which were valued using significant unobservable inputs (level 3) amounted to $(126,302). This amount is included in Change in net unrealized appreciation/depreciation on investments in non-affiliates on the Statements of Operations.
Transfers between level 2 and level 3 are due to a decline or an increase in market activity (e.g. frequency of trades), which resulted in a lack or increase of available market inputs to determine the price for the year ended October 31, 2022.
The significant unobservable inputs used in the fair value measurement of the Funds' investments are listed below. Generally, a change in the assumptions used in any input in isolation may be accompanied by a change in another input. Significant changes in any of the unobservable inputs may significantly impact the fair value measurement. The impact is based on the relationship between each unobservable input and the fair value measurement. Significant increases (decreases) in enterprise multiples may increase (decrease) the fair value measurement. Significant increases (decreases) in the discount for lack of marketability, liquidity discount, probability of default, yield and default rate may decrease (increase) the fair value measurement. A significant change in the discount rate or prepayment rate (Constant Prepayment Rate or PSA Prepayment Model) may decrease or increase the fair value measurement.
Income Builder Fund
Quantitative Information about Level 3 Fair Value Measurements#
(Amounts in thousands)
| Fair Value at October 31, 2022 | | | Range (Weighted Average) (a) |
| | Market Comparable Companies | | |
| | | | |
| | | | |
| | Market Comparable Companies | | |
| | | | |
| | | | |
| | | | |
| | | | |
| | | Yield (Discount Rateof Cash Flows) | |
| | | | |
| | | | |
| | | | |
| | | | |
| | | Yield (Discount Rate of Cash Flows) | |
Collateralized Mortgage Obligations | | | | |
NOTES TO FINANCIAL STATEMENTS
AS OF October 31, 2022 (continued)
(Dollar values in thousands)
| Fair Value at October 31, 2022 | | | Range (Weighted Average) (a) |
| | | | |
| | | | |
| | | Yield (Discount Rate of Cash Flows) | |
Commercial Mortgage- Backed Securities | | | | |
| | | | |
| | | | |
| | | | |
| | | | |
| | | | |
| | | | |
| | Pending Distribution Amount | | |
| | | | |
| | | | |
| | | | |
| The table above does not include certain level 3 investments that are valued by brokers and Pricing Services. At October 31 2022, the value of these investments was $46,170. The inputs for these investments are not readily available or cannot be reasonably estimated and are generally those inputs described in Note 2.A. |
| Unobservable inputs were weighted by the relative fair value of the instruments. |
| Amount rounds to less than one thousand. |
| Represents amounts used when the reporting entity has determined that market participants would take into account such multiples when pricing the investments. |
B. Restricted Securities — Certain securities held by the Funds may be subject to legal or contractual restrictions on resale. Restricted securities generally are resold in transactions exempt from registration under the Securities Act of 1933, as amended (the “Securities Act”). Disposal of these securities may involve time-consuming negotiations and expense. Prompt sale at the current valuation may be difficult and could adversely affect the NAVs of the Funds.
As of October 31, 2022, the Funds had no investments in restricted securities other than securities sold to the Funds under Rule 144A and/or Regulation S under the Securities Act.
C. Loan Assignments — The Funds invested in debt instruments that are interests in amounts owed to lenders or lending syndicates (a “Lender”) by corporate, governmental or other borrowers (a “Borrower”). A loan is often administered by a bank or other financial institution (the “Agent”) that acts as Agent for all holders. The Agent administers the terms of the loan, as specified in the loan agreement. The invest in loan assignments of all or a portion of the loans. When a Fund purchases a loan assignment, the Fund has direct rights against the Borrower on a loan, provided, however, the Fund's rights may be more limited than the Lender from which it acquired the assignment and the Fund may be able to enforce its rights only through the Agent. As a result, a Fund assumes the credit risk of the Borrower as well as any other persons interpositioned between the Fund and the Borrower (“Intermediate Participants”). A Fund may incur certain costs and delays in realizing payment on a loan assignment or suffer a loss of principal and/or interest if assets or interests held by the Agent or other Intermediate Participants are determined to be subject to the claims by their creditors. In addition, it is unclear whether loan assignments and other forms of direct indebtedness offer securities law protections against fraud and misrepresentation. Also, because JPMIM may wish to invest in publicly traded securities of a Borrower, it may not have access to material non-public information regarding the Borrower to which other investors have access. Although certain loan assignments are secured by collateral, a Fund could experience delays or limitations in realizing the value on such collateral or have its interest subordinated to other indebtedness of the Borrower.
Loan assignments are vulnerable to market conditions such that economic conditions or other events may reduce the demand for assignments and certain assignments which were liquid when purchased, may become illiquid and difficult to value. In addition, the settlement period for loans is uncertain as there is no standardized settlement schedule applicable to such investments. Therefore, the Fund may not receive the proceeds from a sale of such investments for a period after the sale.
Certain loan assignments are also subject to the risks associated with high yield securities described under Note 7.
D. Unfunded Commitments —The Funds entered into commitments to buy and sell investments including commitments to buy loan assignments to settle on future dates as part of their normal investment activities. Unfunded commitments may include revolving loan facilities which may obligate the Funds to provide cash to the borrower on demand. Unfunded commitments are generally traded and priced as part of a related loan assignment (Note 2.C.). The value of the unfunded portion of the investment is determined using a pro-rata allocation, based on its par value relative to the par value of the entire investment. The unrealized appreciation/depreciation from unfunded commitments is reported on the Statements of Assets and Liabilities. Credit risk exists on these commitments to the extent of any difference between the sales price and current value of the underlying securities sold. Market risk exists on these commitments to buy to the same extent as if the securities were owned on a settled basis and gains and losses are recorded and reported in the same manner. The Funds may receive an ongoing commitment fee based on the undrawn portion of the underlying loan facility, which is recorded as a component of Interest income from non-affiliates on the Statements of Operations.
At October 31, 2022, had the following loan commitments outstanding in which all or a portion of the commitments was unfunded which could be extended at the options of the borrower:
| | | | | | |
| | | | | | | | | |
|
Moran Foods LLC, Delayed Draw 1st Lien Term Loan B | | | | | | | | | |
Tekni-Plex, Inc., Delayed Draw Term Loan B | | | | | | | | | |
Traeger Grills, Delayed Draw Term Loan | | | | | | | | | |
E. When-Issued Securities, Delayed Delivery Securities and Forward Commitments — Income Builder Fund purchased when-issued securities, including To Be Announced (“TBA”) securities, and entered into contracts to purchase or sell securities for a fixed price that may be settled a month or more after the trade date, or purchased delayed delivery securities which generally settle seven days after the trade date. When-issued securities are securities that have been authorized, but not issued in the market. A forward commitment involves entering into a contract to purchase or sell securities for a fixed price at a future date that may be settled a month or more after the trade date. A delayed delivery security is agreed upon in advance between the buyer and the seller of the security and is generally delivered beyond seven days of the agreed upon date. The purchase of securities on a when-issued, delayed delivery or forward commitment basis involves the risk that the value of the security to be purchased declines before the settlement date. The sale of securities on a forward commitment basis involves the risk that the value of the securities sold may increase before the settlement date. The Funds may be exposed to credit risk if the counterparty fails to perform under the terms of the transaction. Interest income for securities purchased on a when-issued, delayed delivery or forward commitment basis is not accrued until the settlement date.
The Funds may be required to post or receive collateral for delayed delivery securities in the form of cash or securities under a Master Securities Forward Transaction Agreement with the counterparties (each, an “MSFTA”). The collateral requirements are generally calculated by netting the mark-to-market amount for a Fund's transactions under the MSFTA and comparing that amount to the value of the collateral pledged by a fund and the counterparty. Daily movement of cash collateral is subject to minimum threshold amounts. Collateral posted by a Fund is held in a segregated account at the Fund's custodian bank and is included on the Statements of Assets and Liabilities as Restricted cash. Collateral received by the Funds is held in a separate segregated account maintained by JPMorgan Chase Bank, N.A. ("JPMCB"), a wholly-owned subsidiary of JPMorgan. These amounts are not reflected on the Funds' Statements of Assets and Liabilities.
Income Builder Fund had when-issued securities, delayed delivery securities or forward commitments outstanding as of October 31, 2022, which are shown as a Payable for Investment securities purchased — delayed delivery securities on the Statements of Assets and Liabilities. The values of these securities held at October 31, 2022 are detailed on the SOIs.
F. Securities Lending — The Funds are authorized to engage in securities lending in order to generate additional income. The Funds are able to lend to approved borrowers. Citibank N.A. (“Citibank”) serves as lending agent for the Funds, pursuant to a Securities Lending Agency Agreement (the “Securities Lending Agency Agreement”). Securities loaned are collateralized by cash equal to at least 100% of the market value plus accrued interest on the securities lent, which is invested in . The Funds retain the interest earned on cash collateral investments but are required to pay the borrower a rebate for the use of the cash collateral. In cases where the lent security is of high value to borrowers, there may be a negative rebate (i.e., a net payment from the borrower to the Funds). Upon termination of a loan, the Funds are required to return to the borrower an amount equal to the cash collateral, plus any rebate owed to the borrowers. The remaining maturities of the securities lending transactions are considered overnight and continuous. Loans are subject to termination by the Funds or the borrower at any time.
The net income earned on the securities lending (after payment of rebates and Citibank’s fee) is included on the Statements of Operations as Income from securities lending (net). The Funds also receive payments from the borrower during the period of the loan, equivalent to dividends and interest earned on the securities loaned, which are recorded as Dividend or Interest income, respectively, on the Statements of Operations.
NOTES TO FINANCIAL STATEMENTS
AS OF October 31, 2022 (continued)
(Dollar values in thousands)
Under the Securities Lending Agency Agreement, Citibank marks to market the loaned securities on a daily basis. In the event the cash received from the borrower is less than 102% of the value of the loaned securities (105% for loans of non-U.S. securities), Citibank requests additional cash from the borrower so as to maintain a collateralization level of at least 102% of the value of the loaned securities plus accrued interest (105% for loans of non-U.S. securities), subject to certain de minimis amounts.
The value of securities out on loan is recorded as an asset on the Statements of Assets and Liabilities. The value of the cash collateral received is recorded as a liability on the Statements of Assets and Liabilities and details of collateral investments are disclosed on the SOIs.
The Funds bear the risk of loss associated with the collateral investments and are not entitled to additional collateral from the borrower to cover any such losses. To the extent that the value of the collateral investments declines below the amount owed to a borrower, the Funds may incur losses that exceed the amount they earned on lending the security. Upon termination of a loan, the Funds may use leverage (borrow money) to repay the borrower for cash collateral posted if the Adviser does not believe that it is prudent to sell the collateral investments to fund the payment of this liability. Securities lending activity is subject to master netting arrangements.
The following table presents for each lending Fund, the value of the securities on loan with Citibank, net of amounts available for offset under the master netting arrangements and any related collateral received or posted by the Funds as of October 31, 2022.
| Investment Securities
on Loan, at value,
Presented on the
Statements of Assets
and Liabilities | Cash Collateral
Posted by Borrower* | Net Amount Due
to Counterparty
(not less than zero) |
| | | |
| | | |
|
| Collateral posted reflects the value of securities on loan and does not include any additional amounts received from the borrower. |
Securities lending also involves counterparty risks, including the risk that the loaned securities may not be returned in a timely manner or at all. Subject to certain conditions, Citibank has agreed to indemnify the Funds from losses resulting from a borrower’s failure to return a loaned security.
JPMIM voluntarily waived investment advisory fees charged to the Funds to reduce the impact of the cash collateral investment in the JPMorgan U.S. Government Money Market Fund from 0.13% to 0.06%. For the year ended October 31, 2022, JPMIM waived fees associated with the Funds' investment in the JPMorgan U.S. Government Money Market Fund as follows:
The above waiver is included in the determination of earnings on cash collateral investment and in the calculation of Citibank’s compensation and is included on the Statements of Operations as Income from securities lending (net).
G. Investment Transactions with Affiliates — The Funds invested in Underlying Funds and ETFs, which are advised by the Adviser. An issuer which is under common control with a Fund may be considered an affiliate. For the purposes of the financial statements, the Funds assume the issuers listed in the tables below to be affiliated issuers. The Underlying Funds’ and ETFs' distributions may be reinvested into such Underlying Funds and ETFs. Reinvestment amounts are included in the purchases at cost amounts in the tables below.
|
For the year ended October 31, 2022 |
| | | | | Change in
Unrealized
Appreciation/
(Depreciation) | | | | Capital Gain
Distributions |
JPMorgan Income Fund Class R6 Shares (a) | | | | | | | | | |
JPMorgan Prime Money Market Fund Class Institutional Shares, 3.12% (a) (b) | | | | | | | | | |
Global Allocation Fund (continued) |
For the year ended October 31, 2022 |
| | | | | Change in Unrealized Appreciation/ (Depreciation) | | | | Capital Gain Distributions |
JPMorgan Securities Lending Money Market Fund Agency SL Class Shares, 3.23% (a) (b) | | | | | | | | | |
JPMorgan U.S. Government Money Market Fund Class IM Shares, 2.85% (a) (b) | | | | | | | | | |
| | | | | | | | | |
|
| Investment in an affiliated fund, which is registered under the Investment Company Act of 1940, as amended, and is advised by J.P. Morgan Investment Management Inc. |
| The rate shown is the current yield as of October 31, 2022. |
| Amount is included on the Statements of Operations as Income from securities lending (net) (after payments of rebates and Citibank’s fee). |
|
For the year ended October 31, 2022 |
| | | | | Change in
Unrealized
Appreciation/
(Depreciation) | | | | Capital Gain
Distributions |
JPMorgan Equity Premium Income ETF (a) | | | | | | | | | |
JPMorgan Prime Money Market Fund Class IM Shares, 3.18% (a) (b) | | | | | | | | | |
JPMorgan Prime Money Market Fund Class Institutional Shares, 3.12% (a) (b) | | | | | | | | | |
JPMorgan Securities Lending Money Market Fund Agency SL Class Shares, 3.23% (a) (b) | | | | | | | | | |
JPMorgan U.S. Government Money Market Fund Class IM Shares, 2.85% (a) (b) | | | | | | | | | |
| | | | | | | | | |
|
| Investment in an affiliated fund, which is registered under the Investment Company Act of 1940, as amended, and is advised by J.P. Morgan Investment Management Inc. |
| The rate shown is the current yield as of October 31, 2022. |
| Amount is included on the Statements of Operations as Income from securities lending (net) (after payments of rebates and Citibank’s fee). |
H. Foreign Currency Translation — The books and records of the Funds are maintained in U.S. dollars. Foreign currency amounts are translated into U.S. dollars at the prevailing exchange rates of such currencies against the U.S. dollar. The market value of investment securities and other assets and liabilities are translated at the exchange rate as of the valuation date. Purchases and sales of investment securities, income and expenses are translated at the exchange rate prevailing on the respective dates of such transactions.
The Funds do not isolate the effect of changes in foreign exchange rates from changes in market prices on securities held. Accordingly, such changes are included within Change in net unrealized appreciation/depreciation on investments in non-affiliates on the Statements of Operations.
Reported realized foreign currency gains and losses arise from the disposition of foreign currency, currency gains or losses realized between the trade and settlement dates on securities transactions, and the difference between the amounts of dividends, interest and foreign withholding taxes recorded on each Fund's books on the transaction date and the U.S. dollar equivalent of the amounts actually received or paid. These reported realized foreign currency gains and losses are included in Net realized gain (loss) on foreign currency transactions on the Statements of Operations. Unrealized foreign currency gains and losses arise from changes (due to changes in exchange rates) in the value of foreign currency and other assets and liabilities denominated in foreign currencies, which are held at year end and are included in Change in net unrealized appreciation/depreciation on foreign currency translations on the Statements of Operations.
NOTES TO FINANCIAL STATEMENTS
AS OF October 31, 2022 (continued)
(Dollar values in thousands)
I. Derivatives — The Funds used derivative instruments including options, futures contracts, forward foreign currency exchange contracts and swaps, in connection with their respective investment strategy. Derivative instruments may be used as substitutes for securities in which the Funds can invest, to hedge portfolio investments or to generate income or gain to the Funds. Derivatives may also be used to manage duration, sector and yield curve exposures and credit and spread volatility. Certain derivatives are synthetic instruments that attempt to replicate the performance of certain reference assets.
The Funds may be subject to various risks from the use of derivatives, including the risk that changes in the value of a derivative may not correlate perfectly with the underlying asset, rate or index; counterparty credit risk related to derivatives counterparties’ failure to perform under contract terms; liquidity risk related to the potential lack of a liquid market for these contracts allowing the Funds to close out their position(s); and documentation risk relating to disagreement over contract terms. Investing in certain derivatives also results in a form of leverage and as such, the Funds’ risk of loss associated with these instruments may exceed their value, as recorded on the Statements of Assets and Liabilities.
The Funds are party to various derivative contracts governed by International Swaps and Derivatives Association master agreements (“ISDA agreements”). The Funds’ ISDA agreements, which are separately negotiated with each dealer counterparty, may contain provisions allowing, absent other considerations, a counterparty to exercise rights, to the extent not otherwise waived, against the Funds in the event the Funds’ net assets decline over time by a pre-determined percentage or fall below a pre-determined floor. The ISDA agreements may also contain provisions allowing, absent other conditions, the Funds to exercise rights, to the extent not otherwise waived, against a counterparty (e.g., decline in a counterparty’s credit rating below a specified level). Such rights for both a counterparty and the Funds often include the ability to terminate (i.e., close out) open contracts at prices which may favor a counterparty, which could have an adverse effect on the Funds. The ISDA agreements give the Funds and a counterparty the right, upon an event of default, to close out all transactions traded under such agreements and to net amounts owed or due across all transactions and offset such net payable or receivable against collateral posted to a segregated account by one party for the benefit of the other.
Counterparty credit risk may be mitigated to the extent a counterparty posts additional collateral for mark-to-market gains to the Funds.
Notes I(1) - I(4) below describe the various derivatives used by the Funds.
(1) Options — Global Allocation Fund purchased put and call options on various instruments including futures, securities, currencies and interest rate swaps (“swaptions”) to manage and hedge interest rate risks within its portfolio and also to gain long or short exposure to the underlying instrument, index, currency or rate. A purchaser of a put option has the right, but not the obligation, to sell the underlying instrument at an agreed upon price (“strike price”) to the option seller. A purchaser of a call option has the right, but not the obligation, to purchase the underlying instrument at the strike price from the option seller. Swaptions and Eurodollar options are settled for cash.
Options Purchased — Premiums paid by the Fund for options purchased are included on the Statements of Assets and Liabilities as Options Purchased. The option is adjusted daily to reflect the current market value of the option and the change is recorded as Change in unrealized appreciation/depreciation on options purchased on the Statements of Operations. If the option is allowed to expire, the Fund will lose the entire premium it paid and record a realized loss for the premium amount. Premiums paid for options purchased which are exercised or closed are added to the amounts paid or will offset against the proceeds on the underlying investment transaction to determine the realized gain (loss) or cost basis of the underlying investment.
Options Written — Premiums received by the Fund for options written are included on the Statements of Assets and Liabilities as a liability. The amount of the liability is adjusted daily to reflect the current market value of the option written and the change in market value is recorded as Change in unrealized appreciation/depreciation on options written on the Statements of Operations. Premiums received from options written that expire are treated as realized gains. If a written option is closed, the Fund records a realized gain or loss on options written based on whether the cost of the closing transaction exceeds the premium received. If a call option is exercised by the option buyer, the premium received by the Fund is added to the proceeds from the sale of the underlying security to the option buyer and compared to the cost of the closing transaction to determine whether there has been a realized gain or loss. If a put option is exercised by an option buyer, the premium received by the option seller reduces the cost basis of the purchased security.
The Funds pledge collateral to the counterparty in the form of securities for options written. Securities designated as collateral are denoted on the SOIs.
Written uncovered call options subject the Fund to unlimited risk of loss. Written covered call options limit the upside potential of a security above the strike price. Written put options subjects the Fund to risk of loss if the value of the security declines below the exercise price minus the put premium.
The Fund is not subject to credit risk on options written as the counterparty has already performed its obligation by paying the premium at the inception of the contract.
The Fund’s exchange-traded option contracts are not subject to master netting arrangements (the right to close out all transactions traded with a counterparty and net amounts owed or due across transactions).
(2) Futures Contracts — The Funds used currency, index, interest rate, treasury or other financial futures contracts to manage and hedge interest rate risk associated with portfolio investments and to gain or reduce exposure to particular countries or regions. The Funds also used futures contracts to lengthen or shorten the duration of the overall investment portfolio.
Futures contracts provide for the delayed delivery of the underlying instrument at a fixed price or are settled for a cash amount based on the change in the value of the underlying instrument at a specific date in the future. Upon entering into a futures contract, the Funds are required to deposit with the broker, cash or securities in an amount equal to a certain percentage of the contract amount, which is referred to as the initial margin deposit. Subsequent payments, referred to as variation margin, are made or received by the Funds periodically and are based on changes in the market value of open futures contracts. Changes in the market value of open futures contracts are recorded as Change in net unrealized appreciation/depreciation on futures contracts on the Statements of Operations. Realized gains or losses, representing the difference between the value of the contract at the time it was opened and the value at the time it was closed, are reported on the Statements of Operations at the closing or expiration of the futures contract. Securities deposited as initial margin are designated on the SOIs, while cash deposited, which is considered restricted, is recorded on the Statements of Assets and Liabilities. A receivable from and/or a payable to brokers for the daily variation margin is also recorded on the Statements of Assets and Liabilities.
The use of futures contracts exposes the Funds to equity price, foreign exchange and interest rate risks. The Funds may be subject to the risk that the change in the value of the futures contract may not correlate perfectly with the underlying instrument. Use of long futures contracts subjects the Funds to risk of loss in excess of the amounts shown on the Statements of Assets and Liabilities, up to the notional amount of the futures contracts. Use of short futures contracts subjects the Funds to unlimited risk of loss. The Funds may enter into futures contracts only on exchanges or boards of trade. The exchange or board of trade acts as the counterparty to each futures transaction; therefore, the Funds' credit risk is limited to failure of the exchange or board of trade. Under some circumstances, futures exchanges may establish daily limits on the amount that the price of a futures contract can vary from the previous day’s settlement price, which could effectively prevent liquidation of positions.
The Funds' futures contracts are not subject to master netting arrangements (the right to close out all transactions traded with a counterparty and net amounts owed or due across transactions).
(3) Forward Foreign Currency Exchange Contracts — Global Allocation Fund is exposed to foreign currency risks associated with some or all of its portfolio investments and used forward foreign currency exchange contracts to hedge or manage certain of these exposures as part of its investment strategy. The Fund also bought forward foreign currency exchange contracts to gain exposure to currencies. Forward foreign currency exchange contracts represent obligations to purchase or sell foreign currency on a specified future date at a price fixed at the time the contracts are entered into. Non-deliverable forward foreign currency exchange contracts are settled with the counterparty in U.S. dollar without the delivery of the foreign currency.
The values of the forward foreign currency exchange contracts are adjusted daily based on the applicable exchange rates of the underlying currencies. Changes in the value of these contracts are recorded as Change in net unrealized appreciation or depreciation until the contract settlement date. When the forward foreign currency exchange contract is closed, the Fund records a realized gain or loss equal to the difference between the value at the time the contract was opened and the value at the time it was closed. The Fund also records a realized gain or loss, upon settlement, when a forward foreign currency exchange contract offsets another forward foreign currency exchange contract with the same counterparty.
The Fund’s forward foreign currency exchange contracts are subject to master netting arrangements (the right to close out all transactions with a counterparty and net amounts owed or due across transactions).
The Fund may be required to post or receive collateral for non-deliverable forward foreign currency exchange contracts.
(4) Swaps — Global Allocation Fund engaged in various swap transactions to manage total return risks within its portfolio. The Fund also used swaps as alternatives to direct investments. Swap transactions are contracts negotiated over-the-counter (“OTC swaps”) between the Fund and a counterparty or are centrally cleared (“centrally cleared swaps”) through a central clearinghouse managed by a Futures Commission Merchant (“FCM”) that exchange investment cash flows, assets, foreign currencies or market-linked returns at specified, future intervals.
Upfront payments made and/or received by the Fund are recorded as assets or liabilities, respectively, on the Statements of Assets and Liabilities and amortized over the term of the swap. The value of an OTC swap agreement is recorded as either an asset or a liability on the Statements of Assets and Liabilities at the beginning of the measurement period. Upon entering into a centrally cleared swap, the Fund is required to deposit with the FCM cash or securities, which is referred to as initial margin deposit. Securities deposited as initial margin are designated on the SOIs, while cash deposited, which is considered restricted, is recorded on the Statements of Assets and Liabilities. Daily changes in valuation of centrally cleared swaps, if any, are recorded as a variation margin receivable or payable on the Statements of Assets and Liabilities. The change in the value of swaps, including accruals of periodic amounts of interest to be paid or received on swaps, is reported as Change in net unrealized appreciation/depreciation on swaps on the Statements of Operations. A realized gain or loss is recorded upon payment or receipt of a periodic payment or payment made upon termination of a swap agreement.
The Fund’s OTC swap contracts are subject to master netting arrangements.
NOTES TO FINANCIAL STATEMENTS
AS OF October 31, 2022 (continued)
(Dollar values in thousands)
Total Return Basket Swaps
Global Allocation Fund entered into total return basket swap agreements to obtain exposure to a portfolio of long and short securities. This is a highly specialized activity.
Under the terms of the agreement, each swap is designed to function as a portfolio of direct investments in long and/or short equity positions. This means that the Fund has the ability to trade in and out of long and short positions within each swap and will receive all of the economic benefits and risks equivalent to direct investments in these positions such as: capital appreciation (depreciation), corporate actions and dividends received and paid, all of which are reflected in the swap value. Each swap value also includes interest charges and credits related to the notional values of the long and short positions and cash balances within each swap. These interest charges and credits are based on defined market rates plus or minus a specified spread and are referred to herein as “financing costs” and net dividends. Positions within each swap, accrued financing costs and net dividends, are part of the periodic reset. During a reset, any unrealized gains (losses) on positions and accrued financing costs become available for cash settlement between the Fund and the swap counterparty are recorded as Due from/to counterparty on swap contract on the Statements of Assets and Liabilities and as Net realized gain (loss) on transactions from swaps on the Statements of Operations.
Each swap involves additional risks than if the Fund had invested in the underlying positions directly including: the risk that changes in the value of each swap may not correlate perfectly with the underlying long and short securities; counterparty risk related to the counterparty’s failure to perform under contract terms; liquidity risk related to the lack of a liquid market for each swap contract, which may limit the ability of the Fund to close out its positions; and, documentation risk relating to disagreement over contract terms. The total return basket swaps consist of securities that are denominated in foreign currencies. Changes in currency exchange rates will affect the value of, and investment income from, such securities. The Fund’s activities in each total return basket swap are concentrated with one counterparty. Investing in swaps results in a form of leverage (i.e., the Fund’s risk of loss associated with these instruments may exceed their value as recorded on the Statements of Assets and Liabilities).
The value of each swap is derived from a combination of (i) the net value of the underlying positions, which are valued daily using the last sale or closing prices on the principal exchange on which the underlying securities are traded; (ii) financing costs; (iii) the value of dividends; (iv) cash balances within the swap and/or other receivables (payables) from gains/(losses) realized when the swap resets; and (v) other factors, as applicable. The value of each swap is reflected on the Statements of Assets and Liabilities as Outstanding swap contracts, at value. Changes in the value of the swap are recognized as Change in net unrealized appreciation/depreciation on swaps on the Statements of Operations.
(5) Summary of Derivatives Information —The following tables present the value of derivatives held as of October 31, 2022, by their primary underlying risk exposure and respective location on the Statements of Assets and Liabilities:
| | |
| | |
Unrealized Appreciation on Futures Contracts * | | |
Unrealized Depreciation on Futures Contracts * | | |
Foreign Exchange Rate Risk Exposure: | | |
Unrealized Appreciation on Forward Foreign Currency Exchange Contracts | | |
Unrealized Depreciation on Futures Contracts * | | |
Unrealized Depreciation on Forward Foreign Currency Exchange Contracts | | |
Interest Rate Risk Exposure: | | |
Unrealized Appreciation on Futures Contracts * | | |
Unrealized Depreciation on Futures Contracts * | | |
Net Fair Value of Derivative Contracts: | | |
Unrealized Appreciation (Depreciation) on Futures Contracts * | | |
Unrealized Appreciation (Depreciation) on Forward Foreign Currency Exchange Contracts | | |
|
| Includes cumulative appreciation/(depreciation) on futures contracts, if any, as reported on the SOIs. Only current day’s variation margin is reported within the Statements of Assets and Liabilities. |
The following tables present the effect of derivatives on the Statements of Operations for the year ended October 31, 2022, by primary underlying risk exposure:
| | |
Realized Gain (Loss) on Derivatives Recognized as a Result From Operations: | | |
| | |
| | |
| | |
| | |
Foreign Exchange Rate Risk Exposure: | | |
| | |
Forward Foreign Currency Exchange Contracts | | |
Interest Rate Risk Exposure: | | |
| | |
Net Change in Unrealized Appreciation (Depreciation) on Derivatives Recognized as a Result of Operations: | | |
| | |
| | |
| | |
| | |
Foreign Exchange Rate Risk Exposure: | | |
| | |
Forward Foreign Currency Exchange Contracts | | |
Interest Rate Risk Exposure: | | |
| | |
Derivatives Volume
The table below discloses the volume of the Funds' options, futures contracts, forward foreign currency exchange contracts and swaps activity during the year ended October 31, 2022. Please refer to the tables in the Summary of Derivatives Information for derivative-related gains and losses associated with volume activity:
| | |
| | |
Average Notional Balance Long | | |
Average Notional Balance Short | | |
Ending Notional Balance Long | | |
Ending Notional Balance Short | | |
Forward Foreign Currency Exchange Contracts: | | |
Average Settlement Value Purchased | | |
Average Settlement Value Sold | | |
Ending Settlement Value Purchased | | |
Ending Settlement Value Sold | | |
| | |
Average Number of Contracts Purchased | | |
Total Return Basket Swaps: | | |
Average Notional Balance Long | | |
The Funds may be required to post or receive collateral based on the net value of the Funds’ outstanding options, non-deliverable forward foreign currency exchange contracts and/or OTC swap contracts with the counterparty in the form of cash or securities. Daily movement of cash collateral is
NOTES TO FINANCIAL STATEMENTS
AS OF October 31, 2022 (continued)
(Dollar values in thousands)
subject to minimum threshold amounts. Collateral posted by the Funds is held in a segregated account at the Funds’ custodian bank. For certain counterparties cash collateral posted by the Funds is invested in an affiliated money market fund (See Note 3.F), otherwise the cash collateral is included on the Statements of Assets and Liabilities as Restricted cash for OTC derivatives. Collateral received by the Funds is held in a separate segregated account maintained by JPMCB, an affiliate of the Funds. These amounts are not reflected on the Funds’ Statements of Assets and Liabilities and are disclosed in the table below.
The Funds' derivatives contracts held at October 31, 2022 are not accounted for as hedging instruments under GAAP.
J. Equity-Linked Notes — Income Builder Fund invested in Equity-Linked Notes (“ELNs”). These are hybrid instruments which combine both debt and equity characteristics into a single note form. ELNs' values are linked to the performance of an underlying index. ELNs are unsecured debt obligations of an issuer and may not be publicly listed or traded on an exchange. ELNs are valued daily, under procedures adopted by the Board, based on values provided by an approved pricing source. These notes have a coupon which is accrued and recorded as interest income on the Statements of Operations. Changes in the market value of ELNs are recorded as Change in net unrealized appreciation or depreciation on the Statements of Operations. The Fund realize a gain or loss when an ELN is sold or matures, which is recorded as Net realized gain (loss) on transactions from investments in non-affiliates on the Statements of Operations.
As of October 31, 2022, Income Builder Fund had outstanding ELNs as listed on the SOIs.
K. Short Sales — Global Allocation Fund engaged in short sales as part of its normal investment activities. In a short sale, the Fund sells securities it does not own in anticipation of a decline in the market value of those securities. In order to deliver securities to the purchaser, the Fund borrows securities from a broker. To close out a short position, the Fund delivers the same securities to the broker.
The Fund is required to pledge cash or securities to the broker as collateral for the securities sold short. Collateral requirements are calculated daily based on the current market value of the short positions. Cash collateral deposited with the broker is recorded as Deposits at broker for securities sold short, while cash collateral deposited at the Fund's custodian for the benefit of the broker is recorded as Restricted cash for securities sold short on the Statements of Assets and Liabilities. Securities segregated as collateral are denoted on the SOIs. The Fund may receive or pay the net of the following amounts: (i) a portion of the income from the investment of cash collateral; (ii) the broker’s fee on the borrowed securities (calculated daily based upon the market value of each borrowed security and a variable rate that is dependent on availability of the security); and (iii) a financing charge for the difference between the market value of the short position and cash collateral deposited with the broker. The net amounts of income or fees are included as interest income or interest expense on securities sold short on the Statements of Operations.
The Fund is obligated to pay the broker dividends declared on short positions when a position is open on the record date. Dividends on short positions are reported on ex-dividend date on the Statements of Operations as Dividend expense on securities sold short. The Fund is obligated to pay the broker interest accrued on short positions while the position is outstanding. Interest expense on short positions is reported as Interest expense to non-affiliates on securities sold short on the Statements of Operations. Liabilities for securities sold short are reported at market value on the Statements of Assets and Liabilities and the change in market value is recorded as Change in net unrealized appreciation/depreciation on the Statements of Operations. Short sale transactions may result in unlimited losses as the security’s price increases and the short position loses value. There is no upward limit on the price a borrowed security could attain. The Fund is also subject to risk of loss if the broker were to fail to perform its obligations under the contractual terms.
The Fund will record a realized loss if the price of the borrowed security increases between the date of the short sale and the date on which the Fund replaces the borrowed security. The Fund will record a realized gain if the price of the borrowed security declines between those dates.
As of October 31, 2022, Global Allocation Fund did not have outstanding short sales.
L. Security Transactions and Investment Income — Investment transactions are accounted for on the trade date (the date the order to buy or sell is executed). Securities gains and losses are calculated on a specifically identified cost basis. Interest income and interest expense on securities sold short, if any, is determined on the basis of coupon interest accrued using the effective interest method, which adjusts for amortization of premiums and accretion of discounts. Dividend income, net of foreign taxes withheld, if any, and dividend expense on securities sold short are recorded on the ex-dividend date or when a Fund first learns of the dividend. Certain Funds may receive other income from investment in loan assignments and/or unfunded commitments, including amendment fees, consent fees and commitment fees. These fees are recorded as income when received by the Funds. These amounts are included in Interest income from non-affiliates on the Statements of Operations.
To the extent such information is publicly available, the Funds record distributions received in excess of income earned from underlying investments as a reduction of cost of investments and/or realized gain. Such amounts are based on estimates if actual amounts are not available and actual amounts of income, realized gain and return of capital may differ from the estimated amounts. The Funds adjust the estimated amounts of the components of distributions (and consequently their net investment income) as necessary, once the issuers provide information about the actual composition of the distributions.
M. Allocation of Income and Expenses— Expenses directly attributable to a Fund are charged directly to that Fund, while the expenses attributable to more than one fund of the Trust are allocated among the applicable funds. Investment income, realized and unrealized gains and losses and expenses, other than class-specific expenses, are allocated daily to each class of shares based upon the proportion of net assets of each class at the beginning of each day.
Transfer agency fees are class-specific expenses. The amount of the transfer agency fees charged to each share class of the Funds for the year ended October 31, 2022 are as follows:
|
| Amount rounds to less than one thousand. |
N. Federal Income Taxes — Each Fund is treated as a separate taxable entity for Federal income tax purposes. Each Fund's policy is to comply with the provisions of the Internal Revenue Code (the “Code”) applicable to regulated investment companies and to distribute to shareholders all of its distributable net investment income and net realized capital gains on investments. Accordingly, no provision for Federal income tax is necessary. Management has reviewed the Funds' tax positions for all open tax years and has determined that as of October 31, 2022, no liability for Federal income tax is required in the Funds' financial statements for net unrecognized tax benefits. However, management’s conclusions may be subject to future review based on changes in, or the interpretation of, the accounting standards or tax laws and regulations. Each Fund's Federal tax returns for the prior three fiscal years remain subject to examination by the Internal Revenue Service.
O. Foreign Taxes —The Funds may be subject to foreign taxes on income, gains on investments or currency purchases/repatriation, a portion of which may be recoverable. The Funds will accrue such taxes and recoveries as applicable, based upon their current interpretation of tax rules and regulations that exist in the markets in which they invest. When a capital gains tax is determined to apply, the Funds record an estimated deferred tax liability in an amount that would be payable if the securities were disposed of on the valuation date.
P. Distributions to Shareholders — Distributions from net investment income, if any, are generally declared and paid at least monthly for Income Builder Fund and declared and paid at least quarterly for Global Allocation Fund. Distributions are declared separately for each class. No class has preferential dividend rights; differences in per share rates are due to differences in separate class expenses. Net realized capital gains, if any, are distributed by each Fund at least annually. The amount of distributions from net investment income and net realized capital gains is determined in accordance with Federal income tax regulations, which may differ from GAAP. To the extent these “book/tax” differences are permanent in nature (i.e., that they result from other than timing of recognition — “temporary differences”), such amounts are reclassified within the capital accounts based on their Federal tax basis treatment.
The following amounts were reclassified within the capital accounts:
| | Accumulated
undistributed
(distributions in
excess of)
net investment
income | Accumulated
net realized
gains (losses) |
| | | |
| | | |
The reclassifications for the Funds relate primarily to foreign currency gains or losses, tax adjustments on certain investments and tax adjustments on certain derivatives.
3. Transactions with Affiliates
A. Investment Advisory Fee — Pursuant to an Investment Advisory Agreement, the Adviser manages the investments of each Fund and for such services is paid a fee. The investment advisory fee is accrued daily and paid monthly at an annual rate based on each Fund's respective average daily net assets. The annual rate for each Fund is as follows:
NOTES TO FINANCIAL STATEMENTS
AS OF October 31, 2022 (continued)
(Dollar values in thousands)
The Adviser waived investment advisory fees and/or reimbursed expenses as outlined in Note 3.F.
B. Administration Fee — Pursuant to an Administration Agreement, the Administrator provides certain administration services to each Fund. In consideration of these services, the Administrator receives a fee accrued daily and paid monthly at an annual rate of 0.075% of the first $10 billion of each Fund's respective average daily net assets, plus 0.050% of each Fund's respective average daily net assets between $10 billion and $20 billion, plus 0.025% of each Fund's respective average daily net assets between $20 billion and $25 billion, plus 0.010% of each Fund's respective average daily net assets in excess of $25 billion. For the year ended October 31, 2022, the effective rate was 0.075% of each Fund's average daily net assets, notwithstanding any fee waivers and/or expense reimbursements.
The Administrator waived administration fees as outlined in Note 3.F.
JPMCB, a wholly-owned subsidiary of JPMorgan, serves as the Funds' sub-administrator (the “Sub-administrator”). For its services as Sub-administrator, JPMCB receives a portion of the fees payable to the Administrator.
C. Distribution Fees — Pursuant to a Distribution Agreement, JPMorgan Distribution Services, Inc. (“JPMDS”), an indirect, wholly-owned subsidiary of JPMorgan, serves as each Fund's principal underwriter and promotes and arranges for the sale of each Fund's shares.
The Board has adopted a Distribution Plan (the “Distribution Plan”) for Class A, Class C, Class R2 and Class R3 Shares of the Funds, as applicable, pursuant to Rule 12b-1 under the 1940 Act. Class I, Class L, Class R4, Class R5 and Class R6 Shares of each Fund do not charge a distribution fee. The Distribution Plan provides that each Fund shall pay, with respect to the applicable share classes, distribution fees, including payments to JPMDS, at annual rates of the average daily net assets as shown in the table below:
In addition, JPMDS is entitled to receive the front-end sales charges from purchases of Class A Shares and the CDSC from redemptions of Class C Shares and certain Class A Shares for which front-end sales charges have been waived. For the year ended October 31, 2022, JPMDS retained the following:
|
| Amount rounds to less than one thousand. |
D. Service Fees — The Trust, on behalf of the Funds, has entered into a Shareholder Servicing Agreement with JPMDS under which JPMDS provides certain support services to fund shareholders. For performing these services, JPMDS receives a fee with respect to all share classes, except Class R6 Shares which do not charge a service fee, that is accrued daily and paid monthly equal to a percentage of the average daily net assets as shown in the table below:
JPMDS has entered into shareholder services contracts with affiliated and unaffiliated financial intermediaries who provide shareholder services and other related services to their clients or customers who invest in the Funds. Pursuant to such contracts, JPMDS will pay all or a portion of such fees earned to financial intermediaries for performing such services.
JPMDS waived service fees as outlined in Note 3.F.
E. Custodian and Accounting Fees — JPMCB provides portfolio custody and accounting services to the Funds. For performing these services, the Funds pay JPMCB transaction and asset-based fees that vary according to the number of transactions and positions, plus out-of-pocket expenses. The amounts paid directly to JPMCB by the Funds for custody and accounting services are included in Custodian and accounting fees on the Statements of Operations.
Interest income earned on cash balances at the custodian, if any, is included in Interest income from affiliates on the Statements of Operations.
Interest expense paid to the custodian related to cash overdrafts, if any, is included in Interest expense to affiliates on the Statements of Operations.
F. Waivers and Reimbursements — The Adviser, Administrator and/or JPMDS have contractually agreed to waive fees and/or reimburse the Funds to the extent that total annual operating expenses (excluding acquired fund fees and expenses other than certain money market fund fees as described below, dividend and interest expenses related to short sales, interest, taxes, expenses related to litigation and potential litigation, expenses related to trustee elections and extraordinary expenses) exceed the percentages of the Funds' respective average daily net assets as shown in the table below:
The expense limitation agreements were in effect for the year ended October 31, 2022 and are in place until at least February 28, 2023.
For the year ended October 31, 2022, the Funds' service providers waived fees and/or reimbursed expenses for each of the Funds as follows. None of these parties expect the Funds to repay any such waived fees and/or reimbursed expenses in future years.
| | |
| | | | | Contractual
Reimbursements |
| | | | | |
| | | | | |
Additionally, the Funds may invest in one or more money market funds advised by the Adviser (affiliated money market funds). The Adviser, Administrator and/or JPMDS, as shareholder servicing agent, have contractually agreed to waive fees and/or reimburse expenses in an amount sufficient to offset the respective net fees each collects from the affiliated money market fund on the applicable Fund’s investment in such affiliated money market fund, except for investments of securities lending cash collateral. None of these parties expect the Funds to repay any such waived fees and/ or reimbursed expenses in future years.
The amounts of these waivers resulting from investments in these money market funds for the year ended October 31, 2022 were as follows:
Effective January 1, 2022, JPMIM voluntarily agreed to reimburse the Funds for the Trustee Fees paid to one of the interested Trustees. For the period January 1, 2022 through October 31, 2022 the amount of these waivers were as follows:
G. Other — Certain officers of the Trust are affiliated with the Adviser, the Administrator and JPMDS. Such officers, with the exception of the Chief Compliance Officer, receive no compensation from the Funds for serving in their respective roles.
The Board designated and appointed a Chief Compliance Officer to the Funds pursuant to Rule 38a-1 under the 1940 Act. Each Fund, along with affiliated funds, makes reimbursement payments, on a pro-rata basis, to the Administrator for a portion of the fees associated with the office of the Chief Compliance Officer. Such fees are included in Trustees’ and Chief Compliance Officer’s fees on the Statements of Operations.
The Trust adopted a Trustee Deferred Compensation Plan (the “Plan”) which allows the independent Trustees to defer the receipt of all or a portion of compensation related to performance of their duties as Trustees. The deferred fees are invested in various J.P. Morgan Funds until distribution in accordance with the Plan.
During the year ended October 31, 2022, the Funds purchased securities from an underwriting syndicate in which the principal underwriter or members of the syndicate were affiliated with the Adviser.
The Securities and Exchange Commission ("SEC") has granted an exemptive order permitting the Funds to engage in principal transactions with J.P. Morgan Securities LLC, an affiliated broker, involving taxable money market instruments, subject to certain conditions.
NOTES TO FINANCIAL STATEMENTS
AS OF October 31, 2022 (continued)
(Dollar values in thousands)
4. Investment Transactions
During the year ended October 31, 2022, purchases and sales of investments (excluding short-term investments) were as follows:
| Purchases
(excluding
U.S. Government) | Sales
(excluding
U.S. Government) | Purchases
of U.S.
Government | | | Covers on
Securities
Sold Short |
| | | | | | |
| | | | | | |
5. Federal Income Tax Matters
For Federal income tax purposes, the estimated cost and unrealized appreciation (depreciation) in value of investments held at October 31, 2022 were as follows:
| | Gross
Unrealized
Appreciation | Gross
Unrealized
Depreciation | Net Unrealized
Appreciation
(Depreciation) |
| | | | |
| | | | |
The difference between book and tax basis appreciation (depreciation) on investments is primarily attributed to wash sale loss deferrals and tax adjustments on certain investments and certain derivatives.
The tax character of distributions paid during the year ended October 31, 2022 was as follows:
| | Net
Long-Term
Capital Gains | |
| | | |
| | | |
| | | |
|
| Short-term gain distributions are treated as ordinary income for income tax purposes. |
The tax character of distributions paid during the year ended October 31, 2021 was as follows:
|
| Short-term gain distributions are treated as ordinary income for income tax purposes. |
As of October 31, 2022, the estimated components of net assets (excluding paid-in-capital) on a tax basis were as follows:
| Current
Distributable
Ordinary
Income | Current
Distributable
Long-Term
Capital Gain
(Tax Basis Capital
Loss Carryover) | Unrealized
Appreciation
(Depreciation) |
| | | |
| | | |
The cumulative timing differences primarily consist of tax adjustments on certain investments, tax adjustments on certain derivatives, straddle loss deferrals and wash sale loss deferrals.
At October 31, 2022, the following Funds had net capital loss carryforwards which are available to offset future realized gains:
| Capital Loss Carryforward Character |
| | |
| | |
| | |
6. Borrowings
The Funds rely upon an exemptive order granted by the SEC (the “Order”) permitting the establishment and operation of an Interfund Lending Facility (the “Facility”). The Facility allows the Funds to directly lend and borrow money to or from any other fund relying upon the Order at rates beneficial to both the borrowing and lending funds. Advances under the Facility are taken primarily for temporary or emergency purposes, including the meeting of redemption requests that otherwise might require the untimely disposition of securities, and are subject to each Fund's borrowing restrictions. The Interfund loan rate is determined, as specified in the Order, by averaging the current repurchase agreement rate and the current bank loan rate. The Order was granted to JPM II and may be relied upon by the Funds because the Funds and the series of JPM II are all investment companies in the same “group of investment companies” (as defined in Section 12(d)(1)(G) of the 1940 Act).
The Funds had no borrowings outstanding from another fund, or loans outstanding to another fund, during the year ended October 31, 2022.
The Trust and JPMCB have entered into a financing arrangement. Under this arrangement, JPMCB provides an unsecured, uncommitted credit facility in the aggregate amount of $100 million to certain of the J.P. Morgan Funds, including the Funds. Advances under the arrangement are taken primarily for temporary or emergency purposes, including the meeting of redemption requests that otherwise might require the untimely disposition of securities, and are subject to each Fund's borrowing restrictions. Interest on borrowings is payable at a rate determined by JPMCB at the time of borrowing. This agreement has been extended until October 30, 2023.
The Funds had no borrowings outstanding from the unsecured, uncommitted credit facility during the year ended October 31, 2022.
The Trust, along with certain other trusts for J.P. Morgan Funds (“Borrowers”), have entered into a joint syndicated senior unsecured revolving credit facility totaling $1.5 billion (“Credit Facility”) with various lenders and The Bank of New York Mellon, as administrative agent for the lenders. This Credit Facility provides a source of funds to the Borrowers for temporary and emergency purposes, including the meeting of redemption requests that otherwise might require the untimely disposition of securities. Under the terms of the Credit Facility, a borrowing fund must have a minimum of $25 million in adjusted net asset value and not exceed certain adjusted net asset coverage ratios prior to and during the time in which any borrowings are outstanding. If a fund does not comply with the aforementioned requirements, the fund must remediate within three business days with respect to the $25 million minimum adjusted net asset value or within one business day with respect to certain asset coverage ratios or the administrative agent at the request of, or with the consent of, the lenders may terminate the Credit Facility and declare any outstanding borrowings to be due and payable immediately.
Interest associated with any borrowing under the Credit Facility is charged to the borrowing fund at a rate of interest equal to 1.00% (the “Applicable Margin”), plus the greater of the federal funds effective rate or one month LIBOR. The annual commitment fee to maintain the Credit Facility is 0.15% and is incurred on the unused portion of the Credit Facility and is allocated to all participating funds pro rata based on their respective net assets. Effective August 9, 2022, the Credit Facility has been amended and restated for a term of 364 days, unless extended, and to include a change in the interest associated with any borrowing to the higher, on the day of the borrowing, of (a) the federal funds effective rate, or (b) the one-month Adjusted SOFR Rate plus reduction of the Applicable Margin charged for borrowing under the Credit Facility from 1.25% to 1.00%.
The Funds did not utilize the Credit Facility during the year ended October 31, 2022.
7. Risks, Concentrations and Indemnifications
In the normal course of business, the Funds enter into contracts that contain a variety of representations which provide general indemnifications. Each Fund's maximum exposure under these arrangements is unknown. The amount of exposure would depend on future claims that may be brought against each Fund. However, based on experience, the Funds expect the risk of loss to be remote.
NOTES TO FINANCIAL STATEMENTS
AS OF October 31, 2022 (continued)
(Dollar values in thousands)
As of October 31, 2022, the Funds had individual shareholder and/or omnibus accounts each owning more than 10% of the respective Fund’s outstanding shares as follows:
| Number of
Individual Shareholder
and/or Affiliated
Omnibus Accounts | | Number of
Individual Shareholder
and/or Non-Affiliated
Omnibus Accounts | |
| | | | |
| | | | |
Significant shareholder transactions by these shareholders may impact the Funds' performance and liquidity.
The Funds are subject to interest rate risk. Investments in bonds and other debt securities will change in value based on changes in interest rates. If rates increase, the value of these investments generally declines. Securities with greater interest rate sensitivity and longer maturities generally are subject to greater fluctuations in value. The Funds invest in variable and floating rate loans and other variable and floating rate securities. Although these investments are generally less sensitive to interest rate changes than fixed rate instruments, the value of floating rate loans and other securities may decline if their interest rates do not rise as quickly, or as much, as general interest rates. The Funds may face a heightened level of interest rate risk due to certain changes in monetary policy. It is difficult to predict the pace at which central banks or monetary authorities may increase interest rates or the timing, frequency, or magnitude of such increases. Any such changes could be sudden and could expose debt markets to significant volatility and reduced liquidity for Fund investments.
The Funds are subject to credit risk. The Funds' investments are subject to the risk that an issuer and/or a counterparty will fail to make payments when due or default completely. Prices of the Funds' investments may be adversely affected if any of the issuers or counterparties it is invested in are subject to an actual or perceived deterioration in their credit quality. Credit spreads may increase, which may reduce the market values of the Funds' securities. Credit spread risk is the risk that economic and market conditions or any actual or perceived credit deterioration may lead to an increase in the credit spreads (i.e. the difference in yield between two securities of similar maturity but different credit quality) and a decline in price of the issuer’s securities.
The Funds invest in high yield securities that are not rated or rated below investment grade (commonly known as "junk bonds"). These securities are considered to be high risk investments. Investments in lower-rated securities or unrated securities of comparable quality tend to be more sensitive to economic conditions than higher rated securities. Junk bonds involve a greater risk of default by the issuer because such securities are generally unsecured and are often subordinated to other creditors' claims. The market price of these securities can change suddenly and unexpectedly. As a result, the Funds are intended for investors who are able and willing to assume a high degree of risk.
Global Allocation Fund may have elements of risk not typically associated with investments in the United States of America due to concentrated investments in a limited number of foreign countries or regions, which may vary throughout the period. Such concentrations may subject the Fund to additional risks resulting from political or economic conditions in such countries or regions and the possible imposition of adverse governmental laws or currency exchange restrictions could cause the securities and their markets to be less liquid and their prices to be more volatile than those of comparable U.S. securities.
As of October 31, 2022, a significant portion of each Fund's investments consisted of securities that were denominated in foreign currencies. Changes in currency exchange rates will affect the value of, and investment income from, such securities.
Derivatives may be riskier than other types of investments because they may be more sensitive to changes in economic and market conditions and could result in losses that significantly exceed the Funds’ original investment. Many derivatives create leverage thereby causing the Funds to be more volatile than they would have been if they had not used derivatives. Derivatives also expose the Funds to counterparty risk (the risk that the derivative counterparty will not fulfill its contractual obligations), including credit risk of the derivative counterparty. The possible lack of a liquid secondary market for derivatives and the resulting inability of the Funds to sell or otherwise close a derivatives position could expose the Funds to losses. Certain derivatives are synthetic instruments that attempt to replicate the performance of certain reference assets. With regard to such derivatives, the Funds do not have a claim on the reference assets and is subject to enhanced counterparty risk. Derivatives may not perform as expected, so the Funds may not realize the intended benefits. When used for hedging, the change in value of a derivative may not correlate as expected with the security or other risk being hedged. In addition, given their complexity, derivatives expose the Funds to risks of mispricing or improper valuation.
The Funds are subject to counterparty credit risk, which is the risk that a counterparty fails to perform on agreements with the Funds.
The Funds invest in foreign issuers and foreign securities (including depositary receipts) that are subject to additional risks, including political and economic risks, civil conflicts and war, greater volatility, expropriation and nationalization risks, sanctions or other measures by the United States or other governments, currency fluctuations, higher transaction costs, delayed settlement, possible foreign controls on investment, liquidity risks and less stringent investor protection and disclosure standards of foreign markets. In certain markets where securities and other instruments are not traded “delivery versus payment,” a Fund may not receive timely payment for securities or other instruments it has delivered or receive delivery of securities paid for and may be subject to increased risk that the counterparty will fail to make payments or delivery when due or default completely.
Events and evolving conditions in certain economies or markets may alter the risks associated with investments tied to countries or regions that historically were perceived as comparatively stable becoming riskier and more volatile.
LIBOR is intended to represent the rate at which contributing banks may obtain short-term borrowings from each other in the London interbank market. On March 5, 2021, the U.K. Financial Conduct Authority ("FCA") publicly announced that (i) immediately after December 31, 2021, publication of the 1-week and 2-month U.S. Dollar LIBOR settings will permanently cease; (ii) immediately after June 30, 2023, publication of the overnight and 12-month U.S. Dollar LIBOR settings will permanently cease; and (iii) immediately after June 30, 2023, the 1-month, 3-month and 6-month U.S. Dollar LIBOR settings will cease to be provided or, subject to the FCA's consideration of the case, be provided on a synthetic basis and no longer be representative of the underlying market and economic reality they are intended to measure and that representativeness will not be restored. There is no assurance that the dates announced by the FCA will not change or that the administrator of LIBOR and/or regulators will not take further action that could impact the availability, composition or characteristics of LIBOR or the currencies and/or tenors for which LIBOR is published. Public and private sector industry initiatives are currently underway to implement new or alternative reference rates to be used in place of LIBOR. There is no assurance that any such alternative reference rate will be similar to or produce the same value or economic equivalence as LIBOR or that it will have the same volume or liquidity as did LIBOR prior to its discontinuance, unavailability or replacement, all of which may affect the value, volatility, liquidity or return on certain of a Fund's loans, notes, derivatives and other instruments or investments comprising some or all of a Fund's investments and result in costs incurred in connection with changing reference rates used for positions, closing out positions and entering into new trades. Certain of a Fund's investments may transition from LIBOR prior to the dates announced by the FCA. The transition from LIBOR to alternative reference rates may result in operational issues for a Fund or its investments. No assurances can be given as to the impact of the LIBOR transition (and the timing of any such impact) on a Fund and its investments.
The Funds are subject to infectious disease epidemics/pandemics risk. The worldwide outbreak of COVID-19 has negatively affected economies, markets and individual companies throughout the world. The effects of this COVID-19 pandemic to public health, and business and market conditions, including among other things, reduced consumer demand and economic output, supply chain disruptions and increased government spending may continue to have a significant negative impact on the performance of a Fund's investments, increase a Fund's volatility, exacerbate other pre-existing political, social and economic risks to the Funds and negatively impact broad segments of businesses and populations. In addition, governments, their regulatory agencies, or self-regulatory organizations have taken or may take actions in response to the pandemic that affect the instruments in which the Funds invest, or the issuers of such instruments, in ways that could also have a significant negative impact on a Fund’s investment performance. The duration and extent of COVID-19 and associated economic and market conditions and uncertainty over the long-term cannot be reasonably estimated at this time. The ultimate impact of COVID-19 and the extent to which the associated conditions impact a Fund will also depend on future developments, which are highly uncertain, difficult to accurately predict and subject to frequent changes.
As of October 31, 2022, the following Funds had non-U.S. country allocations representing greater than 10% of total investments (excluding investment of cash collateral from securities loaned) as follows:
REPORT OF INDEPENDENT REGISTERED PUBLIC ACCOUNTING FIRM
To the Board of Trustees of JPMorgan Trust I and Shareholders of JPMorgan Global Allocation Fund and JPMorgan Income Builder Fund
Opinions on the Financial Statements
We have audited the accompanying statements of assets and liabilities, including the schedules of portfolio investments, of JPMorgan Global Allocation Fund and JPMorgan Income Builder Fund (two of the funds constituting JPMorgan Trust I, hereafter collectively referred to as the "Funds") as of October 31, 2022, the related statements of operations for the year ended October 31, 2022, the statements of changes in net assets for each of the two years in the period ended October 31, 2022, including the related notes, and the financial highlights for each of the periods indicated therein (collectively referred to as the “financial statements”). In our opinion, the financial statements present fairly, in all material respects, the financial position of each of the Funds as of October 31, 2022, the results of each of their operations for the year then ended, the changes in each of their net assets for each of the two years in the period ended October 31, 2022 and each of the financial highlights for each of the periods indicated therein in conformity with accounting principles generally accepted in the United States of America.
Basis for Opinions
These financial statements are the responsibility of the Funds’ management. Our responsibility is to express an opinion on the Funds’ financial statements based on our audits. We are a public accounting firm registered with the Public Company Accounting Oversight Board (United States) (PCAOB) and are required to be independent with respect to the Funds in accordance with the U.S. federal securities laws and the applicable rules and regulations of the Securities and Exchange Commission and the PCAOB.
We conducted our audits of these financial statements in accordance with the standards of the PCAOB. Those standards require that we plan and perform the audit to obtain reasonable assurance about whether the financial statements are free of material misstatement, whether due to error or fraud.
Our audits included performing procedures to assess the risks of material misstatement of the financial statements, whether due to error or fraud, and performing procedures that respond to those risks. Such procedures included examining, on a test basis, evidence regarding the amounts and disclosures in the financial statements. Our audits also included evaluating the accounting principles used and significant estimates made by management, as well as evaluating the overall presentation of the financial statements. Our procedures included confirmation of securities owned as of October 31, 2022 by correspondence with the custodian, transfer agent, agent banks and brokers; when replies were not received from brokers, we performed other auditing procedures. We believe that our audits provide a reasonable basis for our opinions.
/s/ PricewaterhouseCoopers LLP
New York, New York
December 22, 2022
We have served as the auditor of one or more investment companies in the JPMorgan Funds complex since 1993.
The Funds’ Statement of Additional Information includes additional information about the Funds’ Trustees and is available, without charge, upon request by calling 1-800-480-4111 or on the J.P. Morgan Funds’ website at www.jpmorganfunds.com.
Name (Year of Birth);
Positions With
the Funds (1) | Principal Occupation
During Past 5 Years | Number of
Funds in Fund
Complex Overseen
by Trustee (2) | Other Directorships Held
During the Past 5 Years |
| | | |
John F. Finn (1947); Chair
since 2020; Trustee since 1998. | Chairman, Gardner, Inc. (supply chain management company serving industrial and consumer markets) (serving in various roles 1974-present). | | Director, Greif, Inc. (GEF) (industrial package products and services) (2007-present); Trustee, Columbus Association for the Performing Arts (1988-present). |
Stephen P. Fisher (1959);
Trustee since 2018. | Retired; Chairman and Chief Executive Officer, NYLIFE Distributors LLC (registered broker-dealer) (serving in various roles 2008-2013); Chairman, NYLIM Service Company LLC (transfer agent) (2008-2017); New York Life Investment Management LLC (registered investment adviser) (serving in various roles 2005-2017); Chairman, IndexIQ Advisors LLC (registered investment adviser for ETFs) (2014-2017); President, MainStay VP Funds Trust (2007-2017), MainStay DefinedTerm Municipal Opportunities Fund (2011-2017) and MainStay Funds Trust (2007-2017) (registered investment companies). | | Honors Program Advisory Board Member, The Zicklin School of Business, Baruch College, The City University of New York (2017-present). |
Gary L. French (1951);
Trustee since 2014. | Real Estate Investor (2011-2020); Investment management industry Consultant and Expert Witness (2011-present); Senior Consultant for The Regulatory Fundamentals Group LLC (2011-2017). | | Independent Trustee, The China Fund, Inc. (2013-2019); Exchange Traded Concepts Trust II (2012-2014); Exchange Traded Concepts Trust I (2011-2014). |
Kathleen M. Gallagher (1958);
Trustee since 2018. | Retired; Chief Investment Officer — Benefit Plans, Ford Motor Company (serving in various roles 1985-2016). | | Non- Executive Director, Legal & General Investment Management (Holdings) (2018-present); Non-Executive Director, Legal & General Investment Management America (U.S. Holdings) (financial services and insurance) (2017-present); Advisory Board Member, State Street Global Advisors Total Portfolio Solutions (2017-present); Member, Client Advisory Council, Financial Engines, LLC (registered investment adviser) (2011-2016); Director, Ford Pension Funds Investment Management Ltd. (2007-2016). |
Robert J. Grassi (1957);
Trustee since 2014. | Sole Proprietor, Academy Hills Advisors LLC (2012-present); Pension Director, Corning Incorporated (2002-2012). | | |
TRUSTEES
(Unaudited) (continued)
Name (Year of Birth); Positions With the Funds (1) | Principal Occupation During Past 5 Years | Number of Funds in Fund Complex Overseen by Trustee (2) | Other Directorships Held During the Past 5 Years |
Frankie D. Hughes (1952);
Trustee since 2008. | President, Ashland Hughes Properties (property management) (2014-present); President and Chief Investment Officer, Hughes Capital Management, Inc. (fixed income asset management) (1993-2014). | | |
Raymond Kanner (1953);
Trustee since 2017. | Retired; Managing Director and Chief Investment Officer, IBM Retirement Funds (2007-2016). | | Advisory Board Member, Penso Advisors, LLC (2020-present); Advisory Board Member, Los Angeles Capital (2018-present); Advisory Board Member, State Street Global Advisors Total Portfolio Solutions (2017- present); Acting Executive Director, Committee on Investment of Employee Benefit Assets (CIEBA) (2016-2017); Advisory Board Member, Betterment for Business (robo advisor) (2016- 2017); Advisory Board Member, BlueStar Indexes (index creator) (2013-2017); Director, Emerging Markets Growth Fund (registered investment company) (1997-2016); Member, Russell Index Client Advisory Board (2001-2015). |
Thomas P. Lemke (1954);
Trustee since 2014. | | | (1) Independent Trustee of Advisors’ Inner Circle III fund platform, consisting of the following: (i) the Advisors’ Inner Circle Fund III, (ii) the Gallery Trust, (iii) the Schroder Series Trust, (iv) the Delaware Wilshire Private Markets Fund (since 2020), (v) Chiron Capital Allocation Fund Ltd., and (vi) formerly the Winton Diversified Opportunities Fund (2014-2018); and (2) Independent Trustee of the Symmetry Panoramic Trust (since 2018). |
Lawrence R. Maffia (1950);
Trustee since 2014 | Retired; Director and President, ICI Mutual Insurance Company (2006-2013). | | Director, ICI Mutual Insurance Company (1999-2013). |
Mary E. Martinez (1960); Vice
Chair since 2021; Trustee since 2013. | Associate, Special Properties, a Christie’s International Real Estate Affiliate (2010-present); Managing Director, Bank of America (asset management) (2007-2008); Chief Operating Officer, U.S. Trust Asset Management, U.S. Trust Company (asset management) (2003-2007); President, Excelsior Funds (registered investment companies) (2004-2005). | | |
Marilyn McCoy (1948);
Trustee since 2005. | Vice President of Administration and Planning, Northwestern University (1985-present). | | |
Name (Year of Birth); Positions With the Funds (1) | Principal Occupation During Past 5 Years | Number of Funds in Fund Complex Overseen by Trustee (2) | Other Directorships Held During the Past 5 Years |
Dr. Robert A. Oden, Jr. (1946); Trustee
since 2005. | Retired; President, Carleton College (2002-2010); President, Kenyon College (1995-2002). | | Trustee, The Coldwater Conservation Fund (2017-present); Trustee, American Museum of Fly Fishing (2013-present); Trustee and Vice Chair, Trout Unlimited (2017-2021);Trustee, Dartmouth- Hitchcock MedicalCenter (2011-2020). |
Marian U. Pardo* (1946);
Trustee since 2013. | Managing Director and Founder, Virtual Capital Management LLC (investment consulting) (2007-present); Managing Director, Credit Suisse Asset Management (portfolio manager) (2003-2006). | | Board Chair and Member, Board of Governors, Columbus Citizens Foundation (not-for-profit supporting philanthropic and cultural programs) (2006-present). |
Emily A. Youssouf (1951);
Trustee since 2022. | Adjunct Professor (2011-present) and Clinical Professor (2009-2011), NYU Schack Institute of Real Estate; Board Member and Member of the Audit Committee (2013–present), Chair of Finance Committee (2019-present), Member of Related Parties Committee (2013-2018) and Member of the Enterprise Risk Committee (2015-2018), PennyMac Financial Services, Inc.; Board Member (2005-2018), Chair of Capital Committee (2006-2016), Chair of Audit Committee (2005-2018), Member of Finance Committee (2005-2018) and Chair of IT Committee (2016-2018), NYC Health and Hospitals Corporation. | | Trustee, NYC School Construction Authority (2009-present); Board Member, NYS Job Development Authority (2008-present); Trustee and Chair of the Audit Committee of the Transit Center Foundation (2015-2019). |
| | | |
Robert F. Deutsch** (1957);
Trustee since 2014. | Retired; Head of ETF Business for JPMorgan Asset Management (2013-2017); Head of Global Liquidity Business for JPMorgan Asset Management (2003-2013). | | Treasurer and Director of the JUST Capital Foundation (2017-present). |
Nina O. Shenker** (1957);
Trustee since 2022. | Vice Chair (2017-2021), General Counsel and Managing Director (2008-2016), Associate General Counsel and Managing Director (2004-2008), J.P. Morgan Asset & Wealth Management. | | Director and Member of Legal and Human Resources Subcommittees, American Jewish Joint Distribution Committee (2018-present). |
|
| The year shown is the first year in which a Trustee became a member of any of the following: the Mutual Fund Board, the ETF Board, the heritage J.P. Morgan Funds or the heritage One Group Mutual Funds. Trustees serve an indefinite term, until resignation, retirement, removal or death. The Board’s current retirement policy sets retirement at the end of the calendar year in which the Trustee attains the age of 75, provided that any Board member who was a member of the Mutual Fund Board prior to January 1, 2022 and was born prior to January 1, 1950 shall retire from the Board at the end of the calendar year in which the Trustee attains the age of 78. |
| A Fund Complex means two or more registered investment companies that hold themselves out to investors as related companies for purposes of investment and investor services or have a common investment adviser or have an investment adviser that is an affiliated person of the investment adviser of any of the other registered investment companies. The J.P. Morgan Funds Complex for which the Board of Trustees serves currently includes nine registered investment companies (166 J.P. Morgan Funds). |
| In connection with prior employment with JPMorgan Chase, Ms. Pardo was the recipient of non-qualified pension plan payments from JPMorgan Chase in the amount of approximately $2,055 per month, which she irrevocably waived effective January 1, 2013, and deferred compensation payments from JPMorgan Chase in the amount of approximately $7,294 per year, which ended in January 2013. In addition, Ms. Pardo receives payments from a fully-funded qualified plan, which is not an obligation of JPMorgan Chase. |
| Designation as an “Interested Trustee” is based on prior employment by the Adviser or an affiliate of the Adviser or interests in a control person of the Adviser. |
TRUSTEES
(Unaudited) (continued)
| The contact address for each of the Trustees is 277 Park Avenue, New York, NY 10172. |
Name (Year of Birth),
Positions Held with
the Trust (Since) | Principal Occupations During Past 5 Years |
Brian S. Shlissel (1964),
President and Principal Executive
Officer (2016)* | Managing Director and Chief Administrative Officer for J.P. Morgan pooled vehicles, J.P. Morgan Investment Management Inc. since 2014. |
Timothy J. Clemens (1975),
Treasurer and Principal Financial
Officer (2018) | Executive Director, J.P. Morgan Investment Management Inc. since February 2016. Mr. Clemens has been with J.P. Morgan Investment Management Inc. since 2013. |
Gregory S. Samuels (1980),
Secretary (2019) (formerly Assistant
Secretary 2010-2019)** | Managing Director and Assistant General Counsel, JPMorgan Chase & Co. Mr. Samuels has been with JPMorgan Chase & Co. since 2010. |
Stephen M. Ungerman (1953),
Chief Compliance Officer (2005) | Managing Director, JPMorgan Chase & Co. Mr. Ungerman has been with JPMorgan Chase & Co. since 2000. |
Kiesha Astwood-Smith (1973),
Assistant Secretary (2021)** | Vice President and Assistant General Counsel, JPMorgan Chase & Co. since June 2021; Senior Director and Counsel, Equitable Financial Life Insurance Company (formerly, AXA Equitable Life Insurance Company) from September 2015 through June 2021. |
Matthew Beck (1988),
Assistant Secretary (2021)*** | Vice President and Assistant General Counsel, JPMorgan Chase & Co. since May 2021; Senior Legal Counsel, Ultimus Fund Solutions from May 2018 through May 2021; General Counsel, The Nottingham Company from April 2014 through May 2018. |
Elizabeth A. Davin (1964),
Assistant Secretary (2005)*** | Executive Director and Assistant General Counsel, JPMorgan Chase & Co. Ms. Davin has been with JPMorgan Chase & Co. (formerly Bank One Corporation) since 2004. |
Jessica K. Ditullio (1962)
Assistant Secretary (2005)*** | Executive Director and Assistant General Counsel, JPMorgan Chase & Co. Ms. Ditullio has been with JPMorgan Chase & Co. (formerly Bank One Corporation) since 1990. |
Anthony Geron (1971),
Assistant Secretary (2018)** | Vice President and Assistant General Counsel, JPMorgan Chase & Co. since September 2018; Lead Director and Counsel, AXA Equitable Life Insurance Company from 2015 to 2018 and Senior Director and Counsel, AXA Equitable Life Insurance Company from 2014 to 2015. |
Carmine Lekstutis (1980),
Assistant Secretary (2011)** | Executive Director and Assistant General Counsel, JPMorgan Chase & Co. Mr. Lekstutis has been with JPMorgan Chase & Co. since 2011. |
Max Vogel (1990),
Assistant Secretary (2021)** | Vice President and Assistant General Counsel, JPMorgan Chase & Co. since June 2021; Associate, Proskauer Rose LLP (law firm) from March 2017 to June 2021. |
Zachary E. Vonnegut-Gabovitch
(1986),
Assistant Secretary (2017)** | Vice President and Assistant General Counsel, JPMorgan Chase & Co. since September 2016. |
Michael M. D’Ambrosio (1969),
Assistant Treasurer (2012) | Managing Director, J.P. Morgan Investment Management Inc. Mr. D’Ambrosio has been with J.P. Morgan Investment Management Inc. since 2012. |
Aleksandr Fleytekh (1972),
Assistant Treasurer (2019) | Vice President, J.P. Morgan Investment Management Inc. since February 2012. |
Shannon Gaines (1977),
Assistant Treasurer (2018)*** | Vice President, J.P. Morgan Investment Management Inc. since January 2014. |
Jeffrey D. House (1972),
Assistant Treasurer (2017)*** | Vice President, J.P. Morgan Investment Management Inc. since July 2006. |
Michael Mannarino (1985),
Assistant Treasurer (2020) | Vice President, J.P. Morgan Investment Management Inc. since 2014. |
Joseph Parascondola (1963),
Assistant Treasurer (2011)* | Executive Director, J.P. Morgan Investment Management, Inc. Mr. Parascondola has been with J.P. Morgan Investment Management Inc. since 2006. |
Gillian I. Sands (1969),
Assistant Treasurer (2012) | Executive Director, J.P. Morgan Investment Management Inc. Ms. Sands has been with J.P. Morgan Investment Management Inc. since 2012. |
|
The contact address for each of the officers, unless otherwise noted, is 277 Park Avenue, New York, NY 10172. |
OFFICERS
(Unaudited) (continued)
| The contact address for the officer is 575 Washington Boulevard, Jersey City, NJ 07310. |
| The contact address for the officer is 4 New York Plaza, New York, NY 10004. |
| The contact address for the officer is 1111 Polaris Parkway, Columbus, OH 43240. |
SCHEDULE OF SHAREHOLDER EXPENSES
(Unaudited)
Hypothetical $1,000 Investment
As a shareholder of the Funds, you incur two types of costs: (1) transaction costs, including sales charges (loads) on purchase payments and (2) ongoing costs, including investment advisory fees, administration fees, distribution fees and other Fund expenses. The examples below are intended to help you understand your ongoing costs (in dollars) of investing in the Funds (not including expenses of the Underlying Funds and ETFs) and to compare these ongoing costs with the ongoing costs of investing in other mutual funds. The examples assume that you had a $1,000 investment in each Class at the beginning of the reporting period, May 1, 2022, and continued to hold your shares at the end of the reporting period, October 31, 2022.
Actual Expenses
For each Class of each Fund in the table below, the first line provides information about actual account values and actual expenses. You may use the information in this line, together with the amount you invested, to estimate the expenses that you paid over the period. Simply divide your account value by $1,000 (for example, an $8,600 account value divided by $1,000 = 8.6), then multiply the result by the number in the first line of each Class under the heading titled “Expenses Paid During the Period” to estimate the expenses you paid on your account during this period.
Hypothetical Example for Comparison Purposes
The second line of each Class in the table below provides information about hypothetical account values and hypothetical expenses based on the Class’ actual expense ratio and an assumed rate of return of 5% per year before expenses, which is not the Class’ actual return. The hypothetical account values and expenses may not be used to estimate the actual ending account balance or expenses you paid for the period. You may use this information to compare the ongoing costs of investing in the Class of the Funds and other funds. To do so, compare this 5% hypothetical example with the 5% hypothetical examples that appear in the shareholder reports of the other funds. Please note that the expenses shown in the table are meant to highlight your ongoing costs only and do not reflect any transaction costs, such as sales charges (loads), or redemption fees, and expenses of the Underlying Funds and ETFs. Therefore, the second line for each Class in the table is useful in comparing ongoing costs only, and will not help you determine the relative total costs of owning different funds. In addition, if these transaction costs were included, your costs would have been higher. The examples also assume all dividends and distributions have been reinvested.
| Beginning
Account Value
May 1, 2022 | Ending
Account Value
October 31, 2022 | Expenses
Paid During
the Period* | |
JPMorgan Global Allocation Fund | | | | |
| | | | |
| | | | |
| | | | |
| | | | |
| | | | |
| | | | |
| | | | |
| | | | |
| | | | |
| | | | |
| | | | |
| | | | |
| | | | |
| | | | |
| | | | |
| | | | |
| | | | |
| | | | |
| | | | |
| | | | |
| | | | |
| | | | |
| | | | |
| | | | |
SCHEDULE OF SHAREHOLDER EXPENSES
(Unaudited) (continued)
Hypothetical $1,000 Investment
| Beginning Account Value May 1, 2022 | Ending Account Value October 31, 2022 | Expenses Paid During the Period* | |
JPMorgan Income Builder Fund | | | | |
| | | | |
| | | | |
| | | | |
| | | | |
| | | | |
| | | | |
| | | | |
| | | | |
| | | | |
| | | | |
| | | | |
| | | | |
|
| Expenses are equal to each Class’ respective annualized expense ratio, multiplied by the average account value over the period, multiplied by 184/365 (to reflect the one-half year period). |
BOARD APPROVAL OF INVESTMENT ADVISORY AGREEMENTS
(Unaudited)
The Board of Trustees (the “Board” or the “Trustees”) has established various standing committees composed of Trustees with diverse backgrounds, to which the Board has assigned specific subject matter responsibilities to further enhance the effectiveness of the Board’s oversight and decision making. Effective January 2022, the Board consolidated with the J.P. Morgan Exchange-Traded Fund Trust Board and now consists of Trustees from both Boards. The Board and its investment committees (money market and alternative products, equity, and fixed income) met regularly throughout the year and, at each meeting, considered factors that are relevant to their annual consideration of the continuation of the investment advisory agreements. The Board also met for the specific purpose of considering investment advisory agreement annual renewals. The Board held meetings on June 21-22, 2022 and August 9-11, 2022, at which the Trustees considered the continuation of the investment advisory agreement for each Fund whose annual report is contained herein (each an “Advisory Agreement” and collectively, the “Advisory Agreements”). At the June meeting, the Board’s investment committees met to review and consider performance, expense and related information for each Fund and the other J.P. Morgan Funds overseen by the Board in which the Funds may invest (“Underlying Funds”). Each investment committee reported to the full Board, which then considered each investment committee’s preliminary findings. At the August meeting, the Trustees continued their review and consideration. The Trustees, including a majority of the Trustees who are not parties to an Advisory Agreement or “interested persons” (as defined in the Investment Company Act of 1940) of any party to an Advisory Agreement or any of their affiliates, approved the continuation of each Advisory Agreement on August 11, 2022.
As part of their review of the Advisory Agreements, the Trustees considered and reviewed performance and other information about the Funds and Underlying Funds received from the Adviser. This information includes the Funds’ and Underlying Funds’ performance as compared to the performance of the Funds’ and Underlying Funds’ peers and benchmarks and analyses by the Adviser of the Funds’ and Underlying Funds’ performance. In addition, at each of their regular meetings throughout the year, the Trustees considered reports on the performance of certain J.P. Morgan Funds (including certain ETFs, beginning in February 2022) provided by an independent investment consulting firm (“independent consultant”). In addition, in preparation for the June and August meetings, the Trustees requested, received and evaluated extensive materials from the Adviser, including, with respect to the Funds and/or Underlying Funds, performance and expense information compiled by Broadridge, using data from Lipper Inc. and/or Morningstar Inc., independent providers of investment company data (together, “Broadridge”). The Trustees’ independent consultant also provided additional quantitative and statistical analyses of certain Funds, including
risk and performance return assessments as compared to the Funds’ objectives, benchmarks, and peers. Before voting on the Advisory Agreements, the Trustees reviewed the Advisory Agreements with representatives of the Adviser, counsel to the Trusts and independent legal counsel and received a memorandum from independent legal counsel to the Trustees discussing the legal standards for their consideration of the Advisory Agreements. The Trustees also discussed the Advisory Agreements with independent legal counsel in executive sessions at which no representatives of the Adviser were present.
A summary of the material factors evaluated by the Trustees in determining whether to approve each Advisory Agreement is provided below. Each Trustee attributed different weights to the various factors and no factor alone was considered determinative. The Trustees considered information provided with respect to the Funds and Underlying Funds throughout the year, including additional reporting and information provided in connection with the COVID-19 pandemic, as well as materials furnished specifically in connection with the annual review process. From year to year, the Trustees consider and place emphasis on relevant information in light of changing circumstances in market and economic conditions.
After considering and weighing the factors and information they had received, the Trustees found that the compensation to be received by the Adviser from each Fund under the applicable Advisory Agreement was fair and reasonable under the circumstances, and determined that the continuance of each Advisory Agreement was in the best interests of each Fund and its shareholders.
Nature, Extent and Quality of Services Provided by the Adviser
The Trustees received and considered information regarding the nature, extent and quality of services provided to each Fund under the applicable Advisory Agreement. The Trustees took into account information furnished throughout the year at Trustee meetings, as well as the materials furnished specifically in connection with this annual review process. Among other things, the Trustees considered:
(i)
The background and experience of the Adviser’s senior management and investment personnel, including personnel changes, if any;
(ii)
The qualifications, backgrounds and responsibilities of the portfolio management team primarily responsible for the day-to-day management each of the Funds, including personnel changes, if any;
(iii)
The investment strategy for each Fund, and the infrastructure supporting the portfolio management teams;
(iv)
Information about the structure and distribution strategy
BOARD APPROVAL OF INVESTMENT ADVISORY AGREEMENTS
(Unaudited) (continued)
for each Fund and how it fits with the Trusts’ other fund offerings;
(v)
The administration services provided by the Adviser in its role as Administrator;
(vi)
Their knowledge of the nature and quality of the services provided by the Adviser and its affiliates gained from their experience as Trustees of the Trusts and in the financial industry generally;
(vii)
The overall reputation and capabilities of the Adviser and its affiliates;
(viii)
The commitment of the Adviser to provide high quality service to the Funds and Underlying Funds;
(ix)
Their overall confidence in the Adviser’s integrity;
(x)
The Adviser’s responsiveness to requests for additional information, questions or concerns raised by them, including the Adviser’s willingness to consider and implement organizational and operational changes designed to improve investment results and the services provided to each Fund and Underlying Fund; and
(xi)
The Adviser’s business continuity plan and steps the Adviser and its affiliates have taken to provide ongoing services to the Funds and Underlying Funds during the COVID-19 pandemic, and the Adviser’s and its affiliates’ success in continuing to provide services to the Funds, Underlying Funds and their shareholders throughout this period.
Based upon these considerations and other factors, the Trustees concluded that they were satisfied with the nature, extent and quality of the services provided to the Funds by the Adviser.
Costs of Services Provided and Profitability to the Adviser and its Affiliates
The Trustees received and considered information regarding the profitability to the Adviser and its affiliates from providing services to each Fund and Underlying Funds. The Trustees reviewed and discussed this information. The Trustees recognized that this information is not audited and represents the Adviser’s determination of its and its affiliates’ revenues from the contractual services provided to each Fund, less expenses of providing such services. Expenses include direct and indirect costs and are calculated using an allocation methodology developed by the Adviser and reviewed with the Board. The Trustees also recognized that it is difficult to make comparisons of profitability from fund investment advisory contracts because comparative information is not generally publicly available and is affected by numerous factors, including the structure of the particular adviser, the types of funds it manages, its business mix, numerous assumptions regarding allocations and the fact that publicly-traded fund
managers’ operating profits and net income are net of distribution and marketing expenses. Based upon their review, and taking into consideration the factors noted above, the Trustees concluded that the profitability to the Adviser under each Advisory Agreement was not unreasonable in light of the services and benefits provided to each Fund.
The Trustees also considered that JPMDS, an affiliate of the Adviser and the Adviser, earn fees from each Fund and/or Underlying Funds for providing shareholder and administration services, respectively. These fees were shown separately in the profitability analysis presented to the Trustees. The Trustees also considered the payments of Rule 12b-1 fees to JPMDS, which also acts as the Funds’ distributor, and that these fees are in turn generally paid to financial intermediaries that sell the Funds, including financial intermediaries that are affiliates of the Adviser (although they are retained by JPMDS in certain instances). The Trustees also considered the fees earned by JPMorgan Chase Bank, N.A. (“JPMCB”), an affiliate of the Adviser, for custody, fund accounting and other related services for each Fund and/or Underlying Funds, and the profitability of the arrangements to JPMCB. .
Fall-Out Benefits
The Trustees reviewed information regarding potential “fall-out” or ancillary benefits received by the Adviser and its affiliates as a result of their relationship with the Funds. The Trustees considered that the J.P. Morgan Funds' operating accounts are held at JPMCB, which, as a result, will receive float benefits for certain J.P. Morgan Funds, as applicable. The Trustees also noted that the Adviser supports a diverse set of products and services, which benefits the Adviser by allowing it to leverage its infrastructure to serve additional clients, including the benefits received by the Adviser and its affiliates in connection with the Funds’ investments in the Underlying Funds. The Trustees also reviewed the Adviser’s allocation of fund brokerage for the J.P. Morgan Funds complex, including allocations to brokers who provide research to the Adviser, as well as the Adviser’s use of affiliates to provide other services and the benefits to such affiliates of doing so.
Economies of Scale
The Trustees considered the extent to which the Funds may benefit from potential economies of scale. The Trustees considered that there may not be a direct relationship between economies of scale realized by the Funds and those realized by the Adviser as assets increase. The Trustees considered the extent to which the Funds were priced to scale and whether it would be appropriate to add advisory fee breakpoints. The Trustees noted certain Funds with contractual expense limitations and fee waivers (“Fee Caps”), which allow a Fund’s shareholders to share potential economies of scale from a Fund’s inception, prior to reaching scale. The Trustees also noted that certain other Funds that had achieved scale as asset
levels had increased, no longer had Fee Caps in place for some or all of their share classes, but shared economies of scale through lower average expenses. The Trustees noted that the fees remain satisfactory relative to peer funds. The Trustees considered the benefits to the Funds of the use of an affiliated distributor and custodian, including the ability to rely on existing infrastructure supporting distribution, custodial and transfer agent services and the ability to negotiate competitive fees for the Funds. The Trustees further considered the Adviser's and JPMDS's ongoing investments in their business in support of the Funds, including the Adviser's and/or JPMDS's investments in trading systems, technology (including improvements to the J.P. Morgan Funds’ website, and cybersecurity improvements), retention of key talent, and regulatory support enhancements. The Trustees concluded that the current fee structure for each Fund, including any Fee Caps the Adviser has in place that serve to limit the overall net expense ratios of each Fund at competitive levels, was reasonable. The Trustees concluded that, for Funds with Fee Caps in place for some or all of their share classes, the relevant Fund’s shareholders received the benefits of potential economies of scale through the Fee Caps and, for Funds that achieved scale and no longer had Fee Caps in place for some or all of their share classes, the relevant Fund’s shareholders benefited from lower average expenses resulting from increased assets. The Trustees also concluded that all Funds benefited from the Adviser’s reinvestment in its operations to serve the Funds and their shareholders. The Trustees noted that the Adviser’s reinvestment ensures sufficient resources in terms of personnel and infrastructure to support the Funds.
Fees Relative to Adviser’s Other Clients
The Trustees received and considered information about the nature and extent of investment advisory services and fee rates offered to other clients of the Adviser, including, to the extent applicable, institutional separate accounts, collective investment trusts, other registered investment companies and/or private funds sub-advised by the Adviser, for investment management styles substantially similar to that of each Fund. The Trustees considered the complexity of investment management for registered investment companies relative to the Adviser’s other clients and noted differences, as applicable, in the fee structure and the regulatory, legal and other risks and responsibilities of providing services to the different clients. The Trustees considered that serving as an adviser to a registered investment company involves greater responsibilities and risks than acting as a sub-adviser and observed that sub-advisory fees may be lower than those charged by the Adviser to each Fund. The Trustees also noted that the adviser, not the applicable registered investment company, typically bears the sub-advisory fee and that many responsibilities related to the advisory function are typically retained by the
primary adviser. The Trustees concluded that the fee rates charged to each Fund in comparison to those charged to the Adviser’s other clients were reasonable.
Investment Performance
The Trustees receive and consider information about the Funds’ performance throughout the year. In addition, the Trustees received and considered absolute and/or relative performance information for each Fund in a report prepared by Broadridge. The Trustees considered the total return performance information, which included the ranking of each Fund within a performance universe comprised of funds with the same Broadridge investment classification and objective (the “Universe”), as well as a subset of funds within the Universe (the “Peer Group”), by total return for the applicable one-, three- and five-year periods. The Trustees reviewed a description of Broadridge methodology for selecting mutual funds in each Fund’s Universe and Peer Group and noted that Universe and Peer Group quintile rankings were not calculated if the number of funds in the Universe and/or Peer Group did not meet a predetermined minimum. The Broadridge materials provided to the Trustees highlighted information with respect to certain representative classes to assist the Trustees in their review. As part of this review, the Trustees also reviewed each Fund’s performance against its benchmark and considered the performance information provided for each Fund at regular Board meetings by the Adviser and the independent consultant and also considered the special analysis prepared for the certain Funds by the independent consultant. The Trustees also engaged with the Adviser to consider what steps might be taken to improve performance, as applicable. The Broadridge performance data noted by the Trustees as part of their review and the determinations made by the Trustees with respect to each Fund’s performance for certain representative classes are summarized below:
The Trustees noted that the Global Allocation Fund’s performance for both Class A and Class I shares was in the fourth, second and first quintiles of both the Peer Group and Universe, for the one-, three- and five-year periods ended December 31, 2021, respectively. The Trustees noted that the performance for Class R6 shares was in the fourth and first quintiles of the Peer Group, and in the fourth and second quintiles of the Universe, for the one- and three-year periods ended December 31,2021, respectively. The Trustees discussed the performance and investment strategy of the Fund with the Adviser and reviewed the performance analysis and evaluation prepared by the independent consultant. Based upon these discussions and various other factors, the Trustees concluded that the Fund’s performance was satisfactory under the circumstances.
The Trustees noted that the Income Builder Fund’s performance for Class A shares was in the fourth, third and third quintiles of the Peer Group, and in the second, fourth and third quintiles of the Universe, for the one-, three- and five-year periods ended
BOARD APPROVAL OF INVESTMENT ADVISORY AGREEMENTS
(Unaudited) (continued)
December 31, 2021, respectively. The Trustees noted that performance for Class I shares was in the fourth, third and second quintiles of the Peer Group, and in the second, fourth and third quintiles of the Universe, for the one-, three- and five-year periods ended December 31, 2021, respectively. The Trustees noted that performance for Class R6 shares was in the third and fourth quintiles of the Peer Group, and in the second and fourth quintiles of the Universe, for the one- and three-year periods ended December 31, 2021, respectively. The Trustees discussed the performance and investment strategy of the Fund with the Adviser and reviewed the performance analysis and evaluation prepared by the independent consultant. Based upon these discussions and various other factors, the Trustees concluded that the Fund’s performance was satisfactory under the circumstances.
Advisory Fees and Expense Ratios
The Trustees considered the contractual advisory fee rate and administration fee rate paid by each Fund to the Adviser and compared the combined rate to the information prepared by Broadridge concerning management fee rates paid by other funds in the same Broadridge category as each Fund. The Trustees recognized that Broadridge reported each Fund’s management fee rate as the combined contractual advisory fee and administration fee rates. The Trustees also reviewed information about other expenses and the expense ratios for each Fund and noted that Universe and Peer Group quintile rankings were not calculated if the number of funds in the Universe and/or Peer Groups did not meet a predetermined minimum. For each Fund that had a Fee Cap in place, the Trustees considered the net advisory fee rate and net expense ratio for each class, as applicable, taking into account any waivers and/or reimbursements. The Trustees also considered any proposed changes to a Fee Cap, and, where deemed appropriate by the Trustees, additional waivers and/or reimbursements. The Trustees recognized that it can be difficult to make comparisons of advisory fees because there are variations in the services that are included in the fees paid by other funds. The Trustees’ determinations as a result of the review of each Fund’s advisory fees and expense ratios for certain representative classes are summarized below:
The Trustees noted that the Global Allocation Fund’s net advisory fee and actual total expenses for Class A shares were both in the first and second quintiles of the Peer Group and
Universe, respectively. The Trustees noted that the net advisory fee for Class I shares was in the first and third quintiles of the Peer Group and Universe, respectively, and that the actual total expenses for Class I shares were in the first and second quintiles of the Peer Group and Universe, respectively. The Trustees noted that the net advisory fee for Class R6 shares was in the first and third quintiles of the Peer Group and Universe, respectively, and that the actual total expenses for Class R6 shares were in the first quintile of both the Peer Group and Universe. After considering the factors identified above, in light of this information, the Trustees concluded that the advisory fee was satisfactory in light of the services provided to the Fund and that such fees would be for services provided in addition to, rather than duplicative of, services provided under the advisory contracts of the Underlying Funds in which the Fund invests.
The Trustees noted that the Income Builder Fund’s net advisory fee for Class A shares was in the second quintile of both the Peer Group and Universe, and that the actual total expenses for Class A shares were in the first quintile of both the Peer Group and Universe. The Trustees noted that net advisory fee and actual total expenses for Class I shares were both in the first and second quintiles of the Peer Group and Universe, respectively. The Trustees noted that net advisory fee for Class R6 shares was in the second quintile of both the Peer Group and Universe, and that the actual total expenses for Class R6 shares were in the second and first quintiles of the Peer Group and Universe, respectively. After considering the factors identified above, in light of this information, the Trustees concluded that the advisory fee was satisfactory in light of the services provided to the Fund and that such fees would be for services provided in addition to, rather than duplicative of, services provided under the advisory contracts of the Underlying Funds in which the Fund may invest.
TAX LETTER
(Unaudited)
(Dollar values in thousands)
Certain tax information for the J.P. Morgan Funds is required to be provided to shareholders based upon the Funds’ income and distributions for the taxable year ended October 31, 2022. The information and distributions reported in this letter may differ from the information and taxable distributions reported to the shareholders for the calendar year ending December 31, 2022. The information necessary to complete your income tax returns for the calendar year ending December 31, 2022 will be provided under separate cover.
Dividends Received Deduction (DRD)
Each Fund listed below had the following percentage, or maximum allowable percentage, of ordinary income distributions eligible for the dividends received deduction for corporate shareholders for the fiscal year ended October 31, 2022:
| Dividends
Received
Deduction |
JPMorgan Global Allocation Fund | |
JPMorgan Income Builder Fund | |
Long Term Capital Gain
Each Fund listed below distributed the following amount, or maximum allowable amount, of long-term capital gain dividends for the fiscal year ended October 31, 2022:
| Long-Term
Capital Gain
Distribution |
JPMorgan Global Allocation Fund | |
JPMorgan Income Builder Fund | |
Qualified Dividend Income (QDI)
Each Fund listed below had the following amount, or maximum allowable amount, of ordinary income distributions treated as qualified dividends for the fiscal year ended October 31, 2022:
| |
JPMorgan Global Allocation Fund | |
JPMorgan Income Builder Fund | |
| WHAT DOES J.P. MORGAN FUNDS DO WITH YOUR PERSONAL INFORMATION? |
| Financial companies choose how they share your personal information. Federal law gives consumers the right to limit some but not all sharing. Federal law also requires us to tell you how we collect, share, and protect your personal information. Please read this notice carefully to understand what we do. |
| The types of personal information we collect and share depend on the product or service you have with us. This information can include: |
| ○Social Security number and account balances |
| ○transaction history and account transactions |
| ○checking account information and wire transfer instructions |
| When you are no longer our customer, we continue to share your information as described in this notice. |
| All financial companies need to share customers’ personal information to run their everyday business. In the section below, we list the reasons financial companies can share their customers’ personal information; the reasons J.P. Morgan Funds chooses to share; and whether you can limit this sharing. |
Reasons we can share your personal information | Does J.P. Morgan
Funds share? | Can you limit this
sharing? |
For our everyday business purposes — such as to process your transactions, maintain your account(s), respond to court orders and legal investigations, or report to credit bureaus | | |
For marketing purposes — to offer our products and services to you | | |
For joint marketing with other financial companies | | |
For our affiliates’ everyday business purposes — information about your transactions and experiences | | |
For our affiliates’ everyday business purposes — information about your creditworthiness | | |
For nonaffiliates to market to you | | |
Questions? Call 1-800-480-4111 or go to www.jpmorganfunds.com | |
|
Who is providing this notice? | |
|
How does J.P. Morgan Funds protect my personal information? | To protect your personal information from unauthorized access and use, we use security measures that comply with federal law. These measures include computer safeguards and secured files and buildings. We authorize our employees to access your information only when they need it to do their work and we require companies that work for us to protect your information. |
|
How does J.P. Morgan Funds protect my personal information? | We collect your personal information, for example, when you: |
○open an account or provide contact information |
○give us your account information or pay us by check |
|
We also collect your personal information from others, such as credit bureaus, affiliates and other companies. |
|
Why can’t I limit all sharing? | Federal law gives you the right to limit only: |
○sharing for affiliates’ everyday business purposes – information about your creditworthiness |
○affiliates from using your information to market to you |
○sharing for nonaffiliates to market to you |
State laws and individual companies may give you additional rights to limit sharing. |
|
| Companies related by common ownership or control. They can be financial and nonfinancial companies. |
| ○J.P. Morgan Funds does not share with our affiliates. |
|
| Companies not related by common ownership or control. They can be financial and nonfinancial companies. |
| ○J.P. Morgan Funds does not share with nonaffiliates so they can market to you. |
|
| A formal agreement between nonaffiliated financial companies that together market financial products or services to you. |
| ○J.P. Morgan Funds doesn’t jointly market. |
THIS PAGE IS INTENTIONALLY LEFT BLANK
J.P. Morgan Funds are distributed by JPMorgan Distribution Services, Inc., which is an affiliate of JPMorgan Chase & Co. Affiliates of JPMorgan Chase & Co. receive fees for providing various services to the funds.
Contact JPMorgan Distribution Services, Inc. at 1-800-480-4111 for a portfolio prospectus. You can also visit us at www.jpmorganfunds.com. Investors should carefully consider the investment objectives and risk as well as charges and expenses of the mutual fund before investing. The prospectus contains this and other information about the mutual fund. Read the prospectus carefully before investing.
Investors may obtain information about the Securities Investor Protection Corporation (SIPC), including the SIPC brochure, by visiting www.sipc.org or by calling SIPC at 202-371-8300.
Each Fund files a complete schedule of its fund holdings for the first and third quarters of its fiscal year with the SEC as an exhibit to its report on Form N-PORT. The Funds' Form N-PORT reports are available on the SEC’s website at http://www.sec.gov. Each Fund's quarterly holdings can be found by visiting the J.P. Morgan Funds’ website at www.jpmorganfunds.com.
A description of the Portfolio’s policies and procedures with respect to the disclosure of each Funds' holdings is available in the prospectuses and Statement of Additional Information.
A copy of proxy policies and procedures is available without charge upon request by calling 1-800-480-4111 and on the Portfolio’s website at www.jpmorganfunds.com. A description of such policies and procedures is on the SEC’s website at www.sec.gov. The Trustees have delegated the authority to vote proxies for securities owned by the Portfolio to the Adviser. A copy of the Portfolio’s voting record for the most recent 12-month period ended June 30 is available on the SEC’s website at www.sec.gov or at the Portfolio’s website at www.jpmorganfunds.com no later than August 31 of each year. The Portfolio’s proxy voting record will include, among other things, a brief description of the matter voted on for each portfolio security, and will state how each vote was cast, for example, for or against the proposal.
J.P. Morgan Asset Management is the brand name for the asset management business of JPMorgan Chase & Co. and its affiliates worldwide.
© JPMorgan Chase & Co., 2022. All rights reserved. October 2022.
AN-IB-GAL-1022
ITEM 2. CODE OF ETHICS.
Disclose whether, as of the end of the period covered by the report, the registrant has adopted a code of ethics that applies to the registrant’s principal executive officer, principal financial officer, principal accounting officer or controller, or persons performing similar functions, regardless of whether these individuals are employed by the registrant or a third party. If the registrant has not adopted such a code of ethics, explain why it has not done so.
The registrant must briefly describe the nature of any amendment, during the period covered by the report, to a provision of its code of ethics that applies to the registrant’s principal executive officer, principal financial officer, principal accounting officer or controller, or persons performing similar functions, regardless of whether these individuals are employed by the registrant or a third party, and that relates to any element of the code of ethics definition enumerated in paragraph (b) of this Item. The registrant must file a copy of any such amendment as an exhibit pursuant to Item 13(a)(1), unless the registrant has elected to satisfy paragraph (f) of this Item by positing its code of ethics on its website pursuant to paragraph (f)(2) of this Item, or by undertaking to provide its code of ethics to any person without charge, upon request, pursuant to paragraph (f)(3) of this Item.
If the registrant has, during the period covered by the report, granted a waiver, including an implicit waiver, from a provision of the code of ethics that applies to the registrant’s principal executive officer, principal financial officer, principal accounting officer or controller, or persons performing similar functions, regardless of whether these individuals are employed by the registrant or third party, that relates to one or more items set forth in paragraph (b) of this Item, the registrant must briefly describe the nature of the waiver, the name of the person to whom the waiver was granted, and the date of the waiver.
The Registrant has adopted a code of ethics that applies to the Registrant’s principal executive officer and principal financial officer. There were no amendments to the code of ethics or waivers granted with respect to the code of ethics in the period covered by the report.
ITEM 3. AUDIT COMMITTEE FINANCIAL EXPERT.
(a) (1) Disclose that the registrant’s board of directors has determined that the registrant either:
(i) Has at least one audit committee financial expert serving on its audit committee; or
(ii) Does not have an audit committee financial expert serving on its audit committee.
The Registrant’s Board of Trustees has determined that the Registrant has at least one audit committee financial expert serving on its audit committee. The Securities and Exchange Commission has stated that the designation or identification of a person as an audit committee financial expert pursuant to this Item 3 of Form N-CSR does not impose on such person any duties, obligations or liabilities that are greater than the duties, obligations and liabilities imposed on such person as a member of the Audit Committee and the Board of Trustees in the absence of such designation or identification.
(2) If the registrant provides the disclosure required by paragraph (a)(1)(i) of this Item, it must disclose the name of the audit committee financial expert and whether that person is “independent.” In order to be considered “independent” for purposes of this Item, a member of an audit committee may not, other than in his or her capacity as a member of the audit committee, the board of directors, or any other board committee:
(i) Accept directly or indirectly any consulting, advisory, or other compensatory fee from the issuer; or
(ii) Be an “interested person” of the investment company as defined in Section 2(a)(19) of the Act (15 U.S.C. 80a-2(a)(19)).
The Audit committee financial expert is Kathleen M. Gallagher. Ms. Gallagher is not an “interested person” of the Registrant and is also “independent” as defined by the U.S. Securities and Exchange Commission for the purposes of the audit committee financial expert determination.
(3) If the registrant provides the disclosure required by paragraph (a)(1)(ii) of this Item, it must explain why it does not have an audit committee financial expert.
Not applicable.
ITEM 4. PRINCIPAL ACCOUNTANT FEES AND SERVICES.
(a) Disclose, under the caption Audit Fees, the aggregate fees billed for each of the last two fiscal years for professional services rendered by the principal accountant for the audit of the registrant’s annual financial statements or services that are normally provided by the accountant in connection with statutory and regulatory filings or engagements for those fiscal years.
AUDIT FEES
2022 – $837,633
2021 – $715,339
(b) Disclose, under the caption Audit-Related Fees, the aggregate fees billed in each of the last two fiscal years for assurance and related services by the principal accountant that are reasonably related to the performance of the audit of the registrant’s financial statements and are not reported under paragraph (a) of this Item. Registrants shall describe the nature of the services comprising the fees disclosed under this category.
AUDIT-RELATED FEES
2022 – $152,543
2021 – $116,912
Audit-related fees consists of semi-annual financial statement reviews and security count procedures performed as required under Rule 17f-2 of the Investment Company Act of 1940 during the Registrant’s fiscal year.
(c) Disclose, under the caption Tax Fees, the aggregate fees billed in each of the last two fiscal years for professional services rendered by the principal accountant for tax compliance, tax advice, and tax planning. Registrants shall describe the nature of the services comprising the fees disclosed under this category.
TAX FEES
2022 – $235,368
2021 – $172,595
The tax fees consist of fees billed in connection with preparing the federal regulated investment company income tax returns for the Registrant for the tax years ended October 31, 2022 and 2021, respectively.
For the last fiscal year, no tax fees were required to be approved pursuant to paragraph (c)(7)(ii) of Rule 2-01 of Regulation S-X.
(d) Disclose, under the caption All Other Fees, the aggregate fees billed in each of the last two fiscal years for products and services provided by the principal accountant, other than the services reported in paragraphs (a) through (c) of this Item. Registrants shall describe the nature of the services comprising the fees disclosed under this category.
ALL OTHER FEES
2022 – Not applicable
2021 – Not applicable
(e) (1) Disclose the audit committee’s pre-approval policies and procedures described in paragraph (c)(7) of Rule 2-01 of Regulation S-X.
Pursuant to the Registrant’s Audit Committee Charter and written policies and procedures for the pre-approval of audit and non-audit services (the “Pre-approval Policy”), the Audit Committee pre-approves all audit and non-audit services performed by the Registrant’s independent public registered accounting firm for the Registrant. In addition, the Audit Committee pre-approves the auditor’s engagement for non-audit services with the Registrant’s investment adviser (not including a sub-adviser whose role is primarily portfolio management and is sub-contracted or overseen by another investment adviser) and any Service Affiliate in accordance with paragraph (c)(7)(ii) of Rule 2-01 of Regulation S-X, if the engagement relates directly to the operations and financial reporting of the Registrant. Proposed services may be pre-approved either 1) without consideration of specific case-by-case services or 2) require the specific pre-approval of the Audit Committee. Therefore, initially the Pre-approval Policy listed a number of audit and non-audit services that have been approved by the Audit Committee, or which were not subject to pre-approval under the transition provisions of Sarbanes-Oxley Act of 2002 (the
“Pre-approval List”). The Audit Committee annually reviews and pre-approves the services included on the Pre-approval List that may be provided by the independent public registered accounting firm without obtaining additional specific pre-approval of individual services from the Audit Committee. The Audit Committee adds to, or subtracts from, the list of general pre-approved services from time to time, based on subsequent determinations. All other audit and non-audit services not on the Pre-approval List must be specifically pre-approved by the Audit Committee.
One or more members of the Audit Committee may be appointed as the Committee’s delegate for the purposes of considering whether to approve such services. Any pre-approvals granted by the delegate will be reported, for informational purposes only, to the Audit Committee at its next scheduled meeting. The Audit Committee’s responsibilities to pre-approve services performed by the independent public registered accounting firm are not delegated to management.
(2) Disclose the percentage of services described in each of paragraphs (b) through (d) of this Item that were approved by the audit committee pursuant to paragraph (c)(7)(i)(C) of Rule 2-01 of Regulation S-X.
2022 – 0.0%
2021 – 0.0%
(f) If greater than 50 percent, disclose the percentage of hours expended on the principal accountant’s engagement to audit the registrant’s financial statements for the most recent fiscal year that were attributed to work performed by persons other than the principal accountant’s full-time, permanent employees.
Not applicable—Less than 50%.
(g) Disclose the aggregate non-audit fees billed by the registrant’s accountant for services rendered to the registrant, and rendered to the registrant’s investment adviser (not including any sub-adviser whose role is primarily portfolio management and is subcontracted with or overseen by another investment adviser), and any entity controlling, controlled by, or under common control with the adviser that provides ongoing services to the registrant for each of the last two fiscal years of the registrant.
The aggregate non-audit fees billed by the independent registered public accounting firm for services rendered to the Registrant, and rendered to Service Affiliates, for the last two calendar year ends were:
2021—$30.8 million
2020—$30.3 million
(h) Disclose whether the registrant’s audit committee of the board of directors has considered whether the provision of non-audit services that were rendered to the registrant’s investment adviser (not including any subadviser whose role is primarily portfolio management and is subcontracted with or overseen by another investment adviser), and any entity controlling, controlled by, or under common control with the investment adviser that provides ongoing services to the registrant that were not pre-approved pursuant to paragraph (c)(7)(ii) of Rule 2-01 of Regulation S-X is compatible with maintaining the principal accountant’s independence.
The Registrant’s Audit Committee has considered whether the provision of the non-audit services that were rendered to Service Affiliates that were not pre-approved (not requiring pre-approval) is compatible with maintaining the independent public registered accounting firm’s independence. All services provided by the independent public registered accounting firm to the Registrant or to Service Affiliates that were required to be pre-approved were pre-approved as required.
(i) A registrant identified by the Commission pursuant to Section 104(i)(2)(A) of the Sarbanes-Oxley Act of 2002 (15 U.S.C. 7214(i)(2)(A)), as having retained, for the preparation of the audit report on its financial statements included in the Form NCSR, a registered public accounting firm that has a branch or office that is located in a foreign jurisdiction and that the Public Company Accounting Oversight Board has determined it is unable to inspect or investigate completely because of a position taken by an authority in the foreign jurisdiction must electronically submit to the Commission on a supplemental basis documentation that establishes that the registrant is not owned or controlled by a governmental entity in the foreign jurisdiction. The registrant must submit this documentation on or before the due date for this form. A registrant that is owned or controlled by a foreign governmental entity is not required to submit such documentation.
Not applicable.
(j) A registrant that is a foreign issuer, as defined in 17 CFR 240.3b-4, identified by the Commission pursuant to Section 104(i)(2)(A) of the Sarbanes-Oxley Act of 2002 (15 U.S.C. 7214(i)(2)(A)), as having retained, for the preparation of the audit report on its financial statements included in the Form N-CSR, a registered public accounting firm that has a branch or office that is located in a foreign jurisdiction and that the Public Company Accounting Oversight Board has determined it is unable to inspect or investigate completely because of a position taken by an authority in the foreign jurisdiction, for each year in which the registrant is so identified, must
provide the below disclosures. Also, any such identified foreign issuer that uses a variable-interest entity or any similar structure that results in additional foreign entities being consolidated in the financial statements of the registrant is required to provide the below disclosures for itself and its consolidated foreign operating entity or entities. A registrant must disclose:
| | (1) | That, for the immediately preceding annual financial statement period, a registered public accounting firm that the PCAOB was unable to inspect or investigate completely, because of a position taken by an authority in the foreign jurisdiction, issued an audit report for the registrant; |
| | (2) | The percentage of shares of the registrant owned by governmental entities in the foreign jurisdiction in which the registrant is incorporated or otherwise organized; |
| | (3) | Whether governmental entities in the applicable foreign jurisdiction with respect to that registered public accounting firm have a controlling financial interest with respect to the registrant; |
| | (4) | The name of each official of the Chinese Communist Party who is a member of the board of directors of the registrant or the operating entity with respect to the registrant; and |
| | (5) | Whether the articles of incorporation of the registrant (or equivalent organizing document) contains any charter of the Chinese Communist Party, including the text of any such charter. |
Not applicable.
ITEM 5. AUDIT COMMITTEE OF LISTED REGISTRANTS.
(a) If the registrant is a listed issuer as defined in Rule 10A-3 under the Exchange Act (17CFR 240.10A-3), state whether or not the registrant has a separately-designated standing audit committee established in accordance with Section 3(a)(58)(A) of the Exchange Act (15 U.S.C. 78c(a)(58)(A)). If the registrant has such a committee, however designated, identify each committee member. If the entire board of directors is acting as the registrant’s audit committee as specified in Section 3(a)(58)(B) of the Exchange Act (15 U.S.C. 78c(a)(58)(B)), so state.
(b) If applicable, provide the disclosure required by Rule 10A-3(d) under the Exchange Act (17CFR 240.10A-3(d)) regarding an exemption from the listing standards for all audit committees.
Not applicable.
ITEM 6. INVESTMENTS.
File Schedule I – Investments in securities of unaffiliated issuers as of the close of the reporting period as set forth in Section 210.12-12 of Regulation S-X, unless the schedule is included as part of the report to shareholders filed under Item 1 of this Form.
Included in Item 1.
ITEM 7. DISCLOSURE OF PROXY VOTING POLICIES AND PROCEDURES FOR CLOSED-END MANAGEMENT INVESTMENT COMPANIES.
Not applicable.
ITEM 8. PORTFOLIO MANAGERS OF CLOSED-END MANAGEMENT INVESTMENT COMPANIES.
Not applicable.
ITEM 9. PURCHASE OF EQUITY SECURITIES BY CLOSED-END MANAGEMENT INVESTMENT COMPANY AND AFFILIATED PURCHASERS.
Not applicable.
ITEM 10. SUBMISSION OF MATTERS TO A VOTE OF SECURITY HOLDERS.
Describe any material changes to the procedures by which shareholders may recommend nominees to the registrant’s board of directors, where those changes were implemented after the registrant last provided disclosure in response to the requirements of Item 7(d)(2)(ii)(G) of Schedule 14A (17 CFR 240.14a-101), or this Item.
No material changes to report.
ITEM 11. CONTROLS AND PROCEDURES.
(a) Disclose the conclusions of the registrant’s principal executive and principal financial officers, or persons performing similar functions, regarding the effectiveness of the registrant’s disclosure controls and procedures (as defined in Rule 30a-3(c) under the Act (17 CFR 270.30a-3(c))) as of a date within 90 days of the filing date of the report that includes the disclosure required by this paragraph, based on the evaluation of these controls and procedures required by Rule 30a-3(b) under the Act (17 CFR 270.30a-3(b)) and Rules 13a-15(b) or 15d-15(b) under the Exchange Act (17 CFR 240.13a-15(b) or 240.15d-15(b)).
The Registrant’s principal executive and principal financial officers have concluded, based on their evaluation of the Registrant’s disclosure controls and procedures as of a date within 90 days of the filing date of this report, that the Registrant’s disclosure controls and procedures are reasonably designed to ensure that information required to be disclosed by the Registrant on Form N-CSR is recorded, processed, summarized and reported within the required time periods and that information required to be disclosed by the Registrant in the reports that it files or submits on Form N-CSR is accumulated and communicated to the Registrant’s management, including its principal executive and principal financial officers, as appropriate to allow timely decisions regarding required disclosure.
(b) Disclose any change in the registrant’s internal control over financial reporting (as defined in Rule 30a-3(d) under the Act (17 CFR 270.30a-3(d)) that occurred during the period covered by this report that has materially affected, or is reasonably likely to materially affect, the registrant’s internal control over financial reporting.
There were no changes in the Registrant’s internal control over financial reporting that occurred during the period covered by this report that have materially affected, or are reasonably likely to materially affect, the Registrant’s internal control over financial reporting.
ITEM 12. DISCLOSURE OF SECURITIES LENDING ACTIVITIES FOR CLOSED-END MANAGEMENT INVESTMENT COMPANIES.
Not applicable.
ITEM 13. EXHIBITS.
| | (a) | File the exhibits listed below as part of this Form. Letter or number the exhibits in the sequence indicated. |
(1) Any code of ethics, or amendment thereto, that is the subject of the disclosure required by Item 2, to the extent that the registrant intends to satisfy the Item 2 requirements through filing of an exhibit.
Code of Ethics applicable to its Principal Executive and Principal Financial Officers pursuant to Section 406 of the Sarbanes-Oxley Act of 2002 attached hereto.
(2) A separate certification for each principal executive officer and principal financial officer of the registrant as required by Rule 30a-2(a) under the Act (17 CFR 270.30a-2), exactly as set forth below:
Certifications pursuant to Rule 30a-2(a) under the Investment Company Act of 1940 are attached hereto.
(1) Any written solicitation to purchase securities under Rule 23c-1 under the Act (17 CFR 270.23c-1) sent or given during the period covered by the report by or on behalf of the registrant to 10 or more persons.
Not applicable.
(2) Change in the registrant’s independent public accountant. Provide the information called for by Item 4 of Form 8-K under the Exchange Act (17 CFR 249.308). Unless otherwise specified by Item 4, or related to and necessary for a complete understanding of information not previously disclosed, the information should relate to events occurring during the reporting period.
Not applicable.
| | (b) | A separate or combined certification for each principal executive officer and principal officer of the registrant as required by Rule 30a-2(b) under the Act of 1940. |
Certifications pursuant to Rule 30a-2(b) under the Investment Company Act of 1940 are attached hereto.
SIGNATURES
Pursuant to the requirements of the Securities Exchange Act of 1934 and the Investment Company Act of 1940, the registrant has duly caused this report to be signed on its behalf by the undersigned, thereunto duly authorized.
JPMorgan Trust I
| | |
| By: | | /s/ Brian S. Shlissel |
| | Brian S. Shlissel |
| | President and Principal Executive Officer |
| | December 29, 2022 |
Pursuant to the requirements of the Securities Exchange Act of 1934 and the Investment Company Act of 1940, this report has been signed below by the following persons on behalf of the registrant and in the capacities and on the dates indicated.
| | |
| By: | | /s/ Brian S. Shlissel |
| | Brian S. Shlissel |
| | President and Principal Executive Officer |
| | December 29, 2022 |
| |
| By: | | /s/ Timothy J. Clemens |
| | Timothy J. Clemens |
| | Treasurer and Principal Financial Officer |
| | December 29, 2022 |