
| Fund (Class) | Costs of a $10,000 investment* | Costs paid as a percentage of a $10,000 investment** |
| JPMorgan Research Market Neutral Fund (Class A Shares) | $148 | 2.81% |
| * | This charge is annualized. |
| ** | Includes dividend expense on short sales. |
KEY FUND STATISTICS
| Fund net assets after future share reacquisition adjustment (000's) | $254,063 | |
| Total number of portfolio holdings | $328 | |
| Portfolio turnover rate | $112 | %* |
| * | Not annualized. |
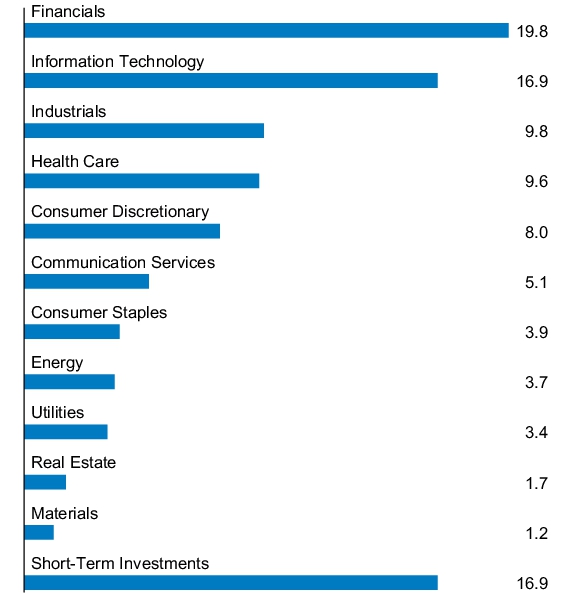
(% of Total Investments)

(% of Total Investments)


- Prospectus
- Financial information
- Fund holdings
- Proxy voting information
| Fund (Class) | Costs of a $10,000 investment* | Costs paid as a percentage of a $10,000 investment** |
| JPMorgan Research Market Neutral Fund (Class C Shares) | $173 | 3.28% |
| * | This charge is annualized. |
| ** | Includes dividend expense on short sales. |
KEY FUND STATISTICS
| Fund net assets after future share reacquisition adjustment (000's) | $254,063 | |
| Total number of portfolio holdings | $328 | |
| Portfolio turnover rate | $112 | %* |
| * | Not annualized. |
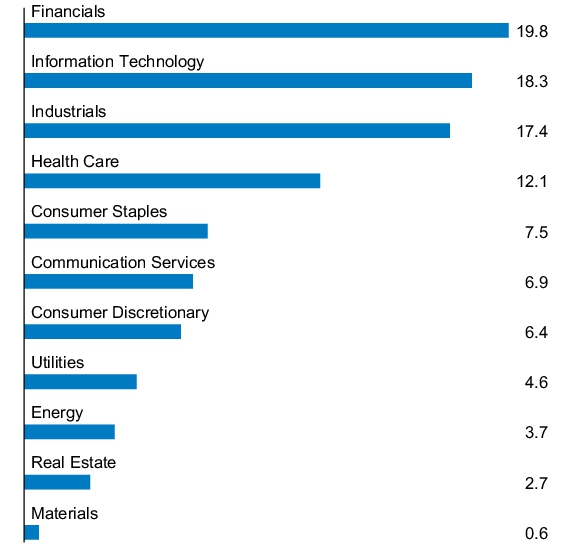
(% of Total Investments)
(% of Total Investments)
- Prospectus
- Financial information
- Fund holdings
- Proxy voting information
| Fund (Class) | Costs of a $10,000 investment* | Costs paid as a percentage of a $10,000 investment** |
| JPMorgan Research Market Neutral Fund (Class I Shares) | $134 | 2.55% |
| * | This charge is annualized. |
| ** | Includes dividend expense on short sales. |
KEY FUND STATISTICS
| Fund net assets after future share reacquisition adjustment (000's) | $254,063 | |
| Total number of portfolio holdings | $328 | |
| Portfolio turnover rate | $112 | %* |
| * | Not annualized. |
(% of Total Investments)

(% of Total Investments)

- Prospectus
- Financial information
- Fund holdings
- Proxy voting information
ITEM 2. CODE OF ETHICS.
Not applicable to a semi-annual report.
ITEM 3. AUDIT COMMITTEE FINANCIAL EXPERT.
Not applicable to a semi-annual report.
ITEM 4. PRINCIPAL ACCOUNTANT FEES AND SERVICES.
Not applicable to a semi-annual report.
ITEM 5. AUDIT COMMITTEE OF LISTED REGISTRANTS.
Not applicable to a semi-annual report.
ITEM 6. INVESTMENTS.
File Schedule I – Investments in securities of unaffiliated issuers as of the close of the reporting period as set forth in Section 210.12-12 of Regulation S-X, unless the schedule is included as part of the report to shareholders filed under Item 7 of this Form.
Included in Item 1.
ITEM 7. FINANCIAL STATEMENTS AND FINANCIAL HIGHLIGHTS FOR OPEN-END MANAGEMENT INVESTMENT COMPANIES
JPMorgan Research Market Neutral Fund |

1 | |
9 | |
16 | |
18 |
INVESTMENTS | SHARES (000) | VALUE ($000) |
Long Positions—97.6% | ||
Common Stocks—81.1% | ||
Aerospace & Defense — 2.9% | ||
Howmet Aerospace, Inc. (a) | 49 | 3,261 |
Northrop Grumman Corp. | 3 | 1,351 |
TransDigm Group, Inc. | 2 | 2,697 |
7,309 | ||
Air Freight & Logistics — 0.1% | ||
United Parcel Service, Inc., Class B | 1 | 155 |
Automobile Components — 0.1% | ||
Mobileye Global, Inc., Class A (Israel) * | 13 | 355 |
Banks — 3.4% | ||
Bank of America Corp. | 20 | 748 |
Fifth Third Bancorp | 68 | 2,490 |
KeyCorp | 31 | 454 |
Truist Financial Corp. | 52 | 1,939 |
Wells Fargo & Co. (a) | 49 | 2,891 |
8,522 | ||
Beverages — 1.1% | ||
Coca-Cola Co. (The) | 9 | 519 |
Keurig Dr Pepper, Inc. | 7 | 242 |
Monster Beverage Corp. * | 30 | 1,594 |
PepsiCo, Inc. | 2 | 374 |
2,729 | ||
Biotechnology — 4.1% | ||
AbbVie, Inc. (a) | 16 | 2,559 |
Biogen, Inc. * | 5 | 972 |
BioMarin Pharmaceutical, Inc. * | 10 | 833 |
Exact Sciences Corp. * | 10 | 600 |
Neurocrine Biosciences, Inc. * | 8 | 1,124 |
Regeneron Pharmaceuticals, Inc. * | 2 | 1,657 |
Sarepta Therapeutics, Inc. * | 10 | 1,235 |
Vertex Pharmaceuticals, Inc. * (a) | 3 | 1,380 |
10,360 | ||
Broadline Retail — 1.3% | ||
Amazon.com, Inc. * (a) | 19 | 3,267 |
Building Products — 1.7% | ||
Carrier Global Corp. | 17 | 1,050 |
Trane Technologies plc | 10 | 3,183 |
4,233 | ||
Capital Markets — 3.7% | ||
Ameriprise Financial, Inc. | 3 | 1,387 |
INVESTMENTS | SHARES (000) | VALUE ($000) |
Capital Markets — continued | ||
Charles Schwab Corp. (The) | 44 | 3,242 |
Goldman Sachs Group, Inc. (The) | 5 | 2,095 |
MSCI, Inc. | 4 | 1,889 |
Raymond James Financial, Inc. | 6 | 765 |
9,378 | ||
Chemicals — 0.4% | ||
Dow, Inc. | 12 | 699 |
Linde plc | 1 | 226 |
925 | ||
Communications Equipment — 0.3% | ||
Arista Networks, Inc. * | 3 | 710 |
Construction Materials — 0.9% | ||
Martin Marietta Materials, Inc. | 4 | 2,176 |
Consumer Staples Distribution & Retail — 0.9% | ||
Costco Wholesale Corp. | 3 | 1,824 |
Maplebear, Inc. * | 14 | 492 |
2,316 | ||
Electric Utilities — 1.6% | ||
Entergy Corp. | 7 | 735 |
NextEra Energy, Inc. (a) | 16 | 1,042 |
PG&E Corp. | 57 | 983 |
Southern Co. (The) | 18 | 1,338 |
4,098 | ||
Electrical Equipment — 0.6% | ||
AMETEK, Inc. | 5 | 859 |
Eaton Corp. plc | 2 | 645 |
1,504 | ||
Electronic Equipment, Instruments & Components — 0.5% | ||
Corning, Inc. | 33 | 1,121 |
Keysight Technologies, Inc. * | 1 | 131 |
1,252 | ||
Energy Equipment & Services — 0.1% | ||
Baker Hughes Co. | 9 | 299 |
Entertainment — 1.6% | ||
Take-Two Interactive Software, Inc. * | 14 | 1,976 |
Warner Music Group Corp., Class A | 60 | 1,974 |
3,950 | ||
April 30, 2024 | J.P. Morgan Specialty Funds | 1 |
INVESTMENTS | SHARES (000) | VALUE ($000) |
Long Positions — continued | ||
Common Stocks — continued | ||
Financial Services—6.7% | ||
Block, Inc. * | 46 | 3,377 |
Corpay, Inc. * | 12 | 3,519 |
Fidelity National Information Services, Inc. | 41 | 2,757 |
Fiserv, Inc. * (a) | 17 | 2,646 |
Jack Henry & Associates, Inc. | 4 | 678 |
Mastercard, Inc., Class A (a) | 9 | 4,107 |
17,084 | ||
Food Products — 0.9% | ||
Hershey Co. (The) | 2 | 350 |
Kellanova | 6 | 375 |
Mondelez International, Inc., Class A | 23 | 1,628 |
2,353 | ||
Ground Transportation — 1.5% | ||
CSX Corp. | 5 | 180 |
Norfolk Southern Corp. | 8 | 1,727 |
Saia, Inc. * | 1 | 231 |
Uber Technologies, Inc. * (a) | 12 | 790 |
XPO, Inc. * | 7 | 805 |
3,733 | ||
Health Care Equipment & Supplies—2.2% | ||
Boston Scientific Corp. * | 26 | 1,874 |
Dexcom, Inc. * | 4 | 538 |
Edwards Lifesciences Corp. * | 6 | 550 |
Medtronic plc | 6 | 443 |
Stryker Corp. | 7 | 2,297 |
5,702 | ||
Health Care Providers & Services—0.7% | ||
Humana, Inc. | 3 | 723 |
UnitedHealth Group, Inc. (a) | 2 | 1,152 |
1,875 | ||
Health Care REITs — 0.0% ^ | ||
Ventas, Inc. | 1 | 61 |
Hotels, Restaurants & Leisure — 3.0% | ||
Chipotle Mexican Grill, Inc. * | 1 | 1,830 |
Expedia Group, Inc. * | 8 | 1,101 |
Hilton Worldwide Holdings, Inc. | 3 | 656 |
Royal Caribbean Cruises Ltd. * | 11 | 1,521 |
Yum! Brands, Inc. (a) | 18 | 2,480 |
7,588 | ||
INVESTMENTS | SHARES (000) | VALUE ($000) |
Household Durables — 0.1% | ||
Lennar Corp., Class A | 2 | 351 |
Household Products — 0.3% | ||
Church & Dwight Co., Inc. | 7 | 744 |
Independent Power and Renewable Electricity Producers — 0.2% | ||
Vistra Corp. | 7 | 560 |
Industrial Conglomerates — 0.4% | ||
Honeywell International, Inc. (a) | 6 | 1,098 |
Industrial REITs — 0.2% | ||
Prologis, Inc. | 4 | 435 |
Insurance—5.5% | ||
Aflac, Inc. | 27 | 2,229 |
Aon plc, Class A | 4 | 1,114 |
Chubb Ltd. | 4 | 916 |
MetLife, Inc. | 29 | 2,038 |
Principal Financial Group, Inc. | 17 | 1,365 |
Progressive Corp. (The) (a) | 15 | 3,027 |
RenaissanceRe Holdings Ltd. (Bermuda) | 3 | 751 |
Travelers Cos., Inc. (The) | 12 | 2,643 |
14,083 | ||
Interactive Media & Services — 1.9% | ||
Alphabet, Inc., Class A * | 5 | 921 |
Meta Platforms, Inc., Class A (a) | 9 | 3,797 |
4,718 | ||
IT Services — 0.5% | ||
Cognizant Technology Solutions Corp., Class A | 6 | 373 |
MongoDB, Inc. * | 2 | 738 |
Snowflake, Inc., Class A * | 1 | 237 |
1,348 | ||
Life Sciences Tools & Services — 1.5% | ||
Danaher Corp. | 7 | 1,697 |
Thermo Fisher Scientific, Inc. | 4 | 2,142 |
3,839 | ||
Machinery — 1.8% | ||
Deere & Co. (a) | 2 | 707 |
Ingersoll Rand, Inc. | 25 | 2,375 |
Otis Worldwide Corp. | 17 | 1,526 |
4,608 | ||
Media — 1.1% | ||
Charter Communications, Inc., Class A * | — | 53 |
2 | J.P. Morgan Specialty Funds | April 30, 2024 |
INVESTMENTS | SHARES (000) | VALUE ($000) |
Long Positions — continued | ||
Common Stocks — continued | ||
Media — continued | ||
Comcast Corp., Class A | 9 | 349 |
Liberty Media Corp-Liberty SiriusXM, Class A * | 102 | 2,454 |
2,856 | ||
Multi-Utilities — 1.5% | ||
CMS Energy Corp. | 15 | 916 |
Dominion Energy, Inc. | 20 | 998 |
DTE Energy Co. | 8 | 868 |
NiSource, Inc. | 28 | 783 |
Public Service Enterprise Group, Inc. | 4 | 314 |
3,879 | ||
Oil, Gas & Consumable Fuels—3.4% | ||
Cheniere Energy, Inc. | 6 | 989 |
Chevron Corp. | 5 | 749 |
ConocoPhillips | 9 | 1,118 |
Diamondback Energy, Inc. | 2 | 352 |
EOG Resources, Inc. | 8 | 1,063 |
Exxon Mobil Corp. | 18 | 2,152 |
Marathon Oil Corp. | 35 | 951 |
Phillips 66 | 2 | 214 |
Targa Resources Corp. | 6 | 725 |
TC Energy Corp. (Canada) | 13 | 448 |
8,761 | ||
Personal Care Products—0.6% | ||
Estee Lauder Cos., Inc. (The), Class A | 11 | 1,566 |
Kenvue, Inc. | 4 | 76 |
1,642 | ||
Pharmaceuticals — 0.9% | ||
Bristol-Myers Squibb Co. (a) | 17 | 750 |
Elanco Animal Health, Inc. * | 107 | 1,414 |
2,164 | ||
Professional Services — 0.3% | ||
Booz Allen Hamilton Holding Corp. | 2 | 289 |
Leidos Holdings, Inc. | 4 | 562 |
851 | ||
Residential REITs — 0.2% | ||
American Homes 4 Rent, Class A | 12 | 413 |
Retail REITs — 0.1% | ||
Kimco Realty Corp. | 7 | 139 |
INVESTMENTS | SHARES (000) | VALUE ($000) |
Semiconductors & Semiconductor Equipment—7.7% | ||
Advanced Micro Devices, Inc. * (a) | 5 | 876 |
Analog Devices, Inc. (a) | 9 | 1,866 |
ASML Holding NV (Registered), NYRS (Netherlands) | 1 | 662 |
Marvell Technology, Inc. | 22 | 1,429 |
Microchip Technology, Inc. | 15 | 1,353 |
Micron Technology, Inc. (a) | 29 | 3,301 |
NVIDIA Corp. (a) | 3 | 2,538 |
NXP Semiconductors NV (China) (a) | 5 | 1,291 |
Qorvo, Inc. * | 8 | 912 |
Taiwan Semiconductor Manufacturing Co. Ltd., ADR (Taiwan) | 26 | 3,528 |
Texas Instruments, Inc. (a) | 10 | 1,821 |
19,577 | ||
Software—4.3% | ||
Crowdstrike Holdings, Inc., Class A * | 2 | 556 |
Intuit, Inc. (a) | 4 | 2,327 |
Microsoft Corp. (a) | 9 | 3,398 |
PTC, Inc. * | 1 | 297 |
Roper Technologies, Inc. | 1 | 448 |
Salesforce, Inc. | 9 | 2,345 |
ServiceNow, Inc. * | 2 | 1,673 |
11,044 | ||
Specialized REITs—1.2% | ||
American Tower Corp. | 1 | 183 |
Digital Realty Trust, Inc. | 21 | 2,942 |
3,125 | ||
Specialty Retail—3.2% | ||
AutoZone, Inc. * | 1 | 1,579 |
Best Buy Co., Inc. | 15 | 1,132 |
Burlington Stores, Inc. * | 13 | 2,351 |
Lowe's Cos., Inc. (a) | 10 | 2,225 |
O'Reilly Automotive, Inc. * (a) | 1 | 882 |
8,169 | ||
Technology Hardware, Storage & Peripherals — 3.2% | ||
Apple, Inc. | 7 | 1,239 |
Hewlett Packard Enterprise Co. | 83 | 1,412 |
Seagate Technology Holdings plc | 29 | 2,493 |
Western Digital Corp. * | 41 | 2,914 |
8,058 | ||
April 30, 2024 | J.P. Morgan Specialty Funds | 3 |
INVESTMENTS | SHARES (000) | VALUE ($000) |
Long Positions — continued | ||
Common Stocks — continued | ||
Trading Companies & Distributors — 0.3% | ||
United Rentals, Inc. | — | 213 |
WW Grainger, Inc. | 1 | 529 |
742 | ||
Wireless Telecommunication Services — 0.4% | ||
T-Mobile US, Inc. | 7 | 1,102 |
Total Common Stocks (Cost $162,224) | 206,240 | |
PRINCIPAL AMOUNT (000) | ||
Short-Term Investments—16.5% | ||
U.S. Treasury Obligations — 3.9% | ||
U.S. Treasury Bills 5.31%, 6/18/2024 (b)(Cost $9,930) | 10,000 | 9,930 |
SHARES (000) | ||
Investment Companies—12.6% | ||
JPMorgan Prime Money Market Fund Class Institutional Shares, 5.33% (c) (d)(Cost $31,916) | 31,906 | 31,912 |
Total Short-Term Investments (Cost $41,846) | 41,842 | |
Total Long Positions (Cost $204,070) | 248,082 | |
Short Positions—(76.0)% | ||
Common Stocks—(76.0)% | ||
Aerospace & Defense—(1.8)% | ||
Boeing Co. (The) * | (3 ) | (585 ) |
Huntington Ingalls Industries, Inc. | (5 ) | (1,313 ) |
L3Harris Technologies, Inc. | (2 ) | (442 ) |
Lockheed Martin Corp. | (5 ) | (2,360 ) |
(4,700 ) | ||
Air Freight & Logistics — (0.3)% | ||
Expeditors International of Washington, Inc. | (6 ) | (653 ) |
Automobiles — (0.7)% | ||
Ford Motor Co. | (84 ) | (1,029 ) |
General Motors Co. | (13 ) | (567 ) |
Harley-Davidson, Inc. | (7 ) | (239 ) |
(1,835 ) | ||
Banks — (1.9)% | ||
Citigroup, Inc. | (9 ) | (528 ) |
Huntington Bancshares, Inc. | (131 ) | (1,766 ) |
INVESTMENTS | SHARES (000) | VALUE ($000) |
Banks — continued | ||
M&T Bank Corp. | (6 ) | (853 ) |
PNC Financial Services Group, Inc. (The) | (11 ) | (1,726 ) |
(4,873 ) | ||
Beverages — (0.5)% | ||
Brown-Forman Corp., Class B | (6 ) | (297 ) |
Molson Coors Beverage Co., Class B | (17 ) | (953 ) |
(1,250 ) | ||
Biotechnology — (1.8)% | ||
Amgen, Inc. | (6 ) | (1,544 ) |
Gilead Sciences, Inc. | (19 ) | (1,214 ) |
Moderna, Inc. * | (16 ) | (1,807 ) |
(4,565 ) | ||
Building Products — (1.7)% | ||
Allegion plc | (3 ) | (345 ) |
Johnson Controls International plc | (37 ) | (2,375 ) |
Lennox International, Inc. | (3 ) | (1,565 ) |
(4,285 ) | ||
Capital Markets — (4.3)% | ||
Bank of New York Mellon Corp. (The) | (35 ) | (1,956 ) |
BlackRock, Inc. | (3 ) | (2,066 ) |
FactSet Research Systems, Inc. | (3 ) | (1,468 ) |
Franklin Resources, Inc. | (26 ) | (585 ) |
LPL Financial Holdings, Inc. | (6 ) | (1,757 ) |
Moody's Corp. | (2 ) | (677 ) |
Nasdaq, Inc. | (25 ) | (1,472 ) |
Northern Trust Corp. | (3 ) | (228 ) |
T. Rowe Price Group, Inc. | (5 ) | (591 ) |
(10,800 ) | ||
Commercial Services & Supplies — (0.1)% | ||
Waste Management, Inc. | (1 ) | (210 ) |
Communications Equipment — (1.7)% | ||
Cisco Systems, Inc. | (94 ) | (4,402 ) |
Consumer Finance — (0.7)% | ||
American Express Co. | (4 ) | (954 ) |
Synchrony Financial | (21 ) | (918 ) |
(1,872 ) | ||
Consumer Staples Distribution & Retail—(3.1)% | ||
Dollar General Corp. | (6 ) | (798 ) |
Kroger Co. (The) | (71 ) | (3,908 ) |
4 | J.P. Morgan Specialty Funds | April 30, 2024 |
INVESTMENTS | SHARES (000) | VALUE ($000) |
Short Positions — continued | ||
Common Stocks — continued | ||
Consumer Staples Distribution & Retail — continued | ||
Sysco Corp. | (37 ) | (2,724 ) |
Walgreens Boots Alliance, Inc. | (17 ) | (308 ) |
Walmart, Inc. | (4 ) | (257 ) |
(7,995 ) | ||
Containers & Packaging — (0.5)% | ||
Ball Corp. | (3 ) | (180 ) |
International Paper Co. | (29 ) | (1,026 ) |
(1,206 ) | ||
Diversified Telecommunication Services — (0.8)% | ||
AT&T, Inc. | (43 ) | (719 ) |
Verizon Communications, Inc. | (35 ) | (1,382 ) |
(2,101 ) | ||
Electric Utilities — (2.8)% | ||
American Electric Power Co., Inc. | (17 ) | (1,482 ) |
Duke Energy Corp. | (12 ) | (1,123 ) |
Eversource Energy | (13 ) | (804 ) |
Exelon Corp. | (35 ) | (1,315 ) |
FirstEnergy Corp. | (41 ) | (1,569 ) |
Pinnacle West Capital Corp. | (10 ) | (729 ) |
(7,022 ) | ||
Electrical Equipment — (0.3)% | ||
Acuity Brands, Inc. | (3 ) | (835 ) |
Energy Equipment & Services — (0.4)% | ||
Halliburton Co. | (26 ) | (961 ) |
Entertainment — (1.5)% | ||
Electronic Arts, Inc. | (22 ) | (2,773 ) |
Netflix, Inc. * | (2 ) | (1,007 ) |
(3,780 ) | ||
Financial Services — (3.3)% | ||
Global Payments, Inc. | (6 ) | (740 ) |
PayPal Holdings, Inc. * | (35 ) | (2,394 ) |
Toast, Inc., Class A * | (76 ) | (1,802 ) |
Voya Financial, Inc. | (20 ) | (1,333 ) |
Western Union Co. (The) | (159 ) | (2,139 ) |
(8,408 ) | ||
Food Products — (1.8)% | ||
Campbell Soup Co. | (40 ) | (1,837 ) |
Conagra Brands, Inc. | (10 ) | (295 ) |
INVESTMENTS | SHARES (000) | VALUE ($000) |
Food Products — continued | ||
General Mills, Inc. | (19 ) | (1,369 ) |
Kraft Heinz Co. (The) | (26 ) | (1,011 ) |
(4,512 ) | ||
Gas Utilities — (0.3)% | ||
National Fuel Gas Co. | (12 ) | (653 ) |
Ground Transportation — (0.3)% | ||
Heartland Express, Inc. | (22 ) | (223 ) |
JB Hunt Transport Services, Inc. | (2 ) | (247 ) |
Old Dominion Freight Line, Inc. | (1 ) | (249 ) |
Werner Enterprises, Inc. | (2 ) | (69 ) |
(788 ) | ||
Health Care Equipment & Supplies—(1.8)% | ||
Abbott Laboratories | (25 ) | (2,623 ) |
Dentsply Sirona, Inc. | (14 ) | (424 ) |
Intuitive Surgical, Inc. * | — | (114 ) |
Solventum Corp. * | — | — |
Zimmer Biomet Holdings, Inc. | (13 ) | (1,520 ) |
(4,681 ) | ||
Health Care Providers & Services — (1.3)% | ||
Cigna Group (The) | (2 ) | (739 ) |
CVS Health Corp. | (21 ) | (1,448 ) |
Henry Schein, Inc. * | (7 ) | (473 ) |
Quest Diagnostics, Inc. | (4 ) | (532 ) |
(3,192 ) | ||
Hotels, Restaurants & Leisure — (1.4)% | ||
Airbnb, Inc., Class A * | (3 ) | (490 ) |
Carnival Corp. * | (18 ) | (266 ) |
Starbucks Corp. | (31 ) | (2,716 ) |
(3,472 ) | ||
Household Durables — (0.3)% | ||
DR Horton, Inc. | (1 ) | (148 ) |
Mohawk Industries, Inc. * | (3 ) | (375 ) |
NVR, Inc. * | — | (112 ) |
PulteGroup, Inc. | (1 ) | (124 ) |
(759 ) | ||
Household Products — (0.3)% | ||
Clorox Co. (The) | (2 ) | (259 ) |
April 30, 2024 | J.P. Morgan Specialty Funds | 5 |
INVESTMENTS | SHARES (000) | VALUE ($000) |
Short Positions — continued | ||
Common Stocks — continued | ||
Household Products — continued | ||
Colgate-Palmolive Co. | (1 ) | (133 ) |
Kimberly-Clark Corp. | (2 ) | (247 ) |
(639 ) | ||
Industrial Conglomerates — (0.9)% | ||
3M Co. | (25 ) | (2,391 ) |
Insurance — (4.9)% | ||
Allstate Corp. (The) | (18 ) | (3,081 ) |
American International Group, Inc. | (35 ) | (2,660 ) |
Arch Capital Group Ltd. * | (8 ) | (750 ) |
Arthur J Gallagher & Co. | (4 ) | (1,006 ) |
Hartford Financial Services Group, Inc. (The) | (7 ) | (630 ) |
Kinsale Capital Group, Inc. | (3 ) | (1,042 ) |
Marsh & McLennan Cos., Inc. | (4 ) | (870 ) |
Ryan Specialty Holdings, Inc. | (13 ) | (660 ) |
WR Berkley Corp. | (22 ) | (1,652 ) |
(12,351 ) | ||
Interactive Media & Services — (0.2)% | ||
Alphabet, Inc., Class C * | (3 ) | (505 ) |
IT Services — (1.7)% | ||
Accenture plc, Class A | (1 ) | (328 ) |
DXC Technology Co. * | (12 ) | (229 ) |
EPAM Systems, Inc. * | (3 ) | (684 ) |
International Business Machines Corp. | (18 ) | (2,986 ) |
(4,227 ) | ||
Life Sciences Tools & Services — (1.7)% | ||
Agilent Technologies, Inc. | (8 ) | (1,115 ) |
Bruker Corp. | (15 ) | (1,168 ) |
Revvity, Inc. | (2 ) | (234 ) |
Waters Corp. * | (6 ) | (1,759 ) |
(4,276 ) | ||
Machinery—(2.8)% | ||
Caterpillar, Inc. | (2 ) | (505 ) |
Donaldson Co., Inc. | (25 ) | (1,810 ) |
IDEX Corp. | (2 ) | (532 ) |
Illinois Tool Works, Inc. | (11 ) | (2,758 ) |
PACCAR, Inc. | (4 ) | (385 ) |
Stanley Black & Decker, Inc. | (13 ) | (1,194 ) |
(7,184 ) | ||
INVESTMENTS | SHARES (000) | VALUE ($000) |
Media—(2.7)% | ||
Fox Corp., Class A | (99 ) | (3,074 ) |
Interpublic Group of Cos., Inc. (The) | (57 ) | (1,731 ) |
Omnicom Group, Inc. | (13 ) | (1,255 ) |
Paramount Global, Class B | (76 ) | (862 ) |
(6,922 ) | ||
Multi-Utilities—(0.4)% | ||
Consolidated Edison, Inc. | (2 ) | (231 ) |
Sempra | (13 ) | (918 ) |
(1,149 ) | ||
Office REITs — (0.3)% | ||
Orion Office REIT, Inc. | — | — |
SL Green Realty Corp. | (7 ) | (370 ) |
Vornado Realty Trust | (12 ) | (311 ) |
(681 ) | ||
Oil, Gas & Consumable Fuels — (2.5)% | ||
APA Corp. | (11 ) | (354 ) |
Coterra Energy, Inc. | (34 ) | (934 ) |
Devon Energy Corp. | (9 ) | (477 ) |
Enbridge, Inc. (Canada) | (38 ) | (1,357 ) |
Kinder Morgan, Inc. | (40 ) | (728 ) |
Marathon Petroleum Corp. | (2 ) | (258 ) |
Occidental Petroleum Corp. | (10 ) | (654 ) |
ONEOK, Inc. | (6 ) | (501 ) |
Valero Energy Corp. | (3 ) | (477 ) |
Williams Cos., Inc. (The) | (14 ) | (513 ) |
(6,253 ) | ||
Passenger Airlines — (0.3)% | ||
American Airlines Group, Inc. * | (18 ) | (243 ) |
Southwest Airlines Co. | (22 ) | (580 ) |
(823 ) | ||
Pharmaceuticals—(2.6)% | ||
Eli Lilly & Co. | (3 ) | (2,230 ) |
Johnson & Johnson | (5 ) | (776 ) |
Merck & Co., Inc. | (12 ) | (1,611 ) |
Pfizer, Inc. | (35 ) | (890 ) |
Zoetis, Inc. | (8 ) | (1,208 ) |
(6,715 ) | ||
Professional Services — (4.0)% | ||
Automatic Data Processing, Inc. | (2 ) | (449 ) |
6 | J.P. Morgan Specialty Funds | April 30, 2024 |
INVESTMENTS | SHARES (000) | VALUE ($000) |
Short Positions — continued | ||
Common Stocks — continued | ||
Professional Services — continued | ||
Dayforce, Inc. * | (32 ) | (1,983 ) |
Equifax, Inc. | (10 ) | (2,095 ) |
Paychex, Inc. | (14 ) | (1,715 ) |
Paycom Software, Inc. | (7 ) | (1,360 ) |
Robert Half, Inc. | (8 ) | (522 ) |
TransUnion | (18 ) | (1,298 ) |
Verisk Analytics, Inc. | (3 ) | (701 ) |
(10,123 ) | ||
Residential REITs—(0.2)% | ||
Essex Property Trust, Inc. | (2 ) | (385 ) |
Retail REITs — (1.3)% | ||
NNN REIT, Inc. | (32 ) | (1,320 ) |
Simon Property Group, Inc. | (14 ) | (1,924 ) |
(3,244 ) | ||
Semiconductors & Semiconductor Equipment—(8.0)% | ||
Applied Materials, Inc. | (33 ) | (6,507 ) |
ARM Holdings plc * | (27 ) | (2,715 ) |
Broadcom, Inc. | (2 ) | (2,316 ) |
Intel Corp. | (81 ) | (2,470 ) |
KLA Corp. | (3 ) | (1,964 ) |
Monolithic Power Systems, Inc. | (1 ) | (1,012 ) |
QUALCOMM, Inc. | (13 ) | (2,274 ) |
Teradyne, Inc. | (10 ) | (1,148 ) |
(20,406 ) | ||
Software — (1.6)% | ||
Adobe, Inc. * | (1 ) | (732 ) |
Bill Holdings, Inc. * | (5 ) | (298 ) |
Oracle Corp. | (12 ) | (1,361 ) |
UiPath, Inc., Class A * | (11 ) | (201 ) |
Workday, Inc., Class A * | (6 ) | (1,428 ) |
(4,020 ) | ||
Specialized REITs — (0.3)% | ||
Iron Mountain, Inc. | (11 ) | (880 ) |
Specialty Retail — (1.1)% | ||
Home Depot, Inc. (The) | (5 ) | (1,692 ) |
Ulta Beauty, Inc. * | (1 ) | (260 ) |
Williams-Sonoma, Inc. | (3 ) | (833 ) |
(2,785 ) | ||
INVESTMENTS | SHARES (000) | VALUE ($000) |
Technology Hardware, Storage & Peripherals — (0.9)% | ||
Dell Technologies, Inc., Class C | (1 ) | (132 ) |
NetApp, Inc. | (21 ) | (2,122 ) |
Xerox Holdings Corp. | (5 ) | (73 ) |
(2,327 ) | ||
Textiles, Apparel & Luxury Goods—(1.3)% | ||
NIKE, Inc., Class B | (33 ) | (3,036 ) |
On Holding AG (Switzerland), Class A * | (12 ) | (381 ) |
(3,417 ) | ||
Trading Companies & Distributors — (0.6)% | ||
Fastenal Co. | (24 ) | (1,615 ) |
Total Common Stocks (Proceeds $(189,816)) | (193,128 ) | |
Total Short Positions (Proceeds $(189,816)) | (193,128 ) | |
Total Investments—21.6% (Cost $14,254) | 54,954 | |
Other Assets Less Liabilities—74.3% | 188,703 | |
Net Assets—95.9% | 243,657 | |
Future share reacquisition adjustment— 4.1% | 10,406 | |
Net assets after future share reacquisition adjustment—100.0% | 254,063 | |
Percentages indicated are based on net assets after future share reacquisition adjustment. | ||
Amounts presented as a dash ("-") represent amounts that round to less than a thousand. |
Abbreviations | |
ADR | American Depositary Receipt |
NYRS | New York Registry Shares |
REIT | Real Estate Investment Trust |
^ | Amount rounds to less than 0.1% of net assets. | |
* | Non-income producing security. | |
(a) | All or a portion of this security is segregated as collateral for short sales. The total value of securities and cash segregated as collateral is $34,494 and $194,296, respectively. | |
(b) | The rate shown is the effective yield as of April 30, 2024. | |
April 30, 2024 | J.P. Morgan Specialty Funds | 7 |
(c) | Investment in an affiliated fund, which is registered under the Investment Company Act of 1940, as amended, and is advised by J.P. Morgan Investment Management Inc. | |
(d) | The rate shown is the current yield as of April 30, 2024. |
DESCRIPTION | NUMBER OF CONTRACTS | EXPIRATION DATE | TRADING CURRENCY | NOTIONAL AMOUNT ($) | VALUE AND UNREALIZED APPRECIATION (DEPRECIATION) ($) |
Short Contracts | |||||
S&P 500 E-Mini Index | (50 ) | 06/21/2024 | USD | (12,662 ) | 459 |
Abbreviations | |
USD | United States Dollar |
8 | J.P. Morgan Specialty Funds | April 30, 2024 |
JPMorgan Research Market Neutral Fund | |
ASSETS: | |
Investments in non-affiliates, at value | $216,170 |
Investments in affiliates, at value | 31,912 |
Deposits at broker for futures contracts | 659 |
Deposits at broker for securities sold short | 194,296 |
Receivables: | |
Investment securities sold | 3,639 |
Fund shares sold | 202 |
Interest from non-affiliates | 950 |
Dividends from non-affiliates | 74 |
Dividends from affiliates | 122 |
Variation margin on futures contracts | 206 |
Class Action proceeds | 1,307 |
Total Assets | 449,537 |
LIABILITIES: | |
Payables: | |
Securities sold short, at value | 193,128 |
Dividend expense to non-affiliates on securities sold short | 187 |
Investment securities purchased | 4,024 |
Fund shares redeemed | 683 |
Accrued liabilities: | |
Investment advisory fees | 56 |
Administration fees | 7 |
Distribution fees | 6 |
Service fees | 51 |
Custodian and accounting fees | 7 |
Trustees’ and Chief Compliance Officer’s fees | — (a) |
Due to shareholders upon reprocessing | 7,687 |
Other | 44 |
Total Liabilities | 205,880 |
Net Assets | 243,657 |
Future share reacquisition adjustment | 10,406 |
Net Assets after future share reacquisition adjustment | $254,063 |
April 30, 2024 | J.P. Morgan Specialty Funds | 9 |
JPMorgan Research Market Neutral Fund | |
NET ASSETS: | |
Paid-in-Capital | $230,350 |
Total distributable earnings (loss) | 13,307 |
Net Assets | 243,657 |
Future share reacquisition adjustment | 10,406 |
Net Assets after future share reacquisition adjustment | $254,063 |
Net Assets after share reacquisition adjustment: | |
Class A | $25,900 |
Class C | 1,764 |
Class I | 226,399 |
Total | $254,063 |
Outstanding units of beneficial interest (shares) ($0.0001 par value; unlimited number of shares authorized): | |
Class A | 1,809 |
Class C | 139 |
Class I | 14,696 |
Net Asset Value (a): | |
(after future share reacquisition adjustment) | |
Class A — Redemption price per share | $14.32 |
Class C — Offering price per share (b) | 12.66 |
Class I — Offering and redemption price per share | 15.41 |
Class A maximum sales charge | 5.25 % |
Class A maximum public offering price per share [net asset value per share/(100% – maximum sales charge)] | $15.11 |
Cost of investments in non-affiliates | $172,154 |
Cost of investments in affiliates | 31,916 |
Proceeds from securities sold short | 189,816 |
10 | J.P. Morgan Specialty Funds | April 30, 2024 |
JPMorgan Research Market Neutral Fund | |
INVESTMENT INCOME: | |
Interest income from non-affiliates | $459 |
Interest income from non-affiliates on securities sold short | 4,992 |
Dividend income from non-affiliates | 1,326 |
Dividend income from affiliates | 560 |
Total investment income | 7,337 |
EXPENSES: | |
Investment advisory fees | 416 |
Administration fees | 89 |
Distribution fees: | |
Class A | 31 |
Class C | 6 |
Service fees: | |
Class A | 31 |
Class C | 2 |
Class I | 264 |
Custodian and accounting fees | 24 |
Interest expense to affiliates | — (a) |
Professional fees | 36 |
Trustees’ and Chief Compliance Officer’s fees | 13 |
Printing and mailing costs | 22 |
Registration and filing fees | 36 |
Transfer agency fees (See Note 2.H.) | 5 |
Dividend expense to non-affiliates on securities sold short | 2,275 |
Other | 5 |
Total expenses | 3,255 |
Less fees waived | (140 ) |
Less expense reimbursements | — (a) |
Net expenses | 3,115 |
Net investment income (loss) | 4,222 |
April 30, 2024 | J.P. Morgan Specialty Funds | 11 |
JPMorgan Research Market Neutral Fund | |
REALIZED/UNREALIZED GAINS (LOSSES): | |
Net realized gain (loss) on transactions from: | |
Investments in non-affiliates | $17,593 |
Investments in affiliates | (11 ) |
Futures contracts | (1,019 ) |
Securities sold short | (11,655 ) |
Net realized gain (loss) | 4,908 |
Change in net unrealized appreciation/depreciation on: | |
Investments in non-affiliates | 30,350 |
Investments in affiliates | (5 ) |
Futures contracts | 261 |
Securities sold short | (19,886 ) |
Change in net unrealized appreciation/depreciation | 10,720 |
Net realized/unrealized gains (losses) | 15,628 |
Change in net assets resulting from operations | $19,850 |
12 | J.P. Morgan Specialty Funds | April 30, 2024 |
JPMorgan Research Market Neutral Fund | ||
Six Months Ended April 30, 2024 (Unaudited) | Year Ended October 31, 2023 | |
CHANGE IN NET ASSETS RESULTING FROM OPERATIONS: | ||
Net investment income (loss) | $4,222 | $5,116 |
Net realized gain (loss) | 4,908 | (2,270 ) |
Change in net unrealized appreciation/depreciation | 10,720 | 14,492 |
Change in net assets resulting from operations | 19,850 | 17,338 |
DISTRIBUTIONS TO SHAREHOLDERS: | ||
Class A | (644 ) | — |
Class C | (43 ) | — |
Class I | (5,534 ) | — |
Total distributions to shareholders | (6,221 ) | — |
CAPITAL TRANSACTIONS: | ||
Change in net assets resulting from capital transactions | 13,722 | 44,172 |
NET ASSETS: | ||
Change in net assets | 27,351 | 61,510 |
Beginning of period | 216,306 | 154,796 |
End of period | 243,657 | 216,306 |
Future share reacquisition adjustment | 10,406 | 9,067 |
End of period after future share reacquisition adjustment | $254,063 | $225,373 |
April 30, 2024 | J.P. Morgan Specialty Funds | 13 |
JPMorgan Research Market Neutral Fund | ||
Six Months Ended April 30, 2024 (Unaudited) | Year Ended October 31, 2023 | |
CAPITAL TRANSACTIONS: | ||
Class A | ||
Proceeds from shares issued | $5,210 | $7,679 |
Distributions reinvested | 626 | — |
Cost of shares redeemed | (4,527 ) | (7,148 ) |
Change in net assets resulting from Class A capital transactions | 1,309 | 531 |
Class C | ||
Proceeds from shares issued | 18 | 355 |
Distributions reinvested | 43 | — |
Cost of shares redeemed | (155 ) | (262 ) |
Change in net assets resulting from Class C capital transactions | (94 ) | 93 |
Class I | ||
Proceeds from shares issued | 66,870 | 144,273 |
Distributions reinvested | 4,538 | — |
Cost of shares redeemed | (58,901 ) | (100,725 ) |
Change in net assets resulting from Class I capital transactions | 12,507 | 43,548 |
Total change in net assets resulting from capital transactions | $13,722 | $44,172 |
SHARE TRANSACTIONS: | ||
Class A | ||
Issued | 385 | 609 |
Reinvested | 47 | — |
Redeemed | (325 ) | (554 ) |
Change in Class A Shares | 107 | 55 |
Class C | ||
Issued | 1 | 33 |
Reinvested | 4 | — |
Redeemed | (13 ) | (23 ) |
Change in Class C Shares | (8 ) | 10 |
Class I | ||
Issued | 4,580 | 10,434 |
Reinvested | 320 | — |
Redeemed | (3,955 ) | (7,253 ) |
Change in Class I Shares | 945 | 3,181 |
14 | J.P. Morgan Specialty Funds | April 30, 2024 |
Per share operating performance | |||||||
Investment operations | Distributions | ||||||
Net asset value, beginning of period * | Net investment income (loss)(b) | Net realized and unrealized gains (losses) on investments | Total from investment operations | Net investment income | Net realized gain | Total distributions | |
JPMorgan Research Market Neutral Fund | |||||||
Class A | |||||||
Six Months Ended April 30, 2024 (Unaudited) | $13.56 | $0.22 | $0.85 | $1.07 | $(0.36 ) | $— | $(0.36 ) |
Year Ended October 31, 2023 (as restated, See Note 8) | 12.30 | 0.34 | 0.84 | 1.18 | — | — | — |
Year Ended October 31, 2022 (as restated, See Note 8) | 12.63 | (0.10 ) | (0.32 ) | (0.42 ) | — | — | — |
Year Ended October 31, 2021 (as restated, See Note 8) | 13.23 | (0.21 ) | 0.41 | 0.20 | — | (0.91 ) | (0.91 ) |
Year Ended October 31, 2020 (as restated, See Note 8) | 13.26 | (0.20 ) | 1.51 | 1.31 | — | (1.49 ) | (1.49 ) |
Year Ended October 31, 2019 (as restated, See Note 8) | 14.32 | (0.03 ) | 0.41 | 0.38 | — | (1.45 ) | (1.45 ) |
Class C | |||||||
Six Months Ended April 30, 2024 (Unaudited) | 12.00 | 0.17 | 0.78 | 0.95 | (0.30 ) | — | (0.30 ) |
Year Ended October 31, 2023 (as restated, See Note 8) | 10.94 | 0.25 | 0.77 | 1.02 | — | — | — |
Year Ended October 31, 2022 (as restated, See Note 8) | 11.29 | (0.14 ) | (0.30 ) | (0.44 ) | — | — | — |
Year Ended October 31, 2021 (as restated, See Note 8) | 11.97 | (0.25 ) | 0.41 | 0.16 | — | (0.91 ) | (0.91 ) |
Year Ended October 31, 2020 (as restated, See Note 8) | 12.20 | (0.23 ) | 1.36 | 1.13 | — | (1.49 ) | (1.49 ) |
Year Ended October 31, 2019 (as restated, See Note 8) | 13.35 | (0.09 ) | 0.39 | 0.30 | — | (1.45 ) | (1.45 ) |
Class I | |||||||
Six Months Ended April 30, 2024 (Unaudited) | 14.58 | 0.26 | 0.87 | 1.13 | (0.39 ) | — | (0.39 ) |
Year Ended October 31, 2023 (as restated, See Note 8) | 13.19 | 0.41 | 0.75 | 1.16 | — | — | — |
Year Ended October 31, 2022 (as restated, See Note 8) | 13.51 | (0.06 ) | (0.53 ) | (0.59 ) | — | — | — |
Year Ended October 31, 2021 (as restated, See Note 8) | 14.03 | (0.20 ) | 0.46 | 0.26 | — | (0.91 ) | (0.91 ) |
Year Ended October 31, 2020 (as restated, See Note 8) | 13.96 | (0.19 ) | 1.00 | 0.81 | — | (1.49 ) | (1.49 ) |
Year Ended October 31, 2019 (as restated, See Note 8) | 14.96 | — (h) | 0.43 | 0.43 | — | (1.45 ) | (1.45 ) |
* | Net asset value per share has been calculated after future share reacquisition adjustment for the impacted periods. |
** | Amount presented after future share reacquisition adjustment. |
(a) | Annualized for periods less than one year, unless otherwise noted. |
(b) | Calculated based upon average shares outstanding. |
(c) | Not annualized for periods less than one year. |
(d) | Includes adjustments in accordance with accounting principles generally accepted in the United States of America and as such, the net asset values for financial reporting purposes and the returns based upon those net asset values may differ from the net asset values and returns for shareholder transactions. |
(e) | Includes interest expense, if applicable, which is less than 0.005% unless otherwise noted. |
(f) | |
April 30, 2024 | October 31, 2023 (as restated, See Note 8) | October 31, 2022 (as restated, See Note 8) | October 31, 2021 (as restated, See Note 8) | October 31, 2020 (as restated, See Note 8) | October 31, 2019 (as restated, See Note 8) | |
Net expenses (excluding dividend and interest expense for securities sold short) | ||||||
Class A | 0.92 % | 0.90 % | 0.90 % | 0.92 % | 1.06 % | 1.21 % |
Class C | 1.41 | 1.39 | 1.39 | 1.41 | 1.58 | 1.71 |
Class I | 0.66 | 0.64 | 0.64 | 0.66 | 0.75 | 0.95 |
Expenses without waivers and reimbursements (excluding dividend and interest expense for securities sold short) | ||||||
Class A | 1.04 | 1.07 | 1.08 | 1.14 | 1.44 | 1.61 |
Class C | 1.55 | 1.55 | 1.57 | 1.64 | 1.93 | 2.07 |
Class I | 0.78 | 0.81 | 0.82 | 0.87 | 1.11 | 1.31 |
(g) | Interest expense on securities sold short is 0.16%. |
(h) | Amount rounds to less than $0.005. |
16 | J.P. Morgan Specialty Funds | April 30, 2024 |
Ratios/Supplemental data | ||||||||
Ratios to average net assets(a) | ||||||||
Future share reacquisition adjustment | Net asset value, end of period * | Total return (excludes sales charge)(c)(d) | Net assets, end of period (000's) ** | Net expenses (including dividend expense for securities sold short)(e)(f) | Net investment income (loss) | Expenses without waivers and reimbursements (including dividend expense for securities sold short)(f) | Portfolio turnover rate (excluding securities sold short)(c) | Portfolio turnover rate (including securities sold short)(c) |
$0.05 | $14.32 | 8.40 % | $25,900 | 2.81 % | 3.26 % | 2.93 % | 55 % | 112 % |
0.08 | 13.56 | 10.24 | 23,101 | 2.84 | 2.69 | 3.01 | 92 | 232 |
0.09 | 12.30 | (2.61 ) | 20,259 | 2.72 | (0.84 ) | 2.90 | 100 | 252 |
0.11 | 12.63 | 2.67 | 17,161 | 2.92 (g) | (1.71 ) | 3.14 | 119 | 307 |
0.15 | 13.23 | 12.39 | 18,509 | 3.18 | (1.53 ) | 3.56 | 224 | 531 |
0.01 | 13.26 | 2.92 | 14,442 | 3.66 | (0.24 ) | 4.06 | 125 | 356 |
0.01 | 12.66 | 8.15 | 1,764 | 3.28 | 2.77 | 3.42 | 55 | 112 |
0.04 | 12.00 | 9.69 | 1,762 | 3.33 | 2.20 | 3.50 | 92 | 232 |
0.09 | 10.94 | (3.10 ) | 1,504 | 3.21 | (1.30 ) | 3.39 | 100 | 252 |
0.07 | 11.29 | 2.25 | 1,233 | 3.44 (g) | (2.22 ) | 3.67 | 119 | 307 |
0.13 | 11.97 | 11.76 | 1,982 | 3.70 | (1.94 ) | 4.04 | 224 | 531 |
— | 12.20 | 2.42 | 3,774 | 4.19 | (0.73 ) | 4.55 | 125 | 356 |
0.09 | 15.41 | 8.56 | 226,399 | 2.55 | 3.52 | 2.66 | 55 | 112 |
0.23 | 14.58 | 10.54 | 200,510 | 2.55 | 2.98 | 2.72 | 92 | 232 |
0.27 | 13.19 | (2.37 ) | 139,458 | 2.41 | (0.47 ) | 2.59 | 100 | 252 |
0.13 | 13.51 | 3.10 | 75,401 | 2.69 (g) | (1.50 ) | 2.90 | 119 | 307 |
0.75 | 14.03 | 12.49 | 123,114 | 2.87 | (1.39 ) | 3.23 | 224 | 531 |
0.02 | 13.96 | 3.21 | 28,014 | 3.40 | 0.03 | 3.76 | 125 | 356 |
April 30, 2024 | J.P. Morgan Specialty Funds | 17 |
Classes Offered | Diversification Classification | |
JPMorgan Research Market Neutral Fund | Class A, Class C and Class I | Diversified |
18 | J.P. Morgan Specialty Funds | April 30, 2024 |
Level 1 Quoted prices | Level 2 Other significant observable inputs | Level 3 Significant unobservable inputs | Total | |
Investments in Securities | ||||
Common Stocks | $206,240 | $— | $— | $206,240 |
Short-Term Investments | ||||
Investment Companies | 31,912 | — | — | 31,912 |
U.S. Treasury Obligations | — | 9,930 | — | 9,930 |
Total Short-Term Investments | 31,912 | 9,930 | — | 41,842 |
Total Investments in Securities | $238,152 | $9,930 | $— | $248,082 |
Liabilities | ||||
Common Stocks | $(193,128 ) | $— | $— | $(193,128 ) |
Total Liabilities for Securities Sold Short | $(193,128 ) | $— | $— | $(193,128 ) |
Appreciation in Other Financial Instruments | ||||
Futures Contracts | $459 | $— | $— | $459 |
April 30, 2024 | J.P. Morgan Specialty Funds | 19 |
For the six months ended April 30, 2024 | |||||||||
Security Description | Value at October 31, 2023 | Purchases at Cost | Proceeds from Sales | Net Realized Gain (Loss) | Change in Unrealized Appreciation/ (Depreciation) | Value at April 30, 2024 | Shares at April 30, 2024 | Dividend Income | Capital Gain Distributions |
JPMorgan Prime Money Market Fund Class Institutional Shares, 5.33% (a) (b) | $10,236 | $167,258 | $145,566 | $(11 ) | $(5 ) | $31,912 | 31,906 | $560 | $— |
(a) | Investment in an affiliated fund, which is registered under the Investment Company Act of 1940, as amended, and is advised by J.P. Morgan Investment Management Inc. |
(b) | The rate shown is the current yield as of April 30, 2024. |
Futures Contracts: | |
Average Notional Balance Short | $(7,977 ) |
Ending Notional Balance Short | (12,662 ) |
20 | J.P. Morgan Specialty Funds | April 30, 2024 |
Class A | Class C | Class I | Total | |
Transfer agency fees | $2 | $— (a) | $3 | $5 |
(a) | Amount rounds to less than one thousand. |
April 30, 2024 | J.P. Morgan Specialty Funds | 21 |
Class A | Class C | |
0.25 % | 0.75 % |
Front-End Sales Charge | CDSC | |
$— (a) | $— |
(a) | Amount rounds to less than one thousand. |
Class A | Class C | Class I | |
0.25 % | 0.25 % | 0.25 % |
22 | J.P. Morgan Specialty Funds | April 30, 2024 |
Class A | Class C | Class I | |
0.95 % | 1.45 % | 0.69 % |
Contractual Waivers | ||||
Investment Advisory Fees | Administration Fees | Service Fees | Total | |
$72 | $48 | $1 | $121 | |
April 30, 2024 | J.P. Morgan Specialty Funds | 23 |
Purchases (excluding U.S. Government) | Sales (excluding U.S. Government) | Securities Sold Short | Covers on Securities Sold Short | |
$109,658 | $121,776 | $111,485 | $113,665 |
Aggregate Cost* | Gross Unrealized Appreciation | Gross Unrealized Depreciation | Net Unrealized Appreciation (Depreciation) | |
$14,254 | $57,375 | $16,216 | $41,159 |
* | The tax cost includes the proceeds from short sales which may result in a net negative cost. |
Capital Loss Carryforward Character | |
Short-Term | |
$27,749 * |
* | Amount includes capital loss carryforwards which are limited in future years under Internal Revenue Code sections 381-384. |
24 | J.P. Morgan Specialty Funds | April 30, 2024 |
deposits at broker for securities sold short, as noted on the Statement of Assets and Liabilities, are held at Citigroup Global Markets, Inc.
Previously Reported | Adjustments | As Restated | |
Assets: | |||
Interest from non-affiliates | $669 | $115 | $784 |
Class Action proceeds | — | 1,308 | 1,308 |
Due from Adviser | — | 82 | 82 |
Total Assets | 387,098 | 1,505 | 388,603 |
Liabilities: | |||
Prior period taxes due | — | 82 | 82 |
Due to shareholders upon reprocessing | — | 6,607 | 6,607 |
Total Liabilities | 165,608 | 6,689 | 172,297 |
Net Assets | 221,490 | (5,184 ) | 216,306 |
April 30, 2024 | J.P. Morgan Specialty Funds | 25 |
Previously Reported | Adjustments | As Restated | |
Future share reacquisition adjustment | — | 9,067 | 9,067 |
Net Assets after future share reacquisition adjustment | $— | $225,373 | $225,373 |
NET ASSETS: | |||
Paid-in-Capital | $223,234 | $(5,491 ) | $217,743 |
Total distributable earnings (loss) | (1,744 ) | 307 | (1,437 ) |
Net Assets | 221,490 | (5,184 ) | 216,306 |
Future share reacquisition adjustment | — | 9,067 | 9,067 |
Net Assets after future share reacquisition adjustment | $— | $225,373 | $225,373 |
Net Assets after future share reacquisition adjustment: | |||
Class A | $22,702 | $399 | $23,101 |
Class C | 1,730 | 32 | 1,762 |
Class I | 197,058 | 3,452 | 200,510 |
Total | $221,490 | $3,883 | $225,373 |
Net Asset Value (a): | |||
(after future share reacquisition adjustment) | |||
Class A — Redemption price per share | $13.33 | $0.23 | $13.56 |
Class C — Offering price per share (b) | 11.79 | 0.21 | 12.00 |
Class I — Offering and redemption price per share | 14.33 | 0.25 | 14.58 |
Class A maximum public offering price per share | |||
[net asset value per share/(100% – maximum sales charge)] | $14.07 | $0.24 | $14.31 |
As presented above, in order to correct the Fund’s net assets under the Fund’s NAV correction policy, the Fund has recorded a future share reacquisition adjustment to net assets. This amount represents the value of shares the Fund has a unilateral right to reacquire through reprocessing for the Error Period and is estimated by using the corrected NAV at each reprocessing date based on the subscription and redemption information currently available. The Fund’s Adviser will be responsible for any shortfall to the Fund to the extent reprocessing is not completed for any applicable purchases during the Error Period.
STATEMENT OF OPERATIONS
Previously Reported | Adjustments | As Restated | |
INVESTMENT INCOME: | |||
Interest income from non-affiliates | $624 | $63 | $687 |
Total investment income | 9,654 | 63 | 9,717 |
EXPENSES: | |||
Tax expense | — | 82 | 82 |
Total expenses | 4,894 | 82 | 4,976 |
Less expense reimbursements | (2 ) | (82 ) | (84 ) |
Net investment income (loss) | 5,053 | 63 | 5,116 |
REALIZED/UNREALIZED GAINS (LOSSES): |
26 | J.P. Morgan Specialty Funds | April 30, 2024 |
Previously Reported | Adjustments | As Restated | |
Net realized gain (loss) on transactions from: | |||
Investments in non-affiliates | 1,748 | 156 | 1,904 |
Net realized gain (loss) | (2,426 ) | 156 | (2,270 ) |
Net realized/unrealized gains (losses) | 12,066 | 156 | 12,222 |
Change in net assets resulting from operations | $17,119 | $219 | $17,338 |
Previously Reported | Adjustments | As Restated | |
CHANGE IN NET ASSETS RESULTING FROM OPERATIONS: | |||
Net investment income (loss) | $5,053 | $63 | $5,116 |
Net realized gain (loss) | (2,426 ) | 156 | (2,270 ) |
Change in net assets resulting from operations | 17,119 | 219 | 17,338 |
CAPITAL TRANSACTIONS: | |||
Change in net assets resulting from capital transactions | 46,025 | (1,853 ) | 44,172 |
NET ASSETS: | |||
Change in net assets | 63,144 | (1,634 ) | 61,510 |
Beginning of period | 158,346 | (3,550 ) | 154,796 |
End of period | 221,490 | (5,184 ) | 216,306 |
Future share reacquisition adjustment | — | 9,067 | 9,067 |
End of period after future share reacquisition adjustment | $ — | $225,373 | $225,373 |
CAPITAL TRANSACTIONS: | |||
Class A | |||
Cost of shares redeemed | $(7,025 ) | $(123 ) | $(7,148 ) |
Change in net assets resulting from Class A capital transactions | 654 | (123 ) | 531 |
Class C | |||
Cost of shares redeemed | (257 ) | (5 ) | (262 ) |
Change in net assets resulting from Class C capital transactions | 98 | (5 ) | 93 |
Class I | |||
Cost of shares redeemed | (99,000 ) | (1,725 ) | (100,725 ) |
Change in net assets resulting from Class I capital transactions | 45,273 | (1,725 ) | 43,548 |
Total change in net assets resulting from capital transactions | $46,025 | $ (1,853 ) | $44,172 |
Previously Reported | Adjustments | As Restated | |
CHANGE IN NET ASSETS RESULTING FROM OPERATIONS: | |||
Net investment income (loss) | $(669 ) | $14 | $(655 ) |
Net realized gain (loss) | 841 | 22 | 863 |
April 30, 2024 | J.P. Morgan Specialty Funds | 27 |
Previously Reported | Adjustments | As Restated | |
Change in net assets resulting from operations | (3,268 ) | 36 | (3,232 ) |
CAPITAL TRANSACTIONS: | |||
Change in net assets resulting from capital transactions | 69,424 | (1,054 ) | 68,370 |
NET ASSETS: | |||
Change in net assets | 66,156 | (1,018 ) | 65,138 |
Beginning of period | 92,190 | (2,532 ) | 89,658 |
End of period | 158,346 | (3,550 ) | 154,796 |
Future share reacquisition adjustment | — | 6,425 | 6,425 |
End of period after future share reacquisition adjustment | $— | $161,221 | $161,221 |
CAPITAL TRANSACTIONS: | |||
Class A | |||
Cost of shares redeemed | $(4,824 ) | $(86 ) | $(4,910 ) |
Change in net assets resulting from Class A capital transactions | 3,594 | (86 ) | 3,508 |
Class C | |||
Cost of shares redeemed | (218 ) | (4 ) | (222 ) |
Change in net assets resulting from Class C capital transactions | 303 | (4 ) | 299 |
Class I | |||
Cost of shares redeemed | (53,961 ) | (964 ) | (54,925 ) |
Change in net assets resulting from Class I capital transactions | 65,527 | (964 ) | 64,563 |
Total change in net assets resulting from capital transactions | $69,424 | $ (1,054 ) | $68,370 |
28 | J.P. Morgan Specialty Funds | April 30, 2024 |
Per share operating performance | ||||||
Investment operations | Distributions | |||||
Net asset value, beginning of period * | Net investment income (loss)(a) | Net realized and unrealized gains (losses) on investments | Total from investment operations | Net realized gain | Future share reacquisition adjustment | |
Class A (As Previously Reported) | ||||||
Year Ended October 31, 2023 | $12.08 | $0.34 | $0.91 | $1.25 | $— | $— |
Year Ended October 31, 2022 | 12.41 | (0.10 ) | (0.23 ) | (0.33 ) | — | — |
Year Ended October 31, 2021 | 13.01 | (0.21 ) | 0.52 | 0.31 | (0.91 ) | — |
Year Ended October 31, 2020 | 13.11 | (0.20 ) | 1.59 | 1.39 | (1.49 ) | — |
Year Ended October 31, 2019 | 14.29 | (0.04 ) | 0.31 | 0.27 | (1.45 ) | — |
Adjustment | ||||||
Year Ended October 31, 2023 | 0.22 | — | (0.07 ) | (0.07 ) | — | 0.08 |
Year Ended October 31, 2022 | 0.22 | — | (0.09 ) | (0.09 ) | — | 0.09 |
Year Ended October 31, 2021 | 0.22 | — | (0.11 ) | (0.11 ) | — | 0.11 |
Year Ended October 31, 2020 | 0.15 | — | (0.08 ) | (0.08 ) | — | 0.15 |
Year Ended October 31, 2019 | 0.03 | 0.01 | 0.10 | 0.11 | — | 0.01 |
Class A (As Restated) | ||||||
Year Ended October 31, 2023 | 12.30 | 0.34 | 0.84 | 1.18 | — | 0.08 |
Year Ended October 31, 2022 | 12.63 | (0.10 ) | (0.32 ) | (0.42 ) | — | 0.09 |
Year Ended October 31, 2021 | 13.23 | (0.21 ) | 0.41 | 0.20 | (0.91 ) | 0.11 |
Year Ended October 31, 2020 | 13.26 | (0.20 ) | 1.51 | 1.31 | (1.49 ) | 0.15 |
Year Ended October 31, 2019 | 14.32 | (0.03 ) | 0.41 | 0.38 | (1.45 ) | 0.01 |
April 30, 2024 | J.P. Morgan Specialty Funds | 29 |
Ratios/Supplemental data | |||||||
Ratios to average net assets | |||||||
Net Asset Value, end of period * | Total return (excludes sales charge)(b) | Net assets, end of period (000's) ** | Net expenses (including dividend expense for securities sold short)(c) | Net expenses (excluding dividend and interest expense for sescurities sold short) | Expenses without waivers and reimbursements (including dividend expense for securities sold short) | Expenses without waivers and reimbursements (excluding dividend and interest expense for sescurities sold short) | Net investment income (loss) |
$13.33 | 10.35 % | $22,702 | 2.89 % | 0.91 % | 3.07 % | 1.09 % | 2.65 % |
12.08 | (2.66 ) | 19,898 | 2.77 | 0.92 | 2.95 | 1.10 | (0.86 ) |
12.41 | 2.72 | 16,867 | 2.99 (d) | 0.93 | 3.22 | 1.16 | (1.77 ) |
13.01 | 11.97 | 18,205 | 3.23 | 1.08 | 3.61 | 1.46 | (1.57 ) |
13.11 | 2.01 | 14,276 | 3.69 | 1.22 | 4.09 | 1.62 | (0.26 ) |
0.23 | (0.11 ) | 399 | (0.05 ) | (0.01 ) | (0.06 ) | (0.02 ) | 0.04 |
0.22 | 0.05 | 361 | (0.05 ) | (0.02 ) | (0.05 ) | (0.02 ) | 0.02 |
0.22 | (0.05 ) | 294 | (0.07 ) | (0.01 ) | (0.08 ) | (0.02 ) | 0.06 |
0.22 | 0.42 | 304 | (0.05 ) | (0.02 ) | (0.05 ) | (0.02 ) | 0.04 |
0.15 | 0.91 | 166 | (0.03 ) | (0.01 ) | (0.03 ) | (0.01 ) | 0.02 |
13.56 | 10.24 | 23,101 | 2.84 | 0.90 | 3.01 | 1.07 | 2.69 |
12.30 | (2.61 ) | 20,259 | 2.72 | 0.90 | 2.90 | 1.08 | (0.84 ) |
12.63 | 2.67 | 17,161 | 2.92 (d) | 0.92 | 3.14 | 1.14 | (1.71 ) |
13.23 | 12.39 | 18,509 | 3.18 | 1.06 | 3.56 | 1.44 | (1.53 ) |
13.26 | 2.92 | 14,442 | 3.66 | 1.21 | 4.06 | 1.61 | (0.24 ) |
* | Net asset value per share has been calculated after future share reacquisition adjustment for the impacted periods. |
** | Amount presented after future share reacquisition adjustment. |
(a) | Calculated based upon average shares outstanding. |
(b) | Includes adjustments in accordance with accounting principles generally accepted in the United States of America and as such, the net asset values for financial reporting purposes and the returns based upon those net asset values may differ from the net asset values and returns for shareholder transactions. |
(c) | Includes interest expense, if applicable, each of which is less than 0.005% unless otherwise noted. |
(d) | Interest expense on securities sold short is 0.16%. |
30 | J.P. Morgan Specialty Funds | April 30, 2024 |
Per share operating performance | ||||||
Investment operations | Distributions | |||||
Net asset value, beginning of period * | Net investment income (loss)(a) | Net realized and unrealized gains (losses) on investments | Total from investment operations | Net realized gain | Future share reacquisition adjustment | |
Class C (As Previously Reported) | ||||||
Year Ended October 31, 2023 | $10.74 | $0.24 | $0.81 | $1.05 | $— | $— |
Year Ended October 31, 2022 | 11.09 | (0.14 ) | (0.21 ) | (0.35 ) | — | — |
Year Ended October 31, 2021 | 11.77 | (0.25 ) | 0.48 | 0.23 | (0.91 ) | — |
Year Ended October 31, 2020 | 12.06 | (0.23 ) | 1.43 | 1.20 | (1.49 ) | — |
Year Ended October 31, 2019 | 13.32 | (0.10 ) | 0.29 | 0.19 | (1.45 ) | — |
Adjustment | ||||||
Year Ended October 31, 2023 | 0.20 | 0.01 | (0.04 ) | (0.03 ) | — | 0.04 |
Year Ended October 31, 2022 | 0.20 | — | (0.09 ) | (0.09 ) | — | 0.09 |
Year Ended October 31, 2021 | 0.20 | — | (0.07 ) | (0.07 ) | — | 0.07 |
Year Ended October 31, 2020 | 0.14 | — | (0.07 ) | (0.07 ) | — | 0.13 |
Year Ended October 31, 2019 | 0.03 | 0.01 | 0.10 | 0.11 | — | — |
Class C (As Restated) | ||||||
Year Ended October 31, 2023 | 10.94 | 0.25 | 0.77 | 1.02 | — | 0.04 |
Year Ended October 31, 2022 | 11.29 | (0.14 ) | (0.30 ) | (0.44 ) | — | 0.09 |
Year Ended October 31, 2021 | 11.97 | (0.25 ) | 0.41 | 0.16 | (0.91 ) | 0.07 |
Year Ended October 31, 2020 | 12.20 | (0.23 ) | 1.36 | 1.13 | (1.49 ) | 0.13 |
Year Ended October 31, 2019 | 13.35 | (0.09 ) | 0.39 | 0.30 | (1.45 ) | — |
April 30, 2024 | J.P. Morgan Specialty Funds | 31 |
Ratios/Supplemental data | |||||||
Ratios to average net assets | |||||||
Net Asset Value, end of period * | Total return (excludes sales charge)(b) | Net assets, end of period (000's) ** | Net expenses (including dividend expense for securities sold short)(c) | Net expenses (excluding dividend and interest expense for securities sold short) | Expenses without waivers and reimbursements (including dividend expense for securities sold short) | Expenses without waivers and reimbursements (excluding dividend and interest expense for sescurities sold short) | Net investment income (loss) |
$11.79 | 9.78 % | $1,730 | 3.39 % | 1.41 % | 3.56 % | 1.58 % | 2.16 % |
10.74 | (3.16 ) | 1,476 | 3.27 | 1.41 | 3.46 | 1.60 | (1.31 ) |
11.09 | 2.29 | 1,211 | 3.49 (d) | 1.43 | 3.73 | 1.67 | (2.25 ) |
11.77 | 11.36 | 1,949 | 3.75 | 1.60 | 4.10 | 1.95 | (2.00 ) |
12.06 | 1.52 | 3,731 | 4.20 | 1.73 | 4.56 | 2.09 | (0.74 ) |
0.21 | (0.09 ) | 32 | (0.06 ) | (0.02 ) | (0.06 ) | (0.03 ) | 0.04 |
0.20 | 0.06 | 28 | (0.06 ) | (0.02 ) | (0.07 ) | (0.03 ) | 0.01 |
0.20 | (0.04 ) | 22 | (0.05 ) | (0.02 ) | (0.06 ) | (0.03 ) | 0.03 |
0.20 | 0.40 | 33 | (0.05 ) | (0.02 ) | (0.06 ) | (0.02 ) | 0.06 |
0.14 | 0.90 | 43 | (0.01 ) | (0.02 ) | (0.01 ) | (0.02 ) | 0.01 |
12.00 | 9.69 | 1,762 | 3.33 | 1.39 | 3.50 | 1.55 | 2.20 |
10.94 | (3.10 ) | 1,504 | 3.21 | 1.39 | 3.39 | 1.57 | (1.30 ) |
11.29 | 2.25 | 1,233 | 3.44 (d) | 1.41 | 3.67 | 1.64 | (2.22 ) |
11.97 | 11.76 | 1,982 | 3.70 | 1.58 | 4.04 | 1.93 | (1.94 ) |
12.20 | 2.42 | 3,774 | 4.19 | 1.71 | 4.55 | 2.07 | (0.73 ) |
* | Net asset value per share has been calculated after future share reacquisition adjustment for the impacted periods. |
** | Amount presented after future share reacquisition adjustment. |
(a) | Calculated based upon average shares outstanding. |
(b) | Includes adjustments in accordance with accounting principles generally accepted in the United States of America and as such, the net asset values for financial reporting purposes and the returns based upon those net asset values may differ from the net asset values and returns for shareholder transactions. |
(c) | Includes interest expense, if applicable, each of which is less than 0.005% unless otherwise noted. |
(d) | Interest expense on securities sold short is 0.16%. |
32 | J.P. Morgan Specialty Funds | April 30, 2024 |
Per share operating performance | ||||||
Investment operations | Distributions | |||||
Net asset value, beginning of period * | Net investment income (loss)(a) | Net realized and unrealized gains (losses) on investments | Total from investment operations | Net realized gain | Future share reacquisition adjustment | |
Class I (As Previously Reported) | ||||||
Year Ended October 31, 2023 | $12.96 | $0.40 | $0.97 | $1.37 | $— | $— |
Year Ended October 31, 2022 | 13.28 | (0.06 ) | (0.26 ) | (0.32 ) | — | — |
Year Ended October 31, 2021 | 13.82 | (0.20 ) | 0.57 | 0.37 | (0.91 ) | — |
Year Ended October 31, 2020 | 13.80 | (0.19 ) | 1.70 | 1.51 | (1.49 ) | — |
Year Ended October 31, 2019 | 14.93 | — (e) | 0.32 | 0.32 | (1.45 ) | — |
Adjustment | ||||||
Year Ended October 31, 2023 | 0.23 | 0.01 | (0.22 ) | (0.21 ) | — | 0.23 |
Year Ended October 31, 2022 | 0.23 | — | (0.27 ) | (0.27 ) | — | 0.27 |
Year Ended October 31, 2021 | 0.21 | — | (0.11 ) | (0.11 ) | — | 0.13 |
Year Ended October 31, 2020 | 0.16 | — | (0.70 ) | (0.70 ) | — | 0.75 |
Year Ended October 31, 2019 | 0.03 | — | 0.11 | 0.11 | — | 0.02 |
Class I (As Restated) | ||||||
Year Ended October 31, 2023 | 13.19 | 0.41 | 0.75 | 1.16 | — | 0.23 |
Year Ended October 31, 2022 | 13.51 | (0.06 ) | (0.53 ) | (0.59 ) | — | 0.27 |
Year Ended October 31, 2021 | 14.03 | (0.20 ) | 0.46 | 0.26 | (0.91 ) | 0.13 |
Year Ended October 31, 2020 | 13.96 | (0.19 ) | 1.00 | 0.81 | (1.49 ) | 0.75 |
Year Ended October 31, 2019 | 14.96 | — (e) | 0.43 | 0.43 | (1.45 ) | 0.02 |
April 30, 2024 | J.P. Morgan Specialty Funds | 33 |
Ratios/Supplemental data | |||||||
Ratios to average net assets | |||||||
Net Asset Value, end of period * | Total return (excludes sales charge)(b) | Net assets, end of period (000's) ** | Net expenses (including dividend expense for securities sold short)(c) | Net expenses (excluding dividend and interest expense for securities sold short) | Expenses without waivers and reimbursements (including dividend expense for securities sold short) | Expenses without waivers and reimbursements (excluding dividend and interest expense for securities sold short) | Net investment income (loss) |
$14.33 | 10.57 % | $197,058 | 2.60 % | 0.65 % | 2.77 % | 0.82 % | 2.95 % |
12.96 | (2.41 ) | 136,972 | 2.45 | 0.65 | 2.64 | 0.84 | (0.48 ) |
13.28 | 3.01 | 74,112 | 2.74 (d) | 0.68 | 2.95 | 0.89 | (1.50 ) |
13.82 | 12.26 | 121,285 | 2.91 | 0.76 | 3.28 | 1.13 | (1.42 ) |
13.80 | 2.27 | 27,694 | 3.43 | 0.96 | 3.79 | 1.32 | 0.01 |
0.25 | (0.03 ) | 3,452 | (0.05 ) | (0.01 ) | (0.05 ) | (0.01 ) | 0.03 |
0.23 | 0.04 | 2,486 | (0.04 ) | (0.01 ) | (0.05 ) | (0.02 ) | 0.01 |
0.23 | 0.09 | 1,289 | (0.05 ) | (0.02 ) | (0.05 ) | (0.02 ) | — |
0.21 | 0.23 | 1,829 | (0.04 ) | (0.01 ) | (0.05 ) | (0.02 ) | 0.03 |
0.16 | 0.94 | 320 | (0.03 ) | (0.01 ) | (0.03 ) | (0.01 ) | 0.02 |
14.58 | 10.54 | 200,510 | 2.55 | 0.64 | 2.72 | 0.81 | 2.98 |
13.19 | (2.37 ) | 139,458 | 2.41 | 0.64 | 2.59 | 0.82 | (0.47 ) |
13.51 | 3.10 | 75,401 | 2.69 (d) | 0.66 | 2.90 | 0.87 | (1.50 ) |
14.03 | 12.49 | 123,114 | 2.87 | 0.75 | 3.23 | 1.11 | (1.39 ) |
13.96 | 3.21 | 28,014 | 3.40 | 0.95 | 3.76 | 1.31 | 0.03 |
* | Net asset value per share has been calculated after future share reacquisition adjustment for the impacted periods. |
** | Amount presented after future share reacquisition adjustment. |
(a) | Calculated based upon average shares outstanding. |
(b) | Includes adjustments in accordance with accounting principles generally accepted in the United States of America and as such, the net asset values for financial reporting purposes and the returns based upon those net asset values may differ from the net asset values and returns for shareholder transactions. |
(c) | Includes interest expense, if applicable, each of which is less than 0.005% unless otherwise noted. |
(d) | Interest expense on securities sold short is 0.16%. |
(e) | Amount rounds to less than $0.005. |
Previously Reported | Adjustments | As Restated | |
Paid-in-Capital | $ — | $1,115 | $1,115 |
Accumulated undistributed (distributions in excess of) net investment income | $44 | (18 ) | $26 |
Accumulated net realized gains (losses) | $ (44 ) | (1,097 ) | $ (1,141 ) |
34 | J.P. Morgan Specialty Funds | April 30, 2024 |


38 |
ITEM 8. Changes in and Disagreements with Accountants for Open-End Management Investment Companies
Refer to Item 7.
ITEM 9. Proxy Disclosures for Open-End Management Investment Companies.
Refer to Item 7.
ITEM 10. Remuneration Paid to Directors, Officers, and Others of Open-End Management Investment Companies.
Refer to Item 7.
ITEM 11. Statement Regarding Basis for Approval of Investment Advisory Contract.
Refer to Item 7.
ITEM 12. Disclosure of Proxy Voting Policies and Procedures for Closed-End Management Investment Companies.
Not applicable to a semi-annual report.
ITEM 13. Portfolio Managers of Closed-End Management Investment Companies.
Not applicable
ITEM 14. Purchases of Equity Securities by Closed-End Management Investment Company and Affiliated Purchasers.
Not applicable
ITEM 15. Submission of Matters to a Vote of Security Holders.
Not applicable
ITEM 16. Controls and Procedures
(a) Disclose the conclusions of the registrant’s principal executive and principal financial officers, or persons performing similar functions, regarding the effectiveness of the registrant’s disclosure controls and procedures (as defined in Rule 30a-3(c) under the Act (17 CFR 270.30a-3(c))) as of a date within 90 days of the filing date of the report that includes the disclosure required by this paragraph, based on the evaluation of these controls and procedures required by Rule 30a-3(b) under the Act (17 CFR 270.30a-3(b)) and Rules 13a-15(b) or 15d-15(b) under the Exchange Act (17 CFR 240.13a-15(b) or 240.15d-15(b)).
The Registrant’s principal executive and principal financial officers have concluded, based on their evaluation of the Registrant’s disclosure controls and procedures as of a date within 90 days of the original filing date of this report, that the Registrant’s disclosure controls and procedures were reasonably designed to ensure that information required to be disclosed by the Registrant on Form N-CSR is recorded, processed, summarized and reported within the required time periods and that information required to be disclosed by the Registrant in the reports that it files or submits on Form N-CSR is accumulated and communicated to the Registrant’s management, including its principal executive and principal financial officers, as appropriate, to allow timely decisions regarding required disclosure. Subsequent to the period covered by this report, an error was identified regarding the untimely recognition of certain class action proceeds that resulted in a restatement of the financial statements for JPMorgan Research Market Neutral Fund (the “Fund”) to correct the impacts of the error for the year ended October 31, 2023 and certain prior fiscal years. Due to the error, a material weakness exists in the design of internal controls relating to the Fund’s monitoring of class action claims filed by the class action administrator (on behalf of the Fund) and reconciliation of class action claim disbursements from the class action administrator to ensure complete, accurate and timely receipt of class action claims by the Fund.
(b) Disclose any change in the registrant’s internal control over financial reporting (as defined in Rule 30a-3(d) under the Act (17 CFR 270.30a-3(d)) that occurred during the period covered by this report that has materially affected, or is reasonably likely to materially affect, the registrant’s internal control over financial reporting.
Subsequent to the identification of the error described above, management has developed a plan to remediate the material weakness described herein. A reconciliation will be established to ensure the timely recording of class action proceeds. Other than this item, there were no other changes in the Registrant’s internal control over financial reporting that occurred during period covered by this report that have materially affected, or are reasonably likely to materially affect, the Registrant’s internal control over financial reporting.
ITEM 17. Disclosure of Securities Lending Activities for Closed-End Management Investment Companies
Not applicable
ITEM 18. Recovery of Erroneously Awarded Compensation
Not applicable
ITEM 19. Exhibits
Not applicable
Not applicable.
Not applicable.
| (a) |
SIGNATURES
Pursuant to the requirements of the Securities Exchange Act of 1934 and the Investment Company Act of 1940, the registrant has duly caused this report to be signed on its behalf by the undersigned, thereunto duly authorized.
| JPMorgan Trust I | ||
| By: | /s/ Brian S. Shlissel | |
| Brian S. Shlissel | ||
| President and Principal Executive Officer | ||
| July 26, 2024 | ||
Pursuant to the requirements of the Securities Exchange Act of 1934 and the Investment Company Act of 1940, this report has been signed below by the following persons on behalf of the registrant and in the capacities and on the dates indicated.
| By: | /s/ Brian S. Shlissel | |
| Brian S. Shlissel | ||
| President and Principal Executive Officer | ||
| July 26, 2024 | ||
| By: | /s/ Timothy J. Clemens | |
| Timothy J. Clemens | ||
| Treasurer and Principal Financial Officer | ||
| July 26, 2024 | ||