Table of Contents
| OMB APPROVAL | ||||||||||||
| OMB Number: | 3235-0570 | |||||||||||
| Expires: | January 31, 2017 | |||||||||||
Estimated average burden Hours per response .��. . . . . . . . | 20.6 | |||||||||||
UNITED STATES
SECURITIES AND EXCHANGE COMMISSION
Washington, DC 20549
FORM N-CSR
CERTIFIED SHAREHOLDER REPORT OF REGISTERED
MANAGEMENT INVESTMENT COMPANIES
Investment Company Act file number: 811-21296
BARON SELECT FUNDS
(Exact Name of Registrant as Specified in Charter)
767 Fifth Avenue, 49th Floor
New York, NY 10153
(Address of Principal Executive Offices) (Zip Code)
Patrick M. Patalino, General Counsel
c/o Baron Select Funds
767 Fifth Avenue, 49th Floor
New York, NY 10153
(Name and Address of Agent for Service)
(Registrant’s Telephone Number, including Area Code): 212-583-2000
Date of fiscal year end: December 31
Date of reporting period: June 30, 2016
Form N-CSR is to be used by management investment companies to file reports with the Commission not later than 10 days after the transmission to stockholders of any report that is required to be transmitted to stockholders under Rule 30e-1 under the Investment Company Act of 1940 (17CRF 270.30e-1). The Commission may use the information provided on Form N-CSR in its regulatory, disclosure review, inspection, and policymaking roles.
A registrant is required to disclose the information specified by Form N-CSR, and the Commission will make this information public. A registrant is not required to respond to the collection of information contained in Form N-CSR unless the Form displays a currently valid Office of Management and Budget (“OMB”) control number. Please direct comments concerning the accuracy of the information collection burden estimate and suggestions for reducing the burden to Secretary, Securities and Exchange Commission, 450 5th Street, NW, Washington, D.C. 20549-0609. The OMB has reviewed this collection of information under the clearance requirements of 44 U.S.C. Section 3507.
Persons who are to respond to the collection of information contained in this form are not required to respond unless the form displays a currently valid OMB control number.
SEC 2569 (5-07)
| Item 1. | Reports to Stockholders. |
Table of Contents
Baron Partners Fund
Baron Focused Growth Fund
Baron International Growth Fund
Baron Real Estate Fund
Baron Emerging Markets Fund
Baron Energy and Resources Fund
Baron Global Advantage Fund
June 30, 2016
Baron Funds®
Semi-Annual Financial Report
DEAR BARON SELECT FUNDS SHAREHOLDER:
In this report, you will find unaudited financial statements for Baron Partners Fund, Baron Focused Growth Fund, Baron International Growth Fund, Baron Real Estate Fund, Baron Emerging Markets Fund, Baron Energy and Resources Fund and Baron Global Advantage Fund (the “Funds”) for the six months ended June 30, 2016. The U.S. Securities and Exchange Commission (the “SEC”) requires mutual funds to furnish these statements semi-annually to their shareholders. We hope you find these statements informative and useful.
We thank you for choosing to join us as fellow shareholders in Baron Funds. We will continue to work hard to justify your confidence.
Sincerely,
 |  |  | ||
Ronald Baron Chief Executive Officer and Chief Investment Officer August 19, 2016 | Linda S. Martinson Chairman, President and Chief Operating Officer August 19, 2016 | Peggy Wong Treasurer and Chief Financial Officer August 19, 2016 |
This Semi-Annual Financial Report is for the Baron Select Funds, which currently has seven series: Baron Partners Fund, Baron Focused Growth Fund, Baron International Growth Fund, Baron Real Estate Fund, Baron Emerging Markets Fund, Baron Energy and Resources Fund and Baron Global Advantage Fund. If you are interested in Baron Investment Funds Trust, which contains the Baron Asset Fund, Baron Growth Fund, Baron Small Cap Fund, Baron Opportunity Fund, Baron Fifth Avenue Growth Fund and Baron Discovery Fund series, please visit the Funds’ website at www.BaronFunds.com or contact us at 1-800-99BARON.
The Funds’ Proxy Voting Policy is available without charge and can be found on the Funds’ website at www.BaronFunds.com, by clicking on the “Legal Notices” link at the bottom left corner of the homepage or by calling 1-800-99BARON and on the SEC’s website at www.sec.gov. The Funds’ most current proxy voting record, Form N-PX, is also available on the Funds’ website and on the SEC’s website.
The Funds file their complete schedules of portfolio holdings with the SEC for the first and third quarters of each fiscal year on Form N-Q. The Funds’ Forms N-Q are available on the SEC’s website at www.sec.gov. The Funds’ Forms N-Q may also be reviewed and copied at the SEC’s Public Reference Room in Washington, DC; information on the operation of the SEC’s Public Reference Room may be obtained by calling 1-202-551-8090. A copy of the Funds’ Forms N-Q may also be obtained upon request by calling 1-800-99BARON. Schedules of portfolio holdings current to the most recent quarter are also available on the Funds’ website.
Some of the comments are based on current management expectations and are considered “forward-looking statements.” Actual future results, however, may prove to be different from our expectations. You can identify forward-looking statements by words such as “estimate,” “may,” “expect,” “should,” “could,” “believe,” “plan” and other similar terms. We cannot promise future returns and our opinions are a reflection of our best judgment at the time this report is compiled.
The views expressed in this report reflect those of BAMCO, Inc. (“BAMCO” or the “Adviser”) only through the end of the period stated in this report. The views are not intended as recommendations or investment advice to any person reading this report and are subject to change at any time without notice based on market and other conditions.
Past performance is no guarantee of future results. The investment return and principal value of an investment will fluctuate; an investor’s shares, when redeemed, may be worth more or less than their original cost. For more complete information about Baron Funds, including charges and expenses, call, write or go to www.BaronFunds.com for a prospectus or summary prospectus. Read them carefully before you invest or send money. This report is not authorized for use as an offer of sale or a solicitation of an offer to buy shares of the Funds, unless accompanied or preceded by the Funds’ current prospectus or summary prospectus.

Table of Contents
| Baron Partners Fund (Unaudited) | June 30, 2016 |
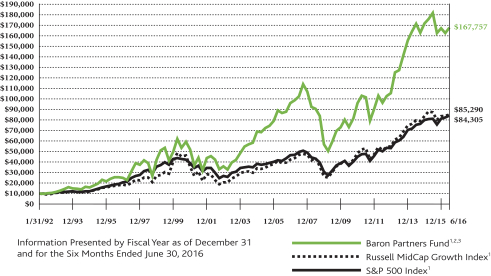
COMPARISONOFTHECHANGEIN VALUEOF $10,000INVESTMENTIN BARON PARTNERS FUND (RETAIL SHARES)
IN RELATIONTOTHE RUSSELL MIDCAP GROWTH INDEXANDTHE S&P 500 INDEX
| AVERAGE ANNUAL TOTAL RETURNSFORTHEPERIODSENDED JUNE 30, 2016 | ||||||||||||||||||||||||
| Six Months* | One Year | Three Years | Five Years | Ten Years | Since Inception (January 31, 1992) | |||||||||||||||||||
Baron Partners Fund — Retail Shares1,2,3 | 0.39% | (7.72)% | 9.60% | 10.55% | 6.81% | 12.24% | ||||||||||||||||||
Baron Partners Fund — Institutional Shares1,2,3,4 | 0.53% | (7.48)% | 9.88% | 10.85% | 7.01% | 12.33% | ||||||||||||||||||
Russell Midcap Growth Index1 | 2.15% | (2.14)% | 10.52% | 9.98% | 8.12% | 9.18% | ||||||||||||||||||
S&P 500 Index1 | 3.84% | 3.99% | 11.66% | 12.10% | 7.42% | 9.12% | ||||||||||||||||||
| * | Not Annualized. |
| 1 | The indexes are unmanaged. The Russell Midcap® Growth Index measures the performance of medium-sized U.S. companies that are classified as growth and the S&P 500 Index of 500 widely held large-cap U.S. companies. The indexes and Baron Partners Fund are with dividends, which positively impact the performance results. |
| 2 | Reflects the actual fees and expenses that were charged when the Fund was a partnership. The predecessor partnership charged a 20% performance fee after reaching a certain performance benchmark. If the annual returns for the Fund did not reflect the performance fees for the years the predecessor partnership charged a performance fee, returns would be higher. The Fund’s shareholders will not be charged a performance fee. The predecessor partnership’s performance is only for periods before the Fund’s registration statement was effective, which was April 30, 2003. During those periods, the predecessor partnership was not registered under the Investment Company Act of 1940 and was not subject to its requirements or the requirements of the Internal Revenue Code relating to regulated investment companies, which, if it were, might have adversely affected its performance. |
| 3 | Past performance is not predictive of future performance. The performance data does not reflect the deduction of taxes that a shareholder would pay on Fund distributions or redemption of Fund shares. The Fund’s transfer agency expenses may be reduced by expense offsets from an unaffiliated transfer agent, without which performance would have been lower. |
| 4 | Performance for the Institutional Shares prior to May 29, 2009 is based on the performance of the Retail Shares, which have a distribution fee. The Institutional Shares do not have a distribution fee. If the annual returns for the Institutional Shares prior to May 29, 2009 did not reflect this fee, the returns would be higher. |
2
Table of Contents
| June 30, 2016 (Unaudited) | Baron Partners Fund |
TOP TEN HOLDINGSASOF JUNE 30, 2016
| Percent of Total Investments | ||||
CoStar Group, Inc. | 11.3% | |||
Tesla Motors, Inc. | 11.0% | |||
Arch Capital Group Ltd. | 8.1% | |||
Vail Resorts, Inc. | 6.0% | |||
Hyatt Hotels Corp. | 6.0% | |||
FactSet Research Systems, Inc. | 5.9% | |||
Zillow Group, Inc. | 5.4% | |||
IDEXX Laboratories, Inc. | 4.3% | |||
Under Armour, Inc. | 4.2% | |||
Manchester United plc | 4.0% | |||
| 66.2% | ||||
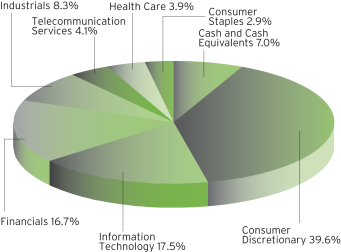
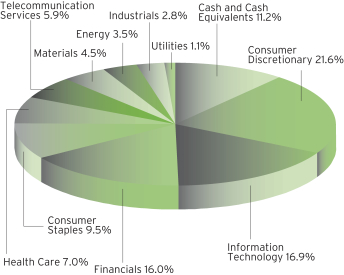
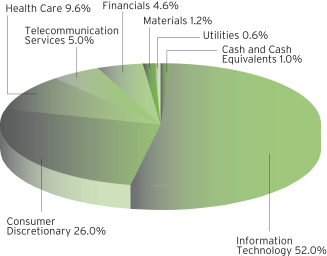
SECTOR BREAKDOWNASOF JUNE 30, 2016†
(as a percentage of total investments)

MANAGEMENT’S DISCUSSIONOF FUND PERFORMANCE
For the six months ended June 30, 2016, Baron Partners Fund1 gained 0.39%,* underperforming the Russell Midcap Growth Index, which gained 2.15%.
The Fund has performed well since its conversion into an open end mutual fund on April 30, 2003. In the period since the Fund’s conversion through June 30, 2016, the Fund gained an annualized 12.45% versus an annualized 10.83% for the Russell Midcap Growth Index. The Fund also has meaningfully outperformed the Russell Midcap Growth Index since its inception on January 31,
1992, gaining an annualized 12.24%* compared to an annualized 9.18% for its index.
Baron Partners Fund invests primarily in U.S. companies of any size with significant long-term growth potential. We believe our process can identify investment opportunities that are attractively priced relative to future prospects. The Fund is non-diversified, so its top 10 holdings are expected to comprise a significant percentage of the portfolio, and the Fund uses leverage, both of which increase risk. Of course, there can be no assurance that we will be successful in achieving the Fund’s investment goals.
The first half of 2016 was bookended by two unusually volatile periods. The U.S. equity markets plunged dramatically during the first six weeks of the period, pressured by investor concerns around the implications of a tightening credit market, signs of slowing global growth, China and the RMB, and declining oil prices. Central banks in Europe and Japan also eased monetary policy, including several that pushed interest rates into negative territory. As global concerns subsided, oil prices ticked up, domestic job numbers improved, and the U.S. Federal Reserve deferred hiking interest rates, the U.S. markets increased modestly. In late June, the U.K.’s vote to exit the European Union sent the markets into a sharp, but thankfully short-lived decline.
At the sector level, the Fund’s investments in Information Technology and Financials contributed to performance. Consumer Discretionary, Industrials, and Utilities were the largest detractors in the period.
The largest contributor was Zillow Group, Inc., the leading real estate website in the U.S. In addition to information on rentals and homes for sale, the company owns the Zillow Mortgage Marketplace and Street Easy, New York City’s leading real estate site. Zillow continues to invest in its brand as the leader in an $8 billion real estate advertising market. Shares were up in the period based on improving fundamentals and the favorable settlement of a lawsuit with Move, Inc. We think Zillow is well positioned to grow its share of the real estate advertising market.
The largest detractor was brokerage firm The Charles Schwab Corp. Shares declined due to the extreme downward pressure on the equity markets to start the year as a result of signs of a slowing Chinese economy and falling energy prices, and later in the period as a result of “Brexit.” Investors appeared concerned that higher volatility will cut into trading revenue, lower market values will pressure asset-based revenue generation, and interest rate hikes will be paused (or reversed), causing net interest margins to remain low and money market fee waivers to persist. We believe Schwab will continue to experience growth in accounts as brokers leave traditional wirehouses.
We expect to continue to establish long positions in securities that, in our opinion, have favorable price-to-value characteristics based on our assessment of their prospects for future growth and profitability.
| † | Industry sector levels are provided from the Global Industry Classification Standard (“GICS”), developed and exclusively owned by MSCI, Inc. and Standard & Poor’s Financial Services LLC, unless otherwise stated that they have been reclassified or classified by the Adviser. All GICS data is provided “as is” with no warranties. |
| 1 | Performance information reflects results of the Retail Shares. |
| * | Please see Footnote 2 on page 2. |
3
Table of Contents
| Baron Focused Growth Fund (Unaudited) | June 30, 2016 |
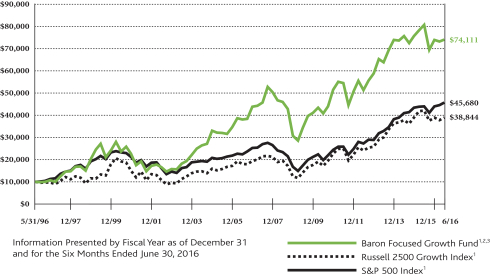
COMPARISONOFTHECHANGEIN VALUEOF $10,000INVESTMENTIN BARON FOCUSED GROWTH FUND† (RETAIL SHARES)
INRELATIONTOTHE RUSSELL 2500 GROWTH INDEXANDTHE S&P 500 INDEX
| AVERAGE ANNUAL TOTAL RETURNSFORTHEPERIODSENDED JUNE 30, 2016 | ||||||||||||||||||||||||
| Six Months* | One Year | Three Years | Five Years | Ten Years | Since Inception (May 31, 1996) | |||||||||||||||||||
Baron Focused Growth Fund — Retail Shares1,2,3 | 0.38% | (8.06)% | 5.08% | 6.37% | 6.91% | 10.49% | ||||||||||||||||||
Baron Focused Growth Fund — Institutional Shares1,2,3,4 | 0.53% | (7.83)% | 5.35% | 6.64% | 7.09% | 10.58% | ||||||||||||||||||
Russell 2500 Growth Index1 | (0.03)% | (7.69)% | 9.06% | 9.27% | 7.96% | 6.99% | ||||||||||||||||||
S&P 500 Index1 | 3.84% | 3.99% | 11.66% | 12.10% | 7.42% | 7.86% | ||||||||||||||||||
| * | Not Annualized. |
| † | The Fund’s historical performance was impacted by gains from IPOs and/or secondary offerings. There is no guarantee that these results can be repeated or that the Fund’s level of participation in IPOs and secondary offerings will be the same in the future. |
| 1 | The indexes are unmanaged. The Russell 2500™ Growth Index measures the performance of small to medium-sized U.S. companies that are classified as growth and the S&P 500 Index of 500 widely held large-cap U.S. companies. The indexes and Baron Focused Growth Fund are with dividends, which positively impact the performance results. |
| 2 | Reflects the actual fees and expenses that were charged when the Fund was a partnership. The predecessor partnership charged a 15% performance fee through 2003 after reaching a certain performance benchmark. If the annual returns for the Fund did not reflect the performance fees for the years the predecessor partnership charged a performance fee, the returns would be higher. The Fund’s shareholders will not be charged a performance fee. The predecessor partnership’s performance is only for periods before the Fund’s registration statement was effective, which was June 30, 2008. During those periods, the predecessor partnership was not registered under the Investment Company Act of 1940 and was not subject to its requirements or the requirements of the Internal Revenue Code relating to regulated investment companies, which, if it were, might have adversely affected its performance. |
| 3 | Past performance is not predictive of future performance. The performance data does not reflect the deduction of taxes that a shareholder would pay on Fund distributions or redemption of Fund shares. The Adviser has reimbursed certain Fund expenses (by contract as long as BAMCO, Inc. is the Adviser to the Fund) and the Fund’s transfer agency expenses may be reduced by expense offsets from an unaffiliated transfer agent, without which performance would have been lower. |
| 4 | Performance for the Institutional Shares prior to May 29, 2009 is based on the performance of the Retail Shares, which have a distribution fee. The Institutional Shares do not have a distribution fee. If the annual returns for the Institutional Shares prior to May 29, 2009 did not reflect this fee, the returns would be higher. |
4
Table of Contents
| June 30, 2016 (Unaudited) | Baron Focused Growth Fund |
TOP TEN HOLDINGSASOF JUNE 30, 2016
| Percent of Net Assets | ||||
Tesla Motors, Inc. | 10.7% | |||
Vail Resorts, Inc. | 10.6% | |||
Hyatt Hotels Corp. | 9.4% | |||
CoStar Group, Inc. | 9.2% | |||
FactSet Research Systems, Inc. | 6.8% | |||
Manchester United plc | 4.9% | |||
Benefitfocus, Inc. | 4.8% | |||
Iridium Communications Inc. | 4.1% | |||
Arch Capital Group Ltd. | 4.0% | |||
Choice Hotels International, Inc. | 4.0% | |||
| 68.5% | ||||
SECTOR BREAKDOWNASOF JUNE 30, 2016†
(as a percentage of net assets)
MANAGEMENT’S DISCUSSIONOF FUND PERFORMANCE
For the six month period ended June 30, 2016, Baron Focused Growth Fund1 increased 0.38%,* outperforming the Russell 2500 Growth Index, which declined 0.03%.
Since its inception on May 31, 1996, through June 30, 2016, the Fund has outperformed the Russell 2500 Growth Index, gaining an
annualized 10.49%, compared to an annualized 6.99% for its index.
Baron Focused Growth Fund invests in a non-diversified portfolio of companies that we believe are well capitalized, and have exceptional management, significant growth potential, and sustainable barriers to competition. The Fund is non-diversified, which is a riskier investment strategy. Of course, there can be no assurance that we will be successful in achieving the Fund’s investment goals.
The first half of 2016 was bookended by two unusually volatile periods. The U.S. equity markets plunged dramatically during the first six weeks of the period, pressured by investor concerns around the implications of a tightening credit market, signs of slowing global growth, China and the RMB, and declining oil prices. Central banks in Europe and Japan also eased monetary policy, including several that pushed interest rates into negative territory. As global concerns subsided, oil prices ticked up, domestic job numbers improved, and the U.S. Federal Reserve deferred hiking interest rates, the U.S. markets increased modestly. In late June, the U.K.’s vote to exit the European Union sent the markets into a sharp, but thankfully short-lived decline.
At the sector level, the Fund’s investments in Consumer Discretionary, Consumer Staples, and Telecommunication Services were the largest contributors to performance. Financials, Industrials, and Utilities detracted in the period.
Shares of ski resort company Vail Resorts, Inc. increased in the period, driven by a strong 2015/2016 ski season with increased visitation and spend across its resorts. Management also indicated that its 2016/2017 season pass sales were off to a robust start, with units up 29% over last year and revenue up 34% as the company successfully converted its destination skiers to its season pass product. We believe these results bode well for the next ski season and could result in further increases in dividends and share price.
The largest detractor was electric vehicle company Tesla Motors, Inc., driven down by concerns over dilution from recent equity financing and the complex Model X ramp and execution risk. The market also appeared skeptical of Tesla’s announced intent to buy Solar City. We feel good about the brand Tesla has built and its execution on two top-of-the-line cars. Tesla has received over 370,000 reservations for the Model 3, representing nearly $18 billion in backlog. We are still evaluating the potential implications of a Tesla/Solar City deal.
We expect to continue to establish positions in small and mid-sized businesses that, in our opinion, have favorable price-to-value characteristics based on our assessment of prospects for future growth and profitability.
| † | Industry sector levels are provided from the Global Industry Classification Standard (“GICS”), developed and exclusively owned by MSCI, Inc. and Standard & Poor’s Financial Services LLC, unless otherwise stated that they have been reclassified or classified by the Adviser. All GICS data is provided “as is” with no warranties. |
| 1 | Performance information reflects results of the Retail Shares. |
| * | Please see Footnote 2 on page 4. |
5
Table of Contents
| Baron International Growth Fund (Unaudited) | June 30, 2016 |
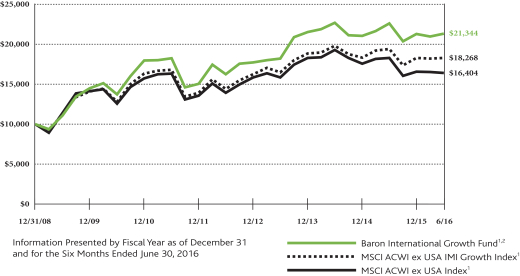
COMPARISONOFTHECHANGEIN VALUEOF $10,000INVESTMENTIN BARON INTERNATIONAL GROWTH FUND† (RETAIL SHARES)
INRELATIONTOTHE MSCI ACWIEX USA IMI GROWTH INDEXANDTHE MSCI ACWIEX USA INDEX
| AVERAGE ANNUAL TOTAL RETURNSFORTHEPERIODSENDED JUNE 30, 2016 | ||||||||||||||||||||
| Six Months* | One Year | Three Years | Five Years | Since Inception (December 31, 2008) | ||||||||||||||||
Baron International Growth Fund — Retail Shares1,2 | 0.22% | (5.64)% | 5.43% | 3.20% | 10.64% | |||||||||||||||
Baron International Growth Fund — Institutional Shares1,2,3 | 0.39% | (5.40)% | 5.73% | 3.47% | 10.91% | |||||||||||||||
MSCI ACWI ex USA IMI Growth Index1 | (0.01)% | (5.90)% | 3.49% | 1.68% | 8.37% | |||||||||||||||
MSCI ACWI ex USA Index1 | (1.02)% | (10.24)% | 1.16% | 0.10% | 6.82% | |||||||||||||||
| * | Not Annualized. |
| † | The Fund’s historical performance was impacted by gains from IPOs and/or secondary offerings. There is no guarantee that these results can be repeated or that the Fund’s level of participation in IPOs and secondary offerings will be the same in the future. |
| 1 | The MSCI ACWI ex USA indexes cited are unmanaged, free float-adjusted market capitalization weighted indexes. The MSCI ACWI ex USA IMI Growth Index Net USD measures the performance of large-, mid- and small-cap growth securities across developed and emerging markets, excluding the United States. The MSCI ACWI ex USA Index Net USD measures the equity market performance of large and mid-cap securities across developed and emerging markets, excluding the United States. The indexes and Baron International Growth Fund include reinvestment of dividends, net of foreign withholding taxes, which positively impact the performance results. |
| 2 | Past performance is not predictive of future performance. The performance data does not reflect the deduction of taxes that a shareholder would pay on Fund distributions or redemption of Fund shares. The Adviser has reimbursed certain Fund expenses (by contract as long as BAMCO, Inc. is the Adviser to the Fund) and the Fund’s transfer agency expenses may be reduced by expense offsets from an unaffiliated transfer agent, without which performance would have been lower. |
| 3 | Performance for the Institutional Shares prior to May 29, 2009 is based on the performance of the Retail Shares, which have a distribution fee. The Institutional Shares do not have a distribution fee. If the annual returns for the Institutional Shares prior to May 29, 2009 did not reflect this fee, the returns would be higher. |
6
Table of Contents
| June 30, 2016 (Unaudited) | Baron International Growth Fund |
TOP TEN HOLDINGSASOF JUNE 30, 2016
| Percent of Net Assets | ||||
Aena SA | 3.5% | |||
Eurofins Scientific SE | 3.3% | |||
Domino’s Pizza Enterprises Ltd. | 3.3% | |||
Fresenius Medical Care Ag & Co | 2.5% | |||
Abcam plc | 2.5% | |||
Check Point Software Technologies Ltd. | 2.4% | |||
Newcrest Mining Ltd. | 2.4% | |||
Constellation Software, Inc. | 2.4% | |||
Arch Capital Group Ltd. | 2.3% | |||
Mellanox Technologies Ltd. | 2.3% | |||
| 26.9% | ||||
SECTOR BREAKDOWNASOF JUNE 30, 2016†
(as a percentage of net assets)
MANAGEMENT’S DISCUSSIONOF FUND PERFORMANCE
For the six months ended June 30, 2016, Baron International Growth Fund1 gained 0.22%, outperforming the MSCI ACWI ex US IMI Growth Index, which declined 0.01%.
Baron International Growth Fund is a diversified fund that invests for the long term primarily in securities of non-U.S. growth
companies. The Fund expects to diversify among several developed countries and developing countries throughout the world, although the Fund’s total exposure to developing countries will not exceed 30%. The Fund may purchase securities of companies of any size.
The first half of 2016 was bookended by two unusually volatile periods. The international equity markets plunged dramatically during the first six weeks of the year, pressured by investor concerns around the implications of a tightening credit market, signs of slowing global growth, China and the RMB, and declining oil prices. Central banks in Europe and Japan also eased monetary policy, including several that pushed interest rates into negative territory. As global concerns subsided and oil prices ticked up, the markets increased modestly. In late June, the U.K.’s vote to exit the European Union (“Brexit”) sent the markets into a sharp decline and the international markets ended the period more or less flat.
On a country basis, holdings in Australia, Brazil, and Spain contributed the most to performance. Investments in the U.K., Italy, and Japan were the biggest detractors.
On a sector basis, investments in Materials, Consumer Discretionary, and Telecommunication Services were the largest contributors. Investments in Information Technology, Consumer Staples, and Financials detracted the most.
The top contributor was Australia-based gold mining company Newcrest Mining Ltd. The company has relatively low cash costs and long reserve lives. Shares rose largely due to a continued rally in the price of gold. We admire new management’s strategic priorities and further believe gold mining equities offer an attractive play on rising capital controls in China as well as continued unconventional global monetary policy.
easyJet plc was the largest detractor in the six month period. Shares of this European budget airline fell following Brexit and a profit warning from the company. The company is facing significant operating challenges following numerous air traffic control strikes and terrorist attacks that have reduced air travel demand in the region. Regarding the long-term outlook for the business, we are in the process of reviewing proposed changes to the aviation regulatory environment.
As we have said before, we believe a global stress event is likely to provoke the U.S. Federal Reserve to join in more aggressive policy measures such as fiscal QE or “helicopter money.” Brexit may well be the catalyst we have been looking for, as we believe such measures would likely mark the end of the U.S. Dollar bull market, drive investors to embrace rising inflation expectations, and stimulate global nominal GDP growth. In such an environment, we would expect international, and in particular, emerging market equities to return to leadership amid a global advance.
| † | Industry sector levels are provided from the Global Industry Classification Standard (“GICS”), developed and exclusively owned by MSCI, Inc. and Standard & Poor’s Financial Services LLC, unless otherwise stated that they have been reclassified or classified by the Adviser. All GICS data is provided “as is” with no warranties. |
| 1 | Performance information reflects results of the Retail Shares. |
7
Table of Contents
| Baron Real Estate Fund (Unaudited) | June 30, 2016 |
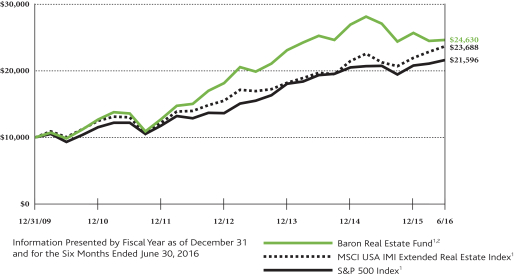
COMPARISONOFTHECHANGEIN VALUEOF $10,000INVESTMENTIN BARON REAL ESTATE FUND† (RETAIL SHARES)
INRELATIONTOTHE MSCI USA IMI EXTENDED REAL ESTATE INDEXANDTHE S&P 500 INDEX
| AVERAGE ANNUAL TOTAL RETURNSFORTHEPERIODSENDED JUNE 30, 2016 | ||||||||||||||||||||
| Six Months* | One Year | Three Years | Five Years | Since Inception (December 31, 2009) | ||||||||||||||||
Baron Real Estate Fund — Retail Shares1,2 | (4.08)% | (9.11)% | 7.43% | 12.61% | 14.87% | |||||||||||||||
Baron Real Estate Fund — Institutional Shares1,2 | (3.96)% | (8.87)% | 7.70% | 12.89% | 15.16% | |||||||||||||||
Baron Real Estate Fund — R6 Shares1,2,3 | (3.96)% | (8.87)% | 7.70% | 12.89% | 15.16% | |||||||||||||||
MSCI USA IMI Extended Real Estate Index1 | 7.92% | 11.30% | 11.80% | 12.75% | 14.19% | |||||||||||||||
S&P 500 Index1 | 3.84% | 3.99% | 11.66% | 12.10% | 12.57% | |||||||||||||||
| * | Not Annualized. |
| † | The Fund’s historical performance was impacted by gains from IPOs and/or secondary offerings. There is no guarantee that these results can be repeated or that the Fund’s level of participation in IPOs and secondary offerings will be the same in the future. |
| 1 | The MSCI USA IMI Extended Real Estate Index is a custom index calculated by MSCI for, and as requested by, BAMCO, Inc. The index includes real estate and real estate-related GICS classification securities. MSCI makes no express or implied warranties or representation and shall have no liability whatsoever with respect to any MSCI data contained herein. The MSCI data may not be further redistributed or used as a basis for other indexes or any securities or financial products. This report is not approved, reviewed or produced by MSCI. The S&P 500 Index measures the performance of 500 widely held large-cap U.S. companies. The indexes and Baron Real Estate Fund are with dividends, which positively impact the performance results. |
| 2 | Past performance is not predictive of future performance. The performance data does not reflect the deduction of taxes that a shareholder would pay on Fund distributions or redemption of Fund shares. The Adviser has reimbursed certain Fund expenses (by contract as long as BAMCO, Inc. is the Adviser to the Fund) and the Fund’s transfer agency expenses may be reduced by expense offsets from an unaffiliated transfer agent, without which performance would have been lower. |
| 3 | Performance for the R6 Shares prior to January 29, 2016 is based on the performance of the Institutional Shares. |
8
Table of Contents
| June 30, 2016 (Unaudited) | Baron Real Estate Fund |
TOP TEN HOLDINGSASOF JUNE 30, 2016
| Percent of Net Assets | ||||
MGM Resorts International | 6.1% | |||
Mohawk Industries, Inc. | 5.6% | |||
InterXion Holding N.V. | 5.4% | |||
Gaming and Leisure Properties, Inc. | 5.2% | |||
CBRE Group, Inc. | 5.1% | |||
American Tower Corp. | 4.1% | |||
Equinix, Inc. | 4.0% | |||
Macquarie Infrastructure Company Trust | 4.0% | |||
MGM Growth Properties LLC | 3.9% | |||
Hilton Worldwide Holdings, Inc. | 3.6% | |||
| 47.0% | ||||
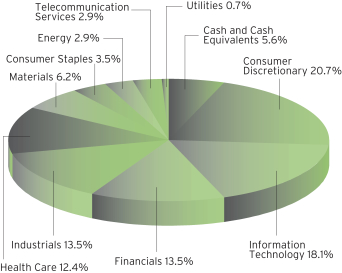
SECTOR BREAKDOWNASOF JUNE 30, 2016†
(as a percentage of net assets)
MANAGEMENT’S DISCUSSIONOF FUND PERFORMANCE
For the six month period ended June 30, 2016, Baron Real Estate Fund1 declined 4.08%, underperforming the MSCI USA IMI Extended Real Estate Index, which gained 7.92%. Since its inception on December 31, 2009 through June 30, 2016, the Fund has outperformed its index, generating an annualized return of 14.87%, compared with an annualized return of 14.19% for the index.
Baron Real Estate Fund is a non-diversified fund that invests broadly in real estate and real estate-related companies of all sizes. The Fund seeks to invest in well-managed companies that we believe have significant long-term growth opportunities. The Fund’s investment universe extends beyond real estate investment trusts (REITs) to include hotels, senior housing operators, casino and gaming operators, tower operators, infrastructure-related companies and master limited partnerships (MLPs), data centers, building products companies, real estate service companies, and real estate operating companies.
The first half of 2016 exhibited an unusual combination of macro developments. Concerns about China’s growth outlook, wild swings in oil prices, inconsistent signals and pronouncements from the U.S. Federal Reserve, plummeting interest rates to record low levels, the surprising referendum vote in the U.K. to withdraw from the E.U. (Brexit), U.S. job growth figures that widely fluctuate from month to month, and an unconventional and divisive U.S. Presidential election year are a sampling of the factors that have impacted the markets.
REIT and data center holdings contributed to performance in the period. Investments in real estate service companies, hotels & leisure, and homebuilders & land developers detracted the most from performance.
The top contributor in the six month period was Digital Realty Trust, Inc. The increase in the share price was driven by strong leasing and occupancy trends, stable pricing, and robust demand from cloud customers. Digital’s successful integration of recent acquisition Telx, with cost synergies fully realized and teams integrated, also boosted share price. Finally, its May 2016 acquisition of eight assets in Europe substantially expanded its global footprint and product offering.
The top detractor was Jones Lang LaSalle, Inc., a commercial real estate services company with leading positions across all of its major businesses. Shares fell over concerns that capital markets activity will slow dramatically and that the commercial real estate cycle is nearing its peak. In late June, given Jones’ exposure to Europe, Brexit further pressured the stock. We believe the outlook for commercial real estate is attractive and remain optimistic on the long-term prospects for Jones Lang.
We expect further macro-economic, political, stock market, and bond market twists and turns in the months ahead. We believe that the Fund, with its expansive, balanced and differentiated approach to investing in real estate, provides the flexibility to perform well over the long term in several different market environments.
| † | Industry sector levels are provided from the Global Industry Classification Standard (“GICS”), developed and exclusively owned by MSCI, Inc. and Standard & Poor’s Financial Services LLC, unless otherwise stated that they have been reclassified or classified by the Adviser. All GICS data is provided “as is” with no warranties. |
| 1 | Performance information reflects results of the Retail Shares. |
9
Table of Contents
| Baron Emerging Markets Fund (Unaudited) | June 30, 2016 |
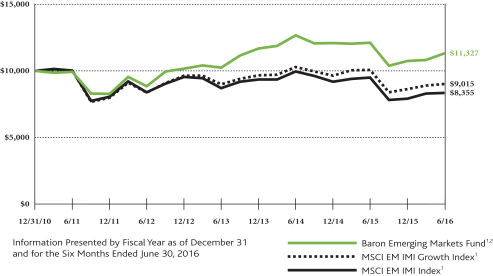
COMPARISONOFTHECHANGEIN VALUEOF $10,000INVESTMENTIN BARON EMERGING MARKETS FUND† (RETAIL SHARES)
INRELATIONTOTHE MSCI EM IMI GROWTH INDEXANDTHE MSCI EM IMI INDEX
| AVERAGE ANNUAL TOTAL RETURNSFORTHEPERIODSENDED JUNE 30, 2016 | ||||||||||||||||||||
| Six Months* | One Year | Three Years | Five Years | Since Inception (December 31, 2010) | ||||||||||||||||
Baron Emerging Markets Fund — Retail Shares1,2 | 5.49% | (6.60)% | 3.41% | 2.69% | 2.29% | |||||||||||||||
Baron Emerging Markets Fund — Institutional Shares1,2 | 5.67% | (6.31)% | 3.69% | 2.95% | 2.54% | |||||||||||||||
Baron Emerging Markets Fund — R6 Shares1,2,3 | 5.76% | (6.23)% | 3.72% | 2.97% | 2.56% | |||||||||||||||
MSCI EM IMI Growth Index1 | 4.43% | (10.55)% | 0.03% | (2.12)% | (1.87)% | |||||||||||||||
MSCI EM IMI Index1 | 5.69% | (12.16)% | (1.36)% | (3.59)% | (3.21)% | |||||||||||||||
| * | Not Annualized. |
| † | The Fund’s historical performance was impacted by gains from IPOs and/or secondary offerings. There is no guarantee that these results can be repeated or that the Fund’s level of participation in IPOs and secondary offerings will be the same in the future. |
| 1 | The MSCI EM (Emerging Markets) IMI indexes cited are unmanaged, free float-adjusted market capitalization indexes. The MSCI EM (Emerging Markets) IMI Growth Index Net USD and the MSCI EM (Emerging Markets) IMI Index Net USD are designed to measure equity market performance of large-, mid- and small-cap securities in the emerging markets. The MSCI EM (Emerging Markets) IMI Growth Index Net USD screens for growth-style securities. The indexes and Baron Emerging Markets Fund include reinvestment of dividends, net of foreign withholding taxes, which positively impact the performance results. |
| 2 | Past performance is not predictive of future performance. The performance data does not reflect the deduction of taxes that a shareholder would pay on Fund distributions or redemption of Fund shares. The Adviser has reimbursed certain Fund expenses (by contract as long as BAMCO, Inc. is the Adviser to the Fund) and the Fund’s transfer agency expenses may be reduced by expense offsets from an unaffiliated transfer agent without which performance would have been lower. |
| 3 | Performance for the R6 Shares prior to January 29, 2016 is based on the performance of the Institutional Shares. |
10
Table of Contents
| June 30, 2016 (Unaudited) | Baron Emerging Markets Fund |
TOP TEN HOLDINGSASOF JUNE 30, 2016
| Percent of Net Assets | ||||
Samsung Electronics Co., Ltd. | 2.6% | |||
Alibaba Group Holding Limited | 2.4% | |||
Tencent Holdings, Ltd. | 2.4% | |||
Taiwan Semiconductor Manufacturing Company Ltd. | 2.3% | |||
SKS Microfinance Limited | 1.9% | |||
BM&FBOVESPA SA | 1.8% | |||
Sinopharm Group Co. Ltd. | 1.8% | |||
TAL Education Group | 1.7% | |||
Far EasTone Telecommunications Co., Ltd. | 1.7% | |||
Steinhoff International Holdings N.V. | 1.6% | |||
| 20.2% | ||||
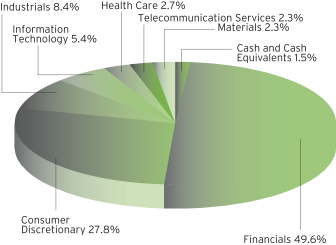
SECTOR BREAKDOWNASOF JUNE 30 2016†
(as a percentage of net assets)
MANAGEMENT’S DISCUSSIONOF FUND PERFORMANCE
For the six months ended June 30, 2016, Baron Emerging Markets Fund1 gained 5.49%, outperforming the MSCI EM IMI Growth Index, which gained 4.43%.
Baron Emerging Markets Fund is a diversified fund that invests for the long term primarily in companies of any size that have their
principal business activities or trading markets in developing countries. The Fund may invest up to 20% of its net assets in developed and frontier countries. The Fund seeks to invest in companies that have significant long-term growth prospects and to purchase them at prices we believe to be favorable.
After years of underperforming their developed market peers, emerging markets appeared to turn a corner in the first half of 2016. The period was bookended by volatility. In the first six weeks of 2016, investor concerns around the implications of a tightening credit market, signs of slowing global growth, China and the RMB, and declining oil prices pressured emerging markets. As global concerns subsided and oil and commodity prices stabilized, emerging markets rose steadily. In late June, the U.K.’s vote to exit the E.U. (“Brexit”) sent the markets into a sharp, but thankfully short-lived decline.
On a country basis, holdings in Brazil, South Africa, and Russia contributed the most to performance. Investments in India, Taiwan, and the United States were the biggest detractors.
On a sector basis, investments in Financials, Information Technology, and Materials were the largest contributors. Investments in Health Care and Utilities detracted.
The top contributor was Brazil-based financial exchange operator BM&FBOVESPA SA. The stock rose along with the broader Brazilian equity market and currency on investor optimism that political changes will lead to structural improvements in the economy. Shares also benefited from shareholder approval of the company’s acquisition of rival Cetip SA — Mercados Organizados.
Kingdee International Software Group Co. Ltd., a China-based software vendor, was the top detractor. Shares declined after the company reported unexpectedly weak earnings results. Its legacy software business, which funds the development costs for the fast-growing Cloud business, was weak due to delays in IT spending by Chinese enterprise clients. We believe Kingdee is well funded and can make the necessary Cloud investment despite the current slowdown in China.
As we have said before, we believe a global stress event is likely to provoke the U.S. Federal Reserve to join in more aggressive policy measures such as fiscal QE or “helicopter money.” Brexit may well be the catalyst we have been looking for, as we believe such measures would likely mark the end of the U.S. Dollar bull market, drive investors to embrace rising inflation expectations, and stimulate global nominal GDP growth. In such an environment, we would expect emerging market equities to return to leadership amid a global advance. For now, we believe the leadership of the emerging markets during the period, including in the aftermath of Brexit, at a minimum confirms the rising likelihood of sustainable outperformance of the emerging markets, although we cannot guarantee that it will.
| † | Industry sector levels are provided from the Global Industry Classification Standard (“GICS”), developed and exclusively owned by MSCI, Inc. and Standard & Poor’s Financial Services LLC, unless otherwise stated that they have been reclassified or classified by the Adviser. All GICS data is provided “as is” with no warranties. |
| 1 | Performance information reflects results of the Retail Shares. |
11
Table of Contents
| Baron Energy and Resources Fund (Unaudited) | June 30, 2016 |
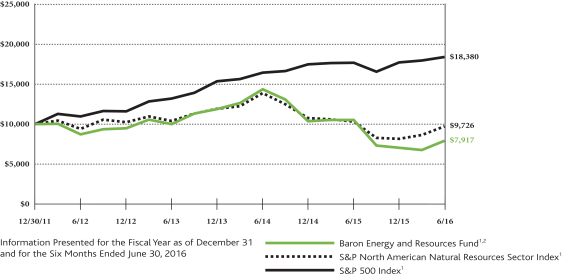
COMPARISONOFTHECHANGEIN VALUEOF $10,000INVESTMENTIN BARON ENERGYAND RESOURCES FUND† (RETAIL SHARES)
INRELATIONTOTHE S&P NORTH AMERICAN NATURAL RESOURCES SECTOR INDEXANDTHE S&P 500 INDEX
| AVERAGE ANNUAL TOTAL RETURNSFORTHEPERIODSENDED JUNE 30, 2016 | ||||||||||||||||
| Six Months* | One Year | Three Years | Since Inception (December 31, 2011) | |||||||||||||
Baron Energy and Resources Fund — Retail Shares1,2 | 12.38% | (24.84)% | (7.52)% | (5.06)% | ||||||||||||
Baron Energy and Resources Fund — Institutional Shares1,2 | 12.54% | (24.62)% | (7.30)% | (4.84)% | ||||||||||||
S&P North American Natural Resources Sector Index1 | 19.56% | (5.56)% | (2.24)% | (0.62)% | ||||||||||||
S&P 500 Index1 | 3.84% | 3.99% | 11.66% | 14.48% | ||||||||||||
| * | Not Annualized. |
| † | The Fund’s historical performance was impacted by gains from IPOs and/or secondary offerings. There is no guarantee that these results can be repeated or that the Fund’s level of participation in IPOs and secondary offerings will be the same in the future. |
| 1 | The indexes are unmanaged. The S&P North American Natural Resources Sector Index measures the performance of U.S.-traded natural resources-related stocks, including mining, energy, paper and forest products, and plantation owning companies. The S&P 500 Index measures the performance of 500 widely held large-cap U.S. companies. The indexes and Baron Energy and Resources Fund are with dividends, which positively impact the performance results. |
| 2 | Past performance is not predictive of future performance. The performance data does not reflect the deduction of taxes that a shareholder would pay on Fund distributions or redemption of Fund shares. The Adviser has reimbursed certain Fund expenses (by contract as long as BAMCO, Inc. is the Adviser to the Fund) and the Fund’s transfer agency expenses may be reduced by expense offsets from an unaffiliated transfer agent, without which performance would have been lower. |
12
Table of Contents
| June 30, 2016 (Unaudited) | Baron Energy and Resources Fund |
TOP TEN HOLDINGSASOF JUNE 30, 2016
| Percent of Net Assets | ||||
Parsley Energy, Inc. | 6.5% | |||
Newfield Exploration Co. | 6.0% | |||
Concho Resources, Inc. | 5.8% | |||
RSP Permian, Inc. | 5.5% | |||
Rice Energy Inc. | 4.9% | |||
Flotek Industries, Inc. | 4.7% | |||
Encana Corp | 4.0% | |||
Halliburton Co. | 3.7% | |||
Schlumberger Limited | 3.5% | |||
Targa Resources Corp. | 3.0% | |||
| 47.6% | ||||
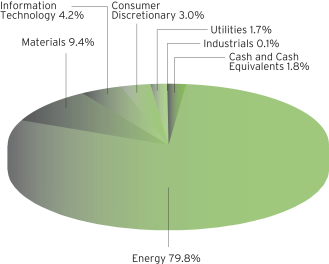
SECTOR BREAKDOWNASOF JUNE 30, 2016†
(as a percentage of net assets)
MANAGEMENT’S DISCUSSIONOF FUND PERFORMANCE
For the six month period ended June 30, 2016, Baron Energy and Resources Fund1 increased 12.38%, underperforming the S&P North American Natural Resources Sector Index, which increased 19.56%.
The Fund is a non-diversified fund that invests primarily in energy and resources companies of any market capitalization, including
master limited partnerships (MLPs). The Fund invests primarily in U.S. securities and may invest up to 25% in non-U.S. securities. We select securities that we believe have favorable price-to-value characteristics, are well managed and appropriately financed, and have significant long-term growth prospects and competitive advantages.
Oil prices bottomed at near 15-year lows in February, then rebounded to end the period significantly stronger. The strengthening in oil and commodity prices was largely a function of improving supply/demand fundamentals in energy commodities and low to negative interest rates driving up demand for precious metals. Key events/developments included: 1) accelerating U.S. oil production declines; 2) fires in Canada that negatively impacted oil production; 3) political unrest in Nigeria, Libya, and Venezuela that also impacted production ; 4) the failure of OPEC and non-OPEC producers to reach an agreement to “freeze” production, let alone cut it; 5) the ongoing saga regarding the potential for additional U.S. interest rate hikes this year; and 6) the surprising vote in the U.K. to exit the European Union.
Investments in Energy sub-industries oil & gas exploration & production (E&P) and oil & gas equipment & services and Materials sub-industry specialty chemicals contributed the most to performance. Holdings in Energy sub-industry oil & gas refining and marketing, Utilities sub-industry renewable electricity, and Consumer Discretionary sub-industry automobile manufacturers were the top detractors.
E&P company Rice Energy, Inc. was the top contributor in the period. Shares rose on a rally in natural gas prices, strong production and lower well costs. In our opinion, Rice is one of the most attractively valued E&Ps and offers exposure to some of the best acreage and industry-leading production growth. We also think that the market underappreciates the value of Rice’s midstream holdings.
Refining and marketing company Marathon Petroleum Corp. was the top detractor. Shares fell due to a combination of refining margins that missed expectations and concerns around forward growth expectations for its subsidiary MPLX LP following the completion of MPLX’s acquisition of MarkWest Energy Partners LP. We think Marathon is currently undervalued and concerns are more than adequately discounted in the share price.
Our outlook for investing in the Energy and Resources sectors remains positive. The trends leading toward a rebalancing in the energy markets remain in place and leave us confident that the energy industry recession of the past two years is coming to an end. We continue to focus our holdings among mostly domestically oriented exploration & production companies and oilfield service and midstream companies, as we believe these are the businesses best positioned to benefit from the long-term need for additional oil supply over the next five years.
| † | Industry sector levels are provided from the Global Industry Classification Standard (“GICS”), developed and exclusively owned by MSCI, Inc. and Standard & Poor’s Financial Services LLC, unless otherwise stated that they have been reclassified or classified by the Adviser. All GICS data is provided “as is” with no warranties. |
| 1 | Performance information reflects results of the Retail Shares. |
13
Table of Contents
| Baron Global Advantage Fund (Unaudited) | June 30, 2016 |
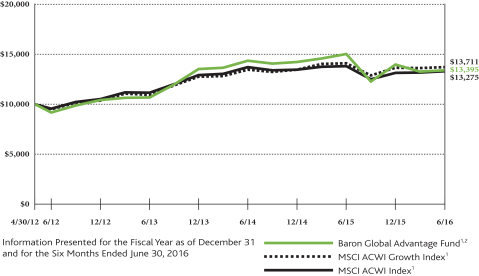
COMPARISONOFTHECHANGEIN VALUEOF $10,000INVESTMENTIN BARON GLOBAL ADVANTAGE FUND† (RETAIL SHARES)
INRELATIONTOTHE MSCI ACWI GROWTH INDEXANDTHE MSCI ACWI INDEX
| AVERAGE ANNUAL TOTAL RETURNS FORTHEPERIODSENDED JUNE 30, 2016 | ||||||||||||||||
| Six Months* | One Year | Three Years | Since Inception (April 30, 2012) | |||||||||||||
Baron Global Advantage Fund — Retail Shares1,2 | (4.03)% | (10.82)% | 7.94% | 7.27% | ||||||||||||
Baron Global Advantage Fund — Institutional Shares1,2 | (3.93)% | (10.64)% | 8.16% | 7.49% | ||||||||||||
MSCI ACWI Growth Index Net1 | 0.44% | (2.71)% | 7.88% | 7.87% | ||||||||||||
MSCI ACWI Index Net1 | 1.23% | (3.73)% | 6.03% | 7.03% | ||||||||||||
| * | Not Annualized. |
| † | The Fund’s historical performance was impacted by gains from IPOs and/or secondary offerings. There is no guarantee that these results can be repeated or that the Fund’s level of participation in IPOs and secondary offerings will be the same in the future. |
| 1 | The MSCI ACWI indexes cited are unmanaged, free float-adjusted market capitalization weighted indexes reflected in US dollars. The MSCI ACWI Growth Index Net USD measures the equity market performance of large- and mid-cap growth securities across developed and emerging markets. The MSCI ACWI Index Net USD measures the equity market performance of large- and mid-cap securities across developed and emerging markets. The indexes and Baron Global Advantage Fund include reinvestment of dividends, net of foreign withholding taxes, which positively impact the performance results. |
| 2 | Past performance is not predictive of future performance. The performance data does not reflect the deduction of taxes that a shareholder would pay on Fund distributions or redemption of Fund shares. The Adviser has reimbursed certain Fund expenses (by contract as long as BAMCO, Inc. is the Adviser to the Fund) and the Fund’s transfer agency expenses may be reduced by expense offsets from an unaffiliated transfer agent, without which performance would have been lower. |
14
Table of Contents
| June 30, 2016 (Unaudited) | Baron Global Advantage Fund |
TOP TEN HOLDINGSASOF JUNE 30, 2016
| Percent of Net Assets | ||||
Amazon.com, Inc. | 10.6% | |||
TAL Education Group | 5.7% | |||
Alphabet Inc. | 5.4% | |||
Facebook, Inc. | 5.0% | |||
Alibaba Group Holding Limited | 4.9% | |||
Naspers Limited | 4.6% | |||
Constellation Software, Inc. | 4.1% | |||
Mobileye N.V. | 3.6% | |||
Mellanox Technologies Ltd. | 3.4% | |||
Sarana Menara Nusantara Tbk PT | 3.4% | |||
| 50.7% | ||||
SECTOR BREAKDOWNASOF JUNE 30, 2016†
(as a percentage of net assets)
MANAGEMENT’S DISCUSSIONOF FUND PERFORMANCE
For the six months ended June 30, 2016, Baron Global Advantage Fund1 lost 4.03%, underperforming the MSCI ACWI Growth Index, which rose 0.44 %.
Baron Global Advantage Fund is a diversified fund that invests primarily in growth companies of any size located throughout the world. We have a long-term mindset, conduct bottom-up
research, and believe insights and perspective are more important than short-term events or results. We invest in companies that we believe have favorable price-to-value and risk/reward characteristics, have strong free cash flow and returns on capital, are well-managed, and have sustainable competitive advantages.
The first half of 2016 was bookended by two unusually volatile periods. Global equity markets plunged dramatically during the first six weeks of the year, pressured by investor concerns around the implications of a tightening credit market, signs of slowing global growth, China and the RMB, and declining oil prices. In addition, central banks in Europe and Japan eased monetary policy, including several that pushed interest rates into negative territory. As global concerns subsided and oil prices ticked up, the markets increased modestly. In late June, the U.K.’s vote to exit the European Union sent the markets into a sharp decline and the global markets ended the period more or less where they started.
On a sector basis, the Fund’s investments in Consumer Discretionary and Financials contributed to performance. Health Care, Information Technology, and Utilities detracted the most. From a country perspective, holdings in Israel, China, and Brazil were top contributors. Investments in the U.S., the U.K., and India were the biggest detractors.
TAL Education Group, a leading K-12 tutoring company in China, was the top contributor. Shares appreciated on strong growth in enrollments. We see significant opportunity for growth as TAL expands existing learning centers, opens new learning centers in existing cities, and enters new cities, while generating strong cash flow. The new hybrid class initiative in which classes are webcast to distant learning centers has the potential to improve teacher utilization and increase margins.
The top detractor was Pacira Pharmaceuticals, Inc., a pharmaceutical that makes pain control drug EXPAREL. Share price peaked early in 2016 in the wake of a favorable settlement of a marketing dispute with the FDA, but then dropped due to broader concerns in the pharma sector as well as growth guidance biased toward the second half of 2016. We believe Pacira has the potential for 25-35% top line growth for years to come.
The portfolio is constructed on a bottom-up basis, with the quality of ideas and conviction level being the most important determinants of the size of each individual investment. We continue to focus on identifying and investing in what we believe are unique companies with sustainable competitive advantages and the ability to redeploy capital at high rates of return. We are optimistic about the long-term opportunities of the companies in which we are invested and continue to search for new ideas and investments.
| † | Industry sector levels are provided from the Global Industry Classification Standard (“GICS”), developed and exclusively owned by MSCI, Inc. and Standard & Poor’s Financial Services LLC, unless otherwise stated that they have been reclassified or classified by the Adviser. All GICS data is provided “as is” with no warranties. |
| 1 | Performance information reflects results of the Retail Shares. |
15
Table of Contents
| Baron Partners Fund | June 30, 2016 |
STATEMENT OF NET ASSETS (Unaudited)
| JUNE 30, 2016 |
| Shares | Cost | Value | ||||||||
| Common Stocks (129.39%) | ||||||||||
| Consumer Discretionary (47.00%) | ||||||||||
Apparel, Accessories & Luxury Goods (5.46%) | ||||||||||
| 2,166,200 | Under Armour, Inc., Cl A1 | $ | 80,170,838 | $ | 86,929,606 | |||||
| 82,920 | Under Armour, Inc., Cl C1 | 2,904,386 | 3,018,288 | |||||||
|
|
|
| |||||||
| 83,075,224 | 89,947,894 | |||||||||
Automobile Manufacturers (14.30%) | ||||||||||
| 1,110,000 | Tesla Motors, Inc.1,5 | 236,819,490 | 235,630,800 | |||||||
Automotive Retail (2.08%) | ||||||||||
| 700,000 | CarMax, Inc.1 | 19,188,775 | 34,321,000 | |||||||
Hotels, Resorts & Cruise Lines (8.73%) | ||||||||||
| 2,600,000 | Hyatt Hotels Corp., Cl A1 | 72,054,423 | 127,764,000 | |||||||
| 405,000 | Norwegian Cruise Line Holdings Ltd.1,2 | 18,287,510 | 16,135,200 | |||||||
|
|
|
| |||||||
| 90,341,933 | 143,899,200 | |||||||||
Internet Retail (2.95%) | ||||||||||
| 15,000 | Amazon.com, Inc.1 | 10,743,712 | 10,734,300 | |||||||
| 20,357,182 | AO World plc (United Kingdom)1,2 | 43,575,320 | 37,940,683 | |||||||
|
|
|
| |||||||
| 54,319,032 | 48,674,983 | |||||||||
Leisure Facilities (7.77%) | ||||||||||
| 925,800 | Vail Resorts, Inc. | 27,801,851 | 127,973,334 | |||||||
Movies & Entertainment (5.20%) | ||||||||||
| 5,374,321 | Manchester United plc, Cl A2 | 91,547,645 | 85,612,934 | |||||||
Restaurants (0.51%) | ||||||||||
| 40,000 | Panera Bread Co., Cl A1 | 6,855,645 | 8,477,600 | |||||||
|
|
|
| |||||||
Total Consumer Discretionary | 609,949,595 | 774,537,745 | ||||||||
|
|
|
| |||||||
| Financials (32.58%) | ||||||||||
Asset Management & Custody Banks (2.86%) | ||||||||||
| 2,900,723 | The Carlyle Group | 73,162,711 | 47,078,734 | |||||||
Hotel & Resort REITs (0.62%) | ||||||||||
| 382,727 | MGM Growth Properties LLC, Cl A | 8,037,267 | 10,211,157 | |||||||
Investment Banking & Brokerage (4.30%) | ||||||||||
| 2,800,000 | The Charles Schwab Corp. | 24,289,154 | 70,868,000 | |||||||
Office REITs (2.12%) | ||||||||||
| 985,000 | Douglas Emmett, Inc. | 29,254,614 | 34,987,200 | |||||||
Property & Casualty Insurance (10.49%) | ||||||||||
| 2,400,000 | Arch Capital Group Ltd.1,2 | 31,929,992 | 172,800,000 | |||||||
Specialized Finance (7.59%) | ||||||||||
| 775,000 | FactSet Research Systems, Inc. | 50,806,618 | 125,100,500 | |||||||
Specialized REITs (4.60%) | ||||||||||
| 2,200,000 | Gaming and Leisure Properties, Inc. | 71,552,343 | 75,856,000 | |||||||
|
|
|
| |||||||
Total Financials | 289,032,699 | 536,901,591 | ||||||||
|
|
|
| |||||||
| Shares | Cost | Value | ||||||||
| Common Stocks (continued) | ||||||||||
| Health Care (12.57%) | ||||||||||
Biotechnology (0.23%) | ||||||||||
| 100,000 | Juno Therapeutics, Inc.1 | $ | 3,875,323 | $ | 3,844,000 | |||||
Health Care Equipment (5.64%) | ||||||||||
| 1,000,000 | IDEXX Laboratories, Inc.1 | 43,593,540 | 92,860,000 | |||||||
Health Care Technology (3.72%) | ||||||||||
| 3,407,450 | Inovalon Holdings, Inc., CI A1 | 83,833,683 | 61,368,174 | |||||||
Life Sciences Tools & Services (2.98%) | ||||||||||
| 350,000 | Illumina, Inc.1 | 35,950,431 | 49,133,000 | |||||||
|
|
|
| |||||||
Total Health Care | 167,252,977 | 207,205,174 | ||||||||
|
|
|
| |||||||
| Industrials (9.98%) | ||||||||||
Research & Consulting Services (4.31%) | ||||||||||
| 875,000 | Verisk Analytics, Inc.1 | 22,892,856 | 70,945,000 | |||||||
Trading Companies & Distributors (5.67%) | ||||||||||
| 1,500,000 | Air Lease Corp. | 47,665,774 | 40,170,000 | |||||||
| 1,200,000 | Fastenal Co. | 20,800,846 | 53,268,000 | |||||||
|
|
|
| |||||||
| 68,466,620 | 93,438,000 | |||||||||
|
|
|
| |||||||
Total Industrials | 91,359,476 | 164,383,000 | ||||||||
|
|
|
| |||||||
| Information Technology (27.26%) | ||||||||||
Application Software (0.84%) | ||||||||||
| 300,000 | Mobileye N.V.1,2 | 7,692,172 | 13,842,000 | |||||||
Internet Software & Services (22.58%) | ||||||||||
| 400,000 | Benefitfocus, Inc.1 | 14,575,230 | 15,248,000 | |||||||
| 1,100,000 | CoStar Group, Inc.1 | 112,737,432 | 240,526,000 | |||||||
| 3,175,000 | Zillow Group, Inc., Cl A1 | 79,696,661 | 116,363,750 | |||||||
|
|
|
| |||||||
| 207,009,323 | 372,137,750 | |||||||||
IT Consulting & Other Services (3.84%) | ||||||||||
| 649,000 | Gartner, Inc.1 | 41,264,138 | 63,219,090 | |||||||
|
|
|
| |||||||
Total Information Technology | 255,965,633 | 449,198,840 | ||||||||
|
|
|
| |||||||
Total Common Stocks | 1,413,560,380 | 2,132,226,350 | ||||||||
|
|
|
| |||||||
| Private Equity Investments (0.21%) | ||||||||||
| Financials (0.21%) | ||||||||||
Asset Management & Custody Banks (0.21%) | ||||||||||
| 7,579,130 | Windy City Investments Holdings, L.L.C.1,3,4,8 | 0 | 3,410,608 | |||||||
|
|
|
| |||||||
| 16 | See Notes to Financial Statements. |
Table of Contents
| June 30, 2016 | Baron Partners Fund |
STATEMENT OF NET ASSETS (Unaudited) (Continued)
| JUNE 30, 2016 |
| Principal Amount | Cost | Value | ||||||||
| Short Term Investments (14.47%) | ||||||||||
| Repurchase Agreement (0.02%) | ||||||||||
| $ 309,625 | Repurchase Agreement with Fixed Income Clearing Corp., dated 6/30/2016, 0.0305% due 7/1/2016; Proceeds at maturity - $309,625; (Fully collateralized by $300,000 U.S. Treasury Note, 2.25% due 11/15/2025; Market | $ | 309,625 | $ | 309,625 | |||||
| Shares | ||||||||||
| Securities Lending Collateral (14.45%) | ||||||||||
| 238,095,000 | State Street Navigator Securities Lending Prime Portfolio6,7 | 238,095,000 | 238,095,000 | |||||||
|
|
|
| |||||||
Total Short Term Investments | 238,404,625 | 238,404,625 | ||||||||
|
|
|
| |||||||
Total Investments (144.07%) | $ | 1,651,965,005 | 2,374,041,583 | |||||||
|
| |||||||||
Liabilities Less Cash and Other Assets (-44.07%) |
| (726,161,325 | ) | |||||||
|
| |||||||||
Net Assets | $ | 1,647,880,258 | ||||||||
|
| |||||||||
Retail Shares (Equivalent to $35.76 per share based on 27,333,255 shares outstanding) |
| $ | 977,383,489 | |||||||
|
| |||||||||
Institutional Shares (Equivalent to $36.34 per share based on 18,452,383 shares outstanding) |
| $ | 670,496,769 | |||||||
|
| |||||||||
| % | Represents percentage of net assets. |
| 1 | Non-income producing securities. |
| 2 | Foreign corporation. |
| 3 | At June 30, 2016, the market value of restricted and fair valued securities amounted to $3,410,608 or 0.21% of net assets. This security is not deemed liquid. See Note 6 regarding Restricted Securities. |
| 4 | The Adviser has reclassified/classified certain securities in or out of this sub-industry. Such reclassifications/classifications are not supported by S&P or MSCI. |
| 5 | The value of all securities loaned at June 30, 2016 amounted to $235,630,800 or 14.30% of net assets. See Note 2d regarding Securities Lending. |
| 6 | Represents investment of cash collateral received from securities lending transactions. See Note 2d regarding Securities Lending. |
| 7 | Level 2 security. See Note 7 regarding Fair Value Measurements. |
| 8 | Level 3 security. See Note 7 regarding Fair Value Measurements. |
All securities are Level 1, unless otherwise noted. |
| See Notes to Financial Statements. | 17 |
Table of Contents
| Baron Focused Growth Fund | June 30, 2016 |
STATEMENT OF NET ASSETS (Unaudited)
| JUNE 30, 2016 |
| Shares | Cost | Value | ||||||||
| Common Stocks (88.95%) | ||||||||||
| Consumer Discretionary (39.55%) | ||||||||||
Automobile Manufacturers (10.71%) | ||||||||||
| 90,000 | Tesla Motors, Inc.1,3 | $ | 20,342,221 | $ | 19,105,200 | |||||
Hotels, Resorts & Cruise Lines (13.37%) | ||||||||||
| 150,000 | Choice Hotels International, Inc. | 5,080,139 | 7,143,000 | |||||||
| 340,000 | Hyatt Hotels Corp., Cl A1 | 12,201,302 | 16,707,600 | |||||||
|
|
|
| |||||||
| 17,281,441 | 23,850,600 | |||||||||
Leisure Facilities (10.56%) | ||||||||||
| 136,230 | Vail Resorts, Inc. | 8,272,836 | 18,831,073 | |||||||
Movies & Entertainment (4.91%) | ||||||||||
| 550,000 | Manchester United plc, Cl A2 | 8,719,506 | 8,761,500 | |||||||
|
|
|
| |||||||
Total Consumer Discretionary | 54,616,004 | 70,548,373 | ||||||||
|
|
|
| |||||||
| Consumer Staples (2.88%) | ||||||||||
Household Products (2.88%) | ||||||||||
| 50,000 | Church & Dwight Co., Inc. | 1,274,171 | 5,144,500 | |||||||
|
|
|
| |||||||
| Financials (16.73%) | ||||||||||
Asset Management & | ||||||||||
| 260,000 | The Carlyle Group | 6,556,081 | 4,219,800 | |||||||
| 175,000 | Financial Engines, Inc. | 5,948,430 | 4,527,250 | |||||||
|
|
|
| |||||||
| 12,504,511 | 8,747,050 | |||||||||
Investment Banking & | ||||||||||
| 100,000 | Virtu Financial, Inc., Cl A | 2,035,675 | 1,800,000 | |||||||
Property & Casualty Insurance (4.03%) | ||||||||||
| 100,000 | Arch Capital Group Ltd.1,2 | 1,800,056 | 7,200,000 | |||||||
Specialized Finance (6.79%) | ||||||||||
| 75,000 | FactSet Research Systems, Inc. | 5,828,282 | 12,106,500 | |||||||
|
|
|
| |||||||
Total Financials | 22,168,524 | 29,853,550 | ||||||||
|
|
|
| |||||||
| Health Care (3.93%) | ||||||||||
Health Care Technology (3.93%) | ||||||||||
| 388,783 | Inovalon Holdings, Inc., CI A1 | 7,368,716 | 7,001,982 | |||||||
|
|
|
| |||||||
| Industrials (8.33%) | ||||||||||
Building Products (3.12%) | ||||||||||
| 160,000 | CaesarStone Ltd. (formerly, CaesarStone Sdot-Yam Ltd.)1,2 | 6,770,357 | 5,561,600 | |||||||
Research & Consulting Services (2.72%) | ||||||||||
| 60,000 | Verisk Analytics, Inc.1 | 1,688,861 | 4,864,800 | |||||||
Trading Companies & | ||||||||||
| 100,000 | Fastenal Co. | 2,169,716 | 4,439,000 | |||||||
|
|
|
| |||||||
Total Industrials | 10,628,934 | 14,865,400 | ||||||||
|
|
|
| |||||||
| Shares | Cost | Value | ||||||||
| Common Stocks (continued) | ||||||||||
| Information Technology (17.53%) | ||||||||||
Application Software (3.53%) | ||||||||||
| 101,870 | Guidewire Software, Inc.1 | $ | 4,816,692 | $ | 6,291,491 | |||||
Internet Software & | ||||||||||
| 225,000 | Benefitfocus, Inc.1 | 5,980,202 | 8,577,000 | |||||||
| 75,000 | CoStar Group, Inc.1 | 13,824,622 | 16,399,500 | |||||||
|
|
|
| |||||||
| 19,804,824 | 24,976,500 | |||||||||
|
|
|
| |||||||
Total Information Technology | 24,621,516 | 31,267,991 | ||||||||
|
|
|
| |||||||
Total Common Stocks | 120,677,865 | 158,681,796 | ||||||||
|
|
|
| |||||||
| Preferred Stocks (4.08%) | ||||||||||
| Telecommunication Services (4.08%) | ||||||||||
Alternative Carriers (4.08%) | ||||||||||
| 22,300 | Iridium Communications, Inc., | 5,814,082 | 7,272,476 | |||||||
|
|
|
| |||||||
| Principal Amount | ||||||||||
| Short Term Investments (17.71%) | ||||||||||
| Repurchase Agreement (6.89%) | ||||||||||
| $12,298,803 | Repurchase Agreement with Fixed Income Clearing Corp., dated 6/30/2016, 0.0305% due 7/1/2016; Proceeds at maturity - $12,298,813; (Fully collateralized by $11,825,000 U.S. Treasury Note, 2.125% due 5/15/2025; Market value - $12,549,281)5 | 12,298,803 | 12,298,803 | |||||||
| Shares | ||||||||||
| Securities Lending Collateral (10.82%) | ||||||||||
| 19,305,000 | State Street Navigator Securities Lending Prime Portfolio4,5 | 19,305,000 | 19,305,000 | |||||||
|
|
|
| |||||||
Total Short Term Investments | 31,603,803 | 31,603,803 | ||||||||
|
|
|
| |||||||
Total Investments (110.74%) | $ | 158,095,750 | 197,558,075 | |||||||
|
| |||||||||
Liabilities Less Cash and Other Assets (-10.74%) |
| (19,161,106 | ) | |||||||
|
| |||||||||
Net Assets | $ | 178,396,969 | ||||||||
|
| |||||||||
Retail Shares (Equivalent to $13.14 per share based on 3,120,976 shares outstanding) |
| $ | 41,005,251 | |||||||
|
| |||||||||
Institutional Shares (Equivalent to $13.32 per share based on 10,317,505 shares outstanding) |
| $ | 137,391,718 | |||||||
|
| |||||||||
| % | Represents percentage of net assets. |
| 1 | Non-income producing securities. |
| 2 | Foreign corporation. |
| 3 | The value of all securities loaned at June 30, 2016 amounted to $19,105,200 or 10.71% of net assets. See Note 2d regarding Securities Lending. |
| 4 | Represents investment of cash collateral received from securities lending transactions. See Note 2d regarding Securities Lending. |
| 5 | Level 2 security. See Note 7 regarding Fair Value Measurements. |
All securities are Level 1, unless otherwise noted. |
| 18 | See Notes to Financial Statements. |
Table of Contents
| June 30, 2016 | Baron International Growth Fund |
STATEMENT OF NET ASSETS (Unaudited)
| JUNE 30, 2016 |
| Shares | Cost | Value | ||||||||
| Common Stocks (94.38%) | ||||||||||
| Australia (6.88%) | ||||||||||
| 130,000 | Bellamy’s Australia Ltd.2 | $ | 1,053,731 | $ | 994,814 | |||||
| 53,169 | Domino’s Pizza Enterprises Ltd.2 | 500,999 | 2,735,943 | |||||||
| 117,000 | Newcrest Mining Ltd.1,2 | 1,239,805 | 2,027,824 | |||||||
|
|
|
| |||||||
Total Australia | 2,794,535 | 5,758,581 | ||||||||
|
|
|
| |||||||
| Brazil (3.81%) | ||||||||||
| 265,000 | BM&FBOVESPA SA | 877,435 | 1,484,917 | |||||||
| 60,000 | Smiles SA | 702,409 | 896,367 | |||||||
| 85,000 | TOTVS SA | 703,494 | 808,113 | |||||||
|
|
|
| |||||||
Total Brazil | 2,283,338 | 3,189,397 | ||||||||
|
|
|
| |||||||
| Canada (5.17%) | ||||||||||
| 21,000 | Agnico Eagle Mines Ltd. | 733,607 | 1,123,500 | |||||||
| 5,200 | Constellation Software, Inc. | 662,016 | 2,012,502 | |||||||
| 43,000 | Suncor Energy, Inc. | 1,518,473 | 1,192,390 | |||||||
|
|
|
| |||||||
Total Canada | 2,914,096 | 4,328,392 | ||||||||
|
|
|
| |||||||
| Chile (1.18%) | ||||||||||
| 40,000 | Sociedad Química y | 837,140 | 988,800 | |||||||
|
|
|
| |||||||
| China (7.51%) | ||||||||||
| 20,000 | Alibaba Group Holding Ltd., ADR1 | 1,594,239 | 1,590,600 | |||||||
| 21,000 | Ctrip.com International Ltd., ADR1 | 756,010 | 865,200 | |||||||
| 275,771 | Haitong Securities Co., Ltd., Cl H1,2 | 411,311 | 469,880 | |||||||
| 2,301,700 | Kingdee International | 313,564 | 712,227 | |||||||
| 15,000 | TAL Education Group, ADR1 | 470,811 | 930,900 | |||||||
| 75,000 | Tencent Holdings Ltd.2 | 393,663 | 1,722,429 | |||||||
|
|
|
| |||||||
Total China | 3,939,598 | 6,291,236 | ||||||||
|
|
|
| |||||||
| France (3.77%) | ||||||||||
| 7,500 | Eurofins Scientific SE2 | 803,359 | 2,778,543 | |||||||
| 3,290 | Ingenico Group SA2 | 52,186 | 381,327 | |||||||
|
|
|
| |||||||
Total France | 855,545 | 3,159,870 | ||||||||
|
|
|
| |||||||
| Germany (8.31%) | ||||||||||
| 20,000 | Brenntag AG2 | 968,979 | 968,839 | |||||||
| 24,425 | Fresenius Medical Care Ag & Co.2 | 2,038,647 | 2,127,574 | |||||||
| 37,066 | ProSiebenSat.1 Media SE1,2 | 1,590,501 | 1,621,343 | |||||||
| 125,100 | RIB Software AG2 | 909,535 | 1,217,143 | |||||||
| 15,000 | Symrise AG2 | 171,804 | 1,023,166 | |||||||
|
|
|
| |||||||
Total Germany | 5,679,466 | 6,958,065 | ||||||||
|
|
|
| |||||||
| Hong Kong (1.70%) | ||||||||||
| 650,000 | Man Wah Holdings Ltd. 2 | 767,478 | 936,114 | |||||||
| 334,995 | Wynn Macau Ltd.1,2 | 417,731 | 487,179 | |||||||
|
|
|
| |||||||
Total Hong Kong | 1,185,209 | 1,423,293 | ||||||||
|
|
|
| |||||||
| Shares | Cost | Value | ||||||||
| Common Stocks (continued) | ||||||||||
| India (5.13%) | ||||||||||
| 250,598 | Dish TV India Ltd.1,2 | $ | 254,843 | $ | 364,518 | |||||
| 75,000 | Multi Commodity Exchange of India Ltd.2 | 1,078,433 | 1,116,394 | |||||||
| 160,000 | SKS Microfinance Limited1,2 | 1,227,106 | 1,762,239 | |||||||
| 155,000 | Zee Entertainment Enterprises Ltd.2 | 819,542 | 1,052,107 | |||||||
|
|
|
| |||||||
Total India | 3,379,924 | 4,295,258 | ||||||||
|
|
|
| |||||||
| Indonesia (2.75%) | ||||||||||
| 849,373 | Matahari Department Store Tbk PT2 | 1,064,961 | 1,294,537 | |||||||
| 1,250,000 | Sarana Menara Nusantara Tbk PT1 | 260,297 | 402,081 | |||||||
| 1,201,400 | Tower Bersama Infrastructure Tbk PT2 | 489,510 | 602,243 | |||||||
|
|
|
| |||||||
Total Indonesia | 1,814,768 | 2,298,861 | ||||||||
|
|
|
| |||||||
| Ireland (1.87%) | ||||||||||
| 22,575 | Ryanair Holdings plc, ADR1 | 758,007 | 1,569,865 | |||||||
|
|
|
| |||||||
| Israel (4.72%) | ||||||||||
| 25,500 | Check Point Software Technologies Ltd.1 | 1,313,235 | 2,031,840 | |||||||
| 40,000 | Mellanox Technologies Ltd.1 | 1,595,672 | 1,918,400 | |||||||
|
|
|
| |||||||
Total Israel | 2,908,907 | 3,950,240 | ||||||||
|
|
|
| |||||||
| Italy (0.91%) | ||||||||||
| 9,000 | Azimut Holding SpA2 | 212,447 | 146,843 | |||||||
| 325,000 | Intesa Sanpaolo SpA2 | 965,116 | 619,031 | |||||||
|
|
|
| |||||||
Total Italy | 1,177,563 | 765,874 | ||||||||
|
|
|
| |||||||
| Japan (7.87%) | ||||||||||
| 30,000 | Bridgestone Corp.2 | 646,285 | 964,108 | |||||||
| 75,000 | Daiwa Securities Group, Inc.2 | 624,195 | 395,128 | |||||||
| 5,000 | FANUC Corp.2 | 338,413 | 813,366 | |||||||
| 36,000 | Mitsui Fudosan Co. Ltd.2 | 729,592 | 826,228 | |||||||
| 33,000 | MonotaRO Co. Ltd.2 | 362,044 | 1,091,011 | |||||||
| 100,000 | Rakuten, Inc.2 | 1,285,140 | 1,085,333 | |||||||
| 25,000 | SoftBank Group Corp.2 | 907,281 | 1,413,801 | |||||||
|
|
|
| |||||||
Total Japan | 4,892,950 | 6,588,975 | ||||||||
|
|
|
| |||||||
| Mexico (1.27%) | ||||||||||
| 190,000 | Grupo Financiero Banorte | 1,055,958 | 1,061,898 | |||||||
|
|
|
| |||||||
| Norway (1.11%) | ||||||||||
| 60,000 | Golar LNG Ltd. | 1,218,231 | 930,000 | |||||||
|
|
|
| |||||||
| Russia (1.44%) | ||||||||||
| 55,000 | Yandex N.V., Cl A1 | 800,166 | 1,201,750 | |||||||
|
|
|
| |||||||
| South Africa (1.50%) | ||||||||||
| 217,622 | Steinhoff International Holdings N.V.2 | 1,003,794 | 1,252,981 | |||||||
|
|
|
| |||||||
| See Notes to Financial Statements. | 19 |
Table of Contents
| Baron International Growth Fund | June 30, 2016 |
STATEMENT OF NET ASSETS (Unaudited) (Continued)
| JUNE 30, 2016 |
| Shares | Cost | Value | ||||||||
| Common Stocks (continued) | ||||||||||
| Spain (6.26%) | ||||||||||
| 22,000 | Aena SA, 144A2 | $ | 2,062,982 | $ | 2,916,109 | |||||
| 75,000 | Grifols SA, ADR | 629,871 | 1,250,250 | |||||||
| 32,105 | Industria de Diseño Textil SA2 | 919,024 | 1,078,534 | |||||||
|
|
|
| |||||||
Total Spain | 3,611,877 | 5,244,893 | ||||||||
|
|
|
| |||||||
| Switzerland (1.78%) | ||||||||||
| 37,067 | Julius Baer Group Ltd.2 | 1,261,880 | 1,491,884 | |||||||
|
|
|
| |||||||
| United Kingdom (14.97%) | ||||||||||
| 200,000 | Abcam plc2 | 1,362,532 | 2,060,395 | |||||||
| 395,214 | AO World plc1 | 1,297,019 | 736,580 | |||||||
| 225,000 | Domino’s Pizza Group plc2 | 675,667 | 999,651 | |||||||
| 45,200 | easyJet plc2 | 1,011,684 | 656,829 | |||||||
| 79,000 | EMIS Group plc | 1,156,891 | 970,181 | |||||||
| 73,000 | Experian plc2 | 770,060 | 1,384,960 | |||||||
| 41,000 | Intertek Group plc2 | 1,259,299 | 1,910,324 | |||||||
| 70,159 | JUST EAT plc1,2 | 290,233 | 400,505 | |||||||
| 1,401,886 | Lekoil Ltd.1 | 507,367 | 335,927 | |||||||
| 19,125 | Reckitt Benckiser Group PLC2 | 1,864,032 | 1,917,693 | |||||||
| 320,000 | Worldpay Group plc, 144A1,2 | 1,170,781 | 1,164,702 | |||||||
|
|
|
| |||||||
Total United Kingdom | 11,365,565 | 12,537,747 | ||||||||
|
|
|
| |||||||
| United States (4.47%) | ||||||||||
| 28,000 | Agilent Technologies, Inc. | 639,432 | 1,242,080 | |||||||
| 27,000 | Arch Capital Group Ltd.1 | 983,682 | 1,944,000 | |||||||
| 170,155 | TerraForm Global, Inc., Cl A | 1,560,949 | 554,705 | |||||||
|
|
|
| |||||||
Total United States | 3,184,063 | 3,740,785 | ||||||||
|
|
|
| |||||||
Total Common Stocks | 58,922,580 | 79,028,645 | ||||||||
|
|
|
| |||||||
| Principal Amount | ||||||||||
| Short Term Investments (5.12%) | ||||||||||
| $4,283,772 | Repurchase Agreement with Fixed Income Clearing Corp., dated 6/30/2016, 0.0305% due 7/1/2016; Proceeds at maturity -$4,283,776; (Fully collateralized by $4,120,000 U.S. Treasury Note, 2.125% due 5/15/2025 Market | 4,283,772 | 4,283,772 | |||||||
|
|
|
| |||||||
Total Investments (99.50%) | $ | 63,206,352 | 83,312,417 | |||||||
|
| |||||||||
Cash and Other Assets Less Liabilities (0.50%) |
| 417,042 | ||||||||
|
| |||||||||
Net Assets | $ | 83,729,459 | ||||||||
|
| |||||||||
Retail Shares (Equivalent to $18.09 per share based on 2,230,011 shares outstanding) |
| $ | 40,350,760 | |||||||
|
| |||||||||
Institutional Shares (Equivalent to $18.24 per share based on 2,378,561 shares outstanding) |
| $ | 43,378,699 | |||||||
|
| |||||||||
| % | Represents percentage of net assets. |
| 1 | Non-income producing securities. |
| 2 | Level 2 security. See Note 7 regarding Fair Value Measurements. |
| ADR | American Depositary Receipt. |
| 144A | Security is exempt from registration under Rule 144A of the Securities Act of 1933. This security may be resold in transactions that are exempt from registration, normally to qualified institutional buyers. This security has been deemed liquid pursuant to policies and procedures approved by the Board of Trustees, unless otherwise noted. At June 30, 2016, the market value of Rule 144A securities amounted to $4,080,811 or 4.87% of net assets. |
All securities are Level 1, unless otherwise noted. |
Summary of Investments by Sector as of June 30, 2016 | Percentage of Net Assets | |||
Consumer Discretionary | 20.7 | % | ||
Information Technology | 18.1 | |||
Financials | 13.5 | |||
Industrials | 13.5 | |||
Health Care | 12.4 | |||
Materials | 6.2 | |||
Consumer Staples | 3.5 | |||
Energy | 2.9 | |||
Telecommunication Services | 2.9 | |||
Utilities | 0.7 | |||
Cash and Cash Equivalents* | 5.6 | |||
| 100.0 | % | |||
*Includes short term investments.
| 20 | See Notes to Financial Statements. |
Table of Contents
| June 30, 2016 | Baron Real Estate Fund |
STATEMENT OF NET ASSETS (Unaudited)
| JUNE 30, 2016 |
| Shares | Cost | Value | ||||||||
| Common Stocks (98.48%) | ||||||||||
| Consumer Discretionary (27.76%) | ||||||||||
Casinos & Gaming (6.08%) | ||||||||||
| 3,378,250 | MGM Resorts International1 | $ | 70,385,726 | $ | 76,449,798 | |||||
Home Furnishings (5.64%) | ||||||||||
| 373,607 | Mohawk Industries, Inc.1 | 55,299,856 | 70,895,664 | |||||||
Home Improvement Retail (4.86%) | ||||||||||
| 245,900 | Home Depot, Inc. | 19,356,166 | 31,398,971 | |||||||
| 375,950 | Lowe’s Companies, Inc. | 16,985,916 | 29,763,962 | |||||||
|
|
|
| |||||||
| 36,342,082 | 61,162,933 | |||||||||
Homebuilding (2.55%) | ||||||||||
| 1,193,100 | Toll Brothers, Inc.1 | 39,597,935 | 32,106,321 | |||||||
Hotels, Resorts & | ||||||||||
| 2,028,150 | Hilton Worldwide Holdings, Inc. | 50,321,807 | 45,694,219 | |||||||
| 1,040,800 | Norwegian Cruise Line Holdings Ltd.1,2 | 34,777,119 | 41,465,472 | |||||||
| 319,000 | Royal Caribbean Cruises Ltd.2 | 25,208,124 | 21,420,850 | |||||||
|
|
|
| |||||||
| 110,307,050 | 108,580,541 | |||||||||
|
|
|
| |||||||
Total Consumer Discretionary | 311,932,649 | 349,195,257 | ||||||||
|
|
|
| |||||||
| Financials (49.57%) | ||||||||||
Asset Management & | ||||||||||
| 1,067,000 | Brookfield Asset | 31,026,694 | 35,285,690 | |||||||
Hotel & Resort REITs (3.89%) | ||||||||||
| 1,833,931 | MGM Growth Properties LLC, Cl A | 39,837,404 | 48,929,279 | |||||||
Office REITs (3.93%) | ||||||||||
| 106,800 | Boston Properties, Inc. | 13,524,394 | 14,086,920 | |||||||
| 996,110 | Douglas Emmett, Inc. | 24,668,223 | 35,381,827 | |||||||
|
|
|
| |||||||
| 38,192,617 | 49,468,747 | |||||||||
Real Estate Operating | ||||||||||
| 579,175 | Kennedy Wilson Europe Real | 9,445,637 | 7,437,053 | |||||||
Real Estate Services (10.55%) | ||||||||||
| 2,414,450 | CBRE Group, Inc., Cl A1 | 61,095,418 | 63,934,636 | |||||||
| 340,780 | Jones Lang LaSalle, Inc. | 32,233,686 | 33,209,011 | |||||||
| 1,876,800 | Kennedy-Wilson Holdings, Inc. | 33,522,627 | 35,584,128 | |||||||
|
|
|
| |||||||
| 126,851,731 | 132,727,775 | |||||||||
Residential REITs (3.16%) | ||||||||||
| 752,589 | American Campus Communities, Inc. | 31,334,749 | 39,789,381 | |||||||
Retail REITs (6.14%) | ||||||||||
| 1,122,150 | General Growth Properties, Inc. | 30,756,190 | 33,462,513 | |||||||
| 202,000 | Simon Property Group, Inc. | 32,869,088 | 43,813,800 | |||||||
|
|
|
| |||||||
| 63,625,278 | 77,276,313 | |||||||||
| Shares | Cost | Value | ||||||||
| Common Stocks (continued) | ||||||||||
| Financials (continued) | ||||||||||
Specialized REITs (18.50%) | ||||||||||
| 247,100 | Alexandria Real Estate Equities, Inc.3 | $ | 17,536,215 | $ | 25,579,792 | |||||
| 454,085 | American Tower Corp. | 40,972,469 | 51,588,597 | |||||||
| 364,800 | Digital Realty Trust, Inc. | 27,815,365 | 39,759,552 | |||||||
| 130,950 | Equinix, Inc. | 25,974,281 | 50,773,243 | |||||||
| 1,885,750 | Gaming and Leisure Properties, Inc. | 55,773,501 | 65,020,660 | |||||||
|
|
|
| |||||||
| 168,071,831 | 232,721,844 | |||||||||
|
|
|
| |||||||
Total Financials | 508,385,941 | 623,636,082 | ||||||||
|
|
|
| |||||||
| Health Care (2.69%) | ||||||||||
Health Care Facilities (2.69%) | ||||||||||
| 2,194,050 | Brookdale Senior Living, Inc.1 | 30,371,675 | 33,876,132 | |||||||
|
|
|
| |||||||
| Industrials (8.35%) | ||||||||||
Airport Services (0.80%) | ||||||||||
| 76,000 | Aena SA, 144A (Spain)2,4 | 8,140,035 | 10,073,833 | |||||||
Building Products (3.55%) | ||||||||||
| 163,600 | Armstrong World Industries, Inc.1 | 6,774,332 | 6,404,940 | |||||||
| 578,200 | Masonite International Corp.1,2 | 34,497,251 | 38,242,148 | |||||||
|
|
|
| |||||||
| 41,271,583 | 44,647,088 | |||||||||
|
|
|
| |||||||
Industrial Conglomerates (4.00%) | ||||||||||
| 679,650 | Macquarie Infrastructure Corp. | 42,174,660 | 50,328,082 | |||||||
|
|
|
| |||||||
Total Industrials | 91,586,278 | 105,049,003 | ||||||||
|
|
|
| |||||||
| Information Technology (5.45%) | ||||||||||
IT Consulting & Other | ||||||||||
| 1,857,000 | InterXion Holding N.V.1,2 | 57,500,915 | 68,486,160 | |||||||
|
|
|
| |||||||
| Materials (2.31%) | ||||||||||
Construction Materials (2.31%) | ||||||||||
| 151,500 | Martin Marietta Materials, Inc. | 20,000,620 | 29,088,000 | |||||||
|
|
|
| |||||||
| Telecommunication Services (2.35%) | ||||||||||
Integrated Telecommunication Services (1.17%) | ||||||||||
| 136,800 | SBA Communications Corp., Cl A1 | 9,117,459 | 14,766,192 | |||||||
Wireless Telecommunication Services (1.18%) | ||||||||||
| 45,991,297 | Sarana Menara Nusantara | 11,597,980 | 14,793,795 | |||||||
|
|
|
| |||||||
Total Telecommunication Services | 20,715,439 | 29,559,987 | ||||||||
|
|
|
| |||||||
Total Common Stocks | 1,040,493,517 | 1,238,890,621 | ||||||||
|
|
|
| |||||||
| See Notes to Financial Statements. | 21 |
Table of Contents
| Baron Real Estate Fund | June 30, 2016 |
STATEMENT OF NET ASSETS (Unaudited) (Continued)
| JUNE 30, 2016 |
| Principal Amount | Cost | Value | ||||||||
| Short Term Investments (2.27%) | ||||||||||
| $28,630,114 | Repurchase Agreement with Fixed Income Clearing Corp., dated 6/30/2016, 0.0305% due 7/1/2016; Proceeds at maturity - $28,630,138; (Fully collateralized by $27,520,000 U.S. Treasury Note, 2.125% due 5/15/2025; Market | $ | 28,630,114 | $ | 28,630,114 | |||||
|
|
|
| |||||||
Total Investments (100.75%) | $ | 1,069,123,631 | 1,267,520,735 | |||||||
|
| |||||||||
Liabilities Less Cash and Other Assets (-0.75%) |
| (9,475,826 | ) | |||||||
|
| |||||||||
Net Assets | $ | 1,258,044,909 | ||||||||
|
| |||||||||
Retail Shares (Equivalent to $23.25 per share based on 24,325,404 shares outstanding) |
| $ | 565,628,789 | |||||||
|
| |||||||||
Institutional Shares (Equivalent to $23.54 per share based on 29,338,242 shares outstanding) |
| $ | 690,695,486 | |||||||
|
| |||||||||
R6 Shares (Equivalent to $23.54 per share based on 73,081 shares outstanding) |
| $ | 1,720,634 | |||||||
|
| |||||||||
| % | Represents percentage of net assets. |
| 1 | Non-income producing securities. |
| 2 | Foreign corporation. |
| 3 | The Adviser has reclassified/classified certain securities in or out of this sub-industry. Such reclassifications/classifications are not supported by S&P or MSCI. |
| 4 | Level 2 security. See Note 7 regarding Fair Value Measurements. |
| 144A | Security is exempt from registration under Rule 144A of the Securities Act of 1933. This security may be resold in transactions that are exempt from registration, normally to qualified institutional buyers. This security has been deemed liquid pursuant to policies and procedures approved by the Board of Trustees, unless otherwise noted. At June 30, 2016, the market value of Rule 144A securities amounted to $10,073,833 or 0.80% of net assets. |
All securities are Level 1, unless otherwise noted. |
| 22 | See Notes to Financial Statements. |
Table of Contents
| June 30, 2016 | Baron Emerging Markets Fund |
STATEMENT OF NET ASSETS (Unaudited)
| JUNE 30, 2016 |
| Shares | Cost | Value | ||||||||
| Common Stocks (88.49%) | ||||||||||
| Australia (0.71%) | ||||||||||
| 1,900,000 | Bellamy’s Australia Ltd.2 | $ | 14,769,679 | $ | 14,539,592 | |||||
|
|
|
| |||||||
| Brazil (7.12%) | ||||||||||
| 6,500,000 | BM&FBOVESPA SA | 22,237,583 | 36,422,501 | |||||||
| 2,000,312 | Cetip SA — Mercados Organizados | 22,581,357 | 27,268,207 | |||||||
| 4,650,000 | Kroton Educacional SA | 18,528,467 | 19,686,829 | |||||||
| 291,626 | Linx SA | 1,674,517 | 1,462,533 | |||||||
| 1,300,000 | Multiplus SA | 14,723,212 | 14,629,705 | |||||||
| 2,000,000 | Smiles SA | 25,870,443 | 29,878,903 | |||||||
| 1,700,818 | TOTVS SA | 24,711,322 | 16,170,028 | |||||||
|
|
|
| |||||||
Total Brazil | 130,326,901 | 145,518,706 | ||||||||
|
|
|
| |||||||
| Chile (1.03%) | ||||||||||
| 850,000 | Sociedad Química y Minera de Chile SA, ADR | 17,805,776 | 21,012,000 | |||||||
|
|
|
| |||||||
| China (20.02%) | ||||||||||
| 612,900 | Alibaba Group Holding Ltd., ADR1 | 47,952,717 | 48,743,937 | |||||||
| 5,500,000 | China Everbright Ltd.2 | 17,423,727 | 10,671,763 | |||||||
| 13,000,000 | China Mengniu Dairy Co. Ltd.2 | 26,924,567 | 22,742,347 | |||||||
| 2,600,000 | China Mobile Ltd.2 | 32,771,216 | 30,074,832 | |||||||
| 24,318,095 | China Telecom Corp. Ltd., Cl H2 | 14,896,086 | 10,936,250 | |||||||
| 725,850 | Ctrip.com International Ltd., ADR1 | 23,188,333 | 29,905,020 | |||||||
| 12,000,400 | Haitong Securities Co., Ltd., Cl H1,2 | 18,303,647 | 20,447,218 | |||||||
| 45,000,000 | Kingdee International Software Group Co. Ltd.1,2 | 14,212,410 | 13,924,583 | |||||||
| 30,000,000 | PetroChina Co. Ltd.2 | 29,465,562 | 20,677,146 | |||||||
| 175,000 | Qihoo 360 Technology Co. Ltd., ADR1 | 10,486,733 | 12,783,750 | |||||||
| 4,500,000 | Shenzhou International Group Holdings Ltd.2 | 19,748,895 | 21,760,493 | |||||||
| 7,500,000 | Sinopharm Group Co. Ltd., Cl H2 | 27,775,405 | 36,027,643 | |||||||
| 6,500,000 | Sunny Optical Technology Group Co., Ltd.2 | 15,181,639 | 22,927,642 | |||||||
| 575,515 | TAL Education Group, ADR1 | 16,159,725 | 35,716,461 | |||||||
| 2,100,000 | Tencent Holdings Ltd.2 | 35,374,869 | 48,228,016 | |||||||
| 22,509,500 | Zhaojin Mining Industry Co. Ltd.2 | 13,553,305 | 23,997,232 | |||||||
|
|
|
| |||||||
Total China | 363,418,836 | 409,564,333 | ||||||||
|
|
|
| |||||||
| Hong Kong (3.27%) | ||||||||||
| 21,500,000 | Man Wah Holdings Ltd.2 | 19,440,494 | 30,963,786 | |||||||
| 5,802,100 | Techtronic Industries Co. Ltd.2 | 23,286,165 | 24,229,551 | |||||||
| 7,999,805 | Wynn Macau Ltd.1,2 | 18,061,215 | 11,634,006 | |||||||
|
|
|
| |||||||
Total Hong Kong | 60,787,874 | 66,827,343 | ||||||||
|
|
|
| |||||||
| India (14.33%) | ||||||||||
| 1,427,000 | Amara Raja Batteries Ltd. 2 | 8,867,611 | 18,406,396 | |||||||
| 6,375,000 | Bank of Baroda1,2 | 13,733,539 | 14,614,957 | |||||||
| 5,400,000 | Coal India Ltd.2 | 31,512,707 | 25,095,795 | |||||||
| 3,752,679 | DEN Networks Ltd.1,2 | 10,244,650 | 5,100,339 | |||||||
| 10,584,985 | Dish TV India Ltd.1,2 | 9,583,267 | 15,396,830 | |||||||
| 1,900,000 | Divi’s Laboratories Ltd.2 | 22,313,748 | 31,314,874 | |||||||
| 8,000,000 | Exide Industries Ltd.2 | 21,365,372 | 20,119,688 | |||||||
| 5,770,000 | Hathway Cable and Datacom Ltd.1,2 | 5,093,897 | 2,855,817 | |||||||
| 1,450,000 | Kotak Mahindra Bank Ltd.2 | 16,307,888 | 16,446,694 | |||||||
| 3,300,000 | Motherson Sumi Systems Ltd.2 | 16,385,486 | 14,235,502 | |||||||
| 750,000 | Multi Commodity Exchange of India Ltd.2 | 11,052,964 | 11,163,939 | |||||||
| 1,500,000 | PVR Ltd.2 | 14,319,858 | 22,505,082 | |||||||
| Shares | Cost | Value | ||||||||
| Common Stocks (continued) | ||||||||||
| India (continued) | ||||||||||
| 3,500,000 | SKS Microfinance Limited1, 2 | $ | 27,684,432 | $ | 38,548,989 | |||||
| 2,750,000 | Sun TV Network Ltd.2 | 16,942,967 | 14,872,999 | |||||||
| 750,000 | Torrent Pharmaceuticals Ltd.2 | 6,039,960 | 15,282,508 | |||||||
| 4,000,000 | Zee Entertainment Enterprises Ltd.2 | 19,280,156 | 27,151,142 | |||||||
|
|
|
| |||||||
Total India | 250,728,502 | 293,111,551 | ||||||||
|
|
|
| |||||||
| Indonesia (2.47%) | ||||||||||
| 16,648,327 | Matahari Department Store Tbk PT2 | 21,154,606 | 25,373,852 | |||||||
| 27,631,350 | Sarana Menara Nusantara Tbk PT1 | 8,841,958 | 8,888,040 | |||||||
| 32,500,000 | Tower Bersama Infrastructure Tbk PT1,2 | 17,325,111 | 16,291,740 | |||||||
|
|
|
| |||||||
Total Indonesia | 47,321,675 | 50,553,632 | ||||||||
|
|
|
| |||||||
| Korea, Republic of (7.89%) | ||||||||||
| 103,000 | LG Chem Ltd.2 | 25,790,333 | 23,521,970 | |||||||
| 31,000 | LG Household & Health Care Ltd.2 | 19,007,621 | 30,273,200 | |||||||
| 53,000 | NAVER Corp.2 | 31,019,721 | 32,834,327 | |||||||
| 42,500 | Samsung Electronics Co., Ltd.2 | 52,852,670 | 52,927,424 | |||||||
| 250,000 | Samsung Life Insurance Co. Ltd.2 | 25,405,707 | 21,877,629 | |||||||
|
|
|
| |||||||
Total Korea, Republic of | 154,076,052 | 161,434,550 | ||||||||
|
|
|
| |||||||
| Mexico (6.42%) | ||||||||||
| 325,000 | Fomento Económico Mexicano, S.A.B. de C.V., ADR | 29,809,533 | 30,059,250 | |||||||
| 1,442,300 | GRUMA S.A.B. de C.V., Cl B | 20,407,030 | 20,747,921 | |||||||
| 5,150,000 | Grupo Financiero Banorte S.A.B. de C.V., Cl O | 28,224,690 | 28,783,020 | |||||||
| 8,600,513 | Grupo Lala S.A.B. de C.V. | 17,548,011 | 18,962,709 | |||||||
| 2,500,000 | Infraestructura Energetica Nova S.A.B. de C.V. | 13,853,880 | 10,536,003 | |||||||
| 9,250,000 | Wal-Mart de Mexico S.A.B de C.V. | 21,280,293 | 22,251,546 | |||||||
|
|
|
| |||||||
Total Mexico | 131,123,437 | 131,340,449 | ||||||||
|
|
|
| |||||||
| Panama (0.82%) | ||||||||||
| 320,000 | Copa Holdings SA, Cl A | 18,248,579 | 16,723,200 | |||||||
|
|
|
| |||||||
| Peru (0.15%) | ||||||||||
| 20,381 | Credicorp, Ltd. | 2,147,793 | 3,145,400 | |||||||
|
|
|
| |||||||
| Philippines (3.20%) | ||||||||||
| 20,505,000 | Ayala Land, Inc.2 | 13,802,951 | 17,009,418 | |||||||
| 9,000,000 | BDO Unibank, Inc2 | 19,450,694 | 21,501,686 | |||||||
| 136,250,000 | Metro Pacific Investments Corp.2 | 14,881,631 | 20,289,966 | |||||||
| 1,500,000 | Universal Robina Corp.2 | 3,782,805 | 6,652,810 | |||||||
|
|
|
| |||||||
Total Philippines | 51,918,081 | 65,453,880 | ||||||||
|
|
|
| |||||||
| Russia (1.76%) | ||||||||||
| 1,000,000 | Sberbank of Russia, ADR | 5,302,367 | 8,730,000 | |||||||
| 1,250,000 | Yandex N.V., Cl A1 | 18,440,711 | 27,312,500 | |||||||
|
|
|
| |||||||
Total Russia | 23,743,078 | 36,042,500 | ||||||||
|
|
|
| |||||||
| See Notes to Financial Statements. | 23 |
Table of Contents
| Baron Emerging Markets Fund | June 30, 2016 |
STATEMENT OF NET ASSETS (Unaudited) (Continued)
| JUNE 30, 2016 |
| Shares | Cost | Value | ||||||||
| Common Stocks (continued) | ||||||||||
| Singapore (0.79%) | ||||||||||
| 12,000,918 | Global Logistic Properties Ltd.2 | $ | 24,370,089 | $ | 16,201,827 | |||||
|
|
|
| |||||||
| South Africa (8.62%) | ||||||||||
| 1,350,100 | AngloGold Ashanti Ltd., ADR1 | 16,546,230 | 24,382,806 | |||||||
| 1,000,700 | Aspen Pharmacare Holdings Ltd.2 | 26,283,543 | 24,686,303 | |||||||
| 1,150,138 | Bid Corp. Ltd.1 | 20,489,046 | 21,553,374 | |||||||
| 2,150,138 | Bidvest Group Ltd.2 | 17,954,883 | 20,284,502 | |||||||
| 6,108,613 | Life Healthcare Group Holdings Ltd.2 | 15,201,448 | 15,029,199 | |||||||
| 1,250,000 | Mr Price Group Ltd.2 | 21,770,592 | 17,562,846 | |||||||
| 475,000 | Sasol Limited2 | 16,020,870 | 12,850,533 | |||||||
| 250,500 | Sasol Limited, ADR | 8,615,581 | 6,793,560 | |||||||
| 5,750,764 | Steinhoff International Holdings N.V.2 | 27,281,755 | 33,110,622 | |||||||
|
|
|
| |||||||
Total South Africa | 170,163,948 | 176,253,745 | ||||||||
|
|
|
| |||||||
| Taiwan, Province of China (8.41%) | ||||||||||
| 1,300,231 | Eclat Textile Co., Ltd.2 | 15,657,180 | 12,609,411 | |||||||
| 14,001,000 | Far EasTone Telecommunications Co., Ltd.2 | 30,922,717 | 33,901,964 | |||||||
| 2,000,000 | Ginko International Co., Ltd.2 | 28,987,229 | 20,895,053 | |||||||
| 500,715 | HIWIN Technologies Corp.2 | 3,789,372 | 2,328,709 | |||||||
| 2,750,934 | Makalot Industrial Co. Ltd.2 | 15,840,800 | 12,948,834 | |||||||
| 1,100,000 | MediaTek, Inc.2 | 16,317,171 | 8,405,707 | |||||||
| 3,500,000 | Novatek Microelectronics Corp.2 | 15,103,109 | 13,117,600 | |||||||
| 6,000,000 | Taiwan Mobile Co., Ltd.2 | 20,129,751 | 20,971,452 | |||||||
| 1,787,900 | Taiwan Semiconductor Manufacturing Company Ltd., ADR | 37,925,431 | 46,896,617 | |||||||
|
|
|
| |||||||
Total Taiwan, Province of China | 184,672,760 | 172,075,347 | ||||||||
|
|
|
| |||||||
| Thailand (0.67%) | ||||||||||
| 100,000 | Bangkok Bank PCL, Cl F2 | 629,574 | 461,013 | |||||||
| 2,901,000 | Bangkok Bank Public Co., Ltd., NVDR2 | 15,755,150 | 13,132,871 | |||||||
|
|
|
| |||||||
Total Thailand | 16,384,724 | 13,593,884 | ||||||||
|
|
|
| |||||||
| United Kingdom (0.25%) | ||||||||||
| 20,996,223 | Lekoil Ltd.1 | 11,970,580 | 5,031,218 | |||||||
|
|
|
| |||||||
| United States (0.56%) | ||||||||||
| 3,500,219 | TerraForm Global, Inc., Cl A | 33,265,281 | 11,410,714 | |||||||
|
|
|
| |||||||
Total Common Stocks | 1,707,243,645 | 1,809,833,871 | ||||||||
|
|
|
| |||||||
| Preferred Stocks (0.02%) | ||||||||||
| India (0.02%) | ||||||||||
| 3,098,340 | Zee Entertainment Enterprises Ltd., 6.00% due 3/5/2022 | 367,971 | 415,897 | |||||||
|
|
|
| |||||||
| Principal Amount | Cost | Value | ||||||||
| Convertible Bonds (0.34%) | ||||||||||
| China (0.34%) | ||||||||||
| $ 50,000,000 | Biostime International Holdings Ltd., 0.00% due 02/20/20191,2 | $ | 6,590,206 | $ | 6,879,906 | |||||
|
|
|
| |||||||
| Short Term Investments (10.99%) | ||||||||||
| 224,903,410 | Repurchase Agreement with Fixed Income Clearing Corp., dated 6/30/2016, 0.0305% due 7/1/2016; Proceeds at maturity - $224,903,597; (Fully collateralized by $210,220,000 U.S. Treasury Note, 2.50% due 5/15/2024; Market | 224,903,410 | 224,903,410 | |||||||
|
|
|
| |||||||
Total Investments (99.84%) | $ | 1,939,105,232 | 2,042,033,084 | |||||||
|
| |||||||||
Cash and Other Assets Less Liabilities (0.16%) |
| 3,300,988 | ||||||||
|
| |||||||||
Net Assets | $ | 2,045,334,072 | ||||||||
|
| |||||||||
Retail Shares (Equivalent to $11.15 per share based on 59,019,592 shares outstanding) |
| $ | 658,354,520 | |||||||
|
| |||||||||
Institutional Shares (Equivalent to $11.19 per share based on 123,886,897 shares outstanding) |
| $ | 1,386,605,746 | |||||||
|
| |||||||||
R6 Shares (Equivalent to $11.20 per share based on 33,370 shares outstanding) |
| $ | 373,806 | |||||||
|
| |||||||||
| % | Represents percentage of net assets. |
| 1 | Non-income producing securities. |
| 2 | Level 2 security. See Note 7 regarding Fair Value Measurements. |
| ADR | American Depositary Receipt. |
| NVDR | Non-Voting Depositary Receipt. |
All securities are Level 1, unless otherwise noted. |
Summary of Investments by Sector as of June 30, 2016 | Percentage of Net Assets | |||
Consumer Discretionary | 21.6 | % | ||
Information Technology | 16.9 | |||
Financials | 16.0 | |||
Consumer Staples | 9.5 | |||
Health Care | 7.0 | |||
Telecommunication Services | 5.9 | |||
Materials | 4.5 | |||
Energy | 3.5 | |||
Industrials | 2.8 | |||
Utilities | 1.1 | �� | ||
Cash and Cash Equivalents* | 11.2 | |||
| 100.0 | % | |||
*Includes short term investments.
| 24 | See Notes to Financial Statements. |
Table of Contents
| June 30, 2016 | Baron Energy and Resources Fund |
STATEMENT OF NET ASSETS (Unaudited)
| JUNE 30, 2016 |
| Shares | Cost | Value | ||||||||
| Common Stocks (98.20%) | ||||||||||
| Consumer Discretionary (2.98%) | ||||||||||
Automobile Manufacturers (2.98%) | ||||||||||
| 14,100 | Tesla Motors, Inc.1,4 | $ | 3,242,965 | $ | 2,993,148 | |||||
|
|
|
| |||||||
| Energy (79.84%) | ||||||||||
Oil & Gas Drilling (1.24%) | ||||||||||
| 18,646 | Helmerich & Payne, Inc. | 1,368,109 | 1,251,706 | |||||||
Oil & Gas Equipment & Services (13.43%) | ||||||||||
| 21,750 | Core Laboratories N.V.2 | 2,747,736 | 2,694,608 | |||||||
| 81,396 | Halliburton Co. | 3,809,495 | 3,686,425 | |||||||
| 49,531 | Oil States International, Inc.1 | 1,898,647 | 1,628,579 | |||||||
| 44,700 | Schlumberger Limited2 | 3,336,460 | 3,534,876 | |||||||
| 56,600 | US Silica Holdings, Inc. | 1,465,530 | 1,951,002 | |||||||
|
|
|
| |||||||
| 13,257,868 | 13,495,490 | |||||||||
Oil & Gas Exploration & Production (41.43%) | ||||||||||
| 71,800 | Antero Resources Corp.1 | 2,093,149 | 1,865,364 | |||||||
| 48,699 | Concho Resources, Inc.1 | 4,914,844 | 5,808,330 | |||||||
| 513,700 | Encana Corp.2 | 3,308,658 | 4,001,723 | |||||||
| 27,566 | Energen Corp. | 1,226,479 | 1,328,957 | |||||||
| 24,568 | EOG Resources, Inc. | 2,047,483 | 2,049,462 | |||||||
| 2,496,354 | Lekoil Ltd. (United Kingdom)1,2 | 1,228,382 | 598,188 | |||||||
| 135,500 | Newfield Exploration Co.1 | 4,025,771 | 5,986,390 | |||||||
| 84,049 | Noble Energy, Inc. | 3,504,588 | 3,014,838 | |||||||
| 242,000 | Parsley Energy, Inc., Cl A1 | 4,137,283 | 6,548,520 | |||||||
| 223,800 | Rice Energy Inc.1 | 2,161,242 | 4,932,552 | |||||||
| 157,400 | RSP Permian, Inc.1 | 3,729,271 | 5,491,686 | |||||||
|
|
|
| |||||||
| 32,377,150 | 41,626,010 | |||||||||
Oil & Gas Refining & Marketing (3.17%) | ||||||||||
| 44,356 | Marathon Petroleum Corp. | 1,731,695 | 1,683,754 | |||||||
| 29,400 | Valero Energy Corporation | 1,997,945 | 1,499,400 | |||||||
|
|
|
| |||||||
| 3,729,640 | 3,183,154 | |||||||||
Oil & Gas Storage & Transportation (20.57%) | ||||||||||
| 36,011 | Dominion Midstream Partners, L.P. | 816,552 | 1,012,989 | |||||||
| 177,700 | Energy Transfer Equity L.P. | 1,627,623 | 2,553,549 | |||||||
| 112,235 | Golar LNG Ltd.2 | 2,462,457 | 1,739,642 | |||||||
| 46,500 | MPLX LP | 1,479,063 | 1,563,795 | |||||||
| 70,000 | PBF Logistics LP | 1,295,000 | 1,611,400 | |||||||
| 214,904 | Scorpio Tankers, Inc.2 | 1,943,453 | 902,597 | |||||||
| 55,400 | SemGroup Corp., Cl A | 1,718,765 | 1,803,824 | |||||||
| 65,940 | Tallgrass Energy Partners, LP | 1,895,028 | 3,034,559 | |||||||
| 72,700 | Targa Resources Corp. | 2,103,915 | 3,063,578 | |||||||
| 54,500 | Valero Energy Partners LP | 2,307,500 | 2,562,045 | |||||||
| 21,376 | Western Gas Equity Partners LP | 1,013,741 | 817,632 | |||||||
|
|
|
| |||||||
| 18,663,097 | 20,665,610 | |||||||||
|
|
|
| |||||||
Total Energy | 69,395,864 | 80,221,970 | ||||||||
|
|
|
| |||||||
| Industrials (0.12%) | ||||||||||
Construction & Engineering (0.12%) | ||||||||||
| 6,507 | Primoris Services Corp. | 120,380 | 123,177 | |||||||
|
|
|
| |||||||
| Information Technology (4.17%) | ||||||||||
Application Software (2.07%) | ||||||||||
| 51,600 | Aspen Technology, Inc.1 | 2,021,535 | 2,076,384 | |||||||
Semiconductor Equipment (2.10%) | ||||||||||
| 107,700 | SolarEdge Technologies, Inc.1 | 2,514,619 | 2,110,920 | |||||||
|
|
|
| |||||||
Total Information Technology | 4,536,154 | 4,187,304 | ||||||||
|
|
|
| |||||||
| Shares | Cost | Value | ||||||||
| Common Stocks (continued) | ||||||||||
| Materials (9.44%) | ||||||||||
Commodity Chemicals (0.96%) | ||||||||||
| 48,032 | Westlake Chemical Partners LP | $ | 1,168,810 | $ | 959,679 | |||||
Gold (2.56%) | ||||||||||
| 72,000 | Barrick Gold Corporation2 | 1,509,500 | 1,537,200 | |||||||
| 26,400 | Newmont Mining Corp. | 994,744 | 1,032,768 | |||||||
|
|
|
| |||||||
| 2,504,244 | 2,569,968 | |||||||||
Specialty Chemicals (5.92%) | ||||||||||
| 354,252 | Flotek Industries, Inc.1 | 4,152,735 | 4,676,127 | |||||||
| 45,700 | Kraton Performance Polymers, Inc.1 | 1,192,571 | 1,276,401 | |||||||
|
|
|
| |||||||
| 5,345,306 | 5,952,528 | |||||||||
|
|
|
| |||||||
Total Materials | 9,018,360 | 9,482,175 | ||||||||
|
|
|
| |||||||
| Utilities (1.65%) | ||||||||||
Renewable Electricity (1.65%) | ||||||||||
| 231,926 | TerraForm Global, Inc., Cl A | 3,085,181 | 756,079 | |||||||
| 82,910 | TerraForm Power, Inc., Cl A | 1,952,438 | 903,719 | |||||||
|
|
|
| |||||||
Total Utilities | 5,037,619 | 1,659,798 | ||||||||
|
|
|
| |||||||
Total Common Stocks | 91,351,342 | 98,667,572 | ||||||||
|
|
|
| |||||||
| Principal Amount | ||||||||||
| Short Term Investments (4.85%) | ||||||||||
| Repurchase Agreement (1.84%) | ||||||||||
| $1,844,687 | Repurchase Agreement with Fixed Income Clearing Corp., dated 6/30/2016, 0.0305% due 7/1/2016; Proceeds at maturity - $1,844,688; (Fully collateralized by $1,775,000 U.S. Treasury Note, 2.125% due 5/15/2025; Market | 1,844,687 | 1,844,687 | |||||||
| Shares | ||||||||||
| Securities Lending Collateral (3.01%) | ||||||||||
| 3,024,450 | State Street Navigator Securities Lending Prime Portfolio3,5 | 3,024,450 | 3,024,450 | |||||||
|
|
|
| |||||||
Total Short Term Investments | 4,869,137 | 4,869,137 | ||||||||
|
|
|
| |||||||
Total Investments (103.05%) | $ | 96,220,479 | 103,536,709 | |||||||
|
| |||||||||
Liabilities Less Cash and Other Assets (-3.05%) |
| (3,062,997 | ) | |||||||
|
| |||||||||
Net Assets | $ | 100,473,712 | ||||||||
|
| |||||||||
Retail Shares (Equivalent to $7.90 per share based on 8,964,467 shares outstanding) |
| $ | 70,858,874 | |||||||
|
| |||||||||
Institutional Shares (Equivalent to $7.99 per share based on 3,705,003 shares outstanding) |
| $ | 29,614,838 | |||||||
|
| |||||||||
| % | Represents percentage of net assets. |
| 1 | Non-income producing securities. |
| 2 | Foreign corporation. |
| 3 | Level 2 security. See Note 7 regarding Fair Value Measurements. |
| 4 | The value of all securities loaned at June 30, 2016 amounted to $2,993,148 or 2.98% of net assets. See Note 2d regarding Securities Lending. |
| 5 | Represents investment of cash collateral received from securities lending transactions. See Note 2d regarding Securities Lending. |
All securities are Level 1, unless otherwise noted. |
| See Notes to Financial Statements. | 25 |
Table of Contents
| Baron Global Advantage Fund | June 30, 2016 |
STATEMENT OF NET ASSETS (Unaudited)
| JUNE 30, 2016 |
| Shares | Cost | Value | ||||||||
| Common Stocks (99.00%) | ||||||||||
| Argentina (0.70%) | ||||||||||
| 1,885 | Globant SA1 | $ | 73,769 | $ | 74,175 | |||||
|
|
|
| |||||||
| Brazil (3.05%) | ||||||||||
| 23,517 | Cetip SA — Mercados Organizados | 244,353 | 320,583 | |||||||
|
|
|
| |||||||
| Canada (4.08%) | ||||||||||
| 1,107 | Constellation Software, Inc. | 338,746 | 428,431 | |||||||
|
|
|
| |||||||
| China (16.21%) | ||||||||||
| 6,482 | Alibaba Group Holding Ltd., ADR1 | 541,292 | 515,513 | |||||||
| 1,517 | Baidu, Inc., ADR1 | 219,237 | 250,532 | |||||||
| 8,258 | Ctrip.com International Ltd., ADR1 | 261,975 | 340,230 | |||||||
| 9,613 | TAL Education Group, ADR1 | 282,611 | 596,583 | |||||||
|
|
|
| |||||||
Total China | 1,305,115 | 1,702,858 | ||||||||
|
|
|
| |||||||
| India (0.28%) | ||||||||||
| 3,199 | Just Dial Ltd.2 | 48,283 | 29,063 | |||||||
|
|
|
| |||||||
| Indonesia (5.06%) | ||||||||||
| 1,116,770 | Sarana Menara Nusantara Tbk PT1 | 321,392 | 359,226 | |||||||
| 343,836 | Tower Bersama Infrastructure Tbk PT2 | 157,981 | 172,359 | |||||||
|
|
|
| |||||||
Total Indonesia | 479,373 | 531,585 | ||||||||
|
|
|
| |||||||
| Israel (10.01%) | ||||||||||
| 3,964 | Check Point Software Technologies Ltd.1 | 307,720 | 315,852 | |||||||
| 7,496 | Mellanox Technologies Ltd.1 | 295,156 | 359,508 | |||||||
| 8,164 | Mobileye N.V.1 | 413,789 | 376,687 | |||||||
|
|
|
| |||||||
Total Israel | 1,016,665 | 1,052,047 | ||||||||
|
|
|
| |||||||
| Netherlands (1.78%) | ||||||||||
| 1,898 | ASML Holding N.V.2 | 143,850 | 186,836 | |||||||
|
|
|
| |||||||
| South Africa (4.64%) | ||||||||||
| 3,193 | Naspers Limited, Cl N2 | 445,555 | 487,555 | |||||||
|
|
|
| |||||||
| United Kingdom (7.58%) | ||||||||||
| 10,079 | ARM Holdings plc2 | 158,166 | 153,097 | |||||||
| 59,967 | JUST EAT plc1,2 | 258,537 | 342,324 | |||||||
| 82,876 | Worldpay Group plc, 144A1,2 | 303,127 | 301,643 | |||||||
|
|
|
| |||||||
Total United Kingdom | 719,830 | 797,064 | ||||||||
|
|
|
| |||||||
| United States (45.61%) | ||||||||||
| 9,405 | Acxiom Corp.1 | 185,152 | 206,816 | |||||||
| 4,248 | Aerie Pharmaceuticals, Inc.1 | 78,096 | 74,765 | |||||||
| 761 | Allergan plc1 | 212,570 | 175,859 | |||||||
| 824 | Alphabet, Inc., Cl C1 | 435,644 | 570,290 | |||||||
| 1,553 | Amazon.com, Inc.1 | 475,611 | 1,111,358 | |||||||
| 787 | athenahealth, Inc.1 | 107,340 | 108,614 | |||||||
| 291 | Bats Global Markets, Inc.1 | 5,529 | 7,476 | |||||||
| 4,399 | Benefitfocus, Inc.1 | 117,819 | 167,690 | |||||||
| 4,888 | EPAM Systems, Inc.1 | 352,033 | 314,347 | |||||||
| 4,592 | Facebook, Inc., Cl A1 | 123,378 | 524,774 | |||||||
| 18,036 | FireEye, Inc.1 | 556,784 | 297,053 | |||||||
| 2,231 | First Republic Bank | 158,847 | 156,148 | |||||||
| 6,725 | Glaukos Corp.1 | 150,392 | 196,101 | |||||||
| 1,954 | Illumina, Inc.1 | 122,487 | 274,303 | |||||||
| Shares | Cost | Value | ||||||||
| Common Stocks (continued) | ||||||||||
| United States (continued) | ||||||||||
| 870 | Luxoft Holding, Inc.1 | $ | 52,315 | $ | 45,257 | |||||
| 5,255 | Pacira Pharmaceuticals, Inc.1 | 336,531 | 177,251 | |||||||
| 157 | The Priceline Group, Inc.1 | 118,920 | 196,000 | |||||||
| 20,259 | TerraForm Global, Inc., Cl A | 288,693 | 66,044 | |||||||
| 6,118 | Westlake Chemical Partners LP | 164,098 | 122,238 | |||||||
|
|
|
| |||||||
Total United States | 4,042,239 | 4,792,384 | ||||||||
|
|
|
| |||||||
Total Investments (99.00%) | $ | 8,857,778 | 10,402,581 | |||||||
|
| |||||||||
Cash and Other Assets Less Liabilities (1.00%) |
| 104,973 | ||||||||
|
| |||||||||
Net Assets | $ | 10,507,554 | ||||||||
|
| |||||||||
Retail Shares (Equivalent to $13.35 per share based on 423,235 shares outstanding) |
| $ | 5,648,688 | |||||||
|
| |||||||||
Institutional Shares (Equivalent to $13.45 per share based on 361,347 shares outstanding) |
| $ | 4,858,866 | |||||||
|
| |||||||||
| % | Represents percentage of net assets. |
| 1 | Non-income producing securities. |
| 2 | Level 2 security. See Note 7 regarding Fair Value Measurements. |
| ADR | American Depositary Receipt. |
| 144A | Security is exempt from registration under Rule 144A of the Securities Act of 1933. This security may be resold in transactions that are exempt from registration, normally to qualified institutional buyers. This security has been deemed liquid pursuant to policies and procedures approved by the Board of Trustees, unless otherwise noted. At June 30, 2016, the market value of Rule 144A securities amounted to $301,643 or 2.87% of net assets. |
All securities are Level 1, unless otherwise noted. |
Summary of Investments by Sector as of June 30, 2016 | Percentage of Net Assets | |||
Information Technology | 52.0 | % | ||
Consumer Discretionary | 26.0 | |||
Health Care | 9.6 | |||
Telecommunication Services | 5.0 | |||
Financials | 4.6 | |||
Materials | 1.2 | |||
Utilities | 0.6 | |||
Cash and Cash Equivalents | 1.0 | |||
| 100.0 | % | |||
| 26 | See Notes to Financial Statements. |
Table of Contents
| June 30, 2016 | Baron Select Funds |
STATEMENTS OF ASSETS AND LIABILITIES (Unaudited)
JUNE 30, 2016
|
| Baron Partners Fund | Baron Focused Growth Fund | Baron International Growth Fund | Baron Real Estate Fund | |||||||||||||
Assets: | ||||||||||||||||
Investments in securities, at value* | $ | 2,373,731,958 | $ | 185,259,272 | $ | 79,028,645 | $ | 1,238,890,621 | ||||||||
Repurchase agreements, at value** | 309,625 | 12,298,803 | 4,283,772 | 28,630,114 | ||||||||||||
|
|
|
|
|
|
|
| |||||||||
Total investments, at value | 2,374,041,583 | 197,558,075 | 83,312,417 | 1,267,520,735 | ||||||||||||
Foreign currency, at value† | — | — | 62,895 | — | ||||||||||||
Dividends and interest receivable | 1,929,173 | 217,425 | 139,495 | 1,653,687 | ||||||||||||
Receivable for shares sold | 708,255 | 8,051 | 262,057 | 761,568 | ||||||||||||
Receivable for securities sold | — | — | 119,862 | 4,581,431 | ||||||||||||
Other assets | — | — | 9,083 | — | ||||||||||||
Prepaid expenses | 127,724 | 1,699 | 960 | 15,521 | ||||||||||||
|
|
|
|
|
|
|
| |||||||||
| 2,376,806,735 | 197,785,250 | 83,906,769 | 1,274,532,942 | |||||||||||||
|
|
|
|
|
|
|
| |||||||||
Liabilities: | ||||||||||||||||
Payable for borrowings against line of credit | 482,000,000 | — | — | — | ||||||||||||
Payable for collateral on loaned securities | 238,095,000 | 19,305,000 | — | — | ||||||||||||
Payable for securities purchased | 5,836,015 | — | — | 1,125,629 | ||||||||||||
Payable for shares redeemed | 2,296,246 | 48,270 | 41,424 | 15,206,760 | ||||||||||||
Distribution fees payable (Note 4) | 910 | 168 | 935 | 190 | ||||||||||||
Investment advisory fees payable (Note 4) | 477 | 222 | 283 | 545 | ||||||||||||
Accrued capital gains taxes | — | — | 81,428 | — | ||||||||||||
Accrued expenses and other payables | 697,829 | 34,621 | 53,240 | 154,909 | ||||||||||||
|
|
|
|
|
|
|
| |||||||||
| 728,926,477 | 19,388,281 | 177,310 | 16,488,033 | |||||||||||||
|
|
|
|
|
|
|
| |||||||||
Net Assets | $ | 1,647,880,258 | $ | 178,396,969 | $ | 83,729,459 | $ | 1,258,044,909 | ||||||||
|
|
|
|
|
|
|
| |||||||||
Net Assets consist of: | ||||||||||||||||
Paid-in capital | $ | 1,116,581,493 | $ | 125,618,981 | $ | 64,180,193 | $ | 1,130,341,178 | ||||||||
Undistributed (accumulated) net investment income (loss) | 7,475,468 | 900,098 | (233,180 | ) | 5,636,087 | |||||||||||
Undistributed (accumulated) net realized gain (loss) on investments and foreign | (198,253,281 | ) | 12,415,565 | (240,308 | ) | (76,315,666 | ) | |||||||||
Net unrealized appreciation on investments, foreign capital gains tax and foreign | 722,076,578 | 39,462,325 | 20,022,754 | 198,383,310 | ||||||||||||
|
|
|
|
|
|
|
| |||||||||
Net Assets | $ | 1,647,880,258 | $ | 178,396,969 | $ | 83,729,459 | $ | 1,258,044,909 | ||||||||
|
|
|
|
|
|
|
| |||||||||
Retail Shares: | ||||||||||||||||
Net Assets | $ | 977,383,489 | $ | 41,005,251 | $ | 40,350,760 | $ | 565,628,789 | ||||||||
Shares Outstanding ($0.01 par value; indefinite shares authorized) | 27,333,255 | 3,120,976 | 2,230,011 | 24,325,404 | ||||||||||||
Net Asset Value and Offering Price Per Share | $ | 35.76 | $ | 13.14 | $ | 18.09 | $ | 23.25 | ||||||||
|
|
|
|
|
|
|
| |||||||||
Institutional Shares: | ||||||||||||||||
Net Assets | $ | 670,496,769 | $ | 137,391,718 | $ | 43,378,699 | $ | 690,695,486 | ||||||||
Shares Outstanding ($0.01 par value; indefinite shares authorized) | 18,452,383 | 10,317,505 | 2,378,561 | 29,338,242 | ||||||||||||
Net Asset Value and Offering Price Per Share | $ | 36.34 | $ | 13.32 | $ | 18.24 | $ | 23.54 | ||||||||
|
|
|
|
|
|
|
| |||||||||
R6 Shares: | ||||||||||||||||
Net Assets | $ | — | $ | — | $ | — | $ | 1,720,634 | ||||||||
Shares Outstanding ($0.01 par value; indefinite shares authorized) | — | — | — | 73,081 | ||||||||||||
Net Asset Value and Offering Price Per Share | $ | — | $ | — | $ | — | $ | 23.54 | ||||||||
|
|
|
|
|
|
|
| |||||||||
*Investments in securities, at cost | $ | 1,651,655,380 | $ | 145,796,947 | $ | 58,922,580 | $ | 1,040,493,517 | ||||||||
**Repurchase agreements, at cost | 309,625 | 12,298,803 | 4,283,772 | 28,630,114 | ||||||||||||
|
|
|
|
|
|
|
| |||||||||
Total investments, at cost | $ | 1,651,965,005 | $ | 158,095,750 | $ | 63,206,352 | $ | 1,069,123,631 | ||||||||
|
|
|
|
|
|
|
| |||||||||
†Foreign currency, at cost: | $ | — | $ | — | $ | 63,097 | $ | — | ||||||||
|
|
|
|
|
|
|
| |||||||||
| See Notes to Financial Statements. | 27 |
Table of Contents
| Baron Select Funds | June 30, 2016 |
STATEMENTS OF ASSETS AND LIABILITIES (Unaudited) (Continued)
JUNE 30, 2016
|
| Baron Emerging Markets Fund | Baron Energy and Resources Fund | Baron Global Advantage Fund | ||||||||||
Assets: | ||||||||||||
Investments in securities, at value* | $ | 1,817,129,674 | $ | 101,692,022 | $ | 10,402,581 | ||||||
Repurchase agreements, at value** | 224,903,410 | 1,844,687 | — | |||||||||
|
|
|
|
|
| |||||||
Total investments, at value | 2,042,033,084 | 103,536,709 | 10,402,581 | |||||||||
Foreign currency, at value† | 3,964,825 | 52 | 15 | |||||||||
Cash | — | — | 63,217 | |||||||||
Dividends and interest receivable | 3,315,099 | 41,896 | 4,685 | |||||||||
Receivable for shares sold | 17,827,607 | 52,774 | 20,238 | |||||||||
Receivable for securities sold | 120,475 | — | 110,186 | |||||||||
Prepaid expenses | 16,433 | 795 | 96 | |||||||||
|
|
|
|
|
| |||||||
| 2,067,277,523 | 103,632,226 | 10,601,018 | ||||||||||
|
|
|
|
|
| |||||||
Liabilities: | ||||||||||||
Payable for collateral on loaned securities | — | 3,024,450 | — | |||||||||
Payable for securities purchased | 15,916,742 | — | 47,524 | |||||||||
Payable for shares redeemed | 1,970,305 | 68,370 | 878 | |||||||||
Distribution fees payable (Note 4) | 334 | 605 | 494 | |||||||||
Investment advisory fees payable (Note 4) | 254 | 11 | — | |||||||||
Accrued capital gains taxes | 3,805,771 | — | — | |||||||||
Accrued expenses and other payables | 250,045 | 65,078 | 44,568 | |||||||||
|
|
|
|
|
| |||||||
| 21,943,451 | 3,158,514 | 93,464 | ||||||||||
|
|
|
|
|
| |||||||
Net Assets | $ | 2,045,334,072 | $ | 100,473,712 | $ | 10,507,554 | ||||||
|
|
|
|
|
| |||||||
Net Assets consist of: | ||||||||||||
Paid-in capital | $ | 2,125,925,966 | $ | 126,339,102 | $ | 9,760,420 | ||||||
Undistributed (accumulated) net investment income (loss) | 6,363,838 | 891,913 | (29,257 | ) | ||||||||
Accumulated net realized loss on investments and foreign currency transactions | (186,005,237 | ) | (34,073,528 | ) | (768,605 | ) | ||||||
Net unrealized appreciation on investments, foreign capital gains tax and foreign | 99,049,505 | 7,316,225 | 1,544,996 | |||||||||
|
|
|
|
|
| |||||||
Net Assets | $ | 2,045,334,072 | $ | 100,473,712 | $ | 10,507,554 | ||||||
|
|
|
|
|
| |||||||
Retail Shares: | ||||||||||||
Net Assets | $ | 658,354,520 | $ | 70,858,874 | $ | 5,648,688 | ||||||
Shares Outstanding ($0.01 par value; indefinite shares authorized) | 59,019,592 | 8,964,467 | 423,235 | |||||||||
Net Asset Value and Offering Price Per Share | $ | 11.15 | $ | 7.90 | $ | 13.35 | ||||||
|
|
|
|
|
| |||||||
Institutional Shares: | ||||||||||||
Net Assets | $ | 1,386,605,746 | $ | 29,614,838 | $ | 4,858,866 | ||||||
Shares Outstanding ($0.01 par value; indefinite shares authorized) | 123,886,897 | 3,705,003 | 361,347 | |||||||||
Net Asset Value and Offering Price Per Share | $ | 11.19 | $ | 7.99 | $ | 13.45 | ||||||
|
|
|
|
|
| |||||||
R6 Shares: | ||||||||||||
Net Assets | $ | 373,806 | $ | — | $ | — | ||||||
Shares Outstanding ($0.01 par value; indefinite shares authorized) | 33,370 | — | — | |||||||||
Net Asset Value and Offering Price Per Share | $ | 11.20 | $ | — | $ | — | ||||||
|
|
|
|
|
| |||||||
*Investments in securities, at cost | $ | 1,714,201,822 | $ | 94,375,792 | $ | 8,857,778 | ||||||
**Repurchase agreements, at cost | 224,903,410 | 1,844,687 | — | |||||||||
|
|
|
|
|
| |||||||
Total investments, at cost | $ | 1,939,105,232 | $ | 96,220,479 | $ | 8,857,778 | ||||||
|
|
|
|
|
| |||||||
†Foreign currency, at cost: | $ | 3,964,803 | $ | 57 | $ | 15 | ||||||
|
|
|
|
|
| |||||||
| 28 | See Notes to Financial Statements. |
Table of Contents
| June 30, 2016 | Baron Select Funds |
STATEMENTS OF OPERATIONS (Unaudited)
FOR THE SIX MONTHS ENDED JUNE 30, 2016
|
| Baron Partners Fund | Baron Focused Growth Fund | Baron International Growth Fund | Baron Real Estate Fund | |||||||||||||
Investment income: | ||||||||||||||||
Income: | ||||||||||||||||
Dividends | $ | 8,665,931 | $ | 915,955 | $ | 794,186 | $ | 15,957,709 | ||||||||
Interest | 46 | 1,766 | 751 | 6,216 | ||||||||||||
Securities lending income, net | 936,763 | 76,063 | — | — | ||||||||||||
Foreign taxes withheld on dividends | — | — | (63,274 | ) | (145,926 | ) | ||||||||||
|
|
|
|
|
|
|
| |||||||||
Total income | 9,602,740 | 993,784 | 731,663 | 15,817,999 | ||||||||||||
|
|
|
|
|
|
|
| |||||||||
Expenses: | ||||||||||||||||
Investment advisory fees (Note 4) | 8,086,695 | 857,312 | 432,443 | 7,032,683 | ||||||||||||
Distribution fees — Retail Shares (Note 4) | 1,184,622 | 50,497 | 50,864 | 781,519 | ||||||||||||
Shareholder servicing agent fees and expenses — Retail Shares | 117,680 | 13,494 | 15,066 | 53,769 | ||||||||||||
Shareholder servicing agent fees and expenses — Institutional Shares | 32,309 | 6,991 | 6,313 | 38,700 | ||||||||||||
Shareholder servicing agent fees and expenses — R6 Shares | — | — | — | 3 | ||||||||||||
Line of credit fees | 273,191 | 728 | 349 | 6,392 | ||||||||||||
Reports to shareholders | 199,450 | 5,261 | 24,920 | 210,600 | ||||||||||||
Professional fees | 134,160 | 25,868 | 24,235 | 49,356 | ||||||||||||
Registration and filing fees | 52,370 | 28,700 | 23,960 | 72,520 | ||||||||||||
Custodian and fund accounting fees | 42,204 | 13,508 | 41,583 | 61,134 | ||||||||||||
Trustee fees and expenses | 31,724 | 3,298 | 1,760 | 29,449 | ||||||||||||
Administration fees | 16,243 | 16,270 | 16,174 | 16,185 | ||||||||||||
Insurance expense | 13,174 | 1,342 | 726 | 12,133 | ||||||||||||
Miscellaneous expenses | 1,256 | 1,256 | 1,310 | 1,856 | ||||||||||||
|
|
|
|
|
|
|
| |||||||||
Total operating expenses | 10,185,078 | 1,024,525 | 639,703 | 8,366,299 | ||||||||||||
Interest expense on borrowings | 2,950,743 | — | — | — | ||||||||||||
|
|
|
|
|
|
|
| |||||||||
Total expenses | 13,135,821 | 1,024,525 | 639,703 | 8,366,299 | ||||||||||||
Reimbursement of expenses by Adviser — Retail Shares (Note 4) | — | (15,868 | ) | (27,334 | ) | — | ||||||||||
Reimbursement of expenses by Adviser — Institutional Shares (Note 4) | — | (15,116 | ) | (20,897 | ) | — | ||||||||||
|
|
|
|
|
|
|
| |||||||||
Net expenses | 13,135,821 | 993,541 | 591,472 | 8,366,299 | ||||||||||||
|
|
|
|
|
|
|
| |||||||||
Net investment income (loss) | (3,533,081 | ) | 243 | 140,191 | 7,451,700 | |||||||||||
|
|
|
|
|
|
|
| |||||||||
Realized and unrealized gain (loss) on investments: | ||||||||||||||||
Net realized gain (loss) on investments sold | 123,829,419 | 5,881,159 | (58,861 | ) | (77,007,946 | ) | ||||||||||
Net realized loss on foreign currency transactions | — | — | (16,755 | ) | (46,251 | ) | ||||||||||
Change in net unrealized appreciation (depreciation) of: | ||||||||||||||||
Investments | (140,617,769 | ) | (5,604,226 | ) | (279,810 | )1 | (21,300,270 | ) | ||||||||
Foreign currency translations | — | — | 362 | (9,850 | ) | |||||||||||
|
|
|
|
|
|
|
| |||||||||
Net gain (loss) on investments | (16,788,350 | ) | 276,933 | (355,064 | ) | (98,364,317 | ) | |||||||||
|
|
|
|
|
|
|
| |||||||||
Net increase (decrease) in net assets resulting from operations | $ | (20,321,431 | ) | $ | 277,176 | $ | (214,873 | ) | $ | (90,912,617 | ) | |||||
|
|
|
|
|
|
|
| |||||||||
| 1 | Net change in accrued foreign capital gains tax of $(63,866). |
| See Notes to Financial Statements. | 29 |
Table of Contents
| Baron Select Funds | June 30, 2016 |
STATEMENTS OF OPERATIONS (Unaudited) (Continued)
FOR THE SIX MONTHS ENDED JUNE 30, 2016
|
| Baron Emerging Markets Fund | Baron Energy and Resources Fund | Baron Global Advantage Fund | ||||||||||
Investment income: | ||||||||||||
Income: | ||||||||||||
Dividends | $ | 18,645,451 | $ | 875,905 | $ | 24,726 | ||||||
Interest | 28,642 | 1,246 | 27 | |||||||||
Securities lending income, net | — | 11,544 | — | |||||||||
Foreign taxes withheld on dividends | (1,328,808 | ) | (5,030 | ) | (1,085 | ) | ||||||
|
|
|
|
|
| |||||||
Total income | 17,345,285 | 883,665 | 23,668 | |||||||||
|
|
|
|
|
| |||||||
Expenses: | ||||||||||||
Investment advisory fees (Note 4) | 8,599,130 | 431,460 | 50,826 | |||||||||
Distribution fees — Retail Shares (Note 4) | 767,921 | 75,138 | 6,806 | |||||||||
Shareholder servicing agent fees and expenses — Retail Shares | 40,285 | 14,454 | 7,801 | |||||||||
Shareholder servicing agent fees and expenses — Institutional Shares | 34,810 | 7,258 | 4,975 | |||||||||
Shareholder servicing agent fees and expenses — R6 Shares | 1 | — | — | |||||||||
Line of credit fees | 7,442 | 214 | 32 | |||||||||
Reports to shareholders | 271,520 | 44,600 | 4,336 | |||||||||
Professional fees | 53,151 | 82,914 | 49,096 | |||||||||
Registration and filing fees | 148,300 | 21,324 | 27,300 | |||||||||
Custodian and fund accounting fees | 496,890 | 18,046 | 18,190 | |||||||||
Trustee fees and expenses | 31,524 | 1,523 | 198 | |||||||||
Administration fees | 16,155 | 16,138 | 16,215 | |||||||||
Insurance expense | 12,288 | 622 | 89 | |||||||||
Miscellaneous expenses | 2,028 | 1,256 | 1,256 | |||||||||
|
|
|
|
|
| |||||||
Total operating expenses | 10,481,445 | 714,947 | 187,120 | |||||||||
Interest expense on borrowings | — | — | — | |||||||||
|
|
|
|
|
| |||||||
Total expenses | 10,481,445 | 714,947 | 187,120 | |||||||||
Reimbursement of expenses by Adviser — Retail Shares (Note 4) | — | (114,549 | ) | (63,584 | ) | |||||||
Reimbursement of expenses by Adviser — Institutional Shares (Note 4) | — | (50,654 | ) | (53,197 | ) | |||||||
|
|
|
|
|
| |||||||
Net expenses | 10,481,445 | 549,744 | 70,339 | |||||||||
|
|
|
|
|
| |||||||
Net investment income (loss) | 6,863,840 | 333,921 | (46,671 | ) | ||||||||
|
|
|
|
|
| |||||||
Realized and unrealized gain (loss) on investments: | ||||||||||||
Net realized loss on investments sold | (67,526,473 | )1 | (3,598,912 | ) | (121,858 | ) | ||||||
Net realized gain (loss) on foreign currency transactions | (193,817 | ) | 339 | (975 | ) | |||||||
Change in net unrealized appreciation (depreciation) of: | ||||||||||||
Investments | 168,095,212 | 15,882,067 | (331,064 | ) | ||||||||
Foreign currency translations | (56,607 | ) | (3 | ) | 415 | |||||||
|
|
|
|
|
| |||||||
Net gain (loss) on investments | 100,318,315 | 12,283,491 | (453,482 | ) | ||||||||
|
|
|
|
|
| |||||||
Net increase (decrease) in net assets resulting from operations | $ | 107,182,155 | $ | 12,617,412 | $ | (500,153 | ) | |||||
|
|
|
|
|
| |||||||
| 1 | Net change in accrued foreign capital gains tax of $(2,480,305). |
| 30 | See Notes to Financial Statements. |
Table of Contents
| June 30, 2016 | Baron Select Funds |
STATEMENTS OF CHANGES IN NET ASSETS (Unaudited)
|
| Baron Partners Fund | Baron Focused Growth Fund | Baron International Growth Fund | ||||||||||||||||||||||
| For the Six Months Ended June 30, 2016 | For the Year Ended December 31, 2015 | For the Six Months Ended June 30, 2016 | For the Year Ended December 31, 2015 | For the Six Months Ended June 30, 2016 | For the Year Ended December 31, 2015 | |||||||||||||||||||
Increase (Decrease) in Net Assets: | ||||||||||||||||||||||||
Operations: | ||||||||||||||||||||||||
Net investment income (loss) | $ | (3,533,081 | ) | $ | (747,224 | ) | $ | 243 | $ | 192,228 | $ | 140,191 | $ | 298,094 | ||||||||||
Net realized gain (loss) | 123,829,419 | 14,265,041 | 5,881,159 | 10,479,808 | (75,616 | ) | (32,526 | ) | ||||||||||||||||
Change in net unrealized appreciation (depreciation) | (140,617,769 | ) | (70,618,314 | ) | (5,604,226 | ) | (14,726,304 | ) | (279,448 | ) | 1,343,071 | |||||||||||||
|
|
|
|
|
|
|
|
|
|
|
| |||||||||||||
Increase (decrease) in net assets resulting from operations | (20,321,431 | ) | (57,100,497 | ) | 277,176 | (4,054,268 | ) | (214,873 | ) | 1,608,639 | ||||||||||||||
|
|
|
|
|
|
|
|
|
|
|
| |||||||||||||
Distributions to shareholders from: | ||||||||||||||||||||||||
Net investment income — Retail Shares | — | (4,106,150 | ) | — | (70,067 | ) | — | (210,570 | ) | |||||||||||||||
Net investment income — Institutional Shares | — | (4,764,671 | ) | — | (580,716 | ) | — | (462,862 | ) | |||||||||||||||
Net realized gain on investments — Retail Shares | — | — | — | (2,417,214 | ) | — | (73,424 | ) | ||||||||||||||||
Net realized gain on investments — Institutional Shares | — | — | — | (7,473,888 | ) | — | (82,646 | ) | ||||||||||||||||
|
|
|
|
|
|
|
|
|
|
|
| |||||||||||||
Decrease in net assets from distributions to shareholders | — | (8,870,821 | ) | — | (10,541,885 | ) | — | (829,502 | ) | |||||||||||||||
|
|
|
|
|
|
|
|
|
|
|
| |||||||||||||
Capital share transactions: | ||||||||||||||||||||||||
Proceeds from the sale of shares — Retail Shares | 43,873,344 | 164,387,862 | 1,186,953 | 6,397,130 | 3,032,961 | 8,899,357 | ||||||||||||||||||
Proceeds from the sale of shares — Institutional Shares | 52,695,185 | 347,495,282 | 165,081 | 3,624,246 | 3,459,468 | 7,680,292 | ||||||||||||||||||
Net asset value of shares issued in reinvestment of distributions — Retail Shares | — | 3,995,569 | — | 2,452,076 | — | 282,158 | ||||||||||||||||||
Net asset value of shares issued in reinvestment of distributions — Institutional Shares | — | 4,177,881 | — | 6,671,379 | — | 341,079 | ||||||||||||||||||
Cost of shares redeemed — Retail Shares | (161,478,705 | ) | (278,717,168 | ) | (3,963,459 | ) | (7,449,535 | ) | (7,463,460 | ) | (17,823,270 | ) | ||||||||||||
Cost of shares redeemed — Institutional Shares | (167,681,189 | ) | (212,397,508 | ) | (3,451,706 | ) | (8,182,326 | ) | (13,682,582 | ) | (6,817,506 | ) | ||||||||||||
|
|
|
|
|
|
|
|
|
|
|
| |||||||||||||
Increase (decrease) in net assets derived from capital | (232,591,365 | ) | 28,941,918 | (6,063,131 | ) | 3,512,970 | (14,653,613 | ) | (7,437,890 | ) | ||||||||||||||
|
|
|
|
|
|
|
|
|
|
|
| |||||||||||||
Net decrease in net assets | (252,912,796 | ) | (37,029,400 | ) | (5,785,955 | ) | (11,083,183 | ) | (14,868,486 | ) | (6,658,753 | ) | ||||||||||||
|
|
|
|
|
|
|
|
|
|
|
| |||||||||||||
Net Assets: | ||||||||||||||||||||||||
Beginning of period | 1,900,793,054 | 1,937,822,454 | 184,182,924 | 195,266,107 | 98,597,945 | 105,256,698 | ||||||||||||||||||
|
|
|
|
|
|
|
|
|
|
|
| |||||||||||||
End of period | $ | 1,647,880,258 | $ | 1,900,793,054 | $ | 178,396,969 | $ | 184,182,924 | $ | 83,729,459 | $ | 98,597,945 | ||||||||||||
|
|
|
|
|
|
|
|
|
|
|
| |||||||||||||
Undistributed (accumulated) net investment income (loss) at end | $ | 7,475,468 | $ | 11,008,549 | $ | 900,098 | $ | 899,855 | $ | (233,180 | ) | $ | (373,371 | ) | ||||||||||
|
|
|
|
|
|
|
|
|
|
|
| |||||||||||||
Capital share transactions — Retail Shares | ||||||||||||||||||||||||
Shares sold | 1,355,325 | 4,413,521 | 94,837 | 442,457 | 173,368 | 479,118 | ||||||||||||||||||
Shares issued in reinvestment of distributions | — | 113,189 | — | 189,066 | — | 15,603 | ||||||||||||||||||
Shares redeemed | (5,113,364 | ) | (7,633,879 | ) | (316,200 | ) | (530,825 | ) | (429,811 | ) | (958,724 | ) | ||||||||||||
|
|
|
|
|
|
|
|
|
|
|
| |||||||||||||
Net increase (decrease) | (3,758,039 | ) | (3,107,169 | ) | (221,363 | ) | 100,698 | (256,443 | ) | (464,003 | ) | |||||||||||||
|
|
|
|
|
|
|
|
|
|
|
| |||||||||||||
Capital share transactions — Institutional Shares | ||||||||||||||||||||||||
Shares sold | 1,598,468 | 9,273,217 | 12,848 | 258,675 | 204,906 | 406,160 | ||||||||||||||||||
Shares issued in reinvestment of distributions | — | 116,701 | — | 508,487 | — | 18,782 | ||||||||||||||||||
Shares redeemed | (5,092,642 | ) | (5,723,538 | ) | (296,972 | ) | (547,515 | ) | (782,680 | ) | (360,893 | ) | ||||||||||||
|
|
|
|
|
|
|
|
|
|
|
| |||||||||||||
Net increase (decrease) | (3,494,174 | ) | 3,666,380 | (284,124 | ) | 219,647 | (577,774 | ) | 64,049 | |||||||||||||||
|
|
|
|
|
|
|
|
|
|
|
| |||||||||||||
| See Notes to Financial Statements. | 31 |
Table of Contents
| Baron Select Funds | June 30, 2016 |
STATEMENTS OF CHANGES IN NET ASSETS (Unaudited) (Continued)
|
| Baron Real Estate Fund | Baron Emerging Markets Fund | |||||||||||||||
| For the Six Months Ended June 30, 2016 | For the Year Ended December 31, 2015 | For the Six Months Ended June 30, 2016 | For the Year Ended December 31, 2015 | |||||||||||||
Increase (Decrease) in Net Assets: | ||||||||||||||||
Operations: | ||||||||||||||||
Net investment income (loss) | $ | 7,451,700 | $ | (1,503,894 | ) | $ | 6,863,840 | $ | 6,124,993 | |||||||
Net realized gain (loss) | (77,054,197 | ) | 35,068,425 | (67,720,290 | ) | (86,230,454 | ) | |||||||||
Change in net unrealized appreciation (depreciation) | (21,310,120 | ) | (127,358,795 | ) | 168,038,605 | (116,515,878 | ) | |||||||||
|
|
|
|
|
|
|
| |||||||||
Increase (decrease) in net assets resulting from operations | (90,912,617 | ) | (93,794,264 | ) | 107,182,155 | (196,621,339 | ) | |||||||||
|
|
|
|
|
|
|
| |||||||||
Distributions to shareholders from: | ||||||||||||||||
Net investment income — Retail Shares | — | (364,929 | ) | — | (701,411 | ) | ||||||||||
Net investment income — Institutional Shares | — | (444,647 | ) | — | (3,988,520 | ) | ||||||||||
Net realized gain on investments — Retail Shares | — | (15,405,999 | ) | — | — | |||||||||||
Net realized gain on investments — Institutional Shares | — | (19,283,111 | ) | — | — | |||||||||||
|
|
|
|
|
|
|
| |||||||||
Decrease in net assets from distributions to shareholders | — | (35,498,686 | ) | — | (4,689,931 | ) | ||||||||||
|
|
|
|
|
|
|
| |||||||||
Capital share transactions: | ||||||||||||||||
Proceeds from the sale of shares — Retail Shares | 53,687,009 | 336,220,314 | 117,274,315 | 426,130,100 | ||||||||||||
Proceeds from the sale of shares — Institutional Shares | 119,951,795 | 432,171,142 | 457,245,002 | 903,660,409 | ||||||||||||
Proceeds from the sale of shares — R6 Shares | 1,723,161 | — | 356,135 | — | ||||||||||||
Net asset value of shares issued in reinvestment of distributions — Retail Shares | — | 15,440,297 | — | 693,798 | ||||||||||||
Net asset value of shares issued in reinvestment of distributions — Institutional Shares | — | 16,601,383 | — | 3,084,734 | ||||||||||||
Cost of shares redeemed — Retail Shares | (236,043,724 | ) | (285,156,542 | ) | (154,826,282 | ) | (320,271,070 | ) | ||||||||
Cost of shares redeemed — Institutional Shares | (372,042,509 | ) | (306,822,077 | ) | (188,253,684 | ) | (453,120,022 | ) | ||||||||
|
|
|
|
|
|
|
| |||||||||
Increase (decrease) in net assets derived from capital share transactions | (432,724,268 | ) | 208,454,517 | 231,795,486 | 560,177,949 | |||||||||||
|
|
|
|
|
|
|
| |||||||||
Net increase (decrease) in net assets | (523,636,885 | ) | 79,161,567 | 338,977,641 | 358,866,679 | |||||||||||
|
|
|
|
|
|
|
| |||||||||
Net Assets: | ||||||||||||||||
Beginning of period | 1,781,681,794 | 1,702,520,227 | 1,706,356,431 | 1,347,489,752 | ||||||||||||
|
|
|
|
|
|
|
| |||||||||
End of period | $ | 1,258,044,909 | $ | 1,781,681,794 | $ | 2,045,334,072 | $ | 1,706,356,431 | ||||||||
|
|
|
|
|
|
|
| |||||||||
Undistributed (accumulated) net investment income (loss) at end of period | $ | 5,636,087 | $ | (1,815,613 | ) | $ | 6,363,838 | $ | (500,002 | ) | ||||||
|
|
|
|
|
|
|
| |||||||||
Capital share transactions — Retail Shares | ||||||||||||||||
Shares sold | 2,415,442 | 12,836,525 | 11,379,024 | 37,014,347 | ||||||||||||
Shares issued in reinvestment of distributions | — | 628,995 | — | 64,902 | ||||||||||||
Shares redeemed | (10,630,764 | ) | (11,123,366 | ) | (15,320,013 | ) | (28,651,234 | ) | ||||||||
|
|
|
|
|
|
|
| |||||||||
Net increase (decrease) | (8,215,322 | ) | 2,342,154 | (3,940,989 | ) | 8,428,015 | ||||||||||
|
|
|
|
|
|
|
| |||||||||
Capital share transactions — Institutional Shares | ||||||||||||||||
Shares sold | 5,376,500 | 16,521,289 | 44,064,439 | 80,184,256 | ||||||||||||
Shares issued in reinvestment of distributions | — | 668,952 | — | 288,024 | ||||||||||||
Shares redeemed | (16,535,652 | ) | (11,879,810 | ) | (18,438,677 | ) | (40,651,773 | ) | ||||||||
|
|
|
|
|
|
|
| |||||||||
Net increase (decrease) | (11,159,152 | ) | 5,310,431 | 25,625,762 | 39,820,507 | |||||||||||
|
|
|
|
|
|
|
| |||||||||
Capital share transactions — R6 Shares | ||||||||||||||||
Shares sold | 73,081 | — | 33,370 | — | ||||||||||||
|
|
|
|
|
|
|
| |||||||||
Net increase | 73,081 | — | 33,370 | — | ||||||||||||
|
|
|
|
|
|
|
| |||||||||
| 32 | See Notes to Financial Statements. |
Table of Contents
| June 30, 2016 | Baron Select Funds |
STATEMENTS OF CHANGES IN NET ASSETS (Unaudited) (Continued)
|
| Baron Energy and Resources Fund | Baron Global Advantage Fund | |||||||||||||||
| For the Six Months Ended June 30, 2016 | For the Year Ended December 31, 2015 | For the Six Months Ended June 30, 2016 | For the Year Ended December 31, 2015 | |||||||||||||
Increase (Decrease) in Net Assets: | ||||||||||||||||
Operations: | ||||||||||||||||
Net investment income (loss) | $ | 333,921 | $ | 300,389 | $ | (46,671 | ) | $ | (59,468 | ) | ||||||
Net realized loss | (3,598,573 | ) | (30,798,728 | ) | (122,833 | ) | (671,076 | ) | ||||||||
Change in net unrealized appreciation (depreciation) | 15,882,064 | 10,358 | (330,649 | ) | 434,079 | |||||||||||
|
|
|
|
|
|
|
| |||||||||
Increase (decrease) in net assets resulting from operations | 12,617,412 | (30,487,981 | ) | (500,153 | ) | (296,465 | ) | |||||||||
|
|
|
|
|
|
|
| |||||||||
Distributions to shareholders from: | ||||||||||||||||
Net investment income — Retail Shares | — | — | — | (11,564 | ) | |||||||||||
Net investment income — Institutional Shares | — | — | — | (16,685 | ) | |||||||||||
Net realized gain on investments — Retail Shares | — | (34,058 | ) | — | (7,375 | ) | ||||||||||
Net realized gain on investments — Institutional Shares | — | (30,966 | ) | — | (6,436 | ) | ||||||||||
|
|
|
|
|
|
|
| |||||||||
Decrease in net assets from distributions to shareholders | — | (65,024 | ) | — | (42,060 | ) | ||||||||||
|
|
|
|
|
|
|
| |||||||||
Capital share transactions: | ||||||||||||||||
Proceeds from the sale of shares — Retail Shares | 13,964,056 | 50,753,381 | 456,686 | 3,922,722 | ||||||||||||
Proceeds from the sale of shares — Institutional Shares | 8,326,018 | 28,394,513 | 185,204 | 2,152,705 | ||||||||||||
Proceeds from the sale of shares — R6 Shares | — | — | — | — | ||||||||||||
Net asset value of shares issued in reinvestment of distributions — Retail Shares | — | 33,774 | — | 18,901 | ||||||||||||
Net asset value of shares issued in reinvestment of distributions — Institutional Shares | — | 26,561 | — | 23,120 | ||||||||||||
Cost of shares redeemed — Retail Shares | (8,039,251 | ) | (18,562,721 | ) | (767,706 | ) | (1,433,194 | ) | ||||||||
Cost of shares redeemed — Institutional Shares | (5,636,237 | ) | (19,895,321 | ) | (388,349 | ) | (792,192 | ) | ||||||||
|
|
|
|
|
|
|
| |||||||||
Increase (decrease) in net assets derived from capital share transactions | 8,614,586 | 40,750,187 | (514,165 | ) | 3,892,062 | |||||||||||
|
|
|
|
|
|
|
| |||||||||
Net increase (decrease) in net assets | 21,231,998 | 10,197,182 | (1,014,318 | ) | 3,553,537 | |||||||||||
|
|
|
|
|
|
|
| |||||||||
Net Assets: | ||||||||||||||||
Beginning of period | 79,241,714 | 69,044,532 | 11,521,872 | 7,968,335 | ||||||||||||
|
|
|
|
|
|
|
| |||||||||
End of period | $ | 100,473,712 | $ | 79,241,714 | $ | 10,507,554 | $ | 11,521,872 | ||||||||
|
|
|
|
|
|
|
| |||||||||
Undistributed (accumulated) net investment income (loss) at end of period | $ | 891,913 | $ | 557,992 | $ | (29,257 | ) | $ | 17,414 | |||||||
|
|
|
|
|
|
|
| |||||||||
Capital share transactions — Retail Shares | ||||||||||||||||
Shares sold | 2,111,654 | 6,311,650 | 35,005 | 275,759 | ||||||||||||
Shares issued in reinvestment of distributions | — | 4,381 | — | 1,505 | ||||||||||||
Shares redeemed | (1,171,802 | ) | (2,138,039 | ) | (59,945 | ) | (101,770 | ) | ||||||||
|
|
|
|
|
|
|
| |||||||||
Net increase (decrease) | 939,852 | 4,177,992 | (24,940 | ) | 175,494 | |||||||||||
|
|
|
|
|
|
|
| |||||||||
Capital share transactions — Institutional Shares | ||||||||||||||||
Shares sold | 1,291,648 | 2,950,290 | 14,166 | 144,495 | ||||||||||||
Shares issued in reinvestment of distributions | — | 3,414 | — | 1,831 | ||||||||||||
Shares redeemed | (800,572 | ) | (2,557,117 | ) | (30,548 | ) | (55,528 | ) | ||||||||
|
|
|
|
|
|
|
| |||||||||
Net increase (decrease) | 491,076 | 396,587 | (16,382 | ) | 90,798 | |||||||||||
|
|
|
|
|
|
|
| |||||||||
| See Notes to Financial Statements. | 33 |
Table of Contents
| Baron Select Funds | June 30, 2016 |
STATEMENTS OF CASH FLOWS (Unaudited)
FORTHE SIX MONTHS ENDED JUNE 30, 2016
|
| Baron Partners Fund | ||||
Increase (Decrease) in Cash: | ||||
Cash Used from Operating Activities | ||||
Net decrease in net assets resulting from operations | $ | (20,321,431 | ) | |
Adjustments to reconcile net decrease in net assets resulting from operations to net cash provided by operating activities: | ||||
Purchases of portfolio securities | (221,591,164 | ) | ||
Proceeds from sales of portfolio securities | 530,768,699 | |||
Net purchases, sales and maturities of short-term investments | (238,263,340 | ) | ||
Increase in dividends and interest receivable | (839,398 | ) | ||
Decrease in prepaid expenses | 148,574 | |||
Increase in payable for collateral on loaned securities | 238,095,000 | |||
Decrease in accrued expenses | (78,234 | ) | ||
Net realized gain on investments | (123,829,419 | ) | ||
Change in net unrealized appreciation (depreciation) of investments | 140,617,769 | |||
|
| |||
Net cash provided by operating activities | $ | 304,707,056 | ||
|
| |||
Cash Provided from Financing Activities | ||||
Proceeds from shares sold | 100,142,700 | |||
Payment for shares redeemed | (329,849,756 | ) | ||
Decrease in payable for borrowings against line of credit | (75,000,000 | ) | ||
|
| |||
Net cash used in financing activities | (304,707,056 | ) | ||
|
| |||
Net decrease in cash | — | |||
Cash at beginning of period | — | |||
|
| |||
Cash at end of period | $ | — | ||
|
| |||
Supplemental cash flow information: | ||||
Interest paid | $ | 3,004,918 | ||
|
| |||
| 34 | See Notes to Financial Statements. |
Table of Contents
| June 30, 2016 | Baron Select Funds |
NOTES TO FINANCIAL STATEMENTS (Unaudited)
1. ORGANIZATION
Baron Select Funds (the “Trust”) is registered under the Investment Company Act of 1940, as amended (the “1940 Act”), as an open-end management investment company established as a Delaware statutory trust on April 30, 2003, and accordingly, follows the investment company accounting and reporting guidance of the Financial Accounting Standards Board (“FASB”) Accounting Standard Codification Topic 946 Financial Services – Investment Companies. The Trust currently offers seven series (individually, a “Fund” and collectively, the “Funds”): Baron Partners Fund, Baron Focused Growth Fund, Baron Real Estate Fund and Baron Energy and Resources Fund, which are non-diversified; and Baron International Growth Fund, Baron Emerging Markets Fund, and Baron Global Advantage Fund, which are diversified. The Funds’ investment objective is to seek capital appreciation. Baron Partners Fund may employ “leverage” by borrowing money and using it to purchase additional securities. Borrowing for investment increases both investment opportunity and investment risk. Baron International Growth Fund, Baron Emerging Markets Fund and Baron Global Advantage Fund invest their assets primarily in non-U.S. companies. Baron Real Estate Fund invests its assets primarily in U.S. and non-U.S. real estate and real estate-related companies. Baron Energy and Resources Fund invests its assets primarily in U.S. and non-U.S. energy and resources companies and related companies and energy and resources master limited partnerships (“MLPs”) of any market capitalization.
Each Fund offers Retail Shares and Institutional Shares. Baron Emerging Markets Fund and Baron Real Estate Fund began offering R6 Shares on January 29, 2016. Each class of shares differs only in its ongoing fees, expenses and eligibility requirements. Retail Shares are offered to all investors. Institutional Shares are for investments in the amount of $1 million or more per Fund. Institutional Shares are intended for certain financial intermediaries that offer shares of Baron Funds through fee-based platforms, retirement platforms or other platforms. R6 Shares are for investments in the amount of $5 million or more per Fund. R6 Shares are available only to qualified 401(a) plans (including 401(k) plans, Keogh plans, profit sharing plans, money purchase pension plans, target benefit plans, defined benefit pension plans and Taft-Hartley multi-employer pension plans), endowment funds and foundations, any state, county or city, or its instrumentality, department, authority, or agency, 457 plans, including 457(a) governmental entity plans and tax-exempt plans, accounts registered to insurance companies, trust companies and bank trust departments, investment companies, both affiliated and not affiliated with the adviser, and any entity that is considered a corporation for tax purposes, including corporate non-qualified deferred compensation plans of such corporations. Each class of shares has equal rights to earnings and assets, except that each class bears different expenses for distribution and shareholder servicing. Each Fund’s investment income, realized and unrealized gains or losses on investments and foreign currency, and expenses other than those attributable to a specific class are allocated to each class based on its relative net assets. Each class of shares has exclusive voting rights with respect to matters that affect just that class.
Baron Partners Fund was organized originally as a limited partnership in January 1992 under the laws of the State of Delaware. Effective as of the close of business on April 30, 2003, the predecessor partnership was reorganized into a series of the Trust. Baron Partners Fund commenced operations on April 30, 2003 with a contribution of assets and liabilities, including securities-in-kind, from the predecessor partnership.
Baron Focused Growth Fund was organized originally as a limited partnership in May 1996 under the laws of the State of Delaware. Effective as of the close of business on June 30, 2008, the predecessor partnership was reorganized into a series of the Trust. Baron Focused Growth Fund commenced operations on June 30, 2008 with a contribution of assets and liabilities, including securities-in-kind, from the predecessor partnership.
2. SIGNIFICANT ACCOUNTING POLICIES
The following is a summary of significant accounting policies followed by the Funds. The policies are in conformity with accounting principles generally accepted in the United States of America (“GAAP”). The preparation of financial statements in accordance with GAAP requires management to make estimates and assumptions that affect the reported amounts of assets and liabilities at the date of the financial statements and the amounts of income and expenses during the period. Actual results could differ from those estimates. Events occurring subsequent to the date of the Statements of Assets and Liabilities and through the date of issuance of the financial statements have been evaluated for adjustment to or disclosure in the financial statements.
a) Security Valuation. The Funds’ share prices or net asset values are calculated as of the scheduled close of the regular trading session (usually 4 p.m. E.T.) on the New York Stock Exchange (“NYSE”) on any day the NYSE is scheduled to be open. Portfolio securities traded on any national stock exchange are valued based on the last sale price on the exchange where such shares are principally traded. For securities traded on NASDAQ, the Funds use the NASDAQ Official Closing Price. If there are no sales on a given day, the value of the security may be the average of the most recent bid and asked quotations on such exchange or the last sale price from a prior day. Where market quotations are not readily available, or, if in BAMCO, Inc.’s (the “Adviser”) judgment, they do not accurately reflect the fair value of a security, or an event occurs after the market close but before the Funds are priced that materially affects the value of a security, the security will be valued by the Adviser using policies and procedures approved by the Board of Trustees (the “Board”). The Adviser has a Fair Valuation Committee (the “Committee”) comprised of senior management representatives and the Committee reports to the Board every quarter. Factors the Committee may consider when valuing a security include whether a current price is stale, there is recent news, the security is thinly traded, transactions are infrequent or quotations are genuine. There can be no guarantee, however, that a fair valuation used by the Funds on any given day will more accurately reflect the market value of an investment than the closing price of such investment in its market. Debt instruments having a remaining maturity greater than 60 days will be valued on the basis of prices obtained from a pricing service approved by the Board or at the mean of the bid and ask prices from the dealer maintaining an active market in that security. The value of the Funds’ investments in convertible bonds is determined primarily by obtaining valuations from independent pricing services based on readily available bid quotations or, if quotations are not available, by methods which include various considerations such as yields or prices of securities of comparable quality, coupon, maturity and type; indications as to values from dealers; and general market conditions. Other inputs used by an independent pricing service to value convertible bonds generally include underlying stock data, conversion premiums, listed bond and preferred stock prices and other market information which may include benchmark curves, trade execution data, and sensitivity analysis, when available. Money market instruments held by the Funds with a remaining maturity of 60 days or less are generally valued at amortized cost, which approximates fair value. Open-end investment companies, including securities lending collateral invested in registered investment company money market funds, are valued at their net asset value each day.
Non-U.S. equity securities are valued on the basis of their most recent closing market prices and translated into U.S. dollars at 4 p.m. E.T. (or such other time as of which the Funds’ NAV is calculated (the “NAV Calculation Time”)), except under the circumstances described below. Most foreign markets close before the NAV Calculation Time. For
35
Table of Contents
| Baron Select Funds | June 30, 2016 |
NOTES TO FINANCIAL STATEMENTS (Unaudited) (Continued)
2. SIGNIFICANT ACCOUNTING POLICIES (Continued)
securities primarily traded in the Far East, for example, the most recent closing prices may be as much as fifteen hours old at the NAV Calculation Time. As a result, the Adviser may use a third-party pricing service to assist in determining fair value of foreign securities. This service utilizes a systematic methodology in making fair value estimates. The Adviser may also fair value securities in other situations, for example, when a particular foreign market is closed but the Funds are open. The Adviser cannot predict how often it will use closing prices or how often it will adjust those prices. As a means of evaluating its fair value process, the Adviser routinely compares closing market prices, the next day’s opening prices in the same markets, and the adjusted prices. Other mutual funds may adjust the prices of their securities by different amounts.
b) Securities Transactions, Investment Income and Expense Allocation. Securities transactions are recorded on a trade date basis. Realized gain and loss from securities transactions are recorded on an identified cost basis for financial reporting and federal income tax purposes. Dividend income is recognized on the ex-dividend date and interest income is recognized on an accrual basis, which includes the accretion of discounts and amortization of premiums. Certain dividends from foreign securities will be recorded as soon as the Funds are informed of the dividend if such information is obtained subsequent to the ex-dividend date. Distributions received from certain investments held by the Funds may be comprised of dividends, realized gains and returns of capital. The Funds originally estimate the expected classification of such payments. The amounts may subsequently be reclassified upon receipt of information from the issuer. The Funds are charged for those expenses of the Trust that are directly attributable to each Fund, such as advisory and custodian fees. Expenses that are not directly attributable to a Fund are typically allocated among the Funds in proportion to their respective net assets.
c) Foreign Currency Translations. Values of assets and liabilities denominated in foreign currencies are translated into U.S. dollars using the price of such currencies at the time the net asset value is determined. Purchases and sales of investments and dividend income are converted at the prevailing rate of exchange on the respective dates of such transactions. Net realized gain (loss) on foreign currency transactions includes gain (loss) arising from the fluctuation in the exchange rates between trade and settlement dates on security transactions and currency gain (loss) between the accrual and payment dates on dividends and foreign withholding taxes. The Funds do not isolate that portion of the results of operations resulting from changes in foreign exchange rates on investments from the fluctuations arising from changes in market prices of securities held. Such fluctuations are included with the net realized and unrealized gain or loss from investments and foreign currency transactions. The Funds may invest in foreign securities and foreign currency transactions that may involve risks not associated with domestic investments as a result of the level of governmental supervision and regulation of foreign securities markets and the possibility of political or economic instability, among others.
Pursuant to U.S. federal income tax regulations, gains and losses from certain foreign currency transactions and the foreign currency portion of gains and losses realized on sales and maturities of foreign denominated debt securities are generally treated as ordinary income for U.S. federal income tax purposes.
d) Securities Lending. The Funds may lend securities to certain brokers under the terms of a master netting agreement. Upon such loans, the Funds receive collateral which is maintained by the custodian. The Funds may pay fees to the custodian for administering the securities lending program. The Funds earn interest on such collateral and earn income in the form of negotiated lenders’ fees, both of which are included in securities lending income in the Statements of Operations. Securities loaned are required to be secured at all times by collateral equal to at least 102% of the market value of the securities loaned. Risks may arise upon entering into securities lending to the extent that the value of the collateral is less than the value of the securities loaned due to the changes in the value of collateral or the loaned securities. The collateral is marked-to-market daily and settled on the next business day. The Funds may receive collateral in the form of cash or other eligible securities, such as a letter of credit issued by a U.S. bank or securities issued or guaranteed by the U.S. government. Securities purchased with cash collateral are subject to the risks inherent in investing in these securities.
The Funds have adopted the disclosure provisions of FASB Accounting Standards Update No. 2014-11 (“ASU No. 2014-11”), Transfers & Servicing (Topic 860): Repurchase-to-Maturity Transactions, Repurchase Financings, and Disclosures. ASU No. 2014-11 is intended to provide increased transparency about the types of collateral pledged in repurchase agreements and other similar transactions that are accounted for as secured borrowing. All securities on loan are classified as common stocks in the Funds’ Statements of Net Assets as of June 30, 2016 with a contractual maturity of overnight and continuous.
At June 30, 2016, Baron Partners Fund, Baron Focused Growth Fund and Baron Energy and Resources Fund had securities on loan with values of $235,630,800, $19,105,200 and $2,993,148 respectively and held $238,095,000, $19,305,000 and $3,024,450 of short term investments as collateral for these loans, respectively.
e) Repurchase Agreements. The Funds may invest in repurchase agreements, which are short term investments whereby the Funds acquire ownership of a debt security and the seller agrees to repurchase the security at a future date at a specified price. When entering into repurchase agreements, it is the Funds’ policy that their custodian take possession of the underlying collateral securities, the market value of which, at all times, equals at least 102% of the principal amount of the repurchase transaction. To the extent that any repurchase transaction exceeds one business day, the value of the collateral is marked-to-market to ensure the adequacy of the collateral. If the seller defaults and the market value of the collateral declines or if bankruptcy proceedings are commenced with respect to the seller of the security, realization of the collateral by the Funds may be delayed or limited.
f) Master Limited Partnerships. The Funds may invest in master limited partnerships (“MLPs”). MLPs are limited partnerships or limited liability companies, whose partnership units or limited liability interests are listed and traded on a U.S. securities exchange, and are treated as publicly traded partnerships for federal income tax purposes. To qualify to be treated as a partnership for tax purposes, an MLP must receive at least 90% of its income from qualifying sources as set forth in Section 7704(d) of the Internal Revenue Code of 1986, as amended. These qualifying sources include interest, dividend, real property rent, gain from sale or other disposition of real property and income from activities such as the exploration, development, mining, production, processing, refining, transportation, storage and marketing of mineral or natural resources.
Investments in securities of MLPs involve risks that differ from investments in common stock including risks related to limited control and limited rights to vote on matters affecting the MLP, risks related to potential conflicts of interest between the MLP and the MLP’s general partner, and cash flow risks. MLP common units and other equity securities can be affected by macro-economic and other factors affecting the stock market in general, expectations of interest rates, investor sentiment towards MLPs or the energy sector, changes in a particular issuer’s financial condition, or unfavorable or unanticipated poor performance of a particular issuer (in the case of MLPs, generally measured in terms of distributable cash flow). Prices of common units of individual MLPs and other equity securities of MLPs also can be affected by fundamentals unique to the partnership or company, including earnings power and coverage ratios.
36
Table of Contents
| June 30, 2016 | Baron Select Funds |
NOTES TO FINANCIAL STATEMENTS (Unaudited) (Continued)
2. SIGNIFICANT ACCOUNTING POLICIES (Continued)
g) Federal and Foreign Income Taxes. The Trust treats each Fund as a separate entity for federal income tax purposes. Each Fund intends to meet the requirements of the Internal Revenue Code of 1986, as amended, applicable to regulated investment companies, and to distribute to its shareholders substantially all of its net investment income and any net realized capital gains at least annually. None of the Funds will be subject to federal or state income taxes to the extent that they qualify as regulated investment companies and substantially all of their income is distributed.
The Funds may be subject to foreign taxes on income and gains on investments that are accrued based upon the Funds’ understanding of the tax rules and regulations that exist in the countries in which the Funds invest. Foreign governments may also impose taxes or other payments on investments with respect to foreign securities. Such taxes are accrued as applicable.
h) Restricted Securities. The Funds may invest in securities that are restricted as to public sale in accordance with the Securities Act of 1933. Such assets are valued by the Adviser pursuant to policies and procedures approved by the Board.
i) Distributions to Shareholders. Income and capital gain distributions to shareholders are determined in accordance with income tax regulations which may differ from GAAP. These differences are primarily due to differing treatments for net investment loss, foreign currency gains and losses, reclassification of distributions, partnership basis adjustments, income from passive foreign investment companies and wash sale losses deferred.
j) Commitments and Contingencies. In the normal course of business, the Funds may enter into contracts and agreements that contain a variety of representations and warranties, which provide general indemnification. The maximum exposure to the Funds under these agreements is unknown, as this would involve future claims that may be made against the Funds that have not yet occurred. However, based on experience, the Funds expect the risk of loss to be remote.
k) Cash and Cash Equivalents. The Funds consider all short term liquid investments with a maturity of three months or less when purchased to be cash equivalents.
l) Fund Diversification and Concentration. Certain of the Funds hold non-diversified or concentrated portfolios that may contain fewer securities or invest in fewer industries than the portfolios of other mutual funds. This may increase the risk that the value of a Fund could decrease because of the poor performance of one or a few investments or of a particular industry. Additionally, non-diversified funds may encounter difficulty liquidating securities.
3. PURCHASES AND SALES OF SECURITIES
Purchases and sales of securities, other than short term securities, for the six months ended June 30, 2016 were as follows:
| Fund | Purchases | Sales | ||||||
Baron Partners Fund | $ | 206,159,186 | $ | 518,476,850 | ||||
Baron Focused Growth Fund | 9,773,206 | 15,796,626 | ||||||
Baron International Growth Fund | 13,350,155 | 28,745,789 | ||||||
Baron Real Estate Fund | 482,094,711 | 884,590,589 | ||||||
Baron Emerging Markets Fund | 436,470,495 | 243,392,269 | ||||||
Baron Energy and Resources Fund | 41,633,567 | 22,848,940 | ||||||
Baron Global Advantage Fund | 1,321,576 | 1,900,479 | ||||||
4. INVESTMENT ADVISORY FEES AND OTHER TRANSACTIONS WITH AFFILIATES
a) Investment Advisory Fees. The Adviser, a wholly owned subsidiary of Baron Capital Group, Inc. (“BCG”), serves as investment adviser to the Funds. As compensation for services rendered, the Adviser receives a fee payable monthly equal to 1% per annum of the average daily net assets of the respective Funds. The Adviser has contractually agreed to reduce its fee, to the extent required to limit the net annual operating expense ratio (excluding portfolio transaction costs, interest, dividend and extraordinary expenses), as follows:
| Annual Operating Expense Ratio Cap | ||||||||||||
| Fund | Retail Shares | Institutional Shares | R6 Shares | |||||||||
Baron Partners Fund | 1.45 | % | 1.20 | % | N/A | |||||||
Baron Focused Growth Fund | 1.35 | % | 1.10 | % | N/A | |||||||
Baron International Growth Fund | 1.50 | % | 1.25 | % | N/A | |||||||
Baron Real Estate Fund | 1.35 | % | 1.10 | % | 1.10 | % | ||||||
Baron Emerging Markets Fund | 1.50 | % | 1.25 | % | 1.25 | % | ||||||
Baron Energy and Resources Fund | 1.35 | % | 1.10 | % | N/A | |||||||
Baron Global Advantage Fund | 1.50 | % | 1.25 | % | N/A | |||||||
b) Distribution Fees. Baron Capital, Inc. (“BCI”), a wholly owned subsidiary of BCG, is a registered limited purpose broker-dealer and the distributor of the Funds’ shares. The Funds are authorized to pay BCI a distribution fee payable monthly pursuant to a distribution plan under Rule 12b-1 of the 1940 Act equal to 0.25% per annum of the Retail Shares’ average daily net assets of the respective Funds.
c) Trustee Fees. Certain Trustees of the Trust may be deemed to be affiliated with, or interested persons (as defined by the 1940 Act) of the Funds’ Adviser or of BCI. None of the Trustees so affiliated received compensation for his or her services as a Trustee of the Trust. None of the Funds’ officers received compensation from the Funds for their services as an officer.
37
Table of Contents
| Baron Select Funds | June 30, 2016 |
NOTES TO FINANCIAL STATEMENTS (Unaudited) (Continued)
4. INVESTMENT ADVISORY FEES AND OTHER TRANSACTIONS WITH AFFILIATES (Continued)
d) Fund Accounting and Administration Fees. The Funds have entered into an agreement with State Street Bank and Trust Company (“State Street”) to perform accounting and certain administrative services. State Street is compensated for fund accounting services based on a percentage of the Funds’ net assets, subject to certain minimums plus fixed annual fees for the administrative services.
e) Cross Trades. The Funds are permitted to purchase securities from, or sell securities to, other Funds within the Trust, other funds in the Baron Investment Funds Trust, and other entities advised or subadvised by the Adviser, pursuant to “Cross-Trading” Procedures adopted by the Board. These procedures have been designed to ensure that any cross-trade of securities by the respective Baron Fund from or to another fund/other entity that is or could be considered an affiliate of the respective Baron Fund under certain limited circumstances by virtue of having a common investment adviser, common officer, or common Trustee complies with Rule 17a-7 under the 1940 Act. Further, as defined under these procedures, each cross-trade is effected at the current market price and with no commissions. Pursuant to these procedures, for the six months ended June 30, 2016, the Funds engaged in the following cross-trades, which resulted in the following net realized gains (losses):
| Purchases | Sales | Net Realized Gains (Losses) | ||||||||||
Baron International Growth Fund | $ | 39,975 | $ | — | $ | — | ||||||
Baron Real Estate Fund | — | 2,992,181 | (231,495 | ) | ||||||||
Baron Emerging Markets Fund | 666,250 | — | — | |||||||||
5. LINE OF CREDIT
Baron Partners Fund participates in a committed syndicated line of credit agreement with State Street in the amount of $600 million. Depending on the outstanding loan amount, a commitment fee of 0.15% or 0.25% per annum is incurred on the unused portion of the line of credit. The line of credit is used for investment purposes and expires on November 4, 2016. Baron Partners Fund may borrow up to the lesser of $600 million or the maximum amount Baron Partners Fund may borrow under the 1940 Act, the limitations included in Baron Partners Fund’s prospectus, or any limit or restriction under any law or regulation to which Baron Partners Fund is subject or any agreement to which Baron Partners Fund is a party. Interest is charged to Baron Partners Fund, based on its borrowings, at a rate per annum equal to the higher of the Federal Funds Rate or the One Month LIBOR Rate plus a margin of 0.85%. An upfront fee of 0.05% is incurred on the commitment amount. For the six months ended June 30, 2016, interest expense incurred on these loans amounted to $2,950,743. During the six months ended June 30, 2016, Baron Partners Fund had an average daily balance on the line of credit of $453.3 million at a weighted average interest rate of 1.31%. At June 30, 2016, Baron Partners Fund had an outstanding balance in the amount of $482,000,000.
The Funds (except Baron Partners Fund), together with the funds in Baron Investment Funds Trust, participate in a committed line of credit agreement with State Street to be used for temporary purposes, primarily for financing redemptions. Each fund may borrow up to the lesser of $100 million or the maximum amount each fund may borrow under the 1940 Act, the limitations included in each fund’s prospectus, or any limit or restriction under any law or regulation to which each fund is subject or any agreement to which each fund is a party; provided that the aggregate outstanding principal amount of all loans to any of the funds may not exceed $100 million. Interest is charged to each fund, based on its borrowings, at a rate per annum equal to the higher of the Overnight Federal Funds Rate or the Overnight LIBOR Rate plus a margin of 1.00%. An upfront fee of 0.05% is incurred on the commitment amount and a commitment fee of 0.15% per annum is incurred on the unused portion of the line of credit. Both fees are allocated to the participating funds based on their relative net assets. During the six months ended June 30, 2016, the Funds did not have any borrowings under the line of credit.
6. RESTRICTED SECURITIES
At June 30, 2016, investments in securities included securities that are restricted and/or illiquid. Restricted securities are often purchased in private placement transactions, are not registered under the Securities Act of 1933, may have contractual restrictions on resale and are valued pursuant to the policies and procedures for fair value pricing approved by the Board. A security may be considered illiquid if it lacks a readily available market or if its valuation has not changed for a certain period of time. The Funds may receive more or less than this valuation in an actual sale and that difference could be material. At June 30, 2016, the Funds held investments in restricted and/or illiquid securities that were valued pursuant to policies and procedures for fair value pricing as follows:
| Baron Partners Fund | ||||||
| Name of Issuer | Acquisition Date(s) | Value | ||||
Private Equity Investments | ||||||
Windy City Investments Holdings, L.L.C. | 11/13/2007-1/27/2011 | $ | 3,410,608 | |||
|
| |||||
(Cost $0) (0.21% of Net Assets) | ||||||
38
Table of Contents
| June 30, 2016 | Baron Select Funds |
NOTES TO FINANCIAL STATEMENTS (Unaudited) (Continued)
7. FAIR VALUE MEASUREMENTS
Fair value is defined by GAAP as the price that the Funds would receive upon selling an investment in a timely transaction to an independent buyer in the principal or most advantageous market for the investment. GAAP provides a three-tier hierarchy to maximize the use of observable market data and minimize the use of unobservable inputs and to establish classification of fair value measurements for disclosure purposes. Inputs refer broadly to the assumptions that market participants would use in pricing the asset or liability. Inputs may be observable or unobservable. Observable inputs are based on market data obtained from sources independent of the Funds. Unobservable inputs are inputs that reflect the Funds’ own assumptions based on the best information available in the circumstances. The three-tier hierarchy of inputs is summarized in the three broad Levels listed below.
| • | Level 1 — quoted prices in active markets for identical assets or liabilities; |
| • | Level 2 — prices determined using other inputs that are observable either directly, or indirectly through corroboration with observable market data (which could include quoted prices for similar assets or liabilities, interest rates, credit risk, etc.); |
| • | Level 3 — prices determined using unobservable inputs when quoted prices or observable inputs are unavailable, such as when there is little or no market activity for an asset or liability (unobservable inputs reflect each Fund’s own assumptions in determining the fair value of assets or liabilities and would be based on the best information available). |
The inputs or methodology used for valuing securities are not necessarily an indication of the risk associated with investing in those securities. For example, non-U.S. securities, with markets that close hours before the Funds value their holdings, may require revised valuations due to significant movement in the U.S. markets. Since these values are not obtained from quoted prices in an active market, such securities are reflected as Level 2.
The Funds have procedures to determine the fair value of securities and other financial instruments for which market prices are not readily available or which may not be reliably priced. Under these procedures, the Funds primarily employ a market-based approach that may use related or comparable assets or liabilities, recent transactions, market multiples, book values, and other relevant information for the investment to determine its fair value. The Funds may also use an income-based valuation approach in which the anticipated future cash flows of the investment are discounted to calculate fair value. Discounts may also be applied due to the nature or duration of any restrictions on the disposition of the investments. Due to the inherent uncertainty of valuations of such investments, the fair values may differ significantly from the values that would have been used had an active market existed.
The following is a summary of the inputs used as of June 30, 2016 in valuing the Funds’ investments carried at fair value:
| Baron Partners Fund | ||||||||||||||||
| Description | Quoted Prices in (Level 1) | Other (Level 2) | Unobservable (Level 3) | Total | ||||||||||||
Common Stocks† | $ | 2,132,226,350 | $ | — | $ | — | $ | 2,132,226,350 | ||||||||
Private Equity Investments | — | — | 3,410,608 | 3,410,608 | ||||||||||||
Short Term Investments | — | 238,404,625 | — | 238,404,625 | ||||||||||||
|
|
|
|
|
|
|
| |||||||||
Total Investments | $ | 2,132,226,350 | $ | 238,404,625 | $ | 3,410,608 | $ | 2,374,041,583 | ||||||||
|
|
|
|
|
|
|
| |||||||||
Transfers between Levels 1, 2 or 3, if any, are recognized at ending value on June 30, 2016. There have been no transfers in and out of Level 1, 2 or 3 fair value measurements for the Fund for the six months ended June 30, 2016.
| Baron Focused Growth Fund | ||||||||||||||||
| Description | Quoted Prices in (Level 1) | Other Observable Inputs (Level 2) | Unobservable (Level 3) | Total | ||||||||||||
Common Stocks† | $ | 158,681,796 | $ | — | $ | — | $ | 158,681,796 | ||||||||
Preferred Stocks | — | 7,272,476 | — | 7,272,476 | ||||||||||||
Short Term Investments | — | 31,603,803 | — | 31,603,803 | ||||||||||||
|
|
|
|
|
|
|
| |||||||||
Total Investments | $ | 158,681,796 | $ | 38,876,279 | $ | — | $ | 197,558,075 | ||||||||
|
|
|
|
|
|
|
| |||||||||
| † | See Statements of Net Assets for additional detailed categorizations. |
39
Table of Contents
| Baron Select Funds | June 30, 2016 |
NOTES TO FINANCIAL STATEMENTS (Unaudited) (Continued)
7. FAIR VALUE MEASUREMENTS (Continued)
Transfers between Levels 1, 2 or 3, if any, are recognized at ending value on June 30, 2016. There have been no transfers in and out of Level 1, 2 or 3 fair value measurements for the Fund for the six months ended June 30, 2016.
| Baron International Growth Fund | ||||||||||||||||
| Description | Quoted Prices in (Level 1) | Other Observable Inputs (Level 2) | Unobservable (Level 3) | Total | ||||||||||||
Common Stocks† | $ | 28,042,846 | $ | 50,985,799 | $ | — | $ | 79,028,645 | ||||||||
Short Term Investments | — | 4,283,772 | — | 4,283,772 | ||||||||||||
|
|
|
|
|
|
|
| |||||||||
Total Investments | $ | 28,042,846 | $ | 55,269,571 | $ | — | $ | 83,312,417 | ||||||||
|
|
|
|
|
|
|
| |||||||||
$3,591,478 was transferred out of Level 2 into Level 1 at June 30, 2016 as a result of not adjusting closing prices for certain securities (as described in Note 2a) due to significant market movements between the time at which the Fund valued its securities and the earlier closing of foreign markets. $427,803 was transferred out of Level 2 into Level 1 at June 30, 2016 due to the expiration of a lock-up restriction. $26,832,376 was transferred out of Level 1 into Level 2 at June 30, 2016 as a result of adjusting closing prices for certain securities and the earlier closing of foreign markets. It is the Fund’s policy to recognize transfers in and transfers out at the fair value as of the end of the period.
| Baron Real Estate Fund | ||||||||||||||||
| Description | Quoted Prices in (Level 1) | Other Observable Inputs (Level 2) | Unobservable (Level 3) | Total | ||||||||||||
Common Stocks† | $ | 1,221,379,735 | $ | 17,510,886 | $ | — | $ | 1,238,890,621 | ||||||||
Short Term Investments | — | 28,630,114 | — | 28,630,114 | ||||||||||||
|
|
|
|
|
|
|
| |||||||||
Total Investments | $ | 1,221,379,735 | $ | 46,141,000 | $ | — | $ | 1,267,520,735 | ||||||||
|
|
|
|
|
|
|
| |||||||||
$14,793,795 was transferred out of Level 2 into Level 1 at June 30, 2016 as a result of not adjusting closing prices for certain securities (as described in Note 2a) due to significant market movements between the time at which the Fund valued its securities and the earlier closing of foreign markets. $17,510,886 was transferred out of Level 1 into Level 2 at June 30, 2016 as a result of adjusting closing prices for certain securities and the earlier closing of foreign markets. It is the Fund’s policy to recognize transfers in and transfers out at the fair value as of the end of the period.
| Baron Emerging Markets Fund | ||||||||||||||||
| Description | Quoted Prices in (Level 1) | Other (Level 2) | Unobservable (Level 3) | Total | ||||||||||||
Common Stocks† | $ | 605,887,752 | $ | 1,203,946,119 | $ | — | $ | 1,809,833,871 | ||||||||
Preferred Stocks | 415,897 | — | — | 415,897 | ||||||||||||
Convertible Bonds | — | 6,879,906 | — | 6,879,906 | ||||||||||||
Short Term Investments | — | 224,903,410 | — | 224,903,410 | ||||||||||||
|
|
|
|
|
|
|
| |||||||||
Total Investments | $ | 606,303,649 | $ | 1,435,729,435 | $ | — | $ | 2,042,033,084 | ||||||||
|
|
|
|
|
|
|
| |||||||||
| † | See Statements of Net Assets for additional detailed categorizations. |
$133,257,384 was transferred out of Level 2 into Level 1 at June 30, 2016 as a result of not adjusting closing prices for certain securities (as described in Note 2a) due to significant market movements between the time at which the Fund valued its securities and the earlier closing of foreign markets. $6,320,964 was transferred out of Level 2 into Level 1 at June 30, 2016 due to the expiration of a lock-up restriction. $805,035,149 was transferred out of Level 1 into Level 2 at June 30, 2016 as a result of adjusting closing prices for certain securities and the earlier closing of foreign markets. It is the Fund’s policy to recognize transfers in and transfers out at the fair value as of the end of the period.
40
Table of Contents
| June 30, 2016 | Baron Select Funds |
NOTES TO FINANCIAL STATEMENTS (Unaudited) (Continued)
7. FAIR VALUE MEASUREMENTS (Continued)
| Baron Energy and Resources Fund | ||||||||||||||||
| Description | Quoted Prices in (Level 1) | Other (Level 2) | Unobservable (Level 3) | Total | ||||||||||||
Common Stocks† | $ | 98,667,572 | $ | — | $ | — | $ | 98,667,572 | ||||||||
Short Term Investments | — | 4,869,137 | — | 4,869,137 | ||||||||||||
|
|
|
|
|
|
|
| |||||||||
Total Investments | $ | 98,667,572 | $ | 4,869,137 | $ | — | $ | 103,536,709 | ||||||||
|
|
|
|
|
|
|
| |||||||||
$686,315 was transferred out of Level 2 into Level 1 at June 30, 2016 due to the expiration of a lock-up restriction. It is the Fund’s policy to recognize transfers in and transfers out at the fair value as of the end of the period.
| Baron Global Advantage Fund | ||||||||||||||||
| Description | Quoted Prices in (Level 1) | Other (Level 2) | Unobservable (Level 3) | Total | ||||||||||||
Common Stocks† | $ | 8,729,704 | $ | 1,672,877 | $ | — | $ | 10,402,581 | ||||||||
|
|
|
|
|
|
|
| |||||||||
Total Investments | $ | 8,729,704 | $ | 1,672,877 | $ | — | $ | 10,402,581 | ||||||||
|
|
|
|
|
|
|
| |||||||||
$679,809 was transferred out of Level 2 into Level 1 at June 30, 2016 as a result of not adjusting closing prices for certain securities (as described in Note 2a) due to significant market movements between the time at which the Fund valued its securities and the earlier closing of foreign markets. $66,044 was transferred out of Level 2 into Level 1 at June 30, 2016 due to the expiration of a lock-up restriction. $1,500,518 was transferred out of Level 1 into Level 2 at June 30, 2016 as a result of adjusting closing prices for certain securities and the earlier closing of foreign markets. It is the Fund’s policy to recognize transfers in and transfers out at the fair value as of the end of the period.
| † | See Statements of Net Assets for additional detailed categorizations. |
The following is a reconciliation of investments in which unobservable inputs (Level 3) were used in determining fair value:
| Baron Partners Fund | ||||||||||||||||||||||||||||||||||||||||
| Investments in Securities | Balance as of December 31, 2015 | Accrued Premiums/ Discounts | Net Realized Gain (Loss) | Change in Net Unrealized Appreciation (Depreciation) | Purchases | Sales/ Distributions | Transfers Into Level 3 | Transfers Out of Level 3 | Balance as of June 30, 2016 | Change in Net 2016 | ||||||||||||||||||||||||||||||
Private Equity Investments | ||||||||||||||||||||||||||||||||||||||||
Financials | $ | 6,442,261 | $ | — | $ | 1,071,714 | $ | (1,198,727 | ) | $ | — | $ | (2,904,640 | ) | $ | — | $ | — | $ | 3,410,608 | $ | (1,198,727 | ) | |||||||||||||||||
|
|
|
|
|
|
|
|
|
|
|
|
|
|
|
|
|
|
|
| |||||||||||||||||||||
41
Table of Contents
| Baron Select Funds | June 30, 2016 |
NOTES TO FINANCIAL STATEMENTS (Unaudited) (Continued)
8. INCOME TAXES AND DISTRIBUTIONS TO SHAREHOLDERS
Federal income tax regulations differ from GAAP. Therefore, distributions determined in accordance with tax regulations may differ in amount or character from net investment income and net realized gain for financial reporting purposes. Net investment income (loss) and net realized and unrealized gain (loss) differ for financial statement and tax purposes due to differing treatments of net investment loss, foreign currency gains and losses, reclassification of distributions, partnership basis adjustments, income from passive foreign investment companies and wash sale losses deferred. Financial reporting records are adjusted for permanent book/tax differences to reflect tax character. Financial records are not adjusted for temporary differences.
As of June 30, 2016, the components of net assets on a tax basis were as follows:
| Baron Partners Fund | Baron Focused Growth Fund | Baron International Growth Fund | Baron Real Estate Fund | Baron Emerging Markets Fund | Baron Energy and Resources Fund | Baron Global Advantage Fund | ||||||||||||||||||||||
Cost of investments | $ | 1,651,965,005 | $ | 158,095,750 | $ | 63,206,352 | $ | 1,069,123,631 | $ | 1,939,105,232 | $ | 96,220,479 | $ | 8,857,778 | ||||||||||||||
|
|
|
|
|
|
|
|
|
|
|
|
|
| |||||||||||||||
Gross tax unrealized appreciation | 793,072,922 | 46,267,974 | 23,909,406 | 216,681,554 | 252,148,757 | 15,973,363 | 2,404,460 | |||||||||||||||||||||
Gross tax unrealized depreciation | (70,996,344 | ) | (6,805,649 | ) | (3,803,341 | ) | (18,284,450 | ) | (149,220,905 | ) | (8,657,133 | ) | (859,657 | ) | ||||||||||||||
|
|
|
|
|
|
|
|
|
|
|
|
|
| |||||||||||||||
Net tax unrealized appreciation | 722,076,578 | 39,462,325 | 20,106,065 | 198,397,104 | 102,927,852 | 7,316,230 | 1,544,803 | |||||||||||||||||||||
Net tax unrealized currency appreciation (depreciation) | — | — | (83,311 | ) | (13,794 | ) | (3,878,347 | ) | (5 | ) | 193 | |||||||||||||||||
Undistributed (accumulated) net investment income (loss) | 7,475,468 | 900,098 | (233,180 | ) | 5,636,087 | 6,363,838 | 891,913 | (29,257 | ) | |||||||||||||||||||
Undistributed (accumulated) net realized gain (loss) | (198,253,281 | ) | 12,415,565 | (240,308 | ) | (76,315,666 | ) | (186,005,237 | ) | (34,073,528 | ) | (768,605 | ) | |||||||||||||||
Paid-in capital | 1,116,581,493 | 125,618,981 | 64,180,193 | 1,130,341,178 | 2,125,925,966 | 126,339,102 | 9,760,420 | |||||||||||||||||||||
|
|
|
|
|
|
|
|
|
|
|
|
|
| |||||||||||||||
Net Assets | $ | 1,647,880,258 | $ | 178,396,969 | $ | 83,729,459 | $ | 1,258,044,909 | $ | 2,045,334,072 | $ | 100,473,712 | $ | 10,507,554 | ||||||||||||||
|
|
|
|
|
|
|
|
|
|
|
|
|
| |||||||||||||||
As of December 31, 2015, the Funds had capital loss carryforwards expiring as follows:
Baron Partners Fund | Baron Fund | Baron International Fund | Baron Real Estate Fund | Baron Emerging Markets Fund | Baron Energy | Baron Global Advantage Fund | ||||||||||||||||||||||
Short term: |
| |||||||||||||||||||||||||||
December 31, 2017 | $ | 304,609,586 | $ | — | $ | — | $ | — | $ | — | $ | — | $ | — | ||||||||||||||
No expiration date | — | — | — | — | 93,180,072 | 4,570,844 | 92,645 | |||||||||||||||||||||
|
|
|
|
|
|
|
|
|
|
|
|
|
| |||||||||||||||
| $ | 304,609,586 | $ | — | $ | — | $ | — | $ | 93,180,072 | $ | 4,570,844 | $ | 92,645 | |||||||||||||||
|
|
|
|
|
|
|
|
|
|
|
|
|
| |||||||||||||||
Long term: |
| |||||||||||||||||||||||||||
No expiration date | $ | — | $ | — | $ | — | $ | — | $ | 14,857,991 | $ | 1,665,516 | $ | 1,981 | ||||||||||||||
|
|
|
|
|
|
|
|
|
|
|
|
|
| |||||||||||||||
The tax character of distributions paid during the six months ended June 30, 2016 and the fiscal year ended December 31, 2015 was as follows:
| Six Months Ended June 30, 2016 | Year Ended December 31, 2015 | |||||||||||||||
| Fund | Ordinary1 | Long Term Capital Gain | Ordinary1 | Long Term Capital Gain | ||||||||||||
Baron Partners Fund | $ | $ | — | $ | 8,870,821 | $ | — | |||||||||
Baron Focused Growth Fund | — | — | 650,535 | 9,891,350 | ||||||||||||
Baron International Growth Fund | — | — | 673,432 | 156,070 | ||||||||||||
Baron Real Estate Fund | — | — | 802,173 | 34,696,513 | ||||||||||||
Baron Emerging Markets Fund | — | — | 4,689,931 | — | ||||||||||||
Baron Energy and Resources Fund | — | — | 71 | 64,953 | ||||||||||||
Baron Global Advantage Fund | — | — | 28,281 | 13,779 | ||||||||||||
| 1 | For tax purposes, short-term capital gains are considered ordinary income distributions. |
42
Table of Contents
| June 30, 2016 | Baron Select Funds |
NOTES TO FINANCIAL STATEMENTS (Unaudited) (Continued)
8. INCOME TAXES AND DISTRIBUTIONS TO SHAREHOLDERS (Continued)
The Funds follow the provisions of FASB Codification Section 740 (“ASC Section 740”) “Accounting for Uncertainty in Income Taxes” which clarifies the accounting for uncertainty in tax positions taken or expected to be taken on a tax return. ASC Section 740 sets forth a threshold for financial statement recognition, measurement and disclosure of tax positions taken or expected to be taken on a tax return. The Funds are required to recognize the tax effects of certain tax positions under a “more likely than not” standard, that based on their technical merits, have more than 50 percent likelihood of being sustained upon examination. Management has analyzed the tax positions taken on the Funds’ federal income tax returns for all open years (current and prior three years), and has concluded that no provision for federal income tax is required in the Funds’ financial statements. At June 30, 2016, the Funds did not have any uncertain tax benefits that require recognition, de-recognition or disclosure. The Funds’ federal, state and local income and federal excise tax returns for which the applicable statutes of limitations have not expired (current and prior three years) are subject to examination by the Internal Revenue Service and state departments of revenue.
9. OWNERSHIP CONCENTRATION
As of June 30, 2016, the officers, trustees and portfolio managers owned, directly or indirectly, 44.29% of Baron Focused Growth Fund and 38.24% of Baron Global Advantage Fund. As of June 30, 2016 the officers, trustees, portfolio managers and one other investor owned, directly or indirectly, 29.19% of Baron International Growth Fund. As a result of their ownership, these investors may be able to materially affect the outcome of matters presented to Baron Focused Growth Fund, Baron International Growth Fund and Baron Global Advantage Fund shareholders.
10. DISCLOSURES REGARDING OFFSETTING ASSETS AND LIABILITIES
In December 2011, FASB issued an Accounting Standards Update (“ASU”) related to disclosures about offsetting assets and liabilities in financial statements. This ASU requires an entity to disclose both gross and net information for derivatives, repurchase agreements and reverse repurchase agreements, and securities borrowing and securities lending transactions that are either offset in the Statements of Assets and Liabilities or subject to an enforceable master netting arrangement or similar agreement. In January 2013, the FASB issued an ASU to clarify the scope of disclosures about offsetting assets and liabilities. The ASU is effective for reporting periods beginning on or after January 1, 2013. The information required to be disclosed by the ASU for the Funds’ investments in repurchase agreements at June 30, 2016, including the fair value of the repurchase agreement and the amount of collateral, can be found in each respective Fund’s Statement of Net Assets. The information required to be disclosed by the ASU for the Funds’ securities lending agreement at June 30, 2016, including the market value of securities on loan and the amount of collateral, can be found in each respective Fund’s Statement of Assets and Liabilities. The Funds did not hold derivatives or participate in securities borrowing activities at June 30, 2016.
43
Table of Contents
| Baron Select Funds | June 30, 2016 |
FINANCIAL HIGHLIGHTS (Unaudited)
BARON PARTNERS FUND
Selected data for a share outstanding throughout each period:
| RETAIL SHARES | Six Months Ended June 30, | Year Ended December 31, | ||||||||||||||||||||||||||||||||||||||
| 2016 | 2015 | 2014 | 2013 | 2012 | 2011 | 2010 | 2009 | 2008 | 2007 | |||||||||||||||||||||||||||||||
Net asset value, beginning of period | $ | 35.62 | $ | 36.74 | $ | 33.32 | $ | 22.56 | $ | 19.39 | $ | 20.57 | $ | 15.64 | $ | 12.20 | $ | 23.76 | $ | 22.34 | ||||||||||||||||||||
|
|
|
|
|
|
|
|
|
|
|
|
|
|
|
|
|
|
|
| |||||||||||||||||||||
Income (loss) from investment operations: | ||||||||||||||||||||||||||||||||||||||||
Net investment income (loss) | (0.09 | )1 | (0.05 | )1 | 0.23 | 1 | (0.19 | )1 | (0.04 | )1 | (0.14 | )1 | (0.09 | )1 | (0.04 | )1 | (0.09 | )1 | (0.21 | )1 | ||||||||||||||||||||
Net realized and unrealized gain (loss) on investments | 0.23 | (0.95 | ) | 3.19 | 10.95 | 3.21 | (1.04 | ) | 5.02 | 3.48 | (10.74 | ) | 2.74 | |||||||||||||||||||||||||||
|
|
|
|
|
|
|
|
|
|
|
|
|
|
|
|
|
|
|
| |||||||||||||||||||||
Total from investment operations | 0.14 | (1.00 | ) | 3.42 | 10.76 | 3.17 | (1.18 | ) | 4.93 | 3.44 | (10.83 | ) | 2.53 | |||||||||||||||||||||||||||
|
|
|
|
|
|
|
|
|
|
|
|
|
|
|
|
|
|
|
| |||||||||||||||||||||
Less distributions to shareholders from: | ||||||||||||||||||||||||||||||||||||||||
Net investment income | 0.00 | (0.12 | ) | 0.00 | 0.00 | 0.00 | 0.00 | 0.00 | 0.00 | 0.00 | 0.00 | |||||||||||||||||||||||||||||
Net realized gain on investments | 0.00 | 0.00 | 0.00 | 0.00 | 0.00 | 0.00 | 0.00 | 0.00 | (0.73 | ) | (1.11 | ) | ||||||||||||||||||||||||||||
|
|
|
|
|
|
|
|
|
|
|
|
|
|
|
|
|
|
|
| |||||||||||||||||||||
Total distributions | 0.00 | (0.12 | ) | 0.00 | 0.00 | 0.00 | 0.00 | 0.00 | 0.00 | (0.73 | ) | (1.11 | ) | |||||||||||||||||||||||||||
|
|
|
|
|
|
|
|
|
|
|
|
|
|
|
|
|
|
|
| |||||||||||||||||||||
Net asset value, end of period | $ | 35.76 | $ | 35.62 | $ | 36.74 | $ | 33.32 | $ | 22.56 | $ | 19.39 | $ | 20.57 | $ | 15.64 | $ | 12.20 | $ | 23.76 | ||||||||||||||||||||
|
|
|
|
|
|
|
|
|
|
|
|
|
|
|
|
|
|
|
| |||||||||||||||||||||
Total return | 0.39 | %4 | (2.71 | )% | 10.26 | % | 47.69 | % | 16.35 | % | (5.74 | )% | 31.52 | % | 28.20 | % | (46.67 | )% | 11.34 | % | ||||||||||||||||||||
|
|
|
|
|
|
|
|
|
|
|
|
|
|
|
|
|
|
|
| |||||||||||||||||||||
Ratios/Supplemental data: | ||||||||||||||||||||||||||||||||||||||||
Net assets (in millions), end of period | $ | 977.4 | $ | 1,107.5 | $ | 1,256.3 | $ | 1,125.6 | $ | 653.7 | $ | 970.4 | $ | 1,251.9 | $ | 1,249.3 | $ | 1,501.3 | $ | 3,384.1 | ||||||||||||||||||||
|
|
|
|
|
|
|
|
|
|
|
|
|
|
|
|
|
|
|
| |||||||||||||||||||||
Ratio of total expenses to average net assets | 1.73 | %5 | 1.52 | % | 1.51 | % | 1.67 | % | 1.74 | % | 1.71 | % | 1.71 | % | 1.51 | % | 1.86 | %2 | 1.88 | %2 | ||||||||||||||||||||
Less: Ratio of interest expense to average net assets | (0.36 | )%5 | (0.20 | )% | (0.19 | )% | (0.29 | )% | (0.34 | )% | (0.36 | )% | (0.34 | )% | (0.10 | )% | (0.51 | )% | (0.57 | )% | ||||||||||||||||||||
|
|
|
|
|
|
|
|
|
|
|
|
|
|
|
|
|
|
|
| |||||||||||||||||||||
Ratio of operating expenses to average net assets | 1.37 | %5 | 1.32 | % | 1.32 | % | 1.38 | % | 1.40 | % | 1.35 | % | 1.37 | % | 1.41 | % | 1.35 | % | 1.31 | % | ||||||||||||||||||||
|
|
|
|
|
|
|
|
|
|
|
|
|
|
|
|
|
|
|
| |||||||||||||||||||||
Ratio of net investment income (loss) to average net assets | (0.55 | )%5 | (0.13 | )% | 0.66 | % | (0.66 | )% | (0.18 | )% | (0.69 | )% | (0.51 | )% | (0.30 | )% | (0.49 | )% | (0.86 | )% | ||||||||||||||||||||
|
|
|
|
|
|
|
|
|
|
|
|
|
|
|
|
|
|
|
| |||||||||||||||||||||
Portfolio turnover rate | 9.67 | %4 | 17.08 | % | 30.82 | % | 18.57 | % | 13.04 | % | 16.96 | % | 15.85 | % | 32.43 | % | 38.02 | % | 32.95 | % | ||||||||||||||||||||
|
| �� |
|
|
|
|
|
|
|
|
|
|
|
|
|
|
|
|
|
| ||||||||||||||||||||
| INSTITUTIONAL SHARES | Six Months Ended June 30, | Year Ended December 31, | ||||||||||||||||||||||||||||||||||||||
| 2016 | 2015 | 2014 | 2013 | 2012 | 2011 | 2010 | 20093 | |||||||||||||||||||||||||||||||||
Net asset value, beginning of period | $ | 36.15 | $ | 37.28 | $ | 33.72 | $ | 22.78 | $ | 19.52 | $ | 20.66 | $ | 15.66 | $ | 12.66 | ||||||||||||||||||||||||
|
|
|
|
|
|
|
|
|
|
|
|
|
|
|
| |||||||||||||||||||||||||
Income (loss) from investment operations: | ||||||||||||||||||||||||||||||||||||||||
Net investment income (loss) | (0.05 | )1 | 0.04 | 1 | 0.25 | 1 | (0.12 | )1 | 0.04 | 1 | (0.08 | )1 | (0.06 | )1 | (0.03 | )1 | ||||||||||||||||||||||||
Net realized and unrealized gain (loss) on investments | 0.24 | (0.95 | ) | 3.31 | 11.06 | 3.22 | (1.06 | ) | 5.06 | 3.03 | ||||||||||||||||||||||||||||||
|
|
|
|
|
|
|
|
|
|
|
|
|
|
|
| |||||||||||||||||||||||||
Total from investment operations | 0.19 | (0.91 | ) | 3.56 | 10.94 | 3.26 | (1.14 | ) | 5.00 | 3.00 | ||||||||||||||||||||||||||||||
|
|
|
|
|
|
|
|
|
|
|
|
|
|
|
| |||||||||||||||||||||||||
Less distributions to shareholders from: | ||||||||||||||||||||||||||||||||||||||||
Net investment income | 0.00 | (0.22 | ) | 0.00 | 0.00 | 0.00 | 0.00 | 0.00 | 0.00 | |||||||||||||||||||||||||||||||
Net realized gain on investments | 0.00 | 0.00 | 0.00 | 0.00 | 0.00 | 0.00 | 0.00 | 0.00 | ||||||||||||||||||||||||||||||||
|
|
|
|
|
|
|
|
|
|
|
|
|
|
|
| |||||||||||||||||||||||||
Total distributions | 0.00 | (0.22 | ) | 0.00 | 0.00 | 0.00 | 0.00 | 0.00 | 0.00 | |||||||||||||||||||||||||||||||
|
|
|
|
|
|
|
|
|
|
|
|
|
|
|
| |||||||||||||||||||||||||
Net asset value, end of period | $ | 36.34 | $ | 36.15 | $ | 37.28 | $ | 33.72 | $ | 22.78 | $ | 19.52 | $ | 20.66 | $ | 15.66 | ||||||||||||||||||||||||
|
|
|
|
|
|
|
|
|
|
|
|
|
|
|
| |||||||||||||||||||||||||
Total return | 0.53 | %4 | (2.43 | )% | 10.56 | % | 48.02 | % | 16.70 | % | (5.52 | )% | 31.93 | % | 23.70 | %4 | ||||||||||||||||||||||||
|
|
|
|
|
|
|
|
|
|
|
|
|
|
|
| |||||||||||||||||||||||||
Ratios/Supplemental data: | ||||||||||||||||||||||||||||||||||||||||
Net assets (in millions), end of period | $ | 670.5 | $ | 793.3 | $ | 681.5 | $ | 349.0 | $ | 146.5 | $ | 123.7 | $ | 119.9 | $ | 158.5 | ||||||||||||||||||||||||
|
|
|
|
|
|
|
|
|
|
|
|
|
|
|
| |||||||||||||||||||||||||
Ratio of total expenses to average net assets | 1.47 | %5 | 1.26 | % | 1.26 | % | 1.41 | % | 1.48 | % | 1.45 | % | 1.45 | % | 1.38 | %5 | ||||||||||||||||||||||||
Less: Ratio of interest expense to average net assets | (0.37 | )%5 | (0.20 | )% | (0.20 | )% | (0.30 | )% | (0.35 | )% | (0.36 | )% | (0.34 | )% | (0.21 | )%5 | ||||||||||||||||||||||||
|
|
|
|
|
|
|
|
|
|
|
|
|
|
|
| |||||||||||||||||||||||||
Ratio of operating expenses to average net assets | 1.10 | %5 | 1.06 | % | 1.06 | % | 1.11 | % | 1.13 | % | 1.09 | % | 1.11 | % | 1.17 | %5 | ||||||||||||||||||||||||
|
|
|
|
|
|
|
|
|
|
|
|
|
|
|
| |||||||||||||||||||||||||
Ratio of net investment income (loss) to average net assets | (0.28 | )%5 | 0.11 | % | 0.69 | % | (0.41 | )% | 0.18 | % | (0.41 | )% | (0.36 | )% | (0.31 | )%5 | ||||||||||||||||||||||||
|
|
|
|
|
|
|
|
|
|
|
|
|
|
|
| |||||||||||||||||||||||||
Portfolio turnover rate | 9.67 | %4 | 17.08 | % | 30.82 | % | 18.57 | % | 13.04 | % | 16.96 | % | 15.85 | % | 32.43 | % | ||||||||||||||||||||||||
|
|
|
|
|
|
|
|
|
|
|
|
|
|
|
| |||||||||||||||||||||||||
1 Based on average shares outstanding. | 4 Not Annualized. | |
2 Benefit of expense reduction rounds to less than 0.01%. | 5 Annualized. | |
3 For the period May 29, 2009 (initial offering of Institutional Shares) to December 31, 2009. |
| 44 | See Notes to Financial Statements. |
Table of Contents
| June 30, 2016 | Baron Select Funds |
FINANCIAL HIGHLIGHTS (Unaudited) (Continued)
BARON FOCUSED GROWTH FUND
Selected data for a share outstanding throughout each period:
| RETAIL SHARES | Six Months Ended June 30, | Year Ended December 31, | ||||||||||||||||||||||||||||||||||
| 2016 | 2015 | 2014 | 2013 | 2012 | 2011 | 2010 | 2009 | 20081 | ||||||||||||||||||||||||||||
Net asset value, beginning of period | $ | 13.09 | $ | 14.21 | $ | 13.97 | $ | 11.26 | $ | 9.71 | $ | 9.85 | $ | 8.14 | $ | 6.27 | $ | 10.00 | ||||||||||||||||||
|
|
|
|
|
|
|
|
|
|
|
|
|
|
|
|
|
| |||||||||||||||||||
Income (loss) from investment operations: | ||||||||||||||||||||||||||||||||||||
Net investment income (loss) | (0.01 | )2 | (0.01 | )2 | 0.04 | 2 | (0.07 | )2 | 0.24 | 2 | (0.07 | )2 | (0.01 | )2 | 0.12 | 2 | 0.00 | 2,3 | ||||||||||||||||||
Net realized and unrealized gain (loss) on investments | 0.06 | (0.35 | ) | 0.29 | 2.95 | 1.31 | (0.07 | ) | 2.05 | 2.00 | (3.33 | ) | ||||||||||||||||||||||||
|
|
|
|
|
|
|
|
|
|
|
|
|
|
|
|
|
| |||||||||||||||||||
Total from investment operations | 0.05 | (0.36 | ) | 0.33 | 2.88 | 1.55 | (0.14 | ) | 2.04 | 2.12 | (3.33 | ) | ||||||||||||||||||||||||
|
|
|
|
|
|
|
|
|
|
|
|
|
|
|
|
|
| |||||||||||||||||||
Less distributions to shareholders from: | ||||||||||||||||||||||||||||||||||||
Net investment income | 0.00 | (0.02 | ) | 0.00 | (0.17 | ) | 0.00 | 0.00 | (0.33 | ) | (0.13 | ) | 0.00 | |||||||||||||||||||||||
Net realized gain on investments | 0.00 | (0.74 | ) | (0.09 | ) | 0.00 | 0.00 | 0.00 | 0.00 | 0.00 | 0.00 | |||||||||||||||||||||||||
Return of capital | 0.00 | 0.00 | 0.00 | 0.00 | 0.00 | 0.00 | 0.00 | (0.12 | ) | (0.40 | ) | |||||||||||||||||||||||||
|
|
|
|
|
|
|
|
|
|
|
|
|
|
|
|
|
| |||||||||||||||||||
Total distributions | 0.00 | (0.76 | ) | (0.09 | ) | (0.17 | ) | 0.00 | 0.00 | (0.33 | ) | (0.25 | ) | (0.40 | ) | |||||||||||||||||||||
|
|
|
|
|
|
|
|
|
|
|
|
|
|
|
|
|
| |||||||||||||||||||
Net asset value, end of period | $ | 13.14 | $ | 13.09 | $ | 14.21 | $ | 13.97 | $ | 11.26 | $ | 9.71 | $ | 9.85 | $ | 8.14 | $ | 6.27 | ||||||||||||||||||
|
|
|
|
|
|
|
|
|
|
|
|
|
|
|
|
|
| |||||||||||||||||||
Total return | 0.38 | %4,5 | (2.42 | )%4 | 2.35 | %4 | 25.69 | %4 | 15.96 | %4 | (1.42 | )%4 | 25.17 | %4 | 33.77 | %4 | (33.11 | )%4,5 | ||||||||||||||||||
|
|
|
|
|
|
|
|
|
|
|
|
|
|
|
|
|
| |||||||||||||||||||
Ratios/Supplemental data: | ||||||||||||||||||||||||||||||||||||
Net assets (in millions), end of period | $ | 41.0 | $ | 43.7 | $ | 46.1 | $ | 47.6 | $ | 31.4 | $ | 28.3 | $ | 46.4 | $ | 39.9 | $ | 59.3 | ||||||||||||||||||
|
|
|
|
|
|
|
|
|
|
|
|
|
|
|
|
|
| |||||||||||||||||||
Ratio of operating expenses to average net assets | 1.43 | %6 | 1.39 | % | 1.39 | % | 1.42 | % | 1.48 | % | 1.48 | % | 1.47 | % | 1.52 | % | 1.54 | %6 | ||||||||||||||||||
Less: Reimbursement of expenses by Adviser | (0.08 | )%6 | (0.04 | )% | (0.04 | )% | (0.07 | )% | (0.13 | )% | (0.13 | )% | (0.12 | )% | (0.17 | )% | (0.19 | )%6 | ||||||||||||||||||
|
|
|
|
|
|
|
|
|
|
|
|
|
|
|
|
|
| |||||||||||||||||||
Ratio of net operating expenses to average net assets | 1.35 | %6 | 1.35 | % | 1.35 | % | 1.35 | % | 1.35 | % | 1.35 | % | 1.35 | % | 1.35 | % | 1.35 | %6 | ||||||||||||||||||
|
|
|
|
|
|
|
|
|
|
|
|
|
|
|
|
|
| |||||||||||||||||||
Ratio of net investment income (loss) to average net assets | (0.20 | )%6 | (0.10 | )% | 0.31 | % | (0.53 | )% | 2.30 | % | (0.69 | )% | (0.16 | )% | 1.81 | % | 0.01 | %6 | ||||||||||||||||||
|
|
|
|
|
|
|
|
|
|
|
|
|
|
|
|
|
| |||||||||||||||||||
Portfolio turnover rate | 5.96 | %5 | 12.18 | % | 36.92 | % | 33.67 | % | 38.38 | % | 44.58 | % | 24.08 | % | 34.76 | % | 35.43 | %5 | ||||||||||||||||||
|
|
|
|
|
|
|
|
|
|
|
|
|
|
|
|
|
| |||||||||||||||||||
| INSTITUTIONAL SHARES | Six Months Ended June 30, | Year Ended December 31, | ||||||||||||||||||||||||||||||||||
| 2016 | 2015 | 2014 | 2013 | 2012 | 2011 | 2010 | 20097 | |||||||||||||||||||||||||||||
Net asset value, beginning of period | $ | 13.25 | $ | 14.37 | $ | 14.10 | $ | 11.35 | $ | 9.77 | $ | 9.88 | $ | 8.15 | $ | 6.88 | ||||||||||||||||||||
|
|
|
|
|
|
|
|
|
|
|
|
|
|
|
| |||||||||||||||||||||
Income (loss) from investment operations: | ||||||||||||||||||||||||||||||||||||
Net investment income (loss) | 0.00 | 2,3 | 0.02 | 2 | 0.08 | 2 | (0.04 | )2 | 0.26 | 2 | (0.04 | )2 | 0.01 | 2 | 0.07 | 2 | ||||||||||||||||||||
Net realized and unrealized gain (loss) on investments | 0.07 | (0.34 | ) | 0.28 | 2.99 | 1.32 | (0.07 | ) | 2.05 | 1.45 | ||||||||||||||||||||||||||
|
|
|
|
|
|
|
|
|
|
|
|
|
|
|
| |||||||||||||||||||||
Total from investment operations | 0.07 | (0.32 | ) | 0.36 | 2.95 | 1.58 | (0.11 | ) | 2.06 | 1.52 | ||||||||||||||||||||||||||
|
|
|
|
|
|
|
|
|
|
|
|
|
|
|
| |||||||||||||||||||||
Less distributions to shareholders from: | ||||||||||||||||||||||||||||||||||||
Net investment income | 0.00 | (0.06 | ) | 0.00 | (0.20 | ) | 0.00 | 0.00 | (0.33 | ) | (0.13 | ) | ||||||||||||||||||||||||
Net realized gain on investments | 0.00 | (0.74 | ) | (0.09 | ) | 0.00 | 0.00 | 0.00 | 0.00 | 0.00 | ||||||||||||||||||||||||||
Return of capital | 0.00 | 0.00 | 0.00 | 0.00 | 0.00 | 0.00 | 0.00 | (0.12 | ) | |||||||||||||||||||||||||||
|
|
|
|
|
|
|
|
|
|
|
|
|
|
|
| |||||||||||||||||||||
Total distributions | 0.00 | (0.80 | ) | (0.09 | ) | (0.20 | ) | 0.00 | 0.00 | (0.33 | ) | (0.25 | ) | |||||||||||||||||||||||
|
|
|
|
|
|
|
|
|
|
|
|
|
|
|
| |||||||||||||||||||||
Net asset value, end of period | $ | 13.32 | $ | 13.25 | $ | 14.37 | $ | 14.10 | $ | 11.35 | $ | 9.77 | $ | 9.88 | $ | 8.15 | ||||||||||||||||||||
|
|
|
|
|
|
|
|
|
|
|
|
|
|
|
| |||||||||||||||||||||
Total return | 0.53 | %4,5 | (2.12 | )% | 2.54 | % | 26.09 | %4 | 16.17 | %4 | (1.11 | )%4 | 25.39 | %4 | 22.06 | %4,5 | ||||||||||||||||||||
|
|
|
|
|
|
|
|
|
|
|
|
|
|
|
| |||||||||||||||||||||
Ratios/Supplemental data: | ||||||||||||||||||||||||||||||||||||
Net assets (in millions), end of period | $ | 137.4 | $ | 140.5 | $ | 149.2 | $ | 148.4 | $ | 87.9 | $ | 63.6 | $ | 44.3 | $ | 36.6 | ||||||||||||||||||||
|
|
|
|
|
|
|
|
|
|
|
|
|
|
|
| |||||||||||||||||||||
Ratio of operating expenses to average net assets | 1.12 | %6 | 1.09 | % | 1.09 | % | 1.12 | % | 1.16 | % | 1.18 | % | 1.19 | % | 1.25 | %6 | ||||||||||||||||||||
Less: Reimbursement of expenses by Adviser | (0.02 | )%6 | 0.00 | % | 0.00 | % | (0.02 | )% | (0.06 | )% | (0.08 | )% | (0.09 | )% | (0.15 | )%6 | ||||||||||||||||||||
|
|
|
|
|
|
|
|
|
|
|
|
|
|
|
| |||||||||||||||||||||
Ratio of net operating expenses to average net assets | 1.10 | %6 | 1.09 | % | 1.09 | % | 1.10 | % | 1.10 | % | 1.10 | % | 1.10 | % | 1.10 | %6 | ||||||||||||||||||||
|
|
|
|
|
|
|
|
|
|
|
|
|
|
|
| |||||||||||||||||||||
Ratio of net investment income (loss) to average net assets | 0.06 | %6 | 0.16 | % | 0.56 | % | (0.28 | )% | 2.53 | % | (0.40 | )% | 0.08 | % | 1.63 | %6 | ||||||||||||||||||||
|
|
|
|
|
|
|
|
|
|
|
|
|
|
|
| |||||||||||||||||||||
Portfolio turnover rate | 5.96 | %5 | 12.18 | % | 36.92 | % | 33.67 | % | 38.38 | % | 44.58 | % | 24.08 | % | 34.76 | % | ||||||||||||||||||||
|
|
|
|
|
|
|
|
|
|
|
|
|
|
|
| |||||||||||||||||||||
1 For the period June 30, 2008 (commencement of operations) to December 31, 2008. | 5 Not Annualized. | |
2 Based on average shares outstanding. | 6 Annualized. | |
3 Less than $0.01 per share. | 7 For the period May 29, 2009 (initial offering of Institutional Shares) to December 31, 2009. | |
4 The total returns would have been lower had certain expenses not been reduced during the period shown. |
| See Notes to Financial Statements. | 45 |
Table of Contents
| Baron Select Funds | June 30, 2016 |
FINANCIAL HIGHLIGHTS (Unaudited) (Continued)
BARON INTERNATIONAL GROWTH FUND
Selected data for a share outstanding throughout each period:
| RETAIL SHARES | Six Months Ended June 30, | Year Ended December 31, | ||||||||||||||||||||||||||||||
| 2016 | 2015 | 2014 | 2013 | 2012 | 2011 | 2010 | 2009 | |||||||||||||||||||||||||
Net asset value, beginning of period | $ | 18.05 | $ | 17.94 | $ | 18.91 | $ | 15.55 | $ | 13.20 | $ | 17.29 | $ | 14.11 | $ | 10.00 | ||||||||||||||||
|
|
|
|
|
|
|
|
|
|
|
|
|
|
|
| |||||||||||||||||
Income (loss) from investment operations: | ||||||||||||||||||||||||||||||||
Net investment income (loss) | 0.02 | 1 | 0.03 | 1 | 0.03 | 1 | (0.01 | )1 | (0.02 | )1 | (0.01 | )1 | 0.01 | 1 | 0.04 | 1 | ||||||||||||||||
Net realized and unrealized gain (loss) on investments | 0.02 | 0.19 | (0.46 | ) | 3.37 | 2.37 | (2.78 | ) | 3.38 | 4.43 | ||||||||||||||||||||||
|
|
|
|
|
|
|
|
|
|
|
|
|
|
|
| |||||||||||||||||
Total from investment operations | 0.04 | 0.22 | (0.43 | ) | 3.36 | 2.35 | (2.79 | ) | 3.39 | 4.47 | ||||||||||||||||||||||
|
|
|
|
|
|
|
|
|
|
|
|
|
|
|
| |||||||||||||||||
Less distributions to shareholders from: | ||||||||||||||||||||||||||||||||
Net investment income | 0.00 | (0.08 | ) | (0.00 | )2 | 0.00 | 0.00 | (0.04 | ) | 0.00 | 0.00 | |||||||||||||||||||||
Net realized gain on investments | 0.00 | (0.03 | ) | (0.54 | ) | 0.00 | 0.00 | (1.26 | ) | (0.21 | ) | (0.36 | ) | |||||||||||||||||||
|
|
|
|
|
|
|
|
|
|
|
|
|
|
|
| |||||||||||||||||
Total distributions | 0.00 | (0.11 | ) | (0.54 | ) | 0.00 | 0.00 | (1.30 | ) | (0.21 | ) | (0.36 | ) | |||||||||||||||||||
|
|
|
|
|
|
|
|
|
|
|
|
|
|
|
| |||||||||||||||||
Net asset value, end of period | $ | 18.09 | $ | 18.05 | $ | 17.94 | $ | 18.91 | $ | 15.55 | $ | 13.20 | $ | 17.29 | $ | 14.11 | ||||||||||||||||
|
|
|
|
|
|
|
|
|
|
|
|
|
|
|
| |||||||||||||||||
Total return | 0.22 | %3,4 | 1.23 | %3 | (2.33 | )%3 | 21.61 | %3 | 17.80 | %3 | (16.35 | )%3 | 24.22 | %3 | 44.69 | %3 | ||||||||||||||||
|
|
|
|
|
|
|
|
|
|
|
|
|
|
|
| |||||||||||||||||
Ratios/Supplemental data: | ||||||||||||||||||||||||||||||||
Net assets (in millions), end of period | $ | 40.3 | $ | 44.9 | $ | 53.0 | $ | 17.0 | $ | 15.6 | $ | 11.7 | $ | 15.3 | $ | 8.4 | ||||||||||||||||
|
|
|
|
|
|
|
|
|
|
|
|
|
|
|
| |||||||||||||||||
Ratio of operating expenses to average net assets | 1.63 | %5 | 1.59 | % | 1.63 | % | 1.74 | % | 1.78 | % | 1.73 | % | 1.76 | % | 2.33 | % | ||||||||||||||||
Less: Reimbursement of expenses by Adviser | (0.13 | )%5 | (0.09 | )% | (0.13 | )% | (0.24 | )% | (0.28 | )% | (0.23 | )% | (0.26 | )% | (0.83 | )% | ||||||||||||||||
|
|
|
|
|
|
|
|
|
|
|
|
|
|
|
| |||||||||||||||||
Ratio of net operating expenses to average net assets | 1.50 | %5 | 1.50 | % | 1.50 | % | 1.50 | % | 1.50 | % | 1.50 | % | 1.50 | % | 1.50 | % | ||||||||||||||||
|
|
|
|
|
|
|
|
|
|
|
|
|
|
|
| |||||||||||||||||
Ratio of net investment income (loss) to average net assets | 0.22 | %5 | 0.15 | % | 0.14 | % | (0.05 | )% | (0.16 | )% | (0.05 | )% | 0.07 | % | 0.38 | % | ||||||||||||||||
|
|
|
|
|
|
|
|
|
|
|
|
|
|
|
| |||||||||||||||||
Portfolio turnover rate | 15.94 | %4 | 42.85 | % | 34.67 | % | 40.60 | % | 39.02 | % | 53.20 | % | 32.70 | % | 53.94 | % | ||||||||||||||||
|
|
|
|
|
|
|
|
|
|
|
|
|
|
|
| |||||||||||||||||
| INSTITUTIONAL SHARES | Six Months Ended June 30, | Year Ended December 31, | ||||||||||||||||||||||||||||||
| 2016 | 2015 | 2014 | 2013 | 2012 | 2011 | 2010 | 20096 | |||||||||||||||||||||||||
Net asset value, beginning of period | $ | 18.17 | $ | 18.09 | $ | 19.05 | $ | 15.63 | $ | 13.25 | $ | 17.36 | $ | 14.13 | $ | 11.13 | ||||||||||||||||
|
|
|
|
|
|
|
|
|
|
|
|
|
|
|
| |||||||||||||||||
Income (loss) from investment operations: | ||||||||||||||||||||||||||||||||
Net investment income (loss) | 0.04 | 1 | 0.08 | 1 | 0.12 | 1 | 0.03 | 1 | 0.01 | 1 | 0.03 | 1 | 0.05 | 1 | (0.02 | )1 | ||||||||||||||||
Net realized and unrealized gain (loss) on investments | 0.03 | 0.19 | (0.50 | ) | 3.39 | 2.40 | (2.79 | ) | 3.39 | 3.38 | ||||||||||||||||||||||
|
|
|
|
|
|
|
|
|
|
|
|
|
|
|
| |||||||||||||||||
Total from investment operations | 0.07 | 0.27 | (0.38 | ) | 3.42 | 2.41 | (2.76 | ) | 3.44 | 3.36 | ||||||||||||||||||||||
|
|
|
|
|
|
|
|
|
|
|
|
|
|
|
| |||||||||||||||||
Less distributions to shareholders from: | ||||||||||||||||||||||||||||||||
Net investment income | 0.00 | (0.16 | ) | (0.04 | ) | (0.00 | )2 | (0.03 | ) | (0.09 | ) | 0.00 | 0.00 | |||||||||||||||||||
Net realized gain on investments | 0.00 | (0.03 | ) | (0.54 | ) | 0.00 | 0.00 | (1.26 | ) | (0.21 | ) | (0.36 | ) | |||||||||||||||||||
|
|
|
|
|
|
|
|
|
|
|
|
|
|
|
| |||||||||||||||||
Total distributions | 0.00 | (0.19 | ) | (0.58 | ) | (0.00 | )2 | (0.03 | ) | (1.35 | ) | (0.21 | ) | (0.36 | ) | |||||||||||||||||
|
|
|
|
|
|
|
|
|
|
|
|
|
|
|
| |||||||||||||||||
Net asset value, end of period | $ | 18.24 | $ | 18.17 | $ | 18.09 | $ | 19.05 | $ | 15.63 | $ | 13.25 | $ | 17.36 | $ | 14.13 | ||||||||||||||||
|
|
|
|
|
|
|
|
|
|
|
|
|
|
|
| |||||||||||||||||
Total return | 0.39 | %3,4 | 1.48 | %3 | (2.07 | )%3 | 21.89 | %3 | 18.17 | %3 | (16.13 | )%3 | 24.54 | %3 | 30.18 | %3,4 | ||||||||||||||||
|
|
|
|
|
|
|
|
|
|
|
|
|
|
|
| |||||||||||||||||
Ratios/Supplemental data: | ||||||||||||||||||||||||||||||||
Net assets (in millions), end of period | $ | 43.4 | $ | 53.7 | $ | 52.3 | $ | 45.4 | $ | 39.0 | $ | 30.5 | $ | 37.4 | $ | 22.1 | ||||||||||||||||
|
|
|
|
|
|
|
|
|
|
|
|
|
|
|
| |||||||||||||||||
Ratio of operating expenses to average net assets | 1.34 | %5 | 1.31 | % | 1.34 | % | 1.37 | % | 1.40 | % | 1.38 | % | 1.40 | % | 1.89 | %5 | ||||||||||||||||
Less: Reimbursement of expenses by Adviser | (0.09 | )%5 | (0.06 | )% | (0.09 | )% | (0.12 | )% | (0.15 | )% | (0.13 | )% | (0.15 | )% | (0.64 | )%5 | ||||||||||||||||
|
|
|
|
|
|
|
|
|
|
|
|
|
|
|
| |||||||||||||||||
Ratio of net operating expenses to average net assets | 1.25 | %5 | 1.25 | % | 1.25 | % | 1.25 | % | 1.25 | % | 1.25 | % | 1.25 | % | 1.25 | %5 | ||||||||||||||||
|
|
|
|
|
|
|
|
|
|
|
|
|
|
|
| |||||||||||||||||
Ratio of net investment income (loss) to average net assets | 0.42 | %5 | 0.41 | % | 0.64 | % | 0.20 | % | 0.09 | % | 0.19 | % | 0.31 | % | (0.29 | )%5 | ||||||||||||||||
|
|
|
|
|
|
|
|
|
|
|
|
|
|
|
| |||||||||||||||||
Portfolio turnover rate | 15.94 | %4 | 42.85 | % | 34.67 | % | 40.60 | % | 39.02 | % | 53.20 | % | 32.70 | % | 53.94 | % | ||||||||||||||||
|
|
|
|
|
|
|
|
|
|
|
|
|
|
|
| |||||||||||||||||
1 Based on average shares outstanding. | 4 Not Annualized. | |
2 Less than $0.01 per share. | 5 Annualized. | |
3 The total returns would have been lower had certain expenses not been reduced during the period shown. | 6 For the period May 29, 2009 (initial offering of Institutional Shares) to December 31, 2009. |
| 46 | See Notes to Financial Statements. |
Table of Contents
| June 30, 2016 | Baron Select Funds |
FINANCIAL HIGHLIGHTS (Unaudited) (Continued)
BARON REAL ESTATE FUND
Selected data for a share outstanding throughout each period:
| RETAIL SHARES | INSTITUTIONAL SHARES |
| R6 SHARES | |||||||||||||||||||||||||||||||||||||||||||||||||||||||||||||||||
| Six Months Ended June 30, | Year Ended December 31, | Six Months Ended June 30, | Year Ended December 31, | Six Months Ended June 30, | ||||||||||||||||||||||||||||||||||||||||||||||||||||||||||||||||
| 2016 | 2015 | 2014 | 2013 | 2012 | 2011 | 2010 | 2016 | 2015 | 2014 | 2013 | 2012 | 2011 | 2010 | 20167 | ||||||||||||||||||||||||||||||||||||||||||||||||||||||
Net asset value, beginning of period | $ | 24.24 | $ | 25.92 | $ | 22.25 | $ | 17.52 | $ | 12.51 | $ | 12.66 | $ | 10.00 | $ | 24.51 | $ | 26.14 | $ | 22.43 | $ | 17.64 | $ | 12.56 | $ | 12.69 | $ | 10.00 | $ | 21.80 | ||||||||||||||||||||||||||||||||||||||
|
|
|
|
|
|
|
|
|
|
|
|
|
|
|
|
|
|
|
|
|
|
|
|
|
|
|
|
|
| |||||||||||||||||||||||||||||||||||||||
Income (loss) from investment operations: | ||||||||||||||||||||||||||||||||||||||||||||||||||||||||||||||||||||
Net investment income (loss) | 0.10 | 1 | (0.06 | )1 | 0.04 | 1 | (0.05 | )1 | 0.01 | 1 | (0.01 | )1 | 0.02 | 1 | 0.13 | 1 | 0.01 | 1 | 0.11 | 1 | 0.03 | 1 | 0.06 | 1 | 0.02 | 1 | 0.04 | 1 | 0.27 | 1 | ||||||||||||||||||||||||||||||||||||||
Net realized and unrealized gain (loss) on investments | (1.09 | ) | (1.14 | ) | 3.66 | 4.80 | 5.31 | 0.07 | 2 | 2.64 | (1.10 | ) | (1.16 | ) | 3.68 | 4.81 | 5.33 | 0.07 | 2 | 2.65 | 1.47 | |||||||||||||||||||||||||||||||||||||||||||||||
|
|
|
|
|
|
|
|
|
|
|
|
|
|
|
|
|
|
|
|
|
|
|
|
|
|
|
|
|
| |||||||||||||||||||||||||||||||||||||||
Total from investment operations | (0.99 | ) | (1.20 | ) | 3.70 | 4.75 | 5.32 | 0.06 | 2.66 | (0.97 | ) | (1.15 | ) | 3.79 | 4.84 | 5.39 | 0.09 | 2.69 | 1.74 | |||||||||||||||||||||||||||||||||||||||||||||||||
|
|
|
|
|
|
|
|
|
|
|
|
|
|
|
|
|
|
|
|
|
|
|
|
|
|
|
|
|
| |||||||||||||||||||||||||||||||||||||||
Less distributions to shareholders from: | ||||||||||||||||||||||||||||||||||||||||||||||||||||||||||||||||||||
Net investment income | 0.00 | (0.01 | ) | (0.03 | ) | 0.00 | 0.00 | (0.00 | )3 | 0.00 | 0.00 | (0.01 | ) | (0.08 | ) | (0.00 | )3 | 0.00 | (0.01 | ) | 0.00 | 0.00 | ||||||||||||||||||||||||||||||||||||||||||||||
Net realized gain on investments | 0.00 | (0.47 | ) | 0.00 | (0.02 | ) | (0.31 | ) | (0.21 | ) | 0.00 | 0.00 | (0.47 | ) | 0.00 | (0.02 | ) | (0.31 | ) | (0.21 | ) | 0.00 | 0.00 | |||||||||||||||||||||||||||||||||||||||||||||
Return of capital | 0.00 | 0.00 | 0.00 | (0.03 | ) | 0.00 | 0.00 | 0.00 | 0.00 | 0.00 | 0.00 | (0.03 | ) | 0.00 | 0.00 | 0.00 | 0.00 | |||||||||||||||||||||||||||||||||||||||||||||||||||
|
|
|
|
|
|
|
|
|
|
|
|
|
|
|
|
|
|
|
|
|
|
|
|
|
|
|
|
|
| |||||||||||||||||||||||||||||||||||||||
Total distributions | 0.00 | (0.48 | ) | (0.03 | ) | (0.02 | ) | (0.31 | ) | (0.21 | ) | 0.00 | 0.00 | (0.48 | ) | (0.08 | ) | (0.05 | ) | (0.31 | ) | (0.22 | ) | 0.00 | 0.00 | |||||||||||||||||||||||||||||||||||||||||||
|
|
|
|
|
|
|
|
|
|
|
|
|
|
|
|
|
|
|
|
|
|
|
|
|
|
|
|
|
| |||||||||||||||||||||||||||||||||||||||
Net asset value, end of period | $ | 23.25 | $ | 24.24 | $ | 25.92 | $ | 22.25 | $ | 17.52 | $ | 12.51 | $ | 12.66 | $ | 23.54 | $ | 24.51 | $ | 26.14 | $ | 22.43 | $ | 17.64 | $ | 12.56 | $ | 12.69 | $
| 23.54
|
| |||||||||||||||||||||||||||||||||||||
|
|
|
|
|
|
|
|
|
|
|
|
|
|
|
|
|
|
|
|
|
|
|
|
|
|
|
|
|
| |||||||||||||||||||||||||||||||||||||||
Total return | (4.08 | )%5 | (4.65 | )% | 16.61 | % | 27.12 | % | 42.60 | %4 | 0.63 | %4 | 26.60 | %4 | (3.96 | )%5 | (4.42 | )% | 16.93 | % | 27.48 | % | 42.99 | %4 | 0.80 | %4 | 26.90 | %4 |
| 7.98
| %5
| |||||||||||||||||||||||||||||||||||||
|
|
|
|
|
|
|
|
|
|
|
|
|
|
|
|
|
|
|
|
|
|
|
|
|
|
|
|
|
| |||||||||||||||||||||||||||||||||||||||
Ratios/Supplemental data: | ||||||||||||||||||||||||||||||||||||||||||||||||||||||||||||||||||||
Net assets (in millions), end of period | $ | 565.6 | $ | 788.9 | $ | 782.8 | $ | 539.5 | $ | 53.6 | $ | 10.9 | $ | 5.5 | $ | 690.7 | $ | 992.8 | $ | 919.7 | $ | 486.1 | $ | 35.5 | $ | 4.9 | $ | 3.2 | $ | 1.7 | ||||||||||||||||||||||||||||||||||||||
|
|
|
|
|
|
|
|
|
|
|
|
|
|
|
|
|
|
|
|
|
|
|
|
|
|
|
|
|
| |||||||||||||||||||||||||||||||||||||||
Ratio of operating expenses to average net assets | 1.33 | %6 | 1.31 | % | 1.32 | % | 1.35 | % | 1.76 | % | 2.33 | % | 4.35 | % | 1.08 | %6 | 1.06 | % | 1.06 | % | 1.09 | % | 1.44 | % | 2.14 | % | 4.26 | % | 1.04 | %6 | ||||||||||||||||||||||||||||||||||||||
Less: Reimbursement of expenses by Adviser | 0.00 | % | 0.00 | % | 0.00 | % | 0.00 | % | (0.41 | )% | (0.98 | )% | (3.00 | )% | 0.00 | % | 0.00 | % | 0.00 | % | 0.00 | % | (0.34 | )% | (1.04 | )% | (3.16 | )% | 0.00 | % | ||||||||||||||||||||||||||||||||||||||
|
|
|
|
|
|
|
|
|
|
|
|
|
|
|
|
|
|
|
|
|
|
|
|
|
|
|
|
|
| |||||||||||||||||||||||||||||||||||||||
Ratio of net operating expenses to average net assets | 1.33 | %6 | 1.31 | % | 1.32 | % | 1.35 | % | 1.35 | % | 1.35 | % | 1.35 | % | 1.08 | %6 | 1.06 | % | 1.06 | % | 1.09 | % | 1.10 | % | 1.10 | % | 1.10 | % | 1.04 | %6 | ||||||||||||||||||||||||||||||||||||||
|
|
|
|
|
|
|
|
|
|
|
|
|
|
|
|
|
|
|
|
|
|
|
|
|
|
|
|
|
| |||||||||||||||||||||||||||||||||||||||
Ratio of net investment income (loss) to average net assets | 0.92 | %6 | (0.23 | )% | 0.17 | % | (0.23 | )% | 0.07 | % | (0.08 | )% | 0.14 | % | 1.17 | %6 | 0.04 | % | 0.44 | % | 0.15 | % | 0.36 | % | 0.17 | % | 0.36 | % | 3.01 | %6 | ||||||||||||||||||||||||||||||||||||||
|
|
|
|
|
|
|
|
|
|
|
|
|
|
|
|
|
|
|
|
|
|
|
|
|
|
|
|
|
| |||||||||||||||||||||||||||||||||||||||
Portfolio turnover rate | 34.43 | %5 | 50.50 | % | 24.40 | % | 19.36 | % | 30.14 | % | 70.99 | % | 58.03 | % | 34.43 | %5 | 50.50 | % | 24.40 | % | 19.36 | % | 30.14 | % | 70.99 | % | 58.03 | % | 34.43 | %5 | ||||||||||||||||||||||||||||||||||||||
|
|
|
|
|
|
|
|
|
|
|
|
|
|
|
|
|
|
|
|
|
|
|
|
|
|
|
|
|
| |||||||||||||||||||||||||||||||||||||||
1 Based on average shares outstanding. | 5 Not Annualized. | |
2 The amount shown for a share outstanding does not correspond with the aggregate realized and unrealized gain (loss) on investments for the period due to the timing of sales and redemptions of fund shares in relation to fluctuating market values of investments of the Fund. | 6 Annualized. 7 For the period January 29, 2016 (initial offering of R6 Shares) to June 30, 2016. | |
3 Less than $0.01 per share. | ||
4 The total returns would have been lower had certain expenses not been reduced during the period shown. |
| See Notes to Financial Statements. | 47 |
Table of Contents
| Baron Select Funds | June 30, 2016 |
FINANCIAL HIGHLIGHTS (Unaudited) (Continued)
BARON EMERGING MARKETS FUND
Selected data for a share outstanding throughout each period:
| RETAIL SHARES | INSTITUTIONAL SHARES | R6 SHARES | ||||||||||||||||||||||||||||||||||||||||||||||||||||||||||
| Six Months Ended June 30, | Year Ended December 31, | Six Months Ended June 30, | Year Ended December 31, | Six Months Ended June 30, | ||||||||||||||||||||||||||||||||||||||||||||||||||||||||
| 2016 | 2015 | 2014 | 2013 | 2012 | 2011 | 2016 | 2015 | 2014 | 2013 | 2012 | 2011 | 20165 | ||||||||||||||||||||||||||||||||||||||||||||||||
Net asset value, beginning of period | $ | 10.57 | $ | 11.91 | $ | 11.54 | $ | 10.06 | $ | 8.28 | $ | 10.00 | $ | 10.59 | $ | 11.94 | $ | 11.56 | $ | 10.05 | $ | 8.30 | $ | 10.00 | $ | 9.94 | ||||||||||||||||||||||||||||||||||
|
|
|
|
|
|
|
|
|
|
|
|
|
|
|
|
|
|
|
|
|
|
|
|
|
| |||||||||||||||||||||||||||||||||||
Income (loss) from investment operations: | ||||||||||||||||||||||||||||||||||||||||||||||||||||||||||||
Net investment income (loss) | 0.03 | 1 | 0.03 | 1 | 0.07 | 1 | (0.06 | )1 | (0.04 | )1 | (0.03 | )1 | 0.05 | 1 | 0.06 | 1 | 0.09 | 1 | 0.01 | 1 | (0.01 | )1 | (0.01 | )1 | 0.11 | 1 | ||||||||||||||||||||||||||||||||||
Net realized and unrealized gain (loss) on investments | 0.55 | (1.36 | ) | 0.33 | 1.54 | 1.94 | (1.69 | ) | 0.55 | (1.37 | ) | 0.34 | 1.50 | 1.93 | (1.69 | ) | 1.15 | |||||||||||||||||||||||||||||||||||||||||||
|
|
|
|
|
|
|
|
|
|
|
|
|
|
|
|
|
|
|
|
|
|
|
|
|
| |||||||||||||||||||||||||||||||||||
Total from investment operations | 0.58 | (1.33 | ) | 0.40 | 1.48 | 1.90 | (1.72 | ) | 0.60 | (1.31 | ) | 0.43 | 1.51 | 1.92 | (1.70 | ) | 1.26 | |||||||||||||||||||||||||||||||||||||||||||
|
|
|
|
|
|
|
|
|
|
|
|
|
|
|
|
|
|
|
|
|
|
|
|
|
| |||||||||||||||||||||||||||||||||||
Less distributions to shareholders from: | ||||||||||||||||||||||||||||||||||||||||||||||||||||||||||||
Net investment income | 0.00 | (0.01 | ) | (0.03 | ) | 0.00 | (0.12 | ) | 0.00 | 0.00 | (0.04 | ) | (0.05 | ) | 0.00 | (0.17 | ) | 0.00 | 0.00 | |||||||||||||||||||||||||||||||||||||||||
Net realized gain on investments | 0.00 | 0.00 | 0.00 | 0.00 | 0.00 | 0.00 | 0.00 | 0.00 | 0.00 | 0.00 | 0.00 | 0.00 | 0.00 | |||||||||||||||||||||||||||||||||||||||||||||||
|
|
|
|
|
|
|
|
|
|
|
|
|
|
|
|
|
|
|
|
|
|
|
|
|
| |||||||||||||||||||||||||||||||||||
Total distributions | 0.00 | (0.01 | ) | (0.03 | ) | 0.00 | (0.12 | ) | 0.00 | 0.00 | (0.04 | ) | (0.05 | ) | 0.00 | (0.17 | ) | 0.00 | 0.00 | |||||||||||||||||||||||||||||||||||||||||
|
|
|
|
|
|
|
|
|
|
|
|
|
|
|
|
|
|
|
|
|
|
|
|
|
| |||||||||||||||||||||||||||||||||||
Net asset value, end of period | $ | 11.15 | $ | 10.57 | $ | 11.91 | $ | 11.54 | $ | 10.06 | $ | 8.28 | $ | 11.19 | $ | 10.59 | $ | 11.94 | $ | 11.56 | $ | 10.05 | $ | 8.30 | $ | 11.20 | ||||||||||||||||||||||||||||||||||
|
|
|
|
|
|
|
|
|
|
|
|
|
|
|
|
|
|
|
|
|
|
|
|
|
| |||||||||||||||||||||||||||||||||||
Total return | 5.49 | %3 | (11.16 | )% | 3.47 | %2 | 14.71 | %2 | 22.98 | %2 | (17.20 | )%2 | 5.67 | %3 | (10.97 | )% | 3.75 | %2 | 15.02 | %2 | 23.22 | %2 | (17.00 | )%2 | 12.68 | %3 | ||||||||||||||||||||||||||||||||||
|
|
|
|
|
|
|
|
|
|
|
|
|
|
|
|
|
|
|
|
|
|
|
|
|
| |||||||||||||||||||||||||||||||||||
Ratios/Supplemental data: | ||||||||||||||||||||||||||||||||||||||||||||||||||||||||||||
Net assets (in millions), end of period | $ | 658.3 | $ | 665.5 | $ | 649.7 | $ | 259.6 | $ | 2.9 | $ | 2.0 | $ | 1,386.6 | $ | 1,040.9 | $ | 697.8 | $ | 116.0 | $ | 6.0 | $ | 4.3 | $ | 0.4 | ||||||||||||||||||||||||||||||||||
|
|
|
|
|
|
|
|
|
|
|
|
|
|
|
|
|
|
|
|
|
|
|
|
|
| |||||||||||||||||||||||||||||||||||
Ratio of operating expenses to average net assets | 1.39 | %4 | 1.45 | % | 1.52 | % | 1.90 | % | 4.01 | % | 4.49 | % | 1.13 | %4 | 1.20 | % | 1.27 | % | 1.80 | % | 3.37 | % | 3.83 | % | 1.12 | %4 | ||||||||||||||||||||||||||||||||||
Less: Reimbursement of expenses by Adviser | 0.00 | % | 0.00 | % | (0.02 | )% | (0.40 | )% | (2.51 | )% | (2.99 | )% | 0.00 | % | 0.00 | % | (0.02 | )% | (0.55 | )% | (2.12 | )% | (2.58 | )% | 0.00 | % | ||||||||||||||||||||||||||||||||||
|
|
|
|
|
|
|
|
|
|
|
|
|
|
|
|
|
|
|
|
|
|
|
|
|
| |||||||||||||||||||||||||||||||||||
Ratio of net operating expenses to average net assets | 1.39 | %4 | 1.45 | % | 1.50 | % | 1.50 | % | 1.50 | % | 1.50 | % | 1.13 | %4 | 1.20 | % | 1.25 | % | 1.25 | % | 1.25 | % | 1.25 | % | 1.12 | %4 | ||||||||||||||||||||||||||||||||||
|
|
|
|
|
|
|
|
|
|
|
|
|
|
|
|
|
|
|
|
|
|
|
|
|
| |||||||||||||||||||||||||||||||||||
Ratio of net investment income (loss) to average net assets | 0.58 | %4 | 0.25 | % | 0.56 | % | (0.53 | )% | (0.39 | )% | (0.32 | )% | 0.92 | %4 | 0.49 | % | 0.76 | % | 0.05 | % | (0.14 | )% | (0.07 | )% | 2.66 | %4 | ||||||||||||||||||||||||||||||||||
|
|
|
|
|
|
|
|
|
|
|
|
|
|
|
|
|
|
|
|
|
|
|
|
|
| |||||||||||||||||||||||||||||||||||
Portfolio turnover rate | 15.50 | %3 | 26.34 | % | 23.38 | % | 14.68 | % | 42.68 | % | 45.86 | % | 15.50 | %3 | 26.34 | % | 23.38 | % | 14.68 | % | 42.68 | % | 45.86 | % | 15.50 | %3 | ||||||||||||||||||||||||||||||||||
|
|
|
|
|
|
|
|
|
|
|
|
|
|
|
|
|
|
|
|
|
|
|
|
|
| |||||||||||||||||||||||||||||||||||
1 Based on average shares outstanding. | 4 Annualized. | |
2 The total returns would have been lower had certain expenses not been reduced during the period shown. | 5 For the period January 29, 2016 (initial offering of R6 shares) to June 30, 2016. | |
3 Not Annualized. |
| 48 | See Notes to Financial Statements. |
Table of Contents
| June 30, 2016 | Baron Select Funds |
FINANCIAL HIGHLIGHTS (Unaudited) (Continued)
BARON ENERGY AND RESOURCES FUND
Selected data for a share outstanding throughout each period:
| RETAIL SHARES | Six Months Ended June 30, | Year Ended December 31, | ||||||||||||||||||
| 2016 | 2015 | 2014 | 2013 | 2012 | ||||||||||||||||
Net asset value, beginning of period | $ | 7.03 | $ | 10.33 | $ | 11.84 | $ | 9.46 | $ | 10.00 | ||||||||||
|
|
|
|
|
|
|
|
|
| |||||||||||
Income (loss) from investment operations: | ||||||||||||||||||||
Net investment income (loss) | 0.02 | 1 | 0.02 | 1 | (0.01 | )1 | (0.01 | )1 | (0.03 | )1 | ||||||||||
Net realized and unrealized gain (loss) on investments | 0.85 | (3.31 | ) | (1.50 | ) | 2.40 | (0.51 | ) | ||||||||||||
|
|
|
|
|
|
|
|
|
| |||||||||||
Total from investment operations | 0.87 | (3.29 | ) | (1.51 | ) | 2.39 | (0.54 | ) | ||||||||||||
|
|
|
|
|
|
|
|
|
| |||||||||||
Less distributions to shareholders from: | ||||||||||||||||||||
Net investment income | 0.00 | 0.00 | 0.00 | (0.01 | ) | 0.00 | ||||||||||||||
Net realized gain on investments | 0.00 | (0.01 | ) | 0.00 | 0.00 | 0.00 | ||||||||||||||
|
|
|
|
|
|
|
|
|
| |||||||||||
Total distributions | 0.00 | (0.01 | ) | 0.00 | (0.01 | ) | 0.00 | |||||||||||||
|
|
|
|
|
|
|
|
|
| |||||||||||
Net asset value, end of period | $ | 7.90 | $ | 7.03 | $ | 10.33 | $ | 11.84 | $ | 9.46 | ||||||||||
|
|
|
|
|
|
|
|
|
| |||||||||||
Total return | 12.38 | %2,3 | (31.88 | )%2 | (12.75 | )%2 | 25.32 | %2 | (5.40 | )%2 | ||||||||||
|
|
|
|
|
|
|
|
|
| |||||||||||
Ratios/Supplemental data: | ||||||||||||||||||||
Net assets (in millions), end of period | $ | 70.9 | $ | 56.4 | $ | 39.7 | $ | 29.2 | $ | 1.8 | ||||||||||
|
|
|
|
|
|
|
|
|
| |||||||||||
Ratio of operating expenses to average net assets | 1.73 | %4 | 1.58 | % | 1.79 | % | 2.25 | % | 9.07 | % | ||||||||||
Less: Reimbursement of expenses by Adviser | (0.38 | )%4 | (0.23 | )% | (0.44 | )% | (0.90 | )% | (7.72 | )% | ||||||||||
|
|
|
|
|
|
|
|
|
| |||||||||||
Ratio of net operating expenses to average net assets | 1.35 | %4 | 1.35 | % | 1.35 | % | 1.35 | % | 1.35 | % | ||||||||||
|
|
|
|
|
|
|
|
|
| |||||||||||
Ratio of net investment income (loss) to average net assets | 0.69 | %4 | 0.24 | % | (0.04 | )% | (0.05 | )% | (0.36 | )% | ||||||||||
|
|
|
|
|
|
|
|
|
| |||||||||||
Portfolio turnover rate | 28.24 | %3 | 48.19 | % | 23.12 | % | 25.60 | % | 35.74 | % | ||||||||||
|
|
|
|
|
|
|
|
|
| |||||||||||
| INSTITUTIONAL SHARES | Six Months Ended June 30, | Year Ended December 31, | ||||||||||||||||||
| 2016 | 2015 | 2014 | 2013 | 2012 | ||||||||||||||||
Net asset value, beginning of period | $ | 7.10 | $ | 10.41 | $ | 11.91 | $ | 9.48 | $ | 10.00 | ||||||||||
|
|
|
|
|
|
|
|
|
| |||||||||||
Income (loss) from investment operations: | ||||||||||||||||||||
Net investment income (loss) | 0.03 | 1 | 0.05 | 1 | 0.03 | 1 | 0.02 | 1 | (0.01 | )1 | ||||||||||
Net realized and unrealized gain (loss) on investments | 0.86 | (3.35 | ) | (1.53 | ) | 2.41 | (0.51 | ) | ||||||||||||
|
|
|
|
|
|
|
|
|
| |||||||||||
Total from investment operations | 0.89 | (3.30 | ) | (1.50 | ) | 2.43 | (0.52 | ) | ||||||||||||
|
|
|
|
|
|
|
|
|
| |||||||||||
Less distributions to shareholders from: | ||||||||||||||||||||
Net investment income | 0.00 | 0.00 | 0.00 | 0.00 | 0.00 | |||||||||||||||
Net realized gain on investments | 0.00 | (0.01 | ) | 0.00 | 0.00 | 0.00 | ||||||||||||||
|
|
|
|
|
|
|
|
|
| |||||||||||
Total distributions | 0.00 | (0.01 | ) | 0.00 | 0.00 | 0.00 | ||||||||||||||
|
|
|
|
|
|
|
|
|
| |||||||||||
Net asset value, end of period | $ | 7.99 | $ | 7.10 | $ | 10.41 | $ | 11.91 | $ | 9.48 | ||||||||||
|
|
|
|
|
|
|
|
|
| |||||||||||
Total return | 12.54 | %2,3 | (31.73 | )%2 | (12.59 | )%2 | 25.63 | %2 | (5.20 | )%2 | ||||||||||
|
|
|
|
|
|
|
|
|
| |||||||||||
Ratios/Supplemental data: | ||||||||||||||||||||
Net assets (in millions), end of period | $ | 29.6 | $ | 22.8 | $ | 29.3 | $ | 4.0 | $ | 1.4 | ||||||||||
|
|
|
|
|
|
|
|
|
| |||||||||||
Ratio of operating expenses to average net assets | 1.49 | %4 | 1.29 | % | 1.52 | % | 2.84 | % | 8.65 | % | ||||||||||
Less: Reimbursement of expenses by Adviser | (0.39 | )%4 | (0.19 | )% | (0.42 | )% | (1.74 | )% | (7.55 | )% | ||||||||||
|
|
|
|
|
|
|
|
|
| |||||||||||
Ratio of net operating expenses to average net assets | 1.10 | %4 | 1.10 | % | 1.10 | % | 1.10 | % | 1.10 | % | ||||||||||
|
|
|
|
|
|
|
|
|
| |||||||||||
Ratio of net investment income (loss) to average net assets | 0.97 | %4 | 0.53 | % | 0.22 | % | 0.20 | % | (0.11 | )% | ||||||||||
|
|
|
|
|
|
|
|
|
| |||||||||||
Portfolio turnover rate | 28.24 | %3 | 48.19 | % | 23.12 | % | 25.60 | % | 35.74 | % | ||||||||||
|
|
|
|
|
|
|
|
|
| |||||||||||
1 Based on average shares outstanding. | 3 Not Annualized. | |
2 The total returns would have been lower had certain expenses not been reduced during the period shown. | 4 Annualized. |
| See Notes to Financial Statements. | 49 |
Table of Contents
| Baron Select Funds | June 30, 2016 |
FINANCIAL HIGHLIGHTS (Unaudited) (Continued)
BARON GLOBAL ADVANTAGE FUND
Selected data for a share outstanding throughout each period:
| RETAIL SHARES | Six Months Ended June 30, | Year Ended December 31, | ||||||||||||||||||
| 2016 | 2015 | 2014 | 2013 | 20121 | ||||||||||||||||
Net asset value, beginning of period | $ | 13.91 | $ | 14.20 | $ | 13.51 | $ | 10.41 | $ | 10.00 | ||||||||||
|
|
|
|
|
|
|
|
|
| |||||||||||
Income (loss) from investment operations: | ||||||||||||||||||||
Net investment income (loss) | (0.07 | )2 | (0.11 | )2 | 0.02 | 2 | (0.02 | )2 | (0.02 | )2 | ||||||||||
Net realized and unrealized gain (loss) on investments | (0.49 | ) | (0.14 | ) | 0.67 | 3.12 | 0.43 | |||||||||||||
|
|
|
|
|
|
|
|
|
| |||||||||||
Total from investment operations | (0.56 | ) | (0.25 | ) | 0.69 | 3.10 | 0.41 | |||||||||||||
|
|
|
|
|
|
|
|
|
| |||||||||||
Less distributions to shareholders from: | ||||||||||||||||||||
Net investment income | 0.00 | (0.02 | ) | 0.00 | 0.00 | 0.00 | ||||||||||||||
Net realized gain on investments | 0.00 | (0.02 | ) | (0.00 | )3 | 0.00 | 0.00 | |||||||||||||
|
|
|
|
|
|
|
|
|
| |||||||||||
Total distributions | 0.00 | (0.04 | ) | 0.00 | 0.00 | 0.00 | ||||||||||||||
|
|
|
|
|
|
|
|
|
| |||||||||||
Net asset value, end of period | $ | 13.35 | $ | 13.91 | $ | 14.20 | $ | 13.51 | $ | 10.41 | ||||||||||
|
|
|
|
|
|
|
|
|
| |||||||||||
Total return | (4.03 | )%4,6 | (1.72 | )%4 | 5.11 | %4,5 | 29.78 | %4 | 4.10 | %4,6 | ||||||||||
|
|
|
|
|
|
|
|
|
| |||||||||||
Ratios/Supplemental data: | ||||||||||||||||||||
Net assets (in millions), end of period | $ | 5.6 | $ | 6.2 | $ | 3.9 | $ | 2.3 | $ | 1.5 | ||||||||||
|
|
|
|
|
|
|
|
|
| |||||||||||
Ratio of operating expenses to average net assets | 3.84 | %8 | 3.19 | % | 3.61 | % | 5.51 | % | 8.35 | %7,8 | ||||||||||
Less: Reimbursement of expenses by Adviser | (2.34 | )%8 | (1.69 | )% | (2.11 | )% | (4.01 | )% | (6.85 | )%7,8 | ||||||||||
|
|
|
|
|
|
|
|
|
| |||||||||||
Ratio of net operating expenses to average net assets | 1.50 | %8 | 1.50 | % | 1.50 | % | 1.50 | % | 1.50 | %7,8 | ||||||||||
|
|
|
|
|
|
|
|
|
| |||||||||||
Ratio of net investment income (loss) to average net assets | (1.04 | )%8 | (0.75 | )% | 0.18 | % | (0.20 | )% | (0.38 | )%7,8 | ||||||||||
|
|
|
|
|
|
|
|
|
| |||||||||||
Portfolio turnover rate | 12.78 | %6 | 25.88 | % | 123.51 | % | 32.78 | % | 24.64 | %6 | ||||||||||
|
|
|
|
|
|
|
|
|
| |||||||||||
| INSTITUTIONAL SHARES | Six Months Ended June 30, | Year Ended December 31, | ||||||||||||||||||
| 2016 | 2015 | 2014 | 2013 | 20121 | ||||||||||||||||
Net asset value, beginning of period | $ | 14.00 | $ | 14.28 | $ | 13.56 | $ | 10.42 | $ | 10.00 | ||||||||||
|
|
|
|
|
|
|
|
|
| |||||||||||
Income (loss) from investment operations: | ||||||||||||||||||||
Net investment income (loss) | (0.05 | )2 | (0.07 | )2 | 0.07 | 2 | 0.00 | 2,3 | (0.02 | )2 | ||||||||||
Net realized and unrealized gain (loss) on investments | (0.50 | ) | (0.15 | ) | 0.65 | 3.14 | 0.44 | |||||||||||||
|
|
|
|
|
|
|
|
|
| |||||||||||
Total from investment operations | (0.55 | ) | (0.22 | ) | 0.72 | 3.14 | 0.42 | |||||||||||||
|
|
|
|
|
|
|
|
|
| |||||||||||
Less distributions to shareholders from: | ||||||||||||||||||||
Net investment income | 0.00 | (0.04 | ) | 0.00 | 0.00 | 0.00 | ||||||||||||||
Net realized gain on investments | 0.00 | (0.02 | ) | (0.00 | )3 | 0.00 | 0.00 | |||||||||||||
|
|
|
|
|
|
|
|
|
| |||||||||||
Total distributions | 0.00 | (0.06 | ) | 0.00 | 0.00 | 0.00 | ||||||||||||||
|
|
|
|
|
|
|
|
|
| |||||||||||
Net asset value, end of period | $ | 13.45 | $ | 14.00 | $ | 14.28 | $ | 13.56 | $ | 10.42 | ||||||||||
|
|
|
|
|
|
|
|
|
| |||||||||||
Total return | (3.93 | )%4,6 | (1.51 | )%4 | 5.32 | %4,5 | 30.13 | %4 | 4.20 | %4,6 | ||||||||||
|
|
|
|
|
|
|
|
|
| |||||||||||
Ratios/Supplemental data: | ||||||||||||||||||||
Net assets (in millions), end of period | $ | 4.9 | $ | 5.3 | $ | 4.1 | $ | 3.3 | $ | 1.6 | ||||||||||
|
|
|
|
|
|
|
|
|
| |||||||||||
Ratio of operating expenses to average net assets | 3.50 | %8 | 2.89 | % | 2.92 | % | 4.91 | % | 7.33 | %7,8 | ||||||||||
Less: Reimbursement of expenses by Adviser | (2.25 | )%8 | (1.64 | )% | (1.67 | )% | (3.66 | )% | (6.08 | )%7,8 | ||||||||||
|
|
|
|
|
|
|
|
|
| |||||||||||
Ratio of net operating expenses to average net assets | 1.25 | %8 | 1.25 | % | 1.25 | % | 1.25 | % | 1.25 | %7,8 | ||||||||||
|
|
|
|
|
|
|
|
|
| |||||||||||
Ratio of net investment income (loss) to average net assets | (0.78 | )%8 | (0.47 | )% | 0.48 | % | 0.02 | % | (0.30 | )%7,8 | ||||||||||
|
|
|
|
|
|
|
|
|
| |||||||||||
Portfolio turnover rate | 12.78 | %6 | 25.88 | % | 123.51 | % | 32.78 | % | 24.64 | %6 | ||||||||||
|
|
|
|
|
|
|
|
|
| |||||||||||
1 For the period April 30, 2012 (commencement of operations) to December 31, 2012. | 5 The Adviser made a voluntary payment to the Fund in the amount of $47,291 to compensate the Fund for a loss incurred due to a shareholder activity processing error. The impact of this payment increased the Fund’s total return by 0.54%. | |
2 Based on average shares outstanding. | ||
3 Less than $0.01 per share. | ||
4 The total returns would have been lower had certain expenses not been reduced during the period shown. | 6 Not Annualized. | |
7 Certain fixed expenses incurred by the Fund were not annualized for the period ended December 31, 2012. | ||
8 Annualized. |
| 50 | See Notes to Financial Statements. |
Table of Contents
| June 30, 2016 | Baron Select Funds |
As a shareholder of the Funds, you may incur two types of costs: ongoing expenses and transaction costs. Ongoing expenses include advisory fees, distribution and service (12b-1) fees and other Fund expenses. Due to the payment of Rule 12b-1 fees, long-term shareholders may indirectly pay more than the maximum permitted front-end sales charge. The information on this page is intended to help you understand your ongoing costs of investing in the Funds and to compare these costs with the ongoing costs of investing in other mutual funds.
The information in the following table is based on an investment of $1,000 invested on January 1, 2016 and held for the six months ended June 30, 2016.
ACTUAL EXPENSES
The table below titled “Based on Actual Total Return” provides information about actual account values and actual expenses. You may use the information provided in this table, together with the amount you invested, to estimate the expenses that you paid over the period. To estimate the expenses you paid on your account, divide your ending account value by $1,000 (for example, an $8,600 ending account value divided by $1,000 = 8.6), then multiply the result by the number under the heading titled “Expenses Paid During the Period”.
BASED ON ACTUAL TOTAL RETURN FOR THE SIX MONTHS ENDED JUNE 30, 20161
Actual Total Return | Beginning Account Value January 1, 2016 | Ending Account Value June 30, 2016 | Annualized Expense Ratio | Expenses Paid During the Period3 | ||||||||||||||||
Baron Partners Fund — Retail Shares2 | 0.39 | % | $ | 1,000.00 | $ | 1,003.90 | 1.73 | %2 | $ | 8.62 | ||||||||||
Baron Partners Fund — Institutional Shares2 | 0.53 | % | $ | 1,000.00 | $ | 1,005.30 | 1.47 | %2 | $ | 7.33 | ||||||||||
Baron Focused Growth Fund — Retail Shares | 0.38 | % | $ | 1,000.00 | $ | 1,003.80 | 4 | 1.35 | %5 | $ | 6.73 | |||||||||
Baron Focused Growth Fund — Institutional Shares | 0.53 | % | $ | 1,000.00 | $ | 1,005.30 | 4 | 1.10 | %5 | $ | 5.48 | |||||||||
Baron International Growth Fund — Retail Shares | 0.22 | % | $ | 1,000.00 | $ | 1,002.20 | 4 | 1.50 | %5 | $ | 7.47 | |||||||||
Baron International Growth Fund — Institutional Shares | 0.39 | % | $ | 1,000.00 | $ | 1,003.90 | 4 | 1.25 | %5 | $ | 6.23 | |||||||||
Baron Real Estate Fund — Retail Shares | (4.08 | %) | $ | 1,000.00 | $ | 959.20 | 1.33 | % | $ | 6.48 | ||||||||||
Baron Real Estate Fund — Institutional Shares | (3.96 | %) | $ | 1,000.00 | $ | 960.40 | 1.08 | % | $ | 5.26 | ||||||||||
Baron Real Estate Fund — R6 Shares6 | 7.98 | % | $ | 1.000.00 | $ | 1,079.80 | 1.04 | % | $ | 4.46 | ||||||||||
Baron Emerging Markets Fund — Retail Shares | 5.49 | % | $ | 1,000.00 | $ | 1,054.90 | 1.39 | % | $ | 7.10 | ||||||||||
Baron Emerging Markets Fund — Institutional Shares | 5.67 | % | $ | 1,000.00 | $ | 1,056.70 | 1.13 | % | $ | 5.78 | ||||||||||
Baron Emerging Markets Fund — R6 Shares6 | 12.68 | % | $ | 1,000.00 | $ | 1,126.80 | 1.12 | % | $ | 4.91 | ||||||||||
Baron Energy & Resources Fund — Retail Shares | 12.38 | % | $ | 1,000.00 | $ | 1,123.80 | 4 | 1.35 | %5 | $ | 7.13 | |||||||||
Baron Energy & Resources Fund — Institutional Shares | 12.54 | % | $ | 1,000.00 | $ | 1,125.40 | 4 | 1.10 | %5 | $ | 5.81 | |||||||||
Baron Global Advantage Fund — Retail Shares | (4.03 | %) | $ | 1,000.00 | $ | 959.70 | 4 | 1.50 | %5 | $ | 7.31 | |||||||||
Baron Global Advantage Fund — Institutional Shares | (3.93 | %) | $ | 1,000.00 | $ | 960.70 | 4 | 1.25 | %5 | $ | 6.09 | |||||||||
HYPOTHETICAL EXAMPLE FOR COMPARISON PURPOSES
The table below titled “Based on Hypothetical Total Return” provides information about hypothetical account values and hypothetical expenses based on the actual expense ratio and an assumed rate of return of 5% per year before expenses, which is not the Funds’ actual return. The hypothetical account values and expenses may not be used to estimate the actual ending account values and expenses you paid for the period. You may use the information provided in this table to compare the ongoing costs of investing in the Funds and other funds. To do so, compare the 5% hypothetical example relating to the Funds with the 5% hypothetical examples that appear in the shareholder reports of other funds.
Please note that expenses shown in the table below are meant to highlight your ongoing costs and do not reflect any transactional costs, such as redemption fees, if any. Therefore, the table is useful in comparing ongoing costs only and will not help you determine your relative total costs of owning different mutual funds. In addition, if these transactional costs were included, your costs would have been higher.
BASED ON HYPOTHETICAL TOTAL RETURN FOR THE SIX MONTHS ENDED JUNE 30, 2016
Hypothetical Annualized Total Return | Beginning Account Value January 1, 2016 | Ending Account Value June 30, 2016 | Annualized Expense Ratio | Expenses Paid During the Period3 | ||||||||||||||||
Baron Partners Fund — Retail Shares2 | 5.00 | % | $ | 1,000.00 | $ | 1,016.26 | 1.73 | %2 | $ | 8.67 | ||||||||||
Baron Partners Fund — Institutional Shares2 | 5.00 | % | $ | 1,000.00 | $ | 1,017.55 | 1.47 | %2 | $ | 7.37 | ||||||||||
Baron Focused Growth Fund — Retail Shares | 5.00 | % | $ | 1,000.00 | $ | 1,018.15 | 4 | 1.35 | %5 | $ | 6.77 | |||||||||
Baron Focused Growth Fund — Institutional Shares | 5.00 | % | $ | 1,000.00 | $ | 1,019.39 | 4 | 1.10 | %5 | $ | 5.52 | |||||||||
Baron International Growth Fund — Retail Shares | 5.00 | % | $ | 1,000.00 | $ | 1,017.40 | 4 | 1.50 | %5 | $ | 7.52 | |||||||||
Baron International Growth Fund — Institutional Shares | 5.00 | % | $ | 1,000.00 | $ | 1,018.65 | 4 | 1.25 | %5 | $ | 6.27 | |||||||||
Baron Real Estate Fund — Retail Shares | 5.00 | % | $ | 1,000.00 | $ | 1,018.25 | 1.33 | % | $ | 6.67 | ||||||||||
Baron Real Estate Fund — Institutional Shares | 5.00 | % | $ | 1,000.00 | $ | 1,019.49 | 1.08 | % | $ | 5.42 | ||||||||||
Baron Real Estate Fund — R6 Shares6 | 5.00 | % | $ | 1,000.00 | $ | 1,016.34 | 1.04 | % | $ | 4.33 | ||||||||||
Baron Emerging Markets Fund — Retail Shares | 5.00 | % | $ | 1,000.00 | $ | 1,017.95 | 1.39 | % | $ | 6.97 | ||||||||||
Baron Emerging Markets Fund — Institutional Shares | 5.00 | % | $ | 1,000.00 | $ | 1,019.24 | 1.13 | % | $ | 5.67 | ||||||||||
Baron Emerging Markets Fund — R6 Shares6 | 5.00 | % | $ | 1,000.00 | $ | 1,016.01 | 1.12 | % | $ | 4.66 | ||||||||||
Baron Energy & Resources Fund — Retail Shares | 5.00 | % | $ | 1,000.00 | $ | 1,018.15 | 4 | 1.35 | %5 | $ | 6.77 | |||||||||
Baron Energy & Resources Fund — Institutional Shares | 5.00 | % | $ | 1,000.00 | $ | 1,019.39 | 4 | 1.10 | %5 | $ | 5.52 | |||||||||
Baron Global Advantage Fund — Retail Shares | 5.00 | % | $ | 1,000.00 | $ | 1,017.40 | 4 | 1.50 | %5 | $ | 7.52 | |||||||||
Baron Global Advantage Fund — Institutional Shares | 5.00 | % | $ | 1,000.00 | $ | 1,018.65 | 4 | 1.25 | %5 | $ | 6.27 | |||||||||
1 Assumes reinvestment of all dividends and capital gain distributions, if any. 2 Annualized expense ratio for Baron Partners Fund for the six months ended June 30, 2016, includes 1.37% and 1.10% for net operating expenses and 0.36% and 0.37% for interest expense for the Retail and Institutional Shares, respectively. 3 Expenses are equal to each Share Class’ respective annualized expense ratio multiplied by the average account value over the period, multiplied by the number of days in the most recent fiscal half-year, then divided by 366. | 4 Ending account value assumes the return earned after waiver and would have been lower if a portion of the expenses had not been waived. 5 Annualized expense ratios are adjusted to reflect fee waiver. 6 For the period January 29, 2016 (Commencement of Operations) to June 30, 2016. |
51
Table of Contents
| Baron Select Funds | June 30, 2016 |
DISCLOSURE REGARDING THE APPROVAL OF THE INVESTMENT ADVISORY AGREEMENTS FOR EACH OF THE SERIES BY THE BOARD OF TRUSTEES (Unaudited)
The Board of Trustees (the “Board”) of Baron Select Funds (the “Trust”) met on May 5, 2016 to discuss the selection of BAMCO, Inc. (the “Adviser”) as the investment adviser and the approval of the investment advisory agreements for Baron Partners Fund, Baron Focused Growth Fund, Baron International Growth Fund, Baron Real Estate Fund, Baron Emerging Markets Fund, Baron Energy and Resources Fund and Baron Global Advantage Fund (each, a “Fund” and collectively, the “Funds”). The members of the Board who are not affiliated with the Trust (the “Independent Trustees”) met in a separate session to discuss and consider the renewal of the advisory agreements for the Funds. An independent consultant provided reports to the Board and attended the Board meeting. The Trustees received a substantial amount of information from the Adviser and from the independent consultant, and were advised by independent legal counsel. Based on its evaluation of this and other information, the Board, including a majority of the Independent Trustees, approved the continuation of the advisory agreements for the Funds for an additional one-year period.
In reaching its determination, the Board considered various factors that it deemed relevant, including the factors listed below.
1. NATURE, EXTENT AND QUALITY OF SERVICES
As part of their consideration of the nature, extent and quality of services provided by the Adviser, the Independent Trustees considered the information provided, their experience and knowledge gained from their service as Trustees and their experience generally, including the following, which they had considered in past years and remained, in their thinking, material to their consideration:
| • | Their confidence in the senior personnel, portfolio management, the financial condition of the Adviser and its affiliates and the Adviser’s available resources; |
| • | The nature, quality and the level of long-term performance of the services provided by the Adviser, including: intensive devotion to research, selection of broker/dealers for Fund portfolio transactions, relationships with and supervision of third party service providers, such as the Funds’ custodian and transfer agent, the quality of shareholder reports, the ability to monitor adherence to investment guidelines and restrictions, the legal, accounting and compliance services provided to the Funds and the support services provided to the Board; |
| • | The Adviser’s investment principles and processes and the historical performance of the Funds as compared to similar funds managed by other advisers and other funds managed by the Adviser over comparable periods; |
| • | The total expense ratio of the Funds and comparisons to similar funds managed by other advisers over comparable periods; |
| • | The costs of portfolio management, including the types of investments made for the Funds, the personnel and systems necessary for implementation of investment strategies, and the pre-tax profits realized by the Adviser and its affiliates from their relationship with the Funds; and |
| • | Additional services provided by the Adviser. |
The Board was provided with information from the Adviser and the independent consultant regarding the fees charged by the Adviser as compared to the fees charged by comparable funds. This information
compared various fees and expenses, as well as the total expense ratios, of the Funds against the fees, expenses and total expense ratios of other funds of similar size, character and investment strategies (“comparable funds”). The Board observed that, for the retail and/or institutional classes of most of the Funds, while the management fee was comparatively higher, the other expenses paid by the Funds generally were comparatively lower, when compared to respective peer groups. They concluded that the Funds’ management fee was justified because, among other reasons, the nature, extent and quality of the services the Adviser provides. The Board concluded that the nature, extent and quality of the services provided by the Adviser to each Fund were appropriate and that each Fund was likely to continue to benefit from those services provided under the relevant advisory agreement with the Adviser.
2. INVESTMENT PERFORMANCE OF THE FUNDS AND THE ADVISER
As part of its consideration of the investment performance of the Funds and the Adviser, the Board took into account the analyses performed by and discussed with the independent consultant. The Board considered for each Fund, among other information, the independent consultant’s comparisons of the expense ratio and contractual advisory fee with those of the comparable funds selected by the independent consultant, as noted above. The Board also considered the independent consultant’s risk-adjusted performance comparisons with comparable funds for Funds that have been in existence for more than three years. The Board also considered comparisons of each Fund’s annualized total return over one-, three-, five- and ten-year periods, where applicable, against the comparable funds and performance universe averages and relevant securities market indices. After considering all the information, the Board concluded that the Adviser continued to invest in accordance with its long-standing principles and that each Fund’s more recent relative performance was consistent with expectations for the Adviser’s investment style under recent market conditions.
3. COSTS OF SERVICES PROVIDED AND PROFITS TO BE REALIZED BY THE ADVISER
The Board considered benefits that accrue to the Adviser and its affiliates from their relationship with the Funds. Representatives of the Adviser said the Board should consider the advisory fee in the context of other fees paid to the Adviser’s affiliates, such as the distribution fee paid to Baron Capital, Inc. and paid out pursuant to the 12b-1 plan.
The Board considered comparisons of the advisory fees charged and services provided by the Adviser and its investment adviser affiliate to sub-advised accounts and separately managed accounts. The Board considered that, while the advisory fees for the other clients are the same as, or lower than, the fees for the Funds, the Adviser or its affiliate performs significantly fewer services for those clients compared with those provided by the Adviser to the Funds. The Board also considered a profitability analysis prepared by the Adviser and discussed with the representatives of the Adviser that the Adviser has continued to invest in quality personnel, systems and facilities, and otherwise continued to invest in its business, even as profits had declined in recent years due to this period of persistent outflows.
52
Table of Contents
| June 30, 2016 | Baron Select Funds |
DISCLOSURE REGARDING THE APPROVAL OF THE INVESTMENT ADVISORY AGREEMENTS FOR EACH OF THE SERIES BY THE BOARD OF TRUSTEES (Unaudited) (Continued)
4. ECONOMIES OF SCALE AND BENEFITS TO INVESTORS
The Board considered the extent to which each Fund’s management fee reflected economies of scale for the benefit of Fund shareholders, appreciating that the economies of scale analysis is predicated on generally predictable increasing assets and noting the small size of certain Funds and the significant fluctuation in assets since 2007. The Board considered that small- and mid-cap investment strategies require more attention by the Adviser than a strategy that involves other types of investing, particularly as asset size increases. The Board considered that the Adviser was continuing to grow and upgrade its staff and invest in its business. The Board members reiterated their intention to continue to scrutinize the extent of economies of scale, asset growth and the Adviser’s plans to invest further to support the Funds. The Board concluded that approval of the management fee for each Fund was supportable in light of the services provided as discussed at the meeting, including the Adviser’s investments in resources to support the Funds.
After due consideration of the above-enumerated factors and other factors it deemed relevant, the Board, including a majority of the Independent Trustees, approved the continuance of each Fund’s investment advisory agreement.
53
Table of Contents
Go Paperless!
It’s fast, simple and a smart way to help the environment.
Enjoy the speed and convenience of receiving Fund documents electronically.
For more information, and to enroll today, go to www.baronfunds.com/edelivery.

767 Fifth Avenue, 49th Fl.
New York, NY 10153
1.800.99.BARON
212-583-2000
www.BaronFunds.com
Table of Contents
JUNE 30
Table of Contents
Item 2. Code of Ethics.
Not applicable.
Item 3. Audit Committee Financial Expert.
Not applicable.
Item 4. Principal Accountant Fees and Services.
Not applicable.
Item 5. Audit Committee of Listed Registrants.
Not applicable.
Item 6. Schedule of Investments.
Included herein under Item 1.
Item 7. Disclosure of Proxy Voting Policies and Procedures for Closed-End Management Investment Companies.
Not applicable.
Item 8. Portfolio Managers of Closed-End Management Investment Companies.
Not applicable.
Item 9. Purchases of Equity Securities by Closed-End Management Investment Company and Affiliated Purchasers.
Not applicable.
Item 10. Submission of Matters to a Vote of Security Holders.
Not applicable.
Item 11. Controls and Procedures.
(a) The Registrant’s principal executive officer and principal financial officer have concluded that the Registrant’s disclosure controls and procedures (as defined in Rule 30a-3(c) under the Investment Company Act of 1940 (the “1940 Act”)) are effective based on their evaluation of these controls and procedures as of a date within 90 days of the filing date of this report.
(b) There were no changes in the Registrant’s internal control over financial reporting (as defined in Rule 30a-3(d) under the 1940 Act) that occurred during the Registrant’s second fiscal quarter of the period covered by this report that have materially affected, or are reasonably likely to materially affect, the Registrant’s internal control over financial reporting.
Item 12. Exhibits.
(a)(1) Not applicable.
(a)(2) Certification of each of the principal executive officers and principal financial officers of the Registrant as required by Rule 30a-2 under the Act (17 CFR 270.30a-2) is attached hereto as a part of EX-99.CERT.
(b) Certification of each of the principal executive officers and principal financial officers of the Registrant as required by Section 906 of the Sarbanes-Oxley Act of 2002 is attached hereto as a part of EX-99.906CERT.
Table of Contents
SIGNATURES
Pursuant to the requirements of the Securities Exchange Act of 1934 and the Investment Company Act of 1940, the registrant has duly caused this report to be signed on its behalf by the undersigned, thereunto duly authorized.
| BARON SELECT FUNDS | ||
| By: | /s/ Ronald Baron | |
| Ronald Baron | ||
| Chief Executive Officer | ||
| Date: August 26, 2016 | ||
Pursuant to the requirements of the Securities Exchange Act of 1934 and the Investment Company Act of 1940, this report has been signed below by the following persons on behalf of the registrant and in the capacities and on the dates indicated.
| By: | /s/ Ronald Baron | |
| Ronald Baron | ||
| Chief Executive Officer | ||
| Date: August 26, 2016 | ||
| By: | /s/ Peggy Wong | |
| Peggy Wong | ||
| Treasurer and Chief Financial Officer | ||
| Date: August 26, 2016 | ||