0001217673baroncapitalmgmt:Russell3000Index11137AdditionalIndexMember2023-07-012024-06-30
UNITED STATES
SECURITIES AND EXCHANGE COMMISSION
Washington, DC 20549
FORM N-CSR
CERTIFIED SHAREHOLDER REPORT OF REGISTERED
MANAGEMENT INVESTMENT COMPANIES
Investment Company Act file number: 811-21296
BARON SELECT FUNDS
(Exact Name of Registrant as Specified in Charter)
767 Fifth Avenue, 49th Floor
New York, NY 10153
(Address of Principal Executive Offices) (Zip Code)
Patrick M. Patalino, General Counsel
c/o Baron Select Funds
767 Fifth Avenue, 49th Floor
New York, NY 10153
(Name and Address of Agent for Service)
(Registrant’s Telephone Number, including Area Code): 212-583-2000
Date of fiscal year end: December 31
Date of reporting period: June 30, 2024
Item 1. Reports to Stockholders.
Semi-Annual Shareholder Report June 30, 2024
This semi-annual shareholder report contains important information about Baron Partners Fund for the period of January 1, 2024 to June 30, 2024.You can find additional information about the Fund at BaronCapitalGroup.com. You can also request this information by contacting us at 1.800.99.BARON.
What were the Fund costs for last year?
(based on a hypothetical $10,000 investment)
| Class Name | Cost of a $10,000 investment | Costs paid as a percentage of a $10,000 investment |
|---|
| Institutional | $98Footnote Reference** | 2.06%Footnote Reference*Footnote Reference+ |
| Footnote | Description |
Footnote** | Includes interest expense of $48. |
Footnote* | Annualized. |
Footnote+ | Includes interest expense of 1.01%. |
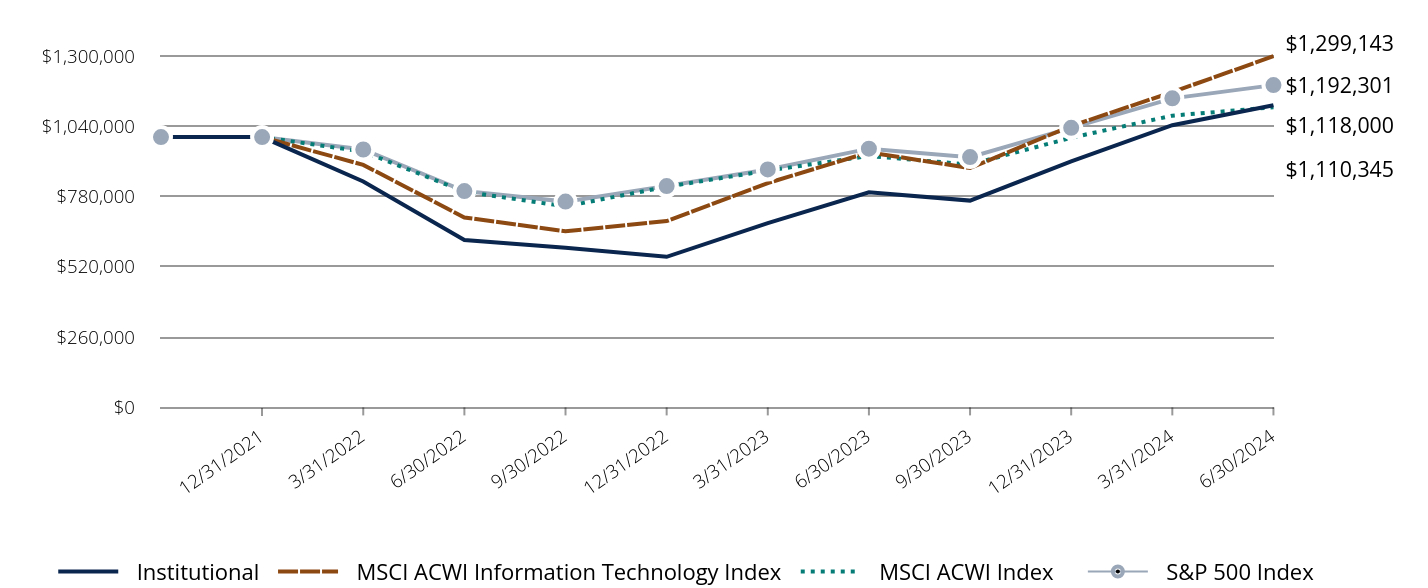
Comparison of the Change in Value of $1,000,000 Investment in the Fund in Relation to the Benchmarks
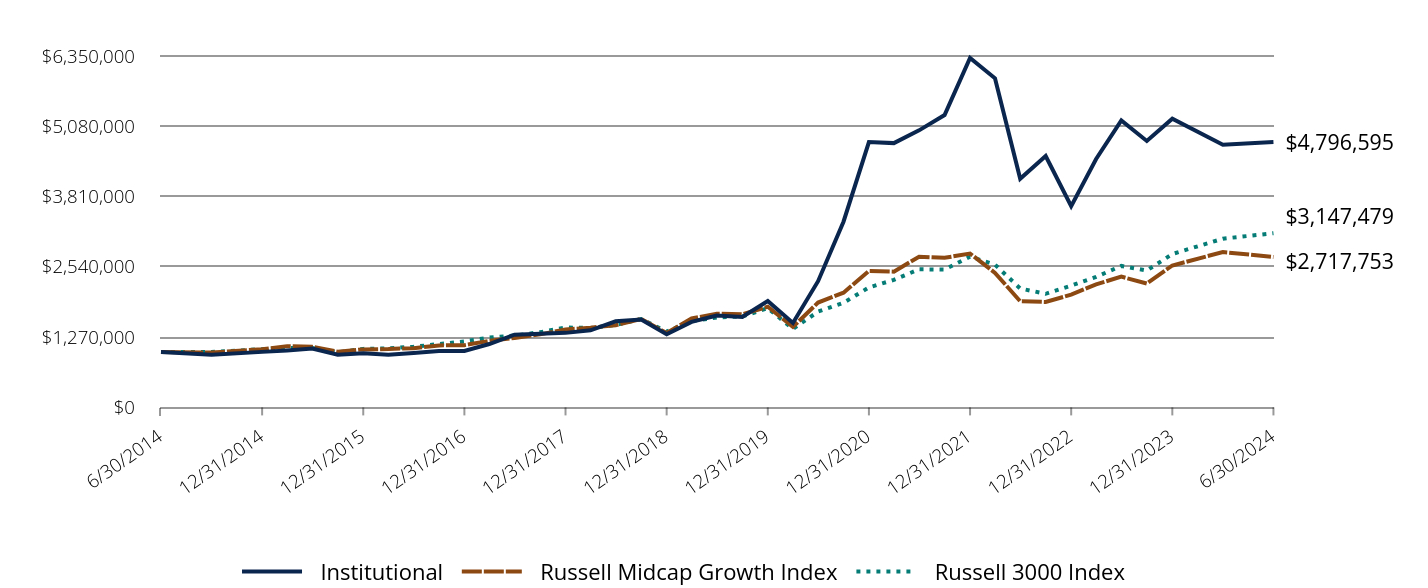
| Institutional | Russell Midcap Growth Index | Russell 3000 Index |
|---|
| 6/30/2014 | $1,000,000 | $1,000,000 | $1,000,000 |
| 9/30/2014 | $952,355 | $992,712 | $1,000,110 |
| 12/31/2014 | $1,003,499 | $1,050,665 | $1,052,517 |
| 3/31/2015 | $1,029,879 | $1,107,170 | $1,071,466 |
| 6/30/2015 | $1,063,795 | $1,094,537 | $1,072,942 |
| 9/30/2015 | $952,042 | $1,007,089 | $995,162 |
| 12/31/2015 | $979,127 | $1,048,562 | $1,057,555 |
| 3/31/2016 | $953,125 | $1,054,635 | $1,067,796 |
| 6/30/2016 | $984,273 | $1,071,115 | $1,095,885 |
| 9/30/2016 | $1,020,838 | $1,120,300 | $1,144,079 |
| 12/31/2016 | $1,021,109 | $1,125,407 | $1,192,237 |
| 3/31/2017 | $1,145,159 | $1,202,997 | $1,260,711 |
| 6/30/2017 | $1,313,358 | $1,253,703 | $1,298,727 |
| 9/30/2017 | $1,331,775 | $1,319,936 | $1,358,096 |
| 12/31/2017 | $1,346,943 | $1,409,774 | $1,444,163 |
| 3/31/2018 | $1,394,071 | $1,440,428 | $1,434,857 |
| 6/30/2018 | $1,555,769 | $1,485,909 | $1,490,655 |
| 9/30/2018 | $1,589,084 | $1,598,460 | $1,596,848 |
| 12/31/2018 | $1,323,379 | $1,342,801 | $1,368,464 |
| 3/31/2019 | $1,545,748 | $1,606,272 | $1,560,643 |
| 6/30/2019 | $1,661,672 | $1,693,040 | $1,624,553 |
| 9/30/2019 | $1,634,091 | $1,681,638 | $1,643,438 |
| 12/31/2019 | $1,923,962 | $1,819,089 | $1,792,948 |
| 3/31/2020 | $1,525,695 | $1,454,544 | $1,418,227 |
| 6/30/2020 | $2,280,392 | $1,894,703 | $1,730,628 |
| 9/30/2020 | $3,355,653 | $2,072,304 | $1,889,976 |
| 12/31/2020 | $4,794,101 | $2,466,439 | $2,167,455 |
| 3/31/2021 | $4,775,950 | $2,452,497 | $2,305,022 |
| 6/30/2021 | $5,006,523 | $2,724,040 | $2,494,951 |
| 9/30/2021 | $5,282,762 | $2,703,339 | $2,492,413 |
| 12/31/2021 | $6,315,140 | $2,780,372 | $2,723,648 |
| 3/31/2022 | $5,946,565 | $2,430,592 | $2,579,881 |
| 6/30/2022 | $4,130,061 | $1,918,424 | $2,149,011 |
| 9/30/2022 | $4,542,936 | $1,905,897 | $2,053,067 |
| 12/31/2022 | $3,636,923 | $2,037,431 | $2,200,519 |
| 3/31/2023 | $4,488,312 | $2,223,568 | $2,358,523 |
| 6/30/2023 | $5,185,872 | $2,362,192 | $2,556,327 |
| 9/30/2023 | $4,813,861 | $2,238,792 | $2,473,149 |
| 12/31/2023 | $5,217,894 | $2,564,450 | $2,771,704 |
| 3/31/2024 | $4,747,935 | $2,807,984 | $3,049,411 |
| 6/30/2024 | $4,796,595 | $2,717,753 | $3,147,479 |
Average Annual Total Returns (%)
| Total Net Assets | $5,867,495,327 |
| # of Issuers | 27 |
| Portfolio Turnover Rate | 0% |
| Total Advisory Fees Paid | $29,698,906 |
| Class/Index Name | 1 Year | 5 Years | 10 Years |
|---|
| Institutional | (7.51%) | 23.62% | 16.98% |
| Russell Midcap Growth Index | 15.05% | 9.93% | 10.51% |
| Russell 3000 Index | 23.13% | 14.14% | 12.15% |
Past performance is not predictive of future performance. The performance data does not reflect the deduction of taxes that a shareholder would pay on Fund distributions or redemption of Fund shares. The Adviser may waive or reimburse certain Fund expenses pursuant to a contract expiring on August 29, 2034, unless renewed for another 11-year term and the Fund’s transfer agency expenses may be reduced by expense offsets from an unaffiliated transfer agent, without which performance would have been lower.
What did the Fund invest in?
| Holding | % of Total Investments (6/30/24)* |
| Tesla, Inc. | 28.9% |
| Space Exploration Technologies Corp. | 13.2% |
| Arch Capital Group Ltd. | 9.5% |
| CoStar Group, Inc. | 7.9% |
| Hyatt Hotels Corp. | 7.3% |
| IDEXX Laboratories, Inc. | 5.0% |
| The Charles Schwab Corp. | 4.8% |
| Gartner, Inc. | 4.5% |
| FactSet Research Systems, Inc. | 4.3% |
| Vail Resorts, Inc. | 3.5% |
| Total | 88.9% |
* Individual weights may not sum to 100% (or displayed total) due to rounding.
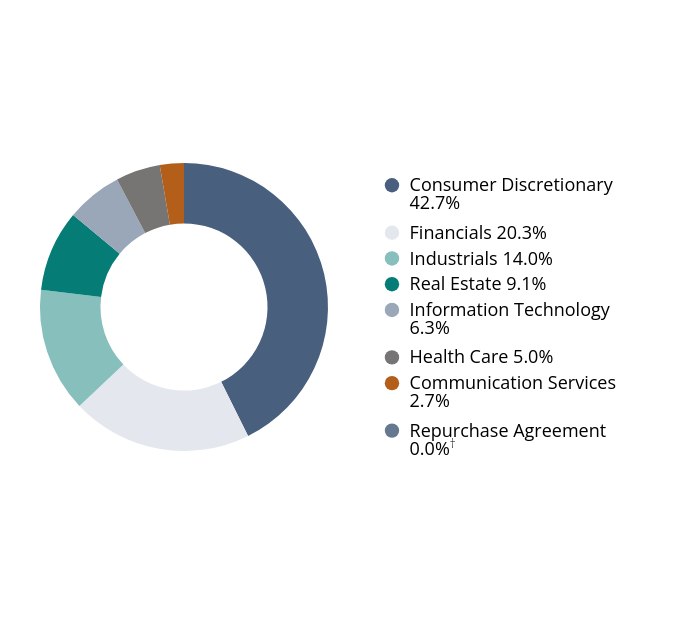
Sector Breakdown
(as a % of total investments)*
| Value | Value |
|---|
| Consumer Discretionary | 42.7% |
| Financials | 20.3% |
| Industrials | 14.0% |
| Real Estate | 9.1% |
| Information Technology | 6.3% |
| Health Care | 5.0% |
| Communication Services | 2.7% |
| Repurchase Agreement | 0.0%Footnote Reference† |
| Footnote | Description |
Footnote† | Includes short-term investments, other assets and liabilities-net. |
If you wish to view additional information about the Fund; including but not limited to its financial statements, prospectus, or holdings, please visit BaronCapitalGroup.com. For benchmark definitions and attribution language please visit connect.rightprospectus.com/Baron.
Phone: 1.800.99.BARON
Email: info@BaronCapitalGroup.com
Semi-Annual Shareholder Report June 30, 2024
Semi-Annual Shareholder Report June 30, 2024
This semi-annual shareholder report contains important information about Baron Partners Fund for the period of January 1, 2024 to June 30, 2024.You can find additional information about the Fund at BaronCapitalGroup.com. You can also request this information by contacting us at 1.800.99.BARON.
What were the Fund costs for last year?
(based on a hypothetical $10,000 investment)
| Class Name | Cost of a $10,000 investment | Costs paid as a percentage of a $10,000 investment |
|---|
| R6 | $98Footnote Reference** | 2.06%Footnote Reference*Footnote Reference+ |
| Footnote | Description |
Footnote** | Includes interest expense of $48. |
Footnote* | Annualized. |
Footnote+ | Includes interest expense of 1.01%. |
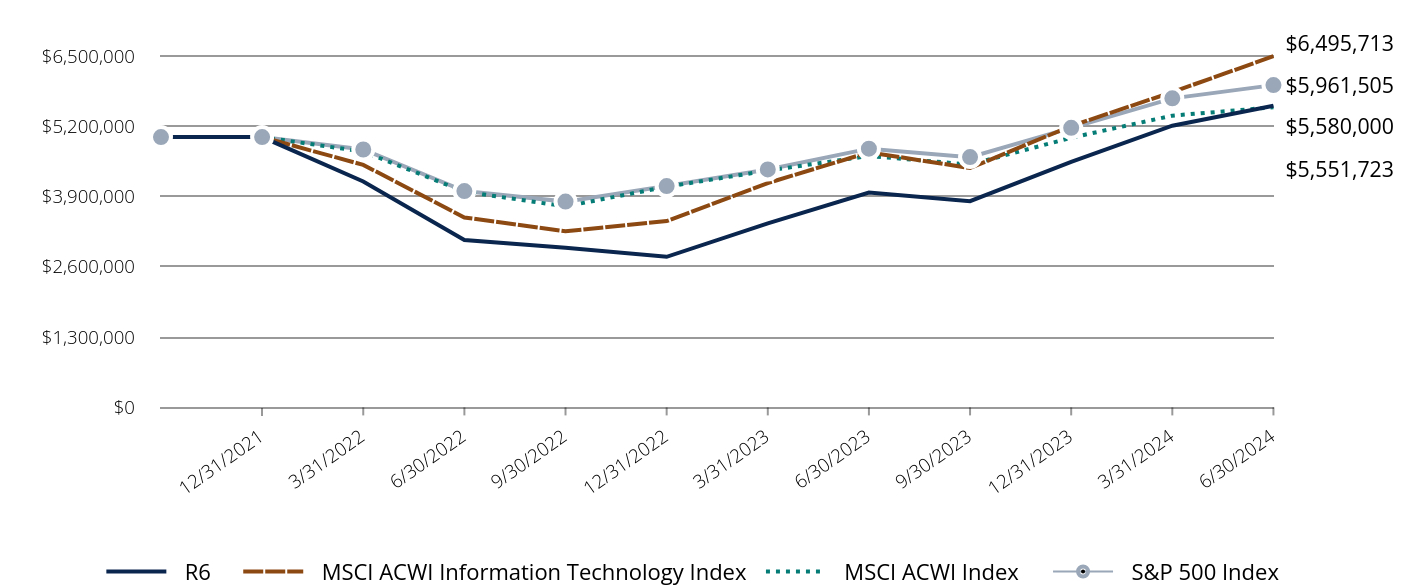
Comparison of the Change in Value of $5,000,000 Investment in the Fund in Relation to the Benchmarks
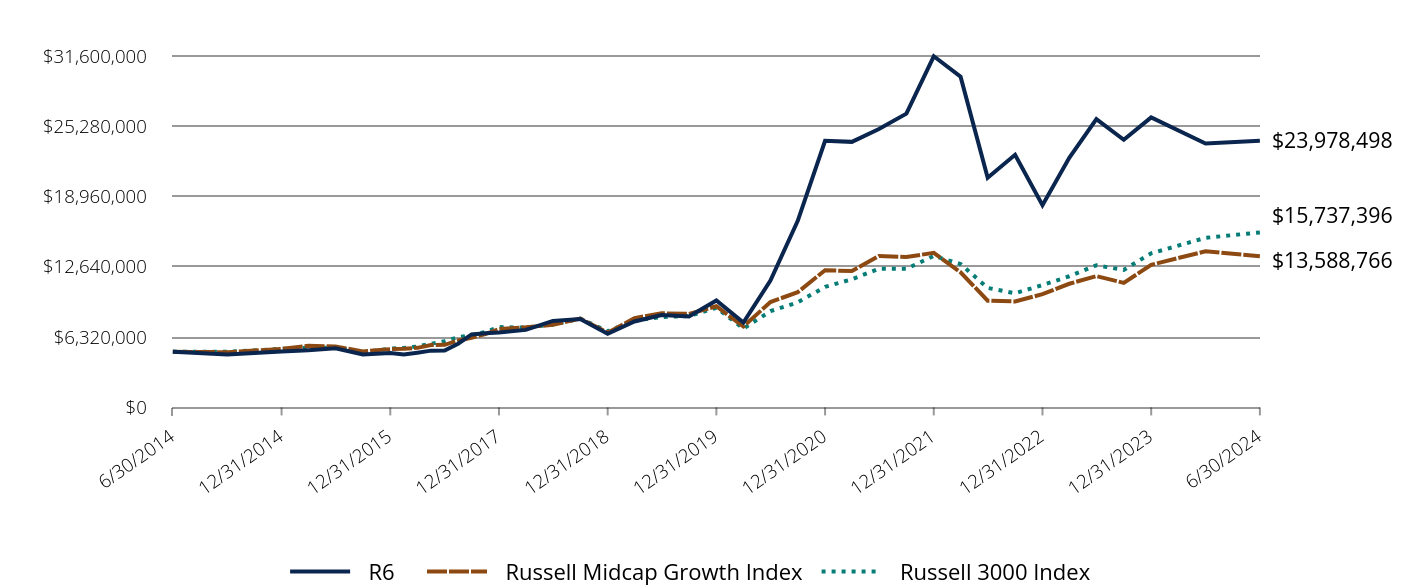
| R6 | Russell Midcap Growth Index | Russell 3000 Index |
|---|
| 6/30/2014 | $5,000,000 | $5,000,000 | $5,000,000 |
| 9/30/2014 | $4,761,777 | $4,963,560 | $5,000,549 |
| 12/31/2014 | $5,017,497 | $5,253,323 | $5,262,585 |
| 3/31/2015 | $5,149,394 | $5,535,850 | $5,357,330 |
| 6/30/2015 | $5,318,977 | $5,472,686 | $5,364,709 |
| 9/30/2015 | $4,760,210 | $5,035,447 | $4,975,809 |
| 12/31/2015 | $4,895,636 | $5,242,811 | $5,287,775 |
| 3/31/2016 | $4,765,627 | $5,273,173 | $5,338,979 |
| 6/30/2016 | $4,921,367 | $5,355,577 | $5,479,425 |
| 9/30/2016 | $5,104,191 | $5,601,500 | $5,720,393 |
| 12/31/2016 | $5,106,900 | $5,627,033 | $5,961,185 |
| 3/31/2017 | $5,725,795 | $6,014,987 | $6,303,553 |
| 6/30/2017 | $6,566,788 | $6,268,514 | $6,493,637 |
| 9/30/2017 | $6,658,877 | $6,599,682 | $6,790,481 |
| 12/31/2017 | $6,734,716 | $7,048,872 | $7,220,816 |
| 3/31/2018 | $6,970,356 | $7,202,140 | $7,174,284 |
| 6/30/2018 | $7,778,847 | $7,429,544 | $7,453,273 |
| 9/30/2018 | $7,945,421 | $7,992,300 | $7,984,238 |
| 12/31/2018 | $6,616,895 | $6,714,007 | $6,842,322 |
| 3/31/2019 | $7,728,740 | $8,031,362 | $7,803,215 |
| 6/30/2019 | $8,309,715 | $8,465,202 | $8,122,764 |
| 9/30/2019 | $8,171,809 | $8,408,188 | $8,217,190 |
| 12/31/2019 | $9,619,805 | $9,095,445 | $8,964,739 |
| 3/31/2020 | $7,628,470 | $7,272,721 | $7,091,136 |
| 6/30/2020 | $11,401,955 | $9,473,512 | $8,653,141 |
| 9/30/2020 | $16,778,269 | $10,361,519 | $9,449,881 |
| 12/31/2020 | $23,969,150 | $12,332,194 | $10,837,276 |
| 3/31/2021 | $23,878,395 | $12,262,485 | $11,525,108 |
| 6/30/2021 | $25,031,263 | $13,620,202 | $12,474,753 |
| 9/30/2021 | $26,412,460 | $13,516,696 | $12,462,065 |
| 12/31/2021 | $31,574,424 | $13,901,862 | $13,618,240 |
| 3/31/2022 | $29,731,535 | $12,152,962 | $12,899,407 |
| 6/30/2022 | $20,650,477 | $9,592,119 | $10,745,057 |
| 9/30/2022 | $22,713,332 | $9,529,483 | $10,265,333 |
| 12/31/2022 | $18,183,223 | $10,187,153 | $11,002,594 |
| 3/31/2023 | $22,438,637 | $11,117,841 | $11,792,613 |
| 6/30/2023 | $25,926,476 | $11,810,958 | $12,781,637 |
| 9/30/2023 | $24,064,830 | $11,193,958 | $12,365,745 |
| 12/31/2023 | $26,085,014 | $12,822,247 | $13,858,519 |
| 3/31/2024 | $23,736,766 | $14,039,918 | $15,247,052 |
| 6/30/2024 | $23,978,498 | $13,588,766 | $15,737,396 |
Average Annual Total Returns (%)
| Total Net Assets | $5,867,495,327 |
| # of Issuers | 27 |
| Portfolio Turnover Rate | 0% |
| Total Advisory Fees Paid | $29,698,906 |
| Class/Index Name | 1 Year | 5 Years | 10 Years |
|---|
| R6 | (7.51%) | 23.61% | 16.97% |
| Russell Midcap Growth Index | 15.05% | 9.93% | 10.51% |
| Russell 3000 Index | 23.13% | 14.14% | 12.15% |
Past performance is not predictive of future performance. The performance data does not reflect the deduction of taxes that a shareholder would pay on Fund distributions or redemption of Fund shares. The Adviser may waive or reimburse certain Fund expenses pursuant to a contract expiring on August 29, 2034, unless renewed for another 11-year term and the Fund’s transfer agency expenses may be reduced by expense offsets from an unaffiliated transfer agent, without which performance would have been lower. Performance for the R6 Shares prior to August 31, 2016 is based on the performance of the Institutional Shares.
What did the Fund invest in?
| Holding | % of Total Investments (6/30/24)* |
| Tesla, Inc. | 28.9% |
| Space Exploration Technologies Corp. | 13.2% |
| Arch Capital Group Ltd. | 9.5% |
| CoStar Group, Inc. | 7.9% |
| Hyatt Hotels Corp. | 7.3% |
| IDEXX Laboratories, Inc. | 5.0% |
| The Charles Schwab Corp. | 4.8% |
| Gartner, Inc. | 4.5% |
| FactSet Research Systems, Inc. | 4.3% |
| Vail Resorts, Inc. | 3.5% |
| Total | 88.9% |
* Individual weights may not sum to 100% (or displayed total) due to rounding.
Sector Breakdown
(as a % of total investments)*
| Value | Value |
|---|
| Consumer Discretionary | 42.7% |
| Financials | 20.3% |
| Industrials | 14.0% |
| Real Estate | 9.1% |
| Information Technology | 6.3% |
| Health Care | 5.0% |
| Communication Services | 2.7% |
| Repurchase Agreement | 0.0%Footnote Reference† |
| Footnote | Description |
Footnote† | Includes short-term investments, other assets and liabilities-net. |
If you wish to view additional information about the Fund; including but not limited to its financial statements, prospectus, or holdings, please visit BaronCapitalGroup.com. For benchmark definitions and attribution language please visit connect.rightprospectus.com/Baron.
Phone: 1.800.99.BARON
Email: info@BaronCapitalGroup.com
Semi-Annual Shareholder Report June 30, 2024
Semi-Annual Shareholder Report June 30, 2024
This semi-annual shareholder report contains important information about Baron Partners Fund for the period of January 1, 2024 to June 30, 2024.You can find additional information about the Fund at BaronCapitalGroup.com. You can also request this information by contacting us at 1.800.99.BARON.
What were the Fund costs for last year?
(based on a hypothetical $10,000 investment)
| Class Name | Cost of a $10,000 investment | Costs paid as a percentage of a $10,000 investment |
|---|
| Retail | $110Footnote Reference** | 2.31%Footnote Reference*Footnote Reference+ |
| Footnote | Description |
Footnote** | Includes interest expense of $48. |
Footnote* | Annualized. |
Footnote+ | Includes interest expense of 1.01%. |
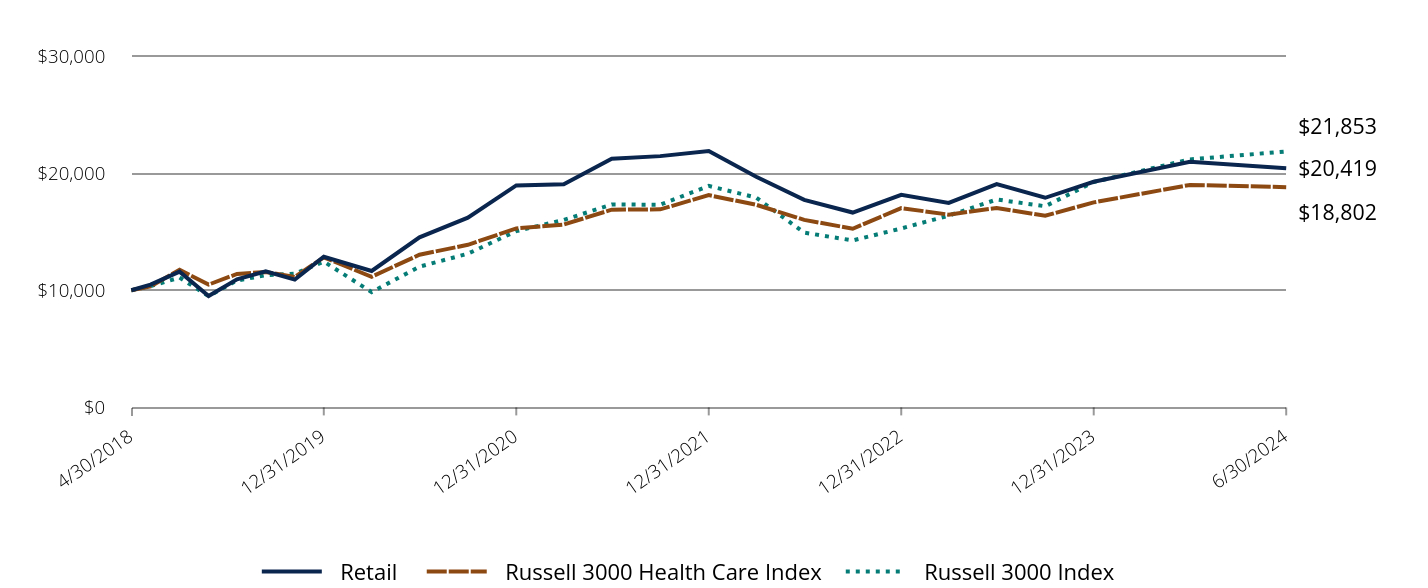
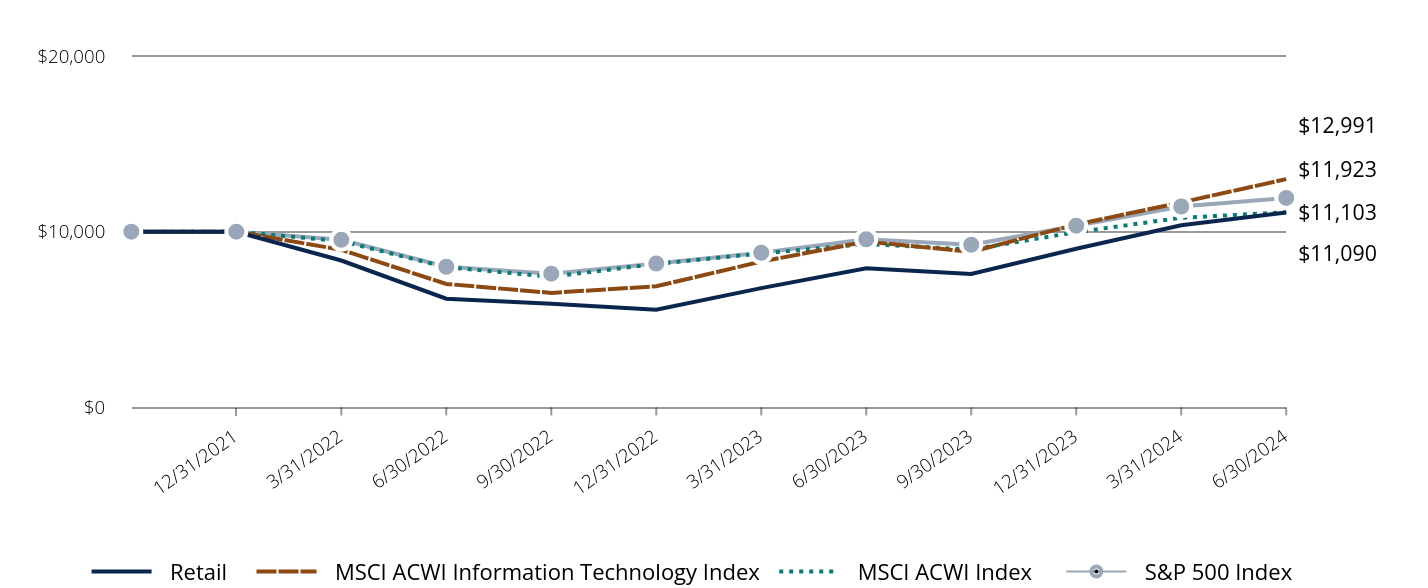
Comparison of the Change in Value of $10,000 Investment in the Fund in Relation to the Benchmarks
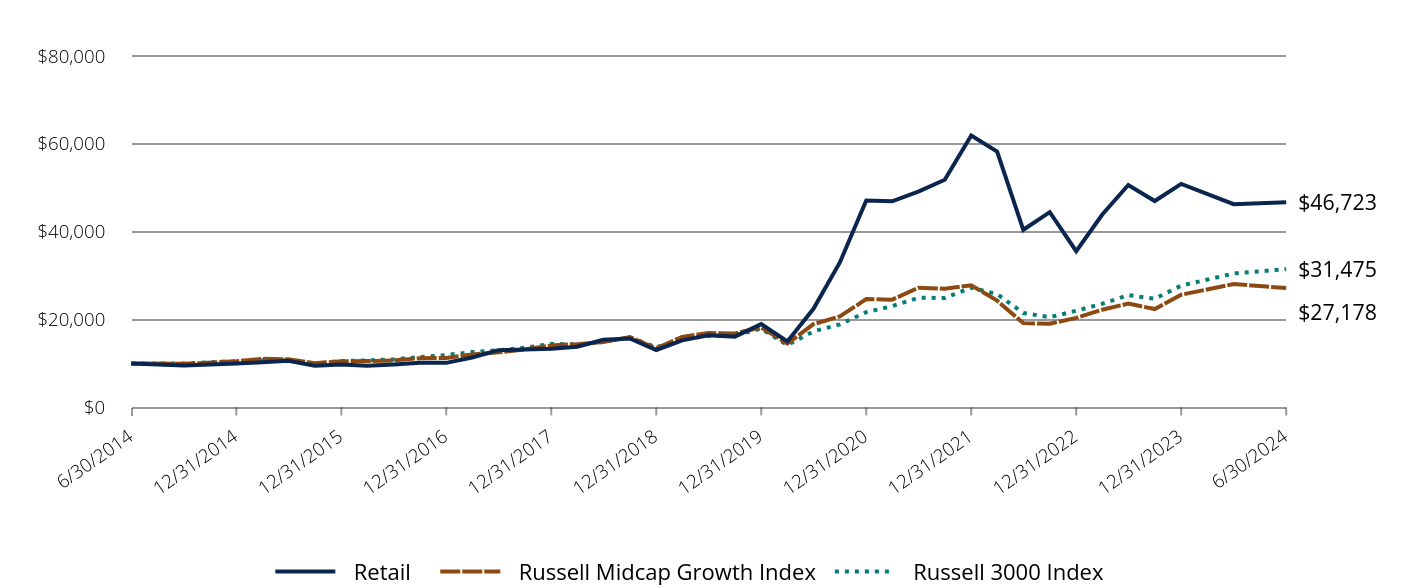
| Retail | Russell Midcap Growth Index | Russell 3000 Index |
|---|
| 6/30/2014 | $10,000 | $10,000 | $10,000 |
| 9/30/2014 | $9,514 | $9,927 | $10,001 |
| 12/31/2014 | $10,022 | $10,507 | $10,525 |
| 3/31/2015 | $10,278 | $11,072 | $10,715 |
| 6/30/2015 | $10,608 | $10,945 | $10,729 |
| 9/30/2015 | $9,488 | $10,071 | $9,952 |
| 12/31/2015 | $9,751 | $10,486 | $10,576 |
| 3/31/2016 | $9,485 | $10,546 | $10,678 |
| 6/30/2016 | $9,789 | $10,711 | $10,959 |
| 9/30/2016 | $10,147 | $11,203 | $11,441 |
| 12/31/2016 | $10,145 | $11,254 | $11,922 |
| 3/31/2017 | $11,366 | $12,030 | $12,607 |
| 6/30/2017 | $13,027 | $12,537 | $12,987 |
| 9/30/2017 | $13,202 | $13,199 | $13,581 |
| 12/31/2017 | $13,345 | $14,098 | $14,442 |
| 3/31/2018 | $13,802 | $14,404 | $14,349 |
| 6/30/2018 | $15,392 | $14,859 | $14,907 |
| 9/30/2018 | $15,710 | $15,985 | $15,969 |
| 12/31/2018 | $13,076 | $13,428 | $13,685 |
| 3/31/2019 | $15,264 | $16,063 | $15,606 |
| 6/30/2019 | $16,400 | $16,930 | $16,246 |
| 9/30/2019 | $16,118 | $16,816 | $16,434 |
| 12/31/2019 | $18,960 | $18,191 | $17,930 |
| 3/31/2020 | $15,025 | $14,545 | $14,182 |
| 6/30/2020 | $22,442 | $18,947 | $17,306 |
| 9/30/2020 | $33,002 | $20,723 | $18,900 |
| 12/31/2020 | $47,120 | $24,664 | $21,675 |
| 3/31/2021 | $46,911 | $24,525 | $23,050 |
| 6/30/2021 | $49,144 | $27,240 | $24,950 |
| 9/30/2021 | $51,824 | $27,033 | $24,924 |
| 12/31/2021 | $61,911 | $27,804 | $27,237 |
| 3/31/2022 | $58,258 | $24,306 | $25,799 |
| 6/30/2022 | $40,438 | $19,184 | $21,490 |
| 9/30/2022 | $44,450 | $19,059 | $20,531 |
| 12/31/2022 | $35,562 | $20,374 | $22,005 |
| 3/31/2023 | $43,857 | $22,236 | $23,585 |
| 6/30/2023 | $50,641 | $23,622 | $25,563 |
| 9/30/2023 | $46,978 | $22,388 | $24,732 |
| 12/31/2023 | $50,889 | $25,645 | $27,717 |
| 3/31/2024 | $46,276 | $28,080 | $30,494 |
| 6/30/2024 | $46,723 | $27,178 | $31,475 |
Average Annual Total Returns (%)
| Total Net Assets | $5,867,495,327 |
| # of Issuers | 27 |
| Portfolio Turnover Rate | 0% |
| Total Advisory Fees Paid | $29,698,906 |
| Class/Index Name | 1 Year | 5 Years | 10 Years |
|---|
| Retail | (7.74%) | 23.29% | 16.67% |
| Russell Midcap Growth Index | 15.05% | 9.93% | 10.51% |
| Russell 3000 Index | 23.13% | 14.14% | 12.15% |
Past performance is not predictive of future performance. The performance data does not reflect the deduction of taxes that a shareholder would pay on Fund distributions or redemption of Fund shares. The Adviser may waive or reimburse certain Fund expenses pursuant to a contract expiring on August 29, 2034, unless renewed for another 11-year term and the Fund’s transfer agency expenses may be reduced by expense offsets from an unaffiliated transfer agent, without which performance would have been lower.
What did the Fund invest in?
| Holding | % of Total Investments (6/30/24)* |
| Tesla, Inc. | 28.9% |
| Space Exploration Technologies Corp. | 13.2% |
| Arch Capital Group Ltd. | 9.5% |
| CoStar Group, Inc. | 7.9% |
| Hyatt Hotels Corp. | 7.3% |
| IDEXX Laboratories, Inc. | 5.0% |
| The Charles Schwab Corp. | 4.8% |
| Gartner, Inc. | 4.5% |
| FactSet Research Systems, Inc. | 4.3% |
| Vail Resorts, Inc. | 3.5% |
| Total | 88.9% |
* Individual weights may not sum to 100% (or displayed total) due to rounding.
Sector Breakdown
(as a % of total investments)*
| Value | Value |
|---|
| Consumer Discretionary | 42.7% |
| Financials | 20.3% |
| Industrials | 14.0% |
| Real Estate | 9.1% |
| Information Technology | 6.3% |
| Health Care | 5.0% |
| Communication Services | 2.7% |
| Repurchase Agreement | 0.0%Footnote Reference† |
| Footnote | Description |
Footnote† | Includes short-term investments, other assets and liabilities-net. |
If you wish to view additional information about the Fund; including but not limited to its financial statements, prospectus, or holdings, please visit BaronCapitalGroup.com. For benchmark definitions and attribution language please visit connect.rightprospectus.com/Baron.
Phone: 1.800.99.BARON
Email: info@BaronCapitalGroup.com
Semi-Annual Shareholder Report June 30, 2024
Semi-Annual Shareholder Report June 30, 2024
This semi-annual shareholder report contains important information about Baron WealthBuilder Fund for the period of January 1, 2024 to June 30, 2024.You can find additional information about the Fund at BaronCapitalGroup.com. You can also request this information by contacting us at 1.800.99.BARON.
What were the Fund costs for last year?
(based on a hypothetical $10,000 investment)
| Class Name | Cost of a $10,000 investment | Costs paid as a percentage of a $10,000 investment |
|---|
| Institutional | $3Footnote Reference† | 0.05%Footnote Reference*Footnote Reference† |
| Footnote | Description |
Footnote* | Annualized. |
Footnote† | Reflects fee waivers and/or expense reimbursements, without which expenses would have been higher. |
Comparison of the Change in Value of $1,000,000 Investment in the Fund in Relation to the Benchmarks
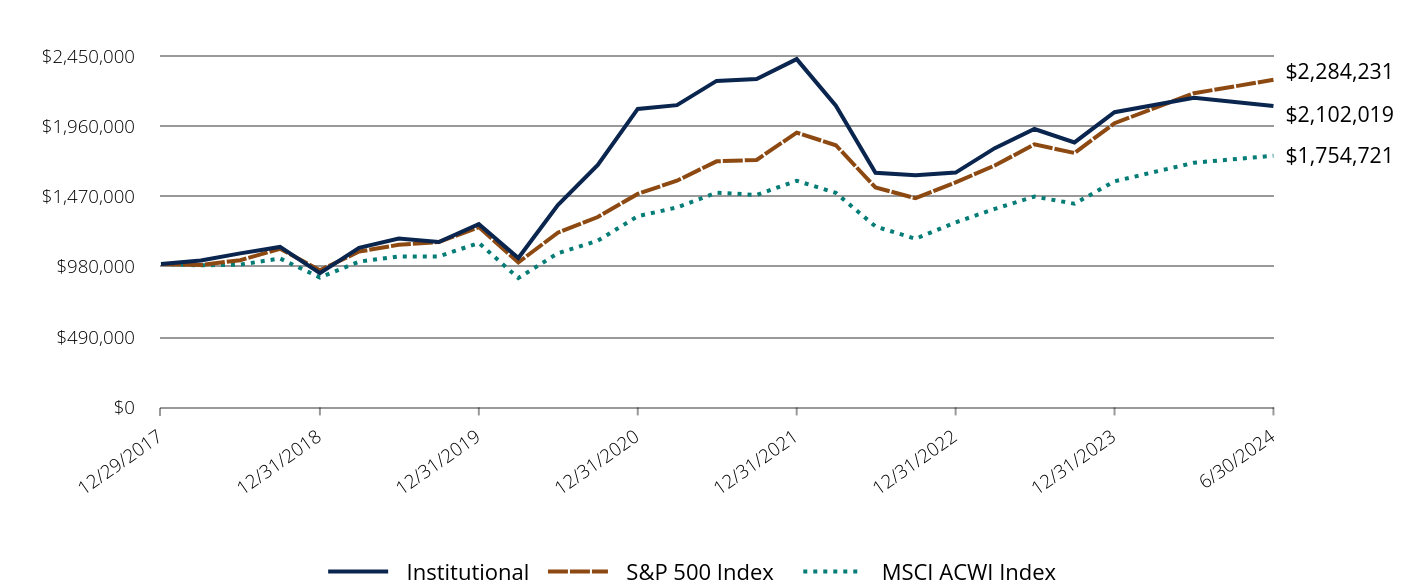
| Institutional | S&P 500 Index | MSCI ACWI Index |
|---|
| 12/29/2017 | $1,000,000 | $1,000,000 | $1,000,000 |
| 3/31/2018 | $1,024,000 | $992,409 | $990,384 |
| 6/30/2018 | $1,074,000 | $1,026,487 | $995,669 |
| 9/30/2018 | $1,119,000 | $1,105,637 | $1,038,253 |
| 12/31/2018 | $936,233 | $956,158 | $905,844 |
| 3/31/2019 | $1,112,465 | $1,086,653 | $1,016,144 |
| 6/30/2019 | $1,177,551 | $1,133,421 | $1,052,846 |
| 9/30/2019 | $1,152,993 | $1,152,670 | $1,052,574 |
| 12/31/2019 | $1,277,865 | $1,257,217 | $1,146,790 |
| 3/31/2020 | $1,041,648 | $1,010,827 | $901,776 |
| 6/30/2020 | $1,411,063 | $1,218,484 | $1,075,088 |
| 9/30/2020 | $1,690,310 | $1,327,288 | $1,162,495 |
| 12/31/2020 | $2,080,960 | $1,488,529 | $1,333,199 |
| 3/31/2021 | $2,107,368 | $1,580,446 | $1,394,145 |
| 6/30/2021 | $2,276,380 | $1,715,555 | $1,497,221 |
| 9/30/2021 | $2,289,056 | $1,725,540 | $1,481,433 |
| 12/31/2021 | $2,428,424 | $1,915,818 | $1,580,339 |
| 3/31/2022 | $2,103,667 | $1,827,719 | $1,495,621 |
| 6/30/2022 | $1,636,062 | $1,533,435 | $1,261,399 |
| 9/30/2022 | $1,618,614 | $1,458,564 | $1,175,375 |
| 12/31/2022 | $1,637,047 | $1,568,847 | $1,290,126 |
| 3/31/2023 | $1,807,549 | $1,686,464 | $1,384,380 |
| 6/30/2023 | $1,941,185 | $1,833,897 | $1,469,897 |
| 9/30/2023 | $1,847,333 | $1,773,866 | $1,419,882 |
| 12/31/2023 | $2,058,227 | $1,981,259 | $1,576,558 |
| 3/31/2024 | $2,158,488 | $2,190,399 | $1,705,778 |
| 6/30/2024 | $2,102,019 | $2,284,231 | $1,754,721 |
Average Annual Total Returns (%)
| Total Net Assets | $540,429,253 |
| # of Issuers | 16 |
| Portfolio Turnover Rate | 1% |
| Total Advisory Fees Paid | $- |
| Class/Index Name | 1 Year | 5 Years | Since Inception 12/29/2017 |
|---|
| Institutional | 8.29% | 12.29% | 12.12% |
| S&P 500 Index | 24.56% | 15.05% | 13.55% |
| MSCI ACWI Index | 19.38% | 10.76% | 9.04% |
Past performance is not predictive of future performance. The performance data does not reflect the deduction of taxes that a shareholder would pay on Fund distributions or redemption of Fund shares. The Adviser has agreed that, pursuant to a contract expiring on August 29, 2034, unless renewed for another 11-year term, it will reimburse certain expenses of the Fund, limiting net annual operating expenses (portfolio transaction costs, interest and dividend expense, acquired fund fees and expenses, fees and expenses related to filing foreign tax reclaims, and extraordinary expense are not subject to the operating expense limitation) to 0.05% of average expense limitation) to 0.05% of average daily net assets of TA shares, 0.30% of average daily net assets of Retail Shares, and 0.05% of average daily net assets of Institutional shares, without which performance would have been lower.
What did the Fund invest in?
Country Exposures
(as a % of net assets)
| United States | 87.0% |
| India | 1.4% |
| Netherlands | 1.3% |
| Canada | 1.2% |
| Ireland | 1.0% |
| Korea | 0.9% |
| China | 0.9% |
| Sweden | 0.8% |
| Israel | 0.7% |
| Other | 5.0% |
* Individual weights may not sum to 100% (or displayed total) due to rounding.
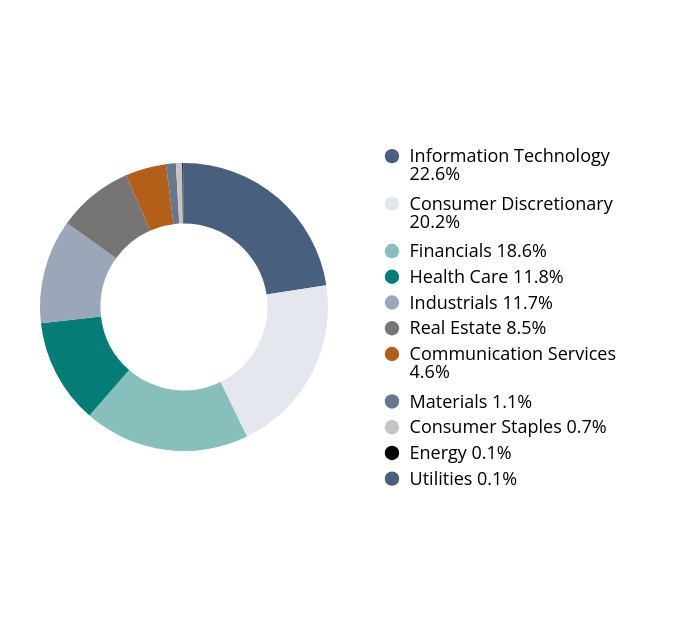
Sector Breakdown
(as a % of net assets)*
| Value | Value |
|---|
| Information Technology | 22.6% |
| Consumer Discretionary | 20.2% |
| Financials | 18.6% |
| Health Care | 11.8% |
| Industrials | 11.7% |
| Real Estate | 8.5% |
| Communication Services | 4.6% |
| Materials | 1.1% |
| Consumer Staples | 0.7% |
| Energy | 0.1% |
| Utilities | 0.1% |
If you wish to view additional information about the Fund; including but not limited to its financial statements, prospectus, or holdings, please visit BaronCapitalGroup.com. For benchmark definitions and attribution language please visit connect.rightprospectus.com/Baron.
Phone: 1.800.99.BARON
Email: info@BaronCapitalGroup.com
Semi-Annual Shareholder Report June 30, 2024
Semi-Annual Shareholder Report June 30, 2024
This semi-annual shareholder report contains important information about Baron WealthBuilder Fund for the period of January 1, 2024 to June 30, 2024.You can find additional information about the Fund at BaronCapitalGroup.com. You can also request this information by contacting us at 1.800.99.BARON.
What were the Fund costs for last year?
(based on a hypothetical $10,000 investment)
| Class Name | Cost of a $10,000 investment | Costs paid as a percentage of a $10,000 investment |
|---|
| Retail | $15Footnote Reference† | 0.30%Footnote Reference*Footnote Reference† |
| Footnote | Description |
Footnote* | Annualized. |
Footnote† | Reflects fee waivers and/or expense reimbursements, without which expenses would have been higher. |
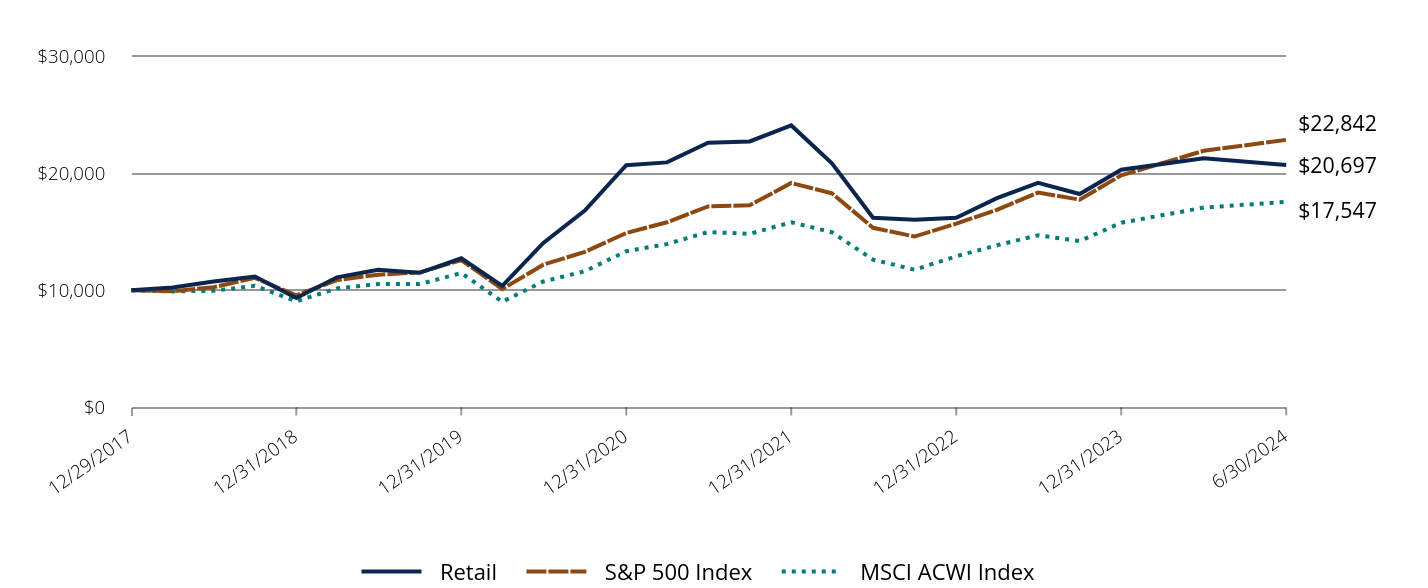
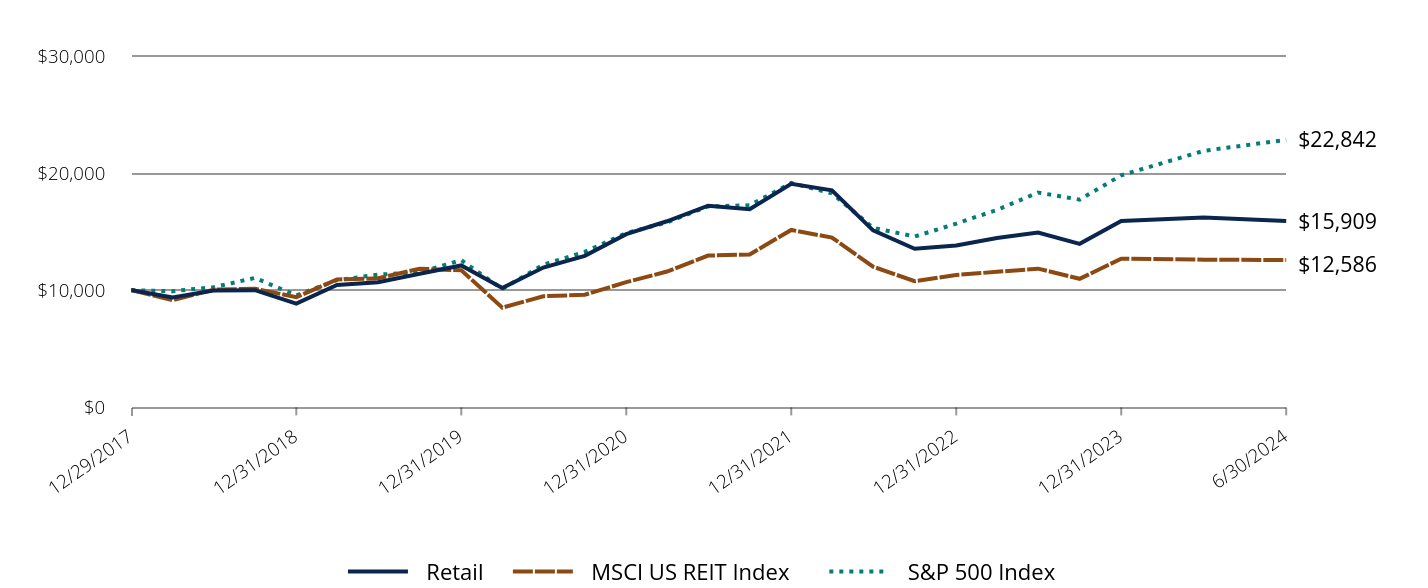
Comparison of the Change in Value of $10,000 Investment in the Fund in Relation to the Benchmarks
| Retail | S&P 500 Index | MSCI ACWI Index |
|---|
| 12/29/2017 | $10,000 | $10,000 | $10,000 |
| 3/31/2018 | $10,240 | $9,924 | $9,904 |
| 6/30/2018 | $10,740 | $10,265 | $9,957 |
| 9/30/2018 | $11,180 | $11,056 | $10,383 |
| 12/31/2018 | $9,342 | $9,562 | $9,058 |
| 3/31/2019 | $11,105 | $10,867 | $10,161 |
| 6/30/2019 | $11,745 | $11,334 | $10,529 |
| 9/30/2019 | $11,490 | $11,527 | $10,526 |
| 12/31/2019 | $12,728 | $12,572 | $11,468 |
| 3/31/2020 | $10,376 | $10,108 | $9,018 |
| 6/30/2020 | $14,039 | $12,185 | $10,751 |
| 9/30/2020 | $16,811 | $13,273 | $11,625 |
| 12/31/2020 | $20,676 | $14,885 | $13,332 |
| 3/31/2021 | $20,919 | $15,805 | $13,941 |
| 6/30/2021 | $22,589 | $17,156 | $14,972 |
| 9/30/2021 | $22,705 | $17,255 | $14,814 |
| 12/31/2021 | $24,072 | $19,158 | $15,803 |
| 3/31/2022 | $20,834 | $18,277 | $14,956 |
| 6/30/2022 | $16,190 | $15,334 | $12,614 |
| 9/30/2022 | $16,015 | $14,586 | $11,754 |
| 12/31/2022 | $16,188 | $15,689 | $12,901 |
| 3/31/2023 | $17,860 | $16,865 | $13,844 |
| 6/30/2023 | $19,163 | $18,339 | $14,699 |
| 9/30/2023 | $18,218 | $17,739 | $14,199 |
| 12/31/2023 | $20,293 | $19,813 | $15,766 |
| 3/31/2024 | $21,273 | $21,904 | $17,058 |
| 6/30/2024 | $20,697 | $22,842 | $17,547 |
Average Annual Total Returns (%)
| Total Net Assets | $540,429,253 |
| # of Issuers | 16 |
| Portfolio Turnover Rate | 1% |
| Total Advisory Fees Paid | $- |
| Class/Index Name | 1 Year | 5 Years | Since Inception 12/29/2017 |
|---|
| Retail | 8.00% | 12.00% | 11.85% |
| S&P 500 Index | 24.56% | 15.05% | 13.55% |
| MSCI ACWI Index | 19.38% | 10.76% | 9.04% |
Past performance is not predictive of future performance. The performance data does not reflect the deduction of taxes that a shareholder would pay on Fund distributions or redemption of Fund shares. The Adviser has agreed that, pursuant to a contract expiring on August 29, 2034, unless renewed for another 11-year term, it will reimburse certain expenses of the Fund, limiting net annual operating expenses (portfolio transaction costs, interest and dividend expense, acquired fund fees and expenses, fees and expenses related to filing foreign tax reclaims, and extraordinary expense are not subject to the operating expense limitation) to 0.05% of average expense limitation) to 0.05% of average daily net assets of TA shares, 0.30% of average daily net assets of Retail Shares, and 0.05% of average daily net assets of Institutional shares, without which performance would have been lower.
What did the Fund invest in?
Country Exposures
(as a % of net assets)
| United States | 87.0% |
| India | 1.4% |
| Netherlands | 1.3% |
| Canada | 1.2% |
| Ireland | 1.0% |
| Korea | 0.9% |
| China | 0.9% |
| Sweden | 0.8% |
| Israel | 0.7% |
| Other | 5.0% |
* Individual weights may not sum to 100% (or displayed total) due to rounding.
Sector Breakdown
(as a % of net assets)*
| Value | Value |
|---|
| Information Technology | 22.6% |
| Consumer Discretionary | 20.2% |
| Financials | 18.6% |
| Health Care | 11.8% |
| Industrials | 11.7% |
| Real Estate | 8.5% |
| Communication Services | 4.6% |
| Materials | 1.1% |
| Consumer Staples | 0.7% |
| Energy | 0.1% |
| Utilities | 0.1% |
If you wish to view additional information about the Fund; including but not limited to its financial statements, prospectus, or holdings, please visit BaronCapitalGroup.com. For benchmark definitions and attribution language please visit connect.rightprospectus.com/Baron.
Phone: 1.800.99.BARON
Email: info@BaronCapitalGroup.com
Semi-Annual Shareholder Report June 30, 2024
Semi-Annual Shareholder Report June 30, 2024
This semi-annual shareholder report contains important information about Baron WealthBuilder Fund for the period of January 1, 2024 to June 30, 2024.You can find additional information about the Fund at BaronCapitalGroup.com. You can also request this information by contacting us at 1.800.99.BARON.
What were the Fund costs for last year?
(based on a hypothetical $10,000 investment)
| Class Name | Cost of a $10,000 investment | Costs paid as a percentage of a $10,000 investment |
|---|
| TA Shares | $3Footnote Reference† | 0.05%Footnote Reference*Footnote Reference† |
| Footnote | Description |
Footnote* | Annualized. |
Footnote† | Reflects fee waivers and/or expense reimbursements, without which expenses would have been higher. |
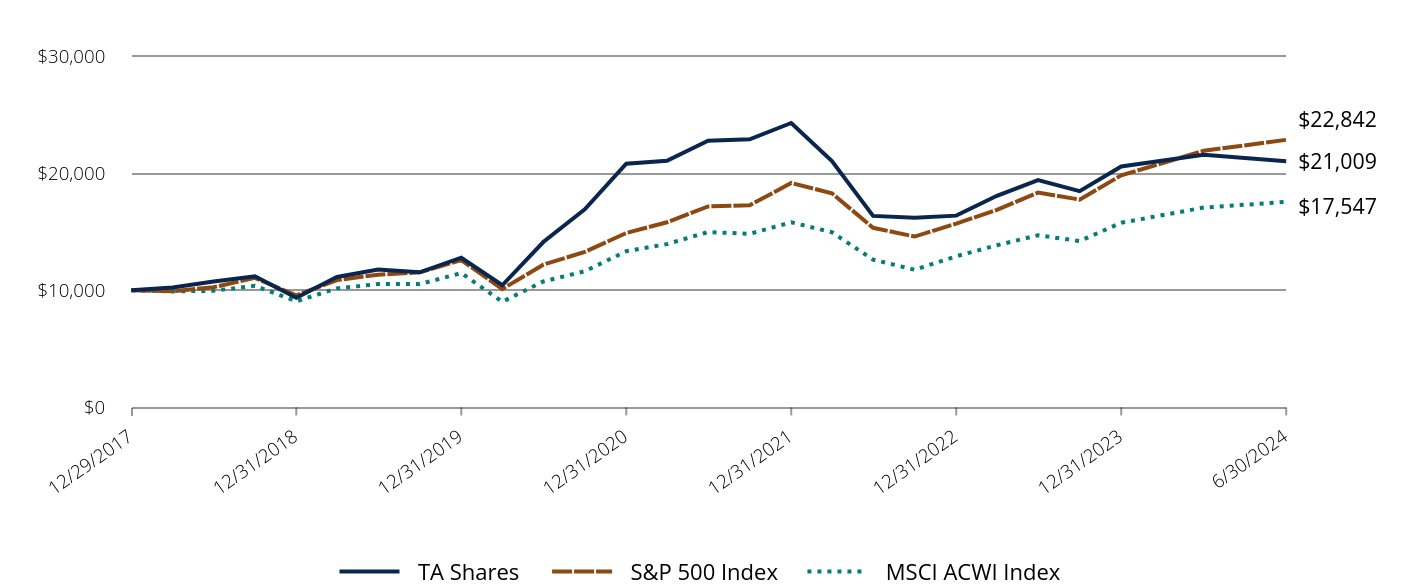
Comparison of the Change in Value of $10,000 Investment in the Fund in Relation to the Benchmarks
| TA Shares | S&P 500 Index | MSCI ACWI Index |
|---|
| 12/29/2017 | $10,000 | $10,000 | $10,000 |
| 3/31/2018 | $10,240 | $9,924 | $9,904 |
| 6/30/2018 | $10,740 | $10,265 | $9,957 |
| 9/30/2018 | $11,200 | $11,056 | $10,383 |
| 12/31/2018 | $9,362 | $9,562 | $9,058 |
| 3/31/2019 | $11,135 | $10,867 | $10,161 |
| 6/30/2019 | $11,776 | $11,334 | $10,529 |
| 9/30/2019 | $11,530 | $11,527 | $10,526 |
| 12/31/2019 | $12,778 | $12,572 | $11,468 |
| 3/31/2020 | $10,427 | $10,108 | $9,018 |
| 6/30/2020 | $14,121 | $12,185 | $10,751 |
| 9/30/2020 | $16,913 | $13,273 | $11,625 |
| 12/31/2020 | $20,809 | $14,885 | $13,332 |
| 3/31/2021 | $21,062 | $15,805 | $13,941 |
| 6/30/2021 | $22,763 | $17,156 | $14,972 |
| 9/30/2021 | $22,890 | $17,255 | $14,814 |
| 12/31/2021 | $24,284 | $19,158 | $15,803 |
| 3/31/2022 | $21,036 | $18,277 | $14,956 |
| 6/30/2022 | $16,349 | $15,334 | $12,614 |
| 9/30/2022 | $16,186 | $14,586 | $11,754 |
| 12/31/2022 | $16,371 | $15,689 | $12,901 |
| 3/31/2023 | $18,064 | $16,865 | $13,844 |
| 6/30/2023 | $19,401 | $18,339 | $14,699 |
| 9/30/2023 | $18,462 | $17,739 | $14,199 |
| 12/31/2023 | $20,571 | $19,813 | $15,766 |
| 3/31/2024 | $21,574 | $21,904 | $17,058 |
| 6/30/2024 | $21,009 | $22,842 | $17,547 |
Average Annual Total Returns (%)
| Total Net Assets | $540,429,253 |
| # of Issuers | 16 |
| Portfolio Turnover Rate | 1% |
| Total Advisory Fees Paid | $- |
| Class/Index Name | 1 Year | 5 Years | Since Inception 12/29/2017 |
|---|
| TA Shares | 8.29% | 12.28% | 12.11% |
| S&P 500 Index | 24.56% | 15.05% | 13.55% |
| MSCI ACWI Index | 19.38% | 10.76% | 9.04% |
Past performance is not predictive of future performance. The performance data does not reflect the deduction of taxes that a shareholder would pay on Fund distributions or redemption of Fund shares. The Adviser has agreed that, pursuant to a contract expiring on August 29, 2034, unless renewed for another 11-year term, it will reimburse certain expenses of the Fund, limiting net annual operating expenses (portfolio transaction costs, interest and dividend expense, acquired fund fees and expenses, fees and expenses related to filing foreign tax reclaims, and extraordinary expense are not subject to the operating expense limitation) to 0.05% of average expense limitation) to 0.05% of average daily net assets of TA shares, 0.30% of average daily net assets of Retail Shares, and 0.05% of average daily net assets of Institutional shares, without which performance would have been lower.
What did the Fund invest in?
Country Exposures
(as a % of net assets)
| United States | 87.0% |
| India | 1.4% |
| Netherlands | 1.3% |
| Canada | 1.2% |
| Ireland | 1.0% |
| Korea | 0.9% |
| China | 0.9% |
| Sweden | 0.8% |
| Israel | 0.7% |
| Other | 5.0% |
* Individual weights may not sum to 100% (or displayed total) due to rounding.
Sector Breakdown
(as a % of net assets)*
| Value | Value |
|---|
| Information Technology | 22.6% |
| Consumer Discretionary | 20.2% |
| Financials | 18.6% |
| Health Care | 11.8% |
| Industrials | 11.7% |
| Real Estate | 8.5% |
| Communication Services | 4.6% |
| Materials | 1.1% |
| Consumer Staples | 0.7% |
| Energy | 0.1% |
| Utilities | 0.1% |
If you wish to view additional information about the Fund; including but not limited to its financial statements, prospectus, or holdings, please visit BaronCapitalGroup.com. For benchmark definitions and attribution language please visit connect.rightprospectus.com/Baron.
Phone: 1.800.99.BARON
Email: info@BaronCapitalGroup.com
Semi-Annual Shareholder Report June 30, 2024
Semi-Annual Shareholder Report June 30, 2024
Baron Emerging Markets Fund
This semi-annual shareholder report contains important information about Baron Emerging Markets Fund for the period of January 1, 2024 to June 30, 2024.You can find additional information about the Fund at BaronCapitalGroup.com. You can also request this information by contacting us at 1.800.99.BARON.
What were the Fund costs for last year?
(based on a hypothetical $10,000 investment)
| Class Name | Cost of a $10,000 investment | Costs paid as a percentage of a $10,000 investment |
|---|
| Institutional | $58 | 1.12%Footnote Reference* |
| Footnote | Description |
Footnote* | Annualized. |
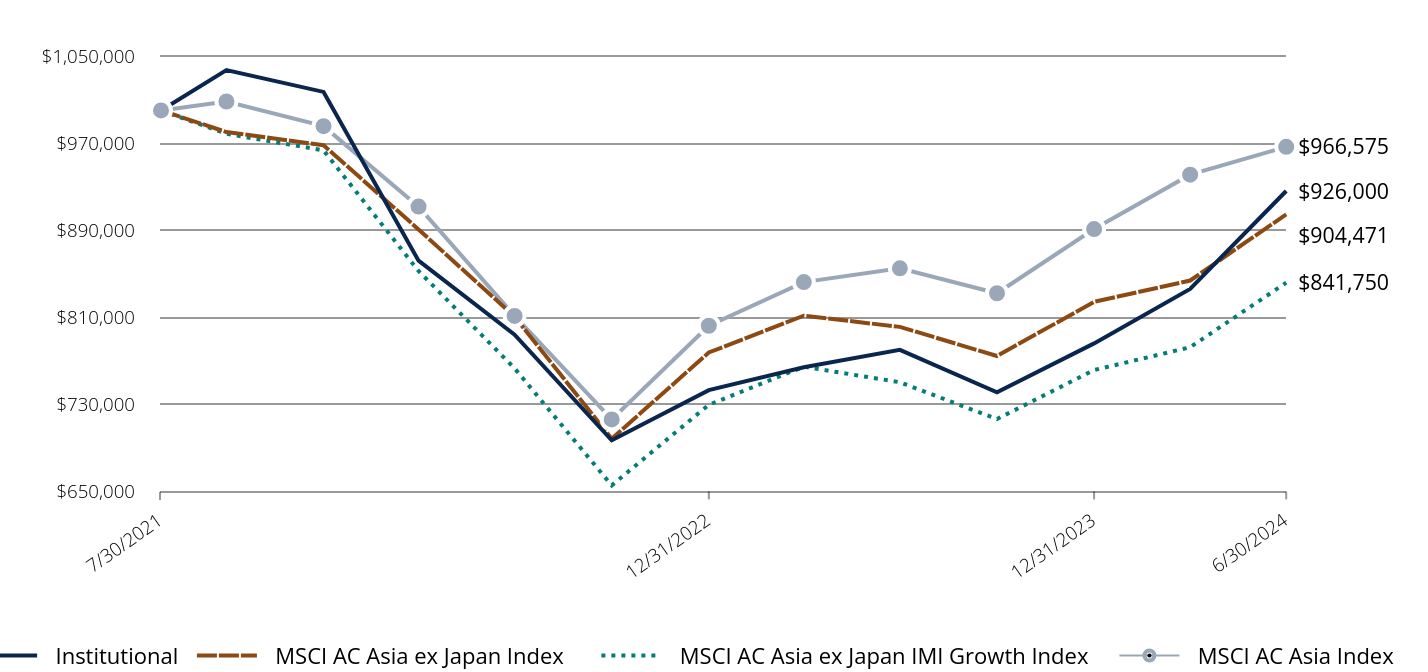
Comparison of the Change in Value of $1,000,000 Investment in the Fund in Relation to the Benchmarks
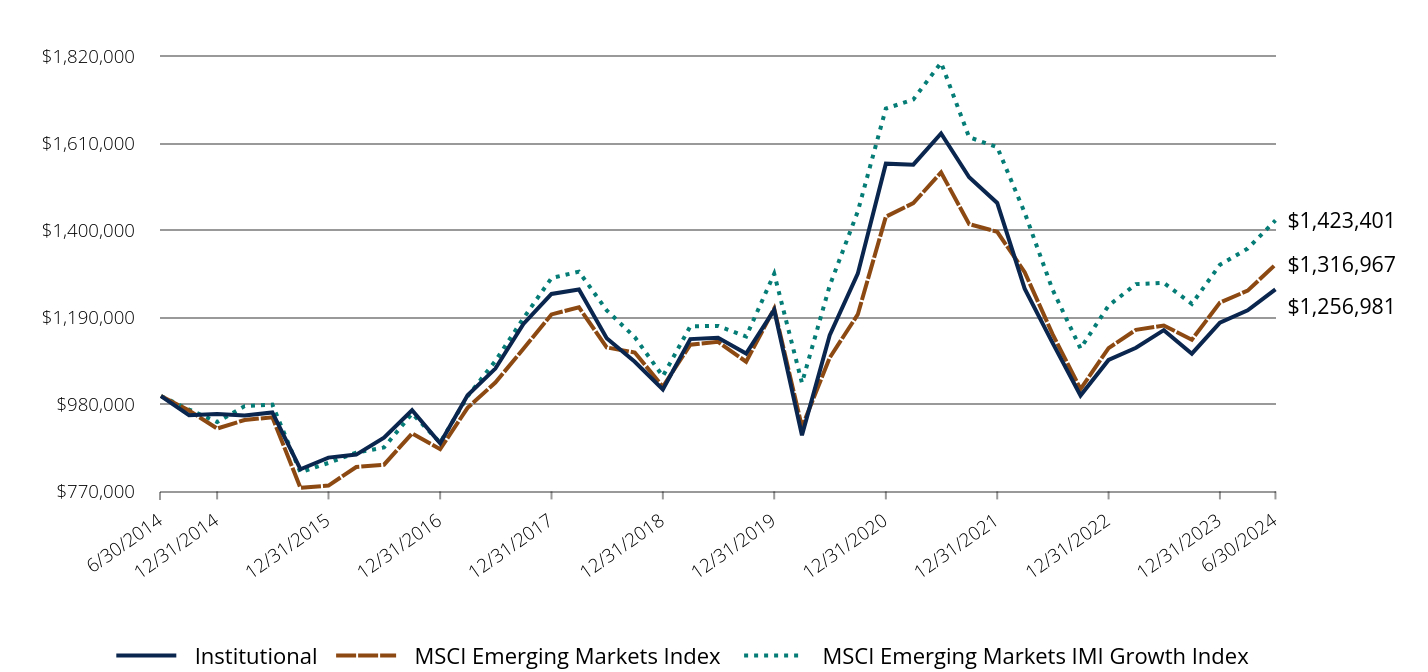
| Institutional | MSCI Emerging Markets Index | MSCI Emerging Markets IMI Growth Index |
|---|
| 6/30/2014 | $1,000,000 | $1,000,000 | $1,000,000 |
| 9/30/2014 | $953,748 | $965,049 | $967,419 |
| 12/31/2014 | $956,382 | $921,576 | $937,327 |
| 3/31/2015 | $953,178 | $942,214 | $975,714 |
| 6/30/2015 | $960,387 | $948,753 | $979,236 |
| 9/30/2015 | $823,418 | $778,962 | $816,005 |
| 12/31/2015 | $851,512 | $784,098 | $838,769 |
| 3/31/2016 | $858,748 | $828,898 | $863,650 |
| 6/30/2016 | $899,756 | $834,382 | $875,898 |
| 9/30/2016 | $965,690 | $909,698 | $957,870 |
| 12/31/2016 | $886,221 | $871,814 | $887,713 |
| 3/31/2017 | $1,001,640 | $971,593 | $999,183 |
| 6/30/2017 | $1,066,210 | $1,032,508 | $1,084,565 |
| 9/30/2017 | $1,173,941 | $1,114,011 | $1,187,507 |
| 12/31/2017 | $1,246,270 | $1,196,853 | $1,284,539 |
| 3/31/2018 | $1,256,811 | $1,213,811 | $1,299,990 |
| 6/30/2018 | $1,139,238 | $1,117,193 | $1,206,691 |
| 9/30/2018 | $1,082,479 | $1,104,967 | $1,141,906 |
| 12/31/2018 | $1,015,893 | $1,022,374 | $1,047,709 |
| 3/31/2019 | $1,137,279 | $1,123,870 | $1,168,217 |
| 6/30/2019 | $1,140,537 | $1,130,686 | $1,169,089 |
| 9/30/2019 | $1,102,435 | $1,082,686 | $1,143,446 |
| 12/31/2019 | $1,207,518 | $1,210,851 | $1,294,988 |
| 3/31/2020 | $905,434 | $925,103 | $1,031,535 |
| 6/30/2020 | $1,146,937 | $1,092,376 | $1,266,339 |
| 9/30/2020 | $1,295,114 | $1,196,788 | $1,444,966 |
| 12/31/2020 | $1,560,359 | $1,432,512 | $1,693,160 |
| 3/31/2021 | $1,557,903 | $1,465,253 | $1,715,142 |
| 6/30/2021 | $1,633,219 | $1,539,209 | $1,803,871 |
| 9/30/2021 | $1,527,612 | $1,414,654 | $1,624,114 |
| 12/31/2021 | $1,465,618 | $1,396,100 | $1,600,071 |
| 3/31/2022 | $1,258,864 | $1,298,723 | $1,442,367 |
| 6/30/2022 | $1,128,809 | $1,150,022 | $1,257,241 |
| 9/30/2022 | $1,001,255 | $1,016,936 | $1,114,563 |
| 12/31/2022 | $1,087,125 | $1,115,604 | $1,217,975 |
| 3/31/2023 | $1,116,304 | $1,159,736 | $1,269,925 |
| 6/30/2023 | $1,158,822 | $1,170,140 | $1,272,838 |
| 9/30/2023 | $1,102,131 | $1,135,910 | $1,222,089 |
| 12/31/2023 | $1,177,212 | $1,225,247 | $1,316,456 |
| 3/31/2024 | $1,206,601 | $1,254,265 | $1,355,634 |
| 6/30/2024 | $1,256,981 | $1,316,967 | $1,423,401 |
Average Annual Total Returns (%)
| Total Net Assets | $4,045,719,258 |
| # of Issuers | 106 |
| Portfolio Turnover Rate | 20% |
| Total Advisory Fees Paid | $20,930,588 |
| Class/Index Name | 1 Year | 5 Years | 10 Years |
|---|
| Institutional | 8.47% | 1.96% | 2.31% |
| MSCI Emerging Markets Index | 12.55% | 3.10% | 2.79% |
| MSCI Emerging Markets IMI Growth Index | 11.83% | 4.01% | 3.59% |
Past performance is not predictive of future performance. The performance data does not reflect the deduction of taxes that a shareholder would pay on Fund distributions or redemption of Fund shares. The Adviser may waive or reimburse certain Fund expenses pursuant to a contract expiring on August 29, 2034, unless renewed for another 11-year term and the Fund’s transfer agency expenses may be reduced by expense offsets from an unaffiliated transfer agent, without which performance would have been lower.
Semi-Annual Shareholder Report | 1
Baron Emerging Markets Fund
What did the Fund invest in?
| Holding | % of Total Net Assets (6/30/24)* |
| Taiwan Semiconductor Manufacturing Co., Ltd. | 9.7% |
| Tencent Holdings Limited | 4.7% |
| Samsung Electronics Co., Ltd. | 4.5% |
| Bharti Airtel Ltd. | 3.2% |
| Indus Towers Ltd. | 2.6% |
| Bundl Technologies Private Ltd. | 2.6% |
| HD Korea Shipbuilding & Offshore Engineering Co. Ltd. | 2.4% |
| Reliance Industries Limited | 2.1% |
| InPost SA | 2.0% |
| Alibaba Group Holding Limited | 1.8% |
| Total | 35.6% |
* Individual weights may not sum to 100% (or displayed total) due to rounding.
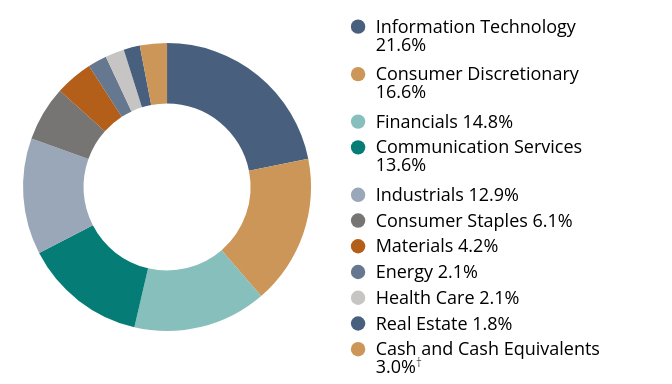
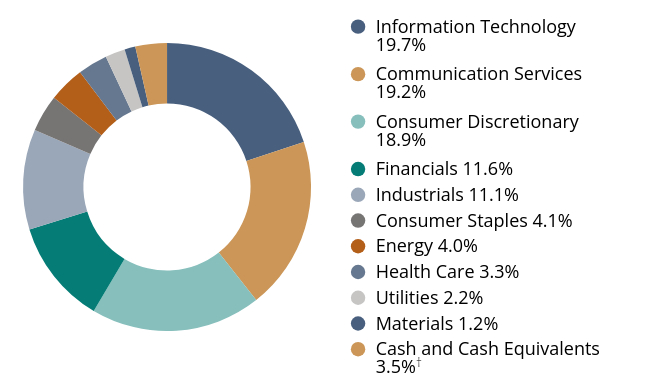
Sector Breakdown
(as a % of net assets)*
| Value | Value |
|---|
| Information Technology | 21.6% |
| Consumer Discretionary | 16.6% |
| Financials | 14.8% |
| Communication Services | 13.6% |
| Industrials | 12.9% |
| Consumer Staples | 6.1% |
| Materials | 4.2% |
| Energy | 2.1% |
| Health Care | 2.1% |
| Real Estate | 1.8% |
| Cash and Cash Equivalents | 3.0%Footnote Reference† |
| Footnote | Description |
Footnote† | Includes short-term investments, other assets and liabilities-net. |
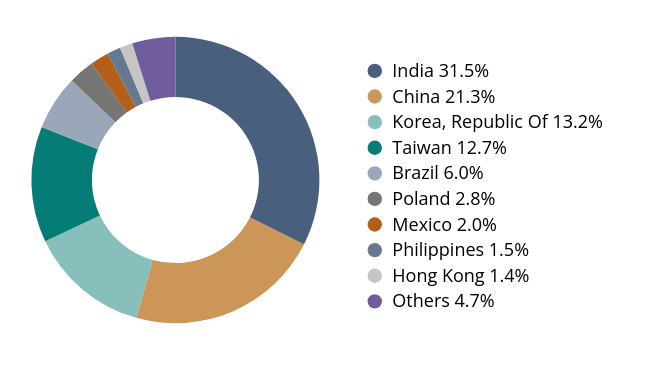
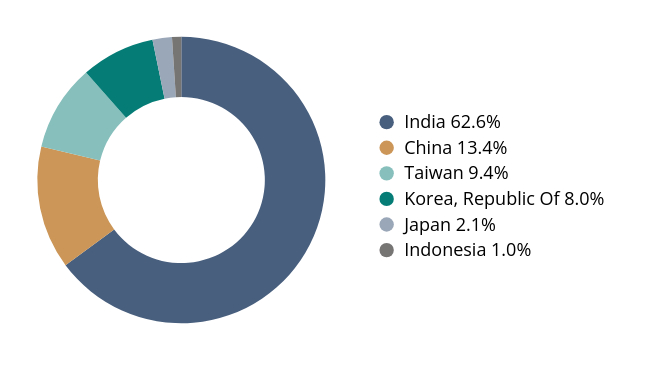
Country Exposures
(as a % of net assets)*
| Value | Value |
|---|
| India | 31.5% |
| China | 21.3% |
| Korea, Republic Of | 13.2% |
| Taiwan | 12.7% |
| Brazil | 6.0% |
| Poland | 2.8% |
| Mexico | 2.0% |
| Philippines | 1.5% |
| Hong Kong | 1.4% |
| Others | 4.7% |
If you wish to view additional information about the Fund; including but not limited to its financial statements, prospectus, or holdings, please visit BaronCapitalGroup.com. For benchmark definitions and attribution language please visit connect.rightprospectus.com/Baron.
Phone: 1.800.99.BARON
Email: info@BaronCapitalGroup.com
Baron Emerging Markets Fund
Semi-Annual Shareholder Report June 30, 2024
Semi-Annual Shareholder Report June 30, 2024
Baron Emerging Markets Fund
This semi-annual shareholder report contains important information about Baron Emerging Markets Fund for the period of January 1, 2024 to June 30, 2024.You can find additional information about the Fund at BaronCapitalGroup.com. You can also request this information by contacting us at 1.800.99.BARON.
What were the Fund costs for last year?
(based on a hypothetical $10,000 investment)
| Class Name | Cost of a $10,000 investment | Costs paid as a percentage of a $10,000 investment |
|---|
| R6 | $58 | 1.13%Footnote Reference* |
| Footnote | Description |
Footnote* | Annualized. |
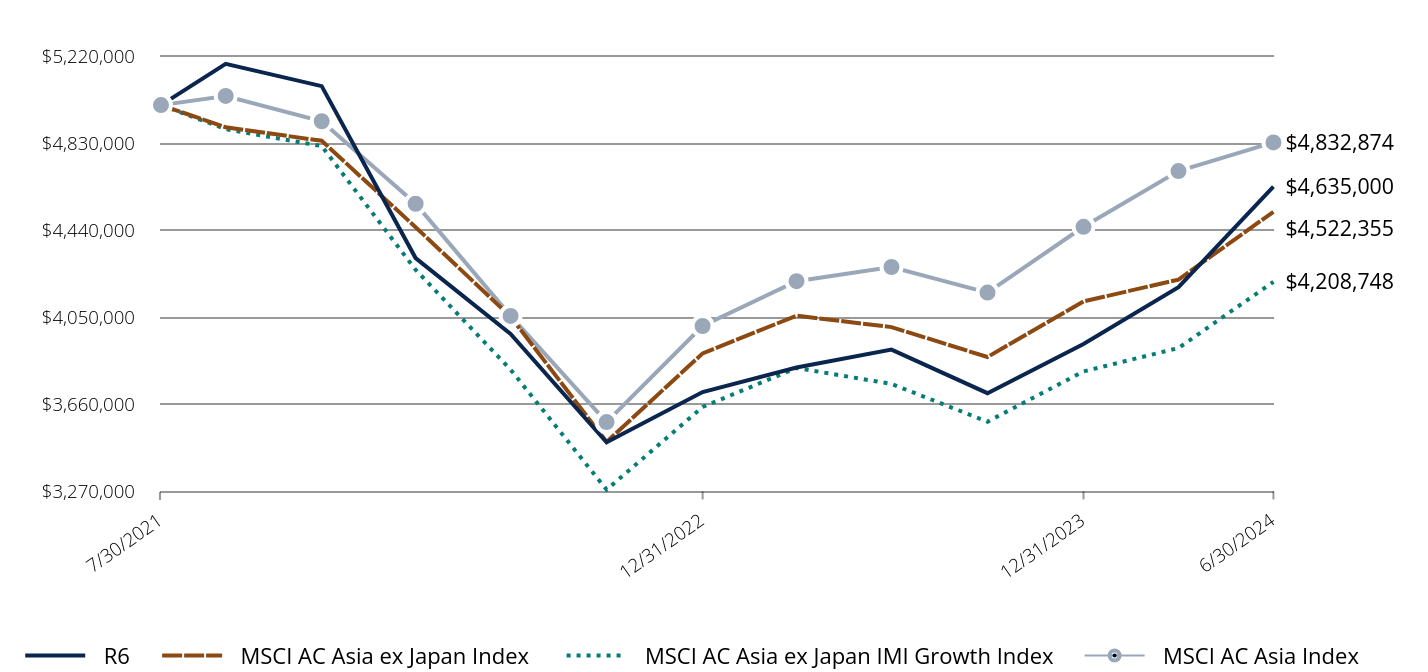
Comparison of the Change in Value of $5,000,000 Investment in the Fund in Relation to the Benchmarks
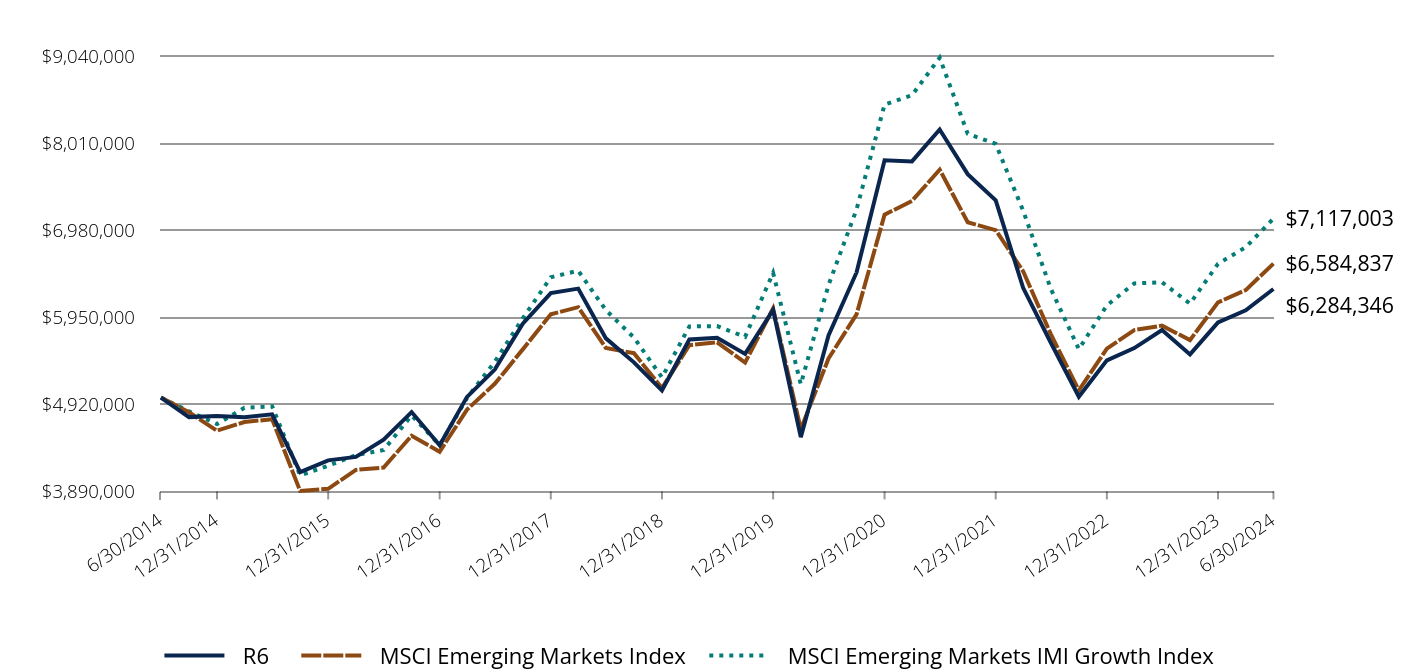
| R6 | MSCI Emerging Markets Index | MSCI Emerging Markets IMI Growth Index |
|---|
| 6/30/2014 | $5,000,000 | $5,000,000 | $5,000,000 |
| 9/30/2014 | $4,768,740 | $4,825,246 | $4,837,096 |
| 12/31/2014 | $4,781,911 | $4,607,882 | $4,686,635 |
| 3/31/2015 | $4,765,892 | $4,711,072 | $4,878,572 |
| 6/30/2015 | $4,801,936 | $4,743,764 | $4,896,180 |
| 9/30/2015 | $4,117,090 | $3,894,810 | $4,080,027 |
| 12/31/2015 | $4,257,559 | $3,920,490 | $4,193,845 |
| 3/31/2016 | $4,297,762 | $4,144,492 | $4,318,252 |
| 6/30/2016 | $4,502,800 | $4,171,909 | $4,379,492 |
| 9/30/2016 | $4,828,449 | $4,548,490 | $4,789,350 |
| 12/31/2016 | $4,435,245 | $4,359,069 | $4,438,564 |
| 3/31/2017 | $5,008,316 | $4,857,964 | $4,995,912 |
| 6/30/2017 | $5,331,173 | $5,162,540 | $5,422,824 |
| 9/30/2017 | $5,873,876 | $5,570,057 | $5,937,533 |
| 12/31/2017 | $6,235,506 | $5,984,267 | $6,422,696 |
| 3/31/2018 | $6,288,212 | $6,069,055 | $6,499,947 |
| 6/30/2018 | $5,700,339 | $5,585,964 | $6,033,454 |
| 9/30/2018 | $5,416,538 | $5,524,836 | $5,709,528 |
| 12/31/2018 | $5,083,564 | $5,111,867 | $5,238,546 |
| 3/31/2019 | $5,686,423 | $5,619,352 | $5,841,086 |
| 6/30/2019 | $5,706,790 | $5,653,427 | $5,845,446 |
| 9/30/2019 | $5,516,280 | $5,413,431 | $5,717,231 |
| 12/31/2019 | $6,037,600 | $6,054,257 | $6,474,941 |
| 3/31/2020 | $4,531,270 | $4,625,517 | $5,157,676 |
| 6/30/2020 | $5,734,697 | $5,461,879 | $6,331,696 |
| 9/30/2020 | $6,479,675 | $5,983,941 | $7,224,831 |
| 12/31/2020 | $7,805,901 | $7,162,557 | $8,465,798 |
| 3/31/2021 | $7,793,621 | $7,326,267 | $8,575,710 |
| 6/30/2021 | $8,170,203 | $7,696,044 | $9,019,354 |
| 9/30/2021 | $7,642,169 | $7,073,271 | $8,120,571 |
| 12/31/2021 | $7,332,076 | $6,980,498 | $8,000,354 |
| 3/31/2022 | $6,298,332 | $6,493,613 | $7,211,835 |
| 6/30/2022 | $5,648,074 | $5,750,108 | $6,286,207 |
| 9/30/2022 | $5,010,321 | $5,084,679 | $5,572,814 |
| 12/31/2022 | $5,439,658 | $5,578,021 | $6,089,877 |
| 3/31/2023 | $5,585,549 | $5,798,681 | $6,349,622 |
| 6/30/2023 | $5,798,134 | $5,850,698 | $6,364,187 |
| 9/30/2023 | $5,510,520 | $5,679,550 | $6,110,447 |
| 12/31/2023 | $5,889,738 | $6,126,236 | $6,582,281 |
| 3/31/2024 | $6,032,469 | $6,271,325 | $6,778,171 |
| 6/30/2024 | $6,284,346 | $6,584,837 | $7,117,003 |
Average Annual Total Returns (%)
| Total Net Assets | $4,045,719,258 |
| # of Issuers | 106 |
| Portfolio Turnover Rate | 20% |
| Total Advisory Fees Paid | $20,930,588 |
| Class/Index Name | 1 Year | 5 Years | 10 Years |
|---|
| R6 | 8.39% | 1.95% | 2.31% |
| MSCI Emerging Markets Index | 12.55% | 3.10% | 2.79% |
| MSCI Emerging Markets IMI Growth Index | 11.83% | 4.01% | 3.59% |
Past performance is not predictive of future performance. The performance data does not reflect the deduction of taxes that a shareholder would pay on Fund distributions or redemption of Fund shares. The Adviser may waive or reimburse certain Fund expenses pursuant to a contract expiring on August 29, 2034, unless renewed for another 11-year term and the Fund’s transfer agency expenses may be reduced by expense offsets from an unaffiliated transfer agent, without which performance would have been lower. Performance for the R6 Shares prior to January 29, 2016 is based on the performance of the Institutional Shares.
Semi-Annual Shareholder Report | 1
Baron Emerging Markets Fund
What did the Fund invest in?
| Holding | % of Total Net Assets (6/30/24)* |
| Taiwan Semiconductor Manufacturing Co., Ltd. | 9.7% |
| Tencent Holdings Limited | 4.7% |
| Samsung Electronics Co., Ltd. | 4.5% |
| Bharti Airtel Ltd. | 3.2% |
| Indus Towers Ltd. | 2.6% |
| Bundl Technologies Private Ltd. | 2.6% |
| HD Korea Shipbuilding & Offshore Engineering Co. Ltd. | 2.4% |
| Reliance Industries Limited | 2.1% |
| InPost SA | 2.0% |
| Alibaba Group Holding Limited | 1.8% |
| Total | 35.6% |
* Individual weights may not sum to 100% (or displayed total) due to rounding.
Sector Breakdown
(as a % of net assets)*
| Value | Value |
|---|
| Information Technology | 21.6% |
| Consumer Discretionary | 16.6% |
| Financials | 14.8% |
| Communication Services | 13.6% |
| Industrials | 12.9% |
| Consumer Staples | 6.1% |
| Materials | 4.2% |
| Energy | 2.1% |
| Health Care | 2.1% |
| Real Estate | 1.8% |
| Cash and Cash Equivalents | 3.0%Footnote Reference† |
| Footnote | Description |
Footnote† | Includes short-term investments, other assets and liabilities-net. |
Country Exposures
(as a % of net assets)*
| Value | Value |
|---|
| India | 31.5% |
| China | 21.3% |
| Korea, Republic Of | 13.2% |
| Taiwan | 12.7% |
| Brazil | 6.0% |
| Poland | 2.8% |
| Mexico | 2.0% |
| Philippines | 1.5% |
| Hong Kong | 1.4% |
| Others | 4.7% |
If you wish to view additional information about the Fund; including but not limited to its financial statements, prospectus, or holdings, please visit BaronCapitalGroup.com. For benchmark definitions and attribution language please visit connect.rightprospectus.com/Baron.
Phone: 1.800.99.BARON
Email: info@BaronCapitalGroup.com
Baron Emerging Markets Fund
Semi-Annual Shareholder Report June 30, 2024
Semi-Annual Shareholder Report June 30, 2024
Baron Emerging Markets Fund
This semi-annual shareholder report contains important information about Baron Emerging Markets Fund for the period of January 1, 2024 to June 30, 2024.You can find additional information about the Fund at BaronCapitalGroup.com. You can also request this information by contacting us at 1.800.99.BARON.
What were the Fund costs for last year?
(based on a hypothetical $10,000 investment)
| Class Name | Cost of a $10,000 investment | Costs paid as a percentage of a $10,000 investment |
|---|
| Retail | $71 | 1.38%Footnote Reference* |
| Footnote | Description |
Footnote* | Annualized. |
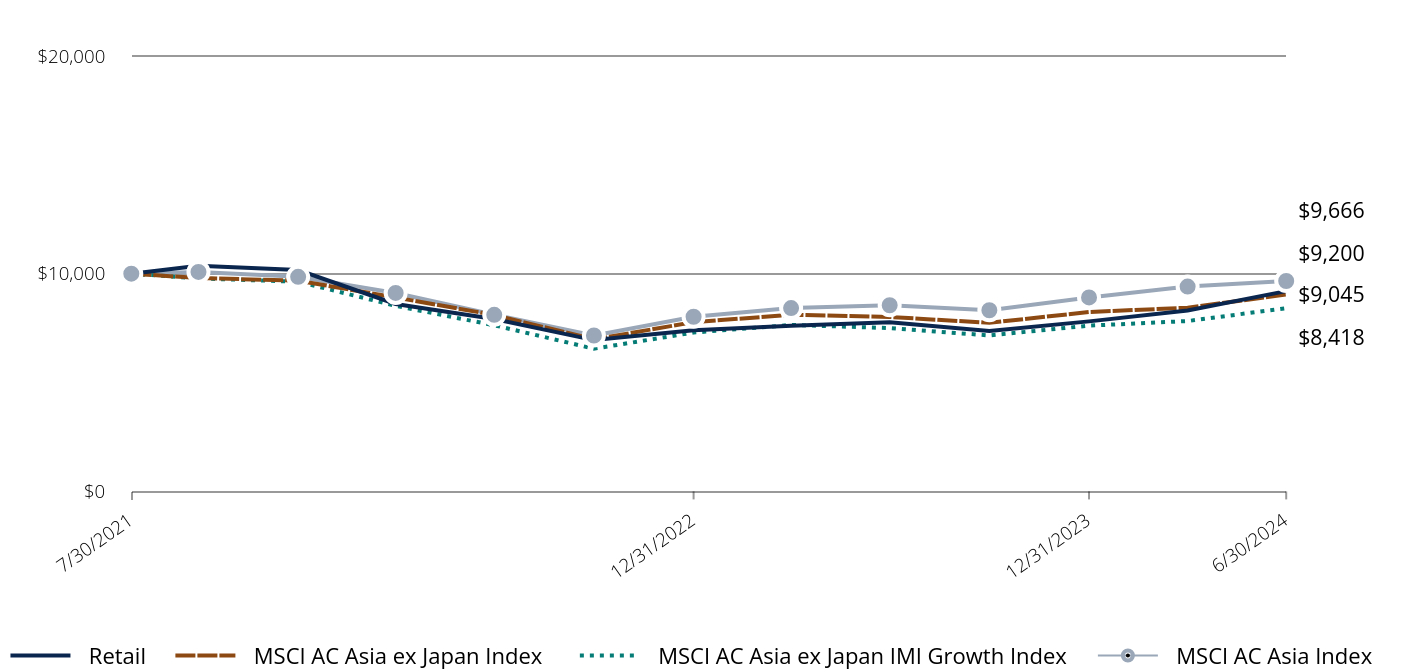
Comparison of the Change in Value of $10,000 Investment in the Fund in Relation to the Benchmarks
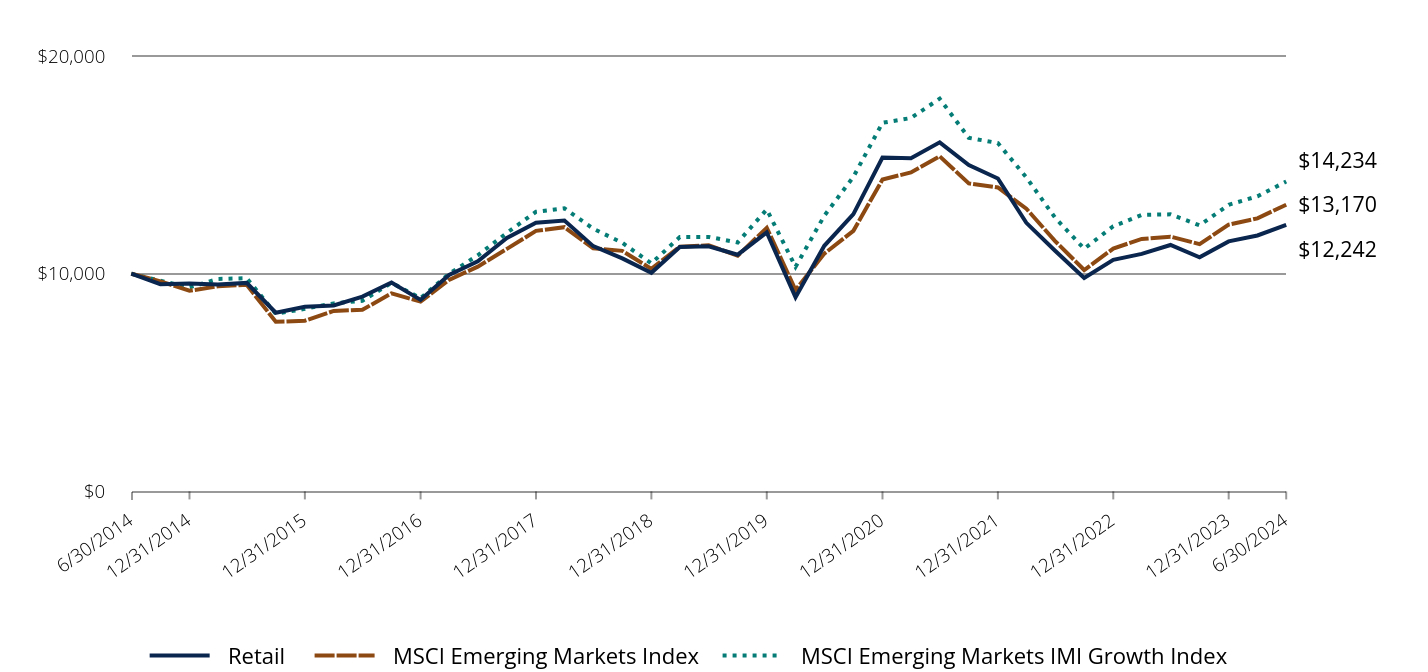
| Retail | MSCI Emerging Markets Index | MSCI Emerging Markets IMI Growth Index |
|---|
| 6/30/2014 | $10,000 | $10,000 | $10,000 |
| 9/30/2014 | $9,520 | $9,651 | $9,674 |
| 12/31/2014 | $9,545 | $9,216 | $9,373 |
| 3/31/2015 | $9,504 | $9,422 | $9,757 |
| 6/30/2015 | $9,577 | $9,488 | $9,792 |
| 9/30/2015 | $8,206 | $7,790 | $8,160 |
| 12/31/2015 | $8,480 | $7,841 | $8,388 |
| 3/31/2016 | $8,544 | $8,289 | $8,637 |
| 6/30/2016 | $8,945 | $8,344 | $8,759 |
| 9/30/2016 | $9,595 | $9,097 | $9,579 |
| 12/31/2016 | $8,798 | $8,718 | $8,877 |
| 3/31/2017 | $9,939 | $9,716 | $9,992 |
| 6/30/2017 | $10,573 | $10,325 | $10,846 |
| 9/30/2017 | $11,638 | $11,140 | $11,875 |
| 12/31/2017 | $12,346 | $11,969 | $12,845 |
| 3/31/2018 | $12,443 | $12,138 | $13,000 |
| 6/30/2018 | $11,267 | $11,172 | $12,067 |
| 9/30/2018 | $10,704 | $11,050 | $11,419 |
| 12/31/2018 | $10,041 | $10,224 | $10,477 |
| 3/31/2019 | $11,226 | $11,239 | $11,682 |
| 6/30/2019 | $11,259 | $11,307 | $11,691 |
| 9/30/2019 | $10,873 | $10,827 | $11,435 |
| 12/31/2019 | $11,897 | $12,109 | $12,950 |
| 3/31/2020 | $8,914 | $9,251 | $10,315 |
| 6/30/2020 | $11,283 | $10,924 | $12,663 |
| 9/30/2020 | $12,737 | $11,968 | $14,450 |
| 12/31/2020 | $15,332 | $14,325 | $16,932 |
| 3/31/2021 | $15,299 | $14,653 | $17,151 |
| 6/30/2021 | $16,035 | $15,392 | $18,039 |
| 9/30/2021 | $14,992 | $14,147 | $16,241 |
| 12/31/2021 | $14,372 | $13,961 | $16,001 |
| 3/31/2022 | $12,337 | $12,987 | $14,424 |
| 6/30/2022 | $11,056 | $11,500 | $12,572 |
| 9/30/2022 | $9,800 | $10,169 | $11,146 |
| 12/31/2022 | $10,638 | $11,156 | $12,180 |
| 3/31/2023 | $10,909 | $11,597 | $12,699 |
| 6/30/2023 | $11,319 | $11,701 | $12,728 |
| 9/30/2023 | $10,753 | $11,359 | $12,221 |
| 12/31/2023 | $11,484 | $12,253 | $13,165 |
| 3/31/2024 | $11,756 | $12,543 | $13,556 |
| 6/30/2024 | $12,242 | $13,170 | $14,234 |
Average Annual Total Returns (%)
| Total Net Assets | $4,045,719,258 |
| # of Issuers | 106 |
| Portfolio Turnover Rate | 20% |
| Total Advisory Fees Paid | $20,930,588 |
| Class/Index Name | 1 Year | 5 Years | 10 Years |
|---|
| Retail | 8.15% | 1.69% | 2.04% |
| MSCI Emerging Markets Index | 12.55% | 3.10% | 2.79% |
| MSCI Emerging Markets IMI Growth Index | 11.83% | 4.01% | 3.59% |
Past performance is not predictive of future performance. The performance data does not reflect the deduction of taxes that a shareholder would pay on Fund distributions or redemption of Fund shares. The Adviser may waive or reimburse certain Fund expenses pursuant to a contract expiring on August 29, 2034, unless renewed for another 11-year term and the Fund’s transfer agency expenses may be reduced by expense offsets from an unaffiliated transfer agent, without which performance would have been lower.
Semi-Annual Shareholder Report | 1
Baron Emerging Markets Fund
What did the Fund invest in?
| Holding | % of Total Net Assets (6/30/24)* |
| Taiwan Semiconductor Manufacturing Co., Ltd. | 9.7% |
| Tencent Holdings Limited | 4.7% |
| Samsung Electronics Co., Ltd. | 4.5% |
| Bharti Airtel Ltd. | 3.2% |
| Indus Towers Ltd. | 2.6% |
| Bundl Technologies Private Ltd. | 2.6% |
| HD Korea Shipbuilding & Offshore Engineering Co. Ltd. | 2.4% |
| Reliance Industries Limited | 2.1% |
| InPost SA | 2.0% |
| Alibaba Group Holding Limited | 1.8% |
| Total | 35.6% |
* Individual weights may not sum to 100% (or displayed total) due to rounding.
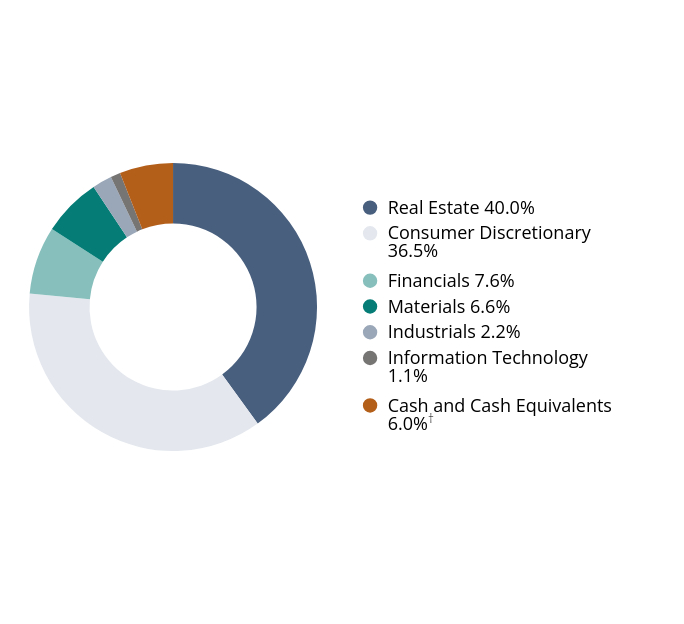
Sector Breakdown
(as a % of net assets)*
| Value | Value |
|---|
| Information Technology | 21.6% |
| Consumer Discretionary | 16.6% |
| Financials | 14.8% |
| Communication Services | 13.6% |
| Industrials | 12.9% |
| Consumer Staples | 6.1% |
| Materials | 4.2% |
| Energy | 2.1% |
| Health Care | 2.1% |
| Real Estate | 1.8% |
| Cash and Cash Equivalents | 3.0%Footnote Reference† |
| Footnote | Description |
Footnote† | Includes short-term investments, other assets and liabilities-net. |
Country Exposures
(as a % of net assets)*
| Value | Value |
|---|
| India | 31.5% |
| China | 21.3% |
| Korea, Republic Of | 13.2% |
| Taiwan | 12.7% |
| Brazil | 6.0% |
| Poland | 2.8% |
| Mexico | 2.0% |
| Philippines | 1.5% |
| Hong Kong | 1.4% |
| Others | 4.7% |
If you wish to view additional information about the Fund; including but not limited to its financial statements, prospectus, or holdings, please visit BaronCapitalGroup.com. For benchmark definitions and attribution language please visit connect.rightprospectus.com/Baron.
Phone: 1.800.99.BARON
Email: info@BaronCapitalGroup.com
Baron Emerging Markets Fund
Semi-Annual Shareholder Report June 30, 2024
Semi-Annual Shareholder Report June 30, 2024
This semi-annual shareholder report contains important information about Baron FinTech Fund for the period of January 1, 2024 to June 30, 2024.You can find additional information about the Fund at BaronCapitalGroup.com. You can also request this information by contacting us at 1.800.99.BARON.
This report describes changes to the Fund that occurred during the reporting period.
What were the Fund costs for last year?
(based on a hypothetical $10,000 investment)
| Class Name | Cost of a $10,000 investment | Costs paid as a percentage of a $10,000 investment |
|---|
| Institutional | $48Footnote Reference† | 0.95%Footnote Reference*Footnote Reference† |
| Footnote | Description |
Footnote* | Annualized. |
Footnote† | Reflects fee waivers and/or expense reimbursements, without which expenses would have been higher. |
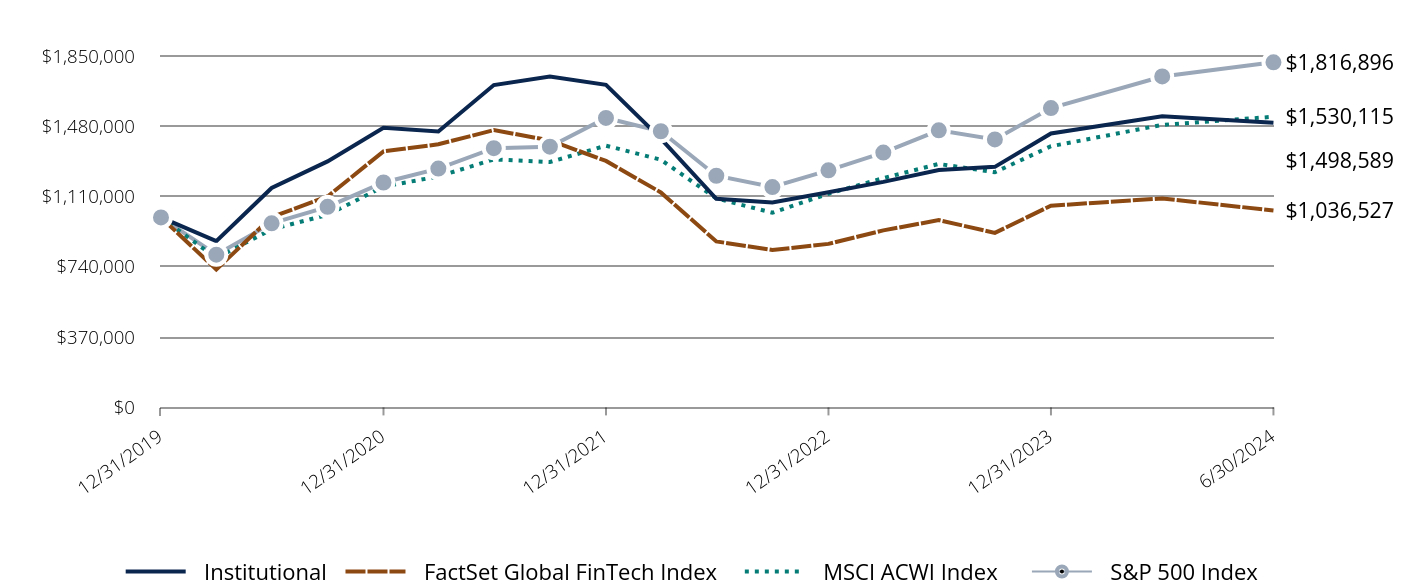
Comparison of the Change in Value of $1,000,000 Investment in the Fund in Relation to the Benchmarks
| Institutional | FactSet Global FinTech Index | MSCI ACWI Index | S&P 500 Index |
|---|
| 12/31/2019 | $1,000,000 | $1,000,000 | $1,000,000 | $1,000,000 |
| 3/31/2020 | $875,000 | $726,226 | $786,348 | $804,020 |
| 6/30/2020 | $1,155,000 | $1,001,783 | $937,476 | $969,192 |
| 9/30/2020 | $1,295,000 | $1,110,680 | $1,013,695 | $1,055,735 |
| 12/31/2020 | $1,472,000 | $1,347,786 | $1,162,549 | $1,183,988 |
| 3/31/2021 | $1,453,000 | $1,385,177 | $1,215,693 | $1,257,099 |
| 6/30/2021 | $1,697,000 | $1,459,964 | $1,305,575 | $1,364,566 |
| 9/30/2021 | $1,742,000 | $1,405,711 | $1,291,808 | $1,372,508 |
| 12/31/2021 | $1,698,000 | $1,297,718 | $1,378,054 | $1,523,856 |
| 3/31/2022 | $1,415,000 | $1,131,913 | $1,304,180 | $1,453,782 |
| 6/30/2022 | $1,098,000 | $873,831 | $1,099,939 | $1,219,707 |
| 9/30/2022 | $1,078,822 | $828,558 | $1,024,926 | $1,160,153 |
| 12/31/2022 | $1,132,560 | $860,953 | $1,124,989 | $1,247,873 |
| 3/31/2023 | $1,187,313 | $931,930 | $1,207,178 | $1,341,427 |
| 6/30/2023 | $1,250,176 | $985,823 | $1,281,749 | $1,458,696 |
| 9/30/2023 | $1,266,399 | $919,086 | $1,238,136 | $1,410,947 |
| 12/31/2023 | $1,441,809 | $1,061,924 | $1,374,757 | $1,575,909 |
| 3/31/2024 | $1,533,063 | $1,100,139 | $1,487,437 | $1,742,261 |
| 6/30/2024 | $1,498,589 | $1,036,527 | $1,530,115 | $1,816,896 |
Average Annual Total Returns (%)
| Total Net Assets | $59,587,433 |
| # of Issuers | 46 |
| Portfolio Turnover Rate | 4% |
| Total Advisory Fees Paid | $240,754 |
| Class/Index Name | 1 Year | Since Inception 12/31/2019 |
|---|
| Institutional | 19.87% | 9.41% |
| FactSet Global FinTech Index | 5.14% | 0.80% |
| MSCI ACWI Index | 19.38% | 9.91% |
| S&P 500 Index | 24.56% | 14.19% |
Past performance is not predictive of future performance. The performance data does not reflect the deduction of taxes that a shareholder would pay on Fund distributions or redemption of Fund shares. The Adviser waives and/or reimburses certain Fund expenses pursuant to a contract expiring on August 29, 2034, unless renewed for another 11-year term and the Fund’s transfer agency expenses may be reduced by expense offsets from an unaffiliated transfer agent, without which performance would have been lower.
What did the Fund invest in?
| Holding | % of Total Net Assets (6/30/24)* |
| Intuit, Inc. | 4.9% |
| S&P Global, Inc. | 4.8% |
| Fair Isaac Corp. | 4.7% |
| MasterCard, Incorporated | 4.7% |
| Visa, Inc. | 4.6% |
| Apollo Global Management, Inc. | 4.5% |
| The Progressive Corp. | 4.0% |
| MercadoLibre, Inc. | 3.7% |
| Fiserv, Inc. | 3.3% |
| Tradeweb Markets, Inc. | 3.3% |
| Total | 42.5% |
* Individual weights may not sum to 100% (or displayed total) due to rounding.
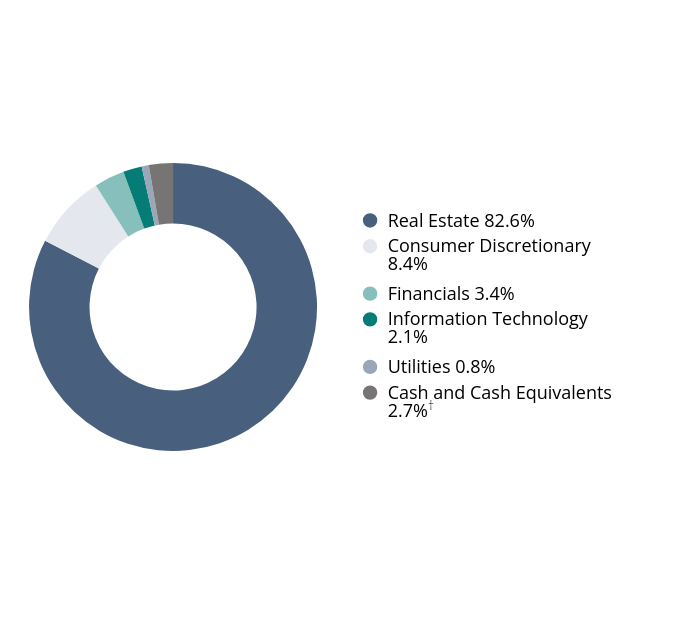
Sector Breakdown
(as a % of net assets)*
| Value | Value |
|---|
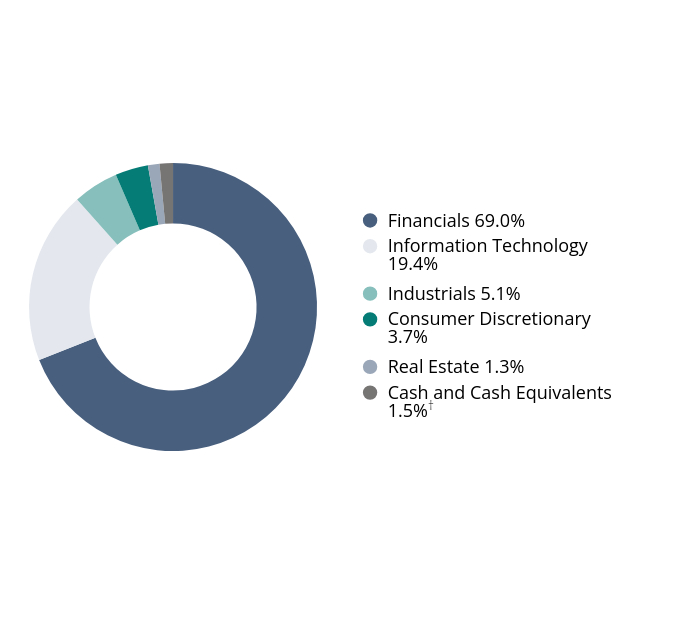
| Financials | 69.0% |
| Information Technology | 19.4% |
| Industrials | 5.1% |
| Consumer Discretionary | 3.7% |
| Real Estate | 1.3% |
| Cash and Cash Equivalents | 1.5%Footnote Reference† |
| Footnote | Description |
Footnote† | Includes short-term investments, other assets and liabilities-net. |
This is a summary of certain Fund changes during the reporting period. For more complete information, review the Fund's current prospectus at www.BaronCapitalGroup.com or call 1-800-992-2766.
Effective July 1, 2024, the classification status of the Fund has changed from non-diversified to diversified and the risks of operating as a non-diversified fund no longer apply to the Fund. The Fund will not operate as a non-diversified fund in the future without first seeking and obtaining shareholder approval to do so or as otherwise may be allowed under the Investment Company Act of 1940, as amended or the rules or interpretations thereof.
If you wish to view additional information about the Fund; including but not limited to its financial statements, prospectus, or holdings, please visit BaronCapitalGroup.com. For benchmark definitions and attribution language please visit connect.rightprospectus.com/Baron.
Phone: 1.800.99.BARON
Email: info@BaronCapitalGroup.com
Semi-Annual Shareholder Report June 30, 2024
Semi-Annual Shareholder Report June 30, 2024
This semi-annual shareholder report contains important information about Baron FinTech Fund for the period of January 1, 2024 to June 30, 2024.You can find additional information about the Fund at BaronCapitalGroup.com. You can also request this information by contacting us at 1.800.99.BARON.
This report describes changes to the Fund that occurred during the reporting period.
What were the Fund costs for last year?
(based on a hypothetical $10,000 investment)
| Class Name | Cost of a $10,000 investment | Costs paid as a percentage of a $10,000 investment |
|---|
| R6 | $48Footnote Reference† | 0.95%Footnote Reference*Footnote Reference† |
| Footnote | Description |
Footnote* | Annualized. |
Footnote† | Reflects fee waivers and/or expense reimbursements, without which expenses would have been higher. |
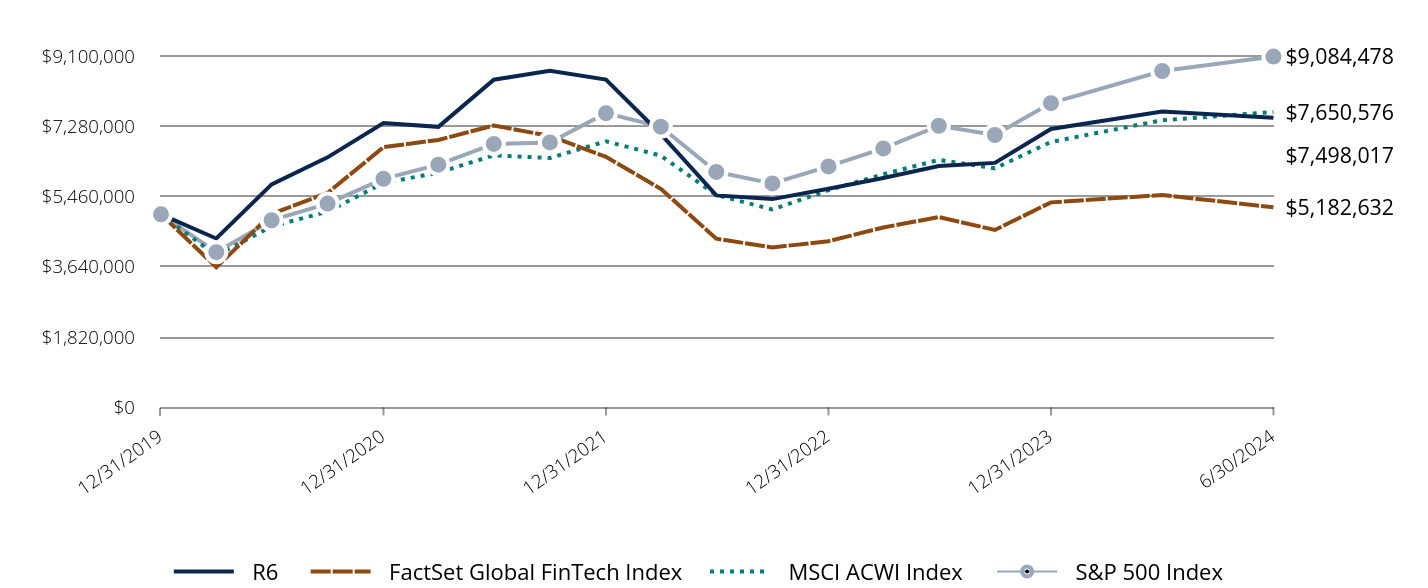
Comparison of the Change in Value of $5,000,000 Investment in the Fund in Relation to the Benchmarks
| R6 | FactSet Global FinTech Index | MSCI ACWI Index | S&P 500 Index |
|---|
| 12/31/2019 | $5,000,000 | $5,000,000 | $5,000,000 | $5,000,000 |
| 3/31/2020 | $4,375,000 | $3,631,131 | $3,931,741 | $4,020,100 |
| 6/30/2020 | $5,775,000 | $5,008,915 | $4,687,378 | $4,845,960 |
| 9/30/2020 | $6,475,000 | $5,553,400 | $5,068,475 | $5,278,677 |
| 12/31/2020 | $7,365,000 | $6,738,932 | $5,812,744 | $5,919,939 |
| 3/31/2021 | $7,265,000 | $6,925,884 | $6,078,466 | $6,285,494 |
| 6/30/2021 | $8,485,000 | $7,299,820 | $6,527,876 | $6,822,830 |
| 9/30/2021 | $8,715,000 | $7,028,555 | $6,459,042 | $6,862,542 |
| 12/31/2021 | $8,490,000 | $6,488,588 | $6,890,272 | $7,619,282 |
| 3/31/2022 | $7,075,000 | $5,659,565 | $6,520,899 | $7,268,909 |
| 6/30/2022 | $5,490,000 | $4,369,154 | $5,499,693 | $6,098,533 |
| 9/30/2022 | $5,394,111 | $4,142,789 | $5,124,630 | $5,800,766 |
| 12/31/2022 | $5,662,802 | $4,304,766 | $5,624,942 | $6,239,364 |
| 3/31/2023 | $5,941,633 | $4,659,651 | $6,035,890 | $6,707,135 |
| 6/30/2023 | $6,250,882 | $4,929,116 | $6,408,744 | $7,293,481 |
| 9/30/2023 | $6,331,996 | $4,595,430 | $6,190,682 | $7,054,736 |
| 12/31/2023 | $7,209,046 | $5,309,620 | $6,873,784 | $7,879,545 |
| 3/31/2024 | $7,665,315 | $5,500,693 | $7,437,186 | $8,711,304 |
| 6/30/2024 | $7,498,017 | $5,182,632 | $7,650,576 | $9,084,478 |
Average Annual Total Returns (%)
| Total Net Assets | $59,587,433 |
| # of Issuers | 46 |
| Portfolio Turnover Rate | 4% |
| Total Advisory Fees Paid | $240,754 |
| Class/Index Name | 1 Year | Since Inception 12/31/2019 |
|---|
| R6 | 19.95% | 9.43% |
| FactSet Global FinTech Index | 5.14% | 0.80% |
| MSCI ACWI Index | 19.38% | 9.91% |
| S&P 500 Index | 24.56% | 14.19% |
Past performance is not predictive of future performance. The performance data does not reflect the deduction of taxes that a shareholder would pay on Fund distributions or redemption of Fund shares. The Adviser waives and/or reimburses certain Fund expenses pursuant to a contract expiring on August 29, 2034, unless renewed for another 11-year term and the Fund’s transfer agency expenses may be reduced by expense offsets from an unaffiliated transfer agent, without which performance would have been lower.
What did the Fund invest in?
| Holding | % of Total Net Assets (6/30/24)* |
| Intuit, Inc. | 4.9% |
| S&P Global, Inc. | 4.8% |
| Fair Isaac Corp. | 4.7% |
| MasterCard, Incorporated | 4.7% |
| Visa, Inc. | 4.6% |
| Apollo Global Management, Inc. | 4.5% |
| The Progressive Corp. | 4.0% |
| MercadoLibre, Inc. | 3.7% |
| Fiserv, Inc. | 3.3% |
| Tradeweb Markets, Inc. | 3.3% |
| Total | 42.5% |
* Individual weights may not sum to 100% (or displayed total) due to rounding.
Sector Breakdown
(as a % of net assets)*
| Value | Value |
|---|
| Financials | 69.0% |
| Information Technology | 19.4% |
| Industrials | 5.1% |
| Consumer Discretionary | 3.7% |
| Real Estate | 1.3% |
| Cash and Cash Equivalents | 1.5%Footnote Reference† |
| Footnote | Description |
Footnote† | Includes short-term investments, other assets and liabilities-net. |
This is a summary of certain Fund changes during the reporting period. For more complete information, review the Fund's current prospectus at www.BaronCapitalGroup.com or call 1-800-992-2766.
Effective July 1, 2024, the classification status of the Fund has changed from non-diversified to diversified and the risks of operating as a non-diversified fund no longer apply to the Fund. The Fund will not operate as a non-diversified fund in the future without first seeking and obtaining shareholder approval to do so or as otherwise may be allowed under the Investment Company Act of 1940, as amended or the rules or interpretations thereof.
If you wish to view additional information about the Fund; including but not limited to its financial statements, prospectus, or holdings, please visit BaronCapitalGroup.com. For benchmark definitions and attribution language please visit connect.rightprospectus.com/Baron.
Phone: 1.800.99.BARON
Email: info@BaronCapitalGroup.com
Semi-Annual Shareholder Report June 30, 2024
Semi-Annual Shareholder Report June 30, 2024
This semi-annual shareholder report contains important information about Baron FinTech Fund for the period of January 1, 2024 to June 30, 2024.You can find additional information about the Fund at BaronCapitalGroup.com. You can also request this information by contacting us at 1.800.99.BARON.
This report describes changes to the Fund that occurred during the reporting period.
What were the Fund costs for last year?
(based on a hypothetical $10,000 investment)
| Class Name | Cost of a $10,000 investment | Costs paid as a percentage of a $10,000 investment |
|---|
| Retail | $61Footnote Reference† | 1.20%Footnote Reference*Footnote Reference† |
| Footnote | Description |
Footnote* | Annualized. |
Footnote† | Reflects fee waivers and/or expense reimbursements, without which expenses would have been higher. |
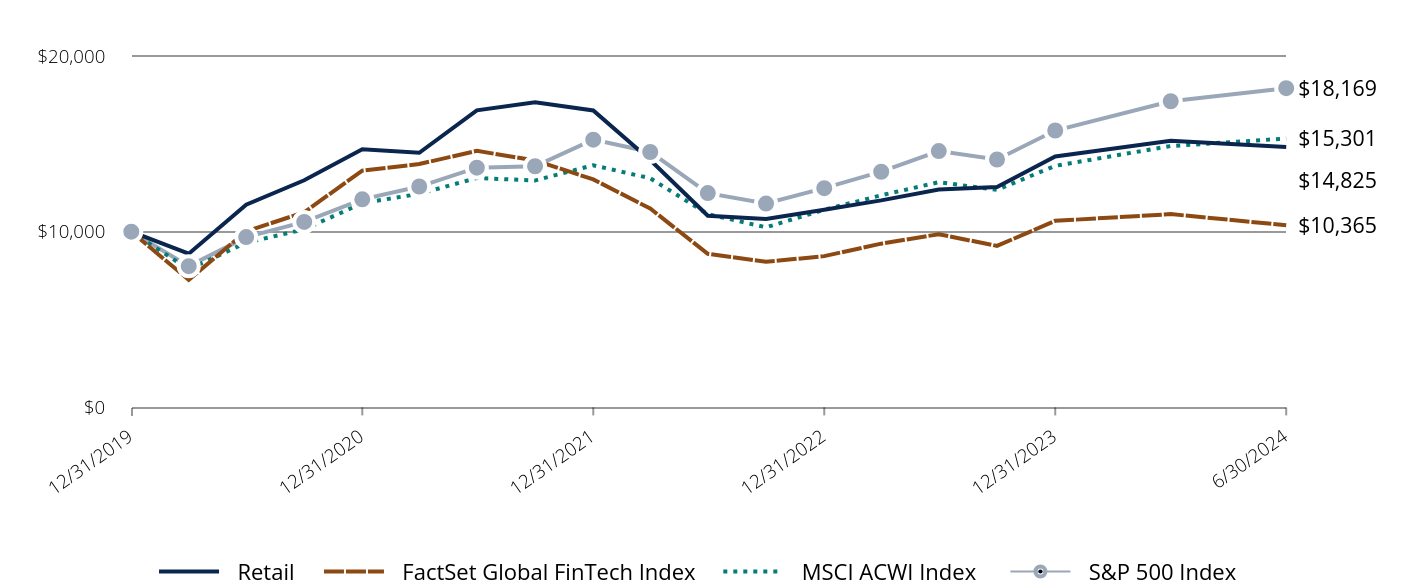
Comparison of the Change in Value of $10,000 Investment in the Fund in Relation to the Benchmarks
| Retail | FactSet Global FinTech Index | MSCI ACWI Index | S&P 500 Index |
|---|
| 12/31/2019 | $10,000 | $10,000 | $10,000 | $10,000 |
| 3/31/2020 | $8,750 | $7,262 | $7,864 | $8,040 |
| 6/30/2020 | $11,540 | $10,018 | $9,375 | $9,692 |
| 9/30/2020 | $12,930 | $11,107 | $10,137 | $10,557 |
| 12/31/2020 | $14,690 | $13,478 | $11,626 | $11,840 |
| 3/31/2021 | $14,490 | $13,852 | $12,157 | $12,571 |
| 6/30/2021 | $16,910 | $14,600 | $13,056 | $13,646 |
| 9/30/2021 | $17,360 | $14,057 | $12,918 | $13,725 |
| 12/31/2021 | $16,900 | $12,977 | $13,781 | $15,239 |
| 3/31/2022 | $14,080 | $11,319 | $13,042 | $14,538 |
| 6/30/2022 | $10,910 | $8,738 | $10,999 | $12,197 |
| 9/30/2022 | $10,718 | $8,286 | $10,249 | $11,602 |
| 12/31/2022 | $11,246 | $8,610 | $11,250 | $12,479 |
| 3/31/2023 | $11,783 | $9,319 | $12,072 | $13,414 |
| 6/30/2023 | $12,402 | $9,858 | $12,818 | $14,587 |
| 9/30/2023 | $12,543 | $9,191 | $12,381 | $14,110 |
| 12/31/2023 | $14,277 | $10,619 | $13,748 | $15,759 |
| 3/31/2024 | $15,180 | $11,001 | $14,874 | $17,423 |
| 6/30/2024 | $14,825 | $10,365 | $15,301 | $18,169 |
Average Annual Total Returns (%)
| Total Net Assets | $59,587,433 |
| # of Issuers | 46 |
| Portfolio Turnover Rate | 4% |
| Total Advisory Fees Paid | $240,754 |
| Class/Index Name | 1 Year | Since Inception 12/31/2019 |
|---|
| Retail | 19.54% | 9.15% |
| FactSet Global FinTech Index | 5.14% | 0.80% |
| MSCI ACWI Index | 19.38% | 9.91% |
| S&P 500 Index | 24.56% | 14.19% |
Past performance is not predictive of future performance. The performance data does not reflect the deduction of taxes that a shareholder would pay on Fund distributions or redemption of Fund shares. The Adviser waives and/or reimburses certain Fund expenses pursuant to a contract expiring on August 29, 2034, unless renewed for another 11-year term and the Fund’s transfer agency expenses may be reduced by expense offsets from an unaffiliated transfer agent, without which performance would have been lower.
What did the Fund invest in?
| Holding | % of Total Net Assets (6/30/24)* |
| Intuit, Inc. | 4.9% |
| S&P Global, Inc. | 4.8% |
| Fair Isaac Corp. | 4.7% |
| MasterCard, Incorporated | 4.7% |
| Visa, Inc. | 4.6% |
| Apollo Global Management, Inc. | 4.5% |
| The Progressive Corp. | 4.0% |
| MercadoLibre, Inc. | 3.7% |
| Fiserv, Inc. | 3.3% |
| Tradeweb Markets, Inc. | 3.3% |
| Total | 42.5% |
* Individual weights may not sum to 100% (or displayed total) due to rounding.
Sector Breakdown
(as a % of net assets)*
| Value | Value |
|---|
| Financials | 69.0% |
| Information Technology | 19.4% |
| Industrials | 5.1% |
| Consumer Discretionary | 3.7% |
| Real Estate | 1.3% |
| Cash and Cash Equivalents | 1.5%Footnote Reference† |
| Footnote | Description |
Footnote† | Includes short-term investments, other assets and liabilities-net. |
This is a summary of certain Fund changes during the reporting period. For more complete information, review the Fund's current prospectus at www.BaronCapitalGroup.com or call 1-800-992-2766.
Effective July 1, 2024, the classification status of the Fund has changed from non-diversified to diversified and the risks of operating as a non-diversified fund no longer apply to the Fund. The Fund will not operate as a non-diversified fund in the future without first seeking and obtaining shareholder approval to do so or as otherwise may be allowed under the Investment Company Act of 1940, as amended or the rules or interpretations thereof.
If you wish to view additional information about the Fund; including but not limited to its financial statements, prospectus, or holdings, please visit BaronCapitalGroup.com. For benchmark definitions and attribution language please visit connect.rightprospectus.com/Baron.
Phone: 1.800.99.BARON
Email: info@BaronCapitalGroup.com
Semi-Annual Shareholder Report June 30, 2024
Semi-Annual Shareholder Report June 30, 2024
Baron Focused Growth Fund
This semi-annual shareholder report contains important information about Baron Focused Growth Fund for the period of January 1, 2024 to June 30, 2024.You can find additional information about the Fund at BaronCapitalGroup.com. You can also request this information by contacting us at 1.800.99.BARON.
What were the Fund costs for last year?
(based on a hypothetical $10,000 investment)
| Class Name | Cost of a $10,000 investment | Costs paid as a percentage of a $10,000 investment |
|---|
| Institutional | $53 | 1.06%Footnote Reference* |
| Footnote | Description |
Footnote* | Annualized. |
Comparison of the Change in Value of $1,000,000 Investment in the Fund in Relation to the Benchmarks
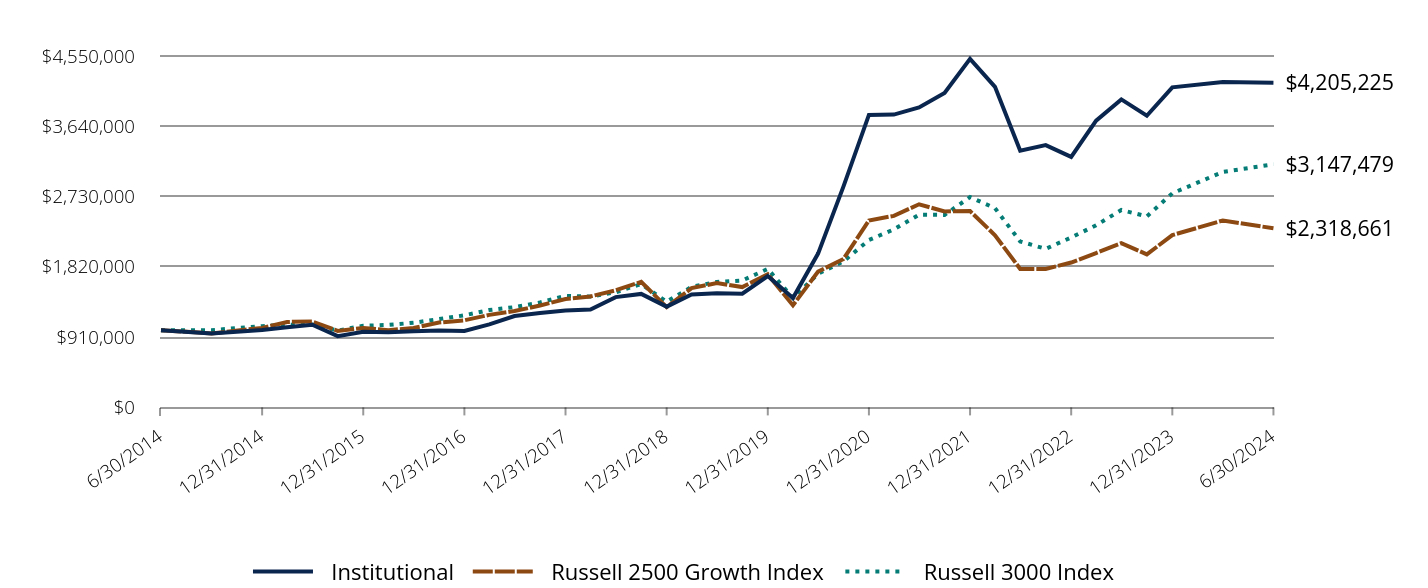
| Institutional | Russell 2500 Growth Index | Russell 3000 Index |
|---|
| 6/30/2014 | $1,000,000 | $1,000,000 | $1,000,000 |
| 9/30/2014 | $958,543 | $957,939 | $1,000,110 |
| 12/31/2014 | $1,002,000 | $1,029,677 | $1,052,517 |
| 3/31/2015 | $1,036,864 | $1,106,265 | $1,071,466 |
| 6/30/2015 | $1,069,636 | $1,113,028 | $1,072,942 |
| 9/30/2015 | $922,317 | $990,068 | $995,162 |
| 12/31/2015 | $980,735 | $1,027,753 | $1,057,555 |
| 3/31/2016 | $972,593 | $1,000,425 | $1,067,796 |
| 6/30/2016 | $985,916 | $1,027,427 | $1,095,885 |
| 9/30/2016 | $996,279 | $1,099,189 | $1,144,079 |
| 12/31/2016 | $990,264 | $1,127,732 | $1,192,237 |
| 3/31/2017 | $1,074,943 | $1,198,224 | $1,260,711 |
| 6/30/2017 | $1,183,143 | $1,247,662 | $1,298,727 |
| 9/30/2017 | $1,221,052 | $1,319,754 | $1,358,096 |
| 12/31/2017 | $1,253,618 | $1,403,525 | $1,444,163 |
| 3/31/2018 | $1,267,227 | $1,436,910 | $1,434,857 |
| 6/30/2018 | $1,428,132 | $1,516,337 | $1,490,655 |
| 9/30/2018 | $1,469,448 | $1,625,003 | $1,596,848 |
| 12/31/2018 | $1,304,650 | $1,298,728 | $1,368,464 |
| 3/31/2019 | $1,462,985 | $1,545,315 | $1,560,643 |
| 6/30/2019 | $1,479,142 | $1,609,322 | $1,624,553 |
| 9/30/2019 | $1,472,679 | $1,558,142 | $1,643,438 |
| 12/31/2019 | $1,700,343 | $1,722,819 | $1,792,948 |
| 3/31/2020 | $1,415,719 | $1,322,801 | $1,418,227 |
| 6/30/2020 | $1,991,549 | $1,757,603 | $1,730,628 |
| 9/30/2020 | $2,861,777 | $1,922,345 | $1,889,976 |
| 12/31/2020 | $3,787,482 | $2,420,027 | $2,167,455 |
| 3/31/2021 | $3,791,732 | $2,480,227 | $2,305,022 |
| 6/30/2021 | $3,883,529 | $2,629,935 | $2,494,951 |
| 9/30/2021 | $4,072,278 | $2,537,048 | $2,492,413 |
| 12/31/2021 | $4,513,251 | $2,542,104 | $2,723,648 |
| 3/31/2022 | $4,150,938 | $2,229,319 | $2,579,881 |
| 6/30/2022 | $3,324,471 | $1,793,471 | $2,149,011 |
| 9/30/2022 | $3,396,821 | $1,791,287 | $2,053,067 |
| 12/31/2022 | $3,243,409 | $1,875,798 | $2,200,519 |
| 3/31/2023 | $3,713,437 | $1,998,546 | $2,358,523 |
| 6/30/2023 | $3,987,620 | $2,126,752 | $2,556,327 |
| 9/30/2023 | $3,776,542 | $1,981,349 | $2,473,149 |
| 12/31/2023 | $4,144,296 | $2,230,890 | $2,771,704 |
| 3/31/2024 | $4,213,929 | $2,420,698 | $3,049,411 |
| 6/30/2024 | $4,205,225 | $2,318,661 | $3,147,479 |
Average Annual Total Returns (%)
| Total Net Assets | $1,411,727,163 |
| # of Issuers | 36 |
| Portfolio Turnover Rate | 5% |
| Total Advisory Fees Paid | $6,739,604 |
| Class/Index Name | 1 Year | 5 Years | 10 Years |
|---|
| Institutional | 5.46% | 23.24% | 15.45% |
| Russell 2500 Growth Index | 9.02% | 7.58% | 8.77% |
| Russell 3000 Index | 23.13% | 14.14% | 12.15% |
Past performance is not predictive of future performance. The performance data does not reflect the deduction of taxes that a shareholder would pay on Fund distributions or redemption of Fund shares. The Adviser may waive or reimburse certain Fund expenses pursuant to a contract expiring on August 29, 2034, unless renewed for another 11-year term and the Fund’s transfer agency expenses may be reduced by expense offsets from an unaffiliated transfer agent, without which performance would have been lower.
Baron Focused Growth Fund
What did the Fund invest in?
| Holding | % of Total Net Assets (6/30/24)* |
| Space Exploration Technologies Corp. | 10.3% |
| Tesla, Inc. | 8.6% |
| Arch Capital Group Ltd. | 6.4% |
| Spotify Technology SA | 5.8% |
| Hyatt Hotels Corp. | 5.4% |
| Guidewire Software, Inc. | 5.1% |
| Vail Resorts, Inc. | 4.6% |
| On Holding AG | 4.2% |
| Interactive Brokers Group, Inc. | 4.1% |
| Red Rock Resorts, Inc. | 3.9% |
| Total | 58.4% |
* Individual weights may not sum to 100% (or displayed total) due to rounding.
Sector Breakdown
(as a % of net assets)*
| Value | Value |
|---|
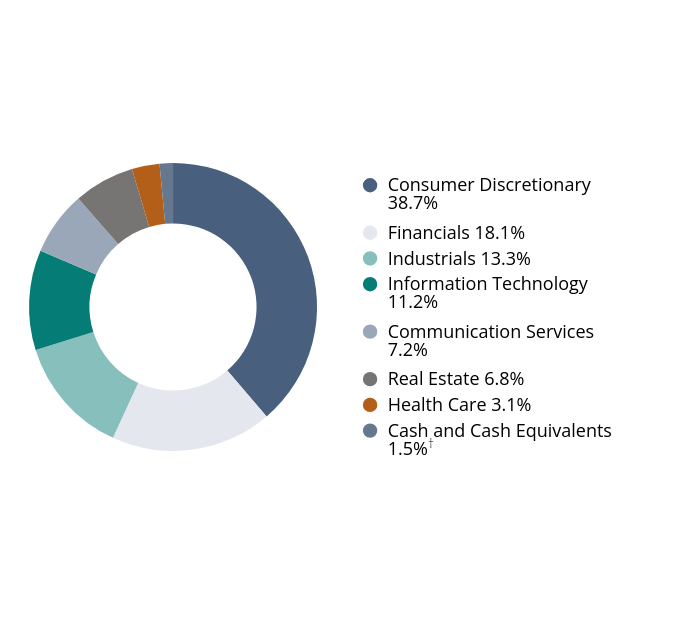
| Consumer Discretionary | 38.7% |
| Financials | 18.1% |
| Industrials | 13.3% |
| Information Technology | 11.2% |
| Communication Services | 7.2% |
| Real Estate | 6.8% |
| Health Care | 3.1% |
| Cash and Cash Equivalents | 1.5%Footnote Reference† |
| Footnote | Description |
Footnote† | Includes short-term investments, other assets and liabilities-net. |
If you wish to view additional information about the Fund; including but not limited to its financial statements, prospectus, or holdings, please visit BaronCapitalGroup.com. For benchmark definitions and attribution language please visit connect.rightprospectus.com/Baron.
Phone: 1.800.99.BARON
Email: info@BaronCapitalGroup.com
Baron Focused Growth Fund
Semi-Annual Shareholder Report June 30, 2024
Semi-Annual Shareholder Report June 30, 2024
Baron Focused Growth Fund
This semi-annual shareholder report contains important information about Baron Focused Growth Fund for the period of January 1, 2024 to June 30, 2024.You can find additional information about the Fund at BaronCapitalGroup.com. You can also request this information by contacting us at 1.800.99.BARON.
What were the Fund costs for last year?
(based on a hypothetical $10,000 investment)
| Class Name | Cost of a $10,000 investment | Costs paid as a percentage of a $10,000 investment |
|---|
| R6 | $53 | 1.06%Footnote Reference* |
| Footnote | Description |
Footnote* | Annualized. |
Comparison of the Change in Value of $5,000,000 Investment in the Fund in Relation to the Benchmarks
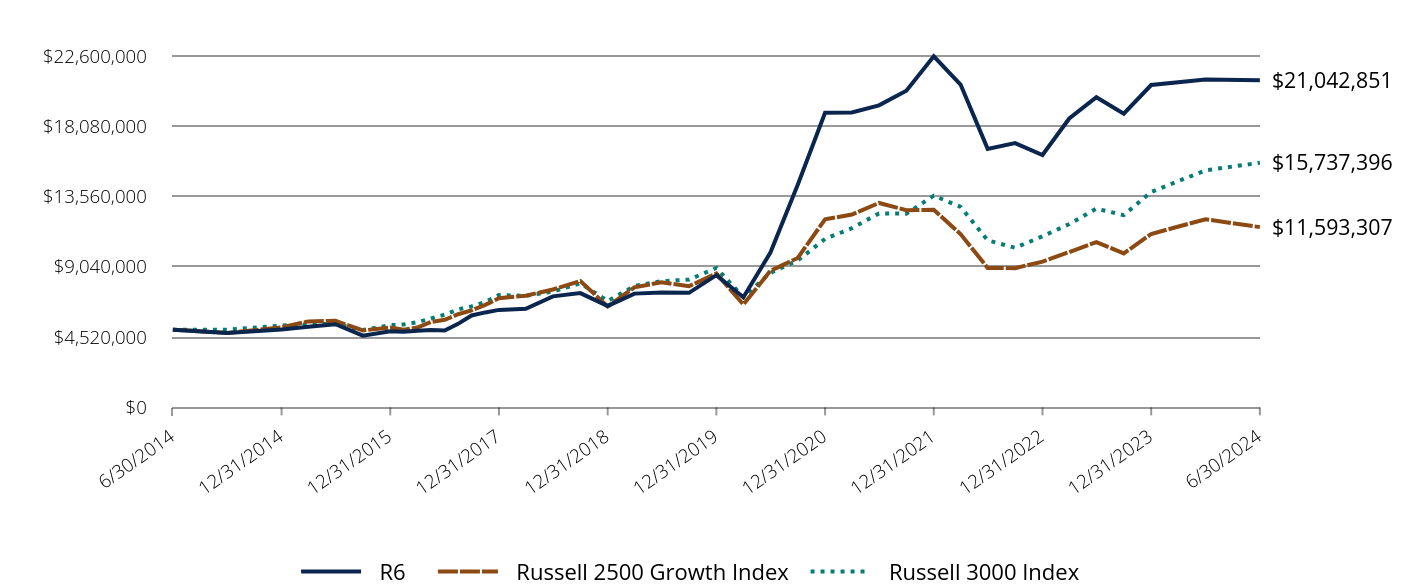
| R6 | Russell 2500 Growth Index | Russell 3000 Index |
|---|
| 6/30/2014 | $5,000,000 | $5,000,000 | $5,000,000 |
| 9/30/2014 | $4,792,714 | $4,789,697 | $5,000,549 |
| 12/31/2014 | $5,009,999 | $5,148,387 | $5,262,585 |
| 3/31/2015 | $5,184,320 | $5,531,324 | $5,357,330 |
| 6/30/2015 | $5,348,182 | $5,565,138 | $5,364,709 |
| 9/30/2015 | $4,611,585 | $4,950,342 | $4,975,809 |
| 12/31/2015 | $4,903,675 | $5,138,765 | $5,287,775 |
| 3/31/2016 | $4,862,966 | $5,002,124 | $5,338,979 |
| 6/30/2016 | $4,929,582 | $5,137,135 | $5,479,425 |
| 9/30/2016 | $4,981,394 | $5,495,946 | $5,720,393 |
| 12/31/2016 | $4,951,103 | $5,638,660 | $5,961,185 |
| 3/31/2017 | $5,374,475 | $5,991,119 | $6,303,553 |
| 6/30/2017 | $5,915,451 | $6,238,310 | $6,493,637 |
| 9/30/2017 | $6,108,907 | $6,598,770 | $6,790,481 |
| 12/31/2017 | $6,271,733 | $7,017,626 | $7,220,816 |
| 3/31/2018 | $6,339,774 | $7,184,550 | $7,174,284 |
| 6/30/2018 | $7,140,251 | $7,581,683 | $7,453,273 |
| 9/30/2018 | $7,350,818 | $8,125,014 | $7,984,238 |
| 12/31/2018 | $6,526,880 | $6,493,642 | $6,842,322 |
| 3/31/2019 | $7,318,507 | $7,726,577 | $7,803,215 |
| 6/30/2019 | $7,395,246 | $8,046,610 | $8,122,764 |
| 9/30/2019 | $7,366,974 | $7,790,710 | $8,217,190 |
| 12/31/2019 | $8,505,221 | $8,614,095 | $8,964,739 |
| 3/31/2020 | $7,082,200 | $6,614,006 | $7,091,136 |
| 6/30/2020 | $9,961,143 | $8,788,016 | $8,653,141 |
| 9/30/2020 | $14,316,083 | $9,611,724 | $9,449,881 |
| 12/31/2020 | $18,948,352 | $12,100,137 | $10,837,276 |
| 3/31/2021 | $18,965,350 | $12,401,136 | $11,525,108 |
| 6/30/2021 | $19,428,541 | $13,149,675 | $12,474,753 |
| 9/30/2021 | $20,372,328 | $12,685,240 | $12,462,065 |
| 12/31/2021 | $22,576,970 | $12,710,519 | $13,618,240 |
| 3/31/2022 | $20,765,721 | $11,146,594 | $12,899,407 |
| 6/30/2022 | $16,629,221 | $8,967,356 | $10,745,057 |
| 9/30/2022 | $16,996,358 | $8,956,436 | $10,265,333 |
| 12/31/2022 | $16,229,482 | $9,378,989 | $11,002,594 |
| 3/31/2023 | $18,579,059 | $9,992,729 | $11,792,613 |
| 6/30/2023 | $19,949,645 | $10,633,759 | $12,781,637 |
| 9/30/2023 | $18,894,511 | $9,906,744 | $12,365,745 |
| 12/31/2023 | $20,732,837 | $11,154,449 | $13,858,519 |
| 3/31/2024 | $21,080,923 | $12,103,488 | $15,247,052 |
| 6/30/2024 | $21,042,851 | $11,593,307 | $15,737,396 |
Average Annual Total Returns (%)
| Total Net Assets | $1,411,727,163 |
| # of Issuers | 36 |
| Portfolio Turnover Rate | 5% |
| Total Advisory Fees Paid | $6,739,604 |
| Class/Index Name | 1 Year | 5 Years | 10 Years |
|---|
| R6 | 5.48% | 23.26% | 15.46% |
| Russell 2500 Growth Index | 9.02% | 7.58% | 8.77% |
| Russell 3000 Index | 23.13% | 14.14% | 12.15% |
Past performance is not predictive of future performance. The performance data does not reflect the deduction of taxes that a shareholder would pay on Fund distributions or redemption of Fund shares. The Adviser may waive or reimburse certain Fund expenses pursuant to a contract expiring on August 29, 2034, unless renewed for another 11-year term and the Fund’s transfer agency expenses may be reduced by expense offsets from an unaffiliated transfer agent, without which performance would have been lower. Performance for the R6 Shares prior to August 31, 2016 is based on the performance of the Institutional Shares.
Baron Focused Growth Fund
What did the Fund invest in?
| Holding | % of Total Net Assets (6/30/24)* |
| Space Exploration Technologies Corp. | 10.3% |
| Tesla, Inc. | 8.6% |
| Arch Capital Group Ltd. | 6.4% |
| Spotify Technology SA | 5.8% |
| Hyatt Hotels Corp. | 5.4% |
| Guidewire Software, Inc. | 5.1% |
| Vail Resorts, Inc. | 4.6% |
| On Holding AG | 4.2% |
| Interactive Brokers Group, Inc. | 4.1% |
| Red Rock Resorts, Inc. | 3.9% |
| Total | 58.4% |
* Individual weights may not sum to 100% (or displayed total) due to rounding.
Sector Breakdown
(as a % of net assets)*
| Value | Value |
|---|
| Consumer Discretionary | 38.7% |
| Financials | 18.1% |
| Industrials | 13.3% |
| Information Technology | 11.2% |
| Communication Services | 7.2% |
| Real Estate | 6.8% |
| Health Care | 3.1% |
| Cash and Cash Equivalents | 1.5%Footnote Reference† |
| Footnote | Description |
Footnote† | Includes short-term investments, other assets and liabilities-net. |
If you wish to view additional information about the Fund; including but not limited to its financial statements, prospectus, or holdings, please visit BaronCapitalGroup.com. For benchmark definitions and attribution language please visit connect.rightprospectus.com/Baron.
Phone: 1.800.99.BARON
Email: info@BaronCapitalGroup.com
Baron Focused Growth Fund
Semi-Annual Shareholder Report June 30, 2024
Semi-Annual Shareholder Report June 30, 2024
Baron Focused Growth Fund
This semi-annual shareholder report contains important information about Baron Focused Growth Fund for the period of January 1, 2024 to June 30, 2024.You can find additional information about the Fund at BaronCapitalGroup.com. You can also request this information by contacting us at 1.800.99.BARON.
What were the Fund costs for last year?
(based on a hypothetical $10,000 investment)
| Class Name | Cost of a $10,000 investment | Costs paid as a percentage of a $10,000 investment |
|---|
| Retail | $66 | 1.32%Footnote Reference* |
| Footnote | Description |
Footnote* | Annualized. |
Comparison of the Change in Value of $10,000 Investment in the Fund in Relation to the Benchmarks
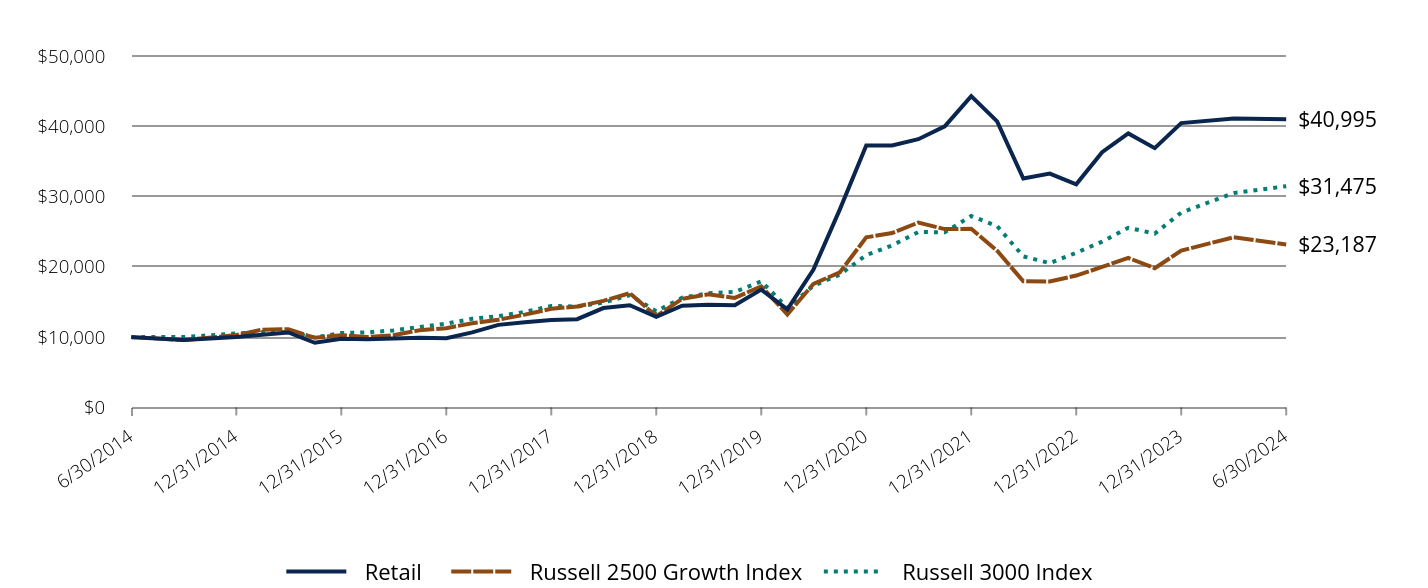
| Retail | Russell 2500 Growth Index | Russell 3000 Index |
|---|
| 6/30/2014 | $10,000 | $10,000 | $10,000 |
| 9/30/2014 | $9,581 | $9,579 | $10,001 |
| 12/31/2014 | $10,013 | $10,297 | $10,525 |
| 3/31/2015 | $10,351 | $11,063 | $10,715 |
| 6/30/2015 | $10,669 | $11,130 | $10,729 |
| 9/30/2015 | $9,197 | $9,901 | $9,952 |
| 12/31/2015 | $9,771 | $10,278 | $10,576 |
| 3/31/2016 | $9,682 | $10,004 | $10,678 |
| 6/30/2016 | $9,809 | $10,274 | $10,959 |
| 9/30/2016 | $9,906 | $10,992 | $11,441 |
| 12/31/2016 | $9,837 | $11,277 | $11,922 |
| 3/31/2017 | $10,676 | $11,982 | $12,607 |
| 6/30/2017 | $11,744 | $12,477 | $12,987 |
| 9/30/2017 | $12,118 | $13,198 | $13,581 |
| 12/31/2017 | $12,430 | $14,035 | $14,442 |
| 3/31/2018 | $12,552 | $14,369 | $14,349 |
| 6/30/2018 | $14,136 | $15,163 | $14,907 |
| 9/30/2018 | $14,537 | $16,250 | $15,969 |
| 12/31/2018 | $12,897 | $12,987 | $13,685 |
| 3/31/2019 | $14,463 | $15,453 | $15,606 |
| 6/30/2019 | $14,602 | $16,093 | $16,246 |
| 9/30/2019 | $14,537 | $15,581 | $16,434 |
| 12/31/2019 | $16,770 | $17,228 | $17,930 |
| 3/31/2020 | $13,953 | $13,228 | $14,182 |
| 6/30/2020 | $19,621 | $17,576 | $17,306 |
| 9/30/2020 | $28,179 | $19,223 | $18,900 |
| 12/31/2020 | $37,265 | $24,200 | $21,675 |
| 3/31/2021 | $37,273 | $24,802 | $23,050 |
| 6/30/2021 | $38,158 | $26,299 | $24,950 |
| 9/30/2021 | $39,981 | $25,371 | $24,924 |
| 12/31/2021 | $44,283 | $25,421 | $27,237 |
| 3/31/2022 | $40,702 | $22,293 | $25,799 |
| 6/30/2022 | $32,575 | $17,935 | $21,490 |
| 9/30/2022 | $33,271 | $17,913 | $20,531 |
| 12/31/2022 | $31,751 | $18,758 | $22,005 |
| 3/31/2023 | $36,312 | $19,986 | $23,585 |
| 6/30/2023 | $38,975 | $21,268 | $25,563 |
| 9/30/2023 | $36,889 | $19,814 | $24,732 |
| 12/31/2023 | $40,451 | $22,309 | $27,717 |
| 3/31/2024 | $41,106 | $24,207 | $30,494 |
| 6/30/2024 | $40,995 | $23,187 | $31,475 |
Average Annual Total Returns (%)
| Total Net Assets | $1,411,727,163 |
| # of Issuers | 36 |
| Portfolio Turnover Rate | 5% |
| Total Advisory Fees Paid | $6,739,604 |
| Class/Index Name | 1 Year | 5 Years | 10 Years |
|---|
| Retail | 5.18% | 22.93% | 15.15% |
| Russell 2500 Growth Index | 9.02% | 7.58% | 8.77% |
| Russell 3000 Index | 23.13% | 14.14% | 12.15% |
Past performance is not predictive of future performance. The performance data does not reflect the deduction of taxes that a shareholder would pay on Fund distributions or redemption of Fund shares. The Adviser may waive or reimburse certain Fund expenses pursuant to a contract expiring on August 29, 2034, unless renewed for another 11-year term and the Fund’s transfer agency expenses may be reduced by expense offsets from an unaffiliated transfer agent, without which performance would have been lower.
Baron Focused Growth Fund
What did the Fund invest in?
| Holding | % of Total Net Assets (6/30/24)* |
| Space Exploration Technologies Corp. | 10.3% |
| Tesla, Inc. | 8.6% |
| Arch Capital Group Ltd. | 6.4% |
| Spotify Technology SA | 5.8% |
| Hyatt Hotels Corp. | 5.4% |
| Guidewire Software, Inc. | 5.1% |
| Vail Resorts, Inc. | 4.6% |
| On Holding AG | 4.2% |
| Interactive Brokers Group, Inc. | 4.1% |
| Red Rock Resorts, Inc. | 3.9% |
| Total | 58.4% |
* Individual weights may not sum to 100% (or displayed total) due to rounding.
Sector Breakdown
(as a % of net assets)*
| Value | Value |
|---|
| Consumer Discretionary | 38.7% |
| Financials | 18.1% |
| Industrials | 13.3% |
| Information Technology | 11.2% |
| Communication Services | 7.2% |
| Real Estate | 6.8% |
| Health Care | 3.1% |
| Cash and Cash Equivalents | 1.5%Footnote Reference† |
| Footnote | Description |
Footnote† | Includes short-term investments, other assets and liabilities-net. |
If you wish to view additional information about the Fund; including but not limited to its financial statements, prospectus, or holdings, please visit BaronCapitalGroup.com. For benchmark definitions and attribution language please visit connect.rightprospectus.com/Baron.
Phone: 1.800.99.BARON
Email: info@BaronCapitalGroup.com
Baron Focused Growth Fund
Semi-Annual Shareholder Report June 30, 2024
Semi-Annual Shareholder Report June 30, 2024
Baron Global Advantage Fund
This semi-annual shareholder report contains important information about Baron Global Advantage Fund for the period of January 1, 2024 to June 30, 2024.You can find additional information about the Fund at BaronCapitalGroup.com. You can also request this information by contacting us at 1.800.99.BARON.
What were the Fund costs for last year?
(based on a hypothetical $10,000 investment)
| Class Name | Cost of a $10,000 investment | Costs paid as a percentage of a $10,000 investment |
|---|
| Institutional | $47Footnote Reference† | 0.92%Footnote Reference*Footnote Reference† |
| Footnote | Description |
Footnote* | Annualized. |
Footnote† | Reflects fee waivers and/or expense reimbursements, without which expenses would have been higher. |
Comparison of the Change in Value of $1,000,000 Investment in the Fund in Relation to the Benchmarks
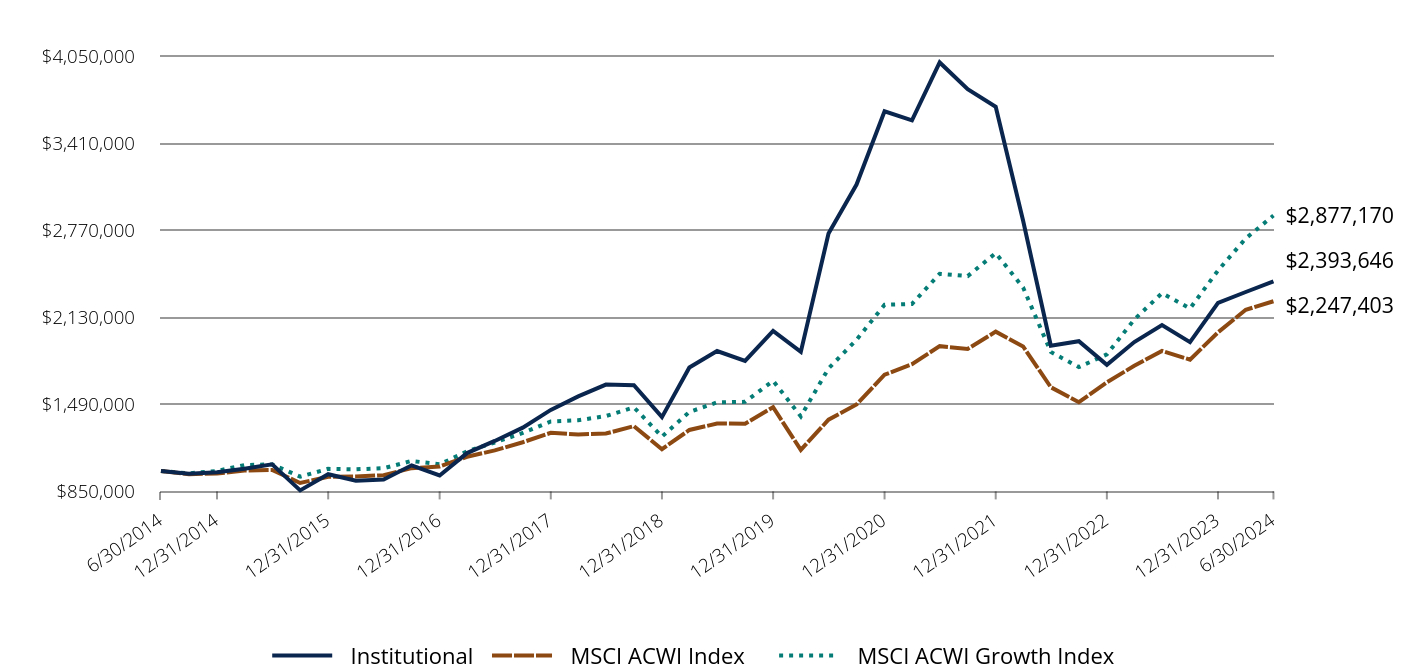
| Institutional | MSCI ACWI Index | MSCI ACWI Growth Index |
|---|
| 6/30/2014 | $1,000,000 | $1,000,000 | $1,000,000 |
| 9/30/2014 | $980,631 | $976,950 | $982,911 |
| 12/31/2014 | $991,041 | $980,982 | $1,000,246 |
| 3/31/2015 | $1,016,025 | $1,003,609 | $1,043,823 |
| 6/30/2015 | $1,049,338 | $1,007,102 | $1,048,571 |
| 9/30/2015 | $857,561 | $911,931 | $958,534 |
| 12/31/2015 | $976,086 | $957,792 | $1,015,748 |
| 3/31/2016 | $927,979 | $960,074 | $1,012,680 |
| 6/30/2016 | $937,740 | $969,567 | $1,020,196 |
| 9/30/2016 | $1,041,623 | $1,020,972 | $1,074,105 |
| 12/31/2016 | $967,022 | $1,033,116 | $1,048,944 |
| 3/31/2017 | $1,131,563 | $1,104,486 | $1,144,225 |
| 6/30/2017 | $1,220,805 | $1,151,682 | $1,209,647 |
| 9/30/2017 | $1,318,413 | $1,211,364 | $1,279,331 |
| 12/31/2017 | $1,448,791 | $1,280,775 | $1,363,638 |
| 3/31/2018 | $1,548,491 | $1,268,460 | $1,372,805 |
| 6/30/2018 | $1,634,944 | $1,275,228 | $1,403,894 |
| 9/30/2018 | $1,630,064 | $1,329,768 | $1,467,903 |
| 12/31/2018 | $1,395,803 | $1,160,182 | $1,252,764 |
| 3/31/2019 | $1,761,138 | $1,301,453 | $1,434,143 |
| 6/30/2019 | $1,881,754 | $1,348,460 | $1,504,422 |
| 9/30/2019 | $1,808,548 | $1,348,111 | $1,508,451 |
| 12/31/2019 | $2,030,259 | $1,468,781 | $1,662,709 |
| 3/31/2020 | $1,875,480 | $1,154,973 | $1,401,425 |
| 6/30/2020 | $2,745,591 | $1,376,946 | $1,753,809 |
| 9/30/2020 | $3,105,348 | $1,488,896 | $1,964,231 |
| 12/31/2020 | $3,643,590 | $1,707,529 | $2,221,344 |
| 3/31/2021 | $3,576,658 | $1,785,587 | $2,227,624 |
| 6/30/2021 | $4,002,650 | $1,917,603 | $2,449,966 |
| 9/30/2021 | $3,806,038 | $1,897,383 | $2,432,210 |
| 12/31/2021 | $3,676,358 | $2,024,060 | $2,601,246 |
| 3/31/2022 | $2,839,016 | $1,915,554 | $2,348,391 |
| 6/30/2022 | $1,920,798 | $1,615,569 | $1,875,083 |
| 9/30/2022 | $1,954,243 | $1,505,391 | $1,763,900 |
| 12/31/2022 | $1,780,328 | $1,652,361 | $1,857,075 |
| 3/31/2023 | $1,947,854 | $1,773,080 | $2,113,024 |
| 6/30/2023 | $2,072,790 | $1,882,608 | $2,307,337 |
| 9/30/2023 | $1,947,145 | $1,818,551 | $2,194,395 |
| 12/31/2023 | $2,235,347 | $2,019,216 | $2,473,985 |
| 3/31/2024 | $2,315,562 | $2,184,719 | $2,709,108 |
| 6/30/2024 | $2,393,646 | $2,247,403 | $2,877,170 |
Average Annual Total Returns (%)
| Total Net Assets | $600,375,556 |
| # of Issuers | 41 |
| Portfolio Turnover Rate | 3% |
| Total Advisory Fees Paid | $2,661,918 |
| Class/Index Name | 1 Year | 5 Years | 10 Years |
|---|
| Institutional | 15.48% | 4.93% | 9.12% |
| MSCI ACWI Index | 19.38% | 10.76% | 8.43% |
| MSCI ACWI Growth Index | 24.70% | 13.85% | 11.15% |
Past performance is not predictive of future performance. The performance data does not reflect the deduction of taxes that a shareholder would pay on Fund distributions or redemption of Fund shares. The Adviser waives and/or reimburses certain Fund expenses pursuant to a contract expiring on August 29, 2034, unless renewed for another 11-year term and the Fund’s transfer agency expenses may be reduced by expense offsets from an unaffiliated transfer agent, without which performance would have been lower.
Semi-Annual Shareholder Report | 1
Baron Global Advantage Fund
What did the Fund invest in?
| Holding | % of Total Net Assets (6/30/24)* |
| NVIDIA Corp. | 9.6% |
| MercadoLibre, Inc. | 9.0% |
| Shopify, Inc. | 7.0% |
| Coupang, Inc. | 6.2% |
| Space Exploration Technologies Corp. | 6.1% |
| Crowdstrike Holdings, Inc. | 5.4% |
| Cloudflare, Inc. | 4.9% |
| ASML Holding N.V. | 4.0% |
| argenx SE | 3.9% |
| Datadog, Inc. | 3.8% |
| Total | 59.9% |
* Individual weights may not sum to 100% (or displayed total) due to rounding.
Sector Breakdown
(as a % of net assets)*
| Value | Value |
|---|
| Information Technology | 51.0% |
| Consumer Discretionary | 26.1% |
| Industrials | 10.3% |
| Financials | 7.3% |
| Health Care | 5.2% |
| Materials | 0.1% |
| Communication Services | 0.0% |
| Cash and Cash Equivalents | 0.0%Footnote Reference† |
| Footnote | Description |
Footnote† | Includes short-term investments, other assets and liabilities-net. |
Country Exposures
(as a % of net assets)*
| Value | Value |
|---|
| United States | 46.6% |
| Argentina | 11.0% |
| Netherlands | 9.8% |
| Canada | 7.0% |
| India | 6.2% |
| Korea, Republic Of | 6.2% |
| Israel | 4.6% |
| United Kingdom | 2.7% |
| Poland | 2.4% |
| Others | 3.6% |
If you wish to view additional information about the Fund; including but not limited to its financial statements, prospectus, or holdings, please visit BaronCapitalGroup.com. For benchmark definitions and attribution language please visit connect.rightprospectus.com/Baron.
Phone: 1.800.99.BARON
Email: info@BaronCapitalGroup.com
Baron Global Advantage Fund
Semi-Annual Shareholder Report June 30, 2024
Semi-Annual Shareholder Report June 30, 2024
Baron Global Advantage Fund
This semi-annual shareholder report contains important information about Baron Global Advantage Fund for the period of January 1, 2024 to June 30, 2024.You can find additional information about the Fund at BaronCapitalGroup.com. You can also request this information by contacting us at 1.800.99.BARON.
What were the Fund costs for last year?
(based on a hypothetical $10,000 investment)
| Class Name | Cost of a $10,000 investment | Costs paid as a percentage of a $10,000 investment |
|---|
| R6 | $47Footnote Reference† | 0.92%Footnote Reference*Footnote Reference† |
| Footnote | Description |
Footnote* | Annualized. |
Footnote† | Reflects fee waivers and/or expense reimbursements, without which expenses would have been higher. |
Comparison of the Change in Value of $5,000,000 Investment in the Fund in Relation to the Benchmarks
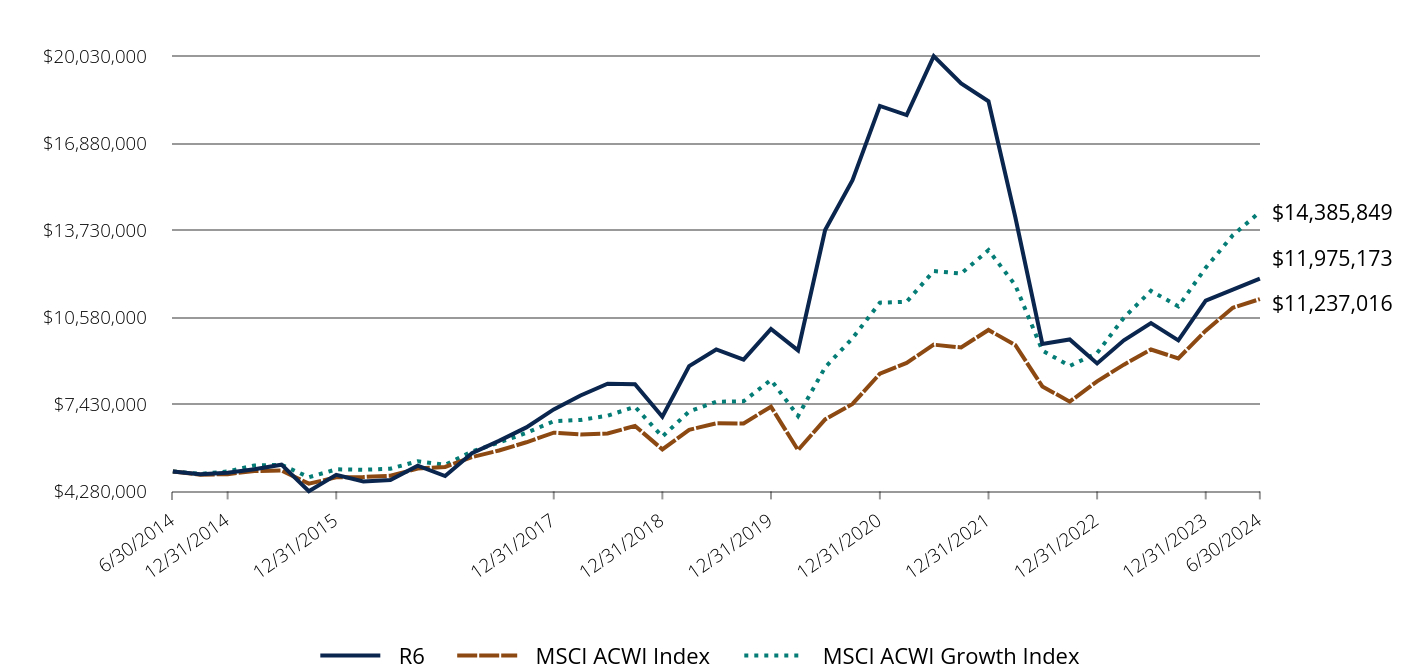
| R6 | MSCI ACWI Index | MSCI ACWI Growth Index |
|---|
| 6/30/2014 | $5,000,000 | $5,000,000 | $5,000,000 |
| 9/30/2014 | $4,903,154 | $4,884,749 | $4,914,555 |
| 12/31/2014 | $4,955,205 | $4,904,910 | $5,001,231 |
| 3/31/2015 | $5,080,126 | $5,018,045 | $5,219,116 |
| 6/30/2015 | $5,246,688 | $5,035,509 | $5,242,855 |
| 9/30/2015 | $4,287,807 | $4,559,656 | $4,792,672 |
| 12/31/2015 | $4,880,430 | $4,788,961 | $5,078,738 |
| 3/31/2016 | $4,639,895 | $4,800,368 | $5,063,401 |
| 6/30/2016 | $4,688,699 | $4,847,836 | $5,100,979 |
| 9/30/2016 | $5,211,602 | $5,104,860 | $5,370,525 |
| 12/31/2016 | $4,835,112 | $5,165,579 | $5,244,719 |
| 3/31/2017 | $5,661,299 | $5,522,428 | $5,721,126 |
| 6/30/2017 | $6,107,510 | $5,758,412 | $6,048,235 |
| 9/30/2017 | $6,595,553 | $6,056,818 | $6,396,653 |
| 12/31/2017 | $7,247,439 | $6,403,877 | $6,818,190 |
| 3/31/2018 | $7,749,426 | $6,342,299 | $6,864,024 |
| 6/30/2018 | $8,178,207 | $6,376,142 | $7,019,470 |
| 9/30/2018 | $8,153,805 | $6,648,841 | $7,339,515 |
| 12/31/2018 | $6,982,501 | $5,800,912 | $6,263,818 |
| 3/31/2019 | $8,812,663 | $6,507,264 | $7,170,712 |
| 6/30/2019 | $9,415,744 | $6,742,299 | $7,522,111 |
| 9/30/2019 | $9,046,226 | $6,740,553 | $7,542,254 |
| 12/31/2019 | $10,154,781 | $7,343,903 | $8,313,544 |
| 3/31/2020 | $9,380,884 | $5,774,864 | $7,007,122 |
| 6/30/2020 | $13,734,925 | $6,884,729 | $8,769,047 |
| 9/30/2020 | $15,537,198 | $7,444,477 | $9,821,154 |
| 12/31/2020 | $18,224,921 | $8,537,645 | $11,106,719 |
| 3/31/2021 | $17,893,749 | $8,927,933 | $11,138,122 |
| 6/30/2021 | $20,023,708 | $9,588,017 | $12,249,830 |
| 9/30/2021 | $19,040,650 | $9,486,915 | $12,161,049 |
| 12/31/2021 | $18,392,250 | $10,120,297 | $13,006,229 |
| 3/31/2022 | $14,205,538 | $9,577,770 | $11,741,955 |
| 6/30/2022 | $9,610,962 | $8,077,842 | $9,375,415 |
| 9/30/2022 | $9,778,187 | $7,526,956 | $8,819,501 |
| 12/31/2022 | $8,908,620 | $8,261,806 | $9,285,374 |
| 3/31/2023 | $9,746,244 | $8,865,398 | $10,565,121 |
| 6/30/2023 | $10,370,912 | $9,413,038 | $11,536,687 |
| 9/30/2023 | $9,742,694 | $9,092,753 | $10,971,974 |
| 12/31/2023 | $11,183,690 | $10,096,081 | $12,369,923 |
| 3/31/2024 | $11,581,206 | $10,923,594 | $13,545,540 |
| 6/30/2024 | $11,975,173 | $11,237,016 | $14,385,849 |
Average Annual Total Returns (%)
| Total Net Assets | $600,375,556 |
| # of Issuers | 41 |
| Portfolio Turnover Rate | 3% |
| Total Advisory Fees Paid | $2,661,918 |
| Class/Index Name | 1 Year | 5 Years | 10 Years |
|---|
| R6 | 15.47% | 4.93% | 9.13% |
| MSCI ACWI Index | 19.38% | 10.76% | 8.43% |
| MSCI ACWI Growth Index | 24.70% | 13.85% | 11.15% |
Past performance is not predictive of future performance. The performance data does not reflect the deduction of taxes that a shareholder would pay on Fund distributions or redemption of Fund shares. The Adviser waives and/or reimburses certain Fund expenses pursuant to a contract expiring on August 29, 2034, unless renewed for another 11-year term and the Fund’s transfer agency expenses may be reduced by expense offsets from an unaffiliated transfer agent, without which performance would have been lower. Performance for the R6 Shares prior to August 31, 2016 is based on the performance of the Institutional Shares.
Semi-Annual Shareholder Report | 1
Baron Global Advantage Fund
What did the Fund invest in?
| Holding | % of Total Net Assets (6/30/24)* |
| NVIDIA Corp. | 9.6% |
| MercadoLibre, Inc. | 9.0% |
| Shopify, Inc. | 7.0% |
| Coupang, Inc. | 6.2% |
| Space Exploration Technologies Corp. | 6.1% |
| Crowdstrike Holdings, Inc. | 5.4% |
| Cloudflare, Inc. | 4.9% |
| ASML Holding N.V. | 4.0% |
| argenx SE | 3.9% |
| Datadog, Inc. | 3.8% |
| Total | 59.9% |
* Individual weights may not sum to 100% (or displayed total) due to rounding.
Sector Breakdown
(as a % of net assets)*
| Value | Value |
|---|
| Information Technology | 51.0% |
| Consumer Discretionary | 26.1% |
| Industrials | 10.3% |
| Financials | 7.3% |
| Health Care | 5.2% |
| Materials | 0.1% |
| Communication Services | 0.0% |
| Cash and Cash Equivalents | 0.0%Footnote Reference† |
| Footnote | Description |
Footnote† | Includes short-term investments, other assets and liabilities-net. |
Country Exposures
(as a % of net assets)*
| Value | Value |
|---|
| United States | 46.6% |
| Argentina | 11.0% |
| Netherlands | 9.8% |
| Canada | 7.0% |
| India | 6.2% |
| Korea, Republic Of | 6.2% |
| Israel | 4.6% |
| United Kingdom | 2.7% |
| Poland | 2.4% |
| Others | 3.6% |
If you wish to view additional information about the Fund; including but not limited to its financial statements, prospectus, or holdings, please visit BaronCapitalGroup.com. For benchmark definitions and attribution language please visit connect.rightprospectus.com/Baron.
Phone: 1.800.99.BARON
Email: info@BaronCapitalGroup.com
Baron Global Advantage Fund
Semi-Annual Shareholder Report June 30, 2024
Semi-Annual Shareholder Report June 30, 2024
Baron Global Advantage Fund
This semi-annual shareholder report contains important information about Baron Global Advantage Fund for the period of January 1, 2024 to June 30, 2024.You can find additional information about the Fund at BaronCapitalGroup.com. You can also request this information by contacting us at 1.800.99.BARON.
What were the Fund costs for last year?
(based on a hypothetical $10,000 investment)
| Class Name | Cost of a $10,000 investment | Costs paid as a percentage of a $10,000 investment |
|---|
| Retail | $60Footnote Reference† | 1.17%Footnote Reference*Footnote Reference† |
| Footnote | Description |
Footnote* | Annualized. |
Footnote† | Reflects fee waivers and/or expense reimbursements, without which expenses would have been higher. |
Comparison of the Change in Value of $10,000 Investment in the Fund in Relation to the Benchmarks
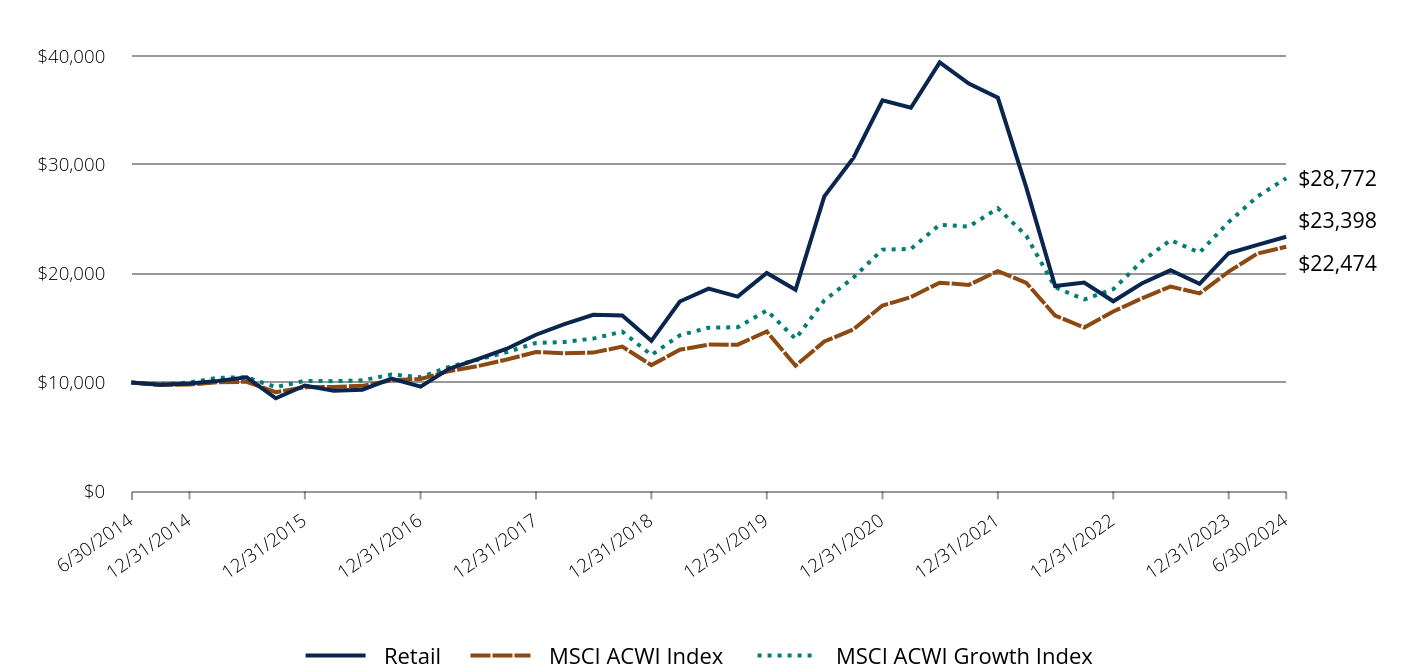
| Retail | MSCI ACWI Index | MSCI ACWI Growth Index |
|---|
| 6/30/2014 | $10,000 | $10,000 | $10,000 |
| 9/30/2014 | $9,798 | $9,770 | $9,829 |
| 12/31/2014 | $9,903 | $9,810 | $10,003 |
| 3/31/2015 | $10,154 | $10,036 | $10,438 |
| 6/30/2015 | $10,475 | $10,071 | $10,486 |
| 9/30/2015 | $8,557 | $9,119 | $9,585 |
| 12/31/2015 | $9,733 | $9,578 | $10,158 |
| 3/31/2016 | $9,250 | $9,601 | $10,127 |
| 6/30/2016 | $9,341 | $9,696 | $10,202 |
| 9/30/2016 | $10,370 | $10,210 | $10,741 |
| 12/31/2016 | $9,621 | $10,331 | $10,489 |
| 3/31/2017 | $11,258 | $11,045 | $11,442 |
| 6/30/2017 | $12,147 | $11,517 | $12,097 |
| 9/30/2017 | $13,105 | $12,114 | $12,793 |
| 12/31/2017 | $14,393 | $12,808 | $13,636 |
| 3/31/2018 | $15,372 | $12,685 | $13,728 |
| 6/30/2018 | $16,226 | $12,752 | $14,039 |
| 9/30/2018 | $16,163 | $13,298 | $14,679 |
| 12/31/2018 | $13,833 | $11,602 | $12,528 |
| 3/31/2019 | $17,444 | $13,015 | $14,341 |
| 6/30/2019 | $18,626 | $13,485 | $15,044 |
| 9/30/2019 | $17,891 | $13,481 | $15,085 |
| 12/31/2019 | $20,068 | $14,688 | $16,627 |
| 3/31/2020 | $18,528 | $11,550 | $14,014 |
| 6/30/2020 | $27,107 | $13,770 | $17,538 |
| 9/30/2020 | $30,640 | $14,889 | $19,642 |
| 12/31/2020 | $35,923 | $17,075 | $22,213 |
| 3/31/2021 | $35,244 | $17,856 | $22,276 |
| 6/30/2021 | $39,414 | $19,176 | $24,500 |
| 9/30/2021 | $37,462 | $18,974 | $24,322 |
| 12/31/2021 | $36,161 | $20,241 | $26,013 |
| 3/31/2022 | $27,911 | $19,156 | $23,484 |
| 6/30/2022 | $18,871 | $16,156 | $18,751 |
| 9/30/2022 | $19,186 | $15,054 | $17,639 |
| 12/31/2022 | $17,468 | $16,524 | $18,571 |
| 3/31/2023 | $19,100 | $17,731 | $21,130 |
| 6/30/2023 | $20,312 | $18,826 | $23,073 |
| 9/30/2023 | $19,072 | $18,186 | $21,944 |
| 12/31/2023 | $21,880 | $20,192 | $24,740 |
| 3/31/2024 | $22,649 | $21,847 | $27,091 |
| 6/30/2024 | $23,398 | $22,474 | $28,772 |
Average Annual Total Returns (%)
| Total Net Assets | $600,375,556 |
| # of Issuers | 41 |
| Portfolio Turnover Rate | 3% |
| Total Advisory Fees Paid | $2,661,918 |
| Class/Index Name | 1 Year | 5 Years | 10 Years |
|---|
| Retail | 15.19% | 4.67% | 8.87% |
| MSCI ACWI Index | 19.38% | 10.76% | 8.43% |
| MSCI ACWI Growth Index | 24.70% | 13.85% | 11.15% |
Past performance is not predictive of future performance. The performance data does not reflect the deduction of taxes that a shareholder would pay on Fund distributions or redemption of Fund shares. The Adviser waives and/or reimburses certain Fund expenses pursuant to a contract expiring on August 29, 2034, unless renewed for another 11-year term and the Fund’s transfer agency expenses may be reduced by expense offsets from an unaffiliated transfer agent, without which performance would have been lower.
Semi-Annual Shareholder Report | 1
Baron Global Advantage Fund
What did the Fund invest in?
| Holding | % of Total Net Assets (6/30/24)* |
| NVIDIA Corp. | 9.6% |
| MercadoLibre, Inc. | 9.0% |
| Shopify, Inc. | 7.0% |
| Coupang, Inc. | 6.2% |
| Space Exploration Technologies Corp. | 6.1% |
| Crowdstrike Holdings, Inc. | 5.4% |
| Cloudflare, Inc. | 4.9% |
| ASML Holding N.V. | 4.0% |
| argenx SE | 3.9% |
| Datadog, Inc. | 3.8% |
| Total | 59.9% |
* Individual weights may not sum to 100% (or displayed total) due to rounding.
Sector Breakdown
(as a % of net assets)*
| Value | Value |
|---|
| Information Technology | 51.0% |
| Consumer Discretionary | 26.1% |
| Industrials | 10.3% |
| Financials | 7.3% |
| Health Care | 5.2% |
| Materials | 0.1% |
| Communication Services | 0.0% |
| Cash and Cash Equivalents | 0.0%Footnote Reference† |
| Footnote | Description |
Footnote† | Includes short-term investments, other assets and liabilities-net. |
Country Exposures
(as a % of net assets)*
| Value | Value |
|---|
| United States | 46.6% |
| Argentina | 11.0% |
| Netherlands | 9.8% |
| Canada | 7.0% |
| India | 6.2% |
| Korea, Republic Of | 6.2% |
| Israel | 4.6% |
| United Kingdom | 2.7% |
| Poland | 2.4% |
| Others | 3.6% |
If you wish to view additional information about the Fund; including but not limited to its financial statements, prospectus, or holdings, please visit BaronCapitalGroup.com. For benchmark definitions and attribution language please visit connect.rightprospectus.com/Baron.
Phone: 1.800.99.BARON
Email: info@BaronCapitalGroup.com
Baron Global Advantage Fund
Semi-Annual Shareholder Report June 30, 2024
Semi-Annual Shareholder Report June 30, 2024
This semi-annual shareholder report contains important information about Baron Health Care Fund for the period of January 1, 2024 to June 30, 2024.You can find additional information about the Fund at BaronCapitalGroup.com. You can also request this information by contacting us at 1.800.99.BARON.
What were the Fund costs for last year?
(based on a hypothetical $10,000 investment)
| Class Name | Cost of a $10,000 investment | Costs paid as a percentage of a $10,000 investment |
|---|
| Institutional | $44Footnote Reference† | 0.85%Footnote Reference*Footnote Reference† |
| Footnote | Description |
Footnote* | Annualized. |
Footnote† | Reflects fee waivers and/or expense reimbursements, without which expenses would have been higher. |
Comparison of the Change in Value of $1,000,000 Investment in the Fund in Relation to the Benchmarks
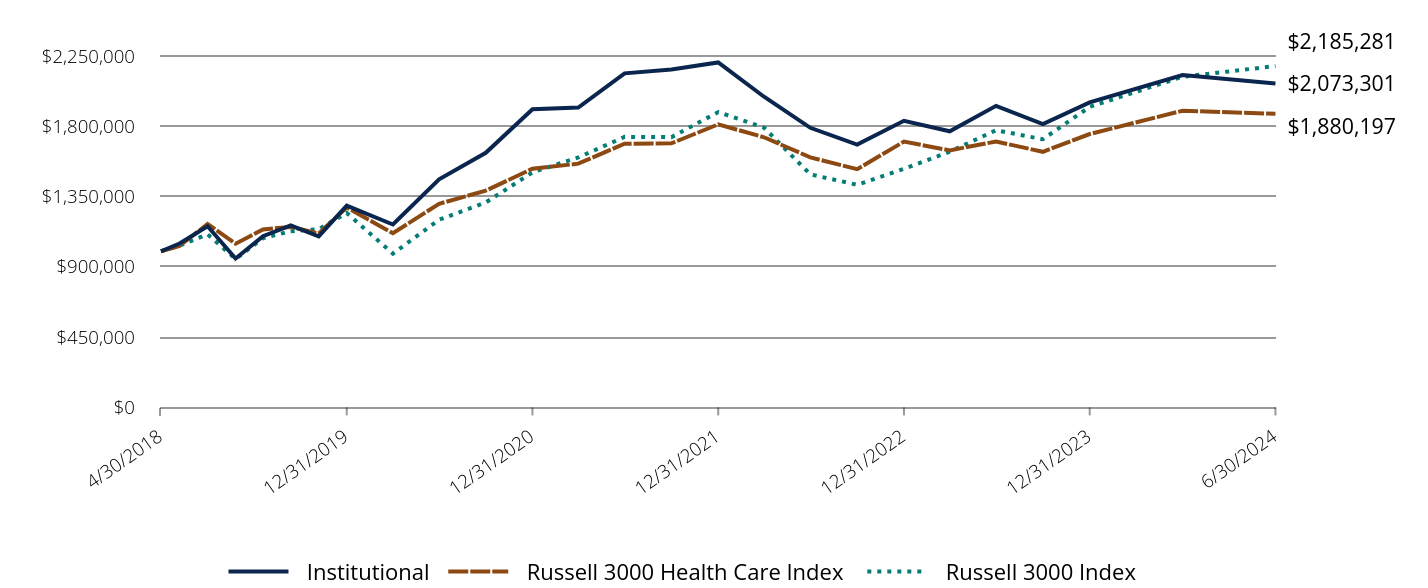
| Institutional | Russell 3000 Health Care Index | Russell 3000 Index |
|---|
| 4/30/2018 | $1,000,000 | $1,000,000 | $1,000,000 |
| 6/30/2018 | $1,049,000 | $1,033,818 | $1,034,955 |
| 9/30/2018 | $1,160,000 | $1,174,485 | $1,108,684 |
| 12/31/2018 | $953,000 | $1,048,493 | $950,119 |
| 3/31/2019 | $1,096,000 | $1,139,446 | $1,083,547 |
| 6/30/2019 | $1,165,000 | $1,155,765 | $1,127,920 |
| 9/30/2019 | $1,095,000 | $1,114,029 | $1,141,032 |
| 12/31/2019 | $1,292,000 | $1,280,313 | $1,244,835 |
| 3/31/2020 | $1,171,000 | $1,115,358 | $984,669 |
| 6/30/2020 | $1,460,000 | $1,303,590 | $1,201,567 |
| 9/30/2020 | $1,630,000 | $1,388,046 | $1,312,202 |
| 12/31/2020 | $1,908,533 | $1,527,934 | $1,504,854 |
| 3/31/2021 | $1,919,653 | $1,560,608 | $1,600,366 |
| 6/30/2021 | $2,139,013 | $1,687,967 | $1,732,233 |
| 9/30/2021 | $2,164,263 | $1,690,815 | $1,730,471 |
| 12/31/2021 | $2,208,650 | $1,812,124 | $1,891,016 |
| 3/31/2022 | $1,989,221 | $1,729,555 | $1,791,200 |
| 6/30/2022 | $1,790,299 | $1,601,125 | $1,492,049 |
| 9/30/2022 | $1,682,635 | $1,525,539 | $1,425,435 |
| 12/31/2022 | $1,835,415 | $1,701,601 | $1,527,810 |
| 3/31/2023 | $1,767,741 | $1,645,925 | $1,637,512 |
| 6/30/2023 | $1,930,775 | $1,702,561 | $1,774,847 |
| 9/30/2023 | $1,813,882 | $1,636,510 | $1,717,096 |
| 12/31/2023 | $1,953,333 | $1,750,387 | $1,924,381 |
| 3/31/2024 | $2,127,646 | $1,899,532 | $2,117,192 |
| 6/30/2024 | $2,073,301 | $1,880,197 | $2,185,281 |
Average Annual Total Returns (%)
| Total Net Assets | $232,868,279 |
| # of Issuers | 41 |
| Portfolio Turnover Rate | 21% |
| Total Advisory Fees Paid | $857,719 |
| Class/Index Name | 1 Year | 5 Years | Since Inception 4/30/2018 |
|---|
| Institutional | 7.38% | 12.22% | 12.54% |
| Russell 3000 Health Care Index | 10.43% | 10.22% | 10.78% |
| Russell 3000 Index | 23.13% | 14.14% | 13.52% |
Past performance is not predictive of future performance. The performance data does not reflect the deduction of taxes that a shareholder would pay on Fund distributions or redemption of Fund shares. The Adviser waives and/or reimburses certain Fund expenses pursuant to a contract expiring on August 29, 2034, unless renewed for another 11-year term and the Fund’s transfer agency expenses may be reduced by expense offsets from an unaffiliated transfer agent, without which performance would have been lower.
What did the Fund invest in?
| Holding | % of Total Net Assets (6/30/24)* |
| Eli Lilly & Co. | 9.3% |
| UnitedHealth Group, Incorporated | 7.3% |
| Intuitive Surgical, Inc. | 5.8% |
| Boston Scientific Corp. | 5.3% |
| Merck & Co., Inc. | 4.8% |
| Thermo Fisher Scientific, Inc. | 4.7% |
| Vertex Pharmaceuticals, Incorporated | 4.6% |
| argenx SE | 4.1% |
| ICON plc | 3.2% |
| Stryker Corp. | 3.2% |
| Total | 52.3% |
* Individual weights may not sum to 100% (or displayed total) due to rounding.
Sector Breakdown
(as a % of net assets)*
| Value | Value |
|---|
| Health Care | 95.8% |
| Cash and Cash Equivalents | 4.2%Footnote Reference† |
| Footnote | Description |
Footnote† | Includes short-term investments, other assets and liabilities-net. |
If you wish to view additional information about the Fund; including but not limited to its financial statements, prospectus, or holdings, please visit BaronCapitalGroup.com. For benchmark definitions and attribution language please visit connect.rightprospectus.com/Baron.
Phone: 1.800.99.BARON
Email: info@BaronCapitalGroup.com
Semi-Annual Shareholder Report June 30, 2024
Semi-Annual Shareholder Report June 30, 2024
This semi-annual shareholder report contains important information about Baron Health Care Fund for the period of January 1, 2024 to June 30, 2024.You can find additional information about the Fund at BaronCapitalGroup.com. You can also request this information by contacting us at 1.800.99.BARON.
What were the Fund costs for last year?
(based on a hypothetical $10,000 investment)
| Class Name | Cost of a $10,000 investment | Costs paid as a percentage of a $10,000 investment |
|---|
| R6 | $44Footnote Reference† | 0.85%Footnote Reference*Footnote Reference† |
| Footnote | Description |
Footnote* | Annualized. |
Footnote† | Reflects fee waivers and/or expense reimbursements, without which expenses would have been higher. |
Comparison of the Change in Value of $5,000,000 Investment in the Fund in Relation to the Benchmarks
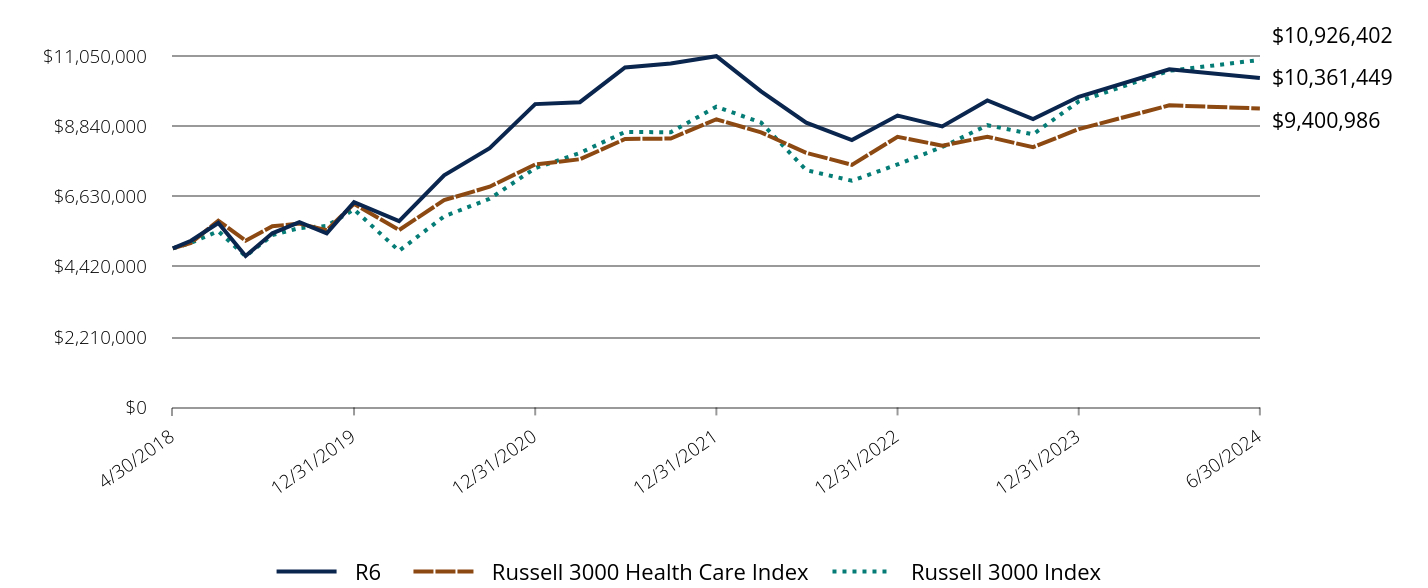
| R6 | Russell 3000 Health Care Index | Russell 3000 Index |
|---|
| 4/30/2018 | $5,000,000 | $5,000,000 | $5,000,000 |
| 6/30/2018 | $5,240,000 | $5,169,090 | $5,174,774 |
| 9/30/2018 | $5,800,000 | $5,872,427 | $5,543,420 |
| 12/31/2018 | $4,760,000 | $5,242,463 | $4,750,593 |
| 3/31/2019 | $5,475,000 | $5,697,230 | $5,417,737 |
| 6/30/2019 | $5,825,000 | $5,778,827 | $5,639,598 |
| 9/30/2019 | $5,475,000 | $5,570,145 | $5,705,158 |
| 12/31/2019 | $6,455,000 | $6,401,566 | $6,224,177 |
| 3/31/2020 | $5,855,000 | $5,576,789 | $4,923,344 |
| 6/30/2020 | $7,300,000 | $6,517,948 | $6,007,836 |
| 9/30/2020 | $8,150,000 | $6,940,232 | $6,561,009 |
| 12/31/2020 | $9,537,612 | $7,639,671 | $7,524,271 |
| 3/31/2021 | $9,598,264 | $7,803,040 | $8,001,830 |
| 6/30/2021 | $10,690,010 | $8,439,835 | $8,661,164 |
| 9/30/2021 | $10,816,260 | $8,454,076 | $8,652,355 |
| 12/31/2021 | $11,043,325 | $9,060,622 | $9,455,082 |
| 3/31/2022 | $9,941,043 | $8,647,772 | $8,956,000 |
| 6/30/2022 | $8,951,553 | $8,005,623 | $7,460,244 |
| 9/30/2022 | $8,408,103 | $7,627,694 | $7,127,174 |
| 12/31/2022 | $9,177,137 | $8,508,004 | $7,639,051 |
| 3/31/2023 | $8,833,635 | $8,229,624 | $8,187,558 |
| 6/30/2023 | $9,653,938 | $8,512,807 | $8,874,232 |
| 9/30/2023 | $9,069,472 | $8,182,549 | $8,585,480 |
| 12/31/2023 | $9,766,729 | $8,751,936 | $9,621,907 |
| 3/31/2024 | $10,633,174 | $9,497,661 | $10,585,959 |
| 6/30/2024 | $10,361,449 | $9,400,986 | $10,926,402 |
Average Annual Total Returns (%)
| Total Net Assets | $232,868,279 |
| # of Issuers | 41 |
| Portfolio Turnover Rate | 21% |
| Total Advisory Fees Paid | $857,719 |
| Class/Index Name | 1 Year | 5 Years | Since Inception 4/30/2018 |
|---|
| R6 | 7.33% | 12.21% | 12.54% |
| Russell 3000 Health Care Index | 10.43% | 10.22% | 10.78% |
| Russell 3000 Index | 23.13% | 14.14% | 13.52% |
Past performance is not predictive of future performance. The performance data does not reflect the deduction of taxes that a shareholder would pay on Fund distributions or redemption of Fund shares. The Adviser waives and/or reimburses certain Fund expenses pursuant to a contract expiring on August 29, 2034, unless renewed for another 11-year term and the Fund’s transfer agency expenses may be reduced by expense offsets from an unaffiliated transfer agent, without which performance would have been lower.
What did the Fund invest in?
| Holding | % of Total Net Assets (6/30/24)* |
| Eli Lilly & Co. | 9.3% |
| UnitedHealth Group, Incorporated | 7.3% |
| Intuitive Surgical, Inc. | 5.8% |
| Boston Scientific Corp. | 5.3% |
| Merck & Co., Inc. | 4.8% |
| Thermo Fisher Scientific, Inc. | 4.7% |
| Vertex Pharmaceuticals, Incorporated | 4.6% |
| argenx SE | 4.1% |
| ICON plc | 3.2% |
| Stryker Corp. | 3.2% |
| Total | 52.3% |
* Individual weights may not sum to 100% (or displayed total) due to rounding.
Sector Breakdown
(as a % of net assets)*
| Value | Value |
|---|
| Health Care | 95.8% |
| Cash and Cash Equivalents | 4.2%Footnote Reference† |
| Footnote | Description |
Footnote† | Includes short-term investments, other assets and liabilities-net. |
If you wish to view additional information about the Fund; including but not limited to its financial statements, prospectus, or holdings, please visit BaronCapitalGroup.com. For benchmark definitions and attribution language please visit connect.rightprospectus.com/Baron.
Phone: 1.800.99.BARON
Email: info@BaronCapitalGroup.com
Semi-Annual Shareholder Report June 30, 2024
Semi-Annual Shareholder Report June 30, 2024
This semi-annual shareholder report contains important information about Baron Health Care Fund for the period of January 1, 2024 to June 30, 2024.You can find additional information about the Fund at BaronCapitalGroup.com. You can also request this information by contacting us at 1.800.99.BARON.
What were the Fund costs for last year?
(based on a hypothetical $10,000 investment)
| Class Name | Cost of a $10,000 investment | Costs paid as a percentage of a $10,000 investment |
|---|
| Retail | $56Footnote Reference† | 1.10%Footnote Reference*Footnote Reference† |
| Footnote | Description |
Footnote* | Annualized. |
Footnote† | Reflects fee waivers and/or expense reimbursements, without which expenses would have been higher. |
Comparison of the Change in Value of $10,000 Investment in the Fund in Relation to the Benchmarks
| Retail | Russell 3000 Health Care Index | Russell 3000 Index |
|---|
| 4/30/2018 | $10,000 | $10,000 | $10,000 |
| 6/30/2018 | $10,480 | $10,338 | $10,350 |
| 9/30/2018 | $11,590 | $11,745 | $11,087 |
| 12/31/2018 | $9,510 | $10,485 | $9,501 |
| 3/31/2019 | $10,930 | $11,395 | $10,836 |
| 6/30/2019 | $11,620 | $11,558 | $11,279 |
| 9/30/2019 | $10,910 | $11,140 | $11,410 |
| 12/31/2019 | $12,860 | $12,803 | $12,448 |
| 3/31/2020 | $11,650 | $11,154 | $9,847 |
| 6/30/2020 | $14,520 | $13,036 | $12,016 |
| 9/30/2020 | $16,200 | $13,881 | $13,122 |
| 12/31/2020 | $18,955 | $15,279 | $15,049 |
| 3/31/2021 | $19,056 | $15,606 | $16,004 |
| 6/30/2021 | $21,220 | $16,880 | $17,322 |
| 9/30/2021 | $21,452 | $16,908 | $17,305 |
| 12/31/2021 | $21,886 | $18,121 | $18,910 |
| 3/31/2022 | $19,691 | $17,296 | $17,912 |
| 6/30/2022 | $17,722 | $16,011 | $14,921 |
| 9/30/2022 | $16,635 | $15,255 | $14,254 |
| 12/31/2022 | $18,142 | $17,016 | $15,278 |
| 3/31/2023 | $17,455 | $16,459 | $16,375 |
| 6/30/2023 | $19,065 | $17,026 | $17,749 |
| 9/30/2023 | $17,896 | $16,365 | $17,171 |
| 12/31/2023 | $19,260 | $17,504 | $19,244 |
| 3/31/2024 | $20,963 | $18,995 | $21,172 |
| 6/30/2024 | $20,419 | $18,802 | $21,853 |
Average Annual Total Returns (%)
| Total Net Assets | $232,868,279 |
| # of Issuers | 41 |
| Portfolio Turnover Rate | 21% |
| Total Advisory Fees Paid | $857,719 |
| Class/Index Name | 1 Year | 5 Years | Since Inception 4/30/2018 |
|---|
| Retail | 7.10% | 11.94% | 12.27% |
| Russell 3000 Health Care Index | 10.43% | 10.22% | 10.78% |
| Russell 3000 Index | 23.13% | 14.14% | 13.52% |
Past performance is not predictive of future performance. The performance data does not reflect the deduction of taxes that a shareholder would pay on Fund distributions or redemption of Fund shares. The Adviser waives and/or reimburses certain Fund expenses pursuant to a contract expiring on August 29, 2034, unless renewed for another 11-year term and the Fund’s transfer agency expenses may be reduced by expense offsets from an unaffiliated transfer agent, without which performance would have been lower.
What did the Fund invest in?
| Holding | % of Total Net Assets (6/30/24)* |
| Eli Lilly & Co. | 9.3% |
| UnitedHealth Group, Incorporated | 7.3% |
| Intuitive Surgical, Inc. | 5.8% |
| Boston Scientific Corp. | 5.3% |
| Merck & Co., Inc. | 4.8% |
| Thermo Fisher Scientific, Inc. | 4.7% |
| Vertex Pharmaceuticals, Incorporated | 4.6% |
| argenx SE | 4.1% |
| ICON plc | 3.2% |
| Stryker Corp. | 3.2% |
| Total | 52.3% |
* Individual weights may not sum to 100% (or displayed total) due to rounding.
Sector Breakdown
(as a % of net assets)*
| Value | Value |
|---|
| Health Care | 95.8% |
| Cash and Cash Equivalents | 4.2%Footnote Reference† |
| Footnote | Description |
Footnote† | Includes short-term investments, other assets and liabilities-net. |
If you wish to view additional information about the Fund; including but not limited to its financial statements, prospectus, or holdings, please visit BaronCapitalGroup.com. For benchmark definitions and attribution language please visit connect.rightprospectus.com/Baron.
Phone: 1.800.99.BARON
Email: info@BaronCapitalGroup.com
Semi-Annual Shareholder Report June 30, 2024
Semi-Annual Shareholder Report June 30, 2024
Baron International Growth Fund
This semi-annual shareholder report contains important information about Baron International Growth Fund for the period of January 1, 2024 to June 30, 2024.You can find additional information about the Fund at BaronCapitalGroup.com. You can also request this information by contacting us at 1.800.99.BARON.
What were the Fund costs for last year?
(based on a hypothetical $10,000 investment)
| Class Name | Cost of a $10,000 investment | Costs paid as a percentage of a $10,000 investment |
|---|
| Institutional | $48Footnote Reference† | 0.96%Footnote Reference*Footnote Reference† |
| Footnote | Description |
Footnote* | Annualized. |
Footnote† | Reflects fee waivers and/or expense reimbursements, without which expenses would have been higher. |
Comparison of the Change in Value of $1,000,000 Investment in the Fund in Relation to the Benchmarks
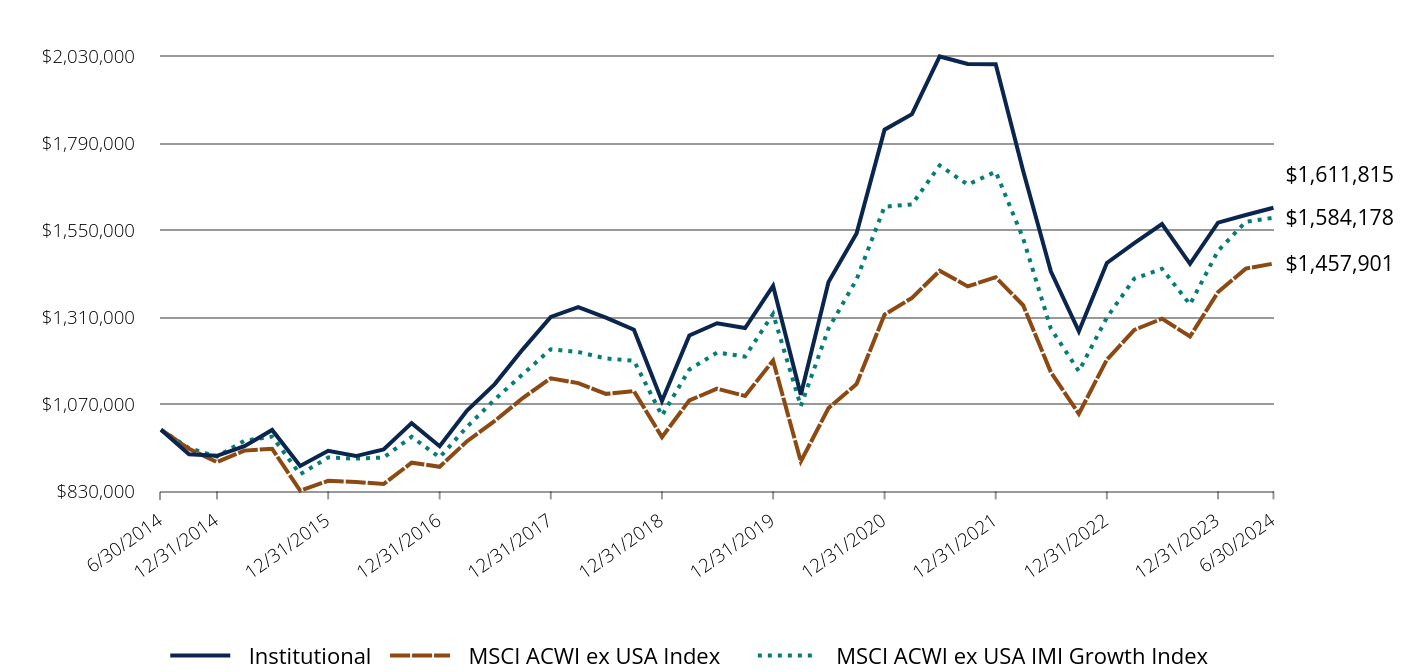
| Institutional | MSCI ACWI ex USA Index | MSCI ACWI ex USA IMI Growth Index |
|---|
| 6/30/2014 | $1,000,000 | $1,000,000 | $1,000,000 |
| 9/30/2014 | $932,119 | $947,341 | $949,181 |
| 12/31/2014 | $928,166 | $910,686 | $925,816 |
| 3/31/2015 | $954,847 | $942,468 | $969,824 |
| 6/30/2015 | $999,485 | $947,431 | $981,182 |
| 9/30/2015 | $899,944 | $832,125 | $877,272 |
| 12/31/2015 | $941,893 | $859,122 | $923,368 |
| 3/31/2016 | $927,379 | $855,889 | $920,387 |
| 6/30/2016 | $945,522 | $850,376 | $923,258 |
| 9/30/2016 | $1,018,095 | $909,148 | $980,455 |
| 12/31/2016 | $954,654 | $897,740 | $923,890 |
| 3/31/2017 | $1,052,997 | $968,306 | $1,008,055 |
| 6/30/2017 | $1,125,707 | $1,024,300 | $1,083,435 |
| 9/30/2017 | $1,221,514 | $1,087,430 | $1,153,001 |
| 12/31/2017 | $1,311,043 | $1,141,851 | $1,221,807 |
| 3/31/2018 | $1,337,600 | $1,128,350 | $1,214,166 |
| 6/30/2018 | $1,308,875 | $1,098,846 | $1,196,476 |
| 9/30/2018 | $1,275,799 | $1,106,596 | $1,190,168 |
| 12/31/2018 | $1,079,239 | $979,732 | $1,039,054 |
| 3/31/2019 | $1,259,951 | $1,080,779 | $1,165,944 |
| 6/30/2019 | $1,293,520 | $1,113,005 | $1,212,756 |
| 9/30/2019 | $1,280,213 | $1,092,997 | $1,201,678 |
| 12/31/2019 | $1,396,410 | $1,190,521 | $1,319,350 |
| 3/31/2020 | $1,096,137 | $912,474 | $1,065,066 |
| 6/30/2020 | $1,407,074 | $1,059,559 | $1,279,038 |
| 9/30/2020 | $1,540,993 | $1,125,805 | $1,413,811 |
| 12/31/2020 | $1,826,992 | $1,317,335 | $1,614,824 |
| 3/31/2021 | $1,869,703 | $1,363,356 | $1,621,010 |
| 6/30/2021 | $2,028,742 | $1,438,017 | $1,728,347 |
| 9/30/2021 | $2,007,909 | $1,395,049 | $1,675,439 |
| 12/31/2021 | $2,007,576 | $1,420,404 | $1,711,172 |
| 3/31/2022 | $1,713,669 | $1,343,119 | $1,527,755 |
| 6/30/2022 | $1,436,353 | $1,158,750 | $1,278,682 |
| 9/30/2022 | $1,271,030 | $1,043,968 | $1,161,385 |
| 12/31/2022 | $1,459,732 | $1,193,094 | $1,309,248 |
| 3/31/2023 | $1,514,419 | $1,275,012 | $1,416,328 |
| 6/30/2023 | $1,566,703 | $1,306,087 | $1,443,665 |
| 9/30/2023 | $1,457,328 | $1,256,810 | $1,345,201 |
| 12/31/2023 | $1,570,703 | $1,379,407 | $1,493,092 |
| 3/31/2024 | $1,591,864 | $1,444,053 | $1,572,991 |
| 6/30/2024 | $1,611,815 | $1,457,901 | $1,584,178 |
Average Annual Total Returns (%)
| Total Net Assets | $342,446,520 |
| # of Issuers | 95 |
| Portfolio Turnover Rate | 14% |
| Total Advisory Fees Paid | $1,740,990 |
| Class/Index Name | 1 Year | 5 Years | 10 Years |
|---|
| Institutional | 2.88% | 4.50% | 4.89% |
| MSCI ACWI ex USA Index | 11.62% | 5.55% | 3.84% |
| MSCI ACWI ex USA IMI Growth Index | 9.73% | 5.49% | 4.71% |
Past performance is not predictive of future performance. The performance data does not reflect the deduction of taxes that a shareholder would pay on Fund distributions or redemption of Fund shares. The Adviser waives and/or reimburses certain Fund expenses pursuant to a contract expiring on August 29, 2034, unless renewed for another 11-year term and the Fund’s transfer agency expenses may be reduced by expense offsets from an unaffiliated transfer agent, without which performance would have been lower.
Semi-Annual Shareholder Report | 1
Baron International Growth Fund
What did the Fund invest in?
| Holding | % of Total Net Assets (6/30/24)* |
| Taiwan Semiconductor Manufacturing Co., Ltd. | 3.2% |
| Linde Public Limited Company | 2.8% |
| Arch Capital Group Ltd. | 2.8% |
| Constellation Software, Inc. | 2.7% |
| AstraZeneca PLC | 2.4% |
| InPost SA | 2.3% |
| eDreams ODIGEO SA | 2.2% |
| argenx SE | 2.1% |
| Symrise AG | 2.1% |
| Novo Nordisk AS | 1.9% |
| Total | 24.5% |
* Individual weights may not sum to 100% (or displayed total) due to rounding.
Sector Breakdown
(as a % of net assets)*
| Value | Value |
|---|
| Information Technology | 16.8% |
| Industrials | 15.1% |
| Financials | 13.8% |
| Consumer Discretionary | 12.4% |
| Health Care | 11.8% |
| Materials | 9.8% |
| Communication Services | 7.7% |
| Consumer Staples | 6.1% |
| Energy | 3.1% |
| Real Estate | 0.6% |
| Cash and Cash Equivalents | 2.8%Footnote Reference† |
| Footnote | Description |
Footnote† | Includes short-term investments, other assets and liabilities-net. |
Country Exposures
(as a % of net assets)*
| Value | Value |
|---|
| Japan | 11.7% |
| India | 10.4% |
| United Kingdom | 8.4% |
| Netherlands | 8.0% |
| China | 6.8% |
| Korea, Republic Of | 6.2% |
| France | 5.7% |
| United States | 4.4% |
| Israel | 4.1% |
| Others | 31.5% |
If you wish to view additional information about the Fund; including but not limited to its financial statements, prospectus, or holdings, please visit BaronCapitalGroup.com. For benchmark definitions and attribution language please visit connect.rightprospectus.com/Baron.
Phone: 1.800.99.BARON
Email: info@BaronCapitalGroup.com
Baron International Growth Fund
Semi-Annual Shareholder Report June 30, 2024
Semi-Annual Shareholder Report June 30, 2024
Baron International Growth Fund
This semi-annual shareholder report contains important information about Baron International Growth Fund for the period of January 1, 2024 to June 30, 2024.You can find additional information about the Fund at BaronCapitalGroup.com. You can also request this information by contacting us at 1.800.99.BARON.
What were the Fund costs for last year?
(based on a hypothetical $10,000 investment)
| Class Name | Cost of a $10,000 investment | Costs paid as a percentage of a $10,000 investment |
|---|
| R6 | $48Footnote Reference† | 0.96%Footnote Reference*Footnote Reference† |
| Footnote | Description |
Footnote* | Annualized. |
Footnote† | Reflects fee waivers and/or expense reimbursements, without which expenses would have been higher. |
Comparison of the Change in Value of $5,000,000 Investment in the Fund in Relation to the Benchmarks
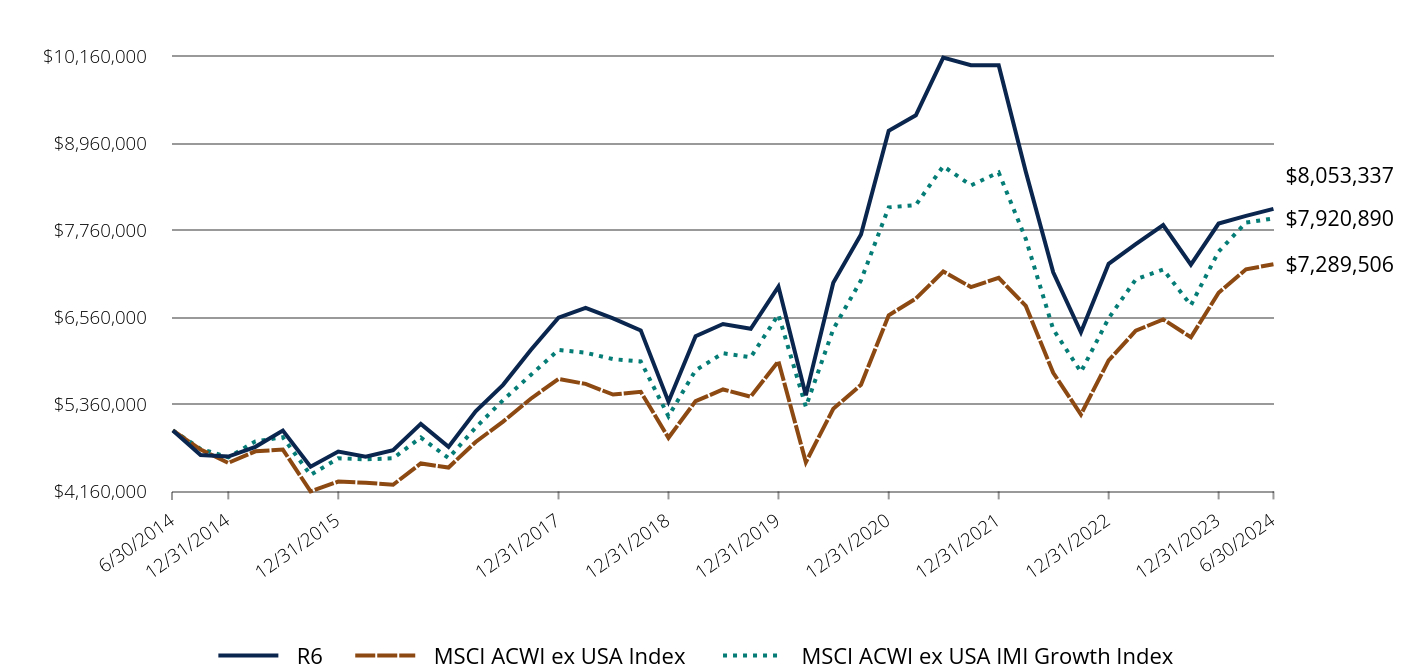
| R6 | MSCI ACWI ex USA Index | MSCI ACWI ex USA IMI Growth Index |
|---|
| 6/30/2014 | $5,000,000 | $5,000,000 | $5,000,000 |
| 9/30/2014 | $4,660,597 | $4,736,706 | $4,745,903 |
| 12/31/2014 | $4,640,832 | $4,553,430 | $4,629,080 |
| 3/31/2015 | $4,774,233 | $4,712,338 | $4,849,118 |
| 6/30/2015 | $4,997,424 | $4,737,155 | $4,905,908 |
| 9/30/2015 | $4,499,719 | $4,160,623 | $4,386,359 |
| 12/31/2015 | $4,709,466 | $4,295,609 | $4,616,841 |
| 3/31/2016 | $4,636,893 | $4,279,445 | $4,601,933 |
| 6/30/2016 | $4,727,609 | $4,251,880 | $4,616,288 |
| 9/30/2016 | $5,090,474 | $4,545,741 | $4,902,274 |
| 12/31/2016 | $4,773,272 | $4,488,702 | $4,619,449 |
| 3/31/2017 | $5,264,984 | $4,841,532 | $5,040,272 |
| 6/30/2017 | $5,628,537 | $5,121,501 | $5,417,175 |
| 9/30/2017 | $6,107,572 | $5,437,149 | $5,765,006 |
| 12/31/2017 | $6,555,216 | $5,709,255 | $6,109,034 |
| 3/31/2018 | $6,688,000 | $5,641,750 | $6,070,829 |
| 6/30/2018 | $6,544,376 | $5,494,229 | $5,982,377 |
| 9/30/2018 | $6,378,981 | $5,532,979 | $5,950,840 |
| 12/31/2018 | $5,396,184 | $4,898,662 | $5,195,271 |
| 3/31/2019 | $6,299,744 | $5,403,897 | $5,829,720 |
| 6/30/2019 | $6,467,588 | $5,565,026 | $6,063,780 |
| 9/30/2019 | $6,401,054 | $5,464,983 | $6,008,388 |
| 12/31/2019 | $6,982,039 | $5,952,605 | $6,596,751 |
| 3/31/2020 | $5,483,482 | $4,562,370 | $5,325,330 |
| 6/30/2020 | $7,035,359 | $5,297,795 | $6,395,191 |
| 9/30/2020 | $7,699,335 | $5,629,023 | $7,069,054 |
| 12/31/2020 | $9,129,328 | $6,586,675 | $8,074,122 |
| 3/31/2021 | $9,342,880 | $6,816,777 | $8,105,051 |
| 6/30/2021 | $10,138,078 | $7,190,087 | $8,641,735 |
| 9/30/2021 | $10,033,913 | $6,975,243 | $8,377,194 |
| 12/31/2021 | $10,032,248 | $7,102,019 | $8,555,857 |
| 3/31/2022 | $8,565,632 | $6,715,597 | $7,638,775 |
| 6/30/2022 | $7,179,013 | $5,793,748 | $6,393,411 |
| 9/30/2022 | $6,352,375 | $5,219,837 | $5,806,925 |
| 12/31/2022 | $7,295,916 | $5,965,472 | $6,546,239 |
| 3/31/2023 | $7,566,358 | $6,375,061 | $7,081,640 |
| 6/30/2023 | $7,830,790 | $6,530,436 | $7,218,323 |
| 9/30/2023 | $7,283,897 | $6,284,048 | $6,726,005 |
| 12/31/2023 | $7,850,795 | $6,897,036 | $7,465,459 |
| 3/31/2024 | $7,956,600 | $7,220,265 | $7,864,956 |
| 6/30/2024 | $8,053,337 | $7,289,506 | $7,920,890 |
Average Annual Total Returns (%)
| Total Net Assets | $342,446,520 |
| # of Issuers | 95 |
| Portfolio Turnover Rate | 14% |
| Total Advisory Fees Paid | $1,740,990 |
| Class/Index Name | 1 Year | 5 Years | 10 Years |
|---|
| R6 | 2.84% | 4.48% | 4.88% |
| MSCI ACWI ex USA Index | 11.62% | 5.55% | 3.84% |
| MSCI ACWI ex USA IMI Growth Index | 9.73% | 5.49% | 4.71% |
Past performance is not predictive of future performance. The performance data does not reflect the deduction of taxes that a shareholder would pay on Fund distributions or redemption of Fund shares. The Adviser waives and/or reimburses certain Fund expenses pursuant to a contract expiring on August 29, 2034, unless renewed for another 11-year term and the Fund’s transfer agency expenses may be reduced by expense offsets from an unaffiliated transfer agent, without which performance would have been lower. Performance for the R6 Shares prior to August 31, 2016 is based on the performance of the Institutional Shares.
Semi-Annual Shareholder Report | 1
Baron International Growth Fund
What did the Fund invest in?
| Holding | % of Total Net Assets (6/30/24)* |
| Taiwan Semiconductor Manufacturing Co., Ltd. | 3.2% |
| Linde Public Limited Company | 2.8% |
| Arch Capital Group Ltd. | 2.8% |
| Constellation Software, Inc. | 2.7% |
| AstraZeneca PLC | 2.4% |
| InPost SA | 2.3% |
| eDreams ODIGEO SA | 2.2% |
| argenx SE | 2.1% |
| Symrise AG | 2.1% |
| Novo Nordisk AS | 1.9% |
| Total | 24.5% |
* Individual weights may not sum to 100% (or displayed total) due to rounding.
Sector Breakdown
(as a % of net assets)*
| Value | Value |
|---|
| Information Technology | 16.8% |
| Industrials | 15.1% |
| Financials | 13.8% |
| Consumer Discretionary | 12.4% |
| Health Care | 11.8% |
| Materials | 9.8% |
| Communication Services | 7.7% |
| Consumer Staples | 6.1% |
| Energy | 3.1% |
| Real Estate | 0.6% |
| Cash and Cash Equivalents | 2.8%Footnote Reference† |
| Footnote | Description |
Footnote† | Includes short-term investments, other assets and liabilities-net. |
Country Exposures
(as a % of net assets)*
| Value | Value |
|---|
| Japan | 11.7% |
| India | 10.4% |
| United Kingdom | 8.4% |
| Netherlands | 8.0% |
| China | 6.8% |
| Korea, Republic Of | 6.2% |
| France | 5.7% |
| United States | 4.4% |
| Israel | 4.1% |
| Others | 31.5% |
If you wish to view additional information about the Fund; including but not limited to its financial statements, prospectus, or holdings, please visit BaronCapitalGroup.com. For benchmark definitions and attribution language please visit connect.rightprospectus.com/Baron.
Phone: 1.800.99.BARON
Email: info@BaronCapitalGroup.com
Baron International Growth Fund
Semi-Annual Shareholder Report June 30, 2024
Semi-Annual Shareholder Report June 30, 2024
Baron International Growth Fund
This semi-annual shareholder report contains important information about Baron International Growth Fund for the period of January 1, 2024 to June 30, 2024.You can find additional information about the Fund at BaronCapitalGroup.com. You can also request this information by contacting us at 1.800.99.BARON.
What were the Fund costs for last year?
(based on a hypothetical $10,000 investment)
| Class Name | Cost of a $10,000 investment | Costs paid as a percentage of a $10,000 investment |
|---|
| Retail | $61Footnote Reference† | 1.21%Footnote Reference*Footnote Reference† |
| Footnote | Description |
Footnote* | Annualized. |
Footnote† | Reflects fee waivers and/or expense reimbursements, without which expenses would have been higher. |
Comparison of the Change in Value of $10,000 Investment in the Fund in Relation to the Benchmarks
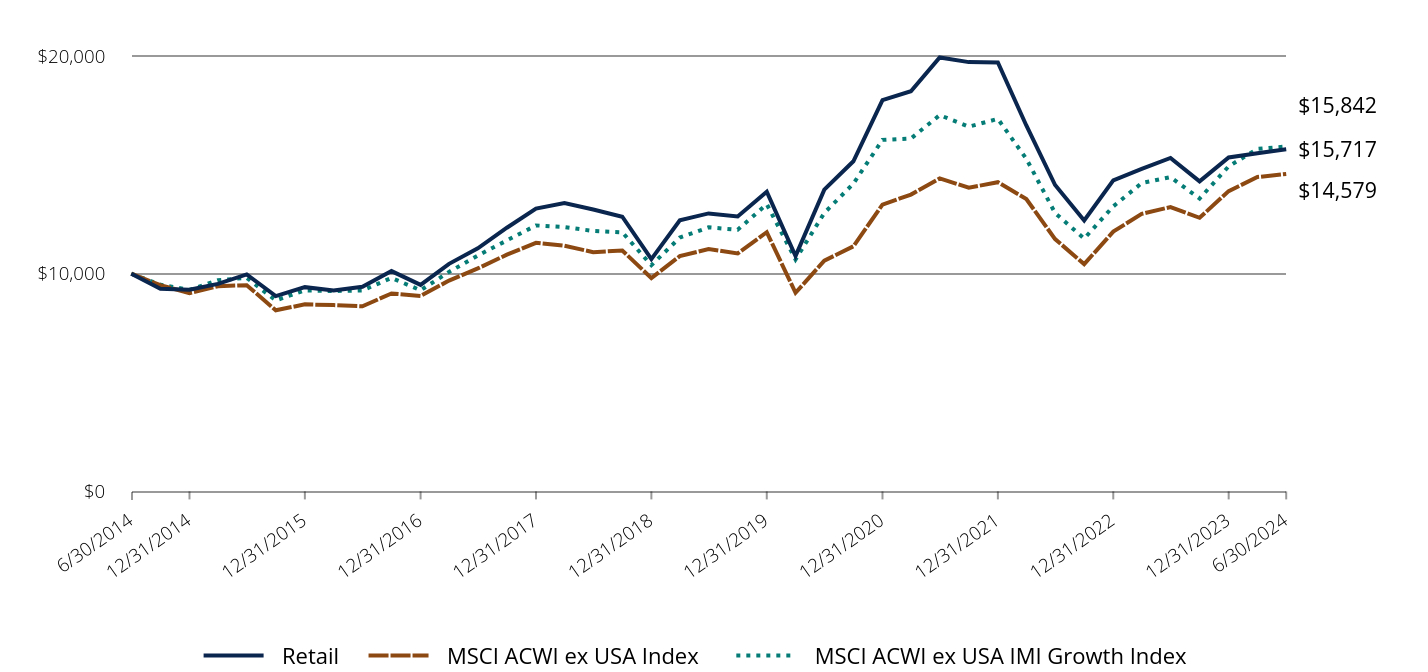
| Retail | MSCI ACWI ex USA Index | MSCI ACWI ex USA IMI Growth Index |
|---|
| 6/30/2014 | $10,000 | $10,000 | $10,000 |
| 9/30/2014 | $9,312 | $9,473 | $9,492 |
| 12/31/2014 | $9,268 | $9,107 | $9,258 |
| 3/31/2015 | $9,531 | $9,425 | $9,698 |
| 6/30/2015 | $9,965 | $9,474 | $9,812 |
| 9/30/2015 | $8,970 | $8,321 | $8,773 |
| 12/31/2015 | $9,382 | $8,591 | $9,234 |
| 3/31/2016 | $9,231 | $8,559 | $9,204 |
| 6/30/2016 | $9,403 | $8,504 | $9,233 |
| 9/30/2016 | $10,120 | $9,092 | $9,805 |
| 12/31/2016 | $9,489 | $8,977 | $9,239 |
| 3/31/2017 | $10,454 | $9,683 | $10,081 |
| 6/30/2017 | $11,167 | $10,243 | $10,834 |
| 9/30/2017 | $12,112 | $10,874 | $11,530 |
| 12/31/2017 | $12,994 | $11,419 | $12,218 |
| 3/31/2018 | $13,250 | $11,284 | $12,142 |
| 6/30/2018 | $12,951 | $10,989 | $11,965 |
| 9/30/2018 | $12,619 | $11,066 | $11,902 |
| 12/31/2018 | $10,669 | $9,797 | $10,391 |
| 3/31/2019 | $12,449 | $10,808 | $11,659 |
| 6/30/2019 | $12,769 | $11,130 | $12,128 |
| 9/30/2019 | $12,632 | $10,930 | $12,017 |
| 12/31/2019 | $13,769 | $11,905 | $13,194 |
| 3/31/2020 | $10,807 | $9,125 | $10,651 |
| 6/30/2020 | $13,859 | $10,596 | $12,790 |
| 9/30/2020 | $15,166 | $11,258 | $14,138 |
| 12/31/2020 | $17,971 | $13,173 | $16,148 |
| 3/31/2021 | $18,382 | $13,634 | $16,210 |
| 6/30/2021 | $19,933 | $14,380 | $17,284 |
| 9/30/2021 | $19,719 | $13,951 | $16,754 |
| 12/31/2021 | $19,703 | $14,204 | $17,112 |
| 3/31/2022 | $16,809 | $13,431 | $15,278 |
| 6/30/2022 | $14,074 | $11,588 | $12,787 |
| 9/30/2022 | $12,447 | $10,440 | $11,614 |
| 12/31/2022 | $14,290 | $11,931 | $13,093 |
| 3/31/2023 | $14,812 | $12,750 | $14,163 |
| 6/30/2023 | $15,317 | $13,061 | $14,437 |
| 9/30/2023 | $14,242 | $12,568 | $13,452 |
| 12/31/2023 | $15,337 | $13,794 | $14,931 |
| 3/31/2024 | $15,536 | $14,441 | $15,730 |
| 6/30/2024 | $15,717 | $14,579 | $15,842 |
Average Annual Total Returns (%)
| Total Net Assets | $342,446,520 |
| # of Issuers | 95 |
| Portfolio Turnover Rate | 14% |
| Total Advisory Fees Paid | $1,740,990 |
| Class/Index Name | 1 Year | 5 Years | 10 Years |
|---|
| Retail | 2.61% | 4.24% | 4.63% |
| MSCI ACWI ex USA Index | 11.62% | 5.55% | 3.84% |
| MSCI ACWI ex USA IMI Growth Index | 9.73% | 5.49% | 4.71% |
Past performance is not predictive of future performance. The performance data does not reflect the deduction of taxes that a shareholder would pay on Fund distributions or redemption of Fund shares. The Adviser waives and/or reimburses certain Fund expenses pursuant to a contract expiring on August 29, 2034, unless renewed for another 11-year term and the Fund’s transfer agency expenses may be reduced by expense offsets from an unaffiliated transfer agent, without which performance would have been lower.
Semi-Annual Shareholder Report | 1
Baron International Growth Fund
What did the Fund invest in?
| Holding | % of Total Net Assets (6/30/24)* |
| Taiwan Semiconductor Manufacturing Co., Ltd. | 3.2% |
| Linde Public Limited Company | 2.8% |
| Arch Capital Group Ltd. | 2.8% |
| Constellation Software, Inc. | 2.7% |
| AstraZeneca PLC | 2.4% |
| InPost SA | 2.3% |
| eDreams ODIGEO SA | 2.2% |
| argenx SE | 2.1% |
| Symrise AG | 2.1% |
| Novo Nordisk AS | 1.9% |
| Total | 24.5% |
* Individual weights may not sum to 100% (or displayed total) due to rounding.
Sector Breakdown
(as a % of net assets)*
| Value | Value |
|---|
| Information Technology | 16.8% |
| Industrials | 15.1% |
| Financials | 13.8% |
| Consumer Discretionary | 12.4% |
| Health Care | 11.8% |
| Materials | 9.8% |
| Communication Services | 7.7% |
| Consumer Staples | 6.1% |
| Energy | 3.1% |
| Real Estate | 0.6% |
| Cash and Cash Equivalents | 2.8%Footnote Reference† |
| Footnote | Description |
Footnote† | Includes short-term investments, other assets and liabilities-net. |
Country Exposures
(as a % of net assets)*
| Value | Value |
|---|
| Japan | 11.7% |
| India | 10.4% |
| United Kingdom | 8.4% |
| Netherlands | 8.0% |
| China | 6.8% |
| Korea, Republic Of | 6.2% |
| France | 5.7% |
| United States | 4.4% |
| Israel | 4.1% |
| Others | 31.5% |
If you wish to view additional information about the Fund; including but not limited to its financial statements, prospectus, or holdings, please visit BaronCapitalGroup.com. For benchmark definitions and attribution language please visit connect.rightprospectus.com/Baron.
Phone: 1.800.99.BARON
Email: info@BaronCapitalGroup.com
Baron International Growth Fund
Semi-Annual Shareholder Report June 30, 2024
Semi-Annual Shareholder Report June 30, 2024
This semi-annual shareholder report contains important information about Baron New Asia Fund for the period of January 1, 2024 to June 30, 2024.You can find additional information about the Fund at BaronCapitalGroup.com. You can also request this information by contacting us at 1.800.99.BARON.
What were the Fund costs for last year?
(based on a hypothetical $10,000 investment)
| Class Name | Cost of a $10,000 investment | Costs paid as a percentage of a $10,000 investment |
|---|
| Institutional | $65Footnote Reference† | 1.20%Footnote Reference*Footnote Reference† |
| Footnote | Description |
Footnote* | Annualized. |
Footnote† | Reflects fee waivers and/or expense reimbursements, without which expenses would have been higher. |
Comparison of the Change in Value of $1,000,000 Investment in the Fund in Relation to the Benchmarks
| Institutional | MSCI AC Asia ex Japan Index | MSCI AC Asia ex Japan IMI Growth Index | MSCI AC Asia Index |
|---|
| 7/30/2021 | $1,000,000 | $1,000,000 | $1,000,000 | $1,000,000 |
| 9/30/2021 | $1,037,000 | $980,151 | $978,537 | $1,008,221 |
| 12/31/2021 | $1,017,000 | $968,072 | $963,316 | $985,536 |
| 3/31/2022 | $862,000 | $890,688 | $852,488 | $911,640 |
| 6/30/2022 | $794,000 | $810,486 | $763,072 | $811,215 |
| 9/30/2022 | $697,000 | $698,364 | $655,526 | $716,097 |
| 12/31/2022 | $743,000 | $777,637 | $729,624 | $802,168 |
| 3/31/2023 | $764,000 | $811,394 | $764,576 | $842,281 |
| 6/30/2023 | $780,000 | $801,165 | $750,277 | $854,980 |
| 9/30/2023 | $741,000 | $774,378 | $716,456 | $832,060 |
| 12/31/2023 | $786,000 | $824,153 | $761,485 | $891,004 |
| 3/31/2024 | $836,000 | $843,736 | $782,447 | $940,949 |
| 6/30/2024 | $926,000 | $904,471 | $841,750 | $966,575 |
Average Annual Total Returns (%)
| Total Net Assets | $5,948,175 |
| # of Issuers | 76 |
| Portfolio Turnover Rate | 29% |
| Total Advisory Fees Paid | $24,088 |
| Class/Index Name | 1 Year | Since Inception 7/30/2021 |
|---|
| Institutional | 18.72% | (2.60%) |
| MSCI AC Asia ex Japan Index | 12.89% | (3.38%) |
| MSCI AC Asia ex Japan IMI Growth Index | 12.19% | (5.74%) |
| MSCI AC Asia Index | 13.05% | (1.16%) |
Past performance is not predictive of future performance. The performance data does not reflect the deduction of taxes that a shareholder would pay on Fund distributions or redemption of Fund shares. The Adviser waives and/or reimburses certain Fund expenses pursuant to a contract expiring on August 29, 2034, unless renewed for another 11-year term and the Fund’s transfer agency expenses may be reduced by expense offsets from an unaffiliated transfer agent, without which performance would have been lower.
Semi-Annual Shareholder Report | 1
What did the Fund invest in?
| Holding | % of Total Net Assets (6/30/24)* |
| Bharti Airtel Ltd. | 7.3% |
| Taiwan Semiconductor Manufacturing Co., Ltd. | 7.3% |
| Trent Ltd. | 6.2% |
| Indus Towers Ltd. | 5.3% |
| Reliance Industries Limited | 4.0% |
| Tencent Holdings Limited | 3.8% |
| Samsung Electronics Co., Ltd. | 3.4% |
| Zomato Ltd. | 3.2% |
| Jio Financial Services Ltd. | 3.0% |
| Kaynes Technology India Ltd. | 2.6% |
| Total | 46.2% |
* Individual weights may not sum to 100% (or displayed total) due to rounding.
Sector Breakdown
(as a % of net assets)*
| Value | Value |
|---|
| Information Technology | 19.7% |
| Communication Services | 19.2% |
| Consumer Discretionary | 18.9% |
| Financials | 11.6% |
| Industrials | 11.1% |
| Consumer Staples | 4.1% |
| Energy | 4.0% |
| Health Care | 3.3% |
| Utilities | 2.2% |
| Materials | 1.2% |
| Cash and Cash Equivalents | 3.5%Footnote Reference† |
| Footnote | Description |
Footnote† | Includes short-term investments, other assets and liabilities-net. |
Country Exposures
(as a % of net assets)*
| Value | Value |
|---|
| India | 62.6% |
| China | 13.4% |
| Taiwan | 9.4% |
| Korea, Republic Of | 8.0% |
| Japan | 2.1% |
| Indonesia | 1.0% |
If you wish to view additional information about the Fund; including but not limited to its financial statements, prospectus, or holdings, please visit BaronCapitalGroup.com. For benchmark definitions and attribution language please visit connect.rightprospectus.com/Baron.
Phone: 1.800.99.BARON
Email: info@BaronCapitalGroup.com
Semi-Annual Shareholder Report June 30, 2024
Semi-Annual Shareholder Report June 30, 2024
This semi-annual shareholder report contains important information about Baron New Asia Fund for the period of January 1, 2024 to June 30, 2024.You can find additional information about the Fund at BaronCapitalGroup.com. You can also request this information by contacting us at 1.800.99.BARON.
What were the Fund costs for last year?
(based on a hypothetical $10,000 investment)
| Class Name | Cost of a $10,000 investment | Costs paid as a percentage of a $10,000 investment |
|---|
| R6 | $65Footnote Reference† | 1.20%Footnote Reference*Footnote Reference† |
| Footnote | Description |
Footnote* | Annualized. |
Footnote† | Reflects fee waivers and/or expense reimbursements, without which expenses would have been higher. |
Comparison of the Change in Value of $5,000,000 Investment in the Fund in Relation to the Benchmarks
| R6 | MSCI AC Asia ex Japan Index | MSCI AC Asia ex Japan IMI Growth Index | MSCI AC Asia Index |
|---|
| 7/30/2021 | $5,000,000 | $5,000,000 | $5,000,000 | $5,000,000 |
| 9/30/2021 | $5,185,000 | $4,900,757 | $4,892,686 | $5,041,105 |
| 12/31/2021 | $5,085,000 | $4,840,361 | $4,816,580 | $4,927,678 |
| 3/31/2022 | $4,315,000 | $4,453,442 | $4,262,439 | $4,558,199 |
| 6/30/2022 | $3,975,000 | $4,052,428 | $3,815,359 | $4,056,073 |
| 9/30/2022 | $3,490,000 | $3,491,818 | $3,277,629 | $3,580,486 |
| 12/31/2022 | $3,715,000 | $3,888,184 | $3,648,119 | $4,010,842 |
| 3/31/2023 | $3,825,000 | $4,056,971 | $3,822,882 | $4,211,403 |
| 6/30/2023 | $3,905,000 | $4,005,826 | $3,751,385 | $4,274,898 |
| 9/30/2023 | $3,710,000 | $3,871,891 | $3,582,280 | $4,160,302 |
| 12/31/2023 | $3,930,000 | $4,120,765 | $3,807,425 | $4,455,022 |
| 3/31/2024 | $4,185,000 | $4,218,678 | $3,912,234 | $4,704,746 |
| 6/30/2024 | $4,635,000 | $4,522,355 | $4,208,748 | $4,832,874 |
Average Annual Total Returns (%)
| Total Net Assets | $5,948,175 |
| # of Issuers | 76 |
| Portfolio Turnover Rate | 29% |
| Total Advisory Fees Paid | $24,088 |
| Class/Index Name | 1 Year | Since Inception 7/30/2021 |
|---|
| R6 | 18.69% | (2.56%) |
| MSCI AC Asia ex Japan Index | 12.89% | (3.38%) |
| MSCI AC Asia ex Japan IMI Growth Index | 12.19% | (5.74%) |
| MSCI AC Asia Index | 13.05% | (1.16%) |
Past performance is not predictive of future performance. The performance data does not reflect the deduction of taxes that a shareholder would pay on Fund distributions or redemption of Fund shares. The Adviser waives and/or reimburses certain Fund expenses pursuant to a contract expiring on August 29, 2034, unless renewed for another 11-year term and the Fund’s transfer agency expenses may be reduced by expense offsets from an unaffiliated transfer agent, without which performance would have been lower.
Semi-Annual Shareholder Report | 1
What did the Fund invest in?
| Holding | % of Total Net Assets (6/30/24)* |
| Bharti Airtel Ltd. | 7.3% |
| Taiwan Semiconductor Manufacturing Co., Ltd. | 7.3% |
| Trent Ltd. | 6.2% |
| Indus Towers Ltd. | 5.3% |
| Reliance Industries Limited | 4.0% |
| Tencent Holdings Limited | 3.8% |
| Samsung Electronics Co., Ltd. | 3.4% |
| Zomato Ltd. | 3.2% |
| Jio Financial Services Ltd. | 3.0% |
| Kaynes Technology India Ltd. | 2.6% |
| Total | 46.2% |
* Individual weights may not sum to 100% (or displayed total) due to rounding.
Sector Breakdown
(as a % of net assets)*
| Value | Value |
|---|
| Information Technology | 19.7% |
| Communication Services | 19.2% |
| Consumer Discretionary | 18.9% |
| Financials | 11.6% |
| Industrials | 11.1% |
| Consumer Staples | 4.1% |
| Energy | 4.0% |
| Health Care | 3.3% |
| Utilities | 2.2% |
| Materials | 1.2% |
| Cash and Cash Equivalents | 3.5%Footnote Reference† |
| Footnote | Description |
Footnote† | Includes short-term investments, other assets and liabilities-net. |
Country Exposures
(as a % of net assets)*
| Value | Value |
|---|
| India | 62.6% |
| China | 13.4% |
| Taiwan | 9.4% |
| Korea, Republic Of | 8.0% |
| Japan | 2.1% |
| Indonesia | 1.0% |
If you wish to view additional information about the Fund; including but not limited to its financial statements, prospectus, or holdings, please visit BaronCapitalGroup.com. For benchmark definitions and attribution language please visit connect.rightprospectus.com/Baron.
Phone: 1.800.99.BARON
Email: info@BaronCapitalGroup.com
Semi-Annual Shareholder Report June 30, 2024
Semi-Annual Shareholder Report June 30, 2024
This semi-annual shareholder report contains important information about Baron New Asia Fund for the period of January 1, 2024 to June 30, 2024.You can find additional information about the Fund at BaronCapitalGroup.com. You can also request this information by contacting us at 1.800.99.BARON.
What were the Fund costs for last year?
(based on a hypothetical $10,000 investment)
| Class Name | Cost of a $10,000 investment | Costs paid as a percentage of a $10,000 investment |
|---|
| Retail | $79Footnote Reference† | 1.45%Footnote Reference*Footnote Reference† |
| Footnote | Description |
Footnote* | Annualized. |
Footnote† | Reflects fee waivers and/or expense reimbursements, without which expenses would have been higher. |
Comparison of the Change in Value of $10,000 Investment in the Fund in Relation to the Benchmarks
| Retail | MSCI AC Asia ex Japan Index | MSCI AC Asia ex Japan IMI Growth Index | MSCI AC Asia Index |
|---|
| 7/30/2021 | $10,000 | $10,000 | $10,000 | $10,000 |
| 9/30/2021 | $10,370 | $9,802 | $9,785 | $10,082 |
| 12/31/2021 | $10,170 | $9,681 | $9,633 | $9,855 |
| 3/31/2022 | $8,610 | $8,907 | $8,525 | $9,116 |
| 6/30/2022 | $7,920 | $8,105 | $7,631 | $8,112 |
| 9/30/2022 | $6,950 | $6,984 | $6,555 | $7,161 |
| 12/31/2022 | $7,400 | $7,776 | $7,296 | $8,022 |
| 3/31/2023 | $7,610 | $8,114 | $7,646 | $8,423 |
| 6/30/2023 | $7,770 | $8,012 | $7,503 | $8,550 |
| 9/30/2023 | $7,370 | $7,744 | $7,165 | $8,321 |
| 12/31/2023 | $7,810 | $8,242 | $7,615 | $8,910 |
| 3/31/2024 | $8,310 | $8,437 | $7,825 | $9,410 |
| 6/30/2024 | $9,200 | $9,045 | $8,418 | $9,666 |
Average Annual Total Returns (%)
| Total Net Assets | $5,948,175 |
| # of Issuers | 76 |
| Portfolio Turnover Rate | 29% |
| Total Advisory Fees Paid | $24,088 |
| Class/Index Name | 1 Year | Since Inception 7/30/2021 |
|---|
| Retail | 18.40% | (2.81%) |
| MSCI AC Asia ex Japan Index | 12.89% | (3.38%) |
| MSCI AC Asia ex Japan IMI Growth Index | 12.19% | (5.74%) |
| MSCI AC Asia Index | 13.05% | (1.16%) |
Past performance is not predictive of future performance. The performance data does not reflect the deduction of taxes that a shareholder would pay on Fund distributions or redemption of Fund shares. The Adviser waives and/or reimburses certain Fund expenses pursuant to a contract expiring on August 29, 2034, unless renewed for another 11-year term and the Fund’s transfer agency expenses may be reduced by expense offsets from an unaffiliated transfer agent, without which performance would have been lower.
Semi-Annual Shareholder Report | 1
What did the Fund invest in?
| Holding | % of Total Net Assets (6/30/24)* |
| Bharti Airtel Ltd. | 7.3% |
| Taiwan Semiconductor Manufacturing Co., Ltd. | 7.3% |
| Trent Ltd. | 6.2% |
| Indus Towers Ltd. | 5.3% |
| Reliance Industries Limited | 4.0% |
| Tencent Holdings Limited | 3.8% |
| Samsung Electronics Co., Ltd. | 3.4% |
| Zomato Ltd. | 3.2% |
| Jio Financial Services Ltd. | 3.0% |
| Kaynes Technology India Ltd. | 2.6% |
| Total | 46.2% |
* Individual weights may not sum to 100% (or displayed total) due to rounding.
Sector Breakdown
(as a % of net assets)*
| Value | Value |
|---|
| Information Technology | 19.7% |
| Communication Services | 19.2% |
| Consumer Discretionary | 18.9% |
| Financials | 11.6% |
| Industrials | 11.1% |
| Consumer Staples | 4.1% |
| Energy | 4.0% |
| Health Care | 3.3% |
| Utilities | 2.2% |
| Materials | 1.2% |
| Cash and Cash Equivalents | 3.5%Footnote Reference† |
| Footnote | Description |
Footnote† | Includes short-term investments, other assets and liabilities-net. |
Country Exposures
(as a % of net assets)*
| Value | Value |
|---|
| India | 62.6% |
| China | 13.4% |
| Taiwan | 9.4% |
| Korea, Republic Of | 8.0% |
| Japan | 2.1% |
| Indonesia | 1.0% |
If you wish to view additional information about the Fund; including but not limited to its financial statements, prospectus, or holdings, please visit BaronCapitalGroup.com. For benchmark definitions and attribution language please visit connect.rightprospectus.com/Baron.
Phone: 1.800.99.BARON
Email: info@BaronCapitalGroup.com
Semi-Annual Shareholder Report June 30, 2024
Semi-Annual Shareholder Report June 30, 2024
This semi-annual shareholder report contains important information about Baron Real Estate Fund for the period of January 1, 2024 to June 30, 2024.You can find additional information about the Fund at BaronCapitalGroup.com. You can also request this information by contacting us at 1.800.99.BARON.
What were the Fund costs for last year?
(based on a hypothetical $10,000 investment)
| Class Name | Cost of a $10,000 investment | Costs paid as a percentage of a $10,000 investment |
|---|
| Institutional | $52 | 1.05%Footnote Reference* |
| Footnote | Description |
Footnote* | Annualized. |
Comparison of the Change in Value of $1,000,000 Investment in the Fund in Relation to the Benchmarks
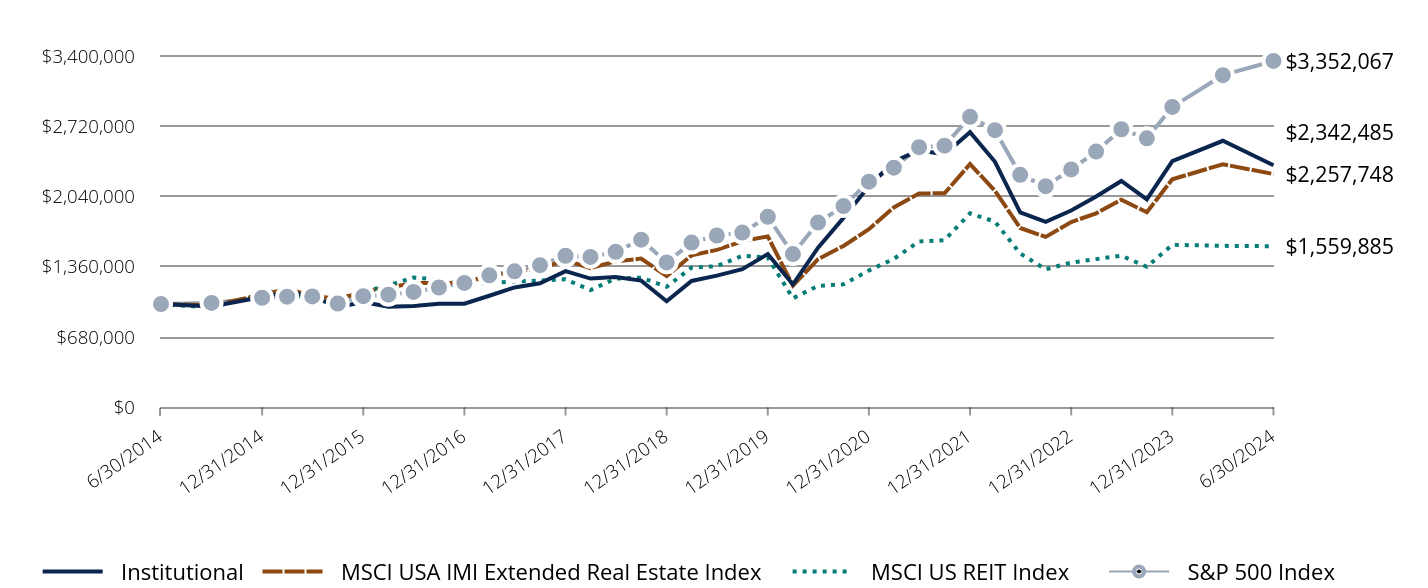
| Institutional | MSCI USA IMI Extended Real Estate Index | MSCI US REIT Index | S&P 500 Index |
|---|
| 6/30/2014 | $1,000,000 | $1,000,000 | $1,000,000 | $1,000,000 |
| 9/30/2014 | $975,977 | $988,678 | $966,160 | $1,011,279 |
| 12/31/2014 | $1,067,848 | $1,089,260 | $1,100,957 | $1,061,162 |
| 3/31/2015 | $1,116,461 | $1,145,078 | $1,150,335 | $1,071,249 |
| 6/30/2015 | $1,075,610 | $1,080,266 | $1,027,320 | $1,074,228 |
| 9/30/2015 | $969,020 | $1,049,314 | $1,045,345 | $1,005,064 |
| 12/31/2015 | $1,020,635 | $1,114,017 | $1,115,096 | $1,075,847 |
| 3/31/2016 | $974,413 | $1,160,161 | $1,180,567 | $1,090,347 |
| 6/30/2016 | $980,243 | $1,202,292 | $1,257,388 | $1,117,118 |
| 9/30/2016 | $1,001,896 | $1,203,469 | $1,235,206 | $1,160,149 |
| 12/31/2016 | $1,002,765 | $1,205,850 | $1,194,662 | $1,204,516 |
| 3/31/2017 | $1,080,287 | $1,274,845 | $1,202,836 | $1,277,584 |
| 6/30/2017 | $1,160,743 | $1,315,374 | $1,219,008 | $1,317,038 |
| 9/30/2017 | $1,201,390 | $1,344,687 | $1,226,667 | $1,376,047 |
| 12/31/2017 | $1,317,807 | $1,423,368 | $1,239,381 | $1,467,481 |
| 3/31/2018 | $1,246,669 | $1,348,221 | $1,135,445 | $1,456,342 |
| 6/30/2018 | $1,261,600 | $1,413,178 | $1,246,044 | $1,506,350 |
| 9/30/2018 | $1,226,804 | $1,440,171 | $1,255,746 | $1,622,501 |
| 12/31/2018 | $1,027,394 | $1,270,709 | $1,167,163 | $1,403,143 |
| 3/31/2019 | $1,223,622 | $1,471,196 | $1,353,006 | $1,594,642 |
| 6/30/2019 | $1,275,235 | $1,523,732 | $1,366,431 | $1,663,273 |
| 9/30/2019 | $1,337,314 | $1,607,798 | $1,467,246 | $1,691,521 |
| 12/31/2019 | $1,484,011 | $1,654,647 | $1,451,151 | $1,844,942 |
| 3/31/2020 | $1,189,212 | $1,178,261 | $1,055,906 | $1,483,370 |
| 6/30/2020 | $1,545,196 | $1,434,653 | $1,176,158 | $1,788,103 |
| 9/30/2020 | $1,833,375 | $1,562,539 | $1,191,911 | $1,947,770 |
| 12/31/2020 | $2,141,131 | $1,724,303 | $1,324,885 | $2,184,389 |
| 3/31/2021 | $2,378,308 | $1,934,608 | $1,437,448 | $2,319,274 |
| 6/30/2021 | $2,488,872 | $2,069,806 | $1,606,274 | $2,517,545 |
| 9/30/2021 | $2,447,520 | $2,071,953 | $1,618,286 | $2,532,198 |
| 12/31/2021 | $2,662,655 | $2,354,526 | $1,877,506 | $2,811,426 |
| 3/31/2022 | $2,376,175 | $2,094,733 | $1,797,146 | $2,682,143 |
| 6/30/2022 | $1,886,262 | $1,736,202 | $1,488,702 | $2,250,288 |
| 9/30/2022 | $1,794,609 | $1,649,527 | $1,335,730 | $2,140,415 |
| 12/31/2022 | $1,905,371 | $1,793,212 | $1,401,180 | $2,302,253 |
| 3/31/2023 | $2,040,000 | $1,878,044 | $1,434,664 | $2,474,855 |
| 6/30/2023 | $2,191,209 | $2,010,298 | $1,468,164 | $2,691,210 |
| 9/30/2023 | $2,011,827 | $1,888,090 | $1,360,710 | $2,603,115 |
| 12/31/2023 | $2,382,470 | $2,207,223 | $1,573,043 | $2,907,460 |
| 3/31/2024 | $2,579,732 | $2,352,573 | $1,563,272 | $3,214,370 |
| 6/30/2024 | $2,342,485 | $2,257,748 | $1,559,885 | $3,352,067 |
Average Annual Total Returns (%)
| Total Net Assets | $1,753,214,001 |
| # of Issuers | 35 |
| Portfolio Turnover Rate | 30% |
| Total Advisory Fees Paid | $8,775,127 |
| Class/Index Name | 1 Year | 5 Years | 10 Years |
|---|
| Institutional | 6.90% | 12.93% | 8.88% |
| MSCI USA IMI Extended Real Estate Index | 12.31% | 8.18% | 8.48% |
| MSCI US REIT Index | 6.25% | 2.68% | 4.55% |
| S&P 500 Index | 24.56% | 15.05% | 12.86% |
Past performance is not predictive of future performance. The performance data does not reflect the deduction of taxes that a shareholder would pay on Fund distributions or redemption of Fund shares. The Adviser may waive or reimburse certain Fund expenses pursuant to a contract expiring on August 29, 2034, unless renewed for another 11-year term and the Fund’s transfer agency expenses may be reduced by expense offsets from an unaffiliated transfer agent, without which performance would have been lower.
What did the Fund invest in?
| Holding | % of Total Net Assets (6/30/24)* |
| Toll Brothers, Inc. | 6.7% |
| Lennar Corp. | 5.6% |
| D.R. Horton, Inc. | 5.0% |
| Equinix, Inc. | 5.0% |
| American Tower Corp. | 4.8% |
| Equity Residential | 4.3% |
| Digital Realty Trust, Inc. | 4.0% |
| Blackstone, Inc. | 4.0% |
| Welltower, Inc. | 3.6% |
| CoStar Group, Inc. | 3.5% |
| Total | 46.5% |
* Individual weights may not sum to 100% (or displayed total) due to rounding.
Sector Breakdown
(as a % of net assets)*
| Value | Value |
|---|
| Real Estate | 40.0% |
| Consumer Discretionary | 36.5% |
| Financials | 7.6% |
| Materials | 6.6% |
| Industrials | 2.2% |
| Information Technology | 1.1% |
| Cash and Cash Equivalents | 6.0%Footnote Reference† |
| Footnote | Description |
Footnote† | Includes short-term investments, other assets and liabilities-net. |
If you wish to view additional information about the Fund; including but not limited to its financial statements, prospectus, or holdings, please visit BaronCapitalGroup.com. For benchmark definitions and attribution language please visit connect.rightprospectus.com/Baron.
Phone: 1.800.99.BARON
Email: info@BaronCapitalGroup.com
Semi-Annual Shareholder Report June 30, 2024
Semi-Annual Shareholder Report June 30, 2024
This semi-annual shareholder report contains important information about Baron Real Estate Fund for the period of January 1, 2024 to June 30, 2024.You can find additional information about the Fund at BaronCapitalGroup.com. You can also request this information by contacting us at 1.800.99.BARON.
What were the Fund costs for last year?
(based on a hypothetical $10,000 investment)
| Class Name | Cost of a $10,000 investment | Costs paid as a percentage of a $10,000 investment |
|---|
| R6 | $52 | 1.05%Footnote Reference* |
| Footnote | Description |
Footnote* | Annualized. |
Comparison of the Change in Value of $5,000,000 Investment in the Fund in Relation to the Benchmarks
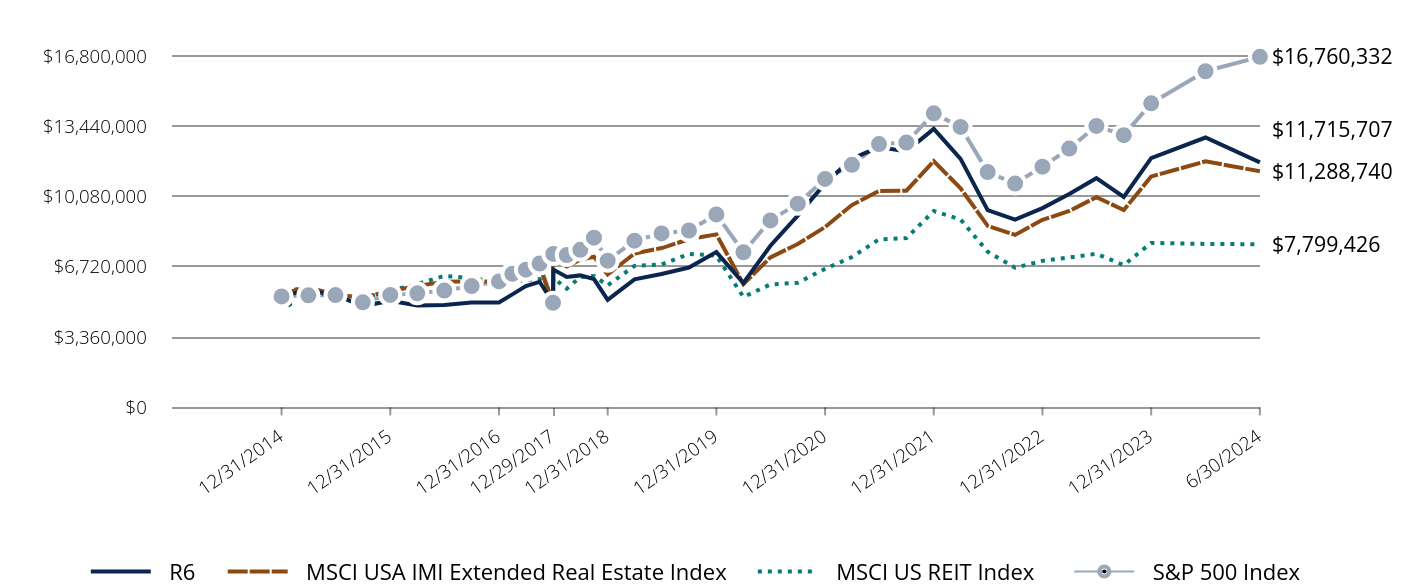
| R6 | MSCI USA IMI Extended Real Estate Index | MSCI US REIT Index | S&P 500 Index |
|---|
| 12/29/2017 | $5,000,000 | $5,000,000 | $5,000,000 | $5,000,000 |
| 9/30/2014 | $4,879,886 | $4,943,391 | $4,830,799 | $5,056,394 |
| 12/31/2014 | $5,339,241 | $5,446,302 | $5,504,786 | $5,305,809 |
| 3/31/2015 | $5,582,305 | $5,725,388 | $5,751,672 | $5,356,244 |
| 6/30/2015 | $5,378,050 | $5,401,332 | $5,136,598 | $5,371,140 |
| 9/30/2015 | $4,845,099 | $5,246,568 | $5,226,724 | $5,025,321 |
| 12/31/2015 | $5,103,176 | $5,570,083 | $5,575,482 | $5,379,233 |
| 3/31/2016 | $4,872,065 | $5,800,804 | $5,902,834 | $5,451,736 |
| 6/30/2016 | $4,901,214 | $6,011,457 | $6,286,940 | $5,585,589 |
| 9/30/2016 | $5,011,564 | $6,017,346 | $6,176,029 | $5,800,744 |
| 12/31/2016 | $5,014,332 | $6,029,248 | $5,973,310 | $6,022,580 |
| 3/31/2017 | $5,401,984 | $6,374,223 | $6,014,178 | $6,387,919 |
| 6/30/2017 | $5,804,304 | $6,576,869 | $6,095,042 | $6,585,192 |
| 9/30/2017 | $6,007,560 | $6,723,437 | $6,133,333 | $6,880,236 |
| 12/31/2017 | $6,589,704 | $7,116,842 | $6,196,906 | $7,337,406 |
| 3/31/2018 | $6,233,979 | $6,741,103 | $5,677,223 | $7,281,707 |
| 6/30/2018 | $6,310,833 | $7,065,890 | $6,230,221 | $7,531,751 |
| 9/30/2018 | $6,135,078 | $7,200,856 | $6,278,731 | $8,112,507 |
| 12/31/2018 | $5,137,859 | $6,353,545 | $5,835,813 | $7,015,716 |
| 3/31/2019 | $6,119,166 | $7,355,979 | $6,765,031 | $7,973,212 |
| 6/30/2019 | $6,377,276 | $7,618,658 | $6,832,157 | $8,316,367 |
| 9/30/2019 | $6,688,192 | $8,038,988 | $7,336,229 | $8,457,604 |
| 12/31/2019 | $7,424,637 | $8,273,237 | $7,255,753 | $9,224,709 |
| 3/31/2020 | $5,947,499 | $5,891,303 | $5,279,531 | $7,416,851 |
| 6/30/2020 | $7,727,854 | $7,173,263 | $5,880,789 | $8,940,514 |
| 9/30/2020 | $9,169,331 | $7,812,694 | $5,959,553 | $9,738,852 |
| 12/31/2020 | $10,708,524 | $8,621,512 | $6,624,425 | $10,921,942 |
| 3/31/2021 | $11,894,726 | $9,673,040 | $7,187,238 | $11,596,369 |
| 6/30/2021 | $12,447,693 | $10,349,032 | $8,031,368 | $12,587,723 |
| 9/30/2021 | $12,240,878 | $10,359,763 | $8,091,429 | $12,660,990 |
| 12/31/2021 | $13,317,020 | $11,772,630 | $9,387,531 | $14,057,132 |
| 3/31/2022 | $11,884,217 | $10,473,667 | $8,985,731 | $13,410,713 |
| 6/30/2022 | $9,433,963 | $8,681,009 | $7,443,511 | $11,251,438 |
| 9/30/2022 | $8,975,570 | $8,247,635 | $6,678,651 | $10,702,075 |
| 12/31/2022 | $9,529,533 | $8,966,059 | $7,005,902 | $11,511,263 |
| 3/31/2023 | $10,202,869 | $9,390,218 | $7,173,318 | $12,374,274 |
| 6/30/2023 | $10,959,129 | $10,051,492 | $7,340,820 | $13,456,048 |
| 9/30/2023 | $10,062,140 | $9,440,448 | $6,803,550 | $13,015,576 |
| 12/31/2023 | $11,915,691 | $11,036,112 | $7,865,214 | $14,537,302 |
| 3/31/2024 | $12,902,276 | $11,762,865 | $7,816,357 | $16,071,848 |
| 6/30/2024 | $11,715,707 | $11,288,740 | $7,799,426 | $16,760,332 |
Average Annual Total Returns (%)
| Total Net Assets | $1,753,214,001 |
| # of Issuers | 35 |
| Portfolio Turnover Rate | 30% |
| Total Advisory Fees Paid | $8,775,127 |
| Class/Index Name | 1 Year | 5 Years | 10 Years |
|---|
| R6 | 6.90% | 12.93% | 8.89% |
| MSCI USA IMI Extended Real Estate Index | 12.31% | 8.18% | 8.48% |
| MSCI US REIT Index | 6.25% | 2.68% | 4.55% |
| S&P 500 Index | 24.56% | 15.05% | 12.86% |
Past performance is not predictive of future performance. The performance data does not reflect the deduction of taxes that a shareholder would pay on Fund distributions or redemption of Fund shares. The Adviser may waive or reimburse certain Fund expenses pursuant to a contract expiring on August 29, 2034, unless renewed for another 11-year term and the Fund’s transfer agency expenses may be reduced by expense offsets from an unaffiliated transfer agent, without which performance would have been lower. Performance for the R6 Shares prior to January 29, 2016 is based on the performance of the Institutional Shares.
What did the Fund invest in?
| Holding | % of Total Net Assets (6/30/24)* |
| Toll Brothers, Inc. | 6.7% |
| Lennar Corp. | 5.6% |
| D.R. Horton, Inc. | 5.0% |
| Equinix, Inc. | 5.0% |
| American Tower Corp. | 4.8% |
| Equity Residential | 4.3% |
| Digital Realty Trust, Inc. | 4.0% |
| Blackstone, Inc. | 4.0% |
| Welltower, Inc. | 3.6% |
| CoStar Group, Inc. | 3.5% |
| Total | 46.5% |
* Individual weights may not sum to 100% (or displayed total) due to rounding.
Sector Breakdown
(as a % of net assets)*
| Value | Value |
|---|
| Real Estate | 40.0% |
| Consumer Discretionary | 36.5% |
| Financials | 7.6% |
| Materials | 6.6% |
| Industrials | 2.2% |
| Information Technology | 1.1% |
| Cash and Cash Equivalents | 6.0%Footnote Reference† |
| Footnote | Description |
Footnote† | Includes short-term investments, other assets and liabilities-net. |
If you wish to view additional information about the Fund; including but not limited to its financial statements, prospectus, or holdings, please visit BaronCapitalGroup.com. For benchmark definitions and attribution language please visit connect.rightprospectus.com/Baron.
Phone: 1.800.99.BARON
Email: info@BaronCapitalGroup.com
Semi-Annual Shareholder Report June 30, 2024
Semi-Annual Shareholder Report June 30, 2024
This semi-annual shareholder report contains important information about Baron Real Estate Fund for the period of January 1, 2024 to June 30, 2024.You can find additional information about the Fund at BaronCapitalGroup.com. You can also request this information by contacting us at 1.800.99.BARON.
What were the Fund costs for last year?
(based on a hypothetical $10,000 investment)
| Class Name | Cost of a $10,000 investment | Costs paid as a percentage of a $10,000 investment |
|---|
| Retail | $65 | 1.31%Footnote Reference* |
| Footnote | Description |
Footnote* | Annualized. |
Comparison of the Change in Value of $10,000 Investment in the Fund in Relation to the Benchmarks
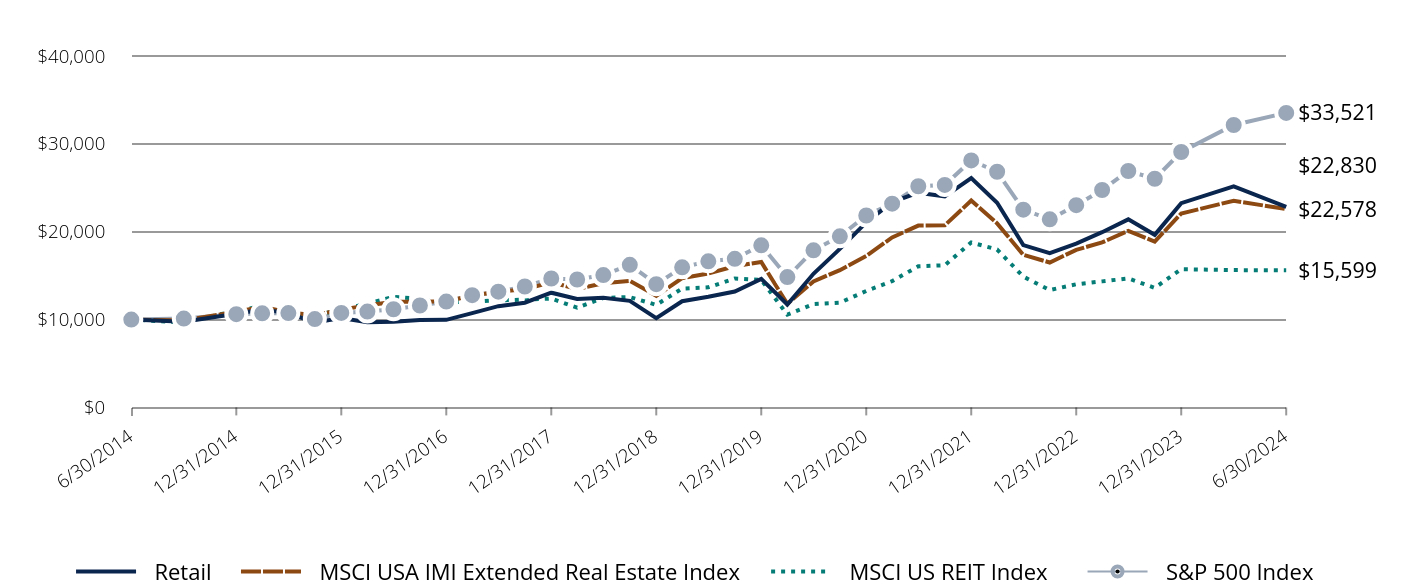
| Retail | MSCI USA IMI Extended Real Estate Index | MSCI US REIT Index | S&P 500 Index |
|---|
| 6/30/2014 | $10,000 | $10,000 | $10,000 | $10,000 |
| 9/30/2014 | $9,753 | $9,887 | $9,662 | $10,113 |
| 12/31/2014 | $10,665 | $10,893 | $11,010 | $10,612 |
| 3/31/2015 | $11,146 | $11,451 | $11,503 | $10,713 |
| 6/30/2015 | $10,730 | $10,803 | $10,273 | $10,742 |
| 9/30/2015 | $9,661 | $10,493 | $10,453 | $10,051 |
| 12/31/2015 | $10,168 | $11,140 | $11,151 | $10,759 |
| 3/31/2016 | $9,703 | $11,602 | $11,806 | $10,904 |
| 6/30/2016 | $9,753 | $12,023 | $12,574 | $11,171 |
| 9/30/2016 | $9,963 | $12,035 | $12,352 | $11,602 |
| 12/31/2016 | $9,964 | $12,059 | $11,947 | $12,045 |
| 3/31/2017 | $10,726 | $12,748 | $12,028 | $12,776 |
| 6/30/2017 | $11,522 | $13,154 | $12,190 | $13,170 |
| 9/30/2017 | $11,914 | $13,447 | $12,267 | $13,761 |
| 12/31/2017 | $13,058 | $14,234 | $12,394 | $14,675 |
| 3/31/2018 | $12,347 | $13,482 | $11,354 | $14,563 |
| 6/30/2018 | $12,488 | $14,132 | $12,460 | $15,064 |
| 9/30/2018 | $12,133 | $14,402 | $12,558 | $16,225 |
| 12/31/2018 | $10,156 | $12,707 | $11,672 | $14,031 |
| 3/31/2019 | $12,087 | $14,712 | $13,530 | $15,946 |
| 6/30/2019 | $12,591 | $15,237 | $13,664 | $16,633 |
| 9/30/2019 | $13,194 | $16,078 | $14,673 | $16,915 |
| 12/31/2019 | $14,635 | $16,547 | $14,512 | $18,449 |
| 3/31/2020 | $11,717 | $11,783 | $10,559 | $14,834 |
| 6/30/2020 | $15,211 | $14,347 | $11,762 | $17,881 |
| 9/30/2020 | $18,041 | $15,625 | $11,919 | $19,478 |
| 12/31/2020 | $21,053 | $17,243 | $13,249 | $21,844 |
| 3/31/2021 | $23,373 | $19,346 | $14,375 | $23,193 |
| 6/30/2021 | $24,443 | $20,698 | $16,063 | $25,175 |
| 9/30/2021 | $24,021 | $20,720 | $16,183 | $25,322 |
| 12/31/2021 | $26,113 | $23,545 | $18,775 | $28,114 |
| 3/31/2022 | $23,296 | $20,947 | $17,972 | $26,821 |
| 6/30/2022 | $18,475 | $17,362 | $14,887 | $22,503 |
| 9/30/2022 | $17,570 | $16,495 | $13,357 | $21,404 |
| 12/31/2022 | $18,641 | $17,932 | $14,012 | $23,023 |
| 3/31/2023 | $19,946 | $18,780 | $14,347 | $24,749 |
| 6/30/2023 | $21,404 | $20,103 | $14,682 | $26,912 |
| 9/30/2023 | $19,645 | $18,881 | $13,607 | $26,031 |
| 12/31/2023 | $23,245 | $22,072 | $15,730 | $29,075 |
| 3/31/2024 | $25,160 | $23,526 | $15,633 | $32,144 |
| 6/30/2024 | $22,830 | $22,578 | $15,599 | $33,521 |
Average Annual Total Returns (%)
| Total Net Assets | $1,753,214,001 |
| # of Issuers | 35 |
| Portfolio Turnover Rate | 30% |
| Total Advisory Fees Paid | $8,775,127 |
| Class/Index Name | 1 Year | 5 Years | 10 Years |
|---|
| Retail | 6.66% | 12.64% | 8.61% |
| MSCI USA IMI Extended Real Estate Index | 12.31% | 8.18% | 8.48% |
| MSCI US REIT Index | 6.25% | 2.68% | 4.55% |
| S&P 500 Index | 24.56% | 15.05% | 12.86% |
Past performance is not predictive of future performance. The performance data does not reflect the deduction of taxes that a shareholder would pay on Fund distributions or redemption of Fund shares. The Adviser may waive or reimburse certain Fund expenses pursuant to a contract expiring on August 29, 2034, unless renewed for another 11-year term and the Fund’s transfer agency expenses may be reduced by expense offsets from an unaffiliated transfer agent, without which performance would have been lower.
What did the Fund invest in?
| Holding | % of Total Net Assets (6/30/24)* |
| Toll Brothers, Inc. | 6.7% |
| Lennar Corp. | 5.6% |
| D.R. Horton, Inc. | 5.0% |
| Equinix, Inc. | 5.0% |
| American Tower Corp. | 4.8% |
| Equity Residential | 4.3% |
| Digital Realty Trust, Inc. | 4.0% |
| Blackstone, Inc. | 4.0% |
| Welltower, Inc. | 3.6% |
| CoStar Group, Inc. | 3.5% |
| Total | 46.5% |
* Individual weights may not sum to 100% (or displayed total) due to rounding.
Sector Breakdown
(as a % of net assets)*
| Value | Value |
|---|
| Real Estate | 40.0% |
| Consumer Discretionary | 36.5% |
| Financials | 7.6% |
| Materials | 6.6% |
| Industrials | 2.2% |
| Information Technology | 1.1% |
| Cash and Cash Equivalents | 6.0%Footnote Reference† |
| Footnote | Description |
Footnote† | Includes short-term investments, other assets and liabilities-net. |
If you wish to view additional information about the Fund; including but not limited to its financial statements, prospectus, or holdings, please visit BaronCapitalGroup.com. For benchmark definitions and attribution language please visit connect.rightprospectus.com/Baron.
Phone: 1.800.99.BARON
Email: info@BaronCapitalGroup.com
Semi-Annual Shareholder Report June 30, 2024
Semi-Annual Shareholder Report June 30, 2024
Baron Real Estate Income Fund
This semi-annual shareholder report contains important information about Baron Real Estate Income Fund for the period of January 1, 2024 to June 30, 2024.You can find additional information about the Fund at BaronCapitalGroup.com. You can also request this information by contacting us at 1.800.99.BARON.
What were the Fund costs for last year?
(based on a hypothetical $10,000 investment)
| Class Name | Cost of a $10,000 investment | Costs paid as a percentage of a $10,000 investment |
|---|
| Institutional | $40Footnote Reference† | 0.80%Footnote Reference*Footnote Reference† |
| Footnote | Description |
Footnote* | Annualized. |
Footnote† | Reflects fee waivers and/or expense reimbursements, without which expenses would have been higher. |
Comparison of the Change in Value of $1,000,000 Investment in the Fund in Relation to the Benchmarks
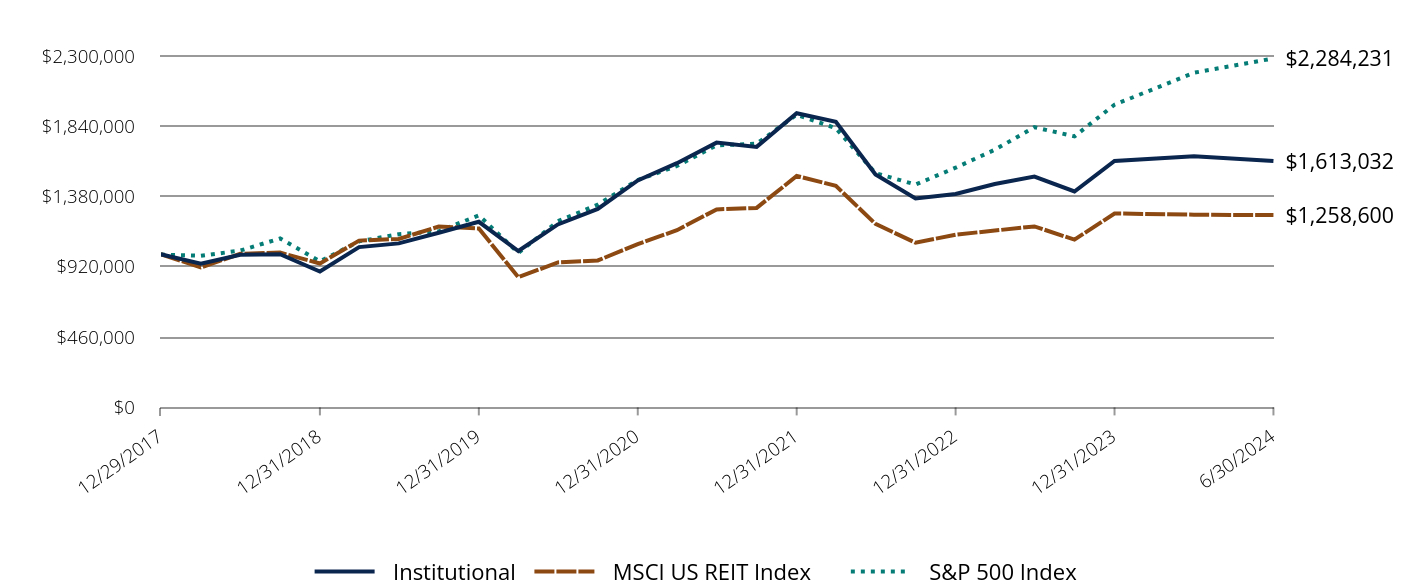
| Institutional | MSCI US REIT Index | S&P 500 Index |
|---|
| 12/29/2017 | $1,000,000 | $1,000,000 | $1,000,000 |
| 12/31/2017 | $1,000,000 | $1,000,000 | $1,000,000 |
| 3/31/2018 | $940,000 | $916,138 | $992,409 |
| 6/30/2018 | $998,508 | $1,005,376 | $1,026,487 |
| 9/30/2018 | $1,002,593 | $1,013,204 | $1,105,637 |
| 12/31/2018 | $889,736 | $941,730 | $956,158 |
| 3/31/2019 | $1,049,110 | $1,091,679 | $1,086,653 |
| 6/30/2019 | $1,073,502 | $1,102,511 | $1,133,421 |
| 9/30/2019 | $1,142,797 | $1,183,854 | $1,152,670 |
| 12/31/2019 | $1,214,860 | $1,170,867 | $1,257,217 |
| 3/31/2020 | $1,023,575 | $851,962 | $1,010,827 |
| 6/30/2020 | $1,197,739 | $948,988 | $1,218,484 |
| 9/30/2020 | $1,299,230 | $961,698 | $1,327,288 |
| 12/31/2020 | $1,485,821 | $1,068,989 | $1,488,529 |
| 3/31/2021 | $1,598,482 | $1,159,811 | $1,580,446 |
| 6/30/2021 | $1,733,020 | $1,296,029 | $1,715,555 |
| 9/30/2021 | $1,705,139 | $1,305,721 | $1,725,540 |
| 12/31/2021 | $1,925,315 | $1,514,874 | $1,915,818 |
| 3/31/2022 | $1,869,667 | $1,450,035 | $1,827,719 |
| 6/30/2022 | $1,525,035 | $1,201,166 | $1,533,435 |
| 9/30/2022 | $1,367,663 | $1,077,740 | $1,458,564 |
| 12/31/2022 | $1,396,373 | $1,130,548 | $1,568,847 |
| 3/31/2023 | $1,462,378 | $1,157,564 | $1,686,464 |
| 6/30/2023 | $1,510,709 | $1,184,594 | $1,833,897 |
| 9/30/2023 | $1,413,162 | $1,097,895 | $1,773,866 |
| 12/31/2023 | $1,612,935 | $1,269,216 | $1,981,259 |
| 3/31/2024 | $1,644,526 | $1,261,332 | $2,190,399 |
| 6/30/2024 | $1,613,032 | $1,258,600 | $2,284,231 |
Average Annual Total Returns (%)
| Total Net Assets | $145,807,258 |
| # of Issuers | 33 |
| Portfolio Turnover Rate | 58% |
| Total Advisory Fees Paid | $537,814 |
| Class/Index Name | 1 Year | 5 Years | Since Inception 12/29/2017 |
|---|
| Institutional | 6.77% | 8.48% | 7.63% |
| MSCI US REIT Index | 6.25% | 2.68% | 3.60% |
| S&P 500 Index | 24.56% | 15.05% | 13.55% |
Past performance is not predictive of future performance. The performance data does not reflect the deduction of taxes that a shareholder would pay on Fund distributions or redemption of Fund shares. The Adviser waives and/or reimburses certain Fund expenses pursuant to a contract expiring on August 29, 2034, unless renewed for another 11-year term and the Fund’s transfer agency expenses may be reduced by expense offsets from an unaffiliated transfer agent, without which performance would have been lower.
Baron Real Estate Income Fund
What did the Fund invest in?
| Holding | % of Total Net Assets (6/30/24)* |
| Equity Residential | 9.8% |
| Welltower, Inc. | 8.8% |
| American Tower Corp. | 8.7% |
| AvalonBay Communities, Inc. | 8.1% |
| Equinix, Inc. | 6.1% |
| Digital Realty Trust, Inc. | 5.9% |
| Invitation Homes, Inc. | 4.9% |
| American Homes 4 Rent | 4.8% |
| Prologis, Inc. | 4.0% |
| Healthpeak Properties, Inc. | 2.9% |
| Total | 64.0% |
* Individual weights may not sum to 100% (or displayed total) due to rounding.
Sector Breakdown
(as a % of net assets)*
| Value | Value |
|---|
| Real Estate | 82.6% |
| Consumer Discretionary | 8.4% |
| Financials | 3.4% |
| Information Technology | 2.1% |
| Utilities | 0.8% |
| Cash and Cash Equivalents | 2.7%Footnote Reference† |
| Footnote | Description |
Footnote† | Includes short-term investments, other assets and liabilities-net. |
If you wish to view additional information about the Fund; including but not limited to its financial statements, prospectus, or holdings, please visit BaronCapitalGroup.com. For benchmark definitions and attribution language please visit connect.rightprospectus.com/Baron.
Phone: 1.800.99.BARON
Email: info@BaronCapitalGroup.com
Baron Real Estate Income Fund
Semi-Annual Shareholder Report June 30, 2024
Semi-Annual Shareholder Report June 30, 2024
Baron Real Estate Income Fund
This semi-annual shareholder report contains important information about Baron Real Estate Income Fund for the period of January 1, 2024 to June 30, 2024.You can find additional information about the Fund at BaronCapitalGroup.com. You can also request this information by contacting us at 1.800.99.BARON.
What were the Fund costs for last year?
(based on a hypothetical $10,000 investment)
| Class Name | Cost of a $10,000 investment | Costs paid as a percentage of a $10,000 investment |
|---|
| R6 | $40Footnote Reference† | 0.80%Footnote Reference*Footnote Reference† |
| Footnote | Description |
Footnote* | Annualized. |
Footnote† | Reflects fee waivers and/or expense reimbursements, without which expenses would have been higher. |
Comparison of the Change in Value of $5,000,000 Investment in the Fund in Relation to the Benchmarks
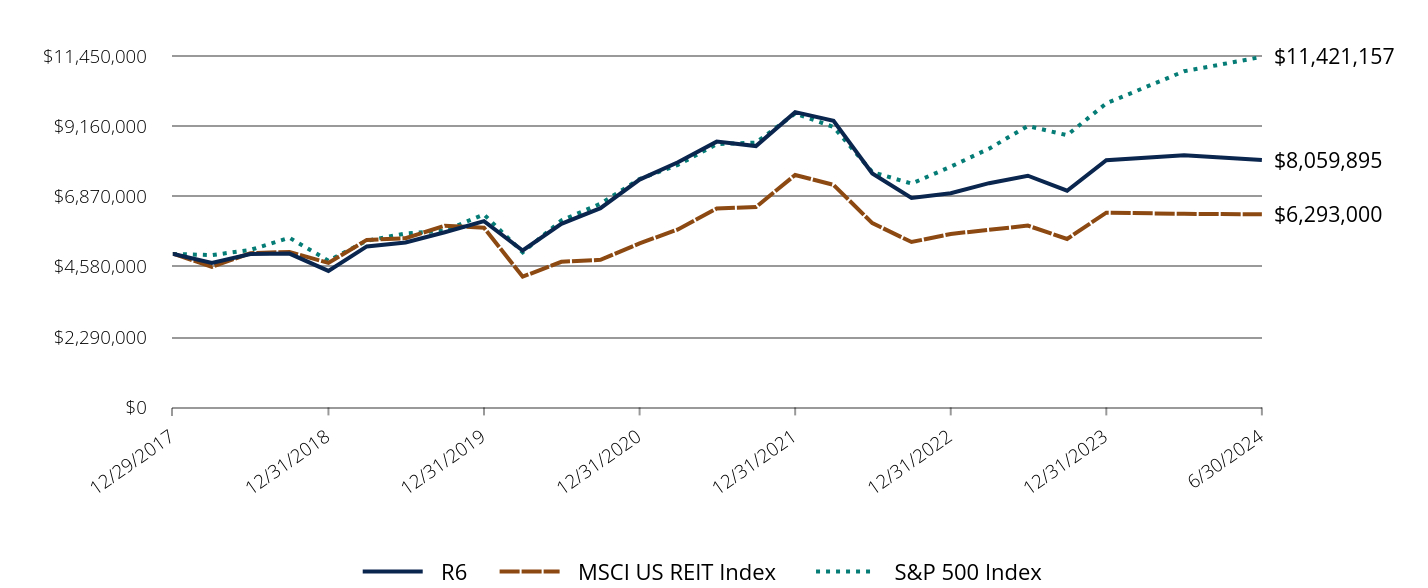
| R6 | MSCI US REIT Index | S&P 500 Index |
|---|
| 12/29/2017 | $5,000,000 | $5,000,000 | $5,000,000 |
| 12/31/2017 | $5,000,000 | $5,000,000 | $5,000,000 |
| 3/31/2018 | $4,705,000 | $4,580,692 | $4,962,045 |
| 6/30/2018 | $4,997,538 | $5,026,880 | $5,132,435 |
| 9/30/2018 | $5,012,835 | $5,066,021 | $5,528,185 |
| 12/31/2018 | $4,448,569 | $4,708,650 | $4,780,788 |
| 3/31/2019 | $5,245,419 | $5,458,394 | $5,433,264 |
| 6/30/2019 | $5,372,526 | $5,512,555 | $5,667,103 |
| 9/30/2019 | $5,708,651 | $5,919,267 | $5,763,348 |
| 12/31/2019 | $6,068,938 | $5,854,335 | $6,286,083 |
| 3/31/2020 | $5,112,523 | $4,259,812 | $5,054,137 |
| 6/30/2020 | $5,983,322 | $4,744,939 | $6,092,422 |
| 9/30/2020 | $6,490,762 | $4,808,490 | $6,636,441 |
| 12/31/2020 | $7,423,695 | $5,344,945 | $7,442,646 |
| 3/31/2021 | $7,986,989 | $5,799,054 | $7,902,227 |
| 6/30/2021 | $8,659,665 | $6,480,144 | $8,577,775 |
| 9/30/2021 | $8,514,971 | $6,528,604 | $8,627,702 |
| 12/31/2021 | $9,621,126 | $7,574,369 | $9,579,089 |
| 3/31/2022 | $9,337,551 | $7,250,175 | $9,138,593 |
| 6/30/2022 | $7,619,763 | $6,005,828 | $7,667,177 |
| 9/30/2022 | $6,827,557 | $5,388,698 | $7,292,820 |
| 12/31/2022 | $6,976,529 | $5,652,741 | $7,844,233 |
| 3/31/2023 | $7,306,561 | $5,787,822 | $8,432,322 |
| 6/30/2023 | $7,548,221 | $5,922,972 | $9,169,486 |
| 9/30/2023 | $7,060,478 | $5,489,473 | $8,869,331 |
| 12/31/2023 | $8,053,838 | $6,346,081 | $9,906,295 |
| 3/31/2024 | $8,217,349 | $6,306,661 | $10,951,997 |
| 6/30/2024 | $8,059,895 | $6,293,000 | $11,421,157 |
Average Annual Total Returns (%)
| Total Net Assets | $145,807,258 |
| # of Issuers | 33 |
| Portfolio Turnover Rate | 58% |
| Total Advisory Fees Paid | $537,814 |
| Class/Index Name | 1 Year | 5 Years | Since Inception 12/29/2017 |
|---|
| R6 | 6.78% | 8.45% | 7.62% |
| MSCI US REIT Index | 6.25% | 2.68% | 3.60% |
| S&P 500 Index | 24.56% | 15.05% | 13.55% |
Past performance is not predictive of future performance. The performance data does not reflect the deduction of taxes that a shareholder would pay on Fund distributions or redemption of Fund shares. The Adviser waives and/or reimburses certain Fund expenses pursuant to a contract expiring on August 29, 2034, unless renewed for another 11-year term and the Fund’s transfer agency expenses may be reduced by expense offsets from an unaffiliated transfer agent, without which performance would have been lower.
Baron Real Estate Income Fund
What did the Fund invest in?
| Holding | % of Total Net Assets (6/30/24)* |
| Equity Residential | 9.8% |
| Welltower, Inc. | 8.8% |
| American Tower Corp. | 8.7% |
| AvalonBay Communities, Inc. | 8.1% |
| Equinix, Inc. | 6.1% |
| Digital Realty Trust, Inc. | 5.9% |
| Invitation Homes, Inc. | 4.9% |
| American Homes 4 Rent | 4.8% |
| Prologis, Inc. | 4.0% |
| Healthpeak Properties, Inc. | 2.9% |
| Total | 64.0% |
* Individual weights may not sum to 100% (or displayed total) due to rounding.
Sector Breakdown
(as a % of net assets)*
| Value | Value |
|---|
| Real Estate | 82.6% |
| Consumer Discretionary | 8.4% |
| Financials | 3.4% |
| Information Technology | 2.1% |
| Utilities | 0.8% |
| Cash and Cash Equivalents | 2.7%Footnote Reference† |
| Footnote | Description |
Footnote† | Includes short-term investments, other assets and liabilities-net. |
If you wish to view additional information about the Fund; including but not limited to its financial statements, prospectus, or holdings, please visit BaronCapitalGroup.com. For benchmark definitions and attribution language please visit connect.rightprospectus.com/Baron.
Phone: 1.800.99.BARON
Email: info@BaronCapitalGroup.com
Baron Real Estate Income Fund
Semi-Annual Shareholder Report June 30, 2024
Semi-Annual Shareholder Report June 30, 2024
Baron Real Estate Income Fund
This semi-annual shareholder report contains important information about Baron Real Estate Income Fund for the period of January 1, 2024 to June 30, 2024.You can find additional information about the Fund at BaronCapitalGroup.com. You can also request this information by contacting us at 1.800.99.BARON.
What were the Fund costs for last year?
(based on a hypothetical $10,000 investment)
| Class Name | Cost of a $10,000 investment | Costs paid as a percentage of a $10,000 investment |
|---|
| Retail | $52Footnote Reference† | 1.05%Footnote Reference*Footnote Reference† |
| Footnote | Description |
Footnote* | Annualized. |
Footnote† | Reflects fee waivers and/or expense reimbursements, without which expenses would have been higher. |
Comparison of the Change in Value of $10,000 Investment in the Fund in Relation to the Benchmarks
| Retail | MSCI US REIT Index | S&P 500 Index |
|---|
| 12/29/2017 | $10,000 | $10,000 | $10,000 |
| 12/31/2017 | $10,000 | $10,000 | $10,000 |
| 3/31/2018 | $9,390 | $9,161 | $9,924 |
| 6/30/2018 | $9,975 | $10,054 | $10,265 |
| 9/30/2018 | $10,006 | $10,132 | $11,056 |
| 12/31/2018 | $8,867 | $9,417 | $9,562 |
| 3/31/2019 | $10,451 | $10,917 | $10,867 |
| 6/30/2019 | $10,694 | $11,025 | $11,334 |
| 9/30/2019 | $11,408 | $11,839 | $11,527 |
| 12/31/2019 | $12,118 | $11,709 | $12,572 |
| 3/31/2020 | $10,195 | $8,520 | $10,108 |
| 6/30/2020 | $11,937 | $9,490 | $12,185 |
| 9/30/2020 | $12,941 | $9,617 | $13,273 |
| 12/31/2020 | $14,787 | $10,690 | $14,885 |
| 3/31/2021 | $15,892 | $11,598 | $15,805 |
| 6/30/2021 | $17,217 | $12,960 | $17,156 |
| 9/30/2021 | $16,927 | $13,057 | $17,255 |
| 12/31/2021 | $19,087 | $15,149 | $19,158 |
| 3/31/2022 | $18,530 | $14,500 | $18,277 |
| 6/30/2022 | $15,115 | $12,012 | $15,334 |
| 9/30/2022 | $13,541 | $10,777 | $14,586 |
| 12/31/2022 | $13,818 | $11,306 | $15,689 |
| 3/31/2023 | $14,456 | $11,576 | $16,865 |
| 6/30/2023 | $14,925 | $11,846 | $18,339 |
| 9/30/2023 | $13,962 | $10,979 | $17,739 |
| 12/31/2023 | $15,917 | $12,692 | $19,813 |
| 3/31/2024 | $16,223 | $12,613 | $21,904 |
| 6/30/2024 | $15,909 | $12,586 | $22,842 |
Average Annual Total Returns (%)
| Total Net Assets | $145,807,258 |
| # of Issuers | 33 |
| Portfolio Turnover Rate | 58% |
| Total Advisory Fees Paid | $537,814 |
| Class/Index Name | 1 Year | 5 Years | Since Inception 12/29/2017 |
|---|
| Retail | 6.59% | 8.27% | 7.40% |
| MSCI US REIT Index | 6.25% | 2.68% | 3.60% |
| S&P 500 Index | 24.56% | 15.05% | 13.55% |
Past performance is not predictive of future performance. The performance data does not reflect the deduction of taxes that a shareholder would pay on Fund distributions or redemption of Fund shares. The Adviser waives and/or reimburses certain Fund expenses pursuant to a contract expiring on August 29, 2034, unless renewed for another 11-year term and the Fund’s transfer agency expenses may be reduced by expense offsets from an unaffiliated transfer agent, without which performance would have been lower.
Baron Real Estate Income Fund
What did the Fund invest in?
| Holding | % of Total Net Assets (6/30/24)* |
| Equity Residential | 9.8% |
| Welltower, Inc. | 8.8% |
| American Tower Corp. | 8.7% |
| AvalonBay Communities, Inc. | 8.1% |
| Equinix, Inc. | 6.1% |
| Digital Realty Trust, Inc. | 5.9% |
| Invitation Homes, Inc. | 4.9% |
| American Homes 4 Rent | 4.8% |
| Prologis, Inc. | 4.0% |
| Healthpeak Properties, Inc. | 2.9% |
| Total | 64.0% |
* Individual weights may not sum to 100% (or displayed total) due to rounding.
Sector Breakdown
(as a % of net assets)*
| Value | Value |
|---|
| Real Estate | 82.6% |
| Consumer Discretionary | 8.4% |
| Financials | 3.4% |
| Information Technology | 2.1% |
| Utilities | 0.8% |
| Cash and Cash Equivalents | 2.7%Footnote Reference† |
| Footnote | Description |
Footnote† | Includes short-term investments, other assets and liabilities-net. |
If you wish to view additional information about the Fund; including but not limited to its financial statements, prospectus, or holdings, please visit BaronCapitalGroup.com. For benchmark definitions and attribution language please visit connect.rightprospectus.com/Baron.
Phone: 1.800.99.BARON
Email: info@BaronCapitalGroup.com
Baron Real Estate Income Fund
Semi-Annual Shareholder Report June 30, 2024
Semi-Annual Shareholder Report June 30, 2024
This semi-annual shareholder report contains important information about Baron Technology Fund for the period of January 1, 2024 to June 30, 2024.You can find additional information about the Fund at BaronCapitalGroup.com. You can also request this information by contacting us at 1.800.99.BARON.
What were the Fund costs for last year?
(based on a hypothetical $10,000 investment)
| Class Name | Cost of a $10,000 investment | Costs paid as a percentage of a $10,000 investment |
|---|
| Institutional | $53Footnote Reference† | 0.95%Footnote Reference*Footnote Reference† |
| Footnote | Description |
Footnote* | Annualized. |
Footnote† | Reflects fee waivers and/or expense reimbursements, without which expenses would have been higher. |
Comparison of the Change in Value of $1,000,000 Investment in the Fund in Relation to the Benchmarks
| Institutional | MSCI ACWI Information Technology Index | MSCI ACWI Index | S&P 500 Index |
|---|
| 9/30/2021 | $1,000,000 | $1,000,000 | $1,000,000 | $1,000,000 |
| 12/31/2021 | $1,000,000 | $1,000,000 | $1,000,000 | $1,000,000 |
| 3/31/2022 | $836,000 | $897,245 | $946,392 | $954,015 |
| 6/30/2022 | $619,000 | $702,743 | $798,182 | $800,408 |
| 9/30/2022 | $591,000 | $651,674 | $743,749 | $761,327 |
| 12/31/2022 | $557,000 | $689,275 | $816,360 | $818,891 |
| 3/31/2023 | $682,000 | $830,077 | $876,002 | $880,284 |
| 6/30/2023 | $796,000 | $943,614 | $930,115 | $957,240 |
| 9/30/2023 | $765,000 | $885,505 | $898,467 | $925,906 |
| 12/31/2023 | $910,000 | $1,040,975 | $997,607 | $1,034,159 |
| 3/31/2024 | $1,044,000 | $1,166,448 | $1,079,375 | $1,143,324 |
| 6/30/2024 | $1,118,000 | $1,299,143 | $1,110,345 | $1,192,301 |
Average Annual Total Returns (%)
| Total Net Assets | $35,178,899 |
| # of Issuers | 38 |
| Portfolio Turnover Rate | 20% |
| Total Advisory Fees Paid | $92,540 |
| Class/Index Name | 1 Year | Since Inception 12/31/2021 |
|---|
| Institutional | 40.45% | 4.57% |
| MSCI ACWI Information Technology Index | 37.68% | 11.04% |
| MSCI ACWI Index | 19.38% | 4.28% |
| S&P 500 Index | 24.56% | 7.29% |
Past performance is not predictive of future performance. The performance data does not reflect the deduction of taxes that a shareholder would pay on Fund distributions or redemption of Fund shares. The Adviser waives and/or reimburses certain Fund expenses pursuant to a contract expiring on August 29, 2034, unless renewed for another 11-year term and the Fund’s transfer agency expenses may be reduced by expense offsets from an unaffiliated transfer agent, without which performance would have been lower.
What did the Fund invest in?
| Holding | % of Total Net Assets (6/30/24)* |
| NVIDIA Corp. | 12.1% |
| Amazon.com, Inc. | 10.2% |
| Microsoft Corporation | 9.8% |
| Apple, Inc. | 7.9% |
| Broadcom, Inc. | 5.2% |
| Spotify Technology SA | 4.8% |
| Taiwan Semiconductor Manufacturing Co., Ltd. | 4.5% |
| Meta Platforms, Inc. | 3.7% |
| Advanced Micro Devices, Inc. | 3.3% |
| CoStar Group, Inc. | 2.8% |
| Total | 64.3% |
* Individual weights may not sum to 100% (or displayed total) due to rounding.
Sector Breakdown
(as a % of net assets)*
| Value | Value |
|---|
| Information Technology | 71.0% |
| Consumer Discretionary | 13.8% |
| Communication Services | 11.0% |
| Real Estate | 2.8% |
| Industrials | 0.9% |
| Cash and Cash Equivalents | 0.5%Footnote Reference† |
| Footnote | Description |
Footnote† | Includes short-term investments, other assets and liabilities-net. |
If you wish to view additional information about the Fund; including but not limited to its financial statements, prospectus, or holdings, please visit BaronCapitalGroup.com. For benchmark definitions and attribution language please visit connect.rightprospectus.com/Baron.
Phone: 1.800.99.BARON
Email: info@BaronCapitalGroup.com
Semi-Annual Shareholder Report June 30, 2024
Semi-Annual Shareholder Report June 30, 2024
This semi-annual shareholder report contains important information about Baron Technology Fund for the period of January 1, 2024 to June 30, 2024.You can find additional information about the Fund at BaronCapitalGroup.com. You can also request this information by contacting us at 1.800.99.BARON.
What were the Fund costs for last year?
(based on a hypothetical $10,000 investment)
| Class Name | Cost of a $10,000 investment | Costs paid as a percentage of a $10,000 investment |
|---|
| R6 | $53Footnote Reference† | 0.95%Footnote Reference*Footnote Reference† |
| Footnote | Description |
Footnote* | Annualized. |
Footnote† | Reflects fee waivers and/or expense reimbursements, without which expenses would have been higher. |
Comparison of the Change in Value of $5,000,000 Investment in the Fund in Relation to the Benchmarks
| R6 | MSCI ACWI Information Technology Index | MSCI ACWI Index | S&P 500 Index |
|---|
| 9/30/2021 | $5,000,000 | $5,000,000 | $5,000,000 | $5,000,000 |
| 12/31/2021 | $5,000,000 | $5,000,000 | $5,000,000 | $5,000,000 |
| 3/31/2022 | $4,180,000 | $4,486,225 | $4,731,961 | $4,770,075 |
| 6/30/2022 | $3,095,000 | $3,513,714 | $3,990,912 | $4,002,039 |
| 9/30/2022 | $2,955,000 | $3,258,369 | $3,718,743 | $3,806,636 |
| 12/31/2022 | $2,785,000 | $3,446,376 | $4,081,800 | $4,094,457 |
| 3/31/2023 | $3,405,000 | $4,150,382 | $4,380,009 | $4,401,422 |
| 6/30/2023 | $3,975,000 | $4,718,072 | $4,650,574 | $4,786,200 |
| 9/30/2023 | $3,815,000 | $4,427,523 | $4,492,335 | $4,629,528 |
| 12/31/2023 | $4,540,000 | $5,204,873 | $4,988,036 | $5,170,792 |
| 3/31/2024 | $5,210,000 | $5,832,238 | $5,396,874 | $5,716,617 |
| 6/30/2024 | $5,580,000 | $6,495,713 | $5,551,723 | $5,961,505 |
Average Annual Total Returns (%)
| Total Net Assets | $35,178,899 |
| # of Issuers | 38 |
| Portfolio Turnover Rate | 20% |
| Total Advisory Fees Paid | $92,540 |
| Class/Index Name | 1 Year | Since Inception 12/31/2021 |
|---|
| R6 | 40.38% | 4.49% |
| MSCI ACWI Information Technology Index | 37.68% | 11.04% |
| MSCI ACWI Index | 19.38% | 4.28% |
| S&P 500 Index | 24.56% | 7.29% |
Past performance is not predictive of future performance. The performance data does not reflect the deduction of taxes that a shareholder would pay on Fund distributions or redemption of Fund shares. The Adviser waives and/or reimburses certain Fund expenses pursuant to a contract expiring on August 29, 2034, unless renewed for another 11-year term and the Fund’s transfer agency expenses may be reduced by expense offsets from an unaffiliated transfer agent, without which performance would have been lower.
What did the Fund invest in?
| Holding | % of Total Net Assets (6/30/24)* |
| NVIDIA Corp. | 12.1% |
| Amazon.com, Inc. | 10.2% |
| Microsoft Corporation | 9.8% |
| Apple, Inc. | 7.9% |
| Broadcom, Inc. | 5.2% |
| Spotify Technology SA | 4.8% |
| Taiwan Semiconductor Manufacturing Co., Ltd. | 4.5% |
| Meta Platforms, Inc. | 3.7% |
| Advanced Micro Devices, Inc. | 3.3% |
| CoStar Group, Inc. | 2.8% |
| Total | 64.3% |
* Individual weights may not sum to 100% (or displayed total) due to rounding.
Sector Breakdown
(as a % of net assets)*
| Value | Value |
|---|
| Information Technology | 71.0% |
| Consumer Discretionary | 13.8% |
| Communication Services | 11.0% |
| Real Estate | 2.8% |
| Industrials | 0.9% |
| Cash and Cash Equivalents | 0.5%Footnote Reference† |
| Footnote | Description |
Footnote† | Includes short-term investments, other assets and liabilities-net. |
If you wish to view additional information about the Fund; including but not limited to its financial statements, prospectus, or holdings, please visit BaronCapitalGroup.com. For benchmark definitions and attribution language please visit connect.rightprospectus.com/Baron.
Phone: 1.800.99.BARON
Email: info@BaronCapitalGroup.com
Semi-Annual Shareholder Report June 30, 2024
Semi-Annual Shareholder Report June 30, 2024
This semi-annual shareholder report contains important information about Baron Technology Fund for the period of January 1, 2024 to June 30, 2024.You can find additional information about the Fund at BaronCapitalGroup.com. You can also request this information by contacting us at 1.800.99.BARON.
What were the Fund costs for last year?
(based on a hypothetical $10,000 investment)
| Class Name | Cost of a $10,000 investment | Costs paid as a percentage of a $10,000 investment |
|---|
| Retail | $66Footnote Reference† | 1.20%Footnote Reference*Footnote Reference† |
| Footnote | Description |
Footnote* | Annualized. |
Footnote† | Reflects fee waivers and/or expense reimbursements, without which expenses would have been higher. |
Comparison of the Change in Value of $10,000 Investment in the Fund in Relation to the Benchmarks
| Retail | MSCI ACWI Information Technology Index | MSCI ACWI Index | S&P 500 Index |
|---|
| 9/30/2021 | $10,000 | $10,000 | $10,000 | $10,000 |
| 12/31/2021 | $10,000 | $10,000 | $10,000 | $10,000 |
| 3/31/2022 | $8,360 | $8,973 | $9,464 | $9,540 |
| 6/30/2022 | $6,190 | $7,027 | $7,982 | $8,004 |
| 9/30/2022 | $5,900 | $6,517 | $7,438 | $7,613 |
| 12/31/2022 | $5,560 | $6,893 | $8,164 | $8,189 |
| 3/31/2023 | $6,790 | $8,301 | $8,760 | $8,803 |
| 6/30/2023 | $7,920 | $9,436 | $9,301 | $9,572 |
| 9/30/2023 | $7,600 | $8,855 | $8,985 | $9,259 |
| 12/31/2023 | $9,030 | $10,410 | $9,976 | $10,342 |
| 3/31/2024 | $10,370 | $11,665 | $10,794 | $11,433 |
| 6/30/2024 | $11,090 | $12,991 | $11,103 | $11,923 |
Average Annual Total Returns (%)
| Total Net Assets | $35,178,899 |
| # of Issuers | 38 |
| Portfolio Turnover Rate | 20% |
| Total Advisory Fees Paid | $92,540 |
| Class/Index Name | 1 Year | Since Inception 12/31/2021 |
|---|
| Retail | 40.03% | 4.23% |
| MSCI ACWI Information Technology Index | 37.68% | 11.04% |
| MSCI ACWI Index | 19.38% | 4.28% |
| S&P 500 Index | 24.56% | 7.29% |
Past performance is not predictive of future performance. The performance data does not reflect the deduction of taxes that a shareholder would pay on Fund distributions or redemption of Fund shares. The Adviser waives and/or reimburses certain Fund expenses pursuant to a contract expiring on August 29, 2034, unless renewed for another 11-year term and the Fund’s transfer agency expenses may be reduced by expense offsets from an unaffiliated transfer agent, without which performance would have been lower.
What did the Fund invest in?
| Holding | % of Total Net Assets (6/30/24)* |
| NVIDIA Corp. | 12.1% |
| Amazon.com, Inc. | 10.2% |
| Microsoft Corporation | 9.8% |
| Apple, Inc. | 7.9% |
| Broadcom, Inc. | 5.2% |
| Spotify Technology SA | 4.8% |
| Taiwan Semiconductor Manufacturing Co., Ltd. | 4.5% |
| Meta Platforms, Inc. | 3.7% |
| Advanced Micro Devices, Inc. | 3.3% |
| CoStar Group, Inc. | 2.8% |
| Total | 64.3% |
* Individual weights may not sum to 100% (or displayed total) due to rounding.
Sector Breakdown
(as a % of net assets)*
| Value | Value |
|---|
| Information Technology | 71.0% |
| Consumer Discretionary | 13.8% |
| Communication Services | 11.0% |
| Real Estate | 2.8% |
| Industrials | 0.9% |
| Cash and Cash Equivalents | 0.5%Footnote Reference† |
| Footnote | Description |
Footnote† | Includes short-term investments, other assets and liabilities-net. |
If you wish to view additional information about the Fund; including but not limited to its financial statements, prospectus, or holdings, please visit BaronCapitalGroup.com. For benchmark definitions and attribution language please visit connect.rightprospectus.com/Baron.
Phone: 1.800.99.BARON
Email: info@BaronCapitalGroup.com
Semi-Annual Shareholder Report June 30, 2024
Item 2. Code of Ethics.
Not applicable.
Item 3. Audit Committee Financial Expert.
Not applicable.
Item 4. Principal Accountant Fees and Services.
Not applicable.
Item 5. Audit Committee of Listed Registrants.
Not applicable.
Item 6. Investments.
(a) The information is disclosed as part of the Financial Statements included in Item 7 of this Form N-CSR.
(b) Not applicable.
Item 7. Financial Statements and Financial Highlights for Open-End Management Investment Companies.
Baron Partners Fund
Baron Focused Growth Fund
Baron International Growth Fund
Baron Real Estate Fund
Baron Emerging Markets Fund
Baron Global Advantage Fund
Baron Real Estate Income Fund
Baron Health Care Fund
Baron FinTech Fund
Baron New Asia Fund
Baron Technology Fund
Baron Funds®
Baron Select Funds
Semi-Annual Financial Statements and Other Important Information
| | | | | | | | |
| Baron Partners Fund | | | | | | | | |
Retail Shares: BPTRX | | Institutional Shares: BPTIX | | R6 Shares: BPTUX | | | | |
| Baron Focused Growth Fund | | | | |
Retail Shares: BFGFX | | Institutional Shares: BFGIX | | R6 Shares: BFGUX | | | | |
| Baron International Growth Fund | | | | |
Retail Shares: BIGFX | | Institutional Shares: BINIX | | R6 Shares: BIGUX | | | | |
| Baron Real Estate Fund | | | | |
Retail Shares: BREFX | | Institutional Shares: BREIX | | R6 Shares: BREUX | | | | |
| Baron Emerging Markets Fund | | | | |
Retail Shares: BEXFX | | Institutional Shares: BEXIX | | R6 Shares: BEXUX | | | | |
| Baron Global Advantage Fund | | | | |
Retail Shares: BGAFX | | Institutional Shares: BGAIX | | R6 Shares: BGLUX | | | | |
| Baron Real Estate Income Fund | | | | |
Retail Shares: BRIFX | | Institutional Shares: BRIIX | | R6 Shares: BRIUX | | | | |
| Baron Health Care Fund | | | | |
Retail Shares: BHCFX | | Institutional Shares: BHCHX | | R6 Shares: BHCUX | | | | |
| Baron FinTech Fund | | | | | | | | |
Retail Shares: BFINX | | Institutional Shares: BFIIX | | R6 Shares: BFIUX | | | | |
| Baron New Asia Fund | | | | | | | | |
Retail Shares: BNAFX | | Institutional Shares: BNAIX | | R6 Shares: BNAUX | | | | |
| Baron Technology Fund | | | | |
Retail Shares: BTEEX | | Institutional Shares: BTECX | | R6 Shares: BTEUX | | | | |
DEAR BARON SELECT FUNDS SHAREHOLDER:
In this report, you will find unaudited semi-annual financial statements and other important information for Baron Partners Fund, Baron Focused Growth Fund, Baron International Growth Fund, Baron Real Estate Fund, Baron Emerging Markets Fund, Baron Global Advantage Fund, Baron Real Estate Income Fund, Baron Health Care Fund, Baron FinTech Fund, Baron New Asia Fund, and Baron Technology Fund (the Funds) for the six months ended June 30, 2024.
We thank you for choosing to join us as fellow shareholders in Baron Funds. We will continue to work hard to justify your confidence.
Sincerely,
| | | | |
 | |  | |  |
Ronald Baron Chief Executive Officer August 23, 2024 | | Rachel Stern Chief Operating Officer August 23, 2024 | | Christopher Snively
Chief Financial Officer and Treasurer August 23, 2024 |
These Semi-Annual Financial Statements are for the Baron Select Funds, which currently has 12 series: Baron Partners Fund, Baron Focused Growth Fund, Baron International Growth Fund, Baron Real Estate Fund, Baron Emerging Markets Fund, Baron Global Advantage Fund, Baron Real Estate Income Fund, Baron Health Care Fund, Baron FinTech Fund, Baron WealthBuilder Fund, Baron New Asia Fund, and Baron Technology Fund. Baron WealthBuilder Fund is included in separate Semi-Annual Financial Statements. If you are interested in Baron WealthBuilder Fund or Baron Investment Funds Trust, which contains the Baron Asset Fund, Baron Growth Fund, Baron Small Cap Fund, Baron Opportunity Fund, Baron Fifth Avenue Growth Fund, Baron Discovery Fund, and Baron Durable Advantage Fund, please visit the Funds’ website at BaronCapitalGroup.com or contact us at 1-800-99BARON.
The Funds’ Proxy Voting Policy is available without charge and can be found on the Funds’ website at BaronCapitalGroup.com, by clicking on the “Regulatory Documents” link at the bottom left corner of the homepage or by calling 1-800-99BARON and on the SEC’s website at sec.gov. The Funds’ most current proxy voting record, Form N-PX, is also available on the Funds’ website and on the SEC’s website.
The Funds file their complete Portfolios of Investments with the SEC for the first and third quarters of each fiscal year as an exhibit to their reports on Form N-PORT. The Funds’ Form N-PORT reports are available on the SEC’s website at sec.gov. Portfolios of Investments current to the most recent first and third quarters are also available on the Funds’ website.
Past performance is no guarantee of future results. The investment return and principal value of an investment will fluctuate; an investor’s shares, when redeemed, may be worth more or less than their original cost. For more complete information about Baron Funds, including charges and expenses, call, write or go to BaronCapitalGroup.com for a prospectus or summary prospectus. Read them carefully before you invest or send money. This report is not authorized for use as an offer of sale or a solicitation of an offer to buy shares of the Funds, unless accompanied or preceded by the Funds’ current prospectus or summary prospectus.
| | |
| Baron Partners Fund | | June 30, 2024 |
PORTFOLIO OF INVESTMENTS (Unaudited)
| | | | | | | | | | | | |
| Shares | | | | | Cost | | | Value | |
| Common Stocks (100.19%) | |
| Communication Services (2.07%) | |
| | | | Alternative Carriers (0.84%) | | | | | | | | |
| | 1,850,000 | | | Iridium Communications, Inc.6 | | $ | 45,348,699 | | | $ | 49,247,000 | |
| | |
| | | | Movies & Entertainment (1.23%) | | | | | |
| | 230,000 | | | Spotify Technology SA1,2,6 | | | 37,473,451 | | | | 72,171,700 | |
| | | | | | | | | | | | |
| | Total Communication Services | | | 82,822,150 | | | | 121,418,700 | |
| | | | | | | | | | | | |
|
| Consumer Discretionary (49.82%) | |
| | | | Automobile Manufacturers (33.73%) | | | | | |
| | 10,000,000 | | | Tesla, Inc.1,5 | | | 146,471,967 | | | | 1,978,800,000 | |
| | | |
| | | | Casinos & Gaming (1.78%) | | | | | | | | |
| | 1,904,558 | | | Red Rock Resorts, Inc., Cl A6 | | | 68,465,660 | | | | 104,617,371 | |
| | | |
| | | | Footwear (1.60%) | | | | | | | | |
| | 1,725,000 | | | Birkenstock Holding PLC1,2 | | | 78,199,680 | | | | 93,857,250 | |
| | | |
| | | | Hotels, Resorts & Cruise Lines (8.57%) | | | | | | | | |
| | 3,310,000 | | | Hyatt Hotels Corp., Cl A6 | | | 114,517,357 | | | | 502,855,200 | |
| | | |
| | | | Leisure Facilities (4.14%) | | | | | | | | |
| | 1,348,209 | | | Vail Resorts, Inc.6 | | | 125,288,572 | | | | 242,852,887 | |
| | | | | | | | | | | | |
| | Total Consumer Discretionary | | | 532,943,236 | | | | 2,922,982,708 | |
| | | | | | | | | | | | |
|
| Financials (23.73%) | |
| | | | Financial Exchanges & Data (7.06%) | | | | | |
| | 720,000 | | | FactSet Research Systems, Inc.6 | | | 54,960,987 | | | | 293,954,400 | |
| | 250,000 | | | MSCI, Inc.6 | | | 88,967,758 | | | | 120,437,500 | |
| | | | | | | | | | | | |
| | | | | | | 143,928,745 | | | | 414,391,900 | |
| | | |
| | | | Investment Banking & Brokerage (5.58%) | | | | | | | | |
| | 4,440,000 | | | The Charles Schwab Corp. | | | 115,944,118 | | | | 327,183,600 | |
| | | |
| | | | Property & Casualty Insurance (11.09%) | | | | | | | | |
| | 6,450,000 | | | Arch Capital Group Ltd.1,2,6 | | | 29,408,775 | | | | 650,740,500 | |
| | | | | | | | | | | | |
| | Total Financials | | | 289,281,638 | | | | 1,392,316,000 | |
| | | | | | | | | | | | |
|
| Health Care (5.81%) | |
| | | | Health Care Equipment (5.81%) | | | | | | | | |
| | 700,000 | | | IDEXX Laboratories, Inc.1,6 | | | 30,611,907 | | | | 341,040,000 | |
| | | | | | | | | | | | |
|
| Industrials (0.83%) | |
| | | | Aerospace & Defense (0.83%) | | | | | | | | |
| | 125,625 | | | HEICO Corp.6 | | | 9,632,520 | | | | 28,091,006 | |
| | 116,875 | | | HEICO Corp., Cl A6 | | | 7,586,429 | | | | 20,747,650 | |
| | | | | | | | | | | | |
| | Total Industrials | | | 17,218,949 | | | | 48,838,656 | |
| | | | | | | | | | | | |
|
| Information Technology (7.31%) | |
| | | | Application Software (2.10%) | | | | | | | | |
| | 895,000 | | | Guidewire Software, Inc.1,6 | | | 72,387,812 | | | | 123,411,550 | |
| | | |
| | | | IT Consulting & Other Services (5.21%) | | | | | | | | |
| | 680,000 | | | Gartner, Inc.1,6 | | | 81,488,474 | | | | 305,360,800 | |
| | | | | | | | | | | | |
| | Total Information Technology | | | 153,876,286 | | | | 428,772,350 | |
| | | | | | | | | | | | |
| | | | | | | | | | | | |
| Shares | | | | | Cost | | | Value | |
| Common Stocks (continued) | |
| Real Estate (10.62%) | |
| | | | Other Specialized REITs (1.39%) | | | | | |
| | 1,800,000 | | | Gaming and Leisure Properties, Inc.6 | | $ | 56,364,979 | | | $ | 81,378,000 | |
| | | |
| | | | Real Estate Services (9.23%) | | | | | | | | |
| | 7,310,000 | | | CoStar Group, Inc.1,6 | | | 98,320,389 | | | | 541,963,400 | |
| | | | | | | | | | | | |
| | Total Real Estate | | | 154,685,368 | | | | 623,341,400 | |
| | | | | | | | | | | | |
| | Total Common Stocks | | | 1,261,439,534 | | | | 5,878,709,814 | |
| | | | | | | | | | | | |
| | | | | | | | | | | | |
| Private Common Stocks (5.89%) | |
| Communication Services (1.08%) | |
| | | | Interactive Media & Services (0.28%) | | | | | | | | |
| | 600,000 | | | X Holdings I, Inc., Cl A1,3,4,8 | | | 60,000,000 | | | | 16,392,000 | |
| | | |
| | | | Movies & Entertainment (0.80%) | | | | | | | | |
| | 197,613 | | | StubHub Holdings, Inc., Cl A1,3,4,8 | | | 50,000,041 | | | | 47,162,319 | |
| | | | | | | | | | | | |
| | Total Communication Services | | | 110,000,041 | | | | 63,554,319 | |
| | | | | | | | | | | | |
|
| Industrials (4.81%) | |
| | | | Aerospace & Defense (4.81%) | | | | | | | | |
| | 2,216,310 | | | Space Exploration Technologies Corp., Cl A1,3,4,8 | | | 29,920,185 | | | | 248,226,720 | |
| | 302,210 | | | Space Exploration Technologies Corp., Cl C1,3,4,8 | | | 4,079,835 | | | | 33,847,520 | |
| | | | | | | | | | | | |
| | Total Industrials | | | 34,000,020 | | | | 282,074,240 | |
| | | | | | | | | | | | |
| | Total Private Common Stocks | | | 144,000,061 | | | | 345,628,559 | |
| | | | | | | | | | | | |
| | | | | | | | | | | | |
| Private Convertible Preferred Stocks (0.12%) | |
| Industrials (0.12%) | |
| | | | Electrical Components & Equipment (0.12%) | | | | | | | | |
| | 21,213,656 | | | Northvolt AB, Series E2 (Sweden)1,2,3,4,8 | | | 7,843,621 | | | | 6,923,310 | |
| | | | | | | | | | | | |
| | | | | | | | | | | | |
| Private Preferred Stocks (10.57%) | |
| Industrials (10.57%) | |
| | | | Aerospace & Defense (10.57%) | | | | | | | | |
| | 311,111 | | | Space Exploration Technologies Corp., Cl H1,3,4,8 | | | 41,999,985 | | | | 348,444,320 | |
| | 131,657 | | | Space Exploration
Technologies Corp., Cl I1,3,4,8 | | | 22,250,032 | | | | 147,455,840 | |
| | 111,111 | | | Space Exploration
Technologies Corp., Series N1,3,4,8 | | | 29,999,970 | | | | 124,444,320 | |
| | | | | | | | | | | | |
| | Total Private Preferred Stocks | | | 94,249,987 | | | | 620,344,480 | |
| | | | | | | | | | | | |
| | |
| 2 | | See Notes to Financial Statements. |
| | |
| June 30, 2024 | | Baron Partners Fund |
PORTFOLIO OF INVESTMENTS (Unaudited) (Continued)
| | | | | | | | | | | | |
| Principal Amount | | | | | Cost | | | Value | |
| Short-Term Investments (0.01%) | |
| | $465,324 | | | Repurchase Agreement with Fixed Income Clearing Corp., dated 6/28/2024, 4.85% due 7/1/2024; Proceeds at maturity $465,512; (Fully Collateralized by $470,500 U.S. Treasury Floating Rate Note, 5.385% due 4/30/2026 Market value - $474,710)7 | | $ | 465,324 | | | $ | 465,324 | |
| | | | | | | | | | | | |
| | Total Investments (116.78%) | | $ | 1,507,998,527 | | | | 6,852,071,487 | |
| | | | | | | | | | | | |
| | Liabilities Less Cash and Other Assets (-16.78%) | | | | (984,576,160 | ) |
| | | | | | | | | | | | |
| | Net Assets | | | $ | 5,867,495,327 | |
| | | | | | | | | | | | |
| % | Represents percentage of net assets. |
| 1 | Non-income producing securities. |
| 3 | At June 30, 2024, the market value of restricted securities amounted to $972,896,349 or 16.58% of net assets. See Note 6 regarding Restricted Securities. |
| 4 | The Adviser has reclassified/classified certain securities in or out of this sub-industry. Such reclassifications/classifications are not supported by S&P or MSCI (unaudited). |
| 5 | Investors in the Fund may view Tesla, Inc.’s financial statements on the EDGAR website of the U.S. Securities and Exchange Commission by going to https://www.sec.gov/cgi-bin/browse-edgar?CIK=1318605&owner=exclude. Please note that the Fund is not responsible for Tesla’s financial statements and can provide no assurances as to their accuracy or completeness. |
| 6 | All or a portion of this security is pledged with the custodian in connection with the Fund’s loans payable outstanding. At June 30, 2024, the total market value of pledged securities amounted to $1,978,168,380 or 33.71% of net assets. |
| 7 | Level 2 security. See Note 7 regarding Fair Value Measurements. |
| 8 | Level 3 security. See Note 7 regarding Fair Value Measurements. |
All securities are Level 1, unless otherwise noted.
| | |
| See Notes to Financial Statements. | | 3 |
| | |
| Baron Focused Growth Fund | | June 30, 2024 |
PORTFOLIO OF INVESTMENTS (Unaudited)
| | | | | | | | | | | | |
| Shares | | | | | Cost | | | Value | |
| Common Stocks (86.75%) | |
| Communication Services (7.25%) | |
| | | | Alternative Carriers (1.43%) | | | | | | | | |
| | 755,000 | | | Iridium Communications, Inc. | | $ | 17,168,416 | | | $ | 20,098,100 | |
| | |
| | | | Movies & Entertainment (5.82%) | | | | | |
| | 262,000 | | | Spotify Technology SA1,2 | | | 35,016,218 | | | | 82,212,980 | |
| | | | | | | | | | | | |
| | Total Communication Services | | | 52,184,634 | | | | 102,311,080 | |
| | | | | | | | | | | | |
|
| Consumer Discretionary (38.71%) | |
| | | | Apparel, Accessories & Luxury Goods (2.68%) | | | | | | | | |
| | 7,100,000 | | | Figs, Inc., Cl A1 | | | 57,581,867 | | | | 37,843,000 | |
| | | |
| | | | Automobile Manufacturers (8.62%) | | | | | | | | |
| | 615,000 | | | Tesla, Inc.1 | | | 8,168,271 | | | | 121,696,200 | |
| | | |
| | | | Casinos & Gaming (5.04%) | | | | | | | | |
| | 365,000 | | | Las Vegas Sands Corp. | | | 16,080,177 | | | | 16,151,250 | |
| | 1,002,100 | | | Red Rock Resorts, Inc., Cl A | | | 35,155,656 | | | | 55,045,353 | |
| | | | | | | | | | | | |
| | | | | | | 51,235,833 | | | | 71,196,603 | |
| | | |
| | | | Footwear (6.45%) | | | | | | | | |
| | 595,000 | | | Birkenstock Holding PLC1,2 | | | 27,132,959 | | | | 32,373,950 | |
| | 1,510,000 | | | On Holding AG, Cl A1,2 | | | 42,609,637 | | | | 58,588,000 | |
| | | | | | | | | | | | |
| | | | | | | 69,742,596 | | | | 90,961,950 | |
| | | |
| | | | Hotels, Resorts & Cruise Lines (8.75%) | | | | | | | | |
| | 400,000 | | | Choice Hotels International, Inc. | | | 33,100,258 | | | | 47,600,000 | |
| | 500,000 | | | Hyatt Hotels Corp., Cl A | | | 24,424,809 | | | | 75,960,000 | |
| | | | | | | | | | | | |
| | | | | | | 57,525,067 | | | | 123,560,000 | |
| | | |
| | | | Leisure Facilities (4.58%) | | | | | | | | |
| | 358,842 | | | Vail Resorts, Inc. | | | 62,569,515 | | | | 64,638,210 | |
| | | |
| | | | Restaurants (2.59%) | | | | | | | | |
| | 3,400,000 | | | Krispy Kreme, Inc. | | | 47,017,602 | | | | 36,584,000 | |
| | | | | | | | | | | | |
| | Total Consumer Discretionary | | | 353,840,751 | | | | 546,479,963 | |
| | | | | | | | | | | | |
|
| Financials (18.12%) | |
| | | | Financial Exchanges & Data (6.68%) | | | | | | | | |
| | 125,000 | | | FactSet Research Systems, Inc. | | | 25,848,439 | | | | 51,033,750 | |
| | 90,000 | | | MSCI, Inc. | | | 43,089,524 | | | | 43,357,500 | |
| | | | | | | | | | | | |
| | | | | | | 68,937,963 | | | | 94,391,250 | |
| | | |
| | | | Investment Banking & Brokerage (5.01%) | | | | | | | | |
| | 475,000 | | | Interactive Brokers Group, Inc., Cl A | | | 39,320,199 | | | | 58,235,000 | |
| | 250,000 | | | Jefferies Financial Group, Inc. | | | 7,732,070 | | | | 12,440,000 | |
| | | | | | | | | | | | |
| | | | | | | 47,052,269 | | | | 70,675,000 | |
| | | |
| | | | Property & Casualty Insurance (6.43%) | | | | | | | | |
| | 900,000 | | | Arch Capital Group Ltd.1,2 | | | 25,104,585 | | | | 90,801,000 | |
| | | | | | | | | | | | |
| | Total Financials | | | 141,094,817 | | | | 255,867,250 | |
| | | | | | | | | | | | |
| | | | | | | | | | | | |
| Shares | | | | | Cost | | | Value | |
| Common Stocks (continued) | |
| Health Care (3.07%) | |
| | | | Health Care Equipment (1.17%) | | | | | | | | |
| | 34,000 | | | IDEXX Laboratories, Inc.1 | | $ | 15,205,826 | | | $ | 16,564,800 | |
| | | |
| | | | Life Sciences Tools & Services (1.90%) | | | | | | | | |
| | 256,200 | | | Illumina, Inc.1 | | | 27,908,681 | | | | 26,742,156 | |
| | | | | | | | | | | | |
| | Total Health Care | | | 43,114,507 | | | | 43,306,956 | |
| | | | | | | | | | | | |
|
| Industrials (3.06%) | |
| | | | Research & Consulting Services (3.06%) | | | | | | | | |
| | 160,000 | | | Verisk Analytics, Inc. | | | 28,339,398 | | | | 43,128,000 | |
| | | | | | | | | | | | |
|
| Information Technology (9.76%) | |
| | | |
| | | | Application Software (7.30%) | | | | | | | | |
| | 95,000 | | | ANSYS, Inc.1 | | | 24,133,643 | | | | 30,542,500 | |
| | 526,300 | | | Guidewire Software, Inc.1 | | | 48,175,978 | | | | 72,571,507 | |
| | | | | | | | | | | | |
| | | | | | | 72,309,621 | | | | 103,114,007 | |
| | | |
| | | | Internet Services & Infrastructure (2.46%) | | | | | | | | |
| | 525,000 | | | Shopify, Inc., Cl A1,2 | | | 26,207,834 | | | | 34,676,250 | |
| | | | | | | | | | | | |
| | Total Information Technology | | | 98,517,455 | | | | 137,790,257 | |
| | | | | | | | | | | | |
|
| Real Estate (6.78%) | |
| | | | Health Care REITs (1.20%) | | | | | | | | |
| | 145,000 | | | Alexandria Real Estate Equities, Inc. | | | 19,951,450 | | | | 16,960,649 | |
| | | |
| | | | Office REITs (1.36%) | | | | | | | | |
| | 1,450,000 | | | Douglas Emmett, Inc. | | | 20,931,980 | | | | 19,299,500 | |
| | | |
| | | | Real Estate Services (3.60%) | | | | | | | | |
| | 685,000 | | | CoStar Group, Inc.1 | | | 18,896,854 | | | | 50,785,900 | |
| | | |
| | | | Single-Family Residential REITs (0.62%) | | | | | | | | |
| | 235,000 | | | American Homes 4 Rent, Cl A | | | 5,062,679 | | | | 8,732,600 | |
| | | | | | | | | | | | |
| | Total Real Estate | | | 64,842,963 | | | | 95,778,649 | |
| | | | | | | | | | | | |
| | Total Common Stocks | | | 781,934,525 | | | | 1,224,662,155 | |
| | | | | | | | | | | | |
| | | | | | | | | | | | |
| Private Common Stocks (6.13%) | |
| Industrials (6.13%) | |
| | | | Aerospace & Defense (6.13%) | | | | | | | | |
| | 629,570 | | | Space Exploration
Technologies Corp., Cl A1,3,4,6 | | | 26,390,845 | | | | 70,511,840 | |
| | 143,170 | | | Space Exploration
Technologies Corp., Cl C1,3,4,6 | | | 6,808,820 | | | | 16,035,040 | |
| | | | | | | | | | | | |
| | Total Private Common Stocks | | | 33,199,665 | | | | 86,546,880 | |
| | | | | | | | | | | | |
| | | | | | | | | | | | |
| | |
| 4 | | See Notes to Financial Statements. |
| | |
| June 30, 2024 | | Baron Focused Growth Fund |
PORTFOLIO OF INVESTMENTS (Unaudited) (Continued)
| | | | | | | | | | | | |
| Shares | | | | | Cost | | | Value | |
| Private Preferred Stocks (5.60%) | |
| Industrials (4.18%) | |
| | | | Aerospace & Defense (4.18%) | | | | | | | | |
| | 29,630 | | | Space Exploration
Technologies Corp., Cl H1,3,4,6 | | $ | 4,000,050 | | | $ | 33,185,600 | |
| | 1,479 | | | Space Exploration
Technologies Corp., Cl I1,3,4,6 | | | 249,951 | | | | 1,656,480 | |
| | 12,346 | | | Space Exploration
Technologies Corp., Series K1,3,4,6 | | | 10,000,260 | | | | 13,827,520 | |
| | 9,259 | | | Space Exploration
Technologies Corp., Series N1,3,4,6 | | | 2,499,930 | | | | 10,370,080 | |
| | | | | | | | | | | | |
| | Total Industrials | | | 16,750,191 | | | | 59,039,680 | |
| | | | | | | | | | | | |
|
| Information Technology (1.42%) | |
| | | | Application Software (1.42%) | | | | | | | | |
| | 1,670,843 | | | X.AI Corp.1,3,4,6 | | | 19,999,991 | | | | 19,999,991 | |
| | | | | | | | | | | | |
| | Total Private Preferred Stocks | | | 36,750,182 | | | | 79,039,671 | |
| | | | | | | | | | | | |
| | | | | | | | | | | | |
| | | |
| Principal Amount | | | | | | |
| Short-Term Investments (1.15%) | |
| | $16,270,861 | | | Repurchase Agreement with Fixed Income Clearing Corp., dated 6/28/2024, 4.85% due 7/1/2024; Proceeds at maturity $16,277,437; (Fully Collateralized by $16,450,500 U.S. Treasury Floating Rate Note, 5.385% due 4/30/2026 Market value - $16,596,324)5 | | | 16,270,861 | | | | 16,270,861 | |
| | | | | | | | | | | | |
| | Total Investments (99.63%) | | $ | 868,155,233 | | | | 1,406,519,567 | |
| | | | | | | | | | | | |
| | Cash and Other Assets Less Liabilities (0.37%) | | | | 5,207,596 | |
| | | | | | | | | | | | |
| | Net Assets | | | $ | 1,411,727,163 | |
| | | | | | | | | | | | |
| % | Represents percentage of net assets. |
| 1 | Non-income producing securities. |
| 3 | At June 30, 2024, the market value of restricted securities amounted to $165,586,551 or 11.73% of net assets. See Note 6 regarding Restricted Securities. |
| 4 | The Adviser has reclassified/classified certain securities in or out of this sub-industry. Such reclassifications/classifications are not supported by S&P or MSCI (unaudited). |
| 5 | Level 2 security. See Note 7 regarding Fair Value Measurements. |
| 6 | Level 3 security. See Note 7 regarding Fair Value Measurements. |
| | All securities are Level 1, unless otherwise noted. |
| | |
| See Notes to Financial Statements. | | 5 |
| | |
| Baron International Growth Fund | | June 30, 2024 |
PORTFOLIO OF INVESTMENTS (Unaudited)
| | | | | | | | | | | | |
| Shares | | | | | Cost | | | Value | |
| Common Stocks (97.22%) | |
| Brazil (2.65%) | |
| | 137,035 | | | Afya Ltd., Cl A1 | | $ | 1,922,076 | | | $ | 2,418,668 | |
| | 209,633 | | | Localiza Rent a Car SA | | | 2,538,422 | | | | 1,575,032 | |
| | 146,823 | | | NU Holdings Ltd., Cl A1 | | | 1,202,583 | | | | 1,892,548 | |
| | 215,870 | | | Suzano SA | | | 1,846,869 | | | | 2,201,526 | |
| | 56,942 | | | XP, Inc., Cl A | | | 683,462 | | | | 1,001,610 | |
| | | | | | | | | | | | |
| | Total Brazil | | | 8,193,412 | | | | 9,089,384 | |
| | | | | | | | | | | | |
|
| Canada (3.81%) | |
| | 58,170 | | | Agnico Eagle Mines Ltd. | | | 2,787,340 | | | | 3,804,318 | |
| | 3,203 | | | Constellation Software, Inc. | | | 73,710 | | | | 9,229,079 | |
| | | | | | | | | | | | |
| | Total Canada | | | 2,861,050 | | | | 13,033,397 | |
| | | | | | | | | | | | |
|
| China (6.81%) | |
| | 25,250 | | | Alibaba Group Holding Limited, ADR | | | 2,139,087 | | | | 1,818,000 | |
| | 7,533 | | | Baidu, Inc., ADR1 | | | 742,329 | | | | 651,454 | |
| | 477,710 | | | Full Truck Alliance Co. Ltd., ADR | | | 3,318,476 | | | | 3,840,788 | |
| | 313,398 | | | Fuyao Glass Industry
Group Co. Ltd., Cl A | | | 1,902,355 | | | | 2,066,015 | |
| | 1,804,325 | | | Kingdee International Software Group Co. Ltd.1,3 | | | 1,497,464 | | | | 1,687,222 | |
| | 16,369 | | | PDD Holdings, Inc., ADR1 | | | 2,065,227 | | | | 2,176,259 | |
| | 43,915 | | | Shenzhen Mindray Bio-Medical Electronics Co. Ltd., Cl A3 | | | 1,826,222 | | | | 1,756,964 | |
| | 69,942 | | | Tencent Holdings Limited3 | | | 1,787,760 | | | | 3,318,071 | |
| | 57,907 | | | Tencent Holdings Limited, ADR | | | 2,462,553 | | | | 2,742,476 | |
| | 122,600 | | | Tencent Music Entertainment Group, ADR | | | 1,104,332 | | | | 1,722,530 | |
| | 89,389 | | | Zai Lab Limited, ADR1 | | | 2,007,360 | | | | 1,549,111 | |
| | | | | | | | | | | | |
| | Total China | | | 20,853,165 | | | | 23,328,890 | |
| | | | | | | | | | | | |
|
| Denmark (2.56%) | |
| | 87,153 | | | Genmab A/S, ADR1 | | | 3,191,956 | | | | 2,190,155 | |
| | 45,982 | | | Novo Nordisk AS, ADR | | | 4,532,650 | | | | 6,563,471 | |
| | | | | | | | | | | | |
| | Total Denmark | | | 7,724,606 | | | | 8,753,626 | |
| | | | | | | | | | | | |
|
| France (5.70%) | |
| | 91,784 | | | BNP Paribas S.A.3 | | | 3,336,423 | | | | 5,869,778 | |
| | 79,606 | | | Eurofins Scientific SE3 | | | 1,366,113 | | | | 3,985,789 | |
| | 4,255 | | | LVMH Moët Hennessy Louis Vuitton SE3 | | | 951,397 | | | | 3,266,950 | |
| | 12,598 | | | Pernod Ricard SA3 | | | 2,375,233 | | | | 1,718,867 | |
| | 272,881 | | | Waga Energy SA1,3 | | | 7,210,843 | | | | 4,675,035 | |
| | | | | | | | | | | | |
| | Total France | | | 15,240,009 | | | | 19,516,419 | |
| | | | | | | | | | | | |
|
| Germany (2.83%) | |
| | 80,912 | | | Befesa SA, 144A3 | | | 3,266,746 | | | | 2,677,057 | |
| | 57,389 | | | Symrise AG3 | | | 4,599,683 | | | | 7,021,953 | |
| | | | | | | | | | | | |
| | Total Germany | | | 7,866,429 | | | | 9,699,010 | |
| | | | | | | | | | | | |
|
| Hong Kong (0.80%) | |
| | 240,981 | | | Techtronic Industries Co. Ltd.3 | | | 1,892,741 | | | | 2,747,157 | |
| | | | | | | | | | | | |
|
| India (10.38%) | |
| | 468,420 | | | Bharti Airtel Ltd. PP3 | | | 2,474,376 | | | | 5,848,158 | |
| | 159,625 | | | Godrej Consumer Products Ltd.3 | | | 1,979,040 | | | | 2,629,178 | |
| | 54,869 | | | Godrej Properties Ltd.1,3 | | | 608,954 | | | | 2,105,784 | |
| | 514,636 | | | Indus Towers Ltd.1,3 | | | 1,914,299 | | | | 2,313,756 | |
| | 38,903 | | | InterGlobe Aviation Ltd., 144A1,3 | | | 1,538,521 | | | | 1,971,469 | |
| | 467,276 | | | Jio Financial Services Ltd.1,3 | | | 1,108,121 | | | | 2,001,515 | |
| | 960,476 | | | JM Financial Limited3 | | | 912,870 | | | | 1,004,523 | |
| | | | | | | | | | | | |
| Shares | | | | | Cost | | | Value | |
| Common Stocks (continued) | |
| India (continued) | |
| | 44,968 | | | Kaynes Technology India Ltd.1,3 | | $ | 1,491,066 | | | $ | 2,076,173 | |
| | 165,157 | | | Max Healthcare Institute Ltd.3 | | | 1,106,306 | | | | 1,860,054 | |
| | 293,765 | | | Nippon Life India Asset Management Ltd., 144A3 | | | 940,944 | | | | 2,267,663 | |
| | 154,644 | | | Reliance Industries Limited3 | | | 2,690,287 | | | | 5,797,082 | |
| | 24,108 | | | Tata Communications Ltd.3 | | | 457,709 | | | | 535,348 | |
| | 78,284 | | | Trent Ltd.3 | | | 1,809,463 | | | | 5,136,955 | |
| | | | | | | | | | | | |
| | Total India | | | 19,031,956 | | | | 35,547,658 | |
| | | | | | | | | | | | |
|
| Ireland (1.42%) | |
| | 464,079 | | | Bank of Ireland Group PLC3 | | | 3,490,150 | | | | 4,847,983 | |
| | | | | | | | | | | | |
|
| Israel (4.11%) | |
| | 14,733 | | | CyberArk Software Ltd.1 | | | 2,665,597 | | | | 4,028,297 | |
| | 111,381 | | | Oddity Tech Ltd., Cl A1 | | | 3,652,012 | | | | 4,372,818 | |
| | 290,599 | | | Taboola.com Ltd.1 | | | 1,605,286 | | | | 999,660 | |
| | 29,369 | | | Wix.com Ltd.1 | | | 2,121,011 | | | | 4,671,727 | |
| | | | | | | | | | | | |
| | Total Israel | | | 10,043,906 | | | | 14,072,502 | |
| | | | | | | | | | | | |
|
| Italy (0.56%) | |
| | 104,115 | | | Stevanato Group SpA | | | 2,173,137 | | | | 1,909,469 | |
| | | | | | | | | | | | |
|
| Japan (11.71%) | |
| | 117,500 | | | Ajinomoto Co., Inc.3 | | | 4,320,040 | | | | 4,135,439 | |
| | 51,844 | | | Japan Airport Terminal Co. Ltd.3 | | | 2,139,332 | | | | 1,772,583 | |
| | 170,533 | | | Japan Exchange Group, Inc.3 | | | 3,160,597 | | | | 3,999,570 | |
| | 10,118 | | | Keyence Corporation3 | | | 2,600,374 | | | | 4,428,425 | |
| | 1,006,662 | | | LY Corp.3 | | | 3,063,855 | | | | 2,430,757 | |
| | 343,750 | | | Mitsubishi UFJ Financial Group, Inc., ADR | | | 2,474,102 | | | | 3,712,500 | |
| | 86,900 | | | Recruit Holdings Co, Ltd.3 | | | 1,453,680 | | | | 4,675,841 | |
| | 227,200 | | | SMS Co. Ltd.3 | | | 6,237,826 | | | | 2,885,916 | |
| | 88,031 | | | Sumitomo Mitsui Financial Group, Inc.3 | | | 3,741,032 | | | | 5,909,070 | |
| | 28,084 | | | Tokyo Electron Limited3 | | | 2,530,193 | | | | 6,147,598 | |
| | | | | | | | | | | | |
| | Total Japan | | | 31,721,031 | | | | 40,097,699 | |
| | | | | | | | | | | | |
|
| Korea, Republic of (6.18%) | |
| | 160,369 | | | Coupang, Inc., Cl A1 | | | 2,058,471 | | | | 3,359,730 | |
| | 21,392 | | | HD Hyundai Heavy Industries Co. Ltd.1,3 | | | 1,971,006 | | | | 2,413,039 | |
| | 56,864 | | | HD Korea Shipbuilding & Offshore Engineering Co. Ltd.1,3 | | | 4,217,591 | | | | 6,545,785 | |
| | 19,960 | | | Park Systems Corp.3 | | | 2,635,287 | | | | 2,693,768 | |
| | 77,353 | | | Samsung Electronics Co., Ltd.3 | | | 4,205,051 | | | | 4,552,516 | |
| | 9,346 | | | SK Hynix, Inc.3 | | | 1,189,368 | | | | 1,586,096 | |
| | | | | | | | | | | | |
| | Total Korea, Republic of | | | 16,276,774 | | | | 21,150,934 | |
| | | | | | | | | | | | |
|
| Mexico (0.32%) | |
| | 206,616 | | | Grupo Mexico S.A.B. de C.V., Series B | | | 520,023 | | | | 1,114,789 | |
| | | | | | | | | | | | |
|
| Netherlands (7.99%) | |
| | 198,344 | | | AMG Critical Materials NV3 | | | 5,399,502 | | | | 3,289,676 | |
| | 16,519 | | | argenx SE, ADR1 | | | 463,028 | | | | 7,103,831 | |
| | 13,058 | | | BE Semiconductor Industries NV3 | | | 1,744,262 | | | | 2,181,356 | |
| | 56,551 | | | DSM-Firmenich AG3 | | | 7,177,151 | | | | 6,367,935 | |
| | 74,220 | | | Prosus NV3 | | | 2,610,613 | | | | 2,639,150 | |
| | 194,063 | | | Universal Music Group NV3 | | | 3,416,566 | | | | 5,773,038 | |
| | | | | | | | | | | | |
| | Total Netherlands | | | 20,811,122 | | | | 27,354,986 | |
| | | | | | | | | | | | |
| | |
| 6 | | See Notes to Financial Statements. |
| | |
| June 30, 2024 | | Baron International Growth Fund |
PORTFOLIO OF INVESTMENTS (Unaudited) (Continued)
| | | | | | | | | | | | |
| Shares | | | | | Cost | | | Value | |
| Common Stocks (continued) | |
| Norway (0.10%) | |
| | 571,106 | | | Aker Carbon Capture ASA1,3 | | $ | 673,640 | | | $ | 356,711 | |
| | | | | | | | | | | | |
|
| Peru (0.85%) | |
| | 18,162 | | | Credicorp, Ltd. | | | 2,564,129 | | | | 2,930,076 | |
| | | | | | | | | | | | |
|
| Poland (3.59%) | |
| | 44,365 | | | Dino Polska SA, 144A1,3 | | | 3,187,171 | | | | 4,470,673 | |
| | 444,491 | | | InPost SA1,3 | | | 4,086,825 | | | | 7,821,064 | |
| | | | | | | | | | | | |
| | Total Poland | | | 7,273,996 | | | | 12,291,737 | |
| | | | | | | | | | | | |
|
| Russia (0.00%)^ | |
| | 487,800 | | | Sberbank of Russia PJSC1,2,4 | | | 1,650,983 | | | | 329 | |
| | | | | | | | | | | | |
|
| Spain (3.95%) | |
| | 1,072,756 | | | eDreams ODIGEO SA1 | | | 7,517,700 | | | | 7,467,646 | |
| | 122,025 | | | Industria de Diseno Textil, S.A.3 | | | 3,552,715 | | | | 6,055,295 | |
| | | | | | | | | | | | |
| | Total Spain | | | 11,070,415 | | | | 13,522,941 | |
| | | | | | | | | | | | |
|
| Sweden (2.37%) | |
| | 293,721 | | | Epiroc AB, Cl A3 | | | 4,979,357 | | | | 5,885,389 | |
| | 76,067 | | | EQT AB3 | | | 2,448,139 | | | | 2,230,084 | |
| | | | | | | | | | | | |
| | Total Sweden | | | 7,427,496 | | | | 8,115,473 | |
| | | | | | | | | | | | |
|
| Switzerland (2.02%) | |
| | 21,417 | | | Compagnie Financiere Richemont SA, Cl A3 | | | 2,854,354 | | | | 3,347,112 | |
| | 34,933 | | | Nestle S.A.3 | | | 3,220,720 | | | | 3,565,760 | |
| | | | | | | | | | | | |
| | Total Switzerland | | | 6,075,074 | | | | 6,912,872 | |
| | | | | | | | | | | | |
|
| Taiwan (3.79%) | |
| | 23,821 | | | eMemory Technology, Inc.3 | | | 1,849,001 | | | | 1,871,193 | |
| | 316,093 | | | Taiwan Semiconductor Manufacturing Co., Ltd.3 | | | 6,418,552 | | | | 9,365,081 | |
| | 9,957 | | | Taiwan Semiconductor Manufacturing Co., Ltd., ADR | | | 957,612 | | | | 1,730,626 | |
| | | | | | | | | | | | |
| | Total Taiwan | | | 9,225,165 | | | | 12,966,900 | |
| | | | | | | | | | | | |
|
| United Kingdom (8.36%) | |
| | 105,451 | | | AstraZeneca PLC, ADR | | | 4,148,285 | | | | 8,224,123 | |
| | 527,544 | | | B&M European Value Retail S.A.3 | | | 2,038,589 | | | | 2,906,229 | |
| | 44,887 | | | Endava plc, ADR1 | | | 1,470,154 | | | | 1,312,496 | |
| | 140,802 | | | Experian plc3 | | | 2,722,320 | | | | 6,541,202 | |
| | 22,038 | | | Linde Public Limited Company3 | | | 3,213,542 | | | | 9,659,143 | |
| | | | | | | | | | | | |
| | Total United Kingdom | | | 13,592,890 | | | | 28,643,193 | |
| | | | | | | | | | | | |
|
| United States (4.36%) | |
| | 42,137 | | | Agilent Technologies, Inc. | | | 1,642,511 | | | | 5,462,219 | |
| | 93,702 | | | Arch Capital Group Ltd.1 | | | 1,530,349 | | | | 9,453,595 | |
| | | | | | | | | | | | |
| | Total United States | | | 3,172,860 | | | | 14,915,814 | |
| | | | | | | | | | | | |
| | Total Common Stocks | | | 231,426,159 | | | | 332,919,949 | |
| | | | | | | | | | | | |
| | | | | | | | | | | | |
| Rights (0.00%)^ | |
| Brazil (0.00%)^ | |
| | 2,118 | | | Localiza Rent a Car SA
exercise price BRL 33.481 | | | 0 | | | | 3,410 | |
| | | | | | | | | | | | |
| | | | | | | | | | | | |
| | | | | | | | | | | | |
| Shares | | | | | Cost | | | Value | |
| Warrants (0.01%) | |
| Canada (0.00%)^ | |
| | 5,029 | | | Constellation Software, Inc.
Exp. 3/31/20401,2,4 | | $ | 0 | | | $ | 0 | |
| | | | | | | | | | | | |
| Israel (0.01%) | |
| | 56,745 | | | Taboola.com Ltd. Exp. 6/29/2026 exercise price USD 11.501 | | | 104,540 | | | | 9,079 | |
| | | | | | | | | | | | |
| | Total Warrants | | | 104,540 | | | | 9,079 | |
| | | | | | | | | | | | |
| | | | | | | | | | | | |
| | | |
| Principal Amount | | | | | | |
| Short-Term Investments (3.50%) | |
| | $11,998,666 | | | Repurchase Agreement with Fixed Income Clearing Corp., dated 6/28/2024, 4.85% due 7/1/2024; Proceeds at maturity $12,003,516; (Fully Collateralized by $12,131,200 U.S. Treasury Floating Rate Note, 5.385% due 4/30/2026 Market value - $12,238,799)3 | | | 11,998,666 | | | | 11,998,666 | |
| | | | | | | | | | | | |
| | Total Investments (100.73%) | | $ | 243,529,365 | | | | 344,931,104 | |
| | | | | | | | | | | | |
| | Liabilities Less Cash and Other Assets (-0.73%) | | | | (2,484,584 | ) |
| | | | | | | | | | | | |
| | Net Assets | | | $ | 342,446,520 | |
| | | | | | | | | | | | |
| % | Represents percentage of net assets. |
| 1 | Non-income producing securities. |
| 2 | At June 30, 2024, the market value of restricted securities amounted to $329 or less than 0.01% of net assets. See Note 6 regarding Restricted Securities. |
| 3 | Level 2 security. See Note 7 regarding Fair Value Measurements. |
| 4 | Level 3 security. See Note 7 regarding Fair Value Measurements. |
| ^ | Rounds to less than 0.01%. |
| ADR | American Depositary Receipt. |
| 144A | Security is exempt from registration pursuant to Rule 144A under the Securities Act of 1933. This security may be resold in transactions that are exempt from registration, normally to qualified institutional buyers. At June 30, 2024, the market value of Rule 144A securities amounted to $11,386,862 or 3.33% of net assets. |
| | All securities are Level 1, unless otherwise noted. |
| | | | |
Summary of Investments by Sector
as of June 30, 2024 | | Percentage of
Net Assets | |
| |
Information Technology | | | 16.8 | % |
| |
Industrials | | | 15.1 | % |
| |
Financials | | | 13.8 | % |
| |
Consumer Discretionary | | | 12.5 | % |
| |
Health Care | | | 11.9 | % |
| |
Materials | | | 9.8 | % |
| |
Communication Services | | | 7.7 | % |
| |
Consumer Staples | | | 6.1 | % |
| |
Energy | | | 3.1 | % |
| |
Real Estate | | | 0.6 | % |
| |
Cash and Cash Equivalents* | | | 2.8 | % |
| | | | 100.0 | %** |
| * | Includes short-term investments, other assets and liabilities-net. |
| ** | Individual weights may not sum to 100% due to rounding. |
| | |
| See Notes to Financial Statements. | | 7 |
| | |
| Baron Real Estate Fund | | June 30, 2024 |
PORTFOLIO OF INVESTMENTS (Unaudited)
| | | | | | | | | | | | |
| Shares | | | | | Cost | | | Value | |
| Common Stocks (94.00%) | |
| Consumer Discretionary (36.52%) | |
| | | | Casinos & Gaming (9.63%) | | | | | | | | |
| | 843,950 | | | Las Vegas Sands Corp. | | $ | 37,959,677 | | | $ | 37,344,787 | |
| | 1,091,505 | | | MGM Resorts International1 | | | 40,017,710 | | | | 48,506,482 | |
| | 546,549 | | | Red Rock Resorts, Inc., Cl A | | | 7,683,956 | | | | 30,021,937 | |
| | 591,600 | | | Wynn Resorts Ltd. | | | 55,478,834 | | | | 52,948,200 | |
| | | | | | | | | | | | |
| | | | 141,140,177 | | | | 168,821,406 | |
| | | |
| | | | Home Improvement Retail (2.82%) | | | | | | | | |
| | 148,950 | | | Floor & Decor Holdings, Inc., Cl A1 | | | 10,677,267 | | | | 14,807,120 | |
| | 157,150 | | | Lowe’s Companies, Inc. | | | 30,087,167 | | | | 34,645,289 | |
| | | | | | | | | | | | |
| | | | 40,764,434 | | | | 49,452,409 | |
| | | |
| | | | Homebuilding (18.62%) | | | | | | | | |
| | 620,550 | | | D.R. Horton, Inc. | | | 52,365,407 | | | | 87,454,111 | |
| | 110,900 | | | Installed Building Products, Inc. | | | 12,378,584 | | | | 22,809,912 | |
| | 659,449 | | | Lennar Corp., Cl A | | | 56,855,447 | | | | 98,831,622 | |
| | 1,018,550 | | | Toll Brothers, Inc. | | | 47,695,938 | | | | 117,316,589 | |
| | | | | | | | | | | | |
| | | | 169,295,376 | | | | 326,412,234 | |
| | | |
| | | | Hotels, Resorts & Cruise Lines (5.45%) | | | | | | | | |
| | 238,500 | | | Hilton Worldwide Holdings, Inc. | | | 38,093,580 | | | | 52,040,700 | |
| | 286,900 | | | Hyatt Hotels Corp., Cl A | | | 34,652,407 | | | | 43,585,848 | |
| | | | | | | | | | | | |
| | | | 72,745,987 | | | | 95,626,548 | |
| | | | | | | | | | | | |
| | Total Consumer Discretionary | | | 423,945,974 | | | | 640,312,597 | |
| | | | | | | | | | | | |
|
| Financials (7.54%) | |
| | | | Asset Management & Custody Banks (7.54%) | | | | | | | | |
| | 559,450 | | | Blackstone, Inc. | | | 51,449,803 | | | | 69,259,910 | |
| | 730,406 | | | Brookfield Asset Management Ltd., Cl A2 | | | 24,501,060 | | | | 27,791,948 | |
| | 844,425 | | | Brookfield Corp., Cl A2 | | | 25,342,127 | | | | 35,077,415 | |
| | | | | | | | | | | | |
| | Total Financials | | | 101,292,990 | | | | 132,129,273 | |
| | | | | | | | | | | | |
|
| Industrials (2.22%) | |
| | | | Building Products (0.64%) | | | | | | | | |
| | 104,586 | | | Fortune Brands Innovations, Inc. | | | 5,348,225 | | | | 6,791,815 | |
| | 341,848 | | | Janus International Group, Inc.1 | | | 3,919,627 | | | | 4,317,540 | |
| | | | | | | | | | | | |
| | | | 9,267,852 | | | | 11,109,355 | |
| | | |
| | | | Trading Companies & Distributors (1.58%) | | | | | | | | |
| | 228,585 | | | SiteOne Landscape Supply, Inc.1 | | | 26,725,148 | | | | 27,752,505 | |
| | | | | | | | | | | | |
| | Total Industrials | | | 35,993,000 | | | | 38,861,860 | |
| | | | | | | | | | | | |
|
| Information Technology (1.10%) | |
| | | | Internet Services & Infrastructure (1.10%) | | | | | | | | |
| | 2,073,006 | | | GDS Holdings Ltd., ADR1,2 | | | 17,427,297 | | | | 19,258,226 | |
| | | | | | | | | | | | |
|
| Materials (6.60%) | |
| | | | Construction Materials (5.16%) | | | | | | | | |
| | 67,901 | | | Martin Marietta Materials, Inc. | | | 40,551,188 | | | | 36,788,762 | |
| | 216,345 | | | Vulcan Materials Co. | | | 47,723,371 | | | | 53,800,674 | |
| | | | | | | | | | | | |
| | | | 88,274,559 | | | | 90,589,436 | |
| | | | Forest Products (1.44%) | | | | | | | | |
| | 306,302 | | | Louisiana-Pacific Corp. | | | 26,888,185 | | | | 25,217,844 | |
| | | | | | | | | | | | |
| | Total Materials | | | 115,162,744 | | | | 115,807,280 | |
| | | | | | | | | | | | |
| | | | | | | | | | | | |
| Shares | | | | | Cost | | | Value | |
| Common Stocks (continued) | |
| Real Estate (40.02%) | |
| | | | Data Center REITs (8.99%) | | | | | | | | |
| | 462,254 | | | Digital Realty Trust, Inc. | | $ | 55,122,179 | | | $ | 70,285,721 | |
| | 115,535 | | | Equinix, Inc. | | | 69,706,817 | | | | 87,413,781 | |
| | | | | | | | | | | | |
| | | | 124,828,996 | | | | 157,699,502 | |
| | | |
| | | | Health Care REITs (3.61%) | | | | | | | | |
| | 606,600 | | | Welltower, Inc. | | | 48,560,605 | | | | 63,238,050 | |
| | | |
| | | | Industrial REITs (3.57%) | | | | | | | | |
| | 409,500 | | | Prologis, Inc. | | | 36,004,363 | | | | 45,990,945 | |
| | 371,909 | | | Rexford Industrial Realty, Inc. | | | 16,654,826 | | | | 16,583,422 | |
| | | | | | | | | | | | |
| | | | 52,659,189 | | | | 62,574,367 | |
| | | | Multi-Family Residential REITs (7.24%) | | | | | | | | |
| | 253,115 | | | AvalonBay Communities, Inc. | | | 49,346,843 | | | | 52,366,962 | |
| | 1,074,717 | | �� | Equity Residential | | | 66,257,858 | | | | 74,520,877 | |
| | | | | | | | | | | | |
| | | | 115,604,701 | | | | 126,887,839 | |
| | | | Real Estate Services (9.09%) | | | | | | | | |
| | 550,650 | | | CBRE Group, Inc., Cl A1 | | | 39,942,281 | | | | 49,068,421 | |
| | 821,313 | | | CoStar Group, Inc.1 | | | 44,411,937 | | | | 60,892,146 | |
| | 241,092 | | | Jones Lang LaSalle, Inc.1 | | | 35,516,583 | | | | 49,491,366 | |
| | | | | | | | | | | | |
| | | | | | | 119,870,801 | | | | 159,451,933 | |
| | | |
| | | | Single-Family Residential REITs (2.73%) | | | | | | | | |
| | 1,334,043 | | | Invitation Homes, Inc. | | | 41,532,463 | | | | 47,878,803 | |
| | | |
| | | | Telecom Tower REITs (4.79%) | | | | | | | | |
| | 432,151 | | | American Tower Corp. | | | 73,290,286 | | | | 84,001,512 | |
| | | | | | | | | | | | |
| | Total Real Estate | | | 576,347,041 | | | | 701,732,006 | |
| | | | | | | | | | | | |
| | Total Common Stocks | | | 1,270,169,046 | | | | 1,648,101,242 | |
| | | | | | | | | | | | |
| | | | | | | | | | | | |
| | | |
| Principal Amount | | | | | | |
| Short-Term Investments (5.77%) | |
| | $101,095,122 | | | Repurchase Agreement with Fixed Income Clearing Corp., dated 6/28/2024, 4.85% due 7/1/2024; Proceeds at maturity $101,135,982; (Fully Collateralized by $102,211,200 U.S. Treasury Floating Rate Note, 5.385% due 4/30/2026 Market value - $103,1171,175)3 | | | 101,095,122 | | | | 101,095,122 | |
| | | | | | | | | | | | |
| | Total Investments (99.77%) | | $ | 1,371,264,168 | | | | 1,749,196,364 | |
| | | | | | | | | | | | |
| | Cash and Other Assets Less Liabilities (0.23%) | | | | 4,017,637 | |
| | | | | | | | | | | | |
| | Net Assets | | | $ | 1,753,214,001 | |
| | | | | | | | | | | | |
| % | Represents percentage of net assets. |
| 1 | Non-income producing securities. |
| 3 | Level 2 security. See Note 7 regarding Fair Value Measurements. |
| ADR | American Depositary Receipt. |
All securities are Level 1, unless otherwise noted.
| | |
| 8 | | See Notes to Financial Statements. |
| | |
| June 30, 2024 | | Baron Emerging Markets Fund |
PORTFOLIO OF INVESTMENTS (Unaudited)
| | | | | | | | | | | | |
| Shares | | | | | Cost | | | Value | |
| Common Stocks (93.48%) | |
| Brazil (6.00%) | |
| | 1,372,134 | | | Afya Ltd., Cl A1 | | $ | 30,227,140 | | | $ | 24,218,165 | |
| | 3,038,889 | | | Banco BTG Pactual SA | | | 21,902,963 | | | | 16,803,288 | |
| | 2,803,487 | | | Inter & Co., Inc. BDR | | | 12,547,581 | | | | 17,101,466 | |
| | 5,005,405 | | | Localiza Rent a Car SA | | | 36,709,479 | | | | 37,607,021 | |
| | 3,927,130 | | | NU Holdings Ltd., Cl A1 | | | 30,813,723 | | | | 50,620,706 | |
| | 5,282,356 | | | Suzano SA | | | 45,073,550 | | | | 53,871,508 | |
| | 2,107,872 | | | WEG SA | | | 16,294,878 | | | | 15,908,682 | |
| | 1,506,809 | | | XP, Inc., Cl A | | | 21,125,715 | | | | 26,504,770 | |
| | | | | | | | | | | | |
| | Total Brazil | | | 214,695,029 | | | | 242,635,606 | |
| | | | | | | | | | | | |
|
| China (21.29%) | |
| | 1,034,018 | | | Alibaba Group Holding Limited, ADR | | | 85,732,783 | | | | 74,449,296 | |
| | 304,229 | | | Baidu, Inc., ADR1 | | | 33,308,544 | | | | 26,309,724 | |
| | 15,703,709 | | | China Mengniu Dairy Co. Ltd.3 | | | 30,434,518 | | | | 28,103,591 | |
| | 5,776,793 | | | Estun Automation Co. Ltd., Cl A3 | | | 16,687,494 | | | | 11,271,153 | |
| | 7,673,442 | | | Full Truck Alliance Co. Ltd., ADR | | | 56,493,339 | | | | 61,694,474 | |
| | 4,781,584 | | | Fuyao Glass Industry
Group Co. Ltd., Cl A | | | 28,589,700 | | | | 31,521,648 | |
| | 4,549,280 | | | Galaxy Entertainment Group Ltd.1,3 | | | 28,705,269 | | | | 21,172,013 | |
| | 2,982,175 | | | Jiangsu Hengli
Hydraulic Co. Ltd., Cl A3 | | | 23,454,566 | | | | 19,106,262 | |
| | 1,543,239 | | | Kanzhun Ltd., ADR1 | | | 25,557,307 | | | | 29,028,326 | |
| | 37,998,706 | | | Kingdee International Software Group Co. Ltd.1,3 | | | 29,730,382 | | | | 35,532,548 | |
| | 5,782,016 | | | Kingsoft Corp. Ltd.3 | | | 19,314,261 | | | | 16,654,341 | |
| | 158,010 | | | Kweichow Moutai Co. Ltd., Cl A3 | | | 38,900,140 | | | | 31,836,172 | |
| | 1,824,353 | | | Midea Group Co., Ltd., Cl A3 | | | 9,545,120 | | | | 16,174,259 | |
| | 12,227,746 | | | NARI Technology Co. Ltd., Cl A3 | | | 38,335,679 | | | | 41,914,762 | |
| | 538,453 | | | PDD Holdings, Inc., ADR1 | | | 61,620,211 | | | | 71,587,326 | |
| | 781,835 | | | Shenzhen Mindray Bio-Medical Electronics Co. Ltd., Cl A3 | | | 24,826,406 | | | | 31,279,887 | |
| | 4,726,108 | | | Shenzhou International Group Holdings Ltd.3 | | | 25,469,110 | | | | 46,166,444 | |
| | 3,364,917 | | | Tencent Holdings Limited3 | | | 79,451,156 | | | | 159,632,766 | |
| | 673,790 | | | Tencent Holdings Limited, ADR | | | 29,233,737 | | | | 31,910,694 | |
| | 2,137,552 | | | Tencent Music Entertainment Group, ADR | | | 19,763,576 | | | | 30,032,606 | |
| | 371,953 | | | Yum China Holdings, Inc. | | | 17,680,409 | | | | 11,471,031 | |
| | 372,554 | | | Yum China Holdings, Inc., (Hong Kong)3 | | | 19,472,042 | | | | 11,513,286 | |
| | 1,331,073 | | | Zai Lab Limited, ADR1 | | | 27,092,949 | | | | 23,067,495 | |
| | | | | | | | | | | | |
| | Total China | | | 769,398,698 | | | | 861,430,104 | |
| | | | | | | | | | | | |
|
| Hong Kong (1.37%) | |
| | 16,745,799 | | | Budweiser Brewing Co.
APAC Ltd., 144A3 | | | 44,846,962 | | | | 19,709,467 | |
| | 3,133,152 | | | Techtronic Industries Co. Ltd.3 | | | 13,307,733 | | | | 35,717,589 | |
| | | | | | | | | | | | |
| | Total Hong Kong | | | 58,154,695 | | | | 55,427,056 | |
| | | | | | | | | | | | |
|
| India (27.96%) | |
| | 2,945,042 | | | Aarti Industries Ltd.3 | | | 29,560,301 | | | | 24,199,706 | |
| | 590,222 | | | Bajaj Finance Limited3 | | | 17,093,819 | | | | 50,300,502 | |
| | 4,949,284 | | | Bharti Airtel Ltd.3 | | | 35,436,168 | | | | 85,629,686 | |
| | 1,775,711 | | | Bharti Airtel Ltd. PP3 | | | 7,858,257 | | | | 22,169,502 | |
| | 456,062 | | | Cholamandalam Investment & Finance Co. Ltd.3 | | | 6,884,936 | | | | 7,771,470 | |
| | 388,513 | | | Cummins India Ltd.3 | | | 17,535,321 | | | | 18,448,367 | |
| | 6,897,973 | | | Edelweiss Financial Services Ltd.3 | | | 2,890,958 | | | | 5,378,318 | |
| | 3,375,496 | | | Godrej Consumer Products Ltd.3 | | | 39,206,879 | | | | 55,597,674 | |
| | 1,215,325 | | | Godrej Properties Ltd.1,3 | | | 22,669,006 | | | | 46,642,217 | |
| | 1,387,564 | | | HDFC Bank Ltd.3 | | | 19,632,124 | | | | 28,020,733 | |
| | 23,106,306 | | | Indus Towers Ltd.1,3 | | | 74,938,116 | | | | 103,883,834 | |
| | | | | | | | | | | | |
| Shares | | | | | Cost | | | Value | |
| Common Stocks (continued) | |
| India (continued) | |
| | 718,490 | | | InterGlobe Aviation Ltd., 144A1,3 | | $ | 27,764,110 | | | $ | 36,410,580 | |
| | 9,721,619 | | | Jio Financial Services Ltd.1,3 | | | 23,812,120 | | | | 41,641,279 | |
| | 28,296,628 | | | JM Financial Limited3 | | | 33,035,571 | | | | 29,594,294 | |
| | 651,181 | | | Kaynes Technology India Ltd.1,3 | | | 21,960,299 | | | | 30,065,030 | |
| | 1,416,777 | | | Mahindra & Mahindra Ltd.3 | | | 26,476,681 | | | | 48,634,516 | |
| | 2,679,882 | | | Max Healthcare Institute Ltd.3 | | | 19,684,624 | | | | 30,181,742 | |
| | 6,176,665 | | | Nippon Life India Asset Management Ltd., 144A3 | | | 19,784,174 | | | | 47,679,599 | |
| | 329,243 | | | Nuvama Wealth Management Ltd.1,3 | | | 13,608,791 | | | | 19,498,852 | |
| | 13,360,216 | | | Power Grid Corp. of India Ltd.3 | | | 51,285,598 | | | | 52,910,506 | |
| | 2,300,764 | | | Reliance Industries Limited3 | | | 38,488,294 | | | | 86,247,878 | |
| | 2,822,131 | | | SBI Life Insurance Company Limited, 144A3 | | | 29,078,705 | | | | 50,451,465 | |
| | 613,520 | | | SRF Ltd.3 | | | 19,300,379 | | | | 17,896,304 | |
| | 2,095,149 | | | Tata Communications Ltd.3 | | | 11,404,086 | | | | 46,525,410 | |
| | 132,111 | | | Tata Consultancy Services Ltd.3 | | | 5,529,596 | | | | 6,171,331 | |
| | 2,909,204 | | | Tata Consumer Products Ltd.3 | | | 12,616,226 | | | | 38,218,513 | |
| | 728,086 | | | Titan Co. Ltd.3 | | | 10,074,586 | | | | 29,671,298 | |
| | 1,085,812 | | | Trent Ltd.3 | | | 24,688,771 | | | | 71,250,413 | |
| | | | | | | | | | | | |
| | Total India | | | 662,298,496 | | | | 1,131,091,019 | |
| | | | | | | | | | | | |
|
| Indonesia (1.20%) | |
| | 172,559,871 | | | Bank Rakyat Indonesia (Persero) Tbk PT3 | | | 50,375,373 | | | | 48,385,156 | |
| | | | | | | | | | | | |
|
| Japan (0.48%) | |
| | 44,667 | | | Keyence Corporation3 | | | 15,054,968 | | | | 19,549,760 | |
| | | | | | | | | | | | |
|
| Korea, Republic of (13.16%) | |
| | 3,234,423 | | | Coupang, Inc., Cl A1 | | | 42,334,156 | | | | 67,761,162 | |
| | 365,012 | | | HD Hyundai Heavy
Industries Co. Ltd.1,3 | | | 19,127,266 | | | | 41,173,720 | |
| | 831,450 | | | HD Korea Shipbuilding & Offshore Engineering Co. Ltd.1,3 | | | 75,937,198 | | | | 95,710,690 | |
| | 638,586 | | | KB Financial Group, Inc.3 | | | 31,316,152 | | | | 36,322,859 | |
| | 679,078 | | | Korea Aerospace Industries Ltd.3 | | | 21,987,367 | | | | 26,066,183 | |
| | 51,001 | | | Park Systems Corp.3 | | | 6,765,928 | | | | 6,883,008 | |
| | 3,074,881 | | | Samsung Electronics Co., Ltd.3 | | | 90,346,577 | | | | 180,968,357 | |
| | 67,594 | | | Samsung SDI Co. Ltd.3 | | | 27,302,113 | | | | 17,260,170 | |
| | 355,039 | | | SK Hynix, Inc.3 | | | 31,152,694 | | | | 60,253,155 | |
| | | | | | | | | | | | |
| | Total Korea, Republic of | | | 346,269,451 | | | | 532,399,304 | |
| | | | | | | | | | | | |
|
| Mexico (2.05%) | |
| | 7,824,674 | | | Grupo Mexico
S.A.B. de C.V., Series B | | | 19,241,215 | | | | 42,217,741 | |
| | 11,928,728 | | | Wal-Mart de Mexico,
S.A.B de C.V. | | | 26,967,988 | | | | 40,744,805 | |
| | | | | | | | | | | | |
| | Total Mexico | | | 46,209,203 | | | | 82,962,546 | |
| | | | | | | | | | | | |
|
| Peru (1.14%) | |
| | 285,156 | | | Credicorp, Ltd. | | | 34,909,454 | | | | 46,004,217 | |
| | | | | | | | | | | | |
|
| Philippines (1.53%) | |
| | 50,914,865 | | | Ayala Land, Inc.3 | | | 35,220,934 | | | | 24,715,986 | |
| | 16,998,871 | | | BDO Unibank, Inc. | | | 28,718,088 | | | | 37,182,946 | |
| | | | | | | | | | | | |
| | Total Philippines | | | 63,939,022 | | | | 61,898,932 | |
| | | | | | | | | | | | |
|
| Poland (2.78%) | |
| | 301,284 | | | Dino Polska SA, 144A1,3 | | | 27,289,075 | | | | 30,360,471 | |
| | 4,677,590 | | | InPost SA1,3 | | | 59,125,487 | | | | 82,304,769 | |
| | | | | | | | | | | | |
| | Total Poland | | | 86,414,562 | | | | 112,665,240 | |
| | | | | | | | | | | | |
| | |
| See Notes to Financial Statements. | | 9 |
| | |
| Baron Emerging Markets Fund | | June 30, 2024 |
PORTFOLIO OF INVESTMENTS (Unaudited) (Continued)
| | | | | | | | | | | | |
| Shares | | | | | Cost | | | Value | |
| Common Stocks (continued) | |
| Russia (0.00%)^ | |
| | 17,949,100 | | | Sberbank of Russia PJSC1,2,4 | | $ | 64,430,586 | | | $ | 12,120 | |
| | | | | | | | | | | | |
|
| South Africa (1.34%) | |
| | 687,962 | | | Gold Fields Ltd.3 | | | 7,491,069 | | | | 10,279,873 | |
| | 1,506,276 | | | Gold Fields Ltd., ADR | | | 14,509,219 | | | | 22,443,512 | |
| | 109,437 | | | Naspers Ltd., Cl N | | | 15,541,356 | | | | 21,457,141 | |
| | | | | | | | | | | | |
| | Total South Africa | | | 37,541,644 | | | | 54,180,526 | |
| | | | | | | | | | | | |
|
| Spain (0.44%) | |
| | 1,791,760 | | | Codere Online Luxembourg, S.A. Forward Shares1 | | | 17,917,600 | | | | 14,602,844 | |
| | 358,352 | | | Codere Online Luxembourg, S.A. Founders Shares1 | | | 3,116 | | | | 2,920,569 | |
| | 26,518 | | | Codere Online Luxembourg, S.A. Private Shares, Cl A1 | | | 265,181 | | | | 216,122 | |
| | | | | | | | | | | | |
| | Total Spain | | | 18,185,897 | | | | 17,739,535 | |
| | | | | | | | | | | | |
|
| Taiwan (12.74%) | |
| | 214,913 | | | ASPEED Technology, Inc.3 | | | 24,895,118 | | | | 31,891,104 | |
| | 5,337,586 | | | Delta Electronics, Inc.3 | | | 20,273,848 | | | | 63,664,038 | |
| | 331,621 | | | eMemory Technology, Inc.3 | | | 27,655,178 | | | | 26,049,576 | |
| | 10,304,528 | | | Taiwan Semiconductor Manufacturing Co., Ltd.3 | | | 189,936,875 | | | | 305,298,567 | |
| | 508,781 | | | Taiwan Semiconductor Manufacturing Co., Ltd., ADR | | | 12,809,121 | | | | 88,431,225 | |
| | | | | | | | | | | | |
| | Total Taiwan | | | 275,570,140 | | | | 515,334,510 | |
| | | | | | | | | | | | |
| | Total Common Stocks | | | 2,743,447,218 | | | | 3,781,715,631 | |
| | | | | | | | | |
| | | | | | | | | | | | |
| Private Common Stocks (1.00%) | |
| India (1.00%) | |
| | 27,027 | | | Pine Labs PTE. Ltd., Series 11,2,4 | | | 10,077,362 | | | | 10,160,801 | |
| | 6,833 | | | Pine Labs PTE. Ltd., Series A1,2,4 | | | 2,547,771 | | | | 2,568,866 | |
| | 7,600 | | | Pine Labs PTE. Ltd., Series B1,2,4 | | | 2,833,757 | | | | 2,857,220 | |
| | 6,174 | | | Pine Labs PTE. Ltd., Series B21,2,4 | | | 2,302,055 | | | | 2,321,115 | |
| | 9,573 | | | Pine Labs PTE. Ltd., Series C1,2,4 | | | 3,569,416 | | | | 3,598,969 | |
| | 1,932 | | | Pine Labs PTE. Ltd., Series C11,2,4 | | | 720,371 | | | | 726,336 | |
| | 2,459 | | | Pine Labs PTE. Ltd., Series D1,2,4 | | | 916,870 | | | | 924,461 | |
| | 45,680 | | | Pine Labs PTE. Ltd., Series J1,2,4 | | | 17,032,398 | | | | 17,173,396 | |
| | | | | | | | | | | | |
| | Total Private Common Stocks | | | 40,000,000 | | | | 40,331,164 | |
| | | | | | | | | |
| | | | | | | | | | | | |
| Private Convertible Preferred Stocks (2.55%) | |
| India (2.55%) | |
| | 11,578 | | | Bundl Technologies Private Ltd., Series K1,2,4 | | | 76,776,872 | | | | 103,193,835 | |
| | 15,334 | | | Think & Learn Private Limited, Series F1,2,4 | | | 49,776,072 | | | | 75,499 | |
| | | | | | | | | | | | |
| | Total Private Convertible Preferred Stocks | | | 126,552,944 | | | | 103,269,334 | |
| | | | | | | | | | | | |
| | | | | | | | | | | | |
| Rights (0.00%)^ | |
| Brazil (0.00%)^ | |
| | 50,575 | | | Localiza Rent a Car SA exercise price BRL 33.481 | | | 0 | | | | 81,425 | |
| | | | | | | | | | | | |
| | | | | | | | | | | | |
| | | | | | | | | | | | |
| Shares | | | | | Cost | | | Value | |
| Warrants (0.00%)^ | |
| Spain (0.00%)^ | |
| | 13,259 | | | Codere Online Luxembourg S.A. Private Shares Exp. 11/30/2026 exercise price USD 11.501 | | $ | 0 | | | $ | 13,657 | |
| | | | | | | | | | | | |
| | | | | | | | | | | | |
| | | |
| Principal Amount | | | | | | |
| Short-Term Investments (4.12%) | |
| | $166,846,413 | | | Repurchase Agreement with Fixed Income Clearing Corp., dated 6/28/2024, 4.85% due 7/1/2024; Proceeds at maturity $166,913,847; (Fully Collateralized by $168,688,300 U.S. Treasury Floating Rate Note, 5.385% due 4/30/2026 Market value - $170,183,435)3 | | | 166,846,413 | | | | 166,846,413 | |
| | | | | | | | | | | | |
| | Total Investments (101.15%) | | $ | 3,076,846,575 | | | | 4,092,257,624 | |
| | | | | | | | | | | | |
| | Liabilities Less Cash and Other Assets (-1.15%) | | | | (46,538,366 | ) |
| | | | | | | | | | | | |
| | Net Assets | | | $ | 4,045,719,258 | |
| | | | | | | | | | | | |
| % | Represents percentage of net assets. |
| 1 | Non-income producing securities. |
| 2 | At June 30, 2024, the market value of restricted securities amounted to $143,612,618 or 3.55% of net assets. See Note 6 regarding Restricted Securities. |
| 3 | Level 2 security. See Note 7 regarding Fair Value Measurements. |
| 4 | Level 3 security. See Note 7 regarding Fair Value Measurements. |
| ^ | Rounds to less than 0.01%. |
| ADR | American Depositary Receipt. |
| 144A | Security is exempt from registration pursuant to Rule 144A under the Securities Act of 1933. This security may be resold in transactions that are exempt from registration, normally to qualified institutional buyers. At June 30, 2024, the market value of Rule 144A securities amounted to $184,611,582 or 4.56% of net assets. |
All securities are Level 1, unless otherwise noted.
| | | | |
Summary of Investments by Sector
as of June 30, 2024 | | Percentage of
Net Assets | |
| |
Information Technology | | | 21.6 | % |
| |
Consumer Discretionary | | | 16.5 | % |
| |
Financials | | | 14.8 | % |
| |
Communication Services | | | 13.6 | % |
| |
Industrials | | | 12.9 | % |
| |
Consumer Staples | | | 6.0 | % |
| |
Materials | | | 4.2 | % |
| |
Energy | | | 2.1 | % |
| |
Health Care | | | 2.1 | % |
| |
Real Estate | | | 1.8 | % |
| |
Utilities | | | 1.3 | % |
| |
Cash and Cash Equivalents* | | | 3.0 | % |
| | | | 100.0 | %** |
| * | Includes short-term investments, other assets and liabilities-net. |
| ** | Individual weights may not sum to 100% due to rounding. |
| | |
| 10 | | See Notes to Financial Statements. |
| | |
| June 30, 2024 | | Baron Global Advantage Fund |
PORTFOLIO OF INVESTMENTS (Unaudited)
| | | | | | | | | | | | |
| Shares | | | | | Cost | | | Value | |
| Common Stocks (93.21%) | |
| Argentina (10.99%) | |
| | 66,177 | | | Globant S.A.1 | | $ | 4,447,351 | | | $ | 11,796,712 | |
| | 32,985 | | | MercadoLibre, Inc.1 | | | 17,817,450 | | | | 54,207,549 | |
| | | | | | | | | | | | |
| | Total Argentina | | | 22,264,801 | | | | 66,004,261 | |
| | | | | | | | | | | | |
|
| Brazil (1.76%) | |
| | 598,218 | | | Afya Ltd., Cl A1 | | | 11,070,880 | | | | 10,558,548 | |
| | | | | | | | | | | | |
|
| Canada (7.03%) | |
| | 639,201 | | | Shopify, Inc., Cl A1 | | | 23,857,688 | | | | 42,219,226 | |
| | | | | | | | | | | | |
|
| India (6.22%) | |
| | 252,006 | | | Bajaj Finance Limited3 | | | 14,454,904 | | | | 21,476,712 | |
| | 6,607,712 | | | Zomato Ltd.1,3 | | | 10,977,766 | | | | 15,856,983 | |
| | | | | | | | | | | | |
| | Total India | | | 25,432,670 | | | | 37,333,695 | |
| | | | | | | | | | | | |
|
| Israel (4.57%) | |
| | 331,500 | | | Fiverr International Ltd.1 | | | 7,554,652 | | | | 7,767,045 | |
| | 123,787 | | | Wix.com Ltd.1 | | | 10,402,730 | | | | 19,690,798 | |
| | | | | | | | | | | | |
| | Total Israel | | | 17,957,382 | | | | 27,457,843 | |
| | | | | | | | | | | | |
|
| Korea, Republic of (6.20%) | |
| | 1,777,248 | | | Coupang, Inc., Cl A1 | | | 34,853,426 | | | | 37,233,346 | |
| | | | | | | | | | | | |
|
| Netherlands (9.74%) | |
| | 8,934 | | | Adyen N.V., 144A1,3 | | | 6,863,044 | | | | 10,610,694 | |
| | 54,933 | | | argenx SE, ADR1 | | | 3,628,348 | | | | 23,623,387 | |
| | 23,795 | | | ASML Holding N.V.3 | | | 4,438,507 | | | | 24,251,052 | |
| | | | | | | | | | | | |
| | Total Netherlands | | | 14,929,899 | | | | 58,485,133 | |
| | | | | | | | | | | | |
|
| Poland (2.37%) | |
| | 809,144 | | | InPost SA1,3 | | | 9,080,670 | | | | 14,237,334 | |
| | | | | | | | | | | | |
|
| Spain (1.64%) | |
| | 827,902 | | | Codere Online Luxembourg S.A.1 | | | 7,576,156 | | | | 6,747,401 | |
| | 271,380 | | | Codere Online Luxembourg, S.A. Forward Shares1 | | | 2,713,800 | | | | 2,211,747 | |
| | 104,612 | | | Codere Online Luxembourg, S.A. Founders Shares1 | | | 910 | | | | 852,588 | |
| | | | | | | | | | | | |
| | Total Spain | | | 10,290,866 | | | | 9,811,736 | |
| | | | | | | | | | | | |
|
| United Kingdom (2.74%) | |
| | 562,450 | | | Endava plc, ADR1 | | | 22,183,544 | | | | 16,446,038 | |
| | | | | | | | | | | | |
| | | | | | | | | | | | |
| Shares | | | | | Cost | | | Value | |
| Common Stocks (continued) | |
| United States (39.95%) | |
| | 139,157 | | | Bill.Com Holdings, Inc.1 | | $ | 5,551,115 | | | $ | 7,322,441 | |
| | 180,421 | | | Block, Inc.1 | | | 14,648,530 | | | | 11,635,350 | |
| | 356,991 | | | Cloudflare, Inc., Cl A1 | | | 8,167,699 | | | | 29,569,565 | |
| | 84,873 | | | Crowdstrike Holdings, Inc., Cl A1 | | | 4,718,385 | | | | 32,522,485 | |
| | 177,426 | | | Datadog, Inc., Cl A1 | | | 8,157,291 | | | | 23,010,378 | |
| | 154 | | | GRAIL, Inc.1 | | | 7,341 | | | | 2,367 | |
| | 928 | | | Illumina, Inc.1 | | | 252,159 | | | | 96,865 | |
| | 716,102 | | | indie Semiconductor, Inc., Cl A1 | | | 4,606,701 | | | | 4,418,349 | |
| | 465,089 | | | NVIDIA Corp. | | | 8,841,626 | | | | 57,457,095 | |
| | 634,936 | | | Rivian Automotive, Inc., Cl A1 | | | 13,602,870 | | | | 8,520,841 | |
| | 166,462 | | | Snowflake, Inc., Cl A1 | | | 21,519,122 | | | | 22,487,352 | |
| | 85,442 | | | Tempus AI, Inc.1 | | | 3,161,354 | | | | 2,990,470 | |
| | 101,367 | | | Tesla, Inc.1 | | | 27,919,942 | | | | 20,058,502 | |
| | 91,425 | | | Viking Therapeutics, Inc.1 | | | 7,113,884 | | | | 4,846,439 | |
| | 77,494 | | | Zscaler, Inc.1 | | | 3,707,666 | | | | 14,893,571 | |
| | | | | | | | | | | | |
| | Total United States | | | 131,975,685 | | | | 239,832,070 | |
| | | | | | | | | | | | |
| | Total Common Stocks | | | 323,897,511 | | | | 559,619,230 | |
| | | | | | | | | | | | |
| | | | | | | | | | | | |
| Private Common Stocks (6.20%) | |
| United States (6.20%) | |
| | 299,761 | | | Farmers Business Network, Inc.1,2,4 | | | 12,250,006 | | | | 557,556 | |
| | 252,130 | | | Space Exploration
Technologies Corp., Cl A1,2,4 | | | 11,571,518 | | | | 28,238,560 | |
| | 75,250 | | | Space Exploration
Technologies Corp., Cl C1,2,4 | | | 3,428,124 | | | | 8,428,000 | |
| | | | | | | | | | | | |
| | Total Private Common Stocks | | | 27,249,648 | | | | 37,224,116 | |
| | | | | | | | | | | | |
| | | | | | | | | | | | |
| Private Convertible Preferred Stocks (0.01%) | |
| India (0.01%) | |
| | 9,201 | | | Think & Learn Private Limited, Series F1,2,4 | | | 29,867,591 | | | | 45,302 | |
| | | | | | | | | | | | |
| | | | | | | | | | | | |
| Private Preferred Stocks (0.47%) | |
| United States (0.47%) | |
| | 461,004 | | | GM Cruise Holdings LLC, Cl G1,2,4 | | | 12,147,455 | | | | 2,798,294 | |
| | | | | | | | | | | | |
| | | | | | | | | | | | |
| Warrants (0.09%) | |
| Israel (0.01%) | |
| | 68,986 | | | Innovid Corp., Exp. 12/31/2027 exercise price USD 11.501 | | | 117,942 | | | | 4,484 | |
| | 228,748 | | | Taboola.com Ltd., Exp. 6/29/2026 exercise price USD 11.501 | | | 417,100 | | | | 36,600 | |
| | | | | | | | | | | | |
| | Total Israel | | | 535,042 | | | | 41,084 | |
| | | | | | | | | | | | |
|
| Spain (0.08%) | |
| | 502,360 | | | Codere Online Luxembourg S.A. Private Shares, Exp. 11/30/2026 exercise price USD 11.501 | | | 845,632 | | | | 517,431 | |
| | | | | | | | | | | | |
| | Total Warrants | | | 1,380,674 | | | | 558,515 | |
| | | | | | | | | | | | |
| | | | | | | | | | | | |
| | |
| See Notes to Financial Statements. | | 11 |
| | |
| Baron Global Advantage Fund | | June 30, 2024 |
PORTFOLIO OF INVESTMENTS (Unaudited) (Continued)
| | | | | | | | | | | | |
| Principal Amount | | Cost | | | Value | |
| Short-Term Investments (0.11%) | |
| | $684,891 | | | Repurchase Agreement with Fixed Income Clearing Corp., dated 6/28/2024, 4.85% due 7/1/2024; Proceeds at maturity $685,168; (Fully Collateralized by $692,500 U.S. Treasury Floating Rate Note, 5.385% due 4/30/2026 Market value - $698,686)3 | | $ | 684,891 | | | $ | 684,891 | |
| | | | | | | | | | | | |
| | Total Investments (100.09%) | | $ | 395,227,770 | | | | 600,930,348 | |
| | | | | | | | | | | | |
| | Liabilities Less Cash and Other Assets (-0.09%) | | | | (554,792 | ) |
| | | | | | | | | | | | |
| | Net Assets | | | $ | 600,375,556 | |
| | | | | | | | | | | | |
| % | Represents percentage of net assets. |
| 1 | Non-income producing securities. |
| 2 | At June 30, 2024, the market value of restricted securities amounted to $40,067,712 or 6.67% of net assets. See Note 6 regarding Restricted Securities. |
| 3 | Level 2 security. See Note 7 regarding Fair Value Measurements. |
| 4 | Level 3 security. See Note 7 regarding Fair Value Measurements. |
| ADR | American Depositary Receipt. |
| 144A | Security is exempt from registration pursuant to Rule 144A under the Securities Act of 1933. This security may be resold in transactions that are exempt from registration, normally to qualified institutional buyers. At June 30, 2024, the market value of Rule 144A securities amounted to $10,610,694 or 1.77% of net assets. |
| | All securities are Level 1, unless otherwise noted. |
| | | | |
Summary of Investments by Sector
as of June 30, 2024 | | Percentage of
Net Assets | |
| |
Information Technology | | | 51.0 | % |
| |
Consumer Discretionary | | | 26.1 | % |
| |
Industrials | | | 10.2 | % |
| |
Financials | | | 7.3 | % |
| |
Health Care | | | 5.3 | % |
| |
Materials | | | 0.1 | % |
| |
Communication Services | | | 0.0 | %^ |
| |
Cash and Cash Equivalents* | | | 0.0 | %^ |
| | | | 100.0 | %** |
| ^ | Rounds to less than 0.1%. |
| * | Includes short-term investments, other assets and liabilities-net. |
| ** | Individual weights may not sum to 100% due to rounding. |
| | |
| 12 | | See Notes to Financial Statements. |
| | |
| June 30, 2024 | | Baron Real Estate Income Fund |
PORTFOLIO OF INVESTMENTS (Unaudited)
| | | | | | | | | | | | |
| Shares | | | | | Cost | | | Value | |
| Common Stocks (97.34%) | |
| Consumer Discretionary (8.37%) | |
| | | | Casinos and Gaming (1.98%) | |
| | 32,270 | | | Wynn Resorts Ltd. | | $ | 2,933,543 | | | $ | 2,888,165 | |
| |
| | | | Home Improvement Retail (0.88%) | |
| | 5,820 | | | Lowe’s Companies, Inc. | | | 1,304,813 | | | | 1,283,077 | |
| |
| | | | Homebuilding (4.08%) | |
| | 14,025 | | | Lennar Corp., Cl A | | | 2,080,438 | | | | 2,101,927 | |
| | 26,395 | | | Toll Brothers, Inc. | | | 1,690,914 | | | | 3,040,176 | |
| | 21,570 | | | Tri Pointe Homes, Inc.1 | | | 751,077 | | | | 803,482 | |
| | | | | | | | | | | | |
| | | | 4,522,429 | | | | 5,945,585 | |
| | | |
| | | | Hotels, Resorts & Cruise Lines (1.43%) | | | | | | | | |
| | 9,538 | | | Hilton Worldwide Holdings, Inc. | | | 1,858,821 | | | | 2,081,192 | |
| | | | | | | | | | | | |
| | Total Consumer Discretionary | | | 10,619,606 | | | | 12,198,019 | |
| | | | | | | | | | | | |
|
| Financials (3.37%) | |
| | | | Asset Management & Custody Banks (3.37%) | | | | | | | | |
| | 15,085 | | | Blackstone, Inc. | | | 1,864,586 | | | | 1,867,523 | |
| | 26,661 | | | Brookfield Corp., Cl A2 | | | 826,572 | | | | 1,107,498 | |
| | 51,061 | | | Brookfield Asset Management Ltd., Cl A2 | | | 1,653,067 | | | | 1,942,871 | |
| | | | | | | | | | | | |
| | Total Financials | | | 4,344,225 | | | | 4,917,892 | |
| | | | | | | | | | | | |
|
| Information Technology (2.16%) | |
| | | | Internet Services & Infrastructure (2.16%) | | | | | | | | |
| | 339,205 | | | GDS Holdings Ltd., ADR1,2 | | | 2,377,738 | | | | 3,151,215 | |
| | | | | | | | | | | | |
|
| Real Estate (82.60%) | |
| | | | Data Center REITs (11.94%) | |
| | 56,213 | | | Digital Realty Trust, Inc. | | | 6,312,080 | | | | 8,547,186 | |
| | 11,713 | | | Equinix, Inc. | | | 8,272,523 | | | | 8,862,056 | |
| | | | | | | | | | | | |
| | | | 14,584,603 | | | | 17,409,242 | |
| |
| | | | Health Care REITs (13.75%) | |
| | 216,085 | | | Healthpeak Properties, Inc. | | | 3,973,286 | | | | 4,235,266 | |
| | 58,600 | | | Ventas, Inc. | | | 2,749,730 | | | | 3,003,836 | |
| | 122,840 | | | Welltower, Inc. | | | 9,371,138 | | | | 12,806,070 | |
| | | | | | | | | | | | |
| | | | 16,094,154 | | | | 20,045,172 | |
| |
| | | | Hotel & Resort REITs (4.01%) | |
| | 228,707 | | | Park Hotels & Resorts, Inc. | | | 3,775,342 | | | | 3,426,031 | |
| | 24,273 | | | Ryman Hospitality Properties, Inc. | | | 2,608,263 | | | | 2,423,902 | |
| | | | | | | | | | | | |
| | | | 6,383,605 | | | | 5,849,933 | |
| |
| | | | Industrial REITs (6.11%) | |
| | 29,813 | | | First Industrial Realty Trust, Inc. | | | 1,494,224 | | | | 1,416,415 | |
| | 51,358 | | | Prologis, Inc. | | | 5,300,948 | | | | 5,768,017 | |
| | 38,503 | | | Rexford Industrial Realty, Inc. | | | 1,860,403 | | | | 1,716,849 | |
| | | | | | | | | | | | |
| | | | 8,655,575 | | | | 8,901,281 | |
| | | |
| | | | Multi-Family Residential REITs (20.53%) | | | | | | | | |
| | 57,102 | | | AvalonBay Communities, Inc. | | | 10,410,254 | | | | 11,813,833 | |
| | 205,796 | | | Equity Residential | | | 12,726,000 | | | | 14,269,894 | |
| | 205,727 | | | Independence Realty Trust, Inc. | | | 3,478,657 | | | | 3,855,324 | |
| | | | | | | | | | | | |
| | | | 26,614,911 | | | | 29,939,051 | |
| |
| | | | Retail REITs (5.26%) | |
| | 15,150 | | | Federal Realty Investment Trust | | | 1,590,940 | | | | 1,529,696 | |
| | 127,850 | | | Macerich Co. | | | 1,901,455 | | | | 1,974,004 | |
| | 27,435 | | | Simon Property Group, Inc. | | | 3,600,976 | | | | 4,164,633 | |
| | | | | | | | | | | | |
| | | | 7,093,371 | | | | 7,668,333 | |
| | | | | | | | | | | | |
| Shares | | | | | Cost | | | Value | |
| Common Stocks (continued) | |
| Real Estate (continued) | |
| |
| | | | Self Storage REITs (0.73%) | |
| | 3,685 | | | Public Storage | | $ | 1,076,696 | | | $ | 1,059,990 | |
| | | |
| | | | Single-Family Residential REITs (11.55%) | | | | | | | | |
| | 190,286 | | | American Homes 4 Rent, Cl A | | | 6,574,823 | | | | 7,071,028 | |
| | 199,670 | | | Invitation Homes, Inc. | | | 6,684,949 | | | | 7,166,156 | |
| | 21,613 | | | Sun Communities, Inc. | | | 2,293,993 | | | | 2,600,909 | |
| | | | | | | | | | | | |
| | | | 15,553,765 | | | | 16,838,093 | |
| |
| | | | Telecom Tower REITs (8.72%) | |
| | 65,445 | | | American Tower Corp. | | | 11,586,417 | | | | 12,721,199 | |
| | | | | | | | | | | | |
| | Total Real Estate | | | 107,643,097 | | | | 120,432,294 | |
| | | | | | | | | | | | |
|
| Utilities (0.84%) | |
| | | | Renewable Electricity (0.84%) | |
| | 43,416 | | | Brookfield Renewable Corp., Cl A2 | | | 1,346,061 | | | | 1,232,146 | |
| | | | | | | | | | | | |
| | Total Common Stocks | | | 126,330,727 | | | | 141,931,566 | |
| | | | | | | | | | | | |
| | | | | | | | | | | | |
| | | |
| Principal Amount | | | | | | |
| Short-Term Investments (2.28%) | |
| | 3,320,521 | | | Repurchase Agreement with Fixed Income Clearing Corp., dated 6/28/2024, 4.85% due 7/1/2024; Proceeds at maturity $3,321,863; (Fully Collateralized by $3,357,200 U.S. Treasury Floating Rate Note, 5.385% due 4/30/2026 Market value - $3,386,978)3 | | | 3,320,521 | | | | 3,320,521 | |
| | | | | | | | | | | | |
| | Total Investments (99.62%) | | $ | 129,651,248 | | | | 145,252,087 | |
| | | | | | | | | | | | |
| | Cash and Other Assets Less Liabilities (0.38%) | | | | 555,171 | |
| | | | | | | | | | | | |
| | Net Assets | | | $ | 145,807,258 | |
| | | | | | | | | | | | |
| % | Represents percentage of net assets. |
| 1 | Non-income producing securities. |
| 3 | Level 2 security. See Note 7 regarding Fair Value Measurements. |
| ADR | American Depositary Receipt. |
| | All securities are Level 1, unless otherwise noted. |
| | |
| See Notes to Financial Statements. | | 13 |
| | |
| Baron Health Care Fund | | June 30, 2024 |
PORTFOLIO OF INVESTMENTS (Unaudited)
| | | | | | | | | | | | |
| Shares | | Cost | | | Value | |
| Common Stocks (95.82%) | |
| Health Care (95.82%) | |
| | | | Biotechnology (18.57%) | |
| | 110,000 | | | Arcellx, Inc.1 | | $ | 5,504,329 | | | $ | 6,070,900 | |
| | 22,055 | | | argenx SE, ADR1,2 | | | 7,449,896 | | | | 9,484,532 | |
| | 35,000 | | | Biohaven Ltd.1,2 | | | 1,225,216 | | | | 1,214,850 | |
| | 55,000 | | | Immunovant, Inc.1 | | | 1,938,084 | | | | 1,452,000 | |
| | 20,000 | | | Jasper Therapeutics, Inc.1 | | | 483,549 | | | | 454,000 | |
| | 60,000 | | | Legend Biotech Corp., ADR1,2 | | | 3,351,367 | | | | 2,657,400 | |
| | 250,000 | | | Rocket Pharmaceuticals, Inc.1 | | | 4,591,165 | | | | 5,382,500 | |
| | 23,000 | | | Vertex Pharmaceuticals, Incorporated1 | | | 5,946,486 | | | | 10,780,560 | |
| | 35,000 | | | Viking Therapeutics, Inc.1 | | | 1,080,070 | | | | 1,855,350 | |
| | 100,100 | | | Xenon Pharmaceuticals, Inc.1,2 | | | 3,651,406 | | | | 3,902,899 | |
| | | | | | | | | | | | |
| | | | | | | 35,221,568 | | | | 43,254,991 | |
| |
| | | | Health Care Distributors (2.71%) | |
| | 10,800 | | | McKesson Corp. | | | 2,651,423 | | | | 6,307,632 | |
| |
| | | | Health Care Equipment (22.74%) | |
| | 159,000 | | | Boston Scientific Corp.1 | | | 8,552,673 | | | | 12,244,590 | |
| | 35,000 | | | DexCom, Inc.1 | | | 3,975,410 | | | | 3,968,300 | |
| | 40,000 | | | Edwards Lifesciences Corp.1 | | | 3,555,611 | | | | 3,694,800 | |
| | 20,000 | | | Glaukos Corp.1 | | | 1,931,207 | | | | 2,367,000 | |
| | 6,995 | | | IDEXX Laboratories, Inc.1 | | | 2,933,296 | | | | 3,407,964 | |
| | 10,000 | | | Inspire Medical Systems, Inc.1 | | | 1,273,951 | | | | 1,338,300 | |
| | 30,233 | | | Intuitive Surgical, Inc.1 | | | 7,267,519 | | | | 13,449,150 | |
| | 46,500 | | | iRhythm Technologies, Inc.1 | | | 5,186,209 | | | | 5,005,260 | |
| | 22,000 | | | Stryker Corp. | | | 6,547,461 | | | | 7,485,500 | |
| | | | | | | | | | | | |
| | | | | | | 41,223,337 | | | | 52,960,864 | |
| |
| | | | Health Care Facilities (4.11%) | |
| | 18,300 | | | HCA Healthcare, Inc. | | | 4,144,546 | | | | 5,879,424 | |
| | 85,000 | | | Surgery Partners, Inc.1 | | | 2,666,783 | | | | 2,022,150 | |
| | 12,500 | | | Tenet Healthcare Corp.1 | | | 1,616,370 | | | | 1,662,875 | |
| | | | | | | | | | | | |
| | | | | | | 8,427,699 | | | | 9,564,449 | |
| |
| | | | Health Care Services (0.89%) | |
| | 35,000 | | | RadNet, Inc.1 | | | 1,643,218 | | | | 2,062,200 | |
| |
| | | | Health Care Supplies (2.62%) | |
| | 70,000 | | | The Cooper Companies., Inc. | | | 6,104,272 | | | | 6,111,000 | |
| |
| | | | Life Sciences Tools & Services (17.26%) | |
| | 40,000 | | | Bio-Techne Corporation | | | 3,091,287 | | | | 2,866,000 | |
| | 17,500 | | | Danaher Corp. | | | 4,027,743 | | | | 4,372,375 | |
| | 24,000 | | | ICON plc1,2 | | | 5,295,120 | | | | 7,523,280 | |
| | 2,650 | | | Mettler-Toledo International, Inc.1 | | | 2,726,860 | | | | 3,703,614 | |
| | 41,000 | | | Natera, Inc.1,3 | | | 2,772,310 | | | | 4,439,890 | |
| | 5,000 | | | Repligen Corp.1 | | | 802,260 | | | | 630,300 | |
| | 52,500 | | | Tempus AI, Inc.1 | | | 1,981,663 | | | | 1,837,500 | |
| | 19,849 | | | Thermo Fisher Scientific, Inc. | | | 9,773,188 | | | | 10,976,497 | |
| | 11,650 | | | West Pharmaceutical Services, Inc. | | | 3,438,733 | | | | 3,837,393 | |
| | | | | | | | | | | | |
| | | | | | | 33,909,164 | | | | 40,186,849 | |
| | | | | | | | | | | | |
| Shares | | Cost | | | Value | |
| Common Stocks (continued) | |
| Health Care (continued) | |
| |
| | | | Managed Health Care (10.03%) | |
| | 11,600 | | | Elevance Health, Inc. | | $ | 5,523,931 | | | $ | 6,285,576 | |
| | 33,500 | | | UnitedHealth Group, Incorporated | | | 12,190,803 | | | | 17,060,210 | |
| | | | | | | | | | | | |
| | | | | | | 17,714,734 | | | | 23,345,786 | |
| |
| | | | Pharmaceuticals (16.89%) | |
| | 45,000 | | | AstraZeneca PLC, ADR2 | | | 2,626,938 | | | | 3,509,550 | |
| | 24,000 | | | Eli Lilly & Co. | | | 5,250,618 | | | | 21,729,120 | |
| | 90,000 | | | Merck & Co., Inc. | | | 8,514,795 | | | | 11,142,000 | |
| | 17,000 | | | Zoetis, Inc. | | | 2,512,788 | | | | 2,947,120 | |
| | | | | | | | | | | | |
| | | | | | | 18,905,139 | | | | 39,327,790 | |
| | | | | | | | | | | | |
| | Total Common Stocks | | | 165,800,554 | | | | 223,121,561 | |
| | | | | | | | | | | | |
| | | | | | | | | | | | |
| | | |
| Principal Amount | | | | | | |
| Short-Term Investments (4.06%) | |
| | $9,462,323 | | | Repurchase Agreement with Fixed Income Clearing Corp., dated 6/28/2024, 4.85% due 7/1/2024; Proceeds at maturity $9,466,147; (Fully Collateralized by $9,566,800 U.S. Treasury Floating Rate Note, 5.385% due 4/30/2026 Market value - $9,651,612)4 | | | 9,462,323 | | | | 9,462,323 | |
| | | | | | | | | | | | |
| | Total Investments (99.88%) | | $ | 175,262,877 | | | | 232,583,884 | |
| | | | | | | | | | | | |
| | Cash and Other Assets Less Liabilities (0.12%) | | | | 284,395 | |
| | | | | | | | | | | | |
| | Net Assets | | | $ | 232,868,279 | |
| | | | | | | | | | | | |
| % | Represents percentage of net assets. |
| 1 | Non-income producing securities. |
| 3 | The Adviser has reclassified/classified certain securities in or out of this sub-industry. Such reclassifications/classifications are not supported by S&P or MSCI (unaudited). |
| 4 | Level 2 security. See Note 7 regarding Fair Value Measurements. |
| ADR | American Depositary Receipt. |
All securities are Level 1, unless otherwise noted.
| | |
| 14 | | See Notes to Financial Statements. |
| | |
| June 30, 2024 | | Baron FinTech Fund |
PORTFOLIO OF INVESTMENTS (Unaudited)
| | | | | | | | | | | | |
| Shares | | | | | Cost | | | Value | |
| Common Stocks (98.49%) | |
| Consumer Discretionary (3.73%) | |
| | | | Broadline Retail (3.73%) | |
| | 1,352 | | | MercadoLibre, Inc.1 | | $ | 1,992,630 | | | $ | 2,221,877 | |
| | | | | | | | | | | | |
|
| Financials (68.97%) | |
| | | | Asset Management & Custody Banks (3.29%) | | | | | | | | |
| | 1,500 | | | BlackRock, Inc. | | | 1,159,547 | | | | 1,180,980 | |
| | 7,400 | | | KKR & Co., Inc. | | | 757,673 | | | | 778,776 | |
| | | | | | | | | | | | |
| | | | | | | 1,917,220 | | | | 1,959,756 | |
| | | |
| | | | Diversified Banks (3.01%) | | | | | | | | |
| | 139,300 | | | NU Holdings Ltd., Cl A1,2 | | | 1,136,780 | | | | 1,795,577 | |
| | | |
| | | | Diversified Financial Services (4.48%) | | | | | | | | |
| | 22,600 | | | Apollo Global Management, Inc. | | | 1,654,296 | | | | 2,668,382 | |
| | | |
| | | | Financial Exchanges & Data (20.22%) | | | | | | | | |
| | 5,464 | | | CME Group, Inc. | | | 1,136,935 | | | | 1,074,222 | |
| | 3,550 | | | FactSet Research Systems, Inc. | | | 1,481,589 | | | | 1,449,359 | |
| | 4,000 | | | Moody’s Corp. | | | 1,417,488 | | | | 1,683,720 | |
| | 5,166 | | | Morningstar, Inc. | | | 1,133,088 | | | | 1,528,361 | |
| | 3,080 | | | MSCI, Inc. | | | 1,320,776 | | | | 1,483,790 | |
| | 6,457 | | | S&P Global, Inc. | | | 2,537,796 | | | | 2,879,822 | |
| | 18,379 | | | Tradeweb Markets, Inc., Cl A | | | 1,504,323 | | | | 1,948,174 | |
| | | | | | | | | | | | |
| | | | | | | 10,531,995 | | | | 12,047,448 | |
| | | |
| | | | Insurance Brokers (0.59%) | | | | | | | | |
| | 10,000 | | | Baldwin Insurance Group, Inc. Cl A (formerly BRP Group, Inc.)1 | | | 287,121 | | | | 354,700 | |
| | | |
| | | | Investment Banking & Brokerage (9.12%) | | | | | | | | |
| | 10,500 | | | Houlihan Lokey, Inc. | | | 792,917 | | | | 1,416,030 | |
| | 9,934 | | | Interactive Brokers Group, Inc., Cl A | | | 791,486 | | | | 1,217,909 | |
| | 6,854 | | | LPL Financial Holdings, Inc. | | | 1,155,054 | | | | 1,914,322 | |
| | 12,020 | | | The Charles Schwab Corp. | | | 892,280 | | | | 885,754 | |
| | | | | | | | | | | | |
| | | | | | | 3,631,737 | | | | 5,434,015 | |
| | | |
| | | | Property & Casualty Insurance (8.11%) | | | | | | | | |
| | 17,900 | | | Arch Capital Group Ltd1,2 | | | 1,467,472 | | | | 1,805,931 | |
| | 1,600 | | | Kinsale Capital Group, Inc. | | | 270,056 | | | | 616,448 | |
| | 11,600 | | | The Progressive Corp. | | | 1,397,264 | | | | 2,409,436 | |
| | | | | | | | | | | | |
| | | | | | | 3,134,792 | | | | 4,831,815 | |
| | | |
| | | | Transaction & Payment Processing Services (20.15%) | | | | | | | | |
| | 13,908 | | | Block, Inc.1 | | | 2,510,341 | | | | 896,927 | |
| | 13,300 | | | Fiserv, Inc.1 | | | 1,426,580 | | | | 1,982,232 | |
| | 8,400 | | | Global Payments, Inc. | | | 1,036,440 | | | | 812,280 | |
| | 5,960 | | | Jack Henry & Associates, Inc. | | | 993,006 | | | | 989,479 | |
| | 6,300 | | | MasterCard, Incorporated, Cl A | | | 2,171,411 | | | | 2,779,308 | |
| | 12,915 | | | Repay Holdings Corporation1 | | | 258,465 | | | | 136,382 | |
| | 10,400 | | | Visa, Inc., Cl A | | | 2,194,913 | | | | 2,729,688 | |
| | 3,576 | | | WEX, Inc.1 | | | 730,811 | | | | 633,453 | |
| | 122,000 | | | Wise PLC, Cl A (United Kingdom)1,2,3 | | | 1,404,362 | | | | 1,046,350 | |
| | | | | | | | | | | | |
| | | | | | | 12,726,329 | | | | 12,006,099 | |
| | | | | | | | | | | | |
| | Total Financials | | | 35,020,270 | | | | 41,097,792 | |
| | | | | | | | | | | | |
|
| Industrials (5.14%) | |
| | | | Research & Consulting Services (5.14%) | | | | | | | | |
| | 2,700 | | | Equifax, Inc. | | | 573,159 | | | | 654,642 | |
| | 9,934 | | | TransUnion | | | 960,745 | | | | 736,705 | |
| | 6,200 | | | Verisk Analytics, Inc. | | | 1,183,525 | | | | 1,671,210 | |
| | | | | | | | | | | | |
| | Total Industrials | | | 2,717,429 | | | | 3,062,557 | |
| | | | | | | | | | | | |
| | | | | | | | | | | | |
| Shares | | | | | Cost | | | Value | |
| Common Stocks (continued) | |
| Information Technology (19.41%) | |
| | | | Application Software (15.14%) | | | | | | | | |
| | 11,921 | | | Alkami Technology, Inc.1 | | $ | 302,180 | | | $ | 339,510 | |
| | 4,470 | | | Bill.Com Holdings, Inc.1 | | | 530,116 | | | | 235,212 | |
| | 19,869 | | | Clearwater Analytics Holdings, Inc., Cl A1 | | | 480,932 | | | | 367,974 | |
| | 1,900 | | | Fair Isaac Corp.1 | | | 885,253 | | | | 2,828,454 | |
| | 13,412 | | | Guidewire Software, Inc.1 | | | 1,501,822 | | | | 1,849,381 | |
| | 13,908 | | | Intapp, Inc.1 | | | 610,006 | | | | 510,006 | |
| | 4,400 | | | Intuit, Inc. | | | 1,634,342 | | | | 2,891,724 | |
| | | | | | | | | | | | |
| | | | | | | 5,944,651 | | | | 9,022,261 | |
| | | |
| | | | Internet Services & Infrastructure (1.32%) | | | | | | | | |
| | 11,921 | | | Shopify, Inc., Cl A1,2 | | | 1,685,376 | | | | 787,382 | |
| |
| | | | IT Consulting & Other Services (2.95%) | |
| | 1,600 | | | Accenture plc, Cl A2 | | | 383,949 | | | | 485,456 | |
| | 25,830 | | | CI&T, Inc., Cl A1,2 | | | 377,142 | | | | 134,316 | |
| | 18,875 | | | Endava plc, ADR1,2 | | | 1,351,424 | | | | 551,905 | |
| | 3,300 | | | Globant S.A.1,2 | | | 764,106 | | | | 588,258 | |
| | | | | | | | | | | | |
| | | | | | | 2,876,621 | | | | 1,759,935 | |
| | | | | | | | | | | | |
| | Total Information Technology | | | 10,506,648 | | | | 11,569,578 | |
| | | | | | | | | | | | |
|
| Real Estate (1.24%) | |
| | | | Real Estate Services (1.24%) | | | | | | | | |
| | 10,000 | | | CoStar Group, Inc.1 | | | 863,826 | | | | 741,400 | |
| | | | | | | | | | | | |
| | Total Common Stocks | | | 51,100,803 | | | | 58,693,204 | |
| | | | | | | | | | | | |
| | | | | | | | | | | | |
| | | |
| Principal Amount | | | | | | |
| Short-Term Investments (1.41%) | |
| | $837,303 | | | Repurchase Agreement with Fixed Income Clearing Corp., dated 6/28/2024, 4.85% due 7/1/2024; Proceeds at maturity $837,642; (Fully Collateralized by $846,600 U.S. Treasury Floating Rate Note, 5.385% due 4/30/2026 Market value - $854,157)3 | | | 837,303 | | | | 837,303 | |
| | | | | | | | | | | | |
| | Total Investments (99.90%) | | $ | 51,938,106 | | | | 59,530,507 | |
| | | | | | | | | | | | |
| | Cash and Other Assets Less Liabilities (0.10%) | | | | 56,926 | |
| | | | | | | | | | | | |
| | Net Assets | | | | | | $ | 59,587,433 | |
| | | | | | | | | | | | |
| % | Represents percentage of net assets. |
| 1 | Non-income producing securities. |
| 3 | Level 2 security. See Note 7 regarding Fair Value Measurements. |
| ADR | American Depositary Receipt. |
All securities are Level 1, unless otherwise noted.
| | |
| See Notes to Financial Statements. | | 15 |
| | |
| Baron New Asia Fund | | June 30, 2024 |
PORTFOLIO OF INVESTMENTS (Unaudited)
| | | | | | | | | | | | |
| Shares | | | | | Cost | | | Value | |
| Common Stocks (96.45%) | |
| China (13.36%) | |
| | 993 | | | Alibaba Group Holding Limited, ADR | | $ | 90,146 | | | $ | 71,496 | |
| | 738 | | | Baidu, Inc., Cl A1,2 | | | 12,030 | | | | 7,990 | |
| | 5,154 | | | Estun Automation Co. Ltd., Cl A2 | | | 17,510 | | | | 10,056 | |
| | 7,196 | | | Full Truck Alliance Co. Ltd., ADR | | | 50,328 | | | | 57,856 | |
| | 4,157 | | | Galaxy Entertainment Group Ltd.1,2 | | | 26,387 | | | | 19,346 | |
| | 2,997 | | | Jiangsu Hengli Hydraulic Co. Ltd., Cl A2 | | | 24,307 | | | | 19,201 | |
| | 1,514 | | | Kanzhun Ltd., ADR1 | | | 24,483 | | | | 28,478 | |
| | 37,351 | | | Kingdee International Software Group Co. Ltd.1,2 | | | 55,295 | | | | 34,927 | |
| | 5,544 | | | Kingsoft Corp. Ltd.2 | | | 22,268 | | | | 15,969 | |
| | 198 | | | Kweichow Moutai Co. Ltd., Cl A2 | | | 50,306 | | | | 39,893 | |
| | 2,245 | | | Midea Group Co., Ltd., Cl A2 | | | 17,424 | | | | 19,904 | |
| | 13,320 | | | NARI Technology Co. Ltd., Cl A2 | | | 44,296 | | | | 45,659 | |
| | 523 | | | PDD Holdings, Inc., ADR1 | | | 58,598 | | | | 69,533 | |
| | 576 | | | Shenzhen Mindray Bio-Medical
Electronics Co. Ltd., Cl A2 | | | 27,317 | | | | 23,045 | |
| | 3,423 | | | Shenzhou International Group Holdings Ltd.2 | | | 34,500 | | | | 33,437 | |
| | 4,764 | | | Tencent Holdings Limited, ADR | | | 226,482 | | | | 225,623 | |
| | 2,102 | | | Tencent Music Entertainment Group, ADR | | | 19,762 | | | | 29,533 | |
| | 719 | | | Yum China Holdings, Inc., (Hong Kong)2 | | | 39,700 | | | | 22,220 | |
| | 1,170 | | | Zai Lab Limited, ADR1 | | | 54,149 | | | | 20,276 | |
| | | | | | | | | | | | |
| | Total China | | | 895,288 | | | | 794,442 | |
| | | | | | | | | | | | |
|
| India (62.59%) | |
| | 5,874 | | | 360 ONE WAM Ltd.2 | | | 41,020 | | | | 68,959 | |
| | 644 | | | Amber Enterprises India Ltd.1,2 | | | 16,170 | | | | 34,797 | |
| | 10,396 | | | Aster DM Healthcare Ltd., 144A2 | | | 52,200 | | | | 43,107 | |
| | 1,021 | | | Bajaj Finance Limited2 | | | 83,317 | | | | 87,013 | |
| | 10,848 | | | Bharat Electronics Ltd.2 | | | 40,840 | | | | 39,700 | |
| | 7,714 | | | Bharti Airtel Ltd.2 | | | 74,934 | | | | 133,463 | |
| | 24,266 | | | Bharti Airtel Ltd. PP2 | | | 197,475 | | | | 302,957 | |
| | 3,389 | | | Cholamandalam Investment &
Finance Co. Ltd.2 | | | 49,078 | | | | 57,750 | |
| | 589 | | | Cummins India Ltd.2 | | | 26,691 | | | | 27,968 | |
| | 310 | | | Dixon Technologies India Ltd.2 | | | 16,193 | | | | 44,460 | |
| | 85,199 | | | GMR Power & Urban Infra Ltd.1,2 | | | 70,422 | | | | 84,984 | |
| | 8,733 | | | Godrej Consumer Products Ltd.2 | | | 111,288 | | | | 143,841 | |
| | 1,818 | | | Godrej Properties Ltd.1,2 | | | 32,291 | | | | 69,772 | |
| | 3,475 | | | HDFC Bank Ltd.2 | | | 67,136 | | | | 70,175 | |
| | 69,520 | | | Indus Towers Ltd.1,2 | | | 248,053 | | | | 312,555 | |
| | 1,443 | | | InterGlobe Aviation Ltd., 144A1,2 | | | 57,429 | | | | 73,126 | |
| | 42,258 | | | Jio Financial Services Ltd.1,2 | | | 118,812 | | | | 181,006 | |
| | 25,240 | | | JM Financial Limited2 | | | 23,121 | | | | 26,397 | |
| | 3,392 | | | Kaynes Technology India Ltd.1,2 | | | 123,723 | | | | 156,609 | |
| | 5,158 | | | Kirloskar Oil Engines Ltd.2 | | | 46,109 | | | | 85,970 | |
| | 2,109 | | | Mahindra & Mahindra Ltd.2 | | | 46,104 | | | | 72,397 | |
| | 5,809 | | | Max Healthcare Institute Ltd.2 | | | 45,377 | | | | 65,423 | |
| | 1,960 | | | Neogen Chemicals Ltd.2 | | | 28,169 | | | | 37,274 | |
| | 447 | | | Nuvama Wealth Management Ltd.1,2 | | | 28,047 | | | | 26,473 | |
| | 32,795 | | | Power Grid Corp. of India Ltd.2 | | | 123,052 | | | | 129,878 | |
| | 17,430 | | | Precision Wires India Ltd.2 | | | 28,783 | | | | 33,659 | |
| | 5,507 | | | REC Ltd.2 | | | 34,410 | | | | 34,639 | |
| | 6,370 | | | Reliance Industries Limited2 | | | 208,937 | | | | 238,790 | |
| | 4,158 | | | SBI Life Insurance Company Limited, 144A2 | | | 67,241 | | | | 74,333 | |
| | 1,197 | | | SRF Ltd.2 | | | 37,952 | | | | 34,916 | |
| | 1,956 | | | Tata Communications Ltd.2 | | | 31,550 | | | | 43,435 | |
| | 904 | | | Tata Consultancy Services Ltd.2 | | | 40,180 | | | | 42,229 | |
| | 4,634 | | | Tata Consumer Products Ltd.2 | | | 48,166 | | | | 60,877 | |
| | 1,139 | | | Thermax Ltd.2 | | | 63,523 | | | | 73,062 | |
| | 9,028 | | | Tips Industries Ltd. | | | 46,568 | | | | 44,205 | |
| | 1,442 | | | Titan Co. Ltd.2 | | | 42,144 | | | | 58,765 | |
| | 5,654 | | | Trent Ltd.2 | | | 190,588 | | | | 371,012 | |
| | 860 | | | Tube Investments of India Ltd.2 | | | 32,059 | | | | 43,881 | |
| | 80,518 | | | Zomato Ltd.1,2 | | | 85,809 | | | | 193,225 | |
| | | | | | | | | | | | |
| | Total India | | | 2,724,961 | | | | 3,723,082 | |
| | | | | | | | | | | | |
| | | | | | | | | | | | |
| Shares | | | | | Cost | | | Value | |
| Common Stocks (continued) | |
| Indonesia (1.00%) | |
| | 213,200 | | | Bank Rakyat Indonesia (Persero) Tbk PT2 | | $ | 62,520 | | | $ | 59,780 | |
| | | | | | | | | | | | |
|
| Japan (2.10%) | |
| | 388 | | | Hoya Corp.2 | | | 53,040 | | | | 45,373 | |
| | 71 | | | Keyence Corporation2 | | | 37,597 | | | | 31,075 | |
| | 221 | | | Tokyo Electron Limited2 | | | 30,683 | | | | 48,377 | |
| | | | | | | | | | | | |
| | Total Japan | | | 121,320 | | | | 124,825 | |
| | | | | | | | | | | | |
|
| Korea, Republic of (8.04%) | |
| | 3,347 | | | Coupang, Inc., Cl A1 | | | 47,134 | | | | 70,120 | |
| | 377 | | | HD Hyundai Heavy Industries Co. Ltd.1,2 | | | 29,272 | | | | 42,526 | |
| | 313 | | | HD Korea Shipbuilding & Offshore
Engineering Co. Ltd.1,2 | | | 20,402 | | | | 36,030 | |
| | 769 | | | Korea Aerospace Industries Ltd.2 | | | 25,969 | | | | 29,518 | |
| | 130 | | | Park Systems Corp.2 | | | 17,125 | | | | 17,544 | |
| | 3,405 | | | Samsung Electronics Co., Ltd.2 | | | 185,236 | | | | 200,397 | |
| | 52 | | | Samsung SDI Co. Ltd.2 | | | 22,523 | | | | 13,278 | |
| | 406 | | | SK Hynix, Inc.2 | | | 35,899 | | | | 68,902 | |
| | | | | | | | | | | | |
| | Total Korea, Republic of | | | 383,560 | | | | 478,315 | |
| | | | | | | | | | | | |
|
| Taiwan (9.36%) | |
| | 292 | | | ASPEED Technology, Inc.2 | | | 34,970 | | | | 43,330 | |
| | 4,810 | | | Delta Electronics, Inc.2 | | | 39,963 | | | | 57,371 | |
| | 304 | | | eMemory Technology, Inc.1,2 | | | 24,114 | | | | 23,880 | |
| | 11,015 | | | Taiwan Semiconductor
Manufacturing Co., Ltd.2 | | | 206,047 | | | | 326,348 | |
| | 608 | | | Taiwan Semiconductor
Manufacturing Co., Ltd., ADR | | | 43,816 | | | | 105,677 | |
| | | | | | | | | | | | |
| | Total Taiwan | | | 348,910 | | | | 556,606 | |
| | | | | | | | | | | | |
| | Total Common Stocks | | | 4,536,559 | | | | 5,737,050 | |
| | | | | | | | | | | | |
| | | | | | | | | | | | |
| | | |
| Principal Amount | | | | | | |
| Short-Term Investments (5.52%) | |
| | |
| | $328,356 | | | Repurchase Agreement with Fixed Income Clearing Corp., dated 6/28/2024, 4.85% due 7/1/2024; Proceeds at maturity $328,489; (Fully Collateralized by $331,000 U.S. Treasury Note, 4.50% due 5/31/2029 Market value - $335,045)2 | | | 328,356 | | | | 328,356 | |
| | | | | | | | | | | | |
| | Total Investments (101.97%) | | $ | 4,864,915 | | | | 6,065,406 | |
| | | | | | | | | | | | |
| | Liabilities Less Cash and Other Assets (-1.97%) | | | | (117,231 | ) |
| | | | | | | | | | | | |
| | Net Assets | | | $ | 5,948,175 | |
| | | | | | | | | | | | |
| % | Represents percentage of net assets. |
| 1 | Non-income producing securities. |
| 2 | Level 2 security. See Note 7 regarding Fair Value Measurements. |
| ADR | American Depositary Receipt. |
| 144A | Security is exempt from registration pursuant to Rule 144A under the Securities Act of 1933. This security may be resold in transactions that are exempt from registration, normally to qualified institutional buyers. At June 30, 2024, the market value of Rule 144A securities amounted to $190,566 or 3.20% of net assets. |
All securities are Level 1, unless otherwise noted.
| | |
| 16 | | See Notes to Financial Statements. |
| | |
| June 30, 2024 | | Baron New Asia Fund |
PORTFOLIO OF INVESTMENTS (Unaudited) (Continued)
| | | | |
Summary of Investments by Sector
as of June 30, 2024 | | Percentage of
Net Assets | |
| |
Information Technology | | | 19.7 | % |
| |
Communication Services | | | 19.2 | % |
| |
Consumer Discretionary | | | 18.9 | % |
| |
Financials | | | 11.5 | % |
| |
Industrials | | | 11.1 | % |
| |
Consumer Staples | | | 4.1 | % |
| |
Energy | | | 4.0 | % |
| |
Health Care | | | 3.3 | % |
| |
Utilities | | | 2.2 | % |
| |
Materials | | | 1.2 | % |
| |
Real Estate | | | 1.2 | % |
| |
Cash and Cash Equivalents* | | | 3.5 | % |
| | | | 100.0 | %** |
| * | Includes short-term investments, other assets and liabilities - net. |
| ** | Individual weights may not sum to 100% due to rounding. |
| | |
| See Notes to Financial Statements. | | 17 |
| | |
| Baron Technology Fund | | June 30, 2024 |
PORTFOLIO OF INVESTMENTS (Unaudited)
| | | | | | | | | | | | |
| Shares | | | | | Cost | | | Value | |
| Common Stocks (99.55%) | |
| Communication Services (11.04%) | |
| | | | Advertising (2.19%) | | | | | | | | |
| | 3,233 | | | Ibotta, Inc., Cl A1 | | $ | 313,841 | | | $ | 242,992 | |
| | 5,420 | | | The Trade Desk, Inc., Cl A1 | | | 381,129 | | | | 529,372 | |
| | | | | | | | | | | | |
| | | | | | | 694,970 | | | | 772,364 | |
| | | |
| | | | Interactive Media & Services (4.04%) | | | | | | | | |
| | 2,547 | | | Meta Platforms, Inc., Cl A | | | 961,713 | | | | 1,284,248 | |
| | 2,130 | | | Reddit, Inc., Cl A1 | | | 72,420 | | | | 136,086 | |
| | | | | | | | | | | | |
| | | | 1,034,133 | | | | 1,420,334 | |
| | | |
| | | | Movies & Entertainment (4.81%) | | | | | | | | |
| | 5,392 | | | Spotify Technology SA1,2 | | | 1,419,288 | | | | 1,691,955 | |
| | | | | | | | | | | | |
| | Total Communication Services | | | 3,148,391 | | | | 3,884,653 | |
| | | | | | | | | | | | |
|
| Consumer Discretionary (13.77%) | |
| | | | Automobile Manufacturers (2.52%) | | | | | | | | |
| | 4,479 | | | Tesla, Inc.1 | | | 844,652 | | | | 886,305 | |
| | | |
| | | | Broadline Retail (10.24%) | | | | | | | | |
| | 18,638 | | | Amazon.com, Inc.1 | | | 3,093,658 | | | | 3,601,793 | |
| | | |
| | | | Hotels, Resorts & Cruise Lines (1.01%) | | | | | | | | |
| | 50,878 | | | eDreams ODIGEO SA (Spain)1,2 | | | 386,021 | | | | 354,171 | |
| | | | | | | | | | | | |
| | Total Consumer Discretionary | | | 4,324,331 | | | | 4,842,269 | |
| | | | | | | | | | | | |
|
| Industrials (0.96%) | |
| | | | Aerospace & Defense (0.96%) | | | | | | | | |
| | 1,149 | | | Axon Enterprise, Inc.1 | | | 359,287 | | | | 338,082 | |
| | | | | | | | | | | | |
|
| Information Technology (71.02%) | |
| | | | Application Software (7.88%) | | | | | | | | |
| | 1,770 | | | Cadence Design Systems, Inc.1 | | | 516,791 | | | | 544,717 | |
| | 5,748 | | | Gitlab, Inc., Cl A1,3 | | | 304,596 | | | | 285,791 | |
| | 2,812 | | | Guidewire Software, Inc.1 | | | 317,767 | | | | 387,747 | |
| | 8,591 | | | Intapp, Inc.1 | | | 349,849 | | | | 315,032 | |
| | 1,136 | | | Intuit, Inc. | | | 681,123 | | | | 746,590 | |
| | 625 | | | ServiceNow, Inc.1,3 | | | 420,701 | | | | 491,669 | |
| | | | | | | | | | | | |
| | | | | | | 2,590,827 | | | | 2,771,546 | |
| | | | Electronic Equipment & Instruments (2.89%) | | | | | | | | |
| | 14,780 | | | PAR Technology Corp.1 | | | 656,857 | | | | 695,990 | |
| | 2,373 | | | Park Systems Corp. (Korea, Republic of)2,4 | | | 313,095 | | | | 320,256 | |
| | | | | | | | | | | | |
| | | | 969,952 | | | | 1,016,246 | |
| | | |
| | | | Internet Services & Infrastructure (1.70%) | | | | | | | | |
| | 9,035 | | | Shopify, Inc., Cl A1,2 | | | 670,001 | | | | 596,762 | |
| | | |
| | | | IT Consulting & Other Services (2.32%) | | | | | | | | |
| | 1,815 | | | Gartner, Inc.1 | | | 772,653 | | | | 815,044 | |
| | | |
| | | | Semiconductor Materials & Equipment (5.01%) | | | | | | | | |
| | 649 | | | ASML Holding N.V.2 | | | 547,380 | | | | 663,752 | |
| | 1,505 | | | BE Semiconductor Industries NV (Netherlands)2,4 | | | 209,794 | | | | 251,412 | |
| | 797 | | | Lam Research Corp. | | | 638,879 | | | | 848,685 | |
| | | | | | | | | | | | |
| | | | 1,396,053 | | | | 1,763,849 | |
| | | | | | | | | | | | |
| Shares | | | | | Cost | | | Value | |
| Common Stocks (continued) | |
|
| Information Technology (continued) | |
| | | |
| | | | Semiconductors (29.58%) | | | | | | | | |
| | 7,177 | | | Advanced Micro Devices, Inc.1 | | $ | 1,021,008 | | | $ | 1,164,181 | |
| | 1,140 | | | Broadcom, Inc. | | | 1,346,054 | | | | 1,830,304 | |
| | 4,318 | | | eMemory Technology, Inc. (Taiwan)2,4 | | | 334,663 | | | | 339,189 | |
| | 95,336 | | | indie Semiconductor, Inc., Cl A1 | | | 638,678 | | | | 588,223 | |
| | 3,371 | | | Micron Technology, Inc. | | | 290,683 | | | | 443,388 | |
| | 228 | | | Monolithic Power Systems, Inc. | | | 116,873 | | | | 187,343 | |
| | 34,510 | | | NVIDIA Corp. | | | 1,958,202 | | | | 4,263,365 | |
| | 7,884 | | | Taiwan Semiconductor
Manufacturing Co., Ltd. (Taiwan)2,4 | | | 161,540 | | | | 233,584 | |
| | 7,802 | | | Taiwan Semiconductor
Manufacturing Co., Ltd., ADR2 | | | 1,013,096 | | | | 1,356,066 | |
| | | | | | | | | | | | |
| | | | 6,880,797 | | | | 10,405,643 | |
| | | |
| | | | Systems Software (13.72%) | | | | | | | | |
| | 3,333 | | | Cloudflare, Inc., Cl A1,3 | | | 266,297 | | | | 276,072 | |
| | 5,945 | | | Datadog, Inc., Cl A1,3 | | | 703,253 | | | | 771,007 | |
| | 7,777 | | | Dynatrace, Inc.1,3 | | | 379,206 | | | | 347,943 | |
| | 7,680 | | | Microsoft Corporation | | | 2,949,247 | | | | 3,432,576 | |
| | | | | | | | | | | | |
| | | | | | | 4,298,003 | | | | 4,827,598 | |
| | | |
| | | | Technology Hardware, Storage & Peripherals (7.92%) | | | | | | | | |
| | 13,229 | | | Apple, Inc. | | | 2,539,452 | | | | 2,786,292 | |
| | | | | | | | | | | | |
| | Total Information Technology | | | 20,117,738 | | | | 24,982,980 | |
| | | | | | | | | | | | |
|
| Real Estate (2.76%) | |
| | | | Real Estate Services (2.76%) | | | | | | | | |
| | 13,114 | | | CoStar Group, Inc.1 | | | 1,128,138 | | | | 972,272 | |
| | | | | | | | | | | | |
| | Total Common Stocks | | | 29,077,885 | | | | 35,020,256 | |
| | | | | | | | | | | | |
| | | | | | | | | | | | |
| | | |
| Principal Amount | | | | | | |
| Short-Term Investments (0.56%) | |
| | $197,486 | | | Repurchase Agreement with Fixed Income Clearing Corp., dated 6/28/2024, 4.85% due 7/1/2024; Proceeds at maturity $197,566; (Fully Collateralized by $217,200 U.S. Treasury Note, 0.75% due 5/31/2026 Market value - $201,550)4 | | | 197,486 | | | | 197,486 | |
| | | | | | | | | | | | |
| | Total Investments (100.11%) | | $ | 29,275,371 | | | | 35,217,742 | |
| | | | | | | | | | | | |
| | Liabilities Less Cash and Other Assets (-0.11%) | | | | (38,843 | ) |
| | | | | | | | | | | | |
| | Net Assets | | | | | | $ | 35,178,899 | |
| | | | | | | | | | | | |
| % | Represents percentage of net assets. |
| 1 | Non-income producing securities. |
| 3 | The Adviser has reclassified/classified certain securities in or out of this sub-industry. Such reclassifications/classifications are not supported by S&P or MSCI (unaudited). |
| 4 | Level 2 security. See Note 7 regarding Fair Value Measurements. |
| ADR | American Depositary Receipt. |
All securities are Level 1, unless otherwise noted.
| | |
| 18 | | See Notes to Financial Statements. |
| | |
| June 30, 2024 | | Baron Select Funds |
STATEMENTS OF ASSETS AND LIABILITIES (Unaudited)
| | | | | | | | | | | | | | | | |
| | | Baron Partners
Fund | | | Baron Focused
Growth Fund | | | Baron
International
Growth Fund | | | Baron Real
Estate Fund | |
Assets: | | | | | | | | | | | | | | | | |
Investments in securities, at value* | | $ | 6,852,071,487 | | | $ | 1,406,519,567 | | | $ | 344,931,104 | | | $ | 1,749,196,364 | |
Foreign currency, at value† | | | — | | | | — | | | | 158,807 | | | | — | |
Cash | | | — | | | | — | | | | — | | | | 267,687 | |
Receivable for capital shares sold | | | 10,313,238 | | | | 5,368,510 | | | | 201,953 | | | | 6,593,255 | |
Dividends and interest receivable | | | 2,993,212 | | | | 1,248,805 | | | | 749,942 | | | | 1,730,592 | |
Prepaid expenses | | | 219,231 | | | | 9,560 | | | | 4,586 | | | | 14,521 | |
Receivable for securities sold | | | — | | | | 6,318,038 | | | | 311,243 | | | | 7,842,106 | |
| | | | | | | | | | | | | | | | |
| | | 6,865,597,168 | | | | 1,419,464,480 | | | | 346,357,635 | | | | 1,765,644,525 | |
| | | | | | | | | | | | | | | | |
Liabilities: | | | | | | | | | | | | | | | | |
Payable for borrowings against line of credit | | | 989,000,000 | | | | — | | | | — | | | | — | |
Payable for capital shares redeemed | | | 3,538,637 | | | | 704,839 | | | | 1,362,436 | | | | 1,480,613 | |
Investment advisory fees payable (Note 4) | | | 955 | | | | 455 | | | | 101 | | | | 882 | |
Distribution fees payable (Note 4) | | | 138 | | | | 686 | | | | 211 | | | | 151 | |
Payable for securities purchased | | | — | | | | 6,849,004 | | | | 579,308 | | | | 10,671,162 | |
Accrued capital gains taxes | | | — | | | | — | | | | 1,779,376 | | | | — | |
Other accrued expenses and other payables | | | 5,562,111 | | | | 182,333 | | | | 189,683 | | | | 277,716 | |
| | | | | | | | | | | | | | | | |
| | | 998,101,841 | | | | 7,737,317 | | | | 3,911,115 | | | | 12,430,524 | |
| | | | | | | | | | | | | | | | |
Net Assets | | $ | 5,867,495,327 | | | $ | 1,411,727,163 | | | $ | 342,446,520 | | | $ | 1,753,214,001 | |
| | | | | | | | | | | | | | | | |
Net Assets consist of: | | | | | | | | | | | | | | | | |
Paid-in capital | | $ | 722,338,086 | | | $ | 977,689,000 | | | $ | 312,290,261 | | | $ | 1,451,988,061 | |
Distributable earnings (losses) | | | 5,145,157,241 | | | | 434,038,163 | | | | 30,156,259 | | | | 301,225,940 | |
| | | | | | | | | | | | | | | | |
Net Assets | | $ | 5,867,495,327 | | | $ | 1,411,727,163 | | | $ | 342,446,520 | | | $ | 1,753,214,001 | |
| | | | | | | | | | | | | | | | |
Retail Shares: | | | | | | | | | | | | | | | | |
Net Assets | | $ | 2,454,033,899 | | | $ | 289,323,065 | | | $ | 75,456,378 | | | $ | 350,632,720 | |
Shares Outstanding ($0.01 par value; indefinite shares authorized) | | | 16,744,590 | | | | 7,831,997 | | | | 2,893,479 | | | | 10,282,079 | |
| | | | | | | | | | | | | | | | |
Net Asset Value Per Share | | $ | 146.56 | | | $ | 36.94 | | | $ | 26.08 | | | $ | 34.10 | |
| | | | | | | | | | | | | | | | |
Institutional Shares: | | | | | | | | | | | | | | | | |
Net Assets | | $ | 2,946,292,509 | | | $ | 787,765,427 | | | $ | 244,245,781 | | | $ | 1,358,660,810 | |
Shares Outstanding ($0.01 par value; indefinite shares authorized) | | | 19,282,777 | | | | 20,380,417 | | | | 9,162,797 | | | | 38,647,995 | |
| | | | | | | | | | | | | | | | |
Net Asset Value Per Share | | $ | 152.79 | | | $ | 38.65 | | | $ | 26.66 | | | $ | 35.15 | |
| | | | | | | | | | | | | | | | |
R6 Shares: | | | | | | | | | | | | | | | | |
Net Assets | | $ | 467,168,919 | | | $ | 334,638,671 | | | $ | 22,744,361 | | | $ | 43,920,471 | |
Shares Outstanding ($0.01 par value; indefinite shares authorized) | | | 3,058,094 | | | | 8,650,350 | | | | 853,796 | | | | 1,249,451 | |
| | | | | | | | | | | | | | | | |
Net Asset Value Per Share | | $ | 152.76 | | | $ | 38.68 | | | $ | 26.64 | | | $ | 35.15 | |
| | | | | | | | | | | | | | | | |
| | | | |
*Total investments, at cost | | $ | 1,507,998,527 | | | $ | 868,155,233 | | | $ | 243,529,365 | | | $ | 1,371,264,168 | |
| | | | | | | | | | | | | | | | |
| | | | |
†Foreign currency, at cost: | | $ | — | | | $ | — | | | $ | 158,855 | | | $ | — | |
| | | | | | | | | | | | | | | | |
| | |
| See Notes to Financial Statements. | | 19 |
| | |
| Baron Select Funds | | June 30, 2024 |
STATEMENTS OF ASSETS AND LIABILITIES (Unaudited) (Continued)
| | | | | | | | | | | | | | | | |
| | | Baron
Emerging
Markets Fund | | | Baron Global
Advantage
Fund | | | Baron
Real Estate
Income Fund | | | Baron
Health
Care Fund | |
Assets: | | | | | | | | | | | | | | | | |
Investments in securities, at value* | | $ | 4,092,257,624 | | | $ | 600,930,348 | | | $ | 145,252,087 | | | $ | 232,583,884 | |
Foreign currency, at value† | | | 2,165,373 | | | | — | | | | — | | | | — | |
Cash | | | 338,221 | | | | — | | | | 30,571 | | | | — | |
Receivable for capital shares sold | | | 3,199,950 | | | | 274,420 | | | | 124,748 | | | | 572,858 | |
Dividends and interest receivable | | | 8,078,434 | | | | 87,314 | | | | 441,073 | | | | 138,860 | |
Prepaid expenses | | | 45,224 | | | | 7,375 | | | | 757 | | | | 1,970 | |
Receivable for securities sold | | | 688,514 | | | | 2,249,273 | | | | 507,401 | | | | — | |
| | | | | | | | | | | | | | | | |
| | | 4,106,773,340 | | | | 603,548,730 | | | | 146,356,637 | | | | 233,297,572 | |
| | | | | | | | | | | | | | | | |
Liabilities: | | | | | | | | | | | | | | | | |
Payable for borrowings against line of credit | | | — | | | | 2,200,000 | | | | — | | | | — | |
Payable for capital shares redeemed | | | 5,227,515 | | | | 717,808 | | | | 23,316 | | | | 336,050 | |
Investment advisory fees payable (Note 4) | | | 824 | | | | 669 | | | | 266 | | | | 583 | |
Distribution fees payable (Note 4) | | | 901 | | | | 430 | | | | 320 | | | | 551 | |
Payable for securities purchased | | | 9,739,177 | | | | — | | | | 443,294 | | | | — | |
Accrued capital gains taxes | | | 44,226,183 | | | | — | | | | — | | | | — | |
Other accrued expenses and other payables | | | 1,859,482 | | | | 254,267 | | | | 82,183 | | | | 92,109 | |
| | | | | | | | | | | | | | | | |
| | | 61,054,082 | | | | 3,173,174 | | | | 549,379 | | | | 429,293 | |
| | | | | | | | | | | | | | | | |
Net Assets | | $ | 4,045,719,258 | | | $ | 600,375,556 | | | $ | 145,807,258 | | | $ | 232,868,279 | |
| | | | | | | | | | | | | | | | |
Net Assets consist of: | | | | | | | | | | | | | | | | |
Paid-in capital | | $ | 4,359,216,918 | | | $ | 732,604,086 | | | $ | 154,319,287 | | | $ | 215,979,718 | |
Distributable earnings (losses) | | | (313,497,660 | ) | | | (132,228,530 | ) | | | (8,512,029 | ) | | | 16,888,561 | |
| | | | | | | | | | | | | | | | |
Net Assets | | $ | 4,045,719,258 | | | $ | 600,375,556 | | | $ | 145,807,258 | | | $ | 232,868,279 | |
| | | | | | | | | | | | | | | | |
Retail Shares: | | | | | | | | | | | | | | | | |
Net Assets | | $ | 223,348,920 | | | $ | 178,128,766 | | | $ | 12,271,579 | | | $ | 48,359,029 | |
Shares Outstanding ($0.01 par value; indefinite shares authorized) | | | 15,041,617 | | | | 5,425,557 | | | | 863,033 | | | | 2,429,346 | |
| | | | | | | | | | | | | | | | |
Net Asset Value Per Share | | $ | 14.85 | | | $ | 32.83 | | | $ | 14.22 | | | $ | 19.91 | |
| | | | | | | | | | | | | | | | |
Institutional Shares: | | | | | | | | | | | | | | | | |
Net Assets | | $ | 3,813,754,056 | | | $ | 411,998,229 | | | $ | 127,973,874 | | | $ | 169,941,330 | |
Shares Outstanding ($0.01 par value; indefinite shares authorized) | | | 254,813,960 | | | | 12,216,888 | | | | 8,890,786 | | | | 8,404,018 | |
| | | | | | | | | | | | | | | | |
Net Asset Value Per Share | | $ | 14.97 | | | $ | 33.72 | | | $ | 14.39 | | | $ | 20.22 | |
| | | | | | | | | | | | | | | | |
R6 Shares: | | | | | | | | | | | | | | | | |
Net Assets | | $ | 8,616,282 | | | $ | 10,248,561 | | | $ | 5,561,805 | | | $ | 14,567,920 | |
Shares Outstanding ($0.01 par value; indefinite shares authorized) | | | 575,452 | | | | 303,766 | | | | 386,820 | | | | 720,771 | |
| | | | | | | | | | | | | | | | |
Net Asset Value Per Share | | $ | 14.97 | | | $ | 33.74 | | | $ | 14.38 | | | $ | 20.21 | |
| | | | | | | | | | | | | | | | |
| | | | |
*Total investments, at cost | | $ | 3,076,846,575 | | | $ | 395,227,770 | | | $ | 129,651,248 | | | $ | 175,262,877 | |
| | | | | | | | | | | | | | | | |
| | | | |
†Foreign currency, at cost: | | $ | 2,164,068 | | | $ | — | | | $ | — | | | $ | — | |
| | | | | | | | | | | | | | | | |
| | |
| 20 | | See Notes to Financial Statements. |
| | |
| June 30, 2024 | | Baron Select Funds |
STATEMENTS OF ASSETS AND LIABILITIES (Unaudited) (Continued)
| | | | | | | | | | | | |
| | | Baron FinTech
Fund | | | Baron New Asia
Fund | | | Baron
Technology
Fund | |
Assets: | | | | | | | | | | | | |
Investments in securities, at value* | | $ | 59,530,507 | | | $ | 6,065,406 | | | $ | 35,217,742 | |
Foreign currency, at value† | | | — | | | | 3,119 | | | | 1 | |
Cash | | | — | | | | — | | | | — | |
Receivable for capital shares sold | | | 223,527 | | | | 78,398 | | | | 44,555 | |
Dividends and interest receivable | | | 338 | | | | 6,990 | | | | 5,986 | |
Prepaid expenses | | | 471 | | | | 45 | | | | 76 | |
Receivable for securities sold | | | — | | | | 63,395 | | | | — | |
| | | | | | | | | | | | |
| | | 59,754,843 | | | | 6,217,353 | | | | 35,268,360 | |
| | | | | | | | | | | | |
Liabilities: | | | | | | | | | | | | |
Payable for borrowings against line of credit | | | — | | | | — | | | | — | |
Payable for capital shares redeemed | | | 46,774 | | | | — | | | | 9,572 | |
Investment advisory fees payable (Note 4) | | | 887 | | | | — | | | | 916 | |
Distribution fees payable (Note 4) | | | 919 | | | | 46 | | | | 668 | |
Payable for securities purchased | | | 45,315 | | | | 65,590 | | | | 10,130 | |
Accrued capital gains taxes | | | — | | | | 128,208 | | | | — | |
Other accrued expenses and other payables | | | 73,515 | | | | 75,334 | | | | 68,175 | |
| | | | | | | | | | | | |
| | | 167,410 | | | | 269,178 | | | | 89,461 | |
| | | | | | | | | | | | |
Net Assets | | $ | 59,587,433 | | | $ | 5,948,175 | | | $ | 35,178,899 | |
| | | | | | | | | | | | |
Net Assets consist of: | | | | | | | | | | | | |
Paid-in capital | | $ | 59,087,175 | | | $ | 6,149,162 | | | $ | 30,377,157 | |
Distributable earnings (losses) | | | 500,258 | | | | (200,987 | ) | | | 4,801,742 | |
| | | | | | | | | | | | |
Net Assets | | $ | 59,587,433 | | | $ | 5,948,175 | | | $ | 35,178,899 | |
| | | | | | | | | | | | |
Retail Shares: | | | | | | | | | | | | |
Net Assets | | $ | 7,073,591 | | | $ | 1,345,897 | | | $ | 12,181,656 | |
Shares Outstanding ($0.01 par value; indefinite shares authorized) | | | 483,676 | | | | 146,330 | | | | 1,098,181 | |
| | | | | | | | | | | | |
Net Asset Value Per Share | | $ | 14.62 | | | $ | 9.20 | | | $ | 11.09 | |
| | | | | | | | | | | | |
Institutional Shares: | | | | | | | | | | | | |
Net Assets | | $ | 41,941,783 | | | $ | 2,519,073 | | | $ | 19,528,928 | |
Shares Outstanding ($0.01 par value; indefinite shares authorized) | | | 2,836,920 | | | | 271,957 | | | | 1,746,317 | |
| | | | | | | | | | | | |
Net Asset Value Per Share | | $ | 14.78 | | | $ | 9.26 | | | $ | 11.18 | |
| | | | | | | | | | | | |
R6 Shares: | | | | | | | | | | | | |
Net Assets | | $ | 10,572,059 | | | $ | 2,083,205 | | | $ | 3,468,315 | |
Shares Outstanding ($0.01 par value; indefinite shares authorized) | | | 715,001 | | | | 224,710 | | | | 310,778 | |
| | | | | | | | | | | | |
Net Asset Value Per Share | | $ | 14.79 | | | $ | 9.27 | | | $ | 11.16 | |
| | | | | | | | | | | | |
| | | |
*Total investments, at cost | | $ | 51,938,106 | | | $ | 4,864,915 | | | $ | 29,275,371 | |
| | | | | | | | | | | | |
| | | |
†Foreign currency, at cost: | | $ | — | | | $ | 3,118 | | | $ | 1 | |
| | | | | | | | | | | | |
| | |
| See Notes to Financial Statements. | | 21 |
| | |
| Baron Select Funds | | June 30, 2024 |
STATEMENTS OF OPERATIONS (Unaudited)
|
FOR THE SIX MONTHS ENDED JUNE 30, 2024 |
| | | | | | | | | | | | | | | | |
| | | Baron Partners
Fund | | | Baron Focused
Growth Fund | | | Baron
International
Growth Fund | | | Baron Real
Estate Fund | |
Investment income (loss): | | | | | | | | | | | | | | | | |
Income: | | | | | | | | | | | | | | | | |
Dividends1 | | $ | 17,319,564 | | | $ | 5,648,742 | | | $ | 3,156,901 | | | $ | 13,109,960 | |
Interest2 | | | 6,159 | | | | 498,610 | | | | 293,218 | | | | 1,415,917 | |
| | | | | | | | | | | | | | | | |
Total income | | | 17,325,723 | | | | 6,147,352 | | | | 3,450,119 | | | | 14,525,877 | |
| | | | | | | | | | | | | | | | |
Expenses: | | | | | | | | | | | | | | | | |
Investment advisory fees (Note 4) | | | 29,698,906 | | | | 6,739,604 | | | | 1,740,990 | | | | 8,775,127 | |
Distribution fees — Retail Shares (Note 4) | | | 3,127,376 | | | | 370,803 | | | | 94,034 | | | | 461,004 | |
Shareholder servicing agent fees and expenses — Retail Shares | | | 102,980 | | | | 24,305 | | | | 10,805 | | | | 24,980 | |
Shareholder servicing agent fees and expenses — Institutional Shares | | | 55,990 | | | | 20,668 | | | | 10,538 | | | | 35,494 | |
Shareholder servicing agent fees and expenses — R6 Shares | | | 12,931 | | | | 9,131 | | | | 1,532 | | | | 1,226 | |
Reports to shareholders | | | 347,800 | | | | 126,290 | | | | 36,246 | | | | 196,980 | |
Line of credit fees | | | 291,424 | | | | 8,632 | | | | 2,518 | | | | 11,232 | |
Trustee fees and expenses (Note 4) | | | 206,667 | | | | 44,880 | | | | 14,252 | | | | 58,649 | |
Custodian and fund accounting fees | | | 153,630 | | | | 34,426 | | | | 101,522 | | | | 26,206 | |
Professional fees | | | 94,150 | | | | 27,490 | | | | 53,142 | | | | 31,768 | |
Registration and filing fees | | | 67,200 | | | | 88,800 | | | | 36,800 | | | | 61,900 | |
Insurance expense | | | 50,950 | | | | 12,874 | | | | 4,004 | | | | 14,954 | |
Administration fees | | | 23,315 | | | | 22,980 | | | | 22,201 | | | | 22,598 | |
Miscellaneous expenses | | | 2,550 | | | | 2,700 | | | | 2,734 | | | | 2,905 | |
| | | | | | | | | | | | | | | | |
Total operating expenses | | | 34,235,869 | | | | 7,533,583 | | | | 2,131,318 | | | | 9,725,023 | |
| | | | | | | | | | | | | | | | |
Interest expense on borrowings | | | 29,979,115 | | | | — | | | | — | | | | — | |
| | | | | | | | | | | | | | | | |
Total gross expenses | | | 64,214,984 | | | | 7,533,583 | | | | 2,131,318 | | | | 9,725,023 | |
Management fees waived/expenses reimbursed — Retail Shares (Note 4) | | | — | | | | — | | | | (34,142 | ) | | | — | |
Management fees waived/expenses reimbursed — Institutional Shares (Note 4) | | | — | | | | — | | | | (89,126 | ) | | | — | |
Management fees waived/expenses reimbursed — R6 Shares (Note 4) | | | — | | | | — | | | | (12,350 | ) | | | — | |
| | | | | | | | | | | | | | | | |
Total net expenses | | | 64,214,984 | | | | 7,533,583 | | | | 1,995,700 | | | | 9,725,023 | |
| | | | | | | | | | | | | | | | |
Net investment income (loss) | | | (46,889,261 | ) | | | (1,386,231 | ) | | | 1,454,419 | | | | 4,800,854 | |
| | | | | | | | | | | | | | | | |
Realized and unrealized gain (loss) on investments: | | | | | | | | | | | | | | | | |
Net realized gain (loss) on investments sold — Unaffiliated investments | | | 355,780,612 | | | | (9,654,725 | ) | | | 7,999,325 | 3 | | | 47,351,359 | |
Net realized gain (loss) on foreign currency transactions | | | — | | | | — | | | | (220,327 | ) | | | — | |
Change in net unrealized appreciation (depreciation) of: | | | | | | | | | | | | | | | | |
Investments — Unaffiliated investments | | | (889,415,363 | ) | | | 32,305,909 | | | | (2,376,966 | )4 | | | (83,001,565 | ) |
Foreign currency translations | | | — | | | | — | | | | (13,565 | ) | | | — | |
| | | | | | | | | | | | | | | | |
Net gain (loss) on investments | | | (533,634,751 | ) | | | 22,651,184 | | | | 5,388,467 | | | | (35,650,206 | ) |
| | | | | | | | | | | | | | | | |
Net increase (decrease) in net assets resulting from operations | | $ | (580,524,012 | ) | | $ | 21,264,953 | | | $ | 6,842,886 | | | $ | (30,849,352 | ) |
| | | | | | | | | | | | | | | | |
| | | | |
1 Net of foreign taxes withheld on dividends | | $ | — | | | $ | — | | | $ | 340,218 | | | $ | 92,944 | |
| | | | | | | | | | | | | | | | |
2 Net of foreign taxes withheld on interest | | $ | — | | | $ | — | | | $ | — | | | $ | — | |
| | | | | | | | | | | | | | | | |
3 Net of realized foreign capital gains tax of | | $ | — | | | $ | — | | | $ | 1,033,851 | | | $ | — | |
| | | | | | | | | | | | | | | | |
4 Increase in accrued foreign capital gains tax payable of | | $ | — | | | $ | — | | | $ | 257,485 | | | $ | — | |
| | | | | | | | | | | | | | | | |
| | |
| 22 | | See Notes to Financial Statements. |
| | |
| June 30, 2024 | | Baron Select Funds |
STATEMENTS OF OPERATIONS (Unaudited) (Continued)
|
FOR THE SIX MONTHS ENDED JUNE 30, 2024 |
| | | | | | | | | | | | | | | | |
| | | Baron
Emerging
Markets Fund | | | Baron Global
Advantage
Fund | | | Baron
Real Estate
Income Fund | | | Baron
Health
Care Fund | |
Income: | | | | | | | | | | | | | | | | |
Dividends1 | | $ | 31,040,865 | | | $ | 167,513 | | | $ | 2,018,154 | | | $ | 568,121 | |
Interest2 | | | 3,362,517 | | | | 13,354 | | | | 81,892 | | | | 257,017 | |
| | | | | | | | | | | | | | | | |
Total income | | | 34,403,382 | | | | 180,867 | | | | 2,100,046 | | | | 825,138 | |
| | | | | | | | | | | | | | | | |
Expenses: | | | | | | | | | | | | | | | | |
Investment advisory fees (Note 4) | | | 20,930,588 | | | | 2,661,918 | | | | 537,814 | | | | 857,719 | |
Distribution fees — Retail Shares (Note 4) | | | 292,255 | | | | 231,885 | | | | 16,127 | | | | 62,779 | |
Shareholder servicing agent fees and expenses — Retail Shares | | | 15,270 | | | | 14,726 | | | | 8,359 | | | | 19,012 | |
Shareholder servicing agent fees and expenses — Institutional Shares | | | 64,640 | | | | 16,712 | | | | 8,267 | | | | 7,430 | |
Shareholder servicing agent fees and expenses — R6 Shares | | | 223 | | | | 282 | | | | 110 | | | | 373 | |
Reports to shareholders | | | 747,650 | | | | 126,900 | | | | 14,055 | | | | 27,660 | |
Line of credit fees | | | 27,290 | | | | 5,286 | | | | 841 | | | | 1,339 | |
Trustee fees and expenses (Note 4) | | | 143,430 | | | | 21,713 | | | | 4,810 | | | | 7,536 | |
Custodian and fund accounting fees | | | 1,295,307 | | | | 27,150 | | | | 14,895 | | | | 11,811 | |
Professional fees | | | 152,037 | | | | 65,190 | | | | 26,938 | | | | 26,846 | |
Registration and filing fees | | | 76,300 | | | | 46,900 | | | | 28,210 | | | | 47,290 | |
Insurance expense | | | 32,375 | | | | 4,554 | | | | 1,636 | | | | 1,856 | |
Administration fees | | | 21,032 | | | | 22,520 | | | | 22,019 | | | | 22,279 | |
Miscellaneous expenses | | | 3,678 | | | | 2,600 | | | | 2,609 | | | | 2,706 | |
| | | | | | | | | | | | | | | | |
Total operating expenses | | | 23,802,075 | | | | 3,248,336 | | | | 686,690 | | | | 1,096,636 | |
| | | | | | | | | | | | | | | | |
Interest expense on borrowings | | | — | | | | 67,308 | | | | — | | | | — | |
| | | | | | | | | | | | | | | | |
Total gross expenses | | | 23,802,075 | | | | 3,315,644 | | | | 686,690 | | | | 1,096,636 | |
Management fees waived/expenses reimbursed — Retail Shares (Note 4) | | | — | | | | (63,899 | ) | | | (15,525 | ) | | | (26,247 | ) |
Management fees waived/expenses reimbursed — Institutional Shares (Note 4) | | | — | | | | (131,014 | ) | | | (78,777 | ) | | | (32,854 | ) |
Management fees waived/expenses reimbursed — R6 Shares (Note 4) | | | — | | | | (3,036 | ) | | | (2,593 | ) | | | (2,676 | ) |
| | | | | | | | | | | | | | | | |
Total net expenses | | | 23,802,075 | | | | 3,117,695 | | | | 589,795 | | | | 1,034,859 | |
| | | | | | | | | | | | | | | | |
Net investment income (loss) | | | 10,601,307 | | | | (2,936,828 | ) | | | 1,510,251 | | | | (209,721 | ) |
| | | | | | | | | | | | | | | | |
Realized and unrealized gain (loss) on investments: | | | | | | | | | | | | | | | | |
Net realized gain (loss) on investments sold — Unaffiliated investments | | | 162,873,861 | 3 | | | 70,496,899 | 3 | | | 1,382,245 | | | | 818,661 | |
Net realized gain (loss) on foreign currency transactions | | | (1,986,712 | ) | | | (8,921 | ) | | | — | | | | (6 | ) |
Change in net unrealized appreciation (depreciation) of: | | | | | | | | | | | | | | | | |
Investments — Unaffiliated investments | | | 93,387,785 | 4 | | | (26,000,972 | ) | | | (2,973,568 | ) | | | 12,466,168 | |
Foreign currency translations | | | 46,387 | | | | 156 | | | | — | | | | — | |
| | | | | | | | | | | | | | | | |
Net gain (loss) on investments | | | 254,321,321 | | | | 44,487,162 | | | | (1,591,323 | ) | | | 13,284,823 | |
| | | | | | | | | | | | | | | | |
Net increase (decrease) in net assets resulting from operations | | $ | 264,922,628 | | | $ | 41,550,334 | | | $ | (81,072 | ) | | $ | 13,075,102 | |
| | | | | | | | | | | | | | | | |
| | | | |
1 Net of foreign taxes withheld on dividends | | $ | 4,021,362 | | | $ | 34,394 | | | $ | 12,429 | | | $ | (4,601 | ) |
| | | | | | | | | | | | | | | | |
2 Net of foreign taxes withheld on interest | | $ | 27 | | | $ | — | | | $ | — | | | $ | — | |
| | | | | | | | | | | | | | | | |
3 Net of realized foreign capital gains tax of | | $ | 13,090,023 | | | $ | 268,219 | | | $ | — | | | $ | — | |
| | | | | | | | | | | | | | | | |
4 Increase in accrued foreign capital gains tax payable of | | $ | 14,012,147 | | | $ | — | | | $ | — | | | $ | — | |
| | | | | | | | | | | | | | | | |
| | |
| See Notes to Financial Statements. | | 23 |
| | |
| Baron Select Funds | | June 30, 2024 |
STATEMENTS OF OPERATIONS (Unaudited) (Continued)
|
FOR THE SIX MONTHS ENDED JUNE 30, 2024 |
| | | | | | | | | | | | |
| | | Baron FinTech
Fund | | | Baron New Asia
Fund | | | Baron
Technology
Fund | |
Investment income (loss): | | | | | | | | | | | | |
Income: | | | | | | | | | | | | |
Dividends1 | | $ | 193,824 | | | $ | 32,381 | | | $ | 39,542 | |
Interest | | | 15,426 | | | | 6,352 | | | | 19,128 | |
| | | | | | | | | | | | |
Total income | | | 209,250 | | | | 38,733 | | | | 58,670 | |
| | | | | | | | | | | | |
Expenses: | | | | | | | | | | | | |
Investment advisory fees (Note 4) | | | 240,754 | | | | 24,088 | | | | 92,540 | |
Distribution fees — Retail Shares (Note 4) | | | 9,166 | | | | 1,332 | | | | 10,835 | |
Shareholder servicing agent fees and expenses — Retail Shares | | | 7,346 | | | | 9,222 | | | | 7,877 | |
Shareholder servicing agent fees and expenses — Institutional Shares | | | 6,565 | | | | 5,408 | | | | 6,414 | |
Shareholder servicing agent fees and expenses — R6 Shares | | | 294 | | | | 53 | | | | 85 | |
Reports to shareholders | | | 7,164 | | | | 3,710 | | | | 2,896 | |
Line of credit fees | | | 441 | | | | 24 | | | | 211 | |
Trustee fees and expenses (Note 4) | | | 2,024 | | | | 153 | | | | 632 | |
Custodian and fund accounting fees | | | 7,776 | | | | 28,607 | | | | 3,322 | |
Professional fees | | | 24,750 | | | | 40,100 | | | | 23,100 | |
Registration and filing fees | | | 22,780 | | | | 20,690 | | | | 25,530 | |
Insurance expense | | | 582 | | | | 29 | | | | 123 | |
Administration fees | | | 22,131 | | | | 22,017 | | | | 23,080 | |
Miscellaneous expenses | | | 2,608 | | | | 3,252 | | | | 2,608 | |
| | | | | | | | | | | | |
Total operating expenses | | | 354,381 | | | | 158,685 | | | | 199,253 | |
| | | | | | | | | | | | |
Interest expense on borrowings | | | — | | | | — | | | | — | |
| | | | | | | | | | | | |
Total gross expenses | | | 354,381 | | | | 158,685 | | | | 199,253 | |
Management fees waived/expenses reimbursed — Retail Shares (Note 4) | | | (12,841 | ) | | | (34,414 | ) | | | (34,370 | ) |
Management fees waived/expenses reimbursed — Institutional Shares (Note 4) | | | (38,340 | ) | | | (49,738 | ) | | | (34,116 | ) |
Management fees waived/expenses reimbursed — R6 Shares (Note 4) | | | (8,139 | ) | | | (44,297 | ) | | | (10,040 | ) |
| | | | | | | | | | | | |
Total net expenses | | | 295,061 | | | | 30,236 | | | | 120,727 | |
| | | | | | | | | | | | |
Net investment income (loss) | | | (85,811 | ) | | | 8,497 | | | | (62,057 | ) |
| | | | | | | | | | | | |
Realized and unrealized gain (loss) on investments: | | | | | | | | | | | | |
Net realized gain (loss) on investments sold — Unaffiliated investments | | | 65,290 | | | | (234,079 | ) | | | (146,492 | ) |
Net realized gain (loss) on foreign currency transactions | | | (8 | ) | | | (3,442 | ) | | | (2,256 | ) |
Change in net unrealized appreciation (depreciation) of | | | | | | | | | | | | |
Investments — Unaffiliated investments | | | 2,432,709 | | | | 1,047,020 | 2 | | | 4,555,348 | |
Foreign currency translations | | | — | | | | (18 | ) | | | (21 | ) |
| | | | | | | | | | | | |
Net gain (loss) on investments | | | 2,497,991 | | | | 809,481 | | | | 4,406,579 | |
| | | | | | | | | | | | |
Net increase (decrease) in net assets resulting from operations | | $ | 2,412,180 | | | $ | 817,978 | | | $ | 4,344,522 | |
| | | | | | | | | | | | |
| | | |
1 Net of foreign taxes withheld on dividends | | $ | — | | | $ | 5,696 | | | $ | 2,631 | |
| | | | | | | | | | | | |
2 Increase in accrued foreign capital gains tax payable of | | $ | — | | | $ | 91,105 | | | $ | — | |
| | | | | | | | | | | | |
| | |
| 24 | | See Notes to Financial Statements. |
| | |
| June 30, 2024 | | Baron Select Funds |
STATEMENTS OF CHANGES IN NET ASSETS (Unaudited)
| | | | | | | | | | | | | | | | | | | | | | | | |
| | | Baron Partners Fund | | | Baron Focused Growth Fund | | | Baron International Growth Fund | |
| | | For the Six
Months Ended
June 30,
2024 | | | For the Year
Ended
December 31,
2023 | | | For the Six
Months Ended
June 30,
2024 | | | For the Year
Ended
December 31,
2023 | | | For the Six
Months Ended
June 30,
2024 | | | For the Year
Ended
December 31,
2023 | |
Increase (Decrease) in Net Assets: | | | | | | | | | | | | | | | | | | | | | | | | |
Operations: | | | | | | | | | | | | | | | | | | | | | | | | |
Net investment income (loss) | | $ | (46,889,261 | ) | | $ | (100,956,529 | ) | | $ | (1,386,231 | ) | | $ | (3,872,144 | ) | | $ | 1,454,419 | | | $ | 3,056,499 | |
Net realized gain (loss) | | | 355,780,612 | | | | (157,505,280 | ) | | | (9,654,725 | ) | | | (13,273,815 | ) | | | 7,778,998 | | | | (27,656,100 | ) |
Change in net unrealized appreciation (depreciation) | | | (889,415,363 | ) | | | 2,335,451,959 | | | | 32,305,909 | | | | 248,550,090 | | | | (2,390,531 | ) | | | 60,250,289 | |
| | | | | | | | | | | | | | | | | | | | | | | | |
Increase (decrease) in net assets resulting from operations | | | (580,524,012 | ) | | | 2,076,990,150 | | | | 21,264,953 | | | | 231,404,131 | | | | 6,842,886 | | | | 35,650,688 | |
| | | | | | | | | | | | | | | | | | | | | | | | |
Distributions to shareholders from (Note 8): | | | | | | | | | | | | | | | | | | | | | | | | |
Distributable earnings — Retail Shares | | | — | | | | — | | | | — | | | | — | | | | — | | | | (269,980 | ) |
Distributable earnings — Institutional Shares | | | — | | | | — | | | | — | | | | — | | | | — | | | | (1,804,572 | ) |
Distributable earnings — R6 Shares | | | — | | | | — | | | | — | | | | — | | | | — | | | | (696,052 | ) |
| | | | | | | | | | | | | | | | | | | | | | | | |
Decrease in net assets from distributions to shareholders | | | — | | | | — | | | | — | | | | — | | | | — | | | | (2,770,604 | ) |
| | | | | | | | | | | | | | | | | | | | | | | | |
Capital share transactions: | | | | | | | | | | | | | | | | | | | | | | | | |
Proceeds from the sale of shares — Retail Shares | | | 113,621,501 | | | | 355,190,468 | | | | 51,200,938 | | | | 151,146,892 | | | | 14,890,254 | | | | 23,092,120 | |
Proceeds from the sale of shares — Institutional Shares | | | 243,829,518 | | | | 688,166,838 | | | | 224,187,708 | | | | 388,100,609 | | | | 18,133,814 | | | | 71,220,517 | |
Proceeds from the sale of shares — R6 Shares | | | 3,280,939 | | | | 10,042,606 | | | | 8,386,552 | | | | 11,089,009 | | | | 2,571,466 | | | | 5,559,120 | |
Net asset value of shares issued in reinvestment of distributions — Retail Shares | | | — | | | | — | | | | — | | | | — | | | | — | | | | 264,640 | |
Net asset value of shares issued in reinvestment of distributions — Institutional Shares | | | — | | | | — | | | | — | | | | — | | | | — | | | | 1,785,299 | |
Net asset value of shares issues in reinvestment of distribution — R6 Shares | | | — | | | | — | | | | — | | | | — | | | | — | | | | 696,053 | |
Cost of shares redeemed — Retail Shares | | | (370,711,529 | ) | | | (437,752,854 | ) | | | (82,570,869 | ) | | | (62,689,099 | ) | | | (17,395,700 | ) | | | (19,130,327 | ) |
Cost of shares redeemed — Institutional Shares | | | (473,189,481 | ) | | | (567,565,311 | ) | | | (139,485,244 | ) | | | (104,575,692 | ) | | | (93,633,369 | ) | | | (82,237,151 | ) |
Cost of shares redeemed — R6 Shares | | | (13,598,671 | ) | | | (6,188,636 | ) | | | (6,951,090 | ) | | | (6,298,090 | ) | | | (100,923,224 | ) | | | (4,827,045 | ) |
| | | | | | | | | | | | | | | | | | | | | | | | |
Increase (decrease) in net assets derived from capital share transactions | | | (496,767,723 | ) | | | 41,893,111 | | | | 54,767,995 | | | | 376,773,629 | | | | (176,356,759 | ) | | | (3,576,774 | ) |
| | | | | | | | | | | | | | | | | | | | | | | | |
Net increase (decrease) in net assets | | | (1,077,291,735 | ) | | | 2,118,883,261 | | | | 76,032,948 | | | | 608,177,760 | | | | (169,513,873 | ) | | | 29,303,310 | |
| | | | | | | | | | | | | | | | | | | | | | | | |
Net Assets: | | | | | | | | | | | | | | | | | | | | | | | | |
Beginning of period | | | 6,944,787,062 | | | | 4,825,903,801 | | | | 1,335,694,215 | | | | 727,516,455 | | | | 511,960,393 | | | | 482,657,083 | |
| | | | | | | | | | | | | | | | | | | | | | | | |
End of period | | $ | 5,867,495,327 | | | $ | 6,944,787,062 | | | $ | 1,411,727,163 | | | $ | 1,335,694,215 | | | $ | 342,446,520 | | | $ | 511,960,393 | |
| | | | | | | | | | | | | | | | | | | | | | | | |
Capital share transactions — Retail Shares | | | | | | | | | | | | | | | | | | | | | | | | |
Shares sold | | | 795,923 | | | | 2,460,850 | | | | 1,423,598 | | | | 4,483,400 | | | | 589,417 | | | | 937,676 | |
Shares issued in reinvestment of distributions | | | — | | | | — | | | | — | | | | — | | | | — | | | | 10,873 | |
Shares redeemed | | | (2,593,938 | ) | | | (3,069,315 | ) | | | (2,286,075 | ) | | | (1,882,429 | ) | | | (683,014 | ) | | | (769,094 | ) |
| | | | | | | | | | | | | | | | | | | | | | | | |
Net increase (decrease) | | | (1,798,015 | ) | | | (608,465 | ) | | | (862,477 | ) | | | 2,600,971 | | | | (93,597 | ) | | | 179,455 | |
| | | | | | | | | | | | | | | | | | | | | | | | |
Capital share transactions — Institutional Shares | | | | | | | | | | | | | | | | | | | | | | | | |
Shares sold | | | 1,631,870 | | | | 4,650,011 | | | | 5,948,452 | | | | 11,070,554 | | | | 702,875 | | | | 2,811,311 | |
Shares issued in reinvestment of distributions | | | — | | | | — | | | | — | | | | — | | | | — | | | | 71,872 | |
Shares redeemed | | | (3,192,634 | ) | | | (3,915,668 | ) | | | (3,696,832 | ) | | | (3,014,353 | ) | | | (3,647,305 | ) | | | (3,277,033 | ) |
| | | | | | | | | | | | | | | | | | | | | | | | |
Net increase (decrease) | | | (1,560,764 | ) | | | 734,343 | | | | 2,251,620 | | | | 8,056,201 | | | | (2,944,430 | ) | | | (393,850 | ) |
| | | | | | | | | | | | | | | | | | | | | | | | |
Capital share transactions — R6 Shares | | | | | | | | | | | | | | | | | | | | | | | | |
Shares sold | | | 22,084 | | | | 66,908 | | | | 221,494 | | | | 317,595 | | | | 101,951 | | | | 226,005 | |
Shares issued in reinvestment of distributions | | | — | | | | — | | | | — | | | | — | | | | — | | | | 28,033 | |
Shares redeemed | | | (95,819 | ) | | | (41,442 | ) | | | (183,654 | ) | | | (179,386 | ) | | | (3,923,365 | ) | | | (200,345 | ) |
| | | | | | | | | | | | | | | | | | | | | | | | |
Net increase (decrease) | | | (73,735 | ) | | | 25,466 | | | | 37,840 | | | | 138,209 | | | | (3,821,414 | ) | | | 53,693 | |
| | | | | | | | | | | | | | | | | | | | | | | | |
| | |
| See Notes to Financial Statements. | | 25 |
| | |
| Baron Select Funds | | June 30, 2024 |
STATEMENTS OF CHANGES IN NET ASSETS (Unaudited) (Continued)
| | | | | | | | | | | | | | | | | | | | | | | | |
| | | Baron Real Estate Fund | | | Baron Emerging Markets Fund | | | Baron Global Advantage Fund | |
| | | For the Six
Months Ended
June 30,
2024 | | | For the Year
Ended
December 31,
2023 | | | For the Six
Months Ended
June 30,
2024 | | | For the Year
Ended
December 31,
2023 | | | For the Six
Months Ended
June 30,
2024 | | | For the Year
Ended
December 31,
2023 | |
Increase (Decrease) in Net Assets: | | | | | | | | | | | | | | | | | | | | | | | | |
Operations: | | | | | | | | | | | | | | | | | | | | | | | | |
Net investment income (loss) | | $ | 4,800,854 | | | $ | 6,741,535 | | | $ | 10,601,307 | | | $ | 24,155,343 | | | $ | (2,936,828 | ) | | $ | (7,033,822 | ) |
Net realized gain (loss) | | | 47,351,359 | | | | 12,262,036 | | | | 160,887,149 | | | | (272,251,793 | ) | | | 70,487,978 | | | | (79,786,942 | ) |
Change in net unrealized appreciation (depreciation) | | | (83,001,565 | ) | | | 316,689,615 | | | | 93,434,172 | | | | 609,334,651 | | | | (26,000,816 | ) | | | 256,276,035 | |
| | | | | | | | | | | | | | | | | | | | | | | | |
Increase (decrease) in net assets resulting from operations | | | (30,849,352 | ) | | | 335,693,186 | | | | 264,922,628 | | | | 361,238,201 | | | | 41,550,334 | | | | 169,455,271 | |
| | | | | | | | | | | | | | | | | | | | | | | | |
Distributions to shareholders from (Note 8): | | | | | | | | | | | | | | | | | | | | | | | | |
Distributable earnings — Retail Shares | | | — | | | | (219,246 | ) | | | — | | | | (1,068,956 | ) | | | — | | | | — | |
Distributable earnings — Institutional Shares | | | — | | | | (5,656,763 | ) | | | — | | | | (29,796,790 | ) | | | — | | | | — | |
Distributable earnings — R6 Shares | | | — | | | | (168,604 | ) | | | — | | | | (56,931 | ) | | | — | | | | — | |
| | | | | | | | | | | | | | | | | | | | | | | | |
Decrease in net assets from distributions to shareholders | | | — | | | | (6,044,613 | ) | | | — | | | | (30,922,677 | ) | | | — | | | | — | |
| | | | | | | | | | | | | | | | | | | | | | | | |
Capital share transactions: | | | | | | | | | | | | | | | | | | | | | | | | |
Proceeds from the sale of shares — Retail Shares | | | 25,359,405 | | | | 67,278,351 | | | | 13,247,599 | | | | 40,745,092 | | | | 5,763,765 | | | | 22,472,386 | |
Proceeds from the sale of shares — Institutional Shares | | | 236,059,963 | | | | 434,878,375 | | | | 339,922,964 | | | | 727,020,825 | | | | 24,356,843 | | | | 88,776,514 | |
Proceeds from the sale of shares — R6 Shares | | | 9,775,473 | | | | 12,458,566 | | | | 1,538,489 | | | | 2,085,300 | | | | 286,428 | | | | 923,807 | |
Net asset value of shares issued in reinvestment of distributions — Retail Shares | | | — | | | | 210,783 | | | | — | | | | 1,040,501 | | | | — | | | | — | |
Net asset value of shares issued in reinvestment of distributions — Institutional Shares | | | — | | | | 5,182,287 | | | | — | | | | 24,745,777 | | | | — | | | | — | |
Net asset value of shares issues in reinvestment of distribution — R6 Shares | | | — | | | | 168,604 | | | | — | | | | 56,930 | | | | — | | | | — | |
Cost of shares redeemed — Retail Shares | | | (49,954,329 | ) | | | (84,800,749 | ) | | | (57,646,922 | ) | | | (91,482,177 | ) | | | (45,544,587 | ) | | | (88,867,488 | ) |
Cost of shares redeemed — Institutional Shares | | | (172,772,417 | ) | | | (295,426,736 | ) | | | (1,055,620,787 | ) | | | (1,256,147,547 | ) | | | (110,832,910 | ) | | | (275,508,788 | ) |
Cost of shares redeemed — R6 Shares | | | (5,003,776 | ) | | | (5,356,823 | ) | | | (1,630,710 | ) | | | (5,106,803 | ) | | | (997,932 | ) | | | (2,188,193 | ) |
| | | | | | | | | | | | | | | | | | | | | | | | |
Increase (decrease) in net assets derived from capital share transactions | | | 43,464,319 | | | | 134,592,658 | | | | (760,189,367 | ) | | | (557,042,102 | ) | | | (126,968,393 | ) | | | (254,391,762 | ) |
| | | | | | | | | | | | | | | | | | | | | | | | |
Net increase (decrease) in net assets | | | 12,614,967 | | | | 464,241,231 | | | | (495,266,739 | ) | | | (226,726,578 | ) | | | (85,418,059 | ) | | | (84,936,491 | ) |
| | | | | | | | | | | | | | | | | | | | | | | | |
Net Assets: | | | | | | | | | | | | | | | | | | | | | | | | |
Beginning of period | | | 1,740,599,034 | | | | 1,276,357,803 | | | | 4,540,985,997 | | | | 4,767,712,575 | | | | 685,793,615 | | | | 770,730,106 | |
| | | | | | | | | | | | | | | | | | | | | | | | |
End of period | | $ | 1,753,214,001 | | | $ | 1,740,599,034 | | | $ | 4,045,719,258 | | | $ | 4,540,985,997 | | | $ | 600,375,556 | | | $ | 685,793,615 | |
| | | | | | | | | | | | | | | | | | | | | | | | |
Capital share transactions — Retail Shares | | | | | | | | | | | | | | | | | | | | | | | | |
Shares sold | | | 725,431 | | | | 2,171,746 | | | | 940,942 | | | | 3,020,438 | | | | 184,615 | | | | 823,556 | |
Shares issued in reinvestment of distributions | | | — | | | | 6,599 | | | | — | | | | 77,717 | | | | — | | | | — | |
Shares redeemed | | | (1,427,902 | ) | | | (2,754,375 | ) | | | (4,080,904 | ) | | | (6,811,892 | ) | | | (1,453,642 | ) | | | (3,239,565 | ) |
| | | | | | | | | | | | | | | | | | | | | | | | |
Net increase (decrease) | | | (702,471 | ) | | | (576,030 | ) | | | (3,139,962 | ) | | | (3,713,737 | ) | | | (1,269,027 | ) | | | (2,416,009 | ) |
| | | | | | | | | | | | | | | | | | | | | | | | |
Capital share transactions — Institutional Shares | | | | | | | | | | | | | | | | | | | | | | | | |
Shares sold | | | 6,564,638 | | | | 13,796,839 | | | | 24,121,842 | | | | 53,560,711 | | | | 762,874 | | | | 3,227,760 | |
Shares issued in reinvestment of distributions | | | — | | | | 162,795 | | | | — | | | | 1,840,640 | | | | — | | | | — | |
Shares redeemed | | | (4,816,987 | ) | | | (9,387,663 | ) | | | (74,557,150 | ) | | | (93,111,422 | ) | | | (3,470,983 | ) | | | (9,762,152 | ) |
| | | | | | | | | | | | | | | | | | | | | | | | |
Net increase (decrease) | | | 1,747,651 | | | | 4,571,971 | | | | (50,435,308 | ) | | | (37,710,071 | ) | | | (2,708,109 | ) | | | (6,534,392 | ) |
| | | | | | | | | | | | | | | | | | | | | | | | |
Capital share transactions — R6 Shares | | | | | | | | | | | | | | | | | | | | | | | | |
Shares sold | | | 267,879 | | | | 392,706 | | | | 107,080 | | | | 154,253 | | | | 8,994 | | | | 33,096 | |
Shares issued in reinvestment of distributions | | | — | | | | 5,295 | | | | — | | | | 4,231 | | | | — | | | | — | |
Shares redeemed | | | (139,732 | ) | | | (169,687 | ) | | | (116,015 | ) | | | (376,879 | ) | | | (31,284 | ) | | | (77,573 | ) |
| | | | | | | | | | | | | | | | | | | | | | | | |
Net increase (decrease) | | | 128,147 | | | | 228,314 | | | | (8,935 | ) | | | (218,395 | ) | | | (22,290 | ) | | | (44,477 | ) |
| | | | | | | | | | | | | | | | | | | | | | | | |
| | |
| 26 | | See Notes to Financial Statements. |
| | |
| June 30, 2024 | | Baron Select Funds |
STATEMENTS OF CHANGES IN NET ASSETS (Unaudited) (Continued)
| | | | | | | | | | | | | | | | | | | | | | | | |
| | | Baron Real Estate Income Fund | | | Baron Health Care Fund | | | Baron FinTech Fund | |
| | | For the Six
Months Ended
June 30,
2024 | | | For the Year
Ended
December 31,
2023 | | | For the Six
Months Ended
June 30,
2024 | | | For the Year
Ended
December 31,
2023 | | | For the Six
Months Ended
June 30,
2024 | | | For the Year
Ended
December 31,
2023 | |
Increase (Decrease) in Net Assets: | | | | | | | | | | | | | | | | | | | | | | | | |
Operations: | | | | | | | | | | | | | | | | | | | | | | | | |
Net investment income (loss) | | $ | 1,510,251 | | | $ | 2,095,948 | | | $ | (209,721 | ) | | $ | (65,847 | ) | | $ | (85,811 | ) | | $ | (73,120 | ) |
Net realized gain (loss) | | | 1,382,245 | | | | (4,766,635 | ) | | | 818,655 | | | | (2,666,948 | ) | | | 65,282 | | | | (2,485,044 | ) |
Change in net unrealized appreciation (depreciation) | | | (2,973,568 | ) | | | 18,322,473 | | | | 12,466,168 | | | | 15,141,244 | | | | 2,432,709 | | | | 14,978,959 | |
| | | | | | | | | | | | | | | | | | | | | | | | |
Increase (decrease) in net assets resulting from operations | | | (81,072 | ) | | | 15,651,786 | | | | 13,075,102 | | | | 12,408,449 | | | | 2,412,180 | | | | 12,420,795 | |
| | | | | | | | | | | | | | | | | | | | | | | | |
Distributions to shareholders from (Note 8): | | | | | | | | | | | | | | | | | | | | | | | | |
Distributable earnings — Retail Shares | | | (109,636 | ) | | | (273,623 | ) | | | — | | | | — | | | | — | | | | — | |
Distributable earnings — Institutional Shares | | | (1,231,428 | ) | | | (1,858,134 | ) | | | — | | | | — | | | | — | | | | — | |
Distributable earnings — R6 Shares | | | (39,764 | ) | | | (16,765 | ) | | | — | | | | — | | | | — | | | | — | |
| | | | | | | | | | | | | | | | | | | | | | | | |
Decrease in net assets from distributions to shareholders | | | (1,380,828 | ) | | | (2,148,522 | ) | | | — | | | | — | | | | — | | | | — | |
| | | | | | | | | | | | | | | | | | | | | | | | |
Capital share transactions: | | | | | | | | | | | | | | | | | | | | | | | | |
Proceeds from the sale of shares — Retail Shares | | | 1,064,285 | | | | 3,858,342 | | | | 5,904,422 | | | | 11,277,945 | | | | 238,007 | | | | 674,929 | |
Proceeds from the sale of shares — Institutional Shares | | | 10,353,613 | | | | 89,883,119 | | | | 30,541,543 | | | | 41,603,727 | | | | 3,957,719 | | | | 12,484,414 | |
Proceeds from the sale of shares — R6 Shares | | | 4,010,844 | | | | 837,376 | | | | 8,460,040 | | | | 136,269 | | | | 14,356 | | | | 3,965,552 | |
Net asset value of shares issued in reinvestment of distributions — Retail Shares | | | 107,900 | | | | 258,789 | | | | — | | | | — | | | | — | | | | — | |
Net asset value of shares issued in reinvestment of distributions — Institutional Shares | | | 693,595 | | | | 1,435,472 | | | | — | | | | — | | | | — | | | | — | |
Net asset value of shares issues in reinvestment of distribution — R6 Shares | | | 39,005 | | | | 15,675 | | | | — | | | | — | | | | — | | | | — | |
Cost of shares redeemed — Retail Shares | | | (2,592,920 | ) | | | (5,258,306 | ) | | | (10,288,362 | ) | | | (19,305,819 | ) | | | (779,554 | ) | | | (2,051,948 | ) |
Cost of shares redeemed — Institutional Shares | | | (14,401,373 | ) | | | (33,748,918 | ) | | | (24,763,411 | ) | | | (45,451,361 | ) | | | (5,820,484 | ) | | | (10,235,367 | ) |
Cost of shares redeemed — R6 Shares | | | (88,965 | ) | | | (22,027 | ) | | | (493,459 | ) | | | (250,830 | ) | | | (33,676 | ) | | | (260,999 | ) |
| | | | | | | | | | | | | | | | | | | | | | | | |
Increase (decrease) in net assets derived from capital share transactions | | | (814,016 | ) | | | 57,259,522 | | | | 9,360,773 | | | | (11,990,069 | ) | | | (2,423,632 | ) | | | 4,576,581 | |
| | | | | | | | | | | | | | | | | | | | | | | | |
Net increase (decrease) in net assets | | | (2,275,916 | ) | | | 70,762,786 | | | | 22,435,875 | | | | 418,380 | | | | (11,452 | ) | | | 16,997,376 | |
| | | | | | | | | | | | | | | | | | | | | | | | |
Net Assets: | | | | | | | | | | | | | | | | | | | | | | | | |
Beginning of period | | | 148,083,174 | | | | 77,320,388 | | | | 210,432,404 | | | | 210,014,024 | | | | 59,598,885 | | | | 42,601,509 | |
| | | | | | | | | | | | | | | | | | | | | | | | |
End of period | | $ | 145,807,258 | | | $ | 148,083,174 | | | $ | 232,868,279 | | | $ | 210,432,404 | | | $ | 59,587,433 | | | $ | 59,598,885 | |
| | | | | | | | | | | | | | | | | | | | | | | | |
Capital share transactions — Retail Shares | | | | | | | | | | | | | | | | | | | | | | | | |
Shares sold | | | 75,739 | | | | 288,086 | | | | 300,018 | | | | 624,918 | | | | 16,480 | | | | 54,697 | |
Shares issued in reinvestment of distributions | | | 7,676 | | | | 19,885 | | | | — | | | | — | | | | — | | | | — | |
Shares redeemed | | | (184,794 | ) | | | (394,095 | ) | | | (522,717 | ) | | | (1,082,437 | ) | | | (53,572 | ) | | | (170,211 | ) |
| | | | | | | | | | | | | | | | | | | | | | | | |
Net increase (decrease) | | | (101,379 | ) | | | (86,124 | ) | | | (222,699 | ) | | | (457,519 | ) | | | (37,092 | ) | | | (115,514 | ) |
| | | | | | | | | | | | | | | | | | | | | | | | |
Capital share transactions — Institutional Shares | | | | | | | | | | | | | | | | | | | | | | | | |
Shares sold | | | 726,670 | | | | 6,621,682 | | | | 1,533,997 | | | | 2,302,824 | | | | 268,249 | | | | 1,028,407 | |
Shares issued in reinvestment of distributions | | | 48,767 | | | | 108,728 | | | | — | | | | — | | | | — | | | | — | |
Shares redeemed | | | (1,016,766 | ) | | | (2,527,701 | ) | | | (1,249,629 | ) | | | (2,523,545 | ) | | | (390,699 | ) | | | (851,462 | ) |
| | | | | | | | | | | | | | | | | | | | | | | | |
Net increase (decrease) | | | (241,329 | ) | | | 4,202,709 | | | | 284,368 | | | | (220,721 | ) | | | (122,450 | ) | | | 176,945 | |
| | | | | | | | | | | | | | | | | | | | | | | | |
Capital share transactions — R6 Shares | | | | | | | | | | | | | | | | | | | | | | | | |
Shares sold | | | 280,924 | | | | 63,270 | | | | 435,143 | | | | 7,425 | | | | 977 | | | | 337,021 | |
Shares issued in reinvestment of distributions | | | 2,750 | | | | 1,175 | | | | — | | | | — | | | | — | | | | — | |
Shares redeemed | | | (6,207 | ) | | | (1,792 | ) | | | (24,509 | ) | | | (13,542 | ) | | | (2,267 | ) | | | (21,573 | ) |
| | | | | | | | | | | | | | | | | | | | | | | | |
Net increase (decrease) | | | 277,467 | | | | 62,653 | | | | 410,634 | | | | (6,117 | ) | | | (1,290 | ) | | | 315,448 | |
| | | | | | | | | | | | | | | | | | | | | | | | |
| | |
| See Notes to Financial Statements. | | 27 |
| | |
| Baron Select Funds | | June 30, 2024 |
STATEMENTS OF CHANGES IN NET ASSETS (Unaudited) (Continued)
| | | | | | | | | | | | | | | | |
| | | Baron New Asia Fund | | | Baron Technology Fund | |
| | | For the Six
Months Ended
June 30,
2024 | | | For the Year
Ended
December 31,
2023 | | | For the Six
Months Ended
June 30,
2024 | | | For the Year
Ended
December 31,
2023 | |
Increase (Decrease) in Net Assets: | | | | | | | | | | | | | | | | |
Operations: | | | | | | | | | | | | | | | | |
Net investment income (loss) | | $ | 8,497 | | | $ | 5,990 | | | $ | (62,057 | ) | | $ | (33,974 | ) |
Net realized gain (loss) | | | (237,521 | ) | | | (549,012 | ) | | | (148,748 | ) | | | (492,906 | ) |
Change in net unrealized appreciation (depreciation) | | | 1,047,002 | | | | 764,469 | | | | 4,555,327 | | | | 3,027,405 | |
| | | | | | | | | | | | | | | | |
Increase (decrease) in net assets resulting from operations | | | 817,978 | | | | 221,447 | | | | 4,344,522 | | | | 2,500,525 | |
| | | | | | | | | | | | | | | | |
Distributions to shareholders from (Note 8): | | | | | | | | | | | | | | | | |
Distributable earnings — Retail Shares | | | — | | | | — | | | | — | | | | — | |
Distributable earnings — Institutional Shares | | | — | | | | — | | | | — | | | | — | |
Distributable earnings — R6 Shares | | | — | | | | — | | | | — | | | | — | |
| | | | | | | | | | | | | | | | |
Decrease in net assets from distributions to shareholders | | | — | | | | — | | | | — | | | | — | |
| | | | | | | | | | | | | | | | |
Capital share transactions: | | | | | | | | | | | | | | | | |
Proceeds from the sale of shares — Retail Shares | | | 273,059 | | | | 402,312 | | | | 7,031,762 | | | | 3,720,001 | |
Proceeds from the sale of shares — Institutional Shares | | | 776,749 | | | | 326,790 | | | | 19,906,984 | | | | 1,130,035 | |
Proceeds from the sale of shares — R6 Shares | | | 7,013 | | | | 1,618,999 | | | | 223,076 | | | | 1,269,655 | |
Net asset value of shares issued in reinvestment of distributions — Retail Shares | | | — | | | | — | | | | — | | | | — | |
Net asset value of shares issued in reinvestment of distributions — Institutional Shares | | | — | | | | — | | | | — | | | | — | |
Net asset value of shares issues in reinvestment of distribution — R6 Shares | | | — | | | | — | | | | — | | | | — | |
Cost of shares redeemed — Retail Shares | | | (91,378 | ) | | | (352,228 | ) | | | (1,519,075 | ) | | | (1,297,617 | ) |
Cost of shares redeemed — Institutional Shares | | | (131,046 | ) | | | (1,616,622 | ) | | | (3,838,584 | ) | | | (1,603,427 | ) |
Cost of shares redeemed — R6 Shares | | | (40,261 | ) | | | (4,787 | ) | | | — | | | | — | |
| | | | | | | | | | | | | | | | |
Increase (decrease) in net assets derived from capital share transactions | | | 794,136 | | | | 374,464 | | | | 21,804,163 | | | | 3,218,647 | |
| | | | | | | | | | | | | | | | |
Net increase (decrease) in net assets | | | 1,612,114 | | | | 595,911 | | | | 26,148,685 | | | | 5,719,172 | |
| | | | | | | | | | | | | | | | |
Net Assets: | | | | | | | | | | | | | | | | |
Beginning of period | | | 4,336,061 | | | | 3,740,150 | | | | 9,030,214 | | | | 3,311,042 | |
| | | | | | | | | | | | | | | | |
End of period | | $ | 5,948,175 | | | $ | 4,336,061 | | | $ | 35,178,899 | | | $ | 9,030,214 | |
| | | | | | | | | | | | | | | | |
Capital share transactions — Retail Shares | | | | | | | | | | | | | | | | |
Shares sold | | | 31,920 | | | | 52,612 | | | | 699,408 | | | | 468,981 | |
Shares issued in reinvestment of distributions | | | — | | | | — | | | | — | | | | — | |
Shares redeemed | | | (11,303 | ) | | | (46,209 | ) | | | (150,455 | ) | | | (161,692 | ) |
| | | | | | | | | | | | | | | | |
Net increase (decrease) | | | 20,617 | | | | 6,403 | | | | 548,953 | | | | 307,289 | |
| | | | | | | | | | | | | | | | |
Capital share transactions — Institutional Shares | | | | | | | | | | | | | | | | |
Shares sold | | | 89,588 | | | | 43,069 | | | | 1,952,285 | | | | 135,967 | |
Shares issued in reinvestment of distributions | | | — | | | | — | | | | — | | | | — | |
Shares redeemed | | | (15,548 | ) | | | (205,853 | ) | | | (364,856 | ) | | | (257,119 | ) |
| | | | | | | | | | | | | | | | |
Net increase (decrease) | | | 74,040 | | | | (162,784 | ) | | | 1,587,429 | | | | (121,152 | ) |
| | | | | | | | | | | | | | | | |
Capital share transactions — R6 Shares | | | | | | | | | | | | | | | | |
Shares sold | | | 825 | | | | 205,665 | | | | 21,811 | | | | 216,024 | |
Shares issued in reinvestment of distributions | | | — | | | | — | | | | — | | | | — | |
Shares redeemed | | | (4,806 | ) | | | (633 | ) | | | — | | | | — | |
| | | | | | | | | | | | | | | | |
Net increase (decrease) | | | (3,981 | ) | | | 205,032 | | | | 21,811 | | | | 216,024 | |
| | | | | | | | | | | | | | | | |
| | |
| 28 | | See Notes to Financial Statements. |
| | |
| June 30, 2024 | | Baron Select Funds |
STATEMENT OF CASH FLOWS (Unaudited)
|
FOR THE SIX MONTHS ENDED JUNE 30, 2024 |
| | | | |
| | | Baron Partners
Fund | |
Increase (Decrease) in Cash: | | | | |
Cash Provided (Used) from Operating Activities | | | | |
Net increase (decrease) in net assets resulting from operations | | $ | (580,524,013 | ) |
Adjustments to reconcile net increase (decrease) in net assets resulting from operations to net cash provided (used) by operating activities: | | | | |
Purchases of portfolio securities | | | (32,673,526 | ) |
Proceeds from sales of portfolio securities | | | 582,154,433 | |
Net purchases (sales and maturities) of short-term investments | | | 199,665 | |
(Increase) decrease in dividends and interest receivable | | | (411,879 | ) |
(Increase) decrease in prepaid expenses | | | 205,152 | |
Increase (decrease) in accrued expenses | | | (217,874 | ) |
Net realized (gain) loss on investments | | | (355,780,611 | ) |
Change in net unrealized (appreciation) depreciation of investments | | | 889,415,363 | |
| | | | |
Net cash provided (used) by operating activities | | $ | 502,366,709 | |
| | | | |
Cash Provided in Financing Activities | | | | |
Proceeds from shares sold | | | 355,621,150 | |
Payment for shares redeemed | | | (859,365,859 | ) |
Increase (decrease) in due to custodian bank | | | (622,000 | ) |
Borrowings against line of credit | | | 332,900,000 | |
Repayments against line of credit | | | (330,900,000 | ) |
| | | | |
Net cash provided (used) in financing activities | | | (502,366,709 | ) |
| | | | |
Net increase (decrease) in cash | | | — | |
Cash at beginning of year | | | — | |
| | | | |
Cash at end of year | | | — | |
| | | | |
Supplemental cash flow information: | | | | |
Interest paid on line of credit | | $ | 30,384,721 | |
| | | | |
| | |
| See Notes to Financial Statements. | | 29 |
| | |
| Baron Select Funds | | June 30, 2024 |
NOTES TO FINANCIAL STATEMENTS (Unaudited)
1. ORGANIZATION
Baron Select Funds (the Trust) is registered under the Investment Company Act of 1940, as amended (the 1940 Act), as an open-end management investment company established as a Delaware statutory trust on April 30, 2003. The Trust currently offers 12 series (individually, a Fund and collectively, the Funds): Baron Partners Fund, Baron Focused Growth Fund, Baron International Growth Fund, Baron Real Estate Fund, Baron Emerging Markets Fund, Baron Global Advantage Fund, Baron Real Estate Income Fund, Baron WealthBuilder Fund, Baron Health Care Fund, Baron FinTech Fund, Baron New Asia Fund, and Baron Technology Fund. Baron WealthBuilder Fund is presented in a separate report.
Each Fund presented in this report offers Retail Shares, Institutional Shares, and R6 Shares. Each class of shares differs only in its ongoing fees, expenses, and eligibility requirements. Each class of shares has equal rights to earnings and assets, except that each class bears different expenses for distribution and shareholder servicing. Each Fund’s investment income, realized and unrealized gains or losses on investments and foreign currency, and expenses other than those attributable to a specific class are allocated to each class based on its relative net assets. Each class of shares has exclusive voting rights with respect to matters that affect just that class.
Baron Partners Fund was organized originally as a limited partnership in January 1992 under the laws of the State of Delaware. Effective as of the close of business on April 30, 2003, the predecessor partnership was reorganized into a series of the Trust. Baron Partners Fund commenced operations on April 30, 2003 with a contribution of assets and liabilities, including securities-in-kind, from the predecessor partnership.
Baron Focused Growth Fund was organized originally as a limited partnership in May 1996 under the laws of the State of Delaware. Effective as of the close of business on June 30, 2008, the predecessor partnership was reorganized into a series of the Trust. Baron Focused Growth Fund commenced operations on June 30, 2008 with a contribution of assets and liabilities, including securities-in-kind, from the predecessor partnership.
The investment goals of the Funds are as follows:
Baron Partners Fund is a non-diversified fund that seeks capital appreciation through long-term investments primarily in U.S. growth companies. The Fund may employ “leverage” by borrowing money and using it to purchase additional securities. Borrowing for investments increases both investment opportunity and investment risk.
Baron Focused Growth Fund is a non-diversified fund that seeks capital appreciation through long-term investments primarily in U.S. small- and mid-sized growth companies.
Baron International Growth Fund is a diversified fund that seeks capital appreciation through long-term investments primarily in non-U.S. growth companies.
Baron Real Estate Fund is a diversified fund that seeks capital appreciation through long-term investments primarily in U.S. and non-U.S. real estate and real estate-related companies.
Baron Emerging Markets Fund is a diversified fund that seeks capital appreciation through investments primarily in growth companies in developing countries.
Baron Global Advantage Fund is a diversified fund that seeks capital appreciation through investments primarily in equity securities of established and emerging markets companies located throughout the world.
Baron Real Estate Income Fund is a non-diversified fund that seeks both capital appreciation and current income through investments primarily in real estate income-producing securities and other real estate securities.
Baron Health Care Fund is a non-diversified fund that seeks capital appreciation through investments primarily in equity securities engaged in research, development, production, sale, delivery or distribution of products and services related to the health care industry.
Baron FinTech Fund is a diversified fund that seeks capital appreciation through investments primarily in equity securities that develop, use, or rely on innovative technologies or services, in a significant way, for banking, lending, capital markets, financial data analytics, insurance, payments, asset management, or wealth management.
Baron New Asia Fund is a diversified fund that seeks capital appreciation through investments primarily in equity securities located in Asia, but including all other developed, developing, and frontier countries in the Asian region.
Baron Technology Fund is a non-diversified fund that seeks capital appreciation through investments primarily in equity securities of U.S. and non-U.S. technology companies, selected for their durable growth potential from the development, advancement, and use of technology.
2. SIGNIFICANT ACCOUNTING POLICIES AND INVESTMENT RISKS
The following is a summary of significant accounting policies followed by the Funds. The policies are in conformity with accounting principles generally accepted in the United States of America (GAAP). The Trust is an investment company and therefore follows the investment company accounting and reporting guidance of the Financial Accounting Standards Board (FASB) Accounting Standard Codification Topic 946 Financial Services — Investment Companies.
a) Net Asset Value. The Funds’ share prices or net asset values (NAV) are calculated as of the scheduled close of the regular trading session (usually 4 p.m. E.T. or such other time as of which the Funds’ NAVs are calculated (the NAV Calculation Time)) on the New York Stock Exchange (the Exchange) on any day the Exchange is scheduled to be open. The NAV per share of a class is determined by dividing the value of the total assets of the Fund represented by such class, less all liabilities, by the total number of Fund shares of such class outstanding.
b) Security Valuation. Portfolio securities traded on any national stock exchange are valued based on the last sale price on the exchange where such shares are principally traded. For securities traded on NASDAQ, the Funds use the NASDAQ Official Closing Price. If there are no sales on a given day, the value of the security may be the average of the most recent bid and asked quotations on such exchange or the last sale price from a prior day. Where market quotations are not readily available, or, if in BAMCO, Inc.’s (the Adviser) judgment, they do not accurately reflect the fair value of a security, or an event occurs after the market close but before the Funds are priced that materially affects the value of a security, the security will be valued by the Adviser using policies and procedures approved by the Board of Trustees (the Board). The Board
30
| | |
| June 30, 2024 | | Baron Select Funds |
NOTES TO FINANCIAL STATEMENTS (Unaudited) (Continued)
2. SIGNIFICANT ACCOUNTING POLICIES AND INVESTMENT RISKS (Continued)
has designated the Adviser to perform fair value determinations pursuant to Rule 2a-5 under the 1940 Act. The Adviser has a Fair Valuation Committee (the Committee) comprised of senior management representatives and the Committee reports to the Board every quarter. Accordingly, the Committee may evaluate a variety of factors to determine the fair value of securities for which market quotations are determined not to be readily available or reliable. These factors include, but are not limited to, the type of security, the value of comparable securities, observations from financial institutions and relevant news events. Input from the Adviser’s portfolio management team also will be considered. Using a fair value pricing methodology to price securities may result in a value that is different from the most recent closing price of a security and from the prices used by other investment companies to calculate their portfolios’ NAVs.
U.S. Government obligations, money market instruments, and other debt instruments held by the Funds with a remaining maturity of 60 days or less are generally valued at amortized cost, which approximates fair value, unless an independent pricing service provides a valuation for such security or in the opinion of the Board or the Committee, the amortized cost method would not represent fair value. Debt instruments having a greater remaining maturity will be valued on the basis of prices obtained from a pricing service approved by the Board or at the mean of the bid and ask prices from the dealer maintaining an active market in that security. The value of the Funds’ investments in convertible bonds/convertible preferred stocks is determined primarily by obtaining valuations from independent pricing services based on readily available bid quotations or, if quotations are not available, by methods which include various considerations such as yields or prices of securities of comparable quality, coupon, maturity and type; indications as to values from dealers; and general market conditions. Other inputs used by an independent pricing service to value convertible bonds/convertible preferred stocks generally include underlying stock data, conversion premiums, listed bond and preferred stock prices and other market information which may include benchmark curves, trade execution data, sensitivity analysis, when available, or an estimated value calculated based on the price of the underlying common share on the valuation date adjusted for accrued and unpaid dividends. Open-end investment companies, including securities lending collateral invested in registered investment company money market funds, are valued at their NAV each day.
Non-U.S. equity securities traded on foreign securities exchanges are generally valued using an independent pricing vendor that provides daily fair value adjustment factors based on information such as local closing price, relevant general and sector indexes, currency fluctuations, and depositary receipts, as applicable. Securities valued using such adjustment factors are classified as Level 2 in the fair value hierarchy. The models of the independent pricing vendor generate an adjustment factor for each security, which is applied to the local closing price to adjust it for post-closing market movements up to the time the Funds are valued and translated into U.S. dollars. If the vendor does not provide an adjustment factor for a security, the security is valued based on its most recent local closing price and translated into U. S. dollars. The Adviser may also fair value securities in other situations, for example, when a particular foreign market is closed but the Funds are open. Other mutual funds may adjust the prices of their securities by different amounts.
c) Securities Transactions and Investment Income. Fund securities transactions are accounted for on trade date. Realized gain and loss from securities transactions are recorded on an identified cost basis for financial reporting and federal income tax purposes. Interest income is recognized on an accrual basis, which includes the accretion of discounts and amortization of premiums. Dividend income (net of withholding taxes, if any) is recognized on the ex-dividend date, except in the case of certain dividends from foreign securities which are recorded as soon as the Funds are informed of the dividend if such information is obtained subsequent to the ex-dividend date. Non-cash dividends received in the form of stock are recognized and recorded at fair value as non-cash dividend income.
Distributions received from certain investments such as real estate investment trusts (REITs) may be characterized as ordinary income, net capital gain, or a return of capital to the Funds. Since the classification of such payments are generally not known until after the end of the calendar year, the Funds estimate the expected classification of such payments based upon available information which may include the previous year’s allocation. Recharacterizations will be reflected in the following year as additional information becomes available from the issuers. The Funds record as dividend income the amounts characterized as ordinary income and as realized gain the amounts characterized as capital gain in the accompanying Statements of Operations. The amounts characterized as a return of capital are reflected as a reduction of cost of the related investment in the accompanying Portfolios of Investments.
d) Expense Allocation. The Funds are charged for those expenses that are directly attributable to each Fund, such as advisory and custodian fees. Expenses of the Trust and Baron Investment Funds Trust (collectively, the Fund Complex), not directly chargeable to one or more specific Baron Funds are typically allocated among the funds in the Fund Complex in proportion to their respective net assets. The Funds accrue distribution and service (12b-1) fees to Retail Shares.
e) Single Issuer. Single issuer risk is the possibility that factors specific to an issuer to which a Fund is exposed will affect the market prices of the issuer’s securities and therefore the NAV of the Fund. Due to the size of Baron Partners Fund’s investment in Tesla, Inc. (Tesla), 34% of the Fund’s net assets as of June 30, 2024, the NAV of the Fund will be materially impacted by the price of Tesla stock.
f) Non-Diversified Portfolio. Certain Funds are non-diversified, which means they will likely have a greater percentage of their assets in a single issuer than a diversified fund. As a result, a non-diversified Fund will likely invest a greater percentage of its assets in fewer issuers, and the performance of those issuers may have a greater effect on the Fund’s performance compared to a diversified fund. Thus, a non-diversified Fund is more likely to experience significant fluctuations in value, exposing the Fund to a greater risk of loss in any given period than a diversified fund. Additionally, non-diversified Funds may encounter difficulty liquidating securities.
g) Industry Concentration. From time to time, market fluctuations in the value of a Fund’s investments, combined with a Fund’s non-diversified portfolio, may result in a Fund being concentrated in the securities of a single issuer or a small number of issuers, including in a particular industry. As a result, this Fund will be particularly exposed to the risks of that company or industry relative to the risk exposure of investment companies holding a diversified portfolio of securities or those that seek to maintain near-index weightings in their portfolio securities. Accordingly, in those cases, a Fund will be disproportionately exposed to the market conditions, interest rates, and economic, regulatory, or financial developments that significantly affect that company or industry. For example, due to the size of Baron Partners Fund’s investment in Tesla, which represents about 34% of the Fund’s net assets as of June 30, 2024, the Fund will be more adversely impacted by negative developments affecting the automotive and energy industries, as well as governmental environmental regulations.
h) Use of Estimates. The preparation of financial statements in accordance with GAAP requires management to make estimates and assumptions that affect the reported amounts of assets and liabilities at the date of the financial statements and the amounts of income and expenses during the period. Actual results could differ from those estimates.
31
| | |
| Baron Select Funds | | June 30, 2024 |
NOTES TO FINANCIAL STATEMENTS (Unaudited) (Continued)
2. SIGNIFICANT ACCOUNTING POLICIES AND INVESTMENT RISKS (Continued)
i) Foreign Currency Translations. The accounting records of the Funds are maintained in U.S. dollars. Values of assets and liabilities denominated in foreign currencies are translated into U.S. dollars using the price of such currencies at the NAV Calculation Time. Purchases and sales of investments and dividend income are converted at the prevailing rate of exchange on the respective dates of such transactions. Net realized gain (loss) on foreign currency transactions includes gain (loss) arising from the fluctuation in the exchange rates between trade and settlement dates on security transactions and currency gain (loss) between the accrual and payment dates on dividends and foreign withholding taxes. The Funds do not isolate the portion of operations resulting from changes in foreign exchange rates on investments from the fluctuations arising from changes in their market prices. Such fluctuations are included with the net realized and unrealized gain or loss from investments and foreign currency transactions on the Statements of Operations. The Funds may invest in foreign securities and foreign currency transactions that may involve risks not associated with domestic investments as a result of the level of governmental supervision and regulation of foreign securities markets and the possibility of political or economic instability, among others.
Pursuant to U.S. federal income tax regulations, gains and losses from certain foreign currency transactions and the foreign currency portion of gains and losses realized on sales and maturities of foreign denominated debt securities are generally treated as ordinary income for U.S. federal income tax purposes.
j) Securities Lending. The Funds may lend securities to certain brokers under the terms of a master netting agreement. Upon such loans, the Funds receive collateral which is maintained by the custodian. The Funds may pay fees to the custodian for administering the securities lending program. The Funds earn interest on such collateral and earn income in the form of negotiated lenders’ fees, both of which are included in securities lending income in the Statements of Operations. Securities loaned are required to be secured at all times by collateral equal to at least 102% of the market value of the securities loaned. Risks may arise upon entering into securities lending to the extent that the value of the collateral is less than the value of the securities loaned due to the changes in the value of collateral or the loaned securities. The collateral is marked-to-market daily and settled on the next business day. The Funds may receive collateral in the form of cash or other eligible securities, such as a letter of credit issued by a U.S. bank or securities issued or guaranteed by the U.S. government. Securities purchased with cash collateral are subject to the risks inherent in investing in these securities.
There were no securities on loan at June 30, 2024.
k) Repurchase Agreements. The Funds may invest in repurchase agreements, which are short-term investments whereby the Funds acquire ownership of a debt security and the seller agrees to repurchase the security at a future date at a specified price. When entering into repurchase agreements, it is the Funds’ policy that their custodian take possession of the underlying collateral securities, the market value of which, at all times, equals at least 102% of the principal amount of the repurchase transaction. To the extent that any repurchase transaction exceeds one business day, the value of the collateral is marked-to-market to ensure the adequacy of the collateral. If the seller defaults and the market value of the collateral declines or if bankruptcy proceedings are commenced with respect to the seller of the security, realization of the collateral by the Funds may be delayed or limited. The information required to be disclosed by FASB Accounting Standards Update No. 2011-11 for the Funds’ investments in repurchase agreements at June 30, 2024, including the fair value of the repurchase agreement and the amount of collateral, can be found in each respective Fund’s Portfolio of Investments.
l) Master Limited Partnerships. The Funds may invest in master limited partnerships (MLPs). MLPs are limited partnerships or limited liability companies, whose partnership units or limited liability interests are listed and traded on a U.S. securities exchange, and are treated as publicly traded partnerships for federal income tax purposes. To qualify to be treated as a partnership for tax purposes, an MLP must receive at least 90% of its income from qualifying sources as set forth in Section 7704(d) of the Internal Revenue Code of 1986, as amended. These qualifying sources include interest, dividend, real property rent, gain from sale or other disposition of real property and income from activities such as the exploration, development, mining, production, processing, refining, transportation, storage and marketing of mineral or natural resources.
m) Special Purpose Acquisition Company. The Funds may acquire an interest in a special purpose acquisition company (SPAC) in an initial public offering (IPO), via a private placement or a secondary market transaction. A SPAC is typically a publicly traded company that raises investment capital via an IPO for the purpose of acquiring the equity securities of one or more existing companies via merger, combination, acquisition or other similar transactions. To the extent the SPAC is invested in cash or similar securities, this may negatively affect a Fund’s performance if the Fund is invested in the SPAC during such period. There is no guarantee that the SPACs will complete an acquisition or that any acquisitions that are completed will be profitable. Some SPACs may pursue acquisitions only within certain industries or regions, which may increase the volatility of their prices. These transactions will require the approval of the respective shareholders and are subject to other customary closing conditions, including the receipt of certain regulatory approvals. If these conditions are not met, the SPAC’s acquisition may not close and, to the extent a Fund had committed to participate in a private placement (i.e., PIPE transaction, defined below), the Fund will no longer be obligated to fulfill its commitment.
n) Private Investment in Public Equity. The Funds may acquire equity securities of an issuer that are issued through a private investment in public equity (PIPE) transaction, including through commitments to purchase securities on a when-issued basis. A Fund will generally earmark an amount of cash or high quality securities equal to the amount of its commitment to purchase the when-issued securities. PIPE transactions typically involve the purchase of securities directly from a publicly traded company in a private placement transaction, including securities issued by a SPAC, typically at a discount to the market price of the company’s securities. There is a risk that if the market price of the securities drops below a set threshold, the company may have to issue additional stock at a significantly reduced price, which may dilute the value of a Fund’s investment. Shares in PIPEs generally are not registered with the SEC until after a certain time period from the date the private sale is completed. This restriction can last an uncertain amount of time and may be many months. Until the public registration process is completed, securities acquired via a PIPE are restricted as to resale and a Fund cannot freely trade the securities. Generally, such restrictions cause these securities to be illiquid during this time. PIPEs may contain provisions that the issuer will pay specified financial penalties to the holder if the issuer does not publicly register the restricted equity securities within a specified period of time, but there is no assurance that the restricted equity securities will be publicly registered, or that the registration will remain in effect.
Publicly traded securities acquired via a PIPE transaction are typically valued at the market price of an issuer’s common stock and classified as Level 2 in the fair value hierarchy.
32
| | |
| June 30, 2024 | | Baron Select Funds |
NOTES TO FINANCIAL STATEMENTS (Unaudited) (Continued)
2. SIGNIFICANT ACCOUNTING POLICIES AND INVESTMENT RISKS (Continued)
o) Federal and Foreign Income Taxes. The Trust treats each Fund as a separate entity for federal income tax purposes. Each Fund intends to meet the requirements of the Internal Revenue Code of 1986, as amended, applicable to regulated investment companies, and to distribute to its shareholders substantially all of its net investment income and any net realized capital gains at least annually. None of the Funds will be subject to federal or state income taxes to the extent that they qualify as regulated investment companies and substantially all of their income is distributed.
The Funds are subject to foreign tax on capital gains and withholding taxes on income from foreign investments that are accrued based upon the Funds’ understanding of the tax rules and regulations that exist in the countries in which they invest. Foreign governments may also impose taxes or other payments on investments with respect to foreign securities. Such taxes are accrued as applicable.
The Funds attempt to qualify for reduced tax rates or exemptions in countries with which the United States has a tax treaty and may file withholding tax reclaims in certain countries to recover portions of amounts previously withheld.
Further, as a result of several court cases across the European Union, the Funds may also file tax reclaims for previously withheld taxes in those countries. These filings are subject to various administrative proceedings by the local jurisdictions’ tax authorities, as well as several related judicial proceedings. Uncertainty exists as to the ultimate resolution of these proceedings, the likelihood of receipt of these claims, and the potential timing of payment, and accordingly no amounts are reflected in the financial statements until a positive decision has been awarded, at which time the amount will be recorded as a reduction of foreign taxes withheld on dividends, or as dividend income to the extent such claims exceed the foreign taxes withheld on dividends included within dividend income on the Statement of Operations. Such amounts, if and when recorded, could result in an increase in the respective Funds’ NAV per share.
p) Restricted Securities. The Funds may invest in securities that are restricted as to public sale in accordance with the Securities Act of 1933. Such assets are valued by the Adviser pursuant to policies and procedures approved by the Board. Refer to Note 6 for additional information.
q) Distributions to Shareholders. Income and capital gain distributions to shareholders are determined in accordance with income tax regulations which may differ from GAAP. These differences are primarily due to differing treatments for net investment loss, foreign currency gains and losses, non-deductible interest expense, reclassification of distributions, partnership basis adjustments, income from passive foreign investment companies, foreign capital gains tax, late-year loss deferral, post-October loss deferral, and wash sale loss deferral. Income dividends are normally declared and paid annually, except that the Baron Real Estate Income Fund’s income dividends (if any), will be declared and paid quarterly. During any particular year, net realized gains from investment transactions in excess of available capital loss carryforwards would be taxable to the Funds, if not distributed. The Funds intend to declare and distribute these amounts, at least annually, to shareholders, but may be distributed more frequently. Differences in per share distributions, by class, are generally due to differences in class specific expenses.
r) Commitments and Contingencies. In the normal course of business, the Funds may enter into contracts and agreements that contain a variety of representations and warranties, which provide general indemnification. The maximum exposure to the Funds under these agreements is unknown, as this would involve future claims that may be made against the Funds that have not yet occurred. However, based on experience, the Funds expect the risk of loss to be remote.
s) Cash and Cash Equivalents. The Funds consider all short-term liquid investments with a maturity of three months or less when purchased to be cash equivalents.
t) Russia and Ukraine Risk. Certain Funds invested in securities and instruments that are economically tied to Russia. Due to the uncertainty of the geopolitical tension in Russia/Ukraine, investments in Russia are subject to political, economic, legal, market and currency risks, as well as the risk that further economic sanctions may be imposed by the U.S. and/or other countries. Such sanctions — which may impact companies in many sectors, including energy, financial services and defense, among others — may negatively impact a Fund’s performance and/or ability to achieve its investment objective. For example, certain transactions may be prohibited and/or existing investments may become illiquid (e.g., in the event that transacting in certain existing investments is prohibited), which could cause a Fund to sell other portfolio holdings at a disadvantageous time or price in order to meet shareholder redemptions.
3. PURCHASES AND SALES OF SECURITIES
Purchases and sales of securities, other than short-term securities, for the six months ended June 30, 2024 were as follows:
| | | | | | | | |
| | |
| Fund | | Purchases | | | Sales | |
Baron Partners Fund | | $ | 32,673,526 | | | $ | 569,061,225 | |
Baron Focused Growth Fund | | | 103,606,671 | | | | 64,728,086 | |
Baron International Growth Fund | | | 53,908,447 | | | | 219,932,330 | |
Baron Real Estate Fund | | | 507,132,842 | | | | 537,088,214 | |
Baron Emerging Markets Fund | | | 803,248,268 | | | | 1,564,105,666 | |
Baron Global Advantage Fund | | | 17,678,491 | | | | 148,858,428 | |
Baron Real Estate Income Fund | | | 82,350,941 | | | | 85,127,417 | |
Baron Health Care Fund | | | 51,115,757 | | | | 46,965,979 | |
Baron FinTech Fund | | | 2,188,453 | | | | 4,891,808 | |
Baron New Asia Fund | | | 2,065,984 | | | | 1,350,014 | |
Baron Technology Fund | | | 26,477,585 | | | | 4,497,620 | |
33
| | |
| Baron Select Funds | | June 30, 2024 |
NOTES TO FINANCIAL STATEMENTS (Unaudited) (Continued)
4. INVESTMENT ADVISORY FEES AND OTHER TRANSACTIONS WITH AFFILIATES
a) Investment Advisory Fees. The Adviser, a wholly owned subsidiary of Baron Capital Group, Inc. (BCG), serves as investment adviser to the Funds. As compensation for services rendered, the Adviser receives a fee accrued daily as a percentage of each Fund’s average daily net assets and payable monthly, at an annual rate set forth below:
| | | | |
| |
| Fund | | Annual Rate | |
Baron Partners Fund | | | 1.00 | % |
Baron Focused Growth Fund | | | 1.00 | % |
Baron International Growth Fund | | | 0.88 | % |
Baron Real Estate Fund | | | 1.00 | % |
Baron Emerging Markets Fund | | | 1.00 | % |
Baron Global Advantage Fund | | | 0.85 | % |
Baron Real Estate Income Fund | | | 0.75 | % |
Baron Health Care Fund | | | 0.75 | % |
Baron FinTech Fund | | | 0.80 | % |
Baron New Asia Fund | | | 1.00 | % |
Baron Technology Fund | | | 0.80 | % |
The Adviser has contractually agreed to waive its fee or reimburse Fund expenses to the extent required to limit the net annual operating expense ratio (excluding portfolio transaction costs, interest and dividend expense, acquired fund fees and expenses, fees and expenses related to filing foreign tax reclaims, and extraordinary expenses) pursuant to a contract expiring on August 29, 2034, unless renewed for another 11-year term , as follows:
| | | | | | | | | | | | |
| |
| | | Annual Operating
Expense Ratio Cap | |
| | | |
| Fund | | Retail
Shares | | | Institutional
Shares | | | R6
Shares | |
Baron Partners Fund | | | 1.45 | % | | | 1.20 | % | | | 1.20 | % |
Baron Focused Growth Fund | | | 1.35 | % | | | 1.10 | % | | | 1.10 | % |
Baron International Growth Fund | | | 1.20 | % | | | 0.95 | % | | | 0.95 | % |
Baron Real Estate Fund | | | 1.35 | % | | | 1.10 | % | | | 1.10 | % |
Baron Emerging Markets Fund | | | 1.50 | % | | | 1.25 | % | | | 1.25 | % |
Baron Global Advantage Fund | | | 1.15 | % | | | 0.90 | % | | | 0.90 | % |
Baron Real Estate Income Fund | | | 1.05 | % | | | 0.80 | % | | | 0.80 | % |
Baron Health Care Fund | | | 1.10 | % | | | 0.85 | % | | | 0.85 | % |
Baron FinTech Fund | | | 1.20 | % | | | 0.95 | % | | | 0.95 | % |
Baron New Asia Fund | | | 1.45 | % | | | 1.20 | % | | | 1.20 | % |
Baron Technology Fund | | | 1.20 | % | | | 0.95 | % | | | 0.95 | % |
During the six months ended June 30, 2024, the Adviser waived its management fees and reimbursed other expenses, if applicable, as follows:
| | | | | | | | | | | | | | | | | | | | | | | | |
| | | |
| | | Retail Shares | | | Institutional Shares | | | R6 Shares | |
| | | | | | |
| Fund | | Management
Fees Waived | | | Expenses
Reimbursed | | | Management
Fees Waived | | | Expenses
Reimbursed | | | Management
Fees Waived | | | Expenses
Reimbursed | |
Baron International Growth Fund | | $ | 34,142 | | | $ | — | | | $ | 89,126 | | | $ | — | | | $ | 12,350 | | | $ | — | |
Baron Global Advantage Fund | | | 63,899 | | | | — | | | | 131,014 | | | | — | | | | 3,036 | | | | — | |
Baron Real Estate Income Fund | | | 15,525 | | | | — | | | | 78,777 | | | | — | | | | 2,593 | | | | — | |
Baron Health Care Fund | | | 26,247 | | | | — | | | | 32,854 | | | | — | | | | 2,676 | | | | — | |
Baron FinTech Fund | | | 12,841 | | | | — | | | | 38,340 | | | | — | | | | 8,139 | | | | — | |
Baron New Asia Fund | | | 5,329 | | | | 29,085 | | | | 9,327 | | | | 40,411 | | | | 9,432 | | | | 34,865 | |
Baron Technology Fund | | | 34,370 | | | | — | | | | 34,116 | | | | — | | | | 10,040 | | | | — | |
The aforementioned fee waivers and reimbursements, if applicable, are not subject to recoupment by the Adviser.
b) Distribution Fees. Baron Capital, Inc. (BCI), a wholly owned subsidiary of BCG, is a registered broker-dealer and the distributor of the Funds’ shares. The Funds are authorized to pay BCI a distribution fee payable monthly pursuant to a distribution plan under Rule 12b-1 of the 1940 Act equal to 0.25% per annum of the Retail Shares’ average daily net assets of the respective Funds.
c) Trustee Fees. Certain Trustees of the Trust are officers of the Adviser and received no direct renumeration in such capacity from the Fund Complex. The Fund Complex pays each Independent Trustee (an Independent Trustee is a Trustee who is not an interested person (as defined in the 1940 Act) of the Fund Complex) annual compensation in addition to reimbursement of out-of-pocket expenses in connection with attendance at meetings of the Board. Specifically, each Independent Trustee receives an annual base compensation of $215,000 with the lead Independent Trustee receiving an additional $25,000. An additional $60,000 per annum is paid to each Independent Trustee for attendance at the quarterly meetings of the Board. Each member of the Audit Committee receives an additional $12,500 in annual compensation with the Audit Committee Chairperson receiving an additional $12,500.
d) Custody, Fund Accounting and Administration Fees. The Funds have entered into an agreement with State Street Bank and Trust Company (State Street) to perform custody, accounting and certain administrative services.
34
| | |
| June 30, 2024 | | Baron Select Funds |
NOTES TO FINANCIAL STATEMENTS (Unaudited) (Continued)
4. INVESTMENT ADVISORY FEES AND OTHER TRANSACTIONS WITH AFFILIATES (Continued)
e) Cross Trades. The Funds are permitted to purchase securities from, or sell securities to, other Funds within the Trust, the funds in Baron Investment Funds Trust and other entities advised or subadvised by the Adviser, pursuant to “Cross-Trading Procedures” adopted by the Board. These procedures have been designed to ensure that any cross-trade of securities by the respective Baron Fund from or to another fund/other entity that is or could be considered an affiliate of a Fund under certain limited circumstances by virtue of having a common investment adviser, common officers, or common trustees complies with Rule 17a-7 under the 1940 Act. Further, as defined under these procedures, each cross-trade is effected at the current market price and with no commissions. Pursuant to these procedures, for the six months ended June 30, 2024, the Funds did not engage in the cross-trades.
f) Ownership Concentration. As of June 30, 2024, the officers, Trustees, and portfolio managers owned, directly or indirectly, 34.69% of Baron Focused Growth Fund, 23.77% of Baron FinTech Fund, 65.32% of Baron New Asia Fund, and 11.49% of Baron Technology Fund. As a result of their ownership, these investors may be able to materially affect the outcome of matters presented to Baron Focused Growth Fund, Baron FinTech Fund, Baron New Asia Fund and Baron Technology Fund shareholders.
5. LINE OF CREDIT
Baron Partners Fund participates in a committed syndicated line of credit agreement with State Street in the amount of $1 billion that is used for investment purposes. Depending on the outstanding loan amount, a commitment fee of 0.15% or 0.25% per annum is incurred on the unused portion of the line of credit. Baron Partners Fund may borrow up to the lesser of $1 billion or the maximum amount Baron Partners Fund may borrow under the 1940 Act, the limitations included in Baron Partners Fund’s prospectus, or any limit or restriction under any law or regulation to which Baron Partners Fund is subject or any agreement to which Baron Partners Fund is a party. Interest is charged to Baron Partners Fund, based on its borrowings, at a rate per annum equal to the higher of the One-Month Term Secured Overnight Financing Rate plus 0.10%, the Federal Funds Effective Rate, or the Overnight Bank Funding Rate (OBFR); plus a margin of 0.85%. An upfront fee of 0.05% is incurred on the commitment amount.
The Fund Complex (except Baron Partners Fund), participates in a committed line of credit agreement with State Street to be used for temporary purposes, primarily for financing redemptions. Each fund may borrow up to the lesser of $200 million or the maximum amount each fund may borrow under the 1940 Act, the limitations included in each fund’s prospectus, or any limit or restriction under any law or regulation to which each fund is subject or any agreement to which each fund is a party; provided that the aggregate outstanding principal amount of all loans to any of the funds may not exceed $200 million. Interest is charged to each fund, based on its borrowings, at a rate per annum equal to the higher of the OBFR plus 0.10% or the Federal Funds Effective Rate plus 0.10%; plus a margin of 1.00%. An upfront fee of 0.05% is incurred on the commitment amount and a commitment fee of 0.20% per annum is incurred on the unused portion of the line of credit. Both fees are allocated to the participating funds based on their relative net assets.
During the six months ended June 30, 2024, the following Funds had borrowings under the line of credit as follows:
| | | | | | | | | | | | | | | | | | | | |
| | | | | |
| Fund | | Average
Daily Loan
Balance* | | | Maximum
Daily Loan
Outstanding | | | Weighted
Average
Interest
Rate* | | | Number of
Days
Borrowing
Outstanding | | | Outstanding
Balance as
of
6/30/2024 | |
Baron Partners Fund | | $ | 944.7 million | | | $ | 1.0 billion | | | | 6.38 | % | | | 182 | | | $ | 989 million | |
Baron Global Advantage Fund | | $ | 3.1 million | | | $ | 11.7 million | | | | 6.54 | % | | | 123 | | | $ | 2.2 million | |
| * | For the days borrowings were outstanding. |
The Adviser believes that the fair value of the liabilities under each line of credit is equivalent to the recorded amount based on its short-term maturity and interest rate, which fluctuates over time. A Fund’s outstanding balance under the line of credit, if any, would be categorized as Level 2 in the fair value hierarchy, which is further discussed in Note 7.
6. RESTRICTED SECURITIES
At June 30, 2024, investments in securities included securities that are restricted and/or illiquid. Restricted securities are often purchased in private placement transactions, are not registered under the Securities Act of 1933, may have contractual restrictions on resale and are valued pursuant to the policies and procedures for fair value pricing approved by the Board. An illiquid investment is any investment that the Funds reasonably expect cannot be sold or disposed of in current market conditions in seven calendar days or less without the sale or disposition significantly changing the market value of the investment, as determined pursuant to the provisions of SEC Rule 22e -4 (the Liquidity Rule) governing classification of portfolio securities. The Funds may receive more or less than this valuation in an actual sale and that difference could be material.
At June 30, 2024, the Funds held investments in restricted and/or illiquid securities that were valued pursuant to policies and procedures for fair value pricing as follows:
| | | | | | | | |
| |
| | | Baron Partners Fund | |
| | |
| Name of Issuer | | Acquisition Date(s) | | | Value | |
Private Common Stocks | | | | | | | | |
Space Exploration Technologies Corp. | | | 9/13/2017 | | | $ | 282,074,240 | |
StubHub Holdings, Inc. | | | 12/22/2021 | | | | 47,162,319 | |
X Holdings I, Inc. | | | 5/4/2022 | | | | 16,392,000 | |
| | |
Private Convertible Preferred Stocks | | | | | | | | |
Northvolt AB | | | 5/19/2021 | | | | 6,923,310 | |
| | |
Private Preferred Stocks | | | | | | | | |
Space Exploration Technologies Corp. | | | 11/15/2017-8/4/2020 | | | | 620,344,480 | |
| | | | | | | | |
| | |
Total Restricted Securities: | | | | | | $ | 972,896,349 | |
| | | | | | | | |
(Cost $246,093,669)† (16.58% of Net Assets) | | | | | | | | |
| † | See Portfolios of Investments for cost of individual securities. |
35
| | |
| Baron Select Funds | | June 30, 2024 |
NOTES TO FINANCIAL STATEMENTS (Unaudited) (Continued)
6. RESTRICTED SECURITIES (Continued)
| | | | | | | | |
| |
| | | Baron Focused Growth Fund | |
| | |
| Name of Issuer | | Acquisition Date(s) | | | Value | |
Private Common Stocks | | | | | | | | |
Space Exploration Technologies Corp. | | | 9/13/2017 | | | $ | 86,546,880 | |
| | |
Private Preferred Stocks | | | | | | | | |
Space Exploration Technologies Corp. | | | 11/15/2017-11/29/2023 | | | | 59,039,680 | |
X.AI Corp. | | | 6/11/2024 | | | | 19,999,991 | |
| | | | | | | | |
| | |
Total Restricted Securities: | | | | | | $ | 165,586,551 | |
| | | | | | | | |
(Cost $69,949,847)† (11.73% of Net Assets) | | | | |
| | | | |
| |
| | | Baron International Growth Fund | |
| | |
| Name of Issuer | | Acquisition Date(s) | | | Value | |
Common Stocks | | | | | | | | |
Sberbank of Russia PJSC | | | 1/24/2017-10/29/2021 | | | $ | 329 | |
| | |
Warrants | | | | | | | | |
Constellation Software, Inc., Exp 3/31/2040 | | | 8/23/2023 | | | | 0 | |
| | | | | | | | |
| | |
Total Restricted Securities: | | | | | | $ | 329 | |
| | | | | | | | |
(Cost $1,650,983)† (0.00%^ of Net Assets) | | | | |
| |
| | | Baron Emerging Markets Fund | |
| | |
| Name of Issuer | | Acquisition Date(s) | | | Value | |
Common Stocks | |
Sberbank of Russia PJSC | | | 2/11/2016 | | | $ | 12,120 | |
| |
Private Common Stocks | | | | | |
Pine Labs PTE. Ltd. | | | 5/17/2021 | | | | 40,331,164 | |
| |
Private Convertible Preferred Stocks | | | | |
Bundl Technologies Private Ltd. | | | 1/3/2022 | | | | 103,193,835 | |
Think & Learn Private Limited | | | 3/31/2021 | | | | 75,499 | |
| | | | | | | | |
| | |
Total Restricted Securities: | | | | | | $ | 143,612,618 | |
| | | | | | | | |
(Cost $230,983,530)† (3.55% of Net Assets) | |
| |
| | | Baron Global Advantage Fund | |
| | |
| Name of Issuer | | Acquisition Date(s) | | | Value | |
Private Common Stocks | | | | |
Farmers Business Network, Inc. | | | 7/31/2020-9/15/2021 | | | $ | 557,556 | |
Space Exploration Technologies Corp. | | | 3/25/2021-12/3/2021 | | | | 36,666,560 | |
| |
Private Convertible Preferred Stocks | | | | | |
Think & Learn Private Limited | | | 3/31/2021 | | | | 45,302 | |
| |
Private Preferred Stocks | | | | |
GM Cruise Holdings LLC | | | 1/19/2021 | | | | 2,798,294 | |
| | | | | | | | |
| | |
Total Restricted Securities: | | | | | | $ | 40,067,712 | |
| | | | | | | | |
(Cost $69,264,694)† (6.67% of Net Assets) | |
| † | See Portfolios of Investments for cost of individual securities. |
| ^ | Rounds to less than 0.01%. |
7. FAIR VALUE MEASUREMENTS
Fair value is defined by GAAP as the price that the Funds would receive upon selling an investment in a timely transaction to an independent buyer in the principal or most advantageous market for the investment. GAAP provides a three-tier hierarchy to maximize the use of observable market data and minimize the use of unobservable inputs and to establish classification of fair value measurements for disclosure purposes. Inputs refer broadly to the assumptions that market participants would use in pricing the asset or liability. Inputs may be observable or unobservable. Observable inputs are based on market data obtained from sources independent of the Funds. Unobservable inputs are inputs that reflect the Funds’ own assumptions based on the best information available in the circumstances. The three-tier hierarchy of inputs is summarized in the three broad Levels listed below.
| | • | | Level 1 — quoted prices in active markets for identical assets or liabilities; |
36
| | |
| June 30, 2024 | | Baron Select Funds |
NOTES TO FINANCIAL STATEMENTS (Unaudited) (Continued)
7. FAIR VALUE MEASUREMENTS (Continued)
| | • | | Level 2 — prices determined using other inputs that are observable either directly or indirectly through corroboration with observable market data (which could include quoted prices for similar assets or liabilities, interest rates, credit risk, etc.); |
| | • | | Level 3 — prices determined using unobservable inputs when quoted prices or observable inputs are unavailable, such as when there is little or no market activity for an asset or liability (unobservable inputs reflect each Fund’s own assumptions in determining the fair value of assets or liabilities and would be based on the best information available). |
The inputs or methodology used for valuing securities are not necessarily an indication of the risk or liquidity associated with investing in those securities. For example, non-U.S. securities, with markets that close hours before the Funds value their holdings, may require revised valuations to more accurately reflect their fair value. Since these values obtained from quoted prices in an active market are adjusted, such securities are reflected as Level 2.
The Funds have procedures to determine the fair value of securities and other financial instruments for which market prices are not readily available or which may not be reliably priced. Under these procedures, the Funds primarily employ a market-based approach that may use related or comparable assets or liabilities, recent transactions, market multiples, book values, and other relevant information for the investment to determine its fair value. The Funds may also use an income-based valuation approach in which the anticipated future cash flows of the investment are discounted to calculate fair value. Discounts may also be applied due to the nature or duration of any restrictions on the disposition of the investments. Due to the inherent uncertainty of valuations of such investments, the fair values may differ significantly from the values that would have been used had an active market existed.
The following is a summary of the inputs used as of June 30, 2024 in valuing the Funds’ investments carried at fair value:
| | | | | | | | | | | | | | | | |
| |
| | | Baron Partners Fund | |
| | | | |
| Description | | Quoted Prices in
Active Markets
for Identical
Assets
(Level 1) | | | Other
Observable
Inputs
(Level 2) | | | Unobservable
Inputs
(Level 3) | | | Total | |
Common Stocks† | | $ | 5,878,709,814 | | | $ | — | | | $ | — | | | $ | 5,878,709,814 | |
Private Common Stocks† | | | — | | | | — | | | | 345,628,559 | | | | 345,628,559 | |
Private Convertible Preferred Stocks | | | — | | | | — | | | | 6,923,310 | | | | 6,923,310 | |
Private Preferred Stocks | | | — | | | | — | | | | 620,344,480 | | | | 620,344,480 | |
Short-Term Investments | | | — | | | | 465,324 | | | | — | | | | 465,324 | |
| | | | | | | | | | | | | | | | |
Total Investments | | $ | 5,878,709,814 | | | $ | 465,324 | | | $ | 972,896,349 | | | $ | 6,852,071,487 | |
| | | | | | | | | | | | | | | | |
| |
| | | Baron Focused Growth Fund | |
| | | | |
| Description | | Quoted Prices in
Active Markets
for Identical
Assets
(Level 1) | | | Other
Observable
Inputs
(Level 2) | | | Unobservable
Inputs
(Level 3) | | | Total | |
Common Stocks† | | $ | 1,224,662,155 | | | $ | — | | | $ | — | | | $ | 1,224,662,155 | |
Private Common Stocks | | | — | | | | — | | | | 86,546,880 | | | | 86,546,880 | |
Private Preferred Stocks† | | | — | | | | — | | | | 79,039,671 | | | | 79,039,671 | |
Short-Term Investments | | | — | | | | 16,270,861 | | | | — | | | | 16,270,861 | |
| | | | | | | | | | | | | | | | |
Total Investments | | $ | 1,224,662,155 | | | $ | 16,270,861 | | | $ | 165,586,551 | | | $ | 1,406,519,567 | |
| | | | | | | | | | | | | | | | |
| |
| | | Baron International Growth Fund | |
| | | | |
| Description | | Quoted Prices in
Active Markets
for Identical
Assets
(Level 1) | | | Other
Observable
Inputs
(Level 2) | | | Unobservable
Inputs
(Level 3) | | | Total | |
Common Stocks† | | $ | 115,296,642 | | | $ | 217,622,978 | | | $ | 329 | | | | 332,919,949 | |
Rights | | | 3,410 | | | | — | | | | — | | | | 3,410 | |
Warrants | | | 9,079 | | | | — | | | | — | | | | 9,079 | |
Short-Term Investments | | | — | | | | 11,998,666 | | | | — | | | | 11,998,666 | |
| | | | | | | | | | | | | | | | |
Total Investments | | $ | 115,309,131 | | | $ | 229,621,644 | | | $ | 329 | | | $ | 344,931,104 | |
| | | | | | | | | | | | | | | | |
| † | See Portfolios of Investments for additional detailed categorizations. |
37
| | |
| Baron Select Funds | | June 30, 2024 |
NOTES TO FINANCIAL STATEMENTS (Unaudited) (Continued)
7. FAIR VALUE MEASUREMENTS (Continued)
| | | | | | | | | | | | | | | | |
| |
| | | Baron Real Estate Fund | |
| | | | |
| Description | | Quoted Prices in
Active Markets
for Identical
Assets
(Level 1) | | | Other
Observable
Inputs
(Level 2) | | | Unobservable
Inputs
(Level 3) | | | Total | |
Common Stocks† | | $ | 1,648,101,242 | | | $ | — | | | $ | — | | | $ | 1,648,101,242 | |
Short-Term Investments | | | — | | | | 101,095,122 | | | | — | | | | 101,095,122 | |
| | | | | | | | | | | | | | | | |
Total Investments | | $ | 1,648,101,242 | | | $ | 101,095,122 | | | $ | — | | | $ | 1,749,196,364 | |
| | | | | | | | | | | | | | | | |
| |
| | | Baron Emerging Markets Fund | |
| | | | |
| Description | | Quoted Prices in
Active Markets
for Identical
Assets
(Level 1) | | | Other
Observable
Inputs
(Level 2) | | | Unobservable
Inputs
(Level 3) | | | Total | |
Common Stocks† | | $ | 1,017,690,510 | | | $ | 2,764,013,001 | | | $ | 12,120 | | | $ | 3,781,715,631 | |
Private Common Stocks | | | — | | | | — | | | | 40,331,164 | | | | 40,331,164 | |
Private Convertible Preferred Stocks† | | | — | | | | — | | | | 103,269,334 | | | | 103,269,334 | |
Rights | | | 81,425 | | | | — | | | | — | | | | 81,425 | |
Warrants | | | 13,657 | | | | — | | | | — | | | | 13,657 | |
Short-Term Investments | | | — | | | | 166,846,413 | | | | — | | | | 166,846,413 | |
| | | | | | | | | | | | | | | | |
Total Investments | | $ | 1,017,785,592 | | | $ | 2,930,859,414 | | | $ | 143,612,618 | | | $ | 4,092,257,624 | |
| | | | | | | | | | | | | | | | |
| |
| | | Baron Global Advantage Fund | |
| | | | |
| Description | | Quoted Prices in
Active Markets
for Identical
Assets
(Level 1) | | | Other
Observable
Inputs
(Level 2) | | | Unobservable
Inputs
(Level 3) | | | Total | |
Common Stocks† | | $ | 473,186,455 | | | $ | 86,432,775 | | | $ | — | | | $ | 559,619,230 | |
Private Common Stocks† | | | — | | | | — | | | | 37,224,116 | | | | 37,224,116 | |
Private Convertible Preferred Stocks | | | — | | | | — | | | | 45,302 | | | | 45,302 | |
Private Preferred Stocks | | | — | | | | — | | | | 2,798,294 | | | | 2,798,294 | |
Warrants† | | | 558,515 | | | | — | | | | — | | | | 558,515 | |
Short-Term Investments | | | — | | | | 684,891 | | | | — | | | | 684,891 | |
| | | | | | | | | | | | | | | | |
Total Investments | | $ | 473,744,970 | | | $ | 87,117,666 | | | $ | 40,067,712 | | | $ | 600,930,348 | |
| | | | | | | | | | | | | | | | |
| |
| | | Baron Real Estate Income Fund | |
| | | | |
| Description | | Quoted Prices in
Active Markets
for Identical
Assets
(Level 1) | | | Other
Observable
Inputs
(Level 2) | | | Unobservable
Inputs
(Level 3) | | | Total | |
Common Stocks† | | $ | 141,931,566 | | | $ | — | | | $ | — | | | $ | 141,931,566 | |
Short-Term Investments | | | — | | | | 3,320,521 | | | | — | | | | 3,320,521 | |
| | | | | | | | | | | | | | | | |
Total Investments | | $ | 141,931,566 | | | $ | 3,320,521 | | | $ | — | | | $ | 145,252,087 | |
| | | | | | | | | | | | | | | | |
| |
| | | Baron Health Care Fund | |
| | | | |
| Description | | Quoted Prices in
Active Markets
for Identical
Assets
(Level 1) | | | Other
Observable
Inputs (Level 2) | | | Unobservable
Inputs
(Level 3) | | | Total | |
Common Stocks† | | $ | 223,121,561 | | | $ | — | | | $ | — | | | $ | 223,121,561 | |
Short-Term Investments | | | — | | | | 9,462,323 | | | | — | | | | 9,462,323 | |
| | | | | | | | | | | | | | | | |
Total Investments | | $ | 223,121,561 | | | $ | 9,462,323 | | | $ | — | | | $ | 232,583,884 | |
| | | | | | | | | | | | | | | | |
| † | See Portfolios of Investments for additional detailed categorizations. |
38
| | |
| June 30, 2024 | | Baron Select Funds |
NOTES TO FINANCIAL STATEMENTS (Unaudited) (Continued)
7. FAIR VALUE MEASUREMENTS (Continued)
| | | | | | | | | | | | | | | | |
| |
| | | Baron FinTech Fund | |
| | | | |
| Description | | Quoted Prices in
Active Markets
for Identical
Assets
(Level 1) | | | Other
Observable
Inputs
(Level 2) | | | Unobservable
Inputs
(Level 3) | | | Total | |
Common Stocks† | | $ | 57,646,854 | | | $ | 1,046,350 | | | $ | — | | | $ | 58,693,204 | |
Short-Term Investments | | | — | | | | 837,303 | | | | — | | | | 837,303 | |
| | | | | | | | | | | | | | | | |
Total Investments | | $ | 57,646,854 | | | $ | 1,883,653 | | | $ | — | | | $ | 59,530,507 | |
| | | | | | | | | | | | | | | | |
| |
| | | Baron New Asia Fund | |
| | | | |
| Description | | Quoted Prices in
Active Markets
for Identical
Assets
(Level 1) | | | Other
Observable
Inputs
(Level 2) | | | Unobservable
Inputs
(Level 3) | | | Total | |
Common Stocks† | | $ | 722,797 | | | $ | 5,014,253 | | | $ | — | | | $ | 5,737,050 | |
Short-Term Investments | | | — | | | | 328,356 | | | | — | | | | 328,356 | |
| | | | | | | | | | | | | | | | |
Total Investments | | $ | 722,797 | | | $ | 5,342,609 | | | $ | — | | | $ | 6,065,406 | |
| | | | | | | | | | | | | | | | |
| |
| | | Baron Technology Fund | |
| | | | |
| Description | | Quoted Prices in
Active Markets
for Identical
Assets
(Level 1) | | | Other
Observable
Inputs
(Level 2) | | | Unobservable
Inputs
(Level 3) | | | Total | |
Common Stocks† | | $ | 33,875,815 | | | $ | 1,144,441 | | | $ | — | | | $ | 35,020,256 | |
Short-Term Investments | | | — | | | | 197,486 | | | | — | | | | 197,486 | |
| | | | | | | | | | | | | | | | |
Total Investments | | $ | 33,875,815 | | | $ | 1,341,927 | | | $ | — | | | $ | 35,217,742 | |
| | | | | | | | | | | | | | | | |
| † | See Portfolios of Investments for additional detailed categorizations. |
The following is a reconciliation of investments in which unobservable inputs (Level 3) were used in determining fair value:
| | | | | | | | | | | | | | | | | | | | | | | | | | | | | | | | | | | | | | | | |
| |
| | | Baron Partners Fund | |
| | | | | | | | | | |
| Investments in Securities | | Balance as of
December 31,
2023 | | | Accrued
Premiums/
Discounts | | | Net
Realized
Gain
(Loss) | | | Change in Net
Unrealized
Appreciation
(Depreciation) | | | Purchases | | | Sales | | | Transfers
Into
Level 3 | | | Transfers
Out of
Level 3 | | | Balance as of
June 30, 2024 | | | Change in Net
Unrealized
Appreciation
(Depreciation)
from Investments
still held at
June 30, 2024 | |
Private Common Stocks | | | | | |
Communication Services | | $ | 60,040,760 | | | $ | — | | | $ | — | | | $ | 3,513,559 | | | $ | — | | | $ | — | | | $ | — | | | $ | — | | | $ | 63,554,319 | | | $ | 3,513,559 | |
Industrials | | | 244,296,440 | | | | — | | | | — | | | | 37,777,800 | | | | — | | | | — | | | | — | | | | — | | | | 282,074,240 | | | | 37,777,800 | |
Private Convertible
Preferred Stocks | |
Industrials | | | 7,361,160 | | | | — | | | | — | | | | (437,850 | ) | | | — | | | | — | | | | — | | | | — | | | | 6,923,310 | | | | (437,850 | ) |
Private Preferred Stocks | | | | | |
Industrials | | | 537,262,630 | | | | — | | | | — | | | | 83,081,850 | | | | — | | | | — | | | | — | | | | — | | | | 620,344,480 | | | | 83,081,850 | |
| | | | | | | | | | | | | | | | | | | | | | | | | | | | | | | | | | | | | | | | |
Total | | $ | 848,960,990 | | | $ | — | | | $ | — | | | $ | 123,935,359 | | | $ | — | | | $ | — | | | $ | — | | | $ | — | | | $ | 972,896,349 | | | $ | 123,935,359 | |
| | | | | | | | | | | | | | | | | | | | | | | | | | | | | | | | | | | | | | | | |
39
| | |
| Baron Select Funds | | June 30, 2024 |
NOTES TO FINANCIAL STATEMENTS (Unaudited) (Continued)
7. FAIR VALUE MEASUREMENTS (Continued)
| | | | | | | | | | | | | | | | | | | | | | | | | | | | | | | | | | | | | | | | |
| |
| | | Baron Focused Growth Fund | |
| | | | | | | | | | |
| Investments in Securities | | Balance as of
December 31,
2023 | | | Accrued
Premiums/
Discounts | | | Net
Realized
Gain
(Loss) | | | Change in Net
Unrealized
Appreciation
(Depreciation) | | | Purchases | | | Sales | | | Transfers
Into
Level 3 | | | Transfers
Out of
Level 3 | | | Balance as of
June 30, 2024 | | | Change in Net
Unrealized
Appreciation
(Depreciation)
from Investments
still held at
June 30, 2024 | |
Private Common Stocks | | | | | |
Industrials | | $ | 74,955,780 | | | $ | — | | | $ | — | | | $ | 11,591,100 | | | $ | — | | | $ | — | | | $ | — | | | $ | — | | | $ | 86,546,880 | | | $ | 11,591,100 | |
Private Preferred Stocks | | | | | |
Industrials | | | 51,132,580 | | | | — | | | | — | | | | 7,907,100 | | | | — | | | | — | | | | — | | | | — | | | | 59,039,680 | | | | 7,907,100 | |
Information Technology | | | — | | | | — | | | | — | | | | — | | | | 19,999,991 | | | | — | | | | — | | | | — | | | | 19,999,991 | | | | — | |
| | | | | | | | | | | | | | | | | | | | | | | | | | | | | | | | | | | | | | | | |
Total | | $ | 126,088,360 | | | $ | — | | | $ | — | | | $ | 19,498,200 | | | $ | 19,999,991 | | | $ | — | | | $ | — | | | $ | — | | | $ | 165,586,551 | | | $ | 19,498,200 | |
| | | | | | | | | | | | | | | | | | | | | | | | | | | | | | | | | | | | | | | | |
| |
| | | Baron International Growth Fund | |
| | | | | | | | | | |
| Investments in Securities | | Balance as of
December 31,
2023 | | | Accrued
Premiums/
Discounts | | | Net
Realized
Gain
(Loss) | | | Change in Net
Unrealized
Appreciation
(Depreciation) | | | Purchases | | | Sales | | | Transfers
Into
Level 3 | | | Transfers
Out of
Level 3 | | | Balance as of
June 30, 2024 | | | Change in Net
Unrealized
Appreciation
(Depreciation)
from Investments
still held at
June 30, 2024 | |
Common Stocks | | | | | | | | | |
Russia | | $ | 316 | | | $ | — | | | $ | — | | | $ | 13 | | | $ | — | | | $ | — | | | $ | — | | | $ | — | | | $ | 329 | | | $ | 13 | |
Warrants | | | | | | | | | | | | | | | | | | | | | | | | | | | | | | | | | | | | | | | | |
Canada | | | — | | | | — | | | | — | | | | — | | | | — | | | | — | | | | — | | | | — | | | | — | | | | — | |
| | | | | | | | | | | | | | | | | | | | | | | | | | | | | | | | | | | | | | | | |
Total | | $ | 316 | | | $ | — | | | $ | — | | | $ | 13 | | | $ | — | | | $ | — | | | $ | — | | | $ | — | | | $ | 329 | | | $ | 13 | |
| | | | | | | | | | | | | | | | | | | | | | | | | | | | | | | | | | | | | | | | |
| |
| | | Baron Emerging Markets Fund | |
| | | | | | | | | | |
| Investments in Securities | | Balance as of
December 31,
2023 | | | Accrued
Premiums/
Discounts | | | Net
Realized
Gain
(Loss) | | | Change in Net
Unrealized
Appreciation
(Depreciation) | | | Purchases | | | Sales | | | Transfers
Into
Level 3 | | | Transfers
Out of
Level 3 | | | Balance as of
June 30,
2024 | | | Change in Net
Unrealized
Appreciation
(Depreciation)
from Investments
still held at
June 30,
2024 | |
Common Stocks | | | | | | | | | | | | | | | | | | | | | | | | | | | | | | | | | | | | | | | | |
Russia | | $ | 11,644 | | | $ | — | | | $ | — | | | $ | 476 | | | $ | — | | | $ | — | | | $ | — | | | $ | — | | | $ | 12,120 | | | $ | 476 | |
Private Common Stocks | | | | | | | | | | | | | | | | | | | | | | | | | | | | | | | | | | | | | | | | |
India | | | 74,029,330 | | | | — | | | | — | | | | (33,698,166 | ) | | | — | | | | — | | | | — | | | | — | | | | 40,331,164 | | | | (33,698,166 | ) |
Private Convertible
Preferred Stocks | | | | | | | | | | | | | | | | | | | | | | | | | | | | | | | | | | | | | | | | |
India | | | 96,887,511 | | | | — | | | | — | | | | 6,381,823 | | | | — | | | | — | | | | — | | | | — | | | | 103,269,334 | | | | 6,381,823 | |
| | | | | | | | | | | | | | | | | | | | | | | | | | | | | | | | | | | | | | | | |
Total | | $ | 170,928,485 | | | $ | — | | | $ | — | | | $ | (27,315,867 | ) | | $ | — | | | $ | — | | | $ | — | | | $ | — | | | $ | 143,612,618 | | | $ | (27,315,867 | ) |
| | | | | | | | | | | | | | | | | | | | | | | | | | | | | | | | | | | | | | | | |
40
| | |
| June 30, 2024 | | Baron Select Funds |
NOTES TO FINANCIAL STATEMENTS (Unaudited) (Continued)
7. FAIR VALUE MEASUREMENTS (Continued)
| | | | | | | | | | | | | | | | | | | | | | | | | | | | | | | | | | | | | | | | |
| |
| | | Baron Global Advantage Fund | |
| | | | | | | | | | |
| Investments in Securities | | Balance as of
December 31,
2023 | | | Accrued
Premiums/
Discounts | | | Net
Realized
Gain
(Loss) | | | Change in Net
Unrealized
Appreciation
(Depreciation) | | | Purchases | | | Sales | | | Transfers
Into
Level 3 | | | Transfers
Out of
Level 3 | | | Balance as of June 30,
2024 | | | Change in Net
Unrealized
Appreciation
(Depreciation)
from Investments
still held at
June 30, 2024 | |
Private Common Stocks | | | | | | | | | | | | | | | | | | | | | | | | | | | | | | | | | | | | | | | | |
United States | | $ | 32,313,416 | | | | $— | | | $ | — | | | $ | 4,910,700 | | | $ | — | | | $ | — | | | $ | — | | | $ | — | | | $ | 37,224,116 | | | $ | 4,910,700 | |
Private Convertible
Preferred Stocks | | | | | | | | | | | | | | | | | | | | | | | | | | | | | | | | | | | | | | | | |
India | | | 5,784,290 | | | | — | | | | — | | | | (5,738,988 | ) | | | — | | | | — | | | | — | | | | — | | | | 45,302 | | | | (5,738,988 | ) |
United States | | | 3,601,189 | | | | — | | | | 2,674,305 | | | | 1,398,779 | | | | — | | | | (7,674,273 | ) | | | — | | | | — | | | | — | | | | — | |
Private Preferred Stocks | | | | | | | | | | | | | | | | | | | | | | | | | | | | | | | | | | | | | | | | |
United States | | | 2,798,294 | | | | — | | | | — | | | | — | | | | — | | | | — | | | | — | | | | — | | | | 2,798,294 | | | | — | |
| | | | | | | | | | | | | | | | | | | | | | | | | | | | | | | | | | | | | | | | |
Total | | $ | 44,497,189 | | | $ | — | | | $ | 2,674,305 | | | $ | 570,491 | | | $ | — | | | $ | (7,674,273 | ) | | $ | — | | | $ | — | | | $ | 40,067,712 | | | $ | (828,288 | ) |
| | | | | | | | | | | | | | | | | | | | | | | | | | | | | | | | | | | | | | | | |
Unobservable valuation inputs developed by the Adviser for significant (greater than 1% of net assets) Level 3 investments as of June 30, 2024 were as follows:
| | | | | | | | | | | | | | |
|
Baron Partners Fund |
| | | | | | | |
| Sector | | Company | | Fair Value as of June 30, 2024 | | Valuation Technique | | Unobservable Input | | Weighted Average used on June 30, 2024 | | Range used on June 30, 2024 | | Impact to Valuation from an Increase in Input* |
Private Common Stocks: Communication Services | | StubHub Holdings,
Inc. | | $47,162,319 | | Combination of
valuation using
multiples, current
value via comparable
companies, and
option-pricing
analysis methods | | Projected Company
EBITDA (2025) | | $989 million | | $989 million | | Increase |
| | Enterprise Value /
EBITDA Multiple | | 17.9x | | 10.3x - 21.5x | | Increase |
| | Change in the
composite equity
index of comparable
companies | | (0.35)% | | (1.19)% -3.23% | | Increase |
| | Discount for lack of
marketability | | 6.42% | | 6.42% | | Decrease |
| | Estimated volatility
of the returns of
equity4 | | 34.07% | | 25.68% - 45.54% | | Decrease |
Private Common Stocks: Communication Services | | X Holdings I, Inc. | | $16,392,000 | | Recent valuation for
employee grants | | Enterprise Value
Estimate
| | $19 billion | | $19 billion | | n/a |
Private Common Stocks: Industrials | | Space Exploration
Technologies
Corp. | | $282,074,240 | | Observed
Transaction | | Observed
Transaction Price | | $112.00 | | $112.00 | | Increase |
Private Preferred Stocks: Industrials | | Space Exploration
Technologies
Corp. | | $620,344,480 | | Observed
Transaction | | Observed
Transaction Price | | $1,120.00 | | $1,120.00 | | Increase |
Private Convertible Preferred Stocks: Industrials | | Northvolt AB | | $6,923,310 | | Combination of
observed transaction,
current value via
comparable
companies, and
option-pricing
methods | | Observed
Transaction Price | | $0.37 | | $0.37 | | Increase |
| | Change in the
composite
equity index of
comparable
companies | | (3.00)% | | (14.29)% - 1.11% | | Increase |
| | Discount for lack of
marketability | | 15.14% | | 15.14% | | Decrease |
| | Estimated volatility
of the returns of
equity1 | | 53.16% | | 29.33% - 95.53% | | Decrease |
41
| | |
| Baron Select Funds | | June 30, 2024 |
NOTES TO FINANCIAL STATEMENTS (Unaudited) (Continued)
7. FAIR VALUE MEASUREMENTS (Continued)
| | | | | | | | | | | | | | |
|
Baron Focused Growth Fund |
| | | | | | | |
| Sector | | Company | | Fair Value as of
June 30, 2024 | | Valuation Technique | | Unobservable Input | | Weighted Average used on June 30, 2024 | | Range used on
June 30, 2024 | | Impact to
Valuation
from an
Increase
in Input* |
Private Common Stocks: Industrials | | Space Exploration
Technologies
Corp. | | $86,546,880 | | Observed
Transaction | | Observed
Transaction Price | | $112.00 | | $112.00 | | Increase |
Private Preferred Stocks: Industrials | | Space Exploration
Technologies
Corp. | | $59,039,680 | | Observed
Transaction | | Observed
Transaction Price | | $1,120.00 | | $1,120.00 | | Increase |
Private Preferred Stocks: Information Technology | | X.AI Corp. | | $19,999,991 | | Observed
Transaction | | Observed
Transaction Price | | $11.97 | | $11.97 | | Increase |
| | | | | | | | | | | | | | |
|
Baron Emerging Markets Fund |
| | | | | | | |
| Sector | | Company | | Fair Value as of
June 30, 2024 | | Valuation Technique | | Unobservable Input | | Weighted Average used on June 30, 2024 | | Range used on June 30, 2024 | | Impact to
Valuation
from an
Increase
in Input* |
Private Common Stocks: Financials | | Pine Labs PTE. Ltd. | | $40,331,164 | | Combination of
observed transaction,
current value via
comparable
companies,scenario analysis, and option-pricing
methods | | Projected Company
Sales (2024) | | $247 million | | $247 million | | Increase |
| | Projected Company
Sales (2025) | | $309 million | | $309 million | | Increase |
| | Price / Sales Multiple | | 13.65x | | 9.79x - 17.50x | | Increase |
| | Equity Valuation
Scenario Weights8 | | 50% | | 50% | | n/a |
| | Change in the composite
equity index of
comparable companies | | (0.06)% | | (2.89)% - 3.49% | | Increase |
| | Discount for lack of
marketability | | 10.56% | | 10.56% | | Decrease |
| | Estimated volatility of
the returns of equity5 | | 40.70% | | 8.00% - 80.59% | | Decrease |
| | Scenario Probabilities:
Scenario A / Scenario B7 | | 100% / 0% | | 0% - 100% | | n/a |
Private Convertible Preferred Stocks: Consumer Discretionary | | Bundl
Technologies
Private Ltd. | | $103,193,835 | | Combination of
observed transaction,
current value via
comparable
companies, scenario
analysis, and option-
pricing methods | | Projected Company
Sales (2023) | | $976 million | | $976 million | | Increase |
| | Projected Company
Sales (2024) | | $1,260 million | | $1,260 million | | Increase |
| | Price / Sales Multiple
(2023) | | 13.94x | | 13.94x | | Increase |
| | Price / Sales Multiple
(2024) | | 10.34x | | 10.34x | | Increase |
| | Valuation Scenario
Probabilities:
Scenario A / Scenario B6 | | 50.00% | | 50% - 50% | | n/a |
| | Change in the composite
equity index of
comparable companies | | 0.28% | | 0.05% - 2.06% | | Increase |
| | Discount for lack of
marketability | | 2.73% | | 2.73% | | Decrease |
| | Estimated volatility of
the returns of equity5 | | 29.23% | | 15.95% - 35.92% | | Decrease |
| | Exit Scenario
Probabilities:
Scenario A / Scenario B7 | | 100% / 0% | | 0% - 100% | | n/a |
Private Convertible Preferred Stocks: Consumer Discretionary | | Think & Learn
Private Limited | | $75,499 | | Recent Transaction | | Rights Offering Price | | INR 410.57 | | INR 410.57 | | Increase |
42
| | |
| June 30, 2024 | | Baron Select Funds |
NOTES TO FINANCIAL STATEMENTS (Unaudited) (Continued)
7. FAIR VALUE MEASUREMENTS (Continued)
| | | | | | | | | | | | | | |
|
Baron Global Advantage Fund |
| | | | | | | |
| Sector | | Company | | Fair Value as of
June 30, 2024 | | Valuation Technique | | Unobservable Input | | Weighted Average used on June 30, 2024 | | Range used on June 30, 2024 | | Impact to
Valuation
from an
Increase
in Input* |
Private Common Stocks: Industrials | | Space Exploration
Technologies
Corp. | | $36,666,560 | | Observed Transaction | | Observed Transaction
Price | | $112.00 | | $112.00 | | Increase |
Private Common Stocks: Materials | | Farmers Business
Network, Inc. | | $557,556 | | Scenario analysis | | Public Markets Event
Scenario Probablities2 | | 9.1% | | 8% - 10% | | n/a |
| | Liquidity Scenario
Probabilities:
Scenario A / Scenario
B7 | | 50.00% | | 50% - 50% | | n/a |
Private Convertible Preferred Stocks: Consumer Discretionary | | Think & Learn
Private Limited | | $45,302 | | Recent Transaction | | Rights Offering Price | | INR 410.57 | | INR 410.57 | | Increase |
Private Preferred Stocks: Industrials | | GM Cruise
Holdings LLC | | $2,798,294 | | Combination of
observed transaction
price andscenario analysis
methods | | Observed Transaction
Price | | $24.27 | | $24.27 | | Increase |
| | Scenario Probabilities:
Scenario A / Scenario B
/ Scenario C3 | | 50% / 50% /0% | | 0% - 50% | | n/a |
| 1 | The volatility was calculated as a simple-average of the volatilities of the individual comparable companies. |
| 2 | The probabilities are associated with a range of potential IPO valuations. |
| 3 | Scenario A represents a worst case scenario. Scenario B represents a negative scenario that is better than the worst case. Scenario C represents a positive scenario. |
| 4 | The volatility was calculated as a weighted-average of the volatilities of the individual comparable companies. Some companies have a higher weight in the calculation than others. |
| 5 | The volatility was calculated as a weighted-average of the volatilities of the individual comparable companies and an index. Some companies have a higher weight in the calculation than others. |
| 6 | Scenario A is based on 2023 multiples while Scenario B is based on 2024 multiples. |
| 7 | Scenario A represents an IPO Event, while Scenario B represents a Liquidation/M&A Event. |
| 8 | The company’s equity value was estimated in two different scenarios, each of which was given a 50% weight in the final equity value calculation. |
| * | Represents the directional change in the fair value of Level 3 investments that could have resulted from an increase in the corresponding input as of period end. A decrease to the unobservable input would have had the opposite effect. Significant changes in these inputs may have resulted in a significantly higher or lower fair value measurement at period end. |
A significant change in the EV/EBITDA multiple ratio may result in a directionally similar significant change in the fair value measurement, while a significant change in the discount for lack of marketability and equity index of comparable companies may not result in a materially higher or lower fair value measurement.
8. INCOME TAXES AND DISTRIBUTIONS TO SHAREHOLDERS
Federal income tax regulations differ from GAAP. Therefore, distributions determined in accordance with tax regulations may differ in amount or character from net investment income and net realized gain for financial reporting purposes. Net investment income (loss) and net realized and unrealized gain (loss) may differ for financial statement and tax purposes due to differing treatments of net investment loss, foreign currency gains and losses, non-deductible interest expense, reclassification of distributions, partnership basis adjustments, income from passive foreign investment companies, foreign capital gains tax, late year loss deferral, post-October loss deferral, and wash sale loss deferral. Financial reporting records are adjusted for permanent book/tax differences to reflect tax character. Financial records are not adjusted for temporary differences.
As of June 30, 2024, the Funds’ cost of investments and gross unrealized appreciation (depreciation) for U.S. federal income tax purposes were as follows:
| | | | | | | | | | | | | | | | | | | | |
| | | | | |
| | | Baron
Partners Fund | | | Baron Focused Growth Fund | | | Baron
International
Growth Fund | | | Baron Real
Estate Fund | | | Baron Emerging Markets Fund | |
Cost of investments | | $ | 1,507,998,527 | | | $ | 868,155,233 | | | $ | 243,529,365 | | | $ | 1,371,264,168 | | | $ | 3,076,846,575 | |
| | | | | | | | | | | | | | | | | | | | |
Gross tax unrealized appreciation | | | 5,391,438,993 | | | | 574,326,607 | | | | 118,180,550 | | | | 386,581,890 | | | | 1,270,236,051 | |
Gross tax unrealized depreciation | | | (47,366,033 | ) | | | (35,962,273 | ) | | | (16,778,811 | ) | | | (8,649,694 | ) | | | (254,825,002 | ) |
| | | | | | | | | | | | | | | | | | | | |
Net tax unrealized appreciation (depreciation) | | | 5,344,072,960 | | | | 538,364,334 | | | | 101,401,739 | | | | 377,932,196 | | | | 1,015,411,049 | |
| | | | | | | | | | | | | | | | | | | | |
43
| | |
| Baron Select Funds | | June 30, 2024 |
NOTES TO FINANCIAL STATEMENTS (Unaudited) (Continued)
8. INCOME TAXES AND DISTRIBUTIONS TO SHAREHOLDERS (Continued)
| | | | | | | | | | | | | | | | | | | | | | | | |
| | | | | | |
| | | Baron Global
Advantage
Fund | | | Baron Real
Estate
Income Fund | | | Baron
Health Care
Fund | | | Baron
FinTech
Fund | | | Baron
New Asia
Fund | | | Baron
Technology
Fund | |
Cost of investments | | $ | 395,227,770 | | | $ | 129,651,248 | | | $ | 175,262,877 | | | $ | 51,938,106 | | | $ | 4,864,915 | | | $ | 29,275,371 | |
| | | | | | | | | | | | | | | | | | | | | | | | |
Gross tax unrealized appreciation | | | 283,717,359 | | | | 16,614,853 | | | | 59,915,074 | | | | 13,082,938 | | | | 1,381,022 | | | | 6,430,721 | |
Gross tax unrealized depreciation | | | (78,014,781 | ) | | | (1,014,014 | ) | | | (2,594,067 | ) | | | (5,490,537 | ) | | | (180,531 | ) | | | (488,350 | ) |
| | | | | | | | | | | | | | | | | | | | | | | | |
Net tax unrealized appreciation (depreciation) | | | 205,702,578 | | | | 15,600,839 | | | | 57,321,007 | | | | 7,592,401 | | | | 1,200,491 | | | | 5,942,371 | |
| | | | | | | | | | | | | | | | | | | | | | | | |
As of December 31, 2023 the Funds had capital loss carryforwards as follows:
| | | | | | | | | | | | | | | | | | | | |
| | | | | |
| | | Baron
Partners Fund | | | Baron
Focused
Growth
Fund | | | Baron
International
Growth
Fund | | | Baron Real
Estate Fund | | | Baron
Emerging
Markets Fund | |
Short-Term | | $ | 199,606,737 | | | $ | 65,670,065 | | | $ | 41,024,927 | | | $ | 87,516,612 | | | $ | 691,198,756 | |
| | | | | | | | | | | | | | | | | | | | |
Long-Term | | $ | 223,829,536 | | | $ | 27,347,488 | | | $ | 26,943,336 | | | $ | — | | | $ | 543,046,992 | |
| | | | | | | | | | | | | | | | | | | | |
| | | | | | | | | | | | | | | | | | | | | | | | |
| | | | | | |
| | | Baron Global
Advantage
Fund | | | Baron Real
Estate
Income Fund | | | Baron
Health Care
Fund | | | Baron
FinTech
Fund | | | Baron
New Asia
Fund | | | Baron
Technology
Fund | |
Short-Term | | $ | 176,960,057 | | | $ | 19,495,138 | | | $ | 35,739,625 | | | $ | 2,787,006 | | | $ | 423,470 | | | $ | 563,218 | 1 |
| | | | | | | | | | | | | | | | | | | | | | | | |
Long-Term | | $ | 215,018,744 | | | $ | 1,983,979 | | | $ | 4,541,769 | | | $ | 3,879,475 | | | $ | 584,541 | | | $ | 357,677 | 1 |
| | | | | | | | | | | | | | | | | | | | | | | | |
| 1 | Future utilization of losses may be subject to limitations under current tax laws. |
The tax character of distributions paid during the six months ended June 30, 2024 and the year ended December 31, 2023 was as follows:
| | | | | | | | | | | | | | | | |
| | |
| | | Six Months Ended June 30,
2024 | | | Year Ended December 31,
2023 | |
| | | | |
| Fund | | Ordinary1 | | | Long-Term
Capital Gain | | | Ordinary1 | | | Long-Term
Capital Gain | |
Baron Partners Fund | | $ | — | | | $ | — | | | $ | — | | | $ | — | |
Baron Focused Growth Fund | | | — | | | | — | | | | — | | | | — | |
Baron International Growth Fund | | | — | | | | — | | | | 2,770,604 | | | | — | |
Baron Real Estate Fund | | | — | | | | — | | | | 6,044,613 | | | | — | |
Baron Emerging Markets Fund | | | — | | | | — | | | | 30,922,677 | | | | — | |
Baron Global Advantage Fund | | | — | | | | — | | | | — | | | | — | |
Baron Real Estate Income Fund | | | 1,380,828 | | | | — | | | | 2,148,522 | | | | — | |
Baron Health Care Fund | | | — | | | | — | | | | — | | | | — | |
Baron FinTech Fund | | | — | | | | — | | | | — | | | | — | |
Baron New Asia Fund | | | — | | | | — | | | | — | | | | — | |
Baron Technology Fund | | | — | | | | — | | | | — | | | | — | |
| 1 | For tax purposes, short-term capital gains are considered ordinary income distributions. |
The Funds follow the provisions of FASB Codification Section 740 (ASC Section 740) “Accounting for Uncertainty in Income Taxes” which clarifies the accounting for uncertainty in tax positions taken or expected to be taken on a tax return. ASC Section 740 sets forth a threshold for financial statement recognition, measurement and disclosure of tax positions taken or expected to be taken on a tax return. The Funds are required to recognize the tax effects of certain tax positions under a “more likely than not” standard, that based on their technical merits, have more than 50% likelihood of being sustained upon examination. Management has analyzed the tax positions taken on the Funds’ federal income tax returns for all open years (current and prior three years), and has concluded that no provision for federal income tax is required in the Funds’ financial statements. At June 30, 2024 the Funds did not have any uncertain tax benefits that require recognition, de-recognition or disclosure. The Funds’ federal, state and local income and federal excise tax returns for which the applicable statutes of limitations have not expired (current and prior three years) are subject to examination by the Internal Revenue Service and state departments of revenue.
9. SUBSEQUENT EVENTS
Management has evaluated events occurring subsequent to the date of the Statements of Assets and Liabilities and through the date of issuance of the financial statements and has determined that there were no subsequent events that required adjustment to or disclosure in the financial statements.
44
| | |
| June 30, 2024 | | Baron Select Funds |
FINANCIAL HIGHLIGHTS (Unaudited)
BARON PARTNERS FUND
Selected data for a share outstanding throughout each period:
| | | | | | | | | | | | | | | | | | | | | | | | | | | | | | | | | | | | | | | | | | | | | | | | | | | | | | | | | | | | |
| | | | | | | |
| | | | | | Income (loss) from
investment operations: | | | Less distributions to
shareholders from: | | | | | | | | | Ratios to Average Net Assets: | | | Supplemental
Data: | |
| | | | | | | | | | | | | | | |
| | | Net
asset
value, beginning of period ($) | | | Net
investment income (loss) ($)1 | | | Net
realized
and unrealized gain
(loss) ($) | | | Total
from investment operations ($) | | | Net
investment income ($) | | | Net
realized gains ($) | | | Total
distributions ($) | | | Net
asset value,
end of
period ($) | | | Total
return (%)2 | | | Operating expenses (%) | | | Interest
expense
(%) | | | Total expenses (%) | | | Net
investment income
(loss) (%) | | | Net
assets (in
millions),
end of
period ($) | | | Portfolio turnover rate (%) | |
| | | | | | |
RETAIL SHARES | | | | | | | | | | | | | | | | | | | | | | | | | |
| | | | | | |
Six Months Ended June 30, | | | | | | | | | | | | | | | | | | | | | | | | | |
| | | | | | | | | | | | | | | |
2024 | | | 159.63 | | | | (1.23 | ) | | | (11.84 | ) | | | (13.07 | ) | | | 0.00 | | | | 0.00 | | | | 0.00 | | | | 146.56 | | | | (8.19 | )3 | | | 1.30 | 4 | | | 1.01 | 4 | | | 2.31 | 4 | | | (1.73 | )4 | | | 2,454.0 | | | | 0.46 | 3 |
| | | | | | |
Year Ended December 31, | | | | | | | | | | | | | | | | | | | | | | | | | |
| | | | | | | | | | | | | | | |
2023 | | | 111.55 | | | | (2.52 | ) | | | 50.60 | | | | 48.08 | | | | 0.00 | | | | 0.00 | | | | 0.00 | | | | 159.63 | | | | 43.10 | | | | 1.30 | | | | 0.94 | | | | 2.24 | | | | (1.77 | ) | | | 2,959.9 | | | | 5.19 | |
| | | | | | | | | | | | | | | |
2022 | | | 199.00 | | | | (1.96 | ) | | | (81.93 | ) | | | (83.89 | ) | | | 0.00 | | | | (3.56 | ) | | | (3.56 | ) | | | 111.55 | | | | (42.56 | ) | | | 1.30 | | | | 0.39 | | | | 1.69 | | | | (1.29 | ) | | | 2,136.4 | | | | 6.19 | |
| | | | | | | | | | | | | | | |
2021 | | | 164.18 | | | | (1.98 | ) | | | 52.16 | | | | 50.18 | | | | 0.00 | | | | (15.36 | ) | | | (15.36 | ) | | | 199.00 | | | | 31.39 | | | | 1.30 | | | | 0.06 | | | | 1.36 | | | | (1.11 | ) | | | 3,903.2 | | | | 9.14 | |
| | | | | | | | | | | | | | | |
2020 | | | 69.04 | | | | (1.12 | ) | | | 102.29 | | | | 101.17 | | | | 0.00 | | | | (6.03 | ) | | | (6.03 | ) | | | 164.18 | | | | 148.56 | | | | 1.31 | | | | 0.25 | | | | 1.56 | | | | (1.18 | ) | | | 3,219.4 | | | | 10.70 | |
| | | | | | | | | | | | | | | |
2019 | | | 47.77 | | | | (0.75 | ) | | | 22.20 | | | | 21.45 | | | | 0.00 | | | | (0.18 | ) | | | (0.18 | ) | | | 69.04 | | | | 44.97 | | | | 1.32 | | | | 0.90 | | | | 2.22 | | | | (1.29 | ) | | | 1,353.6 | | | | 7.97 | |
| | | | | | |
INSTITUTIONAL SHARES | | | | | | | | | | | | | | | | | | | | | | | | | |
| | | | | | |
Six Months Ended June 30, | | | | | | | | | | | | | | | | | | | | | | | | | |
| | | | | | | | | | | | | | | |
2024 | | | 166.21 | | | | (1.09 | ) | | | (12.33 | ) | | | (13.42 | ) | | | 0.00 | | | | 0.00 | | | | 0.00 | | | | 152.79 | | | | (8.07 | )3 | | | 1.05 | 4 | | | 1.01 | 4 | | | 2.06 | 4 | | | (1.47 | )4 | | | 2,946.3 | | | | 0.46 | 3 |
| | | | | | |
Year Ended December 31, | | | | | | | | | | | | | | | | | | | | | | | | | |
| | | | | | | | | | | | | | | |
2023 | | | 115.85 | | | | (2.25 | ) | | | 52.61 | | | | 50.36 | | | | 0.00 | | | | 0.00 | | | | 0.00 | | | | 166.21 | | | | 43.47 | | | | 1.04 | | | | 0.95 | | | | 1.99 | | | | (1.52 | ) | | | 3,464.4 | | | | 5.19 | |
| | | | | | | | | | | | | | | |
2022 | | | 205.95 | | | | (1.63 | ) | | | (84.91 | ) | | | (86.54 | ) | | | 0.00 | | | | (3.56 | ) | | | (3.56 | ) | | | 115.85 | | | | (42.41 | ) | | | 1.04 | | | | 0.40 | | | | 1.44 | | | | (1.04 | ) | | | 2,329.7 | | | | 6.19 | |
| | | | | | | | | | | | | | | |
2021 | | | 169.04 | | | | (1.58 | ) | | | 53.85 | | | | 52.27 | | | | 0.00 | | | | (15.36 | ) | | | (15.36 | ) | | | 205.95 | | | | 31.73 | | | | 1.05 | | | | 0.06 | | | | 1.11 | | | | (0.86 | ) | | | 4,126.7 | | | | 9.14 | |
| | | | | | | | | | | | | | | |
2020 | | | 70.82 | | | | (0.92 | ) | | | 105.17 | | | | 104.25 | | | | 0.00 | | | | (6.03 | ) | | | (6.03 | ) | | | 169.04 | | | | 149.18 | | | | 1.05 | | | | 0.25 | | | | 1.30 | | | | (0.93 | ) | | | 3,191.4 | | | | 10.70 | |
| | | | | | | | | | | | | | | |
2019 | | | 48.86 | | | | (0.62 | ) | | | 22.76 | | | | 22.14 | | | | 0.00 | | | | (0.18 | ) | | | (0.18 | ) | | | 70.82 | | | | 45.38 | | | | 1.06 | | | | 0.90 | | | | 1.96 | | | | (1.03 | ) | | | 1,187.0 | | | | 7.97 | |
| | | | | | |
R6 SHARES | | | | | | | | | | | | | | | | | | | | | | | | | |
| | | | | | |
Six Months Ended June 30, | | | | | | | | | | | | | | | | | | | | | | | | | |
| | | | | | | | | | | | | | | |
2024 | | | 166.18 | | | | (1.09 | ) | | | (12.33 | ) | | | (13.42 | ) | | | 0.00 | | | | 0.00 | | | | 0.00 | | | | 152.76 | | | | (8.08 | )3 | | | 1.05 | 4 | | | 1.01 | 4 | | | 2.06 | 4 | | | (1.47 | )4 | | | 467.2 | | | | 0.46 | 3 |
| | | | | | |
Year Ended December 31, | | | | | | | | | | | | | | | | | | | | | | | | | |
| | | | | | | | | | | | | | | |
2023 | | | 115.84 | | | | (2.25 | ) | | | 52.59 | | | | 50.34 | | | | 0.00 | | | | 0.00 | | | | 0.00 | | | | 166.18 | | | | 43.46 | | | | 1.05 | | | | 0.94 | | | | 1.99 | | | | (1.52 | ) | | | 520.5 | | | | 5.19 | |
| | | | | | | | | | | | | | | |
2022 | | | 205.94 | | | | (1.63 | ) | | | (84.91 | ) | | | (86.54 | ) | | | 0.00 | | | | (3.56 | ) | | | (3.56 | ) | | | 115.84 | | | | (42.41 | ) | | | 1.04 | | | | 0.40 | | | | 1.44 | | | | (1.04 | ) | | | 359.8 | | | | 6.19 | |
| | | | | | | | | | | | | | | |
2021 | | | 169.03 | | | | (1.58 | ) | | | 53.85 | | | | 52.27 | | | | 0.00 | | | | (15.36 | ) | | | (15.36 | ) | | | 205.94 | | | | 31.73 | | | | 1.05 | | | | 0.06 | | | | 1.11 | | | | (0.86 | ) | | | 627.5 | | | | 9.14 | |
| | | | | | | | | | | | | | | |
2020 | | | 70.82 | | | | (0.91 | ) | | | 105.15 | | | | 104.24 | | | | 0.00 | | | | (6.03 | ) | | | (6.03 | ) | | | 169.03 | | | | 149.16 | | | | 1.05 | | | | 0.25 | | | | 1.30 | | | | (0.93 | ) | | | 465.0 | | | | 10.70 | |
| | | | | | | | | | | | | | | |
2019 | | | 48.86 | | | | (0.62 | ) | | | 22.76 | | | | 22.14 | | | | 0.00 | | | | (0.18 | ) | | | (0.18 | ) | | | 70.82 | | | | 45.38 | | | | 1.06 | | | | 0.90 | | | | 1.96 | | | | (1.03 | ) | | | 186.9 | | | | 7.97 | |
| 1 | Based on average shares outstanding. |
| 2 | Total returns reflect reinvestment of all dividends and distributions, if any. |
| | |
| See Notes to Financial Statements. | | 45 |
| | |
| Baron Select Funds | | June 30, 2024 |
FINANCIAL HIGHLIGHTS (Unaudited) (Continued)
BARON FOCUSED GROWTH FUND
Selected data for a share outstanding throughout each period:
| | | | | | | | | | | | | | | | | | | | | | | | | | | | | | | | | | | | | | | | | | | | | | | | | | | | | | | | |
| | | | | | | |
| | | | | | Income (loss) from
investment operations: | | | Less distributions to
shareholders from: | | | | | | | | | Ratios to Average Net Assets: | | | Supplemental
Data: | |
| | | | | | | | | | | | | | |
| | | Net
asset
value, beginning of period
($) | | | Net
investment income (loss)
($)1 | | | Net
realized
and unrealized gain
(loss)
($) | | | Total
from investment operations
($) | | | Net
investment income
($) | | | Net
realized gains
($) | | | Total
distributions
($) | | | Net
asset value,
end of
period
($) | | | Total
return
(%)2 | | | Gross expenses (%) | | | Net expenses (%) | | | Net
investment income
(loss)
(%) | | | Net
assets (in
millions),
end of
period
($) | | | Portfolio turnover rate
(%) | |
|
RETAIL SHARES | |
|
Six Months Ended June 30, | |
| | | | | | | | | | | | | | |
2024 | | | 36.45 | | | | (0.08 | ) | | | 0.57 | | | | 0.49 | | | | 0.00 | | | | 0.00 | | | | 0.00 | | | | 36.94 | | | | 1.34 | 3 | | | 1.32 | 4 | | | 1.32 | 4 | | | (0.42 | )4 | | | 289.3 | | | | 4.83 | 3 |
|
Year Ended December 31, | |
| | | | | | | | | | | | | | |
2023 | | | 28.61 | | | | (0.19 | ) | | | 8.03 | | | | 7.84 | | | | 0.00 | | | | 0.00 | | | | 0.00 | | | | 36.45 | | | | 27.40 | | | | 1.32 | | | | 1.32 | | | | (0.57 | ) | | | 316.9 | | | | 5.84 | |
| | | | | | | | | | | | | | |
2022 | | | 44.52 | | | | (0.26 | ) | | | (12.14 | ) | | | (12.40 | ) | | | 0.00 | | | | (3.51 | ) | | | (3.51 | ) | | | 28.61 | | | | (28.30 | ) | | | 1.32 | | | | 1.32 | | | | (0.74 | ) | | | 174.3 | | | | 22.34 | |
| | | | | | | | | | | | | | |
2021 | | | 43.36 | | | | (0.51 | ) | | | 8.59 | | | | 8.08 | | | | 0.00 | | | | (6.92 | ) | | | (6.92 | ) | | | 44.52 | | | | 18.83 | | | | 1.32 | 5 | | | 1.32 | 5 | | | (1.12 | ) | | | 209.8 | | | | 45.28 | |
| | | | | | | | | | | | | | |
2020 | | | 20.18 | | | | (0.32 | ) | | | 24.74 | | | | 24.42 | | | | 0.00 | | | | (1.24 | ) | | | (1.24 | ) | | | 43.36 | | | | 122.21 | | | | 1.35 | | | | 1.35 | | | | (1.15 | ) | | | 157.7 | | | | 18.09 | |
| | | | | | | | | | | | | | |
2019 | | | 15.81 | | | | (0.12 | ) | | | 4.85 | | | | 4.73 | | | | 0.00 | | | | (0.36 | ) | | | (0.36 | ) | | | 20.18 | | | | 30.03 | 6 | | | 1.39 | 5 | | | 1.35 | 5 | | | (0.67 | ) | | | 49.1 | | | | 4.53 | |
|
INSTITUTIONAL SHARES | |
|
Six Months Ended June 30, | |
| | | | | | | | | | | | | | |
2024 | | | 38.09 | | | | (0.03 | ) | | | 0.59 | | | | 0.56 | | | | 0.00 | | | | 0.00 | | | | 0.00 | | | | 38.65 | | | | 1.47 | 3 | | | 1.06 | 4 | | | 1.06 | 4 | | | (0.14 | )4 | | | 787.8 | | | | 4.83 | 3 |
|
Year Ended December 31, | |
| | | | | | | | | | | | | | |
2023 | | | 29.82 | | | | (0.11 | ) | | | 8.38 | | | | 8.27 | | | | 0.00 | | | | 0.00 | | | | 0.00 | | | | 38.09 | | | | 27.73 | | | | 1.06 | | | | 1.06 | | | | (0.31 | ) | | | 690.5 | | | | 5.84 | |
| | | | | | | | | | | | | | |
2022 | | | 46.09 | | | | (0.16 | ) | | | (12.60 | ) | | | (12.76 | ) | | | 0.00 | | | | (3.51 | ) | | | (3.51 | ) | | | 29.82 | | | | (28.11 | ) | | | 1.06 | | | | 1.06 | | | | (0.45 | ) | | | 300.3 | | | | 22.34 | |
| | | | | | | | | | | | | | |
2021 | | | 44.56 | | | | (0.40 | ) | | | 8.85 | | | | 8.45 | | | | 0.00 | | | | (6.92 | ) | | | (6.92 | ) | | | 46.09 | | | | 19.16 | | | | 1.05 | 5 | | | 1.05 | 5 | | | (0.85 | ) | | | 307.8 | | | | 45.28 | |
| | | | | | | | | | | | | | |
2020 | | | 20.67 | | | | (0.24 | ) | | | 25.37 | | | | 25.13 | | | | 0.00 | | | | (1.24 | ) | | | (1.24 | ) | | | 44.56 | | | | 122.75 | | | | 1.07 | | | | 1.07 | | | | (0.88 | ) | | | 233.7 | | | | 18.09 | |
| | | | | | | | | | | | | | |
2019 | | | 16.15 | | | | (0.08 | ) | | | 4.96 | | | | 4.88 | | | | 0.00 | | | | (0.36 | ) | | | (0.36 | ) | | | 20.67 | | | | 30.33 | 6 | | | 1.11 | 5 | | | 1.10 | 5 | | | (0.42 | ) | | | 91.3 | | | | 4.53 | |
|
R6 SHARES | |
|
Six Months Ended June 30, | |
| | | | | | | | | | | | | | |
2024 | | | 38.12 | | | | (0.03 | ) | | | 0.59 | | | | 0.56 | | | | 0.00 | | | | 0.00 | | | | 0.00 | | | | 38.68 | | | | 1.47 | 3 | | | 1.06 | 4 | | | 1.06 | 4 | | | (0.15 | )4 | | | 334.6 | | | | 4.83 | 3 |
|
Year Ended December 31, | |
| | | | | | | | | | | | | | |
2023 | | | 29.84 | | | | (0.11 | ) | | | 8.39 | | | | 8.28 | | | | 0.00 | | | | 0.00 | | | | 0.00 | | | | 38.12 | | | | 27.75 | | | | 1.06 | | | | 1.06 | | | | (0.32 | ) | | | 328.3 | | | | 5.84 | |
| | | | | | | | | | | | | | |
2022 | | | 46.12 | | | | (0.17 | ) | | | (12.60 | ) | | | (12.77 | ) | | | 0.00 | | | | (3.51 | ) | | | (3.51 | ) | | | 29.84 | | | | (28.11 | ) | | | 1.05 | | | | 1.05 | | | | (0.48 | ) | | | 252.9 | | | | 22.34 | |
| | | | | | | | | | | | | | |
2021 | | | 44.59 | | | | (0.40 | ) | | | 8.85 | | | | 8.45 | | | | 0.00 | | | | (6.92 | ) | | | (6.92 | ) | | | 46.12 | | | | 19.15 | | | | 1.05 | 5 | | | 1.05 | 5 | | | (0.86 | ) | | | 320.6 | | | | 45.28 | |
| | | | | | | | | | | | | | |
2020 | | | 20.68 | | | | (0.24 | ) | | | 25.39 | | | | 25.15 | | | | 0.00 | | | | (1.24 | ) | | | (1.24 | ) | | | 44.59 | | | | 122.78 | | | | 1.07 | | | | 1.07 | | | | (0.87 | ) | | | 271.3 | | | | 18.09 | |
| | | | | | | | | | | | | | |
2019 | | | 16.16 | | | | (0.07 | ) | | | 4.95 | | | | 4.88 | | | | 0.00 | | | | (0.36 | ) | | | (0.36 | ) | | | 20.68 | | | | 30.31 | | | | 1.10 | 5 | | | 1.10 | 5 | | | (0.40 | ) | | | 122.0 | | | | 4.53 | |
| 1 | Based on average shares outstanding. |
| 2 | Total returns reflect reinvestment of all dividends and distributions, if any. |
| 5 | Includes interest expense of less than 0.01%. |
| 6 | The total returns would have been lower had certain expenses not been reduced during the period shown. |
| | |
| 46 | | See Notes to Financial Statements. |
| | |
| June 30, 2024 | | Baron Select Funds |
FINANCIAL HIGHLIGHTS (Unaudited) (Continued)
BARON INTERNATIONAL GROWTH FUND
Selected data for a share outstanding throughout each period:
| | | | | | | | | | | | | | | | | | | | | | | | | | | | | | | | | | | | | | | | | | | | | | | | | | | | | | | | |
| | | | | | | |
| | | | | | Income (loss) from
investment operations: | | | Less distributions to
shareholders from: | | | | | | | | | Ratios to Average Net Assets: | | | Supplemental
Data: | |
| | | | | | | | | | | | | | |
| | | Net asset
value, beginning of period ($) | | | Net
investment income (loss) ($)1 | | | Net
realized
and unrealized gain (loss) ($) | | | Total from investment operations ($) | | | Net
investment income ($) | | | Net
realized gains ($) | | | Total
distributions ($) | | | Net
asset value,
end of
period ($) | | | Total
return (%)2 | | | Gross
expenses (%) | | | Net expenses (%) | | | Net
investment
income
(loss) (%) | | | Net
assets (in
millions),
end of
period ($) | | | Portfolio turnover rate (%) | |
| | | | | |
RETAIL SHARES | | | | | | | | | | | | | | | | | | | | | |
| | | | | |
Six Months Ended June 30, | | | | | | | | | | | | | | | | | | | | | |
| | | | | | | | | | | | | | |
2024 | | | 25.45 | | | | 0.08 | | | | 0.55 | | | | 0.63 | | | | 0.00 | | | | 0.00 | | | | 0.00 | | | | 26.08 | | | | 2.48 | 3,4 | | | 1.30 | 5 | | | 1.21 | 5 | | | 0.64 | 5 | | | 75.5 | | | | 13.93 | 4 |
| | | | | |
Year Ended December 31, | | | | | | | | | | | | | | | | | | | | | |
| | | | | | | | | | | | | | |
2023 | | | 23.80 | | | | 0.10 | | | | 1.64 | | | | 1.74 | | | | (0.09 | ) | | | 0.00 | | | | (0.09 | ) | | | 25.45 | | | | 7.33 | 3 | | | 1.26 | | | | 1.20 | | | | 0.40 | | | | 76.0 | | | | 32.76 | |
| | | | | | | | | | | | | | |
2022 | | | 33.29 | | | | 0.02 | | | | (9.21 | ) | | | (9.19 | ) | | | 0.00 | | | | (0.30 | ) | | | (0.30 | ) | | | 23.80 | | | | (27.47 | )3 | | | 1.26 | | | | 1.20 | | | | 0.06 | | | | 66.8 | | | | 47.04 | |
| | | | | | | | | | | | | | |
2021 | | | 31.97 | | | | (0.11 | ) | | | 3.18 | | | | 3.07 | | | | (0.63 | ) | | | (1.12 | ) | | | (1.75 | ) | | | 33.29 | | | | 9.64 | 3 | | | 1.23 | | | | 1.20 | | | | (0.33 | ) | | | 100.2 | | | | 36.00 | |
| | | | | | | | | | | | | | |
2020 | | | 24.50 | | | | (0.01 | ) | | | 7.49 | | | | 7.48 | | | | (0.01 | ) | | | 0.00 | | | | (0.01 | ) | | | 31.97 | | | | 30.52 | 3 | | | 1.28 | | | | 1.20 | | | | (0.05 | ) | | | 85.5 | | | | 41.13 | |
| | | | | | | | | | | | | | |
2019 | | | 19.00 | | | | 0.01 | | | | 5.51 | | | | 5.52 | | | | (0.01 | ) | | | (0.01 | ) | | | (0.02 | ) | | | 24.50 | | | | 29.06 | 3 | | | 1.31 | | | | 1.20 | | | | 0.06 | | | | 82.0 | | | | 56.52 | |
| | | | | |
INSTITUTIONAL SHARES | | | | | | | | | | | | | | | | | | | | | |
| | | | | |
Six Months Ended June 30, | | | | | | | | | | | | | | | | | | | | | |
| | | | | | | | | | | | | | |
2024 | | | 25.98 | | | | 0.11 | | | | 0.57 | | | | 0.68 | | | | 0.00 | | | | 0.00 | | | | 0.00 | | | | 26.66 | | | | 2.62 | 3,4 | | | 1.03 | 5 | | | 0.96 | 5 | | | 0.84 | 5 | | | 244.2 | | | | 13.93 | 4 |
| | | | | |
Year Ended December 31, | | | | | | | | | | | | | | | | | | | | | |
| | | | | | | | | | | | | | |
2023 | | | 24.29 | | | | 0.16 | | | | 1.68 | | | | 1.84 | | | | (0.15 | ) | | | 0.00 | | | | (0.15 | ) | | | 25.98 | | | | 7.60 | 3 | | | 0.98 | | | | 0.95 | | | | 0.64 | | | | 314.6 | | | | 32.76 | |
| | | | | | | | | | | | | | |
2022 | | | 33.88 | | | | 0.08 | | | | (9.37 | ) | | | (9.29 | ) | | | 0.00 | | | | (0.30 | ) | | | (0.30 | ) | | | 24.29 | | | | (27.29 | )3 | | | 0.99 | | | | 0.95 | | | | 0.30 | | | | 303.7 | | | | 47.04 | |
| | | | | | | | | | | | | | |
2021 | | | 32.51 | | | | (0.02 | ) | | | 3.22 | | | | 3.20 | | | | (0.71 | ) | | | (1.12 | ) | | | (1.83 | ) | | | 33.88 | | | | 9.88 | 3 | | | 0.96 | | | | 0.95 | | | | (0.05 | ) | | | 497.2 | | | | 36.00 | |
| | | | | | | | | | | | | | |
2020 | | | 24.88 | | | | 0.06 | | | | 7.61 | | | | 7.67 | | | | (0.04 | ) | | | 0.00 | | | | (0.04 | ) | | | 32.51 | | | | 30.83 | 3 | | | 1.01 | | | | 0.95 | | | | 0.25 | | | | 362.9 | | | | 41.13 | |
| | | | | | | | | | | | | | |
2019 | | | 19.29 | | | | 0.06 | | | | 5.61 | | | | 5.67 | | | | (0.07 | ) | | | (0.01 | ) | | | (0.08 | ) | | | 24.88 | | | | 29.39 | 3 | | | 1.04 | | | | 0.95 | | | | 0.27 | | | | 223.6 | | | | 56.52 | |
| | | | | |
R6 SHARES | | | | | | | | | | | | | | | | | | | | | |
| | | | | |
Six Months Ended June 30, | | | | | | | | | | | | | | | | | | | | | |
| | | | | | | | | | | | | | |
2024 | | | 25.97 | | | | 0.04 | | | | 0.63 | | | | 0.67 | | | | 0.00 | | | | 0.00 | | | | 0.00 | | | | 26.64 | | | | 2.58 | 3,4 | | | 1.00 | 5 | | | 0.96 | 5 | | | 0.33 | 5 | | | 22.7 | | | | 13.93 | 4 |
| | | | | |
Year Ended December 31, | | | | | | | | | | | | | | | | | | | | | |
| | | | | | | | | | | | | | |
2023 | | | 24.28 | | | | 0.16 | | | | 1.68 | | | | 1.84 | | | | (0.15 | ) | | | 0.00 | | | | (0.15 | ) | | | 25.97 | | | | 7.61 | 3 | | | 0.98 | | | | 0.95 | | | | 0.64 | | | | 121.4 | | | | 32.76 | |
| | | | | | | | | | | | | | |
2022 | | | 33.86 | | | | 0.08 | | | | (9.36 | ) | | | (9.28 | ) | | | 0.00 | | | | (0.30 | ) | | | (0.30 | ) | | | 24.28 | | | | (27.28 | )3 | | | 0.99 | | | | 0.95 | | | | 0.31 | | | | 112.2 | | | | 47.04 | |
| | | | | | | | | | | | | | |
2021 | | | 32.49 | | | | (0.03 | ) | | | 3.23 | | | | 3.20 | | | | (0.71 | ) | | | (1.12 | ) | | | (1.83 | ) | | | 33.86 | | | | 9.89 | 3 | | | 0.96 | | | | 0.95 | | | | (0.10 | ) | | | 160.3 | | | | 36.00 | |
| | | | | | | | | | | | | | |
2020 | | | 24.88 | | | | 0.04 | | | | 7.61 | | | | 7.65 | | | | (0.04 | ) | | | 0.00 | | | | (0.04 | ) | | | 32.49 | | | | 30.75 | 3 | | | 0.98 | | | | 0.95 | | | | 0.15 | | | | 163.5 | | | | 41.13 | |
| | | | | | | | | | | | | | |
2019 | | | 19.29 | | | | 0.06 | | | | 5.61 | | | | 5.67 | | | | (0.07 | ) | | | (0.01 | ) | | | (0.08 | ) | | | 24.88 | | | | 29.39 | 3 | | | 1.03 | | | | 0.95 | | | | 0.28 | | | | 17.7 | | | | 56.52 | |
| 1 | Based on average shares outstanding. |
| 2 | Total returns reflect reinvestment of all dividends and distributions, if any. |
| 3 | The total returns would have been lower had certain expenses not been reduced during the period shown. |
| | |
| See Notes to Financial Statements. | | 47 |
| | |
| Baron Select Funds | | June 30, 2024 |
FINANCIAL HIGHLIGHTS (Unaudited) (Continued)
BARON REAL ESTATE FUND
Selected data for a share outstanding throughout each period:
| | | | | | | | | | | | | | | | | | | | | | | | | | | | | | | | | | | | | | | | | | | | | | | | | | | | |
| | | | | | | |
| | | | | | Income (loss) from
investment operations: | | | Less distributions to
shareholders from: | | | | | | | | | Ratios to Average Net Assets: | | | Supplemental
Data: | |
| | | | | | | | | | | | | |
| | | Net asset
value, beginning of period ($) | | | Net
investment income (loss) ($)1 | | | Net
realized
and unrealized gain (loss) ($) | | | Total from investment operations ($) | | | Net
investment income ($) | | | Net
realized gains ($) | | | Total
distributions ($) | | | Net
asset value,
end of
period ($) | | | Total
return (%)2 | | | Total expenses (%) | | | Net
investment income (loss) (%) | | | Net
assets (in
millions),
end of
period ($) | | | Portfolio
turnover
rate (%) | |
| | | | |
RETAIL SHARES | | | | | | | | | | | | | | | | | |
| | | | |
Six Months Ended June 30, | | | | | | | | | | | | | | | | | |
| | | | | | | | | | | | | |
2024 | | | 34.72 | | | | 0.06 | | | | (0.68 | ) | | | (0.62 | ) | | | 0.00 | | | | 0.00 | | | | 0.00 | | | | 34.10 | | | | (1.79 | )3 | | | 1.31 | 4 | | | 0.34 | 4 | | | 350.6 | | | | 29.81 | 3 |
| | | | |
Year Ended December 31, | | | | | | | | | | | | | | | | | |
| | | | | | | | | | | | | |
2023 | | | 27.86 | | | | 0.08 | | | | 6.80 | | | | 6.88 | | | | (0.02 | ) | | | 0.00 | | | | (0.02 | ) | | | 34.72 | | | | 24.70 | | | | 1.31 | | | | 0.25 | | | | 381.4 | | | | 57.86 | |
| | | | | | | | | | | | | |
2022 | | | 40.24 | | | | 0.00 | 5 | | | (11.56 | ) | | | (11.56 | ) | | | (0.02 | ) | | | (0.80 | ) | | | (0.82 | ) | | | 27.86 | | | | (28.61 | ) | | | 1.33 | | | | 0.00 | 6 | | | 322.0 | | | | 112.74 | |
| | | | | | | | | | | | | |
2021 | | | 35.21 | | | | (0.10 | ) | | | 8.42 | | | | 8.32 | | | | 0.00 | | | | (3.29 | ) | | | (3.29 | ) | | | 40.24 | | | | 24.03 | | | | 1.31 | | | | (0.26 | ) | | | 514.8 | | | | 64.39 | |
| | | | | | | | | | | | | |
2020 | | | 26.18 | | | | (0.10 | ) | | | 11.34 | | | | 11.24 | | | | (0.00 | )5 | | | (2.21 | ) | | | (2.21 | ) | | | 35.21 | | | | 43.85 | | | | 1.34 | | | | (0.36 | ) | | | 321.8 | | | | 71.46 | |
| | | | | | | | | | | | | |
2019 | | | 20.77 | | | | (0.03 | ) | | | 9.08 | | | | 9.05 | | | | 0.00 | | | | (3.64 | ) | | | (3.64 | ) | | | 26.18 | | | | 44.11 | | | | 1.33 | 7 | | | (0.10 | ) | | | 246.9 | | | | 53.44 | |
| | | | |
INSTITUTIONAL SHARES | | | | | | | | | | | | | | | | | |
| | | | |
Six Months Ended June 30, | | | | | | | | | | | | | | | | | |
| | | | | | | | | | | | | |
2024 | | | 35.75 | | | | 0.11 | | | | (0.71 | ) | | | (0.60 | ) | | | 0.00 | | | | 0.00 | | | | 0.00 | | | | 35.15 | | | | (1.68 | )3 | | | 1.05 | 4 | | | 0.60 | 4 | | | 1,358.7 | | | | 29.81 | 3 |
| | | | |
Year Ended December 31, | | | | | | | | | | | | | | | | | |
| | | | | | | | | | | | | |
2023 | | | 28.73 | | | | 0.16 | | | | 7.01 | | | | 7.17 | | | | (0.15 | ) | | | 0.00 | | | | (0.15 | ) | | | 35.75 | | | | 25.04 | | | | 1.06 | | | | 0.51 | | | | 1,319.1 | | | | 57.86 | |
| | | | | | | | | | | | | |
2022 | | | 41.36 | | | | 0.08 | | | | (11.89 | ) | | | (11.81 | ) | | | (0.02 | ) | | | (0.80 | ) | | | (0.82 | ) | | | 28.73 | | | | (28.44 | ) | | | 1.07 | | | | 0.25 | | | | 928.7 | | | | 112.74 | |
| | | | | | | | | | | | | |
2021 | | | 36.02 | | | | 0.01 | | | | 8.62 | | | | 8.63 | | | | 0.00 | | | | (3.29 | ) | | | (3.29 | ) | | | 41.36 | | | | 24.36 | | | | 1.05 | | | | 0.04 | | | | 1,490.8 | | | | 64.39 | |
| | | | | | | | | | | | | |
2020 | | | 26.68 | | | | (0.03 | ) | | | 11.60 | | | | 11.57 | | | | (0.02 | ) | | | (2.21 | ) | | | (2.23 | ) | | | 36.02 | | | | 44.28 | | | | 1.08 | | | | (0.10 | ) | | | 705.4 | | | | 71.46 | |
| | | | | | | | | | | | | |
2019 | | | 21.10 | | | | 0.04 | | | | 9.22 | | | | 9.26 | | | | (0.04 | ) | | | (3.64 | ) | | | (3.68 | ) | | | 26.68 | | | | 44.44 | | | | 1.08 | 7 | | | 0.15 | | | | 360.2 | | | | 53.44 | |
| | | | |
R6 SHARES | | | | | | | | | | | | | | | | | |
| | | | |
Six Month Ended June 30, | | | | | | | | | | | | | | | | | |
| | | | | | | | | | | | | |
2024 | | | 35.75 | | | | 0.11 | | | | (0.71 | ) | | | (0.60 | ) | | | 0.00 | | | | 0.00 | | | | 0.00 | | | | 35.15 | | | | (1.68 | )3 | | | 1.05 | 4 | | | 0.61 | 4 | | | 43.9 | | | | 29.81 | 3 |
| | | | |
Year Ended December 31, | | | | | | | | | | | | | | | | | |
| | | | | | | | | | | | | |
2023 | | | 28.73 | | | | 0.16 | | | | 7.01 | | | | 7.17 | | | | (0.15 | ) | | | 0.00 | | | | (0.15 | ) | | | 35.75 | | | | 25.04 | | | | 1.06 | | | | 0.52 | | | | 40.1 | | | | 57.86 | |
| | | | | | | | | | | | | |
2022 | | | 41.36 | | | | 0.09 | | | | (11.90 | ) | | | (11.81 | ) | | | (0.02 | ) | | | (0.80 | ) | | | (0.82 | ) | | | 28.73 | | | | (28.44 | ) | | | 1.07 | | | | 0.29 | | | | 25.7 | | | | 112.74 | |
| | | | | | | | | | | | | |
2021 | | | 36.02 | | | | 0.01 | | | | 8.62 | | | | 8.63 | | | | 0.00 | | | | (3.29 | ) | | | (3.29 | ) | | | 41.36 | | | | 24.36 | | | | 1.05 | | | | 0.02 | | | | 33.3 | | | | 64.39 | |
| | | | | | | | | | | | | |
2020 | | | 26.69 | | | | (0.03 | ) | | | 11.59 | | | | 11.56 | | | | (0.02 | ) | | | (2.21 | ) | | | (2.23 | ) | | | 36.02 | | | | 44.23 | | | | 1.07 | | | | (0.10 | ) | | | 20.0 | | | | 71.46 | |
| | | | | | | | | | | | | |
2019 | | | 21.10 | | | | 0.04 | | | | 9.23 | | | | 9.27 | | | | (0.04 | ) | | | (3.64 | ) | | | (3.68 | ) | | | 26.69 | | | | 44.51 | | | | 1.07 | 7 | | | 0.17 | | | | 13.2 | | | | 53.44 | |
| 1 | Based on average shares outstanding. |
| 2 | Total returns reflect reinvestment of all dividends and distributions, if any. |
| 5 | Less than $0.01 per share. |
| 7 | Includes interest expense of less than 0.01%. |
| | |
| 48 | | See Notes to Financial Statements. |
| | |
| June 30, 2024 | | Baron Select Funds |
FINANCIAL HIGHLIGHTS (Unaudited) (Continued)
BARON EMERGING MARKETS FUND
Selected data for a share outstanding throughout each period:
| | | | | | | | | | | | | | | | | | | | | | | | | | | | | | | | | | | | | | | | | | | | | | | | | | | | | | | | |
| | | | | | | |
| | | | | | Income (loss) from
investment operations: | | | Less distributions to
shareholders from: | | | | | | | | | Ratios to Average Net Assets: | | | Supplemental
Data: | |
| | | | | | | | | | | | | | |
| | | Net asset
value, beginning of period ($) | | | Net
investment income (loss) ($)1 | | | Net
realized
and unrealized gain (loss) ($) | | | Total from investment operations ($) | | | Net
investment income ($) | | | Net
realized gains ($) | | | Return
of capital ($) | | | Total
distributions ($) | | | Net
asset
value,
end of
period ($) | | | Total
return (%)2 | | | Total expenses (%) | | | Net
investment income (loss) (%) | | | Net
assets (in
millions),
end of
period ($) | | | Portfolio turnover rate (%) | |
| | | | | |
RETAIL SHARES | | | | | | | | | | | | | | | | | | | | | |
| | | | | |
Six Months Ended June 30, | | | | | | | | | | | | | | | | | | | | | |
| | | | | | | | | | | | | | |
2024 | | | 13.93 | | | | 0.02 | | | | 0.90 | | | | 0.92 | | | | 0.00 | | | | 0.00 | | | | 0.00 | | | | 0.00 | | | | 14.85 | | | | 6.60 | 3 | | | 1.38 | 4 | | | 0.27 | 4 | | | 223.3 | | | | 19.77 | 3 |
| | | | | |
Year Ended December 31, | | | | | | | | | | | | | | | | | | | | | |
| | | | | | | | | | | | | | |
2023 | | | 12.96 | | | | 0.04 | | | | 0.99 | | | | 1.03 | | | | (0.06 | ) | | | 0.00 | | | | 0.00 | | | | (0.06 | ) | | | 13.93 | | | | 7.95 | | | | 1.37 | | | | 0.26 | | | | 253.2 | | | | 33.37 | |
| | | | | | | | | | | | | | |
2022 | | | 17.51 | | | | (0.01 | ) | | | (4.54 | ) | | | (4.55 | ) | | | 0.00 | | | | 0.00 | | | | 0.00 | | | | 0.00 | | | | 12.96 | | | | (25.99 | ) | | | 1.38 | | | | (0.07 | ) | | | 283.7 | | | | 43.74 | |
| | | | | | | | | | | | | | |
2021 | | | 18.97 | | | | (0.09 | ) | | | (1.09 | ) | | | (1.18 | ) | | | (0.28 | ) | | | 0.00 | | | | (0.00 | )5 | | | (0.28 | ) | | | 17.51 | | | | (6.26 | ) | | | 1.33 | | | | (0.46 | ) | | | 462.6 | | | | 33.10 | |
| | | | | | | | | | | | | | |
2020 | | | 14.72 | | | | (0.06 | ) | | | 4.31 | | | | 4.25 | | | | 0.00 | | | | 0.00 | | | | 0.00 | | | | 0.00 | | | | 18.97 | | | | 28.87 | | | | 1.35 | | | | (0.44 | ) | | | 507.7 | | | | 55.65 | |
| | | | | | | | | | | | | | |
2019 | | | 12.45 | | | | 0.03 | | | | 2.27 | | | | 2.30 | | | | (0.03 | ) | | | 0.00 | | | | (0.00 | )5 | | | (0.03 | ) | | | 14.72 | | | | 18.48 | | | | 1.35 | | | | 0.23 | | | | 667.1 | | | | 59.00 | |
| | | | | |
INSTITUTIONAL SHARES | | | | | | | | | | | | | | | | | | | | | |
| | | | | |
Six Months Ended June 30, | | | | | | | | | | | | | | | | | | | | | |
| | | | | | | | | | | | | | |
2024 | | | 14.02 | | | | 0.04 | | | | 0.91 | | | | 0.95 | | | | 0.00 | | | | 0.00 | | | | 0.00 | | | | 0.00 | | | | 14.97 | | | | 6.78 | 3 | | | 1.12 | 4 | | | 0.52 | 4 | | | 3,813.8 | | | | 19.77 | 3 |
| | | | | |
Year Ended December 31, | | | | | | | | | | | | | | | | | | | | | |
| | | | | | | | | | | | | | |
2023 | | | 13.04 | | | | 0.07 | | | | 1.01 | | | | 1.08 | | | | (0.10 | ) | | | 0.00 | | | | 0.00 | | | | (0.10 | ) | | | 14.02 | | | | 8.29 | | | | 1.11 | | | | 0.52 | | | | 4,279.6 | | | | 33.37 | |
| | | | | | | | | | | | | | |
2022 | | | 17.58 | | | | 0.03 | | | | (4.57 | ) | | | (4.54 | ) | | | 0.00 | | | | 0.00 | | | | 0.00 | | | | 0.00 | | | | 13.04 | | | | (25.82 | ) | | | 1.12 | | | | 0.20 | | | | 4,473.6 | | | | 43.74 | |
| | | | | | | | | | | | | | |
2021 | | | 19.06 | | | | (0.04 | ) | | | (1.11 | ) | | | (1.15 | ) | | | (0.33 | ) | | | 0.00 | | | | (0.00 | )5 | | | (0.33 | ) | | | 17.58 | | | | (6.07 | ) | | | 1.08 | | | | (0.22 | ) | | | 8,408.8 | | | | 33.10 | |
| | | | | | | | | | | | | | |
2020 | | | 14.75 | | | | (0.03 | ) | | | 4.34 | | | | 4.31 | | | | 0.00 | | | | 0.00 | | | | 0.00 | | | | 0.00 | | | | 19.06 | | | | 29.22 | | | | 1.09 | | | | (0.20 | ) | | | 6,228.8 | | | | 55.65 | |
| | | | | | | | | | | | | | |
2019 | | | 12.47 | | | | 0.07 | | | | 2.28 | | | | 2.35 | | | | (0.06 | ) | | | 0.00 | | | | (0.01 | ) | | | (0.07 | ) | | | 14.75 | | | | 18.86 | | | | 1.09 | | | | 0.50 | | | | 4,644.8 | | | | 59.00 | |
| | | | | |
R6 SHARES | | | | | | | | | | | | | | | | | | | | | |
| | | | | |
Six Months Ended June 30 | | | | | | | | | | | | | | | | | | | | | |
| | | | | | | | | | | | | | |
2024 | | | 14.03 | | | | 0.04 | | | | 0.90 | | | | 0.94 | | | | 0.00 | | | | 0.00 | | | | 0.00 | | | | 0.00 | | | | 14.97 | | | | 6.70 | 3 | | | 1.13 | 4 | | | 0.58 | 4 | | | 8.6 | | | | 19.77 | 3 |
| | | | | |
Year Ended December 31, | | | | | | | | | | | | | | | | | | | | | |
| | | | | | | | | | | | | | |
2023 | | | 13.05 | | | | 0.07 | | | | 1.01 | | | | 1.08 | | | | (0.10 | ) | | | 0.00 | | | | 0.00 | | | | (0.10 | ) | | | 14.03 | | | | 8.27 | | | | 1.11 | | | | 0.50 | | | | 8.2 | | | | 33.37 | |
| | | | | | | | | | | | | | |
2022 | | | 17.59 | | | | 0.03 | | | | (4.57 | ) | | | (4.54 | ) | | | 0.00 | | | | 0.00 | | | | 0.00 | | | | 0.00 | | | | 13.05 | | | | (25.81 | ) | | | 1.13 | | | | 0.20 | | | | 10.4 | | | | 43.74 | |
| | | | | | | | | | | | | | |
2021 | | | 19.07 | | | | (0.04 | ) | | | (1.11 | ) | | | (1.15 | ) | | | (0.33 | ) | | | 0.00 | | | | (0.00 | )5 | | | (0.33 | ) | | | 17.59 | | | | (6.07 | ) | | | 1.08 | | | | (0.21 | ) | | | 17.4 | | | | 33.10 | |
| | | | | | | | | | | | | | |
2020 | | | 14.75 | | | | (0.03 | ) | | | 4.35 | | | | 4.32 | | | | 0.00 | | | | 0.00 | | | | 0.00 | | | | 0.00 | | | | 19.07 | | | | 29.29 | | | | 1.09 | | | | (0.18 | ) | | | 13.9 | | | | 55.65 | |
| | | | | | | | | | | | | | |
2019 | | | 12.48 | | | | 0.07 | | | | 2.27 | | | | 2.34 | | | | (0.06 | ) | | | 0.00 | | | | (0.01 | ) | | | (0.07 | ) | | | 14.75 | | | | 18.77 | | | | 1.09 | | | | 0.49 | | | | 10.1 | | | | 59.00 | |
| 1 | Based on average shares outstanding. |
| 2 | Total returns reflect reinvestment of all dividends and distributions, if any. |
| 5 | Less than $0.01 per share. |
| | |
| See Notes to Financial Statements. | | 49 |
| | |
| Baron Select Funds | | June 30, 2024 |
FINANCIAL HIGHLIGHTS (Unaudited) (Continued)
BARON GLOBAL ADVANTAGE FUND
Selected data for a share outstanding throughout each period:
| | | | | | | | | | | | | | | | | | | | | | | | | | | | | | | | | | | | | | | | | | | | | | | | | | | | | | | | |
| | | | | | | |
| | | | | | Income (loss) from
investment operations: | | | Less distributions to
shareholders from: | | | | | | | | | Ratios to Average Net Assets: | | | Supplemental
Data: | |
| | | | | | | | | | | | | | |
| | | Net
asset
value,
beginning
of period
($) | | | Net
investment
income
(loss)
($)1 | | | Net
realized
and
unrealized
gain (loss)
($) | | | Total
from
investment
operations
($) | | | Net
investment
income
($) | | | Net
realized
gains
($) | | | Total
distributions
($) | | | Net
asset
value,
end of
period
($) | | | Total
return
(%)2 | | | Gross
expenses
(%) | | | Net
expenses
(%) | | | Net
investment
income
(loss)
(%) | | | Net
assets (in
millions),
end of
period
($) | | | Portfolio
turnover
rate
(%) | |
|
RETAIL SHARES | |
|
Six Months Ended June 30, | |
| | | | | | | | | | | | | | |
2024 | | | 30.70 | | | | (0.17 | ) | | | 2.30 | | | | 2.13 | | | | 0.00 | | | | 0.00 | | | | 0.00 | | | | 32.83 | | | | 6.94 | 3,4 | | | 1.24 | 5,8 | | | 1.17 | 5,8 | | | (1.11 | )5 | | | 178.1 | | | | 2.81 | 4 |
|
Year Ended December 31, | |
| | | | | | | | | | | | | | |
2023 | | | 24.51 | | | | (0.30 | ) | | | 6.49 | | | | 6.19 | | | | 0.00 | | | | 0.00 | | | | 0.00 | | | | 30.70 | | | | 25.26 | 3 | | | 1.21 | 6 | | | 1.16 | 6 | | | (1.11 | ) | | | 205.5 | | | | 2.03 | |
| | | | | | | | | | | | | | |
2022 | | | 51.65 | | | | (0.37 | ) | | | (26.27 | ) | | | (26.64 | ) | | | 0.00 | | | | (0.50 | ) | | | (0.50 | ) | | | 24.51 | | | | (51.69 | )3,9 | | | 1.20 | 6 | | | 1.15 | 6 | | | (1.14 | ) | | | 223.3 | | | | 11.50 | |
| | | | | | | | | | | | | | |
2021 | | | 51.34 | | | | (0.62 | ) | | | 0.93 | | | | 0.31 | | | | 0.00 | | | | 0.00 | | | | 0.00 | | | | 51.65 | | | | 0.60 | 3,10 | | | 1.15 | 7 | | | 1.15 | 7 | | | (1.14 | ) | | | 786.3 | | | | 23.73 | |
| | | | | | | | | | | | | | |
2020 | | | 28.68 | | | | (0.44 | ) | | | 23.10 | | | | 22.66 | | | | 0.00 | | | | 0.00 | | | | 0.00 | | | | 51.34 | | | | 79.01 | 3 | | | 1.17 | | | | 1.15 | | | | (1.10 | ) | | | 921.7 | | | | 8.75 | |
| | | | | | | | | | | | | | |
2019 | | | 19.77 | | | | (0.02 | ) | | | 8.93 | | | | 8.91 | | | | 0.00 | | | | 0.00 | | | | 0.00 | | | | 28.68 | | | | 45.07 | 3 | | | 1.25 | 7 | | | 1.15 | 7 | | | (0.08 | ) | | | 174.6 | | | | 19.44 | |
|
INSTITUTIONAL SHARES | |
|
Six Months Ended June 30, | |
| | | | | | | | | | | | | | |
2024 | | | 31.49 | | | | (0.14 | ) | | | 2.37 | | | | 2.23 | | | | 0.00 | | | | 0.00 | | | | 0.00 | | | | 33.72 | | | | 7.08 | 3,4 | | | 0.98 | 5,8 | | | 0.92 | 5,8 | | | (0.86 | )5 | | | 412.0 | | | | 2.81 | 4 |
|
Year Ended December 31, | |
| | | | | | | | | | | | | | |
2023 | | | 25.08 | | | | (0.24 | ) | | | 6.65 | | | | 6.41 | | | | 0.00 | | | | 0.00 | | | | 0.00 | | | | 31.49 | | | | 25.56 | 3 | | | 0.95 | 6 | | | 0.91 | 6 | | | (0.86 | ) | | | 470.0 | | | | 2.03 | |
| | | | | | | | | | | | | | |
2022 | | | 52.70 | | | | (0.30 | ) | | | (26.82 | ) | | | (27.12 | ) | | | 0.00 | | | | (0.50 | ) | | | (0.50 | ) | | | 25.08 | | | | (51.57 | )3,9 | | | 0.94 | 6 | | | 0.90 | 6 | | | (0.89 | ) | | | 538.1 | | | | 11.50 | |
| | | | | | | | | | | | | | |
2021 | | | 52.25 | | | | (0.49 | ) | | | 0.94 | | | | 0.45 | | | | 0.00 | | | | 0.00 | | | | 0.00 | | | | 52.70 | | | | 0.86 | 3,10 | | | 0.90 | 7 | | | 0.90 | 7 | | | (0.89 | ) | | | 1,803.3 | | | | 23.73 | |
| | | | | | | | | | | | | | |
2020 | | | 29.12 | | | | (0.35 | ) | | | 23.48 | | | | 23.13 | | | | 0.00 | | | | 0.00 | | | | 0.00 | | | | 52.25 | | | | 79.43 | 3 | | | 0.92 | | | | 0.90 | | | | (0.85 | ) | | | 1,470.9 | | | | 8.75 | |
| | | | | | | | | | | | | | |
2019 | | | 20.02 | | | | (0.01 | ) | | | 9.11 | | | | 9.10 | | | | 0.00 | | | | 0.00 | | | | 0.00 | | | | 29.12 | | | | 45.45 | 3 | | | 1.00 | 7 | | | 0.90 | 7 | | | (0.03 | ) | | | 212.8 | | | | 19.44 | |
|
R6 SHARES | |
|
Six Months Ended June 30, | |
| | | | | | | | | | | | | | |
2024 | | | 31.51 | | | | (0.14 | ) | | | 2.37 | | | | 2.23 | | | | 0.00 | | | | 0.00 | | | | 0.00 | | | | 33.74 | | | | 7.08 | 3,4 | | | 0.98 | 5,8 | | | 0.92 | 5,8 | | | (0.86 | )5 | | | 10.3 | | | | 2.81 | 4 |
|
Year Ended December 31, | |
| | | | | | | | | | | | | | |
2023 | | | 25.09 | | | | (0.24 | ) | | | 6.66 | | | | 6.42 | | | | 0.00 | | | | 0.00 | | | | 0.00 | | | | 31.51 | | | | 25.59 | 3 | | | 0.95 | 6 | | | 0.91 | 6 | | | (0.86 | ) | | | 10.3 | | | | 2.03 | |
| | | | | | | | | | | | | | |
2022 | | | 52.73 | | | | (0.29 | ) | | | (26.85 | ) | | | (27.14 | ) | | | 0.00 | | | | (0.50 | ) | | | (0.50 | ) | | | 25.09 | | | | (51.58 | )3,9 | | | 0.95 | 8 | | | 0.90 | 8 | | | (0.89 | ) | | | 9.3 | | | | 11.50 | |
| | | | | | | | | | | | | | |
2021 | | | 52.28 | | | | (0.50 | ) | | | 0.95 | | | | 0.45 | | | | 0.00 | | | | 0.00 | | | | 0.00 | | | | 52.73 | | | | 0.86 | 3,10 | | | 0.90 | 7 | | | 0.90 | 7 | | | (0.89 | ) | | | 18.4 | | | | 23.73 | |
| | | | | | | | | | | | | | |
2020 | | | 29.14 | | | | (0.32 | ) | | | 23.46 | | | | 23.14 | | | | 0.00 | | | | 0.00 | | | | 0.00 | | | | 52.28 | | | | 79.41 | 3 | | | 0.92 | | | | 0.90 | | | | (0.83 | ) | | | 15.0 | | | | 8.75 | |
| | | | | | | | | | | | | | |
2019 | | | 20.03 | | | | (0.03 | ) | | | 9.14 | | | | 9.11 | | | | 0.00 | | | | 0.00 | | | | 0.00 | | | | 29.14 | | | | 45.48 | 3 | | | 1.00 | 7 | | | 0.90 | 7 | | | (0.10 | ) | | | 6.8 | | | | 19.44 | |
| 1 | Based on average shares outstanding. |
| 2 | Total returns reflect reinvestment of all dividends and distributions, if any. |
| 3 | The total returns would have been lower had certain expenses not been reduced during the period shown. |
| 6 | Includes interest expense of 0.01%. |
| 7 | Includes interest expense of less than 0.01%. |
| 8 | Includes interest expense of 0.02%. |
| 9 | The Adviser made a voluntary payment to the Fund in the amount of $82,890 to compensate the Fund for a loss incurred due to a valuation error. The impact of this payment increased the Fund’s total return by less than 0.01%. |
| 10 | The Adviser made voluntary payments to the Fund in the amount of $162,538 to compensate the Fund for losses incurred due to valuation errors. The impact of these payments increased the Fund’s total return by less than 0.01%. |
| | |
| 50 | | See Notes to Financial Statements. |
| | |
| June 30, 2024 | | Baron Select Funds |
FINANCIAL HIGHLIGHTS (Unaudited) (Continued)
BARON REAL ESTATE INCOME FUND
Selected data for a share outstanding throughout each period:
| | | | | | | | | | | | | | | | | | | | | | | | | | | | | | | | | | | | | | | | | | | | | | | | | | | | | | | | |
| | | | | | | |
| | | | | | Income (loss) from
investment operations: | | | Less distributions to
shareholders from: | | | | | | | | | Ratios to Average Net Assets: | | | Supplemental
Data: | |
| | | | | | | | | | | | | | |
| | | Net asset
value,
beginning
of period
($) | | | Net
investment
income
(loss)
($)1 | | | Net
realized
and
unrealized
gain (loss) ($) | | | Total
from
investment
operations
($) | | | Net
investment
income
($) | | | Net
realized
gains
($) | | | Total
distributions
($) | | | Net
asset
value,
end of
period
($) | | | Total
return
(%)2 | | | Gross
expenses
(%) | | | Net
expenses
(%) | | | Net
investment
income
(%) | | | Net
assets (in
millions),
end of
period
($) | | | Portfolio
turnover
rate (%) | |
| | | | | |
RETAIL SHARES | | | | | | | | | | | | | | | | | | | | | |
| | | | | |
Six Months Ended June 30 , | | | | | | | | | | | | | | | | | | | | | |
| | | | | | | | | | | | | | |
2024 | | | 14.35 | | | | 0.13 | | | | (0.14 | ) | | | (0.01 | ) | | | (0.12 | ) | | | 0.00 | | | | (0.12 | ) | | | 14.22 | | | | (0.05 | )3,4 | | | 1.29 | 5 | | | 1.05 | 5 | | | 1.84 | 5 | | | 12.3 | | | | 58.31 | 4 |
| | | | | |
Year Ended December 31 , | | | | | | | | | | | | | | | | | | | | | |
| | | | | | | | | | | | | | |
2023 | | | 12.71 | | | | 0.21 | | | | 1.69 | | | | 1.90 | | | | (0.26 | ) | | | 0.00 | | | | (0.26 | ) | | | 14.35 | | | | 15.19 | 3 | | | 1.32 | | | | 1.05 | | | | 1.62 | | | | 13.8 | | | | 109.95 | |
| | | | | | | | | | | | | | |
2022 | | | 17.90 | | | | 0.17 | | | | (5.10 | ) | | | (4.93 | ) | | | (0.17 | ) | | | (0.09 | ) | | | (0.26 | ) | | | 12.71 | | | | (27.61 | )3 | | | 1.32 | 6 | | | 1.05 | 6 | | | 1.13 | | | | 13.3 | | | | 185.25 | 7 |
| | | | | | | | | | | | | | |
2021 | | | 14.08 | | | | 0.15 | | | | 3.93 | | | | 4.08 | | | | (0.19 | ) | | | (0.07 | ) | | | (0.26 | ) | | | 17.90 | | | | 29.08 | 3 | | | 1.42 | 6 | | | 1.05 | 6 | | | 0.94 | | | | 17.9 | | | | 96.59 | |
| | | | | | | | | | | | | | |
2020 | | | 11.65 | | | | 0.11 | | | | 2.43 | | | | 2.54 | | | | (0.11 | ) | | | 0.00 | | | | (0.11 | ) | | | 14.08 | | | | 22.02 | 3 | | | 4.40 | | | | 1.05 | | | | 0.91 | | | | 2.9 | | | | 41.75 | |
| | | | | | | | | | | | | | |
2019 | | | 8.63 | | | | 0.13 | | | | 3.02 | | | | 3.15 | | | | (0.13 | ) | | | 0.00 | | | | (0.13 | ) | | | 11.65 | | | | 36.67 | 3 | | | 6.87 | | | | 1.05 | | | | 1.20 | | | | 1.4 | | | | 52.50 | |
| | | | | |
INSTITUTIONAL SHARES | | | | | | | | | | | | | | | | | | | | | |
| | | | | |
Six Months Ended June 30 , | | | | | | | | | | | | | | | | | | | | | |
| | | | | | | | | | | | | | |
2024 | | | 14.53 | | | | 0.15 | | | | (0.15 | ) | | | 0.00 | | | | (0.14 | ) | | | 0.00 | | | | (0.14 | ) | | | 14.39 | | | | 0.01 | 3,4 | | | 0.92 | 5 | | | 0.80 | 5 | | | 2.12 | 5 | | | 128.0 | | | | 58.31 | 4 |
| | | | | |
Year Ended December 31 , | | | | | | | | | | | | | | | | | | | | | |
| | | | | | | | | | | | | | |
2023 | | | 12.85 | | | | 0.27 | | | | 1.69 | | | | 1.96 | | | | (0.28 | ) | | | 0.00 | | | | (0.28 | ) | | | 14.53 | | | | 15.51 | 3 | | | 0.96 | | | | 0.80 | | | | 2.00 | | | | 132.7 | | | | 109.95 | |
| | | | | | | | | | | | | | |
2022 | | | 18.05 | | | | 0.20 | | | | (5.14 | ) | | | (4.94 | ) | | | (0.17 | ) | | | (0.09 | ) | | | (0.26 | ) | | | 12.85 | | | | (27.43 | )3 | | | 0.96 | 6 | | | 0.80 | 6 | | | 1.31 | | | | 63.4 | | | | 185.25 | 7 |
| | | | | | | | | | | | | | |
2021 | | | 14.15 | | | | 0.18 | | | | 3.98 | | | | 4.16 | | | | (0.19 | ) | | | (0.07 | ) | | | (0.26 | ) | | | 18.05 | | | | 29.51 | 3 | | | 1.08 | 6 | | | 0.80 | 6 | | | 1.11 | | | | 113.7 | | | | 96.59 | |
| | | | | | | | | | | | | | |
2020 | | | 11.68 | | | | 0.37 | | | | 2.21 | | | | 2.58 | | | | (0.11 | ) | | | 0.00 | | | | (0.11 | ) | | | 14.15 | | | | 22.30 | 3 | | | 3.45 | | | | 0.80 | | | | 3.00 | | | | 43.6 | | | | 41.75 | |
| | | | | | | | | | | | | | |
2019 | | | 8.66 | | | | 0.14 | | | | 3.01 | | | | 3.15 | | | | (0.13 | ) | | | 0.00 | | | | (0.13 | ) | | | 11.68 | | | | 36.54 | 3 | | | 5.63 | | | | 0.80 | | | | 1.37 | | | | 2.7 | | | | 52.50 | |
| | | | | |
R6 SHARES | | | | | | | | | | | | | | | | | | | | | |
| | | | | |
Six Months Ended June 30, | | | | | | | | | | | | | | | | | | | | | |
| | | | | | | | | | | | | | |
2024 | | | 14.51 | | | | 0.17 | | | | (0.16 | ) | | | 0.01 | | | | (0.14 | ) | | | 0.00 | | | | (0.14 | ) | | | 14.38 | | | | 0.08 | 3,4 | | | 0.93 | 5 | | | 0.80 | 5 | | | 2.39 | 5 | | | 5.5 | | | | 58.31 | 4 |
| | | | | |
Year Ended December 31, | | | | | | | | | | | | | | | | | | | | | |
| | | | | | | | | | | | | | |
2023 | | | 12.84 | | | | 0.28 | | | | 1.67 | | | | 1.95 | | | | (0.28 | ) | | | 0.00 | | | | (0.28 | ) | | | 14.51 | | | | 15.44 | 3 | | | 0.97 | | | | 0.80 | | | | 2.12 | | | | 1.6 | | | | 109.95 | |
| | | | | | | | | | | | | | |
2022 | | | 18.03 | | | | 0.21 | | | | (5.14 | ) | | | (4.93 | ) | | | (0.17 | ) | | | (0.09 | ) | | | (0.26 | ) | | | 12.84 | | | | (27.41 | )3 | | | 0.97 | 6 | | | 0.80 | 6 | | | 1.38 | | | | 0.6 | | | | 185.25 | 7 |
| | | | | | | | | | | | | | |
2021 | | | 14.14 | | | | 0.16 | | | | 3.99 | | | | 4.15 | | | | (0.19 | ) | | | (0.07 | ) | | | (0.26 | ) | | | 18.03 | | | | 29.46 | 3 | | | 1.08 | 6 | | | 0.80 | 6 | | | 1.01 | | | | 0.9 | | | | 96.59 | |
| | | | | | | | | | | | | | |
2020 | | | 11.67 | | | | 0.11 | | | | 2.47 | | | | 2.58 | | | | (0.11 | ) | | | 0.00 | | | | (0.11 | ) | | | 14.14 | | | | 22.32 | 3 | | | 3.47 | | | | 0.80 | | | | 1.06 | | | | 0.6 | | | | 41.75 | |
| | | | | | | | | | | | | | |
2019 | | | 8.66 | | | | 0.14 | | | | 3.00 | | | | 3.14 | | | | (0.13 | ) | | | 0.00 | | | | (0.13 | ) | | | 11.67 | | | | 36.42 | 3 | | | 5.27 | | | | 0.80 | | | | 1.36 | | | | 0.4 | | | | 52.50 | |
| 1 | Based on average shares outstanding. |
| 2 | Total returns reflect reinvestment of all dividends and distributions, if any. |
| 3 | The total returns would have been lower had certain expenses not been reduced during the period shown. |
| 6 | Includes interest expense of less than 0.01%. |
| 7 | Increased market volatility and large net capital stock outflows caused an increase in the Fund’s portfolio turnover rate in 2022 beyond historical levels. |
| | |
| See Notes to Financial Statements. | | 51 |
| | |
| Baron Select Funds | | June 30, 2024 |
FINANCIAL HIGHLIGHTS (Unaudited) (Continued)
BARON HEALTH CARE FUND
Selected data for a share outstanding throughout each period:
| | | | | | | | | | | | | | | | | | | | | | | | | | | | | | | | | | | | | | | | | | | | | | | | | | | | | | | | |
| | | | | | | |
| | | | | | Income (loss) from
investment operations: | | | Less distributions to
shareholders from: | | | | | | | | | Ratios to Average Net Assets: | | | Supplemental
Data: | |
| | | | | | | | | | | | | | |
| | | Net
asset
value, beginning of period ($) | | | Net
investment income (loss) ($)1 | | | Net
realized
and unrealized gain
(loss) ($) | | | Total
from investment operations ($) | | | Net
investment income ($) | | | Net
realized gains ($) | | | Total
distributions ($) | | | Net
asset value,
end of
period ($) | | | Total
return (%)2 | | | Gross
expenses
(%) | | | Net expenses (%) | | | Net
investment income
(loss) (%) | | | Net
assets (in
millions),
end of
period ($) | | | Portfolio turnover rate (%) | |
| | | | | |
RETAIL SHARES | | | | | | | | | | | | | | | | | | | | | |
| | | | | |
Six Months Ended June 30, | | | | | | | | | | | | | | | | | | | | | |
| | | | | | | | | | | | | | |
2024 | | | 18.78 | | | | (0.04 | ) | | | 1.17 | | | | 1.13 | | | | 0.00 | | | | 0.00 | | | | 0.00 | | | | 19.91 | | | | 6.02 | 3,4 | | | 1.20 | 5 | | | 1.10 | 5 | | | (0.39 | )5 | | | 48.4 | | | | 21.48 | 4 |
| | | | | |
Year Ended December 31, | | | | | | | | | | | | | | | | | | | | | |
| | | | | | | | | | | | | | |
2023 | | | 17.69 | | | | (0.04 | ) | | | 1.13 | | | | 1.09 | | | | 0.00 | | | | 0.00 | | | | 0.00 | | | | 18.78 | | | | 6.16 | 3 | | | 1.20 | | | | 1.10 | | | | (0.22 | ) | | | 49.8 | | | | 51.83 | |
| | | | | | | | | | | | | | |
2022 | | | 21.34 | | | | (0.06 | ) | | | (3.59 | ) | | | (3.65 | ) | | | 0.00 | | | | 0.00 | | | | 0.00 | | | | 17.69 | | | | (17.10 | )3 | | | 1.21 | | | | 1.10 | | | | (0.31 | ) | | | 55.0 | | | | 71.55 | |
| | | | | | | | | | | | | | |
2021 | | | 18.75 | | | | (0.17 | ) | | | 3.06 | | | | 2.89 | | | | 0.00 | | | | (0.30 | ) | | | (0.30 | ) | | | 21.34 | | | | 15.46 | 3 | | | 1.17 | | | | 1.10 | | | | (0.82 | ) | | | 76.3 | | | | 55.38 | |
| | | | | | | | | | | | | | |
2020 | | | 12.86 | | | | (0.09 | ) | | | 6.17 | | | | 6.08 | | | | 0.00 | | | | (0.19 | ) | | | (0.19 | ) | | | 18.75 | | | | 47.40 | 3 | | | 1.73 | | | | 1.10 | | | | (0.60 | ) | | | 26.8 | | | | 35.84 | |
| | | | | | | | | | | | | | |
2019 | | | 9.51 | | | | (0.06 | ) | | | 3.41 | | | | 3.35 | | | | 0.00 | | | | 0.00 | | | | 0.00 | | | | 12.86 | | | | 35.23 | 3 | | | 2.80 | | | | 1.10 | | | | (0.54 | ) | | | 5.0 | | | | 68.10 | |
| | | | | |
INSTITUTIONAL SHARES | | | | | | | | | | | | | | | | | | | | | |
| | | | | |
Six Months Ended June 30, | | | | | | | | | | | | | | | | | | | | | |
| | | | | | | | | | | | | | |
2024 | | | 19.05 | | | | (0.01 | ) | | | 1.18 | | | | 1.17 | | | | 0.00 | | | | 0.00 | | | | 0.00 | | | | 20.22 | | | | 6.14 | 3,4 | | | 0.89 | 5 | | | 0.85 | 5 | | | (0.13 | )5 | | | 169.9 | | | | 21.48 | 4 |
| | | | | |
Year Ended December 31, | | | | | | | | | | | | | | | | | | | | | |
| | | | | | | | | | | | | | |
2023 | | | 17.91 | | | | 0.01 | | | | 1.13 | | | | 1.14 | | | | 0.00 | | | | 0.00 | | | | 0.00 | | | | 19.05 | | | | 6.37 | 3 | | | 0.88 | | | | 0.85 | | | | 0.03 | | | | 154.7 | | | | 51.83 | |
| | | | | | | | | | | | | | |
2022 | | | 21.54 | | | | (0.01 | ) | | | (3.62 | ) | | | (3.63 | ) | | | 0.00 | | | | 0.00 | | | | 0.00 | | | | 17.91 | | | | (16.85 | )3 | | | 0.90 | | | | 0.85 | | | | (0.05 | ) | | | 149.3 | | | | 71.55 | |
| | | | | | | | | | | | | | |
2021 | | | 18.88 | | | | (0.12 | ) | | | 3.08 | | | | 2.96 | | | | 0.00 | | | | (0.30 | ) | | | (0.30 | ) | | | 21.54 | | | | 15.72 | 3 | | | 0.89 | | | | 0.85 | | | | (0.57 | ) | | | 172.4 | | | | 55.38 | |
| | | | | | | | | | | | | | |
2020 | | | 12.92 | | | | (0.05 | ) | | | 6.20 | | | | 6.15 | | | | 0.00 | | | | (0.19 | ) | | | (0.19 | ) | | | 18.88 | | | | 47.72 | 3 | | | 1.45 | | | | 0.85 | | | | (0.31 | ) | | | 38.6 | | | | 35.84 | |
| | | | | | | | | | | | | | |
2019 | | | 9.53 | | | | (0.03 | ) | | | 3.42 | | | | 3.39 | | | | 0.00 | | | | 0.00 | | | | 0.00 | | | | 12.92 | | | | 35.57 | 3 | | | 2.39 | | | | 0.85 | | | | (0.28 | ) | | | 9.1 | | | | 68.10 | |
| | | | | |
R6 SHARES | | | | | | | | | | | | | | | | | | | | | |
| | | | | |
Six Months Ended June 30, | | | | | | | | | | | | | | | | | | | | | |
| | | | | | | | | | | | | | |
2024 | | | 19.05 | | | | (0.01 | ) | | | 1.17 | | | | 1.16 | | | | 0.00 | | | | 0.00 | | | | 0.00 | | | | 20.21 | | | | 6.09 | 3,4 | | | 0.89 | 5 | | | 0.85 | 5 | | | (0.07 | )5 | | | 14.6 | | | | 21.48 | 4 |
| | | | | |
Year Ended December 31, | | | | | | | | | | | | | | | | | | | | | |
| | | | | | | | | | | | | | |
2023 | | | 17.90 | | | | 0.01 | | | | 1.14 | | | | 1.15 | | | | 0.00 | | | | 0.00 | | | | 0.00 | | | | 19.05 | | | | 6.42 | 3 | | | 0.88 | | | | 0.85 | | | | 0.03 | | | | 5.9 | | | | 51.83 | |
| | | | | | | | | | | | | | |
2022 | | | 21.54 | | | | (0.01 | ) | | | (3.63 | ) | | | (3.64 | ) | | | 0.00 | | | | 0.00 | | | | 0.00 | | | | 17.90 | | | | (16.90 | )3 | | | 0.89 | | | | 0.85 | | | | (0.05 | ) | | | 5.7 | | | | 71.55 | |
| | | | | | | | | | | | | | |
2021 | | | 18.87 | | | | (0.12 | ) | | | 3.09 | | | | 2.97 | | | | 0.00 | | | | (0.30 | ) | | | (0.30 | ) | | | 21.54 | | | | 15.79 | 3 | | | 0.89 | | | | 0.85 | | | | (0.57 | ) | | | 6.5 | | | | 55.38 | |
| | | | | | | | | | | | | | |
2020 | | | 12.91 | | | | (0.04 | ) | | | 6.19 | | | | 6.15 | | | | 0.00 | | | | (0.19 | ) | | | (0.19 | ) | | | 18.87 | | | | 47.76 | 3 | | | 1.44 | | | | 0.85 | | | | (0.25 | ) | | | 4.9 | | | | 35.84 | |
| | | | | | | | | | | | | | |
2019 | | | 9.52 | | | | (0.03 | ) | | | 3.42 | | | | 3.39 | | | | 0.00 | | | | 0.00 | | | | 0.00 | | | | 12.91 | | | | 35.61 | 3 | | | 2.22 | | | | 0.85 | | | | (0.28 | ) | | | 1.3 | | | | 68.10 | |
| 1 | Based on average shares outstanding. |
| 2 | Total returns reflect reinvestment of all dividends and distributions, if any. |
| 3 | The total returns would have been lower had certain expenses not been reduced during the period shown. |
| | |
| 52 | | See Notes to Financial Statements. |
| | |
| June 30, 2024 | | Baron Select Funds |
FINANCIAL HIGHLIGHTS (Unaudited) (Continued)
BARON FINTECH FUND
Selected data for a share outstanding throughout each period:
| | | | | | | | | | | | | | | | | | | | | | | | | | | | | | | | | | | | | | | | | | | | | | | | | | | | | | | | |
| | | | | | | |
| | | | | | Income (loss) from
investment operations: | | | Less distributions to
shareholders from: | | | | | | | | | Ratios to Average Net Assets: | | | Supplemental
Data: | |
| | | | | | | | | | | | | | |
| | | Net
asset
value, beginning of period ($) | | | Net
investment income (loss) ($)1 | | | Net
realized
and unrealized gain
(loss) ($) | | | Total
from investment operations ($) | | | Net
investment income ($) | | | Net
realized gains ($) | | | Total
distributions ($) | | | Net
asset value,
end of
period ($) | | | Total
return (%)2 | | | Gross
expenses
(%) | | | Net expenses (%) | | | Net
investment income
(loss) (%) | | | Net
assets (in
millions),
end of
period ($) | | | Portfolio turnover rate (%) | |
| | | | | |
RETAIL SHARES | | | | | | | | | | | | | | | | | | | | | |
| | | | | |
Six Months Ended June 30, | | | | | | | | | | | | | | | | | | | | | |
| | | | | | | | | | | | | | |
2024 | | | 14.08 | | | | (0.04 | ) | | | 0.58 | | | | 0.54 | | | | 0.00 | | | | 0.00 | | | | 0.00 | | | | 14.62 | | | | 3.84 | 3,4 | | | 1.55 | 5 | | | 1.20 | 5 | | | (0.51 | )5 | | | 7.1 | | | | 3.67 | 4 |
| | | | | |
Year Ended December 31, | | | | | | | | | | | | | | | | | | | | | |
| | | | | | | | | | | | | | |
2023 | | | 11.09 | | | | (0.04 | ) | | | 3.03 | | | | 2.99 | | | | 0.00 | | | | 0.00 | | | | 0.00 | | | | 14.08 | | | | 26.96 | 3 | | | 1.66 | | | | 1.20 | | | | (0.36 | ) | | | 7.3 | | | | 16.31 | |
| | | | | | | | | | | | | | |
2022 | | | 16.90 | | | | (0.07 | ) | | | (5.59 | ) | | | (5.66 | ) | | | 0.00 | | | | (0.15 | ) | | | (0.15 | ) | | | 11.09 | | | | (33.46 | )3 | | | 1.63 | 6 | | | 1.20 | 6 | | | (0.56 | ) | | | 7.0 | | | | 27.08 | |
| | | | | | | | | | | | | | |
2021 | | | 14.69 | | | | (0.14 | ) | | | 2.35 | | | | 2.21 | | | | 0.00 | | | | 0.00 | | | | 0.00 | | | | 16.90 | | | | 15.04 | 3 | | | 1.57 | | | | 1.20 | | | | (0.85 | ) | | | 13.2 | | | | 11.88 | |
| | | | | | | | | | | | | | |
20207 | | | 10.00 | | | | (0.09 | ) | | | 4.78 | | | | 4.69 | | | | 0.00 | | | | 0.00 | | | | 0.00 | | | | 14.69 | | | | 46.90 | 3 | | | 3.09 | | | | 1.20 | | | | (0.77 | ) | | | 6.4 | | | | 8.12 | |
| | | | | |
INSTITUTIONAL SHARES | | | | | | | | | | | | | | | | | | | | | |
| | | | | |
Six Months Ended June 30, | | | | | | | | | | | | | | | | | | | | | |
| | | | | | | | | | | | | | |
2024 | | | 14.22 | | | | (0.02 | ) | | | 0.58 | | | | 0.56 | | | | 0.00 | | | | 0.00 | | | | 0.00 | | | | 14.78 | | | | 3.94 | 3,4 | | | 1.13 | 5 | | | 0.95 | 5 | | | (0.25 | )5 | | | 41.9 | | | | 3.67 | 4 |
| | | | | |
Year Ended December 31, | | | | | | | | | | | | | | | | | | | | | |
| | | | | | | | | | | | | | |
2023 | | | 11.17 | | | | (0.01 | ) | | | 3.06 | | | | 3.05 | | | | 0.00 | | | | 0.00 | | | | 0.00 | | | | 14.22 | | | | 27.31 | 3 | | | 1.21 | | | | 0.95 | | | | (0.11 | ) | | | 42.1 | | | | 16.31 | |
| | | | | | | | | | | | | | |
2022 | | | 16.98 | | | | (0.04 | ) | | | (5.62 | ) | | | (5.66 | ) | | | 0.00 | | | | (0.15 | ) | | | (0.15 | ) | | | 11.17 | | | | (33.30 | )3 | | | 1.20 | 6 | | | 0.95 | 6 | | | (0.30 | ) | | | 31.1 | | | | 27.08 | |
| | | | | | | | | | | | | | |
2021 | | | 14.72 | | | | (0.10 | ) | | | 2.36 | | | | 2.26 | | | | 0.00 | | | | 0.00 | | | | 0.00 | | | | 16.98 | | | | 15.35 | 3 | | | 1.18 | | | | 0.95 | | | | (0.60 | ) | | | 58.5 | | | | 11.88 | |
| | | | | | | | | | | | | | |
20207 | | | 10.00 | | | | (0.07 | ) | | | 4.79 | | | | 4.72 | | | | 0.00 | | | | 0.00 | | | | 0.00 | | | | 14.72 | | | | 47.20 | 3 | | | 2.43 | | | | 0.95 | | | | (0.54 | ) | | | 24.0 | | | | 8.12 | |
|
R6 SHARES | |
| | | | | |
Six Months Ended June 30, | | | | | | | | | | | | | | | | | | | | | |
| | | | | | | | | | | | | | |
2024 | | | 14.22 | | | | (0.02 | ) | | | 0.59 | | | | 0.57 | | | | 0.00 | | | | 0.00 | | | | 0.00 | | | | 14.79 | | | | 4.01 | 3,4 | | | 1.11 | 5 | | | 0.95 | 5 | | | (0.26 | )5 | | | 10.6 | | | | 3.67 | 4 |
| | | | | |
Year Ended December 31, | | | | | | | | | | | | | | | | | | | | | |
| | | | | | | | | | | | | | |
2023 | | | 11.17 | | | | (0.01 | ) | | | 3.06 | | | | 3.05 | | | | 0.00 | | | | 0.00 | | | | 0.00 | | | | 14.22 | | | | 27.31 | 3 | | | 1.18 | | | | 0.95 | | | | (0.12 | ) | | | 10.2 | | | | 16.31 | |
| | | | | | | | | | | | | | |
2022 | | | 16.98 | | | | (0.04 | ) | | | (5.62 | ) | | | (5.66 | ) | | | 0.00 | | | | (0.15 | ) | | | (0.15 | ) | | | 11.17 | | | | (33.30 | )3 | | | 1.18 | 6 | | | 0.95 | 6 | | | (0.30 | ) | | | 4.5 | | | | 27.08 | |
| | | | | | | | | | | | | | |
2021 | | | 14.73 | | | | (0.10 | ) | | | 2.35 | | | | 2.25 | | | | 0.00 | | | | 0.00 | | | | 0.00 | | | | 16.98 | | | | 15.28 | 3 | | | 1.18 | | | | 0.95 | | | | (0.60 | ) | | | 6.6 | | | | 11.88 | |
| | | | | | | | | | | | | | |
20207 | | | 10.00 | | | | (0.06 | ) | | | 4.79 | | | | 4.73 | | | | 0.00 | | | | 0.00 | | | | 0.00 | | | | 14.73 | | | | 47.30 | 3 | | | 2.33 | | | | 0.95 | | | | (0.53 | ) | | | 3.7 | | | | 8.12 | |
| 1 | Based on average shares outstanding. |
| 2 | Total returns reflect reinvestment of all dividends and distributions, if any. |
| 3 | The total returns would have been lower had certain expenses not been reduced during the period shown. |
| 6 | Includes interest expense of less than 0.01%. |
| 7 | For the period January 2, 2020 (commencement of operations) to December 31, 2020. |
| | |
| See Notes to Financial Statements. | | 53 |
| | |
| Baron Select Funds | | June 30, 2024 |
FINANCIAL HIGHLIGHTS (Unaudited) (Continued)
BARON NEW ASIA FUND
Selected data for a share outstanding throughout each period:
| | | | | | | | | | | | | | | | | | | | | | | | | | | | | | | | | | | | | | | | | | | | | | | | | | | | | | | | |
| | | | | | Income (loss) from
investment operations: | | | Less distributions to
shareholders from: | | | | | | | | | Ratios to Average Net Assets: | | | Supplemental
Data: | |
| | | | | | | | | | | | | | |
| | | Net asset value, beginning of period ($) | | | Net
investment income (loss) ($)1 | | | Net
realized
and unrealized gain
(loss) ($) | | | Total from investment operations ($) | | | Net
investment income ($) | | | Net
realized gains ($) | | | Total
distributions ($) | | | Net
asset value,
end of
period ($) | | | Total
return (%)2 | | | Gross expenses
(%) | | | Net expenses (%) | | | Net
investment income
(loss) (%) | | | Net
assets (in
millions),
end of
period ($) | | | Portfolio turnover rate (%) | |
| | | | | |
RETAIL SHARES | | | | | | | | | | | | | | | | | | | | | |
| | | | | |
Six Months Ended June 30, | | | | | | | | | | | | | | | | | | | | | |
| | | | | | | | | | | | | | |
2024 | | | 7.81 | | | | 0.01 | | | | 1.38 | | | | 1.39 | | | | 0.00 | | | | 0.00 | | | | 0.00 | | | | 9.20 | | | | 17.80 | 3,4 | | | 7.91 | 5 | | | 1.45 | 5 | | | 0.16 | 5 | | | 1.3 | | | | 28.73 | 4 |
| | | | | |
Year Ended December 31, | | | | | | | | | | | | | | | | | | | | | |
| | | | | | | | | | | | | | |
2023 | | | 7.40 | | | | 0.00 | | | | 0.41 | | | | 0.41 | | | | 0.00 | | | | 0.00 | | | | 0.00 | | | | 7.81 | | | | 5.54 | 3 | | | 7.37 | | | | 1.45 | | | | (0.05 | ) | | | 1.0 | | | | 47.66 | |
| | | | | | | | | | | | | | |
2022 | | | 10.17 | | | | (0.05 | ) | | | (2.72 | ) | | | (2.77 | ) | | | 0.00 | | | | 0.00 | | | | 0.00 | | | | 7.40 | | | | (27.24 | )3 | | | 8.96 | | | | 1.45 | | | | (0.58 | ) | | | 0.9 | | | | 56.48 | |
| | | | | | | | | | | | | | |
20216 | | | 10.00 | | | | (0.05 | ) | | | 0.22 | | | | 0.17 | | | | 0.00 | | | | 0.00 | | | | 0.00 | | | | 10.17 | | | | 1.70 | 3,4 | | | 10.06 | 5,7 | | | 1.45 | 5,7 | | | (1.25 | )5 | | | 1.3 | | | | 14.32 | 4 |
| | | | | |
INSTITUTIONAL SHARES | | | | | | | | | | | | | | | | | | | | | |
| | | | | |
Six Months Ended June 30, | | | | | | | | | | | | | | | | | | | | | |
| | | | | | | | | | | | | | |
2024 | | | 7.86 | | | | 0.02 | | | | 1.38 | | | | 1.40 | | | | 0.00 | | | | 0.00 | | | | 0.00 | | | | 9.26 | | | | 17.81 | 3,4 | | | 6.54 | 5 | | | 1.20 | 5 | | | 0.44 | 5 | | | 2.5 | | | | 28.73 | 4 |
| | | | | |
Year Ended December 31, | | | | | | | | | | | | | | | | | | | | | |
| | | | | | | | | | | | | | |
2023 | | | 7.43 | | | | 0.03 | | | | 0.40 | | | | 0.43 | | | | 0.00 | | | | 0.00 | | | | 0.00 | | | | 7.86 | | | | 5.79 | 3 | | | 6.93 | | | | 1.20 | | | | 0.35 | | | | 1.5 | | | | 47.66 | |
| | | | | | | | | | | | | | |
2022 | | | 10.17 | | | | (0.03 | ) | | | (2.71 | ) | | | (2.74 | ) | | | 0.00 | | | | 0.00 | | | | 0.00 | | | | 7.43 | | | | (26.94 | )3 | | | 7.22 | | | | 1.20 | | | | (0.33 | ) | | | 2.7 | | | | 56.48 | |
| | | | | | | | | | | | | | |
20216 | | | 10.00 | | | | (0.04 | ) | | | 0.21 | | | | 0.17 | | | | 0.00 | | | | 0.00 | | | | 0.00 | | | | 10.17 | | | | 1.70 | 3,4 | | | 8.59 | 5,7 | | | 1.20 | 5,7 | | | (1.00 | )5 | | | 3.2 | | | | 14.32 | 4 |
| | | | | |
R6 SHARES | | | | | | | | | | | | | | | | | | | | | |
| | | | | |
Six Months Ended June 30, | | | | | | | | | | | | | | | | | | | | | |
| | | | | | | | | | | | | | |
2024 | | | 7.86 | | | | 0.02 | | | | 1.39 | | | | 1.41 | | | | 0.00 | | | | 0.00 | | | | 0.00 | | | | 9.27 | | | | 17.94 | 3,4 | | | 5.89 | 5 | | | 1.20 | 5 | | | 0.37 | 5 | | | 2.1 | | | | 28.73 | 4 |
| | | | | |
Year Ended December 31, | | | | | | | | | | | | | | | | | | | | | |
| | | | | | | | | | | | | | |
2023 | | | 7.44 | | | | 0.01 | | | | 0.41 | | | | 0.42 | | | | 0.00 | | | | 0.00 | | | | 0.00 | | | | 7.86 | | | | 5.65 | 3 | | | 6.21 | | | | 1.20 | | | | 0.07 | | | | 1.8 | | | | 47.66 | |
| | | | | | | | | | | | | | |
2022 | | | 10.17 | | | | (0.03 | ) | | | (2.70 | ) | | | (2.73 | ) | | | 0.00 | | | | 0.00 | | | | 0.00 | | | | 7.44 | | | | (26.84 | )3 | | | 7.95 | | | | 1.20 | | | | (0.42 | ) | | | 0.1 | | | | 56.48 | |
| | | | | | | | | | | | | | |
20216 | | | 10.00 | | | | (0.04 | ) | | | 0.21 | | | | 0.17 | | | | 0.00 | | | | 0.00 | | | | 0.00 | | | | 10.17 | | | | 1.70 | 3,4 | | | 8.10 | 5,7 | | | 1.20 | 5,7 | | | (0.99 | )5 | | | 0.0 | 8 | | | 14.32 | 4 |
| 1 | Based on average shares outstanding. |
| 2 | Total returns reflect reinvestment of all dividends and distributions, if any. |
| 3 | The total returns would have been lower had certain expenses not been reduced during the period shown. |
| 6 | For the period July 30, 2021 (commencement of operations) to December 31, 2021. |
| 7 | Certain fixed expenses incurred by the Fund were not annualized for the period ended December 31, 2021. |
| 8 | Amount represents less than $500,000. |
| | |
| 54 | | See Notes to Financial Statements. |
| | |
| June 30, 2024 | | Baron Select Funds |
FINANCIAL HIGHLIGHTS (Unaudited) (Continued)
BARON TECHNOLOGY FUND
Selected data for a share outstanding throughout each period:
| | | | | | | | | | | | | | | | | | | | | | | | | | | | | | | | | | | | | | | | | | | | | | | | | | | | | | | | |
| | | | | | | |
| | | | | | Income (loss) from
investment operations: | | | Less distributions to
shareholders from: | | | | | | | | | Ratios to Average Net Assets: | | | Supplemental
Data: | |
| | | | | | | | | | | | | | |
| | | Net asset
value, beginning of period ($) | | | Net
investment income (loss) ($)1 | | | Net
realized
and unrealized gain
(loss) ($) | | | Total from investment operations ($) | | | Net
investment income ($) | | | Net
realized gains ($) | | | Total
distributions ($) | | | Net
asset value,
end of
period ($) | | | Total
return (%)2 | | | Gross
expenses
(%) | | | Net expenses (%) | | | Net
investment income
(loss)
(%) | | | Net
assets (in
millions),
end of
period ($) | | | Portfolio turnover rate (%) | |
| | | | | |
RETAIL SHARES | | | | | | | | | | | | | | | | | | | | | |
| | | | | |
Six Months Ended June 30, | | | | | | | | | | | | | | | | | | | | | |
| | | | | | | | | | | | | | |
2024 | | | 9.03 | | | | (0.03 | ) | | | 2.09 | | | | 2.06 | | | | 0.00 | | | | 0.00 | | | | 0.00 | | | | 11.09 | | | | 22.81 | 3,4 | | | 1.99 | 5 | | | 1.20 | 5 | | | (0.69 | )5 | | | 12.2 | | | | 20.05 | 4 |
| | | | | |
Year Ended December 31, | | | | | | | | | | | | | | | | | | | | | |
| | | | | | | | | | | | | | |
2023 | | | 5.56 | | | | (0.05 | ) | | | 3.52 | | | | 3.47 | | | | 0.00 | | | | 0.00 | | | | 0.00 | | | | 9.03 | | | | 62.41 | 3 | | | 4.58 | | | | 1.20 | | | | (0.72 | ) | | | 5.0 | | | | 27.21 | |
| | | | | | | | | | | | | | |
20226 | | | 10.00 | | | | (0.06 | ) | | | (4.38 | ) | | | (4.44 | ) | | | 0.00 | | | | 0.00 | | | | 0.00 | | | | 5.56 | | | | (44.40 | )3 | | | 6.86 | | | | 1.20 | | | | (0.81 | ) | | | 1.3 | | | | 19.13 | |
| | | | | |
INSTITUTIONAL SHARES | | | | | | | | | | | | | | | | | | | | | |
| | | | | |
Six Months Ended June 30, | | | | | | | | | | | | | | | | | | | | | |
| | | | | | | | | | | | | | |
2024 | | | 9.10 | | | | (0.02 | ) | | | 2.10 | | | | 2.08 | | | | 0.00 | | | | 0.00 | | | | 0.00 | | | | 11.18 | | | | 22.86 | 3,4 | | | 1.55 | 5 | | | 0.95 | 5 | | | (0.44 | )5 | | | 19.5 | | | | 20.05 | 4 |
| | | | | |
Year Ended December 31, | | | | | | | | | | | | | | | | | | | | | |
| | | | | | | | | | | | | | |
2023 | | | 5.57 | | | | (0.04 | ) | | | 3.57 | | | | 3.53 | | | | 0.00 | | | | 0.00 | | | | 0.00 | | | | 9.10 | | | | 63.38 | 3 | | | 5.04 | | | | 0.95 | | | | (0.48 | ) | | | 1.4 | | | | 27.21 | |
| | | | | | | | | | | | | | |
20226 | | | 10.00 | | | | (0.04 | ) | | | (4.39 | ) | | | (4.43 | ) | | | 0.00 | | | | 0.00 | | | | 0.00 | | | | 5.57 | | | | (44.30 | )3 | | | 6.42 | | | | 0.95 | | | | (0.55 | ) | | | 1.6 | | | | 19.13 | |
| | | | | |
R6 SHARES | | | | | | | | | | | | | | | | | | | | | |
| | | | | |
Six Months Ended June 30, | | | | | | | | | | | | | | | | | | | | | |
| | | | | | | | | | | | | | |
2024 | | | 9.08 | | | | (0.02 | ) | | | 2.10 | | | | 2.08 | | | | 0.00 | | | | 0.00 | | | | 0.00 | | | | 11.16 | | | | 22.91 | 3,4 | | | 1.62 | 5 | | | 0.95 | 5 | | | (0.45 | )5 | | | 3.5 | | | | 20.05 | 4 |
| | | | | |
Year Ended December 31, | | | | | | | | | | | | | | | | | | | | | |
| | | | | | | | | | | | | | |
2023 | | | 5.57 | | | | (0.04 | ) | | | 3.55 | | | | 3.51 | | | | 0.00 | | | | 0.00 | | | | 0.00 | | | | 9.08 | | | | 63.02 | 3 | | | 3.80 | | | | 0.95 | | | | (0.48 | ) | | | 2.6 | | | | 27.21 | |
| | | | | | | | | | | | | | |
20226 | | | 10.00 | | | | (0.03 | ) | | | (4.40 | ) | | | (4.43 | ) | | | 0.00 | | | | 0.00 | | | | 0.00 | | | | 5.57 | | | | (44.30 | )3 | | | 3.75 | | | | 0.95 | | | | (0.46 | ) | | | 0.4 | | | | 19.13 | |
| 1 | Based on average shares outstanding. |
| 2 | Total returns reflect reinvestment of all dividends and distributions, if any. |
| 3 | The total returns would have been lower had certain expenses not been reduced during the period shown. |
| 6 | For the period January 3, 2022 (commencement of operations) to December 31, 2022. |
| | |
| See Notes to Financial Statements. | | 55 |
| | |
| Baron Select Funds | | June 30, 2024 |
| | |
| Changes In and Disagreements with Accountants (Unaudited) | | For the period covered by this report |
| |
| Not applicable. | | |
| |
| Results of Meeting(s) of Shareholders (Unaudited) | | For the period covered by this report |
| |
| Not applicable. | | |
| |
| Remuneration Paid to Directors, Officers and Others (Unaudited) | | For the period covered by this report |
| |
| Refer to the financial statements included herein. | | |
56
| | |
| June 30, 2024 | | Baron Select Funds |
DISCLOSURE REGARDING THE APPROVAL OF THE INVESTMENT ADVISORY AGREEMENTS BY THE BOARD OF TRUSTEES (Unaudited)
The Board of Trustees (the “Board”) of Baron Select Funds (the “Trust”) met on May 9, 2024 to discuss the selection of BAMCO, Inc. (the “Adviser”) as the investment adviser and the approval of the investment advisory agreements for Baron Partners Fund, Baron Focused Growth Fund, Baron International Growth Fund, Baron Real Estate Fund, Baron Emerging Markets Fund, Baron Global Advantage Fund, Baron Real Estate Income Fund, Baron Health Care Fund, Baron FinTech Fund, Baron Technology Fund and Baron New Asia Fund (each, a “Fund” and collectively, the “Funds”). The members of the Board who are not “interested persons” (as defined in the Investment Company Act of 1940, as amended) of the Trust (the “Independent Trustees”) met in a separate session to discuss and consider the renewal of the investment advisory agreements for the Funds. Broadridge Financial Solutions, Inc. (“Broadridge”), an independent provider of investment company data, provided reports to the Board containing information upon which the Trustees relied during their considerations. The Trustees received a substantial amount of information from the Adviser and from Broadridge, and were advised by independent legal counsel. Based on its evaluation of this and other information, the Board, including a majority of the Independent Trustees, approved the continuation of the investment advisory agreements for the Funds for an additional one-year period.
In reaching its determination, the Board considered various factors that it deemed relevant, including the factors listed below.
1. NATURE, EXTENT AND QUALITY OF SERVICES
The Trustees considered the information provided, including, for many, their experience and knowledge gained from their service as Trustees and their experience generally, including the following, which they had considered in past years and remained, in their thinking, material to their consideration:
| • | | Their confidence in the senior personnel, portfolio management, the financial condition of the Adviser and its affiliates and the Adviser’s available resources; |
| • | | The nature, extent and quality of the services provided by the Adviser, including: intensive devotion to research, selection of broker/dealers for Fund portfolio transactions, relationships with and supervision of third party service providers, such as the Funds’ custodian and transfer agent, the quality of shareholder reports, the ability to monitor adherence to investment guidelines and restrictions, the legal, accounting and compliance services provided to the Funds and the support services provided to the Board; |
| • | | The Adviser’s investment principles and processes and the historical performance of the Funds as compared to similar funds managed by other advisers and other funds managed by the Adviser over comparable periods; |
| • | | The advisory fees and total expense ratios of the Funds and comparisons to similar funds managed by other advisers over comparable periods. They observed that, for most of the Funds, while the advisory fee was comparatively higher, the net operating expenses paid by the Funds (total expense ratio) were within the range of those of the funds in their respective peer groups; and |
| • | | Additional services provided by the Adviser. |
| • | | In their consideration of the investment advisory agreement for Baron New Asia Fund, the Board also considered proposed strategic changes to the Fund that were discussed during the meeting. |
The Board concluded that the nature, extent and quality of the services the Adviser provides to each Fund, including performance consistent with its investing principles, supported approval of the investment advisory agreement for each Fund.
2. INVESTMENT PERFORMANCE OF THE FUNDS AND THE ADVISER
As part of its consideration of the investment performance of the Funds and the Adviser, the Board took into account the analyses presented in the Broadridge materials. The Board considered for each Fund, among other information, Broadridge’s comparisons of the expense ratio and contractual advisory fee with those of peer group funds selected by Broadridge and custom category medians. The Board also considered, among other performance information, Broadridge’s comparisons of each Fund’s annualized total return and related risk metrics over one-, three-, five- and ten-year periods, where applicable, against peer group funds and custom category medians. After considering all the information, the Board concluded that the Adviser continued to invest in accordance with its long-standing principles and that each Fund’s performance remained consistent with expectations for the Adviser’s investment style, in light of recent market conditions.
3. COSTS OF SERVICES PROVIDED AND PROFITS TO BE REALIZED BY THE ADVISER
The Board considered comparisons of the advisory fees charged and services provided by the Adviser and its investment adviser affiliate to sub-advised accounts and separately managed accounts. The Board considered that, while the advisory fees for the other clients are the same as, or lower than, the fees for the Funds, the Adviser or its affiliate performs significantly fewer services for those clients compared with those provided by the Adviser to the Funds. The Board also considered a profitability analysis prepared by the Adviser and discussed with the representatives of the Adviser that the Adviser has continued to invest in quality personnel, systems and facilities, and otherwise continued to invest in its business, irrespective of fund flows.
The Board also considered benefits that accrue to the Adviser and its affiliates from their relationship with the Funds. The Board considered the costs of portfolio management, including the types of investments made for the Funds, the personnel and systems necessary for implementation of investment strategies, and the pre-tax profits realized by the Adviser and its affiliates from their relationship with the Funds.
4. ECONOMIES OF SCALE AND BENEFITS TO INVESTORS
The Board considered the extent to which each Fund’s advisory fee reflected economies of scale for the benefit of Fund shareholders, appreciating that the economies of scale analysis is predicated on generally predictable increasing assets and noting the significant fluctuation in assets in recent years. The Board considered that small- and mid-cap investment strategies require more attention by the Adviser than a strategy that involves other types of investing, particularly as asset size increases. The Board considered that the Adviser was continuing to grow and upgrade its staff and invest in its business. The Board members reiterated their intention to continue to consider the extent of economies of scale, asset growth and the Adviser’s plans to invest further to support the Funds.
57
| | |
| Baron Select Funds | | June 30, 2024 |
DISCLOSURE REGARDING THE APPROVAL OF THE INVESTMENT ADVISORY AGREEMENTS BY THE BOARD OF TRUSTEES (Unaudited) (Continued)
The Board concluded that the advisory fee for each Fund was supported by the entirety of the presentation and particularly in light of the services provided as discussed at this meeting.
After due consideration of the above-enumerated factors and other factors it deemed relevant, the Board, including a majority of the Independent Trustees, approved the continuance of each Fund’s investment advisory agreement.
58

SEMI SELECT 6/30/2024
Baron Funds
Baron WealthBuilder Fund
Semi-Annual Financial Statements and Other Important Information
| | | | |
| Ticker Symbols: | | | | |
Retail Shares: BWBFX | | | | |
TA Shares: BWBTX | | | | |
Institutional Shares: BWBIX | | | | |
| | |
| Financial Statements | | | | |
| Portfolio of Investments | | | 3 | |
| Statement of Assets and Liabilities | | | 4 | |
| Statement of Operations | | | 5 | |
| Statements of Changes in Net Assets | | | 6 | |
| Notes to Financial Statements | | | 7 | |
| |
| Financial Highlights | | | 12 | |
| |
| Changes in and Disagreements with Accountants | | | 13 | |
| |
| Results of Meeting(s) of Shareholders | | | 13 | |
| |
| Remuneration Paid to Directors, Officers, and Others | | | 13 | |
| |
| Disclosure Regarding the Approval of the Investment Advisory Agreement for Baron WealthBuilder Fund by the Board of Trustees | | | 14 | |
DEAR BARON WEALTHBUILDER FUND SHAREHOLDER:
In this report, you will find unaudited semi-annual financial statements and other important information for Baron WealthBuilder Fund (the Fund) for the six months ended June 30, 2024.
We thank you for choosing to join us as fellow shareholders in Baron Funds. We will continue to work hard to justify your confidence.
Sincerely,
| | | | |
 | | 
| | 
|
Ronald Baron Chief Executive Officer August 23, 2024 | | Rachel Stern Chief Operating Officer August 23, 2024 | | Christopher Snively Chief Financial Officer and Treasurer August 23, 2024 |
These Semi-Annual Financial Statements are for the Baron WealthBuilder Fund. If you are interested in the other series of Baron Select Funds, which contains the Baron Partners Fund, Baron Focused Growth Fund, Baron International Growth Fund, Baron Real Estate Fund, Baron Emerging Markets Fund, Baron Global Advantage Fund, Baron Real Estate Income Fund, Baron Health Care Fund, Baron FinTech Fund, Baron New Asia Fund, and Baron Technology Fund or Baron Investment Funds Trust, which contains the Baron Asset Fund, Baron Growth Fund, Baron Small Cap Fund, Baron Opportunity Fund, Baron Fifth Avenue Growth Fund, Baron Discovery Fund, and Baron Durable Advantage Fund, please visit the Funds’ website at BaronCapitalGroup.com or contact us at 1-800-99BARON.
The Funds’ Proxy Voting Policy is available without charge and can be found on the Funds’ website at BaronCapitalGroup.com, by clicking on the “Regulatory Documents” link at the bottom left corner of the homepage or by calling 1-800-99BARON and on the SEC’s website at sec.gov. The Funds’ most current proxy voting record, Form N-PX, is also available on the Funds’ website and on the SEC’s website.
The Funds file their complete Portfolios of Investments with the SEC for the first and third quarters of each fiscal year as an exhibit to their reports on Form N-PORT. The Funds’ Form N-PORT reports are available on the SEC’s website at sec.gov. Portfolio of Investments current to the most recent first and third quarters are also available on the Funds’ website.
Past performance is no guarantee of future results. The investment return and principal value of an investment will fluctuate; an investor’s shares, when redeemed, may be worth more or less than their original cost. For more complete information about Baron Funds, including charges and expenses, call, write or go to BaronCapitalGroup.com for a prospectus or summary prospectus. Read them carefully before you invest or send money. This report is not authorized for use as an offer of sale or a solicitation of an offer to buy shares of the Fund, unless accompanied or preceded by the Fund’s current prospectus or summary prospectus.

| | |
| Baron WealthBuilder Fund | | June 30, 2024 |
Baron WealthBuilder Fund is an open end, no-load mutual fund that invests only in shares of individual Baron mutual funds (Baron Funds). Long-term capital appreciation is its objective. It is not a target date fund.
| | 1. | Baron WealthBuilder Fund’s objective is to provide investors with a diversified portfolio of Baron Funds that will outperform its benchmark index over the long term, although we cannot guarantee it will meet its objective. |
| | 2. | Baron WealthBuilder Fund’s minimum initial investment is $2,000, making it suitable for periodic purchases. |
| | 3. | Baron WealthBuilder Fund has no management fee, but it will indirectly bear its pro-rata share of the expenses of the Baron Funds in which it invests (acquired fund fees and expenses). |
| | 4. | Baron WealthBuilder Fund’s annual operating expenses are capped at 5 bps per year for TA Shares (available directly through Baron Funds) and Institutional Shares. Retail Shares annual operating expenses are capped at 30 bps per year. Portfolio transaction costs, interest and dividend expense, acquired fund fees and expenses, fees and expenses related to filing foreign tax reclaims, and extraordinary expenses are not subject to the operating expense limitation. |
Several criteria, including our qualitative assessments, are used to continually determine Baron WealthBuilder Fund allocations among Baron Funds.
Among the criteria are: (a) absolute performance; (b) excess performance vs. benchmark; (c) performance standard deviation (a measure of risk); (d) Sharpe ratio (a measure of performance per unit of risk); (e) beta (a measure of a fund’s sensitivity to market movements); (f) alpha (a measure of excess return given level of risk as measured by beta); (g) portfolio turnover; (h) growth rates of portfolio investments; (i) fund size; and (j) manager tenure.
As of June 30, 2024, the five largest Baron Funds represented 58.8% of Baron WealthBuilder Fund’s net assets.
Ronald Baron, CEO of Baron Capital is the lead portfolio manager of Baron WealthBuilder Fund. Michael Baron, Co-President, is the co-portfolio manager.
2
| | |
| June 30, 2024 | | Baron WealthBuilder Fund |
PORTFOLIO OF INVESTMENTS (Unaudited)
| | | | | | | | | | | | |
| Shares | | | | | Cost | | | Value | |
| Affiliated Mutual Funds (100.01%) | |
|
| Small Cap Funds (31.52%) | |
| | 882,083 | | | Baron Discovery Fund — Institutional Shares | | $ | 22,071,279 | | | $ | 23,825,065 | |
| | 756,180 | | | Baron Growth Fund — Institutional Shares | | | 71,215,950 | | | | 74,014,867 | |
| | 2,119,054 | | | Baron Small Cap Fund — Institutional Shares | | | 69,623,719 | | | | 72,471,635 | |
| | | | | | | | | | | | |
| | Total Small Cap Funds | | | 162,910,948 | | | | 170,311,567 | |
| | | | | | | | | | | | |
|
| Small/Mid Cap Funds (6.21%) | |
| | 868,462 | | | Baron Focused Growth Fund — Institutional Shares | | | 27,882,774 | | | | 33,566,062 | |
| | | | | | | | | | | | |
|
| Mid Cap Funds (12.97%) | |
| | 659,197 | | | Baron Asset Fund — Institutional Shares | | | 63,211,347 | | | | 70,112,194 | |
| | | | | | | | | | | | |
|
| Large Cap Funds (8.61%) | |
| | 674,754 | | | Baron Durable Advantage Fund — Institutional Shares | | | 10,513,571 | | | | 17,752,784 | |
| | 557,577 | | | Baron Fifth Avenue Growth Fund — Institutional Shares | | | 19,653,040 | | | | 28,776,532 | |
| | | | | | | | | | | | |
| | Total Large Cap Funds | | | 30,166,611 | | | | 46,529,316 | |
| | | | | | | | | | | | |
|
| All Cap Funds (17.80%) | |
| | 627,095 | | | Baron Opportunity Fund — Institutional Shares | | | 15,631,443 | | | | 28,376,069 | |
| | 444,008 | | | Baron Partners Fund — Institutional Shares | | | 38,701,588 | | | | 67,840,056 | |
| | | | | | | | | | | | |
| | Total All Cap Funds | | | 54,333,031 | | | | 96,216,125 | |
| | | | | | | | | | | | |
|
| Non-U.S./Global Funds (9.45%) | |
| | 1,015,912 | | | Baron Emerging Markets Fund — Institutional Shares | | | 14,416,858 | | | | 15,208,197 | |
| | 590,127 | | | Baron Global Advantage Fund — Institutional Shares | | | 15,706,644 | | | | 19,899,081 | |
| | 597,518 | | | Baron International Growth Fund — Institutional Shares | | | 15,904,982 | | | | 15,929,841 | |
| | | | | | | | | | | | |
| | Total Non-U.S./Global Funds | | | 46,028,484 | | | | 51,037,119 | |
| | | | | | | | | | | | |
|
| Sector Funds (13.45%) | |
| | 971,932 | | | Baron FinTech Fund — Institutional Shares | | | 13,311,079 | | | | 14,365,158 | |
| | 765,654 | | | Baron Health Care Fund — Institutional Shares | | | 13,419,349 | | | | 15,481,528 | |
| | 896,226 | | | Baron Real Estate Fund — Institutional Shares | | | 29,796,424 | | | | 31,502,346 | |
| | 789,185 | | | Baron Real Estate Income Fund — Institutional Shares | | | 12,347,531 | | | | 11,356,373 | |
| | | | | | | | | | | | |
| | Total Sector Funds | | | 68,874,383 | | | | 72,705,405 | |
| | | | | | | | | | | | |
| | |
| | Total Affiliated Mutual Funds (100.01%) | | $ | 453,407,578 | | | | 540,477,788 | |
| | | | | | | | | | | | |
| | |
| | Liabilities Less Cash and Other Assets (-0.01%) | | | | | | | (48,535 | ) |
| | | | | | | | | | | | |
| | |
| | Net Assets | | | | | | $ | 540,429,253 | |
| | | | | | | | | | | | |
| % | Represents percentage of net assets. |
| | All Affiliated Mutual Funds are Level 1, see footnote 5f for dividend income and other distributions. |
| | |
| See Notes to Financial Statements. | | 3 |
| | |
| Baron WealthBuilder Fund | | June 30, 2024 |
STATEMENT OF ASSETS AND LIABILITIES (Unaudited)
| | | | |
Assets: | | | | |
Investments in Affiliated Mutual Funds, at value* | | $ | 540,477,788 | |
Cash | | | 251,470 | |
Receivable for capital shares sold | | | 340,637 | |
Prepaid expenses | | | 4,507 | |
| | | | |
| | | 541,074,402 | |
| | | | |
Liabilities: | | | | |
Payable for securities purchased | | | 483,773 | |
Payable for capital shares redeemed | | | 44,204 | |
Distribution fees payable (Note 5) | | | 188 | |
Other accrued expenses and other payables | | | 116,984 | |
| | | | |
| | | 645,149 | |
| | | | |
Net Assets | | $ | 540,429,253 | |
| | | | |
Net Assets consist of: | | | | |
Paid-in capital | | $ | 492,107,568 | |
Distributable earnings (losses) | | | 48,321,685 | |
| | | | |
Net Assets | | $ | 540,429,253 | |
| | | | |
Retail Shares: | | | | |
Net Assets | | $ | 86,905,417 | |
Shares Outstanding ($0.01 par value; indefinite shares authorized) | | | 4,841,122 | |
| | | | |
Net Asset Value Per Share | | $ | 17.95 | |
| | | | |
TA Shares: | | | | |
Net Assets | | $ | 51,397,773 | |
Shares Outstanding ($0.01 par value; indefinite shares authorized) | | | 2,819,898 | |
| | | | |
Net Asset Value Per Share | | $ | 18.23 | |
| | | | |
Institutional Shares: | | | | |
Net Assets | | $ | 402,126,063 | |
Shares Outstanding ($0.01 par value; indefinite shares authorized) | | | 22,050,732 | |
| | | | |
Net Asset Value Per Share | | $ | 18.24 | |
| | | | |
| |
*Investments in Affiliated Mutual Funds, at cost | | $ | 453,407,578 | |
| | | | |
| | |
| 4 | | See Notes to Financial Statements. |
| | |
| June 30, 2024 | | Baron WealthBuilder Fund |
STATEMENT OF OPERATIONS (Unaudited)
| | | | |
| | | For the Six
Months Ended
June 30,
2024 | |
Investment income (loss): | | | | |
Income: | | | | |
Dividends from Affiliated Mutual Funds | | $ | 110,990 | |
| | | | |
Expenses: | | | | |
Distribution fees — Retail Shares (Note 5) | | | 114,013 | |
Shareholder servicing agent fees and expenses — Retail Shares | | | 3,202 | |
Shareholder servicing agent fees and expenses — TA Shares | | | 1,938 | |
Shareholder servicing agent fees and expenses — Institutional Shares | | | 13,489 | |
Reports to shareholders | | | 43,900 | |
Registration and filing fees | | | 35,860 | |
Custodian and fund accounting fees | | | 29,126 | |
Trustee fees and expenses (Note 5) | | | 18,272 | |
Administration fees | | | 22,228 | |
Insurance expense | | | 4,839 | |
Line of credit fees | | | 3,368 | |
Professional fees | | | 24,120 | |
Miscellaneous expenses | | | 2,608 | |
| | | | |
Total operating expenses | | | 316,963 | |
Expenses reimbursed — Retail Shares (Note 5) | | | (11,287 | ) |
Expenses reimbursed — TA Shares (Note 5) | | | (6,458 | ) |
Expenses reimbursed — Institutional Shares (Note 5) | | | (49,388 | ) |
| | | | |
Total net expenses | | | 249,830 | |
| | | | |
Net investment income (loss) | | | (138,840 | ) |
| | | | |
Realized and unrealized gain (loss) on investments: | | | | |
Net realized gain (loss) on Affiliated Mutual Funds | | | (3,582,670 | ) |
Change in net unrealized appreciation (depreciation) of Affiliated Mutual Funds | | | 15,107,282 | |
| | | | |
Net gain (loss) on investments | | | 11,524,612 | |
| | | | |
Net increase (decrease) in net assets resulting from operations | | $ | 11,385,772 | |
| | | | |
| | |
| See Notes to Financial Statements. | | 5 |
| | |
| Baron WealthBuilder Fund | | June 30, 2024 |
STATEMENTS OF CHANGES IN NET ASSETS (Unaudited)
| | | | | | | | |
| | | For the Six
Months Ended
June 30,
2024 | | | For the Year
Ended
December 31,
2023 | |
Increase (Decrease) in Net Assets: | | | | | | | | |
Operations: | | | | | | | | |
Net investment income (loss) | | $ | (138,840 | ) | | $ | 115,217 | |
Net realized gain (loss) | | | (3,582,670 | ) | | | (1,672,989 | ) |
Change in net unrealized appreciation (depreciation) | | | 15,107,282 | | | | 111,694,543 | |
| | | | | | | | |
Increase (decrease) in net assets resulting from operations | | | 11,385,772 | | | | 110,136,771 | |
| | | | | | | | |
Distributions to shareholders from (Note 8): | | | | | | | | |
Distributable earnings — Retail Shares | | | — | | | | — | |
Distributable earnings — TA Shares | | | — | | | | (14,380 | ) |
Distributable earnings — Institutional Shares | | | — | | | | (119,687 | ) |
| | | | | | | | |
Decrease in net assets from distributions to shareholders | | | — | | | | (134,067 | ) |
| | | | | | | | |
Capital share transactions: | | | | | | | | |
Proceeds from the sale of shares — Retail Shares | | | 5,627,390 | | | | 21,626,006 | |
Proceeds from the sale of shares — TA Shares | | | 1,617,069 | | | | 5,477,405 | |
Proceeds from the sale of shares — Institutional Shares | | | 19,098,188 | | | | 50,611,997 | |
Net asset value of shares issued in reinvestment of distributions — Retail Shares | | | — | | | | — | |
Net asset value of shares issued in reinvestment of distributions — TA Shares | | | — | | | | 14,145 | |
Net asset value of shares issued in reinvestment of distributions — Institutional Shares | | | — | | | | 113,694 | |
Cost of shares redeemed — Retail Shares | | | (15,494,375 | ) | | | (21,734,046 | ) |
Cost of shares redeemed — TA Shares | | | (795,872 | ) | | | (3,879,233 | ) |
Cost of shares redeemed — Institutional Shares | | | (28,527,388 | ) | | | (41,154,632 | ) |
| | | | | | | | |
Increase (decrease) in net assets derived from capital share transactions | | | (18,474,988 | ) | | | 11,075,336 | |
| | | | | | | | |
Net increase (decrease) in net assets | | | (7,089,216 | ) | | | 121,078,040 | |
| | | | | | | | |
Net Assets: | | | | | | | | |
Beginning of period | | | 547,518,469 | | | | 426,440,429 | |
| | | | | | | | |
End of period | | $ | 540,429,253 | | | $ | 547,518,469 | |
| | | | | | | | |
Capital share transactions — Retail Shares | | | | | | | | |
Shares sold | | | 317,286 | | | | 1,353,390 | |
Shares redeemed | | | (871,626 | ) | | | (1,372,977 | ) |
| | | | | | | | |
Net increase (decrease) | | | (554,340 | ) | | | (19,587 | ) |
| | | | | | | | |
Capital share transactions — TA Shares | | | | | | | | |
Shares sold | | | 90,103 | | | | 340,795 | |
Shares issued in reinvestment of distributions | | | — | | | | 890 | |
Shares redeemed | | | (44,215 | ) | | | (237,997 | ) |
| | | | | | | | |
Net increase (decrease) | | | 45,888 | | | | 103,688 | |
| | | | | | | | |
Capital share transactions — Institutional Shares | | | | | | | | |
Shares sold | | | 1,062,056 | | | | 3,140,359 | |
Shares issued in reinvestment of dividends | | | — | | | | 7,151 | |
Shares redeemed | | | (1,584,666 | ) | | | (2,557,664 | ) |
| | | | | | | | |
Net increase (decrease) | | | (522,610 | ) | | | 589,846 | |
| | | | | | | | |
| | |
| 6 | | See Notes to Financial Statements. |
| | |
| June 30, 2024 | | Baron WealthBuilder Fund |
NOTES TO FINANCIAL STATEMENTS (Unaudited)
1. ORGANIZATION
Baron Select Funds (the Trust) is registered under the Investment Company Act of 1940, as amended (the 1940 Act), as an open-end management investment company established as a Delaware statutory trust on April 30, 2003. The Trust currently offers 12 series. This report covers only the Baron WealthBuilder Fund (the Fund). The Fund’s investment objective is capital appreciation. The Fund is a diversified fund that invests, at any given time, in the securities of a select number of Baron mutual funds (the Underlying Funds), representing specific investment strategies. The Fund normally invests in a variety of Baron domestic and international equity funds managed by BAMCO, Inc. (BAMCO or the Adviser). The Fund can invest in Underlying Funds holding U.S. and international stocks; small-cap, small- to mid-cap, large-cap, all-cap stocks; and sector stocks. The Adviser decides how much of the Fund’s assets to allocate to Underlying Funds based on the outlook for, and on the relative valuations of, the Underlying Funds and the various markets in which they invest. For information on the Underlying Funds, please refer to the Prospectuses and Statements of Additional Information of the Underlying Funds. Also, information on the Underlying Funds is available at BaronCapitalGroup.com.
The Fund offers Retail Shares, TA Shares, and Institutional Shares. Each class of shares differs only in its ongoing fees, expenses, and eligibility requirements. Each class of shares has equal rights to earnings and assets, except that each class bears different expenses for distribution and shareholder servicing. The Fund’s investment income, realized and unrealized gains or losses on investments, and expenses other than those attributable to a specific class are allocated to each class based on its relative net assets. Each class of shares has exclusive voting rights with respect to matters that affect just that class.
2. SIGNIFICANT ACCOUNTING POLICIES AND INVESTMENT RISKS
The following is a summary of significant accounting policies followed by the Fund. The policies are in conformity with accounting principles generally accepted in the United States of America (GAAP). The Trust is an investment company and therefore follows the investment company accounting and reporting guidance of the Financial Accounting Standards Board (FASB) Accounting Standard Codification Topic 946 Financial Services — Investment Companies.
a) Net Asset Value. The Fund’s share price or net asset value (NAV) is calculated as of the scheduled close of the regular trading session (usually 4 p.m. E.T. or such other time as of which the Fund’s NAV is calculated (the NAV Calculation Time)) on the New York Stock Exchange (the Exchange) on any day the Exchange is scheduled to be open. The NAV per share of a class is determined by dividing the value of the total assets less all liabilities, of the Fund represented by such class, by the total number of Fund shares of such class outstanding.
b) Security Valuation. Investments in the Underlying Funds are valued at their closing NAV per share on the day of valuation. Portfolio securities held by the Underlying Funds traded on any national stock exchange are valued based on the last sale price on the exchange where such shares are principally traded. For securities traded on NASDAQ, the Underlying Funds use the NASDAQ Official Closing Price. If there are no sales on a given day, the value of the security may be the average of the most recent bid and asked quotations on such exchange or the last sale price from a prior day. Where market quotations are not readily available, or, if in the Adviser’s judgment, they do not accurately reflect the fair value of a security held by one of the Underlying Funds, or an event occurs after the market close but before the Underlying Funds are priced that materially affects the value of a security, the security will be valued by the Adviser using policies and procedures approved by the Board of Trustees (the Board). The Board has designated the Adviser to perform fair value determinations pursuant to Rule 2a-5 under the 1940 Act. The Adviser has a Fair Valuation Committee (the Committee) comprised of senior management representatives and the Committee reports to the Board every quarter. Accordingly, the Committee may evaluate a variety of factors to determine the fair value of securities for which market quotations are determined not to be readily available or reliable. These factors include, but are not limited to, the type of security, the value of comparable securities, observations from financial institutions and relevant news events. Input from the Adviser’s portfolio management team also will be considered. Using a fair value pricing methodology to price securities may result in a value that is different from the most recent closing price of a security and from the prices used by other investment companies to calculate their portfolios’ NAVs.
U.S. Government obligations, money market instruments, and other debt instruments held by the Underlying Funds with a remaining maturity of 60 days or less are generally valued at amortized cost, which approximates fair value, unless an independent pricing service provides a valuation for such security or in the opinion of the Board or the Committee, the amortized cost method would not represent fair value. Debt instruments having a greater remaining maturity will be valued on the basis of prices obtained from a pricing service approved by the Board or at the mean of the bid and ask prices from the dealer maintaining an active market in that security. The value of the Underlying Funds’ investments in convertible bonds/convertible preferred stocks is determined primarily by obtaining valuations from independent pricing services based on readily available bid quotations or, if quotations are not available, by methods which include various considerations such as yields or prices of securities of comparable quality, coupon, maturity and type; indications as to values from dealers; and general market conditions. Other inputs used by an independent pricing service to value convertible bonds/convertible preferred stocks generally include underlying stock data, conversion premiums, listed bond and preferred stock prices and other market information which may include benchmark curves, trade execution data, sensitivity analysis, when available, or an estimated value calculated based on the price of the underlying common share on the valuation date adjusted for accrued and unpaid dividends. Open-end investment companies, including securities lending collateral invested in registered investment company money market funds, are valued at their NAV each day.
Non-U.S. equity securities held by the Underlying Funds traded on foreign securities exchanges are generally valued using an independent pricing vendor that provides daily fair value adjustment factors based on information such as local closing price, relevant general and sector indexes, currency fluctuations, and depositary receipts, as applicable. Securities valued using such adjustment factors are classified as Level 2 in the fair value hierarchy. The models of the independent pricing vendor generate an adjustment factor for each security, which is applied to the local closing price to adjust it for post-closing market movements up to the time the Underlying Funds are valued and translated into U.S. dollars. If the vendor does not provide an adjustment factor for a security, the security is valued based on its most recent local closing price and translated into U.S. dollars. The Adviser may also fair value securities in other situations, for example, when a particular foreign market is closed but the Underlying Funds are open. Other mutual funds may adjust the prices of their securities by different amounts.
c) Securities Transactions and Investment Income. Fund securities transactions are accounted for on trade date. Realized gain and loss from securities transactions are recorded on an identified cost basis for financial reporting and federal income tax purposes. Dividend income and capital gain distributions from the Underlying Funds are recognized on the ex-dividend date and interest income is recognized on an accrual basis. Dividends received from Underlying Funds are reflected as dividend income; capital gain distributions are reflected as realized gains.
7
| | |
| Baron WealthBuilder Fund | | June 30, 2024 |
NOTES TO FINANCIAL STATEMENTS (Unaudited) (Continued)
2. SIGNIFICANT ACCOUNTING POLICIES AND INVESTMENT RISKS (Continued)
d) Expense Allocation. The Fund is charged for those expenses directly attributable to the Fund, such as distribution and transfer agency fees. Expenses that are not directly attributable to the Fund are typically allocated among the funds in the Trust and Baron Investment Funds Trust (collectively, the Fund Complex) in proportion to their respective net assets. The Fund accrues distribution and service (12b-1) fees to Retail Shares.
Expenses included in the accompanying financial statements reflect the expenses of the Fund and do not include any expenses associated with the Underlying Funds. Because Underlying Funds have varied expenses and fee levels and the Fund may own different proportion of Underlying Funds at different times, the amount of acquired fund fees and expenses incurred indirectly by the Fund will vary.
e) Single Issuer. Single issuer risk is the possibility that factors specific to an issuer to which an Underlying Fund is exposed will affect the market prices of the issuer’s securities and therefore the NAV of the Underlying Fund. Due to the size of Baron Partners Fund’s investment in Tesla, Inc. (Tesla), 34% of Baron Partners Fund’s net assets as of June 30, 2024, the NAV of Baron Partners Fund will be materially impacted by the price of Tesla stock. The Fund’s indirect proportionate ownership of Tesla is $28,339,076, which represents 5.2% of the Fund’s net assets as of June 30, 2024. The financial statements of the Underlying Funds are available at BaronCapitalGroup.com.
f) Non-Diversified Portfolio. Certain Underlying Funds are non-diversified, which means they will likely have a greater percentage of their assets in a single issuer than a diversified fund. As a result, a non-diversified fund will likely invest a greater percentage of its assets in fewer issuers, and the performance of those issuers may have a greater effect on the Underlying Fund’s performance (and consequently the Fund’s performance) compared to a diversified fund. Thus, a non-diversified fund is more likely to experience significant fluctuations in value, exposing the Underlying Fund (and consequently the Fund) to a greater risk of loss in any given period than a diversified fund. Additionally, non-diversified funds may encounter difficulty liquidating securities.
g) Industry Concentration. From time to time, market fluctuations in the value of an Underlying Fund’s investments, combined with an Underlying Fund’s non-diversified portfolio, may result in an Underlying Fund being concentrated in the securities of a single issuer or a small number of issuers, in a particular industry. As a result, this Underlying Fund will be particularly exposed to the risks of that company or industry relative to the risk exposure of investment companies holding a diversified portfolio of securities or those that seek to maintain near-index weightings in their portfolio securities. Accordingly, in those cases, an Underlying Fund will be disproportionately exposed to the market conditions, interest rates, and economic, regulatory, or financial developments that significantly affect that company or industry. For example, due to the size of Baron Partners Fund’s investment in Tesla, which represents about 34% of Baron Partners Fund’s net assets as of June 30, 2024, Baron Partners Fund will be more adversely impacted by negative developments affecting the automotive and energy industries, as well as governmental environmental regulations.
h) Use of Estimates. The preparation of financial statements in accordance with GAAP requires management to make estimates and assumptions that affect the reported amounts of assets and liabilities at the date of the financial statements and the amounts of income and expenses during the period. Actual results could differ from those estimates.
i) Federal Income Taxes. The Fund intends to meet the requirements of the Internal Revenue Code of 1986, as amended, applicable to regulated investment companies, and to distribute to its shareholders substantially all of its net investment income and any net realized capital gains at least annually. The Fund will not be subject to federal or state income taxes to the extent that it qualifies as regulated investment companies and substantially all of its income is distributed.
j) Distributions to Shareholders. Income and capital gain distributions to shareholders are determined in accordance with income tax regulations which may differ from GAAP. These differences are primarily due to differing treatments for net investment loss, short-term capital gain distributions, and wash sale losses deferred. Income dividends are normally declared and paid annually. During any particular year, net realized gains from investment transactions in excess of available capital loss carryforwards would be taxable to the Fund, if not distributed. The Fund intends to declare and distribute these amounts, at least annually, to shareholders, but may be distributed more frequently. Differences in per share distributions, by class, are generally due to differences in class specific expenses.
k) Commitments and Contingencies. In the normal course of business, the Fund may enter into contracts and agreements that contain a variety of representations and warranties, which provide general indemnification. The maximum exposure to the Fund under these agreements is unknown, as this would involve future claims that may be made against the Fund that have not yet occurred.
l) Cash and Cash Equivalents. The Fund considers all short-term liquid investments with a maturity of three months or less when purchased to be cash equivalents.
3. ASSET ALLOCATION AND RISKS OF INVESTING IN THE UNDERLYING FUNDS
The Fund’s ability to meet its investment objective depends largely upon selecting the best mix of Underlying Funds. The selection of the Underlying Funds and the allocation of the Fund’s assets among the various market sectors could cause the Fund to underperform in comparison to other funds with a similar investment objective. In addition, each of the Underlying Funds has its own investment risks, and those risks can affect the value of the Fund’s investments. To the extent that the Fund invests more of its assets in one Underlying Fund than in another, it will have greater exposure to the risks of that Underlying Fund.
4. PURCHASES AND SALES OF SECURITIES
Purchases and sales of securities, other than short-term securities, for the six months ended June 30, 2024 were as follows:
| | | | | | | | |
| | |
| Fund | | Purchases | | | Sales | |
Baron WealthBuilder Fund | | $ | 6,776,416 | | | $ | 25,416,328 | |
8
| | |
| June 30, 2024 | | Baron WealthBuilder Fund |
NOTES TO FINANCIAL STATEMENTS (Unaudited) (Continued)
5. INVESTMENT ADVISORY FEES AND OTHER TRANSACTIONS WITH AFFILIATES
a) Investment Advisory Fees. The Adviser, a wholly owned subsidiary of Baron Capital Group, Inc. (BCG), serves as investment adviser to the Fund and the Underlying Funds. The Adviser will not be paid a management fee for performing investment management services for the Fund. However, the Adviser receives management fees for managing the Underlying Funds. See the Underlying Funds’ Prospectuses or Statements of Additional Information for specific fees. The Adviser has contractually agreed to reimburse Fund expenses to the extent required to limit the net annual operating expense ratio (excluding portfolio transaction costs, interest, and dividend expense, acquired fund fees and expenses, fees and expenses related to filing foreign tax reclaims, and extraordinary expenses) pursuant to a contract expiring on August 29, 2034, unless renewed for another 11-year term as follows:
| | | | | | | | | | |
|
Annual Operating
Expense Ratio Cap | |
| | |
Retail
Shares | | | TA
Shares | | | Institutional
Shares | |
| | 0.30 | % | | | 0.05 | % | | | 0.05 | % |
The aforementioned reimbursement, if applicable, is not subject to recoupment by the Adviser.
b) Distribution Fees. Baron Capital, Inc. (BCI), a wholly owned subsidiary of BCG, is a registered broker-dealer and the distributor of the Fund’s shares. The Fund is authorized to pay BCI a distribution fee payable monthly pursuant to a distribution plan under Rule 12b-1 of the 1940 Act equal to 0.25% per annum of the Retail Shares’ average daily net assets.
c) Trustee Fees. Certain Trustees of the Trust are officers of the Adviser and received no direct renumeration in such capacity from the Fund Complex. The Fund Complex pays each Independent Trustee (an Independent Trustee is a Trustee who is not an “interested person” (as defined in the 1940 Act) of the Fund Complex) annual compensation in addition to reimbursement of out-of-pocket expenses in connection with attendance at meetings of the Board. Specifically, each Independent Trustee receives an annual base compensation of $215,000 with the lead Independent Trustee receiving an additional $25,000. An additional $60,000 per annum is paid to each Independent Trustee for attendance at the quarterly meetings of the Board. Each member of the Audit Committee receives an additional $12,500 in annual compensation with the Audit Committee Chairperson receiving an additional $12,500.
d) Custody, Fund Accounting and Administration Fees. The Fund has entered into an agreement with State Street Bank and Trust Company (State Street) to perform custody, accounting and certain administrative services.
e) Ownership Concentration. As of June 30, 2024 the officers, Trustees and portfolio managers owned, directly or indirectly, 15.33% of the Fund. As a result of their ownership, these investors may be able to materially affect the outcome of matters presented to the Fund’s shareholders.
f) Transactions in “Affiliated” Companies. The Fund invests in the Institutional Shares of the Underlying Funds which are considered to be affiliated with the Fund.
| | | | | | | | | | | | | | | | | | | | | | | | | | | | | | | | | | | | | | | | |
| | | | | | | | | | |
| Name of Issuer | | Value at
December 31,
2023 | | | Purchase
Cost | | | Sales
Proceeds/ Return of
Capital | | | Change in Net
Unrealized
Appreciation
(Depreciation) | | | Realized
Gains (Losses) | | | Dividend
Income | | | Other
Distributions | | | Shares
Held at
June 30,
2024 | | | Value at
June 30,
2024 | | | % of Net
Assets at
June 30,
2024 | |
“Affiliated” Company as of June 30, 2024: | | | | | |
Baron Asset Fund, Institutional Shares | | $ | 70,431,241 | | | $ | 683,206 | | | $ | 2,605,174 | | | $ | 1,987,309 | | | $ | (384,388 | ) | | $ | — | | | $ | — | | | | 659,197 | | | $ | 70,112,194 | | | | 12.97 | % |
Baron Discovery Fund,
Institutional Shares | | | 25,608,172 | | | | 316,607 | | | | 1,207,276 | | | | (676,270 | ) | | | (216,168 | ) | | | — | | | | — | | | | 882,083 | | | | 23,825,065 | | | | 4.41 | % |
Baron Durable Advantage Fund, Institutional Shares | | | 15,896,384 | | | | 266,618 | | | | 1,016,653 | | | | 2,456,846 | | | | 149,589 | | | | — | | | | — | | | | 674,754 | | | | 17,752,784 | | | | 3.28 | % |
Baron Emerging Markets Fund, Institutional Shares | | | 14,742,838 | | | | 183,299 | | | | 698,949 | | | | 1,170,388 | | | | (189,379 | ) | | | — | | | | — | | | | 1,015,912 | | | | 15,208,197 | | | | 2.81 | % |
Baron Fifth Avenue Growth Fund, Institutional Shares | | | 24,884,344 | | | | 283,280 | | | | 1,080,194 | | | | 4,752,914 | | | | (63,812 | ) | | | — | | | | — | | | | 557,577 | | | | 28,776,532 | | | | 5.33 | % |
Baron FinTech Fund, Institutional Shares | | | 14,276,057 | | | | 166,635 | | | | 635,408 | | | | 653,590 | | | | (95,716 | ) | | | — | | | | — | | | | 971,932 | | | | 14,365,158 | | | | 2.66 | % |
Baron Focused Growth Fund, Institutional Shares | | | 34,402,480 | | | | 466,580 | | | | 1,779,143 | | | | 886,158 | | | | (410,013 | ) | | | — | | | | — | | | | 868,462 | | | | 33,566,062 | | | | 6.21 | % |
Baron Global Advantage Fund, Institutional Shares | | | 19,317,565 | | | | 266,617 | | | | 1,016,654 | | | | 1,277,208 | | | | 54,345 | | | | — | | | | — | | | | 590,127 | | | | 19,899,081 | | | | 3.69 | % |
Baron Growth Fund, Institutional Shares | | | 79,085,859 | | | | 933,160 | | | | 3,558,285 | | | | (1,846,059 | ) | | | (599,808 | ) | | | — | | | | — | | | | 756,180 | | | | 74,014,867 | | | | 13.70 | % |
Baron Health Care Fund,
Institutional Shares | | | 15,118,679 | | | | 199,963 | | | | 762,490 | | | | 960,822 | | | | (35,446 | ) | | | — | | | | — | | | | 765,654 | | | | 15,481,528 | | | | 2.86 | % |
Baron International Growth Fund, Institutional Shares | | | 16,078,360 | | | | 199,963 | | | | 762,490 | | | | 687,497 | | | | (273,489 | ) | | | — | | | | — | | | | 597,518 | | | | 15,929,841 | | | | 2.95 | % |
Baron Opportunity Fund,
Institutional Shares | | | 24,261,417 | | | | 283,281 | | | | 1,080,195 | | | | 4,812,499 | | | | 99,067 | | | | — | | | | — | | | | 627,095 | | | | 28,376,069 | | | | 5.25 | % |
9
| | |
| Baron WealthBuilder Fund | | June 30, 2024 |
NOTES TO FINANCIAL STATEMENTS (Unaudited) (Continued)
5. INVESTMENT ADVISORY FEES AND OTHER TRANSACTIONS WITH AFFILIATES (Continued)
| | | | | | | | | | | | | | | | | | | | | | | | | | | | | | | | | | | | | | | | |
| | | | | | | | | | |
| Name of Issuer | | Value at
December 31,
2023 | | | Purchase
Cost | | | Sales
Proceeds/ Return of
Capital | | | Change in Net
Unrealized
Appreciation
(Depreciation) | | | Realized
Gains (Losses) | | | Dividend
Income | | | Other
Distributions | | | Shares
Held at
June 30,
2024 | | | Value at
June 30,
2024 | | | % of Net
Assets at
June 30,
2024 | |
Baron Partners Fund,
Institutional Shares | | $ | 76,974,292 | | | $ | 999,814 | | | $ | 3,812,449 | | | $ | (5,760,875 | ) | | $ | (560,726 | ) | | $ | — | | | $ | — | | | | 444,008 | | | $ | 67,840,056 | | | | 12.55 | % |
Baron Real Estate Fund,
Institutional Shares | | | 33,160,012 | | | | 399,926 | | | | 1,524,980 | | | | (263,077 | ) | | | (269,535 | ) | | | — | | | | — | | | | 896,226 | | | | 31,502,346 | | | | 5.83 | % |
Baron Real Estate Income Fund, Institutional Shares | | | 11,832,569 | | | | 277,625 | | | | 635,407 | | | | 22,455 | | | | (140,869 | ) | | | 110,990 | | | | — | | | | 789,185 | | | | 11,356,373 | | | | 2.10 | % |
Baron Small Cap Fund, Institutional Shares | | | 71,522,819 | | | | 849,842 | | | | 3,240,581 | | | | 3,985,877 | | | | (646,322 | ) | | | — | | | | — | | | | 2,119,054 | | | | 72,471,635 | | | | 13.41 | % |
| | | | | | | | | | | | | | | | | | | | | | | | | | | | | | | | | | | | | | | | |
| | $ | 547,593,088 | | | $ | 6,776,416 | | | $ | 25,416,328 | | | $ | 15,107,282 | | | $ | (3,582,670 | ) | | $ | 110,990 | | | $ | — | | | | | | | $ | 540,477,788 | | | | 100.01 | % |
| | | | | | | | | | | | | | | | | | | | | | | | | | | | | | | | | | | | | | | | |
6. LINE OF CREDIT
The Fund Complex (except Baron Partners Fund) participates in a committed line of credit agreement with State Street to be used for temporary purposes, primarily for financing redemptions. Each fund may borrow up to the lesser of $200 million or the maximum amount each fund may borrow under the 1940 Act, the limitations included in each fund’s prospectus, or any limit or restriction under any law or regulation to which each fund is subject or any agreement to which each fund is a party; provided that the aggregate outstanding principal amount of all loans to any of the funds may not exceed $200 million. Interest is charged to each fund, based on its borrowings, at a rate per annum equal to the higher of the Overnight Bank Funding Rate plus 0.10% or the Federal Funds Effective Rate plus 0.10%; plus a margin of 1.00%. An upfront fee of 0.05% is incurred on the commitment amount and a commitment fee of 0.20% per annum is incurred on the unused portion of the line of credit. Both fees are allocated to the participating funds based on their relative net assets.
During the six months ended June 30, 2024, the Fund did not have any borrowings under the line of credit.
The Adviser believes that the fair value of the liabilities under the line of credit agreement is equivalent to the recorded amount based on its short-term maturity and interest rate, which fluctuates over time. The Fund’s outstanding balance under the line of credit agreement, if any, would be categorized as Level 2 in the fair value hierarchy, which is further discussed in Note 7.
7. FAIR VALUE MEASUREMENTS
Fair value is defined by GAAP as the price that the Fund would receive upon selling an investment in a timely transaction to an independent buyer in the principal or most advantageous market for the investment. GAAP provides a three-tier hierarchy to maximize the use of observable market data and minimize the use of unobservable inputs and to establish classification of fair value measurements for disclosure purposes. Inputs refer broadly to the assumptions that market participants would use in pricing the asset or liability. Inputs may be observable or unobservable. Observable inputs are based on market data obtained from sources independent of the Fund. Unobservable inputs are inputs that reflect the Fund’s own assumptions based on the best information available in the circumstances. The three-tier hierarchy of inputs is summarized in the three broad Levels listed below.
| | • | | Level 1 — quoted prices in active markets for identical assets or liabilities; |
| | • | | Level 2 — prices determined using other inputs that are observable either directly, or indirectly through corroboration with observable market data (which could include quoted prices for similar assets or liabilities, interest rates, credit risk, etc.); |
| | • | | Level 3 — prices determined using unobservable inputs when quoted prices or observable inputs are unavailable, such as when there is little or no market activity for an asset or liability (unobservable inputs reflect the Fund’s own assumptions in determining the fair value of assets or liabilities and would be based on the best information available). |
Investments in open-end registered investment companies are valued at NAV and are classified in the fair value hierarchy as Level 1.
8. INCOME TAXES AND DISTRIBUTIONS TO SHAREHOLDERS
Federal income tax regulations differ from GAAP. Therefore, distributions determined in accordance with tax regulations may differ in amount or character from net investment income and net realized gain for financial reporting purposes. Net investment income (loss) and net realized and unrealized gain (loss) differ for financial statement and tax purposes due to differing treatments of net investment loss, short-term capital gain distributions, and wash sale losses deferred. Financial reporting records are adjusted for permanent book/tax differences to reflect tax character. Financial records are not adjusted for temporary differences.
As of June 30, 2024, the Fund’s cost of investments and gross unrealized appreciation (depreciation) for U.S. federal income tax purposes were as follows:
| | | | |
Cost of investments | | $ | 453,407,578 | |
| | | | |
Gross tax unrealized appreciation | | | 88,061,369 | |
Gross tax unrealized depreciation | | | (991,159 | ) |
| | | | |
Net tax unrealized appreciation (depreciation) | | | 87,070,210 | |
| | | | |
10
| | |
| June 30, 2024 | | Baron WealthBuilder Fund |
NOTES TO FINANCIAL STATEMENTS (Unaudited) (Continued)
8. INCOME TAXES AND DISTRIBUTIONS TO SHAREHOLDERS (Continued)
At December 31, 2023, the Fund had capital loss carryforwards as follows:
| | | | |
Short-Term | | $ | 17,257,222 | |
| | | | |
Long-Term | | $ | — | |
| | | | |
The estimated tax character of distributions paid during the six months ended June 30, 2024 and the year ended December 31, 2023 was as follows:
| | | | | | | | | | | | | | | | |
| | |
| | | Six Months Ended
June 30, 2024 | | | Year Ended
December 31, 2023 | |
| | | | |
| | | Ordinary1 | | | Long-Term
Capital Gain | | | Ordinary1 | | | Long-Term
Capital Gain | |
| | $ | — | | | $ | — | | | $ | 134,067 | | | $ | — | |
| 1 | For tax purposes, short-term capital gains are considered ordinary income distributions. |
The Fund follows the provisions of FASB Codification Section 740 (ASC Section 740) “Accounting for Uncertainty in Income Taxes” which clarifies the accounting for uncertainty in tax positions taken or expected to be taken on a tax return. ASC Section 740 sets forth a threshold for financial statement recognition, measurement and disclosure of tax positions taken or expected to be taken on a tax return. The Fund is required to recognize the tax effects of certain tax positions under a “more likely than not” standard, that based on their technical merits, have more than 50 percent likelihood of being sustained upon examination. Management has analyzed the tax positions taken on the Fund’s federal income tax returns for the current year and prior two years, and has concluded that no provision for federal income tax is required in the Fund’s financial statements. At June 30, 2024, the Fund did not have any uncertain tax benefits that require recognition, de-recognition or disclosure. The Fund’s federal, state and local income and federal excise tax returns for which the applicable statutes of limitations have not expired (current and prior three years) are subject to examination by the Internal Revenue Service and state departments of revenue.
9. SUBSEQUENT EVENTS
Management has evaluated events occurring subsequent to the date of the Statements of Assets and Liabilities and through the date of issuance of the financial statements and has determined that there were no subsequent events that required adjustment to or disclosure in the financial statements.
11
| | |
| Baron WealthBuilder Fund | | June 30, 2024 |
FINANCIAL HIGHLIGHTS (Unaudited)
BARON WEALTHBUILDER FUND
Selected data for a share outstanding throughout each period:
| | | | | | | | | | | | | | | | | | | | | | | | | | | | | | | | | | | | | | | | | | | | | | | | | | | | | | | | | | | | | | | | | | | | | | |
| | | | | | | |
| | | | | Income (loss) from
Investment operations: | | Less distributions to
shareholders from: | | | | | | Ratios to Average Net Assets: | | Supplemental
Data: |
| | | | | | | | | | | | | | |
| | | Net asset
value,
beginning
of period
($) | | Net
investment
income
(loss)
($)1 | | Net
realized
and
unrealized
gain
(loss)
($) | | Total from
investment
operations
($) | | Net
investment
income
($) | | Net
realized
gains
($) | | Total
distributions
($) | | Net
asset
value,
end of
period
($) | | Total
return
(%)2 | | Gross
expenses (%)3 | | Net
expenses
(%)3 | | Net
investment
income
(loss)
(%) | | Net
assets (in
millions),
end of
period
($) | | Portfolio
turnover
rate
(%) |
| | | | | |
RETAIL SHARES | | | | | | | | | | | | | | | | | | | | | | | | | | |
| | | | | |
Six Months Ended June 30, | | | | | | | | | | | | | | | | | | | | | | | | | | |
| | | | | | | | | | | | | | |
2024 | | | | 17.60 | | | | | (0.02 | ) | | | | 0.37 | | | | | 0.35 | | | | | 0.00 | | | | | 0.00 | | | | | 0.00 | | | | | 17.95 | | | | | 1.99 | 4,5 | | | | 0.32 | 6 | | | | 0.30 | 6 | | | | (0.26 | )6 | | | | 86.9 | | | | | 1.24 | 5 |
| | | | | | |
Year Ended December 31, | | | | | | | | | | | | | | | | | | | | | | | | | | |
| | | | | | | | | | | | | | |
2023 | | | | 14.04 | | | | | (0.03 | ) | | | | 3.59 | | | | | 3.56 | | | | | 0.00 | | | | | 0.00 | | | | | 0.00 | | | | | 17.60 | | | | | 25.36 | 4 | | | | 0.33 | | | | | 0.30 | | | | | (0.18 | ) | | | | 94.9 | | | | | 6.70 | |
| | | | | | | | | | | | | | |
2022 | | | | 21.56 | | | | | (0.04 | ) | | | | (7.02 | ) | | | | (7.06 | ) | | | | (0.08 | ) | | | | (0.38 | ) | | | | (0.46 | ) | | | | 14.04 | | | | | (32.75 | )4 | | | | 0.34 | | | | | 0.30 | | | | | (0.27 | ) | | | | 76.0 | | | | | 20.73 | |
| | | | | | | | | | | | | | |
2021 | | | | 19.57 | | | | | (0.03 | ) | | | | 3.21 | | | | | 3.18 | | | | | 0.00 | | | | | (1.19 | ) | | | | (1.19 | ) | | | | 21.56 | | | | | 16.42 | 4 | | | | 0.33 | 7 | | | | 0.30 | 7 | | | | (0.13 | ) | | | | 117.4 | | | | | 0.18 | |
| | | | | | | | | | | | | | |
2020 | | | | 12.23 | | | | | (0.04 | ) | | | | 7.62 | | | | | 7.58 | | | | | 0.00 | | | | | (0.24 | ) | | | | (0.24 | ) | | | | 19.57 | | | | | 62.45 | 4 | | | | 0.41 | 7 | | | | 0.30 | 7 | | | | (0.29 | ) | | | | 44.5 | | | | | 6.65 | |
| | | | | | | | | | | | | | |
2019 | | | | 9.33 | | | | | (0.03 | ) | | | | 3.37 | | | | | 3.34 | | | | | (0.01 | ) | | | | (0.43 | ) | | | | (0.44 | ) | | | | 12.23 | | | | | 36.24 | 4 | | | | 0.41 | 9 | | | | 0.32 | 9 | | | | (0.26 | ) | | | | 5.9 | | | | | 22.48 | |
| | | | | |
TA SHARES | | | | | | | | | | | | | | | | | | | | | | | | | | |
| | | | | |
Six Months Ended June 30, | | | | | | | | | | | | | | | | | | | | | | | | | | |
| | | | | | | | | | | | | | |
2024 | | | | 17.85 | | | | | (0.00 | )8 | | | | 0.38 | | | | | 0.38 | | | | | 0.00 | | | | | 0.00 | | | | | 0.00 | | | | | 18.23 | | | | | 2.13 | 4,5 | | | | 0.08 | 6 | | | | 0.05 | 6 | | | | (0.01 | )6 | | | | 51.4 | | | | | 1.24 | 5 |
| | | | | | |
Year Ended December 31, | | | | | | | | | | | | | | | | | | | | | | | | | | |
| | | | | | | | | | | | | | |
2023 | | | | 14.21 | | | | | 0.01 | | | | | 3.64 | | | | | 3.65 | | | | | (0.01 | ) | | | | 0.00 | | | | | (0.01 | ) | | | | 17.85 | | | | | 25.66 | 4 | | | | 0.08 | | | | | 0.05 | | | | | 0.07 | | | | | 49.5 | | | | | 6.70 | |
| | | | | | | | | | | | | | |
2022 | | | | 21.76 | | | | | (0.00 | )8 | | | | (7.09 | ) | | | | (7.09 | ) | | | | (0.08 | ) | | | | (0.38 | ) | | | | (0.46 | ) | | | | 14.21 | | | | | (32.59 | )4 | | | | 0.08 | | | | | 0.05 | | | | | (0.02 | ) | | | | 37.9 | | | | | 20.73 | |
| | | | | | | | | | | | | | |
2021 | | | | 19.70 | | | | | 0.03 | | | | | 3.22 | | | | | 3.25 | | | | | (0.00 | )8 | | | | (1.19 | ) | | | | (1.19 | ) | | | | 21.76 | | | | | 16.70 | 4 | | | | 0.08 | 7 | | | | 0.05 | 7 | | | | 0.12 | | | | | 47.2 | | | | | 0.18 | |
| | | | | | | | | | | | | | |
2020 | | | | 12.28 | | | | | (0.01 | ) | | | | 7.67 | | | | | 7.66 | | | | | 0.00 | | | | | (0.24 | ) | | | | (0.24 | ) | | | | 19.70 | | | | | 62.85 | 4 | | | | 0.16 | 7 | | | | 0.05 | 7 | | | | (0.04 | ) | | | | 44.0 | | | | | 6.65 | |
| | | | | | | | | | | | | | |
2019 | | | | 9.35 | | | | | (0.00 | )8 | | | | 3.37 | | | | | 3.37 | | | | | (0.01 | ) | | | | (0.43 | ) | | | | (0.44 | ) | | | | 12.28 | | | | | 36.49 | 4 | | | | 0.17 | 9 | | | | 0.07 | 9 | | | | (0.03 | ) | | | | 21.4 | | | | | 22.48 | |
| | | | | |
INSTITUTIONAL SHARES | | | | | | | | | | | | | | | | | | | | | | | | | | |
| | | | | |
Six Months Ended June 30, | | | | | | | | | | | | | | | | | | | | | | | | | | |
| | | | | | | | | | | | | | |
2024 | | | | 17.86 | | | | | (0.00 | )8 | | | | 0.38 | | | | | 0.38 | | | | | 0.00 | | | | | 0.00 | | | | | 0.00 | | | | | 18.24 | | | | | 2.13 | 4,5 | | | | 0.07 | 6 | | | | 0.05 | 6 | | | | (0.01 | )6 | | | | 402.1 | | | | | 1.24 | 5 |
| | | | | | |
Year Ended December 31, | | | | | | | | | | | | | | | | | | | | | | | | | | |
| | | | | | | | | | | | | | |
2023 | | | | 14.21 | | | | | 0.01 | | | | | 3.65 | | | | | 3.66 | | | | | (0.01 | ) | | | | 0.00 | | | | | (0.01 | ) | | | | 17.86 | | | | | 25.73 | 4 | | | | 0.08 | | | | | 0.05 | | | | | 0.07 | | | | | 403.1 | | | | | 6.70 | |
| | | | | | | | | | | | | | |
2022 | | | | 21.76 | | | | | (0.00 | )8 | | | | (7.09 | ) | | | | (7.09 | ) | | | | (0.08 | ) | | | | (0.38 | ) | | | | (0.46 | ) | | | | 14.21 | | | | | (32.59 | )4 | | | | 0.09 | | | | | 0.05 | | | | | (0.02 | ) | | | | 312.5 | | | | | 20.73 | |
| | | | | | | | | | | | | | |
2021 | | | | 19.70 | | | | | 0.02 | | | | | 3.23 | | | | | 3.25 | | | | | (0.00 | )8 | | | | (1.19 | ) | | | | (1.19 | ) | | | | 21.76 | | | | | 16.70 | 4 | | | | 0.08 | 7 | | | | 0.05 | 7 | | | | 0.09 | | | | | 412.2 | | | | | 0.18 | |
| | | | | | | | | | | | | | |
2020 | | | | 12.28 | | | | | (0.01 | ) | | | | 7.67 | | | | | 7.66 | | | | | 0.00 | | | | | (0.24 | ) | | | | (0.24 | ) | | | | 19.70 | | | | | 62.85 | 4 | | | | 0.16 | 7 | | | | 0.05 | 7 | | | | (0.04 | ) | | | | 184.1 | | | | | 6.65 | |
| | | | | | | | | | | | | | |
2019 | | | | 9.35 | | | | | (0.00 | )8 | | | | 3.37 | | | | | 3.37 | | | | | (0.01 | ) | | | | (0.43 | ) | | | | (0.44 | ) | | | | 12.28 | | | | | 36.49 | 4 | | | | 0.17 | 9 | | | | 0.07 | 9 | | | | (0.02 | ) | | | | 93.8 | | | | | 22.48 | |
| 1 | Based on average shares outstanding. |
| 2 | Total returns reflect reinvestment of all dividends and distributions, if any. |
| 3 | Expenses do not include acquired fund fees and expenses of the Underlying Funds. |
| 4 | The total returns would have been lower had certain expenses not been reduced during the period shown. |
| 7 | Includes interest expense of less than 0.01%. |
| 8 | Less than $0.01 per share. |
| 9 | Includes interest expense of 0.02%. |
| | |
| 12 | | See Notes to Financial Statements. |
| | |
| June 30, 2024 | | Baron WealthBuilder Fund |
| | |
| Changes In and Disagreements with Accountants (Unaudited) | | For the period covered by this report |
| |
| Not applicable. | | |
| |
| Results of Meeting(s) of Shareholders (Unaudited) | | For the period covered by this report |
| |
| Not applicable. | | |
| |
| Remuneration Paid to Directors, Officers and Others (Unaudited) | | For the period covered by this report |
| |
| Refer to the financial statements included herein. | | |
13
| | |
| Baron WealthBuilder Fund | | June 30, 2024 |
DISCLOSURE REGARDING THE APPROVAL OF THE INVESTMENT ADVISORY AGREEMENT BY THE BOARD OF TRUSTEES (Unaudited)
The Board of Trustees (the “Board”) of Baron Select Funds (the “Trust”) met on May 9, 2024 to discuss the selection of BAMCO, Inc. (the “Adviser”) as the investment adviser and the approval of the investment advisory agreement for Baron WealthBuilder Fund (the “Fund”). The members of the Board who are not “interested persons” (as defined in the Investment Company Act of 1940, as amended) of the Trust (the “Independent Trustees”) met in a separate session to discuss and consider the renewal of the investment advisory agreement for the Fund. Financial Solutions, Inc. (“Broadridge”), an independent provider of investment company data, provided reports to the Board containing information upon which the Trustees relied during their considerations. The Trustees received a substantial amount of information from the Adviser and from Broadridge, and were advised by independent legal counsel. Based on its evaluation of this and other information, the Board, including a majority of the Independent Trustees, approved the continuation of the investment advisory agreement for the Fund for an additional one-year period.
In reaching its determination, the Board considered various factors that it deemed relevant, including the factors listed below.
1. NATURE, EXTENT AND QUALITY OF SERVICES
The Trustees considered the information provided, including, for many, their experience and knowledge gained from their service as Trustees and their experience generally, including the following, which they had previously considered in connection with approving the investment advisory agreement for the Fund and those of the underlying Baron funds in which it invests and remained, in their thinking, material to their consideration:
| • | | Their confidence in the senior personnel, portfolio management, the financial condition of the Adviser and its affiliates and the Adviser’s available resources; |
| • | | The nature, extent and quality of the services provided by the Adviser, including: relationships with and supervision of third party service providers, such as the Fund’s custodian and transfer agent, the quality of shareholder reports, the ability to monitor adherence to investment guidelines and restrictions, the legal, accounting and compliance services provided to the Fund and the support services provided to the Board; |
| • | | The Adviser’s investment principles and processes and the historical performance of the Fund as compared to similar funds managed by other advisers over comparable periods; |
| • | | The total expense ratio of the Fund and comparisons to similar funds managed by other advisers over comparable periods. They observed that the net operating expenses paid by the Fund (total expense ratio) were within the range of those of the funds in its peer group and custom category; and |
| • | | Additional services provided by the Adviser. |
No advisory fee is payable by the Fund to the Adviser, although the Fund bears indirectly its pro rata share of the expenses of the underlying Baron funds in which it invests, including advisory fees payable by such underlying Baron funds to the Adviser.
The Board concluded that the nature, extent and quality of the services the Adviser provides to the Fund supported approval of the investment advisory agreement for the Fund.
2. INVESTMENT PERFORMANCE OF THE FUND AND THE ADVISER
As part of its consideration of the investment performance of the Fund and the Adviser, the Board took into account the analyses presented in the Broadridge materials. The Board considered, among other information, Broadridge’s comparison of the expense ratio with those of peer group funds selected by Broadridge and custom category medians. The Board also considered, among other performance information, Broadridge’s comparisons of the Fund’s annualized total return and related risk metrics over one-, three- and five- year periods against peer group funds and custom category medians. After considering all the information, the Board concluded that the Adviser continued to invest in accordance with its long-standing principles and that the Fund’s performance remained consistent with expectations for the Adviser’s investment style, in light of recent market conditions.
3. COSTS OF SERVICES PROVIDED AND PROFITS TO BE REALIZED BY THE ADVISER
Since the Fund does not pay advisory fees, the Board did not consider any comparisons to the advisory fees charged and services provided by the Adviser and its investment adviser affiliate to any other funds or separately managed accounts. The Board was provided with a profitability analysis prepared by the Adviser and discussed with the representatives of the Adviser that the Adviser has continued to invest in quality personnel, systems and facilities, and otherwise continued to invest in its business, irrespective of fund flows. However, since the Fund does not pay an advisory fee, the Board did not consider the profitability analysis material to its considerations.
The Board also considered benefits that accrue to the Adviser and its affiliates from their relationship with the Fund.
4. ECONOMIES OF SCALE AND BENEFITS TO INVESTORS
Since the Fund does not pay an advisory fee, the Board did not consider potential economies of scale. The Board did consider that the Adviser was continuing to grow and upgrade its staff and invest in its business.
After due consideration of the above-enumerated factors and other factors it deemed relevant, the Board, including a majority of the Independent Trustees, approved the continuance of the Fund’s investment advisory agreement.
14
SEMIWEALTH 6/30/2024
Item 8. Changes in and Disagreements with Accountants for Open-End Management Investment Companies.
The information is disclosed as part of the Financial Statements included in Item 7 of this Form N-CSR.
Item 9. Proxy Disclosures for Open-End Management Investment Companies.
The information is disclosed as part of the Financial Statements included in Item 7 of this Form N-CSR.
Item 10. Remuneration Paid to Directors, Officers, and Others of Open-End Management Investment Companies.
The information is disclosed as part of the Financial Statements included in Item 7 of this Form N-CSR.
Item 11. Statement Regarding Basis for Approval of Investment Advisory Contract.
The information is disclosed as part of the Financial Statements included in Item 7 of this Form N-CSR.
Item 12. Disclosure of Proxy Voting Policies and Procedures for Closed-End Management Investment Companies.
Not applicable.
Item 13. Portfolio Managers of Closed-End Management Investment Companies.
Not applicable.
Item 14. Purchases of Equity Securities by Closed-End Management Investment Company and Affiliated Purchasers.
Not applicable.
Item 15. Submission of Matters to a Vote of Security Holders.
Not applicable.
Item 16. Controls and Procedures.
(a) The Registrant’s principal executive officer and principal financial officer have concluded that the Registrant’s disclosure controls and procedures (as defined in Rule 30a-3(c) under the Investment Company Act of 1940 (the “1940 Act”)) are effective based on their evaluation of these controls and procedures as of a date within 90 days of the filing date of this report.
(b) There were no changes in the Registrant’s internal control over financial reporting (as defined in Rule 30a-3(d) under the 1940 Act) that occurred during the period covered by this report that have materially affected, or are reasonably likely to materially affect, the Registrant’s internal control over financial reporting.
Item 17. Disclosure of Securities Lending Activities for Closed-End Management Investment Companies.
Not applicable.
Item 18. Recovery of Erroneously Awarded Compensation
Not applicable.
Item 19. Exhibits.
(a)(1) Not applicable.
(a)(2) Not applicable.
(a)(3) Certification of each of the principal executive officers and principal financial officers of the Registrant as required by Rule 30a-2(a) under the 1940 Act.
(b) Certification of each of the principal executive officers and principal financial officers of the Registrant as required by the 1940 Act.
SIGNATURES
Pursuant to the requirements of the Securities Exchange Act of 1934 and the Investment Company Act of 1940, the registrant has duly caused this report to be signed on its behalf by the undersigned, thereunto duly authorized.
| | |
| BARON SELECT FUNDS |
| |
| By: | | /s/ Ronald Baron |
| | Ronald Baron |
| | Principal Executive Officer |
|
| Date: September 4, 2024 |
Pursuant to the requirements of the Securities Exchange Act of 1934 and the Investment Company Act of 1940, this report has been signed below by the following persons on behalf of the registrant and in the capacities and on the dates indicated.
| | |
| By: | | /s/ Ronald Baron |
| | Ronald Baron |
| | Principal Executive Officer |
|
| Date: September 4, 2024 |
| |
| By: | | /s/ Christopher Snively |
| | Christopher Snively |
| | Principal Financial Officer |
|
| Date: September 4, 2024 |