Exhibit (C)(2)
|
Preliminary Draft – Confidential The Conflicts Committee of the Board of Directors of Midcoast Holdings, L.L.C. Discussion Materials December 20, 2016
|
Preliminary Draft— Confidential These materials have been prepared by Evercore Group L.L.C. (“Evercore”) for the Conflicts Committee of the Board of Directors of Midcoast Holdings, L.L.C. (the “Conflicts Committee”), the general partner of Midcoast Energy Partners, L.P. (“MEP” or the “Partnership”), to whom such materials are directly addressed and delivered and may not be used or relied upon by any other party or for any purpose other than as specifically contemplated by a written agreement with Evercore. These materials are based on information provided by or on behalf of the Conflicts Committee, from public sources or otherwise reviewed by Evercore. Evercore assumes no responsibility for independent investigation or verification of such information and has relied on such information being complete and accurate in all material respects. To the extent such information includes estimates and forecasts of future financial performance prepared by or reviewed with the management of MEP and/or other potential transaction participants or obtained from public sources, Evercore has assumed that such estimates and forecasts have been reasonably prepared on bases reflecting the best currently available estimates and judgments of such management (or, with respect to estimates and forecasts obtained from public sources, represent reasonable estimates). No representation or warranty, express or implied, is made as to the accuracy or completeness of such information and nothing contained herein is, or shall be relied upon as, a representation, whether as to the past, the present or the future. These materials were designed for use by specific persons familiar with the business and affairs of MEP. These materials are not intended to provide the sole basis for evaluating, and should not be considered a recommendation with respect to, any transaction or other matter. These materials have been developed by and are proprietary to Evercore and were prepared exclusively for the benefit and internal use of the Conflicts Committee. These materials were compiled on a confidential basis for the sole use of the Conflicts Committee and not with a view to public disclosure or filing thereof under state or federal securities laws, and may not be reproduced, disseminated, quoted or referred to, in whole or in part, without the prior written consent of Evercore. These materials do not constitute an offer or solicitation to sell or purchase any securities and are not a commitment by Evercore or any of its affiliates to provide or arrange any financing for any transaction or to purchase any security in connection therewith. Evercore assumes no obligation to update or otherwise revise these materials. These materials may not reflect information known to other professionals in other business areas of Evercore and its affiliates. Evercore and its affiliates do not provide legal, accounting, tax or regulatory advice. Accordingly, any statements contained herein as to tax matters were neither written nor intended by Evercore or its affiliates to be used and cannot be used by any taxpayer for the purpose of avoiding tax penalties that may be imposed on such taxpayer. Each person should seek legal, accounting, tax and regulatory advice based on his, her or its particular circumstances from independent advisors regarding the impact of the transactions or matters described herein.
|
Preliminary Draft— Confidential Table of Contents Section Executive Summary I Midcoast Situation Analysis II Midcoast Preliminary Valuation III Overview of Potential Standalone Alternatives IV Appendix A. Weighted Average Cost of Capital Analysis B. Midcoast Financial Projections C. Tax Input to Unitholders
|
Preliminary Draft – Confidential I. Executive Summary
|
Preliminary Draft— Confidential Executive Summary Introduction Evercore Group L.L.C. (“Evercore”) is pleased to provide the materials herein to the Conflicts Committee of the Board of Directors (the “Conflicts Committee”) of Midcoast Holdings, L.L.C., the general partner of Midcoast Energy Partners, L.P. (“MEP”, “Midcoast” or the “Partnership”) regarding the proposed merger of the Partnership with Enbridge Energy Company, Inc., a wholly owned subsidiary of Enbridge Inc. (“ENB”) (the “Proposed Transaction” or “Project Leather”) As part of the Proposed Transaction, ENB has proposed to acquire each publicly-owned common unit of MEP for $6.25 of cash per share (the “Proposed Consideration”) • The Proposed Consideration represents an 11.3% discount to MEP’s closing unit price of $7.05 as of December 16, 2016 • The Proposed Consideration represents an 8.9% discount to MEP’s30-day volume weighted-average unit price of $6.86 as of December 16, 2016 The Proposed Transaction is subject to the negotiation and approval of the definitive merger agreement (the “Merger Agreement”) and approval by MEP’s board of directors, EEP’s board of directors, the Conflicts Committee and a majority of MEP’s unitholders • As currently contemplated, MEP management expects the Board of Directors of Midcoast Holdings, L.L.C. to declare a quarterly cash distribution on all of its outstanding common and subordinated units for the quarter ending December 31, 2016 in conjunction with the Proposed Transaction • Enbridge Energy Partners, L.P.’s (“EEP”) subordinated units will be converted into common units one business day after such distribution payment in February 2017, which will result in EEP holding 53% of MEP’s common units and give EEP the ability to approve the Proposed Transaction by written consent 1
|
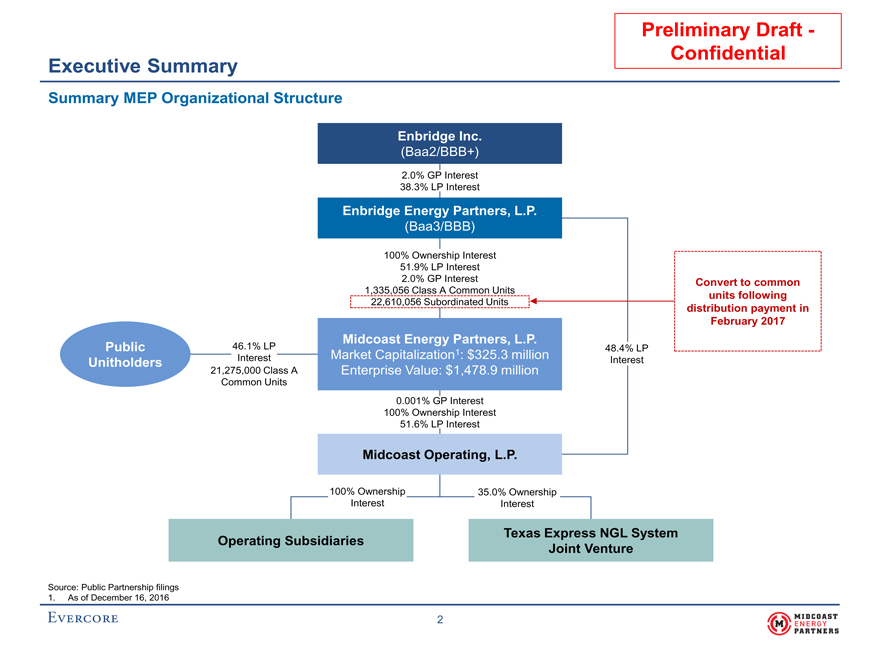
Preliminary Draft— Confidential Executive Summary Summary MEP Organizational Structure Enbridge Inc. (Baa2/BBB+) 2.0% GP Interest 38.3% LP Interest Enbridge Energy Partners, L.P. (Baa3/BBB) 100% Ownership Interest 51.9% LP Interest 2.0% GP Interest Convert to common 1,335,056 Class A Common Units units following 22,610,056 Subordinated Units distribution payment in February 2017 Midcoast Energy Partners, L.P. Public 46.1% LP 48.4% LP Market Capitalization1: $325.3 million Unitholders Interest Interest 21,275,000 Class A Enterprise Value: $1,478.9 million Common Units 0.001% GP Interest 100% Ownership Interest 51.6% LP Interest Midcoast Operating, L.P. 100% Ownership 35.0% Ownership Interest Interest Texas Express NGL System Operating Subsidiaries Joint Venture Source: Public Partnership filings 1. As of December 16, 2016 2
|
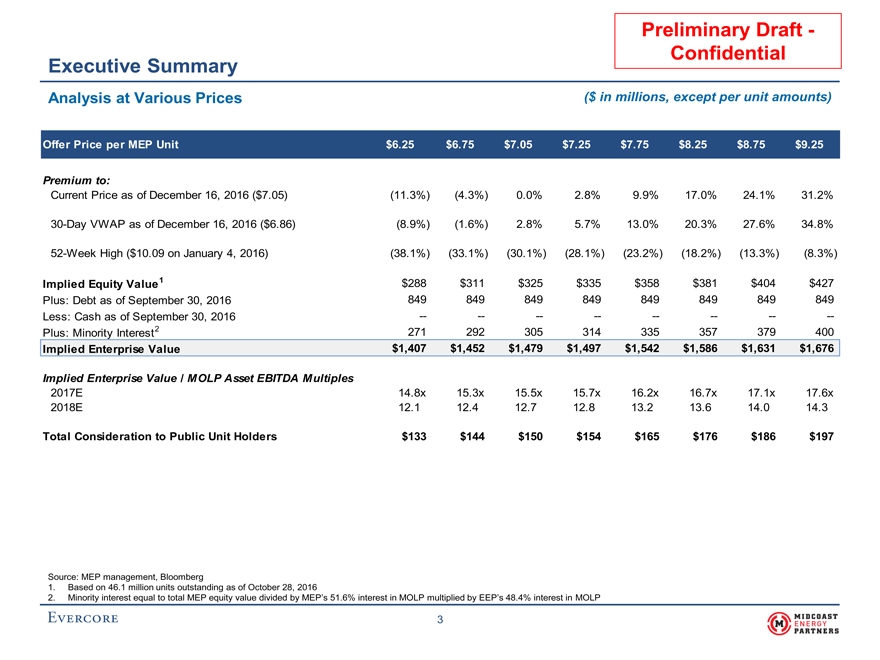
Preliminary Draft—Confidential Executive Summary Analysis at Various Prices($ in millions, except per unit amounts) Offer Price per MEP Unit$6.25$6.75$7.05$7.25$7.75$8.25$8.75$9.25 Premium to: Current Price as of December 16, 2016 ($7.05)(11.3%)(4.3%)0.0%2.8%9.9%17.0%24.1%31.2%30-Day VWAP as of December 16, 2016 ($6.86)(8.9%)(1.6%)2.8%5.7%13.0%20.3%27.6%34.8%52-Week High ($10.09 on January 4, 2016)(38.1%)(33.1%)(30.1%)(28.1%)(23.2%)(18.2%)(13.3%)(8.3%) Implied Equity Value 1$288$311$325$335$358$381$404$427 Plus: Debt as of September 30, 2016849849849849849849849849 Less: Cash as of September 30, 2016———————— Plus: Minority Interest2271292305314335357379400 Implied Enterprise Value$1,407$1,452$1,479$1,497$1,542$1,586$1,631$1,676 Implied Enterprise Value / MOLP Asset EBITDA Multiples 2017E14.8x15.3x15.5x15.7x16.2x16.7x17.1x17.6x 2018E12.112.412.712.813.213.614.014.3 Total Consideration to Public Unit Holders$133$144$150$154$165$176$186$197 Source: MEP management, Bloomberg 1.Based on 46.1 million units outstanding as of October 28, 2016 2.Minority interest equal to total MEP equity value divided by MEP’s 51.6% interest in MOLP multiplied by EEP’s 48.4% interest in MOLP 3
|
Preliminary Draft – Confidential II. Midcoast Situation Analysis
|
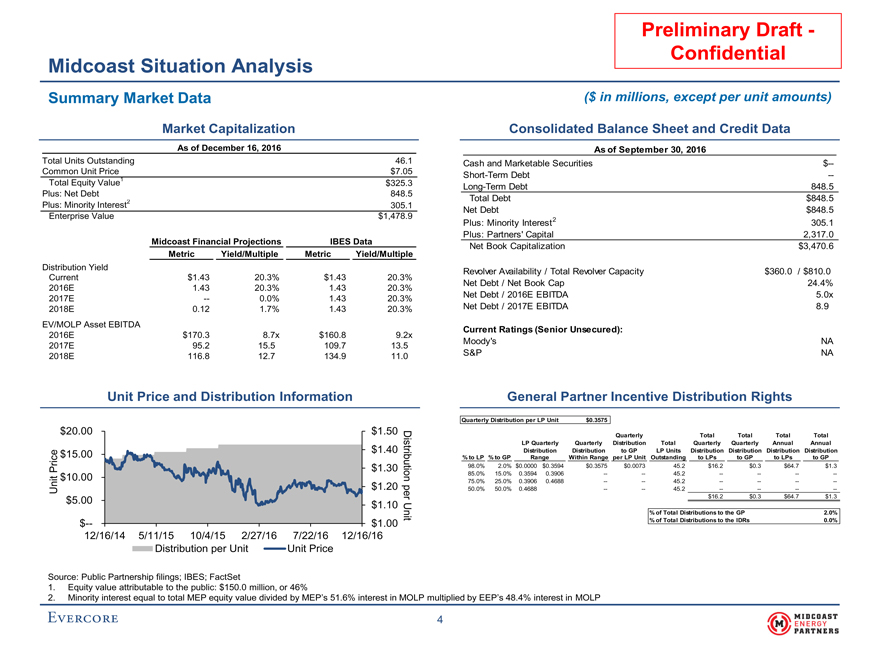
Preliminary Draft - Confidential Midcoast Situation Analysis Summary Market Data ($ in millions, except per unit amounts) Market Capitalization Consolidated Balance Sheet and Credit Data As of December 16, 2016 As of September 30, 2016 Total Units Outstanding 46.1 Cash and Marketable Securities $-- Common Unit Price $7.05 Short-Term Debt -- Total Equity Value1 $325.3 Long-Term Debt 848.5 Plus: Net Debt 848.5 Total Debt $848.5 Plus: Minority Interest2 305.1 Net Debt $848.5 Enterprise Value $1,478.9 Plus: Minority Interest2 305.1 Plus: Partners’ Capital 2,317.0 Midcoast Financial Projections IBES Data Net Book Capitalization $3,470.6 Metric Yield/Multiple Metric Yield/Multiple Distribution Yield Revolver Availability / Total Revolver Capacity $360.0 / $810.0 Current $1.43 20.3% $1.43 20.3% 2016E 1.43 20.3% 1.43 20.3% Net Debt / Net Book Cap 24.4% 2017E -- 0.0% 1.43 20.3% Net Debt / 2016E EBITDA 5.0x 2018E 0.12 1.7% 1.43 20.3% Net Debt / 2017E EBITDA 8.9 EV/MOLP Asset EBITDA Current Ratings (Senior Unsecured): 2016E $170.3 8.7x $160.8 9.2x 2017E 95.2 15.5 109.7 13.5 Moody’s NA 2018E 116.8 12.7 134.9 11.0 S&P NA Unit Price and Distribution Information General Partner Incentive Distribution Rights Quarterly Distribution per LP Unit $0.3575 $20.00 $1.50 Quarterly Total Total Total Total Dis LP Quarterly Quarterly Distribution Total Quarterly Quarterly Annual Annual $15.00 $1.40 Distribution Distribution to GP LP Units Distribution Distribution Distribution Distribution % to LP % to GP Range Within Range per LP Unit Outstanding to LPs to GP to LPs to GP Price $1.30 tributi 98.0% 2.0% $0.0000 $0.3594 $0.3575 $0.0073 45.2 $16.2 $0.3 $64.7 $1.3 $10.00 on 85.0% 15.0% 0.3594 0.3906 -- -- 45.2 -- -- -- -- 75.0% 25.0% 0.3906 0.4688 -- -- 45.2 -- -- -- -- Unit $1.20 50.0% 50.0% 0.4688 -- -- 45.2 -- -- -- -- per $16.2 $0.3 $64.7 $1.3 $5.00 $1.10 Unit % of Total Distributions to the GP 2.0% $-- $1.00 % of Total Distributions to the IDRs 0.0% 12/16/14 5/11/15 10/4/15 2/27/16 7/22/16 12/16/16 Distribution per Unit Unit Price Source: Public Partnership filings; IBES; FactSet 1. Equity value attributable to the public: $150.0 million, or 46% 2. Minority interest equal to total MEP equity value divided by MEP’s 51.6% interest in MOLP multiplied by EEP’s 48.4% interest in MOLP 4
|
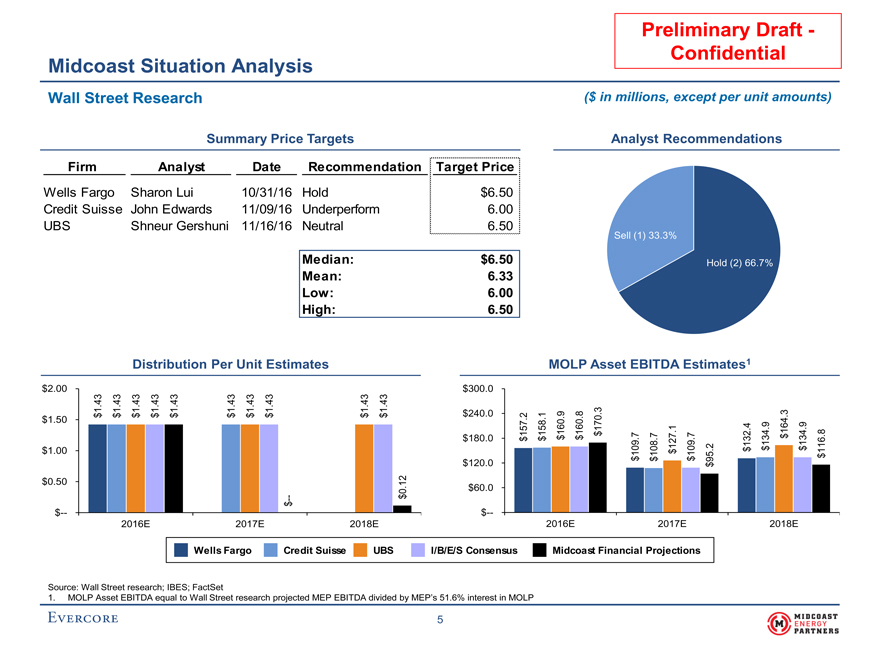
PreliminaryDraft- Confidential Midcoast Situation Analysis Wall Street Research($ in millions, except per unit amounts) Summary Price TargetsAnalyst Recommendations FirmAnalystDateRecommendationTarget Price Wells FargoSharon Lui10/31/16Hold$6.50 Credit Suisse John Edwards11/09/16Underperform6.00 UBSShneur Gershuni11/16/16Neutral6.50 Sell (1) 33.3% Median:$6.50Hold (2) 66.7% Mean:6.33 Low:6.00 High:6.50 Distribution Per Unit EstimatesMOLP Asset EBITDA Estimates1 $2.00$300.0 3 33 3 333 33 3 4 44 4 444 44 4 11 1 111 11 13 . $ 1 $$ $ $$$ $$ $$240.02 198. 3 $1.500 61. 499 157 58160170.164 11 $772. 8 $180.0$ $$$.73$1346 127211341 $1.0010908 $ 109.$$$1 1$ $$$95 $120.0$ 2 $0.501 .$60.0 0 —$ $ $—$— 2016E2017E2018E2016E2017E2018E Wells FargoCredit SuisseUBSI/B/E/S ConsensusMidcoast Financial Projections Source: Wall Street research; IBES; FactSet 1. MOLP Asset EBITDA equal to Wall Street research projected MEP EBITDA divided by MEP’s 51.6% interest in MOLP 5
|
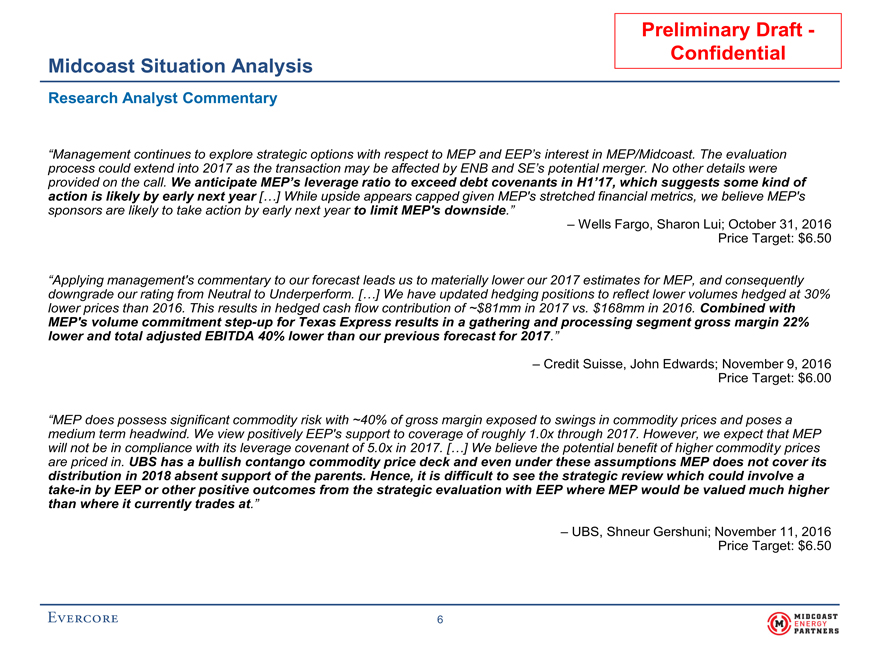
Preliminary Draft— Confidential Midcoast Situation Analysis Research Analyst Commentary “Management continues to explore strategic options with respect to MEP and EEP’s interest in MEP/Midcoast. The evaluation process could extend into 2017 as the transaction may be affected by ENB and SE’s potential merger. No other details were provided on the call. We anticipate MEP’s leverage ratio to exceed debt covenants in H1’17, which suggests some kind of action is likely by early next year […] While upside appears capped given MEP’s stretched financial metrics, we believe MEP’s sponsors are likely to take action by early next year to limit MEP’s downside.” – Wells Fargo, Sharon Lui; October 31, 2016 Price Target: $6.50 “Applying management’s commentary to our forecast leads us to materially lower our 2017 estimates for MEP, and consequently downgrade our rating from Neutral to Underperform. […] We have updated hedging positions to reflect lower volumes hedged at 30% lower prices than 2016. This results in hedged cash flow contribution of ~$81mm in 2017 vs. $168mm in 2016. Combined with MEP’s volume commitmentstep-up for Texas Express results in a gathering and processing segment gross margin 22% lower and total adjusted EBITDA 40% lower than our previous forecast for 2017.” – Credit Suisse, John Edwards; November 9, 2016 Price Target: $6.00 “MEP does possess significant commodity risk with ~40% of gross margin exposed to swings in commodity prices and poses a medium term headwind. We view positively EEP’s support to coverage of roughly 1.0x through 2017. However, we expect that MEP will not be in compliance with its leverage covenant of 5.0x in 2017. […] We believe the potential benefit of higher commodity prices are priced in. UBS has a bullish contango commodity price deck and even under these assumptions MEP does not cover its distribution in 2018 absent support of the parents. Hence, it is difficult to see the strategic review which could involve atake-in by EEP or other positive outcomes from the strategic evaluation with EEP where MEP would be valued much higher than where it currently trades at.” – UBS, Shneur Gershuni; November 11, 2016 Price Target: $6.50 6
|
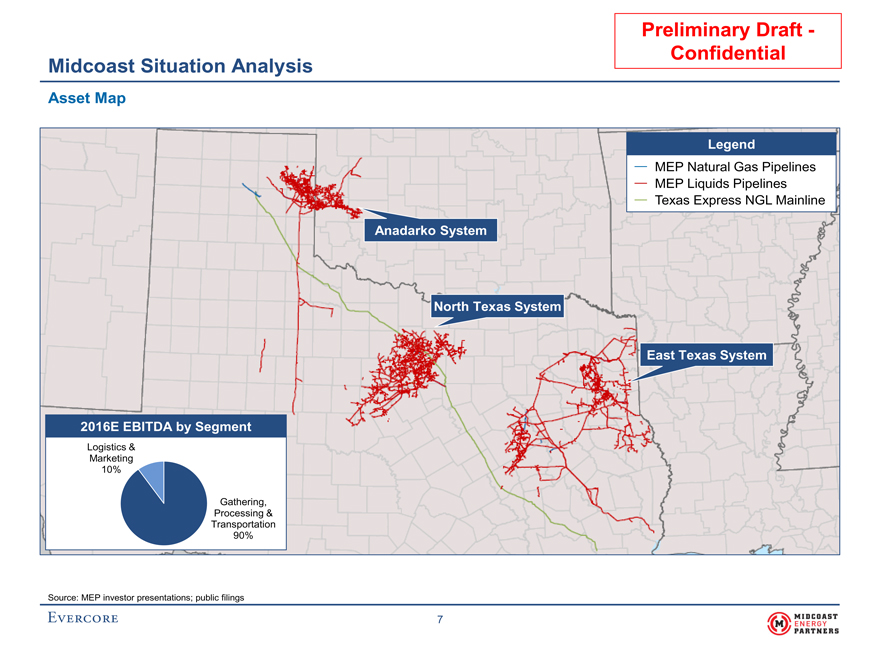
Preliminary Draft— Confidential Midcoast Situation Analysis Asset Map Legend MEP Natural Gas Pipelines MEP Liquids Pipelines Texas Express NGL Mainline Anadarko System North Texas System East Texas System 2016E EBITDA by Segment Logistics & Marketing 10% Gathering, Processing & Transportation 90% Source: MEP investor presentations; public filings 7
|
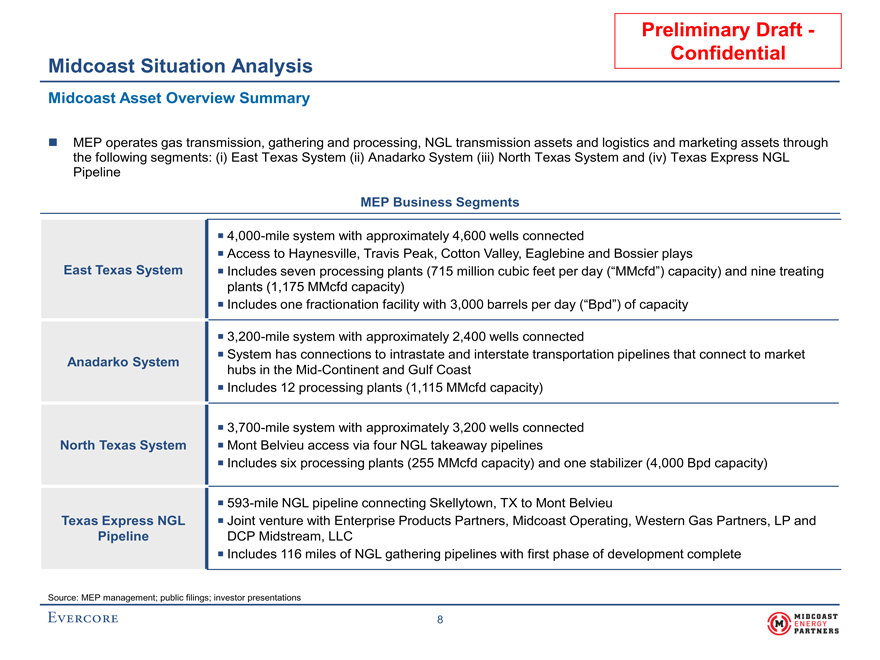
Preliminary Draft— Confidential Midcoast Situation Analysis Midcoast Asset Overview Summary MEP operates gas transmission, gathering and processing, NGL transmission assets and logistics and marketing assets through the following segments: (i) East Texas System (ii) Anadarko System (iii) North Texas System and (iv) Texas Express NGL Pipeline MEP BusinessSegments 4,000-mile system with approximately 4,600 wells connected Access to Haynesville, Travis Peak, Cotton Valley, Eaglebine and Bossier plays East Texas System Includes seven processing plants (715 million cubic feet per day (“MMcfd”) capacity) and nine treating plants (1,175 MMcfd capacity) Includes one fractionation facility with 3,000 barrels per day (“Bpd”) ofcapacity 3,200-mile system with approximately 2,400 wells connected System has connections to intrastate and interstate transportation pipelines that connect to market Anadarko System hubs in theMid-Continent and Gulf Coast Includes 12 processing plants (1,115 MMcfdcapacity) 3,700-mile system with approximately 3,200 wells connected North Texas System Mont Belvieu access via four NGL takeaway pipelines Includes six processing plants (255 MMcfd capacity) and one stabilizer (4,000 Bpdcapacity) 593-mile NGL pipeline connecting Skellytown, TX to Mont Belvieu Texas Express NGL Joint venture with Enterprise Products Partners, Midcoast Operating, Western Gas Partners, LP and Pipeline DCP Midstream, LLC Includes 116 miles of NGL gathering pipelines with first phase of development complete Source: MEP management; public filings; investor presentations 8
|
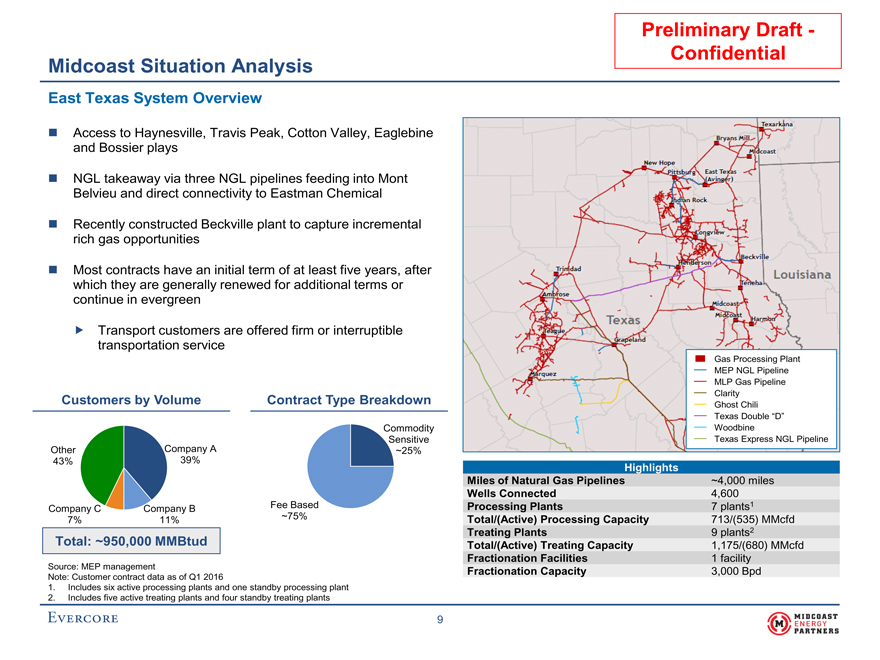
Preliminary Draft— Confidential Midcoast Situation Analysis East Texas System Overview Access to Haynesville, Travis Peak, Cotton Valley, Eaglebine and Bossier plays NGL takeaway via three NGL pipelines feeding into Mont Belvieu and direct connectivity to Eastman Chemical Recently constructed Beckville plant to capture incremental rich gas opportunities Most contracts have an initial term of at least five years, after which they are generally renewed for additional terms or continue in evergreen Transport customers are offered firm or interruptible transportation service Gas Processing Plant MEP NGL Pipeline MLP Gas Pipeline Clarity Customers by Volume Contract Type Breakdown Ghost Chili Texas Double “D” Commodity Woodbine Sensitive Texas Express NGL Pipeline Other Company A ~25% 43% 39% Highlights Miles of Natural Gas Pipelines ~4,000 miles Wells Connected 4,600 Company C Company B Fee Based Processing Plants 7 plants1 7% 11% ~75% Total/(Active) Processing Capacity 713/(535) MMcfd Treating Plants 9 plants2 Total: ~950,000 MMBtud Total/(Active) Treating Capacity 1,175/(680) MMcfd Source: MEP management Fractionation Facilities 1 facility Fractionation Capacity 3,000 Bpd Note: Customer contract data as of Q1 2016 1. Includes six active processing plants and one standby processing plant 2. Includes five active treating plants and four standby treating plants 9
|
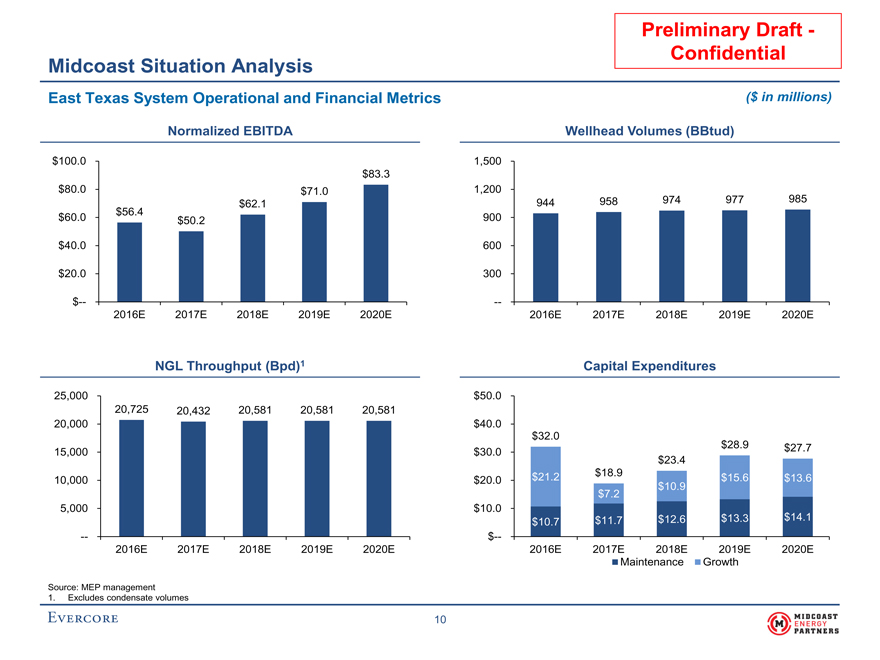
Preliminary Draft— Confidential Midcoast Situation Analysis East Texas System Operational and Financial Metrics ($ in millions) Normalized EBITDA Wellhead Volumes (BBtud) $100.0 1,500 $83.3 $80.0 $71.0 1,200 985 $62.1 944 958 974 977 $56.4 $60.0 $50.2 900 $40.0 600 $20.0 300 $-—- 2016E 2017E 2018E 2019E 2020E 2016E 2017E 2018E 2019E 2020E NGL Throughput (Bpd)1 Capital Expenditures 25,000 $50.0 20,725 20,432 20,581 20,581 20,581 20,000 $40.0 $32.0 $28.9 $27.7 15,000 $30.0 $23.4 $21.2 $18.9 10,000 $20.0 $15.6 $13.6 $10.9 $7.2 5,000 $10.0 $11.7 $12.6 $13.3 $14.1 $10.7 — $— 2016E 2017E 2018E 2019E 2020E 2016E 2017E 2018E 2019E 2020E Maintenance Growth Source: MEP management 1. Excludes condensate volumes 10
|
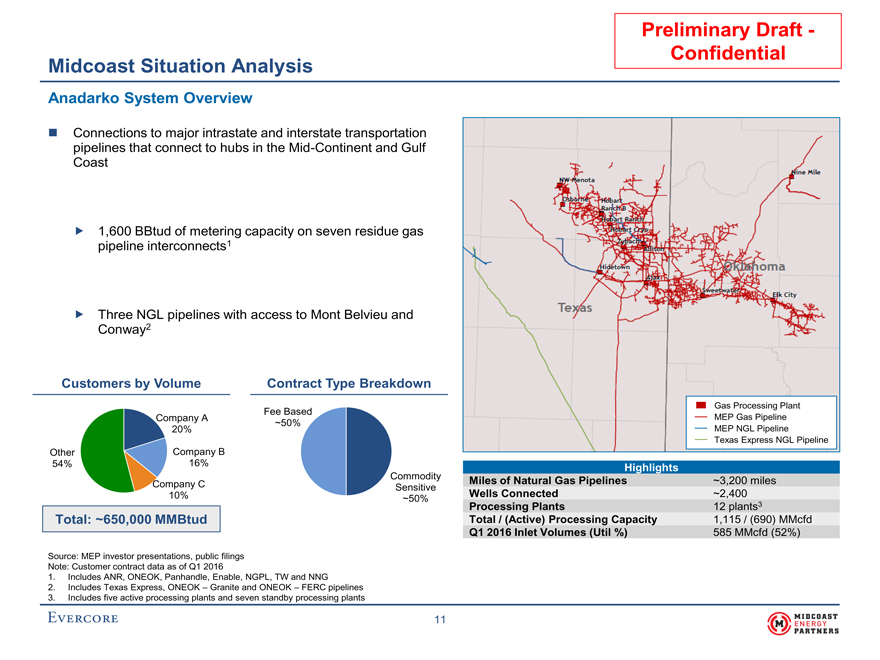
Preliminary Draft— Confidential Midcoast Situation Analysis Anadarko System Overview Connections to major intrastate and interstate transportation pipelines that connect to hubs in theMid-Continent and Gulf Coast 1,600 BBtud of metering capacity on seven residue gas pipeline interconnects1 Three NGL pipelines with access to Mont Belvieu and Conway2 Customers by Volume Contract Type Breakdown Gas Processing Plant Fee Based Company A MEP Gas Pipeline ~50% 20% MEP NGL Pipeline Texas Express NGL Pipeline Other Company B 54% 16% Highlights Company C Commodity Miles of Natural Gas Pipelines ~3,200 miles Sensitive 10% Wells Connected ~2,400 ~50% Processing Plants 12 plants3 Total: ~650,000 MMBtud Total / (Active) Processing Capacity 1,115 / (690) MMcfd Q1 2016 Inlet Volumes (Util %) 585 MMcfd (52%) Source: MEP investor presentations, public filings Note: Customer contract data as of Q1 2016 1. Includes ANR, ONEOK, Panhandle, Enable, NGPL, TW and NNG 2. Includes Texas Express, ONEOK – Granite and ONEOK – FERC pipelines 3. Includes five active processing plants and seven standby processing plants 11
|
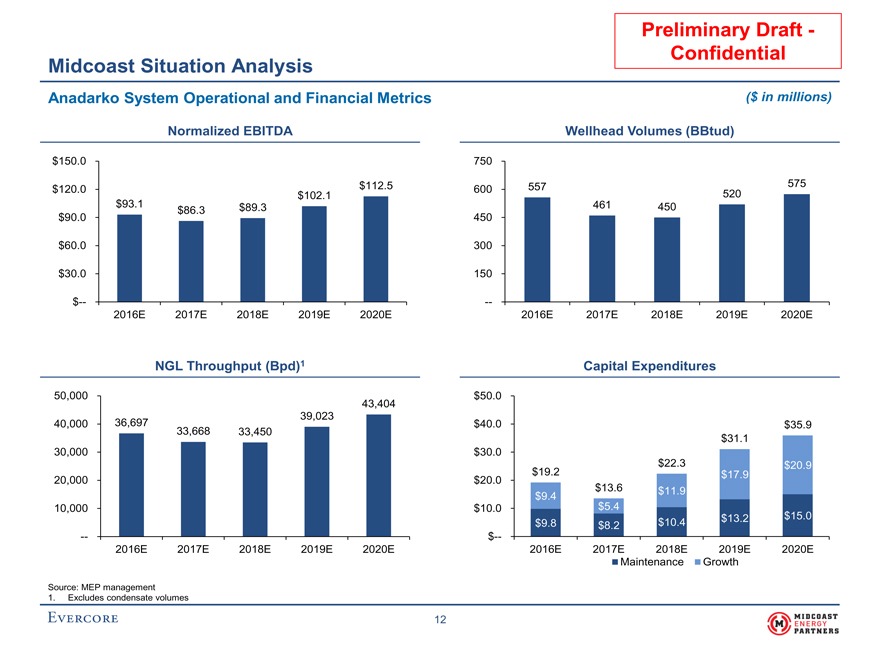
Preliminary Draft— Confidential Midcoast Situation Analysis Anadarko System Operational and Financial Metrics ($ in millions) Normalized EBITDA Wellhead Volumes (BBtud) $150.0 750 $112.5 557 575 $120.0 600 520 $102.1 $93.1 $89.3 461 450 $86.3 $90.0 450 $60.0 300 $30.0 150 $-—- 2016E 2017E 2018E 2019E 2020E 2016E 2017E 2018E 2019E 2020E NGL Throughput (Bpd)1 Capital Expenditures 50,000 $50.0 43,404 39,023 40,000 36,697 $40.0 $35.9 33,668 33,450 $31.1 30,000 $30.0 $22.3 $20.9 $19.2 $17.9 20,000 $20.0 $13.6 $11.9 $9.4 10,000 $10.0 $5.4 $15.0 $10.4 $13.2 $9.8 $8.2 — $— 2016E 2017E 2018E 2019E 2020E 2016E 2017E 2018E 2019E 2020E Maintenance Growth Source: MEP management 1. Excludes condensate volumes 12
|
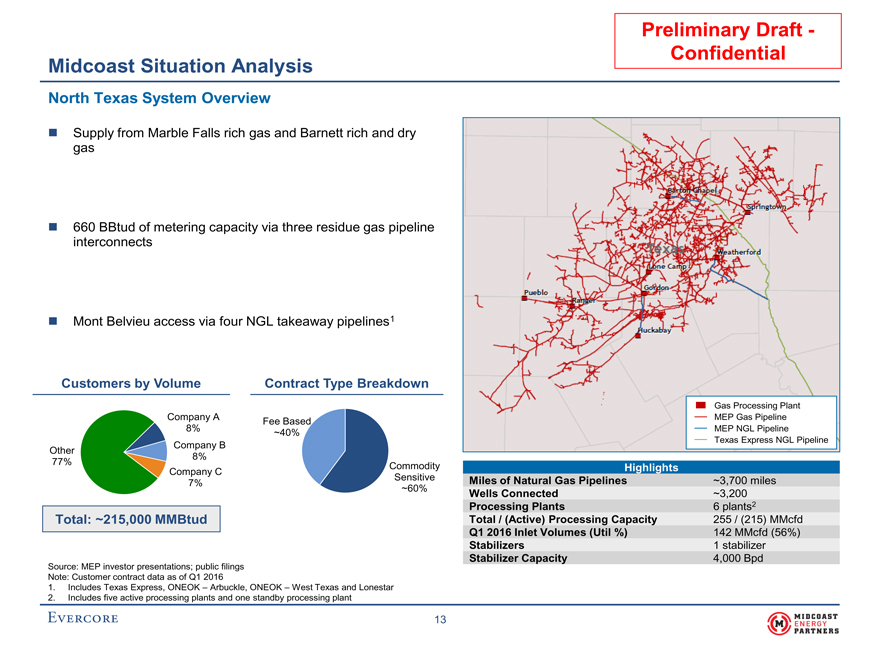
Preliminary Draft— Confidential Midcoast Situation Analysis North Texas System Overview Supply from Marble Falls rich gas and Barnett rich and dry gas 660 BBtud of metering capacity via three residue gas pipeline interconnects Mont Belvieu access via four NGL takeaway pipelines1 Customers by Volume Contract Type Breakdown Gas Processing Plant Company A Fee Based MEP Gas Pipeline 8% ~40% MEP NGL Pipeline Texas Express NGL Pipeline Company B Other 8% 77% Commodity Company C Highlights Sensitive Miles of Natural Gas Pipelines ~3,700 miles 7% ~60% Wells Connected ~3,200 Processing Plants 6 plants2 Total: ~215,000 MMBtud Total / (Active) Processing Capacity 255 / (215) MMcfd Q1 2016 Inlet Volumes (Util %) 142 MMcfd (56%) Stabilizers 1 stabilizer Source: MEP investor presentations; public filings Stabilizer Capacity 4,000 Bpd Note: Customer contract data as of Q1 2016 1. Includes Texas Express, ONEOK – Arbuckle, ONEOK – West Texas and Lonestar 2. Includes five active processing plants and one standby processing plant 13
|
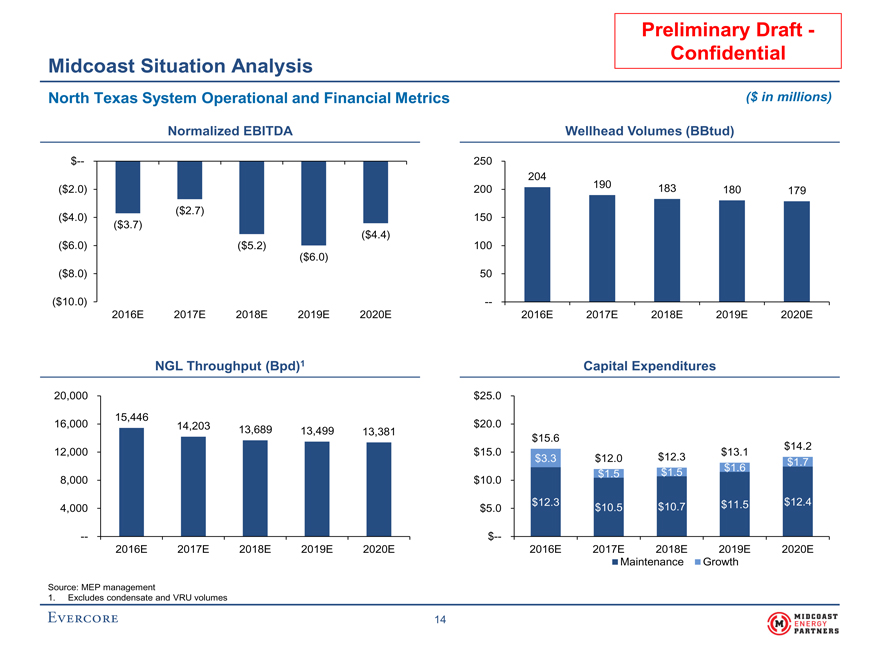
Preliminary Draft— Confidential Midcoast Situation Analysis North Texas System Operational and Financial Metrics ($ in millions) Normalized EBITDA Wellhead Volumes (BBtud) $— 250 204 190 183 ($2.0) 200 180 179 ($2.7) ($4.0) 150 ($3.7) ($4.4) ($6.0) ($5.2) 100 ($6.0) ($8.0) 50 ($10.0) — 2016E 2017E 2018E 2019E 2020E 2016E 2017E 2018E 2019E 2020E NGL Throughput (Bpd)1 Capital Expenditures 20,000 $25.0 15,446 16,000 14,203 $20.0 13,689 13,499 13,381 $15.6 $14.2 12,000 $15.0 $13.1 $3.3 $12.0 $12.3 $1.7 $1.5 $1.6 $1.5 8,000 $10.0 $12.3 $11.5 $12.4 4,000 $5.0 $10.5 $10.7 — $— 2016E 2017E 2018E 2019E 2020E 2016E 2017E 2018E 2019E 2020E Maintenance Growth Source: MEP management 1. Excludes condensate and VRU volumes 14
|
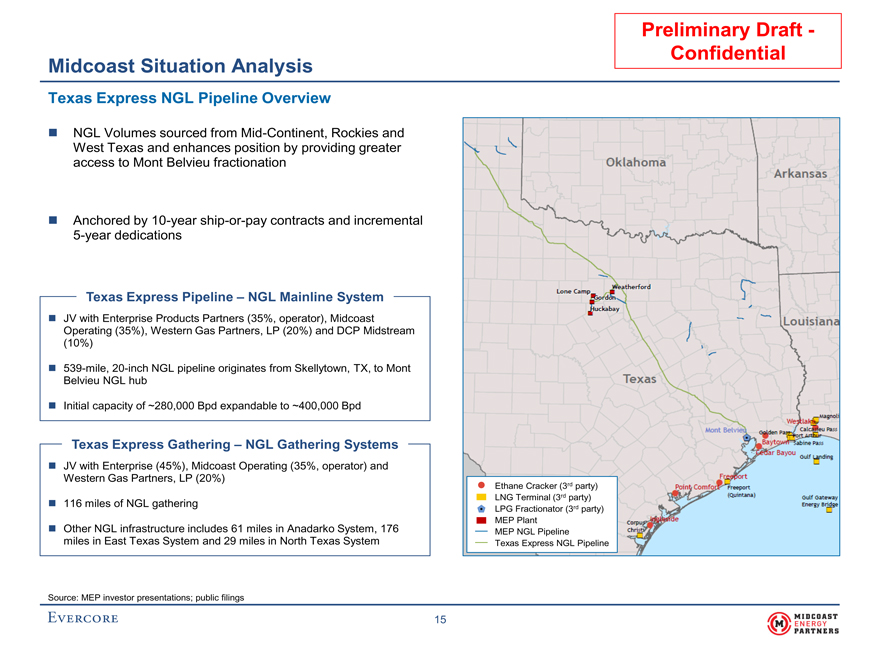
Preliminary Draft— Confidential Midcoast Situation Analysis Texas Express NGL Pipeline Overview NGL Volumes sourced fromMid-Continent, Rockies and West Texas and enhances position by providing greater access to Mont Belvieu fractionation Anchored by10-yearship-or-pay contracts and incremental5-year dedications Texas Express Pipeline – NGL Mainline System JV with Enterprise Products Partners (35%, operator), Midcoast Operating (35%), Western Gas Partners, LP (20%) and DCP Midstream(10%) 539-mile,20-inch NGL pipeline originates from Skellytown, TX, to Mont Belvieu NGL hub Initial capacity of ~280,000 Bpd expandable to ~400,000 Bpd Texas Express Gathering – NGL Gathering Systems JV with Enterprise (45%), Midcoast Operating (35%, operator) and Western Gas Partners, LP (20%) Ethane Cracker (3rd party) 116 miles of NGL gathering LNG Terminal (3rd party) LPG Fractionator (3rd party) includes 61 miles in Anadarko System, 176 MEP Plant Other NGL infrastructure MEP NGL Pipeline miles in East Texas System and 29 miles in North Texas System Texas Express NGL Pipeline Source: MEP investor presentations; public filings 15
|
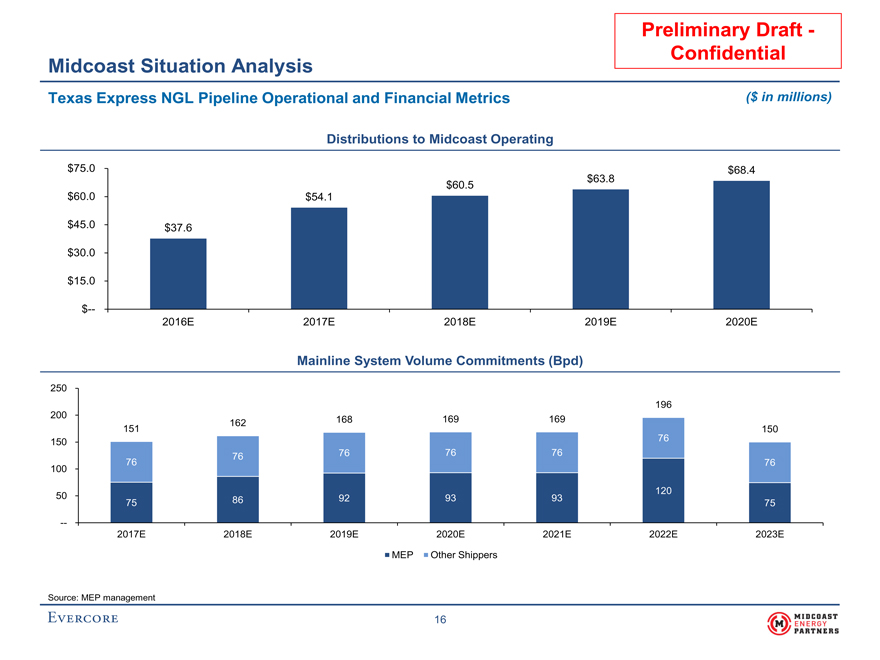
Preliminary Draft— Confidential Midcoast Situation Analysis Texas Express NGL Pipeline Operational and Financial Metrics ($ in millions) Distributions to Midcoast Operating $75.0 $68.4 $63.8 $60.5 $60.0 $54.1 $45.0 $37.6 $30.0 $15.0 $— 2016E 2017E 2018E 2019E 2020E Mainline System Volume Commitments (Bpd) 250 196 200 169 169 162 168 151 150 150 76 76 76 76 76 76 76 100 120 50 86 92 93 93 75 75 — 2017E 2018E 2019E 2020E 2021E 2022E 2023E MEP Other Shippers Source: MEP management 16
|
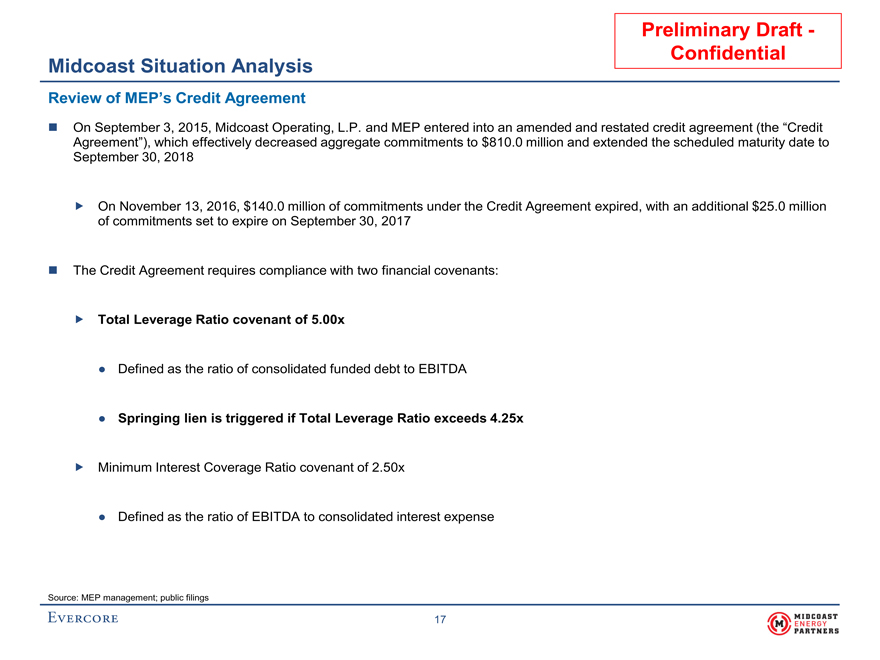
Preliminary Draft— Confidential Midcoast Situation Analysis Review of MEP’s Credit Agreement On September 3, 2015, Midcoast Operating, L.P. and MEP entered into an amended and restated credit agreement (the “Credit Agreement”), which effectively decreased aggregate commitments to $810.0 million and extended the scheduled maturity date to September 30, 2018 On November 13, 2016, $140.0 million of commitments under the Credit Agreement expired, with an additional $25.0 million of commitments set to expire on September 30, 2017 The Credit Agreement requires compliance with two financial covenants: Total Leverage Ratio covenant of 5.00x • Defined as the ratio of consolidated funded debt to EBITDA • Springing lien is triggered if Total Leverage Ratio exceeds 4.25x Minimum Interest Coverage Ratio covenant of 2.50x • Defined as the ratio of EBITDA to consolidated interest expense Source: MEP management; public filings 17
|
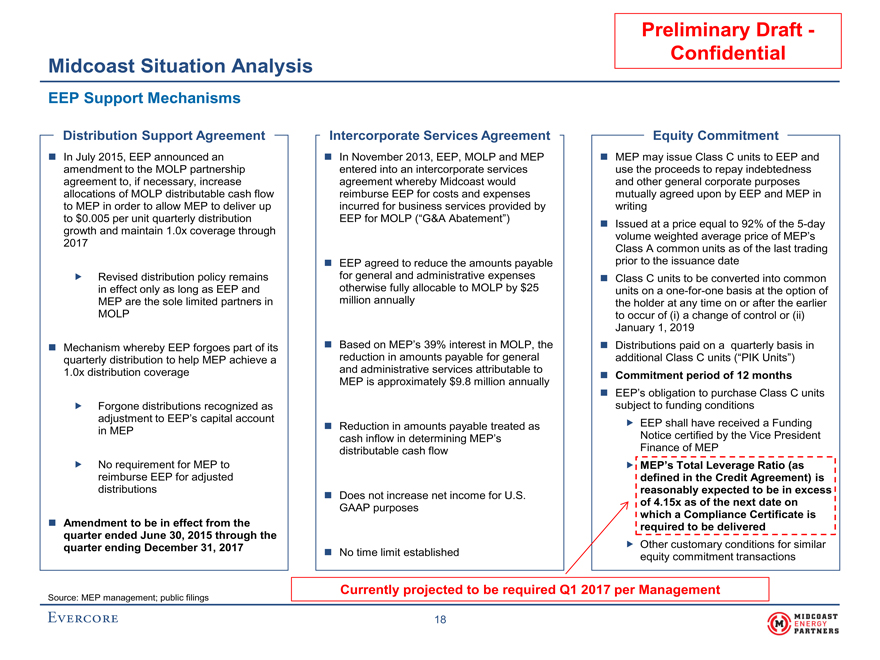
Preliminary Draft— Confidential Midcoast Situation Analysis EEP Support Mechanisms Distribution Support AgreementIntercorporate Services AgreementEquity Commitment In July 2015, EEP announced an In November 2013, EEP, MOLP and MEP MEP may issue Class C units to EEP and amendment to the MOLP partnershipentered into an intercorporate servicesuse the proceeds to repay indebtedness agreement to, if necessary, increaseagreement whereby Midcoast wouldand other general corporate purposes allocations of MOLP distributable cash flowreimburse EEP for costs and expensesmutually agreed upon by EEP and MEP in to MEP in order to allow MEP to deliver upincurred for business services provided bywriting to $0.005 per unit quarterly distributionEEP for MOLP (“G&A Abatement”) Issued at a price equal to 92% of the5-day growth and maintain 1.0x coverage throughvolume weighted average price of MEP’s 2017Class A common units as of the last trading EEP agreed to reduce the amounts payableprior to the issuance date Revised distribution policy remainsfor general and administrative expenses Class C units to be converted into common in effect only as long as EEP andotherwise fully allocable to MOLP by $25units on aone-for-one basis at the option of MEP are the sole limited partners inmillion annuallythe holder at any time on or after the earlier MOLPto occur of (i) a change of control or (ii) January 1, 2019 Mechanism whereby EEP forgoes part of its Based on MEP’s 39% interest in MOLP, the Distributions paid on a quarterly basis in quarterly distribution to help MEP achieve areduction in amounts payable for generaladditional Class C units (“PIK Units”) 1.0x distribution coverageand administrative services attributable to Commitment period of 12 months MEP is approximately $9.8 million annually EEP’s obligation to purchase Class C units Forgone distributions recognized assubject to funding conditions adjustment to EEP’s capital account Reduction in amounts payable treated as EEP shall have received a Funding in MEPcash inflow in determining MEP’sNotice certified by the Vice President distributable cash flowFinance of MEP No requirement for MEP to MEP’s Total Leverage Ratio (as reimburse EEP for adjusteddefined in the Credit Agreement) is distributionsreasonably expected to be in excess Does not increase net income for U.S. GAAP purposesof 4.15x as of the next date on which a Compliance Certificate is Amendment to be in effect from therequired to be delivered quarter ended June 30, 2015 through the quarter ending December 31, 2017 Other customary conditions for similar No time limit establishedequity commitment transactions Currently projected to be required Q1 2017 per Management Source: MEP management; public filings 18
|
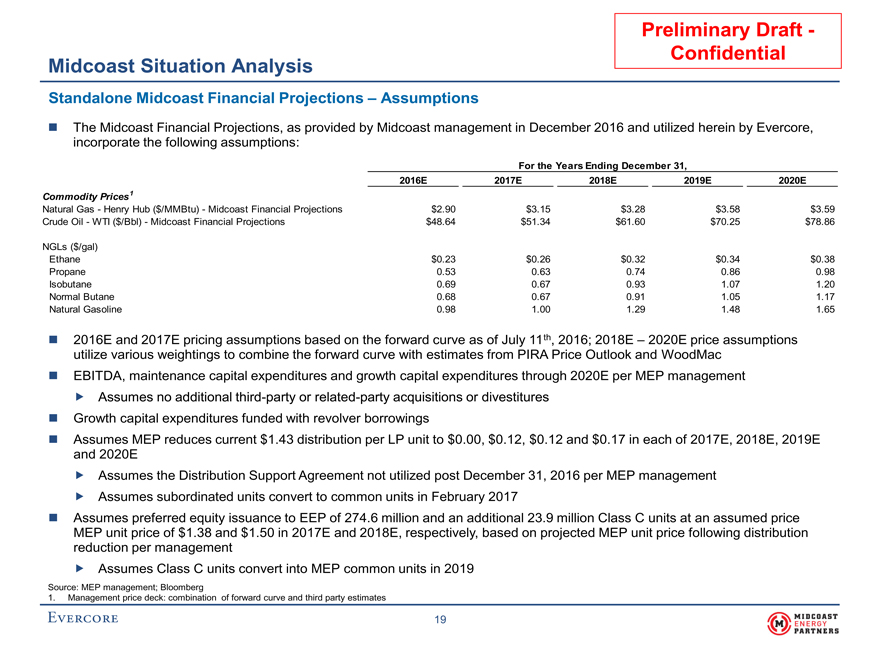
Preliminary Draft- Confidential Midcoast Situation Analysis Standalone Midcoast Financial Projections – Assumptions The Midcoast Financial Projections, as provided by Midcoast management in December 2016 and utilized herein by Evercore, incorporate the following assumptions: For the Years Ending December 31, 2016E2017E2018E2019E2020E CommodityPrices 1 Natural Gas—Henry Hub ($/MMBtu)—Midcoast Financial Projections$2.90$3.15$3.28$3.58$3.59 Crude Oil—WTI ($/Bbl)—Midcoast Financial Projections$48.64$51.34$61.60$70.25$78.86 NGLs ($/gal) Ethane$0.23$0.26$0.32$0.34$0.38 Propane0.530.630.740.860.98 Isobutane0.690.670.931.071.20 Normal Butane0.680.670.911.051.17 Natural Gasoline0.981.001.291.481.65 2016E and 2017E pricing assumptions based on the forward curve as of July 11th, 2016; 2018E – 2020E price assumptions utilize various weightings to combine the forward curve with estimates from PIRA Price Outlook and WoodMac EBITDA, maintenance capital expenditures and growth capital expenditures through 2020E per MEP management Assumes no additional third-party or related-party acquisitions or divestitures Growth capital expenditures funded with revolver borrowings Assumes MEP reduces current $1.43 distribution per LP unit to $0.00, $0.12, $0.12 and $0.17 in each of 2017E, 2018E, 2019E and 2020E Assumes the Distribution Support Agreement not utilized post December 31, 2016 per MEP management Assumes subordinated units convert to common units in February 2017 Assumes preferred equity issuance to EEP of 274.6 million and an additional 23.9 million Class C units at an assumed price MEP unit price of $1.38 and $1.50 in 2017E and 2018E, respectively, based on projected MEP unit price following distribution reduction per management Assumes Class C units convert into MEP common units in 2019 Source: MEP management; Bloomberg 1.Management price deck: combination of forward curve and third party estimates 19
|
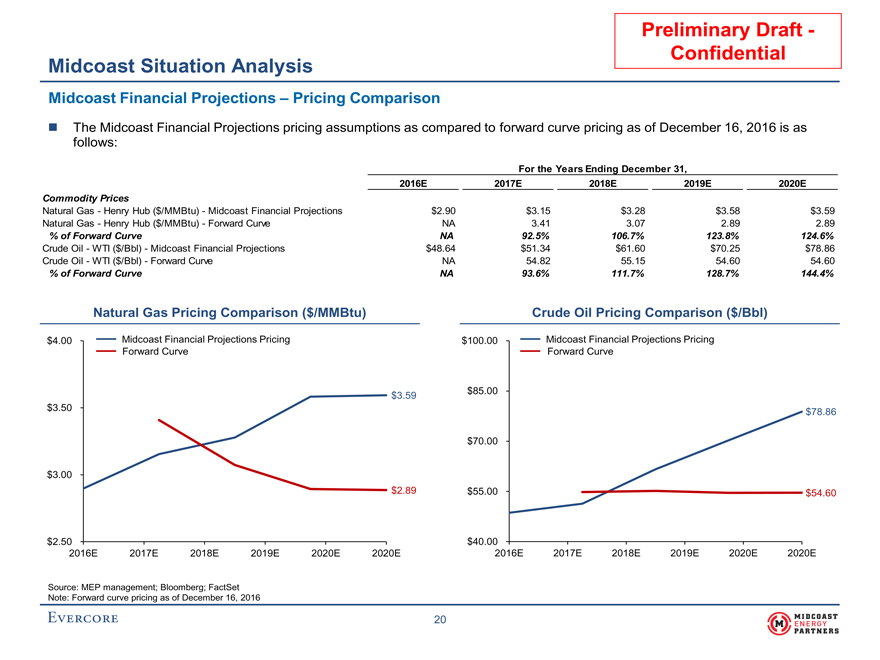
Preliminary Draft—Confidential Midcoast Situation Analysis Midcoast Financial Projections – Pricing Comparison The Midcoast Financial Projections pricing assumptions as compared to forward curve pricing as of December 16, 2016 is as follows: For the Years Ending December 31, 2016E2017E2018E2019E2020E Commodity Prices Natural Gas—Henry Hub ($/MMBtu)—Midcoast Financial Projections$2.90$3.15$3.28$3.58$3.59 Natural Gas—Henry Hub ($/MMBtu)—Forward CurveNA3.413.072.892.89 % of Forward CurveNA92.5%106.7%123.8%124.6% Crude Oil—WTI ($/Bbl)—Midcoast Financial Projections$48.64$51.34$61.60$70.25$78.86 Crude Oil—WTI ($/Bbl)—Forward CurveNA54.8255.1554.6054.60 % of Forward CurveNA93.6%111.7%128.7%144.4% Natural Gas Pricing Comparison ($/MMBtu)Crude Oil Pricing Comparison ($/Bbl) $4.00Midcoast Financial Projections Pricing$100.00Midcoast Financial Projections Pricing Forward CurveForward Curve $3.59$85.00 $3.50$78.86 $70.00 $3.00 $2.89$55.00$54.60 $2.50$40.00 2016E2017E2018E2019E2020E2020E2016E2017E2018E2019E2020E2020E Source: MEP management; Bloomberg; FactSet Note: Forward curve pricing as of December 16, 2016 20
|
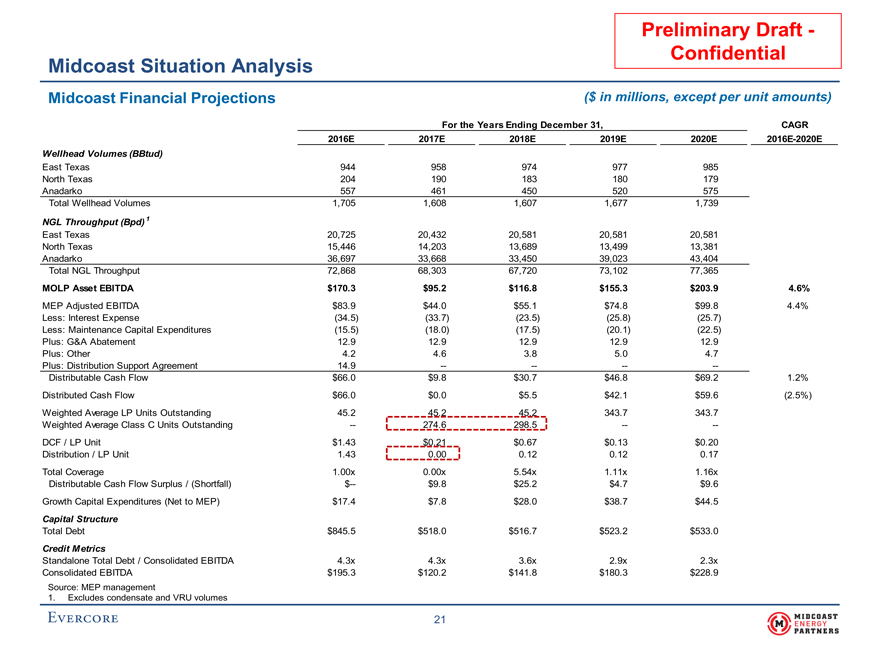
Preliminary Draft—Confidential Midcoast Situation Analysis Midcoast Financial Projections($ in millions, except per unit amounts) For the Years Ending December 31,CAGR 2016E2017E2018E2019E2020E2016E-2020E Wellhead Volumes (BBtud) East Texas944958974977985 North Texas204190183180179 Anadarko557461450520575 Total Wellhead Volumes1,7051,6081,6071,6771,739 NGL Throughput (Bpd) 1 East Texas20,72520,43220,58120,58120,581 North Texas15,44614,20313,68913,49913,381 Anadarko36,69733,66833,45039,02343,404 Total NGL Throughput72,86868,30367,72073,10277,365 MOLP Asset EBITDA$170.3$95.2$116.8$155.3$203.94.6% MEP Adjusted EBITDA$83.9$44.0$55.1$74.8$99.84.4% Less: Interest Expense(34.5)(33.7)(23.5)(25.8)(25.7) Less: Maintenance Capital Expenditures(15.5)(18.0)(17.5)(20.1)(22.5) Plus: G&A Abatement12.912.912.912.912.9 Plus: Other4.24.63.85.04.7 Plus: Distribution Support Agreement14.9———— Distributable Cash Flow$66.0$9.8$30.7$46.8$69.21.2% Distributed Cash Flow$66.0$0.0$5.5$42.1$59.6(2.5%) Weighted Average LP Units Outstanding45.245.245.2343.7343.7 Weighted Average Class C Units Outstanding—274.6298.5—— DCF / LP Unit$1.43$0.21$0.67$0.13$0.20 Distribution / LP Unit1.430.000.120.120.17 Total Coverage1.00x0.00x5.54x1.11x1.16x Distributable Cash Flow Surplus / (Shortfall)$—$9.8$25.2$4.7$9.6 Growth Capital Expenditures (Net to MEP)$17.4$7.8$28.0$38.7$44.5 Capital Structure Total Debt$845.5$518.0$516.7$523.2$533.0 Credit Metrics Standalone Total Debt / Consolidated EBITDA4.3x4.3x3.6x2.9x2.3x Consolidated EBITDA$195.3$120.2$141.8$180.3$228.9 Source: MEP management 1. Excludes condensate and VRU volumes 21
|
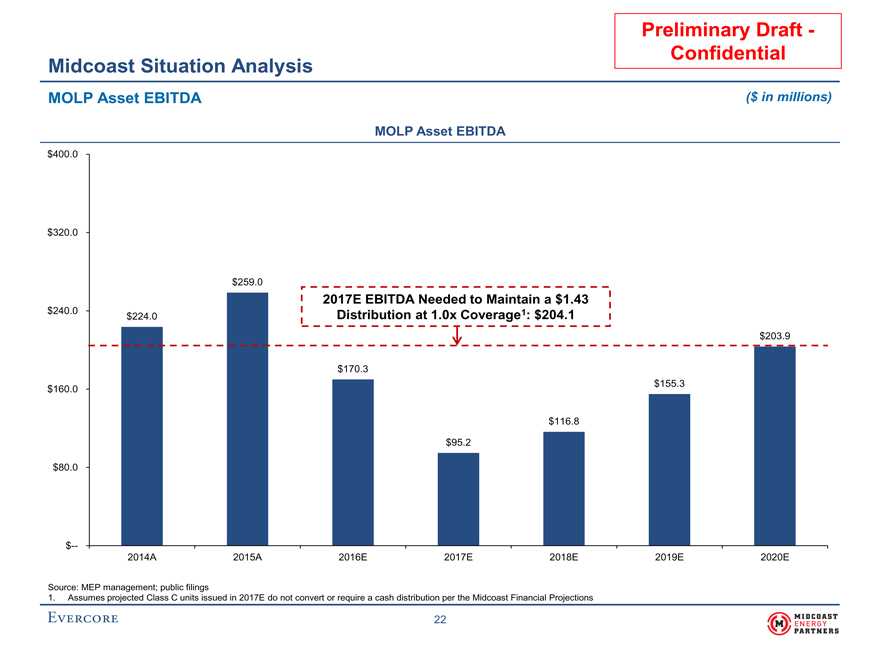
Preliminary Draft— Confidential Midcoast Situation Analysis MOLP Asset EBITDA ($ in millions) MOLP Asset EBITDA $400.0 $320.0 $259.0 2017E EBITDA Needed to Maintain a $1.43 $240.0 Distribution at 1.0x Coverage1: $204.1 $224.0 $203.9 $170.3 $155.3 $160.0 $116.8 $95.2 $80.0 $— 2014A 2015A 2016E 2017E 2018E 2019E 2020E Source: MEP management; public filings 1. Assumes projected Class C units issued in 2017E do not convert or require a cash distribution per the Midcoast Financial Projections 22
|
Preliminary Draft – Confidential III. Midcoast Preliminary Valuation
|
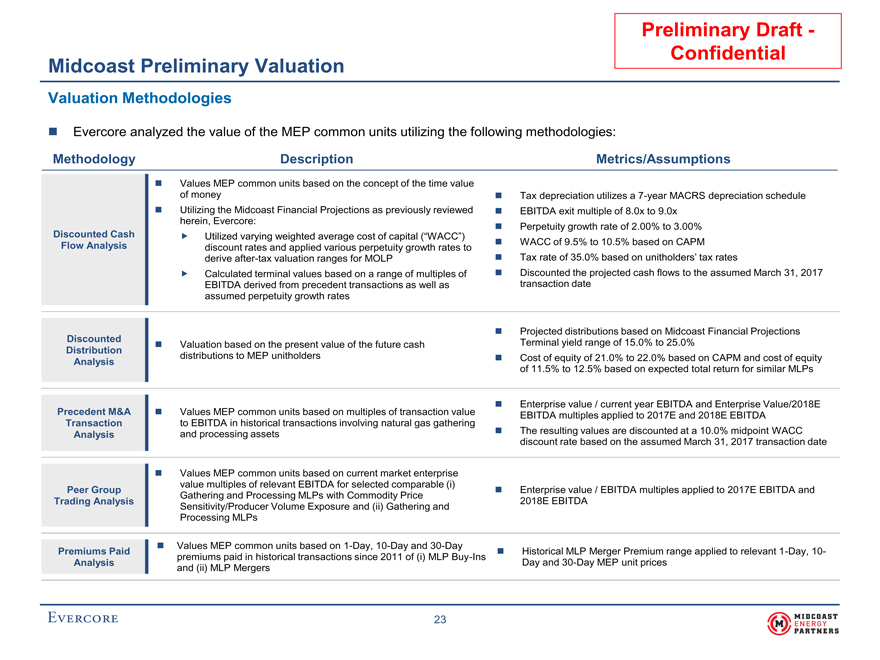
Preliminary Draft—Confidential Midcoast Preliminary Valuation Valuation Methodologies Evercore analyzed the value of the MEP common units utilizing the following methodologies: MethodologyDescriptionMetrics/Assumptions Values MEP common units based on the concept of the time value of money Tax depreciation utilizes a7-year MACRS depreciation schedule Utilizing the Midcoast Financial Projections as previously reviewed EBITDA exit multiple of 8.0x to 9.0x herein, Evercore: Perpetuity growth rate of 2.00% to 3.00% Discounted Cash Utilized varying weighted average cost of capital (“WACC”) Flow Analysisdiscount rates and applied various perpetuity growth rates to WACC of 9.5% to 10.5% based on CAPM deriveafter-tax valuation ranges for MOLP Tax rate of 35.0% based on unitholders’ tax rates Calculated terminal values based on a range of multiples of Discounted the projected cash flows to the assumed March 31, 2017 EBITDA derived from precedent transactions as well astransaction date assumed perpetuity growth rates Projected distributions based on Midcoast Financial Projections Discounted Valuation based on the present value of the future cashTerminal yield range of 15.0% to 25.0% Distribution Analysisdistributions to MEP unitholders Cost of equity of 21.0% to 22.0% based on CAPM and cost of equity of 11.5% to 12.5% based on expected total return for similar MLPs Enterprise value / current year EBITDA and Enterprise Value/2018E Precedent M&A Values MEP common units based on multiples of transaction valueEBITDA multiples applied to 2017E and 2018E EBITDA Transactionto EBITDA in historical transactions involving natural gas gathering Analysisand processing assets The resulting values are discounted at a 10.0% midpoint WACC discount rate based on the assumed March 31, 2017 transaction date Values MEP common units based on current market enterprise value multiples of relevant EBITDA for selected comparable (i) Peer Group Enterprise value / EBITDA multiples applied to 2017E EBITDA and Gathering and Processing MLPs with Commodity Price Trading Analysis2018E EBITDA Sensitivity/Producer Volume Exposure and (ii) Gathering and Processing MLPs Values MEP common units based on1-Day,10-Day and30-Day Premiums Paid Historical MLP Merger Premium range applied to relevant1-Day,10- premiums paid in historical transactions since 2011 of (i) MLPBuy-Ins AnalysisDay and30-Day MEP unit prices and (ii) MLP Mergers 23
|
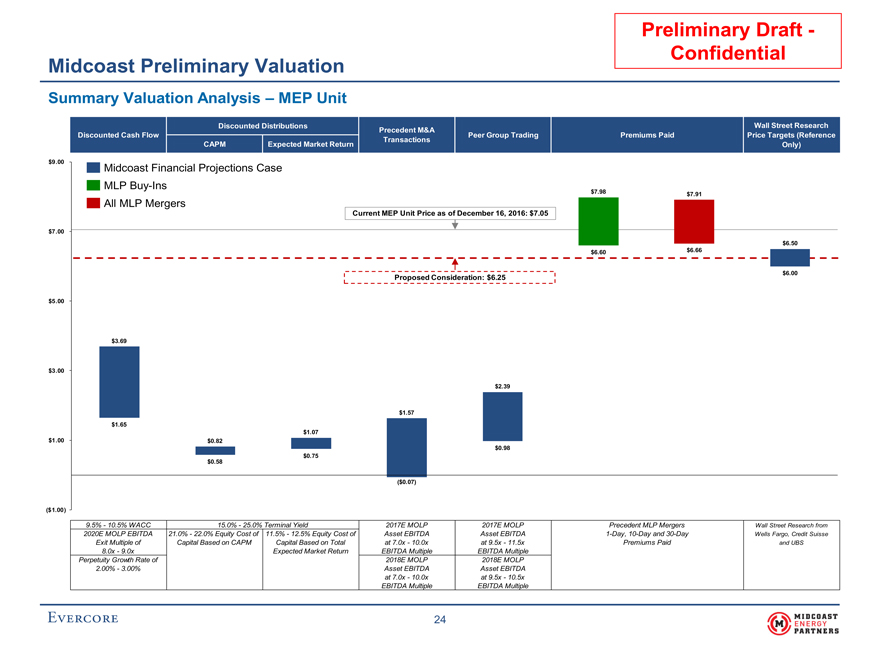
Preliminary Draft— Confidential Midcoast Preliminary Valuation Summary Valuation Analysis – MEP Unit Discounted Distributions Wall Street Research Precedent M&A Discounted Cash Flow Peer Group Trading Premiums Paid Price Targets (Reference Transactions CAPM Expected Market Return Only) $9.00 Midcoast Financial Projections Case MLPBuy-Ins $7.98 $7.91 All MLP Mergers Current MEP Unit Price as of December 16, 2016: $7.05 $7.00 $6.50 $6.60 $6.66 $6.00 Proposed Consideration: $6.25 $5.00 $3.69 $3.00 $2.39 $1.57 $1.65 $1.07 $1.00 $0.82 $0.98 $0.75 $0.58 ($0.07) ($1.00) 9.5%—10.5% WACC 15.0%—25.0% Terminal Yield 2017E MOLP 2017E MOLP Precedent MLP Mergers Wall Street Research from 2020E MOLP EBITDA 21.0%—22.0% Equity Cost of 11.5%—12.5% Equity Cost of Asset EBITDA Asset EBITDA1-Day,10-Day and30-Day Wells Fargo, Credit Suisse Exit Multiple of Capital Based on CAPM Capital Based on Total at 7.0x—10.0x at 9.5x—11.5x Premiums Paid and UBS 8.0x—9.0x Expected Market Return EBITDA Multiple EBITDA Multiple Perpetuity Growth Rate of 2018E MOLP 2018E MOLP 2.00%—3.00% Asset EBITDA Asset EBITDA at 7.0x—10.0x at 9.5x—10.5x EBITDA Multiple EBITDA Multiple 24
|
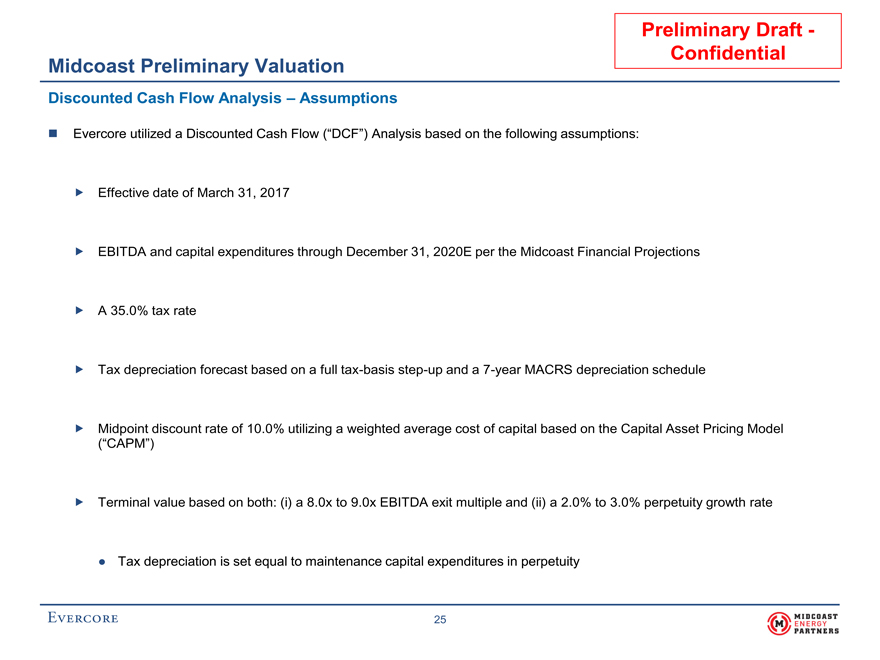
Preliminary Draft— Confidential Midcoast Preliminary Valuation Discounted Cash Flow Analysis – Assumptions Evercore utilized a Discounted Cash Flow (“DCF”) Analysis based on the following assumptions: Effective date of March 31, 2017 EBITDA and capital expenditures through December 31, 2020E per the Midcoast Financial Projections A 35.0% tax rate Tax depreciation forecast based on a fulltax-basisstep-up and a7-year MACRS depreciation schedule Midpoint discount rate of 10.0% utilizing a weighted average cost of capital based on the Capital Asset Pricing Model (“CAPM”) Terminal value based on both: (i) a 8.0x to 9.0x EBITDA exit multiple and (ii) a 2.0% to 3.0% perpetuity growth rate • Tax depreciation is set equal to maintenance capital expenditures in perpetuity 25
|
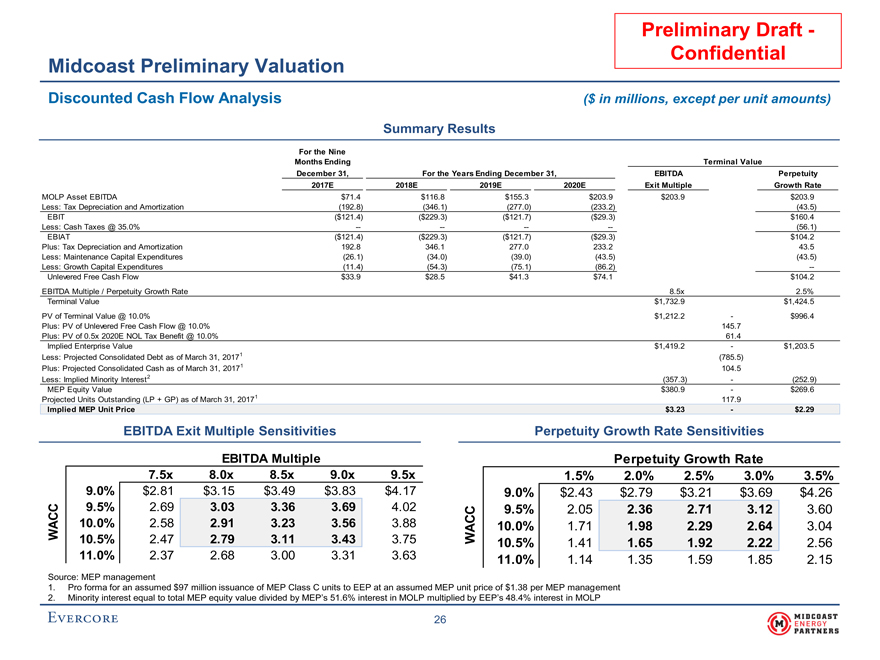
Preliminary Draft— Confidential Midcoast Preliminary Valuation Discounted Cash Flow Analysis($ in millions, except per unit amounts) Summary Results For the Nine Months EndingTerminal Value December 31,For the Years Ending December 31,EBITDAPerpetuity 2017E2018E2019E2020EExit MultipleGrowth Rate MOLP Asset EBITDA$71.4$116.8$155.3$203.9$203.9$203.9 Less: Tax Depreciation and Amortization(192.8)(346.1)(277.0)(233.2)(43.5) EBIT($121.4)($229.3)($121.7)($29.3)$160.4 Less: Cash Taxes @ 35.0%————(56.1) EBIAT($121.4)($229.3)($121.7)($29.3)$104.2 Plus: Tax Depreciation and Amortization192.8346.1277.0233.243.5 Less: Maintenance Capital Expenditures(26.1)(34.0)(39.0)(43.5)(43.5) Less: Growth Capital Expenditures(11.4)(54.3)(75.1)(86.2)— Unlevered Free Cash Flow$33.9$28.5$41.3$74.1$104.2 EBITDA Multiple / Perpetuity Growth Rate8.5x2.5% Terminal Value$1,732.9$1,424.5 PV of Terminal Value @ 10.0%$1,212.2-$996.4 Plus: PV of Unlevered Free Cash Flow @ 10.0%145.7 Plus: PV of 0.5x 2020E NOL Tax Benefit @ 10.0%61.4 Implied Enterprise Value$1,419.2-$1,203.5 Less: Projected Consolidated Debt as of March 31, 20171(785.5) Plus: Projected Consolidated Cash as of March 31, 20171104.5 Less: Implied Minority Interest2(357.3)-(252.9) MEP Equity Value$380.9-$269.6 Projected Units Outstanding (LP + GP) as of March 31, 20171117.9 Implied MEP Unit Price$3.23-$2.29 EBITDA Exit Multiple SensitivitiesPerpetuity Growth Rate Sensitivities EBITDA MultiplePerpetuity Growth Rate $3.27.5x8.0x8.5x9.0x9.5x$2.31.5%2.0%2.5%3.0%3.5% 9.0%$2.81$3.15$3.49$3.83$4.179.0%$2.43$2.79$3.21$3.69$4.26 9.5%2.693.033.363.694.029.5%2.052.362.713.123.60 WACC10.0%2.582.913.233.563.88WACC10.0%1.711.982.292.643.04 10.5%2.472.793.113.433.7510.5%1.411.651.922.222.56 11.0%2.372.683.003.313.6311.0%1.141.351.591.852.15 Source: MEP management 1.Pro forma for an assumed $97 million issuance of MEP Class C units to EEP at an assumed MEP unit price of $1.38 per MEP management 2.Minority interest equal to total MEP equity value divided by MEP’s 51.6% interest in MOLP multiplied by EEP’s 48.4% interest in MOLP 26
|

Preliminary Draft- Confidential Midcoast Preliminary Valuation Discounted Distribution Analysis The analysis below sets forth MEP’s projected annual distribution per unit assuming the Midcoast Financial Projections without the assumed distribution increase in 2020E, discounted at a cost of equity for MEP ranging between 21.0% and 22.0% based on CAPM and 11.5% to 12.5% based on the total expected market return Summary Results For the Nine Months Ending December 31,For the Years Ending December 31,Terminal Value 2017E2018E2019E2020ELow-High MEP Standalone Distribution per LP Unit$0.00$0.12$0.12$0.17$0.17 Terminal Yield125.0%-15.0% Terminal Value$0.68$1.13 Equity Cost of CapitalBased on CAPM PV@ 20.5% of Value per MEP Common Unit$0.60-$0.83 PV@21.0% of Valueper MEP Common Unit0.60-0.82 PV@21.5% of Valueper MEP Common Unit0.59-0.81 PV@22.0% of Valueper MEP Common Unit0.58-0.80 PV@ 22.5% of Value per MEP Common Unit0.57-0.79 Implied MEP Common Unit Value Range—Based on CAPM$0.58-$0.82 Equity Cost of CapitalBased on Expected Market Return PV@ 11.0% of Value per MEP Common Unit$0.78-$1.09 PV@11.5% of Valueper MEP Common Unit0.77-1.07 PV@12.0% of Valueper MEP Common Unit0.76-1.06 PV@12.5% of Valueper MEP Common Unit0.75-1.04 PV@ 13.0% of Value per MEP Common Unit0.74-1.03 Implied MEP Common Unit Value Range—Based on Expected Market Return$0.75-$1.07 1.MEP yield range over past three months of 16.2% to 24.2%, with an average of 19.2% as of December 16, 2016 27
|
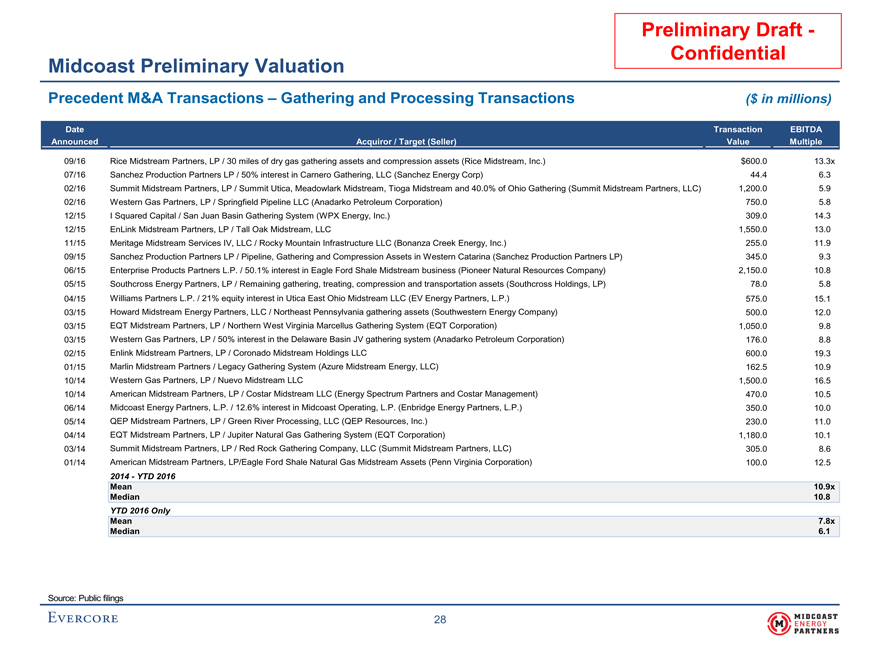
Preliminary Draft— Confidential Midcoast Preliminary Valuation Precedent M&A Transactions – Gathering and Processing Transactions($ in millions) DateTransactionEBITDA AnnouncedAcquiror / Target (Seller)ValueMultiple 09/16Rice Midstream Partners, LP / 30 miles of dry gas gathering assets and compression assets (Rice Midstream, Inc.)$600.013.3x 07/16Sanchez Production Partners LP / 50% interest in Carnero Gathering, LLC (Sanchez Energy Corp)44.46.3 02/16Summit Midstream Partners, LP / Summit Utica, Meadowlark Midstream, Tioga Midstream and 40.0% of Ohio Gathering (Summit Midstream Partners, LLC)1,200.05.9 02/16Western Gas Partners, LP / Springfield Pipeline LLC (Anadarko Petroleum Corporation)750.05.8 12/15I Squared Capital / San Juan Basin Gathering System (WPX Energy, Inc.)309.014.3 12/15EnLink Midstream Partners, LP / Tall Oak Midstream, LLC1,550.013.0 11/15Meritage Midstream Services IV, LLC / Rocky Mountain Infrastructure LLC (Bonanza Creek Energy, Inc.)255.011.9 09/15Sanchez Production Partners LP / Pipeline, Gathering and Compression Assets in Western Catarina (Sanchez Production Partners LP)345.09.3 06/15Enterprise Products Partners L.P. / 50.1% interest in Eagle Ford Shale Midstream business (Pioneer Natural Resources Company)2,150.010.8 05/15Southcross Energy Partners, LP / Remaining gathering, treating, compression and transportation assets (Southcross Holdings, LP)78.05.8 04/15Williams Partners L.P. / 21% equity interest in Utica East Ohio Midstream LLC (EV Energy Partners, L.P.)575.015.1 03/15Howard Midstream Energy Partners, LLC / Northeast Pennsylvania gathering assets (Southwestern Energy Company)500.012.0 03/15EQT Midstream Partners, LP / Northern West Virginia Marcellus Gathering System (EQT Corporation)1,050.09.8 03/15Western Gas Partners, LP / 50% interest in the Delaware Basin JV gathering system (Anadarko Petroleum Corporation)176.08.8 02/15Enlink Midstream Partners, LP / Coronado Midstream Holdings LLC600.019.3 01/15Marlin Midstream Partners / Legacy Gathering System (Azure Midstream Energy, LLC)162.510.9 10/14Western Gas Partners, LP / Nuevo Midstream LLC1,500.016.5 10/14American Midstream Partners, LP / Costar Midstream LLC (Energy Spectrum Partners and Costar Management)470.010.5 06/14Midcoast Energy Partners, L.P. / 12.6% interest in Midcoast Operating, L.P. (Enbridge Energy Partners, L.P.)350.010.0 05/14QEP Midstream Partners, LP / Green River Processing, LLC (QEP Resources, Inc.)230.011.0 04/14EQT Midstream Partners, LP / Jupiter Natural Gas Gathering System (EQT Corporation)1,180.010.1 03/14Summit Midstream Partners, LP / Red Rock Gathering Company, LLC (Summit Midstream Partners, LLC)305.08.6 01/14American Midstream Partners, LP/Eagle Ford Shale Natural Gas Midstream Assets (Penn Virginia Corporation)100.012.5 2014—YTD 2016 Mean10.9x Median10.8 YTD 2016 Only Mean7.8x Median6.1 Source: Public filings 28
|
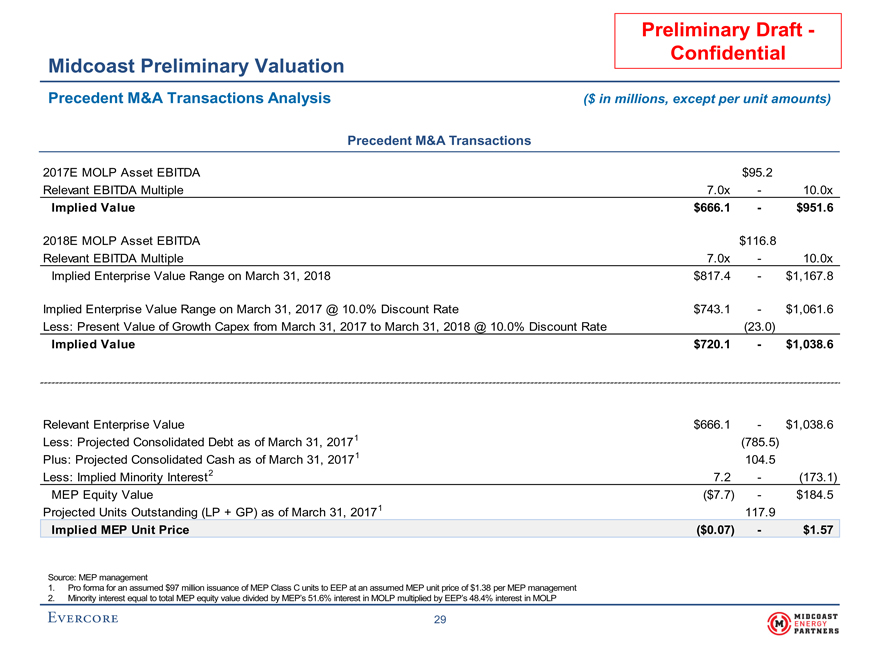
Preliminary Draft—Confidential Midcoast Preliminary Valuation Precedent M&A Transactions Analysis($ in millions, except per unit amounts) Precedent M&A Transactions 2017E MOLP Asset EBITDA$95.2 Relevant EBITDA Multiple7.0x-10.0x Implied Value$666.1-$951.6 2018E MOLP Asset EBITDA$116.8 Relevant EBITDA Multiple7.0x-10.0x Implied Enterprise Value Range on March 31, 2018$817.4-$1,167.8 Implied Enterprise Value Range on March 31, 2017 @ 10.0% Discount Rate$743.1-$1,061.6 Less: Present Value of Growth Capex from March 31, 2017 to March 31, 2018 @ 10.0% Discount Rate(23.0) Implied Value$720.1-$1,038.6 Relevant Enterprise Value$666.1-$1,038.6 Less: Projected Consolidated Debt as of March 31, 20171(785.5) Plus: Projected Consolidated Cash as of March 31, 20171104.5 Less: Implied Minority Interest 27.2-(173.1) MEP Equity Value($7.7)-$184.5 Projected Units Outstanding (LP + GP) as of March 31, 20171117.9 Implied MEP Unit Price($0.07)-$1.57 Source: MEP management 1.Pro forma for an assumed $97 million issuance of MEP Class C units to EEP at an assumed MEP unit price of $1.38 per MEP management 2.Minority interest equal to total MEP equity value divided by MEP’s 51.6% interest in MOLP multiplied by EEP’s 48.4% interest in MOLP 29
|
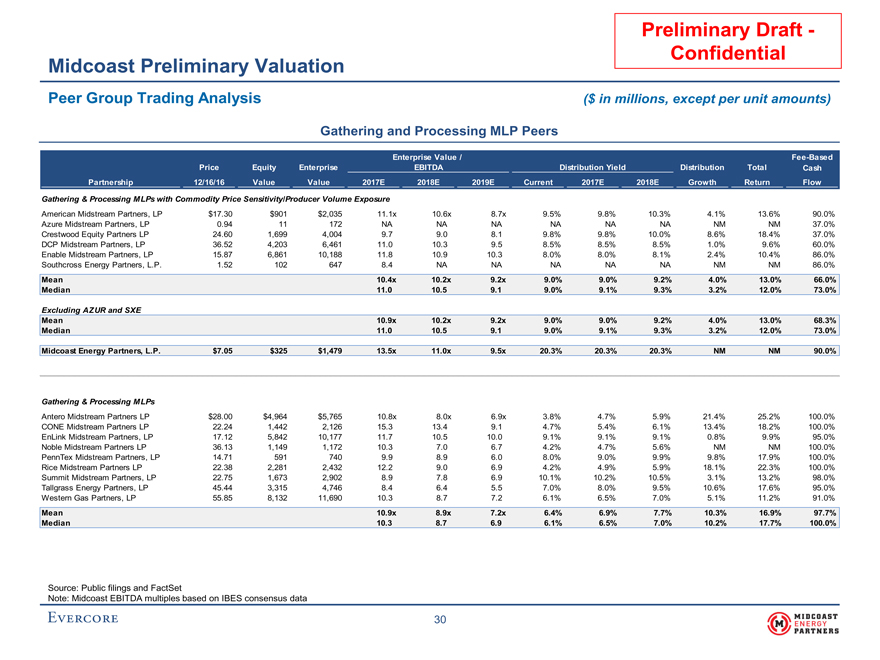
Preliminary Draft- Confidential Midcoast Preliminary Valuation Peer Group Trading Analysis($ in millions, except per unit amounts) Gathering and Processing MLP Peers Enterprise Value/Fee-Based PriceEquityEnterpriseEBITDADistribution YieldDistributionTotalCash Partnership12/16/16ValueValue2017E2018E2019ECurrent2017E2018EGrowthReturnFlow Gathering & Processing MLPs with Commodity Price Sensitivity/Producer Volume Exposure American Midstream Partners, LP$17.30$901$2,03511.1x10.6x8.7x9.5%9.8%10.3%4.1%13.6%90.0% Azure Midstream Partners, LP0.9411172NANANANANANANMNM37.0% Crestwood Equity Partners LP24.601,6994,0049.79.08.19.8%9.8%10.0%8.6%18.4%37.0% DCP Midstream Partners, LP36.524,2036,46111.010.39.58.5%8.5%8.5%1.0%9.6%60.0% Enable Midstream Partners, LP15.876,86110,18811.810.910.38.0%8.0%8.1%2.4%10.4%86.0% Southcross Energy Partners, L.P.1.521026478.4NANANANANANMNM86.0% Mean10.4x10.2x9.2x9.0%9.0%9.2%4.0%13.0%66.0% Median11.010.59.19.0%9.1%9.3%3.2%12.0%73.0% Excluding AZUR and SXE Mean10.9x10.2x9.2x9.0%9.0%9.2%4.0%13.0%68.3% Median11.010.59.19.0%9.1%9.3%3.2%12.0%73.0% Midcoast Energy Partners, L.P.$7.05$325$1,47913.5x11.0x9.5x20.3%20.3%20.3%NMNM90.0% Gathering & Processing MLPs Antero Midstream Partners LP$28.00$4,964$5,76510.8x8.0x6.9x3.8%4.7%5.9%21.4%25.2%100.0% CONE Midstream Partners LP22.241,4422,12615.313.49.14.7%5.4%6.1%13.4%18.2%100.0% EnLink Midstream Partners, LP17.125,84210,17711.710.510.09.1%9.1%9.1%0.8%9.9%95.0% Noble Midstream Partners LP36.131,1491,17210.37.06.74.2%4.7%5.6%NMNM100.0% PennTex Midstream Partners, LP14.715917409.98.96.08.0%9.0%9.9%9.8%17.9%100.0% Rice Midstream Partners LP22.382,2812,43212.29.06.94.2%4.9%5.9%18.1%22.3%100.0% Summit Midstream Partners, LP22.751,6732,9028.97.86.910.1%10.2%10.5%3.1%13.2%98.0% Tallgrass Energy Partners, LP45.443,3154,7468.46.45.57.0%8.0%9.5%10.6%17.6%95.0% Western Gas Partners, LP55.858,13211,69010.38.77.26.1%6.5%7.0%5.1%11.2%91.0% Mean10.9x8.9x7.2x6.4%6.9%7.7%10.3%16.9%97.7% Median10.38.76.96.1%6.5%7.0%10.2%17.7%100.0% Source: Public filings and FactSet Note: Midcoast EBITDA multiples based on IBES consensus data 30
|
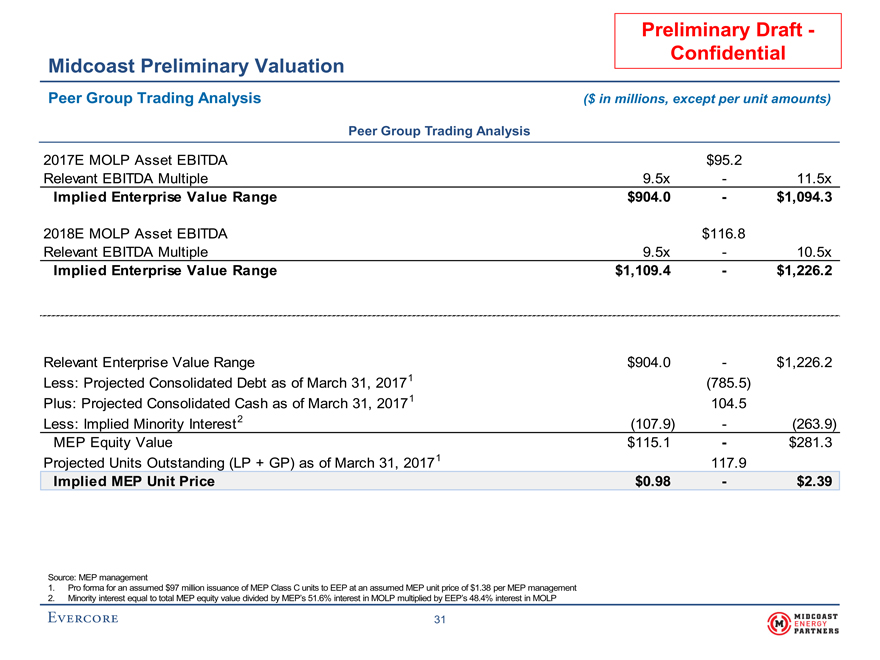
Preliminary Draft—Confidential Midcoast Preliminary Valuation Peer Group Trading Analysis($ in millions, except per unit amounts) Peer Group Trading Analysis 2017E MOLP Asset EBITDA$95.2 Relevant EBITDA Multiple9.5x-11.5x Implied Enterprise Value Range$904.0-$1,094.3 2018E MOLP Asset EBITDA$116.8 Relevant EBITDA Multiple9.5x-10.5x Implied Enterprise Value Range$1,109.4-$1,226.2 Relevant Enterprise Value Range$904.0-$1,226.2 Less: Projected Consolidated Debt as of March 31, 20171(785.5) Plus: Projected Consolidated Cash as of March 31, 20171104.5 Less: Implied Minority Interest 2(107.9)-(263.9) MEP Equity Value$115.1-$281.3 Projected Units Outstanding (LP + GP) as of March 31, 2017 1117.9 Implied MEP Unit Price$0.98-$2.39 Source: MEP management 1.Pro forma for an assumed $97 million issuance of MEP Class C units to EEP at an assumed MEP unit price of $1.38 per MEP management 2.Minority interest equal to total MEP equity value divided by MEP’s 51.6% interest in MOLP multiplied by EEP’s 48.4% interest in MOLP 31
|
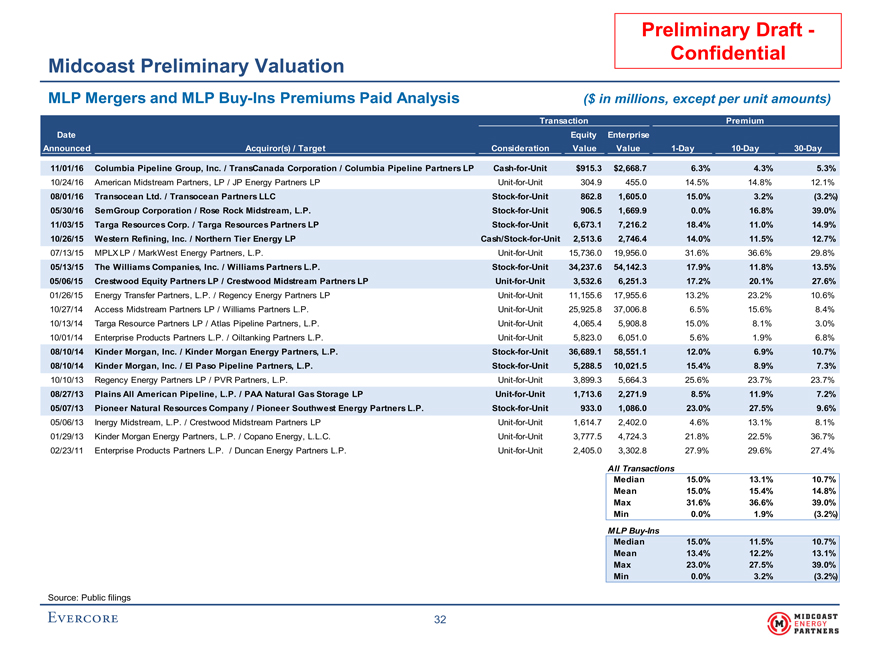
Preliminary Draft—Confidential Midcoast Preliminary Valuation MLP Mergers and MLPBuy-Ins Premiums Paid Analysis($ in millions, except per unit amounts) TransactionPremium DateEquity Enterprise AnnouncedAcquiror(s) /TargetConsiderationValueValue1-Day10-Day30-Day 11/01/16Columbia Pipeline Group, Inc. / TransCanada Corporation / Columbia Pipeline PartnersLPCash-for-Unit$915.3$2,668.76.3%4.3%5.3% 10/24/16American Midstream Partners, LP / JP Energy PartnersLPUnit-for-Unit304.9455.014.5%14.8%12.1% 08/01/16Transocean Ltd. / Transocean PartnersLLCStock-for-Unit862.81,605.015.0%3.2%(3.2%) 05/30/16SemGroup Corporation / Rose Rock Midstream,L.P.Stock-for-Unit906.51,669.90.0%16.8%39.0% 11/03/15Targa Resources Corp. / Targa Resources PartnersLPStock-for-Unit6,673.17,216.218.4%11.0%14.9% 10/26/15Western Refining, Inc. / Northern Tier EnergyLPCash/Stock-for-Unit2,513.62,746.414.0%11.5%12.7% 07/13/15MPLX LP / MarkWest Energy Partners,L.P.Unit-for-Unit15,736.019,956.031.6%36.6%29.8% 05/13/15The Williams Companies, Inc. / Williams PartnersL.P.Stock-for-Unit34,237.654,142.317.9%11.8%13.5% 05/06/15Crestwood Equity Partners LP / Crestwood Midstream PartnersLPUnit-for-Unit3,532.66,251.317.2%20.1%27.6% 01/26/15Energy Transfer Partners, L.P. / Regency Energy PartnersLPUnit-for-Unit11,155.617,955.613.2%23.2%10.6% 10/27/14Access Midstream Partners LP / Williams PartnersL.P.Unit-for-Unit25,925.837,006.86.5%15.6%8.4% 10/13/14Targa Resource Partners LP / Atlas Pipeline Partners,L.P.Unit-for-Unit4,065.45,908.815.0%8.1%3.0% 10/01/14Enterprise Products Partners L.P. / Oiltanking PartnersL.P.Unit-for-Unit5,823.06,051.05.6%1.9%6.8% 08/10/14Kinder Morgan, Inc. / Kinder Morgan Energy Partners,L.P.Stock-for-Unit36,689.158,551.112.0%6.9%10.7% 08/10/14Kinder Morgan, Inc. / El Paso Pipeline Partners,L.P.Stock-for-Unit5,288.510,021.515.4%8.9%7.3% 10/10/13Regency Energy Partners LP / PVR Partners,L.P.Unit-for-Unit3,899.35,664.325.6%23.7%23.7% 08/27/13Plains All American Pipeline, L.P. / PAA Natural Gas StorageLPUnit-for-Unit1,713.62,271.98.5%11.9%7.2% 05/07/13Pioneer Natural Resources Company / Pioneer Southwest Energy PartnersL.P.Stock-for-Unit933.01,086.023.0%27.5%9.6% 05/06/13Inergy Midstream, L.P. / Crestwood Midstream PartnersLPUnit-for-Unit1,614.72,402.04.6%13.1%8.1% 01/29/13Kinder Morgan Energy Partners, L.P. / Copano Energy,L.L.C.Unit-for-Unit3,777.54,724.321.8%22.5%36.7% 02/23/11Enterprise Products Partners L.P. / Duncan Energy PartnersL.P.Unit-for-Unit2,405.03,302.827.9%29.6%27.4% All Transactions Median15.0%13.1%10.7% Mean15.0%15.4%14.8% Max31.6%36.6%39.0% Min0.0%1.9%(3.2%) MLPBuy-Ins Median15.0%11.5%10.7% Mean13.4%12.2%13.1% Max23.0%27.5%39.0% Min0.0%3.2%(3.2%) Source: Public filings 32
|
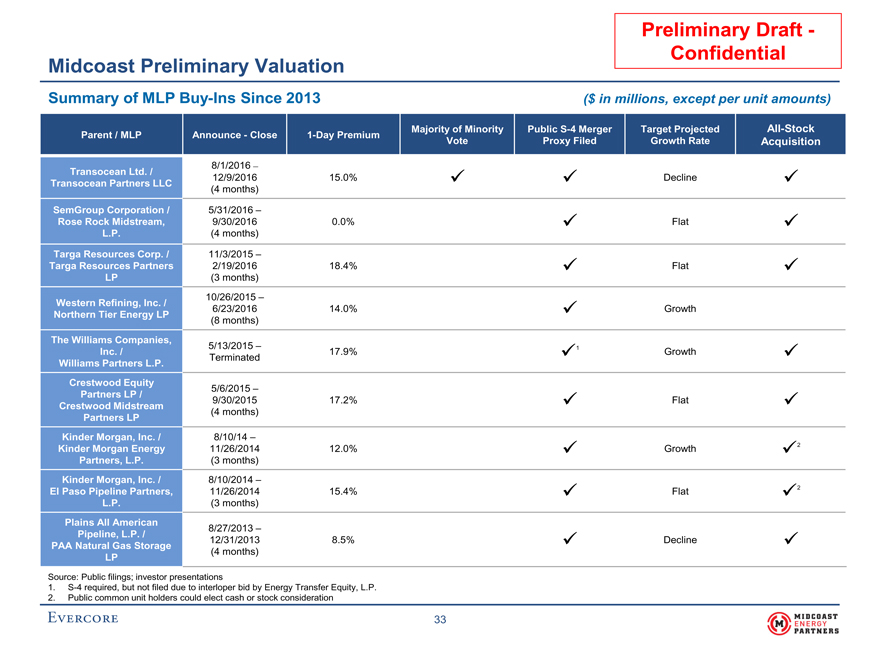
Preliminary Draft—Confidential Midcoast Preliminary Valuation Summary of MLPBuy-Ins Since 2013($ in millions, except per unit amounts) Parent /MLPAnnounce—Close1-Day PremiumMajority of MinorityPublicS-4 MergerTargetProjectedAll-Stock VoteProxy FiledGrowth RateAcquisition 8/1/2016 – Transocean Ltd. /12/9/201615.0% Decline Transocean Partners LLC(4 months) SemGroup Corporation /5/31/2016 – Rose Rock Midstream,9/30/20160.0% Flat L.P.(4 months) Targa Resources Corp. /11/3/2015 – Targa Resources Partners2/19/201618.4% Flat LP(3 months) Western Refining, Inc. /10/26/2015 – 6/23/201614.0% Growth Northern Tier Energy LP(8 months) The Williams Companies, Inc. /5/13/2015 –17.9% 1Growth Williams Partners L.P.Terminated Crestwood Equity5/6/2015 – Partners LP /9/30/201517.2% Flat Crestwood Midstream Partners LP(4 months) Kinder Morgan, Inc. /8/10/14 – Kinder Morgan Energy11/26/201412.0% Growth 2 Partners, L.P.(3 months) Kinder Morgan, Inc. /8/10/2014 – El Paso Pipeline Partners,11/26/201415.4% Flat 2 L.P.(3 months) Plains All American8/27/2013 – Pipeline, L.P. /12/31/20138.5% Decline PAA Natural Gas Storage LP(4 months) Source: Public filings; investor presentations1.S-4 required, but not filed due to interloper bid by Energy Transfer Equity, L.P. 2.Public common unit holders could elect cash or stock consideration
|
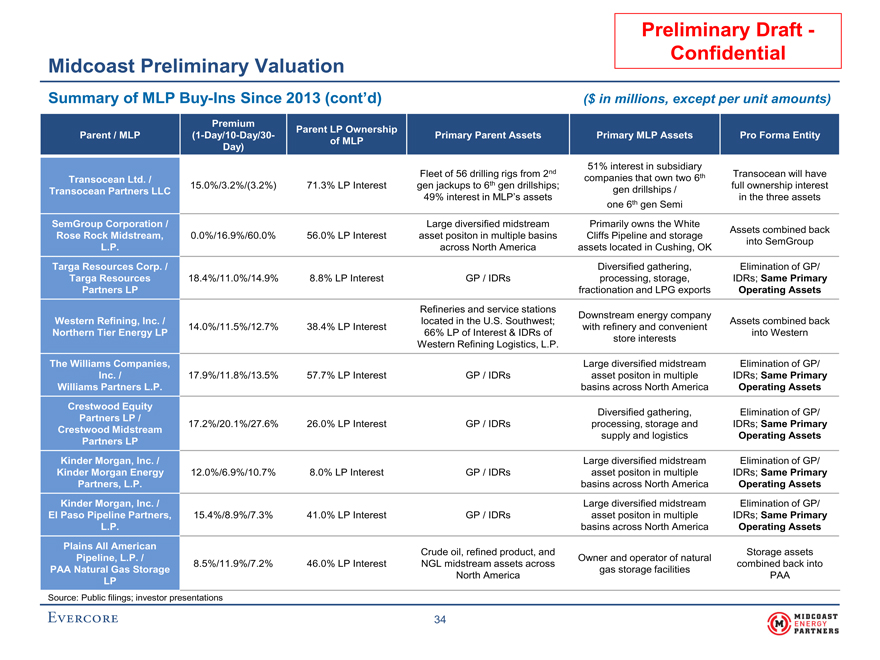
33 Preliminary Draft—Confidential Midcoast Preliminary Valuation Summary of MLPBuy-Ins Since 2013 (cont’d)($ in millions, except per unit amounts) PremiumParent LP Ownership Parent /MLP(1-Day/10-Day/30-Primary Parent AssetsPrimary MLP AssetsPro Forma Entity Day)of MLP 51% interest in subsidiary Transocean Ltd. /Fleet of 56 drilling rigs from 2ndcompanies that own two 6thTransocean will have 15.0%/3.2%/(3.2%)71.3% LP Interestgen jackups to 6th gen drillships;full ownership interest Transocean Partners LLCgen drillships / 49% interest in MLP’s assetsin the three assets one 6th gen Semi SemGroup Corporation /Large diversified midstreamPrimarily owns the WhiteAssets combined back Rose Rock Midstream,0.0%/16.9%/60.0%56.0% LP Interestasset positon in multiple basinsCliffs Pipeline and storageinto SemGroup L.P.across North Americaassets located in Cushing, OK Targa Resources Corp. /Diversified gathering,Elimination of GP/ Targa Resources18.4%/11.0%/14.9%8.8% LP InterestGP / IDRsprocessing, storage,IDRs; Same Primary Partners LPfractionation and LPG exportsOperating Assets Refineries and service stationsDownstream energy company Western Refining, Inc. /located in the U.S. Southwest;Assets combined back 14.0%/11.5%/12.7%38.4% LP Interestwith refinery and convenient Northern Tier Energy LP66% LP of Interest & IDRs ofinto Western Western Refining Logistics, L.P.store interests The Williams Companies,Large diversified midstreamElimination of GP/ Inc. /17.9%/11.8%/13.5%57.7% LP InterestGP / IDRsasset positon in multipleIDRs; Same Primary Williams Partners L.P.basins across North AmericaOperating Assets Crestwood Equity Partners LP /Diversified gathering,Elimination of GP/ 17.2%/20.1%/27.6%26.0% LP InterestGP / IDRsprocessing, storage andIDRs; Same Primary Crestwood Midstreamsupply and logisticsOperating Assets Partners LP Kinder Morgan, Inc. /Large diversified midstreamElimination of GP/ Kinder Morgan Energy12.0%/6.9%/10.7%8.0% LP InterestGP / IDRsasset positon in multipleIDRs; Same Primary Partners, L.P.basins across North AmericaOperating Assets Kinder Morgan, Inc. /Large diversified midstreamElimination of GP/ El Paso Pipeline Partners,15.4%/8.9%/7.3%41.0% LP InterestGP / IDRsasset positon in multipleIDRs; Same Primary L.P.basins across North AmericaOperating Assets Plains All AmericanCrude oil, refined product, andStorage assets Pipeline, L.P. /Owner and operator of natural 8.5%/11.9%/7.2%46.0% LP InterestNGL midstream assets acrosscombined back into PAA Natural Gas Storagegas storage facilities LPNorth AmericaPAA Source: Public filings; investor presentations 34
|
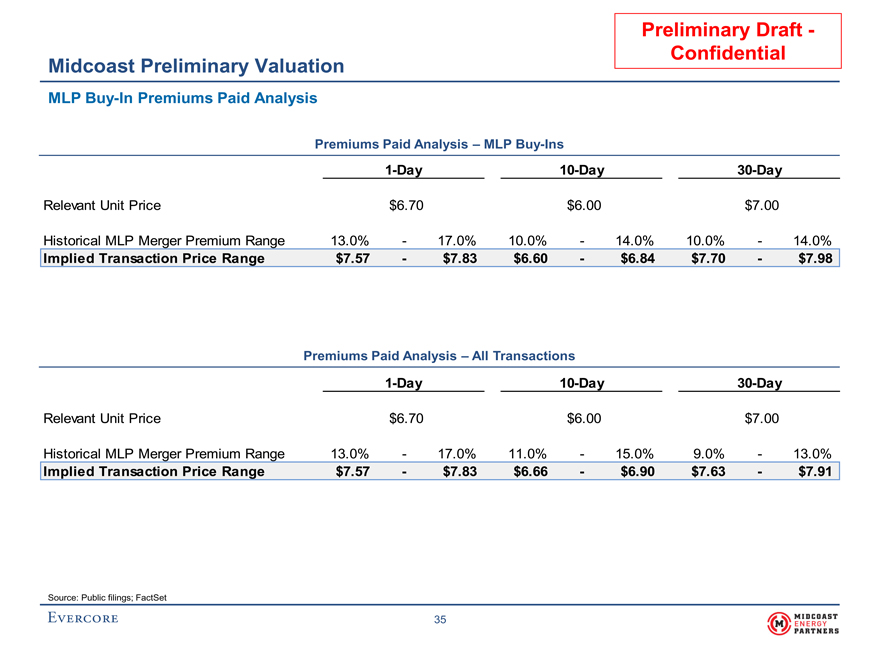
Preliminary Draft - Confidential Midcoast Preliminary Valuation MLP Buy-In Premiums Paid Analysis Premiums Paid Analysis – MLP Buy-Ins 1-Day 10-Day 30-Day Relevant Unit Price $6.70 $6.00 $7.00 Historical MLP Merger Premium Range 13.0% - 17.0% 10.0% - 14.0% 10.0% - 14.0% Implied Transaction Price Range $7.57 - $7.83 $6.60 - $6.84 $7.70 - $7.98 Premiums Paid Analysis – All Transactions 1-Day 10-Day 30-Day Relevant Unit Price $6.70 $6.00 $7.00 Historical MLP Merger Premium Range 13.0% - 17.0% 11.0% - 15.0% 9.0% - 13.0% Implied Transaction Price Range $7.57 - $7.83 $6.66 - $6.90 $7.63 - $7.91 Source: Public filings; FactSet
|
Preliminary Draft – Confidential IV. Overview of Potential Standalone Alternatives
|
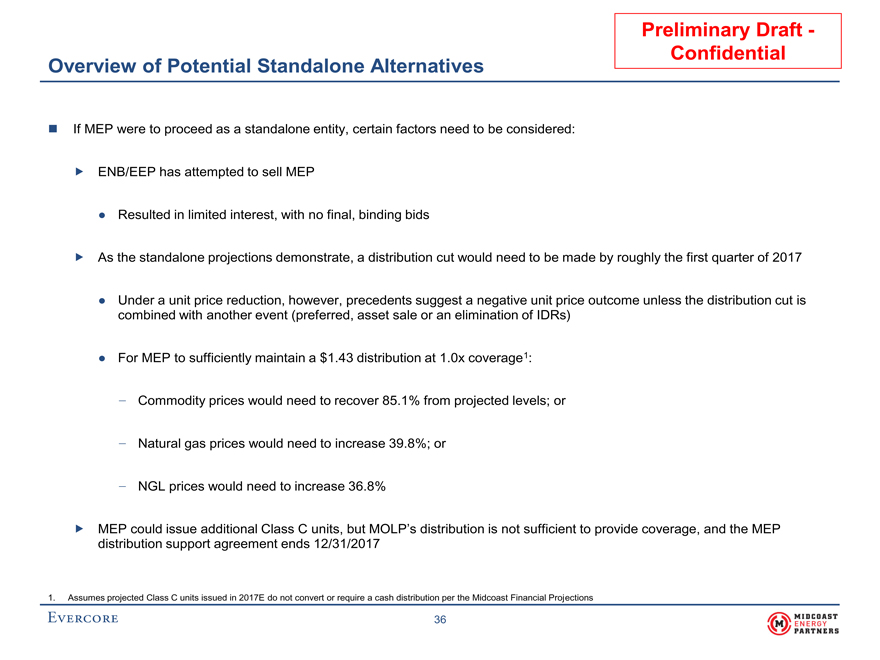
Preliminary Draft— Confidential Overview of Potential Standalone Alternatives If MEP were to proceed as a standalone entity, certain factors need to be considered: ENB/EEP has attempted to sell MEP • Resulted in limited interest, with no final, binding bids As the standalone projections demonstrate, a distribution cut would need to be made by roughly the first quarter of 2017 • Under a unit price reduction, however, precedents suggest a negative unit price outcome unless the distribution cut is combined with another event (preferred, asset sale or an elimination of IDRs) • For MEP to sufficiently maintain a $1.43 distribution at 1.0x coverage1: —Commodity prices would need to recover 85.1% from projected levels; or —Natural gas prices would need to increase 39.8%; or —NGL prices would need to increase 36.8% MEP could issue additional Class C units, but MOLP’s distribution is not sufficient to provide coverage, and the MEP distribution support agreement ends 12/31/2017 1. Assumes projected Class C units issued in 2017E do not convert or require a cash distribution per the Midcoast Financial Projections 36
|
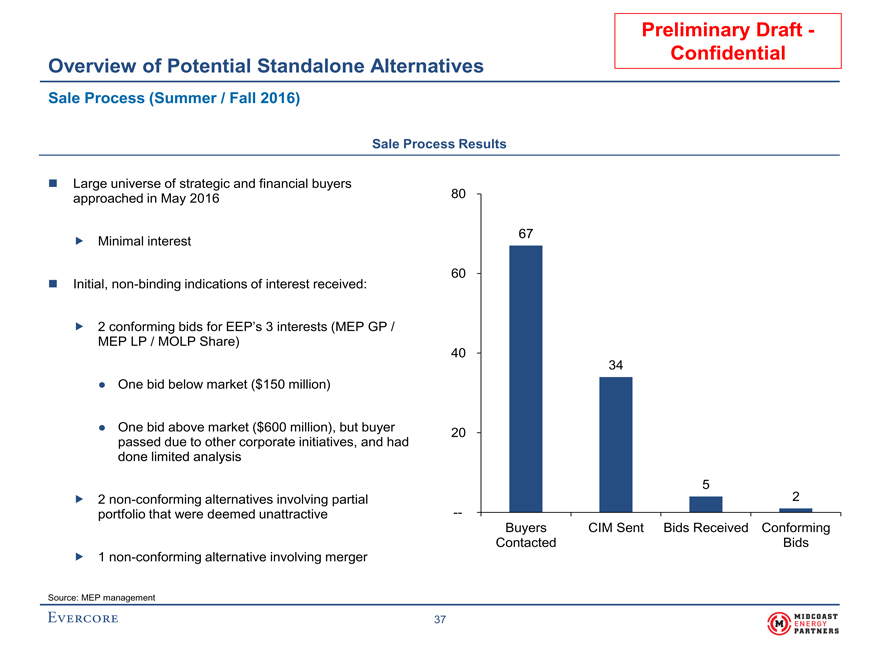
Sale Process (Summer / Fall 2016) Sale Process Results Large universe of strategic and financial buyers approached in May 2016 80 67 Minimal interest 60 Initial, non-binding indications of interest received: 2 conforming bids for EEP’s 3 interests (MEP GP / MEP LP / MOLP Share) 40 34 ● One bid below market ($150 million) ● One bid above market ($600 million), but buyer 20 passed due to other corporate initiatives, and had done limited analysis 5 2 non-conforming alternatives involving partial 2 portfolio that were deemed unattractive --Buyers CIM Sent Bids Received Conforming Contacted Bids 1 non-conforming alternative involving merger Source: MEP management 37
|
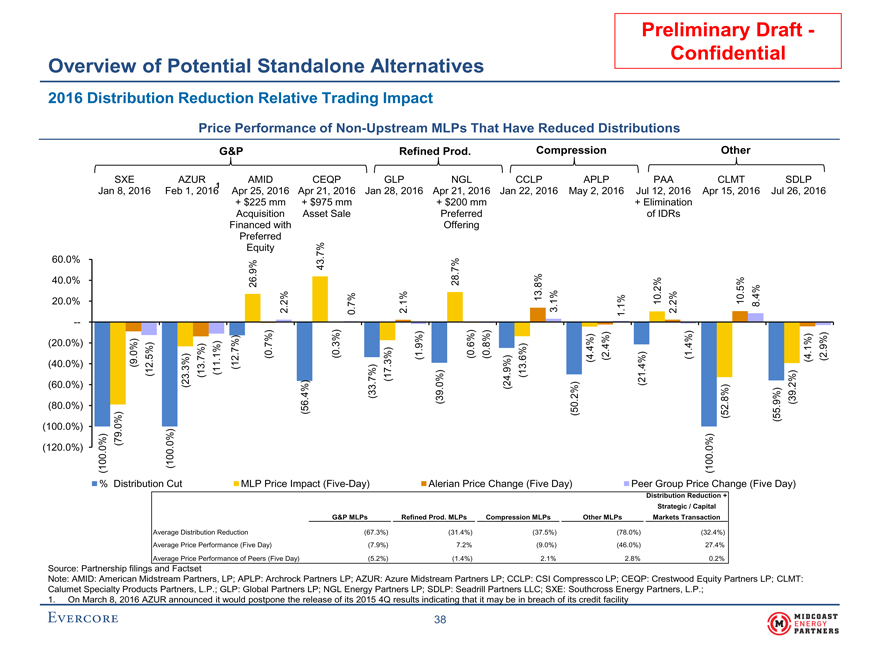
Preliminary Draft—Confidential Overview of Potential Standalone Alternatives 2016 Distribution Reduction Relative Trading Impact Price Performance ofNon-Upstream MLPs That Have Reduced Distributions G&PRefined Prod.CompressionOther SXEAZURAMIDCEQPGLPNGLCCLPAPLPPAACLMTSDLP Jan 8, 2016Feb 1, 20161Apr 25, 2016Apr 21, 2016Jan 28, 2016Apr 21, 2016Jan 22, 2016May 2, 2016 Jul 12, 2016Apr 15, 2016Jul 26, 2016 + $225 mm+ $975 mm+ $200 mm+ Elimination AcquisitionAsset SalePreferredof IDRs Financed withOffering Preferred Equity 60.0%43.7% 40.0%26.9%28.7% 20.0%2.2%0.7%2.1%13.8% 3.1%1.1%10.2% 2.2%10.5% 8.4% — )) ) (20.0%) (0.8%)(1.4% (40.0%) (9.0%) (12.5%)(13.7%) (11.1%)(12.7%(0.7%)(0.3%)(17.3%)(1.9%))(0.6%)(13.6%)(4.4%) (2.4%)(4.1%) (2.9%) ) (60.0%)) (23.3%)(33.7%)(24.9%)(21.4%) (80.0%)(56.4%)(39.0%(50.2%(52.8%(55.9% (39.2%) (100.0%)(79.0%) (120.0%) (100.0%)(100.0%)(100.0%) %Distribution CutMLP Price Impact(Five-Day)Alerian Price Change (Five Day)Peer Group Price Change (Five Day) Distribution Reduction + Strategic / Capital G&P MLPsRefined Prod. MLPsCompression MLPsOther MLPsMarkets Transaction Average Distribution Reduction(67.3%)(31.4%)(37.5%)(78.0%)(32.4%) Average Price Performance (Five Day)(7.9%)7.2%(9.0%)(46.0%)27.4% Average Price Performance of Peers (Five Day)(5.2%)(1.4%)2.1%2.8%0.2% Source: Partnership filings and Factset Note: AMID: American Midstream Partners, LP; APLP: Archrock Partners LP; AZUR: Azure Midstream Partners LP; CCLP: CSI Compressco LP; CEQP: Crestwood Equity Partners LP; CLMT: Calumet Specialty Products Partners, L.P.; GLP: Global Partners LP; NGL Energy Partners LP; SDLP: Seadrill Partners LLC; SXE: Southcross Energy Partners, L.P.; 1. On March 8, 2016 AZUR announced it would postpone the release of its 2015 4Q results indicating that it may be in breach of its credit facility 38
|
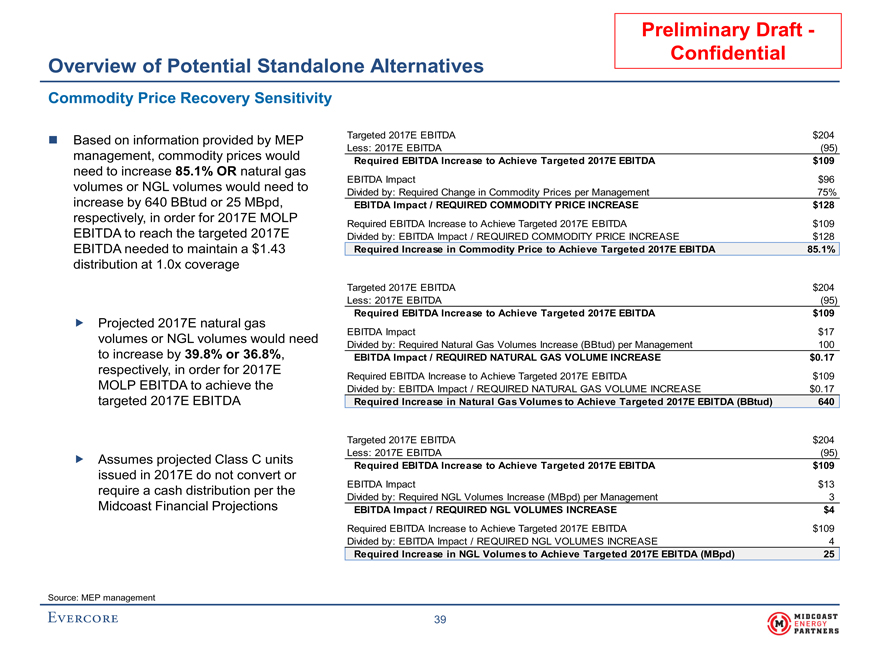
Preliminary Draft - Confidential Overview of Potential Standalone Alternatives Commodity Price Recovery Sensitivity Based on information provided by MEPTargeted 2017E EBITDA$204 Less: 2017E EBITDA(95) management, commodity prices wouldRequired EBITDA Increase to Achieve Targeted 2017E EBITDA$109 need to increase 85.1% OR natural gas EBITDA Impact$96 volumes or NGL volumes would need toDivided by: Required Change in Commodity Prices per Management75% increase by 640 BBtud or 25 MBpd,EBITDA Impact / REQUIRED COMMODITY PRICE INCREASE$128 respectively, in order for 2017E MOLPRequired EBITDA Increase to Achieve Targeted 2017E EBITDA$109 EBITDA to reach the targeted 2017EDivided by: EBITDA Impact / REQUIRED COMMODITY PRICE INCREASE$128 EBITDA needed to maintain a $1.43Required Increase in Commodity Price to Achieve Targeted 2017E EBITDA85.1% distribution at 1.0x coverage Targeted 2017E EBITDA$204 Less: 2017E EBITDA(95) Required EBITDA Increase to Achieve Targeted 2017E EBITDA$109 Projected 2017E natural gas EBITDA Impact$17 volumes or NGL volumes would needDivided by: Required Natural Gas Volumes Increase (BBtud) per Management100 to increase by 39.8% or 36.8%,EBITDA Impact / REQUIRED NATURAL GAS VOLUME INCREASE$0.17 respectively, in order for 2017ERequired EBITDA Increase to Achieve Targeted 2017E EBITDA$109 MOLP EBITDA to achieve theDivided by: EBITDA Impact / REQUIRED NATURAL GAS VOLUME INCREASE$0.17 targeted 2017E EBITDARequired Increase in Natural Gas Volumes to Achieve Targeted 2017E EBITDA (BBtud)640 Targeted 2017E EBITDA$204 Assumes projected Class C unitsLess: 2017E EBITDA(95) Required EBITDA Increase to Achieve Targeted 2017E EBITDA$109 issued in 2017E do not convert or require a cash distribution per theEBITDA Impact$13 Divided by: Required NGL Volumes Increase (MBpd) per Management3 Midcoast Financial ProjectionsEBITDA Impact / REQUIRED NGL VOLUMES INCREASE$4 Required EBITDA Increase to Achieve Targeted 2017E EBITDA$109 Divided by: EBITDA Impact / REQUIRED NGL VOLUMES INCREASE4 Required Increase in NGL Volumes to Achieve Targeted 2017E EBITDA (MBpd)25 Source: MEP management 39
|
Preliminary Draft – Confidential Appendix
|
Preliminary Draft – Confidential A. Weighted Average Cost of Capital Analysis
|
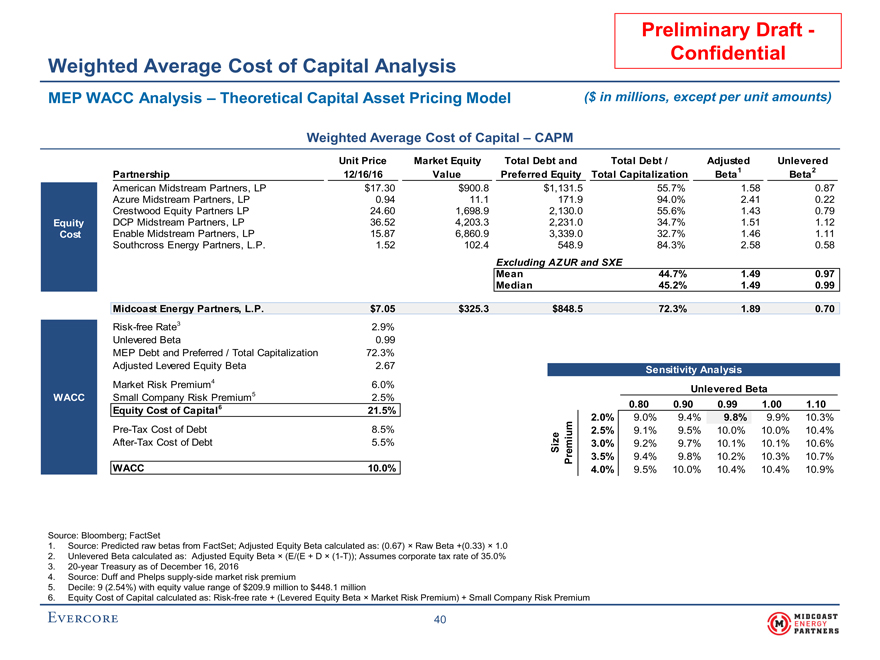
Preliminary Draft- Confidential Weighted Average Cost of Capital Analysis MEP WACC Analysis – Theoretical Capital Asset Pricing Model($ in millions, except per unit amounts) Weighted Average Cost of Capital – CAPM Unit PriceMarket EquityTotal Debt andTotal Debt /AdjustedUnlevered Partnership12/16/16ValuePreferred Equity Total CapitalizationBeta1Beta2 American Midstream Partners, LP$17.30$900.8$1,131.555.7%1.580.87 Azure Midstream Partners, LP0.9411.1171.994.0%2.410.22 Crestwood Equity Partners LP24.601,698.92,130.055.6%1.430.79 EquityDCP Midstream Partners, LP36.524,203.32,231.034.7%1.511.12 CostEnable Midstream Partners, LP15.876,860.93,339.032.7%1.461.11 Southcross Energy Partners, L.P.1.52102.4548.984.3%2.580.58 Excluding AZUR and SXE Mean44.7%1.490.97 Median45.2%1.490.99 Midcoast Energy Partners, L.P.$7.05$325.3$848.572.3%1.890.70 Risk-free Rate32.9% Unlevered Beta0.99 MEP Debt and Preferred / Total Capitalization72.3% Adjusted Levered Equity Beta2.67Sensitivity Analysis Market Risk Premium46.0%Unlevered Beta WACCSmall Company Risk Premium52.5% Equity Cost of Capital621.5%10.0%0.800.900.991.001.10 2.0%9.0%9.4%9.8%9.9%10.3%Pre-Tax Cost of Debt8.5%2.5%9.1%9.5%10.0%10.0%10.4%After-Tax Cost of Debt5.5%ize mium3.0%9.2%9.7%10.1%10.1%10.6% S e r3.5%9.4%9.8%10.2%10.3%10.7% P WACC10.0%4.0%9.5%10.0%10.4%10.4%10.9% Source: Bloomberg; FactSet 1. Source: Predicted raw betas from FactSet; Adjusted Equity Beta calculated as: (0.67) × Raw Beta +(0.33) × 1.0 2. Unlevered Beta calculated as: Adjusted Equity Beta × (E/(E + D ×(1-T)); Assumes corporate tax rate of 35.0% 3.20-year Treasury as of December 16, 2016 4. Source: Duff and Phelps supply-side market risk premium 5. Decile: 9 (2.54%) with equity value range of $209.9 million to $448.1 million 6. Equity Cost of Capital calculated as: Risk-free rate + (Levered Equity Beta × Market Risk Premium) + Small Company Risk Premium 40
|
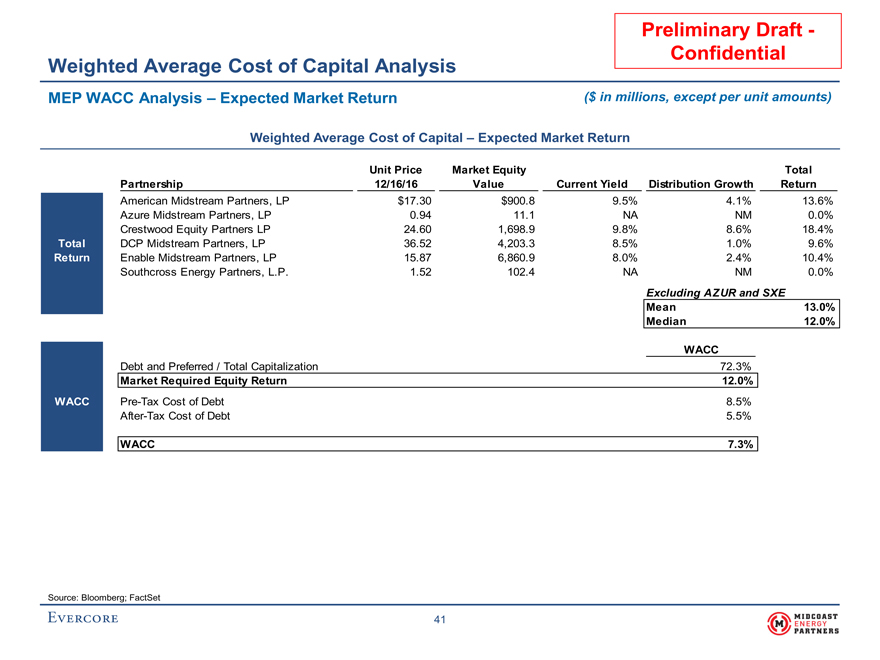
Preliminary Draft—Confidential Weighted Average Cost of Capital Analysis MEP WACC Analysis – Expected Market Return($ in millions, except per unit amounts) Weighted Average Cost of Capital – Expected Market Return Unit PriceMarket EquityTotal Partnership12/16/16ValueCurrent YieldDistribution GrowthReturn American Midstream Partners, LP$17.30$900.89.5%4.1%13.6% Azure Midstream Partners, LP0.9411.1NANM0.0% Crestwood Equity Partners LP24.601,698.99.8%8.6%18.4% TotalDCP Midstream Partners, LP36.524,203.38.5%1.0%9.6% ReturnEnable Midstream Partners, LP15.876,860.98.0%2.4%10.4% Southcross Energy Partners, L.P.1.52102.4NANM0.0% Excluding AZUR and SXE Mean13.0% Median12.0% WACC Debt and Preferred / Total Capitalization72.3% Market Required Equity Return12.0%WACCPre-Tax Cost of Debt8.5%After-Tax Cost of Debt5.5% WACC7.3% Source: Bloomberg; FactSet 41
|
Preliminary Draft– Confidential B.MidcoastFinancialProjections
|
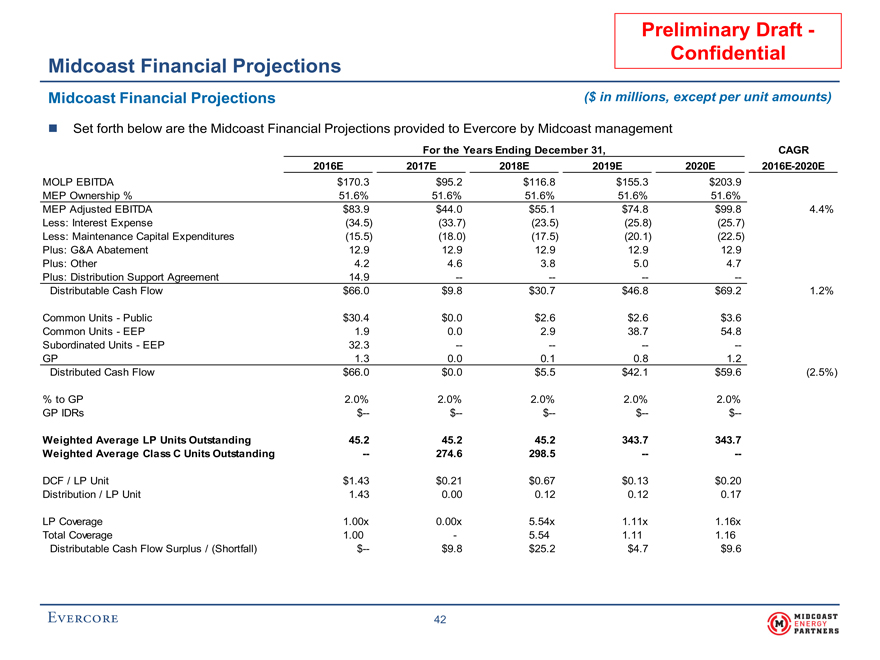
Preliminary Draft—Confidential Midcoast Financial Projections Midcoast Financial Projections($ in millions, except per unit amounts) Set forth below are the Midcoast Financial Projections provided to Evercore by Midcoast management For the Years Ending December 31,CAGR 2016E2017E2018E2019E2020E2016E-2020E MOLP EBITDA$170.3$95.2$116.8$155.3$203.9 MEP Ownership %51.6%51.6%51.6%51.6%51.6% MEP Adjusted EBITDA$83.9$44.0$55.1$74.8$99.84.4% Less: Interest Expense(34.5)(33.7)(23.5)(25.8)(25.7) Less: Maintenance Capital Expenditures(15.5)(18.0)(17.5)(20.1)(22.5) Plus: G&A Abatement12.912.912.912.912.9 Plus: Other4.24.63.85.04.7 Plus: Distribution Support Agreement14.9———— Distributable Cash Flow$66.0$9.8$30.7$46.8$69.21.2% Common Units—Public$30.4$0.0$2.6$2.6$3.6 Common Units—EEP1.90.02.938.754.8 Subordinated Units—EEP32.3———— GP1.30.00.10.81.2 Distributed Cash Flow$66.0$0.0$5.5$42.1$59.6(2.5%) % to GP2.0%2.0%2.0%2.0%2.0% GP IDRs$—$—$—$—$— Weighted Average LP Units Outstanding45.245.245.2343.7343.7 Weighted Average Class C Units Outstanding—274.6298.5—— DCF / LP Unit$1.43$0.21$0.67$0.13$0.20 Distribution / LP Unit1.430.000.120.120.17 LP Coverage1.00x0.00x5.54x1.11x1.16x Total Coverage1.00-5.541.111.16 Distributable Cash Flow Surplus / (Shortfall)$—$9.8$25.2$4.7$9.6 42
|
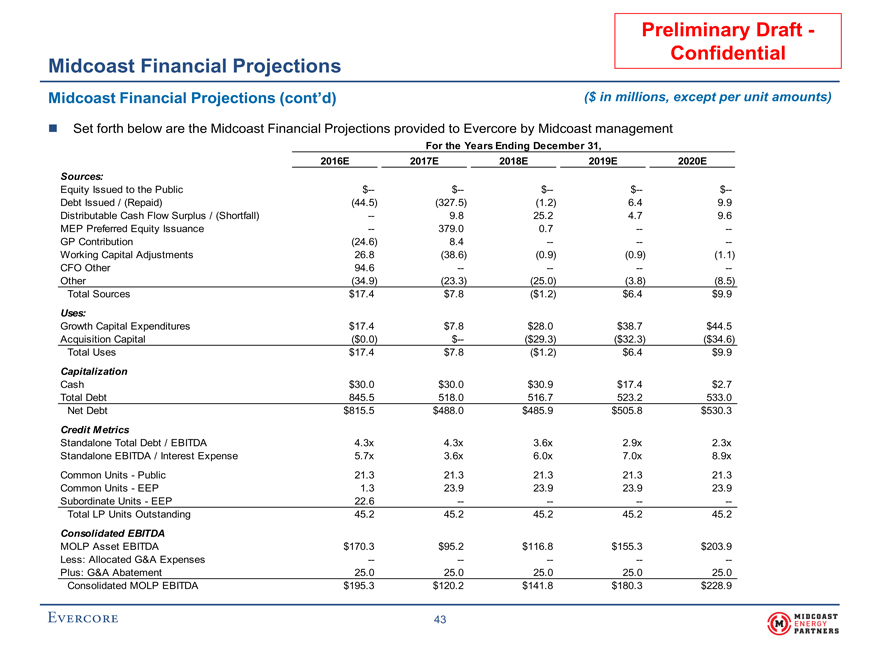
Preliminary Draft—Confidential Midcoast Financial Projections Midcoast Financial Projections (cont’d)($ in millions, except per unit amounts) Set forth below are the Midcoast Financial Projections provided to Evercore by Midcoast management For the Years Ending December 31, 2016E2017E2018E2019E2020E Sources: Equity Issued to the Public$—$—$—$—$— Debt Issued / (Repaid)(44.5)(327.5)(1.2)6.49.9 Distributable Cash Flow Surplus / (Shortfall)—9.825.24.79.6 MEP Preferred Equity Issuance—379.00.7—— GP Contribution(24.6)8.4——— Working Capital Adjustments26.8(38.6)(0.9)(0.9)(1.1) CFO Other94.6———— Other(34.9)(23.3)(25.0)(3.8)(8.5) Total Sources$17.4$7.8($1.2)$6.4$9.9 Uses: Growth Capital Expenditures$17.4$7.8$28.0$38.7$44.5 Acquisition Capital($0.0)$—($29.3)($32.3)($34.6) Total Uses$17.4$7.8($1.2)$6.4$9.9 Capitalization Cash$30.0$30.0$30.9$17.4$2.7 Total Debt845.5518.0516.7523.2533.0 Net Debt$815.5$488.0$485.9$505.8$530.3 Credit Metrics Standalone Total Debt / EBITDA4.3x4.3x3.6x2.9x2.3x Standalone EBITDA / Interest Expense5.7x3.6x6.0x7.0x8.9x Common Units—Public21.321.321.321.321.3 Common Units—EEP1.323.923.923.923.9 Subordinate Units—EEP22.6———— Total LP Units Outstanding45.245.245.245.245.2 Consolidated EBITDA MOLP Asset EBITDA$170.3$95.2$116.8$155.3$203.9 Less: Allocated G&A Expenses————— Plus: G&A Abatement25.025.025.025.025.0 Consolidated MOLP EBITDA$195.3$120.2$141.8$180.3$228.9 43
|
Preliminary Draft – Confidential C. Tax Input to Unitholders
|
Preliminary Draft— Confidential Tax Input to Unitholders Potential Standalone Alternatives Evercore analyzed the estimated unitholder tax basis data as provided by MEP management and as calculated by PricewaterhouseCoopers Plc Utilizedpre-merger tax data for schedulesK-1 for MEP Analysis as of December 31, 2015 Utilized MEP unit price of $7.25 based on materials provided by MEP management 44
|
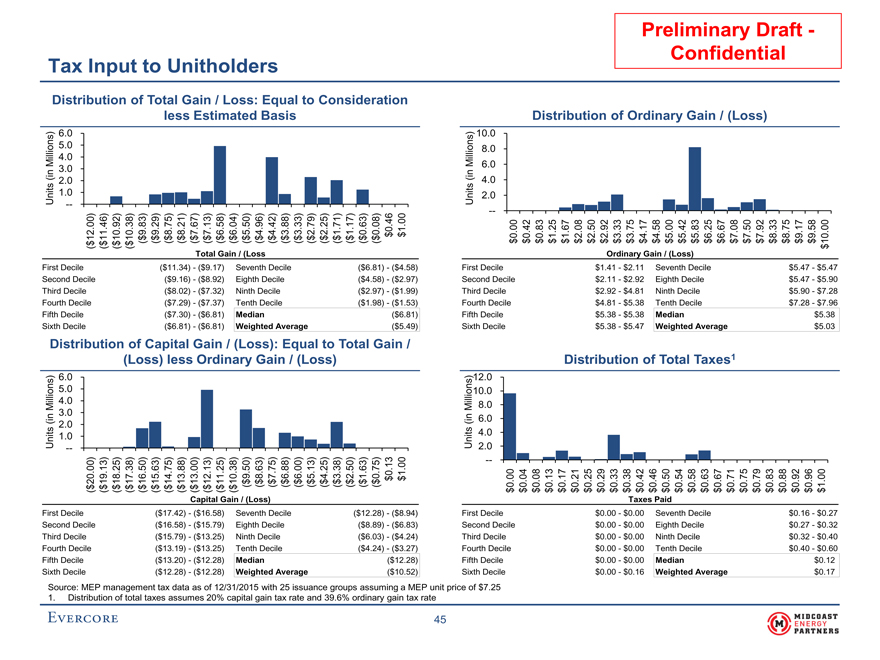
Preliminary Draft—Confidential Tax Input to Unitholders Distribution of Total Gain / Loss: Equal to Consideration less Estimated BasisDistribution of Ordinary Gain / (Loss) s)6.0s) 10.0 ion5.0ion8.0 ll4.0ll MiMi6.0 (in3.0(in 2.04.0 Units1.0 —Units2.0 — . 11.46) 10.92) 10.38) 9.83) 9.29) 8.75) 8.21) 7.67) 7.13) 6.58) 6.04) 5.50) 4.96) 4.42) 3.88) 3.33) 2.79) 2.25) 1.71) 1.17) 0.63) 0.08) 00) 12$ $ $ $ $ $ $ $ $ $ $ $ $ $ $ $ $ $ $ $ 0.46 $ 1.000.00 0.42 0.83 1.25 1.67 2.08 2.50 2.92 3.33 3.75 4.17 4.58 5.00 5.42 5.83 6.25 6.67 7.08 7.50 7.92 8.33 8.75 9.17 9.58 10.00 $ $ $ $ ( ( ( ( ( ( ( ( ( ( ( ( ( ( ( ( ( ( ($ $ $ $ $ $ $ $ $ $ $ $ $ $ $ $ $ $ $ $ $ $ $ $ ( ( ( ($ Total Gain / (LossOrdinary Gain / (Loss) First Decile($11.34)—($9.17)Seventh Decile($6.81)—($4.58)First Decile$1.41—$2.11Seventh Decile$5.47—$5.47 Second Decile($9.16)—($8.92)Eighth Decile($4.58)—($2.97)Second Decile$2.11—$2.92Eighth Decile$5.47—$5.90 Third Decile($8.02)—($7.32)Ninth Decile($2.97)—($1.99)Third Decile$2.92—$4.81Ninth Decile$5.90—$7.28 Fourth Decile($7.29)—($7.37)Tenth Decile($1.98)—($1.53)Fourth Decile$4.81—$5.38Tenth Decile$7.28—$7.96 Fifth Decile($7.30)—($6.81)Median($6.81)Fifth Decile$5.38—$5.38Median$5.38 Sixth Decile($6.81)—($6.81)Weighted Average($5.49)Sixth Decile$5.38—$5.47Weighted Average$5.03 Distribution of Capital Gain / (Loss): Equal to Total Gain / (Loss) less Ordinary Gain / (Loss)Distribution of Total Taxes1 s)6.0s) 12.0 lion5.0lion 10.0 Mi l4.0Mi l8.0 n3.0n6.0 (i2.0(i Units1.0Units4.0 —2.0 — . 00) 20 19.13) 18.25) 17.38) 16.50) 15.63) 14.75) 13.88) 13.00) 12.13) 11.25) 10.38) $ 9.50) $ 8.63) $ 7.75) $ 6.88) $ 6.00) $ 5.13) $ 4.25) $ 3.38) $ 2.50) $ 1.63) $ 0.75) $ 0.13 $ 1.000.00 0.04 0.08 0.13 0.17 0.21 0.25 0.29 0.33 0.38 0.42 0.46 0.50 0.54 0.58 0.63 0.67 0.71 0.75 0.79 0.83 0.88 0.92 0.96 1.00 $ $ $ $ $ $ $ $ $ $ $ $ ( ( ( ( ( ( ( ( ( ( ( ( ( ( ( ( ( ( ( ( ( ( ($ $ $ $ $ $ $ $ $ $ $ $ $ $ $ $ $ $ $ $ $ $ $ $ $ Capital Gain / (Loss)Taxes Paid First Decile($17.42)—($16.58)Seventh Decile($12.28)—($8.94)First Decile$0.00—$0.00Seventh Decile$0.16—$0.27 Second Decile($16.58)—($15.79)Eighth Decile($8.89)—($6.83)Second Decile$0.00—$0.00Eighth Decile$0.27—$0.32 Third Decile($15.79)—($13.25)Ninth Decile($6.03)—($4.24)Third Decile$0.00—$0.00Ninth Decile$0.32—$0.40 Fourth Decile($13.19)—($13.25)Tenth Decile($4.24)—($3.27)Fourth Decile$0.00—$0.00Tenth Decile$0.40—$0.60 Fifth Decile($13.20)—($12.28)Median($12.28)Fifth Decile$0.00—$0.00Median$0.12 Sixth Decile($12.28)—($12.28)Weighted Average($10.52)Sixth Decile$0.00—$0.16Weighted Average$0.17 Source: MEP management tax data as of 12/31/2015 with 25 issuance groups assuming a MEP unit price of $7.25 1.Distribution of total taxes assumes 20% capital gain tax rate and 39.6% ordinary gain tax rate 45