| | OMB APPROVAL |
| | OMB Number: 3235-0570
Expires: July 31, 2022
Estimated average burden hours per
response 20.6 |
UNITED STATES
SECURITIES AND EXCHANGE COMMISSION
Washington, D.C. 20549
FORM N-CSR
CERTIFIED SHAREHOLDER REPORT OF REGISTERED
MANAGEMENT INVESTMENT COMPANIES
Investment Company Act file number 811-21308
Alger Global Focus Fund
(Exact name of registrant as specified in charter)
360 Park Avenue South New York, New York 10010
(Address of principal executive offices) (Zip code)
Mr. Hal Liebes
Fred Alger Management, LLC
360 Park Avenue South
New York, New York 10010
(Name and address of agent for service)
Registrant's telephone number, including area code: 212-806-8800
Date of fiscal year end: October 31
Date of reporting period: October 31, 2020
Form N-CSR is to be used by management investment companies to file reports with the Commission, not later than 10 days after the transmission to Stockholders of any report to be transmitted to Stockholders under Rule 30e-1 under the Investment Company Act of 1940 (17 CFR 270.30e1). The Commission may use the information provided on Form N-CSR in its regulatory, disclosure review, inspection, and policymaking roles.
A registrant is required to disclose the information specified by Form N-CSR, and the Commission will make this information public. A registrant is not required to respond to the collection of information contained in Form N-CSR unless the Form displays a currently valid Office of Management and Budget ("OMB") control number. Please direct comments concerning the accuracy of the information collection burden estimate and any suggestions for reducing the burden to the Secretary, Securities and Exchange Commission, 450 Fifth Street, NW, Washington, DC 20549-0609. The OMB has reviewed this collection of information under the clearance requirements of 44 U.S.C. § 3507.
ITEM 1. REPORTS TO STOCKHOLDERS.
Table of Contents
ALGER GLOBAL FOCUS FUND
| Shareholders’ Letter (Unaudited) | 1 |
| Fund Highlights (Unaudited) | 9 |
| Portfolio Summary (Unaudited) | 11 |
| Schedule of Investments | 12 |
| Statement of Assets and Liabilities | 16 |
| Statement of Operations | 18 |
| Statements of Changes in Net Assets | 19 |
| Financial Highlights | 20 |
| Notes to Financial Statements | 24 |
| Report of Independent Registered Public Accounting Firm | 38 |
| Additional Information (Unaudited) | 40 |
Optional Internet Availability of Alger Shareholder Reports
Beginning on January 1, 2021, as permitted by regulations adopted by the Securities and Exchange Commission, paper copies of the Funds’ shareholder reports will no longer be sent by mail, unless you specifically request paper copies of the reports from the Fund or from your financial intermediary. Instead, the reports will be made available on a website, and you will be notified by mail each time a report is posted and provided with a website link to access the report.
If you already elected to receive shareholder reports electronically, you will not be affected by this change and you need not take any action. You may elect to receive shareholder reports and other communications from the Fund electronically by signing up for paperless delivery at www.icsdelivery.com/alger. If you own these shares through a financial intermediary, contact your financial intermediary.
You may elect to receive all future reports in paper free of charge. If you invest directly with the Fund you can inform the Fund that you wish to continue receiving paper copies of your shareholder reports by contacting us at 1-866-345-5954 or fundreports.com. If you own these shares through a financial intermediary, contact your financial intermediary to elect to continue to receive paper copies of your shareholder reports. Your election to receive reports in paper will apply to all funds held within the Alger Fund Complex or your financial intermediary.
| Shareholders’ Letter (Unaudited) | October 31, 2020 |
Dear Shareholders,
The New Normal Provides Reason for Optimism
As I write this letter, we are experiencing some of the most significant events in our country in many years, with voters preparing to cast ballots for the 46th presidential term in an election that is expected to have more participation than any in our history. At the same time, work to create Covid-19 vaccines is advancing quickly. This past year has been tremendously challenging for us all. The Covid-19 pandemic continues to spread across the U.S. and the world; the economic challenges and losses it has created will haunt many for years to come—even as we hopefully begin to see the end of the pandemic itself as public vaccination programs are expected to ramp up in 2021. During the past 12 months, our healthcare system was challenged by the Covid-19 pandemic while at the same time social justice issues became front and center in America. These issues are daunting and Alger has responded by supporting several causes related to social justice organizations and frontline healthcare workers.
I am proud to say our employees quickly adjusted to a remote work environment and achieved notable and attractive investment performance. As sobering as the past months have been, we remain hopeful for our future, notwithstanding the challenges that lie ahead.
We believe the following points are essential:
| · | Investors may want to consider seeking companies that are benefiting from dramatic changes occurring throughout the economy, including innovation, rather than align portfolios based on the outcome of elections. |
| · | A “New Normal” may continue after the pandemic, which has dramatically accelerated the speed at which digitization and other forms of innovation are occurring in our personal lives and the business world. |
| · | The rapid transformation occurring across industries, we believe, will continue after the pandemic and potentially create attractive opportunities for well-managed, innovative companies to reward investors by generating strong earnings growth with new products that disrupt entire industries. |
A Challenging Time
For the year ended October 31, 2020, the S&P 500 Index generated a 9.71% return. Corporate fundamentals initially supported investor sentiment, and from November 1, 2019 to the middle of February 2020, the S&P 500 Index climbed 12.18%. The spread of the novel coronavirus across the globe, however, caused investor sentiment to plummet and from the February 19 historical market peak to March 23, the S&P 500 Index dropped 33.79% as investors grew increasingly concerned that efforts to slow the growth of the virus, such as stay-at-home orders and economic shutdowns, would trigger a global recession.
Sentiment quickly reversed when the Federal Reserve (the Fed) responded aggressively with two rate cuts totaling 150 basis points, bringing the fed funds target rate to 0.0% - 0.25%. The Fed also unveiled a round of quantitative easing while U.S. legislators began creating programs initially valued at more than $2 trillion to support businesses, increase unemployment benefits and provide one-time payments to certain individuals. Optimism about these stimulus efforts caused equities to reverse course and from late March until early September, the S&P 500 Index climbed more than 50%, even though fears of a recession were eventually realized when the U.S. reported that second quarter gross domestic product (GDP) contracted at an annual rate of 31.4%. Yet, other economic data supported optimistic sentiment. After peaking in May at approximately 25 million, U.S. continuing unemployment claims decreased while monthly retail sales (ex. food services) strengthened in June, July and August. Housing starts and the median sale price for existing homes also strengthened. Investors also remained optimistic that reopening the economy would support renewed GDP growth and a potential second wave of the coronavirus wouldn’t require extensive shutdowns of states’ economies.
The Fed, however, had a mixed impact on sentiment. On one hand, the Fed expressed its willingness to maintain low interest rates, but on the other hand, Fed Chairman Jerome Powell explained that additional stimulus from Congress was needed to support the economy. This concern was echoed by Federal Reserve Bank of Richmond President, Thomas Barkin, who stated in early August that the pandemic-sparked recession could take a turn for the worse if Congress doesn’t provide additional aid to workers and businesses.
As stimulus debates in Congress deteriorated and the pandemic appeared to strengthen, sentiment plunged and the S&P 500 Index declined 6.36% in September and October even though analysts surveyed by Bloomberg in early October said they believed the U.S. government would report that GDP grew at a 30% annualized rate in the third quarter. The U.S. Commerce Department in late October eventually reported 33.1% annualized GDP growth for the quarter.
International Markets Provide a Glimmer of Hope
Foreign equity markets also exhibited considerable volatility with MSCI ACWI ex USA Index declining 2.19% during the 12-month reporting period, although the MSCI Emerging Markets Index generated a positive 8.62% return over the same time period. Most of the positive performance of emerging markets was attributable to China and a handful of other Asian countries that implemented early and aggressive measures to curtail the pandemic. By containing the spread and reopening their economies, or in the case of Taiwan, avoiding the need for a shutdown, these countries are generating notable economic growth.
The Beneficiaries of Change
The pandemic is accelerating the already rapid pace at which new products and services disrupt their industries and capture market share. Many of these changes, we believe, will continue even after the pandemic.
| · | Remote working: The widespread implementation of work from home has created strong demand for new technologies that support online collaboration, videoconferencing, business process management, network capacity and security. As remote working has grown, firms such as CrowdStrike Holdings, Inc. that provide end-point protection against viruses, malware and other digital threats are experiencing increased demand for cloud-based security systems. We believe this trend may continue after the pandemic. In a June study by Gartner, Inc., 82% of executives said they plan on letting employees work remotely some of the time and 47% said they will allow employees to work remotely all of the time (executives could select more than one answer). |
| · | Communications: In both government and commercial firms, the need for real-time communication with the public or their employees has driven the adoption of new communications platforms to manage dialogues. Everbridge, which provides text messaging and other digital communications for governments, employers and other organizations, is an example. During its second quarter earnings call, the company announced it had processed more than 700 million messages related to the pandemic. |
| · | E-commerce: Online shopping has seen near exponential acceleration while people have been under stay-at-home orders. In fact, FedEx recently said shipping volumes that were previously expected to be reached by 2026 will now be reached by 2023 due to increased e-commerce. This acceleration is occurring after decades of growth in online retailing, which increased 14.9% last year while overall retail sales increased only 3.8%. For this year, e-commerce has grown 27% through August, compared to only 2% for brick and mortar retailing. This trend benefits large online retailers such as Amazon. com, Inc., but it is also helping smaller retailers who had the foresight to adopt and even primarily build their businesses online, often using technology from companies such as Shopify, Square and HubSpot. |
| · | Healthcare: The adoption of telemedicine has accelerated as healthcare consumers and medical professionals embrace the technology to practice social distancing. In addition to convenience for patients, telemedicine is helping healthcare providers reduce their reliance on costly offices within hospitals or other facilities. We believe the adoption of this technology will continue after the pandemic. Separately, the rapid advancements in developing vaccines have illustrated the groundbreaking power of genetic sequencing. It took only three months for researchers to prepare a Covid-19 vaccine for human trial, compared to 20 months for preparing a vaccine for SARS in 2003 and 11 months for Influenza A in Indonesia in 2006. |
Going Forward
At Alger, we focus on in-depth fundamental research while striving to understand how large-scale changes, such as innovation, create investment opportunities. A potential change in the president, of course, is a significant factor, with each political party having meaningful differences in their platforms. Aligning portfolios based on the political party of a president, however, may be misguided and would have yielded disappointing results in recent years. For example, a portfolio of $10,000 invested in the S&P 500 Index only during either Republican or Democratic presidents from 1968 until 2020 would have grown to less than $200,000 compared to approximately $1.4 million that would have resulted from staying fully invested, regardless of the party in the White House. We believe our in-depth fundamental research may be better suited for finding companies that are potentially positioned to thrive during the new normal. At the same time, we are optimistic that an eventual recovery in earnings growth, low interest rates and a return to more normal conditions resulting from a potential coronavirus vaccine or new treatments for Covid-19 could support equity markets.
Portfolio Matters
Alger Global Focus Fund
Alger Global Focus Fund returned 26.08% for the fiscal year ended October 31, 2020, compared to the 5.42% return of the MSCI ACWI Index.
Contributors to Performance
During the reporting period, the largest sector weightings were Information Technology and Consumer Discretionary. The largest sector overweight was Information Technology and the largest underweight was Financials. The Financials and Information Technology sectors provided the greatest contributions to relative performance. From a country perspective, the United States, France, the Netherlands, Australia and Italy were among the top contributors to relative performance.
Regarding individual positions, Amazon.com, Inc.; NVIDIA Corp.; Adyen NV; Adobe, Inc.; and Microsoft Corp. were among the top contributors to performance. Amazon.com continues to generate strong high unit volume growth by taking market share from brick and mortar retailing and by growing its cloud computing service. During the reporting period, consumer uptake of one-day shipping supported the acceleration of the company’s online retailing. Later in the reporting period, investors became excited about the significant revenue gains associated with coronavirus quarantining and social distancing that are accelerating the pace at which e-commerce is capturing market share from traditional retailers. Additionally, investors reacted favorably to increased demand for Amazon.com’s cloud service, AWS, during the pandemic.
Detractors from Performance
The Consumer Staples and Utilities sectors were among the sectors that detracted from results. From a country perspective, Ireland, Spain, South Korea, India and China were among the top detractors from performance.
Regarding individual positions, American Express Company; Grifols, S.A. Sponsored ADR, Cl. B; Sands China Ltd.; Burberry Group plc; and NMI Holdings, Inc., Cl. A were among the top detractors from performance. Burberry Group is a British luxury fashion house headquartered in London. It focuses on the manufacturing and distribution of trench coats, ready-to-wear outerwear, fashion accessories, fragrances, sunglasses and cosmetics. The company was undergoing a successful and significant transformation under the leadership of a new management team and a new creative designer. However, the Covid-19 outbreak and the lockdown announcements that began in Asia and later spread to other major parts of the world created a significant amount of uncertainty for the company’s short-term outlook. Concerns over the impact from store closures and travel restrictions around the globe weighed on the share price.
I thank you for putting your trust in Alger.
Sincerely,

Daniel C. Chung, CFA
Chief Investment Officer
Fred Alger Management, LLC
Investors cannot invest directly in an index. Index performance does not reflect the deduction for fees, expenses, or taxes.
This report and the financial statements contained herein are submitted for the general information of shareholders of the Fund. This report is not authorized for distribution to prospective investors in the Fund unless preceded or accompanied by an effective prospectus for the Fund. Fund performance returns represent the 12-month period return of Class A shares prior to the deduction of any sales charges and include the reinvestment of any dividends or distributions.
The performance data quoted represents past performance, which is not an indication or guarantee of future results.
Standardized performance results can be found on the following pages. The investment return and principal value of an investment in the fund will fluctuate so that an investor’s shares, when redeemed, may be worth more or less than their original cost. Current performance may be lower or higher than the performance quoted. For performance data current to the most recent month-end, visit us at www.alger.com or call us at (800) 992-3863.
The views and opinions of the Fund’s management in this report are as of the date of the Shareholders’ Letter and are subject to change at any time subsequent to this date. There is no guarantee that any of the assumptions that formed the basis for the opinions stated herein are accurate or that they will materialize. Moreover, the information forming the basis for such assumptions is from sources believed to be reliable; however, there is no guarantee that such information is accurate. Any securities mentioned, whether owned in the fund or otherwise, are considered in the context of the construction of an overall portfolio of securities and therefore reference to them should not be construed as a recommendation or offer to purchase or sell any such security. Inclusion of such securities in the fund and transactions in such securities, if any, may be for a variety of reasons, including, without limitation, in response to cash flows, inclusion in a benchmark, and risk control. The reference to a specific security should also be understood in such context and not viewed as a statement that the security is a significant holding in the Fund. Please refer to the Schedule of Investments for the Fund which is included in this report for a complete list of fund holdings as of October 31, 2020. Securities mentioned in the Shareholders’ Letter, if not found in the Schedule of Investments, may have been held by the Fund during the fiscal year ended October 31, 2020.
Risk Disclosures
Investing in the stock market involves risks, including the potential loss of principal. Growth stocks may be more volatile than other stocks as their prices tend to be higher in relation to their companies’ earnings and may be more sensitive to market, political, and economic developments. Assets may be focused in a small number of holdings, making them susceptible to risks associated with a single economic, political or regulatory event than a more diversified portfolio. Foreign securities and emerging markets involve special risks including currency fluctuations, inefficient trading, political and economic instability, and increased volatility. Investing in companies of small capitalizations involves the risk that such issuers may have limited product lines or financial resources, lack management depth, or have limited liquidity. Active trading may increase transaction costs, brokerage commissions, and taxes, which can lower the return on investment. For a more detailed discussion of the risks associated with the Fund, please see the prospectus.
Before investing, carefully consider the Fund’s investment objective, risks, charges, and expenses.
For a prospectus or a summary prospectus containing this and other information about the Alger Global Focus Fund call us at (800) 992-3863 or visit us at www.alger. com. Read it carefully before investing.
Fred Alger & Company, LLC, Distributor. Member NYSE Euronext, SIPC.
NOT FDIC INSURED. NOT BANK GUARANTEED. MAY LOSE VALUE.
Definitions:
| · | The S&P 500 Index: An index of large company stocks considered to be representative of the U.S. stock market. |
| · | The MSCI ACWI ex USA Index (gross) captures large and mid cap representation across 22 of 23 Developed Markets (DM) countries (excluding the US) and 26 emerging markets (EM) countries. The index covers approximately 85% of the global equity opportunity set outside the US. |
| · | The Morgan Stanley Capital International (MSCI) Emerging Markets Index (gross) is a free float-adjusted market capitalization index that is designed to measure equity market performance in the global emerging markets. |
| · | The MSCI ACWI Index (gross) is a free float-adjusted market capitalization weighted index that is designed to measure the equity market performance of developed and emerging markets. The MSCI ACWI captures large and mid cap representation across 23 Developed Markets (DM) and 26 Emerging Markets (EM) countries. |
FUND PERFORMANCE AS OF 09/30/20 (Unaudited)
AVERAGE ANNUAL TOTAL RETURNS
| | | | 1 | | | | 5 | | | | 10 | | | | SINCE | |
| | | | YEAR | | | | YEARS | | | | YEARS | | | | INCEPTION | |
| Alger Global Focus Class A (Inception 11/3/03) | | | 25.66 | % | | | 9.16 | % | | | 6.50 | % | | | 8.87 | % |
| Alger Global Focus Class C (Inception 3/3/08)* | | | 30.67 | % | | | 9.52 | % | | | 6.28 | % | | | 8.43 | % |
| Alger Global Focus Class I (Inception 5/31/13) | | | 33.09 | % | | | 10.65 | % | | | n/a | | | | 9.29 | % |
| Alger Global Focus Class Z (Inception 5/31/13) | | | 33.30 | % | | | 10.85 | % | | | n/a | | | | 9.52 | % |
The performance data quoted represents past performance, which is not an indication or a guarantee of future results. The Fund’s average annual total returns include changes in share price and reinvestment of dividends and capital gains. Class A returns reflect the maximum initial sales charge and Class C returns reflect the applicable contingent deferred sales charge. Alger Global Focus Fund, prior to March 28, 2018, followed different investment strategies and was managed by different portfolio managers, and before August 15, 2018 was named “Alger Global Growth Fund”. Prior to May 31, 2013, the Fund was named “Alger China-U.S. Growth Fund” and followed different investment strategies. Performance prior to March 28, 2018, reflects these prior management styles and does not reflect the Fund’s current investment strategies and investment personnel.
| * | Since inception performance is calculated since the inception of the Class A shares. Historical performance prior to March 3, 2008, inception of the class, is that of the Fund’s Class A shares, reduced to reflect the current maximum sales charge and the higher operating expenses of Class C shares. |
ALGER GLOBAL FOCUS FUND
Fund Highlights Through October 31, 2020 (Unaudited)
HYPOTHETICAL $10,000 INVESTMENT IN CLASS A SHARES
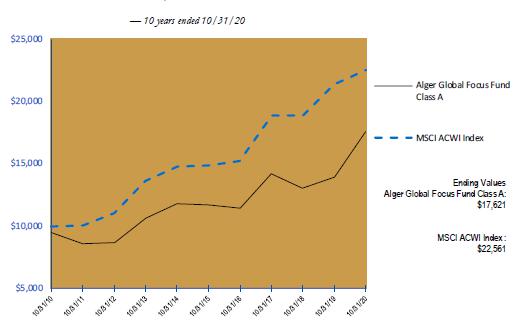
The chart above illustrates the change in value of a hypothetical $10,000 investment made in the Alger Global Focus Fund Class A shares, with an initial maximum sales charge of 5.25%, and the MSCI ACWI Index (an unmanaged index of common stocks) for the ten years ended October 31, 2020. Alger Global Focus Fund, prior to March 28, 2018, followed different investment strategies and was managed by different portfolio managers, and before August 15, 2018 was named “Alger Global Growth Fund”. Prior to May 31, 2013, the Fund was named “Alger China-U.S. Growth Fund” and followed different investment strategies. Performance prior to March 28, 2018, reflects these prior management styles and does not reflect the Fund’s current investment strategies and investment personnel. Figures for the Alger Global Focus Fund Class A shares and the MSCI ACWI Index include reinvestment of dividends. Figures for the Alger Global Focus Fund Class A shares also include reinvestment of capital gains. Performance for the Alger Global Focus Fund Class C, Class I and Class Z shares will vary from the results shown above due to differences in expenses and sales charges that each class bears. Investors cannot invest directly in any index. Index performance does not reflect deduction for fees, expenses, or taxes.
ALGER GLOBAL FOCUS FUND
Fund Highlights Through October 31, 2020 (Unaudited) (Continued)
PERFORMANCE COMPARISON AS OF 10/31/20
AVERAGE ANNUAL TOTAL RETURNS
| | | | | | | | | | | | Since | |
| | | 1 YEAR | | | 5 YEARS | | | 10 YEARS | | | 11/3/2003 | |
| Class A (Inception 11/3/03) | | | 19.49 | % | | | 7.29 | % | | | 5.83 | % | | | 8.69 | % |
| Class C (Inception 3/3/08)* | | | 24.17 | % | | | 7.63 | % | | | 5.60 | % | | | 8.24 | % |
| MSCI ACWI Index | | | 5.42 | % | | | 8.70 | % | | | 8.48 | % | | | 7.86 | % |
| | | | | | | | | | | | Since | |
| | | 1 YEAR | | | 5 YEARS | | | 10 YEARS | | | 5/31/2013 | |
| Class I (Inception 5/31/13) | | | 26.55 | % | | | 8.76 | % | | | n/a | | | | 8.88 | % |
| Class Z (Inception 5/31/13) | | | 26.76 | % | | | 8.94 | % | | | n/a | | | | 9.10 | % |
| MSCI ACWI Index | | | 5.42 | % | | | 8.70 | % | | | n/a | | | | 8.28 | % |
The performance data quoted represents past performance, which is not an indication or a guarantee of future results. The Fund’s average annual total returns include changes in share price and reinvestment of dividends and capital gains. Class A returns reflect the maximum initial sales charge and Class C returns reflect the applicable contingent deferred sales charge. Alger Global Focus Fund prior, to March 28, 2018, followed different investment strategies and was managed by different portfolio managers, and before August 15, 2018 was named “Alger Global Growth Fund.” Prior to May 31, 2013, the Fund was named “Alger China-U.S. Growth Fund” and followed different investment strategies. Performance prior to March 28, 2018, reflects these prior management styles and does not reflect the Fund’s current investment strategies and investment personnel. The chart and table above do not reflect the deduction of taxes that a shareholder would have paid on Fund distributions or on the redemption of Fund shares. Investment return and principal will fluctuate and the Fund’s shares, when redeemed, may be worth more or less than their original cost. Current performance may be higher or lower than the performance quoted. For updated performance, visit us at www.alger.com or call us at (800) 992-3863.
| * | Since inception performance is calculated since the inception of Class A shares. Historical performance prior to March 3, 2008, inception of the class, is that of the Fund’s Class A shares, reduced to reflect the current maximum sales charge and the higher operating expenses of Class C shares. |
PORTFOLIO SUMMARY†
October 31, 2020 (Unaudited)
| | | Alger Global Focus | |
| COUNTRY | | Fund | |
| Australia | | | 5.0 | % |
| Belgium | | | 1.9 | |
| China | | | 7.0 | |
| Denmark | | | 2.3 | |
| France | | | 10.5 | |
| Hong Kong | | | 6.1 | |
| India | | | 1.9 | |
| Ireland | | | 2.3 | |
| Italy | | | 4.6 | |
| Japan | | | 7.6 | |
| Netherlands | | | 3.1 | |
| New Zealand | | | 2.3 | |
| Spain | | | 2.2 | |
| Sweden | | | 2.9 | |
| Switzerland | | | 2.8 | |
| United States | | | 34.2 | |
| Cash and Net Other Assets | | | 3.3 | |
| | | | 100.0 | % |
| † | Based on net assets for the fund. |
ALGER GLOBAL FOCUS FUND
Schedule of Investments October 31, 2020
| COMMON STOCKS—96.7% | | SHARES | | | VALUE | |
| AUSTRALIA—5.0% | | | | | | | | |
| INTERNET & DIRECT MARKETING RETAIL—2.7% | | | | | | | | |
| Kogan.com Ltd. | | | 42,049 | | | $ | 608,919 | |
| | | | | | | | | |
| IT CONSULTING & OTHER SERVICES—2.3% | | | | | | | | |
| Appen Ltd. | | | 22,200 | | | | 505,817 | |
| | | | | | | | | |
| TOTAL AUSTRALIA | | | | | | | | |
| (Cost $832,709) | | | | | | | 1,114,736 | |
| | | | | | | | | |
| BELGIUM—1.9% | | | | | | | | |
| APPLICATION SOFTWARE—1.9% | | | | | | | | |
| Unifiedpost Group SA* | | | 16,713 | | | | 434,084 | |
| (Cost $429,261) | | | | | | | | |
| | | | | | | | | |
| CHINA—7.0% | | | | | | | | |
| AUTOMOBILE MANUFACTURERS—1.9% | | | | | | | | |
| Geely Automobile Holdings Ltd. | | | 208,000 | | | | 427,408 | |
| | | | | | | | | |
| INTERACTIVE MEDIA & SERVICES—3.0% | | | | | | | | |
| Tencent Holdings Ltd. | | | 8,950 | | | | 683,826 | |
| | | | | | | | | |
| INTERNET & DIRECT MARKETING RETAIL—2.1% | | | | | | | | |
| JD.com, Inc.#,* | | | 5,750 | | | | 468,740 | |
| | | | | | | | | |
| TOTAL CHINA | | | | | | | | |
| (Cost $1,374,434) | | | | | | | 1,579,974 | |
| | | | | | | | | |
| DENMARK—2.3% | | | | | | | | |
| BIOTECHNOLOGY—2.3% | | | | | | | | |
| Genmab AS* | | | 1,525 | | | | 509,412 | |
| (Cost $309,174) | | | | | | | | |
| | | | | | | | | |
| FRANCE—10.5% | | | | | | | | |
| AEROSPACE & DEFENSE—1.9% | | | | | | | | |
| Airbus SE | | | 6,000 | | | | 439,015 | |
| | | | | | | | | |
| APPAREL ACCESSORIES & LUXURY GOODS—3.0% | | | | | | | | |
| LVMH Moet Hennessy Louis Vuitton SE | | | 1,430 | | | | 670,338 | |
| | | | | | | | | |
| LIFE SCIENCES TOOLS & SERVICES—3.0% | | | | | | | | |
| Eurofins Scientific SE* | | | 850 | | | | 676,902 | |
| | | | | | | | | |
| RESEARCH & CONSULTING SERVICES—2.6% | | | | | | | | |
| Teleperformance | | | 1,950 | | | | 585,382 | |
| | | | | | | | | |
| TOTAL FRANCE | | | | | | | | |
| (Cost $1,839,615) | | | | | | | 2,371,637 | |
| | | | | | | | | |
| HONG KONG—6.1% | | | | | | | | |
| APPAREL ACCESSORIES & LUXURY GOODS—1.7% | | | | | | | | |
| Samsonite International SA*,(a) | | | 369,740 | | | | 377,188 | |
| | | | | | | | | |
| FINANCIAL EXCHANGES & DATA—2.4% | | | | | | | | |
| Hong Kong Exchanges & Clearing Ltd. | | | 11,200 | | | | 536,686 | |
| | | | | | | | | |
| INDUSTRIAL MACHINERY—2.0% | | | | | | | | |
| Techtronic Industries Co., Ltd. | | | 34,600 | | | | 466,036 | |
| | | | | | | | | |
| TOTAL HONG KONG | | | | | | | | |
| (Cost $992,020) | | | | | | | 1,379,910 | |
ALGER GLOBAL FOCUS FUND
Schedule of Investments October 31, 2020 (Continued)
| COMMON STOCKS—96.7% (CONT.) | | SHARES | | | VALUE | |
| INDIA—1.9% | | | | | | | | |
| OIL & GAS REFINING & MARKETING—1.9% | | | | | | | | |
| Reliance Industries Ltd. | | | 15,300 | | | $ | 423,693 | |
| (Cost $445,392) | | | | | | | | |
| | | | | | | | | |
| IRELAND—2.3% | | | | | | | | |
| PACKAGED FOODS & MEATS—2.3% | | | | | | | | |
| Kerry Group PLC, Cl. A | | | 4,350 | | | | 520,726 | |
| (Cost $488,707) | | | | | | | | |
| | | | | | | | | |
| ITALY—4.6% | | | | | | | | |
| APPAREL ACCESSORIES & LUXURY GOODS—2.1% | | | | | | | | |
| Moncler SpA | | | 11,953 | | | | 478,280 | |
| | | | | | | | | |
| AUTOMOBILE MANUFACTURERS—2.5% | | | | | | | | |
| Ferrari NV | | | 3,100 | | | | 553,102 | |
| | | | | | | | | |
| TOTAL ITALY | | | | | | | | |
| (Cost $936,347) | | | | | | | 1,031,382 | |
| | | | | | | | | |
| JAPAN—7.6% | | | | | | | | |
| ELECTRONIC COMPONENTS—2.2% | | | | | | | | |
| Murata Manufacturing Co., Ltd. | | | 6,900 | | | | 483,842 | |
| | | | | | | | | |
| HEALTHCARE SUPPLIES—2.2% | | | | | | | | |
| Hoya Corp. | | | 4,400 | | | | 496,523 | |
| | | | | | | | | |
| INDUSTRIAL MACHINERY—1.7% | | | | | | | | |
| FANUC Corp. | | | 1,800 | | | | 380,168 | |
| | | | | | | | | |
| SEMICONDUCTOR EQUIPMENT—1.5% | | | | | | | | |
| Lasertec Corp. | | | 3,900 | | | | 337,789 | |
| | | | | | | | | |
| TOTAL JAPAN | | | | | | | | |
| (Cost $1,486,578) | | | | | | | 1,698,322 | |
| | | | | | | | | |
| NETHERLANDS—3.1% | | | | | | | | |
| DATA PROCESSING & OUTSOURCED SERVICES—3.1% | | | | | | | | |
| Adyen NV*,(a) | | | 415 | | | | 697,539 | |
| (Cost $337,571) | | | | | | | | |
| | | | | | | | | |
| NEW ZEALAND—2.3% | | | | | | | | |
| APPLICATION SOFTWARE—2.3% | | | | | | | | |
| Xero Ltd.* | | | 6,700 | | | | 519,961 | |
| (Cost $295,876) | | | | | | | | |
| | | | | | | | | |
| SPAIN—2.2% | | | | | | | | |
| BIOTECHNOLOGY—2.2% | | | | | | | | |
| Grifols SA# | | | 28,597 | | | | 485,577 | |
| (Cost $582,439) | | | | | | | | |
| | | | | | | | | |
| SWEDEN—2.9% | | | | | | | | |
| INTERACTIVE HOME ENTERTAINMENT—2.9% | | | | | | | | |
| Stillfront Group AB* | | | 5,463 | | | | 642,089 | |
| (Cost $425,331) | | | | | | | | |
| | | | | | | | | |
| SWITZERLAND—2.8% | | | | | | | | |
| SPECIALTY CHEMICALS—2.8% | | | | | | | | |
| Sika AG | | | 2,600 | | | | 639,613 | |
| (Cost $475,449) | | | | | | | | |
ALGER GLOBAL FOCUS FUND
Schedule of Investments October 31, 2020 (Continued)
| COMMON STOCKS—96.7% (CONT.) | | SHARES | | | VALUE | |
| UNITED STATES—34.2% | | | | | | | | |
| APPAREL ACCESSORIES & LUXURY GOODS—2.8% | | | | | | | | |
| Lululemon Athletica, Inc.* | | | 2,000 | | | $ | 638,580 | |
| | | | | | | | | |
| APPLICATION SOFTWARE—9.4% | | | | | | | | |
| Adobe, Inc.* | | | 1,943 | | | | 868,715 | |
| Autodesk, Inc.* | | | 2,325 | | | | 547,630 | |
| Intuit, Inc. | | | 1,900 | | | | 597,892 | |
| Palantir Technologies, Inc., Cl. A*,@,(b) | | | 12,902 | | | | 111,755 | |
| | | | | | | | 2,125,992 | |
| FINANCIAL EXCHANGES & DATA—2.2% | | | | | | | | |
| MSCI, Inc., Cl. A | | | 1,400 | | | | 489,776 | |
| | | | | | | | | |
| HEALTHCARE EQUIPMENT—2.4% | | | | | | | | |
| Insulet Corp.* | | | 2,400 | | | | 533,400 | |
| | | | | | | | | |
| INTERNET & DIRECT MARKETING RETAIL—5.3% | | | | | | | | |
| Amazon.com, Inc.* | | | 390 | | | | 1,184,098 | |
| | | | | | | | | |
| SEMICONDUCTOR EQUIPMENT—3.2% | | | | | | | | |
| Applied Materials, Inc. | | | 12,200 | | | | 722,606 | |
| | | | | | | | | |
| SEMICONDUCTORS—4.0% | | | | | | | | |
| NVIDIA Corp. | | | 1,800 | | | | 902,448 | |
| | | | | | | | | |
| SYSTEMS SOFTWARE—4.9% | | | | | | | | |
| Microsoft Corp. | | | 5,450 | | | | 1,103,462 | |
| | | | | | | | | |
| TOTAL UNITED STATES | | | | | | | | |
| (Cost $5,105,799) | | | | | | | 7,700,362 | |
| | | | | | | | | |
| TOTAL COMMON STOCKS | | | | | | | | |
| (Cost $16,356,702) | | | | | | | 21,749,017 | |
| | | | | | | | | |
| PREFERRED STOCKS—0.0% | | | SHARES | | | | VALUE | |
| UNITED STATES—0.0% | | | | | | | | |
| BIOTECHNOLOGY—0.0% | | | | | | | | |
| Prosetta Biosciences, Inc., Series D*,@,(c),(d) | | | 33,858 | | | | 5,079 | |
| (Cost $152,361) | | | | | | | | |
| Total Investments | | | | | | | | |
| (Cost $16,509,063) | | | 96.7 | % | | $ | 21,754,096 | |
| Affiliated Securities (Cost $152,361) | | | | | | | 5,079 | |
| Unaffiliated Securities (Cost $16,356,702) | | | | | | | 21,749,017 | |
| Other Assets in Excess of Liabilities | | | 3.3 | % | | | 750,181 | |
| NET ASSETS | | | 100.0 | % | | $ | 22,504,277 | |
| # | American Depositary Receipts. |
| (a) | Pursuant to Securities and Exchange Commission Rule 144A, these securities may be sold prior to their maturity only to qualified institutional buyers. These securities represent 4.8% of the net assets of the Fund. |
| (b) | Restricted security – Security restricted from resale until the public disclosure of the company’s financial results for the year ending December 31, 2020. |
| (c) | Security is valued in good faith at fair value determined using significant unobservable inputs pursuant to procedures established by the Board. |
| (d) | Deemed an affiliate of the Fund in accordance with Section 2(a)(3) of the Investment Company Act of 1940. See Note 11 - Affiliated Securities. |
| * | Non-income producing security. |
ALGER GLOBAL FOCUS FUND
Schedule of Investments October 31, 2020 (Continued)
| @ | Restricted security - Investment in security not registered under the Securities Act of 1933. Sales or transfers of the investment may be restricted only to qualified buyers. |
| | | | | | % of net assets | | | | | | % of net assets | |
| | | Acquisition | | | Acquisition | | | (Acquisition | | | Market | | | as of | |
| Security | | Date(s) | | | Cost | | | Date) | | | Value | | | 10/31/2020 | |
| Palantir Technologies, Inc., Cl. A | | | 10/1/20 | | | $ | 84,952 | | | | 0.36 | % | | $ | 111,755 | | | | 0.50 | % |
| Prosetta Biosciences, Inc., Series D | | | 2/6/15 | | | | 152,361 | | | | 0.40 | % | | | 5,079 | | | | 0.02 | % |
| Total | | | | | | | | | | | | | | $ | 116,834 | | | | 0.52 | % |
See Notes to Financial Statements.
ALGER GLOBAL FOCUS FUND
Statement of Assets and Liabilities October 31, 2020
| | | Alger Global Focus | |
| | | Fund | |
| ASSETS: | | | | |
| Investments in unaffiliated securities, at value (Identified cost below)* see accompanying schedule of investments | | $ | 21,749,017 | |
| Investments in affiliated securities, at value (Identified cost below)** see accompanying schedule of investments | | | 5,079 | |
| Cash and cash equivalents | | | 598,421 | |
| Foreign cash † | | | 481 | |
| Receivable for investment securities sold | | | 566,083 | |
| Receivable for shares of beneficial interest sold | | | 25,150 | |
| Dividends and interest receivable | | | 30,922 | |
| Receivable from Investment Manager | | | 13,728 | |
| Prepaid expenses | | | 62,845 | |
| Total Assets | | | 23,051,726 | |
| | | | | |
| LIABILITIES: | | | | |
| Payable for investment securities purchased | | | 435,851 | |
| Accrued professional fees | | | 32,480 | |
| Accrued printing fees | | | 21,915 | |
| Accrued investment advisory fees | | | 15,993 | |
| Accrued transfer agent fees | | | 11,716 | |
| Accrued custodian fees | | | 10,747 | |
| Accrued distribution fees | | | 5,535 | |
| Accrued administrative fees | | | 550 | |
| Accrued shareholder administrative fees | | | 308 | |
| Accrued trustee fees | | | 55 | |
| Accrued other expenses | | | 12,299 | |
| Total Liabilities | | | 547,449 | |
| NET ASSETS | | $ | 22,504,277 | |
| | | | | |
| NET ASSETS CONSIST OF: | | | | |
| Paid in capital (par value of $.001 per share) | | | 17,814,724 | |
| Distributable earnings | | | 4,689,553 | |
| NET ASSETS | | $ | 22,504,277 | |
| * Identified cost | | $ | 16,356,702 | (a) |
| ** Identified cost | | $ | 152,361 | (a) |
| † Cost of foreign cash | | $ | 484 | |
See Notes to Financial Statements.
ALGER GLOBAL FOCUS FUND
Statement of Assets and Liabilities October 31, 2020 (Continued)
| | | Alger Global Focus | |
| | | Fund | |
| NET ASSETS BY CLASS: | | | | |
| Class A | | $ | 16,702,567 | |
| Class C | | $ | 1,909,732 | |
| Class I | | $ | 546,368 | |
| Class Z | | $ | 3,345,610 | |
| | | | | |
| SHARES OF BENEFICIAL INTEREST OUTSTANDING — NOTE 6: | | | | |
| Class A | | | 637,242 | |
| Class C | | | 77,813 | |
| Class I | | | 21,492 | |
| Class Z | | | 124,909 | |
| | | | | |
| NET ASSET VALUE PER SHARE: | | | | |
| Class A — Net Asset Value Per Share Class A | | $ | 26.21 | |
| Class A — Offering Price Per Share (includes a 5.25% sales charge) | | $ | 27.66 | |
| Class C — Net Asset Value Per Share Class C | | $ | 24.54 | |
| Class I — Net Asset Value Per Share Class I | | $ | 25.42 | |
| Class Z — Net Asset Value Per Share Class Z | | $ | 26.78 | |
See Notes to Financial Statements.
| (a) | At October 31, 2020, the net unrealized appreciation on investments, based on cost for federal income tax purposes of $16,577,653, amounted to $5,176,443 which consisted of aggregate gross unrealized appreciation of $5,573,584 and aggregate gross unrealized depreciation of $397,141. |
ALGER GLOBAL FOCUS FUND
Statement of Operations for the year ended October 31, 2020
| | | Alger Global Focus | |
| | | Fund | |
| INCOME: | | | | |
| Dividends (net of foreign withholding taxes*) | | $ | 167,936 | |
| Interest | | | 1,906 | |
| Total Income | | | 169,842 | |
| | | | | |
| EXPENSES: | | | | |
| Investment advisory fees — Note 3(a) | | | 167,445 | |
| Distribution fees — Note 3(c) | | | | |
| Class A | | | 38,666 | |
| Class C | | | 20,976 | |
| Class I | | | 1,252 | |
| Shareholder administrative fees — Note 3(f) | | | 3,235 | |
| Administration fees — Note 3(b) | | | 5,756 | |
| Custodian fees | | | 51,656 | |
| Transfer agent fees — Note 3(f) | | | 15,333 | |
| Printing fees | | | 6,470 | |
| Professional fees | | | 55,219 | |
| Registration fees | | | 66,796 | |
| Trustee fees — Note 3(g) | | | 681 | |
| Fund accounting fees | | | 15,685 | |
| Other expenses | | | 15,702 | |
| Total Expenses | | | 464,872 | |
| Less, expense reimbursements/waivers — Note 3(a) | | | (151,494 | ) |
| Net Expenses | | | 313,378 | |
| NET INVESTMENT LOSS | | | (143,536 | ) |
| | | | | |
| REALIZED AND UNREALIZED GAIN (LOSS) ON INVESTMENTS AND FOREIGN CURRENCY: | | | | |
| Net realized gain on unaffiliated investments | | | 1,022,667 | |
| Net realized (loss) on foreign currency transactions | | | (14,215 | ) |
| Net change in unrealized appreciation on unaffiliated investments | | | 3,979,224 | |
| Net change in unrealized (depreciation) on affiliated investments | | | (30,810 | ) |
| Net change in unrealized appreciation on foreign currency | | | 2,504 | |
| Net realized and unrealized gain on investments and foreign currency | | | 4,959,370 | |
| NET INCREASE IN NET ASSETS RESULTING FROM OPERATIONS | | $ | 4,815,834 | |
| * Foreign withholding taxes | | $ | 16,859 | |
See Notes to Financial Statements.
ALGER GLOBAL FOCUS FUND
Statements of Changes in Net Assets
| | | Alger Global Focus Fund | |
| | | For the | | | For the | |
| | | Year Ended | | | Year Ended | |
| | | October 31, 2020 | | | October 31, 2019 | |
| Net investment loss | | $ | (143,536 | ) | | $ | (132,586 | ) |
| Net realized gain (loss) on investments, forward foreign currency contracts and foreign currency | | | 1,008,452 | | | | (639,717 | ) |
| Net change in unrealized appreciation on investments and foreign currency | | | 3,950,918 | | | | 2,195,875 | |
| Net increase in net assets resulting from operations | | | 4,815,834 | | | | 1,423,572 | |
| | | | | | | | | |
| Dividends and distributions to shareholders: | | | | | | | | |
| Class A | | | (431,711 | ) | | | (1,231,732 | ) |
| Class C | | | (49,694 | ) | | | (218,988 | ) |
| Class I | | | (16,795 | ) | | | (62,552 | ) |
| Class Z | | | (96,643 | ) | | | (376,514 | ) |
| Total dividends and distributions to shareholders | | | (594,843 | ) | | | (1,889,786 | ) |
| | | | | | | | | |
| Increase (decrease) from shares of beneficial interest transactions: | | | | | | | | |
| Class A | | | (1,373,317 | ) | | | (455,650 | ) |
| Class C | | | (756,625 | ) | | | (529,659 | ) |
| Class I | | | (13,835 | ) | | | (234,158 | ) |
| Class Z | | | 35,112 | | | | (2,017,044 | ) |
| Net decrease from shares of beneficial interest transactions — Note 6 | | | (2,108,665 | ) | | | (3,236,511 | ) |
| Total increase (decrease) | | | 2,112,326 | | | | (3,702,725 | ) |
| | | | | | | | | |
| Net Assets: | | | | | | | | |
| Beginning of period | | | 20,391,951 | | | | 24,094,676 | |
| END OF PERIOD | | $ | 22,504,277 | | | $ | 20,391,951 | |
See Notes to Financial Statements.
ALGER GLOBAL FOCUS FUND
Financial Highlights for a share outstanding throughout the period
| | | Class A | |
| | | Year ended | | | Year ended | | | Year ended | | | Year ended | | | Year ended | |
| Alger Global Focus Fund | | 10/31/2020 | | | 10/31/2019 | | | 10/31/2018 | | | 10/31/2017 | | | 10/31/2016 | |
| Net asset value, beginning of period | | $ | 21.37 | | | $ | 21.88 | | | $ | 24.76 | | | $ | 20.20 | | | $ | 20.65 | |
| INCOME FROM INVESTMENT OPERATIONS: | | | | | | | | | | | | | | | | | | | | |
| Net investment income (loss)(i) | | | (0.16 | ) | | | (0.12 | ) | | | (0.04 | ) | | | 0.03 | | | | 0.10 | |
| Net realized and unrealized gain (loss) on investments | | | 5.62 | | | | 1.36 | | | | (1.86 | ) | | | 4.74 | | | | (0.55 | ) |
| Total from investment operations | | | 5.46 | | | | 1.24 | | | | (1.90 | ) | | | 4.77 | | | | (0.45 | ) |
| Dividends from net investment income | | | (0.62 | ) | | | (0.14 | ) | | | (0.98 | ) | | | (0.21 | ) | | | – | |
| Distributions from net realized gains | | | – | | | | (1.61 | ) | | | – | | | | – | | | | – | |
| Net asset value, end of period | | $ | 26.21 | | | $ | 21.37 | | | $ | 21.88 | | | $ | 24.76 | | | $ | 20.20 | |
| Total return(ii) | | | 26.08 | % | | | 6.84 | % | | | (8.03 | )% | | | 23.80 | % | | | (2.18 | )% |
| RATIOS/SUPPLEMENTAL DATA: | | | | | | | | | | | | | | | | | | | | |
| Net assets, end of period (000’s omitted) | | $ | 16,703 | | | $ | 14,967 | | | $ | 15,679 | | | $ | 19,962 | | | $ | 19,805 | |
| Ratio of gross expenses to average net assets | | | 2.19 | % | | | 2.50 | % | | | 2.19 | % | | | 2.48 | % | | | 2.37 | % |
| Ratio of expense reimbursements to average net assets | | | (0.69 | )% | | | (1.08 | )% | | | (0.69 | )% | | | (0.98 | )% | | | (0.87 | )% |
| Ratio of net expenses to average net assets | | | 1.50 | % | | | 1.42 | % | | | 1.50 | % | | | 1.50 | % | | | 1.50 | % |
| Ratio of net investment income (loss) to average net assets | | | (0.69 | )% | | | (0.60 | )% | | | (0.18 | )% | | | 0.14 | % | | | 0.52 | % |
| Portfolio turnover rate | | | 102.71 | % | | | 224.06 | % | | | 217.51 | % | | | 134.76 | % | | | 138.05 | % |
See Notes to Financial Statements.
| (i) | Amount was computed based on average shares outstanding during the period. |
| (ii) | Does not reflect the effect of sales charges, if applicable. |
ALGER GLOBAL FOCUS FUND
Financial Highlights for a share outstanding throughout the period
| | | Class C | |
| | | Year ended | | | Year ended | | | Year ended | | | Year ended | | | Year ended | |
| Alger Global Focus Fund | | 10/31/2020 | | | 10/31/2019 | | | 10/31/2018 | | | 10/31/2017 | | | 10/31/2016 | |
| Net asset value, beginning of period | | $ | 20.05 | | | $ | 20.65 | | | $ | 23.41 | | | $ | 19.11 | | | $ | 19.69 | |
| INCOME FROM INVESTMENT OPERATIONS: | | | | | | | | | | | | | | | | | | | | |
| Net investment loss(i) | | | (0.31 | ) | | | (0.26 | ) | | | (0.22 | ) | | | (0.12 | ) | | | (0.04 | ) |
| Net realized and unrealized gain (loss) on Investments | | | 5.27 | | | | 1.27 | | | | (1.74 | ) | | | 4.48 | | | | (0.54 | ) |
| Total from investment operations | | | 4.96 | | | | 1.01 | | | | (1.96 | ) | | | 4.36 | | | | (0.58 | ) |
| Dividends from net investment income | | | (0.47 | ) | | | – | | | | (0.80 | ) | | | (0.06 | ) | | | – | |
| Distributions from net realized gains | | | – | | | | (1.61 | ) | | | – | | | | – | | | | – | |
| Net asset value, end of period | | $ | 24.54 | | | $ | 20.05 | | | $ | 20.65 | | | $ | 23.41 | | | $ | 19.11 | |
| Total return(ii) | | | 25.17 | % | | | 6.00 | % | | | (8.70 | )% | | | 22.88 | % | | | (2.95 | )% |
| RATIOS/SUPPLEMENTAL DATA: | | | | | | | | | | | | | | | | | | | | |
| Net assets, end of period (000’s omitted) | | $ | 1,910 | | | $ | 2,241 | | | $ | 2,844 | | | $ | 3,673 | | | $ | 4,720 | |
| Ratio of gross expenses to average net assets | | | 2.96 | % | | | 3.30 | % | | | 2.94 | % | | | 3.24 | % | | | 3.13 | % |
| Ratio of expense reimbursements to average net assets | | | (0.71 | )% | | | (1.13 | )% | | | (0.69 | )% | | | (0.99 | )% | | | (0.88 | )% |
| Ratio of net expenses to average net assets | | | 2.25 | % | | | 2.17 | % | | | 2.25 | % | | | 2.25 | % | | | 2.25 | % |
| Ratio of net investment loss to average net assets | | | (1.42 | )% | | | (1.35 | )% | | | (0.94 | )% | | | (0.59 | )% | | | (0.23 | )% |
| Portfolio turnover rate | | | 102.71 | % | | | 224.06 | % | | | 217.51 | % | | | 134.76 | % | | | 138.05 | % |
See Notes to Financial Statements.
| (i) | Amount was computed based on average shares outstanding during the period. |
| (ii) | Does not reflect the effect of sales charges, if applicable. |
ALGER GLOBAL FOCUS FUND
Financial Highlights for a share outstanding throughout the period
| | | Class I | |
| | | Year ended | | | Year ended | | | Year ended | | | Year ended | | | Year ended | |
| Alger Global Focus Fund | | 10/31/2020 | | | 10/31/2019 | | | 10/31/2018 | | | 10/31/2017 | | | 10/31/2016 | |
| Net asset value, beginning of period | | $ | 20.79 | | | $ | 21.27 | | | $ | 24.05 | | | $ | 20.36 | | | $ | 20.78 | |
| INCOME FROM INVESTMENT OPERATIONS: | | | | | | | | | | | | | | | | | | | | |
| Net investment income (loss)(i) | | | (0.08 | ) | | | (0.06 | ) | | | (0.01 | ) | | | 0.08 | | | | 0.17 | |
| Net realized and unrealized gain (loss) on investments | | | 5.45 | | | | 1.32 | | | | (1.77 | ) | | | 4.64 | | | | (0.59 | ) |
| Total from investment operations | | | 5.37 | | | | 1.26 | | | | (1.78 | ) | | | 4.72 | | | | (0.42 | ) |
| Dividends from net investment income | | | (0.74 | ) | | | (0.13 | ) | | | (1.00 | ) | | | (1.03 | ) | | | – | |
| Distributions from net realized gains | | | – | | | | (1.61 | ) | | | – | | | | – | | | | – | |
| Net asset value, end of period | | $ | 25.42 | | | $ | 20.79 | | | $ | 21.27 | | | $ | 24.05 | | | $ | 20.36 | |
| Total return(ii) | | | 26.55 | % | | | 7.18 | % | | | (7.77 | )% | | | 24.15 | % | | | (2.02 | )% |
| RATIOS/SUPPLEMENTAL DATA: | | | | | | | | | | | | | | | | | | | | |
| Net assets, end of period (000’s omitted) | | $ | 546 | | | $ | 466 | | | $ | 714 | | | $ | 286 | | | $ | 384 | |
| Ratio of gross expenses to average net assets | | | 2.18 | % | | | 2.63 | % | | | 2.19 | % | | | 2.63 | % | | | 2.33 | % |
| Ratio of expense reimbursements to average net assets | | | (1.03 | )% | | | (1.51 | )% | | | (0.94 | )% | | | (1.38 | )% | | | (1.08 | )% |
| Ratio of net expenses to average net assets | | | 1.15 | % | | | 1.12 | % | | | 1.25 | % | | | 1.25 | % | | | 1.25 | % |
| Ratio of net investment income (loss) to average net assets | | | (0.35 | )% | | | (0.28 | )% | | | (0.04 | )% | | | 0.37 | % | | | 0.86 | % |
| Portfolio turnover rate | | | 102.71 | % | | | 224.06 | % | | | 217.51 | % | | | 134.76 | % | | | 138.05 | % |
See Notes to Financial Statements.
| (i) | Amount was computed based on average shares outstanding during the period. |
| (ii) | Does not reflect the effect of sales charges, if applicable. |
ALGER GLOBAL FOCUS FUND
Financial Highlights for a share outstanding throughout the period
| | | Class Z | |
| | | Year ended | | | Year ended | | | Year ended | | | Year ended | | | Year ended | |
| Alger Global Focus Fund | | 10/31/2020 | | | 10/31/2019 | | | 10/31/2018 | | | 10/31/2017 | | | 10/31/2016 | |
| Net asset value, beginning of period | | $ | 21.89 | | | $ | 22.37 | | | $ | 25.26 | | | $ | 20.55 | | | $ | 20.92 | |
| INCOME FROM INVESTMENT OPERATIONS: | | | | | | | | | | | | | | | | | | | | |
| Net investment income (loss)(i) | | | (0.04 | ) | | | (0.03 | ) | | | 0.05 | | | | 0.12 | | | | 0.19 | |
| Net realized and unrealized gain (loss) on investments | | | 5.74 | | | | 1.39 | | | | (1.90 | ) | | | 4.83 | | | | (0.56 | ) |
| Total from investment operations | | | 5.70 | | | | 1.36 | | | | (1.85 | ) | | | 4.95 | | | | (0.37 | ) |
| Dividends from net investment income | | | (0.81 | ) | | | (0.23 | ) | | | (1.04 | ) | | | (0.24 | ) | | | – | |
| Distributions from net realized gains | | | – | | | | (1.61 | ) | | | – | | | | – | | | | – | |
| Net asset value, end of period | | $ | 26.78 | | | $ | 21.89 | | | $ | 22.37 | | | $ | 25.26 | | | $ | 20.55 | |
| Total return(ii) | | | 26.76 | % | | | 7.33 | % | | | (7.67 | )% | | | 24.33 | % | | | 1.77 | % |
| RATIOS/SUPPLEMENTAL DATA: | | | | | | | | | | | | | | | | | | | | |
| Net assets, end of period (000’s omitted) | | $ | 3,346 | | | $ | 2,718 | | | $ | 4,857 | | | $ | 4,946 | | | $ | 3,563 | |
| Ratio of gross expenses to average net assets | | | 1.86 | % | | | 2.35 | % | | | 2.01 | % | | | 2.35 | % | | | 2.36 | % |
| Ratio of expense reimbursements to average net assets | | | (0.87 | )% | | | (1.38 | )% | | | (0.92 | )% | | | (1.26 | )% | | | (1.31 | )% |
| Ratio of net expenses to average net assets | | | 0.99 | % | | | 0.97 | % | | | 1.09 | % | | | 1.09 | % | | | 1.05 | % |
| Ratio of net investment income (loss) to average net assets | | | (0.19 | )% | | | (0.12 | )% | | | 0.21 | % | | | 0.53 | % | | | 0.92 | % |
| Portfolio turnover rate | | | 102.71 | % | | | 224.06 | % | | | 217.51 | % | | | 134.76 | % | | | 138.05 | % |
See Notes to Financial Statements.
| (i) | Amount was computed based on average shares outstanding during the period. |
| (ii) | Does not reflect the effect of sales charges, if applicable. |
ALGER GLOBAL FOCUS FUND
NOTES TO FINANCIAL STATEMENTS
NOTE 1 — General:
Alger Global Focus Fund (the “Fund”) is an open-end registered investment company organized as a business trust under the laws of the Commonwealth of Massachusetts. The Fund qualifies as an investment company as defined in Financial Accounting Standards Board (“FASB”) Accounting Standards Codification 946-Financial Services — Investment Companies. The Fund’s investment objective is long-term capital appreciation. It seeks to achieve its objective by investing in equity securities in the United States and foreign countries. The Fund’s foreign investments will include securities of companies in both developed and emerging market countries. The Fund offers Class A, C, I and Z shares. Class A shares are generally subject to an initial sales charge while Class C shares are generally subject to a deferred sales charge. Class C shares will automatically convert to Class A shares on the fifth business day of the month following the tenth anniversary of the purchase date of a shareholder’s Class C shares, without the imposition of any sales load, fee or other charge. Class C shares held at certain dealers may not convert to Class A shares or may be converted on a different schedule. At conversion, a proportionate amount of shares representing reinvested dividends and distributions will also be converted into Class A shares. Effective August 27, 2019, Class C shares were closed to direct shareholders and are only available for purchase through certain financial intermediaries and group retirement plan recordkeeping platforms. Class I and Z shares are sold to institutional investors without an initial or deferred sales charge. Each class has identical rights to assets and earnings except that each share class bears the pro rata allocation of the Fund’s expenses other than a class expense (not including advisory or custodial fees or other expenses related to the management of the Fund’s assets).
NOTE 2 — Significant Accounting Policies:
(a) Investment Valuation: The Fund values its financial instruments at fair value using independent dealers or pricing services under policies approved by the Fund’s Board of Trustees (the “Board”). Investments held by the Fund are valued on each day the New York Stock Exchange (the “NYSE”) is open, as of the close of the NYSE (normally 4:00 p.m. Eastern Time).
Investments in money market funds and short-term securities held by the Fund having a remaining maturity of sixty days or less are valued at amortized cost which approximates market value.
Equity securities, including traded rights, warrants and option contracts for which valuation information is readily available, are valued at the last quoted sales price or official closing price on the primary market or exchange on which they are traded as reported by an independent pricing service. In the absence of quoted sales, such securities are valued at the bid price or, in the absence of a recent bid price, the equivalent as obtained from one or more of the major market makers for the securities to be valued.
ALGER GLOBAL FOCUS FUND
NOTES TO FINANCIAL STATEMENTS (Continued)
Debt securities generally trade in the over-the-counter market. Debt securities with remaining maturities of more than sixty days at the time of acquisition are valued on the basis of the last available bid prices or current market quotations provided by dealers or pricing services. In determining the value of a particular investment, pricing services may use certain information with respect to transactions in such investments, quotations from dealers, pricing matrixes, market transactions in comparable investments, various relationships observed in the market between investments and calculated yield measures based on valuation technology commonly employed in the market for such investments. Asset-backed and mortgage-backed securities are valued by independent pricing services using models that consider estimated cash flows of each tranche of the security, establish a benchmark yield and develop an estimated tranche-specific spread to the benchmark yield based on the unique attributes of the tranche. Debt securities with a remaining maturity of sixty days or less are valued at amortized cost which approximates market value.
Securities for which market quotations are not readily available are valued at fair value, as determined in good faith pursuant to procedures established by the Board and described further herein.
Securities in which the Fund invests may be traded in foreign markets that close before the close of the NYSE. Developments that occur between the close of the foreign markets and the close of the NYSE may result in adjustments to the closing foreign prices to reflect what the Fund’s investment adviser, pursuant to policies established by the Board, believes to be the fair value of these securities as of the close of the NYSE. The Fund may also fair value securities in other situations, for example, when a particular foreign market is closed but the Fund is open.
FASB Accounting Standards Codification 820 – Fair Value Measurements and Disclosures (“ASC 820”) defines fair value as the price that the Fund would receive upon selling an investment in a timely transaction to an independent buyer in the principal or most advantageous market of the investment. ASC 820 established a three-tier hierarchy to maximize the use of observable market data and minimize the use of unobservable inputs and to establish classification of fair value measurements for disclosure purposes. Inputs refer broadly to the assumptions that market participants would use in pricing the asset or liability and may be observable or unobservable. Observable inputs are based on market data obtained from sources independent of the Fund. Unobservable inputs are inputs that reflect the Fund’s own assumptions based on the best information available in the circumstances. The three-tier hierarchy of inputs is summarized in the three broad Levels listed below.
| · | Level 1 – quoted prices in active markets for identical investments |
| · | Level 2 – significant other observable inputs (including quoted prices for similar investments, interest rates, prepayment speeds, credit risk, etc.) |
| · | Level 3 – significant unobservable inputs (including the Fund’s own assumptions in determining the fair value of investments) |
ALGER GLOBAL FOCUS FUND
NOTES TO FINANCIAL STATEMENTS (Continued)
The Fund’s valuation techniques are generally consistent with either the market or the income approach to fair value. The market approach considers prices and other relevant information generated by market transactions involving identical or comparable assets to measure fair value. The income approach converts future amounts to a current, or discounted, single amount. These fair value measurements are determined on the basis of the value indicated by current market expectations about such future events. Inputs for Level 1 include exchange-listed prices and broker quotes in an active market. Inputs for Level 2 include the last trade price in the case of a halted security, an exchange-listed price which has been adjusted for fair value factors, and prices of closely related securities. Additional Level 2 inputs include an evaluated price which is based upon a compilation of observable market information such as spreads for fixed income and preferred securities. Inputs for Level 3 include, but are not limited to, revenue multiples, earnings before interest, taxes, depreciation and amortization (“EBITDA”) multiples, discount rates, time to exit and the probabilities of success of certain outcomes. Such unobservable market information may be obtained from a company’s financial statements and from industry studies, market data, and market indicators such as benchmarks and indexes. Because of the inherent uncertainty and often limited markets for restricted securities, the valuations assigned to such securities by the Fund may significantly differ from the valuations that would have been assigned by the Fund had there been an active market for such securities.
Valuation processes are determined by a Valuation Committee (“Committee”) authorized by the Board and comprised of representatives of the Fund’s investment adviser and officers of the Fund. The Committee reports its fair valuation determinations and related valuation information to the Board. The Board is responsible for approving the valuation policy and procedures.
While the Committee meets on an as-needed basis, the Committee generally meets quarterly to review and evaluate the effectiveness of the procedures for making fair value determinations. The Committee considers, among other things, the results of quarterly back testing of the fair value model for foreign securities, pricing comparisons between primary and secondary price sources, the outcome of price challenges put to the Fund’s pricing vendor, and variances between transactional prices and the previous day’s price.
(b) Cash and Cash Equivalents: Cash and cash equivalents include U.S. dollars, foreign cash and overnight time deposits.
(c) Securities Transactions and Investment Income: Securities transactions are recorded on a trade date basis. Realized gains and losses from securities transactions are recorded on the identified cost basis. Dividend income is recognized on the ex-dividend date and interest income is recognized on the accrual basis.
Premiums and discounts on debt securities purchased are amortized or accreted over the lives of the respective securities.
(d) Foreign Currency Transactions: The books and records of the Fund are maintained in U.S. dollars. Foreign currencies, investments and other assets and liabilities are translated into U.S. dollars at the prevailing rates of exchange on the valuation date. Purchases and sales of investment securities and income and expenses are translated into U.S. dollars at the prevailing exchange rates on the respective dates of such transactions.
Net realized gains and losses on foreign currency transactions represent net gains and losses from the disposition of foreign currencies, currency gains and losses realized between the trade dates and settlement dates of security transactions, and the difference between the amount of net investment income accrued and the U.S. dollar amount actually received. The effects of changes in foreign currency exchange rates on investments in securities are included in realized and unrealized gain or loss on investments in the accompanying Statement of Operations.
ALGER GLOBAL FOCUS FUND
NOTES TO FINANCIAL STATEMENTS (Continued)
(e) Forward Foreign Exchange Contracts: The Fund may enter into forward foreign currency contracts to hedge against foreign currency exchange rate risk on its non-U.S. dollar denominated securities or to facilitate settlement of foreign currency denominated portfolio transactions. A forward foreign currency contract is an agreement between two parties to buy and sell a currency at a set price on a future date. The contract is marked-to-market daily and the change in value is recorded by the Fund as an unrealized gain or loss. Realized gains or losses equal to the difference between the value of the contract at the time it was opened and the value at the time it was closed are recorded upon delivery or receipt of the currency.
These contracts may involve market risk in excess of the unrealized gain or loss reflected on the Statement of Assets and Liabilities. In addition, the Fund could be exposed to risk if the counterparties are unable to meet the terms of the contracts or if the value of the currency changes unfavorably to the base currency.
(f) Dividends to Shareholders: Dividends and distributions payable to shareholders are recorded on the ex-dividend date. The Fund declares and pays dividends from net investment income, if available, annually. Dividends from net realized gains, offset by any loss carryforward, are declared and paid annually after the end of the fiscal year in which earned.
Each class is treated separately in determining the amounts of dividends from net investment income payable to holders of its shares.
The characterization of distributions to shareholders for financial reporting purposes is determined in accordance with federal income tax rules. Therefore, the source of the Fund’s distributions may be shown in the accompanying financial statements as either from, or in excess of, net investment income, net realized gain on investment transactions, or return of capital, depending on the type of book/tax differences that may exist. Capital accounts within the financial statements are adjusted for permanent book/tax differences. Reclassifications result primarily from the differences in tax treatment of net operating losses, passive foreign investment companies, and foreign currency transactions. The reclassifications are done annually at fiscal year-end and have no impact on the net asset value of the Fund and are designed to present the Fund’s capital accounts on a tax basis.
(g) Federal Income Taxes: It is the Fund’s policy to comply with the requirements of the Internal Revenue Code Subchapter M applicable to regulated investment companies and to distribute all of its taxable income to its shareholders. Provided that the Fund maintains such compliance, no federal income tax provision is required.
FASB Accounting Standards Codification 740 – Income Taxes (“ASC 740”) requires the Fund to measure and recognize in its financial statements the benefit of a tax position taken (or expected to be taken) on an income tax return if such position will more likely than not be sustained upon examination based on the technical merits of the position. No tax years are currently under investigation. The Fund files income tax returns in the U.S. Federal jurisdiction, as well as the New York State and New York City jurisdictions. The statute of limitations on the Fund’s tax returns remains open for the tax years 2017-2020. Management does not believe there are any uncertain tax positions that require recognition of a tax liability.
ALGER GLOBAL FOCUS FUND
NOTES TO FINANCIAL STATEMENTS (Continued)
(h) Allocation Methods: Income, realized and unrealized gains and losses, and expenses of the Fund are allocated among the Fund’s classes based on relative net assets, with the exception of distribution fees, transfer agency fees, and shareholder servicing and related fees.
(i) Estimates: These financial statements have been prepared in accordance with accounting principles generally accepted in the United States of America, which require using estimates and assumptions that affect the reported amounts therein. Actual results may differ from those estimates. All such estimates are of a normal recurring nature.
(j) Recent Accounting Pronouncement: In August 2018, FASB issued Accounting Standards Update 2018-13 “Disclosure Framework - Changes to the Disclosure Requirements for Fair Value Measurement” (“ASU 2018-13”) which modifies disclosure requirements for fair value measurements, principally for Level 3 securities and transfers between levels of the fair value hierarchy. ASU 2018-13 is effective for fiscal years beginning after December 15, 2019 and for interim periods within those fiscal years. The Fund has complied with ASU 2018-13 for the year ended October 31, 2020, resulting in (1) new disclosure for the total unrealized gain or loss attributable to fair value changes in Level 3 securities, and (2) the elimination of the disclosure of (a) the reasons for and amounts of transfers between Level 1 and Level 2, and (b) the Fund’s valuation processes for Level 3 securities.
NOTE 3 — Investment Advisory Fees and Other Transactions with Affiliates:
(a) Investment Advisory Fees: Fees incurred by the Fund, pursuant to the provisions of the Fund’s Investment Advisory Agreement with Fred Alger Management, LLC (“Alger Management” or the “Investment Manager”), are payable monthly and computed based on the following rates. The actual rate paid as a percentage of average daily net assets, for the year ended October 31, 2020, is set forth below under the heading “Actual Rate”:
| | | Tier 1 | | | Tier 2 | | | Actual Rate | |
| Alger Global Focus Fund(a) | | | 0.80 | % | | | 0.70 | % | | | 0.80 | % |
(a) Tier 1 rate is paid on assets up to $500 million, Tier 2 rate is paid on assets in excess of $500 million.
ALGER GLOBAL FOCUS FUND
NOTES TO FINANCIAL STATEMENTS (Continued)
Alger Management has agreed to limit the expenses of the share classes, through February 28, 2021, whereby it reimburses the share classes if annualized operating expenses (excluding acquired fund fees and expenses, interest, taxes, dividend expenses on short sales, borrowing costs, brokerage and extraordinary expenses) exceed the rates, based on average daily net assets, listed below:
| | | | | | | | | | | | | | | FEES WAIVED / |
| | | | | | | | | | | | | | | REIMBURSED FOR |
| | | CLASS | | | THE YEAR ENDED |
| | | A | | | C | | | I | | | Z | | | OCTOBER 31, 2020 |
| Alger Global Focus Fund | | | 1.50 | % | | | 2.25 | % | | | 1.15 | % | | | 0.99 | % | | $ | 151,494 |
Alger Management may, during the first year of the two-year term of the expense limitation contract, recoup any fees waived or expenses reimbursed pursuant to the expense limitation contract to the extent that such recoupment would not cause the expense ratio to exceed the lesser of the stated limitation in effect at the time of (i) the waiver or reimbursement and (ii) the recoupment after the repayment of the recoupment is taken into account. For the period ended February 28, 2020, when the recoupment provision ended, there were no recoupments made by the Fund to the Investment Manager.
(b) Administration Fees: Fees incurred by the Fund, pursuant to the provisions of the Fund’s Fund Administration Agreement with Alger Management, are payable monthly and computed based on the average daily net assets of the Fund at the annual rate of 0.0275%.
(c) Distribution/Shareholder Servicing Fees: The Fund has adopted a distribution plan pursuant to which the Fund pays Fred Alger & Company, LLC, the Fund’s distributor and an affiliate of the Investment Manager a fee at the annual rate of 0.25% of the average daily net assets of the Class A and Class I shares and 1.00% of the average daily net assets of the Class C shares to compensate Alger LLC for its activities and expenses incurred in distributing the Fund’s shares and/or shareholder servicing. Fees paid may be more or less than the expenses incurred by Alger LLC.
(d) Sales Charges: Purchases and sales of shares of the Fund may be subject to initial sales charges or contingent deferred sales charges. For the year ended October 31, 2020, there were no initial sales charges imposed. For the year ended October 31, 2020, contingent deferred sales charges of approximately $4 for the Class A Shares were imposed, all of which was retained by Alger LLC. The initial sales charges and contingent deferred sales charges are used by Alger LLC to offset distribution expenses previously incurred. Sales charges do not represent expenses of the Fund. Effective July 24, 2020, Alger LLC does not collect any sales charges on assets held by direct shareholders.
(e) Brokerage Commissions: During the year ended October 31, 2020, the Fund paid Alger LLC $374 in connection with securities transactions.
(f) Shareholder Administrative Fees: The Fund has entered into a Shareholder Administrative Services Agreement with Alger Management to compensate Alger Management for liaising with, and providing administrative oversight of, the Fund’s transfer agent, and for other related services. The Fund compensates Alger Management at the annual rate of 0.0165% of the respective average daily net assets of Class A and Class C shares and 0.01% of the respective average daily net assets of the Class I and Class Z shares for these services.
Alger Management makes payments to intermediaries that provide sub-accounting services to omnibus accounts invested in the Fund. A portion of the fees paid by Alger Management to intermediaries that provide sub-accounting services are charged back to the Fund, subject to certain limitations, as approved by the Board. For the year ended October 31, 2020, Alger Management charged back $8,116 to the Fund for these services, which are included in transfer agent fees in the accompanying Statement of Operations.
ALGER GLOBAL FOCUS FUND
NOTES TO FINANCIAL STATEMENTS (Continued)
(g) Trustee Fees: Each trustee who is not an “interested person” of the Trust, as defined in the Investment Company Act of 1940, as amended (“Independent Trustee”) receives a fee of $134,000 per annum, paid pro rata based on net assets by each fund in the Alger Fund Complex, plus travel expenses incurred for attending board meetings. The term “Alger Fund Complex” refers to the Trust, The Alger Institutional Funds, The Alger Funds II, The Alger Portfolios and Alger Global Focus Fund, each of which is a registered investment company managed by Alger Management. The Independent Trustee appointed as Chairman of the Board receives additional compensation of $20,000 per annum paid pro rata based on net assets by each fund in the Alger Fund Complex. Additionally, each member of the Audit Committee receives a fee of $13,000 per annum, paid pro rata based on net assets by each fund in the Alger Fund Complex.
Prior to January 1, 2020, each Independent Trustee received a fee of $122,000 per annum, paid pro rata based on net assets by each fund in the Alger Fund Complex, plus travel expenses incurred for attending board meetings. The Independent Trustee appointed as Chairman of the Board received additional compensation of $30,000 per annum paid pro rata based on net assets by each fund in the Alger Fund Complex. Additionally, each member of the Audit Committee received a fee of $11,000 per annum, paid pro rata based on net assets by each fund in the Alger Fund Complex.
(h) Interfund Trades: The Fund may engage in purchase and sale transactions with other funds advised by Alger Management or its affiliate, Weatherbie Capital, LLC (“Weatherbie” or the “Sub-Advisor”). There were no interfund trades during the year ended October 31, 2020.
(i) Interfund Loans: The Fund, along with other funds in the Alger Fund Complex, may borrow money from and lend money to each other for temporary or emergency purposes. To the extent permitted under its investment restrictions, each fund may lend uninvested cash in an amount up to 15% of its net assets to other funds. If a fund has borrowed from other funds and has aggregate borrowings from all sources that exceed 10% of the fund’s total assets, such fund will secure all of its loans from other funds. The interest rate charged on interfund loans is equal to the average of the overnight time deposit rate and bank loan rate available to the funds. There were no interfund loans outstanding as of October 31, 2020.
During the year ended October 31, 2020, the Fund did not incur interfund loan interest expense.
ALGER GLOBAL FOCUS FUND
NOTES TO FINANCIAL STATEMENTS (Continued)
(j) Other Transactions with Affiliates: Certain officers of the Fund are directors or officers of Alger Management, the Distributor, or their affiliates. At year ended October 31, 2020, Alger Management and its affiliated entities owned the following shares of the Fund:
| | | SHARE CLASS | |
| | | A | | | C | | | I | | | Z | |
| Alger Global Focus Fund | | | — | | | | — | | | | — | | | | 16,199 | |
NOTE 4 — Securities Transactions:
The following summarizes the securities transactions by the Fund, other than U.S. Government securities and short-term securities, for the year ended October 31, 2020:
| | | PURCHASES | | | SALES | |
| Alger Global Focus Fund | | $ | 20,928,835 | | | $ | 23,772,424 | |
Transactions in foreign securities may involve certain considerations and risks not typically associated with those of U.S. companies because of, among other factors, the level of governmental supervision and regulation of foreign security markets, and the possibility of political or economic instability. Additional risks associated with investing in emerging markets include increased volatility, limited liquidity, and less stringent regulatory and legal systems.
NOTE 5 — Borrowings:
The Fund may borrow from Brown Brothers Harriman & Co., the Fund’s Custodian (“BBH” or the “Custodian”), on an uncommitted basis. The Fund pays the Custodian a market rate of interest, generally based upon a rate of return with respect to each respective currency borrowed taking into consideration relevant overnight and short-term reference rates, the range of distribution between and among the interest rates paid on deposits to other institutions, less applicable commissions, if any. The Fund may also borrow from other funds in the Alger Fund Complex, as discussed in Note 3(i). For the year ended October 31, 2020, the Fund had the following borrowings from the Custodian and other funds in the Alger Fund Complex:
| | | AVERAGE DAILY | | | WEIGHTED AVERAGE | |
| | | BORROWING | | | INTEREST RATE | |
| Alger Global Focus Fund | | $ | 418 | | | | 2.24 | % |
The highest amount borrowed from the Custodian and other funds during the year ended October 31, 2020 by the Fund was as follows:
| | | HIGHEST BORROWING | |
| Alger Global Focus Fund | | $ | 146,715 | |
ALGER GLOBAL FOCUS FUND
NOTES TO FINANCIAL STATEMENTS (Continued)
NOTE 6 — Share Capital:
The Fund has an unlimited number of authorized shares of beneficial interest of $.001 par value. The transactions of shares of beneficial interest were as follows:
| | | FOR THE YEAR ENDED | | | FOR THE YEAR ENDED | |
| | | OCTOBER 31, 2020 | | | OCTOBER 31, 2019 | |
| | | SHARES | | | AMOUNT | | | SHARES | | | AMOUNT | |
| Alger Global Focus Fund | | | | | | | | | | | | | | | | |
| Class A: | | | | | | | | | | | | | | | | |
| Shares sold | | | 33,538 | | | $ | 773,788 | | | | 34,925 | | | $ | 726,516 | |
| Shares converted from Class C | | | 294 | | | | 6,626 | | | | 2,154 | | | | 44,938 | |
| Dividends reinvested | | | 18,059 | | | | 401,259 | | | | 61,753 | | | | 1,145,555 | |
| Shares redeemed | | | (114,948 | ) | | | (2,554,990 | ) | | | (115,003 | ) | | | (2,372,659 | ) |
| Net decrease | | | (63,057 | ) | | $ | (1,373,317 | ) | | | (16,171 | ) | | $ | (455,650 | ) |
| Class C: | | | | | | | | | | | | | | | | |
| Shares sold | | | 3,307 | | | $ | 70,141 | | | | 5,825 | | | $ | 112,650 | |
| Shares converted to Class A | | | (312 | ) | | | (6,626 | ) | | | (2,291 | ) | | | (44,938 | ) |
| Dividends reinvested | | | 2,269 | | | | 47,531 | | | | 11,702 | | | | 205,020 | |
| Shares redeemed | | | (39,189 | ) | | | (867,671 | ) | | | (41,230 | ) | | | (802,391 | ) |
| Net decrease | | | (33,925 | ) | | $ | (756,625 | ) | | | (25,994 | ) | | $ | (529,659 | ) |
| Class I: | | | | | | | | | | | | | | | | |
| Shares sold | | | 4,535 | | | $ | 102,831 | | | | 4,796 | | | $ | 99,995 | |
| Dividends reinvested | | | 781 | | | | 16,795 | | | | 3,477 | | | | 62,552 | |
| Shares redeemed | | | (6,241 | ) | | | (133,461 | ) | | | (19,411 | ) | | | (396,705 | ) |
| Net decrease | | | (925 | ) | | $ | (13,835 | ) | | | (11,138 | ) | | $ | (234,158 | ) |
| Class Z: | | | | | | | | | | | | | | | | |
| Shares sold | | | 20,420 | | | $ | 470,797 | | | | 31,118 | | | $ | 652,797 | |
| Dividends reinvested | | | 3,638 | | | | 82,250 | | | | 14,319 | | | | 270,896 | |
| Shares redeemed | | | (23,293 | ) | | | (517,935 | ) | | | (138,384 | ) | | | (2,940,737 | ) |
| Net increase (decrease) | | | 765 | | | $ | 35,112 | | | | (92,947 | ) | | $ | (2,017,044 | ) |
NOTE 7 — Income Tax Information:
The tax character of distributions paid during the year ended October 31, 2020 and the year ended October 31, 2019 were as follows:
| | | FOR THE YEAR ENDED | | | FOR THE YEAR ENDED | |
| | �� | OCTOBER 31, 2020 | | | OCTOBER 31, 2019 | |
| Alger Global Focus Fund | | | | | | | | |
| Distributions paid from: | | | | | | | | |
| Ordinary Income | | $ | 594,843 | | | $ | 146,777 | |
| Long-term capital gain | | | — | | | | 1,743,009 | |
| Total distributions paid | | $ | 594,843 | | | $ | 1,889,786 | |
ALGER GLOBAL FOCUS FUND
NOTES TO FINANCIAL STATEMENTS (Continued)
As of October 31, 2020, the components of accumulated gains (losses) on a tax basis were as follows:
| Alger Global Focus Fund | | | |
| Undistributed ordinary income | | $ | — | |
| Undistributed long-term gains | | | — | |
| Net accumulated earnings | | | — | |
| Capital loss carryforwards | | | (303,780 | ) |
| Late year ordinary income losses | | | (185,059 | ) |
| Net unrealized appreciation | | | 5,178,392 | |
| Total accumulated earnings | | $ | 4,689,553 | |
At October 31, 2020, the Fund, for federal income tax purposes, had capital loss carryforwards of $303,780.
Under the Regulated Investment Company Modernization Act of 2010, capital losses incurred by the Fund on or after January 1, 2011(Post Act) will not be subject to expiration.
The difference between book-basis and tax-basis unrealized appreciation (depreciation) is determined annually and is attributable primarily to the tax deferral of losses on wash sales, U.S. Internal Revenue Code Section 988 currency transactions, the tax treatment of partnership investments, the realization of unrealized appreciation of passive foreign investment companies, and the return of capital from real estate investment trust investments.
Permanent differences, primarily from net operating losses and real estate investment trusts and partnership investments sold by the Fund, resulted in the following reclassifications among the Fund’s components of net assets at October 31, 2020.
| Alger Global Focus Fund | | | |
| Distributable earnings | | $ | 68,336 | |
| Paid-in Capital | | $ | (68,336 | ) |
NOTE 8 — Fair Value Measurements:
The following is a summary of the inputs used as of October 31, 2020 in valuing the Fund’s investments carried at fair value on a recurring basis. Based upon the nature, characteristics, and risks associated with its investments, the Fund has determined that presenting them by security type and sector is appropriate.
ALGER GLOBAL FOCUS FUND
NOTES TO FINANCIAL STATEMENTS (Continued)
| Alger Global Focus Fund | | TOTAL | | | LEVEL 1 | | | LEVEL 2 | | | LEVEL 3 | |
| COMMON STOCKS | | | | | | | | | | | | | | | | |
| Communication Services | | $ | 1,325,915 | | | $ | — | | | $ | 1,325,915 | | | $ | — | |
| Consumer Discretionary | | | 5,406,653 | | | | 2,844,520 | | | | 2,562,133 | | | | — | |
| Consumer Staples | | | 520,726 | | | | — | | | | 520,726 | | | | — | |
| Energy | | | 423,693 | | | | — | | | | 423,693 | | | | — | |
| Financials | | | 1,026,462 | | | | 489,776 | | | | 536,686 | | | | — | |
| Healthcare | | | 2,701,814 | | | | 1,018,977 | | | | 1,682,837 | | | | — | |
| Industrials | | | 1,870,601 | | | | — | | | | 1,870,601 | | | | — | |
| Information Technology | | | 7,833,540 | | | | 5,176,837 | | | | 2,656,703 | | | | — | |
| Materials | | | 639,613 | | | | — | | | | 639,613 | | | | — | |
| TOTAL COMMON STOCKS | | $ | 21,749,017 | | | $ | 9,530,110 | | | $ | 12,218,907 | | | $ | — | |
| PREFERRED STOCKS | | | | | | | | | | | | | | | | |
| Healthcare | | | 5,079 | | | | — | | | | — | | | | 5,079 | |
| TOTAL INVESTMENTS IN SECURITIES | | $ | 21,754,096 | | | $ | 9,530,110 | | | $ | 12,218,907 | | | $ | 5,079 | |
| | | FAIR VALUE
MEASUREMENTS
USING SIGNIFICANT
UNOBSERVABLE
INPUTS (LEVEL 3) | |
| Alger Global Focus Fund | | Common Stocks | |
| Opening balance at November 1, 2019 | | $ | 18,262 | |
| Transfers into Level 3 | | | — | |
| Transfers out of Level 3 | | | (106,187 | ) |
| Total gains or losses | | | | |
| Included in net realized gain (loss) on investments | | | — | |
| Included in net change in unrealized appreciation (depreciation) on investments | | | 2,404 | |
| Purchases and sales | | | | |
| Purchases/Conversion | | | 85,521 | |
| Sales | | | — | |
| Closing balance at October 31, 2020 | | | — | |
| Net change in unrealized appreciation (depreciation) attributable to investments still held at October 31, 2020* | | $ | — | |
ALGER GLOBAL FOCUS FUND
NOTES TO FINANCIAL STATEMENTS (Continued)
| | | FAIR VALUE
MEASUREMENTS
USING SIGNIFICANT
UNOBSERVABLE
INPUTS (LEVEL 3) | |
| Alger Global Focus Fund | | Preferred Stocks | |
| Opening balance at November 1, 2019 | | $ | 110,358 | |
| Transfers into Level 3 | | | — | |
| Transfers out of Level 3 | | | — | |
| Total gains or losses | | | | |
| Included in net realized gain (loss) on investments | | | — | |
| Included in net change in unrealized appreciation (depreciation) on investments | | | (19,758 | ) |
| Purchases and sales | | | | |
| Purchases | | | — | |
| Sales/Conversion | | | (85,521 | ) |
| Closing balance at October 31, 2020 | | | 5,079 | |
| Net change in unrealized appreciation (depreciation) attributable to investments still held at October 31, 2020* | | $ | (30,810 | ) |
* Net change in unrealized appreciation (depreciation) is included in net change in unrealized appreciation (depreciation) on investments in the accompanying statement of operations.
The following table provides quantitative information about the Fund’s Level 3 fair value measurements of the Fund’s investments as of October 31, 2020. The table below is not intended to be all-inclusive, but rather provides information on the Level 3 inputs as they relate to the Fund’s fair value measurements.
| | | Fair Value | | | Valuation | | Unobservable | | | | | Weighted |
| | | October 31, 2020 | | | Methodology | | Input | | Range/Input | | | Average Inputs |
| Alger Global Focus Fund | | | | | | | | | | | | | | |
| Preferred Stocks | | $ | 5,079 | | | Income Approach | | Discount Rate | | | 72.50%-77.50% | | | N/A |
The significant unobservable inputs used in the fair value measurement of the Fund's securities are revenue and EBITDA multiples, discount rates, and the probabilities of success of certain outcomes. Significant increases and decreases in these inputs in isolation and interrelationships between these inputs could result in significantly higher or lower fair value measurements than those noted in the table above. Generally, all other things being equal, increases in revenue and EBITDA multiples, decreases in discount rates, and increases in the probabilities of success result in higher fair value measurements, whereas decreases in revenues and EBITDA multiples, increases in discount rates, and decreases in the probabilities of success result in lower fair value measurements.
Certain of the Fund's assets and liabilities are held at carrying amount or face value, which approximates fair value for financial statements purposes. As of October 31, 2020, such assets were categorized within the ASC 820 disclosure hierarchy as follows:
| | | TOTAL | | | LEVEL 1 | | | LEVEL 2 | | | LEVEL 3 | |
| Cash, foreign cash and cash equivalents | | $ | 598,902 | | | $ | 481 | | | $ | 598,421 | | | $ | – | |
ALGER GLOBAL FOCUS FUND
NOTES TO FINANCIAL STATEMENTS (Continued)
NOTE 9 — Derivatives:
FASB Accounting Standards Codification 815 — Derivatives and Hedging (“ASC 815”) requires qualitative disclosures about objectives and strategies for using derivatives, quantitative disclosures about fair value amounts of and gains and losses on derivative instruments, and disclosures about credit-risk-related contingent features in derivative agreements.
Forward foreign currency contracts - In connection with portfolio purchases and sales of securities denominated in foreign currencies, the Fund may enter into forward foreign currency contracts. Additionally, the Fund may enter into such contracts to economically hedge certain other foreign currency denominated investments. These contracts are valued at the current cost of covering or offsetting such contracts and the related realized and unrealized foreign exchange gains and losses are included in the Statement of Operations. In the event that counterparties fail to settle these currency contracts or the related foreign security trades, the Fund could be exposed to foreign currency fluctuation.
There were no derivative instruments held by the Fund throughout the year or as of October 31, 2020.
NOTE 10 — Principal Risks:
Investing in the stock market involves certain risks, including the potential loss of principal. Your investment in Fund shares represents an indirect investment in the securities owned by the Fund. The value of these securities, like other investments, may move up or down, sometimes rapidly and unpredictably. Your Fund shares at any point in time may be worth less than what you invested, even after taking into account the reinvestment of Fund dividends and distributions. Local, regional or global events such as war, acts of terrorism, the spread of infectious illness such as COVID-19 or other public health issues, recessions, or other events could have a significant impact on the Fund and its investments. Growth stocks tend to be more volatile than other stocks as their prices tend to be higher in relation to their companies’ earnings and may be more sensitive to market, political, and economic developments. Assets may be focused in a small number of holdings, making them susceptible to risks associated with a single economic, political or regulatory event than a more diversified portfolio. Foreign and emerging markets securities involves special risks including currency fluctuations, less liquidity, inefficient trading, political instability, and increased volatility. Investing in companies of small capitalizations involves the risk that such issuers may have limited product lines or financial resources, lack management depth, or have limited liquidity. Active trading may increase transaction costs, brokerage commissions, and taxes, which can lower the return on investment.
ALGER GLOBAL FOCUS FUND
NOTES TO FINANCIAL STATEMENTS (Continued)
NOTE 11 — Affiliated Securities:
The issuers of the securities listed below are deemed to be affiliates of the Fund because the Fund or its affiliates owned 5% or more of the issuer’s voting securities during all or part of the year ended October 31, 2020. Purchase and sale transactions, interest income and dividend income earned during the year were as follows:
| | | | | | | | | | | | | | | | | | Net Increase | | | | |
| | | | | | | | | | | | | | | | | | (Decrease) | | | | |
| | | Value at | | | | | | | | | Dividend/ | | | | | | in | | | Value at | |
| | | October 31, | | | Purchases/ | | | Sales/ | | | Interest | | | Realized | | | Unrealized | | | October 31, | |
| Security | | 2019 | | | Conversion | | | Conversion | | | Income | | | Gain (Loss) | | | App(Dep) | | | 2020 | |
| Alger Global Focus Fund | | | | | | | | | | | | | | | | | | | | | | | | | | | | |
| Preferred Stocks | | | | | | | | | | | | | | | | | | | | | | | | | | | | |
| Prosetta Biosciences, Inc., Series D | | $ | 35,889 | | | $ | – | | | $ | – | | | $ | – | | | $ | – | | | $ | (30,810 | ) | | $ | 5,079 | |
| Total | | $ | 35,889 | | | $ | – | | | $ | – | | | $ | – | | | $ | – | | | $ | (30,810 | ) | | $ | 5,079 | |
NOTE 12 — Subsequent Events:
Management of the Fund has evaluated events that have occurred subsequent to October 31, 2020, through the issuance date of the Financial Statements. No such events have been identified which require recognition and/or disclosure.
REPORT OF INDEPENDENT REGISTERED PUBLIC ACCOUNTING FIRM
To the Shareholders and the Board of Trustees of Alger Global Focus Fund:
Opinion on the Financial Statements and Financial Highlights
We have audited the accompanying statement of assets and liabilities of Alger Global Focus Fund (the “Fund”), including the schedule of investments, as of October 31, 2020, the related statement of operations for the year then ended, the statements of changes in net assets for each of the two years in the period then ended, the financial highlights for each of the five years in the period then ended, and the related notes. In our opinion, the financial statements and financial highlights present fairly, in all material respects, the financial position of the Fund as of October 31, 2020, and the results of its operations for the year then ended, the changes in its net assets for each of the two years in the period then ended, and the financial highlights for each of the five years in the period then ended in conformity with accounting principles generally accepted in the United States of America.
Basis for Opinion
These financial statements and financial highlights are the responsibility of the Fund’s management. Our responsibility is to express an opinion on the Fund’s financial statements and financial highlights based on our audits. We are a public accounting firm registered with the Public Company Accounting Oversight Board (United States) (PCAOB) and are required to be independent with respect to the Fund in accordance with the U.S. federal securities laws and the applicable rules and regulations of the Securities and Exchange Commission and the PCAOB.
We conducted our audits in accordance with the standards of the PCAOB. Those standards require that we plan and perform the audit to obtain reasonable assurance about whether the financial statements and financial highlights are free of material misstatement, whether due to error or fraud. The Fund is not required to have, nor were we engaged to perform, an audit of its internal control over financial reporting. As part of our audits we are required to obtain an understanding of internal control over financial reporting but not for the purpose of expressing an opinion on the effectiveness of the Fund’s internal control over financial reporting. Accordingly, we express no such opinion.
Our audits included performing procedures to assess the risks of material misstatement of the financial statements and financial highlights, whether due to error or fraud, and performing procedures that respond to those risks. Such procedures included examining, on a test basis, evidence regarding the amounts and disclosures in the financial statements and financial highlights. Our audits also included evaluating the accounting principles used and significant estimates made by management, as well as evaluating the overall presentation of the financial statements and financial highlights. Our procedures included confirmation of securities owned as of October 31, 2020, by correspondence with the custodian and brokers; when replies were not received from brokers, we performed other auditing procedures. We believe that our audits provide a reasonable basis for our opinion.
REPORT OF INDEPENDENT REGISTERED PUBLIC ACCOUNTING FIRM
Deloitte & Touche LLP
New York, New York
December 21, 2020
We have served as the auditor of one or more investment companies within the group of investment companies since 2009.
ALGER GLOBAL FOCUS FUND
ADDITIONAL INFORMATION (Unaudited)
Shareholder Expense Example
As a shareholder of the Fund, you incur two types of costs: transaction costs, if applicable, including sales charges (loads) and redemption fees; and ongoing costs, including management fees, distribution (12b-1) fees, if applicable, and other fund expenses. This example is intended to help you understand your ongoing costs (in dollars) of investing in the Fund and to compare these costs with the ongoing costs of investing in other mutual funds.
The example below is based on an investment of $1,000 invested at the beginning of the six-month period starting May 1, 2020 and ending October 31, 2020 and held for the entire period.
Actual Expenses
The first line for each class of shares in the table below provides information about actual account values and actual expenses. You may use the information in this line, together with the amount you invested, to estimate the expenses that you paid over the period. Simply divide your account value by $1,000 (for example, an $8,600 account value divided by $1,000 = 8.6), then multiply the result by the number in the first line under the heading entitled “Expenses Paid During the Six Months Ended October 31, 2020” to estimate the expenses you paid on your account during this period.
Hypothetical Example for Comparison Purposes
The second line for each class of shares in the table below provides information about hypothetical account values and hypothetical expenses based on the actual expense ratio for each class of the Fund’s shares and an assumed rate of return of 5% per year before expenses, which is not the Fund’s actual return. The hypothetical account values and expenses may not be used to estimate the actual ending account balance or expenses you paid for the period. You may use this information to compare the ongoing costs of investing in the Fund and other funds. To do so, compare this 5% hypothetical example with the 5% hypothetical examples that appear in the shareholder reports of other funds.
Please note that the expenses shown in the table are meant to highlight your ongoing costs only and do not reflect any transaction costs, such as sales charges (loads) and redemption fees. Therefore, the second line under each class of shares in the table is useful in comparing ongoing costs only, and will not help you determine the relative total costs of owning different funds. In addition, if these transactional costs were included, your costs would have been higher.
ALGER GLOBAL FOCUS FUND
ADDITIONAL INFORMATION (Unaudited) (Continued)
| | | | | | | | | Annualized | |
| | | | | | | Expenses | | Expense Ratio | |
| | | | | | | Paid During | | For the | |
| | | Beginning | | Ending | | the Six Months | | Six Months | |
| | | Account | | Account | | Ended | | Ended | |
| | | Value | | Value | | October 31, | | October 31, | |
| | | May 1, 2020 | | October 31, 2020 | | 2020(a) | | 2020(b) | |
| Alger Global Focus Fund | | | | | | | | | | | | |
| Class A | Actual | | $ | 1,000.00 | | $ | 1,187.60 | | $ | 8.25 | | 1.50 | % |
| | Hypothetical(c) | | | 1,000.00 | | | 1,017.60 | | | 7.61 | | 1.50 | |
| Class C | Actual | | | 1,000.00 | | | 1,238.70 | | | 12.66 | | 2.25 | |
| | Hypothetical(c) | | | 1,000.00 | | | 1,013.83 | | | 11.39 | | 2.25 | |
| Class I | Actual | | | 1,000.00 | | | 1,255.80 | | | 6.52 | | 1.15 | |
| | Hypothetical(c) | | | 1,000.00 | | | 1,019.36 | | | 5.84 | | 1.15 | |
| Class Z | Actual | | | 1,000.00 | | | 1,256.60 | | | 5.62 | | 0.99 | |
| | Hypothetical(c) | | | 1,000.00 | | | 1,020.16 | | | 5.03 | | 0.99 | |
| (a) | Expenses are equal to the annualized expense ratio of the respective share class, multiplied by the average account value over the period, multiplied by 184/366 (to reflect the one-half year period). |
| (c) | 5% annual return before expenses. |
ALGER GLOBAL FOCUS FUND
ADDITIONAL INFORMATION (Unaudited) (Continued)
Tax Information
In accordance with subchapter M of the Internal Revenue Code of 1986, as amended, for the year ended October 31, 2020, 5.17% of Alger Global Focus Fund’s dividends qualified for the dividends deduction for corporations. For the year ended October 31, 2020, certain dividends paid by the Fund may be subject to a maximum rate of 15%, as provided by the Jobs and Growth Tax Relief Reconciliation Act of 2003. Of the distributions paid during the fiscal year, 25.76% of the Fund’s dividends may be considered qualified dividend income.
Shareholders should not use the above information to prepare their tax returns. Since the Fund’s fiscal year is not the calendar year, another notification will be sent with respect to calendar year 2020. Such notification, which will reflect the amount to be used by tax payers on their federal income tax returns, will be made in conjunction with Form 1099 DIV and will be mailed in January 2021. Shareholders are advised to consult their own tax advisers with respect to the consequences of their investment in the Fund.
ALGER GLOBAL FOCUS FUND
ADDITIONAL INFORMATION (Unaudited) (Continued)
Trustees and Officers of the Fund
Information about the trustees and officers of the Fund is set forth below. In the table the term “Alger Fund Complex” refers to the Fund, The Alger Portfolios, The Alger Funds, The Alger Institutional Funds and The Alger Funds II, each of which is a registered investment company managed by Alger Management. Each Trustee serves until an event of termination, such as death or resignation, or until his or her successor is duly elected; each officer’s term of office is one year. Unless otherwise noted, the address of each person named below is 360 Park Avenue South, New York, NY 10010.
Additional information regarding the Trustees and Officers of the Fund is available in the Fund’s Statement of Additional Information.
ALGER GLOBAL FOCUS FUND
ADDITIONAL INFORMATION (Unaudited) (Continued)
| | | | | | | Number | | |
| | | | | | | of Funds | | Other |
| | | | | | | in the | | Directorships |
| | | Position(s) | | | | Alger Fund | | Held by |
| | | Held with | | | | Complex(3) | | Trustee |
| | | the Fund and | | | | which are | | During |
| Name (Year of Birth) | | Length of | | Principal Occupation(s) | | Overseen | | Past Five |
| and Address(1) | | Time Served | | During Past Five Years | | by Trustee | | Years |
| Interested Trustee(2): | | | | | | | | |
| | | | | | | | | |
| Hilary M. Alger (1961) | | Trustee since 2003 | | Fundraising Consultant since 2015, Schultz & Williams; Trustee since 2013, Pennsylvania Ballet; School Committee Member since 2017, Germantown Friends School. | | 27 | | Board of Directors, Alger Associates, Inc.; Trustee of Target Margin Theater |
| Non-Interested Trustees: | | | | | | | | |
| | | | | | | | | |
| Charles F. Baird, Jr. (1953) | | Trustee since 2000 | | Managing Director since 1997, North Castle Partners (private equity securities group). | | 27 | | None |
| Roger P. Cheever (1945) | | Trustee since 2000 | | Associate Vice President for Principal Gifts since 2008, Harvard University. | | 27 | | Board of Directors, Alger SICAV Fund |
| Stephen E. O’Neil (1932) | | Trustee since 1986 | | Retired. | | 27 | | None |
| David Rosenberg (1962) | | Trustee since 2007 | | Associate Professor of Law since August 2000, Zicklin School of Business, Baruch College, City University of New York. | | 27 | | None |
| Nathan E. Saint-Amand M.D. (1938) | | Trustee since 1986 | | Medical doctor in private practice since 1970; Member of the Board of the Manhattan Institute (non- profit policy research) since 1988. | | 27 | | None |
(1) The address of each Trustee is c/o Fred Alger Management, LLC, 360 Park Avenue South, New York, NY 10010.
(2) Ms. Alger is an “interested person” (as defined in the Investment Company Act of 1940, as amended) of the Funds by virtue of her ownership control of Alger Associates, Inc. (“Alger Associates”), which controls Alger Management and its affiliates.
(3) “Alger Fund Complex” refers to the Fund and the four other registered investment companies managed by Alger Management. Each Trustee serves until an event of termination, such as death or resignation, or until his or her successor is duly elected. Each of the Trustees serves on the Boards of Trustees of the other four registered investment companies in the Alger Fund Complex.
ALGER GLOBAL FOCUS FUND
ADDITIONAL INFORMATION (Unaudited) (Continued)
| Name (Year of Birth), Position | | | | Officer |
| with Fund and Address(1) | | Principal Occupations | | Since |
| Officers(2): | | | | |
| | | | | |
Hal Liebes (1964)
President | | Executive Vice President, Chief Operating Officer (“COO”) and Secretary of Alger Management; COO and Secretary of Alger Associates, Inc. and Alger Alternative Holdings, LLC; Director of Alger SICAV, Alger International Holdings, and Alger Dynamic Return Offshore Fund; Vice President, COO, Member, and Secretary, Alger Capital, LLC and Alger Group Holdings, LLC; Executive Director and Chairman, Alger Management, Ltd.; Manager and Secretary, Weatherbie Capital, LLC and Alger Apple Real Estate LLC; Manager, Alger Partners Investors I, LLC and Alger Partners Investors KEIGF; Secretary of Alger-Weatherbie Holdings, LLC and Alger Boulder I LLC; and Director and Secretary, The Foundation for Alger Families. | | 2005 |
Tina Payne (1974)
Secretary,
Chief Compliance Officer | | Since 2017, Senior Vice President, General Counsel, and Chief Compliance Officer (“CCO”), Alger Management; Senior Vice President, General Counsel, and Secretary, Alger LLC; CCO, Alger Management, Ltd.; Assistant Secretary, Weatherbie Capital, LLC and Alger Alternative Holdings, LLC; and since 2019, Assistant Secretary, Alger-Weatherbie Holdings, LLC. Formerly, Senior Vice President and Associate General Counsel, Cohen & Steers Capital Management, from 2007 to 2017. | | 2017 |
| Michael D. Martins (1965) | | Senior Vice President of Alger Management. | | 2005 |
| Treasurer, | | | | |
| AML Compliance Officer | | | | |
| Anthony S. Caputo (1955) | | Vice President of Alger Management. | | 2007 |
| Assistant Treasurer | | | | |
| Sergio M. Pavone (1961) | | Vice President of Alger Management. | | 2007 |
| Assistant Treasurer | | | | |
| Mia G. Pillinger (1989) | | Associate Counsel of Alger Management. | | 2020 |
| Assistant Secretary | | | | |
| Rachel I. Winters (1987) | | Paralegal and Compliance Officer of Alger Management. | | 2020 |
| Assistant Secretary | | | | |
| (1) | The address of each officer is c/o Fred Alger Management, LLC, 360 Park Avenue South, New York, NY 10010. |
| (2) | Each officer’s term of office is one year. Each officer serves in the same capacity for the other funds in the Alger Fund Complex. |
ALGER GLOBAL FOCUS FUND
ADDITIONAL INFORMATION (Unaudited) (Continued)
Board Approval of Investment Advisory Agreements
At a meeting held on September 29, 2020 (Meeting), the Board of Trustees (Board) of the Fund, including a majority of the trustees who are not “interested persons” (as defined in the Investment Company Act of 1940, as amended) of the Alger Global Focus Fund (the Fund) (Independent Trustees), reviewed and approved the continuance of the investment advisory agreement between Fred Alger Management, LLC (Fred Alger Management) and the Fund (the Management Agreement) for an additional one-year period. The Independent Trustees received advice from, and met separately with, their Independent Trustee counsel in considering whether to approve the continuation of the Management Agreement.
In considering the continuation of the Management Agreement, the Board reviewed and considered information provided by the Manager at the Meeting and throughout the year at meetings of the Board and its committees. The Board also reviewed and considered information provided in response to a detailed request for information submitted to the Manager by Independent Trustee counsel on behalf of the Independent Trustees in connection with the annual contract renewal process, as well as information provided in response to a supplemental request list. The materials for the Meeting included a presentation and analysis of the Fund and the Manager’s services by FUSE Research Network LLC (FUSE), an independent consulting firm. In addition, prior to the Meeting, the chair of the Board conferred with Independent Trustee counsel about the contract renewal process. The Board reviewed the materials provided and considered all of the factors it deemed relevant in approving the continuance of the Management Agreement, including, but not limited to: (i) the nature, extent and quality of the services provided by the Manager; (ii) the investment performance of the Fund; (iii) the costs of the services the Manager provided and profits it realized; (iv) the extent to which economies of scale are realized as the Fund grows; and (v) whether fee levels reflect these economies of scale for the benefit of Fund investors. As part of the Board’s review, the Board received and considered information on the impact of the COVID-19 pandemic on the Funds and the Funds’ performance and operations.
In approving the continuance of the Management Agreement, the Board, including a majority of the Independent Trustees, determined that the terms of the Management Agreement are fair and reasonable and that the continuance of the Management Agreement is in the best interests of the Fund and its shareholders. While attention was given to all information furnished, the following discusses some primary factors relevant to the Board’s determination.
Nature, Extent and Quality of Services
The Board reviewed and considered information regarding the nature, extent and quality of investment management services provided by the Manager to the Fund. This information included, among other things, the qualifications, background and experience of the professional personnel who perform services for the Fund; the structure of investment professional compensation; oversight of third-party service providers; investment performance, fee information and related financial information for the Fund; fees and payments to intermediaries for fund administration, transfer agency and shareholder services; legal and compliance matters; risk controls; pricing and other services provided by the Manager and its affiliates; and the range of management fees charged by the Manager and its affiliates to other funds and accounts, including management’s explanation of differences among accounts where relevant. The Board noted Fred Alger Management’s history and expertise in the “growth” style of investment management and management’s ongoing efforts to develop strategies and adjust portfolios to address the changing investment landscape.
ALGER GLOBAL FOCUS FUND
ADDITIONAL INFORMATION (Unaudited) (Continued)
The Board also noted Fred Alger Management’s continuing efforts in connection with business continuity plans, including the effectiveness of those plans during the pandemic. The Board further noted Fred Alger Management’s engagement with key service providers regarding the COVID-19 pandemic. The Board noted the length of time the Manager had provided services as an investment adviser to each Fund and also noted FUSE’s analysis that certain of the Manager’s offerings should sustain growth and maintain interest in the Manager’s investment capabilities.
The Board also reviewed and considered the benefits provided to Fund shareholders of investing in a Fund that is part of the Alger family of funds. The Board noted the strong financial position of the Manager and its commitment to the mutual fund business as evidenced, in part, by a continued focus on offerings in focused strategies. The Board also noted that certain administrative, compliance, reporting and accounting services necessary for the conduct of the Fund’s affairs are provided separately under a Fund Administration Agreement and a Shareholder Administrative Services Agreement with Fred Alger Management.
Following consideration of such information, the Board was satisfied with the nature, extent and quality of services provided by the Manager and its affiliates to the Fund.
Fund Performance
The Board reviewed and considered the performance results of the Fund over various time periods. The Board considered the performance returns for the Fund in comparison to the performance returns of a universe of mutual funds deemed comparable to the Fund based on various investment, operational, and pricing characteristics (Peer Universe), and a group of mutual funds from within such Peer Universe deemed comparable to the Fund based primarily on investment strategy similarity (Peer Group), each as selected by FUSE, as well as the Fund’s benchmark index. Class A shares (the Fund’s oldest share class) were used as the representative share class for the Fund’s performance results. It was noted that each class of the Fund would have substantially similar returns because the shares are invested in the same portfolio of securities and the returns would differ only to the extent that the classes do not have the same expenses. The Board received a description of the methodology FUSE used to select the mutual funds included in the Peer Universe and Peer Group. The Board noted that long-term performance could be impacted by even one period of significant outperformance or underperformance.
The Board also reviewed and considered Fund performance reports provided and discussions that occurred with investment personnel and senior management at Board meetings throughout the year. As had been the practice at every quarterly meeting of Trustees throughout the year, representatives of the Manager discussed with the Trustees the recent and longer term performance of the Fund and the measures that the Manager was in the process of instituting, or had instituted, to seek to improve the performance of funds, if necessary. In expanding orally on the written materials they had provided to the Trustees, the FUSE representatives commented further on the performance of the Fund and discussed the enhancements FUSE has made to its reports.
ALGER GLOBAL FOCUS FUND
ADDITIONAL INFORMATION (Unaudited) (Continued)
The Peer Group for the Fund consisted of the Fund and 14 other world large stock funds. The Peer Universe for this Fund included the Fund, the other funds of the Peer Group, and other world large stock funds. The Board noted that the Fund’s annualized total return for the one-, three-, five- and 10-year periods outperformed the median of its Peer Group. The Board also noted that the Fund’s annualized total return for the one-year period was in the first quartile of its Peer Universe, for the three- and five-year periods was in the second quartile of its Peer Universe, and for the 10-year period was in the third quartile of its Peer Universe. The Board further noted that the Fund had outperformed the Fund’s benchmark index for the one- and three-year periods and underperformed for the five- and 10-year periods. FUSE noted that the Fund produced more than 1,000 basis points of outperformance over the last 12 months versus both its world stock peers and its benchmark. The Board concluded that the Fund’s performance was acceptable.
Comparative Fees and Expenses
The Board considered the contractual management fee rate without the effect of fee waivers or expense reimbursements, if any (Management Rate), of the Fund in comparison to the median Management Rate of the Fund’s Peer Group. FUSE fee data was based upon information taken from each Peer Group fund’s most recent annual report, which reflects historical asset levels that may be different from those currently existing, particularly in a period of market volatility. While recognizing such inherent limitation and the fact that expense ratios and Management Rates generally increase as assets decline and decrease as assets grow, the Board noted that the independent analysis conducted by FUSE was an appropriate measure of comparative fees and expenses. The FUSE Management Rate included administrative charges. The Board received a description of the methodology FUSE used to select the mutual funds included in a Peer Group. The Board discussed those factors that could contribute to a Fund’s total expense ratio or management fee being above the median of the Fund’s Peer Group, including, for example, considerations related to unique or specialty strategies and related costs to implement such strategies, the nature and quality of services provided by the Manager, and strategy capacity considerations.
The Board noted that the Management Rate for the Fund was equal to the median and in the second quartile of its Peer Group.
The Board reviewed and considered information regarding the Fund’s total expense ratio and its various components, including, as applicable, management fees, operating expenses, and Rule 12b-1 fees. The Board considered the total net expense ratio of the Fund in comparison to the median expense ratio of the Fund’s Peer Group. The total net expense ratio, for comparative consistency, was shown for Class A shares for funds with multiple classes of shares.
ALGER GLOBAL FOCUS FUND
ADDITIONAL INFORMATION (Unaudited) (Continued)
The Board noted that the total net expense ratio for the Fund was above the median and in the fourth (most expensive) quartile of its Peer Group. The Board noted that the Fund’s total net expense ratio for each share class reflected a fee waiver from management. It was noted that Fred Alger Management considered the total net expense ratio of the Fund and concluded the fee arrangements for all share classes were appropriate, with the exception of Class I shares. The Board considered, and subsequently approved, Fred Alger Management’s proposal to change the expense cap for Class I shares of the Fund to 1.15% effective February 28, 2021, noting the rationale for such change, and the impact to the Fund.
The Board concluded that the Management Rate charged to the Fund is reasonable.
Profitability
The Board reviewed and considered information regarding the profits realized by Fred Alger Management and its affiliates in connection with the operation of the Fund. In this respect, the Board considered overall profitability, as well as the profits, of Fred Alger Management and its affiliates in providing investment management and other services to the Fund during the year ended June 30, 2020. The Board took particular note of Alger’s profitability in managing the Fund, noting that it will monitor this profitability as appropriate. The Board also reviewed the profitability methodology and the changes thereto, noting that management applies its methods consistently from year to year.
The Board noted that costs incurred in establishing the infrastructure necessary for the type of mutual fund operations conducted by the Manager and its affiliates may not be fully reflected in the expenses allocated to the Fund in determining the Manager’s profitability. The Board also noted management’s expenditures related to additional regulatory and compliance requirements resulting from recent SEC and other regulatory developments.
The Board also considered the extent to which the Manager and its affiliates might derive ancillary benefits from fund operations. Based upon its consideration of all these factors, the Board concluded that the level of profits realized by the Manager and its affiliates from providing services to the Fund was not excessive in view of the nature, extent and quality of services provided to the Fund.
Economies of Scale
The Board reviewed and considered the extent to which the Manager may realize economies of scale, if any, as the Fund grows larger and whether the Fund’s management fee structure reflects any economies of scale for the benefit of shareholders. The Board noted the existence of a management fee breakpoint for the Fund, which operates to share economies of scale with the Fund’s shareholders by reducing the Fund’s effective management fees as the Fund grows in size. The Board considered the Manager’s view that the overall size of Fred Alger Management allows it to realize other economies of scale, such as with office space, purchases of technology, and other general business expenses. The Board concluded that for the Fund, to the extent economies of scale may be realized by Fred Alger Management and its affiliates, the benefits of such economies of scale would be shared with the Fund and its shareholders as the Fund grows, including through the management fee breakpoint in place for the Fund.
ALGER GLOBAL FOCUS FUND
ADDITIONAL INFORMATION (Unaudited) (Continued)
Conclusion
Based on its review, consideration and evaluation of all factors it believed relevant, including the above-described factors and conclusions, the Board unanimously approved the continuation of the Management Agreement for an additional one-year period.
ALGER GLOBAL FOCUS FUND
ADDITIONAL INFORMATION (Unaudited) (Continued)
Privacy Policy
| U.S. Consumer Privacy Notice | Rev. 12/20/16 |
| FACTS | | WHAT DOES ALGER DO WITH YOUR PERSONAL INFORMATION? |
| Why? | | Financial companies choose how they share your personal information. Federal law gives consumers the right to limit some but not all sharing. Federal law also requires us to tell you how we collect, share, and protect your personal information. Please read this notice carefully to understand what we do. |
| What? | | The types of personal information we collect and share depend on the product or service you have with us. This information can include: |
| | | • Social Security number and |
| | | • Account balances and |
| | | • Transaction history and |
| | | • Purchase history and |
| | | • Assets |
| | | When you are no longer our customer, we continue to share your information as described in this notice. |
| How? | | All financial companies need to share personal information to run their everyday business. In the section below, we list the reasons financial companies can share personal information; the reasons Alger chooses to share; and whether you can limit this sharing. |
| Reasons we can share your personal | | Does | | Can you limit |
| information | | Alger share? | | this sharing? |
| For our everyday business purposes — such as to process your transactions, maintain your account(s), respond to court orders and legal investigations, or report to credit bureaus | | Yes | | No |
| For our marketing purposes — to offer our products and services to you | | Yes | | No |
| For joint marketing with other financial companies | | No | | We don’t share |
| For our affiliates’ everyday business purposes — information about your transactions and experiences | | Yes | | No |
| For our affiliates’ everyday business purposes — information about your creditworthiness | | No | | We don’t share |
| For nonaffiliates to market to you Questions? Call 1-800-342-2186 | | No | | We don’t share |
ALGER GLOBAL FOCUS FUND
ADDITIONAL INFORMATION (Unaudited) (Continued)
| Who we are | | |
| | | |
| Who is providing this notice? | | Alger includes Fred Alger Management, LLC and Fred Alger & Company, LLC as well as the following funds: The Alger Funds, The Alger Funds II, The Alger Institutional Funds, The Alger Portfolios, and Alger Global Focus Fund. |
| | | |
| What we do |
| |
| How does Alger protect my personal information? | | To protect your personal information from unauthorized access and use, we use security measures that comply with federal law. These measures include computer safeguards and secured files and buildings. |
| | | |
| How does Alger collect my personal information? | | We collect your personal information, for example, when you: |
| | | · Open an account or |
| | | · Make deposits or withdrawals from your account or |
| | | · Give us your contact information or |
| | | · Provide account information or |
| | | · Pay us by check. |
| | | |
| Why can’t I limit all sharing? | | Federal law gives you the right to limit some but not all sharing related to: |
| | | · sharing for affiliates’ everyday business purposes — information about your credit worthiness |
| | | · affiliates from using your information to market to you |
| | | · sharing for nonaffiliates to market to you |
| | | State laws and individual companies may give you additional rights to limit sharing. |
| | | |
| Definitions |
| |
| Affiliates | | Companies related by common ownership or control. They can be financial and nonfinancial companies. |
| | | · Our affiliates include Fred Alger Management, LLC, Weatherbie Capital, LLC and Fred Alger & Company, LLC as well as the following funds: The Alger Funds, The Alger Funds II, The Alger Institutional Funds, The Alger Portfolios, and Alger Global Focus Fund. |
| | | |
| Nonaffiliates | | Companies not related by common ownership or control. They can be financial and nonfinancial companies. |
| | | |
| Joint marketing | | A formal agreement between nonaffiliated financial companies that together market financial products or services to you. |
ALGER GLOBAL FOCUS FUND
ADDITIONAL INFORMATION (Unaudited) (Continued)
Proxy Voting Policies
A description of the policies and procedures the Fund uses to determine how to vote proxies relating to portfolio securities and the proxy voting record is available, without charge, by calling (800) 992-3863 or online on the Fund’s website at http://www.alger.com or on the SEC’s website at http://www.sec.gov.
Fund Holdings
The Board of Trustees has adopted policies and procedures relating to disclosure of the Fund’s portfolio securities. These policies and procedures recognize that there may be legitimate business reasons for holdings to be disclosed and seek to balance those interests to protect the proprietary nature of the trading strategies and implementation thereof by the Fund.
Generally, the policies prohibit the release of information concerning portfolio holdings, which have not previously been made public, to individual investors, institutional investors, intermediaries that distribute the Fund’s shares and other parties which are not employed by the Investment Manager or its affiliates except when the legitimate business purposes for selective disclosure and other conditions (designed to protect the Fund) are acceptable.
The Fund files its complete schedule of portfolio holdings with the SEC semi-annually in shareholder reports on Form N-CSR and after the first and third fiscal quarters as an exhibit to its reports on Form N-PORT. The Fund’s Forms N-CSR and N-PORT are available online on the SEC’s website at www.sec.gov.
In addition, the Fund makes publicly available its month-end top 10 holdings with a 10 day lag and its month-end full portfolio with a 60 day lag on its website www.alger.com and through other marketing communications (including printed advertising/sales literature and/or shareholder telephone customer service centers). No compensation or other consideration is received for the non-public disclosure of portfolio holdings information.
In accordance with the foregoing, the Fund provides portfolio holdings information to third parties including financial intermediaries and service providers who need access to this information in the performance of their services and are subject to duties of confidentiality (1) imposed by law, including a duty not to trade on non-public information, and/or (2) pursuant to an agreement that confidential information is not to be disclosed or used (including trading on such information) other than as required by law. From time to time, the Fund will communicate with these third parties to confirm that they understand the Fund’s policies and procedures regarding such disclosure. This agreement must be approved by the Fund’s Chief Compliance Officer.
The Board of Trustees periodically reviews a report disclosing the third parties to whom the Fund’s holdings information has been disclosed and the purpose for such disclosure, and it considers whether or not the release of information to such third parties is in the best interest of the Fund and its shareholders.
ALGER GLOBAL FOCUS FUND
ADDITIONAL INFORMATION (Unaudited) (Continued)
In addition to material the Fund routinely provides to shareholders, the Investment Manager may make additional statistical information available regarding the Alger Family of Funds. Such information may include, but not be limited to, relative weightings and characteristics of the Fund versus an index (such as P/E ratio, alpha, beta, capture ratio, maximum drawdown, standard deviation, EPS forecasts, Sharpe ratio, information ratio, R-squared, and market cap analysis), security specific impact on overall portfolio performance, month- end top ten contributors to and detractors from performance, portfolio turnover, and other similar information. Shareholders should visit www.alger.com or may also contact the Funds at (800) 992-3863 to obtain such information.
ALGER GLOBAL FOCUS FUND
360 Park Avenue South
New York, NY 10010
(800) 992-3863
www.alger.com
Investment Manager
Fred Alger Management, LLC
360 Park Avenue South
New York, NY 10010
Distributor
Fred Alger & Company, LLC
360 Park Avenue South
New York, NY 10010
Transfer Agent and Dividend Disbursing Agent
UMB Fund Services, Inc.
235 W. Galena Street
Milwaukee, WI 53212
Custodian
Brown Brothers Harriman & Company
50 Post Office Square
Boston, MA 02110
Independent Registered Public Accounting Firm
Deloitte & Touche LLP
30 Rockefeller Plaza
New York, NY 10112
This report is submitted for the general information of the shareholders of Alger Global Focus Fund. It is not authorized for distribution to prospective investors unless accompanied by an effective prospectus for the Fund, which contains information concerning the Fund’s investment policies, fees and expenses as well as other pertinent information.
(This page has been intentionally left blank.)
(This page has been intentionally left blank.)
(This page has been intentionally left blank.)
(This page has been intentionally left blank.)
(This page has been intentionally left blank.)
(This page has been intentionally left blank.)

ITEM 2. CODE OF ETHICS.
| (a) | The Registrant has adopted a code of ethics (the "Code of Ethics") that applies to its principal executive officer, principal financial officer, principal accounting officer or controller, or persons performing similar functions. |
| (c) | The Registrant has not amended its Code of Ethics during the period covered by the shareholder report presented in Item 1 hereto. |
| (d) | The Registrant has not granted a waiver or an implicit waiver from a provision of its Code of Ethics during the period covered by the shareholder report presented in Item 1 hereto. |
| (f) | The Registrant's Code of Ethics is attached as an Exhibit hereto. |
ITEM 3. AUDIT COMMITTEE FINANCIAL EXPERT.
| The Board of Trustees of the Registrant determined that Stephen E. O’Neil is an audit committee financial expert (within the meaning of that phrase specified in the instructions to Form N-CSR) on the Registrant’s audit committee. Mr. O’Neil is an “independent” trustee – i.e., he is not an interested person of the Registrant as defined in the Investment Company Act of 1940, nor has he accepted directly or indirectly any consulting, advisory or other compensatory fee from the Registrant, other than in his capacity as Trustee. |
ITEM 4. PRINCIPAL ACCOUNTANT FEES AND SERVICES.
| October 31, 2020 | | $ | 38,200 | |
| October 31, 2019 | | $ | 38,200 | |
| b) | Audit-Related Fees: NONE |
| c) | Tax Fees for tax advice, tax compliance and tax planning: |
| October 31, 2020 | | $ | 12,340 | |
| October 31, 2019 | | $ | 7,955 | |
| October 31, 2020 | | $ | 1,972 | |
| October 31, 2019 | | $ | 1,972 | |
Other fees include a review and consent for Registrants registration statement filing and a review of the semi-annual financial statements.
| e) 1) | Audit Committee Pre-Approval Policies And Procedures: |
Audit and non-audit services provided by the Registrant’s independent registered public accounting firm (the “Auditors”) on behalf the Registrant must be pre-approved by the Audit Committee. Non-audit services provided by the Auditors on behalf of the Registrant’s Investment Adviser or any entity controlling, controlled by, or under common control with the Investment Adviser must be pre-approved by the Audit Committee if such non-audit services directly relate to the operations or financial reporting of the Registrant.
| 2) | All fees in item 4(b) through 4(d) above were approved by the Registrants’ Audit Committee. |
f) Not Applicable
g) Non-Audit Fees:
| October 31, 2020 | | $ | 232,670, €72,885 | |
| October 31, 2019 | | $ | 230,152, €75,612 | |
h) The audit committee of the board of trustees has considered whether the provision of the non-audit services that were rendered to the registrant's investment adviser and any entity controlling, controlled by, or under common control, with the adviser that provides ongoing services to the registrant that were not approved pursuant to (c)(7)(ii) of Rule 2-01 of Regulation S-X is compatible with maintaining the principle accountant's independence.
ITEM 5. AUDIT COMMITTEE OF LISTED REGISTRANTS.
Not applicable
ITEM 6. INVESTMENTS.
a) A Schedule of Investments in securities of unaffiliated issuers is included as part of the report to shareholders filed under Item 1 of this Form N-CSR.
ITEM 7. DISCLOSURE OF PROXY VOTING POLICIES AND PROCEDURES FOR CLOSED-END MANAGEMENT INVESTMENT COMPANIES.
Not applicable
ITEM 8. PORTFOLIO MANAGERS OF CLOSED-END MANAGEMENT INVESTMENT COMPANIES.
Not applicable
ITEM 9. PURCHASES OF EQUITY SECURITIES BY CLOSED-END MANAGEMENT INVESTMENT COMPANY AND AFFILIATED PURCHASERS.
Not applicable
ITEM 10. SUBMISSION OF MATTERS TO A VOTE OF SECURITY HOLDERS.
None
ITEM 11. CONTROLS AND PROCEDURES.
(a) The Registrant’s principal executive officer and principal financial officer have concluded that the Registrant’s disclosure controls and procedures (as defined in Rule 30a-3(c) under the Investment Company Act of 1940, as amended) are effective based on their evaluation of the disclosure controls and procedures as of a date within 90 days of the filing date of this document.
(b) No changes in the Registrant’s internal control over financial reporting occurred during the Registrant’s second fiscal half-year that materially affected, or are reasonably likely to materially affect, the Registrant’s internal control over financial reporting.
ITEM 12. Disclosure of Securities Lending Activities for Closed-End Management Investment Companies.
Not applicable.
ITEM 13. EXHIBITS.
(a) (1) Code of Ethics as Exhibit 99.CODE ETH
(a) (2) Certifications of principal executive officer and principal financial officer as required by rule 30a-2(a) under the Investment Company Act of 1940 are attached as Exhibit 99.CERT
(a) (3) Not applicable
(a) (4) Not applicable
(b) Certifications of principal executive officer and principal financial officer as required by rule 30a-2(b) under the Investment Company Act of 1940 are attached as Exhibit 99.906CERT
SIGNATURES
Pursuant to the requirements of the Securities Exchange Act of 1934 and the Investment Company Act of 1940, the registrant has duly caused this report to be signed on its behalf by the undersigned, thereunto duly authorized.
| Alger Global Focus Fund | |
| | |
| By: | /s/Hal Liebes | |
| | | |
| | Hal Liebes | |
| | | |
| | President | |
Date: December 21, 2020
Pursuant to the requirements of the Securities Exchange Act of 1934 and the Investment Company Act of 1940, this report has been signed below by the following persons on behalf of the registrant and in the capacities and on the dates indicated.
| By: | /s/Hal Liebes | |
| | | |
| | Hal Liebes | |
| | | |
| | President | |
Date: December 21, 2020
| By: | /s/Michael D. Martins | |
| | | |
| | Michael D. Martins | |
| | | |
| | Treasurer | |
Date: December 21, 2020