OMB APPROVAL
OMB Number: 3235-0570
Expires: January 31, 2017
Estimated average burden
hours per response 20.6
UNITED STATES
SECURITIES AND EXCHANGE COMMISSION
Washington, D.C. 20549
FORM N-CSR
CERTIFIED SHAREHOLDER REPORT OF REGISTERED MANAGEMENT
INVESTMENT COMPANIES
Investment Company Act file number 811-21308
Alger Global Growth Fund
(Exact name of registrant as specified in charter)
360 Park Avenue South New York, New York 10010
(Address of principal executive offices) (Zip code)
Mr. Hal Liebes
Fred Alger Management, Inc.
360 Park Avenue South
New York, New York 10010
(Name and address of agent for service)
Registrant's telephone number, including area code: 212-806-8800
Date of fiscal year end: October 31
Date of reporting period: October 31, 2016
ITEM 1. REPORTS TO STOCKHOLDERS.
Table of Contents
ALGER GLOBAL GROWTH FUND
|
| Shareholders’ Letter (Unaudited) | 1 |
| Fund Highlights (Unaudited) | 9 |
| Portfolio Summary (Unaudited) | 11 |
| Schedule of Investments | 12 |
| Statement of Assets and Liabilities | 19 |
| Statement of Operations | 21 |
| Statement of Changes in Net Assets | 22 |
| Financial Highlights | 23 |
| Notes to Financial Statements | 27 |
| Report of Independent Registered Public Accounting Firm | 43 |
| Additional Information (Unaudited) | 44 |
Go Paperless With Alger Electronic Delivery Service
Alger is pleased to provide you with the ability to access regulatory materials online.
When documents such as prospectuses and annual and semi-annual reports are
available, we’ll send you an e-mail notification with a convenient link that will take you
directly to the fund information on our website. To sign up for this free service, simply
enroll at www.icsdelivery.com/alger.
Shareholders' Letter (Unaudited) October 31, 2016
Dear Shareholders,
Dangers of Bond-Like Equities Materialize
In our last shareholder letter, we discussed the risks of investors stampeding into bond-like
equities, with the trend being particularly strong in the U.S. In that letter, we noted that
bond-like equities had outperformed the overall S&P 500 Index, but we urged investors to
avoid joining the stampede because the category of equities is highly vulnerable to rising
interest rates and other risks. Due to the strong results of bond-like stocks in the months
leading up to July, U.S. equities generated positive performance for the one-year reporting
period ended October 31, 2016, but the inherent risks that we had identified started to
surface in a spectacular fashion.
During the first eight months of the reporting period, the bond-like Telecommunications
sector within the S&P 500 led with a 25.4% return. With a massive reversal, it became the
worst performing sector with a -11.7% return for the last four months of the reporting
period. Utilities and Consumer Staples, which were the second- and third-best performing
sectors during the first eight months of the reporting period with double-digit gains, were
the fourth- and fifth-worst performers with negative returns during the final four months
of the reporting period. Growth sectors, meanwhile, led with Information Technology
generating a 12.8% return during the last four months of the reporting period.
Equities Advance
From a broader perspective, the S&P 500 climbed 4.51% during the reporting period and
global equities gained 2.63% as measured by the MSCI ACWI Index. Broadly speaking,
accommodative monetary policies across the globe helped support investor sentiment. From
a regional perspective, Latin America and Asia/Pacific Ex-Japan outperformed while the
negative returns of Europe and Africa/Mideast trailed the MSCI ACWI Index. Emerging
markets were a bright spot with strengthening commodity prices, attractive valuations, and
improving economic data helping the MSCI Emerging Markets Index rally 9.67%.
In the U.S., the strong market leadership of bond-like stocks early in the reporting period
created challenging conditions for firms such as Alger that invest in companies with attractive
fundamentals and strong potential for generating earnings growth. Despite those challenges,
we continued with our more than 50-year tradition of employing extensive bottom-up
research to identify and invest in well managed companies with strong fundamentals,
including the potential for generating earnings growth. Since our founding in 1964, we have
believed that those types of companies offer the greatest potential for creating wealth for
our clients.
Our View of Risks and Bond-Like Equities
The rotation out of bond-like equities was no surprise at Alger. Indeed, in our last letter, we
identified the following risks associated with bond-like equities:
• Bond-like equities are highly interest-rate sensitive so investors who stam-
peded into the category of stocks faced substantial interest rate risk. With
record-low interest rates, the risk of rising rates was considerable.
- 1 -
• Due to the stampede, valuations of sectors with companies that offer stable
earnings and high dividend yields such as Consumer Staples were historically
high, especially relative to growth sectors. At of the start of the 12-month
reporting period, for example, the P/E ratios for Consumer Staples and Util-
ities sectors traded at 20% and 12% premiums respectively, to their 20-year
medians while Information Technology and Health Care traded with P/E
ratios that were 7% and 3%, respectively, below their 20-year medians. The
large disparity in valuations implied that growth stocks were more attractive
than bond-like equities.
• Investors focused on bond-like equities could miss the potentially strong re-
turns that result when leading companies with attractive fundamentals gener-
ate earnings growth. Importantly, massive forms of innovation, such as inter-
net-related technologies and health care advancements, are creating attractive
opportunities for companies to grow their earnings and reward investors.
Global Economy Takes a Toll on Bond-Like Equities
Various developments during the one-year reporting period fueled fears of rising interest
rates and inflation, which in turn sparked the dramatic investor rotation out of bond-like
sectors and into growth sectors. During the past few years, low commodity prices have
tempered inflation expectations, but that trend ended abruptly during the reporting period.
During the first 10 months of 2016, the multi-year decline in commodity prices reversed with
the Bloomberg Commodity Index gaining 8.3%. In the past, expectations that moderating
economic growth in China would limit commodity price increases also helped to temper
investors’ inflation expectations. During the reporting period, however, a more favorable
view of China emerged. Year-over-year industrial production in October of 2015 grew only
5.6% but from November of 2015 through September of this year, production growth
trended above 6%. In the U.S., inflation concerns were also stoked by a strengthening job
market creating wage pressures, with compensation increasing 2.8% during the 12-month
period ended October 31. Inflation expectations as measured by comparing the nominal yield
of a 10-year Treasury to its inflation protected counterpart also grew during the reporting
period with the spread increasing from 1.59% to 1.73%. Finally, anticipation that the Federal
Reserve would continue normalizing monetary policy supported expectations that interest
rates will rise. We believe that investors’ rotation into growth equities in response to those
developments was rational. Leading growth companies have potential for growing their
earnings, which can help offset the adverse impact of inflation and rising interest rates on
corporate fundamentals. Bond-like sectors such as Utilities, however, have less potential for
generating earnings growth, so they are susceptible to interest rate increases.
The Value of a Long-Term Perspective and Fundamental Research
Emotions can easily distort individuals’ views of reality, especially when it comes to
investing. We believe that the incorrect view that bond-like equities are the only way to
generate yield during times of low interest rates is an example of a distorted and potentially
costly perspective. This distorted view caused many investors to overlook growth stocks’
return of capital, which can be measured by total yield. Total yield is dividend yield plus
the share repurchase yield. As an example, at the end of June, the Information Technology
and Consumer Discretionary sectors offered total yields of 6.5% and 6.0%, respectively,
compared to the 4.7% total yield of Telecommunication Services and the 4.3% total yield
of Utilities.
- 2 -
In addition, performance of sectors is driven by three primary factors: dividends, earnings
growth, and changes to P/E ratios. During the reporting period, those three factors pointed
to growth sectors having strong potential for outperforming bond-like sectors. Data as of
the end of June illustrate this point, with consensus expectations having called for the bond-
like Utilities and Consumer Staples sectors to generate earnings growth per share of 4%
and 7%, respectively, over the next three to five years. For this analysis, we reduced earnings
growth expectations by 20% simply to have a conservative outlook. For the Utilities and
Consumer Staples sectors, the dividend yield for the prior 12 months was 4% and 3%.
For both sectors, a reversion to the 20-year P/E median would imply a decline of 5%.
The potential changes in earnings and P/E ratios combined with dividend payments would
result in hypothetical returns of 3% for Utilities and 5% for Consumer Staples.
After factoring in the previously mentioned 20% reduction, growth sectors such as
Information Technology, Health Care, and Consumer Discretionary could potentially have
earnings growth ranging from 8% to 14%. As of June 30, those sectors offered 2% dividend
yields for the trailing 12 months. In the event of a reversion to 20-year medians, the sectors’
P/E ratios would increase 2%, which would result in hypothetical returns ranging from 12%
to 18%.
The U.S. Presidential Election
Emotions also played a role when investors weighed in on the presidential campaign and the
subsequent victory of Donald Trump. The election was a highly emotional event for many
Americans, but it is important to remember that corporate fundamentals and economic
cycles ultimately drive market performance. With that in mind, we urge investors to focus
on corporate fundamentals and avoid making large bets on the potential policies of a new
president.
As Jason Zweig of the Wall Street Journal points out, investors have a poor track record
of making bets on presidents. Regulations from President Barack Obama were expected to
hurt the performance of Health Care stocks, but the sector has outperformed the overall
market during his presidency. Increased military spending under President George W. Bush,
furthermore, had a counterintuitive impact on defense stocks, with the category of equities
declining in 2001 and 2002.
Reasons for Optimism
Rather than chasing dividend yields or making bets on potential policies of President-elect
Trump, we believe equity investors should assess the ongoing U.S. economic recovery, strong
corporate fundamentals, and the rapid pace of innovation. Those factors, we maintain, are
likely to support growth equities in the foreseeable future. The economy has benefited from
an expanding labor market that has created 15.5 million jobs since February of 2010. With
a strengthening job market, compensation as measured by hourly wages increased 2.8%
during the 12-month reporting period. Personal finances are also encouraging, with the
Household Debt Service Ratio, which is the ratio of total required household debt payments
to total disposable income, having improved substantially. After hitting a high of 13.20% in
the fourth quarter of 2007, the ratio has declined to an attractive level of only 9.98% as of
the second quarter of this year, according to the Federal Reserve.
We believe corporate fundamentals are also encouraging. According to FactSet Research
Systems, S&P 500 companies (ex-financials) held $1.45 trillion in cash at the end of the
- 3 -
second quarter of this year. Despite declining 0.2% from the prior quarter, it was still the
second-largest amount in at least 10 years.
As mentioned earlier, corporations are using their large cash positions to reward shareholders
with dividends and aggressive share repurchase programs. In the second quarter, S&P 500
companies (ex-financials) paid a total of $176.6 billion in dividends and share repurchases,
according to FactSet. It was a 1.7% year-over-year decrease, but the 12-month period ended
June 30 was strong with buybacks and dividends growing 6.1% and 6.6%, respectively,
compared to the 12-month period ended in June of 2015.
We maintain that investors should also assess the attractive valuations of growth sectors
relative to bond-like sectors. As of the end of the reporting period, the Information
Technology sector within the S&P 500 had a P/E ratio that was 2% below its 20-year
median. Health Care and Consumer Discretionary sectors had P/E ratios that were 15%
and 4%, respectively, below their 20-year medians. The P/E ratios for Consumer Staples and
Utilities, however, were at 21% and 20% premiums to their 20-year medians.
We also believe that innovation that can help drive corporate earnings growth is strong
across the globe, thanks in large part to internet related technologies and advancements
in health care. At the same time, the adoption of new technologies by consumers and
corporations is accelerating. The internet, smartphones, ebooks, and social media illustrate
this trend, with each form of technology reaching 50% market penetration in a fraction of
the time that was required by washing machines, landline telephones, and dishwashers. At
the same time, medical innovation in orthopedic, cardiac, and cancer is occurring rapidly.
Our optimism extends beyond the U.S. We think global equities and emerging markets may
potentially benefit from increased trade as the U.S. economy continues to expand. In addition,
many developed-market countries are continuing to provide accommodative monetary
policies. We believe that the estimated 4.9% 2016 earnings growth rate for MSCI Emerging
Markets Index constituents, which is higher than for both the MSCI Europe, Australasia,
and Far East Index (EAFE) and the S&P 500 Index, is also attractive. Emerging markets
are also attractive when considering that the asset class is trading at a P/E discount of 22%
to developed markets. We continue to believe that a 10% to 12% discount is appropriate.
Conclusion
We urge investors to embrace an investment strategy that employs intensive research to
identify companies with strong fundamentals and potential for earnings growth. At the
same time, investors should maintain a long-term perspective and avoid the risky behavior
of focusing on bond-like equities. At Alger, we will continue to focus on our fundamental
research and disciplined investment approach as we seek to generate attractive returns for
our valued clients.
Portfolio Matters
The Alger Global Growth Fund returned -2.18% for the fiscal year ended October 31, 2016,
compared to the 2.63% return of the MSCI ACWI Index.
Stock selection resulted in China, South Korea, and Switzerland being among countries that
provided the largest contributions to relative performance. During the reporting period,
equities in France declined significantly, so the portfolio’s underweighting of that country
- 4 -
was beneficial. Stock selection, however, resulted in Japan, Germany, the U.S., and the
United Kingdom being among countries that detracted from results.
During the reporting period, the largest portfolio sector weightings were Information
Technology and Health Care. The largest sector overweight was Health Care and the largest
sector underweight was Financials. The Energy and Utilities sectors provided the largest
contributions to relative performance while Health Care and Industrials were among sectors
that detracted from results.
Tencent Holdings Ltd.; AT&T, Inc.; UnitedHealth Group, Inc.; and Commerzbank AG
were among top contributors to performance. Shares of social network operator Facebook,
Inc., Cl. A also contributed to performance. The shares performed strongly in response to
the company continuing to take advertising market share from print and television media.
We believe investors have also been encouraged by the growth of Instagram, which is the
company’s video- and photo-sharing network.
Allergan PLC.; Norwegian Cruise Line Holdings Ltd.; Shire PLC.; and Apple, Inc. were
among top detractors from performance. Shares of Vertex Pharmaceuticals, Inc. also
detracted from results. Vertex is a biotechnology company that offers treatments for cystic
fibrosis and inflammatory diseases. The shares detracted from performance early in the
reporting period in response to a product ramp up of a cystic fibrosis drug generating
fewer-than-expected patient additions and therefore disappointing investors.
I thank you for putting your trust in Alger.
Daniel C. Chung, CFA
Chief Investment Officer
Fred Alger Management, Inc.
FactSet Research Systems represented 0.00% of Alger assets under management as of
October 31, 2016.
Investors cannot invest directly in an index. Index performance does not reflect the
deduction for fees, expenses, or taxes.
This report and the financial statements contained herein are submitted for the general
information of shareholders of the Fund. This report is not authorized for distribution
to prospective investors in the Fund unless proceeded or accompanied by an effective
prospectus for the Fund. Fund performance returns represent the 12-month period return
of Class A shares prior to the deduction of any sales charges and include the reinvestment
of any dividends or distributions.
The performance data quoted represents past performance, which is not an
indication or guarantee of future results.
Standardized performance results can be found on the following pages. The investment
return and principal value of an investment in the Fund will fluctuate so that an investor’s
- 5 -
shares, when redeemed, may be worth more or less than their original cost. Current
performance may be lower or higher than the performance quoted. For performance data
current to the most recent month-end, visit us at www.alger.com or call us at (800) 992-3863.
The views and opinions of the Fund’s management in this report are as of the date of the
Shareholders’ Letter and are subject to change at any time subsequent to this date. There
is no guarantee that any of the assumptions that formed the basis for the opinions stated
herein are accurate or that they will materialize. Moreover, the information forming the basis
for such assumptions is from sources believed to be reliable; however, there is no guarantee
that such information is accurate. Any securities mentioned, whether owned in the Fund
or otherwise, are considered in the context of the construction of an overall portfolio of
securities and therefore reference to them should not be construed as a recommendation
or offer to purchase or sell any such security. Inclusion of such securities in the Fund and
transactions in such securities, if any, may be for a variety of reasons, including, without
limitation, in response to cash flows, inclusion in a benchmark, and risk control. The
reference to a specific security should also be understood in such context and not viewed as
a statement that the security is a significant holding in the Fund. Please refer to the Schedule
of Investments for the Fund which is included in this report for a complete list of Fund
holdings as of October 31, 2016. Securities mentioned in the Shareholders’ Letter, if not
found in the Schedule of Investments, may have been held by the Fund during the fiscal
period.
A Word about Risk
Growth stocks tend to be more volatile than other stocks as the price of growth stocks tends
to be higher in relation to their companies’ earnings and may be more sensitive to market,
political and economic developments. Investing in the stock market involves gains and losses
and may not be suitable for all investors. Stocks of small- and mid-sized companies are subject
to greater risk than stocks of larger, more established companies owing to such factors as
limited liquidity, inexperienced management, and limited financial resources. Investing in
foreign securities involves additional risk (including currency risk, risks related to political,
social or economic conditions, and risks associated with foreign markets, such as increased
volatility, limited liquidity, less stringent regulatory and legal systems, and lack of industry
and country diversification), and may not be suitable for all investors. Special risks associated
with investments in emerging country issuers include exposure to currency fluctuations, less
liquidity, less developed or less efficient trading markets, lack of comprehensive company
information, political instability and different auditing and legal standards.
Foreign currencies are subject to risks caused by inflation, interest rates, budget deficits and
low savings rates, political factors and government controls. Some of the countries where
the Fund can invest may have restrictions that could limit access to investment opportunities.
The securities of issuers located in emerging markets can be more volatile and less liquid
than those of issuers in more mature economies. Investing in emerging markets involves
higher levels of risk, including increased information, market, and valuation risks, and may
not be suitable for all investors.
Funds that participate in leveraging are subject to the risk that the cost of borrowing money
to leverage will exceed the returns for securities purchased or that the securities purchased
may actually go down in value; thus, a fund’s net asset value can decrease more quickly than
if the fund had not borrowed.
- 6 -
For a more detailed discussion of the risks associated with the Fund, please see the
prospectus.
Before investing, carefully consider the Fund’s investment objective, risks, charges,
and expenses.
For a prospectus or a summary prospectus containing this and other information
about the Alger Global Growth Fund call us at (800) 992-3863 or visit us at www.
alger.com. Read it carefully before investing.
Fred Alger & Company, Incorporated, Distributor. Member NYSE Euronext, SIPC.
NOT FDIC INSURED. NOT BANK GUARANTEED. MAY LOSE VALUE.
Definitions:
• S&P 500 Index: An index of large company stocks considered representative
of the U.S. stock market.
• The Bloomberg Commodity Index reflects the performance of 20 commod-
ities, which are weighted to account for economic significance and market
liquidity.
• Morgan Stanley Capital International (MSCI) All Country World Index
(ACWI): An unmanaged, market capitalization-weighted index designed
to provide a broad measure of equity market performance throughout the
world, including both developed and emerging markets.
• The EAFE Index measures the performance of major international equity
markets as represented by 21 major MSCI indexes from Europe, Australia
and Southeast Asia.
• MSCI Emerging Markets Index: A free float-adjusted market capitalization
index designed to measure equity market performance in the global emerging
markets.
• FactSet Research Systems, Inc. is a multinational financial data and software
company.
- 7 -
| | | | | | | | |
| FUND PERFORMANCE AS OF 9/30/16 (Unaudited) |
| AVERAGE ANNUAL TOTAL RETURNS |
| | 1 | | 5 | | 10 | | SINCE | |
| | YEAR | | YEARS | | YEARS | | INCEPTION | |
| Alger Global Growth Class A (Inception 11/3/03) | 1.76 | % | 8.16 | % | 5.19 | % | 8.19 | % |
| Alger Global Growth Class C (Inception 3/3/08)* | 5.61 | % | 8.52 | % | 5.01 | % | 7.86 | % |
| Alger Global Growth Class I (Inception 5/31/13) | 7.71 | % | n/a | | n/a | | 6.81 | % |
| Alger Global Growth Class Z (Inception 5/31/13) | 7.92 | % | n/a | | n/a | | 7.07 | % |
The performance data quoted represents past performance, which is not an indication or a guarantee of future
results. The Fund’s average annual total returns include changes in share price and reinvestment of dividends and
capital gains. Class A returns reflect the maximum initial sales charge and Class C returns reflect the applicable
contingent deferred sales charge. Beginning May 31, 2013 Alger Global Growth Fund changed its investment
strategy to emphasize foreign (including emerging markets) securities and the United States, its previous investment
strategy considered securities economically tied to China (including Hong Kong and Taiwan) and the United States.
* Since inception performance is calculated since the inception of the Class A shares. Historical performance prior to March 3,
2008, inception of the class, is that of the Fund's Class A shares, reduced to reflect the current maximum sales charge and the
higher operating expenses of Class C shares.
- 8 -
ALGER GLOBAL GROWTH FUND
Fund Highlights Through October 31, 2016 (Unaudited)
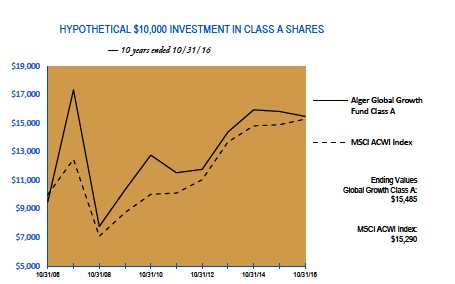
The chart above illustrates the growth in value of a hypothetical $10,000 investment made in the Alger Global Growth
Fund Class A shares, with an initial maximum sales charge of 5.25%, and the MSCI ACWI Index (unmanaged index
of common stocks) for the ten years ended October 31, 2016. Beginning May 31, 2013 Alger Global Growth Fund
changed its investment strategy to emphasize foreign (including emerging markets) securities and the United States.
Its previous investment strategy considered securities economically tied to China (including Hong Kong and Taiwan)
and the United States. Figures for the Alger Global Growth Fund Class A shares, and the MSCI ACWI Index include
reinvestment of dividends. Performance for the Alger Global Growth Fund Class C, Class I and Class Z shares will
vary from the results shown above due to differences in expenses and sales charges that each class bears. Investors
cannot invest directly in any index. Index performance does not reflect deduction for fees, expenses, or taxes.
| | | | | | | | |
| PERFORMANCE COMPARISON AS OF 10/31/16 |
| AVERAGE ANNUAL TOTAL RETURNS |
| | | | | | | | Since | |
| | 1 YEAR | | 5 YEARS | | 10 YEARS | | 11/3/2003 | |
| Class A (Inception 11/3/03) | (7.30 | )% | 4.92 | % | 4.47 | % | 7.90 | % |
| Class C (Inception 3/3/08)* | (3.92 | )% | 5.26 | % | 4.29 | % | 7.57 | % |
| MSCI ACWI Index | 2.63 | % | 8.62 | % | 4.34 | % | 7.13 | % |
| |
| | | | | | | | Since | |
| | 1 YEAR | | 5 YEARS | | 10 YEARS | | 5/31/2013 | |
| Class I (Inception 5/31/13) | (2.02 | )% | n/a | | n/a | | 5.74 | % |
| Class Z (Inception 5/31/13) | (1.77 | )% | n/a | | n/a | | 6.02 | % |
| MSCI ACWI Index | 2.63 | % | n/a | | n/a | | 5.99 | % |
The performance data quoted represents past performance, which is not an indication or a guarantee of future results. The Fund’s average
annual total returns include changes in share price and reinvestment of dividends and capital gains. Class A returns reflect the maximum
initial sales charge and Class C returns reflect the applicable contingent deferred sales charge. The chart and table above do not reflect the
deduction of taxes that a shareholder would have paid on Fund distributions or on the redemption of Fund shares. Investment return
and principal will fluctuate and the Fund’s shares, when redeemed, may be worth more or less than their original cost. Current performance
may be higher or lower than the performance quoted. For updated performance, visit us at www.alger.com or call us at (800) 992-3863.
- 9 -
ALGER GLOBAL GROWTH FUND
Fund Highlights Through October 31, 2016 (Unaudited) (Continued)
* Since inception performance is calculated since the inception of the Class A shares. Historical performance prior to March
3, 2008, inception of the class, is that of the Fund's Class A shares, reduced to reflect the current maximum sales charge
and the higher operating expenses of Class C shares.
- 10 -
PORTFOLIO SUMMARY†
October 31, 2016 (Unaudited)
| | | |
| | | Alger Global Growth | |
| COUNTRY | | Fund | |
| Australia | | 1.2 | % |
| Brazil | | 1.0 | |
| Canada | | 0.8 | |
| China | | 3.6 | |
| France | | 2.2 | |
| Germany | | 2.1 | |
| Hong Kong | | 0.9 | |
| India | | 1.4 | |
| Indonesia | | 0.8 | |
| Ireland | | 1.0 | |
| Japan | | 2.4 | |
| Mexico | | 0.5 | |
| Netherland | | 0.3 | |
| Netherlands | | 3.8 | |
| Norway | | 0.5 | |
| South Africa | | 0.4 | |
| South Korea | | 1.7 | |
| Sweden | | 0.4 | |
| Switzerland | | 1.8 | |
| Taiwan | | 0.9 | |
| United Kingdom | | 4.8 | |
| United States | | 63.1 | |
| Cash and Net Other Assets | | 4.4 | |
| | | 100.0 | % |
† Based on net assets for the Fund.
- 11 -
ALGER GLOBAL GROWTH FUND
Schedule of Investments October 31, 2016
| | | | |
| COMMON STOCKS—92.8% | | SHARES | | VALUE |
| AUSTRALIA—1.2% | | | | |
| DIVERSIFIED METALS & MINING—1.2% | | | | |
| BHP Billiton Ltd. | | 19,000 | $ | 331,946 |
| (Cost $299,133) | | | | |
| BRAZIL—1.0% | | | | |
| DIVERSIFIED REAL ESTATE ACTIVITIES—0.6% | | | | |
| BR Malls Participacoes SA* | | 40,861 | | 163,533 |
| INDEPENDENT POWER AND RENEWABLE ENERGY—0.4% | | | | |
| AES Tiete Energia SA | | 23,086 | | 119,578 |
| TOTAL BRAZIL | | | | |
| (Cost $241,868) | | | | 283,111 |
| CANADA—0.8% | | | | |
| FOOD RETAIL—0.8% | | | | |
| Alimentation Couche-Tard, Inc. | | 4,250 | | 213,538 |
| (Cost $181,955) | | | | |
| CHINA—3.6% | | | | |
| INTERNET SOFTWARE & SERVICES—3.6% | | | | |
| Alibaba Group Holding Ltd.#* | | 4,212 | | 428,318 |
| Tencent Holdings Ltd. | | 23,185 | | 614,453 |
| (Cost $422,325) | | | | 1,042,771 |
| FRANCE—2.2% | | | | |
| DIVERSIFIED BANKS—0.6% | | | | |
| BNP Paribas SA | | 3,000 | | 173,966 |
| INTEGRATED OIL & GAS—1.6% | | | | |
| TOTAL SA | | 9,528 | | 456,480 |
| TOTAL FRANCE | | | | |
| (Cost $607,257) | | | | 630,446 |
| GERMANY—2.1% | | | | |
| APPLICATION SOFTWARE—0.8% | | | | |
| SAP SE | | 2,550 | | 224,674 |
| AUTOMOBILE MANUFACTURERS—0.6% | | | | |
| Bayerische Motoren Werke AG | | 2,000 | | 174,507 |
| INTEGRATED TELECOMMUNICATION SERVICES—0.7% | | | | |
| Deutsche Telekom AG | | 12,648 | | 206,374 |
| TOTAL GERMANY | | | | |
| (Cost $616,959) | | | | 605,555 |
| HONG KONG—0.9% | | | | |
| CONSTRUCTION & ENGINEERING—0.4% | | | | |
| China State Construction International Holdings Ltd. | | 70,000 | | 102,119 |
| INDUSTRIAL CONGLOMERATES—0.5% | | | | |
| China Everbright International Ltd. | | 122,000 | | 145,841 |
| TOTAL HONG KONG | | | | |
| (Cost $313,732) | | | | 247,960 |
| INDIA—1.4% | | | | |
| DIVERSIFIED BANKS—1.1% | | | | |
| HDFC Bank Ltd. | | 13,850 | | 310,356 |
| PHARMACEUTICALS—0.3% | | | | |
| Aurobindo Pharma Ltd. | | 7,520 | | 92,254 |
| TOTAL INDIA | | | | |
| (Cost $322,427) | | | | 402,610 |
ALGER GLOBAL GROWTH FUND
Schedule of Investments (Continued) October 31, 2016
| | | | |
| COMMON STOCKS—(CONT.) | | SHARES | | VALUE |
| INDONESIA—0.8% | | | | |
| AUTOMOBILE MANUFACTURERS—0.8% | | | | |
| Astra International Tbk PT | | 356,200 | $ | 224,729 |
| (Cost $193,204) | | | | |
| IRELAND—1.0% | | | | |
| PHARMACEUTICALS—1.0% | | | | |
| Shire PLC. | | 5,000 | | 282,325 |
| (Cost $317,452) | | | | |
| JAPAN—2.4% | | | | |
| BREWERS—0.6% | | | | |
| Asahi Group Holdings Ltd. | | 5,000 | | 178,346 |
| DIVERSIFIED BANKS—0.6% | | | | |
| Mitsubishi UFJ Financial Group, Inc. | | 33,496 | | 172,825 |
| DIVERSIFIED REAL ESTATE ACTIVITIES—0.7% | | | | |
| Mitsui Fudosan Co., Ltd. | | 8,861 | | 201,790 |
| WIRELESS TELECOMMUNICATION SERVICES—0.5% | | | | |
| KDDI Corp. | | 4,300 | | 130,685 |
| TOTAL JAPAN | | | | |
| (Cost $789,389) | | | | 683,646 |
| MEXICO—0.5% | | | | |
| DIVERSIFIED REAL ESTATE ACTIVITIES—0.5% | | | | |
| Corp Inmobiliaria Vesta SAB de CV | | 100,705 | | 152,226 |
| (Cost $192,252) | | | | |
| NETHERLANDS—4.1% | | | | |
| DIVERSIFIED BANKS—0.6% | | | | |
| ING Groep NV | | 12,127 | | 159,206 |
| FOOD RETAIL—0.3% | | | | |
| X5 Retail Group NV*,(a) | | 3,299 | | 98,331 |
| PERSONAL PRODUCTS—1.0% | | | | |
| Unilever NV | | 6,500 | | 271,894 |
| SEMICONDUCTOR EQUIPMENT—1.0% | | | | |
| ASML Holding NV# | | 2,700 | | 285,174 |
| SEMICONDUCTORS—1.2% | | | | |
| NXP Semiconductors NV* | | 3,450 | | 345,000 |
| TOTAL NETHERLANDS | | | | |
| (Cost $1,120,913) | | | | 1,159,605 |
| NORWAY—0.5% | | | | |
| PACKAGED FOODS & MEATS—0.5% | | | | |
| Orkla ASA | | 16,000 | | 151,085 |
| (Cost $153,329) | | | | |
| SOUTH AFRICA—0.4% | | | | |
| PHARMACEUTICALS—0.4% | | | | |
| Aspen Pharmacare Holdings Ltd. | | 5,247 | | 114,293 |
| (Cost $145,109) | | | | |
| SOUTH KOREA—1.7% | | | | |
| AUTO PARTS & EQUIPMENT—0.8% | | | | |
| Mando Corp. | | 953 | | 222,915 |
- 13 -
ALGER GLOBAL GROWTH FUND
Schedule of Investments (Continued) October 31, 2016
| | | | |
| COMMON STOCKS—(CONT.) | | SHARES | | VALUE |
| SOUTH KOREA—(CONT.) | | | | |
| SEMICONDUCTORS—0.9% | | | | |
| Samsung Electronics Co., Ltd. | | 192 | $ | 274,742 |
| TOTAL SOUTH KOREA | | | | |
| (Cost $442,616) | | | | 497,657 |
| SWEDEN—0.4% | | | | |
| DIVERSIFIED BANKS—0.4% | | | | |
| Nordea Bank AB* | | 12,000 | | 126,116 |
| (Cost $118,177) | | | | |
| SWITZERLAND—1.8% | | | | |
| IT CONSULTING & OTHER SERVICES—0.5% | | | | |
| Luxoft Holding, Inc.* | | 2,743 | | 145,379 |
| PACKAGED FOODS & MEATS—1.3% | | | | |
| Nestle SA | | 5,000 | | 362,625 |
| TOTAL SWITZERLAND | | | | |
| (Cost $528,600) | | | | 508,004 |
| TAIWAN—0.9% | | | | |
| TECHNOLOGY HARDWARE STORAGE & PERIPHERALS—0.4% | | | | |
| Ennoconn Corp. | | 7,000 | | 111,026 |
| TEXTILES—0.5% | | | | |
| Eclat Textile Co., Ltd.* | | 12,000 | | 136,098 |
| TOTAL TAIWAN | | | | |
| (Cost $266,318) | | | | 247,124 |
| UNITED KINGDOM—4.8% | | | | |
| HOUSEHOLD PRODUCTS—0.8% | | | | |
| Reckitt Benckiser Group PLC. | | 2,474 | | 221,334 |
| INTEGRATED OIL & GAS—1.4% | | | | |
| Royal Dutch Shell PLC., Cl. B | | 15,000 | | 386,903 |
| PHARMACEUTICALS—1.0% | | | | |
| GlaxoSmithKline PLC. | | 14,500 | | 286,449 |
| TOBACCO—1.6% | | | | |
| Imperial Brands PLC.* | | 9,578 | | 463,324 |
| TOTAL UNITED KINGDOM | | | | |
| (Cost $1,401,250) | | | | 1,358,010 |
| UNITED STATES—60.3% | | | | |
| ADVERTISING—–% | | | | |
| Choicestream, Inc.*,@,(b) | | 1,969 | | – |
| AEROSPACE & DEFENSE—0.6% | | | | |
| Lockheed Martin Corp. | | 750 | | 184,785 |
| APPLICATION SOFTWARE—0.9% | | | | |
| salesforce.com, Inc.* | | 3,400 | | 255,544 |
| BIOTECHNOLOGY—4.6% | | | | |
| Biogen, Inc.* | | 650 | | 182,117 |
| BioMarin Pharmaceutical, Inc.* | | 1,800 | | 144,936 |
| Celgene Corp.* | | 3,000 | | 306,540 |
| Gilead Sciences, Inc. | | 1,750 | | 128,853 |
| Incyte Corp.* | | 1,000 | | 86,970 |
| Sarepta Therapeutics, Inc.* | | 2,000 | | 78,480 |
| Vertex Pharmaceuticals, Inc.* | | 5,100 | | 386,886 |
| | | | | 1,314,782 |
- 14 -
ALGER GLOBAL GROWTH FUND
Schedule of Investments (Continued) October 31, 2016
| | | | |
| COMMON STOCKS—(CONT.) | | SHARES | | VALUE |
| UNITED STATES—(CONT.) | | | | |
| BREWERS—0.8% | | | | |
| Molson Coors Brewing Co., Cl. B | | 2,100 | $ | 218,001 |
| BROADCASTING—1.1% | | | | |
| CBS Corp., Cl. B | | 5,800 | | 328,396 |
| CABLE & SATELLITE—1.8% | | | | |
| Comcast Corporation, Cl. A | | 8,150 | | 503,833 |
| COMMUNICATIONS EQUIPMENT—0.6% | | | | |
| Finisar Corp.* | | 3,750 | | 102,675 |
| Palo Alto Networks, Inc.* | | 500 | | 76,915 |
| | | | | 179,590 |
| CONSTRUCTION & FARM MACHINERY & HEAVY TRUCKS—0.5% | | | | |
| Wabtec Corp. | | 1,800 | | 139,158 |
| DIVERSIFIED BANKS—1.5% | | | | |
| JPMorgan Chase & Co. | | 6,000 | | 415,560 |
| DRUG RETAIL—1.0% | | | | |
| CVS Caremark Corp. | | 3,400 | | 285,940 |
| ELECTRICAL COMPONENTS & EQUIPMENT—0.5% | | | | |
| AMETEK, Inc. | | 3,300 | | 145,530 |
| GENERAL MERCHANDISE STORES—0.8% | | | | |
| Dollar Tree, Inc.* | | 3,000 | | 226,650 |
| HEALTH CARE EQUIPMENT—2.4% | | | | |
| Boston Scientific Corp.* | | 10,700 | | 235,400 |
| DexCom, Inc.* | | 1,400 | | 109,536 |
| Medtronic PLC. | | 4,000 | | 328,080 |
| | | | | 673,016 |
| HEALTH CARE FACILITIES—0.6% | | | | |
| Amsurg Corp.* | | 3,000 | | 179,250 |
| HOME ENTERTAINMENT SOFTWARE—1.4% | | | | |
| Activision Blizzard, Inc. | | 2,300 | | 99,291 |
| Electronic Arts, Inc.* | | 4,000 | | 314,080 |
| | | | | 413,371 |
| HOUSEWARES & SPECIALTIES—1.3% | | | | |
| Newell Brands, Inc. | | 8,000 | | 384,160 |
| HUMAN RESOURCE & EMPLOYMENT SERVICES—0.5% | | | | |
| WageWorks, Inc.* | | 2,200 | | 129,690 |
| INDUSTRIAL CONGLOMERATES—2.5% | | | | |
| General Electric Co. | | 9,207 | | 267,924 |
| Honeywell International, Inc. | | 4,000 | | 438,720 |
| | | | | 706,644 |
| INDUSTRIAL GASES—0.5% | | | | |
| Air Products & Chemicals, Inc. | | 1,000 | | 133,420 |
| INTEGRATED OIL & GAS—1.6% | | | | |
| Chevron Corp. | | 4,500 | | 471,375 |
| INTERNET RETAIL—1.7% | | | | |
| Amazon.com, Inc.* | | 600 | | 473,892 |
| INTERNET SOFTWARE & SERVICES—6.2% | | | | |
| Alphabet, Inc., Cl. C* | | 1,200 | | 941,448 |
| eBay, Inc.* | | 5,600 | | 159,656 |
| Facebook, Inc., Cl. A* | | 4,700 | | 615,653 |
- 15 -
ALGER GLOBAL GROWTH FUND
Schedule of Investments (Continued) October 31, 2016
| | | | |
| COMMON STOCKS—(CONT.) | | SHARES | | VALUE |
| UNITED STATES—(CONT.) | | | | |
| INTERNET SOFTWARE & SERVICES—(CONT.) | | | | |
| Palantir Technologies, Inc., Cl. A*,@ | | 3,176 | $ | 24,296 |
| | | | | 1,741,053 |
| INVESTMENT BANKING & BROKERAGE—1.0% | | | | |
| Morgan Stanley | | 5,200 | | 174,564 |
| The Goldman Sachs Group, Inc. | | 700 | | 124,768 |
| | | | | 299,332 |
| LIFE SCIENCES TOOLS & SERVICES—0.8% | | | | |
| Thermo Fisher Scientific, Inc. | | 1,500 | | 220,545 |
| MANAGED HEALTH CARE—3.5% | | | | |
| Aetna, Inc. | | 3,000 | | 322,050 |
| Centene Corp.* | | 2,000 | | 124,960 |
| Humana, Inc. | | 1,500 | | 257,295 |
| UnitedHealth Group, Inc. | | 2,000 | | 282,660 |
| | | | | 986,965 |
| MULTI-UTILITIES—1.1% | | | | |
| CMS Energy Corp. | | 3,600 | | 151,740 |
| WEC Energy Group, Inc. | | 2,600 | | 155,272 |
| | | | | 307,012 |
| OIL & GAS EQUIPMENT & SERVICES—0.5% | | | | |
| Halliburton Company | | 3,000 | | 138,000 |
| OIL & GAS EXPLORATION & PRODUCTION—4.3% | | | | |
| Anadarko Petroleum Corp. | | 4,600 | | 273,424 |
| ConocoPhillips | | 8,000 | | 347,600 |
| Devon Energy Corp. | | 5,800 | | 219,762 |
| Pioneer Natural Resources Co. | | 2,100 | | 375,942 |
| | | | | 1,216,728 |
| OTHER DIVERSIFIED FINANCIAL SERVICES—1.0% | | | | |
| Bank of America Corp. | | 18,000 | | 297,000 |
| PHARMACEUTICALS—2.9% | | | | |
| Allergan PLC.* | | 2,000 | | 417,880 |
| Bristol-Myers Squibb Co. | | 5,650 | | 287,642 |
| Eli Lilly & Co. | | 1,500 | | 110,760 |
| | | | | 816,282 |
| RESTAURANTS—0.6% | | | | |
| Starbucks Corp. | | 3,300 | | 175,131 |
| SEMICONDUCTORS—1.5% | | | | |
| Broadcom Ltd. | | 2,450 | | 417,186 |
| SOFT DRINKS—1.1% | | | | |
| PepsiCo, Inc. | | 3,000 | | 321,600 |
| SPECIALTY CHEMICALS—1.4% | | | | |
| PPG Industries, Inc. | | 1,000 | | 93,130 |
| The Sherwin-Williams Co. | | 600 | | 146,916 |
| WR Grace & Co. | | 2,500 | | 167,400 |
| | | | | 407,446 |
| SYSTEMS SOFTWARE—2.0% | | | | |
| Microsoft Corp. | | 8,000 | | 479,360 |
| TubeMogul, Inc.* | | 13,000 | | 94,900 |
| | | | | 574,260 |
- 16 -
ALGER GLOBAL GROWTH FUND
Schedule of Investments (Continued) October 31, 2016
| | | | |
| COMMON STOCKS—(CONT.) | | SHARES | | VALUE |
| UNITED STATES—(CONT.) | | | | |
| TECHNOLOGY HARDWARE STORAGE & PERIPHERALS—3.0% | | | | |
| Apple, Inc. | | 6,000 | $ | 681,240 |
| Western Digital Corp. | | 2,800 | | 163,632 |
| | | | | 844,872 |
| TOBACCO—2.2% | | | | |
| Altria Group, Inc. | | 4,800 | | 317,376 |
| Philip Morris International, Inc. | | 3,200 | | 308,608 |
| | | | | 625,984 |
| TOTAL UNITED STATES | | | | |
| (Cost $16,870,006) | | | | 17,151,983 |
| TOTAL COMMON STOCKS | | | | |
| (Cost $25,544,271) | | | | 26,414,740 |
| PREFERRED STOCKS—1.3% | | SHARES | | VALUE |
| UNITED STATES—1.3% | | | | |
| ADVERTISING—0.1% | | | | |
| Choicestream, Inc., Series A*,@,(b) | | 16,980 | | – |
| Choicestream, Inc., Series B*,@,(b) | | 36,618 | | 21,605 |
| | | | | 21,605 |
| BIOTECHNOLOGY—0.5% | | | | |
| Prosetta Biosciences, Inc., Series D*,@,(b) | | 33,858 | | 136,786 |
| INTERNET SOFTWARE & SERVICES—0.4% | | | | |
| Palantir Technologies, Inc., Cl. B*,@ | | 12,951 | | 99,075 |
| Palantir Technologies, Inc., Cl. D*,@ | | 1,687 | | 12,906 |
| | | | | 111,981 |
| PHARMACEUTICALS—0.3% | | | | |
| Intarcia Therapeutics, Inc., Series DD*,@ | | 1,728 | | 98,565 |
| TOTAL UNITED STATES | | | | |
| (Cost $340,541) | | | | 368,937 |
| TOTAL PREFERRED STOCKS | | | | |
| (Cost $340,541) | | | | 368,937 |
| WARRANTS—0.0% | | SHARES | | VALUE |
| UNITED STATES—0.0% | | | | |
| ADVERTISING—0.0% | | | | |
| Choicestream, Inc., 6/22/26@,(b) | | 4,637 | | 4,544 |
| (Cost $4,633) | | | | |
| REAL ESTATE INVESTMENT TRUST—1.3% | | SHARES | | VALUE |
| UNITED STATES—1.3% | | | | |
| MORTGAGE—1.3% | | | | |
| Blackstone Mortgage Trust, Inc., Cl. A | | 12,000 | | 362,400 |
| (Cost $340,799) | | | | |
| | | PRINCIPAL | | |
| CORPORATE BONDS—0.0% | | AMOUNT | | VALUE |
| UNITED STATES—0.0% | | | | |
| ADVERTISING—0.0% | | | | |
| Choicestream, Inc., 11.00%, 8/05/18@,(b) | | 4,637 | | 4,637 |
| (Cost $563) | | | | |
- 17 -
ALGER GLOBAL GROWTH FUND
Schedule of Investments (Continued) October 31, 2016
| | | | | |
| SPECIAL PURPOSE VEHICLE—0.2% | | SHARES | | | VALUE |
| UNITED STATES—0.2% | | | | | |
| CONSUMER FINANCE—0.2% | | | | | |
| JS Kred SPV I, LLC.@ | | 55,986 | | $ | 58,175 |
| (Cost $55,986) | | | | | |
| Total Investments | | | | | |
| (Cost $26,286,793)(c) | | 95.6 | % | | 27,213,433 |
| Other Assets in Excess of Liabilities | | 4.4 | % | | 1,258,881 |
| NET ASSETS | | 100.0 | % | $ | 28,472,314 |
# American Depositary Receipts.
(a) Global Depositary Receipts.
(b) Deemed an affiliate of the Alger fund complex during the year for purposes of Section 2(a)(3) of the Investment
Company Act of 1940. See Affiliated Securities Note 11.
(c) At October 31, 2016, the net unrealized appreciation on investments, based on cost for federal income tax
purposes of $26,460,527, amounted to $752,906 which consisted of aggregate gross unrealized appreciation of
$2,191,069 and aggregate gross unrealized depreciation of $1,438,163.
* Non-income producing security.
@ Restricted security - Investment in security not registered under the Securities Act of 1933. The investment is deemed
to not be liquid and may be sold only to qualified buyers.
| | | | | | | | | |
| | | | | % of net assets | | | | % of net assets | |
| | Acquisition | | Acquisition | (Acquisition | | | Market | as of | |
| Security | Date(s) | | Cost | Date) | | | Value | 10/31/2016 | |
| Choicestream, Inc. | 03/14/14 | $ | 571 | 0.00 | % | $ | 0 | 0.00 | % |
| Choicestream, Inc., 11.00%, | | | | | | | | | |
| 8/05/18 | 08/04/16 | | 5 | 0.00 | % | | 4,637 | 0.02 | % |
| Choicestream, Inc., 6/22/26 | 08/04/16 | | 4,633 | 0.02 | % | | 4,544 | 0.02 | % |
| Choicestream, Inc., Cl. A | 12/17/13 | | 13,578 | 0.03 | % | | 0 | 0.00 | % |
| Choicestream, Inc., Cl. B | 07/10/14 | | 21,971 | 0.05 | % | | 21,605 | 0.08 | % |
| Intarcia Therapeutics, Inc., Series | | | | | | | | | |
| DD | 03/27/14 | | 55,970 | 0.14 | % | | 98,565 | 0.35 | % |
| JS Kred SPV I, LLC. | 06/26/15 | | 55,986 | 0.15 | % | | 58,175 | 0.20 | % |
| Palantir Technologies, Inc., Cl. A | 10/07/14 | | 20,666 | 0.05 | % | | 24,296 | 0.09 | % |
| Palantir Technologies, Inc., Cl. B | 10/07/14 | | 85,521 | 0.22 | % | | 99,075 | 0.35 | % |
| Palantir Technologies, Inc., Cl. D | 10/14/14 | | 11,139 | 0.03 | % | | 12,906 | 0.04 | % |
| Prosetta Biosciences, Inc., Series D | 02/06/15 | | 152,361 | 0.40 | % | | 136,786 | 0.48 | % |
| Total | | | | | | $ | 460,589 | 1.63 | % |
Industry classifications are unaudited.
See Notes to Financial Statements.
- 18 -
ALGER GLOBAL GROWTH FUND
Statement of Assets and Liabilities October 31, 2016
| | | | |
| | | Alger Global Growth | |
| | | | Fund | |
| |
| ASSETS: | | | | |
| Investments in securities, at value (Identified cost below)* | | | | |
| see accompanying schedules of investments | | $ | 27,045,861 | |
| Investments in affiliated securities, at value (Identified cost below)** see accompanying | | | |
| schedules of investments | | | 167,572 | |
| Cash and cash equivalents | | | 1,066,180 | |
| Foreign cash † | | | 1,311 | |
| Receivable for investment securities sold | | | 908,241 | |
| Receivable for shares of beneficial interest sold | | | 5,518 | |
| Dividends and interest receivable | | | 38,250 | |
| Receivable from Investment Manager | | | 48,393 | |
| Prepaid expenses | | | 42,992 | |
| Total Assets | | | 29,324,318 | |
| |
| LIABILITIES: | | | | |
| Payable for investment securities purchased | | | 659,129 | |
| Payable for shares of beneficial interest redeemed | | | 68,757 | |
| Foreign capital gain tax payable | | | 10,409 | |
| Accrued investment advisory fees | | | 20,324 | |
| Accrued transfer agent fees | | | 19,696 | |
| Accrued distribution fees | | | 8,458 | |
| Accrued administrative fees | | | 678 | |
| Accrued shareholder administrative fees | | | 385 | |
| Accrued other expenses | | | 64,168 | |
| Total Liabilities | | | 852,004 | |
| NET ASSETS | | $ | 28,472,314 | |
| |
| NET ASSETS CONSIST OF: | | | | |
| Paid in capital (par value of $.001 per share) | | | 30,504,928 | |
| Undistributed net investment income | | | 176,700 | |
| Undistributed net realized gain (accumulated realized loss) | | | (3,124,354 | ) |
| Net unrealized appreciation on investments | | | 915,040 | |
| NET ASSETS | | $ | 28,472,314 | |
| * Identified cost | | $ | 26,093,115 | |
| ** Identified cost | | $ | 193,678 | |
| † Cost of foreign cash | | $ | 1,310 | |
| See Notes to Financial Statements. | | | | |
| | | | | |
- 19 -
ALGER GLOBAL GROWTH FUND
Statement of Assets and Liabilities October 31, 2016 (Continued)
| | |
| | Alger Global Growth |
| | | Fund |
| |
| NET ASSETS BY CLASS: | | |
| Class A | $ | 19,805,454 |
| Class C | $ | 4,719,852 |
| Class I | $ | 383,722 |
| Class Z | $ | 3,563,286 |
| |
| SHARES OF BENEFICIAL INTEREST OUTSTANDING — NOTE 6: | | |
| Class A | | 980,546 |
| Class C | | 247,021 |
| Class I | | 18,843 |
| Class Z | | 173,429 |
| |
| NET ASSET VALUE PER SHARE: | | |
| Class A — Net Asset Value Per Share Class A | $ | 20.20 |
| Class A — Offering Price Per Share | | |
| (includes a 5.25% sales charge) | $ | 21.32 |
| Class C — Net Asset Value Per Share Class C | $ | 19.11 |
| Class I — Net Asset Value Per Share Class I | $ | 20.36 |
| Class Z — Net Asset Value Per Share Class Z | $ | 20.55 |
| See Notes to Financial Statements. | | |
- 20 -
ALGER GLOBAL GROWTH FUND
Statement of Operations For the year ended October 31, 2016
| | | |
| | Alger Global Growth | |
| | | Fund | |
| |
| INCOME: | | | |
| Dividends (net of foreign withholding taxes*) | $ | 609,572 | |
| Interest from affiliated securities – Note 11 | | 42 | |
| Interest | | 1,966 | |
| Total Income | | 611,580 | |
| |
| EXPENSES: | | | |
| Advisory fees — Note 3(a) | | 242,366 | |
| Distribution fees — Note 3(c) | | | |
| Class A | | 53,487 | |
| Class C | | 47,390 | |
| Class I | | 3,960 | |
| Shareholder administrative fees — Note 3(f) | | 4,728 | |
| Administration fees — Note 3(b) | | 8,331 | |
| Custodian fees | | 74,091 | |
| Interest expenses | | 6 | |
| Transfer agent fees and expenses — Note 3(f) | | 40,270 | |
| Printing fees | | 35,084 | |
| Professional fees | | 155,580 | |
| Registration fees | | 64,599 | |
| Trustee fees — Note 3(g) | | 1,219 | |
| Fund accounting fees | | 8,394 | |
| Miscellaneous | | 13,467 | |
| Total Expenses | | 752,972 | |
| Less, expense reimbursements/waivers — Note 3(a) | | (278,261 | ) |
| Net Expenses | | 474,711 | |
| NET INVESTMENT INCOME | | 136,869 | |
| |
| REALIZED AND UNREALIZED GAIN (LOSS) ON INVESTMENTS AND FOREIGN CURRENCY: | | |
| Net realized gain on investments | | 284,177 | |
| Net realized (loss) on foreign currency transactions | | (8,791 | ) |
| Net change in unrealized (depreciation) on investments and foreign currency | | (1,191,444 | ) |
| Net realized and unrealized (loss) on investments and foreign currency | | (916,058 | ) |
| NET DECREASE IN NET ASSETS RESULTING FROM OPERATIONS | $ | (779,189 | ) |
| * Foreign withholding taxes | $ | 26,399 | |
| See Notes to Financial Statements. | | | |
- 21 -
ALGER GLOBAL GROWTH FUND
Statement of Changes in Net Assets
| | | | | | | |
| | | | Alger Global Growth Fund | |
| | | | For the | | | For the | |
| | | | Year Ended | | | Year Ended | |
| | | | October 31, 2016 | | | October 31, 2015 | |
| |
| Net investment income (loss) | $ | 136,869 | | $ | (53,711 | ) |
| Net realized gain on investments and foreign currency | | | 275,386 | | | 3,995,747 | |
| Net change in unrealized depreciation on investments and | | | | | | | |
| foreign currency | | | (1,191,444 | ) | | (4,099,404 | ) |
| Net decrease in net assets resulting from operations | | | (779,189 | ) | | (157,368 | ) |
| |
| Increase (decrease) from shares of beneficial interest transactions: | | | | | | |
| Class A | | | (3,892,139 | ) | | (6,206,766 | ) |
| Class C | | | 131,502 | | | (615,958 | ) |
| Class I | | | (1,522,028 | ) | | 297,562 | |
| Class Z | | | 1,377,702 | | | 950,883 | |
| Net decrease from shares of beneficial interest transactions | | | | | | | |
| — Note 6(a) | | | (3,904,963 | ) | | (5,574,279 | ) |
| |
| Redemption Fees: | | | | | | | |
| Class A | | | — | | | 13 | |
| Total Redemption Fees — Note 6(b) | | | — | | | 13 | |
| Total decrease | | | (4,684,152 | ) | | (5,731,634 | ) |
| |
| Net Assets: | | | | | | | |
| Beginning of period | | | 33,156,466 | | | 38,888,100 | |
| END OF PERIOD | $ | 28,472,314 | | $ | 33,156,466 | |
| Undistributed net investment income (accumulated loss) | $ | 176,700 | | $ | (79,861 | ) |
| See Notes to Financial Statements. | | | | | | | |
- 22 -
ALGER GLOBAL GROWTH FUND
Financial Highlights for a share outstanding throughout the period
| | | | | | | | | | | | | | | | | | | | | | | | |
| Alger Global Growth Fund | | | | | | | | | | | | | Class A | | | | | | | | | | | |
| | | Year ended | | | Year ended | | | Year ended | | | Year ended | | | Year ended | |
| | | 10/31/2016 | | | 10/31/2015 | | | 10/31/2014 | | | 10/31/2013 | | | 10/31/2012 | |
| Net asset value, beginning of period | | $ | 20.65 | | | $ | | 20.79 | | | $ | | 18.76 | | | $ | | 15.42 | | | $ | | 15.11 | |
| INCOME FROM INVESTMENT | | | | | | | | | | | | | | | | | | | | | | | | |
| OPERATIONS: | | | | | | | | | | | | | | | | | | | | | | | | |
| Net investment income (loss)(i) | | | 0.10 | | | | | (0.01 | ) | | | | (0.02 | ) | | | | (0.01 | ) | | | | (0.06 | ) |
| Net realized and unrealized gain (loss) | | | | | | | | | | | | | | | | | | | | | | | | |
| on investments | | | (0.55 | ) | | | | (0.13 | ) | | | | 2.05 | | | | | 3.41 | | | | | 0.37 | |
| Total from investment operations | | | (0.45 | ) | | | | (0.14 | ) | | | | 2.03 | | | | | 3.40 | | | | | 0.31 | |
| Dividends from net investment income | – | | | | | – | | | | | – | | | | | (0.06 | ) | | | | – | |
| Net asset value, end of period | | $ | 20.20 | | | $ | | 20.65 | | | $ | | 20.79 | | | $ | | 18.76 | | | $ | | 15.42 | |
| Total return(ii) | | | (2.18 | )% | | | | (0.67 | )% | | | | 10.82 | % | | | | 22.20 | % | | | | 2.00 | % |
| RATIOS/SUPPLEMENTAL DATA: | | | | | | | | | | | | | | | | | | | | | | | | |
| Net assets, end of period (000's | | | | | | | | | | | | | | | | | | | | | | | | |
| omitted) | $ | 19,805 | | $ | | 24,269 | | $ | | 30,542 | | $ | | 33,657 | | $ | | 41,051 | |
| Ratio of gross expenses to average | | | | | | | | | | | | | | | | | | | | | | | | |
| net assets | | | 2.37 | % | | | | 2.03 | % | | | | 1.98 | % | | | | 2.35 | % | | | | 2.29 | % |
| Ratio of expense reimbursements to | | | | | | | | | | | | | | | | | | | | | | | | |
| average net assets | | | (0.87 | )% | | | | (0.53 | )% | | | | (0.48 | )% | | | | (0.33 | )% | | | | – | |
| Ratio of net expenses to average net | | | | | | | | | | | | | | | | | | | | | | | | |
| assets | | | 1.50 | % | | | | 1.50 | % | | | | 1.50 | % | | | | 2.02 | % | | | | 2.29 | % |
| Ratio of net investment income (loss) to | | | | | | | | | | | | | | | | | | | | | | | | |
| average net assets | | | 0.52 | % | | | | (0.07 | )% | | | | (0.08 | )% | | | | (0.07 | )% | | | | (0.38 | )% |
| Portfolio turnover rate | | | 138.05 | % | | | | 143.87 | % | | | | 81.13 | % | | | | 96.45 | % | | | | 84.55 | % |
| See Notes to Financial Statements. | | | | | | | | | | | | | | | | | | | | | | |
(i) Amount was computed based on average shares outstanding during the period.
(ii) Does not reflect the effect of sales charges, if applicable.
- 23 -
ALGER GLOBAL GROWTH FUND
Financial Highlights for a share outstanding throughout the period
| | | | | | | | | | | | | | | | | | | |
| Alger Global Growth Fund | | | | | | | | | | Class C | | | | | | | | | |
| | Year ended | | Year ended | | Year ended | | Year ended | | Year ended | |
| | 10/31/2016 | | 10/31/2015 | | 10/31/2014 | | 10/31/2013 | | 10/31/2012 | |
| Net asset value, beginning of period | $ | 19.69 | | $ | | 19.97 | | $ | | 18.15 | | $ | | 14.97 | | $ | | 14.79 | |
| INCOME FROM INVESTMENT | | | | | | | | | | | | | | | | | | | |
| OPERATIONS: | | | | | | | | | | | | | | | | | | | |
| Net investment loss(i) | | (0.04 | ) | | | (0.17 | ) | | | (0.16 | ) | | | (0.13 | ) | | | (0.16 | ) |
| Net realized and unrealized gain (loss) | | | | | | | | | | | | | | | | | | | |
| on investments | | (0.54 | ) | | | (0.11 | ) | | | 1.98 | | | | 3.31 | | | | 0.34 | |
| Total from investment operations | | (0.58 | ) | | | (0.28 | ) | | | 1.82 | | | | 3.18 | | | | 0.18 | |
| Net asset value, end of period | $ | 19.11 | | $ | | 19.69 | | $ | | 19.97 | | $ | | 18.15 | | $ | | 14.97 | |
| Total return(ii) | | (2.95 | )% | | | (1.40 | )% | | | 10.03 | % | | | 21.24 | % | | | 1.20 | % |
| RATIOS/SUPPLEMENTAL DATA: | | | | | | | | | | | | | | | | | | | |
| Net assets, end of period (000's | | | | | | | | | | | | | | | | | | | |
| omitted) | $ | 4,720 | | $ | | 4,730 | | $ | | 5,392 | | $ | | 4,888 | | $ | | 4,048 | |
| Ratio of gross expenses to average | | | | | | | | | | | | | | | | | | | |
| net assets | | 3.13 | % | | | 2.80 | % | | | 2.75 | % | | | 3.13 | % | | | 3.06 | % |
| Ratio of expense reimbursements to | | | | | | | | | | | | | | | | | | | |
| average net assets | | (0.88 | )% | | | (0.55 | )% | | | (0.50 | )% | | | (0.40 | )% | | | – | |
| Ratio of net expenses to average net | | | | | | | | | | | | | | | | | | | |
| assets | | 2.25 | % | | | 2.25 | % | | | 2.25 | % | | | 2.73 | % | | | 3.06 | % |
| Ratio of net investment income (loss) to | | | | | | | | | | | | | | | | | | | |
| average net assets | | (0.23 | )% | | | (0.82 | )% | | | (0.83 | )% | | | (0.81 | )% | | | (1.08 | )% |
| Portfolio turnover rate | | 138.05 | % | | | 143.87 | % | | | 81.13 | % | | | 96.45 | % | | | 84.55 | % |
| See Notes to Financial Statements. | | | | | | | | | | | | | | | | | | |
(i) Amount was computed based on average shares outstanding during the period.
(ii) Does not reflect the effect of sales charges, if applicable.
- 24 -
ALGER GLOBAL GROWTH FUND
Financial Highlights for a share outstanding throughout the period
| | | | | | | | | | | | | | | | | |
| Alger Global Growth Fund | | | | | | Class I | | | | | | | |
| | | | | | | | | | | | | | From 5/31/2013 | |
| | Year ended | | | | Year ended | | | | | Year ended | | | | | (commencement of operations) | |
| | | 10/31/2016 | | | | 10/31/2015 | | | | | 10/31/2014 | | | | | to 10/31/2013 (i) | |
| Net asset value, beginning of period | $ | 20.78 | | $ | | 20.87 | | $ | 18.78 | | $ | 16.83 | |
| INCOME FROM INVESTMENT | | | | | | | | | | | | | | | | | |
| OPERATIONS: | | | | | | | | | | | | | | | | | |
| Net investment income(ii) | | 0.17 | | | | 0.04 | | | | | 0.03 | | | | | 0.03 | |
| Net realized and unrealized gain (loss) | | | | | | | | | | | | | | | | | |
| on investments | | (0.59 | ) | | | (0.13 | ) | | | | 2.06 | | | | | 1.92 | |
| Total from investment operations | | (0.42 | ) | | | (0.09 | ) | | | | 2.09 | | | | | 1.95 | |
| Net asset value, end of period | $ | 20.36 | | $ | | 20.78 | | $ | 20.87 | | $ | 18.78 | |
| Total return(iii) | | (2.02 | )% | | | (0.43 | )% | | | | 11.13 | % | | | | 11.59 | % |
| RATIOS/SUPPLEMENTAL DATA: | | | | | | | | | | | | | | | | | |
| Net assets, end of period (000's | | | | | | | | | | | | | | | | | |
| omitted) | $ | 384 | | $ | | 1,914 | | $ | | | 1,646 | | $ | 1,296 | |
| Ratio of gross expenses to average | | | | | | | | | | | | | | | | | |
| net assets | | 2.33 | % | | | 2.02 | % | | | | 1.94 | % | | | | 2.97 | % |
| Ratio of expense reimbursements to | | | | | | | | | | | | | | | | | |
| average net assets | | (1.08 | )% | | | (0.77 | )% | | | | (0.69 | )% | | | | (1.72 | )% |
| Ratio of net expenses to average net | | | | | | | | | | | | | | | | | |
| assets | | 1.25 | % | | | 1.25 | % | | | | 1.25 | % | | | | 1.25 | % |
| Ratio of net investment income (loss) to | | | | | | | | | | | | | | | | | |
| average net assets | | 0.86 | % | | | 0.17 | % | | | | 0.17 | % | | | | 0.47 | % |
| Portfolio turnover rate | | 138.05 | % | | | 143.87 | % | | | | 81.13 | % | | | | 96.45 | % |
| See Notes to Financial Statements. | | | | | | | | | | | | | | | | |
(i) Ratios have been annualized; total return has not been annualized; portfolio turnover is for the twelve months then ended.
(ii) Amount was computed based on average shares outstanding during the period.
(iii) Does not reflect the effect of sales charges, if applicable.
- 25 -
ALGER GLOBAL GROWTH FUND
Financial Highlights for a share outstanding throughout the period
| | | | | | | | | | | | | | | | | |
| Alger Global Growth Fund | | | | | | Class Z | | | | | | | |
| | | | | | | | | | | | | | From 5/31/2013 | |
| | | | | | | | | | | | | | | | (commencement of operations) to | |
| | | Year ended 10/31/2016 | | | | Year ended 10/31/2015 | | | | | Year ended 10/31/2014 | | | | | 10/31/2013 (i) | |
| Net asset value, beginning of period | $ | 20.92 | | $ | | 20.95 | | $ | 18.80 | | $ | 16.83 | |
| INCOME FROM INVESTMENT | | | | | | | | | | | | | | | | | |
| OPERATIONS: | | | | | | | | | | | | | | | | | |
| Net investment income(ii) | | 0.19 | | | | 0.09 | | | | | 0.06 | | | | | 0.04 | |
| Net realized and unrealized gain (loss) | | | | | | | | | | | | | | | | | |
| on investments | | (0.56 | ) | | | (0.12 | ) | | | | 2.09 | | | | | 1.93 | |
| Total from investment operations | | (0.37 | ) | | | (0.03 | ) | | | | 2.15 | | | | | 1.97 | |
| Net asset value, end of period | $ | 20.55 | | $ | | 20.92 | | $ | 20.95 | | $ | 18.80 | |
| Total return(iii) | | (1.77 | )% | | | (0.14 | )% | | | | 11.44 | % | | | | 11.71 | % |
| RATIOS/SUPPLEMENTAL DATA: | | | | | | | | | | | | | | | | | |
| Net assets, end of period (000's | | | | | | | | | | | | | | | | | |
| omitted) | $ | 3,563 | | $ | | 2,243 | | $ | 1,308 | | $ | 112 | |
| Ratio of gross expenses to average | | | | | | | | | | | | | | | | | |
| net assets | | 2.36 | % | | | 2.20 | % | | | | 3.72 | % | | | | 12.42 | % |
| Ratio of expense reimbursements to | | | | | | | | | | | | | | | | | |
| average net assets | | (1.31 | )% | | | (1.21 | )% | | | | (2.73 | )% | | | | (11.43 | )% |
| Ratio of net expenses to average net | | | | | | | | | | | | | | | | | |
| assets | | 1.05 | % | | | 0.99 | % | | | | 0.99 | % | | | | 0.99 | % |
| Ratio of net investment income (loss) to | | | | | | | | | | | | | | | | | |
| average net assets | | 0.92 | % | | | 0.44 | % | | | | 0.30 | % | | | | 0.62 | % |
| Portfolio turnover rate | | 138.05 | % | | | 143.87 | % | | | | 81.13 | % | | | | 96.45 | % |
| See Notes to Financial Statements. | | | | | | | | | | | | | | | | |
(i) Ratios have been annualized; total return has not been annualized; portfolio turnover is for the twelve months then ended.
(ii) Amount was computed based on average shares outstanding during the period.
(iii) Does not reflect the effect of sales charges, if applicable.
- 26 -
Alger Global Growth Fund
NOTES TO FINANCIAL STATEMENTS
NOTE 1 — General:
Alger Global Growth Fund (the “Fund”) is a diversified, open-end registered investment
company organized as a business trust under the laws of the Commonwealth of
Massachusetts. The Fund qualifies as an investment company as defined in the Financial
Accounting Standards Board Accounting Standards Codification 946-Financial Services –
Investment Companies. The Fund’s investment objective is long-term capital appreciation.
It seeks to achieve its objective by investing in equity securities in the United States and
foreign countries. The Fund’s foreign investments will include securities of companies
in both developed and emerging market countries. The Fund offers Class A, C, I and Z
shares. Class A shares are generally subject to an initial sales charge while Class C shares
are generally subject to a deferred sales charge. Class I and Z shares are sold to institutional
investors without an initial or deferred sales charge. Each class has identical rights to assets
and earnings except that each share class bears the pro rata allocation of the Fund’s expense
other than a Class Expense (not including advisory or custodial fees or other expenses
related to the management of the Fund’s assets) to a share class.
NOTE 2 — Significant Accounting Policies:
(a) Investment Valuation: The Fund values its financial instruments at fair value using
independent dealers or pricing services under policies approved by the Fund’s Board of
Trustees (“Board”). Investments are valued on each day the New York Stock Exchange (the
“NYSE”) is open, as of the close of the NYSE (normally 4:00 p.m. Eastern Standard Time).
Equity securities and option contracts for which valuation information is readily available are
valued at the last quoted sales price or official closing price as reported by an independent
pricing service on the primary market or exchange on which they are traded. In the absence
of quoted sales, such securities are valued at the bid price or, in the absence of a recent
bid price, the equivalent as obtained from one or more of the major market makers for the
securities to be valued.
The industry classifications of the Funds’ investments, as presented in the accompanying
Schedules of Investments, represent management’s belief as to the most meaningful
presentation of the classification of such investments. For Fund compliance purposes, the
Funds’ industry classifications refer to any one or more of the industry sub-classifications
used by one or more widely recognized market indexes or rating group indexes, with the
primary source being Global Industry Classification Standard (GICS).
Debt securities generally trade in the over-the-counter market. Debt securities with
remaining maturities of more than sixty days at the time of acquisition are valued on
the basis of last available bid prices or current market quotations provided by dealers
or pricing services. In determining the value of a particular investment, pricing services
may use certain information with respect to transactions in such investments, quotations
from dealers, pricing matrixes, market transactions in comparable investments, various
relationships observed in the market between investments and calculated yield measures
based on valuation technology commonly employed in the market for such investments.
Asset-backed and mortgage-backed securities are valued by independent pricing services
- 27 -
Alger Global Growth Fund
NOTES TO FINANCIAL STATEMENTS (Continued)
using models that consider estimated cash flows of each tranche of the security, establish a
benchmark yield and develop an estimated tranche-specific spread to the benchmark yield
based on the unique attributes of the tranche. Debt securities with a remaining maturity of
sixty days or less are valued at amortized cost which approximates market value.
Securities for which market quotations are not readily available are valued at fair value, as
determined in good faith pursuant to procedures established by the Board.
Securities in which the Fund invests may be traded in foreign markets that close before the
close of the NYSE. Developments that occur between the close of the foreign markets
and the close of the NYSE may result in adjustments to the foreign closing prices to reflect
what the investment adviser, pursuant to policies established by the Board, believes to be
the fair value of these securities as of the close of the NYSE. The Fund may also fair value
securities in other situations, for example, when a particular foreign market is closed but the
Fund is open.
Financial Accounting Standards Board Accounting Standards Codification 820 – Fair Value
Measurements and Disclosures (“ASC 820”) defines fair value as the price that the Fund
would receive upon selling an investment in a timely transaction to an independent buyer
in the principal or most advantageous market of the investment. ASC 820 established a
three-tier hierarchy to maximize the use of observable market data and minimize the use of
unobservable inputs and to establish classification of fair value measurements for disclosure
purposes. Inputs refer broadly to the assumptions that market participants would use in
pricing the asset or liability and may be observable or unobservable. Observable inputs
are based on market data obtained from sources independent of the Fund. Unobservable
inputs are inputs that reflect the Funds’ own assumptions based on the best information
available in the circumstances. The three-tier hierarchy of inputs is summarized in the three
broad Levels listed below.
• Level 1 – quoted prices in active markets for identical investments
• Level 2 – significant other observable inputs (including quoted prices for similar
investments, interest rates, prepayment speeds, credit risk, etc.)
• Level 3 – significant unobservable inputs (including the Funds’ own assumptions in
determining the fair value of investments)
The Fund’s valuation techniques are generally consistent with either the market or the
income approach to fair value. The market approach considers prices and other relevant
information generated by market transactions involving identical or comparable assets
to measure fair value. The income approach converts future amounts to a current, or
discounted, single amount. These fair value measurements are determined on the basis
of the value indicated by current market expectations about such future events. Inputs
for Level 1 include exchange-listed prices and broker quotes in an active market. Inputs
for Level 2 include the last trade price in the case of a halted security, an exchange-listed
price which has been adjusted for fair value factors, and prices of closely related securities.
Additional Level 2 inputs include an evaluated price which is based upon a compilation of
observable market information such as spreads for fixed income and preferred securities.
- 28 -
Alger Global Growth Fund
NOTES TO FINANCIAL STATEMENTS (Continued)
Inputs for Level 3 include revenue multiples, earnings before interest, taxes, depreciation
and amortization (“EBITDA”) multiples, discount rates, and the probabilities of success of
certain outcomes. Such unobservable market information may be obtained from a company’s
financial statements and from industry studies, market data, and market indicators such as
benchmarks and indices. Because of the inherent uncertainty and often limited markets for
restricted securities, the values may significantly differ from values if there was an active
market.
Valuation processes are determined by a Valuation Committee (“Committee”) established
by the Board and comprised of representatives of the Fund’s investment adviser. The
Committee reports its fair valuation determinations to the Board which is responsible for
approving valuation policy and procedures.
While the Committee meets on an as-needed basis, the Committee generally meets
quarterly to review and evaluate the effectiveness of the procedures for making fair value
determinations. The Committee considers, among other things, the results of quarterly
back testing of the fair value model for foreign securities, pricing comparisons between
primary and secondary price sources, the outcome of price challenges put to the Fund’s
pricing vendor, and variances between transactional prices and previous mark-to-markets.
The Fund will record a change to a security’s fair value level if new inputs are available
or it becomes evident that inputs previously considered for leveling have changed or are
no longer relevant. Transfers between Levels 1, 2 and 3 are recognized at the end of the
reporting period.
(b) Cash and Cash Equivalents: Cash and cash equivalents include U.S. dollars, foreign cash
and overnight time deposits.
(c) Securities Transactions and Investment Income: Securities transactions are recorded on a
trade date basis. Realized gains and losses from securities transactions are recorded on the
identified cost basis. Dividend income is recognized on the ex-dividend date and interest
income is recognized on the accrual basis.
Premiums and discounts on debt securities purchased are amortized or accreted over the
lives of the respective securities.
(d) Foreign Currency Translations: The books and records of the Fund are maintained in U.S.
dollars. Foreign currencies, investments and other assets and liabilities are translated into
U.S. dollars at the prevailing rates of exchange on the valuation date. Purchases and sales
of investment securities and income and expenses are translated into U.S. dollars at the
prevailing exchange rates on the respective dates of such transactions.
Net realized gains and losses on foreign currency transactions represent net gains and losses
from the disposition of foreign currencies, currency gains and losses realized between the
trade dates and settlement dates of security transactions, and the difference between the
amount of net investment income accrued and the U.S. dollar amount actually received.
The effects of changes in foreign currency exchange rates on investments in securities
- 29 -
Alger Global Growth Fund
NOTES TO FINANCIAL STATEMENTS (Continued)
are included in realized and unrealized gain or loss on investments in the accompanying
Statement of Operations.
(e) Dividends to Shareholders: Dividends payable to shareholders are recorded on the ex-
dividend date. The Fund declares and pays dividends from net investment income annually.
Dividends from net realized gains, offset by any loss carryforward, are declared and paid
annually after the end of the fiscal year in which earned.
Each class is treated separately in determining the amounts of dividends from net investment
income payable to holders of its shares.
The characterization of distributions to shareholders for financial reporting purposes is
determined in accordance with federal income tax rules. Therefore, the source of the Fund’s
distributions may be shown in the accompanying financial statements as either from, or in
excess of, net investment income, net realized gain on investment transactions or return of
capital, depending on the type of book/tax differences that may exist. Capital accounts within
the financial statements are adjusted for permanent book/tax differences. Reclassifications
result primarily from the difference in tax treatment of net operating losses, passive foreign
investment companies, and foreign currency transactions. The reclassifications are done
annually at fiscal year end and have no impact on the net asset value of the Fund and are
designed to present the Fund’s capital accounts on a tax basis.
(f) Lending of Fund Securities: The Fund may lend its securities to financial institutions,
provided that the market value of the securities loaned will not at any time exceed one
third of the Fund’s total assets, as defined in its prospectus. The Fund earns fees on the
securities loaned, which are included in interest income in the accompanying Statement
of Operations. In order to protect against the risk of failure by the borrower to return the
securities loaned or any delay in the delivery of such securities, the loan is collateralized by
cash or securities that are maintained with the Custodian in an amount equal to at least 102
percent of the current market value of U.S. loaned securities or 105 percent for non-U.S.
loaned securities. The market value of the loaned securities is determined at the close of
business of the Fund. Any required additional collateral is delivered to the Custodian and
any excess collateral is returned to the borrower on the next business day. In the event the
borrower fails to return the loaned securities when due, the Fund may take the collateral
to replace the securities. If the value of the collateral is less than the purchase cost of
replacement securities, the Custodian shall be responsible for any shortfall, but only to the
extent that the shortfall is not due to any diminution in collateral value, as defined in the
securities lending agreement. The Fund is required to maintain the collateral in a segregated
account and determine its value each day until the loaned securities are returned. Cash
collateral may be invested as determined by the Fund. Collateral is returned to the borrower
upon settlement of the loan. There were no securities loaned as of October 31, 2016.
(g) Federal Income Taxes: It is the Fund’s policy to comply with the requirements of the
Internal Revenue Code Subchapter M applicable to regulated investment companies and
to distribute all of its taxable income to its shareholders. Provided that the Fund maintains
such compliance, no federal income tax provision is required.
- 30 -
Alger Global Growth Fund
NOTES TO FINANCIAL STATEMENTS (Continued)
Financial Accounting Standards Board Accounting Standards Codification 740 – Income
Taxes (“ASC 740”) requires the Fund to measure and recognize in its financial statements
the benefit of a tax position taken (or expected to be taken) on an income tax return
if such position will more likely than not be sustained upon examination based on the
technical merits of the position. No tax years are currently under investigation. The Fund
files income tax returns in the U.S., as well as New York State and New York City. The
statute of limitations on the Fund’s tax returns remains open for the tax years 2013-2016.
Management does not believe there are any uncertain tax positions that require recognition
of a tax liability.
(h) Allocation Methods: Income, realized and unrealized gains and losses, and expenses of the
Fund are allocated among the Fund’s classes based on relative net assets, with the exception
of distribution fees, transfer agency fees, and shareholder servicing and related fees.
(i) Estimates: These financial statements have been prepared in accordance with accounting
principles generally accepted in the United States of America, which require using estimates
and assumptions that affect the reported amounts therein. Actual results may differ from
those estimates. All such estimates are of normal recurring nature.
NOTE 3 — Investment Advisory Fees and Other Transactions with Affiliates:
(a) Investment Advisory Fees: Fees incurred by the Fund, pursuant to the provisions of the Fund’s
Investment Advisory Agreement with Fred Alger Management, Inc. (“Alger Management”
or the “Manager”), are payable monthly and computed based on the following rates. The
actual rate paid as a percentage of average daily net assets, for the year ended October 31,
2016, is set forth below under the heading “Actual Rate.”
| | | | | | | |
| | | Tier 1 | | Tier 2 | | Actual Rate | |
| Alger Global | | | | | | | |
| Growth Fund(a) | | 0.800 | % | 0.700 | % | 0.800 | % |
(a) Tier 1 rate is paid on assets up to $500 million, Tier 2 rate is paid on assets in excess of $500 million.
Effective March 1, 2016, Alger Management has established expense caps for the share
classes, through February 28, 2017, whereby it reimburses the share classes if annualized
operating expenses (excluding interest, taxes, brokerage, dividend expenses and extraordinary
expenses) exceed the rates, based on average daily net assets, listed below:
| | | | | |
| | | | | | FEES WAIVED / |
| | | | | | REIMBURSED FOR |
| | | CLASS | | THE YEAR ENDED |
| | | | | | OCTOBER 31, |
| | A | C | I | Z | 2016 |
| Alger Global Growth Fund* | 1.50% | 2.25% | 1.25% | 1.09% | 278,261 |
*Prior to March 1, 2016, the expense cap for the Alger Global Growth Fund Class Z was
0.99%.
Fred Alger Management Inc., may recoup reimbursed expenses during the one-year term of
the expense reimbursement contract if the expense ratio falls below the stated limitation.
- 31 -
Alger Global Growth Fund
NOTES TO FINANCIAL STATEMENTS (Continued)
(b) Administration Fees: Fees incurred by the Fund, pursuant to the provisions of the Fund’s
Administration Agreement with Fred Alger Management, Inc., are payable monthly and
computed based on the average daily net assets of the Fund at the annual rate of 0.0275%.
(c) Distribution/Shareholder Servicing Fees: The Fund has adopted a distribution plan pursuant
to which the Fund pays Alger Inc. a fee at the annual rate of 0.25% of the average daily
net assets of the Class A and Class I shares and 1.00% of the average daily net assets
of the Class C shares to compensate Alger Inc. for its activities and expenses incurred in
distributing the Fund’s shares and shareholder servicing. Fees paid may be more or less than
the expenses incurred by Alger Inc.
(d) Sales Charges: Purchases and sales of shares of the Fund may be subject to initial sales
charges or contingent deferred sales charges. For the year ended October 31, 2016, the initial
sales charges and contingent deferred sales charges imposed, all of which were retained by
Fred Alger & Company, Incorporated, the Fund’s distributor (the “Distributor” or “Alger
Inc.”), were approximately $1,513 and $1,437, respectively. The initial sales charges and
contingent deferred sales charges are used by Alger Inc. to offset distribution expenses
previously incurred. Sales charges do not represent expenses of the Fund.
(e) Brokerage Commissions: During the year ended October 31, 2016, the Fund paid Alger Inc.
$13,060 in connection with securities transactions.
(f) Shareholder Administrative Fees: The Fund has entered into a shareholder administrative
services agreement with Alger Management to compensate Alger Management for its
liaison and administrative oversight of Boston Financial Data Services, Inc. the transfer
agent, and other related services. The Fund compensates Alger Management at the annual
rate of 0.0165% of their respective average daily net assets for Class A and Class C shares
and 0.01% of their respective average daily net assets of the Class I and Class Z shares for
these services.
Alger Management makes payments to intermediaries that provide sub-accounting services
to omnibus accounts invested in the Fund. A portion of the fees paid by Alger Management
to intermediaries that provide sub-accounting services are charged back to the Fund, subject
to certain limitations, as approved by the Board. For the year ended October 31, 2016, Alger
Management charged back $16,774 to the Fund for these services, which are included in
transfer agent fees and expenses in the accompanying Statement of Operations.
(g) Trustees’ Fees: From November 1, 2015 through February 29, 2016, each trustee who
is not affiliated with Alger Management or its affiliates (each, an “Independent Trustee”)
received a fee of $25,875 for each board meeting attended, to a maximum of $103,500
per annum, paid pro rata by each fund in the Alger Fund Complex, plus travel expenses
incurred for attending the meeting. The Independent Trustee appointed as Chairman of the
Board of Trustees received additional compensation of $24,300 per annum paid pro rata by
each fund in the Alger Fund Complex. Additionally, each member of the Audit Committee
received a fee of $2,500 for each Audit Committee meeting attended to a maximum of
$10,000 per annum, paid pro rata by each fund in the Alger Fund Complex.
- 32 -
Alger Global Growth Fund
NOTES TO FINANCIAL STATEMENTS (Continued)
Effective March 1, 2016, each Independent Trustee receives a fee of $27,250 for each board
meeting attended, to a maximum of $109,000 per annum, paid pro rata by each fund in
the Alger Fund Complex, plus travel expenses incurred for attending the meeting. The
Independent Trustee appointed as Chairman of the Board of Trustees receives additional
compensation of $26,000 per annum paid pro rata by each fund in the Alger Fund Complex.
Additionally, each member of the Audit Committee receives a fee of $2,500 for each Audit
Committee meeting attended to a maximum of $10,000 per annum, paid pro rata by each
fund in the Alger Fund Complex.
(h) Interfund Loans: The Fund, along with other funds advised by Alger Management, may
borrow money from and lend money to each other for temporary or emergency purposes.
To the extent permitted under its investment restrictions, each fund may lend uninvested
cash in an amount up to 15% of its net assets to other funds. If a fund has borrowed from
other funds and has aggregate borrowings from all sources that exceed 10% of the fund’s
total assets, such fund will secure all of its loans from other funds. The interest rate charged
on interfund loans is equal to the average of the overnight time deposit rate and bank loan
rate available to the funds. There were no interfund loans outstanding as of October 31,
2016.
(i) Other Transactions with Affiliates: Certain officers of the Fund are directors and officers of
Alger Management and Alger Inc. At October 31, 2016, Alger Management and its affiliated
entities owned the following shares of the Fund:
| | | | |
| | | SHARE CLASS |
| | | I | | Z |
| Alger Global Growth Fund | | 5,942 | | 19,947 |
NOTE 4 — Securities Transactions:
The following summarizes the securities transactions by the Fund for the year ended
October 31, 2016:
| | | | | | |
| | | | PURCHASES | | | SALES |
| Alger Global Growth Fund | | $ | 40,713,826 | | $ | 44,974,196 |
Transactions in foreign securities may involve certain considerations and risks not typically
associated with those of U.S. companies because of, among other factors, the level of
governmental supervision and regulation of foreign security markets, and the possibility of
political or economic instability. Additional risks associated with investing in the emerging
markets include increased volatility, limited liquidity, and less stringent regulatory and legal
system.
NOTE 5 — Borrowings:
The Fund may borrow from its custodian on an uncommitted basis. The Fund pays the
custodian a market rate of interest, generally based upon the London Interbank Offered
Rate. The Fund may also borrow from other funds advised by Alger Management, as
discussed in Note 3(h). For the year ended October 31, 2016, the Fund had the following
borrowings:
- 33 -
Alger Global Growth Fund
NOTES TO FINANCIAL STATEMENTS (Continued)
| | | | | | |
| | AVERAGE DAILY | | WEIGHTED AVERAGE | |
| | | BORROWING | | INTEREST RATE | |
| Alger Global Growth Fund | $ | 253 | | | 2.04 | % |
| |
| | | | | HIGHEST BORROWING | |
| Alger Global Growth Fund | | | | $ | 92,205 | |
NOTE 6 — Share Capital:
(a) The Fund has an unlimited number of authorized shares of beneficial interest of $.001
par value. Transactions of shares of beneficial interest were as follows:
| | | | | | | | | | | | | | | |
| | | FOR THE YEAR ENDED | | | | FOR THE YEAR ENDED | |
| | | OCTOBER 31, 2016 | | | | OCTOBER 31, 2015 | |
| | | SHARES | | | | AMOUNT | | | | SHARES | | | | AMOUNT | |
| Alger Global Growth Fund | | | | | | | | | | | | | | | |
| Class A: | | | | | | | | | | | | | | | |
| Shares sold | | 26,306 | | $ | | 527,477 | | | | 33,296 | | $ | | 710,669 | |
| Shares redeemed | | (220,777 | ) | | | (4,419,616 | ) | | | (327,350 | ) | | | (6,917,422 | ) |
| Net decrease | | (194,471 | ) | $ | | (3,892,139 | ) | | | (294,054 | | $ | | (6,206,753 | ) |
| Class C: | | | | | | | | | | | | | | | |
| Shares sold | | 36,112 | | $ | | 700,092 | | | | 66,823 | | $ | | 1,358,291 | |
| Shares redeemed | | (29,364 | ) | | | (568,590 | ) | | | (96,618 | ) | | | (1,974,249 | ) |
| Net increase (decrease) | | 6,748 | | $ | | 131,502 | | | | (29,795 | ) | $ | | (615,958 | ) |
| Class I: | | | | | | | | | | | | | | | |
| Shares sold | | 10,971 | | $ | | 219,633 | | | | 27,679 | | $ | | 602,990 | |
| Shares redeemed | | (84,234 | ) | | | (1,741,661 | ) | | | (14,429 | ) | | | (305,428 | ) |
| Net increase (decrease) | | (73,263 | ) | $ | | (1,522,028 | ) | | | 13,250 | | $ | | 297,562 | |
| Class Z: | | | | | | | | | | | | | | | |
| Shares sold | | 95,159 | | $ | | 1,973,446 | | | | 46,485 | | $ | | 988,212 | |
| Shares redeemed | | (28,953 | ) | | | (595,744 | ) | | | (1,732 | ) | | | (37,329 | ) |
| Net increase | | 66,206 | | $ | | 1,377,702 | | | | 44,753 | | $ | | 950,883 | |
(b) Redemption Fee: Prior to March 1, 2015, the Fund imposed a 2.00% redemption fee on
certain Class A and Class C shares redeemed (including shares redeemed by exchange) less
than 30 days after such shares were acquired. Since March 1, 2015, the redemption fee is no
longer imposed.
NOTE 7 — Income Tax Information:
The tax character of distributions paid during the year ended October 31, 2016 and the
year ended October 31, 2015 was as follows:
- 34 -
Alger Global Growth Fund
NOTES TO FINANCIAL STATEMENTS (Continued)
| | | | |
| | FOR THE YEAR ENDED | FOR THE YEAR ENDED |
| | OCTOBER 31, 2016 | OCTOBER 31, 2015 |
| Alger Global Growth Fund | | | | |
| Distributions paid from: | | | | |
| Ordinary Income | | — | | — |
| Long-term capital gain | | — | | — |
| Total distributions paid | | — | | — |
As of October 31, 2016 the components of accumulated gains (losses) on a tax basis were
as follows:
| | | |
| Alger Global Growth Fund | | | |
| Undistributed ordinary income | $ | 200,043 | |
| Undistributed long-term gains | | — | |
| Net accumulated earnings | $ | 200,043 | |
| Capital loss carryforwards | | (2,973,963 | ) |
| Net unrealized appreciation | | 741,306 | |
| Total accumulated losses | $ | (2,032,614 | ) |
At October 31, 2016, the Fund, for federal income tax purposes, had a capital loss
carryforward of $2,973,963 which expires in 2017. Such amounts may be applied against
future net realized gains until the earlier of their utilization or expiration. During the year
ended October 31, 2016 the Fund utilized $132,708 of its capital loss carryforwards.
Under the Regulated Investment Company Modernization Act of 2010, capital losses
incurred by the Fund after October 31, 2011 will not be subject to expiration. In addition,
losses incurred after October 31, 2011 must be utilized prior to the utilization of capital loss
carryforwards above.
The difference between book-basis and tax-basis unrealized appreciation (depreciation) is
determined annually and is attributable primarily to the tax deferral of losses on wash sales,
U.S. Internal Revenue Code Section 988 currency transactions, the realization of unrealized
appreciation of passive foreign investment companies, and partnership basis adjustments.
Permanent differences, primarily from net operating losses and real estate investment trusts
and partnership investments sold by the Fund, resulted in the following reclassifications
among the Fund’s components of net assets at October 31, 2016:
| | | |
| Alger Global Growth Fund | | | |
| Accumulated undistributed net investment income (accumulated loss) | $ | 119,692 | |
| Accumulated net realized gain (accumulated realized loss) | $ | (119,692 | ) |
| Paid-in Capital | $ | – | |
- 35 -
Alger Global Growth Fund
NOTES TO FINANCIAL STATEMENTS (Continued)
NOTE 8 — Fair Value Measurements
The following is a summary of the inputs used as of October 31, 2016 in valuing the Fund’s
investments carried at fair value on a recurring basis. Based upon the nature, characteristics,
and risks associated with its investments, the Fund has determined that presenting them by
security type and sector is appropriate.
| | | | | | | | | | | | | |
| Alger Global Growth Fund | | TOTAL FUND | | | LEVEL 1 | | | LEVEL 2 | | | LEVEL 3 | |
| COMMON STOCKS | | | | | | | | | | | | | |
| Consumer Discretionary | $ | 2,850,311 | $ | 2,092,062 | $ | 758,249 | | | —* | |
| Consumer Staples | | | 3,412,002 | | 1,665,063 | | 1,746,939 | | | — | |
| Energy | | | 2,669,486 | | 1,826,103 | | 843,383 | | | — | |
| Financials | | | 2,471,910 | | 1,327,651 | | 1,144,259 | | | — | |
| Health Care | | | 4,966,161 | | 4,190,840 | | 775,321 | | | — | |
| Industrials | | | 1,553,767 | | 1,305,807 | | 247,960 | | | — | |
| Information Technology | | | 6,854,642 | | 5,605,451 | | 1,224,895 | | 24,296 | |
| Materials | | | 872,812 | | 540,866 | | 331,946 | | | — | |
| Telecommunication Services | | | 337,059 | | | — | | 337,059 | | | — | |
| Utilities | | | 426,590 | | 426,590 | | | — | | | — | |
| TOTAL COMMON STOCKS | $ | 26,414,740 | $ | | 18,980,433 | $ | | 7,410,011 | $ | | 24,296 | |
| CORPORATE BONDS | | | | | | | | | | | | | |
| Consumer Discretionary | | | 4,637 | | | — | | | — | | 4,637 | |
| PREFERRED STOCKS | | | | | | | | | | | | | |
| Consumer Discretionary | | | 21,605 | | | — | | | — | | 21,605 | * |
| Health Care | | | 235,351 | | | — | | | — | | 235,351 | |
| Information Technology | | | 111,981 | | | — | | | — | | 111,981 | |
| TOTAL PREFERRED STOCKS | $ | 368,937 | | | — | | | — | $ | | 368,937 | |
| REAL ESTATE INVESTMENT TRUST | | | | | | | | | | | | |
| Financials | | | 362,400 | | 362,400 | | | — | | | — | |
| SPECIAL PURPOSE VEHICLE | | | | | | | | | | | | | |
| Financials | | | 58,175 | | | — | | | — | | 58,175 | |
| WARRANTS | | | | | | | | | | | | | |
| Consumer Discretionary | | | 4,544 | | | — | | | — | | 4,544 | |
| TOTAL INVESTMENTS IN | | | | | | | | | | | | | |
| SECURITIES | $ | 27,213,433 | $ | | 19,342,833 | $ | | 7,410,011 | $ | | 460,589 | |
Alger Global Growth Fund’s shares of Choicestream Inc. common stock and preferred
stock are classified as a Level 3 investment and are fair valued at zero as of October 31,
2016.
- 36 -
Alger Global Growth Fund
NOTES TO FINANCIAL STATEMENTS (Continued)
| | | |
| | | FAIR VALUE | |
| | MEASUREMENTS | |
| | USING SIGNIFICANT | |
| | UNOBSERVABLE | |
| | INPUTS (LEVEL 3) | |
| Alger Global Growth Fund | Common Stocks | |
| Opening balance at November 1, 2015 | $ | 29,411 | |
| Transfers into Level 3 | | — | |
| Transfers out of Level 3 | | — | |
| Total gains or losses | | | |
| Included in net realized gain (loss) on investments | | – | |
| Included in net unrealized gain (loss) on investments | | (5,115 | ) |
| Purchases and sales | | – | |
| Purchases | | – | |
| Sales | | – | |
| Closing balance at October 31, 2016 | | 24,296 | |
| The amount of total gains or losses for the period included in net realized | | | |
| and unrealized gain (loss) attributable to change in unrealized appreciation | | | |
| (depreciation) relating to investments still held at 10/31/2016 | $ | (5,115 | ) |
| |
| Alger Global Growth Fund | Corporate Bonds | |
| Opening balance at November 1, 2015 | $ | — | |
| Transfers into Level 3 | | — | |
| Transfers out of Level 3 | | — | |
| Total gains or losses | | | |
| Included in net realized gain (loss) on investments | | – | |
| Included in net unrealized gain (loss) on investments | | 4,632 | |
| Purchases and sales | | – | |
| Purchases | | 5 | |
| Sales | | – | |
| Closing balance at October 31, 2016 | | 4,637 | |
| The amount of total gains or losses for the period included in net realized | | | |
| and unrealized gain (loss) attributable to change in unrealized appreciation | | | |
| (depreciation) relating to investments still held at 10/31/2016 | $ | 4,632 | |
- 37 -
Alger Global Growth Fund
NOTES TO FINANCIAL STATEMENTS (Continued)
| | | |
| Alger Global Growth Fund | Preferred Stocks | |
| Opening balance at November 1, 2015 | $ | 371,725 | |
| Transfers into Level 3 | | — | |
| Transfers out of Level 3 | | — | |
| Total gains or losses | | | |
| Included in net realized gain (loss) on investments | | – | |
| Included in net unrealized gain (loss) on investments | | (2,788 | ) |
| Purchases and sales | | – | |
| Purchases | | – | |
| Sales | | – | |
| Closing balance at October 31, 2016 | | 368,937 | |
| The amount of total gains or losses for the period included in net realized | | | |
| and unrealized gain (loss) attributable to change in unrealized appreciation | | | |
| (depreciation) relating to investments still held at 10/31/2016 | $ | (2,788 | ) |
| |
| | Special Purpose | |
| Alger Global Growth Fund | | Vehicle | |
| Opening balance at November 1, 2015 | $ | 55,986 | |
| Transfers into Level 3 | | — | |
| Transfers out of Level 3 | | — | |
| Total gains or losses | | | |
| Included in net realized gain (loss) on investments | | – | |
| Included in net unrealized gain (loss) on investments | | 2,189 | |
| Purchases and sales | | – | |
| Purchases | | – | |
| Sales | | – | |
| Closing balance at October 31, 2016 | | 58,175 | |
| The amount of total gains or losses for the period included in net realized | | | |
| and unrealized gain (loss) attributable to change in unrealized appreciation | | | |
| (depreciation) relating to investments still held at 10/31/2016 | $ | 2,189 | |
- 38 -
Alger Global Growth Fund
NOTES TO FINANCIAL STATEMENTS (Continued)
| | | |
| Alger Global Growth Fund | | Warrants | |
| Opening balance at November 1, 2015 | $ | — | |
| Transfers into Level 3 | | — | |
| Transfers out of Level 3 | | — | |
| Total gains or losses | | | |
| Included in net realized gain (loss) on investments | | – | |
| Included in net unrealized gain (loss) on investments | | (89 | ) |
| Purchases and sales | | – | |
| Purchases | | 4,633 | |
| Sales | | – | |
| Closing balance at October 31, 2016 | | 4,544 | |
| The amount of total gains or losses for the period included in net realized | | | |
| and unrealized gain (loss) attributable to change in unrealized appreciation | | | |
| (depreciation) relating to investments still held at 10/31/2016 | $ | (89 | ) |
The following table provides quantitative information about our Level 3 fair value
measurements of our investments as of October 31, 2016. In addition to the techniques
and inputs noted in the table below, according to our valuation policy we may also use other
valuation techniques and methodologies when determining our fair value measurements.
The table below is not intended to be all-inclusive, but rather provides information on the
Level 3 inputs as they relate to our fair value measurements.
| | | | | | | |
| | | Fair Value | Valuation | Unobservable | | | Weighted |
| | | October 31, 2016 | Methodology | Input | Range/Input | | Average Inputs |
| Alger Global Growth Fund | | | | | | | |
| Common Stock | $ | - | Income | Discount Rate | 40 | % | N/A |
| | | Approach | | | | |
| Common Stock | | 24,296 | Income | Revenue Multiple | 10x | -18x | N/A |
| | | | Approach | Discount Rate | 20 | % | |
| | | | | Scenario | 10-50 | % | |
| | | | | Probability | | | |
| | | | | Time to Exit | 1.3-3.3 Years | | |
| Preferred Stocks | | 21,605 | Income | Discount Rate | 40 | % | N/A |
| | | Approach | | | | |
| Preferred Stocks | | 111,981 | Income | Revenue Multiple | 10x | -18x | N/A |
| | | | Approach | Discount Rate | 20 | % | |
| | | | | Scenario | 10-50 | % | |
| | | | | Probability | | | |
| | | | | Time to Exit | 1.3-3.3 Years | | |
| Preferred Stocks | | 98,565 | Market | Scenario | 80 to 100% | | N/A |
| | | | Approach | Probability | | | |
| | | | | Time to Exit | 1.0-2.5 Years | | |
| | | | | Volatility | 67.8 | % | |
| Preferred Stocks | | 136,786 | Income | Discount Rate | 35.5-39.5% | | N/A |
| | | Approach | | | | |
| Warrants | | 4,544 | Income | Discount Rate | 40 | % | N/A |
| | | Approach | | | | |
- 39 -
Alger Global Growth Fund
NOTES TO FINANCIAL STATEMENTS (Continued)
| | | | | | |
| Corporate Bonds | 4,637 | Income | Discount Rate | 40 | % | N/A |
| | | Approach | | | | |
| Special Purpose Vehicle | 58,175 | Market | Revenue Multiple | 2.6x-3.1x | | N/A |
| | | Approach | | | | |
The significant unobservable inputs used in the fair value measurement of the Fund’s
securities are revenue and EBITDA multiples, discount rates, and the probabilities of
success of certain outcomes. Significant increases and decreases in these inputs in isolation
and interrelationships between those inputs could result in significantly higher or lower fair
value measurements than those noted in the table above.
On October 31, 2016, there were no transfers of securities between Level 1 and Level 2.
Certain of the Fund’s assets and liabilities are held at carrying amount or face value, which
approximates fair value for financial statement purposes. As of October 31, 2016, such
assets are categorized within the ASC 820 disclosure hierarchy as follows:
| | | | | | | | |
| | | TOTAL FUND | | LEVEL 1 | | LEVEL 2 | LEVEL 3 |
| Cash, Foreign cash and Cash equivalents: | | | | | | | | |
| Alger Global Growth Fund | $ | 1,067,491 | $ | 1,311 | $ | 1,066,180 | | — |
NOTE 9 — Derivatives:
Financial Accounting Standards Board Accounting Standards Codification 815 – Derivatives
and Hedging (“ASC 815”) requires qualitative disclosures about objectives and strategies for
using derivatives, quantitative disclosures about fair value amounts of and gains and losses
on derivative instruments, and disclosures about credit-risk-related contingent features in
derivative agreements.
There were no open derivative instruments as of October 31, 2016.
NOTE 10 — Principal Risks:
In the normal course of business, the Fund invests in securities and enters into transactions
where risks exist due to fluctuations in the market (market risk) or failure of the issuer
of a security to meet all its obligations (issuer credit risk). The value of securities held by
the Fund may decline in response to certain events, including those directly involving the
issuers whose securities are owned by the Fund; conditions affecting the general economy;
overall market changes; local, regional or global political, social or economic instability; and
currency and interest rate and price fluctuations. Similar to issuer credit risk, the Fund may
be exposed to counterparty credit risk, or the risk that an entity with which the Fund has
unsettled or open transactions may fail to or be unable to perform on its commitments. The
Fund manages counterparty credit risk by entering into transactions only with counterparties
that it believes have the financial resources to honor their obligations and by monitoring
the financial stability of those counterparties. Financial assets, which potentially expose
the Fund to market, issuer and counterparty credit risks, consist principally of financial
instruments and receivables due from counterparties. The extent of the Fund’s exposure to
market, issuer and counterparty credit risks with respect to these financial assets is generally
- 40 -
Alger Global Growth Fund
NOTES TO FINANCIAL STATEMENTS (Continued)
approximated by its value recorded in the Statement of Assets and Liabilities, less any
collateral held by the Fund.
The Funds invest in companies that are not yet available in the public markets and that are
accessible only through private equity investments. The Funds may also invest in venture
capital or private equity funds, direct private equity investments and other investments that
may have limited liquidity. There may be no trading market for these securities, and their sale
or transfer be limited or prohibited by contract or legal requirements, or may be dependent
on an exit strategy, such as an initial public offering or the sale of a business, which may
not occur, or may be dependent on managerial assistance provided by other investors and
their willingness to provide additional financial support. The securities may be able to be
liquidated, if at all, at disadvantageous prices. As a result, the Funds may be required to hold
these positions for several years, if not longer, regardless of adverse price movements. Such
positions may cause the Funds to be less liquid than would otherwise be the case.
NOTE 11 — Affiliated Securities:
The issuers of the securities listed below are deemed to be affiliates of the Fund because the
Fund or its affiliates owned 5% or more of the issuer’s voting securities during all or part
of the year ended October 31, 2016. Purchase and sale transactions and dividend income
earned during the period were as follows:
- 41 -
Alger Global Growth Fund
NOTES TO FINANCIAL STATEMENTS (Continued)
| | | | | | | | |
| | Shares/Par | | | Shares/Par | | | | |
| | at | | | at | | Realized | | Value at |
| | October 31, | Purchases/ | Sales/ | October | | Gain | | October |
| Security | 2015 | Conversion | Conversion | 31, 2016 | Interest Income | (Loss) | | 31, 2016 |
| |
| Alger Global Growth Fund | | | | | | | |
| Common Stock | | | | | | | | |
| Choicestream, Inc.* | 1,969 | – | – | 1,969 | – | – | $ | 0 |
| Preferred Stocks | | | | | | | | |
| Choicestream, Inc. | | | | | | | | |
| Series A and B* | 53,598 | – | – | 53,598 | – | – | | 21,605 |
| Prosetta | | | | | | | | |
| Biosciences, Inc., | | | | | | | | |
| Series D* | 33,858 | – | – | 33,858 | – | – | | 136,786 |
| Corporate Bonds | | | | | | | | |
| Choicestream, Inc., | | | | | | | | |
| 11.0%, 8/05/18 | – | 4,637 | – | 4,637 | 42 | – | | 4,637 |
| Warrants | | | | | | | | |
| Choicestream, | | | | | | | | |
| Inc.6/22/26* | – | 4,637 | – | 4,637 | – | – | | 4,544 |
| * Non-income producing security. | | | | | | |
NOTE 12 — Subsequent Events:
Management of the Fund has evaluated events that have occurred subsequent to October
31, 2016 through the issuance date of the Financial Statements. No such events have been
identified which require recognition and/or disclosure.
- 42 -
REPORT OF INDEPENDENT REGISTERED PUBLIC ACCOUNTING FIRM
To the Board of Trustees and Shareholders of the Alger Global Growth Fund:
We have audited the accompanying statement of assets and liabilities of Alger Global
Growth Fund (the “Fund”), including the schedule of investments as of October 31, 2016,
and the related statement of operations for the year then ended, the statements of changes
in net assets for each of the two years in the period then ended, and the financial highlights
for each of the periods presented. These financial statements and financial highlights are
the responsibility of the Fund’s management. Our responsibility is to express an opinion on
these financial statements and financial highlights based on our audits.
We conducted our audits in accordance with the standards of the Public Company
Accounting Oversight Board (United States). Those standards require that we plan and
perform the audit to obtain reasonable assurance about whether the financial statements
and financial highlights are free of material misstatement. The Fund is not required to have,
nor were we engaged to perform, an audit of their internal control over financial reporting.
Our audits included consideration of internal control over financial reporting as a basis for
designing audit procedures that are appropriate in the circumstances, but not for the purpose
of expressing an opinion on the effectiveness of the Fund’s internal control over financial
reporting. Accordingly, we express no such opinion. An audit also includes examining, on
a test basis, evidence supporting the amounts and disclosures in the financial statements,
assessing the accounting principles used and significant estimates made by management,
as well as evaluating the overall financial statement presentation. Our procedures included
confirmation of securities owned as of October 31, 2016, by correspondence with the
custodian and brokers; when replies were not received from brokers, we performed other
auditing procedures. We believe that our audits provide a reasonable basis for our opinion.
In our opinion, the financial statements and financial highlights referred to above present
fairly, in all material respects, the financial position of Alger Global Growth Fund as of
October 31, 2016, the results of its operations for the year then ended, the changes in its
net assets for each of the two years in the period then ended, and the financial highlights for
each of the periods presented, in conformity with accounting principles generally accepted
in the United States of America.
Deloitte & Touche LLP
New York, New York
December 29, 2016
- 43 -
ALGER GLOBAL GROWTH FUND
ADDITIONAL INFORMATION (Unaudited)
Shareholder Expense Example
As a shareholder of the Fund, you incur two types of costs: transaction costs, if applicable,
including sales charges (loads) and redemption fees; and ongoing costs, including
management fees, distribution (12b-1) fees, if applicable, and other fund expenses. This
example is intended to help you understand your ongoing costs (in dollars) of investing in
the Fund and to compare these costs with the ongoing costs of investing in other mutual
funds.
The example below is based on an investment of $1,000 invested at the beginning of the
six-month period starting May 1, 2016 and ending October 31, 2016.
Actual Expenses
The first line for each class of shares in the table below provides information about actual
account values and actual expenses. You may use the information in this line, together
with the amount you invested, to estimate the expenses that you would have paid over the
period. Simply divide your account value by $1,000 (for example, an $8,600 account value
divided by $1,000 = 8.6), then multiply the result by the number in the first line under the
heading entitled “Expenses Paid during the Period” to estimate the expenses you paid on
your account during this period.
Hypothetical Example for Comparison Purposes
The second line for each class of shares in the table below provides information about
hypothetical account values and hypothetical expenses based on the Fund’s actual expense
ratios for each class of shares and an assumed rate of return of 5% per year before expenses,
which is not the Fund’s actual return. The hypothetical account values and expenses may not
be used to estimate the actual ending account balance or expenses you paid for the period.
You may use this information to compare the ongoing costs of investing in the Fund and
other funds. To do so, compare this 5% hypothetical example with the 5% hypothetical
examples that appear in the shareholder reports of other funds.
Please note that the expenses shown in the table are meant to highlight your ongoing costs
only and do not reflect any transaction costs, such as sales charges (loads) and redemption
fees. Therefore, the second line under each class of shares in the table is useful in comparing
ongoing costs only, and will not help you determine the relative total costs of owning
different funds. In addition, if these transactional costs were included, your costs would
have been higher.
- 44 -
ALGER GLOBAL GROWTH FUND
ADDITIONAL INFORMATION (Unaudited) (Continued)
| | | | | | | | | | | |
| | | | | | | | | | Annualized | |
| | | | | | | Expenses | | Expense Ratio | |
| | | | | | | Paid During | | | For the | |
| | | Beginning | | Ending | the Six Months | | Six Months | |
| | | | Account | | Account | | Ended | | | Ended | |
| | | | Value | | Value | October 31, | | October 31, | |
| | | May 1, 2016 | | October 31, 2016 | | 2016 | (a) | | 2016 | (b) |
| Alger Global Growth Fund | | | | | | | | | | |
| Class A | Actual | $ | 1,000.00 | $ | 1,000.50 | $ | 7.54 | | | 1.50 | % |
| | Hypothetical(c) | | 1,000.00 | | 1,017.60 | | 7.61 | | | 1.50 | |
| Class C | Actual | | 1,000.00 | | 996.87 | | 11.29 | | | 2.25 | |
| | Hypothetical(c) | | 1,000.00 | | 1,013.83 | | 11.39 | | | 2.25 | |
| Class I | Actual | | 1,000.00 | | 1,000.98 | | 6.34 | | | 1.25 | |
| | Hypothetical(c) | | 1,000.00 | | 1,018.80 | | 6.39 | | | 1.25 | |
| Class Z | Actual | | 1,000.00 | | 1,002.44 | | 5.29 | | | 1.05 | |
| | Hypothetical(c) | | 1,000.00 | | 1,019.86 | | 5.33 | | | 1.05 | |
| | | | | | | | | | | | |
(a) Expenses are equal to the annualized expense ratio of the respective share class, multiplied by the average account
value over the period, multiple by 184/366 (to reflect the one-half year period).
(b) Annualized.
(c) 5% annual return before expenses.
Trustees and Officers of the Fund
Information about the trustees and officers of the Fund is set forth below. In the table
the term “Alger Fund Complex” refers to the Fund, The Alger Portfolios, The Alger
Institutional Funds, The Alger Funds and The Alger Funds II, each of which is a registered
investment company managed by Fred Alger Management, Inc. (“Alger Management”).
Each Trustee serves until an event of termination, such as death or resignation, or until his
or her successor is duly elected; each officer’s term of office is one year. Unless otherwise
noted, the address of each person named below is 360 Park Avenue South, New York, NY
10010.
- 45 -
ALGER GLOBAL GROWTH FUND
ADDITIONAL INFORMATION (Unaudited) (Continued)
| | | |
| | | | Number |
| | | | of Funds |
| | | | in the |
| | | | Alger Fund |
| | | Trustee | Complex |
| | | and/or | which are |
| Name, Age, Position with the | | Officer | Overseen |
| Fund | Principal Occupations | Since | by Trustee |
| INTERESTED TRUSTEE | | | |
| |
| Hilary M. Alger (55) | Director of Development, Pennsylvania Ballet | 2003 | 25 |
| | 2004-2013; Associate Director of Development, | | |
| | College of Arts and Sciences and Graduate School, | | |
| | University of Virginia 1999-2003. | | |
| NON-INTERESTED TRUSTEE | | | |
| |
| Charles F. Baird, Jr. (63) | Managing Partner of North Castle Partners, a | 2000 | 25 |
| | private equity securities group; Chairman of | | |
| | Elizabeth Arden Red Door Spas and Barry’s | | |
| | Bootcamp, former Chairman of Cascade Helmets, | | |
| | gloProfessional (makeup and skincare business), | | |
| | Contigo (manufacturer of mugs and water bottles), | | |
| | and International Fitness. | | |
| Roger P. Cheever (71) | Associate Vice President for Principal Gifts, and | 2000 | 25 |
| | Senior Associate Dean for Development in the | | |
| | Faculty of Arts and Sciences at Harvard University; | | |
| | Formerly Deputy Director of the Harvard College | | |
| | Fund. | | |
| Stephen E. O'Neil (83) | Attorney. Private Investor since 1981. Formerly of | 1986 | 25 |
| | Counsel to the law firm of Kohler & Barnes. | | |
| David Rosenberg (54) | Associate Professor of Law since January 2006 | 2007 | 25 |
| | (Assistant Professor 2000-2005), Zicklin School of | | |
| | Business, Baruch College, City University of New | | |
| | York. | | |
| Nathan E. Saint-Amand | Medical doctor in private practice; Member of the | 1986 | 25 |
| M.D. (78) | Board of the Manhattan Institute (non-profit policy | | |
| | research) since 1988; Formerly Co-Chairman, Special | | |
| | Projects Committee, Memorial Sloan Kettering. | | |
Ms. Alger is an “interested person” (as defined in the Investment Company Act) of the
Fund because of her affiliations with Alger Management. No Trustee is a director of any
public company except as indicated under “Principal Occupations”.
- 46 -
ALGER GLOBAL GROWTH FUND
ADDITIONAL INFORMATION (Unaudited) (Continued)
| | | | |
| | | | | Number |
| | | | | of Funds |
| | | | | in the |
| | | | | Alger Fund |
| | | | Trustee | Complex |
| | | | and/or | which are |
| Name, Age, Position with the | | | Officer | Overseen |
| Fund | Principal Occupations | | Since | by Trustee |
| OFFICERS | | | | |
| |
| Hal Liebes (52) | Executive Vice President, Chief Operating Officer, | | 2005 | N/A |
| President | Chief Legal Officer and Secretary of Alger | | | |
| | Management and Alger Inc.; Director since 2006 of | | | |
| | Alger Management, Alger Inc. and Resources. | | | |
| Lisa A. Moss (51) | Senior Vice President since 2009, and Vice | | 2006 | N/A |
| Secretary | President and Assistant General Counsel of Alger | | | |
| | Management since June 2006. | | | |
| Michael D. Martins (51) | Senior Vice President of Alger Management; | | 2005 | N/A |
| Treasurer | Assistant Treasurer since 2004. | | | |
| Anthony S. Caputo (61) | Employed by Alger Management since 1986, | | 2007 | N/A |
| Assistant Treasurer | currently serving as Vice President. | | | |
| Sergio M. Pavone (55) | Employed by Alger Management since 2002, | | 2007 | N/A |
| Assistant Treasurer | currently serving as Vice President. | | | |
| Patrick J. Murphy (46) | Senior Vice President of Alger Management since | | 2014 | N/A |
| Chief Compliance Officer | 2014 | . | | |
| Christopher E. Ullman (31) | Associate Counsel of Alger Management since | | 2016 | N/A |
| Assistant Secretary | 2016. Formerly, Associate, Legal and Compliance, | | | |
| | BlackRock from 2015 to 2016; Compliance | | | |
| | Associate, Bridgewater Associates, from 2013 to | | | |
| | 2014; and full-time student from 2010 to 2013. | | |
The Statement of Additional Information contains additional information about the
Fund’s Trustees and is available without charge upon request by calling (800) 992-3863.
- 47 -
ALGER GLOBAL GROWTH FUND
ADDITIONAL INFORMATION (Unaudited) (Continued)
Investment Management Agreement Renewal
At an in-person meeting held on September 27, 2016, the Trustees, including the Independent
Trustees, unanimously approved renewal of the Investment Advisory Agreement (the
“Agreement”) between the Fund and Fred Alger Management, Inc. (“Alger Management”).
The Independent Trustees were assisted in their review by independent legal counsel and met
with such counsel in executive session separate from representatives of Alger Management.
In evaluating the Agreement, the Trustees drew on materials that they had requested and
which were provided to them in advance of the meeting by Alger Management and by
counsel. The materials covered, among other matters, (i) the nature, extent and quality
of the services provided by Alger Management under the Agreement, (ii) the investment
performance of the Fund, (iii) the costs to Alger Management of its services and the profits
realized by Alger Management and Fred Alger & Company, Incorporated (“Alger Inc.”),
from their relationship with the Fund, and (iv) the extent to which economies of scale
would be realized if and as the Fund grows and whether the fee levels in the Agreement
reflected such economies of scale. These materials included a presentation and analysis of
the Fund and Alger Management’s services by FUSE Research Network LLC (“FUSE”), an
independent consulting firm selected by the Fund’s Chief Compliance Officer and having
no other material relationship with Alger Management.
In deciding whether to approve renewal of the Agreement, the Trustees considered various
factors, including those enumerated above. They also considered other direct and indirect
benefits to Alger Management and its affiliates from their relationship with the Fund.
Nature, Extent and Quality of Services. In considering the nature, extent and quality of
the services provided by Alger Management pursuant to the Agreement, the Trustees relied
on their prior experience as Trustees of the Fund, their familiarity with the personnel and
resources of Alger Management and its affiliates (derived in part from periodic meetings
with and presentations by investment management and Fund distribution personnel), and the
materials provided at the meeting. They noted that under the Agreement Alger Management
is responsible for managing the investment operations of the Fund. The Trustees reviewed
the background and experience of Alger Management's senior investment management
personnel, including the individuals responsible for the investment operations of the Fund.
They also considered the resources and practices of Alger Management in managing the
Fund's portfolio, as well as Alger Management's overall investment management business.
They noted especially Alger Management's established expertise in managing portfolios of
"growth" stocks. They further noted that Alger Management’s investment management team
includes several individuals with deep and successful backgrounds in international investing,
a sector in which the Fund is active. The Trustees concluded that Alger Management's
experience, resources and strength in the areas of importance to the Fund are considerable.
The Trustees considered the level and depth of Alger Management's ability to execute
portfolio transactions to effect investment decisions, including those through Alger Inc.
They also noted that certain administrative, compliance, reporting and accounting services
necessary for the conduct of the Trust’s affairs are provided separately under a Fund
Administration Agreement and a Shareholder Administrative Services Agreement with
- 48 -
ALGER GLOBAL GROWTH FUND
ADDITIONAL INFORMATION (Unaudited) (Continued)
Alger Management. The Trustees also considered the control and compliance environment
at Alger Management and within the Fund.
Investment Performance of the Fund. Drawing upon information provided at the
meeting by Alger Management as well as FUSE and upon reports provided to the Trustees
by Alger Management throughout the preceding year, the Trustees reviewed the Fund’s
returns for the year-to-date (at 6/30/16), second-quarter of 2016, and 1- and 3-year periods,
and compared them with benchmark and peer-group data for the same periods. Because
the Fund had adopted a significantly different investment strategy on May 31, 2013, so
that performance data from periods prior to that date would not be reliably informative,
the Trustees considered only the investment performance of the Fund for 3-year and
shorter, more recent periods. They noted that the Fund’s performance for the quarter ended
6/30/16 and the year to date was at or above the median for its peers but somewhat below
its benchmark. Its performance for one year was well below its peer median and benchmark
but its overall performance over its approximately three-year life ranked in or near the top
quartile of its peers and above its benchmark. Consistent with the practice followed at every
quarterly meeting of Trustees throughout the year, representatives of Alger Management
discussed with the Trustees the performance of the Fund. Throughout, the Trustees were
mindful of the point, alluded to in the discussion, that the current market in equity securities
favors dividend-paying equities rather than pure growth stocks, a trend directly contrary
to the Alger investment approach and tending to depress the prices of growth stocks as
compared with those of dividend stocks. On the basis of these discussions and their review,
the Trustees determined that the performance of the Fund was acceptable.
Fund Fee and Expense Ratio; Profitability to Alger Management and its Affiliates.
The Trustees reviewed the Fund's management fee and expense ratios at June 30, 2016
and compared them with a group of comparable funds. In order to assist the Trustees
in this comparison, FUSE had provided the Trustees with comparative information with
respect to the advisory fees and expense ratios of relevantly similar funds. That information
indicated that the advisory fee for the Fund was well below the median for the fees in the
FUSE reference group. Of the expense ratios for the Fund’s four classes of shares, all were
above the medians for the FUSE reference group, but two of the four were in the quartile
just above the median. The other two were in the highest quartile, but the asset levels of
the relevant share classes were so low that the classes suffered thereby in comparison
with their peers. The Trustees noted that Alger Management had committed to expense-
reimbursement provisions that capped Fund expense ratios at specified levels. The Trustees
determined that the expense-ratio information should be taken into account in weighing the
size of the fee against the nature, extent and quality of the services provided.
The Trustees also considered fees paid to Alger Management by four other types of clients,
specifically mutual funds for which Alger Management was sub-adviser, separately managed
institutional accounts, “wrap programs,” and collective investment trusts. The Trustees
determined that in all four cases the fees were of doubtful relevance for purposes of
comparison with that of the Fund because of the differences in services provided by Alger
- 49 -
ALGER GLOBAL GROWTH FUND
ADDITIONAL INFORMATION (Unaudited) (Continued)
Management to those types of clients as opposed to the Fund, but that to the extent that
meaningful comparison was practicable, the differences in services adequately explained the
differences in the fees. The Trustees then considered the profitability of the Investment
Advisory Agreement to Alger Management and its affiliates, and the methodology used by
Alger Management in determining such profitability. The Trustees reviewed previously-
provided data on the Fund’s profitability to Alger Management and its affiliates for the year
ended June 30, 2016. After discussing with representatives of the Adviser and FUSE the
expense-allocation practices, which FUSE reported to be consistent with accepted industry
practice, used in computing the costs that formed the bases of the profitability calculations,
the Trustees turned to the profitability data provided. After analysis and discussion, they
concluded that, to the extent that Alger Management’s and its affiliates’ relationships with
the Fund had been profitable to those entities, the profit margins were not unacceptable.
Economies of Scale. On the basis of their discussions with management and their
analysis of information provided at the meeting, the Trustees determined that the nature
of the Fund and its operations is such that Alger Management is likely to realize economies
of scale in the management of the Fund at some point as (and if) it grows in size. In
that connection, they noted that the advisory fee schedule in the Agreement includes a
fee reduction at a specified asset level (a “breakpoint”); this has the effect of lowering the
Fund’s overall management fee as the Fund grows past the breakpoint, thus sharing with
the Fund’s shareholders economies of scale achieved by Alger Management in managing
the growing Fund.
Other Benefits to Alger Management. The Trustees considered whether Alger
Management benefits in other ways from its relationship with the Fund. They noted that
Alger Management maintains soft-dollar arrangements in connection with the Fund’s
brokerage transactions, reports on which are regularly supplied to the Trustees at their
quarterly meetings and summaries of which, listing soft-dollar commissions for the twelve
months through June 30, 2016, had been included in the materials supplied prior to the
meeting. The Trustees also noted that Alger Management receives fees from the Fund
under the Fund Administration Agreement and the Shareholder Administrative Services
Agreement, and that Alger Inc. provides a considerable portion of the Fund’s equity
brokerage and receives shareholder servicing fees from the Fund as well. The Trustees
had been provided with information regarding, and had considered, the administration fee,
shareholder administrative services fee, brokerage and shareholder servicing fee benefits in
connection with their review of the profitability to Alger Management and its affiliates of
their relationships with the Fund. As to other benefits received, the Trustees decided that
none were so significant as to render Alger Management's fees excessive.
Conclusions and Determinations. At the conclusion of these discussions, each of the
Independent Trustees expressed the opinion that he had been furnished with sufficient
information to make an informed business decision with respect to renewal of the Fund's
Investment Advisory Agreement. Based on its discussions and considerations as described
above, the Board made the following conclusions and determinations:
• The Board concluded that the nature, extent and quality of the services provided
- 50 -
ALGER GLOBAL GROWTH FUND
ADDITIONAL INFORMATION (Unaudited) (Continued)
by Alger Management are adequate and appropriate.
• The Board determined that the Fund’s performance was acceptable.
• The Board concluded that the Fund’s advisory fee paid to Alger Management was
reasonable in light of comparative expense and advisory fee information, costs
of the services provided and profits to be realized and benefits derived or to be
derived by Alger Management and its affiliates from the relationship with the
Fund. The Trustees noted that Alger Management had undertaken to cap Fund
expenses through expense reimbursements, thus in effect lowering the fees it
actually received from the Fund.
• The Board accepted Alger Management’s acknowledgement that economies of
scale were likely to be achieved in the management of the Fund as (and if) it
grew in size and determined that the fee breakpoint in the Agreement provided a
means by which Alger Management would share the benefits of such economies
with Fund shareholders.
The Board considered these conclusions and determinations and, without any one factor
being dispositive, determined that renewal of the Investment Advisory Agreement was in
the best interests of the Fund and its shareholders.
- 51 -
ALGER GLOBAL GROWTH FUND
ADDITIONAL INFORMATION (Unaudited) (Continued)
| | | |
| Privacy Policy | | | |
| |
| U.S. Consumer Privacy Notice | Rev. 12/20/16 |
| FACTS | WHAT DOES ALGER DO WITH YOUR PERSONAL INFORMATION? |
| |
| |
| Why? | Financial companies choose how they share your personal information. Federal law |
| | gives consumers the right to limit some but not all sharing. Federal law also requires us |
| | to tell you how we collect, share, and protect your personal information. Please read this |
| | notice carefully to understand what we do. | |
| What? | The types of personal information we collect and share depend on the product or service |
| | you have with us. This information can include: | |
| | • Social Security number and | |
| | • Account balances and | | |
| | • Transaction history and | | |
| | • Purchase history and | | |
| | • Assets | | |
| | When you are no longer our customer, we continue to share your information as |
| | described in this notice. | | |
| How? | All financial companies need to share personal information to run their everyday business. |
| | In the section below, we list the reasons financial companies can share personal |
| | information; the reasons Alger chooses to share; and whether you can limit this sharing. |
| |
| Reasons we can share your personal | Does | Can you limit |
| information | | Alger share? | this sharing? |
| For our everyday business purposes — | Yes | No |
| such as to process your transactions, maintain | | |
| your account(s), respond to court orders and | | |
| legal investigations, or report to credit bureaus | | |
| For our marketing purposes — | Yes | No |
| to offer our products and services to you | | |
| For joint marketing with other financial | No | We don’t share |
| companies | | | |
| For our affiliates’ everyday business | Yes | No |
| purposes — information about your | | |
| transactions and experiences | | |
| For our affiliates’ everyday business | No | We don’t share |
| purposes — information about your | | |
| creditworthiness | | | |
| For nonaffiliates to market to you | No | We don’t share |
| Questions ? Call 1-800-342-2186 | | |
- 52 -
ALGER GLOBAL GROWTH FUND
ADDITIONAL INFORMATION (Unaudited) (Continued)
| |
| Who we are | |
| |
| Who is providing this notice? | Alger includes Fred Alger Management, Inc. and Fred |
| | Alger & Company, Incorporated as well as the following |
| | funds: The Alger Funds, The Alger Funds II, The Alger |
| | Institutional Funds, The Alger Portfolios, and Alger |
| | Global Growth Fund. |
| |
| |
| What we do | |
| How does Alger | To protect your personal information from unauthorized |
| protect my personal | access and use, we use security measures that comply |
| information? | with federal law. These measures include computer |
| | safeguards and secured files and buildings. |
| How does Alger | We collect your personal information, for example, |
| collect my personal | when you: |
| information? | • Open an account or |
| | • Make deposits or withdrawals from you account |
| | • Give us your contact information or |
| | • Provide account information or |
| | • Pay us by check. |
| Why can’t I limit all sharing? | Federal law gives you the right to only |
| | • sharing for affiliates’ everyday business purposes |
| | information about your credit worthiness |
| | • affiliates from using your information to market to you |
| | • sharing for nonaffiliates to market to you |
| | State laws and individual companies may give you |
| | additional rights to limit sharing. |
| |
| |
| Definitions | |
| Affiliates | Companies related by common ownership or control. |
| | They can be financial and nonfinancial companies. |
| | • Our affiliates include Fred Alger Management, Inc. |
| | and Fred Alger & Company, Incorporated as well as the |
| | following funds: The Alger Funds, The Alger Funds II, |
| | The Alger Institutional Funds, The Alger Portfolios, and |
| | Alger Global Growth Fund. |
| Nonaffiliates | Companies not related by common ownership or |
| | control. They can be financial and nonfinancial |
| | companies |
| Joint marketing | A formal agreement between nonaffiliated financial |
| | companies that together market financial products or |
| | services to you. |
| Other important information | |
- 53 -
ALGER GLOBAL GROWTH FUND
ADDITIONAL INFORMATION (Unaudited) (Continued)
Proxy Voting Policies
A description of the policies and procedures the Trust uses to determine how to vote
proxies relating to portfolio securities and information regarding how the Fund voted
proxies relating to portfolio securities during the most recent 12-month period ended June
30 are available, without charge, by calling (800) 992-3863 or online on the Funds’ website
at www.alger.com or on the SEC’s website at www.sec.gov.
Fund Holdings
The Board of Trustees has adopted policies and procedures relating to disclosure of the
Fund’s portfolio securities. These policies and procedures recognize that there may be
legitimate business reasons for holdings to be disclosed and seek to balance those interests
to protect the proprietary nature of the trading strategies and implementation thereof by
the Fund.
Generally, the policies prohibit the release of information concerning portfolio holdings
which have not previously been made public to individual investors, institutional investors,
intermediaries that distribute the Fund’s shares and other parties which are not employed
by the Manager or its affiliates except when the legitimate business purposes for selective
disclosure and other conditions (designed to protect the Fund) are acceptable.
The Fund makes its full holdings available semi-annually in shareholder reports filed on
Form N-CSR and after the first and third fiscal quarters in regulatory filings on Form N-Q.
These shareholder reports and regulatory filings are filed with the SEC, as required by federal
securities laws, and are generally available within sixty (60) days of the end of the Fund’s
fiscal quarter. The Fund’s Forms N-Q are available online on the SEC’s website at www.
sec.gov or may be reviewed and copied at the SEC’s Public Reference Room in Washington,
D.C. Information regarding the operation of the SEC’s Public Reference Room may be
obtained by calling 1-800-SEC-0330.
In addition, the Fund makes publicly available its respective month-end top 10 holdings
with a 15 day lag and their month-end full portfolios with a 60 day lag on their website www.
alger.com and through other marketing communications (including printed advertising/
sales literature and/or shareholder telephone customer service centers). No compensation
or other consideration is received for the non-public disclosure of portfolio holdings
information.
In accordance with the foregoing, the Fund provides portfolio holdings information to
service providers who provide necessary or beneficial services when such service providers
need access to this information in the performance of their services and are subject to
duties of confidentiality (1) imposed by law, including a duty not to trade on non-public
information, and/or (2) pursuant to an agreement that confidential information is not to be
disclosed or used (including trading on such information) other than as required by law. From
time to time, the Fund will communicate with these service providers to confirm that they
understand the Fund’s policies and procedures regarding such disclosure. This agreement
must be approved by the Fund’s Chief Compliance Officer, President or Secretary.
- 54 -
ALGER GLOBAL GROWTH FUND
ADDITIONAL INFORMATION (Unaudited) (Continued)
The Board of Trustees periodically reviews a report disclosing the third parties to whom
the Fund’s holdings information has been disclosed and the purpose for such disclosure,
and it considers whether or not the release of information to such third parties is in the best
interest of the Fund and its shareholders.
In addition to material the Fund routinely provides to shareholders, the Manager may,
upon request, make additional statistical information available regarding the Fund. Such
information will include, but not be limited to, relative weightings and characteristics of
the Fund’s portfolio versus its peers or an index (such as P/E ratio, alpha, beta, capture
ratio, standard deviation, EPS forecasts, Sharpe ratio, information ratio, R-squared, and
market cap analysis), security specific impact on overall portfolio performance month-end
top ten contributors to and detractors from performance, breakdown of High Unit Volume
Growth holdings vs. Positive Lifecycle Change holdings, portfolio turnover, and requests
of a similar nature. Please contact the Fund at (800) 992-3863 to obtain such information.
- 55 -
ALGER GLOBAL GROWTH FUND
360 Park Avenue South
New York, NY 10010
(800) 992-3863
www.alger.com
Investment Manager
Fred Alger Management, Inc.
360 Park Avenue South
New York, NY 10010
Distributor
Fred Alger & Company, Incorporated
360 Park Avenue South
New York, NY 10010
Transfer Agent and Dividend Disbursing Agent
State Street Bank and Trust Company
c/o Boston Financial Data Services, Inc.
P.O. Box 8480
Boston, MA 02266-8480
Custodian
Brown Brothers Harriman & Company
50 Post Office Square
Boston, MA 02110
This report is submitted for the general information of the shareholders of Alger
Global Growth Fund. It is not authorized for distribution to prospective investors
unless accompanied by an effective prospectus for the Fund, which contains information
concerning the Fund’s investment policies, fees and expenses as well as other pertinent
information
- 56 -
ITEM 2. CODE OF ETHICS.
(a) The Registrant has adopted a code of ethics (the "Code of Ethics") that applies to its
principal executive officer, principal financial officer, principal accounting officer or
controller, or persons performing similar functions.
(b) Not applicable.
(c) The Registrant has not amended its Code of Ethics during the period covered by the
shareholder report presented in Item 1 hereto.
(d) The Registrant has not granted a waiver or an implicit waiver from a provision of its
Code of Ethics during the period covered by the shareholder report presented in Item 1
hereto.
(e) Not applicable.
(f) The Registrant's Code of Ethics is attached as an Exhibit hereto.
ITEM 3. AUDIT COMMITTEE FINANCIAL EXPERT.
The Board of Trustees of the Registrant determined that Stephen E. O’Neil is an audit committee
financial expert (within the meaning of that phrase specified in the instructions to Form N-CSR)
on the Registrant’s audit committee. Mr. O’Neil is an “independent” trustee – i.e., he is not an
interested person of the Registrant as defined in the Investment Company Act of 1940, nor has
he accepted directly or indirectly any consulting, advisory or other compensatory fee from the
Registrant, other than in his capacity as Trustee.
ITEM 4. PRINCIPAL ACCOUNTANT FEES AND SERVICES.
| | |
| a) Audit Fees: | | |
| October 31, 2016 | $ | 36,500 |
| October 31, 2015 | $ | 35,500 |
b) Audit-Related Fees: NONE
c) Tax Fees for tax advice, tax compliance and tax planning:
| | |
| October 31, 2016 | $ | 5,100 |
| October 31, 2015 | $ | 4,700 |
| |
| d) All Other Fees: | | |
| October 31, 2016 | $ | 7,020 |
| October 31, 2015 | $ | 10,100 |
Other fees include a review and consent for Registrants registration statement filing and
a review of the semi-annual financial statements.
e) 1) Audit Committee Pre-Approval Policies And Procedures:
Audit and non-audit services provided by the Registrant’s independent registered public
accounting firm (the “Auditors”) on behalf the Registrant must be pre-approved by the
Audit Committee. Non-audit services provided by the Auditors on behalf of the
Registrant’s Investment Adviser or any entity controlling, controlled by, or under
common control with the Investment Adviser must be pre-approved by the Audit
Committee if such non-audit services directly relate to the operations or financial
reporting of the Registrant.
2) All fees in item 4(b) through 4(d) above were approved by the Registrants’ Audit
Committee.
f) Not Applicable
g) Non-Audit Fees:
| | | |
| October 31, 2016 | $ | 219,975 | , €93,631 |
| October 31, 2015 | $ | 191,042 | , €69,347 |
h) The audit committee of the board of trustees has considered whether the provision of the
non-audit services that were rendered to the registrant's investment adviser and any entity
controlling, controlled by, or under common control, with the adviser that provides ongoing
services to the registrant that were not approved pursuant to (c)(7)(ii) of Rule 2-01 of
Regulation S-X is compatible with maintaining the principle accountant's independence.
ITEM 5. AUDIT COMMITTEE OF LISTED REGISTRANTS.
Not applicable
ITEM 6. INVESTMENTS.
Not applicable
ITEM 7. DISCLOSURE OF PROXY VOTING POLICIES AND PROCEDURES FOR CLOSED-END MANAGEMENT
INVESTMENT COMPANIES.
Not applicable
ITEM 8. PORTFOLIO MANAGERS OF CLOSED-END MANAGEMENT INVESTMENT COMPANIES.
Not applicable
ITEM 9. PURCHASES OF EQUITY SECURITIES BY CLOSED-END MANAGEMENT INVESTMENT COMPANY
AND AFFILIATED PURCHASERS.
Not applicable
ITEM 10. SUBMISSION OF MATTERS TO A VOTE OF SECURITY HOLDERS.
None
ITEM 11. CONTROLS AND PROCEDURES.
(a) The Registrant’s principal executive officer and principal financial officer have concluded
that the Registrant’s disclosure controls and procedures (as defined in Rule 30a-3(c) under
the Investment Company Act of 1940, as amended) are effective based on their evaluation
of the disclosure controls and procedures as of a date within 90 days of the filing date of
this document.
(b) No changes in the Registrant’s internal control over financial reporting occurred during
the Registrant’s second fiscal half-year that materially affected, or are reasonably likely to
materially affect, the Registrant’s internal control over financial reporting.
ITEM 12. EXHIBITS.
(a) (1) Code of Ethics as Exhibit 99.CODE ETH
(a) (2) Certifications of principal executive officer and principal financial officer as required by
rule 30a-2(a) under the Investment Company Act of 1940 are attached as Exhibit 99.CERT
(b) Certifications of principal executive officer and principal financial officer as required by rule
30a-2(b) under the Investment Company Act of 1940 are attached as Exhibit 99.906CERT
SIGNATURES
Pursuant to the requirements of the Securities Exchange Act of 1934 and the Investment
Company Act of 1940, the registrant has duly caused this report to be signed on its behalf
by the undersigned, thereunto duly authorized.
Alger Global Growth Fund
By: /s/Hal Liebes
Hal Liebes
President
Date: December 21, 2016
Pursuant to the requirements of the Securities Exchange Act of 1934 and the Investment
Company Act of 1940, this report has been signed below by the following persons on behalf
of the registrant and in the capacities and on the dates indicated.
By: /s/Hal Liebes
Hal Liebes
President
Date: December 21, 2016
By: /s/Michael D. Martins
Michael D. Martins
Treasurer
Date: December 21, 2016