
Q3 2017 Update November 8, 2017

Page 2 Forward-looking Statements This presentation contains “forward-looking statements” within the meaning of the Private Securities Litigation Reform Act of 1995. Words such as “believe,” “demonstrate,” “expect,” “estimate,” “forecast,” “anticipate,” “should” and “likely” and similar expressions identify forward-looking statements. In addition, statements that are not historical should also be considered forward-looking statements. Readers are cautioned not to place undue reliance on those forward-looking statements, which speak only as of the date the statement was made. Such forward-looking statements are based on current expectations that involve a number of known and unknown risks, uncertainties and other factors which may cause actual events to be materially different from those expressed or implied by such forward-looking statements. These factors include, but are not limited to, our continuing relationship with government entities and our ability to procure business from them, our ability to manage growing and changing operations, the implementation of healthcare reform law, government budget changes and legislation related to the services that we provide, our ability to renew or replace existing contracts that have expired or are scheduled to expire with significant clients, and other risks detailed in Providence’s filings with the Securities and Exchange Commission, including its Annual Report on Form 10-K. Providence is under no obligation to (and expressly disclaims any such obligation to) update any of the information in this press release if any forward-looking statement later turns out to be inaccurate whether as a result of new information, future events or otherwise. Non-GAAP Financial Information In addition to the financial results prepared in accordance with U.S. generally accepted accounting principles (GAAP), this presentation includes EBITDA, Adjusted EBITDA, Adjusted EBITDA margin, Segment-level Adjusted EBITDA, and Adjusted ROIC (Return on Invested Capital) for the Company and its operating segments, which are performance measures that are not recognized under GAAP. EBITDA is defined as income (loss) from continuing operations, net of taxes, before: (1) interest expense, net, (2) provision (benefit) for income taxes and (3) depreciation and amortization. Adjusted EBITDA is calculated as EBITDA before certain items, including: (1) asset impairment charges, (2) redundancy and severance related expenses, (3) foreign currency transactions, (4) equity in net earnings or losses of investees, (5) certain litigation related expenses, (6) expenses related to restricted shares and cash placed into escrow at the time of the Ingeus acquisition, (7) contingent consideration adjustments, (8) costs related to departure of former CEOs, (9) costs related to the implementation of value enhancement initiatives, (10) management fees, (11) transaction costs, and (12) gain on disposition. Adjusted EBITDA margin is calculated as Adjusted EBITDA divided by Revenue. Segment-level Adjusted EBITDA is calculated as Adjusted EBITDA for the Company excluding the Adjusted EBITDA associated with corporate and holding company costs reported as our Corporate and Other Segment. Adjusted ROIC means Adjusted Return on Invested Capital and represents a ratio of Adjusted EBITA less cash taxes (assumed to equal 40% of Adj. EBITA) to Invested Capital. EBITA represents Operating Income prior to Amortization expense. Adj. EBITA represents EBITA before (1) certain litigation related expenses, (2) redundancy and severance related expenses, (3) costs related to departure of former CEOs, and (4) costs related to the implementation of value enhancement initiatives. The Company believes that Adjusted Return on Invested Capital (Adjusted ROIC) is a useful measure of the earnings of the Company prior to taking into consideration amortization of intangible assets, deferred income taxes, and certain other non-cash expenses (income) incurred or recognized by the Company from time to time. We utilize these non-GAAP performance measures, which exclude certain expenses and amounts, because we believe the timing of such expenses is unpredictable and not driven by our core operating results, and therefore render comparisons with prior periods as well as with other companies in our industry less meaningful. We believe such measures allow investors to gain a better understanding of the factors and trends affecting the ongoing operations of our business. We consider our core operations to be the ongoing activities to provide services from which we earn revenue, including direct operating costs and indirect costs to support these activities. In addition, our net earnings in equity investees are excluded from these measures, as we do not have the ability to manage these ventures, allocate resources within the ventures, or directly control their operations or performance. Our non-GAAP financial measures may not provide information that is directly comparable to that provided by other companies in our industry, as other companies in our industry may calculate non-GAAP financial results differently. In addition, there are limitations in using non-GAAP financial measures because they are not prepared in accordance with GAAP, may be different from non-GAAP financial measures used by other companies, and exclude expenses that may have a material impact on our reported financial results. The presentation of non- GAAP financial information is not meant to be considered in isolation from or as a substitute for the directly comparable financial measures prepared in accordance with GAAP. We urge you to review the reconciliations of our non-GAAP financial measures to the comparable GAAP financial measures included below, and not to rely on any single financial measure to evaluate our business. Forward-looking Statements and Non-GAAP Financial Information
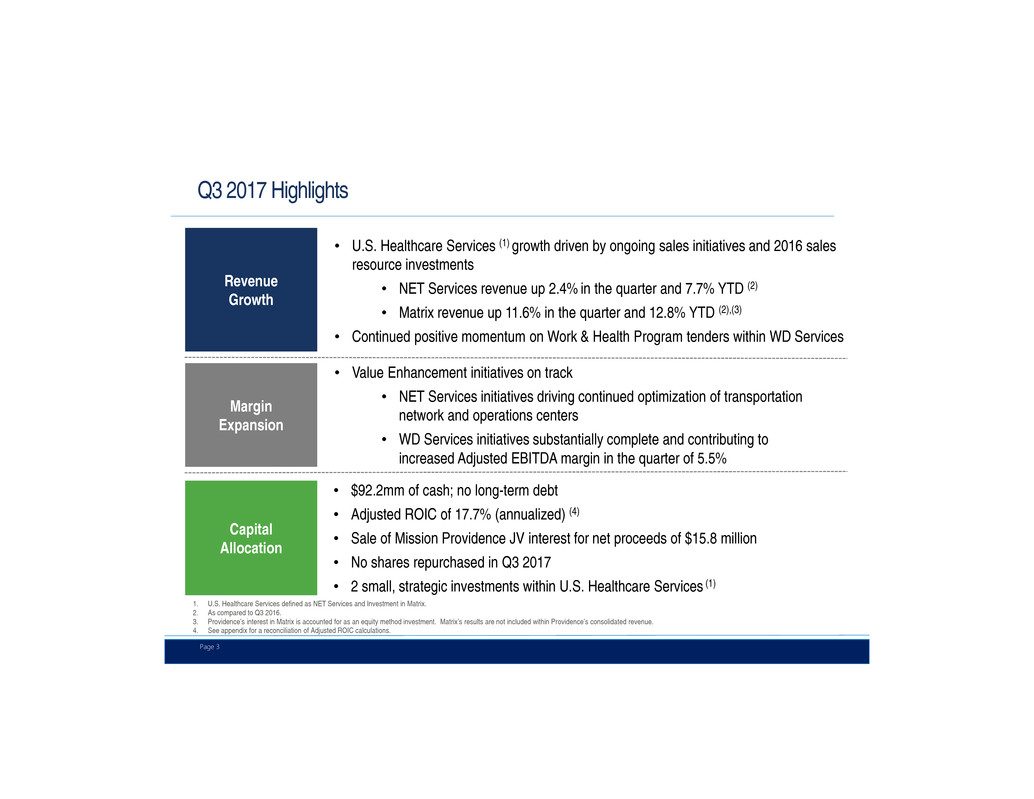
Page 3 Q3 2017 Highlights • U.S. Healthcare Services (1) growth driven by ongoing sales initiatives and 2016 sales resource investments • NET Services revenue up 2.4% in the quarter and 7.7% YTD (2) • Matrix revenue up 11.6% in the quarter and 12.8% YTD (2),(3) • Continued positive momentum on Work & Health Program tenders within WD Services Revenue Growth Margin Expansion • Value Enhancement initiatives on track • NET Services initiatives driving continued optimization of transportation network and operations centers • WD Services initiatives substantially complete and contributing to increased Adjusted EBITDA margin in the quarter of 5.5% Capital Allocation • $92.2mm of cash; no long-term debt • Adjusted ROIC of 17.7% (annualized) (4) • Sale of Mission Providence JV interest for net proceeds of $15.8 million • No shares repurchased in Q3 2017 • 2 small, strategic investments within U.S. Healthcare Services (1) 1. U.S. Healthcare Services defined as NET Services and Investment in Matrix. 2. As compared to Q3 2016. 3. Providence’s interest in Matrix is accounted for as an equity method investment. Matrix’s results are not included within Providence’s consolidated revenue. 4. See appendix for a reconciliation of Adjusted ROIC calculations.

Page 4 $Millions Q3:16 Q3:17 YTD Q3:16 YTD Q3:17 LTM Q3:17 Revenue 317.3 324.8 917.2 987.7 1,304.2 Adjusted EBITDA (2) 21.2 19.7 63.6 56.6 85.4 % Margin (2) 6.7% 6.1% 6.9% 5.7% 6.5% Capex 2.2 4.2 7.1 11.2 14.9 Q3 2017 Highlights Key Financial Metrics 2018 Focus • Member Experience initiative expected to optimize client service and improve profitability • Leveraging of national network through organic and acquisitive growth in market adjacencies to increase addressable market and drive longer term growth NET Services 1. As compared to Q3 2016. 2. See appendix for a reconciliation of non-GAAP financial measures. • Revenue growth driven by new contracts as well as rate adjustments and release of revenue hold-backs on an existing contract in the quarter • Philadelphia contract renewed for 3 years, plus extensions. Two new Texas regions added. Multiple new MCO contracts (including multi-state MCO contracts) secured • Previously announced loss of NY State contract and utilization challenges in certain markets negatively impacting margins on a year-over-year basis (1)

Page 5 $Millions Q3:16 Q3:17 YTD Q3:16 YTD Q3:17 LTM Q3:17 Revenue 52.6 58.6 155.4 175.3 227.7 Adjusted EBITDA (3) 13.2 12.2 40.0 40.1 51.8 % Margin (3) 25.1% 20.8% 25.7% 22.8% 22.7% Capex 2.6 3.1 8.0 7.5 12.0 Net Debt 176.3 176.3 • Work with strategic partner to pursue further synergistic acquisitions, accelerate complementary offerings, and maintain optimal capital structure • Increase core client base and expand chronic care revenues • Operational improvements and further member engagement Matrix Investment Q3 2017 Highlights Key Financial Metrics (2) 2018 Focus 1. As compared to Q3 2016. 2. Represents 100% of Matrix’s results of operations. Providence’s 46.6% equity interest in Matrix is accounted for as an equity method investment. Matrix’s results are not included within Providence’s consolidated results of operations in any period presented. See appendix for additional detail. 3. See appendix for a reconciliation of non-GAAP financial measures. • Industry trends and sales investments in early 2016 led to revenue growth of 11.6% in the quarter and 12.8% YTD (1),(2) • Small, strategic acquisition of LP Health expands clinical skills and accelerates expansion into Medicaid • New customer wins and successful new product rollouts continued to diversify revenue base
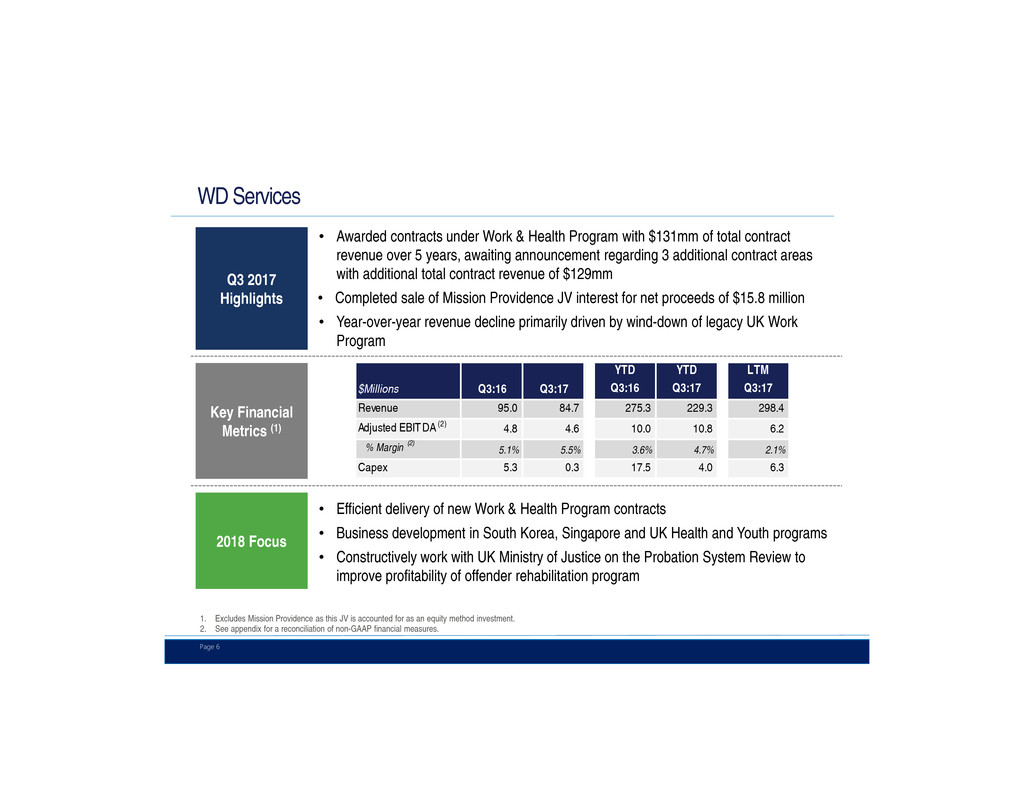
Page 6 $Millions Q3:16 Q3:17 YTD Q3:16 YTD Q3:17 LTM Q3:17 Revenue 95.0 84.7 275.3 229.3 298.4 Adjusted EBITDA (2) 4.8 4.6 10.0 10.8 6.2 % Margin (2) 5.1% 5.5% 3.6% 4.7% 2.1% Capex 5.3 0.3 17.5 4.0 6.3 • Efficient delivery of new Work & Health Program contracts • Business development in South Korea, Singapore and UK Health and Youth programs • Constructively work with UK Ministry of Justice on the Probation System Review to improve profitability of offender rehabilitation program WD Services Q3 2017 Highlights Key Financial Metrics (1) 2018 Focus 1. Excludes Mission Providence as this JV is accounted for as an equity method investment. 2. See appendix for a reconciliation of non-GAAP financial measures. • Awarded contracts under Work & Health Program with $131mm of total contract revenue over 5 years, awaiting announcement regarding 3 additional contract areas with additional total contract revenue of $129mm • Completed sale of Mission Providence JV interest for net proceeds of $15.8 million • Year-over-year revenue decline primarily driven by wind-down of legacy UK Work Program

Page 7 $Millions Q3:16 Q3:17 YTD Q3:16 YTD Q3:17 LTM Q3:17 Revenue % Growth % Growth NET Services 317.3 324.8 2.4% 917.2 987.7 7.7% 1,304.2 WD Services 95.0 84.7 -10.8% 275.3 229.3 -16.7% 298.4 Total Revenue (1) 412.3 409.5 -0.7% 1,192.4 1,217.0 2.1% 1,602.8 Matrix (2) 52.6 58.6 11.6% 155.4 175.3 12.8% 227.7 Adj. EBITDA (3) NET Services 21.2 19.7 63.6 56.6 85.4 WD Services 4.8 4.6 10.0 10.8 6.2 Total Segment-Level 26.0 24.3 73.6 67.4 91.6 Corporate and Other (7.3) (8.7) (20.7) (21.3) (26.3) Total Adj. EBITDA 18.7 15.6 52.9 46.1 65.4 Matrix (2) 13.2 12.2 40.0 40.1 51.8 Adj. EBITDA Margins (3) NET Services 6.7% 6.1% 6.9% 5.7% 6.5% WD Services 5.1% 5.5% 3.6% 4.7% 2.1% Segment-Level 6.3% 5.9% 6.2% 5.5% 5.7% Total 4.5% 3.8% 4.4% 3.8% 4.1% Matrix (2) 25.1% 20.8% 25.7% 22.8% 22.7% Segment Results 1. Total Revenue includes revenue from Corporate and Other. 2. Represents 100% of Matrix’s total revenue and Adj. EBITDA. Providence’s 46.6% equity interest is accounted for as an equity method investment. Matrix’s results are not included within Providence’s consolidated revenue or Adjusted EBITDA in any period presented. 3. See appendix for a reconciliation of non-GAAP financial measures.
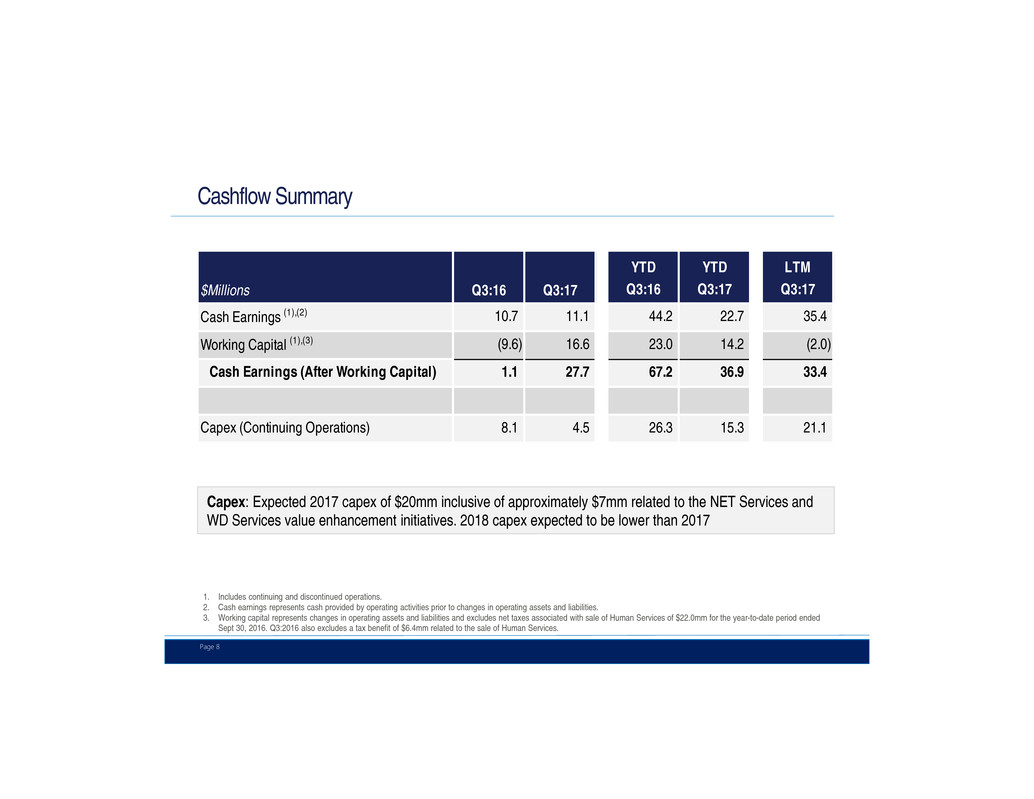
Page 8 $Millions Q3:16 Q3:17 YTD Q3:16 YTD Q3:17 LTM Q3:17 Cash Earnings (1),(2) 10.7 11.1 44.2 22.7 35.4 Working Capital (1),(3) (9.6) 16.6 23.0 14.2 (2.0) Cash Earnings (After Working Capital) 1.1 27.7 67.2 36.9 33.4 Capex (Continuing Operations) 8.1 4.5 26.3 15.3 21.1 Cashflow Summary 1. Includes continuing and discontinued operations. 2. Cash earnings represents cash provided by operating activities prior to changes in operating assets and liabilities. 3. Working capital represents changes in operating assets and liabilities and excludes net taxes associated with sale of Human Services of $22.0mm for the year-to-date period ended Sept 30, 2016. Q3:2016 also excludes a tax benefit of $6.4mm related to the sale of Human Services. Capex: Expected 2017 capex of $20mm inclusive of approximately $7mm related to the NET Services and WD Services value enhancement initiatives. 2018 capex expected to be lower than 2017

Page 9 $Millions 12/31/15 12/31/16 9/30/17 Cash (1) 84.8 72.3 92.2 Long-term Debt (1) 305.0 - - Net Debt 220.2 (72.3) (92.2) Matrix Carrying Value (2) - 157.2 156.9 Shares Outstanding (mm) (3) 17.3 15.9 15.5 Balance Sheet Summary 1. Includes Cash and Long-term Debt related to discontinued operations. 2. Represents the carrying value of Providence’s 46.6% retained equity interest in Matrix. 3. Shares outstanding equals common shares outstanding plus total preferred shares on an as converted basis. As of 11/3/17 shares outstanding equaled 15.5mm. Matrix Balance Sheet: Strong cash flow generation continues to de-lever Matrix’s standalone balance sheet
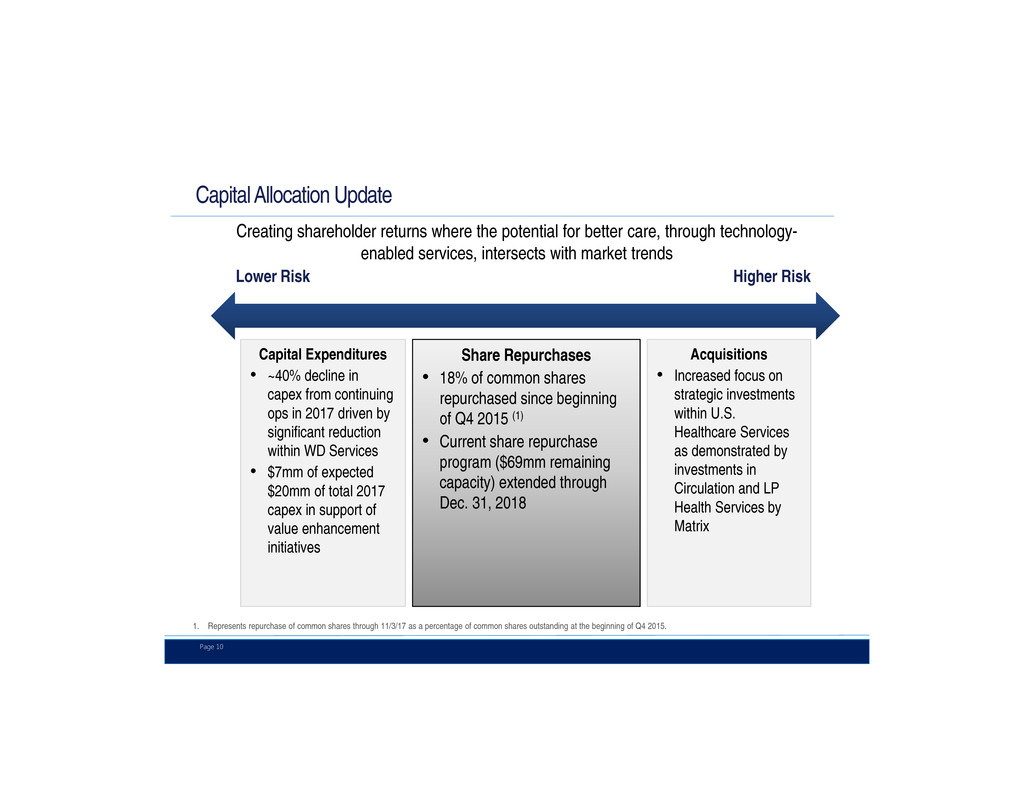
Page 10 Lower Risk Higher Risk Capital Allocation Update Capital Expenditures • ~40% decline in capex from continuing ops in 2017 driven by significant reduction within WD Services • $7mm of expected $20mm of total 2017 capex in support of value enhancement initiatives Share Repurchases • 18% of common shares repurchased since beginning of Q4 2015 (1) • Current share repurchase program ($69mm remaining capacity) extended through Dec. 31, 2018 Acquisitions • Increased focus on strategic investments within U.S. Healthcare Services as demonstrated by investments in Circulation and LP Health Services by Matrix 1. Represents repurchase of common shares through 11/3/17 as a percentage of common shares outstanding at the beginning of Q4 2015. Creating shareholder returns where the potential for better care, through technology- enabled services, intersects with market trends

Appendix

Page 12 NET Services WD Services Segment-Level $Millions Q3:16 Q3:17 YTD Q3:16 YTD Q3:17 FYE 2016 LTM Q3:17 Q3:16 Q3:17 YTD Q3:16 YTD Q3:17 FYE 2016 LTM Q3:17 Q3:16 Q3:17 YTD Q3:16 YTD Q3:17 FYE 2016 LTM Q3:17 Revenue 317.3 324.8 917.2 987.7 1,233.7 1,304.2 95.0 84.7 275.3 229.3 344.4 298.4 412.2 409.5 1,192.5 1,217.0 1,578.1 1,602.7 Income from Cont Ops after Income Taxes 10.1 8.7 33.0 25.7 47.4 40.0 (1.0) 12.6 (10.7) 9.1 (46.2) (26.4) 9.2 21.2 22.3 34.8 1.2 13.7 Interest Expense, Net (0.0) 0.0 (0.0) 0.0 (0.0) 0.0 0.5 0.4 0.6 1.0 0.8 1.2 0.5 0.4 0.6 1.0 0.8 1.2 Provision (Benefit) For Income Taxes 7.3 5.5 20.5 16.2 29.7 25.4 0.1 (0.0) (0.9) (0.4) (1.2) (0.7) 7.4 5.5 19.6 15.8 28.5 24.7 Depreciation and Amortization 3.1 3.3 8.9 9.8 12.4 13.3 3.5 3.2 10.9 9.7 13.8 12.6 6.5 6.5 19.8 19.5 26.2 25.9 EBITDA 20.5 17.5 62.4 51.7 89.5 78.8 3.1 16.1 (0.1) 19.3 (32.8) (13.3) 23.6 33.6 62.3 71.0 56.7 65.5 Asset Impairment - - - - - - - - - - 19.6 19.6 - - - - 19.6 19.6 Redundancy/Severance Related Expenses - - - - - - 0.1 0.3 5.2 1.3 9.0 5.1 0.1 0.3 5.2 1.3 9.0 5.1 Former CEO Departure Cost - 0.0 - 0.2 0.9 1.1 - - - - - - - 0.0 - 0.2 0.9 1.1 Value Enhancement Initiative Implementation 0.7 2.2 1.2 4.7 2.0 5.5 0.6 0.2 0.6 0.7 2.6 2.7 1.2 2.4 1.8 5.4 4.6 8.2 Equity in Net Loss (Gain) of Investee - - - - - - 1.5 0.5 5.7 1.4 8.5 4.2 1.5 0.5 5.7 1.4 8.5 4.2 (Gain) on Sale of Mission Providence - - - - - - - (12.6) - (12.6) - (12.6) - (12.6) - (12.6) - (12.6) Foreign Currency Transactions - - - - - - (0.5) 0.2 (1.3) 0.6 (1.4) 0.6 (0.5) 0.2 (1.3) 0.6 (1.4) 0.6 Litigation Expense - - - - - - - - - - - - - - - - - - Adjusted EBITDA 21.2 19.7 63.6 56.6 92.4 85.4 4.8 4.6 10.0 10.8 5.5 6.2 26.0 24.3 73.6 67.4 97.8 91.6 % Margin 6.7% 6.1% 6.9% 5.7% 7.5% 6.5% 5.1% 5.5% 3.6% 4.7% 1.6% 2.1% 6.3% 5.9% 6.2% 5.5% 6.2% 5.7% Adjusted EBITDA Reconciliation (Segment-Level)
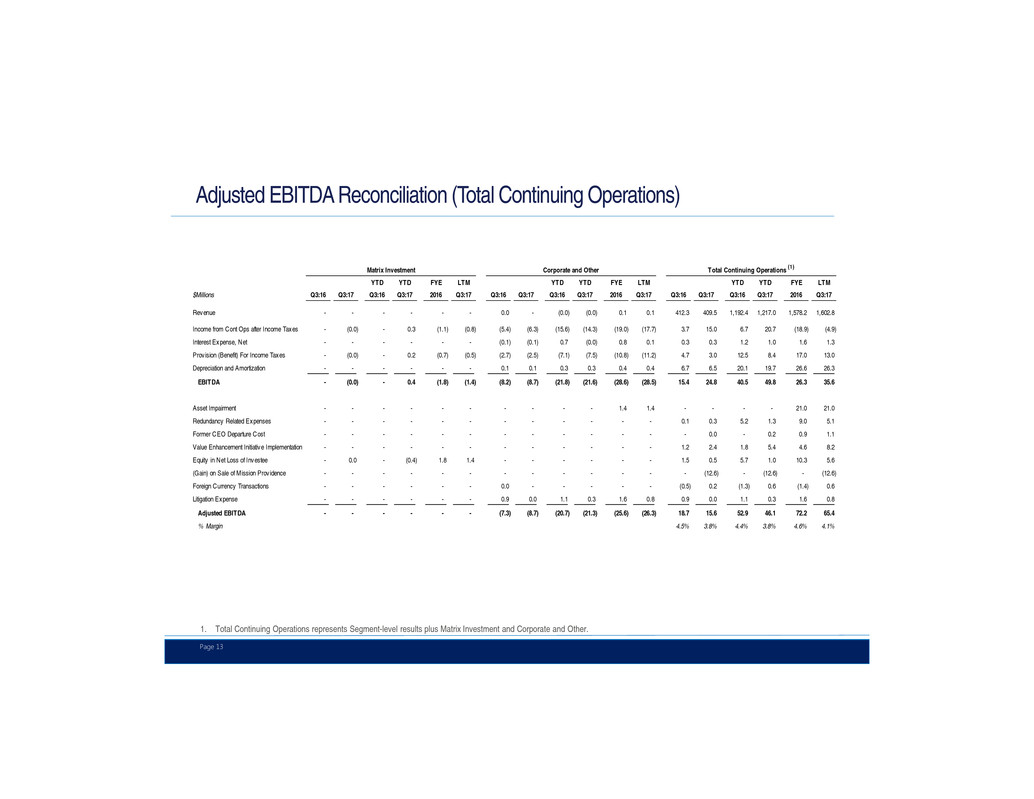
Page 13 Matrix Investment Corporate and Other Total Continuing Operations (1) $Millions Q3:16 Q3:17 YTD Q3:16 YTD Q3:17 FYE 2016 LTM Q3:17 Q3:16 Q3:17 YTD Q3:16 YTD Q3:17 FYE 2016 LTM Q3:17 Q3:16 Q3:17 YTD Q3:16 YTD Q3:17 FYE 2016 LTM Q3:17 Revenue - - - - - - 0.0 - (0.0) (0.0) 0.1 0.1 412.3 409.5 1,192.4 1,217.0 1,578.2 1,602.8 Income from Cont Ops after Income Taxes - (0.0) - 0.3 (1.1) (0.8) (5.4) (6.3) (15.6) (14.3) (19.0) (17.7) 3.7 15.0 6.7 20.7 (18.9) (4.9) Interest Expense, Net - - - - - - (0.1) (0.1) 0.7 (0.0) 0.8 0.1 0.3 0.3 1.2 1.0 1.6 1.3 Prov ision (Benefit) For Income Taxes - (0.0) - 0.2 (0.7) (0.5) (2.7) (2.5) (7.1) (7.5) (10.8) (11.2) 4.7 3.0 12.5 8.4 17.0 13.0 Depreciation and Amortization - - - - - - 0.1 0.1 0.3 0.3 0.4 0.4 6.7 6.5 20.1 19.7 26.6 26.3 EBITDA - (0.0) - 0.4 (1.8) (1.4) (8.2) (8.7) (21.8) (21.6) (28.6) (28.5) 15.4 24.8 40.5 49.8 26.3 35.6 Asset Impairment - - - - - - - - - - 1.4 1.4 - - - - 21.0 21.0 Redundancy Related Expenses - - - - - - - - - - - - 0.1 0.3 5.2 1.3 9.0 5.1 Former CEO Departure Cost - - - - - - - - - - - - - 0.0 - 0.2 0.9 1.1 Value Enhancement Initiative Implementation - - - - - - - - - - - - 1.2 2.4 1.8 5.4 4.6 8.2 Equity in Net Loss of Investee - 0.0 - (0.4) 1.8 1.4 - - - - - - 1.5 0.5 5.7 1.0 10.3 5.6 (Gain) on Sale of Mission Prov idence - - - - - - - - - - - - - (12.6) - (12.6) - (12.6) Foreign Currency Transactions - - - - - - 0.0 - - - - - (0.5) 0.2 (1.3) 0.6 (1.4) 0.6 Litigation Expense - - - - - - 0.9 0.0 1.1 0.3 1.6 0.8 0.9 0.0 1.1 0.3 1.6 0.8 Adjusted EBITDA - - - - - - (7.3) (8.7) (20.7) (21.3) (25.6) (26.3) 18.7 15.6 52.9 46.1 72.2 65.4 % Margin 4.5% 3.8% 4.4% 3.8% 4.6% 4.1% Adjusted EBITDA Reconciliation (Total Continuing Operations) 1. Total Continuing Operations represents Segment-level results plus Matrix Investment and Corporate and Other.
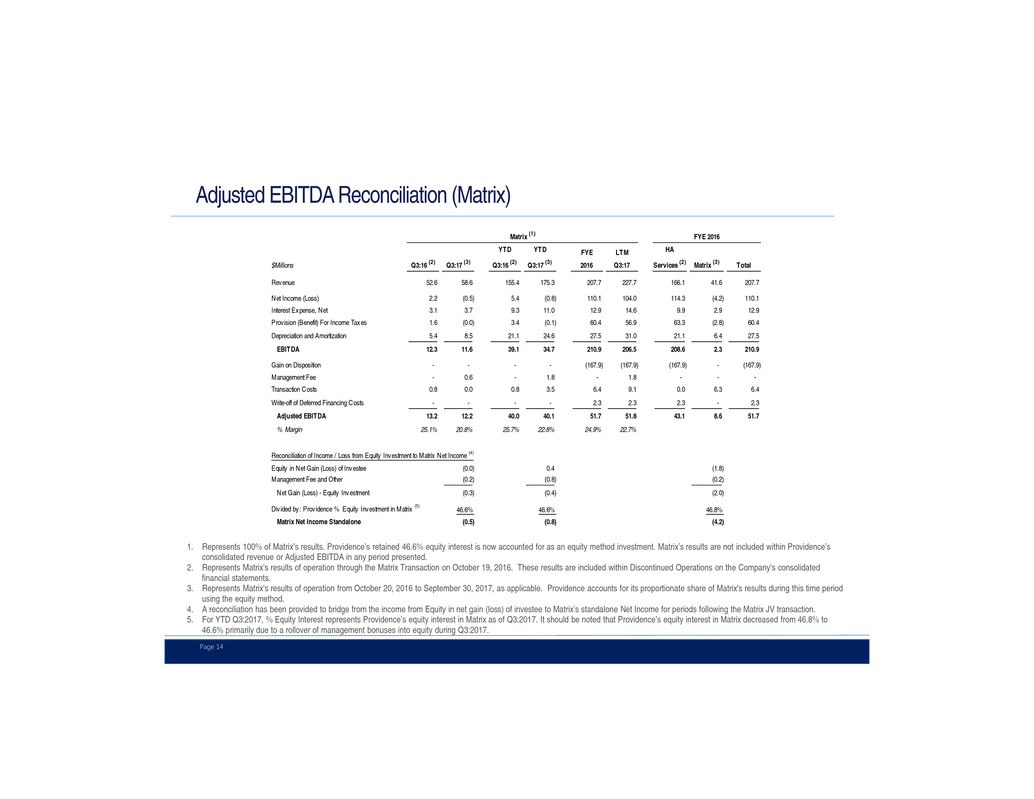
Page 14 Matrix (1) FYE 2016 $Millions Q3:16 (2) Q3:17 (3) YTD Q3:16 (2) YTD Q3:17 (3) FYE 2016 LTM Q3:17 HA Services (2) Matrix (3) Total Revenue 52.6 58.6 155.4 175.3 207.7 227.7 166.1 41.6 207.7 Net Income (Loss) 2.2 (0.5) 5.4 (0.8) 110.1 104.0 114.3 (4.2) 110.1 Interest Expense, Net 3.1 3.7 9.3 11.0 12.9 14.6 9.9 2.9 12.9 Provision (Benefit) For Income Taxes 1.6 (0.0) 3.4 (0.1) 60.4 56.9 63.3 (2.8) 60.4 Depreciation and Amortization 5.4 8.5 21.1 24.6 27.5 31.0 21.1 6.4 27.5 EBITDA 12.3 11.6 39.1 34.7 210.9 206.5 208.6 2.3 210.9 Gain on Disposition - - - - (167.9) (167.9) (167.9) - (167.9) Management Fee - 0.6 - 1.8 - 1.8 - - - Transaction Costs 0.8 0.0 0.8 3.5 6.4 9.1 0.0 6.3 6.4 Write-off of Deferred Financing Costs - - - - 2.3 2.3 2.3 - 2.3 Adjusted EBITDA 13.2 12.2 40.0 40.1 51.7 51.8 43.1 8.6 51.7 % Margin 25.1% 20.8% 25.7% 22.8% 24.9% 22.7% Reconciliation of Income / Loss from Equity Investment to Matrix Net Income (4) Equity in Net Gain (Loss) of Investee (0.0) 0.4 (1.8) Management Fee and Other (0.2) (0.8) (0.2) Net Gain (Loss) - Equity Investment (0.3) (0.4) (2.0) Div ided by : Providence % Equity Investment in Matrix (5) 46.6% 46.6% 46.8% Matrix Net Income Standalone (0.5) (0.8) (4.2) Adjusted EBITDA Reconciliation (Matrix) 1. Represents 100% of Matrix’s results. Providence’s retained 46.6% equity interest is now accounted for as an equity method investment. Matrix’s results are not included within Providence’s consolidated revenue or Adjusted EBITDA in any period presented. 2. Represents Matrix's results of operation through the Matrix Transaction on October 19, 2016. These results are included within Discontinued Operations on the Company's consolidated financial statements. 3. Represents Matrix's results of operation from October 20, 2016 to September 30, 2017, as applicable. Providence accounts for its proportionate share of Matrix's results during this time period using the equity method. 4. A reconciliation has been provided to bridge from the income from Equity in net gain (loss) of investee to Matrix’s standalone Net Income for periods following the Matrix JV transaction. 5. For YTD Q3:2017, % Equity Interest represents Providence’s equity interest in Matrix as of Q3:2017. It should be noted that Providence’s equity interest in Matrix decreased from 46.8% to 46.6% primarily due to a rollover of management bonuses into equity during Q3:2017.

Page 15 Q3:17A Cont Ops Disc Ops Total Operating Income 6.3 (0.0) 6.3 Amortization 2.0 - 2.0 EBITA 8.3 (0.0) 8.3 Adjustments Certain Litigation Related Expenses 0.0 0.0 0.0 Redundancy/Severance Related Expenses 0.3 - 0.3 Value Enhancement Implementation 2.4 - 2.4 Costs Related to Departure of Former CEO 0.0 - 0.0 Adj. EBITA 11.0 - 11.0 Cash Taxes (4.4) NOPAT (EBITA - Cash Taxes) 6.6 ROIC 4.4% Annualized 17.7% Invested Capital (6/30/17 BS) Long-term Debt 3.0 Preferred Shares 77.6 Shareholders Equity 285.7 Invested Capital 366.3 Less: Cash (56.6) Less: BV of Equity Investments (160.6) Adjusted Invested Capital 149.1 Adjusted Return on Invested Capital (ROIC) Reconciliation 1. EBITA defined as Operating Income plus Amortization expense. 2. Cash Taxes rate assumed to be 40%. 3. ROIC equals EBITA - Cash Taxes divided by Adj. Invested Capital. 4. Beginning Invested Capital for Q3 2017 based on balance sheets as of June 30, 2017.


