PROVIDENCE SERVICE CORP Investor Presentation October 2019

FORWARD‐LOOKING STATEMENTS AND NON‐GAAP FINANCIAL INFORMATION Forward‐looking Statements This presentation contains “forward‐looking statements” within the meaning of the Private Securities Litigation Reform Act of 1995. Words such as “believe,” “demonstrate,” “expect,” “estimate,” “forecast,” “anticipate,” “should” and “likely” and similar expressions identify forward‐looking statements. In addition, statements that are not historical should also be considered forward‐looking statements. Readers are cautioned not to place undue reliance on those forward‐looking statements, which speak only as of the date the statement was made. Such forward‐looking statements are based on current expectations that involve a number of known and unknown risks, uncertainties and other factors which may cause actual events to be materially different from those expressed or implied by such forward‐looking statements. These factors include, but are not limited to, our continuing relationship with government entities and our ability to procure business from them, our ability to manage growing and changing operations, the implementation of healthcare reform law, government budget changes and legislation related to the services that we provide, our ability to renew or replace existing contracts that have expired or are scheduled to expire with significant clients, and other risks detailed in Providence’s filings with the Securities and Exchange Commission, including its Annual Report on Form 10‐K. Providence is under no obligation to (and expressly disclaims any such obligation to) update any of the information in this press release if any forward‐ looking statement later turns out to be inaccurate whether as a result of new information, future events or otherwise. Non‐GAAP Financial Information In addition to the financial results prepared in accordance with U.S. generally accepted accounting principles (GAAP), this presentation includes EBITDA and Adjusted EBITDA for the Company, which are performance measures that are not recognized under GAAP. EBITDA is defined as income (loss) from continuing operations, net of taxes, before: (1) interest expense, net, (2) provision (benefit) for income taxes and (3) depreciation and amortization. Adjusted EBITDA is calculated as EBITDA before certain items, including (as applicable): (1) restructuring and related charges including costs related to the corporate reorganization, (2) foreign currency transactions, (3) equity in net earnings or losses of investees, (4) certain litigation related expenses or settlement income, (5) gain or loss on sale of equity investments, (6) management fees and (7) transaction and related costs. We utilize these non‐GAAP performance measures, which exclude certain expenses and amounts, because we believe the timing of such expenses is unpredictable and not driven by our core operating results, and therefore render comparisons with prior periods as well as with other companies in our industry less meaningful. We believe such measures allow investors to gain a better understanding of the factors and trends affecting the ongoing operations of our business. We consider our core operations to be the ongoing activities to provide services from which we earn revenue, including direct operating costs and indirect costs to support these activities. In addition, our net earnings in equity investees are excluded from these measures, as we do not have the ability to manage these ventures, allocate resources within the ventures, or directly control their operations or performance. Our non‐GAAP financial measures may not provide information that is directly comparable to that provided by other companies in our industry, as other companies in our industry may calculate non‐ GAAP financial results differently. In addition, there are limitations in using non‐GAAP financial measures because they are not prepared in accordance with GAAP, may be different from non‐GAAP financial measures used by other companies, and exclude expenses that may have a material impact on our reported financial results. The presentation of non‐GAAP financial information is not meant to be considered in isolation from or as a substitute for the directly comparable financial measures prepared in accordance with GAAP. We urge you to review the reconciliations of our non‐GAAP financial measures to the comparable GAAP financial measures included below, and not to rely on any single financial measure to evaluate our business. 2
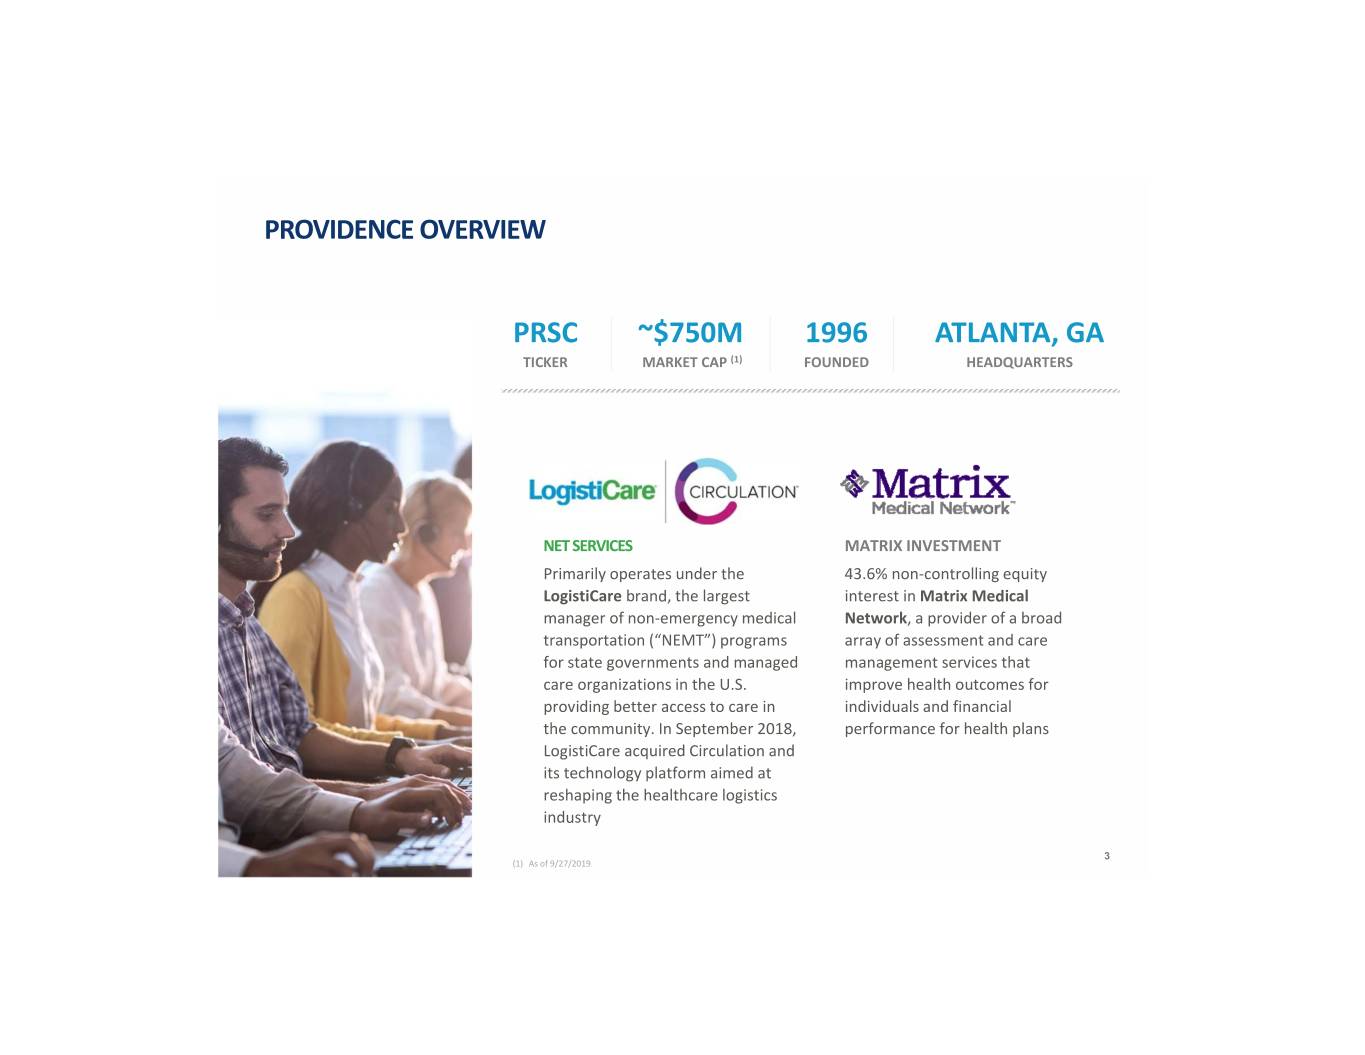
PROVIDENCE OVERVIEW PRSC ~$750M 1996 ATLANTA, GA TICKER MARKET CAP (1) FOUNDED HEADQUARTERS NET SERVICES MATRIX INVESTMENT Primarily operates under the 43.6% non‐controlling equity LogistiCare brand, the largest interest in Matrix Medical manager of non‐emergency medical Network, a provider of a broad transportation (“NEMT”) programs array of assessment and care for state governments and managed management services that care organizations in the U.S. improve health outcomes for providing better access to care in individuals and financial the community. In September 2018, performance for health plans LogistiCare acquired Circulation and its technology platform aimed at reshaping the healthcare logistics industry 3 (1) As of 9/27/2019.

PROVIDENCE TIMELINE AND EVOLUTION 1996 2007 2013 2014 2015 2016 2018 2019 Sold majority Completed Acquired stake in Organizational Acquired Ingeus LogistiCare (i.e. Matrix Consolidation and Matrix Providence Service NET Services) covering initial on track to result Medical Network Corporation Formed holding investment Announced in at least $10M founded as a company structure Sold Providence cost basis organizational of run‐rate behavioral health and re‐branded Human Services consolidation and savings by services business legacy behavior completed removal of health company as acquisition of holding Providence Human Circulation, Inc. company Services and sale of operations and Ingeus structure Elimination of the holding company structure and simplifying story to focus on the non‐emergency transportation space 4
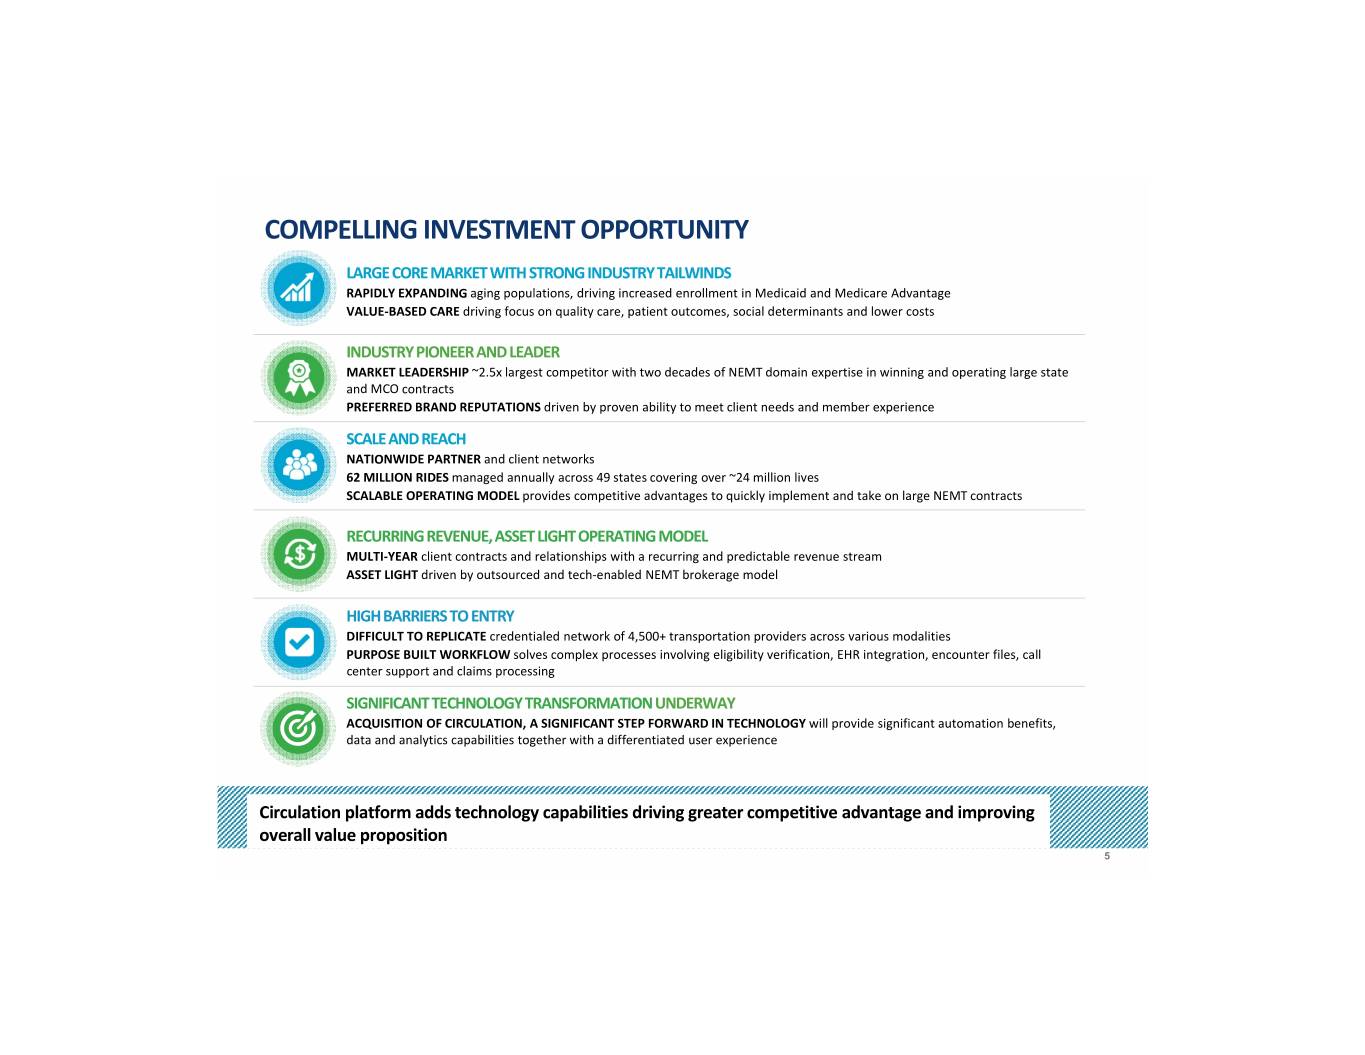
COMPELLING INVESTMENT OPPORTUNITY LARGE CORE MARKET WITH STRONG INDUSTRY TAILWINDS RAPIDLY EXPANDING aging populations, driving increased enrollment in Medicaid and Medicare Advantage VALUE‐BASED CARE driving focus on quality care, patient outcomes, social determinants and lower costs INDUSTRY PIONEER AND LEADER MARKET LEADERSHIP ~2.5x largest competitor with two decades of NEMT domain expertise in winning and operating large state and MCO contracts PREFERRED BRAND REPUTATIONS driven by proven ability to meet client needs and member experience SCALE AND REACH NATIONWIDE PARTNER and client networks 62 MILLION RIDES managed annually across 49 states covering over ~24 million lives SCALABLE OPERATING MODEL provides competitive advantages to quickly implement and take on large NEMT contracts RECURRING REVENUE, ASSET LIGHT OPERATING MODEL MULTI‐YEAR client contracts and relationships with a recurring and predictable revenue stream ASSET LIGHT driven by outsourced and tech‐enabled NEMT brokerage model HIGH BARRIERS TO ENTRY DIFFICULT TO REPLICATE credentialed network of 4,500+ transportation providers across various modalities PURPOSE BUILT WORKFLOW solves complex processes involving eligibility verification, EHR integration, encounter files, call center support and claims processing SIGNIFICANT TECHNOLOGY TRANSFORMATION UNDERWAY ACQUISITION OF CIRCULATION, A SIGNIFICANT STEP FORWARD IN TECHNOLOGY will provide significant automation benefits, data and analytics capabilities together with a differentiated user experience Circulation platform adds technology capabilities driving greater competitive advantage and improving overall value proposition 5

POSITIONED TO BENEFIT FROM ATTRACTIVE INDUSTRY GROWTH DRIVERS Medicaid enrollment (lives in millions) Medicare Advantage enrollment (lives in millions) 79 77 78 75 73 73 71 26 69 23 25 66 22 19 21 17 18 59 16 14 2013 2014 2015 2016 2017 2018 2019 2020 2021 2022 2013 2014 2015 2016 2017 2018 2019 2020 2021 2022 The Aged, Blind and Disabled population represents 23% of the total In 2017 only ~25% of MA enrollees had NEMT benefits, but this is expected Medicaid populations while accounting for ~80% of the total Medicaid NEMT to increase to ~50‐75% over the next few years spend MA plans are becoming increasingly sophisticated at identifying The aging population in the U.S. is expected to drive increased demand for populations that can benefit from transport services to reduce overall cost NEMT services as age 65+ members seek more community‐based care (e.g. of care in the long‐term adult day care facilities) MA plans that have implemented transport services have seen an uptick in access to care Prevalence of comorbidities drives need for healthcare services and associated transportation 25% of adults 50%+ older adults 62% prevalence of 82% prevalence of have 2+ chronic have 3+ chronic multimorbidity at multimorbidity at conditions conditions ages 64 – 74 years ages 85+ years Source: 2018 Mayo Clinic Proceedings; Health Catalyst; Medicaid membership from CMS, Medicare Advantage membership from KFF and Medicare Advantage members with NEMT benefits from Health Affairs 6
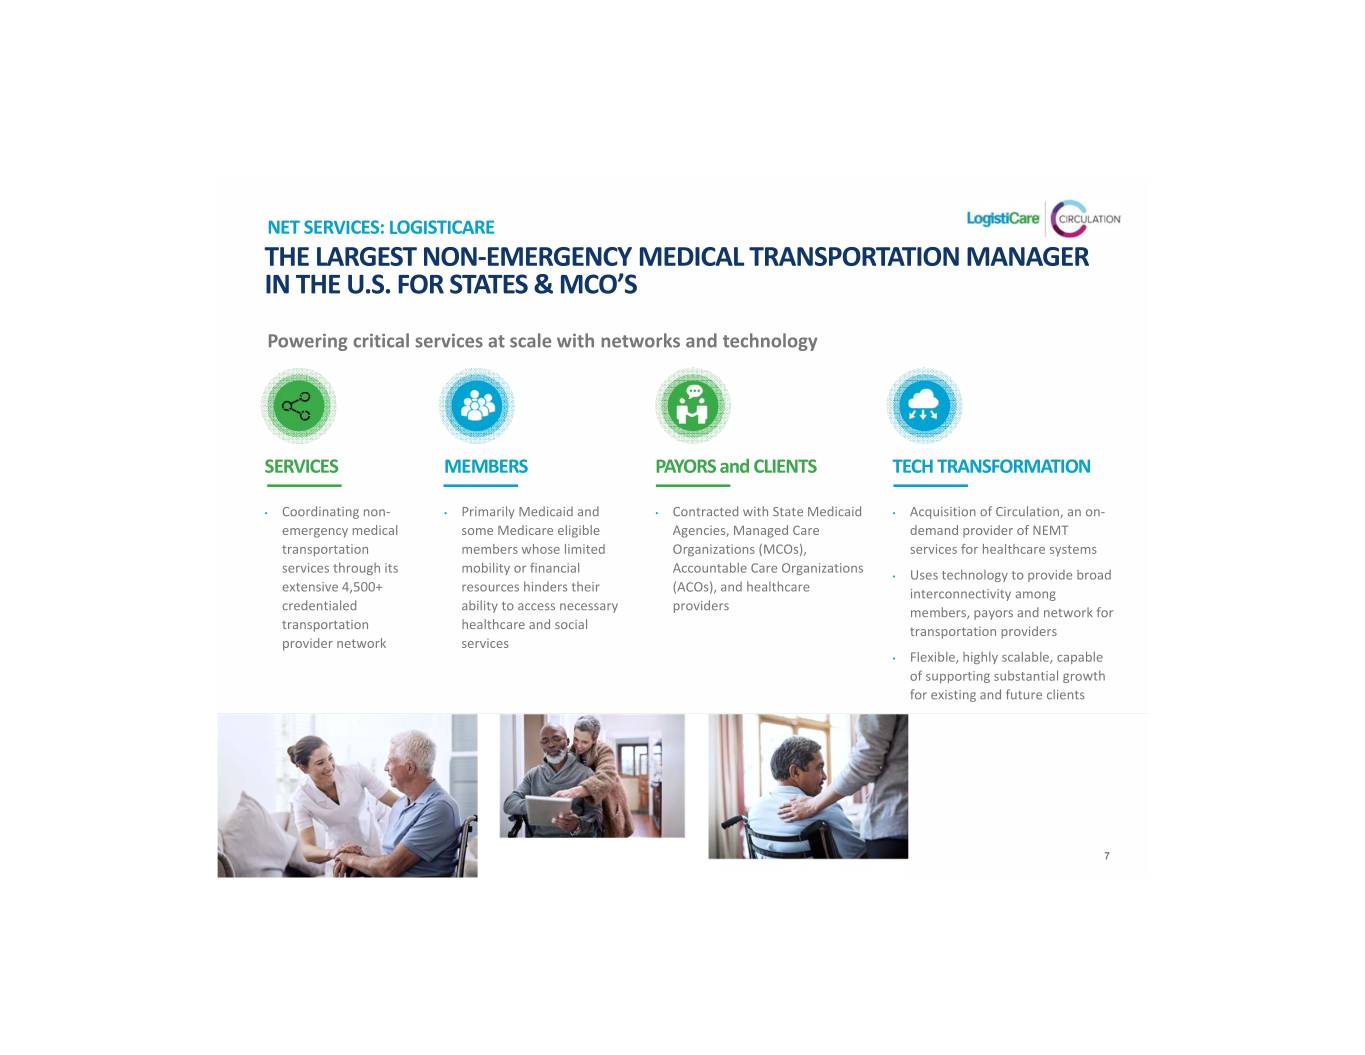
NET SERVICES: LOGISTICARE THE LARGEST NON‐EMERGENCY MEDICAL TRANSPORTATION MANAGER IN THE U.S. FOR STATES & MCO’S Powering critical services at scale with networks and technology SERVICES MEMBERS PAYORS and CLIENTS TECH TRANSFORMATION • Coordinating non‐ • Primarily Medicaid and • Contracted with State Medicaid • Acquisition of Circulation, an on‐ emergency medical some Medicare eligible Agencies, Managed Care demand provider of NEMT transportation members whose limited Organizations (MCOs), services for healthcare systems services through its mobility or financial Accountable Care Organizations • Uses technology to provide broad extensive 4,500+ resources hinders their (ACOs), and healthcare interconnectivity among credentialed ability to access necessary providers members, payors and network for transportation healthcare and social transportation providers provider network services • Flexible, highly scalable, capable of supporting substantial growth for existing and future clients 7
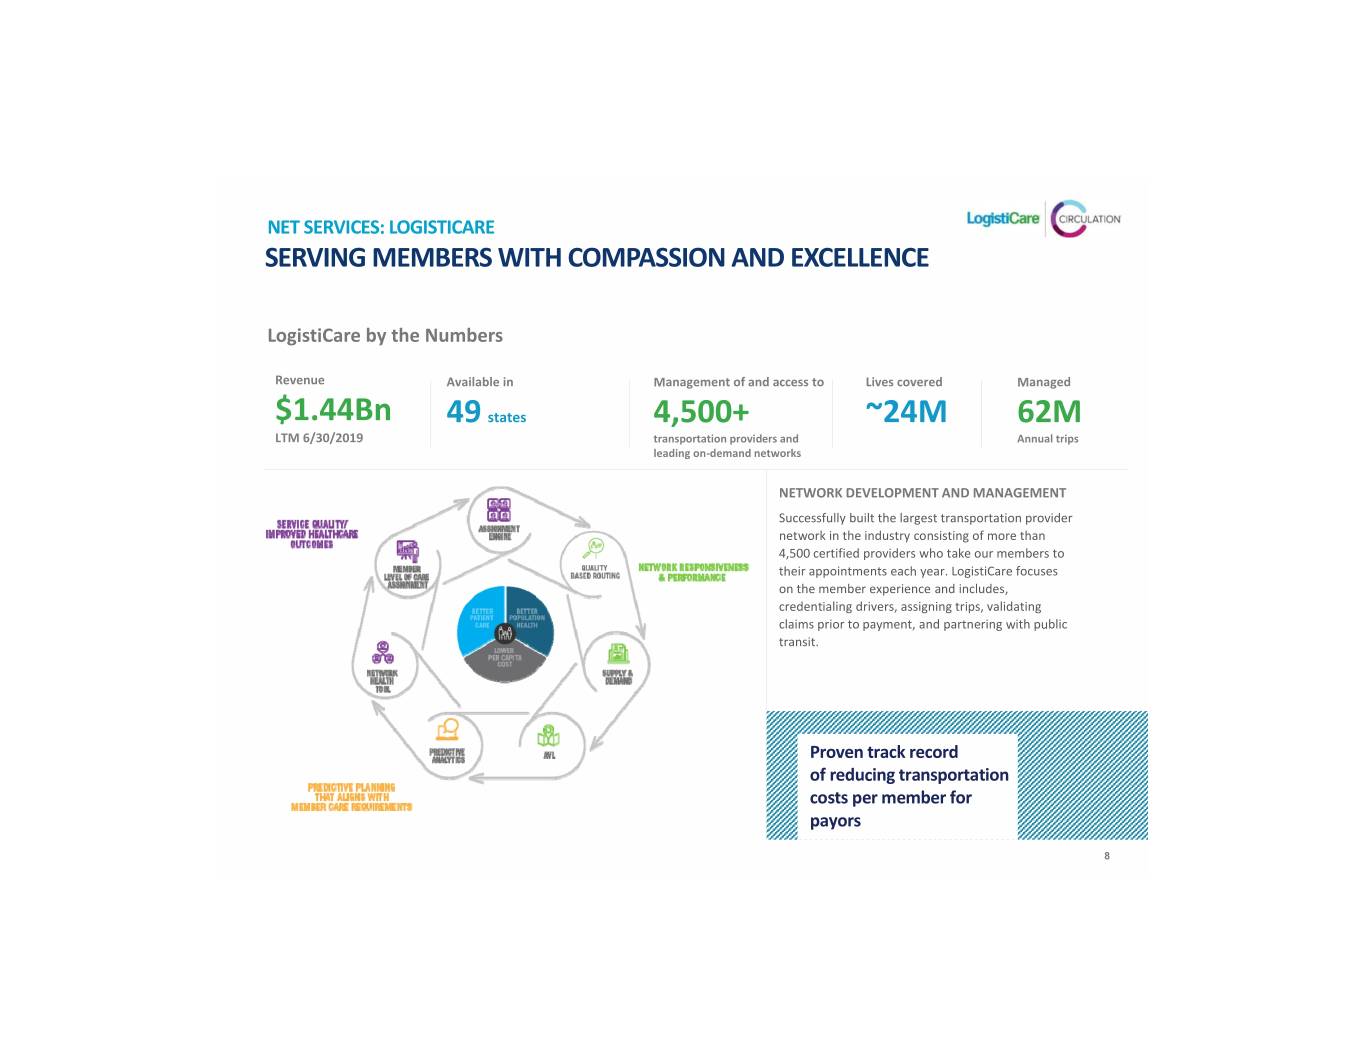
NET SERVICES: LOGISTICARE SERVING MEMBERS WITH COMPASSION AND EXCELLENCE LogistiCare by the Numbers Revenue Available in Management of and access to Lives covered Managed $1.44Bn 49 states 4,500+ ~24M 62M LTM 6/30/2019 transportation providers and Annual trips leading on‐demand networks NETWORK DEVELOPMENT AND MANAGEMENT Successfully built the largest transportation provider network in the industry consisting of more than 4,500 certified providers who take our members to their appointments each year. LogistiCare focuses on the member experience and includes, credentialing drivers, assigning trips, validating claims prior to payment, and partnering with public transit. Proven track record of reducing transportation costs per member for payors 8
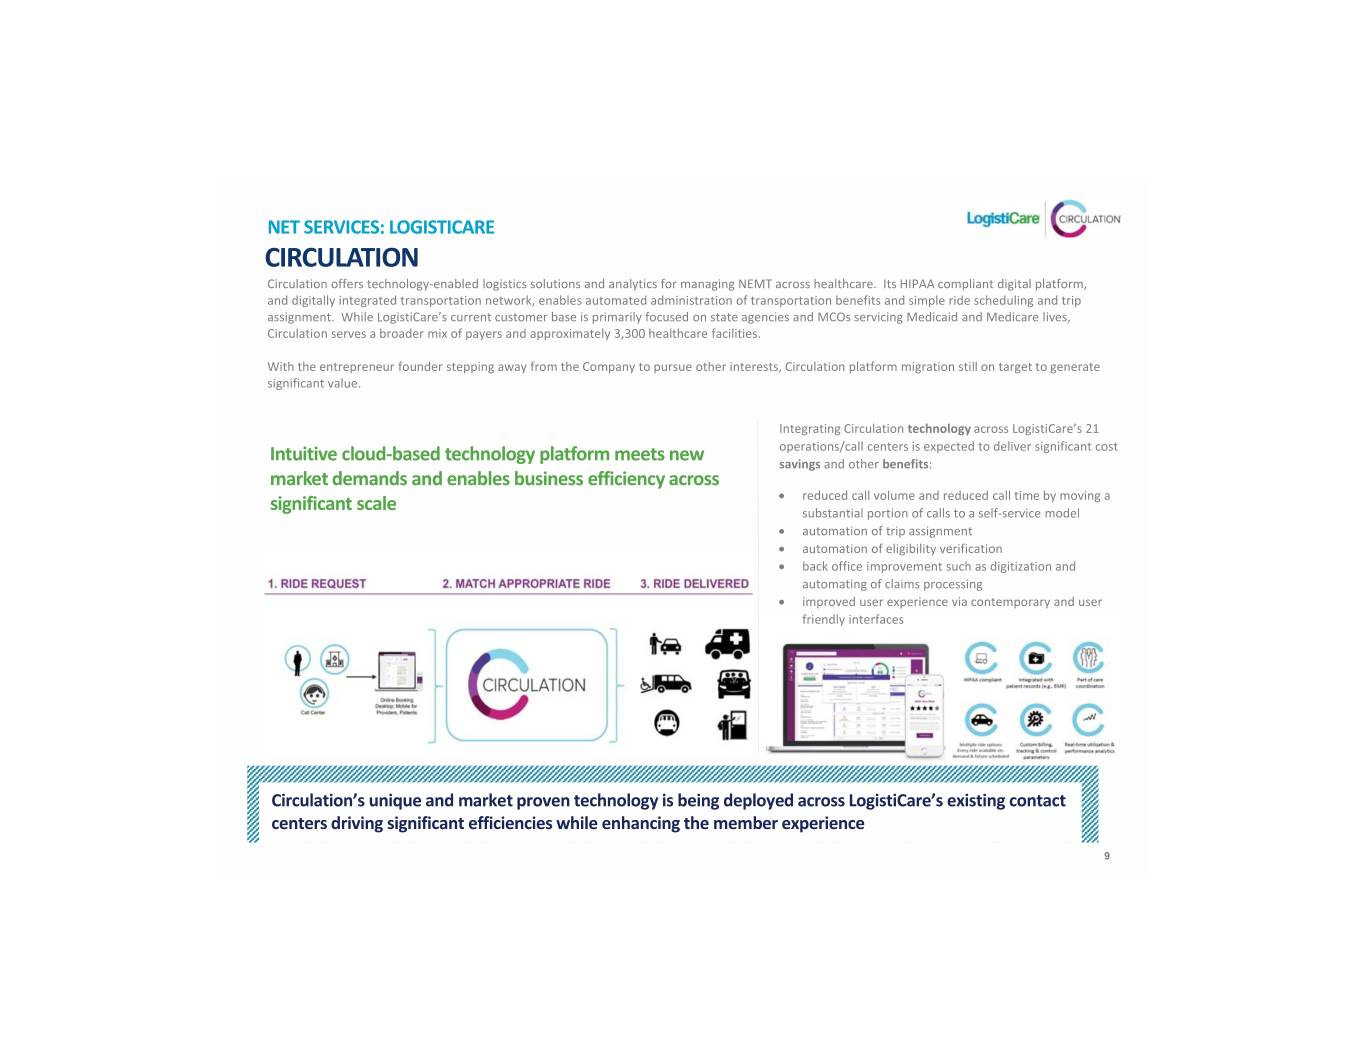
NET SERVICES: LOGISTICARE CIRCULATION Circulation offers technology‐enabled logistics solutions and analytics for managing NEMT across healthcare. Its HIPAA compliant digital platform, and digitally integrated transportation network, enables automated administration of transportation benefits and simple ride scheduling and trip assignment. While LogistiCare’s current customer base is primarily focused on state agencies and MCOs servicing Medicaid and Medicare lives, Circulation serves a broader mix of payers and approximately 3,300 healthcare facilities. With the entrepreneur founder stepping away from the Company to pursue other interests, Circulation platform migration still on target to generate significant value. Integrating Circulation technology across LogistiCare’s 21 operations/call centers is expected to deliver significant cost Intuitive cloud‐based technology platform meets new savings and other benefits: market demands and enables business efficiency across reduced call volume and reduced call time by moving a significant scale substantial portion of calls to a self‐service model automation of trip assignment automation of eligibility verification back office improvement such as digitization and automating of claims processing improved user experience via contemporary and user friendly interfaces Circulation’s unique and market proven technology is being deployed across LogistiCare’s existing contact centers driving significant efficiencies while enhancing the member experience 9

STRATEGIC PRIORITIES • Maintain market leadership in core NET • Leverage Circulation technology platform to target Services and refocused emphasis on organic NEMT market adjacencies (i.e. VA and Workers Comp) sales opportunities within core markets • Create “one��stop shop” logistics platform for care • Complete search for permanent CEO coordination and healthcare exchange • Continue working with payors to realign contract rates with costs • Continued integration of Circulation’s technology platform and migration of legacy LogistiCare contracts • Pilot programs: NEMT in commercial and Medicare Advantage spaces 10

NET Services: Value Proposition Unmanaged (1) Transportation Missed appointments can an Average missed increase the risk of k of appointment rate Average hospitalization $2,100 $2,100 30% ambulance +400% Average Average cost of cost of trip cost 25% due to ER visit ER visit $400 - transportation $525 issues Managed Proactive healthcare $15 Improved health Transportation(1) management can Average outcomes and decrease costs cost of patient/provider -800% ride to satisfaction doctor Key NET Facts (2) • Patients with lack of access to transportation are 7x less likely to comply with chemotherapy treatment • 95% of diabetic patients want to keep up with follow‐up appointments but 50% indicate it would be difficult due to lack of NET services • For every funded medical trip that prevents a trip to the emergency department, the payback to the state for each $1 invested in NET is estimated to be > 10x VALUE PROPOSITION Alleviation of transportation barriers improves outcomes and reduces healthcare costs for Medicaid agencies and MCO’s Ability to provide capitated, multi‐year contracts allows both lower and more predictable costs Reduction of fraud, waste, and abuse in a fragmented system High barriers to entry – technology platforms, leading market share, strong brand reputation Well positioned to take advantage of the shift to in‐home/community based healthcare services Sources: (1) Center for Medicare and Medicaid Services (CMS), National Health Expenditure (NHE). (2) Health Management Technology, SCI Solutions, National Center for Biological Information, National Institute of Health, Factors Associated with Adherence to Chemotherapy Guidelines in Patients with Non‐Small Cell Lung Cancer (2011). 11
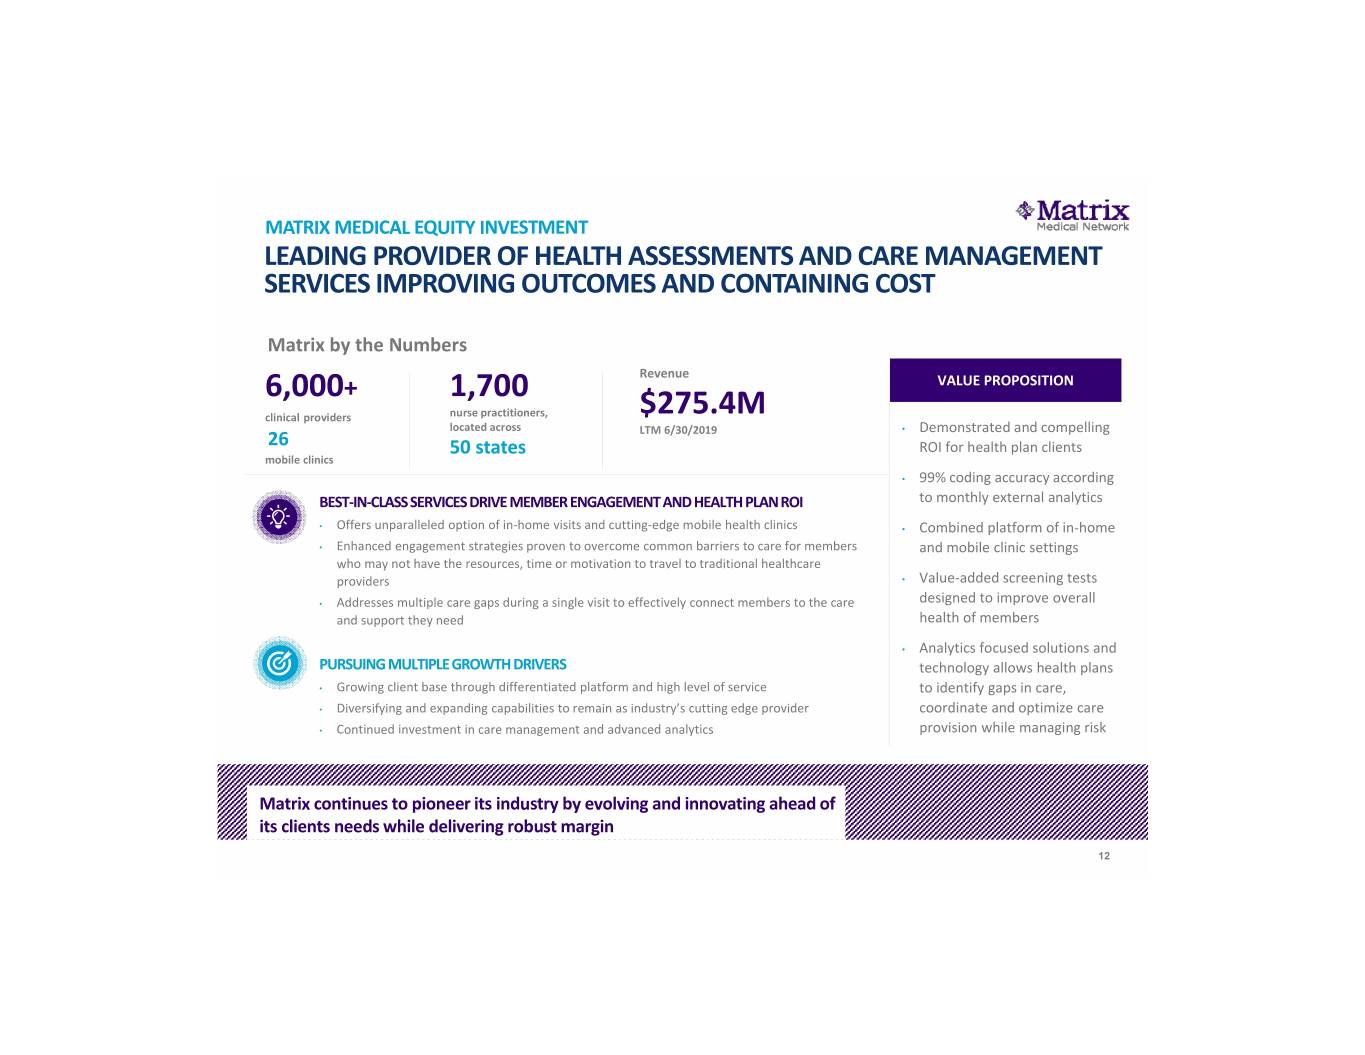
MATRIX MEDICAL EQUITY INVESTMENT LEADING PROVIDER OF HEALTH ASSESSMENTS AND CARE MANAGEMENT SERVICES IMPROVING OUTCOMES AND CONTAINING COST Matrix by the Numbers Revenue 6,000+ 1,700 VALUE PROPOSITION clinical providers nurse practitioners, $275.4M located across LTM 6/30/2019 • Demonstrated and compelling 26 50 states ROI for health plan clients mobile clinics • 99% coding accuracy according BEST‐IN‐CLASS SERVICES DRIVE MEMBER ENGAGEMENT AND HEALTH PLAN ROI to monthly external analytics • Offers unparalleled option of in‐home visits and cutting‐edge mobile health clinics • Combined platform of in‐home • Enhanced engagement strategies proven to overcome common barriers to care for members and mobile clinic settings who may not have the resources, time or motivation to travel to traditional healthcare providers • Value‐added screening tests • Addresses multiple care gaps during a single visit to effectively connect members to the care designed to improve overall and support they need health of members • Analytics focused solutions and PURSUING MULTIPLE GROWTH DRIVERS technology allows health plans • Growing client base through differentiated platform and high level of service to identify gaps in care, • Diversifying and expanding capabilities to remain as industry’s cutting edge provider coordinate and optimize care • Continued investment in care management and advanced analytics provision while managing risk Matrix continues to pioneer its industry by evolving and innovating ahead of its clients needs while delivering robust margin 12
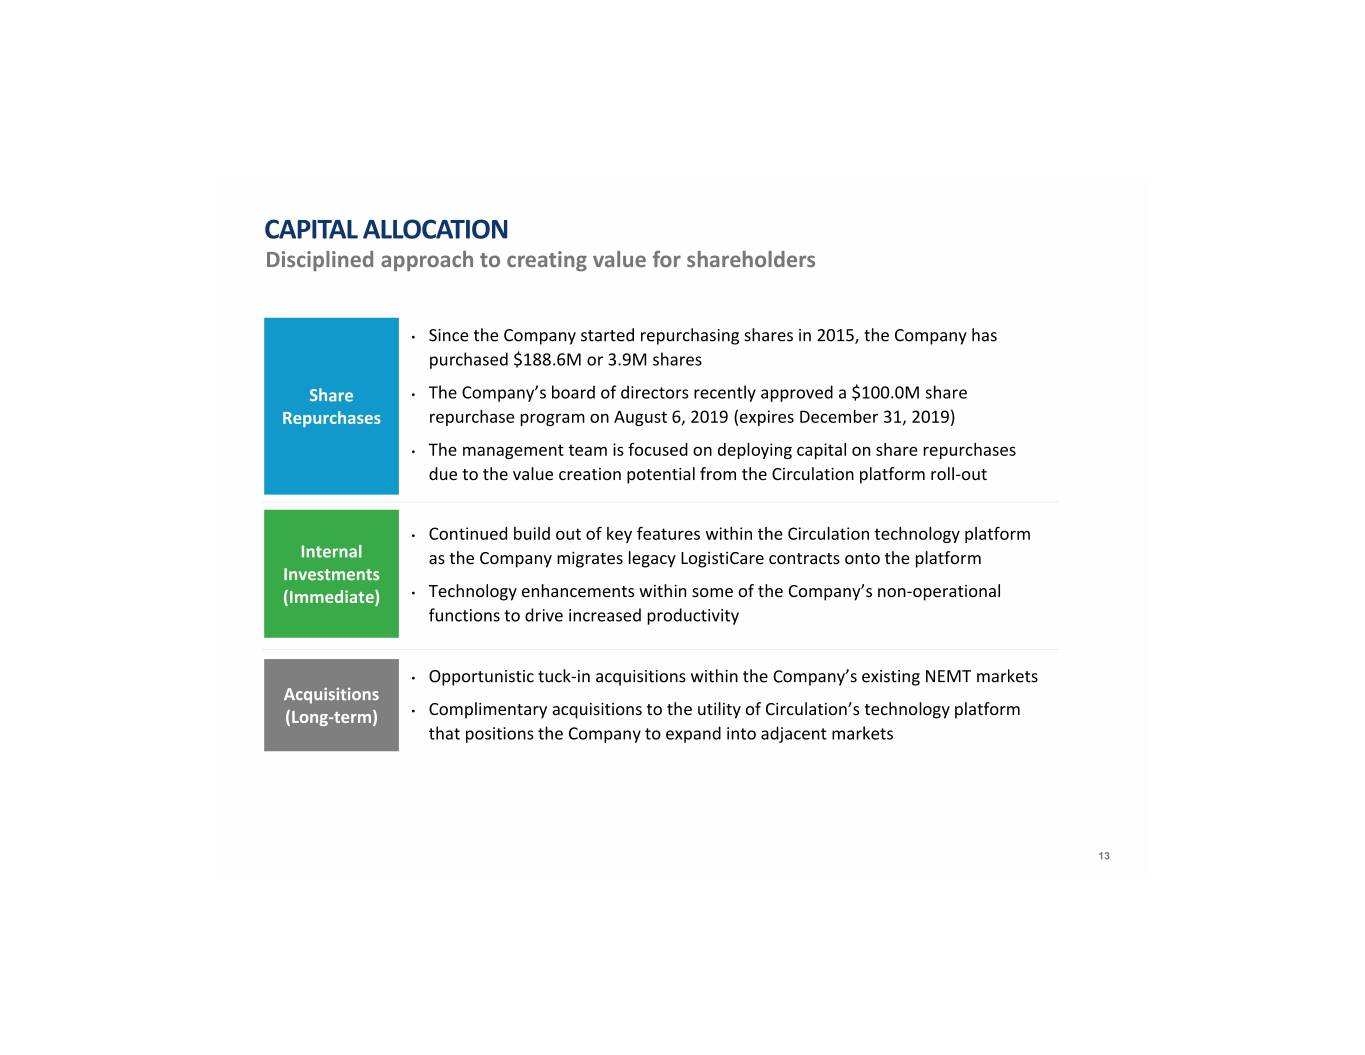
CAPITAL ALLOCATION Disciplined approach to creating value for shareholders • Since the Company started repurchasing shares in 2015, the Company has purchased $188.6M or 3.9M shares Share • The Company’s board of directors recently approved a $100.0M share Repurchases repurchase program on August 6, 2019 (expires December 31, 2019) • The management team is focused on deploying capital on share repurchases due to the value creation potential from the Circulation platform roll‐out • Continued build out of key features within the Circulation technology platform Internal as the Company migrates legacy LogistiCare contracts onto the platform Investments (Immediate) • Technology enhancements within some of the Company’s non‐operational functions to drive increased productivity • Opportunistic tuck‐in acquisitions within the Company’s existing NEMT markets Acquisitions (Long‐term) • Complimentary acquisitions to the utility of Circulation’s technology platform that positions the Company to expand into adjacent markets 13
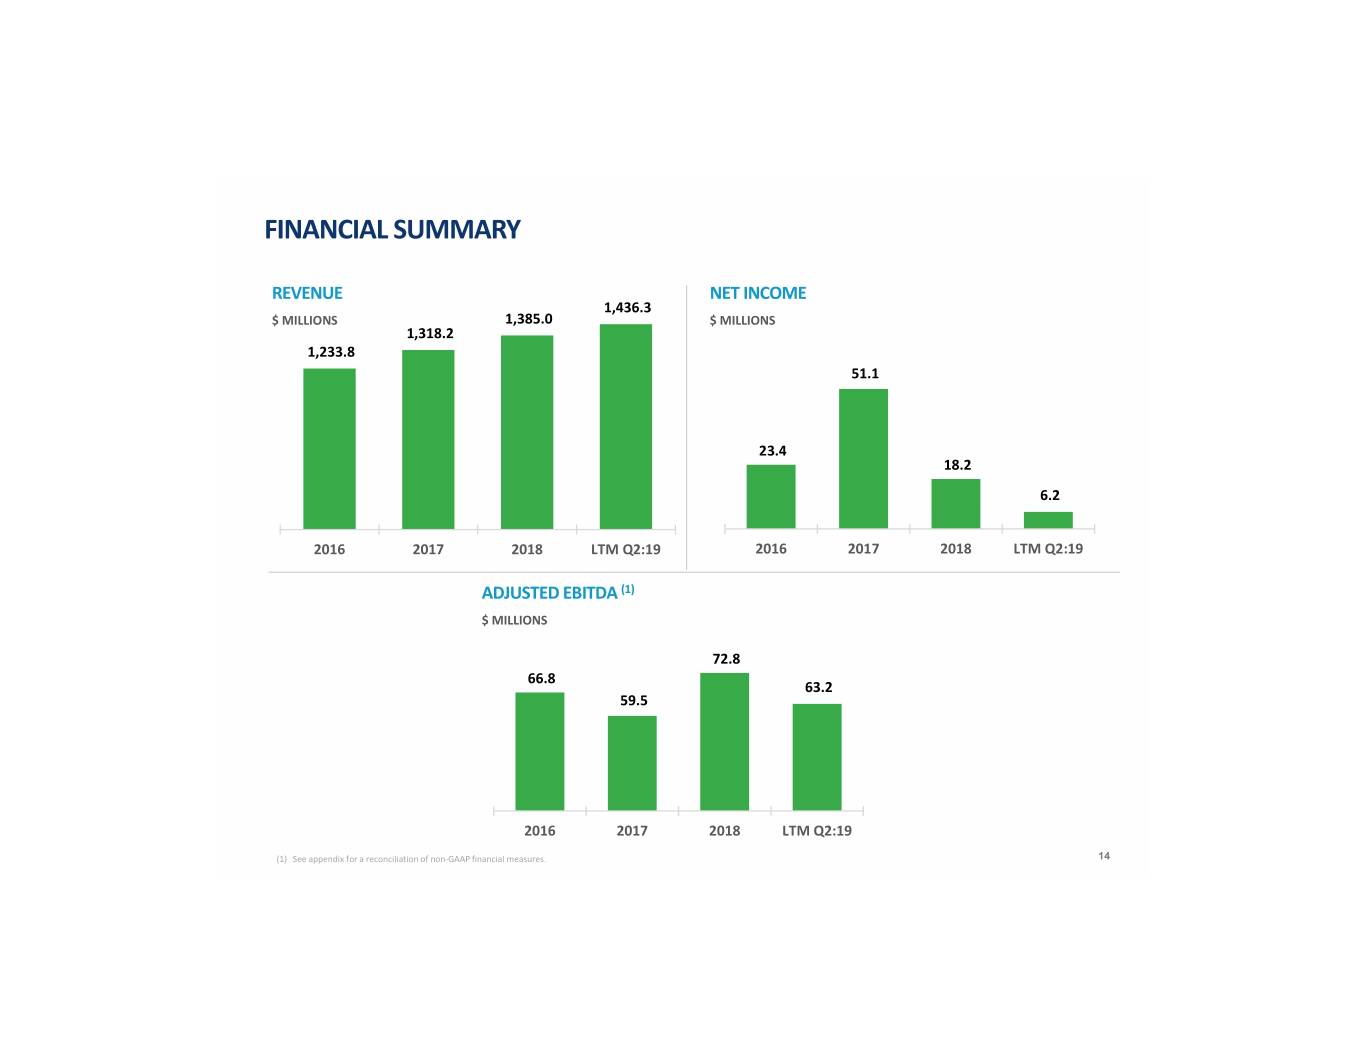
FINANCIAL SUMMARY REVENUE NET INCOME 1,436.3 $ MILLIONS 1,385.0 $ MILLIONS 1,318.2 1,233.8 51.1 23.4 18.2 6.2 2016 2017 2018 LTM Q2:19 2016 2017 2018 LTM Q2:19 ADJUSTED EBITDA (1) $ MILLIONS 72.8 66.8 63.2 59.5 2016 2017 2018 LTM Q2:19 (1) See appendix for a reconciliation of non‐GAAP financial measures. 14

APPENDIX
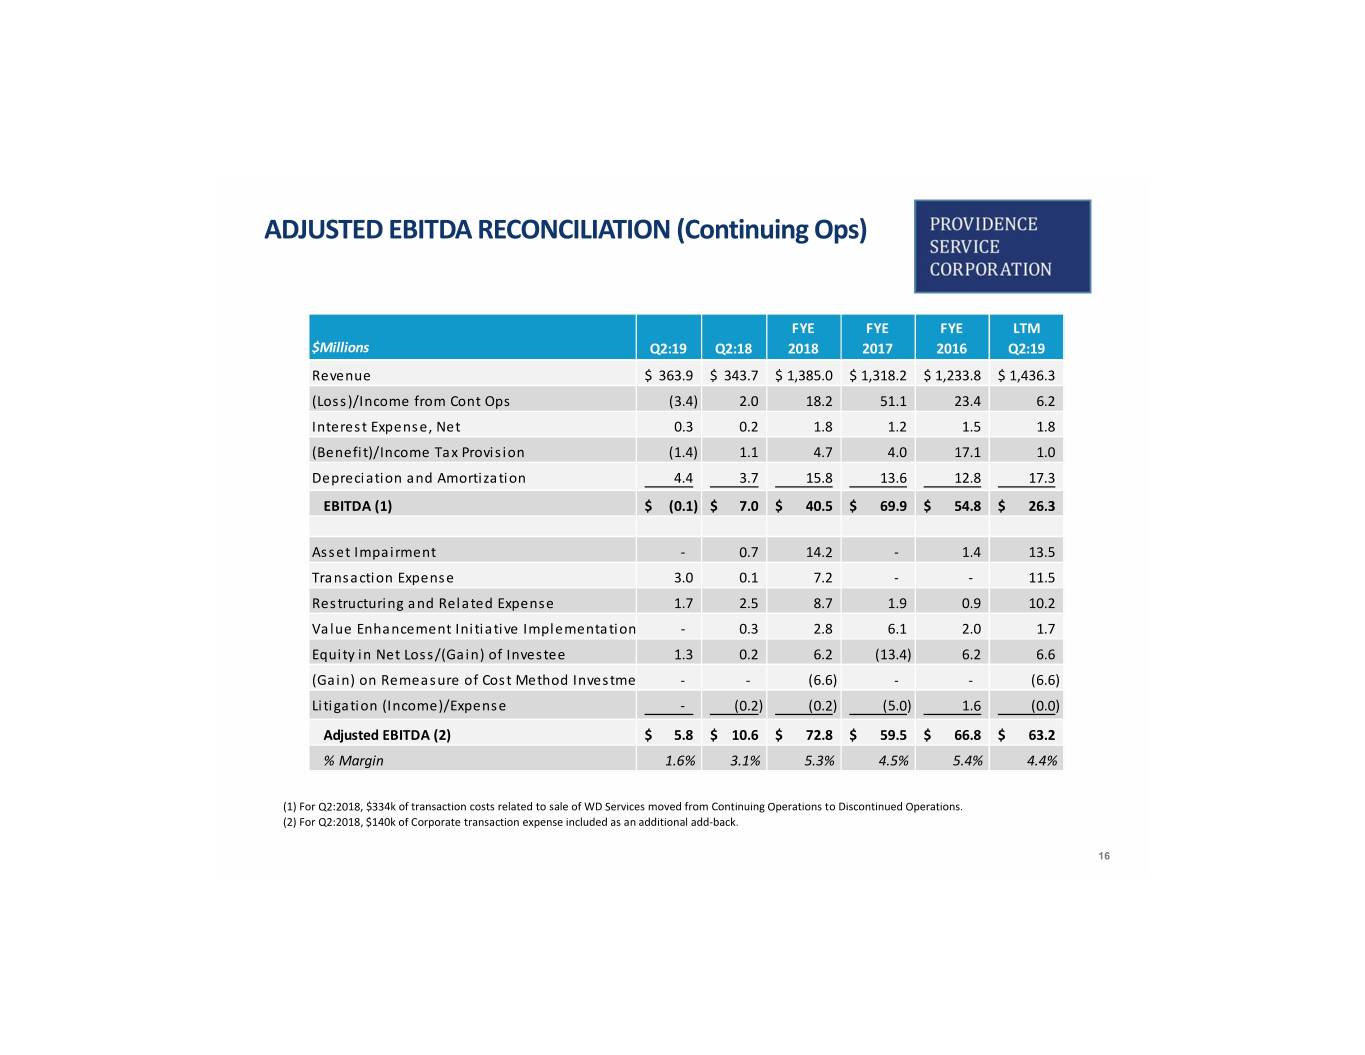
ADJUSTED EBITDA RECONCILIATION (Continuing Ops) FYE FYE FYE LTM $Millions Q2:19 Q2:18 2018 2017 2016 Q2:19 Revenue$ 363.9 $ 343.7 $ 1,385.0 $ 1,318.2 $ 1,233.8 $ 1,436.3 (Loss)/Income from Cont Ops (3.4) 2.0 18.2 51.1 23.4 6.2 Interest Expense, Net 0.3 0.2 1.8 1.2 1.5 1.8 (Benefit)/Income Tax Provision (1.4) 1.1 4.7 4.0 17.1 1.0 Depreciation and Amortization 3.7 4.4 15.8 13.6 12.8 17.3 EBITDA (1)$ (0.1) $ 7.0 $ 40.5 $ 69.9 $ 54.8 $ 26.3 Asset Impairment ‐ 0.7 14.2 ‐ 1.4 13.5 Transaction Expense 3.0 0.1 7.2 ‐ ‐ 11.5 Restructuring and Related Expense 1.7 2.5 8.7 1.9 0.9 10.2 Value Enhancement Initiative Implementation ‐ 0.3 2.8 6.1 2.0 1.7 Equity in Net Loss/(Gain) of Investee 1.3 0.2 6.2 (13.4) 6.2 6.6 (Gain) on Remeasure of Cost Method Investme ‐ ‐ (6.6) ‐ ‐ (6.6) Litigation (Income)/Expense (0.2) ‐ (5.0) (0.2) 1.6 (0.0) Adjusted EBITDA (2)$ 5.8 $ 10.6 $ 72.8 $ 59.5 $ 66.8 $ �� 63.2 % Margin 1.6% 3.1% 5.3% 4.5% 5.4% 4.4% (1) For Q2:2018, $334k of transaction costs related to sale of WD Services moved from Continuing Operations to Discontinued Operations. (2) For Q2:2018, $140k of Corporate transaction expense included as an additional add‐back. 16


