Exhibit 99.1
For more information please visit www.cementospacasmayo.com.pe/investors or contact: Manuel Ferreyros, CFO Claudia Bustamante, Investor Relations Manager C e m en t o s P aca s m a y o T e l : (5 1 1 ) 317 - 60 0 0 e x t. 2 1 6 5 E - m a il : cbus t aman t e @ cpsaa . com . p e

Second Quarter 2021 Earnings Release Cementos Pacasmayo S.A.A. Announces Consolidated Results for Second Q ua r te r 2021 Lima, Peru, July 19 , 2021 – Cementos Pacasmayo S . A . A . and subsidiaries (NYSE : CPAC ; BVL : CPACASC 1 ) (“the Company” or “Pacasmayo”) a leading cement company serving the Peruvian construction industry, announced today its consolidated results for the second quarter (“ 2 Q 21 ”) and the six months ( 6 M 21 ) ended June 30 , 2021 . These results have been prepared in accordance with International Financial Reporting Standards (“ IFRS”) and are stated in nominal PeruvianSoles (S/) . 2Q21 Financial and Operational Highlights: (All comparisons are to 2Q20, unless otherwise stated) Sales volume of cement, concrete and precast increased 257 . 2 % mainly due to the continued increase in sales of bagged cement, to the self - construction segment and to the public sector for reconstruction related projects, and to the halt in commercialization experience during 2 Q 20 . If we compare volume to 2 Q 19 , which did not have any external effects, the increase is 41 . 8 % . Revenues increased 285 . 7 % , mainly due to the continued increase in sales and to the halt in commercialization during 2 Q 20 mentioned above . When compared to 2 Q 19 , revenues increased 37 . 0 % . Consolidated EBITDA of S/ 90 . 0 million, an increase due to negative EBITDA during 2 Q 20 mainly due to the halt in sales of cement mentioned above, as well as the fixed costs derived from the halt in production during said quarter, as well as higher sales during 2 Q 21 . Net income of S/ 27.7 million, an increase mainly due to the halt in commercialization mentioned above, as well as increased sales during this quarter. 6M21 Financial and Operational Highlights: (All comparisons are to 6M20, unless otherwise stated) Sales volume of cement, concrete and precast increased 124 . 1 % mainly due to the continued increase in sales of bagged cement, to the self - construction segment and to the public sector for reconstruction related projects, and to the halt in commercialization experience during 2 Q 20 . Revenues increased 119.0%, mainly due to the continued increase in sales and to the halt in commercialization during 2Q20 mentioned above. Consolidated EBITDA of S/195.2 million, a 193.1% increase due to the halt in sales of cement and the increase in fixed costs mentioned above. Net income of S/ 59.5 million, an increase mainly due the loss during 6M20 because of the halt in commercialization mentioned above, as well as increased sales during this quarter. 2

Second Quarter 2021 Earnings Release Financial and Operating Results Financial and Operating Results 2Q21 2Q20 % Var. 6M21 6M20 % Var. Cement, concrete and precast shipments (MT) 847.7 237.3 257.2% 1,780.7 794.7 124.1% In millions of S/ Sales of goods 440.9 114.3 285.7% 905.7 413.6 119.0% Gross profit 116.4 2.1 N/R 249.6 94.2 165.0% Operating profit 56.1 - 40.2 N/R 127.4 - 2.1 N/R Net income 27.7 - 45.5 N/R 59.5 - 34.8 N/R Consolidated EBITDA 90.0 - 5.7 N/R 195.2 66.6 193.1% Gross Margin 26.4% 1.8% 24.6 pp. 27.6% 22.8% 4.8 pp. Operating Margin 12.7% - 35.2% 47.9 pp. 14.1% - 0.5% 14.6 pp. Net income Margin 6.3% - 39.8% 46.1 pp. 6.6% - 8.4% 15.0 pp. Consolidated EBITDA Margin 20.4% - 5.0% 25.4 pp. 21.6% 16.1% 5.4 pp. 3

Second Quarter 2021 Earnings Release Management Comments During 2 Q 21 our volumes continued strong, despite the high levels of uncertainty, since, more than a month after the runoff for the Presidential elections this past June 6 , the winner has not yet been officially proclaimed . This shows our resilience, especially in terms of sales of bagged cement, which have sustained its strong performance . As expected though, volumes from private projects have been affected by the political situation, and will most likely remain low for the rest of the year . However, we are confident that we will continue experiencing high sales volumes, since demand from the public sector, mainly from the infrastructure spending related to the government to government agreement with the UK government for the reconstruction of the damage cause by El Niño has already started materializing and will increase during the second half of the year . We would like to briefly go into further detail in terms of cement, concrete and precast sales, since the comparison to 2 Q 20 shines little light on their true performance this quarter . If we look at quarter - on - quarter sales, these have decreased slightly, however, this does not affect our expectations for year - end sales since we expected this trend . If we compare sales of cement, concrete and precast from this quarter to those from 2 Q 19 , as the most recent pre - pandemic comparison for a similar period, they increased 41 . 8 % . Although the largest portion of this growth can be attributed to bagged cement sales, concrete and precast also increased . Precast continued to perform outstandingly, as we mentioned last quarter, mainly due to our efforts to expand the customer base . Concrete had a small set back as most of the investment from private projects has come to a halt until the political situation becomes more clear . However, volumes from the public sector should offset this loss in volumes and we expect to see record levels again as soon as the third quarter . During this quarter, our solid and innovative commercial efforts were rewarded, as we are very pleased to have received a Silver Effie award . The Effie Awards honor the world's most effective companies and brands . Pacasmayo was a winner in the brand experience category, for “construyexperto . pe”, an online platform created to redesign the foreman Dz s experience, with training and tools that help them be more efficient . We are very proud of the award, which acknowledges the effectiveness of our client - focused strategy . Finally, as we have always mentioned, our people are definitely our most important asset . This year, our ranking place in Merco Talento Perú, which aims to identify the 100 most attractive companies to work, has improved 37 positions from last year . This ranking is based on eight different evaluations, which are integrated to obtain the monitor that is made public every year . We believe this is a significant improvement, which shows our commitment to improve our human capital management . We will strive to continue improving in this ranking every year . To sum up, this quarter has yet again proven the resilience of our business, as well as the effectiveness of our commercial strategy . We expect sales to continue the positive trend for the rest of the year, as the self - construction segment remains solid and the added demand from the public sector should offset a weaker private sector . As always, we remain committed to continue generating value and to improve our business in the most sustainable manner . 4

Second Quarter 2021 Earnings Release Economic Overview 2 Q 21 : During 2 Q 21 , the runoff election between Pedro Castillo and Keiko Fujimori took place on June 6 . The result was extremely tight, and, as of the day of this report Castillo leads with less than 0 . 5 % margin, while Fujimori claims that there have been irregularities during the voting process and has taken a variety of political and legal measures that are still being resolved . This has resulted in high levels of uncertainty, that are likely to prevail for some months . This uncertainty arises not only from the fact that there is still no official pronouncement from the highest electoral authority regarding who will be proclaimed President, but also because who has the best chance of being declared the winner, Pedro Castilllo, has not given clear signals of what his government will be like, or who will participate . Castillo represents a radical left wing party, which despite having shown some signs of moderation in recent weeks in some aspects such as the inclination towards free market policies on the macroeconomic side, continues to speak of drafting a new Constitution for Peru . Nonetheless, the Peruvian Central Bank (BCR for its Spanish acronym) has not modified its GDP growth projections for the year, since it believes that the negative effect of the political uncertainty will be offset by higher public spending and a strong self - construction segment . During 2 Q 21 , we have seen the self - construction segment remain strong and the expectation is for it to continue the same path for the rest of the year . In terms of public spending, its growth comes basically from infrastructure spending, most of it from Reconstruction related works, mainly the government to government agreement with the UK government, and the plans implemented to fight against COVID - 19 such as Arranca Perú and those included in the National Competitiveness Plan . Finally, it is very important to mention that, after being the country with the most deaths per million and one of the last ones to begin to vaccinate its population, Peru is finally performing better in its fight against COVID - 19 . Peru is the country that has most decreased its number of deaths in Latin America and should have around 20 % of the population vaccinated by the end of July, and 80 % by the end of the year, as long as the new government maintains the current efforts and strategies . This increase in the speed of vaccination will not only protect people’s health, but will also help reactivate the economy 5

Second Quarter 2021 Earnings Release Peruvian Cement Industry Overview : Pacasmayo, UNACEM and Cementos Yura mainly supply cement demand in Peru . Pacasmayo primarily supplies the northern region of Peru, while UNACEM supplies the central region and Cementos Yura the southern region . The northern region of Peru, according to the Instituto Nacional de Estadística e Informática (INEI) and Apoyo Consultoría, represents approximately 28 . 9 % of the country’s population and 14 . 9 % of national Gross Domestic Product (“GDP”) . Despite the country’s growth over the last 10 years, Peru continues to have a significant housing deficit, estimated at 1 . 9 million households throughout the country as per the Ministry ofHousing, Construction and Sanitation . In Peru, the majority of cement is sold to a highly fragmented consumer base of individuals that tend to gradually buy bags of cement to build or to improve their homes, a segment the industry refers to as “self - construction” . 6 Peruvian Cement Market Cement Dispatches and Market Share *Import figures are sourced from Aduanet. They represent quantities of imported cement, not shipped cement. Source: INEI, Aduanet Northern Region (thousands of metric tons) Plant 2017 2018 2019 2020 Apr - 21 LTM % part Central Region (thousands of metric tons) Plant 2017 2018 2019 2020 Apr - 21 LTM % part Southern Region (thousands of metric tons) Plant 2017 2018 2019 2020 Apr - 21 LTM % part Grupo Pacasmayo 2,267 2,364 2,615 2,576 3,207 27.4% Importaciones 76 32 13 38 40 0.3% Total 2,343 2,396 2,628 2,614 3,247 27.7% UNACEM 4,993 5,058 5,316 4,172 4,877 41.7% Caliza Inca 387 448 513 382 445 3.8% Imports 496 885 663 493 529 4.5% Total 5,876 6,391 6,492 5,047 5,851 50.0% Grupo Yura 2,618 2,597 2,584 2,019 2,384 20.5% Imports 42 65 98 189 226 1.9% Total 2,660 2,662 2,682 2,208 2,610 22.3% T o t a l , A l l R e g i on s 10,879 11,449 11,802 9,870 11,708 100.0%

Second Quarter 2021 Earnings Release Infrastructure Investment in the Area of Influence: R e co nst r uct i o n o f t h e N o rth A boost in infrastructure is expected from the government’s reconstruction plan, now that the agreement between the Peruvian and UK government is under execution . This agreement includes an investment of S/ 7 billion in 2 years and includes 74 schools, 15 hospitals and integral solutions for 17 rivers, 5 brooks, and drainage of 7 Northern cities . This will have a significant impact on our cement shipments, as most of this budget is concentrated in our area of influence . 50 % of this investment is expected to be executed by the end of 2021 . Other projects Although the anticipated increase in Peru’s large infrastructure projects has been delayed, this remains an important growth driver for the country and a necessity due to Peru’s significant infrastructure deficit . Although the progress of these projects has been slow, we have continued shipping cement to the ongoing projects, which are shown below, along with the potential demand for the next 5 years . During 2 Q 21 , we continued shipping to the Talara Refinery, and the Salaverry Port . These projects should be executed and finished in the next 12 to 18 months . Source: Company filings, Proinversion, MINEM 7

Second Quarter 2021 Earnings Release Operating Results: Production: Cement Production Volume ( t ho u s a n d s o f m e tr i c t o n s ) 8 P aca sm a y o P l a nt Rioja Plant P i ur a p l a nt Total Cement production volume at the Pacasmayo plant increased 262 . 5 % in 2 Q 21 compared to 2 Q 20 and 137 . 2 % in 6 M 21 compared to 6 M 20 , mainly due to the halt in production during 2 Q 20 for most of the quarter after the government mandated state of emergency, which ended in mid - May 2020 , as well as the continued increase in cement sales volume during this quarter . Cement production volume at the Rioja Plant increased 290 . 1 % in 2 Q 21 compared to 2 Q 20 and 111 . 1 % in 6 M 21 compared to 6 M 20 , mainly due to the above - mentioned halt in production in 2 Q 20 , as well as higher cement sales . Cement production volume at the Piura Plant in 2 Q 21 increased 279 . 3 % , compared to 2 Q 20 and 115 . 9 % in 6 M 21 compared to 6 M 20 , mainly due to the halt in production during 2 Q 20 as well as an increase in demand from the self - construction segment as well as the public sector for reconstruction - related projects . Total cement production volume increased 270 . 2 % in 2 Q 21 compared to 2 Q 20 , and 126 . 5 % in 6 M 21 compared to 6 M 20 , in line with the increase in demand . Clinker Production Volume ( t ho u s a n d s o f m e tr i c t o n s) Pacasmayo Plant Rioja Plant Piura Plant Total Clinker production volume at the Pacasmayo plant increased 94.0% in 2Q21 compared to 2Q20 and 46.7% in 6M21 compared to 6M20, mainly due to the halt in production during 2Q20. Clinker production volume at the Rioja plant increased 190.4% in 2Q21 compared to 2Q20 and 83.7% in 6M21 compared to 6M20, in line with increased cement demand. Production 2Q21 2Q20 % Var. 6M21 6M20 % Var. 509.7 140.6 262.5% 977.2 411.9 137.2% 83.1 21.3 290.1% 174.4 82.6 111.1% 274.2 72.3 279.3% 637.7 295.4 115.9% 867.0 234.2 270.2% 1,789.3 789.9 126.5% Production 2Q21 2Q20 % Var. 6M21 6M20 % Var. 160.8 82.9 94.0% 392.8 267.7 46.7% 66.2 22.8 190.4% 133.0 72.4 83.7% 139.2 - N/R 372.6 202.3 84.2% 366.2 105.8 246.1% 898.4 542.4 65.6%

Second Quarter 2021 Earnings Release Clinker production volume at the Piura plant increased from 0 to 139.2 thousand tons in 2Q21 compared to 2Q20, and 84.2% in 6M21 compared to 6M20, mainly due to the complete halt in production during 2Q20. Total clinker production volumes increased 246.1% in 2Q21 compared to 2Q20, and 65.6% in 6M21 compared to 6M20. Quicklime Production Volume ( t ho u s a n ds o f m et ri c t o n s) Pacasmayo Plant Quicklime production volume decreased 39.4% in 2Q21 compared to 2Q20 and 4.6% in 6M21 compared to 6M20, mainly due to the use of inventories during this quarter. Ins t a ll e d C a p a ci t y: Ins t a ll e d C e m e nt a n d C li nker Ca p a ci ty Full year installed cement capacity at the Pacasmayo, Piura and Rioja plants remained stable at 2.9 million MT, 1.6 million MT and440,000 MT, respectively. Full year installed clinker capacity at the Pacasmayo, Piura and Rioja plants remained stable at 1.5 million MT, 1.0 million MT and280,000 MT, respectively. Full year installed quicklime capacity at the Pacasmayo plant remained stable at 240,000 MT. U t ili z a t i o n R a t e 1 : Pacasmayo Plant Utilization Rate Cement Clinker Q ui c k li m e Cement production utilization rate at the Pacasmayo plant increased 50 . 9 percentage points in 2 Q 21 when compared to 2 Q 20 and 39 . 0 percentage points in 6 M 21 when compared to 6 M 20 , mainly due to the halt in production and the increase in cement demand mentioned above . Clinker production utilization rate in 2 Q 21 increased 20 . 8 percentage points compared to 2 Q 20 and 16 . 7 percentage points in 6 M 21 compared to 6 M 20 , mainly due to increased cement production to satisfy demand, as well as the halt in clinker production during most of 2 Q 20 due to the government mandated state of emergency . 1 The utilization rates are calculated by dividing production in a given period over installed capacity . The utilization rate implies annualized production, which is calculated by multiplying real production for each quarter by four . Production 2Q21 2Q20 % Var. 6M21 6M20 % Var. 8.0 13.2 - 39.4% 26.9 28.2 - 4.6% 9 Utilization Rate 2Q21 2Q20 % Var. 6M21 6M20 % Var. 70.3% 19.4% 50.9 pp. 67.4% 28.4% 39.0 pp. 42.9% 22.1% 20.8 pp. 52.4% 35.7% 16.7 pp. 13.3% 22.0% - 8.7 pp. 22.4% 23.5% - 1.1 pp.

Second Quarter 2021 Earnings Release Quicklime production utilization rate in 2Q21 and 6M21, decreased 8.7 and 1.1 percentage points when compared to 2Q20 and 6M20 respectively, mainly due to use of inventories during this quarter. Rioja Plant Utilization Rate The cement production utilization rate at the Rioja plant in 2 Q 21 and 6 M 21 increased 56 . 2 and 41 . 7 percentage points when compared to 2 Q 20 and 6 M 20 respectively, mainly due to increased production to satisfy demand, as well as the halt in operations during 2 Q 20 . The clinker production utilization rate at the Rioja plant during 2 Q 21 and 6 M 21 increased 62 . 0 and 43 . 1 percentage points compared to 2 Q 20 and 6 M 20 respectively . P i ura P l an t U tili z a ti o n R a t e The cement production utilization rate at the Piura plant during 2 Q 21 and 6 M 21 increased 50 . 5 and 42 . 8 percentage points compared to 2 Q 20 and 6 M 20 respectively, mainly due to the significant increase in cement demand experienced during this, and previous quarters, as well as the halt in production during 2 Q 20 . The clinker production utilization rate at the Piura plant during 2 Q 21 and 6 M 21 increased 55 . 7 and 34 . 1 percentage points compared to 2 Q 20 and 6 M 20 respectively, mainly due to the complete halt in production during 2 Q 20 . Consolidated Utilization Rate The consolidated cement production utilization rate during 2 Q 21 and 6 M 21 increased 51 . 2 and 40 . 4 percentage points compared to 2 Q 20 and 6 M 20 respectively, in line with increased cement production to satisfy demand during this quarter, as well as the low production level in 2 Q 20 because of the government - mandated halt in production during this period . The consolidated clinker production utilization rate during 2Q21 and 6M21 increased 37.5 and 25.6 percentage points compared to 2Q20 and 6M20 respectively. 2Q2 0 2Q21 75 .5% Utilization Rate % Var. C e m e nt Clinker 2Q2 0 2Q21 68. 6% Utilization Rate % Var. C e m e nt Clinker 2 T 2 0 2T21 70. 2% Ratio de utilización % Var. C e m e n t o Clinker 10

Second Quarter 2021 Earnings Release Financial Results: Income Statement: The following table shows a summary of the Consolidated Financial Results: Consolidated Financial Results (i n m i l li o ns o f So l e s S / ) During 2 Q 21 and 6 M 21 , revenues increased 285 . 7 % and 119 % year - on - year respectively, mainly due to a lower comparative basis in 2 Q 20 , after the government - mandated state of emergency resulted in a complete halt in operations until mid - May, as well as increased sales volume of bagged cement to the self - construction segment and some cement and concrete for reconstruction - related projects . Gross profit increased, mainly due to a very low comparative basis from 2 Q 20 as high fixed cost and very low sales resulted from the halt in operations during most of the quarter . Profit for the period increased, primarily due to increased revenues for the above - mentioned reasons . S a l e s o f G oods The following table shows the Sales of Goods and their respective margins by business segment : Sales: cement, concrete and precast (i n m illi on s o f So l e s S / ) Sales of cement, concrete and precast increased 296 . 5 % and 120 . 1 % in 2 Q 21 and 6 M 21 , when compared to 2 Q 20 and 6 M 20 respectively, mainly due to the halt in commercialization during 2 Q 20 , as well as a continued increase in demand, mainly of bagged cement . Gross margin during 2 Q 21 and 6 M 21 increased 26 . 4 percentage points and 5 . 1 percentage points compared to 2 Q 20 and 6 M 20 mainly due to the halt in production mentioned above . 6 M Income Statement 2Q21 2Q20 % Var. 6M21 440 . 9 114 . 3 285 . 7 % 9 05 . 7 116.4 2.1 N/R - 60.3 - 42.4 56.1 - 16. Sales of goods Gross Profit Total operating expenses, net Operating Profit Total other expenses, net Profit before income tax Income tax expens Profit 11

Second Quarter 2021 Earnings Release Cement 2Q21 2Q20 % Var. 6M21 6M20 % Var. 350.5 97.1 261.0% 722.3 325.7 121.8% - 238.5 - 84.7 181.6% - 484.2 - 226.4 113.9% 112.0 12.4 803.2% 238.1 99.3 139.8% 32.0% 12.8% 19.2 pp. 33.0% 30.5% 2.5 pp. 12 Sales of goods Cost of Sales Gross Profit Gross Margin Sales of cement during 2 Q 21 and 6 M 21 increased 261 . 0 % and 121 . 8 % compared to 2 Q 20 and 6 M 20 respectively, mainly due to increased demand from the self - construction segment, as well as to the public sector for reconstruction related projects, and due to a lower comparative basis because of the halt in commercialization during 2 Q 20 . Although the effect of the halt is in fact substantial, if we compare cement sales during 2 Q 21 with those of 2 Q 19 , there is still a significant increase of 41 . 1 % . Gross margin during 2 Q 21 and 6 M 21 increased 19 . 2 and 2 . 5 percentage points compared to 2 Q 20 and 6 M 20 respectively, mainly due to the halt in commercialization during 2 Q 20 . Sales of concrete represented 11 . 5 % of cement, concrete and precast sales during 2 Q 21 . Sales of cement represented 86.4% of cement, concrete and precast sales during 2Q21. Sales of goods Cost of Sales Gross Profit Gross Margin Sales of concrete increased substantially during 2 Q 21 compared to 2 Q 20 , mainly due to minimal sales during 2 Q 20 due to the halt in commercialization because of the government mandated state of emergency to prevent the spread of COVID - 19 . If we compare 2 Q 21 sales to 2 Q 19 , there is still a 9 . 6 % increase . During 6 M 21 , sales of concrete increased 132 . 0 % compared to 6 M 20 , mainly due to the halt in commercialization during 2 Q 20 , as well as increased sales, mainly to small construction companies . Gross margin increased 273 . 5 percentage points in 2 Q 21 compared to 2 Q 20 , mainly due to a recovery from negative margins during 2 Q 20 during the halt in commercialization . In 6 M 21 , gross margin increased 20 . 2 percentage points when compared to 6 M 20 , mainly due to the halt in commercialization . Sales of precast represented 2 . 1 % of cement, concrete and precast sales during 2 Q 21 . Sales of goods Cost of Sales Gross Profit Gross Margin During 2Q21 and 6M21, precast sales increased 347.4% and 31.6% compared to 2Q20 and 6M20 respectively, mainly due to the recovery in demand after the halt in commercialization during 2Q20. However, it is important to note that if we compare precast sales from 2Q21 to those from 2Q19, to eliminate the effect of the government mandated halt, there is still a substantial increase of 32.8%. Gross margin during 2Q21 and 6M21 increased 94.8 and 20.1 percentage points compared to 2Q20 and 6M20 respectively, mainly due to the above - mentioned halt in commercialization and its negative effect on costs. Concrete and pavement 2Q21 2Q20 % V a r . 6M21 6M20 % V a r . 46.6 3.3 N/R 98.8 42.6 132.0% - 44.8 - 12.2 267.2% - 92.7 - 48.6 90.7% 1.8 - 8.9 N/R 6.1 - 6.0 N/R 3.8% - 269.7% 273.5 pp. 6.1% - 14.1% 20.2 pp. Precast 2Q21 2Q20 % Var. 6M21 6M20 % Var. 8.5 1.9 347.4% 15.0 11.4 31.6% - 7.6 - 3.5 117.1% - 12.9 - 12.1 6.6% 0.9 - 1.6 N/R 2.1 - 0.7 N/R 10.6% - 84.2% 94.8 pp. 14.0% - 6.1% 20.1 pp.

Second Quarter 2021 Earnings Release Quicklime 2Q21 2Q20 % V a r . 6M21 6M20 % V a r . 7.6 6.3 20.6% 16.1 13.2 22.0% - 7.1 - 5.4 31.5% 14.5 - 12.1 19.8% 0.5 0.9 - 44.4% 1.6 1.1 45.5% 6.6% 14.3% - 7.7 pp. 9.9% 8.3% 1.6 pp. Sales of goods Cost of Sales Gross Profit Gross Margin During 2 Q 21 and 6 M 21 , quicklime sales increased 20 . 6 % and 22 . 0 % when compared to 2 Q 20 and 6 M 20 respectively, mainly due to increased sales volume, as a result of the halt in operations of most sectors during the government - mandated lockdown in 2 Q 20 . Gross margin however, decreased 7 . 7 percentage points during 2 Q 21 compared to 2 Q 20 , mainly due to lower sales of ground quicklime which has a higher margin . Sales: Construction Supplies 2 (i n m illi on s o f So l e s S / ) Sales: Quicklime (i n m il l i o ns o f S o l e s S / ) During 2 Q 21 and 6 M 21 , construction supply sales increased 384 . 2 % and 161 . 3 % compared to 2 Q 20 and 6 M 20 respectively, mainly due to increased sales to self - construction as families worked on home improvement projects, as well as a lower comparative basis due to the government - mandated lockdown during 2 Q 20 . Gross margin increased 12 . 4 percentage points in 2 Q 21 compared to 2 Q 20 , mainly due to the recovery from negative margins during the lockdown period . Gross margin in 6 M 21 remained in line with 6 M 20 . 2 Construction supplies include the following products: steel rebar, wires, nails, corrugated iron, electric conductors, plastic tubes and accessories, among others. 13

Second Quarter 2021 Earnings Release Operating Expenses: Administrative Expenses (i n m illi on s o f So l e s S / ) Administrative expenses increased 41 . 7 % in 2 Q 21 compared to 2 Q 20 and 28 . 0 % in 6 M 21 compared to 6 M 20 , mainly due to a significant reduction during 2 Q 20 because of the halt in operations, as well as higher workers’ profit sharing because of the increase in income . If we compare to 1 Q 21 , administrative expenses remained in line . S e l l i n g E x p e n s es (i n m il l i o ns o f S o l e s S / ) Selling expenses in 2 Q 21 and 6 M 21 increased 71 . 1 % and 29 . 1 % compared to 2 Q 20 and 6 M 20 respectively, mainly due to the significant reduction in expenses during the halt in operations, as well as increase in workers’ profit sharing as results improves this quarter . 2Q2 1 2Q2 0 6 Personnel expenses 8.2 4.9 67.3% Advertising and promotion 2.6 0.3 Third party services 1.8 Doubtful payment O t h e r Total Selling and distribution expenses % Var. 6M21 2 Q 2 1 2 Q 2 0 6 Personnel expenses 22.7 14.6 55.5% Third - party services 14.0 9.6 Board of directors 1.6 Depreciation and amortization O t h e r Total Administrative expenses % Var. 6M21 14

Second Quarter 2021 Earnings Release E B IT D A R e c o n c i li a t i o n : Consolidated EBITDA (i n m illi on s o f So l e s S / ) Consolidated EBITDA increased substantially during 2 Q 21 , considering that it was negative during 2 Q 20 due to the halt in production and commercialization because of the government mandated state of emergency until mid - May . During 6 M 21 , consolidated EBITDA increased 193 . 1 % compared to 6 M 20 , mainly due to increased sales . Cash and Debt Position: Cash: Consolidated Cash (i n m illi on s o f So l e s S / ) As of June 30, 2021, the Company’s cash position was S/ 369.0 million (US$ 95.8 million). This balance includes certificates of deposit in the amount of S/ 15.0 million (US$ 3.9 million), distributed as follows: The remaining balance of S/ 353.7 million (US$ 91.9 million) is held mainly in the Company’s bank accounts, of which US$ 27.2 million are denominated in US dollars and the rest in Soles. Certificates of deposits in Soles Bank Amount (S/) Interest Rate Initial Date M a t u r J une Banco de Crédito del Perú S/ 8.0 0.30% Banco de Crédito del Perú S/ 7.0 0.3 Net Income + Income tax expense - Finance income + Finance costs +/ - Net loss on the valuation of trading derivative financial instruments +/ - Net loss from exchange rate + Depreciation and amortization Consolidated EBITDA Consolidated EBITDA 2Q21 2Q20 Var %. 6M21 6M20 Var %. 27.7 - 45.5 N/R 59.5 - 34.8 N/R 11.7 - 18.0 N/R 26.2 - 11.9 N/R - 0.3 - 1.2 - 75.0% - 0.8 - 1.7 - 52.9% 21.1 23.2 - 9.1% 41.9 43.8 - 4.3% 0.0 - 1.4 N/R 1.1 - 4.4 N/R - 4.0 2.7 N/R - 0.4 6.9 N/R 33.8 34.5 N/R 67.7 68.7 - 1.5% 90.0 - 5.7 N/R 195.2 66.6 193.1% 15

Second Quarter 2021 Earnings Release D e b t Po s i ti o n: Consolidated Debt (i n m il l i o ns o f S o l e s S / ) Below are the contractual obligations with payment deadlines related to the Company’s debt, including interest. As of June 30 , 2021 , the Company’s total outstanding debt reached S/ 1 , 305 . 2 million (equivalent to US $ 337 . 6 million) . This debt is primarily composed by the outstanding part of the international bond issued in February 2013 , the two issuances of the local bond issued in January 2019 and short - term loans . As of June 30 , 2021 , the Company maintains cross currency swap hedging agreements for US $ 132 million in order to mitigate foreign exchange risks related to US dollar - denominated debt . The adjusted debt in soles considering the exchange rate of the cross currency swap hedging agreements amounts to S/ 1 , 212 . 9 million (equivalent to US $ 313 . 7 million) . As of June 30 , 2021 , Net Adjusted Debt/EBITDA 3 ratio was 1 . 9 times . Capex Capex (i n m illi on s o f So l e s S / ) As of June 30 , 2021 , the Company invested S/ 32 . 6 million (US $ 8 . 4 million), allocated to the following projects : 3 It is calculated by taking the Adjusted Debt in soles, according to the exchange rate set for the bonds in dollars, minus the consolidated cash, and this amount is divided by the cement EBITDA of the last 12 months. 1 - 3 Years 3 Less than 1 year 22 8 Indebtedness Future interest payments Total Payments due by period Projects 6M21 Pacasmayo Plant Projects 7.9 Concrete and aggregates equipment 13.8 Rioja Plant Projects 5.0 Piura Plant Projects 5.9 Total 32.6 16

Second Quarter 2021 Earnings Release About Cementos Pacasmayo S . A . A . Cementos Pacasmayo S . A . A . is a cement company, located in the Northern region of Peru . In February 2012 , the Company’s shares were listed on The New York Stock Exchange - Euronext under the ticker symbol "CPAC" . With more than 60 years of operating history, the Company produces, distributes and sells cement and cement - related materials, such ready - mix concrete and precast materials . Pacasmayo’s products are primarily used in construction, which has been one of the fastest - growing segments of the Peruvian economy in recent years . The Company also produces and sells quicklime for use in mining operations . For more information, please visit : http : //www . cementospacasmayo . com . pe/ Note : The Company presented some figures converted from Soles to U . S . Dollars for comparison purposes . The exchange rate used to convert Soles to U . S . dollars was S/ 3 . 858 per US $ 1 . 00 , which was the average exchange rate, reported as of June 30 , 2021 by the Superintendencia de Banca, Seguros y AFP’s (SBS) . The information presented in U . S . dollars is for the convenience of the reader only . Certain figures included in this report have been subject to rounding adjustments . Accordingly, figures shown as totals in certain tables may not be arithmetic aggregations of the figures presented in previous quarters . 17 This press release may contain forward - looking statements. These statements are statements that are not historical facts, and are based on management’s current view and estimates of future economic circumstances, industry conditions, Company performance and financial results. Also, certain reclassifications have been made to make figures comparable for the periods. The words “anticipates”, “believes”, “estimates”, “expects”, “plans” and similar expressions, as they relate to the Company, are intended to identify forward - looking statements. Statements regarding the declaration or payment of dividends, the implementation of principal operating and financing strategies and capital expenditure plans, the direction of future operations and the factors or trends affecting financial condition, liquidity or results of operations are examples of forward - looking statements. Such statements reflect the current views of management and are subject to a number of risks and uncertainties. There is no guarantee that the expected events, trends or results will actually occur. The statements are e based on many assumptions and factors, including general economic and market conditions, industry conditions, and operating factors. Any changes in such assumptions or factors could cause actual results to differ materially from currentexpectations.
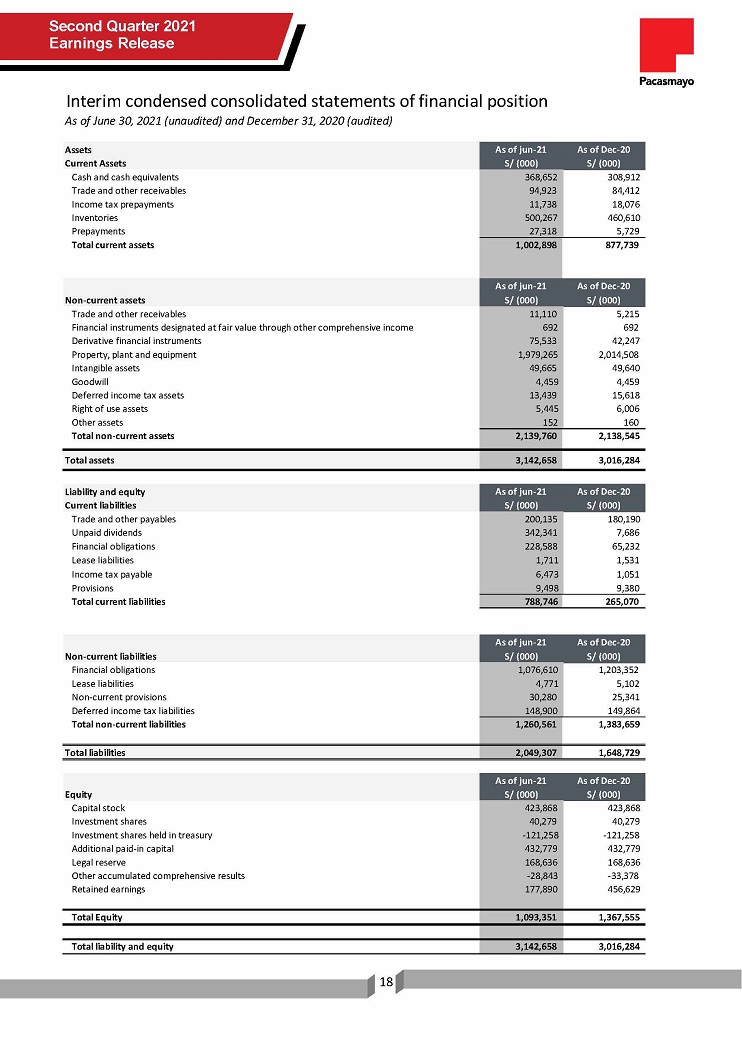
Second Quarter 2021 Earnings Release Assets C u rr e n t A ss e t s As of jun - 21 S/ (000) As of Dec - 20 S/ (000) Cash and cash equivalents 368,652 308,912 Trade and other receivables 94,923 84,412 Income tax prepayments 11,738 18,076 Inventories 500,267 460,610 Prepayments 27,318 5,729 Total current assets 1,002,898 877,739 Non - current assets As of jun - 21 S/ (000) As of Dec - 20 S/ (000) Trade and other receivables 11,110 5,215 Financial instruments designated at fair value through other comprehensive income 692 692 Derivative financial instruments 75,533 42,247 Property, plant and equipment 1,979,265 2,014,508 Intangible assets 49,665 49,640 Goodwill 4,459 4,459 Deferred income tax assets 13,439 15,618 Right of use assets 5,445 6,006 Other assets 152 160 Total non - current assets 2,139,760 2,138,545 T o t al a ss e t s 3,142,658 3,016,284 18 Liability and equity Current liabilities As of jun - 21 S/ (000) As of Dec - 20 S/ (000) Trade and other payables 200,135 180,190 U np a i d d ivi d e n d s 342,341 7,686 Financial obligations 228,588 65,232 Lease liabilities 1,711 1,531 Income tax payable 6,473 1,051 Provisions 9,498 9,380 Total current liabilities 788,746 265,070 Non - current liabilities As of jun - 21 S/ (000) As of Dec - 20 S/ (000) Financial obligations 1,076,610 1,203,352 Lease liabilities 4,771 5,102 Non - current provisions 30,280 25,341 Deferred income tax liabilities 148,900 149,864 Total non - current liabilities 1,260,561 1,383,659 Total liabilities 2,049,307 1,648,729 Equity As of jun - 21 S/ (000) As of Dec - 20 S/ (000) Capital stock 423,868 423,868 Investment shares 40,279 40,279 Investment shares held in treasury - 121,258 - 121,258 Additional paid - in capital 432,779 432,779 Legal reserve 168,636 168,636 Other accumulated comprehensive results - 28,843 - 33,378 R et a i n ed e a r n i ng s 177,890 456,629 T o t al E qu i t y 1,093,351 1,367,555 Total liability and equity 3,142,658 3,016,284 Interim condensed consolidated statements of financial position As of June 30, 2021 (unaudited) and December 31, 2020 (audited)

Second Quarter 2021 Earnings Release 2Q21 2Q20 6M21 6M20 S/ (000) S/ (000) S/ (000) S/ (000) 19 Interim condensed consolidated statements of profit or loss For the three and six - month periods ended June 30, 2021 and June 30, 2020 (unaudited) Sales of goods 440,923 114,345 905,728 413,603 Cost of sales - 324,522 - 112,203 - 656,101 - 319,450 Gross profit 116,401 2,142 249,627 94,153 Operating income (expenses) Administrative expenses - 47,213 - 33,263 - 94,302 - 73,578 Selling and distribution expenses - 14,172 - 8,268 - 28,355 - 21,993 Other operating income (expenses), net 1,107 - 848 429 - 644 Total operating expenses , net - 60,278 - 42,379 - 122,228 - 96,215 Operating profit 56,123 - 40,237 127,399 - 2,062 Other income (expenses) Finance income 279 1,163 780 1,697 Financial costs - 21,054 - 23,184 - 41,890 - 43,813 Cumulative net loss due on settlement of derivative financial instruments 0 0 - 1,569 0 Net profit for valuation of trading derivative financial instruments 45 1,445 500 4,391 Gain (loss) from exchange difference, net 3,967 - 2,746 417 - 6,896 Total other expenses, net - 16,763 - 23,322 - 41,762 - 44,621 Profit before income tax 39,360 - 63,559 85,637 - 46,683 Income tax expense - 11,696 18,010 - 26,172 11,858 Profit for the period 27,664 - 45,549 59,465 - 34,825 Earnings per share Basic profit for period attributable to equity holders of common shares and investment shares of the parent (S/ per share) 0.06 - 0.11 0.14 - 0.08

S ec ond Q u arter 2 0 21 Earnings Release Interim condensed consolidated statements of changes in equity For the six - month periods ended June 30, 2021 and June 30, 2020 (unaudited) C a p i t al s t o c k S/ (000) I n v e s t m e n t shares S/ (000) Treasury shares S/ (000) A dd i t i on al p a i d - in capital S/ (000) L e g al r e s e r v e S/ (000) o n f i n a n c i al instrumen des Attributable to equity holders of the parent Unrealized gain Balance of January 1, 2020 423,868 40,279 - 121,258 Profit for the period - - - Other comprehensive income - - Total comprehensive income - Balance as of June 30, 2020 423,86 8 Balance as of January 1, 2021 Profit for the period Ot h er c o m p r e h e n s iv e i n c o m e T o t al c omp r e h e n s i v e i n c om e Distribution of B