Exhibit 99.1

Cementos Pacasmayo S.A.A. Announces Consolidated Results for Third Quarter 2021
Lima, Peru, October 26, 2021 – Cementos Pacasmayo S.A.A. and subsidiaries (NYSE: CPAC; BVL: CPACASC1) (“the Company” or “Pacasmayo”) a leading cement company serving the Peruvian construction industry, announced today its consolidated results for the third quarter (“3Q21”) and the nine months (“9M21”) ended September 30, 2021. These results have been prepared in accordance with International Financial Reporting Standards (“IFRS”) and are stated in nominal Peruvian Soles (S/).
3Q21 Financial and Operational Highlights:
(All comparisons are to 3Q20, unless otherwise stated)
| ● | Sales volume of cement, concrete and precast increased 14.4%, continuing the positive trend from previous quarters. Bagged cement continues to be the biggest driver for growth, but concrete volumes performed very well this quarter as well. |
| ● | Revenues increased 24.5% primarily due to the increase in the sales volume of cement, concrete and precast, and to an increase in cement and concrete prices, in line with cost inflation. |
| ● | Consolidated EBITDA of S/ 117.3 million, a slight decrease, mainly due to the use of imported clinker needed to sustain the record levels of cement sales. |
| ● | Consolidated EBITDA margin of 23.1% a 6.5 percentage points decrease mainly due to the use of imported clinker mentioned above. If we compare to 2Q21, since we were already using imported clinker then, there is an improvement of 2.7 percentage points. |
| ● | Net income of S/ 42.1 million, a 6.9% decrease mainly due to lower operating income because of the cost increases mentioned above. However, if we compare to 2Q21, there is a significant improvement of 52%, mainly due to higher revenues and operating profit. |
| ● | Pacasmayo plant expansion – due to the significant increase in demand, and In line with our client centered vision, the Company has decided to invest US$ 70 million to produce an additional 600 thousand MT of cement per year in its Pacasmayo plant. This once more ratifies our commitment and confidence in the development of the country. |
9M21 Financial and Operational Highlights:
(All comparisons are to 9M20, unless otherwise stated)
| ● | Sales volume of cement, concrete and precast increased 49% mainly due to a significant recovery in demand after the halt in production and commercialization during 2Q20. |
| ● | Revenues increased 72.1%, primarily due the increased demand during 2021 and the halt in production during 2020 mentioned above. |
| | ● | Consolidated EBITDA of S/ 312.4 million; a 66.9% increase, primarily due to increased revenues during 2021, and higher costs due to the halt in production during 2020. |
| | ● | Consolidated EBITDA margin of 22.1%, 0.7 percentage points lower, mainly due to the use of imported clinker because of the significant increase in demand. |
 | 2 |  |
| ● | Net income of S/ 101.6 million, an increase over 100% mainly due to higher sales and a low comparative base because of a net loss during 2Q20 for the above-mentioned halt in production and commercialization. |
| | | Financial and Operating Results | |
| | | 3Q21 | | | 3Q20 | | | % Var. | | | 9M21 | | | 9M21 | | | % Var. | |
| Financial and Operating Results | | | | | | | | | | | | |
| Cement, concrete and precast shipments (MT) | | | 937.7 | | | | 819.7 | | | | 14.4 | % | | | 2,404.8 | | | | 1,614.4 | | | | 49.0 | % |
| | | | | | | | | | | | | | | | | | | | | | | | | |
| In millions of S/ | | | | | | | | | | | | | | | | | | | | | | | | |
| Sales of goods | | | 507.2 | | | | 407.4 | | | | 24.5 | % | | | 1,412.9 | | | | 821.0 | | | | 72.1 | % |
| Gross profit | | | 148.4 | | | | 131.1 | | | | 13.2 | % | | | 398.0 | | | | 225.3 | | | | 76.7 | % |
| Operating profit | | | 83.4 | | | | 85.8 | | | | -2.8 | % | | | 210.8 | | | | 83.8 | | | | N/R | |
| Net income | | | 42.1 | | | | 45.2 | | | | -6.9 | % | | | 101.6 | | | | 10.4 | | | | N/R | |
| Consolidated EBITDA | | | 117.3 | | | | 120.6 | | | | -2.7 | % | | | 312.4 | | | | 187.2 | | | | 66.9 | % |
| Gross Margin | | | 29.3 | % | | | 32.2 | % | | | -2.9 pp. | | | | 28.2 | % | | | 27.4 | % | | | 0.7 pp. | |
| Operating Margin | | | 16.4 | % | | | 21.1 | % | | | -4.7 pp. | | | | 14.9 | % | | | 10.2 | % | | | 4.7 pp. | |
| Net income Margin | | | 8.3 | % | | | 11.1 | % | | | -2.8 pp. | | | | 7.2 | % | | | 1.3 | % | | | 5.9 pp. | |
| Consolidated EBITDA Margin | | | 23.1 | % | | | 29.6 | % | | | -6.5 pp. | | | | 22.1 | % | | | 22.8 | % | | | -0.7 pp. | |
| | 3 | |
Management Comments
During this third quarter, we experienced a sustained positive trend in sales volume of bagged cement, despite the economic effects related to the political instability, which once again shows our resilience, and gives us confidence to believe that our results will remain very strong. As expected, the demand from infrastructure projects related to the reconstruction of the damage caused by El Niño executed under the government to government agreement with the UK have continued and accelerated. Precisely because of this substantial and sustained increase in demand, the Company has recently decided to invest an estimated US$ 70 million for the construction of a new kiln at the Pacasmayo Plant, which will increase the installed clinker production capacity by an estimated 600 thousand tons per year. The project execution period will be approximately 15 months. This decision is clearly framed within our client-centric vision and seeks to adequately meet current and future demand levels and reaffirms our commitment and confidence in the development of the country.
As we mentioned in our last report, during 2Q21 we experienced a slight decrease in cement, concrete and precast sales volume when looking at quarter-on-quarter results. This quarter, the trend was reversed, as 3Q21 sales of cement, concrete and precast increased 15.7% when compared to 2Q21. Although sales of bagged cement are, of course, a significant driver of this growth, we would like to highlight the growth in concrete sales, as it had a small setback last quarter due to the halt in private investment as a result of political instability. This quarter, year-on-year growth of concrete sales was 73%, with a very solid margin 12% margin. When looking at quarter-on-quarter results, there is still substantial growth of 21.2%, furthermore, if we look at margins, there has been an outstanding increase of 8.2 percentage points. The increase in both sales and margin is mainly explained by higher sales volumes and higher prices, both as a result of demand for reconstruction related projects. In terms of pricing, during this quarter we also decided to slowly but persistently increase prices, since they were at a low point after the lockdown in 2020 and the slow recovery afterwards. This, alongside higher prices from more complex types of cement for reconstruction projects, has allowed for the significant margin expansion, which we are confident will be sustainable for at least the next 6 months.
We are very proud to communicate that, for third consecutive year, we have been recognized as the leading Peruvian cement company on corporate reputation by Merco Empresas 2021. Additionally, this year we have improved 38 positions in this ranking, reaching 24th place overall. This achievement is the result of a combined and sustained effort by every member of our company. Last year, we began a process of change, looking to reinvent ourselves as a new Pacasmayo, with an innovative commercial focus, initiatives that are driven by our purpose and by strategic investments to adapt to the new virtual world, supported by the digitalization of our main processes. We are very pleased and grateful to our customers, consumers and workers for this recognition, which helps us reinforce our commitment to continue generating value and to improve our business in the most sustainable manner.
To sum up, this quarter has continued the very strong demand trend we have experienced for the past 12 months now. Although beneficial market conditions in the North cannot be denied, we are also confident that part of this success stems from the fact that we have been at the forefront of digitalization, always staying in touch with our final consumer and adapting as fast as possible to their changing needs. It is now our turn to operate in a highly volatile environment, but we strongly believe that we have the knowledge, tools and adaptability to deliver the best possible results.
| | 4 | |
Economic Overview 3Q20:
During 3Q21, Pedro Castillo became President of Peru, after a disputed election results. The confirmation of Castillo's triumph generated uncertainty and instability since Castillo represented a radical leftist party. With a platform of new constitution and more government intervention in the Peruvian economy, the extreme position of some members of the ruling Peru Libre party, and the appointment of some of them as members of its first cabinet, generated distrust and unease in the opposition in Congress. After sixty days of controversial announcements, actions, and statements, Prime Minister Guido Bellido resigned on October 6, and Mirtha Vásquez was appointed as the new Prime Minister. Although this designation shows some signs of moderation, mistrust remains due to the ideological and political position of the Prime Minister.
This first cabinet produced a significant increase in the risk index of Peru, with a historically high devaluation, a drop in the Lima Stock Exchange indexes, and an outflow of money oout of the country. The restructuring of the cabinet generated a drop in the price of the dollar in recent days, going from S/ 4.15 to S/ 3.97 per dollar. After some uncertainty regarding the permanence of Julio Velarde as President of the Central Bank of Peru (BCR for its Spanish abbreviation), his appointment was finally made official on October 2, which has brought greater tranquility.
In spite of this political turmoil, the Peruvian economy has continued its recovery from the effects of COVID-19. Exports will reach record numbers during 2021, which will in turn give a record on the positive account blance of Peru. However, expectations of private investment are still negative, according to BCR.
Regarding the construction sector, domestic cement consumption continued to grow at high rates in recent months due to self-construction and the high level of execution of investment projects. Public investment in 2021 and 2022 is expected to grow 20.0% and 4.5% respectively, as a result of higher spending on reconstruction works under the Government-to-Government Agreement with the United Kingdom, as well as Special Public Investment Projects and projects within the framework of the National Infrastructure Plan for Competitiveness.
In terms of GDP growth, although in Latin America, the Peruvian economy was the one that contracted the most in 2020, due to the strong impact of COVID-19 in the country and the restrictions to combat it, during 2021 it is the one with the fastest recovery. According to the BCR, a growth of 11.9% is expected for 2021, achieving a total recovery of the 11% decrease experienced in 2020, and a growth of 3.4% for 2022.
| | 5 | |
Peruvian Cement Industry Overview:
Pacasmayo, UNACEM and Cementos Yura mainly supply cement demand in Peru. Pacasmayo primarily supplies the northern region of Peru, while UNACEM supplies the central region and Cementos Yura the southern region.
The northern region of Peru, according to the Instituto Nacional de Estadística e Informática (INEI) and Apoyo Consultoría, represents approximately 28.9% of the country’s population and 14.9% of national Gross Domestic Product (“GDP”). Despite the country’s sustained growth over the last 10 years, Peru continues to have a significant housing deficit, estimated at 1.9 million households throughout the country as per the Ministry of Housing, Construction and Sanitation.
In Peru, the majority of cement is sold to a highly fragmented consumer base of individuals that tend to gradually buy bags of cement to build or to improve their homes, a segment the industry refers to as “self-construction”.
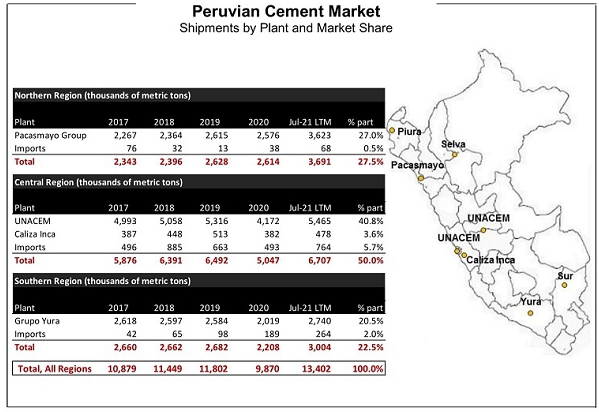
* Import figures are sourced from Aduanet. They represent quantities of imported cement, not shipped cement. Source: INEI, Aduanet |
| | 6 | |
Infrastructure Investment in the Area of Influence:
Reconstruction of the North
A boost in infrastructure is expected from the government’s reconstruction plan, now that the agreement between the Peruvian and UK government is under execution. This agreement includes an investment of S/ 7 billion in 2 years and includes 74 schools, 15 hospitals and integral solutions for 17 rivers, 5 brooks, and drainage of 7 Northern cities. This will have a significant impact on our cement shipments, as most of this budget is concentrated in our area of influence. There have been some delays in the execution of these projects, so the expected execution has been reduced to 35-40% by year-end.
Other projects
Although the anticipated increase in Peru’s large infrastructure projects has been delayed, this remains an important growth driver for the country and a necessity due to Peru’s significant infrastructure deficit. Although the progress of these projects has been slow, we have continued shipping cement to the ongoing projects, which are shown below, along with the potential demand for the next 5 years. During 3Q21, we finished shipping to the Talara Refinery, and the Salaverry Port continues until 1Q22.
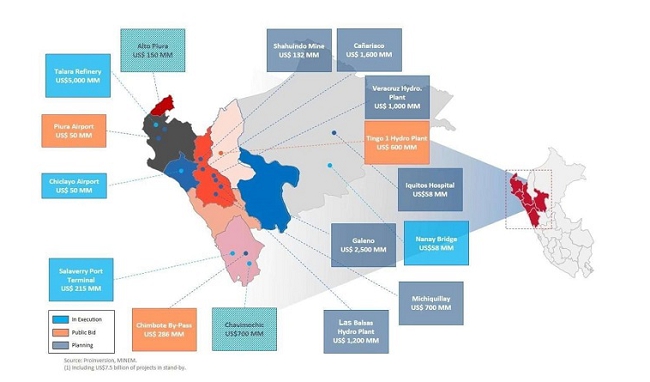
Source: Company filings, Proinversion, MINEM |
| | 7 | |
Operating Results:
Production:
Cement Production Volume
(thousands of metric tons)
| | | Production | |
| | | 3Q21 | | | 3Q20 | | | % Var. | | | 9M21 | | | 9M20 | | | % Var. | |
| Pacasmayo Plant | | | 517.9 | | | | 405.3 | | | | 27.8 | % | | | 1,495.1 | | | | 817.2 | | | | 83.0 | % |
| Rioja Plant | | | 85.3 | | | | 86.4 | | | | -1.3 | % | | | 259.8 | | | | 169.0 | | | | 53.7 | % |
| Piura plant | | | 333.4 | | | | 328.2 | | | | 1.6 | % | | | 971.1 | | | | 623.5 | | | | 55.7 | % |
| Total | | | 936.6 | | | | 819.9 | | | | 14.2 | % | | | 2,726.0 | | | | 1,609.7 | | | | 69.3 | % |
Cement production volume at the Pacasmayo plant increased 27.8% in 3Q21 compared to 3Q20, mainly due to the increase in bagged cement demand. During 9M21, cement production volume at the Pacasmayo plant increased 83.0%, mainly due to the significant increase in demand during 2021, and the low comparative base from 2020 because of the stop in production between March 16 and May 20, 2020.
Cement production volume at the Rioja Plant remained in line in 3Q21 compared to 3Q20. In 9M21, cement production volume at the Rioja plant increased 53.7%, compared to 9M20, mainly due to the above-mentioned halt in production during 2Q20.
Cement production volume at the Piura Plant in 3Q21 remained in line with 3Q20. During 9M21, cement production volume increased 55.7%, when compared to 9M20 mainly due to the stop in production mentioned above.
Total cement production volumes increased 14.2% in 3Q21 compared to 3Q20. During 9M21, total cement production volumes increased 69.3% compared to 9M20.
Clinker Production Volume
(thousands of metric tons)
| | | Production | |
| | | 3Q21 | | | 3Q20 | | | % Var. | | | 9M21 | | | 9M20 | | | % Var. | |
| Pacasmayo Plant | | | 249.7 | | | | 212.2 | | | | 17.7 | % | | | 642.6 | | | | 479.9 | | | | 33.9 | % |
| Rioja Plant | | | 65.0 | | | | 60.1 | | | | 8.2 | % | | | 198.0 | | | | 132.5 | | | | 49.5 | % |
| Piura Plant | | | 257.7 | | | | 117.4 | | | | N/R | | | | 630.3 | | | | 319.7 | | | | 97.2 | % |
| Total | | | 572.4 | | | | 389.7 | | | | 47.0 | % | | | 1,470.9 | | | | 932.1 | | | | 57.8 | % |
Clinker production volume at the Pacasmayo plant in 3Q21 increased 17.7% compared to 3Q20, and 33.9% in 9M21 compared to 9M20, in line with increased cement demand.
Clinker production volume at the Rioja plant increased 8.2% in 3Q21 compared to 3Q20 and 49.5% in 9M21 compared to 9M20, in line with increased cement demand.
Clinker production volume at the Piura plant increased over 100% in 3Q21, mainly due to the decision to use inventories during 3Q20. In 9M20, clinker production volume at the Piura plant increased 97.2% when compared to 9M20, mainly due to the significant increase in demand during 2021, and the halt in production mentioned above, as well as the consumption of existing inventories.
| | 8 | |
Quicklime Production Volume
(thousands of metric tons)
| | | Production | |
| | | 3Q21 | | | 3Q20 | | | % Var. | | | 9M21 | | | 9M20 | | | % Var. | |
Pacasmayo Plant
| | | 18.8 | | | | 10.1 | | | | 86.1 | % | | | 45.7 | | | | 38.3 | | | | 19.3 | % |
Quicklime production volume increased 86.1% in 3Q21 compared to 3Q20, mainly due to high production levels this quarters due to our annual production plan. Quicklime production volume increased 19.3% in 9M21 compared to 9M20, mainly due to increased demand.
Installed Capacity:
Installed Cement and Clinker Capacity
Full year installed cement capacity at the Pacasmayo, Piura and Rioja plants remained stable at 2.9 million MT, 1.6 million MT and 440,000 MT, respectively.
Full year installed clinker capacity at the Pacasmayo, Piura and Rioja plants remained stable at 1.5 million MT, 1.0 million MT and 280,000 MT, respectively.
Full year installed quicklime capacity at the Pacasmayo plant remained stable at 240,000 MT.
Utilization Rate1:
Pacasmayo Plant Utilization Rate
| | | Utilization Rate | |
| | | 3Q21 | | | 3Q20 | | | % Var. | | | 9M21 | | | 9M20 | | | % Var. | |
| Cement | | | 71.4 | % | | | 55.9 | % | | | 15.5 pp. | | | | 68.7 | % | | | 37.6 | % | | | 31.1 pp. | |
| Clinker | | | 66.6 | % | | | 56.6 | % | | | 10.0 pp. | | | | 57.1 | % | | | 42.7 | % | | | 14.4 pp. | |
| Quicklime | | | 31.3 | % | | | 16.8 | % | | | 14.5 pp. | | | | 25.4 | % | | | 21.3 | % | | | 4.1 pp. | |
Cement production utilization rate at the Pacasmayo plant increased 15.5 percentage points in 3Q21 when compared to 3Q20, and 31.1 percentage points in 9M21 compared to 9M20, mainly due to the increase in cement demand mentioned above.
Clinker production utilization rate in 3Q21 increased 10 percentage points when compared to 3Q20 and 14.4 percentage points in 9M21 compared to 9M20, mainly due increased cement demand and lower clinker production in 2Q20 due to the halt in production.
Additionally, the quicklime production utilization rate increased 14.5 percentage points during 3Q21 compared to 3Q20 and 4.1 percentage points in 9M21 compared to 9M20, in line with increased demand.
| 1 | The utilization rates are calculated by dividing production in a given period over installed capacity. The utilization rate implies annualized production, which is calculated by multiplying real production for each quarter by four. |
| | 9 | |
Rioja Plant Utilization Rate
| | | Utilization Rate | |
| | | 3Q21 | | | 3Q20 | | | % Var. | | | 9M21 | | | 9M20 | | | % Var. | |
| Cement | | | 77.6 | % | | | 78.5 | % | | | -0.9 pp. | | | | 78.7 | % | | | 51.2 | % | | | 27.5 pp. | |
| Clinker | | | 92.9 | % | | | 85.9 | % | | | 7.0 pp. | | | | 94.3 | % | | | 63.1 | % | | | 31.2 pp. | |
The cement production utilization rate at the Rioja plant was 77.6% in 3Q21; in line with 3Q20. In 9M21, cement production utilization rate was 78.7%; a 27.5 percentage point increase as compared to 9M20, mainly due to the decreased production during 2Q20 because of government mandated measures to fight against the spread of COVID-19.
The clinker production utilization rate at the Rioja plant was 92.9% in 3Q21 and 94.3% in 9M21; 7.0 percentage points and 31.2 percentage points higher than 3Q20 and 9M20 respectively, mainly due to increased demand during 2021, as well as the lower production due to the above-mentioned halt in production during 2020.
Piura Plant Utilization Rate
| | | Utilization Rate | |
| | | 3Q21 | | | 3Q20 | | | % Var. | | | 9M21 | | | 9M20 | | | % Var. | |
| Cement | | | 83.3 | % | | | 82.1 | % | | | 1.2 pp. | | | | 80.9 | % | | | 52.0 | % | | | 28.9 pp. | |
| Clinker | | | 100.0 | % | | | 47.0 | % | | | 53.0 pp. | | | | 84.0 | % | | | 42.6 | % | | | 41.4 pp. | |
The cement production utilization rate at the Piura plant was 83.3% in 3Q21, a 1.2 percentage point increase when compared to 3Q20. During 9M21, the cement production utilization rate was 80.9%, a 28.9 percentage points increase when compared to 9M20, mainly due to sustained demand increase during 2021, as well as to the low comparative base of 2020 due to the government-mandated state of emergency resulting in the halt in production for over 2 months during 2Q20.
The clinker production utilization rate at the Piura plant was 100% in 3Q21, mainly due to increased cement demand, as well as to the fact that during 3Q20, we only restarted clinker production during the second half of the quarter after we consumed our existing inventories. In 9M21, our utilization rate was 84%; 41.4 percentage points higher than 9M20, mainly due increased demand and to the stop in production during 2Q20 mentioned above.
Consolidated Utilization Rate
| | | Utilization Rate | |
| | | 3Q21 | | | 3Q20 | | | % Var. | | | 9M21 | | | 9M20 | | | % Var. | |
| Cement | | | 75.8 | % | | | 66.4 | % | | | 9.4 pp. | | | | 73.6 | % | | | 43.4 | % | | | 30.2 pp. | |
| Clinker | | | 82.4 | % | | | 56.1 | % | | | 26.3 pp. | | | | 70.5 | % | | | 44.7 | % | | | 25.8 pp. | |
The consolidated cement production utilization rate was 75.8% in 3Q21, and 73.6% in 9M21, 9.4 percentage points and 30.2 percentage points when compared to 3Q20 and 9M20 respectively, mainly due to the increase in cement production to satisfy demand, as well as to lower production rates in 2Q20 due to the halt in production.
The consolidated clinker production utilization rate was 82.4% in 3Q21 and 70.5% in 9M21; 26.3 percentage points and 25.8 percentage points higher than in 3Q20 and 9M20 respectively, mainly due to the increase in cement demand during 2021, and to the halt in clinker production during 2Q20, as well as the Company’s decision to consume existing inventories before restarting production.
| | 10 | |
Financial Results:
Income Statement:
The following table shows a summary of the Consolidated Financial Results:
Consolidated Financial Results
(in millions of Soles S/)
| | | Income Statement | |
| | | 3Q21 | | | 3Q20 | | | % Var. | | | 9M21 | | | 9M20 | | | % Var. | |
| Sales of goods | | | 507.2 | | | | 407.4 | | | | 24.5 | % | | | 1,412.9 | | | | 821.0 | | | | 72.1 | % |
| Gross Profit | | | 148.4 | | | | 131.1 | | | | 13.2 | % | | | 398.0 | | | | 225.3 | | | | 76.7 | % |
| Total operating expenses, net | | | -65.0 | | | | -45.3 | | | | 43.5 | % | | | -187.2 | | | | -141.5 | | | | 32.3 | % |
| Operating Profit | | | 83.4 | | | | 85.8 | | | | -2.8 | % | | | 210.8 | | | | 83.8 | | | | N/R | |
| Total other expenses, net | | | -22.2 | | | | -23.3 | | | | -4.7 | % | | | -64.0 | | | | -67.9 | | | | -5.7 | % |
| Profit before income tax | | | 61.2 | | | | 62.5 | | | | -2.1 | % | | | 146.9 | | | | 15.9 | | | | N/R | |
| Income tax expense | | | -19.1 | | | | -17.4 | | | | 9.8 | % | | | -45.3 | | | | -5.5 | | | | N/R | |
| Profit for the period | | | 42.1 | | | | 45.2 | | | | -6.9 | % | | | 101.6 | | | | 10.4 | | | | N/R | |
During 3Q21, revenues increased 24.5% year-on-year mainly due to increased sales volume due to increased cement demand, as well as a recovery in concrete sales volume, and a slight increase in the price of cement, in line with increased cost inflation. Gross profit increased 13.2% in 3Q21 compared to 3Q20, mainly due to higher sales. Operating profit during 3Q21 decreased slightly to S/ 83.4 million, mainly due increased workers profit sharing, in line with increased income tax base, as well as increased COVID-19 related expenses to comply with protocols to ensure the safety of our workers, as well as software and licenses, training and workers’ compensation. It is also important to note that, administrative expenses during 2Q20 were low due to budget restrictions after the halt in production and commercialization. Profit for the period decreased 6.9% in 3Q21 compared to 3Q20, primarily due to lower operating profit for the above mentioned reasons.
During 9M21, revenues increased 72.1%, mainly due to increased sales volume and price during 2021, as well as lower comparative basis in 2020 due to the halt in commercialization from March 16 until mid-May, to fight against the spread of COVID-19. Gross profit increased 76.7%, mainly due to increased revenues. Profit for the period increased significantly, due to higher revenues and to a low comparative base in 2020 due to negative net income during 2Q20 because of the halt in operations, which resulted in lower operating profit, as well as a slight increase in financial expenses derived from increased interest expenses from short-term loans to cover working capital.
Sales of Goods
The following table shows the Sales of Goods and their respective margins by business segment:
Sales: cement, concrete and precast
(in millions of Soles S/)
| | | Cement, concrete and precasts | |
| | | 3Q21 | | | 3Q20 | | | % Var. | | | 9M21 | | | 9M20 | | | % Var. | |
| Sales of goods | | | 469.1 | | | | 368.1 | | | | 27.3 | % | | | 1,305.2 | | | | 747.9 | | | | 74.5 | % |
| Cost of Sales | | | -322.1 | | | | -239.9 | | | | 34.3 | % | | | -911.9 | | | | -527.0 | | | | 73.0 | % |
| Gross Profit | | | 147.0 | | | | 128.2 | | | | 14.7 | % | | | 393.3 | | | | 220.9 | | | | 78.0 | % |
| Gross Margin | | | 31.3 | % | | | 34.8 | % | | | -3.5 pp. | | | | 30.1 | % | | | 29.5 | % | | | 0.6 pp. | |
Sales of cement, concrete and precast increased 27.3% during 3Q21 when compared to 3Q20, mainly due to increased sales of cement and concrete during this quarter, as well as an increase in the price of cement. Gross margin decreased 3.5 percentage points during 3Q21 compared to 3Q20 mainly due to the use of imported clinker because of the sharp increase in demand.
| | 11 | |
During 9M21, net sales of cement, concrete and precast increased 74.5%, mainly due the increase in sales mentioned above, as well as unusually low revenues during 2Q20 because of the halt in production and commercialization. Gross margin increased slightly, mainly due to increased sales, partially offset by higher costs mainly derived from the use of imported clinker.
Sales of cement represented 85.6% of cement, concrete and precast sales during 3Q21.
| | | Cement | |
| | | 3Q21 | | | 3Q20 | | | % Var. | | | 9M21 | | | 9M20 | | | % Var. | |
| Sales of goods | | | 401.6 | | | | 325.9 | | | | 23.2 | % | | | 1,124.0 | | | | 651.6 | | | | 72.5 | % |
| Cost of Sales | | | -261.9 | | | | -202.1 | | | | 29.6 | % | | | -746.1 | | | | -428.5 | | | | 74.1 | % |
| Gross Profit | | | 139.7 | | | | 123.8 | | | | 12.8 | % | | | 377.9 | | | | 223.1 | | | | 69.4 | % |
| Gross Margin | | | 34.8 | % | | | 38.0 | % | | | -3.2 pp. | | | | 33.6 | % | | | 34.2 | % | | | -0.6 pp. | |
Sales of cement increased 23.2% in 3Q21 compared to 3Q20, mainly due to increased demand from the self-construction segment and some from infrastructure projects relations to the reconstruction of the North. Gross margin decreased, 3.2 percentage points, mainly due to increased costs from the use of imported clinker.
During 9M21 cement sales increased 72.5% compared to 9M20, and gross margin remained in line with 9M20, mainly due to the halt in production during 2Q20 mentioned above.
Sales of concrete represented 12% of cement, concrete and precast sales during 3Q21.
| | | Concrete | |
| | | 3Q21 | | | 3Q20 | | | % Var. | | | 9M21 | | | 9M20 | | | % Var. | |
| Sales of goods | | | 56.5 | | | | 32.7 | | | | 72.8 | % | | | 155.3 | | | | 75.2 | | | | 106.5 | % |
| Cost of Sales | | | -49.7 | | | | -29.9 | | | | 66.2 | % | | | -142.4 | | | | -78.5 | | | | 81.4 | % |
| Gross Profit | | | 6.8 | | | | 2.8 | | | | N/R | | | | 12.9 | | | | -3.3 | | | | N/R | |
| Gross Margin | | | 12.0 | % | | | 8.6 | % | | | 3.4 pp. | | | | 8.3 | % | | | -4.4 | % | | | 12.7 pp. | |
Sales of concrete increased 72.8% during 3Q21 compared to 3Q20, mainly due to increased sales volume for reconstruction related projects, as well as an increase in price. During 9M21, sales of concrete increased 106.5% compared to 9M20, mainly due to the sharp increase in sales during this quarter, as well as the low comparative base due to the complete stop in sales during 2Q20.
Gross margin increased 3.4 percentage points in 3Q21 compared to 3Q20, mainly due to operational efficiencies from higher volumes, and higher prices. In 9M21, gross margin increased 12.7 percentage points compared to 9M20, mainly due to higher dilution fixed costs because of higher sales.
Sales of precast represented 2.4% of cement, concrete and precast sales during 3Q21.
| | | Precast | |
| | | 3Q21 | | | 3Q20 | | | % Var. | | | 9M21 | | | 9M20 | | | % Var. | |
| Sales of goods | | | 11.0 | | | | 9.5 | | | | 15.8 | % | | | 26.0 | | | | 21.0 | | | | 23.8 | % |
| Cost of Sales | | | -10.5 | | | | -7.9 | | | | 32.9 | % | | | -23.4 | | | | -20.0 | | | | 17.0 | % |
| Gross Profit | | | 0.5 | | | | 1.6 | | | | -68.8 | % | | | 2.6 | | | | 1.0 | | | | N/R | |
| Gross Margin | | | 4.5 | % | | | 16.8 | % | | | -12.3 pp. | | | | 10.0 | % | | | 4.8 | % | | | 5.2 pp. | |
| | 12 | |
During 3Q21, precast sales increased 15.8% compared to 3Q20, and 23.8% in 9M21 when compared to 9M20, mainly due to increased sales of light precast products, such as blocks and pavement, for reconstruction-related projects.
Gross margin during 3Q21 decreased 12.3 percentage points, mainly due sales mix, as we sold higher margin products during 3Q20. However gross margin during 9M21, increased 5.2 percentage points.
Sales: Quicklime
(in millions of Soles S/)
| | | Quicklime | |
| | | 3Q21 | | | 3Q20 | | | % Var. | | | 9M21 | | | 9M20 | | | % Var. | |
| Sales of goods | | | 7.9 | | | | 9.0 | | | | -12.2 | % | | | 24.0 | | | | 22.2 | | | | 8.1 | % |
| Cost of Sales | | | -6.6 | | | | -7.5 | | | | -12.0 | % | | | -21.1 | | | | -19.6 | | | | 7.7 | % |
| Gross Profit | | | 1.3 | | | | 1.5 | | | | -13.3 | % | | | 2.9 | | | | 2.6 | | | | 11.5 | % |
| Gross Margin | | | 16.5 | % | | | 16.7 | % | | | -0.2 pp. | | | | 12.1 | % | | | 11.7 | % | | | 0.4 pp. | |
During 3Q21, quicklime sales decreased 12.2%, mainly due to decreased demand in the first part of the quarter, partially offset by higher sales towards the end, which will continue during 4Q21. During 9M21, quicklime sales increased 8.1%, mainly due to higher sales volume.
Gross margin remained flat in 3Q21 and 9M21 when compared to 3Q20 and 9M20 respectively.
Sales: Construction Supplies2
(in millions of Soles S/)
| | | Construction Supplies | |
| | | 3Q21 | | | 3Q20 | | | % Var. | | | 9M21 | | | 9M20 | | | % Var. | |
| Sales of goods | | | 30.2 | | | | 29.9 | | | | 1.0 | % | | | 83.5 | | | | 50.2 | | | | 66.3 | % |
| Cost of Sales | | | -29.5 | | | | -28.3 | | | | 4.2 | % | | | -81.1 | | | | -48.0 | | | | 69.0 | % |
| Gross Profit | | | 0.7 | | | | 1.6 | | | | -56.3 | % | | | 2.4 | | | | 2.2 | | | | 9.1 | % |
| Gross Margin | | | 2.3 | % | | | 5.4 | % | | | -3.1 pp. | | | | 2.9 | % | | | 4.4 | % | | | -1.5 pp. | |
During 3Q21, construction supply sales were in line with 3Q20. During 9M21, construction supplies sales increased 66.3% compared to 9M20, mainly due unusually low sales during 2Q20 because of the state of emergency and subsequent halt in commercialization as previously mentioned.
Gross margin decreased 3.1 percentage points in 3Q21 and 1.5 percentage point in 9M21 when compared to 3Q20 and 9M20 respectively, mainly due to exchange rate effects that affected the cost of imported materials such as steel rebars.
| 2 | Construction supplies include the following products: steel rebar, wires, nails, corrugated iron, electric conductors, plastic tubes and accessories, among others. |
| | 13 | |
Operating Expenses:
Administrative Expenses
(in millions of Soles S/)
| | | Administrative expenses | |
| | | 3Q21 | | | 3Q20 | | | % Var. | | | 9M21 | | | 9M20 | | | % Var. | |
| Personnel expenses | | | 26.4 | | | | 17.5 | | | | 50.9 | % | | | 73.3 | | | | 51.3 | | | | 42.9 | % |
| Third-party services | | | 14.3 | | | | 9.6 | | | | 49.0 | % | | | 40.9 | | | | 30.9 | | | | 32.4 | % |
| Board of directors | | | 1.9 | | | | 1.3 | | | | 46.2 | % | | | 5.0 | | | | 4.9 | | | | 2.0 | % |
| Depreciation and amortization | | | 4.2 | | | | 4.3 | | | | -2.3 | % | | | 12.4 | | | | 12.4 | | | | - | |
| Other | | | 3.9 | | | | 3.4 | | | | 14.7 | % | | | 13.4 | | | | 10.3 | | | | 30.1 | % |
| Total | | | 50.7 | | | | 36.1 | | | | 40.4 | % | | | 145.0 | | | | 109.8 | | | | 32.1 | % |
Administrative expenses increased 40.4% in 3Q21 compared to 3Q20 and 32.1% in 9M21 compared to 9M20, mainly due to an increased workers profit sharing, in line with increased income tax base, as well as increased third-party services, mainly COVID-19 related expenses to comply with protocols to ensure the safety of our workers, software and licenses, training and workers’ compensation. It is also important to note that, administrative expenses during 2Q20 were low due to budget restrictions after the halt in production and commercialization.
Selling Expenses
(in millions of Soles S/)
| | | Selling and distribution expenses | |
| | | 3Q21 | | | 3Q20 | | | % Var. | | | 9M21 | | | 9M20 | | | % Var. | |
| Personnel expenses | | | 8.5 | | | | 6.4 | | | | 32.8 | % | | | 25.0 | | | | 18.9 | | | | 32.3 | % |
| Advertising and promotion | | | 2.4 | | | | 1.3 | | | | 84.6 | % | | | 7.6 | | | | 3.7 | | | | N/R | |
| Other | | | 3.3 | | | | 1.7 | | | | 94.1 | % | | | 10.0 | | | | 8.8 | | | | 13.6 | % |
| Total | | | 14.2 | | | | 9.4 | | | | 51.1 | % | | | 42.6 | | | | 31.4 | | | | 35.7 | % |
Selling expenses increased 51.1% in 3Q21 compared to 3Q20, and 35.7% in 9M21 compared to 9M20, mainly due to an increase in variable salaries and advertising and promotion, in line with increased sales.
| | 14 | |
EBITDA Reconciliation:
Consolidated EBITDA
(in millions of Soles S/)
| | | Consolidated EBITDA | |
| | | 3Q21 | | | 3Q20 | | | Var %. | | | 9M21 | | | 9M20 | | | Var %. | |
| Net Income | | | 42.1 | | | | 45.2 | | | | -6.9 | % | | | 101.6 | | | | 10.4 | | | | N/R | |
| + Income tax expense | | | 19.1 | | | | 17.4 | | | | 9.8 | % | | | 45.3 | | | | 5.5 | | | | N/R | |
| - Finance income | | | -1.5 | | | | -0.7 | | | | N/R | | | | -2.3 | | | | -2.4 | | | | -4.2 | % |
| + Finance costs | | | 24.4 | | | | 23.2 | | | | 5.2 | % | | | 66.3 | | | | 67.0 | | | | -1.0 | % |
| +/- Gain on the valuation of trading derivative financial instrument | | | -0.1 | | | | -0.6 | | | | -83.3 | % | | | 0.9 | | | | -5.0 | | | | N/R | |
| +/- Net loss from exchange rate | | | -0.6 | | | | 1.4 | | | | N/R | | | | -0.9 | | | | 8.4 | | | | N/R | |
| + Depreciation and amortization | | | 33.9 | | | | 34.7 | | | | -2.3 | % | | | 101.5 | | | | 103.3 | | | | -1.7 | % |
| Consolidated EBITDA | | | 117.3 | | | | 120.6 | | | | -2.7 | % | | | 312.4 | | | | 187.2 | | | | 66.9 | % |
Consolidated EBITDA decreased 2.7% in 3Q21 compared to 3Q20, mainly due to higher use of imported clinker to satisfy the substantial increase in demand. During 9M21, consolidated EBITDA increased 66.9% compared to 9M20, mainly due to higher revenues and to the lower comparative base in 2020 due to negative EBITDA during 2Q20 because of the government-mandated state of emergency declared to prevent the spread of COVID-19, which effectively stopped production and commercialization for over 2 months. This also resulted in higher costs from a lower dilution of fixed costs.
| | 15 | |
Cash and Debt Position:
Cash:
Consolidated Cash
(in millions of Soles S/)
As of September 30, 2021, the Company’s cash position was S/ 298.9 million (US$ 72.3 million). This balance includes cash deposits for S/ 67.2 million (US$ 16.3 million), distributed as follows:
Certificates of deposits in Soles
| Bank | | Amount (S/) | | | Interest Rate | | | Initial Date | | | Maturity Date | |
| Banco de Crédito del Perú | | | S/23.0 | | | | 0.60 | % | | | September 30th, 2021 | | | | October 4th, 2021 | |
| Banco de Crédito del Perú | | | S/7.0 | | | | 0.60 | % | | | September 30th, 2021 | | | | October 7th, 2021 | |
| | | | | | | | | | | | | | | | | |
| | | | S/30.0 | | | | | | | | | | | | | |
Certificates of deposits in US Dollars
| Bank | | Amount (USD) | | | Interest Rate | | | Initial Date | | | Maturity Date | |
| Banco de Crédito del Perú | | | USD 8.0 | | | | 0.22 | % | | | September 30th, 2021 | | | | October 4th, 2021 | |
| Banco de Crédito del Perú | | | USD 1.0 | | | | 0.22 | % | | | September 30th, 2021 | | | | October 7th, 2021 | |
The remaining balance of S/ 231.7 million (US$ 56 million) is held mainly in the Company’s bank accounts, of which US$ 51.9 million are denominated in US dollars and the difference in Soles.
| | 16 | |
Debt Position:
Consolidated Debt
(in millions of Soles S/)
Below are the contractual obligations with payment deadlines related to the Company’s debt, including interest.
| | | Payments due by period | |
| | | Less than
1 year | | | 1-3 Years | | | 3-5 Years | | | More than
5 Years | | | Total | |
| Indebtedness | | | 233.4 | | | | 634.3 | | | | - | | | | 570.0 | | | | 1,437.7 | |
| Future interest payments | | | 65.5 | | | | 93.6 | | | | 77.2 | | | | 154.9 | | | | 391.2 | |
| Total | | | 298.9 | | | | 727.9 | | | | 77.2 | | | | 724.9 | | | | 1,828.9 | |
As of September 30, 2021, the Company’s total outstanding debt reached S/ 1,565.8 million (equivalent to US$ 378.6 million). This debt is primarily composed by the outstanding part of the international bond issued in February 2013, the two issuances of the local bond issued in January 2019 and short-term loans.
As of September 30, 2021, the Company maintains cross currency swap hedging agreements for US$ 132 million in order to mitigate foreign exchange risks related to US dollar-denominated debt. The adjusted debt in soles considering the exchange rate of the cross currency swap hedging agreements amounts to 1,437.7 million (equivalent to US$ 347.6 million).
As of September 30, 2021, Net Adjusted Debt/EBITDA ratio was 2.6 times.
Capex
Capex
(in millions of Soles S/)
As of September 30, 2021, the Company invested S/ 48.9 million (US$ 11.8 million), allocated to the following projects:
| Projects | | 9M21 | |
| Concrete and aggregates equipment | | | 19.7 | |
| Pacasmayo Plant Projects | | | 11.5 | |
| Piura Plant Projects | | | 11.2 | |
| Rioja Plant Projects | | | 6.5 | |
| Total | | | 48.9 | |
| | 17 | |
About Cementos Pacasmayo S.A.A.
Cementos Pacasmayo S.A.A. is a cement company, located in the Northern region of Peru. In February 2012, the Company’s shares were listed on The New York Stock Exchange - Euronext under the ticker symbol "CPAC". With more than 65 years of operating history, the Company produces, distributes and sells cement and cement-related materials, such ready-mix concrete and precast materials. Pacasmayo’s products are primarily used in construction, which has been one of the fastest-growing segments of the Peruvian economy in recent years. The Company also produces and sells quicklime for use in mining operations.
For more information, please visit: http://www.cementospacasmayo.com.pe/
Note: The Company presented some figures converted from Soles to U.S. Dollars for comparison purposes. The exchange rate used to convert Soles to U.S. dollars was S/ 4.136 per US$ 1.00, which was the average exchange rate, reported as of September 30, 2021 by the Superintendencia de Banca, Seguros y AFP’s (SBS). The information presented in U.S. dollars is for the convenience of the reader only. Certain figures included in this report have been subject to rounding adjustments. Accordingly, figures shown as totals in certain tables may not be arithmetic aggregations of the figures presented in previous quarters.
This press release may contain forward-looking statements. These statements are statements that are not historical facts, and are based on management’s current view and estimates of future economic circumstances, industry conditions, Company performance and financial results. Also, certain reclassifications have been made to make figures comparable for the periods. The words “anticipates”, “believes”, “estimates”, “expects”, “plans” and similar expressions, as they relate to the Company, are intended to identify forward-looking statements. Statements regarding the declaration or payment of dividends, the implementation of principal operating and financing strategies and capital expenditure plans, the direction of future operations and the factors or trends affecting financial condition, liquidity or results of operations are examples of forward-looking statements. Such statements reflect the current views of management and are subject to a number of risks and uncertainties. There is no guarantee that the expected events, trends or results will actually occur. The statements are based on many assumptions and factors, including general economic and market conditions, industry conditions, and operating factors. Any changes in such assumptions or factors could cause actual results to differ materially from current expectations. |
| | 18 | |
Interim condensed consolidated statements of financial position
As of September 30, 2021 (unaudited) and December 31, 2020 (audited)
| Assets | | As of sep-21 | | | As of Dec-20 | |
| Current Assets | | S/ (000) | | | S/ (000) | |
| Cash and cash equivalents | | | 298,914 | | | | 308,912 | |
| Trade and other receivables | | | 126,922 | | | | 84,412 | |
| Income tax prepayments | | | 12,247 | | | | 18,076 | |
| Inventories | | | 508,058 | | | | 460,610 | |
| Prepayments | | | 25,671 | | | | 5,729 | |
| | | | | | | | | |
| Total current assets | | | 971,812 | | | | 877,739 | |
| | | As of sep-21 | | | As of Dec-20 | |
| Non-current assets | | S/ (000) | | | S/ (000) | |
| Miscellaneous receivables, net | | | 22,446 | | | | 5,215 | |
| Financial instruments designated at fair value through other comprehensive income | | | 692 | | | | 692 | |
| Derivative financial instruments | | | 123,489 | | | | 42,247 | |
| Property, plant and equipment | | | 1,961,765 | | | | 2,014,508 | |
| Intangible assets | | | 49,756 | | | | 49,640 | |
| Goodwill | | | 4,459 | | | | 4,459 | |
| Deferred income tax assets | | | 9,660 | | | | 15,618 | |
| Right of use assets | | | 5,056 | | | | 6,006 | |
| Other assets | | | 106 | | | | 160 | |
| Total non-current assets | | | 2,177,429 | | | | 2,138,545 | |
| | | | | | | | | |
| Total assets | | | 3,149,241 | | | | 3,016,284 | |
| Liabilities and equity | | As of sep-21 | | | As of Dec-20 | |
| Current liabilities | | S/ (000) | | | S/ (000) | |
| Trade and other payables | | | 211,989 | | | | 180,190 | |
| Dividends payable | | | 9,536 | | | | 7,686 | |
| Financial obligations | | | 233,448 | | | | 65,232 | |
| Lease Liabilities | | | 1,804 | | | | 1,531 | |
| Income tax payable | | | 10,674 | | | | 1,051 | |
| Provisions | | | 15,644 | | | | 9,380 | |
| Total current liabilities | | | 483,095 | | | | 265,070 | |
| | | As of sep-21 | | | As of Dec-20 | |
| Non-current liabilities | | S/ (000) | | | S/ (000) | |
| Financial obligations | | | 1,332,349 | | | | 1,203,352 | |
| Lease liabilities | | | 4,680 | | | | 5,102 | |
| Non-current provisions | | | 34,702 | | | | 25,341 | |
| Deferred income tax liabilities | | | 149,733 | | | | 149,864 | |
| Total non-current liabilities | | | 1,521,464 | | | | 1,383,659 | |
| | | | | | | | | |
| Total liabilities | | | 2,004,559 | | | | 1,648,729 | |
| | | As of sep-21 | | | As of Dec-20 | |
| Equity | | S/ (000) | | | S/ (000) | |
| Capital stock | | | 423,868 | | | | 423,868 | |
| Investment shares | | | 40,279 | | | | 40,279 | |
| Investment shares holds in treasury | | | -121,258 | | | | -121,258 | |
| Additional paid-in capital | | | 432,779 | | | | 432,779 | |
| Legal reserve | | | 168,636 | | | | 168,636 | |
| Other accumulated comprehensive results | | | -19,628 | | | | -33,378 | |
| Retained earnings | | | 220,006 | | | | 456,629 | |
| | | | 1,144,682 | | | | 1,367,555 | |
| Total liabilities and equity | | | 3,149,241 | | | | 3,016,284 | |
| | 19 | |
Interim condensed consolidated statements of profit or loss
For the three and nine-month periods ended September 30, 2021 and 2020 (both unaudited)
| | | 3Q21 S/ (000) | | | 3Q20 S/ (000) | | | 9M21 S/ (000) | | | 9M20 S/ (000) | |
| Net Sales | | | 507,170 | | | | 407,393 | | | | 1,412,898 | | | | 820,996 | |
| Cost of sales | | | -358,767 | | | | -276,263 | | | | -1,014,868 | | | | -595,713 | |
| Gross profit | | | 148,403 | | | | 131,130 | | | | 398,030 | | | | 225,283 | |
| | | | | | | | | | | | | | | | | |
| Operating income (expenses) | | | | | | | | | | | | | | | | |
| Administrative expenses | | | -50,675 | | | | -36,200 | | | | -144,977 | | | | -109,778 | |
| Selling and distribution expenses | | | -14,204 | | | | -9,427 | | | | -42,559 | | | | -31,420 | |
| Other operating income (expense), net | | | -93 | | | | 327 | | | | 336 | | | | -317 | |
| Total operating expenses, net | | | -64,972 | | | | -45,300 | | | | -187,200 | | | | -141,515 | |
| | | | | | | | | | | | | | | | | |
| Operating profit | | | 83,431 | | | | 85,830 | | | | 210,830 | | | | 83,768 | |
| | | | | | | | | | | | | | | | | |
| Other income (expenses) | | | | | | | | | | | | | | | | |
| Finance income | | | 1,524 | | | | 748 | | | | 2,304 | | | | 2,445 | |
| Finance costs | | | -24,371 | | | | -23,172 | | | | -66,261 | | | | -66,985 | |
| Accumulated net loss due to settlement of trading derivative financial | | | | | | | | | | | | | | | | |
| instruments | | | - | | | | | | | | -1,569 | | | | - | |
| Net gain on the valuation of trading derivative financial instruments | | | 140 | | | | 610 | | | | 640 | | | | 5,001 | |
| Loss from exchange difference, net | | | 510 | | | | -1,454 | | | | 927 | | | | -8,350 | |
| Total other expenses, net | | | -22,197 | | | | -23,268 | | | | -63,959 | | | | -67,889 | |
| | | | | | | | | | | | | | | | | |
| Profit before income tax | | | 61,234 | | | | 62,562 | | | | 146,871 | | | | 15,879 | |
| | | | | | | | | | | | | | | | | |
| Income tax | | | -19,118 | | | | -17,370 | | | | -45,290 | | | | -5,512 | |
| Profit for the period | | | 42,116 | | | | 45,192 | | | | 101,581 | | | | 10,367 | |
| | | | | | | | | | | | | | | | | |
| Earning per share | | | | | | | | | | | | | | | | |
| Basic and diluted for period atributable to equity holders of common shares and investment shares of the parent (S/ per share) | | | 0.10 | | | | 0.11 | | | | 0.24 | | | | 0.02 | |
| | 20 | |
Interim condensed consolidated statements of changes in equity
For the nine-month periods ended September 30, 2021 and 2020 (unaudited)
| | | Attributable to equity holders of the parent | |
| | | Capital stock
S/ (000) | | | Investment shares
S/ (000) | | | Treasury shares
S/ (000) | | | Additional
paid- in capital
S/ (000) | | | Legal reserve
S/ (000) | | | Unrealized gain (loss) on
financial
instruments
designated at
fair value
S/ (000) | | | Unrealized
gain (loss) on
cash flow hedge
S/(000) | | | Retained earnings
S/ (000) | | | Total
S/ (000) | |
| | | | | | | | | | | | | | | | | | | | | | | | | | | | |
| Balance as of January 1, 2020 | | | 423,868 | | | | 40,279 | | | | -121,258 | | | | 432,779 | | | | 168,636 | | | | -2,103 | | | | -17,750 | | | | 497,200 | | | | 1,421,651 | |
| Net profit | | | - | | | | - | | | | - | | | | - | | | | - | | | | - | | | | - | | | | 10,367 | | | | 10,367 | |
| Other comprehensive income | | | - | | | | - | | | | - | | | | - | | | | - | | | | - | | | | -578 | | | | - | | | | -578 | |
| | | | | | | | | | | | | | | | | | | | | | | | | | | | | | | | | | | | | |
| Total comprehensive income | | | - | | | | - | | | | - | | | | - | | | | - | | | | - | | | | -578 | | | | 10,367 | | | | 9,789 | |
| | | | | | | | | | | | | | | | | | | | | | | | | | | | | | | | | | | | | |
| Balance as of September 30, 2020 | | | 423,868 | | | | 40,279 | | | | -121,258 | | | | 432,779 | | | | 168,636 | | | | -2,103 | | | | -18,328 | | | | 507,567 | | | | 1,431,440 | |
| | | | | | | | | | | | | | | | | | | | | | | | | | | | | | | | | | | | | |
| Balance as of January 1, 2021 | | | 423,868 | | | | 40,279 | | | | -121,258 | | | | 432,779 | | | | 168,636 | | | | -14,463 | | | | -18,915 | | | | 456,629 | | | | 1,367,555 | |
| Profit for the period | | | - | | | | - | | | | - | | | | - | | | | - | | | | - | | | | - | | | | 101,581 | | | | 101,581 | |
| Other comprehensive income | | | - | | | | - | | | | - | | | | - | | | | - | | | | - | | | | 13,750 | | | | - | | | | 13,750 | |
| | | | | | | | | | | | | | | | | | | | | | | | | | | | | | | | | | | | | |
| Total comprehensive income | | | - | | | | - | | | | - | | | | - | | | | - | | | | - | | | | 13,750 | | | | 101,581 | | | | 115,331 | |
| | | | | | | | | | | | | | | | | | | | | | | | | | | | | | | | | | | | | |
| Dividend distribution, note 8 | | | - | | | | - | | | | - | | | | - | | | | - | | | | - | | | | - | | | | -338204 | | | | -338,204 | |
| | | | | | | | | | | | | | | | | | | | | | | | | | | | | | | | | | | | | |
| Balance as of September 30, 2021 | | | 423,868 | | | | 40,279 | | | | -121,258 | | | | 432,779 | | | | 168,636 | | | | -14,463 | | | | -5,165 | | | | 220,006 | | | | 1,144,682 | |