Exhibit 99.1

Cementos Pacasmayo S.A.A. Announces Consolidated Results for Fourth Quarter 2021
Lima, Peru, February 14, 2021 – Cementos Pacasmayo S.A.A. and subsidiaries (NYSE: CPAC; BVL: CPACASC1) (“the Company” or “Pacasmayo”) a leading cement company serving the Peruvian construction industry, announced today its consolidated results for the fourth quarter (“4Q21”) and the full year (“2021”) ended December 31, 2021. These results have been prepared in accordance with International Financial Reporting Standards (“IFRS”) and are stated in nominal Peruvian Soles (S/).
4Q21 Financial and Operational Highlights:
(All comparisons are to 4Q20, unless otherwise stated)
| ● | Sales volume of cement, concrete and precast decreased 6.2%, mainly due to very high comparative basis from 4Q20, as well as moderation of record demand levels experienced during this year. |
| ● | Revenues increased 10.4% primarily an increase in cement and concrete prices, in line with cost inflation, as well as a change in sales mix, favoring higher priced cement and concrete. |
| ● | Consolidated EBITDA of S/ 141.5 million, a 10.5% increase, in line with increased revenues. |
| ● | Consolidated EBITDA margin of 27%, similar to 4Q20. |
| ● | Net income of S/ 51.6 million, an 8.6% increase mainly due higher revenues, as well as to lower administrative expenses. |
| ● | The Sustainability Yearbook 2022 – We are honored to have been included in the Yearbook by S&P, for the second consecutive year. This Yearbook incorporates companies that score in the top 15% of their industry globally and have a gap of less than 30% from the leader’s Global ESG score. |
2021 Financial and Operational Highlights:
(All comparisons are to 2020, unless otherwise stated)
| ● | Sales volume of cement, concrete and precast increased 40.4% mainly due to a significant recovery in demand after the halt in production and commercialization during 2Q20. |
| ● | Revenues increased 49.5%, primarily due the increased demand and prices during 2021 and the halt in production during 2020 mentioned above. |
| ● | Consolidated EBITDA of S/ 453.9 million; a 44% increase, primarily due to increased revenues during 2021. |
| ● | Consolidated EBITDA margin of 23.4%, 0.9 percentage points lower, mainly due to the use of imported clinker because of the significant increase in demand. |
| ● | Net income of S/ 153.2 million, an increase of 164.5% mainly due to higher sales and a low comparative base because of a net loss during 2Q20 for the above-mentioned halt in production and commercialization. |
 | 2 |  |
| | | Financial and Operating Results | |
| | | 4Q21 | | | 4Q20 | | | % Var. | | | 2021 | | | 2020 | | | % Var. | |
| Financial and Operating Results | | | | | | | | | | | | | | | | | | |
| Cement, concrete and precast shipments (MT) | | | 906.8 | | | | 967.0 | | | | -6.2 | % | | | 3,625.2 | | | | 2,581.4 | | | | 40.4 | % |
| | | | | | | | | | | | | | | | | | | | | | | | | |
| In millions of S/ | | | | | | | | | | | | | | | | | | | | | | | | |
| Sales of goods | | | 524.9 | | | | 475.3 | | | | 10.4 | % | | | 1,937.8 | | | | 1,296.3 | | | | 49.5 | % |
| Gross profit | | | 161.4 | | | | 150.0 | | | | 7.6 | % | | | 559.4 | | | | 375.3 | | | | 49.1 | % |
| Operating profit | | | 107.4 | | | | 92.3 | | | | 16.4 | % | | | 318.3 | | | | 176.1 | | | | 80.7 | % |
| Net income | | | 51.6 | | | | 47.5 | | | | 8.6 | % | | | 153.2 | | | | 57.9 | | | | N/R | |
| Consolidated EBITDA | | | 141.5 | | | | 128.1 | | | | 10.5 | % | | | 453.9 | | | | 315.3 | | | | 44.0 | % |
| Gross Margin | | | 30.7 | % | | | 31.6 | % | | | -0.9 pp. | | | | 28.9 | % | | | 29.0 | % | | | -0.1 pp. | |
| Operating Margin | | | 20.5 | % | | | 19.4 | % | | | 1.1 pp. | | | | 16.4 | % | | | 13.6 | % | | | 2.8 pp. | |
| Net income Margin | | | 9.8 | % | | | 10.0 | % | | | -0.2 pp. | | | | 7.9 | % | | | 4.5 | % | | | 3.4 pp. | |
| Consolidated EBITDA Margin | | | 27.0 | % | | | 27.0 | % | | | - | | | | 23.4 | % | | | 24.3 | % | | | -0.9 pp. | |
| 3 | |
Management Comments
During this last quarter, we experienced some moderation in sales volume, mainly of bagged cement, which were offset by higher prices of both cement and concrete, as well as higher sales volume of concrete. This, in turn, led us to an increase in both revenues and EBITDA of over 10% for the quarter, compared to the same period of last year.
If we look at 2021 as a whole, there is no doubt that it has been an outstanding year. In 2019, we reached a then historical record level of 2.6 million MT of cement sales volume. In 2020, despite a complete stop in production and commercialization for over 2 months, we were able to reach almost the same level, due to a significant pickup during the second half of the year. In 2021, a new record has been established, and not just slightly above our previous record, almost 40% higher than in 2019. This is undeniably exceptional and beyond any estimates we could have rationally calculated. As we have mentioned before, the market conditions have boosted sales throughout the country, but as it is evidenced by our increased national market share, which has gone from a historical average of around 20% to close to 27%, we have done better. Part of this is derived from public spending for the reconstruction of the North, but we believe it is fair to say that our strategy has also generated additional demand. We have generated a variety of different products, sales channels and user experiences, to provide comprehensive solutions and respond to the unique needs of our final consumer. For the industrial segment and under our “Pacasmayo professional” brand, we continue digitalizing the purchasing process and the uses of our products and services. We have digitalized almost entirely our transactional relationship with our clients. For our self-builders we have Mundo Experto, an ecosystem that integrates physical and digital solutions, improves the purchasing experience and contributes to the professionalization and formalization of the construction market.
2021 has also been a very successful year, beyond commercial and financial results, also in terms of other significant achievements at the corporate level. We are very proud to work under the sustainability approach integrated into the business, ensuring a balance between the economic profitability of the company, the social development of our surroundings and care for the environment. We are constantly working to improve and aim to stay at the forefront of sustainability. This is why we have committed to net zero emissions by 2050, and actively participate of the Global Cement and Concrete Association (GCCA). Due to the progress made, in 2021, we were selected as one of the 15 Peruvian companies that make up the first General ESG Index of the Lima Stock Exchange and S&P Global, which identifies the companies with the best environmental, social and security performance. governance. This recognition replaced the Good Corporate Governance index that we received annually between 2010 and 2020. Likewise, we were recognized with first place in the category “Leading Company in Corporate Governance Peru” and second place in the category “Leading Company in Investor Relations Peru” in the “ALAS 20-Sustainable Leaders Agenda” award, organized by GOVERNART in Peru and other countries in the region. Furthermore, we were included in the Dow Jones Sustainability Index for the third consecutive year, and in the 2022 Sustainability Yearbook for the second consecutive year.
To sum up, 2021 has been an excellent year in terms of results at the corporate, strategic and financial levels. Despite a difficult macro environment, with political uncertainty and lingering effects of the pandemic, we proved our resilience once again, our value generation model based on innovation and agility, digital transformation, excellence and, above all, the focus on our customers, has allowed us to obtain truly outstanding results. The key to success is to understand that there is always room for improvement, that the humbleness of recognizing that learning opportunities are everywhere and identifying the areas we need to work harder on during the upcoming years will allow our business to continue to thrive.
| 4 | |
Economic Overview 4Q21:
During 4Q21, despite continued political uncertainty, economic activity continued its gradual recovery, already reaching pre-pandemic levels. One of the most important engines for this recovery has been self-construction. The rebound after the months of halt in operations in 2020 due to COVID-19 was very fast, reaching pre pandemic levels during the third quarter of 2020, and throughout 2021 we have seen sustained growth.
The resurgence of COVID-19 during this quarter, so far, has been less lethal than expected, perhaps due to the predominance of the Omicron variant. Peru faces the third wave of infections with a great advance in vaccination, including the booster dose and the start of vaccination of children over 5 years of age. There is also the possibility of saturation of our health system as it is quite limited. Furthermore, there is a risk that many companies will have to paralyze their operations as they have a significant percentage of infected workers, which could have negative effects on the economy.
The inflation rate in Peru, as in the rest of the world, has suffered a significant increase this year, exceeding 6%, the highest rate in the last 12 years, due to the higher price of food, fuel, and the devaluation of the Peruvian sol.
Finally, at the political level, during the first six months of President Pedro Castillo’s administration, he, members of his government, and people around him have been confronted with a series of complaints and accusations of corruption. Some of these cases are under investigation and others, specifically against the President, have been suspended until the end of his mandate.
On January 31, Mirtha Vásquez presented her resignation from the position of president of the Council of Ministers, after President Pedro Castillo accepted the resignation of Avelino Guillén from the Ministry of the Interior. Her resignation implied an absolute re-composition of the cabinet. The Prime Minister was Héctor Valer, but after a widespread rejection from congress, the private sector, and the public in general, he was replaced by Anibal Torres. This is the fourth cabinet since Pedro Castillo took office July 28th, 2021.
| 5 | |
Peruvian Cement Industry Overview:
Pacasmayo, UNACEM and Cementos Yura mainly supply cement demand in Peru. Pacasmayo primarily supplies the northern region of Peru, while UNACEM supplies the central region and Cementos Yura the southern region.
The northern region of Peru, according to the Instituto Nacional de Estadística e Informática (INEI) and Apoyo Consultoría, represents approximately 28.9% of the country’s population and 14.9% of national Gross Domestic Product (“GDP”). Despite the country’s sustained growth over the last 10 years, Peru continues to have a significant housing deficit, estimated at 1.9 million households throughout the country as per the Ministry of Housing, Construction and Sanitation.
In Peru, the majority of cement is sold to a highly fragmented consumer base of individuals that tend to gradually buy bags of cement to build or to improve their homes, a segment the industry refers to as “self-construction”.

*Import figures are sourced from Aduanet. They represent quantities of imported cement, not shipped cement.
Source: INEI, Aduanet
| 6 | |
Infrastructure Investment in the Area of Influence:
Reconstruction of the North
Currently, there is a boost in infrastructure from the government’s reconstruction plan, now that the agreement between the Peruvian and UK government is under execution. This agreement includes an investment of S/ 7 billion in 2 years and includes 74 schools, 15 hospitals and integral solutions for 17 rivers, 5 brooks, and drainage of 7 Northern cities. This will have a significant impact on our cement shipments, as most of this budget is concentrated in our area of influence. Due to some delays during this year, the execution has only reached 40% with the remaining expected between 2022 and part of 2023.
Other projects
Although the anticipated increase in Peru’s large infrastructure projects has been delayed, this remains an important growth driver for the country and a necessity due to Peru’s significant infrastructure deficit. Although the progress of these projects has been slow, we have continued shipping cement to the ongoing projects, which are shown below, along with the potential demand for the next 5 years.
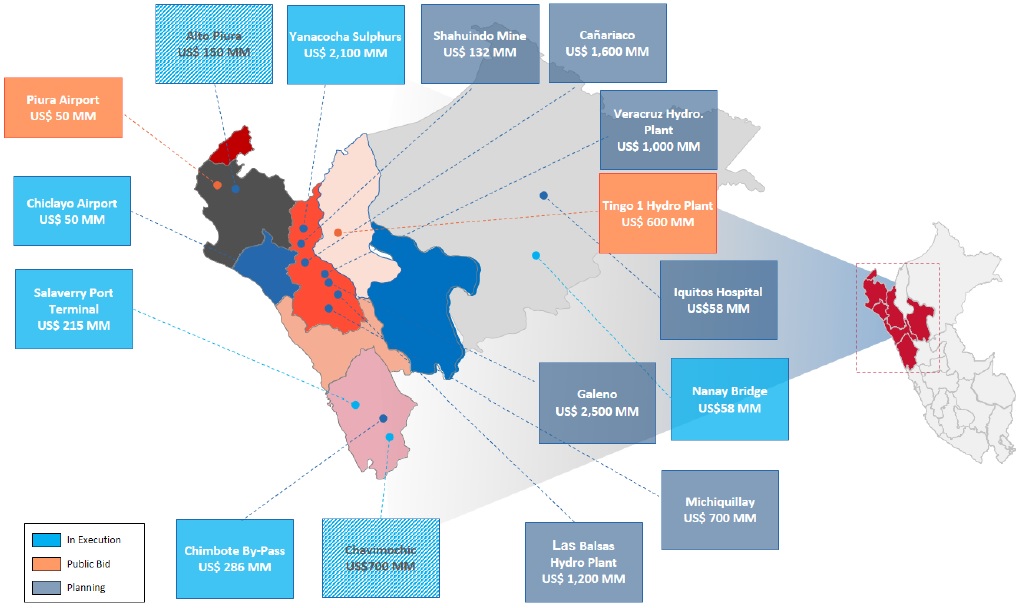
Source: Company filings, Proinversion, MINEM
| 7 | |
Operating Results:
Production:
Cement Production Volume
(thousands of metric tons)
| | | Production | |
| | | 4Q21 | | | 4Q20 | | | % Var. | | | 2021 | | | 2020 | | | % Var. | |
| Pacasmayo Plant | | | 474.4 | | | | 489.9 | | | | -3.2 | % | | | 1,969.5 | | | | 1,307.1 | | | | 50.7 | % |
| Rioja Plant | | | 78.2 | | | | 94.2 | | | | -17.0 | % | | | 338.0 | | | | 263.2 | | | | 28.4 | % |
| Piura plant | | | 352.7 | | | | 396.3 | | | | -11.0 | % | | | 1,323.8 | | | | 1,019.8 | | | | 29.8 | % |
| Total | | | 905.3 | | | | 980.4 | | | | -7.7 | % | | | 3,631.3 | | | | 2,590.1 | | | | 40.2 | % |
Cement production volume at the Pacasmayo plant decreased 3.2% in 4Q21 compared to 4Q20, mainly due to decreased demand. During 2021, cement production volume at the Pacasmayo plant increased 50.7%, mainly due to the significant increase in demand during 2021, and the low comparative base from 2020 because of the stop in production between March 16 and May 20, 2020.
Cement production volume at the Rioja Plant decreased 17% in 4Q21 compared to 4Q20, mainly due to decreased cement sales volumes, partly due to the earthquake in the Amazonas region in November, which affected both demand and the supply of raw materials because of road damages. In 2021, cement production volume at the Rioja plant increased 28.4%, compared to 2020, mainly due to the above-mentioned halt in production during 2Q20.
Cement production volume at the Piura Plant in 4Q21 decreased 11% compared to 4Q20 mainly due to lower demand. During 2021, cement production volume increased 29.8%, when compared to 2020 mainly due to the stop in production mentioned above.
Total cement production volumes decreased 7.7% in 4Q21 compared to 4Q20. During 2021 however, total cement production volumes increased 40.2% compared to 2020.
Clinker Production Volume
(thousands of metric tons)
| | | Production | |
| | | 4Q21 | | | 4Q20 | | | % Var. | | | 2021 | | | 2020 | | | % Var. | |
| Pacasmayo Plant | | | 236.5 | | | | 232.0 | | | | 1.9 | % | | | 879.1 | | | | 711.9 | | | | 23.5 | % |
| Rioja Plant | | | 66.1 | | | | 65.9 | | | | 0.3 | % | | | 264.2 | | | | 198.4 | | | | 33.2 | % |
| Piura Plant | | | 263.0 | | | | 246.6 | | | | 6.7 | % | | | 893.3 | | | | 566.3 | | | | 57.7 | % |
| Total | | | 565.6 | | | | 544.5 | | | | 3.9 | % | | | 2,036.6 | | | | 1,476.6 | | | | 37.9 | % |
Clinker production volume at the Pacasmayo plant in 4Q21 increased 1.9% compared to 4Q20, mainly due to the continued need to produce clinker to satisfy increased demand. In 2021, clinker production volume at the Pacasmayo plant increased 23.5% compared to 2020, in line with increased cement demand.
Clinker production volume at the Rioja plant in 4Q21 remained in line with 4Q20, and increased 33.2% in 2021 when compared to 2020, in line with increased cement demand.
Clinker production volume at the Piura plant increased 6.7% in 4Q21 compared to 4Q20, and 57.7% in 2021 when compared to 2020.
| 8 | |
Consolidated clinker production volume increase 3.9% in 4Q21 and 37.9% in 2021 when compared to 4Q20 and 2020 respectively, mainly due to the increased demand of cement, and to the low production levels experienced in 2020 due to the halt in production in 2Q20 mentioned above.
Quicklime Production Volume
(thousands of metric tons)
| | | Production | |
| | | 4Q21 | | | 4Q20 | | | % Var. | | | 2021 | | | 2020 | | | % Var. | |
| Pacasmayo Plant | | | 23.3 | | | | 16.1 | | | | 44.7 | % | | | 69.0 | | | | 54.4 | | | | 26.8 | % |
Quicklime production volume increased 44.7% in 4Q21 and 26.8% in 2021, compared to 4Q20 and 2020 respectively, mainly due higher sales volume, as we obtained some larger contracts during the second half of the year.
Installed Capacity:
Installed Cement and Clinker Capacity
Full year installed cement capacity at the Pacasmayo, Piura and Rioja plants remained stable at 2.9 million MT, 1.6 million MT and 440,000 MT, respectively.
Full year installed clinker capacity at the Pacasmayo, Piura and Rioja plants remained stable at 1.5 million MT, 1.0 million MT and 280,000 MT, respectively.
Full year installed quicklime capacity at the Pacasmayo plant remained stable at 240,000 MT.
Utilization Rate1:
Pacasmayo Plant Utilization Rate
| | | Utilization Rate | |
| | | 4Q21 | | | 4Q20 | | | % Var. | | | 2021 | | | 2020 | | | % Var. | |
| Cement | | | 65.4 | % | | | 67.6 | % | | | -2.2 pp. | | | | 67.9 | % | | | 45.1 | % | | | 22.8 pp. | |
| Clinker | | | 63.1 | % | | | 61.9 | % | | | 1.2 pp. | | | | 58.6 | % | | | 47.5 | % | | | 11.1 pp. | |
| Quicklime | | | 38.8 | % | | | 26.8 | % | | | 12.0 pp. | | | | 28.8 | % | | | 22.7 | % | | | 6.1 pp. | |
Cement production utilization rate at the Pacasmayo plant decreased 2.2 percentage points in 4Q21 when compared to 4Q20, mainly due to the slight decrease in demand. During 2021, cement production utilization rate at the Pacasmayo plant increased 22.8 percentage points compared to 2020, mainly due to the increase in cement demand during the first nine months of the year.
Clinker production utilization rate in 4Q21 increased 1.2 percentage points when compared to 4Q20 and 11.1 percentage points in 2021 when compared to 2020, mainly due to increased demand for cement production.
| 1 | The utilization rates are calculated by dividing production in a given period over installed capacity. The utilization rate implies annualized production, which is calculated by multiplying real production for each quarter by four. |
| 9 | |
Additionally, the quicklime production utilization rate increased 12 percentage points in 4Q21 and 6.1 percentage points in 2021 when compared to 4Q20 and 2020 respectively, mainly due to increased sales volume as we increased our client base.
Rioja Plant Utilization Rate
| | | Utilization Rate | |
| | | 4Q21 | | | 4Q20 | | | % Var. | | | 2021 | | | 2020 | | | % Var. | |
| Cement | | | 71.2 | % | | | 85.6 | % | | | -14.4 pp. | | | | 76.8 | % | | | 59.8 | % | | | 17.0 pp. | |
| Clinker | | | 94.4 | % | | | 94.1 | % | | | 0.3 pp. | | | | 94.4 | % | | | 70.9 | % | | | 23.5 pp. | |
The cement production utilization rate at the Rioja plant was 71.2% in 4Q21, 14.4 percentage points lower than in 4Q20, in line with decreased cement demand during this quarter due to the negative effects of the earthwuake mentioned above. In 2021, cement production utilization rate was 76.8%; a 17 percentage point increase as compared to 2020, mainly due to the decreased production during 2Q20 because of government mandated measures to fight against the spread of COVID-19.
The clinker production utilization rate at the Rioja plant was 94.4% in 4Q21 and 94.4% in 2021; 0.3 percentage points and 23.5 percentage points higher than 4Q20 and 2020 respectively, mainly due to increased demand during 2021, as well as the lower production due to the above-mentioned halt in production during 2020.
Piura Plant Utilization Rate
| | | Utilization Rate | |
| | | 4Q21 | | | 4Q20 | | | % Var. | | | 2021 | | | 2020 | | | % Var. | |
| Cement | | | 88.1 | % | | | 99.1 | % | | | -11.0 pp. | | | | 82.7 | % | | | 63.7 | % | | | 19.0 pp. | |
| Clinker | | | 100.0 | % | | | 98.6 | % | | | 1.4 pp. | | | | 89.3 | % | | | 56.6 | % | | | 32.7 pp. | |
The cement production utilization rate at the Piura plant was 88.1% in 4Q21, a 11.0 percentage point decrease when compared to 4Q20, mainly due to a slight decrease in cement demand during this quarter. During 2021, the cement production utilization rate was 82.7%, a 19 percentage points increase when compared to 2020, mainly due to sustained demand increase during 2021, as well as to the low comparative base of 2020 due to the government-mandated state of emergency resulting in the halt in production for over 2 months during 2Q20.
The clinker production utilization rate at the Piura plant was 100% in 4Q21, mainly due to high levels of cement demand, as well as to the fact that we had preventive maintenance during the first half of the year, resulting in lower levels of clinker production, that were offset during the second half of the year. In 2021, our utilization rate was 89.3%; 32.7 percentage points higher than 2020, mainly due increased demand and to the stop in production during 2Q20 mentioned above.
Consolidated Utilization Rate
| | | Utilization Rate | |
| | | 4Q21 | | | 4Q20 | | | % Var. | | | 2021 | | | 2020 | | | % Var. | |
| Cement | | | 73.3 | % | | | 79.4 | % | | | -6.1 pp. | | | | 73.5 | % | | | 52.4 | % | | | 21.1 pp. | |
| Clinker | | | 81.4 | % | | | 78.3 | % | | | 3.1 pp. | | | | 73.3 | % | | | 53.1 | % | | | 20.2 pp. | |
| 10 | |
The consolidated cement production utilization rate was 73.3% in 4Q21, 6.1 percentage points lower than 4Q20, mainly due to a slight decrease in demand during this quarter. In 2021, the consolidated cement production utilization rate was 73.5%, 21.1 percentage points higher than 2020, mainly due to the increase in cement production to satisfy demand, as well as to lower production rates in 2Q20 due to the halt in production.
The consolidated clinker production utilization rate was 81.4% in 4Q21, and 73.3% in 2021, 3.1 percentage points and 20.2 percentage points higher than 4Q20 and 2020 respectively, mainly due to the increase in cement demand during 2021, and to the halt in clinker production during 2Q20, as well as the Company’s decision to consume existing inventories before restarting production.
Financial Results:
Income Statement:
The following table shows a summary of the Consolidated Financial Results:
Consolidated Financial Results
(in millions of Soles S/)
| | | Income Statement | |
| | | 4Q21 | | | 4Q20 | | | % Var. | | | 2021 | | | 2020 | | | % Var. | |
| Sales of goods | | | 524.9 | | | | 475.3 | | | | 10.4 | % | | | 1,937.8 | | | | 1,296.3 | | | | 49.5 | % |
| Gross Profit | | | 161.4 | | | | 150.0 | | | | 7.6 | % | | | 559.4 | | | | 375.3 | | | | 49.1 | % |
| Total operating expenses, net | | | -54.0 | | | | -57.7 | | | | -6.4 | % | | | -241.2 | | | | -199.2 | | | | 21.1 | % |
| Operating Profit | | | 107.4 | | | | 92.3 | | | | 16.4 | % | | | 318.3 | | | | 176.1 | | | | 80.7 | % |
| Total other expenses, net | | | -30.2 | | | | -22.3 | | | | 35.4 | % | | | -94.1 | | | | -90.2 | | | | 4.3 | % |
| Profit before income tax | | | 77.2 | | | | 70.0 | | | | 10.3 | % | | | 224.1 | | | | 85.9 | | | | N/R | |
| Income tax expense | | | -25.6 | | | | -22.5 | | | | 13.8 | % | | | -70.9 | | | | -28.0 | | | | N/R | |
| Profit for the period | | | 51.6 | | | | 47.5 | | | | 8.6 | % | | | 153.2 | | | | 57.9 | | | | N/R | |
During 4Q21, revenues increased 10.4% year-on-year mainly due to increased sales as concrete and cement prices increased, in line with increased cost inflation, as well as a favorable sales mix, with more sales of our higher priced products. Gross profit increased 7.6% in 4Q21 compared to 4Q20, mainly due to higher sales. Operating profit during 4Q21 increased to S/ 107.4 million, mainly due decreased administrative expenses because of savings compared to budgeted amounts. Profit for the period increased 8.6% in 4Q21 compared to 4Q20, primarily due to higher operating profit, slightly offset by exchange rate differences because of the depreciation of the sol.
During 2021, revenues increased 49.5%, mainly due to increased sales volume and price during 2021, as well as lower comparative basis in 2020 due to the halt in commercialization from March 16 until mid-May, to fight against the spread of COVID-19. Gross profit increased 49.1%, in line with increased revenues. Profit for the period increased significantly, due to higher revenues and to a low comparative base in 2020 due to negative net income during 2Q20 because of the halt in operations, which resulted in lower operating profit.
| 11 | |
Sales of Goods
The following table shows the Sales of Goods and their respective margins by business segment:
Sales: cement, concrete and precast
(in millions of Soles S/)
| | | Cement, concrete and precasts | |
| | | 4Q21 | | | 4Q20 | | | % Var. | | | 2021 | | | 2020 | | | % Var. | |
| Sales of goods | | | 474.1 | | | | 434.8 | | | | 9.0 | % | | | 1,784.5 | | | | 1,185.2 | | | | 50.6 | % |
| Cost of Sales | | | -316.4 | | | | -288.5 | | | | 9.7 | % | | | -1,233.7 | | | | -817.7 | | | | 50.9 | % |
| Gross Profit | | | 157.7 | | | | 146.3 | | | | 7.8 | % | | | 550.8 | | | | 367.5 | | | | 49.9 | % |
| Gross Margin | | | 33.3 | % | | | 33.6 | % | | | -0.3 pp. | | | | 30.9 | % | | | 31.0 | % | | | -0.1 pp. | |
Sales of cement, concrete and precast increased 9.0% during 4Q21 when compared to 4Q20, mainly due to increased prices and sales mix of cement products. Gross margin remained in line despite increased sales, mainly due increased costs from the use of imported clinker.
During 2021, net sales of cement, concrete and precast increased 50.6%, mainly due the increase in sales mentioned above, as well as unusually low revenues during 2Q20 because of the halt in production and commercialization. Gross margin remained in line with 2020, mainly due to increased sales, partially offset by higher costs mainly derived from the use of imported clinker.
Sales of cement represented 86.7% of cement, concrete and precast sales during 4Q21.
| | | Cement | |
| | | 4Q21 | | | 4Q20 | | | % Var. | | | 2021 | | | 2020 | | | % Var. | |
| Sales of goods | | | 410.9 | | | | 372.3 | | | | 10.4 | % | | | 1,534.9 | | | | 1,023.9 | | | | 49.9 | % |
| Cost of Sales | | | -254.8 | | | | -233.8 | | | | 9.0 | % | | | -1,000.9 | | | | -662.3 | | | | 51.1 | % |
| Gross Profit | | | 156.1 | | | | 138.5 | | | | 12.8 | % | | | 534.0 | | | | 361.6 | | | | 47.7 | % |
| Gross Margin | | | 38.0 | % | | | 37.2 | % | | | 0.8 pp. | | | | 34.8 | % | | | 35.3 | % | | | -0.5 pp. | |
Sales of cement increased 10.4% in 4Q21 compared to 4Q20, mainly due to increased demand from the self-construction segment and some from infrastructure projects related to the reconstruction of the North. Gross margin increased, 0.8 percentage points mainly due to higher pricing and sales mix favoring higher priced cement.
During 2021 cement sales increased 49.9% compared to 2020, and gross margin decreased slightly when compared to 2020, mainly due to the use of imported clinker, needed to satisfy the increased demand.
Sales of concrete, pavement and mortar represented 11.2% of cement, concrete and precast sales during 4Q21.
| | | Concrete, pavement and mortar | |
| | | 4Q21 | | | 4Q20 | | | % Var. | | | 2021 | | | 2020 | | | % Var. | |
| Sales of goods | | | 53.1 | | | | 48.4 | | | | 9.7 | % | | | 213.5 | | | | 126.1 | | | | 69.3 | % |
| Cost of Sales | | | -49.1 | | | | -43.9 | | | | 11.8 | % | | | -196.9 | | | | -124.7 | | | | 57.9 | % |
| Gross Profit | | | 4.0 | | | | 4.5 | | | | -11.1 | % | | | 16.6 | | | | 1.4 | | | | N/R | |
| Gross Margin | | | 7.5 | % | | | 9.3 | % | | | -1.8 pp. | | | | 7.8 | % | | | 1.1 | % | | | 6.7 pp. | |
Sales of concrete, pavement and mortar increased 9.7% during 4Q21 compared to 4Q20, mainly due to increased sales volume for reconstruction related projects. During 2021, sales of concrete increased 69.3% compared to 2020, mainly due to the sharp increase in sales, both in volume and in terms of pricing, as well as the low comparative base due to the complete stop in sales during 2Q20.
| 12 | |
Gross margin decreased 1.8 percentage points in 4Q21 compared to 4Q20, mainly due to higher margins in 4Q20 due to shipments of special concrete for the Salaverry port. In 2021, gross margin increased 6.7 percentage points compared to 2020, mainly due to higher dilution fixed costs because of higher sales.
Sales of precast represented 2.1% of cement, concrete and precast sales during 4Q21.
| | | Precast | |
| | | 4Q21 | | | 4Q20 | | | % Var. | | | 2021 | | | 2020 | | | % Var. | |
| Sales of goods | | | 10.1 | | | | 14.1 | | | | -28.4 | % | | | 36.1 | | | | 35.2 | | | | 2.6 | % |
| Cost of Sales | | | -12.5 | | | | -10.7 | | | | 16.8 | % | | | -35.9 | | | | -30.7 | | | | 16.9 | % |
| Gross Profit | | | -2.4 | | | | 3.4 | | | | N/R | | | | 0.2 | | | | 4.5 | | | | -95.6 | % |
| Gross Margin | | | -23.8 | % | | | 24.1 | % | | | -47.9 pp. | | | | 0.6 | % | | | 12.8 | % | | | -12.2 pp. | |
During 4Q21, precast sales decreased 28.4% compared to 4Q20, mainly due a high comparative basis from 4Q20 as we sold specific products during this period. In 2021, precast sales increased 2.6% when compared to 2020, mainly due to increased sales of light precast products, such as blocks and pavement, for reconstruction-related projects.
Gross margin during 4Q21 decreased 47.9 percentage points and 12.2 percentage points during 2021 when compared to 4Q20 and 2020 respectively, mainly due to the write off of past inventory during this quarter, which generated a cost increase.
Sales: Quicklime
(in millions of Soles S/)
| | | Quicklime | |
| | | 4Q21 | | | 4Q20 | | | % Var. | | | 2021 | | | 2020 | | | % Var. | |
| Sales of goods | | | 15.2 | | | | 10.2 | | | | 49.0 | % | | | 39.1 | | | | 32.5 | | | | 20.3 | % |
| Cost of Sales | | | -12.4 | | | | -7.9 | | | | 57.0 | % | | | -33.5 | | | | -27.5 | | | | 21.8 | % |
| Gross Profit | | | 2.8 | | | | 2.3 | | | | 21.7 | % | | | 5.6 | | | | 5.0 | | | | 12.0 | % |
| Gross Margin | | | 18.4 | % | | | 22.5 | % | | | -4.1 pp. | | | | 14.3 | % | | | 15.4 | % | | | -1.1 pp. | |
During 4Q21, quicklime increased 49% when compared to 4Q20, and 20.3% in 2021 when compared to 2020, mainly due to a significant increase in sales volume.
Gross margin decreased 4.1 percentage points in 4Q21 when compared to 4Q20, and 1.1 percentage point in 2021 when compared to 2020, mainly due increased freight costs due to the location of our final clients. It is important to note that, despite of this margin decrease, these new clients have added profitability to our business since we are able to use idle capacity as well as increase overall gross profit.
| 13 | |
Sales: Construction Supplies2
(in millions of Soles S/)
| | | Construction Supplies | |
| | | 4Q21 | | | 4Q20 | | | % Var. | | | 2021 | | | 2020 | | | % Var. | |
| Sales of goods | | | 35.6 | | | | 30.4 | | | | 17.1 | % | | | 113.9 | | | | 78.2 | | | | 45.7 | % |
| Cost of Sales | | | -34.6 | | | | -29.5 | | | | 17.3 | % | | | -110.4 | | | | -75.2 | | | | 46.8 | % |
| Gross Profit | | | 1.0 | | | | 0.9 | | | | 11.1 | % | | | 3.5 | | | | 3.0 | | | | 16.7 | % |
| Gross Margin | | | 2.8 | % | | | 3.0 | % | | | -0.2 pp. | | | | 3.1 | % | | | 3.8 | % | | | -0.7 pp. | |
Construction supply sales increased 17.1% in 4Q21 and 45.7% in 2021 when compared to 4Q20 and 2020 respectively, mainly due to increased sales this year, as well as unusually low sales during 2Q20 because of the state of emergency and subsequent halt in commercialization as previously mentioned.
Gross margin in 4Q21 and 2021, remained in line with 4Q20 and 2020 respectively, mainly due to exchange rate effects that affected the cost of imported materials such as steel rebars.
Operating Expenses:
Administrative Expenses
(in millions of Soles S/)
| | | Administrative expenses | |
| | | 4Q21 | | | 4Q20 | | | % Var. | | | 2021 | | | 2020 | | | % Var. | |
| Personnel expenses | | | 23.6 | | | | 25.0 | | | | -5.6 | % | | | 96.9 | | | | 76.3 | | | | 27.0 | % |
| Third-party services | | | 19.0 | | | | 17.8 | | | | 6.7 | % | | | 59.9 | | | | 48.7 | | | | 23.0 | % |
| Board of directors | | | 1.4 | | | | 1.1 | | | | 27.3 | % | | | 6.4 | | | | 6.0 | | | | 6.6 | % |
| Depreciation and amortization | | | 4.1 | | | | 4.2 | | | | -2.4 | % | | | 16.6 | | | | 16.6 | | | | -0.2 | % |
| Taxes | | | 1.2 | | | | 1.1 | | | | 9.1 | % | | | 5.6 | | | | 5.3 | | | | 5.7 | % |
| Other | | | 1.8 | | | | 4.4 | | | | -59.1 | % | | | 10.8 | | | | 10.5 | | | | 2.9 | % |
| Total | | | 51.1 | | | | 53.6 | | | | -4.7 | % | | | 196.2 | | | | 163.4 | | | | 20.0 | % |
Administrative expenses decreased 4.7% in 4Q21 compared to 4Q20, mainly due to a decrease in personnel expenses and donations, which were high due to COVID-19 during 2020. During 2021, administrative expenses increased 20% when compared to 2020, mainly due to increased workers profit sharing, in line with increased income tax base, increases in the exchange rate, as well as increased third-party services, mainly COVID-19 related expenses to comply with protocols to ensure the safety of our workers, software and licenses, training and workers’ compensation. It is also important to note that, administrative expenses during a period of 2020 were low due to budget restrictions after the halt in production and commercialization.
| 2 | Construction supplies include the following products: steel rebar, wires, nails, corrugated iron, electric conductors, plastic tubes and accessories, among others. |
| 14 | |
Selling Expenses
(in millions of Soles S/)
| | | Selling and distribution expenses | |
| | | 4Q21 | | | 4Q20 | | | % Var. | | | 2021 | | | 2020 | | | % Var. | |
| Personnel expenses | | | 8.9 | | | | 7.4 | | | | 20.3 | % | | | 33.9 | | | | 26.3 | | | | 28.9 | % |
| Advertising and promotion | | | -1.9 | | | | -0.4 | | | | N/R | | | | 5.6 | | | | 3.3 | | | | 69.7 | % |
| Other | | | 2.0 | | | | 1.7 | | | | 17.6 | % | | | 12.0 | | | | 10.6 | | | | 13.2 | % |
| Total | | | 9.0 | | | | 8.7 | | | | 3.4 | % | | | 51.5 | | | | 40.2 | | | | 28.1 | % |
Selling expenses increased 3.4% in 4Q21 compared to 4Q20, and 28.1% in 2021 compared to 2020, mainly due to an increase in variable salaries, in line with increased sales.
EBITDA Reconciliation:
Consolidated EBITDA
(in millions of Soles S/)
| | | Consolidated EBITDA | |
| | | 4Q21 | | | 4Q20 | | | Var %. | | | 2021 | | | 2020 | | | Var %. | |
| Net Income | | | 51.6 | | | | 47.5 | | | | 8.6 | % | | | 153.2 | | | | 57.9 | | | | N/R | |
| + Income tax expense | | | 25.7 | | | | 22.5 | | | | 14.2 | % | | | 70.9 | | | | 28.0 | | | | N/R | |
| - Finance income | | | -0.6 | | | | -0.5 | | | | 20.0 | % | | | -2.9 | | | | -3.0 | | | | -3.3 | % |
| + Finance costs | | | 22.7 | | | | 21.7 | | | | 4.6 | % | | | 89.0 | | | | 88.7 | | | | 0.3 | % |
| +/- Gain on the valuation of trading derivative financial instrument | | | 0.1 | | | | -0.3 | | | | N/R | | | | 1.0 | | | | -5.3 | | | | N/R | |
| +/- Net loss from exchange rate | | | 8.0 | | | | 1.5 | | | | N/R | | | | 7.1 | | | | 9.8 | | | | -27.6 | % |
| + Depreciation and amortization | | | 34.0 | | | | 35.7 | | | | -4.8 | % | | | 135.6 | | | | 139.2 | | | | -2.6 | % |
| Consolidated EBITDA | | | 141.5 | | | | 128.1 | | | | 10.5 | % | | | 453.9 | | | | 315.3 | | | | 44.0 | % |
Consolidated EBITDA increased 10.5% in 4Q21 compared to 4Q20, mainly due to higher sales and operating profit, as a result of higher prices in line with cost inflation, and favorable sales mix. During 2021, consolidated EBITDA increased 44% compared to 2020, mainly due to higher revenues and to the lower comparative base in 2020 due to negative EBITDA during 2Q20 because of the government-mandated state of emergency declared to prevent the spread of COVID-19, which effectively stopped production and commercialization for over 2 months. This also resulted in higher costs from a lower dilution of fixed costs.
| 15 | |
Cash and Debt Position:
Cash:
Consolidated Cash
(in millions of Soles S/ and USD)
As of December 31, 2021, the Company’s cash position was S/ 273.4 million (US$ 68.8 million). This balance includes cash deposits for S/ 47.5 million (US$ 11.9 million), distributed as follows:
Certificates of deposits in Soles
| Bank | | Amount (S/) | | | Interest Rate | | | Initial Date | | | Maturity Date | |
| Banco de Crédito del Perú | | | S/ 7.5 | | | | 2.10 | % | | | December 17, 2021 | | | | January 6, 2022 | |
| Banco de Crédito del Perú | | | S/ 10.0 | | | | 2.00 | % | | | December 30, 2021 | | | | January 4, 2022 | |
| Banco de Crédito del Perú | | | S/ 15.0 | | | | 2.00 | % | | | December 30, 2021 | | | | January 6, 2022 | |
| Banco de Crédito del Perú | | | S/ 5.0 | | | | 2.00 | % | | | December 31, 2021 | | | | January 4, 2022 | |
| Banco de Crédito del Perú | | | S/ 10.0 | | | | 2.00 | % | | | December 31, 2021 | | | | January 6, 2022 | |
| | | | | | | | | | | | | | | | | |
| | | | S/ 47.5 | | | | | | | | | | | | | |
The remaining balance of S/ 225.9 million (US$ 56.9 million) is held mainly in the Company’s bank accounts, of which US$ 51.4 million are denominated in US dollars and the difference in Soles.
| 16 | |
Debt Position:
Consolidated Debt
(in millions of Soles S/)
Below are the contractual obligations with payment deadlines related to the Company’s debt, including interest.
| | | Payments due by period | |
| | | Less than
1 year | | | 1-3 Years | | | 3-5 Years | | | More than
5 Years | | | Total | |
| Indebtedness | | | 451.0 | | | | 414.3 | | | | - | | | | 570.0 | | | | 1,435.3 | |
| Future interest payments | | | 66.4 | | | | 89.0 | | | | 77.2 | | | | 154.9 | | | | 387.5 | |
| Total | | | 517.4 | | | | 503.3 | | | | 77.2 | | | | 724.9 | | | | 1,822.8 | |
As of December 30, 2021, the Company’s total outstanding debt reached S/ 1,545.4 million (equivalent to US$ 386.5 million). This debt is primarily composed by the outstanding part of the international bond issued in February 2013, the two issuances of the local bond issued in January 2019 and short-term loans.
As of December 31, 2021, the Company maintains cross currency swap hedging agreements for US$ 132 million in order to mitigate foreign exchange risks related to US dollar-denominated debt. The adjusted debt in soles considering the exchange rate of the cross currency swap hedging agreements amounts to 1,435.3 million (equivalent to US$ 359 million).
As of December 31, 2021, Net Adjusted Debt/EBITDA ratio was 2.6 times.
Capex
Capex
(in millions of Soles S/)
As of December 31, 2021, the Company invested S/ 97.3 million (US$ 24.3 million), allocated to the following projects:
| Projects | | 2021 | |
| Concrete and aggregates equipment | | | 27.9 | |
| Pacasmayo Plant Projects | | | 45.4 | |
| Piura Plant Projects | | | 15.1 | |
| Rioja Plant Projects | | | 8.9 | |
| Total | | | 97.3 | |
| 17 | |
About Cementos Pacasmayo S.A.A.
Cementos Pacasmayo S.A.A. is a cement company, located in the Northern region of Peru. In February 2012, the Company’s shares were listed on The New York Stock Exchange - Euronext under the ticker symbol "CPAC". With more than 65 years of operating history, the Company produces, distributes and sells cement and cement-related materials, such ready-mix concrete and precast materials. Pacasmayo’s products are primarily used in construction, which has been one of the fastest-growing segments of the Peruvian economy in recent years. The Company also produces and sells quicklime for use in mining operations.
For more information, please visit: http://www.cementospacasmayo.com.pe/
Note: The Company presented some figures converted from Soles to U.S. Dollars for comparison purposes. The exchange rate used to convert Soles to U.S. dollars was S/ 3.998 per US$ 1.00, which was the average exchange rate, reported as of December 31, 2021 by the Superintendencia de Banca, Seguros y AFP’s (SBS). The information presented in U.S. dollars is for the convenience of the reader only. Certain figures included in this report have been subject to rounding adjustments. Accordingly, figures shown as totals in certain tables may not be arithmetic aggregations of the figures presented in previous quarters.
This press release may contain forward-looking statements. These statements are statements that are not historical facts, and are based on management’s current view and estimates of future economic circumstances, industry conditions, Company performance and financial results. Also, certain reclassifications have been made to make figures comparable for the periods. The words “anticipates”, “believes”, “estimates”, “expects”, “plans” and similar expressions, as they relate to the Company, are intended to identify forward-looking statements. Statements regarding the declaration or payment of dividends, the implementation of principal operating and financing strategies and capital expenditure plans, the direction of future operations and the factors or trends affecting financial condition, liquidity or results of operations are examples of forward-looking statements. Such statements reflect the current views of management and are subject to a number of risks and uncertainties. There is no guarantee that the expected events, trends or results will actually occur. The statements are based on many assumptions and factors, including general economic and market conditions, industry conditions, and operating factors. Any changes in such assumptions or factors could cause actual results to differ materially from current expectations.
| 18 | |
Consolidated statements of financial position
As of December 31, 2021 and 2020 (both audited)
| Assets | | As of Dec-21 | | | As of Dec-20 | |
| Current Assets | | S/ (000) | | | S/ (000) | |
| Cash and cash equivalents | | | 273,402 | | | | 308,912 | |
| Trade and other receivables, net | | | 102,718 | | | | 84,412 | |
| Income tax prepayments | | | 9,288 | | | | 18,076 | |
| Inventories | | | 605,182 | | | | 460,610 | |
| Prepayments | | | 18,800 | | | | 5,729 | |
| Total current assets | | | 1,009,390 | | | | 877,739 | |
| | | As of Dec-21 | | | As of Dec-20 | |
| Non-current assets | | S/ (000) | | | S/ (000) | |
| Trade and other receivables, net | | | 41,206 | | | | 5,215 | |
| Financial instruments designated at fair value through other comprehensive income | | | 476 | | | | 692 | |
| Other financial instruments | | | 106,601 | | | | 42,247 | |
| Property, plant and equipment, net | | | 1,974,931 | | | | 2,014,508 | |
| Intangible assets | | | 50,494 | | | | 49,640 | |
| Goodwill | | | 4,459 | | | | 4,459 | |
| Deferred income tax assets | | | 9,446 | | | | 15,618 | |
| Right of use assets | | | 4,668 | | | | 6,006 | |
| Other assets | | | 101 | | | | 160 | |
| Total non-current assets | | | 2,192,382 | | | | 2,138,545 | |
| | | | | | | | | |
| Total assets | | | 3,201,772 | | | | 3,016,284 | |
| Liabilities and equity | | As of Dec-21 | | | As of Dec-20 | |
| Current liabilities | | S/ (000) | | | S/ (000) | |
| Trade and other payables | | | 227,554 | | | | 187,876 | |
| Financial obligations | | | 450,964 | | | | 65,232 | |
| Lease Liabilities | | | 1,856 | | | | 1,531 | |
| Income tax payable | | | 17,517 | | | | 1,051 | |
| Provisions | | | 24,269 | | | | 9,380 | |
| Total current liabilities | | | 722,160 | | | | 265,070 | |
| | | As of Dec-21 | | | As of Dec-20 | |
| Non-current liabilities | | S/ (000) | | | S/ (000) | |
| Financial obligations | | | 1,094,391 | | | | 1,203,352 | |
| Lease liabilities | | | 3,973 | | | | 5,102 | |
| Other non-current provisions | | | 36,639 | | | | 25,341 | |
| Deferred income tax liabilities | | | 148,804 | | | | 149,864 | |
| Total non-current liabilities | | | 1,283,807 | | | | 1,383,659 | |
| | | | | | | | | |
| Total liability | | | 2,005,967 | | | | 1,648,729 | |
| | | As of Dec-21 | | | As of Dec-20 | |
| Equity | | S/ (000) | | | S/ (000) | |
| Capital stock | | | 423,868 | | | | 423,868 | |
| Investment shares | | | 40,279 | | | | 40,279 | |
| Treasury shares held in treasury | | | -121,258 | | | | -121,258 | |
| Additional paid-in-capital | | | 432,779 | | | | 432,779 | |
| Legal reserve | | | 168,636 | | | | 168,636 | |
| Other accumulated comprehensive results | | | -20,094 | | | | -33,378 | |
| Retained earnings | | | 271,595 | | | | 456,629 | |
| Total equity | | | 1,195,805 | | | | 1,367,555 | |
| | | | | | | | | |
| Total liability and equity | | | 3,201,772 | | | | 3,016,284 | |
| 19 | |
Consolidated statements of profit or loss
For the three and twelve-month periods ended December 30, 2021 and 2020 (both audited)
| | | 4Q21 | | | 4Q20 | | | 2021 | | | 2020 | |
| | | S/ (000) | | | S/ (000) | | | S/ (000) | | | S/ (000) | |
| Revenues | | | 524,869 | | | | 475,338 | | | | 1,937,767 | | | | 1,296,334 | |
| Cost of sales | | | -363,468 | | | | -325,335 | | | | -1,378,336 | | | | -921,048 | |
| Gross profit | | | 161,401 | | | | 150,003 | | | | 559,431 | | | | 375,286 | |
| | | | | | | | | | | | | | | | | |
| Operating income (expenses) | | | | | | | | | | | | | | | | |
| Administrative expenses | | | -51,092 | | | | -53,591 | | | | -196,069 | | | | -163,369 | |
| Selling and distribution expenses | | | -8,961 | | | | -8,733 | | | | -51,520 | | | | -40,153 | |
| Other operating income, net | | | 6,072 | | | | 4,663 | | | | 6,408 | | | | 4,346 | |
| Total operating expenses, net | | | -53,981 | | | | -57,661 | | | | -241,181 | | | | -199,176 | |
| | | | | | | | | | | | | | | | | |
| Operating profit | | | 107,420 | | | | 92,342 | | | | 318,250 | | | | 176,110 | |
| | | | | | | | | | | | | | | | | |
| Other income (expenses) | | | | | | | | | | | | | | | | |
| Finance income | | | 587 | | | | 531 | | | | 2,891 | | | | 2,976 | |
| Finance costs | | | -22,704 | | | | -21,709 | | | | -88,965 | | | | -88,694 | |
| Gain (loss) on the valuation of trading derivative financial instruments at fair value through profit or loss | | | -51 | | | | 336 | | | | 589 | | | | 5,337 | |
| Accumulated net loss due to settlement of derivative financial instruments at fair value through profit or loss | | | - | | | | - | | | | -1,569 | | | | - | |
| Loss from exchange difference, net | | | -8,013 | | | | -1,481 | | | | -7,086 | | | | -9,831 | |
| Total other expenses, net | | | -30,181 | | | | -22,323 | | | | -94,140 | | | | -90,212 | |
| | | | | | | | | | | | | | | | | |
| Profit before income tax | | | 77,239 | | | | 70,019 | | | | 224,110 | | | | 85,898 | |
| | | | | | | | | | | | | | | | | |
| Income tax expense | | | -25,650 | | | | -22,492 | | | | -70,940 | | | | -28,004 | |
| Profit for the period | | | 51,589 | | | | 47,527 | | | | 153,170 | | | | 57,894 | |
| | | | | | | | | | | | | | | | | |
| Basic and diluted earnings per share for year atributable to equity holders of common shares and investment shares of the parent (S/ per share) | | | 0.12 | | | | 0.11 | | | | 0.36 | | | | 0.14 | |
| 20 | |
Consolidated statements of changes in equity
For the years ended December 31, 2021, 2020 and 2019 (audited)
| | | Attributable to equity holders of the parent | |
| | | Capital stock
S/ (000) | | | Investment
shares
S/ (000) | | | Treasury
shares
S/ (000) | | | Additional
paid-in
capital
S/ (000) | | | Legal
reserve
S/ (000) | | | Unrealized
gain (loss)
on financial
instruments
designated
at fair value
S/ (000) | | | Unrealized
gain (loss)
on cash
flow hedge
S/(000) | | | Retained
earnings
S/ (000) | | | Total
S/ (000) | |
| Balance as of January 1, 2019 | | | 423,868 | | | | 40,279 | | | | -121,258 | | | | 432,779 | | | | 168,356 | | | | 4,002 | | | | -15,948 | | | | 519,285 | | | | 1,451,363 | |
| Change in accounting policy | | | - | | | | - | | | | - | | | | - | | | | - | | | | - | | | | - | | | | -13 | | | | -13 | |
| | | | | | | | | | | | | | | | | | | | | | | | | | | | | | | | | | | | | |
| Restated total equity as of January 1, 2019 | | | 423,868 | | | | 40,279 | | | | -121,258 | | | | 432,779 | | | | 168,356 | | | | 4,002 | | | | -15,948 | | | | 519,272 | | | | 1,451,350 | |
| Profit for the period | | | - | | | | - | | | | - | | | | - | | | | - | | | | - | | | | - | | | | 132,047 | | | | 132,047 | |
| Other comprehensive income | | | - | | | | - | | | | - | | | | - | | | | - | | | | -6,105 | | | | -1,802 | | | | - | | | | -7,907 | |
| | | | | | | | | | | | | | | | | | | | | | | | | | | | | | | | | | | | | |
| Total comprehensive income | | | - | | | | - | | | | - | | | | - | | | | - | | | | -6,105 | | | | -1,802 | | | | 132,047 | | | | 124,140 | |
| Terminated dividends | | | - | | | | - | | | | - | | | | - | | | | 280 | | | | - | | | | - | | | | - | | | | 280 | |
| Dividend distribution | | | - | | | | - | | | | - | | | | - | | | | - | | | | - | | | | - | | | | -154,119 | | | | -154,119 | |
| | | | | | | | | | | | | | | | | | | | | | | | | | | | | | | | | | | | | |
| Balance as of December 31, 2019 | | | 423,868 | | | | 40,279 | | | | -121,258 | | | | 432,779 | | | | 168,636 | | | | -2,103 | | | | -17,750 | | | | 497,200 | | | | 1,421,651 | |
| Profit for the period | | | - | | | | - | | | | - | | | | - | | | | - | | | | - | | | | - | | | | 57,894 | | | | 57,894 | |
| Other comprehensive income | | | - | | | | - | | | | - | | | | - | | | | - | | | | -12,360 | | | | -1,165 | | | | - | | | | -13,525 | |
| | | | | | | | | | | | | | | | | | | | | | | | | | | | | | | | | | | | | |
| Total comprehensive income | | | - | | | | - | | | | - | | | | - | | | | - | | | | -12,360 | | | | -1,165 | | | | 57,894 | | | | 44,369 | |
| Dividend distribution | | | - | | | | - | | | | - | | | | - | | | | - | | | | - | | | | - | | | | -98,465 | | | | -98,465 | |
| | | | | | | | | | | | | | | | | | | | | | | | | | | | | | | | | | | | | |
| Balance as of December 31, 2020 | | | 423,868 | | | | 40,279 | | | | -121,258 | | | | 432,779 | | | | 168,636 | | | | -14,463 | | | | -18,915 | | | | 456,629 | | | | 1,367,555 | |
| Profit for the period | | | - | | | | - | | | | - | | | | - | | | | - | | | | - | | | | - | | | | 153,170 | | | | 153,170 | |
| Other comprehensive income | | | - | | | | - | | | | - | | | | - | | | | - | | | | -1,406 | | | | 14,690 | | | | - | | | | 13,284 | |
| | | | | | | | | | | | | | | | | | | | | | | | | | | | | | | | | | | | | |
| Total comprehensive income | | | 423,868 | | | | 40,279 | | | | -121,258 | | | | 432,779 | | | | 168,636 | | | | -15,869 | | | | -4,225 | | | | 609,799 | | | | 1,534,009 | |
| Dividend distribution | | | - | | | | - | | | | - | | | | - | | | | - | | | | - | | | | - | | | | -338,204 | | | | -338,204 | |
| | | | | | | | | | | | | | | | | | | | | | | | | | | | | | | | | | | | | |
| Balance as of December 31, 2021 | | | 423,868 | | | | 40,279 | | | | -121,258 | | | | 432,779 | | | | 168,636 | | | | -15,869 | | | | -4,225 | | | | 271,595 | | | | 1,195,805 | |