Exhibit 99.1

E-mail: cbustamante@cpsaa.com.pe

CEMENTOS PACASMAYO S.A.A. ANNOUNCES CONSOLIDATED RESULTS
FOR FOURTH QUARTER 2023
Lima, Peru, February 14, 2024 – Cementos Pacasmayo S.A.A. and subsidiaries (NYSE: CPAC; BVL: CPACASC1) (“the Company” or “Pacasmayo”) a leading cement company serving the Peruvian construction industry, announced today its consolidated results for the fourth quarter (“4Q23”) and for the year (“2023”) ended December 31, 2023. These results have been prepared in accordance with International Financial Reporting Standards (“IFRS”) and are stated in Soles (S/).
4Q23 FINANCIAL AND OPERATIONAL HIGHLIGHTS:
(All comparisons are to 4Q22, unless otherwise stated)
| ● | Adjusted EBITDA was S/156.1 million, a 29.0% increase, mainly due to operational efficiencies derived from our new kiln in Pacasmayo, as well as decreased costs of raw materials. |
| ● | Adjusted EBITDA margin of 30.5%, an increase of 7.9 percentage points, due to the above-mentioned operational efficiencies and decreased raw material costs. |
| ● | Revenues decreased 4.2%, mainly due to a contraction in demand, which affected the self-construction segment and the private sector. However, revenues were in line with those in 3Q23, which was the quarter with highest revenues this year, showing a sustained positive trend in demand. |
| ● | Sales volume of cement, concrete and precast decreased 10.3%, mainly due to the above-mentioned decrease in demand. |
| ● | Consolidated EBITDA reached S/119.5 million, a decrease of 1.2%, mainly due to the impairment of our vertical kilns in Pacasmayo, as the new kiln entered into operations, which is both more efficient and produces lower emissions, replacing older kilns. |
| ● | Net income of S/ 35.9 million, a 7.7% decrease mainly due to the impairment of our vertical kilns. |
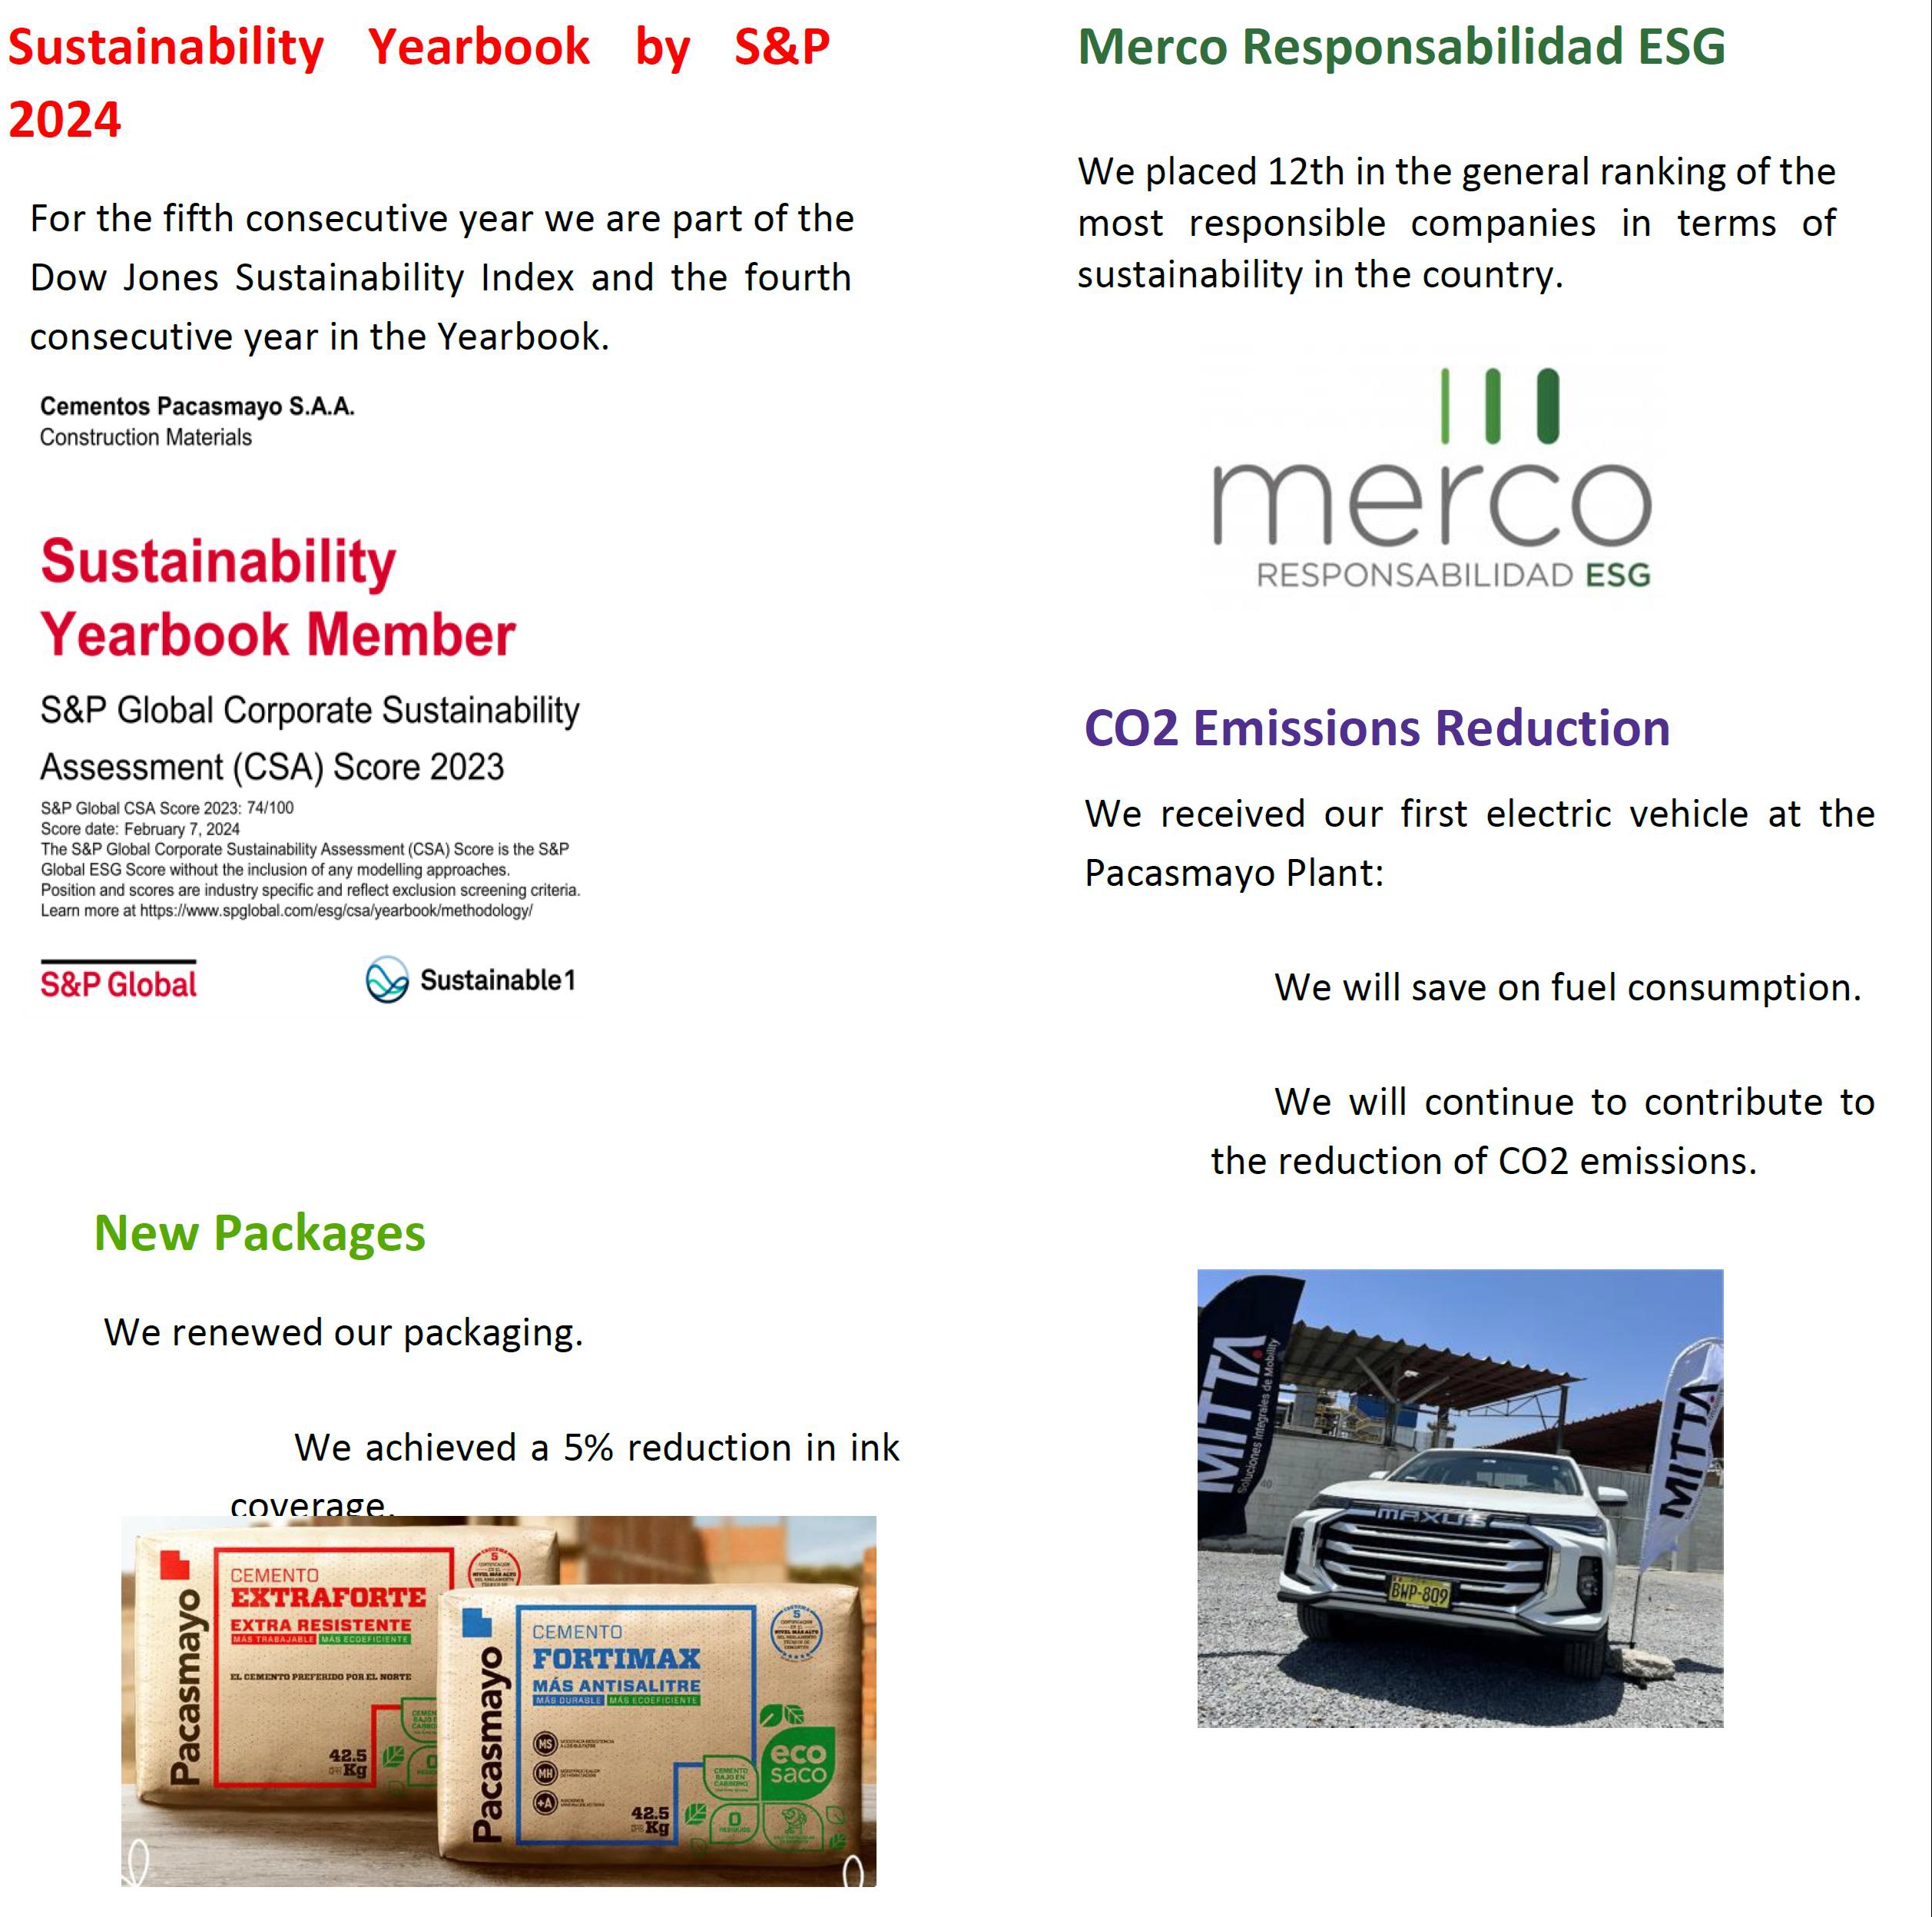
| ● | The Sustainability Yearbook 2024 - We are honored to be included in the Yearbook by S&P, for the fourth consecutive year. This Yearbook incorporates companies that score in the top 15% of their industry globally and have a gap of less than 30% from the leader’s Global ESG score. |
2023 FINANCIAL AND OPERATIONAL HIGHLIGHTS:
(All comparisons are to 2022, unless otherwise stated)
| ● | Adjusted EBITDA increased 4.9%, reaching S/518.3 million, mainly due to lower costs and operational efficiencies as we discontinued the use of imported clinker, started operating our new, more efficient kiln, and benefited from more favorable costs of raw materials. |
| ● | Adjusted EBITDA margin of 26.6%, a 3.2 percentage point increase, mainly due to improved cost structure as a result of both operational efficiencies and lower raw material costs. |
| ● | Revenues decreased 7.8%, mainly due to the low levels of private and public investment, which affected cement demand, as well as the impact of cyclone Yaku during the first months of the year. |
| ● | Sales volume of cement, concrete and precast decreased 13.9%, mainly due to the above-mentioned reasons. |
| ● | Consolidated EBITDA of S/ 481.8 million, a decrease of 2.4%, mainly due to the S/.36.6 million impairment of our vertical kilns. |
| ● | Net income of S/ 168.9 million, a 4.5% decrease, mainly due to the above-mentioned impairment. However, net income margin increased 0.3 percentage point, reaching 8.7% during this period. If we take away the non-cash effect, net profit for 2023 would have been S/ 194.7 million, a 10.1% increase when compared to the previous year, mainly due to the operational efficiencies mentioned above. |

We invite you to review our historical results by clicking on the underlined titles:
| | | Financial and Operating Results | |
| | | 4Q23 | | | 4Q22 | | | % Var. | | | 2023 | | | 2022 | | | % Var. | |
| Cement, concrete and precast shipments (MT) | | | 750.6 | | | | 836.8 | | | | -10.3 | % | | | 2,953.4 | | | | 3,431.9 | | | | -13.9 | % |
| In millions of S/ | | | | | | | | | | | | | | | | | | | | | | | | |
| Sales of goods | | | 511.4 | | | | 533.8 | | | | -4.2 | % | | | 1,950.1 | | | | 2,115.7 | | | | -7.8 | % |
| Gross profit | | | 201.6 | | | | 163.1 | | | | 23.6 | % | | | 689.4 | | | | 652.0 | | | | 5.7 | % |
| Operating profit | | | 80.6 | | | | 86.1 | | | | -6.4 | % | | | 337.5 | | | | 355.3 | | | | -5.0 | % |
| Net income | | | 35.9 | | | | 38.9 | | | | -7.7 | % | | | 168.9 | | | | 176.8 | | | | -4.5 | % |
| Consolidated EBITDA | | | 119.5 | | | | 121.0 | | | | -1.2 | % | | | 481.8 | | | | 493.9 | | | | -2.4 | % |
| Adjusted EBITDA/1 | | | 156.1 | | | | 121.0 | | | | 29.0 | % | | | 518.3 | | | | 493.9 | | | | 4.9 | % |
| Gross Margin | | | 39.4 | % | | | 30.6 | % | | | 8.9 pp. | | | | 35.4 | % | | | 30.8 | % | | | 4.5 pp. | |
| Operating Margin | | | 15.8 | % | | | 16.1 | % | | | -0.4 pp. | | | | 17.3 | % | | | 16.8 | % | | | 0.5 pp. | |
| Net income Margin | | | 7.0 | % | | | 7.3 | % | | | -0.3 pp. | | | | 8.7 | % | | | 8.4 | % | | | 0.3 pp. | |
| Consolidated EBITDA Margin | | | 23.4 | % | | | 22.7 | % | | | 0.7 pp. | | | | 24.7 | % | | | 23.3 | % | | | 1.4 pp. | |
| Adjusted EBITDA Margin | | | 30.5 | % | | | 22.7 | % | | | 7.9 pp. | | | | 26.6 | % | | | 23.3 | % | | | 3.2 pp. | |
1/EBITDA has been adjusted to exclude the effect of the impairment of our vertical kilns.
MANAGEMENT COMMENTS
During this quarter, we were able to focus on efficiencies, achieving a gross profit margin of 39.4%, almost 9 percentage points higher than in 4Q22. This significant increase in margin was mainly due to the lower production cost of our new kiln in Pacasmayo, which also allowed us to replace imported clinker with our own clinker, as well as to the decrease in the cost of coal. Since we have this new and more efficient capacity, and are therefore certain that we will not need to use the vertical kilns again, we decided to make an impairment, which affected our EBITDA. If we consider adjusted EBITDA, without this non-cash effect, the increase year-over-year this quarter was 29%, and adjusted EBITDA margin was 30.5%. These outstanding quarterly results have allowed us to reach a record adjusted EBITDA of S/ 518.3 million in 2023. We firmly believe this is a remarkable achievement in a year with a very challenging demand environment, as social conflict and cyclone Yaku affected sales during the first half of the year. We are convinced that, as we plan to sustain these efficiencies, we are very well equipped to take advantage of a more favorable demand environment this upcoming year.
We would like to take this opportunity to look over this past year’s performance, taking a more strategic view and assessing our progress towards our longer-term goals. First, we would like to point out our main investments this year. As we mentioned above, in 2023 we finished investing around US$ 85 million in a more efficient kiln for our Pacasmayo plant. This investment is fully aligned with our medium and long term strategy as it demonstrates on one hand, our firm belief in the future growth of our country and on the other hand, our commitment to carbon neutrality as this new kiln lowers our emissions. Our other investment was related to the connectivity between our main quarry and the Piura plant. As you may recall, during the first quarter of 2023, rains interrupted this road, and even though we were able to continue operating as usual because of our inventory policy, it was crucial to restore access. We are investing approximately S/ 13 million in order to rebuild the road, in a manner that will allow water to pass below in the event of rains. Since November, access through an alternate road has been restored and the final work should be finished by March 2024.
One of the most important pillars of our strategy is digital transformation. We are aware of the importance of reducing technological gaps in the construction sector and are therefore keen on developing digital tools in order to improve our competitiveness and offer value added products and services to our clients. However, it is also very important to develop tools to improve our internal processes, hence translating into enhanced decision making abilities, agility and building robust data lakes that will in turn result in better business results. During this past year, we have worked extensively on this front, but also focusing on the cultural component. We are aware that many tools may be developed, but in order for them to truly transform the business, they need to be understood and widely used. This is why culture is crucial. This year we held workshops for our senior leaders where they could listen to experiences from other organizations, related to data, agility and artificial intelligence. We also developed learning paths for all of our workers, to develop their skills in artificial intelligence, data & analytics, and agility applied to their roles.
Finally, we would like to focus on two recognitions that we received these past weeks. First, we are extremely pleased to be included, for the fourth consecutive year, in The Sustainability Yearbook by S&P. Along the same lines, for the eighth consecutive year, we were the industry leaders in the Merco Responsabilidad ESG ranking this year. This evaluation includes three types of criteria: environment (E), clients and society (S), ethics and corporate governance (G). We placed 12th in the general ranking of the most responsible companies in terms of sustainability in the country. These recognitions give us the confidence to continue moving forward with our sustainability strategy, embedding it at the heart of our business.
2023 has been a challenging year in terms of demand as not only the construction sector, but all of the Peruvian economy significantly slowed down. Despite this, we have invested to capitalize on efficiencies today, and to better face what we believe will be a brighter future because we are firm believers in the potential this great country holds.
ECONOMIC OVERVIEW 4Q23:
During 4Q23, the Peruvian economy continued the period of contraction that began with the social conflicts and negative weather conditions that affected the country in the first months of the year. Private and regional government investment continued to decline. Therefore, the Central Reserve Bank’s projections were adjusted downward, estimating a 0.5% decrease in GDP for 2023. However, since these were temporary effects, in 2024 the expected growth rate is around 2.8%, which would be the highest in the region. This growth rate assumes a moderate coastal El Niño Phenomenon, according to the latest ENFEN statement and hence, the most probable scenario. This growth rate is based on an improved confidence to invest by the private sector and an increase in public investment by sub-national governments.
Regarding infrastructure projects in the north of the country, it is important to mention that during this quarter work began at the Piura Airport, estimating its completion during the first quarter of 2025. Additionally, this January the Chavimochic III project was awarded, which had been paralyzed since 2017. The project will be executed under the government-to-government agreement modality, with the Government of Canada as counterpart.
PERUVIAN CEMENT INDUSTRY OVERVIEW:
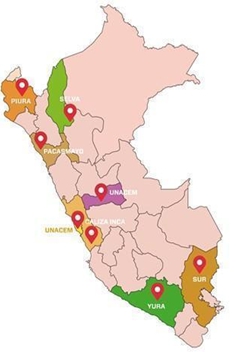
The demand for cement in Peru is covered mainly by Pacasmayo, UNACEM and Cementos Yura, and to a lesser extent by Caliza Inca, imports and other small producers. Pacasmayo mainly covers the demand in the northern region of the country, while UNACEM covers the central region and Cementos Yura the southern region.
The northern region of Peru, according to the Instituto Nacional de Estadística e Informática (INEI) and Apoyo Consultoría, represents approximately 32.5% of the country’s population and 16.0% of national Gross Domestic Product (“GDP”). Despite the country’s sustained growth over the last 10 years, Peru continues to have a significant housing deficit, estimated at 1.9 million households throughout the country as per the Ministry of Housing, Construction and Sanitation.
In Peru, the majority of cement is sold to a highly fragmented consumer base of individuals that tend to gradually buy bags of cement to build or to improve their homes, a segment the industry refers to as “self-construction”.
Northern Region (thousands of metric tons)
| Plant | | 2019 | | | 2020 | | | 2021 | | | 2022 | | | As of
Nov-23 | | | % part | |
| Pacasmayo Group | | | 2,615 | | | | 2,576 | | | | 3,614 | | | | 3,437 | | | | 2,994 | | | | 24.0 | % |
| Imports | | | 13 | | | | 38 | | | | 40 | | | | 2 | | | | - | | | | 0.0 | % |
| Total | | | 2,628 | | | | 2,614 | | | | 3,654 | | | | 3,439 | | | | 2,994 | | | | 24.0 | % |
Central Region (thousands of metric tons)
| Plant | | 2019 | | | 2020 | | | 2021 | | | 2022 | | | As of
Nov-23 | | | % part | |
| UNACEM | | | 5,316 | | | | 4,172 | | | | 5,838 | | | | 6,297 | | | | 5,697 | | | | 45.6 | % |
| Caliza Inca | | | 513 | | | | 382 | | | | 492 | | | | 515 | | | | 572 | | | | 4.6 | % |
| Imports | | | 663 | | | | 493 | | | | 691 | | | | 202 | | | | 145 | | | | 1.2 | % |
| Total | | | 6,492 | | | | 5,047 | | | | 7,021 | | | | 7,014 | | | | 6,414 | | | | 51.3 | % |
Southern Region (thousands of metric tons)
| Plant | | 2019 | | | 2020 | | | 2021 | | | 2022 | | | As of
Nov-23 | | | % part | |
| Grupo Yura | | | 2,584 | | | | 2,019 | | | | 2,904 | | | | 3,047 | | | | 2,617 | | | | 20.9 | % |
| Imports | | | 98 | | | | 189 | | | | 150 | | | | 67 | | | | 69 | | | | 0.6 | % |
| Total | | | 2,682 | | | | 2,208 | | | | 3,054 | | | | 3,114 | | | | 2,686 | | | | 21.5 | % |
| | | | | | | | | | | | | | | | | | | | | | | | | |
| Others | | | 769 | | | | 732 | | | | 877 | | | | 427 | | | | 404 | | | | 3.2 | % |
| | | | | | | | | | | | | | | | | | | | | | | | | |
| Total, All Region | | | 12,571 | | | | 10,601 | | | | 14,606 | | | | 13,994 | | | | 12,498 | | | | 100.0 | % |
| * | Import figures are sourced from Aduanet. They represent quantities of imported cement, not shipped cement. |
Source: INEI, Aduanet
OUR STRATEGIC PROGRESS

OPERATING RESULTS:
Production:
Cement Production Volume
(thousands of metric tons)
| | | Production | |
| | | 4Q23 | | | 4Q22 | | | % Var. | | | 2023 | | | 2022 | | | % Var. | |
| Pacasmayo Plant | | | 477.9 | | | | 432.2 | | | | 10.6 | % | | | 1,655.8 | | | | 1,768.0 | | | | -6.3 | % |
| Rioja Plant | | | 46.9 | | | | 78.9 | | | | -40.5 | % | | | 258.5 | | | | 307.2 | | | | -15.8 | % |
| Piura Plant | | | 239.5 | | | | 347.7 | | | | -31.1 | % | | | 1,031.9 | | | | 1,361.0 | | | | -24.2 | % |
| Total | | | 764.3 | | | | 858.8 | | | | -11.0 | % | | | 2,946.2 | | | | 3,436.2 | | | | -14.3 | % |
Cement production volume at the Pacasmayo plant increased 10.6% in 4Q23 compared to 4Q22, mainly due to the production of the new kiln, replacing imported clinker. During 2023, production decreased 6.3% compared to 2022, as severe rainfall significantly reduced consumption during March and April.
In 4Q23, cement production volume at the Rioja plant decreased 40.5% compared to 4Q22, mainly due to electrical problems in the area which resulted in a halt in operations. During 2023, cement production decreased 15.8% compared to 2022, mainly due to a moderation in demand, as well as the above-mentioned temporary halt in production.
Cement production volume at the Piura Plant decreased 31.1% in 4Q23 and 24.2% in 2023, compared to 4Q22 and 2022 respectively, mainly due to the moderation in demand mentioned above, as well as a shift in production to the Pacasmayo plant.
Total cement production volume decreased 11.0% in 4Q23 compared to 4Q22 and 14.3% in 2023 compared to 2022, in line with the decreased demand for cement.
Clinker Production Volume
(thousands of metric tons)
| | | Production | |
| | | 4Q23 | | | 4Q22 | | | % Var. | | | 2023 | | | 2022 | | | % Var. | |
| Pacasmayo Plant | | | 334.0 | | | | 260.5 | | | | 28.2 | % | | | 1,097.9 | | | | 934.9 | | | | 17.4 | % |
| Rioja Plant | | | 37.4 | | | | 56.9 | | | | -34.3 | % | | | 199.6 | | | | 239.9 | | | | -16.8 | % |
| Piura Plant | | | 271.9 | | | | 275.7 | | | | -1.4 | % | | | 799.4 | | | | 1,023.2 | | | | -21.9 | % |
| Total | | | 643.4 | | | | 593.1 | | | | 8.5 | % | | | 2,096.9 | | | | 2,198.0 | | | | -4.6 | % |
Clinker production volume at the Pacasmayo plant increased 28.2% in 4Q23 and 17.4% in 2023 compared to 4Q22 and 2022 respectively, mainly due to production in our new kiln that replaced imported clinker,
Clinker production volume at the Rioja plant decreased 34.3% in 4Q23 compared to 4Q22 and 16.8% in 2023 compared to 2022, due to the temporary halt in production mentioned above.
Clinker production at the Piura plant decreased 1.4% and 21.9% in 4Q23 and 2023, when compared to 4Q22 and 2022 respectively, in line with decreased cement demand and the shift in production to the Pacasmayo plant.
Total clinker production volume increased 8.5% in 4Q23, mainly due to increased production from our own kilns, replacing imported clinker. Total clinker production volume decreased 4.6% in 2023, compared to 2022, mainly due to the moderation in cement demand.
Quicklime Production Volume
(thousands of metric tons)
| | | Production | |
| | | 4Q23 | | | 4Q22 | | | % Var. | | | 2023 | | | 2022 | | | % Var. | |
| Pacasmayo Plant | | | 5.9 | | | | 12.2 | | | | -51.3 | % | | | 29.0 | | | | 46.0 | | | | -36.9 | % |
Quicklime production volume in 4Q23 decreased 51.3% when compared to 4Q22 and 36.9% in 2023 when compared to 2022, mainly due to lower sales volume, as a result of the decrease in demand in the northern region of Peru
INSTALLED CAPACITY:
Installed Clinker and Cement Capacity
Full year installed cement capacity at the Pacasmayo, Piura and Rioja plants remained stable at 2.9 million MT, 1.6 million MT and 440,000 MT, respectively.
Full year installed clinker capacity at the Piura and Rioja plants remained stable at 990,000 MT and 289,080 MT, respectively. Clinker capacity at the Pacasmayo plant increased from 1.5 million MT to 1.8 million MT, due to the optimization resulting from our new kiln, partially offset by the impairment of our vertical kilns in the fourth quarter.
Full year installed quicklime capacity at the Pacasmayo plant remained stable at 240,000 MT.
UTILIZATION RATE1:
Pacasmayo Plant Utilization Rate
| | | Utilization Rate | |
| | | | 4Q23 | | | | 4Q22 | | | | % Var. | | | | 2023 | | | | 2022 | | | | % Var. | |
| Cement | | | 65.9 | % | | | 59.6 | % | | | 6.3 pp. | | | | 57.1 | % | | | 61.0 | % | | | -3.9 pp. | |
| Clinker | | | 69.9 | % | | | 69.5 | % | | | 0.5 pp. | | | | 61.6 | % | | | 62.3 | % | | | -0.7 pp. | |
| Quicklime | | | 9.9 | % | | | 20.3 | % | | | -10.4 pp. | | | | 12.1 | % | | | 19.2 | % | | | -7.1 pp. | |
Cement production utilization rate at the Pacasmayo plant increased 6.3 percentage points in 4Q23 compared to 4Q22, mainly due to a shift in production from the Piura plant. During 2023, cement production utilization rate decreased 3.9 percentage points, mainly due to the decreased cement demand mentioned above.
Clinker production utilization rate remained in line in 4Q23 and 2023, increasing 0.5 and decreasing 0.7 percentage points compared to 4Q22 and 2023, respectively, mainly due to the replacement of imported clinker with or own clinker during the second half of the year.
Quicklime production utilization rate in 4Q23 and 2023 decreased 10.4 percentage points and 7.1 percentage points when compared to 4Q22 and 2022 respectively, mainly due to the decreased sales volume and the consumption of our inventory.
Rioja Plant Utilization Rate
| | | Utilization Rate | |
| | | 4Q23 | | | 4Q22 | | | % Var. | | | 2023 | | | 2022 | | | % Var. | |
| Cement | | | 42.6 | % | | | 71.7 | % | | | -29.1 pp. | | | | 58.8 | % | | | 69.8 | % | | | -11.1 pp. | |
| Clinker | | | 51.8 | % | | | 81.3 | % | | | -29.5 pp. | | | | 69.0 | % | | | 85.7 | % | | | -16.6 pp. | |
The cement production utilization rate at the Rioja plant was 42.6% in 4Q23 and 58.8% in 2023; 29.1 and 11.1 percentages points lower than 4Q22 and 2022 respectively, mainly due to the interruptions in the electrical supply mentioned above, as well as the decreased cement demand.
The clinker production utilization rate at the Rioja plant was 51.8% in 4Q23 and 69.0% in 2023; 29.5 and 16.6 percentage points lower than 4Q22 and 2022 respectively, mainly due to decreased cement demand, and the aforementioned interruptions in the electricity supply.
| 1 | The utilization rates are calculated by dividing production in a given period over installed capacity. The utilization rate implies annualized production, which is calculated by multiplying real production for each quarter by four. |
Piura Plant Utilization Rate
| | | Utilization Rate | |
| | | 4Q23 | | | 4Q22 | | | % Var. | | | 2023 | | | 2022 | | | % Var. | |
| Cement | | | 59.9 | % | | | 86.9 | % | | | -27.1 pp. | | | | 64.5 | % | | | 85.1 | % | | | -20.6 pp. | |
| Clinker | | | 100.0 | % | | | 100.0 | % | | | 0.0 pp. | | | | 80.7 | % | | | 100.0 | % | | | -19.3 pp. | |
The cement production utilization rate at the Piura plant was 59.9% in 4Q23 and 64.5% in 2023, a 27.1 and 20.6 percentage point decrease when compared to 4Q22 and 2022 respectively, mainly due to the shift in production to the Pacasmayo plant, as well as to the temporary slowdown in demand.
The clinker production utilization rate at the Piura plant was over 100.0% in 4Q23, mainly due to [our annual production plan that aims to maximize the operational efficiency of our kilns. In 2023, the clinker production utilization rate of the Piura plant was 80.7%, 19.3 points lower than 2022, mainly due to the shift in production mentioned above.
Consolidated Utilization Rate
| | | Utilization Rate | |
| | | 4Q23 | | | 4Q22 | | | % Var. | | | 2023 | | | 2022 | | | % Var. | |
| Cement | | | 61.9 | % | | | 69.5 | % | | | -7.7 pp. | | | | 59.6 | % | | | 69.6 | % | | | -9.9 pp. | |
| Clinker | | | 80.7 | % | | | 85.3 | % | | | -4.7 pp. | | | | 68.5 | % | | | 79.1 | % | | | -10.6 pp. | |
The consolidated cement production utilization rate was 61.9% in 4Q23 and 59.6% in 2023, 7.7 and 9.9 percentage points lower than 4Q22 and 2022 respectively, in line with the slowdown in demand.
The consolidated clinker production utilization rate was 80.7% in 4Q23 and 68.5% in 2023, 4.7 and 10.6 percentage points lower than 4Q22 and 2022 respectively, mainly due to the decrease in cement demand.
FINANCIAL RESULTS:
Income Statement:
The following table shows a summary of the Consolidated Financial Results:
Consolidated Financial Results
(in millions of Soles S/)
| | | Income Statement | |
| | | 4Q23 | | | 4Q22 | | | % Var. | | | 2023 | | | 2022 | | | % Var. | |
| Sales of goods | | | 511.4 | | | | 533.8 | | | | -4.2 | % | | | 1,950.1 | | | | 2,115.7 | | | | -7.8 | % |
| Gross Profit | | | 201.7 | | | | 163.1 | | | | 23.6 | % | | | 689.4 | | | | 652.0 | | | | 5.7 | % |
| Total operating expenses, net | | | -121.0 | | | | -77.0 | | | | 57.1 | % | | | -351.9 | | | | -296.7 | | | | 18.6 | % |
| Operating Profit | | | 80.6 | | | | 86.1 | | | | -6.4 | % | | | 337.5 | | | | 355.3 | | | | -5.0 | % |
| Total other expenses, net | | | -25.0 | | | | -22.3 | | | | 12.1 | % | | | -91.8 | | | | -92.9 | | | | -1.2 | % |
| Profit before income tax | | | 55.6 | | | | 63.8 | | | | -12.9 | % | | | 245.7 | | | | 262.4 | | | | -6.4 | % |
| Income tax expense | | | -19.7 | | | | -24.9 | | | | -20.9 | % | | | -76.8 | | | | -85.6 | | | | -10.3 | % |
| Profit for the period | | | 35.9 | | | | 38.9 | | | | -7.7 | % | | | 168.9 | | | | 176.8 | | | | -4.5 | % |
During 4Q23, revenues decreased 4.2% and 7.8% in 2023, compared to 4Q22 and 2022 respectively, mainly due to decreased sales volumes. However, gross profit increased 23.6% in 4Q23 and 5.7% in 2023, compared to 4Q22 and 2022 respectively, mainly due to decreased costs, as we maximized the use of our own clinker and benefitted from lower costs of raw materials. Profit for the period decreased 7.7% in 4Q23 and 4.5% in 2023 as compared to 4Q22 and 2022 respectively, primarily due to the impairment of our vertical kilns during this quarter. If we take away this effect, net profit for 2023 would have been S/ 194.7 million, a 10.1% increase when compared to the previous year, mainly due to the operational efficiencies mentioned above.
SALES OF GOODS
The following table shows the Sales of Goods and their respective margins by business segment:
Sales: cement, concrete and precast
(in millions of Soles S/)
| | | Cement, concrete and precasts | |
| | | 4Q23 | | | 4Q22 | | | % Var. | | | 2023 | | | 2022 | | | % Var. | |
| Sales of goods | | | 485.4 | | | | 500.6 | | | | -3.0 | % | | | 1,850.2 | | | | 1,963.8 | | | | -5.8 | % |
| Cost of Sales | | | -284.1 | | | | -338.9 | | | | -16.2 | % | | | -1,162.5 | | | | -1,316.5 | | | | -11.7 | % |
| Gross Profit | | | 201.3 | | | | 161.7 | | | | 24.5 | % | | | 687.7 | | | | 647.3 | | | | 6.2 | % |
| Gross Margin | | | 41.5 | % | | | 32.3 | % | | | 9.2 pp. | | | | 37.2 | % | | | 33.0 | % | | | 4.2 pp. | |
Sales of cement, concrete and precast decreased 3.0% in 4Q23 and 5.8% in 2023, when compared to 4Q22 and 2022 respectively, mainly due to decreased volume of bagged cement and concrete as a result of lower demand for self-construction, public and private works. Gross margin increased 9.2 percentage points during 4Q23 and 4.2 percentage points during 2023, when compared to 4Q22 and 2022 respectively, mainly due to the decreased use of imported clinker, operational efficiencies, as well as decreased costs of raw materials.
Sales: cement
(in millions of Soles S/)
Sales of cement represented 85.3% of cement, concrete, and precast sales during 4Q23.
| | | Cement | |
| | | 4Q23 | | | 4Q22 | | | %Var. | | | 2023 | | | 2022 | | | %Var. | |
| Sales of goods | | | 414.2 | | | | 446.7 | | | | -7.3 | % | | | 1,642.4 | | | | 1,742.7 | | | | -5.8 | % |
| Cost of Sales | | | -219.4 | | | | -288.7 | | | | -24.0 | % | | | -966.1 | | | | -1,111.5 | | | | -13.1 | % |
| Gross Profit | | | 194.8 | | | | 158.0 | | | | 23.3 | % | | | 676.3 | | | | 631.2 | | | | 7.1 | % |
| Gross Margin | | | 47.0 | % | | | 35.4 | % | | | 11.7 pp. | | | | 41.2 | % | | | 36.2 | % | | | 5.0 pp. | |
Sales of cement decreased 7.3% in 4Q23 compared to 4Q22 and 5.8% in 2023 compared to 2022, mainly due to decreased demand from the self-construction segment, from the record levels reached in the post-pandemic times. However, gross margin increased 11.7 percentage points during 4Q23 and 5.0 percentage points during 2023, when compared to 4Q22 and 2022 respectively, mainly due to cost optimization, as we reduced the consumption of imported clinker and and lower production costs with our new kiln in Pacasmayo, as well as lower costs of raw materials, such as coal.
Sales: concrete, pavement and mortar
(in millions of Soles S/)
Sales of concrete, pavement and mortar represented 12.7% of cement, concrete, and precast sales during 4Q23.
| | | Concrete, pavement and mortar | |
| | | 4Q23 | | | 4Q22 | | | % Var. | | | 2023 | | | 2022 | | | % Var. | |
| Sales of goods | | | 61.5 | | | | 45.8 | | | | 34.3 | % | | | 182.3 | | | | 189.9 | | | | -4.0 | % |
| Cost of Sales | | | -56.4 | | | | -41.2 | | | | 36.9 | % | | | -170.2 | | | | -169.6 | | | | 0.4 | % |
| Gross Profit | | | 5.1 | | | | 4.6 | | | | 10.9 | % | | | 12.1 | | | | 20.3 | | | | -40.4 | % |
| Gross Margin | | | 8.3 | % | | | 10.0 | % | | | -1.8 pp. | | | | 6.6 | % | | | 10.7 | % | | | -4.1 pp. | |
Sales of concrete, pavement and mortar increased 34.3% during 4Q23, when compared to 4Q22, mainly due to increased sales of pavement for the Piura airport. During 2023, sales of concrete, pavement and mortar decreased 4.0% when compared to 2022, mainly due to decreased public and private investment. Gross margin decreased 1.8 percentage points in 4Q23 compared to 4Q22 and 4.1 percentage points in 2023 compared to 2022, mainly due to lower margins for larger projects.
Sales: precast
(in millions of Soles S/)
Sales of precast represented 2.0% of cement, concrete, and precast sales during 4Q23.
| | | Precast | |
| | | 4Q23 | | | 4Q22 | | | % Var. | | | 2023 | | | 2022 | | | % Var. | |
| Sales of goods | | | 9.7 | | | | 8.1 | | | | 19.8 | % | | | 25.5 | | | | 31.2 | | | | -18.3 | % |
| Cost of Sales | | | -8.2 | | | | -9.0 | | | | -8.9 | % | | | -26.2 | | | | -35.4 | | | | -26.0 | % |
| Gross Profit | | | 1.5 | | | | -0.9 | | | | N/R | | | | -0.7 | | | | -4.2 | | | | -83.3 | % |
| Gross Margin | | | 15.5 | % | | | -11.1 | % | | | 26.6 pp. | | | | -2.7 | % | | | -13.5 | % | | | 10.7 pp. | |
During 4Q23, precast sales increased 19.8% compared to 4Q22, mainly due to increased public investment this quarter, for reconstruction related projects. Gross margin increased significantly by 26.6 percentage points in 4Q23 and 10.7 percentage points in 2023, compared to 4Q22 and 2022, respectively.
Sales: Quicklime
(in millions of Soles S/)
| | | Quicklime | |
| | | 4Q23 | | | 4Q22 | | | % Var. | | | 2023 | | | 2022 | | | % Var. | |
| Sales of goods | | | 6.1 | | | | 6.4 | | | | -4.7 | % | | | 25.7 | | | | 37.9 | | | | -32.2 | % |
| Cost of Sales | | | -6.2 | | | | -5.1 | | | | 21.6 | % | | | -24.2 | | | | -35.9 | | | | -32.6 | % |
| Gross Profit | | | -0.1 | | | | 1.3 | | | | N/R | | | | 1.5 | | | | 2.0 | | | | -25.0 | % |
| Gross Margin | | | -1.6 | % | | | 20.3 | % | | | -22.0 pp. | | | | 5.8 | % | | | 5.3 | % | | | 0.6 pp. | |
During 4Q23, quicklime sales decreased 4.7%, when compared to 4Q22 and 32.2% in 2023 when compared to the same period of the previous year, mainly due to decreased sales volume. In addition, gross margin decreased 22.0 percentage points in 4Q23 compared to 4Q22, mainly due to lower sales prices, in order to serve a larger number of clients. However, during 2023, gross margin increased 0.6 percentage points.
Sales: Construction Supplies2
(in millions of Soles S/)
| | | Construction Supplies | |
| | | 4Q23 | | | 4Q22 | | | % Var. | | | 2023 | | | 2022 | | | % Var. | |
| Sales of goods | | | 19.8 | | | | 26.9 | | | | -26.4 | % | | | 74.1 | | | | 114 | | | | -35.0 | % |
| Cost of Sales | | | -19.4 | | | | -26.5 | | | | -26.8 | % | | | -73.4 | | | | -110.4 | | | | -33.5 | % |
| Gross Profit | | | 0.4 | | | | 0.4 | | | | 0.0 | % | | | 0.7 | | | | 3.6 | | | | -80.6 | % |
| Gross Margin | | | 2.0 | % | | | 1.5 | % | | | 0.5 pp. | | | | 0.9 | % | | | 3.2 | % | | | -2.2 pp. | |
| 2 | Construction supplies include the following products: steel rebar, wires, nails, corrugated iron, electric conductors, plastic tubes and accessories, among others. |
During 4Q23, construction supplies sales decreased 26.4% compared to 4Q22 and 35.0% in 2023 compared to 2022, mainly due to the contraction in demand for the construction segment. Gross margin in 4Q23 remained in line with 4Q22 and decreased 2.2 percentage points in 2023, compared to 2022, mainly due to higher costs.
OPERATING EXPENSES:
Administrative Expenses
(in millions of Soles S/)
| | | Administrative Expenses | |
| | | 4Q23 | | | 4Q22 | | | % Var. | | | 2023 | | | 2022 | | | % Var. | |
| Personnel expenses | | | 35.4 | | | | 30.7 | | | | 15.3 | % | | | 125.1 | | | | 116.7 | | | | 7.2 | % |
| Third-party services | | | 16.3 | | | | 21.9 | | | | -25.6 | % | | | 65.0 | | | | 72.2 | | | | -10.0 | % |
| Board of Directors | | | 1.3 | | | | 1.3 | | | | 0.0 | % | | | 5.9 | | | | 6.1 | | | | -3.3 | % |
| Depreciation and amortization | | | 4.4 | | | | 4.5 | | | | -2.2 | % | | | 15.3 | | | | 16.7 | | | | -8.4 | % |
| Other | | | 6.1 | | | | 2.8 | | | | N/R | | | | 23.4 | | | | 15.9 | | | | 47.2 | |
| Total | | | 63.5 | | | | 61.2 | | | | 3.8 | % | | | 234.7 | | | | 227.6 | | | | 3.1 | % |
Administrative expenses increased 3.8% in 4Q23 and 3.1% in 2023 when compared to 4Q22 and 2022 respectively in line with inflation.
Selling Expenses
(in millions of Soles S/)
| | | Selling and distribution expenses | |
| | | 4Q23 | | | 4Q22 | | | % Var. | | | 2023 | | | 2022 | | | % Var. | |
| Personnel expenses | | | 10.6 | | | | 9.5 | | | | 11.6 | % | | | 41.6 | | | | 42.3 | | | | -1.7 | % |
| Advertising and promotion | | | 1.4 | | | | 0.2 | | | | N/R | | | | 7.5 | | | | 6.4 | | | | 17.2 | % |
| Third party services | | | 1.8 | | | | 1.5 | | | | 20.0 | % | | | 7.5 | | | | 7.1 | | | | 5.6 | % |
| Other | | | 2.1 | | | | 2.9 | | | | -27.6 | % | | | 10.2 | | | | 9.4 | | | | 8.5 | % |
| Total | | | 15.9 | | | | 14.1 | | | | 12.8 | % | | | 66.8 | | | | 65.2 | | | | 2.5 | % |
Selling expenses increased 12.8% in 4Q23 compared to 4Q22 and 2.5% in 2023 when compared to 4Q22 and 2022 respectively, mainly due to increased advertising expenses, as well as expenses related to the advancement of our digital strategy.
EBITDA RECONCILIATION:
Consolidated EBITDA
(in millions of Soles S/)
| | | Consolidated EBITDA | |
| | | 4Q23 | | | 4Q22 | | | % Var. | | | 2023 | | | 2022 | | | % Var. | |
| Net Income | | | 35.9 | | | | 38.9 | | | | -7.7 | % | | | 168.9 | | | | 176.8 | | | | -4.5 | % |
| + Income tax expense | | | 19.7 | | | | 24.9 | | | | -20.9 | % | | | 76.8 | | | | 85.6 | | | | -10.3 | % |
| - Finance income | | | -2.9 | | | | -0.9 | | | | N/R | | | | -7.2 | | | | -3.3 | | | | N/R | |
| + Financial expenses | | | 27.2 | | | | 23.6 | | | | 15.3 | % | | | 104.0 | | | | 95.2 | | | | 9.2 | % |
| +/- Net loss from exchange rate | | | 0.8 | | | | -0.4 | | | | N/R | | | | -4.9 | | | | 1.1 | | | | N/R | |
| + Depreciation and amortization | | | 38.8 | | | | 34.9 | | | | 11.2 | % | | | 144.2 | | | | 138.5 | | | | 4.1 | % |
| Consolidated EBITDA | | | 119.5 | | | | 121.0 | | | | -1.2 | % | | | 481.8 | | | | 493.9 | | | | -2.4 | % |
| Impairment of vertical kilns | | | 36.6 | | | | 0.0 | | | | N/R | | | | 36.6 | | | | 0.0 | | | | N/R | |
| Adjusted EBITDA | | | 156.1 | | | | 121.0 | | | | 29.0 | % | | | 518.3 | | | | 493.9 | | | | 4.9 | % |
Consolidated EBITDA decreased 1.2% in 4Q23 and 2.4% in 2023, when compared to 4Q22 and 2022 respectively, mainly due to the impairment of our vertical kilns, which had a negative effect of S/ 36.6 million. However, adjusted EBITDA increased 29.0% in 4Q23 and 4.9% in 2023, when compared to 4Q22 and 2022 respectively, mainly due to operational efficiencies derived from the new kiln in Pacasmayo, the halt in use of imported clinker, and decreased costs of raw materials such as coal.
Cash and Debt Position:
Consolidated Cash (in millions of Soles S/)
As of December 31, 2023, the cash balance was S/ 90.2 million (US $24.3 million). This balance includes certificates of deposit in the amount of S/ 43.4 million (US $11.7 million), distributed as follows:
Certificates of deposits in Soles
| Bank | | Amount (S/) | | | Interest
Rate | | | Initial Date | | Maturity Date |
| Banco de Crédito del Perú | | | S/ 28.0 | | | | 6.25 | % | | December 29, 2023 | | January 4, 2024 |
| BBVA | | | S/ 7.4 | | | | 7.00 | % | | December 15, 2023 | | January 19, 2024 |
| BBVA | | | S/ 2.0 | | | | 7.00 | % | | December 15, 2023 | | January 30, 2024 |
| Banco de Crédito del Perú | | | S/ 6.0 | | | | 6.25 | % | | December 29, 2023 | | January 2, 2024 |
| | | | | | | | | | | | | |
| | | | S/ 43.4 | | | | | | | | | |
The remaining balance of S/ 46.8 million (US$ 12.6 million) is held mainly in the Company’s bank accounts, of which US$ 5.9 million are denominated in US dollars and the balance in Soles.
DEBT POSITION:
Consolidated Debt
(in millions of Soles S/)
Below are the contractual obligations with payment deadlines related to the Company’s debt, including interest.
| | | Payments due by period | |
| | | Less than
1 year | | | 1-3
Years | | | 3-5
Years | | | More than
5 Years | | | Total | |
| Indebtedness | | | 384.4 | | | | 312.7 | | | | 312.7 | | | | 570.0 | | | | 1,579.8 | |
| Future interest payments | | | 89.1 | | | | 133.7 | | | | 97.5 | | | | 77.6 | | | | 397.9 | |
| Total | | | 473.5 | | | | 446.4 | | | | 410.2 | | | | 647.6 | | | | 1,977.7 | |
As of December 31, 2023, the Company’s total outstanding debt, as shown in the financial statements, amounted to S/ 1,579.8 million (US$ 425.5 million). This debt is mainly composed of the two local bonds issued in January 2019 and the club deal obtained last year.
As of December 31, 2023, Debt/adjusted EBITDA ratio was 3.0 times.
Capex
(in millions of Soles S/)
As of December 31, 2023, the Company invested S/ 299.3 million (US$ 80.6 million), allocated to the following projects:
| Projects | | 2023 | |
| Pacasmayo Plant Projects | | | 251.1 | |
| Concrete and aggregates equipment | | | 18.2 | |
| Rioja Plant Projects | | | 9.4 | |
| Piura Plant Projects | | | 17.6 | |
| Others | | | 3.0 | |
| Total | | | 299.3 | |
ABOUT CEMENTOS PACASMAYO S.A.A.
Cementos Pacasmayo S.A.A. is a cement company, located in the Northern region of Peru. In February 2012, the Company’s shares were listed on The New York Stock Exchange - Euronext under the ticker symbol “CPAC”. With more than 65 years of operating history, the Company produces, distributes and sells cement and cement-related materials, such ready-mix concrete and precast materials. Pacasmayo’s products are primarily used in construction, which has been one of the fastest-growing segments of the Peruvian economy in recent years. The Company also produces and sells quicklime for use in mining operations.
For more information, please visit: http://www.cementospacasmayo.com.pe/
Note: The Company presented some figures converted from Soles to U.S. Dollars for comparison purposes. The exchange rate used to convert Soles to U.S. dollars was S/ 3.713 per US$ 1.00, which was the average exchange rate, reported as of December 30, 2023 by the Superintendencia de Banca, Seguros y AFP’s (SBS). The information presented in U.S. dollars is for the convenience of the reader only. Certain figures included in this report have been subject to rounding adjustments. Accordingly, figures shown as totals in certain tables may not be arithmetic aggregations of the figures presented in previous quarters.
| This press release may contain forward-looking statements. These statements are statements that are not historical facts, and are based on management’s current view and estimates of future economic circumstances, industry conditions, Company performance and financial results. Also, certain reclassifications have been made to make figures comparable for the periods. The words “anticipates”, “believes”, “estimates”, “expects”, “plans” and similar expressions, as they relate to the Company, are intended to identify forward-looking statements. Statements regarding the declaration or payment of dividends, the implementation of principal operating and financing strategies and capital expenditure plans, the direction of future operations and the factors or trends affecting financial condition, liquidity or results of operations are examples of forward-looking statements. Such statements reflect the current views of management and are subject to a number of risks and uncertainties. There is no guarantee that the expected events, trends or results will actually occur. The statements are based on many assumptions and factors, including general economic and market conditions, industry conditions, and operating factors. Any changes in such assumptions or factors could cause actual results to differ materially from current expectations. |
CONSOLIDATED STATEMENTS OF FINANCIAL POSITION
As of December 31, 2023 and December 31,2022 (both audited)
| | | As of Dec-23 | | | As of Dec-22 | |
| | | S/ (000) | | | S/ (000) | |
| Cash and cash equivalents | | | 90,193 | | | | 81,773 | |
| Other financial instruments | | | - | | | | 86,893 | |
| Trade and other receivables,net | | | 99,688 | | | | 101,491 | |
| Income tax prepayments | | | 4,485 | | | | 8,268 | |
| Inventories | | | 791,074 | | | | 884,969 | |
| Prepayments | | | 6,809 | | | | 25,059 | |
| Total current assets | | | 992,249 | | | | 1,188,453 | |
| Trade and other receivables, net | | | 43,397 | | | | 43,543 | |
| Financial instruments designated at fair value through OCI | | | 249 | | | | 274 | |
| Property, plant and equipment, net | | | 2,099,351 | | | | 2,007,838 | |
| Intangible assets, net | | | 62,920 | | | | 56,861 | |
| Goodwill | | | 4,459 | | | | 4,459 | |
| Deferred income tax assets | | | 11,428 | | | | 9,005 | |
| Right-of-use assets | | | 7,609 | | | | 3,639 | |
| Other assets | | | 73 | | | | 89 | |
| Total non-current assets | | | 2,229,486 | | | | 2,125,708 | |
| Total assets | | | 3,221,735 | | | | 3,314,161 | |
| Trade and other payables | | | 231,511 | | | | 284,554 | |
| Financial obligations | | | 383,146 | | | | 618,907 | |
| Lease liabilities | | | 3,999 | | | | 2,005 | |
| Income tax payable | | | 14,222 | | | | 16,340 | |
| Provisions | | | 56,510 | | | | 31,333 | |
| Total current liabilities | | | 689,388 | | | | 953,139 | |
| Financial obligations | | | 1,189,880 | | | | 974,264 | |
| Lease liabilities | | | 4,130 | | | | 2,350 | |
| Provisions | | | 27,453 | | | | 47,638 | |
| Deferred income tax liabilities | | | 120,876 | | | | 141,635 | |
| Total non-current liabilities | | | 1,342,339 | | | | 1,165,887 | |
| Total liabilities | | | 2,031,727 | | | | 2,119,026 | |
| Capital stock | | | 423,868 | | | | 423,868 | |
| Investment shares | | | 40,279 | | | | 40,279 | |
| Invest shares holds in Treasury shares | | | (121,258 | ) | | | (121,258 | ) |
| Additional paid-in capital | | | 432,779 | | | | 432,779 | |
| Legal reserve | | | 168,636 | | | | 168,636 | |
| Other accumulated comprehensive results (loss) | | | (16,290 | ) | | | (17,787 | ) |
| Retained earnings | | | 261,994 | | | | 268,618 | |
| Total Equity | | | 1,190,008 | | | | 1,195,135 | |
| Total liability and equity | | | 3,221,735 | | | | 3,314,161 | |
INTERIM AND ANNUAL CONDENSED CONSOLIDATED STATEMENTS OF PROFIT AND LOSS
For the three(unaudited) and twelve-month(audited) periods ended December 31, 2023 and 2022.
| | | 4Q23 | | | 4Q22 | | | 2023 | | | 2022 | |
| | | S/ (000) | | | S/ (000) | | | S/ (000) | | | S/ (000) | |
| Sales of goods | | | 511,377 | | | | 533,895 | | | | 1,950,075 | | | | 2,115,746 | |
| Cost of sales | | | (309,737 | ) | | | (370,772 | ) | | | (1,260,623 | ) | | | (1,463,715 | ) |
| Gross profit | | | 201,640 | | | | 163,123 | | | | 689,452 | | | | 652,031 | |
| Operating income (expenses) | | | | | | | | | | | | | | | | |
| Administrative expenses | | | (63,556 | ) | | | (61,178 | ) | | | (234,711 | ) | | | (227,577 | ) |
| Selling and distribution expenses | | | (15,928 | ) | | | (14,000 | ) | | | (66,825 | ) | | | (65,237 | ) |
| Other operating (expenses) income, net | | | (4,996 | ) | | | (1,876 | ) | | | (13,810 | ) | | | (3,899 | ) |
| Assets impairment | | | (36,551 | ) | | | - | | | | (36,551 | ) | | | - | |
| Total operating expenses , net | | | (121,031 | ) | | | (77,054 | ) | | | (351,897 | ) | | | (296,713 | ) |
| | | | | | | | | | | | | | | | | |
| Operating profit | | | 80,609 | | | | 86,069 | | | | 337,555 | | | | 355,318 | |
| Other income (expenses) | | | | | | | | | | | | | | | | |
| Finance income | | | 2,992 | | | | 881 | | | | 7,246 | | | | 3,306 | |
| Financial costs | | | (27,261 | ) | | | (23,498 | ) | | | (104,045 | ) | | | (95,105 | ) |
| Accumulated net loss due on settlement of derivative financial instruments | | | - | | | | (57 | ) | | | 19 | | | | (59 | ) |
| Loss from exchange difference, net | | | (784 | ) | | | 441 | | | | 4,933 | | | | (1,040 | ) |
| | | | | | | | | | | | | | | | | |
| Total other expenses, net | | | (25,053 | ) | | | (22,233 | ) | | | (91,847 | ) | | | (92,898 | ) |
| Profit before income tax | | | 55,556 | | | | 63,836 | | | | 245,708 | | | | 262,420 | |
| Income tax expense | | | (19,697 | ) | | | (24,913 | ) | | | (76,808 | ) | | | (85,592 | ) |
| | | | | | | | | | | | | | | | | |
| Profit for the period | | | 35,859 | | | | 38,923 | | | | 168,900 | | | | 176,828 | |
| | | | | | | | | | | | | | | | | |
| Earnings per share | | | | | | | | | | | | | | | | |
| Basic and diluted earnings per year attributable to equity holders of common shares and investment in shares of Cementos Pacasmayo S.A.A. (S/ per share) | | | 0.10 | | | | 0.10 | | | | 0.39 | | | | 0.41 | |
CONSOLIDATED STATEMENTS OF CHANGES IN EQUITY
For the years ended December 31, 2023, 2022 (audited)
| | | Attributable to equity holders of the parent | |
| | | Capital | | | Investment
Shares | | | Investments
Shares hold
in Treasury | | | Additional
paid-in
capital | | | Legal
reserve | | | Unrealized
gain(loss)
in financial
instruments
designated at
fair value | | | Unrealized
gain(loss) on
cash flow
hedge | | | Retained
earnings | | | Total | |
| | | S/(000) | | | S/(000) | | | S/(000) | | | S/(000) | | | S/(000) | | | S/ (000) | | | S/ (000) | | | S/ (000) | | | S/ (000) | |
| Balance as of January 1, 2022 | | | 423,868 | | | | 40,279 | | | | (121,258 | ) | | | 432,779 | | | | 168,636 | | | | (15,869 | ) | | | (4,225 | ) | | | 271,595 | | | | 1,195,805 | |
| Profit for the year | | | - | | | | - | | | | - | | | | - | | | | - | | | | - | | | | - | | | | 176,828 | | | | 176,828 | |
| Other comprehensive loss | | | - | | | | - | | | | - | | | | - | | | | - | | | | (398 | ) | | | 2,705 | | | | - | | | | 2,307 | |
| Total comprehensive income | | | - | | | | - | | | | - | | | | - | | | | - | | | | (16,267 | ) | | | (1,520 | ) | | | 448,423 | | | | 430,636 | |
| Dividend Distribution | | | - | | | | - | | | | - | | | | - | | | | - | | | | - | | | | - | | | | (179,805 | ) | | | (179,805 | ) |
| Balance as of December 31, 2022 | | | 423,868 | | | | 40,279 | | | | (121,258 | ) | | | 432,779 | | | | 168,636 | | | | (16,267 | ) | | | (1,520 | ) | | | 268,618 | | | | 1,195,135 | |
| Balance as of January 1, 2023 | | | 423,868 | | | | 40,279 | | | | (121,258 | ) | | | 432,779 | | | | 168,636 | | | | (16,267 | ) | | | (1,520 | ) | | | 268,618 | | | | 1,195,135 | |
| Profit for the year | | | - | | | | - | | | | - | | | | - | | | | - | | | | - | | | | - | | | | 168,900 | | | | 168,900 | |
| Other comprehensive loss | | | - | | | | - | | | | - | | | | - | | | | - | | | | (18 | ) | | | 1,520 | | | | - | | | | 1,520 | |
| Others | | | - | | | | - | | | | - | | | | - | | | | - | | | | (5 | ) | | | - | | | | (1 | ) | | | (6 | ) |
| Total comprehensive income | | | - | | | | - | | | | - | | | | - | | | | - | | | | (23 | ) | | | 1,520 | | | | 168,899 | | | | 170,396 | |
| Dividend Distribution | | | - | | | | - | | | | - | | | | - | | | | - | | | | - | | | | - | | | | (175,523 | ) | | | (175,523 | ) |
| Balance as of December 31, 2023 | | | 423,868 | | | | 40,279 | | | | (121,258 | ) | | | 432,779 | | | | 168,636 | | | | (16,290 | ) | | | - | | | | 261,994 | | | | 1,190,008 | |