Exhibit 99.1
CEMENTOS PACASMAYO S.A.A. ANNOUNCES CONSOLIDATED RESULTS FOR FIRST QUARTER 2024
Lima, Peru, April 29, 2024 – Cementos Pacasmayo S.A.A. and subsidiaries (NYSE: CPAC; BVL: CPACASC1) (“the Company” or “Pacasmayo”) a leading cement company serving the Peruvian construction industry, announced today its consolidated results for the first quarter (“1Q24”). These results have been prepared in accordance with International Financial Reporting Standards (“IFRS”) and are stated in Soles (S/).
1Q24 FINANCIAL AND OPERATIONAL HIGHLIGHTS:
(All comparisons are to 1Q23, unless otherwise stated)
| ● | Consolidated EBITDA of S/132.8 million, a 10.0% increase, mainly due to lower costs and operational efficiencies as we discontinued the use of imported clinker and used our new and more efficient kiln. |
| ● | Consolidated EBITDA margin of 27.9%, a 2.8 percentage point increase. |
| ● | Sales volume of cement, concrete and precast decreased 7.2%, mainly due to a contraction in demand due to a decrease in public and private investment, a high level of insecurity and a decrease in the self-construction segment explained by a negative effect on activities like fishing and agriculture, two of the most significant sources in our area of influence. |
| ● | Revenues decreased 0.7%, in line with the decrease in volumes mentioned above. |
| ● | Net income of S/ 49.5 million, a 13.8% increase mainly due to the operational efficiencies mentioned above. |
We invite you to review our historical results by clicking on the underlined titles:
| | | Financial and Operating Results | |
| Financial and Operating Results | | 1Q24 | | | 1Q23 | | | % Var. | |
| Cement, concrete and precast shipments sales volume (MT) | | | 685.7 | | | | 738.6 | | | | -7.2 | % |
| In millions of S/ | | | | | | | | | | | | |
| Sales of goods | | | 476.5 | | | | 480.0 | | | | -0.7 | % |
| Gross profit | | | 173.9 | | | | 160.6 | | | | 8.3 | % |
| Operating profit | | | 95.0 | | | | 86.7 | | | | 9.6 | % |
| Net income | | | 49.5 | | | | 43.5 | | | | 13.8 | % |
| Consolidated EBITDA | | | 132.8 | | | | 120.7 | | | | 10.0 | % |
| Gross Margin | | | 36.5 | % | | | 33.5 | % | | | 3.0 | pp. |
| Operating Margin | | | 19.9 | % | | | 18.1 | % | | | 1.8 | pp. |
| Net income Margin | | | 10.4 | % | | | 9.1 | % | | | 1.3 | pp. |
| Consolidated EBITDA Margin | | | 27.9 | % | | | 25.1 | % | | | 2.8 | pp. |

MANAGEMENT COMMENTS
During this quarter, we were able to achieve improved margins, despite a challenging demand environment. Although El Niño did not occur in the magnitude that it was formerly expected, Northern Peru was impacted by climatic effects such as higher temperatures and increased water temperatures, which in turn affected agriculture and fishing. Since these are two of the main sources of income in our region, their performance is directly correlated to self-construction demand. Additionally, public and private infrastructure continue to lag behind and a general lack of safety in the country, mainly in the form of extortions, is affecting overall economic activity, including self-construction. Despite the decrease in volumes, we were able to achieve a 10% increase in consolidated EBITDA and 13.8% increase in net income year-over-year, mainly due to operational efficiencies derived from our new kiln in Pacasmayo and our multi-plant production plan. We are confident that we can sustain these efficiencies, and we will strive for more in order to continue being profitable, and also be ready to take advantage of a more favorable demand environment when it occurs.
In our journey to continue developing our building solutions, we recently embarked on the reconstruction of the two runways and the perimeter fence of the Piura Airport, not only as a concrete and pavement provider, but with direct involvement in the construction as part of a consortium. The project has been planned in three phases: Phase 1 includes the construction of the temporary runway, in order to use it while the main runway is rebuilt. This temporary runway is currently in the practical testing process and should be fully operational by the end of May. Phase 2 of the project will tackle the reconstruction of the main runway, which is planned between June and December, and finally phase 3 involves the perimeter and the nucleus between the runways and will also be executed before December 2024. This project marks an inflection point, since we have been involved since the prospecting phase to ensure that the technical terms included the use of concrete pavement, and will be involved until the final delivery of the project. We believe this is a clear example of our transformation from a cement producer to a building solutions company.
As we mentioned last quarter, we invested in the connectivity between our main quarry and the Piura plant. As you may recall, during the first quarter of 2023, rains interrupted this road, and even though we were able to continue operating because of our inventory in plant, restoring regular access was crucial. We invested in rebuilding the road allowing the water to pass beneath it in the event of rains. This new road and the bridges that connect them were inaugurated this March and therefore transit was recovered in both directions, reestablishing communication and economic activity between the cities and towns that are already integrated by this highway.
Finally, we would like to briefly mention that we have recently taken an important step towards the decarbonization of the transport of our main raw materials, incorporating our first gas-powered units to transport seashells from the quarry to our plant in Piura. Migrating our entire fleet from diesel to gas will achieve a 20% decrease in total CO2 emissions of our transport, as well as cost savings. Our goal is to achieve this by the second half of this year, and then move on to replicate this for our Pacasmayo plant. We are convinced that by focusing on cost-efficient alternatives we will continue to progress in our path to lower emissions.
To sum up, this quarter we were able to deliver increased profitability, even with decreasing demand, mostly because of our improved cost structure. Likewise, by focusing on our strategy and providing building solutions, resilient infrastructure and lowering CO2 emissions, we continue to fulfill our purpose of building together the future you dream of.
ECONOMIC OVERVIEW 1Q24:
During 1Q24, the Peruvian economy continued the period of contraction that began with the social conflicts and negative climatic conditions that affected the country in 2023, starting with Yaku and followed by the climatic anomalies associated with the coastal El Niño Phenomenon, droughts in the south, and the bird flu outbreak. These climatic events had a direct negative impact on primary sectors such as agriculture, fishing and their related industry. For example, mango production in Peru has experienced a drastic decrease during the 2023-2024 agricultural campaign, severely affected by the El Niño Phenomenon.
At the political and regulatory level, in April, Congress approved the seventh withdrawal from private pension funds for up to 4 UITs, equivalent to S/ 20,600, per member. The Superintendency of Banking, Insurance and AFP (SBS) estimates that with the approval of this law, up to S/ 34 billion would be withdrawn, of which only a small portion would go to consumption, so it will not have an effect on inflation. However, it does estimate that it would have an impact on the financial market through increases in long-term interest rates, since pension fund administrators will have to sell part of their portfolios to be able to meet payments.
PERUVIAN CEMENT INDUSTRY OVERVIEW:
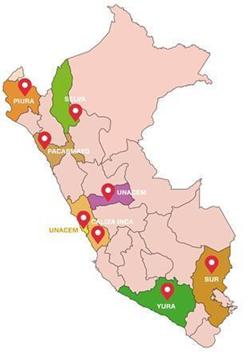
The demand for cement in Peru is covered mainly by Pacasmayo, UNACEM and Cementos Yura, and to a lesser extent by Caliza Inca, imports and other small producers. Pacasmayo mainly covers the demand in the northern region of the country, while UNACEM covers the central region and Cementos Yura the southern region.
The northern region of Peru, according to the Instituto Nacional de Estadística e Informática (INEI) and Apoyo Consultoría, represents approximately 32.9% of the country’s population and 20.0% of national Gross Domestic Product (“GDP”). Despite the country’s sustained growth over the last 10 years, Peru continues to have a significant housing deficit, estimated at 1.9 million households throughout the country as per the Ministry of Housing, Construction and Sanitation.
In Peru, the majority of cement is sold to a highly fragmented consumer base of individuals that tend to gradually buy bags of cement to build or to improve their homes, a segment the industry refers to as “self-construction”.
Northern Region (thousands of metric tons)
| Plant | | 2020 | | | 2021 | | | 2022 | | | 2023 | | | Feb-24
LTM | | | % part | |
| Pacasmayo Group | | | 2,576 | | | | 3,614 | | | | 3,437 | | | | 2,951 | | | | 2,910 | | | | 23.4 | % |
| Imports | | | 38 | | | | 40 | | | | 2 | | | | - | | | | - | | | | 0.0 | % |
| Total | | | 2,614 | | | | 3,654 | | | | 3,439 | | | | 2,951 | | | | 2,910 | | | | 23.4 | % |
Central Region (thousands of metric tons)
| Plant | | 2020 | | | 2021 | | | 2022 | | | 2023 | | | Feb-24
LTM | | | % part | |
| UNACEM | | | 4,172 | | | | 5,838 | | | | 6,297 | | | | 5,617 | | | | 5,583 | | | | 45.0 | % |
| Caliza Inca | | | 382 | | | | 492 | | | | 515 | | | | 585 | | | | 614 | | | | 5.0 | % |
| Imports | | | 493 | | | | 691 | | | | 202 | | | | 145 | | | | 129 | | | | 1.0 | % |
| Total | | | 5,047 | | | | 7,021 | | | | 7,014 | | | | 6,347 | | | | 6,326 | | | | 51.0 | % |
Southern Region (thousands of metric tons)
| Plant | | 2020 | | | 2021 | | | 2022 | | | 2023 | | | Feb-24
LTM | | | % part | |
| Grupo Yura | | | 2,019 | | | | 2,904 | | | | 3,047 | | | | 2,581 | | | | 2,660 | | | | 21.4 | % |
| Imports | | | 189 | | | | 150 | | | | 67 | | | | 65 | | | | 62 | | | | 0.5 | % |
| Total | | | 2,208 | | | | 3,054 | | | | 3,114 | | | | 2,646 | | | | 2,722 | | | | 21.9 | % |
| | | | | | | | | | | | | | | | | | | | | | | | | |
| Others | | | 732 | | | | 877 | | | | 427 | | | | 423 | | | | 455 | | | | 3.7 | % |
| Total, All Region | | | 10,601 | | | | 14,606 | | | | 13,994 | | | | 12,367 | | | | 12,413 | | | | 100.0 | % |
| * | Import figures are sourced from Aduanet. They represent quantities of imported cement, not shipped cement. |
Source: INEI, Aduanet

Transport Decarbonization We are changing our truck fleet from diesel to gas, estimating a saving in CO2 emissions of 20% in the first stage, concluding in July. A big step towards sustainability and efficiency. | | |
 |
 | | Local Infrastructure In line with our purpose and aiming to contribute to our country’s progress, we delivered the Regional Archive of Cajamarca, through the mechanism of Works for Taxes. This emblematic building was financed and executed by our Company and stores all the historical documentation of the culture and tradition of the city. |
Kukla It is the project that, through Artificial Intelligence, will allow us to revolutionize the timely identification of projects. | |  |
OPERATING RESULTS:
Production:
Cement Production Volume
(thousands of metric tons)
| | | Production | |
| | | 1Q24 | | | 1Q23 | | | % Var. | |
| Pacasmayo Plant | | | 394.3 | | | | 352.1 | | | | 12.0 | % |
| Rioja Plant | | | 75.8 | | | | 77.0 | | | | -1.6 | % |
| Piura plant | | | 193.4 | | | | 294.4 | | | | -34.3 | % |
| Total | | | 663.5 | | | | 723.5 | | | | -8.3 | % |
Cement production volume at the Pacasmayo plant increased 12.0% in 1Q24 compared to 1Q23 mainly due to the transfer of production from the Piura plant.
In 1Q24, cement production volume at the Rioja Plant decreased 1.6%, mainly due to the decreased demand.
Cement production volume at the Piura Plant decreased 34.3% in 1Q24, mainly due to the decreased demand, as well as the annual production plan that aims to produce at optimal capacity during certain periods in order to maximize efficiencies.
Total cement production volume decreased 8.3% in 1Q24 compared to 1Q23, in line with decreased demand.
Clinker Production Volume
(thousands of metric tons)
| | | Production | |
| | | 1Q24 | | | 1Q23 | | | % Var. | |
| Pacasmayo Plant | | | 285.6 | | | | 230.0 | | | | 24.2 | % |
| Rioja Plant | | | 57.5 | | | | 64.0 | | | | -10.2 | % |
| Piura Plant | | | 170.0 | | | | 257.6 | | | | -34.0 | % |
| Total | | | 513.1 | | | | 551.6 | | | | -7.0 | % |
Clinker production volume at the Pacasmayo plant during 1Q24 increased 24.2%, compared to 1Q23, mainly due to the decision to transfer part of the production from the Piura plant to optimize utilization of our new kiln.
Clinker production volume at the Rioja plant decreased 10.2% in 1Q24 compared to 1Q23, in line with decreased cement demand.
Clinker production volume at the Piura plant decreased 34.0% in 1Q24 compared to 1Q23, mainly due to our annual production plan that aims to maximize the operational efficiency of our kilns.
Total clinker production volume decreased 7.0% in 1Q24 when compared to 1Q23, in line with decreased cement demand.
Quicklime Production Volume
(thousands of metric tons)
| | | Production | |
| | | 1Q24 | | | 1Q23 | | | %Var. | |
| Pacasmayo Plant | | | 6.7 | | | | 10.2 | | | | -34.3 | % |
Quicklime production volume in 1Q24 decreased 34.3% when compared to 1Q23, mainly due to decreased demand, as well as to our annual production plan to increase productivity.
INSTALLED CAPACITY:
Installed Clinker and Cement Capacity
Full year installed cement capacity at the Pacasmayo, Piura and Rioja plants remained stable at 2.9 million MT, 1.6 million MT and 440,000 MT, respectively.
Full year installed clinker capacity at the Pacasmayo, Piura and Rioja plants remained stable at 1.8 million MT, 990,000 MT and 289,080 MT, respectively.
Full year installed quicklime capacity at the Pacasmayo plant remained stable at 240,000 MT.
UTILIZATION RATE1:
Pacasmayo Plant Utilization Rate
| | | Utilization Rate | |
| | | 1Q24 | | | 1Q23 | | | % Var. | |
| Cement | | | 54.4 | % | | | 48.6 | % | | | 5.8 | pp. |
| Clinker | | | 63.5 | % | | | 61.3 | % | | | 2.2. | pp. |
| Quicklime | | | 11.1 | % | | | 17.0 | % | | | -5.9 | pp. |
Cement production utilization rate at the Pacasmayo plant increased 5.8 percentage points in 1Q24, when compared to 1Q23, mainly due to a shift in production from the Piura plant.
Clinker production utilization rate in 1Q24 increased 2.2 percentage points compared to 1Q23, mainly due to higher clinker production in Pacasmayo because of the optimization of our capacity.
Quicklime production utilization rate in 1Q24 decreased 5.9 percentage points compared to 1Q23 mainly due to decreased demand.
| 1 | The utilization rates are calculated by dividing production in a given period over installed capacity. The utilization rate implies annualized production, which is calculated by multiplying real production for each quarter by four. |
Rioja Plant Utilization Rate
| | | Utilization Rate | |
| | | 1Q24 | | | 1Q23 | | | % Var. | |
| Cement | | | 68.9 | % | | | 70.0 | % | | | -1.1 | pp. |
| Clinker | | | 79.3 | % | | | 91.4 | % | | | -12.1 | pp. |
The cement production utilization rate at the Rioja plant was 68.9% in 1Q24, 1.1 percentage points lower than 1Q23, in line with decreased cement demand.
The clinker production utilization rate at the Rioja plant was 79.3% in 1Q24, a 12.1 percentage decrease when compared to 1Q23, mainly due to decreased cement demand, as well as inventory consumption.
Piura Plant Utilization Rate
| | | Utilization Rate | |
| | | 1Q24 | | | 1Q23 | | | % Var. | |
| Cement | | | 48.3 | % | | | 73.6 | % | | | -25.3 | pp. |
| Clinker | | | 68.7 | % | | | 100.0 | % | | | -31.3 | pp. |
The cement production utilization rate at the Piura plant was 48.3% in 1Q24, a 25.3 percentage point decrease when compared to 1Q23, mainly due to a change in our production plan.
The clinker production utilization rate at the Piura plant was 68.7%, a 31.3 percentage point decrease when compared to 1Q23, as we have changed our annual production plan in order to maximize productivity.
Consolidated Utilization Rate
| | | Utilization Rate | |
| | | 1Q24 | | | 1Q23 | | | % Var. | |
| Cement | | | 53.7 | % | | | 58.6 | % | | | -4.9 | pp. |
| Clinker | | | 66.7 | % | | | 79.4 | % | | | -12.7 | pp. |
The consolidated cement production utilization rate decreased 4.9 percentage points in 1Q24, when compared to 1Q23, in line with the decrease in cement demand.
The consolidated clinker production utilization rate decreased 12.7 percentage points in 1Q24 when compared to 1Q23, in line with decreased cement demand and inventory consumption.
FINANCIAL RESULTS:
Income Statement:
The following table shows a summary of the Consolidated Financial Results:
Consolidated Financial Results
(in millions of Soles S/)
| | | Income Statement | |
| | | 1Q24 | | | 1Q23 | | | % Var. | |
| Sales of goods | | | 476.5 | | | | 480.0 | | | | -0.7 | % |
| Gross Profit | | | 173.9 | | | | 160.6 | | | | 8.3 | % |
| Total operating expenses, net | | | -78.9 | | | | -73.9 | | | | 6.8 | % |
| Operating Profit | | | 95.0 | | | | 86.7 | | | | 9.6 | % |
| Total other expenses, net | | | -24.4 | | | | -23.5 | | | | 3.8 | % |
| Profit before income tax | | | 70.6 | | | | 63.2 | | | | 11.7 | % |
| Income tax expense | | | -21.1 | | | | -19.7 | | | | 7.1 | % |
| Profit for the period | | | 49.5 | | | | 43.5 | | | | 13.8 | % |
During 1Q24, revenues decreased 0.7%, in line with 1Q23. Gross profit increased 8.3% in 1Q24, compared to 1Q23, mainly due to lower costs as we are currently using our optimized capacity in Pacasmayo, as well as lower costs of raw materials and lower freight costs to final consumers. Profit for the period increased 13.8% in 1Q24, compared to 1Q23, primarily due to increased operating profit.
SALES OF GOODS
The following table shows the Sales of Goods and their respective margins by business segment:
Sales: cement, concrete and precast
(in millions of Soles S/)
| | | Cement, concrete and precasts | |
| | | 1Q24 | | | 1Q23 | | | % Var. | |
| Sales of goods | | | 456.7 | | | | 447.1 | | | | 2.1 | % |
| Cost of Sales | | | -283.6 | | | | -288.0 | | | | -1.5 | % |
| Gross Profit | | | 173.1 | | | | 159.1 | | | | 8.8 | % |
| Gross Margin | | | 37.9 | % | | | 35.6 | % | | | 2.3 | pp. |
Sales of cement, concrete and precast increased 2.1% in 1Q24, when compared to 1Q23, mainly due to increased sales of pavement as we continue to execute the construction of the two runways of the Piura airport. Gross margin increased 2.3 percentage points during 1Q24 when compared to 1Q23, mainly due to lower clinker and cement production costs, as mentioned above.
Sales: cement
(in millions of Soles S/)
Sales of cement represented 84.8% of cement, concrete and precast sales during 1Q24.
| | | Cement | |
| | | 1Q24 | | | 1Q23 | | | % Var. | |
| Sales of goods | | | 387.2 | | | | 405.8 | | | | -4.6 | % |
| Cost of Sales | | | -217.2 | | | | -248.6 | | | | -12.6 | % |
| Gross Profit | | | 170.0 | | | | 157.2 | | | | 8.1 | % |
| Gross Margin | | | 43.9 | % | | | 38.7 | % | | | 5.2 | pp. |
Sales of cement decreased 4.6% in 1Q24, compared to 1Q23, mainly due to decreased sales volume in the self-construction segment because of the negative climatic effects and lack of safety. Nonetheless, gross margin increased 5.2 percentage points in 1Q24, compared to 1Q23, mainly due to the operational efficiencies mentioned above.
Sales: concrete, pavement and mortar
(in millions of Soles S/)
Sales of concrete, pavement and mortar represented 13.9% of cement, concrete, and precast sales during 1Q24.
| | | Concrete, pavement and mortar | |
| | | 1Q24 | | | 1Q23% | | | Var. | |
| Sales of goods | | | 63.6 | | | | 36.6 | | | | 73.8 | % |
| Cost of Sales | | | -60.7 | | | | -34.0 | | | | 78.5 | % |
| Gross Profit | | | 2.9 | | | | 2.6 | | | | 11.5 | % |
| Gross Margin | | | 4.6 | % | | | 7.1 | % | | | -2.5 | pp. |
Sales of concrete, pavement and mortar increased 73.8% when compared to 1Q23, mainly due to increased sales of pavement for the Piura airport project. However, gross margin decreased 2.5 percentage points in 1Q24, compared to 1Q23, mainly due to changes in sales mix.
Sales: precast
(in millions of Soles S/)
Sales of precast represented 1.3% of cement, concrete, and precast sales during 1Q24.
| | | Precast | |
| | | 1Q24 | | | 1Q23% | | | Var. | |
| Sales of goods | | | 5.9 | | | | 4.7 | | | | 25.5 | % |
| Cost of Sales | | | -5.7 | | | | -5.4 | | | | 5.6 | % |
| Gross Profit | | | 0.2 | | | | -0.7 | | | | N/R | |
| Gross Margin | | | 3.4 | % | | | -14.9 | % | | | 18.3 | pp. |
During 1Q24, precast sales increased 25.5%, compared to 1Q23, mainly due to an increase in sales volumes to the public sector. Gross margin in 1Q24 was 18.3 percentage points higher compared to 1Q23.
Sales: Quicklime
(in millions of Soles S/)
| | | Quicklime | |
| | | 1Q24 | | | 1Q23% | | | Var. | |
| Sales of goods | | | 6.1 | | | | 11.1 | | | | -45.0 | % |
| Cost of Sales | | | -6.1 | | | | -9.5 | | | | -35.8 | % |
| Gross Profit | | | 0.0 | | | | 1.6 | | | | -100.0 | % |
| Gross Margin | | | 0.0 | % | | | 14.4 | % | | | -14.4 | pp. |
During 1Q24, quicklime sales decreased 45.0%, when compared to 1Q23, mainly due to decreased sales volume. Gross margin decreased 14.4 percentage points in 1Q24, mainly due to a one-off sale during 1Q23, which boosted our results. However, quicklime dispatches are in line with last quarter.
Sales: Construction Supplies2
(in millions of Soles S/)
| | | Construction Supplies | |
| | | 1Q24 | | | 1Q23% | | | Var. | |
| Sales of goods | | | 13.7 | | | | 21.8 | | | | -37.2 | % |
| Cost of Sales | | | -13.0 | | | | -21.9 | | | | -40.6 | % |
| Gross Profit | | | 0.7 | | | | -0.1 | | | | N/R | |
| Gross Margin | | | 5.1 | % | | | -0.5 | % | | | 5.6 | pp. |
During 1Q24, construction supply sales decreased 37.2%, when compared to 1Q23, in line with decreased sales of cement and other construction materials. Gross margin increased 5.6 percentage points.
| 2 | Construction supplies include the following products: steel rebar, wires, nails, corrugated iron, electric conductors, plastic tubes and accessories, among others. |
OPERATING EXPENSES:
Administrative Expenses
(in millions of Soles S/)
| | | Administrative Expenses | |
| | | 1Q24 | | | 1Q23% | | | Var. | |
| Personnel expenses | | | 29.8 | | | | 31.7 | | | | -6.0 | % |
| Third-party services | | | 16.0 | | | | 18.2 | | | | -12.1 | % |
| Board of Directors | | | 1.5 | | | | 1.5 | | | | - | |
| Depreciation and amortization | | | 5.1 | | | | 4.3 | | | | 18.6 | % |
| Other | | | 4.8 | | | | 2.0 | | | | N/R | |
| Total | | | 57.2 | | | | 57.7 | | | | -0.9 | % |
Administrative expenses during 1Q24 remained in line with 1Q23.
Selling Expenses
(in millions of Soles S/)
| | | Selling and distribution expenses | |
| | | 1Q24 | | | 1Q23% | | | Var. | |
| Personnel expenses | | | 11.4 | | | | 10.2 | | | | 11.8 | % |
| Advertising and promotion | | | 2.2 | | | | 2.1 | | | | 4.8 | % |
| Third party services | | | 1.8 | | | | 1.5 | | | | 20.0 | % |
| Other | | | 3.7 | | | | 3.7 | | | | - | |
| Total | | | 19.1 | | | | 17.5 | | | | 9.1 | % |
Selling expenses increased 9.1% in 1Q24, when compared to 1Q23, mainly due to increased personnel expenses, in line with inflation, as well as software and licenses and provision for doubtful payment.
EBITDA RECONCILIATION:
Consolidated EBITDA
(in millions of Soles S/)
| | | Consolidated EBITDA | |
| | | 1Q24 | | | 1Q23% | | | Var. | |
| Net Income | | | 49.5 | | | | 43.5 | | | | 13.8 | % |
| + Income tax expense | | | 21.1 | | | | 19.7 | | | | 7.1 | % |
| - Finance income | | | -1.3 | | | | -1.4 | | | | -7.1 | % |
| + Finance costs | | | 25.7 | | | | 25.7 | | | | - | |
| +/- Net loss on the valuation of trading derivative financial instruments | | | 0.0 | | | | 0.0 | | | | - | |
| +/- Net loss from exchange rate | | | 0.0 | | | | -0.8 | | | | N/R | |
| + Depreciation and amortization | | | 37.8 | | | | 34.0 | | | | 11.2 | % |
| Consolidated EBITDA | | | 132.8 | | | | 120.7 | | | | 10.0 | % |
Consolidated EBITDA increased 10.0% in 1Q24 when compared to 1Q23, mainly due to operational efficiencies from lower production costs of clinker and cement, as we maximized the use of our own clinker, as well as the benefit of decreased costs of raw materials.
Cash and Debt Position:
Consolidated Cash (in millions of Soles S/)
As of March 31, 2024, the cash balance was S/55.3 million (US$ 14.9 million). This balance includes certificates of deposit in the amount of S/ 22.9 million (US$ 6.2 million), distributed as follows:
Certificates of deposits in Soles
| Bank | | Amount
(S/) | | | Interest
Rate | | | Initial Date | | Maturity Date |
| Banco de Crédito del Perú | | | S/ 16.9 | | | | 5.05 | % | | March 27, 2024 | | April 1, 2024 |
| BBVA | | | S/ 6.0 | | | | 5.98 | % | | March 15, 2024 | | May 28 , 2024 |
| | | | S/. 22.9 | | | | | | | | | |
The remaining balance of S/ 32.4 million (US$ 8.7 million) is held mainly in the Company’s bank accounts, of which US$ 1.6 million are denominated in US dollars and the balance in Soles.
DEBT POSITION:
Consolidated Debt
(in millions of Soles S/)
Below are the contractual obligations with payment deadlines related to the Company’s debt, including interest.
| | | Payments due by period | |
| | | Less than 1 year | | | 1-3 Years | | | 3-5 Years | | | More than 5 Years | | | Total | |
| Indebtedness | | | 421.6 | | | | 312.7 | | | | 533.6 | | | | 310.0 | | | | 1,577.9 | |
| Future interest payments | | | 91.8 | | | | 129.2 | | | | 93.0 | | | | 58.3 | | | | 372.3 | |
| Total | | | 513.4 | | | | 441.9 | | | | 626.6 | | | | 368.3 | | | | 1,950.2 | |
As of March 31, 2024, the Company’s total outstanding debt, as shown in the financial statements, reached S/ 1,571.5 million (US$ 422.3 million). This debt is mainly composed of two local bonds issued in January 2019 and the club deal obtained in 2022.
As of March 31, 2024, Net Adjusted Debt/EBITDA ratio was 3.2 times.
Capex
(in millions of Soles S/)
As of March 31, 2024, the Company invested S/ 14.5 million (US$ 3.9 million), allocated to the following projects:
| Projects | | 1Q24 | |
| Pacasmayo Plant Projects | | | 5.1 | |
| Concrete and aggregates equipment | | | 6.9 | |
| Rioja Plant Projects | | | 0.4 | |
| Piura Plant Projects | | | 1.7 | |
| Other | | | 0.4 | |
| Total | | | 14.5 | |
ABOUT CEMENTOS PACASMAYO S.A.A.
Cementos Pacasmayo S.A.A. is a cement company, located in the Northern region of Peru. In February 2012, the Company’s shares were listed on The New York Stock Exchange - Euronext under the ticker symbol “CPAC”. With more than 65 years of operating history, the Company produces, distributes and sells cement and cement-related materials, such ready-mix concrete and precast materials. Pacasmayo’s products are primarily used in construction, which has been one of the fastest-growing segments of the Peruvian economy in recent years. The Company also produces and sells quicklime for use in mining operations.
For more information, please visit: http://www.cementospacasmayo.com.pe/
Note: The Company presented some figures converted from Soles to U.S. Dollars for comparison purposes. The exchange rate used to convert Soles to U.S. dollars was S/ 3.721 per US$ 1.00, which was the average exchange rate, reported as of March 31, 2024, by the Superintendencia de Banca, Seguros y AFP’s (SBS). The information presented in U.S. dollars is for the convenience of the reader only. Certain figures included in this report have been subject to rounding adjustments. Accordingly, figures shown as totals in certain tables may not be arithmetic aggregations of the figures presented in previous quarters.
| This press release may contain forward-looking statements. These statements are statements that are not historical facts, and are based on management’s current view and estimates of future economic circumstances, industry conditions, Company performance and financial results. Also, certain reclassifications have been made to make figures comparable for the periods. The words “anticipates”, “believes”, “estimates”, “expects”, “plans” and similar expressions, as they relate to the Company, are intended to identify forward-looking statements. Statements regarding the declaration or payment of dividends, the implementation of principal operating and financing strategies and capital expenditure plans, the direction of future operations and the factors or trends affecting financial condition, liquidity or results of operations are examples of forward-looking statements. Such statements reflect the current views of management and are subject to a number of risks and uncertainties. There is no guarantee that the expected events, trends or results will actually occur. The statements are based on many assumptions and factors, including general economic and market conditions, industry conditions, and operating factors. Any changes in such assumptions or factors could cause actual results to differ materially from current expectations. |
CONSOLIDATED STATEMENTS OF FINANCIAL POSITION
As of March 31, 2024 (unaudited) and December 31,2023 (audited)
| | | As of Mar-24 | | | As of Dec-23 | |
| | | S/ (000) | | | S/ (000) | |
| Cash and cash equivalents | | | 55,325 | | | | 90,193 | |
| Trade and other receivables,net | | | 136,950 | | | | 99,688 | |
| Income tax prepayments | | | 3,474 | | | | 4,485 | |
| Inventories | | | 772,824 | | | | 791,074 | |
| Prepayments | | | 33,534 | | | | 6,809 | |
| Total current assets | | | 1,002,107 | | | | 992,249 | |
| Trade and other receivables, net | | | 43,290 | | | | 43,397 | |
| Financial instruments designated at fair value through OCI | | | 604 | | | | 249 | |
| Property, plant and equipment, net | | | 2,077,054 | | | | 2,099,351 | |
| Intangible assets, net | | | 62,019 | | | | 62,920 | |
| Goodwill | | | 4,459 | | | | 4,459 | |
| Deferred income tax assets | | | 12,550 | | | | 11,428 | |
| Right-of-use asset, net | | | 6,977 | | | | 7,609 | |
| Other assets | | | 71 | | | | 73 | |
| Total non-current assets | | | 2,207,024 | | | | 2,229,486 | |
| Total assets | | | 3,209,131 | | | | 3,221,735 | |
| Trade and other payables | | | 222,717 | | | | 231,511 | |
| Financial obligations | | | 420,346 | | | | 383,146 | |
| Lease liabilities | | | 3,547 | | | | 3,999 | |
| Income tax payable | | | 6,185 | | | | 14,222 | |
| Provisions | | | 7,404 | | | | 56,510 | |
| Total current liabilities | | | 660,199 | | | | 689,388 | |
| Financial obligations | | | 1,151,117 | | | | 1,189,880 | |
| Lease liabilities | | | 3,875 | | | | 4,130 | |
| Provisions | | | 28,255 | | | | 27,453 | |
| Deferred income tax liabilities | | | 126,239 | | | | 120,876 | |
| Total non-current liabilities | | | 1,309,486 | | | | 1,342,339 | |
| Total liabilities | | | 1,969,685 | | | | 2,031,727 | |
| Capital stock | | | 423,868 | | | | 423,868 | |
| Investment shares | | | 40,279 | | | | 40,279 | |
| Invest shares holds in Treasury shares | | | (121,258 | ) | | | (121,258 | ) |
| Additional paid-in capital | | | 432,779 | | | | 432,779 | |
| Legal reserve | | | 168,636 | | | | 168,636 | |
| | | | | | | | | |
| Other accumulated comprehensive results (loss) | | | (16,290 | ) | | | (16,290 | ) |
| Retained earnings | | | 311,432 | | | | 261,994 | |
| Total Equity | | | 1,239,446 | | | | 1,190,008 | |
| Total liability and equity | | | 3,209,131 | | | | 3,221,735 | |
INTERIM AND ANNUAL CONDENSED CONSOLIDATED STATEMENTS OF PROFIT AND LOSS
For the three-month periods ended March 31, 2024 and 2023.
| | | 1Q24 | | | 1Q23 | |
| | | S/ (000) | | | S/ (000) | |
| Sales of goods | | | 476,549 | | | | 479,995 | |
| Cost of sales | | | (302,696 | ) | | | (319,400 | ) |
| Gross profit | | | 173,853 | | | | 160,595 | |
| Operating income (expenses) | | | | | | | | |
| | | | | | | | | |
| Administrative expenses | | | (57,187 | ) | | | (57,729 | ) |
| Selling and distribution expenses | | | (19,076 | ) | | | (17,534 | ) |
| Other operating income (expense), net | | | (2,630 | ) | | | 1,403 | |
| Total operating expenses , net | | | (78,893 | ) | | | (73,860 | ) |
| | | | | | | | | |
| Operating profit | | | 94,960 | | | | 86,735 | |
| Other income (expenses) | | | | | | | | |
| | | | | | | | | |
| Finance income | | | 1,327 | | | | 1,355 | |
| Financial costs | | | (25,716 | ) | | | (25,721 | ) |
| Net profit for valuation of trading derivative financial instruments | | | - | | | | 19 | |
| | | | | | | | | |
| (Loss) gain from exchange difference, net | | | (22 | ) | | | 823 | |
| | | | | | | | | |
| Total other expenses, net | | | (24,411 | ) | | | (23,524 | ) |
| Profit before income tax | | | 70,549 | | | | 63,211 | |
| Income tax expense | | | (21,111 | ) | | | (19,719 | ) |
| | | | | | | | | |
| Profit for the period | | | 49,438 | | | | 43,492 | |
| | | | | | | | | |
| Earnings per share | | | | | | | | |
| Basic profit for the period attributable to equity holders of common shares and investment in shares of the parent. (S/ per share) | | | 0.12 | | | | 0.10 | |
CONSOLIDATED STATEMENTS OF CHANGES IN EQUITY
For the three-month periods ended March 31, 2024, 2023 (unaudited)
| | | Attributable to equity holders of the parent | |
| | | Capital | | | Investment
Shares | | | Investments
Shares hold
in Treasury | | | Additional
paid-in
capital | | | Legal
reserve | | | Unrealized
gain(loss)
in financial
instruments
designated at
fair value | | | Unrealized
gain(loss) on
cash flow
hedge | | | Retained
earnings | | | Total | |
| | | S/(000) | | | S/(000) | | | S/(000) | | | S/(000) | | | S/(000) | | | S/ (000) | | | S/ (000) | | | S/ (000) | | | S/ (000) | |
| Balance as of January 1, 2023 | | | 423,868 | | | | 40,279 | | | | (121,258 | ) | | | 432,779 | | | | 168,636 | | | | (16,267 | ) | | | (1,520 | ) | | | 268,618 | | | | 1,195,805 | |
| Profit for the year | | | - | | | | - | | | | - | | | | - | | | | - | | | | - | | | | - | | | | 43,492 | | | | 43,492 | |
| Other comprehensive loss | | | - | | | | - | | | | - | | | | - | | | | - | | | | - | | | | 1,520 | | | | - | | | | 1,520 | |
| Others | | | - | | | | - | | | | - | | | | - | | | | - | | | | (5 | ) | | | - | | | | - | | | | (5 | ) |
| Total comprehensive income | | | - | | | | - | | | | - | | | | - | | | | - | | | | (16,272 | ) | | | 1,520 | | | | 43,492 | | | | 45,007 | |
| Dividend Distribution | | | - | | | | - | | | | - | | | | - | | | | - | | | | - | | | | - | | | | - | | | | - | |
| Balance as of March 31, 2023 | | | 423,868 | | | | 40,279 | | | | (121,258 | ) | | | 432,779 | | | | 168,636 | | | | (16,272 | ) | | | - | | | | 312,110 | | | | 1,240,142 | |
| | | | | | | | | | | | | | | | | | | | | | | | | | | | | | | | | | | | | |
| Balance as of January 1, 2024 | | | 423,868 | | | | 40,279 | | | | (121,258 | ) | | | 432,779 | | | | 168,636 | | | | (16,290 | ) | | | - | | | | 261,994 | | | | 1,190,008 | |
| Profit for the year | | | - | | | | - | | | | - | | | | - | | | | - | | | | - | | | | - | | | | 49,438 | | | | 49,438 | |
| Total comprehensive income | | | - | | | | - | | | | - | | | | - | | | | - | | | | - | | | | - | | | | 49,438 | | | | 49,438 | |
| Dividend Distribution | | | - | | | | - | | | | - | | | | - | | | | - | | | | - | | | | - | | | | - | | | | - | |
| | | | | | | | | | | | | | | | | | | | | | | | | | | | | | | | | | | | | |
| Balance as of March 31, 2024 | | | 423,868 | | | | 40,279 | | | | (121,258 | ) | | | 432,779 | | | | 168,636 | | | | (16,290 | ) | | | - | | | | 311,432 | | | | 1,239,446 | |
19