UNITED STATES
SECURITIES AND EXCHANGE COMMISSION
Washington, D.C. 20549
FORM 20-F
| ☐ | REGISTRATION STATEMENT PURSUANT TO SECTION 12(b) OR (g) OF THE SECURITIES EXCHANGE ACT OF 1934 |
OR
| ☒ | ANNUAL REPORT PURSUANT TO SECTION 13 OR 15(d) OF THE SECURITIES EXCHANGE ACT OF 1934 |
For the fiscal year ended December 31, 2017
OR
| ☐ | TRANSITION REPORT PURSUANT TO SECTION 13 OR 15(d) OF THE SECURITIES EXCHANGE ACT OF 1934 |
OR
| ☐ | SHELL COMPANY REPORT PURSUANT TO SECTION 13 OR 15(d) OF THE SECURITIES EXCHANGE ACT OF 1934 |
Commission file number 001-35401
CEMENTOS PACASMAYO S.A.A.
(Exact name of Registrant as specified in its charter)
PACASMAYO CEMENT CORPORATION
(Translation of Registrant’s name into English)
Republic of Peru
(Jurisdiction of incorporation or organization)
Calle La Colonia 150, Urbanización El Vivero
Surco, Lima
Peru
(Address of principal executive offices)
Javier Durand, Esq., General Counsel
Tel. +51-1-317-6000
Calle La Colonia 150
Urb. El Vivero - Lima, Peru
(Name, telephone, email and/or facsimile number and address of company contact person)
Securities registered pursuant to Section 12(b) of the Act.
| | |
Title of each class | Name of each exchange on which registered |
Common Shares, par value S/1.00 per share,
in the form of American Depositary Shares,
each representing five Common Shares | New York Stock Exchange |
Securities registered pursuant to Section 12(g) of the Act:
None
Securities for which there is a reporting obligation pursuant to Section 15(d) of the Act:
None
Indicate the number of outstanding shares of each of the issuer’s classes of capital or common stock as of the close of the period covered by the annual report:
| | |
| At December 31, 2017 | 423,868,449 common shares 4,238,397 investment shares* |
* Excluding 36,040,497 investment shares held in treasury.
Indicate by check mark if the Registrant is a well-known seasoned issuer, as defined in Rule 405 of the Securities Act. Yes ☐ No ☒
If this report is an annual or transition report, indicate by check mark if the Registrant is not required to file reports pursuant to Section 13 or 15(d) of the Securities Exchange Act of 1934. Yes ☐ No ☒
Note- Checking the box above will not relieve any registrant required to file reports pursuant to Section 13 or 15(d) of the Securities Exchange Act of 1934 from their obligations under those Sections.
Indicate by check mark whether the Registrant (1) has filed all reports required to be filed by Section 13 or 15(d) of the Securities Exchange Act of 1934 during the preceding 12 months (or for such shorter period that the Registrant was required to file such reports), and (2) has been subject to such filing requirements for the past 90 days. Yes ☒ No ☐
Indicate by check mark whether the Registrant has submitted electronically and posted on its corporate website, if any, every Interactive Data File required to be submitted and posted pursuant to Rule 405 of Regulation S-T (§ 203.405 of this chapter) during the preceding 12 months (or for such other period that the registrant was required to submit and post such files) Yes ☐ No ☐
Note: Not required for Registrant.
Indicate by check mark whether the Registrant is a large accelerated filer, an accelerated filer, or a non-accelerated filer. See definition of “accelerated filer and large accelerated filer” in Rule 12b-2 of the Exchange Act. (Check one):
| | | |
| Large accelerated filer ☒ | Accelerated filer ☐ | Non-accelerated filer ☐ |
Indicate by check mark which basis of accounting the Registrant has used to prepare the financial statements included in this filing:
| | | |
| U.S. GAAP ☐ | International Financial Reporting Standards as issued
by the International Accounting Standards Board ☒ | Other ☐ |
If “Other” has been checked in response to the previous question, indicate by check mark which financial statement item the Registrant has elected to follow. Item 17 ☐ Item 18 ☐
If this is an annual report, indicate by check mark whether the Registrant is a shell company (as defined in Rule 12b-2 of the Exchange Act). Yes ☐ No ☒
Table of Contents
PART I
INTRODUCTION
Certain Definitions
All references to “we,” “us,” “our,” “our company” and “Cementos Pacasmayo” in this annual report are to Cementos Pacasmayo S.A.A., a publicly-held corporation (sociedad anónima abierta) organized under the laws of Peru, and, unless the context requires otherwise, its consolidated subsidiaries. The term “U.S. dollar” and the symbol “US$” refer to the legal currency of the United States; and the term “sol” and the symbol “S/” refer to the legal currency of Peru.
Financial Information
Our consolidated financial statements included in this annual report have been prepared insoles and in accordance with International Financial Reporting Standards (“IFRS”) as issued by the International Accounting Standards Board (“IASB”) and audited in accordance with the standards of the Public Company Accountings Oversight Board (United States).
In this annual report, we present EBITDA and Adjusted EBITDA, which are financial measures that are not recognized under IFRS. We refer to such financial measures as “non-IFRS” financial measures. A non-IFRS financial measure is generally defined as one that purports to measure financial performance, financial position or cash flows of the subject reporting company but excludes or includes amounts that would not be so adjusted in the most comparable IFRS measure. We present EBITDA and Adjusted EBITDA because we believe it provides the reader with a supplemental measure of the financial performance of our core operations that facilitates period-to-period comparisons on a consistent basis. EBITDA and Adjusted EBITDA should not be construed as an alternative to profit or operating profit, as an indicator of operating performance, as an alternative to cash flow provided by operating activities or as a measure of liquidity (in each case, as determined in accordance with IFRS). EBITDA and Adjusted EBITDA, as calculated by us, may not be comparable to similarly titled measures reported by other companies, including those in the cement industry. For a calculation of EBITDA and Adjusted EBITDA and a reconciliation of EBITDA and Adjusted EBITDA to the most directly comparable IFRS financial measure, see “Item 3. Key Information—A. Selected Financial Data.”
We have translated some of thesoles amounts appearing in this annual report into U.S. dollars for convenience purposes only. Unless the context otherwise requires, the rate used to translatesoles amounts to U.S. dollars was S/3.241 to US$1.00, which was the average accounting exchange rate (tipo de cambio contable) reported on December 31, 2017, by the Peruvian Superintendence of Banks, Insurance and Private Pension Fund Administrators (Superintendencia de Banca,Seguros y AFPs,or“SBS”). The Federal Reserve Bank of New York does not report a noon buying rate forsoles. The U.S. dollar equivalent information presented in this annual report is provided solely for convenience of the reader and should not be construed as implying that thesoles amounts represent, or could have been or could be converted into, U.S. dollars at such rates or at any other rate. See “Item 3. Key Information—A. Selected Financial Data—Exchange Rates” for information regarding historical exchange rates ofsoles to U.S. dollars.
Certain figures included in this annual report have been subject to rounding adjustments. Accordingly, figures shown as totals in certain tables may not be arithmetic aggregations of the figures that precede them.
Market Information
We make estimates in this annual report regarding our competitive position and market share, as well as the market size and expected growth of the construction sector and cement industry in Peru. We have made these estimates on the basis of our management’s knowledge and statistics and other information available from the following sources:
| • | the Central Bank of Peru (Banco Central de Reserva del Perú); |
| • | the National Statistical Institute of Peru (Instituto Nacional de Estadística e Informática, or “INEI”); |
| • | the Association of Cement Producers of Peru (Asociación de Productores de Cemento, or “ASOCEM”); |
| • | the Ministry of Housing, Construction and Sanitation; |
| • | ADUANET, a website administered by the Peruvian Tax Superintendence (Superintendencia Nacional de Administración Tributaria, or “SUNAT”); |
| • | the Peruvian Chamber of Construction (Cámara Peruana de la Construcción); and |
| • | the Global Competitiveness Index prepared by the World Economic Forum. |
We believe these estimates to be accurate as of the date of this annual report.
Forward-Looking Statements
This annual report contains forward-looking statements. Forward-looking statements convey our current expectations or forecasts of future events. These statements involve known and unknown risks, uncertainties and other factors, including those listed under “Item 3. Key Information – D. Risk Factors,” which may cause our actual results, performance or achievements to differ materially from the forward-looking statements that we make.
Forward-looking statements typically are identified by words or phrases such as “may,” “will,” “expect,” “anticipate,” “aim,” “estimate,” “intend,” “project,” “plan,” “believe,” “potential,” “continue,” “is/are likely to,” or other similar expressions. Any or all of our forward- looking statements in this annual report may turn out to be inaccurate. Our actual results could differ materially from those contained in forward-looking statements due to a number of factors, including:
| • | general economic, political and social risks inherent to conducting business in Peru; |
| • | exchange rates, inflation and interest rates; |
| • | the entry of new competitors into the market we serve; |
| • | construction activity levels, particularly in the northern region of Peru; |
| • | private investment and public spending in construction projects; |
| • | unpredictable natural disasters, such as floods and earthquakes affecting the northern region of Peru; |
| • | availability and prices of energy, admixtures and raw materials; |
| • | changes in the regulatory framework, including tax, environmental and other laws; |
| • | the successful expansion of our production capacity; |
| • | our ability to compete with potential substitutes of cement products that may be introduced in the Peruvian construction industry; |
| • | our ability to maintain and expand our distribution network; |
| • | our ability to retain and attract skilled employees; and |
| • | other factors discussed under “Item 3. Key Information—D. Risk Factors.” |
The forward-looking statements in this annual report represent our expectations and forecasts as of the date of this annual report. Except as required by law, we undertake no obligation to update or revise publicly any forward-looking statements, whether as a result of new information, future events or otherwise, after the date of this annual report.
| ITEM 1. | IDENTITY OF DIRECTORS, SENIOR MANAGEMENT AND ADVISERS |
Not applicable.
| ITEM 2. | OFFER STATISTICS AND EXPECTED TIMETABLE |
Not applicable.
| A. | Selected Financial Data |
The following selected consolidated financial data should be read together with “Item 5. Operating and Financial Review and Prospects” and our consolidated financial statements and the related notes included in this annual report. As of December 31, 2017, the consolidated financial statements comprise the financial statements of the Company and its subsidiaries: Cementos Selva S.A. and subsidiaries, Distribuidora Norte Pacasmayo S.R.L., Empresa de Transmisión Guadalupe S.A.C., Calizas del Norte S.A.C. (in liquidation) and Salmueras Sudamericanas S.A. Discontinued operations are excluded from the results of continuing operations and are presented as a single amount as profit or loss after tax from discontinued operations in the income statement.
The following selected financial data as of and for the years ended December 31, 2017, 2016, 2015, 2014 and 2013 have been derived from our annual audited consolidated financial statements included in this annual report, which have been prepared in accordance with IFRS as issued by the IASB.
| | | | | | | | | | | | | | | | | | | |
| | | Year ended December 31, | |
| | | 2017 | | | 2017 | | | 2016 | | | 2015 | | | 2014 | | | 2013 | |
Statement of Financial Position: | | (in millions
of US$,
except share
and per share
data)(1) | | | (in millions of S/,
except share and per share data)(1) | |
| | | | | | | | | | | | | | | | | | | |
| Sales of goods | | US$ | 378.2 | | | S/ | 1,225.6 | | | S/ | 1,240.2 | | | S/ | 1,231.0 | | | S/ | 1,242.6 | | | | 1,239.7 | |
| Cost of sales | | | (226.1 | ) | | | (732.9 | ) | | | (736.6 | ) | | | (695.8 | ) | | | (724.1 | ) | | | (716.2 | ) |
| Gross profit | | | 152.0 | | | | 492.7 | | | | 503.6 | | | | 535.3 | | | | 518.4 | | | | 523.4 | |
| Operating income (expenses): | | | | | | | | | | | | | | | | | | | | | | | | |
| Administrative expenses | | | (60.4 | ) | | | (195.6 | ) | | | (193.4 | ) | | | (179.7 | ) | | | (185.6 | ) | | | (200.4 | ) |
| Selling and distribution expenses | | | (14.4 | ) | | | (46.6 | ) | | | (39.9 | ) | | | (31.5 | ) | | | (30.5 | ) | | | (29.8 | ) |
| Net gain on sale of available-for-sale financial investment | | | — | | | | — | | | | — | | | | — | | | | 10.5 | | | | — | |
| Impairment on brine project | | | (14.7 | ) | | | (47.6 | ) | | | — | | | | — | | | | — | | | | — | |
| Other operating income, net | | | (1.3 | ) | | | (4.3 | ) | | | 2.4 | | | | 3.9 | | | | (2.9 | ) | | | 8.0 | |
| Total operating expenses, net | | | (90.7 | ) | | | (294.1 | ) | | | (230.8 | ) | | | (207.3 | ) | | | (208.4 | ) | | | (222.2 | ) |
| Operating profit | | | 61.3 | | | | 198.6 | | | | 272.8 | | | | 328.0 | | | | 310.0 | | | | 301.3 | |
| Other income (expenses): | | | | | | | | | | | | | | | | | | | | | | | | |
| Finance income | | | 1.8 | | | | 5.8 | | | | 3.2 | | | | 3.4 | | | | 11.3 | | | | 26.7 | |
| Finance costs | | | (22.8 | ) | | | (73.8 | ) | | | (75.4 | ) | | | (36.8 | ) | | | (31.2 | ) | | | (37.1 | ) |
| (Loss) Gain from exchange difference, net | | | (0.7 | ) | | | (2.2 | ) | | | (2.5 | ) | | | 12.2 | | | | (14.7 | ) | | | (48.4 | ) |
| Total other expenses, net | | | (21.7 | ) | | | (70.2 | ) | | | (74.7 | ) | | | (21.2 | ) | | | (34.6 | ) | | | (58.8 | ) |
| Profit before income tax | | | 39.6 | | | | 128.4 | | | | 198.1 | | | | 306.8 | | | | 275.4 | | | | 242.5 | |
| Income tax expense | | | (14.5 | ) | | | (47.0 | ) | | | (78.6 | ) | | | (89.4 | ) | | | (78.8 | ) | | | (85.9 | ) |
| Profit for the year from continuing operations | | | 25.1 | | | | 81.4 | | | | 119.5 | | | | 217.4 | | | | 196.5 | | | | 156.6 | |
| Loss for the year from discontinued operations | | | (0.2 | ) | | | (0.8 | ) | | | (6.6 | ) | | | (5.7 | ) | | | (7.7 | ) | | | (4.3 | ) |
| Profit for the year | | | 24.9 | | | | 80.6 | | | | 112.9 | | | | 211.7 | | | | 188.8 | | | | 152.3 | |
| | | | | | | | | | | | | | | | | | | | | | | | | |
Share and Per Share Data: | | | | | | | | | | | | | | | | | | | | | | | | |
| Attributable to: | | | | | | | | | | | | | | | | | | | | | | | | |
| Equity holders of the parent | | | 28.9 | | | | 93.8 | | | | 116.2 | | | | 215.5 | | | | 192.8 | | | | 155.6 | |
| Non-controlling interests | | | (4.1 | ) | | | (13.2 | ) | | | (3.3 | ) | | | (3.9 | ) | | | (4.0 | ) | | | (3.4 | ) |
| | | US$ | 24.9 | | | S/ | 80.6 | | | S/ | 112.9 | | | S/ | 211.7 | | | S/ | 188.8 | | | S/ | 152.3 | |
| | | | | | | | | | | | | | | | | | | | | | | | | |
| Profit per share (4) | | US$ | 0.06 | | | S/ | 0.21 | | | S/ | 0.21 | | | S/ | 0.38 | | | S/ | 0.33 | | | S/ | 0.27 | |
| Number of shares outstanding(5) | | | | | | | 446,063,120 | | | | 544,688,023 | | | | 573,998,649 | | | | 581,964,603 | | | | 581,964,603 | |
| Dividends per share | | US$ | 0.11 | | | S/ | 0.35 | | | S/ | 0.285 | | | S/ | 0.28 | | | S/ | 0.20 | | | S/ | 0.10 | |
| | | | | | | | | | | | | | | | | | | |
| | | As of December 31, | |
| | | 2017 | | | 2017 | | | 2016 | | | 2015 | | | 2014 | | | 2013 | |
| Balance Sheet Data: | | (in millions
of US$)(1) | | | (in millions of S/,
except share and per share data)(1) | |
| Current assets | | | | | | | | | | | | | | | | | | | | | | | | |
| Cash and term deposits | | US$ | 15.2 | | | S/ | 49.2 | | | S/ | 80.2 | | | S/ | 158.0 | | | S/ | 580.5 | | | S/ | 977.0 | |
| Trade and other receivables | | | 30.7 | | | | 99.5 | | | | 81.1 | | | | 110.9 | | | | 110.8 | | | | 68.5 | |
| Income tax prepayments | | | 8.6 | | | | 27.8 | | | | 46.5 | | | | 44.9 | | | | 15.0 | | | | 27.7 | |
| Inventories | | | 115.1 | | | | 373.0 | | | | 346.5 | | | | 307.5 | | | | 324.1 | | | | 334.5 | |
| Prepayments | | | 1.2 | | | | 3.8 | | | | 8.0 | | | | 7.2 | | | | 4.4 | | | | 11.7 | |
| Total current assets | | | 170.7 | | | | 553.3 | | | | 562.3 | | | | 628.5 | | | | 1,034.8 | | | | 1,419.4 | |
| | | | | | | | | | | | | | | | | | | | | | | | | |
| Assets held for distribution | | | — | | | | — | | | | 338.4 | | | | — | | | | — | | | | — | |
| Non-current assets | | | | | | | | | | | | | | | | | | | | | | | | |
| Other receivables | | | 5.0 | | | | 16.2 | | | | 25.1 | | | | 64.1 | | | | 53.9 | | | | 46.3 | |
| Prepayments | | | 0.2 | | | | 0.6 | | | | 1.2 | | | | 1.4 | | | | 2.3 | | | | — | |
| Available-for-sale financial investments | | | 6.5 | | | | 21.2 | | | | 0.7 | | | | 0.4 | | | | 0.7 | | | | 36.1 | |
| Other financial instruments | | | 0.2 | | | | 0.5 | | | | 69.9 | | | | 124.8 | | | | 12.3 | | | | — | |
| Property, plant and equipment | | | 681.5 | | | | 2,208.6 | | | | 2,273.1 | | | | 2,490.8 | | | | 2,061.0 | | | | 1,537.1 | |
| Exploration and evaluation assets | | | 4.1 | | | | 13.4 | | | | 43.0 | | | | 81.9 | | | | 57.7 | | | | 59.3 | |
| Deferred income tax assets | | | 0.0 | | | | 0.1 | | | | 6.4 | | | | 21.1 | | | | 17.2 | | | | 15.2 | |
| Other assets | | | 0.1 | | | | 0.2 | | | | 0.6 | | | | 0.8 | | | | 1.0 | | | | 1.2 | |
| Total non-current assets | | | 697.6 | | | | 2,260.8 | | | | 2,419.9 | | | | 2,785.3 | | | | 2,206.1 | | | | 1,695.2 | |
| Total assets | | US$ | 868.3 | | | S/ | 2,814.1 | | | S/ | 3,320.6 | | | S/ | 3,413.8 | | | S/ | 3,240.9 | | | S/ | 3,114.5 | |
| | | | | | | | | | | | | | | | | | | | | | | | | |
| Current liabilities | | | | | | | | | | | | | | | | | | | | | | | | |
| Trade and other payables | | US$ | 54.9 | | | S/ | 178.0 | | | S/ | 142.8 | | | S/ | 170.8 | | | S/ | 137.6 | | | | 126.9 | |
| Interest-bearing loans and borrowings | | | | | | | | | | | | | | | — | | | | — | | | | — | |
| Income tax payable | | | 0.7 | | | | 2.4 | | | | 3.5 | | | | 3.9 | | | | 8.7 | | | | 2.8 | |
| Provisions | | | 7.6 | | | | 24.6 | | | | 31.7 | | | | 28.9 | | | | 53.8 | | | | 28.0 | |
| Total current liabilities | | | 63.3 | | | | 205.0 | | | | 178.0 | | | | 203.5 | | | | 200.1 | | | | 157.7 | |
| Liabilities directly related to assets held for distribution | | | — | | | | — | | | | 2.7 | | | | — | | | | — | | | | — | |
| | | | | | | | | | | | | | | | | | | | | | | | | |
| Non-current liabilities | | | | | | | | | | | | | | | | | | | | | | | | |
| Interest-bearing loans and borrowings | | | 297.8 | | | | 965.3 | | | | 998.2 | | | | 1,012.4 | | | | 883.6 | | | | 824.0 | |
| Other non-current provisions | | | 8.7 | | | | 28.3 | | | | 22.0 | | | | 32.6 | | | | 0.7 | | | | 20.5 | |
| Deferred income tax liabilities, net | | | 33.6 | | | | 108.8 | | | | 139.8 | | | | 119.1 | | | | 85.9 | | | | 102.9 | |
| Total non-current liabilities | | | 340.1 | | | | 1,102.4 | | | | 1,160.0 | | | | 1,164.1 | | | | 970.1 | | | | 947.4 | |
| Total liabilities | | US$ | 403.4 | | | S/ | 1,307.4 | | | S/ | 1,340.6 | | | S/ | 1,367.7 | | | S/ | 1,170.2 | | | S/ | 1,105.1 | |
| Equity: | | | | | | | | | | | | | | | | | | | | | | | | |
| Capital stock | | US$ | 130.8 | | | S/ | 423.9 | | | S/ | 531.5 | | | S/ | 531.5 | | | S/ | 531.5 | | | S/ | 531.5 | |
| Investment shares | | | 12.4 | | | | 40.3 | | | | 50.5 | | | | 50.5 | | | | 50.5 | | | | 50.5 | |
| Treasury shares | | | (36.7 | ) | | | (119.0 | ) | | | (108.2 | ) | | | (108.2 | ) | | | — | | | | — | |
| Additional paid-in capital | | | 133.5 | | | | 432.8 | | | | 545.2 | | | | 553.5 | | | | 553.8 | | | | 556.3 | |
| Legal reserve | | | 49.6 | | | | 160.7 | | | | 188.1 | | | | 176.5 | | | | 154.9 | | | | 119.8 | |
| Other reserves | | | (13.5 | ) | | | (43.7 | ) | | | (16.6 | ) | | | 11.6 | | | | 5.1 | | | | 19.0 | |
| Retained earnings | | | 188.7 | | | | 611.7 | | | | 677.1 | | | | 727.8 | | | | 696.7 | | | | 653.7 | |
| Non-controlling interests | | | — | | | | 0.1 | | | | 112.6 | | | | 103.1 | | | | 78.1 | | | | 78.6 | |
| Total equity | | | 464.9 | | | | 1,506.7 | | | | 1,980.0 | | | | 2,046.1 | | | | 2,070.7 | | | | 2,009.5 | |
| Total liabilities and equity | | US$ | 868.3 | | | S/ | 2,814.1 | | | S/ | 3,320.6 | | | S/ | 3,413.8 | | | S/ | 3,240.9 | | | S/ | 3,114.5 | |
| | | | | | | | | | | | | | | | | | | |
| | | As of and for the year ended December 31, | |
| | | 2017 | | | 2017 | | | 2016 | | | 2015 | | | 2014 | | | 2013 | |
Other Financial Information: | | (in millions
of US$)(1) | | | (in millions of S/, except
percentage and operating data) | |
| | | | | | | | | | | | | | | | | | | |
| Net working capital (4) | | US$ | 107.5 | | | S/ | 348.3 | | | S/ | 384.3 | | | S/ | 424.9 | | | S/ | 834.7 | | | S/ | 1,261.7 | |
| Capital expenditures (5) | | | 21.6 | | | | 70.0 | | | | 120.3 | | | | 490.8 | | | | 586.6 | | | | 200.6 | |
| Depreciation and amortization | | | 38.3 | | | | 124.2 | | | | 111.3 | | | | 70.8 | | | | 64.8 | | | | 55.9 | |
| Net cash flows from operating activities | | | 77.3 | | | | 250.4 | | | | 241.7 | | | | 275.6 | | | | 240.4 | | | | 191.8 | |
| Net cash flows from (used in) investing activities | | | (21.8 | ) | | | (70.6 | ) | | | (135.6 | ) | | | (475.9 | ) | | | (553.5 | ) | | | 194.5 | |
| Net cash flows from (used in) financing activities | | | (57.2 | ) | | | (185.4 | ) | | | (177.5 | ) | | | (257.8 | ) | | | (114.8 | ) | | | 507.4 | |
| Adjusted EBITDA | | | 114.6 | | | | 371.5 | | | | 371.0 | | | | 389.7 | | | | 365.3 | | | | 348.9 | |
| Adjusted EBITDA margin | | | 30.3 | % | | | 30.3 | % | | | 29.9 | % | | | 31.7 | % | | | 29.4 | % | | | 28.1 | % |
| Operating Data: | | As of and for the year ended December 31, | |
| Installed capacity (000 metric tons/year): | | 2017 | | | 2016 | | | 2015 | | | 2014 | | | 2013 | |
| Cement: | | | | | | | | | | | | | | | |
| Pacasmayo | | | 2,900 | | | | 2,900 | | | | 2,900 | | | | 2,900 | | | | 2,900 | |
| Rioja | | | 440 | | | | 440 | | | | 440 | | | | 440 | | | | 440 | |
| Piura | | | 1,600 | | | | 1,600 | | | | 1,600 | | | | — | | | | — | |
| Total | | | 4,940 | | | | 4,940 | | | | 4,940 | | | | 3,340 | | | | 3,340 | |
| | | | | | | | | | | | | | | | | | | | | |
| Clinker: | | | | | | | | | | | | | | | | | | | | |
| Pacasmayo | | | 1,500 | | | | 1,500 | | | | 1,500 | | | | 1,500 | | | | 1,500 | |
| Rioja | | | 280 | | | | 280 | | | | 280 | | | | 280 | | | | 280 | |
| Piura | | | 1,000 | | | | 1,000 | | | | 1,000 | | | | — | | | | — | |
| Total | | | 2,780 | | | | 2,780 | | | | 2,780 | | | | 1,780 | | | | 1,780 | |
| Quicklime | | | | | | | | | | | | | | | | | | | | |
| Pacasmayo | | | 240 | | | | 240 | | | | 240 | | | | 240 | | | | 240 | |
| Production (000 metric tons/year): | | | | | | | | | | | | | | | | | | | | |
| Cement: | | | | | | | | | | | | | | | | | | | | |
| Pacasmayo | | | 1,141 | | | | 1,177 | | | | 1,884 | | | | 2,054 | | | | 2,101 | |
| Rioja | | | 287 | | | | 281 | | | | 288 | | | | 296 | | | | 240 | |
| Piura | | | 858 | | | | 817 | | | | 161 | | | | — | | | | — | |
| Total | | | 2,286 | | | | 2,275 | | | | 2,333 | | | | 2,350 | | | | 2,341 | |
| Clinker: | | | | | | | | | | | | | | | | | | | | |
| Pacasmayo | | | 687 | | | | 887 | | | | 967 | | | | 1,014 | | | | 1,189 | |
| Rioja | | | 209 | | | | 215 | | | | 235 | | | | 228 | | | | 196 | |
| Piura | | | 746 | | | | 629 | | | | — | | | | — | | | | — | |
| Total | | | 1,642 | | | | 1,731 | | | | 1,202 | | | | 1,242 | | | | 1,385 | |
| Quicklime | | | | | | | | | | | | | | | | | | | | |
| Pacasmayo | | | 168 | | | | 156 | | | | 98 | | | | 101 | | | | 67 | |
| (1) | Calculated based on an average exchange rate of S/3.241 to US$1.00 as of December 31, 2017. |
| (2) | Basic earnings per share amounts are calculated by dividing profit for the year attributable to common shares and investment shares of the equity holders of the Company by the weighted average number of common shares and investment shares outstanding during the year. The weighted average number of shares in 2017, 2016 and 2015 takes into account the weighted average effect of changes in shares held in treasury. On October 15, 2015, we acquired 37,276,580 of our investment shares. In January 2017, we acquired 7,911,845 of our investment shares. |
| (3) | In addition number of common and investment shares was reduced due to the spin-off of the net assets of Fosfatos del Pacífico S.A. to Fossal S.A.A. |
| (4) | Represents current assets minus current liabilities. |
| (5) | Represents expenditures for the purchase of property, plant, equipment and intangibles. |
Non-IFRS Financial Measure and Reconciliation
We define EBITDA as profit minus finance income and plus finance costs, income tax expenses, and depreciation and amortization, and plus or minus gain from exchange difference, net. We define Adjusted EBITDA as EBITDA plus impairment on the brine project.
EBITDA and Adjusted EBITDA should not be construed as an alternative to profit or operating profit, as an indicator of operating performance, as an alternative to cash flow provided by operating activities or as a measure of liquidity (in each case, as determined in accordance with IFRS). EBITDA and Adjusted EBITDA, as calculated by us, may not be comparable to similarly titled measures reported by other companies, including those in the cement industry.
The following table sets forth the reconciliation of our profit to EBITDA and Adjusted EBITDA:
| | | | | | | | | | | | | | | | | | | |
| | | Year ended December 31, | |
| | | 2017 | | | 2017 | | | 2016 | | | 2015 | | | 2014 | | | 2013 | |
| | | (in millions
of US$)(1) | | | (in millions of S/) | |
| Profit | | US$ | 24.9 | | | S/ | 80.6 | | | S/ | 112.9 | | | S/ | 211.7 | | | S/ | 188.8 | | | S/ | 152.3 | |
| Finance income | | | (1.8 | ) | | | (5.8 | ) | | | (3.3 | ) | | | (3.5 | ) | | | (11.7 | ) | | | (27.2 | ) |
| Finance costs | | | 22.8 | | | | 73.8 | | | | 75.4 | | | | 36.8 | | | | 31.2 | | | | 37.1 | |
| (Gain) loss from exchange difference, net | | | 0.7 | | | | 2.2 | | | | 2.5 | | | | (12.4 | ) | | | 14.8 | | | | 48.4 | |
| Income tax expense | | | 15.1 | | | | 48.9 | | | | 78.6 | | | | 89.4 | | | | 78.8 | | | | 85.9 | |
| Depreciation and amortization | | | 38.3 | | | | 124.2 | | | | 111.3 | | | | 70.8 | | | | 64.8 | | | | 55.9 | |
| EBITDA | | US$ | 99.9 | | | S/ | 323.9 | | | S/ | 371.0 | | | S/ | 389.7 | | | S/ | 365.3 | | | S/ | 348.9 | |
| Impairment on brine project | | | 14.7 | | | | 47.6 | | | | — | | | | — | | | | — | | | | — | |
| Adjusted EBITDA | | US$ | 114.6 | | | S/ | 371.5 | | | S/ | 371.0 | | | S/ | 389.7 | | | S/ | 365.3 | | | S/ | 348.9 | |
| (1) | Calculated based on an average exchange rate of S/3.241 to US$1.00 as of December 31, 2017. |
Exchange Rates
The Peruviansol is freely traded in the currency exchange market. Current Peruvian regulations on foreign investment allow foreign equity holders of Peruvian companies to receive and repatriate 100% of the cash dividends distributed by these companies. Non-Peruvian equity holders are allowed to purchase foreign currency at free market currency rates through any member of the Peruvian banking system and transfer such foreign currency outside Peru without restriction. Peruvian law in the past, however, has imposed restrictions on the conversion of Peruvian currency and the transfer of funds abroad, and we cannot assure you that Peruvian law will continue to permit such payments, transfers, conversions or remittances without restrictions.
The following table sets forth, for the periods indicated, certain information regarding the exchange rates forsoles per U.S. dollar, as published by the SBS. The Federal Reserve Bank of New York does not report a noon buying rate forsoles.
| | | | | | | | | | | | | | |
| | | | High | | | Low | | | Average(1) | | | Period end | |
| | | | | | | | | | | | | | | |
| 2013 | | | | 2.820 | | | | 2.540 | | | | 2.701 | | | | 2.795 | |
| 2014 | | | | 2.988 | | | | 2.761 | | | | 2.839 | | | | 2.985 | |
| 2015 | | | | 3.411 | | | | 2.982 | | | | 3.186 | | | | 3.411 | |
| 2016 | | | | 3.537 | | | | 3.249 | | | | 3.375 | | | | 3.356 | |
| 2017 | | | | | | | | | | | | | | | | | |
| November 2017 | | | | 3.251 | | | | 3.233 | | | | 3.241 | | | | 3.233 | |
| December 2017 | | | | 3.290 | | | | 3.232 | | | | 3.246 | | | | 3.242 | |
| January 2018 | | | | 3.229 | | | | 3.207 | | | | 3.215 | | | | 3.216 | |
| February 2018 | | | | 3.269 | | | | 3.212 | | | | 3.248 | | | | 3.260 | |
| March 2018 | | | | 3.272 | | | | 3.217 | | | | 3.252 | | | | 3.227 | |
| April 2018 (through April 24) | | | | 3.238 | | | | 3.216 | | | | 3.228 | | | | 3.232 | |
| | | | | | | | | | | | | | | | | | | |
Source: SBS
| (1) | Averages are based on daily exchange rates. |
On April 24, 2018, the exchange rate was S/3.232 per US$1.00.
| B. | Capitalization and Indebtedness |
Not applicable.
| C. | Reasons for the Offer and Use of Proceeds |
Not applicable.
Risks Relating to Peru
Economic, social and political developments in Peru including political instability, inflation and unemployment could have a material adverse effect on our business.
All of our operations and customers are located in Peru. Accordingly, our financial condition and results of operation depend on the level of economic activity in Peru. Our financial condition and results of operations could be affected by changes in economic and other policies of the Peruvian government (which has exercised and continues to exercise substantial influence over many aspects of the private sector), and by other economic and political developments in Peru, including devaluation or depreciation, currency exchange controls, inflation, economic downturns, political instability, corruption scandals, social unrest and terrorism.
In the past, Peru has experienced political instability that included a succession of regimes with disparate economic policies and programs that created uncertainty for domestic and foreign investors. At present, Peru is a democracy under the administration of President Martin Vizcarra, who took office in March 2018 after peacefully assuming the presidency following President Pedro Pablo Kuczynski’s resignation following allegations of his involvement in a corruption scandal. Prior governments have imposed controls on prices, exchange rates, local and foreign investment and international trade, restricted the ability of companies to dismiss employees, expropriated private sector assets and prohibited the remittance of profits to foreign investors. We cannot be certain whether the Peruvian government will continue or be able to pursue its agenda, including business-friendly and open-market economic policies that stimulate economic growth and social stability.
During the 1980s and the early 1990s, Peru experienced severe terrorist activity targeted against, among others, the government and the private sector. Since then, terrorist activity in Peru has been mostly confined to small-scale operations in the Huallaga Valley and the Valleys of the Rivers Apurimac, Ene and Mantaro, or “VRAEM,” areas, both in the Eastern part of the country. The Huallaga Valley and VRAEM constitute the largest areas of coca cultivation in the country and thus serve as a hub for the illegal drug trade. Terrorist activity and the illegal drug trade continue to be key challenges for Peruvian authorities. Any violence derived from the drug trade or a resumption of large-scale terrorist activities which may occur could hurt our operations and, could disrupt the economy of Peru and our business. In addition, Peru has, from time to time, experienced social and political turmoil, including riots, nationwide protests, strikes and street demonstrations. Despite Peru’s ongoing economic growth and stabilization, the social and political tensions and high levels of poverty and unemployment continue. Future government policies to preempt or respond to social unrest could include, among other things, expropriation, nationalization, suspension of the enforcement of creditors’ rights and new taxation policies. These policies could adversely and materially affect the Peruvian economy and our business.
Furthermore, some of the measures proposed by the new administration may generate political and social opposition, which may in turn prevent the current government from adopting such measures as proposed. Political parties opposed to the current administration retained a majority of the seats in the Peruvian Congress in the last elections, which will require the current administration to seek political support from such opposition parties for its economic proposals. Additionally, the opposition in the Peruvian Congress called a vote to impeach former President Kuczynski in connection with certain alleged links to Brazilian construction firm Odebrecht. The vote took place on December 21, 2017 and only obtained 78 (60%) of the 87 (67%) votes needed for impeachment. Therefore, former President Kuczynski remained in his position. This created political instability going forward and further uncertainty in the ability of the current administration to pass measures that it expects to implement. During this process, the sol weakened against the U.S. dollar and local currency bond yields rose.
On December 24, 2017, President Kuczynski used his constitutional presidential prerogative and pardoned former President Alberto Fujimori who was serving a 25 year sentence, it is believed, in an attempt to gain support from the ruling majority in the Peruvian Congress. The move triggered protests in Peru from various sectors of Peruvian society and political parties.
On March 8, 2018, a group of 30 congressmen (from a total of 130) introduced a motion to hold a new impeachment proceeding against former President Kuczynski. On March 15, 2018, the Peruvian Congress approved such motion with an affirmative vote of 87 members of Congress, and President Kuczynski was summoned to appear before Congress on March 22, 2018.
On March 21, 2018, President Kuczynski presented resigned his office as president, due to allegations in the context of the impeachment proceeding planned by Congress. On March 23, 2018, Congress accepted his resignation and his first vice president, Martín Vizcarra, was sworn in as acting president. On April 2, 2018, President Vizcarra appointed the members of his cabinet. We cannot assure you whether President Vizcarra will remain in office for the remainder of the presidential term, which ends in July 2021. If President Vizcarra and the current second vice president both resign, the president of the Congress would become acting president and Congress would call for new elections, which may include both new presidential and congressional elections. The political instability caused by these events could affect macroeconomic conditions in the country, including currency volatility, as well as have a negative effect on our business.
Another source of risk is related to political and social unrest in areas where mining, oil and gas operations take place. In recent years, Peru has experienced protests against mining projects in several regions around the country. Mining is an important part of the Peruvian economy, with mining and oil and gas as of December 31, 2017, accounted for approximately 3.2% of the country’s GDP according to the Central Bank of Peru. On several occasions, local communities have opposed these operations and accused them of polluting the environment and hurting agricultural and other traditional economic activities. In late 2011 and throughout 2012, social and political tension peaked around Conga, a gold project in the northern region of Cajamarca. The launch of Conga, which involved investments of approximately US$4.5 billion, failed as a result of the protests. Social demands and conflicts could have an effect on the Peruvian economy.
The foregoing political uncertainty and presidential decisions could further increase interest rate and currency volatility, as well as adversely and materially affect the Peruvian economy and our business.
A depreciation or devaluation of the sol could have a material adverse effect on our financial condition and results of operations.
A significant depreciation or devaluation of the Sol may affect us due to the fact that our revenues are denominated in soles while 100% of our indebtedness, as of December 31, 2017, is denominated in U.S. dollars. As a result, we are exposed to currency mismatch risks. As of December 31, 2017, we maintain cross currency swap hedging agreements in aggregate principal amount of 100% of our current U.S. dollar-denominated debt to hedge against the foreign exchange risks associated. Nonetheless, a devaluation of the sol against the U.S. dollar and increased exchange rate volatility such as the one recently experienced due to political uncertainty would increase the cost of our interest payments obligations which could have a material adverse effect on our financial condition and results of operations.
The re-implementation by the Peruvian government of restrictive exchange rate policies and other laws could have an adverse effect on our business, financial condition and results of operations.
Since 1991, the Peruvian economy has undergone a major transformation from a highly protected and regulated system to a free market economy. During this period, protectionist and interventionist laws and policies have been dismantled. The Peruvian economy has responded to this transformation by growing at a compound average annual rate of 4.6% during the period from 1994 to 2017. Currently, foreign exchange rates are determined by market conditions, with regular open-market operations by the Central Bank of Peru in the foreign exchange market to reduce volatility in the value of Peru’s currency against the U.S. dollar.
We cannot assure you that the Peruvian government will not institute restrictive exchange rate policies in the future. Any such restrictive exchange rate policy could have a material adverse effect on our business, financial condition and results of operations and adversely affect our ability to repay debt or other obligations and restrict our access to international financing.
In addition, if the Peruvian government were to institute restrictive exchange rate policies in the future, we might be obligated to seek an authorization from the Peruvian government to make payments on the notes and the guarantees. We cannot assure you that such an authorization would be obtained. Any such exchange rate restrictions or the failure to obtain such an authorization could materially and adversely affect our ability to make payments under US dollar denominated debt and to pay dividends on our ADRs.
Increased inflation in Peru could have an adverse effect on the Peruvian long-term credit market, as well as the Peruvian economy generally and, therefore, on our financial condition and results of operations.
In the past, Peru has suffered through periods of high and hyper-inflation, which has materially undermined the Peruvian economy and the government’s ability to create conditions that support economic growth. In response to increased inflation, the Central Bank of Peru, which sets the Peruvian basic interest rate, may increase or decrease the basic interest rate in an attempt to control inflation or foster economic growth. Increases in the base interest rate could adversely affect our results of operations, increasing the cost of certain funding. Additionally, a return to a high-inflation environment would also undermine Peru’s foreign competitiveness, with negative effects on the level of economic activity and employment, while increasing our operating costs and adversely impacting our operating margins if we are unable to pass the increased costs on to our customers.
Changes in tax laws or their interpretation may increase our tax burden and, as a result, negatively affect our business.
The Peruvian Congress and government regularly implement changes to tax laws that may increase our tax burden, or the tax burden of our subsidiaries. These changes may include modifications in our taxable base, tax rates and, on occasion, the enactment of temporary taxes that in some cases have become permanent taxes or changes to VAT exemptions applicable to certain of our operations in the Amazonian region. We are unable to estimate the outcomes that these changes may have on business. In that sense, the Peruvian government recently introduced several changes related to transfer pricing rules and formal obligations in order to comply with BEPS (base erosion and profit shifting) Guidelines on transactions performed between related parties or with the intervention of low or no-tax jurisdictions, such as the obligation to file new local-files, master-files and country-by-country reports with the Peruvian tax authority, and to adjust taxable bases accordingly for income tax purposes.
The effects of any tax reforms that could be proposed in the future and any other changes that result from the enactment of additional reforms have not been, and cannot be, quantified. However, any changes to our tax regime or interpretations thereof (including in connection with the tax rates, tax base (base imponible), deductions rules, payments in advance regime (regimen de pagos a cuenta), time of payment or the establishment of new taxes thereof, may result in increases in our overall costs and/or our overall compliance costs, which could negatively affect our results of operation.
Our operations could be adversely affected by an earthquake, flood or other natural disasters.
Severe weather conditions and other natural disasters in areas in which we have shopping malls may materially adversely affect our operations. Peru is affected by El Niño, an oceanic and atmospheric phenomenon that causes a warming of temperatures in the Pacific Ocean, resulting in heavy rains off the coast of Peru and various other effects in other parts of the world. The effects of El Niño, which typically occurs every two to seven years, include flooding and the destruction of fish populations and agriculture, and accordingly have a negative impact on Peru’s economy. For example, in early 2017, El Niño adversely affected agricultural production, transportation services, tourism and commercial activity, caused widespread damage to infrastructure and displaced significant populations. El Niño is expected to have produced a 1.2% drop in GDP in 2017 relative to 2016 figures. The Peruvian government estimated that El Niño caused US$2.8 billion in damages in affected regions in the first half of 2017. Peru also is located in an area that experiences seismic activity and occasionally is affected by earthquakes. For example, in 2007, an earthquake with a magnitude of 7.9 on the Richter scale struck the central coast of Peru, severely damaging the region south of Lima. Such conditions may result in physical damage to our properties, closure of one or more of our shopping centers or our tenants-stores, inadequate work forces in our markets, temporary disruptions in the supply of products to our tenants, delays in the delivery of goods to our tenants’ stores and a reduction in the availability of products in our tenants’ stores. In addition, adverse climate conditions (due to climate change or otherwise) and adverse weather patterns, such as droughts or floods that impact growing conditions and the quantity and quality of crops, may materially adversely affect the availability or cost of certain commodities or other products within our supply chain. Any of these factors may disrupt and materially adversely affect our operations.
The Peruvian economy could be adversely affected by economic developments in regional or global markets.
Financial and securities markets in Peru are influenced by economic and market conditions in regional or global markets. Although economic conditions vary from country to country, investors’ perceptions of the events occurring in one country may adversely affect cash flows and securities from issuers in other countries, including Peru. For example, the Peruvian economy was adversely affected by the political and economic events that occurred in several emerging economies in the 1990s, including in Mexico in 1994, which impacted the fair value of securities issued by companies from markets throughout Latin America. The crisis in the Asian markets beginning in 1997 also negatively affected markets throughout Latin America. Similar adverse consequences resulted from the economic crisis in Russia in 1998, the Brazilian devaluation in 1999 and the Argentine crisis in 2001. In addition, Peru’s economy continues to be affected by events in the economies of its major regional partners and in developed economies that are trading partners or that affect the global economy.
The 2008 and 2009 global economic and financial crisis substantially affected the financial system, including Peru’s securities market and economy. Additionally, the debt crisis in Europe that began with financial crises in Greece, Spain, Italy and Portugal, reduced the confidence of foreign investors, caused volatility in the securities markets and affected the ability of companies to obtain financing globally. Doubts about the pace of global growth, particularly in the United States, contributed to already weak international growth in 2011, 2012 and 2013. Brexit continues to create volatility and uncertainty in a number of financial markets. Any interruption to the recovery of developed economies, the continued effects of the global crisis in 2008 and 2009, a worsening or resurgence of the debt crisis in Europe, impacts due to Brexit or a new economic and/or financial crisis, or a combination of the above, could affect the Peruvian economy, and consequently, materially adversely affect our business. In particular, the Peruvian economy recently has suffered the effects of fluctuating commodity prices in the international markets, a decrease in export volumes, a decrease in foreign direct investment inflows and, as a result, a decline in foreign reserves and an increase in its current account deficit. Further, the United States has imposed new tariffs that could undermine economic growth and raise costs for manufacturers around the world
Additionally, adverse developments in regional or global markets or an increase in the perceived risks associated with investing in emerging markets in the future could adversely affect the Peruvian economy and, as a result, adversely affect our business, financial condition and results of operations.
A decline in the prices of certain commodities in the international markets could have a material adverse effect on our financial condition and results of operations.
In 2017, traditional exports, in particular mineral products, fishing products, agricultural products and petroleum and its derivatives, represented 73.8% of Peru’s total exports, according to the figures published by the Central Bank of Peru. Changes in commodity prices in the international markets, especially traditional minerals which represented 60.5% of exports by value as of the third quarter of 2017 (according to the Central Bank of Peru), may have an adverse impact on government finances, which could affect both investor confidence and the sustainability of government expenditure and social programs. Thus, a decline in commodity prices could, ultimately, affect the political environment in Peru, especially as regional and local governments are particularly reliant on tax revenue from mining concerns. By potentially affecting private sector demand and investor confidence, lower commodity prices could also affect the retail sector, leading to, for example, a decline in purchasing power and consumer spending. A decline in commodity prices could also materially affect demand for our discretionary products as well as lower traffic.
Corruption and ongoing high-profile corruption investigations may hinder the growth of the Peruvian economy and have a negative impact on our business and operations.
Peruvian authorities are currently conducting several high-profile corruption investigations relating to the activities of certain Brazilian companies and its Peruvian partners in the construction and infrastructure sectors, which have resulted in suspension or delay of important infrastructure projects that were otherwise operational and permitted. The overall delay relating to such projects has resulted in a drop in GDP growth and overall infrastructure investment.
In July 2017, former President Ollanta Humala and his wife were detained in connection with a corruption probe and in February 2018, a Peruvian judge submitted a request to extradite former president Alejandro Toledo on allegations of bribery, both in connection with Brazilian construction company Odebrecht SA. Several high-profile politicians are subject to corruption investigations. Corruption and corruption investigations could directly affect the Peruvian government, divert resources that would otherwise be focused on developing the economy, create political instability, and result in slower or negative economic growth, such as has recently happened in Brazil. In turn, this could impact our ability to successfully implement our growth and expansion strategies.
On March 8, 2018, a group of 30 congressmen (of 130) introduced a motion for a new impeachment proceeding against President Kuczynski. On March 15, 2018, the Peruvian Congress approved such motion with an affirmative vote of 87 members of Congress, and President Kuczynski was summoned to testify before Congress on March 22, 2018.
On March 21, 2018, President Kuczynski announced his decision to resign his office as president, due to allegations of corruption he faced. On March 23, 2018, Congress accepted his resignation and his first vice president, Martín Vizcarra, was sworn in as acting president. On April 2, 2018, President Vizcarra appointed the members of his cabinet. We cannot assure you whether President Vizcarra will remain in office for the remainder of the presidential term, which ends in July 2021. If President Vizcarra and the current second vice president both step down, the president of Congress would become acting president and Congress would call for new elections, which may include both new presidential and congressional elections. The political instability caused by these events could affect macroeconomic conditions in the country, including currency volatility, as well as have a negative effect on our business and the price and volatility of the notes.
See “—Economic, social and political developments in Peru including political instability, inflation and unemployment could have a material adverse effect on our business.”
Risks Relating to our Business and Industry
We are subject to the possible entry of domestic or international competitors into our market, which could decrease our market share and profitability.
The cement market in Peru is competitive and is currently served mainly by three main groups which together supply most of the cement consumed in the country. In the cement industry, the location of a production plant tends to limit the market a plant can serve because transportation costs are high, reducing profit margins. Historically, we have supplied the northern region of Peru while two other groups have supplied the central (which includes the Lima metropolitan area) and southern regions of Peru, driven principally by the location of production facilities and distribution focus. However, competition could intensify if other manufacturers decide to enter our market.
We may face increased competition if the other Peruvian cement manufacturers, despite incremental freight costs, expand their distribution of cement to the northern region of Peru, or if they develop a cement plant in the north, particularly if the cement markets in Lima or other areas of Peru become saturated. Some large foreign cement manufacturers have announced plans to build cement plants in the central region of the country. If competition intensifies in the central region of Peru due to the presence of foreign cement manufacturers or otherwise, it may have price repercussions in our market.
We also face the possibility of competition from the entry into our market of imported clinker for grinding facilities, cement or other materials or products from foreign manufacturers, which may have significantly greater financial resources than us, particularly as production capacity continues to exceed depressed demand in other parts of the world and transportation costs decrease.
We may not be able to maintain our market share if we cannot match our competitors’ prices or keep pace with the development of new products. If any of these events were to occur, our business, financial condition and results of operations could be adversely affected.
Demand for our cement products is highly related to housing construction in northern Peru, which, in turn, is affected by economic conditions in the region.
Cement consumption is highly related to construction levels. Demand for our cement products depends, in large part, on residential construction in the north of Peru, which consists mostly of low-income families gradually building or improving their own homes without technical assistance, which we refer to asauto-construcción. We estimate that in 2017,auto-construcción accounted for approximately 62.2% of our cement sales. Residential construction, in turn, is highly correlated to prevailing economic conditions in Peru. A decline in economic conditions would reduce household disposable income and cause a significant reduction in residential construction, leading to a decrease in demand for cement. As a result, a deterioration of economic conditions in the northern region of Peru would have a material adverse effect on our financial performance. We cannot assure you that growth in Peru’s GDP, or the contribution to GDP growth attributable to the northern region of the country, will continue at the recent pace or at all.
A reduction in private or public construction projects in the northern region of Peru would have a material adverse effect on our business, financial condition and results of operations.
We estimate that in 2017, approximately 23.9% of our cement sales were derived from private construction (other thanauto-construcción) and 13.9% from public construction in the north of Peru. Significant interruptions or delays in, or the termination of, private or public construction projects may adversely affect our business, financial condition and results of operations. Private and public construction levels in our market depend on investments in the region which, in turn, are affected by economic conditions. During the first nine months of 2017, there was a decline in public spending due to El Niño phenomenon and the Odebrecht corruption scandal which delayed investments. However, we expect a significant pickup in public investment during 2018-2021 due to reconstruction works in the North from El Niño related damages.
The level of public infrastructure construction also depends, to a great extent, on the priorities and financial resources of the national, regional and local governmental authorities. Although the anticipated increase in Peru’s large infrastructure projects has been delayed, this remains an important growth driver for the country and also a necessity due to Peru’s significant infrastructure deficit. In the North, significant spending will be directed towards reconstruction works to address the damage caused by Coastal El Niño, based on Peru’s “Reconstruction with Changes” Plan. This Plan has an approved budget of S/25.7 billion (US$7.9 billion). We cannot assure you that the Peruvian government will continue promoting recent levels of public infrastructure spending in our market. A reduction in public infrastructure spending in our market would adversely affect our business, financial condition and results of operations.
Our business, financial condition and results of operations may be adversely affected by increases in energy prices or shortages in the supply of energy.
Energy accounts for a significant percentage of our production costs. Our principal energy sources are coal and electricity. In 2017, the cost of energy represented approximately 28.1% of our cement production costs, compared to 26.2% in 2016. We use a substantial amount of coal as a source of fuel in our production process. Most of the coal we use is anthracite coal which we purchase from domestic suppliers and import a small amount of bituminous coal from suppliers primarily in Colombia in each case at market prices. We do not have long-term coal supply agreements, and we do not engage in hedging transactions in connection with the price of coal. Any shortage or interruption in the supply of coal could also disrupt our operations. In addition, the price of coal is largely driven by the price of oil, and, as a result, increases in international oil prices are likely to affect the price of coal and adversely affect our results of operations.
We have a long-term electricity supply agreement with Electroperú S.A. (“Electroperú”), a government-owned company, to serve the electricity requirements of our Pacasmayo and Piura facilities until 2025. We have also entered into a supply agreement with Electro Oriente S.A. (“ELOR”) to supply the Rioja facility until November 2022. Our business, financial condition and results of operations could be materially and adversely affected by higher costs, interruptions, and unavailability or shortage of electricity. We have no back-up power system at our plants and cannot assure you that, in case of interruption or failure in Electroperú’s or ELOR’s operations, we will have access to other energy sources at the same prices and conditions, which could adversely affect our business, financial condition and results of operations. Moreover, electricity to our plants is transmitted through the Peruvian Electricity Interconnection System (Sistema Eléctrico Interconectado Nacional del Perú, or “SEIN”). Any interruptions or failures in SEIN’s system would also have a material adverse effect on our business, financial condition and results of operations.
In the recent past, we have experienced electricity rationing, limiting our use of electricity to certain times of the day. In such cases, we were forced to readjust our production schedules in order to ensure that our production process was not interrupted. In the event of any future rationing of electricity, we may not be able to readjust quickly enough and our production process may be interrupted. Future shortages or efforts to respond to or prevent shortages, such as rationing, may adversely impact the cost or supply of electricity for our operations.
A significant increase in the prices of coal or electricity would increase our costs of production. We may not be able to increase the prices of our cement products in the future if the prices of coal or electricity rises, which would adversely affect our business, financial condition and results of operations.
Changes in the cost or availability of admixtures and raw materials supplied by third parties may adversely affect our business, financial condition and results of operations.
We use certain admixtures and raw materials in the production of cement, such as gypsum, blast furnace slag and iron that we obtain from third parties. In 2017, our cost of admixtures and raw materials supplied by third parties as a percentage of our cement production costs was approximately 5.1% compared to 10.5% in 2016. We do not have long-term contracts for the supply of admixtures, raw materials and imported clinker that we use and if existing suppliers cease operations or reduce or eliminate production of these products, our costs to procure these materials may increase significantly or we may be obligated to procure alternatives to replace these products.
We may make future acquisitions that may not achieve expected benefits.
Our strategic initiatives include pursuing acquisitions that tend to diversify our existing portfolio of products and services and expand our geographic footprint. In the future, we may decide to expand by acquiring other companies in Peru or abroad. Any future acquisitions will depend on our ability to identify suitable candidates, negotiate acceptable terms, and obtain financing for the acquisitions. If future acquisitions are significant, they could change the scale of our business and expose us to new geographic, political, operating and financial risks. In addition, each acquisition involves a number of risks, such as the diversion of our management’s attention from our existing business to integrating the operations and personnel of the acquired business, possible adverse effects on our results of operations during the integration process, our inability to achieve the intended objectives of the combination and potential unknown liabilities associated with the acquired assets.
We may not be able to obtain the funding required to implement future strategies.
Our strategies to continue to expand our cement production capacity and distribution network require significant capital expenditures. We cannot assure you that we will generate sufficient cash flow from operations, or that we will have access to external financing sources, to adequately fund such capital expenditures. Our access to external sources of financing will depend on many factors, including factors beyond our control, such as conditions in the global capital markets and investors’ risk perception of investing in Peru and in emerging markets generally. Any equity or debt financing, if available, may not be on terms that are favorable to us. If our access to external financing is limited, we may not be able to execute our strategy, which could adversely affect our business, financial condition and results of operations.
In addition, the indenture pursuant to which we issued our 4.50% Senior Notes due 2023 contains covenants that limit our ability and that of our restricted subsidiaries to incur additional indebtedness if we do not meet certain financial ratios. If we are unable to incur additional debt to fund our future strategies, our business could be adversely affected.
We are subject to risks related to litigation and administrative proceedings that could adversely affect our business and financial performance in the event of an unfavorable ruling.
The nature of our business exposes us to litigation relating to product liability claims, labor, health and safety matters, environmental matters, regulatory, tax and administrative proceedings, governmental investigations, tort claims and contract disputes, among other matters. In the past, we have been subject to antitrust and tax proceedings or investigations. While we contest these matters vigorously and make insurance claims when appropriate, litigation is inherently costly and unpredictable, making it difficult to accurately estimate the outcome of actual or potential litigation. Although we establish provisions as we deem necessary, the amounts that we reserve could vary significantly from any amounts we actually pay due to the inherent uncertainties in the estimation process. We cannot assure you that these or other legal proceedings will not materially affect our ability to conduct our business, financial condition and results of operations in the event of an unfavorable ruling.
Our business is subject to a number of operational risks, which may adversely affect our business, financial condition and results of operations.
Our business is subject to several industry-specific operational risks, including accidents, natural disasters, labor disputes and equipment failures. Such occurrences could result in damage to our production facilities and equipment, and/or the injury or death of our employees and others involved in our production process. Moreover, such accidents or failures could lead to environmental damage, loss of resources or intermediate goods, delays or the interruption of production activities and monetary losses, as well as damage to our reputation. Our insurance may not be sufficient to cover losses from these events, which could adversely affect our business, financial condition and results of operations.
In addition, key equipment at our facilities, such as our mills and kilns, may deteriorate sooner than we currently estimate. Such deterioration of our assets may result in additional maintenance or capital expenditures, and could cause delays or the interruption of our production activities. If these assets do not generate the cash flows we expect, and we are not able to procure replacement assets in an economically feasible manner, our business, financial condition and results of operations may be materially and adversely affected.
Our business depends on the continued operation of our Pacasmayo and Piura facilities.
Our production facilities in Pacasmayo and Piura are essential to our business. In 2017, approximately 87.4% of our total cement and all of our quicklime was produced at the Pacasmayo and Piura facilities. We estimate that for 2018, close to 41% of our total cement will be produced at the new Piura facility, and 46.4% at the Pacasmayo facility. These plants are subject to normal hazards of operating any cement production facility, including accidents, natural disasters and unexpected malfunctioning of the equipment. Any interruption in our operation of the Pacasmayo or Piura facilities or a decrease in the effective capacity of these facilities would adversely affect our results of operations, and any prolonged disruption in the operation of these facilities would have a material adverse effect on our business, financial condition and results of operations.
The introduction of cement substitutes into the market and the development of new construction techniques could have a material adverse effect on our business, financial condition and results of operations.
Materials such as plastic, aluminum, ceramics, glass, wood and steel can be used in construction as a substitute for cement. In addition, other construction techniques, such as the use of drywall, could decrease the demand for cement and concrete. In Peru, drywall has only been introduced into the housing construction market in recent years and it is not widely used. However, the use of drywall for housing construction could increase significantly in the future as it becomes more popular. In addition, research aimed at developing new construction techniques and modern materials may introduce new products in the future. The use of substitutes for cement could cause a significant reduction in the demand and prices for our cement products.
Our success depends on key members of our management.
Our success depends largely on the efforts and strategic vision of our executive management team and board of directors. The loss of the services of some or all of our executive management and members of our board of directors could have a material adverse effect on our business, financial condition and results of operations.
The execution of our business plan also depends on our ongoing ability to attract and retain additional qualified employees capable of operating our plants. Due to the limited pool of skilled workers in the north of Peru or workers from other regions willing to relocate to the north of Peru, we may not be successful in attracting and retaining the personnel we require. If we are unable to hire, train and retain qualified employees at a reasonable cost, we may be unable to successfully operate our business or reach full planned production levels in a timely manner and, as a result, our business, financial condition and results of operations could be adversely affected.
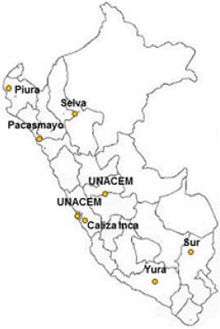
Our operations and sales are highly concentrated in the northern region of Peru.
All of our operations are located in the northern region of Peru, including our production facilities and the quarries from where we obtain limestone to produce cement. In addition, substantially all of our cement products are sold to consumers in this market. As a result, any adverse economic, political or social conditions affecting the northern region of Peru, as well as natural disasters and weather conditions, such as the El Niño climate pattern, among other factors that may affect this region, could have a material adverse effect on our business, financial condition and results of operations. During the first four months of 2017, the North of Peru experienced severe rain, landslides and flooding, which affected the demand for cement, and the ability to ship it, as well as the provision of raw materials since some roads were destroyed. Our plants did not suffer any significant damage that halted operations
We are subject to environmental regulations and may be exposed to liability and political cost as a result of our handling of hazardous materials and potential costs for environmental compliance.
We are subject to various environmental protection and health and safety laws and regulations that regulate, among other things, the generation, storage, handling, use and transportation of hazardous materials; emissions and discharge of hazardous materials; and the health and safety of our employees. Pursuant to Peruvian law, in order to conduct mining and industrial activities, we are required, among other things, to (i) submit an environmental impact assessment to the Ministry of Production (Ministerio de la Producción) and a mining closure plan to the Ministry of Energy and Mines (Ministerio de Energía y Minas,or “MEM”) prior to initiating mining activities, (ii) comply with certain air emission and wastewater discharge standards, (iii) obtain approval from the water management authority to discharge wastewater into natural water sources or soil, (iv) dispose solid waste generated by us in special landfills exclusively through companies registered with the environmental agency, and (v) store fuel in compliance with environmental and safety standards. In addition, we are required to have a health and safety committee and develop an internal health and safety code. Although we believe we are in compliance with all these regulations in all material respects, we cannot assure you that we have been or will be at all times in full compliance with these laws and regulations. Any violation of such laws or regulations could result in substantial fines, criminal sanctions, revocations of operating permits and shutdowns of our facilities. In addition, current or future governments may also impose stricter regulations which may require us to incur higher compliance costs.
Pursuant to certain applicable environmental laws, we could be found liable for all or substantially all of the damages caused by pollution at our current or former facilities or those of our predecessors or at disposal sites. We could also be found liable for all incidental damages due to the exposure of individuals to hazardous substances or other environmental damage.
We cannot assure you that our costs of complying with current and future environmental and health and safety laws and regulations, and any liabilities arising from past or future releases of, or exposure to, hazardous substances will not adversely affect our business, financial condition and results of operations.
International agreements related to climate change may result in an increase in our costs.
There are ongoing international efforts to address greenhouse emissions. The United Nations and certain international organizations have taken action against activities that may increase the atmospheric concentration of greenhouse gases. Regulatory measures, such as the Kyoto Protocol, aimed at addressing greenhouse gas emissions and climate changes, are in various stages of negotiation and implementation. Such measures may result in increased costs to us for installation of new controls aimed at reducing greenhouse gas emissions, purchase of credits or licenses for atmospheric emissions, and monitoring and registration of greenhouse gas emissions from our operations. These measures, if adopted in Peru, could adversely affect our business, financial condition and results of operations.
Changes in regulations or in the interpretation of regulations may adversely affect our business, financial condition and results of operations.
Our business is subject to extensive regulation in Peru, including, among others, relating to tax, environmental, labor, health and safety, and mining matters. We believe that our facilities are currently operating in all material respects in accordance with all applicable concessions, laws and regulations. Future regulatory changes, changes in the interpretation of such regulations or stricter enforcement of such regulations, including changes to our concession agreements, may increase our compliance costs and could potentially require us to alter our operations. We cannot assure you that regulatory changes in the future will not adversely affect our business, financial condition and results of operations.
A dispute with the labor unions that represent our employees could have an adverse effect on our business, financial condition and results of operations.
As of December 31, 2017, approximately 10.1% of our employees were members of employee unions. Our practice is to extend some of the benefits we offer our unionized employees to other employees. Although we consider our relations with our employees are currently positive, we cannot assure you that we will not experience work slowdowns, work stoppages, strikes or other labor disputes in the future, which could adversely affect our business, financial condition and results of operations.
New projects may require the prior approval of local indigenous communities.
On September 7, 2011, Peru enacted Law No. 29785, regarding the Prior Consultation Right of Local Indigenous Communities, in accordance with the International Labor Organization Convention No. 169 (Ley del Derecho a la Consulta Previa a los Pueblos Indígenas y Originarios, Reconocido en el Convenio 169 de la Organización Internacional del Trabajo). This law, which became effective on December 6, 2011, establishes a prior consultation procedure (procedimiento de consulta previa) that the Peruvian government must carry out with local indigenous communities, whose rights may be directly affected by new legislative or administrative measures, including the granting of new mining concessions. Local indigenous communities do not have a veto right; upon completion of this prior consultation procedure, the Peruvian government retains the discretion to approve or reject the applicable legislative or administrative measure. However, to the extent that in the future our new projects may require legislative or administrative measures that impact local indigenous communities, we may not be able to undertake such projects, unless the Peruvian government first conducts the foregoing consultation procedure. We cannot assure you that this law will not adversely affect our new projects and have an adverse effect on our business, financial condition and results of operations.
The indenture pursuant to which we issued our 4.50% Senior Notes due 2023 contains financial covenants, and any default under the indenture may have a material adverse effect on our financial condition and cash flows.
The indenture pursuant to which we issued our 4.50% Senior Notes due 2023 contains restrictions and covenants, including restrictions on our and our guarantor subsidiaries’ ability to incur further indebtedness or issue disqualified stock and preferred stock, unless certain conditions are met. Failure to meet or satisfy any of these covenants could result in an event of default under the indenture.
Risks Relating to our Common Shares and ADSs
The market price of our ADSs may fluctuate significantly, and you could lose all or part of your investment.
Volatility in the market price of our ADSs may prevent you from being able to sell your ADSs at or above the price you paid for them. The market price and liquidity of the market for our ADSs may be significantly affected by numerous factors, some of which are beyond our control and may not be directly related to our operating performance. These factors include, among others:
| ● | actual or anticipated changes in our results of operations, or failure to meet expectations of financial market analysts and investors; |
| ● | investor perceptions of our prospects or our industry; |
| ● | operating performance of companies comparable to us and increased competition in our industry; |
| ● | new laws or regulations or new interpretations of laws and regulations applicable to our business; |
| ● | general economic trends in Peru; |
| ● | catastrophic events, such as earthquakes and other natural disasters; and |
| ● | developments and perceptions of risks in Peru and in other countries. |
Our controlling shareholder has significant influence over us and his interests could conflict with the interests of other shareholders.
As of March 31, 2018, our controlling shareholder beneficially owned 50.01% of our outstanding common shares. As a result, our controlling shareholder has the ability to determine the outcome of substantially all matters submitted for a vote to our shareholders and thus exercise control over our business policies and affairs, including, among others, the following:
| ● | the composition of our board of directors and, consequently, any determinations of our board with respect to our business direction and policy, including the appointment and removal of our executive officers; |
| ● | determinations with respect to mergers, other business combinations and other transactions, including those that may result in a change of control; |
| ● | whether dividends are paid or other distributions are made and the amount of any such dividends or distributions; |
| ● | whether we offer preemptive and accretion rights to holders of our common shares in the event of a capital increase; |
| ● | sales and dispositions of our assets; and |
| ● | the amount of debt financing we incur. |
Our controlling shareholder may direct us to take actions that could be contrary to the interests of our other shareholders and may be able to prevent other shareholders from blocking these actions or from causing different actions to be taken. Also, our controlling shareholder may prevent change of control transactions that might otherwise provide the shareholders with an opportunity to dispose of or realize a premium on their investment in our common shares and ADSs. We cannot assure you that our controlling shareholder will act in a manner consistent with our other shareholders’ best interests.
Holders of ADSs may be unable to exercise voting rights with respect to our common shares underlying the ADSs at our shareholders’ meetings.
Holders of ADSs may exercise voting rights with respect to the common shares represented by the ADSs only in accordance with the deposit agreement relating to the ADSs. Holders of our common shares will receive notice of shareholders’ meetings through publication of a notice 25 days in advance, pursuant to Peruvian law, in the official gazette in Peru, a Peruvian newspaper of general circulation, the bulletin of the Lima Stock Exchange and the website of theSuperintendencia del Mercado de Valores (the “Peruvian Securities Commission”), and will be able to exercise their voting rights by either attending the meeting in person or voting by proxy. ADS holders will not receive notice directly from us. Instead, pursuant to the deposit agreement, we will notify the depositary, which will mail to holders of ADSs the notice of the meeting and a statement as to the manner in which voting instructions may be given. To exercise their voting rights, ADS holders must instruct the depositary how to exercise the voting rights for the common shares which underlie their ADSs. Due to these additional procedural steps involving the depositary, the process for exercising voting rights may take longer for ADS holders than for holders of our common shares.
Holders of ADSs also may not receive voting materials in time to instruct the depositary to vote the common shares underlying their ADSs. In addition, the depositary and its agents are not responsible for failing to carry out voting instructions of the holders of ADS or for the manner of carrying out such instructions, unless such failure can be attribute to gross negligence, bad faith or willful misconduct on the part of the depositary or its agents. Accordingly, holders of ADSs may not be able to exercise voting rights, and they will have little, if any, recourse if the underlying common shares are not voted as requested.
Our shareholders’ ability to receive cash dividends may be limited.
Our shareholders’ ability to receive cash dividends may be limited by the ability of the depositary to convert cash dividends paid insoles into U.S. dollars. Under the terms of our deposit agreement with the depositary for the ADSs, the depositary will convert any cash dividend or other cash distribution we pay on the common shares underlying the ADSs into U.S. dollars, if it can do so on a reasonable basis and can transfer the U.S. dollars to the United States. If this conversion is not possible or if any government approval is needed and cannot be obtained, the deposit agreement allows the depositary to distribute the foreign currency only to those ADS holders to whom it is possible to do so. If the exchange rate fluctuates significantly during a time when the depositary cannot convert the foreign currency, holders of ADSs may lose some or all of the value of the dividend distribution.
Holders of ADSs may be unable to exercise pre-emptive or accretion rights with respect to the common shares underlying their ADSs.
Under Peruvian corporate law, if we issue new common shares as part of a capital increase, unless otherwise agreed to by holders of 40% of our outstanding common shares, our shareholders will generally have the right to subscribe to a proportional number of common shares of the class held by them to maintain their existing ownership percentage, which is known as preemptive rights. In addition, shareholders are entitled to the right to subscribe for the unsubscribed common shares of either the class held by them or other classes which remain unsubscribed at the end of a preemptive rights offering, on a pro rata basis, which is known as accretion rights. Holders of ADSs may not be able to exercise the preemptive or accretion rights relating to common shares underlying the ADSs unless a registration statement under the U.S. Securities Act of 1933, as amended (the “Securities Act”), is effective with respect to those rights or an exemption from the registration requirements of the Securities Act is available. We are not obligated to file a registration statement with respect to the common shares relating to these preemptive and accretion rights and we cannot assure you that we will file any such registration statement. Unless we file a registration statement or an exemption from registration is available, holders of ADSs may receive only the net proceeds from the sale of their preemptive and accretion rights by the depositary or, if the preemptive and accretion rights cannot be sold, they will be allowed to lapse. As a result, U.S. holders of our ADSs may suffer dilution of their interest in our company upon future capital increases.
We are entitled to amend the deposit agreement under which our ADSs were issued, and to change the rights of ADS holders under the terms of such agreement, without the prior consent of the ADS holders.
We are entitled to amend the deposit agreement and to change the rights of the ADS holders under the terms of such agreement, without the prior consent of the ADS holders. Any change related to an increase in deposits or charges for book-entry securities services or any modification that might hinder the rights of the ADS holders will be effective within 30 days after the ADS holders have received notice of such change or modification and such holders will have no right to any compensation whatsoever.
Our status as a foreign private issuer allows us to follow alternate standards to the corporate governance standards of the New York Stock Exchange, which may limit the protections afforded to investors.
We are a “foreign private issuer” within the meaning of the New York Stock Exchange corporate governance standards. Under New York Stock Exchange rules, a foreign private issuer may elect to comply with the practices of its home country and not to comply with certain corporate governance requirements applicable to U.S. companies with securities listed on the exchange. We currently follow certain Peruvian practices concerning corporate governance and intend to continue to do so. Accordingly, holders of our ADSs will not have the same protections afforded to shareholders of companies that are subject to all New York Stock Exchange corporate governance requirements.
For example, the New York Stock Exchange listing standards provide that the board of directors of a U.S. listed company must have a majority of independent directors at the time the company ceases to be a “controlled company.” Under Peruvian corporate governance practices, a Peruvian company is not required to have a majority of independent members on its board of directors.
The listing standards for the New York Stock Exchange also require that U.S. listed companies; at the time they cease to be “controlled companies,” have a nominating/corporate governance committee and a compensation committee (in addition to an audit committee). Each of these committees must consist solely of independent directors and must have a written charter that addresses certain matters specified in the listing standards. Under Peruvian law, a Peruvian company may, but is not required to, form special governance committees, which may be composed partially or entirely of non-independent directors.
In addition, New York Stock Exchange rules require the independent non-executive directors of U.S. listed companies to meet on a regular basis without management being present. There is no similar requirement under Peruvian law.
The New York Stock Exchange’s listing standards also require U.S. listed companies to adopt and disclose corporate governance guidelines. In November 2013, the Peruvian Securities Commission and a committee comprised of regulatory agencies and associations prepared and published a list of suggested non-mandatory corporate governance guidelines called the “Good Corporate Governance Code for Peruvian Companies.” Although we have implemented a number of these measures, we are not required to comply with the corporate governance guidelines by law or regulation, only to disclose whether or not we are in compliance.
Minority shareholders in Peru are not afforded equivalent protections as minority shareholders in other jurisdictions and investors may face difficulties in commencing judicial and arbitration proceedings against our company or the controlling shareholder.
Our company is organized and existing under the laws of Peru, and our controlling shareholder is resident in Peru. Accordingly, investors may face difficulties in serving process on our company, our officers and directors or the controlling shareholder in other jurisdictions, and in enforcing decisions granted by courts located in other jurisdictions against our company, our officers and directors or the controlling shareholder that are based on securities laws of jurisdictions other than Peru.
In Peru, there are no proceedings to file class action suits or shareholder derivative actions with respect to issues arising between minority shareholders and an issuer, its controlling shareholders or directors and officers. Furthermore, the procedural requirements to file actions by shareholders differ from those of other jurisdictions, such as in the United States. As a result, it may be more difficult for our minority shareholders to enforce their rights against us, our directors, officers or controlling shareholder as compared to the shareholders of a U.S. company. The deposit agreement provides that the depositary has no obligation to commence or become involved in any judicial proceedings and any other legal actions relating to the ADSs or the deposit agreement, either on behalf of the ADS holders or on behalf of any other person.
The ability of investors to enforce civil liabilities under U.S. securities laws may be limited.
Most of our directors or executive officers are not residents of the United States. All or a substantial portion of our assets and those of our directors and executive officers are located outside of the United States. As a result, it may not be possible for investors in our securities to affect service of process within the United States upon such persons or to enforce in U.S. courts or outside of the United States judgments obtained against such persons outside of the United States.
We are a company organized and existing under the laws of Peru, and there is no existing treaty between the United States and Peru for the reciprocal enforcement of foreign judgments. It is not clear whether a Peruvian court would accept jurisdiction and impose civil liability if proceedings were commenced in a foreign jurisdiction predicated solely upon U.S. federal securities laws.
| ITEM 4. | INFORMATION ON THE COMPANY |
| A. | History and Development of the Company |
Our History
Cementos Pacasmayo S.A.A. began its operations in 1957 and is a publicly-held corporation (sociedad anónima abierta) organized under the laws of Peru. Our executive offices are located at Calle La Colonia 150, Urbanización El Vivero, Surco, Lima, Peru. Our telephone number at this location is + (511) 317-6000. Our website address is www.cementospacasmayo.com.pe. Information on or accessible through our website is not a part of, nor incorporated by reference in, this annual report.
Cementos Pacasmayo S.A.A. and Hochschild Mining plc together constitute the two businesses of the Hochschild Group, which has operated in Latin America for more than 100 years. Hochschild Mining plc is incorporated in the United Kingdom and its shares have been listed on the London Stock Exchange since 2006. Cementos Pacasmayo S.A.A. has been listed on the Lima Stock Exchange since 1995. As of March 31, 2018, Eduardo Hochschild, directly and indirectly, owned and controlled 50.81% of the shares of Hochschild Mining plc. Through Inversiones ASPI S.A. (“ASPI”), Eduardo Hochschild, directly and indirectly, owns and controls 50.01% of the outstanding common shares of Cementos Pacasmayo S.A.A.
The Hochschild Group traces its origins to 1911, when Mauricio Hochschild, a German mining engineer, founded a group of companies in South America that came to be known as the Hochschild Group. Following World War I, the Hochschild Group expanded into Bolivia where it developed significant interests in tin. The Hochschild Group commenced operations in Peru in 1925 and in 1945 Luis Hochschild, the nephew of Mauricio Hochschild (and the father of Eduardo Hochschild), joined the Hochschild Group’s Peruvian operations.
During the first decades of its operations, the Hochschild Group focused on the commercialization of minerals, although it later began operating its own mines and other industrial companies. During World War II, the Hochschild Group was a key supplier of tin and other metals to the allied forces.
Cementos Pacasmayo, was incorporated in Lima, Peru in 1949, by a group of private investors that founded the company to serve the cement market in the northern region of Peru. The Hochschild Group acquired its initial ownership interest in us in 1956. Set forth below are key developments in our company’s history.
| ● | In 1957, we began our operations with the installation of our first clinker line with an installed production capacity of approximately 110,000 metric tons per year. In 1966 and 1977, we added a second and third clinker line, respectively, increasing our installed clinker production capacity to approximately 830,000 metric tons per year. |
| ● | In November 1984, the South American mining and industrial operations of the Hochschild Group were sold to the Anglo American Corporation of South Africa which, in the same month, sold the Peruvian operations of the Hochschild Group, including its interest in Cementos Pacasmayo and predecessors of Hochschild Mining plc, to a group of companies controlled by Luis Hochschild. |
| ● | In 1995, we launched our distribution network to commercialize and distribute our products throughout the northern region of Peru. In that same year, we also listed our common shares for trading on the Lima Stock Exchange, currently under the ticker symbol “CPACASC1.” |
| ● | In 1998, we acquired from the Peruvian government our Rioja facility, located in the northeast of Peru. At the time, the Rioja facility had one clinker line with an installed cement production capacity of approximately 35,000 metric tons per year. |
| ● | In 2003, we acquired Zemex Corporation, a U.S. company engaged in non-metallic mining and industrial activities in the United States and Canada, which we sold in 2007 in a series of transactions. |
| ● | In 2009, we created Fosfatos del Pacífico in order to explore phosphate rock deposits from our concession at Bayóvar in the north of Peru. |
| ● | In 2010, we reached an aggregate total installed cement production capacity of 3.1 million in our Pacasmayo and Rioja facilities and completed the conversion of our Waelz kiln, retrofitting it to produce quicklime or calcine zinc interchangeably. That same year, we also sold our copper mining concessions in the central region of Peru known as “Mina Raul,” which were previously leased to a third party, for US$28.0 million. |
| ● | In 2011, we created Salmueras jointly with our minority shareholder Quimpac, which is the leading chemical company in Peru, to develop brine deposits in our combined fields in the coastal region of Piura in the north of Peru. |
| ● | In December 2011, we sold a minority equity interest in Fosfatos to an affiliate of Mitsubishi to develop our phosphate deposits in the Bayóvar fields, in the northwest of Peru. |
| ● | In March 2012, we completed our initial equity offering of 22,296,800 ADSs in the United States and listed our ADSs on the New York Stock Exchange. |
| ● | In February 2013, we issued US$300,000,000 of our 4.50% Senior Notes due 2023, in our inaugural international bond offering. A portion of the proceeds from this offering were used to prepay amounts outstanding on our secured loan agreement with BBVA Banco Continental, and the remaining proceeds will be used to fund a portion of the capital expenditures related to the construction and operation of the new Piura plant and our cement business. |
| ● | In 2014, we entered into cross currency swap agreements for US$120 million to manage foreign exchange risks to hedge against our U.S. dollar-denominated debt. |
| ● | In 2015, we entered into cross currency swap agreements for US$180 million to manage foreign exchange risks to hedge against our U.S. dollar-denominated debt. The principal amount of all currency swaps is US$300 million, covering all of our U.S. dollar-denominated debt. |
| ● | In September 2015, we began producing cement at our new plant in Piura. This was a very important milestone for us, since we have been investing in this project since 2012 and can begin to reap the benefits of this investment. |
| ● | In January 2016, we began producing clinker at our new cement plant in Piura, finishing the start-up of the plant, adding one million metric tons of clinker’s annual production capacity. |
| ● | In March 2017, the Company consummated the spin-off of Fostatos del Pacífico. |
| ● | In December 2017, our board of directors resolved to focus our strategy on our core business of developing cement and related construction products and constructive solutions. In furtherance of this strategy, we have focused on disposing our non-core investments. In the fourth quarter of 2017, we discontinued our brine project. |
| ● | In March 2018, the Company launched its new image and updated our vision: a leading Company in construction solutions that anticipate the needs of our clients and that contributes to the progress of our country. |
Capital Expenditures
We expect to spend over the next five years approximately US$20 million per year on recurring capital expenditures necessary to maintain our plants and equipment.
In February 2013, we issued US$300 million of our 4.50% Senior Notes due 2023. The international rating given by Fitch and S&P to these notes was BBB- and BB+, respectively. The notes were issued pursuant to Rule 144A under the Securities Act and in compliance with Regulation S under the Securities Act, and listed on the Irish Stock Exchange. The funds for this placement were allocated to prepay our outstanding long-term debt with BBVA Banco Continental, which amounted to S/202.2 million, and the remaining balance was set aside to cover a portion of the construction costs for the new Piura plant and our cement business.
The table below sets forth our total capital expenditures incurred in 2017, 2016 and 2015.
| | | | | | | | | | |
| | | Year ended December 31, | |
(in millions of S/) | | 2017 | | | 2016 | | | 2015 | |
| | | | | | | | | | |
| Concrete and block business | | | 35.0 | | | | 10.4 | | | | 9.6 | |
| New cement plant in Piura | | | 17.3 | | | | 61.3 | | | | 415.7 | |
| Expansion of Pacasmayo cement plant | | | 15.5 | | | | 29.9 | | | | 11.2 | |
| Expansion of Rioja cement plant | | | 2.2 | | | | 2.7 | | | | 6.2 | |
| Phosphate project | | | — | | | | 15.6 | | | | 37.4 | |
| Construction of diatomite brick plant | | | — | | | | 0.4 | | | | 10.5 | |
| Other investing activities | | | — | | | | — | | | | 0.2 | |
| Total | | | 70.0 | | | | 120.3 | | | | 490.8 | |
| | | | | | | | | | | | | |
Overview
We are a leading Peruvian cement company, and the only cement manufacturer in the northern region of Peru. With more than 60 years of operating history, we produce, distribute and sell cement and cement-related materials, such as concrete blocks and ready-mix concrete. Our products are primarily used in construction, which has been one of the fastest growing segments of the Peruvian economy in recent years. We also produce and sell quicklime for use in mining operations.
In 2017, our cement shipments were approximately 2.3 million metric tons, representing an estimated 21.2% share of Peru’s total cement shipments, and substantially all the cement consumed in the northern region of Peru. Cement volumes in 2017 did not increase compared to 2016 resulting from primarily due to a slowdown in public and private investment during the year as well as a decrease in investor confidence resulting from corruption scandals that implicated construction companies in recent months, resulting in reduced construction activity. We believe the construction sector has significant potential to grow with the expected continued expansion of the economy, the continued deficit in infrastructure and the persistent housing deficit in the country, as well as the reconstruction of northern Peru following the impact of El Niño weather conditions in the first four months of 2017.
We own three cement production facilities, our flagship Pacasmayo facility located in the northwest region of Peru, our new cement plant in Piura and our smaller Rioja facility located in the northeast. Our facilities have total installed annual cement production capacity of approximately 4.9 million metric tons. We also have installed annual production capacity of 240,000 metric tons of quicklime. We own concession rights to several quarries with reserves of limestone and other raw materials located near our facilities. We estimate that our existing quarries have sufficient reserves to supply our limestone and seashells needs for approximately 105 years, based on our 2017 limestone consumption levels.
We completed an expansion of our Rioja plant in April 2013. We more than doubled the cement production capacity of our Rioja facility by installing a new production line with 240,000 metric tons of installed annual cement production capacity. We finished construction of our cement plant in Piura in 2015. This facility has annual production capacity of 1.6 million metric tons of cement. In September 2015, we began cement production, and clinker production began in January 2016.
We provide consumers with high-quality and value-added cement products and, as a result, we believe we have developed strong brand recognition and customer loyalty in our market. We have developed one of the largest independent retail distribution networks for construction materials in Peru. Through our network of 247 independent retailers and 394 hardware stores as of December 31, 2017, we distribute our cement products as well as other construction materials manufactured by third parties, such as steel rebar, cables and pipes, in the northern region of Peru. We also sell our cement products directly to other retailers that are not part of our distribution network and to private construction companies and government entities.
The following table sets forth certain macroeconomic data for Peru and operating and financial data for our company for the periods indicated.
| | | | | | | | | | |
| | | As of and for the year ended December 31, | |
| | | 2017 | | | 2016 | | | 2015 | |
| Economic data(1): | | | | | | | | | | | | |
| GDP growth in Peru | | | 2.7% | | | | 3.9% | | | | 3.3% | |
| Construction sector growth in Peru | | | 2.2% | | | | (3.1)% | | | | (5.9)% | |
| | | | | | | | | | | | | |
| Operating data: | | | | | | | | | | | | |
| Capacity (thousands metric tons per year): | | | | | | | | | | | | |
| Installed cement capacity | | | 4,940 | | | | 4,940 | | | | 4,940 | |
| Installed clinker capacity | | | 2,780 | | | | 2,780 | | | | 1,780 | |
| Production (thousands metric tons): | | | | | | | | | | | | |
| Cement production | | | 2,286 | | | | 2,276 | | | | 2,333 | |
| Clinker production | | | 1,642 | | | | 1,731 | | | | 1,202 | |
| Utilization rate at Pacasmayo plant(2): | | | | | | | | | | | | |
| Cement | | | 39.4% | | | | 40.6% | | | | 65.0% | |
| Clinker | | | 45.8% | | | | 59.1% | | | | 64.5% | |
| Utilization rate at Rioja plant(2): | | | | | | | | | | | | |
| Cement | | | 65.2% | | | | 63.9% | | | | 65.5% | |
| Clinker | | | 74.6% | | | | 76.7% | | | | 83.9% | |
| | | | | | | | | | | | | |
| Utilization rate at Piura plant(2): | | | | | | | | | | | | |
| Cement | | | 53.6% | | | | 51.1% | | | | 31.1% | |
| Clinker | | | 74.6% | | | | 62.9% | | | | — | |
| | | | | | | | | | | | | |
Gross profit (S/ million)
| | | 492.7 | | | | 503.6 | | | | 535.3 | |
| Gross profit margin | | | 40.2% | | | | 40.6% | | | | 43.5% | |
| Adjusted EBITDA(3) (S/ million) | | | 371.5 | | | | 371.0 | | | | 389.7 | |
| Adjusted EBITDA margin | | | 30.3% | | | | 29.9% | | | | 31.7% | |
| Profit (S/ million) | | | 80.6 | | | | 112.9 | | | | 211.7 | |
| Profit margin | | | 6.6% | | | | 9.1% | | | | 17.2% | |
| (1) | Source: Central Bank of Peru. In 2014, the methodology for GDP calculations was changed, changing base year and the contribution of certain sectors to GDP. |
| (2) | Utilization rate is calculated by dividing production for the specified period by installed capacity. |
| (3) | For a calculation of Adjusted EBITDA and a reconciliation of Adjusted EBITDA to the most directly comparable IFRS financial measure, see “Item 3. Key Information—A. Selected Financial Data.” |
Peruvian Cement Market
Peru has experienced sustained economic growth over the past decade. From 2013 to 2017, GDP grew at a CAGR of 3.1%. Growth during the 2013 to 2017 period was accompanied by low inflation, which averaged 3.0% per year. In addition, at December 31, 2017, the government had accumulated foreign exchange reserves of approximately US$63.6 billion, and the sovereign debt achieved an investment grade rating from each of the three major international credit rating agencies. This economic growth has resulted, among other key trends, in significant poverty reduction, with a decrease in the percentage of the country’s population living below the poverty line from approximately 48.6% in 2004 to approximately 20.6% in 2017. According to the Central Bank of Peru, the Peruvian GDP grew at a rate of 2.5% in 2017 and is projected to grow at a rate of 4% in 2018.
We sell substantially all our cement in the northern region of Peru, which in 2017 accounted for approximately 22.8% of the country’s population and 13.9% of national GDP. Two other groups sold substantially all the cement consumed in each of the central and southern regions of Peru, with less than 5% of all the cement consumed in the country coming from imports, and approximately 4% coming from a small domestic producer. From 2013 to 2017, total cement consumption in Peru remained relatively flat according to the INEI. Peru continues to have a significant housing deficit, estimated by the INEI at 1.9 million homes nationwide. In Peru, cement is mainly sold to a highly fragmented consumer base, consisting primarily of households that buy cement in bags to gradually build or improve their own homes without professional technical assistance, a segment known in our industry asauto-construcción. We estimate that in 2017 sales to theauto-construcción segment accounted for approximately 62.2% of our total sales of cement, private construction projects accounted for 23.9%, and public construction projects accounted for the remaining 13.9%. Approximately 92.3% of our total cement sales in 2017 were in the form of bagged cement, substantially all of which was sold through retailers.
Even though our ready mix sales are still a small proportion of our sales, we expect this trend to change as infrastructure becomes a bigger driver of demand in the upcoming years.
Brine Project Impairment
Our board of directors resolved to prioritize investments in the development of products related to the manufacture and sale of cement and constructive solutions. Consequently, in furtherance of this strategy, we have pursued the sale or other disposition of investments that are not central to our core cement production business. As a result of this decision, during fourth quarter of 2017 we discontinued the brine project.
Competitive Strengths
Our principal competitive strengths include the following:
Strong corporate governance standards and international recognition
Our common shares are listed on the Lima Stock Exchange and our ADSs are listed on the New York Stock Exchange. We are subject to the disclosure requirements of the U.S. Securities and Exchange Commission (the “SEC”) and the Peruvian Securities Commission and we must comply with and adopt internal compliance standards to increase transparency and improve corporate governance standards including an audit committee and appointment of independent directors. Since 2009, we have been selected as part of the Good Corporate Governance Index of the Lima Stock Exchange, which is currently comprised of only six listed companies. Furthermore, in 2017, we received the Top Social Responsibility Award (Distintivo de Empresa Socialmente Responsable) for the sixth consecutive year, in recognition of our having achieved corporate goals in a socially responsible manner, the principle that is ingrained in our corporate culture and business strategy.
Track record of cash flow generation and strong results through multiple business cycles
We have historically generated strong cash flow and high profit margins mainly due to the following key factors:
| • | our leadership position in the northern region of Peru; and |
| • | our extensive distribution network, operational flexibility and efficiency, and focus on innovation. |
In 2017, we generated cash flow from operating activities of S/250.4 million (US$77.3 million) and adjusted EBITDA of S/371.5 million (US$114.6 million), recorded profit for the year of S/80.6 million (US$24.9 million), and our operating margin and adjusted EBITDA margins were 16.0% and 30.3%, respectively. Adjusted EBITDA for 2017 increased by 0.1% (S/0.5 million) compared to 2016, due to operational efficiencies from the Piura plant and the elimination of imported clinker, despite a decrease in sales and higher costs during the first four months of the year resulting from the effects of road and other damage caused by the El Niño.
Leader in attractive and expanding market with solid macroeconomic fundamentals
We are currently the only cement manufacturer in the northern region of Peru and we produce and sell substantially all of the cement consumed in the region. In 2017, the northern region accounted for approximately 22.8% of the country’s population and 13.9% of its GDP. From 2013 to 2017, GDP in the northern region grew at a CAGR of 0.8%. During the same period, our cement sales volume contracted at a CAGR of 0.9%, mainly as a consequence of decreased public spending resulting from government corruption scandals and political uncertain associated with the administration of President Kuczynski. However, the northern region continues to experience significant housing and infrastructure deficits which we expect will drive demand for cement in coming years, especially considering the reconstruction investment that will be required to restore infrastructure damaged or destroyed by El Niño.
Best-in-class operating efficiencies with vertical integration and strong brand recognition
Our quarries are located in close proximity to our plants, enabling us to minimize transportation costs. We strive to enhance our operational efficiency by focusing on lowering costs and improving profitability. We also benefit from our vertically integrated operations, participating in the entire chain of production from the quarries which we own directly, to the related products such as quicklime, ready–mix, precast and our large distribution network. We have developed one of the largest independent retail distribution networks for construction materials in Peru, known as “DINO,” consisting of 247 independent retailers and 394 hardware stores as of December 31, 2017, primarily small, local stores in the northern region, through which we distribute our cement products as well as construction materials manufactured by third parties. We use our distribution network, together with our strategically located commercial offices, to promote our products and stay abreast of market developments. We have developed this network through years of fostering relationships with retailers in the region, which we believe would be difficult for a competitor to replicate. Our distribution network has enabled us to build strong recognition for our Pacasmayo brand among retailers and end-consumers in our market, which we believe is important to our business, particularly because our cement is principally sold in bags to retail consumers.
Disciplined capital expenditure plan with attractive risk / return profile
We seek to minimize risk while securing an adequate return on our development projects. In 2015, we completed construction of our new cement plant in Piura, the third largest city in northern Peru, which has an annual production capacity of 1.6 million metric tons of cement. The first ton of cement from the Piura facility was produced and shipped on September 17, 2015. The Piura plant improves our competitive position in the northern region of Peru. With production from three plants, we are able to serve our market more efficiently. This state-of-the-art plant is one of the most modern in Latin America. It also reduces transportation costs by enabling the dispatching of cement from plants within closer proximity to the point of sale.
Emphasis on innovation
We place significant emphasis on research and development to ensure our products meet the needs of consumers in our market and to improve the efficiency of our operations. For example, we have developed cement products suitable to coastal construction that tend to be more exposed to erosion from sulfate. We believe that, by educating retailers and end consumers of these attributes of our products, we have been successful in building demand and realizing higher margins for our differentiated product offering.
In July 2016, we created the Innovation Department with the main objective of systematizing the continuous transformation process of the business in order to ensure a sustainable growth for the company and the improvement of its margins. To achieve this objective it is necessary to:
| • | Put the customer at the center of all our processes. |
| • | Design an innovation management model. |
| • | Promote an organizational culture that encourages entrepreneurship and innovation. |
Given that customers, consumption patterns can change quickly and unexpectedly we must quickly adapt in order to retain our customers.
In 2017, we executed eight pilot projects in which we resolved different strategic challenges, from customer loyalty to internal processes and the work method designed for the company was proven. These projects were presented on the first innovation Fair which took place on the Lima offices. We were invited to participate in the Regional Entrepreneurship Accelerating Program of MIT, an initiative led by the Ministry of Production Innovation Management which seeks to promote an innovation ecosystem in Peru.
Strong relationship with local communities
Since we began operations 60 years ago, we have been committed to improving the quality of life of the communities surrounding our plants, whose members we regularly employ. We have developed close and cooperative relationships with the local communities, which are supported by several social responsibility initiatives we have undertaken. For example, the family of our controlling shareholder founded, and we and Hochschild Mining plc continue to fund, Asociación Tecsup, a leading non-profit institute in Peru that provides technical education to high-school students. We provide scholarships and financial aid to local qualified students interested in studying at Tecsup. Through its three campuses in Peru, as of December 31, 2017, Tecsup had graduated over 9,639 students in various technical fields, some of whom currently work for us and our affiliates.
Highly experienced and professional management and board of directors
Our management team, with an average of 15 years of experience in the cement industry in Peru, has extensive technical and local market expertise and has led our company through our recent growth. We have developed a strong professional business culture and a team of highly qualified executives. We also have a well-regarded and experienced board of directors that includes some of Peru’s business leaders and former senior government officials. For the ninth consecutive year, we have been selected to form part of the Best Corporate Governance Practices Index of the Lima Stock Exchange, which is currently comprised of six listed companies.
Our Strategies
Our objective is to maximize shareholder value, while honoring our commitment to the environment and abiding by our social responsibility goals. We intend to achieve our objective through the following principal strategies:
Continue to focus on our core business of supplying the rising demand for cement
We plan to continue to meet the increasing demand for cement in our market, while controlling production costs. We intend to increase our production capacity through the expansion of our installed cement and clinker capacity. In line with this strategy, we are on target to complete the planned expansion of our new cement plant in Piura. Our principal goal is to maintain our market share in the northern region of Peru without reducing the profitability of our business.
Maintain operational efficiencies to control production costs
We intend to sustain operational efficiencies in an effort to control costs and maintain our operating margins. One of our principal initiatives to maintain costs is to secure our own source of coal. In 2011, we exercised certain of our options to purchase coal mining concessions in the north region of Peru, and we have also replaced a high proportion of imported bituminous coal consumption, which generally is more expensive, with anthracite coal produced locally.
Deepen our commercial relationship with retailers and end-consumers
We plan to enhance our commercial relationships with retailers and end-consumers in our market, both to maintain brand loyalty and to foster demand for our cement products. We will continue to support retailers in our DINO distribution network by providing product education, training sessions, rewards programs, and assistance in financing purchases of our products. In addition, we continue with our door-to-door commercial strategy for cement sales. We believe that these initiatives have been successful in strengthening our relationship with retailers and end-consumers.
Continue to focus on being the preferred provider of building solutions
We strive to be the supplier of choice for cement consumers in the northern region of Peru, whether its individuals building their homes or private construction companies or governmental entities undertaking projects of any size. We continue to focus on providing consumers with efficient and customized building solutions for their construction needs. Over the past several years, we have evolved from being a single type cement manufacturer to offering five different types of cement products, under 2 brands, and other building solutions, such as assembly gravity walls, sheet piles, precast beams, among others . Moreover, in 2018 we have launched a new image and future vision, transforming ourselves from a cement producer to a building solutions company. We are the leading cement manufacturer in innovation and care for the environment and are constantly searching for ways to improve building practices, inspired by our culture based on sustainability. For example, we offer cement that contains special properties that protect against sulfate erosion, as well as other products designed to meet the needs of consumers in the northern region of Peru. In order to provide a portfolio of specialized solutions for our clients, with 60 years of experience and research, we have developedPacasmayo Profesional: a business unit focused on the development and commercialization of constructive solutions. Our mission is to provide a comprehensive solution for all project types and thus respond to the unique needs of each client, generating savings and efficiencies in the construction processes.
Selectively pursue acquisitions
We will continue to evaluate and may selectively pursue strategic acquisitions of cement and complementary businesses that expand our geographic footprint and diversify our portfolio of products. Our management team has significant operating experience and industry knowledge in the production and commercialization of cement and cement-related materials, and we believe this experience will enable us to identify and pursue attractive acquisitions that will maximize shareholder value.
Continue to Strengthen our Enterprise Risk Management
We continue to strengthen our enterprise risk management methods and processes that allow us to identify, assess and monitor the legal, commercial, operational, financial and reputational risks, as well as fraud, corruption, bribery and money laundering and financing of terrorism risks, determining the existing controls and establishing a plan along with other areas in order to mitigate existing risks.
Maintain high Environmental, Social and Governance Standards
We are committed to maintaining high environment, social and corporate governance standards. We are focused on developing and strengthening a favorable social environment for the continuity and growth of our operations, prioritizing our social investment in innovative education, health and local development programs in coordination with other stakeholders to contribute to sustainable development. Since 2009, we have been selected as part of the Good Corporate Governance Index of the Lima Stock Exchange which is currently comprised of only six listed companies. Furthermore, in 2017, we received the Top Social Responsibility Award (Distintivo de Empresa Socialmente Responsible) for the sixth consecutive year, in recognition of our having achieved corporate goals in a socially responsible manner, the principle that is ingrained in our corporate culture and business strategy.
Our Products
Our core products are cement and other cement-related materials. We also produce quicklime. In 2017, cement, concrete and blocks accounted for 87.9% of our net sales and quicklime accounted for 6.6%. We also sell and distribute construction materials, such as steel rebar, cables and pipes, manufactured by large third-party manufacturing companies, which in 2017 represented 5.4% of our net sales.
The following table sets forth a breakdown of our shipments by type of product for the periods indicated:
| | | | | | | | | | |
| | | Year ended December 31, | |
(in thousands of metric tons) | | 2017 | | | 2016 | | | 2015 | |
| Cement, concrete and blocks | | | 2,268 | | | | 2,286 | | | | 2,310 | |
| Quicklime | | | 163 | | | | 152 | | | | 104 | |
The following table sets forth a breakdown of our total net sales by product for the periods indicated:
| | | | | | | | | | |
| | | Year ended December 31, | |
(in millions of S/) | | 2017 | | | 2016 | | | 2015 | |
| Cement, concrete and blocks | | | 1,076.7 | | | | 1,103.4 | | | | 1,089.2 | |
| Quicklime | | | 80.7 | | | | 75.1 | | | | 64.1 | |
| Construction supplies(1) | | | 66.4 | | | | 59.9 | | | | 75.6 | |
| Others | | | 1.8 | | | | 1.8 | | | | 2.1 | |
| Total | | | 1,225.6 | | | | 1,240.2 | | | | 1,231.0 | |
| (1) | Refers to construction materials manufactured by third parties that we distribute. Construction supplies include the following products: steel rebar, wires, nails, corrugated iron, electric conductors, plastic tubes and accessories, among others. |
Cement
Cement is a powdered mixture of ground minerals that, when mixed with water, adheres to other materials and hardens to form a rock-like substance. Cement is generally mixed with other materials, such as gravel and sand, forming concrete with a high degree of compressive strength that is able to withstand substantial pressure.
Cement types are generally classified as either Portland cement or blended hydraulic cement. Portland cement is a hydraulic cement produced by pulverizing clinker, consisting essentially of crystalline hydraulic calcium silicates and calcium sulfate. Blended hydraulic cement consists of a mixture of Portland cement clinker and mineral admixtures, such as blast furnace slag, pozzolanic materials and limestone.
We produce both types of cement in a range of cement products suitable for various uses, such as residential and commercial construction and civil engineering. We currently offer the following five types of cement products designed for specific uses:
| • | Type ICo. This type of cement is used for general purposes and is similar to Portland Type I cement. It is widely used in our market due to its effectiveness and low hydration heat. |
| • | Type MS/MH/R (called Fortimax3). This is the new formula for the type of cement that is used to protect against moderate sulfate action, such as drainage structures, with higher-than-normal, but not unusually severe, sulfate concentrations in ground water. It is designed for sites and structures in humid areas that are exposed to sulfates and sea water. It also prevents thermal contraction cracking due to moderate heat hydration, and is resistant to contact with alkaline reagents. |
| • | Type I.This type of cement is for general purposes and suitable if special properties are not needed. It is generally used for constructing pavements, floors, reinforced concrete buildings, bridges, reservoirs, pipes, masonry units and precast concrete products. |
| • | Type V. Type V cement is used in concrete exposed to severe sulfate action, principally in places where soil or ground water has high sulfate content. It is generally used in hydraulic construction, such as irrigation canals, tunnels, water conduits and drains. |
| • | Type HS. Type HS cement is used in concrete that is exposed to severe sulfate action, principally where soil or ground water has high sulfate content. It is recommended for port construction, industrial plants and construction of sewage sites. Our Portland Type HS cement has low reactivity with alkali-reactive aggregates, making it more durable than other types of cement. |
We believe that our Type V, Fortimax and HS cement products are particularly suitable for construction in the northern coastal region of Peru, where sulfate and chloride concentrations from soil, ground water and sea water affect the durability of construction structures. By educating retailers about the different cement characteristics and conducting marketing campaigns, we believe we have been successful in building demand for our cement products. Our research and development department is also equipped to produce custom-tailored cement products on demand. In addition, through our dedicated team of geologists and scientists, we have significantly reduced the amount of clinker required for cement production minimizing our capital expenditures and significantly reducing our carbon dioxide emissions (CO2).
We market and distribute our cement primarily in 42.5 kilogram bags. Most of our bagged cement is sold to the retail sector consisting primarily of households that buy bags of cement to build or expand their own homes over time with little or no formal technical assistance (commonly referred to asauto-construcción). The bags are made of Kraft paper to preserve the quality of the cement. Our bags include information relating to the composition of our cement, handling instructions, production dates and storage instructions. Our cement bags have different colors to easily identify the different types of cement. Once bagged at our Pacasmayo, Rioja and Piura facilities, our cement is loaded onto trucks operated by third parties. Cement in bulk is sold to large industrial consumers.
Concrete Products
We also produce and sell concrete products principally in the form of ready-mix concrete used in large construction sites, as well as blocks, bricks and pavers.
| • | Ready-mix concrete. Ready-mix is a blend of cement, aggregates (sand and stone), admixtures and water. It is manufactured and delivered to construction sites in a form that is ready to use. This mixture hardens to form a building material, ranging from sidewalks to skyscrapers. We have 19 fixed and mobile ready-mix plants. |
| • | Concrete blocks. We produce and sell concrete blocks, such as paving units, or paver stones for pedestrian walkways, as well as other bricks for partition walls and concrete blocks for structural and non-structural uses. |
| • | New cement based products. We have developed, and are in the process of developing more cement-based products that are innovative and easy building solutions. These products include assembly gravity walls using large concrete blocks, beams and vaults, precast beams, sheet piles, seawalls, piles, as well as more complex products such as basic bathroom and housing units. |
Quicklime
We produce and distribute quicklime, which has several industrial uses. Quicklime serves as a neutralizer, lubricant, drying and absorbing material, disinfectant, and as a raw material. Quicklime has various applications, including in the steel, food, fishing and chemical industries. It is also used in mining operations to treat water and industrial residues, in agriculture as a fertilizer enhancer and, to a lesser extent, in other industries. In Peru, quicklime is mainly used in the mining industry, as an additive to treat water residues. We produce quicklime in finely and coarsely ground varieties and sell it either in bags of one metric ton or in bulk, according to clients’ requirement.
Production Process
Cement Production Process
The diagram below depicts the standard cement production process, which consists of the following main stages:
| • | extraction and transportation of limestone or seashells from the quarry; |
| • | grinding and homogenization to make the raw material of consistent quality; |
| • | packaging, loading and distribution. |
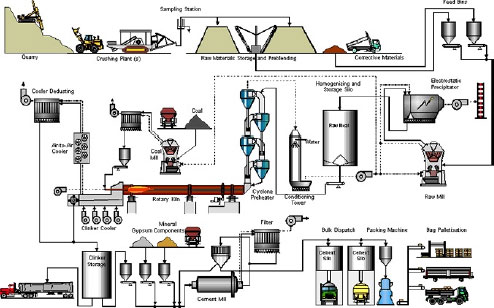
Extraction of raw materials. To produce cement, limestone/seashells are extracted from our quarries. We use explosives to loosen the limestone and deploy bulldozers to remove dirt and the overburden covering the limestone. We crush the limestone in our primary and secondary cone crusher and the resulting limestone is loaded into trucks and hauled to our Pacasmayo or Rioja facilities from the adjacent quarry where it is stored. In the case of Piura, our surface miner drills out our seashell quarry and then it is also loaded into trucks and hauled to the Piura facilities.
Grinding and homogenization. Limestone, clay and sand are mixed with iron that is acquired from third parties. The quality of the resulting raw meal is monitored by examining samples of each batch and processing them through our quality control x-ray software that automatically measures the mix of materials to confirm the blend is in compliance with our quality standards. Subsequently, the raw meal is sent to a blending silo and then to a storage silo from where it is fed into the pre-heater.
Clinkerization.The raw meal is heated at a temperature of approximately 1,450 degrees Celsius in our kilns. The intense heat causes the limestone and other materials in the mixture to react inside the kiln, turning the mixture into clinker. Clinker is then cooled to a temperature of approximately 200 degrees Celsius and stored in a silo or in an outdoor yard.
Cement grinding. After being cooled, clinker, together with gypsum and some admixtures, is fed into a ball mill or into a vertical roller mill where it is ground into a fine powder to produce cement. In this form, cement reacts as a binding agent that, when mixed with water, sand, stone and other aggregates, is transformed into concrete or mortar.
Storage in silos. After passing through the ball mills, the cement is transferred on conveyor belts and stored in concrete silos in order to preserve its quality until distribution.
Packaging, loading and transport. Cement is transferred through another conveyor belt from the silo to be packaged in 42.5 kilogram bags and then loaded into trucks operated by third parties to be transported for distribution. Bulk cement may be transported (unpackaged) on especially designed trucks that deliver large amounts of cement directly to the work site.
Quicklime Production Process
Quicklime is produced by crushing limestone with a calcium carbonate content of at least 95% by calcinating it in a rotary kiln. The limestone for quicklime comes from our quarries. The crushing of the limestone is done at the quarry and the calcination process takes place only at our Pacasmayo facility. We produce quicklime in finely and coarsely ground varieties and sell both varieties in bags of 40 kilograms and up to one metric ton, as well as in bulk.
Raw Materials and Energy Sources
Limestone and Other Calcareous Resources
We obtain limestone required to produce clinker and quicklime principally from land where we have concession rights. For our Pacasmayo plant, we extract limestone from our Acumulación Tembladera quarry located approximately 60 kilometers from the plant, and for our Rioja plant, we extract limestone from our Calizas Tioyacu quarry which is adjacent to our Rioja plant. For our Piura plant, we extract seashells from our Bayovar 4 and Virrilá quarries, located approximately 140 and 120 kilometers, respectively, from the plant.
Acumulación Tembladera. We have a concession with an indefinite term to extract limestone and other minerals from our Acumulación Tembladera quarry, a 3,390 hectare open-pit mine located in the district of Yonan, in the department of Cajamarca. We acquired this concession in November 2002.
Calizas Tioyacu. For our Rioja production, we have a concession with an indefinite term to extract limestone and other minerals from a 400 hectare open-pit mine near our Rioja facility in the district of Elias Soplin Vargas, in the department of San Martín. We acquired this concession in February 1998.
Bayovar 4. For our Piura production, we have a concession with an indefinite term to extract seashells and other minerals from our Bayovar 4 quarry, a 22,326 hectare open-pit mine located in the district of Sechura, in the department of Piura. We acquired this concession in 2008
Virrilá. For our Piura production, we also have a group of concessions with an indefinite term to extract seashells and other minerals from our Virrilá quarry, a 931 hectare open-pit mine located in the district of Sechura, in the department of Piura. We acquired these concessions between 2000 and 2008.
In each of our limestone and seashell concessions, the term of the concession is indefinite, provided we pay an annual concession fee and a penalty fee if we fail to meet required minimum annual production levels. Failure to pay such fees in a timely manner for two consecutive years will cause us to forfeit our concession titles. As of the date of this annual report, we have fully paid all applicable fees on our operating concessions.
We extracted from our Acumulación Tembladera quarry approximately 1.0 million metric tons in 2015, 0.7 million metric tons in 2016, and 1.9 million metric tons in 2017 which were used for cement and quicklime production at our Pacasmayo facility. We extracted from our Calizas Tioyacu quarry approximately 481,858 metric tons in 2015, 293,990 metric tons in 2016, and 331,497 metric tons in 2017, which were used for cement production at our Rioja facility. We extracted from our Bayovar 4 quarry approximately 44,702 metric tons of limestone in 2016, and 40,183 metric tons in 2017, which were used for cement production at our Piura facility. We extracted from our Virrilá quarry approximately 1.2 million metric tons of limestone in 2016 and 866,023 metric tons in 2017, which were used for cement production at our Piura facility.
We estimate that as of December 31, 2017, our Acumulación Tembladera quarry contains approximately 110 million metric tons of proven and probable limestone reserves with an average grade of 85.7% of calcium carbonate; our Calizas Tioyacu quarry contains approximately 8.2 million metric tons of proven limestone reserves with an average grade of 90.3% of calcium carbonate; our Bayovar 4 quarry contains approximately 20.0 million metric tons of proven seashells reserves with an average grade of 87.2 % of calcium carbonate; and our Virrilá quarry contains approximately 118.7 million metric tons of proven seashells reserves with an average grade of 90.1% of calcium carbonate. Based on limestone consumption at 2017 levels, we estimate that our limestone reserves at our Acumulación Tembladera quarry have a remaining life of approximately 108 years and our limestone reserves at our Calizas Tioyacu quarry have a remaining life of approximately 25 years.Based seashells consumption for 2017, we estimate that our seashells reserves at our Bayovar 4 and Virrilá quarries have a remaining life of approximately 108 years. Our estimates were prepared by our internal engineers and geologist and are reviewed periodically.
In addition to our Acumulación Tembladera, Calizas Tioyacu, Bayovar 4 and Virrilá quarries, we also own concession rights to various other calcareous material quarries consisting, in total, of approximately 40,997 hectares located in the northern region of Peru. None of these quarries are in operation as of the date of this annual report.
Clay, Sand and Other Raw Materials and Admixtures
The other raw materials that we use to produce clinker are clay, sand, iron and diatomite.
Clay
For cement production in our Pacasmayo facility, we extract clay from our Señor de los Milagros de Pacasmayo quarry, a 400 hectare open-pit concession located in the district and province of Pacasmayo, department of La Libertad. We were granted this concession by the MEM in 1996. The term of the concession is indefinite, provided we pay an annual concession fee and meet minimum annual production requirements. We extracted from our Señor de los Milagros de Pacasmayo quarry approximately 53,855 metric tons of clay in 2015, 41,772 metric tons in 2016, and 49,618 metric tons in 2017.
For cement production in our Rioja facility, we extract clay from our Pajonal 2 quarry, a 400 hectares open-pit concession located in the district and province of Rioja, department of San Martin. This concession was granted to us by the MEM in 1998. The term of the concession is indefinite, provided we pay an annual concession fee and meet minimum annual production requirements. We extracted from our Pajonal 2 quarry approximately 53,632 metric tons of clay in 2015, 41,592 metric tons in 2016, and 48,215 metric tons in 2017.
We have not calculated our clay reserves, as we believe there is an abundant supply of clay in our concessions and more broadly in the northern region where we operate.
Sand
For cement production in our Pacasmayo facility, we use sand extracted from our Señor de los Milagros de Pacasmayo quarry. We extract approximately 120,000 metric tons of sand per year on average for use at our Pacasmayo facility. Our Rioja facility does not utilize sand as a raw material given the type of cement it produces.
We have not calculated our sand reserves, as we believe there is an abundant supply of sand in our concessions and more broadly in the northern region where we operate.
Iron
We use small quantities of iron in our cement production, which we purchase from third parties at market prices.
Pozzolanic Materials and Other Admixtures
Our cement production also requires small amounts of other admixtures, such as pozzolanic materials, gypsum and blast furnace slag.
For cement production in our Pacasmayo facility, we use pozzolanic materials obtained from our Cunyac quarry, a 200 hectare open-pit concession located in the district of Sexi, province of Santa Cruz, department of Cajamarca. The concession was granted to us by the MEM in 2008. The term of the concession is indefinite, provided we pay an annual concession fee and meet minimum annual production requirements. We began using pozzolanic material at our Pacasmayo facility in 2010 and in 2014 we extracted 127,746 metric tons and used 80,073 metric tons. In 2015, we used 59,694 metric tons from our stock, in 2016 we extracted 65,691 metric tons and in 2017 we extracted 22,287 metric tons.
For cement production in our Rioja facility, we use pozzolanic materials obtained from our Fila Larga quarry, a 1,000 hectare open-pit concession located in the district of El Milagro, province of Utcubamba, department of Amazonas. The concession was granted to us by the MEM in 1998. We did not use pozzolanic materials to produce cement in 2015, 2016 or 2017.
We also own several other concessions containing pozzolanic material which have not been exploited. In addition, our use of pozzolanic materials may be substituted with clinker or other admixtures. Other admixtures, such as gypsum and blast furnace slag, are purchased at market prices from third-party suppliers. If we are unable to acquire raw materials or admixtures from current suppliers, we believe that other sources of raw materials and admixtures would be available without significant interruption to our business.
Energy Sources
Our main energy sources are fuel in the form of coal and electricity. Our production processes consume significant amounts of energy, because our kilns must reach extreme temperatures to produce clinker and quicklime. In addition, milling operations, homogenization and transportation of materials consume significant amounts of energy.
Coal
We purchase mostly anthracite coal from local suppliers and import small amounts of bituminous coal from suppliers mainly in Colombia and Venezuela, in each case at spot market prices. Anthracite coal tends to be less expensive than bituminous coal. We store coal at our premises and in our warehouse facility adjacent to the Salaverry port, located approximately 130 kilometers south of our Pacasmayo facility, where we have sufficient stock of coal to maintain our production levels for the next eight months.
In December 2009 and February 2010, we entered into option agreements to acquire coal mining concessions as a means to secure a steady and reliable source for our coal requirements and to reduce the volatility in costs related to coal. In 2011, we exercised certain options under these agreements to acquire coal mining concessions for 908.5 hectares near our Pacasmayo facility for a total purchase price of US$4.5 million. In 2013, we exercised our remaining options to purchase an additional coal mining concession for 501.2 hectares for US$1.0 million, thereby completing the acquisition of the related coal mining concessions.
Electricity
As of December 31, 2017, all of the electricity requirements for our Pacasmayo and Piura facilities were supplied by Electroperú and for our Rioja facility by ELOR.
We have a long-term electricity supply contract with Electroperú currently valid until 2025. Electroperú has agreed to provide us with sufficient energy to operate our Pacasmayo and Piura facilities at pre-determined maximum amounts during the term of the contract. Payments for electricity are based on a formula that takes into consideration our energy consumption and certain market variables, such as the U.S. purchase price index, the global price of oil, the local price of natural gas and the import price of bituminous coal.
In addition, we have a medium-term electricity supply contract with ELOR to supply the Rioja facility, which was recently extended until November 2022. ELOR supplies the Rioja facility with six megawatts of electricity at peak hours and eight megawatts at non-peak hours. Payments for electricity are based on a formula that takes into consideration our energy consumption and certain market variables, such as the U.S. dollar price, the local price of natural gas, the global price of oil and the import price of bituminous coal.
Other Production Materials
We use other materials in the cement production process, including paper bags to package cement, which we purchase principally from local suppliers; plastic bags used to package quicklime, which we purchase from local suppliers; and water to cool the kiln exhaust gases and for our crushing operations at our Acumulación Tembladera quarry, which we obtain principally from a well located at our Pacasmayo facility and from the Jequetepeque river. Water used in our production process is maintained in a closed system at our plants and re-processed for utilization in our production process.
Consumer Base
The retail cement sector in Peru is characterized by households that purchase single bags of cement to gradually build or improve their homes with little or no professional assistance. This sector is known asauto-construcción. Families in this sector tend to invest a large portion of their savings in building or improving their own homes.Auto-construcción is often conducted with the help of a builder (maestro de obra) who generally has experience in construction. Our retail marketing plans typically target themaestro de obra who is usually the decision maker when buying cement and other related construction materials.
We also sell directly to small, medium and large private construction companies working on a variety of construction projects, from housing complexes to commercial developments. In the public sector, we provide cement for national, regional and local governments carrying out construction projects including housing complexes and public construction, ranging from local schools and hospitals to large infrastructure projects.
Sales and Distribution
Distribution
Our market extends from the Ecuadorian border in the north of Peru to the city of Barranca in the south (approximately 180 kilometers north of Lima), to the Andes mountains in the east and the Pacific Ocean in the west. Our market covers the provinces of Amazonas, Cajamarca, La Libertad, Lambayeque, Piura and Tumbes in the north; and San Martín and Loreto in the northeast.
Our Pacasmayo, Piura and Rioja facilities supply the entire northern region of Peru, interchangeably subject to where it is most efficient to ship from at the moment, depending on the distance and type of cement being produced, among other factors.
In 2017, approximately 92.3% of our total cement shipments were in the form of bagged cement, substantially all of which was sold through retailers both within and outside of our distribution network. The remaining 7.7% of our cement was sold in bulk or in shipments of concrete blocks or ready-mix concrete directly to large construction companies.
We have developed one of the largest independent retail distribution networks for construction materials in Peru, consisting of more than 394 local hardware stores, with which we have a distribution agreement. In addition, we also distribute to other independent retailers located throughout the northern region of Peru with whom we do not have contractual relationships. We have built our distribution network by investing in strengthening our relationship with retailers.
Even though our ready mix sales are still a small proportion of our sales, we expect this trend to change as infrastructure becomes a bigger driver of demand in the upcoming years. Additionally, we sell and distribute other construction materials manufactured by third parties that are used alongside cement, such as steel rebar, plastic pipes and electrical wires, among others.
Marketing and Brand Awareness
We use our distribution network, together with our strategically located local commercial offices, to promote our products and brands, as well as to keep us informed of market developments. We believe our distribution network has enabled us to build strong recognition for our Pacasmayo brand amongmaestros de obra, retailers and end consumers which we believe is important to our business, particularly because our cement is principally sold in bags to retail consumers.
Our marketing expenses in 2017 were approximately S/19 million, or 1.6% of our sales. Historically, our marketing strategy has been to develop brand loyalty by providing high-quality products, tailored to the needs of our customers, and customer service accompanied by complimentary training for themaestros de obra, who are typically the decision makers in theauto-construcciónsegment.
To maintain and improve our relationship with retailers, we have developed several loyalty and incentive programs designed for our distribution network. For instance, members of our distribution network can redeem points for various prizes, ranging from computers to trucks. We have also partnered with Financiera Efectiva to provide our customers who qualify access to small loans to help finance the purchase of our products.
Quality Control
In Peru, cement production is subject to standardization (normalización) regulations approved by the National Institute for the Protection of Competition and Intellectual Property (Instituto Nacional de Defensa de la Competencia y de la Protección de la Propiedad Intelectual, or “INDECOPI”). Although the standardization regulations are not mandatory, they are useful in achieving an optimum level of management. As of the date of this annual report, there are 81 standardization regulations approved by INDECOPI in connection with the production of cement and its commercialization. We are currently in compliance with all standardization regulations applicable to our products.
We have established a quality assurance program in accordance with ISO Standard 9001-2008, certified by SGS del Perú S.A.C., a company that provides inspection, verification, testing and certification services. We monitor quality at every stage of the cement production process. In our facilities, we periodically test the quality of our raw materials. These tests include chemical, physical and x-ray tests. We perform similar examinations of the clinker we produce. Additionally, we also perform regular quality tests on our finished products.
We have a quality control area with computerized systems to access real-time information on the quality of our products. As part of our quality control process, we monitor the performance of our different cement products, monitor the performance of additives in our cement and review monthly statistical analysis on the resistance of cement, among other things.
Competitive Position
Peru’s cement production is segmented into three main geographic regions: the northern region, the central region, including Lima’s metropolitan area, and the southern region. We are the only cement manufacturer in the northern region of Peru. UNACEM (formerly known as Cementos Lima and Cemento Andino) principally serves the central region and Cementos Yura and Cementos Sur operate in the southern region. In 2017, our cement shipments were approximately 2.3 million metric tons, representing an estimated 21.3% share of total cement shipments in Peru, and substantially all the cement consumed in the northern region of Peru.
Regulatory Matters
Overview
Although our core business is the production of cement, we hold a number of mining concessions granted by the Peruvian government for the supply of limestone and other raw materials required for cement production. As a result, we are subject both to the mining and the general industrial legal framework in Peru. The regulatory framework applicable to our cement production may be divided into rules and regulations relating to (i) the mining and crushing of limestone and clay, and (ii) the production process.
Mining Regulations
The General Mining Law (Texto Único Ordenado de la Ley General de la Minería) approved by Supreme Decree No. 014-92-EM, published in the Peruvian Official Gazette,El Peruano, on June 3, 1992, is the primary law governing both metallic and non-metallic mining activities in Peru and is supplemented by implementing guidelines and policies regarding mining and the processing of minerals enacted by the MEM. Under the General Mining Law, mining activities (except storage, reconnaissance, prospecting and trade) are carried out exclusively through various forms of concessions. Mining concessions are granted by the Geological, Mining and Metallurgical Institute (Instituto Geológico Minero y Metalúrgico, or “INGEMMET”), and all other concessions, including our mineral processing concessions, are granted by the Directorate General for Mining of the MEM. Any act, transfer, termination or agreement related to these concessions must be registered with the Mining Rights Registry, which is part of the National Public Registry System, to be effective against the Peruvian government and third parties.
Holders of concessions or mining claims must comply with several obligations, including the payment of an annual concession fee (derecho de vigencia) of US$3.00 per applicable hectare. The annual concession fee is due and payable on or prior to June 30 of each year. Failure to pay the annual concession fee for two consecutive years will result in the termination of the mining concession.
Mining activities require holders to obtain title to the surface land from individual landowners, peasant communities or the Peruvian government. Mining concessions are granted for an unlimited period, subject to the achievement of minimum annual production levels. Two different regimes apply depending on the date the concession was granted:
For concessions granted before 2008, the following rules apply:
| • | the minimum annual production is equivalent to US$100 per year per hectare, in the case of metallic concessions, and US$50 per year per hectare, in the case of non-metallic mining concessions; |
| • | the minimum production level is to be achieved no later than the end of the sixth year from the date of grant; |
| • | if the minimum production level is not achieved within that period, an annual penalty equivalent to US$6.00 per year per hectare must be paid starting with the first semester of the seventh year and until the minimum production level is achieved; and |
| • | if the minimum annual production has not been achieved by the twelfth year, then the annual penalty increases to US$20 per year per hectare. |
However, under Supreme Decree No. 054-2008-EM, the rules above will apply only until 2019. As of 2019, if the annual minimum production has not been met, the annual penalty and the causes to terminate a mining concession will be determined by the General Mining Law for concessions granted in 2008 or thereafter, as described below.
For concessions granted in 2008 or thereafter, the following rules apply:
| • | the minimum annual production target is equivalent to one tax unit (approximately US$1,280) per year per hectare, in case of metallic mining concessions, and 10% of one tax unit (approximately US$128) per year per hectare, in the case of non-metallic mining concessions; |
| • | the minimum production level is to be achieved no later than the end of the tenth year from the date of grant; |
| • | if the minimum production level is not achieved within that period, an annual penalty equivalent to 10% of the minimum annual production level is due until such level is achieved; and |
| • | if the minimum production level is not achieved by the end of the fifteenth year, the mining concession expires. Exceptionally, the concession can be extended for five additional years, provided that (i) the non-compliance of the minimum production level is caused byforce majeure, or (ii) a minimum annual investment of 10 times the annual penalty is devoted to exploration and the annual penalty is paid. If the minimum annual production is not achieved by the end of this additional five-year term, the mining concession will immediately expire. |
Any penalty must be paid prior to June 30 of each year. Failure to pay the penalty for two consecutive years results in the termination of the mining concession.
In addition to the payment of the annual concession fee and the penalty, holders of mining concessions must, pursuant to the Mining Royalty Law, pay a royalty for the exploitation of metallic and non-metallic resources. Prior to the amendment of the Mining Royalty Law described below, the amount of the royalty was determined on a monthly basis. For those minerals with an international market price (gold, silver, copper, zinc, lead and tin), the amounts were computed by applying the rates to the value of the concentrate or its equivalent, according to the applicable international market price. The historic rate scales were established in the Mining Royalty Law’s regulations as shown in the following table:
| | | | |
Annual sales
(in millions of US$) | | Rate | |
| Up to 60 | | | 1 | % |
| Between 60 and up to 120 | | | 2 | % |
| More than 120 | | | 3 | % |
In case of minerals without an international reference market price (minerals other than gold, silver, copper, zinc, lead and tin), the mining royalty amounted to 1% of the value of the final product obtained from the mineral separation process, net of any costs incurred in the mineral separation process (componente minero).
However, the Mining Royalty Law was amended on September 29, 2011 to increase the tax payable on metallic and non-metallic mineral resources. Effective October 1, 2011, the royalty for the exploitation of metallic and non-metallic resources is payable on a quarterly basis in an amount equal to the greater of (i) an amount determined in accordance with the following statutory scale of tax rates based on a company’s operating profit margin and applied to the company’s operating profit, as adjusted by certain non-deductible expenses, and (ii) 1% of a company’s net sales, in each case, during the applicable quarter. The royalty rate applied to the company’s operating profit is based on its operating profit margin according to the following statutory scale of rates:
| | | | |
Operating margin |
| | | Applicable
rate | |
| 0% - 10% | | | 1.00 | % |
| 10% - 15% | | | 1.75 | % |
| 15% - 20% | | | 2.50 | % |
| 20% - 25% | | | 3.25 | % |
| 25% - 30% | | | 4.00 | % |
| 30% - 35% | | | 4.75 | % |
| 35% - 40% | | | 5.50 | % |
| 40% - 45% | | | 6.25 | % |
| 45% - 50% | | | 7.00 | % |
| 50% - 55% | | | 7.75 | % |
| 55% - 60% | | | 8.50 | % |
| 60% - 65% | | | 9.25 | % |
| 65% - 70% | | | 10.00 | % |
| 70% - 75% | | | 10.75 | % |
| 75% - 80% | | | 11.50 | % |
| More than 80% | | | 12.00 | % |
Mining royalty payments will be deductible for income tax purposes in the fiscal year in which such payments are made.
We believed that certain portions of the regulations of the Mining Royalty Law were unconstitutional, because they impose a mining royalty tax on non-mining activities. For instance, for cement companies, the amended Mining Royalty Law and its regulations established that the mining royalty tax was calculated based on the total operating profit or net sales, as opposed to operating profit or net sales attributable exclusively to mining products, such as limestone, used to produce cement. Accordingly, in December 2011, we filed a claim to declare that the mining royalty tax applicable for the exploitation of non-metallic mining resources be calculated based on the value of the final product obtained from the mineral separation process, net of any costs incurred in the mineral separation process (“componente minero”).
In November 2013, the Peruvian Constitutional Court affirmed the constitutional challenge we filed against the new regulation of the Mining Royalty Law, in a final and unappealable ruling, on the grounds that the new regulation violates the constitutional right of property, as well as the principles of legal reserve and proportionality. Therefore, the new regulation is rendered inapplicable to our operation. As a result, we will continue to use as a basis for the calculation of the mining royalty the value of the concentrate or mining component, and not the value of the product obtained from the industrial or manufacturing process.
Finally, holders of mining concessions are required at the beginning of their operations to submit a mining closure plan that must contain a description of the steps to restore the areas and facilities of each mining operation area to pre-mining condition. Holders of mining concessions are required to secure completion of the restorative measures by means of the following guarantees: (i) banking guarantee or credit insurance; (ii) cash guarantees; (iii) trusts; or (iv) those indicated in the Peruvian Civil Code.
As of the date of this annual report, we primarily owned non-metallic mining concessions and limited metallic mining concessions with respect to iron. Substantially all of our concessions were granted prior to 2008. Our mining rights and concessions are in full force and effect under applicable Peruvian laws. We believe that we are in compliance in all material respects with the terms and requirements applicable to our mining rights and concessions.
Production Process
The cement production process along with other manufacturing activities are governed by General Industry Law (Ley General de Industrias), Law No. 23407, published inEl Peruano on May 29, 1982, which establishes basic rules that promote and regulate activities in the manufacturing industry. The Ministry of Production is vested with authority to promote private investments in connection with industrial, processing and manufacturing activities, the surveillance of sustainable exploitation of natural resources (except for those extractive activities involving primary transformation of natural products), the protection of the environment, and the supervision of the quality of manufactured products. All industrial companies are subject to the General Industry Law and its regulations to the extent that the company’s gross income is primarily derived from industrial activities. Pursuant to Supreme Decree No. 009-2011-MINAM, the supervisory and monitoring functions of the Ministry of Production were transferred to the OEFA in 2013.
Environmental Regulations
Industrial companies and particularly cement companies are required to comply with several environmental regulations. Pursuant to Article 50 of Legislative Decree No. 757, the competent environmental authority is that corresponding to the activity of the company which generates the higher gross annual income. For that reason, the environmental authority that monitors our operations, considering that cement production represents the highest proportion of our gross profit, is the Ministry of Production.
The Environmental Regulations for Manufacturing Industries (Reglamento de Protección Ambiental para el Desarrollo de Actividades de la Industria Manufacturera—Supreme Decree No. 019-97-ITINCI, or the “Environmental Regulations”), set forth different environmental obligations depending on the date of commencement of the subject company’s industrial activities. Thus, companies with industrial cement activities operational at the time these regulations entered into force (September 1997) were obliged to submit an Environmental Adaptation Management Plan (Programa de Adecuación y Manejo Ambiental, or “PAMA”) to the Ministry of Production; while companies with industrial activities starting from that date onwards are obliged to submit either an environmental impact assessment or an environmental impact declaration depending on the level of risk and the impact of their activities on the environment. Furthermore, the Environmental Regulations establish that the Ministry of Production may require a mining closure plan (as an independent environmental assessment) with environmental measures that all companies must comply with before closing their operations to prevent any negative effects on the environment.
With regard to air emissions and wastewater discharges, the Ministry of Production has adopted legally binding environmental quality standards (Limites Máximos Permisibles, or “LMPs”) for cement industries (approved by Supreme Decree No. 003-2002-PRODUCE). These standards are legally enforceable and all cement industry operations are required to comply with them.
A violation of the Environmental Regulations is subject to different types of administrative sanctions, as determined in the Environmental Sanctions Regime of the Ministry of Production(Régimen de Sanciones e Incentivos del Reglamento de Protección Ambiental para el Desarrollo de Actividades de la Industria Manufacturera—Supreme Decree No. 025-2001-ITINCI),including warnings notice; fines of up to 600 UIT (US$677,400); restrictions, suspension or cancellation of the authorization or concession; and total or partial closing of the industrial facilities. The type of sanction imposed ultimately depends on the seriousness of the violation. Although the environmental competent authority for industrial activities is the Ministry of Production, other government agencies may impose fines in case of non-compliance with applicable permits.
By Directing Council Resolution No. 023-2013-OEFA/CD, of theOrganismo de Evaluación y Fiscalización Ambiental (the Envirnomental Monitoring and Enforecement Agency or “OEFA”), OEFA assumes the functions of monitoring, supervision, control and sanctioning of environmental matters in the Cement Sector of the Manufacturing Industry, of the Industrial Subsector of the Ministry of Production - PRODUCE.
In 2016, by Ministerial Resolution No. 201-2016-MINAM, the “National Protocol of Continuous Emission Monitoring Systems – CEMS” was approved. Its objective is to standardize the process of continuous monitoring of polluting gases and particles emitted into the atmosphere by manufacturing activities. It establishes the technical criteria for the selection of continuous monitoring methodologies, as well as the location of the monitoring points, the operation of the equipment and the calibration tests required for the assurance of the quality of the measurements.
By Ministerial Resolution Nº 191-2016-MINAM, the “National Plan for the Integral Management of Solid Waste - PLANRES 2016-2024” was approved. It establishes among other things, obligations to managers regarding the management of non-municipal solid waste, as well as the modification of the environmental studies in case it is planned to carry out co-processing.
Prior Consultation with Local Indigenous Communities
On September 7, 2011, Peru enacted Law No. 29785, Prior Consultation Right of Local Indigenous Communities. The law was enacted in order to implement Convention No. 169 of the International Labor Organization on Local Indigenous Communities in Independent Countries, previously ratified by Peru through Legislative Decree No. 26253. This law, which became effective on December 6, 2011, establishes a prior consultation procedure to be undertaken by the Peruvian government in favor of local indigenous communities, whose collective rights may be directly affected by new legislative or administrative measures, including the granting of new mining concessions. Regulation implementing this law was approved on April 3, 2012, by Supreme Decree No. 001-2012-MC, which defines the local indigenous communities that are entitled to the prior consultation rights and establishes the different stages that comprise the prior consultation procedure.
Consultation procedures for mining and processing concessions are carried out by the MEM prior to the granting of a new processing concession.
According to the recent practice of the Geologic Institute of Mining and Metallurgy (Instituto Geológico Minero Metalúrgico), the granting of mining concessions does not qualify as an “administrative measure” that potentially affects the rights of indigenous people because it does not grantper se a right to explore and exploit mineral deposits. Accordingly, the granting of mining concessions has not been included among measures that require consultation procedures with indigenous people. According to Ministerial Resolution No. 003-2013-MEM-DM, the MEM has established that consultation procedures are applicable prior to the commencement of: (i) exploration activities (Autorización de inicio de actividades de exploración);(ii) exploitation activities (Autorización de inicio o reinicio de las actividades de desarrollo, preparación y explotación - incluye plan de minado y botaderos); and (iii) processing concessions (otorgamiento de concesión de beneficio).
Local indigenous communities do not have a veto right; upon completion of this prior consultation procedure, the Peruvian government can discretionarily approve or reject the applicable legislative or administrative measure. In addition, any sale, lease or other act of disposal of surface land owned by local indigenous communities is subject to the approval of an assembly composed of the members of such communities according to the following rules:
| • | for local indigenous communities located on the coast, approval of not less than 50% of members attending the assembly is required; and |
| • | for local indigenous communities located in the highlands and the Amazon region, approval of at least 2/3 of all members attending the assembly is required. |
Permits and Licenses
Mining Concessions
According to the General Mining Law, a mining concession is required in order to extract mineral resources needed to produce cement. The mining concession grants the right to explore and exploit the mineral resources located in a solid of indefinite depth, limited by the vertical plane corresponding to the sides of square, rectangle or polygon referred to by the Universal Transversal Mercator coordinates. The Geological Mining and Metallurgical Institute(Instituto Geológico Minero y Metalúrgico) is in charge of managing the procedure of granting mining concessions, which includes the receipt of the request, the granting and the termination of mining concessions.
Explosives.Mining concessionaires are required to obtain the following permits to operate and store explosives:
| • | Certificate of Mining Operation (Certificado de Operación Minera), granted by the MEM; |
| • | Semiannual Authorization for Use of Explosives, granted by the General Bureau of Explosives of the Ministry of Interior (Superintendencia Nacional de Control de Servicios de Seguridad, Armas, Municiones y Explosivos de Uso Civil, or “SUCAMEC”); |
| • | Manipulation of Explosives License for each individual that intends to handle explosives, granted by the SUCAMEC; and |
| • | Explosive’s Warehouse Operation License, granted by SUCAMEC. |
Water and Wastewaters
To use water resources in cement industry activities, it is necessary to obtain a water right granted by the Water Management Authority (Autoridad Nacional del Agua, or “ANA”) prior to the use of underground or fresh water sources. If the proposed activities will generate domestic or industrial wastewaters, which will be discharged into natural water sources or soil, authorization from ANA is required, with a favorable opinion of the General Bureau of Environmental Health (Dirección General de Salud Ambiental, or “DIGESA”).
Hazardous Waste
Hazardous waste generated as a consequence of cement production activities must be disposed of in specialized landfills. The transportation of solid waste outside the limits of the industrial complex must be conducted exclusively through specialized companies registered with DIGESA. Industries are free to contract with an EPS-RS (a company that provides solid waste services such as transportation, treatment or disposal) or with an EC-RS (a company that carries out commercialization activities aiming at the reuse of solid waste). Yet in order to limit their liability in case of environmental harm, industries must make sure the EPS-RS and EC-RS they retain count with all necessary permits to collect, transport and dispose hazardous wastes.
Chemical Feedstock
The commercialization, transportation and use of controlled chemical feedstock (Insumos Químicos y Productos Fiscalizados,or “IQPF”) is restricted, because of their potential use in the production of illegal drugs or controlled substances. Companies that require an IQPF must obtain an IQPF User Certificate (Certificado de Usuario de IQPF) from the General Bureau of Chemical Feedstock of the Ministry of Interior (Unidad Antidrogas de la Policía Nacional del Perú, or “DIRANDRO”). Companies such as ours are also required to register with the Ministry of Production any IQPF activities they plan to carry out (Registro Único para el Control de IQPF).
Fuel Storage
Any company that purchases fuels for its own activities and has facilities to receive and store fuel with a minimum capacity of one meter cubed (264,170 gallons) is required to (i) receive from the Mining and Energy Investment Supervision Body (Organismo Supervisor de la Inversión en Energía y Minería, or “OSINERGMIN”) prior permission to build and operate said installations, and (ii) be registered with the Registry of Direct Fuel Consumers, in order to obtain the SCOP Code (Código del Sistema de Control de Órdenes de Pedido) necessary to purchase fuel.
Cultural Heritage Protection
If the design and development of cement industry activities involves the removal of topsoil, a Certificate of Non-Existence of Archaeological Ruins (Certificado de Inexistencia de Restos Arqueológicos, or “CIRA”) from the Ministry of Culture (Ministerio de Cultura) with respect to the area under construction must be obtained. The CIRA will either certify that on the surface of the evaluated area no archaeological sites or features were discovered, or will identify their exact location and extent in order to implement precautionary measures to protect the archaeological artifact. The CIRA is valid for an unlimited period, but will become void should any archaeological artifacts be accidentally discovered during the construction works or due to any natural cause. In such an instance, the company must stop the construction work immediately and notify the Ministry of Culture. Failure to stop the construction work may generate civil and criminal liabilities. Under certain exceptional circumstances, Peruvian legislation allows the removal of archeological artifacts when the area is required for development of projects that are of national interest.
Labor Regulations
Peruvian legislation allows hiring employees through: (i) a fixed-term contract, (ii) a contract for an indefinite duration; or (iii) a contract for part-time employment.
The minimum wage established in Peru is S/930.00 per month. Peruvian labor legislation establishes a maximum 8-hour work day or 48 hours per week for employees older than 18 years. For overtime, employers must pay at least an additional 25% and an additional 35% over the regular hourly wage for the first two hours and for any additional hours, respectively. Employees are entitled to a minimum rest of 24 consecutive hours per week.
Regardless of the type of employment contract, pursuant to Peruvian law full-time employees are entitled to receive:
(i) an additional 10% of the minimum wage, provided that they are responsible for (a) one or more children under the age of 18 or (b) persons who are up to 24 years of age if they are pursuing higher education,
(ii) two additional months’ salary per year, one in July and one in December (pursuant to Law No. 29351, until December 31, 2017, said payments were not subject to any social contribution, except for Income Tax; consequently, until December 2017, employers paid directly to their employees as an Extraordinary Bonus, the amount of the contribution to the Social Health Insurance (ESSALUD) for such payments, equivalent to 9% of the bonus paid),
(iii) thirty calendar days of annual paid vacation per year,
(iv) life insurance, provided they have been employed for at least four years,
(v) a compensation for years of service (CTS) equal to 1.16% of a monthly salary and is deposited each year in May and November, provided they work an average of at least four hours per day for the same employer,
(vi) benefits from the Peruvian Social Health Insurance (ESSALUD) to which employers must contribute a rate equivalent to 9% of their employees’ income, and
(vii) a percentage of the company’s annual income net of taxes (10% in the case of income derived from industrial cement operations, and 8% in the case of income derived from our mining or commercial activities), provided the company has twenty or more employees.
Free and Fair Competition Protection
In Peru, businesses are generally not required to receive the prior authorization of the antitrust authority, which in Peru is INDECOPI. However, in order to promote economic efficiency and protect consumers, anti-competitive behavior is subject to sanctions under applicable law. Behavior that is prohibited according to national law includes: (i) the abuse of a dominant market position, (ii) concerted horizontal practices and (iii) concerted vertical practices. Moreover, under the Unfair Competition Law it is illegal to act in a way that may hinder the competitive process. An unfair behavior is one that is objectively contrary to the entrepreneurial good faith, ethical behavior and efficiency in a market economy.
| C. | Organizational Structure |
All of our operating subsidiaries are incorporated in Peru. The following chart sets forth our simplified corporate structure, operating subsidiaries only, as of the date of this annual report.
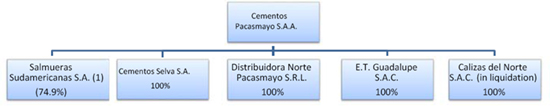
| (1) | Quimpac owns the remaining 25.1%. |
The following is a brief description of the principal activities of our consolidated subsidiaries:
| • | Cementos Selva S.A. is engaged in the production and marketing of cement and other cement-related materials in the northern region of Peru, near the Peruvian jungle. It holds all of the outstanding shares of Dinoselva Iquitos S.A.C., our cement and construction materials distributor for products processed in our Rioja facility. |
| • | Distribuidora Norte Pacasmayo S.R.L. is primarily engaged in selling and distributing cement products produced at our Pacasmayo facility. It produces and sells cement-related materials, such as concrete blocks and ready mix concrete, and sells other construction materials manufactured by large manufacturers. |
| • | Calizas del Norte S.A.C., En Liquidación (in liquidation) was engaged in the mining activities of prospecting, exploration and exploitation of Acumulación tembladera quarry. On May 31, 2016, we dissolved this subsidiary because a third party was engaged to assume these activities. |
| • | Empresa de Transmisión Guadalupe S.A.C.’s sole operation is to provide electricity transmission services to the Pacasmayo facility. |
| • | Salmueras was created in 2011, with Quimpac as a minority equity holder, in order to develop our combined brine fields in the coastal region of Piura in the north of Peru. We own a 74.9% equity interest in Salmueras and Quimpac owns the remaining 25.1%. In the fourth quarter of 2017, we resolved to cease our participation in the brine project and discontinue this operation. |
| D. | Property, Plant and Equipment |
Properties
We own our headquarters office in Lima, Peru, at Calle La Colonia 150, Urbanización El Vivero, Surco. We also own our plants, warehouses, transportation facilities and the office space at our production facilities, including our workers’ facilities occupying approximately 50,000 square meters at our Pacasmayo facility and a warehouse occupying approximately 25,000 square meters at the Salaverry port facility.
Area of Operation
We own and operate three cement production facilities. Our largest facility is located in the city of Pacasmayo, department of La Libertad, approximately 667 kilometers north of Lima. The second facility is located in the city of Piura, department of Piura, approximately 330 kilometers north of Pacasmayo. This facility started cement production in September 2015. We also own and operate a smaller cement facility, located in the city of Rioja, department of San Martín, approximately 468 kilometers east of the Panamericana Norte highway. From the Pacasmayo and Piura facilities we supply cement principally to the coastal and central regions of northern Peru, including the cities of Piura, Chiclayo, Cajamarca, Trujillo and Chimbote. From our Rioja facility, we supply cement to the northeastern region of Peru, including the cities of Moyobamba and Tarapoto, among others.
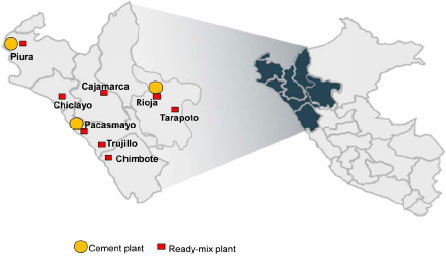
Pacasmayo Facility
As of December 31, 2017, our Pacasmayo facility had 10 kilns, which produce clinker (one of which is also equipped to produce quicklime), and an additional Waelz rotary kiln that produces quicklime. Additionally, our facility has a primary and secondary cone crusher located near our Acumulación Tembladera limestone quarry. The main crusher has installed crushing capacity of 800 metric tons per hour and the secondary crusher has installed crushing capacity of 170 metric tons per hour. Our Pacasmayo facility operates with three horizontal rotary kilns with total installed annual clinker production capacity of 1,034,880 metric tons and six vertical shaft kilns with total installed annual clinker production capacity of 465,120 metric tons. The total installed annual clinker production capacity at our Pacasmayo facility is 1.5 million tons. Our Pacasmayo facility also features three cement finishing mills with installed annual cement production capacity of 2.9 million metric. Our Pacasmayo facility is also equipped with silos containing storage capacity for 27,200 metric tons of cement.
As of December 31, 2017, our Pacasmayo facility had installed production capacity of approximately 240,000 metric tons of quicklime per year, including the annual installed capacity of one of our clinker kilns and our Waelz rotary kiln, which are equipped to also produce quicklime.
Piura Facility
Annual installed production capacity of our Piura facility is 1,600,000 metric tons of cement and 1,000,000 metric tons of clinker.
The Piura plant operates with a horizontal kiln with installed clinker production capacity of 1 million metric tons per year, as well as a cement mill with installed cement production capacity of 1.6 million metric tons per year. The Piura facility also has two storage silos with storage capacity of 24,000 metric tons of cement.
Rioja Facility
Annual installed production capacity of our Rioja facility is 440,000 metric tons of cement and 280,000 metric tons of clinker.
Our Rioja facility currently operates with a small cone crusher and four vertical shaft kilns with total annual installed clinker production capacity of 280,000 metric tons and three cement finishing mills with total annual installed cement production capacity of 440,000 metric tons. Our Rioja facility is also equipped with silos with storage capacity of 1,750 metric tons of cement.
Ready-Mix Concrete Facilities
We also have 19 fixed and mobile ready-mix concrete facilities located in the northern cities of Chimbote, Trujillo, Chiclayo, Piura, Cajamarca, Tarapoto, and Moyobamba, among others. These facilities allow us to supply ready-mix concrete to large construction projects throughout the entire northern region of Peru. As of December 31, 2017, our ready-mix operations had 109 mixer trucks and 29 concrete pumps available to deliver ready-mix concrete.
Capacity and Volumes
The table below sets forth our clinker, cement and quicklime production capacity and volumes in our Pacasmayo and Rioja facilities for the periods indicated.
| | | | | | | | | | | | | | | | | | | | | | | | | | | | |
| (in thousands of | | As of and for the year ended December 31, | |
| metric tons, | | 2017 | | | 2016 | | | 2015 | |
except
percentages) | | Capacity | | | Production | | | Utilization
rate(1) | | | Capacity | | | Production | | | Utilization
rate(1) | | | Capacity | | | Production | | | Utilization
rate(1) | |
| Cement: | | | | | | | | | | | | | | | | | | | | | | | | | | | |
| Pacasmayo facility | | | 2,900 | | | | 1,141 | | | | 39.4 | % | | | 2,900 | | | | 1,177 | | | | 40.6 | % | | | 2,900 | | | | 1,884 | | | | 65.0 | % |
| Piura facility(2) | | | 1,600 | | | | 858 | | | | 53.6 | % | | | 1,600 | | | | 817 | | | | 51.1 | % | | | 1,600 | | | | 161 | | | | 10.1 | % |
| Rioja facility | | | 440 | | | | 287 | | | | 65.2 | % | | | 440 | | | | 281 | | | | 63.9 | % | | | 440 | | | | 288 | | | | 65.5 | % |
| Total | | | 4,940 | | | | 2,286 | | | | 46.3 | % | | | 4,940 | | | | 2,276 | | | | 46.1 | % | | | 4,940 | | | | 2,333 | | | | 47.2 | % |
| Clinker: | | | | | | | | | | | | | | | | | | | | | | | | | | | | | | | | | | | | |
| Pacasmayo facility | | | 1,500 | | | | 687 | | | | 45.8 | % | | | 1,500 | | | | 887 | | | | 59.1 | % | | | 1,500 | | | | 967 | | | | 64.5 | % |
| Piura facility | | | 1,000 | | | | 746 | | | | 74.6 | % | | | 1,000 | | | | 629 | | | | 62.9 | % | | | — | | | | — | | | | — | |
| Rioja facility | | | 280 | | | | 209 | | | | 74.6 | % | | | 280 | | | | 215 | | | | 76.8 | % | | | 280 | | | | 235 | | | | 83.9 | % |
| Total | | | 2,780 | | | | 1,642 | | | | 59.1 | % | | | 2,780 | | | | 1,731 | | | | 62.3 | % | | | 1,780 | | | | 1,202 | | | | 67.5 | % |
| Quicklime(3): | | | | | | | | | | | | | | | | | | | | | | | | | | | | | | | | | | | | |
| Pacasmayo facility | | | 240 | | | | 168 | | | | 70.0 | % | | | 240 | | | | 156 | | | | 65.0 | % | | | 240 | | | | 98 | | | | 40.8 | % |
| (1) | Utilization rate is calculated by dividing production for the specified period by installed capacity. |
| (2) | Our Piura facility started producing cement in September 2015 and clinker in February 2016. |
| (3) | Our Rioja facility does not produce quicklime. In addition, one of our clinker kilns and our Waelz rotary kiln are equipped to produce quicklime. |
Insurance
We maintain a comprehensive insurance program that protects us from certain types of property and casualty losses. Our plants and equipment are insured against losses. Additionally, our insurance policy provides coverage for business interruption in our cement manufacturing facilities. We also purchase commercial insurance to cover risks associated with workers’ compensation and other general liabilities. We believe our insurance programs and policy limits and deductibles are appropriate for the risks associated with our business and are in line with the insurance policies of similar cement manufactures that operate in Peru.
Environmental Compliance and Social Responsibility Projects
We are in compliance in all material respects with applicable environmental laws and regulations and have all the required environmental permits and licenses to conduct our business. We have Environmental, Health and Safety management systems in place to address the environmental, health and safety risks inherent to our business.
We are committed to the development and quality of life of communities that surround the area where we operate. We have developed a good relationship with the local communities surrounding our plant facilities since we started operations in Pacasmayo. We have a number of social responsibility programs aimed at improving health and education in the area. Below is a brief description of a few of our social initiatives.
Tecsup.Tecsup is a leading not-for-profit institute in Peru that provides technical education to high-school students. It was founded by the family of our controlling shareholder, and we support it by providing scholarships to promising high school students living near our plants to study at the Trujillo campus of Tecsup. Through its three campuses in Peru, Tecsup has graduated over 9,639 students in various technical fields, some of whom currently work for us and our affiliated companies.
Center for Technological Training. We have three training centers at our facilities where we teach students and adults business and technical skills. Our centers are staffed with instructors from Tecsup. The goal of the center is to help develop the professional skills of the local population, especially of students and teachers at the educational institutions in the towns of Tembladera, Pacasmayo and Piura. In 2017, this program benefited over 354 students and teachers.
Abilities Strengthening.This program seeks to provide training to local stakeholders such as grassroots organizations, local entrepreneurs, teachers, journalists, among others. The objective of the program is to strengthen their skills and knowledge by providing courses and seminars especially designed for that purpose. The program is funded by us, in coordination with local governments and social institutions, and in 2017 benefited six stakeholders.
Mi Escuela, mi comunidad (My School, My Community.) We have developed this project for a second year in partnership with the Instituto Peruano de Acción Empresarial – IPAE (Peruvian Institute of Business Action). 42 educational institutions from the Pacasmayo, Rioja and Tembladera communities participated in this project with the purpose of strengthening the management capacities of school leaders in order to mobilize resources for the education of students. In 2017, this program benefited over 11,324 students and teachers.
Universidad de Ingeniería y Tecnología – UTEC (University of Engineering and Technology) is an educational nonprofit proposal that since 2012 is aimed at the development of people in the engineering field, looking to satisfy the need for these types of professionals in the labor market by implementing a curriculum in line with the trends and demands that globalization poses to modern engineering, with an integrated approach to innovative teaching models. We support it by providing financial aid for its operations. To enhance students’ knowledge, UTEC also has various national and international alliances with top organizations.
Acuícola Los Paiches. Through our social venture, Acuícola Los Paiches S.A.C., we studied the reproductive forms of the “paiche” (arapaima giga), a native fish species that was on the edge of extinction. After years of studies and scientific testing, we have successfully bred this species in captivity, and we have obtained thousands of fingerlings. In 2014, Acuícola Los Paiches S.A.C. received the “Award for Innovative Exports” from the Peruvian Exporters Association – ADEX for its research and for developing “paiche” farming in the Yurimaguas rainforest.
| ITEM 4A. | UNRESOLVED STAFF COMMENTS |
Not applicable.
| ITEM 5. | OPERATING AND FINANCIAL REVIEW AND PROSPECTS |
Overview
We are a leading Peruvian cement company, and the only cement manufacturer in the northern region of Peru. With more than 60 years of operating history, we produce, distribute and sell cement and cement-related materials, such as concrete blocks and ready-mix concrete. Our products are primarily used in construction. We also produce and sell quicklime for use in mining operations.
In 2017, our cement shipments were approximately 2.3 million metric tons, representing an estimated 21.3% share of Peru’s total cement shipments, and substantially all the cement consumed in the northern region of Peru. That same year, we also sold approximately 163,000 metric tons of quicklime.
We own three cement production facilities, our Pacasmayo and Piura facilities located in the northwest region of, Peru, and our smaller Rioja facility located in the northeast. Our facilities have total installed annual cement production capacity of approximately 4.9 million metric tons. We also have installed annual production capacity of 240,000 metric tons of quicklime. We own concession rights to several quarries with reserves of limestone/seashells and other raw materials located near our facilities. We estimate that our existing quarries have sufficient reserves to supply our limestone and seashell needs for approximately 105 years, based on our 2017 limestone/seashell consumption levels. We completed an expansion of our Rioja plant in April 2013. We more than doubled the cement production capacity of our Rioja facility by installing a new production line that added 240,000 metric tons of installed annual cement production capacity. In 2015, completed construction of our new cement plant in Piura, the third largest city in northern Peru, which has an annual production capacity of 1.6 million metric tons of cement. The first ton of cement from the Piura facility was produced and shipped on September 17, 2015, and clinker production started in January 2016. The Piura plant improved our competitive position in the northern region of Peru. With production from three plants, we are able to serve our market more efficiently. This state-of-the-art plant is one of the most modern in Latin America. It also reduces transportation costs by enabling the dispatching of cement from plants within closer proximity to the point of sale.
Factors Affecting our Results of Operations
Revenue Drivers
In 2017, approximately 92.3% of our total cement sales were in the form of bagged cement, substantially all of which was sold through retailers both within and outside of our distribution network. The remaining 7.7% of our cement was sold in bulk or in shipments of concrete blocks or ready-mix concrete directly to large construction companies. Our retail sales are directed to both theauto-construcciónsegment and construction companies that buy cement for a variety of small construction works, including minor residential, commercial and infrastructure projects. Cement destined for large private and public projects, such as housing complexes, highways, irrigation channels, hospitals, schools and mining and industrial facilities, is typically sold in bulk or in shipments of concrete blocks or ready-mix concrete.
According to our estimates, sales to theauto-construcciónsegment accounted for approximately 62.2% of our total cement sales in 2017, 58.0% in 2016 and 55.0% in 2015; private construction projects, both large and small, accounted for approximately 23.9% of our total cement sales in 2017, 25.0% in 2016 and 26.0% in 2015; and public construction projects accounted for the remaining 13.9% of our total cement sales in 2017, 17.0% in 2016 and 26.0% in 2015. Whileauto-construcción continues to represent the majority of our sales, it is expected that as the country continues to grow and formalize, private construction projects and infrastructure will become increasingly more important to our business.
Our cement sales are largely driven by residential construction (bothauto-construcción and small and large housing projects undertaken by construction companies), which is generally affected by economic conditions in the northern region of Peru.Auto-construcción is particularly affected by levels of disposable household income, as low-income families tend to invest most of their savings in developing their homes. Larger residential construction is more susceptible to the economic outlook, the availability of financing and prevailing investment levels in the region. During 2016, there was significant public investment during the first months of the year due to El Niño prevention investments, but this slowed down significantly afterwards for the rest of the year. GDP in the northern region of Peru is estimated to have contracted 1.0% in 2017, grown 0.6% in 2016, and grown 1.2% in 2015. Our cement volumes, which represented substantially all cement sales in the northern region of Peru, contracted by 0.8% in 2017, by 1.0% in 2016, and by 1.6% in 2015 in terms of metric tons of cement shipments.
Our cement sales are also driven, to a lesser extent, by commercial developments and infrastructure projects. Commercial and other private construction projects are also affected by investment levels in the region, while public infrastructure projects depend on the priorities and financial resources of the national, regional and local governments. During the first nine months of 2017, there was a decline in public spending due to El Niño phenomenon and the Odebrecht corruption scandal which delayed investments. However, we expect a significant pickup in public investment during 2018-2021 due to reconstruction works in the North as the infrastructure damaged or destroyed by the landslides, floods and heavy rain resulting from El Niño is restored.
Cost Drivers
Coal is the main source of energy used in our production process, in particular to fuel our kilns. We purchase anthracite coal from nearby coal mines and import a small amount of bituminous coal primarily from Colombia and Venezuela. We do not have long-term coal supply agreements, and we do not engage in hedging transactions in connection with the price of coal. In the past, the price of bituminous coal has been related to the international price of oil, as it is used as a substitute for oil. Coal accounted for an estimated 14.7% of our costs of production in 2017, 13.1% in 2016 and 11.3% in 2015. In 2011, we exercised certain of our options to purchase coal mining concessions, which we intend to use to continue to reduce our use of bituminous coal.
Electricity is used in our facilities mainly to power our cement mills. We power our Pacasmayo facility with electricity purchased from Electroperú, with which we have a long-term supply agreement expiring in 2025. Our Rioja facility is powered primarily with electricity from ELOR, with which we have a medium-term supply agreement expiring in 2022. Under these agreements, the price of electricity is based on a formula that takes into consideration our consumption of electricity and certain market variables, including the international price of oil. Electricity accounted for approximately 13.4% of our cost of production in 2017, 13.1% in 2016 and 11.3% in 2015. Electricity costs tend to be lower during the rainy season, from January to March of each year, as our region is served primarily by hydro-electric power plants.
In addition, we purchase from third parties admixtures and certain raw materials that we use in our production process, including gypsum, blast furnace slag, iron and other materials. Admixtures and raw materials used in our cement production process do not include construction supplies that we acquire from third-parties for resale through our distribution network along with our cement products. The cost of admixtures and raw materials purchased from third parties accounted for approximately 5.1% of our cost of production in 2017, 10.5% in 2016 and 9.7% in 2015. The decrease in the amount of third party admixtures was due to a more efficient dosage of these materials to achieve cost savings.
Our labor costs decreased slightly in 2017, mainly as a result of one-off severance payments incurred in 2016. Personnel expenses represented 18.4% of our total costs and expenses in 2017, 21.4% in 2016, and 19.8% in 2015.
Third-Party Construction Supplies
In addition to selling our own products, we also sell and distribute construction supplies manufactured by third parties, such as steel rebar, wires and pipes that are typically used in construction along with our cement. Our profit margins from the sale of third party construction supplies are significantly lower than the margins on our cement products and they are affected by fluctuations in product prices and the exchange rate between thesol and the U.S. dollar between the time we purchase these products and the time we resell them. We sell these products primarily as a service to retailers in our distribution network in an effort to support the sale of our cement products.
Mining Royalty Tax
The mining royalty tax for the exploitation of metallic and non-metallic minerals is payable on a quarterly basis in an amount equal to the greater of (i) an amount determined in accordance with a statutory scale of tax rates based on a company’s operating profit margin that is applied to its operating profit, as adjusted by certain non-deductible expenses and (ii) 1% of a company’s net sales, in each case during the applicable quarter. These amounts are determined based on our unconsolidated financial statements and those of our subsidiaries with operations that are under the scope of the Mining Royalty Law. Mining royalty payments are deductible for income tax purposes in the fiscal year in which such payments are made. For additional information, see note 27 to our annual audited consolidated financial statements included in this annual report.
Operating Segments
We have three operating segments: (i) cement, concrete and blocks, (ii) quicklime and (iii) sales of construction supplies. For additional information on our operating segments, see note 31 to our annual audited consolidated financial statements included in this annual report.
New Accounting Pronouncements
For a description of new interpretations and improvements to IFRS in effect since 2017, see note 2.3.20 and note 4 to our annual audited consolidated financial statements included in this annual report.
Critical Accounting Policies
The following is a discussion of our application of critical accounting policies that require our management to make certain assumptions about matters that are uncertain at the time the accounting estimate is made, where our management could reasonably use different estimates, or where accounting changes may reasonably occur from period to period, and in each case would have a material effect on our financial statements. For additional information, see note 2.3 to our annual audited consolidated financial statements included in this annual report.
Determination of Useful Live of Assets for Depreciation and Amortization Purposes
Depreciation of mining concessions and mine development costs are charged to cost of production on a units-of-production basis using proved reserves. Other assets are depreciated on a straight-line-basis over their estimated useful lives, as follows:
| | | |
Property, Plant and Equipment | | Estimated Years of Useful Life |
| Buildings and other construction: | | |
| Administrative facilities | | Between 35 and 48 |
| Main production structures | | Between 30 and 49 |
| Minor production structures | | Between 20 and 35 |
| Machinery and equipment: | | |
| Mills and horizontal furnaces | | Between 42 and 49 |
| Vertical furnaces, crushers and grinders | | Between 23 and 36 |
| Electricity facilities and other minors | | Between 12 and 35 |
| Furniture and fixtures | | 10 |
| Transportation units: | | |
| Heavy units | | Between 11 and 21 |
| Light units | | Between 8 and 11 |
| Computer equipment | | 4 |
| Tools | | Between 5 and 10 |
The assets’ residual value, useful lives and methods of depreciation/amortization are reviewed at each reporting period, and adjusted prospectively, if appropriate.
An item of property, plant and equipment and any significant part initially recognized is derecognized upon disposal or when no future economic benefits are expected from its use or disposal. Any gain or loss arising on derecognition of the asset (calculated as the difference between the net disposal proceeds and the carrying amount of the asset) is included in the consolidated income statement when recognition of the asset is derecognized.
Exploration, Evaluation and Mine Development Costs
Mining Concessions
Mining concessions correspond to the exploration rights in areas of interest acquired. Mining concessions are stated at cost, net of accumulated amortization and/or accumulated impairment losses, if any, and are presented within the property, plant and equipment caption. Those mining concessions are amortized starting from the production phase following the units-of-production method based on proved reserves to which they relate. The unit-of-production rate for the amortization of mining concessions takes into account expenditures incurred to the date of the calculation. If we abandon the concession, the costs associated are written-off in the consolidated statement of profit or loss.
As of December 31, 2017 and 2016, no amortization under units-of-production method was determined since our mining concessions are not yet on production phase.
Mine development costs and stripping costs
Mine development costs.Mine development costs incurred are stated at cost and are the next step in development of mining projects after exploration and evaluation stage. Mine development costs are, upon commencement of the production phase, presented net of accumulated amortization and/or accumulated impairment losses, if any, and are presented within the property, plant and equipment caption. The amortization is calculated using the unit of-production method based on proved reserves to which they relate. The unit-of-production rate for the amortization of mine development costs takes into account expenditures incurred to the date of the calculation. Expenditures that increase significantly the economic reserves in the mining unit under exploitation are capitalized.
As of December 31, 2017 and 2016, no amortization under the units-of-production method was determined since the projects of the Company are not yet in production phase.
Stripping costs.Stripping costs incurred in the development of a mine before production commences are capitalized as part of mine development costs and subsequently amortized over the life of the mine on a units-of-production basis, using the proved reserves. Stripping costs incurred subsequently during the production phase of its operation are recorded as part of cost of production.
Exploration and Evaluation Assets
Exploration and evaluation activity involves the search for mineral resources, the determination of technical feasibility and the assessment of commercial viability of an identified resource. Exploration and evaluation activity includes:
| ● | Researching and analyzing historical exploration data. |
| ● | Gathering exploration data through geophysical studies. |
| ● | Exploratory drilling and sampling. |
| ● | Determining and examining the volume and grade of the resource. |
| ● | Surveying transportation and infrastructure requirements. |
| ● | Conducting market and finance studies. |
License costs paid in connection with a right to explore in an existing exploration area are capitalized and amortized over the term of the license. Once the legal right to explore has been acquired, exploration and evaluation costs are charged to the consolidated statement of profit or loss, unless management concludes that a future economic benefit is more likely than not to be realized, in which case such costs are capitalized. These costs include directly attributable employee remuneration, materials and fuel used, surveying costs, drilling costs and payments made to contractors.
In evaluating if costs meet the criteria to be capitalized, several different sources of information are used, including the nature of the assets, extension of the explored area and results of sampling, among others. The information that is used to determine the probability of future benefits depends on the extent of exploration and evaluation that has been performed. Exploration and evaluation costs are capitalized when the exploration and evaluation activity is within an area of interest for which it is expected that the costs will be recouped by future exploitation and active and significant operations in relation to the area are continuing or planned for the future.
The main estimates and assumptions the Company uses to determine whether is likely that future exploitation will result in future economic benefits include: expected operational costs, committed capital expenditures, expected mineral prices and mineral resources found. For this purpose, the future economic benefit of the project can reasonably be regarded as assured when mine-site exploration is being conducted to confirm resources, mine-site exploration is being conducted to convert resources to reserves or when the Group is conducting a feasibility study, based on supporting geological information.
As the capitalized exploration and evaluation costs asset is not available for use, it is not amortized. These exploration costs are transferred to mine development assets once the work completed to date supports the future development of the property and such development receives appropriate approvals. In this phase, the exploration costs are amortized in accordance with the estimated useful life of the mining property from the time the commercial exploitation of the reserves begins. All capitalized exploration and evaluation costs are monitored for indications of impairment. Where a potential impairment is indicated, assessment is performed for each area of interest in conjunction with the group of operating assets (representing a cash generating unit) to which the exploration is attributed.
Exploration areas in which resources have been discovered but require major capital expenditure before production can begin, are continually evaluated to ensure that commercial quantities of resources exist or to ensure that additional exploration work is under way or planned. To the extent that capitalized expenditure is no longer expected to be recovered it is charged to the consolidated statement of profit or loss. The Group assesses at each reporting date whether there is an indication that an exploration and evaluation assets may be impaired. The following facts and circumstances are considered in this assessment:
| (i) | the period for which the entity has the right to explore in the specific area has expired during the period or will expire in the near future, and is not expected to be renewed; |
| (ii) | substantive expenditure on further exploration for and evaluation of mineral resources in the specific area is neither budgeted nor planned; |
| (iii) | exploration for and evaluation of mineral resources in the specific area have not led to the discovery of commercially viable quantities of mineral resources and the entity has decided to discontinue such activities in the specific area; and |
| (iv) | sufficient data exist to indicate that, although a development in the specific area is likely to proceed, the carrying amount of the exploration and evaluation asset is unlikely to be recovered in full from successful development or by sale. |
If any indication exists, an impairment of the exploration and evaluation assets is recorded.
Revenue Recognition
Revenue is recognized to the extent it is probable that we will obtain the economic benefits and the revenue can be reliably measured, regardless of when the payment received. Revenue is measured at the fair value of the consideration received or receivable, taking into account contractually defined terms of payment and excluding taxes or duty.
We have concluded that we are acting as a principal in all of our revenue arrangements.
The following specific recognition criteria must be also met before revenue is recognized:
Sales of Goods
Revenue from sales of goods is recognized when the significant risks and rewards of ownership have passed to the buyer on delivery of the goods. Revenue from the sale of goods is measured at fair value of the consideration received or receivable, net of returns and trade discounts.
Operating Lease Income
Income from operating lease of land and office was recognized on a monthly accrual basis during the term of the lease.
Interest Income
For all financial instruments measured at amortized cost and interest-bearing financial assets, interest income is recorded using the effective interest rate (“EIR”). EIR is the rate that exactly discounts the estimated future cash payments or receipts over the expected life of the financial instrument or a shorter period, where appropriate, to the net carrying amount of the financial asset or liability. Interest income is included in finance income in the consolidated statement of profit or loss.
Impairment of Non-Financial Assets
We assess at each reporting date whether there is an indication that an asset may be impaired. If any indication exists, or when annual impairment testing for an asset is required, we estimate the asset’s recoverable amount. An asset’s recoverable value is the higher of an asset’s or cash-generating unit’s fair value less costs of disposal and its value in use, and is determined for an individual asset, unless the asset does not generate net cash inflows that are largely independent of those from other assets or groups of assets. Where the carrying amount of an asset’s cash-generating unit exceeds its recoverable amount, the asset is considered impaired and is written down to its recoverable amount. In assessing value in use, the estimated future cash flows are discounted to their present value using a pre-tax discount rate that reflects current market assessments of the time value of money and the risks specific to the asset. In determining fair value less costs of disposal, recent market transactions are taken into account. If no such transactions can be identified, an appropriate valuation model is used. These calculations are corroborated by valuation multiples, quoted share prices for publicly traded companies or other available fair value indicators.
We base our impairment calculation on detailed budgets and forecast calculations, which are prepared separately from our cash generation units to which the individual assets are allocated. Impairment losses of continuing operations, including impairment on inventories, are recognized in the consolidated statement of profit or loss in expense categories consistent with the function of the impaired asset.
An assessment is made at each reporting date as to whether there is any indication that previously recognized impairment losses may no longer exist or have decreased. If such indication exists, we estimate the asset’s or cash-generating unit’s recoverable amount. A previously recognized impairment loss is reversed only if there has been a change in the assumptions used to determine the asset’s recoverable amount since the last impairment loss was recognized. The reversal is limited so that the carrying amount of the asset does not exceed its recoverable amount, nor exceed the carrying amount that would have been determined, net of depreciation, had no impairment loss been recognized for the asset in prior years. Such reversal is recognized in the consolidated statement of profit or loss. Exploration and evaluation assets are tested for impairment annually as of December 31, either individually or at the cash-generating unit level, as appropriate and when circumstances indicate that the carrying value may be impaired.
Deferred Tax
Deferred tax is provided using the liability method on temporary differences between the tax bases of assets and liabilities and their carrying amounts for financial reporting purposes at the reporting date. Deferred tax liabilities are recognized for all taxable temporary differences.
Deferred tax assets are recognized for all deductible temporary differences, the carry forward of unused tax credits and unused tax losses. Deferred tax assets are recognized to the extent that it is probable that taxable profit will be available against which the deductible temporary differences, and the carry forward of unused tax credits and unused tax losses can be utilized, except in respect of deductible temporary differences associated with investments in subsidiaries, where deferred assets are recognized only to the extent that it is probable that the temporary differences will reverse in the foreseeable future and taxable profit will be available against which the temporary differences can be utilized.
The carrying amount of deferred tax assets is reviewed at each reporting date and reduced to the extent that it is no longer probable that sufficient taxable profit will be available to allow all or part of the deferred tax asset to be utilized. Unrecognized deferred tax assets are re-assessed at each reporting date and are recognized to the extent that it has become probable that future taxable profits will allow the deferred tax asset to be recovered.
Deferred tax assets and liabilities are measured at the tax rates that are expected to apply in the year when the asset is realized or the liability is settled, based on tax rates (and tax laws) that have been enacted or substantively enacted at the reporting date. Deferred tax related to items recognized outside profit or loss is recognized outside profit or loss. Deferred tax items are recognized in correlation to the underlying transaction either in other comprehensive income or directly in equity.
Deferred tax assets and deferred tax liabilities are offset if a legally enforceable right exists to set off current tax assets against current income tax liabilities and the deferred taxes relate to the same taxable entity and the same taxation authority.
Borrowing Costs
Borrowing costs directly attributable to the acquisition, construction or production of an asset that necessarily takes a substantial period of time to get ready for its intended use or sale are capitalized as part of the cost of the respective assets. All other borrowing costs are expensed in the period in which they occur. Borrowing costs consist of interest and other costs that an entity incurs in connection with the borrowing of funds. Where the funds used to finance a project form part of general borrowings, the amount capitalized is calculated using a weighted average of rates applicable to relevant general borrowings of the Group during the period. All other borrowing costs are recognized in the consolidated statement of profit or loss in the period in which they are incurred.
Derivative Financial Instruments and Hedge Accounting
Initial Recognition and Subsequent Measurement
We use derivative financial instruments, such as cross currency swaps, to hedge our foreign currency risk. Such derivative financial instruments are initially recognized at fair value on the date on which a derivative contract is entered into and are subsequently remeasured at fair value. Derivatives are carried as financial assets when the fair value is positive and as financial liabilities when fair value is negative.
Any gains or losses arising from changes in the fair value of derivatives are taken directly to profit or loss, except for the effective portion of cash flows hedges, which is recognized in other comprehensive income (“OCI”) and later reclassified to profit or loss when the hedges item affects profit or loss.
For the purpose of hedge accounting, the cross currency swap instrument was classified as cash flow hedge.
At inception of the hedge relationship, we formally designate and document the hedge relationship to which we wish to apply hedge accounting and the risk management objective and strategy for undertaking the hedge. The documentation includes identification of the hedging instrument, the hedged item or transaction, the nature of the risk being hedged and how our management will assess the effectiveness of changes in the hedging instrument’s fair value in offsetting the exposure to changes in the hedged item’s fair value or cash flows attributable to the hedged risk. Such hedges are expected to be highly effective in achieving offsetting changes in fair value or cash flows and are assessed on an ongoing basis to determine that they actually have been highly effective throughout the financial reporting periods for which they were designated.
Hedges that meet the strict criteria for hedge accounting and are between a range of 80 and 125 days of effectiveness, are accounted for as described below:
Cash Flow Hedges
The effective portion of the gain or loss on the hedging instrument is recognized directly in other comprehensive income in the caption “Unrealized gain on cash flow hedge,” while any ineffective portion is recognized immediately in the consolidated statements of profit or loss as finance costs.
Amounts recognized as other comprehensive income are transferred to the consolidated statements of profit or loss when the hedged transaction affects profit or loss, such as when the hedged financial income or financial expense is recognized or when a forecast sale occurs.
If the hedging instrument expires or is sold, terminated or exercised without replacement or rollover, or if its designation as a hedge is revoked, or when the hedge no longer meets the criteria for hedge accounting, any cumulative gain or loss previously recognized in OCI hedge reserve remains separately in equity until the forecast transaction occurs or the foreign currency firm commitment is met.
Non-current assets held for distribution to equity holders of the parent and discontinued operations
The Group classifies non-current assets and disposal groups as held for distribution to equity holders of the parent if their carrying amounts will be recovered principally through a distribution rather than through continuing use. Such non-current assets and disposal groups classified as held for distribution are measured at the lower of their carrying amount and fair value less costs to distribute. Costs to distribute are the incremental costs directly attributable to the distribution, excluding finance costs and income tax expense.
The criteria for held for distribution classification is regarded as met only when the distribution is highly probable and the asset or disposal group is available for immediate distribution in its present condition. Actions required to complete the distribution should indicate that it is unlikely that significant changes to the distribution will be made or that the decision to distribute will be withdrawn. Management must be committed to the distribution expected within one year from the date of the classification.
Assets and liabilities classified as held for distribution are presented separately as current items in the statement of financial position. Discontinued operations are excluded from the results of continuing operations and are presented as a single amount as profit or loss after tax from discontinued operations in the statement of profit or loss. Additional disclosures are provided in Note 1 of the notes to our audited consolidated financial statements filed as part of this annual report. All other notes to the financial statements include amounts for continuing operations, unless indicated otherwise.
Results of Operations
Comparison of Year Ended December 31, 2017 to Year Ended December 31, 2016
| | | | | | | | | | |
| | | Year ended December 31, | | | | |
(amounts in millions of S/) | | 2017 | | | 2016 | | | Variation % | |
| Sales of goods | | | 1,225.6 | | | | 1,240.2 | | | | (1.2 | ) |
| Cost of sales | | | (732.9 | ) | | | (736.6 | ) | | | (0.5 | ) |
| Gross profit | | | 492.7 | | | | 503.6 | | | | (2.2 | ) |
| Operating income (expense): | | | | | | | | | | | | |
| Administrative expenses | | | (195.6 | ) | | | (193.4 | ) | | | 1.1 | |
| Selling and distribution expenses | | | (46.6 | ) | | | (39.9 | ) | | | 16.8 | |
| Impairment on brine project | | | (47.6 | ) | | | — | | | | 100.0 | |
Other operating income (loss) or (expense), net | | | (4.3 | ) | | | 2.4 | | | | (279.2 | ) |
| Total operating expense, net | | | (294.1 | ) | | | (230.8 | ) | | | 27.4 | |
| Operating profit | | | 198.6 | | | | 272.8 | | | | (27.2 | ) |
| Other income (expense): | | | | | | | | | | | | |
| Finance income | | | 5.8 | | | | 3.2 | | | | 79.0 | |
| Finance costs | | | (73.8 | ) | | | (75.4 | ) | | | 2.1 | |
| Loss from exchange difference, net | | | (2.2 | ) | | | (2.5 | ) | | | 12.0 | |
| Total other expenses, net | | | (70.2 | ) | | | (74.7 | ) | | | (6.0) | |
| Profit before income tax | | | 128.4 | | | | 198.1 | | | | (35.2 | ) |
| Income tax expense | | | (47.0 | ) | | | (78.6 | ) | | | (40.2) | |
| Profit for the year from continuing operations | | | 81.4 | | | | 119.5 | | | | (31.9 | ) |
| Profit [loss] for the year from discontinued operations | | | (0.8 | ) | | | (6.6 | ) | | | 87.9 | |
| | | | | | | | | | | | | |
| Profit for the year | | | 80.6 | | | | 112.9 | | | | (28.6 | ) |
Sales of Goods
The following table sets forth a breakdown of our sales of goods by segment for 2017 and 2016:
| | | | | | | | | | | | | |
| | | Year ended December 31, | |
| | | 2017 | | | 2016 | |
| | | (in millions
of S/) | | | % | | | (in millions
of S/) | | | % | |
| Cement, concrete and blocks | | | 1,076.7 | | | | 87.9 | | | | 1,103.4 | | | | 88.9 | |
| Quicklime | | | 80.7 | | | | 6.6 | | | | 75.1 | | | | 6.1 | |
| Construction supplies | | | 66.4 | | | | 5.4 | | | | 59.9 | | | | 4.8 | |
| Other | | | 1.8 | | | | 0.1 | | | | 1.8 | | | | 0.2 | |
| Total sales of goods | | | 1,225.6 | | | | 100.0 | | | | 1,240.2 | | | | 100.0 | |
Our total sales of goods decreased by 1.2%, or S/14.6 million, to S/1,225.6 million in 2017 from S/1,240.2 million in 2016. This decrease was primarily due to the following factors:
| • | a 2.4%, or S/26.8 million, decrease in 2017 in sales of cement, concrete and blocks mainly due to decreased sales of concrete and blocks, mainly due to delays in large infrastructure projects and private construction, partially offset by an increase in sales of cement. |
| • | offset in part by a 7.4%, or S/5.6 million, increase in 2017 in the sales of quicklime, mainly due to an increase in sales volume. |
| • | offset partially by a 10.9%, or S/6.5 million, increase in 2017 in the sale of construction supplies, mainly due to spending by the self-construction segment as families were rebuilding their homes after coastal El Niño. |
The following table sets forth the composition of our sales of cement, concrete and blocks for 2017 and 2016:
| | | | | | | | | | | |
| | | | Year ended December 31, | | | | |
| | | | 2017 | | | 2016 | | | Variation | |
| | | | (in millions
of S/) | | | % | |
| Cement | | | | 949.0 | | | | 924.4 | | | | 2.7 | |
| Concrete | | | | 110.2 | | | | 152.6 | | | | (27.8 | ) |
| Blocks | | | | 17.5 | | | | 26.4 | | | | (33.7 | ) |
| Total | | | | 1,076.7 | | | | 1,103.4 | | | | (2.4 | ) |
| | | | | | | | | | | | | | | |
Our total sales of cement, concrete and blocks decreased by 2.4%, or S/26.7 million, to S/1,076.7 million in 2017 from S/1,103.4 million in 2016. This decrease was primarily due to the following factors:
| • | sales of cement increased by 2.7%, or S/24.6 million in 2017 due to an increase in the average price of cement (1.5%), and higher volume of cement sold (1.2%); |
| • | sales of concrete decreased by 27.8%, or S/42.4 million, in 2017, due to a decrease in volume (18.3%) and a decrease in the average price of concrete (9.5%); and |
| • | sales of blocks decreased by 33.7%, or S/8.9 million, in 2017. During 2016, we sold a new product called “piles” for the upgrade of the Talara refinery, which accounted for S/2.2 million in 2016, and none in 2017. Excluding this product, sales of blocks decreased by 27.8% or S/6.7 million, in 2017, due to a decrease in volume (26.2%) offset by an increase in the average price of blocks (2.0%). |
Cost of Sales
The following table sets forth a breakdown of our cost of sales by segment for 2017 and 2016:
| | | | | | | | | | | | | |
| | | Year ended December 31, | |
| | | 2017 | | | 2016 | |
| | | (in millions
of S/) | | | % | | | (in millions
of S/) | | | % | |
| Cement, concrete and blocks | | | 599.7 | | | | 81.8 | | | | 615.8 | | | | 83.6 | |
| Quicklime | | | 67.0 | | | | 9.2 | | | | 60.9 | | | | 8.3 | |
| Construction supplies | | | 64.6 | | | | 8.8 | | | | 58.7 | | | | 8.0 | |
| Other | | | 1.6 | | | | 0.2 | | | | 1.2 | | | | 0.2 | |
| Total | | | 732.9 | | | | 100.0 | | | | 736.6 | | | | 100.0 | |
Our total cost of sales decreased by 0.5%, or S/3.7 million, to S/732.9 million for 2017, from S/736.6 million for 2016, primarily due to the following factors:
| • | a 2.6%, or S/16.1 million, decrease in the cost of sales of cement, concrete and blocks in 2017, due primarily to a decreased in sales volume of concrete and blocks; |
| • | a 10%, or S/6.1 million, increase in 2017 in the cost of sales of quicklime, due primarily to higher sales volume, higher raw materials costs, higher transportation costs and a slight increase in the price of coal; and |
| • | a 10.1%, or S/5.9 million, increase in 2017 in the cost of sales of construction supplies, mainly due to an increase in sales and the international price of steel. |
The following table sets forth the composition of our cost of sales of cement, concrete and blocks for 2017 and 2016:
| | | | | | | | | | | |
| | | | Year ended December 31, | | | | |
| | | | 2017 | | | 2016 | | | Variation | |
| | | | (in millions
of S/) | | | % | |
| Cement | | | | 496.3 | | | | 489.5 | | | | 1.4 | |
| Concrete | | | | 88.0 | | | | 105.3 | | | | (16.4 | ) |
| Blocks | | | | 15.4 | | | | 21.0 | | | | (26.7 | ) |
| Total | | | | 599.7 | | | | 615.8 | | | | (2.6 | ) |
| | | | | | | | | | | | | | | |
Our cost of sales represented 55.7% of our sales in 2017, compared to 55.8% in 2016. Our total cost of sales of cement, concrete and blocks decreased by 2.6%, or S/16.1 million, in 2017, primarily due to the following factors:
| • | cost of sales of cement increased by 1.4%, or S/6.8 million, in 2017, mainly due to an increase in production cost (1.4)%, due to the El Niño related damages which affected our ability to ship cement and source raw materials; |
| • | a decrease in the cost of sales of concrete of 16.4%, or S/17.3 million, in 2017, due to a decrease in volume sold (18.3%) as well as an increase in production cost (1.8%); and |
| • | during 2016 we sold a new product called piles for the upgrade of the Talara refinery, which accounted for S/1.1 million and none in 2017. Excluding this product, cost of sales of blocks decreased by 22.6% or S/5.2 million in 2017 due to a decrease in volume. |
Gross Profit
The following table sets forth a breakdown of our gross profit and gross profit margin by segment for 2017 and 2016:
| | | | | | | | | | | | | |
| | | Year ended December 31, | |
| | | 2017 | | | 2016 | |
| | | Gross
profit | | | Gross
profit
margin | | | Gross
profit | | | Gross
profit
margin | |
| | | (in millions
of S/) | | | % | | | (in millions
of S/) | | | % | |
| Cement, concrete and blocks | | | 477.0 | | | | 44.3 | | | | 487.7 | | | | 44.2 | |
| Quicklime | | | 13.7 | | | | 17.0 | | | | 14.2 | | | | 18.9 | |
| Construction supplies | | | 1.8 | | | | 2.7 | | | | 1.2 | | | | 2.0 | |
| Other | | | 0.2 | | | | 11.1 | | | | 0.5 | | | | 27.8 | |
| Total gross profit | | | 492.7 | | | | 40.2 | | | | 503.6 | | | | 40.6 | |
Total gross profit decreased by 2.2%, or S/10.9 million, to S/492.7 million in 2017, from S/503.6 million in 2016, mainly because of lower sales of cement, concrete and blocks, higher raw material costs of quicklime, which offset higher sales volumes. Our gross profit margin (i.e., gross profit as a percentage of net sales) for 2017 was 40.2% compared to 40.6% for 2016.
The following table sets forth a breakdown of our gross profit and gross profit margin for the cement, concrete and blocks segment for 2017 and 2016:
| | | | | | | | | | | | | | | | |
| | | Year ended December 31, | | | | |
| | | 2017 | | | 2016 | | | | |
| | | Gross
profit | | | Gross
profit
margin | | | Gross
profit | | | Gross
profit
margin | | | Variation | |
| | | (in millions
of S/) | | | % | | | (in millions
of S/) | | | % | | | percentage
points | |
| Cement | | | 452.7 | | | | 47.7 | | | | 434.9 | | | | 47.0 | | | | 0.7 | |
| Concrete | | | 22.2 | | | | 20.1 | | | | 47.3 | | | | 31.0 | | | | (10.9 | ) |
| Blocks | | | 2.1 | | | | 12.0 | | | | 5.5 | | | | 20.8 | | | | (8.8 | ) |
| Total gross profit | | | 477.0 | | | | 44.3 | | | | 487.7 | | | | 44.2 | | | | (0.1 | ) |
Gross profit margin for cement, concrete and blocks increased by 0.1% percentage points in 2017 compared to 2016. This was due mainly to an increase in cement margin (0.7 percentage points) due to higher sales volume and price, a decrease in the concrete margin (10.9 percentage points) due to lower sales volume and average price because of delays in infrastructure projects, and a decrease in the block margin (8.8 percentage points) mainly due to sales of piles for the Talara refinery in 2016 that did not continue in 2017.
Operating Income (Expense)
Our operating expenses primarily reflect administrative and selling and distribution expenses. In 2017, our operating expenses increased by S/8.9 million to S/242.2 million from S/233.3 million in 2016.
Administrative Expenses
The following table sets forth the composition of our administrative expenses for 2017 and 2016:
| | | | | | | |
| | | Year ended December 31, | |
(in millions of S/) | | 2017 | | | 2016 | |
| Personnel expenses | | | 94.4 | | | | 100.1 | |
| Third-party services | | | 65.4 | | | | 63.0 | |
| Board of directors compensation | | | 6.6 | | | | 6.1 | |
| Depreciation and amortization | | | 14.9 | | | | 12.8 | |
| Taxes | | | 3.8 | | | | 2.9 | |
| Consumption of supplies | | | 2.7 | | | | 2.1 | |
| Donations | | | 7.3 | | | | 5.8 | |
| Others | | | 0.5 | | | | 0.6 | |
| Total | | | 195.6 | | | | 193.4 | |
Our administrative expenses increased by 1.1%, or S/2.2 million, to S/195.6 million in 2017 from S/193.4 million in 2016. Personnel expenses decreased by S/5.7 million mainly due to lower severance payments. On the other hand third party services increased by S/2.4 million mainly due to an increase in legal advisory, labor consultancy and the implementation of the innovation model.
Administrative expenses related to the cement, concrete and blocks segment accounted for approximately 89% of total administrative expenses for 2017 compared to approximately 89.6% for 2016. Administrative expenses related to the quicklime, construction supplies and other segments accounted for approximately 8%, 0.8% and 2.3%, respectively, of total administrative expenses for 2017 compared to approximately 7.5%, 0.5% and 2.4% respectively, for 2016.
Selling and Distribution Expenses
The following table sets forth the components of our selling and distribution expenses for 2017 and 2016:
| | | | | | | |
| | | Year ended December 31, | |
(in millions of S/) | | 2017 | | | 2016 | |
| Personnel expenses | | | 18.0 | | | | 17.1 | |
| Advertising and promotion expenses | | | 19.0 | | | | 15.6 | |
| Other | | | 9.6 | | | | 7.2 | |
| Total | | | 46.6 | | | | 39.9 | |
Our total selling and distribution expenses increased by 16.8%, or S/6.7 million, to S/46.6 million in 2017 from S/39.9 million in 2016, primarily related to an increase in the advertising and promotion expenses budget to successfully defend the Company’s market share.
Selling and distribution expenses related to the cement, concrete and blocks segment represented approximately 95% of total selling and distribution expenses for 2017, compared to 95.4% for 2016. Selling and distribution expenses related to quicklime, the construction supplies and other segments represented approximately 0%, 4.9% and 0.1% respectively, of total selling and distribution expenses for 2017, compared to 0%, 4.1% and 0.5%, respectively, for 2016.
Other Operating Income, Net
Our other operating income, net decreased S/6.7 million, to a loss of S/4.3 million in 2017 from income of S/2.4 million in 2016, mainly due to additional costs incurred resulting from roadway damage caused by the landslides, floods and heavy rains generated by the effects of El Niño.
Impairment on brine project
The Company had decided to prioritize its investments in the development of products related to the manufacture and sale of cement and construction solutions; therefore, the disposal of investments that are not in line with the strategic plan that has been approved. As a result of this decision, in the fourth quarter of 2017, the Company decided not to continue with the brine project and recorded and impairment in the project.
Other Expenses, Net
Our other expenses, net decreased by S/4.5 million, to S/70.2 million in 2017 from S/74.7 million in 2016, mainly due to a decrease in the counterparty risk for the cross-currency swap.
Income Tax Expense
Our income tax expense decreased by 40.2%, or S/31.6 million, to S/47.0 million for 2017 from S/78.6 million for 2016. In December 2016, the Peruvian government approved an increase of the income tax rate from 28% to 29.5% to be effective as of January 1, 2017. This increase resulted in an increase in our deferred income tax liability of S/22.3 million and increased the deferred income tax asset by S/8.5 million (S/14.6 million was recognized as a higher income tax expense in the consolidated statement of profit or loss and S/824,000 as an income in Other Comprehensive Income). Our effective tax rate for 2017 was 36.6%, 39.0% for 2016, and 28.9% for 2015. It was unusually high in 2017 mainly due to the non-deductible expenses related to the impairment on the brine project and in 2016 due to the increase in the future tax rate from 26% to 29.5%.
Profit from continuing operations
As a result of the foregoing, our profit from continuing operations for 2017 decreased by 31.9%, or S/38.1 million, from S/119.5 million for 2016 to S/81.4 million for 2017, mainly due to the impairment on the brine project. The Company decided to prioritize its investments in the development of products related to the production and sale of cement and constructive solutions, for which the disposal of investments that are not in line with the strategic plan has been approved. Because of this decision, in the last quarter of the year the Company decided not to continue with the Salmueras project and consequently wrote-off all of the investment related to this project as of December 2017. This write-off accounted for S/47.6 million, Profit from continuing operations without the impairment would have been S/118.8 million.
Results of Operations
Comparison of Year Ended December 31, 2016 to Year Ended December 31, 2015
| | | | | | | | | | |
| | | Year ended December 31, | | | | |
(amounts in millions of S/) | | 2016 | | | 2015 | | | Variation % | |
| Sales of goods | | | 1,240.2 | | | | 1,231.0 | | | | 0.7 | |
| Cost of sales | | | (736.5 | ) | | | (695.8 | ) | | | 5.8 | |
| Gross profit | | | 503.6 | | | | 535.3 | | | | (5.9 | ) |
| Operating income (expense): | | | | | | | | | | | | |
| Administrative expenses | | | (193.4 | ) | | | (179.7 | ) | | | 7.6 | |
| Selling and distribution expenses | | | (39.9 | ) | | | (31.5 | ) | | | 26.7 | |
| Net gain on sale of available-for-sale financial investment | | | — | | | | — | | | | | |
| Other operating income, net | | | 2.4 | | | | 3.9 | | | | (38.5 | ) |
| Total operating expense, net | | | (230.8 | ) | | | (207.3 | ) | | | 11.3 | |
| Operating profit | | | 272.8 | | | | 328.0 | | | | (16.8 | ) |
| Other income (expense): | | | | | | | | | | | | |
| Finance income | | | 3.2 | | | | 3.4 | | | | (5.9 | ) |
| Finance costs | | | (75.4 | ) | | | (36.8 | ) | | | 104.9 | |
| Gain (loss) from exchange difference, net | | | (2.5 | ) | | | 12.2 | | | | N/M | |
| Total other expenses, net | | | (74.7 | ) | | | (21.2 | ) | | | 252.5 | |
| Profit before income tax | | �� | 198.1 | | | | 306.8 | | | | (35.4 | ) |
| Income tax expense | | | (78.6 | ) | | | (89.4 | ) | | | (12.1 | ) |
| | | | | | | | | | | | | |
| Profit for the year from continuing operations | | | 119.5 | | | | 217.4 | | | | (45 | ) |
| Loss for the year from discontinued operations | | | (6.6 | ) | | | (5.7 | ) | | | 15.8 | |
| Profit for the year | | | 112.9 | | | | 211.7 | | | | (46.7 | ) |
N/M means not meaningful.
Sales of Goods
The following table sets forth a breakdown of our sales of goods by segment for 2016 and 2015:
| | | | | | | | | | | | | |
| | | Year ended December 31, | |
| | | 2016 | | | 2015 | |
| | | (in millions
of S/) | | | % | | | (in millions
of S/) | | | % | |
| Cement, concrete and blocks | | | 1,103.4 | | | | 88.9 | | | | 1,089.2 | | | | 88.5 | |
| Quicklime | | | 75.1 | | | | 6.1 | | | | 64.1 | | | | 5.2 | |
| Construction supplies | | | 59.9 | | | | 4.8 | | | | 75.6 | | | | 6.1 | |
| Other | | | 1.8 | | | | 0.2 | | | | 2.1 | | | | 0.2 | |
| Total sales of goods | | | 1,240.2 | | | | 100.0 | | | | 1,231.0 | | | | 100.0 | |
Our total sales of goods increased by 0.7%, or S/9.2 million, to S/1,240.2 million in 2016 from S/1,231.0 million in 2015. This increase was primarily due to the following factors:
| ● | a 1.3%, or S/14.2 million, increase in 2016 in sales of cement, concrete and blocks as a result of strong growth from sales to the public sector during the first months of the year, despite a slowdown after this period; |
| ● | a 17.2%, or S/11.0 million, increase in 2016 in sales of quicklime, due to increased sales volume; and |
| ● | offset in part by a 20.8%, or S/15.7 million, decrease in 2016 in the sale of construction supplies, due to increased competition in this segment and a general slowdown in the construction sector. |
The following table sets forth the composition of our sales of cement, concrete and blocks for 2016 and 2015:
| | | | | | | | | | | |
| | | | Year ended December 31, | | | | |
| | | | 2016 | | | 2015 | | | Variation | |
| | | | (in millions
of S/) | | | % | |
| Cement | | | | 924.4 | | | | 928.7 | | | | (0.5 | ) |
| Concrete | | | | 152.6 | | | | 123.9 | | | | 23.1 | |
| Blocks | | | | 26.4 | | | | 36.5 | | | | (27.7 | ) |
| Total | | | | 1,103.4 | | | | 1,089.2 | | | | 1.3 | |
| | | | | | | | | | | | | | | |
Our total sales of cement, concrete and blocks increased by 1.3%, or S/14.2 million, to S/1,103.4 million in 2016 from S/1,089.2 million in 2015. This increase was primarily due to the following factors:
| ● | sales of cement decreased slightly by 0.5%, or S/4.3 million, in 2016 due to an increase in the average price of cement (1.5%), offset by lower sales volume of cement (2.0%); |
| ● | sales of concrete increased by 23.2%, or S/28.7 million, in 2016 due to an increase in sales volume (11.7%) and an increase in the average price of concrete (11.5%); and |
| ● | partially offset by a 27.7%, or S/10.1 million, decrease in sales of blocks, in 2016. During 2015, we introduced a new product called “piles” that was supplied to the developer for the upgrade of the Talara oil refinery project being developed on behalf of Petroperú, which accounted for S/11.6 million and S/2.2 million in 2016. Excluding this product, sales of blocks in 2016 decreased by 2.9%, or S/0.7 million, due to decreased volume (6.9%) offset by an increase in the average price of blocks (4.0%). |
Cost of Sales
The following table sets forth a breakdown of our cost of sales by segment for 2016 and 2015:
| | | | | | | | | | | | | |
| | | Year ended December 31, | |
| | | 2016 | | | 2015 | |
| | | (in millions
of S/) | | | % | | | (in millions
of S/) | | | % | |
| Cement, concrete and blocks | | | 615.8 | | | | 83.6 | | | | 572.0 | | | | 82.2 | |
| Quicklime | | | 60.9 | | | | 8.3 | | | | 49.0 | | | | 7.0 | |
| Construction supplies | | | 58.7 | | | | 8.0 | | | | 73.1 | | | | 10.5 | |
| Other | | | 1.2 | | | | 0.2 | | | | 1.7 | | | | 0.2 | |
| Total | | | 736.5 | | | | 100.0 | | | | 695.8 | | | | 100.0 | |
Our total cost of sales increased by 5.9%, or S/40.8 million, to S/736.6 million for 2016, from S/695.8 million for 2015, primarily due to the following factors:
| ● | a 7.7%, or S/43.8 million, increase in the cost of sales of cement, concrete and blocks in 2016, due primarily to increased depreciation from the Piura plant; |
| ● | a 24.3%, or S/11.9 million, increase in 2016 in the cost of sales of quicklime, due primarily to higher sales volume; and |
| ● | offset in part by a 19.7%, or S/14.4 million, decrease in 2016 in the cost of sales of construction supplies, due to a decrease in sales volume and lower price paid for steel bars. |
The following table sets forth the composition of our cost of sales of cement, concrete and blocks for 2016 and 2015:
| | | | | | | | | | | |
| | | | Year ended December 31, | | | | |
| | | | 2016 | | | 2015 | | | Variation | |
| | | | (in millions
of S/) | | | % | |
| Cement | | | | 489.5 | | | | 460.2 | | | | 6.4 | |
| Concrete | | | | 105.3 | | | | 87.9 | | | | 19.8 | |
| Blocks | | | | 21.0 | | | | 23.9 | | | | (12.1 | ) |
| Total | | | | 615.8 | | | | 572.0 | | | | 7.7 | |
| | | | | | | | | | | | | | | |
Our cost of sales represented 55.8% of our sales in 2016, compared to 52.5% in 2015. Our total cost of sales of cement, concrete and blocks increased by 7.7%, or S/43.8 million, in 2016, primarily due to the following factors:
| ● | cost of sales of cement increased by 6.4%, or S/29.3 million, in 2016, mainly due to a 2.0% decrease in sales volume of cement offset by an 8.4% increase in production cost, due to the higher depreciation expense of the Piura plant; |
| ● | an increase in the cost of sales of concrete of 19.8%, or S/17.4 million, in 2016, due to an 11.7% increase in sales volume as well as a 8.1% increase in production cost; and |
| ● | offset by a 12.1%, or S/2.9 million, decrease in the cost of sales of blocks in 2016. Excluding the S/6.3 million increase in cost of sales of piles sold to the Talara refinery in 2015 and S/1.2 million in 2016, cost of sales of blocks increased by 11.9%, or S/2.1 million in 2016, due primarily to a 6.9% decrease in sales volume offset by a 18.8% increase in production cost. |
Gross Profit
The following table sets forth a breakdown of our gross profit and gross profit margin by segment for 2016 and 2015:
| | | | | | | | | | | | | |
| | | Year ended December 31, | |
| | | 2016 | | | 2015 | |
| | | Gross
profit | | | Gross
profit
margin | | | Gross
profit | | | Gross
profit
margin | |
| | | (in millions
of S/) | | | % | | | (in millions
of S/) | | | % | |
| Cement, concrete and blocks | | | 487.7 | | | | 44.2 | | | | 517.3 | | | | 47.5 | |
| Quicklime | | | 14.2 | | | | 18.9 | | | | 15.1 | | | | 23.6 | |
| Construction supplies | | | 1.2 | | | | 2.0 | | | | 2.5 | | | | 3.3 | |
| Other | | | 0.5 | | | | 27.8 | | | | 0.4 | | | | 19.0 | |
| Total gross profit | | | 503.6 | | | | 40.6 | | | | 535.3 | | | | 43.5 | |
Gross profit decreased by 5.9%, or S/31.7 million, to S/503.6 million in 2016 from S/535.3 million in 2015 mainly as a result of, increased depreciation from the Piura plant, and to a lesser extent due to a 6.0%, or S/0.9 million decrease in gross profit from the quicklime segment in 2016 that resulted from a decrease in sales of the higher priced product during the year, despite an overall increase in sales volume. Our gross profit margin (gross profit as a percentage of net sales) for 2016 was 40.6% compared to 43.5% for 2015.
The following table sets forth a breakdown of our gross profit and gross profit margin for the cement, concrete and blocks segment for 2016 and 2015:
| | | | | | | | | | | | | | | | |
| | | Year ended December 31, | | | | |
| | | 2016 | | | 2015 | | | | |
| | | Gross
profit | | | Gross
profit
margin | | | Gross
profit | | | Gross
profit
margin | | | Variation | |
| | | (in millions
of S/) | | | % | | | (in millions
of S/) | | | % | | | percentage
points | |
| Cement | | | 434.9 | | | | 47.0 | | | | 468.6 | | | | 50.4 | | | | (3.4 | ) |
| Concrete | | | 47.3 | | | | 31.0 | | | | 36.0 | | | | 29.1 | | | | 1.9 | |
| Blocks | | | 5.5 | | | | 20.8 | | | | 12.7 | | | | 34.5 | | | | (13.7 | ) |
| Total gross profit | | | 487.7 | | | | 44.2 | | | | 517.3 | | | | 47.5 | | | | (3.3 | ) |
Gross profit margin for the cement, concrete and blocks segment decreased 3.3 percentage points in 2016 compared to 2015. This was due mainly to a decrease in cement margin (3.4 percentage points) that resulted from increased depreciation from the Piura plant, a 13.7 percentage point decrease in the margin of our blocks segment attributable to sales of piles for the Talara refinery in 2015, partially offset by a 1.9 percentage point increase in concrete margin that resulted primarily from higher prices and dilution of fixed costs that resulted from increased demand during the first nine months of the year.
Operating Income (Expense)
Our operating expenses primarily reflect administrative and selling and distribution expenses. In 2016, our operating expenses increased by S/23.6 million to S/230.9 million in 2016 from S/207.3 million in 2015.
Administrative Expenses
The following table sets forth the composition of our administrative expenses for 2016 and 2015:
| | | | | | | |
| | | Year ended December 31, | |
(in millions of S/) | | 2016 | | | 2015 | |
| Personnel expenses | | | 100.1 | | | | 94.1 | |
| Third-party services | | | 63.0 | | | | 56.7 | |
| Board of directors compensation | | | 6.1 | | | | 7.1 | |
| Depreciation and amortization | | | 12.8 | | | | 10.7 | |
| Taxes | | | 2.9 | | | | 2.2 | |
| Consumption of supplies | | | 2.1 | | | | 2.4 | |
| Donations | | | 5.8 | | | | 6.1 | |
| Others | | | 0.6 | | | | 0.4 | |
| Total | | | 193.4 | | | | 179.7 | |
Our administrative expenses increased by 7.6%, or S/13.7 million, to S/193.4 million in 2016 from S/179.7 million in 2015. Personnel expenses increased by S/6.0 million, primarily as a result of higher severance payments and third-party services increased by S/6.4 million mainly due to an increase in consulting services in IT, environment and security, and logistics services for the Piura plant, among others.
Administrative expenses related to the cement, concrete and blocks segment accounted for approximately 89.6% of total administrative expenses for 2016 compared to approximately 90.1% for 2015. Administrative expenses related to the quicklime, construction supplies and other segments accounted for approximately 7.5%, 0.5% and 2.4% respectively, of total administrative expenses for 2016 compared to approximately 6.3%, 0.7% and 2.9% respectively, for 2015.
Selling and Distribution Expenses
The following table sets forth the components of our selling and distribution expenses for 2016 and 2015:
| | | | | | | |
| | | Year ended December 31, | |
(in millions of S/) | | 2016 | | | 2015 | |
| Personnel expenses | | | 17.1 | | | | 16.2 | |
| Advertising and promotion expenses | | | 15.6 | | | | 8.5 | |
| Other | | | 7.2 | | | | 6.8 | |
| Total | | | 39.9 | | | | 31.5 | |
Our total selling and distribution expenses increased by 26.7%, or S/8.4 million, to S/39.9 million in 2016 from S/31.5 million in 2015, primarily related to an increase in advertising and promotion expenses invested to protect our market share in light of decreased sales volumes during the year.
Selling and distribution expenses related to the cement, concrete and blocks segment represented approximately 95.4% of total selling and distribution expenses for 2016, compared to 94.3% for 2015. Selling and distribution expenses related to quicklime, the construction supplies and other segments represented approximately 0%, 4.1% and 0.5% respectively, of total selling and distribution expenses for 2016, compared to 0%, 4.8% and 0.9%, respectively, for 2015.
Other Operating Income, Net
Our other operating income, net decreased S/1.5 million, to S/2.4 million in 2016 from S/3.9 million in 2015.
Other Expenses, Net
Our other expenses, net increased by S/53.5 million, to S/74.7 million in 2016 from S/21.2 million in 2015, mainly due to an increase in finance cost, due to the termination of borrowing cost capitalization following the conclusion of the Piura plant project, and to an adverse exchange rate effect since we held cash in dollars, which depreciated in relation to the sol, resulting in a loss of S/2.5 million, compared to a gain of S/12.2 million in 2015.
Income Tax Expense
Our income tax expense decreased by 12.0%, or S/10.8 million, to S/78.6 million for 2016 from S/89.4 million for 2015. In December 2016, the Peruvian government approved an increase of the income tax rate from 28% to 29.5% to be effective as of January 1, 2017. This increase resulted in an increase in our deferred income tax liability of S/22.3 million and increased the deferred income tax asset by S/8.5 million (S/14.6 million was recognized as a higher income tax expense in the consolidated statement of profit or loss and S/824,000 as income in Other Comprehensive Income). Our effective tax rate for 2016 was 39.0%, and 28.9% for 2015.
Profit from Continuing Operations
As a result of the foregoing, our profit from continuing operations for 2016 decreased by 45.0%, or S/97.9 million, from S/217.4 million for 2015 to S/119.5 million for 2016.
| B. | Liquidity and Capital Resources |
Our main cash requirements are our operating expenses, capital expenditures relating to the maintenance and expansion of our facilities, the servicing of our debt, the payment of dividends and payment of taxes. Our primary sources of cash have been cash flow from operating activities, and our issuance of Senior Notes and, to a lesser extent, loans and other financings. We believe that these sources of cash will be sufficient to cover our working capital needs in the ordinary course of our business.
Cash Flows
The table below sets forth certain components of our cash flows for the years ended December 31, 2017, 2016 and 2015.
| | | | | | | | | | |
| | | Year ended December 31, | |
(in millions of S/) | | 2017 | | | 2016 | | | 2015 | |
| Net cash flows from operating activities (1) | | | 250.4 | | | | 241.7 | | | | 275.6 | |
| Net cash flows from (used in) investing activities (1) | | | (70.6 | ) | | | (135.6 | ) | | | (475.9 | ) |
| Net cash flows from (used in) financing activities (1) | | | (185.4 | ) | | | (177.5 | ) | | | (257.8 | ) |
| Increase (decrease) in cash | | | 5.6 | | | | (71.4 | ) | | | (458.1 | ) |
| (1) | Includes continuing and discontinued operations. For detail on cash flow from discontinued operations please see Item 18. Financial Statements – Consolidated Statements of Cash Flow. |
Cash Flows from Operating Activities
Net cash flow from operating activities increased by 3.6% or S/8.7 million, to S/250.4 million in 2017 from S/241.7 million in 2016, mainly due to a decrease in income tax payments.
Net cash flow from operating activities decreased by 12.3% or S/33.9 million, to S/241.7 million in 2016 from S/275.6 million in 2015, due primarily to a decrease in our operating income.
Net cash flow from operating activities increased by 14.6% or S/35.2 million, to S/275.6 million in 2015 from S/240.4 million in 2014, due primarily to an increase in operating income.
Cash Flows used in Investing Activities
Net cash flow used in investing activities were S/70.6 million for 2017, and were primarily related to maintenance capex for our cement plants and purchase of equipment for concrete and aggregates equipment.
Net cash flow used in investing activities were S/135.6 million for 2016, and were primarily related to investments related to the new cement plant in Piura.
Net cash flows used in investing activities were S/475.9 million for 2015, and were primarily related to the purchase of property, plant and equipment for the Piura plant net of the income derived from the sale of real estate assets.
Cash Flows used in Financing Activities
Net cash flows used in financing activities were S/185.4 million for 2017, and were primarily due to dividends paid to our shareholders.
Net cash flows used in financing activities were S/177.5 million for 2016, and were primarily due to dividends paid to our shareholders.
Net cash flows used in financing activities were S/257.8 million for 2015, and were primarily due to dividends paid to our shareholders and the buyback of investment shares.
Indebtedness
As of December 31, 2017, we had total outstanding indebtedness of S/972.3 million (US$300 million). As of December 31, 2017, we maintain cross currency swap hedging agreements for US$300 million to manage foreign exchange risks related to our U.S. dollar-denominated debt. The adjusted debt by hedge is S/913.3 million (US$281.8 million).
| | | | | | | | | |
(amounts in millions of S/) | | As of
December 31,
2017 | | | Interest
rate | | | Maturity
date |
| 4.50% Senior Notes due 2023 | | | 972.3 | | | | 4.5 | % | | February 8, 2023 |
International Bonds.In February 2013, we issued US$300,000,000 of our 4.50% Senior Notes due 2023 in our inaugural international bond offering. A portion of the proceeds from this offering were used to prepay amounts outstanding on our secured loan agreement with BBVA Banco Continental, and the remaining proceeds was used in capital expenditures incurred in connection with the construction and operation of the new Piura plant and our cement business. The notes were issued pursuant to Rule 144A under the Securities Act and in compliance with Regulation S under the Securities Act, and listed on the Irish Stock Exchange.
The indenture pursuant to which the notes were issued contains certain covenants, including restrictions on our and our restricted subsidiaries’ ability to incur further indebtedness or issue disqualified stock and preferred stock, unless the following conditions are met:
| • | the fixed charge coverage ratio for our most recently ended four fiscal quarters for which internal financial statements are available immediately preceding the date on which such additional indebtedness is incurred or such disqualified stock or such preferred stock is issued, as the case may be, would have been at least 2.5 to 1.0; and |
| • | the consolidated debt to adjusted EBITDA ratio for our most recently ended four fiscal quarters for which internal financial statements are available immediately preceding the date on which such additional indebtedness is incurred or such disqualified stock or such preferred stock is issued, as the case may be, would have been no greater than 3.5 to 1.0, |
in each case, determined on a pro forma basis (including a pro forma application of the net proceeds therefrom), as if the additional indebtedness had been incurred or the disqualified stock or the preferred stock had been issued, as the case may be, at the beginning of such four fiscal quarters. The indenture also contains restrictions on our ability and that of our restricted subsidiaries to incur liens and to merge, consolidate or transfer all or substantially all of our assets.
In management’s opinion, we were in compliance with all of applicable covenants as of the date of this annual report.
The subsidiaries that guarantee the notes are those related to our cement business namely, Cementos Selva S.A., Distribuidora Norte Pacasmayo S.R.L., Empresa de Transmisión Guadalupe S.A.C., Dinoselva Iquitos S.A.C. and Calizas del Norte S.A.C., in liquidation.
Derivative Financial Instruments
As of December 31, 2017, we maintain cross currency swap hedging agreement in aggregate principal amount of US$300 million to hedge against the foreign exchange risks associated with our U.S. dollar-denominated debt.
Capital Expenditures
See “Item 4—Information on the Company—A. History and Development of the Company—Capital Expenditures.”
| C. | Research and Development, Patents and Licenses, Etc. |
As of December 31, 2017, our research and development group consisted of 10 geologists. Our research and development team is mainly focused on developing (i) an ideal mix of additives for our cement products in an effort to reduce the amount of clinker material in our cement; (ii) other concrete products with various practical applications; and (iii) products with specific characteristics that meet market demands. We believe our research and development department is an integral part of our strategy to develop innovative cement products by continuously studying the chemical composition of cement and making it adaptable to the requirements and specific needs of our end consumer.
Cement Market
The Peruvian Cement Market
Peru’s cement production is segmented into three principal geographic regions: the northern region, the central region, including Lima’s metropolitan area, and the southern region. The table below sets forth selected data with respect to each region in Peru and the corresponding cement manufacturers. Market share data is based on metric tons of cement delivered during 2017.
Geographic Breakdown
| Northern Region (thousands of metric tons) | | | | | |
| Plant | | 2013 | | | 2014 | | | 2015 | | | 2016 | | | 2017 | | | % share | |
| C. Pacasmayo | | | 2,110 | | | | 2,051 | | | | 2,022 | | | | 2,004 | | | | 1,981 | | | | 18.6 | % |
| C. Selva | | | 240 | | | | 296 | | | | 288 | | | | 281 | | | | 286 | | | | 2.7 | % |
| Imports | | | 34 | | | | 40 | | | | 12 | | | | | | | | 38 | | | | 0.4 | % |
| Total | | | 2,384 | | | | 2,387 | | | | 2,322 | | | | 2.285 | | | | 2,305 | | | | 21.7 | % |
| | | | | | | | | | | | | | | | | | | | | | | | | |
| Central Region (thousands of metric tons) | | | | | | | | | |
| Plant | | 2013 | | | 2014 | | | 2015 | | | 2016 | | | 2017 | | | % share | |
| UNACEM | | | 5,612 | | | | 5,701 | | | | 5,546 | | | | 5,110 | | | | 4,993 | | | | 46.8 | % |
| Caliza Inca | | | 288 | | | | 383 | | | | 357 | | | | 347 | | | | 387 | | | | 3.6 | % |
| Imports | | | 465 | | | | 461 | | | | 507 | | | | 490 | | | | 313 | | | | 2.9 | % |
| Total | | | 6,365 | | | | 6,545 | | | | 6,410 | | | | 5,947 | | | | 5,693 | | | | 53.3 | % |
| | | | | | | | | | | | | | | | | | | | | | | | | |
| Southern Region (thousands of metric tons) | | | | | | | | | |
| Plant | | 2013 | | | 2014 | | | 2015 | | | 2016 | | | 2017 | | | % share | |
| Grupo Yura | | | 2,515 | | | | 2,600 | | | | 2,480 | | | | 2,645 | | | | 2,618 | | | | 24.6 | % |
| Total | | | 2,515 | | | | 2,600 | | | | 2,480 | | | | 2,645 | | | | 2,618 | | | | 24.6 | % |
| Total Regions | | | 11,264 | | | | 11,532 | | | | 11,212 | | | | 10,877 | | | | 10,616 | | | | 100.0 | % |
Sources: ASOCEM, INEI, ADUANET (SUNAT).
The table below sets forth production by type of cement produced by each manufacturer in Peru:
| | | | | | | | | | | | | | | |
| | | Portland Cement | | Other Portland Cements |
Business | | I | | II | | V | | IP | | I(PM) | | MS | | I Co |
| UNACEM | | ✓(1) | | ✓(1) | | ✓(1) | | ✓ | | ✓ | | | | |
| Cementos Pacasmayo | | ✓ | | ✓(2) | | ✓ | | ✓ | | | | ✓(2) | | ✓ |
| Cementos Selva | | ✓(1) | | ✓(1),(3) | | ✓(1),(3) | | | | | | | | ✓ |
| Cementos Sur | | ✓ | | ✓(2) | | ✓(2) | | ✓ | | ✓ | | | | |
| Yura | | ✓ | | ✓(2) | | ✓(2) | | ✓ | | ✓ | | | | |
Source: ASOCEM
| (2) | Our Portland cement II is the same as our type MS/MH/R cement. |
| (3) | Manufactured upon request. |
Although a large part of housing construction is mainly concentrated in the Lima metropolitan area, located in the central region of Peru, the housing market in the provinces of Peru, including the northern region, has grown significantly in recent years. Despite this trend, Peru continues to have significant shortages in housing, estimated by the INEI at 1.9 million homes nationwide. Economic growth, particularly in the mining and agribusiness sectors, rising employment levels and the implementation of real estate projects, have resulted in the creation of higher paying jobs, which have ultimately resulted in the expansion of the housing market.
Although Peru has improved by 38 places on the Global Competitiveness Index prepared by the World Economic Forum which measures the quality of infrastructure, among other things, from 110th place in 2008 to 72nd in 2017, it continues to have a significant deficit in infrastructure. In recent years, significant efforts have been made to channel investments into the infrastructure sector through a series of initiatives that range from the creation of financial instruments (such as the infrastructure investment and trust funds) to regulatory changes, to promotion of more public private partnerships (for example “taxes for infrastructure” which allows private companies to use part of their tax payments to directly finance infrastructure works).
Distribution and Logistics
Peru’s cement market is divided into three regions circumscribed primarily by the location of established production facilities. Our facilities are located in the northern region of Peru, UNACEM controls the central region, and Yura the southern region. Cement is mainly sold in bags of 42.5 kilograms (approximately 94 pounds). However, cement can also be sold in bulk according to customer requirements.
The transportation and storage of cement requires specialized equipment. A favorable location of the production facilities not only reduces the time required to transport cement products to distributors and third-party merchants but also diminishes the costs of necessary equipment and resources. The location of a cement plant relative to its distribution network provides operational efficiencies and advantages that translate into stronger market share.
Cement can be stored in silos for up to 12 months if the silo is completely humidity proof. The typical vehicles used for the transport of cement are adapted to maintain the necessary environment during shipment. The proximity of production plants and storage centers to distribution centers, third-party vendors and retail outlets, creates a more efficient supply chain and minimizes the time and resources required to transport products from the production line to the construction site. The streamlined nature of this process ensures that cement products in the northern region of Peru, for example, reach customers within approximately one week of production. A cement company’s success is inherently linked to the sophistication of its distribution network and its emphasis on quality assurance throughout the supply chain.
Competitive Dynamics
The Peruvian cement market is comprised basically of three groups and one small plant, which own six cement producing companies:
| • | Cementos Pacasmayo and Cementos Selva, which principally serve the northern region; |
| • | UNACEM, which principally serves the central region; |
| • | Cementos Yura and Cementos Sur, which primarily serve the southern region; and |
| • | Caliza Cemento Inca, located in Cajamarquilla, Lima which principally serves the central region. |
The level of competitiveness of cement companies generally depends on their cost structure, which is a function of the cost of energy, fuel, costs of raw materials and transportation. Cement companies in Peru generally compete within the limits of their distribution market, which is determined principally by their geographic locations.
The following are the main characteristics of the cement sector in Peru:
| • | highly fragmented consumer base; |
| • | relatively low cost of energy and raw materials; |
| • | operations and distribution primarily determined by geographic location; and |
| • | high correlation toauto-construcción and public and private investments. |
| E. | Off-Balance Sheet Arrangements |
There are no off-balance sheet arrangements that have, or are reasonably likely to have, a current or future material effect on our results of operations, financial condition or liquidity.
| F. | Tabular Disclosure of Contractual Obligations |
The following table sets forth our contractual obligations with definitive payment terms as of December 31, 2017.
| | | | | | | | | | | | | | | | |
| | | Payments due by period | | | | |
(in millions of S/) | | Less than
1 Year | | | 1-3 Years | | | 3-5 Years | | | More than
5 Years | | | Total | |
| Debt adjusted by hedge (principal portion)(1) | | | — | | | | — | | | | — | | | | 913.3 | | | | 913.3 | |
| Interest payments | | | 43.8 | | | | 87.6 | | | | 87.6 | | | | 21.9 | | | | 240.9 | |
| Hedge commission | | | 26.1 | | | | 52.2 | | | | 52.2 | | | | 13.0 | | | | 143.5 | |
| Energy Supply (2) | | | 6.0 | | | | — | | | | — | | | | — | | | | 6.0 | |
| Total | | | 75.9 | | | | 139.8 | | | | 139.8 | | | | 948.2 | | | | 1,303.7 | |
| (1) | Does not include issuance costs. |
| (2) | Relates to take-or-pay contracts for the supply of gas to Cementos Pacasmayo. |
In addition, we have various mining fees and royalties payable to the government and third parties in connection with our concessions and surface land use.
See “Part I—Introduction—Forward-Looking Statements.”
| ITEM 6. | DIRECTORS, SENIOR MANAGEMENT AND EMPLOYEES |
| A. | Directors and Senior Management |
General
Our business and affairs are managed by the board of directors in accordance with our by-laws and Peruvian Corporate Law No. 26887 (“Peruvian Corporate Law”). Our by-laws provide for a board of directors of between seven and eleven members. Between three and five alternate directors may be elected by the shareholders to act on behalf of any director who is absent from meetings or who is unable to exercise his or her duties, when and for whatever period fixed by the chairman of the board. Alternate directors have the same responsibilities, duties and powers of directors to the extent they are called to replace them.
Directors are elected at a shareholders’ meeting and hold office for three years. Directors may be elected to multiple terms. Our current board of directors is composed of nine directors and two alternates. If a director resigns or otherwise becomes unable to continue with the duties, a majority of our directors may appoint one of the alternate directors to serve as director for the remaining term of the board. In the first board meeting held after the annual shareholders’ meeting where members of the board are elected, the board of directors must elect among its members a chairman and a vice chairman.
The board of directors typically meets in regularly scheduled bi-monthly meetings and when called by the chairman of the board or a person representing the chairman. Resolutions must be adopted by a majority of the directors present at the meeting and the chairman is entitled to cast the deciding vote in the event of a tie.
Duties and Liabilities of Directors
Pursuant to Article 177 of Peruvian Corporate Law, directors are jointly and severally liable to a corporation, shareholders and third parties for any damages caused by abuse of power, fraud, willful misconduct or gross negligence. In addition, pursuant to Article 3 of Law No. 29720, as of June 26, 2011, directors of companies listed on the Lima Stock Exchange are also strictly liable for any damages caused as a result of any transactions in which they were involved and which resulted in damages or other losses to the corporation. A director cannot be found liable if the director expressed disagreement at the time the vote was cast or upon learning of such transaction and if there is a record expressing such opposition.
Our by-laws prohibit a director from voting on matters in which such director has an interest. In addition, Article 180 of the Peruvian Corporate Law requires a director with a conflicting interest on a specific matter to disclose such interest and abstain from the deliberation and decision-making process with respect to such matter. A director who violates this requirement is liable for any damages caused to us and may be removed by a majority of the board of directors upon request of any member of the board or by a majority vote of the shareholders.
Our by-laws stipulate that Directors’ compensation is determined by the Mandatory Annual General Shareholders’ Meeting at the time it reviews our annual audited financial statements. The fixed portion of the Chairman’s compensation shall be twice the amount allocated to any other director. If directors are part of one or more Committees, their compensation may include an additional amount for the work performed as members of such Committees. The additional compensation of the directors may not exceed the aggregate fixed portion of the compensation that the directors are entitled to receive. Our by-laws do not restrict Directors from voting upon matters relating to their own compensation.
Our by-laws do not prohibit our directors from borrowing from us. However, Article 179 of the Peruvian Corporate Law provides that directors of a company may enter into an agreement with such company only if the related loan agreement relates to operations the company performs in the regular course of business and in an arms’-length transaction. Further, a company may provide a loan to a director or grant securities in such director’s favor only in connection with operations that the company usually performs with third parties. Agreements, credits, loans or guarantees that do not meet the requirements set forth above require prior approval from at least two thirds of the members of the Company’s Board of Directors. Directors are jointly liable to the company and the Company’s creditors for contracts, credit, loans or securities executed or granted without complying with Article 179 of the Peruvian Corporate Law.
Neither our by-laws nor Peruvian Corporate Law contain age limit requirements for the retirement or non-retirement of directors.
Board of Directors
The following sets forth our directors and alternate directors and their respective positions as of the date of this annual report. On March 24, 2017, the Annual Shareholder’s meeting was held and new directors were elected for the period 2017-2020. On December 19, 2017, Mr. Dionisio Romero Paoletti, Director, submitted his resignation to the Board of Directors. On February 12, 2018, Mr. Juan Francisco Correa Sabogal was appointed as his replacement.
| | | | | |
Name | | Position | | Year of
Birth |
| Eduardo Hochschild Beeck | | Chairman of the Board | | 1963 |
| José Raimundo Morales Dasso | | Vice Chairman of the Board | | 1946 |
| Juan Francisco Correa Sabogal | | Director | | 1974 |
| Roberto Dañino Zapata | | Director | | 1951 |
| Carlos Miguel Heeren Ramos | | Director | | 1968 |
| Humberto Nadal Del Carpio | | Director, Chief Executive Officer | | 1964 |
| Hilda Ochoa-Brillembourg | | Director | | 1945 |
Felipe Ortíz de Zevallos Madueño | | Director | | 1947 |
| Marco Antonio Zaldívar Garcia | | Director | | 1960 |
| Robert Patrick Bredthauer | | Alternate director | | 1947 |
Manuel Bartolomé Ferreyros Peña | | Alternate director, Chief Financial Officer | | 1966 |
The following sets forth selected biographical information for each of the members of our board of directors. The business address of each of our current directors is Calle La Colonia 150, Urb. El Vivero, Surco, Lima, Peru.
Eduardo Hochschild Beeck. Mr. Hochschild serves as Director since April 1991 and is currently Chairman of the Board. He holds a Mechanical Engineering degree from Tufts University, Boston, United States. Mr. Hochschild is also the President of Hochschild Mining plc, Inversiones ASPI S.A. and the Board of Trustees of UTEC and TECSUP. He is also Director of Banco de Crédito del Perú, El Pacífico Peruano-Suiza Compañía de Seguros y Reaseguros, Fosfatos del Pacífico, Sociedad de Comercio Exterior del Perú (COMEX Perú), and of the National Society of Mining, Petroleum and Energy (Sociedad Nacional de Minería, Petroleo y Energía). In addition, he is Vice-Chairman of the Silver Trust of Peru, and an expert consultant of the Economic Counsel of the Episcopal Conference.
José Raimundo Morales Dasso. Mr. Morales serves as Director since March 2008. He holds a Bachelor degree in Economics and Business Administration from Universidad del Pacífico and a Master in Business Administration from Wharton Business School, University of Pennsylvania, United States. Between 1970 and 1980 he worked in different positions on the Bank of America and Wells Fargo Bank. In 1980, he started to work at Banco de Crédito del Perú and served senior management positions. Mr. Morales worked as the Chief Executive Officer of Banco de Crédito del Perú from October 1990 to April 2008. Currently, he is Chairman of the Board of Atlantic Security Bank, Vice Chairman of the Board of Credicorp Ltd., Banco de Crédito del Perú and El Pacífico Peruano-Suiza Compañía de Seguros y Reaseguros. In addition, he is member of the Board of Directors Salmueras Sudamericanas, Fosfatos del Pacífico, Alicorp S.A.A., Pesquera Centinela S.A., Grupo Romero, Cerámica Lima S.A., Corporación Cerámica S.A., and Inversiones y Propiedades S.A. He is also a board member of the Peruvian Institute of Economics.
Juan Francisco Correa Sabogal. Mr. Correa serves as Director since February 2018. He completed Business Administration studies at Universidad de Lima and has an MBA from Wharton Business School, University of Pennsylvania. He was Managing Director with Lazard Freres LLC at its Midwest Advisory practice until July 2017, following a career of more than 11 years with that firm. Mr. Correa was one of the founding members of the practice and responsible for establishing the business and developing its client base in the U.S. Midwest across a variety of industries. Prior to that, Mr. Correa was a Director in Lazard’s Power, Energy & Infrastructure group out of New York, covering a variety of sub-sectors. Mr. Correa also held a number or responsibilities in connection to Lazard’s efforts in Latin America and was a member of the Board of Directors of MBA Lazard (Lazard’s former joint venture for Spanish speaking Latin America). Prior to joining Lazard, Mr. Correa held positions with RWE/Thames Water, Merrill Lynch and Banco de Crédito del Peru. In addition, Mr. Correa has advised a broad number of U.S. and international corporations in matters that are not in the public domain related to strategic and M&A activity, and corporate finance topics.
Roberto Dañino Zapata. Mr. Dañino serves as Director since 1995. In July 2001, he resigned from the Board of Directors to take office as Prime Minister of the Peruvian Government, before rejoining the Board in June 2008. He is an attorney-at-law graduated from the schools of Law of Harvard University and Pontificia Universidad Católica del Perú. Mr. Dañino was the Ambassador of Peru to the United States and Senior Vice-President and General Counsel of the World Bank. He has also been Partner and Chairman of the Latin American Practice at Wilmer, Cutler & Pickering, Washington D.C. (now Wilmer Hale). He is currently Chairman of Everis (Peru) and Independent Director of Inversiones Centenario, Results for Development and LUMNI, as well as member of the Advisory Board of UBER Technologies, Open Society Foundation, and Goldman Sachs.
Carlos Heeren Ramos.Mr. Heeren serves as Director since March 2017. He is Executive Director of the University of Engineering and Technology (UTEC) and TECSUP, as well as Director in different nonprofit companies and organizations. He holds a bachelor’s degree in economics from Universidad del Pacífico, with a master degree in economics from the University of Texas at Austin. He previously served as partner in APOYO Consultoría. He is also Director of San Fernando, Interbank, Talma, Montana and other non-profit companies and institutions.
Humberto Reynaldo Nadal Del Carpio.Mr. Nadal joined our company as Corporate Development Manager in June 2007 and has served as our Director since March 2008 and Chief Executive Officer since April 2011. He has a Bachelor degree in Economics from Universidad del Pacífico and a Master degree in Business Administration from Georgetown University. He is the representative of Cementos Pacasmayo in the General Management of ASPI, Fosfatos del Pacífico S.A. and Salmueras. Moreover, he is Chairman of the Board of Trustees of Universidad del Pacífico, Director of Ferreycorp and has been Chairman of the Board of Directors of Fondo Mivivienda. In April 2006, he joined Compañía Minera Ares S.A.C. (a subsidiary of Hochschild Mining plc) as Corporate Development Manager. Mr. Nadal has also served as Business, Administration and Finance Manager of the Instituto Libertad y Democracia and Chief Executive Officer at Socosani S.A. He was recognized by Institutional Investor magazine as one of the three best CEO’s in the construction industry of Latin America for 2014, 2015, 2016 and 2017.
Hilda Ochoa-Brillembourg. Mrs. Ochoa-Brillembourg was appointed as a Director of Cementos Pacasmayo S.A.A. in October 2011. She holds a Bachelor of Science degree in Economics fromUniversidad Católica Andres Bello of Venezuela, a Master’s degree in Public Administration and is a Business Administration PhD candidate from Harvard Business School. She is the founder, and since 1987, President and Executive Director, of Strategic Investment Group and a group of affiliated investment management firms. In 2014 she was appointed Chairperson of the Board of Directors. From 1976 to 1987, she was Chief Investment Officer of the Pension Investment Division at the World Bank. Mrs. Ochoa- Brillembourg is on the Board of Directors of S&P Global, where she is also a member of its audit and financial policy committees.Independent Director.
Felipe Ortíz de Zevallos. Mr. Ortiz de Zevallos studied at the Universidad Nacional de Ingeniería in Lima, at the University of Rochester in New York and at Harvard Business School. He is the founder and chairperson of Grupo Apoyo since 1977. Mr. Ortiz de Zevallos served as Ambassador of Peru to the United States from 2006 to 2009 where he was responsible for negotiating the US Congress’ approval of the Free Trade Agreement between both countries. He has been professor at Universidad del Pacífico and served as said university’s President from 2004 a 2006. He is currently an independent board member of various companies and non-profit organizations. In addition, he is currently President of theAsociación Civil Transparencia (Transparency Civil Association). He has received numerous awards, such as the IPAE Award in 1990, the Journalism Jerusalem Prize in 1998 and the Manuel J. Bustamante de la Fuente Award in 2008. In 2009, the Lima Chamber of Commerce paid tribute to Mr. Ortiz de Zevallos for these contributions to the social and economic development of Peru, and in 2011 the Ministry of Economy and Finance awarded him with the “Hipólito Unanue” award for his contributions to the country’s economic and financial development. He was “ad honorem” advisor to the President Kuczynski between August 2016 and December 2017.Independent Director.
Marco Antonio Zaldívar.Mr. Zaldívar is Chairman of the Board of the Lima Stock Exchange. He is a Certified Public Accountant, graduated from the University of Lima and the General Management Program at PAD, Universidad de Piura. He holds an MBA from the Adolfo Ibañez School of Management (USA). Previously, at Ernst & Young, he was a Partner of Risk Management and Regulatory Matters, Senior Partner of the Firm’s Audit and Business Advisory Division. He has also been Vice Dean of the Lima Public Accountants’ Association, President of the Board of Directors and Chairman of the Procapitales Corporate Governance Committee. He is currently Independent Director of Banco Santander del Perú, Edpyme Santander Consumo and Unión de Cervecerías Peruanas Backus y Johnston, among other positions, highlighting his extensive experience in corporate governance issues.Independent Director.
Robert Patrick Bredthauer. Mr. Bredthauer has been an alternate director since March 2003. He has a degree in Business Administration from Hochschule St. Gallen and a commerce degree from the École Supérieure de Commerce, La Neuveville, and the École Supérieure de Commerce, Lausanne, both in Switzerland. Since 1976, he acted as Vice-President of Finance and Executive Vice-President of Cemento Nacional C.A. (Guayaquil, Ecuador) and prior to that was the regional Controller for Holderbank Management and Consulting in Nyon, Switzerland. Independent Alternate Director.
Manuel Bartolomé Ferreyros Peña.Mr. Ferreyros has been an alternate director since March 2008 and our Chief Financial Officer since January 2008. He is member of the Board of Directors of Fosfatos del Pacífico. Mr. Ferreyros has a Bachelor degree in Business Administration from Universidad de Lima, a Multinational MBA at the Adolfo Ibañez School of Management, Miami and a Master’s in Business Administration from The College of Insurance in New York. Mr. Ferreyros has pursued the Advanced Management Program at Instituto Centroamericano de Administración de Empresas - INCAE and the CEO Management Program at Kellogg University, among others. Prior to joining Cementos Pacasmayo, Mr. Ferreyros was Chief Executive Officer of La Positiva Seguros y Reaseguros. He was recognized by Institutional Investor magazine as one of the three best CFO’s in the construction industry of Latin America for 2014, 2015, 2016 and 2017.Alternate Director.
Executive Officers
Our executive officers oversee our business and are responsible for the execution of the decisions of the board of directors. The following table presents information concerning the current executive officers of the company and their respective positions:
| | | | | | | |
Name | | Position | | Year of
Birth | | Year of
Appointment |
| Humberto Nadal Del Carpio | | Chief Executive Officer | | 1964 | | 2011 |
| Jorge Javier Durand Planas | | General Counsel | | 1966 | | 2008 |
| Manuel Bartolomé Ferreyros Peña | | Chief Financial Officer | | 1966 | | 2008 |
| Carlos Julio Pomarino Pezzia | | Vice President, Cement and Building Solutions Business | | 1962 | | 2009 |
| Aldo Bertoli Estrella | | Commercial Director | | 1969 | | 2016 |
| Carlos Paul Cateriano Alzamora | | Corporate Social Responsibility Director | | 1957 | | 2006 |
| Martin Ferraro Murdock | | Innovation Director | | 1982 | | 2016 |
| Rodolfo Ricardo Jordan Musso | | Infrastructure and Engineering Director, Cement Business | | 1952 | | 2009 |
| Tito Alberto Inope Mantero | | Building Solutions Director | | 1972 | | 2015 |
| Joaquin Larrea Gubbins | | Special Projects Director | | 1974 | | 2011 |
| Diego Reyes Pazos | | Supply Chain Director | | 1977 | | 2013 |
| Hugo Villanueva Castillo | | Operations Director, Pacasmayo and Rioja Cement Plant | | 1962 | | 2012 |
The following sets forth selected biographical information for each of our executive officers:
Humberto Reynaldo Nadal Del Carpio.See “Item 6. Directors, Senior Management and Employees—A. Directors and Senior Management—Board of Directors.”
Jorge Javier Durand Planas. Mr. Durand joined the Hochschild Group in 1994 and has been our General Counsel since 2008. Previously, he was General Counsel of Hochschild Mining plc. He holds a Law degree from Universidad de Lima (Peru), and a Master’s in Business Administration from the Universidad del Pacífico (Peru). Among other studies, he has also completed the Management Program for Lawyers and the Corporate Governance and Performance Program at the Yale School of Management (USA). Mr. Durand currently also is a board member of Salmueras, Inversiones Aspi S.A. and Cementos Selva S.A. and he is member of the Board Committee of UTEC and TECSUP. In addition, Mr. Durand is alternate director of the National Confederation of Private Business Associations (CONFIEP).
Manuel Bartolomé Ferreyros Peña. See “Item 6. Directors, Senior Management and Employees—A. Directors and Senior Management—Board of Directors.”
Carlos Julio Pomarino Pezzia. Mr. Pomarino acts as Vice President, Cement and Building Solutions Business since January 2012. He has a degree in Economic Engineering from Universidad Nacional de Ingeniería and a Master in Business Administration from Adolfo Ibañez School of Management and ESAN, pursued the Advanced Management Program at the Universidad de Piura and completed the Certification of Independent board members at Centrum Católica. He served as Commercial Officer of our Company from 2002 to 2009 and as Chief Executive Officer of Distribuidora Norte Pacasmayo S.R.L. from 1998 to 2009. Prior to joining our Company, Mr. Pomarino worked as Administration and Finance Manager at Comercializadora de Alimentos S.A. and as Chief Financial Officer at Fábrica de Tejidos San Jacinto S.A.
Aldo Bertoli Estrella.Mr. Bertoli acts as Commercial Director since May 2016. He has a degree in Business Administration from Universidad Pacífico and a Master’s in Business Management from Universidad de Piura. Before joining the company he worked for five years as Sales Manager in Perú – Ecuador- Bolivia at Pepsico Inc., he previously spent 12 years at Procter & Gamble in various commercial positions including four years in Bolivia as Country Manager.
Carlos Paul Cateriano Alzamora. Mr. Cateriano acts as Corporate Social Responsibility Director since June 2012. Previously, he was Human Resources Manager from 2006 to 2012. He studied Mechanical Engineering at the Pontificia Universidad Católica del Peru and has pursued different studies in the Advanced Management Program at the Universidad de Piura. Prior to joining our company, Mr. Cateriano worked as Human Resources Deputy Manager at Banco Wiese Sudameris S.A. (acquired by Scotiabank Perú S.A.A.) from 1999 to 2006. In addition, he has worked as Head of Training at Banco Santander Perú S.A., and as a consultant at Polimeros y Adhesivos S.A.
Martin Ferraro Murdock. Mr. Ferraro serves as Innovation Director since July 2016. He holds a degree on Business Administration and Finance from the Universidad Peruana de Ciencias Aplicadas - UPC (Peruvian University of Applied Sciences) and a Master in Business Administration (MBA) from Stanford Graduate School of Business. Mr. Ferraro joined our Company in January 2004 and since then has served in different positions, most recently as Commercial Manager between June 2012 and December 2014, and Finance, IT and Administration Manager between January 2015 and June 2016.
Rodolfo Ricardo Jordan Musso. Mr. Jordan serves as Engineering and Infrastructure Director since January 2015. Previously he was Industrial Development Manager. He has a degree in Civil Engineering from Universidad Católica del Perú and pursued an Advanced Management Program at the Universidad de Piura. Prior to joining our Company he served as Chief Executive Officer of the Mexican affiliate of Graña & Montero Ingenieros Consultores. From 2007 through 2009 he served as Marketing Manager of Distribuidora Norte Pacasmayo S.R.L.
Tito Alberto Inope Mantero.Mr. Inope serves as Building Solutions Director since January 2015. He is an economist, graduated from Universidad de Lima and has an MBA from the Universidad Peruana de Ciencias Aplicadas (UPC). Mr. Inope has worked at our company since 1996 and has held different management positions during the past 18 years.
Joaquin Larrea Gubbins.Mr. Larrea serves as Special Projects Director since October 2016. He holds a degree in Business Administration from Universidad de Lima (University of Lima) and a Master in Business Administration from the Kellogg School of Management. Prior to joining our Company, Mr. Larrea worked as Corporate Development Director of General Electric for Peru, Ecuador and Bolivia. At Cementos Pacasmayo, he served as Business Manager of the Zinc Division for one year, as our Corporate Finance Head for five years, and as Central Manager of Corporate Development for five years.
Diego Reyes Pazos. Mr. Reyes serves as Supply Chain Director since July 2013. He has extensive experience in the supply chain, project development, design and implementation of systems/processes and financial analysis. He graduated with a degree in Business Administration from the University of Lima and received an MBA from the University of Piura. Before joining our Company, Mr. Reyes worked as Operations and Finance Manager at Belcorp, as Senior Business Process Expert for Latin America at SAB Miller, Project Manager in the Vice Presidency of Supply Chain at UCP Backus & Johnston, among others.
Hugo Pedro Villanueva Castillo. Mr. Villanueva serves as Operations Director for the Pacasmayo and Rioja cement plant since January 2012. Previously he was Operations Manager for Cementos Selva S.A. for over nine years. Mr. Villanueva has worked at our Company for over 20 years, holding different positions. Mr. Villanueva holds a Master degree in Business from EGADE and has taken coursework at the General Management Program at PAD, Universidad de Piura and Program for Senior Management at INCAE in Costa Rica. He has also participated in different specialty programs in the industry.
As of December 31, 2017, the total short term compensations amounted to S/22,705,000 (2016: S/21,752,000) and the total long term compensations amounted to S/11,401,000 (2016: S/16,088,000). This compensation included payments made in connection with the workers’ profit sharing required under Peruvian labor laws, which require us to distribute between 8% and 10% of our taxable annual income, net of taxes, to all employees, including our executive officers. See “Item 4. Information on the Company—B. Business Overview—Regulatory Matters” for additional information on the profit sharing regulatory requirements.
In 2011, we decided to pay each of our directors a yearly compensation of US$200,000 (US$400,000 in the case of our Chairman). In addition, compensation paid to certain of our directors for serving on board committees will be, in aggregate per year, not higher than the total amount paid to our directors for serving on our board of directors. Our 2017 director compensation was approved at our annual shareholders’ meeting.
Neither we nor any of our subsidiaries have entered into any agreement that provides for any benefit or compensation to any director or executive officer after expiration of his or her term.
Executive Compensation Plan
Our business operates in a competitive environment where highly trained professionals and executives are in demand. Continued expansion of the Peruvian economy over the past several years has created new opportunities resulting in additional competition for local talent. As a result, we have in place compensation plan to retain our key executives and attract new executives with the skills and experience required to achieve our strategic objectives and create long-term value for our shareholders. We believe that executive compensation should reward individual performance and the achievement of our strategic objectives.
Our executive compensation plan has been designed to achieve the following primary objectives:
| • | recruit, retain and incentivize highly talented and dedicated executives with the skills and experience required to manage and operate our business and create long-term value for our shareholders; |
| • | provide our executive officers with compensation opportunities that are fair, reasonable and competitive in the market; |
| • | compensate based on our performance and individual performance; |
| • | promote transparency by using clear and straightforward compensation metrics; and |
| • | align the interests of our executive officers with the interests of our shareholders, both in the short-term and long-term. |
Our executive compensation plan is in addition to workers’ profit sharing requirements applicable to all of our employees, including our executive officers, under Peruvian labor laws.
Our compensation plan has been designed to compensate our executives through a combination of base salary, a cash bonus incentive and other benefits that we believe are fair and equitable to us and our shareholders and competitive in the market. We believe that the combination of salary, cash bonus incentive and other benefits help distinguish us from other companies in the cement industry in Peru, and serve as an important retention tool as we compete for executive talent. We also believe that it will provide an appropriate compensation structure to retain our executives, reward them for individual performance, and induce them to contribute to the creation of long-term value.
Components of Executive Compensation
The key components of our executive compensation plan are:
| • | short-term cash bonus incentives; and |
| • | long-term cash bonus incentives. |
We believe that the use of few and straightforward compensation components promotes the effectiveness and transparency of our executive compensation plan and enables us to be competitive. No formula or specific weightings or relationships are used to allocate the various components in our executive compensation plan. Each component has an important role in implementing our executive compensation philosophy and in meeting the executive compensation objectives described above.
Base Salary
We compensate our executive officers and other employees with a base salary to compensate them for services rendered on a day-to-day basis during the fiscal year. Base salaries provide stable compensation to executives, allow us to recruit and retain highly talented and dedicated executives and, through periodic merit increases, provide a basis upon which executives may be rewarded for individual performance.
Short-Term Cash Bonus Incentives
As a key component of our compensation plan, we currently provide our executive officers the opportunity to earn annual cash bonuses based on the achievement of our short-term business objectives. As additional cash compensation that is contingent on achieving our business objectives, cash incentives augment the base salary component while being tied directly to corporate and individual performance objectives.
Long-Term Cash Bonus Incentives
In addition, as a tool to promote retention of our executive officers, we have implemented a deferred cash incentive program that we believe aligns compensation with corporate performance, allows us to recruit and retain competent executive talent, and rewards for superior performance measured over the long-term. Our plan provides for the payment of bonuses in addition to the annual bonuses that are paid to our executive officers.
Our long-term bonus incentive program features the following key components:
| • | available to senior executives who have been employed by our company at this level for at least four years; |
| • | at the end of each year, the cash bonus will be accrued in a “personal virtual account” for the benefit of the relevant executive; |
| • | on the fifth or sixth anniversary of the creation or beginning of the bonus plan, the relevant executive will receive the amount accrued during the first four years; |
| • | additional annual bonuses will be accrued for the following four years and a final payout will be made at the end of the eighth year from the creation or beginning of the plan; and |
| • | if the employee decides to voluntarily leave the company before a scheduled distribution, he will not receive this compensation. |
Our plan provides that the executive must meet the following eligibility criteria:
| • | must be no older than 58 years at the time his or her participation in the incentive program begins; |
| • | must have at least four years as senior executives with either our company, or our subsidiaries or affiliates; |
| • | is a professional who is deemed to have characteristics that are attractive to the market; and |
| • | the executive’s departure is deemed by the board of directors or a committee thereof to have an adverse effect on our performance. |
For information about the date of expiration of the current term of office and the period during which each director has served in such office, see “Item 6. Directors, Senior Management and Employees—A. Directors and Senior Management.”
Benefits upon Termination of Employment
There are no contracts providing for benefits to directors upon termination of employment
Board Committees
We have four board committees comprised of members of our board of directors, which are described below.
Executive Committee
Our by-laws permit us to delegate an executive committee composed of three to five members of the board of directors. Mr. Eduardo Hochschild Beeck (chair), Mr. Roberto Dañino Zapata, Mr. Raimundo Morales Dasso and Mr. Humberto Nadal del Carpio are currently members of our executive committee. Our executive committee is mainly responsible for (i) supervising and supporting our management in executing the resolutions passed by our board of directors, (ii) executing the strategy approved by our board of directors, (iii) meeting short-term and medium-term goals, as well as designing action plans to meet such goals in accordance with the long-term strategy and goals approved by our board of directors, (iv) approving agreements or transactions involving amounts greater than US$3 million but less than US$20 million, (v) monitoring compliance with the annual budget and approving any significant deviations from approved levels of working capital, (vi) making strategic decisions that do not rise to the level of a full board approval, and (vii) approving and executing new projects in amounts up to US$20 million.
Our executive committee also performs the functions of a compensation committee.
Antitrust Best Practices Committee
The antitrust best practices committee is composed of three members:Mr. Raimundo Morales Dasso, Mr. Humberto Nadal del Carpio and Mr. Eduardo Hochschild Beeck. The antitrust best practices committee is responsible for informing our employees about our competition best practices and for monitoring compliance with such practices, including compliance with antitrust regulations.
Audit Committee
Our audit committee is composed of three directors: Ms. Hilda Ochoa-Brillembourg, who is the chairman of the audit committee, Mr. Felipe Ortiz de Zevallos and Mr. Marco Antonio Zaldívar. All of the members of the audit committee qualify as independent in accordance with the SEC rules applicable to foreign private issuers. Ms. Hilda Ochoa-Brillembourg and Mr. Marco Antonio Zaldívar also qualify as financial experts under SEC rules. The audit committee is responsible for (i) reviewing our financial statements; (ii) evaluating our internal controls and procedures, and identifying deficiencies; (iii) the appointment, compensation, retention; and (iv) oversight of our external auditors. Additionally, it is responsible for informing our board of directors regarding any issues that arise with respect to the quality or integrity of our financial statements, our compliance with legal or regulatory requirements, the performance and independence of the external auditors, or the performance of the internal audit function; and overseeing measures adopted as a result of any observations made by our shareholders, directors, executive officers, employees or any third parties with respect to accounting, internal controls and internal and external audit, as well as any complaints regarding management irregularities, including anonymous and confidential methods for addressing concerns raised by employees.
Corporate Governance Committee
Our corporate governance committee is composed of four directors. The current members are Mr. Felipe Ortiz de Zevallos (chair), Mr. Humberto Nadal del Carpio, Mr. Roberto Dañino Zapata and Mr. Eduardo Hochschild Beeck. The corporate governance committee is responsible for assisting the board on its oversight of director nomination and committee assignments, as well as the board and CEO successions. Similarly, it is responsible for assisting in the implementation of the committee and board self-assessment surveys and the review of governance principles.
As of December 31, 2017, we had a total of 1,386 permanent employees. The following table sets forth a breakdown of our employees by category as of the periods indicated.
| | | | | | | | | | |
| | | As of December 31, | |
| | | 2017 | | | 2016 | | | 2015 | |
| Management | | | 35 | | | | 30 | | | | 35 | |
| Administrative personnel | | | 1,032 | | | | 1,004 | | | | 1,002 | |
| Plant workers | | | 319 | | | | 297 | | | | 507 | |
| Total (1) | | | 1,386 | | | | 1,331 | | | | 1,544 | |
| (1) | Workers from our social venture Acuícola Los Paiches S.A.C. are excluded from these calculations. |
As of December 31, 2017, approximately 10.1% of our employees were members of labor unions (Sindicato Único de Trabajadores de Cementos Pacasmayo S.A.A) that represents its members in collective bargaining negotiations. Our management and administrative personnel are not members of a labor union. Labor relations for unionized and non-unionized employees in our production facilities, including compensation and benefits, are governed by a collective bargaining agreement that is renewed annually. In February 2016, three-year Union Agreements were signed with our union.
Under Peruvian law, it is illegal to lay off employees without cause or without following certain formal procedures. In addition, employees who are laid off are entitled to severance payments upon termination of their employment in an amount equal to one and a half month’s salary for each full year of work performed with a maximum payment equal to 12 monthly salaries provided they are indefinite term employees. In case of fixed term employment relationship the severance payment is equal to 1.5 monthly salaries for each month, until the completion of the contract, with a maximum of 12 monthly salaries.
Our employees are enrolled in either the national public pension fund or a privately managed pension fund. In both cases the applicable payment (approximately 13%) is withheld by the employer from the employees’ monthly salary. As of December 31, 2017, approximately 11.4% of our employees were enrolled with the national public pension fund and 89.5% with a private social pension plan.
We believe we have a good relationship with our employees. In the past, we have not experienced any material strikes, work stoppages or any other significant disruptions.
As of March 31, 2018, persons who are currently members of our board of directors and our executive officers held as a group 836,149 of our common shares and no investment shares (not including common shares held by Mr. Eduardo Hochschild through ASPI). This amount represented less than 1% of our outstanding share capital as of March 31, 2018. Mr. Eduardo Hochschild through ASPI indirectly controls 211,985,547 common shares.
Mr. Humberto Nadal, Mr. Raimundo Morales, Mr. Roberto Dañino, Mr. Carlos Heeren, Mr. Carlos Pomarino and Mr. Martín Ferraro own individually and in the aggregate less than 1% of our common shares.
| ITEM 7. | MAJOR SHAREHOLDERS AND RELATED PARTY TRANSACTIONS |
As of March 31, 2018, our issued and outstanding share capital was composed of 423,868,449 common shares. In addition, as of March 31, 2018, we had 40,278,894 non-voting investment shares outstanding, 36,040,497 of which were held in treasury.
The following table sets forth the beneficial ownership of our common shares and non-voting investment shares as of March 31, 2018.
| | | | | | | | | | | | | | | | | | | |
| | | As of March 31, 2018 | |
| | | Common shares | | | Investment shares | | | Total | |
Shareholder | | Number of
shares | | | Percentage | | | Number of
shares | | | Percentage | | | Number of
shares | | | Percentage | |
| ASPI(1) | | | 211,985,547 | | | | 50.01 | % | | | — | | | | — | | | | 211,985,547 | | | | 45.67 | % |
| CPSAA (treasury shares) | | | — | | | | — | | | | 36,040,497 | | | | 89.48 | % | | | 36,040,497 | | | | 7.76 | % |
| RI—Fondo 2 (AFP Prima) | | | 15,272,426 | | | | 3.60 | % | | | — | | | | — | | | | 15,272,426 | | | | 3.29 | % |
| RI—Fondo 3 (AFP Prima) | | | 11,979,550 | | | | 2.83 | % | | | — | | | | — | | | | 11,979,550 | | | | 2.58 | % |
| Directors and officers(2) | | | 836,149 | | | | 0.20 | % | | | — | | | | — | | | | 836,149 | | | | 0.18 | % |
| American Depositary Receipt Program | | | 70,097,971 | | | | 16.54 | % | | | — | | | | — | | | | 70,097,971 | | | | 15.10 | % |
| Other shareholders | | | 113,696,806 | | | | 26.82 | % | | | 4,238,397 | | | | 10.52 | % | | | 117,935,203 | | | | 25.41 | % |
| Total | | | 423,868,449 | | | | 100.00 | % | | | 40,278,894 | | | | 100.00 | % | | | 461,147,343 | | | | 100.00 | % |
| (1) | ASPI is indirectly controlled by Mr. Eduardo Hochschild through Farragut Holdings, Inc. (Cayman Islands). Mr. Eduardo Hochschild is a member of the board of directors of our company. The shares expressed here include those held through ASPI. |
| (2) | See “Item 6. Directors, Senior Management and Employees—Share Ownership” for information regarding shares of our common stock owned by members of our board of directors and executive officers. The number of common shares held by directors and executive officers excludes any shares that may be deemed to be beneficially owned by Mr. Eduardo Hochschild through ASPI. |
Changes in Ownership
The following sets forth the composition of ownership from December 31, 2013 to December 31, 2017.
| | | | | | | | | | | | | | | | |
| | | As of December 31, | |
Shareholder | | 2017 | | | 2016 | | | 2015 | | | 2014 | | | 2013 | |
| ASPI | | | 45.67 | % | | | 45.67 | % | | | 45.67 | % | | | 50.94 | % | | | 50.94 | % |
| CPSAA (treasury shares) | | | 7.76 | % | | | 6.41 | % | | | 6.41 | % | | | — | | | | — | |
| IN—Fondo 2 (AFP Integra) | | | — | | | | — | | | | — | | | | 1.05 | % | | | 1.05 | % |
| RI—Fondo 2 (AFP Prima) | | | 3.29 | % | | | 4.19 | % | | | 5.10 | % | | | 4.66 | % | | | 4.71 | % |
| RI—Fondo 3 (AFP Prima) | | | 2.58 | % | | | 3.12 | % | | | 4.29 | % | | | 4.29 | % | | | 4.78 | % |
| HO-Fondo 3 (AFP Horizonte) | | | — | | | | — | | | | — | | | | — | | | | — | |
| HO-Fondo 2 (AFP Horizonte) | | | — | | | | — | | | | — | | | | — | | | | — | |
| IN—Fondo 3 (AFP Integra) | | | — | | | | — | | | | — | | | | 0.78 | % | | | 0.78 | % |
| PR—Fondo 2 (AFP Profuturo) | | | — | | | | — | | | | — | | | | 0.86 | % | | | 0.86 | % |
| PR—Fondo 3 (AFP Profuturo) | | | — | | | | — | | | | — | | | | 0.50 | % | | | 0.50 | % |
| American Depositary Receipt Program | | | 15.10 | % | | | 16.23 | % | | | 16.66 | % | | | 18.13 | % | | | 18.38 | % |
| Other shareholders | | | 25.41 | % | | | 24.38 | % | | | 21.87 | % | | | 18.79 | % | | | 18.00 | % |
| Total | | | 100.00 | % | | | 100.00 | % | | | 100.00 | % | | | 100.00 | % | | | 100.00 | % |
On March 24, 2014, Mr. Eduardo Hochschild sold 1,310 of our common shares.
On October 14 and 15, 2015, ASPI sold 9,863,277 and 4,036,723, respectively, of our common shares. On October 15, 2015, we bought back 37,276,580 investment shares, which we currently hold in treasury.
On January 19, 2017, our management approved the buyback of an additional 7,911,845 investment shares, which we currently hold in treasury.
On March 1, 2018, we spun-off a portion of the net assets (consisting of the assets and liabilities) related to Fosfatos del Pacífico S.A. to Fossal S.A.A. (“FOSSAL”), and as a result our capital stock was reduced by approximately S/107,593,030, from S/531,461,479 to S/423,868,449.
Differences in Voting Rights
Our major shareholders do not have different voting rights.
Securities Held in the Host Country
On February 7, 2012, we completed our initial public offering of 20,000,000 ADSs, each representing five common shares, in the United States. On March 2, 2012, we sold an additional 2,296,800 ADSs pursuant to an over-allotment option granted to the underwriters in that offering. Our ADSs are listed on the New York Stock Exchange. As of March 31, 2018, we estimate that there were 13,922,305 ADSs outstanding, which represented 16.42% of our common shares outstanding as of such date. As of December 31, 2017, the number of record holders of our common shares (or ADSs representing our common shares) that file Form 13-Fs in the United States was 17.
Arrangements for Change in Control
We are not aware of any arrangements that may, when in force, result in a change in control.
| B. | Related Party Transactions |
Peruvian Law Concerning Related Party Transactions
Under Peruvian law, board members and executive officers of a publicly-held company may not (i) engage in transactions with the company or any related party of the company, except for transactions entered into in the ordinary course of business and on an arm’s length basis, (ii) appropriate for their own benefit a business opportunity that belongs to the company, or (iii) participate in any transaction or decision that presents a conflict of interest with the company.
Peruvian law sets forth certain restrictions and limitations on transactions with certain related parties.
For instance, from a tax standpoint, the value of those transactions must be equal to the fair market value assessed under transfer pricing rules (i.e., the value agreed to by non-related parties under the same or similar circumstances). Similarly, companies with securities registered in the Peruvian Public Registry of Securities (Registro Público del Mercado de Valores), such as us, are required to comply with the following rules:
| • | The directors and managers of the company cannot, without the prior authorization of the board of directors, (i) receive in the form of a loan money or assets of the company; or (ii) use, for their own benefit or for the benefit of related parties, assets, services or credits of the company. |
| • | The execution of agreements that involve at least 5% of the assets of the company with persons or entities related to directors, managers or shareholders that own, directly or indirectly, 10% of the share capital, requires the prior authorization of the board of directors (with no participation of the director involved in the transaction, if any). |
| • | The execution of agreements with a party controlled by the company’s controlling shareholder requires the prior authorization of the board of directors and an evaluation of the terms of the transaction by an external independent company (audit companies or other to be determined by the Peruvian Securities Commission). |
The external independent company that reviews the transaction should not be related to the parties involved therein, nor to directors, managers or shareholders that own at least 10% of the share capital of the company.
Related Party Transactions
As a general policy, we do not enter into transactions with related parties, including our board members and officers, on terms more favorable than what we would offer third parties. Any related party transaction we have entered into in the past has been in the ordinary course of business and on an arm’s length basis.
As of December 31, 2017, we had an accounts receivable balance with ASPI, our controlling shareholder, in the amount of S/641,000 (US$197,470).
The following transactions have been entered into by us with related parties:
| • | We lease a plot of land adjacent to our headquarters to our affiliate, Compañía Minera Ares S.A.C., a subsidiary of Hochschild Mining plc. We received rental payments of, S/330,000 in 2015, and S/326,000 in 2016 and S/336,000 in 2017. |
| • | We lease part of our headquarters as office space to ASPI and its affiliates. We received rental payments of S/334,000 in 2015; and S/374,000 in 2016; and S/386,000 in 2017. |
| • | We provide back office management and administrative services to ASPI and its affiliates, for which we received S/505,000 in 2015; and S/1,103,000 in 2016; and S/1,560,000 in 2017. |
| • | We receive security services from our affiliate Compañía Minera Ares S.A.C., a subsidiary of Hochschild Mining plc. We paid a total of S/1,146,000 in 2015; and S/1,301,000 in 2016; and S/1,195,000 in 2017 for these services. |
ASPI and Hochschild Mining plc are majority-owned and controlled, directly and indirectly, by Mr. Eduardo Hochschild.
For more information about our related-party transactions please see note 25 to our annual consolidated financial statements included elsewhere in this annual report.
| C. | Interests of Experts and Counsel |
Not applicable.
| ITEM 8. | FINANCIAL INFORMATION |
| A. | Consolidated Statements and Other Financial Information. |
See Item 19. — Exhibits.
Legal and Administrative Proceedings
From time to time, we may become subject to various legal and administrative proceedings that are incidental to the ordinary conduct of our business. We are currently not party to any material legal or administrative proceedings.
Dividends and Dividend Policy
Our ability to pay dividends is subject to our results of operations for each year. Holders of our common shares and investment shares are entitled to receive dividends on a pro rata basis in accordance with their respective number of shares held.
Under our dividend policy, shareholders must take the following factors into consideration prior to declaring dividends: our financial and economic condition, including committed and budgeted expenses and obligations, and previously approved investments. In addition, our dividend policy states that (a) our board of directors may declare advanced dividends based on either the net income resulting from financial statements prepared for such purpose or the cumulative net income corresponding to previous years, provided that shareholders delegated such authority to the board of directors, and (b) holders of common shares representing no less than 20% of our total share capital may request the distribution of dividends up to 50% of the net income corresponding to the previous year, net of any legal reserve requirements. Our board of directors makes a recommendation at the annual shareholders’ meeting with respect to the amount and timing of dividend payments, if any, to be made on our common shares and investment shares.
Under Peruvian law, companies may distribute up to 100% of their profit (after payment of income tax) subject to a 10% legal reserve until the legal reserve equals 20% of shareholders’ equity. According to Article 40 of the Peruvian Corporate Law, in order to distribute dividends, profits must be determined in accordance with the individual financial statements of the company.
Payment of Dividends
Dividends are paid to holders of our common shares and investment shares, as of a record date determined by us. In order to allow for the settlement of securities, under the rules of the Peruvian Securities Commission, investors who purchase shares of a publicly-held company three business days prior to a dividend payment date do not have the right to receive such dividend payment. Dividends on issued and outstanding common shares and investment shares are distributed pro rata.
Holders of common shares and investment shares are not entitled to interest on accrued dividends. In addition, under Article 232 of the Peruvian Corporate Law, the right to collect accrued dividends declared by a publicly-held company expires 10 years from the original dividend payment date.
Previous Dividend Payments
The following table sets forth the amounts of cash dividends declared and paid from 2012 through the date hereof for our common shares and our investment shares.
| | | | | | | | |
Year ended December 31, | | | Dividends paid | | | Per share
(in S/) | |
| 2017 | | | | 149,837,396 | | | | 0.35000 | |
| 2016 | | | | 155,236,000 | | | | 0.28500 | |
| 2015 | | | | 162,950,000 | | | | 0.28000 | |
| 2014 | | | | 116,393,000 | | | | 0.20000 | |
| 2013 | | | | 58,196,000 | | | | 0.10000 | |
| 2012 | | | | 52,000,000 | | | | 0.08935 | |
At the annual shareholders’ meeting held on March 27, 2018, the shareholders of the Company approved the financial statements for fiscal year 2017 including the net income for such year and delegated to the Board of Directors the authority to decide the distribution of dividends from the retained earnings account and fiscal year 2018 operating results.
We are not aware of any changes bearing upon our financial condition since the date of the financial statements included in this annual report.
| ITEM 9. | THE OFFER AND LISTING |
| A. | Offer and Listing Details |
Market Price of Our Common Shares and ADSs
Our ADSs
On February 7,2012, we completed our initial public offering of 20,000,000 ADSs, each representing five common shares, in the United States. On March 2, 2012, we sold an additional 2,296,800 ADSs pursuant to an over-allotment option granted to the underwriters in that offering.
Our ADSs are listed on the New York Stock Exchange under the symbol “CPAC.” On April 24, 2018, the closing price per ADS as quoted on the New York Stock Exchange was US$12.27.
The following table sets forth for each of the most recent three months and for the current month the high and low closing prices in U.S. dollars of our ADSs on the New York Stock Exchange as reported by the New York Stock Exchange.
| | | | | | | |
| | | ADSs | |
(in US$) | | High | | | Low | |
| 2017: | | | | | | | | |
| January | | | 9.59 | | | | 9.22 | |
| February | | | 9.94 | | | | 9.07 | |
| March | | | 11.40 | | | | 9.73 | |
| April | | | 11.41 | | | | 10.66 | |
| May | | | 11.91 | | | | 10.30 | |
| June | | | 11.87 | | | | 11.20 | |
| July | | | 11.90 | | | | 11.11 | |
| August | | | 12.44 | | | | 11.39 | |
| September | | | 13.15 | | | | 12.20 | |
| October | | | 13.04 | | | | 12.70 | |
| November | | | 13.19 | | | | 11.97 | |
| December | | | 12.59 | | | | 11.55 | |
| 2018: | | | | | | | | |
| January | | | 13.49 | | | | 12.40 | |
| February | | | 13.15 | | | | 11.78 | |
| March | | | 12.43 | | | | 11.49 | |
| April (through April 24, 2018) | | | 12.73 | | | | 11.80 | |
Our Shares
Our common shares and our investment shares are registered in the Public Registry of Securities held with the Peruvian Securities Commission and are listed on the Lima Stock Exchange under the symbols “CPACASC1” and “CPACASCI1,” respectively. On April 24, 2018, the closing price per common share as quoted on the Lima Stock Exchange was S/8.00 and S/6.63 per investment share. Historically, the trading volume of our investment shares on the Lima Stock Exchange has been limited.
The following table sets forth for the five most recent full years the high and low closing prices insoles of our common shares and investment shares on the Lima Stock Exchange as reported by the Lima Stock Exchange.
| | | | | | | | | | | | | | |
| | | | Common shares | | | Investment shares | |
(in S/) | | | High | | | Low | | | High | | | Low | |
| 2012 | | | | 6.90 | | | | 4.75 | | | | 6.00 | | | | 4.45 | |
| 2013 | | | | 7.85 | | | | 5.45 | | | | 6.50 | | | | 3.75 | |
| 2014 | | | | 6.50 | | | | 4.70 | | | | 4.00 | | | | 2.50 | |
| 2015 | | | | 5.45 | | | | 3.57 | | | | 2.60 | | | | 2.25 | |
| 2016 | | | | 6.70 | | | | 4.27 | | | | 4.70 | | | | 2.13 | |
| 2017 | | | | 8.59 | | | | 5.96 | | | | 6.80 | | | | 4.20 | |
The following table sets forth for each quarter of the three most recent financial years the high and low closing prices insolesof our common shares and investment shares and the Lima Stock Exchange as reported by the Lima Stock Exchange.
| | | | | | | | | | | | | |
| | | Common Shares | | | Investment Shares | |
(in S/) | | High | | | Low | | | High | | | Low | |
| 2015: | | | | | | | | | | | | | | | | |
| First quarter | | | 5.45 | | | | 4.64 | | | | 2.50 | | | | 2.45 | |
| Second quarter | | | 5.15 | | | | 4.37 | | | | 2.60 | | | | 2.46 | |
| Third quarter | | | 5.27 | | | | 3.80 | | | | 2.60 | | | | 2.25 | |
| Fourth quarter | | | 5.00 | | | | 3.57 | | | | — | | | | — | |
| 2016: | | | | | | | | | | | | | | | | |
| First quarter | | | 5.36 | | | | 4.27 | | | | 2.33 | | | | 2.13 | |
| Second quarter | | | 6.08 | | | | 4.90 | | | | 3.39 | | | | 2.70 | |
| Third quarter | | | 6.70 | | | | 6.38 | | | | 4.70 | | | | 4.43 | |
| Fourth quarter | | | 6.60 | | | | 6.10 | | | | 4.55 | | | | 4.30 | |
| 2017: | | | | | | | | | | | | | | | | |
| First quarter | | | 7.50 | | | | 5.96 | | | | 4.80 | | | | 4.20 | |
| Second quarter | | | 7.62 | | | | 6.90 | | | | 4.82 | | | | 4.70 | |
| Third quarter | | | 8.41 | | | | 7.35 | | | | 5.90 | | | | 4.50 | |
| Fourth quarter | | | 8.59 | | | | 7.75 | | | | 6.80 | | | | 6.00 | |
The following table sets forth for each of the most recent six months and for the current month the high and low closing prices insoles of our common shares and investment shares on the Lima Stock Exchange as reported by the Lima Stock Exchange.
| | | | | | | | | | | | | |
| | | Common Shares | | | Investment Shares | |
(in S/) | | High | | | Low | | | High | | | Low | |
| 2017: | | | | | | | | | | | | | | | | |
| October | | | 8.50 | | | | 8.35 | | | | 6.50 | | | | 6.00 | |
| November | | | 8.59 | | | | 7.90 | | | | 6.80 | | | | 6.15 | |
| December | | | 8.20 | | | | 7.75 | | | | 6.32 | | | | 6.00 | |
| 2018: | | | | | | | | | | | | | | | | |
| January | | | 8.40 | | | | 8.05 | | | | 6.50 | | | | 6.50 | |
| February | | | 8.33 | | | | 7.90 | | | | 6.65 | | | | 6.55 | |
| March | | | 8.15 | | | | 7.57 | | | | 6.65 | | | | 6.65 | |
| April (through April 24, 2018) | | | 8.10 | | | | 7.85 | | | | 6.65 | | | | 6.63 | |
Not applicable.
Trading in the Peruvian securities market
The Lima Stock Exchange
As of December 31, 2017, there were 282 companies with securities listed on the Lima Stock Exchange. Established in 1970, the Lima Stock Exchange is Peru’s only securities exchange. On November 19, 2003, the members of the Lima Stock Exchange approved to convert its corporate status to a publicly held corporation effective as of January 1, 2003. As of December 31, 2017, The Lima Stock Exchange had a share capital of S/182,092,340, divided into 173,659,481 class “A” shares and 8,432,859 class “B” shares of par value S/1.00 each. Class “A” shares are entitled to one vote per share while class “B” shares do not have voting rights. As of December 31, 2017, the Lima Stock Exchange had 225 shareholders.
Trading on the Lima Stock Exchange is primarily done on an electronic trading system that became operational in August 1995. From the first Monday of November through the second Sunday of March of each year, trading hours are Monday through Friday (except holidays) as follows: 8:20 a.m.-8:30 a.m. (pre-market ordering); 8:30 a.m.-2:55 p.m. (trading); 2:55 p.m.-3:00 p.m. (after-market sales); and 3:00 p.m.-3:10 p.m. (after-market trading). At all other times, trading hours are from Monday to Friday (except holidays) as follows: 9:00 a.m.-9:30 a.m. (pre-market ordering); 9:30 a.m.-3:55 p.m. (trading); 3:55 p.m.-4:00 p.m. (after-market sales); and 4:00 p.m.-4:10 p.m. (after-market trading).
Substantially all of the transactions on the Lima Stock Exchange are traded on the electronic system. Transactions during the electronic sessions are executed through brokerage firms and stock brokers on behalf of their clients. Brokers submit orders in the order in which they are received. The orders must specify the type of security as well as the amount and price of the proposed sale or purchase. In order to control price volatility, the Lima Stock Exchange imposes a 15 minute suspension on trading when the price of a security varies on a single day by more than 15% for Peruvian companies and 30% for non-Peruvian companies.
Regulation of the Peruvian Securities Market
The Securities Market Law regulates certain securities matters, such as transparency and disclosure, corporate takeovers, capital market instruments and operations, the securities markets and broker-dealers, and credit-rating agencies. In 1996, the Peruvian Securities Commission, “Superintendencia del Mercado de Valores – SMV” , formerly known as the National Supervisory Commission for Securities and Companies (Comisión Nacional Supervisora de Empresas y Valores, or “CONASEV”), was given additional responsibilities relating to the supervision, regulation and development of the securities market, while the Lima Stock Exchange was granted the status of a self-regulatory organization. Additionally, a unified system of guarantees and capital requirements was established for the Lima Stock Exchange.
Pursuant to Law No. 29,782, published in the Peruvian Official Gazette,El Peruano, on July 28, 2011, the Peruvian Securities Commission is a governmental entity reporting to Peru’s Ministry of Economy and Finance with functional, administrative, economic, technical and budgetary autonomy.
The Peruvian Securities Commission is governed by the Superintendent and a five board-members confirmed by the Superintendent (who acts as President of the board) and four members appointed by the Peruvian Executive Power (one suggested by the Ministry of Economy and Finance, one suggested by the Peruvian Central Reserve Bank, one suggested by the Peruvian Superintendence of Banking, Insurance and Private Pension Funds and one independent member). The Peruvian Securities Commission has broad regulatory powers, including reviewing, promoting, and making rules regarding the securities market, supervising its participants, and approving the registration of public offerings of securities.
The Peruvian Securities Commission supervises the securities markets and the dissemination of information to investors. It also (i) governs the operations of the Public Registry of Securities, (ii) regulates mutual funds, publicly placed investment funds and their respective management companies and broker-dealers, (iii) monitors compliance with accounting regulations by companies under its supervision as well as the accuracy of financial statements and (iv) registers and supervises auditors who provide accounting services to those companies registered with the Peruvian Securities Commission.
Pursuant to the Securities Market Law, broker-dealers must maintain a guarantee fund. This guarantee fund must be managed by an entity supervised by the Peruvian Securities Commission. Contributions to the guarantee fund must be made by the 25 broker-dealers that are members of the Lima Stock Exchange and are based on the volume traded over the exchange. In addition to the guarantee fund managed, each broker-dealer is required to maintain a guarantee in favor of the Peruvian Securities Commission to guarantee any liability that broker-dealers may have with respect to their clients. Such guarantees are generally established through letters of credit issued by local banks.
Disclosure Obligations
Issuers of securities registered with the Peruvian Securities Commission are required to disclose material information relating to the issuer. Pursuant to the Securities Market Law and relevant regulations enacted thereunder, all material information in connection with the issuer of registered securities (such as our common shares and investment shares), its activities or securities issued or secured by such issuer which may influence the liquidity or price of such securities must be disclosed. Accordingly, issuers must file with the Peruvian Securities Commission mainly two types of information: (a) financial information, including interim unaudited financial statements on a quarterly basis (which are not required to be subject to limited review), and annual audited consolidated financial statements on an annual basis, and (b) material information relating to the issuer and its activities that may significantly affect the price, offering or negotiation of the issued securities, and in general, all the information that may be relevant for investors to be able to make investment decisions.
In order to comply with the foregoing disclosure obligations, issuers must disclose reaffirmation to the Peruvian Securities Commission and, if the securities are listed, with the Lima Stock Exchange as soon as practicable but not later than one business day after having become aware of such information.
Not applicable.
Not applicable.
Not applicable.
| ITEM 10. | ADDITIONAL INFORMATION |
Not applicable.
| B. | Memorandum and Articles of Association |
Set forth below is certain information relating to our share capital, including brief summaries of the material provisions of our by-laws, Peruvian corporate law and certain related laws and regulations of Peru, all as in effect as of the date hereof.
General
We are a publicly-held corporation under Peruvian Corporate law registered with the Public Registry of Corporations in Lima. We are currently listed on the Lima Stock Exchange.
The second article of our by-laws provides that our principal corporate purpose is mining and the production and sale of cement, quicklime and other construction materials in Peru and internationally.
We have common shares and investment shares.
See “Item 6. Directors, Senior Management and Employees—A. Directors and Senior Management” for information regarding our Board of Directors.
Common Shares
Common shares represent 100% of our voting shares. As of March 31, 2018, 423,868,449 of our common shares were outstanding. As of March 31, 2018, there were 7,155 owners of record of our common shares (considering the ADSs listed in the New York Stock Exchange are held by one registered owner). Our common shares have a par value of S/1.00 per share and have been fully subscribed and are fully paid. Our common shares are registered in the Securities Public Registry of the Peruvian Securities Commission and are listed on the Lima Stock Exchange.
Investment Shares
As of March 31, 2018, 4,238,397 of our investment shares were outstanding excluding 36,040,497 investment shares that were held in treasury. Investment shares have no voting rights and are not, under Peruvian law and accounting regulations, characterized as share capital. However, investment shares are still considered part of a company’s equity. As of March 31, 2018, there were 385 owners of record of our investment shares. Our investment shares have a par value of S/1.00 per share and have been fully subscribed and are fully paid. Our investment shares are registered in the Securities Public Registry of the Peruvian Securities Commission and are listed on the Lima Stock Exchange.
Shareholders’ Liability
Under Peruvian Corporate Law, holders of our common shares cannot vote on matters with respect to which they have a conflict of interest.
Under Article 133 of the Peruvian Corporate Law, a shareholder must abstain from voting if such shareholder has a conflict of interest. A resolution approved in disregard of this provision may be challenged under Article 139 of the Peruvian Corporate Law and any shareholder that participated in the determination in breach of this provision, if such shareholder’s vote was key in attaining the required majority, may be held liable individually, or jointly with any other shareholder voting in breach of the provision.
Redemption and Rights of Withdrawal
Under Article 200 of the Peruvian Corporate Law, holders of our common shares have redemption rights if: (i) we change our corporate purpose; (ii) a change occurs in the place of organization to a foreign country; or (iii) any transformation, merger or significant spin-off occurs with respect to our company.
Preemptive and Accretion Rights
If we increase our share capital, holders of our common shares and investment shares have the right to subscribe to new common shares and investment shares, respectively, on a pro rata basis. Holders of common shares have preemptive rights in order to maintain their share interest in our share capital, unless the capital increase (i) results from a conversion of debt to common shares; (ii) is approved by shareholders representing at least 40% of the subscribed voting shares provided that the capital increase does not favor, directly or indirectly, certain shareholders to the detriment of others; and (iii) results from a corporate reorganization. Holders of investment shares have preemptive rights to maintain their proportional ownership in our share capital.
Shareholders who are in default of any payments relating to a capital call may not exercise their preemptive rights.
Preemptive rights are exercised in two rounds. During the first round, shareholders may subscribe to the new shares on a pro rata basis. During the second round, shareholders who participated in the first round may subscribe to any remaining shares on a pro rata basis up to the amount of shares such shareholders subscribed for in the first round. The first round must remain open for at least 15 business days. The second round must remain open for at least three business days.
Voting Rights and Dividends
Common Shares
Holders of common shares are entitled to one vote per share, with the exception of the election of the board of directors, where each holder is entitled to one vote per share per nominee. Each holder’s votes may be cast for a single nominee or distributed among the nominees at the holder’s discretion. To that effect, each of our common shares gives the holder the rights to as many votes as there are directors to be elected. Shareholders may pool votes in favor of one person or distribute them among various persons. Those candidates for the board who receive the most votes are elected directors. Holders of common shares may attend and vote at shareholders’ meetings either in person or through a proxy.
Holders of common shares have the right to participate in the distribution of dividends and shareholder equity resulting from liquidation. Our by-laws do not establish a maximum time limit for the payment of the dividends. However, according to Article 232 of the Peruvian Corporate law, the right to collect past-due dividends in the case of companies that are publicly held companies, such as ours, expires 10 years after the date on which the dividend payment was due.
Our share capital may be increased by a decision of holders of common shares at a shareholders’ meeting. Capital reductions may be voluntary or mandatory and must be approved by holders of common shares at a shareholders’ meeting. Capital reductions are mandatory when accumulated losses exceed 50% of the capital and to the extent such accumulated losses are not offset by accumulated earnings and capital increases within the following fiscal year. Capital increases and reductions must be communicated to the Peruvian Securities Commission, the Lima Stock Exchange and theSuperintendencia Nacional de Administración Tributaria(SUNAT). Voluntary capital reductions must also be published in the official gazette El Peruano and in a widely circulated newspaper in the city in which we are located.
Investment Shares
Under Peruvian Corporate Law, investment shares do not represent share capital. Accordingly, our balance sheet reflects the investment shares as a separate account from our share capital. Holders of investment shares are neither entitled neither to vote nor to participate in shareholders’ meetings. However, investment shares confer upon the holders thereof the right to participate in the dividends distributed according to their par value, in the same manner as common shares. Investment shares also confer to the holders thereof the preemptive right to (i) maintain the current proportion of the investment shares in the case of a capital increase through new contributions; (ii) increase the number of investment shares upon capitalization of retained earnings, revaluation surplus or other reserves that do not represent cash contributions; (iii) participate in the distribution of assets resulting from a liquidation in the same manner as common shares; and, (iv) redeem the investment shares in case of a merger and/or change of business activity.
Liquidation Rights
If we are liquidated, our shareholders have the right to receive net assets resulting from the liquidation, after we comply with our obligation to pay all our creditors and after discounting any existing dividend liabilities. For this reason, we cannot assure that we will be able to reimburse 100% of the book value of the common shares and investment shares in case of bankruptcy or liquidation.
Ordinary and Extraordinary Meetings
Pursuant to Peruvian Corporate Law and our by-laws, the annual shareholders’ meeting must be held during the three-month period after the end of each fiscal year. Additional shareholders’ meetings may be held during the year. Because we are a publicly-held corporation, we are subject to the special control of the Peruvian Securities Commission, as provided in Article 253 of the Peruvian Corporate Law. If we do not hold the annual shareholders’ meeting during the three-month period after the end of each fiscal year or any other shareholders’ meeting required by our by-laws, a public notary or a competent judge shall call for such a meeting at the request of at least one shareholder of the common shares. Such meeting will take place within a reasonable period of time.
Other shareholders’ meetings are convened by the board of directors when deemed convenient by our company or when it is requested by the holders of at least 20% of our common shares. If, at the request of holders of 20% of the common shares, the shareholders’ meeting is not convened by the board of directors within 15 business days of the receipt of such request, or the board expressly or implicitly refuses to convene the shareholders’ meeting, a public notary or a competent judge will call pursuant to Law No. 29560 for such meeting at the request of holders of at least 20% of our common shares. If a public notary or competent judge calls for a shareholders’ meeting, the place, time and hour of the meeting, the agenda and the person who will preside shall be indicated on the meeting notice. If the meeting called is other than the annual shareholders’ meeting or a shareholders’ meeting required by the Peruvian Corporate Law or the by-laws, the agenda will contain those matters requested by the shareholders who requested the meeting.
Holders of investment shares have no right to request the board to call a shareholders’ meeting.
Notices of Meetings
Since we are a publicly-held corporation, notice of shareholders’ meetings must be given by publication of a notice. The publication shall occur at least 25 days prior to any shareholders’ meeting in the Peruvian Official Gazette,El Peruano, and in a widely circulated newspaper in the city in which we are located. The notice requirement may be waived at the shareholders’ meeting by agreement of the holders of 100% of the outstanding common shares.
Quorum and Voting Requirements
According to Article 25 of our by-laws and Article 257 of the Peruvian Corporate Law, shareholders’ meetings called for the purpose of considering a capital increase or decrease, the issuance of obligations, a change in the by-laws, the sale in a single act of assets with an accounting value that exceeds 50% of our share capital, a merger, division, reorganization, transformation or dissolution, are subject to a first, second and third quorum call, each of the second and third quorum call to occur upon the failure of the preceding one. A quorum for the first call requires the presence of shareholders holding 50% of our total common shares. For the second call, the presence of shareholders holding at least 25% of our total common shares is adequate, while for the third call there is no quorum requirement. These decisions require the approval of the majority of the common shares represented at the shareholders’ meeting. Shareholders’ meetings convened to consider all other matters are subject to a first and second quorum call, the second quorum call to occur upon the failure of the first quorum.
In accordance with Peruvian Corporate Law, only those holders of common shares whose names are registered in our stock ledger not less than 10 days in advance of a meeting will be entitled to attend the shareholders’ meeting and to exercise their rights.
Limitations on the Rights of Non-residents or Foreign Shareholders
There are no limitations under our by-laws or Peruvian Corporate Law on the rights of nonresidents or foreign shareholders to own securities or exercise voting rights with respect to our securities.
Disclosure of Shareholdings and Tender Offer Regulations
Disclosure of Shareholdings
There are no provisions in our by-laws governing the ownership threshold above which share ownership must be disclosed.
However, according to Article 10 of CONASEV Resolution No. 090-2005-EF-94.10, as amended, we must inform the Peruvian Securities Commission of the members of our economic group and a list of our holders of common shares owning more than a 5% share interest, as well as any change to such information.
Tender Offer Regulations
Peruvian security regulations include mandatory takeover rules applicable to the acquisition of control of a listed company.
Subject to certain conditions, such regulations generally establish the obligation to make a tender offer when a person or group of persons acquires a relevant interest in a listed company. According to Peruvian law, a person acquires a relevant interest in a listed company when such person (a) holds or has the power to exercise directly or indirectly 25%, 50% or 60% of the voting rights in a listed company, or (b) has the power to appoint or remove the majority of the board members or to amend its by-laws.
In general, the tender offer must be launched prior to the acquisition of the relevant interest. The tender offer may be launched after the “relevant interest” is acquired if it is acquired (a) by means of an indirect transaction, (b) as a consequence of a public sale offer, or (c) in no more than four transactions within a three-year period.
This mandatory procedure has the effect of alerting other shareholders and the market that an individual or financial group has acquired a significant percentage of a company’s voting shares, and gives other shareholders the opportunity to sell their shares at the price offered by the purchaser. The purchaser is required to launch a tender offer unless: (a) shareholders representing 100% of the voting rights consent in writing, (b) voting shares are acquired by a depositary in order to subsequently issue ADSs, or (c) voting shares are acquired pursuant to the exercise of preemptive rights.
Changes in Capital
Our by-laws do not establish special conditions to increase or reduce our share capital beyond what is required under Peruvian Corporate Law.
Anti-Takeover Provisions
Our by-laws do not contain any provision that would have the effect of delaying, deferring or preventing a change of control. However, acquisitions of shares of our capital stock that involve a change of control may be subject to Peruvian securities and exchange regulations (Ley de Mercado de Valores y Reglamento de Oferta Pública de Adquisición y de Compra de Valores por Exclusión) applicable to tender offers.
Form and Transfer
Common shares and investment shares may be either physical share certificates in registered form or book-entry securities in the CAVALI S.A. ICLV book-entry settlement system, also in registered form.
Furthermore, the Peruvian Corporate Law forbids publicly-held corporations, such as us, from including in their by-laws stipulations limiting the transfer of their shares or restraining their trading in other ways. In addition, pursuant to our by-laws, we cannot recognize a shareholders’ agreement that contemplates limitations, restrictions or preferential rights on the transfer of shares, even if such an agreement is recorded in our stock ledger (matrícula de acciones) or in CAVALI S.A. ICLV.
On December 31, 2007, we entered into a contract for the general management and provision of services with ASPI, pursuant to which we provide legal and corporate services to it. See “Item 7. Major Shareholders and Related Party Transactions—A. Related Party Transactions.”
On February 1, 2008, we entered into a surface rights agreement with Compañía Minera Ares S.A.C., pursuant to which we lease a plot of land adjacent to our headquarters to our affiliate, Compañía Minera Ares S.A.C., a subsidiary of Hochschild Mining plc. See “Item 7. Major Shareholders and Related Party Transactions—A. Related Party Transactions.”
On June 30, 2008, we entered into a property lease agreement with ASPI pursuant to which we lease part of our headquarters as office space to ASPI. See “Item 7. Major Shareholders and Related Party Transactions—A. Related Party Transactions.”
On June 3, 2010, we entered into a long-term electricity supply agreement with Electroperú, a government-owned company, which expires in July 2020, to serve the electricity requirements of our Pacasmayo facility. Electroperú has agreed to provide us with sufficient energy to operate our Pacasmayo facility at pre-determined maximum amounts during the term of the contract. Payments for electricity are based on a formula that takes into consideration our energy consumption and certain market variables, such as the U.S. purchase price index, the global price of oil, the local price of natural gas and the import price of bituminous coal. We entered into an addendum to this agreement, effective February 1, 2016, which extends the term of the agreement until December 31, 2025, reduces the prices for the 2016-2020 period and establishes new prices for the 2020-2025 period. See “Item 4. Information on the Company—A. History and Development of the Company—Raw Materials and Energy Sources.”
On February 8, 2013, we issued US$300,000,000 of our 4.50% Senior Notes due 2023, in our inaugural international bond offering, pursuant to an indenture. A portion of the proceeds were used to prepay amounts outstanding our secured loan agreement with BBVA Banco Continental, and the remaining proceeds will be used to cover a portion of the capital expenditures we expect to incur in connection with the construction and development of the new Piura plant and our cement business. See “Item 5. Operating and Financial Review and Prospects—B. Liquidity and Capital Resources.”
Since August 1990, there have been no exchange controls in Peru and all foreign exchange transactions are based on free market exchange rates. Prior to August 1990, the Peruvian foreign exchange market consisted of several alternative exchange rates. Additionally, during the 1990s, the Peruvian currency experienced a significant number of large devaluations, and Peru has consequently adopted, and operated under, various exchange rate control practices and exchange rate determination policies, ranging from strict control over exchange rates to market determination of rates. Current Peruvian regulations on foreign investment allow the foreign holders of equity shares of Peruvian companies to receive and repatriate 100 percent of the cash dividends distributed by such companies. Such investors are allowed to purchase foreign exchange at free market currency rates through any member of the Peruvian banking system and transfer such foreign currency outside Peru without restriction.
The following summary contains a description of certain Peruvian and United States federal income tax consequences of the acquisition, ownership and disposition of common shares or ADSs, but it does not purport to be a comprehensive description of all the tax considerations that may be relevant to a decision to purchase common shares or ADSs. The summary is based upon the tax laws of Peru and regulations thereunder and on the tax laws of the United States and regulations thereunder as in effect on the date hereof, which are subject to change.
Prospective holders of common shares or ADSs should consult their own tax advisors as to the tax consequences of the acquisition, ownership and disposition of common shares or ADSs in their particular circumstances.
Peruvian Tax Considerations
The following are the principal tax consequences of ownership of common shares or ADSs by non-resident individuals or entities (“Non-Peruvian Holders”) as of the date hereof. Legislative, judicial or administrative changes or interpretations may, however, be forthcoming. Any such changes or interpretations could affect the tax consequences to holders of common shares or ADSs and could alter or modify the conclusions set forth herein. This summary is not intended to be a comprehensive description of all the tax consequences of acquisition, ownership and disposition of common shares or ADSs and does not describe any tax consequences arising under the laws of any taxing jurisdiction other than Peru or applicable to a resident of Peru or to a person with a permanent establishment in Peru.
For purposes of Peruvian taxation:
| • | individuals are residents of Peru, if they are Peruvian nationals who have established their principal place of residence in Peru or if they are foreign nationals with a permanence in Peru of 183 days in any 12-month period (the condition of Peruvian resident can only be acquired as of the 1st of January of the year following the fulfillment of residence conditions); and |
| • | legal entities are residents of Peru if they are established or incorporated in Peru. |
Changes to Peruvian tax law
In December 2016, the Peruvian Government approved an increase of the income tax rate from 28% to 29.5% to be effective from 2017 onwards.
Cash Dividends and Other Distributions
Cash dividends paid with respect to common shares and amounts distributed with respect to ADSs are currently subject to a Peruvian withholding tax, at a rate of 5% of the dividend paid. In December 2016, the Peruvian government approved the decrease in the withholding tax rate on dividend paid from 6.8% to 5% effective in 2017. As a general rule, the distribution of additional common shares representing profits, distribution of shares which differ from the distribution of earnings or profits, as well as the distribution of preemptive rights with respect to common shares, which are carried out as part of a pro rata distribution to shareholders, will not be subject to Peruvian tax or withholding taxes.
Capital Gains
Pursuant to Article 6 of the Peruvian income tax law, individuals and entities resident in Peru are subject to Peruvian income tax on their worldwide income while Non-Peruvian Holders are subject to Peruvian income tax on Peruvian source income only.
The general rule of the Law of Income Tax in Peru provides that income derived from the disposal of securities issued by Peruvian entities is considered Peruvian source income and is therefore subject to income tax. Peruvian income tax law also provides that capital gains resulting from the disposal of ADSs that represent shares issued by Peruvian entities are considered Peruvian source income and therefore also subject to Peruvian income tax. Peruvian income tax law also provides that taxable income resulting from the disposal of securities is determined by the difference between the sale price of the securities at market value and the tax basis.
Notwithstanding the foregoing, capital gains resulting from the disposal of ADSs or beneficial interest in ADSs that represent shares issued by a Peruvian entity are not considered Peruvian source income as long as the ADSs issued by the foreign depositary are held in the name of a nominee and such ADSs are not transferred to a third party as a result of the disposal of the ADSs.
In the event ADSs are exchanged into common shares and such common shares are disposed of, capital gains resulting therefrom will be subject to an income tax rate of either 5% or 30%, depending on where the transaction takes place. If the transaction is consummated in Peru, the income tax rate is 5%; if the transaction is consummated outside of Peru, capital gains are taxed at a rate of 30%. Peruvian income tax law regulations have stated that transactions are deemed to be consummated in Peru if the common shares are transferred through the Lima Stock Exchange. Any gain resulting from the conversion of ADSs into common shares or common shares into ADSs will not be subject to taxation in Peru.
Any Non-Peruvian Holder who acquires common shares will have the following tax basis: (i) for common shares purchased by the transferor, the acquisition price paid for the shares; (ii) for common shares received by the transferor as a result of a share capital increase because of a capitalization of net profits, the face or nominal value of such common shares; (iii) for other common shares received free of any payment, the stock market value of such shares if listed on the Lima Stock Exchange or, if not, the face or nominal value of such common shares and (iv) for common shares of the same type acquired at different opportunities and at different values, the tax basis will be the weighted average cost. In cases where common shares are sold by Non-Peruvian Holders outside the Lima Stock Exchange, the tax basis must be certified by the Peruvian tax administration prior to the time payment is made to the transferor; otherwise it would not be possible to deduct the tax basis and a 30% Peruvian income tax would apply to the total sale price. Under Peruvian income tax law, tax basis certification is granted by the tax authorities within 30 days from the date of the application (which application must contain supporting evidence with respect to the tax basis) is made by the transferor. If the tax authorities do not respond within such 30 day period, the tax basis presented for approval by the transferor is deemed automatically approved.
On December 31, 2010, Law No. 29645 was enacted and took effect from January 1, 2011. This law states that in transactions relating to Peruvian securities through the Lima Stock Exchange, CAVALI S.A. ICLV (the Peruvian clearing house) will act as withholding agent to the extent that such transactions are settled in cash through CAVALI’s account (liquidación en efectivo). The implementing regulations of Law No. 29645 enacted on July 9, 2011 provide that CAVALI began acting as a withholding agent as from November 1, 2011. As a result, while such regulations do not apply to securities transferred though the Lima Stock Exchange by a Non-Peruvian Holder, such transferor must still self-assess and pay its income tax liability directly to Peruvian tax authorities within the first 12 working days following the month in which Peruvian source income was earned. With respect to transactions of Peruvian securities conducted through the Lima Stock Exchange that are settled directly without CAVALI’s intervention (liquidación directa), Non-Peruvian Holders are required to self-assess and pay income taxes directly to the Peruvian tax authorities within the first 12 working days following the month in which income from a Peruvian source was earned. Finally, if the purchaser is resident in Peru and the sale is not performed through the Lima Stock Exchange, the purchaser will act as withholding agent.
Nevertheless, Law No. 30,341 was enacted on December 12, 2015 and took effect on January 1, 2016, and Legislative Decree No. 1262, which complements Law No. 30,341 took effect on January 1, 2017. Such law, which will be in effect until December 31, 2019, regulates an exception to a general rule. The exemption regulated in the law applies to the income from the sale of shares and other securities representing shares made through a centralized negotiation mechanism supervised by the Superintendency of Securities, where the shares disposed of are not 10% or more of the shares issued by a specific company.
Law No. 30,341 and the amendment through Legislative Decree No. 1262 includes the following provisions:
| • | Securities covered by the exemption: |
| Ø | American Depositary Receipts (ADR) and Global Depositary Receipts (GDRs); |
| Ø | Exchange Trade Fund (ETF) units having underlying shares and / or debt securities as underlying; |
| Ø | Certificates of participation in mutual funds for investment in securities; |
| Ø | Certificates of participation in in Investment Fund in Real Estate Income (FIRBI) and certificates of participation in Trust for Securitization for Investment in Real Estate Income (FIBRA); and |
| • | Requirements for application of the exemption: |
| Ø | No transfer of 10% or more of the shares or securities representing shares in a period of twelve (12) months. In the case of ADRs and GDRs, this requirement will be determined by considering the underlying shares; |
| Ø | In the case of shares or securities representing shares, the calculation of the percentage shall be determined based on the total number of shares of capital or account of investment shares at the time of disposal; |
| Ø | The law indicates those operations to be considered for calculating this percentage, as well as those that do not; |
| Ø | The securities must have a stock market presence. To determine if the securities have a stock market presence, the following shall be taken into account; |
| Ø | Within 180 business days prior to the transfer, the number of days in which the daily negotiated amount has exceeded the limit established in the regulation shall be determined. This limit cannot be less than four (4) Tax Units (ITU) and will be established considering the volume of transactions that take place in the centralized negotiation mechanisms; |
| Ø | The number of days determined according to what is indicated in the previous section will be divided between 180 and multiplied by 100; and |
| Ø | The result cannot be less than the limit established by the regulation. This limit may not exceed thirty five percent (35%). |
| Ø | If, after applying the waiver, the issuer delivers the values of the Securities Registry of the Stock Exchange, in whole or in part, in an act or progressively, within the 12 months following the sale, the exoneration Applied with respect to the values listed; and |
| Ø | Those responsible for conducting the centralized trading mechanisms must notify SUNAT, in accordance with the procedure set forth in the regulations, of the securities whose registrations are canceled within 12 months of the sale. |
Other Considerations
No Peruvian estate or gift taxes are imposed on the gratuitous transfer of ADSs or common shares. No stamp, transfer or similar tax applies to any transfer of ADSs or common shares, except for commissions payable by seller and buyer to the Lima Stock Exchange (0.15% of value sold), fees payable to the Peruvian Securities Commission (0.05% of value sold), brokers’ fees (about 0.05% to 1% of value sold) and Value Added Tax (at the rate of 18%) on commissions and fees. Any investor who sells its common shares on the Lima Stock Exchange will incur these fees and taxes upon purchase and sale of the common shares.
United States Federal Income Tax Considerations
The following are the material United States federal income tax consequences as of the date hereof to a United States Holder (as defined below) of the acquisition, ownership and disposition of our common shares and ADSs. Except where noted, this summary deals only with common shares and ADSs held as capital assets (generally, property held for investment). As used herein, the term “United States Holder” means a beneficial owner of common shares or ADSs that is for United States federal income tax purposes:
| • | an individual citizen or resident of the United States; |
| • | a corporation (or other entity treated as a corporation for United States federal income tax purposes) created or organized in or under the laws of the United States, any state thereof or the District of Columbia; |
| • | an estate the income of which is subject to United States federal income taxation regardless of its source; or |
| • | a trust if it (1) is subject to the primary supervision of a court within the United States and one or more United States persons have the authority to control all substantial decisions of the trust, or (2) has a valid election in effect under applicable United States Treasury regulations to be treated as a United States person. |
This summary does not represent a detailed description of the United States federal income tax consequences applicable to you if you are subject to special treatment under the United States federal income tax laws, including if you are:
| • | a dealer in securities or currencies; |
| • | a financial institution; |
| • | a regulated investment company; |
| • | a real estate investment trust; |
| • | a tax-exempt organization; |
| • | a person holding our common shares or ADSs as part of a hedging, integrated or conversion transaction, a constructive sale or a straddle; |
| • | a trader in securities that has elected the mark-to-market method of accounting for your securities; |
| • | a person liable for alternative minimum tax; |
| • | a person who owns or is deemed to own 10% or more of our stock (by vote or value); |
| • | a partnership or other pass-through entity for United States federal income tax purposes; |
| • | a person required to accelerate the recognition of any item of gross income with respect to our common shares or ADSs as a result of such income being recognized on an applicable financial statement; or |
| • | a person whose “functional currency” is not the U.S. dollar. |
The discussion below is based upon the provisions of the U.S. Internal Revenue Code of 1986, as amended (the “Code”), and regulations, rulings and judicial decisions thereunder as of the date hereof, and such authorities may be replaced, revoked or modified so as to result in United States federal income tax consequences different from those discussed below. There is currently no income tax treaty between the United States and Peru that would provide for United States federal income tax consequences different from those discussed below. In addition, this summary is based, in part, upon representations made by the depositary to us and assumes that the deposit agreement, and all other related agreements, will be performed in accordance with their terms.
If a partnership (or other entity treated as a partnership for United States federal income tax purposes) holds our common shares or ADSs, the tax treatment of a partner in the partnership will generally depend upon the status of the partner and the activities of the partnership. If you are a partner of a partnership holding our common shares or ADSs, you should consult your tax advisors.
This summary does not address the Medicare tax on net investment income or the effects of any state, local or non-United States tax laws. If you are considering the acquisition, ownership or disposition of our common shares or ADSs, you should consult your own tax advisors concerning the United States federal income tax consequences to you in light of your particular situation as well as any consequences arising under the laws of any other taxing jurisdiction.
ADSs
If you hold ADSs, for United States federal income tax purposes, you generally will be treated as the owner of the underlying common shares that are represented by such ADSs. Accordingly, deposits or withdrawals of common shares for ADSs will not be subject to United States federal income tax.
Taxation of Dividends
The gross amount of distributions on the ADSs or common shares (including amounts withheld to reflect Peruvian withholding taxes) will be taxable as dividends, to the extent paid out of our current or accumulated earnings and profits, as determined under United States federal income tax principles.
To the extent that the amount of any distribution (including amounts withheld to reflect Peruvian withholding taxes) exceeds our current and accumulated earnings and profits for a taxable year, as determined under United States federal income tax principles, the distribution will first be treated as a tax-free return of capital, causing a reduction in the adjusted basis of the ADSs or common shares, and the balance in excess of adjusted basis will be taxed as capital gain recognized on a sale or exchange. However, we do not expect to keep earnings and profits in accordance with United States federal income tax principles. Therefore, you should expect that a distribution will generally be treated as a dividend. Such dividends (including withheld taxes) will be includable in your gross income as ordinary income on the day actually or constructively received by you, in the case of the common shares, or by the depositary, in the case of ADSs. Such dividends will not be eligible for the dividends received deduction allowed to corporations under the Code.
With respect to non-corporate United States Holders, certain dividends received from a qualified foreign corporation may be subject to reduced rates of taxation. A non-United States corporation is treated as a qualified foreign corporation with respect to dividends received from that corporation on common shares (or ADSs backed by such shares) that are readily tradable on an established securities market in the United States. United States Treasury Department guidance indicates that our ADSs, which are listed on the New York Stock Exchange, but not our common shares, are readily tradable on an established securities market in the United States. Thus, we believe that dividends we pay on our common shares that are represented by ADSs, but not our common shares that are not so represented, will meet such conditions required for the reduced tax rates. There can be no assurance that our ADSs will be considered readily tradable on an established securities market in later years. Non-corporate United States Holders that do not meet a minimum holding period requirement during which they are not protected from the risk of loss or that elect to treat the dividend income as “investment income” pursuant to Section 163(d)(4) of the Code will not be eligible for the reduced rates of taxation regardless of our status as a qualified foreign corporation. In addition, the rate reduction will not apply to dividends if the recipient of a dividend is obligated to make related payments with respect to positions in substantially similar or related property. This disallowance applies even if the minimum holding period has been met. You should consult your own tax advisors regarding the application of these rules given your particular circumstances.
The amount of any dividend paid insoles will equal the U.S. dollar value of thesoles received, calculated by reference to the exchange rate in effect on the date the dividend is actually or constructively received by you, in the case of the common shares, or by the depositary, in the case of ADSs, regardless of whether thesoles are converted into U.S. dollars at that time. If thesoles received as a dividend are converted into U.S. dollars on the date they are received, you generally will not be required to recognize foreign currency gain or loss in respect of the dividend income. If thesoles received as a dividend are not converted into U.S. dollars on the date of receipt, you will have a tax basis in thesoles equal to their U.S. dollar value on the date of receipt. Any gain or loss realized on a subsequent conversion or other disposition of thesoles will be treated as United States source ordinary income or loss.
Subject to certain conditions and limitations, Peruvian withholding taxes on dividends may be treated as foreign taxes eligible for credit against your United States federal income tax liability. For purposes of calculating the foreign tax credit, dividends paid on the ADSs or common shares will be treated as foreign source income and will generally constitute passive category income. However, in certain circumstances, if you have held the ADSs or common shares for less than a specified minimum period during which you are not protected from risk of loss, or are obligated to make payments related to the dividends, you will not be allowed a foreign tax credit for any Peruvian withholding taxes imposed on dividends paid on the ADSs or common shares. If you do not elect to claim a United States foreign tax credit, you may instead claim a deduction for Peruvian income tax withheld, but only for a taxable year in which you elect to do so with respect to all foreign income taxes paid or accrued in such taxable year. The rules governing the foreign tax credit are complex. You are urged to consult your tax advisors regarding the availability of the foreign tax credit under your particular circumstances.
Taxation of Capital Gains
For United States federal income tax purposes, you will recognize taxable gain or loss on any sale or exchange of ADSs or common shares in an amount equal to the difference between the amount realized for the ADSs or common shares and your tax basis in the ADSs or common shares. Such gain or loss will generally be capital gain or loss. Capital gains of non-corporate United States Holders derived with respect to capital assets held for more than one year are eligible for reduced rates of taxation. The deductibility of capital losses is subject to limitations.
If Peruvian income tax is withheld on the sale or other disposition of our ADSs or common shares, your amount realized will include the gross amount of the proceeds of that sale or other disposition before deduction of the Peruvian income tax. Any gain or loss recognized by you will generally be treated as United States source gain or loss. Consequently, in the case of gain from the disposition of ADSs or common shares that is subject to Peruvian income tax, you may not be able to benefit from the foreign tax credit for that Peruvian income tax (i.e., because the gain from the disposition would be United States source), unless you can apply the credit (subject to applicable limitations) against United States federal income tax payable on other income from foreign sources. Alternatively, you may take a deduction for the Peruvian income tax if you do not take a credit for any foreign taxes paid or accrued during the taxable year. You are urged to consult your tax advisors regarding the tax consequences if Peruvian income tax is imposed on a disposition of ADSs or common shares, including the availability of the foreign tax credit under your particular circumstances.
Passive Foreign Investment Company
We do not believe that we are, for United States federal income tax purposes, a passive foreign investment company (“PFIC”), and we expect to operate in such a manner so as not to become a PFIC. If, however, we are or become a PFIC, you could be subject to additional United States federal income taxes on gain recognized with respect to the ADSs or common shares and on certain distributions, plus an interest charge on certain taxes treated as having been deferred under the PFIC rules. Non-corporate United States Holders will not be eligible for reduced rates of taxation on any dividends received from us (as discussed above under “Taxation of Dividends”), if we are a PFIC in the taxable year in which such dividends are paid or in the preceding taxable year.
Information Reporting and Backup Withholding
In general, information reporting will apply to dividends in respect of our ADSs or common shares and the proceeds from the sale, exchange or redemption of our ADSs or common shares that are paid to you within the United States (and in certain cases, outside the United States), unless you are an exempt recipient. Backup withholding may apply to such payments if you fail to provide a taxpayer identification number or certification of other exempt status or fail to report in full dividend and interest income.
Any amounts withheld under the backup withholding rules will be allowed as a refund or a credit against your United States federal income tax liability provided the required information is furnished to the Internal Revenue Service in a timely manner.
The above description is not intended to constitute a complete analysis of all tax consequences relating to the acquisition, ownership or disposition of our ADSs or common shares. You should consult your own tax advisors concerning the overall tax consequences to you, including the consequences under laws other than United States federal income tax laws, of an investment in our ADSs or common shares.
| F. | Dividends and Paying Agents |
Not applicable.
Not applicable.
We make our filings in electronic form under the EDGAR filing system of the SEC. Our filings are available through the EDGAR system at www.sec.gov. In addition, our filings are available to the public over our website www.cementospacasmayo.com.pe. Such filings and other information on our website are not incorporated by reference in this annual report. You may request a copy of this filing, and any other report, at no cost, by writing to us at the following address or telephoning us:
Investor Relations Department
Calle La Colonia 150,
Urbanización El Vivero, Surco,
Lima, Peru.
Tel.: + (511) 317-6000
E-mail: cbustamante@cpsaa.com.pe
See note 1 to our consolidated financial statements included in this annual report for a description of our subsidiaries.
| ITEM 11. | QUANTITATIVE AND QUALITATIVE DISCLOSURES ABOUT MARKET RISK |
For a description of our market risks, see note 29 to our consolidated financial statements included in this annual report.
| ITEM 12. | DESCRIPTION OF SECURITIES OTHER THAN EQUITY SECURITIES |
Not applicable.
Not applicable.
Not applicable.
| D. | American Depositary Shares |
Fees and expenses
JPMorgan Chase Bank, N.A., as depositary, pursuant to our Deposit Agreement, dated as of February 7, 2012, and the amendment dated February 21, 2017 (as so amended the “Deposit Agreement”), may charge each person to whom ADSs are issued, including, without limitation, issuances against deposits of common shares, issuances in respect of common share distributions, rights and other distributions, issuances pursuant to a stock dividend or stock split declared by us or issuances pursuant to a merger, exchange of securities or any other transaction or event affecting the ADSs or deposited securities, and each person surrendering ADSs for withdrawal of deposited securities or whose ADSs or American Depositary Receipts representing ADSs (“ADRs”) are cancelled or reduced for any other reason, US$5.00 for each 100 ADSs (or any portion thereof) issued, delivered, reduced, cancelled or surrendered, as the case may be. The depositary may sell (by public or private sale) sufficient securities and property received in respect of a common share distribution, rights and/or other distribution prior to such deposit to pay such charge.
The following additional charges shall be incurred by the ADR holders, by any party depositing or withdrawing common shares or by any party surrendering ADSs or to whom ADSs are issued (including, without limitation, issuance pursuant to a stock dividend or stock split declared by us or an exchange of stock regarding the ADRs or the deposited securities or a distribution of ADSs), whichever is applicable:
| • | a fee of US$1.50 per ADR or ADRs for transfers of certificated or direct registration ADRs; |
| • | a fee of US$0.05 or less per ADS for any cash distribution made pursuant to the deposit agreement; |
| • | a fee of US$0.05 or less per ADS per calendar year (or portion thereof) for services performed by the depositary in administering the ADRs (which fee may be charged on a periodic basis during each calendar year and shall be assessed against holders of ADRs as of the record date or record dates set by the depositary during each calendar year and shall be payable in the manner described in the next succeeding provision); |
| • | reimbursement of such fees, charges and expenses as are incurred by the depositary and/or any of the depositary’s agents (including, without limitation, the custodian and expenses incurred on behalf of holders in connection with compliance with foreign exchange control regulations or any law or regulation relating to foreign investment) in connection with the servicing of the common shares or other deposited securities, the delivery of deposited securities or otherwise in connection with the depositary’s or its custodian’s compliance with applicable law, rule or regulation (which charge shall be assessed on a proportionate basis against holders as of the record date or dates set by the depositary and shall be payable at the sole discretion of the depositary by billing such holders or by deducting such charge from one or more cash dividends or other cash distributions); |
| • | a fee for the distribution of securities (or the sale of securities in connection with a distribution), such fee being in an amount equal to US$0.05 per ADS issuance fee for the execution and delivery of ADSs which would have been charged as a result of the deposit of such securities (treating all such securities as if they were common shares) but which securities or the net cash proceeds from the sale thereof are instead distributed by the depositary to those holders entitled thereto; |
| • | stock transfer or other taxes and other governmental charges; |
| • | cable and facsimile transmission and delivery charges incurred at your request in connection with the deposit or delivery of common shares; |
| • | transfer or registration fees for the registration of transfer of deposited securities on any applicable register in connection with the deposit or withdrawal of deposited securities; and |
| • | expenses of the depositary in connection with the conversion of foreign currency into U.S. dollars. |
We will pay all other charges and expenses of the depositary and any agent of the depositary (except the custodian) pursuant to agreements from time to time between us and the depositary. The charges described above may be amended from time to time by agreement between us and the depositary.
Our depositary has agreed to reimburse us for certain expenses we incur that are related to establishment and maintenance of the ADR program, including investor relations expenses and exchange application and listing fees. The amounts of reimbursements available to us are not based upon the amounts of fees the depositary collects from investors. The depositary collects its fees for issuance and cancellation of ADSs directly from investors depositing common shares or surrendering ADSs for the purpose of withdrawal or from intermediaries acting on their behalf. The depositary collects fees for making distributions to investors by deducting those fees from the amounts distributed or by selling a portion of distributable property to pay the fees. The depositary may collect its annual fee for depositary services by deduction from cash distributions, or by directly billing investors, or by charging the book-entry system accounts of participants acting for them. The depositary will generally set off the amounts owing from distributions made to holders of ADSs. If, however, no distribution exists and payment owing is not timely received by the depositary, the depositary may refuse to provide any further services to holders that have not paid those fees and expenses owing until such fees and expenses have been paid. At the discretion of the depositary, all fees and charges owing under the deposit agreement are due in advance and/or when declared owing by the depositary.
The Deposit Agreement is filed as Exhibit 2.2 to this annual report, and Amendment number 1 is incorporated by reference in this annual report. We encourage you to review this document carefully if you are a holder of ADRs.
PART II
| ITEM 13. | DEFAULTS, DIVIDEND ARREARAGES AND DELINQUENCIES |
Not applicable.
| ITEM 14. | MATERIAL MODIFICATIONS TO THE RIGHTS OF SECURITY HOLDERS AND USE OF PROCEEDS |
Not applicable. See “Item 10. Additional Information—B. Memorandum and Articles of Association—Dispute Resolution.”
| ITEM 15. | CONTROLS AND PROCEDURES |
| A. | Disclosure Controls and Procedures |
As of the end of the period covered by this annual report, the Company’s management, with the participation of our Chief Executive Officer and Chief Financial Officer, performed an evaluation of the effectiveness of the design and operation of our disclosure controls and procedures as defined in Rules 13a-15€ and 15d-15€ of the Exchange Act. Our disclosure controls and procedures are designed to ensure that information required to be disclosed in the reports we file or submit under the Exchange Act is recorded, processed, summarized and reported within the time periods specified in the SEC’s rules and forms, and that such information is accumulated and communicated to our management, including the Chief Executive Officer and the Chief Financial Officer, to allow timely decisions regarding required disclosures. Any controls and procedures, no matter how well designed and operated, can provide only reasonable assurance of achieving the desired control objective. Based on this evaluation, our Chief Executive Officer and Chief Financial Officer concluded that, as of December 31, 2017, the design and operation of our disclosure controls and procedures were effective at the reasonable assurance level.
| B. | Management’s Annual Report on Internal Control Over Financial Reporting |
Our management is responsible for establishing and maintaining adequate internal control over financial reporting. Our internal control over financial reporting is designed to provide reasonable assurance regarding the reliability of financial reporting and the preparation of the financial statements for external purposes in accordance with generally accepted accounting principles.
Because of its inherent limitations, internal control over financial reporting may not necessarily prevent or detect some misstatements. It can only provide reasonable assurance regarding financial statement preparation and presentation. Also, projections of any evaluation of effectiveness for future periods are subject to the risk that controls may become inadequate because of changes in conditions or because the degree of compliance with the polices or procedures may deteriorate over time.
Management assessed the effectiveness of its internal control over financial reporting for the year ended December 31, 2017. The assessment was based on criteria established in the framework “Internal Controls—Integrated Framework” issued by the Committee of Sponsoring Organizations of the Treadway Commission (1992 Framework) (COSO). Based on this assessment, our management has concluded that as of December 31, 2017, our internal control over financial reporting was effective.
The effectiveness of internal control over financial reporting as of December 31, 2017, has been audited by Paredes, Burga & Asociados SCRL, member firm of EY (formerly Ernst & Young), an independent registered public accounting firm, as stated in their attestation report, which is included under “Item 15—Controls and Procedures—C. Attestation Report of Independent Registered Public Accounting Firm.”
| C. | Report of the Independent Registered Public Accounting Firm |
To the Shareholders and the Board of Directors of Cementos Pacasmayo S.A.A. and subsidiaries
Opinion on the Financial Statements
We have audited the accompanying consolidated statements of financial position of Cementos Pacasmayo S.A.A. and subsidiaries (the Company) as of December 31, 2017 and 2016, and the related consolidated statements of profit or loss, other comprehensive income, changes in equity and cash flows for each of the three years in the period ended December 31, 2017, and the related notes (collectively referred to as the “consolidated financial statements”). In our opinion, the consolidated financial statements present fairly, in all material respects, the consolidated financial position of the Company as of December 31, 2017 and 2016, and the consolidated results of its operations and its cash flows for each of the three years in the period ended December 31, 2017, in conformity with International Financial Reporting Standards as issued by the International Accounting Standards Board (IASB).
We also have audited, in accordance with the standards of the Public Company Accounting Oversight Board (United States) (PCAOB) the Company´s internal control over financial reporting as of December 31, 2017, based on criteria established in Internal Control - Integrated Framework issued by the Committee of Sponsoring Organizations of the Treadway Commission (2013 framework) and our report dated April 27, 2018 expressed an unqualified opinion thereon.
Basis for Opinion
These consolidated financial statements are the responsibility of the Company‘s management. Our responsibility is to express an opinion on the Company‘s consolidated financial statements based on our audits. We are a public accounting firm registered with the PCAOB and are required to be independent with respect to the Company in accordance with the U.S. federal securities laws and the applicable rules and regulations of the Securities and Exchange Commission and the PCAOB. Likewise, we are a public accounting firm registered with the Peruvian Board of Public Accountants Associations and are required to be independent with respect to the Company in accordance with International Auditing Standards approved for its application in Peru by the Peruvian Board of Public Accountants Associations.
We conducted our audits in accordance with the standards of the PCAOB. Those standards require that we plan and perform the audit to obtain reasonable assurance about whether the consolidated financial statements are free of material misstatement, whether due to error or fraud. Our audits included performing procedures to assess the risks of material misstatement of the consolidated financial statements, whether due to error or fraud, and performing procedures that respond to those risks. Such procedures included examining, on a test basis, evidence regarding the amounts and disclosures in the consolidated financial statements. Our audits also included evaluating the accounting principles used and significant estimates made by management, as well as evaluating the overall presentation of the consolidated financial statements. We believe that our audits provide a reasonable basis for our opinion.
Paredes, Burga & Asociados Sociedad Civil de Responsabilidad Limitada
A member practice of
Ernst & Young Global Limited
/s/ Carlos Valdivia
Paredes, Burga & Asociados Sociedad Civil de Responsabilidad Limitada Lima, Peru.
We have served as the Company’s auditor since 2002.
Lima, Peru
April 27, 2018.
| D. | Changes in Internal Control Over Financial Reporting |
There have been no changes in our internal control over financial reporting identified in connection with the evaluation required under Rules 13a-15 or 15d-15 that occurred during the period covered by this annual report that has materially affected, or is reasonably likely to materially affect, our internal control over financial reporting.
| ITEM 16A. | AUDIT COMMITTEE FINANCIAL EXPERT |
Our Board of Directors has determined that Ms. Hilda Ochoa-Brillembourg and Mr. Marco Antonio Zaldivar, members of the audit committee, are “financial experts,” as such term is defined in the SEC rules. We have determined that Ms. Hilda Ochoa-Brillembourg and Mr. Felipe Ortiz de Zevallos and Mr. Marco Antonio Zaldívar are independent under the standards of the New York Stock Exchange listing rules and Rule 10A-3 under the Exchange Act.
We have adopted a code of ethics that applies to our directors, officers and employees. Our code of ethics is available on our website http://www.cementospacasmayo.com.pe. Information on our website is not incorporated by reference in this annual report.
If we make any substantive amendment to our code of ethics or if we grant any waivers, including any implicit waiver, from a provision of the code of ethics, we will disclose the nature of such amendment or waiver by filing a current report on a Form 6-K or in our subsequent annual report on Form 20-F to be filed with the SEC. During the year ended December 31, 2017, no such amendment was made nor did we grant any waiver to any provision of our code of ethics.
| ITEM 16C. | PRINCIPAL ACCOUNTANT FEES AND SERVICES |
Audit and Non-Audit Fees
The following table presents the aggregate fees for professional services and other services rendered by our independent auditors, Paredes, Burga & Asociados SCRL, member firm of EY (formerly Ernst & Young), responsible for auditing the annual consolidated financial statements included in the annual report, during the fiscal years ended December 31, 2017 and 2016.
| | | | | | | |
| | | Year Ended December 31, | |
(in thousands of S/) | | 2017 | | | 2016 | |
| | | | | | | |
| Audit fees | | | 1,332 | | | | 1,491 | |
| Tax fees | | | 358 | | | | 196 | |
| Total fees | | | 1,690 | | | | 1,687 | |
Audit fees in the above table are the aggregate fees billed and billable by our independent auditors in connection with the audit of our annual consolidated financial statements and review of our quarterly financial information.
Tax fees in the above table are fees billed relating to tax compliance services.
Our audit committee is responsible for the oversight of the independent auditors and has established pre-approval procedures for the engagement of its independent registered public accounting firm for audit and non-audit services. Such services can only be contracted if they are approved by the audit committee, they comply with the restriction provided under applicable rules and they do not jeopardize the independence of our auditors.
| ITEM 16D. | EXEMPTIONS FROM THE LISTING STANDARDS FOR AUDIT COMMITTEES |
Not applicable.
| ITEM 16E. | PURCHASES OF EQUITY SECURITIES BY THE ISSUER AND AFFILIATED PURCHASERS |
Not applicable.
| ITEM 16F. | CHANGE IN REGISTRANT’S CERTIFYING ACCOUNTANT |
Not applicable.
| ITEM 16G. | CORPORATE GOVERNANCE |
We are a “foreign private issuer” within the meaning of the New York Stock Exchange corporate governance standards. Under New York Stock Exchange rules, a foreign private issuer may elect to comply with the practices of its home country and not to comply with certain corporate governance requirements applicable to U.S. companies with securities listed on the exchange.
We currently follow certain Peruvian practices concerning corporate governance and intend to continue to do so. There are significant differences in the Peruvian corporate governance practices as compared to those followed by United States domestic companies under the New York Stock Exchange’s listing standards.
The New York Stock Exchange listing standards provide that the board of directors of a U.S. listed company must have a majority of independent directors at the time the company ceases to be a “controlled company.” Under Peruvian corporate governance practices, a Peruvian company is not required to have a majority of independent members on its board of directors.
The listing standards for the New York Stock Exchange also require that U.S. listed companies, at the time they cease to be “controlled companies,” have a nominating/corporate governance committee and a compensation committee (in addition to an audit committee). Each of these committees must consist solely of independent directors and must have a written charter that addresses certain matters specified in the listing standards. Under Peruvian law, a Peruvian company may, but is not required to, form special governance committees, which may be composed partially or entirely of non-independent directors.
In addition, New York Stock Exchange rules require the independent non-executive directors of U.S. listed companies to meet on a regular basis without management being present. There is no similar requirement under Peruvian law.
The New York Stock Exchange’s listing standards also require U.S. listed companies to adopt and disclose corporate governance guidelines. In November 2013, the Peruvian Securities Commission and a committee comprised of regulatory agencies and associations prepared and published a list of suggested non-mandatory corporate governance guidelines called the “Good Corporate Governance Code for Peruvian Companies.” These principles are disclosed on the Peruvian Securities Commission web page at http:// http://www.smv.gob.pe/ and the Lima Stock Exchange web page at http://www.bvl.com.pe. Although we have implemented a number of these measures and are part of the Best Corporate Governance Practices Index of the Lima Stock Exchange, we are not required to comply with the referred corporate governance guidelines by law or regulation, only to disclose whether or not we are in compliance.
| ITEM 16H. | MINE SAFETY DISCLOSURE |
PART III
| ITEM 17. | FINANCIAL STATEMENTS |
Not applicable.
| ITEM 18. | FINANCIAL STATEMENTS |
See our consolidated financial statements beginning at page F-1. Our financial statements have been prepared in accordance with IFRS as issued by the IASB.
| Exhibit | | |
| Number | | Description of Document |
| | | |
| 1.1 | | Amended and Restated By-laws of the Registrant, as currently in effect, incorporated by reference to Exhibit 1.1 of the Registrant’s Annual Report on Form 20-F filed with the SEC on May 1, 2017 (File No. 001-35401) |
| | | |
| 2.1 | | Registrant’s Form of American Depositary Receipt, incorporated by reference to Exhibit 4.1 to the Registrant’s Registration Statement on Form F-1 filed with the SEC on January 6, 2012 (File No. 333-178922) |
| | | |
| 2.2 | | Deposit Agreement dated January 19, 2012 among the Registrant, J.P. Morgan Chase N.A., as depositary, and the holders from time to time of American depositary shares issued thereunder, incorporated by reference to Exhibit 4.2 to the Registrant’s Registration Statement on Form F-1 filed with the SEC on January 6, 2012 (File No. 333-178922) |
| | | |
| 2.2A | | Amendment N°. 1, dated as of February 21, 2017, to the Deposit Agreement dated as of February 7, 2012, among the Registrant, J.P. Morgan Chase Bank, N.A., as depositary, and all holders from time to time of American depositary receipts issued thereunder, incorporated by reference to the Registrant’s Registration Statement on Form F-6 filed with the SEC on February 21, 2017 (File No. 333-216152) |
| | | |
| 2.3 | | Indenture, dated as of February 8, 2013, among the Registrant, the Subsidiary Guarantors named therein and Deutsche Bank Trust Company Americas incorporated by reference to Exhibit 2.3 of the Registrant’s Annual Report on Form 20-F filed with the SEC on April 30, 2014 (File No. 001-35401) |
| | | |
| 4.1 | | Power Supply Agreement, dated June 3, 2010, between the Registrant and Electroperú S.A., incorporated by reference to Exhibit 4.1 of the Registrant’s Annual Report on Form 20-F filed with the SEC on April 30, 2012 (File No. 001-35401) |
| | | |
| 4.2 | | Contract of General Management and Provision of Services, dated December 31, 2007, between the Registrant and Inversiones ASPI S.A. (formerly Inversiones Pacasmayo S.A.), incorporated by reference to Exhibit 10.2 to the Registrant’s Registration Statement on Form F-1 filed with the SEC on January 6, 2012 (File No. 333-178922) |
| | | |
| 4.3 | | Property Lease Agreement, dated June 30, 2008, between the Registrant and Inversiones ASPI S.A. (formerly Inversiones Pacasmayo S.A.), incorporated by reference to Exhibit 10.3 to the Registrant’s Registration Statement on Form F-1 filed with the SEC on January 6, 2012 (File No. 333-178922) |
| | | |
| 4.4 | | Surface Rights Agreement, dated February 1, 2008, between the Registrant and Compañía Minera Ares S.A.C., incorporated by reference to Exhibit 10.4 to the Registrant’s Registration Statement on Form F-1 filed with the SEC on January 6, 2012 (File No. 333-178922) |
| | | |
| 4.5 | | Addendum, effective February 1, 2016, to the Power Supply Agreement, dated June 3, 2010, between the Registrant and Electroperú S.A., incorporated by reference to Exhibit 4.10 of the Registrant’s Annual Report on Form 20-F filed with the SEC on April 29, 2016 (File No. 001-35401) |
| * | This certification will not be deemed “filed” for purposes of Section 18 of the Exchange Act (15 U.S.C. 78r), or otherwise subject to the liability of that section. Such certification will not be deemed to be incorporated by reference into any filing under the Securities Act or the Exchange Act, except to the extent that the Registrant specifically incorporates it by reference. |
SIGNATURES
The registrant hereby certifies that it meets all of the requirements for filing on Form 20-F and that it has duly caused and authorized the undersigned to sign this annual report on Form 20-F on its behalf.
| | | |
| | CEMENTOS PACASMAYO S.A.A. |
| | | |
| | By: | /s/ Humberto Nadal Del Carpio |
| | Name: | Humberto Nadal Del Carpio |
| | Title: | Chief Executive Officer |
| | | |
| | By: | /s/ Manuel Bartolome Ferreyros Peña |
| | Name: | Manuel Bartolome Ferreyros Peña |
| | Title: | Chief Financial Officer |
Date: April 27, 2018
Report of Independent Registered Public Accounting Firm
To the Shareholders and the Board of Directors of Cementos Pacasmayo S.A.A. and subsidiaries
Opinion on Internal Control over Financial Reporting
We have audited Cementos Pacasmayo S.A.A. and subsidiaries internal control over financial reporting as of December 31, 2017, based on criteria established in Internal Control—Integrated Framework issued by the Committee of Sponsoring Organizations of the Treadway Commission (2013 framework), (the COSO criteria). In our opinion, Cementos Pacasmayo S.A.A. and subsidiaries (the Company) maintained, in all material respects, effective internal control over financial reporting as of December 31, 2017, based on the COSO criteria.
We also have audited, in accordance with the standards of the Public Company Accounting Oversight Board (United States) (PCAOB), the consolidated statements of financial position of the Company as of December 31, 2017 and 2016, the related consolidated statements of profit or loss, other comprehensive income, changes in equity and cash flows for each of the three years in the period ended December 31, 2017, and the related notes and our report dated April 27, 2018, expressed an unqualified opinion thereon.
Basis for Opinion
The Company’s management is responsible for maintaining effective internal control over financial reporting and for its assessment of the effectiveness of internal control over financial reporting included in the accompanying Management’s Annual Report on Internal Control Over Financial Reporting. Our responsibility is to express an opinion on the Company’s internal control over financial reporting based on our audit. We are a public accounting firm registered with the PCAOB and are required to be independent with respect to the Company in accordance with the U.S. federal securities laws and the applicable rules and regulations of the Securities and Exchange Commission and the PCAOB. Likewise, we are a public accounting firm registered with the Peruvian Board of Public Accountants Associations and are required to be independent with respect to the Company in accordance with International Auditing Standards approved for its application in Peru by the Peruvian Board of Public Accountants Associations.
We conducted our audit in accordance with the standards of the PCAOB. Those standards require that we plan and perform the audit to obtain reasonable assurance about whether effective internal control over financial reporting was maintained in all material respects.
Our audit included obtaining an understanding of internal control over financial reporting, assessing the risk that a material weakness exists, testing and evaluating the design and operating effectiveness of internal control based on the assessed risk, and performing such other procedures as we considered necessary in the circumstances. We believe that our audit provides a reasonable basis for our opinion.
Definition and Limitations of Internal Control Over Financial Reporting
A company’s internal control over financial reporting is a process designed to provide reasonable assurance regarding the reliability of financial reporting and the preparation of financial statements for external purposes in accordance with International Financial Reporting Standards, as issued by the International Accounting Standard Board. A company’s internal control over financial reporting includes those policies and procedures that (1) pertain to the maintenance of records that, in reasonable detail, accurately and fairly reflect the transactions and dispositions of the assets of the company; (2) provide reasonable assurance that transactions are recorded as necessary to permit preparation of financial statements in accordance with International Financial Reporting Standards, as issued by the International Accounting Standard Board, and that receipts and expenditures of the company are being made only in accordance with authorizations of management and directors of the company; and (3) provide reasonable assurance regarding prevention or timely detection of unauthorized acquisition, use, or disposition of the company’s assets that could have a material effect on the financial statements.
Because of its inherent limitations, internal control over financial reporting may not prevent or detect misstatements. Also, projections of any evaluation of effectiveness to future periods are subject to the risk that controls may become inadequate because of changes in conditions, or that the degree of compliance with the policies or procedures may deteriorate.
Paredes, Burga & Asociados Sociedad Civil de Responsabilidad Limitada
A member practice of
Ernst & Young Global Limited
/s/ Carlos Valdivia
Paredes, Burga & Asociados Sociedad Civil de Responsabilidad Limitada
We have served as the Company’s auditor since 2002.
Lima, Peru,
April 27, 2018
Cementos Pacasmayo S.A.A. and Subsidiaries
Consolidated statements of financial position
As of December 31, 2017 and 2016
| | | Note | | | 2017 | | | 2016 | |
| | | | | | S/(000) | | | S/(000) | |
| Assets | | | | | | | | | | | |
| Current assets | | | | | | | | | | | |
| Cash and cash equivalents | | 6 | | | | 49,216 | | | | 80,215 | |
| Trade and other receivables | | 7 | | | | 99,518 | | | | 81,121 | |
| Income tax prepayments | | | | | | 27,755 | | | | 46,546 | |
| Inventories | | 8 | | | | 373,020 | | | | 346,535 | |
| Prepayments | | | | | | 3,846 | | | | 7,909 | |
| Total current assets | | | | | | 553,355 | | | | 562,326 | |
| Assets held for distribution | | 1.1 | | | | — | | | | 338,411 | |
| Non-current assets | | | | | | | | | | | |
| Trade and other receivables | | 7 | | | | 16,207 | | | | 25,120 | |
| Prepayments | | | | | | 533 | | | | 1,222 | |
| Available-for-sale financial investments | | 9 | | | | 21,206 | | | | 657 | |
| Derivative financial instruments | | 30 | | | | 489 | | | | 69,912 | |
| Property, plant and equipment | | 10 | | | | 2,208,553 | | | | 2,273,048 | |
| Exploration, evaluation and intangible assets | | 11 | | | | 13,416 | | | | 43,028 | |
| Deferred income tax assets | | 15 | | | | 142 | | | | 6,350 | |
| Other assets | | | | | | 214 | | | | 549 | |
| Total non-current assets | | | | | | 2,260,760 | | | | 2,419,886 | |
| Total assets | | | | | | 2,814,115 | | | | 3,320,623 | |
| Liabilities and equity | | | | | | | | | | | |
| Current liabilities | | | | | | | | | | | |
| Trade and other payables | | 12 | | | | 177,995 | | | | 142,773 | |
| Income tax payable | | | | | | 2,431 | | | | 3,464 | |
| Provisions | | 13 | | | | 24,575 | | | | 31,711 | |
| Total current liabilities | | | | | | 205,001 | | | | 177,948 | |
| Liabilities directly related to assets held for distribution | | 1.1 | | | | — | | | | 2,704 | |
| Non-current liabilities | | | | | | | | | | | |
| Interest-bearing loans and borrowings | | 14 | | | | 965,290 | | | | 998,148 | |
| Other non-current provisions | | 13 | | | | 28,293 | | | | 22,042 | |
| Deferred income tax liabilities | | 15 | | | | 108,823 | | | | 139,752 | |
| Total non-current liabilities | | | | | | 1,102,406 | | | | 1,159,942 | |
| Total liabilities | | | | | | 1,307,407 | | | | 1,340,594 | |
| Equity | | 16 | | | | | | | | | |
| Capital stock | | | | | | 423,868 | | | | 531,461 | |
| Investment shares | | | | | | 40,279 | | | | 50,503 | |
| Treasury shares | | | | | | (119,005 | ) | | | (108,248 | ) |
| Additional paid-in capital | | | | | | 432,779 | | | | 545,165 | |
| Legal reserve | | | | | | 160,686 | | | | 188,075 | |
| Other reserves | | | | | | (43,699 | ) | | | (16,602 | ) |
| Retained earnings | | | | | | 611,652 | | | | 677,086 | |
| Equity attributable to equity holders of the parent | | | | | | 1,506,560 | | | | 1,867,440 | |
| Non-controlling interests | | | | | | 148 | | | | 112,589 | |
| Total equity | | | | | | 1,506,708 | | | | 1,980,029 | |
| Total liabilities and equity | | | | | | 2,814,115 | | | | 3,320,623 | |
The accompanying notes are an integral part of these consolidated financial statements.
Cementos Pacasmayo S.A.A. and Subsidiaries
Consolidated statements of profit or loss
For the years ended December 31, 2017, 2016 and 2015
| | | Note | | | 2017 | | | 2016 | | | 2015 | |
| | | | | | S/(000) | | | S/(000) | | | S/(000) | |
| | | | | | | | | | | | | | | | |
| Sales of goods | | 17 | | | | 1,225,639 | | | | 1,240,169 | | | | 1,231,015 | |
| Cost of sales | | 18 | | | | (732,956 | ) | | | (736,530 | ) | | | (695,757 | ) |
| Gross profit | | | | | | 492,683 | | | | 503,639 | | | | 535,258 | |
| | | | | | | | | | | | | | | | |
| Operating income (expenses) | | | | | | | | | | | | | | | |
| Administrative expenses | | 19 | | | | (195,617 | ) | | | (193,376 | ) | | | (179,723 | ) |
| Selling and distribution expenses | | 20 | | | | (46,567 | ) | | | (39,899 | ) | | | (31,481 | ) |
| Impairment on brine project | | 1 | | | | (47,582 | ) | | | — | | | | — | |
| Other operating income (expense), net | | 22 | | | | (4,357 | ) | | | 2,444 | | | | 3,913 | |
| Total operating expenses, net | | | | | | (294,123 | ) | | | (230,831 | ) | | | (207,291 | ) |
| Operating profit | | | | | | 198,560 | | | | 272,808 | | | | 327,967 | |
| | | | | | | | | | | | | | | | |
| Other income (expenses) | | | | | | | | | | | | | | | |
| Finance income | | 23 | | | | 5,842 | | | | 3,240 | | | | 3,416 | |
| Finance costs | | 24 | | | | (73,759 | ) | | | (75,397 | ) | | | (36,807 | ) |
| (Loss) gain from exchange difference, net | | 5 | | | | (2,226 | ) | | | (2,541 | ) | | | 12,194 | |
| Total other expenses, net | | | | | | (70,143 | ) | | | (74,698 | ) | | | (21,197 | ) |
| Profit before income tax | | | | | | 128,417 | | | | 198,110 | | | | 306,770 | |
| Income tax expense | | 15 | | | | (47,032 | ) | | | (78,627 | ) | | | (89,383 | ) |
| Profit for the year from continuing operations | | | | | | 81,385 | | | | 119,483 | | | | 217,387 | |
| | | | | | | | | | | | | | | | |
| Loss for the year from discontinued operations | | 1.1 | | | | (754 | ) | | | (6,589 | ) | | | (5,720 | ) |
| Profit for the year | | | | | | 80,631 | | | | 112,894 | | | | 211,667 | |
| | | | | | | | | | | | | | | | |
| Attributable to: | | | | | | | | | | | | | | | |
| Equity holders of the parent | | | | | | 93,782 | | | | 116,174 | | | | 215,532 | |
| Non-controlling interests | | | | | | (13,151 | ) | | | (3,280 | ) | | | (3,865 | ) |
| | | | | | | 80,631 | | | | 112,894 | | | | 211,667 | |
| Earnings per share | | 26 | | | | | | | | | | | | | |
| Basic profit from continuing and discontinued operations attributable to equity holders of common shares and investment shares of Cementos Pacasmayo S.A.A. (S/ per share) | | | | | | 0.21 | | | | 0.21 | | | | 0.38 | |
The accompanying notes are an integral part of these consolidated financial statements.
Cementos Pacasmayo S.A.A. and Subsidiaries
Consolidated statements of other comprehensive income
For the years ended December 31, 2017, 2016 and 2015
| | | Note | | | 2017 | | | 2016 | | | 2015 | |
| | | | | | S/(000) | | | S/(000) | | | S/(000) | |
| | | | | | | | | | | | | | | | |
| Profit for the year | | | | | | 80,631 | | | | 112,894 | | | | 211,667 | |
| | | | | | | | | | | | | | | | |
| Other comprehensive income | | | | | | | | | | | | | | | |
| Other comprehensive income to be reclassified to profit or loss in subsequent periods (net of income tax): | | | | | | | | | | | | | | | |
| Change in fair value of available-for-sale financial investments | | 9(a) | | | | 37 | | | | 221 | | | | (308 | ) |
| Net (loss) gain on cash flows hedges | | 30(b) | | | | (38,230 | ) | | | (39,511 | ) | | | 10,832 | |
| Deferred income tax related to component of other comprehensive income | | 15 | | | | 11,339 | | | | 11,039 | | | | (4,019 | ) |
| Transfer to profit or loss of fair value of available-for-sale financial investments sold | | 9(c) | | | | (243 | ) | | | — | | | | — | |
| Other comprehensive income (loss) for the year, net of income tax | | | | | | (27,097 | ) | | | (28,251 | ) | | | 6,505 | |
| | | | | | | | | | | | | | | | |
| Total comprehensive income for the year, net of income tax | | | | | | 53,534 | | | | 84,643 | | | | 218,172 | |
| | | | | | | | | | | | | | | | |
| Total comprehensive income attributable to: | | | | | | | | | | | | | | | |
| Equity holders of the parent | | | | | | 66,685 | | | | 87,923 | | | | 222,037 | |
| Non-controlling interests | | | | | | (13,151 | ) | | | (3,280 | ) | | | (3,865 | ) |
| | | | | | | | | | | | | | | | |
| | | | | | | 53,534 | | | | 84,643 | | | | 218,172 | |
The accompanying notes are an integral part of these consolidated financial statements.
Cementos Pacasmayo S.A.A. and Subsidiaries
Consolidated statements of changes in equity
For the years ended December 31, 2017, 2016 and 2015
| | | Attributable to equity holders of the parent | | | | | |
| | | Capital
stock | | Investment
shares | | Treasury shares | | Additional paid-in capital | | Legal
reserve | | Unrealized gain (loss) on available-for-sale investments | | Unrealized gain on cash flow hedge | | Retained
earnings | | Total | | Non-controlling interests | | Total
equity | |
| | | S/(000) | | S/(000) | | S/(000) | | S/(000) | | S/(000) | | S/(000) | | S/(000) | | S/(000) | | S/(000) | | S/(000) | | S/(000) | |
| | | | | | | | | | | | | | | | | | | | | | | | | | | | | | | | | | | |
| Balance as of January 1, 2015 | | | 531,461 | | | 50,503 | | | — | | | 553,791 | | | 154,905 | | | 218 | | | 4,926 | | | 696,736 | | | 1,992,540 | | | 78,145 | | | 2,070,685 | |
| Profit for the year | | | — | | | — | | | — | | | — | | | — | | | — | | | — | | | 215,532 | | | 215,532 | | | (3,865 | ) | | 211,667 | |
| Other comprehensive income | | | — | | | — | | | — | | | — | | | — | | | (229 | ) | | 6,734 | | | — | | | 6,505 | | | — | | | 6,505 | |
| Total comprehensive income | | | — | | | — | | | — | | | — | | | — | | | (229 | ) | | 6,734 | | | 215,532 | | | 222,037 | | | (3,865 | ) | | 218,172 | |
| | | | | | | | | | | | | | | | | | | | | | | | | | | | | | | | | | | |
| Appropriation of legal reserve, note 16(e) | | | — | | | — | | | — | | | — | | | 21,553 | | | — | | | — | | | (21,553 | ) | | — | | | — | | | — | |
| Acquisition of treasury shares, note 16(c) | | | — | | | — | | | (108,248 | ) | | — | | | — | | | — | | | — | | | — | | | (108,248 | ) | | — | | | (108,248 | ) |
| Dividends, note 16(g) | | | — | | | — | | | — | | | — | | | — | | | — | | | — | | | (162,950 | ) | | (162,950 | ) | | — | | | (162,950 | ) |
| Contribution of non-controlling interests, note 16(h) | | | — | | | — | | | — | | | — | | | — | | | — | | | — | | | — | | | — | | | 28,475 | | | 28,475 | |
| Other adjustments of non-controlling interests, note 16(h) | | | — | | | — | | | — | | | (325 | ) | | — | | | — | | | — | | | — | | | (325 | ) | | 325 | | | — | |
| | | | | | | | | | | | | | | | | | | | | | | | | | | | | | | | | | | |
| Balance as of December 31, 2015 | | | 531,461 | | | 50,503 | | | (108,248 | ) | | 553,466 | | | 176,458 | | | (11 | ) | | 11,660 | | | 727,765 | | | 1,943,054 | | | 103,080 | | | 2,046,134 | |
| Profit for the year | | | — | | | — | | | — | | | — | | | — | | | — | | | — | | | 116,174 | | | 116,174 | | | (3,280 | ) | | 112,894 | |
| Other comprehensive income | | | — | | | — | | | — | | | — | | | — | | | 156 | | | (28,407 | ) | | — | | | (28,251 | ) | | — | | | (28,251 | ) |
| Total comprehensive income | | | — | | | — | | | — | | | — | | | — | | | 156 | | | (28,407 | ) | | 116,174 | | | 87,923 | | | (3,280 | ) | | 84,643 | |
| | | | | | | | | | | | | | | | | | | | | | | | | | | | | | | | | | | |
| Appropriation of legal reserve, note 16(e) | | | — | | | — | | | — | | | — | | | 11,617 | | | — | | | — | | | (11,617 | ) | | — | | | — | | | — | |
| Dividends, note 16(g) | | | — | | | — | | | — | | | — | | | — | | | — | | | — | | | (155,236 | ) | | (155,236 | ) | | — | | | (155,236 | ) |
| Contribution of non-controlling interests, note 16(h) | | | — | | | — | | | — | | | — | | | — | | | — | | | — | | | — | | | — | | | 4,488 | | | 4,488 | |
| Other adjustments of non-controlling interests, note 16(h) | | | — | | | — | | | — | | | (8,301 | ) | | — | | | — | | | — | | | — | | | (8,301 | ) | | 8,301 | | | — | |
| | | | | | | | | | | | | | | | | | | | | | | | | | | | | | | | | | | |
| Balance as of December 31, 2016 | | | 531,461 | | | 50,503 | | | (108,248 | ) | | 545,165 | | | 188,075 | | | 145 | | | (16,747 | ) | | 677,086 | | | 1,867,440 | | | 112,589 | | | 1,980,029 | |
| Profit for the year | | | — | | | — | | | — | | | — | | | — | | | — | | | — | | | 93,782 | | | 93,782 | | | (13,151 | ) | | 80,631 | |
| Other comprehensive loss | | | — | | | — | | | — | | | — | | | — | | | (145 | ) | | (26,952 | ) | | — | | | (27,097 | ) | | — | | | (27,097 | ) |
| Total comprehensive income | | | — | | | — | | | — | | | — | | | — | | | (145 | ) | | (26,952 | ) | | 93,782 | | | 66,685 | | | (13,151 | ) | | 53,534 | |
| | | | | | | | | | | | | | | | | | | | | | | | | | | | | | | | | | | |
| Appropriation of legal reserve, note 16(e) | | | — | | | — | | | — | | | — | | | 9,379 | | | — | | | — | | | (9,379 | ) | | — | | | — | | | — | |
| Contribution of non-controlling interests, note 16(h) | | | — | | | — | | | — | | | — | | | — | | | — | | | — | | | — | | | — | | | 491 | | | 491 | |
| Acquisition of treasury shares, note 16(c) | | | — | | | — | | | (34,216 | ) | | — | | | — | | | — | | | — | | | — | | | (34,216 | ) | | — | | | (34,216 | ) |
| Splitting effects of equity block, note 1.1 | | | (107,593 | ) | | (10,224 | ) | | 23,459 | | | (118,569 | ) | | (36,957 | ) | | — | | | — | | | — | | | (249,884 | ) | | (100,357 | ) | | (350,241 | ) |
| Dividends, note 16(g) | | | — | | | — | | | — | | | — | | | — | | | — | | | — | | | (149,837 | ) | | (149,837 | ) | | — | | | (149,837 | ) |
| Terminated dividends, note 16(g) | | | — | | | — | | | — | | | — | | | 189 | | | — | | | — | | | — | | | 189 | | | — | | | 189 | |
| Impairment on brine project, note 1.2 | | | — | | | — | | | — | | | 6,759 | | | — | | | — | | | — | | | — | | | 6,759 | | | — | | | 6,759 | |
| Other adjustments of non-controlling interests, note 16(h) | | | — | | | — | | | — | | | (576 | ) | | — | | | — | | | — | | | — | | | (576 | ) | | 576 | | | — | |
| | | | | | | | | | | | | | | | | | | | | | | | | | | | | | | | | | | |
| Balance as of December 31, 2017 | | | 423,868 | | | 40,279 | | | (119,005 | ) | | 432,779 | | | 160,686 | | | — | | | (43,699 | ) | | 611,652 | | | 1,506,560 | | | 148 | | | 1,506,708 | |
The accompanying notes are an integral part of these consolidated financial statements.
Cementos Pacasmayo S.A.A. and Subsidiaries
Consolidated statements of cash flows
For the years ended December 31, 2017, 2016 and 2015
| | | Note | | | 2017 | | | 2016 | | | 2015 | |
| | | | | | S/(000) | | | S/(000) | | | S/(000) | |
| Operating activities | | | | | | | | | | | | | | | |
| Profit before income tax | | | | | | 127,112 | | | | 185,122 | | | | 297,909 | |
| Non-cash adjustments to reconcile profit before income tax to net cash flows | | | | | | | | | | | | | | | |
| Depreciation and amortization | | 10 and 11 | | | | 124,206 | | | | 111,266 | | | | 70,810 | |
| Finance costs | | 24 | | | | 73,759 | | | | 75,397 | | | | 36,807 | |
| Impairment on brine project | | 1.2 | | | | 47,582 | | | | — | | | | — | |
| Long-term incentive plan | | 21 | | | | 11,401 | | | | 16,088 | | | | 14,159 | |
| Provision of impairment of inventories, net | | 8 | | | | 2,718 | | | | 3,493 | | | | 8,909 | |
| Adjustment as a result of physical inventories | | | | | | 2,700 | | | | 4,683 | | | | 2,548 | |
| Estimation of impairment of trade and other accounts receivables | | 20 | | | | 1,190 | | | | 114 | | | | 315 | |
| Unrealized exchange difference related to monetary transactions | | | | | | 185 | | | | (1,268 | ) | | | (10,029 | ) |
| Finance income | | 23 | | | | (5,842 | ) | | | (3,251 | ) | | | (3,478 | ) |
| Net (gain) loss on disposal of property, plant and equipment | | 22 | | | | (42 | ) | | | 3,445 | | | | (6,674 | ) |
| Net gain on sale of available-for-sale investments | | 9(c) | | | | (243 | ) | | | — | | | | — | |
| Change in the estimation of rehabilitation costs | | 22 | | | | — | | | | 5,259 | | | | 514 | |
| Other operating, net | | | | | | 477 | | | | 220 | | | | 1,217 | |
| | | | | | | | | | | | | | | | |
| Working capital adjustments | | | | | | | | | | | | | | | |
| (Increase) decrease in trade and other receivables | | | | | | (31,178 | ) | | | 28,079 | | | | (6,230 | ) |
| Decrease (increase) in prepayments | | | | | | 4,662 | | | | (734 | ) | | | (1,985 | ) |
| (Increase) decrease in inventories | | | | | | (31,863 | ) | | | (49,967 | ) | | | 5,135 | |
| Increase (decrease) in trade and other payables | | | | | | 14,083 | | | | (36,203 | ) | | | 2,949 | |
| | | | | | | 340,907 | | | | 341,743 | | | | 412,876 | |
| Interest received | | | | | | 2,251 | | | | 2,619 | | | | 3,176 | |
| Interest paid | | | | | | (52,346 | ) | | | (48,000 | ) | | | (43,200 | ) |
| Income tax paid | | | | | | (40,404 | ) | | | (54,683 | ) | | | (97,208 | ) |
| | | | | | | | | | | | | | | | |
| Net cash flows from operating activities | | | | | | 250,408 | | | | 241,679 | | | | 275,644 | |
| Which includes cash used in discontinued operations for | | 1.1 | | | | (2,611 | ) | | | (14,647 | ) | | | (9,421 | ) |
The accompanying notes are an integral part of these consolidated financial statements.
Consolidated statement of cash flows (continued)
| | | | | 2017 | | | 2016 | | | 2015 | |
| | | | | S/(000) | | | S/(000) | | | S/(000) | |
| Investing activities | | | | | | | | | | | | | | |
| Purchase of property, plant and equipment | | | | | (71,355 | ) | | | (126,449 | ) | | | (471,179 | ) |
| Purchase of exploration and evaluation assets | | | | | (6,331 | ) | | | (10,619 | ) | | | (12,187 | ) |
| Proceeds from sale of property, plant and equipment | | | | | 6,353 | | | | 1,441 | | | | 7,499 | |
| Proceeds from sale of available-for-sale investment | | 9(c) | | | 694 | | | | — | | | | — | |
| Net cash flows used in investing activities | | | | | (70,639 | ) | | | (135,627 | ) | | | (475,867 | ) |
| | | | | | | | | | | | | | | |
| Which includes cash used in investment activities of discontinued operations for | | 1.1 | | | (6,410 | ) | | | (22,352 | ) | | | (42,737 | ) |
| | | | | | | | | | | | | | | |
| Financing activities | | | | | | | | | | | | | | |
| Dividends paid | | | | | (124,993 | ) | | | (154,401 | ) | | | (162,168 | ) |
| Purchase of treasury shares | | 16(c) | | | (34,216 | ) | | | — | | | | (108,218 | ) |
| Payment of hedge finance cost | | | | | (26,708 | ) | | | (27,624 | ) | | | (15,898 | ) |
| Contribution of non-controlling interests | | 16(h) | | | 491 | | | | 4,488 | | | | 28,475 | |
| Net cash flows used in financing activities | | | | | (185,426 | ) | | | (177,537 | ) | | | (257,809 | ) |
| | | | | | | | | | | | | | | |
| Which includes cash provided by financing activities of discontinued operations for | | 1.1 | | | — | | | | 4,015 | | | | 28,198 | |
| | | | | | | | | | | | | | | |
| Net decrease in cash and cash equivalents | | | | | (5,657 | ) | | | (71,485 | ) | | | (458,032 | ) |
| Net foreign exchange difference | | | | | (185 | ) | | | 1,268 | | | | 35,540 | |
| Cash and cash equivalents as of January 1 | | 6 | | | 80,215 | | | | 158,007 | | | | 580,499 | |
| Cash transferred to discontinued operations | | 1.1 | | | (34,178 | ) | | | — | | | | — | |
| Change in cash and cash equivalents of discontinued operations | | | | | 9,021 | | | | (7,575 | ) | | | — | |
| | | | | | | | | | | | | | | |
| Cash and cash equivalents as of December 31 | | 6 | | | 49,216 | | | | 80,215 | | | | 158,007 | |
| Transactions with no effect on cash flows: | | | | | | | | | | | | | | |
| Unrealized exchange difference related to monetary transactions | | | | | 185 | | | | (1,268 | ) | | | (10,029 | ) |
| Purchase of property, plant and equipment, pending liquidation | | | | | — | | | | — | | | | 7,441 | |
| Sale of property, plant and equipment, pending collection | | | | | — | | | | 8,419 | | | | 4,034 | |
| Deferred income tax on costs related to the purchase of treasury shares | | 15 | | | — | | | | — | | | | 30 | |
See transfer of net assets and impairment on brine project that did not generated cash flows in notes 1.1 and 1.2.
The accompanying notes are an integral part of these consolidated financial statements.
Cementos Pacasmayo S.A.A. and Subsidiaries
Notes to the consolidated financial statements
As of December 31, 2017, 2016 and 2015
Cementos Pacasmayo S.A.A. (hereinafter “the Company”) was incorporated in 1957 and, under the Peruvian General Corporation Law, is an open stock corporation with publicly traded shares. The Company is a subsidiary of Inversiones ASPI S.A., which holds 50.01 percent of the Company’s common shares as of December 31, 2017 and 2016. The Company’s registered address is Calle La Colonia No. #150, Urbanización El Vivero, Santiago de Surco, Lima, Peru.
The Company’s main activity is the production and marketing of cement, blocks, concrete and quicklime in La Libertad region, in the North of Peru.
The issuance of the consolidated financial statements of the Company and its subsidiaries (hereinafter “the Group”) as of December 31, 2017 and 2016 was authorized by the Company’s Management on April 27, 2018.
As of December 31, 2017, the consolidated financial statements comprise the financial statements of the Company and its subsidiaries: Cementos Selva S.A. and subsidiaries, Distribuidora Norte Pacasmayo S.R.L., Empresa de Transmisión Guadalupe S.A.C., Salmueras Sudamericanas S.A. and Calizas del Norte S.A.C. (in liquidation).
The main activities of the subsidiaries incorporated in the consolidated financial statements are described as follows:
| - | Cementos Selva S.A. is engaged in production and marketing of cement and other construction materials in the northeast region of Peru. Also, it holds shares in Dinoselva Iquitos S.A.C. (a cement and construction materials distributor in the north of Peru, which also produces and sells blocks, cement bricks and ready-mix concrete) and in Acuícola Los Paiches S.A.C. (a fish farm entity). |
| - | Distribuidora Norte Pacasmayo S.R.L. is mainly engaged in selling cement produced by the Company. Additionally, it produces and sells blocks, cement bricks and ready-mix concrete. In May 2017, Distribuidora Norte Pacasmayo S.R.L. formed Prefabricados del Pacífico S.A.C., a company dedicated to the production and commercialization of cement bricks in northern Peru, which as of the date of this report has not started operations. |
| - | Empresa de Transmisión Guadalupe S.A.C. is mainly engaged in providing energy transmission services to the Company. |
| - | Salmueras Sudamericanas S.A. (“Salmueras”) which is engaged in the exploration of a brine project located in the northern region of Peru. To develop this brine project the subsidiary has a minority shareholder Quimpac S.A. which holds 25.1% of its common shares. In December 2017, the Company decided not to continue with the activities related to this project, as explained in note 1.2 below. |
| - | Calizas del Norte S.A.C. (in liquidation), is engaged in the mining activities of prospecting, exploration, marketing and transportation of other goods. On May 31, 2016, the Company decided to liquidate the subsidiary Calizas del Norte S.A.C., in order to contract a third party to provide the services performed by this subsidiary. |
As explained above, as of December 31, 2017 and 2016, the Company has a 100% interest in all its subsidiaries, except the following listed below:
| | | 2017 | | | 2016 | |
| Subsidiary | | % | | | % | |
| | | | | | | |
| Salmueras Sudamericanas S.A. | | 74.90 | | | 74.90 | |
| Fosfatos del Pacífico S.A. | | — | | | 70.00 | |
In September 2016, the Company’s General Shareholders’ Meeting approved a spin-off project that will allow the transfer of a portion of net assets (composed by the assets and liabilities related to the Company’s interest in Fosfatos del Pacífico S.A.) in favor of Fossal S.A.A. (enterprise created as a subsidiary of Inversiones ASPI S.A.). The purpose of the spin-off project is to allocate the assets and liabilities of the Company in accordance with the specialization of each business, creating greater flexibility for shareholders and greater clarity in long-term operations.
The project contemplates that for each common and investment share of the Company, each shareholder will receive approximately 0.20 common and investment shares of Fossal S.A.A. and approximately 0.80 common and investment shares of Cementos Pacasmayo S.A.A.
On March 1, 2017, the spin-off project was executed; in that sense, capital stock, investment shares, additional capital and legal reserve decreased by S/107,593,000, S/10,224,000, S/118,569,000 and S/36,957,000, respectively. The related non-controlling interest was reduced by S/100,357,000.
As of the date of the spin-off’s execution, part of the investment shares transferred to Fossal S.A.A. were owned by the Company (treasury shares). As a consequence, the Company received 9,148,373 investment shares of Fossal S.A.A. The transaction was recorded with a debit to available-for-sale investments, at cost, in an amount of S/21,206,000 and a credit to equity of S/23,459,000. The difference between the financial and tax value of those investments generated a deferred income tax asset of S/2,253,000. See note 9(a).
Notes to the consolidated financial statements (continued)
As of December 31, 2016, Fosfatos del Pacífico S.A. was classified as a group of assets (along with related liabilities) held for distribution to shareholders and as a discontinued operation.
The net assets to be transferred are presented in the segment denominated “Other” in Note 31.
Below the detail of the results generated by Fosfatos del Pacífico S.A. (net of intercompany eliminations), which have been included in the consolidated statements of profit or loss for the years 2017, 2016 and 2015:
| | | Fosfatos del Pacífico S.A.
(net of intercompany transactions) | |
| | | 2017
(From Jan 1, 2017 to
March 31, 2017) | | | 2016 | | | 2015 | |
| | | S/(000) | | | S/(000) | | | S/(000) | |
| | | | | | | | | | |
| Sales | | 11 | | | 2,044 | | | — | |
| Cost of sales | | (626 | ) | | (6,881 | ) | | — | |
| Administrative expenses | | (660 | ) | | (6,352 | ) | | (8,868 | ) |
| Other income (expense) | | 153 | | | (1,006 | ) | | (212 | ) |
| Finance income | | 2 | | | 11 | | | 62 | |
| (Loss) gain from exchange difference, net | | (185 | ) | | (804 | ) | | 157 | |
| | | | | | | | | | |
| Loss from discontinued operations before income tax | | (1,305 | ) | | (12,988 | ) | | (8,861 | ) |
| Income tax | | 551 | | | 6,399 | | | 3,141 | |
| | | | | | | | | | |
| Loss for the year from discontinued operations | | (754 | ) | | (6,589 | ) | | (5,720 | ) |
As of December 31, 2016, the assets and liabilities of Fosfatos del Pacífico S.A. (net of intercompany eliminations), which have been classified as held for distribution mainly comprise the following:
| | | S/(000) | |
| | | | |
| Assets - | | | |
| Cash and cash equivalents | | 7,575 | |
| Inventories | | 2,734 | |
| Income tax prepayments | | 3,892 | |
| Other current assets | | 248 | |
| Other receivables non current | | 48,985 | |
| Property, plant and equipment, net | | 204,725 | |
| Exploration and evaluation assets | | 47,630 | |
| Deferred income tax assets | | 22,622 | |
| | | | |
| | | 338,411 | |
| Liabilities - | | | |
| Trade and other payables | | (2,704 | ) |
| | | | |
| Net assets held for distribution | | 335,707 | |
Notes to the consolidated financial statements (continued)
As of March 1, 2017, the assets and liabilities of Fosfatos del Pacífico S.A. (net of intercompany eliminations), that were transferred mainly comprise the following:
| | | S/(000) | |
| | | | |
| Assets - | | | |
| Cash and cash equivalents | | 34,178 | |
| Accounts receivable from related parties | | 5,822 | |
| Inventories | | 2,694 | |
| Income tax prepayments | | 3,892 | |
| Other current assets | | 5,126 | |
| Other receivables non current | | 50,200 | |
| Property, plant and equipment, net | | 204,975 | |
| Exploration and evaluation assets | | 52,578 | |
| Deferred income tax assets | | 23,173 | |
| | | | |
| | | 382,638 | |
| | | | |
| Liabilities and equity - | | | |
| Trade and other payables | | 8,938 | |
| Capital stock | | 107,593 | |
| Investment shares | | 10,224 | |
| Additional paid-in capital | | 118,569 | |
| Other reserves | | 36,957 | |
| Non-controlling interest | | 100,357 | |
| | | | |
| | | 382,638 | |
Notes to the consolidated financial statements (continued)
| 1.2 | Impairment on brine project - |
The Company has decided to prioritize its investments in the development of products related to the manufacture and sale of cement and construction solutions; therefore, the disposal of investments that are not in line with the strategic plan has been approved. As a result of this decision, in the fourth quarter of 2017, the Company decided not to continue with the brine project. The consolidated financial statements of the Company include a charge to results related to the impairment on the assets of this project, as detailed below:
| | | Salmueras
Sudamericanas S.A. | | | Cementos
Pacasmayo S.A.A. | | | Total
consolidated | |
| | | S/(000) | | | S/(000) | | | S/(000) | |
| | | | | | | | | | |
| Assets - | | | | | | | | | |
| Income tax prepayments | | (5,654 | ) | | — | | | (5,654 | ) |
| Property, plant and equipment (note 10) | | (1,732 | ) | | — | | | (1,732 | ) |
| Exploration and evaluation assets (note 11) | | (33,469 | ) | | — | | | (33,469 | ) |
| Other current liabilities | | 32 | | | — | | | 32 | |
| Additional paid in capital | | — | | | (6,759 | ) | | (6,759 | ) |
| | | | | | | | | | |
| Total impairment | | (40,823 | ) | | (6,759 | ) | | (47,582 | ) |
| Income tax | | (6,937 | ) | | 17,087 | | | 10,150 | |
| | | | | | | | | | |
| Total | | (47,760 | ) | | 10,328 | | | (37,432 | ) |
| | | | | | | | | | |
| Attributable to - | | | | | | | | | |
| Equity holders of the parent | | (35,772 | ) | | 10,328 | | | (25,444 | ) |
| Non controlling interests | | (11,988 | ) | | — | | | (11,988 | ) |
| | | | | | | | | | |
| | | (47,760 | ) | | 10,328 | | | (37,432 | ) |
Notes to the consolidated financial statements (continued)
The table presented below shows the summary of the main captions of the audited financial statements of the subsidiaries controlled by the Group as of December 31, 2017, 2016 and 2015:
| | | Assets | | Liabilities | | Net equity | | Net income (loss) | |
| Entity | | 2017 | | 2016 | | 2017 | | 2016 | | 2017 | | 2016 | | 2017 | | 2016 | | 2015 | |
| | | S/(000) | | S/(000) | | S/(000) | | S/(000) | | S/(000) | | S/(000) | | S/(000) | | S/(000) | | S/(000) | |
| | | | | | | | | | | | | | | | | | | | |
| Cementos Selva S.A. and subsidiaries | | 244,386 | | 260,927 | | 34,969 | | 36,477 | | 209,417 | | 224,450 | | 37,467 | | 37,361 | | 244,386 | |
| Fosfatos del Pacífico S.A. | | — | | 339,236 | | — | | 3,495 | | — | | 335,741 | | (1,216 | ) | (9,010 | ) | — | |
| Distribuidora Norte Pacasmayo S.R.L. and subsidiary | | 243,568 | | 211,787 | | 119,182 | | 87,182 | | 124,386 | | 124,605 | | (220 | ) | 11,242 | | 243,568 | |
| Empresa de Transmisión Guadalupe S.A.C. | | 42,136 | | 49,339 | | 1,397 | | 724 | | 40,739 | | 48,615 | | 124 | | 504 | | 42,136 | |
| Salmueras Sudamericanas S.A. | | 587 | | 47,661 | | — | | 382 | | 587 | | 47,279 | | (50,942 | ) | (2,300 | ) | 587 | |
| Calizas del Norte S.A.C. (in liquidation) | | 713 | | 1,219 | | 7 | | 409 | | 706 | | 810 | | (121 | ) | 407 | | 713 | |
Notes to the consolidated financial statements (continued)
| 2. | Significant accounting policies |
| 2.1 | Basis of preparation - |
The consolidated financial statements of the Group have been prepared in accordance with International Financial Reporting Standards (IFRS), as issued by the International Accounting Standards Board (IASB).
The consolidated financial statements have been prepared on a historical cost basis, except for some available-for-sale financial investments and derivative financial instruments that have been measured at fair value. The carrying values of recognized assets and liabilities that are designated as hedged items in fair value hedges that would otherwise be carried at amortized cost are adjusted to record changes in fair values attributable to the risks that are being hedged in effective hedge relationships. The consolidated financial statements are presented in Soles and all values are rounded to the nearest thousand (S/000), except when otherwise indicated.
The consolidated financial statements provide comparative information in respect of the previous period, there are certain standards and amendments applied for the first time by the Group during 2017 that did not require the restatement of previous financial statements, as explained in Note 2.3.20.
| 2.2 | Basis of consolidation -
|
The consolidated financial statements comprise the financial statements of the Company and its subsidiaries as of December 31, 2017 and 2016. Control is achieved when the Group is exposed, or has rights, to variable returns from its involvement with the investee and has the ability to affect those returns through its power over the investee. Specifically, the Group controls an investee if and only if it has: i) power over the investee (i.e. existing rights that give it the current ability to direct the relevant activities of the investee), ii) exposure, or rights, to variable returns from its involvement with the investee, and iii) the ability to use its power over the investee to affect its returns.
Generally, there is a presumption that a majority of voting rights result in control. To support this presumption and when the Group has less than a majority of the voting or similar rights of an investee, the Group considers all relevant facts and circumstances in assessing whether it has power over an investee, including: i) the contractual arrangement with the other vote holders of the investee, ii) rights arising from other contractual arrangements, and iii) the Group’s voting rights and potential voting rights.
The Group reassesses whether or not it controls an investee if facts and circumstances indicate that there are changes to one or more of the three elements of control. Consolidation of a subsidiary begins when the Group obtains control over the subsidiary and ceases when the Group loses control of the subsidiary. Assets, liabilities, income and expenses of a subsidiary acquired or disposed of during the year are included in the consolidated financial statements from the date the Group gains control until the date the Group ceases to control the subsidiary.
Notes to the consolidated financial statements (continued)
Profit or loss and each component of other comprehensive income (OCI) are attributed to the equity holders of the parent of the Group and to the non-controlling interests, even if this results in the non-controlling interests having a deficit balance. When necessary, adjustments are made to the financial statements of subsidiaries to bring their accounting policies in line with the Group’s accounting policies. All intra-group assets and liabilities, equity, income, expenses and cash flows relating to transactions between members of the Group are eliminated in full on consolidation.
A change in the ownership interest of a subsidiary, without a loss of control, is accounted for as an equity transaction.
If the Group losses control over a subsidiary it derecognizes the related assets (including goodwill), liabilities, non-controlling interest and other components of equity, while any resultant gain or loss is recognized in the consolidated statement of profit or loss. Any investment retained is recognized at fair value.
| 2.3 | Summary of significant accounting policies - |
| 2.3.1 | Cash and cash equivalents - |
Cash and cash equivalents presented in the statements of cash flows comprise cash at banks and on hand and short-term deposits with original maturity of three months or less.
| 2.3.2 | Financial instruments-initial recognition and subsequent measurement – |
A financial instrument is any contract that gives rise to a financial asset of one entity and a financial liability or equity instrument of another entity.
Initial recognition and measurement -
Financial assets are classified, at initial recognition, as financial assets at fair value through profit or loss, loans and receivables, held-to-maturity investments, available-for-sale financial assets or as derivatives designated as hedging instruments in an effective hedge, as appropriate.
All financial assets are recognized initially at fair value plus, in the case of assets not recorded at fair value through profit or loss, transaction costs that are attributable to the acquisition of the financial asset.
Purchases or sales of financial assets that require delivery of assets within a time frame established by regulation or convention in the market place (regular way trades) are recognized on the trade date, i.e., the date that the Group commits to purchase or sell the asset.
The Group’s financial assets include cash and cash equivalents, trade and other receivables, call options, available-for-sale financial investments and derivatives financial instruments.
Notes to the consolidated financial statements (continued)
Subsequent measurement -
For purpose of subsequent measurement, financial assets are classified in four categories:
| - | Financial assets at fair value through profit or loss |
| - | Held-to-maturity investments |
| - | Available for sale financial investments |
Financial assets at fair value through profit or loss -
Financial assets at fair value through profit or loss includes financial assets held for trading and financial assets designated upon initial recognition as at fair value through profit or loss. Financial assets are classified as held for trading if they are acquired for the purpose of selling or repurchasing in the near term. Derivatives, including separated embedded derivatives, are classified as held for trading unless they are designated as effective hedging instruments as defined by the International Accounting Standard (IAS) 39.
Financial assets at fair value through profit and loss are carried in the consolidated statement of financial position at fair value with net changes in fair value presented as finance costs (negative net changes in fair value) or finance income (positive net changes in fair value) in the consolidated statement of profit or loss.
The Group has not designated any financial assets at fair value through profit or loss as of December 31, 2017 and 2016.
Loans and receivables -
Loans and receivables are non-derivative financial assets with fixed or determinable payments that are not quoted in an active market. After initial measurement, such financial assets are subsequently measured at amortized cost using the effective interest rate method (EIR), less impairment. Amortized cost is calculated by taking into account any discount or premium on acquisition and fees or costs that are an integral part of the EIR. The EIR amortization is included in finance income in the consolidated statement of profit or loss. The losses arising from impairment are recognized in the consolidated statement of profit or loss in finance costs for loans and in selling and distribution expenses for receivables.
This category applies to trade and other receivables. For more information on receivables, refer to Note 7.
Held-to-maturity investments -
Non-derivative financial assets with fixed or determinable payments and fixed maturities are classified as held-to-maturity when the Group has the positive intention and ability to hold them to maturity. After initial measurement, held-to-maturity investments are measured at amortized cost using the EIR, less impairment. Amortized cost is calculated by taking into account any discount or premium on acquisition and fees or costs that are an integral part of the EIR. The EIR amortization is included as finance income in the consolidated statement of profit or loss. The losses arising from impairment are recognized in the consolidated statement of profit or loss as finance costs.
Notes to the consolidated financial statements (continued)
The Group did not have any held-to-maturity investments during the years ended December 31, 2017 and 2016.
Available-for-sale (AFS) financial investments -
AFS financial investments include equity and debt securities. Equity investments classified as AFS are those that are neither classified as held for trading nor designated at fair value through profit or loss.
After initial measurement, AFS financial investments are subsequently measured at fair value with unrealized gains or losses recognized in OCI and credited in the unrealized gain on available-for-sale investments until investment is derecognized, at which time the cumulative gain or loss is recognized in other operating income, or the investment is determined to be impaired, when the cumulative loss is reclassified from the AFS reserve to the consolidated statement of profit or loss in finance costs. Interest earned whilst holding AFS financial investments is reported as interest income using EIR method.
Investments in equity instruments that do not have an active market price and whose fair value cannot be measured reliably are measured at cost.
The Group evaluates whether the ability and intention to sell its AFS financial investments in the near term is still appropriate. When, in rare circumstances, the Group is unable to trade these financial assets due to inactive markets, the Group may elect to reclassify these financial assets if the management has the ability and intention to hold the assets for foreseeable future or until maturity.
The Group has classified equity securities as available-for-sale financial investments as of December 31, 2017 and 2016. See note 9.
Derecognition -
A financial asset is primarily derecognized when:
| (i) | The rights to receive cash flow from such asset have expired; or |
| (ii) | The Group has transferred its rights to receive cash flows from the asset or has assumed an obligation to pay the received cash flows in full without material delay to a third party under a “pass through” arrangement; and either (a) the Group has transferred substantially all the risks and rewards of the asset, or (b) the Group has neither transferred nor retained substantially all the risks and rewards of the asset, but has transferred control of the asset. |
Notes to the consolidated financial statements (continued)
When the Group has transferred its rights to receive cash flows from an asset or has entered into a pass-through arrangement, it evaluates if, and to what extent it has retained the risks and rewards of ownership. When it has neither transferred nor retained substantially all of the risks and rewards of the asset, nor transferred control of the asset, the Group continues to recognize the transferred asset to the extent of the Group’s continuing involvement. In that case, the Group also recognizes an associated liability. The transferred asset and the associated liability are measured on a basis that reflects the rights and obligations that the Group has retained.
Continuing involvement that takes the form of a guarantee over the transferred asset is measured at the lower of the original carrying amount of the asset and the maximum amount of consideration that the Group could be required to repay.
Impairment of financial assets -
Further disclosures relating to impairment of financial assets are also provided in the following notes:
| - | Disclosures for significant assumptions, note 3 |
| - | Financial assets, note 30 |
| - | Trade and other receivables, note 7 |
The Group assesses, at each reporting date, whether there is any objective evidence that a financial asset or a group of financial assets is impaired. An impairment exists if one or more events that has occurred since the initial recognition of the asset (an incurred “loss event”), has an impact on the estimated future cash flows of the financial asset or the group of financial assets that can be reliably estimated. Evidence of impairment may include indications that the debtors or a group of debtors is experiencing significant financial difficulty, default or delinquency in interest or principal payments, the probability that they will enter bankruptcy or other financial reorganization and where observable data indicate that there is a measurable decrease in the estimated future cash flows, such as economic conditions that correlate with defaults.
Financial assets carried at amortized cost
For financial assets carried at amortized cost, the Group first assesses whether impairment exists individually for financial assets that are individually significant, or collectively for financial assets that are not individually significant. If the Group determines that no objective evidence of impairment exists for an individually assessed financial assets, whether significant or not, it includes the asset in a group of financial assets with similar credit risk characteristics and collectively assesses them for impairment. Assets that are individually assessed for impairment and for which an impairment loss is, or continues to be, recognized are not included in a collective assessment of impairment.
Notes to the consolidated financial statements (continued)
The amount of any impairment loss identified is measured as the difference between the assets carrying amount and the present value of estimated future cash flows (excluding future expected credit losses that have not yet been incurred). The present value of the estimated future cash flows is discounted at the financial asset’s original effective interest rate.
The carrying amount of the asset is reduced through the use of an allowance account and the amount of the loss is recognized in the consolidated statement of profit or loss. Interest income (recorded as finance income in the consolidated statement of profit or loss) continues to be accrued on the reduced carrying amount and is accrued using the rate of interest used to discount the future cash flows for the purpose of measuring the impairment loss. Loans together with the associated allowance are written off when there is no realistic prospect of future recovery and all collateral has been realized or has been transferred to the Group. If, in a subsequent year, the amount of the estimated impairment loss increases or decreases because of an event occurring after the impairment was recognized, the previously recognized impairment loss is increased or reduced by adjusting the allowance account. If write-off is later recovered, the recovery is credited to finance costs in the consolidated statement of profit or loss.
Available-for-sale (AFS) financial investments
For AFS financial investments, the Group assesses at each reporting date whether there is objective evidence that an investment or a group of investments is impaired.
In the case of equity investments classified as AFS, objective evidence would include a significant or prolonged decline in the fair value of the investment below its cost. “Significant” is evaluated against the original cost of the investment and “prolonged” against the period in which the fair value has been below its original cost. Where there is evidence of impairment, the cumulative loss – measured as the difference between the acquisition cost and the current fair value, less any impairment loss on that investment previously recognized in the consolidated statement of profit or loss – is removed from OCI and recognized in the consolidated statement of profit or loss. Impairment losses on equity investment are not reversed through profit or loss; increases in their fair value after impairment are recognized in OCI.
The determination of what is “significant” or “prolonged” requires judgment. In making this judgment, the Group evaluates, among others factors the duration or extent to which the fair value of an investment is less than its cost.
Notes to the consolidated financial statements (continued)
| (ii) | Financial liabilities - |
Initial recognition and measurement -
Financial liabilities are classified, at initial recognition, as financial liabilities at fair value through profit or loss, loans and borrowings, payables, or as derivatives designated as hedging instruments in an effective hedge, as appropriate.
All financial liabilities are recognized initially at fair value and, in the case of loans and borrowings and payables, net of directly attributable transaction costs.
The Group’s financial liabilities include trade and other payables, interest-bearing loans and borrowings.
Subsequent measurement -
The measurement of financial liabilities depends on their classification, as described below:
Financial liabilities at fair value through profit or loss -
Financial liabilities at fair value through profit or loss include financial liabilities held for trading and financial liabilities designated upon initial recognition as at fair value through profit or loss.
The Group has not classified any financial liability as fair value through profit or loss as of December 31, 2017 and 2016.
Loans and borrowings -
This is the Group’s most relevant category. After their initial recognition, interest-bearing loans and borrowings are subsequently measured at amortized cost using the EIR method. Gains and losses are recognized in the consolidated statement of profit or loss when the liabilities are derecognized as well as through the EIR amortization process.
Amortized cost is calculated by taking into account any discount or premium on acquisition and fees or costs that are an integral part of the EIR. The EIR amortization is included as finance costs in the consolidated statement of profit or loss.
This category includes trade and other payables and interest-bearing loans and borrowings. For more information refer to notes 12 and 14.
Derecognition -
A financial liability is derecognized when the obligation under the liability is discharged or cancelled or expires. When an existing financial liability is replaced by another one from the same lender on substantially different terms, or the terms of an existing liability are substantially modified, such an exchange or modification is treated as a derecognition of the original liability and the recognition of a new liability. The difference in the respective carrying amount is recognized in the consolidated statement of profit or loss.
Notes to the consolidated financial statements (continued)
| (iii) | Offsetting of financial instruments - |
Financial assets and financial liabilities are offset and the net amount is reported in the consolidated statement of financial position if there is a currently enforceable legal right to offset the recognized amounts and there is an intention to settle on a net basis, to realize the assets and settle the liabilities simultaneously.
| (iv) | Fair value measurement – |
The Group measures financial instruments such as derivative financial instruments and some available-for-sale investments at fair value at each statement of financial position date. Fair value related disclosures for financial instruments that are measured at fair value or where fair values are disclosed are summarized in note 30.
Fair value is the price that would be received to sell an asset or paid to transfer a liability in an orderly transaction between market participants at the measurement date. The fair value measurement is based on the presumption that the transaction to sell the asset or transfer the liability takes place either:
| - | In the principal market for the asset or liability, or |
| - | In the absence of a principal market, in the most advantageous market for the asset or liability. |
The principal or the most advantageous market must be accessible by the Group.
The fair value of an asset or a liability is measured using the assumptions that market participants would use when pricing the asset or liability, assuming that market participants act in their economic best interest.
The Group uses valuation techniques that are appropriate in the circumstances and for which sufficient data are available to measure fair value, maximizing the use of relevant observable inputs and minimizing the use of unobservable inputs.
All assets and liabilities for which fair value is measured or disclosed in the financial statements are categorized within the fair value hierarchy, described as follows, based on the lowest level input that is significant to the fair value measurement as a whole:
| - | Level 1 — Quoted (unadjusted) market prices in active markets for identical assets or liabilities. |
| - | Level 2 — Valuation techniques for which the lowest level input that is significant to the fair value measurement is directly or indirectly observable. |
| - | Level 3 — Valuation techniques for which the lowest level input that is significant to the fair value measurement is unobservable.
|
Notes to the consolidated financial statements (continued)
For assets and liabilities that are recognized in the financial statements on a recurring basis, the Group determines whether transfers have occurred between levels in the hierarchy by re-assessing categorization (based on the lowest level input that is significant to the fair value measurement as a whole) at the end of each reporting period.
The Group’s financial management determines the policies and procedures for both recurring and non-recurring measurement.
At each reporting date, the financial management analyses the movements in the values of assets and liabilities which are required to be re-measured or re-assessed as per the Group’s accounting policies. For this analysis, the financial management verifies the major inputs applied in the latest valuation by agreeing the information in the valuation computation to contracts and other relevant documents.
Financial management also compares the changes in the fair value of each asset and liability with relevant external sources to determine whether the change is reasonable.
For the purpose of fair value disclosures, the Group has determined classes of assets and liabilities on the basis of the nature, characteristics and risks of the asset or liability and the level of the fair value hierarchy, as explained previously.
| (v) | Derivative financial instruments and hedge accounting - |
Initial recognition and subsequent measurement:
The Group uses derivative financial instruments, such as cross currency swaps, to hedge its foreign currency risk. Such derivative financial instruments are initially recognized at fair value on the date on which a derivative contract is entered into and are subsequently remeasured at fair value. Derivatives are carried as financial assets when the fair value is positive and as financial liabilities when fair value is negative.
Any gains or losses arising from changes in the fair value of derivatives are taken directly to profit or loss, except for the effective portion of cash flows hedges, which is recognized in other comprehensive income (OCI) and later reclassified to profit or loss when the hedges item affects profit or loss.
For the purpose of hedge accounting, the cross currency swap instrument was classified as cash flow hedge.
At inception of the hedge relationship, the Group formally designates and documents the hedge relationship to which it wishes to apply hedge accounting and the risk management objective and strategy for undertaking the hedge. The documentation includes identification of the hedging instrument, the hedged item or transaction, the nature of the risk being hedged and how the entity will assess the effectiveness of changes in the hedging instrument’s fair value in offsetting the exposure to changes in the hedged item’s fair value or cash flows attributable to the hedged risk. Such hedges are expected to be highly effective in achieving offsetting changes in fair value or cash flows and are assessed on an ongoing basis to determine that they actually have been highly effective throughout the financial reporting periods for which they were designated.
Notes to the consolidated financial statements (continued)
Hedges that meet the strict criteria for hedge accounting and are between a range of 80 and 125 of effectiveness, are accounted for as described below:
Cash flow hedges
The effective portion of the gain or loss on the hedging instrument is recognized directly in other comprehensive income in the caption “Unrealized gain on cash flow hedge”, while any ineffective portion is recognized immediately in the consolidated statements of profit or loss as finance costs.
Amounts recognized as other comprehensive income are transferred to the consolidated statements of profit or loss when the hedged transaction affects profit or loss, such as when the hedged financial income or financial expense is recognized or when a forecast sale occurs.
If the hedging instrument expires or is sold, terminated or exercised without replacement or rollover, or if its designation as a hedge is revoked, or when the hedge no longer meets the criteria for hedge accounting, any cumulative gain or loss previously recognized in OCI hedge reserve remains separately in equity until the forecast transaction occurs or the foreign currency firm commitment is met.
| 2.3.3 | Foreign currencies - |
The Group’s consolidated financial statements are presented in Soles, which is also the parent company’s functional currency. Each subsidiary determines its own functional currency and items included in financial statements of each subsidiary are measured using that functional currency.
Transactions and balances
Transactions in foreign currencies are initially recorded by the Group at their respective functional currency spot rates at the date the transaction first qualifies for recognition.
Monetary assets and liabilities denominated in foreign currencies are translated at the functional currency spot rates of exchange at the reporting date. Differences arising on settlement or translation of monetary items are recognized in profit or loss.
Non-monetary items that are measured in terms of historical cost in a foreign currency are translated using the exchange rates at the dates of the initial transactions.
Notes to the consolidated financial statements (continued)
| 2.3.4 | Non-current assets held for distribution to equity holders of the parent and discontinued operations – |
The Group classifies non-current assets and disposal groups as held for distribution to equity holders of the parent if their carrying amounts will be recovered principally through a distribution rather than through continuing use. Such non-current assets and disposal groups classified as held for distribution are measured at the lower of their carrying amount and fair value less costs to distribute. Costs to distribute are the incremental costs directly attributable to the distribution, excluding finance costs and income tax expense.
The criteria for held for distribution classification is regarded as met only when the distribution is highly probable and the asset or disposal group is available for immediate distribution in its present condition. Actions required to complete the distribution should indicate that it is unlikely that significant changes to the distribution will be made or that the decision to distribute will be withdrawn. Management must be committed to the distribution expected within one year from the date of the classification.
Assets and liabilities classified as held for distribution are presented separately as current items in the statement of financial position.
Discontinued operations are excluded from the results of continuing operations and are presented as a single amount as profit or loss after tax from discontinued operations in the statement of profit or loss.
Additional disclosures are provided in note 1.1. All other notes to the financial statements include amounts for continuing operations, unless indicated otherwise.
Inventories are valued at the lower of cost and net realizable value. Costs incurred in bringing each product to its present location and conditions are accounted for as follows:
Raw materials
| - | Purchase cost determined using the weighted average method. |
Finished goods and work in progress
| - | Cost of direct materials and supplies, services provided by third parties, direct labor and a proportion of manufacturing overheads based on normal operating capacity, excluding borrowing costs and exchange currency differences. |
Inventory in transit
Net realizable value is the estimated selling price in the ordinary course of business, less estimated cost of completion and the estimated costs necessary to make the sale.
Notes to the consolidated financial statements (continued)
Borrowing costs directly attributable to the acquisition, construction or production of an asset that necessarily takes a substantial period of time to get ready for its intended use or sale are capitalized as part of the cost of the respective asset. All other borrowing costs are expensed in the period in which they occur. Borrowing costs consist of interest and other costs that an entity incurs in connection with the borrowing of funds.
Where the funds used to finance a project form part of general borrowings, the amount capitalized is calculated using a weighted average of rates applicable to relevant general borrowings of the Group during the period. All other borrowing costs are recognized in the consolidated statement of profit or loss in the period in which they are incurred.
The determination of whether an agreement is (or contains) a lease is based on the substance of the arrangement at the inception of the lease. The arrangement is, or contains, a lease if fulfillment of the arrangement is dependent on the use of a specific asset or assets and the arrangement conveys a right to use the asset or assets, even if that right is not explicitly specified in an arrangement.
Group as a lessee:
A lease is classified at the inception date as a finance lease or an operating lease. A lease that transfers substantially all the risks and rewards incidental to ownership to the Group is classified as a finance lease.
Finance leases are capitalized at the commencement of the lease at the inception date fair value of the leased property or, if lower, at the present value of the minimum lease payments. Lease payments are apportioned between financial charges and reduction of the lease liability so as to achieve a constant rate of interest on the remaining balance of the liability. Finance charges are recognized in finance costs in the consolidated statement of profit or loss.
A leased asset is depreciated over the useful life of the asset. However, if there is no reasonable certainty that the Group will obtain ownership by the end of the lease term, the asset is depreciated over the shorter of the estimated useful life of the asset and the lease term.
An operating lease is a lease other than financial lease. Operating lease payments are recognized as an operating expense in the consolidated statement of profit or loss on a straight-line basis over the lease term.
Group as a lessor:
Leases in which the Group does not transfer substantially all the risks and rewards of ownership of an asset are classified as operating leases. Initial direct costs incurred in negotiating and arranging an operating lease are added to the carrying amount of the leased asset and recognized over the lease term on the same basis as rental income. Contingent rents are recognized as revenue in the period in which they are earned.
Notes to the consolidated financial statements (continued)
| 2.3.8 | Property, plant and equipment - |
Property, plant and equipment is stated at cost, net of accumulated depreciation and/or accumulated impairment losses, if any. Such cost includes the cost of replacing component parts of the property, plant and equipment and borrowing costs for long-term construction projects if the recognition criteria are met. The capitalized value of a finance lease is also included within property, plant and equipment. When significant parts of plant and equipment are required to be replaced at intervals, the Group recognizes such parts as individual assets with specific useful lives and depreciated them separately based on their specific useful lives. Likewise, when major inspection is performed, its cost is recognized in the carrying amount of the plant and equipment as a replacement if the recognition criteria are satisfied. All other repair and maintenance costs are recognized in profit or loss as incurred.
The present value of the expected cost for the decommissioning of an asset after its use is included in the cost of the respective asset if the recognition criteria for a provision are met. Refer to significant accounting judgments, estimates and assumptions (note 3) and decommissioning provisions (note 13).
Depreciation of assets is determined using the straight-line method over the estimated useful lives of such assets as follows:
| | Years |
| Buildings and other constructions: | |
| Administrative facilities | Between 35 and 48 |
| Main production structures | Between 30 and 49 |
| Minor production structures | Between 20 and 35 |
| Machinery and equipment: | |
| Mills and horizontal furnaces | Between 42 and 49 |
| Vertical furnaces, crushers and grinders | Between 23 and 36 |
| Electricity facilities and other minors | Between 12 and 35 |
| Furniture and fixtures | 10 |
| Transportation units: | |
| Heavy units | Between 11 and 21 |
| Light units | Between 8 and 11 |
| Computer equipment | 4 |
| Tools | Between 5 and 10 |
The asset’s residual value, useful lives and methods of depreciation are reviewed at each reporting period, and adjusted prospectively if appropriate.
An item of property, plant and equipment and any significant part initially recognized is derecognized upon disposal or when no future economic benefits are expected from its use or disposal. Any gain or loss arising on derecognition of the asset (calculated as the difference between the net disposal proceeds and the carrying amount of the asset) is included in the consolidated statement of profit or loss when the asset is derecognized.
Notes to the consolidated financial statements (continued)
| 2.3.9 | Mining concessions – |
Mining concessions correspond to the exploration rights in areas of interest acquired. Mining concessions are stated at cost, net of accumulated amortization and/or accumulated impairment losses, if any, and are presented within the property, plant and equipment caption. Those mining concessions are amortized starting from the production phase following the units-of-production method based on proved reserves to which they relate. The unit-of-production rate for the amortization of mining concessions takes into account expenditures incurred to the date of the calculation. In the event the Group abandons the concession, the costs associated are written-off in the consolidated statement of profit or loss. As of December 31, 2017, the Company has recognized an impairment on the brine project. See note 1.2.
As of December 31, 2017 and 2016, no amortization under units-of-production method was determined since the mining concessions of the Group are not yet on production phase.
| 2.3.10 | Mine development costs and stripping costs - |
Mine development costs –
Mine development costs incurred are stated at cost and are the next step in development of mining projects after exploration and evaluation stage. Mine development costs are, upon commencement of the production phase, presented net of accumulated amortization and/or accumulated impairment losses, if any, and are presented within the property, plant and equipment caption. The amortization is calculated using the unit of-production method based on proved reserves to which they relate. The unit-of-production rate for the amortization of mine development costs takes into account expenditures incurred to the date of the calculation. Expenditures that increase significantly the economic reserves in the mining unit under exploitation are capitalized.
As of December 31, 2017 and 2016, no amortization under units-of-production method was determined since the projects of the Group are not yet on production phase.
Stripping costs -
Stripping costs incurred in the development of a mine before production commences are capitalized as part of mine development costs and subsequently amortized over the life of the mine on a units-of-production basis, using the proved reserves.
Stripping costs incurred subsequently during the production phase of its operation are recorded as part of cost of production.
Notes to the consolidated financial statements (continued)
| 2.3.11 | Exploration, evaluation and intangible assets - |
Exploration and evaluation activity involves the search for mineral resources, the determination of technical feasibility and the assessment of commercial viability of an identified resource. Exploration and evaluation activity includes:
| - | Researching and analyzing historical exploration data. |
| - | Gathering exploration data through geophysical studies. |
| - | Exploratory drilling and sampling. |
| - | Determining and examining the volume and grade of the resource. |
| - | Surveying transportation and infrastructure requirements. |
| - | Conducting market and finance studies. |
License costs paid in connection with a right to explore in an existing exploration area are capitalized and amortized over the term of the license.
Once the legal right to explore has been acquired, exploration and evaluation costs are charged to the consolidated statement of profit or loss, unless management concludes that a future economic benefit is more likely than not to be realized, in which case such costs are capitalized. These costs include directly attributable employee remuneration, materials and fuel used, surveying costs, drilling costs and payments made to contractors.
In evaluating if costs meet the criteria to be capitalized, several different sources of information are used, including the nature of the assets, extension of the explored area and results of sampling, among others. The information that is used to determine the probability of future benefits depends on the extent of exploration and evaluation that has been performed.
Exploration and evaluation costs are capitalized when the exploration and evaluation activity is within an area of interest for which it is expected that the costs will be recouped by future exploitation and active and significant operations in relation to the area are continuing or planned for the future.
The main estimates and assumptions the Group uses to determine whether is likely that future exploitation will result in future economic benefits include: expected operational costs, committed capital expenditures, expected mineral prices and mineral resources found. For this purpose, the future economic benefit of the project can reasonably be regarded as assured when mine-site exploration is being conducted to confirm resources, mine-site exploration is being conducted to convert resources to reserves or when the Group is conducting a feasibility study, based on supporting geological information.
As the capitalized exploration and evaluation costs asset is not available for use, it is not amortized. These exploration costs are transferred to mine development assets once the work completed to date supports the future development of the property and such development receives appropriate approvals. In this phase, the exploration costs are amortized in accordance with the estimated useful life of the mining property from the time the commercial exploitation of the reserves begins. All capitalized exploration and evaluation costs are monitored for indications of impairment. Where a potential impairment is indicated, assessment is performed for each area of interest in conjunction with the group of operating assets (representing a cash generating unit) to which the exploration is attributed.
Notes to the consolidated financial statements (continued)
Exploration areas in which resources have been discovered but require major capital expenditure before production can begin, are continually evaluated to ensure that commercial quantities of resources exist or to ensure that additional exploration work is under way or planned. To the extent that capitalized expenditure is no longer expected to be recovered it is charged to the consolidated statement of profit or loss. The Group assesses at each reporting date whether there is an indication that an exploration and evaluation assets may be impaired. The following facts and circumstances are considered in this assessment:
| (i) | the period for which the entity has the right to explore in the specific area has expired during the period or will expire in the near future, and is not expected to be renewed. |
| (ii) | substantive expenditure on further exploration for and evaluation of mineral resources in the specific area is neither budgeted nor planned. |
| (iii) | exploration for and evaluation of mineral resources in the specific area have not led to the discovery of commercially viable quantities of mineral resources and the entity has decided to discontinue such activities in the specific area. |
| (iv) | sufficient data exist to indicate that, although a development in the specific area is likely to proceed, the carrying amount of the exploration and evaluation asset is unlikely to be recovered in full from successful development or by sale. |
If any indication exists, the Group exploration and evaluation assess for impairment is required. As of December 31, 2017, the Company has recognized an impairment on the brine project. See note 1.2.
Intangible assets includes software licenses with defined useful lives between one and ten years and are amortized using the straight-line method over the estimated useful lives of such assets.
| 2.3.12 | Ore reserve and resource estimates - |
Ore reserves are estimates of the amount of ore that can be economically and legally extracted from the Group’s mining properties and concessions. The Group estimates its ore reserves and mineral resources, based on information compiled by appropriately qualified persons relating to the geological data on the size, depth and shape of the ore body, and requires complex geological judgments to interpret the data. The estimation of recoverable reserves is based upon factors such as estimates of foreign exchange rates, commodity prices, future capital requirements, and production costs along with geological assumptions and judgments made in estimating the size and grade of the ore body. Changes in the reserve or resource estimates may impact upon the carrying value of exploration and evaluation assets, provision for rehabilitation and depreciation and amortization charges.
Notes to the consolidated financial statements (continued)
| 2.3.13 | Impairment of non-financial assets – |
The Group assesses, at each reporting date, whether there is an indication that an asset may be impaired. If any indication exists, or when annual impairment testing for an asset is required, the Group estimates the asset’s recoverable amount. An asset’s recoverable amount is the higher of an asset’s or cash-generating unit’s (CGU) fair value less costs of disposal and its value in use and is determined for an individual asset, unless the asset does not generate cash inflows that are largely independent of those from other assets or groups of assets. Where the carrying amount of an asset of CGU exceeds its recoverable amount, the asset is considered impaired and is written down to its recoverable amount.
In assessing value in use, the estimated future cash flows are discounted to their present value using a pre-tax discount rate that reflects current market assessments of the time value of money and the risks specific to the asset. In determining fair value less costs of disposal, recent market transactions are taken into account. If no such transactions can be identified, an appropriate valuation model is used. These calculations are corroborated by valuation multiples, quoted share prices for publicly traded companies or other available fair value indicators.
The Group supports its impairment calculation on detailed budgets and forecast calculations, which are prepared separately for each of the Group’s CGUs to which the individual assets are allocated.
Impairment losses of continuing operations, including impairment on inventories, are recognized in the consolidated statement of profit or loss in expense categories consistent with the function of the impaired asset.
An assessment is made at each reporting date to determine whether there is any indication that previously recognized impairment losses may no longer exist or have decreased. If such indication exists, the Group estimates the asset’s or CGU’s recoverable amount. A previously recognized impairment loss is reversed only if there has been a change in the assumptions used to determine the asset’s recoverable amount since the last impairment loss was recognized. The reversal is limited so that the carrying amount of the asset does not exceed its recoverable amount, nor exceed the carrying amount that would have been determined, net of depreciation, had no impairment loss been recognized for the asset in prior years. Such reversal is recognized in the consolidated statement of profit or loss.
Exploration and evaluation assets are tested for impairment annually as of December 31, either individually or at the cash-generating unit level, as appropriate, and when circumstances indicate that the carrying value may be impaired. As a result of the analysis performed, on December 31, 2017, the Company recognized an impairment charge on the brine project. See note 1.2.
Notes to the consolidated financial statements (continued)
General -
Provisions are recognized when the Group has a present obligation (legal or constructive)as a result of a past event, it is probable that an outflow of resources embodying economic benefits will be required to settle the obligation and a reliable estimate can be made of the amount of the obligation. When the Group expects some or all of a provision to be reimbursed, for example under an insurance contract, the reimbursement is recognized as a separate asset but only when the reimbursement is virtually certain. The expense relating to any provision is presented in profit or loss net of any reimbursement.
If the effect of the time value of money is material, provisions are discounted using a current pre-tax rate that reflects where appropriate, the risks specific to the liability. When discounting is used, the increase in the provision due to the passage of time is recognized as finance cost in the consolidated statement of profit or loss.
Rehabilitation provision -
The Group records the present value of estimated costs of legal and constructive obligations required to restore operating locations in the period in which the obligation is incurred. Rehabilitation costs are provided at the present value of expected costs to settle the obligation using estimated cash flows and are recognized as part of the cost of that particular asset. The cash flows are discounted at a current risk free pre-tax rate. The unwinding of the discount is expensed as incurred and recognized in the consolidated statement of profit or loss as a finance cost. The estimated future costs of rehabilitation are reviewed annually and adjusted as appropriate. Changes in the estimated future costs or in the discount rate applied are added to or deducted from the cost of the asset.
As of December 31, 2017 and 2016, the Group only has a rehabilitation provision for the closing of the quarries exploited in operations and for the Bongara mine (fully impaired in 2011), accordingly, changes in estimated future costs have been recorded directly to the consolidated statement of profit or loss.
Environmental expenditures and liabilities -
Environmental expenditures that relate to current or future revenues are expensed or capitalized as appropriate. Expenditures that relate to an existing condition caused by past operations and do not contribute to current or future earnings are expensed.
Liabilities for environmental costs are recognized when a clean-up is probable and the associated costs can be reliably estimated. Generally, the timing of recognition of these provisions coincides with the commitment to a formal plan of action or, if earlier, on divestment or on closure of inactive sites.
The amount recognized is the best estimate of the expenditure required. Where the liability will not be settled for a number of years, the amount recognized is the present value of the estimated future expenditure.
| 2.3.15 | Employees benefits - |
The Group has short-term obligations for employee benefits including salaries, severance contributions, legal bonuses, performance bonuses and profit sharing. These obligations are monthly recorded on an accrual basis.
Notes to the consolidated financial statements (continued)
Additionally, the Group has a long-term incentive plan for key management. This benefit is settled in cash, measured on the salary of each officer and upon fulfilling certain conditions such as years of experience within the Group and permanency. According to IAS 19 “Employee benefits”, the Group recognizes the long-term obligation at its present value at the end of the reporting period using the projected credit unit method. To calculate the present value of these long-term obligations the Group uses a government bond discount rate at the date of the consolidated financial statements. This liability is annually reviewed on the date of the consolidated financial statements, and the accrual updates and the effect of changes in discount rates are recognized in the consolidated statement of profit or loss, until the liability is extinguished.
| 2.3.16 | Revenue recognition - |
Revenue is recognized to the extent it is probable that the economic benefits will flow to the Group and the revenue can be reliably measured, regardless of when the payment is received. Revenue is measured at the fair value of the consideration received or receivable, taking into account contractually defined terms of payment and excluding taxes or duty.
The Group has concluded that it is acting as a principal in all of its revenue arrangements.
The following specific recognition criteria must also be met before revenue is recognized:
Sales of goods -
Revenue from sales of goods is recognized when the significant risks and rewards of ownership have passed to the buyer, on delivery of the goods. Revenue from the sale of goods is measured at fair value of the consideration received or receivable, net of returns and trade discounts.
Operating lease income -
Income from operating lease of land and office was recognized on a monthly accrual basis during the term of the lease.
Notes to the consolidated financial statements (continued)
Interest income -
For all financial instruments measured at amortized cost and interest-bearing financial assets, interest income is recorded using the effective interest rate (EIR). EIR is the rate that exactly discounts the estimated future cash payments or receipts over the expected life of the financial instrument or a shorter period, where appropriate, to the net carrying amount of the financial asset or liability. Interest income is included in finance income in the consolidated statement of profit or loss.
Current income tax -
Current income tax assets and liabilities are measured at the amount expected to be recovered from or paid to the taxation authorities. The tax rates and tax laws used to compute the amount are those that are enacted or substantively enacted, at the reporting date in Peru, where the Group operates and generates taxable income.
Current income tax relating to items recognized directly in equity is recognized in equity and not in the consolidated statement of profit or loss. Management periodically evaluates positions taken in the tax returns with respect to situations in which applicable tax regulations are subject to interpretation and establishes provisions where appropriate.
Deferred tax -
Deferred tax is provided using the liability method on temporary differences between the tax bases of assets and liabilities and their carrying amounts for financial reporting purposes at the reporting date.
Deferred tax liabilities are recognized for all taxable temporary differences, except in respect of taxable temporary differences associated with investments in subsidiaries, associates and interests in joint arrangements, when the timing of the reversal of the temporary differences can be controlled and it is probable that the temporary differences will not reverse in the foreseeable future.
Deferred tax assets are recognized for all deductible temporary differences, the carry forward of unused tax credits and unused tax losses. Deferred tax assets are recognized to the extent that it is probable that taxable profit will be available against which the deductible temporary differences, and the carry forward of unused tax credits and unused tax losses can be utilized, except in respect of deductible temporary differences associated with investments in subsidiaries, where deferred assets are recognized only to the extent that it is probable that the temporary differences will reverse in the foreseeable future and taxable profit will be available against which the temporary differences can be utilized.
Notes to the consolidated financial statements (continued)
The carrying amount of deferred tax assets is reviewed at each reporting date and reduced to the extent that it is no longer probable that sufficient taxable profit will be available to allow all or part of the deferred tax asset to be utilized. Unrecognized deferred tax assets are re-assessed at each reporting date and are recognized to the extent that it has become probable that future taxable profits will allow the deferred tax asset to be recovered.
Deferred tax assets and liabilities are measured at the tax rates that are expected to apply in the year when the asset is realized or the liability is settled, based on tax rates (and tax laws) that have been enacted or substantively enacted at the reporting date.
Deferred tax related to items recognized outside profit or loss is recognize outside profit or loss. Deferred tax items are recognized in correlation to the underlying transaction either in OCI or directly in equity.
Deferred tax assets and deferred tax liabilities are offset if a legally enforceable right exists to set off current tax assets against current income tax liabilities and the deferred taxes relate to the same taxable entity and the same taxation authority.
Mining royalties –
Mining royalties are accounted for under IAS 12 when they have the characteristics of an income tax. This is considered to be the case when they are imposed under government authority and the amount payable is based on taxable net income, rather than based on quantity produced or as a percentage of revenue, after adjustment for temporary differences. For such arrangements, current and deferred tax is provided on the same basis as described above for income tax. Obligations arising from royalty arrangements that do not satisfy these criteria are recognized as current provisions and included in results of the year.
Sales tax -
Expenses and assets are recognized net of the amount of sales tax, except:
| (i) | When the sales tax incurred on a purchase of assets or services is not recoverable from the taxation authority, in which case, the sales tax is recognized as part of the cost of acquisition of the asset or as part of the expense item, as applicable. |
| (ii) | When receivables and payables are stated with the amount of sales tax included. |
The net amount of sales tax recoverable from, or payable to, the taxation authority is included as part of receivables or payables in the consolidated statement of financial position.
Notes to the consolidated financial statements (continued)
Own equity instruments which are reacquired (treasury shares) are recognized at cost and deducted from equity. No gain or loss is recognized in the consolidated statement of profit or loss on the purchase, sale, issue or cancellation of the Group’s own equity instruments. On January, 2017 and October, 2015, the Company acquired 7,911,845 and 37,276,580, respectively of its investment shares which are presented as a reduction of equity, for further details, see note 16(c).
| 2.3.19 | Current versus non-current classification - |
The Group presents assets and liabilities in statement of financial position based on current/non-current classification. An asset is current when it is:
| - | Expected to be realized or intended to sold or consumed in normal operating cycle. |
| - | Held primarily for the purpose of trading. |
| - | Expected to be realized within twelve months after the reporting period, or |
| - | Cash or cash equivalent unless restricted from being exchanged or used to settle a liability for at least twelve months after the reporting period. |
All other assets are classified as non-current.
A liability is current when it is:
| - | Expected to be settled in normal operating cycle. |
| - | Held primarily for the purpose of trading. |
| - | Due to be settled within twelve months after the reporting period, or |
| - | There is no unconditional right to defer the settlement of the liability for at least twelve months after the reporting period. |
The Group classifies all other liabilities as non-current.
Deferred tax assets and liabilities are classified as non-current assets and liabilities.
| 2.3.20 | New amended standards and interpretations - |
The Group applied for the first time certain standards and amendments in 2017, although these new standards and amendments did not have a material impact on the consolidated financial statements of the Group. A summary of the new standards related to the Group is described below:
| - | Amendments to IAS 7 Statement of Cash Flows: Disclosure Initiative |
The amendments require entities to provide disclosure of changes in their liabilities arising from financing activities, including both changes arising from cash flows and non-cash changes (such as foreign exchange gains or losses). The Group has provided the information for both the current and the comparative period in note 29.
| - | Amendments to IAS 12 Income Taxes: Recognition of Deferred Tax Assets for Unrealized Losses |
The amendments clarify that an entity needs to consider whether tax law restricts the sources of taxable profits against which it may make deductions on the reversal of deductible temporary difference related to unrealized losses. Furthermore, the amendments provide guidance on how an entity should determine future taxable profits and explain the circumstances in which taxable profit may include the recovery of some assets for more than their carrying amount. The Group applied amendments retrospectively. However, their application has no effect on the Group’s financial position and performance as the Group has no deductible temporary differences or assets that are in the scope of the amendments.
Notes to the consolidated financial statements (continued)
The Group has not early adopted any other standard, interpretation or amendment that has been issued but is not yet effective.
| 3. | Significant accounting judgments, estimates and assumptions |
The preparation of the Group’s consolidated financial statements requires management to make judgments, estimates and assumptions that affect the reported amounts of revenues, expenses, assets and liabilities, and the accompanying disclosures. Uncertainty about these assumptions and estimates could result in outcomes that require a material adjustment to the carrying amount of assets or liabilities affected in future periods.
Other disclosures relating to the Group’s exposure to risks and uncertainties includes:
| - | Capital management, note 29. |
| - | Financial instruments risk management and policies, note 29. |
| - | Sensitivity analyses disclosures, note 29. |
Estimates and assumptions -
The key assumptions concerning the future and other key sources of estimation uncertainty at the reporting date, that have a significant risk of causing a material adjustment to the carrying amounts of assets and liabilities within the next financial year are described below. The Group based its assumptions and estimates on parameters available when the consolidated financial statements were prepared. Existing circumstances and assumptions about future developments, however, may change due to market changes or circumstances arising beyond the control of the Group. Such changes are reflected in the assumptions when they occur.
The significant areas are summarized below:
| - | Determination of useful lives of assets for depreciation and amortization purposes – notes 2.3.8, 2.3.9, 2.3.10 and 2.3.11. |
| - | Recognition of exploration and evaluation assets and mine development costs – notes 2.3.10, 2.3.11 and note 11. |
| - | Ore reserve and resource estimates – note 2.3.12. |
| - | Review of asset carrying values and impairment charges – note 2.3.2, 2.3.13 and note 10. |
| - | Income tax – notes 2.3.17 and 15. |
| - | Cash flow hedges – notes 2.3.2(vi) and 30(b). |
Notes to the consolidated financial statements (continued)
| 4. | Standards issued but not yet effective |
The standards and interpretations that are issued, but not yet effective, up to the date of issuance of the Group’s financial statements are disclosed below. The Group intends to adopt these standards, if applicable, when they become effective:
| - | IFRS 9 Financial Instruments |
In July 2014, the IASB issued the final version of IFRS 9 Financial Instruments that replaces IAS 39 Financial Instruments: Recognition and Measurement and all previous versions of IFRS 9. IFRS 9 brings together all three aspects of the accounting for financial instruments project: classification and measurement, impairment and hedge accounting. IFRS 9 is effective for annual periods beginning on or after January 1, 2018, with early application permitted. Except for hedge accounting, retrospective application is required but providing comparative information is not compulsory. For hedge accounting, the requirements are generally applied prospectively, with some limited exceptions.
The Group plans to adopt the new standard on the required effective date and will not restate comparative information. During 2017, the Group has performed a detailed impact assessment of all three aspects of IFRS 9. This assessment is based on currently available information and may be subject to changes arising from further reasonable and supportable information being made available to the Group in 2018 when the Group will adopt IFRS 9. The Group expects an impact on its consolidated financial statements for the fair value valuation of its available for sale financial investments as, an increase on assets and equity, as follows:
| (a) | Classification and measurement |
The Group expects a significant impact on its balance sheet and equity on applying the classification and measurement requirements of IFRS 9. It expects to continue measuring at fair value all financial assets currently held at fair value. Equity shares without an active market currently recognized as available-for-sale (AFS) at cost for S/21,206,000 will, instead, be measured at fair value through other comprehensive income (OCI), which will increase volatility in OCI. The impact of the change in measurement of AFS through OCI, has been estimated in S/4,002,000.
Loans as well as trade receivables are held to collect contractual cash flows and are expected to give rise to cash flows representing solely payments of principal and interest. The Group analyzed the contractual cash flow characteristics of those instruments and concluded that they meet the criteria for amortized cost measurement under IFRS 9. Therefore, reclassification for these instruments is not required.
IFRS 9 requires the Group to record expected credit losses on all of its debt securities, loans and trade receivables, either on a 12-month or lifetime basis. The Group will apply the simplified approach and record lifetime expected losses on all trade receivables. The Group has determined that, due to the nature of its loans and receivables, the loss allowance will be immaterial.
The Group determined that all existing hedge relationships that are currently designated in effective hedging relationships will continue to qualify for hedge accounting under IFRS 9. The Group has chosen not to retrospectively apply IFRS 9 on transition to the hedges where the Group excluded the forward points from the hedge designation under IAS 39. As IFRS 9 does not change the general principles of how an entity accounts for effective hedges, applying the hedging requirements of IFRS 9 will not have a significant impact on Group’s financial statements.
Notes to the consolidated financial statements (continued)
In addition to the adjustments described above, on adoption of IFRS 9, other items of the primary financial statements such as deferred taxes, assets held for sale and liabilities associated with them, will be adjusted as necessary.
In summary, the impact of IFRS 9 adoption is expected to be, as follows:
| | | S/(000) | |
| | | | | |
| Assets - | | | | |
| Available for sale financial investments | | | 5,677 | |
| Deferred income tax liability | | | (1,675 | ) |
| | | | | |
| | | | 4,002 | |
| | | | | |
| Liability and equity - | | | | |
| Other comprehensive income | | | 4,002 | |
| | | | | |
| | | | 4,002 | |
| - | IFRS 15 Revenue from Contracts with Customers |
IFRS 15, issued in May 2014 and amended in April 2016, establishes a five-step model to account for revenue arising from contracts with customers. Under IFRS 15, revenue is recognized at an amount that reflects the consideration to which an entity expects to be entitled in exchange for transferring goods or services to a customer.
The new revenue standard will supersede all current revenue recognition requirements under IFRS. Either a full retrospective application or a modified retrospective application is required for annual periods beginning on or after January 1, 2018.
The Group plans to adopt the new standard on the required effective date using the full retrospective method. During 2016, the Group performed a preliminary assessment of the impact of IFRS 15, which was continued with a more detailed analysis completed in 2017.
The Group is in the business of production and commercialization of cement, blocks, concrete and quicklime, as well as the commercialization of construction supplies. These goods are sold in identified contracts with customers.
Notes to the consolidated financial statements (continued)
For contracts with customers in which the sale of goods is expected to be the only performance obligation, adoption of IFRS 15 is not expected to have any impact on the Group’s revenue and profit or loss. The Group expects the revenue recognition to occur at a point in time when control of the asset is transferred to the customer, generally on delivery of the goods.
In preparing to implement the requirements of IFRS 15, the Group is considering the following:
Variable consideration -
Some contracts with customers provide return rights and trade discounts or volume discounts.
If revenue cannot be reliably measured, the Group defers revenue recognition until the uncertainty is resolved. Such provisions give rise to variable consideration under IFRS 15, and will be required to be estimated at contract inception and updated thereafter.
IFRS 15 requires the estimated variable consideration to be constrained to prevent over-recognition of revenue. The Group expects that application of the constraint will result in more revenue being deferred than under current IFRS.
| (i) | Commercial agreements – |
The Group has commercial agreements for the sale of its products with certain customers. In accordance with the current accounting policy, the Group recognizes these payments as a debit in the caption “Selling and distribution expenses” with credit in the caption “Trade and other payables”.
In accordance with IFRS 15, contract combination criteria should be used if they are negotiated as a package with a single commercial objective. The Company applied the requirements of IFRS 15 and concluded that in 2017 it would be necessary to make an adjustment as follows: the revenue from the sale of cement and the selling and distribution expenses would both decrease by S/2,898,000.
Under IFRIC 13 Customer Loyalty Programes, the loyalty program offered by the Group in the sale of cement results in the allocation of part of the price of the transaction to the loyalty program using the fair value of the points issued and the recognition of deferred revenue in relation to the points issued but not yet redeemed or expired. The Group concluded that under IFRS 15 the loyalty programe gives rise to a separate performance obligation, since it generally provides a material right to the customer. According to IFRS 15, the Group will need to allocate a portion of the transaction price to the loyalty programe based on the relative stand-alone selling price, instead of the allocation using the fair value of points issued, as it is done in accordance with IFRIC 13. The Group determined that less revenue should be attributed to the goods sold compared to the existing accounting policy.
When IFRS 15 is adopted, the following adjustments are expected to the current fiscal year: the revenue from the sale of cement and the selling and distribution expenses would both decrease by S/1,819,000.
Notes to the consolidated financial statements (continued)
Transportation services are provide in the business of production and commercialization of cement, blocks, concrete and quicklime. These services are rendered together with the sale of goods to customers.
Under the current policy, the Group registers transportation services as separate benefits from sales of goods when they are sold together. The consideration of the transportation services is differentiated from the consideration for the sale of goods, and is assigned using prices list of each operation.
Under IFRS 15, allocation will be made based on relative stand-alone selling prices. Hence, the allocation of the consideration would not be affected.
The Group concluded that the transportation services are satisfied over time given that the customer simultaneously receives and consumes the benefits provided by the Group. Consequently, under IFRS 15 the Group would continue to recognize revenue for these service in conjunction with the revenue from the sale of goods.
| (c) | Presentation requirements and disclosures – |
The presentation and disclosure requirements in IFRS 15 are more detailed than under current IFRS. The presentation requirements represent a significant change from current practice and significantly increases the volume of disclosures required in the Group’s financial statements. Many of the disclosure requirements in IFRS 15 are new and the Group has assessed that the impact of some of these disclosures requirements will be significant. In particular, the Group expects that the notes to the financial statements will be expanded because of the disclosure of significant judgments made: when determining the transaction price of those contracts that include variable consideration, how the transaction price has been allocated to the performance obligations, and the assumptions made to estimate the stand-alone selling prices of each performance obligation. In addition, as required by IFRS 15, the Group will disaggregate revenue recognized from contracts with customers into categories that depict how the nature, amount, timing and uncertainty of revenue and cash flows are affected by economic factors. It will also disclose information about the relationship between the disclosure of disaggregated revenue and revenue information disclosed for each reportable segment. In 2017 the Group continued testing of appropriate systems, internal controls, policies and procedures necessary to collect and disclose the required information.
Notes to the consolidated financial statements (continued)
In addition to the major adjustments described above, on adoption of IFRS 15, other items of the primary financial statements such as deferred taxes, will be affected and adjusted as necessary. The recognition and measurement requirements in IFRS 15 are also applicable for recognition and measurement of any gains or losses on disposal of non-financial assets (such as items of property and equipment and intangible assets), when that disposal is not in the ordinary course of business. However, on transition, the effect of these changes is not expected to be material for the Group.
In summary, the impact of IFRS 15 adoption is expected to be, as follows:
Impact on equity (increase/(decrease)) as December 31, 2017:
| | | S/(000) | |
| | | | | |
| Sales of goods | | | (4,717,000 | ) |
| Selling and distribution expenses | | | 4,717,000 | |
| | | | | |
| Net impact on profit for the year | | | — | |
| | | | | |
| Attributable to | | | | |
| Equity holders of the parent | | | (4,717,000 | ) |
| Non-controlling interests | | | — | |
| | | | | |
| | | | (4,717,000 | ) |
The profit per share will not be affected by the adoption of IFRS 15.
IFRS 16 was issued in January 2016 and it replaces IAS 17 Leases, IFRIC 4 Determining whether an Arrangement contains a Lease, SIC-15 Operating Leases-Incentives and SIC-27 Evaluating the Substance of Transactions Involving the Legal Form of a Lease. IFRS 16 sets out the principles for the recognition, measurement, presentation and disclosure of leases and requires lessees to account for all leases under a single on-balance sheet model similar to the accounting for finance leases under IAS 17. The standard includes two recognition exemptions for lessees – leases of ‘low-value’ assets (e.g., personal computers) and short-term leases (i.e., leases with a lease term of 12 months or less). At the commencement date of a lease, a lessee will recognize a liability to make lease payments (i.e., the lease liability) and an asset representing the right to use the underlying asset during the lease term (i.e., the right-of-use asset). Lessees will be required to separately recognize the interest expense on the lease liability and the depreciation expense on the right-of-use asset.
Lessees will be also required to remeasure the lease liability upon the occurrence of certain events (e.g., a change in the lease term, a change in future lease payments resulting from a change in an index or rate used to determine those payments). The lessee will generally recognize the amount of the remeasurement of the lease liability as an adjustment to the right-of-use asset.
Lessor accounting under IFRS 16 is substantially unchanged from today’s accounting under IAS 17. Lessors will continue to classify all leases using the same classification principle as in IAS 17 and distinguish between two types of leases: operating and finance leases.
Notes to the consolidated financial statements (continued)
IFRS 16 also requires lessees and lessors to make more extensive disclosures than under IAS 17.
IFRS 16 is effective for annual periods beginning on or after January 1, 2019. Early application is permitted, but not before an entity applies IFRS 15. A lessee can choose to apply the standard using either a full retrospective or a modified retrospective approach. The standard’s transition provisions permit certain exemptions.
In 2018, the Group will continue to assess the potential effect of IFRS 16 on its consolidated financial statements.
| - | IFRIC Interpretation 22 Foreign Currency Transactions and Advance Consideration |
The Interpretation clarifies that, in determining the spot exchange rate to use on initial recognition of the related asset, expense or income (or part of it) on the derecognition of a non-monetary asset or non-monetary liability relating to advance consideration, the date of the transaction is the date on which an entity initially recognizes the non-monetary asset or non-monetary liability arising from the advance consideration. If there are multiple payments or receipts in advance, then the entity must determine the transaction date for each payment or receipt of advance consideration. Entities may apply the amendments on a fully retrospective basis. Alternatively, an entity may apply the Interpretation prospectively to all assets, expenses and income in its scope that are initially recognized on or after:
| (i) | The beginning of the reporting period in which the entity first applies the interpretation, or |
| (ii) | The beginning of a prior reporting period presented as comparative information in the financial statements of the reporting period in which the entity first applies the interpretation. |
The Interpretation is effective for annual periods beginning on or after January 1, 2018. Early application of interpretation is permitted and must be disclosed. However, since the Group’s current practice is in line with the Interpretation, the Group does not expect any effect on its consolidated financial statements.
| - | IFRIC Interpretation 23 Uncertainty over Income Tax Treatment |
The Interpretation addresses the accounting for income taxes when tax treatments involve uncertainty that affects the application of IAS 12 and does not apply to taxes or levies outside the scope of IAS 12, nor does it specifically include requirements relating to interest and penalties associated with uncertain tax treatments.
Notes to the consolidated financial statements (continued)
The Interpretation specifically addresses the following:
| - | Whether an entity considers uncertain tax treatments separately |
| - | The assumptions an entity makes about the examination of tax treatments by taxation authorities |
| - | How an entity determines taxable profit (tax loss), tax bases, unused tax losses, unused tax credits and tax rates |
| - | How an entity considers changes in facts and circumstances |
An entity must determine whether to consider each uncertain tax treatment separately or together with one or more other uncertain tax treatments. The approach that better predicts the resolution of the uncertainty should be followed. The interpretation is effective for annual reporting periods beginning on or after January 1, 2019, but certain transition exemptions are available. The Group will apply interpretation from its effective date. Since the Group operates in a complex tax environment, applying the Interpretation may affect its consolidated financial statements and the required disclosures. In addition, the Group may need to establish processes and procedures to obtain information that is necessary to apply the Interpretation on a timely basis.
| - | Annual Improvements 2014-2016 Cycle (issued in December 2016) |
These improvements include:
IFRS 1 First-time Adoption of International Financial Reporting Standards - Deletion of short-term exemptions for first-time adopters - Short-term exemptions in paragraphs E3–E7 of IFRS 1 were deleted because they have now served their intended purpose. The amendment is effective from January 1, 2018. This amendment is not applicable to the Group.
IAS 28 Investments in Associates and Joint Ventures - Clarification that measuring investees at fair value through profit or loss is an investment-by-investment choice. The amendments clarify that:
| - | An entity that is a venture capital organization, or other qualifying entity, may elect, at initial recognition on an investment-by-investment basis, to measure its investments in associates and joint ventures at fair value through profit or loss. This election can be made separately for each investment. |
Notes to the consolidated financial statements (continued)
| - | If an entity, that is not itself an investment entity, has an interest in an associate or joint venture that is an investment entity, the entity may, when applying the equity method, elect to retain the fair value measurement applied by that investment entity associate or joint venture to the investment entity associate’s or joint venture’s interests in subsidiaries. This election is made separately for each investment entity associate or joint venture, at the later of the date on which: (a) the investment entity associate or joint venture is initially recognized; (b) the associate or joint venture becomes an investment entity; and (c) the investment entity associate or joint venture first becomes a parent. |
The amendments should be applied retrospectively and are effective from January 1, 2018, with earlier application permitted. If an entity applies those amendments for an earlier period, it must disclose that fact.
These amendments are not applicable to the Group.
| - | Annual improvements to IFRS - 2015-2017 Cycle |
The IASB has made the following amendments to the rules:
IFRS 3 Business Combinations – Interest previously held in a joint operation
These amendments clarify that, when an entity obtains control of a business that was previously a joint operation, it must apply the requirements of the business combinations carried out in stages, reassessing the fair value of the shares previously held in the assets and liabilities of the joint operation. These changes will be applied to business combinations whose acquisition date is in the periods beginning on January 1, 2019 or later, allowing early application.
IFRS 11 Joint arrangements - Units previously held in a joint operation
These amendments clarify that, when an entity participates, but has no control, in a joint operation and obtains joint control of that joint operation, which is a business in accordance with IFRS 3, it will not revalue previously held participation in the assets and liabilities of the joint operation to fair value. These modifications will be applied to transactions in which joint control is obtained for the periods beginning on or after January 1, 2019, allowing early application.
IAS 12 Income tax - Consequences of payments of financial instruments classified in equity
The amendments clarify that the tax consequences of the dividends depend more on the transactions or past events that generated that distributable profit than on the distribution to the owners. Therefore, an entity recognizes the tax consequences of a dividend in results, in other comprehensive income or in equity depending on how the entity recorded those transactions or past events. These modifications will be applied to the periods beginning on January 1, 2019 or later, allowing early application. When an entity applies these amendments for the first time, it will do so from the start date of the oldest comparative period.
Notes to the consolidated financial statements (continued)
IAS 23 Interest costs - Capitalized interest costs
The amendments clarify that an entity considers part of its general interest costs any interest costs originally incurred to develop a qualified asset when substantially all the activities necessary to prepare the asset for its use or sale have been completed. These modifications will be applied to the interest costs incurred in the periods beginning on January 1, 2019 or later, allowing early application.
Amendments to IAS 28 - Long-term investments in associates and joint arrangements
These amendments clarify that an entity must apply IFRS 9 Financial Instruments to long-term investments in associates or joint arrangements to which the equity method is not applied, but which in substance form part of the net investment in the associate or in the joint agreement. This clarification is relevant, since it implies that the expected credit loss model of IFRS 9 must be applied to said investments. It is also clarified that, when applying IFRS 9, the entity will not take into account any loss of the associate or the joint arrangement or any impairment loss of the net investment that was recorded as an adjustment to the net investment in the associate or in the joint agreement for the application of IAS 28 Investments in associates and joint agreements. The amendments include an example that illustrates how entities should apply the requirements of IAS 28 and IFRS 9 to these long-term investments. These modifications will be applied retroactively, with certain exceptions, to the periods beginning on January 1, 2019 or later, allowing early application.
Modifications to IAS 40 - Transfers of investment properties
The amendments clarify when an entity should transfer real estate, including those that are under construction or development, from or to investment properties. The modifications establish that the change of use occurs when the property meets, or fails to meet, the definition of investment property and there is evidence of such change in use. A mere change in management intentions does not provide evidence of change of use. Entities must apply the changes prospectively to changes in use that occur on or after the beginning of the year in which the entity applies the amendments for the first time. An entity should reassess the classification of property held on that date and, if applicable, reclassify the property to reflect the conditions existing on that date. The retroactive application in accordance with IAS 8 is only permitted if it is possible to do so without using information obtained subsequently. These modifications are effective for the periods beginning on January 1, 2018 or later, allowing early application. The Group will apply these modifications when they come into force. However, given that the Group’s current practice is in line with the clarifications issued, the Group does not expect any effect in its consolidated financial statements.
Notes to the consolidated financial statements (continued)
| 5. | Transactions in foreign currency |
Transactions in foreign currency take place at the open-market exchange rates published by the Superintendent of Banks, Insurance and Pension Funds Administration. As of December 31, 2017, the exchange rates for transactions in United States dollars, published by this institution, were S/3.238 for purchase and S/3.245 for sale (S/3.352 for purchase and S/3.360 for sale as of December 31, 2016).
As of December 31, 2017 and 2016, the Group had the following assets and liabilities in United States dollars:
| | | 2017 | | | 2016 | |
| | | | US$(000) | | | | US$(000) | |
| | | | | | | | | |
| Assets | | | | | | | | |
| Cash and cash equivalents | | | 1,157 | | | | 3,371 | |
| Trade and other receivables | | | 7,764 | | | | 5,517 | |
| Advances to suppliers for work in progress | | | 5,534 | | | | 2,733 | |
| Assets held for distribution | | | — | | | | 1,885 | |
| | | | 14,455 | | | | 13,506 | |
| | | | | | | | | |
| Liabilities | | | | | | | | |
| Trade and other payables | | | (18,274 | ) | | | (15,224 | ) |
| Liabilities held for distribution | | | — | | | | (379 | ) |
| Interest-bearing loans and borrowings | | | (300,000 | ) | | | (300,000 | ) |
| | | | (318,274 | ) | | | (315,603 | ) |
| | | | | | | | | |
| | | | (303,819 | ) | | | (302,097 | ) |
| Cross currency swap position | | | 300,000 | | | | 300,000 | |
| | | | | | | | | |
| Net monetary position | | | (3,819 | ) | | | (2,097 | ) |
As of December 31, 2017 and 2016, the Group maintains cross currency swaps contracts (“CCS”) designated as cash flow hedges for its Senior Notes denominated in US dollars. See note 14.
During 2017 and 2016, the net loss originated from exchange differences was approximately S/2,226,000 and S/2,541,000, respectively; during 2015 the net result from exchange differences was a gain of S/12,194,000. All these results were presented in the “(Loss) gain from exchange difference, net” caption in the consolidated statements of profit or loss.
Notes to the consolidated financial statements (continued)
| 6. | Cash and cash equivalents |
| (a) | This caption was made up as follows: |
| | | 2017 | | | 2016 | | | 2015 | |
| | | | S/(000) | | | | S/(000) | | | | S/(000) | |
| | | | | | | | | | | | | |
| Cash on hand | | | 1,088 | | | | 1,391 | | | | 1,388 | |
| Cash at banks (b) | | | 24,128 | | | | 28,424 | | | | 46,419 | |
| Short-term deposits (c) | | | 24,000 | | | | 50,400 | | | | 110,200 | |
| | | | | | | | | | | | | |
| | | | 49,216 | | | | 80,215 | | | | 158,007 | |
| (b) | Cash at banks is cash denominated in local and foreign currencies, is deposited in local and foreign banks and is freely available. The demand deposits interest yield is based on daily bank deposit rates. |
| (c) | As of December 31, 2017, 2016 and 2015, short-term deposits held in local banks were freely available and earned interest at the respective short-term deposits rates. These short-term deposits, with original maturities of less than three months, were collected in January 2018, 2017 and 2016, respectively. |
During the years 2017, 2016 and 2015, the term deposits generated interests of S/1,342,000, S/2,154,000 and S/2,587,000, respectively. See note 23. From these amounts S/159,000 and S/114,000 are pending of collection as of December 31, 2017 and 2016, respectively. See note 7(a).
Notes to the consolidated financial statements (continued)
| 7. | Trade and other receivables |
| (a) | This caption was made up as follows: |
| | | Current | | | Non-current | |
| | | | 2017 | | | | 2016 | | | | 2017 | | | | 2016 | |
| | | | S/(000) | | | | S/(000) | | | | S/(000) | | | | S/(000) | |
| | | | | | | | | | | | | | | | | |
| Trade receivables (b) | | | 81,299 | | | | 68,529 | | | | — | | | | — | |
| Indemnification from insurance, note 22(b) | | | 9,380 | | | | — | | | | — | | | | — | |
| Other receivables from sale of fixed assets | | | 3,574 | | | | 2,780 | | | | 3,221 | | | | 5,639 | |
| Accounts receivable from Parent company and affiliates, note 25 | | | 1,372 | | | | 704 | | | | — | | | | — | |
| Loans to employees | | | 1,091 | | | | 1,972 | | | | — | | | | — | |
| Interests receivables, note 6(c) | | | 159 | | | | 114 | | | | — | | | | — | |
| Funds restricted to tax payments | | | 73 | | | | 353 | | | | — | | | | — | |
| Other accounts receivable | | | 2,036 | | | | 4,069 | | | | — | | | | — | |
| Allowance for doubtful accounts (d) | | | (1,685 | ) | | | (781 | ) | | | — | | | | — | |
| Financial assets classified as receivables (e) | | | 97,299 | | | | 77,740 | | | | 3,221 | | | | 5,639 | |
| Value-added tax credit (c) | | | 2,177 | | | | 2,752 | | | | 3,745 | | | | 9,511 | |
| Tax refund receivable (c) | | | 42 | | | | 629 | | | | 9,241 | | | | 9,970 | |
| | | | | | | | | | | | | | | | | |
| Non-financial assets classified as receivables | | | 2,219 | | | | 3,381 | | | | 12,986 | | | | 19,481 | |
| | | | | | | | | | | | | | | | | |
| | | | 99,518 | | | | 81,121 | | | | 16,207 | | | | 25,120 | |
| (b) | Trade account receivables are interest bearing and generally have 30-90 day maturities. |
| (c) | As of December 31, 2016, the value-added tax credit is mainly related to the activities of Salmueras Sudamericanas S.A. (Salmueras). According to the Peruvian current tax rules, the Group has the right to compensate this credit against the value-added tax to be generated by sales. During 2017, the Group has recognized an impairment on the brine project, as a consequence the Group wrote-off value-added tax credit for S/5,654,000, see note 1.2. |
Notes to the consolidated financial statements (continued)
As of December 31, 2017, the value-added tax credit is mainly related to the activities of Empresa de Transmisión Guadalupe S.R.L. and will be compensated against the value-added tax generated by the sales of this subsidiary. As of December 31, 2017 and 2016, the Group had value-added tax refund receivables related to the operations of Dinoselva Iquitos S.A.C. of S/9,241,000 and S/9,970,000, respectively.These tax refund receivables are value-added tax credits originated from purchases made from 2005 to 2007 in the northeast region of Peru. The Group has a formal disagreement with the Peruvian tax authorities in connection with these refunds. In the Group’s legal advisors opinion, the Group has strong basis to recover these tax refunds, however, they consider that such recovery will occur in the long-term, considering the long time that this kind of procedures last due to all instances andformal processes that have to be completed.
| (d) | The movement of the allowance for doubtful accounts is as follows: |
| | | 2017 | | | 2016 | | | 2015 | |
| | | S/(000) | | | S/(000) | | | S/(000) | |
| | | | | | | | | | | | | |
| Opening balance | | | 781 | | | | 667 | | | | 352 | |
| Additions, note 20 | | | 1,190 | | | | 114 | | | | 315 | |
| Write-off | | | (286 | ) | | | — | | | | — | |
| | | | | | | | | | | | | |
| Ending balance | | | 1,685 | | | | 781 | | | | 667 | |
| (e) | The aging analysis of trade and other accounts receivable as of December 31, 2017 and 2016, is as follows: |
| | | | | | | | | | | | Past due but not impaired | |
| | | | Total | | | | Neither past due
nor impaired | | | | <30
days | | | | 30-60
days | | | | 61-90
days | | | | 91-120
days | | | | >120
days | |
| | | | S/(000) | | | | S/(000) | | | | S/(000) | | | | S/(000) | | | | S/(000) | | | | S/(000) | | | | S/(000) | |
| | | | | | | | | | | | | | | | | | | | | | | | | | | | | |
| 2017 | | | 100,520 | �� | | | 79,795 | | | | 7,549 | | | | 1,612 | | | | 1,710 | | | | 453 | | | | 9,401 | |
| 2016 | | | 83,379 | | | | 58,865 | | | | 17,551 | | | | 1,477 | | | | 651 | | | | 374 | | | | 4,461 | |
See note 29 on credit risk of trade receivables, which explains how the Group manages and measures credit quality of trade receivables that are neither past due nor impaired.
Notes to the consolidated financial statements(continued)
| (a) | This caption is made up as follows: |
| | | 2017 | | | 2016 | |
| | | S/(000) | | | S/(000) | |
| | | | | | | | | |
| Goods and finished products | | | 27,386 | | | | 21,427 | |
| Work in progress | | | 105,882 | | | | 107,882 | |
| Raw materials | | | 74,477 | | | | 71,248 | |
| Packages and packing | | | 1,975 | | | | 2,045 | |
| Fuel and carbon | | | 26,986 | | | | 29,033 | |
| Spare parts and supplies | | | 141,623 | | | | 117,643 | |
| Inventory in transit | | | 4,093 | | | | 3,941 | |
| | | | 382,422 | | | | 353,219 | |
| Less - Provision for inventory obsolescence and net realizable value (b) | | | (9,402 | ) | | | (6,684 | ) |
| | | | | | | | | |
| | | | 373,020 | | | | 346,535 | |
| (b) | Movement in the provision for inventory obsolescence and net realizable value is set forth below: |
| | | 2017 | | | 2016 | | | 2015 | |
| | | S/(000) | | | S/(000) | | | S/(000) | |
| | | | | | | | | | | | | |
| Opening balance | | | 6,684 | | | | 14,055 | | | | 5,146 | |
| Additions | | | 3,183 | | | | 1,725 | | | | 9,335 | |
| Recoveries | | | (465 | ) | | | (226 | ) | | | (426 | ) |
| Disposals | | | — | | | | (8,870 | ) | | | — | |
| | | | | | | | | | | | | |
| Final balance | | | 9,402 | | | | 6,684 | | | | 14,055 | |
| 9. | Available–for-sale financial investments |
| (a) | Movement in available-for-sale financial investments is as follow: |
| | | 2017 | | | 2016 | | | 2015 | |
| | | S/(000) | | | S/(000) | | | S/(000) | |
| | | | | | | | | | | | | |
| Beginning balance | | | 657 | | | | 436 | | | | 744 | |
| Investment shares from spin-off, note 1.1 | | | 21,206 | | | | — | | | | — | |
| Fair value change recorded in other comprehensive income | | | 37 | | | | 221 | | | | (308 | ) |
| Disposals (c) | | | (694 | ) | | | — | | | | — | |
| | | | | | | | | | | | | |
| Ending balance | | | 21,206 | | | | 657 | | | | 436 | |
Notes to the consolidated financial statements(continued)
| (b) | As of December 31, 2017, the balance of financial investments available-for-sale corresponds to the investment shares of Fossal S.A.A. owned by the Company, as a result of the execution of the spin-off project, which are recorded at cost. See notes 1.1. and 2.3.2. |
| (c) | As of December 31, 2016, financial investments available-for-sale included 256,624 shares of Unión Andina de Cementos S.A.A. (UNACEM), which are publicly traded on the Lima Stock Exchange (BVL) and whose fair value is determined based on public price quotes. On December 14, 2017, the Company sold its available-for-sale financial investments in UNACEM for S/694,000. As a result of this sale, the Company transferred a gain of S/243,000 from the consolidated statement of other comprehensive income to the consolidated statement of profit or loss. |
Available-for-sale financial investments include the following as of December 31, 2016:
| | | 2016 | |
| | | Cost | | | Unrealized gain | | | Fair value | |
| | | S/(000) | | | S/(000) | | | S/(000) | |
| | | | | | | | | | | | | |
| Equity securities – listed Peruvian company | | | 450 | | | | 207 | | | | 657 | |
| | | | | | | | | | | | | |
| Total | | | 450 | | | | 207 | | | | 657 | |
| (d) | The breakdown of the investments in equity securities held for the years 2017 and 2016 is as follows (number of shares): |
| | | 2017 | | | 2016 | |
| | | | | | | |
| Fossal S.A.A.(*) | | | 9,148,373 | | | | — | |
| Unión Andina de Cementos S.A.A. (**) | | | — | | | | 256,624 | |
| (*) | Represents 7.76% of its common shares. |
| (**) | Represents 0.016% of its common shares. |
Notes to the consolidated financial statements(continued)
| 10. | Property, plant and equipment |
| (a) | The composition and movement in this caption as of the date of the consolidated statements of financial position is presented below: |
| | | Mining concessions
(b) | | Mine development
costs (b) | | Land | | Buildings and other
construction | | Machinery,
equipment and
related spare parts | | Furniture and
accessories | | Transportation units | | Computer
equipment and
tools | | Mine rehabilitation
costs | | Capitalized
interests | | Works in progress
and units
in transit | | Total | |
| | | S/(000) | | S/(000) | | S/(000) | | S/(000) | | S/(000) | | S/(000) | | S/(000) | | S/(000) | | S/(000) | | S/(000) | | S/(000) | | S/(000) | |
| | | | | | | | | | | | | | | | | | | | | | | | | | |
| Cost | | | | | | | | | | | | | | | | | | | | | | | | | |
| As of January 1, 2016 | | 79,217 | | 125,127 | | 219,240 | | 436,670 | | 986,642 | | 31,097 | | 125,286 | | 53,014 | | 4,575 | | 61,595 | | 890,746 | | 3,013,209 | |
| Additions | | 484 | | 4,944 | | 44 | | — | | 13,297 | | 109 | | 2,651 | | 1,803 | | 1,488 | | — | | 82,362 | | 107,182 | |
| Capitalized interests (d) | | — | | — | | — | | — | | — | | — | | — | | — | | — | | 3,309 | | — | | 3,309 | |
| Disposals | | — | | — | | — | | — | | (13,661 | ) | (9 | ) | (7,020 | ) | (18 | ) | — | | — | | (871 | ) | (21,579 | ) |
| Transfers | | 136 | | 1,473 | | 61 | | 240,992 | | 515,631 | | 19 | | 502 | | 1,307 | | — | | — | | (758,749 | ) | 1,372 | |
| Assets held for distribution | | (3,029 | ) | (89,959 | ) | — | | (20,114 | ) | (65,525 | ) | (703 | ) | (1,711 | ) | (2,605 | ) | — | | — | | (28,835 | ) | (212,481 | ) |
| As of December 31, 2016 | | 76,808 | | 41,585 | | 219,345 | | 657,548 | | 1,436,384 | | 30,513 | | 119,708 | | 53,501 | | 6,063 | | 64,904 | | 184,653 | | 2,891,012 | |
| Additions | | — | | 2,260 | | 9,186 | | 232 | | 12,696 | | 88 | | 10,511 | | 1,350 | | — | | — | | 32,280 | | 68,603 | |
| Disposals | | — | | — | | — | | (1,171 | ) | (614 | ) | (17 | ) | (8,213 | ) | (178 | ) | — | | — | | (397 | ) | (10,590 | ) |
| Transfers, note 11 | | — | | 1,402 | | 27 | | 20,328 | | 142,593 | | 817 | | 312 | | 3,740 | | 26 | | — | | (173,664 | ) | (4,419 | ) |
| | | | | | | | | | | | | | | | | | | | | | | | | | |
| As of December 31, 2017 | | 76,808 | | 45,247 | | 228,558 | | 676,937 | | 1,591,059 | | 31,401 | | 122,318 | | 58,413 | | 6,089 | | 64,904 | | 42,872 | | 2,944,606 | |
| | | | | | | | | | | | | | | | | | | | | | | | | | |
| Accumulated depreciation | | | | | | | | | | | | | | | | | | | | | | | | | |
| As of January 1, 2016 | | 12,233 | | 9,457 | | — | | 52,366 | | 229,014 | | 26,605 | | 57,983 | | 37,296 | | 1,432 | | 14 | | — | | 426,400 | |
| Additions | | 72 | | 296 | | — | | 17,194 | | 76,322 | | 852 | | 11,104 | | 3,572 | | — | | 1,403 | | — | | 110,815 | |
| Disposals | | — | | — | | — | | — | | (4,613 | ) | (3 | ) | (2,866 | ) | (7 | ) | — | | — | | — | | (7,489 | ) |
| Assets held for distribution | | (186 | ) | — | | — | | (615 | ) | (3,805 | ) | (250 | ) | (1,511 | ) | (1,389 | ) | — | | — | | — | | (7,756 | ) |
| As of December 31, 2016 | | 12,119 | | 9,753 | | — | | 68,945 | | 296,918 | | 27,204 | | 64,710 | | 39,472 | | 1,432 | | 1,417 | | — | | 521,970 | |
| Additions | | — | | 506 | | — | | 17,482 | | 85,937 | | 728 | | 12,966 | | 3,629 | | 2 | | 1,519 | | — | | 122,769 | |
| Disposals | | — | | — | | — | | (633 | ) | (221 | ) | (17 | ) | (4,697 | ) | (335 | ) | — | | — | | — | | (5,903 | ) |
| Transfers, note 11 | | — | | (509 | ) | — | | — | | — | | — | | — | | — | | — | | — | | — | | (509 | ) |
| As of December 31, 2017 | | 12,119 | | 9,750 | | — | | 85,794 | | 382,634 | | 27,915 | | 72,979 | | 42,766 | | 1,434 | | 2,936 | | — | | 638,327 | |
| | | | | | | | | | | | | | | | | | | | | | | | | | |
| Impairment mining assets (b) | | | | | | | | | | | | | | | | | | | | | | | | | |
| As of December 31, 2016 | | 41,213 | | 24,048 | | 258 | | 13,837 | | 12,166 | | 168 | | 26 | | 400 | | 3,143 | | — | | 735 | | 95,994 | |
| Additions, note 1.2 | | 1,645 | | — | | — | | — | | — | | 33 | | — | | 54 | | — | | — | | — | | 1,732 | |
| As of December 31, 2017 | | 42,858 | | 24,048 | | 258 | | 13,837 | | 12,166 | | 201 | | 26 | | 454 | | 3,143 | | — | | 735 | | 97,726 | |
| | | | | | | | | | | | | | | | | | | | | | | | | | |
| Net book value | | | | | | | | | | | | | | | | | | | | | | | | | |
| | | | | | | | | | | | | | | | | | | | | | | | | | |
| As of December 31, 2017 | | 21,831 | | 11,449 | | 228,300 | | 577,306 | | 1,196,259 | | 3,285 | | 49,313 | | 15,193 | | 1,512 | | 61,968 | | 42,137 | | 2,208,553 | |
| | | | | | | | | | | | | | | | | | | | | | | | | | |
| As of December 31, 2016 | | 23,476 | | 7,784 | | 219,087 | | 574,766 | | 1,127,300 | | 3,141 | | 54,972 | | 13,629 | | 1,488 | | 63,487 | | 183,918 | | 2,273,048 | |
| Assets held for distribution as of December 31, 2016 | | 2,843 | | 89,959 | | — | | 19,499 | | 61,720 | | 453 | | 200 | | 1,216 | | — | | — | | 28,835 | | 204,725 | |
Notes to the consolidated financial statements(continued)
| (b) | Mining concessions mainly include net acquisition costs of S/15,367,000 related to coal concessions acquired through a purchase option executed from 2011 to 2013. The caption also includes some concessions acquired by the Group for exploration activities related to the cement business. |
In previous years management recognized a full impairment charge of approximately S/95,994,000, related to the total net book value of a closed zinc mining unit which includes concession costs, development costs and related facilities and equipments. From this amount, S/41,213,000 corresponds to concessions costs. According to the management’s expectation the recovery amount of this zinc mining unit is zero.
As of December 31, 2017, the Group has recognized an impairment on the brine project. As a consequence the Group wrote-off the concessions and other related assets for S/1,732,000. See note 1.2.
| (c) | There were no additions under finance leases during the years 2017 and 2016. |
| (d) | During 2016 the Group capitalized borrowing costs for S/3,309,000 mainly related with the expansion of the cement plant located in Piura. The rate used to determine the amount of borrowings costs eligible for capitalization was approximately 5.00 percent as of December 31, 2016, which is the effective rate of the only borrowing the Group has as of such date. The amount of borrowing costs eligible for capitalization is determined by applying the capitalization rate to the capital expenditures incurred on qualifying assets. Since September 2015, a part of this project is operating.In February 2016, a significant part of thiscement plant was launched to operations, and the Group ceased to capitalize borrowing costs. |
| (e) | The Group has assessed the recoverable amount of its remnant long-term assets and did not find an impairment of these assets as of December 31, 2017. |
| (f) | Work in progress included in property, plant and equipment as of December 31, 2017 amounted to S/42,137,000 (2016: S/183,918,000) and is mainly related to complementary facilities of the cement plants. |
| (g) | As of December 31, 2017, the Group maintains accounts payable related to the acquisition of property, plant and equipment totaling S/5,368,000 (S/7,870,000 as of December 31, 2016). |
Notes to the consolidated financial statements (continued)
| 11. | Exploration, evaluation and intangible assets |
| (a) | The composition and movement of this caption as of the date of the consolidated statements of financial position is presented below: |
| | | S/(000) | |
| | | | | |
| Cost | | | | |
| As of January 1, 2016 | | | 89,829 | |
| Additions (b) | | | 10,619 | |
| Transfers, note 10 | | | (1,372 | ) |
| Assets held for distribution, note 1.1 | | | (47,630 | ) |
| As of December 31, 2016 | | | 51,446 | |
| Additions | | | 1,384 | |
| Transfers, note 10 | | | 4,419 | |
| | | | | |
| As of December 31, 2017 | | | 57,249 | |
| | | | | |
| Accumulated amortization | | | | |
| As of January 1, 2016 | | | 7,967 | |
| Additions | | | 451 | |
| As of December 31, 2016 | | | 8,418 | |
| Additions | | | 1,437 | |
| Transfers, note 10 | | | 509 | |
| | | | | |
| As of December 31, 2017 | | | 10,364 | |
| | | | | |
| Impairment, note 1.2 | | | 33,469 | |
| | | | | |
| Net value | | | | |
| As of December 31, 2016 | | | 43,028 | |
| | | | | |
| As of December 31, 2017 | | | 13,416 | |
| (b) | As of December 31, 2017, the exploration and evaluation assets mainly include capital expenditures related to the coal project and to others minor projects related to the cement business. As of December 31, 2016, mainly include S/33,469,000 related to the brine project, and S/9,559,000 related to others minor projects. |
| (c) | During 2017, the Group recognized an impairment in the brine project, and the Group wrote-off exploration and evaluation assets for S/33,469,000. See note 1.2. |
As of December 31, 2016, the Group evaluated the conditions of use of the projects related to mining exploration and evaluation costs and did not find any indication of impairment.
Notes to the consolidated financial statements (continued)
| 12. | Trade and other payables |
This caption is made up as follows:
| | | 2017 | | | 2016 | |
| | | S/(000) | | | S/(000) | |
| | | | | | | | | |
| Trade payables | | | 76,478 | | | | 64,098 | |
| Dividends payable, note 16(g) | | | 29,725 | | | | 5,070 | |
| Interests payable | | | 17,280 | | | | 17,892 | |
| Remuneration payable | | | 14,920 | | | | 14,108 | |
| Taxes and contributions | | | 10,904 | | | | 15,003 | |
| Hedge finance cost payable | | | 10,505 | | | | 11,073 | |
| Board of Directors’ fees | | | 5,773 | | | | 5,406 | |
| Advances from customers | | | 4,276 | | | | 1,181 | |
| Guarantee deposits | | | 2,481 | | | | 2,302 | |
| Account payable to related party, note 25 | | | 516 | | | | — | |
| Other accounts payable | | | 5,137 | | | | 6,640 | |
| | | | | | | | | |
| | | | 177,995 | | | | 142,773 | |
Trade accounts payable result from the purchase of material, services and supplies for the Group operation, and mainly correspond to invoices payable to domestic suppliers. Are non-interest bearing and are normally settled on 60 to 120 days term.
Other payables are non-interest bearing and have an average term of 3 months.
Interest payable is normally settled semiannually throughout the financial year.
For explanations on the Group’s liquidity risk management processes, refer to note 29.
Notes to the consolidated financial statements (continued)
This caption is made up as follows:
| | | Workers’
profit-sharing | | | Long-term incentive plan | | | Rehabilitation provision | | | Total | |
| | | S/(000) | | | S/(000) | | | S/(000) | | | S/(000) | |
| | | | | | | | | | | | | | | | | |
| At January 1, 2017 | | | 17,018 | | | | 34,368 | | | | 2,367 | | | | 53,753 | |
| Additions, notes 21 and 25 | | | 21,554 | | | | 11,401 | | | | — | | | | 32,955 | |
| Change in estimates, note 22 | | | — | | | | 477 | | | | 45 | | | | 522 | |
| Payments and advances | | | (18,425 | ) | | | (15,924 | ) | | | (13 | ) | | | (34,362 | ) |
| | | | | | | | | | | | | | | | | |
| At December 31, 2017 | | | 20,147 | | | | 30,322 | | | | 2,399 | | | | 52,868 | |
| | | | | | | | | | | | | | | | | |
| Current portion | | | 20,147 | | | | 4,200 | | | | 228 | | | | 24,575 | |
| Non-current portion | | | — | | | | 26,122 | | | | 2,171 | | | | 28,293 | |
| | | | | | | | | | | | | | | | | |
| | | | 20,147 | | | | 30,322 | | | | 2,399 | | | | 52,868 | |
| | | | | | | | | | | | | | | | | |
| At January 1, 2016 | | | 21,273 | | | | 36,906 | | | | 3,339 | | | | 61,518 | |
| Additions, notes 21 and 25 | | | 18,692 | | | | 16,088 | | | | 1,488 | | | | 36,268 | |
| Change in estimates, note 22 | | | — | | | | — | | | | 5,259 | | | | 5,259 | |
| Unwinding of discount, note 24 | | | — | | | | 345 | | | | — | | | | 345 | |
| Payments and advances | | | (22,947 | ) | | | (18,971 | ) | | | (7,719 | ) | | | (49,637 | ) |
| | | | | | | | | | | | | | | | | |
| At December 31, 2016 | | | 17,018 | | | | 34,368 | | | | 2,367 | | | | 53,753 | |
| | | | | | | | | | | | | | | | | |
| Current portion | | | 17,018 | | | | 13,817 | | | | 876 | | | | 31,711 | |
| Non-current portion | | | — | | | | 20,551 | | | | 1,491 | | | | 22,042 | |
| | | | | | | | | | | | | | | | | |
| | | | 17,018 | | | | 34,368 | | | | 2,367 | | | | 53,753 | |
Workers’ profit sharing -
In accordance with Peruvian legislation, the Group maintains an employee profit sharing plan between 8% and 10% of annual taxable income. Distributions to employees under the plan are based 50% on the number of days that each employee worked during the preceding year and 50% on proportionate annual salary levels.
Notes to the consolidated financial statements (continued)
Long-term incentive plan -
In 2011, the Group implemented a compensation plan for its key management. This long-term benefit is payable in cash, based on the salary of each officer and depends on the years of service of each officer in the Group. Under the plan, the executive would receive the equivalent of an annual salary for each year of service beginning to accrue from 2011. This benefit accrues and accumulates for each officer, and is payable in two moments: to a group on the sixth year since the creation of this bonuses plan, to a second group on the seventh year since the creation of this bonuses plan and the last payment at the end of the ninth year from the creation of the plan. If the executive decides to voluntarily leave the Group before a scheduled distribution, he will not receive this compensation. In accordance with IAS 19, the Group used the Projected Unit Credit Method to determine the present value of this deferred obligation and the related current deferred cost, considering the expected increases in salary base and the corresponding current government bond discount rate. As of December 31, 2017 and 2016, the Group maintains a recorded liability for S/30,322,000 and S/34,368,000, respectively, related to this compensation.
Rehabilitation provision –
As of December 31, 2017 and 2016, it corresponds to the provision for the future costs of rehabilitating the quarries exploited in Company’s operations and the zinc mine site (fully impaired in 2011), located in the Region of Amazonas. The provision has been created based on studies made by internal specialists. Management believes that the assumptions used, based on current economic environment, are a reasonable basis upon which to estimate the future liability. These estimates are reviewed regularly to take into account any material change to the assumptions. However, actual rehabilitation costs will ultimately depend upon future market prices for the necessary decommissioning works required to reflect future economic conditions.
Future cash flows were estimated from financial budgets approved by senior management and the range of risk free discount rates used in the calculation of the present value of this provision as of December 31, 2017 and 2016 were from 6.52 to 7.65 percent.
Management expects to incur a significant part of this obligation in the medium and long term. The Group estimates that this liability is sufficient according to the current environmental protection laws approved by the Ministry of Energy and Mines.
| 14. | Interest-bearing loans and borrowings |
This caption is made up as follows:
| | | Nominal interest
rate | | | Maturity | | | 2017 | | | 2016 | |
| | | % | | | | | | | S/(000) | | | S/(000) | |
| Senior Notes | | | | | | | | | | | | | | | | |
| Principal, net of issuance costs | | | 4.50 | | | | Feb 8, 2023 | | | | 965,290 | | | | 998,148 | |
| | | | | | | | | | | | | | | | | |
| Total non-current loans | | | | | | | | | | | 965,290 | | | | 998,148 | |
Notes to the consolidated financial statements (continued)
Senior Notes
The General Shareholder’s Meeting held on January 7, 2013, approved that the Company complete a financing transaction. In connection with this, the Board of Directors’ Meeting held on January 24, 2013, agreed to issue Senior Notes through a private offering under Rule 144A and Regulation S of the U.S. Securities Act of 1933. Also it was agreed to list these securities in the Ireland Stock Exchange. Consequently, on February 1, 2013, the Company issued Senior Bonds in a principal amount of US$300,000,000, with a nominal annual interest rate of 4.50%, and maturity in 2023, obtaining total net proceeds of US$293,646,000 (S/762,067,000). The Company used part of the net proceeds from the offering to prepay certain of its existing debt and the difference to fund capital expenditures in connection with its cement business. The Senior Notes are guaranteed by the following Company’s subsidiaries: Cementos Selva S.A., Distribuidora Norte Pacasmayo S.R.L., Empresa de Transmision Guadalupe S.A.C., Dinoselva Iquitos S.A.C and Calizas del Norte S.A.C. (in liquidation).
For the year ended December 31, 2017 and 2016, the Senior Notes accrued interest recorded in the consolidated statement of profit or loss of S/45,358,000 and S/44,729,000, net of capitalization of interest, respectively. See note 24.
In the case that the Company and guarantee subsidiaries require to issue debt or equity instruments or merges with another company or dispose or rent significant assets, the senior notes will activate the following covenants, calculated on the Company and Guarantee Subsidiaries annual consolidated financial statements:
| - | The fixed charge covenant ratio would be at least 2.5 to 1. |
| - | The consolidated debt-to-EBITDA ratio would be no greater than 3.5 to 1. |
As of December 31, 2016, the Company has not entered in any of the operations mentioned before. As of December 31, 2017, the Company has complied with the covenants as set forth in the indenture related to the Senior Notes.
As of December 31, 2017 and 2016, the Group maintains cross currency swaps contracts (“CCS”) to reduce the foreign exchange risk of its Senior Notes which are denominated in US dollars, see note 30(b).
Notes to the consolidated financial statements (continued)
| 15. | Deferred income tax assets and liabilities |
This caption is made up as follows:
| | | As of January
01, 2016 | | | Effect on profit or loss | | | Effect on
OCI | | | Discontinued operations | | | As of December
31, 2016 | | | Effect on profit or loss | | | Effect on
OCI | | | Discontinued operations | | | As of December
31, 2017 | |
| | | S/(000) | | | S/(000) | | | S/(000) | | | S/(000) | | | S/(000) | | | S/(000) | | | S/(000) | | | S/(000) | | | S/(000) | |
| | | | | | | | | | | | | | | | | | | | | | | | | | | | |
| Movement of deferred income tax assets: | | | | | | | | | | | | | | | | | | | | | | | | | | | |
| Deferred income tax assets | | | | | | | | | | | | | | | | | | | | | | | | | | | |
| Provision for vacations | | 355 | | | (116 | ) | | — | | | (167 | ) | | 72 | | | 16 | | | — | | | — | | | 88 | |
| Effect of differences between book and tax bases of fixed assets and in the depreciation rates used for book purposes | | (467 | ) | | 14 | | | — | | | 455 | | | 2 | | | 34 | | | — | | | — | | | 36 | |
| Other | | 62 | | | 10 | | | — | | | (36 | ) | | 36 | | | (18 | ) | | — | | | — | | | 18 | |
| Tax-loss carry forward | | 21,127 | | | 301 | | | — | | | (16,475 | ) | | 4,953 | | | (4,953 | ) | | — | | | — | | | — | |
| Pre-operating costs | | — | | | 1,287 | | | — | | | — | | | 1,287 | | | (1,287 | ) | | — | | | — | | | — | |
| Total deferred income tax assets | | 21,077 | | | 1,496 | | | — | | | (16,223 | ) | | 6,350 | | | (6,208 | ) | | — | | | — | | | 142 | |
| | | | | | | | | | | | | | | | | | | | | | | | | | | | |
| Movement of deferred income tax liabilities: | | | | | | | | | | | | | | | | | | | | | | | | | | | |
| Deferred income tax assets | | | | | | | | | | | | | | | | | | | | | | | | | | | |
| Impairment of zinc mining assets | | 24,986 | | | 3,332 | | | — | | | — | | | 28,318 | | | — | | | — | | | — | | | 28,318 | |
| Impairment on brine project assets, note 1.2 | | — | | | — | | | — | | | — | | | — | | | 17,087 | | | — | | | — | | | 17,087 | |
| Long-term incentive plan | | 10,334 | | | (196 | ) | | — | | | — | | | 10,138 | | | (1,194 | ) | | — | | | — | | | 8,944 | |
| Provision for vacations | | 4,051 | | | (382 | ) | | — | | | — | | | 3,669 | | | 157 | | | — | | | — | | | 3,826 | |
| Available-for-sale financial investment from spin-off, note 1.1 | | — | | | — | | | — | | | — | | | — | | | — | | | — | | | 2,253 | | | 2,253 | |
| Discounts on trade receivables | | — | | | — | | | — | | | — | | | — | | | 1,093 | | | — | | | — | | | 1,093 | |
| Other | | 5,795 | | | (2,016 | ) | | — | | | — | | | 3,779 | | | 1,849 | | | — | | | — | | | 5,628 | |
| | | 45,166 | | | 738 | | | — | | | — | | | 45,904 | | | 18,992 | | | — | | | 2,253 | | | 67,149 | |
| Deferred income tax liabilities | | | | | | | | | | | | | | | | | | | | | | | | | | | |
| Effect of differences between book and tax bases of fixed assets and in the depreciation rates used for book purposes | | (124,157 | ) | | (33,479 | ) | | — | | | — | | | (157,636 | ) | | (11,332 | ) | | — | | | — | | | (168,968 | ) |
| Effect of costs of issuance of senior notes | | (3,218 | ) | | 312 | | | — | | | — | | | (2,906 | ) | | 484 | | | — | | | — | | | (2,422 | ) |
| Net gain on cash flow hedge | | (32,439 | ) | | 711 | | | 11,104 | | | — | | | (20,624 | ) | | 9,203 | | | 11,277 | | | — | | | (144 | ) |
| Effect of available-for-sale investments disposed, note 9 | | 3 | | | — | | | (65 | ) | | — | | | (62 | ) | | — | | | 62 | | | — | | | — | |
| Other | | (4,424 | ) | | (4 | ) | | — | | | — | | | (4,428 | ) | | (10 | ) | | — | | | — | | | (4,438 | ) |
| | | (164,235 | ) | | (32,460 | ) | | 11,039 | | | — | | | (185,656 | ) | | (1,655 | ) | | 11,339 | | | — | | | (175,972 | ) |
| Total deferred income tax liabilities, net | | (119,069 | ) | | (31,722 | ) | | 11,039 | | | — | | | (139,752 | ) | | 17,337 | | | 11,339 | | | 2,253 | | | (108,823 | ) |
| | | | | | (30,226 | ) | | 11,039 | | | (16,223 | ) | | | | | 11,129 | | | 11,339 | | | 2,253 | | | | |
The Group offsets tax assets and liabilities if and only if it has a legally enforceable right to set off current tax assets and current tax liabilities and the deferred tax assets and deferred tax liabilities relate to income taxes levied by the same tax authority.
Notes to the consolidated financial statements (continued)
A reconciliation between tax expenses and the product of the accounting profit multiplied by Peruvian tax rate for the years 2017, 2016 and 2015 is as follows:
| | | 2017 | | | 2016 | | | 2015 | |
| | | S/(000) | | | S/(000) | | | S/(000) | |
| | | | | | | | | | | | | |
| Profit before income tax from continuing operations | | | 128,417 | | | | 198,110 | | | | 306,770 | |
| Loss before income tax from discontinued operations | | | (1,305 | ) | | | (12,988 | ) | | | (8,861 | ) |
| Accounting profit before income tax | | | 127,112 | | | | 185,122 | | | | 297,909 | |
| At statutory income tax rate of 29.5% (2016: 28%, 2015:28%) | | | (37,498 | ) | | | (51,834 | ) | | | (83,415 | ) |
| | | | | | | | | | | | | |
| Differences | | | | | | | | | | | | |
| Non-deductible expenses, net | | | (8,776 | ) | | | (5,592 | ) | | | (5,274 | ) |
| Effect of tax-loss carry forward non-recognized | | | (246 | ) | | | (171 | ) | | | (233 | ) |
| Dividends obtained from available-for-sale investments | | | 39 | | | | 8 | | | | 34 | |
| Effect of the change in income tax-rate | | | — | | | | (14,639 | ) | | | 2,646 | |
| | | | | | | | | | | | | |
| At the effective income tax rate of 37% in 2017 (2016: 39% and 2015: 29%) | | | (46,481 | ) | | | (72,228 | ) | | | (86,242 | ) |
| | | | | | | | | | | | | |
| Income tax from continuing operations | | | (47,032 | ) | | | (78,627 | ) | | | (89,383 | ) |
| Income tax from discontinued operations | | | 551 | | | | 6,399 | | | | 3,141 | |
| | | | | | | | | | | | | |
| | | | (46,481 | ) | | | (72,228 | ) | | | (86,242 | ) |
In December 2016, the Peruvian Government approved an increase of the income tax rate from 28 percent to 29.50 percent to be effective from 2017 onwards. This increase on future tax rates has increased the deferred income tax liability on S/22,344,000 and increased the deferred income tax asset on S/8,529,000 (S/14,639,000 was recognized as a higher income tax expense in the consolidated statement of profit or loss and S/824,000 as an income in OCI).
In December 2014, the Peruvian Government approved the progressive reduction of the income tax rate from 30 percent to 28 percent to be effective in 2015 and 2016, to 27 percent during 2017 and 2018 and 26 percent starting from 2019 onwards. As of December 31, 2015, this reduction on future tax rates had a net impact of S/2,646,000, as a reduction of the deferred income tax liability of the Group, respectively. Such amount was recognized as a reduction of income tax expense in the consolidated statement of profit or loss.
Notes to the consolidated financial statements (continued)
The income tax expenses shown for the years ended December 31, 2017, 2016 and 2015 are:
| | | 2017 | | | 2016 | | | 2015 | |
| | | S/(000) | | | S/(000) | | | S/(000) | |
| | | | | | | | | | | | | |
| Consolidated statements of profit or loss | | | | | | | | | | | | |
| Current | | | (58,161 | ) | | | (48,401 | ) | | | (61,007 | ) |
| Deferred | | | 11,129 | | | | (30,226 | ) | | | (28,376 | ) |
| | | | | | | | | | | | | |
| | | | (47,032 | ) | | | (78,627 | ) | | | (89,383 | ) |
The income tax recorded directly to other comprehensive income is a gain of S/11,339,000 and S/11,039,000, during 2017 and 2016, respectively, and a loss of S/4,019,000 during 2015.
Following is the composition of deferred income tax related to items recognized in OCI and equity during the year:
| | | 2017 | | | 2016 | | | 2015 | |
| | | S/(000) | | | S/(000) | | | S/(000) | |
| | | | | | | | | | | | | |
| Tax effect on unrealized gain (loss) on available-for-sale financial asset | | | 61 | | | | (57 | ) | | | 79 | |
| Tax effect on unrealized gain (loss) on derivative financial asset | | | 11,278 | | | | 10,272 | | | | (4,098 | ) |
| Effect of the change in income tax-rate | | | — | | | | 824 | | | | — | |
| | | | | | | | | | | | | |
| Total deferred income tax in OCI | | | 11,339 | | | | 11,039 | | | | (4,019 | ) |
| | | | | | | | | | | | | |
| Temporary difference on purchase of treasury shares | | | — | | | | — | | | | (30 | ) |
| Temporary difference on available for sale financial investments from spin-off, note 1.1 | | | 2,253 | | | | — | | | | — | |
| | | | | | | | | | | | | |
| Total deferred income tax in equity | | | 2,253 | | | | — | | | | (30 | ) |
The tax losses related are available indefinitely for offset against 50% of future annual taxable profits. The amount of losses carried out is subject to the outcome of the reviews of the tax authorities referred in note 27.
Deferred tax assets have not been recognized in respect of certain losses as they may not be used to offset taxable profits elsewhere in the Group, they have arisen in subsidiaries that have been loss-making for some time, and there are no other tax planning opportunities or other evidence of recoverability in the near future. If the Group were able to recognize all unrecognized deferred tax assets, the profit would increase by S/858,000 (2016: S/2,843,000).
Notes to the consolidated financial statements (continued)
As of December 31, 2017, 2016 and 2015, it is not necessary to recognize deferred tax liability for taxes that would be payable on the unremitted earnings of the Group’s subsidiaries. The Group has determined that the timing differences will be reversed by means of dividends to be received in the future that, according to the tax rules in effect in Peru, are not subject to income tax.
For information purposes, the temporary difference associated with investments in subsidiaries, would generate an aggregate deferred tax liability amounting to S/70,365,000 (2016: S/57,615,000), which should not be recognized in the consolidated financial statements according with IAS 12.
As of December 31, 2017, share capital is represented by 423,868,449 authorized common shares subscribed and fully paid, with a nominal value of one Sol per share. From the total outstanding common shares as of December 31, 2017; 70,097,971 are listed in the New York Stock Exchange and 353,770,478 in the Lima Stock Exchange.
As of December 31, 2016 and 2015, share capital is represented by 531,461,479, authorized common shares subscribed and fully paid, with a nominal value of one Sol per share. From the total outstanding common shares as of December 31, 2016 and 2015, 111,484,000 are listed (in the form of ADSs) on the New York Stock Exchange and 419,977,479 in the Lima Stock Exchange.
Investment shares do not have voting rights or participate in shareholder’s meetings but do participate in the distribution of dividends. Investment shares confer upon the holders thereof the right to participate in dividends distributed according to their nominal value, in the same manner as common shares. Investment shares also confer the holders thereof the right to:
| (i) | maintain the current proportion of the investment shares in the case of capital increase by new contributions; |
| (ii) | increase the number of investment shares upon capitalization of retained earnings, revaluation surplus or other reserves that do not represent cash contributions; |
| (iii) | participate in the distribution of the assets resulting from liquidation of the Company in the same manner as common shares; and, |
| (iv) | redeem the investment shares in case of a merger and/or change of business activity of the Company. |
As of December 31, 2017, the Company had 40,278,894 investment shares (50,503,124 investment shares as of December 31, 2017 and 2016) subscribed and fully paid, with a nominal value of one Sol per share.
Notes to the consolidated financial statements (continued)
As of December 31, 2017, the Company maintained 36,040,497 investment shares amounting to S/119,005,000.
In January 2017 and October 2015, the Company acquired 7,911,845 and 37,276,580 investment shares for S/34,216,000 and S/108,248,000, respectively. In March 2017, as a result of the execution of the spin-off of Fosfatos del Pacífico, the Company exchanged 9,148,373 of its treasury investment shares amounting to S/23,459,000 for investment shares of Fossal, see note 1.1.
| (d) | Additional paid-in capital - |
As of December 31, 2016, additional paid-in capital is represented mainly by S/561,191,000 obtained as a result of the issue of 111,484,000 common shares and 928,000 investment shares corresponding to a public offering of American Depositary Shares (ADS) registered with the New York Stock Exchange and Lima Stock Exchange on 2012. This amount corresponds to the excess of the total proceeds obtained by this transaction in relation to the nominal value of these shares.
In March and December 2017, the Company recognized a debit for S/118,569,000 and a credit for S/6,759,000 in this caption as a result of the spin-off of the interest in Fosfatos del Pacífico S.A. and the impairment of the brine project, respectively, see notes 1.1 and 1.2.
Provisions of the General Corporation Law require that a minimum of 10% of the distributable earnings for each period, after deducting the income tax, be transferred to a legal reserve until such is equal to 20% of the capital. This legal reserve can offset losses or can be capitalized, and in both cases there is the obligation to replenish it.
This reserve records fair value changes on available-for-sale financial assets and the unrealized results on cash flow hedge.
| (g) | Distributions made and proposed – |
| | | 2017 | | | 2016 | | | 2015 | |
| | | S/(000) | | | S/(000) | | | S/(000) | |
| | | | | | | | | | | | | |
| Cash dividends on ordinary shares declared and paid | | | | | | | | | | | | |
| Dividend for 2017: S/0.35000 per share (2016: S/0.28500 per share, 2015: S/0.28000 per share) | | | 149,837 | | | | 155,236 | | | | 162,950 | |
| | | | | | | | | | | | | |
| | | | 149,837 | | | | 155,236 | | | | 162,950 | |
Notes to the consolidated financial statements (continued)
As of December 31, 2017 and 2016, dividends payable amount to S/29,725,000 and S/5,070,000, respectively. On 2017, in order to comply with Peruvian law requirements, S/189,000 corresponding to dividends payable with aging greater than ten years were transferred from dividends payable caption to legal reserve caption in the consolidated statements of changes in equity.
| (h) | Contributions of non-controlling interest - |
Salmueras Sudamericanas S.A.
In order to finance the Salmueras Project, the General Shareholders’ Meetings of the subsidiary Salmueras Sudamericanas S.A. of June 13, 2017, December 13, 2016 and February 2, 2016, agreed contributions of S/3,467,000, S/783,000 and S/4,100,000, respectively. The General Shareholders’ Meeting held on June 4, 2015, agreed a contribution of S/2,400,000. Under this agreement, during 2017, the contributions made by Quimpac S.A. amounted to S/490,000 (S/473,000 and 277,000 during 2016 and 2015, respectively).
The effect of the difference on capital contributions and interests acquired by each shareholder amounted to S/576,000, S/556,000 and S/325,000, during the years 2017, 2016 and 2015, respectively, and were recognized as a debit in additional paid-in capital and a credit in non-controlling interest.
All these contributions are partial payments of the capital commitment assumed by the Company and Quimpac S.A., if the brine project is developed up to US$100,000,000 and US$14,000,000, respectively, to maintain its interests in this subsidiary. In 2017, the Group decided not no continue with the brine project, see note 1.2.
Fosfatos del Pacífico S.A.
The General Shareholders’ Meeting of the subsidiary Fosfatos del Pacífico S.A. (subsidiary of the Company until February 28, 2017) held on August 2, 2016 agreed a contribution of S/13,384,000. During 2016, the contribution made by MCA Phosphates Pte. amounted to S/4,015,000.
The General Shareholders’ Meeting of the subsidiary Fosfatos del Pacífico S.A. held on July 14 and September 25, 2015, agreed a contribution of S/78,178,000 and S/15,813,000, respectively. In connection with this agreement, during the year ended December 31, 2015, the contribution made by MCA Phosphates Pte. amounted to S/28,198,000.
During February, July, September and December 2016, the Company made additional capital contributions of S/23,216,000, S/1,000,000, S/1,200,000 and S/400,000, respectively; which was approved by the Board of Directors; this contribution did not include a change in the percentage interests held by the current shareholders. This capital contribution was used as working capital of the brick plant. The effect of the difference on capital contributions and interests acquired by each shareholder amounted to S/7,745,000 during 2016, and it was recognized as a debit in additional paid-in capital and a credit in non-controlling interest.
Notes to the consolidated financial statements (continued)
This caption is made up as follows:
| | | 2017 | | | 2016 | | | 2015 | |
| | | S/(000) | | | S/(000) | | | S/(000) | |
| | | | | | | | | | | | | |
| Cement, concrete and blocks | | | 1,076,648 | | | | 1,103,426 | | | | 1,089,232 | |
| Building materials | | | 66,442 | | | | 59,888 | | | | 75,565 | |
| Quicklime | | | 80,707 | | | | 75,090 | | | | 64,140 | |
| Other | | | 1,842 | | | | 1,765 | | | | 2,078 | |
| | | | | | | | | | | | | |
| | | 1,225,639 | | | | 1,240,169 | | | | 1,231,015 | |
This caption is made up as follows:
| | | 2017 | | | 2016 | | | 2015 | |
| | | S/(000) | | | S/(000) | | | S/(000) | |
| | | | | | | | | | | | | |
| Beginning balance of goods and finished products, note 8(a) | | | 21,427 | | | | 22,929 | | | | 18,951 | |
| Beginning balance of work in progress, note 8(a) | | | 107,882 | | | | 88,349 | | | | 69,711 | |
| Consumption of miscellaneous supplies | | | 232,840 | | | | 246,033 | | | | 286,420 | |
| Maintenance and third-party services | | | 167,735 | | | | 172,781 | | | | 113,042 | |
| Depreciation and amortization | | | 109,262 | | | | 94,726 | | | | 58,856 | |
| Shipping costs | | | 103,928 | | | | 95,031 | | | | 106,464 | |
| Personnel expenses, note 21(b) | | | 76,523 | | | | 90,139 | | | | 67,681 | |
| Costs of packaging | | | 32,011 | | | | 35,924 | | | | 34,273 | |
| Other manufacturing expenses | | | 14,616 | | | | 19,927 | | | | 51,637 | |
| Ending balance of goods and finished products, note 8(a) | | | (27,386 | ) | | | (21,427 | ) | | | (22,929 | ) |
| Ending balance of work in progress, note 8(a) | | | (105,882 | ) | | | (107,882 | ) | | | (88,349 | ) |
| | | | | | | | | | | | | |
| | | | 732,956 | | | | 736,530 | | | | 695,757 | |
Notes to the consolidated financial statements (continued)
| 19. | Administrative expenses |
This caption is made up as follows:
| | | 2017 | | | 2016 | | | 2015 | |
| | | S/(000) | | | S/(000) | | | S/(000) | |
| | | | | | | | | | | | | |
| Personnel expenses, note 21(b) | | | 94,437 | | | | 100,059 | | | | 94,129 | |
| Third-party services | | | 65,435 | | | | 63,085 | | | | 56,669 | |
| Depreciation and amortization | | | 14,949 | | | | 12,761 | | | | 10,671 | |
| Board of Directors’ compensation | | | 6,555 | | | | 6,149 | | | | 7,105 | |
| Donations | | | 7,305 | | | | 5,832 | | | | 6,060 | |
| Taxes | | | 3,756 | | | | 2,861 | | | | 2,214 | |
| Consumption of supplies | | | 2,743 | | | | 2,053 | | | | 2,419 | |
| Environmental expenditures, note 27 | | | 437 | | | | 576 | | | | 456 | |
| | | | | | | | | | | | | |
| | | | 195,617 | | | | 193,376 | | | | 179,723 | |
| 20. | Selling and distribution expenses |
This caption is made up as follows:
| | | 2017 | | | 2016 | | | 2015 | |
| | | S/(000) | | | S/(000) | | | S/(000) | |
| | | | | | | | | | | | | |
| Advertising and promotion | | | 18,955 | | | | 15,631 | | | | 8,410 | |
| Personnel expenses, note 21(b) | | | 17,982 | | | | 17,096 | | | | 16,230 | |
| Third-party services | | | 7,392 | | | | 4,551 | | | | 4,596 | |
| Provision for doubtful accounts, note 7(d) | | | 1,190 | | | | 114 | | | | 315 | |
| Other | | | 1,048 | | | | 2,507 | | | | 1,930 | |
| | | | | | | | | | | | | |
| | | | 46,567 | | | | 39,899 | | | | 31,481 | |
| 21. | Employee benefits expenses |
| (a) | Employee benefits expenses are made up as follow: |
| | | 2017 | | | 2016 | | | 2015 | |
| | | S/(000) | | | S/(000) | | | S/(000) | |
| | | | | | | | | | | | | |
| Wages and salaries | | | 95,684 | | | | 101,250 | | | | 87,052 | |
| Workers’ profit sharing, note 13 | | | 21,554 | | | | 18,692 | | | | 23,393 | |
| Social contributions | | | 20,626 | | | | 23,687 | | | | 17,739 | |
| Legal bonuses | | | 14,133 | | | | 13,477 | | | | 12,124 | |
| Vacations | | | 12,572 | | | | 11,974 | | | | 11,338 | |
| Long-term compensation, note 13 | | | 11,401 | | | | 16,088 | | | | 14,159 | |
| Cessation payments | | | 9,201 | | | | 19,184 | | | | 6,834 | |
| Training | | | 2,557 | | | | 1,510 | | | | 3,429 | |
| Others | | | 1,214 | | | | 1,432 | | | | 1,972 | |
| | | | | | | | | | | | | |
| | | | 188,942 | | | | 207,294 | | | | 178,040 | |
Notes to the consolidated financial statements (continued)
| (b) | Employee benefits expenses are allocated as follows: |
| | | 2017 | | | 2016 |
| | 2015 | |
| | | S/(000) | | | S/(000) | | | S/(000) | |
| | | | | | | | | | | | | |
| Cost of sales, note 18 | | | 76,523 | | | | 90,139 | | | | 67,681 | |
| Administrative expenses, note 19 | | | 94,437 | | | | 100,059 | | | | 94,129 | |
| Selling and distribution expenses, note 20 | | | 17,982 | | | | 17,096 | | | | 16,230 | |
| | | | | | | | | | | | | |
| | | | 188,942 | | | | 207,294 | | | | 178,040 | |
| 22. | Other operating income (expense), net |
| (a) | This caption is made up as follows: |
| | | 2017 | | | 2016 | | | 2015 | |
| | | S/(000) | | | S/(000) | | | S/(000) | |
| | | | | | | | | | | | | |
| Write-off for disasters (b) | | | (9,688 | ) | | | | | | | | |
| Income from management and administrative services provided to related parties, note 25 | | | 1,560 | | | | 1,103 | | | | 505 | |
| Recovery of expenses | | | 796 | | | | 1,053 | | | | 2,533 | |
| Income from land rental and office lease, note 25 | | | 682 | | | | 700 | | | | 664 | |
| Net (loss) gain on disposal of property, plant and equipment | | | 42 | | | | (3,466 | ) | | | 6,851 | |
| Net income from sale of impaired inventories | | | — | | | | 2,593 | | | | — | |
| Changes in the estimation of rehabilitation provision, note 13 | | | — | | | | (5,259 | ) | | | (514 | ) |
| Impairment of inventories | | | — | | | | — | | | | (9,335 | ) |
| Other minor, net | | | 2,251 | | | | 5,720 | | | | 3,209 | |
| | | | | | | | | | | | | |
| | | | (4,357 | ) | | | 2,444 | | | | 3,913 | |
| (b) | During the first quarter of 2017, Peru was affected by the natural phenomenon Coastal El Niño, which caused heavy rains, floods and mudslides in northern Peru since mid-February. The economic losses associated with damage to inventories, machinery and equipment and cost overruns for damage to roads necessary for the distribution of merchandise to customers amounted to S/9,688,000, this amount is presented net of compensation recognized by the insurance company. Of the total amount recognized by the insurance company, S/9,380,000 was pending collection as of December 31, 2017, see note 7(a). |
Notes to the consolidated financial statements (continued)
This caption is made up as follows:
| | | 2017 | | | 2016 | | | 2015 | |
| | | S/(000) | | | S/(000) | | | S/(000) | |
| | | | | | | | | | | | | |
| Credit value adjust on cross currency swaps | | | 3,307 | | | | 552 | | | | — | |
| Interest on term deposits, note 6(c) | | | 1,342 | | | | 2,154 | | | | 2,587 | |
| Interests on accounts receivable | | | 954 | | | | 437 | | | | 492 | |
| Dividends received | | | 226 | | | | 26 | | | | 131 | |
| Other finance income | | | 13 | | | | 71 | | | | 206 | |
| | | | | | | | | | | | | |
| | | | 5,842 | | | | 3,240 | | | | 3,416 | |
This caption is made up as follows:
| | | 2017 | | | 2016 | | | 2015 | |
| | | S/(000) | | | S/(000) | | | S/(000) | |
| | | | | | | | | | | | | |
| Interest on senior notes, net of capitalization, note 14 | | | 45,358 | | | | 44,729 | | | | 8,108 | |
| Finance cost on cross currency swaps | | | 26,140 | | | | 27,800 | | | | 25,169 | |
| Amortization of costs of issuance of senior notes | | | 1,644 | | | | 1,644 | | | | 1,644 | |
| Other | | | 95 | | | | 94 | | | | 1,098 | |
| | | | | | | | | | | | | |
| Total interest expense | | | 73,237 | | | | 74,267 | | | | 36,019 | |
| Unwinding of discount of long-term incentive plan, note 13 | | | 522 | | | | 345 | | | | 788 | |
| Unwinding of discount of other receivables | | | — | | | | 785 | | | | — | |
| | | | | | | | | | | | | |
| Total finance costs | | | 73,759 | | | | 75,397 | | | | 36,807 | |
Notes to the consolidated financial statements (continued)
| 25. | Related party disclosure |
Transactions with related entities -
During the years 2017, 2016 and 2015, the Company carried out the following transactions with its parent company Inversiones ASPI S.A. and its affiliates:
| | | 2017 | | | 2016 | | | 2015 | |
| | | S/(000) | | | S/(000) | | | S/(000) | |
| | | | | | | | | | | | | |
| Income | | | | | | | | | | | | |
| Inversiones ASPI S.A. (ASPI) | | | | | | | | | | | | |
| Income from office lease | | | 12 | | | | 13 | | | | 12 | |
| Fees for management and administrative services | | | 595 | | | | 1,095 | | | | 497 | |
| | | | | | | | | | | | | |
| Servicios Corporativos Pacasmayo S.A.C. (Sercopa) | | | | | | | | | | | | |
| Income from office lease | | | 3 | | | | 13 | | | | 12 | |
| Fees for management and administrative services | | | 2 | | | | 8 | | | | 8 | |
| | | | | | | | | | | | | |
| Compañía Minera Ares S.A.C. (Ares) | | | | | | | | | | | | |
| Income from land lease, note 27 | | | 336 | | | | 326 | | | | 330 | |
| Income from office lease | | | 315 | | | | 348 | | | | 310 | |
| | | | | | | | | | | | | |
| Fossal S.A.A. (Fossal) | | | | | | | | | | | | |
| Income from office lease | | | 16 | | | | — | | | | — | |
| Fees for management and administrative services | | | 46 | | | | — | | | | — | |
| | | | | | | | | | | | | |
| Fosfatos del Pacífico S.A. (Fospac) | | | | | | | | | | | | |
| Income from office lease | | | 40 | | | | — | | | | — | |
| Fees for management and administrative services | | | 917 | | | | — | | | | — | |
| | | | | | | | | | | | | |
| Expense | | | | | | | | | | | | |
| Security services provided by Compañía Minera Ares | | | 1,195 | | | | 1,301 | | | | 1,146 | |
| | | | | | | | | | | | | |
| Other | | | | | | | | | | | | |
| Purchase of investments shares to Inversiones ASPI S.A. | | | — | | | | — | | | | 48,585 | |
| Investment shares on Fossal S.A.A. from spin-off, note 1.1 and 9 | | | 21,206 | | | | — | | | | — | |
Notes to the consolidated financial statements (continued)
As a result of these transactions, the Company had the following rights and obligations with Inversiones ASPI S.A. and its affiliates as of December 31, 2017 and 2016:
| | | 2017 | | | 2016 | |
| | | Accounts
receivable | | | Accounts
payable | | | Accounts
receivable | | | Accounts
payable | |
| | | S/(000) | | | S/(000) | | | S/(000) | | | S/(000) | |
| | | | | | | | | | | | | | | | | |
| Inversiones ASPI S.A. | | | 641 | | | | — | | | | 109 | | | | — | |
| Compañía Minera Ares S.A.C. | | | 339 | | | | 516 | | | | 569 | | | | — | |
| Other | | | 392 | | | | — | | | | 26 | | | | — | |
| | | | | | | | | | | | | | | | | |
| | | | 1,372 | | | | 516 | | | | 704 | | | | — | |
Additionally, as of December 31, 2017, the Company has dividends payable to its Parent of S/24,054,000.
Terms and conditions of transactions with related parties -
The sales to and purchases from related parties are made on terms equivalent to those that prevail in arm’s length transactions. Outstanding balances with related parties at the year-end are unsecured and interest free and settlement occurs in cash. There have been no guarantees provided or received for any related party receivables or payables. For the years ended as of December 31, 2017, 2016 and 2015, the Group has not recorded impairment of receivables relating to amounts owed by relating parties. This assessment is undertaken each financial year through examining the financial position of the related party and the market in which the related party operates.
Compensation of key management personnel of the Group –
The compensation paid to key management personnel includes expenses for profit-sharing, compensation and other concepts for members of the Board of Directors and the key management. As of December 31, 2017, the total short term compensation amounted to S/22,705,000 (2016: S/21,752,000, 2015: S/23,074,000) and the total long term compensation amounted to S/11,401,000 (2016: S/16,088,000, 2015: S/14,159,000). The Company does not compensate Management with post-employment or contract termination benefits or share-based payments.
Notes to the consolidated financial statements(continued)
| 26. | Earnings per share (EPS) |
Basic earnings per share amounts are calculated by dividing the profit for the year attributable to common shares and investment shares of the equity holders of parent by the weighted average number of common shares and investment shares outstanding during the year.
The following reflects the income and share data used in the basic and diluted EPS computations:
| | | 2017 | | | 2016 | | | 2015 | |
| | | | S/(000) | | | | S/(000) | | | | S/(000) | |
| Numerator | | | | | | | | | | | | |
| Net profit from continuing operations attributable to ordinary equity holders of the Parent | | | 94,171 | | | | 120,060 | | | | 218,260 | |
| Net loss from discontinued operations attributable to ordinary equity holders of the Parent | | | (389 | ) | | | (3,886 | ) | | | (2,728 | ) |
| Net profit attributable to ordinary equity holders of the Parent | | | 93,782 | | | | 116,174 | | | | 215,532 | |
| | | 2017 | | | 2016 | | | 2015 | |
| | | Thousands | | | Thousands | | | Thousands | |
| Denominator | | | | | | | | | |
| Weighted average number of common and investment shares | | | 446,062 | | | | 544,687 | | | | 573,998 | |
| | | 2017 | | | 2016 | | | 2015 | |
| | | S/ | | | S/ | | | S/ | |
| | | | | | | | | | |
| Basic profit for common and investment shares from continuing operations | | | 0.21 | | | | 0.22 | | | | 0.39 | |
| Basic loss for common and investment shares from discontinued operations | | | — | | | | (0.01 | ) | | | (0.01 | ) |
| Basic profit for common and investment shares from continuing and discontinued operations | | | 0.21 | | | | 0.21 | | | | 0.38 | |
The weighted average number of shares in 2017, includes the weighted average effect of changes in treasury shares, explained in note 16(c).
The Group has no dilutive potential ordinary shares as of December 31, 2017 and 2016.
There have been no other transactions involving common shares and investment shares between the reporting date and the date of the authorization of these consolidated financial statements.
Notes to the consolidated financial statements(continued)
| 27. | Commitments and contingencies |
Operating lease commitments – Group as lessor
As of December 31, 2017, 2016 and 2015, the Group, as lessor, has a land lease with Compañía Minera Ares S.A.C. a related party of Inversiones ASPI S.A. This lease is annually renewable, and provided an annual rent of S/336,000, S/326,000 and S/330,000, respectively. See note 25.
Capital commitments
As of December 31, 2016, the Group had a commitment of capital contribution, if developed, on brine Project up to US$100,000,000. In connection with this commitment, as of December 31, 2016, the Group had made contributions of S/54,601,000.
As of December 31, 2017, the Group had no significant capital commitments.
Other commitments
| - | The Group maintains long-term electricity supply agreements which billings are determined taking into consideration consumption of electricity and other market variables. |
| - | Since July 2015, the Group has a five-year period natural gas supply agreement for a cement plant located in Piura, which billings are determined taking into account consumption of natural gas and other market variables. Also, the volumes are subject to take or pay clauses that establish minimum levels of natural gas consumption. As of December 31, 2017 and 2016, the Company has accomplished with the requirements established in this agreement. |
Mining royalty
Third parties
Fosfatos del Pacífico S.A. (subsidiary of the Company until February 28, 2017), signed an agreement for the transfer of mining concession with the Peruvian Government, Fundación Comunal San Martin de Sechura and Activos Mineros S.A.C. related to the use of the Bayovar concession, which contains phosphoric rock and diatomites. As part of this agreement, the Subsidiary Fosfatos del Pacífico S.A. is required to pay to Fundación Comunal San Martin de Sechura and Activos Mineros S.A.C. an equivalent amount to US$3.00 for each metric tons of diatomite extracted. The annual royalty may not be less than the equivalent to 40,000 metric tons during the first and second year of production and 80,000 metric tons since the third year of production. The related royalty expense amounted to S/804,000 and S/793,000 for the years ended December 31, 2016 and 2015, respectively.
In December 2013, the Company signed an agreement with a third party, related to the use of the Virrilá concession, to carry out other non-metallic mining activities. This agreement has a term of 30 years, with fixed annual payments of US$600,000 for the first three years and variables to the rest of the contract. The related expense as of December 31, 2017 and 2016 amounted to S/3,932,000 and S/5,517,000, respectively, and was recognized as part of property, plant and equipment on the statement of financial position. As part of this agreement, the Company is required to pay an equivalent amount to US$4.50 each for each metric ton of calcareous extracted; the annual royalty may not be less than the equivalent to 850,000 metric tons since the fourth year of production.
Notes to the consolidated financial statements(continued)
Peruvian government
According to the Royalty Mining Law in force since October 1, 2011, the royalty for the exploitation of metallic and nonmetallic resources is payable on a quarterly basis in an amount equal to the greater of: (i) an amount determined in accordance with a statutory scale of rates based on operating profit margin that is applied to the quarterly operating profit, adjusted by certain items, and (ii) 1% of net sales, in each case during the applicable quarter. These amounts are estimated based on the unconsolidated financial statements of Cementos Pacasmayo S.A.A. and the subsidiaries affected by this mining royalty, prepared in accordance with IFRS. Mining royalty payments will be deductible for income tax purposes in the fiscal year in which such payments are made.
Mining royalty expense paid to the Peruvian Government for 2017, 2016 and 2015 amounted to S/841,000, S/1,052,000 and S/743,000, respectively, and recorded in the consolidated statement of profit or loss.
Tax situation
The Company is subject to Peruvian tax law. As of December 31, 2017, the income tax rate was 29.5 percent (28 percent as of December 31, 2016 and 2015) of the taxable profit after deducting employee participation, which is calculated at a rate of 8 to 10 percent of the taxable income.
For purposes of determining income tax, transfer pricing transactions with related companies and companies resident in territories with low or no taxation, must be supported with documentation and information on the valuation methods used and the criteria considered for determination. Based on the analysis of operations of the Group, Management and its legal advisors believe that as a result of the application of these standards will not result in significant contingencies for the Group as of December 31, 2017 and 2016.
During the four years following the year tax returns are filed, the tax authorities have the power to review and, as applicable, correct the income tax computed by each individual company. The income tax and value-added tax returns for the following years are open to review by the tax authorities:
| | Years open to review by Tax Authorities |
| Entity | Income tax | Value-added tax |
| | | |
| Cementos Pacasmayo S.A.A. | 2012-2017 | Dec. 2013-2017 |
| Cementos Selva S.A. | 2013-2017 | Dec. 2013-2017 |
| Distribuidora Norte Pacasmayo S.R.L. | 2012-2017 | Dec. 2013-2017 |
| Empresa de Transmisión Guadalupe S.A.C. | 2013-2017 | Dec. 2013-2017 |
| Salmueras Sudamericanas S.A. | 2013-2017 | Dec. 2013-2017 |
| Calizas del Norte S.A.C. (in liquidation) | 2013-2017 | 2013-2017 |
Notes to the consolidated financial statements(continued)
Due to possible interpretations that the tax authorities may give to legislation in effect, it is not possible to determine whether or not any of the tax audits will result in increased liabilities for the Group. For that reason, tax or surcharge that could arise from future tax audits would be applied to the income of the period in which it is determined. However, in management’s opinion and legal advisors, any possible additional payment of taxes would not have a material effect on the consolidated financial statements as of December 31, 2017 and 2016.
Environmental matters
The Group’s exploration and exploitation activities are subject to environmental protection standards. Such standards are the same as those disclosed on the consolidated financial statement as of December 31, 2016.
Environmental remediation -
Law No. 28271 regulates environmental liabilities in mining activities. This Law has the objectives of ruling the identification of mining activity’s environmental liabilities and financing the remediation of the affected areas. According to this law, environmental liabilities refer to the impact caused to the environment by abandoned or inactive mining operations.
In compliance with the above-mentioned laws, the Group presented environmental impact studies (EIS), declaration of environmental studies (DES) and Environmental Adaptation and Management Programs (EAMP) for its mining concessions.
Notes to the consolidated financial statements(continued)
The Peruvian authorities approved the EIS, DES and EAMP presented by the Group for its mining concessions and exploration projects. A detail of plans and related expenses approved is presented as follows:
| Project unit | | Resource | | | Resolution
Number | | Year of approval | | | Program approved | | Year expense | |
| | | | | | | | | | | | | | | | 2017 | | | | 2016 | | | | 2015 | |
| | | | | | | | | | | | | | | | S/(000) | | | | S/(000) | | | | S/(000) | |
| | | | | | | | | | | | | | | | | | | | | | | | | |
| Rioja | | | Limestone | | | OF.28-2002-MITINCI | | | 2002 | | | EAMP | | | 236 | | | | 409 | | | | 255 | |
| Tembladera | | | Limestone | | | RD.019-97-EM/DGM | | | 1997 | | | EAMP | | | 201 | | | | 167 | | | | 201 | |
| | | | | | | | | | | | | | | | 437 | | | | 576 | | | | 456 | |
The Group incurs in environmental expenditures related to existing environmental damages caused by current operations. These expenditures which amounted to S/437,000, S/576,000 and S/456,000 during 2017, 2016 and 2015, respectively, are expensed in the year the expenditure is incurred and are presented in administrative expenses caption. See note 19. As of December 31, 2017 and 2016, the Group did not have liabilities in connection with these expenditures since they were all settled before year-end.
Notes to the consolidated financial statements (continued)
Rehabilitation provision -
Additionally, Law No. 28090 regulates the obligations and procedures that must be met by the holders of mining activities for the preparation, filing and implementation of Mine Closure Plans, as well as the establishment of the corresponding environmental guarantees to secure fulfillment of the investments that this includes, subject to the principles of protection, preservation and recovery of the environment. In connection with this obligation, as of December 31, 2017 and 2016, the Group maintains a provision for the closing of the quarries exploited in operations and for a mining unit (Bongara), which is currently without operations, amounting to S/2,399,000 and S/2,367,000, respectively. The Group believes that this liability is adequate to meet the current environmental protection laws approved by the Ministry of Energy and Mines, refer to note 13.
Legal claim contingency
The Group has received claims from third parties in relation with its operations which in aggregate represent S/16,570,000. From this total amount, S/1,687,000 corresponded to labor claims from former employees, S/7,681,000 related to property tax assessment for the periods 2009 to 2014 received from Pacasmayo’s City Hall; S/2,298,000 and S/4,904,000 is related to the tax assessments received from the tax administration corresponding to 2009 and 2010 tax period, which was reviewed by the tax authority during 2012 and 2013, respectively.
Management expects that these claims will be resolved within the next five years based on prior experience; however, the Group cannot assure that these claims will be resolved within this period because the authorities do not have a maximum term to resolve cases. The Group has been advised by its legal counsel that it is only possible, but not probable, that these actions will succeed. Accordingly, no provision for any liability has been made in these consolidated financial statements as of December 31, 2017 and 2016.
| 28. | Material partly-owned subsidiaries |
Financial information of subsidiaries that have material non-controlling interests is provided below:
| (a) | Proportion of equity interest held by non-controlling interests: |
| Name | | Country of incorporation and
operation | | 2017 % | | | 2016 % | |
| | | | | | | | | |
| Fosfatos del Pacífico S.A., note 1.1 | | Peru | | | — | | | | 30.00 | |
| Salmueras Sudamericanas S.A. | | Peru | | | 25.10 | | | | 25.10 | |
| | | | | | | | | | | |
| (b) | Accumulated balances of material non-controlling interest: |
| | | 2017 | | | 2016 | |
| | | S/(000) | | | S/(000) | |
| | | | | | | | | |
| Fosfatos del Pacífico S.A., note 1.1 | | | — | | | | 100,722 | |
| Salmueras Sudamericanas S.A., note 1.2 | | | 147 | | | | 11,867 | |
Notes to the consolidated financial statements (continued)
| (c) | Loss allocated to material non-controlling interest: |
| | | 2017 | | | 2016 | | | 2015 | |
| | | S/(000) | | | S/(000) | | | S/(000) | |
| | | | | | | | | | | | | |
| Fosfatos del Pacífico S.A. | | | 365 | | | | 2,703 | | | | 2,992 | |
| Salmueras Sudamericanas S.A. | | | 12,786 | | | | 577 | | | | 873 | |
| (d) | The summarized financial information of these subsidiaries is provided below. This information is based on amounts before inter-company transactions’ eliminations: |
Summarized statement of profit or loss for the year ended December 31:
| | | Fosfatos del Pacífico S.A. | | | Salmueras Sudamericanas S.A. | |
| | | S/(000) | | | S/(000) | |
| | | | | | | | | |
| 2017 | | | | | | | | |
| Sales of goods | | | 11 | | | | — | |
| Cost of sales | | | (626 | ) | | | — | |
| Administrative expenses | | | (1,068 | ) | | | (3,864 | ) |
| Other income (expenses) | | | 153 | | | | (40,816 | ) |
| Finance (expense) income | | | (237 | ) | | | 3 | |
| Loss before tax | | | (1,767 | ) | | | (44,677 | ) |
| Income tax | | | 551 | | | | (6,265 | ) |
| | | | | | | | | |
| Total comprehensive loss | | | (1,216 | ) | | | (50,942 | ) |
| | | | | | | | | |
| Attributable to non-controlling interest | | | (365 | ) | | | (12,786 | ) |
| | | | | | | | | |
| 2016 | | | | | | | | |
| Sales of goods | | | 1,965 | | | | — | |
| Cost of sales | | | (6,881 | ) | | | — | |
| Administrative expenses | | | (8,694 | ) | | | (3,829 | ) |
| Other (expenses) income | | | (1,006 | ) | | | 52 | |
| Finance expense | | | (793 | ) | | | (114 | ) |
| Loss before tax | | | (15,409 | ) | | | (3,891 | ) |
| Income tax | | | 6,399 | | | | 1,591 | |
| | | | | | | | | |
| Total comprehensive loss | | | (9,010 | ) | | | (2,300 | ) |
| | | | | | | | | |
| Attributable to non-controlling interest | | | (2,703 | ) | | | (577 | ) |
Notes to the consolidated financial statements (continued)
| | | Fosfatos del Pacífico S.A. | | | Salmueras Sudamericanas S.A. | |
| | | S/(000) | | | S/(000) | |
| | | | | | | | | |
| 2015 | | | | | | | | |
| Administrative expenses | | | (11,775 | ) | | | (4,257 | ) |
| Other expenses | | | (212 | ) | | | (2 | ) |
| Finance (expense) income | | | (1,126 | ) | | | 14 | |
| Loss before tax | | | (13,113 | ) | | | (4,245 | ) |
| Income tax | | | 3,141 | | | | 767 | |
| | | | | | | | | |
| Total comprehensive income | | | (9,972 | ) | | | (3,478 | ) |
| Attributable to non-controlling interest | | | (2,992 | ) | | | (873 | ) |
Summarized statement of financial position as of December 31:
| | | Fosfatos del Pacífico S.A. | | | Salmueras Sudamericanas S.A. | |
| | | S/(000) | | | S/(000) | |
| | | | | | | | | |
| 2017 | | | | | | | | |
| Cash, inventories and other current assets | | | — | | | | 587 | |
| | | | | | | | | |
| Total equity | | | — | | | | 587 | |
| | | | | | | | | |
| Attributable to: | | | | | | | | |
| Equity holders of parent | | | — | | | | 440 | |
| Non-controlling interest | | | — | | | | 147 | |
| | | | | | | | | |
| 2016 | | | | | | | | |
| Cash, inventories and other current assets | | | 14,450 | | | | 593 | |
| Other receivables, property, plant and equipment and other non-current assets | | | 324,786 | | | | 47,068 | |
| Trade and other payables current | | | (3,495 | ) | | | (382 | ) |
| | | | | | | | | |
| Total equity | | | 335,741 | | | | 47,279 | |
| | | | | | | | | |
| Attributable to: | | | | | | | | |
| Equity holders of parent | | | 235,019 | | | | 35,412 | |
| Non-controlling interest | | | 100,722 | | | | 11,867 | |
Notes to the consolidated financial statements (continued)
Summarized statement of cash flow for the year ended December31:
| | | Fosfatos del Pacífico S.A. | | | Salmueras Sudamericanas S.A. | |
| | | S/(000) | | | S/(000) | |
| | | | | | | | | |
| 2017 | | | | | | | | |
| Net cash flows used in operating activities | | | (2,611 | ) | | | (4,134 | ) |
| Net cash flows (used in) provided from investing activities | | | (6,410 | ) | | | — | |
| Net cash flows provided from financing activities | | | 5,953 | | | | 4,250 | |
| | | | | | | | | |
| Net (decrease) increase in cash and cash equivalents | | | (3,068 | ) | | | 116 | |
| | | | | | | | | |
| 2016 | | | | | | | | |
| Net cash flows used in operating activities | | | (17,332 | ) | | | (3,870 | ) |
| Net cash flows used in investing activities | | | (22,352 | ) | | | 83 | |
| Net cash flows provided from financing activities | | | 39,200 | | | | 4,100 | |
| | | | | | | | | |
| Net increase (decrease) in cash and cash equivalents | | | (484 | ) | | | 313 | |
| | | | | | | | | |
| 2015 | | | | | | | | |
| Net cash flows used in operating activities | | | (21,950 | ) | | | (4,490 | ) |
| Net cash flows used in investing activities | | | (55,495 | ) | | | — | |
| Net cash flows provided from financing activities | | | 82,676 | | | | 2,400 | |
| | | | | | | | | |
| Net (decrease) increase in cash and cash equivalents | | | 5,231 | | | | (2,090 | ) |
| 29. | Financial risk management, objectives and policies |
The Group’s main financial liabilities, other than derivatives, comprise loans and borrowings, trade payables and other payables. The main purpose of these financial liabilities is to finance the Group’s operations. The Group’s main financial assets include cash and short term deposits and trade and other receivables that derive directly from its operations. The Group also holds available-for-sale financial investments and cash flow hedges instruments.
The Group is exposed to market risk, credit risk and liquidity risk. The Group’s senior management oversees the management of these risks. The Group’s senior management is supported by financial management that advises on financial risks and the appropriate financial risk governance framework for the Group. The financial management provides assurance to the Group’s senior management that the Group’s financial risk-taking activities are governed by appropriate policies and procedures and that financial risks are identified, measured and managed in accordance with the Group’s policies and risk objectives. Derivative activities for risk management purposes are carried out by specialist teams that have the appropriate skills, experience and supervision.
Notes to the consolidated financial statements (continued)
Management reviews and agrees policies for managing each of these risks, which are summarized below.
Market risk -
Market risk is the risk that the fair value or future cash flows of a financial instrument will fluctuate because of changes in market prices. Market risk comprise three types of risk: interest rate risk, currency risk and other price risk, such as equity price risk and commodity risk. Financial instruments affected by market risk include borrowings, deposits, available-for-sale financial investments and derivative financial instruments.
The sensitivity analyses shown in the following sections relate to the Group’s consolidated position as of December 31, 2017 and 2016. The sensitivity analyses have been prepared on the basis that the amount of net debts and the proportion of financial instruments in foreign currencies are all constant and on the basis of the hedge designations in place as of December 31, 2017.
The following assumptions have been made in calculating the sensitivity analyses:
| - | The sensitivity of the relevant statement of profit or loss items is the effect of the assumed changes in respective market risks. This is based on the financial assets and financial liabilities held as of December 31, 2017 and 2016, including the effect of hedge accounting. |
Interest rate risk -
Interest rate risk is the risk that the fair value or future cash flows of a financial instrument will fluctuate because of changes in market interest rates.
As of December 31, 2017 and 2016, all of the Group’s borrowings are at a fixed rate of interest; consequently, the management evaluated that is not relevant to do an interest rate sensitivity analysis.
Foreign currency risk -
Foreign currency risk is the risk that the fair value or future cash flows of a financial instrument will fluctuate because of changes in foreign exchange rates. The Group’s exposure to the risk of changes in foreign exchange relates primarily to the Group’s operating activities (when revenue or expense is denominated in a different currency from the Group’s functional currency).
Since November 2014, the Group hedges its exposure to fluctuations on the translation into Soles of its Senior Notes which are denominated in US dollars, by using cross currency swaps contracts.
Foreign currency sensitivity
The following table demonstrates the sensitivity to a reasonably possible change in the US dollar exchange rate, with all other variables held constant. The impact on the Group’s profit before income tax is due to changes in the fair value of monetary assets and liabilities.
| 2017 | | | Change in
US$ rate | | | Effect on profit
before tax | |
| U.S. Dollar | | | % | | | S/(000) | |
| | | | | | | | | | |
| | | | | +5 | | | | (620 | ) |
| | | | | +10 | | | | (1,239 | ) |
| | | | | -5 | | | | 620 | |
| | | | | -10 | | | | 1,239 | |
| | | | | | | | | | |
| 2016 | | | | Change in US$ rate | | | | Effect on profit before tax | |
| U.S. Dollar | | | % | | | S/(000) | |
| | | | | | | | | | |
| | | | | +5 | | | | (605 | ) |
| | | | | +10 | | | | (1,209 | ) |
| | | | | -5 | | | | 605 | |
| | | | | -10 | | | | 1,209 | |
Notes to the consolidated financial statements (continued)
Commodity price risk -
The Group is affected by the price volatility of certain commodities. Its operating activities require a continuous supply of coal. The Group does not use forward commodity purchase contracts to hedge the purchase price of coal. For the calculation of the commodity price sensitivity, the purchases of this raw material of the last 12 months are used as a basis.
Commodity price sensitivity
The following table shows the effect of price changes in coal:
| | | | Change in
year-end price | | | Effect on profit
before tax | |
| | | | % | | | S/(000) | |
| 2017 | | | | | | | |
| | | | | | +10 | | | (3,148) | |
| | | | | | -10 | | | 3,148 | |
| 2016 | | | | | | | | |
| | | | | | +10 | | | (3,780) | |
| | | | | | -10 | | | 3,780 | |
Equity price risk -
The Group’s listed equity securities are susceptible to market price risk arising from uncertainties about future values of the investment securities. The Group’s Board of Directors reviews and approves all equity investment decisions.
As of December 31, 2017, the Group in not expose to equity price risk.
As of December 31, 2016, the exposure to listed equity securities at fair value was S/657,000, see note 9(a). At that reporting date, a decrease of 10% on Lima stock exchange (BVL) market index could have an impact of approximately S/66,000 on the income or equity attributable to the Group, depending on whether or not the decline is significant or prolonged. An increase of 10% in the value of the listed securities would only impact equity but would not have an effect on profit or loss.
Credit risk -
Credit risk is the risk that counterparty will not meet its obligations under a financial instrument or customer contract, leading to a financial loss. The Group is exposed to a credit risk from its operating activities (primarily for trade receivables) and from its financing activities, including deposits with banks and financial institutions, foreign exchange transactions and other financial instruments.
Notes to the consolidated financial statements (continued)
Trade receivables
Customer credit risk is managed by each business unit subject to the Group’s established policy, procedures and control relating to customer credit risk management. Credit quality of the customer is assessed and individual credit limits are defined in accordance with this assessment. Outstanding customer receivables are regularly monitored and any shipments to major customers are generally covered by letters of credit. As of December 31, 2017 and 2016, the Group had 6 and 3 customers, respectively, that owed the Group more than S/3,000,000 each accounted for approximately 28% and 21% for all receivables owing, respectively. There were 25 and 27 customers as of December 31, 2017 and 2016, respectively, with balances smaller than S/700,000 each and accounting for over 61% and 68%, respectively, of the total amounts receivable.
An impairment analysis is performed at each reporting date on an individual basis for major clients. In addition, a large number of minor receivables are grouped into homogenous groups and assessed for impairment collectively. This calculation is based on actual incurred historical data.
The maximum exposure to credit risk at the reporting date is the carrying value of each class of financial assets disclosed in note 7. The Group does not hold collateral as security.
Financial instruments and cash deposits
Credit risk from balances with banks and financial institutions is managed by the Group’s treasury department in accordance with the Group’s policy. Investments of surplus funds are made only with approved counterparties and within credit limits assigned to each counterparty. Counterparty credit limits are reviewed by the Management on an annual basis, and may be updated throughout the year subject to approval of the Group’s financial management. The limits are set to minimize the concentration of risks and therefore mitigate financial loss through potential counterparty’s failure to make payments. As of December 31, 2017 and 2016, the Group’s maximum exposure to credit risk for the components of the consolidated statement of financial position is the carrying amounts as showed in note 6. The Group’s maximum exposure relating to financial derivative instruments is noted in the liquidity table therefore.
Liquidity risk -
The Group monitors its risk of shortage of funds using a recurring liquidity planning tool.
The Group’s objective is to maintain a balance between continuity of funding and flexibility through the use of bank loans, debentures and finance leases contracts. Access to sources of funding is sufficiently available and debt maturing within 12 months can be rolled over with existing lenders.
As of December 31, 2017 and 2016, no portion of Senior Notes will mature in less than one year.
Notes to the consolidated financial statements (continued)
Excessive risk concentration –
Concentrations arise when a number of counterparties are engaged in similar business activities, or activities in the same geographical region, or have economic features that would cause their ability to meet contractual obligations to be similarly affected by changes in economic, political or other conditions. Concentrations indicate the relative sensitivity of the Group’s performance to developments affecting a particular industry.
In order to avoid excessive concentrations of risk, the Group’s policies and procedures include specific guidelines to focus on the maintenance of a diversified portfolio. Identified concentrations of credit risks are controlled and managed accordingly.
Notes to the consolidated financial statements (continued)
The table below summarizes the maturity profile of the Group’s financial liabilities based on contractual undiscounted payments:
| | | On demand | | | Less than 3 months | | | 3 to 12 months | | | 1 to 5 years | | | More than 5 years | | | Total | |
| | | S/(000) | | | S/(000) | | | S/(000) | | | S/(000) | | | S/(000) | | | S/(000) | |
| | | | | | | | | | | | | | | | | | | | | | | | | |
| As of December 31, 2017 | | | | | | | | | | | | | | | | | | | | | | | | |
| Interest-bearing loans adjusted by hedge | | | — | | | | — | | | | — | | | | — | | | | 913,300 | | | | 913,300 | |
| Interest | | | — | | | | 21,904 | | | | 21,904 | | | | 175,230 | | | | 21,904 | | | | 240,942 | |
| Hedge finance cost payable | | | — | | | | 13,041 | | | | 13,041 | | | | 104,328 | | | | 13,041 | | | | 143,451 | |
| Trade and other payables | | | — | | | | 129,595 | | | | 9,711 | | | | — | | | | — | | | | 139,306 | |
| Energy supply | | | — | | | | 3,357 | | | | 2,648 | | | | — | | | | — | | | | 6,005 | |
| | | | | | | | | | | | | | | | | | | | | | | | | |
| As of December 31, 2016 | | | | | | | | | | | | | | | | | | | | | | | | |
| Interest-bearing loans adjusted by hedge | | | — | | | | — | | | | — | | | | — | | | | 913,300 | | | | 913,300 | |
| Interest | | | — | | | | 22,680 | | | | 22,680 | | | | 181,440 | | | | 68,040 | | | | 294,840 | |
| Hedge finance cost payable | | | — | | | | 13,503 | | | | 13,503 | | | | 108,025 | | | | 40,510 | | | | 175,541 | |
| Trade and other payables | | | — | | | | 89,864 | | | | 8,941 | | | | — | | | | — | | | | 98,805 | |
| Energy supply | | | — | | | | 3,738 | | | | 5,246 | | | | 914 | | | | — | | | | 9,898 | |
The disclosed financial derivative instruments in the table below are the gross undiscounted cash flows. However, those amounts may be settled gross or net. The following table shows the corresponding reconciliation to those amounts to their carrying amounts:
| | | On demand | | | Less than 3 months | | | 3 to 12 months | | | 1 to 5 years | | | More than 5 years | | | Total | |
| | | S/(000) | | | S/(000) | | | S/(000) | | | S/(000) | | | S/(000) | | | S/(000) | |
| | | | | | | | | | | | | | | | | | | | | | | | | |
| As of December 31, 2017 | | | | | | | | | | | | | | | | | | | | | | | | |
| Inflows | | | — | | | | — | | | | — | | | | — | | | | 139,785 | | | | 139,785 | |
| Outflows | | | — | | | | (2,841 | ) | | | (13,032 | ) | | | (100,102 | ) | | | (11,945 | ) | | | (127,920 | ) |
| Net | | | — | | | | (2,841 | ) | | | (13,032 | ) | | | (100,102 | ) | | | 127,840 | | | | 11,865 | |
| | | | | | | | | | | | | | | | | | | | | | | | | |
| Discounted at the applicable interbank rates | | | — | | | | (2,836 | ) | | | (12,885 | ) | | | (94,939 | ) | | | 111,149 | | | | 489 | |
| | | | | | | | | | | | | | | | | | | | | | | | | |
| As of December 31, 2016 | | | | | | | | | | | | | | | | | | | | | | | | |
| Inflows | | | — | | | | — | | | | — | | | | — | | | | 259,195 | | | | 259,195 | |
| Outflows | | | — | | | | (2,942 | ) | | | (13,556 | ) | | | (105,069 | ) | | | (36,948 | ) | | | (158,515 | ) |
| Net | | | — | | | | (2,942 | ) | | | (13,556 | ) | | | (105,069 | ) | | | 222,247 | | | | 100,680 | |
| | | | | | | | | | | | | | | | | | | | | | | | | |
| Discounted at the applicable interbank rates | | | — | | | | (2,933 | ) | | | (13,341 | ) | | | (97,541 | ) | | | 183,727 | | | | 69,912 | |
Notes to the consolidated financial statements (continued)
Changes in liabilities arising from financing activities:
| | | Balance as of January 1 | | | Distribution of dividends | | | Finance cost on cross currency swaps | | | Cash flows | | | Movement of foreign currency | | | Amortization of costs of issuance of senior notes | | | Others | | | Balance as of December 31 | |
| | | S/(000) | | | S/(000) | | | S/(000) | | | S/(000) | | | S/(000) | | | S/(000) | | | S/(000) | | | S/(000) | |
| | | | | | | | | | | | | | | | | | | | | | | | | |
| 2017 | | | | | | | | | | | | | | | | | | | | | | | | |
| Hedge finance cost payable | | 11,073 | | | — | | | 26,140 | | | (26,708 | ) | | — | | | — | | | — | | | 10,505 | |
| Dividends payable | | 5,070 | | | 149,837 | | | — | | | (124,993 | ) | | — | | | — | | | (189 | ) | | 29,725 | |
| Interest-bearing loans | | 998,148 | | | — | | | — | | | — | | | (34,502 | ) | | 1,644 | | | — | | | 965,290 | |
| | | | | | | | | | | | | | | | | | | | | | | | | |
| 2016 | | | | | | | | | | | | | | | | | | | | | | | | |
| Hedge finance cost payable | | 10,897 | | | — | | | 27,800 | | | (27,624 | ) | | — | | | — | | | — | | | 11,073 | |
| Dividends payable | | 4,235 | | | 155,236 | | | — | | | (154,401 | ) | | — | | | — | | | — | | | 5,070 | |
| Interest-bearing loans | | 1,012,406 | | | — | | | — | | | — | | | (15,902 | ) | | 1,644 | | | — | | | 998,148 | |
Notes to the consolidated financial statements (continued)
Capital management -
For the purpose of the Group’s capital management, capital includes capital stock, investment shares, additional paid-in capital and all other equity reserves attributable to the equity holders of the parent. The primary objective of the Group’s capital management is to maximize the shareholders’ value.
In order to achieve this overall objective, the Group’s capital management, among other things, aims to ensure that it meets financial covenants attached to the interest-bearing loans and borrowings that define capital structure requirements. Breaches in meeting the financial covenants would permit the creditors to immediately call senior notes. There have been no breaches in the financial covenants of Senior Notes in the current period.
The Group manages its capital structure and makes adjustments to it in light of changes in economic conditions and the requirements of the financial covenants. To maintain or adjust the capital structure, the Group may adjust the dividend payment to shareholders, return capital to shareholders or issue new shares.
No changes were made in the objectives, policies or processes for managing capital during the years ended December 31, 2017 and 2016.
| 30. | Financial assets and financial liabilities |
| (a) | Financial asset and liabilities – |
| | | 2017 | | | 2016 | |
| | | S/(000) | | | S/(000) | |
| | | | | | | | | |
| Derivative financial instruments | | | | | | | | |
| Cash flow hedge (cross currency swaps) | | | 489 | | | | 69,912 | |
| Total cash flow hedge | | | 489 | | | | 69,912 | |
| | | | | | | | | |
| Available-for-sale financial investments | | | | | | | | |
| Quoted equity shares | | | — | | | | 657 | |
| Total available-for-sale investments, note 9(b) | | | — | | | | 657 | |
| | | | | | | | | |
| Total financial instruments at fair value | | | 489 | | | | 70,569 | |
| | | | | | | | | |
| Total current | | | — | | | | — | |
| Total non-current | | | 489 | | | | 70,569 | |
| | | | | | | | | |
| | | | 489 | | | | 70,569 | |
The financial instruments at fair value through other comprehensive income reflect changes in the fair value of the so-called cash flow hedging contracts that cover the Senior Notes in US dollars.
Notes to the consolidated financial statements (continued)
Except cash flow hedge and available-for-sale investments , all financial assets which included cash and cash equivalents and trade and other receivables are classified in the category of loans and receivable, which are non-derivative financial assets carried at amortized cost, which generate a fixed or variable interest income for the Group. The carrying value may be affected by changes in the credit risk of the counterparties.
Financial liabilities -
All financial liabilities of the Group include trade and other payables and Senior Notes which are classified as loans and borrowings and are carried at amortized cost.
| (b) | Hedging activities and derivatives - |
Cash flow hedges -
Foreign currency risk -
Cross currency swap contracts are designated as hedging instruments in cash flows hedges of the Senior Notes denominated in US dollars with the intention of reducing the foreign exchange risk of expected disbursements of Senior Notes, in a principal amount of US$300,000,000.
The cross currency swap contracts balances vary with the level of expected forward exchange rates.
| | | 2017 | | | 2016 | |
| | | Assets | | | Liabilities | | | Assets | | | Liabilities | |
| | | S/(000) | | | S/(000) | | | S/(000) | | | S/(000) | |
| | | | | | | | | | | | | | | | | |
| Cross currency swap contracts designated as hedging instruments | | | | | | | | | | | | | | | | |
| Fair value | | | 489 | | | | — | | | | 69,912 | | | | — | |
| | | | | | | | | | | | | | | | | |
| | | | 489 | | | | — | | | | 69,912 | | | | — | |
The terms of the cross currency swaps contracts match the terms of the related Senior Notes.
The cash flow hedge of the expected future payments was assessed to be highly effective and a net unrealized loss of S/38,230,000 was included in OCI as of December 31, 2017 (net unrealized loss of S/39,511,000 as of December 31, 2016). The amounts retained in OCI as of December 31, 2017 are expected to mature and affect the consolidated statement of profit or loss in each of the future years until 2023.
Notes to the consolidated financial statements(continued)
Set out below is a comparison by class of the carrying amounts and fair values of the Group’s financial instruments that are carried in the consolidated financial statements:
| | | Carrying amount | | | Fair value | |
| | | | 2017 | | | | 2016 | | | | 2017 | | | | 2016 | |
| | | | S/(000) | | | | S/(000) | | | | S/(000) | | | | S/(000) | |
| | | | | | | | | | | | | | | | | |
| Financial assets | | | | | | | | | | | | | | | | |
| Derivative financial instruments – Cross currency swaps | | | 489 | | | | 69,912 | | | | 489 | | | | 69,912 | |
| Available-for-sale financial investments | | | — | | | | 657 | | | | — | | | | 657 | |
| | | | | | | | | | | | | | | | | |
| Total financial assets - non-current | | | 489 | | | | 70,569 | | | | 489 | | | | 70,569 | |
| | | | | | | | | | | | | | | | | |
| | | | | | | | | | | | | | | | | |
| Financial liabilities | | | | | | | | | | | | | | | | |
| Financial obligations: | | | | | | | | | | | | | | | | |
| Senior Notes | | | 965,290 | | | | 998,148 | | | | 1,005,324 | | | | 1,012,607 | |
| | | | | | | | | | | | | | | | | |
| Total financial liabilities | | | 965,290 | | | | 998,148 | | | | 1,005,324 | | | | 1,012,607 | |
Management assessed that cash and term deposits, trade receivables, trade payables and other current liabilities approximate their carrying amounts largely due to the short-term maturities of these instruments.
The following methods and assumptions were used to estimate the fair values:
| - | The fair value of cross currency swaps is measured by using valuation techniques where inputs are based on market data. The most frequently applied valuation techniques include swap valuation models, using present value calculations. The models incorporate various inputs, including the credit quality of counterparties, foreign exchange, forward rates and interest rate curves. |
A credit valuation adjustment (CVA) is applied to the “Over-The-Counter” derivative exposures to take into account the counterparty’s risk of default when measuring the fair value of the derivative. CVA is the mark-to market cost of protection required to hedge credit risk from counterparties in this type of derivatives portfolio. CVA is calculated by multiplying the probability of default (PD), the loss given default (LGD) and the expected exposure (EE) at the time of default.
A debit valuation adjustment (DVA) is applied to incorporate the Group’s own credit risk in the fair value of derivatives (that is the risk that the Group might default on its contractual obligations), using the same methodology as for CVA.
Notes to the consolidated financial statements(continued)
| - | The fair value of the quoted senior notes is based on price quotations at the reporting date. The Group has not unquoted liability instruments for which fair value is disclosed as of December 31, 2017 and 2016. |
| - | Fair value of available-for-sale investments is derived from quoted market prices in active markets. |
| (d) | Fair value measurement - |
All financial instruments for which fair value is recognized or disclosed are categorized within the fair value hierarchy, based on the lowest level input that is significant to the fair value measurement as a whole, as follows:
Level 1 - Quoted (unadjusted) market prices in active markets for identical assets or liabilities.
Level 2 - Valuation techniques for which the lowest level input that is significant to the fair value measurement is directly or indirectly observable.
Level 3 - Valuation techniques for which the lowest level input that is significant to the fair value measurement is unobservable.
For assets and liabilities that are recognized at fair value on a recurring basis, the Group determines whether transfers have occurred between levels in the hierarchy by re-assessing categorization (based on the lowest level input that is significant to the fair value measurement as a whole) at the end of each reporting period.
The following table provides the fair value measurement hierarchy of the Group’s assets and liabilities.
Quantitative disclosures fair value measurement hierarchy for assets and liabilities as of December 31, 2017 –
| | | Fair value measurement using | |
| | | | Total | | | | Quoted prices in active markets
(Level 1) | | | | Significant
observable inputs (Level 2) | | | | Significant
unobservable
inputs (Level 3) | |
| | | | S/(000) | | | | S/(000) | | | | S/(000) | | | | S/(000) | |
| | | | | | | | | | | | | | | | | |
| Assets measured at fair value: | | | | | | | | | | | | | | | | |
| Derivative financial assets: | | | | | | | | | | | | | | | | |
| Cross currency swaps | | | 489 | | | | — | | | | 489 | | | | — | |
| | | | | | | | | | | | | | | | | |
| Total financial assets | | | 489 | | | | — | | | | 489 | | | | — | |
| Liabilities for which fair values are disclosed: | | | | | | | | | | | | | | | | |
| Senior Notes | | | 1,005,324 | | | | 1,005,324 | | | | — | | | | — | |
| | | | | | | | | | | | | | | | | |
| Total financial liabilities | | | 1,005,324 | | | | 1,005,324 | | | | — | | | | — | |
Notes to the consolidated financial statements(continued)
There have been no transfers between levels during the year ending December 31, 2017.
Quantitative disclosures fair value measurement hierarchy for assets and liabilities as of December 31, 2016 –
| | | Fair value measurement using | |
| | | | Total | | | | Quoted prices in active markets (Level 1) | | | | Significant
observable inputs (Level 2) | | | | Significant
unobservable
inputs (Level 3) | |
| | | | S/(000) | | | | S/(000) | | | | S/(000) | | | | S/(000) | |
| | | | | | | | | | | | | | | | | |
| Assets measured at fair value: | | | | | | | | | | | | | | | | |
| Derivative financial assets: | | | | | | | | | | | | | | | | |
| Cross currency swaps | | | 69,912 | | | | — | | | | 69,912 | | | | — | |
| Available-for-sale financial investments (note 9): | | | | | | | | | | | | | | | | |
| Quoted equity shares | | | 657 | | | | 657 | | | | — | | | | — | |
| | | | | | | | | | | | | | | | | |
| Total financial assets | | | 70,569 | | | | 657 | | | | 69,912 | | | | — | |
| Liabilities for which fair values are disclosed: | | | | | | | | | | | | | | | | |
| Senior Notes | | | 1,012,607 | | | | 1,012,607 | | | | — | | | | — | |
| | | | | | | | | | | | | | | | | |
| Total financial liabilities | | | 1,012,607 | | | | 1,012,607 | | | | — | | | | — | |
There have been no transfers between levels during the year ending December 31, 2016.
Notes to the consolidated financial statements (continued)
For management purposes, the Group is organized into business units based on their products and activities and have three reportable segments as follows:
| - | Production and marketing of cement, concrete and blocks in the northern region of Peru. |
| - | Sale of construction supplies (steel rebar and building materials) in the northern region of Peru. |
| - | Production and marketing of quicklime in the northern region of Peru. |
No operating segments have been aggregated to form the above reportable operating segments.
Management monitors the profit before income tax of each business unit separately for the purpose of making decisions about resource allocation and performance assessment. Segment performance is evaluated based on profit before income tax and is measured consistently with profit before income tax in the consolidated financial statements.
Transfer prices between operating segments are on an arm’s length basis in a manner similar to transactions with third parties.
| | | Revenues from external customers | | Gross profit margin | | Other operating income, net | | Administrative expenses | | Selling and distribution expenses | | Impairment on brine project | | Finance costs | | Finance income | | (Loss) gain from exchange difference, net | | Profit before income tax | | Income tax expense | | Net income from continuing operations | | Net loss from discontinued operations | | Profit for the year | |
| | | S/(000) | | S/(000) | | S/(000) | | S/(000) | | S/(000) | | S/(000) | | S/(000) | | S/(000) | | S/(000) | | S/(000) | | S/(000) | | S/(000) | | S/(000) | | S/(000) | |
| | | | | | | | | | | | | | | | | | | | | | | | | | | | | | |
| 2017 | | | | | | | | | | | | | | | | | | | | | | | | | | | | | |
| Cement, concrete and blocks | | 1,076,648 | | 476,919 | | (4,127 | ) | (174,087 | ) | (44,223 | ) | — | | (73,759 | ) | 5,779 | | (2,012 | ) | 184,490 | | (67,568 | ) | 116,922 | | — | | 116,922 | |
| Construction supplies | | 66,442 | | 1,873 | | 36 | | (1,499 | ) | (2,287 | ) | — | | — | | 48 | | (17 | ) | (1,846 | ) | 676 | | (1,170 | ) | — | | (1,170 | ) |
| Quicklime | | 80,707 | | 13,671 | | — | | (15,613 | ) | — | | — | | — | | — | | (183 | ) | (2,125 | ) | 778 | | (1,347 | ) | — | | (1,347 | ) |
| Other | | 1,842 | | 220 | | (266 | ) | (4,418 | ) | (57 | ) | (47,582 | ) | — | | 15 | | (14 | ) | (52,102 | ) | 19,082 | | (33,020 | ) | (754 | ) | (33,774 | ) |
| | | | | | | | | | | | | | | | | | | | | | | | | | | | | | |
| Consolidated | | 1,225,639 | | 492,683 | | (4,357 | ) | (195,617 | ) | (46,567 | ) | (47,582 | ) | (73,759 | ) | 5,842 | | (2,226 | ) | 128,417 | | (47,032 | ) | 81,385 | | (754 | ) | 80,631 | |
| | | | | | | | | | | | | | | | | | | | | | | | | | | | | | |
| 2016 | | | | | | | | | | | | | | | | | | | | | | | | | | | | | |
| Cement, concrete and blocks | | 1,103,426 | | 487,671 | | 1,907 | | (173,200 | ) | (38,070 | ) | — | | (75,397 | ) | 3,194 | | (2,238 | ) | 203,867 | | (80,912 | ) | 122,955 | | — | | 122,955 | |
| Construction supplies | | 59,888 | | 1,220 | | 136 | | (1,051 | ) | (1,643 | ) | — | | — | | 24 | | (19 | ) | (1,333 | ) | 529 | | (804 | ) | — | | (804 | ) |
| Quicklime | | 75,090 | | 14,216 | | — | | (14,464 | ) | — | | — | | — | | — | | (118 | ) | (366 | ) | 145 | | (221 | ) | — | | (221 | ) |
| Other | | 1,765 | | 532 | | 401 | | (4,661 | ) | (186 | ) | — | | — | | 22 | | (166 | ) | (4,058 | ) | 1,611 | | (2,447 | ) | (6,589 | ) | (9,036 | ) |
| | | | | | | | | | | | | | | | | | | | | | | | | | | | | | |
| Consolidated | | 1,240,169 | | 503,639 | | 2,444 | | (193,376 | ) | (39,899 | ) | — | | (75,397 | ) | 3,240 | | (2,541 | ) | 198,110 | | (78,627 | ) | 119,483 | | (6,589 | ) | 112,894 | |
| | | | | | | | | | | | | | | | | | | | | | | | | | | | | | |
| 2015 | | | | | | | | | | | | | | | | | | | | | | | | | | | | | |
| Cement, concrete and blocks | | 1,089,232 | | 517,266 | | 3,877 | | (161,950 | ) | (29,687 | ) | — | | (36,807 | ) | 3,384 | | 11,141 | | 307,224 | | (89,515 | ) | 217,709 | | — | | 217,709 | |
| Construction supplies | | 75,565 | | 2,506 | | 4 | | (1,228 | ) | (1,519 | ) | — | | — | | 32 | | 19 | | (186 | ) | 54 | | (132 | ) | — | | (132 | ) |
| Quicklime | | 64,140 | | 15,116 | | — | | (11,306 | ) | — | | — | | — | | — | | 969 | | 4,779 | | (1,392 | ) | 3,387 | | — | | 3,387 | |
| Other | | 2,078 | | 370 | | 32 | | (5,239 | ) | (275 | ) | — | | — | | — | | 65 | | (5,047 | ) | 1,470 | | (3,577 | ) | (5,720 | ) | (9,297 | ) |
| | | | | | | | | | | | | | | | | | | | | | | | | | | | | | |
| Consolidated | | 1,231,015 | | 535,258 | | 3,913 | | (179,723 | ) | (31,481 | ) | — | | (36,807 | ) | 3,416 | | 12,194 | | 306,770 | | (89,383 | ) | 217,387 | | (5,720 | ) | 211,667 | |
Notes to the consolidated financial statements (continued)
| | | Segment
assets | | Other
assets | | Assets held for distribution | | Total
assets | | Operating liabilities | | Liabilities held for distribution | | Total
liabilities | | Capital expenditure | | Depreciation and amortization | | Provision of inventory net realizable value and obsolescence | |
| | | S/(000) | | S/(000) | | S/(000) | | S/(000) | | S/(000) | | S/(000) | | S/(000) | | S/(000) | | S/(000) | | S/(000) | |
| | | | | | | | | | | | | | | | | | | | | | |
| 2017 | | | | | | | | | | | | | | | | | | | | | |
| Cement, concrete and blocks | | 2,607,334 | | 489 | | — | | 2,607,823 | | 1,274,322 | | — | | 1,274,322 | | 69,717 | | (119,518 | ) | (2,718 | ) |
| Construction supplies | | 30,791 | | — | | — | | 30,791 | | 31,966 | | — | | 31,966 | | — | | — | | — | |
| Quicklime | | 118,712 | | — | | — | | 118,712 | | — | | — | | — | | — | | (4,504 | ) | — | |
| Other | | 35,583 | | 21,206 | | — | | 56,789 | | 1,119 | | — | | 1,119 | | 15 | | (184 | ) | — | |
| | | | | | | | | | | | | | | | | | | | | | |
| Consolidated | | 2,792,420 | | 21,695 | | — | | 2,814,115 | | 1,307,407 | | — | | 1,307,407 | | 69,732 | | (124,206 | ) | (2,718 | ) |
| | | | | | | | | | | | | | | | | | | | | | |
| 2016 | | | | | | | | | | | | | | | | | | | | | |
| Cement, concrete and blocks | | 2,678,871 | | 69,912 | | — | | 2,748,783 | | 1,316,144 | | — | | 1,316,144 | | 101,729 | | (102,900 | ) | (1,499 | ) |
| Construction supplies | | 27,652 | | — | | — | | 27,652 | | 20,760 | | — | | 20,760 | | — | | — | | — | |
| Quicklime | | 122,446 | | — | | — | | 122,446 | | — | | — | | — | | — | | (4,377 | ) | — | |
| Other | | 82,674 | | 657 | | 338,411 | | 421,742 | | 986 | | 2,704 | | 3,690 | | 16,072 | | (3,989 | ) | — | |
| | | | | | | | | | | | | | | | | | | | | | |
| Consolidated | | 2,911,643 | | 70,569 | | 338,411 | | 3,320,623 | | 1,337,890 | | 2,704 | | 1,340,594 | | 117,801 | | (111,266 | ) | (1,499 | ) |
| | | | | | | | | | | | | | | | | | | | | | |
| 2015 | | | | | | | | | | | | | | | | | | | | | |
| Cement, concrete and blocks | | 2,743,007 | | 124,770 | | — | | 2,867,777 | | 1,326,650 | | — | | 1,326,650 | | 454,275 | | (67,221 | ) | 426 | |
| Construction supplies | | 27,719 | | | | — | | 27,719 | | 30,182 | | — | | 30,182 | | — | | — | | — | |
| Quicklime | | 125,584 | | | | — | | 125,584 | | — | | — | | — | | — | | (2,264 | ) | — | |
| Other | | 392,278 | | 436 | | — | | 392,714 | | 10,828 | | — | | 10,828 | | 36,532 | | (1,325 | ) | (9,335 | ) |
| | | | | | | | | | | | | | | | | | | | | | |
| Consolidated | | 3,288,588 | | 125,206 | | — | | 3,413,794 | | 1,367,660 | | — | | 1,367,660 | | 490,807 | | (70,810 | ) | (8,909 | ) |
Notes to the consolidated financial statements (continued)
During 2017, revenues from two customers, arising from sales within the quicklime segment, amounted to S/65,784,198. During 2016 and 2015, revenues from one customer, arising from sales within the quicklime segment, amounted to S/55,657,000 and S/27,182,000, respectively.
Capital expenditures consist of S/69,732,000, S/117,801,000 and S/490,807,000 during the years ended December 31, 2017, 2016 and 2015, respectively, and are related to additions of property, plant and equipment, exploration and evaluation assets and other minor non-current assets. During 2017, 2016 and 2015, there were no purchases of assets through capital leases.
Inter-segment revenues obtained during the years ended December 31, 2017, 2016 and 2015 were eliminated for consolidation.
The “other” segment includes activities that do not meet the threshold for disclosure under IFRS 8.13 and represent non-material operations of the Group (including phosphates and brine projects).
Other assets
As of December 31, 2017, corresponds to the available-for-sale investments caption and fair value of financial derivate instrument (cross currency swap) for approximately S/21,206,000 and S/489,000, respectively (2016: S/657,000 and S/69,912,000; 2015: S/436,000 and S/124,770,000, respectively), which are not allocated to a segment.
Geographic information
All revenues are from Peruvian clients.
As of December 31, 2017 and December 31, 2016, all non-current assets are located in Peru.