SECURITIES AND EXCHANGE COMMISSION
Washington, D.C. 20549
FORM 10-K
___________________
Annual Report Pursuant to Section 13 or 15(d)
of the Securities Exchange Act of 1934
For the Fiscal Year Ended December 31, 2007
Commission File Number 000-50557
___________________
MARCO COMMUNITY BANCORP, INC.
A Florida Corporation
IRS Employer Identification No. 84-1620092
___________________
1770 San Marco Road
Marco Island, Florida 34145
(239) 389-5200
Securities Registered Pursuant to Section 12(b)
of the Securities Exchange Act of 1934: NONE
Securities Registered Pursuant to Section 12(g) of the Securities Exchange
Act of 1934: Common Stock, $0.01 par value
Indicate by check mark if the registrant is a well-known seasoned issuer, as defined in Rule 405 of the Securities Act. Yes £ No S
Indicate by check mark if the registrant is not required to file reports pursuant to Section 13 or 15(D) of the Exchange Act. Yes £ No S
Note – Checking the box above will not relieve any registrant required to file reports pursuant to Section 13 or 15(d) of the Exchange Act.
Indicate by check mark whether the Registrant (1) has filed all reports required to be filed by Section 13 or 15(d) of the Securities Exchange Act of 1934 during the preceding 12 months (or for such shorter period that the Registrant was required to file such reports), and (2) has been subject to such filing requirements for the past 90 days. Yes S No £
Indicate by check mark if disclosure of delinquent filers pursuant to Item 405 of Regulation S-K (§229.405 of this chapter) is not contained herein, and will not be contained, to the best of registrant’s knowledge, in definitive proxy or information statements incorporated by reference in Part III of this Form 10-K S
Indicate by check mark whether the registrant is a large accelerated filer, an accelerated filer, a non-accelerated filer or a small reporting company. See the definitions of “large accelerated filer,” “accelerated filer,” and “smaller reporting company” in Rule 12b-2 of the Exchange Act.
Large accelerated filer £ | Accelerated filer £ |
Non-accelerated filer £ | Smaller reporting company S |
Indicate by check mark whether the registrant is a shell company (as defined in Rule 12b-2 of the Act).
Yes £ No S
The aggregate market value of the Registrant’s common stock held by non-affiliates of the Registrant, based upon the closing price of $17.00, as quoted on the Over-the-Counter-Bulletin-Board, on June 30, 2007 was approximately $37,242,920. For the purposes of this response, directors and officers of the Registrant are considered the affiliates of the Registrant at that date.
The number of shares outstanding of the Registrant’s common stock, as of February 29, 2008: 3,222,421 shares of $0.01 par value common stock.
Portions of the Proxy Statement of the Registrant for the Annual Meeting of Shareholders to be held in April 2008 are incorporated by reference into Part III of this report.
MARCO COMMUNITY BANCORP, INC. AND SUBSIDIARIES Table of Contents
| | | | Page |
| PART I |
| Item 1. | | | 3 |
| | | | |
Item 1A. | | | 11 |
| | | | |
Item 2. | | | 11 |
| | | | |
Item 3. | | | 11 |
| | | | |
| Item 4. | | | 11 |
| | | | |
| PART II |
| | | | |
| Item 5. | | | 12 |
| | | | |
| Item 6. | | | 14 |
| | | | |
Item 7. | | | 15 |
| | | | |
| Item 8. | | | 29 |
| | | | |
Item 9. | | | 30 |
| | | | |
| Item 9a. | | | 30 |
| | | | |
| Item 9b. | | | 31 |
| | | | |
| PART III |
| | | | |
| Item 10. | | | 31 |
| | | | |
Item 11. | | | 31 |
| | | | |
Item 12. | | | 31 |
| | | | |
| Item 13. | | | 31 |
| | | | |
| Item 14. | | | 31 |
| | | | |
| PART IV |
| | | | |
| Item 15. | | | 32 |
| | | | |
| | | | 62 |
| | | | |
PART I
Forward-Looking Statements
Some of the statements in this Form 10-K discuss future expectations. There may also be statements regarding projections of results of operations or financial condition or state other “forward-looking” information. Those statements are subject to known and unknown risks, uncertainties and other factors that could cause the actual results to differ materially from those contemplated by the statements. We based the forward-looking information on various factors and numerous assumptions, which may or may not turn out to be correct.
Important factors that may cause actual results to differ from those contemplated by forward-looking statements include, for example:
| | § | The success or failure of our efforts to implement our business strategy; |
| | § | The effect of changing economic conditions, both nationally and in our local community; |
| | § | Changes in government regulations, tax and interest rates applicable to our business and similar matters; |
| | § | Our ability to attract and retain quality employees; and |
| | § | Other risks which may be described in our future filings with the SEC. |
We do not promise to update forward-looking information to reflect actual results or changes in assumptions or other factors that could affect those statements other than material changes to such information.
General
Marco Community Bancorp, Inc. (“MCBI”) was incorporated under the laws of the State of Florida on January 28, 2003, for the purpose of organizing Marco Community Bank (“Bank”) (MCBI and the Bank are collectively referred to as the “Company”) and purchasing 100% of the to-be-issued capital stock of the Bank. The Company was formed by a group of Marco Island business leaders, bank executives and community leaders who believed that there was a significant demand for a locally-owned community bank.
Under Federal Reserve Board regulations, MCBI is expected to be a source of financial strength to the Bank. Banking regulations require that the Bank maintain a minimum ratio of capital to assets. In the event that the Bank’s growth is such that this minimum ratio is not maintained, MCBI may borrow funds, subject to the capital adequacy guidelines of the Federal Reserve, and contribute them to the capital of the Bank and otherwise raise capital in a manner which is unavailable to the Bank under existing banking regulations.
The Bank commenced business operations on August 18, 2003 in a temporary facility located at 1770 San Marco Road, Marco Island, Florida 34145, Marco Island, Florida. Our permanent office condominium facility was completed at the same site and we commenced occupancy in the third quarter of 2004.
MCBI’s other wholly-owned subsidiary, Commercial Lending Capital Corp. (“CLCC”) (formerly MCB Commercial Lending Corp.) was incorporated on October 22, 2004, and commenced a commercial lending brokerage business on November 8, 2004. CLCC operates primarily in the same markets as the Bank.
The Company’s fiscal year ends December 31. This Form 10-K is also being used as the Bank’s Annual Disclosure Statement under Federal Deposit Insurance Corporation (“FDIC”) Regulations. This Form 10-K has not been reviewed or confirmed for accuracy or relevance by the FDIC.
Market Area and Competition
The primary service area of the Bank has been experiencing steady growth in both jobs and banking deposits in recent years. Marco Island is the primary residential and commercial center located in the southeast part of Collier County, Florida. Collier County maintains a steady tourist, industrial and agricultural base, which has been expanding in recent years. The largest employers in the County include: Collier County School Board; Naples Community Hospital, Inc.; Publix Supermarket, Inc.; Collier County Board of County Commissioners; Marriott Corporation; Winn-Dixie Stores, Inc.; and Ritz Carlton Hotel. Agricultural activities in the county center around the cattle, produce and saltwater fishing industries. Numerous resorts, hotels and other tourist facilities are located in Marco Island, as well as a number of winter residences.
Competition among financial institutions in our primary service area is intense. There are nine other commercial banks with a total of eleven branches in Marco Island. All nine banks are affiliated with larger bank holding companies. There are no savings associations or credit unions located in Marco Island, however, savings associations and credit unions are located in nearby communities.
We offer a full range of interest bearing and non-interest bearing deposit accounts, including commercial and retail checking accounts, money market accounts, individual retirement and Keogh accounts, regular interest bearing savings accounts and certificates of deposit with fixed and variable rates and a range of maturity date options. The sources of deposits are residents, businesses and employees of businesses within our market area, obtained through the personal solicitation of our officers and directors, direct mail solicitation and advertisements published in the local media. We pay competitive interest rates on time and savings deposits. In addition, we have a service charge fee schedule competitive with other financial institutions in our market area covering such matters as maintenance fees on checking accounts, per item processing fees on checking accounts and returned check charges.
Loan Portfolio
General - We consider the maintenance of a well-underwritten and diversified loan portfolio a prudent and profitable method of employing funds raised through deposits. The Bank’s objective is to maintain a high quality, diversified credit portfolio consisting of commercial, consumer and mortgage loans.
The Bank’s loan policy provides the Bank’s lenders with the discretion necessary to accomplish our lending objectives, while assuring compliance with banking regulations. The Bank Board’s Loan Committee is responsible for ensuring the soundness of the Bank’s credit policy, adherence to lending policies and compliance with applicable laws, rules and regulations. To fulfill these responsibilities, the Loan Committee reviews the adequacy of the Bank’s credit policy on at least an annual basis, reviews all large loans and monitors the performance of the loan portfolio on an ongoing basis. At December 31, 2007, net loans comprised 80% of our total assets.
Commercial Loans - We provide commercial loans to the business community to provide funds for such purposes as financing business equipment and commercial real estate. Our emphasis is on loans secured by commercial real estate, rather than riskier receivables or business inventory loans. Risks of these types of loans include the general business conditions of the local economy and borrowers’ ability to conduct their businesses to generate sufficient profits to repay their loans under the agreed upon terms and conditions. Personal guarantees may be obtained from the principals of business borrowers and third parties to support the borrowers’ ability to service the debt and reduce the risk of non-payment.
Commercial loans are either short term (one year or less) or intermediate term in nature and may be secured, unsecured or partially secured. Maturities are structured in relation to the economic purpose of the loan, conforming to the anticipated source of repayment. Interest rates are typically originated on a floating rate basis, tied to prime rate. The basis upon which we set rates over prime is based upon the risk of the credit facility. We attempt to place floors and pre-payment penalties whenever possible. In addition, we attempt to originate fee income on each loan closed through the Bank.
Term loans are those having an anticipated final maturity of more than one year from the initial funding date. Generally, loans extending more than two years are made pursuant to formal written loan agreements between the borrower and the Bank. Amortization schedules on term loans secured by collateral other than real estate typically reflect a complete payout within seven years of the funding date. Loans secured by commercial real estate are generally amortized over 20 years, with five to seven year maturities.
Demand notes are utilized in connection with certain secured commercial loan transactions where the nature of the transactions suggest that such structure is clearly preferable; however, time notes are utilized as a matter of routine.
The following types of credit are also considered by the Bank, subject to adequate available resources to monitor and service such credit:
· real estate development loans secured by a first lien on the property where the Bank is also providing construction and/or permanent financing;
· term loans secured by machinery and equipment (terms of such loans will be consistent with the purpose, cash flow capacity, and economic life of collateral); and
· credit lines for short-term working capital requirements. All credit lines are subject to review at least annually and will generally carry a requirement for a minimum 30 consecutive day annual out-of-debt period.
Mortgage Loans - We offer mortgage loan programs to provide financing primarily for the acquisition or construction of single-family, owner-occupied primary residences. All loans are structured with an amortization schedule not exceeding 30 years. These loans are maintained in our loan portfolio and also sold in the secondary market, in order to generate fee income.
Normally, the loan to value ratio of each conventional mortgage does not exceed 80%. However, the Bank participates with private mortgage insurance companies for the purpose of providing loans with loan to value ratios of up to 97%. The risk of these loans include our ability to sell the loans to national investors, the frequency of interest rate changes, the financial stability of borrowers and the ability to liquidate foreclosed upon real estate to produce sufficient revenue to prevent a loss.
The Bank also participates in community mortgage programs which are established for the benefit of residents of low to moderate income neighborhoods within the Bank’s trade areas.
Consumer Loans - Consumer loans are being provided to individuals for household, family and personal expenditures. Consumer loans generally involve more risk than mortgage loans because the collateral for a defaulted loan may not provide an adequate source of repayment of the principal. This risk is due to the potential for damage to the collateral or other loss of value, and the fact that any remaining deficiency often does not warrant further collection efforts. In addition, consumer loan performance depends on the borrower’s continued financial stability and is, therefore, more likely to be adversely affected by job loss, divorce, illness or personal bankruptcy. Generally, consumer loans have a maturity of not longer than six years. The primary type of consumer lending will be for the financing of boats and automobiles, pre-approved liens of credit, home improvements and education.
Loan Loss Allowance
In considering the adequacy of our allowance for loan losses, the Bank has considered that as of December 31, 2007, approximately 25.8% of outstanding loans are in the commercial real estate loan category compared to 18.3% at December 31, 2006. At December 31, 2007, commercial loans represented 33.0% of our loan portfolio, compared to 32.5% at December 31, 2006. Commercial loans are generally considered by management as having greater risk than other categories of loans in our loan portfolio. We believe that the real estate collateral securing our commercial real estate loans reduces the risk of loss inherently present in commercial loans.
At December 31, 2007, our consumer loan portfolio consisted primarily of lines of credit and installment loans secured by automobiles, boats and other consumer goods. We believe that the risk associated with these types of loans has been adequately provided for in the loan loss allowance.
The Bank’s Board of Directors monitors the loan portfolio monthly in order to evaluate the adequacy of the allowance for loan losses. In addition to reviews by regulatory agencies, the Bank engages the services of outside consultants to assist in the evaluation of credit quality and loan administration. These professionals complement our internal system, which identifies potential problem credits as early as possible, categorizes the credits as to risk and includes a reporting process to monitor the progress of the credits.
The allowance for loan losses is established through a provision for loan losses charged to expenses. Loans are charged off against the allowance when management believes the collectibility of principal is unlikely. The monthly provision for loan losses is based on management’s judgment, after considering known and inherent risks in the portfolio, our past loss experience, adverse situations that may affect the borrower’s ability to repay, assumed values of the underlying collateral securing the loans, the current and prospective financial condition of the borrower, and the prevailing and anticipated economic condition of the local market. For the year ended December 31, 2007, $6.4 million was charged off against the
allowance for loan losses. For the year ended December 31, 2006 no loans were charged off against the allowance for loan losses.
Deposit Generation
We compete aggressively for deposits in the Marco Island market. Among our product offerings are online business banking, checking accounts, cash management services, safe deposit boxes, travelers’ checks, direct deposit of payroll and social security checks, wire transfers, telephone banking and automatic drafts. We believe these accounts and products are profitable when considering the entire potential customer relationship, which may include other deposit accounts, loans, and sources of fee income.
We also offer certificate of deposit promotions designed to attract customers that we intend to cross-sell other services, including loan products. Our goal is to attract customers who will become permanent customers due to more responsive, more personalized, and faster service. We also seek to garner as much zero interest or low cost deposits as possible.
We offer a tiered money market/savings product whereby the Bank pays higher rates on higher deposit balances. We believe this deposit vehicle allows the Bank to compete with money market mutual funds.
Investments
We enter into Federal Funds transactions with our principal correspondent banks and primarily act as a net seller of such funds. The sale of Federal Funds amount to a short-term loan from us to another bank, usually overnight. At December 31, 2007, Federal Funds sold comprised 5.8% of our total assets, compared to 13.5% as of December 31, 2006.
At December 31, 2007, the Company held $3.3 million in Federal Home Loan Bank bonds compared to $2.2 million for the year ended December 31, 2006. The Company held $3.3 million in Federal National Mortgage Association Mortgage-backed securities at December 31, 2007.
Asset/Liability Management
It is our objective to manage assets and liabilities to provide a satisfactory, consistent level of profitability within the framework of established cash management, loan, investment, borrowing and capital policies. Designated Bank officers are responsible for monitoring policies and procedures that are designed to ensure acceptable composition of the asset/liability mix, stability and leverage of all sources of funds while adhering to prudent banking practices. It is the overall philosophy of management to support asset growth primarily through growth of core deposits, which include deposits of all categories made by individuals, partnerships and corporations.
Our asset/liability mix is monitored on a daily basis with a monthly report reflecting interest-sensitive assets and interest-sensitive liabilities being prepared and presented to the Bank’s Board of Directors. The objective of this policy is to control interest-sensitive assets and liabilities so as to minimize the impact of substantial movements in interest rates on our earnings.
Loan Brokerage
The mission of our commercial lending subsidiary, CLCC is to provide commercial loans to our customers that would otherwise seek financing elsewhere because of credit limit constraints. That flexibility is created by participating at least 50% of the loan amount to a participating bank. Commercial borrowers can receive high touch community bank service with borrowing amounts that are associated with regional bank credit limits. Significant deposits associated with the transaction such as escrows, interest reserves and CD collateralization can provide additional reasonably priced sources of funding for the Bank.
Monetary Policies
The results of our operations are affected by credit policies of monetary authorities, particularly the Federal Reserve Board. The instruments of monetary policy employed by the Federal Reserve include open market operations in U.S. Government securities, changes in the discount rate on member bank borrowings, changes in reserve requirements against member bank deposits and limitations on interest rates which member banks may pay on time and savings deposits. In the view of changing conditions in the national economy and in the money markets, as well as the effect of action by monetary and fiscal authorities, including the Federal Reserve, no accurate prediction can be made as to possible future changes in interest rates, deposit levels, loan demand or our business and earnings.
Employees
As of December 31, 2007, we employed 35 full-time persons, including five executive officers. Employees are hired as needed to meet company-wide personnel demands.
Supervision and Regulation
As a registered bank holding company, MCBI is subject to an extensive body of state and federal banking laws and regulations, which impose specific requirements and restrictions on virtually all aspects of our operations. We are also affected by government monetary policy and by regulatory measures affecting the banking industry in general.
The following is a brief summary of some of the statutes, rules and regulations which affect our operations. This summary is qualified in its entirety by reference to the particular statutory and regulatory provisions referred to below and is not intended to be an exhaustive description of the statutes or regulations applicable to our business. Any change in applicable laws or regulations may have a material adverse effect on the business and prospects of MCBI and the Bank.
On August 14, 2007, the Bank entered into a Written Agreement with the Federal Reserve Bank of Atlanta (“FRB”) and the Florida Office of Financial Regulation (“OFR”). The purpose of the Written Agreement is for the Bank to address the FRB’s and OFR’s supervisory and regulatory concerns primarily related to the volume of certain loan pools which are described elsewhere in this Form 10-K, as well as other loan quality issues. Pursuant to the Written Agreement, the Bank must take corrective actions within specified time frames, which may be extended with the consent of the FRB and the OFR. Failure to comply with the terms of the Written Agreement could result in the assessment of civil money penalties against the Bank and the members of its Board of Directors. The actions to be taken include an evaluation by the Bank’s Board of Directors of its current management and staffing to determine if any additional or replacement personnel are needed; the preparation and implementation of a strategic business plan and budget designed to improve the Bank’s financial condition and credit risk management; a review and adoption of any necessary revisions to the Bank’s loan policy and loan review/grading program; a reduction of the Bank’s volume of adversely classified assets; and the continual monitoring of the Bank’s allowance for loan and lease losses. In addition, the Bank may not make any loans to borrowers who previously had loans charged-off by the Bank; must prepare a plan to effectively manage the Bank’s capital relative to its volume of adversely classified assets, anticipated growth and risk profile; and may not pay any dividends without regulatory consent. At December 31, 2007, the Bank considered itself to be in compliance with substantially all conditions of the Written Agreement.
Since entering into the Written Agreement, (i) the Board of Directors has realigned its operating committee structure to facilitate its involvement in the Bank; (ii) the Bank has added Richard Storm, Jr. as its President & Chief Executive Officer, and a new Chief Credit Officer, a new Commercial Lending Team Leader and an Executive Vice President of Special Projects; (iii) the Board has established a sub-committee to undertake a full review of all officers, senior managers, and department heads; (iv) the Board, upon the recommendation of the Loan Committee, has approved new appropriate lending authorities, scopes and limits for all loan officers; the Bank; (v) the Board has retained an independent third party which has conducted a loan review; (vi) the Bank has commenced development and implementation of various plans to reduce the volume of classified loans; (vii) the Bank has charged off all assets classified as “loss” and established an allowance for loan losses that it has determined to be appropriate; (viii) the Bank has restricted transactions with the Company; and (ix) the Bank has prepared a formal business plan.
Marco Community Bancorp, Inc.
We are a bank holding company within the meaning of the Bank Holding Company Act of 1956. As such, we file annual reports and other information with the Federal Reserve regarding our business operations and those of our subsidiaries. We are also subject to the supervision of, and to periodic inspections by, the Federal Reserve.
The Bank Holding Company Act generally requires every bank holding company to obtain the prior approval of the Federal Reserve before:
| | · | acquiring all or substantially all of the assets of a bank; |
| | · | acquiring direct or indirect ownership or control of more than 5% of the voting shares of any bank or bank holding company; or |
| | · | merging or consolidating with another bank holding company. |
The Bank Holding Company Act and the Federal Change in Bank Control Act, together with regulations of the Federal Reserve, require certain steps be taken before a person or company acquires control of a bank holding company. Depending on the particular circumstances, either the Federal Reserve’s approval must be obtained, or notice must be furnished to the Federal Reserve and not disapproved, before any person or company acquires control of a bank holding company, subject to certain exemptions. Control is conclusively presumed to exist when an individual or company acquires 25% or more of any class of voting securities of a bank holding company. Control is rebuttably presumed to exist if a person acquires 10% or more, but less than 25%, of any class of voting securities, and either: (i) the bank holding company has registered securities under Section 12 of the Securities Exchange Act of 1934; or (ii) no other person owns a greater percentage of that class of securities immediately after the transaction.
Except as authorized by the Bank Holding Company Act and Federal Reserve regulations or orders, a bank holding company is generally prohibited from engaging in, or acquiring direct or indirect control of more than 5% of the voting shares of any company engaged in any business other than the business of banking or managing and controlling banks. Some of the activities the Federal Reserve has determined by regulation to be proper incidents to the business of banking, and thus permissible for bank holding companies, include:
| | · | making or servicing loans and certain types of leases; |
| | · | engaging in certain insurance and discount brokerage activities; |
| | · | performing certain data processing services; |
| | · | acting in certain circumstances as a fiduciary or investment or financial advisor; |
| | · | providing management consulting services; |
| | · | owning savings associations; and |
| | · | making investments in corporations or projects designed primarily to promote community welfare. |
In accordance with Federal Reserve policy, a bank holding company is expected to act as a source of financial strength to its subsidiary banks. In adhering to the Federal Reserve’s policy, MCBI may be required to provide financial support to the Bank when, absent such policy, we might not deem it advisable to provide such assistance.
Under the Bank Holding Company Act, the Federal Reserve may also require a bank holding company to terminate any activity, or relinquish control of a non-bank subsidiary (other than a non-bank subsidiary of a bank) upon the Federal Reserve’s determination that the activity or control constitutes a serious risk to the financial soundness or stability of any subsidiary bank of the bank holding company. Federal bank regulatory authorities also have the discretion to require a bank holding company to divest itself of any bank or non-bank subsidiary if an agency determines that divestiture may aid the depository institution’s financial condition.
The Sarbanes-Oxley Act of 2002 also imposes significant corporate governance standards on the Company. The primary areas of such regulation concern Board oversight of the auditing process, certification of periodic securities reporting and transactions between officers or directors and the Company.
Marco Community Bank
As a state-chartered Federal Reserve member bank, the Bank is subject to the supervision and regulation of the Florida Department of Financial Services (“Florida Department”) and the Federal Reserve. The Bank’s deposits are insured by the FDIC for a maximum of $100,000 per depositor. For this protection, the Bank may be required to pay a quarterly statutory assessment. The assessment, if any, levied for deposit insurance will vary, depending on the capital position of the Bank, and other supervisory factors. In 2007, the Bank was assessed and paid $259,000.00
Areas regulated and monitored by the bank regulatory authorities include:
| | · | security devices and procedures; |
| | · | adequacy of capitalization and loss reserves; |
| | · | issuances of securities; |
| | · | establishment of branches; |
| | · | corporate reorganizations; |
| | · | transactions with affiliates; |
| | · | maintenance of books and records; and |
| | · | adequacy of staff training to carry out safe lending and deposit gathering practices. |
Capital Adequacy Requirements
The Bank and MCBI are subject to regulatory capital requirements imposed by the Federal Reserve. Until a bank and its holding company’s assets reach $500 million, the capital adequacy guidelines issued by the Federal Reserve are applied to bank holding companies on a non-consolidated basis, unless the bank holding company is engaged in non-bank activities involving significant leverage, or it has a significant amount of outstanding debt held by the general public. The Federal Reserve’s risk-based capital guidelines apply directly to insured state banks, regardless of whether they are subsidiaries of a bank holding company. These requirements establish minimum capital ratios in relation to assets, both on an aggregate basis as adjusted for credit risks and off-balance sheet exposures. The risk weights assigned to assets are based primarily on credit risks. For example, securities with an unconditional guarantee by the United States government are assigned to the lowest risk category. The aggregate amount of assets assigned to each risk category is multiplied by the risk weight assigned to that category to determine the weighted values, which are added together to determine total risk-weighted assets.
Capital is then classified into two categories, Tier 1 and Tier 2. Tier 1 capital consists of common and qualifying preferred shareholders’ equity, less goodwill and other adjustments. Tier 2 capital consists of mandatory convertible, subordinated, and other qualifying term debt, preferred stock not qualifying for Tier 1 capital, and a limited amount of allowance for credit losses, up to a designated percentage of risk-weighted assets. Under the risk-based guidelines, banks must maintain a specified minimum ratio of “qualifying” capital to risk-weighted assets. At least 50% of a bank’s qualifying capital must be “core” or Tier 1 capital, and the balance may be “supplementary” or Tier 2 capital. In addition, the guidelines require banks to maintain a minimum leverage ratio standard of capital adequacy. The leverage standard requires top-rated institutions are required to maintain a Tier 1 leverage capital to assets ratio of 3%. All other institutions are required to maintain a Tier 1 leverage capital ratio of 4% or greater, based upon their particular circumstances and risk profiles.
Federal bank regulatory agencies have adopted regulations refining the risk-based capital guidelines to further ensure that the guidelines take adequate account of interest rate risk. Interest rate risk is the adverse effect that changes in market interest rates may have on a bank’s financial condition and is inherent to the business of banking. Under the regulations, when evaluating a bank’s capital adequacy, the revised capital standards now explicitly include a bank’s exposure to declines in the economic value of its capital due to changes in interest rates. The exposure of a bank’s economic value generally represents the change in the present value of its assets, less the change in the value of its liabilities, plus the change in the value of its interest rate off-balance sheet contracts.
Federal bank regulatory agencies possess broad powers to take prompt corrective action as deemed appropriate for an insured depository institution and its holding company, based on the institution’s capital levels. The extent of these powers depends upon whether the bank in question is considered “well-capitalized,” “adequately capitalized,” “undercapitalized,” “significantly undercapitalized,” or “critically undercapitalized.” Generally, as a bank is deemed to be less than well-capitalized, the scope and severity of the agencies’ powers increase, ultimately permitting an agency to appoint a receiver for the bank. Business activities may also be influenced by a bank’s capital classification. For instance, only a “well-capitalized” bank may accept brokered deposits without prior regulatory approval, and can engage in various expansion activities with prior notice, rather than prior regulatory approval. However, rapid growth, poor loan portfolio performance or poor earnings performance, or a combination of these factors, could change the capital position of the bank in a relatively short period of time. Failure to meet these capital requirements could subject the bank to regulatory action, which may include filing with the appropriate bank regulatory authorities a plan describing the means and a schedule for achieving the minimum capital requirements. In addition, the Bank would not be able to receive regulatory approval of any application that required consideration of capital adequacy, such as a branch or merger application, unless we could demonstrate a reasonable plan to meet the capital requirement within an acceptable period of time.
Other Laws
State usury and credit laws limit the amount of interest and various other charges collected or contracted by a bank on loans. Our loans are also subject to federal laws applicable to credit transactions, such as the:
| | · | Federal Truth-In-Lending Act, which governs disclosures of credit terms to consumer borrowers; |
| | · | Community Reinvestment Act, which requires financial institutions to meet their obligations to provide for the total credit needs of the communities they serve, including investing their assets in loans to low- and moderate-income borrowers; |
| | · | Home Mortgage Disclosure Act, which requires financial institutions to provide information to enable public officials to determine whether a financial institution is fulfilling its obligations to meet the housing needs of the community it serves; |
| | · | Equal Credit Opportunity Act, which prohibits discrimination on the basis of race, creed or other prohibitive factors in extending credit; |
| | · | Real Estate Settlement Procedures Act, which requires lenders to disclose certain information regarding the nature and cost of real estate settlements, and prohibits certain lending practices, as well as limits escrow account amounts in real estate transactions; |
| | · | Fair Credit Reporting Act, which governs the manner in which consumer debts may be collected by collection agencies; and |
| | · | Rules and regulations of various federal agencies charged with the responsibility of implementing such federal laws. |
Our operations are also subject to the:
| | · | Privacy provisions of the Gramm-Leach-Bliley Act of 1999, which requires us to maintain privacy policies intended to safeguard consumer financial information, to disclose these policies to our customers, and allow customers to “opt out” of having their financial service providers disclose their confidential financial information to non-affiliated third parties, subject to certain exceptions; |
| | · | Right to Financial Privacy Act, which imposes a duty to maintain confidentiality of consumer financial records and prescribes procedures for complying with administrative subpoenas of financial record; and |
| | · | Electronic Funds Transfer Act and Regulation E, which govern automatic deposits to, and withdrawals from, deposit accounts and customers’ rights and liabilities arising from the use of debit cards, automated teller machines and other electronic banking services. |
Interstate Banking and Branching
Under the Riegle-Neal Interstate Banking and Branching Efficiency Act of 1994, eligible bank holding companies in any state are permitted, with Federal Reserve approval, to acquire banking organizations in any other state. The Interstate Banking and Branching Efficiency Act also removed substantially all of the prohibitions on interstate branching by banks. The authority of a bank to establish and operate branches within a state, however, continues to be subject to applicable state branching laws. Under current Florida law, the Bank is permitted to establish branch offices throughout Florida, with the prior approval of the Florida Department and the Federal Reserve. In addition, with prior regulatory approval, we are able to acquire existing banking operations in other states.
Financial Modernization
The Gramm-Leach-Bliley Act of 1999 sought to achieve significant modernization of the federal bank regulatory framework by allowing the consolidation of banking institutions with other types of financial services firms, subject to various restrictions and requirements. In general, the Gramm-Leach-Bliley Act repealed most of the federal statutory barriers which separated commercial banking firms from insurance and securities firms and authorized the consolidation of such firms in a “financial services holding company.”
Recent Accounting Pronouncements
In September 2006, the Financial Accounting Standards Board ("FASB") issued Statement of Financial Accounting Standards ("SFAS") No. 157, Fair Value Measurements ("SFAS 157"). SFAS 157 defines fair value, establishes a framework for measuring fair value in accordance with generally accepted accounting principles, and expands disclosures about fair value measurements. This statement is effective for financial statements issued for fiscal years beginning after November 15, 2007, and interim periods within those fiscal years. Management is in the process of evaluating the impact of SFAS 157 and does not anticipate it will have a material impact on the Company's consolidated financial condition or results of operations.
In February 2007, the FASB issued SFAS No. 159, The Fair Value Option for Financial Assets and Financial Liabilities ("SFAS 159"). SFAS 159 provides the Company with an option to report selected financial assets and liabilities at fair value. This statement is effective as of the beginning of a Company's first fiscal year beginning after November 15, 2007. Management is in the process of evaluating the impact of SFAS 159 and does not anticipate it will have a material effect on the Company's consolidated financial condition or results of operations.
In December 2007, the FASB issued SFAS No. 141(R), Business Combinations ("SFAS 141(R)"). SFAS 141(R) is effective for fiscal years beginning after December 15, 2008 and early implementation is not permitted. SFAS 141(R) requires the acquiring entity in a business combination to recognize all (and only) the assets acquired and liabilities
assumed in the transaction; establishes the acquisition date fair value as the measurement objective for all assets acquired and liabilities assumed; and requires the acquirer to disclose to investors and other users all of the information they need to evaluate and understand the nature and financial effect of the business combination. Acquisition related costs including finder's fees, advisory, legal, accounting valuation and other professional and consulting fees are required to be expensed as incurred. Management is in the process of evaluating the impact of SFAS 141(R) and does not anticipate it will have any current effect on the Company's consolidated financial condition or results of operations.
In December 2007, the FASB issued SFAS No.160, Noncontrolling Interests in Consolidated Financial Statements ("SFAS 160"). SFAS 160 provides the Company to establish accounting and reporting standards for the noncontrolling interest in a subsidiary and for the deconsolidation of a subsidiary. This Statement shall be effective for fiscal years, and interim periods within those fiscal years, beginning on or after December 15, 2008. Earlier adoption is prohibited. Management is in the process of evaluating the impact of SFAS 160 and does not anticipate it will have a material effect on the Company's consolidated financial condition or results of operations.
| ITEM 1A. | UNRESOLVED STAFF COMMENTS |
None.
On June 18, 2004, we moved into our new headquarters office which is located at 1770 San Marco Road, Marco Island, Florida. This is a two-story 12,500 square foot office condominium building, which was custom built to meet our specifications. The Bank owns the first floor and currently conducts all of its retail operations from this location. There are four drive-through lanes, one of which has an ATM. We have five teller stations in our lobby and nine offices for customer service personnel, loan officers and private banking. There are staff facilities and a community room. MCB owns most of the second floor where its finance, loan and executive offices are located. Approximately 1,168 square feet were sold to an unrelated third party in 2004.
In January 2007, the CLCC leased space on Marco Island, Florida where they conduct their commercial lending brokerage business.
There are no material legal proceedings pending to which we are a party or to which any of our properties are subject. We are not aware of any material proceedings being contemplated by any governmental authority, nor are we aware of any material proceedings, pending or contemplated, in which any director, officer, affiliate or any principal security holder of 10% or more of the common stock of MCBI, or any associate of the foregoing is a party.
| ITEM 4. | SUBMISSION OF MATTERS TO A VOTE OF SECURITY HOLDERS |
No matters were submitted to a vote of security holders, through the solicitation of proxies or otherwise, during the fourth quarter of 2007.
PART II
| ITEM 5. | MARKET FOR REGISTRANT’S COMMON EQUITY AND RELATED STOCKHOLDER MATTERS |
In May 2005, MCBI became quoted on the Over-the-Counter-Bulletin-Board (“OTCBB”) under the symbol “MCBN,” but no trades occurred until October 2005. Prior to that, there was no public market for the stock. The table below shows the high, low and closing bid prices on the OTCBB for the periods indicated. These over-the-counter market quotations reflect inter-dealer prices, without retail mark-up, markdown, or commission and may not necessarily reflect actual transactions.
| Calendar Quarter Ended | | Low | | | High | | | Close | |
| | | | | | | | | | |
| December 31, 2006 | | $ | 13.85 | | | $ | 15.00 | | | $ | 13.85 | |
| March 31, 2007 | | | 13.00 | | | | 14.75 | | | | 13.75 | |
| June 30, 2007 | | | 12.50 | | | | 18.75 | | | | 17.00 | |
| September 30, 2007 | | | 10.01 | | | | 17.70 | | | | 10.01 | |
| December 31, 2007 | | | 6.75 | | | | 12.25 | | | | 8.00 | |
As of December 31, 2007, MCBI common stock was held by approximately 407 shareholders.
Our ability to pay cash dividends will depend almost entirely upon the amount of dividends that the Bank will be permitted to pay by statute or regulation. Additionally, Florida law provides that we may only pay dividends if the dividend payment would not render us insolvent, or unable to meet our obligations as they come due. As a state-chartered bank, the Bank is subject to regulatory restrictions on the payment of dividends, including a prohibition of payment of dividends from the Bank’s capital under certain circumstances without the prior approval of the Florida Department and the Federal Reserve. Presently, the Bank’s written agreement with the Federal Reserve and the Florida Department prohibits the Bank from paying any dividends without regulatory approval. Furthermore, except with the prior approval of the Florida Department, all dividends of any Florida bank must be paid out of retained net profits from the current period and the previous two years, after deducting expenses, including losses and bad debts. On February 20, 2007 the Board of Directors declared a $0.12 cash dividend on all outstanding common shares of stockholders of record on March 16, 2007 which was distributed on April 16, 2007.
The following table sets forth information about the number of shares reserved for issuance under our stock option plans.
Plan Category | | Number of securities to be issued upon exercise of outstanding options | | | Weighted average exercise price of outstanding options | | | Number of securities remaining available for future issuance | |
| | | | | | | | | | |
| Stock option plans approved by security holders | | | 264,701 | | | $ | 9.03 | | | | 80,577 | |
| | | | | | | | | | | | | |
| Equity compensation plans not approved by security holders | | | 0 | | | | N/A | | | | 0 | |
| | | | | | | | | | | | | |
| Total | | | 264,701 | | | $ | 9.03 | | | | 80,577 | |
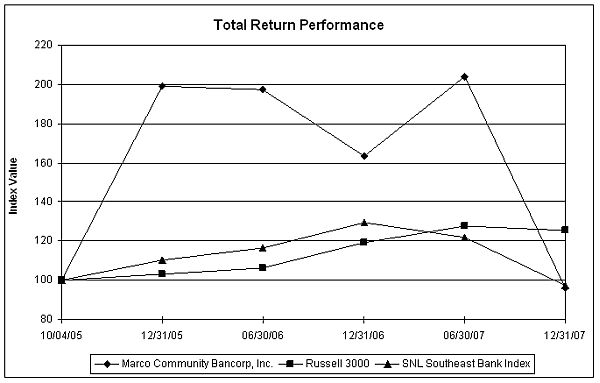
The following graph compares Marco Community Bancorp, Inc.’s cumulative stockholder return on our common stock with: (i) SNL Financial LC’s index for southeastern banks and bank holding companies; and (ii) the Russell 3000 Index, which pertains to listed companies representing 98% of the U.S. market for the period from October 4, 2005 to December 31, 2007, inclusive. The graph assumes an initial investment of $100 on October 4, 2005.
MARCO COMMUNITY BANCORP, INC.
| | | | | | Period Ending | | | | |
| Index | | 10/04/05 | | | 12/31/05 | | | 06/30/06 | | | 12/31/06 | | | 06/30/07 | | | 12/31/07 | |
| Marco Community Bancorp, Inc. | | | 100.00 | | | | 199.22 | | | | 197.36 | | | | 163.19 | | | | 203.92 | | | | 95.96 | |
| Russell 3000 | | | 100.00 | | | | 103.08 | | | | 106.41 | | | | 119.28 | | | | 127.76 | | | | 125.41 | |
| SNL Southeast Bank Index | | | 100.00 | | | | 110.27 | | | | 116.71 | | | | 129.31 | | | | 122.02 | | | | 97.41 | |
| ITEM 6. | SELECTED CONSOLIDATED FINANCIAL DATA |
| December 31, | | 2007 | | | 2006 | |
| | | | | | | |
| (Dollars In Thousands, except per share data.) | | | | | | |
| Statement of Operations Data: | | | | | | |
| Total interest income | | $ | 11,216 | | | | 12,200 | |
| Total interest expense | | | 5,789 | | | | 4,967 | |
| Net interest income before provision for loan losses | | | 5,427 | | | | 7,233 | |
| Provision for loan losses | | | 8,110 | | | | 348 | |
| Net interest (expense) income after provision for loan losses | | | (2,683 | ) | | | 6,885 | |
| Noninterest income | | | 1,026 | | | | 453 | |
| Noninterest expense | | | 6,453 | | | | 4,264 | |
| (Loss) earnings before tax | | | (8,110 | ) | | | 3,074 | |
| Income (benefit) taxes | | | (3,015 | ) | | | 1,220 | |
| Net (loss) earnings | | $ | (5,095 | ) | | | 1,854 | |
| Dividends on preferred stock | | | 35 | | | | - | |
| Net (loss) earnings available to common shareholders | | $ | (5,130 | ) | | | 1,854 | |
| | | | | | | | | |
| Balance Sheet Data: | | | | | | | | |
| Total assets | | | 149,531 | | | | 166,000 | |
| Total cash and cash equivalents | | | 11,174 | | | | 26,905 | |
| Interest-earning assets | | | 139,613 | | | | 160,992 | |
| Investment securities | | | 6,570 | | | | 2,330 | |
| Loans, net | | | 119,876 | | | | 130,988 | |
| Allowance for loan losses | | | 3,794 | | | | 2,047 | |
| Deposits | | | 123,713 | | | | 142,293 | |
| Stockholders’ equity | | | 22,818 | | | | 22,678 | |
| | | | | | | | | |
| Share Data: | | | | | | | | |
| Basic (loss) income per common share | | $ | (1.61 | ) | | | 0.62 | |
| Diluted (loss) income per common share | | | (1.61 | ) | | | 0.58 | |
| Book value per common share | | | 5.56 | | | | 7.19 | |
| Weighted average shares outstanding - basic | | | 3,191 | | | | 3,014 | |
| Weighted average shares outstanding – diluted | | | 3,191 | | | | 3,211 | |
| Total common shares outstanding | | | 3,222 | | | | 3,156 | |
| | | | | | | | | |
| Performance Ratios: | | | | | | | | |
| Return on average assets | | | (3.08 | )% | | | 1.14 | % |
| Return on average common stockholders’ equity | | | (24.12 | )% | | | 8.98 | % |
| Interest-rate spread during the period | | | 2.87 | % | | | 4.09 | % |
| Net interest margin | | | 3.43 | % | | | 4.60 | % |
Efficiency ratio1 | | | 100.00 | % | | | 55.48 | % |
| | | | | | | | | |
| Asset Quality Ratios: | | | | | | | | |
| Allowance for loan losses to period end loans | | | 3.07 | % | | | 1.54 | % |
| Net charge-offs to average loans | | | 4.84 | % | | | N/A | |
| Nonperforming assets to period end total assets | | | 8.18 | % | | | 0.78 | % |
| | | | | | | | | |
| Capital and Liquidity Ratios: | | | | | | | | |
| Average equity to average assets | | | 13.53 | % | | | 12.65 | % |
| Leverage (4.00% required minimum) | | | 10.86 | % | | | 10.73 | % |
| | | | | | | | | |
| Risk-based capital: | | | | | | | | |
| Tier 1 | | | 13.97 | % | | | 12.10 | % |
| Total | | | 15.24 | % | | | 13.18 | % |
| Average loans to average deposits | | | 93.24 | % | | | 93.84 | % |
| (1) | Efficiency ratio = Non-interest expense divided by the total of net interest income before provision for loan losses plus non-interest income (excluding net securities gains and losses). |
| ITEM 7. | MANAGEMENT’S DISCUSSION AND ANALYSIS OF FINANCIAL CONDITION AND RESULTS OF OPERATIONS |
December 31, 2007 and 2006 and the Periods then Ended
General
Marco Community Bancorp, Inc., a Florida corporation (the “Holding Company”), was incorporated on January 28, 2003 for the purpose of operating as a one-bank holding company. The Holding Company currently owns 100% of the outstanding shares of Marco Community Bank (the "Bank") and Commercial Lending Capital Corp. (“CLCC”) (formally known as MCB Commercial Lending Corp.) (collectively, the “Company”). The Holding Company’s only business is the ownership and operation of the Bank and CLCC. The Bank is a Florida-chartered commercial bank which opened for business on August 18, 2003. The Bank is a member of the Federal Reserve System and its deposits are insured by the Federal Deposit Insurance Corporation. The Bank provides community banking services to business and individuals from its banking office located in Marco Island, Florida. CLCC operates as a commercial loan brokerage business.
Critical Accounting Policies
Our financial condition and results of operations are sensitive to accounting measurements and estimates of matters that are inherently uncertain. When applying accounting policies in areas that are subjective in nature, we must use our best judgment to arrive at the carrying value of certain assets. The most critical accounting policy we apply relates to the valuation of the loan portfolio.
A variety of estimates impact carrying value of the loan portfolio including the calculation of the allowance for loan losses, valuation of underlying collateral, the timing of loan charge-offs and the amount and amortization of loan fees and deferred origination costs.
The allowance for loan losses is the most difficult and subjective judgment. The allowance is established and maintained at a level we believe is adequate to cover losses resulting from the inability of borrowers to make required payments on loans. Estimates for loan losses are arrived at by analyzing risks associated with specific loans and the loan portfolio, current trends in delinquencies and charge-offs, the views of our regulators, changes in the size and composition of the loan portfolio and peer comparisons. The analysis also requires consideration of the economic climate and direction, change in the interest rate environment, which may impact a borrower’s ability to pay, legislation impacting the banking industry and economic conditions specific to our service area. Because the calculation of the allowance for loan losses relies on estimates and judgments relating to inherently uncertain events, results may differ from our estimates.
The allowance for loan losses is also discussed as part of "Results of Operations" and in Note 1 to the consolidated financial statements.
Liquidity and Capital Resources
Our total assets at December 31, 2007 were $149.5 million and net loans were $119.9 million, while at December 31, 2006, total assets were $166.0 million and net loans were $ 131.0 million. Deposits totaled $123.7 million at December 31, 2007 and $142.3 million at December 31, 2006. The Company’s primary source of cash during the period ended December 31, 2007, was net proceeds from the issuance of preferred stock of $4.9 million. Cash was used primarily to fund the net decrease in deposits of $18.6 million and to purchase securities for $4.9 million. In 2006, the primary source of cash was deposit inflows of $4.9 million. In 2006, cash was used primarily to increase investments in Federal Funds sold by $7.2 million. At December 31, 2007, we had no outstanding commitments to originate loans, commitments to borrowers for available lines of credit totaled $26.1 million and we had time deposits of $68.9 million maturing in the next twelve months. At December 31, 2006, we had no outstanding commitments to originate loans. Commitments to borrowers for available lines of credit totaled $29.0 million and time deposits totaled $67.3 million maturing in the next twelve months. We expect to fund our commitments from the sources described above and could adjust the interest-rates paid on deposits if necessary to attract or retain time deposit accounts.
Regulation and Legislation
As a state-chartered commercial bank and registered bank holding company, we are subject to extensive regulation by the Florida Department of Financial Services ("Florida DFS") and the Federal Reserve Board of Governors (“FRB”). We file reports with the Florida DFS and the FRB concerning our activities and financial condition, in addition to obtaining regulatory approvals prior to entering into certain transactions such as mergers with or acquisitions of other financial institutions. Periodic examinations are performed by the Florida DFS and the FRB to monitor our compliance with the various regulatory requirements. As described in “Description of Business.” The Bank currently is party to a written agreement with the Federal Reserve Bank and the Florida Office of Financial Regulation.
Credit Risk
Our primary business is making commercial, business, consumer, and real estate loans. That activity entails potential loan losses, the magnitudes of which depend on a variety of economic factors affecting borrowers which are beyond our control. While we have instituted underwriting guidelines and credit review procedures to protect the Company from avoidable credit losses, some losses will inevitably occur. At December 31, 2007, the Company had $12.2 million in non-accrual loans and no loans which were over 90 days past due and still accruing interest. At December 31, 2006, the Company had $1.3 million in non-accrual loans and no loans which were over 90 days past due and still accruing interest. During the year ended December 31, 2007 the Company charged off loan balances of $6.4 million. During the year ended December 31, 2006, we had no charge-offs of loan balances.
We evaluate the allowance for loan losses on a regular basis. It is based upon our periodic review of the collectibility of the loans in light of historical experience, the nature and volume of the loan portfolio, adverse situations that may affect the borrower’s ability to repay, estimated value of any underlying collateral and prevailing economic conditions. We base the allowance for loan losses on a grading system.
The Company grants the majority of its loans to borrowers throughout Collier County, Florida. Although the Company has a diversified loan portfolio, a significant portion of its borrowers' ability to honor their contracts is dependent upon the economy in Florida. The Company does not have significant concentrations to any one industry or customer. The Company does have 11 loans with original terms of one year, aggregating $5.7 million at December 31, 2007, the primary source of repayment is the sale of the related collateral or the conversion of the existing debt into debt at another financial institution. The majority of these loans are located in Duval, Hillsborough and Pinellas Counties. With the uncertain real estate market in Florida, obtaining refinancing or sale of the collateral may be difficult or impossible. Management is closely monitoring these loans and believes the loan loss allowance at December 31, 2007 is adequate.
Summary of Loan Loss Experience
An analysis of the Bank’s allowance for loan losses is furnished in the following table ($ in thousands);
| For the period ending December 31, | | 2007 | | | 2006 | |
| | | | | | | |
| Total loans outstanding at the end of the period: | | $ | 123,587 | | | $ | 132,960 | |
| Allowance at beginning of period: | | $ | 2,047 | | | $ | 1,699 | |
| Loans charged-off during the period: | | | | | | | | |
| Loans secured by real estate | | | (6,366 | ) | | | 0 | |
| Recoveries of loans previously charged off: | | | 3 | | | | 0 | |
| Provision charged to operations: | | | 8,110 | | | | 348 | |
| Allowance at end of period: | | $ | 3,794 | | | $ | 2,047 | |
| Average loans outstanding during the period: | | $ | 131,524 | | | $ | 132,185 | |
| Ratio of net charge-offs to average loans outstanding: | | | 4.84 | % | | | N/A | |
| Allowance as a percentage of total loans: | | | 3.07 | % | | | 1.54 | % |
| Allowance as a percentage of nonperforming and non accrual loans: | | | 33.9 | % | | | 163.2 | % |
At December 31, 2007 and 2006 the allowance was allocated as follows ($ in thousands):
| | | Amount | % of Loans in Category to Total Loans | | | Amount | % of Loans in Category to Total Loans | |
| | | 2007 | | | 2006 | |
| Commercial real estate | | $ | 1,414 | | | | 25.8 | % | | $ | 476 | | | | 18.3 | % |
| Commercial | | | 1,324 | | | | 33.0 | | | | 529 | | | | 32.5 | |
| Residential real estate | | | 797 | | | | 19.8 | | | | 523 | | | | 24.6 | |
| Consumer | | | 13 | | | | 0.9 | | | | 24 | | | | 1.5 | |
| Home equity loans and lines of credit | | | 246 | | | | 20.5 | | | | 495 | | | | 23.1 | |
| Total | | $ | 3,794 | | | | 100.0 | % | | $ | 2,047 | | | | 100.0 | % |
Investment Activity
Investment activities serve to enhance overall yield on earning assets while supporting interest rate sensitivity and liquidity positions. Securities may be classified as either trading, held-to-maturity or available-for-sale. Trading securities are held principally for resale and recorded at their fair values. Unrealized gains and losses on trading securities are included immediately in operations. Held-to-maturity securities are those which the Company has the positive intent and ability to hold to maturity and are reported at amortized cost. Available-for-sale securities consist of securities not classified as trading securities or as held-to-maturity securities.
The securities have been classified according to management’s intent. Following are summaries of the securities (in thousands):
| | | Amortized | | | Fair | |
| | | Cost | | | Value | |
| Securities Available for Sale: | | | | | | |
| At December 31, 2007- | | | | | | |
| U.S. Government and Federal Agencies | | $ | 1,000 | | | | 1,009 | |
| | | | | | | | | |
| Securities Held to Maturity: | | | | | | | | |
| At December 31, 2007: | | | | | | | | |
| U.S. Government and Federal Agencies | | | 2,330 | | | | 2,353 | |
| Mortgage-backed securities of U.S government agencies | | | 3,231 | | | | 3,253 | |
| | | | | | | | | |
| | | $ | 5,561 | | | | 5,606 | |
| At December 31, 2006: | | | | | | | | |
| U.S. Government and Federal Agencies | | | 2,330 | | | | 2,323 | |
| Mortgage-backed securities of U.S government agencies | | | - | | | | - | |
| | | | | | | | | |
| | | $ | 2,330 | | | $ | 2,323 | |
The following table indicates the respective maturity and weighted-average yield of the securities held at December 31, 2007 (dollars in thousands):
| | | After One Year to Five Years | | | After Five Years | | | Total | |
| | | Carrying Value | | | Average Yield | | | Carrying Value | | | Average Yield | | | Carrying Value | | | Average Yield | |
| | | | | | | | | | | | | | | | | | | |
Securities available for sale: | | | | | | | | | | | | | | | | | | |
| | | | | | | | | | | | | | | | | | | |
| U.S. Government agency | | $ | 1,000 | | | | 5.20 | % | | | - | | | | - | | | $ | 1,000 | | | | 5.20 | % |
| | | | | | | | | | | | | | | | | | | | | | | | | |
Securities held to maturity: | | | | | | | | | | | | | | | | | | | | | | | | |
| | | | | | | | | | | | | | | | | | | | | | | | | |
| U.S. Government agency | | | 2,330 | | | | 5.45 | % | | | - | | | | - | | | | 2,330 | | | | 5.45 | % |
| | | | | | | | | | | | | | | | | | | | | | | | | |
| Mortgage-backed and related instruments | | | - | | | | - | | | | 3,231 | | | | 5.37 | % | | | 3,231 | | | | 5.37 | % |
| | | | | | | | | | | | | | | | | | | | | | | | | |
| Total | | $ | 3,330 | | | | 5.37 | % | | $ | 3,231 | | | | 5.37 | % | | $ | 6,561 | | | | 5.37 | % |
Loan Portfolio Composition
Commercial loans comprise the largest group of loans in our portfolio amounting to $40.8 million or 33.0% of the total loan portfolio at December 31, 2007. At December 31, 2006, commercial loans amounted to $43.2 million, or 32.5% of the total loan portfolio. At December 31, 2007, home equity loans and lines of credit were $25.3 million, loans secured by commercial real estate were $31.9 million, residential real estate loans amounted to $24.5 million and consumer loans totaled $1.1 million. At December 31, 2006, home equity loans and lines of credit were $30.7 million, loans secured by commercial real estate were $24.3 million, residential real estate loans amounted to $32.8 million and consumer loans totaled $2.0 million.
The following table sets forth the composition of the loan portfolio:
| At December 31, 2007 ($ in thousands) | | Amount | | | % of Total | |
| | | | | | | |
| Commercial real estate | | $ | 31,925 | | | | 25.8 | % |
| Commercial | | | 40,778 | | | | 33.0 | |
| Residential real estate | | | 24,503 | | | | 19.8 | |
| Consumer | | | 1,107 | | | | 0.9 | |
| Home equity loans and lines of credit | | | 25,274 | | | | 20.5 | |
| Total loans | | | 123,587 | | | | 100.0 | % |
| Add (subtract): | | | | | | | | |
| Deferred loan costs, net | | | 83 | | | | | |
| Allowance for loan lossess | | | (3,794 | ) | | | | |
| Loans, net | | $ | 119,876 | | | | | |
| At December 31, 2006 ($ in thousands) | | Amount | | | % of Total | |
| | | | | | | |
| Commercial real estate | | $ | 24,311 | | | | 18.3 | % |
| Commercial | | | 43,152 | | | | 32.5 | |
| Residential real estate | | | 32,772 | | | | 24.6 | |
| Consumer | | | 2,038 | | | | 1.5 | |
| Home equity loans and lines of credit | | | 30,687 | | | | 23.1 | |
| Total loans | | | 132,960 | | | | 100.0 | % |
| Add (subtract): | | | | | | | | |
| Deferred loan costs, net | | | 75 | | | | | |
| Allowance for loan lossess | | | (2,047 | ) | | | | |
| Loans, net | | $ | 130,988 | | | | | |
The following table sets forth the maturities of loans outstanding as of December 31, 2007 (in thousands):
| | | Due in 1 Year or Less | | | Due After 1 Year but Before 5 Years | | | Due After 5 Years but before 10 Years | | | Total | |
| Commercial real estate | | $ | 11,495 | | | $ | 15,431 | | | $ | 4,999 | | | $ | 31,925 | |
| Commercial | | | 13,199 | | | | 21,609 | | | | 5,970 | | | | 40,778 | |
| Residential real estate | | | 734 | | | | 14,747 | | | | 9,022 | | | | 24,503 | |
| Consumer | | | 40 | | | | 666 | | | | 401 | | | | 1,107 | |
| Home equity loans and lines of credit | | | - | | | | 154 | | | | 25,120 | | | | 25,274 | |
| Total | | $ | 25,468 | | | $ | 52,607 | | | $ | 45,512 | | | $ | 123,587 | |
Scheduled contractual principal payments of loans do not reflect the actual lives of loans. The average life of a loan is substantially less than its contractual term because of prepayments. The average life of a loan tends to increase; however, when the current market rates for that particular type of loan are substantially higher than rates on an existing loan and, conversely, tend to decrease when rates on an existing loan are substantially higher than the current market rate
for that particular type of loan. Prepayment penalties attempt to lessen the income impact of borrows prepaying their loans by imposing fees for any early prepayment of the loans.
As of December 31, 2007, and 2006, no concentrations of loans exceeding 10% of total loans existed which were not disclosed as a separate category of loans.
Sensitivity of Loans to Changes in Interest Rates.
The following table as of December 31, 2007, sets forth the dollar amounts of loans due after one year which had predetermined interest rates and loans due after one year which had floating or adjustable interest rates (dollars in thousands).
| | | Fixed | | | Adjustable | | | Total | |
| Commercial real estate | | $ | 5,690 | | | $ | 14,740 | | | $ | 20,430 | |
| Commercial | | | 16,246 | | | | 11,333 | | | | 27,579 | |
| Residential real estate | | | 1,112 | | | | 22,657 | | | | 23,769 | |
| Consumer | | | 91 | | | | 976 | | | | 1,067 | |
| Home equity loans and lines of credit | | | - | | �� | | 25,274 | | | | 25,274 | |
| Total | | $ | 23,139 | | | $ | 74,980 | | | $ | 98,119 | |
Non-performing Loans
Non-performing loans include non-accrual loans and restructured loans. Non-accrual loans represent loans on which interest accruals have been discontinued. It is our policy to discontinue interest accruals when principal or interest is due and has remained unpaid for 90 days or more unless the loan is both well secured and in the process of collection. When a loan is placed in non-accrual status, all unpaid interest is reversed. Payments on non-accrual loans are generally applied to either principal or interest or both, depending on management’s evaluation of collectibility. Non-accrual loans may not be restored to accrual status until all delinquent principal and interest has been paid or the loan becomes both well secured and in the process of collection.
In 2007, non-accrual loans increased by $10.9 million. $5.7 million of the current $12.2 million total represents the outstanding balances of the loan pools discussed in detail later in this report. Two related loans secured by marinas represent $3.2 million of the increase and $2.3 million non-accrual loans are the result of non-payments by borrowers on loans made for residential real estate purposes.
Non-performing loans are closely monitored on an ongoing basis as part of our loan review and work-out process. The potential risk of loss on these loans is evaluated by comparing the loan balance to the fair value of any underlying collateral or the present value of projected future cash flows. Losses are recognized where appropriate.
The following is a summary of non-performing loans (dollars in thousands):
| At December 31, | | 2007 | | | 2006 | |
| Non-accrual loans | | $ | 12,200 | | | $ | 1,300 | |
| Restructured loans | | | - | | | | - | |
| Total | | $ | 12,200 | | | $ | 1,300 | |
| Non-performing loans as a percentage of total loans | | | 9.87 | % | | | .98 | % |
All loans where information exists about possible credit problems that would cause us to have serious doubts about the borrower’s ability to comply with the current terms of the loan have been reflected within the table summarizing non-performing loans.
The following is a table showing the amounts of contractual interest income and actual interest income recorded on non-accrual and restructured loans (in thousands):
| At December 31, | | 2007 | | | 2006 | |
| Gross interest income that would have been recorded if the loans had been current and in accordance with their original terms | | $ | 1,679 | | | $ | 133 | |
| Interest income recorded during the year | | | 780 | | | | 33 | |
At December 31, 2007 and 2006 the Company had no loans which were over 90 days past due and still accruing interest.
As of December 31, 2007, the Bank had $5.7 million in outstanding loans that were acquired in loan pool purchases. These short term loans were to borrowers with high credit scores and were used to finance the borrowers’ acquisition and renovation of residential real estate primarily in Duval and Hillsborough Counties, Florida. Due to liquidity and pricing weaknesses in those markets, as well as the financial deterioration of the loans’ servicer, we have concluded that the likelihood of full repayment of those loans is unlikely. In 2007, the Bank charged-off $4.7 million related to these loans. The Bank is actively engaged in attempting to mitigate additional losses and is evaluating its options, including but not limited to, selling the loan pools or accepting assignment of individual loans and pursuing refinancing or foreclosures. As of February 29, 2008, the outstanding balance of these loans was $3.8 million as the result of repayments and sales of individual loans
Off-Balance Sheet Arrangements
The Company is a party to financial instruments with off-balance-sheet risk in the normal course of business to meet the financing needs of its customers. These financial instruments include commitments to extend credit, unfunded construction loans, unused lines of credit, and standby letters of credit. These instruments involve, to varying degrees, elements of credit and interest-rate risk in excess of the amounts recognized in the consolidated balance sheet. The contract or notional amounts of these instruments reflect the extent the Company’s involvement in particular classes of financial instruments.
The Company’s exposure to credit loss in the event of nonperformance by the other party to the financial instrument for commitments to extend credit, unfunded construction loans, unused lines of credit and standby letters of credit is represented by the contractual amount of those instruments. To control the credit risk associated with entering into commitments and issuing letters of credit, the Company uses the same credit quality, collateral policies, and monitoring controls in making commitments and letters of credit as it does with its lending activities.
Commitments to extend credit are agreements to lend to a customer as long as there is no violation of any condition established in the contract. Commitments generally have fixed expiration dates or other termination clauses and may require the payment of a fee. Since some of the commitments are expected to expire without being drawn upon, the total committed amounts do not necessarily represent future cash requirements. The Company evaluates each customer’s credit worthiness on a case-by-case basis. The amount of collateral obtained, if it is deemed necessary by the Company upon extension of credit, is based on management’s credit evaluation of the counter party.
Standby letters of credit are conditional commitments issued by the Company to guarantee the performance of a customer to a third party and to support public and private borrowing arrangements. Essentially all letters of credit issued have expiration dates within one year. The credit risk involved in issuing letters of credit is essentially the same as that involved in extending loan facilities to customers. The Company generally holds collateral supporting those commitments.
Unused lines of credit, unfunded construction loans and commitments to extend credit typically result in loans with a market interest rate.
The following table is a summary of the amounts of the financial instruments, with off-balance sheet risk, at December 31, 2007:
| Off-Balance Sheet Arrangements: | | Contract Amount (in thousands) | |
| | | | |
| Commitments to extend credit | | $ | - | |
| Unfunded construction loans | | | 2,309 | |
| Unused lines of credit | | | 26,051 | |
| Standby letters of credit | | | - | |
Liquidity
Liquidity represents the ability to provide steady sources of funds for loan commitments and investment activities, as well as to maintain sufficient funds to cover deposit withdrawals and payment of debt and operating obligations. The Bank’s liquidity position was initially established through the Holding Company’s purchase of $ 6.4 million of the common stock of the Bank. In 2007, the Holding Company contributed an additional $4.5 million to the Bank’s capital. In 2006, the Holding Company contributed an additional $1.3 million to the Bank’s capital. As the Bank grows, liquidity needs can be met either by converting assets to cash or by attracting new deposits. Bank deposits were $123.7 million at December 31, 2007 and $ 142.3 million at December 31, 2006. Below are the pertinent liquidity balances and ratios at December 31, 2007 and 2006 ($ in
thousands).
| At December 31, | | 2007 | | | 2006 | |
| Cash and cash equivalents | | $ | 11,174 | | | $ | 26,905 | |
| Time deposits over $100,000 to total deposits ratio | | | 27.5 | % | | | 21.1 | % |
| Loan to deposit ratio | | | 99.9 | % | | | 93.4 | % |
| Brokered deposits | | $ | 19,728 | | | $ | 36,499 | |
Cash and cash equivalents are the primary source of liquidity. At December 31, 2007, cash and cash equivalents amounted to $11.2 million, representing 7.5% of total assets. At December 31, 2006, cash and cash equivalents amounted to $26.9 million, representing 16.2 % of total assets. At December 31, 2007 and December 31, 2006, large denomination certificates accounted for 27.5% and 21.1%, respectively, of total deposits. Large denomination time deposits generally are more volatile than other deposits. As a result, management continually monitors the competitiveness of the rates it pays on its large denomination time deposits and periodically adjusts the Bank’s rates in accordance with market demands. Significant withdrawals of large denomination time deposits may have a material adverse effect on the Bank’s liquidity. Management believes that since a majority of the above certificates were obtained from bank customers residing outside of Collier County, Florida, the volatility of such deposits is higher than if such deposits were obtained from depositors residing inside of Collier County, as outside depositors are generally more likely to be interest rate sensitive. Brokered deposits are deposit instruments, such as certificates of deposit, deposit notes, bank investment contracts and certain municipal investment contracts that are issued through brokers and dealers who then offer and/or sell these deposit instruments to one or more investors. As of December 31, 2007 and 2006, the Bank had $19.7 million and $36.5 million, respectively, in brokered deposits in its portfolio. Management knows of no trends, demands, commitments, events or uncertainties that should result in or are reasonably likely to result in the Bank’s liquidity increasing or decreasing in any material way in the foreseeable future.
Regulatory Capital Requirements
The Bank is subject to various regulatory capital requirements administered by the federal and state banking agencies. Failure to meet minimum capital requirements can initiate certain mandatory and possibly additional discretionary actions by regulators that, if undertaken, could have a direct material effect on the Company’s and the Bank's financial statements. Under capital adequacy guidelines and the regulatory framework for prompt corrective actions, the Bank must meet specific capital guidelines that involve quantitative measures of their assets, liabilities and certain off-balance sheet items as calculated under regulatory accounting practices. The capital amounts and classification are also subject to qualitative judgments by the regulators about components, risk weightings, and other factors.
Quantitative measures established by regulation to ensure capital adequacy require the Bank to maintain minimum amounts and ratios of total and Tier 1 capital (as defined in the regulations) to risk-weighted assets (as defined) and of Tier 1 capital (as defined) to average assets (as defined). Management believes, as of December 31, 2007, that the Bank met all capital adequacy requirements to which they are subject. As of December 31, 2007, the most recent notification from the regulatory authorities categorized the Bank as well capitalized. An institution must maintain certain minimum total risk-based, Tier 1 risk-based and Tier 1 leverage ratios. See Note 11 to the Consolidated Financial Statements for the actual capital amounts and ratios.
Market Risk
Market risk is the risk of loss from adverse changes in market prices and rates. We do not engage in trading or hedging activities and do not invest in interest-rate derivatives or enter into interest-rate swaps. Our market risk arises primarily from interest-rate risk inherent in our lending and deposit taking activities. To that end, we actively monitor and manage our interest-rate risk exposure. The measurement of market risk associated with financial instruments is meaningful only when all related and offsetting on- and off-balance-sheet transactions are aggregated, and the resulting net positions are
identified. Disclosures about the fair value of financial instruments, which reflect changes in market prices and rates, can be found in Note 7 of Notes to Consolidated Financial Statements.
Our primary objective in managing interest-rate risk is to minimize the adverse impact of changes in interest rates on our net interest income and capital, while adjusting our asset-liability structure to obtain the maximum yield-cost spread on that structure. We rely primarily on our asset-liability structure to control interest-rate risk. See the section below titled Asset-Liability Structure. However, a sudden and substantial increase in interest rates may adversely impact our earnings, to the extent that the interest rates borne by assets and liabilities do not change at the same speed, to the same extent, or on the same basis.
We use modeling techniques to simulate changes in net interest income under various rate scenarios. Important elements of these techniques include the mix of floating versus fixed-rate assets and liabilities, and the scheduled, as well as expected, repricing and maturing volumes and rates of the existing balance sheet.
Asset - Liability Structure
As part of our asset and liability structure we emphasize establishing and implementing internal asset-liability decision processes, as well as communications and control procedures to aid in managing our operations. We believe these processes and procedures provide us with better capital planning, asset mix and volume controls, loan-pricing guidelines, and deposit interest-rate guidelines which should result in tighter controls and less exposure to interest-rate risk.
The matching of assets and liabilities may be analyzed by examining the extent to which such assets and liabilities are “interest-rate sensitive” and by monitoring an institution's interest rate sensitivity “gap.” An asset or liability is said to be interest-rate sensitive within a specific time period if it will mature or reprice within that time period. The interest-rate sensitivity gap is defined as the difference between interest-earning assets and interest-bearing liabilities maturing or repricing within a given time period. The gap ratio is computed as rate sensitive assets/rate sensitive liabilities. A gap ratio of 1.0 represents perfect matching. A gap is considered positive when the amount of interest-rate sensitive assets exceeds interest-rate sensitive liabilities. A gap is considered negative when the amount of interest-rate sensitive liabilities exceeds interest-rate sensitive assets. During a period of rising interest rates, a negative gap would adversely affect net interest income, while a positive gap would result in an increase in net interest income. During a period of falling interest rates, a negative gap would result in an increase in net interest income, while a positive gap would adversely affect net interest income.
In order to minimize the potential for adverse effects of material and prolonged increases in interest rates on the results of operations, we monitor asset and liability management policies to better match the maturities and repricing terms of our interest-earning assets and interest-bearing liabilities. Such policies have consisted primarily of: (i) emphasizing the origination of adjustable-rate loans; (ii) building a stable core deposit base; and (iii) maintaining a significant portion of liquid assets (cash and short-term securities).
The following table sets forth certain information relating to our interest-earning assets and interest-bearing liabilities at December 31, 2007 that are estimated to mature or are scheduled to reprice within the period shown ($ in thousands):
| | | Three Months | | | More Than Three Months to One Year | | | More Than One Year To Five Years | | | More Than Five Years to Fifteen Years | | | Over Fifteen Years | | | Total | |
| Loans (1): | | | | | | | | | | | | | | | | | | |
| Variable rate | | $ | 39,043 | | | | 5,608 | | | | 14,465 | | | | - | | | | - | | | | 59,116 | |
| Fixed rate | | | 10,588 | | | | 5,524 | | | | 36,790 | | | | 11,569 | | | | - | | | | 64,471 | |
| Total loans | | | 49,631 | | | | 11,132 | | | | 51,255 | | | | 11,569 | | | | - | | | | 123,587 | |
| Federal funds sold | | | 8,695 | | | | - | | | | - | | | | - | | | | - | | | | 8,695 | |
| Investment securities | | | - | | | | - | | | | 6,570 | | | | - | | | | - | | | | 6,570 | |
| Federal Reserve and FHLB stock | | | - | | | | - | | | | - | | | | 761 | | | | - | | | | 761 | |
| Total rate-sensitive assets | | | 58,326 | | | | 11,132 | | | | 57,825 | | | | 12,330 | | | | - | | | | 139,613 | |
| Deposit accounts: | | | | | | | | | | | | | | | | | | | | | | | | |
| Savings, NOW and money market deposits (2) | | | 38,342 | | | | - | | | | - | | | | - | | | | - | | | | 38,342 | |
| Time deposits (2) | | | 16,637 | | | | 52,265 | | | | 12,401 | | | | - | | | | - | | | | 81,303 | |
| Repurchase Agreements | | | 1,232 | | | | - | | | | - | | | | - | | | | - | | | | 1,232 | |
| | | | | | | | | | | | | | | | | | | | | | | | | |
| Total rate-sensitive liabilities | | | 56,211 | | | | 52,265 | | | | 12,401 | | | | - | | | | - | | | | 120,877 | |
| GAP repricing differences | | $ | 2,115 | | | | (41,133 | ) | | | 45,424 | | | | 12,330 | | | | - | | | | 18,736 | |
| Cumulative GAP | | $ | 2,115 | | | | (39,018 | ) | | | 6,406 | | | | 18,736 | | | | 18.736 | | | | 18,736 | |
| Cumulative GAP/total assets | | | 1.4 | % | | | (26.1 | ) | | | 4.3 | % | | | 12.5 | % | | | 12.5 | % | | | 12.5 | % |
| (1) | In preparing the table above, adjustable-rate loans are included in the period in which the interest rates are next scheduled to adjust rather than in the period in which the loans mature. Fixed-rate loans are scheduled, including repayment, according to their maturities. |
| (2) | Money-market, NOW, and savings deposits are regarded as ready accessible withdrawable accounts. Time deposits are scheduled through the maturity dates. |
The following table reflects the contractual principal repayments by period of the loan portfolio at December 31, 2007 (in thousands):
Years Ending December 31, | | | Commercial Real Estate | | | Commercial | | | Residential Real Estate | | | Consumer | | | Home Equity and Lines of Credit | | | Total | |
| 2008 | | | $ | 11,710 | | | $ | 13,711 | | | $ | 1,041 | | | $ | 73 | | | $ | 21 | | | $ | 26,556 | |
| 2009 - 2012 | | | | 15,253 | | | | 21,279 | | | | 14,734 | | | | 716 | | | | 85 | | | | 52,067 | |
| 2013 and beyond | | | | 4,962 | | | | 5,788 | | | | 8,728 | | | | 318 | | | | 25,168 | | | | 44,964 | |
| | | | | | | | | | | | | | | | | | | | | | | | | | |
| Total | | | $ | 31,925 | | | $ | 40,778 | | | $ | 24,503 | | | $ | 1,107 | | | $ | 25,274 | | | $ | 123,587 | |
Of the $97.0 million of loans due after 2008, 23.6% of such loans have fixed-interest rates and 76.4% have adjustable interest rates.
Scheduled contractual principal repayments of loans do not reflect the actual life of such assets. The average life of loans is substantially less than their average contractual terms due to prepayments. In addition, due-on-sale clauses on loans generally give us the right to declare a conventional loan immediately due and payable in the event, among other things, that the borrower sells the real property subject to the mortgage and the loan is not repaid. The average life of mortgage loans tends to increase, however, when current mortgage loan rates are substantially higher than rates on existing mortgage loans and, conversely, decrease when rates on existing mortgages are substantially higher than current mortgage loan rates.
Deposit and Other Source of Funds
General - In addition to deposits, the sources of funds available for lending and other business purposes include loan repayments. Loan repayments are a relatively stable source of funds, while deposit inflows and outflows are influenced significantly by general interest rates and money-market conditions. Borrowings may be used on a short-term basis to compensate for reductions in other sources, such as deposits at less than projected levels.
Deposits - Deposits are attracted principally from our primary geographic market area in Marco Island , Florida. We offer a variety of deposit instruments including demand deposit accounts, NOW accounts, money- market accounts, regular savings accounts, term certificate accounts and retirement savings plans (such as IRA accounts). Certificate of deposit rates are set to encourage longer maturities as cost and market conditions will allow. Deposit account terms vary, with the primary differences being the minimum balance required, the time period the funds must remain on deposit and the interest rate. We set the deposit interest rates weekly based on a review of deposit flows for the previous week, a survey of rates among competitors and other financial institutions in Florida.
We have emphasized commercial banking relationships in an effort to increase demand deposits as a percentage of total deposits.
The following table shows the distribution of, and certain other information relating to, our deposit accounts by type (dollars in thousands):
| At December 31, | | 2007 | | | 2006 | |
| | | Amount | | | % of Deposits | | | Amount | | | % of Deposits | |
| | | | | | | | | | | | | |
| Non-interest-bearing deposits | | $ | 4,068 | | | | 3.3 | % | | $ | 4,002 | | | | 2.8 | % |
| Savings | | | 10,501 | | | | 8.5 | | | | 17,133 | | | | 12.0 | |
| NOW and money market deposits | | | 27,841 | | | | 22.5 | | | | 31,461 | | | | 22.1 | |
| Subtotal | | | 42,410 | | | | 34.3 | | | | 52,596 | | | | 36.9 | |
| Certificates of deposits: | | | | | | | | | | | | | | | | |
| 0.00% - 2.99% | | | 3 | | | | .0 | | | | 2 | | | | .1 | |
| 3.00% - 3.99% | | | 3,892 | | | | 3.2 | | | | 5,937 | | | | 4.2 | |
| 4.00% - 4.99% | | | 28,279 | | | | 22.8 | | | | 35,024 | | | | 24.6 | |
| 5.00% - 5.99% | | | 49,088 | | | | 39.7 | | | | 48,734 | | | | 34.2 | |
| 6.00% - 6.49% | | | 41 | | | | .0 | | | | - | | | | - | |
| Total certificates of deposit | | | 81,303 | | | | 65.7 | | | | 89,697 | | | | 63.1 | |
| Total deposits | | $ | 123,713 | | | | 100.0 | % | | $ | 142,293 | | | | 100.0 | % |
Jumbo certificates accounted for $34.1 million of our deposits at December 31, 2007 and $30.0 million of our deposits at December 31, 2006. The Company held $19.7 million in brokered deposits at December 31, 2007 and $36.5 million at December 31, 2006.
Maturity terms, service fees, and withdrawal penalties are established by the Company on a periodic basis. The determination of rates and terms is predicated on funds acquisition and liquidity requirements, rates paid by competitors, growth goals and federal regulations.
Average Deposit Balance and Rates
The following table sets forth the average balance and weighted average rates for the period indicated (dollars in thousands).
| At December 31, | | 2007 | | | 2006 | |
| | | Average Balance | | | Average Rate | | | % of Deposits | | | Average Balance | | | Average Rate | | | % of Deposit | |
| Noninterest bearing demand deposits | | $ | 4,212 | | | | - | % | | | 3.0 | % | | $ | 5,440 | | | | - | % | | | 3.9 | % |
| NOW accounts | | | 18,121 | | | | 1.15 | | | | 12.8 | | | | 17,140 | | | | 1.00 | | | | 12.2 | |
| Money market accounts | | | 11,839 | | | | 4.09 | | | | 8.4 | | | | 8,663 | | | | 3.02 | | | | 6.1 | |
| Regular savings | | | 13,904 | | | | 2.45 | | | | 9.9 | | | | 25,851 | | | | 2.40 | | | | 18.3 | |
| Time deposits | | | 92,983 | | | | 5.10 | | | | 65.9 | | | | 83,770 | | | | 4.67 | | | | 59.5 | |
| Total average deposits | | $ | 141,059 | | | | 4.10 | % | | | 100.0 | % | | $ | 140,864 | | | | 3.53 | % | | | 100.0 | % |
Jumbo certificates ($100,000 and over) mature as follows (in thousands):
| At December 31, 2007 | | | |
| | | | |
| Due in three months or less | | $ | 7,928 | |
| Due in more than three to twelve months | | | 20,788 | |
| Due in more than one year to three years | | | 4,205 | |
| Due in more than three years | | | 1,155 | |
| Total | | $ | 34,076 | |
Results of Operations
Our operating results depend primarily on our net interest income, which is the difference between interest income on interest-earning assets and interest expense on interest-bearing liabilities, consisting primarily of deposits. Net interest income is determined by the difference between yields earned on interest-earning assets and rates paid on interest-bearing liabilities (“interest-rate spread”) and the relative amounts of interest-earning assets and interest-bearing liabilities. Our interest-rate spread is affected by regulatory, economic, and competitive factors that influence interest rates, loan demand, and deposit flows. In addition, our net earnings are also affected by the level of nonperforming loans and foreclosed real estate, as well as the level of noninterest income, and noninterest expenses, such as salaries and employee benefits, occupancy and equipment costs and income taxes.
The following table sets forth, for the periods indicated, information regarding (i) the total dollar amount of interest and dividend income from interest-earning assets and the resultant average yield; (ii) the total dollar amount of interest expense on interest-bearing liabilities and the resultant average costs; (iii) net interest/dividend income; (iv) interest rate spread; (v) net interest margin (in thousands).
| For the Year Ended December 31, | | | | | 2007 | | | | | | | | | 2006 | | | | |
| | | Average Balance | | | Interest and Dividends | | | Average Yield/ Cost | | | Average Balance | | | Interest and Dividends | | | Average Yield/ Cost | |
| Interest-earning assets: | | | | | | | | | | | | | | | | | | |
| Loans | | $ | 131,524 | | | | 9,843 | | | | 7.48 | % | | $ | 132,185 | | | | 10,937 | | | | 8.27 | % |
| Investment Securities | | | 5,688 | | | | 300 | | | | 5.27 | | | | 804 | | | | 43 | | | | 5.35 | |
| Other interest-earning assets (1) | | | 21,054 | | | | 1,073 | | | | 5.10 | | | | 24,201 | | | | 1,220 | | | | 5.04 | |
| | | | | | | | | | | | | | | | | | | | | | | | | |
| Total interest-earning assets | | | 158,266 | | | | 11,216 | | | | 7.09 | | | | 157,190 | | | | 12,200 | | | | 7.76 | |
| | | | | | | | | | | | | | | | | | | | | | | | | |
| Noninterest-earning assets | | | 6,988 | | | | | | | | | | | | 6,045 | | | | | | | | | |
| | | | | | | | | | | | | | | | | | | | | | | | | |
| Total assets | | $ | 165,254 | | | | | | | | | | | $ | 163,235 | | | | | | | | | |
| | | | | | | | | | | | | | | | | | | | | | | | | |
| Interest-bearing liabilities: | | | | | | | | | | | | | | | | | | | | | | | | |
| Savings | | | 13,904 | | | | 340 | | | | 2.45 | | | | 25,851 | | | | 620 | | | | 2.40 | |
| Money market and NOW deposits | | | 29,960 | | | | 693 | | | | 2.31 | | | | 25,803 | | | | 433 | | | | 1.68 | |
| Time deposits | | | 92,983 | | | | 4,744 | | | | 5.10 | | | | 83,770 | | | | 3,914 | | | | 4.67 | |
| | | | | | | | | | | | | | | | | | | | | | | | | |
| Total interest-bearing deposits | | | 136,847 | | | | 5,777 | | | | 4.22 | | | | 135,424 | | | | 4,967 | | | | 3.67 | |
| | | | | | | | | | | | | | | | | | | | | | | | | |
| Repurchase agreements | | | 298 | | | | 12 | | | | 4.03 | | | | - | | | | - | | | | - | |
| | | | | | | | | | | | | | | | | | | | | | | | | |
| Total interest-bearing liabilities | | | 137,145 | | | | 5,789 | | | | 4.22 | | | | - | | | | 4,967 | | | | - | |
| | | | | | | | | | | | | | | | | | | | | | | | | |
| Noninterest-bearing liabilities | | | 5,749 | | | | | | | | | | | | 7,157 | | | | | | | | | |
| Stockholders’ equity | | | 22,360 | | | | | | | | | | | | 20,654 | | | | | | | | | |
| | | | | | | | | | | | | | | | | | | | | | | | | |
| Total liabilities and stockholders’ equity | | $ | 165,254 | | | | | | | | | | | $ | 163,235 | | | | | | | | | |
| | | | | | | | | | | | | | | | | | | | | | | | | |
| Net interest/dividend income | | | | | | $ | 5,427 | | | | | | | | | | | $ | 7,233 | | | | | |
| Interest-rate spread (2) | | | | | | | | | | | 2.87 | % | | | | | | | | | | | 4.09 | % |
| | | | | | | | | | | | | | | | | | | | | | | | | |
| Net interest margin (3) | | | | | | | | | | | 3.43 | % | | | | | | | | | | | 4.60 | % |
| Ratio of average interest-earning assets to average interest-bearing liabilities | | | | | | | | | | | 1.15 | | | | | | | | | | | | 1.16 | |
________________________________
| (1) | Includes interest-bearing deposits, federal funds sold, Federal Reserve Bank stock and Federal Home Loan Bank stock. |
| (2) | Interest-rate spread represents the difference between the average yield on interest-earning assets and the average cost of interest-bearing liabilities. |
| (3) | Net interest margin is net interest income dividend by average interest-earning assets. |
Rate/Volume Analysis
The following table sets forth certain information regarding changes in interest income and interest expense for the periods indicated. For each category of interest-earning assets and interest-bearing liabilities, information is provided on changes attributable to: (1) changes in rate (change in rate multiplied by prior volume); (2) changes in volume (change in volume multiplied by prior rate); and (3) changes in rate-volume (change in rate multiplied by change in volume).
| | | Increase (Decrease) Due to | |
| | | | | | | | | | | | | |
| | | Rate | | | Volume | | | Rate/Volume | | | Total | |
| | | (In thousands) | |
| Year Ended December 31, 2007 vs. 2006: | | | | | | | | | | | | |
| | | | | | | | | | | | | |
| Interest-earning assets: | | | | | | | | | | | | |
| Loans | | $ | (1,044 | ) | | $ | (55 | ) | | $ | 5 | | | $ | (1,094 | ) |
| Investment securities | | | (1 | ) | | | 262 | | | | (4 | ) | | | 257 | |
| Other interest-earning assets | | | 15 | | | | (160 | ) | | | (2 | ) | | | (147 | ) |
| | | | | | | | | | | | | | | | | |
| Total | | | (1,030 | ) | | | 47 | | | | (1 | ) | | | (984 | ) |
| | | | | | | | | | | | | | | | | |
| Interest-bearing liabilities: | | | | | | | | | | | | | | | | |
| Deposits: | | | | | | | | | | | | | | | | |
| Savings, demand, money-market and NOW deposits | | | 164 | | | | (159 | ) | | | (25 | ) | | | (20 | ) |
| Time deposits | | | 360 | | | | 430 | | | | 40 | | | | 830 | |
| Repurchase agreements | | | - | | | | - | | | | 12 | | | | 12 | |
| Total | | | 524 | | | | 271 | | | | 27 | | | | 822 | |
| | | | | | | | | | | | | | | | | |
| Net change in net interest income | | $ | (1,554 | ) | | $ | (224 | ) | | $ | (28 | ) | | $ | (1,806 | ) |
Non-Interest Expense
Non-interest expense for the year ended December 31, 2007 was $6.5 million and $ 4.3 million at December 31, 2006. As a percent of total average assets, non-interest expense amounted to 3.9% at December 31, 2007 and 2.6% at December 31, 2006.
The components of non-interest expense for the periods indicated are set forth below (in thousands):
| | | 2007 | | | 2006 | |
| Salaries and benefits | | $ | 3,007 | | | $ | 2,472 | |
| Occupancy and equipment | | | 648 | | | | 530 | |
| Data processing | | | 251 | | | | 214 | |
| Advertising | | | 192 | | | | 164 | |
| Professional fees | | | 474 | | | | 253 | |
| Director Fees | | | 15 | | | | 77 | |
| Other Real Estate owned | | | 872 | | | | - | |
| General operating expenses | | | 994 | | | | 554 | |
| Total non-interest expense | | $ | 6,453 | | | $ | 4,264 | |
Comparison of the Years Ended December 31, 2007 and 2006
General. Net losses for the year ended December 31, 2007 were $5.1 million or a net loss of $1.61 per basic and diluted common share compared to net earnings of $1.9 million or $0.62 per basic and $0.58 per diluted common share for 2006. The Company’s net loss in 2007 was primarily due to the increase in the provision for loan loss of $7.8 million in 2007 as compared to 2006..
Interest Income. Interest income decreased to $11.2 million for the year ended December 31, 2007 from $12.2 million for the year ended December 31, 2006. Interest income decreased primarily due to lower yields in the portfolio as a result of higher levels of nonaccrual loans. Interest on other interest-earning assets decreased from $1.2 million for the year ended December 31, 2006 to $1.1 million for the year ended December 31, 2007 due to a decrease in the average balance in 2007.
Interest Expense. Interest expense on deposits increased to $5.8 million, for the year ended December 31, 2007 from $5.0 million in 2006. Interest expense increased due to an increase in the average balances in 2007 combined with an increase in the weighted average cost of deposits.
Provision for Loan Losses. The provision for loan losses is charged against earnings to bring the total allowance to a level deemed appropriate by management and is based upon historical experience, the volume and type of lending we conduct, industry standards, the amount of nonperforming loans, general economic conditions, particularly as they relate to our market areas, and other factors related to the collectibility of our loan portfolio. The provision for loan losses was $8.1 million for the year ended December 31, 2007 compared to $348,000 for 2006. This increase was primarily due to an increase in impaired loans in 2007 as compared to 2006. The downturn in the real estate market in Southwest Florida has prompted us to increase the allowance for loan losses in our loan portfolio. The allowance for loan losses is $3.8 million at December 31, 2007. While management believes its allowance for loan losses is adequate as of December 31, 2007, future adjustments to our allowance for loan losses may be necessary if economic conditions differ substantially from the assumptions used in making the determination.
Non-interest Income. Non-interest income increased from $453,000 for the year ended December 31, 2006 to $1.0 million for the year ended December 31, 2007. The increase was mainly due to an increase in loan brokerage fees from CLCC.
Non-interest Expense. Total non-interest expense increased to $6.5 million for the year ended December 31, 2007 from $4.3 million for 2006. Non-interest expense increased primarily due to an increase in other real estate owned expenses in addition to salaries, occupancy, other non-interest expense and professional fees.
Income Taxes. The Company recorded an income tax benefit of $3.0 million for the year-end December 31, 2007 (an effective rate of 37.2%) compared to an income tax provision of $1.2 million for the year ended December 31, 2006 (an effective rate of 39.7%).
Impact of Inflation and Changing Prices
The financial statements and related data presented herein have been prepared in accordance with accounting principles generally accepted in the United States of America, which requires the measurement of financial position and operating results in terms of historical dollars, without considering changes in the relative purchasing power of money over time due to inflation. Unlike most industrial companies, substantially all of our assets and liabilities are monetary in nature. As a result, interest rates have a more significant impact on the Bank's performance than the effects of general levels of inflation. Interest rates do not necessarily move in the same direction or in the same magnitude as the prices of goods and services, since such prices are affected by inflation to a larger extent than interest rates.
ITEM 8. | FINANCIAL STATEMENTS AND SUPPLEMENTARY DATA |
Certain information required by this item is included in Item 6 of Part II of this report under the heading “Selected Quarterly Financial Data” and is incorporated by reference. All other information required by this item is included in Item 15 of Part IV of this report and is incorporated into this item by reference.
| ITEM 9. | CHANGES IN AND DISAGREEMENTS WITH ACCOUNTANTS ON ACCOUNTING AND FINANCIAL DISCLOSURE |
Marco Community Bancorp, Inc. did not have any disagreements with accountants on accounting and financial disclosures during 2007 or 2006.
(a) Evaluation of Disclosure Controls and Procedures
We maintain controls and procedures designed to ensure that information required to be disclosed in the reports that MCBI files or submits under the Securities Exchange Act of 1934 is recorded, processed, summarized and reported within the time periods specified in the rules and forms of the Securities and Exchange Commission. Based upon management’s evaluation of those controls and procedures performed within the 90 days preceding the filing of this Report, our Chief Executive Officer and Chief Financial Officer concluded that, subject to the limitations noted below, MCBI’s disclosure controls and procedures (as defined in Rules 13a-15(e) under the Securities Exchange Act of 1934) are effective to ensure that the information required to be disclosed by the Company in the reports that it files or submits under the Securities Exchange Act of 1934 is recorded, processed, summarized and reported within the time periods specified in the U.S. Securities and Exchange Commission’s rules and forms.
(b) Management’s Report on Internal Control over Financial Reporting
Our management is responsible for establishing and maintaining adequate internal control over financial reporting, as such term is defined in Exchange Act Rule 13a-15(f). Such internal controls over financial reporting were designed to provide reasonable assurance regarding the reliability of financial reporting and the preparation of financial statements for external purposes in accordance with generally accepted accounting principles.
The Company’s management assessed the effectiveness of the Company’s internal control over financial reporting as of December 31, 2007. In making this assessment, the Company used the criteria set forth in Internal Control-Integrated Framework issued by the Committee of Sponsoring Organizations of the Treadway Commission (“COSO”). Based upon our evaluation under the framework in Internal Control-Integrated Framework, our management concluded that our internal control over financial reporting was effective as of December 31, 2007.
This annual report does not include an attestation report of the Company’s registered public accounting firm regarding internal control over financial reporting. Management’s report was not subject to attestation by the Company’s registered public accounting firm pursuant to temporary rules of the Securities and Exchange Commission that permit the Company to provide only management’s report in this annual report.
(c) Changes in Internal Controls
We have made no significant changes in its internal controls over financial reporting during the quarter ended December 31, 2007 that have materially affected or are reasonably likely to materially affect our internal control over financial reporting.
(d) Limitations on the Effectiveness of Controls
Our management, including our Chief Executive Officer and Chief Financial Officer, does not expect that our disclosure controls and internal controls will prevent all error and all fraud. A control system, no matter how well conceived and operated, can provide only reasonable, not absolute, assurance that the objectives of the control system are met. Further, the design of a control system must reflect the fact that there are resource constraints, and the benefits of controls must be considered relative to their costs. Because of the inherent limitations in all control systems, no evaluation of controls can provide absolute assurance that all control issues and instances of fraud, if any, within MCBI have been detected. These inherent limitations include the realities that judgments in decision-making can be faulty, and that breakdowns can occur because of simple error or mistake. Additionally, controls can be circumvented by the individual acts of some persons, by collusion of two or more people, or by management override of the control.
The design of any system of controls also is based in part upon certain assumptions about the likelihood of future events, and there can be no assurance that any design will succeed in achieving its stated goals under all potential future conditions; over time, controls may become inadequate because of changes in conditions, or the degree of compliance with the policies or procedures may deteriorate. Because of the inherent limitations in a cost-effective control system, misstatements due to error or fraud may occur and not be detected.
The Company did not fail to file any Form 8-K or to disclose any information required to be disclosed therein during the fourth quarter of 2007.
PART III
| ITEM 10. | DIRECTORS AND EXECUTIVE OFFICERS OF THE REGISTRANT |
The Company hereby incorporates by reference the sections entitled “General Information,” “Election of Directors” and “Board of Directors” contained in our Proxy Statement filed electronically with the Securities and Exchange Commission within the first 120 days of 2008.
As of December 31, 2007, MCBI’s Board was still considering whether to adopt a specific code of ethics that applies to its principal executive officer and principal financial officer.
The Company hereby incorporates by reference the section entitled “Executive and Board Compensation” contained in our Proxy Statement filed electronically with the Securities and Exchange Commission within the first 120 days of 2008.
| ITEM 12. | SECURITY OWNERSHIP OF CERTAIN BENEFICIAL OWNERS AND MANAGEMENT AND RELATED STOCKHOLDER MATTERS |
Security Ownership of Certain Beneficial Owners
The Company hereby incorporates by reference the section entitled “Beneficial Stock Ownership of Directors and Executive Officers” contained in our Proxy Statement filed electronically with the Securities and Exchange Commission within the first 120 days of 2008.
Changes in Control
At December 31, 2007, the Company was not aware of any arrangements that may result in a change in control of it.
Securities Authorized for Issuance Under Equity Compensation Plans
The Company hereby incorporates by reference Item 5 of this Report.
| ITEM 13. | CERTAIN RELATIONSHIPS AND RELATED TRANSACTIONS |
Information required by this item appears in the Company’s Proxy Statement for the 2008 Annual Meeting of Shareholders under the caption, “Certain Transactions”, and is hereby incorporated by reference.
| ITEM 14. | PRINCIPAL ACCOUNTANT FEES AND SERVICES |
The Company hereby incorporates by reference the section entitled “Ratification of the Appointment of the Independent Auditors for the Fiscal Year Ending December 31, 2007” contained in our Proxy Statement filed electronically with the Securities and Exchange Commission within the first 120 days of 2008.
| ITEM 15. | EXHIBITS AND FINANCIAL STATEMENT SCHEDULES |
The following documents are filed as part of this report at pages 33 through 61
| | · | Consolidated Financial Statements of Marco Community Bancorp, Inc. (including all required schedules): |
| | 1. | Independent Auditor’s Report; |
| | 2. | Consolidated Balance Sheets at December 31, 2007 and 2006; |
| | 3. | Consolidated Statements of Operations, Stockholders’ Equity, Comprehensive Income (Loss), and Statements of Cash Flows for years ended December 31, 2007 and 2006. |
| | 4. | Notes to Consolidated Financial Statements |
The exhibits denominated with (a) were filed with the Company’s Form SB-2, which was filed with the Securities and Exchange Commission on March 7, 2003; those denominated with (b) were filed with the Company’s Form 8-K, which was filed with the Securities and Exchange Commission on July 27, 2006; those denominated with (c) were filed with the Company’s Form SB-2 SEC No. 333-117877, which was filed with the Securities and Exchange Commission on August 2, 2004; those denominated with (d) were field with the Company’s Form 10-QSB, which was filed with the Securities and Exchange Commission on November 15, 2004; and those denominated with an (e) were filed with a Form 8-K filed with the Securities and Exchange Commission on March 6, 2006.
| Exhibit No. | Description of Exhibit |
| | |
| (a) | 3.1 Articles of Incorporation of Marco Community Bancorp, Inc |
| (a) | 3.2 Bylaws of Marco Community Bancorp, Inc. |
| (a) | 4.1 Specimen Common Stock Certificate |
| (d) | 10.1 Employee’s Stock Option Plan |
| (d) | 10.2 Directors’ Stock Option Plan |
| (d) | 10.3 Advisory Directors’ Stock Option Plan |
| | 10.4 Employee Severance Agreement with Paul Nidasio |
| | 10.5 Employee Severance Agreement with Anthony Iannotta |
| | 10.6 Employee Severance Agreement with David Klein |
| | 31.1 Certification of Chief Executive Officer required by Rule 13a-14(a)/15d-14(a) under the Exchange Act |
| | 31.2 Certification of Chief Financial Officer required by Rule 13a-14(a)/15d-14(a) under the Exchange Act |
| | 32. 1 Certification of Chief Executive Officer pursuant to 18 U.S.C. Section 1350 |
| | 32.2 Certification of Chief Financial Officer pursuant to 18 U.S.C. Section 1350 |
MARCO COMMUNITY BANCORP, INC. AND SUBSIDIARIES
Marco Island, Florida
Audited Consolidated Financial Statements
At December 31, 2007 and 2006 and the Years Then Ended
(Together with Report of Independent Registered Public Accounting Firm)
Report of Independent Registered Public Accounting Firm
Marco Community Bancorp, Inc.
Marco Island, Florida:
We have audited the accompanying consolidated balance sheets of Marco Community Bancorp, Inc. and Subsidiaries (the "Company") as of December 31, 2007 and 2006, and the related consolidated statements of operations, changes in stockholders' equity, and cash flows for the years then ended. These financial statements are the responsibility of the Company's management. Our responsibility is to express an opinion on these financial statements based on our audits.
We conducted our audits in accordance with the standards of the Public Company Accounting Oversight Board (United States). Those standards require that we plan and perform the audit to obtain reasonable assurance about whether the financial statements are free of material misstatement. An audit includes examining, on a test basis, evidence supporting the amounts and disclosures in the financial statements. An audit also includes assessing the accounting principles used and significant estimates made by management, as well as evaluating the overall financial statement presentation. We believe that our audits provide a reasonable basis for our opinion.
In our opinion, the consolidated financial statements referred to above present fairly, in all material respects, the financial position of the Company at December 31, 2007 and 2006, and the results of its operations and its cash flows for the years then ended, in conformity with U.S. generally accepted accounting principles.
HACKER, JOHNSON & SMITH PA
Tampa, Florida
March 12, 2008
MARCO COMMUNITY BANCORP, INC. AND SUBSIDIARIES
Consolidated Balance Sheets
($ in thousands, except per share amounts)
| | | At December 31, | |
| | | 2007 | | | 2006 | |
| Assets | | | | | | |
| | | | | | | |
| Cash and due from banks | | $ | 2,479 | | | | 2,437 | |
| Federal funds sold | | | 8,695 | | | | 22,327 | |
| Interest-bearing deposits | | | - | | | | 2,141 | |
| | | | | | | | | |
| Total cash and cash equivalents | | | 11,174 | | | | 26,905 | |
| | | | | | | | | |
| Security available for sale | | | 1,009 | | | | - | |
| Securities held to maturity (fair value of $5,606 and $2,323) | | | 5,561 | | | | 2,330 | |
| Loans, net of allowance for loan losses of $3,794 in 2007 and $2,047 in 2006 | | | 119,876 | | | | 130,988 | |
| Other real estate owned | | | 2,857 | | | | - | |
| Other real estate owned | | | 2,857 | | | | - | |
| Premises and equipment, net | | | 3,360 | | | | 3,590 | |
| Federal Reserve Bank stock, at cost | | | 468 | | | | 424 | |
| Federal Home Loan Bank stock, at cost | | | 293 | | | | 345 | |
| Accrued interest receivable | | | 602 | | | | 887 | |
| Deferred income taxes | | | 2,020 | | | | 228 | |
| Other assets | | | 2,311 | | | | 303 | |
| | | | | | | | | |
| Total assets | | $ | 149,531 | | | | 166,000 | |
| | | | | | | | | |
| Liabilities and Stockholders' Equity | | | | | | | | |
| | | | | | | | | |
| Liabilities: | | | | | | | | |
| Noninterest-bearing demand deposits | | | 4,068 | | | | 4,002 | |
| Savings, NOW and money-market deposits | | | 38,342 | | | | 48,594 | |
| Time deposits | | | 81,303 | | | | 89,697 | |
| | | | | | | | | |
| Total deposits | | | 123,713 | | | | 142,293 | |
| | | | | | | | | |
| Repurchase agreements | | | 1,232 | | | | - | |
| Official checks | | | 797 | | | | 389 | |
| Dividends payable | | | 35 | | | | - | |
| Accrued interest payable and other liabilities | | | 936 | | | | 640 | |
| | | | | | | | | |
| Total liabilities | | | 126,713 | | | | 143,322 | |
| | | | | | | | | |
| Commitments (Notes 4 and 7) | | | | | | | | |
| | | | | | | | | |
| Stockholders' equity: | | | | | | | | |
| Preferred stock, no par value; 1,000,000 shares authorized, none issued or outstanding | | | - | | | | - | |
| Preferred stock, series B, $51,000 liquidation value; 125 shares authorized, 96 shares outstanding | | | 4,896 | | | | - | |
| Common stock, $.01 par value; 9,000,000 shares authorized, 3,222,421 and 3,156,009 shares issued and outstanding in 2007 and 2006 | | | 32 | | | | 32 | |
| Additional paid-in capital | | | 20,874 | | | | 20,165 | |
| (Accumulated deficit) retained earnings | | | (2,993 | ) | | | 2,481 | |
| Accumulated other comprehensive income | | | 9 | | | | - | |
| | | | | | | | | |
| Total stockholders' equity | | | 22,818 | | | | 22,678 | |
| | | | | | | | | |
| Total liabilities and stockholders' equity | | $ | 149,531 | | | | 166,000 | |
See Accompanying Notes to Consolidated Financial Statements.
MARCO COMMUNITY BANCORP, INC. AND SUBSIDIARIES
Consolidated Statements of Operations
($ in thousands, except per share amounts)
| | | Year Ended December 31, | |
| | | 2007 | | | 2006 | |
| Interest income: | | | | | | |
| Loans | | $ | 9,843 | | | | 10,937 | |
| Securities | | | 300 | | | | 43 | |
| Other interest-earning assets | | | 1,073 | | | | 1,220 | |
| | | | | | | | | |
| Total interest income | | | 11,216 | | | | 12,200 | |
| | | | | | | | | |
| Interest expense: | | | | | | | | |
| Deposits | | | 5,777 | | | | 4,967 | |
| Other borrowings | | | 12 | | | | - | |
| | | | | | | | | |
| Total interest expense | | | 5,789 | | | | 4,967 | |
| | | | | | | | | |
| Net interest income | | | 5,427 | | | | 7,233 | |
| | | | | | | | | |
| Provision for loan losses | | | 8,110 | | | | 348 | |
| | | | | | | | | |
| Net interest (expense) income after provision for loan losses | | | (2,683 | ) | | | 6,885 | |
| | | | | | | | | |
| Noninterest income: | | | | | | | | |
| Service charges on deposit accounts | | | 25 | | | | 29 | |
| CLCC loan brokerage fees | | | 827 | | | | 221 | |
| Other service charges and fees | | | 174 | | | | 203 | |
| | | | | | | | | |
| Total noninterest income | | | 1,026 | | | | 453 | |
| | | | | | | | | |
| Noninterest expenses: | | | | | | | | |
| Salaries and employee benefits | | | 3,007 | | | | 2,472 | |
| Occupancy and equipment | | | 648 | | | | 530 | |
| Data processing | | | 251 | | | | 214 | |
| Advertising | | | 192 | | | | 164 | |
| Professional fees | | | 474 | | | | 253 | |
| Telephone | | | 84 | | | | 54 | |
| Insurance | | | 60 | | | | 38 | |
| Director fees | | | 15 | | | | 77 | |
| Stationary and supplies | | | 46 | | | | 47 | |
| Other real estate owned | | | 872 | | | | - | |
| Other | | | 804 | | | | 415 | |
| | | | | | | | | |
| Total noninterest expenses | | | 6,453 | | | | 4,264 | |
| | | | | | | | | |
| (Loss) earnings before income taxes | | | (8,110 | ) | | | 3,074 | |
| | | | | | | | | |
| Income tax (benefit) provision | | | (3,015 | ) | | | 1,220 | |
| | | | | | | | | |
| Net (loss) earnings | | | (5,095 | ) | | | 1,854 | |
| | | | | | | | | |
| Accrued dividends on preferred stock | | | 35 | | | | - | |
| | | | | | | | | |
| Net (loss) earnings available to common shareholders | | $ | (5,130 | ) | | | 1,854 | |
(continued)
MARCO COMMUNITY BANCORP, INC. AND SUBSIDIARIES
Consolidated Statements of Operations, Continued
($ in thousands, except per share amounts)
| | | 2007 | | | 2006 | |
| | | | | | | |
| Net (loss) earnings per common share, basic | | $ | (1.61 | ) | | | 0.62 | |
| | | | | | | | | |
| Weighted-average number of common shares outstanding, basic | | | 3,191 | | | | 3,014 | |
| | | | | | | | | |
| Net (loss) earnings per common share, diluted | | $ | (1.61 | ) | | | 0.58 | |
| | | | | | | | | |
| Weighted-average number of common shares outstanding, diluted | | | 3,191 | | | | 3,211 | |
| | | | | | | | | |
| Dividends per common share | | $ | 0.12 | | | | 0.10 | |
See Accompanying Notes to Consolidated Financial Statements.
MARCO COMMUNITY BANCORP, INC. AND SUBSIDIARIES
Consolidated Statements of Changes in Stockholders' Equity
Years Ended December 31, 2007 and 2006
($ in thousands)
| | | | | | | | | Accumulated | | | | | | | | | | |
| | | | | | | | | Retained | | | Other | | | | | | | |
| | | | | | Additional | | | Earnings | | | Compre- | | | Total | | | | |
| | | Preferred | | | Common | | | Paid-In | | | (Accumulated | | | hensive | | | Stockholders' | |
| | | Stock | | | Stock | | | Capital | | | Deficit) | | | Income | | | Equity | |
| | | | | | | | | | | | | | | | | | | |
| Balance at December 31, 2005 | | $ | - | | | | 28 | | | | 17,420 | | | | 924 | | | | - | | | | 18,372 | |
| | | | | | | | | | | | | | | | | | | | | | | | | |
| Net earnings | | | - | | | | - | | | | - | | | | 1,854 | | | | - | | | | 1,854 | |
| | | | | | | | | | | | | | | | | | | | | | | | | |
| Exercise of stock warrants (260,587 shares) | | | - | | | | 3 | | | | 2,082 | | | | - | | | | - | | | | 2,085 | |
| | | | | | | | | | | | | | | | | | | | | | | | | |
| Exercise of stock options (52,473 shares) including tax benefit of $190 | | | - | | | | 1 | | | | 507 | | | | - | | | | - | | | | 508 | |
| | | | | | | | | | | | | | | | | | | | | | | | | |
| Share-based compensation | | | - | | | | - | | | | 156 | | | | - | | | | - | | | | 156 | |
| | | | | | | | | | | | | | | | | | | | | | | | | |
| Cash dividends paid | | | - | | | | - | | | | - | | | | (297 | ) | | | - | | | | (297 | ) |
| | | | | | | | | | | | | | | | | | | | | | | | | |
| Balance at December 31, 2006 | | | - | | | | 32 | | | | 20,165 | | | | 2,481 | | | | - | | | | 22,678 | |
| | | | | | | | | | | | | | | | | | | | | | | | | |
| Comprehensive income: | | | | | | | | | | | | | | | | | | | | | | | | |
| Net loss | | | - | | | | - | | | | - | | | | (5,095 | ) | | | - | | | | (5,095 | ) |
| | | | | | | | | | | | | | | | | | | | | | | | | |
| Other comprehensive income, change in unrealized gain on security available for sale, net of tax effect | | | - | | | | - | | | | - | | | | - | | | | 9 | | | | 9 | |
| | | | | | | | | | | | | | | | | | | | | | | | | |
| Comprehensive income | | | | | | | | | | | | | | | | | | | | | | | (5,086 | ) |
| | | | | | | | | | | | | | | | | | | | | | | | | |
| Exercise of stock options (66,412 shares) including tax benefit of $220 | | | - | | | | - | | | | 636 | | | | - | | | | - | | | | 636 | |
| | | | | | | | | | | | | | | | | | | | | | | | | |
| Issuance of preferred stock | | | 4,896 | | | | - | | | | - | | | | - | | | | - | | | | 4,896 | |
| | | | | | | | | | | | | | | | | | | | | | | | | |
| Share-based compensation | | | - | | | | - | | | | 108 | | | | - | | | | - | | | | 108 | |
| | | | | | | | | | | | | | | | | | | | | | | | | |
| Dividends paid - common | | | - | | | | - | | | | - | | | | (379 | ) | | | - | | | | (379 | ) |
| | | | | | | | | | | | | | | | | | | | | | | | | |
| Dividends accrued - preferred | | | - | | | | - | | | | (35 | ) | | | - | | | | - | | | | (35 | ) |
| | | | | | | | | | | | | | | | | | | | | | | | | |
| Balance at December 31, 2007 | | $ | 4,896 | | | | 32 | | | | 20,874 | | | | (2,993 | ) | | | 9 | | | | 22,818 | |
See Accompanying Notes to Consolidated Financial Statements.
MARCO COMMUNITY BANCORP, INC. AND SUBSIDIARIES
Consolidated Statements of Cash Flows
(In thousands)
| | | Year Ended December 31, | |
| | | 2007 | | | 2006 | |
| Cash flows from operating activities: | | | | | | |
| Net (loss) earnings | | $ | (5,095 | ) | | | 1,854 | |
| Adjustments to reconcile net (loss) earnings to net cash provided by operating activities: | | | | | | | | |
| Depreciation | | | 283 | | | | 285 | |
| Share-based compensation | | | 108 | | | | 156 | |
| Provision for loan losses | | | 8,110 | | | | 348 | |
| Deferred income (benefit) taxes | | | (1,792 | ) | | | 69 | |
| Amortization of loan fees and costs, net | | | 37 | | | | (10 | ) |
| Amortization of securities held to maturity | | | 2 | | | | - | |
| Decrease (increase) in accrued interest receivable | | | 285 | | | | (177 | ) |
| Increase in other assets | | | (2,008 | ) | | | (104 | ) |
| Write down of other real estate owned | | | 758 | | | | - | |
| Loss on sale of other real estate owned | | | 15 | | | | - | |
| Increase (decrease) in official checks, accrued interest payable and other liabilities | | | 704 | | | | (642 | ) |
| | | | | | | | | |
| Net cash provided by operating activities | | | 1,407 | | | | 1,779 | |
| | | | | | | | | |
| Cash flows from investing activities: | | | | | | | | |
| Purchase of Federal Reserve Bank stock | | | (44 | ) | | | (52 | ) |
| Redemption (purchase) of Federal Home Loan Bank stock | | | 52 | | | | (345 | ) |
| Purchase of security available for sale | | | (1,000 | ) | | | - | |
| Purchases of securities held to maturity | | | (3,924 | ) | | | (2,330 | ) |
| Principal payments on securities held to maturity | | | 691 | | | | - | |
| Loan originations, net of principal repayments | | | (1,934 | ) | | | 1,447 | |
| Proceeds from sale of other real estate owned | | | 1,269 | | | | - | |
| Purchase of premises and equipment | | | (53 | ) | | | (139 | ) |
| | | | | | | | | |
| Net cash used in investing activities | | | (4,943 | ) | | | (1,419 | ) |
| | | | | | | | | |
| Cash flows from financing activities: | | | | | | | | |
| Net (decrease) increase in deposits | | | (18,580 | ) | | | 4,908 | |
| Net increase in repurchase agreements | | | 1,232 | | | | - | |
| Proceeds from exercise of common stock warrants and options | | | 416 | | | | 2,403 | |
| Net proceeds from issuance of preferred stock | | | 4,896 | | | | - | |
| Tax benefit from exercise of stock options | | | 220 | | | | 190 | |
| Common dividends paid | | | (379 | ) | | | (297 | ) |
| | | | | | | | | |
| Net cash (used in) provided by financing activities | | | (12,195 | ) | | | 7,204 | |
| | | | | | | | | |
| Net (decrease) increase in cash and cash equivalents | | | (15,731 | ) | | | 7,564 | |
| | | | | | | | | |
| Cash and cash equivalents at beginning of year | | | 26,905 | | | | 19,341 | |
| | | | | | | | | |
| Cash and cash equivalents at end of year | | $ | 11,174 | | | | 26,905 | |
(continued)
MARCO COMMUNITY BANCORP, INC. AND SUBSIDIARIES
Consolidated Statements of Cash Flows, Continued
(In thousands)
| | | Year Ended December 31, | |
| | | 2007 | | | 2006 | |
| Supplemental disclosure of cash flow information: | | | | | | |
| Cash paid during the year for: | | | | | | |
| Interest | | $ | 5,756 | | | | 4,845 | |
| | | | | | | | | |
| Income taxes | | $ | 660 | | | | 1,374 | |
| | | | | | | | | |
| Noncash transactions: | | | | | | | | |
| Change in accumulated other comprehensive income, net change in unrealized gain on security available for sale, net of tax | | $ | 9 | | | | - | |
| | | | | | | | | |
| Loans reclassified to foreclosed assets | | $ | 4,899 | | | | - | |
| | | | | | | | | |
| Preferred dividends payable | | $ | 35 | | | | - | |
See Accompanying Notes to Consolidated Financial Statements.
MARCO COMMUNITY BANCORP, INC. AND SUBSIDIARIES
Notes to Consolidated Financial Statements
At December 31, 2007 and 2006 and for the Years Then Ended
| (1) | Summary of Significant Accounting Policies |
Organization. Marco Community Bancorp, Inc. (the "Holding Company") which was incorporated on January 28, 2003 owns 100% of the outstanding common stock of Marco Community Bank (the "Bank") and Commercial Lending Capital Corp. ("CLCC") (formerly MCB Commercial Lending Corp.) (collectively the "Company"). The Holding Company's only business activity is the operation of the Bank and CLCC. The Bank is a state (Florida) chartered commercial bank. The Bank offers a variety of community banking services to individual and corporate customers through its banking office located in Marco Island, Florida. The deposits of the Bank are insured by the Federal Deposit Insurance Corporation. CLCC was incorporated to provide commercial loans to customers that would otherwise seek financing elsewhere because of credit limit constraints.
Basis of Presentation. The accompanying consolidated financial statements include the accounts of the Holding Company, the Bank and CLCC. All significant intercompany accounts and transactions have been eliminated in consolidation.
The following is a description of the significant accounting policies and practices followed by the Company, which conform to U.S. generally accepted accounting principles and prevailing practices within the banking industry.
Use of Estimates. In preparing consolidated financial statements in conformity with U.S. generally accepted accounting principles, management is required to make estimates and assumptions that affect the reported amounts of assets and liabilities as of the date of the consolidated balance sheet and reported amounts of revenues and expenses during the reporting period. Actual results could differ from those estimates. Material estimates that are particularly susceptible to significant change in the near term relate to the determination of the allowance for loan losses and deferred tax assets.
Cash and Cash Equivalents. For purposes of the consolidated statements of cash flows, cash and cash equivalents include cash and balances due from banks, federal funds sold and interest-bearing deposits, all of which mature within ninety days.
The Bank is required by law or regulation to maintain cash reserves, in accounts with other banks or in the vault. At December 31, 2007 and 2006, the Bank was required to maintain cash reserves in the amount of $353,000 and $359,000, respectively, with the Federal Reserve.
(continued)
MARCO COMMUNITY BANCORP, INC. AND SUBSIDIARIES
Notes to Consolidated Financial Statements, Continued
| (1) | Summary of Significant Accounting Policies, Continued |
Securities. Securities may be classified as either trading, held-to-maturity or available-for-sale. Trading securities are held principally for resale and recorded at their fair values. Unrealized gains and losses on trading securities are included immediately in operations. Held-to-maturity securities are those which the Company has the positive intent and ability to hold to maturity and are reported at amortized cost. Available-for-sale securities consist of securities not classified as trading securities nor as held-to-maturity securities. Unrealized holding gains and losses, net of tax, on available-for-sale securities are excluded from operations and reported in comprehensive income. Gains and losses on the sale of available-for-sale securities are recorded on the trade date and are determined using the specific-identification method. Premiums and discounts on securities are recognized in interest income using the interest method over the period to maturity. Declines in the fair value of held-to-maturity and available-for-sale securities below their cost that are deemed to be other than temporary are reflected in operations as realized losses. Management evaluates securities for other-than-temporary impairment on at least a quarterly basis, and more frequently when economic or market conditions warrant such evaluation. In estimating other-than-temporary impairment losses, management considers (1) the length of time and the extent to which the fair value has been less than cost, (2) the financial condition and near-term prospects of the issuer, and (3) the intent and ability of the Company to retain its investment in the issuer for a period of time sufficient to allow for any anticipated recovery in fair value.
Loans. Loans that management has the intent and ability to hold for the foreseeable future or until maturity or pay-off are reported at their outstanding principal adjusted for any charge-offs, the allowance for loan losses, and any deferred fees or costs.
Loan origination fees are deferred and certain direct origination costs are capitalized and recognized as an adjustment of the yield of the related loan.
The accrual of interest on loans is discontinued at the time the loan is ninety days delinquent unless the loan is well collateralized and in process of collection. In all cases, loans are placed on nonaccrual or charged-off at an earlier date if collection of principal or interest is considered doubtful.
All interest accrued but not collected for loans that are placed on nonaccrual or charged-off is reversed against interest income. The interest on these loans is accounted for on the cash-basis or cost-recovery method, until qualifying for return to accrual. Loans are returned to accrual status when all the principal and interest amounts contractually due are brought current and future payments are reasonably assured.
Allowance for Loan Losses. The allowance for loan losses is established as losses are estimated to have occurred through a provision for loan losses charged to operations. Loan losses are charged against the allowance when management believes the uncollectibility of a loan balance is confirmed. Subsequent recoveries, if any, are credited to the allowance.
(continued)
MARCO COMMUNITY BANCORP, INC. AND SUBSIDIARIES
Notes to Consolidated Financial Statements, Continued
| (1) | Summary of Significant Accounting Policies, Continued |
Allowance for Loan Losses, Continued. The allowance for loan losses is evaluated on a regular basis by management and is based upon management's periodic review of the collectibility of the loans in light of historical experience, the nature and volume of the loan portfolio, adverse situations that may affect the borrower's ability to repay, estimated value of any underlying collateral and prevailing economic conditions. This evaluation is inherently subjective as it requires estimates that are susceptible to significant revision as more information becomes available.
The allowance consists of specific and general components. The specific components relates to loans that are classified as impaired. For such loans, an allowance is established when the discounted cash flows (or collateral value or observable market price) of the impaired loan is lower than the carrying value of that loan. The general component covers nonclassified loans and is based on industry historical loss experience adjusted for qualitative factors.
A loan is considered impaired when, based on current information and events, it is probable that the Company will be unable to collect the scheduled payments of principal or interest when due according to the contractual terms of the loan agreement. Factors considered by management in determining impairment include payment status, collateral value, and the probability of collecting scheduled principal and interest payments when due. Loans that experience insignificant payment delays and payment shortfalls generally are not classified as impaired. Management determines the significance of payment delays and payment shortfalls on a case-by-case basis, taking into consideration all of the circumstances surrounding the loan and the borrower, including the length of the delay, the reasons for the delay, the borrower's prior payment record, and the amount of the shortfall in relation to the principal and interest owed. Impairment is measured on a loan by loan basis for commercial, commercial real estate and investor real estate loans by either the present value of expected future cash flows discounted at the loan's effective interest rate, the loan's obtainable market price, or the fair value of the collateral if the loan is collateral dependent.
Large groups of smaller balance homogeneous loans are collectively evaluated for impairment. Accordingly, the Company does not separately identify individual consumer, residential, home equity loans, and lines of credit for impairment disclosures.
Other Real Estate Owned. Assets acquired through, or in lieu of, loan foreclosure are to be sold and are initially recorded at the lower of the related loan balance or the fair value at the date of foreclosure establishing a new cost basis. After foreclosure, valuations are periodically performed by management and the real estate is carried at the lower of carrying amount or fair value less cost to sell. Revenue and expenses from operations are included in the consolidated statements of earnings.
Premises and Equipment. Land is stated at cost. Premises and equipment are stated at cost, less accumulated depreciation. Depreciation expense is computed using the straight-line method over the estimated useful life of each type of asset.
(continued)
MARCO COMMUNITY BANCORP, INC. AND SUBSIDIARIES
Notes to Consolidated Financial Statements, Continued
| (1) | Summary of Significant Accounting Policies, Continued |
Transfer of Financial Assets. Transfers of financial assets are accounted for as sales, when control over the assets has been surrendered. Control over transferred assets is deemed to be surrendered when (1) the assets have been isolated from the Company, (2) the transferee obtains the right (free of conditions that constrain it from taking advantage of that right) to pledge or exchange the transferred assets, and (3) the Company does not maintain effective control over the transferred assets through an agreement to repurchase them before their maturity.
Income Taxes. Deferred income tax assets and liabilities are recorded to reflect the tax consequences on future years of temporary differences between revenues and expenses reported for financial statement and those reported for income tax purposes. Deferred tax assets and liabilities are measured using the enacted tax rates expected to apply to taxable income in the years in which those temporary differences are expected to be realized or settled.
Off-Balance-Sheet Financial Instruments. In the ordinary course of business the Company has entered into off-balance-sheet financial instruments consisting of unused lines of credit. Such financial instruments are recorded in the consolidated financial statements when they are funded.
Advertising. The Company expenses all media advertising as incurred.
Fair Values of Financial Instruments. The fair value of a financial instrument is the current amount that would be exchanged between willing parties, other than in a forced liquidation. Fair value is best determined based upon quoted market prices. However, in many instances, there are no quoted market prices for the Company's various financial instruments. In cases where quoted market prices are not available, fair values are based on estimates using present value or other valuation techniques. Those techniques are significantly affected by the assumptions used, including the discount rate and estimates of future cash flows. Accordingly, the fair value estimates may not be realized in an immediate settlement of the instrument. Certain financial instruments and all nonfinancial instruments are excluded from fair value disclosure requirements. Accordingly, the aggregate fair value amounts presented may not necessarily represent the underlying fair value of the Company. The following methods and assumptions were used by the Company in estimating fair values of financial instruments:
Cash and Cash Equivalents. The carrying amounts of cash and cash equivalents approximates their fair value.
Securities. Fair value for the securities are based on a quoted market price.
Loans. For variable-rate loans that reprice frequently and have no significant change in credit risk, fair values are based on carrying values. Fair values for fixed-rate loans are estimated using discounted cash flow analyses, using interest rates currently being offered for loans with similar terms to borrowers of similar credit quality.
MARCO COMMUNITY BANCORP, INC. AND SUBSIDIARIES
Notes to Consolidated Financial Statements, Continued
| (1) | Summary of Significant Accounting Policies, Continued |
Fair Values of Financial Instruments, Continued.
Federal Reserve Bank Stock and Federal Home Loan Bank Stock. The carrying amounts approximates fair value.
Accrued Interest Receivable. The carrying amount approximates fair value.
Deposit Liabilities. The fair values disclosed for demand, savings, NOW and money market deposits are, by definition, equal to the amount payable on demand at the reporting date (that is, their carrying amounts). Fair values for fixed-rate time deposits are estimated using a discounted cash flow calculation that applies interest rates currently being offered on certificates to a schedule of aggregate expected monthly maturities of time deposits.
Repurchase Agreements. The carrying amounts of repurchase agreements approximate their fair values.
Off-Balance-Sheet Instruments. Fair values for off-balance-sheet lending commitments are based on fees currently charged to enter into similar agreements, taking into account the remaining terms of the agreements and the counterparties' credit standing.
Earnings (Loss) Per Common Share ("EPS"). Earnings (loss) per share ("EPS") of common stock has been computed on the basis of the weighted-average number of shares of common stock outstanding. Outstanding stock options and convertible preferred stock are not considered dilutive securities for the twelve months ended December 31, 2007 due to the net loss incurred by the Company. Outstanding stock options are considered dilutive securities in 2006 for purposes of calculating diluted EPS which is computed using the treasury stock method. The following table presents the calculations of EPS (in thousands, except per share amounts).
| | | 2007 | | | 2006 | |
| | | | | | Weighted- | | | Per | | | Weighted- | | | Per | | | | |
| | | | | | Average | | | Share | | | Average | | | Share | | | | |
| | | Earnings | | | Shares | | | Amount | | | Earnings | | | Shares | | | Amount | |
| Basic EPS- | | | | | | | | | | | | | | | | | | |
| Net (loss) earnings available to common stockholders | | $ | (5,130 | ) | | | 3,191 | | | $ | (1.61 | ) | | $ | 1,854 | | | | 3,014 | | | $ | 0.62 | |
| | | | | | | | | | | | | | | | | | | | | | | | | |
| | | | | | | | | | | | | | | | | | | | | | | | | |
| Effect of dilutive securities- | | | | | | | | | | | | | | | | | | | | | | | | |
| Incremental shares from assumed conversion of options | | | | | | | - | | | | | | | | | | | | 197 | | | | | |
| | | | | | | | | | | | | | | | | | | | | | | | | |
| | | | | | | | | | | | | | | | | | | | | | | | | |
| Diluted EPS- | | | | | | | | | | | | | | | | | | | | | | | | |
| Net (loss) earnings available to common stockholders and assumed conversions | | $ | (5,130 | ) | | | 3,191 | | | $ | (1.61 | ) | | $ | 1,854 | | | | 3,211 | | | $ | 0.58 | |
MARCO COMMUNITY BANCORP, INC. AND SUBSIDIARIES
Notes to Consolidated Financial Statements, Continued
| (1) | Summary of Significant Accounting Policies, Continued |
Share-Based Compensation. Effective January 1, 2006, the Company adopted the fair value recognition provisions of FASB Statement No. 123(R), Share-Based Payment ("SFAS 123(R)"), using the modified-prospective-transition method. Under that transition method, compensation cost recognized includes: (a) compensation cost for all share-based payments granted prior to, but not yet vested as of January 1, 2006, based on the grant date fair value calculated in accordance with the original provisions of SFAS 123, Accounting for Stock-Based Compensation (as amended by SFAS No. 148, Accounting for Stock-Based Compensation Transition and Disclosure) (collectively, "SFAS 123") and (b) compensation cost for all share-based payments granted subsequent to December 31, 2005, based on the grant-date fair value estimated in accordance with the provisions of SFAS 123(R).
The Company accelerated the vesting of all unvested options in the Directors' Plan in 2005, primarily to reduce noncash compensation expense that would have been recorded in its consolidated statements of operations in future years due to the adoption of SFAS No. 123(R) in January 2006. In accordance with SFAS 123, in 2005 the Company expensed the remaining unrecognized compensation cost associated with these options in the proforma disclosure. At December 31, 2005, all options in the Directors' Plan were exercisable. In 2007, two directors resigned and exercised 11,250 stock options resulting in a net expense of $14,500 for the stock options that would not have been fully vested under the original vesting schedule. In March 2006, one director resigned and exercised 7,500 stock options resulting in a net expense of $10,000.
MARCO COMMUNITY BANCORP, INC. AND SUBSIDIARIES
Notes to Consolidated Financial Statements, Continued
| (1) | Summary of Significant Accounting Policies, Continued |
Recent Accounting Pronouncements. In September 2006, the Financial Accounting Standards Board ("FASB") issued Statement of Financial Accounting Standards ("SFAS") No. 157, Fair Value Measurements ("SFAS 157"). SFAS 157 defines fair value, establishes a framework for measuring fair value in accordance with generally accepted accounting principles, and expands disclosures about fair value measurements. This statement is effective for financial statements issued for fiscal years beginning after November 15, 2007, and interim periods within those fiscal years. Management is in the process of evaluating the impact of SFAS 157 and does not anticipate it will have a material impact on the Company's consolidated financial condition or results of operations.
In February 2007, the FASB issued SFAS No. 159, The Fair Value Option for Financial Assets and Financial Liabilities ("SFAS 159"). SFAS 159 provides the Company with an option to report selected financial assets and liabilities at fair value. This statement is effective as of the beginning of a Company's first fiscal year beginning after November 15, 2007. Management is in the process of evaluating the impact of SFAS 159 and does not anticipate it will have a material effect on the Company's consolidated financial condition or results of operations.
In December 2007, the FASB issued SFAS No. 141(R), Business Combinations ("SFAS 141(R)"). SFAS 141(R) is effective for fiscal years beginning after December 15, 2008 and early implementation is not permitted. SFAS 141(R) requires the acquiring entity in a business combination to recognize all (and only) the assets acquired and liabilities assumed in the transaction; establishes the acquisition date fair value as the measurement objective for all assets acquired and liabilities assumed; and requires the acquirer to disclose to investors and other users all of the information they need to evaluate and understand the nature and financial effect of the business combination. Acquisition related costs including finder's fees, advisory, legal, accounting valuation and other professional and consulting fees are required to be expensed as incurred. Management is in the process of evaluating the impact of SFAS 141(R) and does not anticipate it will have any current effect on the Company's consolidated financial condition or results of operations.
In December 2007, the FASB issued SFAS No.160, Noncontrolling Interests in Consolidated Financial Statements ("SFAS 160"). SFAS 160 provides the Company to establish accounting and reporting standards for the noncontrolling interest in a subsidiary and for the deconsolidation of a subsidiary. This Statement shall be effective for fiscal years, and interim periods within those fiscal years, beginning on or after December 15, 2008. Earlier adoption is prohibited. Management is in the process of evaluating the impact of SFAS 160 and does not anticipate it will have a material effect on the Company's consolidated financial condition or results of operations.
MARCO COMMUNITY BANCORP, INC. AND SUBSIDIARIES
Notes to Consolidated Financial Statements, Continued
The securities have been classified according to management's intent. Following are summaries of the securities (in thousands):
| | | Gross | | | Gross | | | | | | | |
| | | Amortized | | | Unrealized | | | Unrealized | | | Fair | |
| | | Cost | | | Gains | | | Losses | | | Value | |
| Securities Available for Sale: | | | | | | | | | | | | |
| At December 31, 2007- | | | | | | | | | | | | |
| U.S. Government and Federal Agencies | | $ | 1,000 | | | | 9 | | | | - | | | | 1,009 | |
| | | | | | | | | | | | | | | | | |
| Securities Held to Maturity: | | | | | | | | | | | | | | | | |
| At December 31, 2007: | | | | | | | | | | | | | | | | |
| U.S. Government and Federal Agencies | | | 2,330 | | | | 23 | | | | - | | | | 2,353 | |
| Mortgage-backed securities of U.S government agencies | | | 3,231 | | | | 22 | | | | - | | | | 3,253 | |
| | | | | | | | | | | | | | | | | |
| | | $ | 5,561 | | | | 45 | | | | - | | | | 5,606 | |
| | | | | | | | | | | | | | | | | |
| At December 31, 2006: | | | | | | | | | | | | | | | | |
| U.S. Government and Federal Agencies | | $ | 2,330 | | | | - | | | | 7 | | | $ | 2,323 | |
At December 31, 2007 securities with a par value of $1.8 million were pledged to secure repurchase agreements. Securities with a par value of $1.0 million were pledged to the Federal Reserve Bank Discount Window. There were no securities pledged at December 31, 2006. No securities were sold during the years ended December 31, 2007 and 2006.
As of December 31, 2007, the amortized cost and fair value of securities, by contractual maturities, were as follows (in thousands):
| | | Available for Sale | | | Held to Maturity | |
| | | Amortized | | | Fair | | | Amortized | | | Fair | |
| | | Cost | | | Value | | | Cost | | | Value | |
| | | | | | | | | | | | | |
| Due from one to five years | | $ | 1,000 | | | | 1,009 | | | | 2,330 | | | | 2,353 | |
| Due after ten years | | | - | | | | - | | | | 3,231 | | | | 3,253 | |
| | | | | | | | | | | | | | | | | |
| | | $ | 1,000 | | | | 1,009 | | | | 5,561 | | | | 5,606 | |
MARCO COMMUNITY BANCORP, INC. AND SUBSIDIARIES
Notes to Consolidated Financial Statements, Continued
The components of loans are as follows (in thousands):
| | | At December 31, | |
| | | 2007 | | | 2006 | |
| | | | | | | |
| Commercial real estate | | $ | 31,925 | | | | 24,311 | |
| Commercial | | | 40,778 | | | | 43,152 | |
| Residential real estate | | | 24,503 | | | | 32,772 | |
| Consumer | | | 1,107 | | | | 2,038 | |
| Home equity loans and lines of credit | | | 25,274 | | | | 30,687 | |
| | | | | | | | | |
| | | | 123,587 | | | | 132,960 | |
| Add (subtract): | | | | | | | | |
| Deferred loan costs, net | | | 83 | | | | 75 | |
| Allowance for loan losses | | | (3,794 | ) | | | (2,047 | ) |
| | | | | | | | | |
| Loans, net | | $ | 119,876 | | | | 130,988 | |
An analysis of the change in the allowance for loan losses follows (in thousands):
| | | Year Ended December 31, | |
| | | 2007 | | | 2006 | |
| | | | | | | |
| Beginning balance | | $ | 2,047 | | | | 1,699 | |
| Recoveries | | | 3 | | | | - | |
| Charge-offs | | | (6,366 | ) | | | - | |
| Provision for loan losses | | | 8,110 | | | | 348 | |
| | | | | | | | | |
| Ending balance | | $ | 3,794 | | | | 2,047 | |
Impaired collateral dependent loans in 2007 and 2006 were as follows (in thousands):
| | | At December 31, | |
| | | 2007 | | | 2006 | |
| | | | | | | |
| Impaired loans without a valuation allowance | | $ | - | | | | - | |
| Impaired loans with a valuation allowance | | | 11,480 | | | | 2,093 | |
| Total impaired loans | | | 11,480 | | | | 2,093 | |
| Total related allowance for losses at end of year | | | (1,397 | ) | | | (91 | ) |
| Net investment in impaired loans | | $ | 10,083 | | | | 2,002 | |
| | | | | | | | | |
| Average investment in impaired loans | | $ | 7,532 | | | | 587 | |
| Interest income recognized on impaired loans | | $ | - | | | | - | |
| Interest income received on impaired loans | | $ | - | | | | - | |
(continued)
MARCO COMMUNITY BANCORP, INC. AND SUBSIDIARIES
Notes to Consolidated Financial Statements, Continued
Nonaccrual and past due loans were as follows (in thousands):
| | | At December 31, | |
| | | 2007 | | | 2006 | |
| | | | | | | |
| Nonaccrual loans | | $ | 12,200 | | | | 1,300 | |
| | | | | | | | | |
| Past due ninety days or more, but still accruing interest | | $ | - | | | | - | |
The Company grants the majority of its loans to borrowers throughout Collier County, Florida. Although the Company has a diversified loan portfolio, a significant portion of its borrowers’ ability to honor their contracts is dependent upon the economy in Florida. The Company does not have significant concentrations in any one industry or customer. The Company does have 11 loans with original terms of one year, aggregating $5.7 million at December 31, 2007; the primary source of repayment is the sale of the related collateral or the conversion of the existing debit into debt at another financial institution. The majority of these loans are located in Duval, Hillsborough and Pinellas Counties. With the uncertain real estate market in Florida, obtaining refinancing or sale of the collateral may be difficult or impossible. Management is closely monitoring these loans and believes the loan loss allowance at December 31, 2007 is adequate.
(4) Premises and Equipment
A summary of premises and equipment follows (in thousands):
| | | At December 31, | |
| | | 2007 | | | 2006 | |
| | | | | | | |
| Land | | $ | 1,256 | | | | 1,256 | |
| Building and improvements | | | 1,812 | | | | 1,811 | |
| Furniture, fixtures and equipment | | | 1,231 | | | | 1,181 | |
| | | | | | | | | |
| Total, at cost | | | 4,299 | | | | 4,248 | |
| | | | | | | | | |
| Less accumulated depreciation | | | (939 | ) | | | (658 | ) |
| | | | | | | | | |
| Premises and equipment, net | | $ | 3,360 | | | | 3,590 | |
The Company has one lease for its loan production office located in Fort Myers which was opened in 2006. Rental expense was $96,000 and $36,000 for 2007 and 2006, respectively. A summary of future minimum lease payments for years following December 31, 2007 follows (in thousands):
| Year Ending | | | |
| December 31, | | Amount | |
| | | | |
| 2008 | | $ | 102 | |
| 2009 | | | 60 | |
| | | | | |
| | | $ | 162 | |
MARCO COMMUNITY BANCORP, INC. AND SUBSIDIARIES
Notes to Consolidated Financial Statements, Continued
The aggregate amount of time deposits with a minimum denomination of $100,000, was approximately $34.1 million and $30.0 million at December 31, 2007 and 2006, respectively.
A schedule of maturities of time deposit at December 31, 2007 follows (in thousands):
| Year Ending | | | |
| December 31, | | Amount | |
| | | | |
| 2008 | | $ | 68,902 | |
| 2009 | | | 8,550 | |
| 2010 | | | 2,284 | |
| 2011 | | | 1,048 | |
| 2012 | | | 519 | |
| | | | | |
| | | $ | 81,303 | |
| (6) | Repurchase Agreements |
The Company enters into repurchase agreements with customers. The agreements require the Company to pledge securities as collateral for borrowings under these agreements. At December 31, 2007, the outstanding balance of these repurchase agreements totaled approximately $1,232,000 and the Company pledged securities with a carrying value of approximately $1.8 million as collateral. There was no balance outstanding under repurchase agreements at December 31, 2006.
| (7) | Financial Instruments |
The Company is a party to financial instruments with off-balance-sheet risk in the normal course of business to meet the financing needs of its customers. These financial instruments are unused lines of credit and unfunded construction loans and may involve, to varying degrees, elements of credit risk in excess of the amount recognized in the consolidated balance sheet. The contract amounts of these instruments reflect the extent of involvement the Company has in these financial instruments.
The Company's exposure to credit loss in the event of nonperformance by the other party to the financial instrument for unused lines of credit and unfunded construction loans is represented by the contractual amount of those instruments. The Company uses the same credit policies in making commitments as it does for on-balance-sheet instruments.
(continued)
MARCO COMMUNITY BANCORP, INC. AND SUBSIDIARIES
Notes to Consolidated Financial Statements, Continued
| (7) | Financial Instruments, Continued |
Commitments to extend credit are agreements to lend to a customer as long as there is no violation of any condition established in the contract. Commitments generally have fixed expiration dates or other termination clauses and may require payment of a fee. Since some of the commitments are expected to expire without being drawn upon, the total commitment amounts do not necessarily represent future cash requirements. The Company evaluates each customer's credit worthiness on a case-by-case basis. The amount of collateral obtained if deemed necessary by the Company upon extension of credit is based on management's credit evaluation of the counterparty.
The estimated fair values of the Company's financial instruments were as follows (in thousands):
| | | At December 31, 2007 | | | At December 31, 2006 | |
| | | Carrying | | | Fair | | | Carrying | | | Fair | |
| | | Amount | | | Value | | | Amount | | | Value | |
| Financial assets: | | | | | | | | | | | | |
| Cash and cash equivalents | | $ | 11,174 | | | | 11,174 | | | | 26,905 | | | | 26,905 | |
| | | | | | | | | | | | | | | | | |
| Security available for sale | | $ | 1,009 | | | | 1,009 | | | | - | | | | - | |
| | | | | | | | | | | | | | | | | |
| Securities held to maturity | | $ | 5,561 | | | | 5,606 | | | | 2,330 | | | | 2,323 | |
| | | | | | | | | | | | | | | | | |
| Loans, net | | $ | 119,876 | | | | 121,035 | | | | 130,988 | | | | 130,757 | |
| | | | | | | | | | | | | | | | | |
| Accrued interest receivable | | $ | 602 | | | | 602 | | | | 887 | | | | 887 | |
| | | | | | | | | | | | | | | | | |
| Federal Reserve Bank stock | | $ | 468 | | | | 468 | | | | 424 | | | | 424 | |
| | | | | | | | | | | | | | | | | |
| Federal Home Loan Bank Stock | | $ | 293 | | | | 293 | | | | 345 | | | | 345 | |
| | | | | | | | | | | | | | | | | |
| Financial liabilities: | | | | | | | | | | | | | | | | |
| Deposits | | $ | 123,713 | | | | 124,457 | | | | 142,293 | | | | 142,264 | |
| | | | | | | | | | | | | | | | | |
| Repurchase agreements | | $ | 1,232 | | | | 1,232 | | | | - | | | | - | |
| | | | | | | | | | | | | | | | | |
| Off-balance sheet financial instruments | | $ | - | | | | - | | | | - | | | | - | |
Unused lines of credit and unfunded construction loans typically result in loans with a market interest rate when funded. A summary of the amounts of the Company's financial instruments with off balance sheet risk at December 31, 2007 follows (in thousands):
| | | Contract | |
| | | Amount | |
| | | | |
| Unused lines of credit | | $ | 26,051 | |
| Unfunded construction loans | | $ | 2,309 | |
MARCO COMMUNITY BANCORP, INC. AND SUBSIDIARIES
Notes to Consolidated Financial Statements, Continued
The Company grants the majority of its loans to borrowers throughout the Collier and Lee County, Florida area. Although the Company has a diversified loan portfolio, a significant portion of its borrowers' ability to honor their contracts is dependent upon the economy in the Collier and Lee County, Florida area.
Income taxes (benefit) consisted of the following (in thousands):
| | | Year Ended December 31, | |
| | | 2007 | | | 2006 | |
| Current: | | | | | | |
| Federal | | $ | (1,223 | ) | | | 983 | |
| State | | | - | | | | 168 | |
| | | | | | | | | |
| Total current | | | (1,223 | ) | | | 1,151 | |
| | | | | | | | | |
| Deferred: | | | | | | | | |
| Federal | | | (1,317 | ) | | | 59 | |
| State | | | (475 | ) | | | 10 | |
| | | | | | | | | |
| Total deferred | | | (1,792 | ) | | | 69 | |
| | | | | | | | | |
| Income taxes | | $ | (3,015 | ) | | | 1,220 | |
The reasons for the differences between the statutory Federal income tax rate and the effective tax rate are summarized as follows:
| | | Year Ended December 31, | |
| | | 2007 | | | 2006 | |
| | | | | | % of | | | | | | % of | |
| | | | | | Pretax | | | | | | Pretax | |
| | | Amount | | | Loss | | | Amount | | | Earnings | |
| | | | | | | | | | | | | |
| Income taxes (benefit) at statutory rate | | $ | (2,757 | ) | | | (34.0 | )% | | $ | 1,045 | | | | 34.0 | % |
| Increase (decrease) resulting from: | | | | | | | | | | | | | | | | |
| State taxes, net of Federal tax benefit | | | (314 | ) | | | (3.9 | ) | | | 117 | | | | 3.8 | |
| Other | | | 56 | | | | .7 | | | | 58 | | | | 1.9 | |
| | | | | | | | | | | | | | | | | |
| Income taxes (benefit) | | $ | (3,015 | ) | | | (37.2 | )% | | $ | 1,220 | | | | 39.7 | % |
(continued)
MARCO COMMUNITY BANCORP, INC. AND SUBSIDIARIES
Notes to Consolidated Financial Statements, Continued
| (9) | Income Taxes, Continued |
The tax effects of temporary differences that give rise to significant portions of the deferred tax assets and deferred tax liabilities are presented below (in thousands):
| | | At December 31, | |
| | | 2007 | | | 2006 | |
| Deferred tax assets: | | | | | | |
| Allowance for loan losses | | $ | 1,035 | | | | 498 | |
| Net operating loss carryforwards | | | 888 | | | | - | |
| Organizational and preopening costs | | | 17 | | | | 47 | |
| Foreclosed real estate | | | 211 | | | | - | |
| Alternative minimum tax credits | | | 109 | | | | - | |
| Other | | | 17 | | | | 6 | |
| | | | | | | | | |
| Deferred tax assets | | | 2,277 | | | | 551 | |
| | | | | | | | | |
| Deferred tax liabilities: | | | | | | | | |
| Depreciation | | | (103 | ) | | | (159 | ) |
| Deferred loan costs | | | (38 | ) | | | (40 | ) |
| Accrual to cash conversion | | | (116 | ) | | | (124 | ) |
| | | | | | | | | |
| Deferred tax liabilities | | | (257 | ) | | | (323 | ) |
| | | | | | | | | |
| Net deferred tax asset | | $ | 2,020 | | | | 228 | |
At December 31, 2007, the Company had Federal and Florida net operating loss carryforwards of approximately $1.9 million and $6.5 million, respectively. These carryforwards will expire in 2027.
| (10) | Stockholders' Equity |
In 2004, the Company sold 265,000 units to existing shareholders. Each unit consisted of one share of common stock and one purchase warrant. The price per unit was $10. Each warrant entitled the holder to purchase one share of additional common stock for $12 per share during the two-year period ending October 8, 2006. In 2006 and 2005, 260,587 (adjusted for stock split) and 97,415 warrants, respectively were exercised. All outstanding warrants issued pursuant to the offering expired October 8, 2006.
On February 21, 2006, the Board of Directors declared a $0.10 cash dividend on all outstanding common shares for stockholders of record on March 31, 2006 which was distributed on April 15, 2006.
On February 20, 2007, the Board of Directors declared a $0.12 cash dividend on all outstanding common shares of stockholders of record on March 16, 2007 which was distributed on April 16, 2007.
(continued)
MARCO COMMUNITY BANCORP, INC. AND SUBSIDIARIES
Notes to Consolidated Financial Statements, Continued
| (10) | Stockholders' Equity, Continued |
In 2007, the Company issued ninety-six shares of Series B Preferred Stock ("Preferred Stock"). The shares have no voting rights, but have a liquidation preference value of $51,000 per share. Cash dividends are payable in arrears within the first ten days of each March and September. The dividends are not cumulative, are payable semiannually at an annual rate of $2,900 and are prorated for any partial period. At the Company's discretion, on any dividend payment date occurring at least two years after issuance, each share of Preferred Stock is mandatorily convertible into 6,000 shares of common stock; provided, however, that the Company may also convert the Preferred Stock upon any change in control.
Banking regulations place certain restrictions on dividends paid to the Holding Company and loans or advances made by the Bank to the Holding Company.
The Bank is subject to various regulatory capital requirements administered by the banking agencies. Failure to meet minimum capital requirements can initiate certain mandatory and possibly additional discretionary actions by regulators that, if undertaken, could have a direct material effect on the Company's and Bank's financial statements. Under capital adequacy guidelines and the regulatory framework for prompt corrective action, the Bank must meet specific capital guidelines that involve quantitative measures of their assets, liabilities, and certain off-balance-sheet items as calculated under regulatory accounting practices. The Bank's capital amounts and classification are also subject to qualitative judgments by the regulators about components, risk weightings, and other factors.
Quantitative measures established by regulation to ensure capital adequacy require the Bank to maintain minimum amounts and percents (set forth in the table below) of total and Tier I capital (as defined in the regulations) to risk-weighted assets (as defined), and of Tier I capital (as defined) to average assets (as defined). Management believes, as of December 31, 2007, that the Bank met all capital adequacy requirements to which they were subject.
(continued)
MARCO COMMUNITY BANCORP, INC. AND SUBSIDIARIES
Notes to Consolidated Financial Statements, Continued
| (11) | Regulatory Matters, Continued |
As of December 31, 2007, the most recent notification from the regulatory authorities categorized the Bank as well capitalized under the regulatory framework for prompt corrective action. To be categorized as well capitalized the Bank must maintain minimum total risk-based, Tier I risk-based, and Tier I leverage percents as set forth in the table. There are no conditions or events since that notification that management believes have changed the Bank's category. The Bank's actual capital amounts and percents are also presented in the table ($ in thousands):
| | | | | | | | | For Well | |
| | | | | | For Capital | | | Capitalized | |
| | | Actual | | | Adequacy Purposes | | | Purposes | |
| | | Amount | | | Percent | | | Amount | | | Percent | | | Amount | | | Percent | |
| As of December 31, 2007: | | | | | | | | | | | | | | | | | | |
| Total Capital (to Risk-Weighted Assets) | | $ | 18,285 | | | | 15.24 | % | | $ | 9,596 | | | | 8.00 | % | | $ | 11,995 | | | | 10.00 | % |
| Tier I Capital (to Risk-Weighted Assets) | | | 16,759 | | | | 13.97 | | | | 4,798 | | | | 4.00 | | | | 7,197 | | | | 6.00 | |
| Tier I Capital (to Average Assets) | | | 16,759 | | | | 10.86 | | | | 6,172 | | | | 4.00 | | | | 7,715 | | | | 5.00 | |
| | | | | | | | | | | | | | | | | | | | | | | | | |
| As of December 31, 2006: | | | | | | | | | | | | | | | | | | | | | | | | |
| Total Capital (to Risk-Weighted Assets) | | | 18,824 | | | | 13.18 | | | | 11,430 | | | | 8.00 | | | | 14,287 | | | | 10.00 | |
| Tier I Capital (to Risk-Weighted Assets) | | | 17,292 | | | | 12.10 | | | | 5,715 | | | | 4.00 | | | | 8,572 | | | | 6.00 | |
| Tier I Capital (to Average Assets) | | | 17,292 | | | | 10.73 | | | | 6,446 | | | | 4.00 | | | | 8,057 | | | | 5.00 | |
| (12) | Share-Based Compensation Plans |
In 2004, the Company adopted three stock option plans. The Employees' Stock Option Plan is for the benefit of officers and other key employees of the Holding Company, the Bank and CLCC. Stock options are granted at an exercise price equal to or greater than the fair market value of the common stock on the date of grant. These options have ten year terms and vest 20% a year over a five year period.
The Directors' Stock Option Plan is for the benefit of directors of the Holding Company, the Bank and CLCC. Stock options are granted at an exercise price equal to or greater than the fair market value of the common stock on the date of grant. These options have ten year terms and have various vesting schedules.
The Advisory Directors' Stock Option Plan is for the benefit of advisory directors of the Company. Stock options are granted at an exercise price equal to or greater than the fair market value of the common stock on the date of grant. These options have six year terms and begin vesting one year after the date of grant at 25% a year over a four year period.
(continued)
MARCO COMMUNITY BANCORP, INC. AND SUBSIDIARIES
Notes to Consolidated Financial Statements, Continued
| (12) | Share-Based Compensation Plans, Continued |
The plans were amended in 2007 to increase the size of the three Company plans so that the number of shares of common stock reserved for issuance under all three Company plans is a collective amount equal to 15% of the common stock outstanding, up to a maximum of 1,500,000 shares. At December 31, 2007, an aggregate of 80,577 options remain available for grant in all three plans.
A summary of the plans is as follows (in thousands, except for share and per share information):
| | | | | | Weighted- | | | Weighted- | | | | |
| | | | | | Average Per | | | Average | | | | |
| | | Number | | | Share | | | Remaining | | | Aggregate | |
| | | of | | | Exercise | | | Contractual | | | Intrinsic | |
| | | Shares | | | Price | | | Term | | | Value | |
| The Employees' Plan: | | | | | | | | | | | | |
| Options outstanding at December 31, 2005 | | | 125,800 | | | $ | 9.73 | | | | | | | |
| Options granted | | | 47,000 | | | | 16.00 | | | | | | | |
| Options exercised | | | (12,350 | ) | | | 6.15 | | | | | | | |
| Options forfeited | | | (11,100 | ) | | | 6.35 | | | | | | | |
| | | | | | | | | | | | | | | |
| Options outstanding at December 31, 2006 | | | 149,350 | | | | 9.73 | | | | | | | |
| Options granted | | | 72,000 | | | | 8.86 | | | | | | | |
| Options exercised | | | (11,100 | ) | | | 6.47 | | | | | | | |
| Options forfeited | | | (22,050 | ) | | | 11.16 | | | | | | | |
| | | | | | | | | | | | | | | |
| Options outstanding at December 31, 2007 | | | 188,200 | | | $ | 9.42 | | | | 8.39 | | | $ | 102 | |
| Options exercisable at December 31, 2007 | | | 47,150 | | | $ | 8.21 | | | | 7.11 | | | $ | 57 | |
| | | | | | | | | | | | | | | | | |
| The Directors' Plan: | | | | | | | | | | | | | | | | |
| Options outstanding at December 31, 2005 | | | 138,750 | | | | 6.18 | | | | | | | | | |
| Options exercised | | | (37,500 | ) | | | 6.00 | | | | | | | | | |
| | | | | | | | | | | | | | | | | |
| Options outstanding at December 31, 2006 | | | 101,250 | | | | 6.25 | | | | | | | | | |
| Options granted | | | 7,500 | | | | 17.70 | | | | | | | | | |
| Options exercised | | | (52,500 | ) | | | 6.24 | | | | | | | | | |
| | | | | | | | | | | | | | | | | |
| Options outstanding at December 31, 2007 | | | 56,250 | | | $ | 7.79 | | | | 6.68 | | | $ | 85 | |
| Options exercisable at December 31, 2007 | | | 48,750 | | | $ | 6.26 | | | | 6.25 | | | $ | 85 | |
| | | | | | | | | | | | | | | | | |
| The Advisory Directors' Plan: | | | | | | | | | | | | | | | | |
| Options outstanding at December 31, 2005 | | | 24,000 | | | | 6.00 | | | | | | | | | |
| Options exercised | | | (2,623 | ) | | | 6.00 | | | | | | | | | |
| Options forfeited | | | (5,064 | ) | | | 6.00 | | | | | | | | | |
| | | | | | | | | | | | | | | | | |
| Options outstanding at December 31, 2006 | | | 16,313 | | | | 6.00 | | | | | | | | | |
| Options granted | | | 8,250 | | | | 12.83 | | | | | | | | | |
| Options exercised | | | (2,812 | ) | | | 6.00 | | | | | | | | | |
| Options forfeited | | | (1,500 | ) | | | 6.00 | | | | | | | | | |
| | | | | | | | | | | | | | | | | |
| Options outstanding at December 31, 2007 | | | 20,251 | | | $ | 8.78 | | | | 2.75 | | | $ | 24 | |
| Options exercisable at December 31, 2007 | | | 8,228 | | | $ | 6.00 | | | | 1.00 | | | $ | 16 | |
MARCO COMMUNITY BANCORP, INC. AND SUBSIDIARIES
Notes to Consolidated Financial Statements, Continued
| (12) | Share-Based Compensation, Continued |
The total intrinsic value of options exercised during the years ended December 31, 2007 and 2006 was $708,000 and $584,000, respectively. There was a $220,000 tax benefit relating to the stock options exercised during the year ended December 31, 2007 and a $198,000 tax benefit for the year ended December 31, 2006. At December 31, 2007, there was $489,000 of total unrecognized compensation expense related to nonvested share-based compensation arrangements granted under the plans. The cost is expected to be recognized over a weighted-average period of 4.2 years. The total fair value of shares vested and recognized as compensation expense was $108,000 and $156,000 for each of the years ended December 31, 2007 and 2006, and no income tax benefit was recognized.
The fair value of each option granted for the years ended December 31, 2007 and 2006 is estimated on the date of grant using the Black-Scholes option-pricing model with the following assumptions ($ in thousands):
| | | Year Ended | |
| | | December 30, | |
| | | 2007 | | | 2006 | |
| | | | | | | |
| Weighted-average risk-free interest rate | | | 4.24 | % | | | 4.79 | % |
| Weighted-average dividend yield | | | 0.17 | % | | | 0.94 | % |
| Weighted-average expected stock volatility | | | 32.72 | % | | | 23.98 | % |
| Expected life in years | | 6.5 years | | | 6.5 years | |
| Per share weighted-average grant-date fair value of options issued during the period | | $ | 5.06 | | | | 6.26 | |
As part of its adoption of SFAS 123(R), the Company examined its historical pattern of option exercises in an effort to determine if there were any pattern based on certain employee populations. From this analysis, the Company could not identify any patterns in the exercise of options. As such, the Company used the guidance in Staff Accounting Bulletin No. 107 to determine the estimated life of options issued subsequent to the adoption of SFAS 123(R). Expected volatility is based on historical volatility of the Company's stock. The risk–free rate for periods within the contractual life of the option is based on the U.S. Treasury yield curve in effect at the time of the grant. The dividend yield assumption is based on the Company's history and expectation of dividend payments.
MARCO COMMUNITY BANCORP, INC. AND SUBSIDIARIES
Notes to Consolidated Financial Statements, Continued
(13) Stock Appreciation Rights ("SARS")
In January 2005, the Company initiated a program granting SARS to certain officers. The rights allow the participants to receive a cash payment equal to the appreciation of the fair market value of the Company's common stock. The term of the stock appreciation rights is ten years. At December 31, 2007 and 2006, 3,750 rights and 15,750 rights, respectively were outstanding. There was no expense for the SARS program in 2007. In 2006, $12,000 was expensed for the SARS program.
(14) Employee Benefit Plan
The Company offers a 401(k) plan to all employees electing to participate after meeting certain length-of-service requirements. The Company's contributions to the plan for the years ended December 31, 2007 and 2006 were $37,005 and $19,536, respectively.
(15) Related Party Transactions
In the ordinary course of business, the Company accepts deposits from principal officers and directors and their affiliates. At December 31, 2007 and 2006, these deposits were approximately $3.0 million and $1.8 million, respectively.
The Company also grants loans to certain principal officers. At December 31, 2007 and 2006, the aggregate loan balance was approximately $120,000 and $135,000, respectively.
MARCO COMMUNITY BANCORP, INC. AND SUBSIDIARIES
Notes to Consolidated Financial Statements, Continued
(16) Holding Company Financial Information
The Holding Company's financial information as of December 31, 2007 and 2006 and the years then ended follows (in thousands):
Condensed Balance Sheets
| | | At December 31, | |
| | | 2007 | | | 2006 | |
| Assets | | | | | | |
| | | | | | | |
| Cash | | $ | 2,228 | | | | 1,467 | |
| Loans, net of allowance for loan losses of $150 in 2007 | | | 2,340 | | | | 2,569 | |
| Premises and equipment, net | | | 629 | | | | 632 | |
| Investment in subsidiaries | | | 16,875 | | | | 17,615 | |
| Other assets | | | 802 | | | | 443 | |
| | | | | | | | | |
| Total assets | | $ | 22,874 | | | | 22,726 | |
| | | | | | | | | |
| Liabilities and Stockholders' Equity | | | | | | | | |
| | | | | | | | | |
| Other liabilities | | | 56 | | | | 48 | |
| Stockholders' equity | | | 22,818 | | | | 22,678 | |
| | | | | | | | | |
| Total liabilities and stockholders' equity | | $ | 22,874 | | | | 22,726 | |
Condensed Statements of Operations
| | | Year Ended December 31, | |
| | | 2007 | | | 2006 | |
| | | | | | | |
| Revenues | | $ | 262 | | | | 124 | |
| Expenses | | | (609 | ) | | | (402 | ) |
| (Loss) earnings of subsidiaries | | | (4,748 | ) | | | 2,132 | |
| | | | | | | | | |
| Net (loss) earnings | | $ | (5,095 | ) | | | 1,854 | |
(continued)
MARCO COMMUNITY BANCORP, INC. AND SUBSIDIARIES
Notes to Consolidated Financial Statements, Continued
(16) Holding Company Financial Information, Continued
Condensed Statements of Cash Flows
| | | Year Ended December 31, | |
| | | 2007 | | | 2006 | |
| Cash flows from operating activities: | | | | | | |
| Net (loss) earnings | | $ | (5,095 | ) | | | 1,854 | |
| Adjustments to reconcile net (loss) earnings to net cash used in operating activities: | | | | | | | | |
| Depreciation | | | 17 | | | | 15 | |
| Provision for loan losses | | | 150 | | | | - | |
| Deferred (benefit) income taxes | | | (355 | ) | | | - | |
| Share-based compensation | | | 108 | | | | 156 | |
| Increase in other assets | | | (4 | ) | | | (257 | ) |
| Change in other liabilities | | | (27 | ) | | | (83 | ) |
| Equity in undistributed loss (earnings) of subsidiaries | | | 4,748 | | | | (2,132 | ) |
| | | | | | | | | |
| Net cash used in operating activities | | | (458 | ) | | | (447 | ) |
| | | | | | | | | |
| Cash flows from investing activities: | | | | | | | | |
| Net decrease (increase) in loans | | | 79 | | | | (2,569 | ) |
| Purchase of premises and equipment | | | (14 | ) | | | - | |
| Investment in subsidiaries | | | (3,779 | ) | | | (1,060 | ) |
| | | | | | | | | |
| Net cash used in investing activities | | | (3,714 | ) | | | (3,629 | ) |
| | | | | | | | | |
| Cash flows from financing activities: | | | | | | | | |
| Proceeds from exercise of common stock warrants and options | | | 416 | | | | 2,403 | |
| Net proceeds from sale of preferred stock | | | 4,896 | | | | - | |
| Cash dividends paid | | | (379 | ) | | | (297 | ) |
| | | | | | | | | |
| Net cash provided by financing activities | | | 4,933 | | | | 2,106 | |
| | | | | | | | | |
| Net increase (decrease) in cash | | | 761 | | | | (1,970 | ) |
| | | | | | | | | |
| Cash at beginning of the year | | | 1,467 | | | | 3,437 | |
| | | | | | | | | |
| Cash at end of year | | $ | 2,228 | | | | 1,467 | |
| | | | | | | | | |
| Noncash transactions: | | | | | | | | |
| Tax effect from exercise of common stock options | | $ | 220 | | | | 190 | |
| | | | | | | | | |
| Cash dividends payable | | $ | 35 | | | | - | |
| | | | | | | | | |
| Net change in investment in subsidiary due to net change in accumulated other comprehensive income, net change in unrealized gain on securities available for sale, net of tax | | $ | 9 | | | | - | |
Pursuant to the requirements of Section 15(d) of the Securities Exchange Act of 1934, the Registrant has duly caused this report to be signed on its behalf by the undersigned, thereunto duly authorized.
Marco Community Bancorp, Inc.
| Dated: March 20, 2008 | By: | /s/ Richard Storm, Jr. |
| | | Richard Storm, Jr. |
| | | Chief Executive Officer |
| | | |
| Dated: March 20, 2008 | By: | /s/ Thomas M. Whelan |
| | | Thomas M. Whelan |
| | | Principal Accounting Officer |
Pursuant to the requirements of the Securities Exchange Act of 1934, this Form 10-K has been signed by the following persons in the capacities and as of the dates indicated:
| Signatures | | Dates |
| | | |
| /s/ John V. Cofer | | March 20, 2008 |
| John V. Cofer, Director | | Date |
| | | |
| | | |
| /s/ Joel M. Cox, Sr. | | March 20, 2008 |
| Joel M. Cox, Sr., Director | | Date |
| | | |
| | | |
| /s/ Bruce G. Fedeor | | March 20, 2008 |
| Bruce G. Fedor, Director | | Date |
| | | |
| | | |
| /s/ Jamie B. Greusel | | March 20, 2008 |
| Jamie B. Greusel, Director | | Date |
| | | |
| | | |
/s/ Robert A. Marks | | March 20, 2008 |
| Robert A. Marks, Director | | Date |
| | | |
| | | |
| /s/ Stephen A. McLauglin | | March 20, 2008 |
| Stephen A. McLaughlin, Director | | Date |
| | | |
| | | |
| /s/ E. Terry Skone | | March 20, 2008 |
| E. Terry Skone, Director | | Date |
| | | |
| | | |
| /s/ Richard Storm, Jr. | | March 20, 2008 |
| Richard Storm, Jr. Chairman & CEO | | Date |
| | | |
| | | |
| /s/ Thomas M. Whelan | | March 20, 2008 |
| Thomas M. Whelan, Chief Financial Officer | | Date |