UNITED STATES
SECURITIES AND EXCHANGE COMMISSION
Washington, D.C. 20549
FORM N-CSR
CERTIFIED SHAREHOLDER REPORT OF REGISTERED
MANAGEMENT INVESTMENT COMPANIES
Investment Company Act file number 811-21317
Stadion Investment Trust
(Exact name of registrant as specified in charter)
1061 Cliff Dawson Road, Watkinsville, Georgia 30677
(Address of principal executive offices)(Zip code)
Sareena Khwaja-Dixon, Esq.
ALPS Fund Services, Inc., 1290 Broadway, Suite 1100, Denver, CO 80203
(Name and address of agent for service)
Registrant's telephone number, including area code: (706) 583-5207
Date of fiscal year end: May 31
Date of reporting period: June 1, 2016 through November 30, 2016
Form N-CSR is to be used by management investment companies to file reports with the Commission not later than 10 days after the transmission to stockholders of any report that is required to be transmitted to stockholders under Rule 30e-1 under the Investment Company Act of 1940 (17 CFR 270.30e-1). The Commission may use the information provided on Form N-CSR in its regulatory, disclosure review, inspection, and policymaking roles.
A registrant is required to disclose the information specified by Form N-CSR, and the Commission will make this information public. A registrant is not required to respond to the collection of information contained in Form N-CSR unless the Form displays a currently valid Office of Management and Budget ("OMB") control number. Please direct comments concerning the accuracy of the information collection burden estimate and any suggestions for reducing the burden to Secretary, Securities and Exchange Commission, 450 Fifth Street, NW, Washington, DC 20549-0609. The OMB has reviewed this collection of information under the clearance requirements of 44 U.S.C. § 3507.
Item 1. Reports to Stockholders.
SEMI-ANNUAL REPORT
November 30, 2016
STADION TACTICAL GROWTH FUND
STADION TACTICAL DEFENSIVE FUND
STADION TRILOGY ALTERNATIVE RETURN FUND
STADION ALTERNATIVE INCOME FUND
STADION DEFENSIVE INTERNATIONAL FUND
STADION MANAGED RISK 100 FUND
TABLE OF CONTENTS
Letter to Shareholders | 1 |
Performance Information | 6 |
Disclosure of Fund Expenses | 18 |
Schedules of Investments | 20 |
Statements of Assets and Liabilities | 33 |
Statements of Operations | 35 |
Statements of Changes in Net Assets | 37 |
Financial Highlights | 40 |
Notes to Financial Statements | 58 |
Additional Information | 71 |
| Stadion Investment Trust | Letter to Shareholders |
| | November 30, 2016 (Unaudited) |
Dear Stadion Shareholder,
We are pleased to present the Stadion Funds’ Semi‐Annual Report for the six months ended November 30, 2016. This letter includes a market overview and a discussion of the prevailing market conditions over the past 6 months, highlighting the purpose and approach of each of our funds. First, let’s briefly look at financial market conditions over the last half year.
6 Month Market Condition Overview
Equity Markets
Global equity markets successfully survived a challenging environment, with U.S. equity markets achieving new all‐time highs. The first major speed bump was the June 23 vote for the United Kingdom to leave the European Union (BREXIT). The repercussions on global growth and resulting political uncertainties lead to immediate equities losses. The MSCI Europe Investable Market Index shed nearly ‐14% in US Dollar terms. U.S. markets fared better, only losing ‐5%. However, sentiment quickly changed from pessimism to optimism as doubts arose about the U.K. actually exiting the European Union and hopes that global central banks would keep monetary policies loose thus providing additional liquidity to stabilize markets.
By August U.S equity markets were trading at new all‐time highs. International markets improved as well, but were unable to set new highs. August and September trading could best be described as range bound as the markets awaited the presidential election results. As the polls tightened stocks drifted lower for nine consecutive days, the longest streak since 1980. Although the string of losses generated headlines it totaled only an approximate 3% setback. As voting results trickled in throughout election night and the edge began to shift toward a surprising win for Donald Trump the market went into a tailspin, with the Dow Jones dropping 800 points overnight. But within a day, the market digested its disbelief and went on a tear, recovering all losses and tacking on another +1.4%. Investors seemed to conclude that with a Republican congress, Trump would be successful in implementing tax cuts and public spending programs leading to faster economic growth and higher U.S. equity prices.
Most of the gains for the 6 month period ending November 30 came in the aftermath of the presidential election. The S&P 500 gained +6.01%, the Dow Jones Industrial Average added +8.98%, and the Russell 2000 index—made up of smaller cap stocks that are perceived to benefit more from Trump’s polices—gained +15.37% for the period. Emerging markets also performed well, with the MSCI Emerging Market Index gaining +8.67%. These global rises contrasted to developed markets where, still somewhat stymied by BREXIT, the MSCI EAFE index lost ‐1.12%
Bond Markets
Over the past 6 months, interest rates have seen three distinct periods of movement. Coming out of May, rates moved solidly lower, with the 10‐ year treasury declining from 1.85% to a low of 1.36% on July 8th. From that point through the presidential election, this trend reversed and there was a relatively slow and steady move higher in rates, with the 10‐year recapturing the entire move lower to close back at 1.85% before the election. Then the surprise outcome of the election threw a Trump‐sized wrench into the bond markets. Rates spiked higher, with the 10‐year eventually closing November at 2.38% just slightly higher than where it closed out the calendar year 2015.
After climbing slightly in June, investment grade and high yield corporate bond spreads gradually tightened through the remainder of the period. Overall, the Barclays Aggregate Bond index was down 0.92% with most of the downside occurring post‐election. Going forward, the elephant in the room will be the Federal Open Market Committee (“FOMC”) mystery of if, when, and to what degree they will raise interest rates for the remainder of the year into early 2017. Almost a given based on current probabilities and recent proclamations.
Stadion’s Tactical Equity Portfolio Line‐up
Stadion’s line‐up of tactical equity funds offer varying degrees of risk management and the ability to diversify across markets. For a more growth oriented strategy that still presents a defensive element, the Tactical Growth Fund (“Growth Fund”) might be a logical choice. For added defense, Stadion’s Tactical Defensive Fund (“Defensive Fund”) seeks to provide persistent market exposure but with an eye always on risk management. Stadion’s Managed Risk 100 Fund (“Managed Fund”) is our most defensive/conservative equity strategy. The Stadion Defensive International Fund (“International Fund”) is designed to provide measured access to developed and emerging international markets while attempting to manage exposure to risk and volatility.
Stadion’s Alternative Portfolio Line‐up
Stadion’s Trilogy Alternative Return Fund (“Trilogy Fund”) is an absolute return strategy designed to be market‐direction agnostic over the course of a year. Stadion’s Alternative Income Fund (“Income Fund”) seeks to generate premium from non‐traditional assets outside of traditional fixed income markets.
| Semi-Annual Report | November 30, 2016 | 1 |
| Stadion Investment Trust | Letter to Shareholders |
| | November 30, 2016 (Unaudited) |
Stadion Tactical Growth Fund
The Growth Fund follows a rules based, disciplined, proprietary model. The model quantitatively ranks all actively traded Exchange Traded Funds (“ETFs”) that have first passed a fundamental review, ranking them on risk‐adjusted return. The holdings of the Growth Fund are adjusted ongoing to favor the purchase and holding of ETFs presenting strength within the model. ETFs perceived as weak by the model are sold or not considered for purchase. The goal of the Growth Fund’s investment process is to produce above market returns while assuming below market risk over a market cycle. What differentiates the Growth Fund from Stadion’s trend following strategies is that instead of allocating to cash, the Growth Fund will attempt to allocate among a mix of defensive and non‐correlated assets during turbulent times.
For the six months ending November 30, 2016, the Growth Fund – Class A returned 7.68%. These numbers exclude the impact of the 5.75% sales load. The Fund’s performance reflects allocation decisions and market performance. Its primary benchmark, the Morningstar Moderately Aggressive Target Risk Index, returned 4.53% for the half‐year period. The secondary benchmark, the S&P 500, returned 6.01% for the half‐year period.
The Growth Fund’s security selection and ranking process allocated the portion of the portfolio dedicated to U.S. equities, which maintained an approximate 80% weighting the portfolio during the period, towards small cap and growth stocks, along with some rotation amongst sectors. For a majority of the quarter, this portion of the account remained somewhat status quo. The equity holdings saw some dispersion from the aforementioned Morningstar Index’s equity holdings, primarily from a lower allocation to the strong performing, albeit volatile, Emerging Markets. Then came the market’s reaction to the surprise win of President‐Elect Trump, with small cap stocks strongly outperforming other market segments, and the fund positioned to take advantage. Additionally, international (emerging market) equities sold off, allowing for the equity performance differential to narrow.
The non‐US Equity portion of the Growth Fund likewise allocates to ETFs showing ranking strength but with a low correlation to U.S. equities. The purpose of diversified allocations is to help achieve the Growth Fund’s goal of exhibiting below‐market risk over time. Our non‐correlated holdings had a dual effect this quarter of reducing risk while also keeping pace performance‐wise to their equity‐correlated counterparts. Much of this performance boost came from a position in inverse fixed income holdings, meaning as interest rates rose as would the value of these securities. This tailwind was especially beneficial following the election surprise, as US interest rates spiked to levels not seen since the end of calendar year 2015. This portion also maintained a steady allocation to cash and ultrashort duration ETFs, which provided a lower volatility yet steady return stream.
Stadion Tactical Defensive Fund
The Tactical Defensive Fund seeks to focus on longer term cyclical trends to find a balance of preservation and return that also incorporates shorter term intermediate trends. Fifty percent of the portfolio is governed by the long term trend strategy and 50% is governed by the shorter (more safety conscious) intermediate term strategy.
During the 6 months ended November 30, 2016 the Defensive Fund – Class A was up 4.60% excluding the impact of the 5.75% sales load. During this same time period the S&P 500 Index rose 6.01% while the Morningstar Tactical Allocation Category benchmark gained 2.54%.
Both the long term and intermediate term measures had the Tactical Defensive Fund fully invested to begin the period. Soon thereafter the shorter term risk measures began to identify increasing risk levels heading into the U.K. vote to leave the European Union. By the actual vote this portion of the portfolio was in its most defensive positon holding cash equivalents and avoiding a 5% drawdown in the U.S. equity markets. Market sentiment quickly changed from pessimism to optimism in hopes that central banks would keep monetary policies loose and provide liquidity to stabilize markets. In early July this portion of the portfolio was again fully invested and participated as the market reached new all‐time highs before the market drifted sideways‐to‐lower heading into the uncertainty surrounding the U.S. presidential election. The shorter to intermediate term measures again identified increased risk levels in the market and we began to take defensive positons in this portion of the portfolio. These measures helped avoid much of the volatility surrounding the election. Following the Trump win and reduced volatility the shorter term risk measures improved and the strategy was back to a fully invested positon. Through this reporting period the longer term portion of the portfolio stayed full invested capturing most of the markets gains. Security selection also provided a boost to the strategy having an overweight to some of the better performing sectors. The BREXIT vote and the presidential election were significant market events and the strategy performed well relative to the broader market averages while maintaining ongoing risk management.
Stadion Trilogy Alternative Return Fund
The Trilogy Fund is a multi‐strategy portfolio designed to generate total returns regardless of market direction, with an emphasis on lower risk and volatility than U.S. equity markets. The Trilogy Fund consists of an equity component, an income component and a trend component, designed so that two of the three should be in favor over a given year. For the six months ended November 30 2016, the Trilogy Fund Class A returned +4.79% excluding the impact of the 5.75% sales load, while the HFRX Absolute Return Index was up +0.16% and the Morningstar Multi‐Alternative Category gained +0.41%. From a collateral standpoint, equities contributed strongly as domestic equity markets rallied off the post‐Brexit lows in June, and then again following the surprise Trump election results in November. The fixed income in the Trilogy Fund declined slightly as rates rose towards the end of the period on expectations of the second rate hike from the Federal Open Market Committee (“ FOMC”) in December. The option strategies that the Trilogy Fund employs mostly helped for the six month period. With a somewhat choppy domestic equity rally over the 6 month period, the shorter term option selling strategy continued to provide yield despite a couple of months of large market moves. The positive overall trend in equity markets has also helped the market movement portion of the fund participate to a small degree in the fundamental move over the time frame.
| Stadion Investment Trust | Letter to Shareholders |
| | November 30, 2016 (Unaudited) |
Stadion Alternative Income Fund
The Income Fund seeks to generate income and absolute return while avoiding potential “blow up” risks associated with many income‐producing strategies focused on fixed income. The Income Fund seeks dividend income from equities while utilizing a market collar to limit equity risk, and also sells short term options on a rolling basis to try and collect yield from alternative sources. For the six months ended November 30, 2016, the Income Fund Class A returned +1.67% excluding the impact of the 5.75% sales load, while the Barclays Capital Aggregate Bond Index lost ‐0.92% and the Morningstar Option Writing Category gained +2.68%. The diversified approach to income worked well during the six month period with the equities providing a lift while the collar hedged off some of the equity returns as expected in an up market. The short term options sold in an attempt to collect yield were a slight drag on the portfolio over the time period as volatility was low and a couple of large months of equity moves erased the small premiums collected in the flatter months.
Stadion Defensive International Fund
Similar to Stadion’s other trend following strategies; the International Fund’s investment model assesses market conditions to identify when to be invested. With a security ranking measure to identify leading asset classes, the International Fund can move to fully defensive positions when risk levels are deemed high. The International Fund borrows from Stadion’s domestic model by leveraging cyclical price measures for long term trend exposure, intermediate term price measures for more reactive and adaptive allocations, and a risk management overlay incorporating speculative Emerging Market trends and volatility to help guide shorter term allocations within the intermediate and longer term mandates. When fully defensive, the International Fund has the ability to invest in cash and non‐US short duration fixed income. Due to including both Emerging and Developed market indications into the investment process, analyzing the Defensive International Fund’s returns relative to both a developed‐ market benchmark (MSCI EAFE), and an emerging market benchmark (MSCI EM) is prudent.
For the six month period ending November 30, 2016, the Stadion Defensive International Fund – Class A returned ‐6.75% which does not include a deduction for the 5.75% sales load. During this same six month period, the MSCI EAFE Index returned ‐1.12% while the MSCI EM Index gained +8.67%. A choppy market environment at the beginning of the period (through mid‐July) was the culprit for a majority of the underperformance, while the rest of the period the fund traded more in‐line.
Stadion Managed Risk 100 Fund
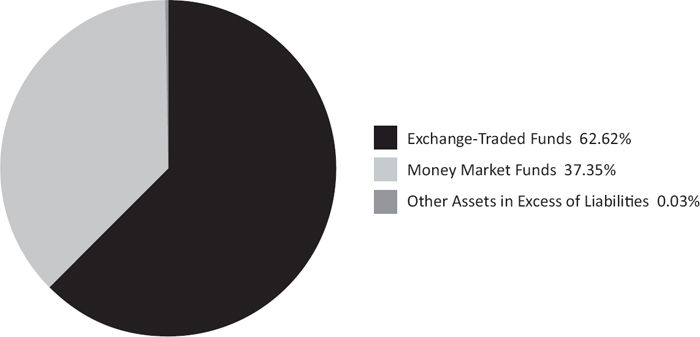
The Managed Risk 100 Fund is a fully unconstrained strategy that can tactically shift between as much as 100% equity and as much as 100% cash based on market risk levels as measured by Stadion’s short to intermediate term trend following model.
During the 6 months ended November 30, 2016 the Managed Risk 100 Fund – Class A gained 0.45%, excluding the impact of the 5.75% sales load. During this same time period the S&P 500 Index rose 6.01% and the Morningstar Tactical Allocation Category gained 2.54%
Managed Risk 100 is Stadion’s most defensive strategy in terms of how quickly it will move to a defensive position. The last six months were a challenge for the strategy as it navigated through what many may consider two once‐in‐a‐life time events. Significant volatility‐inducing events such as the BREXIT vote and the presidential election can lead to frequent large tactical shifts resulting in multiple small losing trades. The strategy entered the period fully invested only to be greeted by the U.K.’s unexpected vote to leave the European Union, resulting in unprofitable tactical shifts. Following the U.K. vote risk levels improved and the strategy was back to a fully invested position. Volatility and risk levels increased approaching the U.S. presidential election resulting in additional unprofitable tactical shifts.
At the time no one was certain of the outcome of either vote. As with all defensive trend following managers, we accept the frustration of small losing trades as preferable to potential devastating losses should the outcome of either vote turned into something much more dramatic and devastating.
| Semi-Annual Report | November 30, 2016 | 3 |
| Stadion Investment Trust | Letter to Shareholders |
| | November 30, 2016 (Unaudited) |
Stadion Observations and Market Outlook
The post‐election rise in stocks injected momentum into the market, a piece of the technical equation that was missing for months. The surge in stocks not only brought many of the major indices to new highs but also created a new enthusiasm for stocks. Finally, there are signs of equity inflows starting to emerge. Equity exposures are still below peak levels. We believe those all make an easy case for stocks to continue their run. The question we need to answer is whether this recent rotation from Bonds to Stocks, Large cap stocks to Small cap stocks, Growth to Value, Defense to Offense can reignite the bull, or is it just a short term gyration in the market?
In recent weeks, the dramatic appreciation of the dollar in tandem with a surge in major U.S. indexes has delivered a shocking surprise to all those who expected a broad‐based selloff in the event of an unanticipated outcome in the U.S. presidential election. Market participants appear to have confidently embraced the view that Donald Trump will be successful in implementing his pro‐growth reforms, strengthening and stimulating the U.S. economy. This has been the main narrative of how the dollar has managed to appreciate so rapidly. It is currently at its highest level since 2003.
The post‐election momentum in equities is certainly encouraging. However, we know that markets move in cycles, and we are cognizant of the length and breadth of the current bull market cycle. The law of averages tells us that we should expect the bear market phase of the cycle to occur within this President’s term. The average length of most bull market cycles is approximately 5 years, and this current bull market run has already far exceeded that. The current cyclical bull is already one of the longest in history. For this reason we will continue to prudently manage measured participation in the markets with sound defensive strategies. At Stadion we avoid making market predictions, instead favoring processes designed to play out over full market cycles.
Thank you for entrusting your serious money to Stadion. Please feel free to contact us with any questions or concerns.
Sincerely,
Stadion Money Management
Brad Thompson, CFA
Chief Investment Officer
The views in this report were those of the Funds’ investment adviser as of the date of this Report and may not reflect their views on the date this report is first published or anytime thereafter. These views are intended to assist shareholders in understanding their investment in the Funds and do not constitute investment advice.
Investment in the Funds are subject to investment risks, including, without limitation, market risk, management style risk, risks related to “fund of funds” structure, sector risk, fixed income risk, tracking risk, risks related to ETF net asset value and market price, foreign securities risk, risks related to portfolio turnover and small capitalization companies risk. Since the Funds are a “fund of funds,” an investor will indirectly bear fees and expenses charged by the underlying ETFs and investment companies in which the Funds invest in addition to the Funds’ direct fees and expenses.
Derivative instruments can be volatile and the potential loss to the Funds may exceed the Funds’ initial investment. Derivative instruments may be difficult to value and may be subject to wide swings in valuations caused by changes in the value of the underlying instrument. The use of these instruments requires special skills and knowledge of investment techniques that are different than those normally required for purchasing and selling securities. The Funds could also experience losses if they are unable to close out a position because the market for an instrument or position is or becomes illiquid.
Options are financial derivatives that represent a contract sold by one party (option writer) to another party (option holder). The contract offers the buyer the right, but not the obligation, to buy (call) or sell (put) a security or other financial asset at an agreed-upon price (the strike price) during a certain period of time or on a specific date (exercise date).
An Option Collar is a protective options strategy that is implemented after a long postion in a stock has experienced substantial gains. It is created by purchasing an out of the money put option while simultaneously writing an out of the money call option.
The Funds’ foreign investments generally carry more risks than funds that invest strictly in U.S. assets, including currency risk, geographic risk, and emerging market risk. Risks can also result from varying stages of economic and political development; differing regulatory environments, trading days, and accounting standards; and higher transaction costs of non-U.S. markets. More information about these risks and other risks can be found in the Funds’ prospectus.
| Stadion Investment Trust | Letter to Shareholders |
| | November 30, 2016 (Unaudited) |
The MSCI Europe Investable Market Index (IMI) captures large, mid and small cap representation across 15 Developed Markets countries in Europe*. With 1,387 constituents, the index covers approximately 99% of the free float-adjusted market capitalization across the Developed Markets countries of Europe.
Barclays Capital US Aggregate Bond Index is an unmanaged index of prices of U.S. dollar-denominated investment-grade fixed income securities with remaining maturities of one year and longer.
Barclays U.S. Corporate High Yield Index covers the U.S. dollar-denominated, non-investment grade fixed-rate, taxable corporate bond market.
MSCI EM Index is an unmanaged free float-adjusted market capitalization index that is designed to measure equity market performance of emerging markets.
MSCI EAFE Index (Europe, Australasia, Far East) is an unmanaged free float-adjusted market capitalization index that is designed to measure the equity market performance of developed markets, excluding the US & Canada.
The Morningstar Multi-Alternative Category is a benchmark created and published by Morningstar and defines Alternative as “Alternative funds may take short positions or invest in currencies, derivatives, or other instruments.”
The Morningstar Tactical Allocation Category is a benchmark created and published by Morningstar and is defined as “Portfolios seek to provide capital appreciation and income by actively shifting allocations between asset classes.”
The Morningstar Option Writing Category is a benchmark created and published by Morningstar and includes option writing funds that aim to generate a significant portion of their returns from the collection of premiums on options contracts sold. This category includes covered call strategies, put writing strategies, as well as options strategies that target returns primarily from contract premiums. In addition, option writing funds may seek to generate a portion of their returns, either indirectly or directly, from the volatility risk premium associated with options trading strategies.
The HFRX Absolute Return Index is designed to be representative of the overall composition of the hedge fund universe. It is comprised of all eligible hedge fund strategies; including but not limited to convertible arbitrage, distressed securities, equity hedge, equity market neutral, event driven, macro, merger arbitrage, and relative value arbitrage. As a component of the optimization process, the index selects constituents which characteristically exhibit lower volatilities and lower correlations to standard directional benchmarks of equity market and hedge fund industry performance.
Nasdaq Composite Index is a stock market index of common stocks and similar securities listed on the Nasdaq stock market. It is highly followed in the U.S. as an indicator of the performance of technology and growth company stocks.
The S&P 500®Total Return Index is an unmanaged index of 500 common stocks chosen for market size, liquidity and industry group representation. It is a market-value weighted index.
The Russell 2000 Small Cap Index measures the performance of the 2,000 smallest companies in the Russell 3000 Index, which represents approximately 8% of the total market capitalization of the Russell 3000 Index.
One may not invest directly in an index, which is unmanaged and does not incur fees, expenses or taxes.
Correlation is a measure of how investments move in relation to one another. A correlation of 1 means the two asset classes move exactly in line with each other, while a correlation of -1 means they move in the exact opposite direction.
| Semi-Annual Report | November 30, 2016 | 5 |
| Stadion Tactical Growth Fund | Performance Information |
| | November 30, 2016 (Unaudited) |
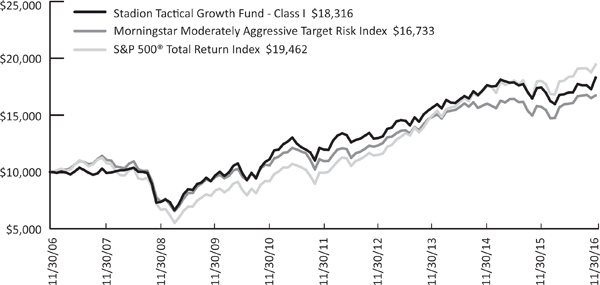
Comparison of the Change in Value of a $10,000 Investment in Stadion Tactical Growth Fund(a), the Morningstar Moderately Aggressive Target Risk Index and the S&P 500® Total Return Index
Average Annual Total Returns(b)(for periods ended November 30, 2016)
| | 6 Month | 1 Year | 5 Year | 10 Year | Since Inception(e) |
Stadion Tactical Growth Fund ‐ A ‐ NAV(c) | 7.68% | 4.92% | 8.61% | 5.97% | 6.31% |
Stadion Tactical Growth Fund ‐ A ‐ POP(c) | 1.48% | ‐1.13% | 7.32% | 5.34% | 5.81% |
Stadion Tactical Growth Fund ‐ C ‐ NAV(c) | 7.28% | 4.06% | 7.79% | 5.18% | 5.51% |
Stadion Tactical Growth Fund ‐ C ‐ CDSC(c) | 6.28% | 3.06% | 7.79% | 5.18% | 5.51% |
| Stadion Tactical Growth Fund ‐ I ‐ NAV | 7.82% | 5.10% | 8.88% | 6.24% | 6.58% |
Morningstar Moderately Aggressive Target Risk Index(d) | 4.53% | 6.38% | 8.85% | 5.28% | 7.01%(f) |
S&P 500® Total Return Index | 6.01% | 8.06% | 14.45% | 6.89% | 7.78%(f) |
| (a) | The line graph above represents performance of Class I shares only, which will vary from the performance of Class A and Class C shares based on the difference in loads and fees paid by shareholders in different classes. |
| (b) | Total return is a measure of the change in value of an investment in the Fund over the periods covered, which assumes any dividends or capital gains distributions are reinvested in shares of the Fund. Returns do not reflect the deduction of taxes a shareholder would pay on Fund distributions or the redemption of Fund shares. Total returns shown do include the effect of applicable sales loads. |
| (c) | The performance shown includes that of the predecessor Fund, the ETF Market Opportunity Fund, a series of Aviemore Trust, which was reorganized into the Fund, as of the close of business on March 29, 2013. Performance information for Class A and Class C shares prior to April 1, 2013, reflects the performance of Class I shares adjusted for the higher expenses paid by Class A and Class C shares. |
(d) | Effective September 28, 2016, the Morningstar Moderately Aggressive Target Risk Index replaced the S&P® 500 Total Return Index as the Fund’s benchmark. The Morningstar Moderately Aggressive Target Risk Index was selected as it more closely aligns to the Stadion Tactical Growth Fund’s strategies. |
| (e) | Class I, Class A and C shares of the Fund commenced operations on May 3, 2004, April 1, 2013 and April 1, 2013, respectively. The performance shown for Class A and C shares for periods pre-dating the commencement of operations of those classes reflects the performance of the Fund’s Class I shares, the initial share class, calculated using the fees and expenses of Class A and C shares respectively and without the effect of any fee and expense limitations or waivers. If Class A and C shares of the Fund had been available during periods prior to April 1, 2013, the performance shown may have been different. |
(f) | Represents the period from May 3, 2004 (date of original public offering of Class I shares) through November 30, 2016. |
The performance information quoted above represents past performance and past performance does not guarantee future results. Investment return and principal value of an investment will fluctuate so that an investor’s shares, when redeemed, may be worth more or less than their original cost. Current performance may be lower or higher than the performance data quoted. Performance data, current to the most recent month end, may be obtained by calling 1-800-222-7636. An investor should consider a Fund’s investment objectives, risks, and charges and expenses carefully before investing. The Fund’s prospectus contains this and other important information. For information on the Fund’s expense ratios, please see the Financial Highlights tables found within this Report.
| Stadion Tactical Growth Fund | Performance Information |
| | November 30, 2016 (Unaudited) |
The Total Annual Fund Operating Expenses for Class A, Class C and Class I are 1.94%, 2.72% and 1.72%, respectively. The Fund’s investment adviser, Stadion Money Management, LLC (the “Advisor”) has entered into an Expense Limitation Agreement with the Fund under which it has contractually agreed to waive Management Fees and to assume other expenses of the Fund, if necessary, in an amount that limits annual operating expenses (exclusive of interest expense on any borrowings, taxes, brokerage commissions, extraordinary expenses, Acquired Fund Fees and Expenses and payments, if any, under a Rule 12b-1 Distribution Plan) of Class A, Class C and Class I shares to not more than 1.30% of the average daily net assets allocable to each Class of the Fund. The Expense Limitation Agreement is currently in effect until October 1, 2017.
POP, the “Public Offering Price”, and NAV, the “Net Asset Value” price, are terms used to describe what share price was applied to Class A and/or Class C shares at the time of purchase. A CDSC (“Contingent Deferred Sales Charge”) is a redemption fee that can be applied if purchased share are redeemed prior to a specified holding period. For additional information please consult the Fund’s Prospectus.
The Morningstar Target Risk Index family is designed to meet the needs of investors who would like to maintain a target level of equity exposure through a portfolio diversified across equities, bonds and inflation-hedged instruments. The Morningstar Moderately Aggressive Target Risk Index seeks approximately 80% global equity exposure.
The S&P 500®Total Return Index is an unmanaged index of 500 common stocks chosen for market size, liquidity and industry group representation. It is a market-value weighted index. The index is not actively managed and does not reflect any deduction for fees, expenses or taxes.
An investor may not invest directly in an index.
Diversification does not eliminate the risk of experiencing investment losses.
Information included or referred to on, or otherwise accessible through, our website is not intended to form part of or be incorporated into this report or the Fund’s prospectus.
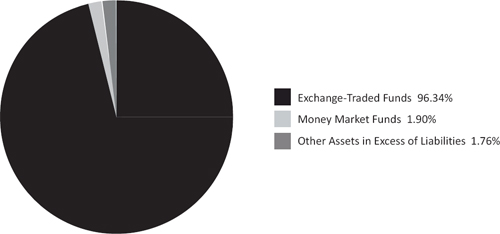
Portfolio Composition (as a % of net assets)
| Semi-Annual Report | November 30, 2016 | 7 |
| Stadion Tactical Defensive Fund | Performance Information |
| | November 30, 2016 (Unaudited) |
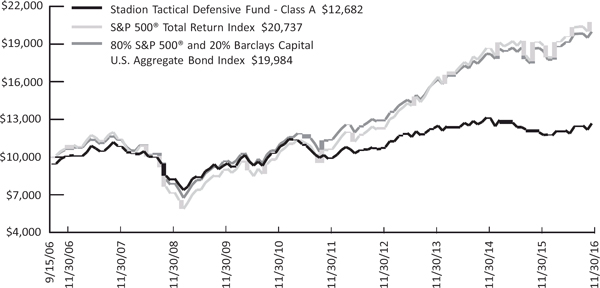
Comparison of the Change in Value of a $10,000 Investment in Stadion Tactical Defensive Fund(a), the S&P 500® Total Return Index and the 80% S&P 500® and 20% Barclays Capital U.S. Aggregate Bond Index
Average Annual Total Returns(b)(for periods ended November 30, 2016)
| | 6 Month | 1 Year | 5 Year | 10 Year | Since Inception(c) |
| Stadion Tactical Defensive Fund ‐ A ‐ NAV | 4.60% | 5.94% | 5.16% | 2.38% | 2.95% |
| Stadion Tactical Defensive Fund ‐ A ‐ POP | ‐1.45% | ‐0.17% | 3.92% | 1.77% | 2.35% |
| Stadion Tactical Defensive Fund ‐ C ‐ NAV | 4.29% | 5.20% | 4.34% | 1.59% | 2.15% |
| Stadion Tactical Defensive Fund ‐ C ‐ CDSC | 3.29% | 4.20% | 4.34% | 1.59% | 2.15% |
| Stadion Tactical Defensive Fund ‐ I ‐ NAV | 4.81% | 6.32% | 5.39% | 2.60% | 3.17% |
S&P 500® Total Return Index | 6.01% | 8.06% | 14.45% | 6.89% | 7.41%(d) |
80% S&P 500® and 20% Barclays Capital U.S. Aggregate Bond Index | 4.63% | 6.96% | 12.05% | 6.57% | 7.02%(d) |
(a) | The line graph above represents performance of Class A shares only, which will vary from the performance of Class C and Class I shares based on the difference in loads and fees paid by shareholders in different classes. The change in value of the initial $10,000 investment shown for Class A shares in the line graph reflects the maximum front-end sales load of 5.75%. |
(b) | Total return is a measure of the change in value of an investment in the Fund over the periods covered, which assumes any dividends or capital gains distributions are reinvested in shares of the Fund. Returns do not reflect the deduction of taxes a shareholder would pay on Fund distributions or the redemption of Fund shares. Total returns shown do include the effect of applicable sales loads. |
(c) | Class A, Class C and I shares of the Fund commenced operations on September 15, 2006, October 1, 2009 and May 28, 2010, respectively. The performance shown for Class C and I shares for periods pre-dating the commencement of operations of those classes reflects the performance of the Fund’s Class A shares, the initial share class, calculated using the fees and expenses of Class C and I shares respectively and without the effect of any fee and expense limitations or waivers. If Class C and I shares of the Fund had been available during periods prior to October 1, 2009 and May 28, 2010, respectively, the performance shown may have been different. |
(d) | Represents the period from September 15, 2006 (date of original public offering of Class A shares) through November 30, 2016. |
The performance information quoted above represents past performance and past performance does not guarantee future results. Investment return and principal value of an investment will fluctuate so that an investor’s shares, when redeemed, may be worth more or less than their original cost. Current performance may be lower or higher than the performance data quoted. Performance data, current to the most recent month end, may be obtained by calling 1-800-222-7636. An investor should consider a Fund’s investment objectives, risks, and charges and expenses carefully before investing. The Fund’s prospectus contains this and other important information. For information on the Fund’s expense ratios, please see the Financial Highlights tables found within this Report.
| Stadion Tactical Defensive Fund | Performance Information |
| | November 30, 2016 (Unaudited) |
The Total Annual Fund Operating Expenses for Class A, Class C and Class I are 2.22%, 2.99% and 2.02%, respectively. The Fund’s investment advisor, Stadion Money Management, LLC (the “Advisor”) has agreed to waive fees and reimburse for other operating expenses (exclusive of interest expense on any borrowings, taxes, brokerage commissions, extraordinary expenses, acquired fund fees and expenses and payments, if any, under a Rule 12b-1 Distribution Plan) in excess of 1.70% of the average daily net assets for Class A, Class C, and Class I, until at least October 1, 2017.
POP, the “Public Offering Price”, and NAV, the “Net Asset Value” price, are terms used to describe what share price was applied to Class A and/or Class C shares at the time of purchase. A CDSC (“Contingent Deferred Sales Charge”) is a redemption fee that can be applied if purchased shares are redeemed prior to a specified holding period. For additional information please consult the Fund’s Prospectus.
The S&P 500®Total Return Index is an unmanaged index of 500 common stocks chosen for market size, liquidity and industry group representation. It is a market-value weighted index. The index is not actively managed and does not reflect any deduction for fees, expenses or taxes.
Barclays Capital U.S. Aggregate Bond Index is an unmanaged index of prices of U.S. dollar-denominated investment-grade fixed income securities with remaining maturities of one year and longer.
An investor may not invest directly in an index.
Diversification does not eliminate the risk of experiencing investment losses.
Information included or referred to on, or otherwise accessible through, our website is not intended to form part of or be incorporated into this report or the Fund’s prospectus.
Portfolio Composition (as a % of net assets)
| Semi-Annual Report | November 30, 2016 | 9 |
| Stadion Trilogy Alternative Return Fund | Performance Information |
| | November 30, 2016 (Unaudited) |
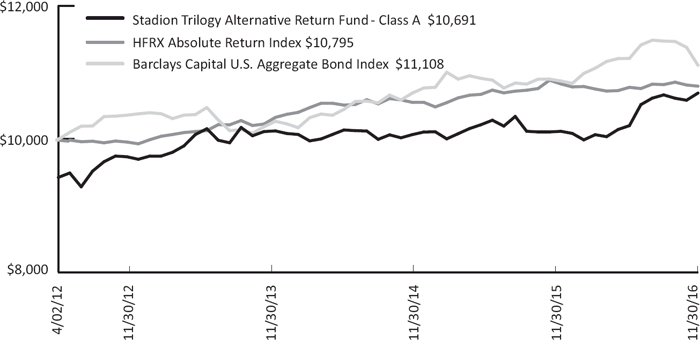
Comparison of the Change in Value of a $10,000 Investment in Stadion Trilogy Alternative Return Fund(a), the HFRX Absolute Return Index and the Barclays Capital U.S. Aggregate Bond Index
Average Annual Total Returns(b) (for periods ended November 30, 2016)
| | 6 Month | 1 Year | Since Inception(c) |
Stadion Trilogy Alternative Return Fund ‐ A ‐ NAV | 4.79% | 5.67% | 2.74% |
Stadion Trilogy Alternative Return Fund ‐ A ‐ POP | ‐1.23% | ‐0.42% | 1.44% |
Stadion Trilogy Alternative Return Fund ‐ C ‐ NAV | 4.34% | 4.74% | 1.98% |
Stadion Trilogy Alternative Return Fund ‐ C ‐ CDSC | 3.34% | 3.74% | 1.98% |
| Stadion Trilogy Alternative Return Fund ‐ I ‐ NAV | 4.90% | 5.91% | 2.98% |
| HFRX Absolute Return Index | 0.16% | ‐0.31% | 1.65%(d) |
| Barclays Capital U.S. Aggregate Bond Index | ‐0.92% | 2.17% | 2.28%(d) |
(a) | The line graph above represents performance of Class A shares only, which will vary from the performance of Class C and Class I shares based on the difference in loads and fees paid by shareholders in different classes. The change in value of the initial $10,000 investment shown for Class A shares in the line graph reflects the maximum front-end sales load of 5.75%. |
(b) | Total return is a measure of the change in value of an investment in the Fund over the periods covered, which assumes any dividends or capital gains distributions are reinvested in shares of the Fund. Returns do not reflect the deduction of taxes a shareholder would pay on Fund distributions or the redemption of Fund shares. Total returns shown do include the effect of applicable sales loads. |
(c) | Class A inception: 04/02/12; Class C inception: 04/02/12; Class I inception: 04/02/12. |
(d) | Represents the period from April 2, 2012 (date of original public offering of Class A shares) through November 30, 2016. |
The performance information quoted above represents past performance and past performance does not guarantee future results. Investment return and principal value of an investment will fluctuate so that an investor’s shares, when redeemed, may be worth more or less than their original cost. Current performance may be lower or higher than the performance data quoted. Performance data, current to the most recent month end, may be obtained by calling 1-800-222-7636. An investor should consider a Fund’s investment objectives, risks, and charges and expenses carefully before investing. The Fund’s prospectus contains this and other important information. For information on the Fund’s expense ratios, please see the Financial Highlights tables found within this Report.
The Total Annual Fund Operating Expenses for Class A, Class C and Class I are 1.97%, 2.75% and 1.76%, respectively. The Fund’s investment advisor, Stadion Money Management, LLC (the “Advisor”) has agreed to waive fees and reimburse for other operating expenses (exclusive of interest expense on any borrowings, taxes, brokerage commissions, extraordinary expenses, acquired fund fees and expenses and payments, if any, under a Rule 12b-1 Distribution Plan) in excess of 1.70% of the average daily net assets for Class A, Class C, and Class I, until at least October 1, 2017.
| Stadion Trilogy Alternative Return Fund | Performance Information |
| | November 30, 2016 (Unaudited) |
POP, the “Public Offering Price”, and NAV, the “Net Asset Value” price, are terms used to describe what share price was applied to Class A and/or Class C shares at the time of purchase. A CDSC (“Contingent Deferred Sales Charge”) is a redemption fee that can be applied if purchased shares are redeemed prior to a specified holding period. For additional information please consult the Fund’s Prospectus.
The HFRX Absolute Return Index is designed to be representative of the overall composition of the hedge fund universe. It is comprised of all eligible hedge fund strategies; including but not limited to convertible arbitrage, distressed securities, equity hedge, equity market neutral, event driven, macro, merger arbitrage, and relative value arbitrage. As a component of the optimization process, the index selects constituents which characteristically exhibit lower volatilities and lower correlations to standard directional benchmarks of equity market and hedge fund industry performance.
Barclays Capital U.S. Aggregate Bond Index is an unmanaged index of prices of U.S. dollar-denominated investment-grade fixed income securities with remaining maturities of one year and longer.
An investor may not invest directly in an index.
Diversification does not eliminate the risk of experiencing investment losses.
Information included or referred to on, or otherwise accessible through, our website is not intended to form part of or be incorporated into this report or the Fund's prospectus.
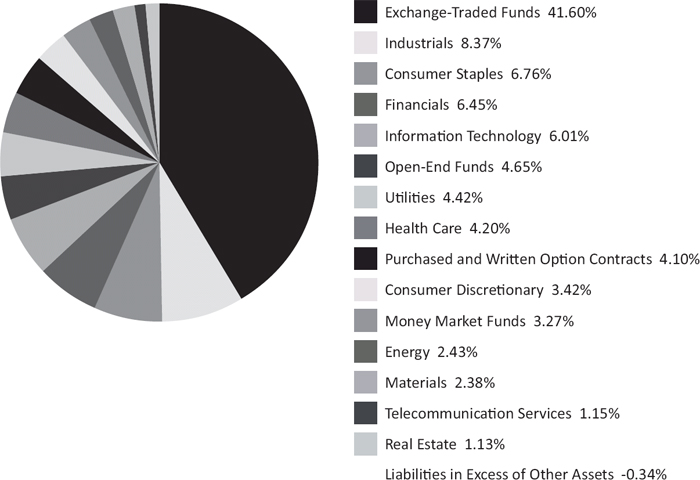
Portfolio Composition (as a % of net assets)
| Semi-Annual Report | November 30, 2016 | 11 |
| Stadion Alternative Income Fund | Performance Information |
| | November 30, 2016 (Unaudited) |
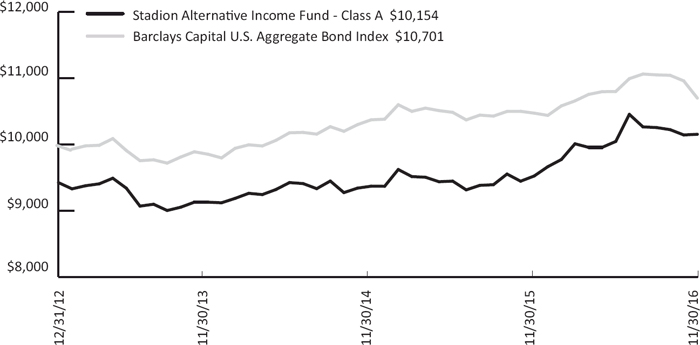
Comparison of the Change in Value of a $10,000 Investment in Stadion Alternative Income Fund(a) and the Barclays Capital U.S. Aggregate Bond Index
Average Annual Total Returns(b) (for periods ended November 30, 2016)
| | 6 Month | 1 Year | Since Inception(c) |
Stadion Alternative Income Fund ‐ A ‐ NAV | 1.08% | 6.61% | 1.92% |
| Stadion Alternative Income Fund ‐ A ‐ POP | ‐4.74% | 0.50% | 0.39% |
Stadion Alternative Income Fund ‐ C ‐ NAV | 0.67% | 5.84% | 1.16% |
Stadion Alternative Income Fund ‐ C ‐ CDSC | ‐0.33% | 4.84% | 1.16% |
| Stadion Alternative Income Fund ‐ I ‐ NAV | 1.26% | 7.00% | 2.20% |
| Barclays Capital U.S. Aggregate Bond Index | ‐0.92% | 2.17% | 1.74%(d) |
(a) | The line graph above represents performance of Class A shares only, which will vary from the performance of Class C and Class I shares based on the difference in loads and fees paid by shareholders in different classes. The change in value of the initial $10,000 investment shown for Class A shares in the line graph reflects the maximum front-end sales load of 5.75%. |
(b) | Total return is a measure of the change in value of an investment in the Fund over the periods covered, which assumes any dividends or capital gains distributions are reinvested in shares of the Fund. Returns do not reflect the deduction of taxes a shareholder would pay on Fund distributions or the redemption of Fund shares. Total returns shown do include the effect of applicable sales loads. |
(c) | Class A inception: 12/31/12; Class C inception: 8/7/15; Class I inception: 2/14/13. The performance shown for Class C and I shares for periods pre-dating the commencement of operations of those classes reflects the performance of the Fund’s Class A shares, the initial share class, calculated using the fees and expenses of Class C and Class I shares, respectively, and without the effect of any fee and expense limitations or waivers. If Class C and Class I shares of the Fund had been available prior to August 7, 2015 and February 14, 2013, respectively, the performance shown may have been different. |
(d) | Represents the period from December 31, 2012 (date of original public offering of Class A shares) through November 30, 2016. |
The performance information quoted above represents past performance and past performance does not guarantee future results. Investment return and principal value of an investment will fluctuate so that an investor’s shares, when redeemed, may be worth more or less than their original cost. Current performance may be lower or higher than the performance data quoted. Performance data, current to the most recent month end, may be obtained by calling 1-800-222-7636. An investor should consider a Fund’s investment objectives, risks, and charges and expenses carefully before investing. The Fund’s prospectus contains this and other important information. For information on the Fund’s expense ratios, please see the Financial Highlights tables found within this Report.
The Total Annual Fund Operating Expenses for Class A, Class C and Class I are 1.74%, 2.19% and 1.30%, respectively. The Fund’s investment advisor, Stadion Money Management, LLC (the “Advisor”) has agreed to waive fees and reimburse for other operating expenses (exclusive of interest expense on any borrowings, taxes, brokerage commissions, extraordinary expenses, acquired fund fees and expenses and payments, if any, under a Rule 12b-1 Distribution Plan) in excess of 1.15% of the average daily net assets for Class A, Class C and Class I, until at least October 1, 2017.
| Stadion Alternative Income Fund | Performance Information |
| | November 30, 2016 (Unaudited) |
POP, the “Public Offering Price”, and NAV, the “Net Asset Value” price, are terms used to describe what share price was applied to Class A shares at the time of purchase. For additional information please consult the Fund’s Prospectus.
Barclays Capital U.S. Aggregate Bond Index is an unmanaged index of prices of U.S. dollar-denominated investment-grade fixed income securities with remaining maturities of one year and longer.
An investor may not invest directly in an index.
Diversification does not eliminate the risk of experiencing investment losses.
Information included or referred to on, or otherwise accessible through, our website is not intended to form part of or be incorporated into this report or the Fund's prospectus.
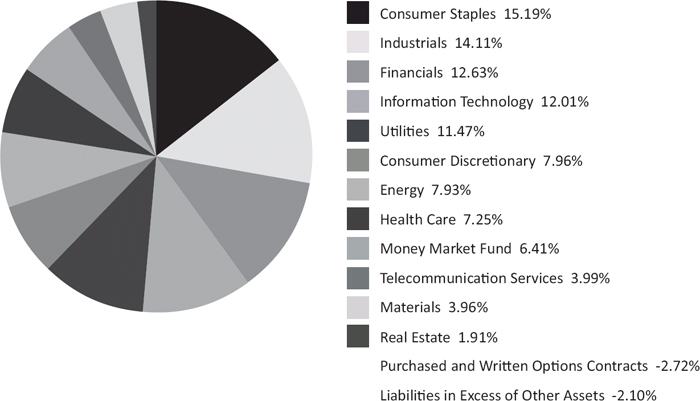
Portfolio Composition (as a % of net assets)
| Semi-Annual Report | November 30, 2016 | 13 |
| Stadion Defensive International Fund | Performance Information |
| | November 30, 2016 (Unaudited) |
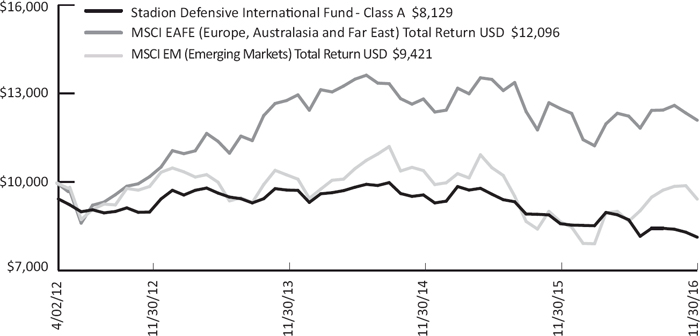
Comparison of the Change in Value of a $10,000 Investment in Stadion Defensive International Fund(a), the MSCI EAFE (Europe, Australasia and Far East) Total Return USD and the MSCI EM (Emerging Markets) Total Return USD
Average Annual Total Returns(b) (for periods ended November 30, 2016)
| | 6 Month | 1 Year | Since Inception(c) |
Stadion Defensive International Fund ‐ A ‐ NAV | ‐6.64% | ‐5.34% | ‐3.12% |
Stadion Defensive International Fund ‐ A ‐ POP | ‐11.99% | ‐10.79% | ‐4.34% |
Stadion Defensive International Fund ‐ C ‐ NAV | ‐7.04% | ‐6.04% | ‐3.85% |
Stadion Defensive International Fund ‐ C ‐ CDSC | ‐7.97% | ‐6.98% | ‐3.85% |
| Stadion Defensive International Fund ‐ I ‐ NAV | ‐6.59% | ‐5.19% | ‐2.88% |
| MSCI EAFE (Europe, Australasia and Far East) Total Return USD | ‐1.12% | ‐3.17% | 4.17%(d) |
| MSCI EM (Emerging Markets) Total Return USD | 8.67% | 8.86% | ‐1.27%(d) |
(a) | The line graph above represents performance of Class A shares only, which will vary from the performance of Class C and Class I shares based on the difference in loads and fees paid by shareholders in different classes. The change in value of the initial $10,000 investment shown for Class A shares in the line graph reflects the maximum front-end sales load of 5.75%. |
(b) | Total return is a measure of the change in value of an investment in the Fund over the periods covered, which assumes any dividends or capital gains distributions are reinvested in shares of the Fund. Returns do not reflect the deduction of taxes a shareholder would pay on Fund distributions or the redemption of Fund shares. Total returns shown do include the effect of applicable sales loads. |
(c) | Class A inception: 04/02/12; Class C inception: 04/02/12; Class I inception: 04/02/12. |
(d) | Represents the period from April 2, 2012 (date of original public offering of Class A shares) through November 30, 2016. |
The performance information quoted above represents past performance and past performance does not guarantee future results. Investment return and principal value of an investment will fluctuate so that an investor’s shares, when redeemed, may be worth more or less than their original cost. Current performance may be lower or higher than the performance data quoted. Performance data, current to the most recent month end, may be obtained by calling 1-800-222-7636. An investor should consider a Fund’s investment objectives, risks, and charges and expenses carefully before investing. The Fund’s prospectus contains this and other important information. For information on the Fund’s expense ratios, please see the Financial Highlights tables found within this Report.
The Total Annual Fund Operating Expenses for Class A, Class C and Class I are 2.97%, 3.79% and 2.86%, respectively. The Fund’s investment advisor, Stadion Money Management, LLC (the “Advisor”) has agreed to waive fees and reimburse for other operating expenses (exclusive of interest expense on any borrowings, taxes, brokerage commissions, extraordinary expenses, acquired fund fees and expenses and payments, if any, under a Rule 12b-1 Distribution Plan) in excess of 1.70% of the average daily net assets for Class A, Class C, and Class I, until at least October 1, 2017.
| Stadion Defensive International Fund | Performance Information |
| | November 30, 2016 (Unaudited) |
POP, the “Public Offering Price”, and NAV, the “Net Asset Value” price, are terms used to describe what share price was applied to Class A and/or Class C shares at the time of purchase. A CDSC (“Contingent Deferred Sales Charge”) is a redemption fee that can be applied if purchased shares are redeemed prior to a specified holding period. For additional information please consult the Fund’s Prospectus.
The MSCI EAFE (Europe, Australasia and Far East) Total Return USD Index (is an unmanaged free float-adjusted market capitalization index that is designed to measure the equity market performance of developed markets, excluding the US & Canada.
The MSCI EM (Emerging Markets) Total Return USD Index is an unmanaged free float-adjusted market capitalization index that is designed to measure equity market performance of emerging markets.
An investor may not invest directly in an index.
Diversification does not eliminate the risk of experiencing investment losses.
Information included or referred to on, or otherwise accessible through, our website is not intended to form part of or be incorporated into this report or the Fund's prospectus.
Portfolio Composition (as a % of net assets)
| Semi-Annual Report | November 30, 2016 | 15 |
| Stadion Managed Risk 100 Fund | Performance Information |
| | November 30, 2016 (Unaudited) |
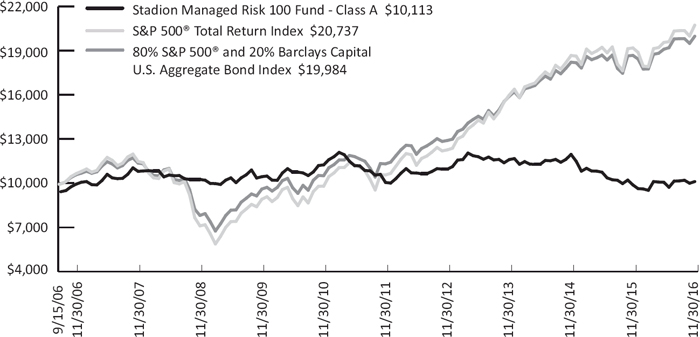
Comparison of the Change in Value of a $10,000 Investment in Stadion Managed Risk 100 Fund(a), the S&P 500® Total Return Index and the 80% S&P 500® and 20% Barclays Capital U.S. Aggregate Bond Index
Average Annual Total Returns(b) (for periods ended November 30, 2016)
| | 6 Month | 1 Year | 5 Year | 10 Year | Since Inception(c) |
| Stadion Managed Risk 100 Fund ‐ A ‐ NAV | 0.45% | 2.31% | 0.12% | 0.17% | 0.69% |
| Stadion Managed Risk 100 Fund ‐ A ‐ POP | ‐5.34% | ‐3.59% | ‐1.05% | ‐0.42% | 0.11% |
| Stadion Managed Risk 100 Fund ‐ C ‐ NAV | 0.00% | 1.45% | ‐0.65% | ‐0.62% | ‐0.10% |
| Stadion Managed Risk 100 Fund ‐ C ‐ CDSC | ‐1.00% | 0.45% | ‐0.65% | ‐0.62% | ‐0.10% |
| Stadion Managed Risk 100 Fund ‐ I ‐ NAV | 0.56% | 2.39% | 0.30% | 0.39% | 0.91% |
S&P 500® Total Return Index | 6.01% | 8.06% | 14.45% | 6.89% | 7.41%(d) |
80% S&P 500® and 20% Barclays Capital U.S. Aggregate Bond Index | 4.63% | 6.96% | 12.05% | 6.57% | 7.02%(d) |
(a) | The line graph above represents performance of Class A shares only, which will vary from the performance of Class C and Class I shares based on the difference in loads and fees paid by shareholders in different classes. The change in value of the initial $10,000 investment shown for Class A shares in the line graph reflects the maximum front-end sales load of 5.75%. |
(b) | Total return is a measure of the change in value of an investment in the Fund over the periods covered, which assumes any dividends or capital gains distributions are reinvested in shares of the Fund. Returns do not reflect the deduction of taxes a shareholder would pay on Fund distributions or the redemption of Fund shares. Total returns shown do include the effect of applicable sales loads. |
(c) | Class A, Class C and I shares of the Fund commenced operations on September 15, 2006, October 1, 2009 and May 28, 2010, respectively. The performance shown for Class C and I shares for periods pre-dating the commencement of operations of those classes reflects the performance of the Fund’s Class A shares, the initial share class, calculated using the fees and expenses of Class C and I shares respectively and without the effect of any fee and expense limitations or waivers. If Class C and I shares of the Fund had been available during periods prior to October 1, 2009 and May 28, 2010, respectively, the performance shown may have been different. |
(d) | Represents the period from September 15, 2006 (date of original public offering of Class A shares) through November 30, 2016. |
The performance information quoted above represents past performance and past performance does not guarantee future results. Investment return and principal value of an investment will fluctuate so that an investor’s shares, when redeemed, may be worth more or less than their original cost. Current performance may be lower or higher than the performance data quoted. Performance data, current to the most recent month end, may be obtained by calling 1-800-222-7636. An investor should consider a Fund’s investment objectives, risks, and charges and expenses carefully before investing. The Fund’s prospectus contains this and other important information. For information on the Fund’s expense ratios, please see the Financial Highlights tables found within this Report.
| Stadion Managed Risk 100 Fund | Performance Information |
| | November 30, 2016 (Unaudited) |
The Total Annual Fund Operating Expenses for Class A, Class C and Class I are 2.05%, 2.84% and 1.87%, respectively. The Fund’s investment advisor, Stadion Money Management, LLC (the “Advisor”) has agreed to waive fees and reimburse for other operating expenses (exclusive of interest expense on any borrowings, taxes, brokerage commissions, extraordinary expenses, acquired fund fees and expenses and payments, if any, under a Rule 12b-1 Distribution Plan) in excess of 1.70% of the average daily net assets for Class A, Class C, and Class I, until at least October 1, 2017.
POP, the “Public Offering Price”, and NAV, the “Net Asset Value” price, are terms used to describe what share price was applied to Class A and/or Class C shares at the time of purchase. A CDSC (“Contingent Deferred Sales Charge”) is a redemption fee that can be applied if purchased shares are redeemed prior to a specified holding period. For additional information please consult the Fund’s Prospectus.
The S&P 500® Total Return Index is an unmanaged index of 500 common stocks chosen for market size, liquidity and industry group representation. It is a market-value weighted index. The index is not actively managed and does not reflect any deduction for fees, expenses or taxes.
Barclays Capital U.S. Aggregate Bond Index is an unmanaged index of prices of U.S. dollar-denominated investment-grade fixed income securities with remaining maturities of one year and longer.
An investor may not invest directly in an index.
Diversification does not eliminate the risk of experiencing investment losses.
Information included or referred to on, or otherwise accessible through, our website is not intended to form part of or be incorporated into this report or the Fund's prospectus.
Portfolio Composition (as a % of net assets)
| Semi-Annual Report | November 30, 2016 | 17 |
| Stadion Investment Trust | Disclosure of Fund Expenses |
| | November 30, 2016 (Unaudited) |
We believe it is important for you to understand the impact of costs on your investment. As a shareholder of the Funds, you may incur two types of costs: (1) transaction costs, possibly including front‐end and contingent deferred sales loads; and (2) ongoing costs, including management fees, distribution (12b‐1) fees and other Fund expenses. The following examples are intended to help you understand your ongoing costs (in dollars) of investing in the Funds and to compare these costs with the ongoing costs of investing in other mutual funds.
A mutual funds’ ongoing costs are expressed as a percentage of its average net assets. This figure is known as the expense ratio. The expenses in the tables that follow are based on an investment of $1,000 made at the beginning of the most recent semi‐annual period (June 1, 2016) and held until the end of the period (November 30, 2016).
The tables that follow illustrate the Funds’ costs in two ways:
Actual fund return – This section helps you to estimate the actual expenses that you paid over the period. The “Ending Account Value” shown is derived from the Funds’ actual returns, and the third column shows the dollar amount of operating expenses that would have been paid by an investor who started with $1,000 in the Funds. You may use the information here, together with the amount you invested, to estimate the expenses that you paid over the period.
To do so, simply divide your account value by $1,000 (for example, an $8,600 account value divided by $1,000 = 8.6), then multiply the result by the number given for the Fund under the heading “Expenses Paid During Period.”
Hypothetical 5% return – This section is intended to help you compare the Funds’ ongoing costs with those of other mutual funds. It assumes that each Fund had an annual return of 5% before expenses during the period shown, but that the expense ratio is unchanged. In this case, because the returns used are not the Funds’ actual returns, the results do not apply to your investment. The example is useful in making comparisons because the SEC requires all mutual funds to calculate expenses based on a 5% return. You can assess the Funds’ ongoing costs by comparing this hypothetical example with the hypothetical examples that appear in shareholder reports of other funds.
Note that expenses shown in the tables are meant to highlight and help you compare ongoing costs only and do not reflect any transaction costs, such as sales charges (loads). The calculations assume no shares were bought or sold during the period. Your actual costs may have been higher or lower, depending on the amount of your investment and the timing of any purchases or redemptions.
More information about the Funds’ expenses, including historical annual expense ratios, can be found in this report. For additional information on operating expenses and other shareholder costs, please refer to the Funds’ prospectus.
| | Beginning
Account Value
6/1/16 | Ending
Account Value
11/30/16 | Expense Ratio(a) | Expenses Paid
During period
6/1/16 - 11/30/16(b) |
Stadion Tactical Growth Fund - Class A | | | | |
| Based on Actual Fund Return | $ 1,000.00 | $ 1,076.80 | 1.55% | $ 8.07 |
| Based on Hypothetical 5% Return (before expenses) | $ 1,000.00 | $ 1,017.30 | 1.55% | $ 7.84 |
Stadion Tactical Growth Fund - Class C | | | | |
| Based on Actual Fund Return | $ 1,000.00 | $ 1,072.80 | 2.30% | $ 11.95 |
| Based on Hypothetical 5% Return (before expenses) | $ 1,000.00 | $ 1,013.54 | 2.30% | $ 11.61 |
Stadion Tactical Growth Fund - Class I | | | | |
| Based on Actual Fund Return | $ 1,000.00 | $ 1,078.20 | 1.30% | $ 6.77 |
| Based on Hypothetical 5% Return (before expenses) | $ 1,000.00 | $ 1,018.55 | 1.30% | $ 6.58 |
| | | | | |
Stadion Tactical Defensive Fund - Class A | | | | |
| Based on Actual Fund Return | $ 1,000.00 | $ 1,046.00 | 1.95% | $ 10.00 |
| Based on Hypothetical 5% Return (before expenses) | $ 1,000.00 | $ 1,015.29 | 1.95% | $ 9.85 |
Stadion Tactical Defensive Fund - Class C | | | | |
| Based on Actual Fund Return | $ 1,000.00 | $ 1,042.90 | 2.70% | $ 13.83 |
| Based on Hypothetical 5% Return (before expenses) | $ 1,000.00 | $ 1,011.53 | 2.70% | $ 13.62 |
Stadion Tactical Defensive Fund - Class I | | | | |
| Based on Actual Fund Return | $ 1,000.00 | $ 1,048.10 | 1.70% | $ 8.73 |
| Based on Hypothetical 5% Return (before expenses) | $ 1,000.00 | $ 1,016.55 | 1.70% | $ 8.59 |
| | | | | |
| Stadion Investment Trust | Disclosure of Fund Expenses |
November 30, 2016 (Unaudited)
| | Beginning
Account Value
6/1/16 | Ending
Account Value
11/30/16 | Expense Ratio(a) | Expenses Paid
During period
6/1/16 - 11/30/16(b) |
Stadion Trilogy Alternative Return Fund - Class A | | | | |
| Based on Actual Fund Return | $ 1,000.00 | $ 1,047.90 | 1.81% | $ 9.29 |
| Based on Hypothetical 5% Return (before expenses) | $ 1,000.00 | $ 1,015.99 | 1.81% | $ 9.15 |
Stadion Trilogy Alternative Return Fund - Class C | | | | |
| Based on Actual Fund Return | $ 1,000.00 | $ 1,043.40 | 2.60% | $ 13.32 |
| Based on Hypothetical 5% Return (before expenses) | $ 1,000.00 | $ 1,012.03 | 2.60% | $ 13.11 |
Stadion Trilogy Alternative Return Fund - Class I | | | | |
| Based on Actual Fund Return | $ 1,000.00 | $ 1,049.00 | 1.61% | $ 8.27 |
| Based on Hypothetical 5% Return (before expenses) | $ 1,000.00 | $ 1,017.00 | 1.61% | $ 8.14 |
| | | | | |
Stadion Alternative Income Fund - Class A | | | | |
| Based on Actual Fund Return | $ 1,000.00 | $ 1,010.80 | 1.40% | $ 7.06 |
| Based on Hypothetical 5% Return (before expenses) | $ 1,000.00 | $ 1,018.05 | 1.40% | $ 7.08 |
Stadion Alternative Income Fund - Class C | | | | |
| Based on Actual Fund Return | $ 1,000.00 | $ 1,006.70 | 2.12% | $ 10.66 |
| Based on Hypothetical 5% Return (before expenses) | $ 1,000.00 | $ 1,014.44 | 2.12% | $ 10.71 |
Stadion Alternative Income Fund - Class I | | | | |
| Based on Actual Fund Return | $ 1,000.00 | $ 1,012.60 | 1.15% | $ 5.80 |
| Based on Hypothetical 5% Return (before expenses) | $ 1,000.00 | $ 1,019.30 | 1.15% | $ 5.82 |
| | | | | |
Stadion Defensive International Fund - Class A | | | | |
| Based on Actual Fund Return | $ 1,000.00 | $ 933.60 | 1.95% | $ 9.45 |
| Based on Hypothetical 5% Return (before expenses) | $ 1,000.00 | $ 1,015.29 | 1.95% | $ 9.85 |
Stadion Defensive International Fund - Class C | | | | |
| Based on Actual Fund Return | $ 1,000.00 | $ 929.60 | 2.70% | $ 13.06 |
| Based on Hypothetical 5% Return (before expenses) | $ 1,000.00 | $ 1,011.53 | 2.70% | $ 13.62 |
Stadion Defensive International Fund - Class I | | | | |
| Based on Actual Fund Return | $ 1,000.00 | $ 934.10 | 1.70% | $ 8.24 |
| Based on Hypothetical 5% Return (before expenses) | $ 1,000.00 | $ 1,016.55 | 1.70% | $ 8.59 |
| | | | | |
Stadion Managed Risk 100 Fund - Class A | | | | |
| Based on Actual Fund Return | $ 1,000.00 | $ 1,004.50 | 1.90% | $ 9.55 |
| Based on Hypothetical 5% Return (before expenses) | $ 1,000.00 | $ 1,015.54 | 1.90% | $ 9.60 |
Stadion Managed Risk 100 Fund - Class C | | | | |
| Based on Actual Fund Return | $ 1,000.00 | $ 1,000.00 | 2.68% | $ 13.44 |
| Based on Hypothetical 5% Return (before expenses) | $ 1,000.00 | $ 1,011.63 | 2.68% | $ 13.51 |
Stadion Managed Risk 100 Fund - Class I | | | | |
| Based on Actual Fund Return | $ 1,000.00 | $ 1,005.60 | 1.70% | $ 8.55 |
| Based on Hypothetical 5% Return (before expenses) | $ 1,000.00 | $ 1,016.55 | 1.70% | $ 8.59 |
| (a) | The Fund's expense ratios have been based on the Fund's most recent fiscal half-year expenses. |
| (b) | Expenses are equal to the Fund's annualized expense ratio, multiplied by the average account value over the period, multiplied by the number of days in the most recent fiscal half-year (183/365). |
| Semi-Annual Report | November 30, 2016 | 19 |
| Stadion Tactical Growth Fund | Schedule of Investments |
November 30, 2016 (Unaudited)
| EXCHANGE‐TRADED FUNDS ‐ 96.34% | | Shares | | | Value | |
iShares® Core S&P® Small‐Cap ETF | | | 247,990 | | | $ | 33,114,105 | |
iShares® Russell 2000® ETF | | | 251,310 | | | | 33,074,909 | |
| PIMCO Enhanced Short Maturity Active ETF | | | 326,280 | | | | 33,110,894 | |
PowerShares® QQQ Trust, Series 1 | | | 138,937 | | | | 16,325,097 | |
ProShares® Short 20+ Year Treasury(a) | | | 1,436,100 | | | | 34,250,985 | |
| SPDR S&P Oil & Gas Exploration & Production ETF | | | 427,390 | | | | 17,920,463 | |
SPDR® S&P 500® ETF Trust | | | 299,930 | | | | 66,098,573 | |
SPDR® S&P® Bank ETF | | | 480,160 | | | | 19,758,584 | |
Technology Select Sector SPDR® Fund | | | 343,730 | | | | 16,327,175 | |
Vanguard® Growth ETF | | | 442,521 | | | | 48,991,500 | |
| | | | | | | | | |
TOTAL EXCHANGE‐TRADED FUNDS (Cost $287,100,850) | | | | | | | 318,972,285 | |
| MONEY MARKET FUNDS ‐ 1.90% | | Shares | | | Value | |
| Morgan Stanley Institutional Liquidity Fund ‐ Government Portfolio, 0.293%, 7‐day effective yield | | | 6,307,693 | | | $ | 6,307,693 | |
| | | | | | | | | |
TOTAL MONEY MARKET FUNDS (Cost $6,307,693) | | | | | | | 6,307,693 | |
| | | | | | | | | |
Total Investments, at Value ‐ 98.24% (Cost $293,408,543) | | | | | | | 325,279,978 | |
| | | | | | | | | |
| Other Assets in Excess of Liabilities ‐ 1.76% | | | | | | | 5,823,116 | |
| | | | | | | | | |
| Net Assets ‐ 100.00% | | | | | | $ | 331,103,094 | |
| (a) | Non-income producing security. |
See Notes to Financial Statements.
| Stadion Tactical Defensive Fund | Schedule of Investments |
November 30, 2016 (Unaudited)
| EXCHANGE‐TRADED FUNDS ‐ 98.94% | | Shares | | | Value | |
Guggenheim S&P 500® Pure Value ETF | | | 50,460 | | | $ | 2,864,109 | |
iShares® Core S&P Mid‐Cap ETF | | | 11,900 | | | | 1,933,988 | |
iShares® Currency Hedged MSCI EAFE ETF | | | 150,470 | | | | 3,825,700 | |
iShares® Russell 2000® ETF | | | 58,490 | | | | 7,697,869 | |
SPDR® Dow Jones® Industrial Average ETF Trust | | | 24,800 | | | | 4,746,720 | |
SPDR® S&P 500® ETF Trust | | | 43,450 | | | | 9,575,511 | |
SPDR® S&P MidCap 400® ETF Trust | | | 6,460 | | | | 1,914,938 | |
Technology Select Sector SPDR® Fund | | | 100,330 | | | | 4,765,675 | |
| | | | | | | | | |
TOTAL EXCHANGE‐TRADED FUNDS (Cost $35,866,106) | | | | | | | 37,324,510 | |
| MONEY MARKET FUNDS ‐ 1.43% | | Shares | | | Value | |
| Morgan Stanley Institutional Liquidity Fund ‐ Government Portfolio, 0.293%, 7‐day effective yield | | | 538,620 | | | $ | 538,620 | |
| | | | | | | | | |
TOTAL MONEY MARKET FUNDS (Cost $538,620) | | | | | | | 538,620 | |
| | | | | | | | | |
Total Investments, at Value ‐ 100.37% (Cost $36,404,726) | | | | | | | 37,863,130 | |
| | | | | | | | | |
| Liabilities in Excess of Other Assets ‐ (0.37)% | | | | | | | (138,115 | ) |
| | | | | | | | | |
| Net Assets ‐ 100.00% | | | | | | $ | 37,725,015 | |
See Notes to Financial Statements.
| Semi-Annual Report | November 30, 2016 | 21 |
| Stadion Trilogy Alternative Return Fund | Schedule of Investments |
November 30, 2016 (Unaudited)
| COMMON STOCKS ‐ 46.72% | | Shares | | | Value | |
| Consumer Discretionary ‐ 3.42% | | | | | | |
| Distributors ‐ 1.09% | | | | | | |
Genuine Parts Co.(a) | | | 9,941 | | | $ | 956,623 | |
| | | | | | | | | |
| Hotels, Restaurants & Leisure ‐ 1.15% | | | | | | | | |
McDonald's Corp.(a) | | | 8,457 | | | | 1,008,666 | |
| | | | | | | | | |
| Household Durables ‐ 1.18% | | | | | | | | |
Garmin Ltd.(a) | | | 19,865 | | | | 1,036,158 | |
| | | | | | | | | |
| Consumer Staples ‐ 6.76% | | | | | | | | |
| Food & Staples Retailing ‐ 1.24% | | | | | | | | |
Sysco Corp.(a) | | | 20,411 | | | | 1,086,886 | |
| | | | | | | | | |
| Food Products ‐ 2.17% | | | | | | | | |
General Mills, Inc.(a) | | | 15,813 | | | | 963,644 | |
Kellogg Co.(a) | | | 13,065 | | | | 940,680 | |
| | | | | | | | 1,904,324 | |
| | | | | | | | | |
| Household Products ‐ 1.07% | | | | | | | | |
Procter & Gamble Co.(a) | | | 11,441 | | | | 943,425 | |
| | | | | | | | | |
| Multiline Retail ‐ 1.15% | | | | | | | | |
Wal‐Mart Stores, Inc.(a) | | | 14,270 | | | | 1,005,036 | |
| | | | | | | | | |
| Tobacco ‐ 1.13% | | | | | | | | |
Archer‐Daniels‐Midland Co.(a) | | | 22,913 | | | | 990,529 | |
| | | | | | | | | |
| Energy ‐ 2.43% | | | | | | | | |
| Oil, Gas & Consumable Fuels ‐ 2.43% | | | | | | | | |
Chevron Corp.(a) | | | 9,660 | | | | 1,077,670 | |
Schlumberger Ltd.(a) | | | 12,582 | | | | 1,057,517 | |
| | | | | | | | 2,135,187 | |
| | | | | | | | | |
| Financials ‐ 6.45% | | | | | | | | |
| Banks ‐ 5.34% | | | | | | | | |
BB&T Corp.(a) | | | 25,433 | | | | 1,150,843 | |
Fifth Third Bancorp(a) | | | 49,642 | | | | 1,291,685 | |
US Bancorp(a) | | | 22,087 | | | | 1,095,957 | |
Wells Fargo & Co.(a) | | | 21,711 | | | | 1,148,946 | |
| | | | | | | | 4,687,431 | |
| | | | | | | | | |
| Insurance ‐ 1.11% | | | | | | | | |
Aflac, Inc.(a) | | | 13,701 | | | | 977,977 | |
| | | | | | | | | |
| Health Care ‐ 4.20% | | | | | | | | |
| Health Care Equipment & Supplies ‐ 1.06% | | | | | | | | |
Abbott Laboratories(a) | | | 24,410 | | | | 929,289 | |
| | | | | | | | | |
| Pharmaceuticals ‐ 3.14% | | | | | | | | |
Eli Lilly & Co.(a) | | | 12,550 | | | | 842,356 | |
Johnson & Johnson(a) | | | 8,229 | | | | 915,888 | |
Merck & Co., Inc.(a) | | | 16,355 | | | | 1,000,762 | |
| | | | | | | | 2,759,006 | |
| Stadion Trilogy Alternative Return Fund | Schedule of Investments |
November 30, 2016 (Unaudited)
| COMMON STOCKS ‐ 46.72% (continued) | | Shares | | | Value | |
| Industrials ‐ 8.37% | | | | | | |
| Aerospace & Defense ‐ 2.43% | | | | | | |
Lockheed Martin Corp.(a) | | | 4,073 | | | $ | 1,080,363 | |
United Technologies Corp.(a) | | | 9,763 | | | | 1,051,671 | |
| | | | | | | | 2,132,034 | |
| | | | | | | | | |
| Commercial Services & Supplies ‐ 1.22% | | | | | | | | |
Waste Management, Inc.(a) | | | 15,379 | | | | 1,069,148 | |
| | | | | | | | | |
| Electrical Equipment ‐ 1.21% | | | | | | | | |
Emerson Electric Co.(a) | | | 18,867 | | | | 1,064,853 | |
| | | | | | | | | |
| Machinery ‐ 1.24% | | | | | | | | |
Illinois Tool Works, Inc.(a) | | | 8,683 | | | | 1,086,938 | |
| | | | | | | | | |
| Miscellaneous Manufacturing ‐ 1.13% | | | | | | | | |
General Electric Co.(a) | | | 32,344 | | | | 994,901 | |
| | | | | | | | | |
| Trading Companies & Distributors ‐ 1.14% | | | | | | | | |
WW Grainger, Inc.(a) | | | 4,329 | | | | 998,138 | |
| | | | | | | | | |
| Information Technology ‐ 6.01% | | | | | | | | |
| Communications Equipment ‐ 2.39% | | | | | | | | |
Cisco Systems, Inc.(a) | | | 32,224 | | | | 960,919 | |
Harris Corp.(a) | | | 10,998 | | | | 1,138,953 | |
| | | | | | | | 2,099,872 | |
| | | | | | | | | |
| IT Services ‐ 1.23% | | | | | | | | |
Automatic Data Processing, Inc.(a) | | | 11,194 | | | | 1,074,848 | |
| | | | | | | | | |
| Software ‐ 1.23% | | | | | | | | |
Microsoft Corp.(a) | | | 17,938 | | | | 1,080,944 | |
| | | | | | | | | |
| Technology Hardware, Storage & Peripherals ‐ 1.16% | | | | | | | | |
International Business Machines Corp.(a) | | | 6,299 | | | | 1,021,824 | |
| | | | | | | | | |
| Materials ‐ 2.38% | | | | | | | | |
| Chemicals ‐ 1.18% | | | | | | | | |
Dow Chemical Co.(a) | | | 18,628 | | | | 1,037,952 | |
| | | | | | | | | |
| Paper & Forest Products ‐ 1.20% | | | | | | | | |
International Paper Co.(a) | | | 21,508 | | | | 1,047,870 | |
| | | | | | | | | |
| Real Estate ‐ 1.13% | | | | | | | | |
| Equity Real Estate Investment ‐ 1.13% | | | | | | | | |
Weyerhaeuser Co.(a) | | | 32,051 | | | | 988,132 | |
| | | | | | | | | |
| Telecommunication Services ‐ 1.15% | | | | | | | | |
| Diversified Telecommunication Services ‐ 1.15% | | | | | | | | |
AT&T, Inc.(a) | | | 26,214 | | | | 1,012,647 | |
| Semi-Annual Report | November 30, 2016 | 23 |
| Stadion Trilogy Alternative Return Fund | Schedule of Investments |
November 30, 2016 (Unaudited)
| COMMON STOCKS ‐ 46.72% (continued) | | Shares | | | Value | |
| Utilities ‐ 4.42% | | | | | | |
| Electric Utilities ‐ 2.13% | | | | | | |
Eversource Energy(a) | | | 18,231 | | | $ | 941,084 | |
Southern Co.(a) | | | 19,785 | | | | 926,334 | |
| | | | | | | | 1,867,418 | |
| | | | | | | | | |
| Energy ‐ 1.12% | | | | | | | | |
Dominion Resources, Inc.(a) | | | 13,492 | | | | 988,829 | |
| | | | | | | | | |
| Gas Utilities ‐ 1.17% | | | | | | | | |
National Fuel Gas Co.(a) | | | 18,195 | | | | 1,025,834 | |
| | | | | | | | | |
TOTAL COMMON STOCKS (Cost $32,028,093) | | | | | | | 41,012,719 | |
| EXCHANGE‐TRADED FUNDS ‐ 41.60% | | Shares | | | Value | |
iShares® 10+ Year Credit Bond ETF(a) | | | 52,100 | | | $ | 3,016,069 | |
iShares® 1‐3 Year Credit Bond ETF(a) | | | 67,861 | | | | 7,122,691 | |
iShares® iBoxx® $ Investment Grade Corporate Bond ETF(a) | | | 34,590 | | | | 4,041,496 | |
iShares® Intermediate Credit Bond ETF(a) | | | 37,409 | | | | 4,048,776 | |
iShares® MBS ETF(a) | | | 75,321 | | | | 8,089,475 | |
VanEck Vectors™ Fallen Angel High Yield Bond ETF(a) | | | 143,700 | | | | 4,118,442 | |
Vanguard® Intermediate‐Term Government Bond ETF(a) | | | 94,465 | | | | 6,074,099 | |
| | | | | | | | | |
TOTAL EXCHANGE‐TRADED FUNDS (Cost $36,743,890) | | | | | | | 36,511,048 | |
| OPEN‐END FUNDS ‐ 4.65% | | Shares | | | Value | |
| AllianzGI Short Duration High Income Fund, Institutional Shares | | | 269,801 | | | $ | 4,082,088 | |
| | | | | | | | | |
TOTAL OPEN‐END FUNDS (Cost $4,156,065) | | | | | | | 4,082,088 | |
| PURCHASED OPTION CONTRACTS ‐ 8.42% | Expiration Date | | | Strike Price | | Contracts | | Value | |
| Call Option Contracts ‐ 3.40% | | | | | | | | | | | | |
S&P 500® Index: | | | | | | | | | | | | |
| | 12/02/2016 | | | $ | 2,275 | | | 50 | | $ | 375 | |
| | 12/09/2016 | | | | 2,250 | | | 50 | | | 4,750 | |
| | 12/16/2016 | | | | 2,050 | | | 40 | | | 605,400 | |
| | 12/16/2016 | | | | 2,250 | | | 50 | | | 14,250 | |
| | 12/23/2016 | | | | 2,300 | | | 50 | | | 3,250 | |
| | 12/30/2016 | | | | 2,300 | | | 50 | | | 5,500 | |
| | 01/06/2017 | | | | 2,300 | | | 50 | | | 8,000 | |
| | 06/16/2017 | | | | 1,900 | | | 30 | | | 956,550 | |
| | 12/15/2017 | | | | 2,050 | | | 30 | | | 692,250 | |
| | 12/21/2018 | | | | 2,150 | | | 30 | | | 683,400 | |
| | | | | | | | | | | | 2,973,725 | |
| Put Option Contracts ‐ 5.02% | | | | | | | | | | | | |
iPATH S&P 500® VIX Short‐Term Futures ETN: | | | | | | | | | | | | |
| | 03/17/2017 | | | | 9 | | | 2,400 | | | 618,000 | |
| | 03/17/2017 | | | | 30 | | | 750 | | | 412,500 | |
| | 03/17/2017 | | | | 32 | | | 750 | | | 523,125 | |
| Stadion Trilogy Alternative Return Fund | Schedule of Investments |
November 30, 2016 (Unaudited)
| PURCHASED OPTION CONTRACTS ‐ 8.42% (continued) | Expiration Date | | | Strike Price | | Contracts | | Value | |
| Put Option Contracts ‐ 5.02% (continued) | | | | | | | | | | | | |
S&P 500® Index: | | | | | | | | | | | | |
| | 12/16/2016 | | | $ | 1,750 | | | 100 | | $ | 1,250 | |
| | 12/16/2016 | | | | 1,900 | | | 100 | | | 4,000 | |
| | 12/30/2016 | | | | 2,075 | | | 50 | | | 27,250 | |
| | 01/06/2017 | | | | 2,100 | | | 50 | | | 47,250 | |
| | 06/16/2017 | | | | 1,900 | | | 100 | | | 313,000 | |
| | 06/17/2017 | | | | 1,875 | | | 100 | | | 284,000 | |
| | 09/15/2017 | | | | 1,925 | | | 200 | | | 1,088,000 | |
SPDR® S&P 500® ETF Trust: | | | | | | | | | | | | |
| | 06/16/2017 | | | | 170 | | | 200 | | | 29,300 | |
| | 06/16/2017 | | | | 180 | | | 500 | | | 108,500 | |
| | 12/15/2017 | | | | 180 | | | 200 | | | 101,700 | |
| | 03/16/2018 | | | | 185 | | | 600 | | | 441,900 | |
| | 06/15/2018 | | | | 185 | | | 100 | | | 88,550 | |
| | 06/15/2018 | | | | 190 | | | 330 | | | 329,670 | |
| | | | | | | | | | | | 4,417,995 | |
TOTAL PURCHASED OPTION CONTRACTS (Cost $11,167,399) | | | | | | | | | | | 7,391,720 | |
| MONEY MARKET FUNDS ‐ 3.27% | | Shares | | | Value | |
Morgan Stanley Institutional Liquidity Fund ‐ Government Portfolio, 0.293%, 7‐day effective yield(a) | | | 2,868,733 | | | $ | 2,868,733 | |
| | | | | | | | | |
TOTAL MONEY MARKET FUNDS (Cost $2,868,733) | | | | | | | 2,868,733 | |
| | | | | | | | | |
Total Investments, at Value ‐ 104.66% (Cost $86,964,180) | | | | | | | 91,866,308 | |
| | | | | | | | | |
| Written Option Contracts ‐ (4.32)% | | | | | | | (3,789,675 | ) |
| | | | | | | | | |
| Liabilities in Excess of Other Assets ‐ (0.34)% | | | | | | | (304,121 | ) |
| | | | | | | | | |
| Net Assets ‐ 100.00% | | | | | | $ | 87,772,512 | |
(a) | All or portion of this security is held as collateral for written options. At period end, the aggregate market value of those securities was $37,644,979, representing 42.89% of net assets. |
| Semi-Annual Report | November 30, 2016 | 25 |
| Stadion Trilogy Alternative Return Fund | Schedule of Investments |
November 30, 2016 (Unaudited)
| WRITTEN OPTION CONTRACTS - 4.32% | | Expiration Date | | Strike Price | | | Contracts | | | Premiums Received | | | Value | |
| Call Option Contracts ‐ 3.07% | | | | | | | | | | | | | | |
S&P 500® Index: | | | | | | | | | | | | | | |
| | 12/09/2016 | | $ | 2,120 | | | | 25 | | | $ | 105,870 | | | $ | 204,625 | |
| | 12/09/2016 | | | 2,125 | | | | 30 | | | | 79,458 | | | | 231,300 | |
| | 12/16/2016 | | | 2,090 | | | | 50 | | | | 253,630 | | | | 563,250 | |
| | 12/16/2016 | | | 2,185 | | | | 30 | | | | 61,158 | | | | 91,050 | |
| | 12/23/2016 | | | 2,160 | | | | 50 | | | | 191,036 | | | | 259,750 | |
| | 12/23/2016 | | | 2,185 | | | | 30 | | | | 84,858 | | | | 100,050 | |
| | 12/30/2016 | | | 2,180 | | | | 50 | | | | 166,591 | | | | 201,500 | |
| | | 12/30/2016 | | | 2,205 | | | | 30 | | | | 81,858 | | | | 72,900 | |
| | | 01/06/2017 | | | 2,200 | | | | 50 | | | | 165,321 | | | | 152,000 | |
| | | 12/15/2017 | | | 2,250 | | | | 60 | | | | 442,417 | | | | 639,900 | |
| | | 06/15/2018 | | | 2,450 | | | | 30 | | | | 182,958 | | | | 176,100 | |
| | | | | | | | | | | | | | 1,815,155 | | | | 2,692,425 | |
| Put Option Contracts ‐ 1.25% | | | | | | | | | | | | | | | | | | |
S&P 500® Index: | | | | | | | | | | | | | | | | | | |
| | | 12/16/2016 | | | 1,550 | | | | 100 | | | | 706,646 | | | | 500 | |
| | | 12/16/2016 | | | 1,800 | | | | 100 | | | | 886,846 | | | | 1,750 | |
| | | 12/30/2016 | | | 2,180 | | | | 50 | | | | 169,500 | | | | 104,500 | |
| | | 01/06/2017 | | | 2,200 | | | | 50 | | | | 163,200 | | | | 157,500 | |
| | | 06/16/2017 | | | 1,675 | | | | 100 | | | | 539,196 | | | | 129,500 | |
| | | 06/16/2017 | | | 1,700 | | | | 100 | | | | 481,896 | | | | 143,500 | |
| | | 09/15/2017 | | | 1,725 | | | | 200 | | | | 877,732 | | | | 560,000 | |
| | | | | | | | | | | | | | 3,825,016 | | | | 1,097,250 | |
| | | | | | | | | | | | | | | | | | | |
| Total Written Option Contracts | | | | | | | | | | | | $ | 5,640,171 | | | $ | 3,789,675 | |
See Notes to Financial Statements.
| Stadion Alternative Income Fund | Schedule of Investments |
November 30, 2016 (Unaudited)
COMMON STOCKS - 98.41% | | Shares | | | Value | |
| Consumer Discretionary - 7.96% | | | | | | |
| Distributors - 2.00% | | | | | | |
Genuine Parts Co.(a) | | | 22,444 | | | $ | 2,159,786 | |
| | | | | | | | | |
| Hotels, Restaurants & Leisure - 1.96% | | | | | | | | |
McDonald's Corp.(a) | | | 17,789 | | | | 2,121,694 | |
| | | | | | | | | |
| Leisure Products - 1.90% | | | | | | | | |
Mattel, Inc.(a) | | | 64,994 | | | | 2,051,861 | |
| | | | | | | | | |
| Multiline Retail - 2.10% | | | | | | | | |
Target Corp.(a) | | | 29,499 | | | | 2,278,503 | |
| | | | | | | | | |
| Consumer Staples - 15.19% | | | | | | | | |
| Beverages - 3.72% | | | | | | | | |
Coca‐Cola Co.(a) | | | 49,549 | | | | 1,999,302 | |
PepsiCo, Inc.(a) | | | 20,200 | | | | 2,022,020 | |
| | | | | | | | 4,021,322 | |
| | | | | | | | | |
| Food & Staples Retailing - 2.05% | | | | | | | | |
Sysco Corp.(a) | | | 41,548 | | | | 2,212,431 | |
| | | | | | | | | |
| Food Products - 5.59% | | | | | | | | |
General Mills, Inc.(a) | | | 33,467 | | | | 2,039,479 | |
JM Smucker Co.(a) | | | 15,809 | | | | 1,991,144 | |
Kellogg Co.(a) | | | 28,037 | | | | 2,018,664 | |
| | | | | | | | 6,049,287 | |
| | | | | | | | | |
| Household Products - 1.87% | | | | | | | | |
Procter & Gamble Co.(a) | | | 24,589 | | | | 2,027,609 | |
| | | | | | | | | |
| Tobacco - 1.96% | | | | | | | | |
Altria Group, Inc.(a) | | | 33,093 | | | | 2,115,635 | |
| | | | | | | | | |
| Energy ‐ 7.93% | | | | | | | | |
| Oil, Gas & Consumable Fuels - 7.93% | | | | | | | | |
Chevron Corp.(a) | | | 19,747 | | | | 2,202,975 | |
Exxon Mobil Corp.(a) | | | 23,932 | | | | 2,089,264 | |
Occidental Petroleum Corp.(a) | | | 29,593 | | | | 2,111,756 | |
| Valero Energy Corp. | | | 35,342 | | | | 2,175,654 | |
| | | | | | | | 8,579,649 | |
| | | | | | | | | |
| Financials ‐ 12.63% | | | | | | | | |
| Banks - 6.51% | | | | | | | | |
BB&T Corp.(a) | | | 52,027 | | | | 2,354,222 | |
JPMorgan Chase & Co.(a) | | | 29,659 | | | | 2,377,762 | |
Wells Fargo & Co.(a) | | | 43,632 | | | | 2,309,005 | |
| | | | | | | | 7,040,989 | |
| | | | | | | | | |
| Diversified Financial Services - 4.19% | | | | | | | | |
CME Group, Inc.(a) | | | 20,128 | | | | 2,272,653 | |
Invesco Ltd.(a) | | | 71,929 | | | | 2,252,097 | |
| | | | | | | | 4,524,750 | |
| Semi-Annual Report | November 30, 2016 | 27 |
| Stadion Alternative Income Fund | Schedule of Investments |
November 30, 2016 (Unaudited)
COMMON STOCKS ‐ 98.41% (continued) | | Shares | | | Value | |
| Financials - 12.63% (continued) | | | | | | |
| Insurance - 1.93% | | | | | | |
Aflac, Inc.(a) | | | 29,280 | | | $ | 2,090,006 | |
| | | | | | | | | |
| Health Care - 7.25% | | | | | | | | |
| Health Care Equipment & Supplies - 1.81% | | | | | | | | |
Abbott Laboratories(a) | | | 51,383 | | | | 1,956,151 | |
| | | | | | | | | |
| | | | | | | | | |
| Pharmaceuticals - 5.44% | | | | | | | | |
Eli Lilly & Co.(a) | | | 27,450 | | | | 1,842,444 | |
Johnson & Johnson(a) | | | 17,709 | | | | 1,971,012 | |
Merck & Co., Inc.(a) | | | 33,953 | | | | 2,077,584 | |
| | | | | | | | 5,891,040 | |
| | | | | | | | | |
| Industrials - 14.11% | | | | | | | | |
| Aerospace & Defense - 4.07% | | | | | | | | |
Lockheed Martin Corp.(a) | | | 8,526 | | | | 2,261,521 | |
United Technologies Corp.(a) | | | 19,879 | | | | 2,141,366 | |
| | | | | | | | 4,402,887 | |
| | | | | | | | | |
| Commercial Services & Supplies - 2.03% | | | | | | | | |
Waste Management, Inc.(a) | | | 31,620 | | | | 2,198,223 | |
| | | | | | | | | |
| Electrical Equipment - 2.05% | | | | | | | | |
Emerson Electric Co.(a) | | | 39,341 | | | | 2,220,406 | |
| | | | | | | | | |
| Machinery - 2.06% | | | 17,804 | | | | 2,228,705 | |
Illinois Tool Works, Inc.(a) | | | | | | | | |
| | | | | | | | | |
| Miscellaneous Manufacturing - 3.90% | | | | | | | | |
3M Co.(a) | | | 12,132 | | | | 2,083,550 | |
General Electric Co.(a) | | | 69,161 | | | | 2,127,392 | |
| | | | | | | | 4,210,942 | |
| | | | | | | | | |
| Information Technology - 12.01% | | | | | | | | |
| Communications Equipment - 2.14% | | | | | | | | |
Harris Corp.(a) | | | 22,358 | | | | 2,315,394 | |
| | | | | | | | | |
| IT Services - 2.04% | | | | | | | | |
Automatic Data Processing, Inc.(a) | | | 22,989 | | | | 2,207,404 | |
| | | | | | | | | |
| Semiconductors & Semiconductor Equipment - 1.90% | | | | | | | | |
Intel Corp.(a) | | | 59,235 | | | | 2,055,455 | |
| | | | | | | | | |
| Software - 3.96% | | | | | | | | |
Microsoft Corp.(a) | | | 34,868 | | | | 2,101,145 | |
Paychex, Inc.(a) | | | 36,946 | | | | 2,177,967 | |
| | | | | | | | 4,279,112 | |
| Technology Hardware, Storage & Peripherals - 1.97% | | | | | | | | |
International Business Machines Corp.(a) | | | 13,142 | | | | 2,131,895 | |
| Stadion Alternative Income Fund | Schedule of Investments |
November 30, 2016 (Unaudited)
COMMON STOCKS - 98.41% (continued) | | Shares | | | Value | |
| Materials - 3.96% | | | | | | |
| Chemicals - 2.03% | | | | | | |
Air Products & Chemicals, Inc.(a) | | | 15,208 | | | $ | 2,196,948 | |
| | | | | | | | | |
| Containers & Packaging - 1.93% | | | | | | | | |
Kimberly-Clark Corp.(a) | | | 18,038 | | | | 2,085,373 | |
| | | | | | | | | |
| Real Estate - 1.91% | | | | | | | | |
| Equity Real Estate Investment - 1.91% | | | | | | | | |
HCP, Inc.(a) | | | 70,129 | | | | 2,070,909 | |
| | | | | | | | | |
| Telecommunication Services - 3.99% | | | | | | | | |
| Diversified Telecommunication Services - 3.99% | | | | | | | | |
AT&T, Inc.(a) | | | 55,632 | | | | 2,149,064 | |
Verizon Communications, Inc.(a) | | | 43,380 | | | | 2,164,662 | |
| | | | | | | | 4,313,726 | |
| | | | | | | | | |
| Utilities ‐ 11.47% | | | | | | | | |
| Electric Utilities - 9.50% | | | | | | | | |
Entergy Corp.(a) | | | 30,319 | | | | 2,083,825 | |
Eversource Energy(a) | | | 39,576 | | | | 2,042,913 | |
NextEra Energy, Inc.(a) | | | 18,094 | | | | 2,066,877 | |
SCANA Corp.(a) | | | 29,500 | | | | 2,080,635 | |
Southern Co.(a) | | | 42,811 | | | | 2,004,411 | |
| | | | | | | | 10,278,661 | |
| | | | | | | | | |
| Gas Utilities - 1.97% | | | | | | | | |
CenterPoint Energy, Inc.(a) | | | 88,987 | | | | 2,123,230 | |
| | | | | | | | | |
TOTAL COMMON STOCKS (Cost $97,149,803) | | | | | | | 106,439,983 | |
PURCHASED OPTION CONTRACTS ‐ 2.33% | | Expiration Date | | Strike Price | | | Contracts | | | Value | |
| Call Option Contracts ‐ 0.11% | | | | | | | | | | | |
S&P 500® Index: | | | | | | | | | | | |
| | | 12/16/2016 | | $ | 2,300 | | | | 530 | | | $ | 23,850 | |
| | | 12/16/2016 | | | 2,600 | | | | 25 | | | | 62 | |
| | 12/16/2016 | | | 2,800 | | | | 116 | | | | 290 | |
| | | 01/20/2017 | | | 2,375 | | | | 390 | | | | 34,125 | |
| | | 06/16/2017 | | | 2,800 | | | | 256 | | | | 8,960 | |
| | | 12/15/2017 | | | 2,800 | | | | 170 | | | | 31,450 | |
| | | 06/15/2018 | | | 2,800 | | | | 35 | | | | 24,675 | |
| | | | | | | | | | | | | | 123,412 | |
| Put Option Contracts ‐ 2.22% | | | | | | | | | | | | | | |
S&P 500® Index | | 01/20/2017 | | | 2,060 | | | | 100 | | | | 98,000 | |
| Semi-Annual Report | November 30, 2016 | 29 |
| Stadion Alternative Income Fund | Schedule of Investments |
November 30, 2016 (Unaudited)
PURCHASED OPTION CONTRACTS ‐ 2.33% (continued) | | Expiration Date | | Strike Price | | | Contracts | | | Value | |
| Put Option Contracts ‐ 2.22% (continued) | | | | | | | | | | | |
SPDR® S&P 500® ETF Trust: | | | | | | | | | | | |
| | | 06/16/2017 | | $ | 170 | | | | 260 | | | $ | 38,090 | |
| | | 06/16/2017 | | | 180 | | | | 400 | | | | 86,800 | |
| | | 06/16/2017 | | | 185 | | | | 430 | | | | 113,305 | |
| | | 06/16/2017 | | | 190 | | | | 1,310 | | | | 418,545 | |
| | 12/15/2017 | | | 185 | | | | 1,750 | | | | 1,031,625 | |
| | | 12/15/2017 | | | 195 | | | | 300 | | | | 235,800 | |
| | 06/15/2018 | | | 190 | | | | 100 | | | | 99,900 | |
| | 06/15/2018 | | | 195 | | | | 250 | | | | 281,375 | |
| | | | | | | | | | | | | | 2,403,440 | |
TOTAL PURCHASED OPTION CONTRACTS (Cost $6,176,039) | | | | | | | | | | | | | 2,526,852 | |
MONEY MARKET FUNDS ‐ 6.41% | | Shares | | | Value | |
| Morgan Stanley Institutional Liquidity Fund ‐ Government | | | | | | |
| Portfolio, 0.293%, 7-day effective yield | | | 6,931,877 | | | $ | 6,931,877 | |
| | | | | | | | | |
TOTAL MONEY MARKET FUNDS (Cost $6,931,877) | | | | | | | 6,931,877 | |
| | | | | | | | | |
Total Investments, at Value ‐ 107.15% (Cost $110,257,719) | | | | | | | 115,898,712 | |
| | | | | | | | | |
| Written Option Contracts - (5.05)% | | | | | | | (5,464,185 | ) |
| | | | | | | | | |
| Liabilities in Excess of Other Assets - (2.10)% | | | | | | | (2,269,468 | ) |
| | | | | | | | | |
| Net Assets - 100.00% | | | | | | $ | 108,165,059 | |
(a) | All or portion of this security is held as collateral for written options. At period end, the aggregate market value of those securities was $51,272,762, representing 47.40% of net assets. |
| WRITTEN OPTION CONTRACTS - 5.05% | | Expiration Date | | Strike Price | | | Contracts | | | Premiums Received | | | Value | |
| Call Option Contracts ‐ 4.62% | | | | | | | | | | | | | | |
S&P 500® Index: | | | | | | | | | | | | | | |
| | | 01/20/2017 | | $ | 2,220 | | | | 390 | | | $ | 1,052,399 | | | $ | 992,550 | |
| | | 06/16/2017 | | | 2,100 | | | | 26 | | | | 166,880 | | | | 407,810 | |
| | | 06/16/2017 | | | 2,200 | | | | 230 | | | | 1,431,816 | | | | 2,066,550 | |
| | | 12/15/2017 | | | 2,250 | | | | 35 | | | | 260,360 | | | | 373,275 | |
| | | 12/15/2017 | | | 2,350 | | | | 130 | | | | 814,539 | | | | 800,150 | |
| | | 06/15/2018 | | | 2,300 | | | | 10 | | | | 77,392 | | | | 117,600 | |
| | | 06/15/2018 | | | 2,350 | | | | 25 | | | | 187,264 | | | | 238,750 | |
| | | | | | | | | | | | | | 3,990,650 | | | | 4,996,685 | |
| Put Option Contracts - 0.43% | | | | | | | | | | | | | | | | | | |
S&P 500® Index | | 01/20/2017 | | | 2,220 | | | | 100 | | | | 445,846 | | | | 467,500 | |
| | | | | | | | | | | | | | 445,846 | | | | 467,500 | |
| | | | | | | | | | | | | | | | | | | |
| Total Written Option Contracts | | | | | | | | | | | | $ | 4,436,496 | | | $ | 5,464,185 | |
See Notes to Financial Statements.
| Stadion Defensive International Fund | Schedule of Investments |
November 30, 2016 (Unaudited)
EXCHANGE‐TRADED FUNDS - 62.62% | | Shares | | | Value | |
iShares® MSCI EAFE ETF | | | 12,390 | | | $ | 703,628 | |
iShares® MSCI Emerging Markets ETF | | | 10,050 | | | | 356,775 | |
| PIMCO Enhanced Short Maturity Active ETF | | | 25,920 | | | | 2,630,362 | |
WisdomTree® Europe Hedged Equity Fund | | | 6,530 | | | | 351,249 | |
WisdomTree® Japan Hedged Equity Fund | | | 7,350 | | | | 361,620 | |
| | | | | | | | | |
TOTAL EXCHANGE-TRADED FUNDS (Cost $4,441,710) | | | | | | | 4,403,634 | |
MONEY MARKET FUNDS - 37.35% | | Shares | | | Value | |
| Morgan Stanley Institutional Liquidity Fund - Government | | | | | | |
| Portfolio, 0.293%, 7-day effective yield | | | 2,626,923 | | | $ | 2,626,923 | |
| | | | | | | | | |
TOTAL MONEY MARKET FUNDS (Cost $2,626,923) | | | | | | | 2,626,923 | |
| | | | | | | | | |
Total Investments, at Value - 99.97% (Cost $7,068,633) | | | | | | | 7,030,557 | |
| | | | | | | | | |
| Other Assets in Excess of Liabilities - 0.03% | | | | | | | 1,852 | |
| | | | | | | | | |
| Net Assets - 100.00% | | | | | | $ | 7,032,409 | |
See Notes to Financial Statements.
| Semi-Annual Report | November 30, 2016 | 31 |
| Stadion Managed Risk 100 Fund | Schedule of Investments |
November 30, 2016 (Unaudited)
EXCHANGE‐TRADED FUNDS - 99.38% | | Shares | | | Value | |
Guggenheim S&P 500® Pure Value ETF | | | 107,950 | | | $ | 6,127,242 | |
iShares® Russell 2000® ETF | | | 86,950 | | | | 11,443,490 | |
SPDR® Dow Jones® Industrial Average ETF Trust | | | 100,600 | | | | 19,254,840 | |
SPDR® S&P 500® ETF Trust | | | 86,560 | | | | 19,076,093 | |
Technology Select Sector SPDR® Fund | | | 398,280 | | | | 18,918,300 | |
| | | | | | | | | |
TOTAL EXCHANGE-TRADED FUNDS (Cost $73,908,264) | | | | | | | 74,819,965 | |
MONEY MARKET FUNDS - 1.06% | | Shares | | | Value | |
| Morgan Stanley Institutional Liquidity Fund - Government | | | | | | |
| Portfolio, 0.293%, 7-day effective yield | | | 800,074 | | | $ | 800,074 | |
| | | | | | | | | |
TOTAL MONEY MARKET FUNDS (Cost $800,074) | | | | | | | 800,074 | |
| | | | | | | | | |
Total Investments, at Value - 100.44% (Cost $74,708,338) | | | | | | | 75,620,039 | |
| | | | | | | | | |
| Liabilities in Excess of Other Assets - (0.44)% | | | | | | | (329,322 | ) |
| | | | | | | | | |
| Net Assets - 100.00% | | | | | | $ | 75,290,717 | |
See Notes to Financial Statements.
| Stadion Investment Trust | Statements of Assets and Liabilities |
| | November 30, 2016 (Unaudited) |
| | | Stadion Tactical Growth Fund | | | Stadion Tactical Defensive Fund | | | Stadion Trilogy Alternative Return Fund | |
| ASSETS | | | | | | | | | |
| Investments in securities: | | | | | | | | | |
| At acquisition cost | | $ | 293,408,543 | | | $ | 36,404,726 | | | $ | 86,964,180 | |
| At value (Note 2) | | $ | 325,279,978 | | | $ | 37,863,130 | | | $ | 91,866,308 | |
| Dividends receivable | | | – | | | | 13,218 | | | | 153,420 | |
| Receivable for capital shares sold | | | 675,893 | | | | 437 | | | | 39,153 | |
| Receivable for investment securities sold | | | 5,881,070 | | | | – | | | | 250,951 | |
| Interest receivable | | | 2,681 | | | | 3,135 | | | | 1,018 | |
| Other assets | | | 83,870 | | | | 28,444 | | | | 41,910 | |
| TOTAL ASSETS | | | 331,923,492 | | | | 37,908,364 | | | | 92,352,760 | |
| | | | | | | | | | | | | |
| LIABILITIES | | | | | | | | | | | | |
| Written Options, at value (Notes 2 and 6) (premiums received $–, $– and $5,640,171, respectively) | | | – | | | | – | | | | 3,789,675 | |
| Payable for capital shares redeemed | | | 357,743 | | | | 104,452 | | | | 277,140 | |
| Payable for investment securities purchased | | | – | | | | – | | | | 370,498 | |
| Payable to Advisor (Note 5) | | | 261,571 | | | | 36,781 | | | | 89,366 | |
| Payable to Directors | | | – | | | | 213 | | | | 77 | |
| Accrued distribution fees (Note 5) | | | 89,397 | | | | 11,040 | | | | 14,205 | |
| Accrued compliance fees (Note 5) | | | 4,554 | | | | 878 | | | | 1,267 | |
| Payable to administrator (Note 5) | | | 20,298 | | | | 2,545 | | | | 6,244 | |
| Other accrued expenses | | | 86,835 | | | | 27,440 | | | | 31,776 | |
| TOTAL LIABILITIES | | | 820,398 | | | | 183,349 | | | | 4,580,248 | |
| | | | | | | | | | | | | |
| NET ASSETS | | $ | 331,103,094 | | | $ | 37,725,015 | | | $ | 87,772,512 | |
| | | | | | | | | | | | | |
| Net assets consist of: | | | | | | | | | | | | |
| Paid-in capital | | $ | 314,012,257 | | | $ | 35,815,450 | | | $ | 81,851,849 | |
| Accumulated net investment income (loss) | | | (737,979 | ) | | | (291,948 | ) | | | 142,553 | |
| Accumulated net realized gains (losses) | | | (14,042,619 | ) | | | 743,109 | | | | (974,514 | ) |
| Net unrealized appreciation | | | 31,871,435 | | | | 1,458,404 | | | | 6,752,624 | |
| NET ASSETS | | $ | 331,103,094 | | | $ | 37,725,015 | | | $ | 87,772,512 | |
| | | | | | | | | | | | | |
| PRICING OF CLASS A SHARES | | | | | | | | | | | | |
| Net assets applicable to Class A shares | | $ | 93,437,657 | | | $ | 17,868,495 | | | $ | 28,597,761 | |
| Class A shares of beneficial interest outstanding (unlimited number of shares authorized, $0.001 par value) | | | 8,849,404 | | | | 1,541,735 | | | | 2,613,840 | |
| Net asset value, offering price and redemption price per share (Note 1) | | $ | 10.56 | | | $ | 11.59 | | | $ | 10.94 | |
| Maximum offering price per share (Note 1) | | $ | 11.20 | | | $ | 12.30 | | | $ | 11.61 | |
| PRICING OF CLASS C SHARES | | | | | | | | | | | | |
| Net assets applicable to Class C shares | | $ | 87,553,712 | | | $ | 8,989,604 | | | $ | 10,089,137 | |
| Class C shares of beneficial interest outstanding (unlimited number of shares authorized, $0.001 par value) | | | 8,484,706 | | | | 822,435 | | | | 938,347 | |
| Net asset value, offering price and redemption price per share (Note 1) | | $ | 10.32 | | | $ | 10.93 | | | $ | 10.75 | |
| PRICING OF CLASS I SHARES | | | | | | | | | | | | |
| Net assets applicable to Class I shares | | $ | 150,111,725 | | | $ | 10,866,916 | | | $ | 49,085,614 | |
| Class I shares of beneficial interest outstanding (unlimited number of shares authorized, $0.001 par value) | | | 14,122,749 | | | | 923,532 | | | | 4,475,154 | |
| Net asset value, offering price and redemption price per share (Note 1) | | $ | 10.63 | | | $ | 11.77 | | | $ | 10.97 | |
See Notes to Financial Statements.
| Semi-Annual Report | November 30, 2016 | 33 |
| Stadion Investment Trust | Statements of Assets and Liabilities |
| | November 30, 2016 (Unaudited) |
| | | Stadion Alternative Income Fund | | | Stadion Defensive International Fund | | | Stadion Managed Risk 100 Fund | |
| ASSETS | | | | | | | | | |
| Investments in securities: | | | | | | | | | |
| At acquisition cost | | $ | 110,257,719 | | | $ | 7,068,633 | | | $ | 74,708,338 | |
| At value (Note 2) | | $ | 115,898,712 | | | $ | 7,030,557 | | | $ | 75,620,039 | |
| Dividends receivable | | | 490,709 | | | | – | | | | 53,625 | |
| Receivable for capital shares sold | | | 163,988 | | | | – | | | | 27,722 | |
| Receivable for investment securities sold | | | 1,498,245 | | | | – | | | | – | |
| Interest receivable | | | 1,682 | | | | 508 | | | | 12,850 | |
| Other assets | | | 34,492 | | | | 26,425 | | | | 34,190 | |
| TOTAL ASSETS | | | 118,087,828 | | | | 7,057,490 | | | | 75,748,426 | |
| | | | | | | | | | | | | |
| LIABILITIES | | | | | | | | | | | | |
| Written Options, at value (Notes 2 and 6) (premiums received $4,436,496, $– and $–, respectively) | | | 5,464,185 | | | | – | | | | – | |
| Payable for capital shares redeemed | | | 29,544 | | | | 5,927 | | | | 294,953 | |
| Payable for investment securities purchased | | | 4,317,242 | | | | – | | | | – | |
| Payable to Advisor (Note 5) | | | 70,500 | | | | 2,324 | | | | 77,685 | |
| Payable to Directors | | | – | | | | 20 | | | | 613 | |
| Accrued distribution fees (Note 5) | | | 3,770 | | | | 1,067 | | | | 24,223 | |
| Accrued compliance fees (Note 5) | | | 1,133 | | | | 144 | | | | 2,187 | |
| Payable to administrator (Note 5) | | | 6,609 | | | | 572 | | | | 4,976 | |
| Other accrued expenses | | | 29,786 | | | | 15,027 | | | | 53,072 | |
| TOTAL LIABILITIES | | | 9,922,769 | | | | 25,081 | | | | 457,709 | |
| | | | | | | | | | | | | |
| NET ASSETS | | $ | 108,165,059 | | | $ | 7,032,409 | | | $ | 75,290,717 | |
| | | | | | | | | | | | | |
| Net assets consist of: | | | | | | | | | | | | |
| Paid-in capital | | $ | 104,164,080 | | | $ | 8,928,982 | | | $ | 119,827,447 | |
| Accumulated net investment income (loss) | | | 654,358 | | | | (68,141 | ) | | | (517,075 | ) |
| Accumulated net realized losses | | | (1,266,683 | ) | | | (1,790,356 | ) | | | (44,931,356 | ) |
| Net unrealized appreciation (depreciation) | | | 4,613,304 | | | | (38,076 | ) | | | 911,701 | |
| NET ASSETS | | $ | 108,165,059 | | | $ | 7,032,409 | | | $ | 75,290,717 | |
| | | | | | | | | | | | | |
| PRICING OF CLASS A SHARES | | | | | | | | | | | | |
| Net assets applicable to Class A shares | | $ | 6,891,162 | | | $ | 4,517,635 | | | $ | 38,477,135 | |
| Class A shares of beneficial interest outstanding (unlimited number of shares authorized, $0.001 par value) | | | 677,970 | | | | 554,391 | | | | 4,338,513 | |
| Net asset value, offering price and redemption price per share (Note 1) | | $ | 10.16 | | | $ | 8.15 | | | $ | 8.87 | |
| Maximum offering price per share (Note 1) | | $ | 10.78 | | | $ | 8.65 | | | $ | 9.41 | |
| PRICING OF CLASS C SHARES | | | | | | | | | | | | |
| Net assets applicable to Class C shares | | $ | 3,051,168 | | | $ | 145,752 | | | $ | 19,325,325 | |
| Class C shares of beneficial interest outstanding (unlimited number of shares authorized, $0.001 par value) | | | 302,356 | | | | 18,400 | | | | 2,307,015 | |
| Net asset value, offering price and redemption price per share (Note 1) | | $ | 10.09 | | | $ | 7.92 | | | $ | 8.38 | |
| PRICING OF CLASS I SHARES | | | | | | | | | | | | |
| Net assets applicable to Class I shares | | $ | 98,222,729 | | | $ | 2,369,022 | | | $ | 17,488,257 | |
| Class I shares of beneficial interest outstanding (unlimited number of shares authorized, $0.001 par value) | | | 9,681,565 | | | | 288,117 | | | | 1,945,312 | |
| Net asset value, offering price and redemption price per share (Note 1) | | $ | 10.15 | | | $ | 8.22 | | | $ | 8.99 | |
See Notes to Financial Statements.
| Stadion Investment Trust | Statements of Operations |
| | For the Six Months Ended November 30, 2016 (Unaudited) |
| | | Stadion Tactical Growth Fund | | | Stadion Tactical Defensive Fund | | | Stadion Trilogy Alternative Return Fund | |
| INVESTMENT INCOME | | | | | | | | | |
| Dividends | | $ | 2,354,132 | | | $ | 312,689 | | | $ | 1,078,093 | |
| TOTAL INVESTMENT INCOME | | | 2,354,132 | | | | 312,689 | | | | 1,078,093 | |
| | | | | | | | | | | | | |
| EXPENSES | | | | | | | | | | | | |
| Investment advisory fees (Note 5) | | | 1,830,764 | | | | 247,757 | | | | 517,018 | |
| Distribution fees, Class A (Note 5) | | | 117,804 | | | | 23,332 | | | | 36,331 | |
| Distribution fees, Class C (Note 5) | | | 426,381 | | | | 47,237 | | | | 51,148 | |
| Transfer agent fees, Common (Note 5) | | | 74,428 | | | | 21,203 | | | | 19,562 | |
| Transfer agent fees, Class A (Note 5) | | | 18,464 | | | | 3,051 | | | | 2,201 | |
| Transfer agent fees, Class C (Note 5) | | | 23,706 | | | | 2,509 | | | | 2,946 | |
| Transfer agent fees, Class I (Note 5) | | | 42,998 | | | | 4,929 | | | | 14,033 | |
| Administrative fees (Note 5) | | | 123,500 | | | | 15,304 | | | | 33,455 | |
| Registration and filing fees | | | 28,900 | | | | 20,479 | | | | 12,619 | |
| Professional fees | | | 35,465 | | | | 11,304 | | | | 15,741 | |
| Custodian fees | | | 11,038 | | | | 2,410 | | | | 4,926 | |
| Compliance fees (Note 5) | | | 30,322 | | | | 3,948 | | | | 7,609 | |
| Trustees' fees | | | 18,648 | | | | 2,573 | | | | 4,833 | |
| Printing of shareholder reports | | | 21,968 | | | | 4,178 | | | | 4,790 | |
| Other expenses | | | 61,802 | | | | 11,144 | | | | 16,983 | |
| TOTAL EXPENSES | | | 2,866,188 | | | | 421,358 | | | | 744,195 | |
| | | | | | | | | | | | | |
| Expenses waived/reimbursed by the Advisor (Note 5) | | | (186,427 | ) | | | (13,840 | ) | | | – | |
| NET EXPENSES | | | 2,679,761 | | | | 407,518 | | | | 744,195 | |
| | | | | | | | | | | | | |
| NET INVESTMENT INCOME (LOSS) | | | (325,629 | ) | | | (94,829 | ) | | | 333,898 | |
| | | | | | | | | | | | | |
| REALIZED AND UNREALIZED GAINS (LOSSES) ON INVESTMENTS | | | | | | | | | | | | |
| Net realized gains (losses) from investments | | | 6,974,588 | | | | 880,985 | | | | (1,048,035 | ) |
| Net realized gains from written option contracts | | | – | | | | – | | | | 3,766,900 | |
| Net realized gains | | | 6,974,588 | | | | 880,985 | | | | 2,718,865 | |
| | | | | | | | | | | | | |
| Net change in unrealized appreciation on investments | | | 16,906,472 | | | | 966,562 | | | | 734,359 | |
| Net change in unrealized depreciation on written option contracts | | | – | | | | – | | | | (56,327 | ) |
| Net change in unrealized appreciation | | | 16,906,472 | | | | 966,562 | | | | 678,032 | |
| NET REALIZED AND UNREALIZED GAINS ON INVESTMENTS | | | 23,881,060 | | | | 1,847,547 | | | | 3,396,897 | |
| | | | | | | | | | | | | |
| NET INCREASE IN NET ASSETS RESULTING FROM OPERATIONS | | $ | 23,555,431 | | | $ | 1,752,718 | | | $ | 3,730,795 | |
See Notes to Financial Statements.
| Semi-Annual Report | November 30, 2016 | 35 |
| Stadion Investment Trust | Statements of Operations |
| | For the Six Months Ended November 30, 2016 (Unaudited) |
| | | Stadion Alternative Income Fund | | | Stadion Defensive International Fund | | | Stadion Managed Risk 100 Fund | |
| INVESTMENT INCOME | | | | | | | | | |
| Dividends | | $ | 1,767,868 | | | $ | 62,121 | | | $ | 720,694 | |
| TOTAL INVESTMENT INCOME | | | 1,767,868 | | | | 62,121 | | | | 720,694 | |
| | | | | | | | | | | | | |
| EXPENSES | | | | | | | | | | | | |
| Investment advisory fees (Note 5) | | | 419,840 | | | | 47,195 | | | | 525,807 | |
| Recoupment of previously waived fees (Note 5) | | | 23 | | | | – | | | | – | |
| Distribution fees, Class A (Note 5) | | | 6,692 | | | | 5,982 | | | | 51,668 | |
| Distribution fees, Class C (Note 5) | | | 8,996 | | | | 845 | | | | 109,307 | |
| Transfer agent fees, Common (Note 5) | | | 15,449 | | | | 14,525 | | | | 37,275 | |
| Transfer agent fees, Class A (Note 5) | | | 1,480 | | | | 28 | | | | 8,381 | |
| Transfer agent fees, Class C (Note 5) | | | 11 | | | | 16 | | | | 8,671 | |
| Transfer agent fees, Class I (Note 5) | | | 41,415 | | | | 1,358 | | | | 13,270 | |
| Administrative fees (Note 5) | | | 38,964 | | | | 3,387 | | | | 31,888 | |
| Registration and filing fees | | | 18,937 | | | | 10,246 | | | | 15,978 | |
| Professional fees | | | 15,444 | | | | 8,209 | | | | 16,961 | |
| Custodian fees | | | 4,709 | | | | 2,506 | | | | 3,467 | |
| Compliance fees (Note 5) | | | 8,764 | | | | 737 | | | | 8,784 | |
| Trustees' fees | | | 5,352 | | | | 472 | | | | 5,725 | |
| Printing of shareholder reports | | | 1,718 | | | | 1,595 | | | | 10,690 | |
| Other expenses | | | 16,857 | | | | 2,946 | | | | 18,511 | |
| TOTAL EXPENSES | | | 604,651 | | | | 100,047 | | | | 866,383 | |
| | | | | | | | | | | | | |
| Expenses waived/reimbursed by the Advisor (Note 5) | | | (21,207 | ) | | | (29,035 | ) | | | (3,177 | ) |
| NET EXPENSES | | | 583,444 | | | | 71,012 | | | | 863,206 | |
| | | | | | | | | | | | | |
| NET INVESTMENT INCOME (LOSS) | | | 1,184,424 | | | | (8,891 | ) | | | (142,512 | ) |
| | | | | �� | | | | | | | | |
| REALIZED AND UNREALIZED GAINS (LOSSES) ON INVESTMENTS | | | | | | | | | | | | |
| Net realized losses from investments | | | (821,752 | ) | | | (170,831 | ) | | | (236,171 | ) |
| Net realized losses from written option contracts | | | (639,646 | ) | | | – | | | | – | |
| Net realized losses on futures contracts | | | – | | | | (305,518 | ) | | | – | |
| Net realized losses | | | (1,461,398 | ) | | | (476,349 | ) | | | (236,171 | ) |
| | | | | | | | | | | | | |
| Net change in unrealized appreciation (depreciation) on investments | | | 1,864,154 | | | | (28,999 | ) | | | 612,315 | |
| Net change in unrealized depreciation on written option contracts | | | (585,164 | ) | | | – | | | | – | |
| Net change in unrealized depreciation on futures contracts | | | – | | | | (3,656 | ) | | | – | |
| Net change in unrealized appreciation (depreciation) | | | 1,278,990 | | | | (32,655 | ) | | | 612,315 | |
| NET REALIZED AND UNREALIZED GAINS (LOSSES) ON INVESTMENTS | | | (182,408 | ) | | | (509,004 | ) | | | 376,144 | |
| | | | | | | | | | | | | |
| NET INCREASE (DECREASE) IN NET ASSETS RESULTING FROM OPERATIONS | | $ | 1,002,016 | | | $ | (517,895 | ) | | $ | 233,632 | |
See Notes to Financial Statements.
| Stadion Investment Trust | Statements of Changes in Net Assets |
| | | Stadion Tactical Growth Fund | | | Stadion Tactical Defensive Fund | |
| | | For the Six Months Ended November 30, 2016 (Unaudited) | | | For the Year Ended May 31, 2016 | | | For the Six Months Ended November 30, 2016 (Unaudited) | | | For the Year Ended May 31, 2016 | |
| FROM OPERATIONS | | | | | | | | | | | | |
| Net investment income (loss) | | $ | (325,629 | ) | | $ | 1,351,836 | | | $ | (94,829 | ) | | $ | (461,338 | ) |
| Net realized gains (losses) | | | 6,974,588 | | | | (21,771,594 | ) | | | 880,985 | | | | (76,250 | ) |
| Net realized capital gain distributions from other investment companies | | | – | | | | 776,472 | | | | – | | | | – | |
| Net change in unrealized appreciation (depreciation) | | | 16,906,472 | | | | 8,682,743 | | | | 966,562 | | | | (2,946,908 | ) |
| Net increase (decrease) in net assets resulting from operations | | | 23,555,431 | | | | (10,960,543 | ) | | | 1,752,718 | | | | (3,484,496 | ) |
| | | | | | | | | | | | | | | | | |
| DISTRIBUTIONS TO SHAREHOLDERS | | | | | | | | | | | | | | | | |
| Distributions from net investment income, Class A | | | (130,434 | ) | | | (263,283 | ) | | | – | | | | – | |
| Distributions from net investment income, Class C | | | – | | | | (47,691 | ) | | | – | | | | – | |
| Distributions from net investment income, Class I | | | (309,975 | ) | | | (626,224 | ) | | | – | | | | – | |
| Distributions from net realized gains, Class A | | | – | | | | (120,006 | ) | | | – | | | | (627,153 | ) |
| Distributions from net realized gains, Class C | | | – | | | | (111,305 | ) | | | – | | | | (332,876 | ) |
| Distributions from net realized gains, Class I | | | – | | | | (207,995 | ) | | | – | | | | (503,101 | ) |
| Decrease in net assets from distributions to shareholders | | | (440,409 | ) | | | (1,376,504 | ) | | | – | | | | (1,463,130 | ) |
| | | | | | | | | | | | | | | | | |
| FROM CAPITAL SHARE TRANSACTIONS (Note 7) | | | | | | | | | | | | | | | | |
| Class A | | | | | | | | | | | | | | | | |
| Proceeds from sales of shares | | | 16,416,970 | | | | 68,221,628 | | | | 1,076,369 | | | | 4,826,430 | |
| Net asset value of shares issued in reinvestment of distributions | | | 119,951 | | | | 351,636 | | | | – | | | | 620,388 | |
| Payments for shares redeemed | | | (18,963,435 | ) | | | (34,562,634 | ) | | | (2,785,678 | ) | | | (13,673,222 | ) |
| Net increase (decrease) in net assets from Class A share transactions | | | (2,426,514 | ) | | | 34,010,630 | | | | (1,709,309 | ) | | | (8,226,404 | ) |
| | | | | | | | | | | | | | | | | |
| Class C | | | | | | | | | | | | | | | | |
| Proceeds from sales of shares | | | 13,577,432 | | | | 58,544,829 | | | | 424,673 | | | | 4,119,784 | |
| Net asset value of shares issued in reinvestment of distributions | | | – | | | | 146,289 | | | | – | | | | 291,183 | |
| Payments for shares redeemed | | | (14,303,453 | ) | | | (8,012,038 | ) | | | (1,504,001 | ) | | | (5,839,610 | ) |
| Net increase (decrease) in net assets from Class C share transactions | | | (726,021 | ) | | | 50,679,080 | | | | (1,079,328 | ) | | | (1,428,643 | ) |
| | | | | | | | | | | | | | | | | |
| Class I | | | | | | | | | | | | | | | | |
| Proceeds from sales of shares | | | 34,763,836 | | | | 115,948,299 | | | | 614,319 | | | | 7,783,476 | |
| Net asset value of shares issued in reinvestment of distributions | | | 289,158 | | | | 797,590 | | | | – | | | | 435,623 | |
| Payments for shares redeemed | | | (40,064,412 | ) | | | (64,518,464 | ) | | | (2,962,487 | ) | | | (19,006,109 | ) |
| Net increase (decrease) in net assets from Class I share transactions | | | (5,011,418 | ) | | | 52,227,425 | | | | (2,348,168 | ) | | | (10,787,010 | ) |
| | | | | | | | | | | | | | | | | |
| TOTAL NET INCREASE (DECREASE) IN NET ASSETS | | | 14,951,069 | | | | 124,580,088 | | | | (3,384,087 | ) | | | (25,389,683 | ) |
| | | | | | | | | | | | | | | | | |
| NET ASSETS: | | | | | | | | | | | | | | | | |
| Beginning of period | | | 316,152,025 | | | | 191,571,937 | | | | 41,109,102 | | | | 66,498,785 | |
| End of period | | $ | 331,103,094 | | | $ | 316,152,025 | | | $ | 37,725,015 | | | $ | 41,109,102 | |
| | | | | | | | | | | | | | | | | |
| ACCUMULATED NET INVESTMENT INCOME (LOSS) | | $ | (737,979 | ) | | $ | 28,059 | | | $ | (291,948 | ) | | $ | (197,119 | ) |
See Notes to Financial Statements.
| Semi-Annual Report | November 30, 2016 | 37 |
| Stadion Investment Trust | Statements of Changes in Net Assets |
| | | Stadion Trilogy Alternative Return Fund | | | Stadion Alternative Income Fund | |
| | | For the Six Months Ended November 30, 2016 (Unaudited) | | | For the Year Ended May 31, 2016 | | | For the Six Months Ended November 30, 2016 (Unaudited) | | | For the Year Ended May 31, 2016 (a) | |
| FROM OPERATIONS | | | | | | | | | | | | |
| Net investment income | | $ | 333,898 | | | $ | 806,857 | | | $ | 1,184,424 | | | $ | 1,174,128 | |
| Net realized gains (losses) | | | 2,718,865 | | | | 1,299,999 | | | | (1,461,398 | ) | | | 189,175 | |
| Net change in unrealized appreciation (depreciation) | | | 678,032 | | | | (3,178,161 | ) | | | 1,278,990 | | | | 3,383,912 | |
| Net increase (decrease) in net assets resulting from operations | | | 3,730,795 | | | | (1,071,305 | ) | | | 1,002,016 | | | | 4,747,215 | |
| | | | | | | | | | | | | | | | | |
| DISTRIBUTIONS TO SHAREHOLDERS | | | | | | | | | | | | | | | | |
| Distributions from net investment income, Class A | | | (138,981 | ) | | | (309,450 | ) | | | (47,885 | ) | | | (35,147 | ) |
| Distributions from net investment income, Class C | | | (6,919 | ) | | | (21,167 | ) | | | (12,729 | ) | | | (49 | ) |
| Distributions from net investment income, Class I | | | (259,994 | ) | | | (467,310 | ) | | | (949,454 | ) | | | (684,392 | ) |
| Distributions from net realized gains, Class A | | | – | | | | – | | | | – | | | | (495 | ) |
| Distributions from net realized gains, Class C | | | – | | | | – | | | | – | | | | (4 | ) |
| Distributions from net realized gains, Class I | | | – | | | | – | | | | – | | | | (23,422 | ) |
| Decrease in net assets from distributions to shareholders | | | (405,894 | ) | | | (797,927 | ) | | | (1,010,068 | ) | | | (743,509 | ) |
| | | | | | | | | | | | | | | | | |
| FROM CAPITAL SHARE TRANSACTIONS (Note 7) | | | | | | | | | | | | | | | | |
| Class A | | | | | | | | | | | | | | | | |
| Proceeds from sales of shares | | | 2,124,910 | | | | 7,205,240 | | | | 5,632,400 | | | | 3,380,050 | |
| Net asset value of shares issued in reinvestment of distributions | | | 137,971 | | | | 307,342 | | | | 46,675 | | | | 32,522 | |
| Payments for shares redeemed | | | (3,777,739 | ) | | | (17,752,328 | ) | | | (2,573,048 | ) | | | (4,878,780 | ) |
| Net increase (decrease) in net assets from Class A share transactions | | | (1,514,858 | ) | | | (10,239,746 | ) | | | 3,106,027 | | | | (1,466,208 | ) |
| | | | | | | | | | | | | | | | | |
| Class C | | | | | | | | | | | | | | | | |
| Proceeds from sales of shares | | | 1,188,799 | | | | 2,958,501 | | | | 2,603,212 | | | | 517,894 | |
| Net asset value of shares issued in reinvestment of distributions | | | 6,437 | | | | 20,426 | | | | 11,117 | | | | 49 | |
| Payments for shares redeemed | | | (2,114,547 | ) | | | (3,845,253 | ) | | | (34,143 | ) | | | (13,693 | ) |
| Net increase (decrease) in net assets from Class C share transactions | | | (919,311 | ) | | | (866,326 | ) | | | 2,580,186 | | | | 504,250 | |
| | | | | | | | | | | | | | | | | |
| Class I | | | | | | | | | | | | | | | | |
| Proceeds from sales of shares | | | 14,864,391 | | | | 15,904,975 | | | | 30,432,938 | | | | 89,377,568 | |
| Net asset value of shares issued in reinvestment of distributions | | | 259,047 | | | | 464,995 | | | | 936,612 | | | | 705,753 | |
| Payments for shares redeemed | | | (6,968,826 | ) | | | (29,249,266 | ) | | | (17,829,970 | ) | | | (9,847,204 | ) |
| Net increase (decrease) in net assets from Class I share transactions | | | 8,154,612 | | | | (12,879,296 | ) | | | 13,539,580 | | | | 80,236,117 | |
| | | | | | | | | | | | | | | | | |
| TOTAL NET INCREASE (DECREASE) IN NET ASSETS | | | 9,045,344 | | | | (25,854,600 | ) | | | 19,217,741 | | | | 83,277,865 | |
| | | | | | | | | | | | | | | | | |
| NET ASSETS: | | | | | | | | | | | | | | | | |
| Beginning of period | | | 78,727,168 | | | | 104,581,768 | | | | 88,947,318 | | | | 5,669,453 | |
| End of period | | $ | 87,772,512 | | | $ | 78,727,168 | | | $ | 108,165,059 | | | $ | 88,947,318 | |
| | | | | | | | | | | | | | | | | |
| ACCUMULATED NET INVESTMENT INCOME | | $ | 142,553 | | | $ | 214,549 | | | $ | 654,358 | | | $ | 480,002 | |
(a) | The Stadion Alternative Income Fund Class C shares commenced operations on August 10, 2015. |
See Notes to Financial Statements.
| Stadion Investment Trust | Statements of Changes in Net Assets |
| | | Stadion Defensive International Fund | | | Stadion Managed Risk 100 Fund | |
| | | For the Six Months Ended November 30, 2016 (Unaudited) | | | For the Year Ended May 31, 2016 | | | For the Six Months Ended November 30, 2016 (Unaudited) | | | For the Year Ended May 31, 2016 | |
| FROM OPERATIONS | | | | | | | | | | | | |
| Net investment loss | | $ | (8,891 | ) | | $ | (43,434 | ) | | $ | (142,512 | ) | | $ | (1,678,795 | ) |
| Net realized losses | | | (476,349 | ) | | | (1,269,150 | ) | | | (236,171 | ) | | | (11,663,950 | ) |
| Net change in unrealized appreciation (depreciation) | | | (32,655 | ) | | | 112,267 | | | | 612,315 | | | | 1,192,820 | |
| Net increase (decrease) in net assets resulting from operations | | | (517,895 | ) | | | (1,200,317 | ) | | | 233,632 | | | | (12,149,925 | ) |
| | | | | | | | | | | | | | | | | |
| DISTRIBUTIONS TO SHAREHOLDERS | | | | | | | | | | | | | | | | |
| Distributions from net realized gains, Class A | | | – | | | | (39,216 | ) | | | – | | | | – | |
| Distributions from net realized gains, Class C | | | – | | | | (1,056 | ) | | | – | | | | – | |
| Distributions from net realized gains, Class I | | | – | | | | (20,562 | ) | | | – | | | | – | |
| Decrease in net assets from distributions to shareholders | | | – | | | | (60,834 | ) | | | – | | | | – | |
| | | | | | | | | | | | | | | | | |
| FROM CAPITAL SHARE TRANSACTIONS (Note 7) | | | | | | | | | | | | | | | | |
| Class A | | | | | | | | | | | | | | | | |
| Proceeds from sales of shares | | | 369,684 | | | | 884,640 | | | | 673,295 | | | | 3,066,278 | |
| Net asset value of shares issued in reinvestment of distributions | | | – | | | | 39,130 | | | | – | | | | – | |
| Payments for shares redeemed | | | (462,927 | ) | | | (6,383,295 | ) | | | (7,174,285 | ) | | | (52,567,194 | ) |
| Net decrease in net assets from Class A share transactions | | | (93,243 | ) | | | (5,459,525 | ) | | | (6,500,990 | ) | | | (49,500,916 | ) |
| | | | | | | | | | | | | | | | | |
| Class C | | | | | | | | | | | | | | | | |
| Proceeds from sales of shares | | | 1,860 | | | | 50,606 | | | | 112,468 | | | | 546,454 | |
| Net asset value of shares issued in reinvestment of distributions | | | – | | | | 1,056 | | | | – | | | | – | |
| Payments for shares redeemed | | | (21,182 | ) | | | (9,879 | ) | | | (4,791,231 | ) | | | (22,178,174 | ) |
| Net increase (decrease) in net assets from Class C share transactions | | | (19,322 | ) | | | 41,783 | | | | (4,678,763 | ) | | | (21,631,720 | ) |
| | | | | | | | | | | | | | | | | |
| Class I | | | | | | | | | | | | | | | | |
| Proceeds from sales of shares | | | 15,709 | | | | 267,580 | | | | 252,032 | | | | 2,061,251 | |
| Net asset value of shares issued in reinvestment of distributions | | | – | | | | 20,562 | | | | – | | | | – | |
| Payments for shares redeemed | | | (326,661 | ) | | | (899,771 | ) | | | (7,566,890 | ) | | | (24,621,296 | ) |
| Net decrease in net assets from Class I share transactions | | | (310,952 | ) | | | (611,629 | ) | | | (7,314,858 | ) | | | (22,560,045 | ) |
| | | | | | | | | | | | | | | | | |
| TOTAL NET DECREASE IN NET ASSETS | | | (941,412 | ) | | | (7,290,522 | ) | | | (18,260,979 | ) | | | (105,842,606 | ) |
| | | | | | | | | | | | | | | | | |
| NET ASSETS: | | | | | | | | | | | | | | | | |
| Beginning of period | | | 7,973,821 | | | | 15,264,343 | | | | 93,551,696 | | | | 199,394,302 | |
| End of period | | $ | 7,032,409 | | | $ | 7,973,821 | | | $ | 75,290,717 | | | $ | 93,551,696 | |
| | | | | | | | | | | | | | | | | |
| ACCUMULATED NET INVESTMENT LOSS | | $ | (68,141 | ) | | $ | (59,250 | ) | | $ | (517,075 | ) | | $ | (374,563 | ) |
See Notes to Financial Statements.
| Semi-Annual Report | November 30, 2016 | 39 |
| Stadion Tactical Growth Fund – Class A | Financial Highlights |
For a Share Outstanding Throughout each of the Periods Presented
| | | For the Six Months Ended November 30, 2016 (Unaudited) | | | Year Ended May 31, 2016 | | | Year Ended May 31, 2015 | | | Year Ended May 31, 2014(a) | | | For the Period May 1, 2013 to May 31, 2013(b) | | | For the Period April 1, 2013 (Commencement of operations) to April 30, 2013 | |
NET ASSET VALUE, BEGINNING OF PERIOD | | $ | 9.82 | | | $ | 10.41 | | | $ | 10.35 | | | $ | 10.22 | | | $ | 10.27 | | | $ | 10.10 | |
| | | | | | | | | | | | | | | | | | | | | | | | | |
| INCOME (LOSS) FROM OPERATIONS: | | | | | | | | | | | | | | | | | | | | | | | | |
Net investment income (loss)(c)(d) | | | (0.01 | ) | | | 0.05 | | | | (0.02 | ) | | | (0.05 | ) | | | (0.01 | ) | | | (0.02 | ) |
| Net realized and unrealized gain (loss) on investments | | | 0.76 | | | | (0.59 | ) | | | 0.92 | | | | 1.32 | | | | (0.04 | ) | | | 0.19 | |
| Total from investment operations | | | 0.75 | | | | (0.54 | ) | | | 0.90 | | | | 1.27 | | | | (0.05 | ) | | | 0.17 | |
| LESS DISTRIBUTIONS: | | | | | | | | | | | | | | | | | | | | | | | | |
| Dividends from net investment income | | | (0.01 | ) | | | (0.03 | ) | | | (0.03 | ) | | | – | | | | – | | | | – | |
| Distributions from net realized gains | | | – | | | | (0.02 | ) | | | (0.81 | ) | | | (1.14 | ) | | | – | | | | – | |
| Total distributions | | | (0.01 | ) | | | (0.05 | ) | | | (0.84 | ) | | | (1.14 | ) | | | – | | | | – | |
| | | | | | | | | | | | | | | | | | | | | | | | | |
| NET ASSET VALUE, END OF PERIOD | | $ | 10.56 | | | $ | 9.82 | | | $ | 10.41 | | | $ | 10.35 | | | $ | 10.22 | | | $ | 10.27 | |
| | | | | | | | | | | | | | | | | | | | | | | | | |
TOTAL RETURN(e) | | | 7.68 | %(f) | | | (5.19 | %) | | | 8.78 | % | | | 12.75 | % | | | (0.49 | %)(f) | | | 1.68 | %(f) |
| | | | | | | | | | | | | | | | | | | | | | | | | |
| RATIOS AND SUPPLEMENTAL DATA: | | | | | | | | | | | | | | | | | | | | | | | | |
| Net assets, end of Period (000's) | | $ | 93,438 | | | $ | 89,271 | | | $ | 59,366 | | | $ | 17,305 | | | $ | 3,430 | | | $ | 1 | |
Ratio of total expenses to average net assets(g) | | | 1.65 | %(h)(i) | | | 1.71 | %(i) | | | 1.84 | %(i) | | | 1.85 | % | | | 5.21 | %(h)(i) | | | 2.83 | %(h)(i) |
Ratio of net expenses to average net assets(g) | | | 1.55 | %(h) | | | 1.55 | % | | | 1.69 | % | | | 1.85 | % | | | 1.95 | %(h) | | | 1.95 | %(h) |
Ratio of net investment – to average net assets(c)(g) | | | (0.11 | %)(h) | | | 0.54 | % | | | (0.21 | %) | | | (0.47 | %) | | | (1.95 | %)(h) | | | (1.95 | %)(h) |
| | | | | | | | | | | | | | | | | | | | | | | | | |
| PORTFOLIO TURNOVER RATE | | | 49 | %(f) | | | 287 | % | | | 333 | % | | | 324 | % | | | 50 | %(f) | | | 294 | %(f)(j) |
| (a) | Prior to March 28, 2014, the Stadion Tactical Growth Fund was known as the Stadion Market Opportunity Fund™. |
| (b) | Effective May 31, 2013, the Stadion Tactical Growth Fund changed its fiscal year from April 30 to May 31. |
| (c) | Recognition of net investment income (loss) by the Fund is affected by the timing of the declaration of dividends by the underlying investment companies in which the Fund invested. |
| (d) | Per share amounts were calculated using average shares method. |
| (e) | Total return is a measure of the change in value of an investment in the Fund over the periods covered, which assumes any dividends or capital gains distributions are reinvested in shares of the Fund. The returns shown do not reflect the deduction of taxes a shareholder would pay on Fund distributions or the redemption of Fund shares. |
| (g) | The ratios of expenses and net investment income (loss) to average net assets do not reflect the Fund's proportionate share of expense of the underlying investment companies in which the Fund invested. |
| (i) | Reflects total expenses prior to fee waivers and expense reimbursements by the advisor (Note 5). |
(j) | Portfolio turnover rate is calculated at the Fund Level and represents the year ended April 30, 2013. |
See Notes to Financial Statements.
| Stadion Tactical Growth Fund – Class C | Financial Highlights |
For a Share Outstanding Throughout each of the Periods Presented
| | | For the Six Months Ended November 30, 2016 (Unaudited) | | | Year Ended May 31, 2016 | | | Year Ended May 31, 2015 | | | Year Ended May 31, 2014(a) | | | For the Period May 1, 2013 to May 31, 2013(b) | | | For the Period April 1, 2013 (Commencement of operations) to April 30, 2013 | |
NET ASSET VALUE, BEGINNING OF PERIOD | | $ | 9.62 | | | $ | 10.25 | | | $ | 10.26 | | | $ | 10.21 | | | $ | 10.26 | | | $ | 10.10 | |
| | | | | | | | | | | | | | | | | | | | | | | | | |
| INCOME (LOSS) FROM OPERATIONS: | | | | | | | | | | | | | | | | | | | | | | | | |
Net investment loss(c)(d) | | | (0.04 | ) | | | (0.01 | ) | | | (0.12 | ) | | | (0.15 | ) | | | (0.02 | ) | | | (0.02 | ) |
| Net realized and unrealized gain (loss) on investments | | | 0.74 | | | | (0.59 | ) | | | 0.93 | | | | 1.33 | | | | (0.03 | ) | | | 0.18 | |
| Total from investment operations | | | 0.70 | | | | (0.60 | ) | | | 0.81 | | | | 1.18 | | | | (0.05 | ) | | | 0.16 | |
| LESS DISTRIBUTIONS: | | | | | | | | | | | | | | | | | | | | | | | | |
| Dividends from net investment income | | | – | | | | (0.01 | ) | | | (0.01 | ) | | | – | | | | – | | | | – | |
| Distributions from net realized gains | | | – | | | | (0.02 | ) | | | (0.81 | ) | | | (1.13 | ) | | | – | | | | – | |
| Total distributions | | | – | | | | (0.03 | ) | | | (0.82 | ) | | | (1.13 | ) | | | – | | | | – | |
| | | | | | | | | | | | | | | | | | | | | | | | | |
| NET ASSET VALUE, END OF PERIOD | | $ | 10.32 | | | $ | 9.62 | | | $ | 10.25 | | | $ | 10.26 | | | $ | 10.21 | | | $ | 10.26 | |
| | | | | | | | | | | | | | | | | | | | | | | | | |
TOTAL RETURN(e) | | | 7.28 | %(f) | | | (5.93 | %) | | | 7.96 | % | | | 11.87 | % | | | (0.49 | %)(f) | | | 1.58 | %(f) |
| | | | | | | | | | | | | | | | | | | | | | | | | |
| RATIOS AND SUPPLEMENTAL DATA: | | | | | | | | | | | | | | | | | | | | | | | | |
| Net assets, end of Period (000's) | | $ | 87,554 | | | $ | 82,347 | | | $ | 34,402 | | | $ | 1,242 | | | $ | 1 | | | $ | 1 | |
Ratio of total expenses to average net assets(g) | | | 2.42 | %(h)(i) | | | 2.49 | %(i) | | | 2.59 | %(i) | | | 2.64 | % | | | 3.01 | %(h)(i) | | | 3.51 | %(h)(i) |
Ratio of net expenses to average net assets(g) | | | 2.30 | %(h) | | | 2.30 | % | | | 2.37 | % | | | 2.64 | % | | | 2.70 | %(h) | | | 2.70 | %(h) |
Ratio of net investment – to average net assets(c)(g) | | | (0.87 | %)(h) | | | (0.11 | %) | | | (1.16 | %) | | | (1.49 | %) | | | (2.70 | %)(h) | | | (2.70 | %)(h) |
| | | | | | | | | | | | | | | | | | | | | | | | | |
| PORTFOLIO TURNOVER RATE | | | 49 | %(f) | | | 287 | % | | | 333 | % | | | 324 | % | | | 50 | %(f) | | | 294 | %(f)(j) |
| (a) | Prior to March 28, 2014, the Stadion Tactical Growth Fund was known as the Stadion Market Opportunity Fund™. |
| (b) | Effective May 31, 2013, the Stadion Tactical Growth Fund changed its fiscal year from April 30 to May 31. |
| (c) | Recognition of net investment income (loss) by the Fund is affected by the timing of the declaration of dividends by the underlying investment companies in which the Fund invested. |
| (d) | Per share amounts were calculated using average shares method. |
| (e) | Total return is a measure of the change in value of an investment in the Fund over the periods covered, which assumes any dividends or capital gains distributions are reinvested in shares of the Fund. The returns shown do not reflect the deduction of taxes a shareholder would pay on Fund distributions or the redemption of Fund shares. |
| (g) | The ratios of expenses and net investment income (loss) to average net assets do not reflect the Fund's proportionate share of expense of the underlying investment companies in which the Fund invested. |
| (i) | Reflects total expenses prior to fee waivers and expense reimbursements by the advisor (Note 5). |
(j) | Portfolio turnover rate is calculated at the Fund Level and represents the year ended April 30, 2013. |
See Notes to Financial Statements.
| Semi-Annual Report | November 30, 2016 | 41 |
| Stadion Tactical Growth Fund – Class I | Financial Highlights |
For a Share Outstanding Throughout each of the Periods Presented
| | | Six Months Ended November 30, 2016 (Unaudited) | | | Year Ended May 31, 2016 | | | Year Ended May 31, 2015 | | | Year Ended May 31, 2014(a) | | | For the Period May 1, 2013 to May 31, 2013(b) | | | Year Ended April 30, 2013 | | | Year Ended April 30, 2012 | |
| NET ASSET VALUE, BEGINNING OF PERIOD | | $ | 9.88 | | | $ | 10.46 | | | $ | 10.38 | | | $ | 10.23 | | | $ | 10.27 | | | $ | 11.20 | | | $ | 13.13 | |
| | | | | | | | | | | | | | | | | | | | | | | | | | | | | |
| INCOME (LOSS) FROM OPERATIONS: | | | | | | | | | | | | | | | | | | | | | | | | | | | | |
Net investment income (loss)(c)(d) | | | 0.01 | | | | 0.08 | | | | 0.00 | (e) | | | (0.02 | ) | | | (0.01 | ) | | | (0.02 | ) | | | (0.08 | ) |
| Net realized and unrealized gain (loss) on investments | | | 0.76 | | | | (0.59 | ) | | | 0.94 | | | | 1.31 | | | | (0.03 | ) | | | 0.90 | | | | 0.11 | |
| Total from investment operations | | | 0.77 | | | | (0.51 | ) | | | 0.94 | | | | 1.29 | | | | (0.04 | ) | | | 0.88 | | | | 0.03 | |
| LESS DISTRIBUTIONS: | | | | | | | | | | | | | | | | | | | | | | | | | | | | |
| Dividends from net investment income | | | (0.02 | ) | | | (0.05 | ) | | | (0.05 | ) | | | – | | | | – | | | | – | | | | – | |
| Distributions from net realized gains | | | – | | | | (0.02 | ) | | | (0.81 | ) | | | (1.14 | ) | | | – | | | | (1.81 | ) | | | (1.96 | ) |
| Total distributions | | | (0.02 | ) | | | (0.07 | ) | | | (0.86 | ) | | | (1.14 | ) | | | – | | | | (1.81 | ) | | | (1.96 | ) |
| | | | | | | | | | | | | | | | | | | | | | | | | | | | | |
| NET ASSET VALUE, END OF PERIOD | | $ | 10.63 | | | $ | 9.88 | | | $ | 10.46 | | | $ | 10.38 | | | $ | 10.23 | | | $ | 10.27 | | | $ | 11.20 | |
| | | | | | | | | | | | | | | | | | | | | | | | | | | | |
TOTAL RETURN(f) | | | 7.82 | %(g) | | | (4.94 | %) | | | 9.07 | % | | | 12.96 | % | | | (0.39 | %)(g) | | | 9.90 | % | | | 1.70 | % |
| | | | | | | | | | | | | | | | | | | | | | | | | | | | | |
| RATIOS AND SUPPLEMENTAL DATA: | | | | | | | | | | | | | | | | | | | | | | | | | | | | |
| Net assets, end of Period (000's) | | $ | 150,112 | | | $ | 144,534 | | | $ | 97,804 | | | $ | 28,721 | | | $ | 24,024 | | | $ | 22,169 | | | $ | 29,546 | |
| | | | | | | | | | | | | | | | | | | | | | | | | | | | | |
Ratio of total expenses to average net assets(h) | | | 1.42 | %(i)(j) | | | 1.49 | %(j) | | | 1.62 | %(j) | | | 1.59 | % | | | 1.98 | %(i)(j) | | | 1.81 | %(j) | | | 1.75 | % |
| | | | | | | | | | | | | | | | | | | | | | | | | | | | | |
Ratio of net expenses to average net assets(h) | | | 1.30 | %(i) | | | 1.30 | % | | | 1.43 | % | | | 1.59 | % | | | 1.70 | %(i) | | | 1.75 | % | | | N/A | |
| | | | | | | | | | | | | | | | | | | | | | | | | | | | | |
Ratio of net investment – to average net assets(c)(h) | | | 0.13 | %(i) | | | 0.85 | % | | | 0.02 | % | | | (0.22 | %) | | | (1.70 | %)(i) | | | (0.21 | %) | | | (0.66 | %) |
| | | | | | | | | | | | | | | | | | | | | | | | | | | | | |
| PORTFOLIO TURNOVER RATE | | | 49 | %(g) | | | 287 | % | | | 333 | % | | | 324 | % | | | 50 | %(g) | | | 294 | % | | | 262 | % |
| (a) | Prior to March 28, 2014, the Stadion Tactical Growth Fund was known as the Stadion Market Opportunity Fund™. |
| (b) | Effective May 31, 2013, the Stadion Tactical Growth Fund changed its fiscal year from April 30 to May 31. |
| (c) | Recognition of net investment income (loss) by the Fund is affected by the timing of the declaration of dividends by the underlying investment companies in which the Fund invested. |
| (d) | Per share amounts were calculated using average shares method. |
| (e) | Amount rounds to less than $0.01 per share or less than 1%. |
| (f) | Total return is a measure of the change in value of an investment in the Fund over the periods covered, which assumes any dividends or capital gains distributions are reinvested in shares of the Fund. The returns shown do not reflect the deduction of taxes a shareholder would pay on Fund distributions or the redemption of Fund shares. |
| (h) | The ratios of expenses and net investment income (loss) to average net assets do not reflect the Fund's proportionate share of expense of the underlying investment companies in which the Fund invested. |
| (j) | Reflects total expenses prior to fee waivers and expense reimbursements by the advisor (Note 5). |
See Notes to Financial Statements.
| Stadion Tactical Defensive Fund – Class A | Financial Highlights |
For a Share Outstanding Throughout each of the Periods Presented
| | | For the Six Months Ended November 30, 2016 (Unaudited) | | | Year Ended May 31, 2016 | | | Year Ended May 31, 2015 | | | Year Ended May 31, 2014(a) | | | Year Ended May 31, 2013 | | | Year Ended May 31, 2012 | |
| NET ASSET VALUE, BEGINNING OF PERIOD | | $ | 11.08 | | | $ | 11.99 | | | $ | 11.69 | | | $ | 11.99 | | | $ | 10.37 | | | $ | 11.72 | |
| | | | | | | | | | | | | | | | | | | | | | | | | |
| INCOME (LOSS) FROM OPERATIONS: | | | | | | | | | | | | | | | | | | | | | | | | |
Net investment income (loss)(b) | | | (0.02 | )(c) | | | (0.09 | )(c) | | | (0.04 | )(c) | | | (0.04 | )(c) | | | 0.02 | (c) | | | (0.09 | ) |
| Net realized and unrealized gain (loss) on investments | | | 0.53 | | | | (0.50 | ) | | | 0.35 | | | | 0.53 | | | | 1.60 | | | | (0.72 | ) |
| Total from investment operations | | | 0.51 | | | | (0.59 | ) | | | 0.31 | | | | 0.49 | | | | 1.62 | | | | (0.81 | ) |
| LESS DISTRIBUTIONS: | | | | | | | | | | | | | | | | | | | | | | | | |
| Dividends from net investment income | | | – | | | | – | | | | – | | | | (0.01 | ) | | | – | | | | – | |
| Distributions from net realized gains | | | – | | | | (0.32 | ) | | | (0.01 | ) | | | (0.78 | ) | | | – | | | | (0.54 | ) |
| Total distributions | | | – | | | | (0.32 | ) | | | (0.01 | ) | | | (0.79 | ) | | | – | | | | (0.54 | ) |
| | | | | | | | | | | | | | | | | | | | | | | | | |
| NET ASSET VALUE, END OF PERIOD | | $ | 11.59 | | | $ | 11.08 | | | $ | 11.99 | | | $ | 11.69 | | | $ | 11.99 | | | $ | 10.37 | |
| | | | | | | | | | | | | | | | | | | | | | | | | |
TOTAL RETURN(d) | | | 4.60 | %(e) | | | (4.80 | %) | | | 2.67 | % | | | 4.12 | % | | | 15.62 | % | | | (6.75 | %) |
| | | | | | | | | | | | | | | | | | | | | | | | | |
| RATIOS AND SUPPLEMENTAL DATA: | | | | | | | | | | | | | | | | | | | | | | | | |
| Net assets, end of Period (000's) | | $ | 17,868 | | | $ | 18,726 | | | $ | 29,073 | | | $ | 43,136 | | | $ | 33,813 | | | $ | 33,892 | |
| | | | | | | | | | | | | | | | | | | | | | | | | |
Ratio of total expenses to average net assets(f) | | | 2.00 | %(g)(h) | | | 1.96 | %(h) | | | 1.88 | % | | | 1.89 | % | | | 2.00 | %(h) | | | 1.91 | %(h) |
| | | | | | | | | | | | | | | | | | | | | | | | | |
Ratio of net expenses to average net assets(f) | | | 1.95 | %(g) | | | 1.95 | % | | | 1.88 | % | | | 1.89 | % | | | 1.95 | % | | | 1.89 | % |
| | | | | | | | | | | | | | | | | | | | | | | | | |
Ratio of net investment – to average net assets(b)(f) | | | (0.37 | %)(g) | | | (0.77 | %) | | | (0.33 | %) | | | (0.34 | %) | | | 0.14 | % | | | (0.67 | %) |
| | | | | | | | | | | | | | | | | | | | | | | | | |
| PORTFOLIO TURNOVER RATE | | | 205 | %(e) | | | 645 | % | | | 482 | % | | | 529 | % | | | 455 | % | | | 826 | % |
| (a) | Prior to March 28, 2014, the Stadion Tactical Defensive Fund was known as the Stadion Core Advantage Fund. |
| (b) | Recognition of net investment income (loss) by the Fund is affected by the timing of the declaration of dividends by the underlying investment companies in which the Fund invested. |
| (c) | Per share amounts were calculated using average shares method. |
| (d) | Total return is a measure of the change in value of an investment in the Fund over the periods covered, which assumes any dividends or capital gains distributions are reinvested in shares of the Fund. The returns shown do not reflect the deduction of taxes a shareholder would pay on Fund distributions or the redemption of Fund shares. |
| (f) | The ratios of expenses and net investment income (loss) to average net assets do not reflect the Fund's proportionate share of expense of the underlying investment companies in which the Fund invested. |
| (h) | Reflects total expenses prior to fee waivers and expense reimbursements by the advisor (Note 5). |
See Notes to Financial Statements.
| Semi-Annual Report | November 30, 2016 | 43 |
| Stadion Tactical Defensive Fund – Class C | Financial Highlights |
For a Share Outstanding Throughout each of the Periods Presented
| | | For the Six Months Ended November 30, 2016 (Unaudited) | | | Year Ended May 31, 2016 | | | Year Ended May 31, 2015 | | | Year Ended May 31, 2014(a) | | | Year Ended May 31, 2013 | | | Year Ended May 31, 2012 | |
| NET ASSET VALUE, BEGINNING OF PERIOD | | $ | 10.48 | | | $ | 11.45 | | | $ | 11.26 | | | $ | 11.64 | | | $ | 10.16 | | | $ | 11.59 | |
| | | | | | | | | | | | | | | | | | | | | | | | | |
| INCOME (LOSS) FROM OPERATIONS: | | | | | | | | | | | | | | | | | | | | | | | | |
Net investment loss(b) | | | (0.06 | )(c) | | | (0.17 | )(c) | | | (0.13 | )(c) | | | (0.13 | )(c) | | | (0.07 | )(c) | | | (0.18 | ) |
| Net realized and unrealized gain (loss) on investments | | | 0.51 | | | | (0.48 | ) | | | 0.33 | | | | 0.53 | | | | 1.55 | | | | (0.71 | ) |
| Total from investment operations | | | 0.45 | | | | (0.65 | ) | | | 0.20 | | | | 0.40 | | | | 1.48 | | | | (0.89 | ) |
| LESS DISTRIBUTIONS: | | | | | | | | | | | | | | | | | | | | | | | | |
| Dividends from net investment income | | | – | | | | – | | | | – | | | | (0.00 | )(d) | | | – | | | | – | |
| Distributions from net realized gains | | | – | | | | (0.32 | ) | | | (0.01 | ) | | | (0.78 | ) | | | – | | | | (0.54 | ) |
| Total distributions | | | – | | | | (0.32 | ) | | | (0.01 | ) | | | (0.78 | ) | | | – | | | | (0.54 | ) |
| | | | | | | | | | | | | | | | | | | | | | | | | |
| NET ASSET VALUE, END OF PERIOD | | $ | 10.93 | | | $ | 10.48 | | | $ | 11.45 | | | $ | 11.26 | | | $ | 11.64 | | | $ | 10.16 | |
| | | | | | | | | | | | | | | | | | | | | | | | | |
TOTAL RETURN(e) | | | 4.29 | %(f) | | | (5.56 | %) | | | 1.80 | % | | | 3.47 | % | | | 14.57 | % | | | (7.54 | %) |
| | | | | | | | | | | | | | | | | | | | | | | | | |
| RATIOS AND SUPPLEMENTAL DATA: | | | | | | | | | | | | | | | | | | | | | | | | |
| Net assets, end of Period (000's) | | $ | 8,990 | | | $ | 9,680 | | | $ | 12,145 | | | $ | 7,807 | | | $ | 5,060 | | | $ | 5,253 | |
| | | | | | | | | | | | | | | | | | | | | | | | | |
Ratio of total expenses to average net assets(g) | | | 2.77 | %(h)(i) | | | 2.73 | %(i) | | | 2.66 | % | | | 2.67 | % | | | 3.20 | %(i) | | | 3.12 | %(i) |
| | | | | | | | | | | | | | | | | | | | | | | | | |
Ratio of net expenses to average net assets(g) | | | 2.70 | %(h) | | | 2.70 | % | | | 2.66 | % | | | 2.67 | % | | | 2.70 | % | | | 2.70 | % |
| | | | | | | | | | | | | | | | | | | | | | | | | |
Ratio of net investment – to average net assets(b)(g) | | | (1.13 | %)(h) | | | (1.55 | %) | | | (1.16 | %) | | | (1.13 | %) | | | (0.61 | %) | | | (1.48 | %) |
| | | | | | | | | | | | | | | | | | | | | | | | | |
| PORTFOLIO TURNOVER RATE | | | 205 | %(f) | | | 645 | % | | | 482 | % | | | 529 | % | | | 455 | % | | | 826 | % |
| (a) | Prior to March 28, 2014, the Stadion Tactical Defensive Fund was known as the Stadion Core Advantage Fund. |
| (b) | Recognition of net investment income (loss) by the Fund is affected by the timing of the declaration of dividends by the underlying investment companies in which the Fund invested. |
| (c) | Per share amounts were calculated using average shares method. |
(d) | Amount rounds to less than $0.01 per share or less than 1%. |
| (e) | Total return is a measure of the change in value of an investment in the Fund over the periods covered, which assumes any dividends or capital gains distributions are reinvested in shares of the Fund. The returns shown do not reflect the deduction of taxes a shareholder would pay on Fund distributions or the redemption of Fund shares. |
| (g) | The ratios of expenses and net investment income (loss) to average net assets do not reflect the Fund's proportionate share of expense of the underlying investment companies in which the Fund invested. |
| (i) | Reflects total expenses prior to fee waivers and expense reimbursements by the advisor (Note 5). |
See Notes to Financial Statements.
| Stadion Tactical Defensive Fund – Class I | Financial Highlights |
For a Share Outstanding Throughout each of the Periods Presented
| | | For the Six Months Ended November 30, 2016 (Unaudited) | | | Year Ended May 31, 2016 | | | Year Ended May 31, 2015 | | | Year Ended May 31, 2014(a) | | | Year Ended May 31, 2013 | | | Year Ended May 31, 2012 | |
| NET ASSET VALUE, BEGINNING OF PERIOD | | $ | 11.23 | | | $ | 12.12 | | | $ | 11.80 | | | $ | 12.07 | | | $ | 10.42 | | | $ | 11.76 | |
| | | | | | | | | | | | | | | | | | | | | | | | | |
| INCOME (LOSS) FROM OPERATIONS: | | | | | | | | | | | | | | | | | | | | | | | | |
Net investment income (loss)(b) | | | (0.01 | )(c) | | | (0.06 | )(c) | | | (0.03 | )(c) | | | (0.02 | )(c) | | | 0.02 | (c) | | | (0.05 | ) |
| Net realized and unrealized gain (loss) on investments | | | 0.55 | | | | (0.51 | ) | | | 0.36 | | | | 0.55 | | | | 1.63 | | | | (0.75 | ) |
| Total from investment operations | | | 0.54 | | | | (0.57 | ) | | | 0.33 | | | | 0.53 | | | | 1.65 | | | | (0.80 | ) |
| LESS DISTRIBUTIONS: | | | | | | | | | | | | | | | | | | | | | | | | |
| Dividends from net investment income | | | – | | | | – | | | | – | | | | (0.02 | ) | | | – | | | | – | |
| Distributions from net realized gains | | | – | | | | (0.32 | ) | | | (0.01 | ) | | | (0.78 | ) | | | – | | | | (0.54 | ) |
| Total distributions | | | – | | | | (0.32 | ) | | | (0.01 | ) | | | (0.80 | ) | | | – | | | | (0.54 | ) |
| | | | | | | | | | | | | | | | | | | | | | | | | |
| NET ASSET VALUE, END OF PERIOD | | $ | 11.77 | | | $ | 11.23 | | | $ | 12.12 | | | $ | 11.80 | | | $ | 12.07 | | | $ | 10.42 | |
| | | | | | | | | | | | | | | | | | | | | | | | | |
TOTAL RETURN(d) | | | 4.81 | %(e) | | | (4.58 | %) | | | 2.82 | % | | | 4.42 | % | | | 15.83 | % | | | (6.65 | %) |
| | | | | | | | | | | | | | | | | | | | | | | | | |
| RATIOS AND SUPPLEMENTAL DATA: | | | | | | | | | | | | | | | | | | | | | | | | |
| Net assets, end of Period (000's) | | $ | 10,867 | | | $ | 12,703 | | | $ | 25,280 | | | $ | 7,333 | | | $ | 4,945 | | | $ | 2,636 | |
| | | | | | | | | | | | | | | | | | | | | | | | | |
Ratio of total expenses to average net assets(f) | | | 1.80 | %(g)(h) | | | 1.76 | %(h) | | | 1.70 | % | | | 1.73 | %(h) | | | 2.38 | %(h) | | | 3.05 | %(h) |
| | | | | | | | | | | | | | | | | | | | | | | | | |
Ratio of net expenses to average net assets(f) | | | 1.70 | %(g) | | | 1.70 | % | | | 1.70 | % | | | 1.70 | % | | | 1.70 | % | | | 1.70 | % |
| | | | | | | | | | | | | | | | | | | | | | | | | |
Ratio of net investment – to average net assets(b)(f) | | | (0.12 | %)(g) | | | (0.53 | %) | | | (0.28 | %) | | | (0.19 | %) | | | 0.20 | % | | | (0.53 | %) |
| | | | | | | | | | | | | | | | | | | | | | | | | |
| PORTFOLIO TURNOVER RATE | | | 205 | %(e) | | | 645 | % | | | 482 | % | | | 529 | % | | | 455 | % | | | 826 | % |
| (a) | Prior to March 28, 2014, the Stadion Tactical Defensive Fund was known as the Stadion Core Advantage Fund. |
| (b) | Recognition of net investment income (loss) by the Fund is affected by the timing of the declaration of dividends by the underlying investment companies in which the Fund invested. |
| (c) | Per share amounts were calculated using average shares method. |
| (d) | Total return is a measure of the change in value of an investment in the Fund over the periods covered, which assumes any dividends or capital gains distributions are reinvested in shares of the Fund. The returns shown do not reflect the deduction of taxes a shareholder would pay on Fund distributions or the redemption of Fund shares. |
| (f) | The ratios of expenses and net investment income (loss) to average net assets do not reflect the Fund's proportionate share of expense of the underlying investment companies in which the Fund invested. |
| (h) | Reflects total expenses prior to fee waivers and expense reimbursements by the advisor (Note 5). |
See Notes to Financial Statements.
| Semi-Annual Report | November 30, 2016 | 45 |
| Stadion Trilogy Alternative Return Fund – Class A | Financial Highlights |
For a Share Outstanding Throughout each of the Periods Presented
| | | For the Six Months Ended November 30, 2016 (Unaudited) | | | Year Ended May 31, 2016 | | | Year Ended May 31, 2015 | | | Year Ended May 31, 2014(a) | | | Year Ended May 31, 2013 | | | For the Period April 2, 2012 (Commencement of operations) to May 31, 2012 | |
NET ASSET VALUE, BEGINNING OF PERIOD | | $ | 10.49 | | | $ | 10.66 | | | $ | 10.53 | | | $ | 10.41 | | | $ | 9.85 | | | $ | 10.00 | |
| | | | | | | | | | | | | | | | | | | | | | | | | |
| INCOME (LOSS) FROM OPERATIONS: | | | | | | | | | | | | | | | | | | | | | | | | |
Net investment income(b) | | | 0.04 | (c) | | | 0.09 | (c) | | | 0.04 | (c) | | | 0.04 | (c) | | | 0.07 | (c) | | | 0.00 | (d) |
| Net realized and unrealized gain (loss) on investments | | | 0.46 | | | | (0.18 | ) | | | 0.12 | | | | 0.11 | | | | 0.67 | | | | (0.15 | ) |
| Total from investment operations | | | 0.50 | | | | (0.09 | ) | | | 0.16 | | | | 0.15 | | | | 0.74 | | | | (0.15 | ) |
| LESS DISTRIBUTIONS: | | | | | | | | | | | | | | | | | | | | | | | | |
| Dividends from net investment income | | | (0.05 | ) | | | (0.08 | ) | | | (0.03 | ) | | | (0.03 | ) | | | (0.05 | ) | | | – | |
| Distributions from net realized gains | | | – | | | | – | | | | – | | | | – | | | | (0.13 | ) | | | – | |
| Total distributions | | | (0.05 | ) | | | (0.08 | ) | | | (0.03 | ) | | | (0.03 | ) | | | (0.18 | ) | | | – | |
| | | | | | | | | | | | | | | | | | | | | | | | | |
| NET ASSET VALUE, END OF PERIOD | | $ | 10.94 | | | $ | 10.49 | | | $ | 10.66 | | | $ | 10.53 | | | $ | 10.41 | | | $ | 9.85 | |
| | | | | | | | | | | | | | | | | | | | | | | | | |
TOTAL RETURN(e) | | | 4.79 | %(f) | | | (0.79 | %) | | | 1.54 | % | | | 1.45 | % | | | 7.53 | % | | | (1.50 | %)(f) |
| | | | | | | | | | | | | | | | | | | | | | | | | |
| RATIOS AND SUPPLEMENTAL DATA: | | | | | | | | | | | | | | | | | | | | | | | | |
| Net assets, end of Period (000's) | | $ | 28,598 | | | $ | 28,898 | | | $ | 39,896 | | | $ | 88,261 | | | $ | 68,967 | | | $ | 49,507 | |
| | | | | | | | | | | | | | | | | | | | | | | | | |
Ratio of total expenses to average net assets(g) | | | 1.81 | %(h) | | | 1.85 | % | | | 1.82 | % | | | 1.76 | % | | | 1.93 | % | | | 2.21 | %(h)(i) |
| | | | | | | | | | | | | | | | | | | | | | | | | |
Ratio of net expenses to average net assets(g) | | | 1.81 | %(h) | | | 1.85 | % | | | 1.82 | % | | | 1.76 | % | | | 1.93 | % | | | 1.95 | %(h) |
| | | | | | | | | | | | | | | | | | | | | | | | | |
Ratio of net investment – to average net assets(b)(g) | | | 0.80 | %(h) | | | 0.88 | % | | | 0.38 | % | | | 0.34 | % | | | 0.66 | % | | | 0.34 | %(h) |
| | | | | | | | | | | | | | | | | | | | | | | | | |
| PORTFOLIO TURNOVER RATE | | | 14 | %(f) | | | 36 | % | | | 37 | % | | | 15 | % | | | 42 | % | | | 0 | %(d)(f) |
| (a) | Prior to March 28, 2014, the Stadion Trilogy Alternative Return Fund was known as the Stadion Trilogy Fund™. |
| (b) | Recognition of net investment income (loss) by the Fund is affected by the timing of the declaration of dividends by the underlying investment companies in which the Fund invested. |
| (c) | Per share amounts were calculated using average shares method. |
| (d) | Amount rounds to less than $0.01 per share or less than 1%. |
| (e) | Total return is a measure of the change in value of an investment in the Fund over the periods covered, which assumes any dividends or capital gains distributions are reinvested in shares of the Fund. The returns shown do not reflect the deduction of taxes a shareholder would pay on Fund distributions or the redemption of Fund shares. |
| (g) | The ratios of expenses and net investment income to average net assets do not reflect the Fund's proportionate share of expense of the underlying investment companies in which the Fund invested. |
| (i) | Reflects total expenses prior to fee waivers and expense reimbursements by the advisor (Note 5). |
See Notes to Financial Statements.
| Stadion Trilogy Alternative Return Fund – Class C | Financial Highlights |
| For a Share Outstanding Throughout each of the Periods Presented |
| | | For the Six
Months Ended
November 30,
2016 (Unaudited) | | | Year Ended
May 31, 2016 | | | Year Ended
May 31, 2015 | | | Year Ended
May 31, 2014(a) | | | Year Ended
May 31, 2013 | | | For the Period
April 2, 2012
(Commencement
of operations) to
May 31, 2012 | |
NET ASSET VALUE, BEGINNING OF PERIOD | | $ | 10.31 | | | $ | 10.49 | | | $ | 10.42 | | | $ | 10.35 | | | $ | 9.85 | | | $ | 10.00 | |
| | | | | | | | | | | | | | | | | | | | | | | | | |
| INCOME (LOSS) FROM OPERATIONS: | | | | | | | | | | | | | | | | | | | | | | | | |
Net investment income (loss)(b) | | | 0.00 | (c)(d) | | | 0.01 | (c) | | | (0.04 | )(c) | | | (0.04 | )(c) | | | (0.01 | )(c) | | | (0.00 | )(d) |
| Net realized and unrealized gain (loss) on investments | | | 0.45 | | | | (0.17 | ) | | | 0.12 | | | | 0.11 | | | | 0.67 | | | | (0.15 | ) |
| Total from investment operations | | | 0.45 | | | | (0.16 | ) | | | 0.08 | | | | 0.07 | | | | 0.66 | | | | (0.15 | ) |
| LESS DISTRIBUTIONS: | | | | | | | | | | | | | | | | | | | | | | | | |
| Dividends from net investment income | | | (0.01 | ) | | | (0.02 | ) | | | (0.01 | ) | | | – | | | | (0.03 | ) | | | – | |
| Distributions from net realized gains | | | – | | | | – | | | | – | | | | – | | | | (0.13 | ) | | | – | |
| Total distributions | | | (0.01 | ) | | | (0.02 | ) | | | (0.01 | ) | | | – | | | | (0.16 | ) | | | – | |
| | | | | | | | | | | | | | | | | | | | | | | | | |
| NET ASSET VALUE, END OF PERIOD | | $ | 10.75 | | | $ | 10.31 | | | $ | 10.49 | | | $ | 10.42 | | | $ | 10.35 | | | $ | 9.85 | |
| | | | | | | | | | | | | | | | | | | | | | | | | |
TOTAL RETURN(e) | | | 4.34 | %(f) | | | (1.53 | %) | | | 0.75 | % | | | 0.68 | % | | | 6.72 | % | | | (1.50 | %)(f) |
| | | | | | | | | | | | | | | | | | | | | | | | | |
| RATIOS AND SUPPLEMENTAL DATA: | | | | | | | | | | | | | | | | | | | | | | | | |
| Net assets, end of Period (000's) | | $ | 10,089 | | | $ | 10,573 | | | $ | 11,654 | | | $ | 21,805 | | | $ | 11,570 | | | $ | 50 | |
| | | | | | | | | | | | | | | | | | | | | | | | | |
Ratio of total expenses to average net assets(g) | | | 2.60 | %(h) | | | 2.63 | % | | | 2.58 | % | | | 2.52 | % | | | 3.36 | %(i) | | | 61.13 | %(h)(i) |
| | | | | | | | | | | | | | | | | | | | | | | | | |
Ratio of net expenses to average net assets(g) | | | 2.60 | %(h) | | | 2.63 | % | | | 2.58 | % | | | 2.52 | % | | | 2.70 | % | | | 2.70 | %(h) |
| | | | | | | | | | | | | | | | | | | | | | | | | |
Ratio of net investment – to average net assets(b)(g) | | | 0.01 | %(h) | | | 0.08 | % | | | (0.36 | %) | | | (0.41 | %) | | | (0.10 | %) | | | (0.11 | %)(h) |
| | | | | | | | | | | | | | | | | | | | | | | | | |
| PORTFOLIO TURNOVER RATE | | | 14 | %(f) | | | 36 | % | | | 37 | % | | | 15 | % | | | 42 | % | | | 0 | %(d)(f) |
(a) | Prior to March 28, 2014, the Stadion Trilogy Alternative Return Fund was known as the Stadion Trilogy Fund™. |
(b) | Recognition of net investment income (loss) by the Fund is affected by the timing of the declaration of dividends by the underlying investment companies in which the Fund invested. |
(c) | Per share amounts were calculated using average shares method. |
(d) | Amount rounds to less than $0.01 per share or less than 1%. |
(e) | Total return is a measure of the change in value of an investment in the Fund over the periods covered, which assumes any dividends or capital gains distributions are reinvested in shares of the Fund. The returns shown do not reflect the deduction of taxes a shareholder would pay on Fund distributions or the redemption of Fund shares. |
(g) | The ratios of expenses and net investment income (loss) to average net assets do not reflect the Fund's proportionate share of expense of the underlying investment companies in which the Fund invested. |
(i) | Reflects total expenses prior to fee waivers and expense reimbursements by the advisor (Note 5). |
See Notes to Financial Statements.
| Semi-Annual Report | November 30, 2016 | 47 |
| Stadion Trilogy Alternative Return Fund – Class I | Financial Highlights |
| For a Share Outstanding Throughout each of the Periods Presented |
| | | For the Six Months Ended November 30, 2016 (Unaudited) | | | Year Ended May 31, 2016 | | | Year Ended May 31, 2015 | | | Year Ended May 31, 2014(a) | | | Year Ended May 31, 2013 | | | For the Period April 2, 2012 (Commencement of operations) to May 31, 2012 | |
NET ASSET VALUE, BEGINNING OF PERIOD | | $ | 10.52 | | | $ | 10.69 | | | $ | 10.55 | | | $ | 10.42 | | | $ | 9.86 | | | $ | 10.00 | |
| | | | | | | | | | | | | | | | | | | | | | | | | |
| INCOME (LOSS) FROM OPERATIONS: | | | | | | | | | | | | | | | | | | | | | | | | |
Net investment income(b) | | | 0.05 | (c) | | | 0.11 | (c) | | | 0.07 | (c) | | | 0.06 | (c) | | | 0.10 | (c) | | | 0.01 | |
| Net realized and unrealized gain (loss) on investments | | | 0.46 | | | | (0.17 | ) | | | 0.12 | | | | 0.11 | | | �� | 0.66 | | | | (0.15 | ) |
| Total from investment operations | | | 0.51 | | | | (0.06 | ) | | | 0.19 | | | | 0.17 | | | | 0.76 | | | | (0.14 | ) |
| LESS DISTRIBUTIONS: | | | | | | | | | | | | | | | | | | | | | | | | |
| Dividends from net investment income | | | (0.06 | ) | | | (0.11 | ) | | | (0.05 | ) | | | (0.04 | ) | | | (0.07 | ) | | | – | |
| Distributions from net realized gains | | | – | | | | – | | | | – | | | | – | | | | (0.13 | ) | | | – | |
| Total distributions | | | (0.06 | ) | | | (0.11 | ) | | | (0.05 | ) | | | (0.04 | ) | | | (0.20 | ) | | | – | |
| | | | | | | | | | | | | | | | | | | | | | | | | |
| NET ASSET VALUE, END OF PERIOD | | $ | 10.97 | | | $ | 10.52 | | | $ | 10.69 | | | $ | 10.55 | | | $ | 10.42 | | | $ | 9.86 | |
| | | | | | | | | | | | | | | | | | | | | | | | | |
TOTAL RETURN(d) | | | 4.90 | %(e) | | | (0.54 | %) | | | 1.78 | % | | | 1.64 | % | | | 7.75 | % | | | (1.40% | )(e) |
| | | | | | | | | | | | | | | | | | | | | | | | | |
| RATIOS AND SUPPLEMENTAL DATA: | | | | | | | | | | | | | | | | | | | | | | | | |
| Net assets, end of Period (000's) | | $ | 49,086 | | | $ | 39,257 | | | $ | 53,031 | | | $ | 46,578 | | | $ | 18,956 | | | $ | 1 | |
| | | | | | | | | | | | | | | | | | | | | | | | | |
Ratio of total expenses to average net assets(f) | | | 1.61 | %(g) | | | 1.64 | % | | | 1.62 | % | | | 1.57 | % | | | 2.01 | %(h) | | | 1,259.15 | %(g)(h) |
| | | | | | | | | | | | | | | | | | | | | | | | | |
Ratio of net expenses to average net assets(f) | | | 1.61 | %(g) | | | 1.64 | % | | | 1.62 | % | | | 1.57 | % | | | 1.70 | % | | | 1.70 | %(g) |
| | | | | | | | | | | | | | | | | | | | | | | | | |
Ratio of net investment – to average net assets(b)(f) | | | 1.00 | %(g) | | | 1.07 | % | | | 0.70 | % | | | 0.54 | % | | | 0.94 | % | | | 0.51 | %(g) |
| | | | | | | | | | | | | | | | | | | | | | | | | |
| PORTFOLIO TURNOVER RATE | | | 14 | %(e) | | | 36 | % | | | 37 | % | | | 15 | % | | | 42 | % | | | 0 | %(e)(i) |
(a) | Prior to March 28, 2014, the Stadion Trilogy Alternative Return Fund was known as the Stadion Trilogy Fund™. |
(b) | Recognition of net investment income (loss) by the Fund is affected by the timing of the declaration of dividends by the underlying investment companies in which the Fund invested. |
(c) | Per share amounts were calculated using average shares method. |
(d) | Total return is a measure of the change in value of an investment in the Fund over the periods covered, which assumes any dividends or capital gains distributions are reinvested in shares of the Fund. The returns shown do not reflect the deduction of taxes a shareholder would pay on Fund distributions or the redemption of Fund shares. |
(f) | The ratios of expenses and net investment income to average net assets do not reflect the Fund's proportionate share of expense of the underlying investment companies in which the Fund invested. |
(h) | Reflects total expenses prior to fee waivers and expense reimbursements by the advisor (Note 5). |
(i) | Amount rounds to less than $0.01 per share or less than 1%. |
See Notes to Financial Statements.
| Stadion Alternative Income Fund – Class A | Financial Highlights |
| For a Share Outstanding Throughout each of the Periods Presented |
| | | For the Six Months Ended November 30, 2016 (Unaudited) | | | Year Ended May 31, 2016 | | | Year Ended May 31, 2015 | | | Year Ended May 31, 2014 | | | For the Period December 31, 2012 (Commencement of operations) to May 31, 2013 | |
NET ASSET VALUE, BEGINNING OF PERIOD | | $ | 10.15 | | | $ | 9.72 | | | $ | 9.89 | | | $ | 9.91 | | | $ | 10.00 | |
| | | | | | | | | | | | | | | | | | | | | |
| INCOME (LOSS) FROM OPERATIONS: | | | | | | | | | | | | | | | | | | | | |
Net investment income(a)(b) | | | 0.12 | | | | 0.16 | | | | 0.15 | | | | 0.15 | | | | 0.06 | |
| Net realized and unrealized gain (loss) on investments | | | (0.01 | ) | | | 0.44 | | | | (0.13 | ) | | | (0.06 | )(c) | | | (0.15 | ) |
| Total from investment operations | | | 0.11 | | | | 0.60 | | | | 0.02 | | | | 0.09 | | | | (0.09 | ) |
| LESS DISTRIBUTIONS: | | | | | | | | | | | | | | | | | | | | |
| Dividends from net investment income | | | (0.10 | ) | | | (0.17 | ) | | | (0.19 | ) | | | (0.11 | ) | | | – | |
| Distributions from net realized gains | | | – | | | | (0.00 | )(d) | | | – | | | | – | | | | – | |
| Total distributions | | | (0.10 | ) | | | (0.17 | ) | | | (0.19 | ) | | | (0.11 | ) | | | – | |
| | | | | | | | | | | | | | | | | | | | | |
| NET ASSET VALUE, END OF PERIOD | | $ | 10.16 | | | $ | 10.15 | | | $ | 9.72 | | | $ | 9.89 | | | $ | 9.91 | |
| | | | | | | | | | | | | | | | | | | | | |
TOTAL RETURN(e) | | | 1.08 | %(f) | | | 6.33 | % | | | 0.24 | % | | | 0.91 | % | | | (0.90 | %)(f) |
| | | | | | | | | | | | | | | | | | | | | |
| RATIOS AND SUPPLEMENTAL DATA: | | | | | | | | | | | | | | | | | | | | |
| Net assets, end of Period (000's) | | $ | 6,891 | | | $ | 3,807 | | | $ | 5,226 | | | $ | 2,065 | | | $ | 1,667 | |
| | | | | | | | | | | | | | | | | | | | | |
Ratio of total expenses to average net assets(g) | | | 1.41 | %(h)(i) | | | 1.73 | %(i) | | | 3.77 | %(i) | | | 2.55 | %(i) | | | 10.69 | %(h)(i) |
| | | | | | | | | | | | | | | | | | | | | |
Ratio of net expenses to average net assets(g) | | | 1.40 | %(h) | | | 1.40 | % | | | 1.40 | % | | | 1.40 | % | | | 1.40 | %(h) |
| | | | | | | | | | | | | | | | | | | | | |
Ratio of net investment – to average net assets(b)(g) | | | 2.34 | %(h) | | | 1.58 | % | | | 1.52 | % | | | 1.53 | % | | | 1.52 | %(h) |
| | | | | | | | | | | | | | | | | | | | | |
| PORTFOLIO TURNOVER RATE | | | 4 | %(f) | | | 18 | % | | | 485 | % | | | 294 | % | | | 84 | %(f) |
(a) | Per share amounts were calculated using average shares method. |
(b) | Recognition of net investment income (loss) by the Fund is affected by the timing of the declaration of dividends by the underlying investment companies in which the Fund invested. |
(c) | Net realized and unrealized loss on investments per share does not correlate to aggregate of the net realized and unrealized gain in the Statements of Operations for the year ended May 31, 2014, primarily due to the timing of the sales and repurchases of the Fund's shares in relation to the fluctuating market values for the Fund's portfolio. |
(d) | Amount rounds to less than $0.01 per share or less than 1%. |
(e) | Total return is a measure of the change in value of an investment in the Fund over the periods covered, which assumes any dividends or capital gains distributions are reinvested in shares of the Fund. The returns shown do not reflect the deduction of taxes a shareholder would pay on Fund distributions or the redemption of Fund shares. |
(g) | The ratios of expenses and net investment income to average net assets do not reflect the Fund's proportionate share of expense of the underlying investment companies in which the Fund invested. |
(i) | Reflects total expenses prior to fee waivers and expense reimbursements by the advisor (Note 5). |
See Notes to Financial Statements.
| Semi-Annual Report | November 30, 2016 | 49 |
| Stadion Alternative Income Fund – Class C | Financial Highlights |
| For a Share Outstanding Throughout each of the Periods Presented |
| | | For the Six Months Ended November 30, 2016 (Unaudited) | | | For the Period August 10, 2015 (Commencement of operations) to May 31, 2016 | |
| NET ASSET VALUE, BEGINNING OF PERIOD | | $ | 10.11 | | | $ | 9.59 | |
| | | | | | | | | |
| INCOME (LOSS) FROM OPERATIONS: | | | | | | | | |
Net investment income(a)(b) | | | 0.10 | | | | 0.09 | |
| Net realized and unrealized gain (loss) on investments | | | (0.03 | ) | | | 0.48 | |
| Total from investment operations | | | 0.07 | | | | 0.57 | |
| LESS DISTRIBUTIONS: | | | | | | | | |
| Dividends from net investment income | | | (0.09 | ) | | | (0.05 | ) |
| Distributions from net realized gains | | | – | | | | (0.00 | )(c) |
| Total distributions | | | (0.09 | ) | | | (0.05 | ) |
| | | | | | | | | |
| NET ASSET VALUE, END OF PERIOD | | $ | 10.09 | | | $ | 10.11 | |
| | | | | | | | | |
TOTAL RETURN(d) | | | 0.67 | %(e) | | | 6.00 | %(e) |
| | | | | | | | | |
| RATIOS AND SUPPLEMENTAL DATA: | | | | | | | | |
| Net assets, end of Period (000's) | | $ | 3,051 | | | $ | 508 | |
| | | | | | | | | |
Ratio of total expenses to average net assets(f) | | | 2.12 | %(g) | | | 2.18 | %(g)(h) |
| | | | | | | | | |
Ratio of net expenses to average net assets(f) | | | 2.12 | %(g) | | | 2.15 | %(g) |
| | | | | | | | | |
Ratio of net investment – to average net assets(b)(f) | | | 1.89 | %(g) | | | 1.15 | %(g) |
| | | | | | | | | |
| PORTFOLIO TURNOVER RATE | | | 4 | %(e) | | | 18 | %(e) |
(a) | Per share amounts were calculated using average shares method. |
(b) | Recognition of net investment income (loss) by the Fund is affected by the timing of the declaration of dividends by the underlying investment companies in which the Fund invested. |
(c) | Amount rounds to less than $0.01 per share or less than 1%. |
(d) | Total return is a measure of the change in value of an investment in the Fund over the periods covered, which assumes any dividends or capital gains distributions are reinvested in shares of the Fund. The returns shown do not reflect the deduction of taxes a shareholder would pay on Fund distributions or the redemption of Fund shares. |
(f) | The ratios of expenses and net investment income (loss) to average net assets do not reflect the Fund's proportionate share of expense of the underlying investment companies in which the Fund invested. |
(h) | Reflects total expenses prior to fee waivers and expense reimbursements by the advisor (Note 5). |
See Notes to Financial Statements.
| Stadion Alternative Income Fund – Class I | Financial Highlights |
| For a Share Outstanding Throughout each of the Periods Presented |
| | | For the Six Months Ended November 30, 2016 (Unaudited) | | | Year Ended
May 31, 2016 | | | Year Ended May 31, 2015 | | | Year Ended May 31, 2014 | | | For the Period February 14, 2013 (Commencement of operations) to May 31, 2013 | |
NET ASSET��VALUE, BEGINNING OF PERIOD | | $ | 10.13 | | | $ | 9.60 | | | $ | 9.89 | | | $ | 9.91 | | | $ | 9.91 | |
| | | | | | | | | | | | | | | | | | | | | |
| INCOME (LOSS) FROM OPERATIONS: | | | | | | | | | | | | | | | | | | | | |
Net investment income(a)(b) | | | 0.12 | | | | 0.20 | | | | 0.30 | | | | 0.17 | | | | 0.04 | |
| Net realized and unrealized gain (loss) on investments | | | 0.01 | | | | 0.44 | | | | (0.25 | ) | | | (0.07 | )(c) | | | (0.04 | ) |
| Total from investment operations | | | 0.13 | | | | 0.64 | | | | 0.05 | | | | 0.10 | | | | 0.00 | |
| LESS DISTRIBUTIONS: | | | | | | | | | | | | | | | | | | | | |
| Dividends from net investment income | | | (0.11 | ) | | | (0.11 | ) | | | (0.34 | ) | | | (0.12 | ) | | | – | |
| Distributions from net realized gains | | | – | | | | (0.00 | )(d) | | | – | | | | – | | | | – | |
| Total distributions | | | (0.11 | ) | | | (0.11 | ) | | | (0.34 | ) | | | (0.12 | ) | | | – | |
| | | | | | | | | | | | | | | | | | | | | |
| NET ASSET VALUE, END OF PERIOD | | $ | 10.15 | | | $ | 10.13 | | | $ | 9.60 | | | $ | 9.89 | | | $ | 9.91 | |
| | | | | | | | | | | | | | | | | | | | | |
TOTAL RETURN(e) | | | 1.26 | %(f) | | | 6.70 | % | | | 0.58 | % | | | 1.09 | % | | | 0.00 | %(f) |
| | | | | | | | | | | | | | | | | | | | | |
| RATIOS AND SUPPLEMENTAL DATA: | | | | | | | | | | | | | | | | | | | | |
| Net assets, end of Period (000's) | | $ | 98,223 | | | $ | 84,632 | | | $ | 444 | | | $ | 4,077 | | | $ | 1,519 | |
| | | | | | | | | | | | | | | | | | | | | |
Ratio of total expenses to average net assets(g) | | | 1.20 | %(h)(i) | | | 1.29 | %(i) | | | 3.75 | %(i) | | | 2.29 | %(i) | | | 14.50 | %(h)(i) |
| | | | | | | | | | | | | | | | | | | | | |
Ratio of net expenses to average net assets(g) | | | 1.15 | %(h) | | | 1.15 | % | | | 1.15 | % | | | 1.15 | % | | | 1.15 | %(h) |
| | | | | | | | | | | | | | | | | | | | | |
Ratio of net investment – to average net assets(b)(g) | | | 2.41 | %(h) | | | 2.08 | % | | | 2.96 | % | | | 1.72 | % | | | 1.42 | %(h) |
| | | | | | | | | | | | | | | | | | | | | |
| PORTFOLIO TURNOVER RATE | | | 4 | %(f) | | | 18 | % | | | 485 | % | | | 294 | % | | | 84 | %(f)(j) |
(a) | Per share amounts were calculated using average shares method. |
(b) | Recognition of net investment income (loss) by the Fund is affected by the timing of the declaration of dividends by the underlying investment companies in which the Fund invested. |
(c) | Net realized and unrealized loss on investments per share does not correlate to aggregate of the net realized and unrealized gain in the Statements of Operations for the year ended May 31, 2014, primarily due to the timing of the sales and repurchases of the Fund's shares in relation to the fluctuating market values for the Fund's portfolio. |
(d) | Amount rounds to less than $0.01 per share or less than 1%. |
(e) | Total return is a measure of the change in value of an investment in the Fund over the periods covered, which assumes any dividends or capital gains distributions are reinvested in shares of the Fund. The returns shown do not reflect the deduction of taxes a shareholder would pay on Fund distributions or the redemption of Fund shares. |
(g) | The ratios of expenses and net investment income to average net assets do not reflect the Fund's proportionate share of expense of the underlying investment companies in which the Fund invested. |
(i) | Reflects total expenses prior to fee waivers and expense reimbursements by the advisor (Note 5). |
(j) | Represents the period December 31, 2012 (commencement of operations of the Fund) to May 31, 2013. |
See Notes to Financial Statements.
| Semi-Annual Report | November 30, 2016 | 51 |
| Stadion Defensive International Fund – Class A | Financial Highlights |
| For a Share Outstanding Throughout each of the Periods Presented |
| | | For the Six Months Ended November 30, 2016 (Unaudited) | | | Year Ended May 31, 2016 | | | Year Ended May 31, 2015 | | | Year Ended May 31, 2014(a) | | | Year Ended May 31, 2013 | | | For the Period April 2, 2012 (Commencement of operations) to May 31, 2012 | |
NET ASSET VALUE, BEGINNING OF PERIOD | | $ | 8.73 | | | $ | 9.68 | | | $ | 10.10 | | | $ | 10.16 | | | $ | 9.54 | | | $ | 10.00 | |
| | | | | | | | | | | | | | | | | | | | | | | | | |
| INCOME (LOSS) FROM OPERATIONS: | | | | | | | | | | | | | | | | | | | | | | | | |
Net investment income (loss)(b) | | | (0.01 | )(c) | | | (0.04 | )(c) | | | 0.12 | (c) | | | (0.10 | )(c) | | | (0.01 | )(c) | | | (0.01 | ) |
| Net realized and unrealized gain (loss) on investments | | | (0.57 | ) | | | (0.85 | ) | | | (0.37 | ) | | | 0.31 | | | | 0.68 | | | | (0.45 | ) |
| Total from investment operations | | | (0.58 | ) | | | (0.89 | ) | | | (0.25 | ) | | | 0.21 | | | | 0.67 | | | | (0.46 | ) |
| LESS DISTRIBUTIONS: | | | | | | | | | | | | | | | | | | | | | | | | |
| Dividends from net investment income | | | – | | | | – | | | | (0.07 | ) | | | – | | | | (0.05 | ) | | | – | |
| Distributions from net realized gains | | | – | | | | (0.06 | ) | | | (0.10 | ) | | | (0.27 | ) | | | – | | | | – | |
| Total distributions | | | – | | | | (0.06 | ) | | | (0.17 | ) | | | (0.27 | ) | | | (0.05 | ) | | | – | |
| | | | | | | | | | | | | | | | | | | | | | | | | |
| NET ASSET VALUE, END OF PERIOD | | $ | 8.15 | | | $ | 8.73 | | | $ | 9.68 | | | $ | 10.10 | | | $ | 10.16 | | | $ | 9.54 | |
| | | | | | | | | | | | | | | | | | | | | | | | | |
TOTAL RETURN(d) | | | (6.64% | )(e) | | | (9.18 | %) | | | (2.40 | %) | | | 2.07 | % | | | 7.04 | % | | | (4.60% | )(e) |
| | | | | | | | | | | | | | | | | | | | | | | | | |
| RATIOS AND SUPPLEMENTAL DATA: | | | | | | | | | | | | | | | | | | | | | | | | |
| Net assets, end of Period (000's) | | $ | 4,518 | | | $ | 4,938 | | | $ | 11,284 | | | $ | 15,853 | | | $ | 13,723 | | | $ | 8,721 | |
| | | | | | | | | | | | | | | | | | | | | | | | | |
Ratio of total expenses to average net assets(f) | | | 2.68 | %(g)(h) | | | 2.63 | %(h) | | | 2.33 | %(h) | �� | | 2.09 | %(h) | | | 2.82 | %(h) | | | 5.31 | %(g)(h) |
| | | | | | | | | | | | | | | | | | | | | | | | | |
Ratio of net expenses to average net assets(f) | | | 1.95 | %(g) | | | 1.95 | % | | | 1.95 | % | | | 1.95 | % | | | 1.95 | % | | | 1.95 | %(g) |
| | | | | | | | | | | | | | | | | | | | | | | | | |
Ratio of net investment – to average net assets(b)(f) | | | (0.34% | )(g) | | | (0.42 | %) | | | 1.22 | % | | | (0.97 | %) | | | (0.15 | %) | | | (1.94% | )(g) |
| | | | | | | | | | | | | | | | | | | | | | | | | |
| PORTFOLIO TURNOVER RATE | | | 283 | %(e) | | | 726 | % | | | 450 | % | | | 627 | % | | | 804 | % | | | 21 | %(e) |
(a) | Prior to March 28, 2014, the Stadion Defensive International Fund was known as the Stadion Olympus Fund™. |
(b) | Recognition of net investment income (loss) by the Fund is affected by the timing of the declaration of dividends by the underlying investment companies in which the Fund invested. |
(c) | Per share amounts were calculated using average shares method. |
(d) | Total return is a measure of the change in value of an investment in the Fund over the periods covered, which assumes any dividends or capital gains distributions are reinvested in shares of the Fund. The returns shown do not reflect the deduction of taxes a shareholder would pay on Fund distributions or the redemption of Fund shares. |
(f) | The ratios of expenses and net investment income (loss) to average net assets do not reflect the Fund's proportionate share of expense of the underlying investment companies in which the Fund invested. |
(h) | Reflects total expenses prior to fee waivers and expense reimbursements by the advisor (Note 5). |
See Notes to Financial Statements.
| Stadion Defensive International Fund – Class C | Financial Highlights |
For a Share Outstanding Throughout each of the Periods Presented
| | | For the Six Months Ended November 30, 2016 (Unaudited) | | | Year Ended May 31, 2016 | | | Year Ended May 31, 2015 | | | Year Ended May 31, 2014(a) | | | Year Ended May 31, 2013 | | | For the Period April 2, 2012 (Commencement of operations) to May 31, 2012 | |
NET ASSET VALUE, BEGINNING OF PERIOD | | $ | 8.52 | | | $ | 9.52 | | | $ | 9.96 | | | $ | 10.09 | | | $ | 9.53 | | | $ | 10.00 | |
| | | | | | | | | | | | | | | | | | | | | | | | | |
| INCOME (LOSS) FROM OPERATIONS: | | | | | | | | | | | | | | | | | | | | | | | | |
Net investment loss(b) | | | (0.04 | )(c) | | | (0.13 | )(c) | | | (0.00 | )(c)(d) | | | (0.17 | )(c) | | | (0.15 | )(c) | | | (0.04 | ) |
| Net realized and unrealized gain (loss) on investments | | | (0.56 | ) | | | (0.81 | ) | | | (0.31 | ) | | | 0.30 | | | | 0.74 | | | | (0.43 | ) |
| Total from investment operations | | | (0.60 | ) | | | (0.94 | ) | | | (0.31 | ) | | | 0.13 | | | | 0.59 | | | | (0.47 | ) |
| LESS DISTRIBUTIONS: | | | | | | | | | | | | | | | | | | | | | | | | |
| Dividends from net investment income | | | – | | | | – | | | | (0.03 | ) | | | – | | | | (0.03 | ) | | | – | |
| Distributions from net realized gains | | | – | | | | (0.06 | ) | | | (0.10 | ) | | | (0.26 | ) | | | – | | | | – | |
| Total distributions | | | – | | | | (0.06 | ) | | | (0.13 | ) | | | (0.26 | ) | | | (0.03 | ) | | | – | |
| | | | | | | | | | | | | | | | | | | | | | | | | |
| NET ASSET VALUE, END OF PERIOD | | $ | 7.92 | | | $ | 8.52 | | | $ | 9.52 | | | $ | 9.96 | | | $ | 10.09 | | | $ | 9.53 | |
| | | | | | | | | | | | | | | | | | | | | | | | | |
TOTAL RETURN(e) | | | (7.04 | %)(f) | | | (9.86 | %) | | | (3.06 | %) | | | 1.32 | % | | | 6.19 | % | | | (4.70 | %)(f) |
| | | | | | | | | | | | | | | | | | | | | | | | | |
| RATIOS AND SUPPLEMENTAL DATA: | | | | | | | | | | | | | | | | | | | | | | | | |
| Net assets, end of Period (000's) | | $ | 146 | | | $ | 177 | | | $ | 153 | | | $ | 151 | | | $ | 64 | | | $ | 1 | |
| | | | | | | | | | | | | | | | | | | | | | | | | |
Ratio of total expenses to average net assets(g) | | | 3.45 | %(h)(i) | | | 3.45 | %(i) | | | 3.10 | %(i) | | | 2.82 | %(i) | | | 73.16 | %(i) | | | 1,345.00 | %(h)(i) |
| | | | | | | | | | | | | | | | | | | | | | | | | |
Ratio of net expenses to average net assets(g) | | | 2.70 | %(h) | | | 2.70 | % | | | 2.70 | % | | | 2.70 | % | | | 2.70 | % | | | 2.70 | %(h) |
| | | | | | | | | | | | | | | | | | | | | | | | | |
Ratio of net investment – to average net assets(b)(g) | | | (1.06 | %)(h) | | | (1.51 | %) | | | (0.03 | %) | | | (1.71 | %) | | | (1.49 | %) | | | (2.70 | %)(h) |
| | | | | | | | | | | | | | | | | | | | | | | | | |
| PORTFOLIO TURNOVER RATE | | | 283 | %(f) | | | 726 | % | | | 450 | % | | | 627 | % | | | 804 | % | | | 21 | %(f) |
(a) | Prior to March 28, 2014, the Stadion Defensive International Fund was known as the Stadion Olympus Fund™. |
(b) | Recognition of net investment income (loss) by the Fund is affected by the timing of the declaration of dividends by the underlying investment companies in which the Fund invested. |
(c) | Per share amounts were calculated using average shares method. |
(d) | Amount rounds to less than $0.01 per share or less than 1%. |
(e) | Total return is a measure of the change in value of an investment in the Fund over the periods covered, which assumes any dividends or capital gains distributions are reinvested in shares of the Fund. The returns shown do not reflect the deduction of taxes a shareholder would pay on Fund distributions or the redemption of Fund shares. |
(g) | The ratios of expenses and net investment income (loss) to average net assets do not reflect the Fund’s proportionate share of expense of the underlying investment companies in which the Fund invested. |
(i) | Reflects total expenses prior to fee waivers and expense reimbursements by the advisor (Note 5). |
See Notes to Financial Statements.
| Semi-Annual Report | November 30, 2016 | 53 |
| Stadion Defensive International Fund – Class I | Financial Highlights |
For a Share Outstanding Throughout each of the Periods Presented
| | | For the Six Months Ended November 30,2016 (Unaudited) | | | Year Ended May 31, 2016 | | | Year Ended May 31, 2015 | | | Year Ended May 31, 2014(a) | | | Year Ended May 31, 2013 | | | For the Period April 2, 2012 (Commencement of operations) to May 31, 2012 | |
NET ASSET VALUE, BEGINNING OF PERIOD | | $ | 8.80 | | | $ | 9.73 | | | $ | 10.14 | | | $ | 10.18 | | | $ | 9.55 | | | $ | 10.00 | |
| | | | | | | | | | | | | | | | | | | | | | | | | |
| INCOME (LOSS) FROM OPERATIONS: | | | | | | | | | | | | | | | | | | | | | | | | |
Net investment income (loss)(b) | | | 0.00 | (c)(d) | | | (0.03 | )(c) | | | 0.01 | (c) | | | (0.08 | )(c) | | | (0.09 | )(c) | | | (0.03 | ) |
| Net realized and unrealized gain (loss) on investments | | | (0.58 | ) | | | (0.84 | ) | | | (0.23 | ) | | | 0.31 | | | | 0.79 | | | | (0.42 | ) |
| Total from investment operations | | | (0.58 | ) | | | (0.87 | ) | | | (0.22 | ) | | | 0.23 | | | | 0.70 | | | | (0.45 | ) |
| LESS DISTRIBUTIONS: | | | | | | | | | | | | | | | | | | | | | | | | |
| Dividends from net investment income | | | – | | | | – | | | | (0.09 | ) | | | – | | | | (0.07 | ) | | | – | |
| Distributions from net realized gains | | | – | | | | (0.06 | ) | | | (0.10 | ) | | | (0.27 | ) | | | – | | | | – | |
| Total distributions | | | – | | | | (0.06 | ) | | | (0.19 | ) | | | (0.27 | ) | | | (0.07 | ) | | | – | |
| | | | | | | | | | | | | | | | | | | | | | | | | |
| NET ASSET VALUE, END OF PERIOD | | $ | 8.22 | | | $ | 8.80 | | | $ | 9.73 | | | $ | 10.14 | | | $ | 10.18 | | | $ | 9.55 | |
| | | | | | | | | | | | | | | | | | | | | | | | | |
TOTAL RETURN(e) | | | (6.59 | %)(f) | | | (8.93 | %) | | | (2.15 | %) | | | 2.29 | % | | | 7.31 | % | | | (4.50 | %)(f) |
| | | | | | | | | | | | | | | | | | | | | | | | | |
| RATIOS AND SUPPLEMENTAL DATA: | | | | | | | | | | | | | | | | | | | | | | | | |
| Net assets, end of Period (000's) | | $ | 2,369 | | | $ | 2,859 | | | $ | 3,828 | | | $ | 9,677 | | | $ | 5,935 | | | $ | 1 | |
| | | | | | | | | | | | | | | | | | | | | | | | | |
Ratio of total expenses to average net assets(g) | | | 2.53 | %(h)(i) | | | 2.52 | %(i) | | | 2.21 | %(i) | | | 1.91 | %(i) | | | 3.63 | %(i) | | | 1,342.77 | %(h)(i) |
| | | | | | | | | | | | | | | | | | | | | | | | | |
Ratio of net expenses to average net assets(g) | | | 1.70 | %(h) | | | 1.70 | % | | | 1.70 | % | | | 1.70 | % | | | 1.70 | % | | | 1.70 | %(h) |
| | | | | | | | | | | | | | | | | | | | | | | | | |
Ratio of net investment – to average net assets(b)(g) | | | 0.02 | %(h) | | | (0.38 | %) | | | 0.11 | % | | | (0.77 | %) | | | (0.90 | %) | | | (1.70 | %)(h) |
| | | | | | | | | | | | | | | | | | | | | | | | | |
| PORTFOLIO TURNOVER RATE | | | 283 | %(f) | | | 726 | % | | | 450 | % | | | 627 | % | | | 804 | % | | | 21 | %(f) |
(a) | Prior to March 28, 2014, the Stadion Defensive International Fund was known as the Stadion Olympus Fund™. |
(b) | Recognition of net investment income (loss) by the Fund is affected by the timing of the declaration of dividends by the underlying investment companies in which the Fund invested. |
(c) | Per share amounts were calculated using average shares method. |
(d) | Amount rounds to less than $0.01 per share or less than 1%. |
(e) | Total return is a measure of the change in value of an investment in the Fund over the periods covered, which assumes any dividends or capital gains distributions are reinvested in shares of the Fund. The returns shown do not reflect the deduction of taxes a shareholder would pay on Fund distributions or the redemption of Fund shares. |
(g) | The ratios of expenses and net investment income (loss) to average net assets do not reflect the Fund’s proportionate share of expense of the underlying investment companies in which the Fund invested. |
(i) | Reflects total expenses prior to fee waivers and expense reimbursements by the advisor (Note 5). |
See Notes to Financial Statements.
| Stadion Managed Risk 100 Fund – Class A | Financial Highlights |
For a Share Outstanding Throughout each of the Periods Presented
| | | For the Six Months Ended November 30, 2016 (Unaudited) | | | Year Ended May 31, 2016 | | | Year Ended May 31, 2015 | | | Year Ended May 31, 2014(a) | | | Year Ended May 31, 2013 | | | Year Ended May 31, 2012 | |
| NET ASSET VALUE, BEGINNING OF PERIOD | | $ | 8.83 | | | $ | 9.43 | | | $ | 9.90 | | | $ | 10.35 | | | $ | 9.38 | | | $ | 9.93 | |
| | | | | | | | | | | | | | | | | | | | | | | | | |
| INCOME (LOSS) FROM OPERATIONS: | | | | | | | | | | | | | | | | | | | | | | | | |
Net investment loss(b) | | | (0.01 | )(c) | | | (0.10 | )(c) | | | (0.01 | )(c) | | | (0.07 | )(c) | | | (0.00 | )(c)(d) | | | (0.17 | ) |
| Net realized and unrealized gain (loss) on investments | | | 0.05 | | | | (0.50 | ) | | | (0.46 | ) | | | (0.38 | ) | | | 0.97 | | | | (0.28 | ) |
| Total from investment operations | | | 0.04 | | | | (0.60 | ) | | | (0.47 | ) | | | (0.45 | ) | | | 0.97 | | | | (0.45 | ) |
| LESS DISTRIBUTIONS: | | | | | | | | | | | | | | | | | | | | | | | | |
| Distributions from net realized gains | | | – | | | | – | | | | – | | | | – | | | | – | | | | (0.10 | ) |
| Total distributions | | | – | | | | – | | | | – | | | | – | | | | – | | | | (0.10 | ) |
| | | | | | | | | | | | | | | | | | | | | | | | | |
| NET ASSET VALUE, END OF PERIOD | | $ | 8.87 | | | $ | 8.83 | | | $ | 9.43 | | | $ | 9.90 | | | $ | 10.35 | | | $ | 9.38 | |
| | | | | | | | | | | | | | | | | | | | | | | | | |
TOTAL RETURN(e) | | | 0.45 | %(f) | | | (6.36 | %) | | | (4.75 | %) | | | (4.35 | %) | | | 10.34 | % | | | (4.45 | %) |
| | | | | | | | | | | | | | | | | | | | | | | | | |
| RATIOS AND SUPPLEMENTAL DATA: | | | | | | | | | | | | | | | | | | | | | | | | |
| Net assets, end of Period (000's) | | $ | 38,477 | | | $ | 44,832 | | | $ | 100,049 | | | $ | 266,853 | | | $ | 371,779 | | | $ | 407,202 | |
| | | | | | | | | | | | | | | | | | | | | | | | | |
Ratio of total expenses to average net assets(g) | | | 1.90 | %(h) | | | 1.86 | % | | | 1.65 | % | | | 1.53 | % | | | 1.59 | % | | | 1.51 | % |
| | | | | | | | | | | | | | | | | | | | | | | | | |
Ratio of net investment – to average net assets(b)(g) | | | (0.19 | %)(h) | | | (1.15 | %) | | | (0.12 | %) | | | (0.66 | %) | | | (0.01 | %) | | | (1.03 | %) |
| | | | | | | | | | | | | | | | | | | | | | | | | |
| PORTFOLIO TURNOVER RATE | | | 482 | %(f) | | | 861 | % | | | 1,046 | % | | | 1,079 | % | | | 737 | % | | | 1,967 | % |
(a) | Prior to March 28, 2014, the Stadion Managed Risk 100 Fund was known as the Stadion Managed Fund. |
(b) | Recognition of net investment income (loss) by the Fund is affected by the timing of the declaration of dividends by the underlying investment companies in which the Fund invested. |
(c) | Per share amounts were calculated using average shares method. |
(d) | Amount rounds to less than $0.01 per share or less than 1%. |
(e) | Total return is a measure of the change in value of an investment in the Fund over the periods covered, which assumes any dividends or capital gains distributions are reinvested in shares of the Fund. The returns shown do not reflect the deduction of taxes a shareholder would pay on Fund distributions or the redemption of Fund shares. |
(g) | The ratios of expenses and net investment income (loss) to average net assets do not reflect the Fund's proportionate share of expense of the underlying investment companies in which the Fund invested. |
See Notes to Financial Statements.
| Semi-Annual Report | November 30, 2016 | 55 |
| Stadion Managed Risk 100 Fund – Class C | Financial Highlights |
For a Share Outstanding Throughout each of the Periods Presented
| | | For the Six Months Ended November 30, 2016(Unaudited) | | | Year Ended May 31, 2016 | | | Year Ended May 31, 2015 | | | Year Ended May 31, 2014(a) | | | Year Ended May 31, 2013 | | | Year Ended May 31, 2012 | |
| NET ASSET VALUE, BEGINNING OF PERIOD | | $ | 8.38 | | | $ | 9.02 | | | $ | 9.54 | | | $ | 10.05 | | | $ | 9.18 | | | $ | 9.79 | |
| | | | | | | | | | | | | | | | | | | | | | | | | |
| INCOME (LOSS) FROM OPERATIONS: | | | | | | | | | | | | | | | | | | | | | | | | |
Net investment loss(b) | | | (0.04 | )(c) | | | (0.16 | )(c) | | | (0.09 | )(c) | | | (0.14 | )(c) | | | (0.07 | )(c) | | | (0.21 | ) |
| Net realized and unrealized gain (loss) on investments | | | 0.04 | | | | (0.48 | ) | | | (0.43 | ) | | | (0.37 | ) | | | 0.94 | | | | (0.30 | ) |
| Total from investment operations | | | (0.00 | )(d) | | | (0.64 | ) | | | (0.52 | ) | | | (0.51 | ) | | | 0.87 | | | | (0.51 | ) |
| LESS DISTRIBUTIONS: | | | | | | | | | | | | | | | | | | | | | | | | |
| Distributions from net realized gains | | | – | | | | – | | | | – | | | | – | | | | – | | | | (0.10 | ) |
| Total distributions | | | – | | | | – | | | | – | | | | – | | | | – | | | | (0.10 | ) |
| | | | | | | | | | | | | | | | | | | | | | | | | |
| NET ASSET VALUE, END OF PERIOD | | $ | 8.38 | | | $ | 8.38 | | | $ | 9.02 | | | $ | 9.54 | | | $ | 10.05 | | | $ | 9.18 | |
| | | | | | | | | | | | | | | | | | | | | | | | | |
TOTAL RETURN(e) | | | 0.00 | %(f) | | | (7.10 | %) | | | (5.45 | %) | | | (5.07 | %) | | | 9.48 | % | | | (5.13 | %) |
| | | | | | | | | | | | | | | | | | | | | | | | | |
| RATIOS AND SUPPLEMENTAL DATA: | | | | | | | | | | | | | | | | | | | | | | | | |
| Net assets, end of Period (000's) | | $ | 19,325 | | | $ | 24,017 | | | $ | 49,008 | | | $ | 92,384 | | | $ | 141,797 | | | $ | 159,112 | |
| | | | | | | | | | | | | | | | | | | | | | | | | |
Ratio of total expenses to average net assets(g) | | | 2.68 | %(h) | | | 2.65 | % | | | 2.43 | % | | | 2.29 | % | | | 2.35 | % | | | 2.30 | % |
| | | | | | | | | | | | | | | | | | | | | | | | | |
Ratio of net investment – to average net assets(b)(g) | | | (0.98 | %)(h) | | | (1.93 | %) | | | (0.91 | %) | | | (1.43 | %) | | | (0.77 | %) | | | (1.80 | %) |
| | | | | | | | | | | | | | | | | | | | | | | | | |
| PORTFOLIO TURNOVER RATE | | | 482 | %(f) | | | 861 | % | | | 1,046 | % | | | 1,079 | % | | | 737 | % | | | 1,967 | % |
(a) | Prior to March 28, 2014, the Stadion Managed Risk 100 Fund was known as the Stadion Managed Fund. |
(b) | Recognition of net investment income (loss) by the Fund is affected by the timing of the declaration of dividends by the underlying investment companies in which the Fund invested. |
(c) | Per share amounts were calculated using average shares method. |
(d) | Amount rounds to less than $0.01 per share or less than 1%. |
(e) | Total return is a measure of the change in value of an investment in the Fund over the periods covered, which assumes any dividends or capital gains distributions are reinvested in shares of the Fund. The returns shown do not reflect the deduction of taxes a shareholder would pay on Fund distributions or the redemption of Fund shares. |
(g) | The ratios of expenses and net investment income (loss) to average net assets do not reflect the Fund's proportionate share of expense of the underlying investment companies in which the Fund invested. |
See Notes to Financial Statements.
| Stadion Managed Risk 100 Fund – Class I | Financial Highlights |
For a Share Outstanding Throughout each of the Periods Presented
| | | For the Six Months Ended November 30, 2016(Unaudited) | | | Year Ended May 31, 2016 | | | Year Ended May 31, 2015 | | | Year Ended May 31, 2014(a) | | | Year Ended May 31, 2013 | | | Year Ended May 31, 2012 | |
| NET ASSET VALUE, BEGINNING OF PERIOD | | $ | 8.94 | | | $ | 9.54 | | | $ | 9.99 | | | $ | 10.43 | | | $ | 9.43 | | | $ | 9.96 | |
| | | | | | | | | | | | | | | | | | | | | | | | | |
| INCOME (LOSS) FROM OPERATIONS: | | | | | | | | | | | | | | | | | | | | | | | | |
Net investment income (loss)(b) | | | 0.00 | (c)(d) | | | (0.09 | )(d) | | | 0.01 | (d) | | | (0.04 | )(d) | | | 0.02 | (d) | | | (0.06 | ) |
| Net realized and unrealized gain (loss) on investments | | | 0.05 | | | | (0.51 | ) | | | (0.46 | ) | | | (0.40 | ) | | | 0.98 | | | | (0.37 | ) |
| Total from investment operations | | | 0.05 | | | | (0.60 | ) | | | (0.45 | ) | | | (0.44 | ) | | | 1.00 | | | | (0.43 | ) |
| LESS DISTRIBUTIONS: | | | | | | | | | | | | | | | | | | | | | | | | |
| Distributions from net realized gains | | | – | | | | – | | | | – | | | | – | | | | – | | | | (0.10 | ) |
| Total distributions | | | – | | | | – | | | | – | | | | – | | | | – | | | | (0.10 | ) |
| | | | | | | | | | | | | | | | | | | | | | | | | |
| NET ASSET VALUE, END OF PERIOD | | $ | 8.99 | | | $ | 8.94 | | | $ | 9.54 | | | $ | 9.99 | | | $ | 10.43 | | | $ | 9.43 | |
| | | | | | | | | | | | | | | | | | | | | | | | | |
TOTAL RETURN(e) | | | 0.56 | %(f) | | | (6.29 | %) | | | (4.50 | %) | | | (4.22 | %) | | | 10.60 | % | | | (4.24 | %) |
| | | | | | | | | | | | | | | | | | | | | | | | | |
| RATIOS AND SUPPLEMENTAL DATA: | | | | | | | | | | | | | | | | | | | | | | | | |
| Net assets, end of Period (000's) | | $ | 17,488 | | | $ | 24,703 | | | $ | 50,337 | | | $ | 98,724 | | | $ | 127,735 | | | $ | 117,986 | |
| | | | | | | | | | | | | | | | | | | | | | | | | |
Ratio of total expenses to average net assets(g) | | | 1.73 | %(h)(i) | | | 1.68 | % | | | 1.47 | % | | | 1.31 | % | | | 1.39 | % | | | 1.28 | % |
| | | | | | | | | | | | | | | | | | | | | | | | | |
Ratio of net expenses to average net assets(g) | | | 1.70 | %(h) | | | N/A | | | | N/A | | | | N/A | | | | N/A | | | | N/A | |
| | | | | | | | | | | | | | | | | | | | | | | | | |
Ratio of net investment – to average net assets(b)(g) | | | 0.03 | %(h) | | | (0.96 | %) | | | 0.10 | % | | | (0.43 | %) | | | 0.18 | % | | | (0.77 | %) |
| | | | | | | | | | | | | | | | | | | | | | | | | |
| PORTFOLIO TURNOVER RATE | | | 482 | %(f) | | | 861 | % | | | 1,046 | % | | | 1,079 | % | | | 737 | % | | | 1,967 | % |
(a) | Prior to March 28, 2014, the Stadion Managed Risk 100 Fund was known as the Stadion Managed Fund. |
(b) | Recognition of net investment income (loss) by the Fund is affected by the timing of the declaration of dividends by the underlying investment companies in which the Fund invested. |
(c) | Amount rounds to less than $0.01 per share or less than 1%. |
(d) | Per share amounts were calculated using average shares method. |
(e) | Total return is a measure of the change in value of an investment in the Fund over the periods covered, which assumes any dividends or capital gains distributions are reinvested in shares of the Fund. The returns shown do not reflect the deduction of taxes a shareholder would pay on Fund distributions or the redemption of Fund shares. |
(g) | The ratios of expenses and net investment income (loss) to average net assets do not reflect the Fund's proportionate share of expense of the underlying investment companies in which the Fund invested. |
(i) | Reflects total expenses prior to fee waivers and expense reimbursements by the advisor (Note 5). |
See Notes to Financial Statements.
| Semi-Annual Report | November 30, 2016 | 57 |
| Stadion Investment Trust | Notes to Financial Statements |
| | November 30, 2016 (Unaudited) |
1. ORGANIZATION
Stadion Tactical Growth Fund (“Tactical Growth Fund”) (formerly known as the Stadion Market Opportunity Fund prior to March 28, 2014), Stadion Tactical Defensive Fund (“Tactical Defensive Fund”) (formerly known as the Stadion Core Advantage Fund prior to March 28, 2014), Stadion Trilogy Alternative Return Fund (“Trilogy Alternative Return Fund”) (formerly known as the Stadion Trilogy FundTM prior to March 28, 2014), Stadion Alternative Income Fund (“Alternative Income Fund”) (formerly known as the Stadion Tactical Income Fund prior to April 30, 2015), Stadion Defensive International Fund (“Defensive International Fund”) (formerly known as the Stadion Olympus FundTM prior to March 28, 2014) and Stadion Managed Risk 100 Fund (“Managed Risk 100 Fund”) (formerly known as the Stadion Managed Fund prior to March 28, 2014), (each, a “Fund,” and collectively, the “Funds”) are each a diversified series of Stadion Investment Trust (the “Trust”), a Delaware Statutory Trust registered under the Investment Company Act of 1940 (the “1940 Act”) as an open‐end management investment company.
Tactical Growth Fund is a successor to a previously operational fund, the ETF Market Opportunity Fund (the “Predecessor Fund”), which was a series of the Aviemore Funds, an Ohio business trust. The Predecessor Fund was organized into a series, Class I Shares, of the Tactical Growth Fund effective as of the close of business on March 29, 2013. The Predecessor Fund commenced operations on May 3, 2004 and was the only series authorized by the Aviemore Funds. Class A and Class C shares were launched from the Tactical Growth Fund effective April 1, 2013. The Fund seeks long‐term capital appreciation.
Tactical Defensive Fund commenced operations on January 27, 2004. The public offering of Class A shares, Class C shares and Class I shares commenced on September 15, 2006, October 1, 2009 and May 28, 2010, respectively. The investment objective of the Fund is to seek capital appreciation.
Trilogy Alternative Return Fund commenced operations on April 2, 2012. The public offering of Class A shares, Class C shares and Class I shares commenced on April 2, 2012. The investment objective of the Fund is total return, with an emphasis on lower risk and volatility than the U.S. equity markets.
Alternative Income Fund commenced operations on December 31, 2012. The public offering of Class A shares, Class C shares and Class I shares commenced on December 31, 2012, August 10, 2015 and February 14, 2013, respectively. The investment objective of the Fund is to seek to provide income and absolute portfolio returns, with a secondary emphasis on lower risk and volatility than the U.S. equity markets.
Defensive International Fund commenced operations on April 2, 2012. The public offering of Class A shares, Class C shares and Class I shares commenced on April 2, 2012. The investment objective of the Fund is to seek long‐term capital appreciation, while maintaining a secondary emphasis on capital preservation.
Managed Risk 100 Fund commenced operations on June 30, 2003. The public offering of Class A shares, Class C shares and Class I shares commenced on September 15, 2006, October 1, 2009 and May 28, 2010, respectively. The investment objective of the Fund is to seek long‐term capital appreciation, while maintaining a secondary emphasis on capital preservation.
Each Fund currently offers three classes of shares, Class A, Class C, and Class I. Class A shares are sold subject to a maximum front‐end sales load equal to 5.75% of the offering price and a distribution and/or service fee of up to 0.25% of the average net assets attributable to Class A shares, are also sold subject to a 1.00% contingent deferred sales load on purchases at or above $1 million if redeemed within 12 months of purchase. Class C shares are sold subject to a distribution and/or service fee of up to 1.00% of the average daily net assets attributable to Class C shares and, effective October 1, 2012, sold subject to a 1.00% contingent deferred sales load if redeemed within one year of purchase. Class I shares are sold without any sales loads and distribution and/ or service fees. Each class of shares represents an interest in the same assets of the Funds, has the same rights and is identical in all material respects except that (1) the classes bear differing levels of sales loads and distribution fees; (2) certain other class specific expenses will be borne solely by the class to which such expenses are attributable; (3) each class has exclusive voting rights with respect to matters relating to its arrangements; and (4) Class I shares require a higher minimum initial investment.
2. SIGNIFICANT ACCOUNTING POLICIES
The following is a summary of the Funds’ significant accounting policies used in the preparation of their financial statements. The policies are in conformity with accounting principles generally accepted in the United States of America (“GAAP”). The Funds are considered investment companies for financial reporting purposes under GAAP and follows the accounting and reporting guidance applicable to investment companies in the Financial Accounting Standards Board Accounting Standards Codification Topic 946.
Security Valuation: The Funds’ investments in securities are carried at market value. Securities listed on an exchange or quoted on a national market system are valued at the last sales price as of the time regular trading closes on the New York Stock Exchange (normally, 4:00 p.m. Eastern Time). Securities traded in the NASDAQ market are valued at the NASDAQ Official Closing Price. Other securities, including listed securities for which no sale was reported on that date, are valued at the most recent bid price. Options are valued at the mean of the last quoted bid and ask prices at the time of valuation, as reported on the option’s primary exchange. If no bid quotation is readily available at the time of valuation, the option shall be valued at the mean of the last quoted ask price and $0.00. Securities and assets for which representative market quotations are not readily available or which cannot be accurately valued using the Funds’ normal pricing procedures are valued at fair value as determined in good faith under policies approved by the Board of Trustees (the “Trustees”) and will be classified as Level 2 or 3 within the fair value hierarchy (see below), depending on the inputs used. Fair value pricing may be used, for example, in situations where (i) a portfolio security is so thinly traded that there have been no transactions for that security over an extended period of time; (ii) an event occurs after the close of the exchange on which a portfolio security is principally traded that is likely to have changed the value of the portfolio security prior to the Funds’ net asset value calculations; (iii) the exchange on which the portfolio security is principally traded closes early; or (iv) trading of the portfolio security is halted during the day and does not resume prior to the Funds’ net asset value calculations. A portfolio security’s “fair value” price may differ from the price next available for that portfolio security using the Funds’ normal pricing procedures. Open‐end investment companies, including money market funds, are valued at the net asset value reported by such registered open‐end investment companies. Instruments with maturities of 60 days or less are valued at amortized cost, which approximates market value.
| Stadion Investment Trust | Notes to Financial Statements |
| | November 30, 2016 (Unaudited) |
GAAP establishes a single authoritative definition of fair value, sets out a framework for measuring fair value and requires certain disclosures about fair value measurements.
Various inputs are used in determining the value of the Funds’ investments. These inputs are summarized in the three broad levels listed below:
Level 1 – quoted prices in active markets for identical securities
Level 2 – other significant observable inputs
Level 3 – significant unobservable inputs
The inputs or methodology used for valuing securities are not necessarily an indication of the risks associated with investing in those securities. The inputs used to measure fair value may fall into different levels of the fair value hierarchy. In such cases, for disclosure purposes, the level in the fair value hierarchy within which the fair value measurement falls in its entirety is determined based on the lowest level input that is significant to the fair value measurement.
The following is a summary of the inputs used to value each Fund’s investments as of November 30, 2016 by security type:
Tactical Growth Fund
| | | Valuation Inputs | | | |
| | Level 1 | | Level 2 | | Level 3 | | Total | |
| Investments in Securities at Value | | | | | | | | |
| Exchange‐Traded Funds | | $ | 318,972,285 | | | $ | – | | | $ | – | | | $ | 318,972,285 | |
| Money Market Funds | | | 6,307,693 | | | | – | | | | – | | | | 6,307,693 | |
| Total Investments in Securities | | $ | 325,279,978 | | | $ | – | | | $ | – | | | $ | 325,279,978 | |
Tactical Defensive Fund
| | | Valuation Inputs | | | |
| | Level 1 | | Level 2 | | Level 3 | | Total | |
| Investments in Securities at Value | | | | | | | | |
| Exchange‐Traded Funds | | $ | 37,324,510 | | | $ | – | | | $ | – | | | $ | 37,324,510 | |
| Money Market Funds | | | 538,620 | | | | – | | | | – | | | | 538,620 | |
| Total Investments in Securities | | $ | 37,863,130 | | | $ | – | | | $ | – | | | $ | 37,863,130 | |
Trilogy Alternative Return Fund
| | | Valuation Inputs | | | | |
| | | Level 1 | | | Level 2 | | | Level 3 | | | Total | |
| Investments in Securities at Value | | | | | | | | | | | | |
| Common Stocks* | | $ | 41,012,719 | | | $ | – | | | $ | – | | | $ | 41,012,719 | |
| Exchange‐Traded Funds | | | 36,511,048 | | | | – | | | | – | | | | 36,511,048 | |
| Open‐End Funds | | | 4,082,088 | | | | – | | | | – | | | | 4,082,088 | |
| Purchased Option Contracts | | | – | | | | 7,391,720 | | | | – | | | | 7,391,720 | |
| Money Market Funds | | | 2,868,733 | | | | – | | | | – | | | | 2,868,733 | |
| Total Investments in Securities | | $ | 84,474,588 | | | $ | 7,391,720 | | | $ | – | | | $ | 91,866,308 | |
| Other Financial Instruments | | | | | | | | | | | | | | | | |
| Liabilities | | | | | | | | | | | | | | | | |
| Written Option Contracts | | $ | – | | | $ | (3,789,675 | ) | | $ | – | | | $ | (3,789,675 | ) |
| Total | | $ | – | | | $ | (3,789,675 | ) | | $ | – | | | $ | (3,789,675 | ) |
Alternative Income Fund
| | | Valuation Inputs | | | | |
| | | Level 1 | | | Level 2 | | | Level 3 | | | Total | |
| Investments in Securities at Value | | | | | | | | | | | | |
| Common Stocks* | | $ | 106,439,983 | | | $ | – | | | $ | – | | | $ | 106,439,983 | |
| Purchased Option Contracts | | | – | | | | 2,526,852 | | | | – | | | | 2,526,852 | |
| Money Market Funds | | | 6,931,877 | | | | – | | | | – | | | | 6,931,877 | |
| Total Investments in Securities | | $ | 113,371,860 | | | $ | 2,526,852 | | | $ | – | | | $ | 115,898,712 | |
| Other Financial Instruments | | | | | | | | | | | | | | | | |
| Liabilities | | | | | | | | | | | | | | | | |
| Written Option Contracts | | $ | – | | | $ | (5,464,185 | ) | | $ | – | | | $ | (5,464,185 | ) |
| Total | | $ | – | | | $ | (5,464,185 | ) | | $ | – | | | $ | (5,464,185 | ) |
| Semi-Annual Report | November 30, 2016 | 59 |
| Stadion Investment Trust | Notes to Financial Statements |
| | November 30, 2016 (Unaudited) |
Defensive International Fund
| | | Valuation Inputs | | | |
| | Level 1 | | Level 2 | | Level 3 | | Total | |
| Investments in Securities at Value | | | | | | | | |
| Exchange‐Traded Funds | | $ | 4,403,634 | | | $ | – | | | $ | – | | | $ | 4,403,634 | |
| Money Market Funds | | | 2,626,923 | | | | – | | | | – | | | | 2,626,923 | |
| Total Investments in Securities | | $ | 7,030,557 | | | $ | – | | | $ | – | | | $ | 7,030,557 | |
Managed Risk 100 Fund
| | | Valuation Inputs | | | |
| | Level 1 | | Level 2 | | Level 3 | | Total | |
| Investments in Securities at Value | | | | | | | | |
| Exchange‐Traded Funds | | $ | 74,819,965 | | | $ | – | | | $ | – | | | $ | 74,819,965 | |
| Money Market Funds | | | 800,074 | | | | – | | | | – | | | | 800,074 | |
| Total Investments in Securities | | $ | 75,620,039 | | | $ | – | | | $ | – | | | $ | 75,620,039 | |
| * | See Schedule of Investments for Common Stocks determined by sector and industry. |
As of November 30, 2016, the Funds did not have any transfers in and/or out of any Level. The Funds did not have any assets or liabilities that were measured at fair value on a recurring basis using significant unobservable inputs (Level 3) as of November 30, 2016. It is the Funds’ policy to recognize transfers into and out of any Level at the end of the reporting period.
Share Valuation: The net asset value per share of each class of shares of each Fund is calculated daily by dividing the total value of the assets attributable to that class, less liabilities attributable to that class, by the number of shares of that class outstanding.
Securities Transactions and Investment Income: Security transactions are accounted for on trade date. Gains and losses on securities sold are determined on a specific identification basis. Dividend income is recorded on the ex‐dividend date. Interest income is accrued as earned.
Option Transactions: Trilogy Alternative Return Fund and Alternative Income Fund may purchase and write put and call options on broad‐based U.S. and International stock indices or ETFs that replicate the performance of broad‐based U.S. and International stock indices as well as short term futures ETFs and bond ETFs. When held, the Funds use option contracts on broad‐based U.S. and International stock indices for the purpose of seeking to generate return and manage risk exposure among varying market conditions.
Exchange‐Traded Funds (“ETFs”): The Funds may invest in ETFs, which are funds whose shares are traded on a national exchange. ETFs may be based on underlying equity or fixed income securities, as well as commodities or currencies. ETFs do not sell individual shares directly to investors and only issue their shares in large blocks known as “creation units.” The investor purchasing a creation unit then sells the individual shares on a secondary market. Although similar diversification benefits may be achieved through an investment in another investment company, ETFs generally offer greater liquidity and lower expenses. Because an ETF incurs its own fees and expenses, shareholders of a fund investing in an ETF will indirectly bear those costs. Such funds will also incur brokerage commissions and related charges when purchasing or selling shares of an ETF. Unlike typical investment company shares, which are valued once daily, shares in an ETF may be purchased or sold on a securities exchange throughout the trading day at market prices.
Allocation Between Classes: Investment income earned, realized capital gains and losses, and unrealized appreciation and depreciation are allocated daily to each class of shares based upon its proportionate share of total net assets of the respective Fund. Class specific expenses are charged directly to the class incurring the expense. Common expenses which are not attributable to a specific class are allocated daily to each class of shares based upon its proportionate share of total net assets of the respective Fund.
Distributions to Shareholders: Each of the Funds may distribute its net investment income to its shareholders quarterly, but, in any event, expects to distribute substantially all of its net investment income to its shareholders at least annually. Net realized gains, if any, are distributed at least once each year. The amount of distributions from net investment income and net realized gains are determined in accordance with federal income tax regulations, which may differ from GAAP. These “book/tax” differences are either temporary or permanent in nature and are primarily due to losses deferred due to wash sales and tax treatment of short term capital gains. Dividends and distributions are recorded on the ex‐ dividend date.
Use of Estimates: The preparation of financial statements in conformity with GAAP requires management to make estimates and assumptions that affect the reported amount of assets and liabilities, the disclosure of contingent assets and liabilities, and revenues and expenses during the reporting period. Actual results could differ from those estimates.
Federal Income Taxes: It is each Fund’s policy to comply with the special provisions of Subchapter M of the Internal Revenue Code of 1986, as amended, applicable to regulated investment companies. As provided therein, in any fiscal year in which a Fund so qualifies and distributes at least 90% of its taxable net income, the Fund (but not the shareholders) will be relieved of federal income tax on the income distributed. Accordingly, no provision for income taxes has been made.
In order to avoid imposition of the excise tax applicable to regulated investment companies, it is also each Fund’s intention to declare as dividends in each calendar year at least 98% of its net investment income (earned during the calendar year) and 98.2% of its net realized capital gains (earned during the twelve months ended October 31) plus undistributed amounts from prior years.
| Stadion Investment Trust | Notes to Financial Statements |
| | November 30, 2016 (Unaudited) |
3. SECURITY TRANSACTIONS
During the six months ended November 30, 2016, cost of purchases and proceeds from sales and maturities of investment securities, other than short‐term investments and U.S. government securities, amounted to:
| | | Tactical
Growth Fund | | | Tactical
Defensive Fund | |
| Purchases | | $ | 153,578,571 | | | $ | 69,008,144 | |
| Sales | | $ | 152,290,055 | | | $ | 73,897,577 | |
| | | Trilogy Alternative Return Fund | | | Alternative Income Fund | |
| Purchases | | $ | 15,776,741 | | | $ | 21,757,847 | |
| Sales | | $ | 11,088,253 | | | $ | 4,184,959 | |
| | | Defensive International Fund | | | Managed Risk
100 Fund | |
| Purchases | | $ | 17,907,922 | | | $ | 286,791,112 | |
| Sales | | $ | 19,591,075 | | | $ | 304,536,538 | |
4. TAX MATTERS
The tax character of distributions made during the year ended May 31, 2016 was as follows:
| | | Ordinary Income | | | Long-term Capital Gains | | | Total Distributions | |
Tactical Growth Fund 5/31/2016 | | $ | 970,026 | | | $ | 406,478 | | | $ | 1,376,504 | |
Tactical Defensive Fund 5/31/2016 | | $ | – | | | $ | 1,463,130 | | | $ | 1,463,130 | |
Trilogy Alternative Return Fund 5/31/2016 | | $ | 797,927 | | | $ | – | | | $ | 797,927 | |
Alternative Income Fund 5/31/2016 | | $ | 724,892 | | | $ | 18,617 | | | $ | 743,509 | |
Defensive International Fund 5/31/2016 | | $ | 60,834 | | | $ | – | | | $ | 60,834 | |
Managed Risk 100 Fund 5/31/2016 | | $ | – | | | $ | – | | | $ | – | |
Tax Basis of Investments:
As of November 30, 2016, the aggregate cost of investments, gross unrealized appreciation (depreciation) and net unrealized appreciation for Federal tax purposes was as follows:
| | | Tactical Growth Fund | | | Tactical Defensive Fund | |
| Tax cost of portfolio investments | | $ | 293,744,363 | | | $ | 36,493,029 | |
| Gross unrealized appreciation | | $ | 31,572,894 | | | $ | 1,370,101 | |
| Gross unrealized depreciation | | | (37,279 | ) | | | – | |
| Net unrealized appreciation | | $ | 31,535,615 | | | $ | 1,370,101 | |
| | | Trilogy Alternative Return Fund | | | Alternative Income Fund | |
| Tax cost of portfolio investments | | $ | 86,974,153 | | | $ | 110,288,020 | |
| Gross unrealized appreciation | | $ | 10,622,558 | | | $ | 11,108,507 | |
| Gross unrealized depreciation | | | (5,730,403 | ) | | | (5,497,815 | ) |
| Net unrealized appreciation | | $ | 4,892,155 | | | $ | 5,610,692 | |
| | | Defensive International Fund | | | Managed Risk 100 Fund | |
| Tax cost of portfolio investments | | $ | 7,092,478 | | | $ | 74,708,338 | |
| Gross unrealized appreciation | | $ | 527 | | | $ | 911,701 | |
| Gross unrealized depreciation | | | (62,448 | ) | | | – | |
| Net unrealized appreciation (depreciation) | | $ | (61,921 | ) | | $ | 911,701 | |
As of November 30, 2016, the tax cost of written option contracts for Trilogy Alternative Return Fund and Alternative Income Fund were $5,640,171 and $4,436,496 respectively.
The difference between the federal income tax cost of portfolio investments and the financial statement cost for Tactical Growth Fund, Tactical Defensive Fund, Trilogy Alternative Return Fund, Alternative Income Fund and Defensive International Fund is due to certain timing differences in the recognition of capital gains or losses under income tax regulations and GAAP. These “book/tax” differences are temporary in nature and are due to the tax deferral of losses on wash sales.
Capital Loss Carryforward:
As of May 31, 2016, the Funds have the following capital loss carryforwards. These capital loss carryforwards may be utilized in future years to offset net realized capital gains, if any, prior to distributing such gains to shareholders.
During the year ended May 31, 2016, the Fund utilized capital loss carryforwards as follows:
| Fund | | Amount | |
Trilogy Alternative Return Fund | | $ | (2,911,169 | ) |
| Semi-Annual Report |��November 30, 2016 | 61 |
| Stadion Investment Trust | Notes to Financial Statements |
| | November 30, 2016 (Unaudited) |
Capital losses (no expiration) carried to the next tax year were as follows:
| Fund | | Short-Term | | | Long-Term | |
| Tactical Growth Fund | | $ | 8,591,600 | | | $ | – | |
| Tactical Defensive Fund | | | 103,826 | | | | – | |
| Trilogy Alternative Return Fund | | | 3,239,204 | | | | – | |
| Alternative Income Fund | | | – | | | | 243,900 | |
| Defensive International Fund | | | 1,129,955 | | | | – | |
| Managed Risk 100 Fund | | | 44,695,185 | | | | – | |
The Funds elect to defer to the tax year ending May 31, 2017, capital losses recognized during the period November 1, 2015 to May 31, 2016 in the amount of:
| Fund | | Amount | |
| Tactical Growth Fund | | $ | 12,089,787 | |
| Trilogy Alternative Return Fund | | | 1,020,667 | |
| Alternative Income Fund | | | 136,288 | |
| Defensive International Fund | | | 17,407 | |
The Funds elect to defer to the tax year ending May 31, 2017, late year ordinary losses recognized in the amount of:
| Fund | | Amount | |
| Tactical Growth Fund | | $ | 412,284 | |
| Tactical Defensive Fund | | | 197,119 | |
| Defensive International Fund | | | 59,250 | |
| Managed Risk 100 Fund | | | 374,563 | |
As of and during the six months ended November 30, 2016, the Funds did not have a liability for any unrecognized tax benefits. The Funds file U.S. federal, state, and local tax returns as required. The Funds’ tax returns are subject to examination by the relevant tax authorities until expiration of the applicable statute of limitations which is generally three years after the filing of the tax return. Tax returns for open years have incorporated no uncertain tax positions that require a provision for income taxes.
5. TRANSACTIONS WITH AFFILIATES
Investment Advisory Agreements
Each Fund’s investments are managed by the Advisor under the terms of an Investment Advisory Agreement (the “Advisory Agreements”). Under the Advisory Agreements, each Fund excluding the Alternative Income Fund has agreed to pay the Advisor an investment advisory fee at an annual rate of 1.25% of its average daily net assets up to $150 million and 1.00% of such assets over $150 million. Effective April 30, 2015, the Alternative Income Fund has agreed to pay the Advisor an investment advisory fee at an annual rate of 0.85% of its average daily net assets. Prior to April 30, 2015, the Alternative Income Fund paid the Advisor an investment advisory fee at the annual rate of 0.65% of its average daily net assets.
The Advisor has entered into an Expense Limitation Agreement with respect to each Fund, excluding the Tactical Growth Fund and the Alternative Income Fund, under which it has agreed to waive its fees and to assume other expenses of the Funds, if necessary, in an amount that limits the annual operating expenses of Class A shares, Class C shares and Class I shares of the Funds (exclusive of interest, taxes, brokerage commissions, extraordinary expenses, Acquired Fund Fees and Expenses and payments, if any, under the Rule 12b‐1 Plan) to not more than 1.70% of the average daily net assets allocable to each Class until October 1, 2017. Effective January 1, 2015, the Advisor has entered into an Expense Limitation Agreement with the Tactical Growth Fund under which it has agreed to waive its fees and to assume other expenses of the Fund, if necessary, in an amount that limits the annual operating expenses of Class A shares, Class C and Class I shares of the Fund (exclusive of interest, taxes, brokerage commissions, extraordinary expenses, Acquired Fund Fees and Expenses and payments, if any, under the Rule 12b‐1 Plan) to not more than 1.30% of the average daily net assets allocable to each Class until October 1, 2017. Prior to January 1, 2015, the Advisor had entered into an Expense Limitation Agreement with the Tactical Growth Fund under which it had agreed to waive its fees and to assume other expenses of the Fund, if necessary, in an amount that limited the annual operating expenses of Class A shares, Class C and Class I shares of the Fund (exclusive of interest, taxes, brokerage commissions, extraordinary expenses, Acquired Fund Fees and Expenses and payments, if any, under the Rule 12b‐1 Plan) to not more than 1.70% of the average daily net assets allocable to each Class. The Advisor has entered into an Expense Limitation Agreement with the Alternative Income Fund under which it has agreed to waive its fees and to assume other expenses of the Fund, if necessary, in an amount that limits the annual operating expenses of Class A shares, Class C shares and Class I shares of the Fund (exclusive of interest, taxes, brokerage commissions, extraordinary expenses, Acquired Fund Fees and Expenses and payments, if any, under the Rule 12b‐1 Plan) to not more than 1.15% of the average daily net assets allocable to each Class until October 1, 2017. Accordingly, during the six months ended November 30, 2016, the Advisor waived fees and reimbursed expenses as follows:
| | | Tactical Growth Fund | | | Tactical Defensive Fund | | | Alternative Income Fund | | | Defensive International Fund | | | Managed Risk 100 Fund | |
| Total waivers and reimbursements | | $ | 186,427 | | | $ | 13,840 | | | $ | 21,207 | | | $ | 29,035 | | | $ | 3,177 | |
During the six months ended November 30, 2016, there were no advisory fees waived or expenses reimbursed by the Advisor for the Trilogy Alternative Return Fund. It is expected that the Expense Limitation Agreements will continue from year‐to‐year, provided such continuance is approved by the Trustees.
If the Advisor so requests, the Advisor may recapture from the Tactical Growth Fund any Tactical Growth Fund operating expenses waived or reimbursed by the Advisor pursuant to the Tactical Growth Fund’s Expense Limitation Agreement that had the effect of reducing Fund Operating Expenses from 1.70% (or lower) to 1.30% from the time the Tactical Growth Fund initially incurred, or the Advisor initially waived or reimbursed, such expenses for a period of three years; provided, however, that the total annual Fund Operating Expenses for the applicable following year, after giving effect to the repayment, shall not exceed 1.30% of the average daily net assets of the Fund (or any lower expense limitation or limitations to which the parties may otherwise agree). If the Advisor so requests, the Advisor may recapture from the Alternative Income Fund any Alternative Income Fund operating expense waived or reimbursed by the Advisor pursuant to the Alternative Income Fund’s Expense Limitation Agreement from the time the Alternative Income Fund initially incurred, or the Advisor initially waived or reimbursed, such expenses for a period of three years.
| Stadion Investment Trust | Notes to Financial Statements |
| | November 30, 2016 (Unaudited) |
As of November 30, 2016, the balance of recoupable expenses for the Tactical Growth Fund and the Alternative Income Fund was as follows:
| Fund | | 2017 | | | 2018 | | | 2019 | | | Total | |
| Tactical Growth Fund | | $ | – | | | $ | 144,690 | | | $ | 460,455 | | | $ | 605,145 | |
| Alternative Income Fund | | $ | 64,957 | | | $ | 99,416 | | | $ | 81,507 | | | $ | 245,880 | |
The Chief Compliance Officer of the Trust is an employee of the Advisor. Effective July 15, 2013, the Trust reimburses the Advisor 50% of the employee’s annual base salary for the services provided by the Chief Compliance Officer of the Trust. Prior to July 15, 2013, the Trust reimbursed the Advisor $82,500 annually for services provided by the Chief Compliance Officer of the Trust. Each Fund bears a proportionate share of this fee based on an allocation approved by the Trustees.
Certain Trustees and officers of the Trust are also officers of the Advisor.
Fund Accounting and Administration Agreement
ALPS Fund Services, Inc. (“ALPS” and the “Administrator”) provides administrative, fund accounting and other services to the Funds under the Administration, Bookkeeping and Pricing Services Agreement with the Trust.
Transfer Agent and Shareholder Services Agreement
ALPS serves as transfer, dividend paying and shareholder servicing agent for the Funds (the “Transfer Agent”) under a Transfer Agency and Services Agreement with the Trust.
Distribution Plan
The Trust has adopted plans of distribution (the “Plans”) pursuant to Rule 12b‐1 under the 1940 Act that permit Class A and Class C shares of each Fund to directly incur or reimburse the Funds’ principal underwriter for certain expenses related to the distribution of its shares. The annual limitation for payment of expenses pursuant to the Plans is 0.25% of each Fund’s average daily net assets attributable to Class A shares and 1.00% of each Fund’s average daily net assets attributable to Class C shares. The Trust has not adopted a plan of distribution with respect to Class I shares. The expenses of the Plans are reflected as distribution fees in the Statement of Operations of the Funds.
Distribution Agreement
ALPS Distributors, Inc. (“ADI” or the “Distributor”) acts as the distributor of the Funds’ shares pursuant to a Distribution Agreement with the Trust. Under the terms of a Distribution Agreement with the Trust, the Distributor provides distribution services to the Trust and serves as principal underwriter to the Funds. ADI receives no compensation from the Funds.
6. DERIVATIVE TRANSACTIONS
Derivative Instruments and Hedging Activities: The following discloses the Funds’ use of derivative instruments and hedging activities.
The Funds’ investment objectives not only permit the Funds to purchase investment securities, they also allow certain Funds to enter into various types of derivative contracts such as purchased and written options. In doing so, the Funds will employ strategies in differing combinations to permit them to increase, decrease, or change the level or types of exposure to market factors. Central to those strategies are features inherent to derivatives that make them more attractive for this purpose than equity or debt securities; they require little or no initial cash investment, they can focus exposure on only certain selected risk factors, and they may not require the ultimate receipt or delivery of the underlying security (or securities) to the contract. This may allow the Funds to pursue their objectives more quickly and efficiently than if they were to make direct purchases or sales of securities capable of effecting a similar response to market factors.
Market Risk Factors: In pursuit of their investment objectives, the Funds may seek to use derivatives to increase or decrease their exposure to the following market risk factors:
Equity Risk: Equity risk relates to the change in value of equity securities as they relate to increases or decreases in the general market.
Interest Rate Risk: Interest rate risk refers to the fluctuations in value of fixed‐income securities resulting from the inverse relationship between price and yield. For example, an increase in general interest rates will tend to reduce market value of fixed income investments and a decline in general interest rates will tend to increase the value of such investments. In addition, debt securities with longer maturities, which tend to have higher yields, are subject to potentially greater fluctuations in value from changes in interest rates than obligations with shorter maturities.
Risk of Investing in Derivatives: The Funds’ use of derivatives can result in losses due to unanticipated changes in the market risk factors and the overall market.
| Semi-Annual Report | November 30, 2016 | 63 |
| Stadion Investment Trust | Notes to Financial Statements |
| November 30, 2016 (Unaudited) |
Derivatives may have little or no initial cash investment relative to their market value exposure and therefore can produce significant gains or losses in excess of their cost. This use of embedded leverage allows the Funds to increase their market value exposure relative to their net assets and can substantially increase the volatility of the Funds’ performance.
Additional associated risks from investing in derivatives also exist and potentially could have significant effects on the valuation of the derivative and the Funds. Typically, the associated risks are not the risks that the Funds are attempting to increase or decrease exposure to, per their investment objectives, but are the additional risks from investing in derivatives.
Examples of these associated risks are liquidity risk, which is the risk that the Funds will not be able to sell the derivative in the open market in a timely manner, and counterparty credit risk, which is the risk that the counterparty will not fulfill its obligation to the Funds.
Futures: Certain Funds may invest in futures contracts in accordance with their investment objectives. Each Fund does so for a variety of reasons, including for cash management, hedging or non‐hedging purposes in an attempt to achieve investment returns consistent with the Fund’s investment objective. A futures contract provides for the future sale by one party and purchase by another party of a specified quantity of the security or other financial instrument at a specified price and time. A futures contract on an index is an agreement pursuant to which two parties agree to take or make delivery of an amount of cash equal to the difference between the value of the index at the close of the last trading day of the contract and the price at which the index contract was originally written. Futures transactions may result in losses in excess of the amount invested in the futures contract. There can be no guarantee that there will be a correlation between price movements in the hedging vehicle and in the portfolio securities being hedged. An incorrect correlation could result in a loss on both the hedged securities in a Fund and the hedging vehicle so that the portfolio return might have been greater had hedging not been attempted. There can be no assurance that a liquid market will exist at a time when a Fund seeks to close out a futures contract or a futures option position. Lack of a liquid market for any reason may prevent a Fund from liquidating an unfavorable position, and the Fund would remain obligated to meet margin requirements until the position is closed. In addition, a Fund could be exposed to risk if the counterparties to the contracts are unable to meet the terms of their contracts. With exchange‐traded futures, there is minimal counterparty credit risk to the Funds since futures are exchange‐ traded and the exchange’s clearinghouse, as counterparty to all exchange‐traded futures, guarantees the futures against default.
When a purchase or sale of a futures contract is made by a Fund, the Fund is required to deposit with its custodian (or broker, if legally permitted) a specified amount of liquid assets (“initial margin”). The margin required for a futures contract is set by the exchange on which the contract is traded and may be modified during the term of the contract. The initial margin is in the nature of a performance bond or good faith deposit on the futures contract that is returned to a Fund upon termination of the contract, assuming all contractual obligations have been satisfied. Each day a Fund may pay or receive cash, called “variation margin,” equal to the daily change in value of the futures contract. Such payments or receipts are recorded for financial statement purposes as unrealized gains or losses by a Fund. Variation margin does not represent a borrowing or loan by a Fund but is instead a settlement between a Fund and the broker of the amount one would owe the other if the futures contract expired. When the contract is closed, a Fund records a realized gain or loss equal to the difference between the value of the contract at the time it was opened and the value at the time it was closed.
Option Writing/Purchasing: Certain Funds may write or purchase option contracts to adjust risk and return of their overall investment positions. When a Fund writes or purchases an option, an amount equal to the premium received or paid by the Fund is recorded as a liability or an asset and is subsequently adjusted to the current market value of the option written or purchased. Premiums received or paid from writing or purchasing options that expire unexercised are treated by the Fund on the expiration date as realized gains or losses. The difference between the premium and the amount paid or received on effecting a closing purchase or sale transaction, including brokerage commissions, is also treated as a realized gain or loss. If an option is exercised, the premium paid or received is added to the cost of the purchase or proceeds from the sale in determining whether the Fund has realized a gain or loss on investment transactions. Risks from entering into option transactions arise from the potential inability of counterparties to meet the terms of the contracts, the potential inability to enter into closing transactions because of an illiquid secondary market and from unexpected movements in security values.
Transactions in option contracts written by Trilogy Alternative Return Fund and Alternative Income Fund during the six months ended November 30, 2016, were as follows:
| Trilogy Alternative Return Fund | |
| | | Written Calls | |
| | | Contracts | | | Premiums | |
| Options outstanding at beginning of period | | | 405 | | | $ | 1,448,017 | |
| Options written | | | 2,200 | | | | 7,298,561 | |
| Options closed | | | (2,170 | ) | | | (6,931,423 | ) |
| Options outstanding at ending of period | | | 435 | | | $ | 1,815,155 | |
| | | Written Puts | |
| | | Contracts | | | Premiums | |
| Options outstanding at beginning of period | | | 650 | | | $ | 3,549,231 | |
| Options written | | | 1,600 | | | | 6,139,035 | |
| Options closed | | | (1,350 | ) | | | (5,043,558 | ) |
| Options expired | | | (200 | ) | | | (819,692 | ) |
| Options outstanding at ending of period | | | 700 | | | $ | 3,825,016 | |
| Stadion Investment Trust | Notes to Financial Statements |
| | November 30, 2016 (Unaudited) |
| Alternative Income Fund | |
| | | Written Calls | |
| | | Contracts | | | Premiums | |
| Options outstanding at beginning of period | | | 701 | | | $ | 2,777,854 | |
| Options written | | | 2,715 | | | | 8,805,998 | |
| Options closed | | | (2,570 | ) | | | (7,593,202 | ) |
| Options outstanding at ending of period | | | 846 | | | $ | 3,990,650 | |
| | | Written Puts | |
| | | Contracts | | | Premiums | |
| Options outstanding at beginning of period | | | 100 | | | $ | 436,846 | |
| Options written | | | 870 | | | | 4,179,798 | |
| Options closed | | | (870 | ) | | | (4,170,798 | ) |
| Options outstanding at ending of period | | | 100 | | | $ | 445,846 | |
A portion of Trilogy Alternative Return Fund’s and Alternative Income Fund’s securities are pledged as collateral for open written option contracts.
The locations in the Statements of Assets and Liabilities of Trilogy Alternative Return Fund’s and Alternative Income Fund’s derivative positions are as follows:
| Risk Exposure | Statement of Assets and Liabilities Location | Fair Value of Asset Derivatives | | Statement of Assets and Liabilities Location | Fair Value of Liability Derivatives | |
| Trilogy Alternative Return Fund | | | | | |
| Equity Contracts (Purchased Options/Written Options) | Investments in securities: At value | | $ | 7,391,720 | | Written Options at value | | $ | 3,789,675 | |
| | | | $ | 7,391,720 | | | | $ | 3,789,675 | |
| Risk Exposure | Statement of Assets and Liabilities Location | Fair Value of Asset Derivatives | | Statement of Assets and Liabilities Location | Fair Value of Liability Derivatives | |
| Alternative Income Fund | | | | | |
| Equity Contracts (Purchased Options/Written Options) | Investments in securities: At value | | $ | 2,526,852 | | Written Options at value | | $ | 5,464,185 | |
| | | | $ | 2,526,852 | | | | $ | 5,464,185 | |
For the Trilogy Alternative Return Fund the average option contracts purchased and written during the six months ended November 30, 2016, were 7,127 contracts and 1,063 contracts, respectively. For the Alternative Income Fund the average option contracts purchased and written during the six months ended November 30, 2016, were 5,956 contracts and 963 contracts, respectively.
For the Defensive International Fund the average notional value of futures contracts during the six months ended November 30, 2016, was $27,738.
Trilogy Alternative Return Fund’s, Alternative Income Fund’s and Defensive International Fund’s transactions in derivative instruments during the six months ended November 30, 2016, are recorded in the following locations in the Statements of Operations:
| Risk Exposure | Statement of Operations Location | Realized Gain (Loss) on Derivatives Recognized in Income | | Change in Unrealized Gain (Loss) on Derivatives Recognized in Income | |
| Trilogy Alternative Return Fund | | | | |
| Equity Contracts (Purchased Options) | Net realized losses from investments/Net change in unrealized depreciation on investments | | $ | (2,371,634 | ) | | $ | (66,733 | ) |
| Equity Contracts (Written Options) | Net realized gains from written option contracts/Net change in unrealized depreciation on written option contracts | | | 3,766,900 | | | | (56,327 | ) |
| Total | | | $ | 1,395,266 | | | $ | (123,060 | ) |
| Semi-Annual Report | November 30, 2016 | 65 |
| Stadion Investment Trust | Notes to Financial Statements |
November 30, 2016 (Unaudited)
| Risk Exposure | Statement of Operations Location | Realized Gain (Loss) on Derivatives Recognized in Income | | Change in Unrealized Gain (Loss) on Derivatives Recognized in Income | |
| Alternative Income Fund | | | | |
| Equity Contracts (Purchased Options) | Net realized losses from investments/Net change in unrealized depreciation on investments | | $ | (1,850,946 | ) | | $ | (1,422,685 | ) |
| Equity Contracts (Written Options) | Net realized losses from written option contracts/Net change in unrealized depreciation on written option contracts | | | (639,646 | ) | | | (585,164 | ) |
| Total | | | $ | (2,490,592 | ) | | $ | (2,007,849 | ) |
| Risk Exposure | Statement of Operations Location | Realized Gain (Loss) on Derivatives Recognized in Income | | Change in Unrealized Gain (Loss) on Derivatives Recognized in Income | |
| Defensive International Fund | | | | | |
| Equity Contracts (Futures Contracts) | Net realized losses on futures contracts/Net change in unrealized depreciation on futures contracts | | $ | (305,518 | ) | | $ | (3,656 | ) |
| Total | | | $ | (305,518 | ) | | $ | (3,656 | ) |
Tactical Growth Fund, Tactical Defensive Fund, and Managed Risk 100 Fund had no transactions in derivative instruments during the six months ended November 30, 2016.
7. CAPITAL SHARE TRANSACTIONS
Proceeds and payments on capital shares as shown in the Statements of Changes in Net Assets are the result of the following capital share transactions for the periods shown:
| | | For the Six Months Ended November 30, 2016(Unaudited) | | | For the Year Ended May 31, 2016 | |
| Tactical Growth Fund ‐ Class A | | | | | | |
| Shares sold | | | 1,623,884 | | | | 6,931,154 | |
| Shares issued in reinvestment of distributions to shareholders | | | 12,007 | | | | 35,519 | |
| Shares redeemed | | | (1,875,982 | ) | | | (3,579,431 | ) |
| Net increase/(decrease) in shares outstanding | | | (240,091 | ) | | | 3,387,242 | |
| Shares outstanding beginning of period | | | 9,089,495 | | | | 5,702,253 | |
| Shares outstanding end of period | | | 8,849,404 | | | | 9,089,495 | |
| | | | | | | | | |
| Tactical Growth Fund ‐ Class C | | | | | | | | |
| Shares sold | | | 1,377,838 | | | | 6,025,591 | |
| Shares issued in reinvestment of distributions to shareholders | | | – | | | | 15,035 | |
| Shares redeemed | | | (1,451,517 | ) | | | (839,273 | ) |
| Net increase/(decrease) in shares outstanding | | | (73,679 | ) | | | 5,201,353 | |
| Shares outstanding beginning of period | | | 8,558,385 | | | | 3,357,032 | |
| Shares outstanding end of period | | | 8,484,706 | | | | 8,558,385 | |
| | | | | | | | | |
| Tactical Growth Fund ‐ Class I | | | | | | | | |
| Shares sold | | | 3,420,477 | | | | 11,740,309 | |
| Shares issued in reinvestment of distributions to shareholders | | | 28,773 | | | | 80,160 | |
| Shares redeemed | | | (3,952,687 | ) | | | (6,541,936 | ) |
| Net increase/(decrease) in shares outstanding | | | (503,437 | ) | | | 5,278,533 | |
| Shares outstanding beginning of period | | | 14,626,186 | | | | 9,347,653 | |
| Shares outstanding end of period | | | 14,122,749 | | | | 14,626,186 | |
| Stadion Investment Trust | Notes to Financial Statements |
November 30, 2016 (Unaudited)
| | | For the Six Months Ended November 30, 2016 (Unaudited) | | | For the Year Ended May 31, 2016 | |
| Tactical Defensive Fund ‐ Class A | | | | | | |
| Shares sold | | | 97,026 | | | | 416,567 | |
| Shares issued in reinvestment of distributions to shareholders | | | – | | | | 57,657 | |
| Shares redeemed | | | (246,029 | ) | | | (1,208,183 | ) |
| Net decrease in shares outstanding | | | (149,003 | ) | | | (733,959 | ) |
| Shares outstanding beginning of period | | | 1,690,738 | | | | 2,424,697 | |
| Shares outstanding end of period | | | 1,541,735 | | | | 1,690,738 | |
| | | | | | | | | |
| Tactical Defensive Fund ‐ Class C | | | | | | | | |
| Shares sold | | | 40,220 | | | | 381,578 | |
| Shares issued in reinvestment of distributions to shareholders | | | – | | | | 28,519 | |
| Shares redeemed | | | (141,027 | ) | | | (547,261 | ) |
| Net decrease in shares outstanding | | | (100,807 | ) | | | (137,164 | ) |
| Shares outstanding beginning of period | | | 923,242 | | | | 1,060,406 | |
| Shares outstanding end of period | | | 822,435 | | | | 923,242 | |
| | | | | | | | | |
| Tactical Defensive Fund ‐ Class I | | | | | | | | |
| Shares sold | | | 53,776 | | | | 675,066 | |
| Shares issued in reinvestment of distributions to shareholders | | | – | | | | 40,002 | |
| Shares redeemed | | | (261,416 | ) | | | (1,669,341 | ) |
| Net decrease in shares outstanding | | | (207,640 | ) | | | (954,273 | ) |
| Shares outstanding beginning of period | | | 1,131,172 | | | | 2,085,445 | |
| Shares outstanding end of period | | | 923,532 | | | | 1,131,172 | |
| | | For the Six Months Ended November 30, 2016 (Unaudited) | | | For the Year Ended May 31, 2016 | |
| Trilogy Alternative Return Fund ‐ Class A | | | | | | |
| Shares sold | | | 196,277 | | | | 689,342 | |
| Shares issued in reinvestment of distributions to shareholders | | | 12,724 | | | | 29,532 | |
| Shares redeemed | | | (349,634 | ) | | | (1,707,242 | ) |
| Net decrease in shares outstanding | | | (140,633 | ) | | | (988,368 | ) |
| Shares outstanding beginning of period | | | 2,754,473 | | | | 3,742,841 | |
| Shares outstanding end of period | | | 2,613,840 | | | | 2,754,473 | |
| | | | | | | | | |
| Trilogy Alternative Return Fund ‐Class C | | | | | | | | |
| Shares sold | | | 111,130 | | | | 287,231 | |
| Shares issued in reinvestment of distributions to shareholders | | | 603 | | | | 1,995 | |
| Shares redeemed | | | (198,979 | ) | | | (374,578 | ) |
| Net decrease in shares outstanding | | | (87,246 | ) | | | (85,352 | ) |
| Shares outstanding beginning of period | | | 1,025,593 | | | | 1,110,945 | |
| Shares outstanding end of period | | | 938,347 | | | | 1,025,593 | |
| | | | | | | | | |
| Trilogy Alternative Return Fund ‐Class I | | | | | | | | |
| Shares sold | | | 1,364,743 | | | | 1,513,180 | |
| Shares issued in reinvestment of distributions to shareholders | | | 23,839 | | | | 44,546 | |
| Shares redeemed | | | (645,287 | ) | | | (2,786,116 | ) |
| Net increase/(decrease) in shares outstanding | | | 743,295 | | | | (1,228,390 | ) |
| Shares outstanding beginning of period | | | 3,731,859 | | | | 4,960,249 | |
| Shares outstanding end of period | | | 4,475,154 | | | | 3,731,859 | |
| Semi-Annual Report | November 30, 2016 | 67 |
| Stadion Investment Trust | Notes to Financial Statements |
November 30, 2016 (Unaudited)
| | | For the Six Months Ended November 30, 2016 (Unaudited) | | | For the Year Ended May 31, 2016 | |
| Alternative Income Fund ‐ Class A | | | | | | |
| Shares sold | | | 547,729 | | | | 340,529 | |
| Shares issued in reinvestment of distributions to shareholders | | | 4,506 | | | | 3,338 | |
| Shares redeemed | | | (249,259 | ) | | | (506,691 | ) |
| Net increase/(decrease) in shares outstanding | | | 302,976 | | | | (162,824 | ) |
| Shares outstanding beginning of period | | | 374,994 | | | | 537,818 | |
| Shares outstanding end of period | | | 677,970 | | | | 374,994 | |
| | | | | | | | | |
Alternative Income Fund ‐ Class C(a) | | | | | | | | |
| Shares sold | | | 254,327 | | | | 51,667 | |
| Shares issued in reinvestment of distributions to shareholders | | | 1,083 | | | | 5 | |
| Shares redeemed | | | (3,351 | ) | | | (1,375 | ) |
| Net increase in shares outstanding | | | 252,059 | | | | 50,297 | |
| Shares outstanding beginning of period | | | 50,297 | | | | – | |
| Shares outstanding end of period | | | 302,356 | | | | 50,297 | |
| | | | | | | | | |
| Alternative Income Fund ‐ Class I | | | | | | | | |
| Shares sold | | | 2,964,028 | | | | 9,251,268 | |
| Shares issued in reinvestment of distributions to shareholders | | | 90,646 | | | | 71,743 | |
| Shares redeemed | | | (1,728,804 | ) | | | (1,013,551 | ) |
| Net increase in shares outstanding | | | 1,325,870 | | | | 8,309,460 | |
| Shares outstanding beginning of period | | | 8,355,695 | | | | 46,235 | |
| Shares outstanding end of period | | | 9,681,565 | | | | 8,355,695 | |
| (a) | The Stadion Alternative Income Fund Class C shares commenced operations on August 10, 2015. |
| | | For the Six Months Ended November 30, 2016 (Unaudited) | | | For the Year Ended May 31, 2016 | |
| Defensive International Fund ‐ Class A | | | | | | |
| Shares sold | | | 44,044 | | | | 97,399 | |
| Shares issued in reinvestment of distributions to shareholders | | | – | | | | 4,571 | |
| Shares redeemed | | | (55,136 | ) | | | (702,226 | ) |
| Net decrease in shares outstanding | | | (11,092 | ) | | | (600,256 | ) |
| Shares outstanding beginning of period | | | 565,483 | | | | 1,165,739 | |
| Shares outstanding end of period | | | 554,391 | | | | 565,483 | |
| | | | | | | | | |
| Defensive International Fund ‐ Class C | | | | | | | | |
| Shares sold | | | 231 | | | | 5,724 | |
| Shares issued in reinvestment of distributions to shareholders | | | – | | | | 126 | |
| Shares redeemed | | | (2,661 | ) | | | (1,099 | ) |
| Net increase/(decrease) in shares outstanding | | | (2,430 | ) | | | 4,751 | |
| Shares outstanding beginning of period | | | 20,830 | | | | 16,079 | |
| Shares outstanding end of period | | | 18,400 | | | | 20,830 | |
| | | | | | | | | |
| Defensive International Fund ‐Class I | | | | | | | | |
| Shares sold | | | 1,857 | | | | 30,308 | |
| Shares issued in reinvestment of distributions to shareholders | | | – | | | | 2,388 | |
| Shares redeemed | | | (38,587 | ) | | | (101,256 | ) |
| Net decrease in shares outstanding | | | (36,730 | ) | | | (68,560 | ) |
| Shares outstanding beginning of period | | | 324,847 | | | | 393,407 | |
| Shares outstanding end of period | | | 288,117 | | | | 324,847 | |
| Stadion Investment Trust | Notes to Financial Statements |
November 30, 2016 (Unaudited)
| | | For the Six Months Ended November 30, 2016 (Unaudited) | | | For the Year Ended May 31, 2016 | |
| Managed Risk 100 Fund ‐ Class A | | | | | | |
| Shares sold | | | 76,403 | | | | 345,859 | |
| Shares redeemed | | | (813,544 | ) | | | (5,876,982 | ) |
| Net decrease in shares outstanding | | | (737,141 | ) | | | (5,531,123 | ) |
Shares outstanding beginning of period | | | 5,075,654 | | | | 10,606,777 | |
| Shares outstanding end of period | | | 4,338,513 | | | | 5,075,654 | |
| | | | | | | | | |
| Managed Risk 100 Fund ‐ Class C | | | | | | | | |
| Shares sold | | | 13,469 | | | | 64,829 | |
| Shares redeemed | | | (573,910 | ) | | | (2,633,623 | ) |
| Net decrease in shares outstanding | | | (560,441 | ) | | | (2,568,794 | ) |
Shares outstanding beginning of period | | | 2,867,456 | | | | 5,436,250 | |
| Shares outstanding end of period | | | 2,307,015 | | | | 2,867,456 | |
| | | | | | | | | |
| Managed Risk 100 Fund ‐ Class I | | | | | | | | |
| Shares sold | | | 28,113 | | | | 231,054 | |
| Shares redeemed | | | (844,488 | ) | | | (2,748,144 | ) |
| Net decrease in shares outstanding | | | (816,375 | ) | | | (2,517,090 | ) |
Shares outstanding beginning of period | | | 2,761,687 | | | | 5,278,777 | |
| Shares outstanding end of period | | | 1,945,312 | | | | 2,761,687 | |
8. COMMITMENTS AND CONTINGENCIES
The Funds indemnify the Trust’s officers and Trustees for certain liabilities that might arise from their performance of their duties to the Funds. Additionally, in the normal course of business, the Funds enter into contracts that contain a variety of representations and warranties and that provide general indemnifications. The Funds’ maximum exposure under these arrangements is unknown, as this would involve future claims that may be made against the Funds that have not yet occurred. However, based on experience, the Funds expect the risk of loss to be remote.
9. UNDERLYING INVESTMENT IN OTHER INVESTMENT COMPANIES
The Funds currently seek to achieve their investment objectives by investing a portion of their assets in Morgan Stanley Institutional Liquidity Fund Government Portfolio (the “Portfolio”), a registered open‐end management investment company organized as a Delaware statutory trust. The Funds may redeem their investments from the Portfolio at any time if the Advisor determines that it is in the best interest of the Funds and their shareholders to do so. The latest financial statements for the Portfolio can be found at www.sec.gov.
The performance of the Funds may be directly affected by the performance of the Portfolio. As of November 30, 2016, the percentage of net assets invested in the Portfolio was 1.90%, 1.43%, 3.27%, 6.41%, 37.35% and 1.06% for the Tactical Growth Fund, Tactical Defensive Fund, Trilogy Alternative Return Fund, Alternative Income Fund, Defensive International Fund and Managed Risk 100 Fund, respectively.
The Tactical Defensive Fund currently seeks to achieve its investment objectives by investing a portion of its assets in the SPDR® S&P 500® ETF Trust. The SPDR® S&P® ETF Trust was established as a New York statutory trust and is registered under the Investment Company Act of 1940, as amended. The Defensive International Fund currently seeks to achieve its investment objectives by investing a portion of its assets in the PIMCO Enhanced Short Maturity Active ETF. The PIMCO Enhanced Short Maturity Active ETF was established as a Delaware statutory trust and is registered under the Investment Company Act of 1940, as amended, as an open‐end management investment company. The Managed Risk 100 Fund currently seeks to achieve its investment objectives by investing a portion of its assets in the SPDR® Dow Jones® Industrial Average ETF, the SPDR® S&P 500® ETF Trust and the Technology Select Sector SPDR® Fund. The SPDR® Dow Jones® Industrial Average ETF was established as a New York statutory trust and is registered under the Investment Company Act of 1940, as amended. The SPDR® S&P® ETF Trust was established as a New York statutory trust and is registered under the Investment Company Act of 1940, as amended. The Technology Select Sector SPDR® Fund was established as a Massachusetts business trust which is registered under the Investment Company Act of 1940, as amended, as an open‐end management investment company. These Funds may redeem their investments from the SPDR® S&P® ETF Trust, the PIMCO Enhanced Short Maturity Active ETF, the SPDR® Dow Jones® Industrial Average ETF and the Technology Select Sector SPDR® Fund, (the “ETFs”) at any time if the Advisor determines that it is in the best interest of a Fund and its shareholders to do so. The latest financial statements for the ETFs can be found at www.sec.gov.
| Semi-Annual Report | November 30, 2016 | 69 |
| Stadion Investment Trust | Notes to Financial Statements |
November 30, 2016 (Unaudited)
A Fund’s performance may be directly affected by the performance of the ETFs. As of November 30, 2016, the percentage of net assets invested in the SPDR® S&P 500® ETF Trust by the Tactical Defensive Fund was 25.38%. As of November 30, 2016, the percentage of net assets invested in the PIMCO Enhanced Short Maturity Active ETF by the Defensive International Fund was 37.40%. As of November 30, 2016, the percentage of net assets invested in the SPDR® Dow Jones® Industrial Average ETF, the SPDR® S&P 500® ETF Trust and the Technology Select Sector SPDR® Fund by the Managed Risk 100 Fund was 25.57%, 25.34% and 25.13%, respectively.
10. SUBSEQUENT EVENTS
The Funds are required to recognize in the financial statements the effects of all subsequent events that provide additional evidence about conditions that existed as of the date of the Statements of Assets and Liabilities. For non‐recognized subsequent events that must be disclosed to keep the financial statements from being misleading, the Funds are required to disclose the nature of the event as well as an estimate of its financial effect, or a statement that such an estimate cannot be made.
On November 14, 2016, the Board determined to discontinue the operations of the Stadion Defensive International Fund (the “Defensive International Fund”). Effective December 30, 2016, the Defensive International Fund was liquidated.
On November 14, 2016 the Board also unanimously approved an Agreement and Plan of Reorganization and Termination (the “Agreement”) pursuant to which the Stadion Tactical Defensive Fund (the “Survivor Fund”) would acquire all of the assets and liabilities of the Stadion Managed Risk 100 Fund (the “Target Fund”) in exchange for shares of the Survivor Fund (the “Reorganization”). The Agreement requires approval of the Target Fund’s shareholders and is currently scheduled to be submitted to such shareholders for their consideration at a meeting on or around March 16, 2017. If the Agreement is approved by the Target Fund’s shareholders, then, upon the closing of the Reorganization, shareholders of the Target Fund will receive a corresponding class of shares of the Survivor Fund in exchange for their shares of the Target Fund, and the Target Fund will thereafter liquidate and cease operations.
Management has evaluated subsequent events through the issuance of these financial statements and has noted no other such events.
| Stadion Investment Trust | Additional Information |
November 30, 2016 (Unaudited)
OTHER INFORMATION
The Trust files a complete listing of portfolio holdings of the Funds with the SEC as of the end of the first and third quarters of each fiscal year on Form N‐Q. The filings are available free of charge, upon request, by calling 1-866-383-7636. Furthermore, you may obtain a copy of these filings on the SEC’s website at http://www.sec.gov. The Trust’s Forms N-Q may also be reviewed and copied at the SEC’s Public Reference Room in Washington, DC, and information on the operation of the Public Reference Room may be obtained by calling (800) SEC-0330.
A description of the policies and procedures that the Funds use to determine how to vote proxies relating to portfolio securities is available without charge upon request by calling toll‐free 1-866-383-7636, or on the SEC’s website at http://www.sec.gov. Information regarding how the Funds voted proxies relating to portfolio securities during the most recent 12‐month period ended June 30 is also available without charge upon request by calling toll-free 1-866-383-7636, or on the SEC’s website at http://www.sec.gov.
| Semi-Annual Report | November 30, 2016 | 71 |
This report and the financial statements contained herein are submitted for the general information of the shareholders of the Stadion Funds (the “Funds”). This report is not authorized for distribution to prospective investors in the Funds unless preceded or accompanied by an effective prospectus. Mutual fund shares are not deposits or obligations of, or guaranteed by, any depository institution. Shares are not insured by the FDIC, Federal Reserve Board or any other agency, and are subject to investment risks, including possible loss of principal amount invested. Neither the Funds nor the Funds’ distributor is a bank.
| The Stadion Funds are distributed by ALPS Distributors, Inc. | |

Not required
| Item 3. | Audit Committee Financial Expert. |
Not required
| Item 4. | Principal Accountant Fees and Services. |
Not required
| Item 5. | Audit Committee of Listed Registrants. |
Not applicable
| Item 6. | Schedule of Investments. |
| (a) | Not applicable [Schedule filed with Item 1] |
| Item 7. | Disclosure of Proxy Voting Policies and Procedures for Closed-End Management Investment Companies. |
Not applicable
| Item 8. | Portfolio Managers of Closed-End Management Investment Companies. |
Not applicable
| Item 9. | Purchases of Equity Securities by Closed-End Management Investment Company and Affiliated Purchasers. |
Not applicable
| Item 10. | Submission of Matters to a Vote of Security Holders. |
The registrant does not have procedures in place to consider nominees recommended by shareholders. The registrant’s nominating committee generally will not consider nominees recommended by shareholders.
| Item 11. | Controls and Procedures. |
(a) Based on their evaluation of the registrant’s disclosure controls and procedures (as defined in Rule 30a-3(c) under the Investment Company Act of 1940) as of a date within 90 days of the filing date of this report, the registrant’s principal executive officer and principal financial officer have concluded that such disclosure controls and procedures are reasonably designed and are operating effectively to ensure that material information relating to the registrant, including its consolidated subsidiaries, is made known to them by others within those entities, particularly during the period in which this report is being prepared, and that the information required in filings on Form N-CSR is recorded, processed, summarized, and reported on a timely basis.
(b) There were no changes in the registrant’s internal control over financial reporting (as defined in Rule 30a-3(d) under the Investment Company Act of 1940) that occurred during the second fiscal quarter of the period covered by this report that have materially affected, or are reasonably likely to materially affect, the registrant’s internal control over financial reporting.
File the exhibits listed below as part of this Form. Letter or number the exhibits in the sequence indicated.
(a)(1) Any code of ethics, or amendment thereto, that is the subject of the disclosure required by Item 2, to the extent that the registrant intends to satisfy the Item 2 requirements through filing of an exhibit: Not required
(a)(2) A separate certification for each principal executive officer and principal financial officer of the registrant as required by Rule 30a-2(a) under the Act (17 CFR 270.30a-2(a)): Attached hereto
(a)(3) Any written solicitation to purchase securities under Rule 23c-1 under the Act (17 CFR 270.23c-1) sent or given during the period covered by the report by or on behalf of the registrant to 10 or more persons: Not applicable
(b) Certifications required by Rule 30a-2(b) under the Act (17 CFR 270.30a-2(b)): Attached hereto
EXHIBIT LIST
Exhibit 99.CERT Certifications required by Rule 30a-2(a) under the Act
Exhibit 99.906CERT Certifications required by Rule 30a-2(b) under the Act
SIGNATURES
Pursuant to the requirements of the Securities Exchange Act of 1934 and the Investment Company Act of 1940, the registrant has duly caused this report to be signed on its behalf by the undersigned, thereunto duly authorized.
| | Stadion Investment Trust | |
| | | |
| By: | /s/ Judson P. Doherty | |
| | Judson P. Doherty, President | |
| | | |
| Date: | February 6, 2017 | |
Pursuant to the requirements of the Securities Exchange Act of 1934 and the Investment Company Act of 1940, this report has been signed below by the following persons on behalf of the registrant and in the capacities and on the dates indicated.
| By: | /s/ Judson P. Doherty | |
| | Judson P. Doherty, President and Principal Executive Officer |
| | | |
| Date: | February 6, 2017 | |
| | | |
| By: | /s/ Duane L. Bernt | |
| | Duane L. Bernt, Treasurer and Principal Financial Officer |
| | | |
| Date: | February 6, 2017 | |