UNITED STATES
SECURITIES AND EXCHANGE COMMISSION
Washington, D.C. 20549
FORMN-CSR/A
CERTIFIED SHAREHOLDER REPORT OF REGISTERED MANAGEMENT
INVESTMENT COMPANIES
Investment Company Act file number:811-21457
Name of Fund: BlackRock Allocation Target Shares
BATS: Series A Portfolio
BATS: Series C Portfolio
BATS: Series E Portfolio
BATS: Series M Portfolio
BATS: Series P Portfolio
BATS: Series S Portfolio
Fund Address: 100 Bellevue Parkway, Wilmington, DE 19809
Name and address of agent for service: John M. Perlowski, Chief Executive Officer, BlackRock Allocation
Target Shares, 55 East 52nd Street, New York, NY 10055
Registrant’s telephone number, including area code: (800)441-7762
Date of fiscal year end: 03/31/2019
Date of reporting period: 03/31/2019
| Item 1 – | Report to Stockholders |
Explanatory Note: The Registrant is filing this amendment to its FormN-CSR for the period ended March 31, 2019, filed with the Securities and Exchange Commission on June 5, 2019 (Accession Number0001193125-19-165886). The sole purpose of this amendment is to amend the years audited for Financial Highlights from three to five years in the Report of Independent Registered Public Accounting Firm for BlackRock Allocation Target Shares. Except for such change, this amendment does not amend, update or change any other items or disclosures found in the original FormN-CSR filing.
MARCH 31, 2019
| | |
ANNUAL REPORT | |  |
BlackRock Allocation Target Shares
| | ▶ | | BATS: Series A Portfolio |
| | ▶ | | BATS: Series C Portfolio |
| | ▶ | | BATS: Series E Portfolio |
| | ▶ | | BATS: Series M Portfolio |
| | ▶ | | BATS: Series P Portfolio |
| | ▶ | | BATS: Series S Portfolio |
Beginning on January 1, 2021, as permitted by regulations adopted by the Securities and Exchange Commission, paper copies of each Fund’s shareholder reports will no longer be sent by mail, unless you specifically request paper copies of the reports from BlackRock or from your financial intermediary, such as a broker-dealer or bank. Instead, the reports will be made available on a website, and you will be notified by mail each time a report is posted and provided with a website link to access the report.
You may elect to receive all future reports in paper free of charge. If you hold accounts directly with BlackRock, you can call(800)-441-7762 to inform BlackRock that you wish to continue receiving paper copies of your shareholder reports. If you hold accounts through a financial intermediary, you can follow the instructions included with this disclosure, if applicable, or contact your financial intermediary to request that you continue to receive paper copies of your shareholder reports. Please note that not all financial intermediaries may offer this service. Your election to receive reports in paper will apply to all funds advised by BlackRock Advisors, LLC, BlackRock Fund Advisors or their affiliates, or all funds held with your financial intermediary, as applicable.
If you already elected to receive shareholder reports electronically, you will not be affected by this change and you need not take any action. You may elect to receive electronic delivery of shareholder reports and other communications by: (i) accessing the BlackRock website at www.blackrock.com/edelivery and logging into your accounts, if you hold accounts directly with BlackRock, or (ii) contacting your financial intermediary, if you hold accounts through a financial intermediary. Please note that not all financial intermediaries may offer this service.
| | |
| | | Not FDIC Insured ∎ May Lose Value ∎ No Bank Guarantee |
The Markets in Review
Dear Shareholder,
In the 12 months ended March 31, 2019, the U.S. equity and bond markets posted positive returns while weathering significant volatility. Though the market’s appetite for risk remained healthy for most of the reporting period, risk taking declined sharply in late 2018. Thereafter, global equity markets rebounded strongly, as inflation diminished and the U.S. Federal Reserve (the “Fed”) announced a shift to less restrictive monetary policy.
Volatility rose in emerging market stocks, as the rising U.S. dollar and higher interest rates in the U.S. disrupted economic growth abroad. U.S.-China trade relations and debt concerns adversely affected the Chinese stock market, while Turkey and Argentina became embroiled in currency crises, largely due to hyperinflation in both countries. An economic slowdown in Europe also led to negative performance for European equities. However, recent economic data indicates that Europe may emerge from its economic soft patch, reinvigorated by a manufacturing rebound and China’s economic stimulus.
Volatility in the U.S. equity market spiked in October, as a wide range of risks were brought to bear on markets, ranging from rising interest rates and slowing global growth to heightened trade tensions and political turmoil in several countries, including the United States. These risks manifested in a broad-basedsell-off in December, leading to the worst December performance on record since 1931.
By comparison, fixed income securities delivered modest positive returns with relatively low volatility. In fixed income markets, short-term U.S. Treasury yields rose the fastest, while longer-term yields declined slightly. This led to positive returns for U.S. Treasuries and a substantial flattening of the yield curve. Investment-grade and high-yield corporate bonds also posted positive returns, as the credit fundamentals in corporate markets remained relatively solid.
The Fed increased short-term interest rates three times during the reporting period. For its last two meetings, the Fed left interest rates unchanged and signaled a slower pace of rate hikes in response to the global economic slowdown. Relatively low inflation and modest economic growth give the Fed room to maintain support for the economy until the economic data builds the case for changing interest rates.
Although fears of recession drove equity volatility higher at the end of 2018, we continue to believe the probability of recession in 2019 remains relatively low. Economic growth and global earnings are likely to slow somewhat in 2019 because the tax cut stimulus will be less pronounced, and the Fed’s rate hikes in 2018 will gain traction in 2019. We expect profit margins to continue to contract, which tends to happen late in the business cycle.
In addition, trade frictions look more baked into asset prices than a year ago, but markets may be overlooking European political risks. As Brexit moves forward, the United Kingdom and the European Union may face significant obstacles. Most recently, Britain’s Parliament voted to extend the deadline for the separation, as policy makers continue to seek the least disruptive ways to disentangle Europe’s second-largest economy from the European Union. U.S. and emerging market equities remain relatively attractive. Within U.S. equities, we believe that companies with high-quality earnings and strong balance sheets offer the most attractive risk/rewardtrade-off.
In this environment, investors need to think globally, extend their scope across a broad array of asset classes, and be nimble as market conditions change. We encourage you to talk with your financial advisor and visitblackrock.comfor further insight about investing in today’s markets.
Sincerely,

Rob Kapito
President, BlackRock Advisors, LLC

Rob Kapito
President, BlackRock Advisors, LLC
| | | | |
| Total Returns as of March 31, 2019 |
| | | 6-month | | 12-month |
| | |
U.S. large cap equities
(S&P 500®Index) | | (1.72)% | | 9.50% |
| | |
U.S. small cap equities
(Russell 2000®Index) | | (8.56) | | 2.05 |
| | |
International equities
(MSCI Europe, Australasia, Far East Index) | | (3.81) | | (3.71) |
| | |
Emerging market equities
(MSCI Emerging Markets Index) | | 1.71 | | (7.41) |
| | |
3-month Treasury bills
(ICE BofAML3-Month U.S. Treasury Bill Index) | | 1.17 | | 2.12 |
| | |
U.S. Treasury securities
(ICE BofAML10-Year U.S. Treasury Index) | | 7.08 | | 5.59 |
| | |
U.S. investment grade
bonds (Bloomberg Barclays U.S. Aggregate Bond Index) | | 4.63 | | 4.48 |
| | |
Tax-exempt municipal
bonds (S&P Municipal Bond Index) | | 4.32 | | 5.12 |
| | |
U.S. high yield bonds
(Bloomberg Barclays U.S. Corporate High Yield 2% Issuer Capped Index) | | 2.39 | | 5.93 |
|
| Past performance is no guarantee of future results. Index performance is shown for illustrative purposes only. You cannot invest directly in an index. |
| | |
| 2 | | T H I S P A G E I S N O T P A R T O F Y O U R F U N D R E P O R T |
Table of Contents
| | |
| Fund Summary as of March 31, 2019 | | BATS: Series A Portfolio |
Investment Objective
BATS: Series A Portfolio’s (the “Fund”)investment objective is to seek a high level of current income consistent with capital preservation.
Portfolio Management Commentary
How did the Fund perform?
For the12-month period ended March 31, 2019, the Fund underperformed both its broad-based benchmark, the Bloomberg Barclays U.S. Universal Index, and its “Reference Benchmark,” consisting of 50% Bloomberg Barclays U.S. Asset-Backed Securities Index and 50% Bloomberg BarclaysNon-Agency Investment Grade CMBS Index. Shares of the Fund can be purchased or held only by or on behalf of (i) certain separately managed account clients; (ii) collective trust funds managed by BlackRock Institutional Trust Company, N.A., an affiliate of the investment adviser; and (iii) mutual funds advised by BlackRock Advisors, LLC or its affiliates. Comparisons of the Fund’s performance versus its Reference Benchmark index will differ from comparisons of the benchmark against the performance of the separately managed accounts.
What factors influenced performance?
The largest detractors from the Fund’s performance were underweight allocations to asset-backed securities (“ABS”) and commercial mortgage-backed securities (“CMBS”), as both sectors outperformed the benchmark. In particular, underweights to credit card and prime and subprime auto loan receivables within ABS weighed on the Fund’s return.
Positive contributions to the Fund’s performance were led by allocations tonon-agency residential mortgage-backed securities (“RMBS”), specifically holdings within thesub-prime, option adjustable-rate mortgage and credit risk-transfer subsectors. Holdings of floating rate collateralized loan obligations also contributed to performance. Finally, exposure to corporate bonds was additive.
Describe recent portfolio activity.
The Fund decreased allocations to corporate credit, floating rate loan interests (“bank loans”) and ABS during the period. Within ABS, exposure to foreign issues was decreased, along with exposure to auto and equipment loan receivables, while the allocation to student loans and small business association loans was increased. The allocation to CMBS was increased, most notably to interest-only securities andAAA-ratednon-agency multifamily loans. RMBS exposure was also increased during the period, specifically within legacy subprime deals.
Describe portfolio positioning at period end.
The Fund ended the period with an underweight duration (and corresponding interest rate sensitivity) relative to the Reference Benchmark. The Fund had anout-of-benchmark exposure to floating rate bank loans and was overweight in high yield corporates. The Fund was also overweight in ABS. The Fund was underweight in CMBS, largely due to relatively light exposure tonon-agency issues within the sector.
The views expressed reflect the opinions of BlackRock as of the date of this report and are subject to change based on changes in market, economic or other conditions. These views are not intended to be a forecast of future events and are no guarantee of future results.
Portfolio Information
PORTFOLIO COMPOSITION
| | | | |
| |
| Asset Type | | Percent of
Total Investments(a) | |
| |
Asset-Backed Securities | | | 60% | |
Non-Agency Mortgage-Backed Securities | | | 35 | |
U.S. Government Sponsored Agency Securities | | | 3 | |
Floating Rate Loan Interests | | | 2 | |
| |
CREDIT QUALITY ALLOCATION(b)
| | | | |
| |
| Credit Rating | | Percent of
Total Investments(a) | |
| |
AAA/Aaa(c) | | | 37% | |
AA/Aa | | | 4 | |
A | | | 4 | |
BBB/Baa | | | 4 | |
BB/Ba | | | 7 | |
B | | | 2 | |
CCC/Caa | | | 4 | |
CC/Ca | | | 5 | |
C | | | 2 | |
N/R | | | 31 | |
| |
| | (a) | Total investments exclude short-term securities. | |
| | (b) | For financial reporting purposes, credit quality ratings shown above reflect the highest rating assigned by either S&P Global Ratings (“S&P”) or Moody’s Investors Service (“Moody’s”) if ratings differ. These rating agencies are independent, nationally recognized statistical rating organizations and are widely used. Investment grade ratings are credit ratings of BBB/Baa or higher. Below investment grade ratings are credit ratings of BB/Ba or lower. Investments designated N/R are not rated by either rating agency. Unrated investments do not necessarily indicate low credit quality. Credit quality ratings are subject to change. | |
| | (c) | The investment adviser evaluates the credit quality of not-rated investments based upon certain factors, including, but not limited to, credit ratings for similar investments and financial analysis of sectors, individual investments and/or issuers. Using this approach, the investment adviser has deemed not-rated U.S.Government Sponsored Agency Securities and U.S. Treasury Obligations as AAA/Aaa. | |
| | |
| 4 | | 2 0 1 9 B L A C K R O C K A N N U A L R E P O R T T O S H A R E H O L D E R S |
| | |
| Fund Summary as of March 31, 2019 (continued) | | BATS: Series A Portfolio |
TOTAL RETURN BASED ON A $10,000 INVESTMENT
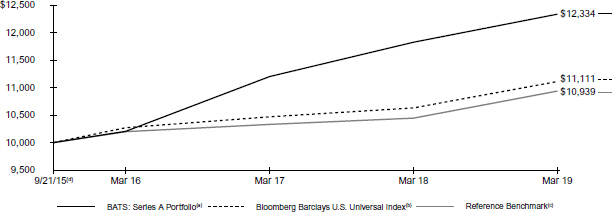
| (a) | The Fund will primarily invest its assets in fixed-income securities, such as ABS, CMBS and RMBS issued or guaranteed by the U.S. Government, various agencies of the U.S. Government or various instrumentalities that have been established or sponsored by the U.S. Government, CMBS and RMBS issued by banks and other financial institutions, collateralized mortgage obligations, loans backed by commercial or residential real estate, derivatives and repurchase agreements and reverse repurchase agreements. |
| (b) | An unmanaged, market value weighted index of fixed-income securities issued in U.S. dollars, including U.S. government and investment grade debt,non-investment grade debt, ABS and mortgage-backed securities, Eurobonds, 144A securities and emerging market debt with maturities of at least one year. |
| (c) | A customized weighted index comprised of the returns of the Bloomberg Barclays U.S. Asset-Backed Securities Index (50%)/Bloomberg BarclaysNon-Agency Investment Grade CMBS Index (50%). The Bloomberg Barclays U.S. Asset-Backed Securities Index is composed of debt securities backed by credit card, auto and home equity loans that are rated investment grade or higher by Moody’s, S&P or Fitch Ratings, Inc. (“Fitch”). Issues must have at least one year to maturity and an outstanding par value of at least $50 million. The Bloomberg BarclaysNon-Agency Investment Grade CMBS Index measures the market of conduit and fusion CMBS deals with a minimum current deal size of $300 million that are rated investment grade or higher using the middle rating of Moody’s, S&P, and Fitch after dropping the highest and lowest available ratings. Securities must have a remaining average life of at least one year and must be fixed-rate, weighted average coupon (WAC), or capped WAC securities. |
| (d) | Commencement of operations. |
Performance Summary for the Period Ended March 31, 2019
| | | | | | |
| | | | | Average Annual Total Returns(a) |
| | | | |
| | | 6-Month
Total Returns | | 1 Year | | Since Inception(b) |
BATS: Series A Portfolio | | 2.06% | | 4.31% | | 6.13% |
Bloomberg Barclays U.S. Universal Index | | 4.53 | | 4.53 | | 3.03 |
Reference Benchmark | | 3.79 | | 4.70 | | 2.58 |
| | (a) | See “About Fund Performance” on page 16 for a detailed description of performance related information. | |
| | (b) | The Fund commenced operations on September 21, 2015. | |
Past performance is not indicative of future results.
Performance results may include adjustments made for financial reporting purposes in accordance with U.S. generally accepted accounting principles.
Expense Example
| | | | | | | | | | | | | | | | | | | | | | | | | | | | | | | | |
| | | Actual | | | | | | Hypothetical(b) | | | | |
| | | Beginning
Account Value
(10/01/18) | | | Ending
Account Value
(03/31/19) | | | Expenses
Paid During
the Period(a) | | | | | | Beginning
Account Value
(10/01/18) | | | Ending
Account Value
(03/31/19) | | | Expenses
Paid During
the Period(a) | | | Annualized
Expense
Ratio | |
BATS: Series A | | | | | | | | | | | | | | | | | | | | | | | | | | | | | | | | |
Portfolio | | | $1,000.00 | | | | $1,020.60 | | | | $0.00 | | | | | | | | $1,000.00 | | | | $1,024.93 | | | | $0.00 | | | | 0.00% | |
| | (a) | For shares of the Fund, expenses are equal to the annualized expense ratio, multiplied by the average account value over the period, multiplied by 182/365 (to reflect theone-half year period shown). BlackRock has contractually agreed to waive all fees and pay or reimburse all direct expenses, except extraordinary expenses, incurred by the Fund. Extraordinary expenses may include dividend expense, interest expense, acquired fund fees and expenses and certain other Fund expenses. This agreement has no fixed term. | |
| | (b) | Hypothetical 5% annual return before expenses is calculated by prorating the number of days in the most recent fiscal half year divided by 365. See “Disclosure of Expenses” on page 16 for further information on how expenses were calculated. | |
| | |
| Fund Summary as of March 31, 2019 | | BATS: Series C Portfolio |
Investment Objective
BATS: Series C Portfolio’s (the “Fund”)investment objective is to seek to maximize total return, consistent with income generation and prudent investment management.
Portfolio Management Commentary
How did the Fund perform?
For the12-month period ended March 31, 2019 the Fund outperformed its benchmark, the Bloomberg Barclays U.S. Credit Index. Shares of the Fund can be purchased or held only by or on behalf of certain separately managed account clients. Comparisons of the Fund’s performance versus its benchmark index will differ from comparisons of the benchmark against the performance of the separately managed accounts.
What factors influenced performance?
The Fund’s positioning in the industrials sector made the largest contribution to returns, primarily as a result of overweight allocations to the midstream energy and technology industries. Duration and curve positioning also helped results. (Duration is a measure of interest rate sensitivity).
An underweight in emerging market issuers detracted from results, as did the Fund’s positioning in taxable municipal bonds and its overweight in the auto industry.
Describe recent portfolio activity.
The investment adviser added risk to the portfolio in the early part of the period, as it believed the widening in yield spreads would subside as thesupply-and-demand backdrop for corporate bonds improved. (Yield spread refers to the difference in a bond’s yield relative to U.S. Treasuries). However, fears about Fed policy sparked a protracted selloff in risk assets in late 2018, negatively affecting the Fund. The investment adviser retained a steady level of portfolio risk going into 2019 on the belief that the improvement in valuations in the fourth quarter more than accounted for any deterioration in corporate fundamentals. As a result, the Fund was in a position to benefit from the subsequent recovery in higher-risk assets.
The investment adviser increased the Fund’s positions in the automotive, railroad and energy industries. The Fund maintained its tilt toward the short and intermediate segments of the yield curve, where supply and demand factors were more favorable than on the long end.
Describe portfolio positioning at period end.
The Fund was overweight in the banking, cable and satellite, and midstream energy industries. The Fund’s largest underweight positions were in life insurance, electric utilities, and property and casualty insurance. The Fund’s duration was neutral relative to the benchmark.
The views expressed reflect the opinions of BlackRock as of the date of this report and are subject to change based on changes in market, economic or other conditions. These views are not intended to be a forecast of future events and are no guarantee of future results.
Portfolio Information
PORTFOLIO COMPOSITION
| | | | |
| |
| Asset Type | | Percent of
Total Investments(a) | |
| |
Corporate Bonds | | | 88% | |
Capital Trusts | | | 4 | |
Taxable Municipal Bonds | | | 3 | |
U.S. Treasury Obligations | | | 2 | |
Foreign Government Obligations | | | 2 | |
Foreign Agency Obligations | | | 1 | |
| |
CREDIT QUALITY ALLOCATION(b)
| | | | |
| |
| Credit Rating | | Percent of
Total Investments(a) | |
| |
AAA/Aaa(c) | | | 3% | |
AA/Aa | | | 12 | |
A | | | 30 | |
BBB/Baa | | | 54 | |
BB/Ba | | | 1 | |
| |
| | (a) | Total investments exclude short-term securities and options purchased. | |
| | (b) | For financial reporting purposes, credit quality ratings shown above reflect the highest rating assigned by either S&P or Moody’s if ratings differ. These rating agencies are independent, nationally recognized statistical rating organizations and are widely used. Investment grade ratings are credit ratings of BBB/Baa or higher. Below investment grade ratings are credit ratings of BB/Ba or lower. Investments designated N/R are not rated by either rating agency. Unrated investments do not necessarily indicate low credit quality. Credit quality ratings are subject to change. | |
| | (c) | The investment adviser evaluates the credit quality of not-rated investments based upon certain factors, including, but not limited to, credit ratings for similar investments and financial analysis of sectors, individual investments and/or issuers. Using this approach, the investment adviser has deemed not-rated U.S. Government Sponsored Agency Securities and U.S. Treasury Obligations as AAA/Aaa. | |
| | |
| 6 | | 2 0 1 9 B L A C K R O C K A N N U A L R E P O R T T O S H A R E H O L D E R S |
| | |
| Fund Summary as of March 31, 2019 (continued) | | BATS: Series C Portfolio |
TOTAL RETURN BASED ON A $10,000 INVESTMENT
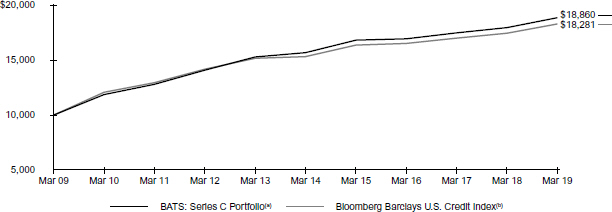
| (a) | The Fund will primarily invest its assets in investment grade fixed-income securities, such as corporate bonds, notes and debentures, ABS, CMBS and RMBS, obligations ofnon-U.S. governments and supranational organizations which are chartered to promote economic development, collateralized mortgage obligations, U.S. Treasury and agency securities, cash equivalent investments, when-issued and delayed delivery securities, derivatives, repurchase agreements and reverse repurchase agreements. |
| (b) | An unmanaged index that includes publicly issued U.S. corporate andnon-corporate securities which include foreign agencies, sovereigns, supranationals and local authorities that meet the specified maturity, liquidity, and quality requirements. |
Performance Summary for the Period Ended March 31, 2019
| | | | | | | | |
| | | | | Average Annual Total Returns(a) |
| | | | |
| | | 6-Month
Total Returns | | 1 Year | | 5 Years | | 10 Years |
BATS: Series C Portfolio | | 4.69% | | 5.05% | | 3.76% | | 6.55% |
Bloomberg Barclays U.S. Credit Index | | 4.89 | | 4.89 | | 3.61 | | 6.22 |
| | (a) | See “About Fund Performance” on page 16 for a detailed description of performance related information. | |
Past performance is not indicative of future results.
Performance results may include adjustments made for financial reporting purposes in accordance with U.S. generally accepted accounting principles.
Expense Example
| | | | | | | | | | | | | | | | | | | | | | | | | | | | | | | | |
| | | Actual | | | | | | Hypothetical(b) | | | | |
| | | Beginning
Account Value
(10/01/18) | | | Ending
Account Value
(03/31/19) | | | Expenses
Paid During
the Period(a) | | | | | | Beginning
Account Value
(10/01/18) | | | Ending
Account Value
(03/31/19) | | | Expenses
Paid During
the Period(a) | | | Annualized
Expense
Ratio | |
BATS: Series C | | | | | | | | | | | | | | | | | | | | | | | | | | | | | | | | |
Portfolio | | | $1,000.00 | | | | $1,046.90 | | | | $0.00 | | | | | | | | $1,000.00 | | | | $1,024.93 | | | | $0.00 | | | | 0.00% | |
| | (a) | For shares of the Fund, expenses are equal to the annualized expense ratio, multiplied by the average account value over the period, multiplied by 182/365 (to reflect theone-half year period shown). BlackRock has contractually agreed to waive all fees and pay or reimburse all direct expenses, except extraordinary expenses, incurred by the Fund. Extraordinary expenses may include dividend expense, interest expense, acquired fund fees and expenses and certain other Fund expenses. This agreement has no fixed term. | |
| | (b) | Hypothetical 5% annual return before expenses is calculated by prorating the number of days in the most recent fiscal half year divided by 365. See “Disclosure of Expenses” on page 16 for further information on how expenses were calculated. | |
| | |
| Fund Summary as of March 31, 2019 | | BATS: Series E Portfolio |
Investment Objective
BATS: Series E Portfolio’s (the “Fund”)investment objective is to seek to maximize Federaltax-free yield with a secondary goal of total return.
Portfolio Management Commentary
How did the Fund perform?
For the12-month period ended March 31, 2019, the Fund outperformed its broad-based benchmark, the S&P® Municipal Bond Index, but underperformed its customized “Reference Benchmark,” consisting of 50% S&P® Municipal High-Yield Index, 25% S&P® Municipal Bond A Rating Band Index (using the returns of only those A rated bonds that have maturities greater than five years) and 25% S&P® Municipal Bond BBB Rating Band Index (using the returns of only those BBB rated bonds that have maturities greater than five years). Shares of the Fund can be purchased or held only by or on behalf of certain separately managed account clients. Comparisons of the Fund’s performance versus its benchmark index will differ from comparisons of the benchmark against the performance of the separately managed accounts.
What factors influenced performance?
The Fund’s performance was hurt by its large underweights in various securities issued by U.S. territories, including Puerto Rico and the Virgin Islands that significantly outperformed the broader market. Puerto Rico’s debt benefited as its economy and revenues proved more resilient than expected following the 2017 hurricane. Underweight positions innon-investment grade bonds and the five-year to15-year maturity range, both of which outperformed, also detracted from results. The Fund sought to manage interest rate risk in an active fashion using U.S. Treasury futures, which was a further detractor in the period.
On the positive side, positions in bonds with maturities of 20 years and above contributed to performance, as did an overweight in BBB rated securities. At the sector level, overweight positions in transportation, health care and tobacco issues added value. Security selection in the tobacco sector detracted, however, as the Fund favored higher-quality issues that underperformed lower-quality debt.
Describe recent portfolio activity.
The Fund’s most significant activity consisted of investing large cash inflows that mostly occurred during the first quarter of 2019. New investments favored longer-dated maturities in an effort to maximize yields and capture more attractive relative value versus shorter-dated issues. The lack of high-yield supply required the investment adviser to invest in higher-quality securities on a temporary basis as it awaited additional opportunities.
The Fund added to various Puerto Rico issues during the period as the outlook for the territory improved.
Describe portfolio positioning at period end.
The Fund held an above-average cash position as of March 31, 2019 due to large cash inflows just prior to period end. Given the rich valuations and low absolute yields in the market, the investment adviser chose to take a patient approach rather than putting all of the cash to work immediately. The Fund’s cash balance had no material impact on Fund performance.
At period end, the Fund had a slightly long duration relative to the benchmark. (Duration is a measure of interest-rate sensitivity). The Fund remained overweight in longer-term bonds, specifically the 20+ year maturity range, due to the investment adviser’s bias toward a continued flattening of the yield curve (i.e., outperformance for longer-dated issues). The Fund’s largest sector overweights included transportation, tobacco and housing. The Fund’s leading underweights were in thetax-backed and school district sectors, which reflected the investment adviser’s preference for revenue bonds (those secured by a specific revenue source) over general obligation debt.
The views expressed reflect the opinions of BlackRock as of the date of this report and are subject to change based on changes in market, economic or other conditions. These views are not intended to be a forecast of future events and are no guarantee of future results.
Portfolio Information
SECTOR ALLOCATION
| | | | |
| |
| |
| Sector | | Percent of
Total Investments(a) | |
| |
County/City/Special District/School District | | | 23% | |
Health Care | | | 17 | |
Transportation | | | 16 | |
Education | | | 12 | |
Tobacco | | | 12 | |
Utilities | | | 10 | |
Housing | | | 7 | |
Corporate | | | 3 | |
| |
CREDIT QUALITY ALLOCATION(b)
| | | | |
| |
| |
| Credit Rating | | Percent of
Total Investments(a) | |
| |
AAA/Aaa | | | 2% | |
AA/Aa | | | 16 | |
A | | | 20 | |
BBB/Baa | | | 26 | |
BB/Ba | | | 6 | |
B | | | 7 | |
CC/Ca | | | 2 | |
N/R | | | 21 | |
| |
| | (a) | Total investments exclude short-term securities. | |
| | (b) | For financial reporting purposes, credit quality ratings shown above reflect the highest rating assigned by either S&P or Moody’s if ratings differ. These rating agencies are independent, nationally recognized statistical rating organizations and are widely used. Investment grade ratings are credit ratings of BBB/Baa or higher. Below investment grade ratings are credit ratings of BB/Ba or lower. Investments designated N/R are not rated by either rating agency. Unrated investments do not necessarily indicate low credit quality. Credit quality ratings are subject to change. | |
| | |
| 8 | | 2 0 1 9 B L A C K R O C K A N N U A L R E P O R T T O S H A R E H O L D E R S |
| | |
| Fund Summary as of March 31, 2019 (continued) | | BATS: Series E Portfolio |
TOTAL RETURN BASED ON A $10,000 INVESTMENT
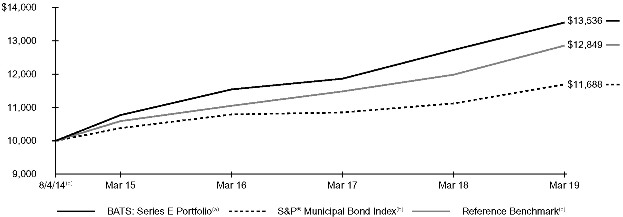
| (a) | The Fund will invest in investment grade andnon-investment grade municipal bonds. Under normal circumstances, the Fund maintains an average portfolio duration that is within ±25% of the duration of the Reference Benchmark. |
| (b) | The S&P® Municipal Bond Index is composed of bonds held by managed municipal bond fund customers of Standard & Poor’s Securities Pricing, Inc. that are priced daily. Bonds in the S&P® Municipal Bond Index must have an outstanding par value of at least $2 million and a remaining maturity of not less than one month. |
| (c) | A customized weighted index comprised of the returns of the S&P® Municipal High-Yield Index (50%)/S&P® Municipal Bond A Rating Band Index (25%) using the returns of only those A rated bonds that have maturities greater than 5 years/S&P® Municipal Bond BBB Rating Band Index (25%) using the returns of only those BBB rated bonds that have the maturities greater than 5 years. The benchmark value used to calculate since inception return is from the close of July 31, 2014. By using this value the benchmark is using 2 extra days of performance (August 1, 2014 and August 4, 2014) compared to the Fund. |
| (d) | Commencement of operations. |
Performance Summary for the Period Ended March 31, 2019
| | | | | | | | | | | | | | | | | | | | |
| | | | | | | Average Annual Total Returns(a) |
| | | | | 6-Month
Total Returns | | 1 Year | | Since Inception(b) |
BATS: Series E Portfolio | | | | | | | | | 4.58% | | | 6.44% | | 6.72% |
S&P®Municipal Bond Index | | | | | | | | | 4.32 | | | 5.12 | | 3.41 |
Reference Benchmark | | | | | | | | | 4.09 | | | 7.30 | | | 5.52(c) |
| | (a) | See “About Fund Performance” on page 16 for a detailed description of performance related information. | |
| | (b) | The Fund commenced operations on August 4, 2014. | |
| | (c) | The benchmark value used to calculate since inception return is from the close of July 31, 2014. By using this value the benchmark is using 2 extra days of performance (August 1, 2014 and August 4, 2014) compared to the Fund. | |
Past performance is not indicative of future results.
Performance results may include adjustments made for financial reporting purposes in accordance with U.S. generally accepted accounting principles.
Expense Example
| | | | | | | | | | | | | | | | | | | | |
| | | Actual | | | | Hypothetical(c) |
| | | | | | | Including
Interest Expense
and Fees | | Excluding
Interest Expense and Fees | | | | | | Including Interest Expense and Fees | | Excluding Interest Expense and Fees |
| | | | | | | | | | | | | | | | |
| | | Beginning
Account Value
(10/01/18) | | Ending
Account Value
(03/31/19) | | Expenses
Paid During
the Period(a) | | Expenses
Paid During
the Period(b) | | | | Beginning
Account Value
(10/01/18) | | Ending
Account Value
(03/31/19) | | Expenses
Paid During
the Period(a) | | Ending
Account Value
(03/31/19) | | Expenses
Paid During
the Period(b) |
|
BATS: Series E Portfolio | | $1,000.00 | | $1,045.80 | | $0.41 | | $0.00 | | | | $1,000.00 | | $1,024.53 | | $0.40 | | $1,024.93 | | $0.00 |
|
| | (a) | For shares of the Fund, expenses are equal to the annualized expense ratio of 0.08%, multiplied by the average account value over the period, multiplied by 182/365 (to reflect theone-half year period shown). BlackRock has contractually agreed to waive all fees and pay or reimburse all direct expenses, except extraordinary expenses, incurred by the Fund. Extraordinary expenses may include dividend expense, interest expense, acquired fund fees and expenses and certain other Fund expenses. This agreement has no fixed term. | |
| | (b) | For shares of the Fund, expenses are equal to the annualized expense ratio of 0.00%, multiplied by the average account value over the period, multiplied by 182/365 (to reflect theone-half year period shown). BlackRock has contractually agreed to waive all fees and pay or reimburse all direct expenses, except extraordinary expenses, incurred by the Fund. Extraordinary expenses may include dividend expense, interest expense, acquired fund fees and expenses and certain other Fund expenses. This agreement has no fixed term. | |
| | (c) | Hypothetical 5% annual return before expenses is calculated by prorating the number of days in the most recent fiscal half year divided by 365. See “Disclosure of Expenses” on page 16 for further information on how expenses were calculated. | |
| | |
| Fund Summary as of March 31, 2019 | | BATS: Series M Portfolio |
Investment Objective
BATS: Series M Portfolio’s (the “Fund”)investment objective is to seek to maximize total return, consistent with income generation and prudent investment management.
Portfolio Management Commentary
How did the Fund perform?
For the12-month period ended March 31, 2019, the Fund outperformed its benchmark, the Bloomberg Barclays MBS Index. Shares of the Fund can be purchased or held only by or on behalf of certain separately managed account clients. Comparisons of the Fund’s performance versus its benchmark index will differ from comparisons of the benchmark against the performance of the separately managed accounts.
What factors influenced performance?
The most significant positive contributor to the Fund’s performance relative to the benchmark was anout-of-benchmark allocation to commercial mortgage-backed securities (“CMBS”). The Fund’s stance with respect to interest rates, including both positioning along the yield curve and with respect to overall portfolio duration (and corresponding sensitivity to interest rate changes) also added to relative performance. An overweight position in both15-year and30-year agency mortgage-backed securities (“MBS”) benefited performance. Exposure to agency collateralized mortgage-obligations (“CMOs”) added to return, as did security selection within15-year agency MBS contributed positively.
The largest detractor from performance was an allocation to Treasury inflation-protected securities (“TIPS”) as inflation expectations declined in late 2018. Selection within30-year agency MBS also detracted, driven by underperformance of specified pool holdings for which the Fund paid a premium valuation to gain exposure to certain prepayment characteristics.
Describe recent portfolio activity.
During the period, the Fund trimmed its position in pass-through agency MBS issues while adding to agency CMOs. The Fund’s allocation to CMBS was increased during the period. The Fund also added exposures in agency MBS interest-only and inverse interest-only instruments as well as TIPS during the period. With respect to duration, the Fund moved from a neutral to an underweight stance.
Describe portfolio positioning at period end.
The Fund ended the period underweight in agency MBS relative to the benchmark, with exposures favoring higher coupons relative to lower coupons. In addition, the Fund favored specified pools with lower loan balances and more sensitivity to changing interest rate levels. The underweight to agency MBS was used to fund exposures in CMBS, which benefit the income and interest rate sensitivity of the Fund. The Fund also maintained exposure to securitized assets viewed as having the potential to benefit from spread tightening, particularly within CMBS. The Fund maintained exposure to interest-only Ginnie Mae securities backed by multi-family project loans based on attractive spreads. The investment adviser continued to hold a small position in5-year TIPS, on the view that valuations are attractive relative to the potential for an uptick in inflation fundamentals. Relative to the Bloomberg Barclays MBS Index, the Fund ended the period underweight to overall portfolio duration.
The views expressed reflect the opinions of BlackRock as of the date of this report and are subject to change based on changes in market, economic or other conditions. These views are not intended to be a forecast of future events and are no guarantee of future results.
Portfolio Information
PORTFOLIO COMPOSITION
| | | | |
| |
| |
| Asset Type | | Percent of
Total Investments(a) | |
| |
U.S. Government Sponsored Agency Securities | | | 91% | |
Non-Agency Mortgage-Backed Securities | | | 8 | |
U.S. Treasury Obligations | | | 1 | |
| |
CREDIT QUALITY ALLOCATION(b)
| | | | |
| |
| |
| Credit Rating | | Percent of
Total Investments(a) | |
| |
AAA/Aaa(c) | | | 98% | |
AA/Aa | | | 1 | |
N/R | | | 1 | |
| |
| | (a) | Total investments exclude short-term securities, TBAsale commitments and options written. | |
| | (b) | For financial reporting purposes, credit quality ratings shown above reflect the highest rating assigned by either S&P or Moody’s if ratings differ. These rating agencies are independent, nationally recognized statistical rating organizations and are widely used. Investment grade ratings are credit ratings of BBB/Baa or higher. Below investment grade ratings are credit ratings of BB/Ba or lower. Investments designated N/R are not rated by either rating agency. Unrated investments do not necessarily indicate low credit quality. Credit quality ratings are subject to change. | |
| | (c) | The investment adviser evaluates the credit quality ofnot-rated investments based upon certain factors, including, but not limited to, credit ratings for similar investments and financial analysis of sectors, individual investments and/or issuers. Using this approach, the investment adviser has deemednot-rated U.S. Government Sponsored Agency Securities and U.S. Treasury Obligations as AAA/Aaa. | |
| | |
| 10 | | 2 0 1 9 B L A C K R O C K A N N U A L R E P O R T T O S H A R E H O L D E R S |
| | |
| Fund Summary as of March 31, 2019 (continued) | | BATS: Series M Portfolio |
TOTAL RETURN BASED ON A $10,000 INVESTMENT
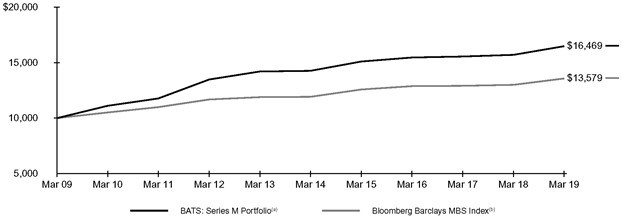
| (a) | The Fund will primarily invest its assets in investment grade CMBS and RMBS, ABS, CMOs, U.S. Treasury and agency securities, cash equivalent instruments, when-issued and delayed delivery securities, derivatives and dollar rolls. |
| (b) | An unmanaged index that includes the mortgage-backed pass-through securities of Ginnie Mae, Fannie Mae and Freddie Mac that meet the maturity and liquidity criteria. |
Performance Summary for the Period Ended March 31, 2019
| | | | | | | | |
| | | | | Average Annual Total Returns(a) |
| | | 6-Month
Total Returns | | 1 Year | | 5 Years | | 10 Years |
|
BATS: Series M Portfolio | | 4.36% | | 4.94% | | 2.92% | | 5.12% |
Bloomberg Barclays MBS Index | | 4.30 | | 4.42 | | 2.65 | | 3.11 |
|
| | (a) | See “About Fund Performance” on page 16 for a detailed description of performance related information. | |
Past performance is not indicative of future results.
Performance results may include adjustments made for financial reporting purposes in accordance with U.S. generally accepted accounting principles.
Expense Example
| | | | | | | | | | | | | | | | | | |
| | | Actual | | | | Hypothetical(b) | | | | |
| | | Beginning
Account Value
(10/01/18) | | Ending
Account Value
(03/31/19) | | Expenses Paid During the Period(a) | | | | Beginning
Account Value
(10/01/18) | | Ending
Account Value (03/31/19) | | Expenses
Paid During the Period(a) | | | | Annualized Expense Ratio |
|
BATS: Series M Portfolio | | $1,000.00 | | $1,043.60 | | $0.00 | | | | $1,000.00 | | $1,024.93 | | $0.00 | | | | 0.00% |
|
| | (a) | For shares of the Fund, expenses are equal to the annualized expense ratio, multiplied by the average account value over the period, multiplied by 182/365 (to reflect theone-half year period shown). BlackRock has contractually agreed to waive all fees and pay or reimburse all direct expenses, except extraordinary expenses, incurred by the Fund. Extraordinary expenses may include dividend expense, interest expense, acquired fund fees and expenses and certain other Fund expenses. This agreement has no fixed term. | |
| | (b) | Hypothetical 5% annual return before expenses is calculated by prorating the number of days in the most recent fiscal half year divided by 365. See “Disclosure of Expenses” on page 16 for further information on how expenses were calculated. | |
| | |
| Fund Summary as of March 31, 2019 | | BATS: Series P Portfolio |
Investment Objective
BATS: Series P Portfolio’s (the “Fund”)investment objective is to seek to provide a duration that is the inverse of its benchmark.
Portfolio Management Commentary
How did the Fund perform?
For the12-month period ended March 31, 2019, the Fund underperformed the Bloomberg Barclays U.S. Treasury7-10 Year Bond Index and the Bloomberg Barclays U.S. Bellwether 10 Year Swap Index. Shares of the Fund can be purchased or held only by or on behalf of certain separately managed account clients. Comparisons of the Fund’s performance versus its benchmark index will differ from comparisons of the benchmark against the performance of the separately managed accounts.
What factors influenced performance?
The Fund held cash at the end of the period as collateral in conjunction with its investments in U.S. Treasury futures and interest rate swaps. The Fund’s cash exposure had no material impact on performance. The use and cost of derivatives will result in a negative contribution to Fund returns when interest rates fall; however, the Fund’s strategy is designed to offset these costs by holding shares of BATS: Series S Portfolio (“Series S Portfolio”), a short-term proprietary fund. The use of derivatives is necessary to achieve the Fund’s objective and should therefore be evaluated in a portfolio context and not as a standalone strategy. Given that yields fell, the Fund’s use of derivatives to facilitate an inverse exposure to the7- to10-year part of the U.S. Treasury and 10 year swap of U.S. Bellwether yield curves detracted from results.
The Fund’s position in the Series S Portfolio, which benefited from its allocations to investment-grade corporate bonds, mortgage-backed securities, asset-backed securities and commercial mortgage-backed securities, was the main contributor to performance. An allocation to U.S. Treasuries was the largest detractor in the Series S Portfolio.
Describe recent portfolio activity.
The Fund actively managed interest rate risk on the7- to10-year part of the yield curve by using derivatives as described above. The Fund maintained its allocation to Series S Portfolio in order to offset the cost of the derivatives. Since this is an overlay strategy designed to manage interest-rate risk, the portfolio’s positioning is relatively static.
Describe portfolio positioning at period end.
The Fund held positions in U.S. Treasury futures, interest rate swaps, Series S Portfolio and the Bank of New York Cash Reserve money market fund.
The views expressed reflect the opinions of BlackRock as of the date of this report and are subject to change based on changes in market, economic or other conditions. These views are not intended to be a forecast of future events and are no guarantee of future results.
Portfolio Information
PORTFOLIO COMPOSITION
| | | | |
| |
| |
| Asset Type | | Percent of
Net Assets | |
| |
Fixed Income Funds | | | 30% | |
Other Assets Less Liabilities | | | 70 | |
| |
PORTFOLIO HOLDINGS
| | | | |
| |
| |
| Security | | Percent of Affiliated
Investment Companies | |
| |
BlackRock Allocation Target Shares: Series S Portfolio | | | 100% | |
| |
| | |
| 12 | | 2 0 1 9 B L A C K R O C K A N N U A L R E P O R T T O S H A R E H O L D E R S |
| | |
| Fund Summary as of March 31, 2019 (continued) | | BATS: Series P Portfolio |
TOTAL RETURN BASED ON A $10,000 INVESTMENT
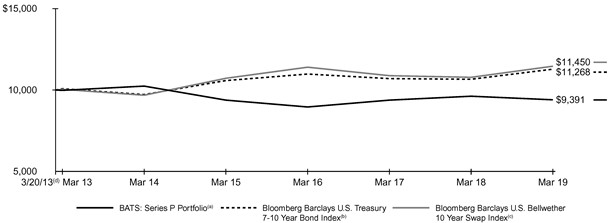
| (a) | The Fund may invest in a portfolio of securities and other financial instruments, including derivative instruments, in an attempt to provide returns that are the inverse of its benchmark index. |
| (b) | An unmanaged index that includes all publicly issued, U.S. Treasury securities that have a remaining maturity of between 7 and 10 years, arenon-convertible, are denominated in U.S. dollars, are rated Baa3 (or better) by Moody’s orBBB- (or better) by S&P, are fixed rate, and have more than $250 million par outstanding. |
| (c) | Provides total returns for swaps with varying maturities. For example, the10-year swap index measures the total return of investing in10-year par swaps over time. |
| (d) | Commencement of operations. |
Performance Summary for the Period Ended March 31, 2019
| | | | | | | | | | | | | | | | | | | | |
| | | 6-Month Total Returns | | Average Annual Total Returns(a) |
| | | 1 Year | | 5 Years | | Since Inception(b) |
BATS: Series P Portfolio | | | | (5.10 | )% | | | | (2.32 | )% | | | | (1.72 | )% | | | | (1.04 | )% |
Bloomberg Barclays U.S. Treasury7-10 Year Bond Index | | | | 6.72 | | | | | 5.77 | | | | | 3.03 | | | | | 2.00 | |
Bloomberg Barclays U.S. Bellwether 10 Year Swap Index | | | | 7.78 | | | | | 6.28 | | | | | 3.44 | | | | | 2.27 | |
| | (a) | See “About Fund Performance” on page 16 for a detailed description of performance related information. | |
| | (b) | The Fund commenced operations on March 20, 2013. | |
Past performance is not indicative of future results.
Performance results may include adjustments made for financial reporting purposes in accordance with U.S. generally accepted accounting principles.
Expense Example
| | | | | | | | | | | | | | | | | | | | | | | | | | | | | | | | |
| | | Actual | | | | | | Hypothetical(b) | | | | |
| | | | | | | | |
| | | Beginning
Account Value
(10/01/18) | | | Ending
Account Value
(03/31/19) | | | Expenses
Paid During
the Period(a) | | | | | | Beginning
Account Value
(10/01/18) | | | Ending
Account Value
(03/31/19) | | | Expenses
Paid During
the Period(a) | | | Annualized
Expense
Ratio | |
| |
BATS: Series P | | | | | | | | | | | | | | | | | | | | | | | | | | | | | | | | |
Portfolio | | | $1,000.00 | | | | $949.00 | | | | $0.00 | | | | | | | | $1,000.00 | | | | $1,024.93 | | | | $0.00 | | | | 0.00 | % |
| |
| | (a) | For shares of the Fund, expenses are equal to the annualized expense ratio, multiplied by the average account value over the period, multiplied by 182/365 (to reflect theone-half year period shown). The fees and expenses of the underlying funds in which the Fund invests are not included in the Fund’s annualized expense ratio. BlackRock has contractually agreed to waive all fees and pay or reimburse all direct expenses, except extraordinary expenses, incurred by the Fund. Extraordinary expenses may include dividend expense, interest expense, acquired fund fees and expenses and certain other Fund expenses. This agreement has no fixed term. | |
| | (b) | Hypothetical 5% annual return before expenses is calculated by prorating the number of days in the most recent fiscal half year divided by 365. See “Disclosure of Expenses” on page 16 for further information on how expenses were calculated. | |
| | |
| Fund Summary as of March 31, 2019 | | BATS: Series S Portfolio |
Investment Objective
BATS: Series S Portfolio’s (the “Fund”)investment objective is to seek to maximize total return, consistent with income generation and prudent investment management.
Portfolio Management Commentary
How did the Fund perform?
For the12-month period ended March 31, 2019, the Fund outperformed its benchmark, the ICE BofAML1-3 Year U.S. Treasury Index. Shares of the Fund can be purchased or held only by or on behalf of certain separately managed account clients. Comparisons of the Fund’s performance versus its benchmark index will differ from comparisons of the benchmark against the performance of the separately managed accounts.
What factors influenced performance?
The Fund’s allocations to investment-grade corporate bonds, mortgage-backed securities (“MBS”), commercial mortgage-backed securities (“CMBS”) and asset backed securities (“ABS”) were the main contributors to relative performance. An underweight in U.S. Treasuries was the primary detractor.
At period end, the Fund held a higher than average cash balance, reflecting a short-term strategy to the Fund in order to reduce overall risk. The cash balance had no material impact on the Fund’s performance, and was subsequently reduced after the period end date.
Describe recent portfolio activity.
The investment adviser reduced the amount of credit risk in the portfolio during the course of the period. The Fund’s allocation to ABS was reduced by decreasing its weighting in securities backed by prime auto loans and credit cards. In addition, the Fund decreased its portfolio allocation to corporate bonds, specifically in banking and finance companies. The Fund also increased its allocation to foreign sovereign debt.
Describe portfolio positioning at period end.
The Fund was positioned with a longer duration relative to the benchmark. The Fund was overweight in U.S. investment-grade corporate bonds, ABS and CMBS due to the positivesupply-and-demand dynamics in these areas.
The views expressed reflect the opinions of BlackRock as of the date of this report and are subject to change based on changes in market, economic or other conditions. These views are not intended to be a forecast of future events and are no guarantee of future results.
Portfolio Information
PORTFOLIO COMPOSITION
| | | | |
| |
| |
| Asset Type | | Percent of
Total Investments(a) | |
| |
Corporate Bonds | | | 55% | |
U.S. Government Sponsored Agency Securities | | | 18 | |
Asset-Backed Securities | | | 17 | |
Non-Agency Mortgage-Backed Securities | | | 9 | |
Foreign Government Obligations | | | 1 | |
| |
CREDIT QUALITY ALLOCATION(b)
| | | | |
| |
| |
| Credit Rating | | Percent of
Total Investments(a) | |
| |
AAA/Aaa(c) | | | 43% | |
AA/Aa | | | 5 | |
A | | | 22 | |
BBB/Baa | | | 30 | |
| |
| | (a) | Total investments exclude short-term securities and options purchased. | |
| | (b) | For financial reporting purposes, credit quality ratings shown above reflect the highest rating assigned by either S&P or Moody’s if ratings differ. These rating agencies are independent, nationally recognized statistical rating organizations and are widely used. Investment grade ratings are credit ratings of BBB/Baa or higher. Below investment grade ratings are credit ratings of BB/Ba or lower. Investments designated N/R are not rated by either rating agency. Unrated investments do not necessarily indicate low credit quality. Credit quality ratings are subject to change. | |
| | (c) | The investment adviser evaluates the credit quality ofnot-rated investments based upon certain factors, including, but not limited to, credit ratings for similar investments and financial analysis of sectors, individual investments and/or issuers. Using this approach, the investment adviser has deemednot-rated U.S. Government Sponsored Agency Securities and U.S. Treasury Obligations as AAA/Aaa. | |
| | |
| 14 | | 2 0 1 9 B L A C K R O C K A N N U A L R E P O R T T O S H A R E H O L D E R S |
| | |
| Fund Summary as of March 31, 2019 (continued) | | BATS: Series S Portfolio |
TOTAL RETURN BASED ON A $10,000 INVESTMENT
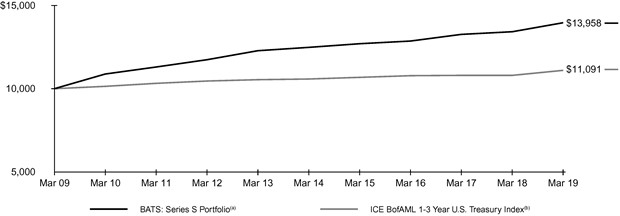
| (a) | The Fund will primarily invest its assets in investment grade fixed-income securities, such as CMBS and RMBS, obligations ofnon-U.S. governments and supranational organizations, which are chartered to promote economic development, obligations of domestic andnon-U.S. corporations, ABS, collateralized mortgage obligations, U.S. Treasury and agency securities, cash equivalent investments, when-issued and delayed delivery securities, derivatives, repurchase agreements, reverse repurchase agreements and dollar rolls. |
| (b) | An unmanaged index comprised of Treasury securities with maturities ranging from one to three years. |
Performance Summary for the Period Ended March 31, 2019
| | | | | | | | | | | | | | | | | | | | |
| | | | | Average Annual Total Returns(a) |
| | | 6 Months
Total Returns | | 1 Year | | 5 Years | | 10 Years |
BATS: Series S Portfolio | | | | 2.97 | % | | | | 4.11 | % | | | | 2.28 | % | | | | 3.39 | % |
ICE BofAML1-3 Year U.S. Treasury Index | | | | 2.29 | | | | | 2.72 | | | | | 0.98 | | | | | 1.04 | |
| | (a) | See “About Fund Performance” on page 16 for a detailed description of performance related information. | |
Past performance is not indicative of future results.
Performance results may include adjustments made for financial reporting purposes in accordance with U.S. generally accepted accounting principles.
Expense Example
| | | | | | | | | | | | | | | | | | | | |
| | | Actual | | | | Hypothetical(c) |
| | | | | | | Including
Interest Expense | | Excluding
Interest Expense | | | | | | Including
Interest Expense | | Excluding
Interest Expense |
| | | Beginning
Account Value
(10/01/18) | | Ending
Account Value
(03/31/19) | | Expenses
Paid During
the Period(a) | | Expenses
Paid During
the Period(b) | | | | Beginning
Account Value
(10/01/18) | | Ending
Account Value
(03/31/19) | | Expenses
Paid During
the Period(a) | | Ending
Account Value
(03/31/19) | | Expenses
Paid During
the Period(b) |
BATS: Series S Portfolio | | $1,000.00 | | $1,029.70 | | $2.94 | | $0.00 | | | | $1,000.00 | | $1,022.04 | | $2.92 | | $1,024.93 | | $0.00 |
| | (a) | For shares of the Fund, expenses are equal to the annualized expense ratio of 0.58%, multiplied by the average account value over the period, multiplied by 182/365 (to reflect theone-half year period shown). BlackRock has contractually agreed to waive all fees and pay or reimburse all direct expenses, except extraordinary expenses, incurred by the Fund. Extraordinary expenses may include dividend expense, interest expense, acquired fund fees and expenses and certain other Fund expenses. This agreement has no fixed term. | |
| | (b) | For shares of the Fund, expenses are equal to the annualized expense ratio of 0.00%, multiplied by the average account value over the period, multiplied by 182/365 (to reflect theone-half year period shown). BlackRock has contractually agreed to waive all fees and pay or reimburse all direct expenses, except extraordinary expenses, incurred by the Fund. Extraordinary expenses may include dividend expense, interest expense, acquired fund fees and expenses and certain other Fund expenses. This agreement has no fixed term. | |
| | (c) | Hypothetical 5% annual return before expenses is calculated by prorating the number of days in the most recent fiscal half year divided by 365. | |
See “Disclosure of Expenses” on page 16 for further information on how expenses were calculated.
About Fund Performance
Performance information reflects past performance and does not guarantee future results. Current performance may be lower or higher than the performance data quoted. Performance results do not reflect the deduction of taxes that a shareholder would pay on fund distributions or the redemption of fund shares. Figures shown in the performance tables on the previous pages assume reinvestment of all distributions, if any, at net asset value (“NAV”) on theex-dividend/payable date. Investment return and principal value of shares will fluctuate so that shares, when redeemed, may be worth more or less than their original cost.
The performance information also reflects fee waivers and reimbursements that subsidize and reduce the total operating expenses of each Fund. The Funds’ returns would have been lower if there were no such waivers and reimbursements.
Disclosure of Expenses
Shareholders of each Fund may incur the following charges: (a) transactional expenses and (b) operating expenses, including administration fees and other fund expenses. The expense examples shown on the previous pages (which are based on a hypothetical investment of $1,000 invested on October 1, 2018 and held through March 31, 2019) are intended to assist shareholders both in calculating expenses based on an investment in each Fund and in comparing these expenses with similar costs of investing in other mutual funds.
The expense examples provide information about actual account values and actual expenses. In order to estimate the expenses a shareholder paid during the period covered by this report, shareholders can divide their account value by $1,000 and then multiply the result by the number corresponding to their Fund under the headings entitled “Expenses Paid During the Period.”
The expense examples also provide information about hypothetical account values and hypothetical expenses based on a Fund’s actual expense ratio and an assumed rate of return of 5% per year before expenses. In order to assist shareholders in comparing the ongoing expenses of investing in these Funds and other funds, compare the 5% hypothetical examples with the 5% hypothetical examples that appear in shareholder reports of other funds.
The expenses shown in the expense examples are intended to highlight shareholders’ ongoing costs only and do not reflect transactional expenses, if any. Therefore, the hypothetical examples are useful in comparing ongoing expenses only, and will not help shareholders determine the relative total expenses of owning different funds. If these transactional expenses were included, shareholder expenses would have been higher.
| | |
| 16 | | 2 0 1 9 B L A C K R O C K A N N U A L R E P O R T T O S H A R E H O L D E R S |
The Benefits and Risks of Leveraging
The Funds may utilize leverage to seek to enhance returns and NAV. However, there is no guarantee that these objectives can be achieved in all interest rate environments.
The Funds may utilize leverage by entering into reverse repurchase agreements.
Series E Portfolio may leverage its assets through the use of proceeds received in tender option bond (“TOB”) transactions, as described in the Notes to Financial Statements. In a TOB Trust transaction, the Series E Portfolio transfers municipal bonds or other municipal securities into a special purpose entity (a “TOB Trust”). TOB investments generally provide the Series E Portfolio with economic benefits in periods of declining short-term interest rates, but expose the Series E Portfolio to risks during periods of rising short-term interest rates. Additionally, fluctuations in the market value of municipal bonds deposited into a TOB Trust may adversely affect the Series E Portfolio’s NAV per share.
In general, the concept of leveraging is based on the premise that the financing cost of leverage, which is based on short-term interest rates, is normally lower than the income earned by each Fund on its longer-term portfolio investments purchased with the proceeds from leverage. To the extent that the total assets of each Fund (including the assets obtained from leverage) are invested in higher-yielding portfolio investments, the Funds’ shareholders benefit from the incremental net income.
The interest earned on securities purchased with the proceeds from leverage is distributed to the Funds’ shareholders, and the value of these portfolio holdings is reflected in the Funds’ per share NAV. However, in order to benefit shareholders, the return on assets purchased with leverage proceeds must exceed the ongoing costs associated with the leverage. If interest and other ongoing costs of leverage exceed a Fund’s return on assets purchased with leverage proceeds, income to shareholders is lower than if the Fund had not used leverage.
Furthermore, the value of each Fund’s portfolio investments generally varies inversely with the direction of long-term interest rates, although other factors can also influence the value of portfolio investments. As a result, changes in interest rates can influence each Fund’s NAV positively or negatively in addition to the impact on each Fund’s performance from leverage. Changes in the direction of interest rates are difficult to predict accurately, and there is no assurance that a Fund’s leveraging strategy will be successful.
The use of leverage also generally causes greater changes in each Fund’s NAV and dividend rates than comparable portfolios without leverage. In a declining market, leverage is likely to cause a greater decline in the NAV of a Fund’s shares than if the Fund were not leveraged. In addition, each Fund may be required to sell portfolio securities at inopportune times or at distressed values in order to comply with regulatory requirements applicable to the use of leverage or as required by the terms of the leverage instruments, which may cause the Funds to incur losses. The use of leverage may limit a Fund’s ability to invest in certain types of securities or use certain types of hedging strategies. Each Fund incurs expenses in connection with the use of leverage, all of which are borne by each Fund’s shareholders and may reduce income.
Derivative Financial Instruments
The Funds may invest in various derivative financial instruments. These instruments are used to obtain exposure to a security, commodity, index, market, and/or other assets without owning or taking physical custody of securities, commodities and/or other referenced assets or to manage market, equity, credit, interest rate, foreign currency exchange rate, commodity and/or other risks. Derivative financial instruments may give rise to a form of economic leverage and involve risks, including the imperfect correlation between the value of a derivative financial instrument and the underlying asset, possible default of the counterparty to the transaction or illiquidity of the instrument. The Funds’ successful use of a derivative financial instrument depends on the investment adviser’s ability to predict pertinent market movements accurately, which cannot be assured. The use of these instruments may result in losses greater than if they had not been used, may limit the amount of appreciation a Fund can realize on an investment and/or may result in lower distributions paid to shareholders. The Funds’ investments in these instruments, if any, are discussed in detail in the Notes to Financial Statements.
| | | | |
| T H E B E N E F I T S A N D R I S K S O F L E V E R A G I N G A N D D E R I V A T I V E F I N A N C I A L I N S T R U M E N T S | | | 17 | |
| | |
Schedule of Investments March 31, 2019 | | BATS: Series A Portfolio (Percentages shown are based on Net Assets) |
| | | | | | | | |
| Security | | Par
(000) | | | Value | |
| | |
Asset-Backed Securities — 58.6% | | | | | | | | |
AIMCO CLO, Series2014-AA, Class AR, (3 mo. LIBOR US + 1.100%), 3.86%, 07/20/26(a)(b) | | $ | 606 | | | $ | 605,662 | |
Ajax Mortgage Loan Trust: | | | | | | | | |
Series2017-D, Class A,
3.75%, 12/25/57(b) | | | 2,152 | | | | 2,208,050 | |
Series2017-D, Class B,
0.00%, 12/25/57(b)(c)(d) | | | 1,704 | | | | 766,946 | |
Series2018-A, Class A,
3.85%, 04/25/58(b)(c) | | | 2,224 | | | | 2,140,464 | |
Series2018-A, Class B,
0.00%, 04/25/58(b)(c) | | | 607 | | | | 333,800 | |
Series2018-B, Class A,
3.75%, 02/26/57(b)(c) | | | 2,066 | | | | 2,061,192 | |
Series2018-B, Class B,
0.00%, 02/26/57(b)(c) | | | 955 | | | | 267,445 | |
Series2018-D, Class A,
3.75%, 08/25/58(b)(c)(d) | | | 3,783 | | | | 3,723,271 | |
Series2018-D, Class B,
0.00%, 08/25/58(b)(c)(d) | | | 918 | | | | 514,242 | |
Series2018-E, Class A,
4.38%, 06/25/58(b)(d) | | | 3,913 | | | | 3,942,927 | |
Series2018-E, Class B,
5.25%, 06/25/58(b)(d) | | | 368 | | | | 360,670 | |
Series2018-E, Class C,
0.00%, 06/25/58(b)(c)(d) | | | 931 | | | | 269,986 | |
Series2018-F, Class A,
4.38%, 11/25/58(b)(c)(d) | | | 4,434 | | | | 4,456,574 | |
Series2018-F, Class B,
5.25%, 11/25/58(b)(c)(d) | | | 420 | | | | 411,765 | |
Series2018-F, Class C,
0.00%, 11/25/58(b)(c) | | | 1,030 | | | | 484,192 | |
Series2018-G, Class A,
4.38%, 06/25/57(b)(c)(d) | | | 5,761 | | | | 5,734,743 | |
Series2018-G, Class B,
5.25%, 06/25/57(b)(c)(d) | | | 560 | | | | 547,400 | |
Series2018-G, Class C,
0.00%, 06/25/57(b) | | | 1,435 | | | | 1,374,148 | |
Series2019-A, Class A,
3.75%, 08/25/57(b)(d) | | | 3,751 | | | | 3,742,699 | |
Series2019-A, Class B,
5.25%, 08/25/57(b)(d) | | | 350 | | | | 342,866 | |
Series2019-A, Class C,
0.00%, 08/25/57(b) | | | 900 | | | | 695,407 | |
Series2019-B, Class A,
3.75%, 01/25/59(b)(d) | | | 4,440 | | | | 4,429,754 | |
Series2019-B, Class B,
5.25%, 01/25/59(b)(d) | | | 409 | | | | 400,670 | |
Series2019-B, Class C,
0.00%, 01/25/59(b) | | | 1,050 | | | | 841,673 | |
Allegro CLOII-S Ltd.: | | | | | | | | |
Series2014-1RA, Class A1, (3 mo. LIBOR US + 1.080%), 3.84%, 10/21/28(a)(b) | | | 2,000 | | | | 1,994,710 | |
Series2014-1RA, Class B, (3 mo. LIBOR US + 2.150%), 4.91%, 10/21/28(a)(b) | | | 300 | | | | 297,336 | |
Series2014-1RA, Class C, (3 mo. LIBOR US + 3.000%), 5.76%, 10/21/28(a)(b) | | | 750 | | | | 736,999 | |
Allegro CLO Ltd., Series2016-1X, Class D, (3 mo. LIBOR US + 3.850%),
6.64%, 01/15/29(a) | | | 500 | | | | 500,010 | |
Allegro CLO VI Ltd., Series2017-2A, Class A, (3 mo. LIBOR US + 1.130%), 3.90%, 01/17/31(a)(b) | | | 1,000 | | | | 993,066 | |
| | | | | | | | |
| Security | | Par
(000) | | | Value | |
ALM VI Ltd., Series2012-6A, Class DR3, (3 mo. LIBOR US + 5.050%), 7.84%, 07/15/26(a)(b) | | $ | 600 | | | $ | 573,742 | |
ALM VII Ltd., Series2012-7A, Class A1R, (3 mo. LIBOR US + 1.480%), 4.27%, 10/15/28(a)(b) | | | 1,000 | | | | 1,000,843 | |
ALM XVI Ltd./ALM XVI LLC: | | | | | | | | |
Series2015-16A, Class A2R2, (3 mo. LIBOR US + 1.500%), 4.29%, 07/15/27(a)(b) | | | 1,000 | | | | 991,821 | |
Series2015-16A, Class CR2, (3 mo. LIBOR US + 2.700%), 5.49%, 07/15/27(a)(b) | | | 1,000 | | | | 980,450 | |
ALM XVII Ltd., Series2015-17A, Class BR, (3 mo. LIBOR US + 2.100%),
4.89%, 01/15/28(a)(b) | | | 500 | | | | 494,884 | |
American Express Credit Account Master Trust: | | | | | | | | |
Series2014-1, Class A, (1 mo. LIBOR US + 0.370%), 2.85%, 12/15/21(a) | | | 3,750 | | | | 3,751,544 | |
Series2019-1, Class A, 2.87%, 10/15/24 | | | 5,060 | | | | 5,106,347 | |
AMMC CLO Ltd., Series2017-20A, Class E, (3 mo. LIBOR US + 5.810%),
8.58%, 04/17/29(a)(b) | | | 500 | | | | 471,523 | |
AMMC CLO XIV Ltd., Series2014-14A, Class A1LR, (3 mo. LIBOR US + 1.250%), 4.02%, 07/25/29(a)(b) | | | 500 | | | | 500,667 | |
Anchorage Capital CLO3-R Ltd.: | | | | | | | | |
Series2014-3RA, Class A, (3 mo. LIBOR US + 1.050%), 3.82%, 01/28/31(a)(b) | | | 1,000 | | | | 993,122 | |
Series2014-3RA, Class B, (3 mo. LIBOR US + 1.500%), 4.27%, 01/28/31(a)(b) | | | 1,000 | | | | 980,876 | |
Series2014-3RA, Class C, (3 mo. LIBOR US + 1.850%), 4.62%, 01/28/31(a)(b) | | | 500 | | | | 481,316 | |
Anchorage Capital CLO4-R Ltd.: | | | | | | | | |
Series2014-4RA, Class A, (3 mo. LIBOR US + 1.050%), 3.82%, 01/28/31(a)(b) | | | 1,500 | | | | 1,489,607 | |
Series2014-4RA, Class C, (3 mo. LIBOR US + 1.850%), 4.62%, 01/28/31(a)(b) | | | 1,500 | | | | 1,446,599 | |
Series2014-4RA, Class D, (3 mo. LIBOR US + 2.600%), 5.37%, 01/28/31(a)(b) | | | 750 | | | | 714,428 | |
Anchorage Capital CLO5-R Ltd.: | | | | | | | | |
Series2014-5RA, Class B, (3 mo. LIBOR US + 1.450%), 4.24%, 01/15/30(a)(b) | | | 1,700 | | | | 1,674,148 | |
Series2014-5RA, Class C, (3 mo. LIBOR US + 1.850%), 4.64%, 01/15/30(a)(b) | | | 3,000 | | | | 2,909,165 | |
Series2014-5RA, Class E, (3 mo. LIBOR US + 5.400%), 8.19%, 01/15/30(a)(b) | | | 1,000 | | | | 935,300 | |
Anchorage Capital CLO 7 Ltd.: | | | | | | | | |
Series2015-7A, Class B1R, (3 mo. LIBOR US + 1.300%), 4.09%, 10/15/27(a)(b) | | | 1,500 | | | | 1,475,381 | |
Series2015-7A, Class CR, (3 mo. LIBOR US + 1.700%), 4.49%, 10/15/27(a)(b) | | | 625 | | | | 613,808 | |
Series2015-7A, Class DR, (3 mo. LIBOR US + 2.700%), 5.49%, 10/15/27(a)(b) | | | 1,000 | | | | 977,948 | |
Anchorage Capital CLO 8 Ltd.: | | | | | | | | |
Series2016-8A, Class AR, (3 mo. LIBOR US + 1.000%), 3.77%, 07/28/28(a)(b) | | | 1,000 | | | | 995,435 | |
Series2016-8A, Class BR, (3 mo. LIBOR US + 1.600%), 4.37%, 07/28/28(a)(b) | | | 1,000 | | | | 992,325 | |
Series2016-8A, Class CR, (3 mo. LIBOR US + 2.100%), 4.87%, 07/28/28(a)(b) | | | 1,000 | | | | 985,015 | |
Series2016-8A, Class DR, (3 mo. LIBOR US + 3.000%), 5.77%, 07/28/28(a)(b) | | | 750 | | | | 737,378 | |
Series2016-8A, Class ER, (3 mo. LIBOR US + 5.750%), 8.52%, 07/28/28(a)(b) | | | 2,060 | | | | 2,019,461 | |
| | |
| 18 | | 2 0 1 9 B L A C K R O C K A N N U A L R E P O R T T O S H A R E H O L D E R S |
| | |
Schedule of Investments (continued) March 31, 2019 | | BATS: Series A Portfolio (Percentages shown are based on Net Assets) |
| | | | | | | | |
| Security | | Par
(000) | | | Value | |
Anchorage Capital CLO 9 Ltd., Series2016-9A, Class E, (3 mo. LIBOR US + 7.250%), 10.04%, 01/15/29(a)(b) | | $ | 600 | | | $ | 593,594 | |
Anchorage Capital CLO Ltd.: | | | | | | | | |
Series2013-1A, Class BR, (3 mo. LIBOR US + 2.150%), 4.95%, 10/13/30(a)(b) | | | 500 | | | | 490,795 | |
Series2013-1A, Class DR, (3 mo. LIBOR US + 6.800%), 9.60%, 10/13/30(a)(b) | | | 1,000 | | | | 994,967 | |
Apidos CLO XII, Series2013-12A, Class AR, (3 mo. LIBOR US + 1.080%),
3.87%, 04/15/31(a)(b) | | | 1,387 | | | | 1,370,770 | |
Apidos CLO XV, Series2013-15A, Class A1RR, (3 mo. LIBOR US + 1.010%), 3.77%, 04/20/31(a)(b) | | | 1,000 | | | | 985,105 | |
Apidos CLO XXI, Series2015-21A, Class DR, (3 mo. LIBOR US + 5.200%), 7.98%, 07/18/27(a)(b) | | | 500 | | | | 480,193 | |
Apidos CLO XXII, Series2015-22A, Class D, (3 mo. LIBOR US + 6.000%), 8.76%, 10/20/27(a)(b) | | | 500 | | | | 500,118 | |
Apidos CLO XXIII, Series2015-23A, Class D2, (3 mo. LIBOR US + 5.950%), 8.74%, 01/15/27(a)(b) | | | 500 | | | | 495,326 | |
Apidos CLO XXIX, Series2018-29A, Class D, (3 mo. LIBOR US + 5.250%),
8.02%, 07/25/30(a)(b) | | | 500 | | | | 455,805 | |
Arbor Realty Commercial Real Estate Notes Ltd.: | | | | | | | | |
Series 2016-FL1A, Class A, (1 mo. LIBOR US + 1.700%), 4.18%, 09/15/26(a)(b) | | | 190 | | | | 191,473 | |
Series2017-FL1, Class A, (1 mo. LIBOR US + 1.300%), 3.78%, 04/15/27(a)(b) | | | 1,920 | | | | 1,920,954 | |
Series2017-FL1, Class B, (1 mo. LIBOR US + 2.500%), 4.98%, 04/15/27(a)(b) | | | 438 | | | | 438,694 | |
ARES XLIII CLO Ltd., Series2017-43A, Class E, (3 mo. LIBOR US + 6.470%), 9.26%, 10/15/29(a)(b) | | | 750 | | | | 725,965 | |
ARES XXXIII CLO Ltd.: | | | | | | | | |
Series2015-1A, Class CR, (3 mo. LIBOR US + 4.200%), 6.80%, 12/05/25(a)(b) | | | 250 | | | | 249,906 | |
Series2015-1A, Class D, (3 mo. LIBOR US + 6.230%), 8.83%, 12/05/25(a)(b) | | | 500 | | | | 502,266 | |
ARES XXXIV CLO Ltd., Series2015-2A, Class E2, (3 mo. LIBOR US + 5.200%), 7.95%, 07/29/26(a)(b) | | | 500 | | | | 494,203 | |
ARES XXXIX CLO Ltd., Series2016-39A, Class E, (3 mo. LIBOR US + 7.250%), 10.03%, 07/18/28(a)(b) | | | 250 | | | | 249,991 | |
ARES XXXVII CLO Ltd., Series2015-4A, Class A1R, (3 mo. LIBOR US + 1.170%), 3.96%, 10/15/30(a)(b) | | | 600 | | | | 596,341 | |
Argent Mortgage Loan Trust, Series2005-W1, Class A2, (1 mo. LIBOR US + 0.480%), 2.97%, 05/25/35(a) | | | 69 | | | | 60,773 | |
Assurant CLO III Ltd., Series2018-2A, Class C, (3 mo. LIBOR US + 2.250%), 5.01%, 10/20/31(a)(b) | | | 500 | | | | 489,642 | |
Atrium IX, Series 9A, Class AR, (3 mo. LIBOR US + 1.240%), 3.87%, 05/28/30(a)(b) | | | 1,825 | | | | 1,817,141 | |
Atrium VIII, Series 8A, Class DR, (3 mo. LIBOR US + 4.000%), 6.77%, 10/23/24(a)(b) | | | 325 | | | | 324,933 | |
Atrium XII, Series 12A, Class AR, (3 mo. LIBOR US + 0.830%), 3.59%, 04/22/27(a)(b) | | | 1,000 | | | | 993,151 | |
Avery Point VI CLO Ltd., Series2015-6A, Class AR, (3 mo. LIBOR US + 1.050%), 3.78%, 08/05/27(a)(b) | | | 1,500 | | | | 1,497,011 | |
| | | | | | | | |
| Security | | Par
(000) | | | Value | |
BA Credit Card Trust, Series2017-A1, Class A1, 1.95%, 08/15/22 | | $ | 2,168 | | | $ | 2,154,689 | |
Babson CLO Ltd., Series2015-2A, Class AR, (3 mo. LIBOR US + 1.190%),
3.95%, 10/20/30(a)(b) | | | 1,000 | | | | 994,315 | |
Bain Capital Credit CLO, Series2018-2A, Class A1, (3 mo. LIBOR US + 1.080%), 3.84%, 07/19/31(a)(b) | | | 1,000 | | | | 988,033 | |
BankAmerica Manufactured Housing Contract Trust, Series1997-2, Class B1, 7.07%, 02/10/22(d) | | | 5,740 | | | | 4,662,170 | |
Barings CLO Ltd., Series2018-3A, Class A1, (3 mo. LIBOR US + 0.950%),
3.71%, 07/20/29(a)(b) | | | 1,000 | | | | 994,284 | |
Battalion CLO VII Ltd.: | | | | | | | | |
Series2014-7A, Class A1RR, (3 mo. LIBOR US + 1.040%), 3.81%, 07/17/28(a)(b) | | | 1,750 | | | | 1,740,270 | |
Series2014-7A, Class BRR, (3 mo. LIBOR US + 2.500%), 5.27%, 07/17/28(a)(b) | | | 750 | | | | 750,172 | |
Battalion CLO X Ltd., Series2016-10A, Class D, (3 mo. LIBOR US + 7.000%),
9.78%, 01/24/29(a)(b) | | | 500 | | | | 483,758 | |
Battalion CLO XI Ltd., Series2017-11A, Class E, (3 mo. LIBOR US + 5.980%),
8.76%, 10/24/29(a)(b) | | | 1,000 | | | | 952,900 | |
Bayview Financial Revolving Asset Trust: | | | | | | | | |
Series2005-A, Class A1, (1 mo. LIBOR US + 1.000%), 3.50%, 02/28/40(a)(b) | | | 6,931 | | | | 6,685,550 | |
Series2005-E, Class A1, (1 mo. LIBOR US + 1.000%), 3.50%, 12/28/40(a)(b) | | | 2,699 | | | | 2,535,061 | |
Series2005-E, Class A2A, (1 mo. LIBOR US + 0.930%), 3.43%, 12/28/40(a)(b) | | | 3,638 | | | | 3,389,434 | |
BDS Ltd., Series2019-FL3, Class A, (1 mo. LIBOR US + 1.400%), 3.88%, 12/15/35(a)(b) | | | 6,205 | | | | 6,221,541 | |
Bear Stearns Asset-Backed Securities I Trust: | | | | | | | | |
Series2007-HE2, Class 1A4, (1 mo. LIBOR US + 0.320%), 2.81%, 03/25/37(a) | | | 844 | | | | 601,397 | |
Series2007-HE2, Class 23A, (1 mo. LIBOR US + 0.140%), 2.63%, 03/25/37(a) | | | 135 | | | | 139,112 | |
Series2007-HE3, Class 1A4, (1 mo. LIBOR US + 0.350%), 2.84%, 04/25/37(a) | | | 315 | | | | 264,125 | |
Bear Stearns Asset-Backed Securities Trust, Series2005-4, Class M2, (1 mo. LIBOR US + 1.200%), 3.69%, 01/25/36(a) | | | 100 | | | | 99,501 | |
Benefit Street Partners CLO IV Ltd., Series2014-IVA, Class A1R, (3 mo. LIBOR US + 1.490%), 4.25%, 01/20/29(a)(b) | | | 500 | | | | 500,419 | |
Benefit Street Partners CLOV-B Ltd., Series2018-5BA, Class A1A, (3 mo. LIBOR US + 1.090%), 3.85%, 04/20/31(a)(b) | | | 1,000 | | | | 990,083 | |
Benefit Street Partners CLO VIII Ltd., Series2015-8A, Class A1AR, (3 mo. LIBOR US + 1.100%), 3.86%, 01/20/31(a)(b) | | | 900 | | | | 890,675 | |
Benefit Street Partners CLO XII Ltd., Series2017-12A, Class D, (3 mo. LIBOR US + 6.410%), 9.20%, 10/15/30(a)(b) | | | 1,000 | | | | 967,566 | |
Black Diamond CLO Ltd., Series2014-1A, Class A1R, (3 mo. LIBOR US + 1.150%), 3.92%, 10/17/26(a)(b) | | | 224 | | | | 223,943 | |
BlueMountain CLO Ltd.: | | | | | | | | |
Series2013-2A, Class A1R, (3 mo. LIBOR US + 1.180%), 3.94%, 10/22/30(a)(b) | | | 2,200 | | | | 2,185,680 | |
| | | | |
| S C H E D U L E S O F I N V E S T M E N T S | | | 19 | |
| | |
Schedule of Investments (continued) March 31, 2019 | | BATS: Series A Portfolio (Percentages shown are based on Net Assets) |
| | | | | | | | |
| Security | | Par
(000) | | | Value | |
Series2015-1A, Class D, (3 mo. LIBOR US + 5.450%), 8.25%, 04/13/27(a)(b) | | $ | 250 | | | $ | 249,563 | |
Series2015-3A, Class A1R, (3 mo. LIBOR US + 1.000%), 3.76%, 04/20/31(a)(b) | | | 1,000 | | | | 987,248 | |
BSPRT Issuer Ltd., Series2018-FL3, Class A, (1 mo. LIBOR US + 1.050%), 3.53%, 03/15/28(a)(b) | | | 1,159 | | | | 1,156,580 | |
Capital One Multi-Asset Execution Trust: | | | | | | | | |
Series2015-A3, Class A3, (1 mo. LIBOR US + 0.400%), 2.88%, 03/15/23(a) | | | 5,700 | | | | 5,719,906 | |
Series2016-A1, Class A1, (1 mo. LIBOR US + 0.450%), 2.93%, 02/15/22(a) | | | 10,000 | | | | 10,001,410 | |
Series2016-A3, Class A3, 1.34%, 04/15/22 | | | 9,000 | | | | 8,975,127 | |
Series2016-A4, Class A4, 1.33%, 06/15/22 | | | 1,500 | | | | 1,492,955 | |
Series2017-A4, Class A4, 1.99%, 07/17/23 | | | 4,000 | | | | 3,966,612 | |
Carlyle Global Market Strategies CLO Ltd.: | | | | | | | | |
Series2012-4A, Class AR, (3 mo. LIBOR US + 1.450%), 4.21%, 01/20/29(a)(b) | | | 935 | | | | 935,535 | |
Series2014-1A, Class A1R2, (3 mo. LIBOR US + 0.970%), 3.74%, 04/17/31(a)(b) | | | 1,515 | | | | 1,493,178 | |
Series2015-1A, Class BR, (3 mo. LIBOR US + 1.500%), 4.26%, 04/20/27(a)(b) | | | 1,000 | | | | 994,218 | |
Series2015-3A, Class A2R, (3 mo. LIBOR US + 1.600%), 4.37%, 07/28/28(a)(b) | | | 1,000 | | | | 995,302 | |
Series2015-4A, Class D, (3 mo. LIBOR US + 6.100%), 8.86%, 10/20/27(a)(b) | | | 500 | | | | 496,241 | |
Series2015-4A, Class SBB1, (3 mo. LIBOR US + 8.500%), 11.26%, 10/20/27(a)(b) | | | 112 | | | | 107,064 | |
Series2016-1A, Class DR, (3 mo. LIBOR US + 5.200%), 7.96%, 04/20/27(a)(b) | | | 1,000 | | | | 958,801 | |
Series2016-2A, Class D2R, (3 mo. LIBOR US + 5.170%), 7.96%, 07/15/27(a)(b) | | | 1,000 | | | | 943,248 | |
Carlyle U.S. CLO Ltd., Series2016-4A, Class DR, (3 mo. LIBOR US + 5.400%), 8.16%, 10/20/27(a)(b) | | | 250 | | | | 239,377 | |
Carrington Mortgage Loan Trust: | | | | | | | | |
Series 2006-FRE2, Class A2, (1 mo. LIBOR US + 0.120%), 2.61%, 10/25/36(a) | | | 277 | | | | 208,486 | |
Series 2006-FRE2, Class A3, (1 mo. LIBOR US + 0.160%), 2.65%, 10/25/36(a) | | | 147 | | | | 111,095 | |
Series 2006-FRE2, Class A4, (1 mo. LIBOR US + 0.250%), 2.74%, 10/25/36(a) | | | 2,259 | | | | 1,726,420 | |
Series2006-NC3, Class A4, (1 mo. LIBOR US + 0.240%), 2.73%, 08/25/36(a) | | | 630 | | | | 475,529 | |
Series2006-NC4, Class A3, (1 mo. LIBOR US + 0.160%), 2.65%, 10/25/36(a) | | | 85 | | | | 79,429 | |
Series 2007-FRE1, Class A3, (1 mo. LIBOR US + 0.260%), 2.75%, 02/25/37(a) | | | 2,200 | | | | 2,036,094 | |
CBAM Ltd.: | | | | | | | | |
Series2017-1A, Class A1, (3 mo. LIBOR US + 1.250%), 4.01%, 07/20/30(a)(b) | | | 1,500 | | | | 1,493,492 | |
Series2017-3A, Class A, (3 mo. LIBOR US + 1.230%), 4.00%, 10/17/29(a)(b) | | | 2,500 | | | | 2,490,927 | |
Series2017-3A, Class B1, (3 mo. LIBOR US + 1.700%), 4.47%, 10/17/29(a)(b) | | | 500 | | | | 493,753 | |
Series2017-3A, Class E1, (3 mo. LIBOR US + 6.500%), 9.27%, 10/17/29(a)(b) | | | 1,000 | | | | 984,805 | |
| | | | | | | | |
| Security | | Par
(000) | | | Value | |
Series2018-6A, Class A, (3 mo. LIBOR US + 0.940%), 3.73%, 07/15/31(a)(b) | | $ | 1,000 | | | $ | 990,767 | |
Series2018-6A, Class B1, (3 mo. LIBOR US + 1.500%), 4.29%, 07/15/31(a)(b) | | | 1,000 | | | | 979,162 | |
Cedar Funding IX CLO Ltd., Series2018-9A, Class A1, (3 mo. LIBOR US + 0.980%), 3.74%, 04/20/31(a)(b) | | | 500 | | | | 490,879 | |
Cedar Funding VI CLO Ltd., Series2016-6A, Class AR, (3 mo. LIBOR US + 1.090%), 3.85%, 10/20/28(a)(b) | | | 500 | | | | 497,555 | |
Cedar Funding VIII CLO Ltd., Series2017-8A, Class A1, (3 mo. LIBOR US + 1.250%), 4.02%, 10/17/30(a)(b) | | | 1,000 | | | | 998,056 | |
Cent CLO Ltd.: | | | | | | | | |
Series2015-24A, Class A1R, (3 mo. LIBOR US + 1.070%), 3.86%, 10/15/26(a)(b) | | | 2,000 | | | | 1,996,232 | |
Series C17A, Class A1AR, (3 mo. LIBOR US + 1.030%), 3.78%, 04/30/31(a)(b) | | | 2,000 | | | | 1,972,321 | |
Chase Issuance Trust, Series2012-A4, Class A4, 1.58%, 08/15/21 | | | 2,470 | | | | 2,460,480 | |
CIFC Funding Ltd.: | | | | | | | | |
Series2013-2A, Class A1LR, (3 mo. LIBOR US + 1.210%), 3.99%, 10/18/30(a)(b) | | | 1,350 | | | | 1,344,847 | |
Series2014-4RA, Class A1A, (3 mo. LIBOR US + 1.130%), 3.90%, 10/17/30(a)(b) | | | 1,500 | | | | 1,494,603 | |
Series2016-1A, Class E, (3 mo. LIBOR US + 6.750%), 9.51%, 10/21/28(a)(b) | | | 500 | | | | 498,925 | |
Series2017-2A, Class A, (3 mo. LIBOR US + 1.240%), 4.00%, 04/20/30(a)(b) | | | 500 | | | | 499,433 | |
Series2018-1A, Class A, (3 mo. LIBOR US + 1.000%), 3.78%, 04/18/31(a)(b) | | | 710 | | | | 698,797 | |
Citibank Credit Card Issuance Trust, Series2016-A1, Class A1, 1.75%, 11/19/21 | | | 1,700 | | | | 1,690,573 | |
Citigroup Mortgage Loan Trust: | | | | | | | | |
Series 2006-WFH4, Class M3, (1 mo. LIBOR US + 0.320%), 2.81%, 11/25/36(a) | | | 290 | | | | 248,694 | |
Series 2007-AHL2, Class A3C, (1 mo. LIBOR US + 0.270%), 2.76%, 05/25/37(a) | | | 17 | | | | 12,875 | |
Series 2007-WFH2, Class M3, (1 mo. LIBOR US + 0.470%), 2.96%, 03/25/37(a) | | | 5,000 | | | | 4,690,939 | |
Series 2007-WFH4, Class M3A, (1 mo. LIBOR US + 2.500%), 4.99%, 07/25/37(a) | | | 1,000 | | | | 1,022,831 | |
Clear Creek CLO Ltd., Series2015-1A, Class ER, (3 mo. LIBOR US + 6.300%), 9.06%, 10/20/30(a)(b) | | | 1,000 | | | | 962,984 | |
Conseco Finance Corp.: | | | | | | | | |
Series1996-10, Class B1,
7.24%, 11/15/28(d) | | | 62 | | | | 50,808 | |
Series1998-4, Class M1, 6.83%, 04/01/30(d) | | | 1,227 | | | | 1,097,580 | |
Series1998-8, Class M1, 6.98%, 09/01/30(d) | | | 1,111 | | | | 957,153 | |
Conseco Finance Securitizations Corp.: | | | | | | | | |
Series2000-1, Class A5, 8.06%, 09/01/29(d) | | | 2,417 | | | | 1,089,765 | |
Series2000-4, Class A6, 8.31%, 05/01/32(d) | | | 2,426 | | | | 1,072,956 | |
Countrywide Asset-Backed Certificates: | | | | | | | | |
| | |
| 20 | | 2 0 1 9 B L A C K R O C K A N N U A L R E P O R T T O S H A R E H O L D E R S |
| | |
Schedule of Investments (continued) March 31, 2019 | | BATS: Series A Portfolio (Percentages shown are based on Net Assets) |
| | | | | | | | |
| Security | | Par
(000) | | | Value | |
Series2005-16, Class 1AF, 5.69%, 05/25/36(d) | | $ | 1,942 | | | $ | 1,884,935 | |
Series2006-11, Class 3AV2, (1 mo. LIBOR US + 0.160%), 2.65%, 09/25/46(a) | | | 14 | | | | 13,361 | |
Countrywide Revolving Home Equity Loan Trust, Series2004-U, Class 2A, (1 mo. LIBOR US + 0.270%), 2.75%, 03/15/34(a) | | | 45 | | | | 42,808 | |
Credit Acceptance Auto Loan Trust, Series2019-1A, Class A, 3.33%, 02/15/28(b) | | | 3,950 | | | | 3,976,086 | |
Credit-Based Asset Servicing & Securitization LLC: | | | | | | | | |
Series2006-CB2, Class AF4, 3.44%, 12/25/36(e) | | | 23 | | | | 20,283 | |
Series2006-MH1, Class B1, 6.25%, 10/25/36(b)(e) | | | 2,900 | | | | 2,903,362 | |
Series2006-SL1, Class A3, (1 mo. LIBOR US + 0.440%), 2.93%, 09/25/36(a)(b) | | | 6,439 | | | | 900,864 | |
Series2007-RP1, Class A, (1 mo. LIBOR US + 0.310%), 2.80%, 05/25/46(a)(b) | | | 82 | | | | 71,769 | |
CSMC Trust, Series 2018-RPL8, Class A1, 4.13%, 07/25/58(b)(d) | | | 4,594 | | | | 4,607,190 | |
CWHEQ Home Equity Loan Trust, Series2006-S2, Class A3, 5.84%, 07/25/27 | | | 248 | | | | 420,989 | |
CWHEQ Revolving Home Equity Loan Resuritization Trust: | | | | | | | | |
Series2006-RES, Class 4Q1B, (1 mo. LIBOR US + 0.300%),
2.78%, 12/15/33(a)(b) | | | 41 | | | | 38,554 | |
Series2006-RES, Class 5B1B, (1 mo. LIBOR US + 0.190%),
2.67%, 05/15/35(a)(b)(c) | | | 14 | | | | 13,219 | |
CWHEQ Revolving Home Equity Loan Trust: | | | | | | | | |
Series2006-C, Class 2A, (1 mo. LIBOR US + 0.180%), 2.66%, 05/15/36(a) | | | 3,375 | | | | 3,252,432 | |
Series2006-G, Class 2A, (1 mo. LIBOR US + 0.150%), 2.63%, 10/15/36(a) | | | 395 | | | | 372,117 | |
Deer Creek CLO Ltd., Series2017-1A, Class A, (3 mo. LIBOR US + 1.180%), 3.94%, 10/20/30(a)(b) | | | 1,000 | | | | 994,285 | |
Dewolf Park CLO Ltd., Series2017-1A, Class E, (3 mo. LIBOR US + 6.200%), 8.99%, 10/15/30(a)(b) | | | 1,000 | | | | 970,720 | |
Dorchester Park CLO DAC: | | | | | | | | |
Series2015-1A, Class BR, (3 mo. LIBOR US + 1.450%), 4.21%, 04/20/28(a)(b) | | | 1,500 | | | | 1,483,531 | |
Series2015-1A, Class CR, (3 mo. LIBOR US + 1.750%), 4.51%, 04/20/28(a)(b) | | | 500 | | | | 485,927 | |
Dryden 53 CLO Ltd., Series2017-53A, Class A, (3 mo. LIBOR US + 1.120%), 3.91%, 01/15/31(a)(b) | | | 2,000 | | | | 1,981,031 | |
Dryden Senior Loan Fund, Series2017-47A, Class E, (3 mo. LIBOR US + 6.200%), 8.99%, 04/15/28(a)(b) | | | 250 | | | | 243,362 | |
Dryden XXV Senior Loan Fund, Series2012-25A, Class ARR, (3 mo. LIBOR US + 0.900%), 3.69%, 10/15/27(a)(b) | | | 250 | | | | 248,877 | |
Dryden XXVIII Senior Loan Fund, Series2013-28A, Class A1LR, (3 mo. LIBOR US + 1.200%), 3.88%, 08/15/30(a)(b) | | | 1,247 | | | | 1,242,084 | |
FCI Funding LLC, Series2019-1A, Class A, 3.63%, 02/18/31(b) | | | 3,870 | | | | 3,869,338 | |
First Franklin Mortgage Loan Trust: | | | | | | | | |
Series 2006-FF16, Class 2A3, (1 mo. LIBOR US + 0.140%),
2.63%, 12/25/36(a) | | | 660 | | | | 380,706 | |
Series 2006-FF17, Class A5, (1 mo. LIBOR US + 0.150%), 2.64%, 12/25/36(a) | | | 3,143 | | | | 2,727,317 | |
| | | | | | | | |
| Security | | Par
(000) | | | Value | |
Fremont Home Loan Trust, Series2006-3, Class 1A1, (1 mo. LIBOR US + 0.140%), 2.63%, 02/25/37(a) | | $ | 2,796 | | | $ | 2,135,826 | |
Galaxy XXIX CLO Ltd., Series2018-29A, Class C, (3 mo. LIBOR US + 1.680%), 4.36%, 11/15/26(a)(b) | | | 2,150 | | | | 2,117,350 | |
GE-WMC Asset-Backed Pass-Through Certificates, Series2005-2, Class A2C, (1 mo. LIBOR US + 0.250%), 2.74%, 12/25/35(a) | | | 21 | | | | 20,869 | |
Gilbert Park CLO Ltd., Series2017-1A, Class E, (3 mo. LIBOR US + 6.400%),
9.19%, 10/15/30(a)(b) | | | 1,000 | | | | 982,646 | |
GMACM Home Equity Loan Trust, Series2006-HE1, Class A, (1 mo. LIBOR US + 0.315%), 2.80%, 11/25/36(a) | | | 298 | | | | 296,267 | |
GoldenTree Loan Opportunities IX Ltd.: | | | | | | | | |
Series2014-9A, Class AR2, (3 mo. LIBOR US + 1.110%), 3.86%, 10/29/29(a)(b) | | | 500 | | | | 498,984 | |
Series2014-9A, Class ER2, (3 mo. LIBOR US + 5.660%), 8.41%, 10/29/29(a)(b) | | | 750 | | | | 694,546 | |
Greywolf CLO IV Ltd., Series2014-2A, Class BR, (3 mo. LIBOR US + 2.350%),
5.12%, 01/17/27(a)(b) | | | 500 | | | | 500,045 | |
GSAA Home Equity Trust, Series2007-2, Class AF3, 5.92%, 03/25/37(d) | | | 29 | | | | 9,760 | |
GSAMP Trust: | | | | | | | | |
Series2007-H1, Class A1B, (1 mo. LIBOR US + 0.200%), 2.69%, 01/25/47(a) | | | 15 | | | | 9,094 | |
Series2007-HS1, Class M7, (1 mo. LIBOR US + 2.250%), 4.74%, 02/25/47(a) | | | 3,000 | | | | 2,875,357 | |
Halcyon Loan Advisors Funding Ltd.: | | | | | | | | |
Series2014-3A, Class B1R, (3 mo. LIBOR US + 1.700%), 4.46%, 10/22/25(a)(b) | | | 1,600 | | | | 1,603,685 | |
Series2015-2A, Class AR, (3 mo. LIBOR US + 1.080%), 3.85%, 07/25/27(a)(b) | | | 250 | | | | 249,862 | |
Highbridge Loan Management Ltd., Series12A-18, Class D, (3 mo. LIBOR US + 5.150%), 7.93%, 07/18/31(a)(b) | | | 1,120 | | | | 1,005,127 | |
Home Equity Mortgage Loan Asset-Backed Trust: | | | | | | | | |
Series2004-A, Class M2, (1 mo. LIBOR US + 2.025%), 4.51%, 07/25/34(a) | | | 32 | | | | 31,229 | |
Series2007-B, Class 2A3, (1 mo. LIBOR US + 0.200%), 2.69%, 07/25/37(a) | | | 296 | | | | 194,763 | |
HPS Loan Management Ltd., Series10A-16, Class C, (3 mo. LIBOR US + 3.650%), 6.41%, 01/20/28(a)(b) | | | 500 | | | | 494,735 | |
Invitation Homes Trust: | | | | | | | | |
Series 2018-SFR1, Class F, (1 mo. LIBOR US + 2.500%), 4.98%, 03/17/37(a)(b) | | | 2,000 | | | | 1,994,750 | |
Series 2018-SFR2, Class E, (1 mo. LIBOR US + 2.000%), 4.48%, 06/17/37(a)(b) | | | 2,000 | | | | 1,997,498 | |
Series 2018-SFR2, Class F, (1 mo. LIBOR US + 2.250%), 4.73%, 06/17/37(a)(b) | | | 2,000 | | | | 1,978,202 | |
Series 2018-SFR3, Class E, (1 mo. LIBOR US + 2.000%), 4.48%, 07/17/37(a)(b) | | | 2,545 | | | | 2,540,563 | |
JPMorgan Mortgage Acquisition Trust, Series2006-CH1, Class M7, (1 mo. LIBOR US + 0.800%), 3.29%, 07/25/36(a) | | | 3,498 | | | | 3,258,933 | |
Kayne CLO II Ltd., Series2018-2A, Class A, (3 mo. LIBOR US + 1.240%),
3.89%, 10/15/31(a)(b) | | | 1,000 | | | | 993,139 | |
KKR CLO Ltd.: | | | | | | | | |
Series 12, Class ER2, (3 mo. LIBOR US + 6.150%), 8.94%, 10/15/30(a)(b) | | | 1,000 | | | | 951,389 | |
Series 22A, Class E, (3 mo. LIBOR US + 6.000%), 8.76%, 07/20/31(a)(b) | | | 500 | | | | 472,553 | |
| | | | |
| S C H E D U L E S O F I N V E S T M E N T S | | | 21 | |
| | |
Schedule of Investments (continued) March 31, 2019 | | BATS: Series A Portfolio (Percentages shown are based on Net Assets) |
| | | | | | | | |
| Security | | Par
(000) | | | Value | |
Series-23, Class E, (3 mo. LIBOR US + 6.000%), 8.49%, 10/20/31(a)(b) | | $ | 500 | | | $ | 474,072 | |
LCM 26 Ltd., Series 26A, Class A1, (3 mo. LIBOR US + 1.070%),
3.83%, 01/20/31(a)(b) | | | 2,000 | | | | 1,981,073 | |
LCM XX LP, Series 20A, Class AR, (3 mo. LIBOR US + 1.040%),
3.80%, 10/20/27(a)(b) | | | 500 | | | | 498,728 | |
LCM XXI LP: | | | | | | | | |
Series 21A, Class AR, (3 mo. LIBOR US + 0.880%), 3.64%, 04/20/28(a)(b) | | | 500 | | | | 496,421 | |
Series 21A, Class ER, (3 mo. LIBOR US + 5.750%), 8.51%, 04/20/28(a)(b) | | | 500 | | | | 490,348 | |
Legacy Mortgage Asset Trust, Series2018-SL1, Class A, 4.00%, 02/25/58(b)(d) | | | 4,007 | | | | 3,988,996 | |
Lehman ABS Manufactured Housing Contract Trust, Series2002-A, Class C, 0.00%, 06/15/33 | | | 1,149 | | | | 910,453 | |
Lendmark Funding Trust: | | | | | | | | |
Series2017-1A, Class A,
2.83%, 12/22/25(b) | | | 4,155 | | | | 4,119,292 | |
Series2017-1A, Class B,
3.77%, 12/22/25(b) | | | 1,570 | | | | 1,571,494 | |
Series2017-2A, Class A,
2.80%, 05/20/26(b) | | | 5,084 | | | | 5,051,330 | |
Series2017-2A, Class B,
3.38%, 05/20/26(b) | | | 2,540 | | | | 2,526,581 | |
LoanCore Issuer Ltd., Series 2018-CRE1, Class A, (1 mo. LIBOR US + 1.130%), 3.61%, 05/15/28(a)(b) | | | 4,190 | | | | 4,188,841 | |
Long Beach Mortgage Loan Trust: | | | | | | | | |
Series2006-10, Class 2A4, (1 mo. LIBOR US + 0.220%), 2.71%, 11/25/36(a) | | | 3,662 | | | | 1,647,187 | |
Series2006-2, Class 1A, (1 mo. LIBOR US + 0.180%), 2.67%, 03/25/46(a) | | | 1,057 | | | | 847,471 | |
Series2006-4, Class 2A4, (1 mo. LIBOR US + 0.260%), 2.75%, 05/25/36(a) | | | 864 | | | | 390,798 | |
Series2006-5, Class 2A3, (1 mo. LIBOR US + 0.150%), 2.64%, 06/25/36(a) | | | 4,138 | | | | 2,265,858 | |
Series2006-7, Class 1A, (1 mo. LIBOR US + 0.155%), 2.64%, 08/25/36(a) | | | 5,259 | | | | 3,207,874 | |
Series2006-7, Class 2A3, (1 mo. LIBOR US + 0.160%), 2.65%, 08/25/36(a) | | | 7,471 | | | | 3,895,330 | |
Series2006-7, Class 2A4, (1 mo. LIBOR US + 0.240%), 2.73%, 08/25/36(a) | | | 1,724 | | | | 910,648 | |
Series2006-8, Class 2A3, (1 mo. LIBOR US + 0.160%), 2.65%, 09/25/36(a) | | | 5,741 | | | | 2,195,681 | |
Series2006-9, Class 2A2, (1 mo. LIBOR US + 0.110%), 2.60%, 10/25/36(a) | | | 7,506 | | | | 3,185,805 | |
Series2006-9, Class 2A3, (1 mo. LIBOR US + 0.160%), 2.65%, 10/25/36(a) | | | 2,503 | | | | 1,070,562 | |
Madison Park Funding X Ltd.: | | | | | | | | |
Series2012-10A, Class CR, (3 mo. LIBOR US + 2.600%), 5.36%, 01/20/29(a)(b) | | | 1,000 | | | | 999,377 | |
Series2012-10A, Class ER, (3 mo. LIBOR US + 7.620%), 10.38%, 01/20/29(a)(b) | | | 500 | | | | 498,489 | |
Madison Park Funding XI Ltd., Series2013-11A, Class ER, (3 mo. LIBOR US + 6.450%), 9.22%, 07/23/29(a)(b) | | | 500 | | | | 484,640 | |
Madison Park Funding XIII Ltd.: | | | | | | | | |
Series2014-13A, Class AR2, (3 mo. LIBOR US + 0.950%), 3.71%, 04/19/30(a)(b) | | | 940 | | | | 932,627 | |
Series2014-13A, Class ER, (3 mo. LIBOR US + 5.750%), 8.51%, 04/19/30(a)(b) | | | 1,000 | | | | 971,759 | |
Madison Park Funding XV Ltd., Series2014-15A, Class CR, (3 mo. LIBOR US + 3.450%), 6.22%, 01/27/26(a)(b) | | | 1,000 | | | | 999,837 | |
| | | | | | | | |
| Security | | Par
(000) | | | Value | |
Madison Park Funding XVIII Ltd., Series2015-18A, Class A1R, (3 mo. LIBOR US + 1.190%), 3.95%, 10/21/30(a)(b) | | $ | 1,750 | | | $ | 1,742,007 | |
Madison Park Funding XXV Ltd., Series2017-25A, Class D, (3 mo. LIBOR US + 6.100%), 8.87%, 04/25/29(a)(b) | | | 1,000 | | | | 966,247 | |
Madison Park Funding XXVI Ltd., Series2017-26A, Class AR, (3 mo. LIBOR US + 1.200%), 3.95%, 07/29/30(a)(b) | | | 1,500 | | | | 1,494,116 | |
Madison Park Funding XXX Ltd.: | | | | | | | | |
Series2018-30A, Class E, (3 mo. LIBOR US + 4.950%), 7.74%, 04/15/29(a)(b) | | | 1,000 | | | | 941,335 | |
Series2018-30X, Class E, (3 mo. LIBOR US + 4.950%), 7.74%, 04/15/29(a) | | | 250 | | | | 235,334 | |
MASTR Asset-Backed Securities Trust: | | | | | | | | |
Series2006-AM2, Class A4, (1 mo. LIBOR US + 0.260%), 2.75%, 06/25/36(a)(b) | | | 460 | | | | 410,997 | |
Series2006-HE2, Class A3, (1 mo. LIBOR US + 0.150%), 2.64%, 06/25/36(a) | | | 1,198 | | | | 646,937 | |
Series2007-HE1, Class A4, (1 mo. LIBOR US + 0.280%), 2.77%, 05/25/37(a) | | | 83 | | | | 71,284 | |
MASTR Specialized Loan Trust, Series2006-3, Class A, (1 mo. LIBOR US + 0.260%), 2.75%, 06/25/46(a)(b) | | | 32 | | | | 29,966 | |
MERIT Securities Corp., Series 13, Class M2, 7.95%, 12/28/33(e) | | | 1,496 | | | | 1,202,473 | |
Merrill Lynch First Franklin Mortgage Loan Trust, Series2007-2, Class A2C, (1 mo. LIBOR US + 0.240%), 2.73%, 05/25/37(a) | | | 2,467 | | | | 1,634,423 | |
Merrill Lynch Mortgage Investors Trust, Series 2006-OPT1, Class M1, (1 mo. LIBOR US + 0.260%), 2.75%, 08/25/37(a) | | | 1,902 | | | | 890,466 | |
MidOcean Credit CLO III, Series2014-3A, Class A3A2, (3 mo. LIBOR US + 0.970%), 3.73%, 04/21/31(a)(b) | | | 1,250 | | | | 1,227,302 | |
Mill City Solar Loan Ltd., Series2019-1A, Class A, 4.34%, 03/20/43(b)(c) | | | 2,500 | | | | 2,499,000 | |
Mosaic Solar Loan Trust: | | | | | | | | |
Series2018-2GS, Class A,
4.20%, 02/22/44(b) | | | 2,642 | | | | 2,676,359 | |
Series2019-1A, Class A, 4.37%, 12/21/43(b) | | | 4,389 | | | | 4,470,667 | |
Mountain Hawk II CLO Ltd., Series2013-2A, Class BR, (3 mo. LIBOR US + 1.600%), 4.36%, 07/20/24(a)(b) | | | 1,000 | | | | 1,000,513 | |
MP CLO VII Ltd., Series2015-1A, Class ARR, (3 mo. LIBOR US + 1.080%),
3.86%, 10/18/28(a)(b) | | | 1,150 | | | | 1,142,529 | |
Navient Private Education Loan Trust: | | | | | | | | |
Series2014-CTA, Class B, (1 mo. LIBOR US + 1.750%), 4.23%, 10/17/44(a)(b) | | | 3,095 | | | | 3,128,075 | |
Series2015-CA, Class B, 3.25%, 05/15/40(b) | | | 821 | | | | 820,834 | |
Series2018-DA, Class A2A, 4.00%, 12/15/59(b) | | | 2,000 | | | | 2,075,026 | |
Series2019-A, Class A2A,
3.42%, 01/15/43(b) | | | 4,160 | | | | 4,218,106 | |
Series2019-BA, Class A2A, 3.39%, 12/15/59(b) | | | 2,590 | | | | 2,589,845 | |
Neuberger Berman CLO XX Ltd.: | | | | | | | | |
Series2015-20A, Class AR, (3 mo. LIBOR US + 0.800%), 3.59%, 01/15/28(a)(b) | | | 525 | | | | 520,743 | |
Series2015-20A, Class DR, (3 mo. LIBOR US + 2.400%), 5.19%, 01/15/28(a)(b) | | | 1,000 | | | | 953,324 | |
| | |
| 22 | | 2 0 1 9 B L A C K R O C K A N N U A L R E P O R T T O S H A R E H O L D E R S |
| | |
Schedule of Investments (continued) March 31, 2019 | | BATS: Series A Portfolio (Percentages shown are based on Net Assets) |
| | | | | | | | |
| Security | | Par (000) | | | Value | |
Series2015-20A, Class ER, (3 mo. LIBOR US + 5.000%), 7.79%, 01/15/28(a)(b) | | $ | 750 | | | $ | 712,456 | |
Neuberger Berman Loan Advisers CLO Ltd.: | | | | | | | | |
Series2017-26A, Class A, (3 mo. LIBOR US + 1.170%), 3.95%, 10/18/30(a)(b) | | | 1,050 | | | | 1,045,777 | |
Series2018-28A, Class E, (3 mo. LIBOR US + 5.600%), 8.36%, 04/20/30(a)(b) | | | 750 | | | | 693,765 | |
Nomura Asset Acceptance Corp. Alternative Loan Trust, Series2006-S5, Class A1, (1 mo. LIBOR US + 0.400%), 2.89%, 10/25/36(a)(b) | | | 644 | | | | 577,845 | |
Oak Hill Credit Partners IX Ltd., Series2013-9A, Class DR, (3 mo. LIBOR US + 3.300%), 6.06%, 10/20/25(a)(b) | | | 750 | | | | 753,570 | |
Oakwood Mortgage Investors, Inc.: | | | | | | | | |
Series2001-D, Class A2,
5.26%, 01/15/20(d) | | | 42 | | | | 30,827 | |
Series2002-A, Class M1,
7.76%, 03/15/32(d) | | | 2,171 | | | | 1,860,666 | |
Series2002-C, Class M1,
6.89%, 11/15/32(d) | | | 2,456 | | | | 2,050,977 | |
OCP CLO Ltd.: | | | | | | | | |
Series2016-12A, Class A1R, (3 mo. LIBOR US + 1.120%), 3.90%, 10/18/28(a)(b) | | | 1,265 | | | | 1,260,023 | |
Series2016-12A, Class CR, (3 mo. LIBOR US + 3.000%), 5.78%, 10/18/28(a)(b) | | | 1,000 | | | | 956,077 | |
Octagon Investment Partners18-R Ltd., Series2018-18A, Class A1A, (3 mo. LIBOR US + 0.960%), 3.74%, 04/16/31(a)(b) | | | 2,000 | | | | 1,964,380 | |
Octagon Investment Partners 30 Ltd., Series2017-1A, Class D, (3 mo. LIBOR US + 6.200%), 8.96%, 03/17/30(a)(b) | | | 540 | | | | 527,875 | |
Octagon Investment Partners 33 Ltd., Series2017-1A, Class A1, (3 mo. LIBOR US + 1.190%), 3.95%, 01/20/31(a)(b) | | | 1,000 | | | | 993,813 | |
Octagon Investment Partners XVII Ltd., Series2013-1A, Class A1R2, (3 mo. LIBOR US + 1.000%), 3.77%, 01/25/31(a)(b) | | | 750 | | | | 738,961 | |
Octagon Investment Partners XXIII Ltd., Series2015-1A, Class CR, (3 mo. LIBOR US + 1.850%), 4.64%, 07/15/27(a)(b) | | | 1,000 | | | | 976,572 | |
OFSI Fund VI Ltd., Series2014-6A, Class A2R, (3 mo. LIBOR US + 1.130%),
3.92%, 03/20/25(a)(b) | | | 2,500 | | | | 2,477,198 | |
OHA Credit Partners XIII Ltd., Series2016-13A, Class E, (3 mo. LIBOR US + 7.150%),
9.91%, 01/21/30(a)(b) | | | 1,000 | | | | 1,001,836 | |
OHA Loan Funding Ltd.: | | | | | | | | |
Series2013-2A, Class AR, (3 mo. LIBOR US + 1.040%), 3.69%, 05/23/31(a)(b) | | | 770 | | | | 760,135 | |
Series2016-1A, Class D, (3 mo. LIBOR US + 3.750%), 6.51%, 01/20/28(a)(b) | | | 2,000 | | | | 1,996,026 | |
Series2016-1A, Class E, (3 mo. LIBOR US + 6.500%), 9.26%, 01/20/28(a)(b) | | | 1,000 | | | | 979,279 | |
OneMain Financial Issuance Trust: | | | | | | | | |
Series2015-1A, Class C,
5.12%, 03/18/26 (b) | | | 3,500 | | | | 3,535,313 | |
Series2015-2A, Class C,
4.32%, 07/18/25 (b) | | | 1,643 | | | | 1,645,729 | |
Series2015-2A, Class D,
5.64%, 07/18/25 (b) | | | 1,000 | | | | 1,004,730 | |
Series2016-1A, Class B,
4.57%, 02/20/29 (b) | | | 3,500 | | | | 3,548,273 | |
Series2019-1A, Class B,
3.79%, 02/14/31 (b) | | | 2,000 | | | | 2,019,314 | |
| | | | | | | | |
| Security | | Par (000) | | | Value | |
Option One Mortgage Loan Trust: | | | | | | | | |
Series 2007-FXD1, Class 1A1,
5.87%, 01/25/37(e) | | $ | 4,991 | | | $ | 4,654,940 | |
Series 2007-FXD1, Class 2A1,
5.87%, 01/25/37(e) | | | 4,195 | | | | 3,921,684 | |
OZLM Funding III Ltd., Series2013-3A, Class BR, (3 mo. LIBOR US + 3.000%),
5.76%, 01/22/29(a)(b) | | | 500 | | | | 500,424 | |
OZLM Funding IV Ltd.: | | | | | | | | |
Series2013-4A, Class A1R, (3 mo. LIBOR US + 1.250%), 4.01%, 10/22/30(a)(b) | | | 500 | | | | 495,825 | |
Series2013-4A, Class A2R, (3 mo. LIBOR US + 1.700%), 4.46%, 10/22/30(a)(b) | | | 500 | | | | 494,953 | |
OZLM VIII Ltd., Series2014-8A, Class BRR,
(3 mo. LIBOR US + 2.200%),
4.66%, 10/17/29(a)(b) | | | 500 | | | | 488,737 | |
OZLM XIV Ltd.: | | | | | | | | |
Series2015-14A, Class A2AR, (3 mo. LIBOR US + 1.700%), 4.49%, 01/15/29(a)(b) | | | 4,000 | | | | 3,975,819 | |
Series2015-14A, Class B1R, (3 mo. LIBOR US + 2.100%), 4.89%, 01/15/29(a)(b) | | | 1,500 | | | | 1,477,079 | |
Series2015-14A, Class CR, (3 mo. LIBOR US + 3.000%), 5.79%, 01/15/29(a)(b) | | | 1,000 | | | | 971,415 | |
Series2015-14A, Class DR, (3 mo. LIBOR US + 5.800%), 8.59%, 01/15/29(a)(b) | | | 1,375 | | | | 1,357,719 | |
OZLM XV Ltd., Series2016-15A, Class A1,
(3 mo. LIBOR US + 1.490%),
4.25%, 01/20/29(a)(b) | | | 500 | | | | 500,401 | |
OZLM XX Ltd., Series2018-20A, Class D, (3 mo. LIBOR US + 5.800%), 8.56%, 04/20/31(a)(b) | | | 1,000 | | | | 941,170 | |
Palmer Square CLO Ltd.: | | | | | | | | |
Series2014-1A, Class A1R2, (3 mo. LIBOR US + 1.130%), 3.90%, 01/17/31(a)(b) | | | 1,000 | | | | 995,033 | |
Series2014-1A, Class CR2, (3 mo. LIBOR US + 2.650%), 5.42%, 01/17/31(a)(b) | | | 400 | | | | 380,697 | |
Series2018-2A, Class D, (3 mo. LIBOR US + 5.600%), 8.38%, 07/16/31(a)(b) | | | 500 | | | | 472,758 | |
Palmer Square Loan Funding Ltd.: | | | | | | | | |
Series2018-4A, Class A1, (3 mo. LIBOR US + 0.900%), 3.58%, 11/15/26(a)(b) | | | 244 | | | | 243,433 | |
Series2018-4A, Class B, (3 mo. LIBOR US + 1.900%), 4.58%, 11/15/26(a)(b) | | | 1,000 | | | | 994,726 | |
Parallel Ltd.: | | | | | | | | |
Series2015-1A, Class AR, (3 mo. LIBOR US + 0.850%), 3.61%, 07/20/27(a)(b) | | | 1,000 | | | | 994,358 | |
Series2015-1A, Class C1R, (3 mo. LIBOR US + 1.750%), 4.51%, 07/20/27(a)(b) | | | 1,000 | | | | 967,534 | |
Park Avenue Institutional Advisers CLO Ltd.: | | | | | | | | |
Series2016-1A, Class DR, (3 mo. LIBOR US + 5.850%), 8.50%, 08/23/31(a)(b) | | | 1,500 | | | | 1,422,687 | |
Series2017-1A, Class D, (3 mo. LIBOR US + 6.220%), 8.91%, 11/14/29(a)(b) | | | 2,250 | | | | 2,178,389 | |
Preston Ridge Partners Mortgage LLC, Series2017-1A, Class A1, 4.25%, 01/25/22(b)(e) | | | 228 | | | | 229,971 | |
Pretium Mortgage Credit Partners I LLC, Series 2019-NPL1, Class A1, 4.21%, 07/25/60(b)(e) | | | 4,832 | | | | 4,847,881 | |
Progress Residential Trust: | | | | | | | | |
Series 2016-SFR2, Class A, (1 mo. LIBOR US + 1.400%), 3.88%, 01/17/34(a)(b) | | | 3,996 | | | | 4,004,827 | |
| | | | |
| S C H E D U L E S O F I N V E S T M E N T S | | | 23 | |
| | |
Schedule of Investments (continued) March 31, 2019 | | BATS: Series A Portfolio (Percentages shown are based on Net Assets) |
| | | | | | | | |
| Security | | Par (000) | | | Value | |
Series 2016-SFR2, Class E, (1 mo. LIBOR US + 3.550%), 6.03%, 01/17/34(a)(b) | | $ | 100 | | | $ | 100,172 | |
Series 2017-SFR1, Class A,
2.77%, 08/17/34(b) | | | 1,435 | | | | 1,422,893 | |
Series 2018-SFR2, Class E,
4.66%, 08/17/35(b) | | | 4,000 | | | | 4,064,905 | |
Series 2018-SFR3, Class E,
4.87%, 10/17/35(b) | | | 5,000 | | | | 5,145,102 | |
RAMP Trust, Series2007-RS1, Class A3, (1 mo. LIBOR US + 0.170%), 2.66%, 02/25/37(a) | | | 3,150 | | | | 1,604,316 | |
Regatta VI Funding Ltd.: | | | | | | | | |
Series2016-1A, Class AR, (3 mo. LIBOR US + 1.080%), 3.84%, 07/20/28(a)(b) | | | 350 | | | | 348,384 | |
Series2016-1A, Class DR, (3 mo. LIBOR US + 2.700%), 5.46%, 07/20/28(a)(b) | | | 250 | | | | 234,401 | |
Series2016-1A, Class ER, (3 mo. LIBOR US + 5.000%), 7.76%, 07/20/28(a)(b) | | | 500 | | | | 476,250 | |
Renaissance Home Equity Loan Trust, Series2005-3, Class AF4, 5.14%, 11/25/35(e) | | | 2,940 | | | | 3,033,533 | |
Rockford Tower CLO Ltd.: | | | | | | | | |
Series2017-1A, Class A, (3 mo. LIBOR US + 1.370%), 4.16%, 04/15/29(a)(b) | | | 1,500 | | | | 1,504,080 | |
Series2017-1A, Class D, (3 mo. LIBOR US + 3.250%), 6.04%, 04/15/29(a)(b) | | | 1,000 | | | | 998,322 | |
Series2017-1A, Class E, (3 mo. LIBOR US + 5.400%), 8.19%, 04/15/29(a)(b) | | | 2,350 | | | | 2,175,532 | |
Series2017-2A, Class B, (3 mo. LIBOR US + 1.750%), 4.54%, 10/15/29(a)(b) | | | 1,250 | | | | 1,237,816 | |
Series2017-2A, Class C, (3 mo. LIBOR US + 2.300%), 5.09%, 10/15/29(a)(b) | | | 1,000 | | | | 985,267 | |
Series2017-2A, Class D, (3 mo. LIBOR US + 3.450%), 6.24%, 10/15/29(a)(b) | | | 1,000 | | | | 999,630 | |
Series2017-2A, Class E, (3 mo. LIBOR US + 6.080%), 8.87%, 10/15/29(a)(b) | | | 1,500 | | | | 1,469,771 | |
Series2017-3A, Class A, (3 mo. LIBOR US + 1.190%), 3.95%, 10/20/30(a)(b) | | | 2,144 | | | | 2,126,094 | |
Series2017-3A, Class E, (3 mo. LIBOR US + 5.750%), 8.51%, 10/20/30(a)(b) | | | 2,250 | | | | 2,123,541 | |
Series2018-1A, Class E, (3 mo. LIBOR US + 5.850%), 8.49%, 05/20/31(a)(b) | | | 1,000 | | | | 946,098 | |
Series2018-2A, Class E, (3 mo. LIBOR US + 6.000%), 8.43%, 10/20/31(a)(b) | | | 1,000 | | | | 956,378 | |
RomarkWM-R Ltd., Series2018-1A, Class A1, (3 mo. LIBOR US + 1.030%),
3.79%, 04/20/31(a)(b) | | | 1,250 | | | | 1,227,694 | |
RR 3 Ltd., Series2018-3A, Class A1R2, (3 mo. LIBOR US + 1.090%), 3.88%, 01/15/30(a)(b) | | | 1,000 | | | | 989,528 | |
Seneca Park CLO Ltd., Series2014-1A, Class D, (3 mo. LIBOR US + 3.500%), 6.27%, 07/17/26(a)(b) | | | 250 | | | | 249,980 | |
Shackleton CLO Ltd.: | | | | | | | | |
Series2013-3A, Class AR, (3 mo. LIBOR US + 1.120%), 3.91%, 07/15/30(a)(b) | | | 1,000 | | | | 994,390 | |
Series2013-3A, Class DR, (3 mo. LIBOR US + 3.020%), 5.81%, 07/15/30(a)(b) | | | 500 | | | | 485,169 | |
Silver Creek CLO Ltd., Series2014-1A, Class AR, (3 mo. LIBOR US + 1.240%), 4.00%, 07/20/30(a)(b) | | | 1,500 | | | | 1,496,761 | |
SLM Private Credit Student Loan Trust: | | | | | | | | |
Series2004-A, Class B, (3 mo. LIBOR US + 0.580%), 3.19%, 06/15/33(a) | | | 682 | | | | 680,126 | |
Series2005-A, Class A4, (3 mo. LIBOR US + 0.310%), 2.92%, 12/15/38(a) | | | 2,240 | | | | 2,167,185 | |
| | | | | | | | |
| Security | | Par (000) | | | Value | |
Series2005-B, Class A4, (3 mo. LIBOR US + 0.330%), 2.94%, 06/15/39(a) | | $ | 2,146 | | | $ | 2,094,310 | |
Series2005-B, Class B, (3 mo. LIBOR US + 0.400%), 3.01%, 06/15/39(a) | | | 2,595 | | | | 2,543,000 | |
Series2005-B, Class C, (3 mo. LIBOR US + 0.700%), 3.31%, 06/15/39(a) | | | 742 | | | | 738,598 | |
Series2006-BW, Class A5, (3 mo. LIBOR US + 0.200%), 2.81%, 12/15/39(a) | | | 3,605 | | | | 3,529,645 | |
SLM Private Education Loan Trust: | | | | | | | | |
Series2013-B, Class B, 3.00%, 05/16/44(b) | | | 2,500 | | | | 2,494,641 | |
Series2013-C, Class B, 3.50%, 06/15/44(b) | | | 1,000 | | | | 998,595 | |
Series2014-A, Class B, 3.50%, 11/15/44(b) | | | 2,405 | | | | 2,413,550 | |
SMB Private Education Loan Trust: | | | | | | | | |
Series2015-C, Class B, 3.50%, 09/15/43(b) | | | 2,365 | | | | 2,375,701 | |
Series2016-B, Class A2A,
2.43%, 02/17/32 (b) | | | 3,717 | | | | 3,656,569 | |
Series2017-A, Class A2B, (1 mo. LIBOR US + 0.900%), 3.38%, 09/15/34(a)(b) | | | 4,858 | | | | 4,867,072 | |
Series2017-B, Class A2A,
2.82%, 10/15/35 (b) | | | 2,235 | | | | 2,210,458 | |
Series2017-B, Class A2B,
(1 mo. LIBOR US + 0.750%),
3.23%, 10/15/35(a)(b) | | | 3,670 | | | | 3,670,710 | |
Series2018-A, Class A2B,
(1 mo. LIBOR US + 0.800%),
3.28%, 02/15/36(a)(b) | | | 5,100 | | | | 5,092,817 | |
Series2019-A, Class A2A,
3.44%, 07/15/36(b) | | | 1,990 | | | | 2,019,742 | |
SoFi Professional Loan Program LLC: | | | | | | | | |
Series2019-A, Class A2FX,
3.69%, 06/15/48(b) | | | 3,115 | | | | 3,201,142 | |
Series2019-B, Class A2FX,
3.09%, 08/17/48(b) | | | 1,160 | | | | 1,159,935 | |
Sound Point CLO X Ltd., Series2015-3A, Class ER, (3 mo. LIBOR US + 5.250%),
8.01%, 01/20/28(a)(b) | | | 750 | | | | 724,097 | |
Sound Point CLO XIV Ltd., Series2016-3A, Class E, (3 mo. LIBOR US + 6.650%),
9.42%, 01/23/29(a)(b) | | | 1,000 | | | | 995,304 | |
Sound Point CLO XV Ltd., Series2017-1A, Class A, (3 mo. LIBOR US + 1.390%),
4.16%, 01/23/29(a)(b) | | | 1,500 | | | | 1,500,842 | |
Soundview Home Loan Trust, Series 2004-WMC1, Class M2, (1 mo. LIBOR US + 0.795%), 3.28%, 01/25/35(a) | | | 165 | | | | 158,597 | |
SpringCastle America Funding LLC, Series2016-AA, Class A, 3.05%, 04/25/29(b) | | | 1,163 | | | | 1,161,813 | |
Springleaf Funding Trust: | | | | | | | | |
Series2015-AA, Class B, 3.62%, 11/15/24(b) | | | 250 | | | | 250,084 | |
Series2016-AA, Class B, 3.80%, 11/15/29(b) | | | 3,500 | | | | 3,507,673 | |
Stanwich Mortgage Loan Co. LLC, Series 2017-NPB1, Class A1, 3.60%, 05/17/22(b)(c)(e) | | | 937 | | | | 933,954 | |
Steele Creek CLO Ltd., Series2017-1A, Class A, (3 mo. LIBOR US + 1.250%),
4.04%, 01/15/30(a)(b) | | | 250 | | | | 249,217 | |
Symphony CLO XII Ltd., Series2013-12A, Class AR, (3 mo. LIBOR US + 1.030%),
3.82%, 10/15/25(a)(b) | | | 658 | | | | 657,958 | |
| | |
| 24 | | 2 0 1 9 B L A C K R O C K A N N U A L R E P O R T T O S H A R E H O L D E R S |
| | |
Schedule of Investments (continued) March 31, 2019 | | BATS: Series A Portfolio (Percentages shown are based on Net Assets) |
| | | | | | | | |
| Security | | Par (000) | | | Value | |
Symphony CLO XIX Ltd., Series2018-19A, Class A, (3 mo. LIBOR US + 0.960%),
3.74%, 04/16/31(a)(b) | | $ | 500 | | | $ | 491,646 | |
Symphony CLO XVII Ltd., Series2016-17A, Class AR, (3 mo. LIBOR US + 0.880%),
3.67%, 04/15/28(a)(b) | | | 1,000 | | | | 995,016 | |
TCI-Flatiron CLO Ltd., Series2017-1A, Class A, (3 mo. LIBOR US + 1.200%),
3.88%, 11/17/30(a)(b) | | | 1,000 | | | | 996,581 | |
Thacher Park CLO Ltd., Series2014-1A, Class D1R, (3 mo. LIBOR US + 3.400%),
6.16%, 10/20/26(a)(b) | | | 1,000 | | | | 998,855 | |
THL Credit Wind River CLO Ltd., Series2016-1A, Class AR, (3 mo. LIBOR US + 1.050%), 3.84%, 07/15/28(a) | | | 2,000 | | | | 1,993,767 | |
TICP CLO VI Ltd., Series2016-6A, Class E,
(3 mo. LIBOR US + 6.550%),
9.34%, 01/15/29(a)(b) | | | 500 | | | | 492,630 | |
TICP CLO VII Ltd., Series2017-7A, Class E,
(3 mo. LIBOR US + 6.510%),
9.30%, 07/15/29(a)(b) | | | 1,500 | | | | 1,474,908 | |
Towd Point Mortgage Trust, Series
2019-SJ2, Class A2, 4.25%, 11/25/58(b)(c)(d) | | | 5,000 | | | | 5,029,903 | |
Treman Park CLO Ltd., Series2015-1A, Class ARR, (3 mo. LIBOR US + 1.070%),
3.83%, 10/20/28(a)(b) | | | 1,000 | | | | 998,317 | |
Tricon American Homes Trust: | | | | | | | | |
Series 2017-SFR2, Class F,
5.10%, 01/17/36 (b) | | | 4,000 | | | | 4,028,095 | |
Series 2018-SFR1, Class E,
4.56%, 05/17/37 (b) | | | 2,000 | | | | 2,001,534 | |
Trinitas CLO II Ltd., Series2014-2A, Class A1R, (3 mo. LIBOR US + 1.180%),
3.97%, 07/15/26(a)(b) | | | 803 | | | | 803,401 | |
Venture XXVI CLO Ltd., Series2017-26A, Class D, (3 mo. LIBOR US + 4.250%),
7.01%, 01/20/29(a)(b) | | | 500 | | | | 499,973 | |
Vericrest Opportunity Loan Trust: | | | | | | | | |
Series 2019-NPL2, Class A1,
3.97%, 02/25/49 (b)(e) | | | 4,958 | | | | 4,964,519 | |
Series 2019-NPL3, Class A1,
3.97%, 03/25/49 (b)(e) | | | 5,000 | | | | 5,000,000 | |
Vibrant CLO IV Ltd., Series2016-4A, Class D, (3 mo. LIBOR US + 4.500%),
7.26%, 07/20/28(a)(b) | | | 1,000 | | | | 1,004,465 | |
Vibrant CLO V Ltd., Series2016-5A, Class A,
(3 mo. LIBOR US + 1.550%), 4.31%, 01/20/29(a)(b) | | | 500 | | | | 500,607 | |
Vibrant CLO VII Ltd., Series2017-7A, Class A1, (3 mo. LIBOR US + 1.270%),
4.03%, 09/15/30(a)(b) | | | 1,000 | | | | 996,396 | |
Voya CLO Ltd.: | | | | | | | | |
Series2013-2A, Class A1R, (3 mo. LIBOR US + 0.970%), 3.74%, 04/25/31(a)(b) | | | 1,000 | | | | 982,807 | |
Series2014-3A, Class A1R, (3 mo. LIBOR US + 0.720%), 3.49%, 07/25/26(a)(b) | | | 746 | | | | 744,023 | |
Series2017-4A, Class A1, (3 mo. LIBOR US + 1.130%), 3.92%, 10/15/30(a)(b) | | | 1,000 | | | | 991,496 | |
Washington Mutual Asset-Backed Certificates Trust: | | | | | | | | |
Series2006-HE4, Class 2A2, (1 mo. LIBOR US + 0.180%), 2.67%, 09/25/36(a) | | | 273 | | | | 127,401 | |
| | | | | | | | |
| Security | | Par (000) | | | Value | |
Series2006-HE5, Class 1A, (1 mo. LIBOR US + 0.155%),
2.64%, 10/25/36(a) | | $ | 107 | | | $ | 86,542 | |
Series2007-HE2, Class 2A3, (1 mo. LIBOR US + 0.250%),
2.74%, 04/25/37(a) | | | 946 | | | | 481,273 | |
Series2007-HE2, Class 2A4, (1 mo. LIBOR US + 0.360%),
2.85%, 04/25/37(a) | | | 102 | | | | 52,619 | |
Wellfleet CLO Ltd.: | | | | | | | | |
Series2017-1A, Class A1, (3 mo. LIBOR US + 1.320%), 4.08%, 04/20/29(a)(b) | | | 1,500 | | | | 1,497,835 | |
Series2017-3A, Class A1, (3 mo. LIBOR US + 1.150%), 3.92%, 01/17/31(a)(b) | | | 1,525 | | | | 1,505,742 | |
Westcott Park CLO Ltd.: | | | | | | | | |
Series2016-1A, Class D, (3 mo. LIBOR US + 4.350%), 7.11%, 07/20/28(a)(b) | | | 500 | | | | 500,703 | |
Series2016-1A, Class E, (3 mo. LIBOR US + 7.200%), 9.96%, 07/20/28(a)(b) | | | 1,500 | | | | 1,498,457 | |
YorkCLO-2 Ltd.: | | | | | | | | |
Series2015-1A, Class AR, (3 mo. LIBOR US + 1.150%), 3.91%, 01/22/31(a)(b) | | | 1,220 | | | | 1,210,628 | |
Series2015-1A, Class ER, (3 mo. LIBOR US + 5.650%), 8.41%, 01/22/31(a)(b) | | | 1,000 | | | | 934,911 | |
YorkCLO-3 Ltd., Series2016-1A, Class AR, (3 mo. LIBOR US + 1.250%),
4.01%, 10/20/29(a)(b) | | | 1,000 | | | | 998,017 | |
| | | | | | | | |
| | |
Total Asset-Backed Securities — 58.6%
(Cost: $583,666,816) | | | | | | | 572,835,290 | |
| | | | | | | | |
| | |
| Corporate Bonds — 0.0% | | | | | | |
| | |
| Banks — 0.0% | | | | | | |
Washington Mutual Escrow Bonds : | | | | | | | | |
0.00%(c)(f)(g)(h) | | | 500 | | | | — | |
0.00%(c)(f)(g)(h) | | | 250 | | | | — | |
| | | | | | | | |
| | | | | | — | |
| | | | | | | | |
| | |
| Insurance — 0.0% | | | | | | |
Ambac Assurance Corp., 5.10%, 06/07/20(b) | | | 58 | | | | 81,128 | |
Ambac LSNI LLC, (3 mo. LIBOR US + 5.000%), 7.59%, 02/12/23(a)(b) | | | 250 | | | | 251,887 | |
| | | | | | | | |
| | | | | | | 333,015 | |
| | | | | | | | |
| | |
Total Corporate Bonds — 0.0%
(Cost: $325,789) | | | | | | | 333,015 | |
| | | | | | | | |
|
| Floating Rate Loan Interests — 2.2% | |
| | |
| Banks — 0.3% | | | | | | |
Goldman Sachs Bank USA, Term Loan B (MFA), (3 mo. LIBOR US + 0.000%,
0.25% Floor), 4.59%, 09/17/20(a)(c) | | | 2,573 | | | | 2,566,292 | |
| | | | | | | | |
| | |
| Capital Markets — 0.5% | | | | | | |
LSTAR Securities Investment Ltd., Term Loan, (1 mo. LIBOR US + 2.000%),
4.49%, 04/01/21(a)(c) | | | 5,163 | | | | 5,144,543 | |
| | | | | | | | |
| | |
| Diversified Financial Services — 0.1% | | | | | | |
Goldman Sachs Lending Partners LLC, Term Loan A (MFA), (3 mo. LIBOR US + 0.000%,
0.25% Floor), 4.59%, 08/26/20(a)(c) | | | 1,070 | | | | 1,067,790 | |
| | | | | | | | |
| | | | |
| S C H E D U L E S O F I N V E S T M E N T S | | | 25 | |
| | |
Schedule of Investments (continued) March 31, 2019 | | BATS: Series A Portfolio (Percentages shown are based on Net Assets) |
| | | | | | | | |
| Security | | Par (000) | | | Value | |
|
| Mortgage Real Estate Investment Trusts (REITs) — 0.5% | |
Chimera Special Holding LLC, Term Loan, (1 mo. LIBOR US + 2.000%),
4.49%, 10/06/19(a)(c) | | $ | 4,926 | | | $ | 4,925,844 | |
| | | | | | | | |
| |
| Thrifts & Mortgage Finance — 0.8% | | | | |
Caliber Home Loans, Inc., Term Loan, (3 mo. LIBOR US + 3.250%, 0.00% Floor),
5.74%, 04/24/21(a)(c) | | | 2,676 | | | | 2,669,673 | |
Roundpoint Mortgage Servicing Corp., Closing Date Term Loan, (1 mo. LIBOR US + 3.375%), 5.87%, 08/27/20(a)(c) | | | 4,560 | | | | 4,516,554 | |
| | | | | | | | |
| | | | | | | 7,186,227 | |
| | | | | | | | |
| |
Total Floating Rate Loan Interests — 2.2%
(Cost: $20,955,472) | | | | 20,890,696 | |
| | | | | | | | |
|
| Non-Agency Mortgage-Backed Securities — 33.6% | |
| | |
| Collateralized Mortgage Obligations — 8.7% | | | | | | |
American Home Mortgage Assets Trust: | | | | | | | | |
Series2006-4, Class 1A12, (1 mo. LIBOR US + 0.210%), 2.70%, 10/25/46(a) | | | 146 | | | | 105,247 | |
Series2006-5, Class A1, (12 mo. Federal Reserve Cumulative Average US + 0.920%), 3.32%, 11/25/46(a) | | | 1,136 | | | | 571,981 | |
Series2007-1, Class A1, (12 mo. Federal Reserve Cumulative Average US + 0.700%), 3.10%, 02/25/47(a) | | | 43 | | | | 26,564 | |
Angel Oak Mortgage Trust I LLC, Series2019-2, Class A1, 3.63%, 03/25/49(b)(d) | | | 5,000 | | | | 4,999,791 | |
APS Resecuritization Trust: | | | | | | | | |
Series2016-3, Class 3A, (1 mo. LIBOR US + 2.850%), 5.34%, 09/27/46(a)(b)(c) | | | 530 | | | | 536,784 | |
Series2016-3, Class 4A, (1 mo. LIBOR US + 2.600%), 5.09%, 04/27/47(a)(b)(c) | | | 123 | | | | 119,332 | |
ARI Investments LLC, Series2017-1, Class A, 4.48%, 01/06/25(c)(d) | | | 649 | | | | 649,317 | |
Banc of America Alternative Loan Trust, | | | | | | | | |
Series2006-4, Class 3CB1, (1 mo. LIBOR US + 0.800%), 3.29%, 05/25/46(a) | | | 1,044 | | | | 919,283 | |
Banc of America Funding Trust: | | | | | | | | |
Series2014-R2, Class 1C,
0.00%, 11/26/36(b)(d) | | | 369 | | | | 79,990 | |
Series2016-R2, Class 1A1,
4.70%, 05/01/33(b)(c)(d) | | | 504 | | | | 517,519 | |
Banc of America Mortgage Trust, Series2007-4, Class 1A1, 6.25%, 12/28/37 | | | 2,314 | | | | 2,187,467 | |
BCAP LLC Trust, Series2011-RR4, Class 3A6, 4.00%, 07/26/36(b)(d) | | | 2,700 | | | | 2,643,209 | |
Bear Stearns Asset-Backed Securities I Trust, Series2006-AC1, Class 1A2,
6.25%, 02/25/36(e) | | | 240 | | | | 213,455 | |
Bear Stearns Mortgage Funding Trust: | | | | | | | | |
Series2006-SL1, Class A1, (1 mo. LIBOR US + 0.280%), 2.77%, 08/25/36(a) | | | 1,697 | | | | 1,691,924 | |
Series2007-AR2, Class A1, (1 mo. LIBOR US + 0.170%), 2.66%, 03/25/37(a) | | | 460 | | | | 419,574 | |
Series2007-AR4, Class 2A1, (1 mo. LIBOR US + 0.210%), 2.70%, 06/25/37(a) | | | 42 | | | | 39,709 | |
Chase Mortgage Finance Trust, Series2007-S6, Class 1A1, 6.00%, 12/25/37 | | | 13,198 | | | | 9,699,795 | |
CHL Mortgage Pass-Through Trust, Series2005-J2, Class 2A4, (1 mo. LIBOR US + 1.400%), 3.89%, 08/25/35(a) | | | 1,467 | | | | 1,258,441 | |
| | | | | | | | |
| Security | | Par (000) | | | Value | |
|
| Collateralized Mortgage Obligations (continued) | |
CIM Trust, Series2017-6, Class A1,
3.02%, 06/25/57(b)(d) | | $ | 364 | | | $ | 355,662 | |
Citicorp Mortgage Securities Trust: | | | | | | | | |
Series2007-9, Class 1A1, 6.25%, 12/25/37 | | | 3,968 | | | | 3,504,995 | |
Series2008-2, Class 1A1, 6.50%, 06/25/38 | | | 553 | | | | 471,411 | |
Countrywide Alternative Loan Trust: | | | | | | | | |
Series 2005-22T1, Class A1, (1 mo. LIBOR US + 0.350%), 2.84%, 06/25/35(a) | | | 1,825 | | | | 1,595,389 | |
Series2005-51, Class 3A3A, (1 mo. LIBOR US + 0.640%), 3.13%, 11/20/35(a) | | | 838 | | | | 781,798 | |
Series2005-72, Class A3, (1 mo. LIBOR US + 0.600%), 3.09%, 01/25/36(a) | | | 625 | | | | 534,076 | |
Series2005-76, Class 2A1, (12 mo. Federal Reserve Cumulative Average US + 1.000%), 3.40%, 02/25/36(a) | | | 799 | | | | 733,712 | |
Series 2006-11CB, Class 3A1,
6.50%, 05/25/36 | | | 1,041 | | | | 811,742 | |
Series 2006-OC10, Class 2A3, (1 mo. LIBOR US + 0.230%), 2.72%, 11/25/36(a) | | | 169 | | | | 134,428 | |
Series2006-OC7, Class 2A3, (1 mo. LIBOR US + 0.250%), 2.74%, 07/25/46(a) | | | 2,326 | | | | 1,852,040 | |
Series2007-3T1, Class 1A1,
6.00%, 04/25/37 | | | 1,849 | | | | 1,313,257 | |
Series2007-9T1, Class 1A1,
6.00%, 05/25/37 | | | 266 | | | | 182,919 | |
Series2007-OA2, Class 1A1, (12 mo. Federal Reserve Cumulative Average US + 0.840%), 3.24%, 03/25/47 (a) | | | 361 | | | | 302,176 | |
Countrywide Home Loan Mortgage Pass-Through Trust, Series2007-15, Class 2A2, 6.50%, 09/25/37 | | | 939 | | | | 690,889 | |
Credit Suisse Mortgage Trust: | | | | | | | | |
Series2007-5, Class 1A11,
7.00%, 08/25/37(d) | | | 2,359 | | | | 1,904,518 | |
Series2009-12R, Class 3A1,
6.50%, 10/27/37(b) | | | 39 | | | | 22,218 | |
Series2009-5R, Class 4A4,
3.92%, 06/25/36(b)(d) | | | 1,900 | | | | 1,751,785 | |
Series2014-9R, Class 9A1,
(1 mo. LIBOR US + 0.120%),
2.61%, 08/27/36(a)(b)(c) | | | 178 | | | | 156,270 | |
Series2017-1, Class A, 4.50%, 03/25/21(b) | | | 444 | | | | 445,624 | |
DeutscheAlt-B Securities Mortgage Loan Trust, Series2006-AB3, Class A8,
6.36%, 07/25/36(d) | | | 32 | | | | 28,155 | |
GreenPoint Mortgage Funding Trust, Series2006-AR2, Class 4A1, (12 mo. Federal Reserve Cumulative Average US + 2.000%), 4.40%, 03/25/36(a) | | | 33 | | | | 31,635 | |
GSMPS Mortgage Loan Trust: | | | | | | | | |
Series2005-RP2, Class 1AF, (1 mo. LIBOR US + 0.350%), 2.84%, 03/25/35(a)(b) | | | 94 | | | | 87,664 | |
Series2006-RP1, Class 1AF1, (1 mo. LIBOR US + 0.350%), 2.84%, 01/25/36(a)(b) | | | 73 | | | | 63,712 | |
GSR Mortgage Loan Trust: | | | | | | | | |
Series2006-AR2, Class 3A1,
4.66%, 04/25/36(d) | | | 2,865 | | | | 2,533,095 | |
| | |
| 26 | | 2 0 1 9 B L A C K R O C K A N N U A L R E P O R T T O S H A R E H O L D E R S |
| | |
Schedule of Investments (continued) March 31, 2019 | | BATS: Series A Portfolio (Percentages shown are based on Net Assets) |
| | | | | | | | |
| Security | | Par (000) | | | Value | |
|
| Collateralized Mortgage Obligations (continued) | |
Series2007-1F, Class 2A4,
5.50%, 01/25/37 | | $ | 3,736 | | | $ | 3,966,803 | |
HarborView Mortgage Loan Trust, Series2007-3, Class 2A1B, (1 mo. LIBOR US + 0.230%), 2.71%, 05/19/47(a) | | | 2,063 | | | | 1,656,588 | |
IndyMac INDX Mortgage Loan Trust, Series 2007-AR19, Class 3A1, 3.74%, 09/25/37(d) | | | 358 | | | | 251,384 | |
JP Morgan Mortgage Trust, Series2005-A4, Class B1, 4.33%, 07/25/35(d) | | | 501 | | | | 497,772 | |
Lehman XS Trust, Series2007-20N, Class A1, (1 mo. LIBOR US + 1.150%),
3.64%, 12/25/37(a) | | | 60 | | | | 55,299 | |
LSTAR Securities Investment Ltd.: Series2017-8, Class A, (1 mo. LIBOR US + 1.650%), 4.15%, 11/01/22(a)(b) | | | 1,384 | | | | 1,395,606 | |
Series2017-9, Class A, (1 mo. LIBOR US + 1.550%), 4.05%, 12/01/22(a)(b) | | | 513 | | | | 513,476 | |
Series2019-1, Class A1, (1 mo. LIBOR US + 1.700%), 4.19%, 03/01/24(a)(b) | | | 5,000 | | | | 5,000,000 | |
MASTR Reperforming Loan Trust, Series2006-2, Class 1A1, 4.39%, 05/25/36(b)(d) | | | 1,796 | | | | 1,720,881 | |
Mastr Resecuritization Trust, Series2008-1, Class A1, 6.00%, 09/27/37(b)(d) | | | 1,664 | | | | 1,532,207 | |
MCM: | | | | | | | | |
Series18-NPL1, Class A,
2.08%, 06/25/58(b)(c)(d) | | | 2,124 | | | | 2,091,196 | |
Series18-NPL1, Class B,
2.08%, 06/25/58(b)(c)(d) | | | 2,730 | | | | 436,800 | |
Series18-NPL2, Class A,
4.00%, 10/25/28(b)(c) | | | 3,555 | | | | 3,517,289 | |
Series18-NPL2, Class B,
0.00%, 10/25/28(b)(c) | | | 3,490 | | | | 994,546 | |
Mortgage Loan Resecuritization Trust, Series2009-RS1, Class A85, (1 mo. LIBOR US + 0.340%), 2.83%, 04/16/36(a)(b) | | | 402 | | | | 356,884 | |
New Residential Mortgage Loan Trust, Series 2019-RPL1, Class A1, 4.34%, 02/26/24(b)(e) | | | 4,982 | | | | 5,021,714 | |
Nomura Asset Acceptance Corp. Alternative Loan Trust, Series2007-2, Class A4, (1 mo. LIBOR US + 0.420%), 2.91%, 06/25/37(a) | | | 1,047 | | | | 865,973 | |
Reperforming Loan REMIC Trust: | | | | | | | | |
Series2005-R2, Class 1AF1, (1 mo. LIBOR US + 0.340%), 2.83%, 06/25/35(a)(b) | | | 156 | | | | 149,346 | |
Series2005-R3, Class AF, (1 mo. LIBOR US + 0.400%), 2.89%, 09/25/35(a)(b) | | | 1,151 | | | | 1,060,253 | |
Seasoned Credit Risk Transfer Trust, Series2018-1, Class M, 4.75%, 05/25/57(d) | | | 1,000 | | | | 974,888 | |
STACR Trust, Series 2018-DNA2, Class M2, (1 mo. LIBOR US + 2.150%),
4.64%, 12/25/30(a)(b) | | | 1,500 | | | | 1,489,552 | |
Structured Asset Mortgage Investments II Trust, Series2006-AR5, Class 2A1, (1 mo. LIBOR US + 0.210%), 2.70%, 05/25/46(a) | | | 57 | | | | 48,701 | |
Structured Asset Securities Corp., Series2005-RF3, Class 1A, (1 mo. LIBOR US + 0.350%), 2.84%, 06/25/35(a)(b) | | | 1,337 | | | | 1,194,718 | |
SunTrust AcquisitionClosed-End Seconds Trust, Series2007-1, Class A, (1 mo. LIBOR US + 0.320%), 2.81%, 04/25/37(a) | | | 237 | | | | 231,706 | |
Washington Mutual Mortgage Pass-Through Certificates Trust: | | | | | | | | |
| | | | | | | | |
| Security | | Par (000) | | | Value | |
| |
| Collateralized Mortgage Obligations (continued) | | | | |
Series2005-AR2, Class B1,
(1 mo. LIBOR US + 0.530%),
3.02%, 01/25/45(a) | | $ | 1,406 | | | $ | 1,111,037 | |
Series2006-4, Class 1A1,
6.00%, 04/25/36 | | | 391 | | | | 356,138 | |
Series2006-4, Class 3A1,
6.50%, 05/25/36(e) | | | 189 | | | | 163,344 | |
Series2007-OA5, Class 1A, (12 mo. Federal Reserve Cumulative Average US + 0.750%), 3.15%, 06/25/47(a) | | | 910 | | | | 853,881 | |
| | | | | | | | |
| | | | | | | 84,476,534 | |
| |
| Commercial Mortgage-Backed Securities — 22.8% | | | | |
245 Park Avenue Trust: | | | | | | | | |
Series 2017-245P, Class A,
3.51%, 06/05/37(b) | | | 5,000 | | | | 5,060,255 | |
Series 2017-245P, Class E,
3.78%, 06/05/37(b)(d) | | | 369 | | | | 350,759 | |
280 Park Avenue Mortgage Trust, Series 2017-280P, Class E, (1 mo. LIBOR US + 2.119%), 4.60%, 09/15/34(a)(b) | | | 1,705 | | | | 1,710,323 | |
Americold LLC, Series 2010-ARTA, Class C,
6.81%, 01/14/29(b) | | | 500 | | | | 524,232 | |
Ashford Hospitality Trust, Series 2018-ASHF, Class D, (1 mo. LIBOR US + 2.100%),
4.58%, 04/15/35(a)(b) | | | 3,000 | | | | 2,999,981 | |
BAMLL Commercial Mortgage Securities Trust: | | | | | | | | |
Series2017-SCH, Class AL, (1 mo. LIBOR US + 0.900%), 3.38%, 11/15/32(a)(b) | | | 2,470 | | | | 2,446,412 | |
Series2019-AHT, Class C, (1 mo. LIBOR US + 2.000%), 4.50%, 03/15/34(a)(b) | | | 1,830 | | | | 1,830,000 | |
Banc of America Commercial Mortgage Trust, Series2007-1, Class AMFX,
5.42%, 01/15/49(d) | | | 11 | | | | 11,299 | |
Banc of America Merrill Lynch Commercial | | | | | | | | |
Mortgage Securities Trust: | | | | | | | | |
Series 2015-200P, Class F,
3.60%, 04/14/33(b)(d) | | | 1,294 | | | | 1,250,504 | |
Series2016-ISQ, Class E,
3.61%, 08/14/34(b)(d) | | | 300 | | | | 280,004 | |
Series2017-SCH, Class DL, (1 mo. LIBOR US + 2.000%), 4.48%, 11/15/32(a)(b) | | | 1,090 | | | | 1,090,000 | |
Bancorp Commercial Mortgage Trust: | | | | | | | | |
Series2018-CR3, Class A, (1 mo. LIBOR US + 0.850%), 3.33%, 01/15/33(a)(b) | | | 272 | | | | 269,641 | |
Series 2018-CRE4, Class A, (1 mo. LIBOR US + 0.900%), 3.38%, 09/15/35(a)(b) | | | 3,929 | | | | 3,918,789 | |
BANK, Series 2018-BN13, Class A5,
4.22%, 08/15/61(d) | | | 1,750 | | | | 1,884,007 | |
Bayview Commercial Asset Trust: | | | | | | | | |
Series2006-1A, Class A1, (1 mo. LIBOR US + 0.270%), 2.76%, 04/25/36(a)(b) | | | 5,377 | | | | 5,156,440 | |
Series2006-1A, Class A2, (1 mo. LIBOR US + 0.360%), 2.85%, 04/25/36(a)(b) | | | 30 | | | | 28,894 | |
Series2007-2A, Class A1, (1 mo. LIBOR US + 0.270%), 2.76%, 07/25/37(a)(b) | | | 63 | | | | 59,516 | |
Series2007-4A, Class A1, (1 mo. LIBOR US + 0.450%), 2.94%, 09/25/37(a)(b) | | | 5,347 | | | | 5,058,354 | |
Series2007-5A, Class A3, (1 mo. LIBOR US + 1.000%), 3.49%, 10/25/37(a)(b) | | | 2,449 | | | | 2,432,208 | |
Series2007-6A, Class A4A, (1 mo. LIBOR US + 1.500%), 3.99%, 12/25/37(a)(b) | | | 4,500 | | | | 3,788,244 | |
BBCMS Mortgage Trust: | | | | | | | | |
Series 2017-DELC, Class F, (1 mo. LIBOR US + 3.500%), 5.98%, 08/15/36(a)(b) | | | 547 | | | | 541,515 | |
| | | | |
| S C H E D U L E S O F I N V E S T M E N T S | | | 27 | |
| | |
Schedule of Investments (continued) March 31, 2019 | | BATS: Series A Portfolio (Percentages shown are based on Net Assets) |
| | | | | | | | |
| Security | | Par (000) | | | Value | |
|
| Commercial Mortgage-Backed Securities (continued) | |
Series 2018-CHRS, Class E, 4.41%, 08/05/38 (b)(d) | | $ | 1,000 | | | $ | 882,445 | |
Series 2018-TALL, Class D, (1 mo. LIBOR US + 1.449%), 3.93%, 03/15/37 (a)(b) | | | 1,100 | | | | 1,093,107 | |
BBCMS Trust: | | | | | | | | |
Series 2015-SRCH, Class A1, 3.31%, 08/10/35(b) | | | 495 | | | | 501,596 | |
Series2019-CLP, Class D, (1 mo. LIBOR US + 1.728%), 4.21%, 12/15/31(a)(b) | | | 316 | | | | 313,274 | |
Series2019-CLP, Class E, (1 mo. LIBOR US + 2.114%), 4.60%, 12/15/31(a)(b) | | | 572 | | | | 565,817 | |
Bear Stearns Commercial Mortgage Securities Trust, Series 2005-PW10, Class B, 5.61%, 12/11/40(d) | | | 876 | | | | 894,651 | |
Benchmark Mortgage Trust: | | | | | | | | |
Series2018-B5, Class A4, 4.21%, 07/15/51 | | | 3,510 | | | | 3,774,223 | |
Series2019-B10, Class 3CCA, 3.90%, 03/15/62(b)(d) | | | 349 | | | | 344,754 | |
Series2019-B9, Class A5, 4.02%, 03/15/52 | | | 544 | | | | 577,342 | |
BHMS: | | | | | | | | |
Series 2018-ATLS, Class A, (1 mo. LIBOR US + 1.250%), 3.73%, 07/15/35(a)(b) | | | 4,000 | | | | 3,993,682 | |
Series 2018-ATLS, Class C, (1 mo. LIBOR US + 1.900%), 4.38%, 07/15/35(a)(b) | | | 1,000 | | | | 998,111 | |
BWAY Mortgage Trust, Series 2013-1515, Class C, 3.45%, 03/10/33(b) | | | 250 | | | | 247,687 | |
BX Trust, Series 2018-MCSF, Class A, (1 mo. LIBOR US + 0.577%), 3.06%, 04/15/35(a)(b) | | | 1,050 | | | | 1,033,556 | |
BXP Trust: | | | | | | | | |
Series2017-GM, Class A,
3.38%, 06/13/39(b) | | | 1,480 | | | | 1,503,107 | |
Series2017-GM, Class B,
3.43%, 06/13/39(b)(d) | | | 265 | | | | 266,420 | |
CAMB Commercial Mortgage Trust, Series 2019-LIFE, Class E, (1 mo. LIBOR US + 2.150%), 4.63%, 12/15/37(a)(b) | | | 1,899 | | | | 1,907,297 | |
CCRESG Commercial Mortgage Trust, Series 2016-HEAT, Class D, 5.49%, 04/10/29(b)(d) | | | 190 | | | | 193,525 | |
CD Mortgage Trust, Series2017-CD4, Class A4, 3.51%, 05/10/50(d) | | | 5,300 | | | | 5,430,596 | |
CFCRE Commercial Mortgage Trust: | | | | | | | | |
Series2011-C1, Class C,
6.07%, 04/15/44(b)(d) | | | 1,000 | | | | 1,047,683 | |
Series2016-C4, Class C,
4.88%, 05/10/58(d) | | | 130 | | | | 134,788 | |
Series2018-TAN, Class C,
5.30%, 02/15/33(b) | | | 1,050 | | | | 1,083,272 | |
CFK Trust: | | | | | | | | |
Series2019-FAX, Class D,
4.64%, 01/15/39(b) | | | 2,500 | | | | 2,634,091 | |
Series2019-FAX, Class E,
4.64%, 01/15/39(b) | | | 2,500 | | | | 2,514,631 | |
CGBAM Commercial Mortgage Trust: | | | | | | | | |
Series 2015-SMRT, Class E,
3.79%, 04/10/28(b)(d) | | | 160 | | | | 161,394 | |
Series 2015-SMRT, Class F,
3.79%, 04/10/28(b)(d) | | | 1,000 | | | | 1,007,807 | |
CGDBB Commercial Mortgage Trust: | | | | | | | | |
Series 2017-BIOC, Class D, (1 mo. LIBOR US + 1.600%), 4.08%, 07/15/32(a)(b) | | | 1,060 | | | | 1,061,331 | |
Series 2017-BIOC, Class E, (1 mo. LIBOR US + 2.150%), 4.63%, 07/15/32(a)(b) | | | 1,290 | | | | 1,289,999 | |
| | | | | | | | |
| Security | | Par (000) | | | Value | |
|
| Commercial Mortgage-Backed Securities (continued) | |
CHT Mortgage Trust, Series 2017-CSMO, Class A, (1 mo. LIBOR US + 0.930%),
3.41%, 11/15/36(a)(b) | | $ | 230 | | | $ | 229,836 | |
Citigroup Commercial Mortgage Trust: | | | | | | | | |
Series 2013-375P, Class C,
3.52%, 05/10/35(b)(d) | | | 100 | | | | 100,176 | |
Series 2015-GC27, Class C,
4.43%, 02/10/48(d) | | | 1,000 | | | | 1,007,524 | |
Series 2015-SHP2, Class A, (1 mo. LIBOR US + 1.280%), 3.76%, 07/15/27(a)(b) | | | 1,200 | | | | 1,199,974 | |
Series 2015-SHP2, Class F, (1 mo. LIBOR US + 5.200%), 7.68%, 07/15/27(a)(b) | | | 750 | | | | 750,092 | |
Series2016-C1, Class C, 4.95%, 05/10/49(d) | | | 10 | | | | 10,639 | |
Series2016-P3, Class A4, 3.33%, 04/15/49 | | | 2,320 | | | | 2,350,845 | |
Series2016-P3, Class D,
2.80%, 04/15/49(b)(d) | | | 2,000 | | | | 1,656,707 | |
Series2017-P7, Class A4, 3.71%, 04/14/50 | | | 6,000 | | | | 6,231,897 | |
Series 2019-SMRT, Class A,
4.15%, 01/10/24(b) | | | 2,000 | | | | 2,098,566 | |
Series 2019-SMRT, Class D,
4.75%, 01/10/24(b)(d) | | | 1,000 | | | | 1,038,539 | |
Citigroup/Deutsche Bank Commercial Mortgage Trust: | | | | | | | | |
Series2006-CD3, Class AM,
5.65%, 10/15/48 | | | 1,079 | | | | 1,115,139 | |
Series2016-CD1, Class A3,
2.46%, 08/10/49 | | | 5,000 | | | | 4,806,008 | |
CLNS Trust, Series 2017-IKPR, Class E, (1 mo. LIBOR US + 3.500%), 5.99%, 06/11/32(a)(b) | | | 345 | | | | 346,294 | |
Commercial Mortgage Trust: | | | | | | | | |
Series2005-C6, Class F,
5.64%, 06/10/44(b)(d) | | | 535 | | | | 542,319 | |
Series2013-GAM, Class B,
3.42%, 02/10/28(b)(d) | | | 1,500 | | | | 1,486,056 | |
Series2013-WWP, Class D,
3.90%, 03/10/31(b) | | | 110 | | | | 114,695 | |
Series2014-TWC, Class A, (1 mo. LIBOR US + 0.850%), 3.35%, 02/13/32(a)(b) | | | 1,375 | | | | 1,375,001 | |
Series2014-TWC, Class D, (1 mo. LIBOR US + 2.250%), 4.75%, 02/13/32(a)(b) | | | 750 | | | | 750,235 | |
Series 2014-UBS4, Class C,
4.63%, 08/10/47(d) | | | 1,500 | | | | 1,519,587 | |
Series 2015-CR23, Class CMC, 3.69%, 05/10/48(b)(d) | | | 2,550 | | | | 2,546,416 | |
Series 2015-CR23, Class CMD, 3.69%, 05/10/48(b)(d) | | | 4,200 | | | | 4,186,600 | |
Series 2015-CR26, Class A4,
3.63%, 10/10/48 | | | 3,535 | | | | 3,643,904 | |
Series 2015-LC19, Class D,
2.87%, 02/10/48(b) | | | 180 | | | | 159,097 | |
Series 2016-667M, Class D,
3.18%, 10/10/36(b)(d) | | | 500 | | | | 463,854 | |
Core Industrial Trust: | | | | | | | | |
Series 2015-TEXW, Class D,
3.85%, 02/10/34(b)(d) | | | 100 | | | | 100,826 | |
Series 2015-TEXW, Class E,
3.85%, 02/10/34(b)(d) | | | 279 | | | | 279,062 | |
Series 2015-TEXW, Class F,
3.85%, 02/10/34(b)(d) | | | 1,530 | | | | 1,518,972 | |
Credit Suisse First Boston Mortgage Securities Corp.: | | | | | | | | |
| | |
| 28 | | 2 0 1 9 B L A C K R O C K A N N U A L R E P O R T T O S H A R E H O L D E R S |
| | |
Schedule of Investments (continued) March 31, 2019 | | BATS: Series A Portfolio (Percentages shown are based on Net Assets) |
| | | | | | | | |
| Security | | Par (000) | | | Value | |
|
| Commercial Mortgage-Backed Securities (continued) | |
Series2004-C4, Class F,
5.23%, 10/15/39(b)(d) | | $ | 500 | | | $ | 500,172 | |
Series2005-C1, Class F,
4.82%, 02/15/38(b) | | | 564 | | | | 563,784 | |
Credit Suisse Mortgage Trust: | | | | | | | | |
Series2016-MFF, Class A, (1 mo. LIBOR US + 1.600%), 4.08%, 11/15/33(a)(b) | | | 166 | | | | 167,017 | |
Series 2017-CHOP, Class E, (1 mo. LIBOR US + 3.300%), 5.78%, 07/15/32(a)(b) | | | 758 | | | | 759,894 | |
Series 2017-PFHP, Class A, (1 mo. LIBOR US + 0.950%), 3.43%, 12/15/30(a)(b) | | | 240 | | | | 239,165 | |
CSAIL Commercial Mortgage Trust: | | | | | | | | |
Series2016-C6, Class C,
4.75%, 01/15/49(d) | | | 10 | | | | 10,388 | |
Series 2018-CX11, Class A5, 4.03%, 04/15/51(d) | | | 4,053 | | | | 4,268,812 | |
Series2019-C15, Class A4,
4.05%, 03/15/52 | | | 2,000 | | | | 2,114,682 | |
Series2019-C15, Class D,
3.00%, 03/15/52(b) | | | 93 | | | | 75,857 | |
CSWF, Series2018-TOP, Class A, (1 mo. LIBOR US + 1.000%), 3.48%, 08/15/35(a)(b) | | | 687 | | | | 685,103 | |
Deutsche Bank UBS Mortgage Trust: | | | | | | | | |
Series 2017-BRBK, Class A,
3.45%, 10/10/34(b) | | | 2,670 | | | | 2,725,647 | |
Series 2017-BRBK, Class D,
3.53%, 10/10/34(b)(d) | | | 990 | | | | 980,167 | |
Series 2017-BRBK, Class F,
3.53%, 10/10/34(b)(c)(d) | | | 600 | | | | 548,586 | |
FREMF Mortgage Trust: | | | | | | | | |
Series2017-K64, Class B,
3.98%, 05/25/50(b)(d) | | | 990 | | | | 1,004,725 | |
Series2018-K74, Class B,
4.09%, 02/25/51(b)(d) | | | 2,150 | | | | 2,190,119 | |
GAHR Commercial Mortgage Trust, Series2015-NRF, Class EFX, 3.38%, 12/15/34(b)(d) | | | 342 | | | | 338,484 | |
GPMT Ltd., Series2018-FL1, Class A, (1 mo. LIBOR US + 0.900%), 3.39%, 11/21/35(a)(b) | | | 2,093 | | | | 2,088,738 | |
GRACE Mortgage Trust, Series 2014-GRCE, Class F, 3.59%, 06/10/28(b)(d) | | | 540 | | | | 534,501 | |
Great Wolf Trust, Series 2017-WOLF, Class A, (1 mo. LIBOR US + 0.850%),
3.48%, 09/15/34(a)(b) | | | 3,500 | | | | 3,491,242 | |
GS Mortgage Securities Corp. II: | | | | | | | | |
Series 2013-KING, Class D,
3.44%, 12/10/27(b)(d) | | | 1,000 | | | | 995,389 | |
Series 2013-KING, Class E,
3.44%, 12/10/27(b)(d) | | | 3,200 | | | | 3,177,716 | |
GS Mortgage Securities Corp. Trust: | | | | | | | | |
Series 2017-500K, Class A, (1 mo. LIBOR US + 0.700%), 3.18%, 07/15/32(a)(b) | | | 1,000 | | | | 998,142 | |
Series 2017-500K, Class F, (1 mo. LIBOR US + 1.800%), 4.28%, 07/15/32(a)(b) | | | 337 | | | | 335,656 | |
Series 2017-500K, Class G, (1 mo. LIBOR US + 2.500%), 4.98%, 07/15/32(a)(b) | | | 70 | | | | 69,634 | |
Series 2018-HULA, Class D, (1 mo. LIBOR US + 1.800%), 4.28%, 07/15/25(a)(b) | | | 1,987 | | | | 1,988,082 | |
GS Mortgage Securities Trust: | | | | | | | | |
Series 2015-GC32, Class C,
4.41%, 07/10/48(d) | | | 1,970 | | | | 2,027,646 | |
Series 2015-GC32, Class D,
3.35%, 07/10/48 | | | 93 | | | | 82,558 | |
Series2017-GS6, Class A3,
3.43%, 05/10/50 | | | 2,000 | | | | 2,026,847 | |
| | | | | | | | |
| Security | | Par (000) | | | Value | |
|
| Commercial Mortgage-Backed Securities (continued) | |
Series2017-GS7, Class A4,
3.43%, 08/10/50 | | $ | 7,000 | | | $ | 7,086,747 | |
InTown Hotel Portfolio Trust, Series 2018-STAY, Class A, (1 mo. LIBOR US + 0.700%),
3.18%, 01/15/33(a)(b) | | | 2,000 | | | | 1,988,045 | |
JPMBB Commercial Mortgage Securities Trust, Series2015-C33, Class D1,
4.12%, 12/15/48(b)(d) | | | 1,190 | | | | 1,146,534 | |
JPMDB Commercial Mortgage Securities Trust, Series2017-C5, Class D, 4.57%, 03/15/50(b)(d) | | | 280 | | | | 271,582 | |
JPMorgan Chase Commercial Mortgage Securities Trust: | | | | | | | | |
Series 2007-CB18, Class AMFL, (1 mo. LIBOR US + 0.165%), 2.67%, 06/12/47(a) | | | 10 | | | | 10,032 | |
Series2014-FL6, Class B, (1 mo. LIBOR US + 2.280%), 4.76%, 11/15/31(a)(b) | | | 4,439 | | | | 4,449,631 | |
Series2015-JP1, Class C,
4.74%, 01/15/49(d) | | | 315 | | | | 325,799 | |
Series2015-UES, Class D,
3.74%, 09/05/32(b)(d) | | | 1,000 | | | | 999,352 | |
Series2015-UES, Class E,
3.74%, 09/05/32(b)(d) | | | 600 | | | | 595,513 | |
Series2017-JP5, Class D,
4.65%, 03/15/50(b)(d) | | | 1,240 | | | | 1,208,054 | |
Series2018-PHH, Class A, (1 mo. LIBOR US + 0.910%), 3.39%, 06/15/35(a)(b) | | | 5,000 | | | | 4,988,679 | |
Series2018-WPT, Class FFX,
5.54%, 07/05/33(b) | | | 950 | | | | 956,818 | |
Lehman Brothers Small Balance Commercial Mortgage Trust, Series2007-1A, Class 1A, (1 mo. LIBOR US + 0.250%),
2.74%, 03/25/37(a)(b) | | | 289 | | | | 279,999 | |
LMREC, Inc., Series 2016-CRE2, Class A, (1 mo. LIBOR US + 1.700%), 4.19%, 11/24/31(a)(b) | | | 814 | | | | 814,447 | |
Lone Star Portfolio Trust, Series2015-LSP, Class B, (1 mo. LIBOR US + 2.850%),
5.33%, 09/15/28(a)(b) | | | 319 | | | | 319,447 | |
Merrill Lynch Mortgage Trust: | | | | | | | | |
Series 2005-CIP1, Class D,
5.60%, 07/12/38(d) | | | 2,039 | | | | 2,069,077 | |
Series 2005-MKB2, Class F,
6.32%, 09/12/42(b)(d) | | | 1,000 | | | | 1,017,638 | |
Morgan Stanley Bank of America Merrill Lynch Trust: | | | | | | | | |
Series2015-C23, Class D,
4.13%, 07/15/50(b)(d) | | | 849 | | | | 798,092 | |
Series2015-C26, Class C,
4.41%, 10/15/48(d) | | | 1,000 | | | | 1,018,188 | |
Series2015-C26, Class D,
3.06%, 10/15/48(b) | | | 578 | | | | 509,760 | |
Morgan Stanley Capital I Trust: | | | | | | | | |
Series2014-CPT, Class E,
3.45%, 07/13/29(b)(d) | | | 500 | | | | 498,846 | |
Series2014-CPT, Class F,
3.45%, 07/13/29(b)(d) | | | 100 | | | | 99,016 | |
Series2014-CPT, Class G,
3.45%, 07/13/29(b)(d) | | | 100 | | | | 98,164 | |
Series2017-CLS, Class F, (1 mo. LIBOR US + 2.600%), 5.08%, 11/15/34(a)(b) | | | 843 | | | | 838,243 | |
Series2017-H1, Class A5, 3.53%, 06/15/50 | | | 3,340 | | | | 3,413,092 | |
| | | | |
| S C H E D U L E S O F I N V E S T M E N T S | | | 29 | |
| | |
Schedule of Investments (continued) March 31, 2019 | | BATS: Series A Portfolio (Percentages shown are based on Net Assets) |
| | | | | | | | |
| Security | | Par (000) | | | Value | |
|
| Commercial Mortgage-Backed Securities (continued) | |
Series2017-H1, Class D,
2.55%, 06/15/50(b) | | $ | 1,010 | | | $ | 816,504 | |
Series 2017-JWDR, Class D, (1 mo. LIBOR US + 1.950%),
4.43%, 11/15/34(a)(b) | | | 860 | | | | 861,607 | |
Series2018-H3, Class C,
4.85%, 07/15/51(d) | | | 1,470 | | | | 1,538,182 | |
Series2018-MP, Class E,
4.28%, 07/11/40(b)(d) | | | 2,000 | | | | 1,876,181 | |
Series2018-SUN, Class D, (1 mo. LIBOR US + 1.650%),
4.13%, 07/15/35(a)(b) | | | 1,000 | | | | 991,224 | |
Series2018-SUN, Class F, (1 mo. LIBOR US + 2.550%),
5.03%, 07/15/35(a)(b) | | | 1,800 | | | | 1,787,588 | |
Series 2019-AGLN, Class D, (1 mo. LIBOR US + 1.750%),
4.25%, 03/15/34(a)(b) | | | 250 | | | | 249,952 | |
Series 2019-AGLN, Class F, (1 mo. LIBOR US + 2.600%),
5.10%, 03/15/34(a)(b) | | | 260 | | | | 259,951 | |
Series2019-L2, Class A4,
4.07%, 03/15/52 | | | 126 | | | | 134,027 | |
Morgan Stanley Capital I, Inc.: | | | | | | | | |
Series2017-HR2, Class D,
2.73%, 12/15/50 | | | 160 | | | | 133,422 | |
Series2018-H3, Class A5,
4.18%, 07/15/51 | | | 3,000 | | | | 3,212,345 | |
Natixis Commercial Mortgage Securities Trust, Series2017-75B, Class A,
3.86%, 04/09/37(b) | | | 1,850 | | | | 1,897,669 | |
Olympic Tower Mortgage Trust: | | | | | | | | |
Series2017-OT, Class D,
3.95%, 05/10/39(b)(d) | | | 1,080 | | | | 1,055,760 | |
Series2017-OT, Class E,
3.95%, 05/10/39(b)(d) | | | 498 | | | | 468,104 | |
RAIT Trust: | | | | | | | | |
Series2017-FL7, Class A, (1 mo. LIBOR US + 0.950%), 3.43%, 06/15/37(a)(b) | | | 766 | | | | 762,360 | |
Series2017-FL7, Class C, (1 mo. LIBOR US + 2.500%), 4.98%, 06/15/37(a)(b) | | | 880 | | | | 867,797 | |
Resource Capital Corp. Ltd., Series 2017-CRE5, Class B, (1 mo. LIBOR US + 2.000%), 4.48%, 07/15/34(a)(b) | | | 560 | | | | 555,240 | |
Shelter Growth CRE Issuer Ltd., Series2018-FL1, Class A, (1 mo. LIBOR US + 1.000%), 3.48%, 01/15/35(a)(b) | | | 4,009 | | | | 4,007,248 | |
VNDO Mortgage Trust, Series 2013-PENN, Class D, 3.95%, 12/13/29(b)(d) | | | 500 | | | | 501,428 | |
Wells Fargo Commercial Mortgage Trust: | | | | | | | | |
Series 2015-NXS4, Class D,
3.60%, 12/15/48(d) | | | 997 | | | | 939,408 | |
Series2016-C34, Class C,
5.03%, 06/15/49(d) | | | 40 | | | | 41,783 | |
Series 2016-NXS5, Class D,
4.88%, 01/15/59(d) | | | 750 | | | | 729,935 | |
Series2017-C39, Class D,
4.36%, 09/15/50(b)(d) | | | 750 | | | | 714,776 | |
Series 2017-HSDB, Class A, (1 mo. LIBOR US + 0.850%),
3.35%, 12/13/31(a)(b) | | | 846 | | | | 843,753 | |
Series2018-C44, Class C,
4.84%, 05/15/51(d) | | | 1,484 | | | | 1,540,446 | |
Series2018-C44, Class D,
3.00%, 05/15/51(b) | | | 1,000 | | | | 803,845 | |
Series2018-C46, Class A4,
4.15%, 08/15/51 | | | 3,740 | | | | 3,980,481 | |
Series2019-C49, Class A5,
4.02%, 03/15/52 | | | 2,796 | | | | 2,948,496 | |
| | | | | | | | |
| | | | | | | 223,085,483 | |
| | | | | | | | |
| Security | | Par (000) | | | Value | |
|
| Interest Only Commercial Mortgage-Backed Securities — 2.1% | |
B2R Mortgage Trust, Series2015-2, Class XA, 2.29%, 11/15/48(b)(d) | | $ | 6,648 | | | $ | 199,438 | |
Banc of America Commercial Mortgage Trust, Series 2017-BNK3, Class XD,
1.29%, 02/15/50(b)(d) | | | 10,000 | | | | 848,200 | |
Banc of America Merrill Lynch Commercial Mortgage Securities Trust: | | | | | | | | |
Series2017-SCH, Class XFCP,
0.15%, 11/15/19(b)(d) | | | 95,950 | | | | 96,910 | |
Series2017-SCH, Class XLCP,
0.02%, 11/15/19(b)(d) | | | 56,050 | | | | 8,407 | |
BBCMS Trust, Series 2015-SRCH, Class XB,
0.20%, 08/10/35(b)(d) | | | 12,500 | | | | 195,125 | |
Benchmark Mortgage Trust, Series2019-B9, Class XA, 1.05%, 03/15/52(d) | | | 24,993 | | | | 2,080,083 | |
BX Commercial Mortgage Trust, Series2018-IND, Class XCP, 0.17%, 11/15/35(b)(d) | | | 706,230 | | | | 714,422 | |
CFCRE Commercial Mortgage Trust, Series2016-C4, Class XA, 1.73%, 05/10/58(d) | | | 365 | | | | 33,645 | |
CFK Trust, Series2019-FAX, Class XA, 0.23%, 01/15/39(b)(c) | | | 62,648 | | | | 1,404,680 | |
Citigroup Commercial Mortgage Trust, Series 2019-SMRT, Class X, 0.51%, 01/10/24(b)(d) | | | 80,300 | | | | 1,952,551 | |
Deutsche Bank JPMorgan Mortgage Trust, Series2017-C6, Class XD,
1.00%, 06/10/50(d) | | | 11,214 | | | | 698,856 | |
GS Mortgage Securities Trust, Series 2014-GC20, Class XA, 1.06%, 04/10/47(d) | | | 666 | | | | 24,626 | |
JPMDB Commercial Mortgage Securities Trust: | | | | | | | | |
Series2016-C4, Class XC,
0.75%, 12/15/49(b)(d) | | | 8,570 | | | | 412,076 | |
Series2017-C5, Class XB,
0.31%, 03/15/50(d) | | | 30,000 | | | | 722,100 | |
JPMorgan Chase Commercial Mortgage Securities Trust, Series2016-JP3, Class XC, 0.75%, 08/15/49(b)(d) | | | 17,400 | | | | 803,880 | |
LSTAR Commercial Mortgage Trust, Series2017-5, Class X, 1.11%, 03/10/50(b)(d) | | | 12,449 | | | | 565,547 | |
Morgan Stanley Bank of America Merrill Lynch Trust, Series2014-C19, Class XF,
1.19%, 12/15/47(b)(d) | | | 220 | | | | 11,504 | |
Morgan Stanley Capital I Trust: | | | | | | | | |
Series2017-H1, Class XD,
2.20%, 06/15/50(b)(d) | | | 8,625 | | | | 1,295,302 | |
Series2018-H4, Class XA,
0.87%, 12/15/51(d) | | | 30,142 | | | | 2,010,612 | |
Series2019-L2, Class XA,
1.20%, 03/15/52(d) | | | 11,324 | | | | 941,261 | |
Olympic Tower Mortgage Trust, Series2017-OT, Class XA, 0.38%, 05/10/39(b)(d) | | | 28,100 | | | | 824,454 | |
One Market Plaza Trust: | | | | | | | | |
Series 2017-1MKT, Class XCP,
0.09%, 02/10/32(b)(d) | | | 110,000 | | | | 451,000 | |
Series 2017-1MKT, Class XNCP,
0.00%, 02/10/32(b)(c)(d) | | | 22,000 | | | | 220 | |
U.S., Series 2018-USDC, Class X,
0.32%, 05/12/38(b)(d) | | | 103,122 | | | | 3,005,470 | |
Wells Fargo Commercial Mortgage Trust: | | | | | | | | |
Series 2015-LC20, Class XB,
0.47%, 04/15/50(d) | | | 7,000 | | | | 187,881 | |
| | |
| 30 | | 2 0 1 9 B L A C K R O C K A N N U A L R E P O R T T O S H A R E H O L D E R S |
| | |
Schedule of Investments (continued) March 31, 2019 | | BATS: Series A Portfolio (Percentages shown are based on Net Assets) |
| | | | | | | | |
| Security | | Par (000) | | | Value | |
|
| Interest Only Commercial Mortgage-Backed Securities (continued) | |
Series 2016-BNK1, Class XD,
1.26%, 08/15/49(b)(d) | | $ | 1,000 | | | $ | 74,380 | |
Series2018-C44, Class XA,
0.76%, 05/15/51(d) | | | 10,639 | | | | 579,487 | |
WFRBS Commercial Mortgage Trust, Series2014-C21, Class XA,
1.07%, 08/15/47(d) | | | 10,188 | | | | 413,950 | |
| | | | | | | | |
| | | | | | | 20,556,067 | |
| | | | | | | | |
| | |
TotalNon-Agency Mortgage-Backed
Securities — 33.6%
(Cost: $327,135,010) | | | | | | | 328,118,084 | |
| | | | | | | | |
|
U.S. Government Sponsored Agency
Securities — 3.1% | |
|
| Collateralized Mortgage Obligations — 0.8% | |
Fannie Mae: | | | | | | | | |
Series2017-C03, Class 1M2, (1 mo. LIBOR US + 3.000%),
5.49%, 10/25/29(a) | | | 106 | | | | 112,029 | |
Series2017-C07, Class 1B1, (1 mo. LIBOR US + 4.000%),
6.49%, 05/25/30(a) | | | 2,000 | | | | 2,077,948 | |
Freddie Mac: | | | | | | | | |
Series 2016-DNA4, Class M3, (1 mo. LIBOR US +3.800%),
6.29%, 03/25/29(a) | | | 2,000 | | | | 2,198,121 | |
Series 2017-DNA2, Class M2, (1 mo. LIBOR US +3.450%),
5.94%, 10/25/29(a) | | | 250 | | | | 270,167 | |
Series 2017-DNA3, Class M2, (1 mo. LIBOR US + 2.500%),
4.99%, 03/25/30(a) | | | 2,494 | | | | 2,553,533 | |
Series 2018-DNA1, Class M2, (1 mo. LIBOR US + 1.800%),
4.29%, 07/25/30(a) | | | 224 | | | | 218,238 | |
| | | | | | | | |
| | | | | | | 7,430,036 | |
|
| Commercial Mortgage-Backed Securities — 1.4% | |
Fannie Mae: | | | | | | | | |
Series2017-M8, Class A2,
3.06%, 05/25/27(d) | | | 170 | | | | 171,306 | |
Series2019-M1, Class A2,
3.56%, 09/25/28(d) | | | 610 | | | | 637,607 | |
Freddie Mac: | | | | | | | | |
Series K072, Class A2,
3.44%, 12/25/27 | | | 5,000 | | | | 5,199,104 | |
Series K085, Class A2,
4.06%, 10/25/28(d) | | | 1,796 | | | | 1,955,414 | |
Series K087, Class A2,
3.77%, 12/25/28 | | | 2,951 | | | | 3,141,121 | |
Series KL4F, Class A2AS,
3.68%, 10/25/25(d) | | | 1,789 | | | | 1,853,487 | |
| | | | | | | | |
| Security | | Par (000) | | | Value | |
| | |
Commercial Mortgage-Backed Securities
(continued) | | | | | | |
Series KPLB, Class A,
2.77%, 05/25/25 | | $ | 380 | | | $ | 378,898 | |
| | | | | | | | |
| | | | | | | 13,336,937 | |
| | |
Interest Only Commercial Mortgage-Backed
Securities — 0.9% | | | | | | |
Freddie Mac, Series KW01, Class X1,
0.98%, 01/25/26(d) | | | 1,155 | | | | 61,721 | |
Ginnie Mae: | | | | | | | | |
Series2016-13, Class IO,
0.92%, 04/16/57(d) | | | 20,156 | | | | 1,299,354 | |
Series2016-36, Class IO,
0.94%, 08/16/57(d) | | | 51,632 | | | | 3,439,087 | |
Series2016-87, Class IO,
1.00%, 08/16/58(d) | | | 459 | | | | 34,605 | |
Series2016-128, Class IO,
0.95%, 09/16/56(d) | | | 5,820 | | | | 454,782 | |
Series2017-7, Class IO,
0.97%, 12/16/58(d) | | | 19,412 | | | | 1,524,331 | |
Series2017-24, Class IO,
0.86%, 12/16/56(d) | | | 38,257 | | | | 2,485,244 | |
| | | | | | | | |
| | |
| | | | | | | 9,299,124 | |
| | | | | | | | |
| | |
Total U.S. Government Sponsored Agency Securities — 3.1%
(Cost: $29,396,725) | | | | | | | 30,066,097 | |
| | | | | | | | |
| | |
Total Long-Term Investments — 97.5%
(Cost: $961,479,812) | | | | | | | 952,243,182 | |
| | | | | | | | |
| | |
| | | Shares | | | | |
| | |
| Short-Term Securities — 3.5% | | | | | | |
Dreyfus Treasury Securities Cash Management, Institutional Class, 2.27%(i) | | | 34,484,803 | | | | 34,484,803 | |
| | | | | | | | |
| | |
Total Short-Term Securities — 3.5%
(Cost: $34,484,803) | | | | | | | 34,484,803 | |
| | | | | | | | |
| | |
Total Investments — 101.0%
(Cost: $995,964,615) | | | | | | | 986,727,985 | |
| | |
Liabilities in Excess of Other Assets — (1.0)% | | | | | | | (9,441,617 | ) |
| | | | | | | | |
| | |
Net Assets — 100.0% | | | | | | $ | 977,286,368 | |
| | | | | | | | |
| (a) | Variable rate security. Rate shown is the rate in effect as of period end. |
| (b) | Security exempt from registration pursuant to Rule 144A under the Securities Act of 1933, as amended. These securities may be resold in transactions exempt from registration to qualified institutional investors. |
| (c) | Security is valued using significant unobservable inputs and is classified as Level 3 in the fair value hierarchy. |
| (d) | Variable or floating rate security, which interest rate adjusts periodically based on changes in current interest rates and prepayments on the underlying pool of assets. Rate shown is the rate in effect as of period end. |
| (e) | Step-up bond that pays an initial coupon rate for the first period and then a higher coupon rate for the following periods. Rate as of period end. |
| (f) | Issuer filed for bankruptcy and/or is in default. |
| (g) | Non-income producing security. |
| (h) | Perpetual security with no stated maturity date. |
| (i) | Annualized7-day yield as of period end. |
For Fund compliance purposes, the Fund’s industry classifications refer to one or more of the industrysub-classifications used by one or more widely recognized market indexes or ratings group indexes, and/or as defined by the investment adviser. These definitions may not apply for purposes of this report, which may combine such industrysub-classifications for reporting ease.
| | | | |
| S C H E D U L E S O F I N V E S T M E N T S | | | 31 | |
| | |
Schedule of Investments (continued) March 31, 2019 | | BATS: Series A Portfolio |
Derivative Financial Instruments Outstanding as of Period End
OTC Credit Default Swaps — Buy Protection
| | | | | | | | | | | | | | | | | | | | | | | | | | | | | | |
Reference Index | | Financing
Rate
Paid
by the
Fund | | | Payment
Frequency | | Counterparty | | Termination
Date | | Notional
Amount
(000) | | | Value | | | Upfront
Premium
Paid
(Received) | | | Unrealized
Appreciation
(Depreciation) | |
| | | | | | | | | |
CMBX.NA.9.BBB- | | | 3.00% | | | Monthly | | Morgan Stanley & Co. International
PLC | | 09/17/58 | | $ | 27 | | | $ | 1,610 | | | $ | 1,562 | | | | | | | $ | 48 | |
CMBX.NA.9.BBB- | | | 3.00% | | | Monthly | | Morgan Stanley & Co. International
PLC | | 09/17/58 | | $ | 53 | | | | 3,160 | | | | 4,293 | | | | | | | | (1,133 | ) |
CMBX.NA.6.AAA | | | 0.50% | | | Monthly | | Deutsche Bank AG | | 05/11/63 | | $ | 580 | | | | (4,350 | ) | | | 183 | | | | | | | | (4,533 | ) |
CMBX.NA.6.AAA | | | 0.50% | | | Monthly | | Deutsche Bank AG | | 05/11/63 | | $ | 513 | | | | (3,842 | ) | | | (367 | ) | | | | | | | (3,475 | ) |
CMBX.NA.6.AAA | | | 0.50% | | | Monthly | | Deutsche Bank AG | | 05/11/63 | | $ | 358 | | | | (2,682 | ) | | | 68 | | | | | | | | (2,750 | ) |
CMBX.NA.6.BBB- | | | 3.00% | | | Monthly | | J.P. Morgan Securities LLC | | 05/11/63 | | $ | 40 | | | | 5,056 | | | | 2,511 | | | | | | | | 2,545 | |
| | | | | | | | | | | | | | | | | | | | | | | | | | | | | | |
| | | | | | | | | | | | | | | | $ | (1,048 | ) | | $ | 8,250 | | | | | | | $ | (9,298 | ) |
| | | | | | | | | | | | | | | | | | | | | | | | | | | | | | |
OTC Credit Default Swaps — Sell Protection
| | | | | | | | | | | | | | | | | | | | | | | | | | | | |
| |
Reference Index | | Financing
Rate
Received
by the
Fund | | | Payment
Frequency | | Counterparty | | Termination
Date | | Credit
Rating(a) | | Notional
Amount
(000)(b) | | | Value | | | Upfront
Premium
Paid
(Received) | | | Unrealized
Appreciation
(Depreciation) | |
| |
| | | | | | | | | |
CMBX.NA.8.A | | | 2.00 | % | | Monthly | | Morgan Stanley & Co. International PLC | | 10/17/57 | | Not Rated | | | $ 78 | | | | $ 111 | | | | $ (7,273 | ) | | | $ 7,384 | |
CMBX.NA.9.BBB- | | | 3.00 | % | | Monthly | | Credit Suisse International | | 9/17/58 | | Not Rated | | | $ 171 | | | | (10,197 | ) | | | (14,994 | ) | | | 4,797 | |
CMBX.NA.9.BBB- | | | 3.00 | % | | Monthly | | Deutsche Bank AG | | 9/17/58 | | Not Rated | | | $4,620 | | | | (275,493 | ) | | | (576,991 | ) | | | 301,498 | |
CMBX.NA.10.BBB- | | | 3.00 | % | | Monthly | | Deutsche Bank AG | | 11/17/59 | | BBB- | | | $1,000 | | | | (52,771 | ) | | | (87,184 | ) | | | 34,413 | |
CMBX.NA.10.BBB- | | | 3.00 | % | | Monthly | | Deutsche Bank AG | | 11/17/59 | | BBB- | | | $ 500 | | | | (26,385 | ) | | | (52,583 | ) | | | 26,198 | |
CMBX.NA.6.BBB- | | | 3.00 | % | | Monthly | | Credit Suisse International | | 5/11/63 | | BBB- | | | $ 40 | | | | (5,056 | ) | | | (3,132 | ) | | | (1,924 | ) |
| | | | | | | | | | | | | | | | | | | | | | | | | | | | |
| | | | | | | | | | | | | | | | | | | $(369,791 | ) | | | $(742,157 | ) | | | $372,366 | |
| | | | | | | | | | | | | | | | | | | | | | | | | | | | |
| | (a) | Using S&P’s rating of the issuer or the underlying securities of the index, as applicable. | |
| | (b) | The maximum potential amount the Fund may pay should a negative credit event take place as defined under the terms of the agreement. | |
Balances Reported in the Statements of Assets and Liabilities for OTC Swaps
| | | | | | | | | | | | | | | | |
| |
| | | Swap Premiums
Paid | | | Swap Premiums
Received | | | Unrealized
Appreciation | | | Unrealized
Depreciation | |
| |
OTC Swaps | | | $8,617 | | | | $742,524 | | | | $376,883 | | | | $13,815 | |
| |
| | |
| 32 | | 2 0 1 9 B L A C K R O C K A N N U A L R E P O R T T O S H A R E H O L D E R S |
| | |
Schedule of Investments (continued) March 31, 2019 | | BATS: Series A Portfolio |
Derivative Financial Instruments Categorized by Risk Exposure
As of period end, the fair values of derivative financial instruments located in the Statements of Assets and Liabilities were as follows:
| | | | | | | | | | | | | | | | | | | | | | | | | | | | | | | | |
| Assets — Derivative Financial Instruments | | | | | Commodity
Contracts | | | Credit
Contracts | | | Equity
Contracts | | | Foreign
Currency
Exchange
Contracts | | | Interest
Rate
Contracts | | | Other
Contracts | | | Total | |
Swaps — OTC | |
| Unrealized
appreciation on
OTC swaps;
Swap premiums
paid |
| | $ | — | | | $ | 385,500 | | | $ | — | | | $ | — | | | $ | — | | | $ | — | | | $ | 385,500 | |
| | | | | | | | | | | | | | | | | | | | | | | | | | | | | | | | |
| | | | | | | | | | | | | | | | | | | | | | | | | | | | | | | | |
| Liabilities — Derivative Financial Instruments | | | | | | | | | | | | | | | | | | | | | | | | |
Swaps — OTC | |
| Unrealized
depreciation on
OTC swaps;
Swap premiums
received |
| | $ | — | | | $ | 756,339 | | | $ | — | | | $ | — | | | $ | — | | | $ | — | | | $ | 756,339 | |
| | | | | | | | | | | | | | | | | | | | | | | | | | | | | | | | |
For the year ended March 31, 2019, the effect of derivative financial instruments in the Statements of Operations was as follows:
| | | | | | | | | | | | | | | | | | | | | | | | | | | | |
| Net Realized Gain from: | | Commodity
Contracts | | | Credit
Contracts | | | Equity
Contracts | | | Foreign
Currency
Exchange
Contracts | | | Interest
Rate
Contracts | | | Other
Contracts | | | Total | |
Swaps | | $ | — | | | $ | 390,118 | | | $ | — | | | $ | — | | | $ | — | | | $ | — | | | $ | 390,118 | |
| | | | | | | | | | | | | | | | | | | | | | | | | | | | |
| | | | | | | | | | | | | | | | | | | | | | | | | | | | |
| Net Change in Unrealized Appreciation (Depreciation) on: | | | | | | | | | | | | | | | | | | | | | |
Swaps | | $ | — | | | $ | 347,942 | | | $ | — | | | $ | — | | | $ | — | | | $ | — | | | $ | 347,942 | |
| | | | | | | | | | | | | | | | | | | | | | | | | | | | |
Average Quarterly Balances of Outstanding Derivative Financial Instruments
| | | | |
| |
Credit default swaps: | | | | |
Average notional value — buy protection | | $ | 3,790,000 | |
Average notional value — sell protection | | | 7,124,750 | |
| |
For more information about the Fund’s investment risks regarding derivative financial instruments, refer to the Notes to Financial Statements.
Derivative Financial Instruments — Offsetting as of Period End
The Fund’s derivative assets and liabilities (by type) were as follows:
| | | | | | | | |
| | | Assets | | | | Liabilities | |
| |
Derivative Financial Instruments: | | | | | | | | |
Swaps — OTC(a) | | $ | 385,500 | | | $ | 756,339 | |
| | | | | | | | |
Total derivative assets and liabilities in the Statements of Assets and Liabilities | | $ | 385,500 | | | $ | 756,339 | |
Derivatives not subject to a Master Netting Agreement or similar agreement (“MNA”) | | | — | | | | — | |
| | | | | | | | |
Total derivative assets and liabilities subject to an MNA | | $ | 385,500 | | | $ | 756,339 | |
| | | | | | | | |
| | (a) | Includes unrealized appreciation (depreciation) on OTC swaps and swap premiums paid/received in the Statements of Assets and Liabilities. | |
| | | | |
| S C H E D U L E S O F I N V E S T M E N T S | | | 33 | |
| | |
Schedule of Investments (continued) March 31, 2019 | | BATS: Series A Portfolio |
The following tables present the Fund’s derivative assets and liabilities by counterparty net of amounts available for offset under an MNA and net of the related collateral received and pledged by the Fund:
| | | | | | | | | | | | | | | | | | | | |
| Counterparty | | Derivative
Assets
Subject to
an MNA by
Counterparty | | | Derivatives
Available
for Offset(a) | | | Non-cash
Collateral
Received | | | Cash
Collateral
Received | | | Net Amount
of
Derivative
Assets(b) | |
Credit Suisse International | | $ | 4,797 | | | $ | (4,797 | ) | | $ | — | | | $ | — | | | $ | — | |
Deutsche Bank AG | | | 362,360 | | | | (362,360 | ) | | | — | | | | — | | | | — | |
J.P. Morgan Securities LLC | | | 5,056 | | | | — | | | | — | | | | — | | | | 5,056 | |
Morgan Stanley & Co. International PLC | | | 13,287 | | | | (8,406 | ) | | | — | | | | — | | | | 4,881 | |
| | | | | | | | | | | | | | | | | | | | |
| | $ | 385,500 | | | $ | (375,563 | ) | | $ | — | | | $ | — | | | $ | 9,937 | |
| | | | | | | | | | | | | | | | | | | | |
| | | | | |
| Counterparty | | Derivative
Liabilities
Subject to
an MNA by
Counterparty | | | Derivatives
Available
for Offset(a) | | | Non-cash
Collateral
Pledged | | | Cash
Collateral
Pledged(c) | | | Net Amount
of
Derivative
Liabilities(d) | |
Credit Suisse International | | $ | 20,050 | | | $ | (4,797 | ) | | $ | — | | | $ | — | | | $ | 15,253 | |
Deutsche Bank AG | | | 727,883 | | | | (362,360 | ) | | | — | | | | (365,523 | ) | | | — | |
Morgan Stanley & Co. International PLC | | | 8,406 | | | | (8,406 | ) | | | — | | | | — | | | | — | |
| | | | | | | | | | | | | | | | | | | | |
| | $ | 756,339 | | | $ | (375,563 | ) | | $ | — | | | $ | (365,523 | ) | | $ | 15,253 | |
| | | | | | | | | | | | | | | | | | | | |
| | (a) | The amount of derivatives available for offset is limited to the amount of derivative assets and/or liabilities that are subject to an MNA. | |
| | (b) | Net amount represents the net amount receivable from the counterparty in the event of default. | |
| | (c) | Excess of collateral pledged to the individual counterparty is not shown for financial reporting purposes. | |
| | (d) | Net amount represents the net amount payable due to the counterparty in the event of default. | |
Fair Value Hierarchy as of Period End
Various inputs are used in determining the fair value of investments and derivative financial instruments. For information about the Fund’s policy regarding valuation of investments and derivative financial instruments, refer to the Notes to Financial Statements.
The following tables summarize the Fund’s investments and derivative financial instruments categorized in the disclosure hierarchy:
| | | | | | | | | | | | | | | | |
| |
| | | Level 1 | | | | Level 2 | | | | Level 3 | | | | Total | |
| |
Assets: | | | | | | | | | | | | | | | | |
Investments: | | | | | | | | | | | | | | | | |
Long-Term Investments: | | | | | | | | | | | | | | | | |
Asset-Backed Securities | | $ | — | | | $ | 542,647,194 | | | $ | 30,188,096 | | | $ | 572,835,290 | |
Corporate Bonds(a) | | | — | | | | 333,015 | | | | — | | | | 333,015 | |
Floating Rate Loan Interests(a) | | | — | | | | — | | | | 20,890,696 | | | | 20,890,696 | |
Non-Agency Mortgage-Backed Securities | | | — | | | | 317,145,545 | | | | 10,972,539 | | | | 328,118,084 | |
U.S. Government Sponsored Agency Securities | | | — | | | | 30,066,097 | | | | — | | | | 30,066,097 | |
Short-Term Securities | | | 34,484,803 | | | | — | | | | — | | | | 34,484,803 | |
| | | | | | | | | | | | | | | | |
| | $ | 34,484,803 | | | $ | 890,191,851 | | | $ | 62,051,331 | | | $ | 986,727,985 | |
| | | | | | | | | | | | | | | | |
Derivative Financial Instruments(b) | | | | | | | | | | | | | | | | |
Assets: | | | | | | | | | | | | | | | | |
Credit contracts | | $ | — | | | $ | 376,883 | | | $ | — | | | $ | 376,883 | |
Liabilities: | | | | | | | | | | | | | | | | |
Credit contracts | | | — | | | | (13,815 | ) | | | — | | | | (13,815 | ) |
| | | | | | | | | | | | | | | | |
| | $ | — | | | $ | 363,068 | | | $ | — | | | $ | 363,068 | |
| | | | | | | | | | | | | | | | |
| | (a) | See above Schedule of Investments for values in each industry. | |
| | (b) | Derivative financial instruments are swaps, which are valued at the unrealized appreciation (depreciation) on the instrument. | |
During the year ended March 31, 2019, there were no transfers between Level 1 and Level 2.
| | |
| 34 | | 2 0 1 9 B L A C K R O C K A N N U A L R E P O R T T O S H A R E H O L D E R S |
| | |
Schedule of Investments (continued) March 31, 2019 | | BATS: Series A Portfolio |
A reconciliation of Level 3 investments is presented when the Fund had a significant amount of Level 3 investments at the beginning and/or end of the period in relation to net assets. The following table is a reconciliation of Level 3 investments for which significant unobservable inputs were used in determining fair value:
| | | | | | | | | | | | | | | | |
| |
| |
| Asset-Backed
Securities |
| |
| Floating Rate
Loan Interests |
| |
| Non-Agency
Mortgage-Backed
Securities |
| | | Total | |
| |
Assets: | | | | | | | | | | | | | | | | |
Opening Balance, as of March 31, 2018 | | $ | 6,206,056 | | | $ | 3,143,637 | | | $ | 7,686,343 | | | $ | 17,036,036 | |
Transfers into Level 3 | | | — | | | | 2,337,305 | | | | — | | | | 2,337,305 | |
Transfers out of Level 3 | | | (2,636,967 | ) | | | — | | | | (2,316,462 | ) | | | (4,953,429 | ) |
Accrued discounts/premiums | | | 342,494 | | | | 6,619 | | | | 12,324 | | | | 361,437 | |
Net realized gain (loss) | | | (42,727 | ) | | | 26,567 | | | | 93,012 | | | | 76,852 | |
Net change in unrealized appreciation (depreciation)(a)(b) | | | (1,043,321 | ) | | | (258,306 | ) | | | (1,413,594 | ) | | | (2,715,221 | ) |
Purchases | | | 32,172,970 | | | | 23,709,624 | | | | 9,336,759 | | | | 65,219,353 | |
Sales | | | (4,810,409 | ) | | | (8,074,750 | ) | | | (2,425,843 | ) | | | (15,311,002 | ) |
| | | | | | | | | | | | | | | | |
Closing Balance, as of March 31, 2019 | | $ | 30,188,096 | | | $ | 20,890,696 | | | $ | 10,972,539 | | | $ | 62,051,331 | |
| | | | | | | | | | | | | | | | |
Net change in unrealized appreciation (depreciation) on investments still held at March 31, 2019(b) | | $ | (1,042,754 | ) | | $ | (213,911 | ) | | $ | (459,536 | ) | | $ | (1,716,201 | ) |
| | | | | | | | | | | | | | | | |
| | (a) | Included in the related net change in unrealized appreciation (depreciation) in the Statements of Operations. | |
| | (b) | Any difference between net change in unrealized appreciation (depreciation) and net change in unrealized appreciation (depreciation) on investments still held at March 31, 2019 is generally due to investments no longer held or categorized as Level 3 at period end. | |
The Fund’s investments that are categorized as Level 3 were valued utilizing third party pricing information without adjustment. Such valuations are based on unobservable inputs. A significant change in third party information could result in a significantly lower or higher value of such Level 3 investments.
See notes to financial statements.
| | | | |
| S C H E D U L E S O F I N V E S T M E N T S | | | 35 | |
| | |
Schedule of Investments March 31, 2019 | | BATS: Series C Portfolio (Percentages shown are based on Net Assets) |
| | | | | | | | |
| Security | | Par
(000) | | | Value | |
|
| Capital Trusts — 3.8% | |
|
| Banks — 1.9% | |
HSBC Holdings PLC, (USD Swap Rate 11:00 am NY 1 + 3.746%), 6.00%(a)(b) | | $ | 520 | | | $ | 515,580 | |
JPMorgan Chase & Co.: | | | | | | | | |
(3 mo. LIBOR US + 3.330%), 6.10%(a)(b) | | | 208 | | | | 218,400 | |
(3 mo. LIBOR US + 3.470%), 6.22%(a)(b) | | | 358 | | | | 359,790 | |
(3 mo. LIBOR US + 3.780%), 6.75%(a)(b) | | | 925 | | | | 1,014,105 | |
Lloyds Banking Group PLC, (5 yr. Swap Semi 30/360 US + 4.496%), 7.50%(a)(b) | | | 780 | | | | 791,466 | |
Nordea Bank Abp, (5 yr. US Treasury Yield | | | | | | | | |
Curve Rate T Note Constant Maturity + 4.110%), 6.63%(a)(b)(c) | | | 740 | | | | 738,150 | |
U.S. Bancorp, Series J, (3 mo. LIBOR US + 2.914%), 5.30%(a)(b) | | | 1,075 | | | | 1,093,813 | |
Wells Fargo & Co.: | | | | | | | | |
(3 mo. LIBOR US + 3.990%), 5.88%(a)(b) | | | 1,550 | | | | 1,656,175 | |
(3 mo. LIBOR US + 3.770%), 6.38%(a)(b) | | | 817 | | | | 822,106 | |
| | | | | | | | |
| | | | | | | 7,209,585 | |
|
| Capital Markets — 0.3% | |
State Street Corp.: | | | | | | | | |
(3 mo. LIBOR US + 3.597%), 5.25%(a)(b) | | | 315 | | | | 321,694 | |
(3 mo. LIBOR US + 2.539%), 5.63%(a)(b) | | | 735 | | | | 740,513 | |
| | | | | | | | |
| | | | | | | 1,062,207 | |
|
| Electric Utilities — 0.2% | |
Exelon Corp., 3.50%, 06/01/22 | | | 785 | | | | 792,993 | |
|
| Insurance — 0.5% | |
Allstate Corp., (3 mo. LIBOR US + 2.938%), 5.75%, 08/15/53(a) | | | 835 | | | | 843,350 | |
MetLife, Inc., (3 mo. LIBOR US + 3.575%),
5.25%(a)(b) | | | 900 | | | | 907,506 | |
| | | | | | | | |
| | | | | | | 1,750,856 | |
|
| Media — 0.6% | |
NBCUniversal Enterprise, Inc., 5.25%(b)(c) | | | 2,200 | | | | 2,233,000 | |
|
| Oil, Gas & Consumable Fuels — 0.3% | |
Enbridge, Inc., (3 mo. LIBOR US + 3.641%), 6.25%, 03/01/78(a) | | | 780 | | | | 775,730 | |
TransCanada Trust: | | | | | | | | |
(3 mo. LIBOR US + 3.528%),
5.63%, 05/20/75(a) | | | 359 | | | | 350,994 | |
(3 mo. LIBOR US + 4.640%),
5.88%, 08/15/76(a) | | | 120 | | | | 121,746 | |
| | | | | | | | |
| | | | | | | 1,248,470 | |
| | |
Total Capital Trusts — 3.8%
(Cost: $14,284,915) | | | | | | | 14,297,111 | |
| | | | | | | | |
| | |
Corporate Bonds — 86.7% | | | | | | | | |
| | |
| Aerospace & Defense — 2.3% | | | | | | |
Harris Corp., 4.40%, 06/15/28 | | | 955 | | | | 1,004,355 | |
Lockheed Martin Corp.: | | | | | | | | |
3.10%, 01/15/23 | | | 95 | | | | 96,053 | |
3.55%, 01/15/26 | | | 145 | | | | 149,651 | |
4.07%, 12/15/42 | | | 575 | | | | 585,722 | |
4.09%, 09/15/52 | | | 124 | | | | 125,981 | |
Northrop Grumman Corp., 3.25%, 01/15/28 | | | 910 | | | | 894,805 | |
Northrop Grumman Systems Corp., 7.88%, 03/01/26 | | | 1,000 | | | | 1,256,531 | |
Rockwell Collins, Inc.: | | | | | | | | |
1.95%, 07/15/19 | | | 180 | | | | 179,545 | |
3.20%, 03/15/24 | | | 550 | | | | 547,648 | |
3.50%, 03/15/27 | | | 520 | | | | 513,441 | |
4.35%, 04/15/47 | | | 240 | | | | 236,637 | |
United Technologies Corp.: | | | | | | | | |
3.35%, 08/16/21 | | | 140 | | | | 141,873 | |
| | | | | | | | |
| Security | | Par
(000) | | | Value | |
|
| Aerospace & Defense (continued) | |
2.30%, 05/04/22 | | $ | 105 | | | $ | 103,411 | |
3.10%, 06/01/22 | | | 810 | | | | 815,226 | |
3.65%, 08/16/23 | | | 410 | | | | 420,850 | |
4.13%, 11/16/28 | | | 710 | | | | 737,631 | |
6.05%, 06/01/36 | | | 450 | | | | 535,110 | |
4.50%, 06/01/42 | | | 340 | | | | 351,429 | |
| | | | | | | | |
| | | | | | | 8,695,899 | |
| | |
| Air Freight & Logistics — 0.3% | | | | | | |
FedEx Corp.: | | | | | | | | |
3.25%, 04/01/26 | | | 120 | | | | 119,409 | |
4.10%, 02/01/45 | | | 475 | | | | 428,549 | |
4.40%, 01/15/47 | | | 597 | | | | 560,912 | |
| | | | | | | | |
| | | | | | | 1,108,870 | |
|
| Airlines — 0.8% | |
Air Canada Pass-Through Trust, Series 2017, | | | | | | | | |
Class 1AA, 3.30%, 07/15/31(c) | | | 124 | | | | 120,237 | |
American Airlines Pass-Through Trust: | | | | | | | | |
Series2014-1, Class B, 4.38%, 04/01/24 | | | 99 | | | | 99,225 | |
Series2017-1, Class AA, 3.65%, 08/15/30 | | | 720 | | | | 723,346 | |
Delta Air Lines, Inc., 3.80%, 04/19/23 | | | 880 | | | | 889,247 | |
Doric Nimrod Air Alpha Pass-Through Trust, | | | | | | | | |
Series2013-1, Class A, 5.25%, 05/30/25(c) | | | 538 | | | | 547,264 | |
U.S. Airways Pass-Through Trust, | | | | | | | | |
Series2013-1, Class A, 3.95%, 05/15/27 | | | 664 | | | | 673,667 | |
Virgin Australia Trust, Series2013-1A, 5.00%, 04/23/25(c) | | | 74 | | | | 75,690 | |
| | | | | | | | |
| | | | | | | 3,128,676 | |
|
| Auto Components — 0.2% | |
ZF North America Capital, Inc., 4.75%, 04/29/25(c) | | | 600 | | | | 582,745 | |
| | | | | | | | |
| | |
| Automobiles — 0.8% | | | | | | |
Ford Motor Co.: | | | | | | | | |
4.35%, 12/08/26 | | | 366 | | | | 339,710 | |
4.75%, 01/15/43 | | | 186 | | | | 145,760 | |
5.29%, 12/08/46 | | | 128 | | | | 107,247 | |
General Motors Co.: | | | | | | | | |
5.00%, 10/01/28 | | | 435 | | | | 433,874 | |
5.20%, 04/01/45 | | | 535 | | | | 475,234 | |
Volkswagen Group of America Finance LLC, 3.88%, 11/13/20(c) | | | 1,275 | | | | 1,291,373 | |
| | | | | | | | |
| | | | | | | 2,793,198 | |
|
| Banks — 14.0% | |
Banco Santander SA: | | | | | | | | |
3.13%, 02/23/23 | | | 800 | | | | 790,607 | |
3.85%, 04/12/23 | | | 200 | | | | 201,703 | |
Bank of America Corp.: | | | | | | | | |
(3 mo. LIBOR US + 0.630%), 3.50%, 05/17/22(a) | | | 800 | | | | 809,366 | |
4.20%, 08/26/24 | | | 1,610 | | | | 1,666,306 | |
4.00%, 01/22/25 | | | 605 | | | | 617,000 | |
(3 mo. LIBOR US + 0.970%), 3.46%, 03/15/25(a) | | | 2,565 | | | | 2,590,530 | |
3.95%, 04/21/25 | | | 790 | | | | 803,560 | |
4.45%, 03/03/26 | | | 2,305 | | | | 2,402,172 | |
(3 mo. LIBOR US + 1.512%), 3.71%, 04/24/28(a) | | | 285 | | | | 286,277 | |
(3 mo. LIBOR US + 1.070%), 3.97%, 03/05/29(a) | | | 1,475 | | | | 1,501,837 | |
(3 mo. LIBOR US + 1.190%), 3.95%, 01/23/49(a) | | | 500 | | | | 488,474 | |
Barclays Bank PLC, 5.14%, 10/14/20 | | | 300 | | | | 308,016 | |
Barclays PLC: | | | | | | | | |
(3 mo. LIBOR US + 1.400%), 4.61%, 02/15/23(a) | | | 1,510 | | | | 1,541,145 | |
| | |
| 36 | | 2 0 1 9 B L A C K R O C K A N N U A L R E P O R T T O S H A R E H O L D E R S |
| | |
Schedule of Investments (continued) March 31, 2019 | | BATS: Series C Portfolio (Percentages shown are based on Net Assets) |
| | | | | | | | |
| Security | | Par
(000) | | | Value | |
| | |
| Banks (continued) | | | | | | |
4.84%, 05/09/28 | | $ | 210 | | | $ | 207,735 | |
(3 mo. LIBOR US + 1.902%),
4.97%, 05/16/29(a) | | | 200 | | | | 206,753 | |
BNP Paribas SA: | | | | | | | | |
3.50%, 03/01/23(c) | | | 900 | | | | 900,075 | |
(5 yr. Swap Semi 30/360 US + 1.483%), 4.38%, 03/01/33 (a)(c) | | | 645 | | | | 633,856 | |
Citigroup, Inc.: | | | | | | | | |
(3 mo. LIBOR US + 1.563%),
3.89%, 01/10/28(a) | | | 425 | | | | 431,581 | |
(3 mo. LIBOR US + 1.390%),
3.67%, 07/24/28(a) | | | 160 | | | | 159,587 | |
(3 mo. LIBOR US + 1.192%),
4.08%, 04/23/29(a) | | | 820 | | | | 841,319 | |
(3 mo. LIBOR US + 1.338%),
3.98%, 03/20/30(a) | | | 610 | | | | 620,132 | |
4.75%, 05/18/46 | | | 550 | | | | 569,872 | |
4.65%, 07/23/48 | | | 225 | | | | 241,218 | |
Citizens Bank N.A., 2.55%, 05/13/21 | | | 330 | | | | 327,660 | |
Cooperatieve Rabobank UA: | | | | | | | | |
3.13%, 04/26/21 | | | 670 | | | | 673,007 | |
4.63%, 12/01/23 | | | 700 | | | | 731,208 | |
Danske Bank A/S, 5.00%, 01/12/22(c) | | | 555 | | | | 569,174 | |
Discover Bank: | | | | | | | | |
3.35%, 02/06/23 | | | 300 | | | | 301,621 | |
(5 yr. Swap Semi 30/360 US + 1.730%),
4.68%, 08/09/28(a) | | | 600 | | | | 610,464 | |
HSBC Holdings PLC: | | | | | | | | |
(3 mo. LIBOR US + 1.055%),
3.26%, 03/13/23(a) | | | 985 | | | | 987,408 | |
(3 mo. LIBOR US + 1.211%),
3.80%, 03/11/25(a) | | | 865 | | | | 876,836 | |
4.25%, 08/18/25 | | | 500 | | | | 510,597 | |
(3 mo. LIBOR US + 1.348%),
4.29%, 09/12/26(a) | | | 500 | | | | 515,617 | |
4.38%, 11/23/26 | | | 270 | | | | 276,570 | |
Huntington Bancshares, Inc., 4.00%, 05/15/25 | | | 905 | | | | 941,164 | |
ING Bank NV, 2.50%, 10/01/19(c) | | | 950 | | | | 948,697 | |
ING Groep NV, (3 mo. LIBOR US + 1.150%), 3.75%, 03/29/22(d) | | | 1,040 | | | | 1,044,411 | |
Intesa Sanpaolo SpA: | | | | | | | | |
3.38%, 01/12/23(c) | | | 485 | | | | 473,396 | |
5.02%, 06/26/24(c) | | | 416 | | | | 402,101 | |
JPMorgan Chase & Co.: | | | | | | | | |
2.25%, 01/23/20 | | | 1,800 | | | | 1,793,434 | |
2.30%, 08/15/21 | | | 665 | | | | 657,285 | |
(3 mo. LIBOR US + 1.000%),
4.02%, 12/05/24(a) | | | 900 | | | | 934,005 | |
(3 mo. LIBOR US + 1.245%),
3.96%, 01/29/27(a) | | | 1,055 | | | | 1,089,483 | |
(3 mo. LIBOR US + 1.337%),
3.78%, 02/01/28(a) | | | 800 | | | | 814,964 | |
(3 mo. LIBOR US + 1.120%),
4.01%, 04/23/29(a) | | | 340 | | | | 349,221 | |
(3 mo. LIBOR US + 1.360%),
3.88%, 07/24/38(a) | | | 1,000 | | | | 980,175 | |
4.95%, 06/01/45 | | | 320 | | | | 354,110 | |
(3 mo. LIBOR US + 1.220%),
3.90%, 01/23/49(a) | | | 915 | | | | 885,966 | |
Lloyds Bank PLC, 5.80%, 01/13/20(c) | | | 2,000 | | | | 2,046,053 | |
Mitsubishi UFJ Financial Group, Inc.: | | | | | | | | |
3.22%, 03/07/22 | | | 575 | | | | 579,586 | |
3.76%, 07/26/23 | | | 1,100 | | | | 1,129,849 | |
Regions Bank, (3 mo. LIBOR US + 0.500%),
3.37%, 08/13/21(a) | | | 920 | | | | 924,311 | |
| | | | | | | | |
| Security | | Par
(000) | | | Value | |
|
| Banks (continued) | |
Royal Bank of Canada, 3.20%, 04/30/21 | | $ | 1,000 | | | $ | 1,011,174 | |
Royal Bank of Scotland Group PLC: | | | | | | | | |
(3 mo. LIBOR US + 1.470%), 4.15%, 05/15/23(d) | | | 670 | | | | 667,357 | |
3.88%, 09/12/23 | | | 990 | | | | 994,103 | |
6.00%, 12/19/23 | | | 348 | | | | 371,473 | |
(3 mo. LIBOR US + 1.762%), 4.27%, 03/22/25(a) | | | 1,020 | | | | 1,030,847 | |
Santander UK PLC: | | | | | | | | |
2.13%, 11/03/20 | | | 750 | | | | 741,770 | |
5.00%, 11/07/23(c) | | | 1,753 | | | | 1,795,012 | |
SunTrust Banks, Inc., 4.00%, 05/01/25 | | | 380 | | | | 397,580 | |
Svenska Handelsbanken AB, 3.35%, 05/24/21 | | | 500 | | | | 505,659 | |
Wells Fargo & Co.: | | | | | | | | |
4.13%, 08/15/23 | | | 350 | | | | 362,673 | |
3.75%, 01/24/24 | | | 385 | | | | 396,195 | |
4.15%, 01/24/29 | | | 575 | | | | 601,067 | |
5.61%, 01/15/44 | | | 200 | | | | 230,889 | |
4.65%, 11/04/44 | | | 980 | | | | 1,006,621 | |
4.75%, 12/07/46 | | | 530 | | | | 556,149 | |
| | | | | | | | |
| | | | | | | 52,216,063 | |
|
| Beverages — 1.2% | |
Anheuser-Busch Cos. LLC/Anheuser-Busch | | | | | | | | |
InBev Worldwide, Inc., 4.90%, 02/01/46(c) | | | 675 | | | | 677,960 | |
Anheuser-Busch InBev Worldwide, Inc.: | | | | | | | | |
4.15%, 01/23/25 | | | 195 | | | | 203,203 | |
4.75%, 01/23/29 | | | 845 | | | | 900,261 | |
4.44%, 10/06/48 | | | 2,145 | | | | 2,019,228 | |
5.55%, 01/23/49 | | | 325 | | | | 356,703 | |
5.80%, 01/23/59 | | | 245 | | | | 272,423 | |
| | | | | | | | |
| | | | | | | 4,429,778 | |
|
| Biotechnology — 1.6% | |
AbbVie, Inc.: | | | | | | | | |
2.50%, 05/14/20 | | | 1,200 | | | | 1,196,459 | |
2.30%, 05/14/21 | | | 495 | | | | 489,457 | |
2.85%, 05/14/23 | | | 550 | | | | 544,011 | |
3.20%, 05/14/26 | | | 240 | | | | 232,607 | |
4.25%, 11/14/28 | | | 320 | | | | 326,836 | |
4.40%, 11/06/42 | | | 795 | | | | 734,859 | |
4.88%, 11/14/48 | | | 205 | | | | 201,625 | |
Amgen, Inc.: | | | | | | | | |
4.40%, 05/01/45 | | | 100 | | | | 98,027 | |
4.66%, 06/15/51 | | | 461 | | | | 463,654 | |
Baxalta, Inc., 4.00%, 06/23/25 | | | 283 | | | | 289,282 | |
Gilead Sciences, Inc.: | | | | | | | | |
3.25%, 09/01/22 | | | 135 | | | | 137,517 | |
4.50%, 02/01/45 | | | 323 | | | | 326,913 | |
4.75%, 03/01/46 | | | 391 | | | | 409,253 | |
4.15%, 03/01/47 | | | 640 | | | | 617,520 | |
| | | | | | | | |
| | | | | | | 6,068,020 | |
|
| Capital Markets — 6.1% | |
Bank of New York Mellon Corp.: | | | | | | | | |
3.45%, 08/11/23 | | | 265 | | | | 271,996 | |
2.20%, 08/16/23 | | | 1,125 | | | | 1,094,124 | |
Credit Agricole SA: | | | | | | | | |
2.75%, 06/10/20(c) | | | 1,000 | | | | 999,405 | |
3.75%, 04/24/23(c) | | | 275 | | | | 278,020 | |
Credit Suisse AG: | | | | | | | | |
3.00%, 10/29/21 | | | 665 | | | | 667,808 | |
3.63%, 09/09/24 | | | 575 | | | | 584,806 | |
Credit Suisse Group AG, (3 mo. LIBOR US + 1.240%), 4.21%, 06/12/24(a)(c) | | | 820 | | | | 839,994 | |
Credit Suisse Group Funding Guernsey Ltd.: | | | | | | | | |
3.45%, 04/16/21 | | | 1,350 | | | | 1,364,082 | |
| | | | |
| S C H E D U L E S O F I N V E S T M E N T S | | | 37 | |
| | |
Schedule of Investments (continued) March 31, 2019 | | BATS: Series C Portfolio (Percentages shown are based on Net Assets) |
| | | | | | | | |
| Security | | Par
(000) | | | Value | |
|
| Capital Markets (continued) | |
3.80%, 06/09/23 | | $ | 547 | | | $ | 555,520 | |
Deutsche Bank AG: | | | | | | | | |
4.25%, 02/04/21 | | | 925 | | | | 928,546 | |
4.25%, 10/14/21 | | | 180 | | | | 180,808 | |
(USD Swap Rate 11:00 am NY 1 + 2.553%),
4.88%, 12/01/32(a) | | | 585 | | | | 515,484 | |
Goldman Sachs Group, Inc.: | | | | | | | | |
2.88%, 02/25/21 | | | 975 | | | | 975,427 | |
3.00%, 04/26/22 | | | 850 | | | | 848,156 | |
4.25%, 10/21/25 | | | 310 | | | | 317,321 | |
(3 mo. LIBOR US + 1.301%),
4.22%, 05/01/29(a) | | | 1,580 | | | | 1,614,759 | |
4.80%, 07/08/44 | | | 370 | | | | 391,385 | |
5.15%, 05/22/45 | | | 350 | | | | 370,150 | |
Morgan Stanley: | | | | | | | | |
2.65%, 01/27/20 | | | 775 | | | | 774,133 | |
2.50%, 04/21/21 | | | 550 | | | | 546,423 | |
5.50%, 07/28/21 | | | 10 | | | | 10,581 | |
(3 mo. LIBOR US + 1.400%),
4.18%, 10/24/23(d) | | | 1,675 | | | | 1,701,045 | |
(3 mo. LIBOR US + 0.847%),
3.74%, 04/24/24(a) | | | 925 | | | | 943,429 | |
3.88%, 04/29/24 | | | 1,625 | | | | 1,671,360 | |
(3 mo. LIBOR US + 1.628%),
4.43%, 01/23/30(a) | | | 845 | | | | 889,977 | |
4.30%, 01/27/45 | | | 700 | | | | 711,777 | |
State Street Corp., (3 mo. LIBOR US + 0.770%),
3.78%, 12/03/24(a) | | | 490 | | | | 508,876 | |
UBS Group Funding Switzerland AG, 3.00%, 04/15/21(c) | | | 2,150 | | | | 2,149,136 | |
| | | | | | | | |
| | | | | | | 22,704,528 | |
|
| Chemicals — 0.9% | |
Air Liquide Finance SA: | | | | | | | | |
2.25%, 09/27/23(c) | | | 520 | | | | 503,205 | |
2.50%, 09/27/26(c) | | | 290 | | | | 275,730 | |
DowDuPont, Inc.: | | | | | | | | |
4.49%, 11/15/25 | | | 890 | | | | 948,012 | |
5.32%, 11/15/38 | | | 290 | | | | 322,387 | |
5.42%, 11/15/48 | | | 485 | | | | 553,236 | |
E.I. du Pont de Nemours & Co., (3 mo. LIBOR | | | | | | | | |
US + 0.530%), 3.27%, 05/01/20(d) | | | 560 | | | | 561,588 | |
Sherwin-Williams Co.: | | | | | | | | |
2.75%, 06/01/22 | | | 135 | | | | 134,182 | |
4.50%, 06/01/47 | | | 180 | | | | 177,139 | |
| | | | | | | | |
| | | | | | | 3,475,479 | |
|
| Commercial Services & Supplies — 0.7% | |
Aviation Capital Group LLC, 6.75%, 04/06/21(c) | | | 1,575 | | | | 1,678,560 | |
GATX Corp., 4.35%, 02/15/24 | | | 510 | | | | 528,667 | |
Republic Services, Inc., 3.95%, 05/15/28 | | | 300 | | | | 314,477 | |
| | | | | | | | |
| | | | | | | 2,521,704 | |
|
| Communications Equipment — 0.3% | |
Cisco Systems, Inc., 2.50%, 09/20/26 | | | 1,035 | | | | 1,007,532 | |
| | | | | | | | |
|
| Consumer Finance — 2.0% | |
Capital One Financial Corp., 4.25%, 04/30/25 | | | 675 | | | | 700,611 | |
Capital One N.A.: | | | | | | | | |
2.35%, 01/31/20 | | | 825 | | | | 820,851 | |
2.95%, 07/23/21 | | | 735 | | | | 737,407 | |
Ford Motor Credit Co. LLC: | | | | | | | | |
3.34%, 03/18/21 | | | 475 | | | | 467,765 | |
3.81%, 10/12/21 | | | 550 | | | | 544,870 | |
3.66%, 09/08/24 | | | 350 | | | | 322,548 | |
4.39%, 01/08/26 | | | 201 | | | | 186,671 | |
General Motors Financial Co., Inc.: | | | | | | | | |
3.20%, 07/06/21 | | | 565 | | | | 562,463 | |
4.15%, 06/19/23 | | | 615 | | | | 620,767 | |
4.35%, 04/09/25 | | | 1,230 | | | | 1,224,694 | |
| | | | | | | | |
| Security | | Par
(000) | | | Value | |
|
| Consumer Finance (continued) | |
4.35%, 01/17/27 | | $ | 1,205 | | | $ | 1,171,140 | |
Synchrony Financial, 4.38%, 03/19/24 | | | 200 | | | | 202,579 | |
| | | | | | | | |
| | | | | | | 7,562,366 | |
|
| Containers & Packaging — 0.5% | |
International Paper Co., 4.35%, 08/15/48 WRKCo, Inc.: | | | 200 | | | | 186,417 | |
3.75%, 03/15/25 | | | 745 | | | | 751,665 | |
4.65%, 03/15/26 | | | 895 | | | | 948,359 | |
| | | | | | | | |
| | | | | | | 1,886,441 | |
|
| Diversified Financial Services — 0.7% | |
AerCap Ireland Capital DAC/AerCap Global | | | | | | | | |
Aviation Trust, 4.50%, 05/15/21 | | | 1,140 | | | | 1,164,643 | |
Charles Schwab Corp., 3.25%, 05/21/21 | | | 665 | | | | 673,341 | |
GE Capital International Funding Co., 4.42%, 11/15/35 | | | 811 | | | | 749,759 | |
| | | | | | | | |
| | | | | | | 2,587,743 | |
|
| Diversified Telecommunication Services — 3.3% | |
AT&T Inc.: | | | | | | | | |
3.40%, 05/15/25 | | | 1,385 | | | | 1,370,480 | |
4.30%, 02/15/30 | | | 1,438 | | | | 1,454,506 | |
4.50%, 05/15/35 | | | 750 | | | | 738,910 | |
5.25%, 03/01/37 | | | 400 | | | | 419,086 | |
5.15%, 03/15/42 | | | 400 | | | | 409,171 | |
4.80%, 06/15/44 | | | 65 | | | | 63,815 | |
4.75%, 05/15/46 | | | 203 | | | | 198,369 | |
5.15%, 11/15/46 | | | 115 | | | | 118,028 | |
5.45%, 03/01/47 | | | 330 | | | | 352,557 | |
4.50%, 03/09/48 | | | 215 | | | | 201,733 | |
5.15%, 02/15/50 | | | 150 | | | | 153,235 | |
Telefonica Emisiones SAU: | | | | | | | | |
4.67%, 03/06/38 | | | 255 | | | | 243,387 | |
4.90%, 03/06/48 | | | 315 | | | | 306,950 | |
Verizon Communications, Inc.: | | | | | | | | |
3.38%, 02/15/25 | | | 459 | | | | 464,405 | |
4.50%, 08/10/33 | | | 550 | | | | 581,347 | |
4.27%, 01/15/36 | | | 1,125 | | | | 1,137,876 | |
5.25%, 03/16/37 | | | 745 | | | | 838,076 | |
4.81%, 03/15/39 | | | 865 | | | | 926,594 | |
3.85%, 11/01/42 | | | 950 | | | | 893,123 | |
4.86%, 08/21/46 | | | 190 | | | | 202,434 | |
5.01%, 04/15/49 | | | 420 | | | | 458,552 | |
4.67%, 03/15/55 | | | 647 | | | | 659,176 | |
| | | | | | | | |
| | | | | | | 12,191,810 | |
|
| Electric Utilities — 5.6% | |
American Electric Power Co., Inc., 2.15%, 11/13/20 | | | 825 | | | | 817,264 | |
American Transmission Systems, Inc., 5.25%, 01/15/22(c) | | | 400 | | | | 423,404 | |
CenterPoint Energy, Inc., 3.85%, 02/01/24 | | | 595 | | | | 606,777 | |
DTE Electric Co., Series A, 4.05%, 05/15/48 | | | 186 | | | | 193,878 | |
Duke Energy Carolinas LLC, 3.75%, 06/01/45 | | | 420 | | | | 415,979 | |
Duke Energy Corp., 2.65%, 09/01/26 | | | 390 | | | | 371,506 | |
Duke Energy Florida LLC, 4.20%, 07/15/48 | | | 240 | | | | 252,349 | |
Duke Energy Progress LLC: | | | | | | | | |
3.70%, 09/01/28 | | | 690 | | | | 719,742 | |
6.30%, 04/01/38 | | | 750 | | | | 982,695 | |
3.60%, 09/15/47 | | | 350 | | | | 334,607 | |
Emera U.S. Finance LP, 2.15%, 06/15/19 | | | 185 | | | | 184,637 | |
Entergy Arkansas LLC, 3.70%, 06/01/24 | | | 825 | | | | 856,142 | |
Entergy Corp., 4.00%, 07/15/22 | | | 700 | | | | 719,180 | |
Evergy Inc., 5.29%, 06/15/22(e) | | | 745 | | | | 790,083 | |
Exelon Corp.: | | | | | | | | |
2.45%, 04/15/21 | | | 2,000 | | | | 1,976,794 | |
3.40%, 04/15/26 | | | 200 | | | | 199,955 | |
FirstEnergy Corp., 4.85%, 07/15/47 | | | 500 | | | | 536,196 | |
| | |
| 38 | | 2 0 1 9 B L A C K R O C K A N N U A L R E P O R T T O S H A R E H O L D E R S |
| | |
Schedule of Investments (continued) March 31, 2019 | | BATS: Series C Portfolio (Percentages shown are based on Net Assets) |
| | | | | | | | |
| Security | | Par
(000) | | | Value | |
|
| Electric Utilities (continued) | |
Florida Power & Light Co., 5.95%, 02/01/38 | | $ | 800 | | | $ | 1,031,785 | |
Georgia Power Co., 2.00%, 09/08/20 | | | 635 | | | | 629,130 | |
Kentucky Utilities Co., 5.13%, 11/01/40 | | | 375 | | | | 440,651 | |
MidAmerican Energy Co., 3.65%, 04/15/29 | | | 975 | | | | 1,014,665 | |
Mid-Atlantic Interstate Transmission LLC,
4.10%, 05/15/28(c) | | | 345 | | | | 353,835 | |
NextEra Energy Capital Holdings, Inc.,
3.55%, 05/01/27 | | | 115 | | | | 115,482 | |
Northern States Power Co., 6.20%, 07/01/37 | | | 725 | | | | 944,592 | |
Ohio Power Co., Series D, 6.60%, 03/01/33 | | | 675 | | | | 865,606 | |
Oncor Electric Delivery Co. LLC,
5.30%, 06/01/42 | | | 660 | | | | 797,430 | |
PacifiCorp, 6.00%, 01/15/39 | | | 450 | | | | 569,107 | |
Progress Energy, Inc.: | | | | | | | | |
4.88%, 12/01/19 | | | 1,075 | | | | 1,089,167 | |
3.15%, 04/01/22 | | | 775 | | | | 780,447 | |
Southern Co.: | | | | | | | | |
2.35%, 07/01/21 | | | 785 | | | | 776,269 | |
2.95%, 07/01/23 | | | 740 | | | | 736,765 | |
Trans-Allegheny Interstate Line Co.,
3.85%, 06/01/25(c) | | | 445 | | | | 454,843 | |
| | | | | | | | |
| | | | | | | 20,980,962 | |
|
| Energy Equipment & Services — 0.5% | |
Halliburton Co.: | | | | | | | | |
3.80%, 11/15/25 | | | 1,545 | | | | 1,579,069 | |
5.00%, 11/15/45 | | | 310 | | | | 329,638 | |
| | | | | | | | |
| | | | | | | 1,908,707 | |
|
| Equity Real Estate Investment Trusts (REITs) — 2.5% | |
American Tower Corp.: | | | | | | | | |
4.70%, 03/15/22 | | | 525 | | | | 549,261 | |
3.00%, 06/15/23 | | | 1,175 | | | | 1,170,996 | |
5.00%, 02/15/24 | | | 430 | | | | 462,764 | |
AvalonBay Communities, Inc.,
3.35%, 05/15/27 | | | 550 | | | | 552,471 | |
Boston Properties LP, 4.50%, 12/01/28 | | | 500 | | | | 530,477 | |
Crown Castle International Corp.: | | | | | | | | |
3.40%, 02/15/21 | | | 1,453 | | | | 1,464,999 | |
2.25%, 09/01/21 | | | 1,765 | | | | 1,739,607 | |
5.25%, 01/15/23 | | | 807 | | | | 866,041 | |
3.65%, 09/01/27 | | | 230 | | | | 226,164 | |
4.30%, 02/15/29 | | | 305 | | | | 314,364 | |
ERP Operating LP, 3.25%, 08/01/27 | | | 525 | | | | 525,045 | |
Host Hotels & Resorts LP, 6.00%, 10/01/21 | | | 725 | | | | 766,882 | |
| | | | | | | | |
| | | | | | | 9,169,071 | |
|
| Food & Staples Retailing — 2.3% | |
CVS Health Corp.: | | | | | | | | |
4.10%, 03/25/25 | | | 1,530 | | | | 1,570,766 | |
4.30%, 03/25/28 | | | 2,360 | | | | 2,391,273 | |
4.78%, 03/25/38 | | | 320 | | | | 316,894 | |
5.13%, 07/20/45 | | | 360 | | | | 365,864 | |
Kroger Co., 4.45%, 02/01/47 | | | 365 | | | | 330,887 | |
Walmart, Inc.: | | | | | | | | |
2.65%, 12/15/24 | | | 691 | | | | 689,181 | |
3.55%, 06/26/25 | | | 273 | | | | 283,357 | |
3.70%, 06/26/28 | | | 1,875 | | | | 1,974,966 | |
4.05%, 06/29/48 | | | 650 | | | | 690,331 | |
| | | | | | | | |
| | | | | | | 8,613,519 | |
| | |
| Food Products — 1.1% | | | | | | |
General Mills, Inc.: | | | | | | | | |
3.20%, 04/16/21 | | | 145 | | | | 146,257 | |
3.70%, 10/17/23 | | | 240 | | | | 245,996 | |
4.20%, 04/17/28 | | | 620 | | | | 644,259 | |
4.70%, 04/17/48 | | | 90 | | | | 89,862 | |
Kraft Heinz Foods Co.: | | | | | | | | |
5.38%, 02/10/20 | | | 1,290 | | | | 1,316,317 | |
3.00%, 06/01/26 | | | 710 | | | | 661,794 | |
4.38%, 06/01/46 | | | 365 | | | | 315,740 | |
| | | | | | | | |
| Security | | Par
(000) | | | Value | |
|
| Food Products (continued) | |
Nestle Holdings, Inc., 4.00%, 09/24/48(c) | | $ | 645 | | | $ | 675,159 | |
| | | | | | | | |
| | | | | | | 4,095,384 | |
| | |
| Gas Utilities — 0.2% | | | | | | |
Fortis, Inc., 2.10%, 10/04/21 | | | 945 | | | | 924,357 | |
| | | | | | | | |
|
| Health Care Equipment & Supplies — 1.5% | |
Abbott Laboratories: | | | | | | | | |
3.75%, 11/30/26 | | | 566 | | | | 588,370 | |
4.75%, 11/30/36 | | | 385 | | | | 430,984 | |
4.75%, 04/15/43 | | | 117 | | | | 130,019 | |
4.90%, 11/30/46 | | | 260 | | | | 300,667 | |
Becton Dickinson and Co.: | | | | | | | | |
2.68%, 12/15/19 | | | 88 | | | | 87,716 | |
(3 mo. LIBOR US + 1.030%),
3.64%, 06/06/22(d) | | | 1,525 | | | | 1,529,044 | |
3.70%, 06/06/27 | | | 1,570 | | | | 1,563,961 | |
Medtronic, Inc.: | | | | | | | | |
3.15%, 03/15/22 | | | 960 | | | | 975,248 | |
4.63%, 03/15/45 | | | 49 | | | | 56,014 | |
| | | | | | | | |
| | | | | | | 5,662,023 | |
|
| Health Care Providers & Services — 2.5% | |
Aetna, Inc.: | | | | | | | | |
2.80%, 06/15/23 | | | 350 | | | | 343,704 | |
3.50%, 11/15/24 | | | 395 | | | | 395,255 | |
Anthem, Inc.: | | | | | | | | |
4.35%, 08/15/20 | | | 700 | | | | 714,175 | |
2.50%, 11/21/20 | | | 285 | | | | 283,546 | |
5.10%, 01/15/44 | | | 300 | | | | 327,668 | |
Cigna Corp., 3.20%, 09/17/20(c) | | | 1,870 | | | | 1,880,080 | |
Coventry Health Care, Inc., 5.45%, 06/15/21 | | | 850 | | | | 888,528 | |
HCA, Inc.: | | | | | | | | |
5.25%, 06/15/26 | | | 563 | | | | 603,237 | |
4.50%, 02/15/27 | | | 389 | | | | 399,494 | |
5.50%, 06/15/47 | | | 365 | | | | 388,050 | |
UnitedHealth Group, Inc.: | | | | | | | | |
3.35%, 07/15/22 | | | 75 | | | | 76,614 | |
2.88%, 03/15/23 | | | 1,175 | | | | 1,181,735 | |
3.75%, 07/15/25 | | | 770 | | | | 803,748 | |
4.63%, 11/15/41 | | | 645 | | | | 706,077 | |
4.75%, 07/15/45 | | | 120 | | | | 135,591 | |
4.25%, 06/15/48 | | | 100 | | | | 105,202 | |
| | | | | | | | |
| | | | | | | 9,232,704 | |
| | |
| Hotels, Restaurants & Leisure — 0.5% | | | | | | |
McDonald’s Corp.: | | | | | | | | |
2.75%, 12/09/20 | | | 85 | | | | 85,149 | |
4.88%, 12/09/45 | | | 748 | | | | 809,092 | |
4.45%, 03/01/47 | | | 455 | | | | 463,780 | |
4.45%, 09/01/48 | | | 475 | | | | 487,523 | |
| | | | | | | | |
| | | | | | | 1,845,544 | |
| | |
| Household Durables — 0.2% | | | | | | |
Newell Brands, Inc., 3.85%, 04/01/23 | | | 850 | | | | 840,508 | |
| | | | | | | | |
|
| Industrial Conglomerates — 0.5% | |
General Electric Co.: | | | | | | | | |
2.70%, 10/09/22 | | | 570 | | | | 559,759 | |
6.75%, 03/15/32 | | | 208 | | | | 240,213 | |
6.15%, 08/07/37 | | | 205 | | | | 224,082 | |
4.13%, 10/09/42 | | | 360 | | | | 312,415 | |
Tyco Electronics Group SA, 3.50%, 02/03/22 | | | 600 | | | | 606,339 | |
| | | | | | | | |
| | | | | | | 1,942,808 | |
| | |
| Insurance — 1.3% | | | | | | |
American International Group, Inc.: | | | | | | | | |
6.40%, 12/15/20 | | | 485 | | | | 512,885 | |
3.30%, 03/01/21 | | | 220 | | | | 221,377 | |
Aon PLC, 4.00%, 11/27/23 | | | 1,760 | | | | 1,828,318 | |
| | | | |
| S C H E D U L E S O F I N V E S T M E N T S | | | 39 | |
| | |
Schedule of Investments (continued) March 31, 2019 | | BATS: Series C Portfolio (Percentages shown are based on Net Assets) |
| | | | | | | | |
| Security | | Par
(000) | | | Value | |
|
| Insurance (continued) | |
Hartford Financial Services Group, Inc.,
4.30%, 04/15/43 | | $ | 115 | | | $ | 114,662 | |
Marsh & McLennan Cos., Inc.: | | | | | | | | |
2.35%, 03/06/20 | | | 1,000 | | | | 996,683 | |
3.75%, 03/14/26 | | | 600 | | | | 617,931 | |
Prudential Financial, Inc., 4.35%, 02/25/50 | | | 425 | | | | 439,360 | |
Teachers Insurance & Annuity Association of America, 6.85%, 12/16/39(c) | | | 90 | | | | 123,705 | |
| | | | | | | | |
| | | | | | | 4,854,921 | |
|
| Internet & Direct Marketing Retail — 1.0% | |
Amazon.com, Inc.: | | | | | | | | |
2.40%, 02/22/23 | | | 550 | | | | 544,969 | |
2.80%, 08/22/24 | | | 1,000 | | | | 1,001,754 | |
3.15%, 08/22/27 | | | 1,975 | | | | 1,988,304 | |
| | | | | | | | |
| | | | | | | 3,535,027 | |
| | |
| IT Services — 0.9% | | | | | | |
Fidelity National Information Services, Inc.: | | | | | | | | |
3.63%, 10/15/20 | | | 1,590 | | | | 1,606,712 | |
3.50%, 04/15/23 | | | 330 | | | | 335,477 | |
5.00%, 10/15/25 | | | 119 | | | | 128,216 | |
4.75%, 05/15/48 | | | 240 | | | | 238,194 | |
Visa, Inc.: | | | | | | | | |
2.80%, 12/14/22 | | | 510 | | | | 515,226 | |
3.15%, 12/14/25 | | | 620 | | | | 629,420 | |
| | | | | | | | |
| | | | | | | 3,453,245 | |
|
| Life Sciences Tools & Services — 0.5% | |
Life Technologies Corp., 6.00%, 03/01/20 | | | 820 | | | | 842,171 | |
Thermo Fisher Scientific, Inc., 4.50%, 03/01/21 | | | 1,000 | | | | 1,032,575 | |
| | | | | | | | |
| | | | | | | 1,874,746 | |
| | |
| Machinery — 0.2% | | | | | | |
John Deere Capital Corp.: | | | | | | | | |
2.65%, 06/24/24 | | | 215 | | | | 213,034 | |
3.45%, 03/07/29 | | | 455 | | | | 467,706 | |
| | | | | | | | |
| | | | | | | 680,740 | |
| | |
| Media — 4.2% | | | | | | |
Charter Communications Operating LLC/Charter Communications Operating Capital: | | | | | | | | |
4.46%, 07/23/22 | | | 1,075 | | | | 1,112,207 | |
4.50%, 02/01/24 | | | 925 | | | | 962,102 | |
6.38%, 10/23/35 | | | 325 | | | | 362,379 | |
6.48%, 10/23/45 | | | 2,100 | | | | 2,354,107 | |
5.75%, 04/01/48 | | | 385 | | | | 402,166 | |
6.83%, 10/23/55 | | | 57 | | | | 64,530 | |
Comcast Corp.: | | | | | | | | |
3.45%, 10/01/21 | | | 385 | | | | 392,593 | |
3.95%, 10/15/25 | | | 400 | | | | 418,328 | |
3.15%, 03/01/26 | | | 395 | | | | 392,999 | |
4.15%, 10/15/28 | | | 635 | | | | 668,362 | |
4.25%, 01/15/33 | | | 650 | | | | 686,045 | |
6.50%, 11/15/35 | | | 125 | | | | 158,225 | |
4.65%, 07/15/42 | | | 130 | | | | 139,549 | |
4.50%, 01/15/43 | | | 225 | | | | 235,128 | |
4.60%, 08/15/45 | | | 230 | | | | 245,147 | |
4.00%, 03/01/48 | | | 340 | | | | 331,402 | |
4.70%, 10/15/48 | | | 405 | | | | 439,063 | |
4.95%, 10/15/58 | | | 475 | | | | 523,925 | |
Cox Communications, Inc.: | | | | | | | | |
3.35%, 09/15/26(c) | | | 460 | | | | 448,249 | |
3.50%, 08/15/27(c) | | | 605 | | | | 591,936 | |
Discovery Communications LLC: | | | | | | | | |
2.95%, 03/20/23 | | | 345 | | | | 341,722 | |
3.80%, 03/13/24 | | | 500 | | | | 504,061 | |
5.20%, 09/20/47 | | | 200 | | | | 194,372 | |
Grupo Televisa SAB, 6.63%, 01/15/40 | | | 205 | | | | 238,775 | |
Interpublic Group of Cos., Inc.: | | | | | | | | |
3.50%, 10/01/20 | | | 115 | | | | 115,991 | |
| | | | | | | | |
| Security | | Par
(000) | | | Value | |
|
| Media (continued) | |
3.75%, 10/01/21 | | $ | 85 | | | $ | 86,477 | |
4.65%, 10/01/28 | | | 695 | | | | 723,541 | |
5.40%, 10/01/48 | | | 115 | | | | 116,345 | |
Sky Ltd., 2.63%, 09/16/19(c) | | | 200 | | | | 199,652 | |
Time Warner Cable LLC, 4.50%, 09/15/42 | | | 137 | | | | 119,742 | |
Viacom, Inc.: | | | | | | | | |
4.38%, 03/15/43 | | | 199 | | | | 178,906 | |
5.85%, 09/01/43 | | | 274 | | | | 297,974 | |
Walt Disney Co., 6.40%, 12/15/35(c) | | | 306 | | | | 405,985 | |
Warner Media LLC: | | | | | | | | |
3.60%, 07/15/25 | | | 305 | | | | 304,235 | |
3.88%, 01/15/26 | | | 592 | | | | 594,022 | |
3.80%, 02/15/27 | | | 315 | | | | 313,719 | |
| | | | | | | | |
| | | | | | | 15,663,961 | |
| | |
| Metals & Mining — 0.3% | | | | | | |
Barrick Gold Corp., 5.25%, 04/01/42 | | | 200 | | | | 216,276 | |
Rio Tinto Finance USA Ltd.: | | | | | | | | |
3.75%, 06/15/25 | | | 74 | | | | 77,658 | |
7.13%, 07/15/28 | | | 550 | | | | 713,977 | |
Southern Copper Corp., 5.88%, 04/23/45 | | | 225 | | | | 252,169 | |
| | | | | | | | |
| | | | | | | 1,260,080 | |
| | |
| Multi-Utilities — 1.5% | | | | | | |
CMS Energy Corp., 5.05%, 03/15/22 | | | 1,644 | | | | 1,736,979 | |
Dominion Energy Gas Holdings LLC,
2.50%, 12/15/19 | | | 845 | | | | 842,637 | |
NiSource, Inc., 5.25%, 02/15/43 | | | 440 | | | | 483,297 | |
Sempra Energy, 2.40%, 02/01/20 | | | 520 | | | | 517,656 | |
Virginia Electric & Power Co.: | | | | | | | | |
6.00%, 01/15/36 | | | 900 | | | | 1,097,759 | |
4.45%, 02/15/44 | | | 350 | | | | 371,433 | |
4.60%, 12/01/48 | | | 320 | | | | 353,217 | |
WEC Energy Group, Inc., 3.38%, 06/15/21 | | | 235 | | | | 237,776 | |
| | | | | | | | |
| | | | | | | 5,640,754 | |
|
| Oil, Gas & Consumable Fuels — 10.1% | |
Andeavor Logistics LP/Tesoro Logistics Finance Corp.: | | | | | | | | |
6.25%, 10/15/22 | | | 336 | | | | 345,240 | |
3.50%, 12/01/22 | | | 70 | | | | 70,707 | |
4.25%, 12/01/27 | | | 180 | | | | 180,868 | |
BP Capital Markets America, Inc.: | | | | | | | | |
3.59%, 04/14/27 | | | 250 | | | | 253,970 | |
4.23%, 11/06/28 | | | 530 | | | | 566,911 | |
BP Capital Markets PLC, 3.28%, 09/19/27 | | | 117 | | | | 116,472 | |
Canadian Natural Resources Ltd.,
3.85%, 06/01/27 | | | 650 | | | | 651,644 | |
Cenovus Energy, Inc.: | | | | | | | | |
4.25%, 04/15/27 | | | 425 | | | | 417,797 | |
5.40%, 06/15/47 | | | 64 | | | | 63,371 | |
Cimarex Energy Co.: | | | | | | | | |
4.38%, 06/01/24 | | | 310 | | | | 322,016 | |
3.90%, 05/15/27 | | | 940 | | | | 937,068 | |
Concho Resources, Inc., 3.75%, 10/01/27 | | | 1,205 | | | | 1,195,165 | |
ConocoPhillips Co., 4.95%, 03/15/26 | | | 600 | | | | 668,604 | |
Continental Resources, Inc.: | | | | | | | | |
4.50%, 04/15/23 | | | 1,330 | | | | 1,376,792 | |
3.80%, 06/01/24 | | | 725 | | | | 729,742 | |
4.90%, 06/01/44 | | | 530 | | | | 538,714 | |
Devon Energy Corp.: | | | | | | | | |
3.25%, 05/15/22 | | | 731 | | | | 737,960 | |
5.00%, 06/15/45 | | | 204 | | | | 213,648 | |
El Paso Natural Gas Co. LLC,
8.63%, 01/15/22 | | | 485 | | | | 552,209 | |
Encana Corp.: | | | | | | | | |
6.50%, 05/15/19 | | | 750 | | | | 751,833 | |
6.63%, 08/15/37 | | | 500 | | | | 589,929 | |
Energy Transfer Operating LP: | | | | | | | | |
5.20%, 02/01/22 | | | 5 | | | | 5,251 | |
| | |
| 40 | | 2 0 1 9 B L A C K R O C K A N N U A L R E P O R T T O S H A R E H O L D E R S |
| | |
Schedule of Investments (continued) March 31, 2019 | | BATS: Series C Portfolio (Percentages shown are based on Net Assets) |
| | | | | | | | |
| Security | | Par
(000) | | | Value | |
| | |
| Oil, Gas & Consumable Fuels (continued) | | | | | | |
6.50%, 02/01/42 | | $ | 560 | | | $ | 622,083 | |
5.30%, 04/15/47 | | | 36 | | | | 35,527 | |
6.25%, 04/15/49 | | | 320 | | | | 358,427 | |
Energy Transfer Partners LP/Regency Energy Finance Corp., 5.00%, 10/01/22 | | | 1,020 | | | | 1,075,255 | |
Enterprise Products Operating LLC: | | | | | | | | |
5.70%, 02/15/42 | | | 435 | | | | 511,772 | |
4.45%, 02/15/43 | | | 854 | | | | 857,588 | |
4.25%, 02/15/48 | | | 155 | | | | 151,066 | |
4.80%, 02/01/49 | | | 220 | | | | 234,019 | |
Hess Corp., 5.80%, 04/01/47 | | | 534 | | | | 555,798 | |
Kerr-McGee Corp., 7.88%, 09/15/31 | | | 450 | | | | 570,526 | |
Kinder Morgan Energy Partners LP: | | | | | | | | |
6.50%, 04/01/20 | | | 1,515 | | | | 1,568,242 | |
7.30%, 08/15/33 | | | 800 | | | | 992,553 | |
5.00%, 03/01/43 | | | 490 | | | | 490,600 | |
5.50%, 03/01/44 | | | 525 | | | | 562,477 | |
Kinder Morgan, Inc., 6.50%, 09/15/20 | | | 925 | | | | 971,449 | |
Marathon Oil Corp.: | | | | | | | | |
2.80%, 11/01/22 | | | 1,200 | | | | 1,185,026 | |
4.40%, 07/15/27 | | | 735 | | | | 756,217 | |
Marathon Petroleum Corp., 4.75%, 09/15/44 | | | 381 | | | | 379,304 | |
MPLX LP: | | | | | | | | |
4.88%, 06/01/25 | | | 1,260 | | | | 1,341,166 | |
4.70%, 04/15/48 | | | 595 | | | | 568,412 | |
5.50%, 02/15/49 | | | 225 | | | | 239,998 | |
Newfield Exploration Co., 5.75%, 01/30/22 | | | 875 | | | | 933,721 | |
Pioneer Natural Resources Co.,
3.45%, 01/15/21 | | | 255 | | | | 257,345 | |
Plains All American Pipeline LP/PAA Finance Corp.: | | | | | | | | |
2.60%, 12/15/19 | | | 900 | | | | 896,832 | |
4.90%, 02/15/45 | | | 300 | | | | 286,413 | |
Sabine Pass Liquefaction LLC: | | | | | | | | |
5.63%, 02/01/21 | | | 750 | | | | 779,004 | |
5.75%, 05/15/24 | | | 425 | | | | 468,363 | |
Schlumberger Norge AS, 4.20%, 01/15/21(c) | | | 975 | | | | 995,063 | |
Shell International Finance BV,
3.50%, 11/13/23 | | | 1,585 | | | | 1,638,544 | |
Spectra Energy Partners LP, 3.38%, 10/15/26 | | | 880 | | | | 865,477 | |
Sunoco Logistics Partners Operations LP, 5.35%, 05/15/45 | | | 800 | | | | 782,537 | |
Texas Eastern Transmission LP,
2.80%, 10/15/22(c) | | | 750 | | | | 739,029 | |
Transcontinental Gas Pipe Line Co. LLC,
4.00%, 03/15/28 | | | 265 | | | | 270,411 | |
Western Midstream Operating LP,
5.38%, 06/01/21 | | | 1,025 | | | | 1,062,498 | |
Williams Cos., Inc.: | | | | | | | | |
4.50%, 11/15/23 | | | 1,300 | | | | 1,364,513 | |
4.30%, 03/04/24 | | | 1,000 | | | | 1,039,616 | |
| | | | | | | | |
| | | | | | | 37,692,782 | |
| | |
| Pharmaceuticals — 3.0% | | | | | | |
Allergan Funding SCS: | | | | | | | | |
3.45%, 03/15/22 | | | 2,835 | | | | 2,860,529 | |
3.80%, 03/15/25 | | | 650 | | | | 658,473 | |
Bayer U.S. Finance II LLC, 3.88%, 12/15/23(c) | | | 825 | | | | 831,246 | |
Eli Lilly & Co.: | | | | | | | | |
3.95%, 03/15/49 | | | 195 | | | | 199,553 | |
4.15%, 03/15/59 | | | 145 | | | | 149,161 | |
Johnson & Johnson: | | | | | | | | |
2.45%, 03/01/26 | | | 510 | | | | 498,536 | |
3.55%, 03/01/36 | | | 560 | | | | 562,514 | |
Merck & Co., Inc., 2.35%, 02/10/22 | | | 310 | | | | 309,487 | |
Mylan NV, 2.50%, 06/07/19 | | | 150 | | | | 149,887 | |
Shire Acquisitions Investments Ireland DAC: | | | | | | | | |
2.40%, 09/23/21 | | | 1,310 | | | | 1,293,834 | |
| | | | | | | | |
| Security | | Par
(000) | | | Value | |
| | |
| Pharmaceuticals (continued) | | | | | | |
2.88%, 09/23/23 | | $ | 1,445 | | | $ | 1,426,051 | |
Takeda Pharmaceutical Co. Ltd.: | | | | | | | | |
3.80%, 11/26/20(c) | | | 260 | | | | 263,771 | |
5.00%, 11/26/28(c) | | | 425 | | | | 460,724 | |
Teva Pharmaceutical Finance IV BV,
3.65%, 11/10/21 | | | 514 | | | | 502,797 | |
Teva Pharmaceutical Finance Netherlands III BV, 2.20%, 07/21/21 | | | 415 | | | | 395,078 | |
Wyeth LLC, 5.95%, 04/01/37 | | | 425 | | | | 540,739 | |
| | | | | | | | |
| | | | | | | 11,102,380 | |
| | |
| Road & Rail — 1.9% | | | | | | |
Burlington Northern Santa Fe LLC: | | | | | | | | |
5.75%, 05/01/40 | | | 500 | | | | 620,299 | |
4.15%, 12/15/48 | | | 385 | | | | 405,092 | |
CSX Corp.: | | | | | | | | |
3.25%, 06/01/27 | | | 195 | | | | 192,482 | |
3.80%, 03/01/28 | | | 480 | | | | 492,368 | |
4.25%, 03/15/29 | | | 135 | | | | 143,339 | |
4.30%, 03/01/48 | | | 105 | | | | 106,781 | |
Kansas City Southern, 2.35%, 05/15/20 | | | 370 | | | | 367,425 | |
Norfolk Southern Corp.: | | | | | | | | |
3.80%, 08/01/28 | | | 875 | | | | 903,054 | |
3.94%, 11/01/47 | | | 210 | | | | 204,003 | |
4.15%, 02/28/48 | | | 140 | | | | 141,901 | |
Penske Truck Leasing Co. LP/PTL Finance Corp., 3.38%, 02/01/22(c) | | | 1,000 | | | | 1,003,900 | |
Ryder System, Inc., 2.88%, 09/01/20 | | | 1,000 | | | | 1,000,965 | |
Union Pacific Corp.: | | | | | | | | |
4.05%, 03/01/46 | | | 355 | | | | 350,645 | |
4.50%, 09/10/48 | | | 680 | | | | 721,731 | |
4.80%, 09/10/58 | | | 350 | | | | 382,084 | |
| | | | | | | | |
| | | | | | | 7,036,069 | |
|
| Semiconductors & Semiconductor Equipment — 1.5% | |
Analog Devices, Inc., 2.50%, 12/05/21 | | | 340 | | | | 336,867 | |
Applied Materials, Inc., 3.30%, 04/01/27 | | | 705 | | | | 711,987 | |
Broadcom Corp./Broadcom Cayman Finance Ltd.: | | | | | | | | |
3.00%, 01/15/22 | | | 10 | | | | 9,952 | |
3.88%, 01/15/27 | | | 645 | | | | 616,184 | |
KLA-Tencor Corp.: | | | | | | | | |
4.65%, 11/01/24 | | | 40 | | | | 42,728 | |
4.10%, 03/15/29 | | | 310 | | | | 315,501 | |
Lam Research Corp.: | | | | | | | | |
3.75%, 03/15/26 | | | 90 | | | | 91,630 | |
4.00%, 03/15/29 | | | 255 | | | | 260,249 | |
NVIDIA Corp.: | | | | | | | | |
2.20%, 09/16/21 | | | 490 | | | | 483,372 | |
3.20%, 09/16/26 | | | 1,185 | | | | 1,180,136 | |
NXP BV/NXP Funding LLC: | | | | | | | | |
4.63%, 06/01/23(c) | | | 775 | | | | 804,838 | |
4.88%, 03/01/24(c) | | | 305 | | | | 322,025 | |
QUALCOMM, Inc., 4.30%, 05/20/47 | | | 435 | | | | 415,121 | |
| | | | | | | | |
| | | | | | | 5,590,590 | |
| | |
| Software — 2.3% | | | | | | |
Microsoft Corp.: | | | | | | | | |
2.88%, 02/06/24 | | | 990 | | | | 1,000,901 | |
2.40%, 08/08/26 | | | 1,235 | | | | 1,197,322 | |
4.10%, 02/06/37 | | | 530 | | | | 576,450 | |
3.75%, 02/12/45 | | | 466 | | | | 477,887 | |
4.45%, 11/03/45 | | | 517 | | | | 586,033 | |
3.70%, 08/08/46 | | | 370 | | | | 377,554 | |
Oracle Corp.: | | | | | | | | |
2.40%, 09/15/23 | | | 2,050 | | | | 2,019,536 | |
| | | | |
| S C H E D U L E S O F I N V E S T M E N T S | | | 41 | |
| | |
Schedule of Investments (continued) March 31, 2019 | | BATS: Series C Portfolio (Percentages shown are based on Net Assets) |
| | | | | | | | |
| Security | | Par
(000) | | | Value | |
| | |
| Software (continued) | | | | | | |
2.65%, 07/15/26 | | $ | 2,125 | | | $ | 2,055,639 | |
4.00%, 11/15/47 | | | 295 | | | | 296,748 | |
| | | | | | | | |
| | | | | | | 8,588,070 | |
| | |
| Specialty Retail — 0.4% | | | | | | |
Home Depot, Inc.: | | | | | | | | |
4.40%, 03/15/45 | | | 215 | | | | 231,679 | |
4.25%, 04/01/46 | | | 335 | | | | 354,415 | |
4.50%, 12/06/48 | | | 335 | | | | 370,860 | |
Lowe’s Cos., Inc., 3.70%, 04/15/46 | | | 425 | | | | 376,225 | |
| | | | | | | | |
| | | | | | | 1,333,179 | |
|
| Technology Hardware, Storage & Peripherals — 1.5% | |
Apple Inc.: | | | | | | | | |
2.85%, 02/23/23 | | | 1,010 | | | | 1,019,237 | |
3.25%, 02/23/26 | | | 855 | | | | 871,212 | |
2.45%, 08/04/26 | | | 1,050 | | | | 1,014,414 | |
2.90%, 09/12/27 | | | 375 | | | | 369,681 | |
4.38%, 05/13/45 | | | 960 | | | | 1,045,020 | |
3.85%, 08/04/46 | | | 730 | | | | 738,216 | |
Dell International LLC/EMC Corp.: | | | | | | | | |
4.42%, 06/15/21(c) | | | 45 | | | | 46,168 | |
8.35%, 07/15/46(c) | | | 405 | | | | 488,821 | |
Hewlett Packard Enterprise Co.,
3.50%, 10/05/21 | | | 125 | | | | 126,642 | |
| | | | | | | | |
| | | | | | | 5,719,411 | |
| | |
| Tobacco — 1.8% | | | | | | |
Altria Group, Inc.: | | | | | | | | |
3.80%, 02/14/24 | | | 270 | | | | 274,803 | |
2.63%, 09/16/26 | | | 210 | | | | 193,827 | |
4.80%, 02/14/29 | | | 1,835 | | | | 1,891,710 | |
4.50%, 05/02/43 | | | 75 | | | | 67,420 | |
5.95%, 02/14/49 | | | 285 | | | | 305,821 | |
BAT Capital Corp., 3.22%, 08/15/24 | | | 1,235 | | | | 1,207,534 | |
BAT International Finance PLC,
2.75%, 06/15/20(c) | | | 1,000 | | | | 996,160 | |
Reynolds American, Inc.: | | | | | | | | |
4.00%, 06/12/22 | | | 730 | | | | 745,574 | |
4.85%, 09/15/23 | | | 220 | | | | 232,064 | |
5.70%, 08/15/35 | | | 550 | | | | 570,623 | |
7.00%, 08/04/41 | | | 350 | | | | 389,885 | |
| | | | | | | | |
| | | | | | | 6,875,421 | |
|
| Trading Companies & Distributors — 0.7% | |
Air Lease Corp.: | | | | | | | | |
2.50%, 03/01/21 | | | 905 | | | | 897,867 | |
3.38%, 06/01/21 | | | 540 | | | | 542,516 | |
Intercontinental Exchange, Inc.,
4.25%, 09/21/48 | | | 320 | | | | 335,322 | |
International Lease Finance Corp.,
5.88%, 04/01/19 | | | 885 | | | | 885,000 | |
| | | | | | | | |
| | | | | | | 2,660,705 | |
|
| Wireless Telecommunication Services — 0.5% | |
America Movil SAB de CV, 5.00%, 03/30/20 | | | 468 | | | | 476,424 | |
Sprint Spectrum Co. LLC/Sprint Spectrum Co. II LLC/Sprint Spectrum Co. III LLC, 3.36%, 03/20/23(c) | | | 213 | | | | 212,436 | |
Vodafone Group PLC: | | | | | | | | |
3.75%, 01/16/24 | | | 850 | | | | 857,134 | |
4.38%, 02/19/43 | | | 227 | | | | 203,374 | |
| | | | | | | | |
| | | | | | | 1,749,368 | |
| | | | | | | | |
| |
Total Corporate Bonds — 86.7%
(Cost: $316,947,111) | | | | 323,487,888 | |
| | | | | | | | |
| | | | | | | | |
| Security | | Par
(000) | | | Value | |
|
| Foreign Agency Obligations — 1.4% | |
| | |
| Mexico — 1.4% | | | | | | |
Petroleos Mexicanos: | | | | | | | | |
5.50%, 01/21/21 | | $ | 1,300 | | | $ | 1,318,850 | |
6.38%, 02/04/21 | | | 633 | | | | 653,256 | |
5.38%, 03/13/22 | | | 155 | | | | 158,218 | |
4.63%, 09/21/23 | | | 825 | | | | 812,633 | |
5.35%, 02/12/28 | | | 1,885 | | | | 1,749,280 | |
6.38%, 01/23/45 | | | 475 | | | | 419,568 | |
6.35%, 02/12/48 | | | 126 | | | | 111,088 | |
| | | | | | | | |
| | | | | | | 5,222,893 | |
| | | | | | | | |
| |
Total Foreign Agency Obligations — 1.4%
(Cost: $5,245,788) | | | | 5,222,893 | |
| | | | | | | | |
|
Foreign Government Obligations — 2.0% | |
| | |
| Colombia — 0.6% | | | | | | |
Republic of Colombia: | | | | | | | | |
4.50%, 03/15/29 | | | 1,050 | | | | 1,110,375 | |
5.63%, 02/26/44 | | | 413 | | | | 465,245 | |
5.00%, 06/15/45 | | | 510 | | | | 534,990 | |
| | | | | | | | |
| | | | | | | 2,110,610 | |
| | |
| Indonesia — 0.4% | | | | | | |
Republic of Indonesia: | | | | | | | | |
4.13%, 01/15/25(c) | | | 350 | | | | 358,517 | |
3.50%, 01/11/28 | | | 975 | | | | 947,202 | |
| | | | | | | | |
| | | | | | | 1,305,719 | |
| | |
| Mexico — 0.6% | | | | | | |
United Mexican States: | | | | | | | | |
4.15%, 03/28/27 | | | 943 | | | | 958,088 | |
4.75%, 03/08/44 | | | 753 | | | | 740,764 | |
4.60%, 02/10/48 | | | 600 | | | | 580,500 | |
| | | | | | | | |
| | | | | | | 2,279,352 | |
| | |
| Peru — 0.1% | | | | | | |
Republic of Peru, 5.63%, 11/18/50 | | | 290 | | | | 373,085 | |
| | | | | | | | |
| | |
| Poland — 0.1% | | | | | | |
Republic of Poland, 3.25%, 04/06/26 | | | 440 | | | | 447,115 | |
| | | | | | | | |
| | |
| Uruguay — 0.2% | | | | | | |
Republic of Uruguay: | | | | | | | | |
4.38%, 10/27/27 | | | 315 | | | | 331,853 | |
5.10%, 06/18/50 | | | 375 | | | | 400,313 | |
| | | | | | | | |
| | | | | | | 732,166 | |
| |
Total Foreign Government Obligations — 2.0%
(Cost: $6,974,525) | | | | 7,248,047 | |
| | | | | | | | |
| | |
| 42 | | 2 0 1 9 B L A C K R O C K A N N U A L R E P O R T ��T O S H A R E H O L D E R S |
| | |
Schedule of Investments (continued) March 31, 2019 | | BATS: Series C Portfolio (Percentages shown are based on Net Assets) |
| | | | | | | | |
| Security | | Par
(000) | | | Value | |
|
Taxable Municipal Bonds — 2.4% | |
Chicago O’Hare International Airport RB, 6.40%, 01/01/40 | | $ | 1,000 | | | $ | 1,333,500 | |
Los Angeles Department of Water & Power Power System RB, 6.57%, 07/01/45 | | | 1,075 | | | | 1,568,038 | |
Metropolitan Transportation Authority, New York RB, 7.34%, 11/15/39 | | | 1,125 | | | | 1,681,763 | |
Port Authority of New York & New Jersey RB, | | | | | | | | |
4.46%, 10/01/62 | | | 1,300 | | | | 1,456,429 | |
State of California GO: | | | | | | | | |
7.30%, 10/01/39 | | | 510 | | | | 737,985 | |
7.63%, 03/01/40 | | | 1,125 | | | | 1,704,015 | |
University of California RB, 3.35%, 07/01/29 | | | 550 | | | | 565,290 | |
| | | | | | | | |
| |
Total Taxable Municipal Bonds — 2.4%
(Cost: $7,412,150) | | | | 9,047,020 | |
| | | | | | | | |
|
U.S. Treasury Obligations — 2.0% | |
U.S. Treasury Bonds, 3.00%, 02/15/49 | | | 7,145 | | | | 7,402,890 | |
| | | | | | | | |
| | |
Total Long-Term Investments — 98.3%
(Cost: $357,996,405) | | | | | | | 366,705,849 | |
| | | | | | | | |
| | | | | | | | |
| Security | | Shares | | | Value | |
|
| Short-Term Securities — 1.1% | |
Dreyfus Treasury Securities Cash Management, Institutional Class, 2.27%(f) | | | 3,914,586 | | | $ | 3,914,586 | |
| | | | | | | | |
| | |
Total Short-Term Securities — 1.1%
(Cost: $3,914,586) | | | | | | | 3,914,586 | |
| | | | | | | | |
| | |
Options Purchased — 0.0%
(Cost: $173,230) | | | | | | | 32,770 | |
| | | | | | | | |
| | |
Total Investments — 99.4%
(Cost: $362,084,221) | | | | | | | 370,653,205 | |
| | |
Other Assets Less Liabilities — 0.6% | | | | | | | 2,275,052 | |
| | | | | | | | |
| | |
Net Assets — 100.0% | | | | | | $ | 372,928,257 | |
| | | | | | | | |
| (a) | Variable rate security. Security may be issued at a fixed coupon rate, which converts to a variable rate at a specified date. Rate shown is the rate in effect as of period end. |
| (b) | Perpetual security with no stated maturity date. |
| (c) | Security exempt from registration pursuant to Rule 144A under the Securities Act of 1933, as amended. These securities may be resold in transactions exempt from registration to qualified institutional investors. |
| (d) | Variable rate security. Rate shown is the rate in effect as of period end. |
| (e) | Step-down bond that pays an initial coupon rate for the first period and then a lower coupon rate for the following periods. Rate as of period end. |
| (f) | Annualized7-day yield as of period end. |
For Fund compliance purposes, the Fund’s industry classifications refer to one or more of the industrysub-classifications used by one or more widely recognized market indexes or ratings group indexes, and/or as defined by the investment adviser. These definitions may not apply for purposes of this report, which may combine such industrysub-classifications for reporting ease.
Derivative Financial Instruments Outstanding as of Period End
Futures Contracts
| | | | | | | | | | | | | | | | |
| Description | | Number of
Contracts | | | Expiration
Date | | | Notional
Amount (000) | | | Value/
Unrealized
Appreciation
(Depreciation) | |
Long Contracts | | | | | | | | | | | | | | | | |
U.S. Treasury Bonds (30 Year) | | | 9 | | | | 06/19/19 | | | $ | 1,347 | | | $ | 9,228 | |
U.S. Treasury Notes (10 Year) | | | 5 | | | | 06/19/19 | | | | 621 | | | | (43 | ) |
U.S. Ultra Treasury Bonds | | | 28 | | | | 06/19/19 | | | | 4,704 | | | | 47,865 | |
U.S. Treasury Notes (2 Year) | | | 84 | | | | 06/28/19 | | | | 17,900 | | | | 58,009 | |
U.S. Treasury Notes (5 Year) | | | 31 | | | | 06/28/19 | | | | 3,591 | | | | 10,273 | |
| | | | | | | | | | | | | | | | |
| | | | | | | | | | | | | | | 125,332 | |
| | | | | | | | | | | | | | | | |
Short Contracts | | | | | | | | | | | | | | | | |
U.S. Ultra Treasury Notes (10 Year) | | | 11 | | | | 06/19/19 | | | | 1,461 | | | | (26,798 | ) |
| | | | | | | | | | | | | | | | |
| | | | | | | | | | | | | | $ | 98,534 | |
| | | | | | | | | | | | | | | | |
OTC Interest Rate Swaptions Purchased
| | | | | | | | | | | | | | | | | | | | | | | | | | | | | | | | | | | | |
| | | Paid by the Fund | | Received by the Fund | | | | | | | | | | | | Notional Amount (000) | | | | |
| Description | | Rate | | | Frequency | | Rate | | | | | | Frequency | | | | Counterparty | | Expiration
Date | | | Exercise
Rate | | | Value | |
Put | | | | | | | | | | | | | | | | | | | | | | | | | | | | | | | | | | | | |
30-Year Interest Rate Swap, 09/10/50 | | | 3.50 | % | | Semi-annual | |
| 3-month
LIBOR,
2.60% |
| | | | | | Quarterly | | | | JPMorgan Chase Bank N.A. | | | 09/08/20 | | | | 3.50 | % | | $ | 4,760 | | | $ | 32,770 | |
| | | | | | | | | | | | | | | | | | | | | | | | | | | | | | | | | | | | |
| | | | |
| S C H E D U L E S O F I N V E S T M E N T S | | | 43 | |
| | |
Schedule of Investments (continued) March 31, 2019 | | BATS: Series C Portfolio |
Centrally Cleared Credit Default Swaps — Buy Protection
| | | | | | | | | | | | | | | | | | | | | | | | | | | | |
| Index | | Financing
Rate Paid
by the Fund | | | Payment
Frequency | | | Termination
Date | | | Notional
Amount (000) | | | Value | | | Upfront
Premium
Paid
(Received) | | | Unrealized
Appreciation
(Depreciation) | |
CDX.NA.IG.31.V1 | | | 1.00 | % | | | Quarterly | | | | 12/20/23 | | | $ | 8,075 | | | $ | (160,196 | ) | | $ | (136,386 | ) | | $ | (23,810 | ) |
| | | | | | | | | | | | | | | | | | | | | | | | | | | | |
OTC Credit Default Swaps — Sell Protection
| | | | | | | | | | | | | | | | | | | | | | | | | | | | | | | | |
| Reference Obligation | | Financing
Rate Received
by the Fund | | | Payment
Frequency | | | Counterparty | | Termination
Date | | | Credit
Rating(a) | | Notional
Amount
(000)(b) | | | Value | | | Upfront
Premium
Paid
(Received) | | | Unrealized
Appreciation
(Depreciation) | |
American Tower Corp. | | | 1.00 | % | | | Quarterly | | | Morgan Stanley & Co.
International PLC | | | 06/20/21 | | | BBB- | | $ | 1,875 | | | $ | 1,055 | | | $ | (34,210 | ) | | $ | 35,265 | |
Boeing Co. | | | 1.00 | % | | | Quarterly | | | BNP Paribas S.A. | | | 12/20/23 | | | A | | $ | 523 | | | | 12,667 | | | | 14,772 | | | | (2,105 | ) |
| | | | | | | | | | | | | | | | | | | | | | | | | | | | | | | | |
| | | | | | | | | | | | | | | | | | | | | | $ | 13,722 | | | $ | (19,438 | ) | | $ | 33,160 | |
| | | | | | | | | | | | | | | | | | | | | | | | | | | | | | | | |
| | (a) | Using S&P’s rating of the issuer or the underlying securities of the index, as applicable. | |
| | (b) | The maximum potential amount the Fund may pay should a negative credit event take place as defined under the terms of the agreement. | |
Balances Reported in the Statements of Assets and Liabilities for Centrally Cleared Swaps and OTC Swaps
| | | | | | | | | | | | | | | | |
| | | Swap
Premiums
Paid | | | Swap
Premiums
Received | | | Unrealized
Appreciation | | | Unrealized
Depreciation | |
Centrally Cleared Swaps(a) | | $ | — | | | $ | 136,386 | | | $ | — | | | $ | 23,810 | |
OTC Swaps | | | 14,772 | | | | 34,210 | | | | 35,265 | | | | 2,105 | |
| | (a) | Includes cumulative appreciation (depreciation) on centrally cleared swaps, as reported in the Schedule of Investments. Only current day’s variation margin is reported within the Statements of Assets and Liabilities and is net of any previously paid (received) swap premium amounts. | |
Derivative Financial Instruments Categorized by Risk Exposure
As of period end, the fair values of derivative financial instruments located in the Statements of Assets and Liabilities were as follows:
| | | | | | | | | | | | | | | | | | | | | | | | | | | | | | |
| Assets — Derivative Financial Instruments | | Commodity
Contracts | | | Credit
Contracts | | | Equity
Contracts | | | Foreign
Currency
Exchange
Contracts | | | Interest
Rate
Contracts | | | Other
Contracts | | | Total | |
Futures contracts | | Net unrealized appreciation(a) | | $ | — | | | $ | — | | | $ | — | | | $ | — | | | $ | 125,375 | | | $ | — | | | $ | 125,375 | |
Options purchased | | Investments at value — unaffiliated(b) | | | — | | | | — | | | | — | | | | — | | | | 32,770 | | | | — | | | | 32,770 | |
Swaps — OTC | | Unrealized appreciation on OTC swaps; Swap premiums paid | | | — | | | | 50,037 | | | | — | | | | — | | | | — | | | | — | | | | 50,037 | |
| | | | | | | | | | | | | | | | | | | | | | | | | | | | | | |
| | | | $ | — | | | $ | 50,037 | | | $ | — | | | $ | — | | | $ | 158,145 | | | $ | — | | | $ | 208,182 | |
| | | | | | | | | | | | | | | | | | | | | | | | | | | | | | |
| | | | | | | | | | | | | | | | | | | | | | | | | | | | | | |
| Liabilities — Derivative Financial Instruments | | | | | | | | | | | | | | | | | | | | | |
Futures contracts | | Net unrealized depreciation(a) | | $ | — | | | $ | — | | | $ | — | | | $ | — | | | $ | 26,841 | | | $ | — | | | $ | 26,841 | |
Swaps — OTC | | Unrealized depreciation on OTC swaps; Swaps premiums received | | | — | | | | 36,315 | | | | — | | | | — | | | | — | | | | — | | | | 36,315 | |
Swaps — centrally cleared | | Net unrealized depreciation(a) | | | — | | | | 23,810 | | | | — | | | | — | | | | — | | | | — | | | | 23,810 | |
| | | | | | | | | | | | | | | | | | | | | | | | | | | | | | |
| | | | $ | — | | | $ | 60,125 | | | $ | — | | | $ | — | | | $ | 26,841 | | | $ | — | | | $ | 86,966 | |
| | | | | | | | | | | | | | | | | | | | | | | | | | | | | | |
| | (a) | Includes cumulative appreciation (depreciation) on futures contracts and centrally cleared swaps, if any, as reported in the Schedule of Investments. Only current day’s variation margin is reported within the Statements of Assets and Liabilities. | |
| | (b) | Includes options purchased at value as reported in the Schedule of Investments. | |
| | |
| 44 | | 2 0 1 9 B L A C K R O C K A N N U A L R E P O R T T O S H A R E H O L D E R S |
| | |
Schedule of Investments (continued) March 31, 2019 | | BATS: Series C Portfolio |
For the year ended March 31, 2019, the effect of derivative financial instruments in the Statements of Operations was as follows
| | | | | | | | | | | | | | | | | | | | | | | | | | | | |
| Net Realized Gain (Loss) from: | | Commodity
Contracts | | | Credit
Contracts | | | Equity
Contracts | | | Foreign
Currency
Exchange
Contracts | | | Interest
Rate
Contracts | | | Other
Contracts | | | Total | |
Futures contracts | | $ | — | | | $ | — | | | $ | — | | | $ | — | | | $ | 1,113,744 | | | $ | — | | | $ | 1,113,744 | |
Options purchased(a) | | | — | | | | — | | | | — | | | | — | | | | (77,442 | ) | | | — | | | | (77,442 | ) |
Swaps | | | — | | | | (24,821 | ) | | | — | | | | — | | | | (291,357 | ) | | | — | | | | (316,178 | ) |
| | | | | | | | | | | | | | | | | | | | | | | | | | | | |
| | $ | — | | | $ | (24,821 | ) | | $ | — | | | $ | — | | | $ | 744,945 | | | $ | — | | | $ | 720,124 | |
| | | | | | | | | | | | | | | | | | | | | | | | | | | | |
| | | | | | | | | | | | | | | | | | | | | | |
| Net Change in Unrealized Appreciation (Depreciation) on: | | | | | | | | | | | | | | | | | | | | | |
Futures contracts | | $ | — | | | $ | — | | | $ | — | | | $ | — | | | $ | (703,859 | ) | | $ | — | | | $ | (703,859 | ) |
Options purchased(a) | | | — | | | | — | | | | — | | | | — | | | | (101,995 | ) | | | — | | | | (101,995 | ) |
Swaps | | | — | | | | (36,731 | ) | | | — | | | | — | | | | 58,993 | | | | — | | | | 22,262 | |
| | | | | | | | | | | | | | | | | | | | | | | | | | | | |
| | $ | — | | | $ | (36,731 | ) | | $ | — | | | $ | — | | | $ | (746,861 | ) | | $ | — | | | $ | (783,592 | ) |
| | | | | | | | | | | | | | | | | | | | | | | | | | | | |
| | (a) | Options purchased are included in net change in unrealized appreciation (depreciation) on investments — unaffiliated. | |
Average Quarterly Balances of Outstanding Derivative Financial Instruments
| | | | |
Futures contracts: | | | | |
Average notional value of contracts — long | | $ | 31,068,118 | |
Average notional value of contracts — short | | | 4,157,721 | |
Options: | | | | |
Average notional value of swaption contracts purchased | | | 5,725,000 | |
Credit default swaps: | | | | |
Average notional value — buy protection | | | 3,887,500 | |
Average notional value — sell protection | | | 2,624,500 | |
Interest rate swaps: | | | | |
Average notional value — pays fixed rate | | | 887,500 | |
For more information about the Fund’s investment risks regarding derivative financial instruments, refer to the Notes to Financial Statements.
Derivative Financial Instruments — Offsetting as of Period End
The Fund’s derivative assets and liabilities (by type) were as follows:
| | | | | | | | |
| | | Assets | | | Liabilities | |
Derivative Financial Instruments: | | | | | | | | |
Futures contracts | | $ | 7,686 | | | $ | 32,230 | |
Options(a) | | | 32,770 | | | | — | |
Swaps — Centrally cleared | | | — | | | | 10,510 | |
Swaps — OTC(b) | | | 50,037 | | | | 36,315 | |
| | | | | | | | |
Total derivative assets and liabilities in the Statements of Assets and Liabilities | | $ | 90,493 | | | $ | 79,055 | |
Derivatives not subject to a Master Netting Agreement or similar agreement (“MNA”) | | | (7,686 | ) | | | (42,740 | ) |
| | | | | | | | |
Total derivative assets and liabilities subject to an MNA | | $ | 82,807 | | | $ | 36,315 | |
| | | | | | | | |
| | (a) | Includes options purchased at value which is included in Investments at value — unaffiliated in the Statements of Assets and Liabilities and reported in the Schedule of Investments. | |
| | (b) | Includes unrealized appreciation (depreciation) on OTC swaps and swap premiums paid/received in the Statements of Assets and Liabilities. | |
The following tables present the Fund’s derivative assets and liabilities by counterparty net of amounts available for offset under an MNA and net of the related collateral received and pledged by the Fund:
| | | | | | | | | | | | | | | | | | | | |
| Counterparty | | Derivative
Assets
Subject to
an MNA by
Counterparty | | | Derivatives
Available
for Offset(a) | | | Non-cash
Collateral
Received | | | Cash
Collateral
Received(b) | | | Net Amount
of Derivative
Assets(c) | |
BNP Paribas S.A. | | $ | 14,772 | | | $ | (2,105 | ) | | $ | — | | | $ | — | | | $ | 12,667 | |
JPMorgan Chase Bank N.A. | | | 32,770 | | | | — | | | | — | | | | (32,770 | ) | | | — | |
Morgan Stanley & Co., International PLC | | | 35,265 | | | | (34,210 | ) | | | — | | | | — | | | | 1,055 | |
| | | | | | | | | | | | | | | | | | | | |
| | $ | 82,807 | | | $ | (36,315 | ) | | $ | — | | | $ | (32,770 | ) | | $ | 13,722 | |
| | | | | | | | | | | | | | | | | | | | |
| | | | |
| S C H E D U L E S O F I N V E S T M E N T S | | | 45 | |
| | |
Schedule of Investments (continued) March 31, 2019 | | BATS: Series C Portfolio |
| | | | | | | | | | | | | | | | | | | | |
| Counterparty | | Derivative Liabilities Subject to
an MNA by
Counterparty | | | Derivatives
Available
for Offset(a) | | | Non-cash
Collateral Pledged | | | Cash Collateral Pledged | | | Net Amount
of Derivative Liabilities | |
BNP Paribas S.A. | | $ | 2,105 | | | $ | (2,105 | ) | | $ | — | | | $ | — | | | $ | — | |
Morgan Stanley & Co., International PLC | | | 34,210 | | | | (34,210 | ) | | | — | | | | — | | | | — | |
| | | | | | | | | | | | | | | | | | | | |
| | $ | 36,315 | | | $ | (36,315 | ) | | $ | — | | | $ | — | | | $ | — | |
| | | | | | | | | | | | | | | | | | | | |
| | (a) | The amount of derivatives available for offset is limited to the amount of derivative assets and/or liabilities that are subject to an MNA. | |
| | (b) | Excess of collateral received from the individual counterparty is not shown for financial reporting purposes. | |
| | (c) | Net amount represents the net amount receivable from the counterparty in the event of default. | |
Fair Value Hierarchy as of Period End
Various inputs are used in determining the fair value of investments and derivative financial instruments. For information about the Fund’s policy regarding valuation of investments and derivative financial instruments, refer to the Notes to Financial Statements.
The following tables summarize the Fund’s investments and derivative financial instruments categorized in the disclosure hierarchy:
| | | | | | | | | | | | | | | | |
| | | Level 1 | | | Level 2 | | | Level 3 | | | Total | |
Assets: | | | | | | | | | | | | | | | | |
Investments: | | | | | | | | | | | | | | | | |
Long-Term Investments(a) | | $ | — | | | $ | 366,705,849 | | | $ | — | | | $ | 366,705,849 | |
Short-Term Securities | | | 3,914,586 | | | | — | | | | — | | | | 3,914,586 | |
Options Purchased: | | | | | | | | | | | | | | | | |
Interest rate contracts | | | — | | | | 32,770 | | | | — | | | | 32,770 | |
| | | | | | | | | | | | | | | | |
| | $ | 3,914,586 | | | $ | 366,738,619 | | | $ | — | | | $ | 370,653,205 | |
| | | | | | | | | | | | | | | | |
Derivative Financial Instruments(b) | | | | | | | | | | | | | | | | |
Assets: | | | | | | | | | | | | | | | | |
Credit contracts | | $ | — | | | $ | 35,265 | | | $ | — | | | $ | 35,265 | |
Interest rate contracts | | | 125,375 | | | | — | | | | — | | | | 125,375 | |
Liabilities: | | | | | | | | | | | | | | | | |
Credit contracts | | | — | | | | (25,915 | ) | | | — | | | | (25,915 | ) |
Interest rate contracts | | | (26,841 | ) | | | — | | | | — | | | | (26,841 | ) |
| | | | | | | | | | | | | | | | |
| | $ | 98,534 | | | $ | 9,350 | | | $ | — | | | $ | 107,884 | |
| | | | | | | | | | | | | | | | |
| | (a) | See above Schedule of Investments for values in each security type. | |
| | (b) | Derivative financial instruments are swaps and futures contracts, which are valued at the unrealized appreciation (depreciation) on the instrument. | |
During the year ended March 31, 2019, there were no transfers between levels.
See notes to financial statements.
| | |
| 46 | | 2 0 1 9 B L A C K R O C K A N N U A L R E P O R T T O S H A R E H O L D E R S |
| | |
Schedule of Investments March 31, 2019 | | BATS: Series E Portfolio (Percentages shown are based on Net Assets) |
| | | | | | | | |
| Security | | Par (000) | | | Value | |
| | |
Municipal Bonds — 89.6% | | | | | | | | |
| | |
Alabama — 1.2% | | | | | | | | |
Alabama Special Care Facilities Financing Authority-Birmingham, Methodist Home for the Aging Project, Series2015-1, RB,
5.50%, 06/01/30 | | $ | 500 | | | $ | 555,495 | |
County of Jefferson Alabama Sewer, Refunding RB,Sub-Lien, Warrants, Series D,
6.50%, 10/01/53 | | | 1,000 | | | | 1,183,070 | |
State of Alabama Docks Department, Refunding RB, AMT, (AGM), Series A,
5.00%, 10/01/35 | | | 1,000 | | | | 1,144,720 | |
| | | | | | | | |
| | | | | | | 2,883,285 | |
| | |
| Alaska — 0.3% | | | | | | |
Northern Tobacco Securitization Corp., Refunding RB, Asset-Backed, Series A: | | | | | | | | |
4.63%, 06/01/23 | | | 85 | | | | 85,020 | |
5.00%, 06/01/46 | | | 730 | | | | 708,713 | |
| | | | | | | | |
| | | | | | | 793,733 | |
| | |
| Arizona — 2.2% | | | | | | |
Arizona IDA: | | | | | | | | |
RB, Academies Math & Science Project, Series B, 5.13%, 07/01/47(a) | | | 195 | | | | 195,831 | |
RB, Great Lakes Senior Living Communities LLC Project, First Tier, Series A, 4.50%, 01/01/49 | | | 750 | | | | 760,230 | |
RB, Great Lakes Senior Living Communities LLC Project, Second Tier, Series B, 5.13%, 01/01/54 | | | 280 | | | | 293,020 | |
Refunding RB, Basis Schools Projects, Series A, 5.00%, 07/01/26(a) | | | 300 | | | | 326,166 | |
Refunding RB, Basis Schools Projects, Series A, 5.13%, 07/01/37(a) | | | 605 | | | | 638,457 | |
Refunding RB, Odyssey Prepatory Academy Project, 5.50%, 07/01/52(a) | | | 485 | | | | 486,872 | |
City of Phoenix IDA: | | | | | | | | |
RB, Legacy Traditional Schools Project, 5.00%, 07/01/46(a) | | | 570 | | | | 587,773 | |
Refunding RB, Basis Schools Projects, 5.00%, 07/01/45(a) | | | 140 | | | | 144,690 | |
Refunding RB, Basis Schools Projects, Series A, 5.00%, 07/01/35(a) | | | 45 | | | | 47,108 | |
Refunding RB, Basis Schools Projects, Series A, 5.00%, 07/01/46(a) | | | 50 | | | | 51,647 | |
Refunding RB, Legacy Traditional Schools Project, 5.00%, 07/01/35(a) | | | 300 | | | | 310,548 | |
Refunding RB, Legacy Traditional Schools Project, 5.00%, 07/01/45(a) | | | 100 | | | | 102,634 | |
La Paz County IDA, RB, Imagine Schools West Middle Project, 5.88%, 06/15/48(a) | | | 285 | | | | 288,668 | |
Maricopa County IDA, Refunding RB, HonorHealth Project, Series A,
4.13%, 09/01/38 | | | 230 | | | | 246,247 | |
Salt Verde Financial Corp., RB,
5.00%, 12/01/37 | | | 500 | | | | 625,060 | |
| | | | | | | | |
| | | | | | | 5,104,951 | |
| | |
| Arkansas — 0.2% | | | | | | |
Pulaski County Public Facilities Board, RB: | | | | | | | | |
5.00%, 12/01/39 | | | 230 | | | | 254,019 | |
5.00%, 12/01/42 | | | 250 | | | | 274,875 | |
| | | | | | | | |
| | | | | | | 528,894 | |
| | |
| California — 8.4% | | | | | | |
California County Tobacco Securitization Agency: | | | | | | | | |
| | | | | | | | |
| Security | | Par (000) | | | Value | |
| | |
| California (continued) | | �� | | | | |
RB, Asset-Backed, 5.45%, 06/01/28 | | $ | 500 | | | $ | 507,550 | |
RB, Asset-Backed, 5.60%, 06/01/36 | | | 425 | | | | 425,259 | |
RB, Asset-Backed, 5.70%, 06/01/46 | | | 760 | | | | 760,281 | |
Refunding RB, Asset-Backed, Merced County Project, Series A, 5.00%, 06/01/26 | | | 20 | | | | 20,050 | |
Refunding RB, Asset-Backed, Sonoma County Corp. Project, 5.00%, 06/01/26 | | | 275 | | | | 275,693 | |
Refunding RB, Asset-Backed, Sonoma County Corp. Project, 5.25%, 06/01/45 | | | 330 | | | | 330,828 | |
Refunding RB, Turbo, Golden Gate Tobacco Project, Series A, 5.00%, 06/01/36 | | | 300 | | | | 300,000 | |
California Educational Facilities Authority, RB, Stanford University Project, SeriesV-1, | | | | | | | | |
5.00%, 05/01/49 | | | 1,175 | | | | 1,636,011 | |
California Infrastructure & Economic Development Bank, Refunding RB, Academy Motion Picture Art Project, 4.00%, 11/01/45 | | | 750 | | | | 770,933 | |
California Municipal Finance Authority: | | | | | | | | |
RB, Sycamore Academy Project,
5.63%, 07/01/44(a) | | | 150 | | | | 153,642 | |
Refunding RB, Community Medical Centers Project, Series A, 5.00%, 02/01/46 | | | 650 | | | | 719,011 | |
Refunding RB, Emerson College Project, Series B, 5.00%, 01/01/37 | | | 630 | | | | 721,709 | |
California School Finance Authority, RB: | | | | | | | | |
Alliance College-Ready Public Schools Project, 5.00%, 07/01/51(a) | | | 300 | | | | 323,970 | |
Alta Public Schools Project, Series A,
6.75%, 11/01/45(a) | | | 250 | | | | 264,460 | |
California Statewide Communities Development Authority: | | | | | | | | |
RB, Loma Linda University Medical Center Project, Series A, 5.25%, 12/01/56(a) | | | 100 | | | | 109,340 | |
Refunding RB, (AGM), 5.00%, 11/15/49 | | | 500 | | | | 559,880 | |
Refunding RB, 899 Charleston Project, Series A, 5.25%, 11/01/44(a) | | | 250 | | | | 267,678 | |
California Statewide Financing Authority, RB, Asset-Backed: | | | | | | | | |
Series A, 6.00%, 05/01/43 | | | 85 | | | | 85,465 | |
Series B, 5.63%, 05/01/29 | | | 80 | | | | 80,545 | |
Series B, 6.00%, 05/01/43 | | | 315 | | | | 316,723 | |
City of Irvine, Community Facilities District No.2013-3, (Great Park) Improvement Area No. 1, Special Tax Bonds, 5.00%, 09/01/44 | | | 250 | | | | 269,613 | |
City of Los Angeles Department of Airports: | | | | | | | | |
RB, AMT, Series C, 5.00%, 05/15/44 | | | 1,000 | | | | 1,156,880 | |
Refunding RB, AMT, Series A,
5.00%, 05/15/39 | | | 2,000 | | | | 2,382,480 | |
City of Roseville, CDF No. 1, Special Tax Bonds,
5.00%, 09/01/44 | | | 500 | | | | 535,410 | |
Golden State Tobacco Securitization Corp., Refunding RB, SeriesA-1, 5.00%, 06/01/47 | | | 955 | | | | 950,215 | |
Oakland Unified School District, GO, Series A, 5.00%, 08/01/40 | | | 350 | | | | 392,098 | |
Riverside County Public Financing Authority, RB, Capital Facilities Project, 5.25%, 11/01/45 | | | 500 | | | | 583,035 | |
San Francisco City & County Redevelopment Agency, Tax Allocation Bonds, Mission Bay’s Redevelopment Project,Sub-Series D,
0.00%, 08/01/31(a)(b) | | | 580 | | | | 322,120 | |
Santa Clara Unified School District, GO,
3.25%, 07/01/44 | | | 2,500 | | | | 2,453,925 | |
| | | | |
| S C H E D U L E S O F I N V E S T M E N T S | | | 47 | |
| | |
Schedule of Investments (continued) March 31, 2019 | | BATS: Series E Portfolio (Percentages shown are based on Net Assets) |
| | | | | | | | |
| Security | | Par (000) | | | Value | |
| | |
| California (continued) | | | | | | |
State of California, GO, 4.00%, 04/01/49 | | $ | 145 | | | $ | 155,544 | |
Tobacco Securitization Authority of Southern California, Refunding RB, Senior,Series A-1: | | | | | | | | |
5.00%, 06/01/37 | | | 1,260 | | | | 1,260,139 | |
5.13%, 06/01/46 | | | 585 | | | | 585,064 | |
| | | | | | | | |
| | | | | | | 19,675,551 | |
| | |
| Colorado — 3.6% | | | | | | |
Amber Creek Metropolitan District, GO, Refunding, Series A, 5.13%, 12/01/47 | | | 1,000 | | | | 1,008,070 | |
Arista Metropolitan District, GO, Refunding, Improvement, County Unlimited and Special Project, Series A, 5.00%, 12/01/38 | | | 500 | | | | 514,065 | |
Centerra Metropolitan District No. 1, Tax Allocation Bonds, 5.00%, 12/01/47(a) | | | 155 | | | | 159,410 | |
Colorado Educational & Cultural Facilities Authority, Refunding RB, Charter School-University Project, 5.00%, 12/15/45 | | | 500 | | | | 524,615 | |
Colorado Health Facilities Authority: | | | | | | | | |
RB, Catholic Health Initiatives Project, Series A, 5.25%, 01/01/40 | | | 815 | | | | 878,065 | |
RB, Catholic Health Initiatives Project, Series A, 5.25%, 01/01/45 | | | 610 | | | | 655,012 | |
Refunding RB, Catholic Health Initiatives Project, Series A, 5.00%, 07/01/39 | | | 400 | | | | 403,260 | |
Refunding RB, Catholic Health Initiatives Project, Series A, 5.00%, 02/01/41 | | | 200 | | | | 207,108 | |
Refunding RB, Catholic Health Initiatives Project, SeriesB-1, 5.00%, 07/01/38 | | | 215 | | | | 230,084 | |
Refunding RB, Catholic Health Initiatives Project, SeriesB-1, 4.00%, 07/01/39 | | | 640 | | | | 652,902 | |
Copperleaf Metropolitan District No. 2, GO, Refunding, 5.75%, 12/01/45 | | | 500 | | | | 523,970 | |
Denver Convention Center Hotel Authority, Refunding RB, 5.00%, 12/01/40 | | | 950 | | | | 1,036,450 | |
North Holly Metropolitan District, GO, Series A, 5.50%, 12/01/48 | | | 500 | | | | 502,130 | |
Serenity Ridge Metropolitan District No. 2, GO, Refunding, Series A, 5.13%, 12/01/37 | | | 550 | | | | 567,721 | |
Westcreek Metropolitan District No. 2, GO, Series A, 5.38%, 12/01/48 | | | 500 | | | | 500,945 | |
| | | | | | | | |
| | | | | | | 8,363,807 | |
| | |
| Connecticut — 0.4% | | | | | | |
Connecticut Housing Finance Authority, Refunding RB,Sub-SeriesB-1,
4.00%, 05/15/45 | | | 335 | | | | 346,239 | |
Mohegan Tribal Finance Authority, RB,
7.00%, 02/01/45(a) | | | 215 | | | | 222,458 | |
Mohegan Tribe of Indians of Connecticut: | | | | | | | | |
RB, Series A, 6.75%, 02/01/45(a) | | | 98 | | | | 104,958 | |
Refunding RB, Priority District Project, Series C, 6.25%, 02/01/30(a) | | | 330 | | | | 364,429 | |
| | | | | | | | |
| | | | | | | 1,038,084 | |
| | |
| Delaware — 0.2% | | | | | | |
Delaware EDA, RB, Exempt Facility Indian River Power Project, 5.38%, 10/01/45 | | | 505 | | | | 524,392 | |
| | | | | | | | |
| | |
| Florida — 4.1% | | | | | | |
Babcock Ranch Community Independent Special District, Special Assessment RB, 4.25%, 11/01/21 | | | 325 | | | | 329,384 | |
Brevard County Health Facilities Authority, Refunding RB, Health First, Inc. Project, 5.00%, 04/01/39 | | | 500 | | | | 546,950 | |
| | | | | | | | |
| Security | | Par (000) | | | Value | |
| | |
| Florida (continued) | | | | | | |
Capital Region Community Development District, Special Assessment Refunding RB, SeriesA-2, 4.60%, 05/01/31 | | $ | 485 | | | $ | 489,244 | |
Capital Trust Agency, Inc., RB, University Bridge LLC Student Housing Project, Series A,
5.25%, 12/01/58(a) | | | 240 | | | | 235,625 | |
Celebration Pointe Community Development District, Special Assessment RB: | | | | | | | | |
5.13%, 05/01/45 | | | 250 | | | | 253,615 | |
Alachua County Project, 4.00%, 05/01/22(a) | | | 100 | | | | 101,324 | |
Collier County Health Facilities Authority, Refunding RB, Series A, 5.00%, 05/01/45 | | | 1,000 | | | | 1,081,470 | |
Florida Development Finance Corp., RB: | | | | | | | | |
AMT, Waste Pro USA, Inc. Project,
5.00%, 08/01/29(a)(c) | | | 470 | | | | 488,358 | |
Renaissance Charter School Project, Series A, 6.13%, 06/15/44 | | | 45 | | | | 47,713 | |
Florida Higher Educational Facilities Financial Authority, RB, Jacksonville University Project, SeriesA-1, 5.00%, 06/01/48 (a) | | | 355 | | | | 377,511 | |
Greater Orlando Aviation Authority, Refunding RB, AMT, Special Purpose JetBlue Airway Project, 5.00%, 11/15/36 | | | 250 | | | | 262,393 | |
Hillsborough County Aviation Authority, Refunding RB, AMT, Tampa International Project, Series A, 5.00%, 10/01/44 | | | 350 | | | | 387,055 | |
Lakewood Ranch Stewardship District, Special Assessment RB: | | | | | | | | |
Lakewood Centre & NW Sector Projects, 4.95%, 05/01/29(a) | | | 135 | | | | 139,482 | |
Lakewood Centre & NW Sector Projects, 5.50%, 05/01/39(a) | | | 135 | | | | 142,051 | |
Lakewood Centre & NW Sector Projects, 5.65%, 05/01/48(a) | | | 210 | | | | 220,937 | |
Lakewood Centre North Project,
4.88%, 05/01/35 | | | 250 | | | | 254,930 | |
Northeast Sector Project - Phase 1B,
4.75%, 05/01/29(a) | | | 180 | | | | 186,530 | |
Northeast Sector Project - Phase 1B,
5.30%, 05/01/39(a) | | | 205 | | | | 213,440 | |
Northeast Sector Project - Phase 1B,
5.45%, 05/01/48(a) | | | 365 | | | | 383,918 | |
Village of Lakewood Ranch Project, Series 2016,5.13%, 05/01/46 | | | 100 | | | | 102,378 | |
Miami Health Facilities Authority, Refunding RB, Miami Jewish Health Systems Obligation Project: | | | | | | | | |
5.13%, 07/01/38 | | | 500 | | | | 548,305 | |
5.13%, 07/01/46 | | | 390 | | | | 423,485 | |
Orange County Health Facilities Authority: | | | | | | | | |
RB, Presbyterian Retirement Community Project, 5.00%, 08/01/35 | | | 250 | | | | 273,560 | |
Refunding RB, Presbyterian Retirement Community Project, 5.00%, 08/01/41 | | | 695 | | | | 753,262 | |
Trout Creek Community Development District, Special Assessment RB: | | | | | | | | |
4.50%, 05/01/23 | | | 250 | | | | 252,527 | |
5.00%, 05/01/28 | | | 240 | | | | 246,830 | |
5.63%, 05/01/45 | | | 250 | | | | 259,155 | |
West Villages Improvement District, Unit Development No. 7, Master Infrastructure, Special Assessment RB: | | | | | | | | |
4.25%, 05/01/29(a)(d) | | | 100 | | | | 99,996 | |
| | |
| 48 | | 2 0 1 9 B L A C K R O C K A N N U A L R E P O R T T O S H A R E H O L D E R S |
| | |
Schedule of Investments (continued) March 31, 2019 | | BATS: Series E Portfolio (Percentages shown are based on Net Assets) |
| | | | | | | | |
| Security | | Par (000) | | | Value | |
| | |
| Florida (continued) | | | | | | |
4.75%, 05/01/39(a)(d) | | $ | 190 | | | $ | 188,782 | |
5.00%, 05/01/50(a)(d) | | | 290 | | | | 289,991 | |
| | | | | | | | |
| | | | | | | 9,580,201 | |
| | |
| Georgia — 1.0% | | | | | | |
Fulton County Development Authority, RB, Georgia Institute of Technology Project, 4.00%, 06/15/49(d) | | | 800 | | | | 855,784 | |
Gainesville & Hall County Hospital Authority, Refunding RB, North East Georgia Health Systems, Inc. Project, 5.50%, 08/15/54 | | | 250 | | | | 289,023 | |
Main Street Natural Gas, Inc., RB, Series A, 5.00%, 05/15/49 | | | 950 | | | | 1,155,770 | |
| | | | | | | | |
| | | | | | | 2,300,577 | |
| | |
| Idaho — 0.2% | | | | | | |
Idaho Health Facilities Authority, RB, Trinity Health Credit Group Project, Series D,
4.00%, 12/01/43 | | | 540 | | | | 574,544 | |
| | | | | | | | |
| | |
| Illinois — 6.7% | | | | | | |
City of Chicago Board of Education, GO: | | | | | | | | |
Refunding, Series B, 4.00%, 12/01/35 | | | 230 | | | | 220,517 | |
Refunding, Series C, 5.00%, 12/01/25 | | | 225 | | | | 243,090 | |
Refunding, Series C, 5.00%, 12/01/34 | | | 625 | | | | 671,563 | |
Refunding, Series D, 5.00%, 12/01/25 | | | 290 | | | | 313,316 | |
Refunding, Series F, 5.00%, 12/01/22 | | | 215 | | | | 227,827 | |
Series A, 5.00%, 12/01/41 | | | 200 | | | | 203,988 | |
Series A, 5.00%, 12/01/42 | | | 570 | | | | 584,849 | |
Series D, 5.00%, 12/01/46 | | | 675 | | | | 698,251 | |
Series H, 5.00%, 12/01/46 | | | 625 | | | | 655,256 | |
City of Chicago, GO: | | | | | | | | |
Refunding, Series A, 6.00%, 01/01/38 | | | 275 | | | | 313,720 | |
Series A, 5.00%, 01/01/44 | | | 195 | | | | 206,780 | |
Series A, 5.50%, 01/01/49 | | | 70 | | | | 77,236 | |
City of Chicago, O’Hare International Airport Revenue: | | | | | | | | |
Refunding RB, Senior Lien, Series D, 5.00%, 01/01/39 | | | 260 | | | | 284,970 | |
Refunding RB, Series D, 5.00%, 01/01/46 | | | 1,000 | | | | 1,112,270 | |
City of Chicago, Wastewater Transmission Revenue, Refunding RB, Second Lien, Series C, 5.00%, 01/01/39 | | | 500 | | | | 541,405 | |
Cook County Community College District No. 508, GO, 5.25%, 12/01/30 | | | 920 | | | | 969,238 | |
Illinois Finance Authority, Refunding RB: | | | | | | | | |
Chicago LLC University of Illinois at Chicago Project, 5.00%, 02/15/47 | | | 900 | | | | 981,486 | |
Presence Health Network Project, Series C, 5.00%, 02/15/41 | | | 650 | | | | 739,551 | |
Senior, Rogers Park Montessori School Project, 6.13%, 02/01/45 | | | 150 | | | | 157,608 | |
Metropolitan Pier & Exposition Authority: | | | | | | | | |
RB, McCormick Place Expansion Project, Series 2015A, 5.50%, 06/15/53 | | | 390 | | | | 421,691 | |
Refunding RB, McCormick Place Expansion Project, Series B,
5.00%, 06/15/52 | | | 80 | | | | 81,870 | |
Refunding RB, McCormick Project,Series B-2, 5.00%, 06/15/50 | | | 600 | | | | 606,360 | |
Refunding RB, McCormick Project,Series B-2, 5.20%, 06/15/50 | | | 405 | | | | 410,233 | |
State of Illinois, GO: | | | | | | | | |
5.00%, 01/01/28 | | | 1,005 | | | | 1,093,329 | |
5.00%, 04/01/31 | | | 1,000 | | | | 1,051,880 | |
5.50%, 07/01/33 | | | 365 | | | | 389,090 | |
5.00%, 03/01/37 | | | 300 | | | | 306,618 | |
5.00%, 02/01/39 | | | 1,000 | | | | 1,034,870 | |
| | | | | | | | |
| Security | | Par (000) | | | Value | |
| | |
| Illinois (continued) | | | | | | |
5.00%, 05/01/39 | | $ | 275 | | | $ | 284,919 | |
Refunding, Series B, 5.00%, 10/01/27 | | | 400 | | | | 443,460 | |
Series A, 5.00%, 01/01/33 | | | 310 | | | | 317,831 | |
| | | | | | | | |
| | | | | | | 15,645,072 | |
| | |
| Indiana — 1.4% | | | | | | |
City of Vincennes, Refunding RB, Southwest Industrial Regional Youth Village Factory Project, 6.25%, 01/01/29(a) | | | 435 | | | | 444,318 | |
County of Allen RB, StoryPoint Fort Wayne Project: | | | | | | | | |
6.63%, 01/15/34(a) | | | 100 | | | | 107,037 | |
6.75%, 01/15/43(a) | | | 395 | | | | 420,233 | |
6.88%, 01/15/52(a) | | | 380 | | | | 405,015 | |
Indiana Finance Authority: | | | | | | | | |
RB, AMT, Green Bonds, Resource Polyflow Indiana Project, 7.00%, 03/01/39(a) | | | 220 | | | | 229,937 | |
RB, AMT, Private Activity Bond, Ohio River Bridges East End Crossing Project,
5.25%, 01/01/51 | | | 1,000 | | | | 1,073,300 | |
Refunding RB, Marquette Project,
4.75%, 03/01/32 | | | 270 | | | | 275,449 | |
Town of Chesterton RB, StoryPoint Chesterton Project, Series A, 6.38%, 01/15/51(a) | | | 265 | | | | 274,744 | |
| | | | | | | | |
| | | | | | | 3,230,033 | |
| | |
| Iowa — 1.9% | | | | | | |
Iowa Finance Authority: | | | | | | | | |
RB, Lifespace Communities Project, Series A, 5.00%, 05/15/48 | | | 940 | | | | 998,271 | |
Refunding RB, Iowa Fertilizer Co. Project, 3.13%, 12/01/22 | | | 795 | | | | 799,865 | |
Refunding RB, Iowa Fertilizer Co. Project, 5.25%, 12/01/25 | | | 310 | | | | 334,112 | |
Refunding RB, Iowa Fertilizer Co. Project, Series A, 5.25%, 12/01/50(c) | | | 400 | | | | 421,792 | |
Refunding RB, Iowa Fertilizer Co. Project, Series B, 5.25%, 12/01/50(c) | | | 750 | | | | 803,550 | |
Refunding RB, Unitypoint Health Project, Series E, 4.00%, 08/15/46 | | | 570 | | | | 585,196 | |
Iowa Tobacco Settlement Authority, Refunding RB, Asset-Backed, Series C, 5.50%, 06/01/42 | | | 485 | | | | 485,034 | |
| | | | | | | | |
| | | | | | | 4,427,820 | |
| | |
| Kentucky — 0.2% | | | | | | |
Kentucky Economic Development Finance Authority, Refunding RB, Owensboro Health Project, Series A, 5.25%, 06/01/41 | | | 500 | | | | 555,395 | |
| | | | | | | | |
| | |
| Louisiana — 0.2% | | | | | | |
Juban Crossing Economic Development District, Refunding RB, General Infrastructure Projects, Series C, 7.00%, 09/15/44(a) | | | 475 | | | | 484,073 | |
| | | | | | | | |
| | |
| Maryland — 1.0% | | | | | | |
Anne Arundel County Consolidated Special Taxing District, Special Tax Bonds, Villages at 2 Rivers Project, 5.25%, 07/01/44 | | | 250 | | | | 253,650 | |
City of Baltimore, Refunding RB, Baltimore Research Park Project, Series A,
4.00%, 09/01/27 | | | 100 | | | | 103,879 | |
County of Frederick, RB, Jefferson Technology Park Project, Series B, 7.13%, 07/01/43(a) | | | 150 | | | | 151,038 | |
Maryland Community Development Administration, Refunding RB, Series A, 4.10%, 09/01/38 | | | 580 | | | | 612,184 | |
| | | | |
| S C H E D U L E S O F I N V E S T M E N T S | | | 49 | |
| | |
Schedule of Investments (continued) March 31, 2019 | | BATS: Series E Portfolio (Percentages shown are based on Net Assets) |
| | | | | | | | |
| Security | | Par (000) | | | Value | |
| | |
| Maryland (continued) | | | | | | |
Maryland Economic Development Corp: | | | | | | | | |
RB, AMT, Green Bonds, Purple Line Light Rail Project, 5.00%, 03/31/51 | | $ | 620 | | | $ | 670,226 | |
Refunding RB, University of Maryland Project, 5.00%, 07/01/39 | | | 100 | | | | 107,244 | |
Maryland Health & Higher Educational Facilities Authority, Refunding RB, Meritus Medical Center Project, 5.00%, 07/01/40 | | | 500 | | | | 548,985 | |
| | | | | | | | |
| | | | | | | 2,447,206 | |
| | |
| Massachusetts — 3.2% | | | | | | |
Massachusetts Development Finance Agency: | | | | | | | | |
RB, Baystate Medical Center Project, Series N, 5.00%, 07/01/44 | | | 500 | | | | 546,965 | |
RB, Emerson College Project,
5.00%, 01/01/43 | | | 500 | | | | 561,055 | |
RB, Emerson College Project,
5.00%, 01/01/48 | | | 1,000 | | | | 1,117,820 | |
RB, Emerson College Project, Series A, 5.00%, 01/01/47 | | | 500 | | | | 553,550 | |
RB, Green Bonds, Boston Medical Center Project, 5.00%, 07/01/44 | | | 180 | | | | 195,986 | |
RB, University of Massachusetts Boston Student Housing Project,
5.00%, 10/01/48 | | | 1,000 | | | | 1,080,340 | |
RB, University of Massachusetts Darthmouth Student Housing Project, 5.00%, 10/01/54 | | | 710 | | | | 770,322 | |
Refunding RB, Emmanuel College Project, Series A, 5.00%, 10/01/35 | | | 750 | | | | 841,830 | |
Refunding RB, Series A, 4.00%, 07/01/44 | | | 1,250 | | | | 1,273,338 | |
Massachusetts Housing Finance Agency, Refunding RB, AMT, Series A, 4.45%, 12/01/42 | | | 640 | | | | 662,854 | |
| | | | | | | | |
| | | | | | | 7,604,060 | |
| | |
| Michigan — 1.9% | | | | | | |
City of Detroit, GO: | | | | | | | | |
5.00%, 04/01/34 | | | 90 | | | | 97,046 | |
5.00%, 04/01/35 | | | 90 | | | | 96,747 | |
5.00%, 04/01/36 | | | 65 | | | | 69,631 | |
5.00%, 04/01/37 | | | 100 | | | | 106,630 | |
5.00%, 04/01/38 | | | 45 | | | | 47,911 | |
Michigan Finance Authority, Refunding RB, AMT, Senior Lien, Detroit Water & Sewerage Department Project, 5.00%, 07/01/44 | | | 250 | | | | 267,200 | |
Michigan Housing Development Authority, RB, Series A, 3.65%, 12/01/39 | | | 1,820 | | | | 1,859,057 | |
Michigan Tobacco Settlement Finance Authority, RB, Turbo, Series A,
6.88%, 06/01/42 | | | 500 | | | | 500,140 | |
Wayne County Airport Authority: | | | | | | | | |
RB, AMT, Detroit Metropolitan Wayne County Airport Project, 5.00%, 12/01/39 | | | 250 | | | | 278,590 | |
RB, Detroit Metropolitan Wayne County Airport Project, Series B,
5.00%, 12/01/44 | | | 500 | | | | 559,680 | |
RB, Series D, 5.00%, 12/01/40 | | | 500 | | | | 569,335 | |
| | | | | | | | |
| | | | | | | 4,451,967 | |
| | |
| Minnesota — 1.5% | | | | | | |
City of Brooklyn Park, RB, Athlos Leadership Academy Project, 5.25%, 07/01/30 | | | 350 | | | | 363,167 | |
City of Deephaven, Refunding RB, Eagle Ridge Academy Project, Series 2015A,
5.25%, 07/01/37 | | | 605 | | | | 646,055 | |
Duluth EDA, Refunding RB, Essentia Health Obligated Group Project, Series A: | | | | | | | | |
| | | | | | | | |
| Security | | Par (000) | | | Value | |
| | |
| Minnesota (continued) | | | | | | |
4.25%, 02/15/48 | | $ | 1,265 | | | $ | 1,326,846 | |
5.25%, 02/15/58 | | | 425 | | | | 481,440 | |
Housing & Redevelopment Authority of the City of St. Paul Minnesota, RB: | | | | | | | | |
Great River School Project, Series A,
5.50%, 07/01/38(a) | | | 240 | | | | 252,984 | |
Hmong College Prep Academy Project, Series E, 5.50%, 09/01/36 | | | 310 | | | | 335,435 | |
| | | | | | | | |
| | | | | | | 3,405,927 | |
| | |
| Missouri — 1.0% | | | | | | |
City of St. Louis IDA, Refunding RB, Ballpark Village Development Project, Series A: | | | | | | | | |
4.38%, 11/15/35 | | | 215 | | | | 221,381 | |
4.75%, 11/15/47 | | | 240 | | | | 247,730 | |
Kansas City IDA, Refunding RB, Kansas City United Methodist Church Project,
5.75%, 11/15/36(a) | | | 220 | | | | 191,981 | |
Kansas City Land Clearance Redevelopment Authority, Tax Allocation Bonds, Convention Center Hotel Project, Series B: | | | | | | | | |
4.38%, 02/01/31(a) | | | 170 | | | | 174,187 | |
5.00%, 02/01/40(a) | | | 260 | | | | 271,211 | |
Plaza at Noah’s Ark Community Improvement District, Refunding Tax Allocation Bonds, 5.00%, 05/01/35 | | | 400 | | | | 401,756 | |
Saint Louis County IDA, Refunding RB, Friendship Village St. Louis Project,
5.00%, 09/01/37 | | | 695 | | | | 744,213 | |
| | | | | | | | |
| | | | | | | 2,252,459 | |
| | |
| Montana — 1.5% | | | | | | |
City of Missoula, Water System Revenue, RB, Series A, 4.00%, 07/01/44 | | | 3,400 | | | | 3,633,308 | |
| | | | | | | | |
| | |
| Nebraska — 0.2% | | | | | | |
Douglas County Hospital Authority No. 3, Refunding RB, Health Facilities NE Methodist Hospital Project, 5.00%, 11/01/45 | | | 500 | | | | 545,355 | |
| | | | | | | | |
| | |
| Nevada — 2.2% | | | | | | |
City of Reno, Refunding RB, (AGM), SeriesA-1, 4.00%, 06/01/46 | | | 5,000 | | | | 5,192,000 | |
| | | | | | | | |
| | |
| New Hampshire — 0.2% | | | | | | |
New Hampshire Business Finance Authority, Refunding RB: | | | | | | | | |
AMT, Resource Recovery Covanta Project, Series C, 4.88%, 11/01/42(a) | | | 130 | | | | 132,562 | |
Resource Recovery Covanta Project, Series B, 4.63%, 11/01/42(a) | | | 320 | | | | 323,856 | |
| | | | | | | | |
| | | | | | | 456,418 | |
| | |
| New Jersey — 7.3% | | | | | | |
Casino Reinvestment Development Authority, Refunding RB: | | | | | | | | |
5.25%, 11/01/39 | | | 250 | | | | 269,238 | |
5.25%, 11/01/44 | | | 560 | | | | 602,218 | |
Essex County Improvement Authority, RB, AMT, 5.25%, 07/01/45(a) | | | 250 | | | | 251,718 | |
New Jersey EDA: | | | | | | | | |
RB, AMT, Continental Airlines, Inc. Project, 4.88%, 09/15/19 | | | 205 | | | | 207,239 | |
RB, AMT, Kapkowski Road Landfill Project, Series 1998B-MB, 6.50%, 04/01/31 | | | 100 | | | | 114,336 | |
RB, AMT, Private Activity - The Goethals Project, 5.38%, 01/01/43 | | | 500 | | | | 551,920 | |
RB, Provident Group-Kean Properties Project, 5.00%, 07/01/32 | | | 200 | | | | 219,340 | |
| | |
| 50 | | 2 0 1 9 B L A C K R O C K A N N U A L R E P O R T T O S H A R E H O L D E R S |
| | |
Schedule of Investments (continued) March 31, 2019 | | BATS: Series E Portfolio (Percentages shown are based on Net Assets) |
| | | | | | | | |
| Security | | Par (000) | | | Value | |
| | |
| New Jersey (continued) | | | | | | |
RB, Series WW, 5.25%, 06/15/40 | | $ | 1,000 | | | $ | 1,083,290 | |
Refunding RB, 5.00%, 06/15/23 | | | 200 | | | | 217,140 | |
Refunding RB, (AGM), Provident Group-Montclair Project, 5.00%, 06/01/37 | | | 200 | | | | 228,180 | |
Refunding RB, Charter, Greater Brunswick Project, Series A,
6.00%, 08/01/49(a) | | | 250 | | | | 254,763 | |
New Jersey Health Care Facilities Financing Authority, RB, Inspira Health Obligated Group Project, Series A, 4.00%, 07/01/47 | | | 540 | | | | 565,029 | |
New Jersey Health Care Facilities Financing Authority, Refunding RB: | | | | | | | | |
Barnabas Health Obligated Project,
4.25%, 07/01/44 | | | 395 | | | | 410,824 | |
Barnabas Health Obligated Project,
5.00%, 07/01/44 | | | 220 | | | | 246,440 | |
New Jersey Transportation Trust Fund Authority, RB, Transportation Program: | | | | | | | | |
Series AA, 5.00%, 06/15/38 | | | 325 | | | | 339,034 | |
Series AA, 5.25%, 06/15/41 | | | 205 | | | | 222,366 | |
Series AA, 5.25%, 06/15/43 | | | 1,615 | | | | 1,800,386 | |
Series AA, 5.00%, 06/15/44 | | | 30 | | | | 31,788 | |
Series AA, 5.00%, 06/15/44 | | | 30 | | | | 31,411 | |
Series AA, 5.00%, 06/15/46 | | | 450 | | | | 478,643 | |
Series B, 5.00%, 06/15/42 | | | 280 | | | | 289,643 | |
New Jersey Turnpike Authority, RB, Series A: | | | | | | | | |
5.00%, 01/01/43 | | | 370 | | | | 401,372 | |
4.00%, 01/01/48 | | | 2,000 | | | | 2,122,860 | |
Tobacco Settlement Financing Corp., Refunding RB: | | | | | | | | |
Series A, 5.00%, 06/01/35 | | | 375 | | | | 425,362 | |
Series A, 5.00%, 06/01/46 | | | 1,100 | | | | 1,195,964 | |
Sub-Series B, 5.00%, 06/01/46 | | | 4,335 | | | | 4,572,688 | |
| | | | | | | | |
| | | | | | | 17,133,192 | |
| | |
| New Mexico — 0.1% | | | | | | |
New Mexico Hospital Equipment Loan Council, Refunding RB, Gerald Champion Regional Medical Center Project, 5.50%, 07/01/42 | | | 325 | | | | 349,229 | |
| | | | | | | | |
| | |
| New York — 7.6% | | | | | | |
Build NYC Resource Corp., Refunding RB, AMT, Pratt Paper, Inc. Project,
5.00%, 01/01/35(a) | | | 285 | | | | 307,236 | |
Chautauqua Tobacco Asset Securitization Corp., Refunding RB, 5.00%, 06/01/48 | | | 1,000 | | | | 1,010,810 | |
County of Cattaraugus, RB, St. Bonaventure University Project, 5.00%, 05/01/44 | | | 195 | | | | 212,035 | |
Dutchess County Industrial Development Agency, Refunding RB, Bard College Civic Facility Project, SeriesA-1, 5.00%, 08/01/46 | | | 530 | | | | 530,005 | |
Erie Tobacco Asset Securitization Corp., Refunding RB, Asset Backed, Series A, 5.00%, 06/01/45 | | | 495 | | | | 494,985 | |
Hempstead Town Local Development Corp., RB, Molloy College Project, 5.00%, 07/01/44 | | | 500 | | | | 536,665 | |
MTA Hudson Rail Yards Trust Obligations, RB, Series A, 5.00%, 11/15/56 | | | 955 | | | | 1,039,823 | |
New York Counties Tobacco Trust IV, Refunding RB: | | | | | | | | |
Series A, 5.00%, 06/01/42 | | | 915 | | | | 909,968 | |
Series A, 5.00%, 06/01/45 | | | 225 | | | | 222,716 | |
Turbo, Series A, 6.25%, 06/01/41(a) | | | 550 | | | | 565,290 | |
New York Counties Tobacco Trust VI, Refunding RB: | | | | | | | | |
5.00%, 06/01/45 | | | 835 | | | | 879,606 | |
| | | | | | | | |
| Security | | Par (000) | | | Value | |
| | |
| New York (continued) | | | | | | |
5.00%, 06/01/51 | | $ | 420 | | | $ | 430,130 | |
New York Liberty Development Corp.: | | | | | | | | |
Refunding RB,Class 1-3 World Trade Center Project, 5.00%, 11/15/44(a) | | | 1,000 | | | | 1,065,900 | |
Refunding RB,Class 2-3 World Trade Center Project, 5.38%, 11/15/40(a) | | | 150 | | | | 162,162 | |
Refunding RB,Class 3-3 World Trade Center Project, 7.25%, 11/15/44(a) | | | 100 | | | | 118,080 | |
New York State Dormitory Authority, Refunding RB, Orange Regional Medical Center Project, 5.00%, 12/01/35(a) | | | 215 | | | | 244,234 | |
New York State Housing Finance Agency, RB, Affordable Housing Project: | | | | | | | | |
Series D, 3.25%, 11/01/34 | | | 1,000 | | | | 1,017,980 | |
Series E, 3.25%, 11/01/34 | | | 1,100 | | | | 1,119,778 | |
New York State Urban Development Corp., RB, State Personal Income Tax General Purpose Project, Series A, 4.00%, 03/15/47 | | | 1,000 | | | | 1,075,180 | |
New York Transportation Development Corp.: | | | | | | | | |
RB, AMT, Laguardia Airport Term B Redevelopment Project, Series A,
5.00%, 07/01/34 | | | 500 | | | | 550,290 | |
RB, AMT, Laguardia Airport Term B Redevelopment Project, Series A,
5.00%, 07/01/41 | | | 1,470 | | | | 1,596,905 | |
Tompkins County Development Corp., Refunding RB, Kendal at Ithaca, Inc. Project, 5.00%, 07/01/44 | | | 385 | | | | 411,326 | |
TSASC, Inc., Refunding RB, Turbo,Sub-Series B, 5.00%, 06/01/48 | | | 270 | | | | 270,270 | |
Westchester County Healthcare Corp., RB, Senior Lien, Series A, 5.00%, 11/01/44 | | | 335 | | | | 363,172 | |
Westchester County Local Development Corp., Refunding RB, Kendal on the Hudson Project, 5.00%, 01/01/34 | | | 1,080 | | | | 1,141,625 | |
Westchester Tobacco Asset Securitization, Refunding RB,Sub-Series C: | | | | | | | | |
4.00%, 06/01/42 | | | 970 | | | | 942,801 | |
5.13%, 06/01/51 | | | 500 | | | | 511,855 | |
| | | | | | | | |
| | | | | | | 17,730,827 | |
| | |
| North Carolina — 0.8% | | | | | | |
North Carolina Department of Transportation, RB, AMT, Hot Lanes Project, Series 1-77, 5.00%, 06/30/54 | | | 115 | | | | 123,128 | |
North Carolina Housing Finance Agency, RB, 3.63%, 07/01/49 | | | 1,165 | | | | 1,163,567 | |
North Carolina Medical Care Commission, Refunding RB, 1st Mortgage, Galloway Ridge Project, Series A, 5.25%, 01/01/41 | | | 250 | | | | 258,890 | |
Town of Mooresville, Special Assessment RB, 5.38%, 03/01/40(a) | | | 250 | | | | 249,833 | |
| | | | | | | | |
| | | | | | | 1,795,418 | |
| | |
| Ohio — 1.6% | | | | | | |
Buckeye Tobacco Settlement Financing Authority, RB, Turbo, Asset-Backed, Senior, SeriesA-2: | | | | | | | | |
5.75%, 06/01/34 | | | 200 | | | | 193,004 | |
5.88%, 06/01/47 | | | 1,775 | | | | 1,730,732 | |
Butler County Port Authority, RB, Storypoint Fairfield Project, 6.38%, 01/15/43(a) | | | 435 | | | | 455,436 | |
| | | | |
| S C H E D U L E S O F I N V E S T M E N T S | | | 51 | |
| | |
Schedule of Investments (continued) March 31, 2019 | | BATS: Series E Portfolio (Percentages shown are based on Net Assets) |
| | | | | | | | |
| Security | | Par (000) | | | Value | |
| | |
| Ohio (continued) | | | | | | |
County of Franklin, RB, OPRS Communities Obligation Group Project, Series 2013A, 6.13%, 07/01/40 | | $ | 585 | | | $ | 633,894 | |
County of Hamilton, RB, Improvement, Life Enriching Community Project,
5.00%, 01/01/46 | | | 190 | | | | 198,497 | |
Port of Greater Cincinnati Development Authority, RB, Colonial Village/Athens Garden Project, 5.00%, 12/01/40 | | | 335 | | | | 255,317 | |
State of Ohio, RB, AMT, Portsmouth Bypass Project, 5.00%, 06/30/53 | | | 370 | | | | 393,610 | |
| | | | | | | | |
| | | | | | | 3,860,490 | |
| | |
| Oklahoma — 2.2% | | | | | | |
Norman Regional Hospital Authority, Refunding RB, 5.00%, 09/01/37 | | | 1,250 | | | | 1,409,912 | |
Oklahoma Development Finance Authority, RB, OU Medicine Project, Series B: | | | | | | | | |
5.00%, 08/15/38 | | | 975 | | | | 1,095,393 | |
5.25%, 08/15/43 | | | 875 | | | | 999,180 | |
Tulsa Airports Improvement Trust, Refunding RB, AMT, American Airlines Project,
5.00%, 06/01/35(c) | | | 615 | | | | 675,098 | |
Tulsa County Industrial Authority, Refunding RB, Montereau, Inc. Project, 5.25%, 11/15/45 | | | 965 | | | | 1,072,028 | |
| | | | | | | | |
| | | | | | | 5,251,611 | |
| | |
| Oregon — 0.3% | | | | | | |
Clackamas County School District No. 12 North Clackamas, GO, Series A,
0.00%, 06/15/38(b) | | | 275 | | | | 130,430 | |
Hospital Facilities Authority of Multnomah County Oregon, Refunding RB, Mirabella at South Waterfront Project, 5.50%, 10/01/49 | | | 150 | | | | 161,388 | |
Polk County Hospital Facility Authority, RB, Dallas Retirement Village Project, Series A, 5.38%, 07/01/45 | | | 80 | | | | 83,460 | |
Yamhill County Hospital Authority, Refunding RB, Friendsview Retirement Community Project, Series 2016A, 5.00%, 11/15/36 | | | 300 | | | | 322,431 | |
| | | | | | | | |
| | | | | | | 697,709 | |
| | |
| Pennsylvania — 4.0% | | | | | | |
Allentown Neighborhood Improvement Zone Development Authority, RB, City Center Project, 5.00%, 05/01/42(a) | | | 295 | | | | 317,296 | |
Lancaster County Hospital Authority, Refunding RB, St. Anne’s Retirement Community Project, 5.00%, 04/01/33 | | | 250 | | | | 255,013 | |
Montgomery County Higher Education & Health Authority, Refunding RB, Thomas Jefferson University Project, Series A, 4.00%, 09/01/49 | | | 1,255 | | | | 1,296,290 | |
Montgomery County IDA: | | | | | | | | |
Refunding RB, Albert Einstein Healthcare Project, 5.25%, 01/15/45 | | | 500 | | | | 544,730 | |
Refunding RB, Whitemarsh Continuing Care Retirement Community Project, 5.38%, 01/01/50 | | | 170 | | | | 172,120 | |
Moon IDA, Refunding RB, Baptist Homes Society Project, 6.00%, 07/01/45 | | | 250 | | | | 265,868 | |
Northampton County IDA, Tax Allocation Bonds, Route 33 Project, 7.00%, 07/01/32 | | | 110 | | | | 123,632 | |
Pennsylvania Economic Development Financing Authority: | | | | | | | | |
RB, AMT, The Pennsylvania Rapid Bridge Replacement Project, 5.00%, 06/30/42 | | | 1,625 | | | | 1,774,987 | |
| | | | | | | | |
| Security | | Par (000) | | | Value | |
| | |
| Pennsylvania (continued) | | | | | | |
Refunding RB, AMT, National Gypson Co. Project, 5.50%, 11/01/44 | | $ | 500 | | | $ | 525,170 | |
Pennsylvania Higher Educational Facilities Authority, Refunding RB, Widener University Project, 5.00%, 07/15/38 | | | 250 | | | | 263,705 | |
Pennsylvania Housing Finance Agency, RB, AMT, State Single Family Housing Project, Series 123B, 4.00%, 10/01/42 | | | 1,170 | | | | 1,202,889 | |
Pennsylvania Turnpike Commission: | | | | | | | | |
RB, Series B, 5.25%, 12/01/44 | | | 1,000 | | | | 1,110,610 | |
RB,Sub-Series A, 5.50%, 12/01/42 | | | 660 | | | | 773,507 | |
Philadelphia Authority for Industrial Development, Refunding RB, First Series 2015,
5.00%, 04/01/45 | | | 500 | | | | 557,410 | |
Philadelphia Hospitals & Higher Education Facilities Authority, RB, Temple University Health System Project, Series A,
5.63%, 07/01/42 | | | 130 | | | | 139,256 | |
| | | | | | | | |
| | | | | | | 9,322,483 | |
| | |
| Puerto Rico — 3.4% | | | | | | |
Children’s Trust Fund, Refunding RB, Asset-Backed: | | | | | | | | |
5.50%, 05/15/39 | | | 160 | | | | 161,669 | |
5.63%, 05/15/43 | | | 375 | | | | 378,986 | |
Commonwealth of Puerto Rico: | | | | | | | | |
GO, Refunding, Series A,
5.50%, 07/01/32(e)(f) | | | 110 | | | | 71,225 | |
GO, Refunding, Series A,
8.00%, 07/01/35(e)(f) | | | 270 | | | | 140,062 | |
GO, Refunding, Series A,
5.50%, 07/01/39(e)(f) | | | 115 | | | | 60,662 | |
GO, Series A, 6.00%, 07/01/38(e)(f) | | | 160 | | | | 103,600 | |
GO, Series B, 5.25%, 07/01/17(e)(f) | | | 30 | | | | 19,275 | |
Puerto Rico Commonwealth Aqueduct & Sewer Authority: | | | | | | | | |
RB, Senior Lien, Series A, 5.75%, 07/01/37 | | | 1,070 | | | | 1,067,325 | |
RB, Senior Lien, Series A, 5.25%, 07/01/42 | | | 360 | | | | 353,700 | |
Refunding RB, Senior Lien, Series A,
6.00%, 07/01/38 | | | 1,505 | | | | 1,506,881 | |
Refunding RB, Senior Lien, Series A,
6.00%, 07/01/44 | | | 485 | | | | 485,606 | |
Puerto Rico Electric Power Authority: | | | | | | | | |
RB, Series A, 5.00%, 07/01/29(e)(f) | | | 385 | | | | 270,944 | |
RB, Series A, 7.00%, 07/01/33(e)(f) | | | 65 | | | | 47,450 | |
RB, Series A, 5.00%, 07/01/42(e)(f) | | | 370 | | | | 260,387 | |
RB, Series A, 7.00%, 07/01/43(e)(f) | | | 65 | | | | 47,450 | |
RB, Series TT, 5.00%, 07/01/25(e)(f) | | | 45 | | | | 31,669 | |
RB, Series WW, 5.38%, 07/01/24(e)(f) | | | 65 | | | | 46,069 | |
RB, Series XX, 5.25%, 07/01/40(e)(f) | | | 150 | | | | 106,125 | |
Refunding RB, Series AAA,
5.25%, 07/01/28(e)(f) | | | 65 | | | | 45,987 | |
Refunding RB, Series ZZ,
5.00%, 07/01/28(e)(f) | | | 75 | | | | 52,781 | |
Puerto Rico Sales Tax Financing Corp., RB: | | | | | | | | |
SeriesA-1, 0.00%, 07/01/24(b) | | | 28 | | | | 23,510 | |
SeriesA-1, 0.00%, 07/01/27(b) | | | 47 | | | | 35,045 | |
SeriesA-1, 0.00%, 07/01/29(b) | | | 46 | | | | 30,501 | |
SeriesA-1, 0.00%, 07/01/31(b) | | | 59 | | | | 34,903 | |
SeriesA-1, 0.00%, 07/01/33(b) | | | 67 | | | | 35,556 | |
SeriesA-1, 4.50%, 07/01/34 | | | 49 | | | | 49,540 | |
SeriesA-1, 4.55%, 07/01/40 | | | 25 | | | | 24,600 | |
SeriesA-1, 0.00%, 07/01/46(b) | | | 636 | | | | 136,804 | |
SeriesA-1, 0.00%, 07/01/51(b) | | | 518 | | | | 81,958 | |
SeriesA-1, 4.75%, 07/01/53 | | | 1,210 | | | | 1,147,286 | |
SeriesA-1, 5.00%, 07/01/58 | | | 863 | | | | 852,687 | |
| | |
| 52 | | 2 0 1 9 B L A C K R O C K A N N U A L R E P O R T T O S H A R E H O L D E R S |
| | |
Schedule of Investments (continued) March 31, 2019 | | BATS: Series E Portfolio (Percentages shown are based on Net Assets) |
| | | | | | | | |
| Security | | Par (000) | | | Value | |
| |
| Puerto Rico (continued) | | | |
SeriesA-2, 4.55%, 07/01/40 | | $ | 252 | | | $ | 222,393 | |
SeriesA-2, 4.75%, 07/01/53 | | | 7 | | | | 6,003 | |
SeriesA-2, 5.00%, 07/01/58 | | | 101 | | | | 88,376 | |
| | | | | | | | |
| | | | | | | 8,027,015 | |
| |
| Rhode Island — 1.4% | | | |
Rhode Island Student Loan Authority, Refunding RB, AMT, Senior, Series A,
3.50%, 12/01/34 | | | 415 | | | | 428,819 | |
Tobacco Settlement Financing Corp., Refunding RB: | | | | |
Series A, 5.00%, 06/01/35 | | | 400 | | | | 426,588 | |
Series A, 5.00%, 06/01/40 | | | 600 | | | | 630,120 | |
Series B, 4.50%, 06/01/45 | | | 750 | | | | 729,712 | |
Series B, 5.00%, 06/01/50 | | | 1,040 | | | | 1,059,250 | |
| | | | | | | | |
| | | | | | | 3,274,489 | |
| |
| South Carolina — 3.6% | | | |
South Carolina Jobs EDA, Refunding RB: | | | | |
Anmed Health Project, 5.00%, 02/01/36 | | | 1,045 | | | | 1,157,567 | |
Anmed Health Project, 5.00%, 02/01/38 | | | 1,000 | | | | 1,100,270 | |
Prisma Health Obligated Group Project, Series A, 5.00%, 05/01/43 | | | 730 | | | | 830,251 | |
Woodlands at Furman Project,
4.00%, 11/15/27 | | | 185 | | | | 186,793 | |
South Carolina Ports Authority, RB, AMT, 5.25%, 07/01/55 | | | 500 | | | | 553,970 | |
South Carolina Public Service Authority: | | | | |
RB, Obligations, Series A, 5.50%, 12/01/54 | | | 1,240 | | | | 1,371,614 | |
RB, Series E, 5.25%, 12/01/55 | | | 1,930 | | | | 2,152,182 | |
Refunding RB, Obligations, Series B, 4.00%, 12/01/56 | | | 200 | | | | 204,632 | |
Refunding RB, Obligations, Series C, 5.00%, 12/01/46 | | | 140 | | | | 153,311 | |
Refunding RB, Santee Cooper Project, Series B, 5.13%, 12/01/43 | | | 390 | | | | 423,259 | |
Refunding RB, Series A, 5.00%, 12/01/50 | | | 190 | | | | 208,880 | |
| | | | | | | | |
| | | | | | | 8,342,729 | |
| |
| Tennessee — 1.4% | | | |
Chattanooga-Hamilton County Hospital Authority, Refunding RB, 5.00%, 10/01/44 | | | 250 | | | | 270,918 | |
Knox County Health Educational & Housing Facility Board, Refunding RB, Facilities Board-University Health Project,
5.00%, 04/01/36 | | | 690 | | | | 762,809 | |
Memphis-Shelby County Industrial Development Board, Refunding Tax Allocation Bonds, Senior Tax Increment, Graceland Project: | | | | | | | | |
5.50%, 07/01/37 | | | 360 | | | | 386,600 | |
5.63%, 01/01/46 | | | 470 | | | | 500,724 | |
Metropolitan Government Nashville & Davidson County Health & Educational Facilities Authority, Refunding RB, Lipscomb University Project, Series A: | | | | | | | | |
4.00%, 10/01/49 | | | 220 | | | | 224,734 | |
5.25%, 10/01/58 | | | 1,095 | | | | 1,256,907 | |
| | | | | | | | |
| | | | | | | 3,402,692 | |
| | |
| Texas — 5.0% | | | | | | |
Bexar County Health Facilities Development Corp., Refunding RB, Army Retirement Residence Foundation Project,
5.00%, 07/15/26 | | | 410 | | | | 457,732 | |
Central Texas Regional Mobility Authority, RB, Senior Lien: | | | | | | | | |
6.25%, 01/01/46 | | | 175 | | | | 188,739 | |
Series A, 5.00%, 01/01/45 | | | 500 | | | | 552,790 | |
| | | | | | | | |
| Security | | Par (000) | | | Value | |
| | |
| Texas (continued) | | | | | | |
Central Texas Turnpike System, Refunding RB, Series C: | | | | | | | | |
5.00%, 08/15/37 | | $ | 200 | | | $ | 219,630 | |
5.00%, 08/15/42 | | | 250 | | | | 272,465 | |
City of Garland, Electric Utility System Revenue, Refunding RB, 4.00%, 03/01/49 | | | 2,400 | | | | 2,539,896 | |
City of Houston Airport System: | | | | | | | | |
RB, AMT, SeriesB-1, 5.00%, 07/15/35 | | | 100 | | | | 109,198 | |
Refunding RB, AMT, Series C,
5.00%, 07/15/20 | | | 140 | | | | 144,284 | |
Refunding RB, AMT, United Airlines, Inc. Project, 4.75%, 07/01/24 | | | 500 | | | | 541,045 | |
Refunding RB, AMT, United Airlines, Inc. Project, 5.00%, 07/01/29 | | | 500 | | | | 552,325 | |
City of San Antonio Airport System, RB, AMT, 5.00%, 07/01/45 | | | 500 | | | | 560,135 | |
County of Hays, Special Assessment RB, La Cima Import District Project, 7.00%, 09/15/45 | | | 250 | | | | 250,500 | |
Fort Bend County Industrial Development Corp., RB, NRG Energy, Inc. Project, Series B, 4.75%, 11/01/42 | | | 465 | | | | 477,295 | |
Mission Economic Development Corp., Refunding RB, AMT, Senior Lien, Natgasoline Project, 4.63%, 10/01/31(a) | | | 285 | | | | 296,067 | |
New Hope Cultural Education Facilities Corp, Refunding RB, Jubilee Academic Center Project, Series A, 4.00%, 08/15/26(a) | | | 775 | | | | 774,969 | |
Newark Higher Education Finance Corp., RB: | | | | | | | | |
Austin Achieve Public Schools, Inc. Project, 5.00%, 06/15/38 | | | 125 | | | | 127,434 | |
Christian Schools, Inc. Project, Series A, 5.50%, 08/15/35(a) | | | 300 | | | | 318,312 | |
North Texas Tollway Authority, Refunding RB: 4.25%, 01/01/49 | | | 1,675 | | | | 1,777,560 | |
Series B, 5.00%, 01/01/40 | | | 250 | | | | 272,515 | |
Tarrant County Cultural Education Facilities Finance Corp., Refunding RB, Trinity Terrace Project, 5.00%, 10/01/49 | | | 250 | | | | 264,547 | |
Texas Transportation Commission, RB, First Tier Toll Revenue, State Highway No. 249 System Project, Series A: | | | | | | | | |
0.00%, 08/01/40(b) | | | 1,000 | | | | 389,740 | |
0.00%, 08/01/42(b) | | | 655 | | | | 227,927 | |
5.00%, 08/01/57 | | | 315 | | | | 352,053 | |
| | | | | | | | |
| | | | | | | 11,667,158 | |
| | |
| Utah — 0.5% | | | | | | |
Utah Charter School Finance Authority RB: | | | | | | | | |
Early Light Academy Project,
5.13%, 07/15/49(a) | | | 545 | | | | 548,564 | |
Spectrum Academy Project,
6.00%, 04/15/45(a) | | | 500 | | | | 508,970 | |
| | | | | | | | |
| | | | | | | 1,057,534 | |
| | |
| Virginia — 2.2% | | | | | | |
Ballston Quarter Community Development Authority, Tax Allocation Bonds, Series A: | | | | | | | | |
5.00%, 03/01/26 | | | 120 | | | | 124,183 | |
5.13%, 03/01/31 | | | 230 | | | | 240,877 | |
Cherry Hill Community Development Authority, Special Assessment RB, Potomac Shores Project, 5.40%, 03/01/45(a) | | | 250 | | | | 258,413 | |
Chesapeake Bay Bridge & Tunnel District, RB, 5.00%, 07/01/51 | | | 810 | | | | 896,905 | |
Fairfax County EDA, RB, Vinson Hall LLC Project, Series A, 5.00%, 12/01/42 | | | 400 | | | | 428,440 | |
| | | | |
| S C H E D U L E S O F I N V E S T M E N T S | | | 53 | |
| | |
Schedule of Investments (continued) March 31, 2019 | | BATS: Series E Portfolio (Percentages shown are based on Net Assets) |
| | | | | | | | |
| Security | | Par (000) | | | Value | |
| | |
| Virginia (continued) | | | | | | |
Lexington IDA, RB, Kendal at Lexington Project, Series A, 5.00%, 01/01/48 | | $ | 330 | | | $ | 352,529 | |
Lower Magnolia Green Community Development Authority, Special Assessment RB: | | | | | | | | |
5.00%, 03/01/35(a) | | | 240 | | | | 244,291 | |
5.00%, 03/01/45(a) | | | 100 | | | | 101,220 | |
Norfolk Redevelopment & Housing Authority, RB, Norfolk Retirement Community Harbors Edge Project, Series A: | | | | | | | | |
4.00%, 01/01/29 | | | 250 | | | | 255,727 | |
5.00%, 01/01/34 | | | 190 | | | | 203,750 | |
4.38%, 01/01/39 | | | 280 | | | | 277,970 | |
5.00%, 01/01/49 | | | 365 | | | | 377,786 | |
Tobacco Settlement Financing Corp., RB, Senior, Series B1, 5.00%, 06/01/47 | | | 1,215 | | | | 1,199,363 | |
Virginia College Building Authority, RB, Green Bonds, Marymount University Project,
5.00%, 07/01/45(a) | | | 250 | | | | 260,735 | |
| | | | | | | | |
| | | | | | | 5,222,189 | |
| | |
| Washington — 1.5% | | | | | | |
Greater Wenatchee Regional Events Center Public Facilities District, Refunding RB, Series A, 5.50%, 09/01/42 | | | 250 | | | | 255,280 | |
King County Public Hospital District No. 4, GO, Refunding: | | | | | | | | |
Improvement, Snoqualmie Valley Hospital Project, 7.00%, 12/01/40 | | | 200 | | | | 206,900 | |
Series A, 5.00%, 12/01/30 | | | 200 | | | | 207,094 | |
Port of Seattle RB, AMT, Series C,
5.00%, 04/01/40 | | | 250 | | | | 275,872 | |
Washington Housing Finance Commission, Refunding RB: | | | | | | | | |
Horizon House Project, 5.00%, 01/01/43(a) | | | 1,100 | | | | 1,203,521 | |
Horizon House Project, 5.00%, 01/01/48(a) | | | 1,000 | | | | 1,091,370 | |
Skyline 1st Hill Project, 6.00%, 01/01/45(a) | | | 210 | | | | 213,028 | |
| | | | | | | | |
| | | | | | | 3,453,065 | |
| | |
| West Virginia — 0.2% | | | | | | |
City of Martinsburg, RB, Kings Daughters Apartments Project, SeriesA-1,
4.63%, 12/01/43 | | | 430 | | | | 435,495 | |
| | | | | | | | |
| | |
| Wisconsin — 1.6% | | | | | | |
Public Finance Authority: | | | | | | | | |
RB, Alabama Proton Theray Center Project, Series A, 6.25%, 10/01/31(a) | | | 195 | | | | 209,323 | |
RB, Alabama Proton Theray Center Project, Series A, 7.00%, 10/01/47(a) | | | 195 | | | | 210,454 | |
RB, Delray Beach Radiation Therapy Project, 6.85%, 11/01/46(a) | | | 275 | | | | 296,477 | |
RB, Delray Beach Radiation Therapy Project, 7.00%, 11/01/46(a) | | | 155 | | | | 168,628 | |
RB, Fund for Affordable Housing, North Carolina & Missouri Portfolio, Series A, 5.00%, 12/01/45 | | | 340 | | | | 349,279 | |
RB, Fund for Affordable Housing, North Carolina & Missouri Portfolio, Series A, 5.15%, 12/01/50 | | | 210 | | | | 216,308 | |
RB, Limited American Prep Academy Project, 5.38%, 07/15/47(a) | | | 335 | | | | 352,695 | |
RB, Senior Minnesota College of Osteopathic Medicine Project, SeriesA-1, 5.50%, 12/01/48(a) | | | 270 | | | | 279,177 | |
RB, Voyager Foundation, Inc. Project, Series A, 5.13%, 10/01/45 | | | 150 | | | | 154,716 | |
| | | | | | | | |
| Security | | Par (000) | | | Value | |
| | |
| Wisconsin (continued) | | | | | | |
Refunding RB, AMT, Senior Obligation Group Project, Series B, 5.00%, 07/01/42 | | $ | 750 | | | $ | 794,302 | |
Refunding RB, Celanese Project, Series D, 4.05%, 11/01/30 | | | 100 | | | | 102,098 | |
Refunding RB, Wingate University Project, Series A, 5.25%, 10/01/48 | | | 435 | | | | 482,711 | |
Wisconsin Housing & EDA, RB, WHPC Madison Pool Project, Series A, 4.55%, 07/01/37 | | | 165 | | | | 176,321 | |
| | | | | | | | |
| | | | | | | 3,792,489 | |
| | | | | | | | |
| | |
Total Municipal Bonds — 89.6%
(Cost: $202,239,374) | | | | | | | 210,514,926 | |
| | | | | | | | |
|
| Municipal Bonds Transferred to Tender Option Bond Trusts — 6.5%(g) | |
| | |
| Illinois — 0.8% | | | | | | |
Illinois Toll Highway Authority, RB: | | | | | | | | |
Series A, 5.00%, 01/01/40 | | | 660 | | | | 742,247 | |
Series C, 5.00%, 01/01/38 | | | 1,000 | | | | 1,122,010 | |
| | | | | | | | |
| | | | | | | 1,864,257 | |
| | |
| Massachusetts — 0.5% | | | | | | |
Massachusetts Housing Finance Agency, Refunding RB, AMT, Series A, 4.50%, 12/01/47 | | | 1,015 | | | | 1,052,679 | |
| | | | | | | | |
| | |
| New York — 3.3% | | | | | | |
City of New York Housing Development Corp., RB, SeriesD-1-B, 4.25%, 11/01/45 | | | 1,000 | | | | 1,035,972 | |
New York City Housing Development Corp., Refunding RB, Sustainable Neighborhood Project, SeriesA-1, 4.15%, 11/01/38 | | | 1,550 | | | | 1,634,785 | |
New York State Dormitory Authority Personal Income Tax Revenue, Refunding RB, Series E, 5.00%, 03/15/36 | | | 3,330 | | | | 3,853,043 | |
Port Authority of New York & New Jersey Refunding, RB, 194th Series, 5.25%, 10/15/55 | | | 1,000 | | | | 1,147,378 | |
| | | | | | | | |
| | | | | | | 7,671,178 | |
| | |
| North Carolina — 0.8% | | | | | | |
North Carolina Capital Facilities Finance Agency, Refunding RB, Duke University Project, Series B, 5.00%, 10/01/55 | | | 1,000 | | | | 1,135,350 | |
North Carolina Housing Finance Agency Home Ownership, RB, Series39-B, 4.00%, 01/01/48 | | | 795 | | | | 819,330 | |
| | | | | | | | |
| | | | | | | 1,954,680 | |
| | |
| Washington — 0.6% | | | | | | |
Snohomish County Public Utilities District No. 1, RB, 5.00%, 12/01/45 | | | 1,340 | | | | 1,513,724 | |
| | | | | | | | |
| | |
| West Virginia — 0.5% | | | | | | |
Morgantown Utility Board, Inc., RB, Series B, 4.00%, 12/01/48(h) | | | 1,215 | | | | 1,272,395 | |
| | | | | | | | |
| | |
Total Municipal Bonds Transferred to Tender Option Bond Trusts — 6.5%
(Cost: $14,635,849) | | | | | | | 15,328,913 | |
| | | | | | | | |
| | |
Total Long-Term Investments — 96.1%
(Cost: $216,875,223) | | | | | | | 225,843,839 | |
| | | | | | | | |
| | |
| 54 | | 2 0 1 9 B L A C K R O C K A N N U A L R E P O R T T O S H A R E H O L D E R S |
| | |
Schedule of Investments (continued) March 31, 2019 | | BATS: Series E Portfolio (Percentages shown are based on Net Assets) |
| | | | | | | | |
| Security | | Shares | | | Value | |
|
Short-Term Securities — 12.4% | |
DreyfusAMT-Free Tax Exempt Cash Management, Institutional Class, 1.37%(i) | | | 29,079,297 | | | $ | 29,079,297 | |
| | | | | | | | |
| | |
Total Short-Term Securities — 12.4%
(Cost: $29,079,297) | | | | | | | 29,079,297 | |
| | | | | | | | |
| | | | | | |
| Security | | | | Value | |
| |
Total Investments — 108.5%
(Cost: $245,954,520) | | $ | 254,923,136 | |
| |
Liabilities in Excess of Other Assets—(5.1)% | | | (11,898,095 | ) |
| |
Liability for TOB Trust Certificates, | | | | |
| |
Including Interest Expense and Fees Payable—(3.5)% | | | (8,138,754 | ) |
| | | | | | |
| |
Net Assets — 100.0% | | $ | 234,886,287 | |
| | | | | | |
| (a) | Security exempt from registration pursuant to Rule 144A under the Securities Act of 1933, as amended. These securities may be resold in transactions exempt from registration to qualified institutional investors. |
| (c) | Variable or floating rate security, which interest rate adjusts periodically based on changes in current interest rates and prepayments on the underlying pool of assets. Rate shown is the rate in effect as of period end. |
| (d) | When-issued security. |
| (e) | Issuer filed for bankruptcy and/or is in default.(f) Non-income producing security. |
| (g) | Represents bonds transferred to a TOB Trust in exchange of cash and residual certificates received by the Fund. These bonds serve as collateral in a secured borrowing. See Note 4 of the Notes to Financial Statements for details. |
| (h) | All or a portion of security is subject to a recourse agreement. The aggregate maximum potential amount the Fund could ultimately be required to pay under the agreements, which expires June 1, 2026, is $635,092. |
| (i) | Annualized7-day yield as of period end. |
Derivative Financial Instruments Outstanding as of Period End
Futures Contracts
| | | | | | | | | | | | | | | | |
| Description | | Number of
Contracts | | | Expiration
Date | | | Notional
Amount
(000) | | | Value/
Unrealized
Appreciation
(Depreciation) | |
Short Contracts | | | | | | | | | | | | | | | | |
U.S. Treasury Bonds (30 Year) | | | 126 | | | | 06/19/19 | | | $ | 18,857 | | | $ | (365,377 | ) |
U.S. Treasury Notes (10 Year) | | | 34 | | | | 06/19/19 | | | | 4,223 | | | | (39,530 | ) |
U.S. Treasury Notes (5 Year) | | | 1 | | | | 06/28/19 | | | | 116 | | | | (400 | ) |
| | | | | | | | | | | | | | | | |
| | | | | | | | | | | | | | $ | (405,307 | ) |
| | | | | | | | | | | | | | | | |
Derivative Financial Instruments Categorized by Risk Exposure
As of period end, the fair values of derivative instruments located in the Statements of Assets and Liabilities were as follows:
| | | | | | | | | | | | | | | | | | | | | | | | | | | | | | |
| Liabilities — Derivative Financial Instruments | | Commodity
Contracts | | | Credit
Contracts | | | Equity
Contracts | | | Foreign
Currency
Exchange
Contracts | | | Interest
Rate
Contracts | | | Other
Contracts | | | Total | |
Futures contracts | | Net unrealized
depreciation(a) | | $ | — | | | $ | — | | | $ | — | | | $ | — | | | $ | 405,307 | | | $ | — | | | $ | 405,307 | |
| | | | | | | | | | | | | | | | | | | | | | | | | | | | | | |
| | (a) | Includes cumulative appreciation (depreciation) on futures contracts, if any, as reported in the Schedule of Investments. Only current day’s variation margin is reported within the Statements of Assets and Liabilities. | |
| | | | |
| S C H E D U L E S O F I N V E S T M E N T S | | | 55 | |
| | |
Schedule of Investments (continued) March 31, 2019 | | BATS: Series E Portfolio |
For the year ended March 31, 2019, the effect of derivative financial instruments in the Statements of Operations was as follows:
| | | | | | | | | | | | | | | | | | | | | | | | | | | | |
| Net Realized Loss from: | | Commodity
Contracts | | | Credit
Contracts | | | Equity
Contracts | | | Foreign
Currency
Exchange
Contracts | | | Interest
Rate
Contracts | | | Other
Contracts | | | Total | |
Futures contracts | | $ | — | | | $ | — | | | $ | — | | | $ | — | | | $ | (398,803 | ) | | $ | — | | | $ | (398,803 | ) |
| | | | | | | | | | | | | | | | | | | | | | | | | | | | |
| | | | | | | | | | | | | | | | | | | | | | | | | | | | |
| Net Change in Unrealized Appreciation (Depreciation) on: | | | | | | | | | | | | | | | | | | | | | |
Futures contracts | | $ | — | | | $ | — | | | $ | — | | | $ | — | | | $ | (147,446 | ) | | $ | — | | | $ | (147,446 | ) |
| | | | | | | | | | | | | | | | | | | | | | | | | | | | |
Average Quarterly Balances of Outstanding Derivative Financial Instruments
| | | | |
Futures contracts: | | | | |
Average notional value of contracts — short | | $ | 12,725,752 | |
For more information about the Fund’s investment risks regarding derivative financial instruments, refer to the Notes to Financial Statements.
Fair Value Hierarchy as of Period End
Various inputs are used in determining the fair value of investments and derivative financial instruments. For information about the Fund’s policy regarding valuation of investments and derivative financial instruments, refer to the Notes to Financial Statements.
The following tables summarize the Fund’s investments and derivative financial instruments categorized in the disclosure hierarchy:
| | | | | | | | | | | | | | | | |
| | | Level 1 | | | Level 2 | | | Level 3 | | | Total | |
Assets: | | | | | | | | | | | | | | | | |
Investments: | | | | | | | | | | | | | | | | |
Long-Term Investments(a) | | $ | — | | | $ | 225,843,839 | | | $ | — | | | $ | 225,843,839 | |
Short-Term Securities | | | 29,079,297 | | | | — | | | | — | | | | 29,079,297 | |
| | | | | | | | | | | | | | | | |
| | $ | 29,079,297 | | | $ | 225,843,839 | | | $ | — | | | $ | 254,923,136 | |
| | | | | | | | | | | | | | | | |
Derivative Financial Instruments(b) | | | | | | | | | | | | | | | | |
Liabilities: | | | | | | | | | | | | | | | | |
Interest rate contracts | | $ | (405,307 | ) | | $ | — | | | $ | — | | | $ | (405,307 | ) |
| | | | | | | | | | | | | | | | |
| | (a) | See above Schedule of Investments for values in each security type. | |
| | (b) | Derivative financial instruments are futures contracts, which are valued at the unrealized appreciation (depreciation) on the instrument. | |
The Fund may hold assets and/or liabilities in which the fair value approximates the carrying amount for financial statement purposes. As of period end, TOB Trust Certificates of $8,085,000 are categorized as Level 2 within the disclosure hierarchy.
During the year ended March 31, 2019, there were no transfers between levels.
See notes to financial statements.
| | |
| 56 | | 2 0 1 9 B L A C K R O C K A N N U A L R E P O R T T O S H A R E H O L D E R S |
| | |
Schedule of Investments March 31, 2019 | | BATS: Series M Portfolio (Percentages shown are based on Net Assets) |
| | | | | | | | |
| Security | | Par (000) | | | Value | |
| | |
Asset-Backed Securities — 0.4% | | | | | | | | |
Progress Residential Trust: | | | | | | | | |
Series 2015-SFR2, Class A, 2.74%, 06/12/32 (a) | | $ | 1,375 | | | $ | 1,366,085 | |
Series 2017-SFR1, Class A, 2.77%, 08/17/34 (a) | | | 867 | | | | 859,665 | |
SMB Private Education Loan Trust, Series2015-C, Class A3, (1 mo. LIBOR US + 1.950%), 4.43%, 08/16/32(a)(b) | | | 1,000 | | | | 1,034,961 | |
| | | | | | | | |
| | |
Total Asset-Backed Securities — 0.4%
(Cost: $3,237,035) | | | | | | | 3,260,711 | |
| | | | | | | | |
|
Non-Agency Mortgage-Backed Securities — 13.0% | |
|
Commercial Mortgage-Backed Securities — 12.4% | |
1211 Avenue of the Americas Trust, Series 2015-1211, Class A1A2, 3.90%, 08/10/35(a) | | | 945 | | | | 988,268 | |
BANK, Series 2019-BN16, Class A4, 4.01%, 02/15/52 | | | 2,226 | | | | 2,362,826 | |
Benchmark Mortgage Trust, Series2019-B9, Class A5, 4.02%, 03/15/52 | | | 2,797 | | | | 2,968,427 | |
BWAY Mortgage Trust, Series 2013-1515, Class A2, 3.45%, 03/10/33(a) | | | 3,920 | | | | 3,996,162 | |
CCRESG Commercial Mortgage Trust, Series 2016-HEAT, Class A, 3.36%, 04/10/29(a) | | | 1,750 | | | | 1,751,747 | |
CCUBS Commercial Mortgage Trust, Series2017-C1, Class A4, 3.54%, 11/15/50 | | | 1,408 | | | | 1,433,153 | |
CFCRE Commercial Mortgage Trust, Series2016-C3, Class A3, 3.87%, 01/10/48 | | | 1,580 | | | | 1,641,970 | |
CityLine Commercial Mortgage Trust, Series 2016-CLNE, Class A, 2.78%, 11/10/31(a)(c) | | | 2,005 | | | | 1,993,428 | |
Commercial Mortgage Trust: | | | | | | | | |
Series2013-CR6, Class A3FL, (1 mo. LIBOR US + 0.630%), 3.12%, 03/10/46(a)(b) | | | 695 | | | | 692,998 | |
Series 2014-LC15, Class A4, 4.01%, 04/10/47 | | | 2,025 | | | | 2,120,723 | |
Series 2014-UBS2, Class A5, 3.96%, 03/10/47 | | | 1,215 | | | | 1,271,641 | |
Series 2015-LC23, Class ASB, 3.60%, 10/10/48 | | | 3,730 | | | | 3,832,665 | |
Series 2017-PANW, Class A, 3.24%, 10/10/29 (a) | | | 3,960 | | | | 3,990,850 | |
Credit Suisse Mortgage Trust, Series2016-MFF, Class A, (1 mo. LIBOR US + 1.600%), 4.08%, 11/15/33(a)(b) | | | 395 | | | | 396,666 | |
CSAIL Commercial Mortgage Trust: | | | | | | | | |
Series 2018-CX11, Class A5, 4.03%, 04/15/51 (c) | | | 1,190 | | | | 1,253,364 | |
Series2019-C15, Class A4, 4.05%, 03/15/52 | | | 3,135 | | | | 3,314,763 | |
FRESB Mortgage Trust, Series 2019-SB60, Class A10F, 3.31%, 01/25/29(c) | | | 3,040 | | | | 3,099,392 | |
GS Mortgage Securities Corp. II, Series 2005-ROCK, Class A, 5.37%, 05/03/32(a) | | | 910 | | | | 1,023,402 | |
IMT Trust, Series 2017-APTS, Class BFX, 3.50%, 06/15/34 (a)(c) | | | 2,425 | | | | 2,426,848 | |
JPMBB Commercial Mortgage Securities Trust: | | | | | | | | |
Series2014-C23, Class ASB, 3.66%, 09/15/47 | | | 5,970 | | | | 6,119,183 | |
Series2016-C1 ,Class ASB, 3.32%, 03/15/49 | | | 3,500 | | | | 3,561,663 | |
| | | | | | | | |
| Security | | Par (000) | | | Value | |
|
Commercial Mortgage-Backed Securities (continued) | |
JPMDB Commercial Mortgage Securities Trust, Series2017-C5, Class D, 4.57%, 03/15/50 (a)(c) | | $ | 140 | | | $ | 135,791 | |
JPMorgan Chase Commercial Mortgage Securities Trust, Series 2016-NINE, Class A, 2.85%, 10/06/38(a)(c) | | | 1,790 | | | | 1,750,427 | |
LMREC, Inc., Series 2016-CRE2, Class A, (1 mo. LIBOR US + 1.700%), 4.19%, 11/24/31 (a)(b) | | | 536 | | | | 536,048 | |
LSTAR Commercial Mortgage Trust, Series2016-4, Class A2, 2.58%, 03/10/49 (a) | | | 2,740 | | | | 2,692,530 | |
Morgan Stanley Bank of America Merrill Lynch Trust: | | | | | | | | |
Series2013-C13, Class A4, 4.04%, 11/15/46 | | | 1,170 | | | | 1,230,040 | |
Series2015-C23, Class A4, 3.72%, 07/15/50 | | | 3,005 | | | | 3,114,004 | |
Morgan Stanley Capital I Trust, Series 2016-UBS9, Class ASB, 3.34%, 03/15/49 | | | 3,730 | | | | 3,781,993 | |
RAIT Trust, Series2017-FL7, Class A, (1 mo. LIBOR US + 0.950%), 3.43%, 06/15/37 (a)(b) | | | 624 | | | | 621,323 | |
Seasoned Credit Risk Transfer Trust: | | | | | | | | |
Series2018-2, Class MA, 3.50%, 11/25/57 | | | 1,616 | | | | 1,638,484 | |
Series2018-3, Class MA, 3.50%, 08/25/57 | | | 2,221 | | | | 2,250,633 | |
Series2018-4, Class MA, 3.50%, 03/25/58 | | | 3,759 | | | | 3,819,079 | |
Wells Fargo Commercial Mortgage Trust: | | | | | | | | |
Series 2015-LC22, Class ASB, 3.57%, 09/15/58 | | | 3,845 | | | | 3,943,826 | |
Series 2015-NXS3, Class ASB, 3.37%, 09/15/57 | | | 3,920 | | | | 3,987,293 | |
Series2015-P2, Class AS, 4.01%, 12/15/48 | | | 1,605 | | | | 1,637,040 | |
Series2019-C49, Class A5, 4.02%, 03/15/52 | | | 5,471 | | | | 5,769,226 | |
WFRBS Commercial Mortgage Trust: | | | | | | | | |
Series2012-C8, Class AFL, (1 mo. LIBOR US | | | | | | | | |
+ 1.000%), 3.48%, 08/15/45(a)(b) | | | 2,927 | | | | 2,962,099 | |
Series2014-C21, Class A4, 3.41%, 08/15/47 | | | 2,805 | | | | 2,865,200 | |
Series 2014-LC14, Class A4, 3.77%, 03/15/47 | | | 5,590 | | | | 5,783,114 | |
| | | | | | | | |
| | | | | | | 98,758,289 | |
|
Interest Only Commercial Mortgage-Backed Securities — 0.6% | |
CFCRE Commercial Mortgage Trust, Series2016-C4, Class XA, 1.73%, 05/10/58(c) | | | 5,396 | | | | 497,900 | |
Citigroup Commercial Mortgage Trust, Series2017-P8, Class XA, 0.93%, 09/15/50(c) | | | 6,685 | | | | 412,927 | |
Commercial Mortgage Trust, Series 2014-LC17, Class XA, 0.89%, 10/10/47 (c) | | | 68,848 | | | | 1,849,508 | |
Core Industrial Trust: | | | | | | | | |
Series 2015-TEXW, Class XA, 0.77%, 02/10/34 (a)(c) | | | 18,460 | | | | 344,625 | |
Series 2015-WEST, Class XA, 0.94%, 02/10/37 (a)(c) | | | 9,127 | | | | 446,050 | |
Credit Suisse Mortgage Capital Certificates, Series2014-USA, Class X1,
0.55%, 09/15/37 (a)(c) | | | 26,000 | | | | 748,171 | |
FREMF Mortgage Trust, Series 2015-K718, Class X2A, 0.10%, 02/25/48(a)(c) | | | 130,768 | | | | 287,231 | |
GS Mortgage Securities Trust, Series 2014-GC20, Class XA, 1.06%, 04/10/47(c) | | | 666 | | | | 24,626 | |
| | | | |
| S C H E D U L E S O F I N V E S T M E N T S | | | 57 | |
| | |
Schedule of Investments (continued) March 31, 2019 | | BATS: Series M Portfolio (Percentages shown are based on Net Assets) |
| | | | | | | | |
| Security | | Par (000) | | | Value | |
| | |
Interest Only Commercial Mortgage-Backed Securities (continued) | | | | | | | | |
Wells Fargo Commercial Mortgage Trust, Series2018-C44, Class XA, 0.76%, 05/15/51(c) | | $ | 8,761 | | | $ | 477,189 | |
| | | | | | | | |
| | | | | | | 5,088,227 | |
| | | | | | | | |
| | |
TotalNon-Agency Mortgage-Backed Securities — 13.0%
(Cost: $103,963,940) | | | | | | | 103,846,516 | |
| | | | | | | | |
| | |
U.S. Government Sponsored
Agency Securities — 155.4% | | | | | | |
|
| Collateralized Mortgage Obligations — 4.4% | |
Fannie Mae: | | | | | | | | |
Series2010-134, Class KZ, 4.50%, 12/25/40 | | | 1,335 | | | | 1,415,629 | |
Series2010-141, Class LZ, 4.50%, 12/25/40 | | | 1,132 | | | | 1,200,329 | |
Series2011-8, Class ZA, 4.00%, 02/25/41 | | | 2,489 | | | | 2,581,347 | |
Series2011-131, Class LZ, 4.50%, 12/25/41 | | | 711 | | | | 753,471 | |
Series2013-81, Class YK, 4.00%, 08/25/43 | | | 200 | | | | 215,663 | |
Series2017-69, Class HA, 3.00%, 06/25/46 | | | 5,453 | | | | 5,482,360 | |
Series2017-76, Class PB, 3.00%, 10/25/57 | | | 900 | | | | 841,755 | |
Series2017-87, Class UA, 3.50%, 12/25/44 | | | 2,756 | | | | 2,821,323 | |
Series2018-32, Class PS, (1 mo. LIBOR US + 7.233%), 4.33%, 05/25/48(b) | | | 3,822 | | | | 4,024,955 | |
Series2019-1, Class AF, (1 mo. LIBOR US + 0.500%), 2.99%, 02/25/49(b) | | | 2,215 | | | | 2,209,955 | |
Freddie Mac: | | | | | | | | |
Series 3745, Class ZA, 4.00%, 10/15/40 | | | 322 | | | | 342,788 | |
Series 3780, Class ZA, 4.00%, 12/15/40 | | | 608 | | | | 643,564 | |
Series 3960, Class PL, 4.00%, 11/15/41 | | | 900 | | | | 956,928 | |
Series 4384, Class LB, 3.50%, 08/15/43 | | | 1,400 | | | | 1,437,532 | |
Ginnie Mae: | | | | | | | | |
Series2014-107, Class WX, 6.81%, 07/20/39(c) | | | 931 | | | | 1,045,564 | |
Series2018-164, Class AF, (1 mo. LIBOR US + 0.400%), 2.89%, 12/20/48(b) | | | 6,867 | | | | 6,837,062 | |
Series2019-5, Class P, 3.50%, 07/20/48 | | | 2,013 | | | | 2,054,292 | |
| | | | | | | | |
| | | | | | | 34,864,517 | |
|
| Commercial Mortgage-Backed Securities — 2.5% | |
Fannie Mae: | | | | | | | | |
Series2017-M15, Class A2, 2.96%, 09/25/27(c) | | | 3,520 | | | | 3,531,258 | |
Series2018-M7, Class A2,
3.05%, 03/25/28(c) | | | 875 | | | | 879,170 | |
Series2019-M1, Class A2,
3.56%, 09/25/28(c) | | | 2,616 | | | | 2,734,394 | |
Freddie Mac: | | | | | | | | |
Series K058, Class A2, 2.65%, 08/25/26 | | | 1,080 | | | | 1,068,307 | |
Series K079, Class A2, 3.93%, 06/25/28 | | | 3,635 | | | | 3,917,694 | |
Series K082, Class A2, 3.92%, 09/25/28(c) | | | 625 | | | | 673,915 | |
Series K086, Class A2, 3.86%, 11/25/28(c) | | | 4,375 | | | | 4,691,874 | |
Series K087, Class A2, 3.77%, 12/25/28 | | | 2,266 | | | | 2,411,989 | |
| | | | | | | | |
| | | | | | | 19,908,601 | |
| | |
Interest Only Collateralized Mortgage Obligations — 1.3% | | | | | | | | |
Fannie Mae: | | | | | | | | |
Series2011-100, Class S, (1 mo. LIBOR US + 6.450%), 3.97%, 10/25/41(b) | | | 1,270 | | | | 184,280 | |
Series2013-10, Class PI, 3.00%, 02/25/43 | | | 2,464 | | | | 233,574 | |
Series2014-68, Class YI, 4.50%, 11/25/44 | | | 1,265 | | | | 247,478 | |
Series2015-66, Class AS, (1 mo. LIBOR US + 6.250%), 3.77%, 09/25/45(b) | | | 12,001 | | | | 1,729,643 | |
Series2016-60, Class SD, (1 mo. LIBOR US + 6.100%), 3.62%, 09/25/46(b) | | | 2,936 | | | | 442,212 | |
| | | | | | | | |
| Security | | Par (000) | | | Value | |
| | |
Interest Only Collateralized Mortgage Obligations (continued) | | | | | | | | |
Series2016-78, Class CS, (1 mo. LIBOR US + 6.100%), 3.62%, 05/25/39(b) | | $ | 3,795 | | | $ | 562,542 | |
Series2016-81, Class CS, (1 mo. LIBOR US + 6.100%), 3.62%, 11/25/46(b) | | | 5,476 | | | | 767,514 | |
Series2017-14, Class DS, (1 mo. LIBOR US + 6.050%), 3.57%, 03/25/47(b) | | | 2,374 | | | | 415,413 | |
Series2017-38, Class S, (1 mo. LIBOR US + 6.100%), 3.62%, 05/25/47(b) | | | 4,835 | | | | 875,223 | |
Series2017-70, Class SA, (1 mo. LIBOR US + 6.150%), 3.67%, 09/25/47(b) | | | 3,116 | | | | 561,196 | |
Series2018-21, Class IO, 3.00%, 04/25/48 | | | 8,158 | | | | 1,320,471 | |
Series2018-63, Class IO, 3.01%, 09/25/48 | | | 3,278 | | | | 567,047 | |
Freddie Mac: | | | | | | | | |
Series 4062, Class GI, 4.00%, 02/15/41 | | | 816 | | | | 79,960 | |
Series-4611, Class BS, (1 mo. LIBOR US + 6.100%), 3.62%, 06/15/41(b) | | | 4,992 | | | | 730,144 | |
Series 4791, Class LI, 3.00%, 05/15/48 | | | 2,851 | | | | 465,341 | |
Ginnie Mae: | | | | | | | | |
Series2014-113, Class NI, 5.00%, 07/20/44 | | | 933 | | | | 188,783 | |
Series2017-139, Class IB, 4.50%, 09/20/47 | | | 2,862 | | | | 493,743 | |
Series2017-144, Class DI, 4.50%, 09/20/47 | | | 2,082 | | | | 344,140 | |
Series2018-89, Class CI, 5.00%, 12/20/47 | | | 1,758 | | | | 355,088 | |
| | | | | | | | |
| | | | | | | 10,563,792 | |
| | |
Interest Only Commercial Mortgage-Backed Securities — 3.1% | | | | | | | | |
Ginnie Mae: | | | | | | | | |
Series2013-63, Class IO, 0.79%, 09/16/51 (c) | | | 22,738 | | | | 1,196,125 | |
Series2015-171, Class IO, 0.87%, 11/16/55 (c) | | | 22,677 | | | | 1,341,229 | |
Series2016-28, Class IO, 0.91%, 12/16/57 (c) | | | 27,970 | | | | 1,835,952 | |
Series2016-45, Class IO, 1.01%, 02/16/58 (c) | | | 43,409 | | | | 3,312,597 | |
Series2016-67, Class IO, 1.17%, 07/16/57 (c) | | | 29,024 | | | | 2,330,243 | |
Series2016-105, Class IO, 1.06%, 10/16/57 (c) | | | 20,024 | | | | 1,611,553 | |
Series2016-119, Class IO, 1.12%, 04/16/58 (c) | | | 39,180 | | | | 3,256,809 | |
Series2016-128, Class IO, 0.95%, 09/16/56 (c) | | | 24,243 | | | | 1,894,299 | |
Series2016-175, Class IO, 0.92%, 09/16/58 (c) | | | 28,660 | | | | 2,085,629 | |
Series2017-53, Class IO, 0.69%, 11/16/56 (c) | | | 17,199 | | | | 982,959 | |
Series2017-54, Class IO, 0.65%, 12/16/58 (c) | | | 2,918 | | | | 173,352 | |
Series2017-61, Class IO, 0.77%, 05/16/59 (c) | | | 4,228 | | | | 295,959 | |
Series2017-64, Class IO, 0.72%, 11/16/57 (c) | | | 39,181 | | | | 2,538,639 | |
Series2017-171, Class IO, 0.70%, 09/16/59 (c) | | | 26,489 | | | | 1,667,438 | |
| | | | | | | | |
| | | | | | | 24,522,783 | |
|
| Mortgage-Backed Securities — 144.1% | |
Fannie Mae Mortgage-Backed Securities: | | | | | | | | |
2.00%, 10/01/31-03/01/32 | | | 3,182 | | | | 3,098,503 | |
2.50%, 09/01/27-02/01/33 | | | 22,398 | | | | 22,302,632 | |
3.00%, 04/01/28-04/01/49(d) | | | 96,410 | | | | 96,759,594 | |
3.13%, 09/01/27 | | | 1,684 | | | | 1,726,567 | |
3.16%, 03/01/27 | | | 2,580 | | | | 2,640,144 | |
3.50%, 03/01/29-04/01/49(d) | | | 133,383 | | | | 136,107,373 | |
4.00%, 02/01/31-04/01/49(d) | | | 159,608 | | | | 165,400,255 | |
4.50%, 05/01/24-04/01/49(d) | | | 165,854 | | | | 173,817,962 | |
4.99%, 09/01/44 | | | 234 | | | | 251,672 | |
| | |
| 58 | | 2 0 1 9 B L A C K R O C K A N N U A L R E P O R T T O S H A R E H O L D E R S |
| | |
Schedule of Investments (continued) March 31, 2019 | | BATS: Series M Portfolio (Percentages shown are based on Net Assets) |
| | | | | | | | |
| Security | | Par (000) | | | Value | |
|
| Mortgage-Backed Securities (continued) | |
5.00%, 05/01/30-04/01/49(d) | | $ | 46,851 | | | $ | 49,661,717 | |
5.50%, 05/01/34-05/01/44 | | | 6,498 | | | | 7,139,809 | |
6.00%, 02/01/38-07/01/41 | | | 4,048 | | | | 4,464,796 | |
6.50%, 05/01/36-01/01/38 | | | 61 | | | | 67,496 | |
Freddie Mac Mortgage-Backed Securities: | | | | | | | | |
2.50%, 02/01/30-04/01/34(d) | | | 11,698 | | | | 11,642,381 | |
3.00%, 09/01/27-04/01/49(d) | | | 59,813 | | | | 59,882,053 | |
3.50%, 09/01/30-04/01/49(d) | | | 27,287 | | | | 27,822,958 | |
4.00%, 04/01/34-04/01/49(d) | | | 45,003 | | | | 46,778,794 | |
4.50%, 04/01/20-04/01/49(d) | | | 23,688 | | | | 25,032,972 | |
5.00%, 05/01/28-04/01/49(d) | | | 5,127 | | | | 5,484,669 | |
5.50%, 01/01/28-06/01/41 | | | 1,736 | | | | 1,899,309 | |
6.00%, 08/01/28-04/01/49(d) | | | 1,255 | | | | 1,367,908 | |
Ginnie Mae Mortgage-Backed Securities: | | | | | | | | |
2.50%, 04/01/48(d) | | | 1,960 | | | | 1,919,247 | |
3.00%, 12/20/44-04/01/49(d) | | | 40,625 | | | | 40,871,703 | |
3.50%, 01/15/42-04/01/49(d) | | | 82,201 | | | | 83,992,313 | |
4.00%, 04/20/39-04/01/49(d) | | | 127,706 | | | | 131,862,888 | |
4.50%, 09/20/39-04/01/49(d) | | | 34,395 | | | | 35,837,517 | |
5.00%, 07/15/33-04/01/49(d) | | | 12,969 | | | | 13,602,331 | |
5.50%, 07/15/38-12/20/41 | | | 1,017 | | | | 1,108,481 | |
| | | | | | | | |
| | | | | | | 1,152,544,044 | |
| |
Total U.S. Government Sponsored Agency
Securities — 155.4%
(Cost: $1,236,819,620) | | | | 1,242,403,737 | |
| | | | | | | | |
|
U.S. Treasury Obligations — 2.2% | |
U.S. Treasury Inflation Indexed Notes, 0.63%, 04/15/23 | | | 17,469 | | | | 17,591,311 | |
| | | | | | | | |
| | |
Total U.S. Treasury Obligations — 2.2%
(Cost: $17,330,784) | | | | | | | 17,591,311 | |
| | | | | | | | |
| | |
Total Long-Term Investments — 171.0%
(Cost: $1,361,351,379) | | | | | | | 1,367,102,275 | |
| | | | | | | | |
| | |
| | | Shares | | | | |
| | |
| Short-Term Securities — 2.0% | | | | | | |
Money Market Fund — 0.7% | | | | | | | | |
Dreyfus Treasury Securities Cash Management, Institutional Class, 2.27% (e) | | | 5,672,864 | | | | 5,672,864 | |
| | | | | | | | |
| | | | | | | | |
| Security | | Par (000) | | | Value | |
U.S. Treasury Obligations — 1.0% | | | | | | | | |
United States Treasury Bill, 2.41%, 4/16/19 | | $ | 7,934 | | | $ | 7,926,173 | |
| | | | | | | | |
| | |
Total U.S. Treasury Obligations — 1.0%
(Cost: $7,926,052) | | | | | | | 7,926,173 | |
| | | | | | | | |
| | |
Total Short-Term Securities — 1.7%
(Cost: $13,598,916) | | | | | | | 13,599,037 | |
| | | | | | | | |
| |
Total Investments Before TBA Commitments — 172.7%
(Cost: $1,374,950,295) | | | | 1,380,701,312 | |
| | | | | | | | |
|
TBA Sale Commitments — (61.5)%(d) | |
| | |
| Mortgage-Backed Securities — (61.5)% | | | | | | |
Fannie Mae Mortgage-Backed Securities: | | | | | | | | |
2.00%, 04/01/34 | | | (2,087 | ) | | | (2,032,401 | ) |
2.50%, 04/01/34 | | | (4,143 | ) | | | (4,118,282 | ) |
3.00%, 04/01/34-04/01/49 | | | (15,154 | ) | | | (15,227,370 | ) |
3.50%, 04/01/34-04/01/49 | | | (110,221 | ) | | | (111,763,965 | ) |
4.00%, 04/01/34-04/01/49 | | | (102,684 | ) | | | (105,621,005 | ) |
4.50%, 04/01/49 | | | (89,959 | ) | | | (93,727,519 | ) |
5.00%, 04/01/49 | | | (7,555 | ) | | | (7,984,711 | ) |
5.50%, 04/01/49 | | | (1,637 | ) | | | (1,747,761 | ) |
6.00%, 04/01/49 | | | (600 | ) | | | (646,559 | ) |
Freddie Mac Mortgage-Backed Securities: | | | | | | | | |
3.00%, 04/01/49 | | | (3,187 | ) | | | (3,172,870 | ) |
3.50%, 04/01/34-04/01/49 | | | (14,091 | ) | | | (14,314,888 | ) |
4.00%, 04/01/34-04/01/49 | | | (19,496 | ) | | | (20,072,382 | ) |
4.50%, 04/01/49 | | | (8,458 | ) | | | (8,826,788 | ) |
5.00%, 04/01/49 | | | (2,219 | ) | | | (2,349,713 | ) |
6.00%, 04/01/49 | | | (600 | ) | | | (648,504 | ) |
Ginnie Mae Mortgage-Backed Securities: | | | | | | | | |
3.00%, 04/15/45 | | | (2,900 | ) | | | (2,910,422 | ) |
3.50%, 04/15/49 | | | (10,306 | ) | | | (10,528,827 | ) |
4.00%, 04/15/49 | | | (69,371 | ) | | | (71,624,203 | ) |
4.50%, 04/15/49 | | | (9,982 | ) | | | (10,367,438 | ) |
5.00%, 04/15/49 | | | (3,800 | ) | | | (3,969,873 | ) |
| | | | | | | | |
| |
Total TBA Sale Commitments — (61.5)%
(Proceeds: $489,758,594) | | | | (491,655,481 | ) |
| | | | | | | | |
| |
Options Written — 0.0%
(Premiums Received: $106,712) | | | | (90,750 | ) |
| | | | | | | | |
| |
Total Investments Net of TBA Sale Commitments — 111.2%
(Cost: $885,084,989) | | | | 888,955,081 | |
| |
Liabilities in Excess of Other Assets—(11.2)% | | | | (89,180,832 | ) |
| | | | | | | | |
| | |
Net Assets — 100.0% | | | | | | $ | 799,774,249 | |
| | | | | | | | |
| (a) | Security exempt from registration pursuant to Rule 144A under the Securities Act of 1933, as amended. These securities may be resold in transactions exempt from registration to qualified institutional investors. |
| (b) | Variable rate security. Rate shown is the rate in effect as of period end. |
| (c) | Variable or floating rate security, which interest rate adjusts periodically based on changes in current interest rates and prepayments on the underlying pool of assets. Rate shown is the rate in effect as of period end. |
| (d) | Represents or includes a TBA transaction. |
| (e) | Annualized7-day yield as of period end. |
| | | | |
| S C H E D U L E S O F I N V E S T M E N T S | | | 59 | |
| | |
Schedule of Investments (continued) March 31, 2019 | | BATS: Series M Portfolio |
Derivative Financial Instruments Outstanding as of Period End
Futures Contracts
| | | | | | | | | | | | | | | | |
| Description | | Number
of
Contracts | | | Expiration
Date | | | Notional
Amount
(000) | | | Value/
Unrealized
Appreciation
(Depreciation) | |
Long Contracts | | | | | | | | | | | | | | | | |
U.S. Treasury Bonds (30 Year) | | | 17 | | | | 06/19/19 | | | $ | 2,544 | | | $ | 3,548 | |
U.S. Treasury Notes (10 Year) | | | 103 | | | | 06/19/19 | | | | 12,795 | | | | 2,859 | |
U.S. Ultra Treasury Bonds | | | 5 | | | | 06/19/19 | | | | 840 | | | | 6,243 | |
U.S. Treasury Notes (2 Year) | | | 74 | | | | 06/28/19 | | | | 15,769 | | | | (11,448 | ) |
| | | | | | | | | | | | | | | | |
| | | | | | | | | | | | | | | 1,202 | |
| | | | | | | | | | | | | | | | |
Short Contracts | | | | | | | | | | | | | | | | |
Euro Dollar | | | 20 | | | | 06/17/19 | | | | 4,873 | | | | (7,767 | ) |
U.S. Ultra Treasury Notes (10 Year) | | | 24 | | | | 06/19/19 | | | | 3,187 | | | | (65,236 | ) |
U.S. Treasury Notes (5 Year) | | | 315 | | | | 06/28/19 | | | | 36,486 | | | | (248,167 | ) |
Euro Dollar | | | 20 | | | | 09/16/19 | | | | 4,877 | | | | (24,376 | ) |
Euro Dollar | | | 27 | | | | 12/16/19 | | | | 6,586 | | | | (6,769 | ) |
Euro Dollar | | | 20 | | | | 03/16/20 | | | | 4,884 | | | | (27,815 | ) |
Euro Dollar | | | 20 | | | | 06/15/20 | | | | 4,889 | | | | (30,714 | ) |
Euro Dollar | | | 20 | | | | 09/14/20 | | | | 4,892 | | | | (37,764 | ) |
Euro Dollar | | | 182 | | | | 12/14/20 | | | | 44,524 | | | | (154,139 | ) |
Euro Dollar | | | 20 | | | | 03/15/21 | | | | 4,894 | | | | 398 | |
| | | | | | | | | | | | | | | | |
| | | | | | | | | | | | | | | (602,349 | ) |
| | | | | | | | | | | | | | | | |
| | | | | | | | | | | | | | $ | (601,147 | ) |
| | | | | | | | | | | | | | | | |
Exchange-Traded Options Written
| | | | | | | | | | | | | | | | |
| Description | | Number of Contracts | | | Expiration Date | | | Exercise Price | | Notional Amount (000) | | | Value |
Call | | | | | | | | | | | | | | | | |
Euro Dollar90-Day | | | 330 | | | | 03/16/20 | | | $98 | | | $80,590 | | | $(90,750) |
| | | | | | | | | | | | | | | | |
Centrally Cleared Interest Rate Swaps
| | | | | | | | | | | | | | | | | | | | | | | | | | | | | | | | |
| Paid by the Fund | | | Received by the Fund | | | | Termination | | Notional Amount | | | | | Upfront
Premium
Paid | | | Unrealized
Appreciation | |
| Rate | | Frequency | | | | | | Rate | | | Frequency | | | | Date | | (000) | | Value | | | (Recieved) | | | (Depreciation) | |
2.50% | | | Semi-annual | | | | | | | | 3-month LIBOR, 2.60% | | | Quarterly | | | | 01/29/23 | | $36,309 | | $ | (256,356 | ) | | $ | 479 | | | $ | (256,835 | ) |
2.71% | | | Semi-annual | | | | | | | | 3-month LIBOR, 2.60% | | | Quarterly | | | | 02/06/23 | | $36,607 | | | (553,685 | ) | | | 483 | | | | (554,168 | ) |
| | | | | | | | | | | | | | | | | | | | | | | | | | | | | | | | |
| | | | | | | | | | | | | | | | | | | | | | $ | (810,041 | ) | | $ | 962 | | | $ | (811,003 | ) |
| | | | | | | | | | | | | | | | | | | | | | | | | | | | | | | | |
OTC Credit Default Swaps — Buy Protection
| | | | | | | | | | | | | | | | | | | | | | | | | | |
Reference Index | | Financing
Rate
Paid by
the Fund | | | Payment
Frequency | | | Counterparty | | Termination
Date | | Notional
Amount
(000) | | Value | | | Upfront
Premium
Paid
(Received) | | | Unrealized
Appreciation
(Depreciation) | |
CMBX.NA.10.BBB- | | | 3.00% | | | | Monthly | | | Goldman Sachs International | | 11/17/59 | | $4,174 | | $ | 220,286 | | | $ | 214,918 | | | $ | 5,368 | |
CMBX.NA.10.BBB- | | | 3.00% | | | | Monthly | | | Goldman Sachs International | | 11/17/59 | | $3,976 | | | 209,796 | | | | 195,126 | | | | 14,670 | |
CMBX.NA.12.BBB- | | | 3.00% | | | | Monthly | | | Credit Suisse International | | 8/17/61 | | $4,200 | | | 319,345 | | | | 345,301 | | | | (25,956 | ) |
CMBX.NA.12.BBB- | | | 3.00% | | | | Monthly | | | Goldman Sachs International | | 8/17/61 | | $4,250 | | | 320,667 | | | | 332,918 | | | | (12,251 | ) |
| | | | | | | | | | | | | | | | | | | | | | | | | | |
| | | | | | | | | | | | | | | | $ | 1,070,094 | | | $ | 1,088,263 | | | $ | (18,169 | ) |
| | | | | | | | | | | | | | | | | | | | | | | | | | |
| | |
| 60 | | 2 0 1 9 B L A C K R O C K A N N U A L R E P O R T T O S H A R E H O L D E R S |
| | |
Schedule of Investments (continued) March 31, 2019 | | BATS: Series M Portfolio |
OTC Credit Default Swaps — Sell Protection
| | | | | | | | | | | | | | | | | | | | | | | | | | | | | | | | | | |
Reference Index | | Financing
Rate
Received
by the
Fund | | | Payment
Frequency | | | Counterparty | | Termination
Date | | | Credit
Rating(a) | | | Notional
Amount
(000)(b) | | | Value | | | Upfront
Premium
Paid
(Received) | | | Unrealized
Appreciation
(Depreciation) | |
CMBX.NA.9.BBB- | | | 3.00% | | | | Monthly | | | Deutsche Bank AG | | | 09/17/58 | | | | Not Rated | | | | $8,000 | | | $ | (477,045 | ) | | $ | (984,168 | ) | | $ | 507,123 | |
CMBX.NA.10.BBB- | | | 3.00% | | | | Monthly | | | Goldman Sachs International | | | 11/17/59 | | | | BBB- | | | | $4,398 | | | | (232,060 | ) | | | (328,118 | ) | | | 96,058 | |
CMBX.NA.10.BBB- | | | 3.00% | | | | Monthly | | | J.P. Morgan Securities LLC | | | 11/17/59 | | | | BBB- | | | | $3,753 | | | | (198,023 | ) | | | (282,165 | ) | | | 84,142 | |
| | | | | | | | | | | | | | | | | | | | | | | | | | | | | | | | | | |
| | | | | | | | | | | | | | | | | | | | | | | | $ | (907,128 | ) | | $ | (1,594,451 | ) | | $ | 687,323 | |
| | | | | | | | | | | | | | | | | | | | | | | | | | | | | | | | | | |
| | (a) | Using S&P’s rating of the issuer or the underlying securities of the index, as applicable. | |
| | (b) | The maximum potential amount the Fund may pay should a negative credit event take place as defined under the terms of the agreement. | |
Balances Reported in the Statements of Assets and Liabilities for Centrally Cleared Swaps and OTC Swaps
| | | | | | | | | | | | | | | | |
| | | Swap Premiums
Paid | | | Swap Premiums
Received | | | Unrealized
Appreciation | | | Unrealized
Depreciation | |
Centrally Cleared Swaps(a) | | $ | 962 | | | $ | — | | | $ | — | | | $ | 811,003 | |
| OTC Swaps | | | 1,088,263 | | | | 1,594,451 | | | | 707,361 | | | | 38,207 | |
| | (a) | Includes cumulative appreciation (depreciation) on centrally cleared swaps, as reported in the Schedule of Investments. Only current day’s variation margin is reported within the Statements of Assets and Liabilities and is net of any previously paid (received) swap premium amounts. | |
Derivative Financial Instruments Categorized by Risk Exposure
As of period end, the fair values of derivative financial instruments located in the Statements of Assets and Liabilities were as follows:
| | | | | | | | | | | | | | | | | | | | | | | | | | | | | | | | |
| Assets — Derivative Financial Instruments | | | | | Commodity
Contracts | | | Credit
Contracts | | | Equity
Contracts | | | Foreign
Currency
Exchange
Contracts | | | Interest
Rate
Contracts | | | Other
Contracts | | | Total | |
Futures contracts | |
| Net unrealized
appreciation(a) |
| | $ | — | | | $ | — | | | $ | — | | | $ | — | | | $ | 13,048 | | | $ | — | | | $ | 13,048 | |
Swaps — OTC | |
| Unrealized
appreciation on
OTC swaps;
Swap premiums
paid |
| | | — | | | | 1,795,624 | | | | — | | | | — | | | | — | | | | — | | | | 1,795,624 | |
| | | | | | | | | | | | | | | | | | | | | | | | | | | | | | | | |
| | | | | | $ | — | | | $ | 1,795,624 | | | $ | — | | | $ | — | | | $ | 13,048 | | | $ | — | | | $ | 1,808,672 | |
| | | | | | | | | | | | | | | | | | | | | | | | | | | | | | | | |
| | | | | | | | | | | | | | | | | | | | | | | | | | | | | | | | |
| Liabilities — Derivative Financial Instruments | | | | | | | | | | | | | | | | | | | | | | | | |
Futures contracts | |
| Net unrealized
depreciation(a) |
| | $ | — | | | $ | — | | | $ | — | | | $ | — | | | $ | 614,195 | | | $ | — | | | $ | 614,195 | |
Options written | |
| Options written at
value |
| | | — | | | | — | | | | — | | | | — | | | | 90,750 | | | | — | | | | 90,750 | |
Swaps — centrally cleared | |
| Net unrealized
depreciation(a) |
| | | — | | | | — | | | | — | | | | — | | | | 811,003 | | | | — | | | | 811,003 | |
Swaps — OTC | |
| Unrealized
depreciation on
OTC swaps;
Swap premiums
received |
| | | — | | | | 1,632,658 | | | | — | | | | — | | | | — | | | | — | | | | 1,632,658 | |
| | | | | | | | | | | | | | | | | | | | | | | | | | | | | | | | |
| | | | | | $ | — | | | $ | 1,632,658 | | | $ | — | | | $ | — | | | $ | 1,515,948 | | | $ | — | | | $ | 3,148,606 | |
| | | | | | | | | | | | | | | | | | | | | | | | | | | | | | | | |
| | (a) | Includes cumulative appreciation (depreciation) on futures contracts and centrally cleared swaps, if any, as reported in the Schedule of Investments. Only current day’s variation margin is reported within the Statements of Assets and Liabilities. | |
| | | | |
| S C H E D U L E S O F I N V E S T M E N T S | | | 61 | |
| | |
Schedule of Investments (continued) March 31, 2019 | | BATS: Series M Portfolio |
For the year ended March 31, 2019, the effect of derivative financial instruments in the Statements of Operations was as follows:
| | | | | | | | | | | | | | | | | | | | | | | | | | | | |
| |
| Net Realized Gain (Loss) from: | | Commodity
Contracts | | | Credit
Contracts | | | Equity
Contracts | | | Foreign
Currency
Exchange
Contracts | | | Interest
Rate
Contracts | | | Other
Contracts | | | Total | |
| |
Futures contracts | | $ | — | | | $ | — | | | $ | — | | | $ | — | | | $ | 242,868 | | | $ | — | | | $ | 242,868 | |
Swaps | | | — | | | | 211,828 | | | | — | | | | — | | | | (970,783 | ) | | | — | | | | (758,955 | ) |
| | | | | | | | | | | | | | | | | | | | | | | | | | | | |
| | $ | — | | | $ | 211,828 | | | $ | — | | | $ | — | | | $ | (727,915 | ) | | $ | — | | | $ | (516,087 | ) |
| | | | | | | | | | | | | | | | | | | | | | | | | | | | |
| | | | | | | | | | | | | | | | | | | | | | | | | | | | |
| |
| Net Change in Unrealized Appreciation (Depreciation) on: | | | | | | | | | | | | | | | | | | | | | |
| |
Futures contracts | | $ | — | | | $ | — | | | $ | — | | | $ | — | | | $ | (221,130 | ) | | $ | — | | | $ | (221,130 | ) |
Options written | | | — | | | | — | | | | — | | | | — | | | | 15,962 | | | | — | | | | 15,962 | |
Swaps | | | — | | | | 850,486 | | | | — | | | | — | | | | (1,242,441 | ) | | | — | | | | (391,955 | ) |
| | | | | | | | | | | | | | | | | | | | | | | | | | | | |
| | $ | — | | | $ | 850,486 | | | $ | — | | | $ | — | | | $ | (1,447,609 | ) | | $ | — | | | $ | (597,123 | ) |
| | | | | | | | | | | | | | | | | | | | | | | | | | | | |
Average Quarterly Balances of Outstanding Derivative Financial Instruments
| | | | |
| |
Futures contracts: | | | | |
Average notional value of contracts — long | | $ | 51,819,022 | |
Average notional value of contracts — short | | | 103,808,451 | |
Options: | | | | |
Average value of option contracts written | | | 22,688 | |
Credit default swaps: | | | | |
Average notional value — buy protection | | | 10,337,500 | |
Average notional value — sell protection | | | 12,804,250 | |
Interest rate swaps: | | | | |
Average notional value — pays fixed rate | | | 102,116,000 | |
| |
For more information about the Fund’s investment risks regarding derivative financial instruments, refer to the Notes to Financial Statements.
Derivative Financial Instruments - Offsetting as of Period End
The Fund’s derivative assets and liabilities (by type) were as follows:
| | | | | | | | |
| | | Assets | | | Liabilities | |
| |
Derivative Financial Instruments: | | | | | | | | |
Futures contracts | | $ | 135,664 | | | $ | 31,558 | |
Options | | | — | | | | 90,750 | |
Swaps — Centrally cleared | | | 507 | | | | — | |
Swaps — OTC(a) | | | 1,795,624 | | | | 1,632,658 | |
| | | | | | | | |
Total derivative assets and liabilities in the Statements of Assets and Liabilities | | $ | 1,931,795 | | | $ | 1,754,966 | |
Derivatives not subject to a Master Netting Agreement or similar agreement (“MNA”) | | | (136,171 | ) | | | (122,308 | ) |
| | | | | | | | |
Total derivative assets and liabilities subject to an MNA | | $ | 1,795,624 | | | $ | 1,632,658 | |
| | | | | | | | |
| | (a) | Includes unrealized appreciation (depreciation) on OTC swaps and swap premiums paid/received in the Statements of Assets and Liabilities. | |
| | |
| 62 | | 2 0 1 9 B L A C K R O C K A N N U A L R E P O R T T O S H A R E H O L D E R S |
| | |
Schedule of Investments (continued) March 31, 2019 | | BATS: Series M Portfolio |
The following table presents the Fund’s derivative assets and liabilities by counterparty net of amounts available for offset under an MNA and net of the related collateral received and pledged by the Fund:
| | | | | | | | | | | | | | | | | | | | |
| Counterparty | | Derivative
Assets
Subject to
an MNA by
Counterparty | | | Derivatives
Available
for Offset(a) | | | Non-cash
Collateral
Received | | | Cash
Collateral
Received | | | Net Amount
of
Derivative
Assets(b) | |
| |
Credit Suisse International | | $ | 345,301 | | | $ | (25,956 | ) | | $ | — | | | $ | — | | | $ | 319,345 | |
Deutsche Bank AG | | | 507,123 | | | | (507,123 | ) | | | — | | | | — | | | | — | |
Goldman Sachs International | | | 859,058 | | | | (340,369 | ) | | | — | | | | (500,000 | ) | | | 18,689 | |
J.P. Morgan Securities LLC | | | 84,142 | | | | (84,142 | ) | | | — | | | | — | | | | — | |
| | | | | | | | | | | | | | | | | | | | |
| | $ | 1,795,624 | | | $ | (957,590 | ) | | $ | — | | | $ | (500,000 | ) | | $ | 338,034 | |
| | | | | | | | | | | | | | | | | | | | |
| | | | | |
| Counterparty | | Derivative
Liabilities
Subject to
an MNA by
Counterparty | | | Derivatives
Available
for Offset(a) | | | Non-cash
Collateral
Pledged | | | Cash
Collateral
Pledged(c) | | | Net Amount
of
Derivative
Liabilities | |
| |
Credit Suisse International | | $ | 25,956 | | | $ | (25,956 | ) | | $ | — | | | $ | — | | | $ | — | |
Deutsche Bank AG | | | 984,168 | | | | (507,123 | ) | | | — | | | | (477,045 | ) | | | — | |
Goldman Sachs International | | | 340,369 | | | | (340,369 | ) | | | — | | | | — | | | | — | |
J.P. Morgan Securities LLC | | | 282,165 | | | | (84,142 | ) | | | — | | | | (198,023 | ) | | | — | |
| | | | | | | | | | | | | | | | | | | | |
| | $ | 1,632,658 | | | $ | (957,590 | ) | | $ | — | | | $ | (675,068 | ) | | $ | — | |
| | | | | | | | | | | | | | | | | | | | |
| | (a) | The amount of derivatives available for offset is limited to the amount of derivative assets and/or liabilities that are subject to an MNA. | |
| | (b) | Net amount represents the net amount receivable from the counterparty in the event of default. | |
| | (c) | Excess of collateral pledged to the individual counterparty is not shown for financial reporting purposes. | |
Fair Value Hierarchy as of Period End
Various inputs are used in determining the fair value of investments and derivative financial instruments. For information about the Fund’s policy regarding valuation of investments and derivative financial instruments, refer to the Notes to Financial Statements.
The following tables summarize the Fund’s investments and derivative financial instruments categorized in the disclosure hierarchy:
| | | | | | | | | | | | | | | | |
| |
| | | Level 1 | | | Level 2 | | | Level 3 | | | Total | |
| |
Assets: | | | | | | | | | | | | | | | | |
Investments: | | | | | | | | | | | | | | | | |
Long-Term Investments: | | | | | | | | | | | | | | | | |
Asset-Backed Securities | | $ | — | | | $ | 3,260,711 | | | $ | — | | | $ | 3,260,711 | |
Non-Agency Mortgage-Backed Securities | | | — | | | | 103,846,516 | | | | — | | | | 103,846,516 | |
U.S. Government Sponsored Agency Securities | | | — | | | | 1,242,403,737 | | | | — | | | | 1,242,403,737 | |
U.S. Treasury Obligations | | | — | | | | 17,591,311 | | | | — | | | | 17,591,311 | |
Short-Term Securities | | | 5,672,864 | | | | 7,926,173 | | | | — | | | | 13,599,037 | |
Liabilities: | | | | | | | | | | | | | | | | |
TBA Sale Commitments | | | — | | | | (491,655,481 | ) | | | — | | | | (491,655,481 | ) |
| | | | | | | | | | | | | | | | |
| | $ | 5,672,864 | | | $ | 883,372,967 | | | $ | — | | | $ | 889,045,831 | |
| | | | | | | | | | | | | | | | |
| | | | |
Derivative Financial Instruments(a) | | | | | | | | | | | | | | | | |
Assets: | | | | | | | | | | | | | | | | |
Credit contracts | | $ | — | | | $ | 707,361 | | | $ | — | | | $ | 707,361 | |
Interest rate contracts | | | 13,048 | | | | — | | | | — | | | | 13,048 | |
Liabilities: | | | | | | | | | | | | | | | | |
Credit contracts | | | — | | | | (38,207 | ) | | | — | | | | (38,207 | ) |
Interest rate contracts | | | (704,945 | ) | | | (811,003 | ) | | | — | | | | (1,515,948 | ) |
| | | | | | | | | | | | | | | | |
| | $ | (691,897 | ) | | $ | (141,849 | ) | | $ | — | | | $ | (833,746 | ) |
| | | | | | | | | | | | | | | | |
| | (a) | Derivative financial instruments are swaps, futures contracts and option written. Swaps and futures contracts are valued at the unrealized appreciation (depreciation) on the instrument and options written are shown at value. | |
During the year ended March 31, 2019, there were no transfers between levels.
See notes to financial statements.
| | | | |
| S C H E D U L E S O F I N V E S T M E N T S | | | 63 | |
| | |
Schedule of Investments March 31, 2019 | | BATS: Series P Portfolio (Percentages shown are based on Net Assets) |
| | | | | | | | |
| Security | | Shares | | | Value | |
|
Affiliated Investment Companies — 30.1% | |
BlackRock Allocation Target Shares: Series S Portfolio(a) | | | 1,636,625 | | | $ | 15,547,936 | |
| | | | | | | | |
| | | | | | |
| | | | | Value | |
| |
Total Affiliated Investment Companies — 30.1%
(Cost: $15,809,366) | | $ | 15,547,936 | |
| |
Other Assets Less Liabilities — 69.9% | | | 36,106,484 | |
| | | | | | |
| |
Net Assets — 100.0% | | $ | 51,654,420 | |
| | | | | | |
| (a) | During the year ended March 31, 2019, investments in issuers considered to be an affiliate of the Fund for purposes of Section 2(a)(3) of the Investment Company Act of 1940, as amended, and/or related parties of the Fund were as follows: |
| | | | | | | | | | | | | | | | | | | | | | | | | | | | | | | | |
| |
| Affiliate | | Shares
Held at
03/31/18 | | | Shares
Purchased | | | Shares
Sold | | | Shares
Held at
03/31/19 | | | Value at
03/31/19 | | | Income | | | Net
Realized
Gain (Loss) | | | Change in
Unrealized
Apprecia-
tion
(Deprecia-
tion) | |
| |
BlackRock Allocation Target Shares: Series S Portfolio | | | 2,660,907 | | | | 2,469,348 | | | | 3,493,630 | | | | 1,636,625 | | | $ | 15,547,936 | | | $ | 595,163 | | | $ | (398,601 | ) | | $ | 591,100 | |
| | | | | | | | | | | | | | | | | | | | | | | | | | | | | | | | |
Derivative Financial Instruments Outstanding as of Period End
Futures Contracts
| | | | | | | | | | | | | | | | |
| |
| Description | | Number
of
Contracts | | | Expiration
Date | | | Notional
Amount
(000) | | | Value/
Unrealized
Appreciation
(Depreciation) | |
| |
Long Contracts | | | | | | | | | | | | | | | | |
U.S. Treasury Notes (10 Year) | | | 144 | | | | 06/19/19 | | | | $17,888 | | | $ | 190,203 | |
U.S. Treasury Notes (2 Year) | | | 78 | | | | 06/28/19 | | | | 16,621 | | | | 61,165 | |
U.S. Treasury Notes (5 Year) | | | 15 | | | | 06/28/19 | | | | 1,737 | | | | 14,722 | |
| | | | | | | | | | | | | | | | |
| | | | | | | | | | | | | | | 266,090 | |
| | | | | | | | | | | | | | | | |
Short Contracts | | | | | | | | | | | | | | | | |
U.S. Ultra Treasury Bonds (10 Year) | | | 8 | | | | 06/19/19 | | | | 1,062 | | | | (23,885 | ) |
| | | | | | | | | | | | | | | | |
| | | | | | | | | | | | | | $ | 242,205 | |
| | | | | | | | | | | | | | | | |
Centrally Cleared Interest Rate Swaps
| | | | | | | | | | | | | | | | | | | | | | | | | | | | | | | | |
| |
| Paid by the Fund | | | | Received by the Fund | | | | | | Termination | | | Notional
Amount | | | | | | Upfront
Premium
Paid | | | Unrealized
Appreciation | |
| Rate | | Frequency | | | | Rate | | Frequency | | | | | | Date | | | (000) | | | Value | | | (Recieved) | | | (Depreciation) | |
| |
| 2.91% | | Semi-annual | | | | 3-month LIBOR, 2.60% | | Quarterly | | | | | | | 12/17/20 | | | $ | 35,000 | | | $ | (533,088 | ) | | $ | 412 | | | $ | (533,500 | ) |
| 3.11% | | Semi-annual | | | | 3-month LIBOR, 2.60% | | Quarterly | | | | | | | 05/21/25 | | | $ | 14,320 | | | | (767,619 | ) | | | 195 | | | | (767,814 | ) |
| 2.23% | | Semi-annual | | | | 3-month LIBOR, 2.60% | | Quarterly | | | | | | | 04/24/27 | | | $ | 26,460 | | | | 163,289 | | | | 383 | | | | 162,906 | |
| 2.27% | | Semi-annual | | | | 3-month LIBOR, 2.60% | | Quarterly | | | | | | | 05/18/27 | | | $ | 6,500 | | | | 15,987 | | | | 94 | | | | 15,893 | |
| 2.23% | | Semi-annual | | | | 3-month LIBOR, 2.60% | | Quarterly | | | | | | | 08/11/27 | | | $ | 3,850 | | | | 48,396 | | | | 61 | | | | 48,335 | |
| 2.90% | | Semi-annual | | | | 3-month LIBOR, 2.60% | | Quarterly | | | | | | | 11/15/27 | | | $ | 11,152 | | | | (532,284 | ) | | | (691 | ) | | | (531,593 | ) |
| 3.18% | | Semi-annual | | | | 3-month LIBOR, 2.60% | | Quarterly | | | | | | | 05/21/28 | | | $ | 7,500 | | | | (542,679 | ) | | | 111 | | | | (542,790 | ) |
| | | | | | | | | | | | | | | | | | | | | | | | | | | | | | | | |
| | | | | | | | | | | | | | | | | | | | | | $ | (2,147,998 | ) | | $ | 565 | | | $ | (2,148,563 | ) |
| | | | | | | | | | | | | | | | | | | | | | | | | | | | | | | | |
| | |
| 64 | | 2 0 1 9 B L A C K R O C K A N N U A L R E P O R T T O S H A R E H O L D E R S |
| | |
Schedule of Investments (continued) March 31, 2019 | | BATS: Series P Portfolio |
Balances Reported in the Statements of Assets and Liabilities for Centrally Cleared Swaps
| | | | | | | | | | | | | | | | |
| |
| | | Swap Premiums
Paid | | | Swap Premiums
Received | | | Unrealized
Appreciation | | | Unrealized
Depreciation | |
| |
Centrally Cleared Swaps(a) | | | $1,256 | | | | $691 | | | | $227,134 | | | | $2,375,697 | |
| |
| | (a) | Includes cumulative appreciation (depreciation) on centrally cleared swaps, as reported in the Schedule of Investments. Only current day’s variation margin is reported within the Statements of Assets and Liabilities and is net of any previously paid (received) swap premium amounts. | |
Derivative Financial Instruments Categorized by Risk Exposure
As of period end, the fair values of derivative financial instruments located in the Statements of Assets and Liabilities were as follows:
| | | | | | | | | | | | | | | | | | | | | | | | | | | | | | |
| |
| Assets — Derivative Financial Instruments | | | | Commodity
Contracts | | | Credit
Contracts | | | Equity
Contracts | | | Foreign
Currency
Exchange
Contracts | | | Interest
Rate
Contracts | | | Other
Contracts | | | Total | |
| |
Futures contracts | | Net unrealized
appreciation(a) | | $ | — | | | $ | — | | | $ | — | | | $ | — | | | $ | 266,090 | | | $ | — | | | $ | 266,090 | |
Swaps — centrally cleared | | Net unrealized
appreciation(a) | | | — | | | | — | | | | — | | | | — | | | | 227,134 | | | | — | | | | 227,134 | |
| | | | | | | | | | | | | | | | | | | | | | | | | | | | | | |
| | | | $ | — | | | $ | — | | | $ | — | | | $ | — | | | $ | 493,224 | | | $ | — | | | $ | 493,224 | |
| | | | | | | | | | | | | | | | | | | | | | | | | | | | | | |
| | | | | | | | | | | | | | | | | | | | | | | | | | | | | | |
| |
| Liabilities — Derivative Financial Instruments | | | | | | | | | | | | | | | | | | | | | | | |
| |
Futures contracts | | Net unrealized
depreciation(a) | | $ | — | | | $ | — | | | $ | — | | | $ | — | | | $ | 23,885 | | | $ | — | | | $ | 23,885 | |
Swaps — centrally cleared | | Net unrealized
depreciation(a) | | | — | | | | — | | | | — | | | | — | | | | 2,375,697 | | | | — | | | | 2,375,697 | |
| | | | | | | | | | | | | | | | | | | | | | | | | | | | | | |
| | | | $ | — | | | $ | — | | | $ | — | | | $ | — | | | $ | 2,399,582 | | | $ | — | | | $ | 2,399,582 | |
| | | | | | | | | | | | | | | | | | | | | | | | | | | | | | |
(a) Includes cumulative appreciation (depreciation) on futures contracts and centrally cleared swaps, if any, as reported in the Schedule of Investments. Only current day’s variation margin is reported within the Statements of Assets and Liabilities. | |
For the year ended March 31, 2019, the effect of derivative financial instruments in the Statements of Operations was as follows: | |
| |
| Net Realized Gain from: | | Commodity
Contracts | | | Credit
Contracts | | | Equity
Contracts | | | Foreign
Currency
Exchange
Contracts | | | Interest
Rate
Contracts | | | Other
Contracts | | | Total | |
| |
Futures contracts | | $ | — | | | $ | — | | | $ | — | | | $ | — | | | $ | 203,087 | | | $ | — | | | $ | 203,087 | |
Swaps | | | — | | | | — | | | | — | | | | — | | | | 1,536,691 | | | | — | | | | 1,536,691 | |
| | | | | | | | | | | | | | | | | | | | | | | | | | | | | | |
| | | | $ | — | | | $ | — | | | $ | — | | | $ | — | | | $ | 1,739,778 | | | $ | — | | | $ | 1,739,778 | |
| | | | | | | | | | | | | | | | | | | | | | | | | | | | | | |
| | | | | | | | | | | | | | | | | | | | | | | | | | | | | | |
| | | | | | | | | | | | | | | | | | | | | | | | | | | | | | |
| |
| Net Change in Unrealized Appreciation (Depreciation) on: | | | | | | | | | | | | | | | | | | | | | |
| |
Futures contracts | | $ | — | | | $ | — | | | $ | — | | | $ | — | | | $ | 360,096 | | | $ | — | | | $ | 360,096 | |
Swaps | | | — | | | | — | | | | — | | | | — | | | | (4,112,425 | ) | | | — | | | | (4,112,425 | ) |
| | | | | | | | | | | | | | | | | | | | | | | | | | | | | | |
| | | | $ | — | | | $ | — | | | $ | — | | | $ | — | | | $ | (3,752,329 | ) | | $ | — | | | $ | (3,752,329 | ) |
| | | | | | | | | | | | | | | | | | | | | | | | | | | | | | |
Average Quarterly Balances of Outstanding Derivative Financial Instruments
| | | | |
| |
Futures contracts: | | | | |
Average notional value of contracts — long | | $ | 15,793,911 | |
Average notional value of contracts — short | | | 14,305,444 | |
Interest rate swaps: | | | | |
Average notional value — pays fixed rate | | | 87,282,000 | |
| |
For more information about the Fund’s investment risks regarding derivative financial instruments, refer to the Notes to Financial Statements.
| | | | |
| S C H E D U L E S O F I N V E S T M E N T S | | | 65 | |
| | |
Schedule of Investments (continued) March 31, 2019 | | BATS: Series P Portfolio |
Fair Value Hierarchy as of Period End
Various inputs are used in determining the fair value of investments and derivative financial instruments. For information about the Fund’s policy regarding valuation of investments and derivative financial instruments, refer to the Notes to Financial Statements.
The following tables summarize the Fund’s investments and derivative financial instruments categorized in the disclosure hierarchy:
| | | | | | | | | | | | | | | | |
| |
| | | Level 1 | | | Level 2 | | | Level 3 | | | Total | |
| |
Assets: | | | | | | | | | | | | | | | | |
Investments: | | | | | | | | | | | | | | | | |
Long-Term Investments: | | | | | | | | | | | | | | | | |
Affiliated Investment Companies | | $ | 15,547,936 | | | $ | — | | | $ | — | | | $ | 15,547,936 | |
| | | | | | | | | | | | | | | | |
Derivative Financial Instruments(a) | | | | | | | | | | | | | | | | |
Assets: | | | | | | | | | | | | | | | | |
Interest rate contracts | | $ | 266,090 | | | $ | 227,134 | | | $ | — | | | $ | 493,224 | |
Liabilities: | | | | | | | | | | | | | | | | |
Interest rate contracts | | | (23,885 | ) | | | (2,375,697 | ) | | | — | | | | (2,399,582 | ) |
| | | | | | | | | | | | | | | | |
| | $ | 242,205 | | | $ | (2,148,563 | ) | | $ | — | | | $ | (1,906,358 | ) |
| | | | | | | | | | | | | | | | |
| | (a) | Derivative financial instruments are swaps and futures contracts, which are valued at the unrealized appreciation (depreciation) on the instrument. | |
During the year ended March 31, 2019, there were no transfers between levels.
See notes to financial statements.
| | |
| 66 | | 2 0 1 9 B L A C K R O C K A N N U A L R E P O R T T O S H A R E H O L D E R S |
| | |
Schedule of Investments March 31, 2019 | | BATS: Series S Portfolio (Percentages shown are based on Net Assets) |
| | | | | | | | |
| Security | | Par
(000) | | | Value | |
|
Asset-Backed Securities — 18.8% | |
AmeriCredit Automobile Receivables Trust,
Series2016-3, Class A3, 1.46%, 05/10/21 | | $ | 411 | | | $ | 409,939 | |
Arbor Realty Commercial Real Estate Notes Ltd., Series 2016-FL1A, Class A, (1 mo. LIBOR US + 1.700%),
4.18%, 09/15/26(a)(b) | | | 350 | | | | 352,714 | |
B2R Mortgage Trust, Series2015-1, Class A1, 2.52%, 05/15/48(b) | | | 179 | | | | 178,022 | |
Capital One Multi-Asset Execution Trust,
Series2016-A4, Class A4,
1.33%, 06/15/22 | | | 1,300 | | | | 1,293,894 | |
Carlyle Global Market Strategies CLO Ltd.,
Series2012-4A, Class AR, (3 mo. LIBOR US + 1.450%), 4.21%, 01/20/29(a)(b) | | | 1,000 | | | | 1,000,572 | |
CarMax Auto Owner Trust: | | | | | | | | |
Series2015-3, Class A4,
1.98%, 02/16/21 | | | 2,399 | | | | 2,391,874 | |
Series2016-2, Class A3,
1.52%, 02/16/21 | | | 133 | | | | 132,624 | |
Chase Issuance Trust: | | | | | | | | |
Series2012-A4, Class A4,
1.58%, 08/15/21 | | | 2,379 | | | | 2,369,831 | |
Series2016-A2, Class A,
1.37%, 06/15/21 | | | 3,500 | | | | 3,490,802 | |
Chesapeake Funding II LLC, Series2016-2A, Class A1, 1.88%, 06/15/28(b) | | | 408 | | | | 406,456 | |
CNH Equipment Trust: | | | | | | | | |
Series2016-B, Class A3,
1.63%, 08/15/21 | | | 339 | | | | 337,275 | |
Series2016-C, Class A3,
1.44%, 12/15/21 | | | 1,006 | | | | 998,791 | |
Credit Acceptance Auto Loan Trust: | | | | | | | | |
Series2016-2A, Class A,
2.42%, 11/15/23(b) | | | 105 | | | | 104,907 | |
Series2016-3A, Class A,
2.15%, 04/15/24(b) | | | 1,064 | | | | 1,061,781 | |
Discover Card Execution Note Trust: | | | | | | | | |
Series2015-A2, Class A,
1.90%, 10/17/22 | | | 1,000 | | | | 992,831 | |
Series2016-A4, Class A4,
1.39%, 03/15/22 | | | 300 | | | | 298,246 | |
Enterprise Fleet Financing LLC: | | | | | | | | |
Series2016-2, Class A2,
1.74%, 02/22/22(b) | | | 201 | | | | 200,305 | |
Series2016-2, Class A3,
2.04%, 02/22/22(b) | | | 530 | | | | 526,254 | |
Series2017-1, Class A2,
2.13%, 07/20/22(b) | | | 111 | | | | 110,349 | |
Series2017-1, Class A3,
2.60%, 07/20/22(b) | | | 210 | | | | 209,304 | |
Ford Credit Auto Owner Trust, Series2016-C, Class A4, 1.40%, 02/15/22 | | | 680 | | | | 670,737 | |
Greystone Commercial Real Estate Notes Ltd., Series 2017-FL1A, Class A, (1 mo. LIBOR US + 1.550%),
4.03%, 03/15/27(a)(b) | | | 610 | | | | 607,697 | |
Honda Auto Receivables Owner Trust, Series2016-4, Class A4, 1.36%, 01/18/23 | | | 640 | | | | 631,980 | |
Mercedes-Benz Receivables Trust, Series2016-1, Class A4, 1.46%, 12/15/22 | | | 2,000 | | | | 1,974,878 | |
Mill City Mortgage Loan Trust, Series2016-1, Class A1, 2.50%, 04/25/57(b)(c) | | | 600 | | | | 594,615 | |
Nissan Master Owner Trust Receivables, Series2016-A, Class A2, 1.54%, 06/15/21 | | | 1,090 | | | | 1,087,133 | |
PFS Financing Corp., Series2016-BA, Class A, 1.87%, 10/15/21(b) | | | 190 | | | | 188,943 | |
| | | | | | | | |
| Security | | Par
(000) | | | Value | |
| | |
SLM Private Education Loan Trust, Series2011-A, Class A3, (1 mo. LIBOR US + 2.500%), 4.98%, 01/15/43(a)(b) | | $ | 1,581 | | | $ | 1,596,179 | |
SLM Student Loan Trust, Series2013-4, Class A, (1 mo. LIBOR US + 0.550%), 3.04%, 06/25/43(a) | | | 301 | | | | 299,922 | |
SMB Private Education Loan Trust, Series2016-B, Class A2A, 2.43%, 02/17/32(b) | | | 571 | | | | 561,649 | |
SoFi Professional Loan Program LLC: | | | | | | | | |
Series2015-A, Class A1, (1 mo. LIBOR US + 1.200%), 3.69%, 03/25/33(a)(b) | | | 594 | | | | 596,585 | |
Series2015-B, Class A2,
2.51%, 09/27/32(b) | | | 691 | | | | 686,793 | |
Series2015-D, Class A2,
2.72%, 10/27/36(b) | | | 364 | | | | 362,301 | |
Series2016-A, Class A2,
2.76%, 12/26/36(b) | | | 1,206 | | | | 1,197,490 | |
Series2016-C, Class A2B,
2.36%, 12/27/32(b) | | | 137 | | | | 134,869 | |
Series2016-D, Class A2B,
2.34%, 04/25/33(b) | | | 121 | | | | 118,760 | |
Series2016-E, Class A2B,
2.49%, 01/25/36(b) | | | 457 | | | | 452,298 | |
Springleaf Funding Trust, Series2015-AA, Class A, 3.16%, 11/15/24(b) | | | 120 | | | | 119,841 | |
Synchrony Credit Card Master Note Trust, Series2015-1, Class A, 2.37%, 03/15/23 | | | 1,185 | | | | 1,181,556 | |
Towd Point Mortgage Trust, Series2016-3, Class A1, 2.25%, 04/25/56(b)(c) | | | 378 | | | | 372,049 | |
Wheels SPV 2 LLC, Series2016-1A, Class A2, 1.59%, 05/20/25(b) | | | 7 | | | | 7,321 | |
World Financial Network Credit Card Master Trust, Series2012-D, Class B,
3.34%, 04/17/23 | | | 330 | | | | 330,088 | |
| | | | | | | | |
Total Asset-Backed Securities — 18.8%
(Cost: $30,855,871) | | | | 30,640,455 | |
| | | | | | | | |
|
Capital Trusts — 0.1% | |
Multi-Utilities — 0.1% | |
Dominion Energy, Inc., 2.58%, 07/01/20 | | | 110 | | | | 109,392 | |
| | | | | | | | |
Total Capital Trusts — 0.1%
(Cost: $110,046) | | | | 109,392 | |
| | | | | | | | |
|
Corporate Bonds — 61.2% | |
|
| Aerospace & Defense — 1.5% | |
Lockheed Martin Corp., 2.50%, 11/23/20 | | | 400 | | | | 398,772 | |
Northrop Grumman Corp., 3.25%, 01/15/28 | | | 485 | | | | 476,901 | |
United Technologies Corp. : | | | | | | | | |
1.90%, 05/04/20 | | | 115 | | | | 114,094 | |
3.35%, 08/16/21 | | | 235 | | | | 238,144 | |
3.10%, 06/01/22 | | | 200 | | | | 201,290 | |
3.65%, 08/16/23 | | | 1,075 | | | | 1,103,447 | |
| | | | | | | | |
| | | | | | | 2,532,648 | |
| | |
| Airlines — 0.6% | | | | | | |
Delta Air Lines, Inc. : | | | | | | | | |
2.88%, 03/13/20 | | | 133 | | | | 132,757 | |
| | | | |
| S C H E D U L E S O F I N V E S T M E N T S | | | 67 | |
| | |
Schedule of Investments (continued) March 31, 2019 | | BATS: Series S Portfolio (Percentages shown are based on Net Assets) |
| | | | | | | | |
| Security | | Par
(000) | | | Value | |
| | |
Airlines (continued) | | | | | | | | |
3.63%, 03/15/22 | | $ | 625 | | | $ | 628,532 | |
Virgin Australia Trust, Series2013-1A, 5.00%, 04/23/25(b) | | | 137 | | | | 139,736 | |
| | | | | | | | |
| | | | | | | 901,025 | |
Automobiles — 1.6% | | | | | | | | |
BMW U.S. Capital LLC, 3.10%, 04/12/21(b) | | | 205 | | | | 206,278 | |
Daimler Finance North America LLC : | | | | | | | | |
1.50%, 07/05/19(b) | | | 1,600 | | | | 1,594,663 | |
2.70%, 08/03/20(b) | | | 150 | | | | 149,461 | |
Volkswagen Group of America Finance LLC : | | | | | | | | |
2.13%, 05/23/19(b) | | | 350 | | | | 349,595 | |
2.40%, 05/22/20(b) | | | 315 | | | | 312,777 | |
| | | | | | | | |
| | | | | | | 2,612,774 | |
Banks — 14.3% | | | | | | | | |
ANZ New Zealand International Ltd.,
2.88%, 01/25/22(b) | | | 615 | | | | 612,918 | |
Bank of America Corp. : | | | | | | | | |
3.30%, 01/11/23 | | | 545 | | | | 551,919 | |
(3 mo. LIBOR US + 1.021%),
2.88%, 04/24/23(d)(e) | | | 2,440 | | | | 2,432,536 | |
Bank of Montreal, 2.10%, 12/12/19 | | | 325 | | | | 323,962 | |
Barclays PLC, (3 mo. LIBOR US + 1.400%),
4.61%, 02/15/23(e) | | | 435 | | | | 443,972 | |
BB&T Corp., 3.20%, 09/03/21 | | | 270 | | | | 272,985 | |
BNP Paribas SA, 3.80%, 01/10/24(b) | | | 485 | | | | 488,825 | |
Canadian Imperial Bank of Commerce, 2.35%, 07/27/22(b) | | | 800 | | | | 791,781 | |
Citigroup, Inc. : | | | | | | | | |
2.90%, 12/08/21 | | | 755 | | | | 754,800 | |
2.75%, 04/25/22 | | | 30 | | | | 29,874 | |
(3 mo. LIBOR US + 0.722%),
3.14%, 01/24/23(e) | | | 35 | | | | 35,121 | |
(3 mo. LIBOR US + 0.950%),
2.88%, 07/24/23(e) | | | 100 | | | | 99,362 | |
Citizens Bank N.A. : | | | | | | | | |
2.45%, 12/04/19 | | | 700 | | | | 698,307 | |
3.25%, 02/14/22 | | | 250 | | | | 252,307 | |
Citizens Financial Group, Inc.,
2.38%, 07/28/21 | | | 335 | | | | 330,466 | |
Commonwealth Bank of Australia : | | | | | | | | |
2.25%, 03/10/20(b) | | | 600 | | | | 597,353 | |
2.75%, 03/10/22(b) | | | 400 | | | | 399,073 | |
Discover Bank, 3.35%, 02/06/23 | | | 250 | | | | 251,351 | |
DNB Boligkreditt AS, 3.25%, 06/28/23(b) | | | 850 | | | | 870,819 | |
Fifth Third Bancorp, 2.60%, 06/15/22 | | | 400 | | | | 397,312 | |
HSBC Holdings PLC, (3 mo. LIBOR US + 1.055%), 3.26%, 03/13/23(e) | | | 465 | | | | 466,137 | |
Huntington Bancshares, Inc.,
2.30%, 01/14/22 | | | 700 | | | | 689,442 | |
ING Groep NV, 4.10%, 10/02/23 | | | 325 | | | | 334,045 | |
JPMorgan Chase & Co. : | | | | | | | | |
2.75%, 06/23/20 | | | 1,770 | | | | 1,770,914 | |
(3 mo. LIBOR US + 0.610%),
3.23%, 06/18/22(a) | | | 810 | | | | 809,069 | |
(3 mo. LIBOR US + 0.935%),
2.78%, 04/25/23(e) | | | 905 | | | | 899,698 | |
2.70%, 05/18/23 | | | 500 | | | | 495,113 | |
(3 mo. LIBOR US + 0.890%),
3.80%, 07/23/24(e) | | | 305 | | | | 313,171 | |
Lloyds Bank PLC, 2.70%, 08/17/20 | | | 550 | | | | 548,616 | |
Lloyds Banking Group PLC, 3.00%, 01/11/22 | | | 420 | | | | 417,926 | |
Mitsubishi UFJ Financial Group, Inc. : | | | | | | | | |
2.95%, 03/01/21 | | | 291 | | | | 291,498 | |
3.54%, 07/26/21 | | | 75 | | | | 76,100 | |
Royal Bank of Scotland Group PLC,
3.88%, 09/12/23 | | | 305 | | | | 306,264 | |
Santander Holdings USA, Inc.,
3.70%, 03/28/22 | | | 210 | | | | 212,497 | |
Santander UK PLC, 2.13%, 11/03/20 | | | 755 | | | | 746,715 | |
| | | | | | | | |
| Security | | Par
(000) | | | Value | |
| | |
Banks (continued) | | | | | | | | |
Sumitomo Mitsui Financial Group, Inc. : | | | | | | | | |
2.44%, 10/19/21 | | $ | 375 | | | $ | 370,647 | |
2.85%, 01/11/22 | | | 605 | | | | 605,526 | |
SunTrust Bank, 2.45%, 08/01/22 | | | 1,000 | | | | 986,943 | |
Svenska Handelsbanken AB, 3.35%, 05/24/21 | | | 600 | | | | 606,791 | |
Swedbank AB, 2.20%, 03/04/20(b) | | | 610 | | | | 605,127 | |
U.S. Bancorp, 2.63%, 01/24/22 | | | 500 | | | | 500,549 | |
Wells Fargo & Co. : | | | | | | | | |
3.07%, 01/24/23 | | | 415 | | | | 415,550 | |
3.75%, 01/24/24 | | | 220 | | | | 226,397 | |
| | | | | | | | |
| | | | | | | 23,329,778 | |
Beverages — 0.2% | | | | | | | | |
Anheuser-Busch InBev Worldwide, Inc.,
4.75%, 01/23/29 | | | 205 | | | | 218,407 | |
Keurig Dr Pepper, Inc., 4.60%, 05/25/28(b) | | | 105 | | | | 109,439 | |
| | | | | | | | |
| | | | | | | 327,846 | |
Biotechnology — 1.2% | | | | | | | | |
AbbVie, Inc. : | | | | | | | | |
2.50%, 05/14/20 | | | 545 | | | | 543,392 | |
3.75%, 11/14/23 | | | 420 | | | | 431,158 | |
Amgen, Inc., 2.20%, 05/22/19 | | | 810 | | | | 809,663 | |
Gilead Sciences, Inc., 3.70%, 04/01/24 | | | 130 | | | | 134,237 | |
| | | | | | | | |
| | | | | | | 1,918,450 | |
Capital Markets — 4.0% | | | | | | | | |
Bank of New York Mellon Corp. : | | | | | | | | |
2.15%, 02/24/20 | | | 175 | | | | 174,223 | |
(3 mo. LIBOR US + 0.634%),
2.66%, 05/16/23(e) | | | 400 | | | | 397,910 | |
Credit Suisse Group AG, 3.57%, 01/09/23(b) | | | 625 | | | | 627,146 | |
Credit Suisse Group Funding Guernsey Ltd., 3.13%, 12/10/20 | | | 525 | | | | 526,335 | |
Deutsche Bank AG, 4.25%, 02/04/21 | | | 370 | | | | 371,418 | |
Goldman Sachs Group, Inc., 3.00%, 04/26/22(d) | | | 875 | | | | 873,102 | |
Morgan Stanley : | | | | | | | | |
2.63%, 11/17/21 | | | 750 | | | | 746,568 | |
2.75%, 05/19/22 | | | 460 | | | | 457,220 | |
3.13%, 01/23/23 | | | 655 | | | | 656,998 | |
Siemens Financieringsmaatschappij NV,
2.70%, 03/16/22(b) | | | 655 | | | | 654,410 | |
UBS Group Funding Switzerland AG : | | | | | | | | |
2.65%, 02/01/22(b) | | | 200 | | | | 198,207 | |
3.49%, 05/23/23(b) | | | 765 | | | | 768,652 | |
| | | | | | | | |
| | | | | | | 6,452,189 | |
Chemicals — 0.9% | | | | | | | | |
Air Liquide Finance SA, 1.75%, 09/27/21(b) | | | 200 | | | | 194,927 | |
Dow Chemical Co., 4.25%, 11/15/20 | | | 110 | | | | 112,090 | |
E.I. du Pont de Nemours & Co.,
2.20%, 05/01/20 | | | 245 | | | | 244,122 | |
Sherwin-Williams Co., 2.25%, 05/15/20 | | | 1,000 | | | | 994,060 | |
| | | | | | | | |
| | | | | | | 1,545,199 | |
Commercial Services & Supplies — 0.1% | |
Aviation Capital Group Corp.,
2.88%, 01/20/22(b) | | | 195 | | | | 192,033 | |
| | | | | | | | |
|
Communications Equipment — 0.4% | |
Cisco Systems, Inc., 2.20%, 09/20/23 | | | 595 | | | | 586,686 | |
| | | | | | | | |
|
Consumer Finance — 5.0% | |
American Express Co., 2.50%, 08/01/22(d) | | | 425 | | | | 420,033 | |
Capital One N.A., 2.25%, 09/13/21 | | | 500 | | | | 492,027 | |
ERAC USA Finance LLC, 2.60%, 12/01/21(b) | | | 350 | | | | 344,392 | |
Ford Motor Credit Co. LLC : | | | | | | | | |
2.68%, 01/09/20 | | | 510 | | | | 507,824 | |
8.13%, 01/15/20 | | | 700 | | | | 725,497 | |
2.43%, 06/12/20 | | | 200 | | | | 197,375 | |
| | |
| 68 | | 2 0 1 9 B L A C K R O C K A N N U A L R E P O R T T O S H A R E H O L D E R S |
| | |
Schedule of Investments (continued) March 31, 2019 | | BATS: Series S Portfolio (Percentages shown are based on Net Assets) |
| | | | | | | | |
| Security | | Par
(000) | | | Value | |
Consumer Finance (continued) | | | | | | | | |
General Motors Financial Co., Inc. : | | | | | | | | |
4.20%, 03/01/21 | | $ | 285 | | | $ | 289,074 | |
3.20%, 07/06/21(d) | | | 1,895 | | | | 1,886,491 | |
3.25%, 01/05/23 | | | 405 | | | | 397,094 | |
Nissan Motor Acceptance Corp. : | | | | | | | | |
2.25%, 01/13/20(b) | | | 1,135 | | | | 1,128,458 | |
2.15%, 07/13/20(b) | | | 340 | | | | 335,453 | |
3.88%, 09/21/23(b) | | | 550 | | | | 554,179 | |
Synchrony Financial, 3.00%, 08/15/19 | | | 900 | | | | 900,185 | |
| | | | | | | | |
| | | | | | | 8,178,082 | |
Containers & Packaging — 0.0% | | | | | | | | |
WRKCo, Inc., 3.75%, 03/15/25 | | | 70 | | | | 70,626 | |
| | | | | | | | |
| | |
Diversified Financial Services — 1.3% | | | | | | | | |
AerCap Ireland Capital DAC/AerCap Global | | | | | | | | |
Aviation Trust : | | | | | | | | |
3.95%, 02/01/22 | | | 900 | | | | 911,616 | |
3.50%, 05/26/22 | | | 170 | | | | 170,039 | |
CK Hutchison International 16 Ltd.,
1.88%, 10/03/21(b) | | | 295 | | | | 286,724 | |
GE Capital International Funding Co.,
2.34%, 11/15/20 | | | 570 | | | | 562,938 | |
Hyundai Capital America, 2.55%, 04/03/20(b) | | | 215 | | | | 213,505 | |
| | | | | | | | |
| | | | | | | 2,144,822 | |
Diversified Telecommunication Services — 0.9% | |
AT&T Inc. : | | | | | | | | |
3.20%, 03/01/22 | | | 50 | | | | 50,442 | |
3.80%, 03/15/22 | | | 285 | | | | 292,276 | |
3.60%, 02/17/23 | | | 720 | | | | 733,921 | |
Verizon Communications, Inc. : | | | | | | | | |
3.38%, 02/15/25 | | | 167 | | | | 168,967 | |
3.88%, 02/08/29 | | | 195 | | | | 199,667 | |
| | | | | | | | |
| | | | | | | 1,445,273 | |
Electric Utilities — 1.6% | | | | | | | | |
American Electric Power Co., Inc. : | | | | | | | | |
2.15%, 11/13/20 | | | 305 | | | | 302,140 | |
3.65%, 12/01/21 | | | 275 | | | | 280,531 | |
2.95%, 12/15/22 | | | 130 | | | | 130,202 | |
Duke Energy Corp., 3.95%, 10/15/23 | | | 590 | | | | 611,585 | |
Emera U.S. Finance LP, 2.15%, 06/15/19 | | | 235 | | | | 234,539 | |
Exelon Corp., 2.45%, 04/15/21 | | | 255 | | | | 252,041 | |
FirstEnergy Corp., 2.85%, 07/15/22 | | | 159 | | | | 157,883 | |
Georgia Power Co., 2.00%, 09/08/20 | | | 525 | | | | 520,147 | |
ITC Holdings Corp., 2.70%, 11/15/22 | | | 85 | | | | 83,465 | |
| | | | | | | | |
| | | | | | | 2,572,533 | |
Electronic Equipment, Instruments & Components — 0.2% | |
Amphenol Corp., 2.20%, 04/01/20 | | | 290 | | | | 288,155 | |
| | | | | | | | |
| | |
Energy Equipment & Services — 0.1% | | | | | | | | |
Baker Hughes a GE Co. LLC / Baker Hughes | | | | | | | | |
Co-Obligor, Inc., 2.77%, 12/15/22 | | | 225 | | | | 223,533 | |
| | | | | | | | |
|
Equity Real Estate Investment Trusts (REITs) — 0.6% | |
American Tower Corp. : | | | | | | | | |
2.25%, 01/15/22 | | | 140 | | | | 137,864 | |
3.50%, 01/31/23 | | | 150 | | | | 152,059 | |
Crown Castle International Corp.,
3.20%, 09/01/24 | | | 385 | | | | 382,057 | |
Realty Income Corp., 3.25%, 10/15/22 | | | 265 | | | | 269,446 | |
| | | | | | | | |
| | | | | | | 941,426 | |
Food & Staples Retailing — 1.3% | | | | | | | | |
Alimentation Couche-Tard, Inc.,
2.70%, 07/26/22(b) | | | 350 | | | | 346,342 | |
CVS Health Corp. : | | | | | | | | |
3.70%, 03/09/23(d) | | | 775 | | | | 787,462 | |
4.30%, 03/25/28 | | | 300 | | | | 303,975 | |
Walgreen Co., 3.10%, 09/15/22 | | | 200 | | | | 201,302 | |
| | | | | | | | |
| Security | | Par
(000) | | | Value | |
Food & Staples Retailing (continued) | | | | | | | | |
Walgreens Boots Alliance, Inc., 3.30%, 11/18/21 | | $ | 500 | | | $ | 505,660 | |
| | | | | | | | |
| | | | | | | 2,144,741 | |
Food Products — 1.0% | | | | | | | | |
Conagra Brands, Inc., (3 mo. LIBOR US + 0.750%), 3.51%, 10/22/20(a) | | | 485 | | | | 484,412 | |
General Mills, Inc., 3.70%, 10/17/23 | | | 75 | | | | 76,874 | |
Tyson Foods, Inc. : | | | | | | | | |
2.25%, 08/23/21 | | | 165 | | | | 162,436 | |
3.90%, 09/28/23 | | | 115 | | | | 118,470 | |
Wm. Wrigley Jr. Co. : | | | | | | | | |
2.90%, 10/21/19(b) | | | 195 | | | | 194,737 | |
3.38%, 10/21/20(b) | | | 595 | | | | 600,906 | |
| | | | | | | | |
| | | | | | | 1,637,835 | |
Health Care Equipment & Supplies — 0.5% | | | | | | | | |
Abbott Laboratories:, 2.90%, 11/30/21 | | | 490 | | | | 492,050 | |
Becton Dickinson and Co., 2.40%, 06/05/20 | | | 280 | | | | 277,994 | |
| | | | | | | | |
| | | | | | | 770,044 | |
Health Care Providers & Services — 0.4% | | | | | | | | |
Anthem, Inc., 2.95%, 12/01/22 | | | 50 | | | | 49,957 | |
UnitedHealth Group, Inc., 2.13%, 03/15/21 | | | 590 | | | | 584,898 | |
| | | | | | | | |
| | | | | | | 634,855 | |
Hotels, Restaurants & Leisure — 1.0% | | | | | | | | |
Carnival Corp., 3.95%, 10/15/20 | | | 600 | | | | 610,996 | |
Marriott International, Inc., 3.13%, 10/15/21 | | | 1,005 | | | | 1,006,612 | |
| | | | | | | | |
| | | | | | | 1,617,608 | |
Industrial Conglomerates — 0.1% | | | | | | | | |
Roper Technologies, Inc., 2.80%, 12/15/21 | | | 130 | | | | 129,577 | |
| | | | | | | | |
| | |
Insurance — 1.3% | | | | | | | | |
Aon PLC, 2.80%, 03/15/21 | | | 560 | | | | 558,819 | |
AXIS Specialty Finance PLC, 2.65%, 04/01/19 | | | 736 | | | | 736,000 | |
Hartford Financial Services Group, Inc.,
5.13%, 04/15/22 | | | 235 | | | | 250,736 | |
New York Life Global Funding,
2.00%, 04/13/21(b) | | | 230 | | | | 226,859 | |
Pricoa Global Funding I, 2.45%, 09/21/22(b) | | | 170 | | | | 168,049 | |
Willis North America, Inc., 3.60%, 05/15/24 | | | 135 | | | | 135,861 | |
| | | | | | | | |
| | | | | | | 2,076,324 | |
Internet Software & Services — 0.2% | | | | | | | | |
Baidu, Inc., 2.88%, 07/06/22 | | | 300 | | | | 295,955 | |
| | | | | | | | |
| | |
IT Services — 0.7% | | | | | | | | |
Fidelity National Information Services, Inc., 3.63%, 10/15/20 | | | 985 | | | | 995,353 | |
Total System Services, Inc., 3.75%, 06/01/23 | | | 145 | | | | 147,197 | |
| | | | | | | | |
| | | | | | | 1,142,550 | |
Machinery — 0.4% | | | | | | | | |
Caterpillar Financial Services Corp.,
2.40%, 06/06/22 | | | 500 | | | | 495,756 | |
Xylem, Inc., 4.88%, 10/01/21 | | | 220 | | | | 230,201 | |
| | | | | | | | |
| | | | | | | 725,957 | |
Media — 2.8% | | | | | | | | |
Charter Communications Operating LLC/Charter | | | | | | | | |
Communications Operating Capital,
4.46%, 07/23/22 | | | 135 | | | | 139,673 | |
| | | | |
| S C H E D U L E S O F I N V E S T M E N T S | | | 69 | |
| | |
Schedule of Investments (continued) March 31, 2019 | | BATS: Series S Portfolio (Percentages shown are based on Net Assets) |
| | | | | | | | |
| Security | | Par
(000) | | | Value | |
Media (continued) | | | | | | | | |
Comcast Corp. : | | | | | | | | |
3.30%, 10/01/20 | | $ | 765 | | | $ | 772,205 | |
2.75%, 03/01/23 | | | 325 | | | | 324,451 | |
4.15%, 10/15/28 | | | 105 | | | | 110,516 | |
COX Communications, Inc.,
3.25%, 12/15/22(b) | | | 455 | | | | 458,158 | |
Discovery Communications LLC,
2.95%, 03/20/23 | | | 900 | | | | 891,448 | |
Interpublic Group of Cos., Inc. : | | | | | | | | |
3.50%, 10/01/20 | | | 135 | | | | 136,164 | |
3.75%, 10/01/21 | | | 45 | | | | 45,782 | |
Omnicom Group, Inc. / Omnicom Capital, Inc., 4.45%, 08/15/20 | | | 465 | | | | 475,236 | |
Sky Ltd., 2.63%, 09/16/19(b) | | | 1,255 | | | | 1,252,816 | |
| | | | | | | | |
| | | | | | | 4,606,449 | |
Metals & Mining — 0.2% | | | | | | | | |
Anglo American Capital PLC,
4.13%, 04/15/21(b) | | | 200 | | | | 201,920 | |
Newmont Mining Corp., 3.50%, 03/15/22 | | | 190 | | | | 192,628 | |
| | | | | | | | |
| | | | | | | 394,548 | |
Multi-Utilities — 0.7% | | | | | | | | |
Alliant Energy Finance LLC,
3.75%, 06/15/23(b) | | | 245 | | | | 249,862 | |
CenterPoint Energy, Inc. : | | | | | | | | |
3.60%, 11/01/21 | | | 130 | | | | 131,923 | |
2.50%, 09/01/22 | | | 270 | | | | 263,494 | |
DTE Energy Co., 3.70%, 08/01/23 | | | 145 | | | | 148,441 | |
Sempra Energy, (3 mo. LIBOR US + 0.500%), 3.29%, 01/15/21(a) | | | 220 | | | | 218,150 | |
WEC Energy Group, Inc., 3.38%, 06/15/21 | | | 200 | | | | 202,363 | |
| | | | | | | | |
| | | | | | | 1,214,233 | |
Oil, Gas & Consumable Fuels — 6.8% | |
Andeavor Logistics LP/Tesoro Logistics Finance Corp. : | | | | | | | | |
6.25%, 10/15/22 | | | 53 | | | | 54,457 | |
3.50%, 12/01/22 | | | 145 | | | | 146,464 | |
Apache Corp., 3.25%, 04/15/22 | | | 193 | | | | 193,152 | |
Canadian Natural Resources Ltd.,
2.95%, 01/15/23 | | | 125 | | | | 124,072 | |
Continental Resources, Inc., 4.50%, 04/15/23 | | | 1,156 | | | | 1,196,670 | |
Devon Energy Corp., 3.25%, 05/15/22 | | | 235 | | | | 237,238 | |
Enbridge Energy Partners LP,
4.38%, 10/15/20 | | | 350 | | | | 357,616 | |
Enbridge, Inc., 2.90%, 07/15/22 | | | 225 | | | | 224,345 | |
Encana Corp., 3.90%, 11/15/21 | | | 725 | | | | 738,130 | |
Energy Transfer Operating LP : | | | | | | | | |
4.15%, 10/01/20 | | | 1,050 | | | | 1,066,911 | |
3.60%, 02/01/23 | | | 150 | | | | 151,251 | |
Energy Transfer Partners LP/Regency Energy Finance Corp.,
5.75%, 09/01/20 | | | 455 | | | | 469,261 | |
Enterprise Products Operating LLC,
2.55%, 10/15/19 | | | 285 | | | | 284,436 | |
EOG Resources, Inc., 2.45%, 04/01/20 | | | 345 | | | | 343,586 | |
Kinder Morgan Energy Partners LP,
5.80%, 03/01/21 | | | 1,235 | | | | 1,298,769 | |
Kinder Morgan, Inc., 4.30%, 03/01/28 | | | 320 | | | | 330,559 | |
Pioneer Natural Resources Co. : | | | | | | | | |
7.50%, 01/15/20 | | | 45 | | | | 46,565 | |
3.45%, 01/15/21 | | | 385 | | | | 388,541 | |
Schlumberger Investment SA,
3.30%, 09/14/21(b) | | | 500 | | | | 505,656 | |
Texas Eastern Transmission LP,
2.80%, 10/15/22(b) | | | 190 | | | | 187,221 | |
TransCanada PipeLines Ltd.,
2.50%, 08/01/22 | | | 1,555 | | | | 1,539,747 | |
Williams Cos., Inc., 3.70%, 01/15/23(d) | | | 1,190 | | | | 1,211,460 | |
| | | | | | | | |
| | | | | | | 11,096,107 | |
Pharmaceuticals — 2.0% | | | | | | | | |
Allergan Finance LLC, 3.25%, 10/01/22(d) | | | 2,415 | | | | 2,415,013 | |
| | | | | | | | |
| Security | | Par
(000) | | | Value | |
Pharmaceuticals (continued) | | | | | | | | |
Allergan Funding SCS, 3.45%, 03/15/22 | | $ | 203 | | | $ | 204,828 | |
Mylan NV, 2.50%, 06/07/19 | | | 69 | | | | 68,948 | |
Shire Acquisitions Investments Ireland DAC, 2.40%, 09/23/21 | | | 93 | | | | 91,852 | |
Takeda Pharmaceutical Co. Ltd.,
5.00%, 11/26/28(b) | | | 475 | | | | 514,927 | |
| | | | | | | | |
| | | | | | | 3,295,568 | |
Road & Rail — 3.4% | | | | | | | | |
CSX Corp., 3.70%, 10/30/20 | | | 180 | | | | 182,309 | |
Penske Truck Leasing Co. LP/PTL Finance Corp. : | | | | | | | | |
2.50%, 06/15/19(b) | | | 320 | | | | 319,564 | |
3.05%, 01/09/20(b) | | | 1,545 | | | | 1,545,093 | |
3.20%, 07/15/20(b) | | | 1,360 | | | | 1,362,872 | |
3.38%, 02/01/22(b) | | | 440 | | | | 441,716 | |
2.70%, 03/14/23(b) | | | 505 | | | | 493,457 | |
Ryder System, Inc. : | | | | | | | | |
2.88%, 09/01/20 | | | 948 | | | | 948,915 | |
3.45%, 11/15/21 | | | 225 | | | | 226,950 | |
| | | | | | | | |
| | | | | | | 5,520,876 | |
Semiconductors & Semiconductor Equipment — 1.1% | |
Analog Devices, Inc., 2.85%, 03/12/20 | | | 70 | | | | 70,023 | |
Broadcom Corp./Broadcom Cayman Finance Ltd., 3.00%, 01/15/22 | | | 214 | | | | 212,965 | |
Lam Research Corp., 2.80%, 06/15/21(d) | | | 1,400 | | | | 1,400,200 | |
QUALCOMM, Inc., 2.60%, 01/30/23 | | | 95 | | | | 93,887 | |
| | | | | | | | |
| | | | | | | 1,777,075 | |
Software — 0.2% | | | | | | | | |
CA, Inc., 3.60%, 08/15/22 | | | 265 | | | | 266,871 | |
| | | | | | | | |
|
Technology Hardware, Storage & Peripherals — 0.6% | |
Hewlett Packard Enterprise Co.,
3.60%, 10/15/20 | | | 600 | | | | 605,233 | |
NetApp, Inc., 2.00%, 09/27/19 | | | 320 | | | | 318,660 | |
| | | | | | | | |
| | | | | | | 923,893 | |
Tobacco — 0.9% | | | | | | | | |
Altria Group, Inc., 3.80%, 02/14/24 | | | 185 | | | | 188,291 | |
BAT Capital Corp., 2.76%, 08/15/22 | | | 1,305 | | | | 1,283,382 | |
| | | | | | | | |
| | | | | | | 1,471,673 | |
Trading Companies & Distributors — 0.8% | |
Air Lease Corp. : | | | | | | | | |
3.38%, 06/01/21 | | | 155 | | | | 155,722 | |
2.63%, 07/01/22 | | | 650 | | | | 634,863 | |
International Lease Finance Corp.,
4.63%, 04/15/21 | | | 468 | | | | 478,848 | |
| | | | | | | | |
| | | | | | | 1,269,433 | |
Wireless Telecommunication Services — 0.3% | |
Sprint Spectrum Co. LLC/Sprint Spectrum Co. II LLC/Sprint Spectrum Co. III LLC : | | | | | | | | |
3.36%, 03/20/23(b) | | | 125 | | | | 124,962 | |
4.74%, 09/20/29(b) | | | 400 | | | | 404,500 | |
| | | | | | | | |
| | | | | | | 529,462 | |
Total Corporate Bonds — 61.2%
(Cost: $99,409,850) | | | | | | | 99,804,712 | |
| | | | | | | | |
| | |
| 70 | | 2 0 1 9 B L A C K R O C K A N N U A L R E P O R T T O S H A R E H O L D E R S |
| | |
Schedule of Investments (continued) March 31, 2019 | | BATS: Series S Portfolio (Percentages shown are based on Net Assets) |
| | | | | | | | |
| Security | | Par
(000) | | | Value | |
Foreign Agency Obligations — 0.4% | | | | | | | | |
Chile — 0.1% | | | | | | | | |
Empresa Nacional del Petroleo,
5.25%, 8/10/20(b) | | $ | 200 | | | $ | 203,989 | |
| | | | | | | | |
| | |
Mexico — 0.3% | | | | | | | | |
Petroleos Mexicanos, 6.00%, 3/05/20 | | | 425 | | | | 434,329 | |
| | | | | | | | |
| | |
Total Foreign Agency Obligations — 0.4%
(Cost: $636,868) | | | | | | | 638,318 | |
| | | | | | | | |
|
Foreign Government Obligations — 0.9% | |
Canada — 0.9% | | | | | | | | |
Province of Alberta, 3.35%, 11/01/23 | | | 183 | | | | 188,898 | |
Province of Ontario, 3.40%, 10/17/23 | | | 1,200 | | | | 1,241,836 | |
| | | | | | | | |
Total Foreign Government
Obligations — 0.9%
(Cost: $1,413,195) | | | | | | | 1,430,734 | |
| | | | | | | | |
|
Non-Agency Mortgage-Backed Securities — 10.0% | |
Collateralized Mortgage Obligations — 0.8% | |
Bear StearnsAlt-A Trust, Series2004-13, | | | | | | | | |
Class A1, (1 mo. LIBOR US + 0.740%), 3.23%, 11/25/34(a) | | | 0 | (f) | | | 482 | |
Countrywide Home Loan Mortgage | | | | | | | | |
Pass-Through Trust, Series 2004-HYB1, | | | | | | | | |
Class 2A, 4.17%, 05/20/34(c) | | | 50 | | | | 50,662 | |
JP Morgan Trust: | | | | | | | | |
Series2015-3, Class A5,
3.50%, 05/25/45(b)(c) | | | 705 | | | | 708,086 | |
Series2016-2, Class A1,
2.80%, 06/25/46(b)(c) | | | 593 | | | | 589,839 | |
| | | | | | | | |
| | |
| | | | | | | 1,349,069 | |
Commercial Mortgage-Backed Securities — 8.8% | |
CGBAM Commercial Mortgage Trust, | | | | | | | | |
Series 2015-SMRT, Class B,
3.21%, 04/10/28(b) | | | 830 | | | | 832,008 | |
Commercial Mortgage Trust: | | | | | | | | |
Series 2013-CR12, Class A2,
2.90%, 10/10/46 | | | 243 | | | | 242,464 | |
Series2013-SFS, Class A1,
1.87%, 04/12/35(b) | | | 215 | | | | 210,232 | |
Series 2014-UBS2, Class A2,
2.82%, 03/10/47 | | | 370 | | | | 369,932 | |
Series 2014-UBS6, Class ASB,
3.39%, 12/10/47 | | | 1,110 | | | | 1,127,595 | |
Series 2015-CR23, Class A2,
2.85%, 05/10/48 | | | 3,740 | | | | 3,733,031 | |
GS Mortgage Securities Trust, | | | | | | | | |
Series 2013-GC16, Class AAB,
3.81%, 11/10/46 | | | 1,412 | | | | 1,442,485 | |
JPMorgan Chase Commercial Mortgage | | | | | | | | |
Securities Trust, Series2012-CBX, Class A4, 3.48%, 06/15/45 | | | 3,000 | | | | 3,042,126 | |
LB-UBS Commercial Mortgage Trust, | | | | | | | | |
Series2007-C6, Class AM,
6.11%, 07/15/40(c) | | | 47 | | | | 46,995 | |
Morgan Stanley Capital I Trust: | | | | | | | | |
| | | | | | | | |
| Security | | Par (000)
| | | Value | |
Commercial Mortgage-Backed Securities (continued) | | | | | | | | |
Series2012-C4, Class A4, 3.24%, 03/15/45 | | $ | 1,900 | | | $ | 1,918,222 | |
Series2014-CPT, Class A, 3.35%, 07/13/29(b) | | | 1,300 | | | | 1,316,423 | |
Waldorf Astoria Boca Raton Trust, | | | | | | | | |
Series 2016-BOCA, Class A, (1 mo. LIBOR US + 1.350%), 3.83%, 06/15/29(a)(b) | | | 150 | | | | 149,996 | |
| | | | | | | | |
| | | | | | | 14,431,509 | |
Interest Only Commercial Mortgage-Backed Securities — 0.4% | |
Citigroup Commercial Mortgage Trust, | | | | | | | | |
Series2015-P1, Class XA, 0.76%, 09/15/48(c) | | | 4,958 | | | | 189,264 | |
Commercial Mortgage Trust: | | | | | | | | |
Series 2015-CR23, Class XA, 0.95%, 05/10/48(c) | | | 2,529 | | | | 94,397 | |
Series 2015-LC21, Class XA, 0.77%, 07/10/48(c) | | | 6,144 | | | | 200,364 | |
CSAIL Commercial Mortgage Trust, | | | | | | | | |
Series2016-C6, Class XA, 1.79%, 01/15/49(c) | | | 982 | | | | 84,892 | |
| | | | | | | | |
| | | | | | | 568,917 | |
TotalNon-Agency Mortgage-Backed
Securities — 10.0%
(Cost: $16,869,598) | | | | | | | 16,349,495 | |
| | | | | | | | |
|
U.S. Government Sponsored Agency
Securities — 19.6% | |
Collateralized Mortgage Obligations — 2.5% | |
Freddie Mac: | | | | | | | | |
Series 3959, Class MA, 4.50%, 11/15/41 | | | 198 | | | | 209,923 | |
Series 3986, Class M, 4.50%, 09/15/41 | | | 217 | | | | 227,811 | |
Series 4253, Class PA, 3.50%, 08/15/41 | | | 433 | | | | 438,725 | |
Series 4274, Class PN, 3.50%, 10/15/35 | | | 377 | | | | 388,825 | |
Series 4390, Class CA, 3.50%, 06/15/50 | | | 394 | | | | 400,177 | |
Series 4459, Class BN, 3.00%, 08/15/43 | | | 765 | | | | 769,936 | |
Series 4482, Class DH, 3.00%, 06/15/42 | | | 411 | | | | 412,036 | |
Series 4493, Class PA, 3.00%, 02/15/44 | | | 579 | | | | 583,798 | |
Series 4494, Class KA, 3.75%, 10/15/42 | | | 677 | | | | 696,024 | |
| | | | | | | | |
| | |
| | | | | | | 4,127,255 | |
Commercial Mortgage-Backed Securities — 0.2% | |
Freddie Mac, Series KP03, Class A2,
1.78%, 07/25/19 | | | 348 | | | | 346,898 | |
| | | | | | | | |
Interest Only Commercial Mortgage-Backed Securities — 0.1% | |
Fannie Mae, Series2013-M5, Class X2,
2.21%, 01/25/22(c) | | | 874 | | | | 25,141 | |
Freddie Mac, Series KW01, Class X1,
0.98%, 01/25/26(c) | | | 2,062 | | | | 110,216 | |
| | | | | | | | |
| | |
| | | | | | | 135,357 | |
Mortgage-Backed Securities — 16.8% | | | | | | | | |
Fannie Mae Mortgage-Backed Securities: | | | | | | | | |
2.50%,12/01/27-04/01/34(d)(g) | | | 5,113 | | | | 5,088,193 | |
3.00%,09/01/30-04/01/34(d)(g) | | | 5,381 | | | | 5,440,497 | |
4.00%,09/01/33-04/01/34(d)(g) | | | 7,260 | | | | 7,540,754 | |
4.50%, 09/01/26 | | | 76 | | | | 78,788 | |
5.00%,07/01/19-07/01/25 | | | 51 | | | | 52,202 | |
(12 mo. LIBOR US + 1.579%),
2.87%, 07/01/44(a)(d) | | | 879 | | | | 888,366 | |
(12 mo. LIBOR US + 1.590%),
3.05%, 10/01/45(a)(d) | | | 1,504 | | | | 1,516,560 | |
| | | | |
| S C H E D U L E S O F I N V E S T M E N T S | | | 71 | |
| | |
Schedule of Investments (continued) March 31, 2019 | | BATS: Series S Portfolio (Percentages shown are based on Net Assets) |
| | | | | | | | |
| Security | | Par (000) | | | Value | |
| | |
| Mortgage-Backed Securities (continued) | | | | | | |
(12 mo. LIBOR US + 1.590%),
3.14%, 06/01/45(a)(d) | | $ | 1,168 | | | $ | 1,181,611 | |
(12 mo. LIBOR US + 1.697%),
2.71%, 07/01/43(a)(d) | | | 1,549 | | | | 1,560,982 | |
Freddie Mac Mortgage-Backed Securities: | | | | | | | | |
2.50%, 11/01/27(d) | | | 729 | | | | 728,764 | |
5.00%,12/01/19-09/01/21 | | | 8 | | | | 8,575 | |
5.50%, 05/01/22 | | | 38 | | | | 38,381 | |
(12 mo. LIBOR US + 1.620%),
2.60%, 03/01/45(a)(d) | | | 1,251 | | | | 1,256,882 | |
(12 mo. LIBOR US + 1.622%),
3.09%, 05/01/45(a)(d) | | | 2,072 | | | | 2,090,957 | |
| | | | | | | | |
| | | | | | | 27,471,512 | |
| |
Total U.S. Government Sponsored Agency Securities — 19.6%
(Cost: $32,219,497) | | | | 32,081,022 | |
| | | | | | | | |
| | |
Total Long-Term Investments — 111.0%
(Cost: $181,514,925) | | | | | | | 181,054,128 | |
| | | | | | | | |
| | | | | | | | |
| | |
| Security | | Shares | | | Value | |
|
| Short-Term Securities — 8.5% | |
Dreyfus Treasury Securities Cash Management, Institutional Class, 2.27%(h) | | | 13,866,889 | | | $ | 13,866,889 | |
| | | | | | | | |
| |
Total Short-Term Securities — 8.5%
(Cost: $13,866,889) | | | | 13,866,889 | |
| | | | | | | | |
| |
Options Purchased — 0.0%
(Cost: $39,038) | | | | 9,196 | |
| | | | | | | | |
| |
Total Investments — 119.5%
(Cost: $195,420,852) | | | | 194,930,213 | |
| | |
Liabilities in Excess of Other Assets — (19.5)% | | | | | | | (31,754,386 | ) |
| | | | | | | | |
| | |
Net Assets — 100.0% | | | | | | $ | 163,175,827 | |
| | | | | | | | |
| | |
| 72 | | 2 0 1 9 B L A C K R O C K A N N U A L R E P O R T T O S H A R E H O L D E R S |
| | |
Schedule of Investments (continued) March 31, 2019 | | BATS: Series S Portfolio |
| (a) | Variable rate security. Rate shown is the rate in effect as of period end. |
| (b) | Security exempt from registration pursuant to Rule 144A under the Securities Act of 1933, as amended. These securities may be resold in transactions exempt from registration to qualified institutional investors. |
| (c) | Variable or floating rate security, which interest rate adjusts periodically based on changes in current interest rates and prepayments on the underlying pool of assets. Rate shown is the rate in effect as of period end. |
| (d) | All or a portion of the security has been pledged as collateral in connection with outstanding reverse repurchase agreements. |
| (e) | Variable rate security. Security may be issued at a fixed coupon rate, which converts to a variable rate at a specified date. Rate shown is the rate in effect as of period end. |
| (f) | Amount is less than $500. |
| (g) | Represents or includes a TBA transaction. |
| (h) | Annualized7-day yield as of period end. |
For Fund compliance purposes, the Fund’s industry classifications refer to one or more of the industrysub-classifications used by one or more widely recognized market indexes or ratings group indexes, and/or as defined by the investment adviser. These definitions may not apply for purposes of this report, which may combine such industrysub-classifications for reporting ease.
Reverse Repurchase Agreements
| | | | | | | | | | | | | | | | | | | | | | | | |
| Counterparty | | Interest
Rate | | | Trade
Date | | | Maturity
Date(a) | | | Face Value | | | Face Value
Including
Accrued
Interest | | | Type of
Non-Cash
Underlying
Collateral | | Remaining
Contractual
Maturity of the
Agreements |
RBC Capital Markets, LLC | | | 2.79 | % | | | 12/06/18 | | | | Open | | | $ | 910,000 | | | $ | 917,594 | | | Corporate Bonds | | Open/Demand |
RBC Capital Markets, LLC | | | 2.79 | % | | | 12/31/18 | | | | Open | | | | 1,091,825 | | | | 1,099,525 | | | Corporate Bonds | | Open/Demand |
RBC Capital Markets, LLC | | | 2.79 | % | | | 01/25/19 | | | | Open | | | | 811,562 | | | | 815,524 | | | Corporate Bonds | | Open/Demand |
BNP Paribas | | | 2.70 | % | | | 01/28/19 | | | | Open | | | | 398,969 | | | | 400,824 | | | Corporate Bonds | | Open/Demand |
RBC Capital Markets, LLC | | | 2.79 | % | | | 02/11/19 | | | | Open | | | | 937,500 | | | | 940,988 | | | Corporate Bonds | | Open/Demand |
Barclays Capital, Inc. | | | 2.75 | % | | | 03/04/19 | | | | Open | | | | 1,840,000 | | | | 1,843,936 | | | Corporate Bonds | | Open/Demand |
Citigroup Global Markets, Inc. | | | 2.72 | % | | | 03/14/19 | | | | 04/15/2019 | | | | 1,488,000 | | | | 1,489,574 | | | U.S. Government Sponsored Agency Securities | | Up to 30 Days |
Citigroup Global Markets, Inc. | | | 2.72 | % | | | 03/14/19 | | | | 04/15/2019 | | | | 2,052,000 | | | | 2,054,171 | | | U.S. Government Sponsored Agency Securities | | Up to 30 Days |
Citigroup Global Markets, Inc. | | | 2.72 | % | | | 03/14/19 | | | | 04/15/2019 | | | | 466,000 | | | | 466,493 | | | U.S. Government Sponsored Agency Securities | | Up to 30 Days |
Citigroup Global Markets, Inc. | | | 2.72 | % | | | 03/14/19 | | | | 04/15/2019 | | | | 434,000 | | | | 434,459 | | | U.S. Government Sponsored Agency Securities | | Up to 30 Days |
Citigroup Global Markets, Inc. | | | 2.72 | % | | | 03/14/19 | | | | 04/15/2019 | | | | 137,000 | | | | 137,145 | | | U.S. Government Sponsored Agency Securities | | Up to 30 Days |
Citigroup Global Markets, Inc. | | | 2.72 | % | | | 03/14/19 | | | | 04/15/2019 | | | | 1,995,000 | | | | 1,997,110 | | | U.S. Government Sponsored Agency Securities | | Up to 30 Days |
Citigroup Global Markets, Inc. | | | 2.72 | % | | | 03/14/19 | | | | 04/15/2019 | | | | 699,000 | | | | 699,739 | | | U.S. Government Sponsored Agency Securities | | Up to 30 Days |
Citigroup Global Markets, Inc. | | | 2.72 | % | | | 03/14/19 | | | | 04/15/2019 | | | | 308,000 | | | | 308,326 | | | U.S. Government Sponsored Agency Securities | | Up to 30 Days |
Citigroup Global Markets, Inc. | | | 2.72 | % | | | 03/14/19 | | | | 04/15/2019 | | | | 390,000 | | | | 390,413 | | | U.S. Government Sponsored Agency Securities | | Up to 30 Days |
Citigroup Global Markets, Inc. | | | 2.72 | % | | | 03/14/19 | | | | 04/15/2019 | | | | 851,000 | | | | 851,900 | | | U.S. Government Sponsored Agency Securities | | Up to 30 Days |
Citigroup Global Markets, Inc. | | | 2.72 | % | | | 03/14/19 | | | | 04/15/2019 | | | | 1,469,000 | | | | 1,470,554 | | | U.S. Government Sponsored Agency Securities | | Up to 30 Days |
Citigroup Global Markets, Inc. | | | 2.72 | % | | | 03/14/19 | | | | 04/15/2019 | | | | 1,275,000 | | | | 1,276,349 | | | U.S. Government Sponsored Agency Securities | | Up to 30 Days |
Citigroup Global Markets, Inc. | | | 2.72 | % | | | 03/14/19 | | | | 04/15/2019 | | | | 1,137,000 | | | | 1,138,203 | | | U.S. Government Sponsored Agency Securities | | Up to 30 Days |
| | | | |
| S C H E D U L E S O F I N V E S T M E N T S | | | 73 | |
| | |
Schedule of Investments (continued) March 31, 2019 | | BATS: Series S Portfolio |
| | | | | | | | | | | | | | | | | | | | | | | | |
| Counterparty | | Interest
Rate | | | Trade
Date | | | Maturity
Date(a) | | | Face Value | | | Face Value
Including
Accrued
Interest | | | Type of
Non-Cash
Underlying
Collateral | | Remaining
Contractual
Maturity of the
Agreements |
Citigroup Global Markets, Inc. | | | 2.72 | % | | | 03/14/19 | | | | 04/15/2019 | | | | 1,203,000 | | | | 1,204,273 | | | U.S. Government Sponsored Agency Securities | | Up to 30 Days |
Citigroup Global Markets, Inc. | | | 2.72 | % | | | 03/14/19 | | | | 04/15/2019 | | | $ | 1,853,000 | | | $ | 1,854,960 | | | U.S. Government Sponsored Agency Securities | | Up to 30 Days |
Citigroup Global Markets, Inc. | | | 2.72 | % | | | 03/14/19 | | | | 04/15/2019 | | | | 1,505,000 | | | | 1,506,592 | | | U.S. Government Sponsored Agency Securities | | Up to 30 Days |
Citigroup Global Markets, Inc. | | | 2.72 | % | | | 03/14/19 | | | | 04/15/2019 | | | | 1,373,000 | | | | 1,374,452 | | | U.S. Government Sponsored Agency Securities | | Up to 30 Days |
Citigroup Global Markets, Inc. | | | 2.72 | % | | | 03/14/19 | | | | 04/15/2019 | | | | 1,308,000 | | | | 1,309,384 | | | U.S. Government Sponsored Agency Securities | | Up to 30 Days |
Citigroup Global Markets, Inc. | | | 2.72 | % | | | 03/14/19 | | | | 04/15/2019 | | | | 425,000 | | | | 425,450 | | | U.S. Government Sponsored Agency Securities | | Up to 30 Days |
Citigroup Global Markets, Inc. | | | 2.72 | % | | | 03/14/19 | | | | 04/15/2019 | | | | 1,548,000 | | | | 1,549,637 | | | U.S. Government Sponsored Agency Securities | | Up to 30 Days |
Citigroup Global Markets, Inc. | | | 2.72 | % | | | 03/14/19 | | | | 04/15/2019 | | | | 187,000 | | | | 187,198 | | | U.S. Government Sponsored Agency Securities | | Up to 30 Days |
Citigroup Global Markets, Inc. | | | 2.72 | % | | | 03/14/19 | | | | 04/15/2019 | | | | 229,000 | | | | 229,242 | | | U.S. Government Sponsored Agency Securities | | Up to 30 Days |
RBC Capital Markets, LLC | | | 2.79 | % | | | 03/14/19 | | | | Open | | | | 1,781,300 | | | | 1,783,785 | | | Corporate Bonds | | Open/Demand |
RBC Capital Markets, LLC | | | 2.79 | % | | | 03/19/19 | | | | Open | | | | 736,250 | | | | 736,935 | | | Corporate Bonds | | Open/Demand |
| | | | | | | | | | | | | | | | | | | | | | | | |
| | | | | | | | | | | | | | $ | 30,839,406 | | | $ | 30,894,735 | | | | | |
| | | | | | | | | | | | | | | | | | | | | | | | |
| | (a) | Certain agreements have no stated maturity and can be terminated by either party at any time. | |
| | |
| 74 | | 2 0 1 9 B L A C K R O C K A N N U A L R E P O R T T O S H A R E H O L D E R S |
| | |
Schedule of Investments (continued) March 31, 2019 | | BATS: Series S Portfolio |
Derivative Financial Instruments Outstanding as of Period End
Forward Foreign Currency Exchange Contracts
| | | | | | | | | | | | | | | | | | | | |
| |
| Currency Purchased | | | | | | Currency
Sold | | | | | | Counterparty | |
| Settlement
Date |
| |
| Unrealized
Appreciation
(Depreciation) |
|
| |
USD | | | 410,000 | | | CAD | | | 546,295 | | | Royal Bank of Canada | | | 06/19/19 | | | $ | 373 | |
| | | | | | | | | | | | | | | | | | | | |
Net Unrealized Appreciation | | | | | | | | | | | | $ | 373 | |
| | | | | | | | | | | | | | | | | | | | |
Futures Contracts
| | | | | | | | | | | | | | | | |
| |
Description | |
| Number
of
Contracts |
| |
| Expiration
Date |
| |
| Notional
Amount
(000) |
| |
| Value/
Unrealized
Appreciation
(Depreciation) |
|
| |
Long Contracts | | | | | | | | | | | | | | | | |
U.S. Treasury Bonds (30 Year) | | | 2 | | | | 06/19/19 | | | $ | 299 | | | $ | 8,995 | |
U.S. Treasury Notes (2 Year) | | | 422 | | | | 06/28/19 | | | | 89,926 | | | | 300,144 | |
| | | | | | | | | | | | | | | | |
| | | | | | | | | | | | | | | 309,139 | |
| | | | | | | | | | | | | | | | |
Short Contracts | | | | | | | | | | | | | | | | |
Euro-Bund | | | 12 | | | | 06/06/19 | | | | 2,239 | | | | (2,276 | ) |
U.S. Treasury Notes (10 Year) | | | 48 | | | | 06/19/19 | | | | 5,963 | | | | (9,535 | ) |
U.S. Ultra Treasury Notes (10 Year) | | | 23 | | | | 06/19/19 | | | | 3,054 | | | | (39,628 | ) |
U.S. Treasury Notes (5 Year) | | | 9 | | | | 06/28/19 | | | | 1,042 | | | | 128 | |
| | | | | | | | | | | | | | | | |
| | | | | | | | | | | | | | | (51,311 | ) |
| | | | | | | | | | | | | | | | |
| | | | | | | | | | | | | | $ | 257,828 | |
| | | | | | | | | | | | | | | | |
OTC Interest Rate Swaptions Purchased
| | | | | | | | | | | | | | | | | | | | | | | | | | | | | | | | | | | | | | | | |
| |
| | | Paid by the Fund | | | | | | | | Received by the Fund | | | | | | |
| Expiration
Date |
| |
| Exercise
Rate |
| |
| Notional
Amount
(000) |
| | | | |
Description | | | Rate | | | | Frequency | | | | | | | | Rate | | | | Frequency | | | | Counterparty | | | | Value | |
| |
Put | | | | | | | | | | | | | | | | | | | | | | | | | | | | | | | | | | | | | | | | |
5-Year Interest Rate Swap, 01/20/27 | | | 3.35 | % | | | Semi-annual | | | | | | |
| 3-month LIBOR,
2.60% |
| | | Quarterly | | | | Deutsche Bank AG | | | | 01/18/22 | | | | 3.35 | % | | | $1,735 | | | $ | 9,196 | |
| | | | | | | | | | | | | | | | | | | | | | | | | | | | | | | | | | | | | | | | |
Centrally Cleared Interest Rate Swaps
| | | | | | | | | | | | | | | | | | | | | | | | | | | | | | | | |
| |
Paid by the Fund | | | Received by the Fund | | | Effective
Date | | | Termination
Date | | Notional
Amount
(000) | | | Value | | | Upfront Premium
Paid
(Received) | | | Unrealized
Appreciation
(Depreciation) | |
| Rate | | Frequency | | | Rate | | Frequency | |
| |
3-month LIBOR,
2.60% | | | Quarterly | | | 1.51% | | | Semi-annual | | | | N/A | | | 04/21/19 | | $ | 20,000 | | | $ | 8,348 | | | $ | 6 | | | $ | 8,342 | |
| 1.22% | | | Semi-annual | | | 3-month LIBOR,
2.60% | | | Quarterly | | | | N/A | | | 05/18/21 | | $ | 10,000 | | | | 227,338 | | | | 103 | | | | 227,235 | |
| 1.30% | | | Semi-annual | | | 3-month LIBOR,
2.60% | | | Quarterly | | | | N/A | | | 05/20/21 | | $ | 10,000 | | | | 206,807 | | | | 103 | | | | 206,704 | |
| 3-month LIBOR, 2.60% | | | Quarterly | | | 2.70% | | | Semi-annual | | | | 01/20/22 | (a) | | 01/20/27 | | $ | 580 | | | | 8,068 | | | | 5 | | | | 8,063 | |
| | | | | | | | | | | | | | | | | | | | | | | | | | | | | | | | |
| | | | | | | | | | | | | | | | | | | | | | $ | 450,561 | | | $ | 217 | | | $ | 450,344 | |
| | | | | | | | | | | | | | | | | | | | | | | | | | | | | | | | |
Balances Reported in the Statements of Assets and Liabilities for Centrally Cleared Swaps
| | | | | | | | | | | | | | | | |
| |
| | | Swap Premiums
Paid | | | Swap Premiums
Received | | | Unrealized
Appreciation | | | Unrealized
Depreciation | |
| |
Centrally Cleared Swaps(a) | | | $217 | | | | $— | | | | $450,344 | | | | $— | |
| |
| | (a) | Includes cumulative appreciation (depreciation) on centrally cleared swaps, as reported in the Schedule of Investments. Only current day’s variation margin is reported within the Statements of Assets and Liabilities and is net of any previously paid (received) swap premium amounts. | |
| | | | |
| S C H E D U L E S O F I N V E S T M E N T S | | | 75 | |
| | |
Schedule of Investments (continued) March 31, 2019 | | BATS: Series S Portfolio |
Derivative Financial Instruments Categorized by Risk Exposure
As of period end, the fair values of derivative financial instruments located in the Statements of Assets and Liabilities were as follows:
| | | | | | | | | | | | | | | | | | | | | | | | | | | | | | |
| |
| Assets — Derivative Financial Instruments | | | | Commodity
Contracts | | | Credit
Contracts | | | Equity
Contracts | | | Foreign
Currency
Exchange
Contracts | | | Interest
Rate
Contracts | | | Other
Contracts | | | Total | |
| |
Futures contracts | | Net
unrealized
appreciation(a) | | $ | — | | | $ | — | | | $ | — | | | $ | — | | | $ | 309,267 | | | $ | — | | | $ | 309,267 | |
Forward foreign currency exchange contracts | | Unrealized
appreciation
on forward
foreign
currency
exchange
contracts | | | — | | | | — | | | | — | | | | 373 | | | | — | | | | — | | | | 373 | |
Options purchased | | Investments
at value —
unaffiliated(b) | | | — | | | | — | | | | — | | | | — | | | | 9,196 | | | | — | | | | 9,196 | |
Swaps — centrally cleared | | Net
unrealized
appreciation(a) | | | — | | | | — | | | | — | | | | — | | | | 450,344 | | | | — | | | | 450,344 | |
| | | | | | | | | | | | | | | | | | | | | | | | | | | | | | |
| | | | $ | — | | | $ | — | | | $ | — | | | $ | 373 | | | $ | 768,807 | | | $ | — | | | $ | 769,180 | |
| | | | | | | | | | | | | | | | | | | | | | | | | | | | | | |
| | | | | | | | | | | | | | | | | | | | | | | | | | | | | | |
| |
| Liabilities — Derivative Financial Instruments | | | | | | | | | | | | | | | | | | | | | | | |
| |
Futures contracts | | Net
unrealized
depreciation(a) | | $ | — | | | $ | — | | | $ | — | | | $ | — | | | $ | 51,439 | | | $ | — | | | $ | 51,439 | |
| | | | | | | | | | | | | | | | | | | | | | | | | | | | | | |
| | (a) | Includes cumulative appreciation (depreciation) on futures contracts and centrally cleared swaps, if any, as reported in the Schedule of Investments. Only current day’s variation margin is reported within the Statements of Assets and Liabilities. | |
| | (b) | Includes options purchased at value as reported in the Schedule of Investments. | |
For the year ended March 31, 2019, the effect of derivative financial instruments in the Statements of Operations was as follows:
| | | | | | | | | | | | | | | | | | | | | | | | | | | | |
| |
| Net Realized Gain (Loss) from: | | Commodity
Contracts | | | Credit
Contracts | | | Equity
Contracts | | | Foreign
Currency
Exchange
Contracts | | | Interest
Rate
Contracts | | | Other
Contracts | | | Total | |
| |
Futures contracts | | $ | — | | | $ | — | | | $ | — | | | $ | — | | | $ | (175,996 | ) | | $ | — | | | $ | (175,996 | ) |
Forward foreign currency exchange contracts | | | — | | | | — | | | | — | | | | 5,571 | | | | — | | | | — | | | | 5,571 | |
Swaps | | | — | | | | 2,280 | | | | — | | | | — | | | | (252,683 | ) | | | — | | | | (250,403 | ) |
| | | | | | | | | | | | | | | | | | | | | | | | | | | | |
| | $ | — | | | $ | 2,280 | | | $ | — | | | $ | 5,571 | | | $ | (428,679 | ) | | $ | — | | | $ | (420,828 | ) |
| | | | | | | | | | | | | | | | | | | | | | | | | | | | |
| | | | | | | | | | | | | | | | | | | | | | | | | | | | |
| |
| Net Change in Unrealized Appreciation (Depreciation) on: | | | | | | | | | | | | | | | | | | | | | |
| |
Futures contracts | | $ | — | | | $ | — | | | $ | — | | | $ | — | | | $ | 530,530 | | | $ | — | | | $ | 530,530 | |
Forward foreign currency exchange contracts | | | — | | | | — | | | | — | | | | 373 | | | | — | | | | — | | | | 373 | |
Options purchased(a) | | | — | | | | — | | | | — | | | | — | | | | (18,433 | ) | | | — | | | | (18,433 | ) |
Swaps | | | — | | | | — | | | | — | | | | — | | | | (31,158 | ) | | | — | | | | (31,158 | ) |
| | | | | | | | | | | | | | | | | | | | | | | | | | | | |
| | $ | — | | | $ | — | | | $ | — | | | $ | 373 | | | $ | 480,939 | | | $ | — | | | $ | 481,312 | |
| | | | | | | | | | | | | | | | | | | | | | | | | | | | |
| | (a) | Options purchased are included in net change in unrealized appreciation (depreciation) on investments — unaffiliated. | |
| | |
| 76 | | 2 0 1 9 B L A C K R O C K A N N U A L R E P O R T T O S H A R E H O L D E R S |
| | |
Schedule of Investments (continued) March 31, 2019 | | BATS: Series S Portfolio |
Average Quarterly Balances of Outstanding Derivative Financial Instruments
| | | | |
| |
Futures contracts: | | | | |
Average notional value of contracts — long | | $ | 88,976,369 | |
Average notional value of contracts — short | | | 23,131,226 | |
Forward foreign currency exchange contracts: | | | | |
Average amounts purchased — in USD | | | 102,500 | |
Options: | | | | |
Average notional value of swaption contracts purchased | | | 1,735,000 | |
Credit default swaps: | | | | |
Average notional value — buy protection | | | — | (a) |
Interest rate swaps: | | | | |
Average notional value — pays fixed rate | | | 25,287,500 | |
Average notional value — receives fixed rate | | | 26,080,000 | |
| |
| | (a) | Derivative not held at any quarter-end. The risk exposure table serves as an indicator of activity during the period. | |
For more information about the Fund’s investment risks regarding derivative financial instruments, refer to the Notes to Financial Statements.
Derivative Financial Instruments — Offsetting as of Period End
The Fund’s derivative assets and liabilities (by type) were as follows:
| | | | | | | | |
| | | Assets | | | Liabilities | |
| |
Derivative Financial Instruments: | | | | | | | | |
Futures contracts | | $ | 39,879 | | | $ | 92,294 | |
Forward foreign currency exchange contracts | | | 373 | | | | — | |
Options(a) | | | 9,196 | | | | — | |
Swaps — Centrally cleared | | | — | | | | 5,082 | |
| | | | | | | | |
Total derivative assets and liabilities in the Statements of Assets and Liabilities | | $ | 49,448 | | | $ | 97,376 | |
Derivatives not subject to a Master Netting Agreement or similar agreement (“MNA”) | | | (39,879 | ) | | | (97,376 | ) |
| | | | | | | | |
Total derivative assets and liabilities subject to an MNA | | $ | 9,569 | | | $ | — | |
| | | | | | | | |
| | (a) | Includes options purchased at value which is included in Investments at value — unaffiliated in the Statements of Assets and Liabilities and reported in the Schedule of Investments. | |
The following table presents the Fund’s derivative assets by counterparty net of amounts available for offset under an MNA and net of the related collateral received and pledged by the Fund:
| | | | | | | | | | | | | | | | | | | | |
| |
| Counterparty | | Derivative
Assets
Subject to
an MNA by
Counterparty | | | Derivatives
Available
for Offset | | | Non-cash
Collateral
Received | | | Cash
Collateral
Received | | | Net Amount
of
Derivative
Assets(a) | |
| |
Deutsche Bank AG | | $ | 9,196 | | | $ | — | | | $ | — | | | $ | — | | | $ | 9,196 | |
Royal Bank of Canada | | | 373 | | | | — | | | | — | | | | — | | | | 373 | |
| | | | |
| | $ | 9,569 | | | $ | — | | | $ | — | | | $ | — | | | $ | 9,569 | |
| | | | |
| | (a) | Net amount represents the net amount receivable from the counterparty in the event of default. | |
| | | | |
| S C H E D U L E S O F I N V E S T M E N T S | | | 77 | |
| | |
Schedule of Investments (continued) March 31, 2019 | | BATS: Series S Portfolio |
Fair Value Hierarchy as of Period End
Various inputs are used in determining the fair value of investments and derivative financial instruments. For information about the Fund’s policy regarding valuation of investments and derivative financial instruments, refer to the Notes to Financial Statements.
The following tables summarize the Fund’s investments and derivative financial instruments categorized in the disclosure hierarchy:
| | | | | | | | | | | | | | | | |
| |
| | | Level 1 | | | Level 2 | | | Level 3 | | | Total | |
| |
Assets: | | | | | | | | | | | | | | | | |
Investments: | | | | | | | | | | | | | | | | |
Long-Term Investments: | | | | | | | | | | | | | | | | |
Asset-Backed Securities | | $ | — | | | $ | 30,640,455 | | | $ | — | | | $ | 30,640,455 | |
Corporate Bonds(a) | | | — | | | | 99,804,712 | | | | — | | | | 99,804,712 | |
Capital Trusts(a) | | | — | | | | 109,392 | | | | — | | | | 109,392 | |
Foreign Agency Obligations | | | — | | | | 638,318 | | | | — | | | | 638,318 | |
Foreign Government Obligations | | | — | | | | 1,430,734 | | | | — | | | | 1,430,734 | |
Non-Agency Mortgage-Backed Securities | | | — | | | | 16,349,495 | | | | — | | | | 16,349,495 | |
U.S. Government Sponsored Agency Securities | | | — | | | | 32,081,022 | | | | — | | | | 32,081,022 | |
Short-Term Securities | | | 13,866,889 | | | | — | | | | — | | | | 13,866,889 | |
Options Purchased: | | | | | | | | | | | | | | | | |
Interest rate contracts | | | — | | | | 9,196 | | | | — | | | | 9,196 | |
| | | | | | | | | | | | | | | | |
| | $ | 13,866,889 | | | $ | 181,063,324 | | | $ | — | | | $ | 194,930,213 | |
| | | | | | | | | | | | | | | | |
Derivative Financial Instruments(b) | | | | | | | | | | | | | | | | |
Assets: | | | | | | | | | | | | | | | | |
Foreign currency exchange contracts | | $ | — | | | $ | 373 | | | $ | — | | | $ | 373 | |
Interest rate contracts | | | 309,267 | | | | 450,344 | | | | — | | | | 759,611 | |
Liabilities: | | | | | | | | | | | | | | | | |
Interest rate contracts | | | (51,439 | ) | | | — | | | | — | | | | (51,439 | ) |
| | | | | | | | | | | | | | | | |
| | $ | 257,828 | | | $ | 450,717 | | | $ | — | | | $ | 708,545 | |
| | | | | | | | | | | | | | | | |
| | (a) | See above Schedule of Investments for values in each industry. | |
| | (b) | Derivative financial instruments are swaps, futures contracts and forward foreign currency exchange contracts, which are valued at the unrealized appreciation (depreciation) on the instrument. | |
The Fund may hold assets and/or liabilities in which the fair value approximates the carrying amount or face value, including accrued interest, for financial statement purposes. As of period end, reverse repurchase agreements of $30,894,735 are categorized as Level 2 within the disclosure hierarchy.
During the year ended March 31, 2019, there were no transfers between levels.
See notes to financial statements.
| | |
| 78 | | 2 0 1 9 B L A C K R O C K A N N U A L R E P O R T T O S H A R E H O L D E R S |
Statements of Assets and Liabilities
March 31, 2019
| | | | | | | | | | | | |
| | | BATS:
Series A Portfolio | | | BATS:
Series C Portfolio | | | BATS:
Series E Portfolio | |
| | | |
ASSETS | | | | | | | | | | | | |
Investments at value — unaffiliated(a) | | $ | 986,727,985 | | | $ | 370,653,205 | | | $ | 254,923,136 | |
Cash pledged: | | | | | | | | | | | | |
Collateral — OTC derivatives | | | 690,000 | | | | — | | | | — | |
Futures contracts | | | — | | | | 138,710 | | | | 365,650 | |
Centrally cleared swaps | | | — | | | | 75,000 | | | | — | |
Receivables: | | | | | | | | | | | | |
Investments sold | | | — | | | | — | | | | 2,539,082 | |
Capital shares sold | | | 858,369 | | | | 636,905 | | | | 1,088,572 | |
Dividends — unaffiliated | | | 1,528 | | | | 14 | | | | 649 | |
Interest — unaffiliated | | | 4,381,471 | | | | 3,549,411 | | | | 2,669,899 | |
From the Manager | | | 39,298 | | | | 74,515 | | | | 47,007 | |
Principal paydowns | | | 4,991 | | | | — | | | | — | |
Variation margin on futures contracts | | | — | | | | 7,686 | | | | 57,039 | |
Swap premiums paid | | | 8,617 | | | | 14,772 | | | | — | |
Unrealized appreciation on OTC swaps | | | 376,883 | | | | 35,265 | | | | — | |
Deferred offering costs | | | — | | | | — | | | | 5,860 | |
Prepaid expenses | | | 45,355 | | | | 22,865 | | | | 25,038 | |
| | | | | | | | | | | | |
Total assets | | | 993,134,497 | | | | 375,208,348 | | | | 261,721,932 | |
| | | | | | | | | | | | |
| | | |
ACCRUED LIABILITIES | | | | | | | | | | | | |
Cash received: | | | | | | | | | | | | |
Collateral — OTC derivatives | | | — | | | | 260,000 | | | | — | |
Payables: | | | | | | | | | | | | |
Investments purchased | | | 10,085,949 | | | | — | | | | 17,739,194 | |
Board realignment and consolidation | | | — | | | | 3,879 | | | | 1,126 | |
Capital shares redeemed | | | 581,453 | | | | 532,935 | | | | 4,774 | |
Income dividends | | | 4,125,778 | | | | 1,247,650 | | | | 791,747 | |
Interest expense and fees | | | — | | | | — | | | | 53,754 | |
Offering costs | | | 85,521 | | | | — | | | | 27,594 | |
Trustees’ and Officer’s fees | | | 9,826 | | | | 3,073 | | | | 1,572 | |
Other accrued expenses | | | 203,263 | | | | 153,499 | | | | 130,884 | |
Variation margin on futures contracts | | | — | | | | 32,230 | | | | — | |
Variation margin on centrally cleared swaps | | | — | | | | 10,510 | | | | — | |
Swap premiums received | | | 742,524 | | | | 34,210 | | | | — | |
Unrealized depreciation on OTC swaps | | | 13,815 | | | | 2,105 | | | | — | |
| | | | | | | | | | | | |
Total accrued liabilities | | | 15,848,129 | | | | 2,280,091 | | | | 18,750,645 | |
| | | | | | | | | | | | |
| | | |
OTHER LIABILITIES | | | | | | | | | | | | |
TOB Trust Certificates | | | — | | | | — | | | | 8,085,000 | |
| | | | | | | | | | | | |
Total other liabilities | | | — | | | | — | | | | 8,085,000 | |
| | | | | | | | | | | | |
Total liabilities | | | 15,848,129 | | | | 2,280,091 | | | | 26,835,645 | |
| | | | | | | | | | | | |
NET ASSETS | | $ | 977,286,368 | | | $ | 372,928,257 | | | $ | 234,886,287 | |
| | | | | | | | | | | | |
| | | |
NET ASSETS CONSIST OF | | | | | | | | | | | | |
Paid-in capital | | $ | 987,307,708 | | | $ | 367,996,581 | | | $ | 226,618,025 | |
Accumulated earnings (loss) | | | (10,021,340 | ) | | | 4,931,676 | | | | 8,268,262 | |
| | | | | | | | | | | | |
NET ASSETS | | $ | 977,286,368 | | | $ | 372,928,257 | | | $ | 234,886,287 | |
| | | | | | | | | | | | |
| | | |
NET ASSET VALUE | | | | | | | | | | | | |
Shares outstanding(b) | | | 97,809,003 | | | | 36,278,387 | | | | 21,538,714 | |
| | | | | | | | | | | | |
Net asset value | | $ | 9.99 | | | $ | 10.28 | | | $ | 10.91 | |
| | | | | | | | | | | | |
| | | |
(a)Investments at cost — unaffiliated | | $ | 995,964,615 | | | $ | 362,084,221 | | | $ | 245,954,520 | |
(b)Unlimited number of shares authorized, $0.001 par value | | | | | | | | | | | | |
See notes to financial statements.
| | | | |
| F I N A N C I A L S T A T E M E N T S | | | 79 | |
Statements of Assets and Liabilities (continued)
March 31, 2019
| | | | | | | | | | | | |
| | | BATS:
Series M Portfolio | | | BATS:
Series P Portfolio | | | BATS:
Series S Portfolio | |
| | | |
ASSETS | | | | | | | | | | | | |
Investments at value — unaffiliated(a) | | $ | 1,380,701,312 | | | $ | — | | | $ | 194,930,213 | |
Investments at value — affiliated(b) | | | — | | | | 15,547,936 | | | | — | |
Cash | | | 33,816 | | | | 34,427,226 | | | | — | |
Cash pledged: | | | | | | | | | | | | |
Collateral — OTC derivatives | | | 918,000 | | | | — | | | | — | |
Futures contracts | | | 483,000 | | | | 210,190 | | | | 189,920 | |
Centrally cleared swaps | | | 871,960 | | | | 1,854,570 | | | | 105,930 | |
Foreign currency at value(c) | | | — | | | | 261 | | | | 47,235 | |
Receivables: | | | | | | | | | | | | |
Investments sold | | | 49,215,028 | | | | — | | | | 807,060 | |
TBA sale commitments | | | 489,758,594 | | | | — | | | | — | |
Capital shares sold | | | 3,568,618 | | | | 13,489 | | | | 2,595,274 | |
Dividends — unaffiliated | | | 64 | | | | 23,563 | | | | 730 | |
Dividends — affiliated | | | — | | | | 39,265 | | | | — | |
Interest — unaffiliated | | | 3,309,681 | | | | — | | | | 1,006,579 | |
From the Manager | | | 154,796 | | | | 30,617 | | | | 49,484 | |
Principal paydowns | | | — | | | | — | | | | 11,394 | |
Variation margin on futures contracts | | | 135,664 | | | | 2,250 | | | | 39,879 | |
Variation margin on centrally cleared swaps | | | 507 | | | | 221,715 | | | | — | |
Swap premiums paid | | | 1,088,263 | | | | — | | | | — | |
Unrealized appreciation on: | | | | | | | | | | | | |
OTC swaps | | | 707,361 | | | | — | | | | — | |
Forward foreign currency exchange contracts | | | — | | | | — | | | | 373 | |
Prepaid expenses | | | 37,135 | | | | 12,343 | | | | 20,875 | |
| | | | | | | | | | | | |
Total assets | | | 1,930,983,799 | | | | 52,383,425 | | | | 199,804,946 | |
| | | | | | | | | | | | |
| | | |
LIABILITIES | | | | | | | | | | | | |
Cash received: | | | | | | | | | | | | |
Collateral — Reverse repurchase agreements | | | — | | | | — | | | | 129,000 | |
Collateral — OTC derivatives | | | 500,000 | | | | — | | | | — | |
Collateral — TBA commitments | | | 1,180,000 | | | | — | | | | — | |
Options written at value(d) | | | 90,750 | | | | — | | | | — | |
TBA sale commitments at value(e) | | | 491,655,481 | | | | — | | | | — | |
Reverse repurchase agreements at value | | | — | | | | — | | | | 30,894,735 | |
Payables: | | | | | | | | | | | | |
Investments purchased | | | 631,720,205 | | | | — | | | | 4,853,867 | |
Board realignment and consolidation | | | 3,795 | | | | 1,118 | | | | 1,537 | |
Capital shares redeemed | | | 1,494,480 | | | | 584,259 | | | | 142,426 | |
Income dividends | | | 2,610,830 | | | | — | | | | 378,308 | |
Trustees’ and Officer’s fees | | | 3,599 | | | | 3,171 | | | | 1,466 | |
Other accrued expenses | | | 286,194 | | | | 80,056 | | | | 130,404 | |
Variation margin on futures contracts | | | 31,558 | | | | 60,401 | | | | 92,294 | |
Variation margin on centrally cleared swaps | | | — | | | | — | | | | 5,082 | |
Swap premiums received | | | 1,594,451 | | | | — | | | | — | |
Unrealized depreciation on OTC swaps | | | 38,207 | | | | — | | | | — | |
| | | | | | | | | | | | |
Total liabilities | | | 1,131,209,550 | | | | 729,005 | | | | 36,629,119 | |
| | | | | | | | | | | | |
NET ASSETS | | $ | 799,774,249 | | | $ | 51,654,420 | | | $ | 163,175,827 | |
| | | | | | | | | | | | |
| | | |
NET ASSETS CONSIST OF | | | | | | | | | | | | |
Paid-in capital | | $ | 815,340,829 | | | $ | 82,198,985 | | | $ | 172,382,327 | |
Accumulated loss | | | (15,566,580 | ) | | | (30,544,565 | ) | | | (9,206,500 | ) |
| | | | | | | | | | | | |
NET ASSETS | | $ | 799,774,249 | | | $ | 51,654,420 | | | $ | 163,175,827 | |
| | | | | | | | | | | | |
| | | |
NET ASSET VALUE | | | | | | | | | | | | |
Shares outstanding(f) | | | 83,415,801 | | | | 5,587,225 | | | | 17,174,294 | |
| | | | | | | | | | | | |
Net asset value | | $ | 9.59 | | | $ | 9.25 | | | $ | 9.50 | |
| | | | | | | | | | | | |
| | | |
(a)Investments at cost — unaffiliated | | $ | 1,374,950,295 | | | $ | — | | | $ | 195,420,852 | |
(b)Investments at cost — affiliated | | $ | — | | | $ | 15,809,366 | | | $ | — | |
(c)Foreign currency at cost | | $ | — | | | $ | 265 | | | $ | 47,679 | |
(d)Premiums received | | $ | 106,712 | | | $ | — | | | $ | — | |
(e)Proceeds from TBA sale commitments | | $ | 489,758,594 | | | $ | — | | | $ | — | |
(f)Unlimited number of shares authorized, $0.001 par value | | | | | | | | | | | | |
See notes to financial statements.
| | |
| 80 | | 2 0 1 9 B L A C K R O C K A N N U A L R E P O R T T O S H A R E H O L D E R S |
Statements of Operations
Year Ended March 31, 2019
| | | | | | | | | | | | |
| | | BATS:
Series A Portfolio | | | BATS:
Series C Portfolio | | | BATS:
Series E Portfolio | |
| | | |
INVESTMENT INCOME | | | | | | | | | | | | |
Interest — unaffiliated | | $ | 39,693,031 | | | $ | 14,481,236 | | | $ | 7,955,623 | |
Dividends — unaffiliated | | | 836,820 | | | | 58,522 | | | | 107,645 | |
Other Income | | | 1,800 | | | | 948 | | | | 1,349 | |
| | | | | | | | | | | | |
Total investment income | | | 40,531,651 | | | | 14,540,706 | | | | 8,064,617 | |
| | | | | | | | | | | | |
| | | |
EXPENSES | | | | | | | | | | | | |
Registration | | | 83,768 | | | | 40,514 | | | | 40,457 | |
Accounting services | | | 72,525 | | | | 52,549 | | | | 43,081 | |
Professional | | | 48,201 | | | | 69,400 | | | | 59,944 | |
Transfer agent | | | 46,001 | | | | 117,462 | | | | 24,750 | |
Trustees and Officer | | | 14,590 | | | | 13,039 | | | | 9,945 | |
Printing | | | 9,777 | | | | 15,266 | | | | 7,929 | |
Custodian | | | 8,784 | | | | 376 | | | | 960 | |
Board realignment and consilidation | | | 2,224 | | | | 4,669 | | | | 1,400 | |
Pricing | | | 5,732 | | | | 19,652 | | | | 46,153 | |
Miscellaneous | | | 15,950 | | | | 9,520 | | | | 6,050 | |
| | | | | | | | | | | | |
Total expenses excluding interest expense | | | 307,552 | | | | 342,447 | | | | 240,669 | |
Interest expense and fees(a) | | | — | | | | — | | | | 144,982 | |
| | | | | | | | | | | | |
Total expenses | | | 307,552 | | | | 342,447 | | | | 385,651 | |
Less: | | | | | | | | | | | | |
Fees waived and/or reimbursed by the Manager | | | (303,204 | ) | | | (335,653 | ) | | | (239,212 | ) |
| | | | | | | | | | | | |
Total expenses after fees waived and/or reimbursed | | | 4,348 | | | | 6,794 | | | | 146,439 | |
| | | | | | | | | | | | |
Net investment income | | | 40,527,303 | | | | 14,533,912 | | | | 7,918,178 | |
| | | | | | | | | | | | |
| | | |
REALIZED AND UNREALIZED GAIN (LOSS) | | | | | | | | | | | | |
Net realized gain (loss) from: | | | | | | | | | | | | |
Investments — unaffiliated | | | (494,172 | ) | | | (3,786,708 | ) | | | 404,001 | |
Futures contracts | | | — | | | | 1,113,744 | | | | (398,803 | ) |
Swaps | | | 390,118 | | | | (316,178 | ) | | | — | |
| | | | | | | | | | | | |
| | | (104,054 | ) | | | (2,989,142 | ) | | | 5,198 | |
| | | | | | | | | | | | |
Net change in unrealized appreciation (depreciation) on: | | | | | | | | | | | | |
Investments — unaffiliated | | | (6,510,452 | ) | | | 6,837,753 | | | | 4,271,474 | |
Futures contracts | | | — | | | | (703,859 | ) | | | (147,446 | ) |
Swaps | | | 347,942 | | | | 22,262 | | | | — | |
| | | | | | | | | | | | |
| | | (6,162,510 | ) | | | 6,156,156 | | | | 4,124,028 | |
| | | | | | | | | | | | |
Realized and unrealized gain (loss) | | | (6,266,564 | ) | | | 3,167,014 | | | | 4,129,226 | |
| | | | | | | | | | | | |
NET INCREASE IN NET ASSETS RESULTING FROM OPERATIONS | | $ | 34,260,739 | | | $ | 17,700,926 | | | $ | 12,047,404 | |
| | | | | | | | | | | | |
(a)Related to TOB Trusts. | | | | | | | | | | | | |
See notes to financial statements.
| | | | |
| F I N A N C I A L S T A T E M E N T S | | | 81 | |
Statements of Operations (continued)
Year Ended March 31, 2019
| | | | | | | | | | | | |
| | | BATS:
Series M Portfolio | | | BATS:
Series P Portfolio | | | BATS:
Series S Portfolio | |
| | | |
INVESTMENT INCOME | | | | | | | | | | | | |
Interest — unaffiliated | | $ | 26,043,874 | | | $ | 312,094 | | | $ | 5,243,539 | |
Dividends — unaffiliated | | | 135,484 | | | | — | | | | 116,244 | |
Dividends — affiliated | | | — | | | | 595,163 | | | | — | |
Other income | | | 1,536 | | | | — | | | | 1,626 | |
| | | | | | | | | | | | |
Total investment income | | | 26,180,894 | | | | 907,257 | | | | 5,361,409 | |
| | | | | | | | | | | | |
| | | |
EXPENSES | | | | | | | | | | | | |
Custodian | | | 160,654 | | | | 2,861 | | | | 15,135 | |
Transfer agent | | | 133,950 | | | | 23,146 | | | | 31,090 | |
Registration | | | 86,937 | | | | 29,182 | | | | 31,276 | |
Pricing | | | 85,275 | | | | — | | | | 12,769 | |
Accounting services | | | 73,710 | | | | 35,401 | | | | 42,413 | |
Professional | | | 58,766 | | | | 27,136 | | | | 61,849 | |
Trustees and Officer | | | 18,729 | | | | 10,433 | | | | 8,513 | |
Printing | | | 17,845 | | | | 9,115 | | | | 11,845 | |
Board realignment and consolidation | | | 5,210 | | | | 1,246 | | | | 1,866 | |
Miscellaneous | | | 18,365 | | | | 5,134 | | | | 5,764 | |
| | | | | | | | | | | | |
Total expenses excluding interest expense | | | 659,441 | | | | 143,654 | | | | 222,520 | |
Interest expense(a) | | | — | | | | — | | | | 939,692 | |
| | | | | | | | | | | | |
Total expenses | | | 659,441 | | | | 143,654 | | | | 1,162,212 | |
Less: | | | | | | | | | | | | |
Fees waived and/or reimbursed by the Manager | | | (652,106 | ) | | | (142,351 | ) | | | (219,530 | ) |
| | | | | | | | | | | | |
Total expenses after fees waived and/or reimbursed | | | 7,335 | | | | 1,303 | | | | 942,682 | |
| | | | | | | | | | | | |
Net investment income | | | 26,173,559 | | | | 905,954 | | | | 4,418,727 | |
| | | | | | | | | | | | |
| | | |
REALIZED AND UNREALIZED GAIN (LOSS) | | | | | | | | | | | | |
Net realized gain (loss) from: | | | | | | | | | | | | |
Investments — unaffiliated | | | (3,886,752 | ) | | | — | | | | (950,696 | ) |
Investments — affiliated | | | — | | | | (398,601 | ) | | | — | |
Foreign currency transactions | | | — | | | | — | | | | 2,952 | |
Forward foreign currency exchange contracts | | | — | | | | — | | | | 5,571 | |
Futures contracts | | | 242,868 | | | | 203,087 | | | | (175,996 | ) |
Swaps | | | (758,955 | ) | | | 1,536,691 | | | | (250,403 | ) |
| | | | | | | | | | | | |
| | | (4,402,839 | ) | | | 1,341,177 | | | | (1,368,572 | ) |
| | | | | | | | | | | | |
Net change in unrealized appreciation (depreciation) on: | | | | | | | | | | | | |
Investments — unaffiliated | | | 17,171,478 | | | | — | | | | 2,951,369 | |
Investments — affiliated | | | — | | | | 591,100 | | | | — | |
Foreign currency translations | | | — | | | | (11 | ) | | | (6,748 | ) |
Forward foreign currency exchange contracts | | | — | | | | — | | | | 373 | |
Futures contracts | | | (221,130 | ) | | | 360,096 | | | | 530,530 | |
Options written | | | 15,962 | | | | — | | | | — | |
Swaps | | | (391,955 | ) | | | (4,112,425 | ) | | | (31,158 | ) |
| | | | | | | | | | | | |
| | | 16,574,355 | | | | (3,161,240 | ) | | | 3,444,366 | |
| | | | | | | | | | | | |
Net realized and unrealized gain (loss) | | | 12,171,516 | | | | (1,820,063 | ) | | | 2,075,794 | |
| | | | | | | | | | | | |
NET INCREASE (DECREASE) IN NET ASSETS RESULTING FROM OPERATIONS | | $ | 38,345,075 | | | $ | (914,109 | ) | | $ | 6,494,521 | |
| | | | | | | | | | | | |
| | (a) | See Note 4 of the Notes to Financial Statements for details of short-term borrowings. | |
See notes to financial statements.
| | |
| 82 | | 2 0 1 9 B L A C K R O C K A N N U A L R E P O R T T O S H A R E H O L D E R S |
Statements of Changes in Net Assets
| | | | | | | | | | | | | | | | | | | | |
| | | BATS: Series A Portfolio | | | | | | BATS: Series C Portfolio | |
| | | Year Ended
March 31, | | | | | | Year Ended
March 31, | |
| | | 2019 | | | 2018 | | | | | | 2019 | | | 2018 | |
| | | | | |
INCREASE (DECREASE) IN NET ASSETS | | | | | | | | | | | | | | | | | | | | |
| | | | | |
OPERATIONS | | | | | | | | | | | | | | | | | | | | |
Net investment income | | $ | 40,527,303 | | | $ | 24,809,695 | | | | | | | $ | 14,533,912 | | | $ | 14,195,947 | |
Net realized gain (loss) | | | (104,054 | ) | | | 1,023,141 | | | | | | | | (2,989,142 | ) | | | 1,858,623 | |
Net change in unrealized appreciation (depreciation) | | | (6,162,510 | ) | | | (3,262,849 | ) | | | | | | | 6,156,156 | | | | (4,155,441 | ) |
| | | | | | | | | | | | | | | | | | | | |
Net increase in net assets resulting from operations | | | 34,260,739 | | | | 22,569,987 | | | | | | | | 17,700,926 | | | | 11,899,129 | |
| | | | | | | | | | | | | | | | | | | | |
| | | | | |
DISTRIBUTIONS TO SHAREHOLDERS(a)(b) | | | | | | | | | | | | | | | | | | | | |
Decrease in net assets resulting from distributions to shareholders | | | (43,556,280 | ) | | | (24,000,709 | ) | | | | | | | (14,687,683 | ) | | | (16,106,903 | ) |
| | | | | | | | | | | | | | | | | | | | |
| | | | | |
CAPITAL SHARE TRANSACTIONS | | | | | | | | | | | | | | | | | | | | |
Shares sold | | | 692,348,692 | | | | 313,859,125 | | | | | | | | 88,295,064 | | | | 100,852,867 | |
Shares redeemed | | | (277,349,588 | ) | | | (64,629,298 | ) | | | | | | | (107,054,054 | ) | | | (125,221,980 | ) |
| | | | | | | | | | | | | | | | | | | | |
Net increase (decrease) in net assets derived from capital share transactions | | | 414,999,104 | | | | 249,229,827 | | | | | | | | (18,758,990 | ) | | | (24,369,113 | ) |
| | | | | | | | | | | | | | | | | | | | |
| | | | | |
NET ASSETS(b) | | | | | | | | | | | | | | | | | | | | |
Total increase (decrease) in net assets | | | 405,703,563 | | | | 247,799,105 | | | | | | | | (15,745,747 | ) | | | (28,576,887 | ) |
Beginning of year | | | 571,582,805 | | | | 323,783,700 | | | | | | | | 388,674,004 | | | | 417,250,891 | |
| | | | | | | | | | | | | | | | | | | | |
End of year | | $ | 977,286,368 | | | $ | 571,582,805 | | | | | | | $ | 372,928,257 | | | $ | 388,674,004 | |
| | | | | | | | | | | | | | | | | | | | |
| (a) | Distributions for annual periods determined in accordance with U.S. federal income tax regulations. |
| (b) | Prior year distribution character information and undistributed (distributions in excess of) net investment income has been modified or removed to conform with current year Regulation S-X presentation changes. Refer to Note 12 for this prior year information. |
See notes to financial statements.
| | | | |
| F I N A N C I A L S T A T E M E N T S | | | 83 | |
Statements of Changes in Net Assets (continued)
| | | | | | | | | | | | | | | | | | |
| | | BATS: Series E Portfolio | | | | | BATS: Series M Portfolio | |
| | | Year Ended
March 31, | | | | | Year Ended
March 31, | |
| | | 2019 | | | 2018 | | | | | 2019 | | | 2018 | |
| | | | | |
INCREASE (DECREASE) IN NET ASSETS | | | | | | | | | | | | | | | | | | |
| | | | | |
OPERATIONS | | | | | | | | | | | | | | | | | | |
Net investment income | | $ | 7,918,178 | | | $ | 7,157,687 | | | | | $ | 26,173,559 | | | $ | 17,345,884 | |
Net realized gain (loss) | | | 5,198 | | | | 1,635,414 | | | | | | (4,402,839 | ) | | | (449,064 | ) |
Net change in unrealized appreciation (depreciation) | | | 4,124,028 | | | | 2,621,284 | | | | | | 16,574,355 | | | | (11,170,177 | ) |
| | | | | | | | | | | | | | | | | | |
Net increase in net assets resulting from operations | | | 12,047,404 | | | | 11,414,385 | | | | | | 38,345,075 | | | | 5,726,643 | |
| | | | | | | | | | | | | | | | | | |
| | | | | |
DISTRIBUTIONS TO SHAREHOLDERS(a)(b) | | | | | | | | | | | | | | | | | | |
Decrease in net assets resulting from distributions to shareholders | | | (9,058,546 | ) | | | (7,271,362 | ) | | | | | (28,369,325 | ) | | | (21,306,246 | ) |
| | | | | | | | | | | | | | | | | | |
| | | | | |
CAPITAL SHARE TRANSACTIONS | | | | | | | | | | | | | | | | | | |
Shares sold | | | 107,337,550 | | | | 60,408,804 | | | | | | 232,427,176 | | | | 412,562,690 | |
Shares redeemed | | | (55,582,026 | ) | | | (30,756,095 | ) | | | | | (252,659,321 | ) | | | (185,019,368 | ) |
| | | | | | | | | | | | | | | | | | |
Net increase (decrease) in net assets derived from capital share transactions | | | 51,755,524 | | | | 29,652,709 | | | | | | (20,232,145 | ) | | | 227,543,322 | |
| | | | | | | | | | | | | | | | | | |
| | | | | |
NET ASSETS(b) | | | | | | | | | | | | | | | | | | |
Total increase (decrease) in net assets | | | 54,744,382 | | | | 33,795,732 | | | | | | (10,256,395 | ) | | | 211,963,719 | |
Beginning of year | | | 180,141,905 | | | | 146,346,173 | | | | | | 810,030,644 | | | | 598,066,925 | |
| | | | | | | | | | | | | | | | | | |
End of year | | $ | 234,886,287 | | | $ | 180,141,905 | | | | | $ | 799,774,249 | | | $ | 810,030,644 | |
| | | | | | | | | | | | | | | | | | |
| (a) | Distributions for annual periods determined in accordance with U.S. federal income tax regulations. |
| (b) | Prior year distribution character information and undistributed net investment income has been modified or removed to conform with current year Regulation S-X presentation changes. Refer to Note 12 for this prior year information. |
See notes to financial statements.
| | |
| 84 | | 2 0 1 9 B L A C K R O C K A N N U A L R E P O R T T O S H A R E H O L D E R S |
Statements of Changes in Net Assets (continued)
| | | | | | | | | | | | | | | | | | |
| | | BATS: Series P Portfolio | | | | | BATS: Series S Portfolio | |
| | | Year Ended
March 31, | | | | | Year Ended
March 31, | |
| | | 2019 | | | 2018 | | | | | 2019 | | | 2018 | |
| |
| | | | | |
INCREASE (DECREASE) IN NET ASSETS | | | | | | | | | | | | | | | | | | |
| | | | | |
OPERATIONS | | | | | | | | | | | | | | | | | | |
Net investment income | | $ | 905,954 | | | $ | 913,172 | | | | | $ | 4,418,727 | | | $ | 3,752,089 | |
Net realized gain (loss) | | | 1,341,177 | | | | (990,090 | ) | | | | | (1,368,572 | ) | | | 373,610 | |
Net change in unrealized appreciation (depreciation) | | | (3,161,240 | ) | | | 1,904,562 | | | | | | 3,444,366 | | | | (1,895,654 | ) |
| | | | | | | | | | | | | | | | | | |
Net increase in net assets resulting from operations | | | (914,109 | ) | | | 1,827,644 | | | | | | 6,494,521 | | | | 2,230,045 | |
| | | | | | | | | | | | | | | | | | |
| | | | | |
DISTRIBUTIONS TO SHAREHOLDERS(a)(b) | | | | | | | | | | | | | | | | | | |
Decrease in net assets resulting from distributions to shareholders | | | (620,004 | ) | | | (549,664 | ) | | | | | (4,649,704 | ) | | | (4,838,425 | ) |
| | | | | | | | | | | | | | | | | | |
| | | | | |
CAPITAL SHARE TRANSACTIONS | | | | | | | | | | | | | | | | | | |
Shares sold | | | 14,053,229 | | | | 23,549,473 | | | | | | 64,260,569 | | | | 59,181,234 | |
Shares redeemed | | | (44,944,841 | ) | | | (61,801,345 | ) | | | | | (78,868,632 | ) | | | (72,536,659 | ) |
| | | | | | | | | | | | | | | | | | |
Net decrease in net assets derived from capital share transactions | | | (30,891,612 | ) | | | (38,251,872 | ) | | | | | (14,608,063 | ) | | | (13,355,425 | ) |
| | | | | | | | | | | | | | | | | | |
NET ASSETS(b) | | | | | | | | | | | | | | | | | | |
Total decrease in net assets | | | (32,425,725 | ) | | | (36,973,892 | ) | | | | | (12,763,246 | ) | | | (15,963,805 | ) |
Beginning of year | | | 84,080,145 | | | | 121,054,037 | | | | | | 175,939,073 | | | | 191,902,878 | |
| | | | | | | | | | | | | | | | | | |
End of year | | $ | 51,654,420 | | | $ | 84,080,145 | | | | | $ | 163,175,827 | | | $ | 175,939,073 | |
| | | | | | | | | | | | | | | | | | |
| (a) | Distributions for annual periods determined in accordance with U.S. federal income tax regulations. |
| (b) | Prior year distribution character information and undistributed (distributions in excess of) net investment income has been modified or removed to conform with current year Regulation S-X presentation changes. Refer to Note 12 for this prior year information. |
See notes to financial statements.
| | | | |
| F I N A N C I A L S T A T E M E N T S | | | 85 | |
Statement of Cash FlowsYear Ended March 31, 2019
| | | | | | | | |
| | | | | | BATS:
Series S Portfolio | |
| | |
CASH PROVIDED (USED FOR) OPERATING ACTIVITIES | | | | | | | | |
Net increase in net assets resulting from operations | | | | | | $ | 6,494,521 | |
Adjustments to reconcile net increase in net assets resulting from operations to net cash provided by operating activities: | | | | | | | | |
Proceeds from sales of long-term investments and principle paydowns | | | | | | | 463,814,158 | |
Purchases of long-term investments | | | | | | | (424,102,599 | ) |
Net purchases of short-term securities | | | | | | | (1,990,050 | ) |
Amortization of premium and accretion of discount on investments and other fees | | | | | | | 423,468 | |
Net realized loss on investments | | | | | | | 950,696 | |
Net unrealized appreciation on investments and foreign currency translations | | | | | | | (2,951,744 | ) |
| | |
(Increase) Decrease in Assets: | | | | | | | | |
Receivables: | | | | | | | | |
Interest — unaffiliated | | | | | | | 83,282 | |
Dividends — unaffiliated | | | | | | | 6,841 | |
From the Manager | | | | | | | (24,145 | ) |
Principal paydowns | | | | | | | (11,394 | ) |
Variation margin on futures contracts | | | | | | | (39,879 | ) |
Prepaid expenses | | | | | | | (5,933 | ) |
| | |
Increase (Decrease) in Liabilities: | | | | | | | | |
Cash received: | | | | | | | | |
Collateral — Reverse repurchase agreements | | | | | | | 129,000 | |
Payables: | | | | | | | | |
Interest expense | | | | | | | (206,968 | ) |
Trustees’ and Officer’s fees | | | | | | | (5,570 | ) |
Variation margin on futures contracts | | | | | | | 92,294 | |
Variation margin on centrally cleared swaps | | | | | | | 285 | |
Board realignment and consolidation | | | | | | | 1,537 | |
Other accrued expenses | | | | | | | (10,516 | ) |
| | | | | | | | |
Net cash provided by operating activities | | | | | | | 42,647,284 | |
| | | | | | | | |
| | |
CASH USED FOR FINANCING ACTIVITIES | | | | | | | | |
Net borrowing of reverse repurchase agreements | | | | | | | (21,359,747 | ) |
Cash dividends paid to shareholders | | | | | | | (4,664,174 | ) |
Payments on redemption of capital shares | | | | | | | (79,403,086 | ) |
Proceeds from issuance of capital shares | | | | | | | 61,694,477 | |
| | | | | | | | |
Net cash used for financing activities | | | | | | | (43,732,530 | ) |
| | | | | | | | |
| | |
CASH IMPACT FROM FOREIGN EXCHANGE FLUCTUATIONS | | | | | | | | |
Cash impact from foreign exchange fluctuations | | | | | | | (6,750 | ) |
| | | | | | | | |
| | |
CASH AND FOREIGN CURRENCY | | | | | | | | |
Net increase in restricted and unrestricted cash and foreign currency | | | | | | | (1,091,996 | ) |
Restricted and unrestricted cash and foreign currency at beginning of year | | | | | | | 1,435,081 | |
| | | | | | | | |
Restricted and unrestricted cash and foreign currency at end of year | | | | | | $ | 343,085 | |
| | | | | | | | |
| | |
SUPPLEMENTAL DISCLOSURE OF CASH FLOW INFORMATION | | | | | | | | |
Cash paid during the year for interest expense | | | | | | $ | 1,146,660 | |
| | | | | | | | |
|
| RECONCILIATION OF RESTRICTED AND UNRESTRICTED CASH AND FOREIGN CURRENCY TO THE STATEMENTS OF ASSETS AND LIABILITIES | |
| |
| | | March 31, | |
| | | 2019 | | | 2018 | |
Cash | | $ | — | | | $ | 938,540 | |
Cash pledged: | | | | | | | | |
Futures contracts | | | 189,920 | | | | 319,920 | |
Centrally cleared swaps | | | 105,930 | | | | 98,930 | |
Foreign currency at value | | | 47,235 | | | | 77,691 | |
| | | | | | | | |
| | $ | 343,085 | | | $ | 1,435,081 | |
| | | | | | | | |
See notes to financial statements.
| | |
| 86 | | 2 0 1 9 B L A C K R O C K A N N U A L R E P O R T T O S H A R E H O L D E R S |
Financial Highlights
(For a share outstanding throughout each period)
| | | | | | | | | | | | | | | | | | | | |
| | | BATS: Series A Portfolio | |
| | | Year Ended March 31, | | | | | | Period from
09/21/2015(a)
to | |
| | | 2019 | | | 2018 | | | 2017 | | | | | | 03/31/2016 | |
| | | | | | |
Net asset value, beginning of period | | $ | 10.14 | | | $ | 10.14 | | | $ | 9.82 | | | | | | | $ | 10.00 | |
| | | | | | | | | | | | | | | | | | | | |
Net investment income(b) | | | 0.53 | | | | 0.58 | | | | 0.51 | | | | | | | | 0.48 | |
Net realized and unrealized gain (loss) | | | (0.11 | ) | | | (0.03 | ) | | | 0.43 | | | | | | | | (0.27 | ) |
| | | | | | | | | | | | | | | | | | | | |
Net increase from investment operations | | | 0.42 | | | | 0.55 | | | | 0.94 | | | | | | | | 0.21 | |
| | | | | | | | | | | | | | | | | | | | |
| | | | | |
Distributions(c) | | | | | | | | | | | | | | | | | | | | |
From net investment income | | | (0.52 | ) | | | (0.49 | ) | | | (0.62 | ) | | | | | | | (0.39 | ) |
From net realized gain | | | (0.05 | ) | | | (0.06 | ) | | | — | | | | | | | | — | |
| | | | | | | | | | | | | | | | | | | | |
Total distributions | | | (0.57 | ) | | | (0.55 | ) | | | (0.62 | ) | | | | | | | (0.39 | ) |
| | | | | | | | | | | | | | | | | | | | |
| | | | | |
Net asset value, end of period | | $ | 9.99 | | | $ | 10.14 | | | $ | 10.14 | | | | | | | $ | 9.82 | |
| | | | | | | | | | | | | | | | | | | | |
| | | | | |
Total Return(d) | | | | | | | | | | | | | | | | | | | | |
Based on net asset value | | | 4.31 | % | | | 5.55 | % | | | 9.76 | % | | | | | | | 2.07 | %(e) |
| | | | | | | | | | | | | | | | | | | | |
| | | | | |
Ratios to Average Net Assets(g) | | | | | | | | | | | | | | | | | | | | |
Total expenses | | | 0.04 | % | | | 0.12 | % | | | 0.26 | % | | | | | | | 1.23 | %(f)(h) |
| | | | | | | | | | | | | | | | | | | | |
Total expenses after fees waived and/or reimbursed excluding amortization of offering costs | | | 0.00 | %(i) | | | 0.00 | % | | | 0.00 | % | | | | | | | 0.01 | %(f) |
| | | | | | | | | | | | | | | | | | | | |
Net investment income | | | 5.26 | % | | | 5.65 | % | | | 5.01 | % | | | | | | | 9.03 | %(f) |
| | | | | | | | | | | | | | | | | | | | |
| | | | | |
Supplemental Data | | | | | | | | | | | | | | | | | | | | |
Net assets, end of period (000) | | $ | 977,286 | | | $ | 571,583 | | | $ | 323,784 | | | | | | | $ | 38,956 | |
| | | | | | | | | | | | | | | | | | | | |
Portfolio turnover rate | | | 43 | % | | | 45 | % | | | 84 | % | | | | | | | 45 | % |
| | | | | | | | | | | | | | | | | | | | |
| (a) | Commencement of operations. |
| (b) | Based on average shares outstanding. |
| (c) | Distributions for annual periods determined in accordance with U.S. federal income tax regulations. |
| (d) | Where applicable, assumes the reinvestment of distributions. |
| (e) | Aggregate total return. |
| (g) | Excludes expenses incurred indirectly as a result of investments in underlying funds as follows: |
| | | | | | | | | | | | | | | | | | | | | | | | | | | | |
| | | Year Ended March 31, | | | | | | Period from
09/21/2015(a) to | |
| | | 2019 | | | | | | 2018 | | | | | | 2017 | | | | | | 03/31/2016 | |
| | | | | | | | |
Investments in underlying funds | | | 0.01 | % | | | | | | | 0.01 | % | | | | | | | 0.01 | % | | | | | | | 0.01 | % |
| | | | | | | | | | | | | | | | | | | | | | | | | | | | |
| (h) | Organization expenses were not annualized in the calculation of the expense ratios. If these expenses were annualized, the total expenses would have been 1.32%. |
| (i) | Amount is less than 0.005%. |
See notes to financial statements.
| | | | |
| F I N A N C I A L H I G H L I G H T S | | | 87 | |
Financial Highlights (continued)
(For a share outstanding throughout each period)
| | | | | | | | | | | | | | | | | | | | | | | | | | | | | | | | | | | | |
| | | BATS: Series C Portfolio | |
| |
| | | Year Ended March 31, | |
| | | | | | | | | |
| | | 2019 | | | | | | 2018 | | | | | | 2017 | | | | | | 2016 | | | | | | 2015 | |
| | | | | | | | | | |
Net asset value, beginning of year | | $ | 10.18 | | | | | | | $ | 10.31 | | | | | | | $ | 10.37 | | | | | | | $ | 10.77 | | | | | | | $ | 10.60 | |
| | | | | | | | | | | | | | | | | | | | | | | | | | | | | | | | | | | | |
Net investment income(a) | | | 0.39 | | | | | | | | 0.37 | | | | | | | | 0.36 | | | | | | | | 0.38 | | | | | | | | 0.41 | |
Net realized and unrealized gain (loss) | | | 0.10 | | | | | | | | (0.08 | ) | | | | | | | (0.04 | ) | | | | | | | (0.31 | ) | | | | | | | 0.33 | |
| | | | | | | | | | | | | | | | | | | | | | | | | | | | | | | | | | | | |
Net increase from investment operations | | | 0.49 | | | | | | | | 0.29 | | | | | | | | 0.32 | | | | | | | | 0.07 | | | | | | | | 0.74 | |
| | | | | | | | | | | | | | | | | | | | | | | | | | | | | | | | | | | | |
| | | | | | | | | |
Distributions(b) | | | | | | | | | | | | | | | | | | | | | | | | | | | | | | | | | | | | |
From net investment income | | | (0.39 | ) | | | | | | | (0.37 | ) | | | | | | | (0.36 | ) | | | | | | | (0.38 | ) | | | | | | | (0.40 | ) |
From net realized gain | | | (0.00 | )(c) | | | | | | | (0.05 | ) | | | | | | | (0.02 | ) | | | | | | | (0.09 | ) | | | | | | | (0.17 | ) |
| | | | | | | | | | | | | | | | | | | | | | | | | | | | | | | | | | | | |
Total distributions | | | (0.39 | ) | | | | | | | (0.42 | ) | | | | | | | (0.38 | ) | | | | | | | (0.47 | ) | | | | | | | (0.57 | ) |
| | | | | | | | | | | | | | | | | | | | | | | | | | | | | | | | | | | | |
| | | | | | | | | |
Net asset value, end of year | | $ | 10.28 | | | | | | | $ | 10.18 | | | | | | | $ | 10.31 | | | | | | | $ | 10.37 | | | | | | | $ | 10.77 | |
| | | | | | | | | | | | | | | | | | | | | | | | | | | | | | | | | | | | |
| | | | | | | | | |
Total Return(d) | | | | | | | | | | | | | | | | | | | | | | | | | | | | | | | | | | | | |
Based on net asset value | | | 5.05 | % | | | | | | | 2.82 | % | | | | | | | 3.12 | % | | | | | | | 0.70 | % | | | | | | | 7.22 | % |
| | | | | | | | | | | | | | | | | | | | | | | | | | | | | | | | | | | | |
| | | | | | | | | |
Ratios to Average Net Assets | | | | | | | | | | | | | | | | | | | | | | | | | | | | | | | | | | | | |
Total expenses | | | 0.09 | %(e) | | | | | | | 0.11 | %(e) | | | | | | | 0.11 | %(e) | | | | | | | 0.13 | %(e) | | | | | | | 0.14 | % |
| | | | | | | | | | | | | | | | | | | | | | | | | | | | | | | | | | | | |
Total expenses after fees waived and/or reimbursed | | | 0.00 | %(e)(f) | | | | | | | 0.00 | %(e) | | | | | | | 0.00 | %(e) | | | | | | | 0.00 | %(e) | | | | | | | 0.01 | % |
| | | | | | | | | | | | | | | | | | | | | | | | | | | | | | | | | | | | |
Total expenses after fees waived and/or reimbursed and excluding interest expense | | | 0.00 | %(e)(f) | | | | | | | 0.00 | %(e) | | | | | | | 0.00 | %(e) | | | | | | | 0.00 | %(e) | | | | | | | 0.00 | % |
| | | | | | | | | | | | | | | | | | | | | | | | | | | | | | | | | | | | |
Net investment income | | | 3.91 | %(e) | | | | | | | 3.55 | %(e) | | | | | | | 3.45 | %(e) | | | | | | | 3.68 | %(e) | | | | | | | 3.81 | % |
| | | | | | | | | | | | | | | | | | | | | | | | | | | | | | | | | | | | |
| | | | | | | | | |
Supplemental Data | | | | | | | | | | | | | | | | | | | | | | | | | | | | | | | | | | | | |
Net assets, end of year (000) | | $ | 372,928 | | | | | | | $ | 388,674 | | | | | | | $ | 417,251 | | | | | | | $ | 353,632 | | | | | | | $ | 361,083 | |
| | | | | | | | | | | | | | | | | | | | | | | | | | | | | | | | | | | | |
Portfolio turnover rate | | | 55 | % | | | | | | | 31 | % | | | | | | | 32 | % | | | | | | | 53 | % | | | | | | | 44 | % |
| | | | | | | | | | | | | | | | | | | | | | | | | | | | | | | | | | | | |
| (a) | Based on average shares outstanding. |
| (b) | Distributions for annual periods determined in accordance with U.S. federal income tax regulations. |
| (c) | Amount is greater than $(0.005) per share. |
| (d) | Where applicable, assumes the reinvestment of distributions. |
| (e) | Excludes expenses incurred indirectly as a result of investments in underlying funds as follows: |
| | | | | | | | | | | | | | | | | | | | | | | | | | | | | | | | | | |
| | | Year Ended March 31, | |
| | | | | | | | | |
| | | | | 2019 | | | | | | 2018 | | | | | | 2017 | | | | | | 2016 | | | | |
| | | | | | | | | |
Investments in underlying funds | | | | | 0.00 | % | | | | | | | 0.00 | % | | | | | | | 0.01 | % | | | | | | | 0.01 | % | | | | |
| | | | | | | | | | | | | | | | | | | | | | | | | | | | | | | | | | |
| (f) | Amount is less than 0.005%. |
See notes to financial statements.
| | |
| 88 | | 2 0 1 9 B L A C K R O C K A N N U A L R E P O R T T O S H A R E H O L D E R S |
Financial Highlights (continued)
(For a share outstanding throughout each period)
| | | | | | | | | | | | | | | | | | | | | | | | | | | | | | | | | | | | |
| | | BATS: Series E Portfolio | |
| | |
| | | Year Ended March 31, | | | Period from 08/04/2014(a) to | |
| | | | | | | | | |
| | | 2019 | | | | | | 2018 | | | | | | 2017 | | | | | | 2016 | | | | | | 03/31/2015 | |
| | | | | | | | | | |
Net asset value, beginning of period | | $ | 10.78 | | | | | | | $ | 10.49 | | | | | | | $ | 10.75 | | | | | | | $ | 10.47 | | | | | | | $ | 10.00 | |
| | | | | | | | | | | | | | | | | | | | | | | | | | | | | | | | | | | | |
Net investment income(b) | | | 0.47 | | | | | | | | 0.45 | | | | | | | | 0.45 | | | | | | | | 0.43 | | | | | | | | 0.28 | |
Net realized and unrealized gain (loss) | | | 0.21 | | | | | | | | 0.30 | | | | | | | | (0.16 | ) | | | | | | | 0.29 | | | | | | | | 0.48 | |
| | | | | | | | | | | | | | | | | | | | | | | | | | | | | | | | | | | | |
Net increase from investment operations | | | 0.68 | | | | | | | | 0.75 | | | | | | | | 0.29 | | | | | | | | 0.72 | | | | | | | | 0.76 | |
| | | | | | | | | | | | | | | | | | | | | | | | | | | | | | | | | | | | |
| | | | | | | | | |
Distributions(c) | | | | | | | | | | | | | | | | | | | | | | | | | | | | | | | | | | | | |
From net investment income | | | (0.47 | ) | | | | | | | (0.45 | ) | | | | | | | (0.45 | ) | | | | | | | (0.43 | ) | | | | | | | (0.28 | ) |
From net realized gain | | | (0.08 | ) | | | | | | | (0.01 | ) | | | | | | | (0.10 | ) | | | | | | | (0.01 | ) | | | | | | | (0.01 | ) |
| | | | | | | | | | | | | | | | | | | | | | | | | | | | | | | | | | | | |
Total distributions | | | (0.55 | ) | | | | | | | (0.46 | ) | | | | | | | (0.55 | ) | | | | | | | (0.44 | ) | | | | | | | (0.29 | ) |
| | | | | | | | | | | | | | | | | | | | | | | | | | | | | | | | | | | | |
| | | | | | | | | |
Net asset value, end of period | | $ | 10.91 | | | | | | | $ | 10.78 | | | | | | | $ | 10.49 | | | | | | | $ | 10.75 | | | | | | | $ | 10.47 | |
| | | | | | | | | | | | | | | | | | | | | | | | | | | | | | | | | | | | |
| | | | | | | | | |
Total Return(d) | | | | | | | | | | | | | | | | | | | | | | | | | | | | | | | | | | | | |
Based on net asset value | | | 6.44 | % | | | | | | | 7.22 | % | | | | | | | 2.78 | % | | | | | | | 7.15 | % | | | | | | | 7.70 | %(e) |
| | | | | | | | | | | | | | | | | | | | | | | | | | | | | | | | | | | | |
| | | | | | | | | |
Ratios to Average Net Assets | | | | | | | | | | | | | | | | | | | | | | | | | | | | | | | | | | | | |
Total expenses | | | 0.21 | %(f) | | | | | | | 0.27 | %(f) | | | | | | | 0.23 | %(f) | | | | | | | 0.34 | %(f) | | | | | | | 0.94 | %(g)(h) |
| | | | | | | | | | | | | | | | | | | | | | | | | | | | | | | | | | | | |
Total expenses after fees waived and/or reimbursed | | | 0.08 | %(f) | | | | | | | 0.06 | %(f) | | | | | | | 0.06 | %(f) | | | | | | | 0.02 | %(f) | | | | | | | 0.00 | %(g) |
| | | | | | | | | | | | | | | | | | | | | | | | | | | | | | | | | | | | |
Total expenses after fees waived and/or reimbursed and excluding interest expense and fees | | | 0.00 | %(f)(i) | | | | | | | 0.00 | %(f) | | | | | | | 0.00 | %(f) | | | | | | | 0.00 | %(f) | | | | | | | 0.00 | %(g) |
| | | | | | | | | | | | | | | | | | | | | | | | | | | | | | | | | | | | |
Net investment income | | | 4.35 | %(f) | | | | | | | 4.17 | %(f) | | | | | | | 4.21 | %(f) | | | | | | | 4.17 | %(f) | | | | | | | 4.07 | %(g) |
| | | | | | | | | | | | | | | | | | | | | | | | | | | | | | | | | | | | |
| | | | | | | | | |
Supplemental Data | | | | | | | | | | | | | | | | | | | | | | | | | | | | | | | | | | | | |
Net assets, end of period (000) | | $ | 234,886 | | | | | | | $ | 180,142 | | | | | | | $ | 146,346 | | | | | | | $ | 110,186 | | | | | | | $ | 48,461 | |
| | | | | | | | | | | | | | | | | | | | | | | | | | | | | | | | | | | | |
Borrowings outstanding, end of period (000) | | $ | 8,085 | | | | | | | $ | 6,625 | | | | | | | $ | 6,625 | | | | | | | $ | 4,835 | | | | | | | $ | — | |
| | | | | | | | | | | | | | | | | | | | | | | | | | | | | | | | | | | | |
Portfolio turnover rate | | | 53 | % | | | | | | | 100 | % | | | | | | | 87 | % | | | | | | | 44 | % | | | | | | | 30 | % |
| | | | | | | | | | | | | | | | | | | | | | | | | | | | | | | | | | | | |
| (a) | Commencement of operations. |
| (b) | Based on average shares outstanding. |
| (c) | Distributions for annual periods determined in accordance with U.S. federal income tax regulations. |
| (d) | Where applicable, assumes the reinvestment of distributions. |
| (e) | Aggregate total return. |
| (f) | Excludes expenses incurred indirectly as a result of investments in underlying funds as follows: |
| | | | | | | | | | | | | | | | | | | | | | | | | | | | | | | | | | |
| | | Year Ended March 31, | |
| | | | | 2019 | | | | | | 2018 | | | | | | 2017 | | | | | | 2016 | | | | |
| | | | | | | | | |
Investments in underlying funds | | | | | 0.01 | % | | | | | | | 0.02 | % | | | | | | | 0.01 | % | | | | | | | 0.01 | % | | | | |
| | | | | | | | | | | | | | | | | | | | | | | | | | | | | | | | | | |
| (h) | Organization expenses were not annualized in the calculation of the expense ratios. If these expenses were annualized, the total expenses would have been 1.02%. |
| (i) | Amount is less than 0.005%. |
See notes to financial statements.
| | | | |
| F I N A N C I A L H I G H L I G H T S | | | 89 | |
Financial Highlights (continued)
(For a share outstanding throughout each period)
| | | | | | | | | | | | | | | | | | | | |
| | | BATS: Series M Portfolio | |
| |
| | | Year Ended March 31, | |
| | | | | |
| | | 2019 | | | 2018 | | | 2017 | | | 2016 | | | 2015 | |
| | | | | |
Net asset value, beginning of year | | $ | 9.47 | | | $ | 9.69 | | | $ | 9.93 | | | $ | 10.03 | | | $ | 9.70 | |
| | | | | | | | | | | | | | | | | | | | |
Net investment income(a) | | | 0.31 | | | | 0.25 | | | | 0.21 | | | | 0.22 | | | | 0.20 | |
Net realized and unrealized gain (loss) | | | 0.15 | | | | (0.16 | ) | | | (0.16 | ) | | | 0.02 | | | | 0.37 | |
| | | | | | | | | | | | | | | | | | | | |
Net increase from investment operations | | | 0.46 | | | | 0.09 | | | | 0.05 | | | | 0.24 | | | | 0.57 | |
| | | | | | | | | | | | | | | | | | | | |
| | | | | |
Distributions(b) | | | | | | | | | | | | | | | | | | | | |
From net investment income | | | (0.34 | ) | | | (0.31 | ) | | | (0.29 | ) | | | (0.27 | ) | | | (0.24 | ) |
From net realized gain | | | — | | | | — | | | | — | | | | (0.07 | ) | | | (0.00 | )(c) |
| | | | | | | | | | | | | | | | | | | | |
Total distributions | | | (0.34 | ) | | | (0.31 | ) | | | (0.29 | ) | | | (0.34 | ) | | | (0.24 | ) |
| | | | | | | | | | | | | | | | | | | | |
| | | | | |
Net asset value, end of year | | $ | 9.59 | | | $ | 9.47 | | | $ | 9.69 | | | $ | 9.93 | | | $ | 10.03 | |
| | | | | | | | | | | | | | | | | | | | |
| | | | | |
Total Return(d) | | | | | | | | | | | | | | | | | | | | |
Based on net asset value | | | 4.94 | % | | | 0.91 | % | | | 0.51 | % | | | 2.44 | % | | | 5.91 | % |
| | | | | | | | | | | | | | | | | | | | |
| | | | | |
Ratios to Average Net Assets(e) | | | | | | | | | | | | | | | | | | | | |
Total expenses | | | 0.08 | % | | | 0.08 | % | | | 0.09 | % | | | 0.11 | % | | | 0.13 | % |
| | | | | | | | | | | | | | | | | | | | |
Total expenses after fees waived and/or reimbursed | | | 0.00 | %(f) | | | 0.00 | % | | | 0.00 | % | | | 0.00 | % | | | 0.00 | % |
| | | | | | | | | | | | | | | | | | | | |
Total expenses after fees waived and/or reimbursed and excluding interest expense | | | 0.00 | %(f) | | | 0.00 | % | | | 0.00 | % | | | 0.00 | % | | | 0.00 | % |
| | | | | | | | | | | | | | | | | | | | |
Net investment income | | | 3.30 | % | | | 2.59 | % | | | 2.12 | % | | | 2.25 | % | | | 2.04 | % |
| | | | | | | | | | | | | | | | | | | | |
| | | | | |
Supplemental Data | | | | | | | | | | | | | | | | | | | | |
Net assets, end of year (000) | | $ | 799,774 | | | $ | 810,031 | | | $ | 598,067 | | | $ | 552,687 | | | $ | 520,933 | |
| | | | | | | | | | | | | | | | | | | | |
Portfolio turnover rate(g) | | | 1,209 | % | | | 1,515 | % | | | 1,728 | % | | | 1,789 | % | | | 2,258 | % |
| | | | | | | | | | | | | | | | | | | | |
| (a) | Based on average shares outstanding. |
| (b) | Distributions for annual periods determined in accordance with U.S. federal income tax regulations. |
| (c) | Amount is greater than $(0.005) per share. |
| (d) | Where applicable, assumes the reinvestment of distributions. |
| (e) | Excludes expenses incurred indirectly as a result of investments in underlying funds as follows: |
| | | | | | | | | | | | | | | | | | | | | | | | | | | | | | | | | | | | | | | | | | |
| | | Year Ended March 31, | |
| | | | | | | | | | | |
| | | | | 2019 | | | | | | 2018 | | | | | | 2017 | | | | | | 2016 | | | | | | 2015 | | | | |
| | | | | | | | | | | |
Investments in underlying funds | | | | | 0.00 | % | | | | | | | 0.01 | % | | | | | | | 0.01 | % | | | | | | | 0.01 | % | | | | | | | 0.01 | % | | | | |
| | | | | | | | | | | | | | | | | | | | | | | | | | | | | | | | | | | | | | | | | | |
| (f) | Amount is less than 0.005%. |
| (g) | Includes mortgage dollar roll transactions (“MDRs”). Additional information regarding portfolio turnover rate is as follows: |
| | | | | | | | | | | | | | | | | | | | | | | | | | | | | | | | | | | | | | | | |
| | | Year Ended March 31, | |
| | | | | | | | | | | |
| | | | | 2019 | | | | | 2018 | | | | | | 2017 | | | | | | 2016 | | | | | | 2015 | | | | |
| | | | | | | | | | | |
Portfolio turnover rate (excluding MDRs) | | | | 683% | | | | | | | 833 | % | | | | | | | 1,040 | % | | | | | | | 1,090 | % | | | | | | | 1,356 | % | | | | |
| | | | | | | | | | | | | | | | | | | | | | | | | | | | | | | | | | | | | | | | |
See notes to financial statements.
| | |
| 90 | | 2 0 1 9 B L A C K R O C K A N N U A L R E P O R T T O S H A R E H O L D E R S |
Financial Highlights (continued)
(For a share outstanding throughout each period)
| | | | | | | | | | | | | | | | | | | | |
| | | BATS: Series P Portfolio | |
| |
| | | Year Ended March 31, | |
| | | | | |
| | | 2019 | | | 2018 | | | 2017 | | | 2016 | | | 2015 | |
| | | | | |
Net asset value, beginning of year | | $ | 9.56 | | | $ | 9.38 | | | $ | 8.95 | | | $ | 9.38 | | | $ | 10.24 | |
| | | | | | | | | | | | | | | | | | | | |
Net investment income(a) | | | 0.12 | | | | 0.08 | | | | 0.09 | | | | 0.10 | | | | 0.07 | |
Net realized and unrealized gain (loss) | | | (0.34 | ) | | | 0.15 | | | | 0.34 | | | | (0.53 | ) | | | (0.93 | ) |
| | | | | | | | | | | | | | | | | | | | |
Net increase (decrease) from investment operations | | | (0.22 | ) | | | 0.23 | | | | 0.43 | | | | (0.43 | ) | | | (0.86 | ) |
| | | | | | | | | | | | | | | | | | | | |
| | | | | |
Distributions(b) | | | | | | | | | | | | | | | | | | | | |
From net investment income | | | (0.09 | ) | | | (0.05 | ) | | | — | | | | — | | | | — | |
| | | | | | | | | | | | | | | | | | | | |
Total distributions | | | (0.09 | ) | | | (0.05 | ) | | | — | | | | — | | | | — | |
| | | | | | | | | | | | | | | | | | | | |
| | | | | |
Net asset value, end of year | | $ | 9.25 | | | $ | 9.56 | | | $ | 9.38 | | | $ | 8.95 | | | $ | 9.38 | |
| | | | | | | | | | | | | | | | | | | | |
| | | | | |
Total Return(c) | | | | | | | | | | | | | | | | | | | | |
Based on net asset value | | | (2.32 | )% | | | 2.49 | % | | | 4.80 | % | | | (4.48 | )% | | | (8.40 | )% |
| | | | | | | | | | | | | | | | | | | | |
| | | | | |
Ratios to Average Net Assets(d) | | | | | | | | | | | | | | | | | | | | |
Total expenses | | | 0.20 | % | | | 0.19 | % | | | 0.13 | % | | | 0.11 | % | | | 0.12 | % |
| | | | | | | | | | | | | | | | | | | | |
Total expenses after fees waived and/or reimbursed | | | 0.00 | %(e) | | | 0.00 | % | | | 0.00 | % | | | 0.00 | % | | | 0.00 | % |
| | | | | | | | | | | | | | | | | | | | |
Net investment income | | | 1.24 | % | | | 0.89 | % | | | 1.00 | % | | | 1.04 | % | | | 0.67 | % |
| | | | | | | | | | | | | | | | | | | | |
| | | | | |
Supplemental Data | | | | | | | | | | | | | | | | | | | | |
Net assets, end of year (000) | | $ | 51,654 | | | $ | 84,080 | | | $ | 121,054 | | | $ | 221,470 | | | $ | 322,498 | |
| | | | | | | | | | | | | | | | | | | | |
Portfolio turnover rate | | | 0 | % | | | 6 | % | | | 10 | % | | | 0 | % | | | 0 | % |
| | | | | | | | | | | | | | | | | | | | |
| (a) | Based on average shares outstanding. |
| (b) | Distributions for annual periods determined in accordance with U.S. federal income tax regulations. |
| (c) | Where applicable, assumes the reinvestment of distributions. |
| (d) | Excludes expenses incurred indirectly as a result of investments in underlying funds as follows: |
| | | | | | | | | | | | | | | | | | | | | | | | | | | | | | | | | | | | | | | | | | | | |
| | | Year Ended March 31, | |
| | | | | | | | | | | |
| | | | | | 2019 | | | | | | 2018 | | | | | | 2017 | | | | | | 2016 | | | | | | 2015 | | | | |
| | | | | | | | | | | |
Investments in underlying funds | | | | | | | 0.16 | % | | | | | | | 0.17 | % | | | | | | | 0.08 | % | | | | | | | 0.05 | % | | | | | | | 0.04 | % | | | | |
| | | | | | | | | | | | | | | | | | | | | | | | | | | | | | | | | | | | | | | | | | | | |
| (e) | Amount is less than 0.005%. |
See notes to financial statements.
| | | | |
| F I N A N C I A L H I G H L I G H T S | | | 91 | |
Financial Highlights (continued)
(For a share outstanding throughout each period)
| | | | | | | | | | | | | | | | | | | | |
| | | BATS: Series S Portfolio | |
| |
| | | Year Ended March 31, | |
| | | | | |
| | | 2019 | | | 2018 | | | 2017 | | | 2016 | | | 2015 | |
| | | | | |
Net asset value, beginning of year | | $ | 9.38 | | | $ | 9.53 | | | $ | 9.54 | | | $ | 9.76 | | | $ | 9.84 | |
| | | | | | | | | | | | | | | | | | | | |
Net investment income(a) | | | 0.25 | | | | 0.20 | | | | 0.19 | | | | 0.26 | | | | 0.23 | |
Net realized and unrealized gain (loss) | | | 0.13 | | | | (0.09 | ) | | | 0.11 | | | | (0.15 | ) | | | (0.05 | ) |
| | | | | | | | | | | | | | | | | | | | |
Net increase from investment operations | | | 0.38 | | | | 0.11 | | | | 0.30 | | | | 0.11 | | | | 0.18 | |
| | | | | | | | | | | | | | | | | | | | |
| | | | | |
Distributions(b) | | | | | | | | | | | | | | | | | | | | |
From net investment income | | | (0.26 | ) | | | (0.26 | ) | | | (0.31 | ) | | | (0.33 | ) | | | (0.26 | ) |
From net realized gain | | | — | | | | — | | | | — | | | | — | | | | — | |
| | | | | | | | | | | | | | | | | | | | |
Total distributions | | | (0.26 | ) | | | (0.26 | ) | | | (0.31 | ) | | | (0.33 | ) | | | (0.26 | ) |
| | | | | | | | | | | | | | | | | | | | |
| | | | | |
Net asset value, end of year | | $ | 9.50 | | | $ | 9.38 | | | $ | 9.53 | | | $ | 9.54 | | | $ | 9.76 | |
| | | | | | | | | | | | | | | | | | | | |
| | | | | |
Total Return(c) | | | | | | | | | | | | | | | | | | | | |
Based on net asset value | | | 4.11 | % | | | 1.15 | % | | | 3.21 | % | | | 1.18 | % | | | 1.81 | %(d) |
| | | | | | | | | | | | | | | | | | | | |
| | | | | |
Ratios to Average Net Assets | | | | | | | | | | | | | | | | | | | | |
Total expenses | | | 0.69 | %(e) | | | 0.76 | %(e) | | | 0.48 | % | | | 0.31 | % | | | 0.16 | % |
| | | | | | | | | | | | | | | | | | | | |
Total expenses after fees waived and/or reimbursed | | | 0.56 | %(e) | | | 0.59 | %(e) | | | 0.34 | % | | | 0.18 | % | | | 0.02 | % |
| | | | | | | | | | | | | | | | | | | | |
Total expenses after fees waived and/or reimbursed and excluding interest expense | | | 0.00 | %(e)(f) | | | 0.00 | %(e) | | | 0.00 | % | | | 0.00 | % | | | 0.00 | % |
| | | | | | | | | | | | | | | | | | | | |
Net investment income | | | 2.62 | %(e) | | | 2.11 | %(e) | | | 2.37 | % | | | 2.91 | % | | | 2.32 | % |
| | | | | | | | | | | | | | | | | | | | |
| | | | | |
Supplemental Data | | | | | | | | | | | | | | | | | | | | |
Net assets, end of year (000) | | $ | 163,176 | | | $ | 175,939 | | | $ | 191,903 | | | $ | 238,237 | | | $ | 266,124 | |
| | | | | | | | | | | | | | | | | | | | |
Portfolio turnover rate(g) | | | 184 | % | | | 263 | % | | | 279 | % | | | 270 | % | | | 318 | % |
| | | | | | | | | | | | | | | | | | | | |
| (a) | Based on average shares outstanding. |
| (b) | Distributions for annual periods determined in accordance with U.S. federal income tax regulations. |
| (c) | Where applicable, assumes the reinvestment of distributions. |
| (d) | Includes a payment by an affiliate to compensate for investments erroneously made in violation of the investment guidelines, which impacted the Fund’s total return. Excluding this payment, the Fund’s total return would have been 1.70%. |
| (e) | Excludes expenses incurred indirectly as a result of investments in underlying funds as follows: |
| | | | | | | | | | | | | | | | | | |
| | | Year Ended March 31, | | | |
| | | | | | |
| | | | | 2019 | | | | | 2018 | | | | | | |
| | | | | | |
Investments in underlying funds | | | | | 0.01 | % | | | | | 0.01 | % | | | | | | |
| | | | | | | | | | | | | | | | | | |
| (f) | Amount is less than 0.005%. |
| (g) | Includes MDRs. Additional information regarding portfolio turnover rate is as follows: |
| | | | | | | | | | | | | | | | | | | | | | | | | | | | | | | | | | | | | | | | | | | | |
| | | Year Ended March 31, | |
| | | | | | | | | | | |
| | | | | | 2019 | | | | | | 2018 | | | | | | 2017 | | | | | | 2016 | | | | | | 2015 | | | | |
| | | | | | | | | | | |
Portfolio turnover rate (excluding MDRs) | | | | | | | 112 | % | | | | | | | 148 | % | | | | | | | 163 | % | | | | | | | 178 | % | | | | | | | 239 | % | | | | |
| | | | | | | | | | | | | | | | | | | | | | | | | | | | | | | | | | | | | | | | | | | | |
See notes to financial statements.
| | |
| 92 | | 2 0 1 9 B L A C K R O C K A N N U A L R E P O R T T O S H A R E H O L D E R S |
Notes to Financial Statements
BlackRock Allocation Target Shares (the “Trust”) is registered under the Investment Company Act of 1940, as amended (the “1940 Act”), as an open-end management investment company. The Trust is organized as a Delaware statutory trust. The following, each of which is a series of the Trust, are referred to herein collectively as the “Funds” or individually as a “Fund”:
| | | | |
| | | |
| Fund Name | | Herein Referred To As | | Diversification Classification |
BATS: Series A Portfolio | | Series A | | Diversified(a) |
BATS: Series C Portfolio | | Series C | | Diversified |
BATS: Series E Portfolio | | Series E | | Diversified |
BATS: Series M Portfolio | | Series M | | Diversified |
BATS: Series P Portfolio | | Series P | | Diversified |
BATS: Series S Portfolio | | Series S | | Diversified |
| | (a) | The Fund’s classification changed from non-diversified to diversified during the reporting period. | |
Shares of the Funds are offered to separate account clients of the adviser, BlackRock Advisors, LLC (the “Manager”) or certain of its affiliates. Series A is also offered to collective trust funds managed by BlackRock Institutional Trust Company, N.A., an affiliate of the investment adviser, and mutual funds advised by the Manager or its affiliates. Participants in wrap-fee programs pay a single aggregate fee to the program sponsor for all costs and expenses of the wrap-fee programs including investment advice and portfolio execution.
The Funds, together with certain other registered investment companies advised by the Manager or its affiliates, are included in a complex of non-index fixed-income mutual funds and all BlackRock-advised closed-end funds referred to as the BlackRock Fixed-Income Complex.
| 2. | SIGNIFICANT ACCOUNTING POLICIES |
The financial statements are prepared in conformity with accounting principles generally accepted in the United States of America (“U.S. GAAP”), which may require management to make estimates and assumptions that affect the reported amounts of assets and liabilities in the financial statements, disclosure of contingent assets and liabilities at the date of the financial statements and the reported amounts of increases and decreases in net assets from operations during the reporting period. Actual results could differ from those estimates. Each Fund is considered an investment company under U.S. GAAP and follows the accounting and reporting guidance applicable to investment companies. Below is a summary of significant accounting policies:
Investment Transactions and Income Recognition:For financial reporting purposes, investment transactions are recorded on the dates the transactions are executed (the “trade dates”). Realized gains and losses on investment transactions are determined on the identified cost basis. Dividend income is recorded on the ex-dividend date. Interest income, including amortization and accretion of premiums and discounts on debt securities, is recognized on an accrual basis.
Foreign Currency Translation:Each Fund’s books and records are maintained in U.S. dollars. Securities and other assets and liabilities denominated in foreign currencies are translated into U.S. dollars using exchange rates determined as of the close of trading on the New York Stock Exchange (“NYSE”). Purchases and sales of investments are recorded at the rates of exchange prevailing on the respective dates of such transactions. Generally, when the U.S. dollar rises in value against a foreign currency, the investments denominated in that currency will lose value; the opposite effect occurs if the U.S. dollar falls in relative value.
Each Fund does not isolate the portion of the results of operations arising as a result of changes in the exchange rates from the changes in the market prices of investments held or sold for financial reporting purposes. Accordingly, the effects of changes in exchange rates on investments are not segregated in the Statements of Operations from the effects of changes in market prices of those investments, but are included as a component of net realized and unrealized gain (loss) from investments. Each Fund reports realized currency gains (losses) on foreign currency related transactions as components of net realized gain (loss) for financial reporting purposes, whereas such components are generally treated as ordinary income for U.S. federal income tax purposes.
Defensive Positions:Investment policies may vary for temporary defensive purposes during periods in which the investment adviser believes that conditions in the securities markets or other economic, financial or political conditions warrant. Under such conditions, a Fund may invest up to 100% of its total assets in U.S. Government securities, certificates of deposit, repurchase agreements that involve purchases of debt securities, bankers’ acceptances and other bank obligations, commercial paper, money market funds and/or other debt securities, or may hold its assets in cash. The investment adviser applies this defensive posture as applicable and is consistent with each Fund’s investment policies.
Segregation and Collateralization:In cases where a Fund enters into certain investments (e.g., dollar rolls, to-be-announced (“TBA”) sale commitments, futures contracts, forward foreign currency exchange contracts, options written and swaps) or certain borrowings (e.g., reverse repurchase transactions and TOB Trust transactions) that would be treated as “senior securities” for 1940 Act purposes, a Fund may segregate or designate on its books and records cash or liquid assets having a market value at least equal to the amount of its future obligations under such investments or borrowings. Doing so allows the investment or borrowing to be excluded from treatment as a “senior security.” Furthermore, if required by an exchange or counterparty agreement, the Funds may be required to deliver/deposit cash and/or securities to/with an exchange, or broker-dealer or custodian as collateral for certain investments or obligations.
Distributions:Distributions from net investment income are declared daily and paid monthly, except for Series P, which declares and pays dividends at least annually. Distributions of capital gains are recorded on the ex-dividend date and made at least annually. The character and timing of distributions are determined in accordance with U.S. federal income tax regulations, which may differ from U.S. GAAP.
Deferred Compensation Plan:Under the Deferred Compensation Plan (the “Plan”) approved by the Trust’s Board effective January 1, 2019, the independent Trustees (“Independent Trustees”) may defer a portion of their annual complex-wide compensation. Deferred amounts earn an approximate return as though equivalent dollar amounts had been invested in common shares of certain funds in the BlackRock Fixed-Income Complex selected by the Independent Trustees. This has the same economic effect for the Independent Trustees as if the Independent Trustees had invested the deferred amounts directly in certain funds in the BlackRock Fixed-Income Complex.
| | | | |
| N O T E S T O F I N A N C I A L S T A T E M E N T S | | | 93 | |
Notes to Financial Statements (continued)
The Plan is not funded and obligations thereunder represent general unsecured claims against the general assets of each Fund, as applicable. Deferred compensation liabilities are included in the Trustees’ and Officer’s fees payable in the Statements of Assets and Liabilities and will remain as a liability of the Funds until such amounts are distributed in accordance with the Plan.
Recent Accounting Standards:In March 2017, the Financial Accounting Standards Board issued Accounting Standards Update “Premium Amortization on Purchased Callable Debt Securities” which amends the amortization period for certain purchased callable debt securities. Under the new guidance, the premium amortization of purchased callable debt securities that have explicit, non-contingent call features and are callable at fixed prices will be amortized to the earliest call date. The guidance will be applied on a modified retrospective basis and is effective for fiscal years, and their interim periods, beginning after December 15, 2018. Management continues to evaluate the impact of this guidance to the Funds.
In August 2018, the Financial Accounting Standards Board issued Accounting Standards Update 2018-13 “Changes to the Disclosure Requirements for Fair Value Measurement” which modifies disclosure requirements for fair value measurements. The guidance is effective for fiscal years beginning after December 15, 2019 and for interim periods within those fiscal years. Management continues to evaluate the impact of this guidance to the Funds.
Indemnifications:In the normal course of business, a Fund enters into contracts that contain a variety of representations that provide general indemnification. A Fund’s maximum exposure under these arrangements is unknown because it involves future potential claims against a Fund, which cannot be predicted with any certainty.
Other:Expenses directly related to a Fund are charged to that Fund. Other operating expenses shared by several funds, including other funds managed by the Manager, are prorated among those funds on the basis of relative net assets or other appropriate methods.
The Funds have an arrangement with their custodian whereby credits are earned on uninvested cash balances, which could be used to reduce custody fees and/or overdraft charges. The Funds may incur charges on certain uninvested cash balances and overdrafts, subject to certain conditions.
| 3. | INVESTMENT VALUATION AND FAIR VALUE MEASUREMENTS |
Investment Valuation Policies:The Funds’ investments are valued at fair value (also referred to as “market value” within the financial statements) as of the close of trading on the NYSE (generally 4:00 p.m., Eastern time) (or if the reporting date falls on a day the NYSE is closed, investments are valued at fair value as of the period end). U.S. GAAP defines fair value as the price the Funds would receive to sell an asset or pay to transfer a liability in an orderly transaction between market participants at the measurement date. The Funds determine the fair values of their financial instruments using various independent dealers or pricing services under policies approved by the Board of Trustees of the Trust (the “Board”). The BlackRock Global Valuation Methodologies Committee (the “Global Valuation Committee”) is the committee formed by management to develop global pricing policies and procedures and to oversee the pricing function for all financial instruments.
Fair Value Inputs and Methodologies:The following methods and inputs are used to establish the fair value of each Fund’s assets and liabilities:
| | • | | Fixed-income securities for which market quotations are readily available are generally valued using the last available bid prices or current market quotations provided by independent dealers or third party pricing services. Floating rate loan interests are valued at the mean of the bid prices from one or more independent brokers or dealers as obtained from a third party pricing service. Pricing services generally value fixed-income securities assuming orderly transactions of an institutional round lot size, but a fund may hold or transact in such securities in smaller, odd lot sizes. Odd lots often trade at lower prices than institutional round lots. The pricing services may use matrix pricing or valuation models that utilize certain inputs and assumptions to derive values, including transaction data (e.g., recent representative bids and offers), credit quality information, perceived market movements, news, and other relevant information. Certain fixed-income securities, including asset-backed and mortgage related securities may be valued based on valuation models that consider the estimated cash flows of each tranche of the entity, establish a benchmark yield and develop an estimated tranche specific spread to the benchmark yield based on the unique attributes of the tranche. The amortized cost method of valuation may be used with respect to debt obligations with sixty days or less remaining to maturity unless the Manager determines such method does not represent fair value. |
| | • | | Municipal investments (including commitments to purchase such investments on a “when-issued” basis) are valued on the basis of prices provided by dealers or pricing services. In determining the value of a particular investment, pricing services may use certain information with respect to transactions in such investments, quotations from dealers, pricing matrixes, market transactions in comparable investments and information with respect to various relationships between investments. |
| | • | | Investments in open-end U.S. mutual funds are valued at net asset value (“NAV”) each business day. |
| | • | | Futures contracts traded on exchanges are valued at their last sale price. |
| | • | | Forward foreign currency exchange contracts are valued at the mean between the bid and ask prices and are determined as of the close of trading on the NYSE. Interpolated values are derived when the settlement date of the contract is an interim date for which quotations are not available. |
| | • | | Exchange-traded options are valued at the mean between the last bid and ask prices at the close of the options market in which the options trade. An exchange-traded option for which there is no mean price is valued at the last bid (long positions) or ask (short positions) price. If no bid or ask price is available, the prior day’s price will be used, unless it is determined that the prior day’s price no longer reflects the fair value of the option. Over-the-counter (“OTC”) options and options on swaps (“swaptions”) are valued by an independent pricing service using a mathematical model, which incorporates a number of market data factors, such as the trades and prices of the underlying instruments. |
| | • | | Swap agreements are valued utilizing quotes received daily by the Funds’ pricing service or through brokers, which are derived using daily swap curves and models that incorporate a number of market data factors, such as discounted cash flows, trades and values of the underlying reference instruments. |
| | • | | TBA commitments are valued on the basis of last available bid prices or current market quotations provided by pricing services. |
If events (e.g., a company announcement, market volatility or a natural disaster) occur that are expected to materially affect the value of such investments, or in the event that the application of these methods of valuation results in a price for an investment that is deemed not to be representative of the market value of such investment, or if a
| | |
| 94 | | 2 0 1 9 B L A C K R O C K A N N U A L R E P O R T T O S H A R E H O L D E R S |
Notes to Financial Statements (continued)
price is not available, the investment will be valued by the Global Valuation Committee, or its delegate, in accordance with a policy approved by the Board as reflecting fair value (“Fair Valued Investments”). The fair valuation approaches that may be used by the Global Valuation Committee will include market approach, income approach and cost approach. Valuation techniques such as discounted cash flow, use of market comparables and matrix pricing are types of valuation approaches and are typically used in determining fair value. When determining the price for Fair Valued Investments, the Global Valuation Committee, or its delegate, seeks to determine the price that each Fund might reasonably expect to receive or pay from the current sale or purchase of that asset or liability in an arm’s-length transaction. Fair value determinations shall be based upon all available factors that the Global Valuation Committee, or its delegate, deems relevant and consistent with the principles of fair value measurement.
The Global Valuation Committee, or its delegate, employs various methods for calibrating valuation approaches for investments where an active market does not exist, including regular due diligence of each Fund’s pricing vendors, regular reviews of key inputs and assumptions, transactional back-testing or disposition analysis to compare unrealized gains and losses to realized gains and losses, reviews of missing or stale prices and large movements in market values and reviews of any market related activity. The pricing of all Fair Valued Investments is subsequently reported to the Board or a committee thereof on a quarterly basis. As a result of the inherent uncertainty in valuation of these investments, the fair values may differ from the values that would have been used had an active market existed.
For investments in equity or debt issued by privately held companies or funds (“Private Company” or collectively, the “Private Companies”) and other Fair Valued Investments, the fair valuation approaches that are used by third party pricing services utilize one or a combination of, but not limited to, the following inputs.
| | |
| | | Standard Inputs Generally Considered By Third Party Pricing Services |
Market approach | | (i) recent market transactions, including subsequent rounds of financing, in the underlying investment or comparable issuers; (ii) recapitalizations and other transactions across the capital structure; and (iii) market multiples of comparable issuers. |
Income approach | | (i) future cash flows discounted to present and adjusted as appropriate for liquidity, credit and/or market risks; (ii) quoted prices for similar investments or assets in active markets; and (iii) other risk factors, such as interest rates, yield curves, volatilities, prepayment speeds, loss severities, credit risks, recovery rates, liquidation amounts and/or default rates. |
Cost approach | | (i) audited or unaudited financial statements, investor communications and financial or operational metrics issued by the Private Company; (ii) changes in the valuation of relevant indices or publicly traded companies comparable to the Private Company; (iii) relevant news and other public sources; and (iv) known secondary market transactions in the Private Company’s interests and merger or acquisition activity in companies comparable to the Private Company. |
Investments in series of preferred stock issued by Private Companies are typically valued utilizing market approach in determining the enterprise value of the company. Such investments often contain rights and preferences that differ from other series of preferred and common stock of the same issuer. Valuation techniques such as an option pricing model (“OPM”), a probability weighted expected return model (“PWERM”) or a hybrid of those techniques are used in allocating enterprise value of the company, as deemed appropriate under the circumstances. The use of OPM and PWERM techniques involve a determination of the exit scenarios of the investment in order to appropriately allocate the enterprise value of the company among the various parts of its capital structure.
The Private Companies are not subject to the public company disclosure, timing, and reporting standards as other investments held by a Fund. Typically, the most recently available information by a Private Company is as of a date that is earlier than the date a Fund is calculating its NAV. This factor may result in a difference between the value of the investment and the price a Fund could receive upon the sale of the investment.
Fair Value Hierarchy:Various inputs are used in determining the fair value of investments and derivative financial instruments. These inputs to valuation techniques are categorized into a fair value hierarchy consisting of three broad levels for financial statement purposes as follows:
| | • | | Level 1 — Unadjusted price quotations in active markets/exchanges for identical assets or liabilities that each Fund has the ability to access |
| | • | | Level 2 — Other observable inputs (including, but not limited to, quoted prices for similar assets or liabilities in markets that are active, quoted prices for identical or similar assets or liabilities in markets that are not active, inputs other than quoted prices that are observable for the assets or liabilities (such as interest rates, yield curves, volatilities, prepayment speeds, loss severities, credit risks and default rates) or other market-corroborated inputs) |
| | • | | Level 3 — Unobservable inputs based on the best information available in the circumstances, to the extent observable inputs are not available (including each Fund’s own assumptions used in determining the fair value of investments and derivative financial instruments) |
The hierarchy gives the highest priority to unadjusted quoted prices in active markets for identical assets or liabilities (Level 1 measurements) and the lowest priority to unobservable inputs (Level 3 measurements). Accordingly, the degree of judgment exercised in determining fair value is greatest for instruments categorized in Level 3. The inputs used to measure fair value may fall into different levels of the fair value hierarchy. In such cases, for disclosure purposes, the fair value hierarchy classification is determined based on the lowest level input that is significant to the fair value measurement in its entirety. Investments classified within Level 3 have significant unobservable inputs used by the Global Valuation Committee in determining the price for Fair Valued Investments. Level 3 investments include equity or debt issued by Private Companies. There may not be a secondary market, and/or there are a limited number of investors. Level 3 investments may also be adjusted to reflect illiquidity and/or non-transferability, with the amount of such discount estimated by the Global Valuation Committee in the absence of market information.
Changes in valuation techniques may result in transfers into or out of an assigned level within the hierarchy. In accordance with each Fund’s policy, transfers between different levels of the fair value hierarchy are deemed to have occurred as of the beginning of the reporting period. The categorization of a value determined for investments and derivative financial instruments is based on the pricing transparency of the investments and derivative financial instruments and is not necessarily an indication of the risks associated with investing in those securities.
| | | | |
| N O T E S T O F I N A N C I A L S T A T E M E N T S | | | 95 | |
Notes to Financial Statements (continued)
| 4. | SECURITIES AND OTHER INVESTMENTS |
Asset-Backed and Mortgage-Backed Securities:Asset-backed securities are generally issued as pass-through certificates or as debt instruments. Asset-backed securities issued as pass-through certificates represent undivided fractional ownership interests in an underlying pool of assets. Asset-backed securities issued as debt instruments, which are also known as collateralized obligations, are typically issued as the debt of a special purpose entity organized solely for the purpose of owning such assets and issuing such debt. Asset-backed securities are often backed by a pool of assets representing the obligations of a number of different parties. The yield characteristics of certain asset-backed securities may differ from traditional debt securities. One such major difference is that all or a principal part of the obligations may be prepaid at any time because the underlying assets (i.e., loans) may be prepaid at any time. As a result, a decrease in interest rates in the market may result in increases in the level of prepayments as borrowers, particularly mortgagors, refinance and repay their loans. An increased prepayment rate with respect to an asset-backed security will have the effect of shortening the maturity of the security. In addition, a fund may subsequently have to reinvest the proceeds at lower interest rates. If a fund has purchased such an asset-backed security at a premium, a faster than anticipated prepayment rate could result in a loss of principal to the extent of the premium paid.
For mortgage pass-through securities (the “Mortgage Assets”) there are a number of important differences among the agencies and instrumentalities of the U.S. Government that issue mortgage-related securities and among the securities that they issue. For example, mortgage-related securities guaranteed by Ginnie Mae are guaranteed as to the timely payment of principal and interest by Ginnie Mae and such guarantee is backed by the full faith and credit of the United States. However, mortgage-related securities issued by Freddie Mac and Fannie Mae, including Freddie Mac and Fannie Mae guaranteed mortgage pass-through certificates, which are solely the obligations of Freddie Mac and Fannie Mae, are not backed by or entitled to the full faith and credit of the United States, but are supported by the right of the issuer to borrow from the U.S. Treasury.
Non-agency mortgage-backed securities are securities issued by non-governmental issuers and have no direct or indirect government guarantees of payment and are subject to various risks. Non-agency mortgage loans are obligations of the borrowers thereunder only and are not typically insured or guaranteed by any other person or entity. The ability of a borrower to repay a loan is dependent upon the income or assets of the borrower. A number of factors, including a general economic downturn, acts of God, terrorism, social unrest and civil disturbances, may impair a borrower’s ability to repay its loans.
Collateralized Debt Obligations:Collateralized debt obligations (“CDOs”), including collateralized bond obligations (“CBOs”) and collateralized loan obligations (“CLOs”), are types of asset-backed securities. A CDO is an entity that is backed by a diversified pool of debt securities (CBOs) or syndicated bank loans (CLOs). The cash flows of the CDO can be split into multiple segments, called “tranches,” which will vary in risk profile and yield. The riskiest segment is the subordinated or “equity” tranche. This tranche bears the greatest risk of defaults from the underlying assets in the CDO and serves to protect the other, more senior, tranches from default in all but the most severe circumstances. Since it is shielded from defaults by the more junior tranches, a “senior” tranche will typically have higher credit ratings and lower yields than their underlying securities, and often receive investment grade ratings from one or more of the nationally recognized rating agencies. Despite the protection from the more junior tranches, senior tranches can experience substantial losses due to actual defaults, increased sensitivity to future defaults and the disappearance of one or more protecting tranches as a result of changes in the credit profile of the underlying pool of assets.
Inflation-Indexed Bonds:Inflation-indexed bonds (other than municipal inflation-indexed and certain corporate inflation-indexed bonds) are fixed-income securities whose principal value is periodically adjusted according to the rate of inflation. If the index measuring inflation rises or falls, the principal value of inflation-indexed bonds (other than municipal inflation-indexed and certain corporate inflation-indexed bonds) will be adjusted upward or downward, and consequently the interest payable on these securities (calculated with respect to a larger or smaller principal amount) will be increased or reduced, respectively. Any upward or downward adjustment in the principal amount of an inflation-indexed bond will be included as interest income in the Statements of Operations, even though investors do not receive their principal until maturity. Repayment of the original bond principal upon maturity (as adjusted for inflation) is guaranteed in the case of U.S. Treasury inflation-indexed bonds. For bonds that do not provide a similar guarantee, the adjusted principal value of the bond repaid at maturity may be less than the original principal. With regard to municipal inflation-indexed bonds and certain corporate inflation-indexed bonds, the inflation adjustment is typically reflected in the semi-annual coupon payment. As a result, the principal value of municipal inflation-indexed bonds and such corporate inflation-indexed bonds does not adjust according to the rate of inflation.
Multiple Class Pass-Through Securities:Multiple class pass-through securities, including collateralized mortgage obligations (“CMOs”) and commercial mortgage-backed securities, may be issued by Ginnie Mae, U.S. Government agencies or instrumentalities or by trusts formed by private originators of, or investors in, mortgage loans. In general, CMOs are debt obligations of a legal entity that are collateralized by a pool of residential or commercial mortgage loans or Mortgage Assets. The payments on these are used to make payments on the CMOs or multiple pass-through securities. Multiple class pass-through securities represent direct ownership interests in the Mortgage Assets. Classes of CMOs include interest only (“IOs”), principal only (“POs”), planned amortization classes and targeted amortization classes. IOs and POs are stripped mortgage-backed securities representing interests in a pool of mortgages, the cash flow from which has been separated into interest and principal components. IOs receive the interest portion of the cash flow while POs receive the principal portion. IOs and POs can be extremely volatile in response to changes in interest rates. As interest rates rise and fall, the value of IOs tends to move in the same direction as interest rates. POs perform best when prepayments on the underlying mortgages rise since this increases the rate at which the principal is returned and the yield to maturity on the PO. When payments on mortgages underlying a PO are slower than anticipated, the life of the PO is lengthened and the yield to maturity is reduced. If the underlying Mortgage Assets experience greater than anticipated prepayments of principal, a fund’s initial investment in the IOs may not fully recoup.
Stripped Mortgage-Backed Securities:Stripped mortgage-backed securities are typically issued by the U.S. Government, its agencies and instrumentalities. Stripped mortgage-backed securities are usually structured with two classes that receive different proportions of the interest (IOs) and principal (POs) distributions on a pool of Mortgage Assets. Stripped mortgage-backed securities may be privately issued.
Zero-Coupon Bonds:Zero-coupon bonds are normally issued at a significant discount from face value and do not provide for periodic interest payments. These bonds may experience greater volatility in market value than other debt obligations of similar maturity which provide for regular interest payments.
Capital Securities and Trust Preferred Securities:Capital securities, including trust preferred securities, are typically issued by corporations, generally in the form of interest-bearing notes with preferred securities characteristics. In the case of trust preferred securities, an affiliated business trust of a corporation issues these securities, generally in the form of beneficial interests in subordinated debentures or similarly structured securities. The securities can be structured with either a fixed or adjustable coupon that can have either a perpetual or stated maturity date. For trust preferred securities, the issuing bank or corporation pays interest to the trust, which is then distributed to holders of these securities as a dividend. Dividends can be deferred without creating an event of default or acceleration, although maturity cannot take place unless
| | |
| 96 | | 2 0 1 9 B L A C K R O C K A N N U A L R E P O R T T O S H A R E H O L D E R S |
Notes to Financial Statements (continued)
all cumulative payment obligations have been met. The deferral of payments does not affect the purchase or sale of these securities in the open market. These securities generally are rated below that of the issuing company’s senior debt securities and are freely callable at the issuer’s option.
Preferred Stocks:Preferred stock has a preference over common stock in liquidation (and generally in receiving dividends as well), but is subordinated to the liabilities of the issuer in all respects. As a general rule, the market value of preferred stock with a fixed dividend rate and no conversion element varies inversely with interest rates and perceived credit risk, while the market price of convertible preferred stock generally also reflects some element of conversion value. Because preferred stock is junior to debt securities and other obligations of the issuer, deterioration in the credit quality of the issuer will cause greater changes in the value of a preferred stock than in a more senior debt security with similar stated yield characteristics. Unlike interest payments on debt securities, preferred stock dividends are payable only if declared by the issuer’s board of directors. Preferred stock also may be subject to optional or mandatory redemption provisions.
Floating Rate Loan Interests:Floating rate loan interests are typically issued to companies (the “borrower”) by banks, other financial institutions, or privately and publicly offered corporations (the “lender”). Floating rate loan interests are generally non-investment grade, often involve borrowers whose financial condition is troubled or uncertain and companies that are highly leveraged or in bankruptcy proceedings. In addition, transactions in floating rate loan interests may settle on a delayed basis, which may result in proceeds from the sale not being readily available for a fund to make additional investments or meet its redemption obligations. Floating rate loan interests may include fully funded term loans or revolving lines of credit. Floating rate loan interests are typically senior in the corporate capital structure of the borrower. Floating rate loan interests generally pay interest at rates that are periodically determined by reference to a base lending rate plus a premium. Since the rates reset only periodically, changes in prevailing interest rates (and particularly sudden and significant changes) can be expected to cause some fluctuations in the NAV of a fund to the extent that it invests in floating rate loan interests. The base lending rates are generally the lending rate offered by one or more European banks, such as the London Interbank Offered Rate (“LIBOR”), the prime rate offered by one or more U.S. banks or the certificate of deposit rate. Floating rate loan interests may involve foreign borrowers, and investments may be denominated in foreign currencies. These investments are treated as investments in debt securities for purposes of a fund’s investment policies.
When a fund purchases a floating rate loan interest, it may receive a facility fee and when it sells a floating rate loan interest, it may pay a facility fee. On an ongoing basis, a fund may receive a commitment fee based on the undrawn portion of the underlying line of credit amount of a floating rate loan interest. Facility and commitment fees are typically amortized to income over the term of the loan or term of the commitment, respectively. Consent and amendment fees are recorded to income as earned. Prepayment penalty fees, which may be received by a fund upon the prepayment of a floating rate loan interest by a borrower, are recorded as realized gains. A fund may invest in multiple series or tranches of a loan. A different series or tranche may have varying terms and carry different associated risks.
Floating rate loan interests are usually freely callable at the borrower’s option. A fund may invest in such loans in the form of participations in loans (“Participations”) or assignments (“Assignments”) of all or a portion of loans from third parties. Participations typically will result in a fund having a contractual relationship only with the lender, not with the borrower. A fund has the right to receive payments of principal, interest and any fees to which it is entitled only from the lender selling the Participation and only upon receipt by the lender of the payments from the borrower. In connection with purchasing Participations, a fund generally will have no right to enforce compliance by the borrower with the terms of the loan agreement, nor any rights of offset against the borrower. A fund may not benefit directly from any collateral supporting the loan in which it has purchased the Participation. As a result, a fund assumes the credit risk of both the borrower and the lender that is selling the Participation. A fund’s investment in loan participation interests involves the risk of insolvency of the financial intermediaries who are parties to the transactions. In the event of the insolvency of the lender selling the Participation, a fund may be treated as a general creditor of the lender and may not benefit from any offset between the lender and the borrower. Assignments typically result in a fund having a direct contractual relationship with the borrower, and a fund may enforce compliance by the borrower with the terms of the loan agreement.
Forward Commitments and When-Issued Delayed Delivery Securities:Certain funds may purchase securities on a when-issued basis and may purchase or sell securities on a forward commitment basis. Settlement of such transactions normally occurs within a month or more after the purchase or sale commitment is made. A fund may purchase securities under such conditions with the intention of actually acquiring them, but may enter into a separate agreement to sell the securities before the settlement date. Since the value of securities purchased may fluctuate prior to settlement, a fund may be required to pay more at settlement than the security is worth. In addition, a fund is not entitled to any of the interest earned prior to settlement. When purchasing a security on a delayed delivery basis, a fund assumes the rights and risks of ownership of the security, including the risk of price and yield fluctuations. In the event of default by the counterparty, a fund’s maximum amount of loss is the unrealized appreciation of unsettled when-issued transactions.
TBA Commitments:TBA commitments are forward agreements for the purchase or sale of mortgage-backed securities for a fixed price, with payment and delivery on an agreed upon future settlement date. The specific securities to be delivered are not identified at the trade date. However, delivered securities must meet specified terms, including issuer, rate and mortgage terms. When entering into TBA commitments, a fund may take possession of or deliver the underlying mortgage-backed securities but can extend the settlement or roll the transaction. TBA commitments involve a risk of loss if the value of the security to be purchased or sold declines or increases, respectively, prior to settlement date.
In order to better define contractual rights and to secure rights that will help a fund mitigate their counterparty risk, TBA commitments may be entered into by a fund under Master Securities Forward Transaction Agreements (each, an “MSFTA”). An MSFTA typically contains, among other things, collateral posting terms and netting provisions in the event of default and/or termination event. The collateral requirements are typically calculated by netting the mark-to-market amount for each transaction under such agreement and comparing that amount to the value of the collateral currently pledged by a fund and the counterparty. Cash collateral that has been pledged to cover the obligations of a fund and cash collateral received from the counterparty, if any, is reported separately in the Statements of Assets and Liabilities as cash pledged as collateral for TBA commitments or cash received as collateral for TBA commitments, respectively. Non-cash collateral pledged by a fund, if any, is noted in the Schedules of Investments. Typically, a fund is permitted to sell, re-pledge or use the collateral it receives; however, the counterparty is not permitted to do so. To the extent amounts due to a fund are not fully collateralized, contractually or otherwise, a fund bears the risk of loss from counterparty non-performance.
Mortgage Dollar Roll Transactions:Certain funds may sell TBA mortgage-backed securities and simultaneously contract to repurchase substantially similar (i.e., same type, coupon and maturity) securities on a specific future date at an agreed upon price. During the period between the sale and repurchase, a fund is not entitled to receive interest and principal payments on the securities sold. Mortgage dollar roll transactions are treated as purchases and sales and realizes gains and losses on these transactions. Mortgage dollar rolls involve the risk that the market value of the securities that a fund is required to purchase may decline below the agreed upon repurchase price of those securities.
Reverse Repurchase Agreements:Reverse repurchase agreements are agreements with qualified third party broker dealers in which a fund sells securities to a bank or
| | | | |
| N O T E S T O F I N A N C I A L S T A T E M E N T S | | | 97 | |
Notes to Financial Statements (continued)
broker-dealer and agrees to repurchase the same securities at a mutually agreed upon date and price. A fund receives cash from the sale to use for other investment purposes. During the term of the reverse repurchase agreement, a fund continues to receive the principal and interest payments on the securities sold. Certain agreements have no stated maturity and can be terminated by either party at any time. Interest on the value of the reverse repurchase agreements issued and outstanding is based upon competitive market rates determined at the time of issuance. A fund may utilize reverse repurchase agreements when it is anticipated that the interest income to be earned from the investment of the proceeds of the transaction is greater than the interest expense of the transaction. Reverse repurchase agreements involve leverage risk. If a fund suffers a loss on its investment of the transaction proceeds from a reverse repurchase agreement, a fund would still be required to pay the full repurchase price. Further, a fund remains subject to the risk that the market value of the securities repurchased declines below the repurchase price. In such cases, a fund would be required to return a portion of the cash received from the transaction or provide additional securities to the counterparty.
Cash received in exchange for securities delivered plus accrued interest due to the counterparty is recorded as a liability in the Statements of Assets and Liabilities at face value including accrued interest. Due to the short-term nature of the reverse repurchase agreements, face value approximates fair value. Interest payments made by a fund to the counterparties are recorded as a component of interest expense in the Statements of Operations. In periods of increased demand for the security, a fund may receive a fee for the use of the security by the counterparty, which may result in interest income to a fund.
For the year ended March 31, 2019, the average amount of reverse repurchase agreements outstanding and the daily weighted average interest rate were as follows:
| | | | | | | | |
| |
| | | Average
Borrowings | | | Daily Weighted
Average Interest Rate | |
| |
Series S | | $ | 40,475,372 | | | | 2.29 | % |
| |
Reverse repurchase transactions are entered into by a fund under Master Repurchase Agreements (each, an “MRA”), which permit a fund, under certain circumstances, including an event of default (such as bankruptcy or insolvency), to offset payables and/or receivables under the MRA with collateral held and/or posted to the counterparty and create one single net payment due to or from a fund. With reverse repurchase transactions, typically a fund and counterparty under an MRA are permitted to sell, re-pledge, or use the collateral associated with the transaction. Bankruptcy or insolvency laws of a particular jurisdiction may impose restrictions on or prohibitions against such a right of offset in the event of the MRA counterparty’s bankruptcy or insolvency. Pursuant to the terms of the MRA, a fund receives or posts securities as collateral with a market value in excess of the repurchase price to be paid or received by a fund upon the maturity of the transaction. Upon a bankruptcy or insolvency of the MRA counterparty, a fund is considered an unsecured creditor with respect to excess collateral and, as such, the return of excess collateral may be delayed.
As of period end, the following table is a summary of Series S’ open reverse repurchase agreements by counterparty which are subject to offset under an MRA on a net basis:
| | | | | | | | |
|
| Counterparty | | Reverse
Repurchase
Agreements | | | Fair Value of Non-cash
Collateral Pledged
Including Accrued Interest(a) | | Net Amount |
|
Barclays Capital Inc. | | $ | 1,843,936 | | | $ (1,843,936) | | $— |
BNP Paribas | | | 400,824 | | | (400,824) | | — |
Citigroup Global Markets, Inc. | | | 22,355,622 | | | (22,355,622) | | — |
RBC Capital Markets, LLC | | | 6,294,353 | | | (6,294,353) | | — |
| | | | | | | | |
| | $ | 30,894,735 | | | $(30,894,735) | | $— |
| | | | | | | | |
| | (a) | Collateral with a value of $32,926,997 has been pledged in connection with open reverse repurchase agreements. Excess of collateral pledged to the individual counterparty is not shown for financial reporting purposes. | |
In the event the counterparty of securities under an MRA files for bankruptcy or becomes insolvent, a fund’s use of the proceeds from the agreement may be restricted while the counterparty, or its trustee or receiver, determines whether or not to enforce a fund’s obligation to repurchase the securities.
Municipal Bonds Transferred to TOB Trusts:Certain funds leverage their assets through the use of “TOB Trust” transactions. The funds transfer municipal bonds into a special purpose trust (a “TOB Trust”). A TOB Trust issues two classes of beneficial interests: short-term floating rate interests (“TOB Trust Certificates”), which are sold to third party investors, and residual inverse floating rate interests (“TOB Residuals”), which are issued to the participating funds that contributed the municipal bonds to the TOB Trust. The TOB Trust Certificates have interest rates that reset weekly and their holders have the option to tender such certificates to the TOB Trust for redemption at par and any accrued interest at each reset date. The TOB Residuals held by a fund provide the fund with the right to cause the holders of a proportional share of the TOB Trust Certificates to tender their certificates to the TOB Trust at par plus accrued interest. The funds may withdraw a corresponding share of the municipal bonds from the TOB Trust. Other funds managed by the investment adviser may also contribute municipal bonds to a TOB Trust into which a fund has contributed bonds. If multiple BlackRock-advised funds participate in the same TOB Trust, the economic rights and obligations under the TOB Residuals will be shared among the funds ratably in proportion to their participation in the TOB Trust.
TOB Trusts are supported by a liquidity facility provided by a third party bank or other financial institution (the “Liquidity Provider”) that allows the holders of the TOB Trust Certificates to tender their certificates in exchange for payment of par plus accrued interest on any business day. The tendered TOB Trust Certificates are remarketed by a Remarketing Agent. In the event of a failed remarketing, the TOB Trust may draw upon a loan from the Liquidity Provider to purchase the tendered TOB Trust Certificates. Any loans made by the Liquidity Provider will be secured by the purchased TOB Trust Certificates held by the TOB Trust and will be subject to an increased interest rate based on number of days the loan is outstanding.
The TOB Trust may be collapsed without the consent of a fund, upon the occurrence of a termination event as defined in the TOB Trust agreement. Upon the occurrence of a termination event, a TOB Trust would be liquidated with the proceeds applied first to any accrued fees owed to the trustee of the TOB Trust, the Remarketing Agent and the Liquidity Provider. Upon certain termination events, TOB Trust Certificates holders will be paid before the TOB Residuals holders (i.e., the Funds) whereas in other termination events, TOB Trust Certificates holders and TOB Residuals holders will be paid pro rata.
| | |
| 98 | | 2 0 1 9 B L A C K R O C K A N N U A L R E P O R T T O S H A R E H O L D E R S |
Notes to Financial Statements (continued)
While a fund’s investment policies and restrictions expressly permit investments in inverse floating rate securities, such as TOB Residuals, they restrict the ability of a fund to borrow money for purposes of making investments. Each fund’s transfer of the municipal bonds to a TOB Trust is considered a secured borrowing for financial reporting purposes. The cash received by the TOB Trust from the sale of the TOB Trust Certificates, less certain transaction expenses, is paid to a fund. A fund typically invests the cash received in additional municipal bonds.
Accounting for TOB Trusts:The municipal bonds deposited into a TOB Trust are presented in a fund’s Schedule of Investments and the TOB Trust Certificates are shown in Other Liabilities in the Statements of Assets and Liabilities. Any loans drawn by the TOB Trust pursuant to the liquidity facility to purchase tendered TOB Trust Certificates are shown as Loan for TOB Trust Certificates. The carrying amount of a fund’s payable to the holder of the TOB Trust Certificates, as reported in the Statements of Assets and Liabilities as TOB Trust Certificates, approximates its fair value.
Interest income, including amortization and accretion of premiums and discounts, from the underlying municipal bonds is recorded by a fund on an accrual basis. Interest expense incurred on the TOB Trust transaction and other expenses related to remarketing, administration, trustee, liquidity and other services to a TOB Trust are shown as interest expense, fees and amortization of offering costs in the Statements of Operations. Fees paid upon creation of the TOB Trust are recorded as debt issuance costs and are amortized to interest expense, fees and amortization of offering costs in the Statements of Operations to the expected maturity of the TOB Trust. In connection with the restructurings of the TOB Trusts to non-bank sponsored TOB Trusts, a fund incurred non-recurring, legal and restructuring fees, which are recorded as interest expense, fees and amortization of deferred offering costs in the Statements of Operations. Amounts recorded within interest expense, fees and amortization of offering costs in the Statements of Operations are:
| | | | | | | | | | | | | | | | |
| |
| | | Interest
Expense | | | Liquidity
Fees | | | Other
Expenses | | | Total | |
| |
Series E | | $ | 130,375 | | | $ | 11,983 | | | $ | 2,624 | | | $ | 144,982 | |
| |
For the year March 31, 2019, the following table is a summary of each Fund’s TOB Trusts:
| | | | | | | | | | | | | | | | | | | | |
| |
| | | Underlying
Municipal Bonds
Transferred to
TOB Trusts(a) | | | Liability for
TOB Trust
Certificates(b) | | | Range of
Interest Rates
on TOB Trust
Certificates at
Period End | | | Average
TOB Trust
Certificates
Outstanding | | | Daily Weighted
Average
Rate of
Interest and
Other Expenses
on TOB Trusts | |
| |
Series E | | | $15,328,913 | | | | $8,085,000 | | | | 1.52% - 1.55% | | | | $6,604,863 | | | | 2.09 | % |
| |
| | (a) | The municipal bonds transferred to a TOB Trust are generally high grade municipal bonds. In certain cases, when municipal bonds transferred are lower grade municipal bonds, the TOB Trust transaction may include a credit enhancement feature that provides for the timely payment of principal and interest on the bonds to the TOB Trust by a credit enhancement provider in the event of default of the municipal bond. The TOB Trust would be responsible for the payment of the credit enhancement fee and the funds, as a TOB Residuals holders, would be responsible for reimbursement of any payments of principal and interest made by the credit enhancement provider. The maximum potential amounts owed by the funds, for such reimbursements, as applicable, are included in the maximum potential amounts disclosed for recourse TOB Trusts. | |
| | (b) | TOB Trusts may be structured on a non-recourse or recourse basis. When a fund invests in TOB Trusts on a non-recourse basis, the Liquidity Provider may be required to make a payment under the liquidity facility to allow the TOB Trust to repurchase TOB Trust Certificates. The Liquidity Provider will be reimbursed from the liquidation of bonds held in the TOB Trust. If a fund invests in a TOB Trust on a recourse basis, a fund enters into a reimbursement agreement with the Liquidity Provider where a fund is required to reimburse the Liquidity Provider for any shortfall between the amount paid by the Liquidity Provider and proceeds received from liquidation of municipal bonds held in the TOB Trust (the “Liquidation Shortfall”). As a result, if a fund invests in a recourse TOB Trust, a fund will bear the risk of loss with respect to any Liquidation Shortfall. If multiple funds participate in any such TOB Trust, these losses will be shared ratably, including the maximum potential amounts owed by a fund at March 31, 2019, in proportion to their participation in the TOB Trust. The recourse TOB Trusts are identified in the Schedules of Investments including the maximum potential amounts owed by a fund at March 31, 2019. | |
| 5. | DERIVATIVE FINANCIAL INSTRUMENTS |
The Funds engage in various portfolio investment strategies using derivative contracts both to increase the returns of the Funds and/or to manage their exposure to certain risks such as credit risk, equity risk, interest rate risk, foreign currency exchange rate risk, commodity price risk or other risks (e.g., inflation risk). Derivative financial instruments categorized by risk exposure are included in the Schedules of Investments. These contracts may be transacted on an exchange or OTC.
Futures Contracts:Futures contracts are purchased or sold to gain exposure to, or manage exposure to, changes in interest rates (interest rate risk) and changes in the value of equity securities (equity risk) or foreign currencies (foreign currency exchange rate risk).
Futures contracts are agreements between the Funds and a counterparty to buy or sell a specific quantity of an underlying instrument at a specified price and on a specified date. Depending on the terms of a contract, it is settled either through physical delivery of the underlying instrument on the settlement date or by payment of a cash amount on the settlement date. Upon entering into a futures contract, the Funds are required to deposit initial margin with the broker in the form of cash or securities in an amount that varies depending on a contract’s size and risk profile. The initial margin deposit must then be maintained at an established level over the life of the contract. Amounts pledged, which are considered restricted, are included in cash pledged for futures contracts in the Statements of Assets and Liabilities.
Securities deposited as initial margin are designated in the Schedules of Investments and cash deposited, if any, is shown as cash pledged for futures contracts in the Statements of Assets and Liabilities. Pursuant to the contract, the Funds agree to receive from or pay to the broker an amount of cash equal to the daily fluctuation in market value of the contract (“variation margin”). Variation margin is recorded as unrealized appreciation (depreciation) and, if any, shown as variation margin receivable (or payable) on futures contracts in the Statements of Assets and Liabilities. When the contract is closed, a realized gain or loss is recorded in the Statements of Operations equal to the difference between the notional amount of the contract at the time it was opened and the notional amount at the time it was closed. The use of futures contracts involves the risk of an imperfect correlation in the movements in the price of futures contracts and interest, foreign currency exchange rates or underlying assets.
Forward Foreign Currency Exchange Contracts: Forward foreign currency exchange contracts are entered into to gain or reduce exposure to foreign currencies (foreign
| | | | |
| N O T E S T O F I N A N C I A L S T A T E M E N T S | | | 99 | |
Notes to Financial Statements (continued)
currency exchange rate risk).
A forward foreign currency exchange contract is an agreement between two parties to buy and sell a currency at a set exchange rate on a specified date. These contracts help to manage the overall exposure to the currencies in which some of the investments held by the Funds are denominated and in some cases, may be used to obtain exposure to a particular market.
The contract is marked-to-market daily and the change in market value is recorded as unrealized appreciation (depreciation) in the Statements of Assets and Liabilities. When a contract is closed, a realized gain or loss is recorded in the Statements of Operations equal to the difference between the value at the time it was opened and the value at the time it was closed. Non-deliverable forward foreign currency exchange contracts are settled with the counterparty in cash without the delivery of foreign currency. The use of forward foreign currency exchange contracts involves the risk that the value of a forward foreign currency exchange contract changes unfavorably due to movements in the value of the referenced foreign currencies. Cash amounts pledged for forward foreign currency exchange contracts are considered restricted and are included in cash pledged as collateral for OTC derivatives in the Statements of Assets and Liabilities.
Options: Certain Funds purchase and write call and put options to increase or decrease their exposure to the risks of underlying instruments, including equity risk, interest rate risk and/or commodity price risk and/or, in the case of options written, to generate gains from options premiums.
A call option gives the purchaser (holder) of the option the right (but not the obligation) to buy, and obligates the seller (writer) to sell (when the option is exercised) the underlying instrument at the exercise or strike price at any time or at a specified time during the option period. A put option gives the holder the right to sell and obligates the writer to buy the underlying instrument at the exercise or strike price at any time or at a specified time during the option period.
Premiums paid on options purchased and premiums received on options written, as well as the daily fluctuation in market value, are included in investments at value — unaffiliated and options written at value, respectively, in the Statements of Assets and Liabilities. When an instrument is purchased or sold through the exercise of an option, the premium is offset against the cost or proceeds of the underlying instrument. When an option expires, a realized gain or loss is recorded in the Statements of Operations to the extent of the premiums received or paid. When an option is closed or sold, a gain or loss is recorded in the Statements of Operations to the extent the cost of the closing transaction exceeds the premiums received or paid. When the Funds write a call option, such option is typically “covered,” meaning that they hold the underlying instrument subject to being called by the option counterparty. When the Funds write a put option, such option is covered by cash in an amount sufficient to cover the obligation. These amounts, which are considered restricted, are included in cash pledged as collateral for options written in the Statements of Assets and Liabilities.
| | • | | Swaptions — Certain Funds purchase and write swaptions primarily to preserve a return or spread on a particular investment or portion of the Funds’ holdings, as a duration management technique or to protect against an increase in the price of securities it anticipates purchasing at a later date. The purchaser and writer of a swaption is buying or granting the right to enter into a previously agreed upon interest rate or credit default swap agreement (interest rate risk and/or credit risk) at any time before the expiration of the option. |
In purchasing and writing options, the Funds bear the risk of an unfavorable change in the value of the underlying instrument or the risk that they may not be able to enter into a closing transaction due to an illiquid market. Exercise of a written option could result in the Funds purchasing or selling a security when they otherwise would not, or at a price different from the current market value.
Swaps:Swap contracts are entered into to manage exposure to issuers, markets and securities. Such contracts are agreements between the Funds and a counterparty to make periodic net payments on a specified notional amount or a net payment upon termination. Swap agreements are privately negotiated in the OTC market and may be entered into as a bilateral contract (“OTC swaps”) or centrally cleared (“centrally cleared swaps”).
For OTC swaps, any upfront premiums paid and any upfront fees received are shown as swap premiums paid and swap premiums received, respectively, in the Statements of Assets and Liabilities and amortized over the term of the contract. The daily fluctuation in market value is recorded as unrealized appreciation (depreciation) on OTC Swaps in the Statements of Assets and Liabilities. Payments received or paid are recorded in the Statements of Operations as realized gains or losses, respectively. When an OTC swap is terminated, a realized gain or loss is recorded in the Statements of Operations equal to the difference between the proceeds from (or cost of) the closing transaction and the Funds’ basis in the contract, if any. Generally, the basis of the contract is the premium received or paid.
In a centrally cleared swap, immediately following execution of the swap contract, the swap contract is notated to a central counterparty (the “CCP”) and the Funds’ counterparty on the swap agreement becomes the CCP. The Funds are required to interface with the CCP through the broker. Upon entering into a centrally cleared swap, the Funds are required to deposit initial margin with the broker in the form of cash or securities in an amount that varies depending on the size and risk profile of the particular swap. Securities deposited as initial margin are designated in the Schedules of Investments and cash deposited is shown as cash pledged for centrally cleared swaps in the Statements of Assets and Liabilities. Amounts pledged, which are considered restricted cash, are included in cash pledged for centrally cleared swaps in the Statements of Assets and Liabilities. Pursuant to the contract, the Funds agree to receive from or pay to the broker variation margin. Variation margin is recorded as unrealized appreciation (depreciation) and shown as variation margin receivable (or payable) on centrally cleared swaps in the Statements of Assets and Liabilities. Payments received from (paid to) the counterparty, including at termination, are recorded as realized gains (losses) in the Statements of Operations.
| | • | | Credit default swaps — Credit default swaps are entered into to manage exposure to the market or certain sectors of the market, to reduce risk exposure to defaults of corporate and/or sovereign issuers or to create exposure to corporate and/or sovereign issuers to which a fund is not otherwise exposed (credit risk). |
The Funds may either buy or sell (write) credit default swaps on single-name issuers (corporate or sovereign), a combination or basket of single-name issuers or traded indexes. Credit default swaps are agreements in which the protection buyer pays fixed periodic payments to the seller in consideration for a promise from the protection seller to make a specific payment should a negative credit event take place with respect to the referenced entity (e.g., bankruptcy, failure to pay, obligation acceleration, repudiation, moratorium or restructuring). As a buyer, if an underlying credit event occurs, the Funds will either (i) receive from the seller an amount equal to the notional amount of the swap and deliver the referenced security or underlying securities comprising the index, or (ii) receive a net settlement of cash equal to the notional amount of the swap less the recovery value of the security or underlying securities comprising the index. As a seller (writer), if an underlying credit event occurs, the Funds will either pay the buyer an amount equal to the notional amount of the swap and take delivery of the referenced security or
| | |
| 100 | | 2 0 1 9 B L A C K R O C K A N N U A L R E P O R T T O S H A R E H O L D E R S |
Notes to Financial Statements (continued)
underlying securities comprising the index or pay a net settlement of cash equal to the notional amount of the swap less the recovery value of the security or underlying securities comprising the index.
| | • | | Interest rate swaps — Interest rate swaps are entered into to gain or reduce exposure to interest rates or to manage duration, the yield curve or interest rate (interest rate risk). |
Interest rate swaps are agreements in which one party pays a stream of interest payments, either fixed or floating, in exchange for another party’s stream of interest payments, either fixed or floating, on the same notional amount for a specified period of time. In more complex interest rate swaps, the notional principal amount may decline (or amortize) over time.
Swap transactions involve, to varying degrees, elements of interest rate, credit and market risk in excess of the amounts recognized in the Statements of Assets and Liabilities. Such risks involve the possibility that there will be no liquid market for these agreements, that the counterparty to the agreements may default on its obligation to perform or disagree as to the meaning of the contractual terms in the agreements, and that there may be unfavorable changes in interest rates and/or market values associated with these transactions.
Master Netting Arrangements:In order to define their contractual rights and to secure rights that will help them mitigate their counterparty risk, the Funds may enter into an International Swaps and Derivatives Association, Inc. Master Agreement (“ISDA Master Agreement”) or similar agreement with their counterparties. An ISDA Master Agreement is a bilateral agreement between each Fund and a counterparty that governs certain OTC derivatives and typically contains, among other things, collateral posting terms and netting provisions in the event of a default and/or termination event. Under an ISDA Master Agreement, each Fund may, under certain circumstances, offset with the counterparty certain derivative financial instruments’ payables and/or receivables with collateral held and/or posted and create one single net payment. The provisions of the ISDA Master Agreement typically permit a single net payment in the event of default including the bankruptcy or insolvency of the counterparty. Bankruptcy or insolvency laws of a particular jurisdiction may restrict or prohibit the right of offset in bankruptcy, insolvency or other events.
Collateral Requirements:For derivatives traded under an ISDA Master Agreement, the collateral requirements are typically calculated by netting the mark-to-market amount for each transaction under such agreement and comparing that amount to the value of any collateral currently pledged by the Fund and the counterparty.
Cash collateral that has been pledged to cover obligations of the Funds and cash collateral received from the counterparty, if any, is reported separately in the Statements of Assets and Liabilities as cash pledged as collateral and cash received as collateral, respectively. Non-cash collateral pledged by the Funds, if any, is noted in the Schedules of Investments. Generally, the amount of collateral due from or to a counterparty is subject to a certain minimum transfer amount threshold before a transfer is required, which is determined at the close of business of the Funds. Any additional required collateral is delivered to/pledged by the Funds on the next business day. Typically, the counterparty is not permitted to sell, re-pledge or use cash and non-cash collateral it receives. A Fund generally agrees not to use non-cash collateral that it receives but may, absent default or certain other circumstances defined in the underlying ISDA Master Agreement, be permitted to use cash collateral received. In such cases, interest may be paid pursuant to the collateral arrangement with the counterparty. To the extent amounts due to the Funds from their counterparties are not fully collateralized, they bear the risk of loss from counterparty non-performance. Likewise, to the extent the Funds have delivered collateral to a counterparty and stand ready to perform under the terms of their agreement with such counterparty, they bear the risk of loss from a counterparty in the amount of the value of the collateral in the event the counterparty fails to return such collateral. Based on the terms of agreements, collateral may not be required for all derivative contracts.
For financial reporting purposes, the Funds do not offset derivative assets and derivative liabilities that are subject to netting arrangements, if any, in the Statements of Assets and Liabilities.
| 6. | INVESTMENT ADVISORY AGREEMENT AND OTHER TRANSACTIONS WITH AFFILIATES |
Investment Advisory:The Trust, on behalf of the Funds, entered into an Investment Advisory Agreement with the Manager, the Funds’ investment adviser and an indirect, wholly-owned subsidiary of BlackRock, Inc. (“BlackRock”), to provide investment advisory services. The Manager receives no advisory fee from the Funds under the Investment Advisory Agreement.
Service and Distribution Fees:The Trust, on behalf of the Funds, entered into a Distribution Agreement with BlackRock Investments, LLC (“BRIL”), an affiliate of the Manager.
Expense Limitations, Waivers and Reimbursements:The Manager contractually agreed to waive all fees and pay or reimburse all operating expenses of each Fund, except extraordinary expenses. Extraordinary expenses may include interest expense, dividend expense, tax expense, acquired fund fees and expenses and certain other fund expenses. This agreement has no fixed termination date. With respect to Series C, Series E, Series M, Series P and Series S, the Manager does not charge the Funds a management fee, although investors in the Funds will pay a fee to BlackRock Investment Management, LLC (“BIM”), an affiliate of the Manager, or their managed account program sponsor. With respect to Series A, the Manager does not charge the Fund a management fee, although investors in the Fund that are (i) retail and institutional separately managed account clients of BIM will pay a fee to BIM or their managed account program sponsor, (ii) participants in the collective trust funds managed by BlackRock Institutional Trust Company, N.A. (“BTC”), an affiliate of the Manager, that invest in the Fund will pay a fee to BTC, and (iii) mutual funds that are advised by the Manager or its affiliates will pay the Manager or its affiliate a management fee pursuant to a management agreement between each such fund and BlackRock or its affiliate. The Manager waived fees for each Fund which are included in fees waived and/or reimbursed by the Manager in the Statements of Operations.
Although the Funds do not compensate the Manager directly for its services under the Investment Advisory Agreement, because each Fund is an investment option for certain wrap-fee or other separately managed account program clients, the Manager may benefit from the fees charged to such clients who have retained the Manager’s affiliates to manage their accounts. The Manager waived fees for each Fund which are included in fees waived and/or reimbursed by the Manager in the Statements of Operations. The waivers were as follows:
| | | | |
| |
Series A | | $ | 303,204 | |
Series C | | | 335,653 | |
Series E | | | 239,212 | |
| | | | |
| N O T E S T O F I N A N C I A L S T A T E M E N T S | | | 101 | |
Notes to Financial Statements (continued)
| | | | |
| |
Series M | | | 652,106 | |
Series P | | | 142,351 | |
Series S | | | 219,530 | |
| |
Interfund Lending:In accordance with an exemptive order (the “Order”) from the U.S. Securities and Exchange Commission (“SEC”), each Fund may participate in a joint lending and borrowing facility for temporary purposes (the “Interfund Lending Program”), subject to compliance with the terms and conditions of the Order, and to the extent permitted by each Fund’s investment policies and restrictions. Series A, Series E and Series P are currently permitted to borrow and lend and Series C, Series M and Series S are currently permitted to borrow under the Interfund Lending Program.
A lending BlackRock fund may lend in aggregate up to 15% of its net assets, but may not lend more than 5% of its net assets, to any one borrowing fund through the Interfund Lending Program. A borrowing BlackRock fund may not borrow through the Interfund Lending Program or from any other source more than 33 1/3% of its total assets (or any lower threshold provided for by the fund’s investment restrictions). If a borrowing BlackRock fund’s total outstanding borrowings exceed 10% of its total assets, each of its outstanding interfund loans will be subject to collateralization of at least 102% of the outstanding principal value of the loan. All interfund loans are for temporary or emergency purposes and the interest rate to be charged will be the average of the highest current overnight repurchase agreement rate available to a lending fund and the bank loan rate, as calculated according to a formula established by the Board.
During the year ended March 31, 2019, the Funds did not participate in the Interfund Lending Program.
Trustees and Officers:Certain trustees and/or officers of the Trust are trustees and/or officers of BlackRock or its affiliates. The Funds reimburse the Manager for a portion of the compensation paid to the Funds’ Chief Compliance Officer, which is included in Trustees and Officer in the Statements of Operations.
For the year ended March 31, 2019, purchases and sales of investments, including paydowns and mortgage dollar rolls and excluding short-term securities, were as follows:
| | | | | | | | | | | | | | | | | | | | | | | | |
| |
| Purchases | | Series A | | | Series C | | | Series E | | | Series M | | | Series P | | | Series S | |
| |
Non-U.S. Government Securities | | | $756,621,949 | | | | $165,101,302 | | | | $143,576,675 | | | | $11,738,159,711 | | | | $— | | | | $394,410,405 | |
U.S. Government Securities | | | — | | | | 36,867,505 | | | | — | | | | 17,339,033 | | | | — | | | | 2,343,473 | |
| | | | | | | | | | | | | | | | | | | | | | | | |
Total Purchases | | | $756,621,949 | | | | $201,968,807 | | | | $143,576,675 | | | | $11,755,498,744 | | | | $— | | | | $396,753,878 | |
| | | | | | | | | | | | | | | | | | | | | | | | |
|
| |
| Sales | | Series A | | | Series C | | | Series E | | | Series M | | | Series P | | | Series S | |
| |
Non-U.S. Government Securities (includes paydowns) | | | $313,212,858 | | | | $190,535,330 | | | | $97,680,070 | | | | $11,869,633,474 | | | | $9,603,868 | | | | $461,935,805 | |
U.S. Government Securities | | | — | | | | 29,855,228 | | | | — | | | | 8,382,478 | | | | — | | | | 2,351,823 | |
| | | | | | | | | | | | | | | | | | | | | | | | |
Total Sales | | | $313,212,858 | | | | $220,390,558 | | | | $97,680,070 | | | | $11,878,015,952 | | | | $9,603,868 | | | | $464,287,628 | |
| | | | | | | | | | | | | | | | | | | | | | | | |
For the year ended March 31, 2019, purchases and sales related to mortgage dollar rolls were as follows:
| | | | | | | | |
| |
| | | Series M | | | Series S | |
| |
Purchases | | | $5,120,254,447 | | | | $153,775,520 | |
Sales | | | 5,122,719,734 | | | | 153,908,290 | |
| |
It is each Fund’s policy to comply with the requirements of the Internal Revenue Code of 1986, as amended, applicable to regulated investment companies, and to distribute substantially all of its taxable income to its shareholders. Therefore, no U.S. federal income tax provision is required.
Each Fund files U.S. federal and various state and local tax returns. No income tax returns are currently under examination. The statute of limitations on each Fund’s U.S. federal tax returns, except with respect to Series A, generally remains open for each of the four years ended March 31, 2019. The statute of limitations on Series A’s U.S. federal tax returns generally remains open for each of the three years ended March 31, 2019 and the period ended March 31, 2016. The statutes of limitations on each Fund’s state and local tax returns may remain open for an additional year depending upon the jurisdiction.
Management has analyzed tax laws and regulations and their application to the Funds as of March 31, 2019, inclusive of the open tax return years, and does not believe that there are any uncertain tax positions that require recognition of a tax liability in the Funds’ financial statements.
| | |
| 102 | | 2 0 1 9 B L A C K R O C K A N N U A L R E P O R T T O S H A R E H O L D E R S |
Notes to Financial Statements (continued)
The tax character of distributions paid was as follows:
| | | | | | | | | | | | | | | | | | | | | | | | | | | | |
| |
| | | | | | Series A | | | Series C | | | Series E | | | Series M | | | Series P | | | Series S | |
| |
Tax-exempt income(a) | | | | | | | | | | | | | | | | | | | | | | | | | | | | |
3/31/19 | | | | | | $ | — | | | $ | — | | | $ | 7,876,747 | | | $ | — | | | $ | — | | | $ | — | |
3/31/18 | | | | | | $ | — | | | $ | — | | | $ | 7,135,621 | | | $ | — | | | $ | — | | | $ | — | |
Ordinary income | | | | | | | | | | | | | | | | | | | | | | | | | | | | |
3/31/19 | | | | | | | 42,880,889 | | | | 14,646,689 | | | | 227,513 | | | | 28,369,325 | | | | 620,004 | | | | 4,649,704 | |
3/31/18 | | | | | | | 23,909,987 | | | | 14,198,725 | | | | 13,107 | | | | 21,306,246 | | | | 549,664 | | | | 4,838,425 | |
Long-term capital gains(b) | | | | | | | | | | | | | | | | | | | | | | | | | | | | |
3/31/19 | | | | | | | 675,391 | | | | 40,994 | | | | 954,286 | | | | — | | | | — | | | | — | |
3/31/18 | | | | | | | 90,722 | | | | 1,908,178 | | | | 122,634 | | | | — | | | | — | | | | — | |
| | | | |
Total | | | | | | | | | | | | | | | | | | | | | | | | | | | | |
3/31/19 | | | | | | $ | 43,556,280 | | | $ | 14,687,683 | | | $ | 9,058,546 | | | $ | 28,369,325 | | | $ | 620,004 | | | $ | 4,649,704 | |
| | | | |
3/31/18 | | | | | | $ | 24,000,709 | | | $ | 16,106,903 | | | $ | 7,271,362 | | | $ | 21,306,246 | | | $ | 549,664 | | | $ | 4,838,425 | |
| | | | |
| | (a) | The Funds designate these amounts paid during the fiscal year ended March 31, 2019 as exempt-interest dividends. | |
| | (b) | The Funds designate these amounts paid during the fiscal year ended March 31, 2019 as 20% rate long-term gain dividends. | |
As of period end, the tax components of accumulated net earnings (losses) were as follows:
| | | | | | | | | | | | | | | | | | | | | | | | | | | | |
| |
| | | | | | Series A | | | Series C | | | Series E | | | Series M | | | Series P | | | Series S | |
| |
Undistributed tax-exempt income | | | | | | $ | — | | | $ | — | | | $ | 20,992 | | | $ | — | | | $ | — | | | $ | — | |
Undistributed ordinary income | | | | | | | — | | | | — | | | | 2,670 | | | | 1,389,885 | | | | 271,454 | | | | — | |
Non-expiring capital loss carryforwards(a) | | | | | | | — | | | | (2,491,680 | ) | | | — | | | | (20,600,892 | ) | | | (29,016,387 | ) | | | (8,851,845 | ) |
Net unrealized gains (losses)(b) | | | | | | | (9,225,365 | ) | | | 8,513,822 | | | | 8,911,596 | | | | 3,644,427 | | | | (1,799,632 | ) | | | (354,655 | ) |
Qualified late year losses(c) | | | | | | | (795,975 | ) | | | (1,090,466 | ) | | | (666,996 | ) | | | — | | | | — | | | | — | |
| | | | | | | | | | | | | | | | | | | | | | | | | | | | |
| | | | | | $ | (10,021,340 | ) | | $ | 4,931,676 | | | $ | 8,268,262 | | | $ | (15,566,580 | ) | | $ | (30,544,565 | ) | | $ | (9,206,500 | ) |
| | | | |
| | (a) | Amounts available to offset future realized capital gains. | |
| | (b) | The differences between book-basis and tax-basis net unrealized gains (losses) was attributable primarily to the tax deferral of losses on wash sales, amortization methods for discounts on fixed income securities, the accrual of income on securities in default, the realization for tax purposes of unrealized gain on investments in passive foreign investment companies, the realization for tax purposes of unrealized gains/losses on certain options and futures contracts, the accounting for swap agreements, the treatment of residual interests in tender option bond trusts and the classification of investments. | |
| | (c) | The Funds have elected to defer certain qualified late-year losses and recognize such losses in the next taxable year. | |
During the year ended March 31, 2019, Series P utilized $1,381,177 of its capital loss carryforward.
As of March 31, 2019, gross unrealized appreciation and depreciation for investments and derivatives based on cost for U.S. federal income tax purposes were as follows:
| | | | | | | | | | | | | | | | | | | | | | | | | | | | |
| |
| | | | | | Series A | | | Series C | | | Series E | | | Series M | | | Series P | | | Series S | |
| |
Tax cost | | | | | | $ | 995,969,934 | | | $ | 362,173,468 | | | $ | 237,926,367 | | | $ | 1,375,006,931 | | | $ | 15,875,917 | | | $ | 195,430,299 | |
| | | | |
Gross unrealized appreciation | | | | | | $ | 9,499,161 | | | $ | 10,852,360 | | | $ | 9,534,951 | | | $ | 13,843,557 | | | $ | 861,384 | | | $ | 1,626,738 | |
Gross unrealized depreciation | | | | | | | (18,381,554 | ) | | | (2,263,535 | ) | | | (623,182 | ) | | | (10,199,130 | ) | | | (2,661,012 | ) | | | (1,671,626 | ) |
| | | | | | | | | | | | | | | | | | | | | | | | | | | | |
Net unrealized appreciation (depreciation) | | | | | | $ | (8,882,393 | ) | | $ | 8,588,825 | | | $ | 8,911,769 | | | $ | 3,644,427 | | | $ | (1,799,628 | ) | | $ | (44,888 | ) |
| | | | |
The Trust, on behalf of the Funds, along with certain other funds managed by the Manager and its affiliates (“Participating Funds”), is a party to a 364-day, $2.25 billion credit agreement with a group of lenders. Under this agreement, the Funds may borrow to fund shareholder redemptions. Excluding commitments designated for certain individual funds, the Participating Funds, including the Funds, can borrow up to an aggregate commitment amount of $1.75 billion at any time outstanding, subject to asset coverage and other limitations as specified in the agreement. The credit agreement has the following terms: a fee of 0.10% per annum on unused commitment amounts and interest at a rate equal to the higher of (a) one-month LIBOR (but, in any event, not less than 0.00%) on the date the loan is made plus 0.80% per annum or (b) the Fed Funds rate (but, in any event, not less than 0.00%) in effect from time to time plus 0.80% per annum on amounts borrowed. The agreement expires in April 2019 unless extended or renewed. Prior to April 19, 2018, the aggregate commitment amount was $2.1 billion and the fee was 0.12% per annum. Participating Funds paid an upfront commitment fee of 0.02% on the total commitment amounts, in addition to administration, legal and arrangement fees, which are included in miscellaneous expenses in the Statements of Operations. These fees were allocated among such funds based upon portions of the aggregate commitment available to them and relative net assets of Participating Funds. During the year ended March 31, 2019, the Funds did not borrow under the credit agreement.
Many municipalities insure repayment of their bonds, which may reduce the potential for loss due to credit risk. The market value of these bonds may fluctuate for other reasons, including market perception of the value of such insurance, and there is no guarantee that the insurer will meet its obligation.
Inventories of municipal bonds held by brokers and dealers may decrease, which would lessen their ability to make a market in these securities. Such a reduction in market
| | | | |
| N O T E S T O F I N A N C I A L S T A T E M E N T S | | | 103 | |
Notes to Financial Statements (continued)
making capacity could potentially decrease a Fund’s ability to buy or sell bonds. As a result, a Fund may sell a security at a lower price, sell other securities to raise cash, or give up an investment opportunity, any of which could have a negative impact on performance. If a Fund needed to sell large blocks of bonds, those sales could further reduce the bonds’ prices and impact performance.
In the normal course of business, certain Funds invest in securities or other instruments and may enter into certain transactions, and such activities subject each Fund to various risks, including among others, fluctuations in the market (market risk) or failure of an issuer to meet all of its obligations. The value of securities or other instruments may also be affected by various factors, including, without limitation: (i) the general economy; (ii) the overall market as well as local, regional or global political and/or social instability; (iii) regulation, taxation or international tax treaties between various countries; or (iv) currency, interest rate and price fluctuations. Each Fund’s prospectus provides details of the risks to which each Fund is subject.
Each Fund may be exposed to prepayment risk, which is the risk that borrowers may exercise their option to prepay principal earlier than scheduled during periods of declining interest rates, which would force each Fund to reinvest in lower yielding securities. Each Fund may also be exposed to reinvestment risk, which is the risk that income from each Fund’s portfolio will decline if each Fund invests the proceeds from matured, traded or called fixed-income securities at market interest rates that are below each Fund portfolio’s current earnings rate.
Series E structures and “sponsors” the TOB Trusts in which it holds TOB Residuals and has certain duties and responsibilities, which may give rise to certain additional risks including, but not limited to, compliance, securities law and operational risks.
Should short-term interest rates rise, Series E’s investments in TOB Trusts may adversely affect Series E’s net investment income and dividends to shareholders. Also, fluctuations in the market value of municipal bonds deposited into the TOB Trust may adversely affect Series E’s NAV per share.
The SEC and various federal banking and housing agencies have adopted credit risk retention rules for securitizations (the “Risk Retention Rules”). The Risk Retention Rules would require the sponsor of a TOB Trust to retain at least 5% of the credit risk of the underlying assets supporting the TOB Trust’s municipal bonds. The Risk Retention Rules may adversely affect Series E’s ability to engage in TOB Trust transactions or increase the costs of such transactions in certain circumstances.
TOB Trusts constitute an important component of the municipal bond market. Any modifications or changes to rules governing TOB Trusts may adversely impact the municipal market and Series E, including through reduced demand for and liquidity of municipal bonds and increased financing costs for municipal issuers. The ultimate impact of any potential modifications on the TOB Trust market and the overall municipal market is not yet certain.
Counterparty Credit Risk:The Funds may be exposed to counterparty credit risk, or the risk that an entity may fail to or be unable to perform on its commitments related to unsettled or open transactions. The Funds manage counterparty credit risk by entering into transactions only with counterparties that the Manager believes have the financial resources to honor their obligations and by monitoring the financial stability of those counterparties. Financial assets, which potentially expose the Funds to market, issuer and counterparty credit risks, consist principally of financial instruments and receivables due from counterparties. The extent of the Funds’ exposure to market, issuer and counterparty credit risks with respect to these financial assets is approximately their value recorded in the Statements of Assets and Liabilities, less any collateral held by the Funds.
A derivative contract may suffer a mark-to-market loss if the value of the contract decreases due to an unfavorable change in the market rates or values of the underlying instrument. Losses can also occur if the counterparty does not perform under the contract.
A Fund’s risk of loss from counterparty credit risk on OTC derivatives is generally limited to the aggregate unrealized gain less the value of any collateral held by such Fund.
For OTC options purchased, each Fund bears the risk of loss in the amount of the premiums paid plus the positive change in market values net of any collateral held by the Funds should the counterparty fail to perform under the contracts. Options written by the Funds do not typically give rise to counterparty credit risk, as options written generally obligate the Funds, and not the counterparty, to perform. The Funds may be exposed to counterparty credit risk with respect to options written to the extent each Fund deposits collateral with its counterparty to a written option.
With exchange-traded options purchased, futures and centrally cleared swaps, there is less counterparty credit risk to the Funds since the exchange or clearinghouse, as counterparty to such instruments, guarantees against a possible default. The clearinghouse stands between the buyer and the seller of the contract; therefore, credit risk is limited to failure of the clearinghouse. While offset rights may exist under applicable law, a Fund does not have a contractual right of offset against a clearing broker or clearinghouse in the event of a default (including the bankruptcy or insolvency). Additionally, credit risk exists in exchange-traded futures and centrally cleared swaps with respect to initial and variation margin that is held in a clearing broker’s customer accounts. While clearing brokers are required to segregate customer margin from their own assets, in the event that a clearing broker becomes insolvent or goes into bankruptcy and at that time there is a shortfall in the aggregate amount of margin held by the clearing broker for all its clients, typically the shortfall would be allocated on a pro rata basis across all the clearing broker’s customers, potentially resulting in losses to the Funds.
Concentration Risk:Certain Funds may invest in securities that are rated below investment grade quality (sometimes called “junk bonds”), which are predominantly speculative, have greater credit risk and generally are less liquid than and have more volatile prices than higher quality securities.
Certain Funds invest a significant portion of their assets in fixed-income securities and/or use derivatives tied to the fixed-income markets. Changes in market interest rates or economic conditions may affect the value and/or liquidity of such investments. Interest rate risk is the risk that prices of bonds and other fixed-income securities will increase as interest rates fall and decrease as interest rates rise. The Funds may be subject to a greater risk of rising interest rates due to the current period of historically low rates. The Federal Reserve has begun to raise the Federal Funds rate, and each increase results in more pronounced interest rate risk in the current market environment.
Certain Funds invest a significant portion of their assets in securities backed by commercial or residential mortgage loans or in issuers that hold mortgage and other asset-backed securities. Investment percentages in these securities are presented in the Schedules of Investments. Changes in economic conditions, including delinquencies and/or defaults on assets underlying these securities, can affect the value, income and/or liquidity of such positions.
| | |
| 104 | | 2 0 1 9 B L A C K R O C K A N N U A L R E P O R T T O S H A R E H O L D E R S |
Notes to Financial Statements (continued)
| 11. | CAPITAL SHARE TRANSACTIONS |
Transactions in capital shares were as follows:
| | | | | | | | |
| | | Year Ended
03/31/19 | | | Year Ended
03/31/18 | |
| | |
Series A | | | | | | | | |
| | |
Shares sold | | | 69,144,009 | | | | 30,751,996 | |
Shares redeemed | | | (27,690,251 | ) | | | (6,319,617 | ) |
| | | | | | | | |
Net increase | | | 41,453,758 | | | | 24,432,379 | |
| | | | | | | | |
| | |
Series C | | | | | | | | |
| | |
Shares sold | | | 8,827,667 | | | | 9,671,665 | |
Shares redeemed | | | (10,736,125 | ) | | | (11,973,055 | ) |
| | | | | | | | |
Net decrease | | | (1,908,458 | ) | | | (2,301,390 | ) |
| | | | | | | | |
| | |
Series E | | | | | | | | |
| | |
Shares sold | | | 10,019,529 | | | | 5,610,010 | |
Shares redeemed | | | (5,189,013 | ) | | | (2,853,357 | ) |
| | | | | | | | |
Net increase | | | 4,830,516 | | | | 2,756,653 | |
| | | | | | | | |
| | |
Series M | | | | | | | | |
| | |
Shares sold | | | 24,770,907 | | | | 42,936,693 | |
Shares redeemed | | | (26,871,015 | ) | | | (19,129,335 | ) |
| | | | | | | | |
Net increase (decrease) | | | (2,100,108 | ) | | | 23,807,358 | |
| | | | | | | | |
| | |
Series P | | | | | | | | |
| | |
Shares sold | | | 1,454,951 | | | | 2,507,403 | |
Shares redeemed | | | (4,667,254 | ) | | | (6,608,248 | ) |
| | | | | | | | |
Net decrease | | | (3,212,303 | ) | | | (4,100,845 | ) |
| | | | | | | | |
| | |
Series S | | | | | | | | |
| | |
Shares sold | | | 6,846,900 | | | | 6,236,573 | |
Shares redeemed | | | (8,424,603 | ) | | | (7,626,335 | ) |
| | | | | | | | |
Net decrease | | | (1,577,703 | ) | | | (1,389,762 | ) |
| | | | | | | | |
| 12. | REGULATION S-X AMENDMENTS |
On August 17, 2018, the SEC adopted amendments to certain disclosure requirements in Securities Act Release No. 33-10532, Disclosure Update and Simplification. The Funds have adopted the amendments pertinent to Regulation S-X in this shareholder report. The amendments impacted certain disclosure presentation on the Statements of Assets and Liabilities, Statements of Changes in Net Assets and Notes to the Financial Statements.
Prior year distribution information and undistributed (distributions in excess of) net investment income in the Statements of Changes in Net Assets has been modified to conform to the current year presentation in accordance with the Regulation S-X changes.
Distributions for the year ended March 31, 2018 were classified as follows:
| | | | | | | | |
| | | Net Investment
Income | | | Net Realized
Gain | |
Series A | | $ | 23,435,702 | | | $ | 565,007 | |
Series C | | | 14,198,725 | | | | 1,908,178 | |
Series E | | | 7,142,855 | | | | 128,477 | |
Series M | | | 21,306,246 | | | | — | |
Series P | | | 549,664 | | | | — | |
Series S | | | 4,838,425 | | | | — | |
| | | | |
| N O T E S T O F I N A N C I A L S T A T E M E N T S | | | 105 | |
Notes to Financial Statements (continued)
Undistributed (distributions in excess of) net investment income as of March 31, 2018 is as follows:
| | | | |
| |
| | | Undistributed
(Distributions in Excess of)
Net Investment Income | |
| |
Series A | | | $ 1,868,628 | |
Series C | | | (45,124) | |
Series E | | | 56,581 | |
Series M | | | 1,235,791 | |
Series P | | | 114,383 | |
Series S | | | (317,687) | |
| |
Management’s evaluation of the impact of all subsequent events on the Funds’ financial statements was completed through the date of the financial statements were issued and the following item was noted:
Effective April 18, 2019, the credit agreement was extended until April 2020 under the same terms.
| | |
| 106 | | 2 0 1 9 B L A C K R O C K A N N U A L R E P O R T T O S H A R E H O L D E R S |
Report of Independent Registered Public Accounting Firm
To the Shareholders of BATS: Series A Portfolio, BATS: Series C Portfolio, BATS: Series E Portfolio, BATS: Series M Portfolio, BATS: Series P Portfolio and BATS: Series S Portfolio and the Board of Trustees of the BlackRock Allocation Target Shares:
Opinion on the Financial Statements and Financial Highlights
We have audited the accompanying statements of assets and liabilities of BATS: Series A Portfolio, BATS: Series C Portfolio, BATS: Series E Portfolio, BATS: Series M Portfolio, BATS: Series P Portfolio, and BATS: Series S Portfolio of BlackRock Allocation Target Shares (the “Funds”), including the schedules of investments, as of March 31, 2019, the related statements of operations for the year then ended, the statements of changes in net assets for each of the two years in the period then ended, the financial highlights for the periods indicated in the table below, the statement of cash flows for BATS: Series S Portfolio for the year then ended, and the related notes. In our opinion, the financial statements and financial highlights present fairly, in all material respects, the financial position of the Funds as of March 31, 2019, and the results of their operations and BATS: Series S Portfolio’s cash flows for the year then ended, the changes in their net assets for each of the two years in the period then ended, and the financial highlights for the periods indicated in the table below, in conformity with accounting principles generally accepted in the United States of America.
| | |
Fund | | Financial Highlights |
BATS: Series C Portfolio, BATS: Series M Portfolio, BATS: Series P Portfolio, BATS: Series S Portfolio | | For each of the five years in the period ended March 31, 2019. |
BATS: Series A Portfolio | | For each of the three years in the period ended March 31, 2019 and for the period from September 21, 2015 (commencement of operations) through March 31, 2016. |
BATS: Series E Portfolio | | For each of the four years in the period ended March 31, 2019 and for the period from August 4, 2014 (commencement of operations) through March 31, 2015. |
Basis for Opinion
These financial statements and financial highlights are the responsibility of the Funds’ management. Our responsibility is to express an opinion on the Funds’ financial statements and financial highlights based on our audits. We are a public accounting firm registered with the Public Company Accounting Oversight Board (United States) (PCAOB) and are required to be independent with respect to the Funds in accordance with the U.S. federal securities laws and the applicable rules and regulations of the Securities and Exchange Commission and the PCAOB.
We conducted our audits in accordance with the standards of the PCAOB. Those standards require that we plan and perform the audits to obtain reasonable assurance about whether the financial statements and financial highlights are free of material misstatement, whether due to error or fraud. The Funds are not required to have, nor were we engaged to perform, an audit of their internal control over financial reporting. As part of our audits we are required to obtain an understanding of internal control over financial reporting but not for the purpose of expressing an opinion on the effectiveness of the Funds’ internal control over financial reporting. Accordingly, we express no such opinion.
Our audits included performing procedures to assess the risks of material misstatement of the financial statements and financial highlights, whether due to error or fraud, and performing procedures that respond to those risks. Such procedures included examining, on a test basis, evidence regarding the amounts and disclosures in the financial statements and financial highlights. Our audits also included evaluating the accounting principles used and significant estimates made by management, as well as evaluating the overall presentation of the financial statements and financial highlights. Our procedures included confirmation of securities owned as of March 31, 2019, by correspondence with the custodian, agent banks, and brokers; when replies were not received from agent banks or brokers, we performed other auditing procedures. We believe that our audits provide a reasonable basis for our opinion.
/s/ Deloitte & Touche LLP
Boston, Massachusetts
May 21, 2019
We have served as the auditor of one or more BlackRock investment companies since 1992.
| | | | |
| R E P O R T O F I N D E P E N D E N T R E G I S T E R E D P U B L I C A C C O U N T I N G F I R M | | | 107 | |
| | |
| Important Tax Information (unaudited) | | |
The following information is provided with respect to the ordinary income distributions paid by the Funds for the fiscal year ended March 31, 2019.
| | | | | | | | | | | | |
| |
Interest Related Dividends and Qualified Short-Term Capital Gains for Non-U.S. Residents(a) | |
| |
| | | April 2018 | | |
| May 2018 —
December 2018 |
| |
| January 2019 —
March 2019 |
|
| |
Series A | | | 54.00 | % | | | 61.77 | % | | | 76.15 | % |
Series C | | | 72.72 | | | | 74.48 | | | | 77.26 | |
Series E | | | N/A | | | | 100.00 | | | | N/A | |
Series M | | | 97.86 | | | | 93.47 | | | | 100.00 | |
Series P | | | N/A | | | | 33.49 | | | | N/A | |
Series S | | | 55.39 | | | | 50.73 | | | | 100.00 | |
| |
Federal Obligation Interest(b) | |
| |
| | | | | | | | | |
| April 2018 —
March 2019 |
|
| |
Series C | | | | | | | | | | | 0.48% | |
Series M | | | | | | | | | | | 1.28% | |
| |
Qualified Dividend Income for Individuals(c) | |
| |
| | | April 2018 | | |
| May 2018 —
December 2018 |
| |
| January 2019 —
March 2019 |
|
| |
Series C | | | 4.18% | | | | 4.95% | | | | 3.55% | |
| |
Dividends Qualifying for the Dividends Received Deduction for Corporations(c) | |
| |
| | | | | | | | | |
| April 2018 —
March 2019 |
|
| |
Series C | | | | | | | | | | | 3.88% | |
| |
| | (a) | Represents the portion of the taxable ordinary income dividends eligible for exemption from U.S. withholding tax for nonresident aliens and foreign corporations. | |
| | (b) | The law varies in each state as to whether and what percentage of ordinary income distributions is eligible for exemption from state income tax. We recommend that you consult your tax advisor to determine if any portion of the distributions you received are exempt from state income tax. | |
| | (c) | The Fund hereby designates the percentage indicated above or the maximum amount allowable by law. | |
| | |
| 108 | | 2 0 1 9 B L A C K R O C K A N N U A L R E P O R T T O S H A R E H O L D E R S |
Trustee and Officer Information
| | | | | | | | |
| Independent Trustees(a) |
| | | | | |
Name Year of Birth(b) | | Position(s) Held (Length of Service)(c) | | Principal Occupation(s) During Past Five Years | | Number of BlackRock- Advised Registered Investment Companies (“RICs”) Consisting of Investment Portfolios (“Portfolios”) Overseen | | Public Company
and Other Investment Company Direc- torships Held During Past Five Years |
| | | | |
Richard E. Cavanagh 1946 | | Co-Chair of the Board and Trustee (Since 2019) | | Director, The Guardian Life Insurance Company of America since 1998; Board Chair, Volunteers of America (anot-for-profit organization) from 2015 to 2018 (board member since 2009); Director, Arch Chemical (chemical and allied products) from 1999 to 2011; Trustee, Educational Testing Service from 1997 to 2009 and Chairman thereof from 2005 to 2009; Senior Advisor, The Fremont Group since 2008 and Director thereof since 1996; Faculty Member/Adjunct Lecturer, Harvard University since 2007 and Executive Dean from 1987 to 1995; President and Chief Executive Officer, The Conference Board, Inc. (global business research organization) from 1995 to 2007. | | 88 RICs consisting of 112 Portfolios | | None |
Karen P. Robards 1950 | | Co-Chair of the Board and Trustee (Since 2019) | | Principal of Robards & Company, LLC (consulting and private investing) since 1987; Co-founder and Director of the Cooke Center for Learning and Development (a not-for-profit organization) since 1987; Director of Enable Injections, LLC (medical devices) since 2019; Investment Banker at Morgan Stanley from 1976 to 1987. | | 88 RICs consisting of 112 Portfolios | | Greenhill & Co., Inc.; AtriCure, Inc. (medical devices) from 2000 until 2017 |
Michael J. Castellano 1946 | | Trustee (Since 2019) | | Chief Financial Officer of Lazard Group LLC from 2001 to 2011; Chief Financial Officer of Lazard Ltd from 2004 to 2011; Director, Support Our Aging Religious (non-profit) from 2009 to June 2015 and since 2017; Director, National Advisory Board of Church Management at Villanova University since 2010; Trustee, Domestic Church Media Foundation since 2012; Director, CircleBlack Inc. (financial technology company) since 2015. | | 88 RICs consisting of 112 Portfolios | | None |
Cynthia L. Egan 1955 | | Trustee (Since 2019) | | Advisor, U.S. Department of the Treasury from 2014 to 2015; President, Retirement Plan Services for T. Rowe Price Group, Inc. from 2007 to 2012; executive positions within Fidelity Investments from 1989 to 2007. | | 88 RICs consisting of 112 Portfolios | | Unum (insurance); The Hanover Insurance Group (insurance); Envestnet (investment platform) from 2013 until 2016 |
Frank J. Fabozzi 1948 | | Trustee (Since 2019) | | Editor of The Journal of Portfolio Management since 1986; Professor of Finance, EDHEC Business School (France) since 2011; Visiting Professor, Princeton University for the 2013 to 2014 academic year and Spring 2017 semester; Professor in the Practice of Finance, Yale University School of Management from 1994 to 2011 and currently a Teaching Fellow in Yale’s Executive Programs; affiliated professor Karlsruhe Institute of Technology from 2008 to 2011. | | 88 RICs consisting of 112 Portfolios | | None |
| | | | |
| T R U S T E E A N D O F F I C E R I N F O R M A T I O N | | | 109 | |
Trustee and Officer Information (continued)
| | | | | | | | |
| Independent Trustees(a) |
| | | | | |
Name Year of Birth(b) | | Position(s) Held (Length of Service)(c) | | Principal Occupation(s) During Past Five Years | | Number of BlackRock- Advised Registered Investment Companies (“RICs”) Consisting of Investment Portfolios (“Portfolios”) Overseen | | Public Company and Other Investment Company Direc- torships Held During Past Five Years |
| | | | |
Henry Gabbay 1947 | | Trustee (Since 2007) | | Board Member, BlackRock Equity-Bond Board from 2007 to 2018; Board Member, BlackRock Equity-Liquidity and BlackRock Closed-End Fund Boards from 2007 through 2014; Consultant, BlackRock, Inc. from 2007 to 2008; Managing Director, BlackRock, Inc. from 1989 to 2007; Chief Administrative Officer, BlackRock Advisors, LLC from 1998 to 2007; President of BlackRock Funds and BlackRock Allocation Target Shares (formerly, BlackRock Bond Allocation Target Shares) from 2005 to 2007 and Treasurer of certain closed-end funds in the BlackRock fund complex from 1989 to 2006. | | 88 RICs consisting of 112 Portfolios | | None |
R. Glenn Hubbard 1958 | | Trustee (Since 2019) | | Dean, Columbia Business School since 2004; Faculty member, Columbia Business School since 1988. | | 88 RICs consisting of 112 Portfolios | | ADP (data and information services); Metropolitan Life Insurance Company (insurance); KKR Financial Corporation (finance) from 2004 until 2014 |
W. Carl Kester 1951 | | Trustee (Since 2019) | | George Fisher Baker Jr. Professor of Business Administration, Harvard Business School since 2008, Deputy Dean for Academic Affairs from 2006 to 2010, Chairman of the Finance Unit, from 2005 to 2006, Senior Associate Dean and Chairman of the MBA Program from 1999 to 2005; Member of the faculty of Harvard Business School since 1981. | | 88 RICs consisting of 112 Portfolios | | None |
Catherine A. Lynch 1961 | | Trustee (Since 2019) | | Chief Executive Officer, Chief Investment Officer and various other positions, National Railroad Retirement Investment Trust from 2003 to 2016; Associate Vice President for Treasury Management, The George Washington University from 1999 to 2003; Assistant Treasurer, Episcopal Church of America from 1995 to 1999. | | 88 RICs consisting of 112 Portfolios | | None |
| | |
| 110 | | 2 0 1 9 B L A C K R O C K A N N U A L R E P O R T T O S H A R E H O L D E R S |
Trustee and Officer Information (continued)
| | | | | | | | |
| Interested Trustees(a)(d) |
| | | | | |
Name Year of Birth(b) | | Position(s) Held (Length of Service)(c) | | Principal Occupation(s) During Past Five Years | | Number of BlackRock- Advised Registered Investment Companies (“RICs”) Consisting of Investment Portfolios (“Portfolios”) Overseen | | Public Company
and Other Investment Company Directorships Held During Past Five Years |
| | | | |
Robert Fairbairn 1965 | | Trustee (Since 2015) | | Senior Managing Director of BlackRock, Inc. since 2010; oversees BlackRock’s Strategic Partner Program and Strategic Product Management Group; Member of BlackRock’s Global Executive and Global Operating Committees; Co-Chair of BlackRock’s Human Capital Committee; Member of the Board of Managers of BlackRock Investments, LLC from 2011 to 2018; Global Head of BlackRock’s Retail and iShares® businesses from 2012 to 2016. | | 129 RICs consisting of 297 Portfolios | | None |
John M. Perlowski 1964 | | Trustee (Since 2015), President and Chief Executive Officer (Since 2010) | | Managing Director of BlackRock, Inc. since 2009; Head of BlackRock Global Accounting and Product Services since 2009; Advisory Director of Family Resource Network (charitable foundation) since 2009. | | 129 RICs consisting of 297 Portfolios | | None |
| (a) | The address of each Trustee is c/o BlackRock, Inc., 55 East 52nd Street, New York, New York 10055. |
| (b) | Each Independent Trustee holds office until his or her successor is duly elected and qualifies or until his or her earlier death, resignation, retirement or removal as provided by the Trust’s by-laws or charter or statute, or until December 31 of the year in which he or she turns 75. Trustees who are “interested persons,” as defined in the Investment Company Act serve until their successor is duly elected and qualifies or until their earlier death, resignation, retirement or removal as provided by the Trust’s by-laws or statute, or until December 31 of the year in which they turn 72. The Board may determine to extend the terms of Independent Trustees on a case-by-case basis, as appropriate. |
| (c) | Following the combination of Merrill Lynch Investment Managers, L.P. (“MLIM”) and BlackRock, Inc. in September 2006, the various legacy MLIM and legacy BlackRock fund boards were realigned and consolidated into three new fund boards in 2007. Certain Independent Trustees first became members of the boards of other legacy MLIM or legacy BlackRock funds as follows: Richard E. Cavanagh, 1994; Frank J. Fabozzi, 1988; R. Glenn Hubbard, 2004; W. Carl Kester, 1995; and Karen P. Robards, 1998. Certain other Independent Trustees became members of the boards of the closed-end funds in the Fixed-Income Complex as follows: Michael J. Castellano, 2011; Cynthia L. Egan, 2016; and Catherine A. Lynch, 2016. |
| (d) | Mr. Fairbairn and Mr. Perlowski are both “interested persons,” as defined in the 1940 Act, of the Trust based on their positions with BlackRock, Inc. and its affiliates. Mr. Fairbairn and Mr. Perlowski are also board members of the BlackRock Multi-Asset Complex. |
| | | | |
| T R U S T E E A N D O F F I C E R I N F O R M A T I O N | | | 111 | |
Trustee and Officer Information (continued)
| | | | |
| Officers Who Are Not Trustees(a) |
| | | |
Name Year of Birth(b) | | Position(s) Held (Length of Service) | | Principal Occupation(s) During Past Five Years |
Jennifer McGovern 1977 | | Vice President
(Since 2014) | | Managing Director of BlackRock, Inc. since 2016; Director of BlackRock, Inc. from 2011 to 2015; Head of Product Structure and Oversight for BlackRock’s U.S. Wealth Advisory Group since 2013. |
Neal J. Andrews 1966 | | Chief Financial Officer
(Since 2007) | | Chief Financial Officer of the iShares® exchange traded funds since 2019; Managing Director of BlackRock, Inc. since 2006. |
Jay M. Fife 1970 | | Treasurer
(Since 2007) | | Managing Director of BlackRock, Inc. since 2007. |
Charles Park 1967 | | Chief Compliance Officer
(Since 2014) | | Anti-Money Laundering Compliance Officer for certain BlackRock-advised Funds from 2014 to 2015; Chief Compliance Officer of BlackRock Advisors, LLC and the BlackRock-advised Funds in the BlackRock Multi-Asset Complex and the BlackRock Fixed-Income Complex since 2014; Principal of and Chief Compliance Officer for iShares® Delaware Trust Sponsor LLC since 2012 and BlackRock Fund Advisors (“BFA”) since 2006; Chief Compliance Officer for the BFA-advised iShares® exchange traded funds since 2006; Chief Compliance Officer for BlackRock Asset Management International Inc. since 2012. |
John MacKessy 1972 | | Anti-Money Laundering Compliance Officer
(Since 2018) | | Director of BlackRock, Inc. since 2017; Global Head of Anti-Money Laundering at BlackRock, Inc. since 2017; Director of AML Monitoring and Investigations Group of Citibank from 2015 to 2017; Global Anti-Money Laundering and Economic Sanctions Officer for MasterCard from 2011 to 2015. |
Benjamin Archibald 1975 | | Secretary
(Since 2012) | | Managing Director of BlackRock, Inc. since 2014; Director of BlackRock, Inc. from 2010 to 2013; Secretary of the iShares® exchange traded funds since 2015; Secretary of the BlackRock-advised mutual funds since 2012. |
(a) The address of each Officer is c/o BlackRock, Inc., 55 East 52nd Street, New York, New York 10055. (b) Officers of the Trust serve at the pleasure of the Board. |
Further information about the Trust’s Trustees and Officers is available in the Trust’s Statement of Additional Information, which can be obtained without charge by calling (800) 441-7762.
At a special meeting of shareholders held on November 21, 2018, each Fund’s shareholders elected Truetees who took office on January 1, 2019. The newly elected Trustees include three former Trustees and eight individuals who served as directors/trustees of the funds in the BlackRock Closed-End Complex.
Investment Adviser
BlackRock Advisors, LLC
Wilmington, DE 19809
Accounting Agent, Administrator and Transfer Agent
BNY Mellon Investment Servicing (US) Inc.
Wilmington, DE 19809
Custodian
The Bank of New York Mellon
New York, NY 10286
Independent Registered Public Accounting Firm
Deloitte & Touche LLP
Boston, MA, 02116
Distributor
BlackRock Investments, LLC
New York, NY 10022
Legal Counsel
Willkie Farr & Gallagher LLP
New York, NY 10019
Address of the Trust
100 Bellevue Parkway
Wilmington, DE 19809
| | |
| 112 | | 2 0 1 9 B L A C K R O C K A N N U A L R E P O R T T O S H A R E H O L D E R S |
Additional Information
Proxy Results
A Special Meeting of Shareholders was held on November 21, 2018 for shareholders of record on September 24, 2018, to elect a Board of Trustees of the Trust. The newly elected Trustees took office effective January 1, 2019.
Shareholders approved the Trustees* of BlackRock Allocation Target Shares with voting results as follows:
| | | | | | | | |
| |
| | | Votes For | | | Votes Withheld | |
| |
Michael J. Castellano | | | 236,146,321 | | | | 0 | |
Richard E. Cavanagh | | | 236,146,321 | | | | 0 | |
Cynthia L. Egan | | | 236,146,321 | | | | 0 | |
Frank J. Fabozzi | | | 236,146,321 | | | | 0 | |
Robert Fairbairn | | | 236,146,321 | | | | 0 | |
Henry Gabbay | | | 236,146,321 | | | | 0 | |
R. Glenn Hubbard | | | 236,146,321 | | | | 0 | |
W. Carl Kester | | | 236,146,321 | | | | 0 | |
Catherine A. Lynch | | | 236,146,321 | | | �� | 0 | |
John M. Perlowski | | | 236,146,321 | | | | 0 | |
Karen P. Robards | | | 236,146,321 | | | | 0 | |
| |
| | * | Denotes Trust-wide proposal and voting results. | |
The above Trustees, referred to as the BlackRock Fixed-Income Board, have also been elected to serve as trustees for other BlackRock-advised non-index fixed-income mutual funds and all of the BlackRock-advised closed-end funds.
General Information
Quarterly performance, semi-annual and annual reports, current net asset value and other information regarding the Funds may be found on BlackRock’s website, which can be accessed athttp://www.blackrock.com. Any reference to BlackRock’s website in this report is intended to allow investors public access to information regarding the Funds and does not, and is not intended to, incorporate BlackRock’s website in this report.
Householding
The Funds will mail only one copy of shareholder documents, including prospectuses, annual and semi-annual reports and proxy statements, to shareholders with multiple accounts at the same address. This practice is commonly called “householding” and is intended to reduce expenses and eliminate duplicate mailings of shareholder documents. Mailings of your shareholder documents may be householded indefinitely unless you instruct us otherwise. If you do not want the mailing of these documents to be combined with those for other members of your household, please call the Funds at (800) 441-7762.
Availability of Quarterly Schedule of Investments
The Funds file their complete schedule of portfolio holdings with the SEC for the first and third quarters of each fiscal year on Form N-Q. The Funds’ Forms N-Q are available on the SEC’s website at http://www.sec.gov. The Funds’ Forms N-Q may also be obtained upon request and without charge by calling (800) 441-7762.
Availability of Proxy Voting Policies and Procedures
A description of the policies and procedures that the Funds use to determine how to vote proxies relating to portfolio securities is available upon request and without charge (1) by calling (800) 441-7762; (2) athttp://www.blackrock.com; and (3) on the SEC’s website at http://www.sec.gov.
Availability of Proxy Voting Record
Information about how the Funds voted proxies relating to securities held in the Funds’ portfolios during the most recent 12-month period ended June 30 is available upon request and without charge (1) athttp://www.blackrock.comor by calling (800) 441-7762 and (2) on the SEC’s website at http://www.sec.gov.
| | | | |
| A D D I T I O N A L I N F O R M A T I O N | | | 113 | |
Additional Information (continued)
BlackRock Privacy Principles
BlackRock is committed to maintaining the privacy of its current and former fund investors and individual clients (collectively, “Clients”) and to safeguarding their non-public personal information. The following information is provided to help you understand what personal information BlackRock collects, how we protect that information and why in certain cases we share such information with select parties.
If you are located in a jurisdiction where specific laws, rules or regulations require BlackRock to provide you with additional or different privacy-related rights beyond what is set forth below, then BlackRock will comply with those specific laws, rules or regulations.
BlackRock obtains or verifies personal non-public information from and about you from different sources, including the following: (i) information we receive from you or, if applicable, your financial intermediary, on applications, forms or other documents; (ii) information about your transactions with us, our affiliates, or others; (iii) information we receive from a consumer reporting agency; and (iv) from visits to our websites.
BlackRock does not sell or disclose to non-affiliated third parties any non-public personal information about its Clients, except as permitted by law or as is necessary to respond to regulatory requests or to service Client accounts. These non-affiliated third parties are required to protect the confidentiality and security of this information and to use it only for its intended purpose.
We may share information with our affiliates to service your account or to provide you with information about other BlackRock products or services that may be of interest to you. In addition, BlackRock restricts access to non-public personal information about its Clients to those BlackRock employees with a legitimate business need for the information. BlackRock maintains physical, electronic and procedural safeguards that are designed to protect the non-public personal information of its Clients, including procedures relating to the proper storage and disposal of such information.
| | |
| 114 | | 2 0 1 9 B L A C K R O C K A N N U A L R E P O R T T O S H A R E H O L D E R S |
Glossary of Terms Used in this Report
| | |
| Currency |
| |
| CAD | | Canadian Dollar |
| |
| USD | | US Dollar |
|
| Portfolio Abbreviations |
| |
| ABS | | Asset-Backed Security |
| |
| AGM | | Assurance Guaranty Municipal Corp. |
| |
| AMT | | Alternative Minimum Tax (subject to) |
| |
| CLO | | Collateralized Loan Obligation |
| |
| DAC | | Designated Activity Company |
| |
| EDA | | Economic Development Authority |
| |
| GO | | General Obligation Bonds |
| |
| IDA | | Industrial Development Authority |
| |
| LIBOR | | London Interbank Offered Rate |
| |
| OTC | | Over-the-counter |
| |
| RB | | Revenue Bonds |
| |
| REMIC | | Real Estate Mortgage Investment Conduit |
| |
| S&P | | S&P Global Ratings |
| |
| TBA | | To-be-announced |
| | | | |
| G L O S S A R Y O F T E R M S U S E D I N T H I S R E P O R T | | | 115 | |
This report is intended for current holders. It is not authorized for use as an offer of sale or a solicitation of an offer to buy shares of the Funds unless preceded or accompanied by the Funds’ current prospectus. Past performance results shown in this report should not be considered a representation of future performance. Investment returns and principal value of shares will fluctuate so that shares, when redeemed, may be worth more or less than their original cost. Statements and other information herein are as dated and are subject to change.

| | |
| BATS-3/19-AR | |  |
| Item 2 – | Code of Ethics – The registrant (or the “Fund”) has adopted a code of ethics, as of the end of the period covered by this report, applicable to the registrant’s principal executive officer, principal financial officer, principal accounting officer or controller, or persons performing similar functions. During the period covered by this report, the code of ethics was amended to update certain information and to make othernon-material changes. During the period covered by this report, there have been no waivers granted under the code of ethics. The registrant undertakes to provide a copy of the code of ethics to any person upon request, without charge, who calls1-800-441-7762. |
| Item 3 – | Audit Committee Financial Expert – The registrant’s board of directors (the “board of directors”), has determined that (i) the registrant has the following audit committee financial experts serving on its audit committee and (ii) each audit committee financial expert is independent: |
Michael Castellano
Frank J. Fabozzi
Henry Gabbay
Catherine A. Lynch
Karen P. Robards
The registrant’s board of directors has determined that Karen P. Robards qualifies as an audit committee financial expert pursuant to Item 3(c)(4) of FormN-CSR.
Ms. Robards has a thorough understanding of generally accepted accounting principles, financial statements and internal control over financial reporting as well as audit committee functions. Ms. Robards has been President of Robards & Company, a financial advisory firm, since 1987. Ms. Robards was formerly an investment banker for more than 10 years where she was responsible for evaluating and assessing the performance of companies based on their financial results. Ms. Robards has over 30 years of experience analyzing financial statements. She also is a member of the audit committee of one publicly held company and anon-profit organization.
Under applicable securities laws, a person determined to be an audit committee financial expert will not be deemed an “expert” for any purpose, including without limitation for the purposes of Section 11 of the Securities Act of 1933, as a result of being designated or identified as an audit committee financial expert. The designation or identification as an audit committee financial expert does not impose on such person any duties, obligations, or liabilities greater than the duties, obligations, and liabilities imposed on such person as a member of the audit committee and board of directors in the absence of such designation or identification. The designation or identification of a person as an audit committee financial expert does not affect the duties, obligations, or liability of any other member of the audit committee or board of directors.
| Item 4 – | Principal Accountant Fees and Services |
The following table presents fees billed by Deloitte & Touche LLP (“D&T”) in each of the last two fiscal years for the services rendered to the Fund:
2
| | | | | | | | | | | | | | | | | | | | | | | | | | | | | | | | | | | | | | | | |
| | | (a) Audit Fees | | (b) Audit-Related Fees1 | | (c) Tax Fees2 | | (d) All Other Fees |
| Entity Name | | Current
Fiscal Year
End | | Previous
Fiscal Year
End | | Current
Fiscal Year
End | | Previous
Fiscal Year
End | | Current
Fiscal Year
End | | Previous
Fiscal Year
End | | Current
Fiscal Year
End | | Previous
Fiscal Year
End |
Series A Portfolio | | | | $40,902 | | | | | $40,902 | | | | | $0 | | | | | $38 | | | | | $15,400 | | | | | $16,600 | | | | | $0 | | | | | $0 | |
Series C Portfolio | | | | $36,006 | | | | | $36,006 | | | | | $0 | | | | | $38 | | | | | $15,400 | | | | | $17,200 | | | | | $0 | | | | | $0 | |
Series E Portfolio | | | | $41,922 | | | | | $41,922 | | | | | $0 | | | | | $38 | | | | | $13,400 | | | | | $14,600 | | | | | $0 | | | | | $0 | |
Series M Portfolio | | | | $32,028 | | | | | $32,028 | | | | | $0 | | | | | $38 | | | | | $15,400 | | | | | $16,000 | | | | | $0 | | | | | $0 | |
Series P Portfolio | | | | $20,400 | | | | | $20,400 | | | | | $0 | | | | | $38 | | | | | $15,400 | | | | | $16,000 | | | | | $0 | | | | | $0 | |
Series S Portfolio | | | | $36,006 | | | | | $36,006 | | | | | $0 | | | | | $38 | | | | | $15,400 | | | | | $16,000 | | | | | $0 | | | | | $0 | |
The following table presents fees billed by D&T that were required to be approved by the registrant’s audit committee (the “Committee”) for services that relate directly to the operations or financial reporting of the Fund and that are rendered on behalf of BlackRock Advisors, LLC (the “Investment Adviser” or “BlackRock”) and entities controlling, controlled by, or under common control with BlackRock (not including anysub-adviser whose role is primarily portfolio management and is subcontracted with or overseen by another investment adviser) that provide ongoing services to the Fund (“Affiliated Service Providers”):
| | | | |
| | | Current Fiscal Year End | | Previous Fiscal Year End |
| (b) Audit-Related Fees1 | | $0 | | $0 |
| (c) Tax Fees2 | | $0 | | $0 |
| (d) All Other Fees3 | | $2,050,500 | | $2,274,000 |
1 The nature of the services includes assurance and related services reasonably related to the performance of the audit or review of financial statements not included in Audit Fees, including accounting consultations, agreed-upon procedure reports, attestation reports, comfort letters,out-of-pocket expenses and internal control reviews not required by regulators.
2 The nature of the services includes tax compliance and/or tax preparation, including services relating to the filing or amendment of federal, state or local income tax returns, regulated investment company qualification reviews, taxable income and tax distribution calculations.
3Non-audit fees of $2,050,500 and $2,274,000 for the current fiscal year and previous fiscal year, respectively, were paid to the Fund’s principal accountant in their entirety by BlackRock, in connection with services provided to the Affiliated Service Providers of the Fund and of certain other funds sponsored and advised by BlackRock or its affiliates for a service organization review and an accounting research tool subscription. These amounts represent aggregate fees paid by BlackRock and were not allocated on a per fund basis.
(e)(1) Audit CommitteePre-Approval Policies and Procedures:
The Committee has adopted policies and procedures with regard to thepre-approval of services. Audit, audit-related and tax compliance services provided to the registrant on an annual basis require specificpre-approval by the Committee. The Committee also must approve othernon-audit services provided to the registrant and thosenon-audit services provided to the Investment Adviser and Affiliated Service Providers that relate directly to the operations and the financial reporting of the registrant. Certain of thesenon-audit services that the Committee believes are (a) consistent with the SEC’s auditor independence rules and (b) routine and recurring services that will not impair the independence of the independent accountants may be approved by the Committee without consideration on a specificcase-by-case basis (“generalpre-approval”). The term of any generalpre-approval is 12 months from the date of thepre-approval, unless the Committee provides for a different period. Tax or othernon-audit services provided to the registrant which have a direct impact on the operations or financial reporting of the registrant will only be deemedpre-approved provided that any individual project does not exceed $10,000 attributable to the registrant or $50,000 per project. For this purpose, multiple projects will be aggregated to determine if they exceed the previously mentioned cost levels.
3
Any proposed services exceeding thepre-approved cost levels will require specificpre-approval by the Committee, as will any other services not subject to generalpre-approval (e.g., unanticipated but permissible services). The Committee is informed of each service approved subject to generalpre-approval at the next regularly scheduledin-person board meeting. At this meeting, an analysis of such services is presented to the Committee for ratification. The Committee may delegate to the Committee Chairman the authority to approve the provision of and fees for any specific engagement of permittednon-audit services, including services exceedingpre-approved cost levels.
(e)(2) None of the services described in each of Items 4(b) through (d) were approved by the Committee pursuant to the de minimis exception in paragraph (c)(7)(i)(C) of Rule2-01 of RegulationS-X.
(f) Not Applicable
(g) The aggregatenon-audit fees, defined as the sum of the fees shown under “Audit-Related Fees,” “Tax Fees” and “All Other Fees,” paid to the accountant for services rendered by the accountant to the registrant, the Investment Adviser and the Affiliated Service Providers were:
| | | | | | | | |
| Entity Name | | Current Fiscal Year
End | | | Previous Fiscal Year
End | |
Series A Portfolio | | | $15,400 | | | | $16,638 | |
Series C Portfolio | | | $15,400 | | | | $17,238 | |
Series E Portfolio | | | $13,400 | | | | $14,638 | |
Series M Portfolio | | | $15,400 | | | | $16,038 | |
Series P Portfolio | | | $15,400 | | | | $16,038 | |
Series S Portfolio | | | $15,400 | | | | $16,038 | |
Additionally, the amounts billed by D&T in connection with services provided to the Affiliated Service Providers of the Fund and of other funds sponsored and advised by BlackRock or its affiliates during the current and previous fiscal years for a service organization review and an accounting research tool subscription were:
| | |
Current Fiscal Year
End | | Previous Fiscal Year
End |
$2,050,500 | | $2,274,000 |
These amounts represent aggregate fees paid by BlackRock and were not allocated on a per fund basis.
(h) The Committee has considered and determined that the provision ofnon-audit services that were rendered to the Investment Adviser and the Affiliated Service Providers that were notpre-approved pursuant to paragraph (c)(7)(ii) of Rule2-01 of RegulationS-X is compatible with maintaining the principal accountant’s independence.
| Item 5 – | Audit Committee of Listed Registrants – Not Applicable |
4
(a) The registrant’s Schedule of Investments is included as part of the Report to Stockholders filed under Item 1 of this Form.
(b) Not Applicable due to no such divestments during the semi-annual period covered since the previousForm N-CSR filing.
| Item 7 – | Disclosure of Proxy Voting Policies and Procedures forClosed-End Management Investment Companies – Not Applicable |
| Item 8 – | Portfolio Managers ofClosed-End Management Investment Companies – Not Applicable |
| Item 9 – | Purchases of Equity Securities byClosed-End Management Investment Company and Affiliated Purchasers – Not Applicable |
| Item 10 – | Submission of Matters to a Vote of Security Holders – There have been no material changes to these procedures. |
| Item 11 – | Controls and Procedures |
(a) The registrant’s principal executive and principal financial officers, or persons performing similar functions, have concluded that the registrant’s disclosure controls and procedures (as defined in Rule30a-3(c) under the Investment Company Act of 1940, as amended (the “1940 Act”)) are effective as of a date within 90 days of the filing of this report based on the evaluation of these controls and procedures required by Rule30a-3(b) under the 1940 Act and Rule 15d-15(b) under the Securities Exchange Act of 1934, as amended.
(b) There were no changes in the registrant’s internal control over financial reporting (as defined in Rule30a-3(d) under the 1940 Act) that occurred during the last fiscal quarter of the period covered by this report that have materially affected, or are reasonably likely to materially affect, the registrant’s internal control over financial reporting.
| Item 12 – | Disclosure of Securities Lending Activities forClosed-End Management Investment Companies – Not Applicable |
| Item 13 – | Exhibits attached hereto |
(a)(1) Code of Ethics – See Item 2
(a)(2) Certifications – Attached hereto
(a)(3) Not Applicable
(a)(4) Not Applicable
(b) Certifications – Attached hereto
5
Pursuant to the requirements of the Securities Exchange Act of 1934 and the Investment Company Act of 1940, the registrant has duly caused this report to be signed on its behalf by the undersigned, thereunto duly authorized.
BlackRock Allocation Target Shares
| | |
| By: | | /s/ John M. Perlowski |
| | John M. Perlowski |
| | Chief Executive Officer (principal executive officer) of |
| | BlackRock Allocation Target Shares |
Date: June 28, 2019
Pursuant to the requirements of the Securities Exchange Act of 1934 and the Investment Company Act of 1940, this report has been signed below by the following persons on behalf of the registrant and in the capacities and on the dates indicated.
| | |
By: | | /s/ John M. Perlowski |
| | John M. Perlowski |
| | Chief Executive Officer (principal executive officer) of |
| | BlackRock Allocation Target Shares |
|
Date: June 28, 2019 |
| |
By: | | /s/ Neal J. Andrews |
| | Neal J. Andrews |
| | Chief Financial Officer (principal financial officer) of |
| | BlackRock Allocation Target Shares |
Date: June 28, 2019
6