In the three months ended June 30, 2020, an additional 81,100,000 Shares (811 Baskets) were created in exchange for 7,625,451.5 ounces of gold, 8,300,000 Shares (83 Baskets) were redeemed in exchange for 780,277.5 ounces of gold, and 32,347.9 ounces of gold were sold to pay expenses.
At June 30, 2020, the Custodian held 37,902,740.8 ounces of gold on behalf of the Trust, 100% of which is allocated gold in the form of good delivery gold bars with a market value of $67,015,836,086 (cost—$54,307,578,223) and which includes gold held with a subcustodian (Bank of England). The greatest amount of gold held by Bank of England during the quarter ended June 30, 2020 was approximately 2,251,607 ounces or 6.3% of the Trust’s gold on May 21, 2020. At June 30, 2020, Bank of England held approximately 1,283,665 ounces or 3.4% of the Trust’s gold in an allocated account.
As at September 30, 2019, the Custodian held 29,737,588 ounces of gold in its vault, 100% of which is allocated gold in the form of good delivery gold bars with a market value of $44,169,239,649 (cost—$39,069,053,854). Subcustodians did not hold any gold on behalf of the Trust.
On September 19, 2019, Inspectorate International Limited, or Inspectorate, concluded the annual full count of the Trust’s gold bullion held by the Custodian. On October 1, 2019, Inspectorate concluded reconciliation procedures from June 28, 2019 through September 30, 2019. The results can be found on www.spdrgoldshares.com.
Cash Resources and Liquidity
At June 30, 2020, the Trust did not have any cash balances. When selling gold to pay expenses, the Trustee endeavors to sell the exact amount of gold needed to pay expenses in order to minimize the Trust’s holdings of assets other than gold. As a consequence, we expect that the Trust will not record any net cash flow from its operations and that its cash balance will be zero at the end of each reporting period.
Analysis of Movements in the Price of Gold
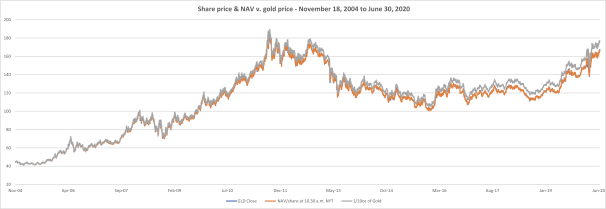
As movements in the price of gold are expected to directly affect the price of the Trust’s Shares, investors should understand what the recent movements in the price of gold have been. Investors, however, should also be aware that past movements in the gold price are not indicators of future movements. This section identifies recent trends in the movements of the gold price.
The following chart provides historical background on the price of gold. The chart illustrates movements in the price of gold in US dollars per ounce over the period from July 1, 2015 to June 30, 2020 and is based on the LBMA Gold Price PM when available.