UNITED STATES
SECURITIES AND EXCHANGE COMMISSION
Washington, D.C. 20549
FORM N-CSR
CERTIFIED SHAREHOLDER REPORT OF REGISTERED MANAGEMENT INVESTMENT COMPANIES
Investment Company Act file number 811-21318
Name of Fund: BlackRock Corporate High Yield Fund, Inc. (HYT)
Fund Address: 100 Bellevue Parkway, Wilmington, DE 19809
Name and address of agent for service: John M. Perlowski, Chief Executive Officer, BlackRock Corporate High Yield Fund, Inc., 55 East 52nd Street, New York, NY 10055
Registrant’s telephone number, including area code: (800) 882-0052, Option 4
Date of fiscal year end: 08/31/2018
Date of reporting period: 02/28/2018
| Item 1 – | Report to Stockholders |
FEBRUARY 28, 2018
| | |
SEMI-ANNUAL REPORT (UNAUDITED) | |  |
BlackRock Core Bond Trust (BHK)
BlackRock Corporate High Yield Fund, Inc. (HYT)
BlackRock Income Trust, Inc. (BKT)
|
| Not FDIC Insured • May Lose Value • No Bank Guarantee |
The Markets in Review
Dear Shareholder,
In the 12 months ended February 28, 2018, assets with higher risk and return potential, such as stocks and high-yield bonds, continued to deliver strong performance. Faster global growth drove the equity market, while rising interest rates constrained bond returns.
Emerging market stocks posted the strongest performance, as accelerating growth in China, the second-largest economy in the world, improved the outlook for corporate profits and economic growth across most developing nations. Chinese demand for commodities and other raw materials allayed concerns about the country’s banking system, leading to rising equity prices and foreign investment. Higher prices for industrial metals also bolstered the outlook for emerging-market countries.
Rising interest rates worked against high-quality assets with more interest rate sensitivity. Consequently, the 10-year U.S. Treasury — a bellwether of the bond market — posted a negative return, as rising energy prices, higher wages, and steady job growth drove expectations of higher inflation and interest rate increases by the U.S. Federal Reserve (the “Fed”).
The market’s performance reflected reflationary expectations early in the reporting period, as investors began to sense that a global recovery was afoot. Thereafter, many countries experienced sustained and synchronized growth for the first time since the financial crisis. Growth rates and inflation are still relatively low, but they are finally rising together.
The Fed responded to these positive developments by increasing short-term interest rates three times during the year. In October 2017, the Fed also began to reduce its balance sheet, while setting expectations for additional rate hikes in 2018.
By contrast, the European Central Bank (“ECB”) and the Bank of Japan (“BoJ”) continued to expand their balance sheets despite nascent signs of sustained economic growth. Rising global growth and inflation, as well as limited bond supply, put steady pressure on other central banks to follow in the Fed’s footsteps. In October 2017, the ECB announced plans to cut its bond purchases in half for 2018, while the BoJ reiterated its commitment to economic stimulus, as the country’s inflation rate remained below 2.0%.
Rising consumer confidence and improving business sentiment are driving momentum for the U.S. economy. If the Fed maintains a measured pace of stimulus reduction, to the extent that inflation rises, it’s likely to be accompanied by rising real growth and higher wages. That could lead to a favorable combination of moderately higher inflation, steadily rising interest rates, and improving growth in 2018. We continue to believe the primary risks to the economic expansion are trade protectionism, rapidly rising interest rates, and geopolitical tension. In particular, we are closely monitoring trade protectionism and the rise of populism in Western nations.
In December 2017, Congress passed a sweeping tax reform bill. The U.S. tax overhaul is likely to accentuate the existing reflationary themes, including faster growth and rising interest rates. Changing the corporate tax rate to a flat 21% will create many winners and losers among high-and-low tax companies, while the windfall from lower taxes could boost business and consumer spending.
In this environment, investors need to think globally, extend their scope across a broad array of asset classes, and be nimble as market conditions change. We encourage you to talk with your financial advisor and visit blackrock.com for further insight about investing in today’s markets.
Sincerely,

Rob Kapito
President, BlackRock Advisors, LLC

Rob Kapito
President, BlackRock Advisors, LLC
| | | | |
| Total Returns as of February 28, 2018 |
| | | 6-month | | 12-month |
U.S. large cap equities
(S&P 500® Index) | | 10.84% | | 17.10% |
U.S. small cap equities
(Russell 2000® Index) | | 8.30 | | 10.51 |
International equities
(MSCI Europe, Australasia,
Far East Index) | | 7.12 | | 20.13 |
Emerging market equities
(MSCI Emerging Markets Index) | | 10.58 | | 30.51 |
3-month Treasury bills
(ICE BofAML 3-Month U.S. Treasury Bill Index) | | 0.58 | | 0.99 |
U.S. Treasury securities
(ICE BofAML 10-Year U.S. Treasury Index) | | (5.47) | | (2.54) |
U.S. investment grade bonds
(Bloomberg Barclays U.S.
Aggregate Bond Index) | | (2.18) | | 0.51 |
Tax-exempt municipal bonds
(S&P Municipal Bond Index) | | (1.15) | | 2.32 |
U.S. high yield bonds
(Bloomberg Barclays U.S. Corporate High Yield 2% Issuer
Capped Index) | | 1.11 | | 4.18 |
| Past performance is no guarantee of future results. Index performance is shown for illustrative purposes only. You cannot invest directly in an index. |
| | |
| 2 | | THIS PAGEISNOT PARTOF YOUR FUND REPORT |
Table of Contents
| | |
| Trust Summary as of February 28, 2018 | | BlackRock Core Bond Trust |
Trust Overview
BlackRock Core Bond Trust’s (BHK) (the “Trust”) investment objective is to provide current income and capital appreciation. The Trust seeks to achieve its investment objective by investing at least 75% of its managed assets in bonds that are investment grade quality at the time of investment. The Trust’s investments will include a broad range of bonds, including corporate bonds, U.S. government and agency securities and mortgage-related securities. The Trust may invest up to 25% of its total managed assets in bonds that at the time of investment are rated Ba/BB or below by Moody’s Investors Service, Inc. (“Moody’s”), Standard & Poors Ratings Group (“S&P”), Fitch Ratings (“Fitch”) or another nationally recognized rating agency or bonds that are unrated but judged to be of comparable quality by the investment adviser. The Trust may invest up to 10% of its managed assets in bonds issued in foreign currencies. The Trust may invest directly in such securities or synthetically through the use of derivatives.
No assurance can be given that the Trust’s investment objective will be achieved.
Trust Information
| | |
Symbol on New York Stock Exchange (“NYSE”) | | BHK |
Initial Offering Date | | November 27, 2001 |
Current Distribution Rate on Closing Market Price as of February 28, 2018 ($13.21)(a) | | 5.90% |
Current Monthly Distribution per Common Share(b) | | $0.0650 |
Current Annualized Distribution per Common Share(b) | | $0.7800 |
Economic Leverage as of February 28, 2018(c) | | 32% |
| | (a) | Current distribution rate on closing market price is calculated by dividing the current annualized distribution per share by the closing market price. The current distribution rate may consist of income, net realized gains and/or a tax return of capital. Past performance does not guarantee future results. | |
| | (b) | The distribution rate is not constant and is subject to change. | |
| | (c) | Represents reverse repurchase agreements outstanding as a percentage of total managed assets, which is the total assets of the Trust (including any assets attributable to borrowings) minus the sum of liabilities (other than borrowings representing financial leverage). For a discussion of leveraging techniques utilized by the Trust, please see The Benefits and Risks of Leveraging on page 13. | |
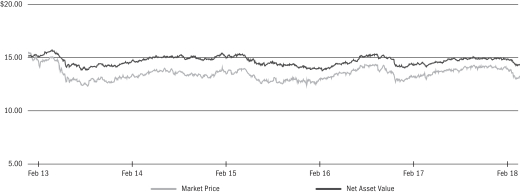
Market Price and Net Asset Value Per Share Summary
| | | | | | | | | | | | | | | | | | | | |
| | | 02/28/18 | | | 08/31/17 | | | Change | | | High | | | Low | |
Market Price | | $ | 13.21 | | | $ | 14.10 | | | | (6.31 | )% | | $ | 14.26 | | | $ | 12.93 | |
Net Asset Value | | | 14.32 | | | | 14.96 | | | | (4.28 | ) | | | 15.01 | | | | 14.21 | |
Market Price and Net Asset Value History For the Past Five Years
| | |
| 4 | | 2018 BLACKROCK SEMI-ANNUAL REPORTTO SHAREHOLDERS |
| | |
| Trust Summary as of February 28, 2018 (continued) | | BlackRock Core Bond Trust |
Performance and Portfolio Management Commentary
Returns for the period ended February 28, 2018 were as follows:
| | | | | | | | | | | | | | | | |
| | | | | | Average Annual Total Returns | |
| | | 6 Months | | | 1 Year | | | 3 Years | | | 5 Years | |
Trust at NAV(a)(b) | | | (1.55 | )% | | | 4.46 | % | | | 4.19 | % | | | 5.53 | % |
Trust at Market Price(a)(b) | | | (3.64 | ) | | | 4.75 | | | | 4.80 | | | | 4.14 | |
Reference Benchmark(c) | | | (1.93 | ) | | | 2.15 | | | | 2.27 | | | | 3.23 | |
Bloomberg Barclays U.S. Long Government/Credit Index(d) | | | (3.40 | ) | | | 2.80 | | | | 1.76 | | | | 3.69 | |
Bloomberg Barclays Intermediate Credit Index(e) | | | (1.62 | ) | | | 1.02 | | | | 1.78 | | | | 2.07 | |
Bloomberg Barclays U.S. Corporate High Yield 2% Issuer Capped Index(f) | | | 1.11 | | | | 4.18 | | | | 5.20 | | | | 5.34 | |
Bloomberg Barclays CMBS, Eligible for U.S. Aggregate(g) | | | (2.29 | ) | | | 0.75 | | | | 1.58 | | | | 2.02 | |
Bloomberg Barclays MBS Index(h) | | | (1.89 | ) | | | 0.16 | | | | 1.03 | | | | 1.70 | |
Bloomberg Barclays ABS Index(i) | | | (0.80 | ) | | | 0.63 | | | | 1.26 | | | | 1.16 | |
| | (a) | All returns reflect reinvestment of dividends and/or distributions at actual reinvestment prices. Performance results reflect the Trust’s use of leverage. | |
| | (b) | The Trust’s discount to NAV widened during the period, which accounts for the difference between performance based on market price and performance based on NAV. | |
| | (c) | The Reference Benchmark is comprised of the Bloomberg Barclays U.S. Long Government/Credit Index (40%); Bloomberg Barclays Intermediate Credit Index (24%); Bloomberg Barclays U.S. Corporate High Yield 2% Issuer Capped Index (16%); Bloomberg Barclays CMBS, Eligible for U.S. Aggregate Index (8%); Bloomberg Barclays MBS Index (8%); and Bloomberg Barclays ABS Index (4%). The Reference Benchmark’s index content and weightings may have varied over past periods. | |
| | (d) | This unmanaged index is the long component of the Bloomberg Barclays U.S. Government/Credit Index. This unmanaged index includes publicly issued U.S. Treasury debt, U.S. government agency debt, taxable debt issued by U.S. states and territories and their political subdivisions, debt issued by U.S. and non-U.S. corporations, non-U.S. government debt and supranational debt. | |
| | (e) | This unmanaged index is the intermediate component of the Bloomberg Barclays U.S. Credit Index. The Bloomberg Barclays U.S. Credit Index includes publicly issued U.S. corporate and foreign debentures and secured notes that meet specified maturity, liquidity, and quality requirements. | |
| | (f) | An unmanaged index comprised of issuers that meet the following criteria: at least $150 million par value outstanding; maximum credit rating of Ba1; at least one year to maturity; and no issuer represents more than 2% of the index. | |
| | (g) | This unmanaged index is the CMBS component of the Bloomberg Barclays U.S. Aggregate Index. | |
| | (h) | This unmanaged index is a market value-weighted index, which covers the mortgage-backed securities component of the Bloomberg Barclays U.S. Aggregate Bond Index. The unmanaged index is comprised of agency mortgage-backed pass-through securities of the Government National Mortgage Association (Ginnie Mae), the Federal National Mortgage Association (Fannie Mae), and the Federal Home Loan Mortgage Corporation (Freddie Mac) with a minimum $150 million par amount outstanding and a weighted-average maturity of at least 1 year. The index includes reinvestment of income. | |
| | (i) | This unmanaged index is the asset-backed securities component of the Bloomberg Barclays U.S. Aggregate Index. | |
Performance results may include adjustments made for financial reporting purposes in accordance with U.S. generally accepted accounting principles.
Past performance is not indicative of future results.
BHK is presenting the Reference Benchmark to accompany trust performance. The Reference Benchmark is presented for informational purposes only, as the Trust is actively managed and does not seek to track or replicate the performance of the Reference Benchmark or any other index. The portfolio investments of the Trust may differ substantially from the securities that comprise the indices within the Reference Benchmark, which may cause the Trust’s performance to differ materially from that of the Reference Benchmark. The Trust employs leverage as part of its investment strategy, which may change over time at the discretion of BlackRock Advisors, LLC (the “Manager”) as market and other conditions warrant. In contrast, the Reference Benchmark is not adjusted for leverage. Therefore, leverage generally may result in the Trust outperforming the Reference Benchmark in rising markets and underperforming in declining markets. The Board considers additional factors to evaluate the Trust’s performance, such as the performance of the Trust relative to a peer group of funds, a leverage-adjusted benchmark and/or other information provided by the Manager.
More information about the Trust’s historical performance can be found in the “Closed End Funds” section of http://www.blackrock.com.
The following discussion relates to the Trust’s absolute performance based on NAV:
What factors influenced performance?
| • | | The principal detractors from the Trust’s performance were its allocations to investment grade corporates, U.S. Treasuries, mortgages, commercial mortgage-backed securities (“CMBS”), cash, and sovereign, supranational and agency issues (“SSAs”). |
| • | | The largest positive contributions to the Trust’s performance came from its allocations to high yield bonds, asset-backed securities (“ABS”), capital securities and derivatives. |
| • | | Derivatives are used by the investment adviser to manage risk and/or take outright views on interest rates, credit risk and/or foreign exchange positions in the portfolio. As noted, during the period, derivatives contributed positively to the Trust’s performance, in particular through the use of financial futures contracts. |
Describe recent portfolio activity.
| • | | Over the reporting period, the Trust’s spread duration (sensitivity to changes in credit spreads) was slightly increased, as the portfolio was shifted toward higher yielding spread sectors. In addition, the Trust’s allocation to CMBS was reduced and rotated into collateralized loan obligations within ABS, SSAs, emerging market debt and high yield corporate bonds. |
| | |
| Trust Summary as of February 28, 2018 (continued) | | BlackRock Core Bond Trust |
Describe portfolio positioning at period end.
| • | | At period end, the Trust maintained diversified exposure within non-government spread sectors, including investment grade corporates, high yield corporates, CMBS and ABS, as well as smaller allocations to non-agency mortgage-backed securities (“MBS”). The Trust also held exposure to government-related sectors such as U.S. Treasury securities, agency debt and agency MBS. |
The views expressed reflect the opinions of BlackRock as of the date of this report and are subject to change based on changes in market, economic or other conditions. These views are not intended to be a forecast of future events and are no guarantee of future results.
Overview of the Trust’s Total Investments
PORTFOLIO COMPOSITION
| | | | | | | | |
| | | 02/28/18 | | | 08/31/17 | |
Corporate Bonds | | | 49 | % | | | 50 | % |
U.S. Treasury Obligations | | | 11 | | | | 11 | |
U.S. Government Sponsored Agency Securities | | | 10 | | | | 8 | |
Preferred Securities | | | 9 | | | | 9 | |
Asset-Backed Securities | | | 9 | | | | 8 | |
Non-Agency Mortgage-Backed Securities | | | 7 | | | | 8 | |
Foreign Agency Obligations | | | 3 | | | | 2 | |
Municipal Bonds | | | 2 | | | | 2 | |
Floating Rate Loan Interests | | | 1 | | | | 1 | |
Options Purchased | | | — | (a) | | | 1 | |
Short-Term Securities | | | — | (a) | | | 1 | |
Options Written | | | (1 | )(a) | | | (1 | ) |
| | (a) | Representing less than 1% of the Trust’s total investments. | |
CREDIT QUALITY ALLOCATION (b)(c)
| | | | | | | | |
| | | 02/28/18 | | | 08/31/17 | |
AAA/Aaa(d) | | | 23 | % | | | 23 | % |
AA/Aa | | | 6 | | | | 6 | |
A | | | 16 | | | | 16 | |
BBB/Baa | | | 30 | | | | 28 | |
BB/Ba | | | 11 | | | | 12 | |
B | | | 10 | | | | 8 | |
CCC/Caa | | | 2 | | | | 2 | |
N/R | | | 2 | | | | 5 | |
| | (b) | For financial reporting purposes, credit quality ratings shown above reflect the highest rating assigned by either S&P or Moody’s if ratings differ. These rating agencies are independent, nationally recognized statistical rating organizations and are widely used. Investment grade ratings are credit ratings of BBB/Baa or higher. Below investment grade ratings are credit ratings of BB/Ba or lower. Investments designated N/R are not rated by either rating agency. Unrated investments do not necessarily indicate low credit quality. Credit quality ratings are subject to change. | |
| | (c) | Excludes Short-Term Securities, Options Purchased and Options Written. | |
| | (d) | The investment adviser evaluates the credit quality of not-rated investments based upon certain factors including, but not limited to, credit ratings for similar investments and financial analysis of sectors and individual investments. Using this approach, the investment adviser has deemed U.S. Government Sponsored Agency Securities and U.S. Treasury Obligations as AAA/Aaa. | |
| | |
| 6 | | 2018 BLACKROCK SEMI-ANNUAL REPORTTO SHAREHOLDERS |
| | |
| Trust Summary as of February 28, 2018 | | BlackRock Corporate High Yield Fund, Inc. |
Trust Overview
BlackRock Corporate High Yield Fund, Inc.’s (HYT) (the “Trust”) primary investment objective is to provide shareholders with current income. The Trust’s secondary investment objective is to provide shareholders with capital appreciation. The Trust seeks to achieve its investment objectives by investing primarily in a diversified portfolio of fixed income securities which are rated at the time of investment to be below investment grade or, if unrated, are considered by the investment adviser to be of comparable quality. The Trust may invest directly in fixed income securities or synthetically through the use of derivatives.
No assurance can be given that the Trust’s investment objectives will be achieved.
Trust Information
| | |
Symbol on NYSE | | HYT |
Initial Offering Date | | May 30, 2003 |
Current Distribution Rate on Closing Market Price as of February 28, 2018 ($10.56)(a) | | 7.95% |
Current Monthly Distribution per Common Share(b) | | $0.0700 |
Current Annualized Distribution per Common Share(b) | | $0.8400 |
Economic Leverage as of February 28, 2018(c) | | 30% |
| | (a) | Current distribution rate on closing market price is calculated by dividing the current annualized distribution per share by the closing market price. The current distribution rate may consist of income, net realized gains and/or a tax return of capital. Past performance does not guarantee future results. | |
| | (b) | The distribution rate is not constant and is subject to change. | |
| | (c) | Represents bank borrowings as a percentage of total managed assets, which is the total assets of the Trust (including any assets attributable to borrowings) minus the sum of liabilities (other than borrowings representing financial leverage). For a discussion of leveraging techniques utilized by the Trust, please see The Benefits and Risks of Leveraging on page 13. | |
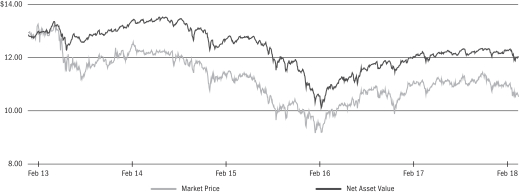
Market Price and Net Asset Value Per Share Summary
| | | | | | | | | | | | | | | | | | | | |
| | | 02/28/18 | | | 08/31/17 | | | Change | | | High | | | Low | |
Market Price | | $ | 10.56 | | | $ | 11.13 | | | | (5.12 | )% | | $ | 11.47 | | | $ | 10.47 | |
Net Asset Value | | | 12.04 | | | | 12.22 | | | | (1.47 | ) | | | 12.37 | | | | 11.91 | |
Market Price and Net Asset Value History For the Past Five Years
| | |
| Trust Summary as of February 28, 2018 (continued) | | BlackRock Corporate High Yield Fund, Inc. |
Performance and Portfolio Management Commentary
Returns for the period ended February 28, 2018 were as follows:
| | | | | | | | | | | | | | | | |
| | | | | | Average Annual Total Returns | |
| | | 6 Months | | | 1 Year | | | 3 Years | | | 5 Years | |
Trust at NAV(a)(b) | | | 2.33 | % | | | 6.51 | % | | | 6.61 | % | | | 7.55 | % |
Trust at Market Price(a)(b) | |
| (1.45
| )
| | | 2.04 | | | | 5.76 | | | | 4.98 | |
Bloomberg Barclays U.S. Corporate High Yield 2% Issuer Capped Index(c) | |
| 1.11
|
| | | 4.18 | | | | 5.20 | | | | 5.34 | |
| | (a) | All returns reflect reinvestment of dividends and/or distributions at actual reinvestment prices. Performance results reflect the Trust’s use of leverage. | |
| | (b) | The Trust’s discount to NAV widened during the period, which accounts for the difference between performance based on market price and performance based on NAV. | |
| | (c) | An unmanaged index (the “Reference Benchmark”) comprised of issuers that meet the following criteria: at least $150 million par value outstanding; maximum credit rating of Ba1; at least one year to maturity; and no issuer represents more than 2% of the index. | |
Performance results may include adjustments made for financial reporting purposes in accordance with U.S. generally accepted accounting principles.
Past performance is not indicative of future results.
HYT is presenting the Reference Benchmark to accompany trust performance. The Reference Benchmark is presented for informational purposes only, as the Trust is actively managed and does not seek to track or replicate the performance of the Reference Benchmark or any other index. The portfolio investments of the Trust may differ substantially from the securities that comprise the indices within the Reference Benchmark, which may cause the Trust’s performance to differ materially from that of the Reference Benchmark. The Trust employs leverage as part of its investment strategy, which may change over time at the discretion of the Manager as market and other conditions warrant. In contrast, the Reference Benchmark is not adjusted for leverage. Therefore, leverage generally may result in the Trust outperforming the Reference Benchmark in rising markets and underperforming in declining markets. The Board considers additional factors to evaluate the Trust’s performance, such as the performance of the Trust relative to a peer group of funds, a leverage-adjusted benchmark and/or other information provided by the Manager.
More information about the Trust’s historical performance can be found in the “Closed End Funds” section of http://www.blackrock.com.
The following discussion relates to the Trust’s performance based on NAV:
What factors influenced performance?
| • | | The Trust’s core exposure to high yield corporate bonds provided positive contributions to return over the six-month period. Smaller positions in bank loans and preferred equities also benefitted performance. Within high yield corporates, the most significant contributions to performance came from within the gaming, independent energy, and technology sectors. B-rated names were the best credit quality performers, followed closely by positions in the CCC and BB rating categories. |
| • | | The most significant detractors from performance came from within the wireless, cable & satellite, and wirelines sectors. The only other detractors over the period were small allocations to equity positions used to manage risk as the market rallied. There were no absolute detractors from a credit rating perspective during the period. |
Describe recent portfolio activity.
| • | | As the high yield market rallied early in the period, the Trust maintained a slightly overweight market sensitivity, while remaining focused on quality and consistent cash-flow stories where balance sheets and asset coverage were strong. While lower-quality and stressed/distressed portions of the high yield market outperformed over the six months, the Trust remained underweight to the riskier, higher yielding portion of the market in order to manage risk. In that vein, the Trust maintained an underweight across the consumer cyclical space, most notably the retail and automotive segments. This positioning reflected the view that the outlook for consumer cyclical continues to deteriorate under pressure from declining sales and secular changes. By contrast, the Trust increased its exposure to energy and chemicals. |
Describe portfolio positioning at period end.
| • | | At period end, the Trust held the majority of its portfolio in corporate bonds, with a modest allocation to floating rate bank loans. Within high yield corporates, the Trust was underweight in lower-coupon, more interest rate-sensitive bonds while being slightly overweight in single B-rated bonds. The Trust was overweight in high conviction CCC-rated issues while remaining underweight in the highest yielding segment of the lower-related universe where downside risks are greater if volatility picks up or credit sentiment weakens. The Trust continued to favor select equity/equity-like assets with more upside as a substitute to higher-beta (more market sensitive) CCC-rated notes. The Trust also maintained exposure to equity futures positions to help reduce portfolio risk. At period-end, top issuer overweight positions included Ligado Networks (wireless), Freeport McMoran Inc. (metals & mining), and the Stars Group (gaming). Broadly, the Trust’s positioning within credit remained centered on cash-flow views, identification of a specific catalyst and/or issuer-specific characteristics. |
The views expressed reflect the opinions of BlackRock as of the date of this report and are subject to change based on changes in market, economic or other conditions. These views are not intended to be a forecast of future events and are no guarantee of future results.
| | |
| 8 | | 2018 BLACKROCK SEMI-ANNUAL REPORTTO SHAREHOLDERS |
| | |
| Trust Summary as of February 28, 2018 (continued) | | BlackRock Corporate High Yield Fund, Inc. |
Overview of the Trust’s Total Investments
PORTFOLIO COMPOSITION
| | | | | | | | |
| | | 02/28/18 | | | 08/31/17 | |
Corporate Bonds | | | 80 | % | | | 82 | % |
Floating Rate Loan Interests | | | 9 | | | | 8 | |
Preferred Securities | | | 5 | | | | 5 | |
Asset-Backed Securities | | | 3 | | | | 3 | |
Investment Companies | | | 2 | | | | 1 | |
Common Stocks | | | 1 | | | | 1 | |
Other(a) | | | — | | | | — | |
| | (a) | Representing less than 1% of the Trust’s total investments and Other may include Non-Agency Mortgage-Backed Securities, Warrants, Other Interests, Short-Term Securities, Options Purchased and Options Written. | |
CREDIT QUALITY ALLOCATION (b)(c)
| | | | | | | | |
| | | 02/28/18 | | | 08/31/17 | |
A | | | 1 | % | | | 1 | % |
BBB/Baa | | | 8 | | | | 7 | |
BB/Ba | | | 36 | | | | 37 | |
B | | | 39 | | | | 41 | |
CCC/Caa | | | 9 | | | | 9 | |
N/R | | | 7 | | | | 5 | |
| | (b) | For financial reporting purposes, credit quality ratings shown above reflect the highest rating assigned by either S&P or Moody’s if ratings differ. These rating agencies are independent, nationally recognized statistical rating organizations and are widely used. Investment grade ratings are credit ratings of BBB/Baa or higher. Below investment grade ratings are credit ratings of BB/Ba or lower. Investments designated N/R are not rated by either rating agency. Unrated investments do not necessarily indicate low credit quality. Credit quality ratings are subject to change. | |
| | (c) | Excludes Short-Term Securities, Options Purchased and Options Written. | |
| | |
| Trust Summary as of February 28, 2018 | | BlackRock Income Trust, Inc. |
Trust Overview
BlackRock Income Trust, Inc.’s (BKT) (the “Trust”) investment objective is to manage a portfolio of high-quality securities to achieve both preservation of capital and high monthly income. The Trust seeks to achieve its investment objective by investing at least 65% of its assets in mortgage-backed securities. The Trust invests at least 80% of its assets in securities that are (i) issued or guaranteed by the U.S. government or one of its agencies or instrumentalities or (ii) rated at the time of investment either AAA by S&P or Aaa by Moody’s. The Trust may invest directly in such securities or synthetically through the use of derivatives.
No assurance can be given that the Trust’s investment objective will be achieved.
Trust Information
| | |
Symbol on NYSE | | BKT |
Initial Offering Date | | July 22, 1988 |
Current Distribution Rate on Closing Market Price as of February 28, 2018 ($5.91)(a) | | 5.38% |
Current Monthly Distribution per Common Share(b) | | $0.0265 |
Current Annualized Distribution per Common Share(b) | | $0.3180 |
Economic Leverage as of February 28, 2018(c) | | 29% |
| | (a) | Current distribution rate on closing market price is calculated by dividing the current annualized distribution per share by the closing market price. The current distribution rate may consist of income, net realized gains and/or a tax return of capital. Past performance does not guarantee future results. | |
| | (b) | The distribution rate is not constant and is subject to change. | |
| | (c) | Represents reverse repurchase agreements outstanding as a percentage of total managed assets, which is the total assets of the Trust (including any assets attributable to borrowings) minus the sum of liabilities (other than borrowings representing financial leverage). For a discussion of leveraging techniques utilized by the Trust, please see the Benefits and Risks of Leveraging on page 13. | |
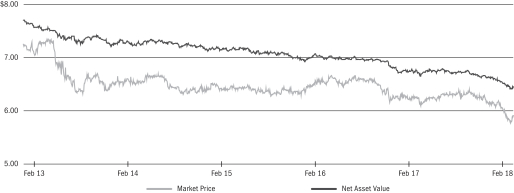
Market Price and Net Asset Value Per Share Summary
| | | | | | | | | | | | | | | | | | | | |
| | | 02/28/18 | | | 08/31/17 | | | Change | | | High | | | Low | |
Market Price | | $ | 5.91 | | | $ | 6.31 | | | | (6.34 | )% | | $ | 6.40 | | | $ | 5.76 | |
Net Asset Value | | | 6.45 | | | | 6.74 | | | | (4.30 | ) | | | 6.76 | | | | 6.41 | |
Market Price and Net Asset Value History For the Past Five Years
| | |
| 10 | | 2018 BLACKROCK SEMI-ANNUAL REPORTTO SHAREHOLDERS |
| | |
| Trust Summary as of February 28, 2018 (continued) | | BlackRock Income Trust, Inc. |
Performance and Portfolio Management Commentary
Returns for the period ended February 28, 2018 were as follows:
| | | | | | | | | | | | | | | | |
| | | | | | Average Annual Total Returns | |
| | | 6 Months | | | 1 Year | | | 3 Years | | | 5 Years | |
Trust at NAV(a)(b) | | | (1.80 | )% | | | 0.55 | % | | | 1.75 | % | | | 2.45 | % |
Trust at Market Price(a)(b) | | | (3.89 | ) | | | (0.66 | ) | | | 2.53 | | | | 2.07 | |
FTSE Mortgage Index(c) | | | (1.96 | ) | | | 0.11 | | | | 1.01 | | | | 1.66 | |
| | (a) | All returns reflect reinvestment of dividends and/or distributions at actual reinvestment prices. Performance results reflect the Trust’s use of leverage. | |
| | (b) | The Trust’s discount to NAV widened during the period, which accounts for the difference between performance based on market price and performance based on NAV. | |
| | (c) | This unmanaged index (formerly known as Citigroup Mortgage Index) (the “Reference Benchmark”) includes all outstanding government sponsored fixed rate mortgage-backed securities, weighted in proportion to their current market capitalization. | |
Performance results may include adjustments made for financial reporting purposes in accordance with U.S. generally accepted accounting principles.
Past performance is not indicative of future results.
BKT is presenting the Reference Benchmark to accompany trust performance. The Reference Benchmark is presented for informational purposes only, as the Trust is actively managed and does not seek to track or replicate the performance of the Reference Benchmark or any other index. The portfolio investments of the Trust may differ substantially from the securities that comprise the indices within the Reference Benchmark, which may cause the Trust’s performance to differ materially from that of the Reference Benchmark. The Trust employs leverage as part of its investment strategy, which may change over time at the discretion of the Manager as market and other conditions warrant. In contrast, the Reference Benchmark is not adjusted for leverage. Therefore, leverage generally may result in the Trust outperforming the Reference Benchmark in rising markets and underperforming in declining markets. The Board considers additional factors to evaluate the Trust’s performance, such as the performance of the Trust relative to a peer group of funds, a leverage-adjusted benchmark and/or other information provided by the Manager.
More information about the Trust’s historical performance can be found in the “Closed End Funds” section of http://www.blackrock.com.
The following discussion relates to the Trust’s absolute performance based on NAV:
What factors influenced performance?
| • | | The only material detractor from performance during the period was the Trust’s underweight within 30-year agency mortgage-backed securities (“MBS”). |
| • | | The largest contributors to performance included the Trust’s allocation to agency collateralized mortgage obligations (“CMOs”), as well as interest rate-based strategies such as duration (sensitivity to interest rate changes) and yield curve positioning. Strategies utilizing U.S. Treasury futures held as short positions against long positions in agency MBS aided performance as interest rates moved higher. Selection within 30-year agency MBS contributed positively driven by the outperformance of specified pool holdings, allocations to agency interest-only tranches, and positioning in legacy (i.e., issued prior to 2008) non-agency residential MBS. Other contributors included allocations to 15-year agency MBS, swap- and swaption-based strategies, and allocations to agency securities as well as to commercial mortgage-backed securities (“CMBS”). |
| • | | The Trust held interest rate derivatives including futures, options, swaps and swaptions, mainly for the purpose of managing duration, convexity (the rate at which duration changes in response to interest rate movements) and yield curve positioning. The Trust’s use of derivatives had a positive effect on performance during the period. |
Describe recent portfolio activity.
| • | | The Trust kept overall exposure to agency MBS relatively unchanged during the period, while decreasing exposure to pass-throughs in favor of CMOs within this allocation. The Trust also added exposure to agency mortgage derivatives and CMBS, while paring its holdings in U.S. government securities. The Trust’s allocation to asset-backed securities remained minimal. |
Describe portfolio positioning at period end.
| • | | The Trust was positioned with a marginally constructive stance regarding the mortgage sector, on the view that MBS valuations appeared relatively attractive and that the unwinding of the Fed’s balance sheet was not likely to have a material impact on the overall MBS market. The Trust maintained an overweight to high quality and well-structured agency CMOs and specified mortgage pools where the attributes of the underlying borrower help to improve the overall risk profile. With spreads in most risk assets at their tightest levels since mid-2014, the Trust’s exposures to non-benchmark positions such as legacy non-agency residential MBS and CMBS were minimal at period end. |
The views expressed reflect the opinions of BlackRock as of the date of this report and are subject to change based on changes in market, economic or other conditions. These views are not intended to be a forecast of future events and are no guarantee of future results.
| | |
| Trust Summary as of February 28, 2018 (continued) | | BlackRock Income Trust, Inc. |
Overview of the Trust’s Total Investments
PORTFOLIO COMPOSITION
| | | | | | | | |
| | | 02/28/18 | | | 08/31/17 | |
U.S. Government Sponsored Agency Securities | | | 116 | % | | | 113 | % |
U.S. Treasury Obligations | | | — | | | | 2 | |
Short-Term Securities | | | 1 | | | | 2 | |
Non-Agency Mortgage-Backed Securities | | | 1 | | | | 1 | |
Asset-Backed Securities(a) | | | — | | | | — | |
Borrowed Bonds(a) | | | — | | | | — | |
TBA Sale Commitments | | | (18 | ) | | | (18 | ) |
| | (a) | Representing less than 1% of the Trust’s total investments. | |
CREDIT QUALITY ALLOCATION (b)(c)
| | | | | | | | |
| | | 02/28/18 | | | 08/31/17 | |
AAA/Aaa(d) | | | 100 | % | | | 99 | % |
BBB | | | — | (a) | | | 1 | |
| | (b) | For financial reporting purposes, credit quality ratings shown above reflect the highest rating assigned by either S&P or Moody’s if ratings differ. These rating agencies are independent, nationally recognized statistical rating organizations and are widely used. Investment grade ratings are credit ratings of BBB/Baa or higher. Below investment grade ratings are credit ratings of BB/Ba or lower. Investments designated N/R are not rated by either rating agency. Unrated investments do not necessarily indicate low credit quality. Credit quality ratings are subject to change. | |
| | (c) | Excludes Money Market Funds. | |
| | (d) | The investment adviser evaluates the credit quality of not-rated investments based upon certain factors including, but not limited to, credit ratings for similar investments and financial analysis of sectors and individual investments. Using this approach, the investment adviser has deemed U.S. Government Sponsored Agency Securities and U.S. Treasury Obligations as AAA/Aaa. | |
| | |
| 12 | | 2018 BLACKROCK SEMI-ANNUAL REPORTTO SHAREHOLDERS |
The Benefits and Risks of Leveraging
The Trusts may utilize leverage to seek to enhance the distribution rate on, and net asset value (“NAV”) of, their common shares (“Common Shares”). However, these objectives cannot be achieved in all interest rate environments.
In general, the concept of leveraging is based on the premise that the financing cost of leverage, which is based on short-term interest rates, is normally lower than the income earned by a Trust on its longer-term portfolio investments purchased with the proceeds from leverage. To the extent that the total assets of the Trusts (including the assets obtained from leverage) are invested in higher-yielding portfolio investments, the Trusts’ shareholders benefit from the incremental net income. The interest earned on securities purchased with the proceeds from leverage is paid to shareholders in the form of dividends, and the value of these portfolio holdings is reflected in the per share NAV.
To illustrate these concepts, assume a Trust’s capitalization is $100 million and it utilizes leverage for an additional $30 million, creating a total value of $130 million available for investment in longer-term income securities. If prevailing short-term interest rates are 3% and longer-term interest rates are 6%, the yield curve has a strongly positive slope. In this case, a Trust’s financing costs on the $30 million of proceeds obtained from leverage are based on the lower short-term interest rates. At the same time, the securities purchased by a Trust with the proceeds from leverage earn income based on longer-term interest rates. In this case, a Trust’s financing cost of leverage is significantly lower than the income earned on a Trust’s longer-term investments acquired from such leverage proceeds, and therefore the holders of Common Shares (“Common Shareholders”) are the beneficiaries of the incremental net income.
However, in order to benefit shareholders, the return on assets purchased with leverage proceeds must exceed the ongoing costs associated with the leverage. If interest and other costs of leverage exceed the Trusts’ return on assets purchased with leverage proceeds, income to shareholders is lower than if the Trusts had not used leverage. Furthermore, the value of the Trusts’ portfolio investments generally varies inversely with the direction of long-term interest rates, although other factors can influence the value of portfolio investments. In contrast, the value of the Trusts’ obligations under their respective leverage arrangements generally does not fluctuate in relation to interest rates. As a result, changes in interest rates can influence the Trusts’ NAVs positively or negatively. Changes in the future direction of interest rates are very difficult to predict accurately, and there is no assurance that the Trusts’ intended leveraging strategy will be successful.
The use of leverage also generally causes greater changes in each Trust’s NAV, market price and dividend rates than comparable portfolios without leverage. In a declining market, leverage is likely to cause a greater decline in the NAV and market price of a Trust’s shares than if the Trust were not leveraged. In addition, each Trust may be required to sell portfolio securities at inopportune times or at distressed values in order to comply with regulatory requirements applicable to the use of leverage or as required by the terms of leverage instruments, which may cause the Fund to incur losses. The use of leverage may limit a Trust’s ability to invest in certain types of securities or use certain types of hedging strategies. Each Trust incurs expenses in connection with the use of leverage, all of which are borne by shareholders and may reduce income to the shareholders. Moreover, to the extent the calculation of the Trusts’ investment advisory fees includes assets purchased with the proceeds of leverage, the investment advisory fees payable to the Trusts’ investment adviser will be higher than if the Trusts did not use leverage.
Each Trust may utilize leverage through a credit facility or reverse repurchase agreements as described in the Notes to Financial Statements.
Under the Investment Company Act of 1940, as amended (the “1940 Act”), each Trust is permitted to issue debt up to 33 1/3% of its total managed assets. A Trust may voluntarily elect to limit its leverage to less than the maximum amount permitted under the 1940 Act. In addition, a Trust may also be subject to certain asset coverage, leverage or portfolio composition requirements imposed by its credit facility, which may be more stringent than those imposed by the 1940 Act.
If a Trust segregates or designates on its books and records cash or liquid assets having a value not less than the value of a Trust’s obligations under the reverse repurchase agreement (including accrued interest) then such transaction is not considered a senior security and is not subject to the foregoing limitations and requirements imposed by the 1940 Act.
Derivative Financial Instruments
The Trusts may invest in various derivative financial instruments. These instruments are used to obtain exposure to a security, commodity, index, market, and/or other assets without owning or taking physical custody of securities, commodities and/or other referenced assets or to manage market, equity, credit, interest rate, foreign currency exchange rate, commodity and/or other risks. Derivative financial instruments may give rise to a form of economic leverage and involve risks, including the imperfect correlation between the value of a derivative financial instrument and the underlying asset, possible default of the counterparty to the transaction or illiquidity of the instrument. The Trusts’ successful use of a derivative financial instrument depends on the investment adviser’s ability to predict pertinent market movements accurately, which cannot be assured. The use of these instruments may result in losses greater than if they had not been used, may limit the amount of appreciation a Trust can realize on an investment and/or may result in lower distributions paid to shareholders. The Trusts’ investments in these instruments, if any, are discussed in detail in the Notes to Financial Statements.
| | | | |
| THE BENEFITSAND RISKSOF LEVERAGING | | | 13 | |
| | |
Schedule of Investments (unaudited) February 28, 2018 | | BlackRock Core Bond Trust (BHK) (Percentages shown are based on Net Assets) |
| | | | | | | | | | | | |
| Security | | Par
(000) | | | Value | |
Asset-Backed Securities — 12.6% | |
| | | |
| Asset-Backed Securities — 12.5% | | | | | | | | | |
AIMCO CLO, Series 2014-AA, Class DR, (3 mo. LIBOR US + 3.25%), 4.99%, 07/20/26(a)(b) | | | USD | | | | 795 | | | $ | 800,519 | |
ALM VI Ltd., Series 2012-6A, Class B2RR, (3 mo. LIBOR US + 2.05%), 3.77%, 07/15/26(a)(b) | | | | | | | 1,000 | | | | 1,007,693 | |
ALM XVI Ltd./ALM XVI LLC, Series 2015-16A, Class C2R, (3 mo. LIBOR US + 3.20%), 4.92%, 07/15/27(a)(b) | | | | | | | 2,080 | | | | 2,110,925 | |
Anchorage Capital CLO 2013-1 Ltd., Series 2013-1A, Class CR, 4.92%, 10/13/30(b)(c) | | | | | | | 1,000 | | | | 1,020,520 | |
Anchorage Capital CLO Ltd.(a)(b): | | | | | | | | | | | | |
Series 2016-8A, Class D, (3 mo. LIBOR US + 4.20%), 5.96%, 07/28/28 | | | | | | | 1,000 | | | | 1,008,816 | |
Series 2016-9A, Class D, (3 mo. LIBOR US + 4.00%), 5.72%, 01/15/29 | | | | | | | 650 | | | | 663,557 | |
Ares XXVIII CLO Ltd., Series 2013-3A, Class DR, (3 mo. LIBOR US + 3.25%), 4.98%, 10/17/24(a)(b) | | | | | | | 1,000 | | | | 1,004,590 | |
Ares XXXII CLO Ltd., Series 2014-32A, Class CR, (3 mo. LIBOR US + 3.45%), 5.29%, 11/15/25(a)(b) | | | | | | | 1,250 | | | | 1,251,507 | |
Atlas Senior Loan Fund Ltd.(3 mo. LIBOR US + 3.90%), 5.38%, 11/30/28(a)(b) | | | | | | | 1,250 | | | | 1,265,162 | |
Ballyrock CLO LLC, Series 2014-1A, Class CR, (3 mo. LIBOR US + 3.65%), 5.39%, 10/20/26(a)(b) | | | | | | | 1,970 | | | | 1,970,589 | |
Battalion CLO VII Ltd., Series 2014-7A, Class C, (3 mo. LIBOR US + 3.90%), 5.63%, 10/17/26(a)(b) | | | | | | | 1,000 | | | | 1,001,801 | |
Battalion CLO X Ltd., Series 2016-10A, Class C, (3 mo. LIBOR US + 4.25%), 5.99%, 01/24/29(a)(b) | | | | | | | 1,000 | | | | 1,022,460 | |
BlueMountain CLO Ltd., Series 2014-3A, Class CR, (3 mo. LIBOR US + 3.20%), 4.92%, 10/15/26(a)(b) | | | | | | | 1,000 | | | | 1,005,948 | |
Bowman Park CLO Ltd., Series 2014-1A, Class D2R, (3 mo. LIBOR US + 3.35%), 5.27%, 11/23/25(a)(b) | | | | | | | 3,000 | | | | 3,005,155 | |
CenterPoint Energy Transition Bond Co. IV LLC, Series 2012-1, Class A3, 3.03%, 10/15/25 | | | | | | | 2,210 | | | | 2,206,513 | |
CIFC Funding Ltd., Series 2014-4A, Class D, (3 mo. LIBOR US + 3.40%), 5.13%, 10/17/26(a)(b) | | | | | | | 2,000 | | | | 2,006,855 | |
Countrywide Asset-Backed Certificates, Series 2006-13, Class 3AV2, (1 mo. LIBOR US + 0.15%), 1.77%, 01/25/37(a) | | | | | | | 203 | | | | 202,096 | |
DCP Rights LLC, Series 2014-1A, Class A, 5.46%, 10/25/44(b) | | | | | | | 3,819 | | | | 3,898,041 | |
Dryden 41 Senior Loan Fund, Series 2015-41A, Class AR, 1.00%, 04/15/31(b)(c)(d) | | | | | | | 2,550 | | | | 2,550,000 | |
Dryden Senior Loan Fund(a)(b): | | | | | | | | | | | | |
Series 2014-31A, Class DR, (3 mo. LIBOR US + 3.35%), 5.08%, 04/18/26 | | | | | | | 1,250 | | | | 1,254,190 | |
Series 2014-34A, Class CR, (3 mo. LIBOR US + 2.15%), 3.87%, 10/15/26 | | | | | | | 1,000 | | | | 1,000,408 | |
Series 2015-41A, Class A, (3 mo. LIBOR US + 1.50%), 3.22%, 01/15/28 | | | | | | | 2,550 | | | | 2,550,896 | |
Dryden XXVIII Senior Loan Fund, Series 2013-28A, Class B1LR, (3 mo. LIBOR US + 3.15%), 4.99%, 08/15/30(a)(b) | | | | | | | 1,000 | | | | 1,014,435 | |
Galaxy XIV CLO Ltd., Series 2012-14A, Class DR, (3 mo. LIBOR US + 4.30%), 6.14%, 11/15/26(a)(b) | | | | | | | 1,000 | | | | 1,004,476 | |
GoldenTree Loan Opportunities IX Ltd., Series 2014-9A, Class D, 5.26%, 10/29/26(c) | | | | | | | 1,000 | | | | 1,005,735 | |
Highbridge Loan Management 3-2014, Series 3A-2014, Class CR, (3 mo. LIBOR US + 3.60%), 5.33%, 07/18/29(a)(b) | | | | | | | 1,000 | | | | 1,023,821 | |
Highbridge Loan Management Ltd., Series 5A-2015(a)(b): | | | | | | | | | | | | |
Class C1R, (3 mo. LIBOR US + 2.10%), 3.86%, 01/29/26 | | | | | | | 4,000 | | | | 4,023,175 | |
Class D1R, (3 mo. LIBOR US + 3.30%), 5.06%, 01/29/26 | | | | | | | 500 | | | | 501,169 | |
| | | | | | | | | | | | |
| Security | | Par
(000) | | | Value | |
Asset-Backed Securities (continued) | |
Lendmark Funding Trust, Series 2017-2A, Class A, 2.80%, 05/20/26(b) | | | USD | | | | 2,880 | | | $ | 2,864,715 | |
Limerock CLO III LLC, Series 2014-3A, Class C, (3 mo. LIBOR US + 3.60%), 5.34%, 10/20/26(a)(b) | | | | | | | 3,750 | | | | 3,764,897 | |
Madison Park Funding XV Ltd., Series 2014-15A, Class B1R, (3 mo. LIBOR US + 2.20%), 3.96%, 01/27/26(a)(b) | | | | | | | 1,800 | | | | 1,805,275 | |
Nelnet Student Loan Trust, Series 2006-1, Class A5, (3 mo. LIBOR US + 0.11%), 2.03%, 08/23/27(a) | | | | | | | 554 | | | | 553,294 | |
Neuberger Berman CLO XV, Series 2013-15A, Class DR, 4.77%, 10/15/29(b)(c) | | | | | | | 1,000 | | | | 1,006,817 | |
Neuberger Berman CLO XVIII Ltd., Series 2014-18A, Class CR, (3 mo. LIBOR US + 4.25%), 6.08%, 11/14/27(a)(b) | | | | | | | 2,250 | | | | 2,284,967 | |
OCP CLO Ltd., Series 2012-2A, Class DR, (3 mo. LIBOR US + 4.47%), 6.37%, 11/22/25(a)(b) | | | | | | | 1,000 | | | | 1,016,582 | |
Octagon Investment Partners XXI Ltd., Series 2014-1A, Class C, (3 mo. LIBOR US + 3.65%), 5.48%, 11/14/26(a)(b) | | | | | | | 2,000 | | | | 2,001,944 | |
OHA Credit Partners XIII Ltd., Series 2016-13A, Class E, (3 mo. LIBOR US + 7.15%), 8.89%, 01/21/30(a)(b) | | | | | | | 595 | | | | 613,457 | |
OHA Loan Funding 2016-1 Ltd., Series 2016-1A, Class D, (3 mo. LIBOR US + 3.75%), 5.49%, 01/20/28(a)(b) | | | | | | | 2,500 | | | | 2,548,851 | |
OneMain Financial Issuance Trust, Series 2015-2A, Class C, 4.32%, 07/18/25(b) | | | | | | | 5,000 | | | | 4,996,520 | |
OZLM Funding III Ltd., Series 2013-3A, Class BR, (3 mo. LIBOR US + 3.00%), 4.74%, 01/22/29(a)(b) | | | | | | | 1,500 | | | | 1,529,118 | |
OZLM VII Ltd., Series 2014-7A, Class CR, (3 mo. LIBOR US + 3.50%), 5.23%, 07/17/26(a)(b) | | | | | | | 950 | | | | 956,055 | |
OZLM VIII Ltd., Series 2014-8A, Class CR, (3 mo. LIBOR US + 3.40%), 5.13%, 10/17/26(a)(b) | | | | | | | 1,750 | | | | 1,755,982 | |
OZLM XXI, Series 2017-21A, Class C, 4.42%, 01/20/31(b)(c) | | | | | | | 1,000 | | | | 1,005,207 | |
Regatta V Funding Ltd., Series 2014-1A, Class C, (3 mo. LIBOR US + 3.45%), 5.20%, 10/25/26(a)(b) | | | | | | | 2,000 | | | | 2,007,823 | |
Rockford Tower CLO Ltd., Series 2017-1A, Class D, (3 mo. LIBOR US + 3.25%), 4.97%, 04/15/29(a)(b) | | | | | | | 1,750 | | | | 1,773,955 | |
Shackleton CLO Ltd., Series 2013-3A, Class DR, 4.74%, 07/15/30(b)(c) | | | | | | | 500 | | | | 503,358 | |
SLM Private Education Loan Trust(b): | | | | | | | | | | | | |
Series 2012-A, Class A2, 3.83%, 01/17/45 | | | | | | | 397 | | | | 400,217 | |
Series 2014-A, Class B, 3.50%, 11/15/44 | | | | | | | 500 | | | | 498,838 | |
SMB Private Education Loan Trust, Series 2015-C, Class C, 4.50%, 09/17/46(b) | | | | | | | 5,900 | | | | 5,932,134 | |
Sound Point CLO IV Ltd., Series 2013-3A, Class DR, (3 mo. LIBOR US + 3.40%), 5.14%, 01/21/26(a)(b) | | | | | | | 700 | | | | 701,446 | |
Sound Point CLO VII Ltd., Series 2014-3A, Class D, (3 mo. LIBOR US + 3.60%), 5.34%, 01/23/27(a)(b) | | | | | | | 1,250 | | | | 1,255,940 | |
Sound Point CLO XIV Ltd., Series 2016-3A, Class D, (3 mo. LIBOR US + 3.85%), 5.59%, 01/23/29(a)(b) | | | | | | | 1,550 | | | | 1,582,451 | |
Structured Asset Securities Corp., Series 2002-AL1, Class A2, 3.45%, 02/25/32 | | | | | | | 576 | | | | 570,798 | |
THL Credit Wind River CLO Ltd., Series 2014-3A, Class DR, (3 mo. LIBOR US + 3.35%), 5.09%, 01/22/27(a)(b) | | | | | | | 1,000 | | | | 1,002,483 | |
Voya CLO 2017-3 Ltd., Series 2017-3A, Class C, (3 mo. LIBOR US + 3.55%), 5.29%, 07/20/30(a)(b) | | | | | | | 1,000 | | | | 1,020,665 | |
Voya CLO Ltd., Series 2016-3A, Class D, (3 mo. LIBOR US + 6.85%), 8.58%, 10/18/27(a)(b) | | | | | | | 615 | | | | 630,075 | |
Wellfleet CLO 2015-1 Ltd., Series 2015-1A, Class DR, 4.54%, 10/20/27(b)(c) | | | | | | | 2,000 | | | | 2,004,410 | |
| | |
| 14 | | 2018 BLACKROCK SEMI-ANNUAL REPORTTO SHAREHOLDERS |
| | |
Schedule of Investments (unaudited) (continued) February 28, 2018 | | BlackRock Core Bond Trust (BHK) (Percentages shown are based on Net Assets) |
| | | | | | | | | | | | |
| Security | | Par
(000) | | | Value | |
Asset-Backed Securities (continued) | |
World Financial Network Credit Card Master Trust, Series 2012-C, Class C, 4.55%, 08/15/22 | | | USD | | | | 2,360 | | | $ | 2,382,991 | |
York CLO Ltd., Series 2016-1A, Class DR, (3 mo. LIBOR US + 3.60%), 5.34%, 10/20/29(a)(b) | | | | | | | 1,750 | | | | 1,789,700 | |
York CLO-4 Ltd., Series 2016-2A, Class D, (3 mo. LIBOR US + 4.10%), 5.84%, 01/20/30(a)(b) | | | | | | | 1,500 | | | | 1,545,280 | |
| | | | | | | | | | | | |
| | | | | | | | | | | 96,687,297 | |
| Interest Only Asset-Backed Securities — 0.1% | |
Sterling Bank Trust, Series 2004-2, Class Note, 2.08%, 03/30/30(b)(e) | | | | | | | 2,637 | | | | 155,331 | |
Sterling Coofs Trust, Series 2004-1, Class A, 2.36%, 04/15/29(b)(c)(e) | | | | | | | 3,146 | | | | 165,127 | |
| | | | | | | | | | | | |
| | | | | | | | | | | 320,458 | |
| | | | | | | | | | | | |
Total Asset-Backed Securities — 12.6%
(Cost — $95,460,142) | | | | 97,007,755 | |
| | | | | | | | |
|
Corporate Bonds — 71.4% | |
|
| Aerospace & Defense — 1.3% | |
Arconic, Inc.: | | | | | | | | | | | | |
5.40%, 04/15/21 | | | | | | | 340 | | | | 353,600 | |
5.13%, 10/01/24 | | | | | | | 923 | | | | 956,459 | |
5.90%, 02/01/27 | | | | | | | 70 | | | | 75,250 | |
6.75%, 01/15/28 | | | | | | | 38 | | | | 43,320 | |
5.95%, 02/01/37 | | | | | | | 30 | | | | 32,028 | |
Bombardier, Inc.(b): | | | | | | | | | | | | |
7.75%, 03/15/20 | | | | | | | 122 | | | | 130,235 | |
8.75%, 12/01/21 | | | | | | | 459 | | | | 503,179 | |
6.00%, 10/15/22 | | | | | | | 13 | | | | 12,968 | |
6.13%, 01/15/23 | | | | | | | 198 | | | | 198,495 | |
7.50%, 12/01/24 | | | | | | | 414 | | | | 430,042 | |
7.50%, 03/15/25 | | | | | | | 602 | | | | 617,802 | |
7.45%, 05/01/34 | | | | | | | 100 | | | | 102,000 | |
Eaton Corp., 4.15%, 11/02/42 | | | | | | | 500 | | | | 492,383 | |
EnPro Industries, Inc., 5.88%, 09/15/22 | | | | | | | 74 | | | | 76,705 | |
KLX, Inc., 5.88%, 12/01/22(b) | | | | | | | 800 | | | | 824,000 | |
Koppers, Inc., 6.00%, 02/15/25(b) | | | | | | | 151 | | | | 156,285 | |
Kratos Defense & Security Solutions, Inc., 6.50%, 11/30/25(b) | | | | | | | 114 | | | | 118,845 | |
Lockheed Martin Corp., 4.09%, 09/15/52 | | | | | | | 1,410 | | | | 1,371,345 | |
Moog, Inc., 5.25%, 12/01/22(b) | | | | | | | 180 | | | | 185,400 | |
Pioneer Holdings LLC/Pioneer Finance Corp., 9.00%, 11/01/22(b) | | | | | | | 116 | | | | 122,090 | |
TransDigm, Inc.: | | | | | | | | | | | | |
6.00%, 07/15/22 | | | | | | | 758 | | | | 776,002 | |
6.50%, 07/15/24 | | | | | | | 191 | | | | 196,969 | |
6.50%, 05/15/25 | | | | | | | 132 | | | | 135,300 | |
6.38%, 06/15/26 | | | | | | | 70 | | | | 71,575 | |
United Technologies Corp., 6.13%, 07/15/38 | | | | | | | 1,450 | | | | 1,793,464 | |
| | | | | | | | |
| | | | | | | | | | | 9,775,741 | |
| Air Freight & Logistics — 0.2% | |
Air Medical Merger Sub Corp., 6.38%, 05/15/23(b) | | | | | | | 60 | | | | 57,000 | |
FedEx Corp., 4.75%, 11/15/45 | | | | | | | 1,250 | | | | 1,299,008 | |
XPO Logistics, Inc., 6.50%, 06/15/22(b) | | | | | | | 495 | | | | 514,181 | |
| | | | | | | | |
| | | | | | | | | | | 1,870,189 | |
| Airlines — 2.2% | |
Air Canada Pass-Through Trust, Series 2015-1, Class B, 3.88%, 09/15/24(b) | | | | | | | 1,710 | | | | 1,705,240 | |
American Airlines Pass-Through Trust: | | | | | | | | | | | | |
Series 2013-2, Class A, 4.95%, 07/15/24(f) | | | | | | | 3,288 | | | | 3,445,360 | |
Series 2015-2, Class A, 4.00%, 03/22/29 | | | | | | | 1,393 | | | | 1,405,668 | |
| | | | | | | | | | | | |
| Security | | Par
(000) | | | Value | |
| Airlines (continued) | |
Series 2015-2, Class AA, 3.60%, 03/22/29 | | | USD | | | | 1,393 | | | $ | 1,383,296 | |
Series 2017-1, Class B, 4.95%, 08/15/26 | | | | | | | 1,797 | | | | 1,857,324 | |
Avianca Holdings SA/Avianca Leasing LLC/Grupo Taca Holdings Ltd., 8.38%, 05/10/20 | | | | | | | 302 | | | | 308,040 | |
Continental Airlines Pass-Through Trust: | | | | | | | | | | | | |
Series 2010-1, Class B, 6.00%, 07/12/20 | | | | | | | 227 | | | | 232,007 | |
Series 2012-3, Class C, 6.13%, 04/29/18 | | | | | | | 150 | | | | 150,938 | |
Latam Finance Ltd., 6.88%, 04/11/24(b) | | | | | | | 257 | | | | 269,850 | |
Mexico City Airport Trust, 5.50%, 07/31/47(b) | | | | | | | 260 | | | | 242,775 | |
United Airlines Pass-Through Trust: | | | | | | | | | | | | |
Series 2013-1, Class A, 4.30%, 02/15/27 | | | | | | | 3,310 | | | | 3,413,047 | |
Series 2014-2, Class B, 4.63%, 03/03/24 | | | | | | | 2,231 | | | | 2,275,992 | |
| | | | | | | | | | | | |
| | | | | | | | | | | 16,689,537 | |
| Auto Components — 0.3% | |
Adient Global Holdings Ltd., 3.50%, 08/15/24 | | | EUR | | | | 100 | | | | 125,050 | |
Allison Transmission, Inc., 5.00%, 10/01/24(b) | | | USD | | | | 19 | | | | 19,261 | |
Aptiv PLC, 4.40%, 10/01/46 | | | | | | | 465 | | | | 451,300 | |
Gestamp Funding Luxembourg SA, 3.50%, 05/15/23 | | | EUR | | | | 100 | | | | 127,033 | |
HP Pelzer Holding GmbH, 4.13%, 04/01/24 | | | | | | | 100 | | | | 124,257 | |
Icahn Enterprises LP/Icahn Enterprises Finance Corp.: | | | | | | | | | | | | |
6.00%, 08/01/20 | | | USD | | | | 20 | | | | 20,390 | |
6.25%, 02/01/22 | | | | | | | 347 | | | | 352,205 | |
6.75%, 02/01/24 | | | | | | | 237 | | | | 241,740 | |
6.38%, 12/15/25 | | | | | | | 106 | | | | 106,397 | |
IHO Verwaltungs GmbH(g): | | | | | | | | | | | | |
(2.75% Cash or 3.50% PIK), 2.75%, 09/15/21 | | | EUR | | | | 100 | | | | 124,269 | |
(3.25% Cash or 4.00% PIK), 3.25%, 09/15/23 | | | | | | | 100 | | | | 126,026 | |
(4.13% Cash or 4.88% PIK), 4.13%, 09/15/21(b) | | | USD | | | | 200 | | | | 199,500 | |
(4.50% Cash or 5.25% PIK), 4.50%, 09/15/23(b) | | | | | | | 205 | | | | 200,900 | |
Tesla, Inc., 5.30%, 08/15/25(b)(f) | | | | | | | 360 | | | | 341,658 | |
| | | | | | | | | | | | |
| | | | | | | | | | | 2,559,986 | |
| Automobiles — 0.9% | |
Ford Motor Co., 4.75%, 01/15/43(f) | | | | | | | 4,255 | | | | 3,927,517 | |
General Motors Co., 6.25%, 10/02/43 | | | | | | | 2,506 | | | | 2,799,247 | |
| | | | | | | | | | | | |
| | | | | | | | | | | 6,726,764 | |
| Banks — 1.8% | |
Allied Irish Banks PLC(5 year EUR Swap + 3.95%), 4.13%, 11/26/25(h) | | | EUR | | | | 100 | | | | 131,707 | |
Banco Inbursa SA Institucion de Banca Multiple, 4.13%, 06/06/24(b) | | | USD | | | | 255 | | | | 252,705 | |
Banco Popolare, 2.75%, 07/27/20 | | | EUR | | | | 100 | | | | 127,316 | |
Bank of Ireland Group PLC, 3.13%, 09/19/27(c) | | | GBP | | | | 100 | | | | 135,988 | |
Bankia SA(5 year EUR Swap + 3.17%), 4.00%, 05/22/24(h) | | | EUR | | | | 100 | | | | 126,673 | |
Barclays PLC, 3.65%, 03/16/25(f) | | | USD | | | | 4,320 | | | | 4,154,700 | |
CaixaBank SA(5 year EUR Swap + 3.35%), 3.50%, 02/15/27(h) | | | EUR | | | | 100 | | | | 130,169 | |
CIT Group, Inc., 5.00%, 08/01/23 | | | USD | | | | 375 | | | | 385,313 | |
Cooperatieve Rabobank UA, 3.95%, 11/09/22 | | | | | | | 1,500 | | | | 1,522,380 | |
HSBC Holdings PLC, 6.10%, 01/14/42 | | | | | | | 610 | | | | 786,606 | |
Inversiones Atlantida SA, 8.25%, 07/28/22(b) | | | | | | | 200 | | | | 204,750 | |
National Bank of Greece SA, 2.75%, 10/19/20 | | | EUR | | | | 100 | | | | 124,783 | |
Santander Holdings USA, Inc., 4.50%, 07/17/25 | | | USD | | | | 2,000 | | | | 2,028,495 | |
Santander UK Group Holdings PLC, 2.88%, 08/05/21 | | | | | | | 1,250 | | | | 1,223,963 | |
Wells Fargo & Co., 3.90%, 05/01/45(f) | | | | | | | 2,250 | | | | 2,163,463 | |
| | | | | | | | |
| | | | | | | | | | | 13,499,011 | |
| Beverages — 0.7% | |
Anheuser-Busch InBev Finance, Inc., 4.90%, 02/01/46 | | | | | | | 4,600 | | | | 4,905,614 | |
| | | | |
| SCHEDULES OF INVESTMENTS | | | 15 | |
| | |
Schedule of Investments (unaudited) (continued) February 28, 2018 | | BlackRock Core Bond Trust (BHK) (Percentages shown are based on Net Assets) |
| | | | | | | | | | | | |
| Security | | Par
(000) | | | Value | |
| Beverages (continued) | |
BWAY Holding Co., 7.25%, 04/15/25(b) | | | USD | | | | 78 | | | $ | 80,535 | |
Central American Bottling Corp., 5.75%, 01/31/27(b) | | | | | | | 222 | | | | 228,660 | |
OI European Group BV, 4.00%, 03/15/23(b) | | | | | | | 158 | | | | 152,865 | |
Silgan Holdings, Inc., 3.25%, 03/15/25 | | | EUR | | | | 100 | | | | 124,416 | |
| | | | | | | | |
| | | | | | | | | | | 5,492,090 | |
| Biotechnology — 0.5% | |
Amgen, Inc., 4.40%, 05/01/45(f) | | | USD | | | | 2,250 | | | | 2,232,291 | |
Baxalta, Inc., 5.25%, 06/23/45 | | | | | | | 500 | | | | 538,807 | |
Gilead Sciences, Inc., 4.80%, 04/01/44 | | | | | | | 1,000 | | | | 1,060,719 | |
Illumina, Inc., 0.50%, 06/15/21 | | | | | | | 215 | | | | 257,677 | |
Senvion Holding GmbH, 3.88%, 10/25/22 | | | EUR | | | | 100 | | | | 112,850 | |
| | | | | | | | |
| | | | | | | | | | | 4,202,344 | |
| Building Materials — 0.0% | |
American Woodmark Corp., Co. GUAR 144A 03/26 4.875, 4.88%, 03/15/26(b) | | | USD | | | | 69 | | | | 68,483 | |
Jeld-Wen, Inc., 4.63%, 12/15/25(b) | | | | | | | 66 | | | | 64,515 | |
Titan Global Finance PLC, 3.50%, 06/17/21 | | | EUR | | | | 100 | | | | 129,015 | |
| | | | | | | | |
| | | | | | | | | | | 262,013 | |
| Building Products — 0.2% | |
Beacon Escrow Corp., 4.88%, 11/01/25(b) | | | USD | | | | 288 | | | | 280,886 | |
Building Materials Corp. of America,
6.00%, 10/15/25(b) | | | | | | | 200 | | | | 211,250 | |
CPG Merger Sub LLC, 8.00%, 10/01/21(b) | | | | | | | 218 | | | | 224,540 | |
Masonite International Corp., 5.63%, 03/15/23(b) | | | | | | | 354 | | | | 365,948 | |
Ply Gem Industries, Inc., 6.50%, 02/01/22 | | | | | | | 147 | | | | 152,377 | |
Standard Industries, Inc.(b): | | | | | | | | | | | | |
5.50%, 02/15/23 | | | | | | | 100 | | | | 102,750 | |
5.38%, 11/15/24 | | | | | | | 29 | | | | 29,653 | |
USG Corp., 4.88%, 06/01/27(b) | | | | | | | 273 | | | | 268,905 | |
| | | | | | | | |
| | | | | | | | | | | 1,636,309 | |
| Building: Roofing, Wallboard & Plumbing — 0.0% | |
Quintiles IMS, Inc., 4.88%, 05/15/23(b) | | | | | | | 74 | | | | 76,035 | |
| | | | | | | | |
| Cable Television Services — 0.0% | |
CB Escrow Corp., 8.00%, 10/15/25(b) | | | | | | | 127 | | | | 124,143 | |
| | | | | | | | |
| Capital Markets — 2.8% | |
Blackstone CQP Holdco LP(b): | | | | | | | | | | | | |
6.50%, 03/20/21 | | | | | | | 1,375 | | | | 1,387,031 | |
6.00%, 08/18/21 | | | | | | | 224 | | | | 225,064 | |
CDP Financial, Inc., 5.60%, 11/25/39(b)(f) | | | | | | | 5,890 | | | | 7,480,621 | |
Goldman Sachs Group, Inc., 3.75%, 05/22/25(f) | | | | | | | 8,965 | | | | 8,930,014 | |
Morgan Stanley: | | | | | | | | | | | | |
4.00%, 07/23/25 | | | | | | | 905 | | | | 916,639 | |
3.13%, 07/27/26(f) | | | | | | | 2,000 | | | | 1,899,370 | |
NFP Corp., 6.88%, 07/15/25(b) | | | | | | | 62 | | | | 62,155 | |
Raymond James Financial, Inc., 4.95%, 07/15/46 | | | | | | | 400 | | | | 433,761 | |
SURA Asset Management SA, 4.38%, 04/11/27(b) | | | | | | | 259 | | | | 255,763 | |
| | | | | | | | |
| | | | | | | | | | | 21,590,418 | |
| Chemicals — 1.2% | |
Air Liquide Finance SA, 3.50%, 09/27/46(b) | | | | | | | 360 | | | | 327,455 | |
Alpha 3 BV/Alpha US Bidco, Inc., 6.25%, 02/01/25(b) | | | | | | | 600 | | | | 603,000 | |
Axalta Coating Systems LLC, 4.88%, 08/15/24(b) | | | | | | | 161 | | | | 161,805 | |
Blue Cube Spinco, Inc.: | | | | | | | | | | | | |
9.75%, 10/15/23 | | | | | | | 319 | | | | 370,040 | |
10.00%, 10/15/25 | | | | | | | 183 | | | | 218,227 | |
CF Industries, Inc.: | | | | | | | | | | | | |
7.13%, 05/01/20 | | | | | | | 38 | | | | 40,518 | |
5.15%, 03/15/34 | | | | | | | 60 | | | | 58,800 | |
4.95%, 06/01/43 | | | | | | | 116 | | | | 105,560 | |
Chemours Co.: | | | | | | | | | | | | |
6.63%, 05/15/23 | | | | | | | 182 | | | | 191,328 | |
| | | | | | | | | | | | |
| Security | | Par
(000) | | | Value | |
| Chemicals (continued) | |
7.00%, 05/15/25 | | | USD | | | | 44 | | | $ | 47,410 | |
5.38%, 05/15/27 | | | | | | | 390 | | | | 390,975 | |
Cydsa SAB de C.V., 6.25%, 10/04/27(b) | | | | | | | 319 | | | | 318,601 | |
Hexion, Inc., 10.38%, 02/01/22(b) | | | | | | | 122 | | | | 118,950 | |
Ineos Finance PLC, 4.00%, 05/01/23 | | | EUR | | | | 100 | | | | 125,045 | |
Methanex Corp., 3.25%, 12/15/19 | | | USD | | | | 1,650 | | | | 1,647,357 | |
Mexichem SAB de CV(b): | | | | | | | | | | | | |
4.00%, 10/04/27 | | | | | | | 200 | | | | 191,500 | |
5.50%, 01/15/48 | | | | | | | 200 | | | | 190,300 | |
Momentive Performance Materials, Inc., 3.88%, 10/24/21 | | | | | | | 735 | | | | 764,400 | |
NOVA Chemicals Corp., 4.88%, 06/01/24(b) | | | | | | | 183 | | | | 180,713 | |
Olin Corp., 5.00%, 02/01/30 | | | | | | | 82 | | | | 79,130 | |
Platform Specialty Products Corp.(b): | | | | | | | | | | | | |
6.50%, 02/01/22 | | | | | | | 1,265 | | | | 1,298,206 | |
5.88%, 12/01/25 | | | | | | | 446 | | | | 443,770 | |
PQ Corp.(b): | | | | | | | | | | | | |
6.75%, 11/15/22 | | | | | | | 251 | | | | 264,805 | |
5.75%, 12/15/25 | | | | | | | 289 | | | | 293,335 | |
PSPC Escrow Corp., 6.00%, 02/01/23 | | | EUR | | | | 100 | | | | 127,185 | |
Tronox Finance PLC, 5.75%, 10/01/25(b) | | | USD | | | | 123 | | | | 122,078 | |
Venator Finance Sarl/Venator Materials LLC, 5.75%, 07/15/25(b) | | | | | | | 100 | | | | 101,750 | |
Versum Materials, Inc., 5.50%, 09/30/24(b) | | | | | | | 81 | | | | 84,645 | |
WR Grace & Co-Conn(b): | | | | | | | | | | | | |
5.13%, 10/01/21 | | | | | | | 333 | | | | 344,655 | |
5.63%, 10/01/24 | | | | | | | 80 | | | | 84,000 | |
| | | | | | | | | | | | |
| | | | | | | | | | | 9,295,543 | |
| Commercial Services & Supplies — 0.8% | |
ADT Corp.: | | | | | | | | | | | | |
6.25%, 10/15/21 | | | | | | | 86 | | | | 91,321 | |
3.50%, 07/15/22 | | | | | | | 143 | | | | 136,565 | |
4.13%, 06/15/23 | | | | | | | 264 | | | | 256,740 | |
4.88%, 07/15/32(b) | | | | | | | 337 | | | | 306,670 | |
Advanced Disposal Services, Inc.,
5.63%, 11/15/24(b) | | | | | | | 151 | | | | 154,020 | |
Aviation Capital Group Corp., 7.13%, 10/15/20(b) | | | | | | | 1,800 | | | | 1,975,735 | |
Booz Allen Hamilton, Inc., 5.13%, 05/01/25(b) | | | | | | | 388 | | | | 385,090 | |
CD&R Waterworks Merger Sub LLC,
6.13%, 08/15/25(b) | | | | | | | 291 | | | | 288,090 | |
Fortress Transportation & Infrastructure Investors LLC, 6.75%, 03/15/22(b) | | | | | | | 28 | | | | 28,840 | |
Harland Clarke Holdings Corp., 8.38%, 08/15/22(b) | | | | | | | 284 | | | | 293,940 | |
Iron Mountain, Inc., 6.00%, 08/15/23 | | | | | | | 80 | | | | 82,800 | |
KAR Auction Services, Inc., 5.13%, 06/01/25(b) | | | | | | | 200 | | | | 201,500 | |
Mobile Mini, Inc., 5.88%, 07/01/24 | | | | | | | 343 | | | | 356,720 | |
Paprec Holding SA, 5.25%, 04/01/22 | | | EUR | | | | 100 | | | | 125,077 | |
Park Aerospace Holdings Ltd.(b): | | | | | | | | | | | | |
3.63%, 03/15/21 | | | USD | | | | 166 | | | | 159,775 | |
5.25%, 08/15/22 | | | | | | | 267 | | | | 267,334 | |
Ritchie Bros Auctioneers, Inc., 5.38%, 01/15/25(b) | | | | | | | 226 | | | | 228,554 | |
United Rentals North America, Inc.: | | | | | | | | | | | | |
5.75%, 11/15/24 | | | | | | | 46 | | | | 47,495 | |
4.63%, 10/15/25 | | | | | | | 342 | | | | 333,450 | |
5.88%, 09/15/26 | | | | | | | 77 | | | | 80,657 | |
5.50%, 05/15/27 | | | | | | | 111 | | | | 113,608 | |
Wrangler Buyer Corp., 6.00%, 10/01/25(b) | | | | | | | 79 | | | | 79,988 | |
| | | | | | | | | | | | |
| | | | | | | | | | | 5,993,969 | |
| Commercial Services & Supplies — 0.0% | | | | | | | | | |
Waste Pro USA, Inc., 5.50%, 02/15/26(b) | | | | | | | 134 | | | | 134,670 | |
| | | | | | | | |
| Communications Equipment — 0.3% | | | | | | | | | |
CommScope Technologies LLC, 5.00%, 03/15/27(b) | | | | | | | 114 | | | | 111,221 | |
| | |
| 16 | | 2018 BLACKROCK SEMI-ANNUAL REPORTTO SHAREHOLDERS |
| | |
Schedule of Investments (unaudited) (continued) February 28, 2018 | | BlackRock Core Bond Trust (BHK) (Percentages shown are based on Net Assets) |
| | | | | | | | | | | | |
| Security | | Par
(000) | | | Value | |
| Communications Equipment (continued) | | | | | | | | | |
CommScope, Inc.(b): | | | | | | | | | | | | |
5.00%, 06/15/21 | | | USD | | | | 250 | | | $ | 253,437 | |
5.50%, 06/15/24 | | | | | | | 154 | | | | 156,888 | |
Nokia OYJ: | | | | | | | | | | | | |
3.38%, 06/12/22 | | | | | | | 72 | | | | 70,013 | |
4.38%, 06/12/27 | | | | | | | 101 | | | | 96,960 | |
6.63%, 05/15/39 | | | | | | | 135 | | | | 145,800 | |
Zayo Group LLC/Zayo Capital, Inc.: | | | | | | | | | | | | |
6.00%, 04/01/23 | | | | | | | 776 | | | | 806,070 | |
6.38%, 05/15/25 | | | | | | | 108 | | | | 112,873 | |
5.75%, 01/15/27(b) | | | | | | | 421 | | | | 423,105 | |
| | | | | | | | | | | | |
| | | | | | | | | | | 2,176,367 | |
| Construction & Engineering — 0.8% | |
Aeropuertos Argentina 2000 SA, 6.88%, 02/01/27(b) | | | | | | | 370 | | | | 385,858 | |
Aeropuertos Dominicanos Siglo XXI SA, 6.75%, 03/30/29(b) | | | | | | | 370 | | | | 404,225 | |
BlueLine Rental Finance Corp., 9.25%, 03/15/24(b) | | | | | | | 798 | | | | 862,837 | |
Brand Energy & Infrastructure Services, Inc., 8.50%, 07/15/25(b) | | | | | | | 244 | | | | 251,930 | |
Engility Corp., 8.88%, 09/01/24 | | | | | | | 176 | | | | 186,560 | |
ITR Concession Co. LLC, 4.20%, 07/15/25(b) | | | | | | | 4,000 | | | | 3,695,387 | |
SPIE SA, 3.13%, 03/22/24 | | | EUR | | | | 100 | | | | 125,975 | |
Tutor Perini Corp., 6.88%, 05/01/25(b) | | | USD | | | | 154 | | | | 161,700 | |
Weekley Homes LLC/Weekley Finance Corp., 6.63%, 08/15/25(b) | | | | | | | 51 | | | | 50,985 | |
| | | | | | | | | | | | |
| | | | | | | | | | | 6,125,457 | |
| Construction Materials — 0.3% | |
American Tire Distributors, Inc., 10.25%, 03/01/22(b) | | | | | | | 262 | | | | 272,839 | |
HD Supply, Inc., 5.75%, 04/15/24(b) | | | | | | | 1,364 | | | | 1,430,495 | |
Navistar International Corp., 6.63%, 11/01/25(b) | | | | | | | 192 | | | | 197,760 | |
New Enterprise Stone & Lime Co., Inc., 10.13%, 04/01/22(b) | | | | | | | 108 | | | | 117,045 | |
PulteGroup, Inc.: | | | | | | | | | | | | |
5.50%, 03/01/26 | | | | | | | 17 | | | | 17,276 | |
6.00%, 02/15/35 | | | | | | | 27 | | | | 27,675 | |
Rexel SA, 3.50%, 06/15/23 | | | EUR | | | | 100 | | | | 127,850 | |
Williams Scotsman International, Inc., 7.88%, 12/15/22(b) | | | USD | | | | 78 | | | | 81,705 | |
| | | | | | | | | | | | |
| | | | | | | | | | | 2,272,645 | |
| Consumer Discretionary — 0.1% | |
Arch Merger Sub, Inc., 8.50%, 09/15/25(b) | | | | | | | 130 | | | | 124,800 | |
Elis SA, 1.88%, 02/15/23 | | | EUR | | | | 100 | | | | 123,068 | |
Nielsen Co. Luxembourg SARL, 5.00%, 02/01/25(b) | | | USD | | | | 30 | | | | 29,953 | |
ServiceMaster Co. LLC, 5.13%, 11/15/24(b) | | | | | | | 168 | | | | 165,480 | |
Viking Cruises Ltd.(b): | | | | | | | | | | | | |
6.25%, 05/15/25 | | | | | | | 95 | | | | 96,425 | |
5.88%, 09/15/27 | | | | | | | 382 | | | | 372,450 | |
| | | | | | | | | | | | |
| | | | | | | | | | | 912,176 | |
| Consumer Finance — 1.9% | |
Ally Financial, Inc., 8.00%, 11/01/31 | | | | | | | 946 | | | | 1,173,040 | |
Capital One Financial Corp., 4.75%, 07/15/21(f) | | | | | | | 1,935 | | | | 2,027,651 | |
CDK Global, Inc., 4.88%, 06/01/27(b) | | | | | | | 209 | | | | 207,370 | |
Corivas Campus Living USG LLC,
5.30%, 07/01/50(e) | | | | | | | 5,700 | | | | 5,700,980 | |
Credivalores-Crediservicios SAS,
9.75%, 07/27/22(b) | | | | | | | 200 | | | | 205,000 | |
Ford Motor Credit Co. LLC(f): | | | | | | | | | | | | |
8.13%, 01/15/20 | | | | | | | 1,530 | | | | 1,663,605 | |
4.25%, 09/20/22 | | | | | | | 1,600 | | | | 1,629,978 | |
IHS Markit Ltd. (b): | | | | | | | | | | | | |
4.75%, 02/15/25 | | | | | | | 156 | | | | 159,510 | |
4.00%, 03/01/26 | | | | | | | 86 | | | | 83,420 | |
| | | | | | | | | | | | |
| Security | | Par
(000) | | | Value | |
| Consumer Finance (continued) | |
Navient Corp.: | | | | | | | | | | | | |
5.00%, 10/26/20 | | | USD | | | | 180 | | | $ | 181,125 | |
6.63%, 07/26/21 | | | | | | | 99 | | | | 103,455 | |
6.50%, 06/15/22 | | | | | | | 159 | | | | 165,757 | |
5.50%, 01/25/23 | | | | | | | 280 | | | | 277,200 | |
7.25%, 09/25/23 | | | | | | | 173 | | | | 183,812 | |
6.13%, 03/25/24 | | | | | | | 21 | | | | 21,210 | |
5.88%, 10/25/24 | | | | | | | 56 | | | | 55,440 | |
6.75%, 06/25/25 | | | | | | | 112 | | | | 114,974 | |
5.63%, 08/01/33 | | | | | | | 101 | | | | 89,890 | |
OneMain Financial Holdings LLC,
7.25%, 12/15/21(b) | | | | | | | 152 | | | | 157,909 | |
Springleaf Finance Corp.: | | | | | | | | | | | | |
6.13%, 05/15/22 | | | | | | | 50 | | | | 51,250 | |
5.63%, 03/15/23 | | | | | | | 78 | | | | 77,220 | |
| | | | | | | | | | | | |
| | | | | | | | | | | 14,329,796 | |
| Containers & Packaging — 0.9% | |
Ardagh Packaging Finance PLC/Ardagh
Holdings USA, Inc.: | | | | | | | | | | | | |
4.25%, 09/15/22(b) | | | | | | | 200 | | | | 199,250 | |
4.63%, 05/15/23(b) | | | | | | | 271 | | | | 270,661 | |
6.75%, 05/15/24 | | | EUR | | | | 100 | | | | 133,133 | |
7.25%, 05/15/24(b) | | | USD | | | | 1,475 | | | | 1,580,094 | |
6.00%, 02/15/25(b) | | | | | | | 2 | | | | 2,050 | |
4.75%, 07/15/27 | | | GBP | | | | 100 | | | | 133,870 | |
Ball Corp.: | | | | | | | | | | | | |
5.00%, 03/15/22 | | | USD | | | | 141 | | | | 146,287 | |
4.00%, 11/15/23 | | | | | | | 256 | | | | 253,440 | |
BWAY Holding Co., 5.50%, 04/15/24(b) | | | | | | | 529 | | | | 540,902 | |
Crown Americas LLC/Crown Americas Capital Corp. V, 4.25%, 09/30/26 | | | | | | | 75 | | | | 71,062 | |
JH-Holding Finance SA, (8.25% PIK), 8.25%, 12/01/22(g) | | | EUR | | | | 100 | | | | 128,787 | |
Mercer International, Inc.: | | | | | | | | | | | | |
7.75%, 12/01/22 | | | USD | | | | 29 | | | | 30,668 | |
6.50%, 02/01/24 | | | | | | | 76 | | | | 79,610 | |
5.50%, 01/15/26(b) | | | | | | | 83 | | | | 82,585 | |
Reynolds Group Issuer, Inc./Reynolds Group Issuer LLC/Reynolds Group Issuer Lu: | | | | | | | | | | | | |
5.75%, 10/15/20 | | | | | | | 188 | | | | 190,827 | |
6.88%, 02/15/21 | | | | | | | 163 | | | | 164,908 | |
(3 mo. LIBOR US + 3.50%),
5.22%, 07/15/21(a)(b) | | | | | | | 352 | | | | 355,960 | |
5.13%, 07/15/23(b) | | | | | | | 161 | | | | 164,019 | |
7.00%, 07/15/24(b) | | | | | | | 851 | | | | 896,209 | |
Sappi Papier Holding GmbH, 4.00%, 04/01/23 | | | EUR | | | | 100 | | | | 127,045 | |
Sealed Air Corp., 4.88%, 12/01/22(b) | | | USD | | | | 533 | | | | 548,990 | |
Signode Industrial Group Lux SA/Signode Industrial Group US, Inc., 6.38%, 05/01/22(b) | | | | | | | 389 | | | | 402,615 | |
Verallia Packaging SASU, 5.13%, 08/01/22 | | | EUR | | | | 100 | | | | 126,280 | |
| | | | | | | | | | | | |
| | | | | | | | | | | 6,629,252 | |
| Diversified Consumer Services — 0.3% | |
APX Group, Inc.: | | | | | | | | | | | | |
6.38%, 12/01/19 | | | USD | | | | 21 | | | | 21,315 | |
8.75%, 12/01/20 | | | | | | | 184 | | | | 185,380 | |
7.88%, 12/01/22 | | | | | | | 121 | | | | 127,504 | |
Ascend Learning LLC, 6.88%, 08/01/25(b) | | | | | | | 212 | | | | 218,360 | |
GW Honos Security Corp., 8.75%, 05/15/25(b) | | | | | | | 58 | | | | 62,422 | |
Laureate Education, Inc., 8.25%, 05/01/25(b) | | | | | | | 210 | | | | 223,650 | |
Matthews International Corp., 5.25%, 12/01/25(b) | | | | | | | 44 | | | | 44,110 | |
Prime Security Services Borrower LLC/Prime Finance, Inc., 9.25%, 05/15/23(b) | | | | | | | 1,127 | | | | 1,227,021 | |
| | | | |
| SCHEDULES OF INVESTMENTS | | | 17 | |
| | |
Schedule of Investments (unaudited) (continued) February 28, 2018 | | BlackRock Core Bond Trust (BHK) (Percentages shown are based on Net Assets) |
| | | | | | | | | | | | |
| Security | | Par
(000) | | | Value | |
| Diversified Consumer Services (continued) | |
RBS Global, Inc./Rexnord LLC, 4.88%, 12/15/25(b) | | | USD | | | | 153 | | | $ | 150,705 | |
| | | | | | | | | | | | |
| | | | | | | | | | | 2,260,467 | |
| Diversified Financial Services — 3.9% | |
Aircastle Ltd.: | | | | | | | | | | | | |
6.25%, 12/01/19 | | | | | | | 353 | | | | 367,561 | |
5.50%, 02/15/22 | | | | | | | 48 | | | | 49,920 | |
Banca IFIS SpA, 4.50%, 10/17/27(c) | | | EUR | | | | 100 | | | | 123,983 | |
Bank of America Corp.: | | | | | | | | | | | | |
5.63%, 07/01/20 | | | USD | | | | 2,200 | | | | 2,333,766 | |
3.25%, 10/21/27(f) | | | | | | | 5,500 | | | | 5,227,559 | |
Docuformas SAPI de C.V., 9.25%, 10/11/22(b) | | | | | | | 200 | | | | 191,500 | |
DPL, Inc., 7.25%, 10/15/21 | | | | | | | 21 | | | | 22,890 | |
FBM Finance, Inc., 8.25%, 08/15/21(b) | | | | | | | 185 | | | | 195,175 | |
FMR LLC, 4.95%, 02/01/33(b)(f) | | | | | | | 2,300 | | | | 2,522,118 | |
General Electric Co., 6.15%, 08/07/37(f) | | | | | | | 2,150 | | | | 2,583,594 | |
General Motors Financial Co., Inc., 4.25%, 05/15/23 | | | | | | | 807 | | | | 822,796 | |
IntercontinentalExchange Group, Inc., 4.00%, 10/15/23 | | | | | | | 470 | | | | 485,983 | |
Intesa Sanpaolo SpA, 5.02%, 06/26/24(b)(f) | | | | | | | 3,151 | | | | 3,144,125 | |
Intrum Justitia AB, 2.75%, 07/15/22 | | | EUR | | | | 100 | | | | 119,867 | |
Jefferies Finance LLC/JFIN Co-Issuer Corp., 7.38%, 04/01/20(b) | | | USD | | | | 595 | | | | 602,146 | |
LHC3 PLC, (4.13% Cash or 4.88% PIK), 4.13%, 08/15/24(g) | | | EUR | | | | 100 | | | | 123,854 | |
Mercury Bondco PLC, (8.25% Cash or 9.00% PIK), 8.25%, 05/30/21(g) | | | | | | | 100 | | | | 127,710 | |
Moody’s Corp., 4.50%, 09/01/22(f) | | | USD | | | | 1,800 | | | | 1,881,458 | |
Northern Trust Corp., 3.95%, 10/30/25(f) | | | | | | | 8,000 | | | | 8,221,541 | |
SPARC EM SPC Panama Metro Line 2 SP, 0.00%, 12/05/22(b) | | | | | | | 280 | | | | 255,150 | |
Tempo Acquisition LLC/Tempo Acquisition Finance Corp., 6.75%, 06/01/25(b) | | | | | | | 345 | | | | 347,587 | |
UniCredit SpA(5 year EUR Swap + 4.10%), 5.75%, 10/28/25(h) | | | EUR | | | | 107 | | | | 144,768 | |
Vantiv LLC/Vanity Issuer Corp.(b): | | | | | | | | | | | | |
3.88%, 11/15/25 | | | GBP | | | | 100 | | | | 136,314 | |
4.38%, 11/15/25 | | | USD | | | | 200 | | | | 193,750 | |
WMG Acquisition Corp., 5.50%, 04/15/26(b) | | | | | | | 84 | | | | 84,000 | |
| | | | | | | | | | | | |
| | | | | | | | | | | 30,309,115 | |
| Diversified Telecommunication Services — 3.6% | |
AT&T, Inc.(f): | | | | | | | | | | | | |
6.38%, 03/01/41 | | | | | | | 520 | | | | 606,846 | |
5.15%, 03/15/42 | | | | | | | 2,400 | | | | 2,426,054 | |
4.75%, 05/15/46 | | | | | | | 2,710 | | | | 2,567,613 | |
CenturyLink, Inc.: | | | | | | | | | | | | |
Series P, 7.60%, 09/15/39 | | | | | | | 7 | | | | 6,108 | |
Series S, 6.45%, 06/15/21 | | | | | | | 383 | | | | 391,618 | |
Series T, 5.80%, 03/15/22 | | | | | | | 172 | | | | 169,635 | |
Series U, 7.65%, 03/15/42 | | | | | | | 138 | | | | 120,060 | |
Series W, 6.75%, 12/01/23(f) | | | | | | | 163 | | | | 160,555 | |
Cincinnati Bell, Inc., 7.00%, 07/15/24(b) | | | | | | | 271 | | | | 257,450 | |
Frontier Communications Corp.: | | | | | | | | | | | | |
7.13%, 03/15/19 | | | | | | | 220 | | | | 223,850 | |
7.13%, 01/15/23 | | | | | | | 113 | | | | 75,286 | |
7.63%, 04/15/24 | | | | | | | 89 | | | | 56,515 | |
6.88%, 01/15/25 | | | | | | | 802 | | | | 489,220 | |
11.00%, 09/15/25 | | | | | | | 71 | | | | 55,646 | |
Level 3 Financing, Inc.: | | | | | | | | | | | | |
5.38%, 08/15/22 | | | | | | | 127 | | | | 128,270 | |
5.63%, 02/01/23 | | | | | | | 254 | | | | 256,540 | |
5.13%, 05/01/23 | | | | | | | 95 | | | | 95,000 | |
5.38%, 01/15/24 | | | | | | | 114 | | | | 113,430 | |
| | | | | | | | | | | | |
| Security | | Par
(000) | | | Value | |
| Diversified Telecommunication Services (continued) | |
5.38%, 05/01/25 | | | USD | | | | 123 | | | $ | 122,078 | |
5.25%, 03/15/26 | | | | | | | 835 | | | | 803,679 | |
OTE PLC, 3.50%, 07/09/20 | | | EUR | | | | 100 | | | | 129,015 | |
Qwest Corp., 6.75%, 12/01/21 | | | USD | | | | 90 | | | | 96,110 | |
SoftBank Group Corp.: | | | | | | | | | | | | |
(5 year USD ICE Swap + 4.85%), 6.88%(h)(i) | | | | | | | 215 | | | | 212,173 | |
4.75%, 09/19/24 | | | | | | | 200 | | | | 194,053 | |
Telecom Italia Capital SA: | | | | | | | | | | | | |
6.38%, 11/15/33 | | | | | | | 229 | | | | 250,755 | |
6.00%, 09/30/34 | | | | | | | 252 | | | | 263,970 | |
7.20%, 07/18/36 | | | | | | | 202 | | | | 236,340 | |
7.72%, 06/04/38 | | | | | | | 48 | | | | 58,800 | |
Telecom Italia SpA: | | | | | | | | | | | | |
1.13%, 03/26/22(j) | | | EUR | | | | 100 | | | | 120,170 | |
3.63%, 01/19/24 | | | | | | | 200 | | | | 268,504 | |
Verizon Communications, Inc.(f): | | | | | | | | | | | | |
6.40%, 02/15/38 | | | USD | | | | 6,879 | | | | 8,220,510 | |
6.55%, 09/15/43 | | | | | | | 6,751 | | | | 8,399,383 | |
| | | | | | | | | | | | |
| | | | | | | | | | | 27,575,236 | |
| Electric Utilities — 6.2% | |
Berkshire Hathaway Energy Co., 6.50%, 09/15/37(f) | | | | | | | 5,515 | | | | 7,292,793 | |
Black Hills Corp., 3.15%, 01/15/27 | | | | | | | 405 | | | | 383,415 | |
Celeo Redes Operacion Chile SA,
5.20%, 06/22/47(b) | | | | | | | 299 | | | | 299,000 | |
Cleveland Electric Illuminating Co., 5.95%, 12/15/36 | | | | | | | 434 | | | | 520,350 | |
CMS Energy Corp., 5.05%, 03/15/22(f) | | | | | | | 1,832 | | | | 1,941,684 | |
Duke Energy Carolinas LLC: | | | | | | | | | | | | |
6.10%, 06/01/37 | | | | | | | 640 | | | | 798,231 | |
6.00%, 01/15/38 | | | | | | | 1,675 | | | | 2,146,856 | |
4.25%, 12/15/41 | | | | | | | 750 | | | | 785,095 | |
Duke Energy Florida LLC, 6.40%, 06/15/38 | | | | | | | 770 | | | | 1,020,966 | |
E.ON International Finance BV, 6.65%, 04/30/38(b) | | | | | | | 3,100 | | | | 3,901,288 | |
Electricite de France SA, 5.60%, 01/27/40(b)(f) | | | | | | | 2,800 | | | | 3,253,785 | |
Enel Finance International NV, 3.63%, 05/25/27(b) | | | | | | | 1,250 | | | | 1,200,943 | |
Energuate Trust, 5.88%, 05/03/27(b) | | | | | | | 201 | | | | 204,015 | |
Florida Power Corp., 6.35%, 09/15/37(f) | | | | | | | 2,775 | | | | 3,666,779 | |
Jersey Central Power & Light Co., 7.35%, 02/01/19 | | | | | | | 490 | | | | 509,279 | |
NextEra Energy Operating Partners LP,
4.25%, 09/15/24(b) | | | | | | | 128 | | | | 126,240 | |
Ohio Power Co., Series D, 6.60%, 03/01/33(f) | | | | | | | 3,000 | | | | 3,929,029 | |
PacifiCorp, 6.25%, 10/15/37(f) | | | | | | | 1,225 | | | | 1,589,732 | |
Pampa Energia SA, 7.50%, 01/24/27(b) | | | | | | | 367 | | | | 384,432 | |
Public Service Co. of Colorado, Series 17, 6.25%, 09/01/37(f) | | | | | | | 2,550 | | | | 3,304,623 | |
Southern California Edison Co.: | | | | | | | | | | | | |
5.63%, 02/01/36(f) | | | | | | | 1,300 | | | | 1,557,568 | |
Series A, 5.95%, 02/01/38 | | | | | | | 2,175 | | | | 2,741,108 | |
Southern Co., 4.40%, 07/01/46 | | | | | | | 1,000 | | | | 1,003,618 | |
Talen Energy Supply LLC, 6.50%, 06/01/25 | | | | | | | 125 | | | | 96,562 | |
Virginia Electric & Power Co., Series A, 6.00%, 05/15/37 | | | | | | | 3,920 | | | | 4,901,913 | |
| | | | | | | | | | | | |
| | | | | | | | | | | 47,559,304 | |
| Electrical Equipment — 0.0% | |
Anixter, Inc., 5.63%, 05/01/19 | | | | | | | 35 | | | | 35,744 | |
Areva SA, 4.88%, 09/23/24 | | | EUR | | | | 50 | | | | 67,530 | |
| | | | | | | | | | | | |
| | | | | | | | | | | 103,274 | |
| Electronic Equipment, Instruments & Components — 0.4% | |
CDW LLC/CDW Finance Corp.: | | | | | | | | | | | | |
5.00%, 09/01/23 | | | USD | | | | 134 | | | | 136,010 | |
5.50%, 12/01/24 | | | | | | | 458 | | | | 478,610 | |
5.00%, 09/01/25 | | | | | | | 72 | | | | 72,540 | |
Corning, Inc., 4.38%, 11/15/57 | | | | | | | 2,000 | | | | 1,872,291 | |
| | |
| 18 | | 2018 BLACKROCK SEMI-ANNUAL REPORTTO SHAREHOLDERS |
| | |
Schedule of Investments (unaudited) (continued) February 28, 2018 | | BlackRock Core Bond Trust (BHK) (Percentages shown are based on Net Assets) |
| | | | | | | | | | | | |
| Security | | Par
(000) | | | Value | |
| Electronic Equipment, Instruments & Components (continued) | |
Itron, Inc., 5.00%, 01/15/26(b) | | | USD | | | | 18 | | | $ | 17,910 | |
SESI LLC, 7.75%, 09/15/24(b) | | | | | | | 140 | | | | 145,600 | |
| | | | | | | | | | | | |
| | | | | | | | | | | 2,722,961 | |
| Energy Equipment & Services — 0.6% | |
Ensco PLC, 5.20%, 03/15/25 | | | | | | | 25 | | | | 20,750 | |
Enterprise Products Operating LLC,
6.13%, 10/15/39(f) | | | | | | | 1,400 | | | | 1,689,339 | |
Gates Global LLC/Gates Global Co.,
6.00%, 07/15/22(b) | | | | | | | 238 | | | | 242,165 | |
Halliburton Co., 5.00%, 11/15/45 | | | | | | | 500 | | | | 540,545 | |
Noble Holding International Ltd., 7.70%, 04/01/25 | | | | | | | 155 | | | | 138,725 | |
Oceaneering International, Inc., 6.00%, 02/01/28 | | | | | | | 151 | | | | 148,825 | |
Pattern Energy Group, Inc., 5.88%, 02/01/24(b) | | | | | | | 148 | | | | 152,410 | |
Pioneer Energy Services Corp., 6.13%, 03/15/22 | | | | | | | 133 | | | | 120,199 | |
Precision Drilling Corp.: | | | | | | | | | | | | |
6.50%, 12/15/21 | | | | | | | 48 | | | | 48,840 | |
5.25%, 11/15/24 | | | | | | | 90 | | | | 85,725 | |
Transocean, Inc.: | | | | | | | | | | | | |
5.80%, 10/15/22 | | | | | | | 256 | | | | 248,359 | |
9.00%, 07/15/23(b) | | | | | | | 501 | | | | 541,080 | |
6.80%, 03/15/38 | | | | | | | 17 | | | | 13,685 | |
Trinidad Drilling Ltd., 6.63%, 02/15/25(b) | | | | | | | 243 | | | | 234,799 | |
Weatherford International Ltd.: | | | | | | | | | | | | |
7.75%, 06/15/21 | | | | | | | 185 | | | | 184,306 | |
8.25%, 06/15/23 | | | | | | | 55 | | | | 53,350 | |
9.88%, 02/15/24 | | | | | | | 307 | | | | 303,930 | |
| | | | | | | | | | | | |
| | | | | | | | | | | 4,767,032 | |
| Environmental, Maintenance, & Security Service — 0.0% | |
Tervita Escrow Corp., 7.63%, 12/01/21(b) | | | | | | | 276 | | | | 277,380 | |
| | | | | | | | | | | | |
| Food & Staples Retailing — 0.5% | |
Albertsons Cos. LLC/Safeway, Inc./New Albertson’s, Inc./Albertson’s LLC: | | | | | | | | | | | | |
6.63%, 06/15/24 | | | | | | | 124 | | | | 114,235 | |
5.75%, 03/15/25 | | | | | | | 68 | | | | 59,500 | |
Casino Guichard Perrachon SA, 4.56%, 01/25/23 | | | EUR | | | | 100 | | | | 135,196 | |
CVS Health Corp., 5.13%, 07/20/45 | | | USD | | | | 2,000 | | | | 2,089,603 | |
Rite Aid Corp., 6.13%, 04/01/23(b) | | | | | | | 164 | | | | 164,820 | |
Walgreens Boots Alliance, Inc., 4.80%, 11/18/44 | | | | | | | 1,000 | | | | 999,452 | |
| | | | | | | | | | | | |
| | | | | | | | | | | 3,562,806 | |
| Food Products — 0.4% | |
Acosta, Inc., 7.75%, 10/01/22(b) | | | | | | | 144 | | | | 102,960 | |
Aramark Services, Inc., 4.75%, 06/01/26 | | | | | | | 151 | | | | 149,113 | |
Arcor SAIC, 6.00%, 07/06/23(b) | | | | | | | 228 | | | | 236,026 | |
B&G Foods, Inc., 5.25%, 04/01/25 | | | | | | | 96 | | | | 92,400 | |
Chobani LLC/Chobani Finance Corp., Inc.,
7.50%, 04/15/25(b) | | | | | | | 267 | | | | 278,347 | |
JBS USA LLC/JBS USA Finance, Inc.(b): | |
5.88%, 07/15/24 | | | | | | | 66 | | | | 64,363 | |
5.75%, 06/15/25 | | | | | | | 485 | | | | 463,175 | |
MARB BondCo PLC, 7.00%, 03/15/24 | | | | | | | 200 | | | | 196,702 | |
Marfrig Holdings Europe BV, 8.00%, 06/08/23(b) | | | | | | | 222 | | | | 229,104 | |
Minerva Luxembourg SA, 6.50%, 09/20/26(b) | | | | | | | 222 | | | | 220,335 | |
Pilgrim’s Pride Corp.(b): | |
5.75%, 03/15/25 | | | | | | | 167 | | | | 166,165 | |
5.88%, 09/30/27 | | | | | | | 144 | | | | 140,011 | |
Post Holdings, Inc.(b): | |
5.50%, 03/01/25 | | | | | | | 71 | | | | 71,444 | |
5.00%, 08/15/26 | | | | | | | 126 | | | | 119,700 | |
5.75%, 03/01/27 | | | | | | | 416 | | | | 410,800 | |
5.63%, 01/15/28 | | | | | | | 51 | | | | 49,661 | |
| | | | | | | | | | | | |
| | | | | | | | | | | 2,990,306 | |
| | | | | | | | | | | | |
| Security | | Par
(000) | | | Value | |
| Forest Products — 0.0% | |
JBS USA LUX SA/JBS USA Finance, Inc.,
6.75%, 02/15/28(b) | | | USD | | | | 205 | | | $ | 202,991 | |
| | | | | | | | | | | | |
| Health Care Equipment & Supplies — 0.5% | |
Avantor, Inc.(b): | | | | | | | | | | | | |
6.00%, 10/01/24 | | | | | | | 1,115 | | | | 1,115,000 | |
9.00%, 10/01/25 | | | | | | | 289 | | | | 289,723 | |
Crimson Merger Sub, Inc., 6.63%, 05/15/22(b) | | | | | | | 801 | | | | 794,992 | |
DJO Finco, Inc./DJO Finance LLC/DJO Finance Corp., 8.13%, 06/15/21(b) | | | | | | | 580 | | | | 562,600 | |
Mallinckrodt International Finance SA/Mallinckrodt CB LLC(b): | | | | | | | | | | | | |
5.75%, 08/01/22 | | | | | | | 12 | | | | 10,620 | |
5.63%, 10/15/23 | | | | | | | 142 | | | | 117,505 | |
5.50%, 04/15/25 | | | | | | | 308 | | | | 243,320 | |
Medtronic, Inc., 4.50%, 03/15/42 | | | | | | | 750 | | | | 786,207 | |
Teleflex, Inc., 5.25%, 06/15/24 | | | | | | | 170 | | | | 174,250 | |
| | | | | | | | | | | | |
| | | | | | | | | | | 4,094,217 | |
| Health Care Providers & Services — 1.5% | |
Acadia Healthcare Co., Inc.: | | | | | | | | | | | | |
5.63%, 02/15/23 | | | | | | | 95 | | | | 97,465 | |
6.50%, 03/01/24 | | | | | | | 258 | | | | 266,385 | |
Aetna, Inc., 4.50%, 05/15/42 | | | | | | | 575 | | | | 564,821 | |
Amsurg Corp., 5.63%, 07/15/22 | | | | | | | 245 | | | | 248,981 | |
Centene Corp.: | | | | | | | | | | | | |
5.63%, 02/15/21 | | | | | | | 227 | | | | 232,391 | |
6.13%, 02/15/24 | | | | | | | 359 | | | | 376,950 | |
CHS/Community Health Systems, Inc.: | | | | | | | | | | | | |
8.00%, 11/15/19 | | | | | | | 118 | | | | 110,980 | |
5.13%, 08/01/21 | | | | | | | 39 | | | | 35,978 | |
6.25%, 03/31/23 | | | | | | | 123 | | | | 111,930 | |
DaVita, Inc., 5.13%, 07/15/24 | | | | | | | 187 | | | | 185,714 | |
Eagle Holding Co. II LLC, (7.63% Cash or 8.38% PIK), 7.63%, 05/15/22(b)(g) | | | | | | | 177 | | | | 177,002 | |
Envision Healthcare Corp.(b): | | | | | | | | | | | | |
5.13%, 07/01/22 | | | | | | | 163 | | | | 164,223 | |
6.25%, 12/01/24 | | | | | | | 68 | | | | 71,570 | |
HCA, Inc.: | | | | | | | | | | | | |
6.50%, 02/15/20 | | | | | | | 824 | | | | 869,320 | |
5.88%, 03/15/22 | | | | | | | 63 | | | | 66,780 | |
4.75%, 05/01/23 | | | | | | | 562 | | | | 571,835 | |
5.00%, 03/15/24 | | | | | | | 469 | | | | 477,794 | |
5.38%, 02/01/25 | | | | | | | 516 | | | | 524,550 | |
5.25%, 04/15/25 | | | | | | | 364 | | | | 374,010 | |
5.88%, 02/15/26 | | | | | | | 335 | | | | 346,725 | |
5.25%, 06/15/26 | | | | | | | 323 | | | | 331,075 | |
4.50%, 02/15/27 | | | | | | | 157 | | | | 153,271 | |
5.50%, 06/15/47 | | | | | | | 585 | | | | 577,687 | |
HealthSouth Corp., 5.75%, 11/01/24 | | | | | | | 26 | | | | 26,260 | |
MEDNAX, Inc., 5.25%, 12/01/23(b) | | | | | | | 90 | | | | 92,138 | |
Molina Healthcare, Inc., 4.88%, 06/15/25(b) | | | | | | | 71 | | | | 67,983 | |
MPH Acquisition Holdings LLC, 7.13%, 06/01/24(b) | | | | | | | 353 | | | | 371,533 | |
Northwell Healthcare, Inc., 4.26%, 11/01/47 | | | | | | | 725 | | | | 706,944 | |
Polaris Intermediate Corp., (8.50% Cash), 8.50%, 12/01/22(b)(g) | | | | | | | 510 | | | | 520,200 | |
RegionalCare Hospital Partners Holdings, Inc., 8.25%, 05/01/23(b) | | | | | | | 97 | | | | 101,850 | |
Sterigenics-Nordion Holdings LLC,
6.50%, 05/15/23(b) | | | | | | | 95 | | | | 96,425 | |
Surgery Center Holdings, Inc.(b): | | | | | | | | | | | | |
8.88%, 04/15/21 | | | | | | | 98 | | | | 101,675 | |
6.75%, 07/01/25(f) | | | | | | | 183 | | | | 172,020 | |
Tenet Healthcare Corp.: | | | | | | | | | | | | |
6.00%, 10/01/20 | | | | | | | 261 | | | | 271,437 | |
| | | | |
| SCHEDULES OF INVESTMENTS | | | 19 | |
| | |
Schedule of Investments (unaudited) (continued) February 28, 2018 | | BlackRock Core Bond Trust (BHK) (Percentages shown are based on Net Assets) |
| | | | | | | | | | | | |
| Security | | Par
(000) | | | Value | |
| Health Care Providers & Services (continued) | |
7.50%, 01/01/22(b) | | | USD | | | | 118 | | | $ | 124,490 | |
8.13%, 04/01/22 | | | | | | | 947 | | | | 999,085 | |
6.75%, 06/15/23(f) | | | | | | | 302 | | | | 302,000 | |
4.63%, 07/15/24(b) | | | | | | | 126 | | | | 120,960 | |
THC Escrow Corp. III(b): | | | | | | | | | | | | |
5.13%, 05/01/25 | | | | | | | 424 | | | | 411,280 | |
7.00%, 08/01/25 | | | | | | | 56 | | | | 55,860 | |
Vizient, Inc., 10.38%, 03/01/24(b) | | | | | | | 228 | | | | 255,360 | |
WellCare Health Plans, Inc., 5.25%, 04/01/25 | | | | | | | 58 | | | | 58,703 | |
| | | | | | | | |
| | | | | | | | | | | 11,793,640 | |
| Health Care Technology — 0.0% | |
Change Healthcare Holdings LLC/Change Healthcare Finance, Inc., 5.75%, 03/01/25(b) | | | | | | | 147 | | | | 147,000 | |
Quintiles IMS, Inc., 3.25%, 03/15/25(b) | | | EUR | | | | 100 | | | | 123,075 | |
| | | | | | | | |
| | | | | | | | | | | 270,075 | |
| Hotels, Restaurants & Leisure — 2.8% | |
Arcos Dorados Holdings, Inc., 5.88%, 04/04/27(b) | | | USD | | | | 257 | | | | 263,592 | |
Burger King France SAS(3 mo. Euribor + 5.25%), 5.25%, 05/01/23(a) | | | EUR | | | | 100 | | | | 124,299 | |
Codere Finance 2 Luxembourg SA, 6.75%, 11/01/21 | | | | | | | 100 | | | | 127,130 | |
CPUK Finance Ltd., 4.25%, 02/28/47 | | | GBP | | | | 100 | | | | 139,059 | |
CRC Escrow Issuer LLC/CRC Finco, Inc., 5.25%, 10/15/25(b) | | | USD | | | | 249 | | | | 243,398 | |
Eldorado Resorts, Inc., 6.00%, 04/01/25 | | | | | | | 77 | | | | 79,310 | |
ESH Hospitality, Inc., 5.25%, 05/01/25(b) | | | | | | | 88 | | | | 87,780 | |
GLP Capital LP/GLP Financing II, Inc.: | | | | | | | | | | | | |
5.38%, 11/01/23 | | | | | | | 90 | | | | 93,825 | |
5.38%, 04/15/26 | | | | | | | 42 | | | | 43,365 | |
Golden Nugget, Inc., 6.75%, 10/15/24(b) | | | | | | | 282 | | | | 289,050 | |
International Game Technology PLC, 4.75%, 02/15/23 | | | EUR | | | | 100 | | | | 135,279 | |
Jacobs Entertainment, Inc., 7.88%, 02/01/24(b) | | | USD | | | | 60 | | | | 64,125 | |
KFC Holding Co./Pizza Hut Holdings LLC/Taco Bell of America LLC, 5.25%, 06/01/26(b) | | | | | | | 158 | | | | 159,975 | |
McDonald’s Corp., 3.70%, 01/30/26 | | | | | | | 510 | | | | 511,568 | |
Melco Resorts Finance Ltd., 4.88%, 06/06/25(b) | | | | | | | 250 | | | | 244,567 | |
MGM Resorts International: | | | | | | | | | | | | |
5.25%, 03/31/20 | | | | | | | 97 | | | | 100,031 | |
6.75%, 10/01/20 | | | | | | | 122 | | | | 130,235 | |
6.63%, 12/15/21 | | | | | | | 835 | | | | 902,259 | |
7.75%, 03/15/22 | | | | | | | 76 | | | | 84,740 | |
New Red Finance, Inc.(b): | | | | | | | | | | | | |
4.25%, 05/15/24 | | | | | | | 171 | | | | 163,305 | |
5.00%, 10/15/25 | | | | | | | 1,062 | | | | 1,034,786 | |
Sabre GLBL, Inc.(b): | | | | | | | | | | | | |
5.38%, 04/15/23 | | | | | | | 62 | | | | 62,465 | |
5.25%, 11/15/23 | | | | | | | 133 | | | | 133,998 | |
Scientific Games International, Inc.: | | | | | | | | | | | | |
7.00%, 01/01/22(b) | | | | | | | 363 | | | | 382,057 | |
10.00%, 12/01/22 | | | | | | | 819 | | | | 888,615 | |
5.00%, 10/15/25(b) | | | | | | | 320 | | | | 316,400 | |
Six Flags Entertainment Corp., 4.88%, 07/31/24(b) | | | | | | | 615 | | | | 613,518 | |
Station Casinos LLC, 5.00%, 10/01/25(b) | | | | | | | 222 | | | | 216,450 | |
Unique Pub Finance Co. PLC: | | | | | | | | | | | | |
Series A3, 6.54%, 03/30/21 | | | GBP | | | | 1,871 | | | | 2,725,075 | |
Series A4, 5.66%, 06/30/27 | | | | | | | 1,027 | | | | 1,582,912 | |
Series M, 7.40%, 03/28/24 | | | | | | | 3,000 | | | | 4,621,914 | |
Series N, 6.46%, 03/30/32 | | | | | | | 2,390 | | | | 3,215,421 | |
Vue International Bidco PLC, 7.88%, 07/15/20 | | | | | | | 100 | | | | 139,735 | |
Wyndham Worldwide Corp., 4.15%, 04/01/24 | | | USD | | | | 1,076 | | | | 1,078,074 | |
Wynn Macau Ltd., 5.50%, 10/01/27(b) | | | | | | | 200 | | | | 196,940 | |
| | | | | | | | | | | | |
| Security | | Par
(000) | | | Value | |
| Hotels, Restaurants & Leisure (continued) | |
Yum! Brands, Inc., 3.88%, 11/01/23 | | | USD | | | | 27 | | | $ | 26,190 | |
| | | | | | | | |
| | | | | | | | | | | 21,221,442 | |
| Household Durables — 0.6% | |
Algeco Scotsman Global Finance 2 PLC, 10.00%, 08/15/23(b) | | | | | | | 200 | | | | 199,000 | |
Algeco Scotsman Global Finance PLC, 8.00%, 02/15/23(b) | | | | | | | 200 | | | | 201,450 | |
Brookfield Residential Properties, Inc., 6.38%, 05/15/25(b) | | | | | | | 47 | | | | 48,704 | |
Century Communities, Inc., 6.88%, 05/15/22 | | | | | | | 460 | | | | 476,726 | |
K Hovnanian Enterprises, Inc., 10.00%, 07/15/22(b) | | | | | | | 143 | | | | 156,049 | |
Lennar Corp.: | | | | | | | | | | | | |
8.38%, 01/15/21(b) | | | | | | | 53 | | | | 59,121 | |
6.25%, 12/15/21(b) | | | | | | | 276 | | | | 294,575 | |
4.13%, 01/15/22 | | | | | | | 77 | | | | 76,230 | |
5.38%, 10/01/22(b) | | | | | | | 2 | | | | 2,085 | |
4.75%, 11/15/22 | | | | | | | 136 | | | | 136,680 | |
4.88%, 12/15/23 | | | | | | | 85 | | | | 86,169 | |
4.75%, 05/30/25 | | | | | | | 180 | | | | 179,100 | |
5.25%, 06/01/26(b) | | | | | | | 18 | | | | 18,360 | |
4.75%, 11/29/27(b) | | | | | | | 255 | | | | 246,712 | |
Mattamy Group Corp.(b): | | | | | | | | | | | | |
6.88%, 12/15/23 | | | | | | | 94 | | | | 98,582 | |
6.50%, 10/01/25 | | | | | | | 129 | | | | 134,805 | |
MDC Holdings, Inc., 6.00%, 01/15/43 | | | | | | | 130 | | | | 123,500 | |
Meritage Homes Corp., 5.13%, 06/06/27 | | | | | | | 52 | | | | 51,350 | |
Newell Brands, Inc., 4.20%, 04/01/26 | | | | | | | 1,000 | | | | 989,606 | |
PulteGroup, Inc., 6.38%, 05/15/33 | | | | | | | 256 | | | | 273,280 | |
Tempur Sealy International, Inc.: | | | | | | | | | | | | |
5.63%, 10/15/23 | | | | | | | 2 | | | | 2,020 | |
5.50%, 06/15/26 | | | | | | | 132 | | | | 129,690 | |
TRI Pointe Group, Inc.: | | | | | | | | | | | | |
4.88%, 07/01/21 | | | | | | | 73 | | | | 73,365 | |
5.25%, 06/01/27 | | | | | | | 34 | | | | 33,617 | |
TRI Pointe Group, Inc./TRI Pointe Homes, Inc.: | | | | | | | | | | | | |
4.38%, 06/15/19 | | | | | | | 10 | | | | 10,025 | |
5.88%, 06/15/24 | | | | | | | 177 | | | | 182,310 | |
William Lyon Homes, Inc., 5.88%, 01/31/25 | | | | | | | 66 | | | | 65,835 | |
| | | | | | | | |
| | | | | | | | | | | 4,348,946 | |
| Household Products — 0.0% | |
ACCO Brands Corp., 5.25%, 12/15/24(b) | | | | | | | 59 | | | | 59,295 | |
Prestige Brands, Inc., 6.38%, 03/01/24(b) | | | | | | | 42 | | | | 43,050 | |
Spectrum Brands, Inc., 6.63%, 11/15/22 | | | | | | | 170 | | | | 175,738 | |
| | | | | | | | |
| | | | | | | | | | | 278,083 | |
| Independent Power and Renewable Electricity Producers — 0.5% | |
AES Corp.: | | | | | | | | | | | | |
4.88%, 05/15/23 | | | | | | | 202 | | | | 203,768 | |
5.50%, 03/15/24 | | | | | | | 8 | | | | 8,170 | |
5.50%, 04/15/25 | | | | | | | 64 | | | | 65,600 | |
6.00%, 05/15/26 | | | | | | | 217 | | | | 227,850 | |
5.13%, 09/01/27 | | | | | | | 244 | | | | 247,050 | |
Calpine Corp.(b): | | | | | | | | | | | | |
5.88%, 01/15/24 | | | | | | | 258 | | | | 263,482 | |
5.25%, 06/01/26 | | | | | | | 512 | | | | 496,640 | |
Colbun SA, 3.95%, 10/11/27(b) | | | | | | | 200 | | | | 194,000 | |
Dynegy, Inc.: | | | | | | | | | | | | |
7.38%, 11/01/22 | | | | | | | 155 | | | | 163,331 | |
5.88%, 06/01/23 | | | | | | | 26 | | | | 26,650 | |
8.00%, 01/15/25(b) | | | | | | | 198 | | | | 215,077 | |
8.13%, 01/30/26(b) | | | | | | | 115 | | | | 125,925 | |
Genneia SA, 8.75%, 01/20/22(b) | | | | | | | 370 | | | | 399,382 | |
| | |
| 20 | | 2018 BLACKROCK SEMI-ANNUAL REPORTTO SHAREHOLDERS |
| | |
Schedule of Investments (unaudited) (continued) February 28, 2018 | | BlackRock Core Bond Trust (BHK) (Percentages shown are based on Net Assets) |
| | | | | | | | | | | | |
| Security | | Par
(000) | | | Value | |
| Independent Power and Renewable Electricity Producers (continued) | |
NRG Energy, Inc.: | | | | | | | | | | | | |
6.63%, 01/15/27 | | | USD | | | | 728 | | | $ | 751,660 | |
5.75%, 01/15/28(b) | | | | | | | 42 | | | | 41,467 | |
NRG Yield Operating LLC, 5.38%, 08/15/24 | | | | | | | 155 | | | | 156,646 | |
QEP Resources, Inc., 5.38%, 10/01/22 | | | | | | | 51 | | | | 51,765 | |
TerraForm Power Operating LLC(b): | | | | | | | | | | | | |
4.25%, 01/31/23 | | | | | | | 128 | | | | 125,440 | |
6.63%, 06/15/25(k) | | | | | | | 15 | | | | 16,238 | |
5.00%, 01/31/28 | | | | | | | 128 | | | | 123,878 | |
| | | | | | | | |
| | | | | | | | | | | 3,904,019 | |
| Industrial Conglomerates — 0.5% | | | | | | | | | |
General Electric Co.: | | | | | | | | | | | | |
6.75%, 03/15/32(f) | | | | | | | 2,500 | | | | 3,107,773 | |
6.88%, 01/10/39 | | | | | | | 135 | | | | 175,562 | |
Smiths Group PLC, 3.63%, 10/12/22(b) | | | | | | | 360 | | | | 355,534 | |
Vertiv Group Corp., 9.25%, 10/15/24(b) | | | | | | | 381 | | | | 401,955 | |
| | | | | | | | |
| | | | | | | | | | | 4,040,824 | |
| Insurance — 3.1% | | | | | | | | | |
Acrisure LLC/Acrisure Finance, Inc.,
7.00%, 11/15/25(b) | | | | | | | 126 | | | | 123,165 | |
Allied World Assurance Co. Holdings Ltd., 4.35%, 10/29/25 | | | | | | | 1,495 | | | | 1,465,514 | |
American International Group, Inc.,
3.75%, 07/10/25(f) | | | | | | | 3,380 | | | | 3,363,672 | |
Aon PLC: | | | | | | | | | | | | |
3.88%, 12/15/25 | | | | | | | 1,445 | | | | 1,459,506 | |
4.60%, 06/14/44 | | | | | | | 500 | | | | 516,818 | |
Ardonagh Midco 3 PLC: | | | | | | | | | | | | |
8.38%, 07/15/23 | | | GBP | | | | 100 | | | | 140,833 | |
8.63%, 07/15/23(b) | | | USD | | | | 200 | | | | 206,500 | |
Assicurazioni Generali SpA (3 mo. Euribor + 7.11%), 7.75%, 12/12/42(h) | | | EUR | | | | 100 | | | | 155,042 | |
AssuredPartners, Inc., 7.00%, 08/15/25(b) | | | USD | | | | 33 | | | | 33,743 | |
AXA SA(3 mo. Euribor + 3.05%), 5.25%, 04/16/40(h) | | | EUR | | | | 500 | | | | 671,916 | |
Fidelity National Financial, Inc., 4.25%, 08/15/18 | | | USD | | | | 73 | | | | 224,570 | |
Five Corners Funding Trust, 4.42%, 11/15/23(b)(f) | | | | | | | 2,050 | | | | 2,150,613 | |
Groupama SA, 6.00%, 01/23/27 | | | EUR | | | | 100 | | | | 150,164 | |
Hartford Financial Services Group, Inc., 5.13%, 04/15/22 | | | USD | | | | 1,860 | | | | 1,986,842 | |
HUB International Ltd., 7.88%, 10/01/21(b) | | | | | | | 802 | | | | 827,062 | |
Liberty Mutual Group, Inc., 6.50%, 05/01/42(b)(f) | | | | | | | 2,000 | | | | 2,522,662 | |
MetLife, Inc., 6.40%, 12/15/66 | | | | | | | 2,554 | | | | 2,879,635 | |
Muenchener Rueckversicherungs AG(3 mo. Euribor + 3.50%), 6.00%, 05/26/41(h) | | | EUR | | | | 400 | | | | 570,376 | |
Nationwide Building Society, 4.13%, 10/18/32(b)(c) | | | USD | | | | 720 | | | | 693,666 | |
Prudential Financial, Inc.: | | | | | | | | | | | | |
5.90%, 03/17/36 | | | | | | | 500 | | | | 601,003 | |
5.70%, 12/14/36(f) | | | | | | | 1,625 | | | | 1,955,543 | |
Radian Group, Inc.: | | | | | | | | | | | | |
5.25%, 06/15/20 | | | | | | | 28 | | | | 28,980 | |
4.50%, 10/01/24 | | | | | | | 177 | | | | 176,611 | |
Teachers Insurance & Annuity Association of America, 4.27%, 05/15/47(b) | | | | | | | 700 | | | | 696,369 | |
USIS Merger Sub, Inc., 6.88%, 05/01/25(b) | | | | | | | 41 | | | | 41,513 | |
Wayne Merger Sub LLC, 8.25%, 08/01/23(b) | | | | | | | 625 | | | | 650,000 | |
| | | | | | | | |
| | | | | | | | | | | 24,292,318 | |
| Internet Software & Services — 0.2% | |
Equinix, Inc.: | | | | | | | | | | | | |
2.88%, 03/15/24(d) | | | EUR | | | | 100 | | | | 122,000 | |
2.88%, 10/01/25 | | | | | | | 100 | | | | 120,856 | |
5.88%, 01/15/26 | | | USD | | | | 435 | | | | 455,662 | |
| | | | | | | | | | | | |
| Security | | Par
(000) | | | Value | |
| Internet Software & Services (continued) | |
Netflix, Inc.: | | | | | | | | | | | | |
4.38%, 11/15/26 | | | USD | | | | 115 | | | $ | 110,400 | |
3.63%, 05/15/27 | | | EUR | | | | 100 | | | | 122,569 | |
Symantec Corp., 5.00%, 04/15/25(b) | | | USD | | | | 124 | | | | 125,807 | |
United Group BV, 4.38%, 07/01/22 | | | EUR | | | | 126 | | | | 155,995 | |
ZPG PLC, 3.75%, 07/15/23 | | | GBP | | | | 100 | | | | 136,228 | |
| | | | | | | | |
| | | | | | | | | | | 1,349,517 | |
| IT Services — 0.5% | |
Ceridian HCM Holding, Inc., 11.00%, 03/15/21(b) | | | USD | | | | 270 | | | | 278,999 | |
Fidelity National Information Services, Inc., 4.50%, 08/15/46 | | | | | | | 1,000 | | | | 982,495 | |
First Data Corp.(b): | | | | | | | | | | | | |
7.00%, 12/01/23 | | | | | | | 756 | | | | 794,745 | |
5.00%, 01/15/24 | | | | | | | 220 | | | | 221,375 | |
5.75%, 01/15/24 | | | | | | | 1,261 | | | | 1,283,068 | |
Gartner, Inc., 5.13%, 04/01/25(b) | | | | | | | 141 | | | | 144,525 | |
WEX, Inc., 4.75%, 02/01/23(b) | | | | | | | 382 | | | | 384,626 | |
| | | | | | | | |
| | | | | | | | | | | 4,089,833 | |
| Leisure Products — 0.0% | |
Mattel, Inc.: | | | | | | | | | | | | |
6.75%, 12/31/25(b) | | | | | | | 218 | | | | 221,815 | |
6.20%, 10/01/40 | | | | | | | 48 | | | | 44,640 | |
5.45%, 11/01/41 | | | | | | | 28 | | | | 24,640 | |
| | | | | | | | |
| | | | | | | | | | | 291,095 | |
| Life Sciences Tools & Services — 0.1% | |
Thermo Fisher Scientific, Inc., 5.30%, 02/01/44 | | | | | | | 1,000 | | | | 1,128,250 | |
| | | | | | | | |
| Machinery — 0.2% | |
Cleaver-Brooks, Inc., 7.88%, 03/01/23(b) | | | | | | | 64 | | | | 67,520 | |
Platin 1426 GmbH, 5.38%, 06/15/23 | | | EUR | | | | 100 | | | | 121,238 | |
SPX FLOW, Inc.(b): | | | | | | | | | | | | |
5.63%, 08/15/24 | | | USD | | | | 115 | | | | 117,013 | |
5.88%, 08/15/26 | | | | | | | 213 | | | | 218,857 | |
Terex Corp., 5.63%, 02/01/25(b) | | | | | | | 455 | | | | 459,550 | |
Wabash National Corp., 5.50%, 10/01/25(b) | | | | | | | 176 | | | | 174,240 | |
| | | | | | | | |
| | | | | | | | | | | 1,158,418 | |
| Marine — 0.3% | |
Nakilat, Inc., Series A, 6.07%, 12/31/33(b) | | | | | | | 2,150 | | | | 2,397,680 | |
| | | | | | | | |
| Media — 5.1% | |
21st Century Fox America, Inc., 7.63%, 11/30/28 | | | | | | | 385 | | | | 495,056 | |
Altice Financing SA(b): | | | | | | | | | | | | |
6.63%, 02/15/23 | | | | | | | 200 | | | | 199,750 | |
7.50%, 05/15/26 | | | | | | | 607 | | | | 611,552 | |
Altice Luxembourg SA: | | | | | | | | | | | | |
7.75%, 05/15/22(b) | | | | | | | 642 | | | | 598,665 | |
6.25%, 02/15/25 | | | EUR | | | | 100 | | | | 113,802 | |
Altice US Finance I Corp., 5.38%, 07/15/23(b) | | | USD | | | | 970 | | | | 985,762 | |
AMC Networks, Inc.: | | | | | | | | | | | | |
5.00%, 04/01/24 | | | | | | | 114 | | | | 114,285 | |
4.75%, 08/01/25 | | | | | | | 206 | | | | 199,563 | |
Cablevision SA, 6.50%, 06/15/21(b) | | | | | | | 222 | | | | 232,117 | |
Cablevision Systems Corp., 8.00%, 04/15/20 | | | | | | | 325 | | | | 345,377 | |
CBS Radio, Inc., 7.25%, 11/01/24(b) | | | | | | | 53 | | | | 54,579 | |
CCO Holdings LLC/CCO Holdings Capital Corp.(b): | | | | | | | | | | | | |
4.00%, 03/01/23 | | | | | | | 252 | | | | 245,385 | |
5.13%, 05/01/23 | | | | | | | 73 | | | | 74,369 | |
5.13%, 05/01/27 | | | | | | | 1,628 | | | | 1,567,634 | |
5.00%, 02/01/28 | | | | | | | 221 | | | | 208,635 | |
Cequel Communications Holdings I LLC/Cequel Capital Corp.(b): | | | | | | | | | | | | |
5.13%, 12/15/21 | | | | | | | 562 | | | | 558,966 | |
7.75%, 07/15/25 | | | | | | | 960 | | | | 1,022,400 | |
| | | | |
| SCHEDULES OF INVESTMENTS | | | 21 | |
| | |
Schedule of Investments (unaudited) (continued) February 28, 2018 | | BlackRock Core Bond Trust (BHK) (Percentages shown are based on Net Assets) |
| | | | | | | | | | | | |
| Security | | Par
(000) | | | Value | |
| Media (continued) | |
Charter Communications Operating LLC/Charter Communications Operating Capital, 4.91%, 07/23/25(f) | | | USD | | | | 4,700 | | | $ | 4,831,602 | |
Clear Channel International BV, 8.75%, 12/15/20(b) | | | | | | | 317 | | | | 331,265 | |
Clear Channel Worldwide Holdings, Inc.: | | | | | | | | | | | | |
6.50%, 11/15/22 | | | | | | | 1,921 | | | | 1,969,676 | |
Series B, 7.63%, 03/15/20 | | | | | | | 443 | | | | 442,446 | |
Comcast Cable Communications Holdings, Inc., 9.46%, 11/15/22(f) | | | | | | | 2,600 | | | | 3,303,006 | |
Comcast Corp.: | | | | | | | | | | | | |
6.45%, 03/15/37 | | | | | | | 790 | | | | 1,011,471 | |
4.60%, 08/15/45 | | | | | | | 2,000 | | | | 2,085,777 | |
CSC Holdings LLC: | | | | | | | | | | | | |
10.13%, 01/15/23(b) | | | | | | | 1,190 | | | | 1,329,825 | |
5.25%, 06/01/24 | | | | | | | 398 | | | | 383,075 | |
10.88%, 10/15/25(b) | | | | | | | 764 | | | | 901,520 | |
Discovery Communications LLC: | | | | | | | | | | | | |
3.25%, 04/01/23 | | | | | | | 1,850 | | | | 1,798,282 | |
3.45%, 03/15/25 | | | | | | | 210 | | | | 200,880 | |
DISH DBS Corp.: | | | | | | | | | | | | |
6.75%, 06/01/21 | | | | | | | 350 | | | | 359,625 | |
5.88%, 07/15/22 | | | | | | | 470 | | | | 458,250 | |
5.00%, 03/15/23 | | | | | | | 264 | | | | 242,550 | |
5.88%, 11/15/24 | | | | | | | 36 | | | | 33,750 | |
7.75%, 07/01/26 | | | | | | | 534 | | | | 525,990 | |
DISH Network Corp., 3.38%, 08/15/26(j) | | | | | | | 155 | | | | 155,940 | |
eircom Finance DAC, 4.50%, 05/31/22 | | | EUR | | | | 100 | | | | 124,989 | |
GTT Communications, Inc., 7.88%, 12/31/24(b) | | | USD | | | | 159 | | | | 165,261 | |
Hughes Satellite Systems Corp.: | | | | | | | | | | | | |
7.63%, 06/15/21 | | | | | | | 64 | | | | 68,880 | |
5.25%, 08/01/26 | | | | | | | 324 | | | | 315,900 | |
Intelsat Jackson Holdings SA: | | | | | | | | | | | | |
7.25%, 10/15/20 | | | | | | | 185 | | | | 172,281 | |
5.50%, 08/01/23 | | | | | | | 325 | | | | 268,531 | |
9.75%, 07/15/25(b) | | | | | | | 377 | | | | 357,679 | |
Interpublic Group of Cos., Inc., 3.75%, 02/15/23 | | | | | | | 2,000 | | | | 2,009,947 | |
LG Finance Co. Corp., 5.88%, 11/01/24(b) | | | | | | | 57 | | | | 59,542 | |
LGE HoldCo VI BV, 7.13%, 05/15/24 | | | EUR | | | | 100 | | | | 131,760 | |
McGraw-Hill Global Education Holdings LLC/McGraw-Hill Global Education Finance, 7.88%, 05/15/24(b) | | | USD | | | | 61 | | | | 59,018 | |
MDC Partners, Inc., 6.50%, 05/01/24(b) | | | | | | | 228 | | | | 227,430 | |
Meredith Corp., 6.88%, 02/01/26(b) | | | | | | | 110 | | | | 113,438 | |
Midcontinent Communications/Midcontinent Finance Corp., 6.88%, 08/15/23(b) | | | | | | | 148 | | | | 156,325 | |
Numericable Group SA, 5.38%, 05/15/22 | | | EUR | | | | 106 | | | | 132,027 | |
Qualitytech LP/QTS Finance Corp.,
4.75%, 11/15/25(b) | | | USD | | | | 104 | | | | 101,140 | |
Radiate Holdco LLC/Radiate Finance, Inc., 6.88%, 02/15/23(b) | | | | | | | 43 | | | | 42,893 | |
SFR Group SA(b): | | | | | | | | | | | | |
6.00%, 05/15/22 | | | | | | | 345 | | | | 335,081 | |
7.38%, 05/01/26 | | | | | | | 1,101 | | | | 1,062,795 | |
Sirius XM Radio, Inc., 5.00%, 08/01/27(b) | | | | | | | 41 | | | | 39,873 | |
TCI Communications, Inc., 7.88%, 02/15/26(f) | | | | | | | 610 | | | | 782,810 | |
TEGNA, Inc., 5.50%, 09/15/24(b) | | | | | | | 45 | | | | 46,238 | |
Telenet Finance Luxembourg Notes Sarl, 5.50%, 03/01/28(b) | | | | | | | 200 | | | | 193,000 | |
Telesat Canada/Telesat LLC, 8.88%, 11/15/24(b) | | | | | | | 167 | | | | 183,283 | |
Time Warner, Inc., 6.10%, 07/15/40 | | | | | | | 830 | | | | 960,445 | |
Tribune Media Co., 5.88%, 07/15/22 | | | | | | | 16 | | | | 16,320 | |
Univision Communications, Inc.(b): | | | | | | | | | | | | |
5.13%, 05/15/23 | | | | | | | 272 | | | | 257,720 | |
5.13%, 02/15/25 | | | | | | | 28 | | | | 25,865 | |
| | | | | | | | | | | | |
| Security | | Par
(000) | | | Value | |
| Media (continued) | |
UPCB Finance IV Ltd., 4.00%, 01/15/27 | | | EUR | | | | 100 | | | $ | 126,841 | |
Viacom, Inc., 5.85%, 09/01/43 | | | USD | | | | 645 | | | | 704,432 | |
Videotron Ltd., 5.13%, 04/15/27(b) | | | | | | | 222 | | | | 223,971 | |
Virgin Media Finance PLC, 5.75%, 01/15/25(b) | | | | | | | 515 | | | | 505,987 | |
Virgin Media Receivables Financing Notes I DAC, 5.50%, 09/15/24 | | | GBP | | | | 100 | | | | 139,771 | |
Virgin Media Secured Finance PLC: | | | | | | | | | | | | |
5.25%, 01/15/26(b) | | | USD | | | | 303 | | | | 296,940 | |
4.88%, 01/15/27 | | | GBP | | | | 100 | | | | 137,326 | |
6.25%, 03/28/29 | | | | | | | 100 | | | | 146,607 | |
Ziggo Bond Finance BV, 5.88%, 01/15/25(b) | | | USD | | | | 260 | | | | 250,250 | |
Ziggo Secured Finance BV, 5.50%, 01/15/27(b) | | | | | | | 150 | | | | 143,813 | |
| | | | | | | | | | | | |
| | | | | | | | | | | 39,079,236 | |
| Metals & Mining — 1.5% | |
Big River Steel LLC/BRS Finance Corp., 7.25%, 09/01/25(b) | | | | | | | 121 | | | | 127,958 | |
Cleveland-Cliffs, Inc., 4.88%, 01/15/24(b) | | | | | | | 131 | | | | 127,889 | |
CONSOL Mining Corp., 11.00%, 11/15/25(b) | | | | | | | 266 | | | | 284,620 | |
Constellium NV(b): | | | | | | | | | | | | |
5.75%, 05/15/24 | | | | | | | 582 | | | | 586,365 | |
5.88%, 02/15/26 | | | | | | | 269 | | | | 271,690 | |
First Quantum Minerals Ltd., 7.00%, 02/15/21(b) | | | | | | | 435 | | | | 448,594 | |
Freeport-McMoRan, Inc.: | | | | | | | | | | | | |
3.10%, 03/15/20 | | | | | | | 759 | | | | 751,410 | |
4.00%, 11/14/21 | | | | | | | 121 | | | | 120,395 | |
3.55%, 03/01/22 | | | | | | | 530 | | | | 515,584 | |
3.88%, 03/15/23 | | | | | | | 774 | | | | 750,780 | |
5.40%, 11/14/34 | | | | | | | 278 | | | | 271,050 | |
5.45%, 03/15/43 | | | | | | | 647 | | | | 624,355 | |
Grinding Media, Inc./Moly-Cop AltaSteel Ltd., 7.38%, 12/15/23(b) | | | | | | | 399 | | | | 421,942 | |
Joseph T Ryerson & Son, Inc., 11.00%, 05/15/22(b) | | | | | | | 115 | | | | 128,035 | |
Kaiser Aluminum Corp., 5.88%, 05/15/24 | | | | | | | 74 | | | | 77,537 | |
Kinross Gold Corp.: | | | | | | | | | | | | |
4.50%, 07/15/27(b) | | | | | | | 82 | | | | 79,540 | |
6.88%, 09/01/41 | | | | | | | 53 | | | | 61,083 | |
Novelis Corp.(b): | | | | | | | | | | | | |
6.25%, 08/15/24 | | | | | | | 823 | | | | 841,517 | |
5.88%, 09/30/26 | | | | | | | 602 | | | | 606,515 | |
Nyrstar Netherlands Holdings BV, 6.88%, 03/15/24 | | | EUR | | | | 100 | | | | 125,033 | |
Ovako AB, 5.00%, 10/05/22 | | | | | | | 100 | | | | 124,206 | |
Rio Tinto Finance USA PLC, 4.75%, 03/22/42 | | | USD | | | | 400 | | | | 443,521 | |
Steel Dynamics, Inc.: | | | | | | | | | | | | |
5.25%, 04/15/23 | | | | | | | 345 | | | | 352,331 | |
5.50%, 10/01/24 | | | | | | | 48 | | | | 49,680 | |
4.13%, 09/15/25 | | | | | | | 142 | | | | 137,385 | |
SunCoke Energy Partners LP/SunCoke Energy Partners Finance Corp., 7.50%, 06/15/25(b) | | | | | | | 193 | | | | 201,202 | |
Teck Resources Ltd.: | | | | | | | | | | | | |
4.50%, 01/15/21 | | | | | | | 96 | | | | 97,248 | |
3.75%, 02/01/23 | | | | | | | 502 | | | | 490,705 | |
8.50%, 06/01/24(b) | | | | | | | 1,096 | | | | 1,219,300 | |
5.20%, 03/01/42 | | | | | | | 312 | | | | 301,860 | |
5.40%, 02/01/43 | | | | | | | 188 | | | | 186,120 | |
thyssenKrupp AG, 1.38%, 03/03/22 | | | EUR | | | | 75 | | | | 92,324 | |
United States Steel Corp.: | | | | | | | | | | | | |
8.38%, 07/01/21(b) | | | USD | | | | 171 | | | | 183,398 | |
6.88%, 08/15/25 | | | | | | | 185 | | | | 194,250 | |
Vale Overseas Ltd., 6.25%, 08/10/26 | | | | | | | 237 | | | | 267,265 | |
VM Holdings SA, 5.38%, 05/04/27(b) | | | | | | | 299 | | | | 308,568 | |
| | | | | | | | | | | | |
| | | | | | | | | | | 11,871,255 | |
| | |
| 22 | | 2018 BLACKROCK SEMI-ANNUAL REPORTTO SHAREHOLDERS |
| | |
Schedule of Investments (unaudited) (continued) February 28, 2018 | | BlackRock Core Bond Trust (BHK) (Percentages shown are based on Net Assets) |
| | | | | | | | | | | | |
| Security | | Par
(000) | | | Value | |
| Multi-Utilities — 0.1% | |
NGL Energy Partners LP/NGL Energy Finance Corp.: | | | | | | | | | | | | |
5.13%, 07/15/19 | | | USD | | | | 28 | | | $ | 28,070 | |
6.88%, 10/15/21 | | | | | | | 459 | | | | 462,442 | |
| | | | | | | | |
| | | | | | | | | | | 490,512 | |
| Multiline Retail — 0.0% | |
Neiman Marcus Group Ltd., 8.00%, 10/15/21(b) | | | | | | | 145 | | | | 87,725 | |
| | | | | | | | |
| Offshore Drilling & Other Services — 0.0% | |
Entegris, Inc., 4.63%, 02/10/26(b) | | | | | | | 135 | | | | 132,638 | |
| | | | | | | | |
| Oil, Gas & Consumable Fuels — 7.5% | |
Alta Mesa Holdings LP/Alta Mesa Finance Services Corp., 7.88%, 12/15/24 | | | | | | | 79 | | | | 84,135 | |
Anadarko Petroleum Corp., 5.55%, 03/15/26 | | | | | | | 1,500 | | | | 1,635,203 | |
Andeavor Logistics LP, Series A, 6.88%(c)(i) | | | | | | | 232 | | | | 236,495 | |
Andeavor Logistics LP/Tesoro Logistics Finance Corp., 4.25%, 12/01/27 | | | | | | | 250 | | | | 244,363 | |
Antero Midstream Partners LP/Antero Midstream Finance Corp., 5.38%, 09/15/24 | | | | | | | 35 | | | | 35,788 | |
Antero Resources Corp.: | | | | | | | | | | | | |
5.13%, 12/01/22 | | | | | | | 52 | | | | 52,455 | |
5.63%, 06/01/23 | | | | | | | 51 | | | | 52,275 | |
Ascent Resources Utica Holdings LLC/ARU Finance Corp., 10.00%, 04/01/22(b) | | | | | | | 139 | | | | 148,035 | |
Berry Petroleum Co. LLC, 7.00%, 02/15/26(b) | | | | | | | 195 | | | | 198,412 | |
California Resources Corp., 8.00%, 12/15/22(b) | | | | | | | 195 | | | | 154,537 | |
Callon Petroleum Co., 6.13%, 10/01/24 | | | | | | | 261 | | | | 266,220 | |
Calumet Specialty Products Partners LP/Calumet Finance Corp.: | | | | | | | | | | | | |
6.50%, 04/15/21 | | | | | | | 18 | | | | 17,550 | |
7.63%, 01/15/22 | | | | | | | 92 | | | | 91,540 | |
Canadian Natural Resources Ltd., 3.90%, 02/01/25 | | | | | | | 500 | | | | 497,341 | |
Carrizo Oil & Gas, Inc.: | | | | | | | | | | | | |
6.25%, 04/15/23 | | | | | | | 138 | | | | 138,345 | |
8.25%, 07/15/25 | | | | | | | 65 | | | | 69,388 | |
Cenovus Energy, Inc., 4.25%, 04/15/27(f) | | | | | | | 400 | | | | 390,873 | |
Cheniere Corpus Christi Holdings LLC: | | | | | | | | | | | | |
7.00%, 06/30/24 | | | | | | | 178 | | | | 199,182 | |
5.88%, 03/31/25 | | | | | | | 384 | | | | 406,080 | |
5.13%, 06/30/27 | | | | | | | 473 | | | | 478,321 | |
Cheniere Energy Partners LP, 5.25%, 10/01/25(b) | | | | | | | 124 | | | | 125,240 | |
Chesapeake Energy Corp.(b): | | | | | | | | | | | | |
8.00%, 01/15/25 | | | | | | | 68 | | | | 67,150 | |
8.00%, 06/15/27(f) | | | | | | | 523 | | | | 501,426 | |
Cia Latinoamericana de Infraestructura & Servicios SA, 9.50%, 07/20/23(b) | | | | | | | 370 | | | | 382,950 | |
Citgo Holding, Inc., 10.75%, 02/15/20(b) | | | | | | | 95 | | | | 101,888 | |
ConocoPhillips Canada Funding Co., 5.95%, 10/15/36 | | | | | | | 685 | | | | 847,477 | |
ConocoPhillips Co., 6.50%, 02/01/39 | | | | | | | 600 | | | | 784,677 | |
CONSOL Energy, Inc.: | | | | | | | | | | | | |
5.88%, 04/15/22 | | | | | | | 1,321 | | | | 1,328,431 | |
8.00%, 04/01/23 | | | | | | | 48 | | | | 50,820 | |
Continental Resources, Inc.: | | | | | | | | | | | | |
3.80%, 06/01/24 | | | | | | | 207 | | | | 201,049 | |
4.38%, 01/15/28(b) | | | | | | | 250 | | | | 243,750 | |
Covey Park Energy LLC/Covey Park Finance Corp., 7.50%, 05/15/25(b) | | | | | | | 295 | | | | 299,425 | |
Crestwood Midstream Partners LP/Crestwood Midstream Finance Corp., 6.25%, 04/01/23 | | | | | | | 20 | | | | 20,600 | |
CrownRock LP/CrownRock Finance, Inc., 5.63%, 10/15/25(b) | | | | | | | 625 | | | | 612,500 | |
DCP Midstream LLC(b): | | | | | | | | | | | | |
4.75%, 09/30/21 | | | | | | | 55 | | | | 55,963 | |
| | | | | | | | | | | | |
| Security | | Par
(000) | | | Value | |
| Oil, Gas & Consumable Fuels (continued) | |
6.45%, 11/03/36 | | | USD | | | | 128 | | | $ | 140,800 | |
6.75%, 09/15/37 | | | | | | | 159 | | | | 177,285 | |
Denbury Resources, Inc., 9.25%, 03/31/22(b) | | | | | | | 332 | | | | 340,300 | |
Devon Energy Corp., 5.85%, 12/15/25 | | | | | | | 1,000 | | | | 1,135,727 | |
Diamond Offshore Drilling, Inc., 7.88%, 08/15/25 | | | | | | | 62 | | | | 62,930 | |
Diamondback Energy, Inc., 5.38%, 05/31/25 | | | | | | | 177 | | | | 177,000 | |
Eclipse Resources Corp., 8.88%, 07/15/23 | | | | | | | 45 | | | | 45,225 | |
Enbridge, Inc., 6.25%, 03/01/78(c)(d) | | | | | | | 1,935 | | | | 1,950,934 | |
Endeavor Energy Resources LP/EER Finance, Inc.(b): | | | | | | | | | | | | |
5.50%, 01/30/26 | | | | | | | 87 | | | | 86,348 | |
5.75%, 01/30/28 | | | | | | | 160 | | | | 160,000 | |
Energy Transfer Equity LP: | | | | | | | | | | | | |
4.25%, 03/15/23 | | | | | | | 128 | | | | 125,560 | |
5.88%, 01/15/24 | | | | | | | 264 | | | | 279,840 | |
5.50%, 06/01/27 | | | | | | | 165 | | | | 170,775 | |
Energy Transfer LP: | | | | | | | | | | | | |
4.75%, 01/15/26 | | | | | | | 1,250 | | | | 1,269,523 | |
5.30%, 04/15/47 | | | | | | | 540 | | | | 519,687 | |
Energy Transfer Partners LP, 4.05%, 03/15/25 | | | | | | | 500 | | | | 491,332 | |
Ensco Jersey Finance Ltd., 3.00%, 01/31/24 | | | | | | | 165 | | | | 135,713 | |
Ensco PLC, 7.75%, 02/01/26 | | | | | | | 223 | | | | 210,735 | |
Enterprise Products Operating LLC, 3.70%, 02/15/26 | | | | | | | 500 | | | | 499,073 | |
EOG Resources, Inc.: | | | | | | | | | | | | |
4.15%, 01/15/26 | | | | | | | 1,000 | | | | 1,033,573 | |
5.10%, 01/15/36 | | | | | | | 200 | | | | 219,896 | |
EP Energy LLC/Everest Acquisition Finance, Inc.: | | | | | | | | | | | | |
9.38%, 05/01/20 | | | | | | | 6 | | | | 5,580 | |
9.38%, 05/01/24(b) | | | | | | | 288 | | | | 212,400 | |
8.00%, 11/29/24(b)(f) | | | | | | | 275 | | | | 283,250 | |
Extraction Oil & Gas, Inc.(b): | | | | | | | | | | | | |
7.38%, 05/15/24 | | | | | | | 281 | | | | 296,455 | |
5.63%, 02/01/26 | | | | | | | 272 | | | | 266,560 | |
Genesis Energy LP/Genesis Energy Finance Corp.: | | | | | | | | | | | | |
6.50%, 10/01/25 | | | | | | | 97 | | | | 96,758 | |
6.25%, 05/15/26 | | | | | | | 112 | | | | 108,360 | |
GNL Quintero SA, 4.63%, 07/31/29(b) | | | | | | | 200 | | | | 203,000 | |
Great Western Petroleum LLC/Great Western Finance, Inc., 9.00%, 09/30/21(b) | | | | | | | 350 | | | | 364,875 | |
Gulfport Energy Corp.: | | | | | | | | | | | | |
6.63%, 05/01/23 | | | | | | | 115 | | | | 118,163 | |
6.00%, 10/15/24 | | | | | | | 68 | | | | 66,810 | |
6.38%, 05/15/25 | | | | | | | 63 | | | | 62,134 | |
6.38%, 01/15/26(b) | | | | | | | 76 | | | | 74,909 | |
Halcon Resources Corp.: | | | | | | | | | | | | |
6.75%, 02/15/25(b) | | | | | | | 108 | | | | 108,810 | |
Series WI, 6.75%, 02/15/25 | | | | | | | 334 | | | | 337,340 | |
Hess Corp., 4.30%, 04/01/27 | | | | | | | 1,100 | | | | 1,076,775 | |
Hess Infrastructure Partners LP/Hess Infrastructure Partners Finance Corp., 5.63%, 02/15/26(b) | | | | | | | 243 | | | | 243,000 | |
Indigo Natural Resources LLC, 6.88%, 02/15/26(b) | | | | | | | 131 | | | | 128,081 | |
Jones Energy Holdings LLC/Jones Energy Finance Corp., 9.25%, 03/15/23(b) | | | | | | | 70 | | | | 68,775 | |
KeySpan Gas East Corp., 5.82%, 04/01/41(b)(f) | | | | | | | 1,010 | | | | 1,254,969 | |
Kinder Morgan, Inc.: | | | | | | | | | | | | |
4.30%, 06/01/25 | | | | | | | 1,750 | | | | 1,765,917 | |
5.05%, 02/15/46 | | | | | | | 1,750 | | | | 1,715,869 | |
Marathon Petroleum Corp., 6.50%, 03/01/41(f) | | | | | | | 2,049 | | | | 2,465,673 | |
Matador Resources Co., 6.88%, 04/15/23 | | | | | | | 570 | | | | 595,650 | |
MEG Energy Corp.(b): | | | | | | | | | | | | |
6.38%, 01/30/23 | | | | | | | 1 | | | | 858 | |
7.00%, 03/31/24 | | | | | | | 320 | | | | 272,800 | |
6.50%, 01/15/25 | | | | | | | 364 | | | | 357,175 | |
| | | | |
| SCHEDULES OF INVESTMENTS | | | 23 | |
| | |
Schedule of Investments (unaudited) (continued) February 28, 2018 | | BlackRock Core Bond Trust (BHK) (Percentages shown are based on Net Assets) |
| | | | | | | | | | | | |
| Security | | Par
(000) | | | Value | |
| Oil, Gas & Consumable Fuels (continued) | |
MidAmerican Energy Co., 5.80%, 10/15/36(f) | | | USD | | | | 1,500 | | | $ | 1,852,357 | |
MidAmerican Energy Holdings Co., 5.95%, 05/15/37 | | | | | | | 1,750 | | | | 2,183,675 | |
Murphy Oil Corp.: | | | | | | | | | | | | |
6.88%, 08/15/24 | | | | | | | 177 | | | | 186,094 | |
5.75%, 08/15/25 | | | | | | | 14 | | | | 13,951 | |
5.88%, 12/01/42 | | | | | | | 31 | | | | 28,985 | |
Nabors Industries, Inc.(b): | | | | | | | | | | | | |
0.75%, 01/15/24 | | | | | | | 262 | | | | 199,245 | |
5.75%, 02/01/25 | | | | | | | 110 | | | | 104,981 | |
Newfield Exploration Co., 5.63%, 07/01/24 | | | | | | | 75 | | | | 78,938 | |
NGPL PipeCo LLC(b): | | | | | | | | | | | | |
4.38%, 08/15/22 | | | | | | | 127 | | | | 126,683 | |
7.77%, 12/15/37 | | | | | | | 354 | | | | 433,650 | |
Noble Holding International Ltd.: | | | | | | | | | | | | |
7.75%, 01/15/24(f) | | | | | | | 187 | | | | 170,871 | |
7.88%, 02/01/26(b) | | | | | | | 539 | | | | 541,695 | |
Oasis Petroleum, Inc.: | | | | | | | | | | | | |
6.50%, 11/01/21 | | | | | | | 35 | | | | 35,700 | |
6.88%, 03/15/22 | | | | | | | 72 | | | | 73,755 | |
6.88%, 01/15/23 | | | | | | | 53 | | | | 54,060 | |
2.63%, 09/15/23 | | | | | | | 495 | | | | 510,021 | |
Paramount Resources Ltd., 6.88%, 06/30/23(b) | | | | | | | 325 | | | | 338,000 | |
Parker Drilling Co., 7.50%, 08/01/20 | | | | | | | 43 | | | | 39,668 | |
Parsley Energy LLC/Parsley Finance Corp.(b): | | | | | | | | | | | | |
6.25%, 06/01/24 | | | | | | | 48 | | | | 49,680 | |
5.38%, 01/15/25 | | | | | | | 209 | | | | 206,910 | |
5.25%, 08/15/25 | | | | | | | 52 | | | | 51,220 | |
5.63%, 10/15/27 | | | | | | | 61 | | | | 60,504 | |
PBF Holding Co. LLC/ PBF Finance Corp., 7.25%, 06/15/25 | | | | | | | 143 | | | | 148,005 | |
PDC Energy, Inc.: | | | | | | | | | | | | |
6.13%, 09/15/24 | | | | | | | 24 | | | | 24,540 | |
5.75%, 05/15/26(b) | | | | | | | 125 | | | | 123,400 | |
Petrobras Global Finance BV: | | | | | | | | | | | | |
8.75%, 05/23/26 | | | | | | | 222 | | | | 260,572 | |
6.00%, 01/27/28(b) | | | | | | | 239 | | | | 235,415 | |
Petroleos Mexicanos(b): | | | | | | | | | | | | |
5.38%, 03/13/22 | | | | | | | 27 | | | | 28,215 | |
6.50%, 03/13/27 | | | | | | | 148 | | | | 158,193 | |
5.35%, 02/12/28 | | | | | | | 123 | | | | 120,909 | |
Plains All American Pipeline LP/PAA Finance Corp., 3.65%, 06/01/22 | | | | | | | 1,000 | | | | 987,088 | |
Precision Drilling Corp.: | | | | | | | | | | | | |
7.75%, 12/15/23 | | | | | | | 50 | | | | 52,750 | |
7.13%, 01/15/26(b) | | | | | | | 159 | | | | 160,391 | |
Range Resources Corp.: | | | | | | | | | | | | |
5.88%, 07/01/22 | | | | | | | 244 | | | | 247,660 | |
5.00%, 08/15/22 | | | | | | | 53 | | | | 52,205 | |
5.00%, 03/15/23 | | | | | | | 88 | | | | 86,020 | |
4.88%, 05/15/25 | | | | | | | 24 | | | | 22,980 | |
Resolute Energy Corp., 8.50%, 05/01/20 | | | | | | | 279 | | | | 278,651 | |
Rockies Express Pipeline LLC(b): | | | | | | | | | | | | |
5.63%, 04/15/20 | | | | | | | 565 | | | | 586,894 | |
6.88%, 04/15/40 | | | | | | | 229 | | | | 268,502 | |
Rowan Cos., Inc.: | | | | | | | | | | | | |
4.88%, 06/01/22 | | | | | | | 50 | | | | 47,000 | |
4.75%, 01/15/24 | | | | | | | 64 | | | | 55,680 | |
7.38%, 06/15/25 | | | | | | | 326 | | | | 321,925 | |
RSP Permian, Inc.: | | | | | | | | | | | | |
6.63%, 10/01/22 | | | | | | | 179 | | | | 186,607 | |
5.25%, 01/15/25 | | | | | | | 102 | | | | 102,765 | |
Sabine Pass Liquefaction LLC, 5.88%, 06/30/26 | | | | | | | 1,750 | | | | 1,910,837 | |
Sanchez Energy Corp.: | | | | | | | | | | | | |
7.75%, 06/15/21 | | | | | | | 548 | | | | 523,340 | |
| | | | | | | | | | | | |
| Security | | Par
(000) | | | Value | |
| Oil, Gas & Consumable Fuels (continued) | |
6.13%, 01/15/23 | | | USD | | | | 128 | | | $ | 96,000 | |
7.25%, 02/15/23(b) | | | | | | | 110 | | | | 111,375 | |
SESI LLC, 7.13%, 12/15/21 | | | | | | | 60 | | | | 61,200 | |
Seven Generations Energy Ltd., 5.38%, 09/30/25(b) | | | | | | | 197 | | | | 192,567 | |
SM Energy Co.: | | | | | | | | | | | | |
6.50%, 11/15/21 | | | | | | | 50 | | | | 50,750 | |
6.50%, 01/01/23(f) | | | | | | | 194 | | | | 194,000 | |
5.00%, 01/15/24 | | | | | | | 30 | | | | 28,200 | |
5.63%, 06/01/25 | | | | | | | 191 | | | | 182,524 | |
6.75%, 09/15/26 | | | | | | | 92 | | | | 92,460 | |
Southwestern Energy Co.: | | | | | | | | | | | | |
6.70%, 01/23/25 | | | | | | | 70 | | | | 68,600 | |
7.50%, 04/01/26 | | | | | | | 124 | | | | 125,240 | |
7.75%, 10/01/27 | | | | | | | 162 | | | | 165,240 | |
Suncor Energy, Inc., 6.50%, 06/15/38 | | | | | | | 1,000 | | | | 1,282,664 | |
Sunoco Logistics Partners Operations LP, 3.90%, 07/15/26 | | | | | | | 310 | | | | 296,470 | |
Sunoco LP/Sunoco Finance Corp.(b): | | | | | | | | | | | | |
4.88%, 01/15/23 | | | | | | | 298 | | | | 296,480 | |
5.88%, 03/15/28 | | | | | | | 4 | | | | 4,015 | |
Tallgrass Energy Partners LP/Tallgrass Energy Finance Corp.(b): | | | | | | | | | | | | |
5.50%, 09/15/24 | | | | | | | 284 | | | | 292,514 | |
5.50%, 01/15/28 | | | | | | | 212 | | | | 212,530 | |
Targa Resources Partners LP/Targa Resources Partners Finance Corp.: | | | | | | | | | | | | |
5.25%, 05/01/23 | | | | | | | 10 | | | | 10,144 | |
5.13%, 02/01/25 | | | | | | | 77 | | | | 76,807 | |
5.38%, 02/01/27 | | | | | | | 52 | | | | 52,000 | |
5.00%, 01/15/28(b) | | | | | | | 278 | | | | 270,007 | |
TransCanada PipeLines Ltd., 4.63%, 03/01/34 | | | | | | | 500 | | | | 529,086 | |
Transocean, Inc., 7.50%, 01/15/26(b) | | | | | | | 310 | | | | 312,325 | |
Weatherford International Ltd.: | | | | | | | | | | | | |
6.50%, 08/01/36 | | | | | | | 75 | | | | 57,000 | |
7.00%, 03/15/38 | | | | | | | 124 | | | | 98,580 | |
5.95%, 04/15/42 | | | | | | | 128 | | | | 92,160 | |
Western Gas Partners LP, 5.38%, 06/01/21 | | | | | | | 1,425 | | | | 1,491,341 | |
Whiting Petroleum Corp., 6.63%, 01/15/26(b) | | | | | | | 305 | | | | 311,100 | |
WildHorse Resource Development Corp., 6.88%, 02/01/25 | | | | | | | 100 | | | | 102,500 | |
Williams Cos., Inc., 5.75%, 06/24/44 | | | | | | | 647 | | | | 687,437 | |
Williams Partners LP: | | | | | | | | | | | | |
3.90%, 01/15/25 | | | | | | | 1,150 | | | | 1,141,410 | |
4.00%, 09/15/25 | | | | | | | 750 | | | | 747,657 | |
WPX Energy, Inc.: | | | | | | | | | | | | |
7.50%, 08/01/20 | | | | | | | 34 | | | | 36,380 | |
6.00%, 01/15/22 | | | | | | | 139 | | | | 144,213 | |
8.25%, 08/01/23 | | | | | | | 45 | | | | 50,963 | |
5.25%, 09/15/24 | | | | | | | 192 | | | | 192,000 | |
YPF SA, 8.50%, 07/28/25 | | | | | | | 370 | | | | 410,811 | |
| | | | | | | | | | | | |
| | | | | | | | | | | 57,701,023 | |
| Oil: Crude Producers — 0.0% | |
MGM Growth Properties Operating Partnership LP/MGP Finance Co-Issuer, Inc., 4.50%, 01/15/28 | | | | | | | 235 | | | | 222,075 | |
| | | | | | | | |
| Paper & Forest Products — 0.2% | |
International Paper Co., 6.00%, 11/15/41 | | | | | | | 870 | | | | 1,038,488 | |
Norbord, Inc., 6.25%, 04/15/23(b) | | | | | | | 120 | | | | 128,286 | |
| | | | | | | | | | | | |
| | | | | | | | | | | 1,166,774 | |
| Pharmaceuticals — 2.0% | |
AbbVie, Inc.: | | | | | | | | | | | | |
3.60%, 05/14/25 | | | | | | | 870 | | | | 860,413 | |
3.20%, 05/14/26 | | | | | | | 500 | | | | 477,405 | |
| | |
| 24 | | 2018 BLACKROCK SEMI-ANNUAL REPORTTO SHAREHOLDERS |
| | |
Schedule of Investments (unaudited) (continued) February 28, 2018 | | BlackRock Core Bond Trust (BHK) (Percentages shown are based on Net Assets) |
| | | | | | | | | | | | |
| Security | | Par
(000) | | | Value | |
| Pharmaceuticals (continued) | |
4.45%, 05/14/46 | | | USD | | | | 2,095 | | | $ | 2,090,666 | |
Actavis Funding SCS: | | | | | | | | | | | | |
3.80%, 03/15/25 | | | | | | | 3,250 | | | | 3,206,808 | |
4.55%, 03/15/35 | | | | | | | 2,140 | | | | 2,135,322 | |
Endo Finance LLC/Endo Finco, Inc.(b): | | | | | | | | | | | | |
5.38%, 01/15/23 | | | | | | | 62 | | | | 46,345 | |
6.00%, 07/15/23 | | | | | | | 315 | | | | 236,250 | |
Forest Laboratories LLC, 5.00%, 12/15/21(b) | | | | | | | 758 | | | | 797,929 | |
inVentiv Group Holdings, Inc./inVentiv Health, Inc./inVentiv Health Clinical, Inc., 7.50%, 10/01/24(b) | | | | | | | 108 | | | | 115,560 | |
Jaguar Holding Co. II/Pharmaceutical Product Development LLC, 6.38%, 08/01/23(b) | | | | | | | 795 | | | | 798,975 | |
Mylan NV, 3.95%, 06/15/26 | | | | | | | 750 | | | | 725,377 | |
Nidda Healthcare Holding AG, 3.50%, 09/30/24 | | | EUR | | | | 100 | | | | 122,238 | |
Synlab Bondco PLC, 6.25%, 07/01/22 | | | | | | | 100 | | | | 127,222 | |
Team Health Holdings, Inc., 6.38%,
02/01/25(b)(f) | | | USD | | | | 267 | | | | 244,305 | |
Teva Pharmaceutical Finance Netherlands II BV, 1.25%, 03/31/23 | | | EUR | | | | 100 | | | | 108,579 | |
Teva Pharmaceutical Finance Netherlands III BV, 1.70%, 07/19/19 | | | USD | | | | 225 | | | | 219,532 | |
Valeant Pharmaceuticals International, Inc.(b): | | | | | | | | | | | | |
7.50%, 07/15/21 | | | | | | | 60 | | | | 60,300 | |
6.75%, 08/15/21 | | | | | | | 301 | | | | 293,475 | |
5.63%, 12/01/21 | | | | | | | 261 | | | | 246,645 | |
6.50%, 03/15/22 | | | | | | | 276 | | | | 287,040 | |
5.50%, 03/01/23 | | | | | | | 297 | | | | 262,845 | |
5.88%, 05/15/23 | | | | | | | 1,318 | | | | 1,171,372 | |
7.00%, 03/15/24 | | | | | | | 320 | | | | 336,800 | |
6.13%, 04/15/25 | | | | | | | 318 | | | | 279,045 | |
5.50%, 11/01/25 | | | | | | | 143 | | | | 141,481 | |
| | | | | | | | | | | | |
| | | | | | | | | | | 15,391,929 | |
| Real Estate Investment Trusts (REITs) — 1.2% | |
ERP Operating LP, 4.50%, 06/01/45 | | | | | | | 1,155 | | | | 1,204,617 | |
Five Point Operating Co. LP/Five Point Capital Corp., 7.88%, 11/15/25(b) | | | | | | | 102 | | | | 103,530 | |
HCP, Inc., 4.00%, 06/01/25(f) | | | | | | | 2,000 | | | | 2,007,150 | |
Hilton Domestic Operating Co., Inc., 4.25%, 09/01/24 | | | | | | | 67 | | | | 65,828 | |
Hilton Worldwide Finance LLC/Hilton Worldwide Finance Corp., 4.63%, 04/01/25 | | | | | | | 48 | | | | 48,180 | |
iStar, Inc.: | | | | | | | | | | | | |
4.63%, 09/15/20 | | | | | | | 25 | | | | 25,125 | |
6.00%, 04/01/22 | | | | | | | 96 | | | | 96,480 | |
5.25%, 09/15/22 | | | | | | | 112 | | | | 110,040 | |
MGM Growth Properties Operating Partnership LP/MGP Finance Co-Issuer, Inc.: | | | | | | | | | | | | |
5.63%, 05/01/24 | | | | | | | 1,182 | | | | 1,222,779 | |
4.50%, 09/01/26 | | | | | | | 364 | | | | 346,710 | |
NH Hotel Group SA, 3.75%, 10/01/23 | | | EUR | | | | 128 | | | | 163,382 | |
Simon Property Group LP, 4.75%, 03/15/42 | | | USD | | | | 1,670 | | | | 1,781,989 | |
Starwood Property Trust, Inc.: | | | | | | | | | | | | |
5.00%, 12/15/21 | | | | | | | 345 | | | | 352,763 | |
4.75%, 03/15/25(b) | | | | | | | 68 | | | | 65,960 | |
Trust F/1401, 6.95%, 01/30/44 | | | | | | | 476 | | | | 499,205 | |
Ventas Realty LP, 4.13%, 01/15/26 | | | | | | | 870 | | | | 878,281 | |
Ventas Realty LP/Ventas Capital Corp., 4.75%, 06/01/21 | | | | | | | 550 | | | | 574,215 | |
| | | | | | | | | | | | |
| | | | | | | | | | | 9,546,234 | |
| Real Estate Management & Development — 0.7% | |
ADLER Real Estate AG, 2.13%, 02/06/24 | | | EUR | | | | 100 | | | | 121,292 | |
Greystar Real Estate Partners LLC,
5.75%, 12/01/25(b) | | | USD | | | | 124 | | | | 125,550 | |
| | | | | | | | | | | | |
| Security | | Par
(000) | | | Value | |
| Real Estate Management & Development (continued) | |
Howard Hughes Corp., 5.38%, 03/15/25(b) | | | USD | | | | 148 | | | $ | 145,965 | |
Northwest Florida Timber Finance LLC, 4.75%, 03/04/29(b)(f) | | | | | | | 4,600 | | | | 4,342,113 | |
Realogy Group LLC/Realogy Co-Issuer Corp.(b): | | | | | | | | | | | | |
5.25%, 12/01/21 | | | | | | | 133 | | | | 134,662 | |
4.88%, 06/01/23 | | | | | | | 109 | | | | 105,458 | |
RESIDOMO Sro, 3.38%, 10/15/24 | | | EUR | | | | 100 | | | | 122,610 | |
| | | | | | | | | | | | |
| | | | | | | | | | | 5,097,650 | |
| Restaurants — 0.0% | |
IRB Holding Corp., 6.75%, 02/15/26(b) | | | USD | | | | 136 | | | | 135,789 | |
| | | | | | | | | | | | |
| Road & Rail — 1.2% | |
Avis Budget Car Rental LLC/Avis Budget Finance, Inc., 5.13%, 06/01/22(b)(f) | | | | | | | 261 | | | | 260,348 | |
Burlington Northern Santa Fe LLC,
5.75%, 05/01/40(f) | | | | | | | 1,890 | | | | 2,322,397 | |
CSX Corp., 4.75%, 05/30/42 | | | | | | | 350 | | | | 369,410 | |
EC Finance PLC, 2.38%, 11/15/22 | | | EUR | | | | 100 | | | | 123,660 | |
Flexi-Van Leasing, Inc., 10.00%, 02/15/23(b) | | | USD | | | | 146 | | | | 145,270 | |
Herc Rentals, Inc.(b): | | | | | | | | | | | | |
7.50%, 06/01/22 | | | | | | | 254 | | | | 271,780 | |
7.75%, 06/01/24 | | | | | | | 82 | | | | 89,355 | |
Hertz Corp., 7.63%, 06/01/22(b) | | | | | | | 288 | | | | 295,920 | |
Lima Metro Line 2 Finance Ltd., 5.88%, 07/05/34(b) | | | | | | | 5,000 | | | | 5,279,500 | |
Loxam SAS, 3.50%, 05/03/23 | | | EUR | | | | 100 | | | | 125,667 | |
United Rentals North America, Inc.: | | | | | | | | | | | | |
4.63%, 07/15/23 | | | USD | | | | 72 | | | | 73,620 | |
5.50%, 07/15/25 | | | | | | | 93 | | | | 95,790 | |
| | | | | | | | | | | | |
| | | | | | | | | | | 9,452,717 | |
| Semiconductors & Semiconductor Equipment — 0.9% | |
Advanced Micro Devices, Inc., 7.50%, 08/15/22 | | | | | | | 51 | | | | 55,972 | |
Analog Devices, Inc.: | | | | | | | | | | | | |
3.90%, 12/15/25 | | | | | | | 470 | | | | 475,938 | |
3.50%, 12/05/26 | | | | | | | 345 | | | | 336,876 | |
Broadcom Corp./Broadcom Cayman Finance Ltd., 3.88%, 01/15/27 | | | | | | | 2,850 | | | | 2,732,635 | |
Microchip Technology, Inc., 1.63%, 02/15/25 | | | | | | | 351 | | | | 610,872 | |
Micron Technology, Inc.: | | | | | | | | | | | | |
5.25%, 01/15/24(b) | | | | | | | 27 | | | | 27,675 | |
5.50%, 02/01/25 | | | | | | | 7 | | | | 7,263 | |
Series G, 3.00%, 11/15/43(j) | | | | | | | 128 | | | | 216,223 | |
Microsemi Corp., 9.13%, 04/15/23(b) | | | | | | | 14 | | | | 15,505 | |
NXP BV/NXP Funding LLC(b): | | | | | | | | | | | | |
4.13%, 06/15/20 | | | | | | | 420 | | | | 427,350 | |
4.13%, 06/01/21 | | | | | | | 278 | | | | 282,921 | |
3.88%, 09/01/22 | | | | | | | 200 | | | | 200,440 | |
5.75%, 03/15/23 | | | | | | | 260 | | | | 267,644 | |
ON Semiconductor Corp., 1.00%, 12/01/20 | | | | | | | 383 | | | | 535,754 | |
QUALCOMM, Inc., 4.65%, 05/20/35 | | | | | | | 250 | | | | 255,189 | |
Sensata Technologies BV,
5.00%, 10/01/25(b) | | | | | | | 312 | | | | 314,340 | |
| | | | | | | | | | | | |
| | | | | | | | | | | 6,762,597 | |
| Software — 2.0% | |
ACI Worldwide, Inc., 6.38%, 08/15/20(b) | | | | | | | 320 | | | | 323,200 | |
BMC Software Finance, Inc.,
8.13%, 07/15/21(b) | | | | | | | 323 | | | | 324,211 | |
CA, Inc., 3.60%, 08/15/22 | | | | | | | 705 | | | | 704,937 | |
Citrix Systems, Inc., 0.50%, 04/15/19 | | | | | | | 99 | | | | 131,612 | |
Genesys Telecommunications Laboratories Inc/Greeneden Lux 3 Sarl/Greeneden US Holdings LLC, 10.00%, 11/30/24(b) | | | | | | | 434 | | | | 480,112 | |
Infinity Acquisition LLC/Infinity Acquisition Finance Corp., 7.25%, 08/01/22(b) | | | | | | | 31 | | | | 31,078 | |
| | | | |
| SCHEDULES OF INVESTMENTS | | | 25 | |
| | |
Schedule of Investments (unaudited) (continued) February 28, 2018 | | BlackRock Core Bond Trust (BHK) (Percentages shown are based on Net Assets) |
| | | | | | | | | | | | |
| Security | | Par
(000) | | | Value | |
| Software (continued) | |
Infor Software Parent LLC/Infor Software Parent, Inc., (7.13% Cash or 7.88% PIK), 7.13%, 05/01/21(b)(g) | | | USD | | | | 305 | | | $ | 310,337 | |
Infor US, Inc., 6.50%, 05/15/22 | | | | | | | 1,096 | | | | 1,120,660 | |
Informatica LLC, 7.13%, 07/15/23(b) | | | | | | | 492 | | | | 501,594 | |
Microsoft Corp., 3.50%, 11/15/42(f) | | | | | | | 4,000 | | | | 3,812,871 | |
Nuance Communications, Inc.: | | | | | | | | | | | | |
5.38%, 08/15/20(b) | | | | | | | 39 | | | | 39,341 | |
6.00%, 07/01/24 | | | | | | | 182 | | | | 190,472 | |
5.63%, 12/15/26 | | | | | | | 81 | | | | 82,013 | |
Oracle Corp., 5.38%, 07/15/40(f) | | | | | | | 3,025 | | | | 3,649,659 | |
PTC, Inc., 6.00%, 05/15/24 | | | | | | | 125 | | | | 131,406 | |
Rackspace Hosting, Inc.,
8.63%, 11/15/24(b)(f) | | | | | | | 135 | | | | 140,590 | |
RP Crown Parent LLC, 7.38%, 10/15/24(b) | | | | | | | 210 | | | | 218,925 | |
Solera LLC/Solera Finance, Inc.,
10.50%, 03/01/24(b) | | | | | | | 1,122 | | | | 1,259,782 | |
Sophia LP/Sophia Finance, Inc., 9.00%, 09/30/23(b) | | | | | | | 210 | | | | 221,288 | |
TIBCO Software, Inc., 11.38%, 12/01/21(b) | | | | | | | 553 | | | | 602,870 | |
Veritas US, Inc./Veritas Bermuda Ltd.(b): | | | | | | | | | | | | |
7.50%, 02/01/23 | | | | | | | 400 | | | | 406,000 | |
10.50%, 02/01/24 | | | | | | | 400 | | | | 382,000 | |
| | | | | | | | | | | | |
| | | | | | | | | | | 15,064,958 | |
| Specialty Retail — 0.6% | |
Asbury Automotive Group, Inc., 6.00%, 12/15/24 | | | | | | | 244 | | | | 253,150 | |
Catalent Pharma Solutions, Inc., 4.88%, 01/15/26(b) | | | | | | | 231 | | | | 228,690 | |
Group 1 Automotive, Inc.: | | | | | | | | | | | | |
5.00%, 06/01/22 | | | | | | | 110 | | | | 112,200 | |
5.25%, 12/15/23(b) | | | | | | | 13 | | | | 13,325 | |
Hexion US Finance Corp., 6.63%, 04/15/20 | | | | | | | 78 | | | | 72,540 | |
Home Depot, Inc., 5.88%, 12/16/36 | | | | | | | 1,660 | | | | 2,112,103 | |
JC Penney Corp., Inc.: | | | | | | | | | | | | |
8.13%, 10/01/19 | | | | | | | 28 | | | | 29,365 | |
6.38%, 10/15/36 | | | | | | | 14 | | | | 9,450 | |
7.40%, 04/01/37 | | | | | | | 39 | | | | 28,080 | |
L Brands, Inc.: | | | | | | | | | | | | |
6.88%, 11/01/35 | | | | | | | 285 | | | | 282,863 | |
6.75%, 07/01/36 | | | | | | | 49 | | | | 48,020 | |
Lowe’s Cos, Inc., 4.38%, 09/15/45 | | | | | | | 1,000 | | | | 1,027,804 | |
Penske Automotive Group, Inc., 5.50%, 05/15/26 | | | | | | | 22 | | | | 21,945 | |
PetSmart, Inc., 5.88%, 06/01/25(b) | | | | | | | 93 | | | | 72,540 | |
PVH Corp., 3.13%, 12/15/27 | | | EUR | | | | 100 | | | | 121,339 | |
Shop Direct Funding PLC, 7.75%, 11/15/22 | | | GBP | | | | 100 | | | | 128,071 | |
| | | | | | | | | | | | |
| | | | | | | | | | | 4,561,485 | |
| Technology Hardware, Storage & Peripherals — 0.8% | |
Apple, Inc., 4.65%, 02/23/46(f) | | | USD | | | | 2,400 | | | | 2,617,802 | |
Dell International LLC/EMC Corp.(b): | | | | | | | | | | | | |
4.42%, 06/15/21 | | | | | | | 20 | | | | 20,420 | |
7.13%, 06/15/24 | | | | | | | 438 | | | | 471,398 | |
6.02%, 06/15/26 | | | | | | | 110 | | | | 117,442 | |
8.35%, 07/15/46 | | | | | | | 45 | | | | 57,010 | |
Hewlett Packard Enterprise Co., 4.90%, 10/15/25 | | | | | | | 1,500 | | | | 1,554,863 | |
Riverbed Technology, Inc., 8.88%, 03/01/23(b) | | | | | | | 133 | | | | 124,688 | |
Western Digital Corp.: | | | | | | | | | | | | |
7.38%, 04/01/23(b) | | | | | | | 638 | | | | 693,506 | |
4.75%, 02/15/26 | | | | | | | 617 | | | | 621,627 | |
| | | | | | | | | | | | |
| | | | | | | | | | | 6,278,756 | |
| Textiles, Apparel & Luxury Goods — 0.0% | |
BiSoho SAS, 5.88%, 05/01/23 | | | EUR | | | | 54 | | | | 70,419 | |
Springs Industries, Inc., 6.25%, 06/01/21 | | | USD | | | | 36 | | | | 36,630 | |
| | | | | | | | | | | | |
| | | | | | | | | | | 107,049 | |
| Thrifts & Mortgage Finance — 0.1% | |
Jerrold Finco PLC, 6.25%, 09/15/21 | | | GBP | | | | 100 | | | | 140,492 | |
| | | | | | | | | | | | |
| Security | | Par
(000) | | | Value | |
| Thrifts & Mortgage Finance (continued) | |
Ladder Capital Finance Holdings LLLP/Ladder Capital Finance Corp.(b): | | | | | | | | | | | | |
5.25%, 03/15/22 | | | USD | | | | 23 | | | $ | 23,173 | |
5.25%, 10/01/25 | | | | | | | 209 | | | | 203,252 | |
| | | | | | | | | | | | |
| | | | | | | | | | | 366,917 | |
| Tobacco — 1.5% | |
Altria Group, Inc.: | | | | | | | | | | | | |
9.95%, 11/10/38 | | | | | | | 516 | | | | 849,341 | |
10.20%, 02/06/39 | | | | | | | 894 | | | | 1,504,403 | |
5.38%, 01/31/44(f) | | | | | | | 4,030 | | | | 4,616,522 | |
3.88%, 09/16/46 | | | | | | | 1,250 | | | | 1,162,539 | |
Reynolds American, Inc.: | | | | | | | | | | | | |
4.45%, 06/12/25 | | | | | | | 635 | | | | 653,693 | |
7.00%, 08/04/41 | | | | | | | 1,000 | | | | 1,289,860 | |
5.85%, 08/15/45 | | | | | | | 1,500 | | | | 1,746,499 | |
| | | | | | | | | | | | |
| | | | | | | | | | | 11,822,857 | |
| Transportation Infrastructure — 0.3% | |
CEVA Group PLC, 7.00%, 03/01/21(b) | | | | | | | 310 | | | | 305,350 | |
I 595 Express LLC, 3.31%, 12/31/31(e)(l) | | | | | | | 889 | | | | 837,770 | |
Penske Truck Leasing Co. LP/PTL Finance Corp., 3.40%, 11/15/26(b) | | | | | | | 490 | | | | 469,374 | |
Rumo Luxembourg Sarl, 7.38%, 02/09/24(b) | | | | | | | 370 | | | | 396,603 | |
Transurban Finance Co. Property Ltd., 4.13%, 02/02/26(b) | | | | | | | 580 | | | | 585,026 | |
| | | | | | | | | | | | |
| | | | | | | | | | | 2,594,123 | |
| Utilities — 0.2% | |
AES Argentina Generacion SA, 7.75%, 02/02/24(b) | | | | | | | 370 | | | | 391,334 | |
AES Panama SRL, 6.00%, 06/25/22(b) | | | | | | | 228 | | | | 236,550 | |
ContourGlobal Power Holdings SA, 5.13%, 06/15/21 | | | EUR | | | | 100 | | | | 124,245 | |
Generacion Mediterranea SA/Generacion Frias SA/Central Termica Roca SA, 9.63%, 07/27/23(b) | | | USD | | | | 370 | | | | 405,150 | |
Stoneway Capital Corp., 10.00%, 03/01/27(b)(f) | | | | | | | 530 | | | | 584,988 | |
| | | | | | | | | | | | |
| | | | | | | | | | | 1,742,267 | |
| Wireless Telecommunication Services — 1.6% | |
CoreCivic, Inc., 4.75%, 10/15/27 | | | | | | | 120 | | | | 114,600 | |
CyrusOne LP/CyrusOne Finance Corp.: | | | | | | | | | | | | |
5.00%, 03/15/24 | | | | | | | 356 | | | | 358,670 | |
5.38%, 03/15/27 | | | | | | | 35 | | | | 35,088 | |
Digicel Group Ltd., 8.25%, 09/30/20(b) | | | | | | | 223 | | | | 209,062 | |
Digicel Ltd., 6.00%, 04/15/21(b) | | | | | | | 1,550 | | | | 1,489,937 | |
GEO Group, Inc.: | | | | | | | | | | | | |
5.13%, 04/01/23 | | | | | | | 278 | | | | 276,610 | |
6.00%, 04/15/26 | | | | | | | 40 | | | | 39,862 | |
Matterhorn Telecom SA(3 mo. Euribor + 3.25%), 3.25%, 02/01/23(a) | | | EUR | | | | 15 | | | | 17,433 | |
Radiate Holdco LLC/Radiate Finance, Inc., 6.63%, 02/15/25(b) | | | USD | | | | 152 | | | | 145,540 | |
Rogers Communications, Inc., 7.50%, 08/15/38 | | | | | | | 2,325 | | | | 3,173,745 | |
SBA Communications Corp., 4.88%, 09/01/24 | | | | | | | 112 | | | | 110,600 | |
Sprint Capital Corp.: | | | | | | | | | | | | |
6.90%, 05/01/19 | | | | | | | 140 | | | | 144,948 | |
8.75%, 03/15/32 | | | | | | | 621 | | | | 673,785 | |
Sprint Communications, Inc., 7.00%, 03/01/20(b) | | | | | | | 776 | | | | 819,650 | |
Sprint Corp.: | | | | | | | | | | | | |
7.88%, 09/15/23 | | | | | | | 711 | | | | 735,885 | |
7.13%, 06/15/24 | | | | | | | 1,000 | | | | 993,100 | |
7.63%, 02/15/25(f) | | | | | | | 707 | | | | 707,000 | |
7.63%, 03/01/26 | | | | | | | 216 | | | | 215,212 | |
T-Mobile USA, Inc.: | | | | | | | | | | | | |
4.00%, 04/15/22 | | | | | | | 132 | | | | 132,000 | |
| | |
| 26 | | 2018 BLACKROCK SEMI-ANNUAL REPORTTO SHAREHOLDERS |
| | |
Schedule of Investments (unaudited) (continued) February 28, 2018 | | BlackRock Core Bond Trust (BHK) (Percentages shown are based on Net Assets) |
| | | | | | | | | | | | |
| Security | | Par
(000) | | | Value | |
| Wireless Telecommunication Services (continued) | |
6.00%, 03/01/23 | | | USD | | | | 205 | | | $ | 213,200 | |
6.50%, 01/15/24 | | | | | | | 240 | | | | 251,400 | |
6.00%, 04/15/24 | | | | | | | 306 | | | | 318,240 | |
6.38%, 03/01/25 | | | | | | | 37 | | | | 39,035 | |
4.50%, 02/01/26 | | | | | | | 249 | | | | 244,331 | |
4.75%, 02/01/28 | | | | | | | 312 | | | | 304,319 | |
Uniti Group LP/Uniti Group Finance, Inc./CSL Capital LLC, 8.25%, 10/15/23 | | | | | | | 287 | | | | 267,627 | |
VICI Properties 1 LLC/VICI FC, Inc., 8.00%, 10/15/23 | | | | | | | 100 | | | | 110,861 | |
Xplornet Communications, Inc., (9.63% Cash or 10.63% PIK), 9.63%,
06/01/22(b)(g) | | | | | | | 83 | | | | 86,549 | |
| | | | | | | | | | | | |
| | | | | | | | | | | 12,228,289 | |
| | | | | | | | | | | | |
Total Corporate Bonds — 71.4%
(Cost — $530,888,870) | | | | | | | | | | | 551,268,539 | |
| | | | | | | | | | | | |
|
Floating Rate Loan Interests(l) — 2.0% | |
|
| Aerospace & Defense — 0.1% | |
Accudyne Industries LLC, 2017 Term Loan, (1 mo. LIBOR + 3.75% 1.00% Floor), 5.40%, 08/18/24 | | | | | | | 330 | | | | 331,870 | |
Sequa Mezzanine Holdings LLC, 2nd Lien Term Loan, (3 mo. LIBOR + 9.00% 1.00% Floor), 10.75%, 04/28/22 | | | | | | | 40 | | | | 40,533 | |
| | | | | | | | | | | | |
| | | | | | | | | | | 372,403 | |
| Air Freight & Logistics — 0.0% | |
CEVA Group PLC, Letter of Credit, (3 mo. LIBOR + 5.50%), 6.50%, 03/19/21(e) | | | | | | | 18 | | | | 17,811 | |
CEVA Intercompany BV, Dutch Term Loan, (3 mo. LIBOR + 5.50% 1.00% Floor), 7.27%, 03/19/21 | | | | | | | 18 | | | | 18,163 | |
CEVA Logistics Canada ULC, Canadian Term Loan, (3 mo. LIBOR + 5.50% 1.00% Floor), 7.27%, 03/19/21 | | | | | | | 3 | | | | 2,710 | |
CEVA Logistics US Holdings, Inc., Term Loan, (3 mo. LIBOR + 5.50% 1.00% Floor), 7.27%, 03/19/21 | | | | | | | 26 | | | | 25,815 | |
XPO Logistics, Inc., 2018 Term Loan B, 02/23/25(m) | | | | | | | 95 | | | | 94,919 | |
| | | | | | | | | | | | |
| | | | | | | | | | | 159,418 | |
| Auto Components — 0.0% | |
USI, Inc., 2017 Repriced Term Loan, (3 mo. LIBOR + 3.00%), 4.69%, 05/16/24 | | | | | | | 56 | | | | 55,760 | |
| | | | | | | | | | | | |
| Banks — 0.0% | |
Capri Finance LLC, 2017 1st Lien Term Loan, (3 mo. LIBOR + 3.25%), 5.02%, 11/01/24 | | | | | | | 71 | | | | 70,956 | |
| | | | | | | | | | | | |
| Chemicals — 0.1% | |
Alpha 3 BV, 2017 Term Loan B1, (3 mo. LIBOR + 3.00% 1.00% Floor), 4.69%, 01/31/24 | | | | | | | 81 | | | | 81,119 | |
Element Materials Technology Group US Holdings, Inc., 2017 Term Loan B, (3 mo. LIBOR + 3.50% 1.00% Floor), 5.19%, 06/28/24 | | | | | | | 35 | | | | 35,372 | |
H.B. Fuller Co., 2017 Term Loan B, (1 mo. LIBOR + 2.25%), 3.84%, 10/20/24 | | | | | | | 188 | | | | 189,353 | |
Invictus: | | | | | | | | | | | | |
1st Lien Term Loan, 01/24/25(m) | | | | | | | 76 | | | | 76,862 | |
2nd Lien Term Loan, 01/23/26(m) | | | | | | | 42 | | | | 42,289 | |
PQ Corp., 2018 Term Loan B, (3 mo. LIBOR + 2.50%), 8.94%, 02/08/25 | | | | | | | 56 | | | | 56,008 | |
WR Grace & Co. (m): | | | | | | | | | | | | |
Term Loan B1, 02/12/25 | | | | | | | 64 | | | | 64,144 | |
Term Loan B2, 02/12/25 | | | | | | | 110 | | | | 110,203 | |
| | | | | | | | | | | | |
| | | | | | | | | | | 655,350 | |
| | | | | | | | | | | | |
| Security | | Par
(000) | | | Value | |
| Commercial Services & Supplies — 0.0% | |
Asurion LLC, 2017 2nd Lien Term Loan, (1 mo. LIBOR + 6.00%), 7.65%, 08/04/25 | | | USD | | | | 43 | | | $ | 44,043 | |
Convergint Technologies LLC, 2018 1st Lien Term Loan, (3 mo. LIBOR + 3.00%), 4.66%, 02/03/25 | | | | | | | 38 | | | | 38,453 | |
West Corp., 2017 Term Loan, (1 mo. LIBOR + 4.00% 1.00% Floor), 5.65%, 10/10/24 | | | | | | | 144 | | | | 144,909 | |
| | | | | | | | | | | | |
| | | | | | | | | | | 227,405 | |
| Construction & Engineering — 0.1% | |
Brand Energy & Infrastructure Services, Inc., 2017 Term Loan, (3 mo. LIBOR + 4.25% 1.00% Floor), 6.01%, 06/21/24 | | | | | | | 1,074 | | | | 1,081,918 | |
| | | | | | | | | | | | |
| Diversified Consumer Services — 0.0% | |
Ascend Learning LLC, 2017 Term Loan B, (1 mo. LIBOR + 3.00% 1.00% Floor), 4.65%, 07/12/24 | | | | | | | 41 | | | | 41,034 | |
Laureate Education, Inc., 2017 Term Loan B, (1 mo. LIBOR + 4.50% 1.00% Floor), 5.15%, 04/26/24 | | | | | | | 147 | | | | 147,620 | |
| | | | | | | | | | | | |
| | | | | | | | | | | 188,654 | |
| Diversified Financial Services — 0.1% | |
Endo Luxembourg Finance Company I Sarl, 2017 Term Loan B, (1 mo. LIBOR + 4.25%), 5.94%, 04/29/24 | | | | | | | 486 | | | | 484,736 | |
| | | | | | | | | | | | |
| Diversified Telecommunication Services — 0.1% | |
CenturyLink, Inc., 2017 Term Loan B, (1 mo. LIBOR + 2.75%), 4.40%, 01/31/25 | | | | | | | 516 | | | | 506,841 | |
MTN Infrastructure TopCo, Inc., MTN Topco Term Loan, 11/17/24(m) | | | | | | | 41 | | | | 41,185 | |
| | | | | | | | | | | | |
| | | | | | | | | | | 548,026 | |
| Electrical Equipment — 0.0% | |
Gates Global LLC, 2017 Repriced Term Loan B, (3 mo. LIBOR + 3.00% 1.00% Floor), 4.44%, 04/01/24 | | | | | | | 162 | | | | 162,655 | |
Generac Power Systems, Inc., 2017 1st Lien Term Loan B, (3 mo. LIBOR + 2.00%), 3.69%, 05/31/23 | | | | | | | 111 | | | | 111,231 | |
| | | | | | | | | | | | |
| | | | | | | | | | | 273,886 | |
| Energy Equipment & Services — 0.1% | |
Gavilan Resources LLC, 2nd Lien Term Loan, (1 mo. LIBOR + 6.00% 1.00% Floor), 7.59%, 03/01/24 | | | | | | | 194 | | | | 194,646 | |
GrafTech Finance, Inc., 2018 Term Loan B, (OR + 3.50% 1.00% Floor), 5.08%, 02/12/25(e) | | | | | | | 121 | | | | 120,849 | |
Pioneer Energy Services Corp., Term Loan, (1 mo. LIBOR + 7.75% 1.00% Floor), 9.33%, 11/08/22 | | | | | | | 420 | | | | 436,275 | |
Weatherford International Ltd., Term Loan, (1 mo. LIBOR + 2.30%), 3.95%, 07/13/20 | | | | | | | 176 | | | | 173,619 | |
| | | | | | | | | | | | |
| | | | | | | | | | | 925,389 | |
| Food Products — 0.0% | |
Chobani LLC, 2017 Term Loan B, (1 mo. LIBOR + 3.50% 1.00% Floor), 5.15%, 10/10/23 | | | | | | | 41 | | | | 40,960 | |
JBS USA LLC, 2017 Term Loan B, (3 mo. LIBOR + 2.50%), 4.10%, 10/30/22 | | | | | | | 190 | | | | 189,050 | |
| | | | | | | | | | | | |
| | | | | | | | | | | 230,010 | |
| Health Care Equipment & Supplies — 0.1% | |
DJO Finance LLC, 2015 Term Loan, (3 mo. LIBOR + 3.25% 1.00% Floor), 4.90%, 06/08/20 | | | | | | | 498 | | | | 493,715 | |
Immucor, Inc., Extended Term Loan B, (2 mo. LIBOR + 5.00% 1.00% Floor), 6.65%, 06/15/21 | | | | | | | 512 | | | | 520,963 | |
Ortho-Clinical Diagnostics SA, Term Loan B, (3 mo. LIBOR + 3.75% 1.00% Floor), 5.44%, 06/30/21 | | | | | | | 20 | | | | 19,944 | |
| | | | | | | | | | | | |
| | | | | | | | | | | 1,034,622 | |
| | | | |
| SCHEDULES OF INVESTMENTS | | | 27 | |
| | |
Schedule of Investments (unaudited) (continued) February 28, 2018 | | BlackRock Core Bond Trust (BHK) (Percentages shown are based on Net Assets) |
| | | | | | | | | | | | |
| Security | | Par
(000) | | | Value | |
| Health Care Providers & Services — 0.1% | |
Quorum Health Corporation, Term Loan B,
04/29/22(m) | | | USD | | | | 97 | | | $ | 99,138 | |
Team Health Holdings, Inc., 1st Lien Term Loan, (1 mo. LIBOR + 2.75% 1.00% Floor), 4.40%, 02/06/24 | | | | | | | 227 | | | | 220,429 | |
| | | | | | | | | | | | |
| | | | | | | | | | | 319,567 | |
| Health Care Technology — 0.0% | |
Change Healthcare Holdings, Inc., 2017 Term Loan B, (1 mo. LIBOR + 2.75% 1.00% Floor), 4.40%, 03/01/24 | | | | | | | 189 | | | | 189,331 | |
Quintiles IMS, Inc., 2017 Term Loan B, (3 mo. LIBOR + 2.00%), 3.69%, 03/07/24 | | | | | | | 22 | | | | 22,148 | |
| | | | | | | | | | | | |
| | | | | | | | | | | 211,479 | |
| Hotels, Restaurants & Leisure — 0.1% | |
Caesars Resort Collection LLC, 2017 1st Lien Term Loan B, (1 mo. LIBOR + 2.75%), 4.40%, 12/22/24 | | | | | | | 302 | | | | 303,851 | |
Cineworld Ltd., 2018 Term Loan, 02/18/25(m) | | | | | | | 180 | | | | 179,730 | |
IRB Holding Corp., 1st Lien Term Loan, (1 mo. LIBOR + 3.25% 1.00% Floor), 4.83%, 02/05/25 | | | | | | | 61 | | | | 61,567 | |
| | | | | | | | | | | | |
| | | | | | | | | | | 545,148 | |
| Industrial Conglomerates — 0.1% | |
Cortes NP Acquisition Corp., 2017 Term Loan B, (1 mo. LIBOR + 4.00% 1.00% Floor), 5.58%, 11/30/23 | | | | | | | 217 | | | | 217,715 | |
Sequa Mezzanine Holdings LLC, 1st Lien Term Loan, (3 mo. LIBOR + 5.00% 1.00% Floor), 6.55%, 11/28/21 | | | | | | | 114 | | | | 115,760 | |
| | | | | | | | | | | | |
| | | | | | | | | | | 333,475 | |
| Insurance — 0.1% | |
Genworth Financial, Inc., Term Loan, 02/25/23(m) | | | | | | | 88 | | | | 89,100 | |
Sedgwick Claims Management Services, Inc.: | | | | | | | | | | | | |
1st Lien Term Loan, (1 mo. LIBOR + 2.75% 1.00% Floor), 5.44%, 03/01/21 | | | | | | | 230 | | | | 230,000 | |
2nd Lien Term Loan, (1 mo. LIBOR + 5.75% 1.00% Floor), 5.44%, 02/28/22 | | | | | | | 96 | | | | 96,420 | |
| | | | | | | | | | | | |
| | | | | | | | | | | 415,520 | |
| IT Services — 0.0% | |
Access CIG LLC(m): | | | | | | | | | | | | |
2018 2nd Lien Delayed Draw Term Loan, 02/13/26 | | | | | | | 3 | | | | 2,619 | |
2018 2nd Lien Term Loan, 02/02/26 | | | | | | | 14 | | | | 14,360 | |
2018 Delayed Draw Term Loan, 02/14/25 | | | | | | | 9 | | | | 8,693 | |
2018 1st Lien Term Loan, 02/02/25(m) | | | | | | | 41 | | | | 41,652 | |
Peak 10 Holding Corp. : | | | | | | | | | | | | |
2017 1st Lien Term Loan, (3 mo. LIBOR + 3.50% 1.00% Floor), 5.19%, 08/01/24 | | | | | | | 102 | | | | 101,948 | |
2nd Lien Term Loan, (3 mo. LIBOR + 7.25% 1.00% Floor), 9.02%, 08/01/25 | | | | | | | 43 | | | | 43,150 | |
WEX, Inc., 2017 Term Loan B2, (3 mo. LIBOR + 2.25%), 3.90%, 06/30/23 | | | | | | | 71 | | | | 71,444 | |
| | | | | | | | | | | | |
| | | | | | | | | | | 283,866 | |
| Life Sciences Tools & Services — 0.0% | |
Albany Molecular Research, Inc., 2017 1st Lien Term Loan, (1 mo. LIBOR + 3.25% 1.00% Floor), 4.90%, 08/30/24 | | | | | | | 62 | | | | 61,977 | |
| | | | | | | | | | | | |
| Machinery — 0.0% | |
Hayward Industries, Inc., 1st Lien Term Loan, (1 mo. LIBOR + 3.50%), 5.15%, 08/05/24 | | | | | | | 38 | | | | 38,047 | |
| | | | | | | | | | | | |
| | | | | | | | | | | | |
| Security | | Par
(000) | | | Value | |
| Media — 0.4% | |
Charter Communications Operating LLC, 2017 Term Loan A2, 7.27%, 03/31/23 | | | USD | | | | 962 | | | $ | 960,797 | |
CSC Holdings LLC, 2018 Term Loan B, (3 mo. LIBOR + 2.50%), 4.14%, 01/25/26 | | | | | | | 102 | | | | 102,085 | |
Intelsat Jackson Holdings SA: | | | | | | | | | | | | |
2017 Term Loan B3, (3 mo. LIBOR + 3.75% 1.00% Floor), 5.71%, 11/27/23 | | | | | | | 64 | | | | 63,905 | |
2017 Term Loan B4, (3 mo. LIBOR + 4.50% 1.00% Floor), 6.46%, 01/14/24 | | | | | | | 161 | | | | 163,932 | |
2017 Term Loan B5, (Fixed + 6.63%), 6.63%, 01/14/24 | | | | | | | 1,138 | | | | 1,140,979 | |
Lamar Media Corp., 2018 Term Loan B, 02/16/25(m) | | | | | | | 69 | | | | 69,345 | |
PSAV Holdings LLC(m): | | | | | | | | | | | | |
2018 1st Lien Term Loan, 02/21/25 | | | | | | | 91 | | | | 91,228 | |
2018 2nd Lien Term Loan, 08/22/25(e) | | | | | | | 74 | | | | 74,185 | |
Virgin Media Bristol LLC, 2017 Term Loan, (1 mo. LIBOR + 2.50%), 4.09%, 01/15/26 | | | | | | | 224 | | | | 224,653 | |
| | | | | | | | | | | | |
| | | | | | | | | | | 2,891,109 | |
| Multiline Retail — 0.0% | |
Neiman Marcus Group, Inc., 2020 Term Loan, (1 mo. LIBOR + 3.25% 1.00% Floor), 4.83%, 10/25/20 | | | | | | | 187 | | | | 158,034 | |
| | | | | | | | | | | | |
| Oil, Gas & Consumable Fuels — 0.3% | |
BCP Renaissance Parent LLC, 2017 Term Loan B, (3 mo. LIBOR + 4.00% 1.00% Floor), 5.77%, 10/31/24 | | | | | | | 141 | | | | 142,150 | |
California Resources Corp., 2017 1st Lien Term Loan, (1 mo. LIBOR + 4.75%), 6.34%, 12/31/22 | | | | | | | 496 | | | | 501,580 | |
Chesapeake Energy Corp., Term Loan, (3 mo. LIBOR + 7.50% 1.00% Floor), 9.44%, 08/23/21 | | | | | | | 1,005 | | | | 1,069,969 | |
CONSOL Energy, Inc., 1st Lien Term Loan B, (3 mo. LIBOR + 6.00% 1.00% Floor), 7.99%, 10/26/22 | | | | | | | 19 | | | | 19,412 | |
Lucid Energy Group II LLC, 2018 1st Lien Term Loan, 4.44%, 02/17/25 | | | | | | | 116 | | | | 116,073 | |
Medallion Midland Acquisition LLC, 1st Lien Term Loan, (1 mo. LIBOR + 3.25% 1.00% Floor), 4.90%, 10/30/24(e) | | | | | | | 78 | | | | 78,195 | |
Vine Oil & Gas LP, Term Loan B, (1 mo. LIBOR + 6.87% 1.00% Floor), 8.52%, 12/12/21(e) | | | | | | | 189 | | | | 189,000 | |
| | | | | | | | | | | | |
| | | | | | | | | | | 2,116,379 | |
| Professional Services — 0.0% | |
Information Resources, Inc., 1st Lien Term Loan, (OR + 4.25% 1.00% Floor), 6.19%, 01/18/24 | | | | | | | 49 | | | | 48,921 | |
| | | | | | | | | | | | |
| Software — 0.2% | |
Applied Systems, Inc.: | | | | | | | | | | | | |
2017 1st Lien Term Loan, (3 mo. LIBOR + 3.25% 1.00% Floor), 4.94%, 09/19/24 | | | | | | | 22 | | | | 21,886 | |
2017 2nd Lien Term Loan, (3 mo. LIBOR + 7.00% 1.00% Floor), 8.69%, 09/19/25 | | | | | | | 21 | | | | 21,656 | |
BMC Software Finance, Inc., 2017 1st Lien Term Loan, (1 mo. LIBOR + 3.25%), 4.90%, 09/10/22 | | | | | | | 91 | | | | 91,266 | |
Cypress Intermediate Holdings III, Inc.: | | | | | | | | | | | | |
2017 1st Lien Term Loan, (1 mo. LIBOR + 3.00% 1.00% Floor), 4.65%, 04/27/24 | | | | | | | 75 | | | | 75,305 | |
2017 2nd Lien Term Loan, (1 mo. LIBOR + 6.75% 1.00% Floor), 8.40%, 04/27/25 | | | | | | | 23 | | | | 23,357 | |
Digicel International Finance Ltd., 2017 Term Loan B, (3 mo. LIBOR + 3.75%), 5.02%, 05/28/24 | | | | | | | 305 | | | | 305,812 | |
Kronos, Inc., 2nd Lien Term Loan, (3 mo. LIBOR + 8.25% 1.00% Floor), 10.02%, 11/01/24 | | | | | | | 353 | | | | 361,605 | |
Mitchell International, Inc.: | | | | | | | | | | | | |
2017 1st Lien Term Loan, (3 mo. LIBOR + 3.25% 1.00% Floor), 4.94%, 11/29/24 | | | | | | | 96 | | | | 95,901 | |
| | |
| 28 | | 2018 BLACKROCK SEMI-ANNUAL REPORTTO SHAREHOLDERS |
| | |
Schedule of Investments (unaudited) (continued) February 28, 2018 | | BlackRock Core Bond Trust (BHK) (Percentages shown are based on Net Assets) |
| | | | | | | | | | | | |
| Security | | Par
(000) | | | Value | |
| Software (continued) | |
2017 2nd Lien Term Loan, (3 mo. LIBOR + 7.25%), 8.94%, 11/20/25 | | | USD | | | | 101 | | | $ | 101,606 | |
Tempo Acquisition LLC, Term Loan, (1 mo. LIBOR + 3.00%), 4.65%, 05/01/24 | | | | | | | 92 | | | | 92,382 | |
| | | | | | | | | | | | |
| | | | | | | | | | | 1,190,776 | |
| Specialty Retail — 0.0% | |
Belron Finance US LLC, Term Loan B, (3 mo. LIBOR + 2.50%), 4.29%, 11/07/24 | | | | | | | 85 | | | | 85,425 | |
| | | | | | | | | | | | |
| Textiles, Apparel & Luxury Goods — 0.0% | |
Ascend Performance Materials Operations LLC, Term Loan B, (3 mo. LIBOR + 5.25% 1.00% Floor), 6.94%, 08/12/22(e) | | | | | | | 185 | | | | 185,629 | |
| | | | | | | | | | | | |
| Trading Companies & Distributors — 0.0% | |
Beacon Roofing Supply, Inc., 2017 Term Loan B, (3 mo. LIBOR + 2.25%), 3.83%, 01/02/25 | | | | | | | 92 | | | | 92,384 | |
| | | | | | | | | | | | |
| Transportation — 0.0% | |
Direct ChassisLink, Inc., 2017 2nd Lien Term Loan, (1 mo. LIBOR + 6.00%), 7.67%, 06/15/23(e) | | | | | | | 33 | | | | 33,495 | |
| | | | | | | | | | | | |
| Utilities — 0.0% | |
ExGen Renewables IV LLC, Term Loan B, (3 mo. LIBOR + 3.00% 1.00% Floor), 4.47%, 11/28/24(e) | | | | | | | 55 | | | | 55,343 | |
| | | | | | | | | | | | |
| Wireless Telecommunication Services — 0.0% | |
Syniverse Holdings, Inc., 2018 Term Loan,
02/08/23(m) | | | | | | | 74 | | | | 74,578 | |
VICI Properties 1 LLC, Replacement Term Loan B, (1 mo. LIBOR + 2.25%), 3.60%, 12/20/24 | | | | | | | 170 | | | | 170,615 | |
| | | | | | | | |
| | | | | | | | | | | 245,193 | |
| | | | | | | | |
Total Floating Rate Loan Interests — 2.0%
(Cost — $15,479,691) | | | | 15,620,300 | |
| | | | | | | | |
|
Foreign Agency Obligations — 4.5% | |
Argentine Republic Government International Bond: | | | | | | | | | | | | |
5.63%, 01/26/22 | | | | | | | 414 | | | | 421,659 | |
7.50%, 04/22/26 | | | | | | | 3,875 | | | | 4,138,500 | |
6.88%, 01/26/27 | | | | | | | 969 | | | | 984,514 | |
5.88%, 01/11/28 | | | | | | | 158 | | | | 147,651 | |
7.63%, 04/22/46 | | | | | | | 3,121 | | | | 3,096,032 | |
Bahrain Government International Bond, 6.75%, 09/20/29(b) | | | | | | | 230 | | | | 218,787 | |
Brazil Letras do Tesouro Nacional,
0.00%, 07/01/18(n) | | | BRL | | | | 1,000 | | | | 301,542 | |
Brazilian Government International Bond, 6.00%, 04/07/26 | | | USD | | | | 786 | | | | 860,277 | |
Cyprus Government International Bond, 4.63%, 02/03/20(b) | | | EUR | | | | 1,210 | | | | 1,603,847 | |
Egypt Government International Bond: | | | | | | | | | | | | |
5.75%, 04/29/20 | | | USD | | | | 941 | | | | 970,284 | |
8.50%, 01/31/47(b) | | | | | | | 291 | | | | 325,786 | |
Iceland Government International Bond, 5.88%, 05/11/22(f) | | | | | | | 3,555 | | | | 3,961,825 | |
Indonesia Government International Bond, 4.75%, 01/08/26 | | | | | | | 580 | | | | 604,683 | |
Italian Government International Bond, 5.38%, 06/15/33 | | | | | | | 2,925 | | | | 3,320,866 | |
Lebanon Government International Bond, 6.85%, 03/23/27 | | | | | | | 577 | | | | 543,822 | |
Mexican Bonos: | | | | | | | | | | | | |
8.00%, 06/11/20 | | | MXN | | | | 3,100 | | | | 165,913 | |
7.50%, 06/03/27 | | | | | | | 5,100 | | | | 267,831 | |
| | | | | | | | | | | | |
| Security | | Par
(000) | | | Value | |
Foreign Agency Obligations (continued) | |
Portugal Government International Bond, 5.13%, 10/15/24(b)(f) | | | USD | | | | 3,970 | | | $ | 4,212,091 | |
Republic of South Africa Government International Bond: | | | | | | | | | | | | |
5.50%, 03/09/20 | | | | | | | 188 | | | | 195,144 | |
5.88%, 05/30/22 | | | | | | | 672 | | | | 724,087 | |
4.88%, 04/14/26 | | | | | | | 288 | | | | 288,685 | |
5.65%, 09/27/47 | | | | | | | 200 | | | | 197,020 | |
Russian Federal Bond — OFZ: | | | | | | | | | | | | |
6.40%, 05/27/20 | | | RUB | | | | 24,900 | | | | 442,608 | |
7.05%, 01/19/28 | | | | | | | 51,400 | | | | 921,110 | |
Russian Foreign Bond — Eurobond: | | | | | | | | | | | | |
4.75%, 05/27/26(b) | | | USD | | | | 400 | | | | 419,488 | |
4.25%, 06/23/27 | | | | | | | 1,200 | | | | 1,211,342 | |
Saudi Government International Bond, 3.63%, 03/04/28 | | | | | | | 691 | | | | 657,486 | |
Slovenia Government International Bond, 5.85%, 05/10/23(b) | | | | | | | 864 | | | | 968,039 | |
Turkey Government International Bond: | | | | | | | | | | | | |
7.00%, 06/05/20 | | | | | | | 674 | | | | 716,826 | |
5.63%, 03/30/21 | | | | | | | 567 | | | | 589,364 | |
5.13%, 03/25/22 | | | | | | | 739 | | | | 756,736 | |
6.25%, 09/26/22 | | | | | | | 200 | | | | 213,350 | |
7.38%, 02/05/25 | | | | | | | 211 | | | | 236,531 | |
6.00%, 03/25/27 | | | | | | | 282 | | | | 288,881 | |
| | | | | | | | |
Total Foreign Agency Obligations — 4.5%
(Cost — $34,449,289) | | | | 34,972,607 | |
| | | | | | | | |
|
Municipal Bonds — 3.1% | |
|
| California — 0.9% | |
East Bay Municipal Utility District, RB, Build America Bonds, 5.87%, 06/01/40 | | | | | | | 1,900 | | | | 2,415,033 | |
State of California, GO, Build America Bonds, Various Purpose: | | | | | | | | | | | | |
7.55%, 04/01/39 | | | | | | | 280 | | | | 421,582 | |
7.63%, 03/01/40 | | | | | | | 1,720 | | | | 2,584,024 | |
University of California, RB, Build America Bonds, 5.95%, 05/15/45 | | | | | | | 885 | | | | 1,106,551 | |
| | | | | | | | |
| | | | | | | | | | | 6,527,190 | |
| Georgia — 0.3% | |
Municipal Electric Authority of Georgia Plant Vogtle Units 3 & 4, Refunding RB, Build America Bonds, Series A, 7.06%, 04/01/57 | | | | | | | 2,000 | | | | 2,362,800 | |
| | | | | | | | |
| Illinois — 0.2% | |
State of Illinois, GO, Pension, 5.10%, 06/01/33 | | | | | | | 2,000 | | | | 1,885,660 | |
| | | | | | | | |
| Indiana — 0.4% | |
Indianapolis Local Public Improvement Bond Bank, RB, Build America Bonds, 6.12%, 01/15/40 | | | | | | | 2,535 | | | | 3,169,460 | |
| | | | | | | | |
| New York — 1.3% | |
City of New York New York Municipal Water Finance Authority, Refunding RB, 2nd General Resolution: | | | | | | | | | | | | |
Series EE, 5.50%, 06/15/43 | | | | | | | 930 | | | | 1,018,015 | |
Series GG, Build America Bonds, 5.72%, 06/15/42 | | | | | | | 1,390 | | | | 1,796,088 | |
Water & Sewer System, Series EE, 5.38%, 06/15/43 | | | | | | | 770 | | | | 840,055 | |
Metropolitan Transportation Authority, RB, Build America Bonds, Series C, 7.34%, 11/15/39 | | | | | | | 1,295 | | | | 1,920,252 | |
New York State Dormitory Authority, RB, Build America Bonds: | | | | | | | | | | | | |
5.63%, 03/15/39 | | | | | | | 1,100 | | | | 1,327,590 | |
| | | | |
| SCHEDULES OF INVESTMENTS | | | 29 | |
| | |
Schedule of Investments (unaudited) (continued) February 28, 2018 | | BlackRock Core Bond Trust (BHK) (Percentages shown are based on Net Assets) |
| | | | | | | | | | | | |
| Security | | Par
(000) | | | Value | |
| New York (continued) | |
5.60%, 03/15/40 | | | USD | | | | 1,900 | | | $ | 2,331,490 | |
Port Authority of New York & New Jersey, RB, 159th Series, 6.04%, 12/01/29 | | | | | | | 780 | | | | 961,366 | |
| | | | | | | | |
| | | | | | | | | | | 10,194,856 | |
| | | | | | | | |
Total Municipal Bonds — 3.1%
(Cost — $20,472,799) | | | | 24,139,966 | |
| | | | | | | | |
|
Non-Agency Mortgage-Backed Securities — 9.1% | |
| Collateralized Mortgage Obligations — 0.5% | |
Banc of America Funding Corp., Series 2007-2, Class 1A2, 6.00%, 03/25/37 | | | | | | | 587 | | | | 526,031 | |
Countrywide Alternative Loan Trust: | | | | | | | | | | | | |
Series 2005-64CB, Class 1A15, 5.50%, 12/25/35 | | | | | | | 1,147 | | | | 1,141,853 | |
Series 2006-OA21, Class A1, (1 mo. LIBOR US + 0.19%), 1.78%, 03/20/47(a) | | | | | | | 860 | | | | 730,014 | |
GMAC Mortgage Corp. Loan Trust, Series 2005-AR3, Class 5A1, 3.76%,
06/19/35(c) | | | | | | | 311 | | | | 303,526 | |
GSR Mortgage Loan Trust: | | | | | | | | | | | | |
Series 2006-4F, Class 1A1, 5.00%, 05/25/36 | | | | | | | 55 | | | | 92,893 | |
Series 2007-4F, Class 3A1, 6.00%, 07/25/37 | | | | | | | 191 | | | | 175,098 | |
JPMorgan Mortgage Trust, Series 2006-S3, Class 1A12, 6.50%, 08/25/36 | | | | | | | 75 | | | | 62,710 | |
Merrill Lynch Mortgage Investors, Inc., Series 2006-A3, Class 3A1, 3.72%, 05/25/36(c) | | | | | | | 571 | | | | 533,523 | |
WaMu Mortgage Pass-Through Certificates, Series 2007-OA4, Class 1A, (12 mo. MTA + 0.77%), 1.97%, 05/25/47(a) | | | | | | | 206 | | | | 196,108 | |
| | | | | | | | |
| | | | | | | | | | | 3,761,756 | |
| Commercial Mortgage-Backed Securities — 8.5% | |
Banc of America Merrill Lynch Commercial Mortgage Securities Trust, Series 2015-200P, Class C, 3.60%, 04/14/33(b)(c) | | | | | | | 4,170 | | | | 4,129,359 | |
Citigroup Commercial Mortgage Trust, Series 2013-GC15, Class B, 5.10%, 09/10/46(c) | | | | | | | 7,183 | | | | 7,665,554 | |
Citigroup/Deutsche Bank Commercial Mortgage Trust, Series 2006-CD3, Class AM, 5.65%, 10/15/48 | | | | | | | 1,618 | | | | 1,677,362 | |
Commercial Mortgage Trust: | | | | | | | | | | | | |
Series 2013-300P, Class A1, 4.35%, 08/10/30(b) | | | | | | | 1,330 | | | | 1,394,615 | |
Series 2013-CR11, Class B, 5.16%, 08/10/50(c) | | | | | | | 7,000 | | | | 7,415,316 | |
Series 2013-LC6, Class B, 3.74%, 01/10/46 | | | | | | | 1,390 | | | | 1,376,537 | |
Series 2015-3BP, Class A, 3.18%, 02/10/35(b) | | | | | | | 7,570 | | | | 7,444,313 | |
Series 2015-CR22, Class C, 4.12%, 03/10/48(c) | | | | | | | 5,000 | | | | 4,876,834 | |
Series 2015-LC19, Class C, 4.26%, 02/10/48(c) | | | | | | | 3,500 | | | | 3,474,809 | |
Core Industrial Trust, Series 2015-TEXW, Class D, 3.85%, 02/10/34(b)(c) | | | | | | | 4,585 | | | | 4,601,954 | |
CSAIL Commercial Mortgage Trust, Series 2015-C1(c): | | | | | | | | | | | | |
Class B, 4.04%, 04/15/50 | | | | | | | 1,110 | | | | 1,116,230 | |
Class C, 4.30%, 04/15/50 | | | | | | | 1,000 | | | | 989,353 | |
GAHR Commercial Mortgage Trust, Series 2015-NRF, Class DFX, 3.38%, 12/15/34(b)(c) | | | | | | | 6,170 | | | | 6,149,535 | |
GS Mortgage Securities Corp. II, Series 2013-GC10, Class B, 3.68%,
02/10/46(b) | | | | | | | 2,505 | | | | 2,495,112 | |
JPMorgan Chase Commercial Mortgage Securities Trust, Series 2016-NINE, Class A, 2.85%, 10/06/38(b)(c) | | | | | | | 4,800 | | | | 4,550,707 | |
Morgan Stanley Capital I Trust, Series 2014-CPT, Class G, 3.45%,
07/13/29(b)(c) | | | | | | | 3,200 | | | | 3,090,951 | |
WF-RBS Commercial Mortgage Trust, Series 2012-C8: | | | | | | | | | | | | |
Class B, 4.31%, 08/15/45 | | | | | | | 1,395 | | | | 1,430,863 | |
Class C, 4.89%, 08/15/45(c) | | | | | | | 1,795 | | | | 1,825,692 | |
| | | | | | | | |
| | | | | | | | | | | 65,705,096 | |
| | | | | | | | | | | | |
| Security | | Par
(000) | | | Value | |
| Interest Only Commercial Mortgage-Backed Securities — 0.1% | |
Commercial Mortgage Loan Trust, Series 2015-LC21, Class XA, 0.84%,
07/10/48(c) | | | USD | | | | 19,166 | | | $ | 748,558 | |
| | | | | | | | |
Total Non-Agency Mortgage-Backed Securities — 9.1%
(Cost — $70,193,478) | | | | 70,215,410 | |
| | | | | | | | |
|
Preferred Securities – 12.8% | |
|
| Capital Trusts — 11.6% | |
| Auto Components — 0.0% | |
General Motors Financial Co., Inc.,
Series A, 5.75%(c)(i) | | | | | | | 264 | | | | 267,670 | |
| | | | | | | | |
| Banks — 3.4% | |
ABN AMRO Bank NV, 5.75%(h)(i) | | | | | | | 200 | | | | 267,790 | |
Banco Bilbao Vizcaya Argentaria SA, 6.13%(c)(f)(i) | | | | | | | 2,000 | | | | 2,035,000 | |
Banco Santander SA, 6.25%(h)(i) | | | | | | | 100 | | | | 127,795 | |
BNP Paribas SA, 7.20%(b)(h)(i) | | | | | | | 2,000 | | | | 2,265,000 | |
Capital One Financial Corp., Series E, 5.55%(h)(i) | | | | | | | 3,500 | | | | 3,606,050 | |
CIT Group, Inc., Series A, 5.80%(h)(i) | | | | | | | 163 | | | | 164,630 | |
Citigroup, Inc.(h)(i): | | | | | | | | | | | | |
Series M, 6.30% | | | | | | | 4,000 | | | | 4,210,800 | |
Series P, 5.95% | | | | | | | 2,200 | | | | 2,286,900 | |
Series Q, 5.95% | | | | | | | 100 | | | | 103,580 | |
Series R, 6.13% | | | | | | | 605 | | | | 639,412 | |
Cooperatieve Rabobank UA, 6.63%(h)(i) | | | | | | | 200 | | | | 281,286 | |
Credit Agricole SA(b)(h)(i): | | | | | | | | | | | | |
6.63% | | | | | | | 1,400 | | | | 1,452,500 | |
7.88% | | | | | | | 1,000 | | | | 1,116,250 | |
Intesa Sanpaolo SpA, 7.00%(h)(i) | | | | | | | 200 | | | | 271,094 | |
Nordea Bank AB, 6.13%(b)(h)(i) | | | | | | | 2,960 | | | | 3,109,480 | |
Wells Fargo & Co.(h)(i): | | | | | | | | | | | | |
Series S, 5.90% | | | | | | | 3,450 | | | | 3,600,938 | |
Series U, 5.88% | | | | | | | 525 | | | | 558,143 | |
| | | | | | | | |
| | | | | | | | | | | 26,096,648 | |
| Capital Markets — 0.7% | |
Goldman Sachs Group, Inc., Series P, 5.00%(c)(i) | | | | | | | 545 | | | | 530,078 | |
Morgan Stanley, Series H, 5.45%(h)(i) | | | | | | | 2,627 | | | | 2,686,107 | |
State Street Corp., Series F, 5.25%(h)(i) | | | | | | | 2,000 | | | | 2,075,000 | |
| | | | | | | | |
| | | | | | | | | | | 5,291,185 | |
| Chemicals — 0.0% | |
Solvay Finance SA, 5.12%(h)(i) | | | | | | | 100 | | | | 136,335 | |
| | | | | | | | |
| Diversified Financial Services — 5.0% | |
ATF Netherlands BV, 3.75%(h)(i) | | | | | | | 100 | | | | 128,389 | |
Bank of America Corp.(h)(i): | | | | | | | | | | | | |
Series AA, 6.10% | | | | | | | 300 | | | | 318,000 | |
Series V, 5.13% | | | | | | | 385 | | | | 389,331 | |
Series X, 6.25% | | | | | | | 4,620 | | | | 4,967,424 | |
Bank of New York Mellon Corp.(h)(i): | | | | | | | | | | | | |
Series D, 4.50%(f) | | | | | | | 8,400 | | | | 8,190,000 | |
Series E, 4.95% | | | | | | | 2,000 | | | | 2,047,500 | |
Barclays PLC, 7.25%(h)(i) | | | | | | | 200 | | | | 300,464 | |
Credit Suisse Group AG, 6.25%(h)(i) | | | | | | | 200 | | | | 210,440 | |
HBOS Capital Funding LP, 6.85%(i) | | | | | | | 100 | | | | 102,016 | |
HSBC Holdings PLC, 6.00%(h)(i) | | | | | | | 435 | | | | 444,352 | |
JPMorgan Chase & Co.(h)(i): | | | | | | | | | | | | |
Series 1, 7.90% | | | | | | | 7,000 | | | | 7,061,250 | |
Series Q, 5.15% | | | | | | | 3,000 | | | | 3,020,100 | |
Series U, 6.13% | | | | | | | 500 | | | | 528,500 | |
Series V, 5.00% | | | | | | | 6,710 | | | | 6,743,550 | |
Series X, 6.10% | | | | | | | 160 | | | | 169,840 | |
Royal Bank of Scotland Group PLC, 8.63%(h)(i) | | | | | | | 200 | | | | 221,000 | |
| | |
| 30 | | 2018 BLACKROCK SEMI-ANNUAL REPORTTO SHAREHOLDERS |
| | |
Schedule of Investments (unaudited) (continued) February 28, 2018 | | BlackRock Core Bond Trust (BHK) (Percentages shown are based on Net Assets) |
| | | | | | | | | | | | |
| Security | | Par
(000) | | | Value | |
| Diversified Financial Services (continued) | |
Societe Generale SA(b)(f)(h)(i): | | | | | | | | | | | | |
6.00% | | | USD | | | | 3,000 | | | $ | 3,065,700 | |
7.88% | | | | | | | 1,000 | | | | 1,112,500 | |
| | | | | | | | |
| | | | | | | | | | | 39,020,356 | |
| Diversified Telecommunication Services — 0.1% | |
SoftBank Group Corp., 6.00%(h)(i) | | | | | | | 215 | | | | 207,475 | |
Telefonica Europe BV, 4.20%(h)(i) | | | | | | | 200 | | | | 257,405 | |
| | | | | | | | |
| | | | | | | | | | | 464,880 | |
| Electric Utilities — 0.6% | |
ComEd Financing III, 6.35%(h)(i) | | | | | | | 300 | | | | 320,250 | |
Electricite de France SA, 5.25%(b)(h)(i) | | | | | | | 4,200 | | | | 4,212,600 | |
Gas Natural Fenosa Finance BV, 4.13%(h)(i) | | | | | | | 100 | | | | 130,693 | |
| | | | | | | | |
| | | | | | | | | | | 4,663,543 | |
| Industrial Conglomerates — 0.3% | |
General Electric Co., Series D, 5.00%(h)(i) | | | | | | | 2,131 | | | | 2,104,363 | |
| | | | | | | | |
| Insurance — 1.5% | |
Allstate Corp.(h): | | | | | | | | | | | | |
5.75% | | | | | | | 2,000 | | | | 2,135,000 | |
6.50% | | | | | | | 4,100 | | | | 4,879,000 | |
Voya Financial, Inc., 5.65%(h) | | | | | | | 4,500 | | | | 4,635,000 | |
| | | | | | | | |
| | | | | | | | | | | 11,649,000 | |
| | | | | | | | |
Total Capital Trusts — 11.6%
(Cost — $86,744,047) | | | | 89,693,980 | |
| | | | | | | | |
| | | |
| | | | | | Shares | | | | |
| Preferred Stocks — 1.1% | |
| Banks — 0.4% | |
Wells Fargo & Co.(i): | | | | | | | | | | | | |
Series Q, 5.85%(h) | | | | | | | 75,000 | | | | 1,991,250 | |
Series Y, 5.63% | | | | | | | 50,000 | | | | 1,248,500 | |
| | | | | | | | |
| | | | | | | | | | | 3,239,750 | |
| Capital Markets — 0.6% | |
Goldman Sachs Group, Inc., Series J, 5.50%(h)(i) | | | | | | | 92,000 | | | | 2,435,240 | |
Morgan Stanley, Series K, 5.85%(h)(i) | | | | | | | 66,567 | | | | 1,770,016 | |
SCE Trust III, Series H, 5.75%(h)(i) | | | | | | | 25,314 | | | | 670,568 | |
| | | | | | | | | | | | |
| | | | | | | | | | | 4,875,824 | |
| Machinery — 0.1% | |
Stanley Black & Decker, Inc., 5.38%(h)(i) | | | | | | | 2,500 | | | | 294,625 | |
| | | | | | | | | | | | |
| Thrifts & Mortgage Finance — 0.0% | |
Fannie Mae, Series S, 8.25%(c)(i) | | | | | | | 10,000 | | | | 70,500 | |
| | | | | | | | | | | | |
Total Preferred Stocks — 1.1%
(Cost — $8,114,477) | | | | 8,480,699 | |
| | | | | | | | | | | | |
|
Trust Preferred – 0.1% | |
|
| Diversified Financial Services — 0.1% | |
Citigroup Capital XIII, 7.88, 10/30/40(h) | | | | | | | 29,583 | | | | 805,545 | |
| | | | | | | | | | | | |
Total Trust Preferred — 0.1%
(Cost — $779,529) | | | | 805,545 | |
| | | | | | | | | | | | |
Total Preferred Securities — 12.8% | | | | 98,980,224 | |
| | | | | | | | | | | | |
| | | | | | | | | | | | |
| | | | | | Par
(000) | | | Value | |
U.S. Government Sponsored Agency Securities — 14.6% | |
|
| Agency Obligations — 1.5% | |
Fannie Mae, 5.63%, 07/15/37(f) | | | USD | | | | 1,600 | | | $ | 2,128,176 | |
Federal Home Loan Bank(f): | | | | | | | | | | | | |
5.25%, 12/09/22 | | | | | | | 1,375 | | | | 1,527,989 | |
5.37%, 09/09/24 | | | | | | | 2,175 | | | | 2,505,661 | |
Residual Funding Corp., 0.00%, 04/15/30(m) | | | | | | | 6,055 | | | | 4,049,329 | |
Resolution Funding Corp., 0.00%, 07/15/18 — 10/15/18(m) | | | | | | | 1,050 | | | | 1,039,287 | |
| | | | | | | | | | | | |
| | | | | | | | | | | 11,250,442 | |
| Collateralized Mortgage Obligations — 4.1% | |
Fannie Mae Mortgage-Backed Securities: | | | | | | | | | | | | |
Series 2015-47, Class GL, 3.50%, 07/25/45 | | | | | | | 1,636 | | | | 1,580,542 | |
Series 2005-5, Class PK, 5.00%, 12/25/34 | | | | | | | 85 | | | | 85,956 | |
Series 1991-87, Class S, (1 mo. LIBOR + 26.68%), 22.39%, 08/25/21(a) | | | | | | | 2 | | | | 2,552 | |
Series G-49, Class S, (1 mo. LIBOR + 1034.80%), 866.25%, 12/25/21(a) | | | | | | | — | (o) | | | 6 | |
Series G-17, Class S, 914.37%, 06/25/21(c) | | | | | | | — | (o) | | | — | |
Series G-07, Class S, (1 mo. LIBOR + 1144.57%), 961.77%, 03/25/21(a) | | | | | | | — | (o) | | | 68 | |
Series G-33, Class PV, 1,078.42%, 10/25/21 | | | | | | | — | (o) | | | — | |
Series 1991-46, Class S, (1 mo. LIBOR + 2519.00%), 2,147.86%, 05/25/21(a) | | | | | | | — | (o) | | | — | |
Freddie Mac Mortgage-Backed Securities: | | | | | | | | | | | | |
Series 4350, Class DY, 4.00%, 06/15/44 | | | | | | | 2,830 | | | | 2,901,922 | |
Series 4480, Class ZX, 4.00%, 11/15/44 | | | | | | | 6,118 | | | | 6,107,169 | |
Series 4549, Class TZ, 4.00%, 11/15/45 | | | | | | | 2,681 | | | | 2,760,943 | |
Series 4398, Class ZX, 4.00%, 09/15/54 | | | | | | | 8,796 | | | | 9,047,727 | |
Series 0173, Class R, 9.00%, 11/15/21(e) | | | | | | | — | (o) | | | — | |
Series 0173, Class RS, 11.10%,
11/15/21(c)(e) | | | | | | | — | (o) | | | 2 | |
Series 1057, Class J, 1,008.00%, 03/15/21 | | | | | | | — | (o) | | | — | |
Series 0192, Class U, 1,009.03%,
02/15/22(c) | | | | | | | — | (o) | | | — | |
Ginnie Mae Mortgage-Backed Securities, Series 2014-72, Class MQ, 4.00%, 02/20/44 | | | | | | | 8,858 | | | | 8,939,211 | |
| | | | | | | | | | | | |
| | | | | | | | | | | 31,426,098 | |
| Commercial Mortgage-Backed Securities — 0.2% | |
Freddie Mac, Series K013, Class A2, 3.97%, 01/25/21(c) | | | | | | | 1,870 | | | | 1,930,079 | |
| | | | | | | | |
| Interest Only Collateralized Mortgage Obligations — 0.6% | |
Fannie Mae Mortgage-Backed Securities: | | | | | | | | | | | | |
Series 1997-50, Class SI, (1 mo. LIBOR + 9.20%), 1.20%, 04/25/23(a) | | | | | | | 31 | | | | 703 | |
Series 2012-96, Class DI, 4.00%, 02/25/27 | | | | | | | 4,563 | | | | 360,464 | |
Series 2012-47, Class NI, 4.50%, 04/25/42 | | | | | | | 4,380 | | | | 1,019,857 | |
Series G92-05, Class H, 9.00%, 01/25/22 | | | | | | | — | (o) | | | 8 | |
Series 094, Class 2, 9.50%, 08/25/21 | | | | | | | — | (o) | | | 17 | |
Series 1990-136, Class S, 18.46%, 11/25/20(a) | | | | | | | 1 | | | | 1 | |
Series 1991-139, Class PT, 648.35%, 10/25/21 | | | | | | | — | (o) | | | — | |
Series 1991-099, Class L, 930.00%, 08/25/21 | | | | | | | — | (o) | | | — | |
Series G-10, Class S, 930.47%, 05/25/21(a) | | | | | | | — | (o) | | | — | |
Series G-12, Class S, (1 mo. LIBOR + 1175.53%), 986.90%, 05/25/21(a) | | | | | | | — | (o) | | | — | |
Series 1990-123, Class M, 1,009.50%, 10/25/20 | | | | | | | — | (o) | | | — | |
Freddie Mac Mortgage-Backed Securities: | | | | | | | | | | | | |
Series K707, Class X1, 1.51%, 12/25/18(c) | | | | | | | 4,619 | | | | 35,500 | |
Series 2611, Class QI, 5.50%, 09/15/32 | | | | | | | 224 | | | | 5,553 | |
Series 1254, Class Z, 8.50%, 04/15/22 | | | | | | | 13 | | | | 1,775 | |
Series 1043, Class H, (1 mo. LIBOR + 45.00%), 37.86%, 02/15/21(a) | | | | | | | 1 | | | | 1 | |
Series 1054, Class I, (1 mo. LIBOR + 881.40%), 743.22%, 03/15/21(a) | | | | | | | — | (o) | | | — | |
| | | | |
| SCHEDULES OF INVESTMENTS | | | 31 | |
| | |
Schedule of Investments (unaudited) (continued) February 28, 2018 | | BlackRock Core Bond Trust (BHK) (Percentages shown are based on Net Assets) |
| | | | | | | | | | | | |
| | | | | | Par
(000) | | | Value | |
| Interest Only Collateralized Mortgage Obligations (continued) | |
Series 1148, Class E, (1 mo. LIBOR + 1196.85%), 1,009.67%, 10/15/21(a) | | | USD | | | | — | (o) | | $ | — | |
Series 0176, Class M, 1,010.00%, 07/15/21 | | | | | | | — | (o) | | | — | |
Series 1056, Class KD, 1,084.50%, 03/15/21 | | | | | | | — | (o) | | | — | |
Series 0019, Class R, 6,696.22%, 03/15/20(c)(e) | | | | | | | — | (o) | | | — | |
Ginnie Mae Mortgage-Backed Securities(a): | | | | | | | | | | | | |
Series 2009-78, Class SD, (1 mo. LIBOR + 6.20%), 4.61%, 09/20/32 | | | | | | | 4,908 | | | | 475,159 | |
Series 2009-116, Class KS, (1 mo. LIBOR + 6.47%), 4.88%, 12/16/39 | | | | | | | 1,762 | | | | 225,063 | |
Series 2011-52, Class NS, (1 mo. LIBOR + 6.67%), 5.08%, 04/16/41 | | | | | | | 14,036 | | | | 2,203,058 | |
| | | | | | | | |
| | | | | | | | | | | 4,327,159 | |
| Mortgage-Backed Securities — 8.2% | |
Fannie Mae Mortgage-Backed Securities(f): | | | | | | | | | | | | |
3.00%, 8/01/43 | | | | | | | 9,576 | | | | 9,345,490 | |
4.00%, 12/01/41 — 04/01/56 | | | | | | | 31,006 | | | | 32,024,864 | |
4.50%, 07/01/41 — 07/01/55 | | | | | | | 17,600 | | | | 18,593,492 | |
5.00%, 8/01/34 | | | | | | | 1,748 | | | | 1,887,144 | |
5.50%, 6/01/38 | | | | | | | 839 | | | | 920,460 | |
6.00%, 12/01/38 | | | | | | | 707 | | | | 788,372 | |
Freddie Mac Mortgage-Backed Securities, 6.00%, 09/01/18 — 12/01/18 | | | | | | | 7 | | | | 6,576 | |
Ginnie Mae Mortgage-Backed Securities: | | | | | | | | | | | | |
5.50%, 8/15/33 | | | | | | | 56 | | | | 60,324 | |
8.00%, 7/15/24 | | | | | | | — | (o) | | | 89 | |
| | | | | | | | |
| | | | | | | | | | | 63,626,811 | |
| Principal Only Collateralized Mortgage Obligations — 0.0% | |
Fannie Mae Mortgage-Backed Securities (m): | | | | | | | | | | | | |
Series 1993-51, Class E, 0.00%, 02/25/23 | | | | | | | 6 | | | | 5,414 | |
Series 203, Class 1, 0.00%, 02/25/23 | | | | | | | 2 | | | | 1,638 | |
Series 1993-70, Class A, 0.00%, 05/25/23 | | | | | | | 1 | | | | 907 | |
Series 0228, Class 1, 0.00%, 06/25/23 | | | | | | | 1 | | | | 1,312 | |
| | | | | | | | |
| | | | | | | | | | | 9,271 | |
| | | | | | | | |
Total U.S. Government Sponsored Agency Securities — 14.6%
(Cost — $113,229,425) | | | | 112,569,860 | |
| | | | | | | | |
|
U.S. Treasury Obligations — 15.6% | |
U.S. Treasury Bonds(f): | | | | | | | | | | | | |
3.00%, 11/15/44 | | | | | | | 61,400 | | | | 60,006,508 | |
2.50%, 02/15/46 | | | | | | | 66,500 | | | | 58,668,066 | |
U.S. Treasury Notes, 2.75%, 11/15/47(f) | | | | | | | 2,000 | | | | 1,852,969 | |
| | | | | | | | |
Total U.S. Treasury Obligations — 15.6%
(Cost — $132,027,630) | | | | 120,527,543 | |
| | | | | | | | |
Total Long-Term Investments — 145.7%
(Cost — $1,107,839,377) | | | | 1,125,302,204 | |
| | | | | | | | |
| | | | | | | | | | | | |
| | | | | |
Shares | | | Value | |
Short-Term Securities — 0.4% | |
BlackRock Liquidity Funds, T-Fund, Institutional Class, 1.29%(p)(q) | | | USD | | | | 2,711,662 | | | $ | 2,711,662 | |
Total Short-Term Securities — 0.4%
(Cost — $2,711,662) | | | | 2,711,662 | |
| | | | | | | | |
| |
Options Purchased — 0.5%
(Cost — $4,020,844) | | | | 3,494,413 | |
| | | | | | | | |
Total Investments Before Options Written — 146.6%
(Cost — $1,114,571,883) | | | | 1,131,508,279 | |
| | | | | | | | |
Options Written — (0.7)%
(Premiums Received — $3,581,260) | | | | (5,205,701 | ) |
| | | | | | | | |
| |
Total Investments, Net of Options Written — 145.9%
(Cost — $1,110,990,623) | | | | 1,126,302,578 | |
Liabilities in Excess of Other Assets — (45.9)% | | | | (354,127,931 | ) |
| | | | | | | | |
Net Assets — 100.0% | | | $ | 772,174,647 | |
| | | | | | | | | | | | |
| (a) | Floating rate security. Rate shown is the rate in effect as of period end. |
| (b) | Security exempt from registration pursuant to Rule 144A under the Securities Act of 1933, as amended. These securities may be resold in transactions exempt from registration to qualified institutional investors. |
| (c) | Variable or floating rate security, which interest rate adjusts periodically based on changes in current interest rates and prepayments on the underlying pool of assets. Rate shown is the rate in effect as of period end. |
| (d) | When-issued security. |
| (e) | Security is valued using significant unobservable inputs and is classified as Level 3 in the fair value hierarchy. |
| (f) | All or a portion of the security has been pledged as collateral in connection with outstanding reverse repurchase agreements. |
| (g) | Payment-in-kind security which may pay interest/dividends in additional par/shares and/or in cash. Rates shown are the current rate and possible payment rates. |
| (h) | Variable rate security. Security may be issued at a fixed coupon rate, which converts to a variable rate at a specified date. Rate shown is the rate in effect as of period end. |
| (i) | Perpetual security with no stated maturity date. |
| (j) | Convertible security. |
| (k) | Step-up bond that pays an initial coupon rate for the first period and then a higher coupon rate for the following periods. Rate as of period end. |
| (l) | Variable rate security. Rate shown is the rate in effect as of period end. |
| (m) | Represents an unsettled loan commitment at period end. Certain details associated with this purchase are not known prior to the settlement date, including coupon rate. |
| (o) | Amount is less than $500. |
| (p) | Annualized 7-day yield as of period end. |
| (q) | During the six months ended February 28, 2018, investments in issuers considered to be an affiliate of the Trust for purposes of Section 2(a)(3) of the Investment Company Act of 1940, as amended, were as follows: |
| | | | | | | | | | | | | | | | | | | | | | | | | | | | |
| Affiliated | | Shares
Held at
08/31/17 | | | Net
Activity | | | Shares Held at
02/28/18 | | | Value at
02/28/18 | | | Income | | | Net
Realized
Gain (Loss) (a) | | | Change in
Unrealized
Appreciation
(Depreciation) | |
BlackRock Liquidity Funds, T-Fund, Institutional Class | | | 4,374,729 | | | | (1,663,067 | ) | | | 2,711,662 | | | $ | 2,711,662 | | | $ | 43,782 | | | $ | 36 | | | $ | — | |
| | | | | | | | | | | | | | | | | | | | | | | | | | | | |
| | (a) | Includes net capital gain distributions, if applicable. | |
| | |
| 32 | | 2018 BLACKROCK SEMI-ANNUAL REPORTTO SHAREHOLDERS |
| | |
Schedule of Investments (unaudited) (continued) February 28, 2018 | | BlackRock Core Bond Trust (BHK) |
Reverse Repurchase Agreements
| | | | | | | | | | | | | | | | | | | | | | | | |
| Counterparty | | Interest
Rate | | | Trade
Date | | | Maturity
Date (a) | | | Face Value | | | Face Value
Including
Accrued Interest | | | Type of Non-Cash
Underlying Collateral | | Remaining Contractual
Maturity of the Agreements (a) |
BNP Paribas Securities Corp. | | | 1.44 | % | | | 12/29/16 | | | | Open | | | $ | 60,555,750 | | | $ | 61,315,153 | | | U.S. Treasury Obligations | | Open/Demand |
Deutsche Bank AG | | | 1.43 | | | | 02/27/17 | | | | Open | | | | 22,562,500 | | | | 22,822,677 | | | U.S. Treasury Obligations | | Open/Demand |
BNP Paribas Securities Corp. | | | 1.86 | | | | 06/15/17 | | | | Open | | | | 802,000 | | | | 811,491 | | | Corporate Bonds | | Open/Demand |
HSBC Securities (USA), Inc. | | | 1.75 | | | | 06/19/17 | | | | Open | | | | 3,648,000 | | | | 3,688,179 | | | Corporate Bonds | | Open/Demand |
HSBC Securities (USA), Inc. | | | 1.75 | | | | 06/19/17 | | | | Open | | | | 3,665,000 | | | | 3,705,366 | | | Corporate Bonds | | Open/Demand |
HSBC Securities (USA), Inc. | | | 1.75 | | | | 06/19/17 | | | | Open | | | | 8,069,000 | | | | 8,157,871 | | | Capital Trusts | | Open/Demand |
HSBC Securities (USA), Inc. | | | 1.75 | | | | 06/19/17 | | | | Open | | | | 3,945,000 | | | | 3,988,450 | | | Corporate Bonds | | Open/Demand |
HSBC Securities (USA), Inc. | | | 2.00 | | | | 06/19/17 | | | | Open | | | | 3,823,000 | | | | 3,871,849 | | | Corporate Bonds | | Open/Demand |
RBC Capital Markets LLC | | | 1.84 | | | | 06/19/17 | | | | Open | | | | 3,329,300 | | | | 3,368,083 | | | Corporate Bonds | | Open/Demand |
RBC Capital Markets LLC | | | 1.84 | | | | 06/19/17 | | | | Open | | | | 2,586,000 | | | | 2,616,124 | | | Corporate Bonds | | Open/Demand |
RBC Capital Markets LLC | | | 1.84 | | | | 06/19/17 | | | | Open | | | | 3,558,938 | | | | 3,600,395 | | | Corporate Bonds | | Open/Demand |
RBC Capital Markets LLC | | | 1.84 | | | | 06/19/17 | | | | Open | | | | 2,472,500 | | | | 2,501,302 | | | Corporate Bonds | | Open/Demand |
RBC Capital Markets LLC | | | 1.84 | | | | 06/19/17 | | | | Open | | | | 3,251,250 | | | | 3,289,123 | | | Corporate Bonds | | Open/Demand |
RBC Capital Markets LLC | | | 1.84 | | | | 06/19/17 | | | | Open | | | | 3,080,000 | | | | 3,115,879 | | | Corporate Bonds | | Open/Demand |
RBC Capital Markets LLC | | | 1.84 | | | | 06/19/17 | | | | Open | | | | 7,128,138 | | | | 7,211,172 | | | Corporate Bonds | | Open/Demand |
RBC Capital Markets LLC | | | 1.84 | | | | 06/19/17 | | | | Open | | | | 3,660,000 | | | | 3,702,635 | | | Corporate Bonds | | Open/Demand |
RBC Capital Markets LLC | | | 1.84 | | | | 06/19/17 | | | | Open | | | | 3,315,000 | | | | 3,353,616 | | | Corporate Bonds | | Open/Demand |
RBC Capital Markets LLC | | | 1.84 | | | | 06/19/17 | | | | Open | | | | 4,634,500 | | | | 4,688,487 | | | Corporate Bonds | | Open/Demand |
Nomura Securities International, Inc. | | | 1.46 | | | | 06/20/17 | | | | Open | | | | 28,687,500 | | | | 28,945,767 | | | U.S. Treasury Obligations | | Open/Demand |
RBC Capital Markets LLC | | | 1.84 | | | | 06/21/17 | | | | Open | | | | 1,930,000 | | | | 1,952,312 | | | Corporate Bonds | | Open/Demand |
RBC Capital Markets LLC | | | 1.84 | | | | 06/21/17 | | | | Open | | | | 1,807,500 | | | | 1,828,396 | | | Corporate Bonds | | Open/Demand |
RBC Capital Markets LLC | | | 1.84 | | | | 06/21/17 | | | | Open | | | | 1,555,750 | | | | 1,573,735 | | | Corporate Bonds | | Open/Demand |
RBC Capital Markets LLC | | | 1.84 | | | | 06/21/17 | | | | Open | | | | 2,091,000 | | | | 2,115,173 | | | Corporate Bonds | | Open/Demand |
RBC Capital Markets LLC | | | 1.84 | | | | 06/21/17 | | | | Open | | | | 1,641,500 | | | | 1,660,477 | | | Corporate Bonds | | Open/Demand |
RBC Capital Markets LLC | | | 1.84 | | | | 06/21/17 | | | | Open | | | | 4,850,000 | | | | 4,906,069 | | | Corporate Bonds | | Open/Demand |
RBC Capital Markets LLC | | | 1.84 | | | | 06/21/17 | | | | Open | | | | 2,480,000 | | | | 2,508,670 | | | Corporate Bonds | | Open/Demand |
RBC Capital Markets LLC | | | 1.84 | | | | 06/21/17 | | | | Open | | | | 2,300,003 | | | | 2,326,592 | | | Corporate Bonds | | Open/Demand |
RBC Capital Markets LLC | | | 1.84 | | | | 06/21/17 | | | | Open | | | | 2,286,900 | | | | 2,313,338 | | | Corporate Bonds | | Open/Demand |
RBC Capital Markets LLC | | | 1.84 | | | | 06/21/17 | | | | Open | | | | 1,867,500 | | | | 1,886,697 | | | Corporate Bonds | | Open/Demand |
RBC Capital Markets LLC | | | 1.84 | | | | 06/21/17 | | | | Open | | | | 3,306,250 | | | | 3,344,472 | | | Corporate Bonds | | Open/Demand |
RBC Capital Markets LLC | | | 1.84 | | | | 06/21/17 | | | | Open | | | | 1,928,180 | | | | 1,950,471 | | | Corporate Bonds | | Open/Demand |
RBC Capital Markets LLC | | | 1.84 | | | | 06/21/17 | | | | Open | | | | 2,002,725 | | | | 2,025,878 | | | Corporate Bonds | | Open/Demand |
Credit Suisse Securities (USA) LLC | | | 1.75 | | | | 06/27/17 | | | | Open | | | | 1,220,838 | | | | 1,233,748 | | | Corporate Bonds | | Open/Demand |
Credit Suisse Securities (USA) LLC | | | 1.75 | | | | 06/27/17 | | | | Open | | | | 590,200 | | | | 596,442 | | | Corporate Bonds | | Open/Demand |
Credit Suisse Securities (USA) LLC | | | 1.75 | | | | 06/27/17 | | | | Open | | | | 2,544,013 | | | | 2,570,916 | | | Corporate Bonds | | Open/Demand |
Credit Suisse Securities (USA) LLC | | | 1.75 | | | | 06/27/17 | | | | Open | | | | 1,564,875 | | | | 1,581,424 | | | Corporate Bonds | | Open/Demand |
Credit Suisse Securities (USA) LLC | | | 1.75 | | | | 06/27/17 | | | | Open | | | | 2,370,000 | | | | 2,395,064 | | | Corporate Bonds | | Open/Demand |
RBC Capital Markets LLC | | | 1.84 | | | | 08/30/17 | | | | Open | | | | 3,509,000 | | | | 3,538,717 | | | Corporate Bonds | | Open/Demand |
RBC Capital Markets LLC | | | 1.84 | | | | 08/30/17 | | | | Open | | | | 1,901,250 | | | | 1,917,351 | | | Corporate Bonds | | Open/Demand |
RBC Capital Markets LLC | | | 1.84 | | | | 08/30/17 | | | | Open | | | | 2,154,375 | | | | 2,172,620 | | | Corporate Bonds | | Open/Demand |
RBC Capital Markets LLC | | | 1.84 | | | | 08/30/17 | | | | Open | | | | 2,227,500 | | | | 2,246,364 | | | Corporate Bonds | | Open/Demand |
RBC Capital Markets LLC | | | 2.20 | | | | 09/12/17 | | | | Open | | | | 6,960,000 | | | | 7,027,087 | | | Corporate Bonds | | Open/Demand |
RBC Capital Markets LLC | | | 1.84 | | | | 09/29/17 | | | | Open | | | | 1,584,000 | | | | 1,595,386 | | | Corporate Bonds | | Open/Demand |
RBC Capital Markets LLC | | | 1.84 | | | | 09/29/17 | | | | Open | | | | 1,644,750 | | | | 1,656,573 | | | Corporate Bonds | | Open/Demand |
RBC Capital Markets LLC | | | 1.84 | | | | 09/29/17 | | | | Open | | | | 1,850,000 | | | | 1,863,298 | | | Corporate Bonds | | Open/Demand |
RBC Capital Markets LLC | | | 1.84 | | | | 09/29/17 | | | | Open | | | | 3,885,700 | | | | 3,913,631 | | | Corporate Bonds | | Open/Demand |
BNP Paribas Securities Corp. | | | 1.92 | | | | 10/05/17 | | | | Open | | | | 4,135,000 | | | | 4,164,978 | | | Corporate Bonds | | Open/Demand |
BNP Paribas Securities Corp. | | | 1.92 | | | | 10/05/17 | | | | Open | | | | 5,225,000 | | | | 5,262,880 | | | Corporate Bonds | | Open/Demand |
BNP Paribas Securities Corp. | | | 2.00 | | | | 10/05/17 | | | | Open | | | | 4,604,000 | | | | 4,638,882 | | | Corporate Bonds | | Open/Demand |
Citigroup Global Market, Inc. | | | 0.00 | | | | 11/01/17 | | | | Open | | | | 225,000 | | | | 224,911 | | | Corporate Bonds | | Open/Demand |
Citigroup Global Market, Inc. | | | 0.50 | | | | 11/01/17 | | | | Open | | | | 195,435 | | | | 195,035 | | | Corporate Bonds | | Open/Demand |
Barclays Capital, Inc. | | | 0.50 | | | | 11/03/17 | | | | Open | | | | 134,048 | | | | 134,215 | | | Corporate Bonds | | Open/Demand |
Barclays Capital, Inc. | | | 0.50 | | | | 11/16/17 | | | | Open | | | | 118,294 | | | | 118,123 | | | Corporate Bonds | | Open/Demand |
BNP Paribas Securities Corp. | | | 1.52 | | | | 12/14/17 | | | | Open | | | | 1,311,750 | | | | 1,316,359 | | | U.S. Government Sponsored Agency Securities | | Open/Demand |
BNP Paribas Securities Corp. | | | 1.52 | | | | 12/14/17 | | | | Open | | | | 797,125 | | | | 799,926 | | | U.S. Government Sponsored Agency Securities | | Open/Demand |
BNP Paribas Securities Corp. | | | 1.52 | | | | 12/14/17 | | | | Open | | | | 1,409,169 | | | | 1,414,120 | | | U.S. Government Sponsored Agency Securities | | Open/Demand |
UBS Securities LLC | | | 1.80 | | | | 12/14/17 | | | | Open | | | | 3,804,917 | | | | 3,819,375 | | | Foreign Agency Obligations | | Open/Demand |
UBS Securities LLC | | | 1.85 | | | | 12/14/17 | | | | Open | | | | 3,875,514 | | | | 3,890,650 | | | Foreign Agency Obligations | | Open/Demand |
UBS Securities LLC | | | 2.00 | | | | 12/14/17 | | | | Open | | | | 341,325 | | | | 342,766 | | | Corporate Bonds | | Open/Demand |
| | | | |
| SCHEDULES OF INVESTMENTS | | | 33 | |
| | |
Schedule of Investments (unaudited) (continued) February 28, 2018 | | BlackRock Core Bond Trust (BHK) |
Reverse Repurchase Agreements (continued)
| | | | | | | | | | | | | | | | | | | | | | | | |
| Counterparty | | Interest
Rate | | | Trade
Date | | | Maturity
Date (a) | | | Face Value | | | Face Value
Including
Accrued Interest | | | Type of Non-Cash
Underlying Collateral | | Remaining Contractual
Maturity of the Agreements (a) |
UBS Securities LLC | | | 2.00 | % | | | 12/14/17 | | | | Open | | | $ | 2,654,718 | | | $ | 2,665,926 | | | Corporate Bonds | | Open/Demand |
J.P. Morgan Securities LLC | | | (0.15 | ) | | | 01/08/18 | | | | Open | | | | 219,313 | | | | 219,266 | | | Corporate Bonds | | Open/Demand |
J.P. Morgan Securities LLC | | | (0.30 | ) | | | 01/08/18 | | | | Open | | | | 157,620 | | | | 157,553 | | | Corporate Bonds | | Open/Demand |
J.P. Morgan Securities LLC | | | (0.50 | ) | | | 01/08/18 | | | | Open | | | | 2,358,750 | | | | 2,357,079 | | | Capital Trusts | | Open/Demand |
J.P. Morgan Securities LLC | | | 0.60 | | | | 01/08/18 | | | | Open | | | | 149,623 | | | | 149,750 | | | Corporate Bonds | | Open/Demand |
J.P. Morgan Securities LLC | | | 1.00 | | | | 01/09/18 | | | | Open | | | | 165,241 | | | | 165,471 | | | Corporate Bonds | | Open/Demand |
Merrill Lynch, Pierce, Fenner & Smith, Inc. | | | 1.46 | | | | 01/22/18 | | | | Open | | | | 761,063 | | | | 762,218 | | | U.S. Government Sponsored Agency Securities | | Open/Demand |
Merrill Lynch, Pierce, Fenner & Smith, Inc. | | | 1.46 | | | | 01/22/18 | | | | Open | | | | 1,263,125 | | | | 1,265,043 | | | U.S. Government Sponsored Agency Securities | | Open/Demand |
Deutsche Bank AG | | | (0.75 | ) | | | 01/25/18 | | | | Open | | | | 71,000 | | | | 70,950 | | | Corporate Bonds | | Open/Demand |
RBC Capital Markets LLC | | | 1.84 | | | | 01/30/18 | | | | Open | | | | 2,590,750 | | | | 2,594,590 | | | Corporate Bonds | | Open/Demand |
RBC Capital Markets LLC | | | 1.84 | | | | 01/30/18 | | | | Open | | | | 8,151,615 | | | | 8,163,698 | | | Corporate Bonds | | Open/Demand |
RBC Capital Markets LLC | | | 1.84 | | | | 01/30/18 | | | | Open | | | | 8,404,995 | | | | 8,417,453 | | | Corporate Bonds | | Open/Demand |
RBC Capital Markets LLC | | | 1.84 | | | | 01/30/18 | | | | Open | | | | 7,171,075 | | | | 7,181,704 | | | Corporate Bonds | | Open/Demand |
Barclays Capital, Inc. | | | (1.50 | ) | | | 02/01/18 | | | | Open | | | | 138,679 | | | | 138,604 | | | Corporate Bonds | | Open/Demand |
BNP Paribas Securities Corp. | | | 1.52 | | | | 02/01/18 | | | | Open | | | | 856,832 | | | | 856,832 | | | Corporate Bonds | | Open/Demand |
HSBC Securities (USA), Inc. | | | 1.54 | | | | 02/12/18 | | | | 3/13/18 | | | | 2,637,000 | | | | 2,638,805 | | | U.S. Government Sponsored Agency Securities | | Up to 30 days |
HSBC Securities (USA), Inc. | | | 1.54 | | | | 02/12/18 | | | | 3/13/18 | | | | 2,379,000 | | | | 2,380,628 | | | U.S. Government Sponsored Agency Securities | | Up to 30 days |
HSBC Securities (USA), Inc. | | | 1.54 | | | | 02/12/18 | | | | 3/13/18 | | | | 9,079,000 | | | | 9,085,214 | | | U.S. Government Sponsored Agency Securities | | Up to 30 days |
HSBC Securities (USA), Inc. | | | 1.54 | | | | 02/12/18 | | | | 3/13/18 | | | | 7,581,993 | | | | 7,592,905 | | | U.S. Government Sponsored Agency Securities | | Up to 30 days |
HSBC Securities (USA), Inc. | | | 1.54 | | | | 02/12/18 | | | | 3/13/18 | | | | 1,844,000 | | | | 1,845,262 | | | U.S. Government Sponsored Agency Securities | | Up to 30 days |
HSBC Securities (USA), Inc. | | | 1.54 | | | | 02/12/18 | | | | 3/13/18 | | | | 890,000 | | | | 890,609 | | | U.S. Government Sponsored Agency Securities | | Up to 30 days |
HSBC Securities (USA), Inc. | | | 1.54 | | | | 02/12/18 | | | | 3/13/18 | | | | 2,064,000 | | | | 2,065,413 | | | U.S. Government Sponsored Agency Securities | | Up to 30 days |
HSBC Securities (USA), Inc. | | | 1.54 | | | | 02/12/18 | | | | 3/13/18 | | | | 5,008,000 | | | | 5,011,428 | | | U.S. Government Sponsored Agency Securities | | Up to 30 days |
HSBC Securities (USA), Inc. | | | 1.54 | | | | 02/12/18 | | | | 3/13/18 | | | | 18,940,000 | | | | 18,952,963 | | | U.S. Government Sponsored Agency Securities | | Up to 30 days |
HSBC Securities (USA), Inc. | | | 1.54 | | | | 02/12/18 | | | | 3/13/18 | | | | 7,890,000 | | | | 7,895,400 | | | U.S. Government Sponsored Agency Securities | | Up to 30 days |
HSBC Securities (USA), Inc. | | | 1.54 | | | | 02/12/18 | | | | 3/13/18 | | | | 760,000 | | | | 760,520 | | | U.S. Government Sponsored Agency Securities | | Up to 30 days |
HSBC Securities (USA), Inc. | | | 1.54 | | | | 02/12/18 | | | | 3/13/18 | | | | 2,785,000 | | | | 2,786,906 | | | U.S. Government Sponsored Agency Securities | | Up to 30 days |
J.P. Morgan Securities LLC | | | 0.00 | | | | 02/13/18 | | | | Open | | | | 211,410 | | | | 211,410 | | | Corporate Bonds | | Open/Demand |
J.P. Morgan Securities LLC | | | 0.30 | | | | 02/13/18 | | | | Open | | | | 398,788 | | | | 398,837 | | | Corporate Bonds | | Open/Demand |
J.P. Morgan Securities LLC | | | (0.75 | ) | | | 02/13/18 | | | | Open | | | | 897,500 | | | | 897,220 | | | Capital Trusts | | Open/Demand |
J.P. Morgan Securities LLC | | | 0.90 | | | | 02/13/18 | | | | Open | | | | 1,645,000 | | | | 1,645,617 | | | Capital Trusts | | Open/Demand |
Citigroup Global Market, Inc. | | | 1.10 | | | | 02/21/18 | | | | Open | | | | 586,376 | | | | 586,502 | | | Corporate Bonds | | Open/Demand |
J.P. Morgan Securities LLC | | | 1.00 | | | | 02/21/18 | | | | Open | | | | 358,500 | | | | 358,570 | | | Corporate Bonds | | Open/Demand |
J.P. Morgan Securities LLC | | | 1.39 | | | | 02/28/18 | | | | 3/01/18 | | | | 1,862,500 | | | | 1,862,572 | | | U.S. Treasury Obligations | | Up to 30 days |
| | | | | | | | | | | | | | | | | | | | | | | | |
| | | $ | 365,936,228 | | | $ | 368,809,658 | | | | | |
| | | | | | | | | | | | | | | | | | | | | | | | |
| | (a) | Certain agreements have no stated maturity and can be terminated by either party at any time. | |
| | |
| 34 | | 2018 BLACKROCK SEMI-ANNUAL REPORTTO SHAREHOLDERS |
| | |
Schedule of Investments (unaudited) (continued) February 28, 2018 | | BlackRock Core Bond Trust (BHK) |
Derivative Financial Instruments Outstanding as of Period End
Futures Contracts
| | | | | | | | | | | | | | | | | | | | |
| Description | | Number of
Contracts | | | Expiration
Date | | | Notional
Amount (000) | | | Value /
Unrealized
Appreciation
(Depreciation) | |
Long Contracts: | | | | | | | | | | | | | | | | |
Euro Stoxx 600 Index | | | 1 | | | | 03/16/18 | | | $ | 9 | | | $ | 242 | |
Ultra Long U.S. Treasury Bond | | | 12 | | | | 06/20/18 | | | | 1,871 | | | | 8,276 | |
90-Day Euro Future | | | 449 | | | | 03/18/19 | | | | 109,315 | | | | (357,749 | ) |
| | | | | | | | | | | | | | | | | | | | |
| | | | | | | | | | | | | | | (349,231 | ) |
| | | | | | | | | | | | | | | | | | | | |
Short Contracts: | | | | | | | | | | | | | | | | |
10-Year U.S. Treasury Note | | | 363 | | | | 06/20/18 | | | | 43,577 | | | | 75,622 | |
10-Year U.S. Ultra Long Treasury Note | | | 94 | | | | 06/20/18 | | | | 12,038 | | | | (8,071 | ) |
Long U.S. Treasury Bond | | | 20 | | | | 06/20/18 | | | | 2,869 | | | | (9,519 | ) |
Long Gilt Future | | | 1 | | | | 06/27/18 | | | | 121 | | | | (15 | ) |
2-Year U.S. Treasury Note | | | 464 | | | | 06/29/18 | | | | 98,586 | | | | 67,341 | |
5-Year U.S. Treasury Note | | | 196 | | | | 06/29/18 | | | | 22,330 | | | | 37,840 | |
90-Day Euro Future | | | 449 | | | | 03/16/20 | | | | 109,028 | | | | 471,211 | |
| | | | | | | | | | | | | | | | | | | | |
| | | | | | | | | | | | | | | 634,409 | |
| | | | | | | | | | | | | | | | |
| | | | | | | | | | | | | | $ | 285,178 | |
| | | | | | | | | | | | | | | | | | | | |
Forward Foreign Currency Exchange Contracts
| | | | | | | | | | | | | | | | | | | | |
| Currency Purchased | | | Currency Sold | | | Counterparty | | Settlement Date | | | Unrealized
Appreciation
(Depreciation) | |
| USD | | | 5,001,349 | | | EUR | | | 4,029,500 | | | BNP Paribas S.A. | | | 03/05/18 | | | $ | 84,443 | |
| USD | | | 5,031,508 | | | EUR | | | 4,029,500 | | | Barclays Bank PLC | | | 03/05/18 | | | | 114,602 | |
| USD | | | 1,380,726 | | | EUR | | | 1,112,000 | | | HSBC Bank USA N.A. | | | 03/05/18 | | | | 23,833 | |
| USD | | | 1,388,571 | | | EUR | | | 1,112,000 | | | HSBC Bank USA N.A. | | | 03/05/18 | | | | 31,678 | |
| USD | | | 2,025,097 | | | GBP | | | 1,427,000 | | | Barclays Bank PLC | | | 03/05/18 | | | | 60,370 | |
| USD | | | 12,086,116 | | | GBP | | | 8,516,573 | | | Barclays Bank PLC | | | 03/05/18 | | | | 360,297 | |
| USD | | | 146,667 | | | NZD | | | 198,000 | | | Australia and New Zealand Bank Group | | | 03/05/18 | | | | 3,875 | |
| USD | | | 185,501 | | | EUR | | | 148,929 | | | Citibank N.A. | | | 03/19/18 | | | | 3,579 | |
| USD | | | 36,909 | | | EUR | | | 29,900 | | | HSBC Bank USA N.A. | | | 03/19/18 | | | | 385 | |
| USD | | | 2,495,328 | | | EUR | | | 2,036,000 | | | Bank of America N.A. | | | 04/04/18 | | | | 5,017 | |
| USD | | | 9,467,783 | | | EUR | | | 7,725,000 | | | Bank of America N.A. | | | 04/04/18 | | | | 19,034 | |
| USD | | | 1,947,484 | | | GBP | | | 1,408,000 | | | Standard Chartered Bank | | | 04/04/18 | | | | 6,023 | |
| USD | | | 11,783,031 | | | GBP | | | 8,517,000 | | | Toronto-Dominion Bank | | | 04/04/18 | | | | 39,128 | |
| USD | | | 142,855 | | | NZD | | | 198,000 | | | Westpac Banking Corp. | | | 04/04/18 | | | | 98 | |
| USD | | | 227,000 | | | ARS | | | 4,653,500 | | | Deutsche Bank AG | | | 05/02/18 | | | | 3,113 | |
| | | | | | | | | | | | | | | | | | | | |
| | | | | | | | | | | | | | | | | | | 755,475 | |
| | | | | | | | | | | | | | | | | | | | |
| EUR | | | 178,829 | | | USD | | | 224,301 | | | Barclays Bank PLC | | | 03/19/18 | | | | (5,856 | ) |
| ARS | | | 4,671,660 | | | USD | | | 227,000 | | | Citibank N.A. | | | 05/02/18 | | | | (2,239 | ) |
| | | | | | | | | | | | | | | | | | | | |
| | | | | | | | | | | | | | | | | | | (8,095 | ) |
| | | | | | | | | | | | | | | | | | | | |
| | | | | | $ | 747,380 | |
| | | | | | | | | | | | | | | | | | | | |
Interest Rate Caps Purchased
| | | | | | | | | | | | | | | | | | | | | | | | | | |
| Description | | Exercise
Rate | | | Counterparty | | Expiration
Date | | | Notional
Amount (000) | | | Value | | | Premiums
Paid | | | Unrealized
Depreciation | |
2Y – 10Y CMS Index Cap | | | 0.24 | % | | Barclays Bank PLC | | | 01/24/19 | | | | USD 18,000 | | | $ | 19,022 | | | $ | 25,560 | | | $ | (6,538 | ) |
2Y – 10Y CMS Index Cap | | | 0.33 | | | Barclays Bank PLC | | | 01/30/19 | | | | USD 19,180 | | | | 14,049 | | | | 21,098 | | | | (7,049 | ) |
| | | | | | | | | | | | | | | | | | | | | | | | | | |
| | | | | | | | | | | | | | | | $ | 33,071 | | | $ | 46,658 | | | $ | (13,587 | ) |
| | | | | | | | | | | | | | | | | | | | | | | | | | |
| | | | |
| SCHEDULES OF INVESTMENTS | | | 35 | |
| | |
Schedule of Investments (unaudited) (continued) February 28, 2018 | | BlackRock Core Bond Trust (BHK) |
OTC Interest Rate Swaptions Purchased
| | | | | | | | | | | | | | | | | | | | | | | | | | | | | | | | | | |
Description | | Paid by the Trust | | Received by the Trust | | Counterparty | | Expiration
Date | | | Exercise
Rate | | | Notional
Amount (000) | | | Value | |
| | Rate | | | Frequency | | Rate | | | Frequency | | | | | |
Call | | | | | | | | | | | | | | | | | | | | | | | | | | | | | | | | | | |
2-Year Interest Rate Swap, 10/19/20 | | | 3-Month LIBOR | | | Quarterly | | | 1.25 | % | | Semi-annual | | Deutsche Bank AG | | | 10/17/18 | | | | 1.25 | % | | | USD | | | | 10,000 | | | $ | 168 | |
10-Year Interest Rate Swap, 03/15/29 | | | 3-Month LIBOR | | | Quarterly | | | 2.75 | | | Semi-annual | | Barclays Bank PLC | | | 03/13/19 | | | | 2.75 | | | | USD | | | | 2,290 | | | | 36,624 | |
2-Year Interest Rate Swap, 03/29/21 | | | 3-Month LIBOR | | | Quarterly | | | 2.25 | | | Semi-annual | | Deutsche Bank AG | | | 03/27/19 | | | | 2.25 | | | | USD | | | | 20,000 | | | | 25,201 | |
2-Year Interest Rate Swap, 04/27/21 | | | 3-Month LIBOR | | | Quarterly | | | 2.35 | | | Semi-annual | | Barclays Bank PLC | | | 04/25/19 | | | | 2.35 | | | | USD | | | | 20,000 | | | | 34,795 | |
10-Year Interest Rate Swap, 02/16/30 | | | 3-Month LIBOR | | | Quarterly | | | 3.09 | | | Semi-annual | | Deutsche Bank AG | | | 02/14/20 | | | | 3.09 | | | | USD | | | | 1,870 | | | | 70,313 | |
15-Year Interest Rate Swap, 06/10/35 | | | 6-Month LIBOR | | | Semi-annual | | | 0.65 | | | Semi-annual | | Barclays Bank PLC | | | 06/08/20 | | | | 0.65 | | | | JPY | | | | 125,000 | | | | 25,026 | |
Call | | | | | | | | | | | | | | | | | | | | | | | | | | | | | | | | | | |
15-Year Interest Rate Swap, 09/16/35 | | | 6-Month LIBOR | | | Semi-annual | | | 0.66 | | | Semi-annual | | Morgan Stanley & Co. International PLC | | | 09/14/20 | | | | 0.66 | | | | JPY | | | | 50,000 | | | | 10,243 | |
15-Year Interest Rate Swap, 09/16/35 | | | 6-Month LIBOR | | | Semi-annual | | | 0.66 | | | Semi-annual | | Barclays Bank PLC | | | 09/14/20 | | | | 0.66 | | | | JPY | | | | 50,000 | | | | 10,243 | |
10-Year Interest Rate Swap, 01/27/37(a) | | | 3-Month LIBOR | | | Quarterly | | | 2.60 | | | Semi-annual | | Deutsche Bank AG | | | 01/25/27 | | | | 2.60 | | | | USD | | | | 1,900 | | | | (57,941 | ) |
10-Year Interest Rate Swap, 02/10/37 | | | 3-Month LIBOR | | | Quarterly | | | 2.40 | | | Semi-annual | | Deutsche Bank AG | | | 02/08/27 | | | | 2.40 | | | | USD | | | | 1,875 | | | | 63,404 | |
| | | | | | | | | | | | | | | | | | | | | | | | | | | | | | | | | | |
| | | | | | | | | | | | | | | | | | | | | | | | | | | | | | | | | 218,076 | |
| | | | | | | | | | | | | | | | | | | | | | | | | | | | | | | | | | |
Put | | | | | | | | | | | | | | | | | | | | | | | | | | | | | | | | | | |
5-Year Interest Rate Swap, 10/07/23 | | | 3.00 | % | | Semi-annual | | | 3-Month LIBOR | | | Quarterly | | Bank of America N.A. | | | 10/05/18 | | | | 3.00 | | | | USD | | | | 6,120 | | | | 40,481 | |
5-Year Interest Rate Swap, 01/31/24 | | | 3.05 | | | Semi-annual | | | 3-Month LIBOR | | | Quarterly | | Deutsche Bank AG | | | 01/29/19 | | | | 3.05 | | | | USD | | | | 23,110 | | | | 200,525 | |
5-Year Interest Rate Swap, 02/15/24 | | | 2.95 | | | Semi-annual | | | 3-Month LIBOR | | | Quarterly | | Deutsche Bank AG | | | 02/13/19 | | | | 2.95 | | | | USD | | | | 25,700 | | | | 281,397 | |
30-Year Interest Rate Swap, 02/05/50 | | | 4.00 | | | Semi-annual | | | 3-Month LIBOR | | | Quarterly | | Goldman Sachs Bank USA | | | 02/03/20 | | | | 4.00 | | | | USD | | | | 1,600 | | | | 25,057 | |
10-Year Interest Rate Swap, 02/16/30 | | | 3.09 | | | Semi-annual | | | 3-Month LIBOR | | | Quarterly | | Deutsche Bank AG | | | 02/14/20 | | | | 3.09 | | | | USD | | | | 1,870 | | | | 56,776 | |
10-Year Interest Rate Swap, 02/20/30 | | | 3.35 | | | Semi-annual | | | 3-Month LIBOR | | | Quarterly | | Deutsche Bank AG | | | 02/18/20 | | | | 3.35 | | | | USD | | | | 3,710 | | | | 81,293 | |
15-Year Interest Rate Swap, 05/17/35 | | | 1.10 | | | Semi-annual | | | 6-Month LIBOR | | | Semi-annual | | Barclays Bank PLC | | | 05/15/20 | | | | 1.10 | | | | JPY | | | | 250,000 | | | | 15,416 | |
15-Year Interest Rate Swap, 06/10/35 | | | 0.65 | | | Semi-annual | | | 6-Month LIBOR | | | Semi-annual | | Barclays Bank PLC | | | 06/08/20 | | | | 0.65 | | | | JPY | | | | 125,000 | | | | 21,758 | |
Put | | | | | | | | | | | | | | | | | | | | | | | | | | | | | | | | | | |
15-Year Interest Rate Swap, 09/16/35 | | | 0.66 | | | Semi-annual | | | 6-Month LIBOR | | | Semi-annual | | Barclays Bank PLC | | | 09/14/20 | | | | 0.66 | | | | JPY | | | | 50,000 | | | | 9,559 | |
15-Year Interest Rate Swap, 09/16/35 | | | 0.66 | | | Semi-annual | | | 6-Month LIBOR | | | Semi-annual | | Morgan Stanley & Co. International PLC | | | 09/14/20 | | | | 0.66 | | | | JPY | | | | 50,000 | | | | 9,559 | |
10-Year Interest Rate Swap, 02/03/21 | | | 3.50 | | | Semi-annual | | | 3-Month LIBOR | | | Quarterly | | Bank of America N.A. | | | 02/01/21 | | | | 3.50 | | | | USD | | | | 4,000 | | | | 98,834 | |
10-Year Interest Rate Swap, 02/03/21 | | | 3.50 | | | Semi-annual | | | 3-Month LIBOR | | | Quarterly | | Citibank N.A. | | | 02/01/21 | | | | 3.50 | | | | USD | | | | 4,380 | | | | 108,223 | |
10-Year Interest Rate Swap, 01/13/32 | | | 1.25 | | | Semi-annual | | | 6-Month LIBOR | | | Semi-annual | | Credit Suisse International | | | 01/11/22 | | | | 1.25 | | | | JPY | | | | 250,000 | | | | 14,447 | |
10-Year Interest Rate Swap, 02/24/32 | | | 1.55 | | | Semi-annual | | | 6-Month LIBOR | | | Semi-annual | | Credit Suisse International | | | 02/22/22 | | | | 1.55 | | | | JPY | | | | 250,000 | | | | 11,113 | |
10-Year Interest Rate Swap, 03/18/32 | | | 1.60 | | | Semi-annual | | | 6-Month LIBOR | | | Semi-annual | | JPMorgan Chase Bank N.A. | | | 03/16/22 | | | | 1.60 | | | | JPY | | | | 250,000 | | | | 10,893 | |
10-Year Interest Rate Swap, 04/06/32 | | | 1.45 | | | Semi-annual | | | 6-Month LIBOR | | | Semi-annual | | JPMorgan Chase Bank N.A. | | | 04/04/22 | | | | 1.45 | | | | JPY | | | | 250,000 | | | | 12,836 | |
15-Year Interest Rate Swap, 05/05/37 | | | 3.25 | | | Semi-annual | | | 3-Month LIBOR | | | Quarterly | | Goldman Sachs Bank USA | | | 05/03/22 | | | | 3.25 | | | | USD | | | | 4,050 | | | | 211,222 | |
10-Year Interest Rate Swap, 08/18/32 | | | 3.00 | | | Semi-annual | | | 3-Month LIBOR | | | Quarterly | | JPMorgan Chase Bank N.A. | | | 08/16/22 | | | | 3.00 | | | | USD | | | | 22,000 | | | | 1,090,361 | |
| | |
| 36 | | 2018 BLACKROCK SEMI-ANNUAL REPORTTO SHAREHOLDERS |
| | |
Schedule of Investments (unaudited) (continued) February 28, 2018 | | BlackRock Core Bond Trust (BHK) |
OTC Interest Rate Swaptions Purchased (continued)
| | | | | | | | | | | | | | | | | | | | | | | | | | | | | | | | | | |
Description | | Paid by the Trust | | Received by the Trust | | Counterparty | | Expiration
Date | | | Exercise
Rate | | | Notional
Amount (000) | | | Value | |
| | Rate | | | Frequency | | Rate | | | Frequency | | | | | |
30-Year Interest Rate Swap, 02/15/53 | | | 3.35 | % | | Semi-annual | | | 3-Month LIBOR | | | Quarterly | | Barclays Bank PLC | | | 02/13/23 | | | | 3.35 | % | | | USD | | | | 9,557 | | | $ | 704,416 | |
10-Year Interest Rate Swap, 04/14/37 | | | 3.00 | | | Semi-annual | | | 3-Month LIBOR | | | Quarterly | | JPMorgan Chase Bank N.A. | | | 04/12/27 | | | | 3.00 | | | | USD | | | | 2,590 | | | | 150,073 | |
Put | | | | | | | | | | | | | | | | | | | | | | | | | | | | | | |
20-Year Interest Rate Swap, 08/11/53 | | | 4.00 | | | Annual | | | 6-Month EURIBOR | | | Semi-annual | | Barclays Bank PLC | | | 08/09/33 | | | | 4.00 | | | | EUR | | | | 2,410 | | | | 89,027 | |
| | | | | | | | | | | | | | | | | | | | | | | | | | | | | | | | | | |
| | | | | | | | | | | | | | | | | | | | | | | | | | | | | | | | | 3,243,266 | |
| | | | | | | | | | | | | | | | | | | | | | | | | | | | | | | | | | |
| | | $ | 3,461,342 | |
| | | | | | | | | | | | | | | | | | | | | | | | | | | | | | | | | | |
| | (a) | Forward settling swaption. | |
OTC Interest Rate Swaptions Written
| | | | | | | | | | | | | | | | | | | | | | | | | | | | | | | | |
| Description | | Paid by the Trust | | Received by the Trust | | Counterparty | | Expiration
Date | | | Exercise
Rate | | | Notional
Amount (000) | | | Value | |
| | Rate | | | Frequency | | Rate | | | Frequency | | | | | |
Call | | | | | | | | | | | | | | | | | | | | | | | | | | | | | | | | |
2-Year Interest Rate Swap, 03/03/20 | | | 1.60 | % | | Semi-annual | | | 3-Month LIBOR | | | Quarterly | | Goldman Sachs Bank USA | | | 03/01/18 | | | | 1.60 | % | | USD | | | 24,400 | | | $ | (2 | ) |
5-Year Interest Rate Swap, 03/15/23 | | | 0.10 | | | Annual | | | 6-Month EURIBOR | | | Semi-annual | | Barclays Bank PLC | | | 03/13/18 | | | | 0.10 | | | EUR | | | 11,520 | | | | (1 | ) |
10-Year Interest Rate Swap, 07/15/28 | | | 2.45 | | | Semi-annual | | | 3-Month LIBOR | | | Quarterly | | Deutsche Bank AG | | | 07/13/18 | | | | 2.45 | | | USD | | | 2,000 | | | | (5,079 | ) |
10-Year Interest Rate Swap, 08/18/28 | | | 2.97 | | | Semi-annual | | | 3-Month LIBOR | | | Quarterly | | Barclays Bank PLC | | | 08/16/18 | | | | 2.97 | | | USD | | | 3,710 | | | | (66,158 | ) |
10-Year Interest Rate Swap, 08/23/28 | | | 2.99 | | | Semi-annual | | | 3-Month LIBOR | | | Quarterly | | JPMorgan Chase Bank N.A. | | | 08/21/18 | | | | 2.99 | | | USD | | | 1,855 | | | | (35,249 | ) |
2-Year Interest Rate Swap, 10/19/20 | | | 0.90 | | | Semi-annual | | | 3-Month LIBOR | | | Quarterly | | Deutsche Bank AG | | | 10/17/18 | | | | 0.90 | | | USD | | | 10,000 | | | | (53 | ) |
10-Year Interest Rate Swap, 01/05/29 | | | 0.65 | | | Annual | | | 6-Month EURIBOR | | | Semi-annual | | Morgan Stanley & Co. International PLC | | | 01/03/19 | | | | 0.65 | | | EUR | | | 1,380 | | | | (1,722 | ) |
10-Year Interest Rate Swap, | | | 3.02 | | | Semi-annual | | | 3-Month LIBOR | | | Quarterly | | Bank of America N.A. | | | 02/28/19 | | | | 3.02 | | | USD | | | 2,670 | | | | (70,267 | ) |
10-Year Interest Rate Swap, 03/15/29 | | | 2.00 | | | Semi-annual | | | 3-Month LIBOR | | | Quarterly | | Barclays Bank PLC | | | 03/13/19 | | | | 2.00 | | | USD | | | 4,580 | | | | (12,292 | ) |
2-Year Interest Rate Swap, 03/23/21 | | | 1.60 | | | Semi-annual | | | 3-Month LIBOR | | | Quarterly | | Goldman Sachs Bank USA | | | 03/21/19 | | | | 1.60 | | | USD | | | 15,400 | | | | (3,212 | ) |
2-Year Interest Rate Swap, 03/29/21 | | | 1.75 | | | Semi-annual | | | 3-Month LIBOR | | | Quarterly | | Deutsche Bank AG | | | 03/27/19 | | | | 1.75 | | | USD | | | 30,000 | | | | (9,846 | ) |
2-Year Interest Rate Swap, 03/30/21 | | | 1.75 | | | Semi-annual | | | 3-Month LIBOR | | | Quarterly | | JPMorgan Chase Bank N.A. | | | 03/28/19 | | | | 1.75 | | | USD | | | 8,470 | | | | (2,789 | ) |
2-Year Interest Rate Swap, 04/14/21 | | | 1.60 | | | Semi-annual | | | 3-Month LIBOR | | | Quarterly | | JPMorgan Chase Bank N.A. | | | 04/12/19 | | | | 1.60 | | | USD | | | 6,700 | | | | (1,597 | ) |
2-Year Interest Rate Swap, 04/27/21 | | | 1.85 | | | Semi-annual | | | 3-Month LIBOR | | | Quarterly | | Barclays Bank PLC | | | 04/25/19 | | | | 1.85 | | | USD | | | 40,000 | | | | (19,754 | ) |
2-Year Interest Rate Swap, 11/06/21 | | | 1.70 | | | Semi-annual | | | 3-Month LIBOR | | | Quarterly | | Barclays Bank PLC | | | 11/04/19 | | | | 1.70 | | | USD | | | 11,900 | | | | (8,622 | ) |
2-Year Interest Rate Swap, 02/09/22 | | | 2.20 | | | Semi-annual | | | 3-Month LIBOR | | | Quarterly | | Deutsche Bank AG | | | 02/07/20 | | | | 2.20 | | | USD | | | 10,790 | | | | (25,708 | ) |
2-Year Interest Rate Swap, 02/16/22 | | | 2.35 | | | Semi-annual | | | 3-Month LIBOR | | | Quarterly | | Deutsche Bank AG | | | 02/14/20 | | | | 2.35 | | | USD | | | 10,690 | | | | (33,377 | ) |
2-Year Interest Rate Swap, 02/23/22 | | | 2.35 | | | Semi-annual | | | 3-Month LIBOR | | | Quarterly | | UBS AG | | | 02/21/20 | | | | 2.35 | | | USD | | | 10,600 | | | | (33,361 | ) |
5-Year Interest Rate Swap, 01/07/27 | | | 1.70 | | | Semi-annual | | | 3-Month LIBOR | | | Quarterly | | Goldman Sachs Bank USA | | | 01/05/22 | | | | 1.70 | | | USD | | | 5,000 | | | | (32,790 | ) |
5-Year Interest Rate Swap, 02/10/27 | | | 1.75 | | | Semi-annual | | | 3-Month LIBOR | | | Quarterly | | Deutsche Bank AG | | | 02/08/22 | | | | 1.75 | | | USD | | | 5,000 | | | | (35,565 | ) |
| | | | | | | | | | | | | | | | | | | | | | | | | | | | | | | | |
| | | | | | | | | | | | | | | | | | | | | | | | | | | | | | | (397,444 | ) |
| | | | | | | | | | | | | | | | | | | | | | | | | | | | | | | | |
| | | | |
| SCHEDULES OF INVESTMENTS | | | 37 | |
| | |
Schedule of Investments (unaudited) (continued) February 28, 2018 | | BlackRock Core Bond Trust (BHK) |
OTC Interest Rate Swaptions Written (continued)
| | | | | | | | | | | | | | | | | | | | | | | | | | | | | | | | |
Description | | Paid by the Trust | | Received by the Trust | | Counterparty | | Expiration
Date | | | Exercise
Rate | | | Notional
Amount (000) | | | Value | |
| | Rate | | | Frequency | | Rate | | | Frequency | | | | | |
Put | | | | | | | | | | | | | | | | | | | | | | | | | | | | | | | | |
2-Year Interest Rate Swap, 04/08/20 | | | 3-Month LIBOR | | | Quarterly | | | 2.15 | % | | Semi-annual | | JPMorgan Chase Bank N.A. | | | 04/06/18 | | | | 2.15 | % | | USD | | | 8,320 | | | $ | (72,837 | ) |
2-Year Interest Rate Swap, 04/14/20 | | | 3-Month LIBOR | | | Quarterly | | | 1.75 | | | Semi-annual | | Goldman Sachs Bank USA | | | 04/12/18 | | | | 1.75 | | | USD | | | 38,200 | | | | (633,097 | ) |
2-Year Interest Rate Swap, 06/29/20 | | | 3-Month LIBOR | | | Quarterly | | | 1.45 | | | Semi-annual | | Goldman Sachs Bank USA | | | 06/27/18 | | | | 1.45 | | | USD | | | 10,000 | | | | (235,761 | ) |
10-Year Interest Rate Swap, 07/15/28 | | | 3-Month LIBOR | | | Quarterly | | | 2.45 | | | Semi-annual | | Deutsche Bank AG | | | 07/13/18 | | | | 2.45 | | | USD | | | 2,000 | | | | (86,477 | ) |
10-Year Interest Rate Swap, 01/18/28 | | | 3-Month LIBOR | | | Quarterly | | | 2.75 | | | Semi-annual | | JPMorgan Chase Bank N.A. | | | 07/16/18 | | | | 2.75 | | | USD | | | 2,000 | | | | (46,126 | ) |
10-Year Interest Rate Swap, 01/21/28 | | | 3-Month LIBOR | | | Quarterly | | | 2.70 | | | Semi-annual | | Deutsche Bank AG | | | 07/19/18 | | | | 2.70 | | | USD | | | 3,240 | | | | (85,150 | ) |
10-Year Interest Rate Swap, 08/18/28 | | | 3-Month LIBOR | | | Quarterly | | | 2.70 | | | Semi-annual | | JPMorgan Chase Bank N.A. | | | 08/16/18 | | | | 2.70 | | | USD | | | 31,000 | | | | (864,602 | ) |
10-Year Interest Rate Swap, 08/18/28 | | | 3-Month LIBOR | | | Quarterly | | | 2.97 | | | Semi-annual | | Barclays Bank PLC | | | 08/16/18 | | | | 2.97 | | | USD | | | 3,710 | | | | (54,194 | ) |
10-Year Interest Rate Swap, 08/23/28 | | | 3-Month LIBOR | | | Quarterly | | | 2.99 | | | Semi-annual | | JPMorgan Chase Bank N.A. | | | 08/21/18 | | | | 2.99 | | | USD | | | 1,855 | | | | (26,160 | ) |
10-Year Interest Rate Swap, 09/08/28 | | | 3-Month LIBOR | | | Quarterly | | | 2.45 | | | Semi-annual | | Barclays Bank PLC | | | 09/06/18 | | | | 2.45 | | | USD | | | 2,400 | | | | (110,114 | ) |
2-Year Interest Rate Swap, 09/08/20 | | | 3-Month LIBOR | | | Quarterly | | | 1.50 | | | Semi-annual | | Goldman Sachs Bank USA | | | 09/06/18 | | | | 1.50 | | | USD | | | 26,000 | | | | (615,416 | ) |
2-Year Interest Rate Swap, 10/19/20 | | | 3-Month LIBOR | | | Quarterly | | | 2.50 | | | Semi-annual | | Barclays Bank PLC | | | 10/17/18 | | | | 2.50 | | | USD | | | 5,000 | | | | (32,149 | ) |
10-Year Interest Rate Swap, 01/05/29 | | | 6-Month EURIIBOR | | | Semi-annual | | | 1.65 | | | Annual | | Morgan Stanley & Co. International PLC | | | 01/03/19 | | | | 1.65 | | | EUR | | | 1,380 | | | | (10,298 | ) |
2-Year Interest Rate Swap, 01/27/21 | | | 3-Month LIBOR | | | Quarterly | | | 2.75 | | | Semi-annual | | Deutsche Bank AG | | | 01/25/19 | | | | 2.75 | | | USD | | | 13,400 | | | | (65,610 | ) |
Put | | | | | | | | | | | | | | | | | | | | | | | | | | | | | | | | |
2-Year Interest Rate Swap, 01/31/21 | | | 3-Month LIBOR | | | Quarterly | | | 2.95 | | | Semi-annual | | Deutsche Bank AG | | | 01/29/19 | | | | 2.95 | | | USD | | | 58,330 | | | | (182,397 | ) |
2-Year Interest Rate Swap, 02/17/21 | | | 3-Month LIBOR | | | Quarterly | | | 3.05 | | | Semi-annual | | Deutsche Bank AG | | | 02/15/19 | | | | 3.05 | | | USD | | | 24,800 | | | | (66,425 | ) |
10-Year Interest Rate Swap, 02/20/29 | | | 6-Month EURIBOR | | | Semi-annual | | | 1.65 | | | Annual | | Barclays Bank PLC | | | 02/18/19 | | | | 1.65 | | | EUR | | | 8,490 | | | | (81,212 | ) |
10-Year Interest Rate Swap, 02/22/29 | | | 6-Month EURIBOR | | | Semi-annual | | | 1.70 | | | Annual | | Barclays Bank PLC | | | 02/20/19 | | | | 1.70 | | | EUR | | | 8,490 | | | | (71,734 | ) |
10-Year Interest Rate Swap, | | | 3-Month LIBOR | | | Quarterly | | | 3.02 | | | Semi-annual | | Bank of America N.A. | | | 02/28/19 | | | | 3.02 | | | USD | | | 2,670 | | | | (58,668 | ) |
2-Year Interest Rate Swap, 03/23/21 | | | 3-Month LIBOR | | | Quarterly | | | 2.60 | | | Semi-annual | | Goldman Sachs Bank USA | | | 03/21/19 | | | | 2.60 | | | USD | | | 15,400 | | | | (112,538 | ) |
2-Year Interest Rate Swap, 03/30/21 | | | 3-Month LIBOR | | | Quarterly | | | 2.75 | | | Semi-annual | | JPMorgan Chase Bank N.A. | | | 03/28/19 | | | | 2.75 | | | USD | | | 8,470 | | | | (48,087 | ) |
2-Year Interest Rate Swap, 04/10/21 | | | 3-Month LIBOR | | | Quarterly | | | 2.35 | | | Semi-annual | | JPMorgan Chase Bank N.A. | | | 04/08/19 | | | | 2.35 | | | USD | | | 7,530 | | | | (82,492 | ) |
2-Year Interest Rate Swap, 04/14/21 | | | 3-Month LIBOR | | | Quarterly | | | 2.60 | | | Semi-annual | | JPMorgan Chase Bank N.A. | | | 04/12/19 | | | | 2.60 | | | USD | | | 13,400 | | | | (101,383 | ) |
2-Year Interest Rate Swap, 11/06/21 | | | 3-Month LIBOR | | | Quarterly | | | 2.70 | | | Semi-annual | | Barclays Bank PLC | | | 11/04/19 | | | | 2.70 | | | USD | | | 11,900 | | | | (100,580 | ) |
2-Year Interest Rate Swap, | | | 3-Month LIBOR | | | Quarterly | | | 2.70 | | | Semi-annual | | JPMorgan Chase Bank N.A. | | | 11/06/19 | | | | 2.70 | | | USD | | | 20,000 | | | | (168,894 | ) |
2-Year Interest Rate Swap, 12/18/21 | | | 3-Month LIBOR | | | Quarterly | | | 2.70 | | | Semi-annual | | JPMorgan Chase Bank N.A. | | | 12/16/19 | | | | 2.70 | | | USD | | | 7,950 | | | | (69,837 | ) |
2-Year Interest Rate Swap, 01/23/22 | | | 3-Month LIBOR | | | Quarterly | | | 2.85 | | | Semi-annual | | JPMorgan Chase Bank N.A. | | | 01/21/20 | | | | 2.85 | | | USD | | | 18,900 | | | | (141,670 | ) |
Put | | | | | | | | | | | | | | | | | | | | | | | | | | | | | | | | |
2-Year Interest Rate Swap, 02/05/22 | | | 3-Month LIBOR | | | Quarterly | | | 3.15 | | | Semi-annual | | Barclays Bank PLC | | | 02/03/20 | | | | 3.15 | | | USD | | | 35,510 | | | | (181,708 | ) |
2-Year Interest Rate Swap, 02/09/22 | | | 3-Month LIBOR | | | Quarterly | | | 3.20 | | | Semi-annual | | Deutsche Bank AG | | | 02/07/20 | | | | 3.20 | | | USD | | | 10,790 | | | | (51,683 | ) |
2-Year Interest Rate Swap, 02/16/22 | | | 3-Month LIBOR | | | Quarterly | | | 3.35 | | | Semi-annual | | Deutsche Bank AG | | | 02/14/20 | | | | 3.35 | | | USD | | | 10,690 | | | | (42,094 | ) |
| | |
| 38 | | 2018 BLACKROCK SEMI-ANNUAL REPORTTO SHAREHOLDERS |
| | |
Schedule of Investments (unaudited) (continued) February 28, 2018 | | BlackRock Core Bond Trust (BHK) |
OTC Interest Rate Swaptions Written (continued)
| | | | | | | | | | | | | | | | | | | | | | | | | | | | | | |
| Description | | Paid by the Trust | | Received by the Trust | | Counterparty | | Expiration
Date | | | Exercise
Rate | | | Notional
Amount (000) | | | Value | |
| | Rate | | Frequency | | Rate | | | Frequency | | | | | |
2-Year Interest Rate Swap, 02/23/22 | | 3-Month LIBOR | | Quarterly | | | 3.35 | % | | Semi-annual | | UBS AG | | | 02/21/20 | | | | 3.35 | % | | USD | | | 10,600 | | | $ | (42,067 | ) |
15-Year Interest Rate Swap, 05/17/35 | | 6-Month LIBOR | | Semi-annual | | | 2.10 | | | Semi-annual | | Barclays Bank PLC | | | 05/15/20 | | | | 2.10 | | | JPY | | | 250,000 | | | | (3,922 | ) |
10-Year Interest Rate Swap, 02/03/21 | | 3-Month LIBOR | | Quarterly | | | 5.50 | | | Semi-annual | | Bank of America N.A. | | | 02/01/21 | | | | 5.50 | | | USD | | | 10,000 | | | | (26,811 | ) |
10-Year Interest Rate Swap, 02/03/21 | | 3-Month LIBOR | | Quarterly | | | 5.50 | | | Semi-annual | | Citibank N.A. | | | 02/01/21 | | | | 5.50 | | | USD | | | 10,950 | | | | (29,358 | ) |
5-Year Interest Rate Swap, 05/05/27 | | 3-Month LIBOR | | Quarterly | | | 3.25 | | | Semi-annual | | Goldman Sachs Bank USA | | | 05/03/22 | | | | 3.25 | | | USD | | | 10,130 | | | | (206,706 | ) |
| | | | | | | | | | | | | | | | | | | | | | | | | | | | | | |
| | | | | | | | | | | | | | | | | | | | | | | | | | | | | (4,808,257 | ) |
| | | | | | | | | | | | | | | | | | | | | | | | | | | | | | |
| | | $ | (5,205,701 | ) |
| | | | | |
Centrally Cleared Credit Default Swaps — Sell Protection
| | | | | | | | | | | | | | | | | | | | | | | | | | | | | | | | | | |
| Reference Obligation/Index | | Financing
Rate Received
by the Trust | | | Payment
Frequency | | | Termination
Date | | Credit
Rating(a) | | | Notional
Amount
(000) (b) | | | Value | | | Upfront
Premium
Paid
(Received) | | | Unrealized
Appreciation
(Depreciation) | |
Chesapeake Energy Corp. | | | 5.00 | % | | | Quarterly | | | 12/20/21 | | | CCC | | | | USD | | | | 270 | | | $ | (1,723 | ) | | $ | (8,601 | ) | | $ | 6,878 | |
Markit iTraxx XO, Series 28, Version 1 | | | 5.00 | | | | Quarterly | | | 12/20/22 | | | N/A | | | | EUR | | | | 130 | | | | 17,929 | | | | 16,435 | | | | 1,494 | |
| | | | | | | | | | | | | | | | | | | | | | | | | | | | | | | | | | |
| | | | | | | | | | | | | | | | | | | | | | | | $ | 16,206 | | | $ | 7,834 | | | $ | 8,372 | |
| | | | | | | | | | | | | | | | | | | | | | | | | | | | | | | | | | |
| | (a) | Using Standard & Poor’s (“S&P’s”) rating of the issuer or the underlying securities of the index, as applicable. | |
| | (b) | The maximum potential amount the Trust may pay should a negative credit event take place as defined under the terms of the agreement. | |
Centrally Cleared Interest Rate Swaps
| | | | | | | | | | | | | | | | | | | | | | | | | | | | | | | | | | | | | | |
| Paid by the Trust | | Received by the Trust | | Effective
Date | | | Termination
Date | | | Notional
Amount (000) | | | Value | | | Upfront
Premium
Paid
(Received) | | | Unrealized
Appreciation
(Depreciation) | |
| Rate | | | Frequency | | Rate | | | Frequency | | | | | | |
| | 3-Month LIBOR | | | Quarterly | | | 1.59 | % | | Semi-annual | | | 06/13/18 | (a) | | | 08/01/18 | | | | USD | | | | 357,000 | | | $ | (128,798 | ) | | $ | 3,632 | | | $ | (132,430 | ) |
| | 1.61 | % | | Semi-annual | | | 3-Month LIBOR | | | Quarterly | | | 08/01/18 | (a) | | | 09/26/18 | | | | USD | | | | 312,000 | | | | 145,433 | | | | 3,174 | | | | 142,259 | |
| | 1.75 | | | Semi-annual | | | 3-Month LIBOR | | | Quarterly | | | 05/21/18 | (a) | | | 05/21/20 | | | | USD | | | | 10,950 | | | | 186,202 | | | | — | | | | 186,202 | |
| | 1.87 | | | Semi-annual | | | 3-Month LIBOR | | | Quarterly | | | 07/03/18 | (a) | | | 07/03/20 | | | | USD | | | | 2,810 | | | | 42,729 | | | | — | | | | 42,729 | |
| | 1.94 | | | Semi-annual | | | 3-Month LIBOR | | | Quarterly | | | 07/09/18 | (a) | | | 07/07/20 | | | | USD | | | | 6,000 | | | | 83,211 | | | | — | | | | 83,211 | |
| | 2.20 | | | Semi-annual | | | 3-Month LIBOR | | | Quarterly | | | 12/03/18 | (a) | | | 12/01/20 | | | | USD | | | | 4,000 | | | | 43,336 | | | | 47 | | | | 43,289 | |
| | 2.20 | | | Semi-annual | | | 3-Month LIBOR | | | Quarterly | | | 12/03/18 | (a) | | | 12/03/20 | | | | USD | | | | 22,400 | | | | 244,391 | | | | 263 | | | | 244,128 | |
| | 2.27 | | | Semi-annual | | | 3-Month LIBOR | | | Quarterly | | | 12/14/18 | (a) | | | 12/14/20 | | | | USD | | | | 4,000 | | | | 38,494 | | | | 47 | | | | 38,447 | |
| | 3-Month LIBOR | | | Quarterly | | | 2.32 | | | Semi-annual | | | 12/17/19 | (a) | | | 12/17/20 | | | | USD | | | | 39,000 | | | | (203,238 | ) | | | 417 | | | | (203,655 | ) |
| | 2.31 | | | Semi-annual | | | 3-Month LIBOR | | | Quarterly | | | 12/21/18 | (a) | | | 12/21/20 | | | | USD | | | | 5,460 | | | | 49,595 | | | | 64 | | | | 49,531 | |
| | 2.33 | | | Semi-annual | | | 3-Month LIBOR | | | Quarterly | | | 12/24/18 | (a) | | | 12/24/20 | | | | USD | | | | 3,760 | | | | 32,882 | | | | 44 | | | | 32,838 | |
| | 2.40 | | | Semi-annual | | | 3-Month LIBOR | | | Quarterly | | | 01/11/19 | (a) | | | 01/11/21 | | | | USD | | | | 2,750 | | | | 20,901 | | | | 32 | | | | 20,869 | |
| | 2.44 | | | Semi-annual | | | 3-Month LIBOR | | | Quarterly | | | 01/11/19 | (a) | | | 01/11/21 | | | | USD | | | | 5,010 | | | | 34,348 | | | | 59 | | | | 34,289 | |
| | 2.44 | | | Semi-annual | | | 3-Month LIBOR | | | Quarterly | | | 01/14/19 | (a) | | | 01/12/21 | | | | USD | | | | 5,120 | | | | 34,695 | | | | 60 | | | | 34,635 | |
| | 2.47 | | | Semi-annual | | | 3-Month LIBOR | | | Quarterly | | | 01/15/19 | (a) | | | 01/15/21 | | | | USD | | | | 2,485 | | | | 15,582 | | | | 29 | | | | 15,553 | |
| | 2.48 | | | Semi-annual | | | 3-Month LIBOR | | | Quarterly | | | 01/15/19 | (a) | | | 01/15/21 | | | | USD | | | | 2,485 | | | | 15,155 | | | | 29 | | | | 15,126 | |
| | 2.50 | | | Semi-annual | | | 3-Month LIBOR | | | Quarterly | | | 01/22/19 | (a) | | | 01/22/21 | | | | USD | | | | 2,500 | | | | 14,151 | | | | 29 | | | | 14,122 | |
| | 2.52 | | | Semi-annual | | | 3-Month LIBOR | | | Quarterly | | | 01/22/19 | (a) | | | 01/22/21 | | | | USD | | | | 3,870 | | | | 20,725 | | | | 46 | | | | 20,679 | |
| | 2.60 | | | Semi-annual | | | 3-Month LIBOR | | | Quarterly | | | 01/24/19 | (a) | | | 01/24/21 | | | | USD | | | | 3,800 | | | | 15,034 | | | | 45 | | | | 14,989 | |
| | 2.66 | | | Semi-annual | | | 3-Month LIBOR | | | Quarterly | | | 01/31/19 | (a) | | | 01/31/21 | | | | USD | | | | 17,170 | | | | 47,939 | | | | 202 | | | | 47,737 | |
| | 2.68 | | | Semi-annual | | | 3-Month LIBOR | | | Quarterly | | | 02/04/19 | (a) | | | 02/04/21 | | | | USD | | | | 2,825 | | | | 6,774 | | | | 33 | | | | 6,741 | |
| | 2.68 | | | Semi-annual | | | 3-Month LIBOR | | | Quarterly | | | 02/04/19 | (a) | | | 02/04/21 | | | | USD | | | | 2,825 | | | | 6,962 | | | | 33 | | | | 6,929 | |
| | 2.81 | | | Semi-annual | | | 3-Month LIBOR | | | Quarterly | | | 02/20/19 | (a) | | | 02/20/21 | | | | USD | | | | 8,260 | | | | 1,243 | | | | 97 | | | | 1,146 | |
| | 2.20 | | | Semi-annual | | | 3-Month LIBOR | | | Quarterly | | | 11/08/19 | (a) | | | 11/08/21 | | | | USD | | | | 5,900 | | | | 76,195 | | | | 69 | | | | 76,126 | |
| | 2.36 | | | Semi-annual | | | 3-Month LIBOR | | | Quarterly | | | 12/17/20 | (a) | | | 12/17/21 | | | | USD | | | | 39,000 | | | | 201,959 | | | | 417 | | | | 201,542 | |
| | 2.62 | | | Semi-annual | | | 3-Month LIBOR | | | Quarterly | | | 01/22/20 | (a) | | | 01/22/22 | | | | USD | | | | 7,200 | | | | 38,350 | | | | 85 | | | | 38,265 | |
| | 2.85 | | | Semi-annual | | | 3-Month LIBOR | | | Quarterly | | | 02/07/20 | (a) | | | 02/07/22 | | | | USD | | | | 13,020 | | | | 14,278 | | | | 153 | | | | 14,125 | |
| | 2.92 | | | Semi-annual | | | 3-Month LIBOR | | | Quarterly | | | 02/18/20 | (a) | | | 02/18/22 | | | | USD | | | | 2,595 | | | | (563 | ) | | | 31 | | | | (594 | ) |
| | 2.93 | | | Semi-annual | | | 3-Month LIBOR | | | Quarterly | | | 02/18/20 | (a) | | | 02/18/22 | | | | USD | | | | 2,595 | | | | (853 | ) | | | 31 | | | | (884 | ) |
| | 2.96 | | | Semi-annual | | | 3-Month LIBOR | | | Quarterly | | | 02/18/20 | (a) | | | 02/18/22 | | | | USD | | | | 3,700 | | | | (3,655 | ) | | | 44 | | | | (3,699 | ) |
| | 2.96 | | | Semi-annual | | | 3-Month LIBOR | | | Quarterly | | | 02/24/20 | (a) | | | 02/24/22 | | | | USD | | | | 3,930 | | | | (3,667 | ) | | | 46 | | | | (3,713 | ) |
| | 2.99 | | | Semi-annual | | | 3-Month LIBOR | | | Quarterly | | | 02/25/20 | (a) | | | 02/25/22 | | | | USD | | | | 2,530 | | | | (3,527 | ) | | | 30 | | | | (3,557 | ) |
| | 3.02 | | | Semi-annual | | | 3-Month LIBOR | | | Quarterly | | | 02/25/20 | (a) | | | 02/25/22 | | | | USD | | | | 5,620 | | | | (11,017 | ) | | | 66 | | | | (11,083 | ) |
| | | | |
| SCHEDULES OF INVESTMENTS | | | 39 | |
| | |
Schedule of Investments (unaudited) (continued) February 28, 2018 | | BlackRock Core Bond Trust (BHK) |
Centrally Cleared Interest Rate Swaps (continued)
| | | | | | | | | | | | | | | | | | | | | | | | | | | | | | | | | | | | | | |
| Paid by the Trust | | Received by the Trust | | Effective
Date | | | Termination
Date | | | Notional
Amount (000) | | | Value | | | Upfront
Premium
Paid
(Received) | | | Unrealized
Appreciation
(Depreciation) | |
| Rate | | | Frequency | | Rate | | | Frequency | | | | | | |
| | 2.97 | % | | Semi-annual | | | 3-Month LIBOR | | | Quarterly | | | 03/02/20 | (a) | | | 03/02/22 | | | | USD | | | | 6,180 | | | $ | (7,405 | ) | | $ | 73 | | | $ | (7,478 | ) |
| | 2.97 | | | Semi-annual | | | 3-Month LIBOR | | | Quarterly | | | 03/02/20 | (a) | | | 03/02/22 | | | | USD | | | | 3,090 | | | | (3,359 | ) | | | 36 | | | | (3,395 | ) |
| | 3-Month LIBOR | | | Quarterly | | | 2.41 | % | | Semi-annual | | | 07/05/18 | (a) | | | 08/31/22 | | | | USD | | | | 18,420 | | | | (4,704 | ) | | | 243 | | | | (4,947 | ) |
| | 2.45 | | | Semi-annual | | | 3-Month LIBOR | | | Quarterly | | | 07/05/18 | (a) | | | 08/31/22 | | | | USD | | | | 7,730 | | | | (1,836 | ) | | | 102 | | | | (1,938 | ) |
| | 3-Month LIBOR | | | Quarterly | | | 2.16 | | | Semi-annual | | | N/A | | | | 10/27/22 | | | | USD | | | | 6,540 | | | | (126,407 | ) | | | 80 | | | | (126,487 | ) |
| | 2.66 | | | Semi-annual | | | 3-Month LIBOR | | | Quarterly | | | N/A | | | | 02/13/23 | | | | USD | | | | 700 | | | | 2,619 | | | | (661 | ) | | | 3,280 | |
| | 3-Month LIBOR | | | Quarterly | | | 2.66 | | | Semi-annual | | | N/A | | | | 02/15/23 | | | | USD | | | | 5,490 | | | | (21,448 | ) | | | 72 | | | | (21,520 | ) |
| | 3-Month LIBOR | | | Quarterly | | | 2.78 | | | Semi-annual | | | 03/02/18 | (a) | | | 03/02/23 | | | | USD | | | | 3,140 | | | | 3,957 | | | | 41 | | | | 3,916 | |
| | 6-Month EURIBOR | | | Semi-annual | | | 0.27 | | | Annual | | | 03/07/18 | (a) | | | 03/07/23 | | | | EUR | | | | 1,000 | | | | (11,874 | ) | | | 16 | | | | (11,890 | ) |
| | 3-Month LIBOR | | | Quarterly | | | 2.65 | | | Semi-annual | | | 01/25/19 | (a) | | | 01/25/24 | | | | USD | | | | 4,670 | | | | (48,853 | ) | | | 62 | | | | (48,915 | ) |
| | 3-Month LIBOR | | | Quarterly | | | 2.75 | | | Semi-annual | | | 01/31/19 | (a) | | | 01/31/24 | | | | USD | | | | 7,480 | | | | (43,995 | ) | | | 99 | | | | (44,094 | ) |
| | 3-Month LIBOR | | | Quarterly | | | 2.93 | | | Semi-annual | | | 02/25/19 | (a) | | | 02/25/24 | | | | USD | | | | 3,660 | | | | 6,679 | | | | 48 | | | | 6,631 | |
| | 3-Month LIBOR | | | Quarterly | | | 2.97 | | | Semi-annual | | | 02/26/19 | (a) | | | 02/26/24 | | | | USD | | | | 2,260 | | | | 9,132 | | | | 30 | | | | 9,102 | |
| | 2.90 | | | Semi-annual | | | 3-Month LIBOR | | | Quarterly | | | 02/26/19 | (a) | | | 02/26/24 | | | | USD | | | | 1,560 | | | | (1,083 | ) | | | 21 | | | | (1,104 | ) |
| | 3-Month LIBOR | | | Quarterly | | | 2.92 | | | Semi-annual | | | 03/04/19 | (a) | | | 03/04/24 | | | | USD | | | | 1,810 | | | | 2,984 | | | | 24 | | | | 2,960 | |
| | 2.90 | | | Semi-annual | | | 3-Month LIBOR | | | Quarterly | | | 06/29/18 | (a) | | | 01/31/25 | | | | USD | | | | 2,550 | | | | (6,804 | ) | | | 36 | | | | (6,840 | ) |
| | 3-Month LIBOR | | | Quarterly | | | 2.75 | | | Semi-annual | | | 01/05/22 | (a) | | | 01/05/27 | | | | USD | | | | 1,430 | | | | (14,365 | ) | | | 18 | | | | (14,383 | ) |
| | 3-Month LIBOR | | | Quarterly | | | 2.32 | | | Semi-annual | | | N/A | | | | 05/03/27 | | | | USD | | | | 1,020 | | | | (38,663 | ) | | | — | | | | (38,663 | ) |
| | 6-Month EURIBOR | | | Semi-annual | | | 1.40 | | | Annual | | | 06/08/22 | (a) | | | 06/08/27 | | | | EUR | | | | 200 | | | | (2,666 | ) | | | — | | | | (2,666 | ) |
| | 2.34 | | | Semi-annual | | | 3-Month LIBOR | | | Quarterly | | | N/A | | | | 10/12/27 | | | | USD | | | | 4,100 | | | | 158,445 | | | | 61 | | | | 158,384 | |
| | 2.38 | | | Semi-annual | | | 3-Month LIBOR | | | Quarterly | | | N/A | | | | 10/25/27 | | | | USD | | | | 2,050 | | | | 72,660 | | | | 31 | | | | 72,629 | |
| | 2.47 | | | Semi-annual | | | 3-Month LIBOR | | | Quarterly | | | N/A | | | | 10/27/27 | | | | USD | | | | 2,640 | | | | 71,758 | | | | 40 | | | | 71,718 | |
| | 2.46 | | | Semi-annual | | | 3-Month LIBOR | | | Quarterly | | | N/A | | | | 10/27/27 | | | | USD | | | | 1,660 | | | | 47,267 | | | | 25 | | | | 47,242 | |
| | 2.96 | | | Semi-annual | | | 3-Month LIBOR | | | Quarterly | | | 06/29/18 | (a) | | | 11/15/27 | | | | USD | | | | 9,940 | | | | (44,555 | ) | | | 156 | | | | (44,711 | ) |
| | 2.96 | | | Semi-annual | | | 3-Month LIBOR | | | Quarterly | | | 06/29/18 | (a) | | | 11/15/27 | | | | USD | | | | 2,135 | | | | (9,468 | ) | | | 33 | | | | (9,501 | ) |
| | 2.95 | | | Semi-annual | | | 3-Month LIBOR | | | Quarterly | | | 06/29/18 | (a) | | | 11/15/27 | | | | USD | | | | 2,135 | | | | (1,345 | ) | | | 33 | | | | (1,378 | ) |
| | 2.47 | | | Semi-annual | | | 3-Month LIBOR | | | Quarterly | | | N/A | | | | 12/28/27 | | | | USD | | | | 2,000 | | | | 68,605 | | | | 31 | | | | 68,574 | |
| | 2.50 | | | Semi-annual | | | 3-Month LIBOR | | | Quarterly | | | N/A | | | | 01/08/28 | | | | USD | | | | 1,400 | | | | 44,469 | | | | 22 | | | | 44,447 | |
| | 2.56 | | | Semi-annual | | | 3-Month LIBOR | | | Quarterly | | | N/A | | | | 01/16/28 | | | | USD | | | | 1,365 | | | | 35,730 | | | | 21 | | | | 35,709 | |
| | 2.60 | | | Semi-annual | | | 3-Month LIBOR | | | Quarterly | | | N/A | | | | 01/19/28 | | | | USD | | | | 800 | | | | 18,557 | | | | 12 | | | | 18,545 | |
| | 2.64 | | | Semi-annual | | | 3-Month LIBOR | | | Quarterly | | | N/A | | | | 01/22/28 | | | | USD | | | | 1,055 | | | | 20,259 | | | | 16 | | | | 20,243 | |
| | 2.66 | | | Semi-annual | | | 3-Month LIBOR | | | Quarterly | | | N/A | | | | 01/22/28 | | | | USD | | | | 1,055 | | | | 18,950 | | | | 16 | | | | 18,934 | |
| | 2.69 | | | Semi-annual | | | 3-Month LIBOR | | | Quarterly | | | N/A | | | | 01/23/28 | | | | USD | | | | 1,000 | | | | 14,939 | | | | 16 | | | | 14,923 | |
| | 2.74 | | | Semi-annual | | | 3-Month LIBOR | | | Quarterly | | | N/A | | | | 01/23/28 | | | | USD | | | | 600 | | | | 6,437 | | | | 9 | | | | 6,428 | |
| | 2.72 | | | Semi-annual | | | 3-Month LIBOR | | | Quarterly | | | N/A | | | | 01/29/28 | | | | USD | | | | 600 | | | | 7,756 | | | | 9 | | | | 7,747 | |
| | 6-Month LIBOR | | | Semi-annual | | | 0.37 | | | Annual | | | N/A | | | | 01/29/28 | | | | JPY | | | | 181,730 | | | | 6,869 | | | | 28 | | | | 6,841 | |
| | 2.78 | | | Semi-annual | | | 3-Month LIBOR | | | Quarterly | | | N/A | | | | 02/02/28 | | | | USD | | | | 500 | | | | 4,009 | | | | 8 | | | | 4,001 | |
| | 2.84 | | | Semi-annual | | | 3-Month LIBOR | | | Quarterly | | | N/A | | | | 02/05/28 | | | | USD | | | | 500 | | | | 1,387 | | | | 8 | | | | 1,379 | |
| | 2.90 | | | Semi-annual | | | 3-Month LIBOR | | | Quarterly | | | N/A | | | | 02/06/28 | | | | USD | | | | 700 | | | | (2,308 | ) | | | 11 | | | | (2,319 | ) |
| | 2.89 | | | Semi-annual | | | 3-Month LIBOR | | | Quarterly | | | N/A | | | | 02/06/28 | | | | USD | | | | 500 | | | | (1,228 | ) | | | 8 | | | | (1,236 | ) |
| | 2.89 | | | Semi-annual | | | 3-Month LIBOR | | | Quarterly | | | N/A | | | | 02/09/28 | | | | USD | | | | 500 | | | | (837 | ) | | | 8 | | | | (845 | ) |
| | 2.91 | | | Semi-annual | | | 3-Month LIBOR | | | Quarterly | | | N/A | | | | 02/12/28 | | | | USD | | | | 200 | | | | (726 | ) | | | 3 | | | | (729 | ) |
| | 2.88 | | | Semi-annual | | | 3-Month LIBOR | | | Quarterly | | | N/A | | | | 02/15/28 | | | | USD | | | | 2,860 | | | | (1,830 | ) | | | 45 | | | | (1,875 | ) |
| | 2.98 | | | Semi-annual | | | 3-Month LIBOR | | | Quarterly | | | N/A | | | | 02/20/28 | | | | USD | | | | 550 | | | | (4,991 | ) | | | 9 | | | | (5,000 | ) |
| | 2.98 | | | Semi-annual | | | 3-Month LIBOR | | | Quarterly | | | N/A | | | | 02/23/28 | | | | USD | | | | 420 | | | | (3,861 | ) | | | 7 | | | | (3,868 | ) |
| | 2.93 | | | Semi-annual | | | 3-Month LIBOR | | | Quarterly | | | 03/02/18 | (a) | | | 03/02/28 | | | | USD | | | | 1,630 | | | | (6,751 | ) | | | 26 | | | | (6,777 | ) |
| | 3-Month LIBOR | | | Quarterly | | | 2.88 | | | Semi-annual | | | 11/30/18 | (a) | | | 11/30/28 | | | | USD | | | | 1,120 | | | | (6,710 | ) | | | 18 | | | | (6,728 | ) |
| | 2.47 | | | Semi-annual | | | 3-Month LIBOR | | | Quarterly | | | 12/11/18 | (a) | | | 12/11/28 | | | | USD | | | | 1,510 | | | | 62,516 | | | | 23 | | | | 62,493 | |
| | 2.46 | | | Semi-annual | | | 3-Month LIBOR | | | Quarterly | | | 12/18/18 | (a) | | | 12/18/28 | | | | USD | | | | 2,090 | | | | 88,521 | | | | 32 | | | | 88,489 | |
| | 1.37 | | | Annual | | | 6-Month EURIBOR | | | Semi-annual | | | 02/20/19 | (a) | | | 02/20/29 | | | | EUR | | | | 1,970 | | | | (12,891 | ) | | | 44 | | | | (12,935 | ) |
| | 1.38 | | | Annual | | | 6-Month EURIBOR | | | Semi-annual | | | 02/22/19 | (a) | | | 02/22/29 | | | | EUR | | | | 2,280 | | | | (17,238 | ) | | | 51 | | | | (17,289 | ) |
| | 3-Month LIBOR | | | Quarterly | | | 2.65 | | | Semi-annual | | | 12/09/22 | (a) | | | 12/09/32 | | | | USD | | | | 1,820 | | | | (57,873 | ) | | | 28 | | | | (57,901 | ) |
| | 3-Month LIBOR | | | Quarterly | | | 2.63 | | | Semi-annual | | | 12/19/22 | (a) | | | 12/18/32 | | | | USD | | | | 2,290 | | | | (76,322 | ) | | | 35 | | | | (76,357 | ) |
| | 2.90 | | | Semi-annual | | | 3-Month LIBOR | | | Quarterly | | | 01/27/27 | (a) | | | 01/27/37 | | | | USD | | | | 730 | | | | 9,504 | | | | 10 | | | | 9,494 | |
| | 3.07 | | | Semi-annual | | | 3-Month LIBOR | | | Quarterly | | | 03/22/27 | (a) | | | 03/20/37 | | | | USD | | | | 1,000 | | | | 888 | | | | 14 | | | | 874 | |
| | 2.68 | | | Semi-annual | | | 3-Month LIBOR | | | Quarterly | | | 06/28/27 | (a) | | | 06/28/37 | | | | USD | | | | 1,130 | | | | 31,579 | | | | — | | | | 31,579 | |
| | 2.80 | | | Semi-annual | | | 3-Month LIBOR | | | Quarterly | | | 09/29/27 | (a) | | | 09/29/37 | | | | USD | | | | 760 | | | | 14,651 | | | | 12 | | | | 14,639 | |
| | 3-Month LIBOR | | | Quarterly | | | 3.06 | | | Semi-annual | | | 02/15/23 | (a) | | | 02/15/53 | | | | USD | | | | 3,210 | | | | 51,389 | | | | 72 | | | | 51,317 | |
| | | | | | | | | | | | | | | | | | | | | | | | | | | | | | | | | | | | | | |
| | | | | | | | | | | | | | | | | | | | | | | | | | | | $ | 1,375,366 | | | $ | 10,725 | | | $ | 1,364,641 | |
| | | | | | | | | | | | | | | | | | | | | | | | | | | | | | | | | | | | | | |
| | |
| 40 | | 2018 BLACKROCK SEMI-ANNUAL REPORTTO SHAREHOLDERS |
| | |
Schedule of Investments (unaudited) (continued) February 28, 2018 | | BlackRock Core Bond Trust (BHK) |
OTC Credit Default Swaps — Sell Protection
| | | | | | | | | | | | | | | | | | | | | | | | | | | | | | | | | | | | | | | | | | |
| Reference Obligation/Index | | | Financing
Rate Received
by the Trust | | | Payment
Frequency | | Counterparty | | | Termination
Date | | | Credit
Rating(a) | | | Notional
Amount
(000)(b) | | | Value | | | Upfront
Premium
Paid
(Received) | | | Unrealized
Appreciation
(Depreciation) | |
Jaguar Land Rover Automotive PLC | | | | 5.00 | % | | Quarterly | | | Credit Suisse International | | | | 06/20/22 | | | | BB+ | | | | EUR | | | | 20 | | | $ | 3,847 | | | $ | 3,408 | | | $ | 439 | |
Jaguar Land Rover Automotive PLC | | | | 5.00 | | | Quarterly | | | Barclays Bank PLC | | | | 12/20/22 | | | | BB+ | | | | EUR | | | | 20 | | | | 4,025 | | | | 3,882 | | | | 143 | |
Telecom Italia SpA/Milano | | | | 1.00 | | | Quarterly | | | Citibank N.A. | | | | 12/20/22 | | | | N/R | | | | EUR | | | | 20 | | | | (280 | ) | | | (398 | ) | | | 118 | |
Markit CMBX North America, Series 8 | | | | 3.00 | | | Monthly | | | Barclays Bank PLC | | | | 10/17/57 | | | | N/R | | | | USD | | | | 5,000 | | | | (767,581 | ) | | | (517,900 | ) | | | (249,681 | ) |
Markit CMBX North America, Series 8 | | | | 3.00 | | | Monthly | | | Credit Suisse International | | | | 10/17/57 | | | | N/R | | | | USD | | | | 2,500 | | | | (383,790 | ) | | | (255,900 | ) | | | (127,890 | ) |
Markit CMBX North America, Series 8 | | | | 3.00 | | | Monthly | |
| Morgan Stanley & Co.
International PLC |
| | | 10/17/57 | | | | N/R | | | | USD | | | | 5,550 | | | | (852,940 | ) | | | (756,605 | ) | | | (96,335 | ) |
Markit CMBX North America, Series 9 | | | | 3.00 | | | Monthly | |
| Morgan Stanley & Co.
International PLC |
| | | 09/17/58 | | | | N/R | | | | USD | | | | 9,450 | | | | (1,121,961 | ) | | | (1,190,710 | ) | | | 68,749 | |
Markit CMBX North America, Series 9 | | | | 3.00 | | | Monthly | | | Credit Suisse International | | | | 09/17/58 | | | | N/R | | | | USD | | | | 5,000 | | | | (593,630 | ) | | | (553,247 | ) | | | (40,383 | ) |
Markit CMBX North America, Series 9 | | | | 3.00 | | | Monthly | | | Credit Suisse International | | | | 09/17/58 | | | | N/R | | | | USD | | | | 5,000 | | | | (593,630 | ) | | | (553,247 | ) | | | (40,383 | ) |
Markit CMBX North America, Series 9 | | | | 3.00 | | | Monthly | | | Credit Suisse International | | | | 09/17/58 | | | | N/R | | | | USD | | | | 5,000 | | | | (593,629 | ) | | | (547,204 | ) | | | (46,425 | ) |
Markit CMBX North America, Series 9 | | | | 3.00 | | | Monthly | | | Credit Suisse International | | | | 09/17/58 | | | | N/R | | | | USD | | | | 5,000 | | | | (593,630 | ) | | | (553,195 | ) | | | (40,435 | ) |
| | | | | | | | | | | | | | | | | | | | | | | | | | | | | | | | | | | | | | | |
| | | | | | | | | | | | | | | | | | | | | | | | | | | | | | | | $ | (5,493,199 | ) | | $ | (4,921,116 | ) | | $ | (572,083 | ) |
| | | | | | | | | | | | | | | | | | | | | | | | | | | | | | | | | | | | | | | | | | |
| | (a) | Using S&P’s rating of the issuer or the underlying securities of the index, as applicable. | |
| | (b) | The maximum potential amount the Trust may pay should a negative credit event take place as defined under the terms of the agreement. | |
Balances Reported in the Statements of Assets and Liabilities for Centrally Cleared Swaps, OTC Derivatives and Options Written
| | | | | | | | | | | | | | | | | | | | |
| | | Swap Premiums Paid | | | Swap Premiums
Received | | | Unrealized
Appreciation | | | Unrealized
Depreciation | | | Value | |
Centrally Cleared Swaps(a) | | $ | 27,821 | | | $ | (9,262 | ) | | $ | 2,316,397 | | | $ | (943,384 | ) | | $ | — | |
OTC Derivatives | | | 7,290 | | | | (4,928,406 | ) | | | 69,449 | | | | (641,532 | ) | | | — | |
Options Written | | | — | | | | — | | | | — | | | | — | | | | (5,205,701 | ) |
| | (a) | Includes cumulative appreciation (depreciation) on centrally cleared swaps, as reported in the Schedule of Investments. Only current day’s variation margin is reported within the Statements of Assets and Liabilities and is net of any previously paid (received) swap premium amounts. | |
Derivative Financial Instruments Categorized by Risk Exposure
As of period end, the fair values of derivative financial instruments located in the Statements of Assets and Liabilities were as follows:
| | | | | | | | | | | | | | | | | | | | | | | | | | | | |
| | | Commodity
Contracts | | | Credit
Contracts | | | Equity
Contracts | | | Foreign
Currency
Exchange
Contracts | | | Interest Rate Contracts | | | Other
Contracts | | | Total | |
Assets — Derivative Financial Instruments | | | | | | | | | | | | | | | | | | | | | | | | | | | | |
Futures contracts | | | | | | | | | | | | | | | | | | | | | | | | | | | | |
Net unrealized appreciation(a) | | $ | — | | | $ | — | | | $ | 242 | | | $ | — | | | $ | 660,290 | | | $ | — | | | $ | 660,532 | |
Forward foreign currency exchange contracts | | | | | | | | | | | | | | | | | | | | | | | | | | | | |
Unrealized appreciation on forward foreign currency exchange contracts | | | — | | | | — | | | | — | | | | 755,475 | | | | — | | | | — | | | | 755,475 | |
Options purchased(b) | | | | | | | | | | | | | | | | | | | | | | | | | | | | |
Investments at value — unaffiliated(c) | | | — | | | | — | | | | — | | | | — | | | | 3,494,413 | | | | — | | | | 3,494,413 | |
Swaps — centrally cleared | | | | | | | | | | | | | | | | | | | | | | | | | | | | |
Net unrealized appreciation(a) | | | — | | | | 8,372 | | | | — | | | | — | | | | 2,308,025 | | | | — | | | | 2,316,397 | |
Swaps — OTC | | | | | | | | | | | | | | | | | | | | | | | | | | | | |
Unrealized appreciation on OTC swaps; Swap premiums paid | | | — | | | | 76,739 | | | | — | | | | — | | | | — | | | | — | | | | 76,739 | |
| | | | | | | | | | | | | | | | | | | | | | | | | | | | |
| | $ | — | | | $ | 85,111 | | | $ | 242 | | | $ | 755,475 | | | $ | 6,462,728 | | | $ | — | | | $ | 7,303,556 | |
| | | | | | | | | | | | | | | | | | | | | | | | | | | | |
| | | | |
| SCHEDULES OF INVESTMENTS | | | 41 | |
| | |
Schedule of Investments (unaudited) (continued) February 28, 2018 | | BlackRock Core Bond Trust (BHK) |
Derivative Financial Instruments Categorized by Risk Exposure (continued)
| | | | | | | | | | | | | | | | | | | | | | | | | | | | |
| | | Commodity
Contracts | | | Credit
Contracts | | | Equity
Contracts | | | Foreign
Currency
Exchange
Contracts | | | Interest Rate Contracts | | | Other
Contracts | | | Total | |
| Liabilities — Derivative Financial Instruments | | | | | | | | | | | | | | | | | | | | | |
Futures contracts | | | | | | | | | | | | | | | | | | | | | | | | | | | | |
Net unrealized depreciation(a) | | $ | — | | | $ | — | | | $ | — | | | $ | — | | | $ | 375,354 | | | $ | — | | | $ | 375,354 | |
Forward foreign currency exchange contracts | | | | | | | | | | | | | | | | | | | | | | | | | | | | |
Unrealized depreciation on forward foreign currency exchange contracts | | | — | | | | — | | | | — | | | | 8,095 | | | | — | | | | — | | | | 8,095 | |
Options written | | | | | | | | | | | | | | | | | | | | | | | | | | | | |
Options written at value | | | — | | | | — | | | | — | | | | — | | | | 5,205,701 | | | | — | | | | 5,205,701 | |
Swaps — centrally cleared | | | | | | | | | | | | | | | | | | | | | | | | | | | | |
Net unrealized depreciation(a) | | | — | | | | — | | | | — | | | | — | | | | 943,384 | | | | — | | | | 943,384 | |
Swaps — OTC | | | | | | | | | | | | | | | | | | | | | | | | | | | | |
Unrealized depreciation on OTC swaps; Swap premiums received | | | — | | | | 5,569,938 | | | | — | | | | — | | | | — | | | | — | | | | 5,569,938 | |
| | | | | | | | | | | | | | | | | | | | | | | | | | | | |
| | $ | — | | | $ | 5,569,938 | | | $ | — | | | $ | 8,095 | | | $ | 6,524,439 | | | $ | — | | | $ | 12,102,472 | |
| | | | | | | | | | | | | | | | | | | | | | | | | | | | |
| | (a) | Includes cumulative appreciation (depreciation) on futures contracts and centrally cleared swaps, if any, as reported in the Schedule of Investments. Only current day’s variation margin is reported within the Statements of Assets and Liabilities. | |
| | (b) | Includes forward settling swaptions. | |
| | (c) | Includes options purchased at value as reported in the Schedule of Investments. | |
For the period ended February 28, 2018, the effect of derivative financial instruments in the Statements of Operations were as follows:
| | | | | | | | | | | | | | | | | | | | | | | | | | | | |
| | | Commodity
Contracts | | | Credit
Contracts | | | Equity
Contracts | | | Foreign
Currency
Exchange
Contracts | | | Interest
Rate
Contracts | | | Other
Contracts | | | Total | |
Net Realized Gain (Loss) from: | | | | | | | | | | | | | | | | | | | | | | | | | | | | |
Futures contracts | | $ | — | | | $ | — | | | $ | — | | | $ | — | | | $ | 4,448,403 | | | $ | — | | | $ | 4,448,403 | |
Forward foreign currency exchange contracts | | | — | | | | — | | | | — | | | | (1,264,152 | ) | | | — | | | | — | | | | (1,264,152 | ) |
Options purchased(a) | | | — | | | | — | | | | — | | | | (2,721,451 | ) | | | (355,733 | ) | | | — | | | | (3,077,184 | ) |
Options written | | | — | | | | — | | | | — | | | | 2,503,278 | | | | 529,579 | | | | — | | | | 3,032,857 | |
Swaps | | | — | | | | 693,874 | | | | — | | | | — | | | | (285,827 | ) | | | — | | | | 408,047 | |
| | | | | | | | | | | | | | | | | | | | | | | | | | | | |
| | $ | — | | | $ | 693,874 | | | $ | — | | | $ | (1,482,325 | ) | | $ | 4,336,422 | | | $ | — | | | $ | 3,547,971 | |
| | | | | | | | | | | | | | | | | | | | | | | | | | | | |
| Net Change in Unrealized Appreciation (Depreciation) on: | | | | | | | | | | | | | | | | | | | | | |
Futures contracts | | $ | — | | | $ | — | | | $ | 242 | | | $ | — | | | $ | 728,717 | | | $ | — | | | $ | 728,959 | |
Forward foreign currency exchange contracts | | | — | | | | — | | | | — | | | | 454,620 | | | | — | | | | — | | | | 454,620 | |
Options purchased(b) | | | — | | | | — | | | | — | | | | (1,139,453 | ) | | | 408,586 | | | | — | | | | (730,867 | ) |
Options written | | | — | | | | — | | | | — | | | | 949,329 | | | | (2,390,132 | ) | | | — | | | | (1,440,803 | ) |
Swaps | | | — | | | | 49,064 | | | | — | | | | — | | | | 1,056,266 | | | | — | | | | 1,105,330 | |
| | | | | | | | | | | | | | | | | | | | | | | | | | | | |
| | $ | — | | | $ | 49,064 | | | $ | 242 | | | $ | 264,496 | | | $ | (196,563 | )�� | | $ | — | | | $ | 117,239 | |
| | | | | | | | | | | | | | | | | | | | | | | | | | | | |
| | (a) | Options purchased are included in net realized gain (loss) from investments. | |
| | (b) | Options purchased are included in net change in unrealized appreciation (depreciation) on investments. | |
Average Quarterly Balances of Outstanding Derivative Financial Instruments
| | | | |
Futures contracts: | | | | |
Average notional value of contracts — long | | $ | 121,430,595 | |
Average notional value of contracts — short | | $ | 296,338,221 | |
Forward foreign currency exchange contracts: | | | | |
Average amounts purchased — in USD | | $ | 124,987,756 | |
Average amounts sold — in USD | | $ | 71,706,817 | |
Options: | | | | |
Average value of option contracts purchased | | $ | 295,995 | |
Average value of option contracts written | | $ | 277,040 | |
Average notional value of swaption contracts purchased | | $ | 252,427,470 | |
Average notional value of swaption contracts written | | $ | 595,880,641 | |
Credit default swaps: | | | | |
Average notional amount — buy protection | | $ | 1,000 | (a) |
Average notional amount — sell protection | | $ | 42,903,754 | |
Interest rate swaps: | | | | |
Average notional amount — pays fixed rate | | $ | 571,635,000 | |
Average notional amount — receives fixed rate | | $ | 446,990,030 | |
| | (a) | Actual amounts for the period are shown due to limited outstanding derivative financial instruments as of each quarter. | |
| | |
| 42 | | 2018 BLACKROCK SEMI-ANNUAL REPORTTO SHAREHOLDERS |
| | |
Schedule of Investments (unaudited) (continued) February 28, 2018 | | BlackRock Core Bond Trust (BHK) |
For more information about the Trust’s investment risks regarding derivative financial instruments, refer to the Notes to Financial Statements.
Derivative Financial Instruments — Offsetting as of Period End
The Trust’s derivative assets and liabilities (by type) were as follows:
| | | | | | | | |
| | | Assets | | | Liabilities | |
Futures contracts | | $ | 7,258 | | | $ | 197,562 | |
Swaps — Centrally cleared | | | — | | | | 117,964 | |
Forward foreign currency exchange contracts | | | 755,475 | | | | 8,095 | |
Options(a) | | | 3,494,413 | (b) | | | 5,205,701 | |
Swaps — OTC(c) | | | 76,739 | | | | 5,569,938 | |
| | | | | | | | |
Total derivative assets and liabilities in the Statements of Assets and Liabilities | | $ | 4,333,885 | | | $ | 11,099,260 | |
Derivatives not subject to a Master Netting Agreement or similar agreement (“MNA”) | | | (7,258 | ) | | | (315,526 | ) |
| | | | | | | | |
Total derivative assets and liabilities subject to an MNA | | $ | 4,326,627 | | | $ | 10,783,734 | |
| | | | | | | | |
| | (a) | Includes forward settling swaptions. | |
| | (b) | Includes options purchased at value which is included in Investments at value — unaffiliated in the Statements of Assets and Liabilities and reported in the Schedule of Investments. | |
| | (c) | Includes unrealized appreciation (depreciation) on OTC swaps and swap premiums (paid/received) in the Statements of Assets and Liabilities. | |
The following table presents the Trust’s derivative assets (and liabilities) by counterparty net of amounts available for offset under an MNA and net of the related collateral received (and pledged) by the Trust:
| | | | | | | | | | | | | | | | | | | | |
Counterparty | | Derivative
Assets
Subject to
an MNA by
Counterparty | | | Derivatives
Available
for Offset (a) | | | Non-cash
Collateral
Received | | | Cash
Collateral
Received (b) | | | Net Amount
of Derivative
Asset (c)(f) | |
Australia and New Zealand Bank Group | | $ | 3,875 | | | $ | — | | | $ | — | | | $ | — | | | $ | 3,875 | |
Bank of America N.A. | | | 163,366 | | | | (155,746 | ) | | | — | | | | — | | | | 7,620 | |
Barclays Bank PLC | | | 1,519,229 | | | | (1,515,877 | ) | | | — | | | | — | | | | 3,352 | |
BNP Paribas S.A. | | | 84,443 | | | | — | | | | — | | | | — | | | | 84,443 | |
Citibank N.A. | | | 111,920 | | | | (31,995 | ) | | | — | | | | (79,925 | ) | | | — | |
Credit Suisse International | | | 29,407 | | | | (29,407 | ) | | | — | | | | — | | | | — | |
Deutsche Bank AG | | | 724,249 | | | | (689,464 | ) | | | — | | | | — | | | | 34,785 | |
Goldman Sachs Bank USA | | | 236,279 | | | | (236,279 | ) | | | — | | | | — | | | | — | |
HSBC Bank USA N.A. | | | 55,896 | | | | — | | | | — | | | | — | | | | 55,896 | |
JPMorgan Chase Bank N.A. | | | 1,264,163 | | | | (1,264,163 | ) | | | — | | | | — | | | | — | |
Morgan Stanley & Co. International PLC | | | 88,551 | | | | (88,551 | ) | | | — | | | | — | | | | — | |
Standard Chartered Bank | | | 6,023 | | | | — | | | | — | | | | — | | | | 6,023 | |
Toronto-Dominion Bank | | | 39,128 | | | | — | | | | — | | | | — | | | | 39,128 | |
Westpac Banking Corp. | | | 98 | | | | — | | | | — | | | | — | | | | 98 | |
| | | | | | | | | | | | | | | | | | | | |
| | $ | 4,326,627 | | | $ | (4,011,482 | ) | | $ | — | | | $ | (79,925 | ) | | $ | 235,220 | |
| | | | | | | | | | | | | | | | | | | | |
| | | | | |
Counterparty | | Derivative
Liabilities Subject to
an MNA by
Counterparty | | | Derivatives
Available
for Offset (a) | | | Non-cash
Collateral
Pledged | | | Cash
Collateral
Pledged (d) | | | Net Amount
of Derivative
Liabilities (e)(f) | |
Bank of America N.A. | | $ | 155,746 | | | $ | (155,746 | ) | | $ | — | | | $ | — | | | $ | — | |
Barclays Bank PLC | | | 1,515,877 | | | | (1,515,877 | ) | | | — | | | | — | | | | — | |
Citibank N.A. | | | 31,995 | | | | (31,995 | ) | | | — | | | | — | | | | — | |
Credit Suisse International | | | 2,758,309 | | | | (29,407 | ) | | | — | | | | (1,800,000 | ) | | | 928,902 | |
Deutsche Bank AG | | | 689,464 | | | | (689,464 | ) | | | — | | | | — | | | | — | |
Goldman Sachs Bank USA | | | 1,839,522 | | | | (236,279 | ) | | | — | | | | (1,350,000 | ) | | | 253,243 | |
JPMorgan Chase Bank N.A. | | | 1,661,723 | | | | (1,264,163 | ) | | | — | | | | (380,000 | ) | | | 17,560 | |
Morgan Stanley & Co. International PLC | | | 2,055,670 | | | | (88,551 | ) | | | — | | | | (1,730,000 | ) | | | 237,119 | |
UBS AG | | | 75,428 | | | | — | | | | — | | | | — | | | | 75,428 | |
| | | | | | | | | | | | | | | | | | | | |
| | $ | 10,783,734 | | | $ | (4,011,482 | ) | | $ | — | | | $ | (5,260,000 | ) | | $ | 1,512,252 | |
| | | | | | | | | | | | | | | | | | | | |
| | (a) | The amount of derivatives available for offset is limited to the amount of derivative asset and/or liabilities that are subject to an MNA. | |
| | (b) | Excess of collateral received from the individual counterparty is not shown for financial reporting purposes. | |
| | (c) | Net amount represents the net amount receivable from the counterparty in the event of default. | |
| | | | |
| SCHEDULES OF INVESTMENTS | | | 43 | |
| | |
Schedule of Investments (unaudited) (continued) February 28, 2018 | | BlackRock Core Bond Trust (BHK) |
| | (d) | Excess of collateral pledged to the individual counterparty is not shown for financial reporting purposes. | |
| | (e) | Net amount represents the net amount payable due to counterparty in the event of default. Net amount may be offset further by the options written receivable/payable on the Statements of Assets and Liabilities. | |
| | (f) | Net amount may also include forward foreign currency exchange contracts and currency options that are not required to be collateralized. | |
Fair Value Hierarchy as of Period End
Various inputs are used in determining the fair value of investments and derivative financial instruments. For information about the Trust’s policy regarding valuation of investments and derivative financial instruments, refer to the Notes to Financial Statements.
The following tables summarize the Trust’s investments and derivative financial instruments categorized in the disclosure hierarchy:
| | | | | | | | | | | | | | | | |
| | | Level 1 | | | Level 2 | | | Level 3 | | | Total | |
Assets: | |
Investments: | |
Long-Term Investments: | |
Asset-Backed Securities | | $ | — | | | $ | 96,687,297 | | | $ | 320,458 | | | $ | 97,007,755 | |
Corporate Bonds | | | 630,191 | | | | 544,099,598 | | | | 6,538,750 | | | | 551,268,539 | |
Floating Rate Loan Interests | | | — | | | | 14,921,136 | | | | 699,164 | | | | 15,620,300 | |
Foreign Agency Obligations | | | — | | | | 34,972,607 | | | | — | | | | 34,972,607 | |
Municipal Bonds | | | — | | | | 24,139,966 | | | | — | | | | 24,139,966 | |
Non-Agency Mortgage-Backed Securities | | | — | | | | 70,215,410 | | | | — | | | | 70,215,410 | |
Preferred Securities | | | 9,286,244 | | | | 89,693,980 | | | | — | | | | 98,980,224 | |
U.S. Government Sponsored Agency Securities | | | — | | | | 112,569,858 | | | | 2 | | | | 112,569,860 | |
U.S. Treasury Obligations | | | — | | | | 120,527,543 | | | | — | | | | 120,527,543 | |
Short-Term Securities | | | 2,711,662 | | | | — | | | | — | | | | 2,711,662 | |
Options Purchased: | |
Interest Rate Contracts | | | — | | | | 3,494,413 | | | | — | | | | 3,494,413 | |
Unfunded Floating Rate Loan Interests(a) | | | — | | | | 61 | | | | — | | | | 61 | |
| | | | | | | | | | | | | | | | |
| | $ | 12,628,097 | | | $ | 1,111,321,869 | | | $ | 7,558,374 | | | $ | 1,131,508,340 | |
| | | | | | | | | | | | | | | | |
Derivative Financial Instruments(b) | |
Assets: | |
Credit contracts | | $ | — | | | $ | 77,821 | | | $ | — | | | $ | 77,821 | |
Forward foreign currency contracts | | | — | | | | 755,475 | | | | — | | | | 755,475 | |
Equity contracts | | | 242 | | | | — | | | | — | | | | 242 | |
Interest rate contracts | | | 660,290 | | | | 2,308,025 | | | | — | | | | 2,968,315 | |
Liabilities: | |
Credit contracts | | | — | | | | (641,532 | ) | | | — | | | | (641,532 | ) |
Forward foreign currency contracts | | | — | | | | (8,095 | ) | | | — | | | | (8,095 | ) |
Interest rate contracts | | | (375,354 | ) | | | (6,149,085 | ) | | | — | | | | (6,524,439 | ) |
| | | | | | | | | | | | | | | | |
| | $ | 285,178 | | | $ | (3,657,391 | ) | | $ | — | | | $ | (3,372,213 | ) |
| | | | | | | | | | | | | | | | |
| | (a) | Unfunded floating rate loan interests are valued at the unrealized appreciation (depreciation) on the commitment. | |
| | (b) | Derivative financial instruments are swaps, futures contracts, forward foreign currency exchange contracts and options written. Swaps, futures contracts and forward foreign currency exchange contracts are valued at the unrealized appreciation (depreciation) on the instrument and options written are shown at value. | |
The Trust may hold assets and/or liabilities in which the fair value approximates the carrying amount or face value, including accrued interest, for financial statement purposes. As of period end, reverse repurchase agreements of $368,809,658 are categorized as level 2 within the disclosure hierarchy.
During the six months ended February 28, 2018, there were no transfers between Level 1 and Level 2.
| | |
| 44 | | 2018 BLACKROCK SEMI-ANNUAL REPORTTO SHAREHOLDERS |
| | |
Schedule of Investments (unaudited) (continued) February 28, 2018 | | BlackRock Core Bond Trust (BHK) |
A reconciliation of Level 3 investments is presented when the Trust had a significant amount of Level 3 investments at the beginning and/or end of the period in relation to net assets. The following table is a reconciliation of Level 3 investments for which significant unobservable inputs were used in determining fair value:
| | | | | | | | | | | | | | | | | | | | |
| | | Asset-Backed
Securities | | | Corporate
Bonds | | | Floating Rate Loan
Interests | | | U.S. Government Sponsored
Agency Securities | | | Total | |
Assets: | | | | | | | | | | | | | | | | | | | | |
Opening Balance, as of August 31, 2017 | | $ | 2,069,938 | | | $ | 7,166,469 | | | $ | 707,182 | | | $ | 2 | | | $ | 9,943,591 | |
Transfers into Level 3 | | | — | | | | — | | | | 16,993 | | | | — | | | | 16,993 | |
Transfers out of Level 3 | | | (1,750,000 | ) | | | — | | | | (218,961 | ) | | | — | | | | (1,968,961 | ) |
Accrued discounts (premiums) | | | (54,627 | ) | | | — | | | | 1,699 | | | | — | | | | (52,928 | ) |
Net realized gain (loss) | | | — | | | | — | | | | 15,889 | | | | — | | | | 15,889 | |
Net change in unrealized appreciation (depreciation)(a)(b) | | | 55,147 | | | | (185,246 | ) | | | 3,229 | | | | — | | | | (126,870 | ) |
Purchases | | | — | | | | — | | | | 589,908 | | | | — | | | | 589,908 | |
Sales | | | — | | | | (442,473 | ) | | | (416,775 | ) | | | — | | | | (859,248 | ) |
| | | | | | | | | | | | | | | | | | | | |
Closing Balance, as of February 28, 2018 | | $ | 320,458 | | | $ | 6,538,750 | | | $ | 699,164 | | | $ | 2 | | | $ | 7,558,374 | |
| | | | | | | | | | | | | | | | | | | | |
Net change in unrealized appreciation (depreciation) on investments still held at February 28, 2018(b) | | $ | 55,147 | | | $ | (185,246 | ) | | $ | 3,841 | | | $ | — | | | $ | (126,258 | ) |
| | | | | | | | | | | | | | | | | | | | |
| | (a) | Included in the related net change in unrealized appreciation (depreciation) in the Statements of Operations. | |
| | (b) | Any difference between net change in unrealized appreciation (depreciation) and net change in unrealized appreciation (depreciation) on investments still held at February 28, 2018 is generally due to derivative financial investments no longer held or categorized as Level 3 at period end. | |
The Trust’s investments that are categorized as Level 3 were valued utilizing third party pricing information without adjustment. Such valuations are based on unobservable inputs. A significant change in third party information could result in a significantly lower or higher value of such Level 3 investments.
| | | | |
| SCHEDULES OF INVESTMENTS | | | 45 | |
| | |
Consolidated Schedule of Investments (unaudited) February 28, 2018 | | BlackRock Corporate High Yield Fund, Inc. (HYT) (Percentages shown are based on Net Assets) |
| | | | | | | | | | | | |
| Security | | | | | Shares | | | Value | |
Common Stocks — 2.2% | |
|
| Chemicals — 0.3% | |
Advanced Emissions Solutions, Inc. | | | | | | | 168,580 | | | $ | 1,625,111 | |
Platform Specialty Products
Corp.(a) | | | | | | | 291,753 | | | | 3,045,902 | |
| | | | | | | | | | | | |
| | | | | | | | | | | 4,671,013 | |
| Consumer Finance — 0.0% | |
Ally Financial, Inc. | | | | | | | 2 | | | | 56 | |
| | | | | | | | | | | | |
| Diversified Financial Services — 0.4% | |
Concrete Investments II S.C.A.(b) | | | | | | | 4,997 | | | | — | |
Kcad Holdings I Ltd.(a)(b) | | | | | | | 2,223,465,984 | | | | 5,914,420 | |
| | | | | | | | | | | | |
| | | | | | | | | | | 5,914,420 | |
| Energy Equipment & Services — 0.1% | |
Larcina Energy Ltd.(a)(b)(q) | | | | | | | 211,764 | | | | 2 | |
Osum Oil Sands Corp.(a)(b)(q) | | | | | | | 400,000 | | | | 1,050,499 | |
| | | | | | | | | | | | |
| | | | | | | | | | | 1,050,501 | |
| Health Care Providers & Services — 0.2% | |
Tenet Healthcare Corp.(a) | | | | | | | 49,760 | | | | 1,025,056 | |
Universal Health Services, Inc., Class B | | | | | | | 13,160 | | | | 1,502,872 | |
| | | | | | | | | | | | |
| | | | | | | | | | | 2,527,928 | |
| IT Services — 0.1% | |
First Data Corp., Class A(a) | | | | | | | 135,954 | | | | 2,123,601 | |
| | | | | | | | | | | | |
| Machinery — 0.0% | |
Gates Industrial Corp. PLC(a) | | | | | | | 18,410 | | | | 319,598 | |
| | | | | | | | | | | | |
| Media — 0.1% | |
Altice USA, Inc., Class A(a) | | | | | | | 87,736 | | | | 1,596,795 | |
Emmis Communications Corp., Class A(a) | | | | | | | 7,210 | | | | 30,066 | |
| | | | | | | | | | | | |
| | | | | | | | | | | 1,626,861 | |
| Metals & Mining — 0.2% | |
Constellium NV, Class A(a) | | | | | | | 259,089 | | | | 3,005,432 | |
Peninsula Energy Ltd.(a) | | | | | | | 1,361,116 | | | | 301,296 | |
| | | | | | | | | | | | |
| | | | | | | | | | | 3,306,728 | |
| Oil, Gas & Consumable Fuels — 0.5% | |
Gener8 Maritime Corp. | | | | | | | 965,338 | | | | 5,357,626 | |
Halcon Resources Corp.(a) | | | | | | | 112,050 | | | | 677,902 | |
SPDR S&P Biotech ETF | | | | | | | 11,280 | | | | 1,019,261 | |
| | | | | | | | | | | | |
| | | | | | | | | | | 7,054,789 | |
| Real Estate Investment Trusts (REITs) — 0.1% | |
Gaming and Leisure Properties, Inc. | | | | | | | 57,580 | | | | 1,915,111 | |
| | | | | | | | | | | | |
| Semiconductors & Semiconductor Equipment — 0.0% | |
SunPower Corp.(a) | | | | | | | 1,025 | | | | 7,267 | |
| | | | | | | | | | | | |
| Specialty Retail — 0.0% | |
Asbury Automotive Group, Inc.(a) | | | | | | | 806 | | | | 53,075 | |
| | | | | | | | | | | | |
| Wireless Telecommunication Services — 0.2% | |
T-Mobile U.S., Inc.(a) | | | | | | | 59,550 | | | | 3,609,325 | |
| | | | | | | | | | | | |
Total Common Stocks — 2.2%
(Cost — $80,626,722) | | | | 34,180,273 | |
| | | | | | | | | | | | |
| | | |
| | | | | | Par
(000) | | | | |
Asset-Backed Securities — 4.0% | |
Accunia European CLO I BV, Series 1X, Class E, (3 mo. Euribor + 7.00%), 7.00%, 07/15/29(c) | | | EUR | | | | 1,400 | | | | 1,742,394 | |
Allegro CLO II Ltd., Series 2014-1A, Class CR, (3 mo. LIBOR US + 3.85%), 5.59%, 01/21/27(c)(d) | | | USD | | | | 1,000 | | | | 1,002,030 | |
Allegro CLO VI Ltd., Series 2017-2A, Class D, 4.48%, 01/17/31(d)(e) | | | | | | | 450 | | | | 450,579 | |
| | | | | | | | | | | | |
| Security | | | | | Par
(000) | | | Value | |
Asset-Backed Securities (continued) | |
ALM Loan Funding(c)(d): | | | | | | | | | | | | |
Series 2013-7R2A, Class BR, (3 mo. LIBOR US + 2.75%), 4.47%, 10/15/27 | | | USD | | | | 500 | | | $ | 505,102 | |
Series 2013-8A, Class CR, (3 mo. LIBOR US + 3.95%), 5.67%, 10/15/28 | | | | | | | 1,400 | | | | 1,418,864 | |
ALM VII R Ltd., Series 2013-7RA, Class BR, (3 mo. LIBOR US + 2.70%), 4.42%,
10/15/28(c)(d) | | | | | | | 500 | | | | 510,942 | |
ALM XII Ltd., Series
2015-12A(c)(d): | | | | | | | | | | | | |
Class BR, (3 mo. LIBOR US + 2.05%), 3.77%, 04/16/27 | | | | | | | 500 | | | | 503,570 | |
Class C1R, (3 mo. LIBOR US + 3.20%), 4.92%, 04/16/27 | | | | | | | 1,500 | | | | 1,508,803 | |
ALM XVI Ltd/ALM XVI LLC,
Series 2015-16A(c)(d): | | | | | | | | | | | | |
Class BR, (3 mo. LIBOR US + 2.05%), 3.77%, 07/15/27 | | | | | | | 590 | | | | 594,469 | |
Class C1R, (3 mo. LIBOR US + 3.20%), 4.92%, 07/15/27 | | | | | | | 742 | | | | 753,539 | |
AMMC CLO 18 Ltd., Series 2016-18A, Class D, (3 mo. LIBOR US + 5.00%), 6.94%,
05/26/28(c)(d) | | | | | | | 500 | | | | 503,513 | |
AMMC CLO 19 Ltd., Series 2016-19A, Class C, (3 mo. LIBOR US + 2.80%), 4.52%,
10/15/28(c)(d) | | | | | | | 413 | | | | 418,987 | |
Anchorage Capital CLO Ltd.(d): | | | | | | | | | | | | |
Series 2014-3RA, Class D,
4.36%, 01/28/31(e) | | | | | | | 500 | | | | 500,174 | |
Series 2014-4RA, Class D,
4.36%, 01/28/31(e) | | | | | | | 1,000 | | | | 1,000,348 | |
Series 2016-8A, Class D, (3 mo. LIBOR US + 4.20%), 5.96%, 07/28/28(c) | | | | | | | 1,000 | | | | 1,008,816 | |
Apidos CLO XVIII, Series 2014-18A, Class CR, (3 mo. LIBOR US + 3.25%),
4.99%, 07/22/26(c)(d) | | | | | | | 550 | | | | 557,047 | |
Apidos CLO XX, Series 2015-20A, Class BR, (3 mo. LIBOR US + 2.60%),
4.32%, 01/16/27(c)(d) | | | | | | | 250 | | | | 250,654 | |
Apidos CLO XXIII, Series 2015-23A, Class D2, (3 mo. LIBOR US + 5.95%),
7.67%, 01/15/27(c)(d) | | | | | | | 750 | | | | 750,558 | |
Ares XXVII CLO Ltd., Series 2013-2A, Class DR, (3 mo. LIBOR US + 3.75%),
5.51%, 07/28/29(c)(d) | | | | | | | 500 | | | | 513,065 | |
Ares XXVIII CLO Ltd., Series 2013-3A, Class DR, (3 mo. LIBOR US + 3.25%),
4.98%, 10/17/24(c)(d) | | | | | | | 350 | | | | 351,607 | |
Ares XXXII CLO Ltd., Series 2014-32A, Class CR, (3 mo. LIBOR US + 3.45%),
5.29%, 11/15/25(c)(d) | | | | | | | 750 | | | | 750,904 | |
Ares XXXIII CLO Ltd., Series 2015-1A, Class CR, (3 mo. LIBOR US + 4.20%),
5.69%, 12/05/25(c)(d) | | | | | | | 1,000 | | | | 1,024,654 | |
Ares XXXVII CLO Ltd., Series 2015-4A(d)(e): | | | | | | | | | | | | |
Class CR, 4.37%, 10/15/30 | | | | | | | 1,000 | | | | 1,006,541 | |
Class DR, 7.87%, 10/15/30 | | | | | | | 500 | | | | 509,222 | |
Atlas Senior Loan Fund X Ltd., Series 2018-10A(d)(e): | | | | | | | | | | | | |
Class B, 3.21%, 01/15/31 | | | | | | | 400 | | | | 400,764 | |
Class C, 3.56%, 01/15/31 | | | | | | | 625 | | | | 626,725 | |
Class D, 4.46%, 01/15/31 | | | | | | | 500 | | | | 500,162 | |
Aurium CLO II DAC, Series 2X, Class E, (3 mo. Euribor + 5.95%), 5.95%, 07/13/29(c) | | | EUR | | | | 2,024 | | | | 2,495,895 | |
| | |
| 46 | | 2018 BLACKROCK SEMI-ANNUAL REPORTTO SHAREHOLDERS |
| | |
Consolidated Schedule of Investments (unaudited) (continued) February 28, 2018 | | BlackRock Corporate High Yield Fund, Inc. (HYT) (Percentages shown are based on Net Assets) |
| | | | | | | | | | | | |
| Security | | | | | Par
(000) | | | Value | |
| Asset-Backed Securities (continued) | |
Ballyrock CLO Ltd., Series 2016-1A, Class C, (3 mo. LIBOR US + 2.70%), 4.42%, 10/15/28(c)(d) | | | USD | | | | 1,000 | | | $ | 1,011,680 | |
Betony CLO Ltd., Series 2015-1A, Class CR, (3 mo. LIBOR US + 2.85%), 4.57%, 04/15/27(c)(d) | | | | | | | 250 | | | | 250,840 | |
Cairn CLO VII BV, Series 2016-7X, Class E, (3 mo. Euribor + 6.35%), 6.35%, 01/31/30(c) | | | EUR | | | | 900 | | | | 1,120,694 | |
Carlyle Global Market Strategies CLO Ltd.(d): | | | | | | | | | | | | |
Series 2012-4A, Class DR, (3 mo. LIBOR US + 4.10%), 5.84%, 01/20/29(c) | | | USD | | | | 500 | | | | 511,805 | |
Series 2014-1A, Class CR, (3 mo. LIBOR US + 2.75%), 4.48%, 04/17/25(c) | | | | | | | 500 | | | | 500,103 | |
Series 2015-3A, Class D, 7.46%, 07/28/28(e) | | | | | | | 500 | | | | 506,467 | |
Series 2016-3A, Class D, (3 mo. LIBOR US + 7.00%), 8.74%, 10/20/29(c) | | | | | | | 500 | | | | 512,982 | |
Series 2017-1A, Class D, (3 mo. LIBOR US + 6.00%), 7.74%, 04/20/31(c) | | | | | | | 500 | | | | 511,365 | |
Cedar Funding Ltd., Series 2017-8A, Class D, 4.98%, 10/17/30(d)(e) | | | | | | | 535 | | | | 543,711 | |
CIFC Funding I Ltd., Series 2017-1A, Class D, (3 mo. LIBOR US + 3.50%),
5.24%, 04/23/29(c)(d) | | | | | | | 500 | | | | 508,093 | |
CIFC Funding III Ltd., Series 2015-3A, Class E, (3 mo. LIBOR US + 6.05%),
7.79%, 10/19/27(c)(d) | | | | | | | 750 | | | | 750,486 | |
CIFC Funding Ltd.(d)(e)(f): | | | | | | | | | | | | |
Series 2014-2A, Class A3LRSeries 2018-1A, Class C, 1.00%, 04/18/31 | | | | | | | 500 | | | | 498,601 | |
Series 2018-1A, Class B, 1.00%, 04/18/31 | | | | | | | 435 | | | | 435,765 | |
CIFC Funding V Ltd.(c)(d): | | | | | | | | | | | | |
Series 2014-5A, Class CR, (3 mo. LIBOR US + 2.70%), 4.43%, 01/17/27 | | | | | | | 750 | | | | 754,309 | |
Series 2015-5A, Class D, (3 mo. LIBOR US + 6.30%), 8.05%, 10/25/27 | | | | | | | 500 | | | | 502,339 | |
Dryden 37 Senior Loan Fund, Series 2015-37A, Class DR, 4.22%, 01/15/31(d)(e) | | | | | | | 500 | | | | 500,613 | |
Dryden Senior Loan Fund(c)(d): | | | | | | | | | | | | |
Series 2014-31A, Class DR, (3 mo. LIBOR US + 3.35%), 5.08%, 04/18/26 | | | | | | | 500 | | | | 501,676 | |
Series 2014-36A, Class DR, (3 mo. LIBOR US + 4.24%), 5.96%, 01/15/28 | | | | | | | 1,500 | | | | 1,530,668 | |
Series 2017-50A, Class C, (3 mo. LIBOR US + 2.25%), 3.97%, 07/15/30 | | | | | | | 500 | | | | 508,464 | |
Greenwood Park CLO Ltd., Series 2018-1A, Class D, 1.00%, 04/15/31(b)(d)(e)(f) | | | | | | | 500 | | | | 500,000 | |
Highbridge Loan Management Ltd.,
Series 5A-2015(c)(d): | | | | | | | | | | | | |
Class C1R, (3 mo. LIBOR US + 2.10%),
3.86%, 01/29/26 | | | | | | | 500 | | | | 502,897 | |
Class D1R, (3 mo. LIBOR US + 3.30%),
5.06%, 01/29/26 | | | | | | | 500 | | | | 501,169 | |
Class D2R, (3 mo. LIBOR US + 3.30%),
5.06%, 01/29/26 | | | | | | | 500 | | | | 501,169 | |
HPS Loan Management Ltd., Series 9A-2016, Class D2, (3 mo. LIBOR US + 6.45%), 8.19%, 07/19/27(c)(d) | | | | | | | 800 | | | | 811,695 | |
LCM XV LP, Series 15A, Class CR, (3 mo. LIBOR US + 2.40%), 3.14%, 07/20/30(c)(d) | | | | | | | 500 | | | | 509,795 | |
Madison Park Funding XIV Ltd., Series 2014-14A, Class DR, (3 mo. LIBOR US + 3.25%), 4.99%, 07/20/26(c)(d) | | | | | | | 500 | | | | 504,028 | |
| | | | | | | | | | | | |
| Security | | | | | Par
(000) | | | Value | |
| Asset-Backed Securities (continued) | |
Madison Park Funding XV Ltd., Series 2014-15A, Class CR, (3 mo. LIBOR US + 3.45%), 5.21%, 01/27/26(c)(d) | | | USD | | | | 500 | | | $ | 501,639 | |
Madison Park Funding XVI Ltd., Series 2015-16A, Class D, (3 mo. LIBOR US + 5.50%), 7.24%, 04/20/26(c)(d) | | | | | | | 500 | | | | 500,996 | |
Mill Creek II CLO Ltd., Series 2016-1A, Class E, (3 mo. LIBOR US + 7.75%),
9.49%, 04/20/28(c)(d) | | | | | | | 500 | | | | 504,404 | |
MP CLO VI Ltd., Series 2014-2A, Class DR, (3 mo. LIBOR US + 3.50%),
5.22%, 01/15/27(c)(d) | | | | | | | 1,000 | | | | 1,014,550 | |
Neuberger Berman CLO XVI-S Ltd., Series 2017-16SA, Class D, 4.22%, 01/15/28(d)(e) | | | | | | | 500 | | | | 500,889 | |
Neuberger Berman CLO XVII Ltd., Series 2014-17A, Class DR, (3 mo. LIBOR US + 3.65%), 5.39%, 04/22/29(c)(d) | | | | | | | 500 | | | | 510,582 | |
Neuberger Berman CLO XVIII Ltd.,
Series 2014-18A(c)(d): | | | | | | | | | | | | |
Class BR, (3 mo. LIBOR US + 2.55%),
4.38%, 11/14/27 | | | | | | | 500 | | | | 506,041 | |
Class CR, (3 mo. LIBOR US + 4.25%),
6.08%, 11/14/27 | | | | | | | 1,500 | | | | 1,523,311 | |
Neuberger Berman CLO XXII Ltd., Series 2016-22A, Class E, (3 mo. LIBOR US + 6.75%), 8.48%, 10/17/27(c)(d) | | | | | | | 500 | | | | 510,143 | |
Neuberger Berman CLO XXIII Ltd., Series 2016-23A, Class E, (3 mo. LIBOR US + 6.58%), 8.31%, 10/17/27(c)(d) | | | | | | | 500 | | | | 509,592 | |
OCP CLO Ltd., Series 2015-8A, Class CR, 4.53%, 04/17/27(d)(e) | | | | | | | 250 | | | | 250,662 | |
Octagon Investment Partners Ltd.(d): | | | | | | | | | | | | |
Series 2013-1A, Class A1R2,
3.02%, 01/25/31(e) | | | | | | | 1,500 | | | | 1,500,000 | |
Series 2013-1A, Class BR2,
3.42%, 01/25/31(e) | | | | | | | 500 | | | | 500,000 | |
Series 2013-1A, Class CR2,
3.72%, 01/25/31(e) | | | | | | | 750 | | | | 750,000 | |
Series 2016-1A, Class D, (3 mo. LIBOR US + 4.95%), 6.67%, 04/15/27(c) | | | | | | | 500 | | | | 501,981 | |
Octagon Investment Partners XXII Ltd., Series 2014-1A, Class DRR, 4.49%, 01/22/30(d)(e) | | | | | | | 1,000 | | | | 999,694 | |
Octagon Investment Partners XXVII Ltd., Series 2016-1A, Class E, (3 mo. LIBOR US + 7.10%), 8.82%, 07/15/27(c)(d) | | | | | | | 1,000 | | | | 1,018,066 | |
Octagon Investment Partners XXXII Ltd.,
Series 2017-1A, Class E,
7.92%, 07/15/29(d)(e) | | | | | | | 500 | | | | 513,940 | |
OneMain Financial Issuance Trust,
Series 2015-2A, Class C, 4.32%, 07/18/25(d) | | | | | | | 200 | | | | 199,861 | |
OZLM IX Ltd., Series 2014-9A Class CR, (3 mo. LIBOR US + 3.55%), 5.29%, 01/20/27(c)(d) | | | | | | | 1,000 | | | | 1,004,514 | |
OZLM XIX Ltd., Series 2017-19A, Class C, 4.47%, 11/22/30(d)(e) | | | | | | | 500 | | | | 507,255 | |
OZLME III DAC, Series 3X, Class E,
4.80%, 08/24/30(e) | | | EUR | | | | 200 | | | | 246,649 | |
Palmer Square CLO Ltd., Series 2014-1A, Class BR2, 3.58%, 01/17/31(d)(e) | | | USD | | | | 500 | | | | 503,377 | |
Stewart Park CLO Ltd., Series 2015-1A(d)(e): | | | | | | | | | | | | |
Class DR, 4.32%, 01/15/30 | | | | | | | 1,000 | | | | 999,768 | |
Class ER, 7.00%, 01/15/30 | | | | | | | 1,000 | | | | 984,803 | |
Symphony CLO Ltd., Series 2016-17A, Class D, (3 mo. LIBOR US + 4.80%),
6.52%, 04/15/28(c)(d) | | | | | | | 250 | | | | 250,949 | |
| | | | |
| SCHEDULES OF INVESTMENTS | | | 47 | |
| | |
Consolidated Schedule of Investments (unaudited) (continued) February 28, 2018 | | BlackRock Corporate High Yield Fund, Inc. (HYT) (Percentages shown are based on Net Assets) |
| | | | | | | | | | | | |
| Security | | | | | Par
(000) | | | Value | |
| Asset-Backed Securities (continued) | |
Symphony CLO XII Ltd., Series 2013-12A, Class DR, (3 mo. LIBOR US + 3.25%),
4.97%, 10/15/25(c)(d) | | | USD | | | | 1,000 | | | $ | 1,001,013 | |
Venture XXVI CLO Ltd., Series 2017-26A, Class D, (3 mo. LIBOR US + 4.25%),
5.99%, 01/20/29(c)(d) | | | | | | | 750 | | | | 774,252 | |
Voya CLO Ltd., Series 2016-3A(c)(d): | | | | | | | | | | | | |
Class C, (3 mo. LIBOR US + 3.85%), 5.58%, 10/18/27 | | | | | | | 1,000 | | | | 1,013,008 | |
Class D, (3 mo. LIBOR US + 6.85%), 8.58%, 10/18/27 | | | | | | | 500 | | | | 512,256 | |
Westcott Park CLO Ltd., Series 2016-1A(c)(d): | | | | | | | | | | | | |
Class D, (3 mo. LIBOR US + 4.35%), 6.09%, 07/20/28 | | | | | | | 500 | | | | 513,051 | |
Class E, (3 mo. LIBOR US + 7.20%), 8.94%, 07/20/28 | | | | | | | 500 | | | | 518,043 | |
York CLO Ltd., Series 2016-1A, Class DR, (3 mo. LIBOR US + 3.60%), 5.34%,
10/20/29(c)(d) | | | | | | | 500 | | | | 511,343 | |
York CLO-3 Ltd., Series 2016-1A, Class ER, (3 mo. LIBOR US + 6.40%),
8.14%, 10/20/29(c)(d) | | | | | | | 500 | | | | 508,540 | |
| | | | | | | | | | | | |
Total Asset-Backed Securities — 4.0%
(Cost — $59,077,130) | | | | 60,616,514 | |
| | | | | | | | | | | | |
| | | |
Corporate Bonds — 114.9% | | | | | | | | | | | | |
| Aerospace & Defense — 3.3% | |
Arconic, Inc.: | | | | | | | | | | | | |
6.15%, 08/15/20 | | | | | | | 1,540 | | | | 1,630,213 | |
5.87%, 02/23/22 | | | | | | | 705 | | | | 747,300 | |
5.13%, 10/01/24 | | | | | | | 4,924 | | | | 5,102,495 | |
5.90%, 02/01/27 | | | | | | | 1,890 | | | | 2,031,750 | |
6.75%, 01/15/28 | | | | | | | 689 | | | | 785,460 | |
5.95%, 02/01/37 | | | | | | | 674 | | | | 719,562 | |
Bombardier, Inc.(d): | | | | | | | | | | | | |
7.75%, 03/15/20 | | | | | | | 1,434 | | | | 1,530,795 | |
8.75%, 12/01/21 | | | | | | | 3,830 | | | | 4,198,637 | |
6.00%, 10/15/22 | | | | | | | 1,369 | | | | 1,365,577 | |
6.13%, 01/15/23 | | | | | | | 438 | | | | 439,095 | |
7.50%, 12/01/24 | | | | | | | 3,060 | | | | 3,178,575 | |
7.50%, 03/15/25 | | | | | | | 5,799 | | | | 5,951,224 | |
7.45%, 05/01/34 | | | | | | | 686 | | | | 699,720 | |
EnPro Industries, Inc., 5.88%, 09/15/22 | | | | | | | 978 | | | | 1,013,746 | |
KLX, Inc., 5.88%, 12/01/22(d) | | | | | | | 5,590 | | | | 5,757,700 | |
Koppers, Inc., 6.00%, 02/15/25(d) | | | | | | | 1,190 | | | | 1,231,650 | |
Kratos Defense & Security Solutions, Inc., 6.50%, 11/30/25(d) | | | | | | | 1,089 | | | | 1,135,283 | |
Pioneer Holdings LLC/Pioneer Finance Corp., 9.00%, 11/01/22(d) | | | | | | | 1,077 | | | | 1,133,543 | |
Telecom Italia SpA/Milano, 2.38%, 10/12/27 | | | EUR | | | | 130 | | | | 156,329 | |
TransDigm, Inc.: | | | | | | | | | | | | |
6.00%, 07/15/22 | | | USD | | | | 6,361 | | | | 6,512,074 | |
6.50%, 07/15/24 | | | | | | | 3,382 | | | | 3,487,687 | |
6.50%, 05/15/25 | | | | | | | 1,160 | | | | 1,189,000 | |
6.38%, 06/15/26 | | | | | | | 96 | | | | 98,160 | |
| | | | | | | | | | | | |
| | | | | | | | | | | 50,095,575 | |
| Air Freight & Logistics — 0.4% | |
Air Medical Merger Sub Corp.,
6.38%, 05/15/23(d) | | | | | | | 805 | | | | 764,750 | |
XPO Logistics, Inc., 6.50%, 06/15/22(d) | | | | | | | 5,442 | | | | 5,652,877 | |
| | | | | | | | | | | | |
| | | | | | | | | | | 6,417,627 | |
| | | | | | | | | | | | |
| Security | | | | | Par
(000) | | | Value | |
| Airlines — 0.3% | |
US Airways Pass-Through Trust, Series 2013-1, Class B, 5.38%, 05/15/23 | | | USD | | | | 2,862 | | | $ | 2,977,079 | |
Virgin Australia Trust, Series 2013-1, Class C, 7.13%, 10/23/18(d) | | | | | | | 1,716 | | | | 1,740,283 | |
| | | | | | | | | | | | |
| | | | | | | | | | | 4,717,362 | |
| Auto Components — 1.1% | |
Adient Global Holdings Ltd., 3.50%, 08/15/24 | | | EUR | | | | 456 | | | | 570,228 | |
Allison Transmission, Inc., 5.00%, 10/01/24(d) | | | USD | | | | 827 | | | | 838,371 | |
Faurecia, 3.63%, 06/15/23 | | | EUR | | | | 180 | | | | 230,400 | |
Fiat Chrysler Automobiles NV, 3.75%, 03/29/24 | | | | | | | 400 | | | | 530,700 | |
Fiat Chrysler Finance Europe, 4.75%, 07/15/22 | | | | | | | 367 | | | | 503,988 | |
Gestamp Funding Luxembourg SA,
3.50%, 05/15/23 | | | | | | | 100 | | | | 127,033 | |
Goodyear Tire & Rubber Co., 5.00%, 05/31/26 | | | USD | | | | 471 | | | | 471,000 | |
Grupo-Antolin Irausa SA, 3.25%, 04/30/24 | | | EUR | | | | 316 | | | | 396,442 | |
HP Pelzer Holding GmbH, 4.13%, 04/01/24 | | | | | | | 286 | | | | 355,375 | |
Icahn Enterprises LP/Icahn Enterprises Finance Corp.: | | | | | | | | | | | | |
6.00%, 08/01/20 | | | USD | | | | 140 | | | | 142,730 | |
6.25%, 02/01/22 | | | | | | | 1,452 | | | | 1,473,780 | |
6.75%, 02/01/24 | | | | | | | 1,586 | | | | 1,617,720 | |
6.38%, 12/15/25 | | | | | | | 982 | | | | 985,683 | |
IHO Verwaltungs GmbH(g): | | | | | | | | | | | | |
(2.75% Cash or 3.50% PIK),
2.75%, 09/15/21 | | | EUR | | | | 262 | | | | 326,205 | |
(3.25% Cash or 4.00% PIK),
3.25%, 09/15/23 | | | | | | | 615 | | | | 775,060 | |
(3.75% Cash or 4.50% PIK),
3.75%, 09/15/26 | | | | | | | 225 | | | | 289,598 | |
(4.13% Cash or 4.88% PIK),
4.13%, 09/15/21(d) | | | USD | | | | 1,280 | | | | 1,276,800 | |
(4.50% Cash or 5.25% PIK),
4.50%, 09/15/23(d) | | | | | | | 1,367 | | | | 1,339,660 | |
Jaguar Land Rover Automotive PLC,
2.20%, 01/15/24 | | | EUR | | | | 200 | | | | 244,305 | |
Schaeffler Finance BV, 4.75%, 05/15/23(d) | | | USD | | | | 1,440 | | | | 1,465,200 | |
Tesla, Inc., 5.30%, 08/15/25(d) | | | | | | | 3,044 | | | | 2,888,908 | |
ZF North America Capital, Inc.: | | | | | | | | | | | | |
2.75%, 04/27/23 | | | EUR | | | | 100 | | | | 130,708 | |
4.75%, 04/29/25(d) | | | USD | | | | 159 | | | | 163,571 | |
| | | | | | | | | | | | |
| | | | | | | | | | | 17,143,465 | |
| Banks — 0.7% | |
Allied Irish Banks PLC(5 year EUR Swap + 3.95%), 4.13%, 11/26/25(h) | | | EUR | | | | 710 | | | | 935,122 | |
Alpha Bank AE, 2.50%, 02/05/23 | | | | | | | 425 | | | | 516,881 | |
Banco Espirito Santo SA, 4.00%, 01/21/19(a)(i) | | | | | | | 1,100 | | | | 402,600 | |
Banco Popolare, 2.75%, 07/27/20 | | | | | | | 800 | | | | 1,018,530 | |
Banco Popolare di Milano Scarl,
4.25%, 01/30/19 | | | | | | | 200 | | | | 252,511 | |
Bank of Ireland (5 year EUR Swap + 3.55%), 4.25%, 06/11/24(h) | | | | | | | 540 | | | | 688,753 | |
Bank of Ireland Group PLC, 3.13%, 09/19/27(e) | | | GBP | | | | 100 | | | | 135,988 | |
Bankia SA(h): | | | | | | | | | | | | |
(5 year EUR Swap + 3.17%),
4.00%, 05/22/24 | | | EUR | | | | 700 | | | | 886,712 | |
(5 year EUR Swap + 3.35%),
3.38%, 03/15/27 | | | | | | | 200 | | | | 258,742 | |
CaixaBank SA(h): | | | | | | | | | | | | |
(5 year EUR Swap + 3.35%),
3.50%, 02/15/27 | | | | | | | 200 | | | | 260,338 | |
(5 year EUR Swap + 2.35%),
2.75%, 07/14/28 | | | | | | | 100 | | | | 125,936 | |
| | |
| 48 | | 2018 BLACKROCK SEMI-ANNUAL REPORTTO SHAREHOLDERS |
| | |
Consolidated Schedule of Investments (unaudited) (continued) February 28, 2018 | | BlackRock Corporate High Yield Fund, Inc. (HYT) (Percentages shown are based on Net Assets) |
| | | | | | | | | | | | |
| Security | | | | | Par
(000) | | | Value | |
| Banks (continued) | |
CIT Group, Inc.: | | | | | | | | | | | | |
5.00%, 08/15/22 | | | USD | | | | 278 | | | $ | 286,687 | |
5.00%, 08/01/23 | | | | | | | 404 | | | | 415,110 | |
6.00%, 04/01/36 | | | | | | | 2,800 | | | | 2,646,000 | |
Deutsche Pfandbriefbank AG, 4.60%, 02/22/27 | | | EUR | | | | 100 | | | | 135,145 | |
IKB Deutsche Industriebank AG,
4.00%, 01/31/28(e) | | | | | | | 200 | | | | 247,050 | |
Intesa Sanpaolo SpA, 6.63%, 09/13/23 | | | | | | | 956 | | | | 1,446,508 | |
National Bank of Greece SA, 2.75%, 10/19/50 | | | | | | | 455 | | | | 567,762 | |
| | | | | | | | | | | | |
| | | | | | | | | | | 11,226,375 | |
| Beverages — 0.2% | |
ARD Finance SA, (6.63% Cash or 7.38% PIK), 6.63%, 09/15/23(g) | | | | | | | 200 | | | | 259,494 | |
BWAY Holding Co., 7.25%, 04/15/25(d) | | | USD | | | | 981 | | | | 1,012,882 | |
Horizon Parent Holdings Sarl, (8.25% Cash or 9.00% PIK), 8.25%, 02/15/22(g) | | | EUR | | | | 350 | | | | 451,190 | |
OI European Group BV: | | | | | | | | | | | | |
4.00%, 03/15/23(d) | | | USD | | | | 1,461 | | | | 1,413,517 | |
3.13%, 11/15/24 | | | EUR | | | | 175 | | | | 218,128 | |
Silgan Holdings, Inc., 3.25%, 03/15/25 | | | | | | | 230 | | | | 286,156 | |
| | | | | | | | | | | | |
| | | | | | | | | | | 3,641,367 | |
| Biotechnology — 0.0% | |
Senvion Holding GmbH, 3.88%, 10/25/22 | | | | | | | 301 | | | | 339,679 | |
| | | | | | | | | | | | |
| Building Materials — 0.1% | |
Jeld-Wen, Inc., 4.63%, 12/15/25(d) | | | USD | | | | 608 | | | | 594,320 | |
Titan Global Finance PLC: | | | | | | | | | | | | |
3.50%, 06/17/21 | | | EUR | | | | 400 | | | | 516,060 | |
2.38%, 11/16/24 | | | | | | | 346 | | | | 417,899 | |
| | | | | | | | | | | | |
| | | | | | | | | | | 1,528,279 | |
| Building Products — 1.3% | |
American Builders & Contractors Supply Co., Inc.(d): | | | | | | | | | | | | |
5.63%, 04/15/21 | | | USD | | | | 526 | | | | 532,575 | |
5.75%, 12/15/23 | | | | | | | 982 | | | | 1,023,735 | |
Beacon Escrow Corp., 4.88%, 11/01/25(d) | | | | | | | 3,473 | | | | 3,387,217 | |
BMBG Bond Finance SCA, 3.00%, 06/15/21 | | | EUR | | | | 225 | | | | 278,070 | |
Building Materials Corp. of America,
6.00%, 10/15/25(d) | | | USD | | | | 2,308 | | | | 2,437,825 | |
CPG Merger Sub LLC, 8.00%, 10/01/21(d) | | | | | | | 2,165 | | | | 2,229,950 | |
Masonite International Corp., 5.63%, 03/15/23(d) | | | | | | | 3,698 | | | | 3,822,807 | |
Ply Gem Industries, Inc., 6.50%, 02/01/22 | | | | | | | 1,249 | | | | 1,294,688 | |
Standard Industries, Inc.(d): | | | | | | | | | | | | |
5.50%, 02/15/23 | | | | | | | 1,708 | | | | 1,754,970 | |
5.38%, 11/15/24 | | | | | | | 299 | | | | 305,728 | |
USG Corp.(d): | | | | | | | | | | | | |
5.50%, 03/01/25 | | | | | | | 904 | | | | 940,160 | |
4.88%, 06/01/27 | | | | | | | 1,586 | | | | 1,562,210 | |
| | | | | | | | | | | | |
| | | | | | | | | | | 19,569,935 | |
| Cable Television Services — 0.1% | |
CB Escrow Corp., 8.00%, 10/15/25(d) | | | | | | | 703 | | | | 687,182 | |
| | | | | | | | | | | | |
| Capital Markets — 1.1% | |
Blackstone CQP Holdco LP(d): | | | | | | | | | | | | |
6.50%, 03/20/21 | | | | | | | 13,913 | | | | 14,034,739 | |
6.00%, 08/18/21 | | | | | | | 2,265 | | | | 2,275,759 | |
LPL Holdings, Inc., 5.75%, 09/15/25(d) | | | | | | | 323 | | | | 327,037 | |
NFP Corp., 6.88%, 07/15/25(d) | | | | | | | 559 | | | | 560,397 | |
| | | | | | | | | | | | |
| | | | | | | | | | | 17,197,932 | |
| Chemicals — 3.8% | |
Alpha 3 BV/Alpha US Bidco, Inc., 6.25%, 02/01/25(d) | | | | | | | 4,500 | | | | 4,522,500 | |
| | | | | | | | | | | | |
| Security | | | | | Par
(000) | | | Value | |
| Chemicals (continued) | |
Axalta Coating Systems Dutch Holding B BV, 3.75%, 01/15/25 | | | EUR | | | | 385 | | | $ | 493,584 | |
Axalta Coating Systems LLC, 4.88%, 08/15/24(d) | | | USD | | | | 1,451 | | | | 1,458,255 | |
Blue Cube Spinco, Inc.: | | | | | | | | | | | | |
9.75%, 10/15/23 | | | | | | | 2,534 | | | | 2,939,440 | |
10.00%, 10/15/25 | | | | | | | 1,565 | | | | 1,866,262 | |
CF Industries, Inc.: | | | | | | | | | | | | |
7.13%, 05/01/20 | | | | | | | 404 | | | | 430,765 | |
5.15%, 03/15/34 | | | | | | | 540 | | | | 529,200 | |
4.95%, 06/01/43 | | | | | | | 1,517 | | | | 1,380,470 | |
Chemours Co.: | | | | | | | | | | | | |
6.13%, 05/15/23 | | | EUR | | | | 100 | | | | 128,303 | |
6.63%, 05/15/23 | | | USD | | | | 375 | | | | 394,219 | |
7.00%, 05/15/25 | | | | | | | 1,387 | | | | 1,494,492 | |
5.38%, 05/15/27 | | | | | | | 1,453 | | | | 1,456,633 | |
CTC Bond Co. GmbH, 5.25%, 12/15/25 | | | EUR | | | | 207 | | | | 252,262 | |
Hexion, Inc., 10.38%, 02/01/22(d) | | | USD | | | | 1,360 | | | | 1,326,000 | |
Huntsman International LLC: | | | | | | | | | | | | |
4.88%, 11/15/20 | | | | | | | 1,304 | | | | 1,333,705 | |
5.13%, 11/15/22 | | | | | | | 1,445 | | | | 1,491,963 | |
INEOS Finance PLC, 4.00%, 05/01/23 | | | EUR | | | | 448 | | | | 560,202 | |
INEOS Group Holdings SA, 5.38%, 08/01/24 | | | | | | | 300 | | | | 386,500 | |
Kronos International, Inc., 3.75%, 09/15/25 | | | | | | | 232 | | | | 291,537 | |
Momentive Performance Materials, Inc., 3.88%, 10/24/21 | | | USD | | | | 6,758 | | | | 7,028,320 | |
NOVA Chemicals Corp., 4.88%, 06/01/24(d) | | | | | | | 1,815 | | | | 1,792,312 | |
Olin Corp., 5.00%, 02/01/30 | | | | | | | 109 | | | | 105,185 | |
Platform Specialty Products Corp.(d): | | | | | | | | | | | | |
6.50%, 02/01/22 | | | | | | | 10,527 | | | | 10,803,334 | |
5.88%, 12/01/25 | | | | | | | 4,158 | | | | 4,137,210 | |
PQ Corp.(d): | | | | | | | | | | | | |
6.75%, 11/15/22 | | | | | | | 2,337 | | | | 2,465,535 | |
5.75%, 12/15/25 | | | | | | | 2,471 | | | | 2,508,065 | |
PSPC Escrow Corp., 6.00%, 02/01/23 | | | EUR | | | | 394 | | | | 501,109 | |
Tronox Finance PLC, 5.75%, 10/01/25(d) | | | USD | | | | 1,206 | | | | 1,196,955 | |
Venator Finance Sarl/Venator Materials LLC, 5.75%, 07/15/25(d) | | | | | | | 764 | | | | 777,370 | |
Versum Materials, Inc., 5.50%, 09/30/24(d) | | | | | | | 834 | | | | 871,530 | |
WR Grace & Co-Conn, 5.13%, 10/01/21(d) | | | | | | | 2,483 | | | | 2,569,905 | |
| | | | | | | | | | | | |
| | | | | | | | | | | 57,493,122 | |
| Commercial Services & Supplies — 2.3% | |
ADT Corp.: | | | | | | | | | | | | |
6.25%, 10/15/21 | | | | | | | 347 | | | | 368,471 | |
3.50%, 07/15/22 | | | | | | | 1,723 | | | | 1,645,465 | |
4.13%, 06/15/23 | | | | | | | 1,781 | | | | 1,732,022 | |
4.88%, 07/15/32(d) | | | | | | | 3,731 | | | | 3,395,210 | |
Advanced Disposal Services, Inc., 5.63%, 11/15/24(d) | | | | | | | 1,563 | | | | 1,594,260 | |
Booz Allen Hamilton, Inc., 5.13%, 05/01/25(d) | | | | | | | 3,107 | | | | 3,083,697 | |
Catalent Pharma Solutions, Inc., 4.75%, 12/15/24 | | | EUR | | | | 100 | | | | 129,194 | |
CD&R Waterworks Merger Sub LLC, 6.13%, 08/15/25(d) | | | USD | | | | 2,453 | | | | 2,428,470 | |
Fortress Transportation & Infrastructure Investors LLC, 6.75%, 03/15/22(d) | | | | | | | 252 | | | | 259,560 | |
Harland Clarke Holdings Corp., 8.38%,
08/15/22(d) | | | | | | | 2,752 | | | | 2,848,320 | |
KAR Auction Services, Inc., 5.13%,
06/01/25(d) | | | | | | | 3,528 | | | | 3,554,460 | |
La Financiere Atalian SAS, 4.00%, 05/15/24 | | | EUR | | | | 415 | | | | 523,145 | |
Mobile Mini, Inc., 5.88%, 07/01/24 | | | USD | | | | 3,503 | | | | 3,643,120 | |
Paprec Holding SA, 5.25%, 04/01/22 | | | EUR | | | | 271 | | | | 338,958 | |
| | | | |
| SCHEDULES OF INVESTMENTS | | | 49 | |
| | |
Consolidated Schedule of Investments (unaudited) (continued) February 28, 2018 | | BlackRock Corporate High Yield Fund, Inc. (HYT) (Percentages shown are based on Net Assets) |
| | | | | | | | | | | | |
| Security | | | | | Par
(000) | | | Value | |
| Commercial Services & Supplies (continued) | |
Park Aerospace Holdings Ltd.(d): | | | | | | | | | | | | |
3.63%, 03/15/21 | | | USD | | | | 1,473 | | | $ | 1,417,762 | |
5.25%, 08/15/22 | | | | | | | 2,560 | | | | 2,563,200 | |
Ritchie Bros Auctioneers, Inc.,
5.38%, 01/15/25(d) | | | | | | | 1,289 | | | | 1,303,566 | |
United Rentals North America, Inc.: | | | | | | | | | | | | |
5.75%, 11/15/24 | | | | | | | 1,354 | | | | 1,398,005 | |
5.50%, 05/15/27 | | | | | | | 1,128 | | | | 1,154,508 | |
Verisure Holding AB, 6.00%, 11/01/22 | | | EUR | | | | 167 | | | | 214,591 | |
Wrangler Buyer Corp., 6.00%, 10/01/25(d) | | | USD | | | | 718 | | | | 726,975 | |
| | | | | | | | | | | | |
| | | | | | | | | | | 34,322,959 | |
| Commercial Services & Supplies — 0.1% | |
Waste Pro USA, Inc., 5.50%, 02/15/26(d) | | | | | | | 828 | | | | 832,140 | |
| | | | | | | | | | | | |
| Communications Equipment — 1.6% | |
CommScope Technologies Finance LLC,
6.00%, 06/15/25(d) | | | | | | | 147 | | | | 151,822 | |
CommScope Technologies LLC, 5.00%, 03/15/27(d) | | | | | | | 1,781 | | | | 1,737,588 | |
CommScope, Inc.(d): | | | | | | | | | | | | |
5.00%, 06/15/21 | | | | | | | 2,278 | | | | 2,309,322 | |
5.50%, 06/15/24 | | | | | | | 1,804 | | | | 1,837,825 | |
Nokia OYJ: | | | | | | | | | | | | |
3.38%, 06/12/22 | | | | | | | 714 | | | | 694,294 | |
4.38%, 06/12/27 | | | | | | | 852 | | | | 817,920 | |
6.63%, 05/15/39 | | | | | | | 3,486 | | | | 3,764,880 | |
Telefonaktiebolaget LM Ericsson, Series 7Y, 1.88%, 03/01/24 | | | EUR | | | | 200 | | | | 235,094 | |
Zayo Group LLC/Zayo Capital, Inc.: | | | | | | | | | | | | |
6.00%, 04/01/23 | | | USD | | | | 4,308 | | | | 4,474,935 | |
6.38%, 05/15/25 | | | | | | | 3,973 | | | | 4,152,262 | |
5.75%, 01/15/27(d) | | | | | | | 3,962 | | | | 3,981,810 | |
| | | | | | | | | | | | |
| | | | | | | | | | | 24,157,752 | |
| Construction & Engineering — 1.1% | |
BlueLine Rental Finance Corp.,
9.25%, 03/15/24(d) | | | | | | | 8,405 | | | | 9,087,906 | |
Brand Energy & Infrastructure Services, Inc., 8.50%, 07/15/25(d) | | | | | | | 3,931 | | | | 4,058,758 | |
Engility Corp., 8.88%, 09/01/24 | | | | | | | 1,728 | | | | 1,831,680 | |
SPIE SA, 3.13%, 03/22/24 | | | EUR | | | | 300 | | | | 377,924 | |
Tutor Perini Corp., 6.88%, 05/01/25(d) | | | USD | | | | 1,357 | | | | 1,424,850 | |
Weekley Homes LLC/Weekley Finance Corp., 6.63%, 08/15/25(d) | | | | | | | 474 | | | | 473,858 | |
| | | | | | | | | | | | |
| | | | | | | | | | | 17,254,976 | |
| Construction Materials — 1.3% | |
American Tire Distributors, Inc., 10.25%, 03/01/22(d) | | | | | | | 1,953 | | | | 2,033,796 | |
Autodis SA: | | | | | | | | | | | | |
(3 mo. Euribor + 4.38%), 4.38%,
05/01/22(c) | | | EUR | | | | 100 | | | | 122,680 | |
4.38%, 05/01/22 | | | | | | | 150 | | | | 187,264 | |
Beacon Roofing Supply, Inc., 6.38%, 10/01/23 | | | USD | | | | 366 | | | | 390,248 | |
HD Supply, Inc., 5.75%, 04/15/24(d) | | | | | | | 10,906 | | | | 11,437,667 | |
LKQ Italia Bondco SpA, 3.88%, 04/01/24 | | | EUR | | | | 220 | | | | 287,524 | |
Navistar International Corp., 6.63%, 11/01/25(d) | | | USD | | | | 1,781 | | | | 1,834,430 | |
New Enterprise Stone & Lime Co., Inc.,
10.13%, 04/01/22(d) | | | | | | | 1,106 | | | | 1,198,627 | |
Rexel SA: | | | | | | | | | | | | |
3.50%, 06/15/23 | | | EUR | | | | 461 | | | | 589,388 | |
2.63%, 06/15/24 | | | | | | | 250 | | | | 313,023 | |
Williams Scotsman International, Inc., 7.88%, 12/15/22(d) | | | USD | | | | 771 | | | | 807,622 | |
| | | | | | | | | | | | |
| | | | | | | | | | | 19,202,269 | |
| | | | | | | | | | | | |
| Security | | | | | Par
(000) | | | Value | |
| Consumer Discretionary — 0.5% | |
Arch Merger Sub, Inc., 8.50%, 09/15/25(d) | | | | | | | 1,356 | | | $ | 1,301,760 | |
Elis SA, 1.88%, 02/15/23 | | | EUR | | | | 100 | | | | 123,067 | |
Live Nation Entertainment, Inc.,
4.88%, 11/01/24(d) | | | USD | | | | 296 | | | | 294,150 | |
Nielsen Co. Luxembourg SARL,
5.00%, 02/01/25(d) | | | | | | | 463 | | | | 462,278 | |
ServiceMaster Co. LLC, 5.13%, 11/15/24(d) | | | | | | | 606 | | | | 596,910 | |
Viking Cruises Ltd.(d): | | | | | | | | | | | | |
6.25%, 05/15/25 | | | | | | | 889 | | | | 902,335 | |
5.88%, 09/15/27 | | | | | | | 3,641 | | | | 3,549,975 | |
| | | | | | | | | | | | |
| | | | | | | | | | | 7,230,475 | |
| Consumer Finance — 2.4% | |
Alliance Data Systems Corp.(d): | | | | | | | | | | | | |
5.88%, 11/01/21 | | | | | | | 3,207 | | | | 3,279,157 | |
5.38%, 08/01/22 | | | | | | | 2,329 | | | | 2,337,734 | |
Ally Financial, Inc.: | | | | | | | | | | | | |
5.13%, 09/30/24 | | | | | | | 1,230 | | | | 1,276,125 | |
8.00%, 11/01/31 | | | | | | | 11,400 | | | | 14,136,000 | |
CDK Global, Inc., 4.88%, 06/01/27(d) | | | | | | | 1,848 | | | | 1,833,586 | |
IHS Markit Ltd.(d): | | | | | | | | | | | | |
4.75%, 02/15/25 | | | | | | | 1,125 | | | | 1,150,312 | |
4.00%, 03/01/26 | | | | | | | 614 | | | | 595,580 | |
Iron Mountain UK PLC, 3.88%, 11/15/25 | | | GBP | | | | 180 | | | | 235,735 | |
Navient Corp.: | | | | | | | | | | | | |
6.63%, 07/26/21 | | | USD | | | | 1,454 | | | | 1,519,430 | |
6.50%, 06/15/22 | | | | | | | 2,048 | | | | 2,135,040 | |
5.50%, 01/25/23 | | | | | | | 932 | | | | 922,680 | |
7.25%, 09/25/23 | | | | | | | 1,100 | | | | 1,168,750 | |
6.13%, 03/25/24 | | | | | | | 642 | | | | 648,420 | |
5.88%, 10/25/24 | | | | | | | 723 | | | | 715,770 | |
6.75%, 06/25/25 | | | | | | | 730 | | | | 749,382 | |
5.63%, 08/01/33 | | | | | | | 1,821 | | | | 1,620,690 | |
OneMain Financial Holdings LLC, 7.25%, 12/15/21(d) | | | | | | | 796 | | | | 826,945 | |
Springleaf Finance Corp.: | | | | | | | | | | | | |
6.13%, 05/15/22 | | | | | | | 490 | | | | 502,250 | |
5.63%, 03/15/23 | | | | | | | 1,212 | | | | 1,199,880 | |
| | | | | | | | | | | | |
| | | | | | | | | | | 36,853,466 | |
| Containers & Packaging — 3.9% | |
Ardagh Packaging Finance PLC/Ardagh Holdings USA, Inc.: | | | | | | | | | | | | |
6.00%, 06/30/21(d) | | | | | | | 3,968 | | | | 4,057,280 | |
4.25%, 09/15/22(d) | | | | | | | 627 | | | | 624,649 | |
4.13%, 05/15/23 | | | EUR | | | | 275 | | | | 351,473 | |
4.63%, 05/15/23(d) | | | USD | | | | 1,738 | | | | 1,735,828 | |
2.75%, 03/15/24 | | | EUR | | | | 231 | | | | 285,627 | |
6.75%, 05/15/24 | | | | | | | 450 | | | | 599,096 | |
7.25%, 05/15/24(d) | | | USD | | | | 9,905 | | | | 10,610,731 | |
6.00%, 02/15/25(d) | | | | | | | 5,909 | | | | 6,056,725 | |
4.75%, 07/15/27(d) | | | GBP | | | | 427 | | | | 571,624 | |
4.75%, 07/15/27 | | | | | | | 362 | | | | 484,608 | |
Ball Corp.: | | | | | | | | | | | | |
5.00%, 03/15/22 | | | USD | | | | 710 | | | | 736,625 | |
4.00%, 11/15/23 | | | | | | | 1,606 | | | | 1,589,940 | |
4.38%, 12/15/23 | | | EUR | | | | 100 | | | | 137,833 | |
BWAY Holding Co., 5.50%, 04/15/24(d) | | | USD | | | | 4,925 | | | | 5,035,813 | |
Crown European Holdings SA, 3.38%, 05/15/25 | | | EUR | | | | 303 | | | | 383,788 | |
Hercule Debtco Sarl, (6.75% Cash or 7.50% PIK), 6.75%, 06/30/24(g) | | | | | | | 100 | | | | 122,763 | |
Horizon Holdings I SASU, 7.25%, 08/01/23 | | | | | | | 100 | | | | 127,996 | |
JH-Holding Finance SA, (8.25% PIK),
8.25%, 12/01/22(c) | | | | | | | 200 | | | | 257,573 | |
| | |
| 50 | | 2018 BLACKROCK SEMI-ANNUAL REPORTTO SHAREHOLDERS |
| | |
Consolidated Schedule of Investments (unaudited) (continued) February 28, 2018 | | BlackRock Corporate High Yield Fund, Inc. (HYT) (Percentages shown are based on Net Assets) |
| | | | | | | | | | | | |
| Security | | | | | Par
(000) | | | Value | |
| Containers & Packaging (continued) | |
Mercer International, Inc.: | | | | | | | | | | | | |
6.50%, 02/01/24 | | | USD | | | | 1,446 | | | $ | 1,514,685 | |
5.50%, 01/15/26(d) | | | | | | | 767 | | | | 763,165 | |
Reynolds Group Issuer, Inc./Reynolds Group Issuer LLC/Reynolds Group Issuer Lu: | | | | | | | | | | | | |
5.75%, 10/15/20 | | | | | | | 6,255 | | | | 6,348,440 | |
(3 mo. LIBOR US + 3.50%),
5.22%, 07/15/21(c)(d) | | | | | | | 3,030 | | | | 3,064,088 | |
5.13%, 07/15/23(d) | | | | | | | 1,259 | | | | 1,282,606 | |
7.00%, 07/15/24(d) | | | | | | | 6,231 | | | | 6,562,022 | |
Sappi Papier Holding GmbH, 4.00%, 04/01/23 | | | EUR | | | | 150 | | | | 190,567 | |
Sealed Air Corp.: | | | | | | | | | | | | |
4.88%, 12/01/22(d) | | | USD | | | | 1,223 | | | | 1,259,690 | |
4.50%, 09/15/23 | | | EUR | | | | 560 | | | | 765,649 | |
6.88%, 07/15/33(d) | | | USD | | | | 700 | | | | 787,500 | |
Signode Industrial Group Lux SA/Signode Industrial Group US, Inc., 6.38%,
05/01/22(d) | | | | | | | 1,754 | | | | 1,815,390 | |
Verallia Packaging SASU, 5.13%, 08/01/22 | | | EUR | | | | 575 | | | | 726,109 | |
| | | | | | | | | | | | |
| | | | | | | | | | | 58,849,883 | |
| Diversified Consumer Services — 1.6% | |
APX Group, Inc.: | | | | | | | | | | | | |
6.38%, 12/01/19 | | | USD | | | | 216 | | | | 219,240 | |
8.75%, 12/01/20 | | | | | | | 1,972 | | | | 1,986,790 | |
7.88%, 12/01/22 | | | | | | | 1,874 | | | | 1,974,727 | |
Ascend Learning LLC, 6.88%, 08/01/25(d) | | | | | | | 2,023 | | | | 2,083,690 | |
Cognita Financing PLC, 7.75%, 08/15/21 | | | GBP | | | | 225 | | | | 319,205 | |
GW Honos Security Corp., 8.75%,
05/15/25(d) | | | USD | | | | 586 | | | | 630,683 | |
Laureate Education, Inc., 8.25%, 05/01/25(d) | | | | | | | 591 | | | | 629,415 | |
Matthews International Corp.,
5.25%, 12/01/25(d) | | | | | | | 774 | | | | 775,935 | |
Pinnacle Bidco PLC, 6.38%, 02/15/25 | | | GBP | | | | 177 | | | | 246,092 | |
Prime Security Services Borrower LLC/Prime Finance, Inc., 9.25%,
05/15/23(d) | | | USD | | | | 12,368 | | | | 13,465,660 | |
RBS Global, Inc./Rexnord LLC,
4.88%, 12/15/25(d) | | | | | | | 1,406 | | | | 1,384,910 | |
| | | | | | | | | | | | |
| | | | | | | | | | | 23,716,347 | |
| Diversified Financial Services — 1.8% | |
Aircastle Ltd.: | | | | | | | | | | | | |
7.63%, 04/15/20 | | | | | | | 128 | | | | 137,600 | |
5.13%, 03/15/21 | | | | | | | 643 | | | | 660,682 | |
5.50%, 02/15/22 | | | | | | | 2,471 | | | | 2,569,840 | |
Arrow Global Finance PLC: | | | | | | | | | | | | |
5.13%, 09/15/24 | | | GBP | | | | 125 | | | | 173,719 | |
(3 mo. Euribor + 2.88%), 2.88%,
04/01/25(c) | | | EUR | | | | 254 | | | | 304,445 | |
Banca IFIS SpA, 4.50%, 10/17/27(e) | | | | | | | 375 | | | | 464,934 | |
Cabot Financial Luxembourg SA: | | | | | | | | | | | | |
6.50%, 04/01/21 | | | GBP | | | | 100 | | | | 139,391 | |
7.50%, 10/01/23 | | | | | | | 220 | | | | 320,174 | |
DPL, Inc., 7.25%, 10/15/21 | | | USD | | | | 230 | | | | 250,700 | |
FBM Finance, Inc., 8.25%, 08/15/21(d) | | | | | | | 2,660 | | | | 2,806,300 | |
Garfunkelux Holdco 3 SA, 4.50%,
09/01/23(e) | | | EUR | | | | 220 | | | | 254,996 | |
Intrum Justitia AB: | | | | | | | | | | | | |
2.75%, 07/15/22 | | | | | | | 437 | | | | 523,818 | |
3.13%, 07/15/24 | | | | | | | 310 | | | | 367,314 | |
Jefferies Finance LLC/JFIN Co-Issuer
Corp.(d): | | | | | | | | | | | | |
7.38%, 04/01/20 | | | USD | | | | 2,695 | | | | 2,727,367 | |
6.88%, 04/15/22 | | | | | | | 2,552 | | | | 2,552,000 | |
Lehman Brother Holding Escrow,
1.00%, 09/22/18(b) | | | | | | | 430 | | | | 17,415 | |
Lehman Brothers Holdings, Inc.(b)(e): | | | | | | | | | | | | |
5.38%, 10/17/18 | | | EUR | | | | 350 | | | | 18,147 | |
4.75%, 01/16/19 | | | | | | | 1,890 | | | | 97,997 | |
| | | | | | | | | | | | |
| Security | | | | | Par
(000) | | | Value | |
| Diversified Financial Services (continued) | |
Lehman Brothers Holdings, Inc.(b)(e) (continued): | | | | | | | | | | | | |
1.00%, 02/05/19 | | | EUR | | | | 3,950 | | | $ | 204,808 | |
1.00%, 12/31/49 | | | USD | | | | 1,535 | | | | 62,167 | |
LHC3 PLC, (4.13% Cash or 4.88% PIK),
4.13%, 08/15/24(g) | | | EUR | | | | 584 | | | | 723,310 | |
Lincoln Finance Ltd., 6.88%, 04/15/21 | | | | | | | 100 | | | | 126,785 | |
Mercury Bondco PLC(g): | | | | | | | | | | | | |
(7.13% Cash or 7.88% PIK),
7.13%, 05/30/21 | | | | | | | 525 | | | | 663,096 | |
(8.25% Cash or 9.00% PIK),
8.25%, 05/30/21 | | | | | | | 564 | | | | 720,002 | |
Newco GB SAS, 8.00%, 12/15/22(g) | | | | | | | 117 | | | | 144,167 | |
Pershing Square Holdings Ltd.,
5.50%, 07/15/22(d) | | | USD | | | | 2,100 | | | | 2,161,845 | |
ProGroup AG: | | | | | | | | | | | | |
5.13%, 05/01/22 | | | EUR | | | | 206 | | | | 257,824 | |
(3 mo. Euribor + 2.50%), 2.50%, 03/31/24(c) | | | | | | | 112 | | | | 137,337 | |
Tempo Acquisition LLC/Tempo Acquisition Finance Corp., 6.75%, 06/01/25(d) | | | USD | | | | 3,093 | | | | 3,116,197 | |
UniCredit SpA: | | | | | | | | | | | | |
6.95%, 10/31/22 | | | EUR | | | | 375 | | | | 561,896 | |
(5 year EUR Swap + 4.10%),
5.75%, 10/28/25(h) | | | | | | | 700 | | | | 947,078 | |
(5 year EUR Swap + 4.32%),
4.38%, 01/03/27(h) | | | | | | | 567 | | | | 752,536 | |
Vantiv LLC/Vanity Issuer Corp.(d): | | | | | | | | | | | | |
3.88%, 11/15/25 | | | GBP | | | | 357 | | | | 486,643 | |
4.38%, 11/15/25 | | | USD | | | | 1,168 | | | | 1,131,500 | |
Verisure Midholding AB, 5.75%, 12/01/23 | | | EUR | | | | 250 | | | | 304,646 | |
WMG Acquisition Corp.: | | | | | | | | | | | | |
4.13%, 11/01/24 | | | | | | | 250 | | | | 320,021 | |
5.50%, 04/15/26(d)(f) | | | USD | | | | 776 | | | | 776,000 | |
| | | | | | | | | | | | |
| | | | | | | | | | | 27,984,697 | |
| Diversified Telecommunication Services — 3.2% | |
CenturyLink, Inc.: | | | | | | | | | | | | |
5.63%, 04/01/25 | | | | | | | 845 | | | | 764,725 | |
Series P, 7.60%, 09/15/39 | | | | | | | 54 | | | | 47,115 | |
Series S, 6.45%, 06/15/21 | | | | | | | 7,518 | | | | 7,687,155 | |
Series T, 5.80%, 03/15/22 | | | | | | | 1,539 | | | | 1,517,839 | |
Series U, 7.65%, 03/15/42 | | | | | | | 743 | | | | 646,410 | |
Cincinnati Bell, Inc., 7.00%, 07/15/24(d) | | | | | | | 2,236 | | | | 2,124,200 | |
Frontier Communications Corp.: | | | | | | | | | | | | |
7.13%, 03/15/19 | | | | | | | 1,445 | | | | 1,470,288 | |
7.13%, 01/15/23 | | | | | | | 719 | | | | 479,034 | |
7.63%, 04/15/24 | | | | | | | 1,188 | | | | 754,380 | |
6.88%, 01/15/25 | | | | | | | 5,097 | | | | 3,109,170 | |
11.00%, 09/15/25 | | | | | | | 2,166 | | | | 1,697,602 | |
Level 3 Financing, Inc.: | | | | | | | | | | | | |
5.38%, 08/15/22 | | | | | | | 243 | | | | 245,430 | |
5.63%, 02/01/23 | | | | | | | 1,971 | | | | 1,990,710 | |
5.13%, 05/01/23 | | | | | | | 1,292 | | | | 1,292,000 | |
5.38%, 01/15/24 | | | | | | | 1,521 | | | | 1,513,395 | |
5.38%, 05/01/25 | | | | | | | 2,469 | | | | 2,450,482 | |
5.25%, 03/15/26 | | | | | | | 5,666 | | | | 5,453,468 | |
OTE PLC, 3.50%, 07/09/20 | | | EUR | | | | 470 | | | | 606,371 | |
Qwest Corp., 6.75%, 12/01/21 | | | USD | | | | 680 | | | | 726,165 | |
SoftBank Group Corp.: | | | | | | | | | | | | |
(5 year USD ICE Swap + 4.85%), 6.88%(h)(j) | | | | | | | 1,935 | | | | 1,909,555 | |
4.75%, 09/19/24 | | | | | | | 700 | | | | 679,187 | |
4.75%, 07/30/25 | | | EUR | | | | 415 | | | | 532,881 | |
Telecom Italia Capital SA: | | | | | | | | | | | | |
6.38%, 11/15/33 | | | USD | | | | 831 | | | | 909,945 | |
6.00%, 09/30/34 | | | | | | | 6,039 | | | | 6,325,852 | |
| | | | |
| SCHEDULES OF INVESTMENTS | | | 51 | |
| | |
Consolidated Schedule of Investments (unaudited) (continued) February 28, 2018 | | BlackRock Corporate High Yield Fund, Inc. (HYT) (Percentages shown are based on Net Assets) |
| | | | | | | | | | | | |
| Security | | | | | Par
(000) | | | Value | |
| Diversified Telecommunication Services (continued) | |
Telecom Italia Capital SA (continued): | | | | | | | | | | | | |
7.20%, 07/18/36 | | | USD | | | | 958 | | | $ | 1,120,860 | |
7.72%, 06/04/38 | | | | | | | 134 | | | | 164,150 | |
Telecom Italia Finance SA, 7.75%, 01/24/33 | | | EUR | | | | 280 | | | | 508,293 | |
Telecom Italia SpA: | | | | | | | | | | | | |
1.13%, 03/26/22(k) | | | | | | | 100 | | | | 120,170 | |
3.25%, 01/16/23 | | | | | | | 300 | | | | 398,009 | |
5.88%, 05/19/23 | | | GBP | | | | 400 | | | | 628,884 | |
3.63%, 01/19/24 | | | EUR | | | | 200 | | | | 268,504 | |
5.30%, 05/30/24(d) | | | USD | | | | 431 | | | | 446,624 | |
| | | | | | | | | | | | |
| | | | | | | | | | | 48,588,853 | |
| Electric Utilities — 0.2% | |
AES Corp., 5.50%, 04/15/25 | | | | | | | 682 | | | | 699,050 | |
NextEra Energy Operating Partners LP,
4.25%, 09/15/24(d) | | | | | | | 1,225 | | | | 1,208,156 | |
Talen Energy Supply LLC, 6.50%, 06/01/25 | | | | | | | 1,782 | | | | 1,376,595 | |
Viridian Group FinanceCo PLC/Viridian Power and Energy, 4.00%, 09/15/25 | | | EUR | | | | 100 | | | | 114,375 | |
| | | | | | | | | | | | |
| | | | | | | | | | | 3,398,176 | |
| Electrical Equipment — 0.1% | |
Areva SA, 4.88%, 09/23/24 | | | | | | | 550 | | | | 742,837 | |
Belden, Inc., 5.50%, 04/15/23 | | | | | | | 13 | | | | 16,375 | |
| | | | | | | | | | | | |
| | | | | | | | | | | 759,212 | |
| Electronic Equipment, Instruments & Components — 0.9% | |
CDW LLC/CDW Finance Corp.: | | | | | | | | | | | | |
5.00%, 09/01/23 | | | USD | | | | 3,624 | | | | 3,678,360 | |
5.50%, 12/01/24 | | | | | | | 6,605 | | | | 6,902,225 | |
5.00%, 09/01/25 | | | | | | | 714 | | | | 719,355 | |
Itron, Inc., 5.00%, 01/15/26(d) | | | | | | | 231 | | | | 229,845 | |
SESI LLC, 7.75%, 09/15/24(d) | | | | | | | 1,389 | | | | 1,444,560 | |
| | | | | | | | | | | | |
| | | | | | | | | | | 12,974,345 | |
| Energy Equipment & Services — 1.6% | |
Ensco PLC, 5.20%, 03/15/25 | | | | | | | 270 | | | | 224,100 | |
Gates Global LLC/Gates Global Co.,
6.00%, 07/15/22(d) | | | | | | | 2,780 | | | | 2,828,650 | |
Noble Holding International Ltd.,
7.70%, 04/01/25 | | | | | | | 1,234 | | | | 1,104,430 | |
Oceaneering International, Inc.,
6.00%, 02/01/28 | | | | | | | 1,378 | | | | 1,358,152 | |
Pattern Energy Group, Inc., 5.88%,
02/01/24(d) | | | | | | | 935 | | | | 962,863 | |
Pioneer Energy Services Corp.,
6.13%, 03/15/22 | | | | | | | 1,431 | | | | 1,293,266 | |
Precision Drilling Corp.: | | | | | | | | | | | | |
6.50%, 12/15/21 | | | | | | | 530 | | | | 539,275 | |
5.25%, 11/15/24 | | | | | | | 600 | | | | 571,500 | |
Transocean, Inc.: | | | | | | | | | | | | |
5.80%, 10/15/22 | | | | | | | 1,246 | | | | 1,208,807 | |
9.00%, 07/15/23(d) | | | | | | | 5,675 | | | | 6,129,000 | |
6.80%, 03/15/38 | | | | | | | 703 | | | | 565,915 | |
Trinidad Drilling Ltd., 6.63%, 02/15/25(d) | | | | | | | 2,272 | | | | 2,195,320 | |
Weatherford International Ltd.: | | | | | | | | | | | | |
7.75%, 06/15/21 | | | | | | | 1,271 | | | | 1,266,234 | |
8.25%, 06/15/23 | | | | | | | 300 | | | | 291,000 | |
9.88%, 02/15/24 | | | | | | | 3,161 | | | | 3,129,390 | |
| | | | | | | | | | | | |
| | | | | | | | | | | 23,667,902 | |
| Environmental, Maintenance, & Security Service — 0.2% | |
Tervita Escrow Corp., 7.63%, 12/01/21(d) | | | | | | | 2,397 | | | | 2,408,985 | |
| | | | | | | | | | | | |
| | | | | | | | | | | | |
| Security | | | | | Par
(000) | | | Value | |
| Food & Staples Retailing — 0.8% | |
Albertsons Cos. LLC/Safeway, Inc./New Albertson’s, Inc./Albertson’s LLC: | | | | | | | | | | | | |
6.63%, 06/15/24 | | | USD | | | | 874 | | | $ | 805,173 | |
5.75%, 03/15/25 | | | | | | | 1,011 | | | | 884,625 | |
B&M European Value Retail SA,
4.13%, 02/01/22 | | | GBP | | | | 225 | | | | 318,991 | |
Casino Guichard Perrachon SA: | | | | | | | | | | | | |
4.56%, 01/25/23 | | | EUR | | | | 300 | | | | 405,588 | |
4.50%, 03/07/24 | | | | | | | 500 | | | | 661,157 | |
Dollar Tree, Inc.: | | | | | | | | | | | | |
5.25%, 03/01/20 | | | USD | | | | 262 | | | | 265,275 | |
5.75%, 03/01/23 | | | | | | | 5,504 | | | | 5,717,280 | |
Post Holdings, Inc., 5.63%, 01/15/28(d) | | | | | | | 484 | | | | 471,295 | |
Rite Aid Corp., 6.13%, 04/01/23(d) | | | | | | | 2,735 | | | | 2,748,675 | |
| | | | | | | | | | | | |
| | | | | | | | | | | 12,278,059 | |
| Food Products — 1.2% | |
Acosta, Inc., 7.75%, 10/01/22(d) | | | | | | | 1,307 | | | | 934,505 | |
Aramark Services, Inc., 5.13%, 01/15/24 | | | | | | | 1,104 | | | | 1,126,080 | |
B&G Foods, Inc., 5.25%, 04/01/25 | | | | | | | 1,705 | | | | 1,641,063 | |
Chobani LLC/Chobani Finance Corp., Inc.,
7.50%, 04/15/25(d) | | | | | | | 2,638 | | | | 2,750,115 | |
Darling Global Finance BV, 4.75%, 05/30/22 | | | EUR | | | | 100 | | | | 125,096 | |
JBS USA LLC/JBS USA Finance, Inc.(d): | | | | | | | | | | | | |
5.88%, 07/15/24 | | | USD | | | | 402 | | | | 392,030 | |
5.75%, 06/15/25 | | | | | | | 3,803 | | | | 3,631,865 | |
Pilgrim’s Pride Corp.(d)(f): | | | | | | | | | | | | |
5.75%, 03/15/25 | | | | | | | 1,548 | | | | 1,540,260 | |
5.88%, 09/30/27 | | | | | | | 1,341 | | | | 1,303,854 | |
Post Holdings, Inc.(d): | | | | | | | | | | | | |
5.50%, 03/01/25 | | | | | | | 847 | | | | 852,294 | |
5.00%, 08/15/26 | | | | | | | 2,006 | | | | 1,905,700 | |
5.75%, 03/01/27 | | | | | | | 1,884 | | | | 1,860,450 | |
| | | | | | | | | | | | |
| | | | | | | | | | | 18,063,312 | |
| Forest Products — 0.1% | |
JBS USA LUX SA/JBS USA Finance, Inc., 6.75%, 02/15/28(d) | | | | | | | 1,884 | | | | 1,865,537 | |
| | | | | | | | | | | | |
| Health Care Equipment & Supplies — 2.1% | |
Avantor, Inc.: | | | | | | | | | | | | |
4.75%, 10/01/24 | | | EUR | | | | 304 | | | | 368,215 | |
6.00%, 10/01/24(d) | | | USD | | | | 9,366 | | | | 9,366,000 | |
9.00%, 10/01/25(d) | | | | | | | 2,620 | | | | 2,626,550 | |
Crimson Merger Sub, Inc., 6.63%, 05/15/22(d) | | | | | | | 7,426 | | | | 7,370,305 | |
DJO Finco, Inc./DJO Finance LLC/DJO Finance Corp., 8.13%, 06/15/21(d) | | | | | | | 7,026 | | | | 6,815,220 | |
Mallinckrodt International Finance SA/Mallinckrodt CB LLC(d): | | | | | | | | | | | | |
4.88%, 04/15/20 | | | | | | | 1,110 | | | | 1,073,925 | |
5.75%, 08/01/22 | | | | | | | 2,210 | | | | 1,955,850 | |
5.63%, 10/15/23 | | | | | | | 67 | | | | 55,443 | |
5.50%, 04/15/25 | | | | | | | 1,794 | | | | 1,417,260 | |
Teleflex, Inc., 4.88%, 06/01/26 | | | | | | | 684 | | | | 677,160 | |
| | | | | | | | | | | | |
| | | | | | | | | | | 31,725,928 | |
| Health Care Providers & Services — 6.3% | |
Acadia Healthcare Co., Inc.: | | | | | | | | | | | | |
5.13%, 07/01/22 | | | | | | | 408 | | | | 412,937 | |
5.63%, 02/15/23 | | | | | | | 974 | | | | 999,275 | |
6.50%, 03/01/24 | | | | | | | 1,734 | | | | 1,790,355 | |
Amsurg Corp., 5.63%, 07/15/22 | | | | | | | 4,779 | | | | 4,856,659 | |
Centene Corp.: | | | | | | | | | | | | |
5.63%, 02/15/21 | | | | | | | 2,080 | | | | 2,129,400 | |
4.75%, 05/15/22 | | | | | | | 2,467 | | | | 2,508,631 | |
6.13%, 02/15/24 | | | | | | | 391 | | | | 410,550 | |
| | |
| 52 | | 2018 BLACKROCK SEMI-ANNUAL REPORTTO SHAREHOLDERS |
| | |
Consolidated Schedule of Investments (unaudited) (continued) February 28, 2018 | | BlackRock Corporate High Yield Fund, Inc. (HYT) (Percentages shown are based on Net Assets) |
| | | | | | | | | | | | |
| Security | | | | | Par
(000) | | | Value | |
| Health Care Providers & Services (continued) | |
CHS/Community Health Systems, Inc.: | | | | | | | | | | | | |
8.00%, 11/15/19 | | | USD | | | | 993 | | | $ | 933,926 | |
6.25%, 03/31/23 | | | | | | | 1,990 | | | | 1,810,900 | |
DaVita, Inc., 5.00%, 05/01/25 | | | | | | | 1,938 | | | | 1,901,662 | |
Eagle Holding Co. II LLC, (7.63% Cash or 8.38% PIK), 7.63%, 05/15/22(d)(g) | | | | | | | 1,776 | | | | 1,776,018 | |
Envision Healthcare Corp.(d): | | | | | | | | | | | | |
5.13%, 07/01/22 | | | | | | | 373 | | | | 375,798 | |
6.25%, 12/01/24 | | | | | | | 1,060 | | | | 1,115,650 | |
HCA, Inc.: | | | | | | | | | | | | |
6.50%, 02/15/20 | | | | | | | 6,990 | | | | 7,374,450 | |
5.88%, 03/15/22 | | | | | | | 2,345 | | | | 2,485,700 | |
4.75%, 05/01/23 | | | | | | | 512 | | | | 520,960 | |
5.88%, 05/01/23 | | | | | | | 2,009 | | | | 2,112,463 | |
5.00%, 03/15/24 | | | | | | | 4,059 | | | | 4,135,106 | |
5.38%, 02/01/25 | | | | | | | 5,861 | | | | 5,958,117 | |
5.25%, 04/15/25 | | | | | | | 549 | | | | 564,098 | |
5.88%, 02/15/26 | | | | | | | 1,216 | | | | 1,258,560 | |
5.25%, 06/15/26 | | | | | | | 4,345 | | | | 4,453,625 | |
4.50%, 02/15/27 | | | | | | | 670 | | | | 654,088 | |
5.50%, 06/15/47 | | | | | | | 7,321 | | | | 7,229,487 | |
HealthSouth Corp., 5.75%, 11/01/24 | | | | | | | 1,170 | | | | 1,181,700 | |
MEDNAX, Inc., 5.25%, 12/01/23(d) | | | | | | | 790 | | | | 808,762 | |
Molina Healthcare, Inc., 4.88%, 06/15/25(d) | | | | | | | 685 | | | | 655,887 | |
MPH Acquisition Holdings LLC,
7.13%, 06/01/24(d) | | | | | | | 3,886 | | | | 4,090,015 | |
Polaris Intermediate Corp., (8.50% Cash), 8.50%, 12/01/22(d)(g) | | | | | | | 4,239 | | | | 4,323,780 | |
RegionalCare Hospital Partners Holdings, Inc., 8.25%, 05/01/23(d) | | | | | | | 1,287 | | | | 1,351,350 | |
Sterigenics-Nordion Holdings LLC,
6.50%, 05/15/23(d) | | | | | | | 424 | | | | 430,360 | |
Surgery Center Holdings, Inc.(d): | | | | | | | | | | | | |
8.88%, 04/15/21 | | | | | | | 1,066 | | | | 1,105,975 | |
6.75%, 07/01/25 | | | | | | | 1,254 | | | | 1,178,760 | |
Tenet Healthcare Corp.: | | | | | | | | | | | | |
4.75%, 06/01/20 | | | | | | | 210 | | | | 213,150 | |
6.00%, 10/01/20 | | | | | | | 4,540 | | | | 4,721,555 | |
7.50%, 01/01/22(d) | | | | | | | 1,284 | | | | 1,354,620 | |
8.13%, 04/01/22 | | | | | | | 5,090 | | | | 5,369,950 | |
6.75%, 06/15/23 | | | | | | | 4,529 | | | | 4,529,000 | |
4.63%, 07/15/24(d) | | | | | | | 2,138 | | | | 2,052,480 | |
THC Escrow Corp. III(d): | | | | | | | | | | | | |
5.13%, 05/01/25 | | | | | | | 300 | | | | 291,000 | |
7.00%, 08/01/25 | | | | | | | 1,430 | | | | 1,426,425 | |
Unilabs Subholding AB, 5.75%, 05/15/25 | | | EUR | | | | 173 | | | | 213,157 | |
Vizient, Inc., 10.38%, 03/01/24(d) | | | USD | | | | 1,875 | | | | 2,100,000 | |
WellCare Health Plans, Inc., 5.25%, 04/01/25 | | | | | | | 706 | | | | 714,557 | |
| | | | | | | | | | | | |
| | | | | | | | | | | 95,880,898 | |
| Health Care Technology — 0.2% | |
Change Healthcare Holdings LLC/Change Healthcare Finance, Inc., 5.75%,
03/01/25(d) | | | | | | | 1,607 | | | | 1,607,000 | |
Quintiles IMS, Inc.: | | | | | | | | | | | | |
3.25%, 03/15/25(d) | | | EUR | | | | 350 | | | | 430,763 | |
3.25%, 03/15/25 | | | | | | | 570 | | | | 701,527 | |
| | | | | | | | | | | | |
| | | | | | | | | | | 2,739,290 | |
| Hotels, Restaurants & Leisure — 4.5% | |
Burger King France SAS: | | | | | | | | | | | | |
(3 mo. Euribor + 5.25%), 5.25%, 05/01/23(c) | | | | | | | 305 | | | | 379,110 | |
6.00%, 05/01/24 | | | | | | | 325 | | | | 420,246 | |
Cirsa Funding Luxembourg SA: | | | | | | | | | | | | |
5.75%, 05/15/21 | | | | | | | 100 | | | | 126,179 | |
5.88%, 05/15/23 | | | | | | | 100 | | | | 126,176 | |
| | | | | | | | | | | | |
| Security | | | | | Par
(000) | | | Value | |
| Hotels, Restaurants & Leisure (continued) | |
Codere Finance 2 Luxembourg SA,
6.75%, 11/01/21 | | | EUR | | | | 210 | | | $ | 266,973 | |
CPUK Finance Ltd.: | | | | | | | | | | | | |
4.25%, 02/28/47 | | | GBP | | | | 274 | | | | 381,022 | |
4.88%, 02/28/47 | | | | | | | 153 | | | | 211,242 | |
CRC Escrow Issuer LLC/CRC Finco, Inc., 5.25%, 10/15/25(d) | | | USD | | | | 3,113 | | | | 3,042,957 | |
Eldorado Resorts, Inc., 6.00%, 04/01/25 | | | | | | | 938 | | | | 966,140 | |
ESH Hospitality, Inc., 5.25%, 05/01/25(d) | | | | | | | 1,800 | | | | 1,795,500 | |
GLP Capital LP/GLP Financing II, Inc.: | | | | | | | | | | | | |
5.38%, 11/01/23 | | | | | | | 256 | | | | 266,880 | |
5.38%, 04/15/26 | | | | | | | 950 | | | | 980,875 | |
Golden Nugget, Inc., 6.75%, 10/15/24(d) | | | | | | | 2,648 | | | | 2,714,200 | |
International Game Technology PLC,
4.75%, 02/15/23 | | | EUR | | | | 210 | | | | 284,085 | |
Jacobs Entertainment, Inc., 7.88%, 02/01/24(d) | | | USD | | | | 473 | | | | 505,519 | |
KFC Holding Co./Pizza Hut Holdings LLC/Taco Bell of America LLC(d): | | | | | | | | | | | | |
5.00%, 06/01/24 | | | | | | | 255 | | | | 257,550 | |
5.25%, 06/01/26 | | | | | | | 1,878 | | | | 1,901,475 | |
4.75%, 06/01/27 | | | | | | | 783 | | | | 765,383 | |
Melco Resorts Finance Ltd., 4.88%, 06/06/25(d) | | | | | | | 1,847 | | | | 1,806,865 | |
MGM Resorts International: | | | | | | | | | | | | |
5.25%, 03/31/20 | | | | | | | 920 | | | | 948,750 | |
6.75%, 10/01/20 | | | | | | | 2,998 | | | | 3,200,365 | |
6.63%, 12/15/21 | | | | | | | 1,724 | | | | 1,862,868 | |
4.63%, 09/01/26 | | | | | | | 3,124 | | | | 3,053,679 | |
New Red Finance, Inc.(d): | | | | | | | | | | | | |
4.25%, 05/15/24 | | | | | | | 3,189 | | | | 3,045,495 | |
5.00%, 10/15/25 | | | | | | | 7,726 | | | | 7,528,021 | |
Pizzaexpress Financing 2 PLC,
6.63%, 08/01/21 | | | GBP | | | | 110 | | | | 143,763 | |
Sabre GLBL, Inc.(d): | | | | | | | | | | | | |
5.38%, 04/15/23 | | | USD | | | | 1,516 | | | | 1,527,370 | |
5.25%, 11/15/23 | | | | | | | 745 | | | | 750,588 | |
Schumann SpA, 7.00%, 07/31/23 | | | EUR | | | | 410 | | | | 520,845 | |
Scientific Games International, Inc.: | | | | | | | | | | | | |
7.00%, 01/01/22(d) | | | USD | | | | 2,070 | | | | 2,178,675 | |
10.00%, 12/01/22 | | | | | | | 9,118 | | | | 9,893,030 | |
5.00%, 10/15/25(d) | | | | | | | 3,466 | | | | 3,427,007 | |
3.38%, 02/15/26 | | | EUR | | | | 100 | | | | 119,150 | |
5.50%, 02/15/26 | | | | | | | 142 | | | | 165,444 | |
Six Flags Entertainment Corp.(d): | | | | | | | | | | | | |
4.88%, 07/31/24 | | | USD | | | | 4,933 | | | | 4,921,111 | |
5.50%, 04/15/27 | | | | | | | 301 | | | | 302,129 | |
Snai SpA, 6.38%, 11/07/21 | | | EUR | | | | 200 | | | | 258,762 | |
Station Casinos LLC, 5.00%, 10/01/25(d) | | | USD | | | | 2,555 | | | | 2,491,125 | |
Stonegate Pub Co. Financing PLC: | | | | | | | | | | | | |
4.88%, 03/15/22 | | | GBP | | | | 187 | | | | 254,858 | |
(3 mo. LIBOR GBP + 4.38%),
4.89%, 03/15/22(c) | | | | | | | 150 | | | | 205,989 | |
Unique Pub Finance Co. PLC, Series N,
6.46%, 03/30/32 | | | | | | | 1,000 | | | | 1,345,364 | |
Vue International Bidco PLC, 7.88%, 07/15/20 | | | | | | | 520 | | | | 726,622 | |
Wyndham Worldwide Corp., 4.15%, 04/01/24 | | | USD | | | | 1,110 | | | | 1,112,140 | |
Wynn Macau Ltd.(d): | | | | | | | | | | | | |
4.88%, 10/01/24 | | | | | | | 860 | | | | 842,800 | |
5.50%, 10/01/27 | | | | | | | 200 | | | | 196,940 | |
Yum! Brands, Inc., 3.88%, 11/01/23 | | | | | | | 721 | | | | 699,370 | |
| | | | | | | | | | | | |
| | | | | | | | | | | 68,920,637 | |
| Household Durables — 2.1% | |
Algeco Scotsman Global Finance 2 PLC, 10.00%, 08/15/23(d) | | | | | | | 396 | | | | 394,020 | |
| | | | |
| SCHEDULES OF INVESTMENTS | | | 53 | |
| | |
Consolidated Schedule of Investments (unaudited) (continued) February 28, 2018 | | BlackRock Corporate High Yield Fund, Inc. (HYT) (Percentages shown are based on Net Assets) |
| | | | | | | | | | | | |
| Security | | | | | Par
(000) | | | Value | |
| Household Durables (continued) | |
Algeco Scotsman Global Finance PLC,
8.00%, 02/15/23(d) | | | USD | | �� | | 1,644 | | | $ | 1,655,919 | |
Brookfield Residential Properties, Inc./Brookfield Residential US Corp., 6.13%, 07/01/22(d) | | | | | | | 1,604 | | | | 1,656,130 | |
K Hovnanian Enterprises, Inc.,
10.00%, 07/15/22(d) | | | | | | | 1,273 | | | | 1,389,161 | |
Lennar Corp.: | | | | | | | | | | | | |
4.50%, 11/15/19 | | | | | | | 2,482 | | | | 2,516,127 | |
6.63%, 05/01/20(d) | | | | | | | 1,160 | | | | 1,226,700 | |
8.38%, 01/15/21(d) | | | | | | | 2,810 | | | | 3,134,555 | |
4.75%, 04/01/21 | | | | | | | 314 | | | | 320,673 | |
4.13%, 01/15/22 | | | | | | | 1,014 | | | | 1,003,860 | |
4.75%, 11/15/22 | | | | | | | 1,542 | | | | 1,549,710 | |
4.88%, 12/15/23 | | | | | | | 968 | | | | 981,310 | |
5.25%, 06/01/26(d) | | | | | | | 302 | | | | 308,040 | |
4.75%, 11/29/27(d) | | | | | | | 2,510 | | | | 2,428,425 | |
Mattamy Group Corp.(d): | | | | | | | | | | | | |
6.88%, 12/15/23 | | | | | | | 1,062 | | | | 1,113,773 | |
6.50%, 10/01/25 | | | | | | | 1,107 | | | | 1,156,815 | |
MDC Holdings, Inc., 6.00%, 01/15/43 | | | | | | | 1,106 | | | | 1,050,700 | |
Meritage Homes Corp., 5.13%, 06/06/27 | | | | | | | 404 | | | | 398,950 | |
PulteGroup, Inc., 6.38%, 05/15/33 | | | | | | | 2,805 | | | | 2,994,337 | |
Tempur Sealy International, Inc.,
5.50%, 06/15/26 | | | | | | | 2,203 | | | | 2,164,447 | |
Toll Brothers Finance Corp., 6.75%, 11/01/19 | | | | | | | 220 | | | | 231,000 | |
TRI Pointe Group, Inc.: | | | | | | | | | | | | |
4.38%, 06/15/19 | | | | | | | 1,060 | | | | 1,062,650 | |
4.88%, 07/01/21 | | | | | | | 1,275 | | | | 1,281,375 | |
5.25%, 06/01/27 | | | | | | | 644 | | | | 636,755 | |
TRI Pointe Group, Inc./TRI Pointe Homes, Inc., 5.88%, 06/15/24 | | | | | | | 770 | | | | 793,100 | |
William Lyon Homes, Inc., 5.88%, 01/31/25 | | | | | | | 769 | | | | 767,078 | |
| | | | | | | | | | | | |
| | | | | | | | | | | 32,215,610 | |
| Household Products — 0.3% | |
ACCO Brands Corp., 5.25%, 12/15/24(d) | | | | | | | 539 | | | | 541,695 | |
Diamond (BC) BV, 5.63%, 08/15/25 | | | EUR | | | | 149 | | | | 177,063 | |
Prestige Brands, Inc., 6.38%, 03/01/24(d) | | | USD | | | | 2,034 | | | | 2,084,850 | |
Spectrum Brands, Inc., 6.63%, 11/15/22 | | | | | | | 1,385 | | | | 1,431,744 | |
| | | | | | | | | | | | |
| | | | | | | | | | | 4,235,352 | |
| Independent Power and Renewable Electricity Producers — 2.2% | |
AES Corp.: | | | | | | | | | | | | |
4.88%, 05/15/23 | | | | | | | 129 | | | | 130,129 | |
5.50%, 03/15/24 | | | | | | | 196 | | | | 200,165 | |
6.00%, 05/15/26 | | | | | | | 1,880 | | | | 1,974,000 | |
5.13%, 09/01/27 | | | | | | | 2,691 | | | | 2,724,638 | |
Calpine Corp.(d): | | | | | | | | | | | | |
6.00%, 01/15/22 | | | | | | | 251 | | | | 258,216 | |
5.88%, 01/15/24 | | | | | | | 1,903 | | | | 1,943,439 | |
5.25%, 06/01/26 | | | | | | | 4,767 | | | | 4,623,990 | |
Dynegy, Inc.: | | | | | | | | | | | | |
7.38%, 11/01/22 | | | | | | | 1,935 | | | | 2,039,006 | |
5.88%, 06/01/23 | | | | | | | 183 | | | | 187,575 | |
8.00%, 01/15/25(d) | | | | | | | 1,653 | | | | 1,795,571 | |
8.13%, 01/30/26(d) | | | | | | | 1,136 | | | | 1,243,920 | |
MPM Escrow LLC, 8.88%, 10/15/20(b)(e) | | | | | | | 3,738 | | | | — | |
NRG Energy, Inc.: | | | | | | | | | | | | |
6.25%, 07/15/22 | | | | | | | 1,384 | | | | 1,428,980 | |
6.25%, 05/01/24 | | | | | | | 469 | | | | 485,415 | |
6.63%, 01/15/27 | | | | | | | 7,549 | | | | 7,794,343 | |
5.75%, 01/15/28(d) | | | | | | | 1,736 | | | | 1,713,953 | |
NRG Yield Operating LLC, 5.38%, 08/15/24 | | | | | | | 1,789 | | | | 1,807,999 | |
QEP Resources, Inc., 5.38%, 10/01/22 | | | | | | | 914 | | | | 927,710 | |
| | | | | | | | | | | | |
| Security | | | | | Par
(000) | | | Value | |
| Independent Power and Renewable Electricity Producers (continued) | |
TerraForm Power Operating LLC(d): | | | | | | | | | | | | |
4.25%, 01/31/23 | | | USD | | | | 1,191 | | | $ | 1,167,180 | |
6.63%, 06/15/25(l) | | | | | | | 140 | | | | 151,550 | |
5.00%, 01/31/28 | | | | | | | 1,185 | | | | 1,146,843 | |
| | | | | | | | | | | | |
| | | | | | | | | | | 33,744,622 | |
| Industrial Conglomerates — 0.3% | |
Colfax Corp., 3.25%, 05/15/25 | | | EUR | | | | 489 | | | | 605,104 | |
Vertiv Group Corp., 9.25%, 10/15/24(d) | | | USD | | | | 3,892 | | | | 4,106,060 | |
| | | | | | | | | | | | |
| | | | | | | | | | | 4,711,164 | |
| Insurance — 1.5% | |
Acrisure LLC/Acrisure Finance, Inc.,
7.00%, 11/15/25(d) | | | | | | | 1,183 | | | | 1,156,382 | |
Ardonagh Midco 3 PLC: | | | | | | | | | | | | |
8.38%, 07/15/23 | | | GBP | | | | 500 | | | | 704,167 | |
8.63%, 07/15/23(d) | | | USD | | | | 3,012 | | | | 3,109,890 | |
Assicurazioni Generali SpA(h): | | | | | | | | | | | | |
(3 mo. Euribor + 7.11%), 7.75%, 12/12/42 | | | EUR | | | | 400 | | | | 620,168 | |
(3 mo. Euribor + 5.35%), 5.50%, 10/27/47 | | | | | | | 200 | | | | 284,990 | |
AssuredPartners, Inc., 7.00%, 08/15/25(d) | | | USD | | | | 441 | | | | 450,923 | |
BNP Paribas Cardif SA(3 mo. Euribor +
3.93%), 4.03%(h)(j) | | | EUR | | | | 100 | | | | 134,818 | |
Credit Agricole Assurances SA(5 year EUR Swap + 4.35%), 4.50%(h)(j) | | | | | | | 200 | | | | 275,110 | |
Delta Lloyd NV(3 mo. Euribor +
3.90%), 4.38%(h)(j) | | | | | | | 190 | | | | 253,666 | |
Groupama SA, 6.00%, 01/23/27 | | | | | | | 300 | | | | 450,493 | |
HUB International Ltd., 7.88%, 10/01/21(d) | | | USD | | | | 5,484 | | | | 5,655,375 | |
Radian Group, Inc.: | | | | | | | | | | | | |
5.25%, 06/15/20 | | | | | | | 107 | | | | 110,745 | |
7.00%, 03/15/21 | | | | | | | 192 | | | | 209,760 | |
4.50%, 10/01/24 | | | | | | | 1,279 | | | | 1,276,186 | |
USIS Merger Sub, Inc., 6.88%, 05/01/25(d) | | | | | | | 544 | | | | 550,800 | |
Wayne Merger Sub LLC, 8.25%, 08/01/23(d) | | | | | | | 6,569 | | | | 6,831,760 | |
| | | | | | | | | | | | |
| | | | | | | | | | | 22,075,233 | |
| Internet Software & Services — 0.7% | |
Equinix, Inc.: | | | | | | | | | | | | |
5.38%, 01/01/22 | | | | | | | 1,110 | | | | 1,150,237 | |
2.88%, 03/15/24(f) | | | EUR | | | | 395 | | | | 481,900 | |
5.88%, 01/15/26 | | | USD | | | | 3,197 | | | | 3,348,857 | |
Netflix, Inc.: | | | | | | | | | | | | |
5.38%, 02/01/21 | | | | | | | 210 | | | | 218,138 | |
5.50%, 02/15/22 | | | | | | | 2,087 | | | | 2,170,480 | |
4.38%, 11/15/26 | | | | | | | 836 | | | | 802,560 | |
3.63%, 05/15/27 | | | EUR | | | | 274 | | | | 335,838 | |
Symantec Corp., 5.00%, 04/15/25(d) | | | USD | | | | 1,596 | | | | 1,619,263 | |
United Group BV: | | | | | | | | | | | | |
4.38%, 07/01/22 | | | EUR | | | | 258 | | | | 319,418 | |
(3 mo. Euribor + 4.38%), 4.38%, 07/01/23(c) | | | | | | | 395 | | | | 484,310 | |
ZPG PLC, 3.75%, 07/15/23 | | | GBP | | | | 268 | | | | 365,090 | |
| | | | | | | | | | | | |
| | | | | | | | | | | 11,296,091 | |
| IT Services — 2.3% | |
Ceridian HCM Holding, Inc.,
11.00%, 03/15/21(d) | | | USD | | | | 1,631 | | | | 1,685,361 | |
First Data Corp.(d): | | | | | | | | | | | | |
7.00%, 12/01/23 | | | | | | | 8,023 | | | | 8,434,179 | |
5.75%, 01/15/24 | | | | | | | 18,420 | | | | 18,742,350 | |
Gartner, Inc., 5.13%, 04/01/25(d) | | | | | | | 1,176 | | | | 1,205,400 | |
WEX, Inc., 4.75%, 02/01/23(d) | | | | | | | 5,476 | | | | 5,513,647 | |
| | | | | | | | | | | | |
| | | | | | | | | | | 35,580,937 | |
| | |
| 54 | | 2018 BLACKROCK SEMI-ANNUAL REPORTTO SHAREHOLDERS |
| | |
Consolidated Schedule of Investments (unaudited) (continued) February 28, 2018 | | BlackRock Corporate High Yield Fund, Inc. (HYT) (Percentages shown are based on Net Assets) |
| | | | | | | | | | | | |
| Security | | | | | Par
(000) | | | Value | |
| Leisure Products — 0.2% | |
Mattel, Inc.: | | | | | | | | | | | | |
6.75%, 12/31/25(d) | | | USD | | | | 1,983 | | | $ | 2,017,702 | |
6.20%, 10/01/40 | | | | | | | 566 | | | | 526,380 | |
5.45%, 11/01/41 | | | | | | | 332 | | | | 292,160 | |
| | | | | | | | | | | | |
| | | | | | | | | | | 2,836,242 | |
| Machinery — 0.6% | |
Cleaver-Brooks, Inc., 7.88%, 03/01/23(d) | | | | | | | 600 | | | | 633,000 | |
Platin 1426 GmbH, 5.38%, 06/15/23 | | | EUR | | | | 258 | | | | 312,793 | |
SPX FLOW, Inc.(d): | | | | | | | | | | | | |
5.63%, 08/15/24 | | | USD | | | | 993 | | | | 1,010,378 | |
5.88%, 08/15/26 | | | | | | | 993 | | | | 1,020,307 | |
Terex Corp., 5.63%, 02/01/25(d) | | | | | | | 4,399 | | | | 4,442,990 | |
Wabash National Corp., 5.50%, 10/01/25(d) | | | | | | | 1,510 | | | | 1,494,900 | |
| | | | | | | | | | | | |
| | | | | | | | | | | 8,914,368 | |
| Media — 13.1% | |
Altice Financing SA(d): | | | | | | | | | | | | |
6.63%, 02/15/23 | | | | | | | 1,145 | | | | 1,143,569 | |
7.50%, 05/15/26 | | | | | | | 6,130 | | | | 6,175,975 | |
Altice Luxembourg SA: | | | | | | | | | | | | |
7.25%, 05/15/22 | | | EUR | | | | 674 | | | | 792,851 | |
7.75%, 05/15/22(d) | | | USD | | | | 6,488 | | | | 6,050,060 | |
6.25%, 02/15/25 | | | EUR | | | | 350 | | | | 398,306 | |
Altice US Finance I Corp.(d): | | | | | | | | | | | | |
5.38%, 07/15/23 | | | USD | | | | 7,810 | | | | 7,936,912 | |
5.50%, 05/15/26 | | | | | | | 1,711 | | | | 1,693,890 | |
AMC Networks, Inc.: | | | | | | | | | | | | |
5.00%, 04/01/24 | | | | | | | 1,165 | | | | 1,167,912 | |
4.75%, 08/01/25 | | | | | | | 2,152 | | | | 2,084,750 | |
Banijay Group SAS, 4.00%, 07/01/22 | | | EUR | | | | 129 | | | | 163,549 | |
Block Communications, Inc., 6.88%, 02/15/25(d) | | | USD | | | | 685 | | | | 708,975 | |
Cablevision Systems Corp., 8.00%, 04/15/20 | | | | | | | 2,224 | | | | 2,363,445 | |
Capital Stage Finance BV, 5.25%(e)(j)(k) | | | EUR | | | | 100 | | | | 137,708 | |
CBS Radio, Inc., 7.25%, 11/01/24(d) | | | USD | | | | 526 | | | | 541,675 | |
CCO Holdings LLC/CCO Holdings Capital Corp.(d): | | | | | | | | | | | | |
4.00%, 03/01/23 | | | | | | | 1,937 | | | | 1,886,154 | |
5.13%, 05/01/23 | | | | | | | 137 | | | | 139,569 | |
5.13%, 05/01/27 | | | | | | | 15,268 | | | | 14,701,863 | |
5.00%, 02/01/28 | | | | | | | 1,960 | | | | 1,850,338 | |
Cellnex Telecom SA: | | | | | | | | | | | | |
2.38%, 01/16/24 | | | EUR | | | | 200 | | | | 247,782 | |
Series CLNX, 1.50%, 01/16/26(k) | | | | | | | 100 | | | | 123,839 | |
Cequel Communications Holdings I LLC/Cequel Capital Corp.(d): | | | | | | | | | | | | |
6.38%, 09/15/20 | | | USD | | | | 210 | | | | 212,363 | |
5.13%, 12/15/21 | | | | | | | 7,150 | | | | 7,112,020 | |
7.75%, 07/15/25 | | | | | | | 7,299 | | | | 7,773,435 | |
Clear Channel International BV,
8.75%, 12/15/20(d) | | | | | | | 4,201 | | | | 4,390,045 | |
Clear Channel Worldwide Holdings, Inc.: | | | | | | | | | | | | |
6.50%, 11/15/22 | | | | | | | 14,259 | | | | 14,617,892 | |
Series B, 7.63%, 03/15/20 | | | | | | | 7,377 | | | | 7,367,779 | |
CSC Holdings LLC: | | | | | | | | | | | | |
7.63%, 07/15/18 | | | | | | | 351 | | | | 355,388 | |
10.13%, 01/15/23(d) | | | | | | | 4,866 | | | | 5,437,755 | |
5.25%, 06/01/24 | | | | | | | 4,789 | | | | 4,609,412 | |
6.63%, 10/15/25(d) | | | | | | | 419 | | | | 439,950 | |
10.88%, 10/15/25(d) | | | | | | | 11,138 | | | | 13,142,840 | |
DISH DBS Corp.: | | | | | | | | | | | | |
6.75%, 06/01/21 | | | | | | | 74 | | | | 76,035 | |
5.88%, 07/15/22 | | | | | | | 2,966 | | | | 2,891,850 | |
5.00%, 03/15/23 | | | | | | | 1,948 | | | | 1,789,725 | |
5.88%, 11/15/24 | | | | | | | 3,024 | | | | 2,835,000 | |
7.75%, 07/01/26 | | | | | | | 4,963 | | | | 4,888,555 | |
| | | | | | | | | | | | |
| Security | | | | | Par
(000) | | | Value | |
| Media (continued) | |
DISH Network Corp., 3.38%, 08/15/26(k) | | | USD | | | | 1,514 | | | $ | 1,523,182 | |
eircom Finance DAC, 4.50%, 05/31/22 | | | EUR | | | | 300 | | | | 374,967 | |
GTT Communications, Inc., 7.88%, 12/31/24(d) | | | USD | | | | 2,446 | | | | 2,542,311 | |
Hughes Satellite Systems Corp.: | | | | | | | | | | | | |
7.63%, 06/15/21 | | | | | | | 595 | | | | 640,369 | |
5.25%, 08/01/26 | | | | | | | 2,908 | | | | 2,835,300 | |
Intelsat Jackson Holdings SA: | | | | | | | | | | | | |
7.25%, 10/15/20 | | | | | | | 2,603 | | | | 2,424,044 | |
5.50%, 08/01/23 | | | | | | | 2,702 | | | | 2,232,527 | |
9.75%, 07/15/25(d) | | | | | | | 3,508 | | | | 3,328,215 | |
LG Finance Co. Corp., 5.88%, 11/01/24(d) | | | | | | | 598 | | | | 624,671 | |
LGE HoldCo VI BV, 7.13%, 05/15/24 | | | EUR | | | | 300 | | | | 395,280 | |
McGraw-Hill Global Education Holdings LLC/McGraw-Hill Global Education Finance,
7.88%, 05/15/24(d) | | | USD | | | | 639 | | | | 618,232 | |
MDC Partners, Inc., 6.50%, 05/01/24(d) | | | | | | | 2,003 | | | | 1,997,992 | |
Meredith Corp., 6.88%, 02/01/26(d) | | | | | | | 776 | | | | 800,250 | |
Midcontinent Communications/Midcontinent Finance Corp., 6.88%, 08/15/23(d) | | | | | | | 1,100 | | | | 1,161,875 | |
NAI Entertainment Holdings/NAI Entertainment Holdings Finance Corp., 5.00%, 08/01/18(d) | | | | | | | 2,039 | | | | 2,039,000 | |
Numericable Group SA: | | | | | | | | | | | | |
5.38%, 05/15/22 | | | EUR | | | | 280 | | | | 348,750 | |
6.00%, 05/15/22 | | | USD | | | | 200 | | | | 194,250 | |
Qualitytech LP/QTS Finance Corp.,
4.75%, 11/15/25(d) | | | | | | | 1,450 | | | | 1,410,125 | |
Radiate Holdco LLC/Radiate Finance, Inc.,
6.88%, 02/15/23(d) | | | | | | | 390 | | | | 389,025 | |
Radio One, Inc., 7.38%, 04/15/22(d) | | | | | | | 805 | | | | 807,012 | |
SFR Group SA(d): | | | | | | | | | | | | |
6.00%, 05/15/22 | | | | | | | 5,489 | | | | 5,331,191 | |
7.38%, 05/01/26 | | | | | | | 9,382 | | | | 9,056,445 | |
Sirius XM Radio, Inc.(d): | | | | | | | | | | | | |
4.63%, 05/15/23 | | | | | | | 230 | | | | 229,425 | |
5.00%, 08/01/27 | | | | | | | 409 | | | | 397,753 | |
TEGNA, Inc.: | | | | | | | | | | | | |
5.13%, 10/15/19 | | | | | | | 457 | | | | 463,284 | |
5.50%, 09/15/24(d) | | | | | | | 344 | | | | 353,460 | |
Telenet Finance Luxembourg Notes Sarl,
5.50%, 03/01/28(d) | | | | | | | 1,800 | | | | 1,737,000 | |
Telenet Finance V Luxembourg SCA,
6.75%, 08/15/24 | | | EUR | | | | 982 | | | | 1,269,923 | |
Telenet Finance VI Luxembourg SCA,
4.88%, 07/15/27 | | | | | | | 290 | | | | 382,412 | |
Telesat Canada/Telesat LLC,
8.88%, 11/15/24(d) | | | USD | | | | 2,154 | | | | 2,364,015 | |
Townsquare Media, Inc., 6.50%, 04/01/23(d) | | | | | | | 517 | | | | 491,150 | |
Tribune Media Co., 5.88%, 07/15/22 | | | | | | | 172 | | | | 175,440 | |
Unitymedia GmbH, 3.75%, 01/15/27 | | | EUR | | | | 300 | | | | 385,508 | |
Unitymedia Hessen GmbH & Co. KG/Unitymedia NRW GmbH: | | | | | | | | | | | | |
5.63%, 04/15/23 | | | | | | | 146 | | | | 183,789 | |
3.50%, 01/15/27 | | | | | | | 200 | | | | 256,810 | |
6.25%, 01/15/29 | | | | | | | 800 | | | | 1,105,808 | |
Univision Communications, Inc.(d): | | | | | | | | | | | | |
5.13%, 05/15/23 | | | USD | | | | 2,315 | | | | 2,193,462 | |
5.13%, 02/15/25 | | | | | | | 1,036 | | | | 957,005 | |
UPCB Finance IV Ltd.: | | | | | | | | | | | | |
5.38%, 01/15/25(d) | | | | | | | 1,974 | | | | 1,951,792 | |
4.00%, 01/15/27 | | | EUR | | | | 400 | | | | 507,364 | |
UPCB Finance VII Ltd., 3.63%, 06/15/29 | | | | | | | 300 | | | | 357,289 | |
Videotron Ltd., 5.13%, 04/15/27(d) | | | USD | | | | 2,383 | | | | 2,404,161 | |
| | | | |
| SCHEDULES OF INVESTMENTS | | | 55 | |
| | |
Consolidated Schedule of Investments (unaudited) (continued) February 28, 2018 | | BlackRock Corporate High Yield Fund, Inc. (HYT) (Percentages shown are based on Net Assets) |
| | | | | | | | | | | | |
| Security | | | | | Par
(000) | | | Value | |
| Media (continued) | |
Virgin Media Finance PLC: | | | | | | | | | | | | |
4.50%, 01/15/25 | | | EUR | | | | 183 | | | $ | 229,355 | |
5.75%, 01/15/25(d) | | | USD | | | | 4,788 | | | | 4,704,210 | |
Virgin Media Receivables Financing Notes I DAC, 5.50%, 09/15/24 | | | GBP | | | | 778 | | | | 1,087,419 | |
Virgin Media Secured Finance PLC: | | | | | | | | | | | | |
5.13%, 01/15/25 | | | | | | | 210 | | | | 298,170 | |
4.88%, 01/15/27 | | | | | | | 309 | | | | 424,337 | |
6.25%, 03/28/29 | | | | | | | 829 | | | | 1,215,376 | |
Ziggo Bond Finance BV: | | | | | | | | | | | | |
4.63%, 01/15/25 | | | EUR | | | | 300 | | | | 371,446 | |
5.88%, 01/15/25(d) | | | USD | | | | 2,643 | | | | 2,543,887 | |
Ziggo Secured Finance BV: | | | | | | | | | | | | |
4.25%, 01/15/27 | | | EUR | | | | 260 | | | | 319,983 | |
5.50%, 01/15/27(d) | | | USD | | | | 756 | | | | 724,815 | |
| | | | | | | | | | | | |
| | | | | | | | | | | 199,410,027 | |
| Metals & Mining — 7.2% | |
Alcoa Nederland Holding BV, 7.00%, 09/30/26(d) | | | | | | | 681 | | | | 735,480 | |
ArcelorMittal: | | | | | | | | | | | | |
3.00%, 04/09/21 | | | EUR | | | | 100 | | | | 131,158 | |
3.13%, 01/14/22 | | | | | | | 100 | | | | 132,385 | |
Big River Steel LLC/BRS Finance Corp., 7.25%, 09/01/25(d) | | | USD | | | | 1,407 | | | | 1,487,903 | |
Cleveland-Cliffs, Inc., 4.88%, 01/15/24(d) | | | | | | | 1,222 | | | | 1,192,978 | |
CONSOL Energy, Inc., 11.00%, 11/15/25(d) | | | | | | | 2,194 | | | | 2,347,580 | |
Constellium NV: | | | | | | | | | | | | |
5.75%, 05/15/24(d) | | | | | | | 1,392 | | | | 1,402,440 | |
6.63%, 03/01/25(d) | | | | | | | 1,231 | | | | 1,274,085 | |
4.25%, 02/15/26 | | | EUR | | | | 151 | | | | 186,339 | |
5.88%, 02/15/26(d) | | | USD | | | | 3,427 | | | | 3,461,270 | |
First Quantum Minerals Ltd.(d): | | | | | | | | | | | | |
7.00%, 02/15/21 | | | | | | | 4,991 | | | | 5,146,969 | |
7.25%, 05/15/22 | | | | | | | 791 | | | | 814,730 | |
6.50%, 03/01/24 | | | | | | | 1,503 | | | | 1,493,606 | |
6.88%, 03/01/26 | | | | | | | 1,789 | | | | 1,780,055 | |
Freeport-McMoRan, Inc.: | | | | | | | | | | | | |
2.38%, 03/15/18 | | | | | | | 15,430 | | | | 15,417,656 | |
3.10%, 03/15/20 | | | | | | | 2,976 | | | | 2,946,240 | |
4.00%, 11/14/21 | | | | | | | 2,078 | | | | 2,067,610 | |
3.55%, 03/01/22 | | | | | | | 5,170 | | | | 5,029,376 | |
3.88%, 03/15/23 | | | | | | | 6,256 | | | | 6,068,320 | |
5.40%, 11/14/34 | | | | | | | 689 | | | | 671,775 | |
5.45%, 03/15/43 | | | | | | | 7,358 | | | | 7,100,470 | |
Grinding Media, Inc./Moly-Cop AltaSteel Ltd., 7.38%, 12/15/23(d) | | | | | | | 2,662 | | | | 2,815,065 | |
Joseph T Ryerson & Son, Inc.,
11.00%, 05/15/22 (d) | | | | | | | 1,378 | | | | 1,534,196 | |
Kaiser Aluminum Corp., 5.88%, 05/15/24 | | | | | | | 773 | | | | 809,949 | |
Kinross Gold Corp.: | | | | | | | | | | | | |
4.50%, 07/15/27 (d) | | | | | | | 807 | | | | 782,790 | |
6.88%, 09/01/41 | | | | | | | 551 | | | | 635,028 | |
Novelis Corp.(d): | | | | | | | | | | | | |
6.25%, 08/15/24 | | | | | | | 8,460 | | | | 8,650,350 | |
5.88%, 09/30/26 | | | | | | | 4,503 | | | | 4,536,772 | |
Nyrstar Netherlands Holdings BV,
6.88%, 03/15/24 | | | EUR | | | | 530 | | | | 662,673 | |
Ovako AB, 5.00%, 10/05/22 | | | | | | | 400 | | | | 496,825 | |
Schmolz+Bickenbach Luxembourg Finance SA, 5.63%, 07/15/22 | | | | | | | 100 | | | | 126,270 | |
Steel Dynamics, Inc.: | | | | | | | | | | | | |
5.13%, 10/01/21 | | | USD | | | | 3,215 | | | | 3,255,187 | |
5.25%, 04/15/23 | | | | | | | 949 | | | | 969,166 | |
| | | | | | | | | | | | |
| Security | | | | | Par
(000) | | | Value | |
| Metals & Mining (continued) | |
Steel Dynamics, Inc. (continued): | | | | | | | | | | | | |
5.50%, 10/01/24 | | | USD | | | | 1,540 | | | $ | 1,593,900 | |
4.13%, 09/15/25 | | | | | | | 1,275 | | | | 1,233,563 | |
5.00%, 12/15/26 | | | | | | | 470 | | | | 479,400 | |
SunCoke Energy Partners LP/SunCoke Energy Partners Finance Corp., 7.50%, 06/15/25(d) | | | | | | | 1,660 | | | | 1,730,550 | |
Teck Resources Ltd.: | | | | | | | | | | | | |
4.50%, 01/15/21 | | | | | | | 902 | | | | 913,726 | |
3.75%, 02/01/23 | | | | | | | 2,259 | | | | 2,208,173 | |
8.50%, 06/01/24(d) | | | | | | | 4,081 | | | | 4,540,112 | |
5.20%, 03/01/42 | | | | | | | 2,547 | | | | 2,464,222 | |
5.40%, 02/01/43 | | | | | | | 3,691 | | | | 3,654,090 | |
ThyssenKrupp AG: | | | | | | | | | | | | |
2.75%, 03/08/21 | | | EUR | | | | 100 | | | | 128,954 | |
1.38%, 03/03/22 | | | | | | | 675 | | | | 830,912 | |
2.50%, 02/25/25 | | | | | | | 100 | | | | 129,381 | |
United States Steel Corp.: | | | | | | | | | | | | |
8.38%, 07/01/21(d) | | | USD | | | | 1,768 | | | | 1,896,180 | |
6.88%, 08/15/25 | | | | | | | 1,912 | | | | 2,007,600 | |
| | | | | | | | | | | | |
| | | | | | | | | | | 109,973,459 | |
| Multi-Utilities — 0.2% | |
NGL Energy Partners LP/NGL Energy Finance Corp.: | | | | | | | | | | | | |
5.13%, 07/15/19 | | | | | | | 980 | | | | 982,450 | |
6.88%, 10/15/21 | | | | | | | 1,624 | | | | 1,636,180 | |
| | | | | | | | | | | | |
| | | | | | | | | | | 2,618,630 | |
| Multiline Retail — 0.1% | |
Neiman Marcus Group Ltd., 8.00%,
10/15/21(d) | | | | | | | 1,214 | | | | 734,470 | |
| | | | | | | | | | | | |
| Offshore Drilling & Other Services — 0.1% | |
Entegris, Inc., 4.63%, 02/10/26(d) | | | | | | | 1,250 | | | | 1,228,125 | |
| | | | | | | | | | | | |
| Oil, Gas & Consumable Fuels — 13.9% | |
Alta Mesa Holdings LP/Alta Mesa Finance Services Corp.,
7.88%, 12/15/24 | | | | | | | 801 | | | | 853,065 | |
Andeavor Logistics LP, Series A, 6.88%(e)(j) | | | | | | | 2,138 | | | | 2,179,424 | |
Antero Midstream Partners LP/Antero Midstream Finance Corp., 5.38%, 09/15/24 | | | | | | | 385 | | | | 393,663 | |
Antero Resources Corp.: | | | | | | | | | | | | |
5.13%, 12/01/22 | | | | | | | 744 | | | | 750,510 | |
5.63%, 06/01/23 | | | | | | | 644 | | | | 660,100 | |
Ascent Resources Utica Holdings LLC/ARU Finance Corp., 10.00%, 04/01/22(d) | | | | | | | 1,471 | | | | 1,566,615 | |
Berry Petroleum Co. LLC, 7.00%, 02/15/26(d) | | | | | | | 1,774 | | | | 1,805,045 | |
California Resources Corp., 8.00%,
12/15/22(d) | | | | | | | 2,740 | | | | 2,171,450 | |
Callon Petroleum Co., 6.13%, 10/01/24 | | | | | | | 3,050 | | | | 3,111,000 | |
Calumet Specialty Products Partners LP/Calumet Finance Corp.: | | | | | | | | | | | | |
6.50%, 04/15/21 | | | | | | | 124 | | | | 120,900 | |
7.63%, 01/15/22 | | | | | | | 1,484 | | | | 1,476,580 | |
Carrizo Oil & Gas, Inc.: | | | | | | | | | | | | |
6.25%, 04/15/23 | | | | | | | 1,034 | | | | 1,036,585 | |
8.25%, 07/15/25 | | | | | | | 711 | | | | 758,993 | |
Cheniere Corpus Christi Holdings LLC: | | | | | | | | | | | | |
7.00%, 06/30/24 | | | | | | | 1,928 | | | | 2,157,432 | |
5.88%, 03/31/25 | | | | | | | 2,359 | | | | 2,494,642 | |
5.13%, 06/30/27 | | | | | | | 5,605 | | | | 5,668,056 | |
Cheniere Energy Partners LP,
5.25%, 10/01/25(d) | | | | | | | 2,065 | | | | 2,085,650 | |
Chesapeake Energy Corp.: | | | | | | | | | | | | |
5.75%, 03/15/23 | | | | | | | 216 | | | | 197,640 | |
8.00%, 01/15/25(d) | | | | | | | 475 | | | | 469,063 | |
8.00%, 06/15/27(d) | | | | | | | 5,527 | | | | 5,299,011 | |
| | |
| 56 | | 2018 BLACKROCK SEMI-ANNUAL REPORTTO SHAREHOLDERS |
| | |
Consolidated Schedule of Investments (unaudited) (continued) February 28, 2018 | | BlackRock Corporate High Yield Fund, Inc. (HYT) (Percentages shown are based on Net Assets) |
| | | | | | | | | | | | |
| Security | | | | | Par
(000) | | | Value | |
| Oil, Gas & Consumable Fuels (continued) | |
CONSOL Energy, Inc.: | | | | | | | | | | | | |
5.88%, 04/15/22 | | | USD | | | | 7,131 | | | $ | 7,171,112 | |
8.00%, 04/01/23 | | | | | | | 786 | | | | 832,178 | |
Continental Resources, Inc.: | | | | | | | | | | | | |
3.80%, 06/01/24 | | | | | | | 2,909 | | | | 2,825,366 | |
4.38%, 01/15/28(d) | | | | | | | 2,200 | | | | 2,145,000 | |
Covey Park Energy LLC/Covey Park Finance Corp., 7.50%, 05/15/25(d) | | | | | | | 2,297 | | | | 2,331,455 | |
Crestwood Midstream Partners LP/Crestwood Midstream Finance Corp., 6.25%, 04/01/23 | | | | | | | 385 | | | | 396,550 | |
CrownRock LP/CrownRock Finance, Inc., 5.63%, 10/15/25(d) | | | | | | | 5,172 | | | | 5,068,560 | |
DCP Midstream LLC(d): | | | | | | | | | | | | |
6.45%, 11/03/36 | | | | | | | 1,258 | | | | 1,383,800 | |
6.75%, 09/15/37 | | | | | | | 1,490 | | | | 1,661,350 | |
DEA Finance SA, 7.50%, 10/15/22 | | | EUR | | | | 330 | | | | 442,813 | |
Denbury Resources, Inc., 9.25%, 03/31/22(d) | | | USD | | | | 3,335 | | | | 3,418,375 | |
Diamond Offshore Drilling, Inc.,
7.88%, 08/15/25 | | | | | | | 620 | | | | 629,300 | |
Diamondback Energy, Inc., 5.38%, 05/31/25 | | | | | | | 1,487 | | | | 1,487,000 | |
Eclipse Resources Corp., 8.88%, 07/15/23 | | | | | | | 550 | | | | 552,750 | |
Endeavor Energy Resources LP/EER Finance, Inc.(d): | | | | | | | | | | | | |
5.50%, 01/30/26 | | | | | | | 804 | | | | 797,970 | |
5.75%, 01/30/28 | | | | | | | 1,470 | | | | 1,470,000 | |
Energy Transfer Equity LP: | | | | | | | | | | | | |
7.50%, 10/15/20 | | | | | | | 665 | | | | 721,525 | |
4.25%, 03/15/23 | | | | | | | 1,164 | | | | 1,141,814 | |
5.88%, 01/15/24 | | | | | | | 2,263 | | | | 2,398,780 | |
5.50%, 06/01/27 | | | | | | | 1,774 | | | | 1,836,090 | |
Ensco PLC, 7.75%, 02/01/26 | | | | | | | 2,037 | | | | 1,924,965 | |
EP Energy LLC/Everest Acquisition Finance, Inc.: | | | | | | | | | | | | |
9.38%, 05/01/20 | | | | | | | 122 | | | | 113,460 | |
9.38%, 05/01/24(d) | | | | | | | 2,753 | | | | 2,030,337 | |
8.00%, 11/29/24(d) | | | | | | | 3,116 | | | | 3,209,480 | |
Extraction Oil & Gas, Inc.(d): | | | | | | | | | | | | |
7.38%, 05/15/24 | | | | | | | 1,181 | | | | 1,245,955 | |
5.63%, 02/01/26 | | | | | | | 2,689 | | | | 2,635,220 | |
Genesis Energy LP/Genesis Energy Finance Corp.: | | | | | | | | | | | | |
6.50%, 10/01/25 | | | | | | | 966 | | | | 963,585 | |
6.25%, 05/15/26 | | | | | | | 1,040 | | | | 1,006,200 | |
Great Western Petroleum LLC/Great Western Finance, Inc., 9.00%, 09/30/21(d) | | | | | | | 2,055 | | | | 2,142,337 | |
Gulfport Energy Corp.: | | | | | | | | | | | | |
6.63%, 05/01/23 | | | | | | | 1,334 | | | | 1,370,685 | |
6.00%, 10/15/24 | | | | | | | 490 | | | | 481,425 | |
6.38%, 05/15/25 | | | | | | | 470 | | | | 463,538 | |
6.38%, 01/15/26(d) | | | | | | | 1,335 | | | | 1,315,843 | |
Halcon Resources Corp.: | | | | | | | | | | | | |
6.75%, 02/15/25(d) | | | | | | | 893 | | | | 899,698 | |
Series WI, 6.75%, 02/15/25 | | | | | | | 3,026 | | | | 3,056,260 | |
Hess Infrastructure Partners LP/Hess Infrastructure Partners Finance Corp.,
5.63%, 02/15/26(d) | | | | | | | 2,470 | | | | 2,470,000 | |
Indigo Natural Resources LLC,
6.88%, 02/15/26(d) | | | | | | | 1,204 | | | | 1,177,175 | |
Jones Energy Holdings LLC/Jones Energy Finance Corp., 9.25%, 03/15/23(d) | | | | | | | 630 | | | | 618,975 | |
Matador Resources Co., 6.88%, 04/15/23 | | | | | | | 6 | | | | 6,270 | |
MEG Energy Corp.(d): | | | | | | | | | | | | |
6.38%, 01/30/23 | | | | | | | 1,897 | | | | 1,626,677 | |
7.00%, 03/31/24 | | | | | | | 2,222 | | | | 1,894,255 | |
6.50%, 01/15/25 | | | | | | | 3,410 | | | | 3,346,062 | |
| | | | | | | | | | | | |
| Security | | | | | Par
(000) | | | Value | |
| Oil, Gas & Consumable Fuels (continued) | |
Murphy Oil Corp.: | | | | | | | | | | | | |
6.88%, 08/15/24 | | | USD | | | | 2,221 | | | $ | 2,335,115 | |
5.75%, 08/15/25 | | | | | | | 106 | | | | 105,629 | |
5.88%, 12/01/42 | | | | | | | 247 | | | | 230,945 | |
Nabors Industries, Inc.: | | | | | | | | | | | | |
4.63%, 09/15/21 | | | | | | | 303 | | | | 295,425 | |
5.75%, 02/01/25(d) | | | | | | | 780 | | | | 744,413 | |
Newfield Exploration Co., 5.63%, 07/01/24 | | | | | | | 872 | | | | 917,780 | |
NGPL PipeCo LLC(d): | | | | | | | | | | | | |
4.38%, 08/15/22 | | | | | | | 1,254 | | | | 1,250,865 | |
7.77%, 12/15/37 | | | | | | | 4,720 | | | | 5,782,000 | |
Noble Holding International Ltd.: | | | | | | | | | | | | |
7.75%, 01/15/24 | | | | | | | 1,479 | | | | 1,351,436 | |
7.88%, 02/01/26(d) | | | | | | | 4,810 | | | | 4,834,050 | |
Oasis Petroleum, Inc.: | | | | | | | | | | | | |
6.50%, 11/01/21 | | | | | | | 837 | | | | 853,740 | |
6.88%, 03/15/22 | | | | | | | 1,432 | | | | 1,466,905 | |
6.88%, 01/15/23 | | | | | | | 663 | | | | 676,260 | |
Paramount Resources Ltd., 6.88%, 06/30/23(d) | | | | | | | 3,070 | | | | 3,192,800 | |
Parker Drilling Co., 7.50%, 08/01/20 | | | | | | | 335 | | | | 309,038 | |
Parsley Energy LLC/Parsley Finance Corp.(d): | | | | | | | | | | | | |
6.25%, 06/01/24 | | | | | | | 458 | | | | 474,030 | |
5.38%, 01/15/25 | | | | | | | 2,170 | | | | 2,148,300 | |
5.25%, 08/15/25 | | | | | | | 532 | | | | 524,020 | |
5.63%, 10/15/27 | | | | | | | 1,647 | | | | 1,633,618 | |
PBF Holding Co. LLC/ PBF Finance Corp.,
7.25%, 06/15/25 | | | | | | | 1,424 | | | | 1,473,840 | |
PDC Energy, Inc.: | | | | | | | | | | | | |
6.13%, 09/15/24 | | | | | | | 250 | | | | 255,625 | |
5.75%, 05/15/26(d) | | | | | | | 1,540 | | | | 1,520,288 | |
Petroleos Mexicanos, 5.38%, 03/13/22(d) | | | | | | | 270 | | | | 282,150 | |
Precision Drilling Corp., 7.13%, 01/15/26(d) | | | | | | | 2,023 | | | | 2,040,701 | |
Range Resources Corp.: | | | | | | | | | | | | |
5.88%, 07/01/22 | | | | | | | 2,612 | | | | 2,651,180 | |
5.00%, 08/15/22 | | | | | | | 530 | | | | 522,050 | |
5.00%, 03/15/23 | | | | | | | 317 | | | | 309,868 | |
4.88%, 05/15/25 | | | | | | | 250 | | | | 239,375 | |
Resolute Energy Corp., 8.50%, 05/01/20 | | | | | | | 2,474 | | | | 2,470,907 | |
Rockies Express Pipeline LLC(d): | | | | | | | | | | | | |
6.00%, 01/15/19 | | | | | | | 1,984 | | | | 2,028,640 | |
5.63%, 04/15/20 | | | | | | | 695 | | | | 721,931 | |
6.88%, 04/15/40 | | | | | | | 2,829 | | | | 3,317,002 | |
Rowan Cos., Inc.: | | | | | | | | | | | | |
4.88%, 06/01/22 | | | | | | | 195 | | | | 183,300 | |
4.75%, 01/15/24 | | | | | | | 716 | | | | 622,920 | |
7.38%, 06/15/25 | | | | | | | 4,173 | | | | 4,120,837 | |
RSP Permian, Inc.: | | | | | | | | | | | | |
6.63%, 10/01/22 | | | | | | | 2,395 | | | | 2,496,787 | |
5.25%, 01/15/25 | | | | | | | 1,046 | | | | 1,053,845 | |
Sanchez Energy Corp.: | | | | | | | | | | | | |
7.75%, 06/15/21 | | | | | | | 3,355 | | | | 3,204,025 | |
6.13%, 01/15/23 | | | | | | | 1,822 | | | | 1,366,500 | |
7.25%, 02/15/23(d) | | | | | | | 1,536 | | | | 1,555,200 | |
SESI LLC, 7.13%, 12/15/21 | | | | | | | 655 | | | | 668,100 | |
Seven Generations Energy Ltd.,
5.38%, 09/30/25(d) | | | | | | | 2,373 | | | | 2,319,607 | |
SM Energy Co.: | | | | | | | | | | | | |
6.50%, 11/15/21 | | | | | | | 845 | | | | 857,675 | |
6.13%, 11/15/22 | | | | | | | 1,620 | | | | 1,636,200 | |
6.50%, 01/01/23 | | | | | | | 1,339 | | | | 1,339,000 | |
5.00%, 01/15/24 | | | | | | | 318 | | | | 298,920 | |
5.63%, 06/01/25 | | | | | | | 324 | | | | 309,623 | |
6.75%, 09/15/26 | | | | | | | 112 | | | | 112,560 | |
| | | | |
| SCHEDULES OF INVESTMENTS | | | 57 | |
| | |
Consolidated Schedule of Investments (unaudited) (continued) February 28, 2018 | | BlackRock Corporate High Yield Fund, Inc. (HYT) (Percentages shown are based on Net Assets) |
| | | | | | | | | | | | |
| Security | | | | | Par
(000) | | | Value | |
| Oil, Gas & Consumable Fuels (continued) | |
Southwestern Energy Co.: | | | | | | | | | | | | |
6.70%, 01/23/25 | | | USD | | | | 232 | �� | | $ | 227,360 | |
7.50%, 04/01/26 | | | | | | | 1,684 | | | | 1,700,840 | |
7.75%, 10/01/27 | | | | | | | 1,290 | | | | 1,315,800 | |
Sunoco LP/Sunoco Finance Corp.(d): | | | | | | | | | | | | |
4.88%, 01/15/23 | | | | | | | 2,733 | | | | 2,719,062 | |
5.88%, 03/15/28 | | | | | | | 808 | | | | 811,030 | |
Tallgrass Energy Partners LP/Tallgrass Energy Finance Corp.(d): | | | | | | | | | | | | |
5.50%, 09/15/24 | | | | | | | 2,617 | | | | 2,695,458 | |
5.50%, 01/15/28 | | | | | | | 1,823 | | | | 1,827,557 | |
Targa Resources Partners LP/Targa Resources Partners Finance Corp.: | | | | | | | | | | | | |
5.25%, 05/01/23 | | | | | | | 78 | | | | 79,122 | |
4.25%, 11/15/23 | | | | | | | 845 | | | | 823,875 | |
5.13%, 02/01/25 | | | | | | | 548 | | | | 546,625 | |
5.38%, 02/01/27 | | | | | | | 531 | | | | 531,000 | |
5.00%, 01/15/28(d) | | | | | | | 2,308 | | | | 2,241,645 | |
Transocean, Inc., 7.50%, 01/15/26(d) | | | | | | | 1,753 | | | | 1,766,147 | |
Tullow Oil PLC: | | | | | | | | | | | | |
6.00%, 11/01/20(d) | | | | | | | 200 | | | | 202,000 | |
6.00%, 11/01/20 | | | | | | | 200 | | | | 202,000 | |
Weatherford International Ltd.: | | | | | | | | | | | | |
6.50%, 08/01/36 | | | | | | | 1,021 | | | | 775,960 | |
7.00%, 03/15/38 | | | | | | | 1,523 | | | | 1,210,785 | |
5.95%, 04/15/42 | | | | | | | 959 | | | | 690,480 | |
Whiting Petroleum Corp., 6.63%,
01/15/26(d) | | | | | | | 2,879 | | | | 2,936,580 | |
WildHorse Resource Development Corp., 6.88%, 02/01/25 | | | | | | | 898 | | | | 920,450 | |
Williams Cos., Inc.: | | | | | | | | | | | | |
4.55%, 06/24/24 | | | | | | | 1,614 | | | | 1,626,105 | |
5.75%, 06/24/44 | | | | | | | 4,897 | | | | 5,203,062 | |
WPX Energy, Inc.: | | | | | | | | | | | | |
7.50%, 08/01/20 | | | | | | | 258 | | | | 276,060 | |
6.00%, 01/15/22 | | | | | | | 1,165 | | | | 1,208,688 | |
8.25%, 08/01/23 | | | | | | | 1,245 | | | | 1,409,963 | |
5.25%, 09/15/24 | | | | | | | 754 | | | | 754,000 | |
| | | | | | | | | | | | |
| | | | | | | | | | | 211,772,293 | |
| Oil: Crude Producers — 0.1% | |
MGM Growth Properties Operating Partnership LP/MGP Finance Co-Issuer, Inc.,
4.50%, 01/15/28 | | | | | | | 2,133 | | | | 2,015,685 | |
| | | | | | | | | | | | |
| Paper & Forest Products — 0.1% | |
Norbord, Inc., 6.25%, 04/15/23(d) | | | | | | | 1,711 | | | | 1,829,145 | |
Stora Enso OYJ, 2.50%, 06/07/27 | | | EUR | | | | 200 | | | | 247,050 | |
| | | | | | | | | | | | |
| | | | | | | | | | | 2,076,195 | |
| Pharmaceuticals — 3.0% | |
Endo Finance LLC/Endo Finco, Inc.(d): | | | | | | | | | | | | |
7.25%, 01/15/22 | | | USD | | | | 1,176 | | | | 981,960 | |
6.00%, 07/15/23 | | | | | | | 931 | | | | 698,250 | |
Ephios Bondco PLC, 6.25%, 07/01/22 | | | EUR | | | | 675 | | | | 858,746 | |
Ephios Holdco II PLC, 8.25%, 07/01/23 | | | | | | | 159 | | | | 207,770 | |
Grifols SA, 3.20%, 05/01/25 | | | | | | | 200 | | | | 245,867 | |
inVentiv Group Holdings, Inc./inVentiv Health, Inc./inVentiv Health Clinical, Inc.,
7.50%, 10/01/24(d) | | | USD | | | | 878 | | | | 939,460 | |
Jaguar Holding Co. II/Pharmaceutical Product Development LLC, 6.38%, 08/01/23(d) | | | | | | | 10,081 | | | | 10,131,405 | |
Nidda BondCo GmbH, 5.00%, 09/30/25 | | | EUR | | | | 204 | | | | 246,428 | |
Nidda Healthcare Holding AG, 3.50%, 09/30/24 | | | | | | | 150 | | | | 183,357 | |
Synlab Bondco PLC, 6.25%, 07/01/22 | | | | | | | 210 | | | | 267,165 | |
| | | | | | | | | | | | |
| Security | | | | | Par
(000) | | | Value | |
| Pharmaceuticals (continued) | |
Team Health Holdings, Inc., 6.38%, 02/01/25(d) | | | USD | | | | 3,064 | | | $ | 2,803,560 | |
Teva Pharmaceutical Finance Netherlands II BV, 1.25%, 03/31/23 | | | EUR | | | | 390 | | | | 423,459 | |
Teva Pharmaceutical Finance Netherlands III BV, 1.70%, 07/19/19 | | | USD | | | | 1,590 | | | | 1,551,361 | |
Valeant Pharmaceuticals International, Inc.: | | | | | | | | | | | | |
7.50%, 07/15/21(d) | | | | | | | 1,841 | | | | 1,850,205 | |
6.75%, 08/15/21(d) | | | | | | | 2,471 | | | | 2,409,225 | |
5.63%, 12/01/21(d) | | | | | | | 724 | | | | 684,180 | |
6.50%, 03/15/22(d) | | | | | | | 2,043 | | | | 2,124,720 | |
5.50%, 03/01/23(d) | | | | | | | 930 | | | | 823,050 | |
4.50%, 05/15/23 | | | EUR | | | | 926 | | | | 986,991 | |
5.88%, 05/15/23(d) | | | USD | | | | 5,709 | | | | 5,073,874 | |
7.00%, 03/15/24(d) | | | | | | | 3,210 | | | | 3,378,525 | |
6.13%, 04/15/25(d) | | | | | | | 5,935 | | | | 5,207,963 | |
5.50%, 11/01/25(d) | | | | | | | 3,825 | | | | 3,784,359 | |
| | | | | | | | | | | | |
| | | | | | | | | | | 45,861,880 | |
| Real Estate Investment Trusts (REITs) — 1.4% | |
Five Point Operating Co. LP/Five Point Capital Corp., 7.88%, 11/15/25(d) | | | | | | | 985 | | | | 999,775 | |
Hilton Domestic Operating Co., Inc.,
4.25%, 09/01/24 | | | | | | | 1,269 | | | | 1,246,793 | |
Hilton Worldwide Finance LLC/Hilton Worldwide Finance Corp., 4.63%, 04/01/25 | | | | | | | 556 | | | | 558,085 | |
iStar, Inc.: | | | | | | | | | | | | |
4.63%, 09/15/20 | | | | | | | 221 | | | | 222,105 | |
6.00%, 04/01/22 | | | | | | | 901 | | | | 905,505 | |
5.25%, 09/15/22 | | | | | | | 1,012 | | | | 994,290 | |
MGM Growth Properties Operating Partnership LP/MGP Finance Co-Issuer, Inc.: | | | | | | | | | | | | |
5.63%, 05/01/24 | | | | | | | 9,671 | | | | 10,004,649 | |
4.50%, 09/01/26 | | | | | | | 3,280 | | | | 3,124,200 | |
NH Hotel Group SA, 3.75%, 10/01/23 | | | EUR | | | | 262 | | | | 334,423 | |
Starwood Property Trust, Inc.: | | | | | | | | | | | | |
5.00%, 12/15/21 | | | USD | | | | 1,695 | | | | 1,733,138 | |
4.75%, 03/15/25(d) | | | | | | | 776 | | | | 752,720 | |
| | | | | | | | | | | | |
| | | | | | | | | | | 20,875,683 | |
| Real Estate Management & Development — 0.6% | |
ADLER Real Estate AG: | | | | | | | | | | | | |
4.75%, 04/08/20 | | | EUR | | | | 134 | | | | 170,300 | |
2.13%, 02/06/24 | | | | | | | 325 | | | | 394,200 | |
Aroundtown Property Holdings PLC, 1.50%, 01/18/21(k) | | | | | | | 100 | | | | 150,143 | |
Greystar Real Estate Partners LLC, 5.75%, 12/01/25(d) | | | USD | | | | 1,158 | | | | 1,172,475 | |
Howard Hughes Corp., 5.38%, 03/15/25(d) | | | | | | | 1,568 | | | | 1,546,440 | |
Realogy Group LLC/Realogy Co-Issuer
Corp.(d): | | | | | | | | | | | | |
4.50%, 04/15/19 | | | | | | | 806 | | | | 817,083 | |
5.25%, 12/01/21 | | | | | | | 2,296 | | | | 2,324,700 | |
4.88%, 06/01/23 | | | | | | | 1,235 | | | | 1,194,863 | |
RESIDOMO Sro, 3.38%, 10/15/24 | | | EUR | | | | 420 | | | | 514,962 | |
Rialto Holdings LLC/Rialto Corp.,
7.00%, 12/01/18(d) | | | USD | | | | 761 | | | | 761,152 | |
Summit Germany Ltd., 2.00%, 01/31/25 | | | EUR | | | | 145 | | | | 172,693 | |
| | | | | | | | | | | | |
| | | | | | | | | | | 9,219,011 | |
| Restaurants — 0.1% | |
IRB Holding Corp., 6.75%, 02/15/26(d) | | | USD | | | | 1,241 | | | | 1,239,076 | |
| | | | | | | | | | | | |
| Road & Rail — 0.9% | |
Avis Budget Car Rental LLC/Avis Budget Finance, Inc., 5.13%, 06/01/22(d) | | | | | | | 927 | | | | 924,682 | |
Avis Budget Finance PLC, 4.13%, 11/15/24 | | | EUR | | | | 250 | | | | 310,492 | |
| | |
| 58 | | 2018 BLACKROCK SEMI-ANNUAL REPORTTO SHAREHOLDERS |
| | |
Consolidated Schedule of Investments (unaudited) (continued) February 28, 2018 | | BlackRock Corporate High Yield Fund, Inc. (HYT) (Percentages shown are based on Net Assets) |
| | | | | | | | | | | | |
| Security | | | | | Par
(000) | | | Value | |
| Road & Rail (continued) | |
CMA CGM SA, 5.25%, 01/15/25 | | | EUR | | | | 100 | | | $ | 114,941 | |
EC Finance PLC, 2.38%, 11/15/22 | | | | | | | 203 | | | | 251,031 | |
Europcar Drive Designated Activity Co., 4.13%, 11/15/24 | | | | | | | 387 | | | | 473,556 | |
Europcar Groupe SA, 5.75%, 06/15/22 | | | | | | | 110 | | | | 139,222 | |
Flexi-Van Leasing, Inc., 10.00%, 02/15/23(d) | | | USD | | | | 1,326 | | | | 1,319,370 | |
Herc Rentals, Inc.(d): | | | | | | | | | | | | |
7.50%, 06/01/22 | | | | | | | 1,406 | | | | 1,504,420 | |
7.75%, 06/01/24 | | | | | | | 1,201 | | | | 1,308,730 | |
Hertz Corp., 7.63%, 06/01/22(d) | | | | | | | 2,628 | | | | 2,700,270 | |
Loxam SAS: | | | | | | | | | | | | |
3.50%, 04/15/22 | | | EUR | | | | 168 | | | | 212,319 | |
3.50%, 05/03/23 | | | | | | | 150 | | | | 188,501 | |
4.25%, 04/15/24 | | | | | | | 100 | | | | 128,971 | |
6.00%, 04/15/25 | | | | | | | 108 | | | | 141,620 | |
United Rentals North America, Inc.: | | | | | | | | | | | | |
4.63%, 07/15/23 | | | USD | | | | 944 | | | | 965,240 | |
4.63%, 10/15/25 | | | | | | | 2,460 | | | | 2,398,500 | |
Watco Cos. LLC/Watco Finance Corp.,
6.38%, 04/01/23(d) | | | | | | | 1,093 | | | | 1,120,325 | |
| | | | | | | | | | | | |
| | | | | | | | | | | 14,202,190 | |
| Semiconductors & Semiconductor Equipment — 1.1% | |
Advanced Micro Devices, Inc.: | | | | | | | | | | | | |
7.50%, 08/15/22 | | | | | | | 422 | | | | 463,145 | |
7.00%, 07/01/24 | | | | | | | 409 | | | | 428,939 | |
Micron Technology, Inc.: | | | | | | | | | | | | |
5.50%, 02/01/25 | | | | | | | 58 | | | | 60,175 | |
Series G, 3.00%, 11/15/43(k) | | | | | | | 1,251 | | | | 2,113,246 | |
Microsemi Corp., 9.13%, 04/15/23(d) | | | | | | | 134 | | | | 148,405 | |
NXP BV/NXP Funding LLC(d): | | | | | | | | | | | | |
4.13%, 06/15/20 | | | | | | | 2,409 | | | | 2,451,157 | |
4.13%, 06/01/21 | | | | | | | 1,448 | | | | 1,473,630 | |
4.63%, 06/15/22 | | | | | | | 1,319 | | | | 1,358,715 | |
3.88%, 09/01/22 | | | | | | | 1,138 | | | | 1,140,504 | |
5.75%, 03/15/23 | | | | | | | 1,070 | | | | 1,101,458 | |
4.63%, 06/01/23 | | | | | | | 928 | | | | 954,912 | |
Sensata Technologies BV(d): | | | | | | | | | | | | |
5.63%, 11/01/24 | | | | | | | 903 | | | | 965,352 | |
5.00%, 10/01/25 | | | | | | | 3,297 | | | | 3,321,727 | |
| | | | | | | | | | | | |
| | | | | | | | | | | 15,981,365 | |
| Software — 4.5% | |
BMC Software Finance, Inc., 8.13%, 07/15/21(d) | | | | | | | 3,715 | | | | 3,728,931 | |
Genesys Telecommunications Laboratories Inc/Greeneden Lux 3 Sarl/Greeneden US Holdings LLC, 10.00%, 11/30/24(d) | | | | | | | 3,875 | | | | 4,286,719 | |
Infinity Acquisition LLC/Infinity Acquisition Finance Corp., 7.25%, 08/01/22(d) | | | | | | | 1,444 | | | | 1,447,610 | |
Infor Software Parent LLC/Infor Software Parent, Inc., (7.13% Cash or 7.88% PIK),
7.13%, 05/01/21(d)(g) | | | | | | | 3,521 | | | | 3,582,618 | |
Infor US, Inc., 6.50%, 05/15/22 | | | | | | | 11,511 | | | | 11,769,997 | |
Informatica LLC, 7.13%, 07/15/23(d) | | | | | | | 4,124 | | | | 4,204,418 | |
Nuance Communications, Inc.: | | | | | | | | | | | | |
5.38%, 08/15/20(d) | | | | | | | 356 | | | | 359,115 | |
6.00%, 07/01/24 | | | | | | | 1,630 | | | | 1,705,877 | |
5.63%, 12/15/26 | | | | | | | 1,410 | | | | 1,427,625 | |
PTC, Inc., 6.00%, 05/15/24 | | | | | | | 1,996 | | | | 2,098,295 | |
Rackspace Hosting, Inc., 8.63%, 11/15/24(d) | | | | | | | 1,828 | | | | 1,903,697 | |
RP Crown Parent LLC, 7.38%, 10/15/24(d) | | | | | | | 2,666 | | | | 2,779,305 | |
Solera LLC/Solera Finance, Inc.,
10.50%, 03/01/24(d) | | | | | | | 10,664 | | | | 11,973,539 | |
Sophia LP/Sophia Finance, Inc.,
9.00%, 09/30/23(d) | | | | | | | 1,553 | | | | 1,636,474 | |
| | | | | | | | | | | | |
| Security | | | | | Par
(000) | | | Value | |
| Software (continued) | |
TIBCO Software, Inc., 11.38%, 12/01/21(d) | | | USD | | | | 7,252 | | | $ | 7,905,985 | |
Veritas US, Inc./Veritas Bermuda Ltd.: | | | | | | | | | | | | |
7.50%, 02/01/23 | | | EUR | | | | 200 | | | | 256,200 | |
7.50%, 02/01/23(d) | | | USD | | | | 3,130 | | | | 3,176,950 | |
10.50%, 02/01/24(d) | | | | | | | 4,492 | | | | 4,289,860 | |
| | | | | | | | | | | | |
| | | | | | | | | | | 68,533,215 | |
| Specialty Retail — 0.8% | |
Asbury Automotive Group, Inc., 6.00%, 12/15/24 | | | | | | | 2,505 | | | | 2,598,937 | |
Catalent Pharma Solutions, Inc., 4.88%, 01/15/26(d) | | | | | | | 1,907 | | | | 1,887,930 | |
Group 1 Automotive, Inc., 5.25%, 12/15/23(d) | | | | | | | 264 | | | | 270,600 | |
Hexion US Finance Corp., 6.63%, 04/15/20 | | | | | | | 658 | | | | 611,940 | |
JC Penney Corp., Inc.: | | | | | | | | | | | | |
8.13%, 10/01/19 | | | | | | | 218 | | | | 228,628 | |
6.38%, 10/15/36 | | | | | | | 554 | | | | 373,950 | |
7.40%, 04/01/37 | | | | | | | 230 | | | | 165,600 | |
L Brands, Inc.: | | | | | | | | | | | | |
6.88%, 11/01/35 | | | | | | | 2,579 | | | | 2,559,658 | |
6.75%, 07/01/36 | | | | | | | 384 | | | | 376,320 | |
Masaria Investments SAU, 5.00%, 09/15/24 | | | EUR | | | | 186 | | | | 230,040 | |
Penske Automotive Group, Inc.: | | | | | | | | | | | | |
5.75%, 10/01/22 | | | USD | | | | 729 | | | | 749,048 | |
5.50%, 05/15/26 | | | | | | | 346 | | | | 345,135 | |
PetSmart, Inc., 5.88%, 06/01/25(d) | | | | | | | 897 | | | | 699,660 | |
PVH Corp., 3.13%, 12/15/27 | | | EUR | | | | 542 | | | | 657,658 | |
Shop Direct Funding PLC, 7.75%, 11/15/22 | | | GBP | | | | 440 | | | | 563,511 | |
| | | | | | | | | | | | |
| | | | | | | | | | | 12,318,615 | |
| Technology Hardware, Storage & Peripherals — 1.0% | |
Dell International LLC/EMC Corp.(d): | | | | | | | | | | | | |
7.13%, 06/15/24 | | | USD | | | | 4,522 | | | | 4,866,802 | |
6.02%, 06/15/26 | | | | | | | 1,390 | | | | 1,484,042 | |
Riverbed Technology, Inc., 8.88%, 03/01/23(d) | | | | | | | 1,221 | | | | 1,144,688 | |
Western Digital Corp.: | | | | | | | | | | | | |
7.38%, 04/01/23(d) | | | | | | | 1,534 | | | | 1,667,458 | |
4.75%, 02/15/26 | | | | | | | 6,121 | | | | 6,166,907 | |
| | | | | | | | | | | | |
| | | | | | | | | | | 15,329,897 | |
| Textiles, Apparel & Luxury Goods — 0.1% | |
3AB Optique Developpement SAS, 4.00%, 10/01/23 | | | EUR | | | | 196 | | | | 238,534 | |
BiSoho SAS, 5.88%, 05/01/23 | | | | | | | 108 | | | | 140,838 | |
Levi Strauss & Co., 3.38%, 03/15/27 | | | | | | | 225 | | | | 282,980 | |
Springs Industries, Inc., 6.25%, 06/01/21 | | | USD | | | | 274 | | | | 278,795 | |
| | | | | | | | | | | | |
| | | | | | | | | | | 941,147 | |
| Thrifts & Mortgage Finance — 0.2% | |
Jerrold Finco PLC: | | | | | | | | | | | | |
6.25%, 09/15/21 | | | GBP | | | | 225 | | | | 316,107 | |
6.13%, 01/15/24 | | | | | | | 545 | | | | 754,338 | |
Ladder Capital Finance Holdings LLLP/Ladder Capital Finance Corp.(d): | | | | | | | | | | | | |
5.25%, 03/15/22 | | | USD | | | | 352 | | | | 354,640 | |
5.25%, 10/01/25 | | | | | | | 2,176 | | | | 2,116,160 | |
| | | | | | | | | | | | |
| | | | | | | | | | | 3,541,245 | |
| Trading Companies & Distributors — 0.0% | |
Ashtead Capital, Inc., 5.63%, 10/01/24(d) | | | | | | | 278 | | | | 290,510 | |
| | | | | | | | | | | | |
| Transportation Infrastructure — 0.1% | |
Swissport Financing Sarl: | | | | | | | | | | | | |
6.75%, 12/15/21 | | | EUR | | | | 227 | | | | 287,361 | |
9.75%, 12/15/22 | | | | | | | 100 | | | | 127,800 | |
WFS Global Holding SAS, 9.50%, 07/15/22 | | | | | | | 565 | | | | 734,704 | |
| | | | | | | | | | | | |
| | | | | | | | | | | 1,149,865 | |
| | | | |
| SCHEDULES OF INVESTMENTS | | | 59 | |
| | |
Consolidated Schedule of Investments (unaudited) (continued) February 28, 2018 | | BlackRock Corporate High Yield Fund, Inc. (HYT) (Percentages shown are based on Net Assets) |
| | | | | | | | | | | | |
| Security | | | | | Par
(000) | | | Value | |
| Utilities — 0.0% | |
ContourGlobal Power Holdings SA, 5.13%, 06/15/21 | | | EUR | | | | 300 | | | $ | 372,734 | |
Viridian Group FinanceCo PLC/Viridian Power and Energy, 4.75%, 09/15/24 | | | GBP | | | | 100 | | | | 129,410 | |
| | | | | | | | | | | | |
| | | | | | | | | | | 502,144 | |
| Wireless Telecommunication Services — 5.7% | |
CoreCivic, Inc., 4.75%, 10/15/27 | | | USD | | | | 1,135 | | | | 1,083,925 | |
CyrusOne LP/CyrusOne Finance Corp.: | | | | | | | | | | | | |
5.00%, 03/15/24 | | | | | | | 3,400 | | | | 3,425,500 | |
5.38%, 03/15/27 | | | | | | | 325 | | | | 325,813 | |
Digicel Group Ltd., 7.13%, 04/01/22(d) | | | | | | | 2,085 | | | | 1,809,780 | |
Digicel Ltd., 6.00%, 04/15/21(d) | | | | | | | 5,495 | | | | 5,282,069 | |
Equinix, Inc., 2.88%, 10/01/25 | | | EUR | | | | 420 | | | | 507,594 | |
GEO Group, Inc.: | | | | | | | | | | | | |
5.88%, 01/15/22 | | | USD | | | | 350 | | | | 359,187 | |
5.13%, 04/01/23 | | | | | | | 300 | | | | 298,500 | |
5.88%, 10/15/24 | | | | | | | 2,030 | | | | 2,050,300 | |
6.00%, 04/15/26 | | | | | | | 630 | | | | 627,826 | |
Iron Mountain, Inc., 3.00%, 01/15/25 | | | EUR | | | | 150 | | | | 182,122 | |
Matterhorn Telecom SA: | | | | | | | | | | | | |
3.88%, 05/01/22 | | | | | | | 635 | | | | 786,321 | |
4.00%, 11/15/27 | | | | | | | 405 | | | | 483,586 | |
Radiate Holdco LLC/Radiate Finance, Inc.,
6.63%, 02/15/25(d) | | | USD | | | | 1,539 | | | | 1,473,592 | |
SBA Communications Corp.: | | | | | | | | | | | | |
4.00%, 10/01/22(d) | | | | | | | 2,644 | | | | 2,591,120 | |
4.88%, 09/01/24 | | | | | | | 2,489 | | | | 2,457,887 | |
Sprint Capital Corp.: | | | | | | | | | | | | |
6.90%, 05/01/19 | | | | | | | 640 | | | | 662,618 | |
8.75%, 03/15/32 | | | | | | | 934 | | | | 1,013,390 | |
Sprint Communications, Inc., 7.00%, 03/01/20(d) | | | | | | | 6,062 | | | | 6,402,987 | |
Sprint Corp.: | | | | | | | | | �� | | | |
7.88%, 09/15/23 | | | | | | | 5,424 | | | | 5,613,840 | |
7.13%, 06/15/24 | | | | | | | 18,967 | | | | 18,836,128 | |
7.63%, 02/15/25 | | | | | | | 9,310 | | | | 9,310,000 | |
7.63%, 03/01/26 | | | | | | | 1,956 | | | | 1,948,861 | |
T-Mobile USA, Inc.: | | | | | | | | | | | | |
4.00%, 04/15/22 | | | | | | | 1,337 | | | | 1,337,000 | |
6.00%, 03/01/23 | | | | | | | 2,169 | | | | 2,255,760 | |
6.50%, 01/15/24 | | | | | | | 2,638 | | | | 2,763,305 | |
6.38%, 03/01/25 | | | | | | | 994 | | | | 1,048,670 | |
4.50%, 02/01/26 | | | | | | | 2,486 | | | | 2,439,387 | |
4.75%, 02/01/28 | | | | | | | 3,741 | | | | 3,648,897 | |
Uniti Group LP/Uniti Group Finance, Inc./CSL Capital LLC, 8.25%, 10/15/23 | | | | | | | 2,418 | | | | 2,254,785 | |
VICI Properties 1 LLC/VICI FC, Inc., 8.00%, 10/15/23 | | | | | | | 1,327 | | | | 1,469,753 | |
Wind Tre SpA: | | | | | | | | | | | | |
2.63%, 01/20/23 | | | EUR | | | | 170 | | | | 188,406 | |
3.13%, 01/20/25 | | | | | | | 210 | | | | 228,659 | |
Xplornet Communications, Inc., (9.63% Cash or 10.63% PIK),
9.63%, 06/01/22(d)(g) | | | USD | | | | 809 | | | | 841,387 | |
| | | | | | | | | | | | |
| | | | | | | | | | | 86,008,955 | |
| | | | | | | | | | | | |
Total Corporate Bonds — 114.9%
(Cost — $1,733,977,958) | | | | 1,745,167,299 | |
| | | | | | | | | | | | |
|
Floating Rate Loan Interests (m) — 12.9% | |
|
| Aerospace & Defense — 0.2% | |
Accudyne Industries LLC, 2017 Term Loan, (1 mo. LIBOR + 3.25% 1.00% Floor), 4.29%, 08/18/24 | | | | | | | 3,261 | | | | 3,277,588 | |
| | | | | | | | | | | | |
| Security | | | | | Par
(000) | | | Value | |
| Aerospace & Defense (continued) | |
Sequa Mezzanine Holdings LLC, 2nd Lien Term Loan, (3 mo. LIBOR + 9.00% 1.00% Floor), 4.69%, 04/28/22 | | | USD | | | | 385 | | | $ | 390,132 | |
| | | | | | | | | | | | |
| | | | | | | | | | | 3,667,720 | |
| Air Freight & Logistics — 0.3% | |
CEVA Group PLC, Letter of Credit,
(3 mo. LIBOR + 5.50%), 4.40%, 03/19/21(b) | | | | | | | 916 | | | | 897,512 | |
CEVA Intercompany BV, Dutch Term Loan, (3 mo. LIBOR + 5.50% 1.00% Floor), 9.44%, 03/19/21 | | | | | | | 934 | | | | 916,246 | |
CEVA Logistics Canada ULC, Canadian Term Loan, (3 mo. LIBOR + 5.50% 1.00% Floor), 5.15%, 03/19/21 | | | | | | | 142 | | | | 139,134 | |
CEVA Logistics US Holdings, Inc., Term Loan, (3 mo. LIBOR + 5.50% 1.00% Floor),
10.19%, 03/19/21 | | | | | | | 1,329 | | | | 1,304,604 | |
XPO Logistics, Inc., 2018 Term Loan B,
02/23/25(n) | | | | | | | 859 | | | | 860,790 | |
| | | | | | | | |
| | | | | | | | | | | 4,118,286 | |
| Airlines — 0.1% | |
Northwest Airlines, Inc.(b)(n): | | | | | | | | | | | | |
Term Loan, 09/10/18 | | | | | | | 1,078 | | | | 1,070,358 | |
Term Loan, 09/10/18 | | | | | | | 546 | | | | 542,718 | |
| | | | | | | | |
| | | | | | | | | | | 1,613,076 | |
| Auto Components — 0.0% | |
USI, Inc., 2017 Repriced Term Loan, (3 mo. LIBOR + 3.00%), 6.19%, 05/16/24 | | | | | | | 591 | | | | 589,463 | |
| | | | | | | | |
| Banks — 0.1% | |
Banco Espirito Santo SA, 4.75%, 01/15/19(i) | | | EUR | | | | 1,900 | | | | 678,015 | |
Capri Finance LLC, 2017 1st Lien Term Loan, (3 mo. LIBOR + 3.25%), 4.40%, 11/01/24 | | | USD | | | | 657 | | | | 656,593 | |
| | | | | | | | |
| | | | | | | | | | | 1,334,608 | |
| Capital Markets — 0.1% | |
Horizon Holdings III SAS, EUR Term Loan B4,
10/29/22(n) | | | EUR | | | | 1,000 | | | | 1,217,609 | |
| | | | | | | | |
| Chemicals — 0.4% | |
Element Materials Technology Group US Holdings, Inc., 2017 Term Loan B, (3 mo. LIBOR + 3.50% 1.00% Floor), 4.94%, 06/28/24 | | | USD | | | | 345 | | | | 348,667 | |
H.B. Fuller Co., 2017 Term Loan B, (1 mo. LIBOR + 2.25%), 6.50%, 10/20/24 | | | | | | | 1,758 | | | | 1,765,293 | |
Invictus(n): | | | | | | | | | | | | |
1st Lien Term Loan, 01/24/25 | | | | | | | 684 | | | | 689,155 | |
2nd Lien Term Loan, 01/23/26 | | | | | | | 374 | | | | 376,573 | |
PQ Corp., 2018 Term Loan B, 02/08/25(n) | | | | | | | 447 | | | | 449,180 | |
WR Grace & Co.(n): | | | | | | | | | | | | |
Term Loan B1, 02/12/25 | | | | | | | 738 | | | | 738,634 | |
Term Loan B2, 02/12/25 | | | | | | | 1,085 | | | | 1,085,706 | |
| | | | | | | | | | | | |
| | | | | | | | | | | 5,453,208 | |
| Commercial Services & Supplies — 0.4% | |
Asurion LLC, 2017 2nd Lien Term Loan, (1 mo. LIBOR + 6.00%), 4.40%, 08/04/25 | | | | | | | 577 | | | | 590,992 | |
Convergint Technologies LLC, 2018 1st Lien Term Loan, (3 mo. LIBOR + 3.00%), 5.58%, 02/03/25 | | | | | | | 355 | | | | 354,215 | |
Silk Bidco AS, EUR Term Loan B, 02/07/25(n) | | | EUR | | | | 1,000 | | | | 1,219,805 | |
West Corp., 2017 Term Loan, (1 mo. LIBOR + 4.00% 1.00% Floor), 5.65%, 10/10/24 | | | USD | | | | 3,350 | | | | 3,377,134 | |
| | | | | | | | | | | | |
| | | | | | | | | | | 5,542,146 | |
| | |
| 60 | | 2018 BLACKROCK SEMI-ANNUAL REPORTTO SHAREHOLDERS |
| | |
Consolidated Schedule of Investments (unaudited) (continued) February 28, 2018 | | BlackRock Corporate High Yield Fund, Inc. (HYT) (Percentages shown are based on Net Assets) |
| | | | | | | | | | | | |
| Security | | | | | Par
(000) | | | Value | |
| Construction & Engineering — 0.6% | |
Brand Energy & Infrastructure Services, Inc., 2017 Term Loan, (3 mo. LIBOR + 4.25% 1.00% Floor), 7.27%, 06/21/24 | | | USD | | | | 9,047 | | | $ | 9,110,233 | |
| | | | | | | | | | | | |
| Diversified Consumer Services — 0.4% | |
Ascend Learning LLC, 2017 Term Loan B, (1 mo. LIBOR + 3.00% 1.00% Floor),
5.88%, 07/12/24 | | | | | | | 404 | | | | 405,333 | |
Gol LuxCo SA, 1st Lien Term Loan, (Fixed + 6.50%), 7.59%, 08/31/20(b) | | | | | | | 3,885 | | | | 3,962,700 | |
Laureate Education, Inc., 2017 Term Loan B, (1 mo. LIBOR + 3.50% 1.00% Floor),
5.15%, 04/26/24 | | | | | | | 1,364 | | | | 1,371,517 | |
| | | | | | | | | | | | |
| | | | | | | | | | | 5,739,550 | |
| Diversified Financial Services — 0.1% | |
Endo Luxembourg Finance Company I Sarl, 2017 Term Loan B, (1 mo. LIBOR + 4.25%),
5.19%, 04/29/24 | | | | | | | 1,880 | | | | 1,875,080 | |
| | | | | | | | | | | | |
| Diversified Telecommunication Services — 0.4% | |
CenturyLink, Inc., 2017 Term Loan B, (1 mo. LIBOR + 2.75%), 4.40%, 01/31/25 | | | | | | | 5,161 | | | | 5,069,392 | |
Eircom Finco Sarl, EUR Term Loan B6,
04/19/24(n) | | | EUR | | | | 1,000 | | | | 1,220,818 | |
MTN Infrastructure TopCo, Inc., MTN Topco Term Loan, 11/17/24(n) | | | | | | | | | | | 380,079 | |
| | | | | | | | | | | | |
| | | | | | | | | | | 6,670,289 | |
| Electrical Equipment — 0.1% | |
Generac Power Systems, Inc., 2017 1st Lien Term Loan B, (3 mo. LIBOR + 2.00%), 4.47%, 05/31/23 | | | | | | | 1,393 | | | | 1,395,897 | |
| | | | | | | | | | | | |
| Energy Equipment & Services — 0.6% | |
Gavilan Resources LLC, 2nd Lien Term Loan, (1 mo. LIBOR + 6.00% 1.00% Floor), 5.94%, 03/01/24 | | | | | | | 1,779 | | | | 1,784,924 | |
GrafTech Finance, Inc., 2018 Term Loan B, (OR + 3.50% 1.00% Floor), 3.69%,
02/12/25(b) | | | | | | | 1,147 | | | | 1,145,566 | |
Pioneer Energy Services Corp., Term Loan, (1 mo. LIBOR + 7.75% 1.00% Floor),
5.19%, 11/08/22 | | | | | | | 3,921 | | | | 4,072,939 | |
Weatherford International Ltd., Term Loan,
(1 mo. LIBOR + 2.30%), 5.65%, 07/13/20 | | | | | | | 1,758 | | | | 1,736,194 | |
| | | | | | | | | | | | |
| | | | | | | | | | | 8,739,623 | |
| Food Products — 0.2% | |
Chobani LLC, 2017 Term Loan B, (1 mo. LIBOR + 3.50% 1.00% Floor), 4.66%, 10/10/23 | | | | | | | 397 | | | | 399,604 | |
Froneri International PLC, 2018 EUR Term Loan B, 3.74%, 01/22/25 | | | EUR | | | | 1,000 | | | | 1,223,819 | |
JBS USA LLC, 2017 Term Loan B, (3 mo. LIBOR + 2.50%), 4.83%, 10/30/22 | | | USD | | | | 1,790 | | | | 1,781,050 | |
| | | | | | | | | | | | |
| | | | | | | | | | | 3,404,473 | |
| Health Care Equipment & Supplies — 0.5% | |
DJO Finance LLC, 2015 Term Loan,
(1 mo. LIBOR + 3.25% 1.00% Floor), 4.90%, 06/08/20 | | | | | | | 3,308 | | | | 3,275,923 | |
Immucor, Inc., Extended Term Loan B, (2 mo. LIBOR + 5.00% 1.00% Floor), 5.15%, 06/15/21 | | | | | | | 4,335 | | | | 4,411,354 | |
Ortho-Clinical Diagnostics SA, Term Loan B, (3 mo. LIBOR + 3.75% 1.00% Floor), 5.44%, 06/30/21 | | | | | | | 238 | | | | 239,320 | |
| | | | | | | | | | | | |
| | | | | | | | | | | 7,926,597 | |
| | | | | | | | | | | | |
| Security | | | | | Par
(000) | | | Value | |
| Health Care Providers & Services — 0.2% | |
Quorum Health Corporation, Term Loan B,
04/29/22(n) | | | USD | | | | 895 | | | $ | 913,276 | |
Team Health Holdings, Inc., 1st Lien Term Loan, (1 mo. LIBOR + 2.75% 1.00% Floor),
4.40%, 02/06/24 | | | | | | | 1,695 | | | | 1,647,236 | |
| | | | | | | | | | | | |
| | | | | | | | | | | 2,560,512 | |
| Health Care Technology — 0.1% | |
Change Healthcare Holdings, Inc., 2017 Term Loan B, (1 mo. LIBOR + 2.75% 1.00% Floor), 3.62%, 03/01/24 | | | | | | | 1,747 | | | | 1,750,057 | |
Quintiles IMS, Inc., 2017 Term Loan B, (3 mo. LIBOR + 2.00%), 3.69%, 03/07/24 | | | | | | | 460 | | | | 463,105 | |
| | | | | | | | | | | | |
| | | | | | | | | | | 2,213,162 | |
| Hotels, Restaurants & Leisure — 0.7% | |
Bronco Midstream Funding LLC, Term Loan B, (3 mo. LIBOR + 4.00% 1.00% Floor),
7.27%, 08/15/20 | | | | | | | 4,685 | | | | 4,728,584 | |
Caesars Resort Collection LLC, 2017 1st Lien Term Loan B, (1 mo. LIBOR + 2.75%),
7.27%, 12/22/24 | | | | | | | 2,931 | | | | 2,948,967 | |
Cineworld Ltd., 2018 Term Loan, 02/18/25(n) | | | | | | | 1,630 | | | | 1,627,555 | |
IRB Holding Corp., 1st Lien Term Loan, (1 mo. LIBOR + 3.25% 1.00% Floor),
6.63%, 02/05/25 | | | | | | | 569 | | | | 574,286 | |
| | | | | | | | | | | | |
| | | | | | | | | | | 9,879,392 | |
| Industrial Conglomerates — 0.2% | |
Cortes NP Acquisition Corp., 2017 Term Loan B, (1 mo. LIBOR + 4.00% 1.00% Floor),
4.65%, 11/30/23 | | | | | | | 1,986 | | | | 1,995,363 | |
Sequa Mezzanine Holdings LLC, 1st Lien Term Loan, (3 mo. LIBOR + 5.00% 1.00% Floor), 4.65%, 11/28/21 | | | | | | | 1,163 | | | | 1,176,729 | |
| | | | | | | | | | | | |
| | | | | | | | | | | 3,172,092 | |
| Insurance — 0.3% | |
Genworth Financial, Inc., Term Loan, 02/22/23(n) | | | | | | | 800 | | | | 810,000 | |
Sedgwick Claims Management Services, Inc.(n): | | | | | | | | | | | | |
1st Lien Term Loan, 03/01/21 | | | | | | | 2,406 | | | | 2,404,635 | |
2nd Lien Term Loan, 02/28/22 | | | | | | | 887 | | | | 890,885 | |
| | | | | | | | | | | | |
| | | | | | | | | | | 4,105,520 | |
| IT Services — 0.3% | |
Access CIG LLC(n): | | | | | | | | | | | | |
2018 1st Lien Term Loan, 02/15/25 | | | | | | | 376 | | | | 378,820 | |
2018 2nd Lien Delayed Draw Term loan, 02/13/26 | | | | | | | 24 | | | | 24,098 | |
2018 2nd Lien Term Loan, 02/02/26 | | | | | | | 129 | | | | 129,524 | |
2018 Delayed Draw Term Loan, 02/27/25 | | | | | | | 78 | | | | 78,884 | |
Altran Technologies SA, EUR 1st Lien Term Loan B, 01/17/25(n) | | | EUR | | | | 1,000 | | | | 1,220,378 | |
Peak 10 Holding Corp.: | | | | | | | | | | | | |
2017 1st Lien Term Loan, (3 mo. LIBOR + 3.50% 1.00% Floor), 5.44%, 08/01/24 | | | USD | | | | 995 | | | | 996,497 | |
2nd Lien Term Loan, (3 mo. LIBOR + 7.25% 1.00% Floor), 5.44%, 08/01/25 | | | | | | | 420 | | | | 421,470 | |
WEX, Inc., 2017 Term Loan B2, (3 mo. LIBOR + 2.25%), 5.65%, 06/30/23 | | | | | | | 638 | | | | 641,988 | |
| | | | | | | | | | | | |
| | | | | | | | | | | 3,891,659 | |
| Life Sciences Tools & Services — 0.0% | |
Albany Molecular Research, Inc., 2017 1st Lien Term Loan, (1 mo. LIBOR + 3.25% 1.00% Floor), 4.90%, 08/30/24 | | | | | | | 733 | | | | 736,246 | |
| | | | | | | | | | | | |
| | | | |
| SCHEDULES OF INVESTMENTS | | | 61 | |
| | |
Consolidated Schedule of Investments (unaudited) (continued) February 28, 2018 | | BlackRock Corporate High Yield Fund, Inc. (HYT) (Percentages shown are based on Net Assets) |
| | | | | | | | | | | | |
| Security | | | | | Par
(000) | | | Value | |
| Machinery — 0.0% | |
Hayward Industries, Inc., 1st Lien Term Loan, (1 mo. LIBOR + 3.50%), 5.08%, 08/05/24 | | | USD | | | | 371 | | | $ | 372,461 | |
| | | | | | | | | | | | |
| Media — 1.8% | |
Charter Communications Operating LLC, 2017 Term Loan A2, 7.99%, 03/31/23 | | | | | | | 8,839 | | | | 8,827,951 | |
CSC Holdings LLC, 2018 Term Loan B, (3 mo. LIBOR + 2.50%), 8.40%, 01/25/26 | | | | | | | 720 | | | | 720,598 | |
Intelsat Jackson Holdings SA: | | | | | | | | | | | | |
2017 Term Loan B3, (3 mo. LIBOR + 3.75% 1.00% Floor), 6.65%, 11/27/23 | | | | | | | 559 | | | | 554,310 | |
2017 Term Loan B4, (3 mo. LIBOR + 4.50% 1.00% Floor), 4.44%, 01/14/24 | | | | | | | 1,478 | | | | 1,504,914 | |
2017 Term Loan B5, (Fixed + 6.62%),
6.62%, 01/14/24 | | | | | | | 10,381 | | | | 10,412,233 | |
Lamar Media Corp., 2018 Term Loan B, 02/16/25(n) | | | | | | | 626 | | | | 629,130 | |
PSAV Holdings LLC(n): | | | | | | | | | | | | |
2018 1st Lien Term Loan, 02/21/25 | | | | | | | 823 | | | | 825,057 | |
2018 2nd Lien Term Loan, 08/22/25(b) | | | | | | | 666 | | | | 667,665 | |
Tele Columbus AG, 2017 EUR Term Loan A, 10/15/24(n) | | | | | | | 1,000 | | | | 1,221,013 | |
Unitymedia Finance LLC, USD Term Loan D, (1 mo. LIBOR + 2.25%), 4.69%, 01/15/26 | | | | | | | 710 | | | | 709,155 | |
Virgin Media Bristol LLC, 2017 Term Loan, (1 mo. LIBOR + 2.50%), 3.95%, 01/15/26 | | | | | | | 1,079 | | | | 1,082,726 | |
| | | | | | | | | | | | |
| | | | | | | | | | | 27,154,752 | |
| Multiline Retail — 0.2% | |
EG Group Ltd.(n): | | | | | | | | | | | | |
2018 EUR Delayed Draw Term Loan B, 01/18/25 | | | EUR | | | | 336 | | | | 409,382 | |
2018 EUR Term Loan B, 01/18/25 | | | | | | | 511 | | | | 620,911 | |
2018 EUR Term Loan B2, 01/31/25 | | | | | | | 153 | | | | 185,896 | |
LSF9 Robin Investments Ltd., EUR 2017 Term Loan B4, (EURIBOR + 3.00%),
3.74%, 12/14/23 | | | | | | | 1,000 | | | | 1,218,854 | |
Neiman Marcus Group, Inc., 2020 Term Loan, (1 mo. LIBOR + 3.25% 1.00% Floor),
2.68%, 10/25/20 | | | USD | | | | 1,419 | | | | 1,200,373 | |
| | | | | | | | | | | | |
| | | | | | | | | | | 3,635,416 | |
| Oil, Gas & Consumable Fuels — 1.2% | |
BCP Renaissance Parent LLC, 2017 Term Loan B, (3 mo. LIBOR + 4.00% 1.00% Floor),
6.34%, 10/31/24 | | | | | | | 1,285 | | | | 1,295,520 | |
California Resources Corp., 2017 1st Lien Term Loan, (1 mo. LIBOR + 4.75%),
4.40%, 12/31/22 | | | | | | | 4,018 | | | | 4,063,202 | |
Chesapeake Energy Corp., Term Loan, (3 mo. LIBOR + 7.50% 1.00% Floor),
7.65%, 08/23/21 | | | | | | | 7,832 | | | | 8,338,968 | |
CONSOL Energy, Inc., 1st Lien Term Loan B, (1 mo. LIBOR + 6.00% 1.00% Floor),
4.57%, 10/26/22 | | | | | | | 176 | | | | 179,814 | |
Lucid Energy Group II LLC, 2018 1st Lien Term Loan, 3.00%, 02/17/25 | | | | | | | 1,063 | | | | 1,063,670 | |
Medallion Midland Acquisition LLC, 1st Lien Term Loan, (1 mo. LIBOR + 3.25% 1.00% Floor), 4.90%, 10/30/24(b) | | | | | | | 969 | | | | 971,422 | |
Vine Oil & Gas LP, Term Loan B, (1 mo. LIBOR + 6.87% 1.00% Floor), 4.09%, 12/12/21(b) | | | | | | | 1,753 | | | | 1,753,000 | |
| | | | | | | | | | | | |
| | | | | | | | | | | 17,665,596 | |
| Professional Services — 0.0% | |
Information Resources, Inc., 1st Lien Term Loan, (OR + 4.25% 1.00% Floor), 8.44%, 01/18/24 | | | | | | | 504 | | | | 507,185 | |
| | | | | | | | | | | | |
| | | | | | | | | | | | |
| Security | | | | | Par
(000) | | | Value | |
| Software — 1.3% | |
Applied Systems, Inc.: | | | | | | | | | | | | |
2017 1st Lien Term Loan, (3 mo. LIBOR + 3.25% 1.00% Floor), 6.01%, 09/19/24 | | | USD | | | | 153 | | | $ | 153,760 | |
2017 2nd Lien Term Loan, (3 mo. LIBOR + 7.00% 1.00% Floor), 5.99%, 09/19/25 | | | | | | | 186 | | | | 191,812 | |
BMC Software Finance, Inc., 2017 1st Lien Term Loan, (1 mo. LIBOR + 3.25%),
6.50%, 09/10/22 | | | | | | | 2,570 | | | | 2,575,917 | |
Cypress Intermediate Holdings III, Inc.: | | | | | | | | | | | | |
2017 1st Lien Term Loan, (1 mo. LIBOR + 3.00% 1.00% Floor), 4.65%, 04/27/24 | | | | | | | 764 | | | | 766,023 | |
2017 2nd Lien Term Loan, (1 mo. LIBOR + 6.75% 1.00% Floor), 5.02%, 04/27/25 | | | | | | | 212 | | | | 215,286 | |
Digicel International Finance Ltd., 2017 Term Loan B, (3 mo. LIBOR + 3.25%), 5.02%, 05/28/24 | | | | | | | 616 | | | | 617,029 | |
Kronos, Inc., 2nd Lien Term Loan, (3 mo. LIBOR + 8.25% 1.00% Floor), 4.10%, 11/01/24 | | | | | | | 3,634 | | | | 3,728,379 | |
McAfee LLC, 2017 Term Loan B, (1 mo. LIBOR + 4.50% 1.00% Floor), 6.15%, 09/30/24 | | | | | | | 1,794 | | | | 1,802,829 | |
Mitchell International, Inc.: | | | | | | | | | | | | |
2017 1st Lien Term Loan, (3 mo. LIBOR + 3.25% 1.00% Floor), 4.94%, 11/29/24 | | | | | | | 943 | | | | 945,100 | |
2017 2nd Lien Term Loan, (3 mo. LIBOR + 7.25%), 8.94%, 11/20/25 | | | | | | | 920 | | | | 925,520 | |
SS&C Technologies Holdings Europe Sarl, 2018 Term Loan B4, 2/25/28(n) | | | | | | | 1,802 | | | | 1,803,529 | |
SS&C Technologies Inc., 2018 Term Loan B3, 2/25/28(n) | | | | | | | 5,052 | | | | 5,055,688 | |
Tempo Acquisition LLC, Term Loan,
(1 mo. LIBOR + 3.00%), 3.84%, 05/01/24 | | | | | | | 642 | | | | 643,722 | |
| | | | | | | | | | | | |
| | | | | | | | | | | 19,424,594 | |
| Specialty Retail — 0.1% | |
Belron Finance US LLC, Term Loan B, (3 mo. LIBOR + 2.50%), 4.40%, 11/07/24 | | | | | | | 798 | | | | 801,990 | |
| | | | | | | | | | | | |
| Textiles, Apparel & Luxury Goods — 0.3% | |
Ascend Performance Materials Operations LLC, Term Loan B, (3 mo. LIBOR + 5.25% 1.00% Floor), 5.87%, 08/12/22(b) | | | | | | | 5,268 | | | | 5,287,758 | |
| | | | | | | | | | | | |
| Trading Companies & Distributors — 0.1% | |
Beacon Roofing Supply, Inc., 2017 Term Loan B, (1 mo. LIBOR + 2.25%), 5.02%, 01/02/25 | | | | | | | 858 | | | | 861,578 | |
| | | | | | | | | | | | |
| Transportation — 0.0% | |
Direct ChassisLink, Inc., 2017 2nd Lien Term Loan, (1 mo. LIBOR + 6.00%), 7.65%, 06/15/23(b) | | | | | | | 300 | | | | 304,500 | |
| | | | | | | | | | | | |
| Utilities — 0.0% | |
ExGen Renewables IV LLC, Term Loan B, (3 mo. LIBOR + 3.00% 1.00% Floor), 5.19%, 11/28/24 | | | | | | | 510 | | | | 514,183 | |
| | | | | | | | | | | | |
| Wireless Telecommunication Services — 1.6% | |
Ligado Networks LLC, 2015 2nd Lien Term Loan, 12/07/20(n) | | | | | | | 38,881 | | | | 21,523,539 | |
Syniverse Holdings, Inc., 2018 Term Loan, 02/08/23(n) | | | | | | | 679 | | | | 684,303 | |
VICI Properties 1 LLC, Replacement Term Loan B, (1 mo. LIBOR + 2.00%), 8.52%, 12/20/24 | | | | | | | 1,709 | | | | 1,716,422 | |
| | | | | | | | | | | | |
| | | | | | | | | | | 23,924,264 | |
| | | | | | | | | | | | |
Total Floating Rate Loan Interests — 12.9%
(Cost — $210,803,679) | | | | 195,410,718 | |
| | | | | | | | | | | | |
| | |
| 62 | | 2018 BLACKROCK SEMI-ANNUAL REPORTTO SHAREHOLDERS |
| | |
Consolidated Schedule of Investments (unaudited) (continued) February 28, 2018 | | BlackRock Corporate High Yield Fund, Inc. (HYT) (Percentages shown are based on Net Assets) |
| | | | | | | | | | | | |
| Security | | | | | Shares/Par
(000)/
Beneficial
Interest (000) | | | Value | |
Investment Companies — 1.9% | |
|
| Capital Markets — 1.5% | |
iShares iBoxx USD High Yield Corporate Bond ETF(r) | | | | | | | 262,556 | | | $ | 22,627,076 | |
| | | | | | | | | | | | |
| Diversified Financial Services — 0.2% | |
Financial Select Sector SPDR Fund | | | | | | | 110,107 | | | | 3,178,789 | |
| | | | | | | | | | | | |
| Energy Equipment & Services — 0.2% | |
SPDR S&P Oil & Gas Exploration & Production ETF | | | | | | | 79,711 | | | | 2,635,246 | |
| | | | | | | | | | | | |
Total Investment Companies — 1.9%
(Cost — $29,319,585) | | | | 28,441,111 | |
| | | | | | | | | | | | |
|
Non-Agency Mortgage-Backed Securities — 0.1% | |
|
| Commercial Mortgage-Backed Securities — 0.1% | |
GAHR Commercial Mortgage Trust NRF, Series 2015-NRF, Class FFX, 3.38%, 12/15/34(d)(e) | | | USD | | | | 1,515 | | | | 1,489,485 | |
| | | | | | | | | | | | |
Total Non-Agency Mortgage-Backed Securities — 0.1%
(Cost — $ 1,464,052) | | | | 1,489,485 | |
| | | | | | | | | | | | |
Other Interests (o) — 0.0% | |
|
| United States — 0.0% | |
Lear Corp. Escrow(b) | | | | | | | 1,250 | | | | 12 | |
| | | | | | | | | | | | |
Total Other Interests — 0.0%
(Cost — $—) | | | | 12 | |
| | | | | | | | | | | | |
|
Preferred Securities — 7.8% | |
|
| Capital Trusts — 5.5% | |
| Aerospace — 0.0% | |
Telefonica Europe BV, 2.63%(e)(j) | | | EUR | | | | 300 | | | | 360,510 | |
| | | | | | | | | | | | |
| Auto Components — 0.2% | |
General Motors Financial Co., Inc., Series A, 5.75%(e)(j) | | | USD | | | | 2.167 | | | | 2,197,121 | |
| | | | | | | | | | | | |
| Banks — 1.5% | |
ABN AMRO Bank NV(j): | | | | | | | | | | | | |
4.75%(e) | | | EUR | | | | 200 | | | | 257,725 | |
5.75%(h) | | | | | | | 300 | | | | 401,685 | |
Allied Irish Banks PLC, 7.38%(h)(j) | | | | | | | 210 | | | | 288,545 | |
Banco Bilbao Vizcaya Argentaria SA, 8.88%(h)(j) | | | EUR | | | | 200 | | | | 292,116 | |
Banco Santander SA, 6.25%(h)(j) | | | | | | | 400 | | | | 511,180 | |
Bankia SA, 6.00%(h)(j) | | | | | | | 200 | | | | 261,690 | |
CIT Group, Inc., Series A, 5.80%(h)(j) | | | USD | | | | 1,647 | | | | 1,663,470 | |
Citigroup, Inc.(h)(j): | | | | | | | | | | | | |
5.95% | | | | | | | 1,405 | | | | 1,457,688 | |
Series O, 5.88% | | | | | | | 2,405 | | | | 2,489,175 | |
Series P, 5.95% | | | | | | | 2,442 | | | | 2,538,459 | |
Series Q, 5.95% | | | | | | | 1,165 | | | | 1,206,707 | |
Series R, 6.13% | | | | | | | 615 | | | | 649,981 | |
Cooperatieve Rabobank UA(h)(j): | | | | | | | | | | | | |
5.50% | | | EUR | | | | 200 | | | | 265,960 | |
6.63% | | | | | | | 400 | | | | 562,571 | |
Danske Bank A/S, 5.75%(h)(j) | | | | | | | 200 | | | | 263,859 | |
Erste Group Bank AG, 6.50%(h)(j) | | | | | | | 400 | | | | 566,690 | |
Hongkong & Shanghai Banking Corp. Ltd., Series 3H, 2.00%(c)(j) | | | USD | | | | 400 | | | | 368,944 | |
| | | | | | | | | | | | |
| Security | | | | | Par
(000) | | | Value | |
| Banks (continued) | |
HSBC Holdings PLC(h)(j): | | | | | | | | | | | | |
6.00% | | | USD | | | | 2,298 | | | $ | 2,347,407 | |
6.38% | | | | | | | 210 | | | | 221,288 | |
Intesa Sanpaolo SpA, 7.00%(h)(j) | | | EUR | | | | 375 | | | | 508,302 | |
KBC Group NV, 5.63%(h)(j) | | | | | | | 200 | | | | 254,675 | |
National Westminster Bank PLC, Series C,
2.25%(e)(j) | | | USD | | | | 200 | | | | 182,000 | |
Swedbank Hypotek AB, 6.00%(h)(j) | | | | | | | 200 | | | | 206,490 | |
Wells Fargo & Co.(h)(j): | | | | | | | | | | | | |
Series S, 5.90% | | | | | | | 1,730 | | | | 1,805,688 | |
Series U, 5.88% | | | | | | | 2,055 | | | | 2,184,732 | |
| | | | | | | | | | | | |
| | | | | | | | | | | 21,757,027 | |
| Capital Markets — 0.7% | |
Goldman Sachs Group, Inc., Series P,
5.00%(e)(j) | | | | | | | 5,140 | | | | 4,999,267 | |
Morgan Stanley(h)(j): | | | | | | | | | | | | |
Series H, 5.45% | | | | | | | 3,309 | | | | 3,383,452 | |
Series J, 5.55% | | | | | | | 440 | | | | 455,972 | |
UBS Group AG (h)(j): | | | | | | | | | | | | |
5.75% | | | EUR | | | | 800 | | | | 1,096,669 | |
7.00% | | | USD | | | | 425 | | | | 468,435 | |
| | | | | | | | | | | | |
| | | | | | | | | | | 10,403,795 | |
| Chemicals — 0.1% | |
Solvay Finance SA, 5.12%(h)(j) | | | EUR | | | | 730 | | | | 995,246 | |
| | | | | | | | |
| Diversified Financial Services — 2.4% | |
ATF Netherlands BV, 3.75%(h)(j) | | | | | | | 200 | | | | 256,778 | |
Banco Santander SA, 6.75%(h)(j) | | | | | | | 300 | | | | 418,539 | |
Bank of America Corp.(h)(j): | | | | | | | | | | | | |
Series AA, 6.10% | | | USD | | | | 5,271 | | | | 5,587,260 | |
Series V, 5.13% | | | | | | | 2,205 | | | | 2,229,806 | |
Series X, 6.25% | | | | | | | 2,874 | | | | 3,090,125 | |
Series Z, 6.50% | | | | | | | 1,816 | | | | 1,991,153 | |
Barclays PLC, 7.25%(h)(j) | | | GBP | | | | 680 | | | | 1,021,576 | |
BNP Paribas SA, 6.13%(h)(j) | | | EUR | | | | 220 | | | | 309,946 | |
Credit Agricole SA, 6.50%(h)(j) | | | | | | | 600 | | | | 831,362 | |
Credit Suisse Group AG, 6.25%(h)(j) | | | USD | | | | 300 | | | | 315,660 | |
HBOS Capital Funding LP, 6.85%(j) | | | | | | | 800 | | | | 816,128 | |
JPMorgan Chase & Co.(h)(j): | | | | | | | | | | | | |
Series Q, 5.15% | | | USD | | | | 850 | | | | 855,695 | |
Series S, 6.75% | | | | | | | 5,324 | | | | 5,883,020 | |
Series U, 6.13% | | | | | | | 4,228 | | | | 4,468,996 | |
Series V, 5.00% | | | | | | | 3,075 | | | | 3,090,375 | |
Series X, 6.10% | | | | | | | 2,425 | | | | 2,574,138 | |
Royal Bank of Scotland Group PLC (h)(j): | | | | | | | | | | | | |
7.50% | | | | | | | 200 | | | | 209,680 | |
8.63% | | | | | | | 982 | | | | 1,085,110 | |
Societe Generale SA, 8.88%(h)(j) | | | GBP | | | | 200 | | | | 279,621 | |
UBS Group Funding Switzerland AG, 5.00%(e)(j) | | | USD | | | | 375 | | | | 361,682 | |
UniCredit SpA(h)(j): | | | | | | | | | | | | |
6.75% | | | EUR | | | | 200 | | | | 268,581 | |
9.25% | | | | | | | 425 | | | | 633,218 | |
| | | | | | | | | | | | |
| | | | | | | | | | | 36,578,449 | |
| Diversified Telecommunication Services — 0.4% | |
Koninklijke KPN NV(h): | | | | | | | | | | | | |
6.13%(j) | | | | | | | 561 | | | | 704,987 | |
6.88% | | | GBP | | | | 230 | | | | 342,352 | |
SoftBank Group Corp. (h)(j) | | | USD | | | | 706 | | | | 681,290 | |
| | | | |
| SCHEDULES OF INVESTMENTS | | | 63 | |
| | |
Consolidated Schedule of Investments (unaudited) (continued) February 28, 2018 | | BlackRock Corporate High Yield Fund, Inc. (HYT) (Percentages shown are based on Net Assets) |
| | | | | | | | | | | | |
| Security | | | | | Par
(000) | | | Value | |
| Diversified Telecommunication Services (continued) | |
Telefonica Europe BV(h)(j): | | | | | | | | | | | | |
3.75% | | | EUR | | | | 200 | | | | 256,932 | |
4.20% | | | | | | | 1,500 | | | | 1,930,541 | |
6.50% | | | | | | | 600 | | | | 756,200 | |
6.75% | | | GBP | | | | 200 | | | | 303,782 | |
7.63% | | | EUR | | | | 300 | | | | 439,611 | |
| | | | | | | | | | | | |
| | | | | | | | | | | 5,415,695 | |
| Electric Utilities — 0.1% | |
Enel SpA(h): | | | | | | | | | | | | |
6.50% | | | | | | | 489 | | | | 627,489 | |
7.75% | | | GBP | | | | 105 | | | | 164,581 | |
Origin Energy Finance Ltd.,
4.00%(h) | | | | | | | 410 | | | | 523,960 | |
RWE AG, 2.75%(h) | | | | | | | 100 | | | | 126,118 | |
| | | | | | | | | | | | |
| | | | | | | | | | | 1,442,148 | |
| Electronic Equipment, Instruments & Components — 0.0% | |
Belden, Inc., 4.13% | | | | | | | 200 | | | | 258,591 | |
| | | | | | | | |
| Insurance — 0.0% | |
Achmea BV, 4.25%(h)(j) | | | | | | | 200 | | | | 257,687 | |
Groupama SA, 6.38%(h)(j) | | | | | | | 200 | | | | 287,616 | |
| | | | | | | | | | | | |
| | | | | | | | | | | 545,303 | |
| Media — 0.0% | |
NBCUniversal Enterprise, Inc.,
5.25%(d)(j) | | | USD | | | | 400 | | | | 412,000 | |
| | | | | | | | |
| Oil, Gas & Consumable Fuels — 0.1% | |
Gas Natural Fenosa Finance BV(j): |
| | | | | | | | |
3.38%(e) | | | EUR | | | | 500 | | | | 621,993 | |
4.13%(h) | | | | | | | 100 | | | | 130,692 | |
Repsol International Finance BV(h): | | | | | | | | | |
3.88%(j) | | | | | | | 300 | | | | 392,077 | |
4.50% | | | | | | | 678 | | | | 913,332 | |
| | | | | | | | |
| | | | | | | | | | | 2,058,094 | |
| Real Estate — 0.0% | |
AT Securities BV, 5.25%(h)(j) | | | USD | | | | 500 | | | | 491,847 | |
| | | | | | | | |
| Real Estate Management & Development — 0.0% | |
Fastighets AB Balder, Series .,
3.00%(e) | | | EUR | | | | 100 | | | | 120,296 | |
| | | | | | | | |
Total Capital Trusts — 5.5%
(Cost — $78,860,392) | | | | 83,036,122 | |
| | | | | | | | |
| | | |
| | | | | | Shares | | | | |
| Preferred Stocks — 1.9% | |
| Auto Components — 0.2% | |
UCI International, Inc., 0.00% | | | | | | | 164,729 | | | | 2,985,713 | |
| | | | | | | | |
| Diversified Financial Services — 0.0% | |
Concrete Investments II, 0.00%(b) | | | | | | | 4,997 | | | | 164,601 | |
| | | | | | | | |
| Hotels, Restaurants & Leisure — 1.6% | |
Stars Group, Inc., 0.00%(b)(k) | | | | | | | 15,609 | | | | 24,193,220 | |
| | | | | | | | |
| Machinery — 0.1% | |
Rexnord Corp., Series A, 5.75%(k) | | | | | | | 21,600 | | | | 1,362,528 | |
| | | | | | | | |
| Wireless Telecommunication Services — 0.0% | |
CF-B L2 (D) LLC, (Acquired 04/08/15, cost $642,898),
0.00%(p) | | | | | | | 649,556 | | | | 558,164 | |
| | | | | | | | |
Total Preferred Stocks — 1.9%
(Cost — $23,828,183) | | | | 29,264,226 | |
| | | | | | | | |
| | | | | | | | | | | | |
| Security | | | | | Shares | | | Value | |
| Trust Preferred | | | | | | | | | |
| Diversified Financial Services — 0.4% | |
GMAC Capital Trust I, Series 2, 7.10% 2/15/2040(e) | | | | | | | 256,246 | | | | 6,611,147 | |
| | | | | | | | | | | | |
Total Trust Preferred — 0.4%
(Cost — $6,729,957) | | | | 6,611,147 | |
| | | | | | | | | | | | |
Total Preferred Securities — 7.8%
(Cost — $109,418,532) | | | | 118,911,495 | |
| | | | | | | | | | | | |
|
Warrants — 0.0% | |
| Metals & Mining — 0.0% | |
Peninsula Energy Ltd.
(1 Share for 1 Warrant, Expires 12/31/18, Strike Price AUD 0.05 ) | | | | | | | 515,378 | | | | 2,004 | |
| | | | | | | | | | | | |
| Software — 0.0% | |
HMH Holdings/EduMedia (Issued/exercisable 3/09/10, 19 Shares for 1 Warrant, Expires 6/22/19, Strike Price $42.27)(b) | | | | | | | 6,494 | | | | — | |
| | | | | | | | | | | | |
Total Warrants — 0.0%
(Cost — $5,592) | | | | 2,004 | |
| | | | | | | | | | | | |
Total Long-Term Investments — 143.8%
(Cost — $2,224,693,250) | | | | 2,184,218,911 | |
| | | | | | | | | | | | |
Options Purchased — 0.0%
(Cost — $67,640) | | | | 1,596 | |
| | | | | | | | | | | | |
Total Investments — 143.8%
(Cost — $2,224,760,890) | | | | 2,184,220,507 | |
Liabilities in Excess of Other Assets — (43.8)% | | | | (665,410,911 | ) |
| | | | | | | | | | | | |
Net Assets Applicable to Common Shares — 100.0% | | | $ | 1,518,809,596 | |
| | | | | | | | | | | | |
| (a) | Non-income producing security. |
| (b) | Security is valued using significant unobservable inputs and is classified as Level 3 in the fair value hierarchy. |
| (c) | Floating rate security. Rate shown is the rate in effect as of period end. |
| (d) | Security exempt from registration pursuant to Rule 144A under the Securities Act of 1933, as amended. These securities may be resold in transactions exempt from registration to qualified institutional investors. |
| (e) | Variable or floating rate security, which interest rate adjusts periodically based on changes in current interest rates and prepayments on the underlying pool of assets. Rate shown is the rate in effect as of period end. |
| (f) | When-issued security. |
| (g) | Payment-in-kind security which may pay interest/dividends in additional par/shares and/or in cash. Rates shown are the current rate and possible payment rates. |
| (h) | Variable rate security. Security may be issued at a fixed coupon rate, which converts to a variable rate at a specified date. Rate shown is the rate in effect as of period end. |
| (i) | Issuer filed for bankruptcy and/or is in default. |
| (j) | Perpetual security with no stated maturity date. |
| (k) | Convertible security. |
| (l) | Step-up bond that pays an initial coupon rate for the first period and then a higher coupon rate for the following periods. Rate as of period end. |
| (m) | Variable rate security. Rate shown is the rate in effect as of period end. |
| (n) | Represents an unsettled loan commitment at period end. Certain details associated with this purchase are not known prior to the settlement date, including coupon rate. |
| (o) | Other interests represent beneficial interests in liquidation trusts and other reorganization or private entities. |
| (p) | Restricted security as to resale, excluding 144A securities. As of period end, the Trust held restricted securities with a current value of $558,164 and an original cost of $642,898, which was less than 0.05% of its net assets. |
| (q) | All or a portion of the security is held by a wholly-owned subsidiary. See Note 1 of the Notes to Financial Statements for details on the wholly-owned subsidiary. |
| | |
| 64 | | 2018 BLACKROCK SEMI-ANNUAL REPORTTO SHAREHOLDERS |
| | |
Consolidated Schedule of Investments (unaudited) (continued) February 28, 2018 | | BlackRock Corporate High Yield Fund, Inc. (HYT) |
| (r) | During the six month ended February 28, 2018, investments in issuers considered to be affiliates of the Trust for purposes of Section 2(a)(3) of the Investment Company Act of 1940, as amended, and/or related parties of the Trust were as follows: |
| | | | | | | | | | | | | | | | | | | | | | | | | | | | | | | | |
| Affiliate Persons and/or Related Parties | | Shares
Held at
08/31/17 | | | Shares
Purchased | | | Shares
Sold | | | Shares
Held at
02/28/18 | | | Value at
02/28/18 | | | Income | | | Net
Realized
Gain (Loss) (a) | | | Change in
Unrealized
Appreciation
(Depreciation) | |
BlackRock Liquidity Funds, T-Fund, Institutional Class | | | — | | | | — | | | | — | | | | — | | | $ | — | | | $ | 13,693 | | | $ | 10 | | | $ | — | |
iShares iBoxx USD High Yield Corporate Bond ETF | | | 349,667 | | | | 85,000 | | | | (172,111 | ) | | | 262,556 | | | | 22,627,076 | | | | 625,592 | | | | (186,055 | ) | | | (458,974 | ) |
| | | | | | | | | | | | | | | | | | | | | | | | | | | | | | | | |
| | | $ | 22,627,076 | | | $ | 639,285 | | | $ | (186,045 | ) | | $ | (458,974 | ) |
| | | | | | | | | | | | | | | | | |
| | (a) | Includes net capital gain distributions, if applicable. | |
For Trust compliance purposes, the Trust’s industry classifications refer to one or more of the industry sub-classifications used by one or more widely recognized market indexes or rating group indexes, and/or as defined by the investment adviser. These definitions may not apply for purposes of this report, which may combine such industry sub-classifications for reporting ease.
Derivative Financial Instruments Outstanding as of Period End
Futures Contracts
| | | | | | | | | | | | | | | | |
| Description | | Number of
Contracts | | | Expiration
Date | | | Notional
Amount (000) | | | Value/
Unrealized
Appreciation
(Depreciation) | |
Long Contracts: | | | | | | | | | | | | | | | | |
Euro Stoxx 50 Index | | | 4 | | | | 03/16/18 | | | $ | 168 | | | $ | 1,043 | |
Euro Stoxx 600 Index | | | 6 | | | | 03/16/18 | | | | 68 | | | | 1,368 | |
| | | | | | | | | | | | | | | | |
| | | | | | | | | | | | | | | 2,411 | |
| | | | | | | | | | | | | | | | |
Short Contracts: | | | | | | | | | | | | | | | | |
10-Year U.S. Treasury Note | | | 103 | | | | 06/20/18 | | | | 12,365 | | | | 21,473 | |
Long Gilt Future | | | 2 | | | | 06/27/18 | | | | 333 | | | | (57 | ) |
| | | | | | | | | | | | | | | | |
| | | | | | | | | | | | | | | 21,416 | |
| | | | | | | | | | | | | | | | |
| | | | | | | | | | | | | | $ | 23,827 | |
| | | | | | | | | | | | | | | | |
Forward Foreign Currency Exchange Contracts
| | | | | | | | | | | | | | | | | | | | |
| Currency Purchased | | | Currency Sold | | | Counterparty | | Settlement Date | | | Unrealized
Appreciation
(Depreciation) | |
| USD | | | 1,104,158 | | | AUD | | | 1,364,000 | | | Nomura International PLC | | | 03/05/18 | | | $ | 44,739 | |
| USD | | | 868,897 | | | CAD | | | 1,077,000 | | | State Street Bank and Trust Co. | | | 03/05/18 | | | | 29,548 | |
| USD | | | 50,895,708 | | | EUR | | | 40,760,000 | | | Barclays Bank PLC | | | 03/05/18 | | | | 1,159,244 | |
| USD | | | 719,309 | | | EUR | | | 575,000 | | | State Street Bank and Trust Co. | | | 03/05/18 | | | | 17,679 | |
| USD | | | 50,588,581 | | | EUR | | | 40,760,000 | | | UBS AG | | | 03/05/18 | | | | 852,117 | |
| USD | | | 13,809,544 | | | GBP | | | 9,731,000 | | | Barclays Bank PLC | | | 03/05/18 | | | | 411,673 | |
| USD | | | 240,274 | | | GBP | | | 173,000 | | | Nomura International PLC | | | 03/05/18 | | | | 2,083 | |
| USD | | | 1,022,040 | | | AUD | | | 1,309,000 | | | National Australia Bank Ltd. | | | 04/04/18 | | | | 5,297 | |
| USD | | | 95,598,260 | | | EUR | | | 78,001,000 | | | Bank of America N.A. | | | 04/04/18 | | | | 192,196 | |
| USD | | | 12,682,288 | | | GBP | | | 9,167,000 | | | Toronto-Dominion Bank | | | 04/04/18 | | | | 42,114 | |
| | | | | | | | | | | | | | | | | | | | |
| | | | | | | | | | | | | | | | | | | 2,756,690 | |
| | | | | | | | | | | | | | | | | | | | |
| EUR | | | 3,600,000 | | | USD | | | 4,422,315 | | | State Street Bank and Trust Co. | | | 03/05/18 | | | | (29,497 | ) |
| GBP | | | 587,000 | | | USD | | | 819,450 | | | State Street Bank and Trust Co. | | | 03/05/18 | | | | (11,255 | ) |
| | | | | | | | | | | | | | | | | | | | |
| | | | | | | | | | | | | | | | | | | (40,752 | ) |
| | | | | | | | | | | | | | | | | | | | |
| | | | | | $ | 2,715,938 | |
| | | | | | | | | | | | | | | | | | | | |
| | | | |
| SCHEDULES OF INVESTMENTS | | | 65 | |
| | |
Consolidated Schedule of Investments (unaudited) (continued) February 28, 2018 | | BlackRock Corporate High Yield Fund, Inc. (HYT) |
Exchange-Traded Options Purchased
| | | | | | | | | | | | | | | | | | | | | | | | |
| Description | | Number of
Contracts | | | Expiration
Date | | | Exercise Price | | | Notional
Amount (000) | | | Value | |
Call | | | | | | | | | | | | | | | | | | | | | | | | |
Euro Stoxx 50 Index | | | 30 | | | | 03/16/18 | | | EUR | | | 3,700.00 | | | EUR | | | 10,300 | | | $ | 165 | |
Euro Stoxx Banks | | | 67 | | | | 03/16/18 | | | EUR | | | 142.50 | | | EUR | | | 900 | | | | 1,431 | |
| | | | | | | | | | | | | | | | | | | | | | | | |
| | | | | | | | | | | | | | | | | | | | | | $ | 1,596 | |
| | | | | | | | | | | | | | | | | | | | | | | | |
OTC Options Purchased
| | | | | | | | | | | | | | | | | | | | | | | | | | |
| Description | | Counterparty | | Number of
Contracts | | | Expiration
Date | | | Exercise
Price | | | Notional
Amount (000) | | | Value | |
Call | |
Marsico Parent Superholdco LLC | | Goldman Sachs & Co. | | | 39 | | | | 12/14/19 | | | USD | | | 942.86 | | | USD | | | — | | | $ | — | |
| | | | | | | | | | | | | | | | | | | | | | | | | | |
Centrally Cleared Credit Default Swaps — Sell Protection
| | | | | | | | | | | | | | | | | | | | | | | | | | | | | | | | | | | | |
| Reference Obligation/Index | | Financing
Rate Received
by the Trust | | | Payment
Frequency | | | Termination
Date | | | Credit
Rating (a) | | | Notional
Amount (000) (b) | | | Value | | | Upfront
Premium
Paid
(Received) | | | Unrealized
Appreciation
(Depreciation) | |
Chesapeake Energy Corp. | | | 5.00 | % | | | Quarterly | | | | 12/20/21 | | | | CCC | | | | USD | | | | 425 | | | $ | (2,711 | ) | | $ | (13,538 | ) | | $ | 10,827 | |
Markit iTraxx XO, Series 28, Version 1 | | | 5.00 | % | | | Quarterly | | | | 12/20/22 | | | | BB- | | | | EUR | | | | 1,320 | | | | 182,042 | | | | 166,390 | | | | 15,652 | |
Markit CDX North America High Yield Index, Series 29, Version 1 | | | 5.00 | % | | | Quarterly | | | | 12/20/22 | | | | N/R | | | | USD | | | | 23,883 | | | | 1,851,843 | | | | 1,893,374 | | | | (41,531 | ) |
| | | | | | | | | | | | | | | | | | | | | | | | | | | | | | | | | | | | |
| | | | | | | | | | | | | | | | | | | | | | | | | | $ | 2,031,174 | | | $ | 2,046,226 | | | $ | (15,052 | ) |
| | | | | | | | | | | | | | | | | | | | | | | | | | | | | | | | | | | | |
| | (a) | Using S&P’s rating of the issuer or the underlying securities of the index, as applicable. | |
| | (b) | The maximum potential amount the Trust may pay should a negative credit event take place as defined under the terms of the agreement. | |
OTC Credit Default Swaps — Sell Protection
| | | | | | | | | | | | | | | | | | | | | | | | | | | | | | | | | | | | | | |
| Reference Obligation/Index | | Financing
Rate Received
by the Trust | | | Payment
Frequency | | | Counterparty | | Termination
Date | | | Credit
Rating (a) | | | Notional
Amount
(000) (b) | | | Value | | | Upfront
Premium
Paid
(Received) | | | Unrealized
Appreciation
(Depreciation) | |
Jaguar Land Rover Automotive PLC | | | 5.00 | % | | | Quarterly | | | Credit Suisse International | | | 06/20/22 | | | | BB+ | | | | EUR | | | | 150 | | | $ | 28,853 | | | $ | 25,560 | | | $ | 3,293 | |
Saipem Finance International BV | | | 5.00 | | | | Quarterly | | | Credit Suisse International | | | 06/20/22 | | | | BB+ | | | | EUR | | | | 200 | | | | 36,677 | | | | 12,723 | | | | 23,954 | |
Casino Guichard Perrachon SA | | | 1.00 | | | | Quarterly | | | J.P. Morgan Chase Bank N.A. | | | 12/20/22 | | | | BB+ | | | | EUR | | | | 150 | | | | (5,705 | ) | | | (6,261 | ) | | | 556 | |
Fiat Chrysler Automobiles NV | | | 5.00 | | | | Quarterly | | | Citibank N.A. | | | 12/20/22 | | | | BB+ | | | | EUR | | | | 100 | | | | 21,496 | | | | 20,786 | | | | 710 | |
Jaguar Land Rover Automotive PLC | | | 5.00 | | | | Quarterly | | | Barclays Bank PLC | | | 12/20/22 | | | | BB+ | | | | EUR | | | | 150 | | | | 30,182 | | | | 29,113 | | | | 1,069 | |
Telecom Italia SpA/Milano | | | 1.00 | | | | Quarterly | | | Citibank N.A. | | | 12/20/22 | | | | BB+ | | | | EUR | | | | 170 | | | | (2,382 | ) | | | (3,383 | ) | | | 1,001 | |
| | | | | | | | | | | | | | | | | | | | | | | | | | | | | | | | | | | | | | |
| | | | | | | | | | | | | | | | | | | | | | | | | | | | $ | 109,121 | | | $ | 78,538 | | | $ | 30,583 | |
| | | | | | | | | | | | | | | | | | | | | | | | | | | | | | | | | | | | | | |
| | (a) | Using S&P’s rating of the issuer or the underlying securities of the index, as applicable. | |
| | (b) | The maximum potential amount the Trust may pay should a negative credit event take place as defined under the terms of the agreement. | |
| | |
| 66 | | 2018 BLACKROCK SEMI-ANNUAL REPORTTO SHAREHOLDERS |
| | |
Consolidated Schedule of Investments (unaudited) (continued) February 28, 2018 | | BlackRock Corporate High Yield Fund, Inc. (HYT) |
OTC Total Return Swaps
| | | | | | | | | | | | | | | | | | | | | | | | | | | | | | | | | | | | | | |
Paid by the Trust | | Received by the Trust | | Counterparty | | Effective
Date | | | Termination
Date | | | Notional
Amount/
Contract
Amount (000) | | | Value | | | Upfront
Premium
Paid
(Received) | | | Unrealized
Appreciation
(Depreciation) | |
| Reference | | Frequency | | Rate | | | Frequency | | | | | | | |
iShares iBoxx $ High Yield Corporate Bond ETF | | Monthly | | | 1-Month LIBOR | | | Monthly | | Goldman Sachs International | | | N/A | | | | 03/01/18 | | | | USD | | | | 92 | | | $ | (53,969 | ) | | $ | — | | | $ | (53,969 | ) |
iBoxx USD Liquid High Yield Index | | Quarterly | | | 3-Month LIBOR | | | Quarterly | | Bank of America N.A. | | | N/A | | | | 03/20/18 | | | | USD | | | | 5,800 | | | | (23,957 | ) | | | — | | | | (23,957 | ) |
iBoxx USD Liquid High Yield Index | | Quarterly | | | 3-Month LIBOR | | | Quarterly | | Bank of America N.A. | | | N/A | | | | 03/20/18 | | | | USD | | | | 10,000 | | | | 43,248 | | | | — | | | | 43,248 | |
iBoxx USD Liquid High Yield Index | | Quarterly | | | 3-Month LIBOR | | | Quarterly | | Morgan Stanley & Co. International PLC | | | N/A | | | | 03/20/18 | | | | USD | | | | 3,600 | | | | 19,668 | | | | — | | | | 19,668 | |
iBoxx USD Liquid High Yield Index | | Quarterly | | | 3-Month LIBOR | | | Quarterly | | Goldman Sachs International | | | N/A | | | | 06/20/18 | | | | USD | | | | 8,900 | | | | 97,052 | | | | (22,102 | ) | | | 119,154 | |
iBoxx USD Liquid High Yield Index | | Quarterly | | | 3-Month LIBOR | | | Quarterly | | Morgan Stanley & Co. International PLC | | | N/A | | | | 06/20/18 | | | | USD | | | | 8,000 | | | | (33,044 | ) | | | — | | | | (33,044 | ) |
iBoxx USD Liquid High Yield Index | | Quarterly | | | 3-Month LIBOR | | | Quarterly | | Goldman Sachs International | | | N/A | | | | 09/20/18 | | | | USD | | | | 9,800 | | | | 106,866 | | | | (21,682 | ) | | | 128,548 | |
iBoxx USD Liquid High Yield Index | | Quarterly | | | 3-Month LIBOR | | | Quarterly | | Morgan Stanley & Co. International PLC | | | N/A | | | | 09/20/18 | | | | USD | | | | 4,000 | | | | 9,732 | | | | (9,031 | ) | | | 18,763 | |
| | | | | | | | | | | | | | | | | | | | | | | | | | | | | | | | | | | | | | |
| | | | | | | | | | | | | | | | | | | | | | | | | | | | $ | 165,596 | | | $ | (52,815 | ) | | $ | 218,411 | |
| | | | | | | | | | | | | | | | | | | | | | | | | | | | | | | | | | | | | | |
Balances Reported in the Consolidated Statements of Assets and Liabilities for Centrally Cleared Swaps and OTC Derivatives
| | | | | | | | | | | | | | | | |
| | | Swap Premiums Paid | | | Swap Premiums
Received | | | Unrealized Appreciation | | | Unrealized Depreciation | |
Centrally Cleared Swaps(a) | | $ | 2,059,764 | | | $ | (13,538 | ) | | $ | 26,479 | | | $ | (41,531 | ) |
OTC Derivatives | | | 88,182 | | | | (62,459 | ) | | | 359,964 | | | | (110,970 | ) |
| | (a) | Includes cumulative appreciation (depreciation) on centrally cleared swaps, as reported in the Consolidated Schedule of Investments. Only current day’s variation margin is reported within the Consolidated Statements of Assets and Liabilities and is net of any previously paid (received) swap premium amounts. | |
Derivative Financial Instruments Categorized by Risk Exposure
As of period end, the fair values of derivative financial instruments located in the Consolidated Statements of Assets and Liabilities were as follows:
| | | | | | | | | | | | | | | | | | | | | | | | | | | | |
| | | Commodity
Contracts | | | Credit
Contracts | | | Equity
Contracts | | | Foreign
Currency
Exchange
Contracts | | | Interest
Rate
Contracts | | | Other
Contracts | | | Total | |
Assets — Derivative Financial Instruments | | | | | | | | | | | | | | | | | | | | | | | | | | | | |
Futures contracts | | | | | | | | | | | | | | | | | | | | | | | | | | | | |
Net unrealized appreciation(a) | | $ | — | | | $ | — | | | $ | 2,411 | | | $ | — | | | $ | 21,473 | | | $ | — | | | $ | 23,884 | |
Forward foreign currency exchange contracts | | | | | | | | | | | | | | | | | | | | | | | | | | | | |
Unrealized appreciation on forward foreign currency exchange contracts | | | — | | | | — | | | | — | | | | 2,756,690 | | | | — | | | | — | | | | 2,756,690 | |
Options purchased | | | | | | | | | | | | | | | | | | | | | | | | | | | | |
Investments at value — unaffiliated(b) | | | — | | | | — | | | | 1,596 | | | | — | | | | — | | | | — | | | | 1,596 | |
Swaps — centrally cleared | | | | | | | | | | | | | | | | | | | | | | | | | | | | |
Net unrealized appreciation(a) | | | — | | | | 26,479 | | | | — | | | | — | | | | — | | | | — | | | | 26,479 | |
Swaps — OTC | | | | | | | | | | | | | | | | | | | | | | | | | | | | |
Unrealized appreciation on OTC swaps; Swap premiums paid | | | — | | | | 118,765 | | | | — | | | | — | | | | 329,381 | | | | — | | | | 448,146 | |
| | | | | | | | | | | | | | | | | | | | | | | | | | | | |
| | $ | — | | | $ | 145,244 | | | $ | 4,007 | | | $ | 2,756,690 | | | $ | 350,854 | | | $ | — | | | | 3,256,795 | |
| | | | | | | | | | | | | | | | | | | | | | | | | | | | |
| Liabilities — Derivative Financial Instruments | | | | | | | | | | | | | | | | | | | | | |
Futures contracts | | | | | | | | | | | | | | | | | | | | | | | | | | | | |
Net unrealized depreciation(a) | | $ | — | | | $ | — | | | $ | — | | | $ | — | | | $ | 57 | | | $ | — | | | $ | 57 | |
Forward foreign currency exchange contracts | | | | | | | | | | | | | | | | | | | | | | | | | | | | |
Unrealized depreciation on forward foreign currency exchange contracts | | | — | | | | — | | | | — | | | | 40,752 | | | | — | | | | — | | | | 40,752 | |
Swaps — centrally cleared | | | | | | | | | | | | | | | | | | | | | | | | | | | | |
Net unrealized depreciation(a) | | | — | | | | 41,531 | | | | — | | | | — | | | | — | | | | — | | | | 41,531 | |
Swaps — OTC | | | | | | | | | | | | | | | | | | | | | | | | | | | | |
Unrealized depreciation on OTC swaps; Swap premiums received | | | — | | | | 9,644 | | | | 53,969 | | | | — | | | | 109,816 | | | | — | | | | 173,429 | |
| | | | | | | | | | | | | | | | | | | | | | | | | | | | |
| | $ | — | | | $ | 51,175 | | | $ | 53,969 | | | $ | 40,752 | | | $ | 109,873 | | | $ | — | | | $ | 255,769 | |
| | | | | | | | | | | | | | | | | | | | | | | | | | | | |
| | (a) | Includes cumulative appreciation (depreciation) on futures contracts and centrally cleared swaps, if any, as reported in the Consolidated Schedule of Investments. Only current day’s variation margin is reported within the Consolidated Statement of Assets and Liabilities. | |
| | (b) | Includes options purchased at value as reported in the Consolidated Schedule of Investments. | |
| | | | |
| SCHEDULES OF INVESTMENTS | | | 67 | |
| | |
Consolidated Schedule of Investments (unaudited) (continued) February 28, 2018 | | BlackRock Corporate High Yield Fund, Inc. (HYT) |
For the six month ended February 28, 2018, the effect of derivative financial instruments in the Consolidated Statements of Operations was as follows:
| | | | | | | | | | | | | | | | | | | | | | | | | | | | |
| | | Commodity
Contracts | | | Credit
Contracts | | | Equity
Contracts | | | Foreign
Currency
Exchange
Contracts | | | Interest
Rate
Contracts | | | Other
Contracts | | | Total | |
Net Realized Gain (Loss) from: | | | | | | | | | | | | | | | | | | | | | | | | | | | | |
Futures contracts | | $ | — | | | $ | — | | | $ | 133,804 | | | $ | — | | | $ | 750,290 | | | $ | — | | | $ | 884,094 | |
Forward foreign currency exchange contracts | | | — | | | | — | | | | — | | | | (5,376,710 | ) | | | — | | | | — | | | | (5,376,710 | ) |
Options purchased(a) | | | — | | | | (35,500 | ) | | | (743,815 | ) | | | — | | | | 108,150 | | | | — | | | | (671,165 | ) |
Options written | | | — | | | | 41,000 | | | | 327,794 | | | | — | | | | (89,730 | ) | | | — | | | | 279,064 | |
Swaps | | | — | | | | 876,820 | | | | 42,700 | | | | — | | | | 194,955 | | | | — | | | | 1,114,475 | |
| | | | | | | | | | | | | | | | | | | | | | | | | | | | |
| | $ | — | | | $ | 882,320 | | | $ | (239,517 | ) | | $ | (5,376,710 | ) | | $ | 963,665 | | | $ | — | | | $ | (3,770,242 | ) |
| | | | | | | | | | | | | | | | | | | | | | | | | | | | |
| Net Change in Unrealized Appreciation (Depreciation) on: | | | | | | | | | | | | | | | | | | | |
Futures contracts | | $ | — | | | $ | — | | | $ | 2,411 | | | $ | — | | | $ | 49,739 | | | $ | — | | | $ | 52,150 | |
Forward foreign currency exchange contracts | | | — | | | | — | | | | — | | | | 3,765,354 | | | | — | | | | — | | | | 3,765,354 | |
Options purchased(b) | | | — | | | | 24,909 | | | | 133,338 | | | | — | | | | — | | | | — | | | | 158,247 | |
Options written | | | — | | | | (35,453 | ) | | | (104,342 | ) | | | — | | | | — | | | | — | | | | (139,795 | ) |
Swaps | | | — | | | | (354,602 | ) | | | (40,051 | ) | | | — | | | | (171,212 | ) | | | — | | | | (565,865 | ) |
| | | | | | | | | | | | | | | | | | | | | | | | | | | | |
| | $ | — | | | $ | (365,146 | ) | | $ | (8,644 | ) | | $ | 3,765,354 | | | $ | (121,473 | ) | | $ | — | | | $ | 3,270,091 | |
| | | | | | | | | | | | | | | | | | | | | | | | | | | | |
| | (a) | Options purchased are included in net realized gain (loss) from investments. | |
| | (b) | Options purchased are included in net change in unrealized appreciation (depreciation) on investments. | |
Average Quarterly Balances of Outstanding Derivative Financial Instruments
| | | | |
Futures contracts: | | | | |
Average notional value of contracts — long | | $ | 117,815 | |
Average notional value of contracts — short | | $ | 14,735,359 | |
Forward foreign currency exchange contracts: | | | | |
Average amounts purchased — in USD | | $ | 245,025,393 | |
Average amounts sold — in USD | | $ | 3,484,175 | |
Options: | | | | |
Average value of option contracts purchased | | $ | 27,199 | |
Average value of option contracts written | | $ | 7,038 | |
Average notional value of swaption contracts purchased | | $ | 9,000,000 | |
Average notional value of swaption contracts written | | $ | 18,000,000 | |
Credit default swaps: | | | | |
Average notional value — sell protection | | $ | 13,788,206 | |
Interest rate swaps: | | | | |
Average notional value — receives fixed rate | | $ | 212,500 | |
Total return swaps: | | | | |
Average notional amount | | $ | 63,670,252 | |
For more information about the Trust’s investment risks regarding derivative financial instruments, refer to the Notes to Financial Statements.
Derivative Financial Instruments — Offsetting as Period End
The Trust’s derivative assets and liabilities (by type) were as follows:
| | | | | | | | |
| | | Assets | | | Liabilities | |
Futures contracts | | $ | — | | | $ | 28,059 | |
Forward foreign currency exchange contracts | | | 2,756,690 | | | | 40,752 | |
Options(a) | | | 1,596 | | | | — | |
Swaps — Centrally cleared | | | — | | | | 53,869 | |
Swaps — OTC(b) | | | 448,146 | | | | 173,429 | |
| | | | | | | | |
Total derivative assets and liabilities in the Consolidated Statements of Assets and Liabilities | | $ | 3,206,432 | | | $ | 296,109 | |
Derivatives not subject to a Master Netting Agreement or similar agreement (“MNA”) | | | (1,596 | ) | | | (81,928 | ) |
| | | | | | | | |
Total derivative assets and liabilities subject to an MNA | | $ | 3,204,836 | | | $ | 214,181 | |
| | | | | | | | |
| | (a) | Includes options purchased at value which is included in Investments at value — unaffiliated in the Consolidated Statements of Assets and Liabilities and reported in the Consolidated Schedule of Investments. | |
| | (b) | Includes unrealized appreciation (depreciation) on OTC swaps and swap premiums (paid/received) in the Consolidated Statements of Assets and Liabilities. | |
| | |
| 68 | | 2018 BLACKROCK SEMI-ANNUAL REPORTTO SHAREHOLDERS |
| | |
Consolidated Schedule of Investments (unaudited) (continued) February 28, 2018 | | BlackRock Corporate High Yield Fund, Inc. (HYT) |
The following table presents the Trust’s derivative assets (and liabilities) by counterparty net of amounts available for offset under an MNA and net of the related collateral received (and pledged) by the Trust:
| | | | | | | | | | | | | | | | | | | | |
| Counterparty | | Derivative
Assets
Subject to
an MNA by
Counterparty | | | Derivatives
Available
for Offset (a) | | | Non-cash
Collateral
Received | | | Cash
Collateral
Received (b) | | | Net Amount
of Derivative
Assets (c)(d) | |
Bank of America N.A. | | $ | 235,444 | | | $ | (23,957 | ) | | $ | — | | | $ | — | | | $ | 211,487 | |
Barclays Bank PLC | | | 1,601,099 | | | | — | | | | — | | | | — | | | | 1,601,099 | |
Citibank N.A. | | | 22,497 | | | | (3,383 | ) | | | — | | | | (19,114 | ) | | | — | |
Credit Suisse International | | | 65,530 | | | | — | | | | — | | | | — | | | | 65,530 | |
Goldman Sachs International | | | 247,702 | | | | (97,753 | ) | | | — | | | | — | | | | 149,949 | |
J.P. Morgan Chase Bank N.A. | | | 556 | | | | (556 | ) | | | — | | | | — | | | | — | |
Morgan Stanley & Co. International PLC | | | 38,431 | | | | (38,431 | ) | | | — | | | | — | | | | — | |
National Australia Bank Ltd. | | | 5,297 | | | | — | | | | — | | | | — | | | | 5,297 | |
Nomura International PLC | | | 46,822 | | | | — | | | | — | | | | — | | | | 46,822 | |
State Street Bank and Trust Co. | | | 47,227 | | | | (40,752 | ) | | | — | | | | — | | | | 6,475 | |
Toronto-Dominion Bank | | | 42,114 | | | | — | | | | — | | | | — | | | | 42,114 | |
UBS AG | | | 852,117 | | | | — | | | | — | | | | — | | | | 852,117 | |
| | | | | | | | | | | | | | | | | | | | |
Total | | $ | 3,204,836 | | | $ | (204,832 | ) | | $ | — | | | $ | (19,114 | ) | | $ | 2,980,890 | |
| | | | | | | | | | | | | | | | | | | | |
| | | | | | | | | | | | | | | | | | | | |
| Counterparty | | Derivative
Liabilities
Subject to
an MNA by
Counterparty | | | Derivatives
Available
for Offset (a) | | | Non-cash
Collateral
Pledged | | | Cash
Collateral
Pledged | | | Net Amount
of Derivative
Liabilities (d)(e) | |
Bank of America N.A. | | $ | 23,957 | | | $ | (23,957 | ) | | $ | — | | | $ | — | | | $ | — | |
Citibank N.A. | | | 3,383 | | | | (3,383 | ) | | | — | | | | — | | | | — | |
Goldman Sachs International | | | 97,753 | | | | (97,753 | ) | | | — | | | | — | | | | — | |
J.P. Morgan Chase Bank N.A. | | | 6,261 | | | | (556 | ) | | | — | | | | | | | | 5,705 | |
Morgan Stanley & Co. International PLC | | | 42,075 | | | | (38,431 | ) | | | — | | | | — | | | | 3,644 | |
State Street Bank and Trust Co. | | | 40,752 | | | | (40,752 | ) | | | — | | | | — | | | | — | |
| | | | | | | | | | | | | | | | | | | | |
Total | | $ | 214,181 | | | $ | (204,832 | ) | | $ | — | | | $ | — | | | $ | 9,349 | |
| | | | | | | | | | | | | | | | | | | | |
| | (a) | The amount of derivatives available for offset is limited to the amount of derivative asset and/or liabilities that are subject to an MNA. | |
| | (b) | Excess of collateral received from the individual counterparty is not shown for financial reporting purposes. | |
| | (c) | Net amount represents the net amount receivable from the counterparty in the event of default. | |
| | (d) | Net amount may also include forward foreign currency exchange contracts that are not required to be collateralized. | |
| | (e) | Net amount represents the net amount payable due to counterparty in the event of default. | |
| | | | |
| SCHEDULES OF INVESTMENTS | | | 69 | |
| | |
Consolidated Schedule of Investments (unaudited) (continued) February 28, 2018 | | BlackRock Corporate High Yield Fund, Inc. (HYT) |
Fair Value Hierarchy as of Period End
Various inputs are used in determining the fair value of investments and derivative financial instruments. For information about the Trust’s policy regarding valuation of investments and derivative financial instruments, refer to the Notes to Financial Statements.
The following tables summarize the Trust’s investments and derivative financial instruments categorized in the disclosure hierarchy:
| | | | | | | | | | | | | | | | |
| | | Level 1 | | | Level 2 | | | Level 3 | | | Total | |
Assets: | | | | | | | | | | | | | | | | |
Investments: | | | | | | | | | | | | | | | | |
Long-Term Investments: | | | | | | | | | | | | | | | | |
Asset-Backed Securities | | $ | — | | | $ | 60,116,514 | | | $ | 500,000 | | | $ | 60,616,514 | |
Common Stocks | | | 21,857,699 | | | | 5,357,654 | | | | 6,964,920 | | | | 34,180,273 | |
Corporate Bonds | | | 531,859 | | | | 1,744,635,440 | | | | — | | | | 1,745,167,299 | |
Floating Rate Loan Interests | | | — | | | | 178,807,519 | | | | 16,603,199 | | | | 195,410,718 | |
Investment Companies | | | 28,441,111 | | | | — | | | | — | | | | 28,441,111 | |
Non-Agency Mortgage-Backed Securities | | | — | | | | 1,489,485 | | | | — | | | | 1,489,485 | |
Other Interests | | | — | | | | — | | | | 12 | | | | 12 | |
Preferred Securities | | | 7,973,674 | | | | 86,021,835 | | | | 24,357,822 | | | | 118,353,331 | |
Warrants | | | 2,002 | | | | 2 | | | | — | | | | 2,004 | |
Options Purchased: | | | | | | | | | | | | | | | | |
Equity contracts | | | 1,596 | | | | — | | | | — | | | | 1,596 | |
Unfunded Floating Rate Loan Interests(a) | | | — | | | | 580 | | | | — | | | | 580 | |
| | | | | | | | | | | | | | | | |
Subtotal | | $ | 58,807,941 | | | $ | 2,076,429,029 | | | $ | 48,425,953 | | | $ | 2,183,662,923 | |
| | | | | | | | | | | | | | | | |
Investments Valued at NAV(b) | | | | 558,164 | |
| | | | | | | | | | | | | | | | |
Total Investments | | | $ | 2,184,221,087 | |
| | | | | | | | | | | | | | | | |
Derivative Financial Instruments(c) | | | | | | | | | | | | | | | | |
Assets: | |
Credit contracts | | $ | — | | | $ | 57,062 | | | $ | — | | | $ | 57,062 | |
Equity contracts | | | 2,411 | | | | — | | | | — | | | | 2,411 | |
Forward foreign currency contracts | | | — | | | | 2,756,690 | | | | — | | | | 2,756,690 | |
Interest rate contracts | | | 21,473 | | | | 329,381 | | | | — | | | | 350,854 | |
Liabilities: | |
Credit contracts | | | — | | | | (41,531 | ) | | | — | | | | (41,531 | ) |
Equity contracts | | | — | | | | (53,969 | ) | | | — | | | | (53,969 | ) |
Forward foreign currency contracts | | | — | | | | (40,752 | ) | | | — | | | | (40,752 | ) |
Interest rate contracts | | | (57 | ) | | | (57,001 | ) | | | — | | | | (57,058 | ) |
| | | | | | | | | | | | | | | | |
| | $ | 23,827 | | | $ | 2,949,880 | | | $ | — | | | $ | 2,973,707 | |
| | | | | | | | | | | | | | | | |
| | (a) | Unfunded floating rate loan interests are valued at the unrealized appreciation (depreciation) on the commitment. | |
| | (b) | As of February 28, 2018, certain investments of the Trust were fair valued using net asset value (“NAV”) per share as no quoted market value is available and therefore have been excluded from the fair value hierarchy. | |
| | (c) | Derivative financial instruments are swaps, futures contracts, forward foreign currency exchange contracts and options written. Swaps, futures contracts and forward foreign currency exchange contracts are valued at the unrealized appreciation (depreciation) on the instrument and options written are shown at value. | |
During the six months ended February 28, 2018, there were no transfers between Level 1 and Level 2.
The Trust may hold assets and/or liabilities in which the fair value approximates the carrying amount for financial statement purposes. As of period end, bank borrowings payable of $663,000,000 are categorized as Level 2 within the disclosure hierarchy.
| | |
| 70 | | 2018 BLACKROCK SEMI-ANNUAL REPORTTO SHAREHOLDERS |
| | |
Consolidated Schedule of Investments (unaudited) (continued) February 28, 2018 | | BlackRock Corporate High Yield Fund, Inc. (HYT) |
A reconciliation of Level 3 investments is presented when the Trust had a significant amount of Level 3 investments at the beginning and/or end of the period in relation to net assets. The following table is a reconciliation of Level 3 investments for which significant unobservable inputs were used in determining fair value:
| | | | | | | | | | | | | | | | | | | | | | | | | | | | | | | | |
| | | Common Stocks | | | Asset-
Backed Securities | | | Corporate Bonds | | | Floating Rate Loan Interests | | | Other Interests | | | Preferred Securities | | | Warrants | | | Total | |
Assets: | | | | | | | | | | | | | | | | | | | | | | | | | | | | | | | | |
Opening Balance, as of August 31, 2017 | | $ | 3,840,544 | | | $ | 2,508,240 | | | $ | 4,761,900 | | | $ | 12,998,092 | | | $ | 13 | | | $ | 19,946,198 | | | $ | 455 | | | $ | 44,055,442 | |
Transfers into Level 3(a) | | | — | | | | — | | | | — | | | | 4,833,568 | | | | — | | | | — | | | | — | | | | 4,833,568 | |
Transfers out of Level 3(b) | | | — | | | | (2,508,240 | ) | | | — | | | | (2,174,312 | ) | | | — | | | | (2,696,614 | ) | | | — | | | | (7,379,166 | ) |
Accrued discounts/premiums | | | — | | | | — | | | | — | | | | 39,197 | | | | — | | | | — | | | | — | | | | 39,197 | |
Net realized gain (loss) | | | — | | | | — | | | | 117,268 | | | | 172,143 | | | | — | | | | 1,026,536 | | | | — | | | | 1,315,947 | |
Net change in unrealized appreciation (depreciation)(c)(d) | | | 3,124,376 | | | | — | | | | 48,100 | | | | 24,244 | | | | (1 | ) | | | 9,115,051 | | | | (455 | ) | | | 12,311,315 | |
Purchases | | | — | | | | 500,000 | | | | — | | | | 5,398,480 | | | | — | | | | — | | | | — | | | | 5,898,480 | |
Sales | | | — | | | | — | | | | (4,927,268 | ) | | | (4,688,213 | ) | | | — | | | | (3,033,349 | ) | | | — | | | | (12,648,830 | ) |
| | | | | | | | | | | | | | | | | | | | | | | | | | | | | | | | |
Closing Balance, as of February 28, 2018 | | $ | 6,964,920 | | | $ | 500,000 | | | $ | — | | | $ | 16,603,199 | | | $ | 12 | | | $ | 24,357,822 | | | $ | — | | | $ | 48,425,953 | |
| | | | | | | | | | | | | | | | | | | | | | | | | | | | | | | | |
Net change in unrealized appreciation (depreciation) on investments still held at February 28, 2018(d) | | $ | 3,124,376 | | | $ | — | | | $ | — | | | $ | 23,721 | | | $ | (1 | ) | | $ | 9,115,051 | | | $ | (455 | ) | | $ | 12,262,692 | |
| | | | | | | | | | | | | | | | | | | | | | | | | | | | | | | | |
| | (a) | As of August 31, 2017, the Trust used observable inputs in determining the value of certain investments. As of February 28, 2018, the Trust used significant unobservable inputs in determining the value of the same investments. As a result, investments at beginning of period value were transferred from Level 2 to Level 3 in the disclosure hierarchy. | |
| | (b) | As of August 31, 2017, the Trust used significant unobservable inputs in determining the value of certain investments. As of February 28, 2018, the Trust used observable inputs in determining the value of the same investments. As a result, investments at beginning of period value were transferred from Level 3 to Level 2 in the disclosure hierarchy. | |
| | (c) | Included in the related net change in unrealized appreciation (depreciation) in the Consolidated Statements of Operations. | |
| | (d) | Any difference between net change in unrealized appreciation (depreciation) and net change in unrealized appreciation (depreciation) on investments still held at February 28, 2018 is generally due to investments no longer held or categorized as Level 3 at period end. | |
The Trust’s investments that are categorized as Level 3 were valued utilizing third party pricing information without adjustment. Such valuations are based on unobservable inputs. A significant change in third party information could result in a significantly lower or higher value of such Level 3 investments.
| | | | |
| SCHEDULES OF INVESTMENTS | | | 71 | |
| | |
Schedule of Investments (unaudited) February 28, 2018 | | BlackRock Income Trust, Inc. (BKT) (Percentages shown are based on Net Assets) |
| | | | | | | | |
| Security | | Par (000) | | | Value | |
Asset-Backed Securities – 0.5% | |
|
| Asset-Backed Securities — 0.5% | |
Securitized Asset Backed Receivables LLC Trust, Series 2005-OP2, Class M1, (1 mo. LIBOR US + 0.43%), 2.05%, 10/25/35(a) | | $ | 1,875 | | | $ | 1,857,494 | |
| Interest Only Asset-Backed Securities — 0.0% | |
Small Business Administration Participation Certificates, Series 2000-1, 1.80%,
03/15/21(b)(c) | | | 230 | | | | 2,015 | |
Sterling Bank Trust, Series 2004-2, Class Note, 2.08%, 03/30/30(b)(d) | | | 1,404 | | | | 81,609 | |
Sterling Coofs Trust, Series 2004-1, Class A, 2.36%, 04/15/29(b)(c)(d) | | | 1,958 | | | | 102,746 | |
| | | | | | | | |
| | | | | | | 186,370 | |
| | | | | | | | |
Total Asset-Backed Securities — 0.5%
(Cost — $2,341,732) | | | | | | | 2,043,864 | |
| | | | | | | | |
|
Non-Agency Mortgage-Backed Securities — 0.5% | |
|
| Collateralized Mortgage Obligations — 0.1% | |
Deutsche Securities, Inc. Mortgage Alternate Loan Trust, Series 2006-AR5, Class 22A, 5.50%, 10/25/21 | | | 112 | | | | 108,481 | |
Kidder Peabody Acceptance Corp., Series 1993-1, Class A6, (1 mo. LIBOR + 16.62%), 13.61%, 08/25/23(a) | | | 29 | | | | 31,025 | |
Structured Adjustable Rate Mortgage Loan Trust, Series 2004-11, Class A, 3.49%, 08/25/34(c) | | | 522 | | | | 510,420 | |
| | | | | | | | |
| | | | | | | 649,926 | |
| Interest Only Collateralized Mortgage Obligations — 0.3% | |
CitiMortgage Alternative Loan Trust, Series 2007-A5, Class 1A7, 6.00%, 05/25/37 | | | 348 | | | | 79,218 | |
IndyMac INDX Mortgage Loan Trust, Series 2006-AR33, Class 4AX, 0.17%, 01/25/37(b) | | | 36,329 | | | | 4 | |
MASTR Adjustable Rate Mortgages Trust, Series 2004-3, Class 3AX, 0.48%,
04/25/34(b)(e) | | | 3,619 | | | | 72,384 | |
MASTR Alternative Loans Trust, Series 2003-9, Class 15X2, 6.00%, 01/25/19 | | | 30 | | | | 66 | |
Morgan Stanley Mortgage Loan Trust, Series 2004-3, Class 1AX, 5.00%, 05/25/19 | | | 20 | | | | 47 | |
Sequoia Mortgage Trust, Series 2005-2, Class XA, 0.72%, 03/20/35(b)(c) | | | 18,999 | | | | 522,461 | |
Structured Adjustable Rate Mortgage Loan Trust, Series 2006-7, Class 3AS, 1.66%, 08/25/36(b)(c) | | | 8,451 | | | | 612,721 | |
Vendee Mortgage Trust, Series 1999-2, Class 1, 0.00%, 05/15/29(c) | | | 20,814 | | | | 21 | |
| | | | | | | | |
| | | | | | | 1,286,922 | |
| Principal Only Collateralized Mortgage Obligations — 0.1% | |
Countrywide Home Loan Mortgage Pass-Through Trust, Series 2003-J8, 0.00%, 09/25/23(f) | | | 23 | | | | 21,217 | |
Residential Asset Securitization Trust, Series 2005-A15, Class 1A8, 0.00%, 02/25/36(f) | | | 256 | | | | 217,291 | |
Washington Mutual Alternative Mortgage Pass-Through Certificates, Series 2005-9, Class CP, 0.00%, 11/25/35(f) | | | 115 | | | | 85,627 | |
| | | | | | | | |
| | | | | | | 324,135 | |
| | | | | | | | |
Total Non-Agency Mortgage-Backed
Securities — 0.5%
(Cost — $1,288,065) | | | | 2,260,983 | |
| | | | | | | | |
|
U.S. Government Sponsored Agency Securities — 145.1% | |
|
| Agency Obligations — 2.6% | |
Federal Housing Administration(b): | | | | | | | | |
USGI Projects, Series 99, 7.43%, 06/01/21 - 10/01/23 | | | 1,888 | | | | 1,803,734 | |
| | | | | | | | |
| Security | | Par (000) | | | Value | |
| Agency Obligations (continued) | |
General Motors Acceptance Corp. Projects, Series 56, 7.43%, 11/01/22 | | $ | — | (g) | | $ | 1 | |
Merrill Lynch Projects, Series 54, 7.43%, 05/15/23 | | | 1 | | | | 919 | |
Reilly Projects, Series 41, 8.77%, 03/01/20(c) | | | 13 | | | | 13,552 | |
Residual Funding Corp., 0.00%, 04/15/30(f) | | | 13,000 | | | | 8,693,852 | |
| | | | | | | | |
| | | | | | | 10,512,058 | |
| Collateralized Mortgage Obligations — 67.3% | |
Fannie Mae Mortgage-Backed Securities: | | | | | | | | |
Series 2017-90, Class WB, 3.00%, 11/25/47 | | | 5,594 | | | | 5,132,648 | |
Series 2017-76, Class PB, 3.00%, 10/25/57 | | | 3,415 | | | | 3,065,322 | |
Series 2011-142, Class PE, 3.50%, 01/25/42 | | | 15,567 | | | | 15,008,670 | |
Series 2014-28, Class BD, 3.50%, 08/25/43 | | | 5,116 | | | | 5,164,828 | |
Series 2010-136, Class CY, 4.00%, 12/25/40 | | | 3,060 | | | | 3,151,522 | |
Series 2011-8, Class ZA, 4.00%, 02/25/41 | | | 6,502 | | | | 6,693,269 | |
Series 2011-117, Class CP, 4.00%, 11/25/41 | | | 14,350 | | | | 14,769,340 | |
Series 2011-99, Class CB, 4.50%, 10/25/41 | | | 43,000 | | | | 45,928,313 | |
Series 2010-47, Class JB, 5.00%, 05/25/30 | | | 8,338 | | | | 8,765,208 | |
Series 2003-135, Class PB, 6.00%, 01/25/34 | | | 5,479 | | | | 5,674,910 | |
Series 2004-31, Class ZG, 7.50%, 05/25/34 | | | 5,156 | | | | 6,068,723 | |
9.99%, 04/25/34(c) | | | 2,305 | | | | 2,620,954 | |
Series 1993-247, Class SN, (11th District Cost of Funds + 63.85%), 10.00%, 12/25/23(a) | | | 76 | | | | 88,194 | |
Series 2005-73, Class DS, (1 mo. LIBOR + 17.55%), 13.34%, 08/25/35(a) | | | 307 | | | | 339,542 | |
Series 1991-87, Class S, (1 mo. LIBOR + 26.68%), 22.39%, 08/25/21(a) | | | 5 | | | | 5,576 | |
Series G-49, Class S, (1 mo. LIBOR + 1034.80%), 866.25%, 12/25/21(a) | | | — | (g) | | | 13 | |
Series G-07, Class S, (1 mo. LIBOR + 1144.57%), 961.77%, 03/25/21(a) | | | — | (g) | | | 146 | |
Freddie Mac Mortgage-Backed Securities: | | | | | | | | |
Series 0173, Class RS, 0.00%, 11/15/21(b)(c) | | | — | (g) | | | 2 | |
Series T-11, Class A9, 3.16%, 01/25/28(c) | | | 636 | | | | 648,214 | |
Series 4242, Class PA, 3.50%, 05/15/41 | | | 5,146 | | | | 5,226,402 | |
Series 4384, Class LB, 3.50%, 08/15/43 | | | 5,100 | | | | 5,105,468 | |
Series 4748, Class BM, 3.50%, 11/15/47 | | | 3,351 | | | | 3,222,492 | |
Series 3745, Class ZA, 4.00%, 10/15/40 | | | 1,166 | | | | 1,199,887 | |
Series 3762, Class LN, 4.00%, 11/15/40 | | | 2,000 | | | | 2,039,420 | |
Series 3780, Class ZA, 4.00%, 12/15/40 | | | 2,201 | | | | 2,267,469 | |
Series 4269, Class PM, 4.00%, 08/15/41 | | | 8,884 | | | | 8,904,762 | |
Series 4016, Class BX, 4.00%, 09/15/41 | | | 15,408 | | | | 16,048,452 | |
Series 3960, Class PL, 4.00%, 11/15/41 | | | 2,859 | | | | 2,926,272 | |
Series 3688, Class PB, 4.50%, 08/15/32 | | | 8,346 | | | | 8,452,713 | |
Series 4316, Class VB, 4.50%, 03/15/34 | | | 10,787 | | | | 11,240,346 | |
Series 3856, Class PB, 5.00%, 05/15/41 | | | 10,000 | | | | 10,707,276 | |
Series 2927, Class BZ, 5.50%, 02/15/35 | | | 4,235 | | | | 4,605,616 | |
Series 2542, Class UC, 6.00%, 12/15/22 | | | 1,179 | | | | 1,234,233 | |
Series 0040, Class K, 6.50%, 08/17/24 | | | 75 | | | | 82,883 | |
Series 0019, Class F, 8.50%, 03/15/20 | | | 2 | | | | 1,651 | |
Series 2218, Class Z, 8.50%, 03/15/30 | | | 1,606 | | | | 1,847,281 | |
Series 1160, Class F, (1 mo. LIBOR + 40.16%), 33.42%, 10/15/21(a) | | | 3 | | | | 3,923 | |
Ginnie Mae Mortgage-Backed Securities: | | | | | | | | |
Series 2010-099, Class JM, 3.75%, 12/20/38 | | | 13,398 | | | | 13,514,450 | |
Series 2010-112, Class TL, 4.00%, 01/20/39 | | | 12,259 | | | | 12,423,698 | |
Series 2011-80, Class PB, 4.00%, 10/20/39 | | | 9,514 | | | | 9,677,713 | |
Series 2012-16, Class HJ, 4.00%, 09/20/40 | | | 10,000 | | | | 10,122,456 | |
Series 2011-88, Class PY, 4.00%, 06/20/41 | | | 15,402 | | | | 15,470,255 | |
Series 2015-96, Class ZM, 4.00%, 07/20/45 | | | 6,959 | | | | 7,266,404 | |
Series 2004-89, Class PE, 6.00%, 10/20/34 | | | 32 | | | | 33,116 | |
| | | | | | | | |
| | | | | | | 276,750,032 | |
| | |
| 72 | | 2018 BLACKROCK SEMI-ANNUAL REPORTTO SHAREHOLDERS |
| | |
Schedule of Investments (unaudited) (continued) February 28, 2018 | | BlackRock Income Trust, Inc. (BKT) (Percentages shown are based on Net Assets) |
| | | | | | | | |
| Security | | Par (000) | | | Value | |
| Interest Only Collateralized Mortgage Obligations — 7.4% | |
Fannie Mae Mortgage-Backed Securities: | | | | | | | | |
Series 2015-M1, Class X2, 0.55%, 09/25/24(c) | | $ | 38,404 | | | $ | 1,161,966 | |
Series 1997-50, Class SI, (1 mo. LIBOR + 9.20%), 1.20%, 04/25/23(a) | | | 62 | | | | 1,405 | |
Series G92-60, Class SB, (11th District Cost of Funds + 9.35%), 1.60%, 10/25/22(a) | | | 31 | | | | 854 | |
Series 2013-10, Class PI, 3.00%, 02/25/43 | | | 12,251 | | | | 1,442,717 | |
Series 2012-96, Class DI, 4.00%, 02/25/27 | | | 2,896 | | | | 228,798 | |
Series 2013-45, Class EI, 4.00%, 04/25/43 | | | 5,530 | | | | 999,545 | |
Series 2016-81, Class CS, (1 mo. LIBOR + 6.10%), 4.48%, 11/25/46(a) | | | 9,831 | | | | 1,358,451 | |
Series 2015-66, Class AS, (1 mo. LIBOR + 6.25%), 4.63%, 09/25/45(a)(b) | | | 57,355 | | | | 8,726,089 | |
Series 2011-100, Class S, (1 mo. LIBOR + 6.45%), 4.83%, 10/25/41(a) | | | 3,103 | | | | 449,374 | |
Series 2006-36, Class PS, (1 mo. LIBOR + 6.60%), 4.98%, 05/25/36(a) | | | 5,995 | | | | 895,863 | |
Series 2010-74, Class DI, 5.00%, 12/25/39 | | | 2,467 | | | | 131,516 | |
Series 2016-64, Class BI, 5.00%, 09/25/46 | | | 12,423 | | | | 2,462,220 | |
Series 2011-124, Class GS, (1 mo. LIBOR + 6.70%), 5.08%, 03/25/37(a) | | | 5,079 | | | | 277,477 | |
Series 1997-90, Class M, 6.00%, 01/25/28 | | | 1,026 | | | | 119,621 | |
Series 1999-W4, 6.50%, 12/25/28 | | | 101 | | | | 8,979 | |
Series G92-05, Class H, 9.00%, 01/25/22 | | | — | (g) | | | 21 | |
Series 094, Class 2, 9.50%, 08/25/21 | | | — | (g) | | | 36 | |
Series 1990-136, Class S, 18.46%, 11/25/20(a) | | | 1 | | | | 1 | |
Series G-10, Class S, 930.47%, 05/25/21(a) | | | — | (g) | | | 1 | |
Freddie Mac Mortgage-Backed Securities: | | | | | | | | |
Series 2559, Class IO, 0.50%, 08/15/30(c) | | | 18 | | | | 62 | |
Series 3745, Class IN, 4.00%, 01/15/35 | | | 5,527 | | | | 205,838 | |
Series 3744, Class PI, 4.00%, 06/15/39 | | | 7,354 | | | | 856,976 | |
Series 4026, Class IO, 4.50%, 04/15/32 | | | 2,311 | | | | 311,110 | |
Series 4611, Class BS, (1 mo. LIBOR + 6.10%), 4.51%, 06/15/41(a) | | | 22,904 | | | | 3,095,134 | |
Series 3796, Class WS, (1 mo. LIBOR + 6.55%), 4.96%, 02/15/40(a) | | | 5,361 | | | | 476,773 | |
Series 2611, Class QI, 5.50%, 09/15/32 | | | 205 | | | | 5,068 | |
Series 1043, Class H, (1 mo. LIBOR + 45.00%), 37.86%, 02/15/21(a) | | | 2 | | | | 2 | |
Ginnie Mae Mortgage-Backed Securities: | | | | | | | | |
Series 2013-63, Class IO, 0.79%, 09/16/51(c) | | | 12,391 | | | | 663,394 | |
Series 2014-169, Class IO, 0.86%, 10/16/56(c) | | | 34,597 | | | | 1,828,681 | |
Series 2012-97, Class JS, (1 mo. LIBOR + 6.25%), 4.66%, 08/16/42(a) | | | 16,623 | | | | 1,922,782 | |
Series 2009-116, Class KS, (1 mo. LIBOR + 6.47%), 4.88%, 12/16/39(a) | | | 1,021 | | | | 130,425 | |
Series 2011-52, Class MJ, (1 mo. LIBOR + 6.65%), 5.06%, 04/20/41(a) | | | 7,965 | | | | 1,115,781 | |
Series 2011-52, Class NS, (1 mo. LIBOR + 6.67%), 5.08%, 04/16/41(a) | | | 9,256 | | | | 1,452,799 | |
| | | | | | | | |
| | | | | | | 30,329,759 | |
| Mortgage-Backed Securities — 67.7% | |
Fannie Mae Mortgage-Backed Securities: | | | | | | | | |
2.50%, 3/01/33(h) | | | 180 | | | | 175,514 | |
3.00%, 01/01/43 - 10/01/46(i) | | | 55,875 | | | | 54,485,305 | |
3.50%, 10/01/42 - 04/01/48(h)(i) | | | 61,824 | | | | 61,892,379 | |
4.00%, 01/01/41 - 06/01/46(i) | | | 34,273 | | | | 35,367,522 | |
4.50%, 08/01/25 - 09/01/41(i) | | | 45,616 | | | | 48,257,207 | |
5.00%, 01/01/23 - 10/01/41(i) | | | 27,902 | | | | 30,143,825 | |
5.50%, 03/01/18 - 10/01/39(i) | | | 10,618 | | | | 11,714,415 | |
6.50%, 12/01/37 - 10/01/39 | | | 3,747 | | | | 4,174,855 | |
7.50%, 2/01/22 | | | — | (g) | | | 4 | |
9.50%, 01/01/19 - 09/01/19 | | | — | (g) | | | 464 | |
| | | | | | | | |
| Security | | Par (000) | | | Value | |
| Mortgage-Backed Securities (continued) | |
Freddie Mac Mortgage-Backed Securities: | | | | | | | | |
3.50%, 8/01/46(i) | | $ | 12,690 | | | $ | 12,745,400 | |
(1 year CMT + 2.43%), 3.68%,
10/01/34(a) | | | 95 | | | | 97,297 | |
5.00%, 02/01/22 - 04/01/22 | | | 95 | | | | 98,625 | |
5.50%, 1/01/39(i) | | | 14,240 | | | | 15,627,224 | |
9.00%, 9/01/20 | | | 1 | | | | 1,451 | |
Ginnie Mae Mortgage-Backed Securities: | | | | | | | | |
5.00%, 10/20/39 | | | 3,551 | | | | 3,815,348 | |
7.50%, 12/15/21 - 11/15/23 | | | 47 | | | | 48,601 | |
8.00%, 10/15/22 - 08/15/27 | | | 27 | | | | 28,783 | |
9.00%, 04/15/20 - 09/15/21 | | | 2 | | | | 1,445 | |
| | | | | | | | |
| | | | | | | 278,675,664 | |
|
| Principal Only Collateralized Mortgage Obligations — 0.1% | |
Fannie Mae Mortgage-Backed Securities(f): | | | | | | | | |
Series 1991-7, Class J, 0.00%, 02/25/21 | | | 1 | | | | 1,004 | |
Series G93-2, Class KB, 0.00%, 01/25/23 | | | 38 | | | | 36,088 | |
Series 1993-51, Class E, 0.00%, 02/25/23 | | | 12 | | | | 11,623 | |
Series 203, Class 1, 0.00%, 02/25/23 | | | 4 | | | | 3,516 | |
Series 1993-70, Class A, 0.00%, 05/25/23 | | | 2 | | | | 1,947 | |
Series 0228, Class 1, 0.00%, 06/25/23 | | | 3 | | | | 2,818 | |
Series 1999-W4, 0.00%, 02/25/29 | | | 44 | | | | 40,010 | |
Series 2002-13, Class PR, 0.00%, 03/25/32 | | | 82 | | | | 73,243 | |
Freddie Mac Mortgage-Backed Securities(f): | | | | | | | | |
Series 1418, Class M, 0.00%, 11/15/22 | | | 12 | | | | 11,754 | |
Series 1571, Class G, 0.00%, 08/15/23 | | | 97 | | | | 91,432 | |
Series 1691, Class B, 0.00%, 03/15/24 | | | 204 | | | | 187,514 | |
Series T-8, Class A10, 0.00%, 11/15/28 | | | 18 | | | | 17,524 | |
| | | | | | | | |
| | | | | | | 478,473 | |
| | | | | | | | |
Total U.S. Government Sponsored Agency Securities — 145.1%
(Cost — $629,472,801) | | | | 596,745,986 | |
| | | | | | | | |
Total Long-Term Investments — 146.1%
(Cost — $633,102,598) | | | | 601,050,833 | |
| | | | | | | | |
| | |
| | | Shares | | | | |
Short-Term Securities — 1.9% | |
| | |
| Money Market Funds — 1.7% | | | | | | |
BlackRock Liquidity Funds, T-Fund, Institutional Class, 1.29%(l)(m) | | | 6,967,792 | | | $ | 6,967,792 | |
| | | | | | | | |
| | |
| | | Par (000) | | | | |
|
| Borrowed Bond Agreement(j)(k) — 0.2% | |
Credit Suisse Securities (USA) LLC, 1.43%, Open (Purchased on 12/28/17 to be repurchased at $925,252. Collateralized by U.S. Treasury Bonds, 2.75%, 11/15/42, par and fair values of $917,000 and $860,010, respectively) | | $ | 925 | | | | 925,024 | |
| | | | | | | | |
Total Short-Term Securities — 1.9%
(Cost — $7,892,816) | | | | 7,892,816 | |
| | | | | | | | |
Total Investments Before Borrowed Bonds and TBA Sale Commitments — 148.0%
(Cost — $640,995,414) | | | | 608,943,649 | |
| | | | | | | | |
Borrowed Bonds — (0.2)% | |
U.S. Treasury Bonds, 2.75%, 11/15/42 | | | (917 | ) | | | (860,010 | ) |
| | | | | | | | |
Total Borrowed Bonds — (0.2)%
(Proceeds — $842,347) | | | | (860,010 | ) |
| | | | | | | | |
| | | | |
| SCHEDULES OF INVESTMENTS | | | 73 | |
| | |
Schedule of Investments (unaudited) (continued) February 28, 2018 | | BlackRock Income Trust, Inc. (BKT) (Percentages shown are based on Net Assets) |
| | | | | | | | |
| Security | | Par (000) | | | Value | |
TBA Sale Commitments — (22.4)% | |
|
| Mortgage-Backed Securities — (22.4)% | |
Fannie Mae Mortgage-Backed Securities(h): | | | | | | | | |
3.00%, 03/01/48 | | $ | 46,200 | | | $ | (44,748,918 | ) |
3.50%, 03/01/48 | | | 12,664 | | | | (12,640,108 | ) |
4.00%, 03/01/48 | | | 20,500 | | | | (20,994,483 | ) |
5.00%, 03/01/48 | | | 12,900 | | | | (13,768,384 | ) |
| | | | | | | | |
Total TBA Sale Commitments — (22.4)%
(Proceeds — $92,280,819) | | | | (92,151,893 | ) |
| | | | | | | | |
| |
Total Investments, Net of Borrowed Bonds and TBA Sale Commitments — 125.4%
(Cost — $547,872,248) | | | | 515,931,746 | |
Liabilities in Excess of Other Assets — (25.4)% | | | | (104,554,277 | ) |
| | | | | | | | |
Net Assets — 100.0% | | | $ | 411,377,469 | |
| | | | | | | | |
| (a) | Floating rate security. Rate shown is the rate in effect as of period end. |
| (b) | Security is valued using significant unobservable inputs and is classified as Level 3 in the fair value hierarchy. |
| (c) | Variable or floating rate security, which interest rate adjusts periodically based on changes in current interest rates and prepayments on the underlying pool of assets. Rate shown is the rate in effect as of period end. |
| (d) | Security exempt from registration pursuant to Rule 144A under the Securities Act of 1933, as amended. These securities may be resold in transactions exempt from registration to qualified institutional investors. |
| (e) | Step-up bond that pays an initial coupon rate for the first period and then a higher coupon rate for the following periods. Rate as of period end. |
| (g) | Amount is less than $500. |
| (h) | Represents or includes a TBA transaction. |
| (i) | All or a portion of the security has been pledged as collateral in connection with outstanding reverse repurchase agreements. |
| (j) | Certain agreements have no stated maturity and can be terminated by either party at any time. |
| (k) | The amount to be repurchased assumes the maturity will be the day after period end. |
| (l) | Annualized 7-day yield as of period end. |
| (m) | During the six months ended February 28, 2018, investments in issuers considered to be an affiliate of the Trust for purposes of Section 2(a)(3) of the Investment Company Act of 1940, as amended, were as follows: |
| | | | | | | | | | | | | | | | | | | | | | | | | | | | |
| Affiliate | | Shares
Held at
08/31/17 | | | Net
Activity | | | Shares
Held at
02/28/18 | | | Value at
02/28/18 | | | Income | | | Net
Realized
Gain (Loss) (a) | | | Change in
Unrealized
Appreciation
(Depreciation) | |
BlackRock Liquidity Funds, T-Fund, Institutional Class | | | 8,868,413 | | | | (1,900,621 | ) | | | 6,967,792 | | | $ | 6,967,792 | | | $ | 47,263 | | | $ | 27 | | | $ | — | |
| | | | | | | | | | | | | | | | | | | | | | | | | | | | |
| | (a) | Includes net capital gain distributions, if applicable. | |
Reverse Repurchase Agreements
| | | | | | | | | | | | | | | | | | | | | | | | |
| Counterparty | | Interest
Rate | | | Trade
Date | | | Maturity
Date | | | Face Value | | | Face Value
Including
Accrued Interest | | | Type of Non-Cash Underlying Collateral | | Remaining Contractual
Maturity of the Agreements |
HSBC Securities (USA), Inc. | | | 1.54 | % | | | 02/12/18 | | | | 3/13/18 | | | $ | 11,768,000 | | | $ | 11,776,055 | | | U.S. Government Sponsored Agency Securities | | Up to 30 Days |
HSBC Securities (USA), Inc. | | | 1.54 | | | | 02/12/18 | | | | 3/13/18 | | | | 6,989,000 | | | | 6,993,784 | | | U.S. Government Sponsored Agency Securities | | Up to 30 Days |
HSBC Securities (USA), Inc. | | | 1.54 | | | | 02/12/18 | | | | 3/13/18 | | | | 15,196,000 | | | | 15,206,401 | | | U.S. Government Sponsored Agency Securities | | Up to 30 Days |
HSBC Securities (USA), Inc. | | | 1.54 | | | | 02/12/18 | | | | 3/13/18 | | | | 14,243,000 | | | | 14,252,748 | | | U.S. Government Sponsored Agency Securities | | Up to 30 Days |
HSBC Securities (USA), Inc. | | | 1.54 | | | | 02/12/18 | | | | 3/13/18 | | | | 16,774,000 | | | | 16,785,481 | | | U.S. Government Sponsored Agency Securities | | Up to 30 Days |
HSBC Securities (USA), Inc. | | | 1.54 | | | | 02/12/18 | | | | 3/13/18 | | | | 8,581,000 | | | | 8,586,873 | | | U.S. Government Sponsored Agency Securities | | Up to 30 Days |
HSBC Securities (USA), Inc. | | | 1.54 | | | | 02/12/18 | | | | 3/13/18 | | | | 14,673,000 | | | | 14,683,043 | | | U.S. Government Sponsored Agency Securities | | Up to 30 Days |
HSBC Securities (USA), Inc. | | | 1.54 | | | | 02/12/18 | | | | 3/13/18 | | | | 12,375,000 | | | | 12,383,470 | | | U.S. Government Sponsored Agency Securities | | Up to 30 Days |
HSBC Securities (USA), Inc. | | | 1.54 | | | | 02/12/18 | | | | 3/13/18 | | | | 7,698,000 | | | | 7,703,269 | | | U.S. Government Sponsored Agency Securities | | Up to 30 Days |
HSBC Securities (USA), Inc. | | | 1.54 | | | | 02/12/18 | | | | 3/13/18 | | | | 8,672,000 | | | | 8,677,935 | | | U.S. Government Sponsored Agency Securities | | Up to 30 Days |
HSBC Securities (USA), Inc. | | | 1.54 | | | | 02/12/18 | | | | 3/13/18 | | | | 12,155,000 | | | | 12,163,319 | | | U.S. Government Sponsored Agency Securities | | Up to 30 Days |
HSBC Securities (USA), Inc. | | | 1.54 | | | | 02/12/18 | | | | 3/13/18 | | | | 14,788,000 | | | | 14,798,122 | | | U.S. Government Sponsored Agency Securities | | Up to 30 Days |
HSBC Securities (USA), Inc. | | | 1.54 | | | | 02/12/18 | | | | 3/13/18 | | | | 17,550,000 | | | | 17,562,012 | | | U.S. Government Sponsored Agency Securities | | Up to 30 Days |
HSBC Securities (USA), Inc. | | | 1.54 | | | | 02/12/18 | | | | 3/13/18 | | | | 9,142,000 | | | | 9,148,257 | | | U.S. Government Sponsored Agency Securities | | Up to 30 Days |
| | | | | | | | | | | | | | | | | | | | | | | | |
| | | | | | | | | | | | | | $ | 170,604,000 | | | $ | 170,720,769 | | | | | |
| | | | | | | | | | | | | | | | | | | | | | | | |
| | |
| 74 | | 2018 BLACKROCK SEMI-ANNUAL REPORTTO SHAREHOLDERS |
| | |
Schedule of Investments (unaudited) (continued) February 28, 2018 | | BlackRock Income Trust, Inc. (BKT) |
Derivative Financial Instruments Outstanding as of Period End
Futures Contracts
| | | | | | | | | | | | | | | | |
| Description | | Number of
Contracts | | | Expiration
Date | | | Notional
Amount (000) | | | Value /
Unrealized
Appreciation
(Depreciation) | |
Short Contracts: | | | | | | | | | | | | | | | | |
90-Day Euro Future | | | 54 | | | | 09/17/18 | | | $ | 13,177 | | | $ | 75,744 | |
90-Day Euro Future | | | 55 | | | | 12/17/18 | | | | 13,402 | | | | 80,118 | |
90-Day Euro Dollar | | | 54 | | | | 06/18/18 | | | | 13,193 | | | | 71,939 | |
90-Day Euro Dollar | | | 48 | | | | 03/19/18 | | | | 11,746 | | | | 57,332 | |
10-Year U.S. Treasury Note | | | 157 | | | | 06/20/18 | | | | 18,847 | | | | 32,735 | |
10-Year U.S. Ultra Long Treasury Note | | | 67 | | | | 06/20/18 | | | | 8,580 | | | | (5,753 | ) |
5-Year U.S. Treasury Note | | | 108 | | | | 06/29/18 | | | | 12,304 | | | | 20,664 | |
Long U.S. Treasury Bond | | | 348 | | | | 06/20/18 | | | | 49,916 | | | | (459,855 | ) |
90-Day Euro Future | | | 9 | | | | 12/16/19 | | | | 2,186 | | | | 4,808 | |
90-Day Euro Dollar | | | 54 | | | | 03/18/19 | | | | 13,147 | | | | 82,617 | |
90-Day Euro-Dollar | | | 24 | | | | 06/17/19 | | | | 5,837 | | | | 36,195 | |
90-Day Euro-Dollar | | | 14 | | | | 09/16/19 | | | | 3,403 | | | | 13,870 | |
| | | | | | | | | | | | | | | | |
| | | | | | | | | | | | | | $ | 10,414 | |
| | | | | | | | | | | | | | | | |
OTC Interest Rate Swaps
| | | | | | | | | | | | | | | | | | | | | | | | | | | | | | | | | | |
| Paid by the Trust | | Received by the Trust | | Counterparty | | Effective
Date | | | Termination
Date | | | Notional
Amount (000) | | | Value | | | Upfront
Premium
Paid
(Received) | | | Unrealized
Appreciation
(Depreciation) | |
| Rate | | Frequency | | Rate | | Frequency | | | | | | | |
| 4.31% | | Semi-annual | | 3-Month LIBOR | | Quarterly | | Deutsche Bank AG | | | N/A | | | | 10/01/18 | | | USD | | | 60,000 | | | $ | (1,657,004 | ) | | $ | — | | | $ | (1,657,004 | ) |
| 3-Month LIBOR | | Quarterly | | 3.43% | | Semi-annual | | JPMorgan Chase Bank N.A. | | | N/A | | | | 03/28/21 | | | USD | | | 6,000 | | | | 207,776 | | | | (88,185 | ) | | | 295,961 | |
| 3-Month LIBOR | | Quarterly | | 5.41 | | Semi-annual | | JPMorgan Chase Bank N.A. | | | N/A | | | | 08/15/22 | | | USD | | | 9,565 | | | | 1,100,147 | | | | — | | | | 1,100,147 | |
| | | | | | | | | | | | | | | | | | | | | | | | | | | | | | | | | | |
| | | $ | (349,081 | ) | | $ | (88,185 | ) | | $ | (260,896 | ) |
| | | | | | | | | | | | | | | |
Balances Reported in the Statements of Assets and Liabilities for OTC Derivatives
| | | | | | | | | | | | | | | | |
| | | Swap Premiums Paid | | | Swap Premiums
Received | | | Unrealized Appreciation | | | Unrealized Depreciation | |
OTC Derivatives | | $ | — | | | $ | (88,185 | ) | | $ | 1,396,108 | | | $ | (1,657,004 | ) |
Derivative Financial Instruments Categorized by Risk Exposure
As of period end, the fair values of derivative financial instruments located in the Statements of Assets and Liabilities were as follows:
| | | | | | | | | | | | | | | | | | | | | | | | | | | | |
| | | Commodity
Contracts | | | Credit
Contracts | | | Equity
Contracts | | | Foreign
Currency
Exchange
Contracts | | | Interest
Rate
Contracts | | | Other
Contracts | | | Total | |
Assets — Derivative Financial Instruments | | | | | | | | | | | | | | | | | | | | | | | | | | | | |
Futures contracts | | | | | | | | | | | | | | | | | | | | | | | | | | | | |
Net unrealized appreciation(a) | | $ | — | | | $ | — | | | $ | — | | | $ | — | | | $ | 476,022 | | | $ | — | | | $ | 476,022 | |
Swaps — OTC | | | | | | | | | | | | | | | | | | | | | | | | | | | | |
Unrealized appreciation on OTC swaps | | | — | | | | — | | | | — | | | | — | | | | 1,396,108 | | | | — | | | | 1,396,108 | |
| | | | | | | | | | | | | | | | | | | | | | | | | | | | |
| | $ | — | | | $ | — | | | $ | — | | | $ | — | | | $ | 1,872,130 | | | $ | — | | | $ | 1,872,130 | |
| | | | | | | | | | | | | | | | | | | | | | | | | | | | |
| | | | |
| SCHEDULES OF INVESTMENTS | | | 75 | |
| | |
Schedule of Investments (unaudited) (continued) February 28, 2018 | | BlackRock Income Trust, Inc. (BKT) |
| | | | | | | | | | | | | | | | | | | | | | | | | | | | |
| | | Commodity
Contracts | | | Credit
Contracts | | | Equity
Contracts | | | Foreign
Currency
Exchange
Contracts | | | Interest
Rate
Contracts | | | Other
Contracts | | | Total | |
| Liabilities — Derivative Financial Instruments | | | | | | | | | | | | | | | | | | | | | |
Futures contracts | | | | | | | | | | | | | | | | | | | | | | | | | | | | |
Net unrealized depreciation(a) | | $ | — | | | $ | — | | | $ | — | | | $ | — | | | $ | 465,608 | | | $ | — | | | $ | 465,608 | |
Swaps — OTC | | | | | | | | | | | | | | | | | | | | | | | | | | | | |
Unrealized depreciation on OTC swaps; Swap premiums received | | | — | | | | — | | | | — | | | | — | | | | 1,745,189 | | | | — | | | | 1,745,189 | |
| | | | | | | | | | | | | | | | | | | | | | | | | | | | |
| | $ | — | | | $ | — | | | $ | — | | | $ | — | | | $ | 2,210,797 | | | $ | — | | | $ | 2,210,797 | |
| | | | | | | | | | | | | | | | | | | | | | | | | | | | |
| | (a) | Includes cumulative appreciation (depreciation) on futures contracts, if any, as reported in the Schedule of Investments. Only current day’s variation margin is reported within the Statements of Assets and Liabilities. | |
For the period ended February 28, 2018, the effect of derivative financial instruments in the Statements of Operations was as follows:
| | | | | | | | | | | | | | | | | | | | | | | | | | | | |
| | | Commodity
Contracts | | | Credit
Contracts | | | Equity
Contracts | | | Foreign
Currency
Exchange
Contracts | | | Interest
Rate
Contracts | | | Other
Contracts | | | Total | |
Net Realized Gain (Loss) from: | | | | | | | | | | | | | | | | | | | | | | | | | | | | |
Futures contracts | | $ | — | | | $ | — | | | $ | — | | | $ | — | | | $ | 6,611,092 | | | $ | — | | | $ | 6,611,092 | |
Swaps | | | — | | | | — | | | | — | | | | — | | | | (615,717 | ) | | | — | | | | (615,717 | ) |
| | | | | | | | | | | | | | | | | | | | | | | | | | | | |
| | $ | — | | | $ | — | | | $ | — | | | $ | — | | | $ | 5,995,375 | | | $ | — | | | $ | 5,995,375 | |
| | | | | | | | | | | | | | | | | | | | | | | | | | | | |
| Net Change in Unrealized Appreciation (Depreciation) on: | | | | | | | | | | | | | | | | | | | | | |
Futures contracts | | $ | — | | | $ | — | | | $ | — | | | $ | — | | | $ | 613,450 | | | $ | — | | | $ | 613,450 | |
Swaps | | | — | | | | — | | | | — | | | | — | | | | 292,109 | | | | — | | | | 292,109 | |
| | | | | | | | | | | | | | | | | | | | | | | | | | | | |
| | $ | — | | | $ | — | | | $ | — | | | $ | — | | | $ | 905,559 | | | $ | — | | | $ | 905,559 | |
| | | | | | | | | | | | | | | | | | | | | | | | | | | | |
Average Quarterly Balances of Outstanding Derivative Financial Instruments
| | | | |
Futures contracts: | |
Average notional value of contracts — long | | $ | 85,768,281 | (a) |
Average notional value of contracts — short | | $ | 187,112,864 | |
Interest rate swaps: | | | | |
Average notional amount-pays fixed rate | | $ | 60,000,000 | |
Average notional amount-receives fixed rate | | $ | 15,565,000 | |
| | (a) | Actual amounts for the period are shown due to limited outstanding derivative financial instruments as of each quarter. | |
For more information about the Trust’s investment risks regarding derivative financial instruments, refer to the Notes to Financial Statements.
Derivative Financial Instruments — Offsetting as of Period End
| | | | | | | | |
| | | Assets | | | Liabilities | |
Derivative Financial Instruments: | | | | | | | | |
Futures contracts | | $ | — | | | $ | 391,197 | |
Swaps — OTC(a) | | | 1,396,108 | | | | 1,745,189 | |
| | | | | | | | |
Total derivative assets and liabilities in the Statements of Assets and Liabilities | | $ | 1,396,108 | | | $ | 2,136,386 | |
Derivatives not subject to a Master Netting Agreement or similar agreement (“MNA”) | | | — | | | | (391,197 | ) |
| | | | | | | | |
Total derivative assets and liabilities subject to an MNA | | $ | 1,396,108 | | | $ | 1,745,189 | |
| | | | | | | | |
| | (a) | Includes unrealized appreciation (depreciation) on OTC swaps and swap premiums (paid/received) in the Statements of Assets and Liabilities. | |
The following table presents the Trust’s derivative assets (and liabilities) by counterparty net of amounts available for offset under an MNA and net of the related collateral received (and pledged) by the Trust:
| | | | | | | | | | | | | | | | | | | | |
| Counterparty | | Derivative
Assets
Subject to
an MNA by
Counterparty | | | Derivatives
Available
for Offset (a) | | | Non-cash
Collateral
Received | | | Cash
Collateral
Received (b) | | | Net Amount
of Derivative
Assets (c) | |
JPMorgan Chase Bank N.A. | | $ | 1,396,108 | | | $ | (88,185 | ) | | $ | — | | | $ | (1,307,923 | ) | | $ | — | |
| | | | | | | | | | | | | | | | | | | | |
| | |
| 76 | | 2018 BLACKROCK SEMI-ANNUAL REPORTTO SHAREHOLDERS |
| | |
Schedule of Investments (unaudited) (continued) February 28, 2018 | | BlackRock Income Trust, Inc. (BKT) |
| | | | | | | | | | | | | | | | | | | | |
| Counterparty | | Derivative
Liabilities
Subject to
an MNA by
Counterparty | | | Derivatives
Available
for Offset (a) | | | Non-cash
Collateral
Pledged | | | Cash
Collateral
Pledged | | | Net Amount
of Derivative
Liabilities (d) | |
Deutsche Bank AG | | $ | 1,657,004 | | | $ | — | | | $ | — | | | $ | (1,640,000 | ) | | $ | 17,004 | |
JPMorgan Chase Bank N.A. | | | 88,185 | | | | (88,185 | ) | | | — | | | | — | | | | — | |
| | | | | | | | | | | | | | | | | | | | |
| | $ | 1,745,189 | | | $ | (88,185 | ) | | $ | — | | | $ | (1,640,000 | ) | | $ | 17,004 | |
| | | | | | | | | | | | | | | | | | | | |
| | (a) | The amount of derivatives available for offset is limited to the amount of derivative asset and/or liabilities that are subject to an MNA. | |
| | (b) | Excess of collateral received from the individual counterparty is not shown for financial reporting purposes. | |
| | (c) | Net amount represents the net amount receivable from the counterparty in the event of default. | |
| | (d) | Net amount represents the net amount payable due to counterparty in the event of default. | |
Fair Value Hierarchy as of Period End
Various inputs are used in determining the fair value of investments and derivative financial instruments. For information about the Trust’s policy regarding valuation of investments and derivative financial instruments, refer to the Notes to Financial Statements.
The following tables summarize the Trust’s investments and derivative financial instruments categorized in the disclosure hierarchy:
| | | | | | | | | | | | | | | | |
| | | Level 1 | | | Level 2 | | | Level 3 | | | Total | |
Assets: | | | | | | | | | | | | | | | | |
Investments: | | | | | | | | | | | | | | | | |
Long-Term Investments: | | | | | | | | | | | | | | | | |
Asset-Backed Securities | | $ | — | | | $ | 1,857,494 | | | $ | 186,370 | | | $ | 2,043,864 | |
Non-Agency Mortgage-Backed Securities | | | — | | | | 1,053,413 | | | | 1,207,570 | | | | 2,260,983 | |
U.S. Government Sponsored Agency Securities | | | — | | | | 586,201,689 | | | | 10,544,297 | | | | 596,745,986 | |
Short-Term Securities: | |
Money Market Funds | | | 6,967,792 | | | | — | | | | — | | | | 6,967,792 | |
Borrowed Bond Agreement | | | — | | | | 925,024 | | | | — | | | | 925,024 | |
Liabilities: | |
Investments: | |
Borrowed Bonds | | | — | | | | (860,010 | ) | | | — | | | | (860,010 | ) |
TBA Sale Commitments | | | — | | | | (92,151,893 | ) | | | — | | | | (92,151,893 | ) |
| | | | | | | | | | | | | | | | |
| | $ | 6,967,792 | | | $ | 497,025,717 | | | $ | 11,938,237 | | | $ | 515,931,746 | |
| | | | | | | | | | | | | | | | |
Derivative Financial Instruments (a) | |
Assets: | |
Interest rate contracts | | $ | 476,022 | | | $ | 1,396,108 | | | $ | — | | | $ | 1,872,130 | |
Liabilities: | |
Interest rate contracts | | | (465,608 | ) | | | (1,657,004 | ) | | | — | | | | (2,122,612 | ) |
| | | | | | | | | | | | | | | | |
| | $ | 10,414 | | | $ | (260,896 | ) | | $ | — | | | $ | (250,482 | ) |
| | | | | | | | | | | | | | | | |
| | (a) | Derivative financial instruments are swaps and futures contracts. Swaps and futures contracts are valued at the unrealized appreciation (depreciation) on the instrument. | |
The Trust may hold assets and/or liabilities in which the fair value approximates the carrying amount for financial statement purposes. As of period end, reverse repurchase agreements of $170,720,769 are categorized as Level 2 within the disclosure hierarchy.
During the six months ended February 28, 2018, there were no transfers between levels.
| | | | |
| SCHEDULES OF INVESTMENTS | | | 77 | |
| | |
Schedule of Investments (unaudited) (continued) February 28, 2018 | | BlackRock Income Trust, Inc. (BKT) |
A reconciliation of Level 3 investments is presented when the Trust had a significant amount of Level 3 investments at the beginning and/or end of the period in relation to net assets. The following table is a reconciliation of Level 3 investments for which significant unobservable inputs were used in determining fair value:
| | | | | | | | | | | | | | | | |
| | | Asset-Backed
Securities | | | Non-Agency Mortgage-
Backed Securities | | | U.S. Government
Sponsored Agency
Securities | | | Total | |
Assets: | | | | | | | | | | | | | | | | |
Opening Balance, as of August 31, 2017 | | $ | 186,351 | | | $ | 1,363,970 | | | $ | 2,060,128 | | | $ | 3,610,449 | |
Transfers into Level 3(a) | | | — | | | | — | | | | 8,737,596 | | | | 8,737,596 | |
Transfers out of Level 3 | | | — | | | | — | | | | — | | | | — | |
Accrued discounts/premiums | | | (34,901 | ) | | | — | | | | (694,491 | ) | | | (729,392 | ) |
Net realized gain (loss) | | | | | | | | | | | (4,014 | ) | | | (4,014 | ) |
Net change in unrealized appreciation (depreciation)(b)(c) | | | 34,920 | | | | (156,400 | ) | | | (1,086,009 | ) | | | (1,207,489 | ) |
Purchases | | | — | | | | — | | | | 1,784,284 | | | | 1,784,284 | |
Sales | | | — | | | | — | | | | (253,197 | ) | | | (253,197 | ) |
| | | | | | | | | | | | | | | | |
Closing Balance, as of February 28, 2018 | | $ | 186,370 | | | $ | 1,207,570 | | | $ | 10,544,297 | | | $ | 11,938,237 | |
| | | | | | | | | | | | | | | | |
Net change in unrealized appreciation (depreciation) on investments held as February 28, 2018(c) | | $ | 34,920 | | | $ | (156,400 | ) | | $ | (1,086,009 | ) | | $ | (1,207,489 | ) |
| | | | | | | | | | | | | | | | |
| | (a) | As of August 31, 2017, the Trust used observable inputs in determining the value of certain investments. As of February 28, 2018, the Trust used significant unobservable inputs in determining the value of the same investments. As a result, investments at beginning of period value were transferred from Level 2 to Level 3 in the disclosure hierarchy. | |
| | (b) | Included in the related net change in unrealized appreciation (depreciation) in the Statements of Operations. | |
| | (c) | Any difference between net change in unrealized appreciation (depreciation) and net change in unrealized appreciation (depreciation) on investments held as of February 28, 2018 is generally due to investments no longer held or categorized as Level 3 at period end. | |
The Trust’s investments that are categorized as Level 3 were valued utilizing third party pricing information without adjustment. Such valuations are based on unobservable inputs. A significant change in third party information inputs could result in a significantly lower or higher value of such Level 3 investments.
| | |
| 78 | | 2018 BLACKROCK SEMI-ANNUAL REPORTTO SHAREHOLDERS |
Statements of Assets and Liabilities (unaudited)
February 28, 2018
| | | | | | | | | | | | |
| | | BHK | | | HYT(a) | | | BKT | |
|
ASSETS | |
Investments at value — unaffiliated(b) | | $ | 1,128,796,617 | | | $ | 2,161,593,431 | | | $ | 601,975,857 | |
Investments at value — affiliated(c) | | | 2,711,662 | | | | 22,627,076 | | | | 6,967,792 | |
Cash | | | 366,174 | | | | 1,595,943 | | | | — | |
Cash pledged: | |
Collateral — OTC derivatives | | | 5,260,000 | | | | — | | | | 1,640,000 | |
Collateral — reverse repurchase agreements | | | 6,581,000 | | | | — | | | | — | |
Centrally cleared swaps | | | 1,832,940 | | | | 1,604,000 | | | | — | |
Futures contracts | | | 913,970 | | | | 126,150 | | | | 1,228,260 | |
Foreign currency at value(d) | | | 2,061,165 | | | | 994,103 | | | | — | |
Receivables: | |
Interest — unaffiliated | | | 11,565,562 | | | | 30,708,092 | | | | 2,170,201 | |
Investments sold | | | 1,267,409 | | | | 19,748,509 | | | | 109,808 | |
Options written | | | 127,626 | | | | — | | | | — | |
Dividends — unaffiliated | | | 45,000 | | | | 43,462 | | | | — | |
Dividends — affiliated | | | 7,309 | | | | 1,272 | | | | 9,861 | |
Variation margin on futures contracts | | | 7,258 | | | | — | | | | — | |
Swaps | | | 4,005 | | | | — | | | | — | |
TBA sale commitments | | | — | | | | — | | | | 92,280,819 | |
Swap premiums paid | | | 7,290 | | | | 88,182 | | | | — | |
Unrealized appreciation on: | |
Forward foreign currency exchange contracts | | | 755,475 | | | | 2,756,690 | | | | — | |
OTC derivatives | | | 69,449 | | | | 359,964 | | | | 1,396,108 | |
Unfunded floating rate loan interests | | | 61 | | | | 580 | | | | — | |
Prepaid expenses | | | 20,043 | | | | 39,553 | | | | 10,521 | |
Other assets | | | 4,077 | | | | — | | | | 527 | |
| | | | | | | | | | | | |
Total assets | | | 1,162,404,092 | | | | 2,242,287,007 | | | | 707,789,754 | |
| | | | | | | | | | | | |
|
LIABILITIES | |
Borrowed bonds at value(e) | | | — | | | | — | | | | 860,010 | |
Bank overdraft | | | — | | | | — | | | | 270,397 | |
Cash received: | |
Collateral — OTC derivatives | | | 280,000 | | | | 350,000 | | | | 1,520,000 | |
TBA Commitments | | | — | | | | — | | | | 11,000 | |
Options written at value(f) | | | 5,205,701 | | | | — | | | | — | |
Reverse repurchase agreements at value | | | 368,809,658 | | | | — | | | | 170,720,769 | |
Payables: | |
Investments purchased | | | 8,813,148 | | | | 54,460,831 | | | | 27,880,408 | |
Investment advisory fees | | | 437,984 | | | | 998,473 | | | | 204,993 | |
Other accrued expenses | | | 300,401 | | | | 775,507 | | | | 138,327 | |
Swaps | | | 207,805 | | | | 68,653 | | | | — | |
Trustees’ and Officer’s fees | | | 206,793 | | | | 581,456 | | | | 212,258 | |
Variation margin on futures contracts | | | 197,562 | | | | 28,059 | | | | 391,197 | |
Variation margin on centrally cleared swaps | | | 117,964 | | | | 53,869 | | | | — | |
Income dividends | | | 74,396 | | | | 560,609 | | | | 50,112 | |
Capital shares redeemed | | | — | | | | 1,034,350 | | | | 200,946 | |
Bank borrowings | | | — | | | | 663,000,000 | | | | — | |
Administration fees | | | — | | | | — | | | | 47,402 | |
Interest expense | | | — | | | | 1,351,423 | | | | 7,384 | |
Swap premiums received | | | 4,928,406 | | | | 62,459 | | | | 88,185 | |
TBA sale commitments at value(g) | | | — | | | | — | | | | 92,151,893 | |
Unrealized depreciation on: | |
OTC derivatives | | | 641,532 | | | | 110,970 | | | | 1,657,004 | |
Forward foreign currency exchange contracts | | | 8,095 | | | | 40,752 | | | | — | |
Contingencies | | | — | | | | — | | | | — | |
| | | | | | | | | | | | |
Total liabilities | | | 390,229,445 | | | | 723,477,411 | | | | 296,412,285 | |
| | | | | | | | | | | | |
| | | |
NET ASSETS | | $ | 772,174,647 | | | $ | 1,518,809,596 | | | $ | 411,377,469 | |
| | | | | | | | | | | | |
Statements of Assets and Liabilities (unaudited) (continued)
February 28, 2018
| | | | | | | | | | | | |
| | | BHK | | | HYT(a) | | | BKT | |
|
NET ASSETS CONSIST OF | |
Paid-in capital(g)(h)(i) | | $ | 755,543,973 | | | $ | 1,678,408,835 | | | $ | 477,559,560 | |
Undistributed (distributions in excess of) net investment income | | | 133,636 | | | | (2,135,232 | ) | | | (899,278 | ) |
Accumulated net realized loss | | | (581,098 | ) | | | (119,788,239 | ) | | | (33,092,359 | ) |
Net unrealized appreciation (depreciation) | | | 17,078,136 | | | | (37,675,768 | ) | | | (32,190,454 | ) |
| | | | | | | | | | | | |
NET ASSETS | | $ | 772,174,647 | | | $ | 1,518,809,596 | | | $ | 411,377,469 | |
| | | | | | | | | | | | |
| | | |
Net asset value | | $ | 14.32 | | | $ | 12.04 | | | $ | 6.45 | |
| | | | | | | | | | | | |
| | | |
(a) Consolidated Statement of Assets and Liabilities | | | | | | | | | | | | |
(b) Investments at cost — unaffiliated | | $ | 1,111,860,221 | | | $ | 2,201,673,371 | | | $ | 634,027,622 | |
(c) Investments at cost — affiliated | | $ | 2,711,662 | | | $ | 23,087,519 | | | $ | 6,967,792 | |
(d) Foreign currency at cost | | $ | 2,062,817 | | | $ | 996,459 | | | $ | — | |
(e) Proceeds received from borrowed bonds | | $ | — | | | $ | — | | | $ | 842,347 | |
(f) Premiums received | | $ | 3,581,260 | | | $ | — | | | $ | — | |
(g) Proceeds from TBA sale commitments | | $ | — | | | $ | — | | | $ | 92,280,819 | |
(h) See Note 12 of the Notes to Financial Statements for details of contingencies. | | | | | | | | | | | | |
(g) Par value | | $ | 0.001 | | | $ | 0.100 | | | $ | 0.010 | |
(h) Shares outstanding | | | 53,935,126 | | | | 126,125,087 | | | | 63,822,874 | |
(i) Shares authorized | | | Unlimited | | | | 200 million | | | | 200 million | |
| | |
| 80 | | 2018 BLACKROCK SEMI-ANNUAL REPORTTO SHAREHOLDERS |
Statements of Operations (unaudited)
Six Months Ended February 28, 2018
| | | | | | | | | | | | |
| | | BHK | | | HYT(a) | | | BKT | |
| | | |
INVESTMENT INCOME | | | | | | | | | | | | |
Interest — unaffiliated | | $ | 24,914,298 | | | $ | 66,242,087 | | | $ | 10,705,298 | |
Dividends — unaffiliated | | | 244,082 | | | | 329,477 | | | | — | |
Dividends — affiliated | | | 43,782 | | | | 639,285 | | | | 47,263 | |
Other income | | | 3,551 | | | | 341,078 | | | | — | |
Foreign taxes withheld | | | (1,169 | ) | | | (1,625 | ) | | | — | |
| | | | | | | | | | | | |
Total investment income | | | 25,204,544 | | | | 67,550,302 | | | | 10,752,561 | |
| | | | | | | | | | | | |
|
EXPENSES | |
Investment advisory | | | 2,814,853 | | | | 6,564,600 | | | | 1,360,612 | |
Administration | | | — | | | | — | | | | 313,988 | |
Professional | | | 79,651 | | | | 140,712 | | | | 51,584 | |
Custodian | | | 65,140 | | | | 111,119 | | | | 20,071 | |
Accounting services | | | 51,975 | | | | 109,658 | | | | 30,804 | |
Transfer agent | | | 43,987 | | | | 51,799 | | | | 76,561 | |
Trustees and Officer | | | 40,251 | | | | 81,422 | | | | 21,662 | |
Printing | | | 12,666 | | | | 17,212 | | | | 18,270 | |
Registration | | | 7,124 | | | | 16,721 | | | | 8,446 | |
Miscellaneous | | | 53,809 | | | | 58,449 | | | | 23,485 | |
| | | | | | | | | | | | |
Total expenses excluding interest expense | | | 3,169,456 | | | | 7,151,692 | | | | 1,925,483 | |
Interest expense | | | 2,588,376 | | | | 7,011,302 | | | | 1,241,310 | |
| | | | | | | | | | | | |
Total expenses | | | 5,757,832 | | | | 14,162,994 | | | | 3,166,793 | |
Less fees waived by the Manager | | | (2,855 | ) | | | (71,977 | ) | | | (3,356 | ) |
| | | | | | | | | | | | |
Total expenses after fees waived | | | 5,754,977 | | | | 14,091,017 | | | | 3,163,437 | |
| | | | | | | | | | | | |
Net investment income | | | 19,449,567 | | | | 53,459,285 | | | | 7,589,124 | |
| | | | | | | | | | | | |
|
REALIZED AND UNREALIZED GAIN (LOSS) | |
Net realized gain (loss) from: | |
Investments — unaffiliated | | | (848,985 | ) | | | 13,380,844 | | | | 1,421,171 | |
Investments — affiliated | | | — | | | | (186,055 | ) | | | — | |
Futures contracts | | | 4,448,403 | | | | 884,094 | | | | 6,611,092 | |
Forward foreign currency exchange contracts | | | (1,264,152 | ) | | | (5,376,710 | ) | | | — | |
Foreign currency transactions | | | (516,732 | ) | | | 218,311 | | | | — | |
Capital gain distributions from investment companies — affiliated | | | 36 | | | | 10 | | | | 27 | |
Options written | | | 3,032,857 | | | | 279,064 | | | | — | |
Swaps | | | 408,047 | | | | 1,114,475 | | | | (615,717 | ) |
| | | | | | | | | | | | |
| | | 5,259,474 | | | | 10,314,033 | | | | 7,416,573 | |
| | | | | | | | | | | | |
Net change in unrealized appreciation (depreciation) on: | | | | | | | | | | | | |
Investments — unaffiliated | | | (39,072,934 | ) | | | (35,943,863 | ) | | | (24,562,236 | ) |
Investments — affiliated | | | — | | | | (458,974 | ) | | | — | |
Futures contracts | | | 728,959 | | | | 52,150 | | | | 613,450 | |
Forward foreign currency exchange contracts | | | 454,620 | | | | 3,765,354 | | | | — | |
Foreign currency translations | | | (122,686 | ) | | | (619,948 | ) | | | — | |
Options written | | | (1,440,803 | ) | | | (139,795 | ) | | | — | |
Swaps | | | 1,105,330 | | | | (565,865 | ) | | | 292,109 | |
Borrowed bonds | | | — | | | | — | | | | 68,130 | |
Unfunded floating rate loan interests | | | 61 | | | | 580 | | | | — | |
| | | | | | | | | | | | |
| | | (38,347,453 | ) | | | (33,910,361 | ) | | | (23,588,547 | ) |
| | | | | | | | | | | | |
Net realized and unrealized loss | | | (33,087,979 | ) | | | (23,596,328 | ) | | | (16,171,974 | ) |
| | | | | | | | | | | | |
NET INCREASE (DECREASE) IN NET ASSETS RESULTING FROM OPERATIONS | | $ | (13,638,412 | ) | | $ | 29,862,957 | | | $ | (8,582,850 | ) |
| | | | | | | | | | | | |
| (a) | Consolidated Statement of Operations. |
Statements of Changes in Net Assets
| | | | | | | | |
| | | BlackRock Core Bond Trust (BHK) | |
| | | Six Months Ended
02/28/18
(unaudited) | | | Year Ended
08/31/17 | |
| | |
INCREASE (DECREASE) IN NET ASSETS | | | | | | | | |
| | |
OPERATIONS | | | | | | | | |
Net investment income | | $ | 19,449,567 | | | $ | 40,810,546 | |
Net realized gain | | | 5,259,474 | | | | 7,829,575 | |
Net change in unrealized appreciation (depreciation) | | | (38,347,453 | ) | | | (22,271,872 | ) |
| | | | | | | | |
Net increase (decrease) in net assets resulting from operations | | | (13,638,412 | ) | | | 26,368,249 | |
| | | | | | | | |
| | |
DISTRIBUTIONS TO SHAREHOLDERS(a) | | | | | | | | |
From net investment income | | | (21,034,700 | ) | | | (42,069,403 | ) |
| | | | | | | | |
| | |
NET ASSETS | | | | | | | | |
Total decrease in net assets | | | (34,673,112 | ) | | | (15,701,154 | ) |
Beginning of period | | | 806,847,759 | | | | 822,548,913 | |
| | | | | | | | |
End of period | | $ | 772,174,647 | | | $ | 806,847,759 | |
| | | | | | | | |
Undistributed net investment income, end of period | | $ | 133,636 | | | $ | 1,718,769 | |
| | | | | | | | |
| (a) | Distributions for annual periods determined in accordance with U.S. federal income tax regulations. |
| | |
| 82 | | 2018 BLACKROCK SEMI-ANNUAL REPORTTO SHAREHOLDERS |
Consolidated Statements of Changes in Net Assets
| | | | | | | | |
| | | BlackRock Corporate High Yield Fund, Inc. (HYT) | |
| | | Six Months Ended
02/28/18 (unaudited) | | | Year Ended 08/31/17 | |
| | |
INCREASE (DECREASE) IN NET ASSETS | | | | | | | | |
| | |
OPERATIONS | | | | | | | | |
Net investment income | | $ | 53,459,285 | | | $ | 107,040,262 | |
Net realized gain | | | 10,314,033 | | | | 35,747,683 | |
Net change in unrealized appreciation (depreciation) | | | (33,910,361 | ) | | | 24,170,407 | |
| | | | | | | | |
Net increase in net assets resulting from operations | | | 29,862,957 | | | | 166,958,352 | |
| | | | | | | | |
| | |
DISTRIBUTIONS TO SHAREHOLDERS(a) | | | | | | | | |
From net investment income | | | (53,112,775 | ) | | | (112,731,371 | ) |
| | | | | | | | |
| | |
CAPITAL SHARE TRANSACTIONS | | | | | | | | |
Cost of shares redeemed | | | (3,562,736 | ) | | | (1,553,292 | ) |
| | | | | | | | |
| | |
NET ASSETS | | | | | | | | |
Total increase (decrease) in net assets | | | (26,812,554 | ) | | | 52,673,689 | |
Beginning of period | | | 1,545,622,150 | | | | 1,492,948,461 | |
| | | | | | | | |
End of period | | $ | 1,518,809,596 | | | $ | 1,545,622,150 | |
| | | | | | | | |
Distributions in excess of net investment income, end of period | | $ | (2,135,232 | ) | | $ | (2,481,742 | ) |
| | | | | | | | |
| (a) | Distributions for annual periods determined in accordance with U.S. federal income tax regulations. |
Statements of Changes in Net Assets
| | | | | | | | |
| | | BlackRock Income Trust, Inc. (BKT) | |
| | | Six Months Ended
02/28/18
(unaudited) | | | Year Ended
08/31/17 | |
| | |
INCREASE (DECREASE) IN NET ASSETS | | | | | | | | |
| | |
OPERATIONS | | | | | | | | |
Net investment income | | $ | 7,589,124 | | | $ | 15,746,349 | |
Net realized gain | | | 7,416,573 | | | | 4,516,347 | |
Net change in unrealized appreciation (depreciation) | | | (23,588,547 | ) | | | (13,981,411 | ) |
| | | | | | | | |
Net increase (decrease) in net assets resulting from operations | | | (8,582,850 | ) | | | 6,281,285 | |
| | | | | | | | |
| | |
DISTRIBUTIONS TO SHAREHOLDERS(a) | | | | | | | | |
From net investment income | | | (10,166,864 | ) | | | (20,333,729 | ) |
| | | | | | | | |
| | |
CAPITAL SHARE TRANSACTIONS | | | | | | | | |
Cost of shares redeemed | | | (702,494 | ) | | | — | |
| | | | | | | | |
| | |
NET ASSETS | | | | | | | | |
Total decrease in net assets | | | (19,452,208 | ) | | | (14,052,444 | ) |
Beginning of period | | | 430,829,677 | | | | 444,882,121 | |
| | | | | | | | |
End of period | | $ | 411,377,469 | | | $ | 430,829,677 | |
| | | | | | | | |
Undistributed (distributions in excess of) net investment income, end of period | | $ | (899,278 | ) | | $ | 1,678,462 | |
| | | | | | | | |
| (a) | Distributions for annual periods determined in accordance with U.S. federal income tax regulations. |
| | |
| 84 | | 2018 BLACKROCK SEMI-ANNUAL REPORTTO SHAREHOLDERS |
Statements of Cash Flows (unaudited)
Six Months Ended February 28, 2018
| | | | | | | | | | | | |
| | | BHK | | | HYT (a) | | | BKT | |
| | | |
CASH PROVIDED BY (USED FOR) OPERATING ACTIVITIES | | | | | | | | | | | | |
Net increase (decrease) in net assets resulting from operations | | $ | (13,638,412 | ) | | $ | 29,862,957 | | | $ | (8,582,850 | ) |
| Adjustments to reconcile net increase (decrease) in net assets resulting from operations to net cash provided by (used for) operating activities: | | | | | | | | | | | | |
Proceeds from sales of long-term investments and principal paydowns | | | 130,004,568 | | | | 714,161,196 | | | | 1,032,680,268 | |
Purchases of long-term investments | | | (204,800,504 | ) | | | (719,167,671 | ) | | | (1,028,876,904 | ) |
Net proceeds from sales of short-term securities | | | 1,663,067 | | | | — | | | | 1,831,846 | |
Amortization of premium and accretion of discount on investments | | | 1,839,015 | | | | (266,892 | ) | | | 4,396,475 | |
Paid-in-kind income | | | — | | | | (2,754,951 | ) | | | — | |
Premiums received from options written | | | 4,002,357 | | | | 449,738 | | | | — | |
Premiums paid on closing options written | | | (1,385,220 | ) | | | (367,020 | ) | | | — | |
Net realized gain on investments and options written | | | (1,810,501 | ) | | | (13,473,853 | ) | | | (1,421,171 | ) |
Net unrealized loss on investments, options written, swaps, unfunded floating rate loan interests and foreign currency translations | | | 40,042,525 | | | | 33,133,164 | | | | 24,201,997 | |
| (Increase) Decrease in Assets: | | | | | | | | | |
Cash pledged: | | | | | | | | | | | | |
Futures contracts | | | 224,952 | | | | (56,000 | ) | | | 627,000 | |
Collateral — OTC derivatives | | | (810,000 | ) | | | — | | | | 900,000 | |
Centrally cleared swaps | | | (1,368,000 | ) | | | 1,766,000 | | | | — | |
Collateral — reverse repurchase agreements | | | (6,122,000 | ) | | | — | | | | — | |
Receivables: | | | | | | | | | | | | |
Interest — unaffiliated | | | (559,855 | ) | | | 991,409 | | | | (18,389 | ) |
Swaps | | | (3,996 | ) | | | 108 | | | | — | |
Dividends — affiliated | | | 5,197 | | | | 187 | | | | 2,970 | |
Dividends — unaffiliated | | | — | | | | (1,337 | ) | | | — | |
Variation margin on futures contracts | | | 30,804 | | | | 589 | | | | 213,750 | |
Variation margin on centrally cleared swaps | | | — | | | | 113,214 | | | | — | |
Swap premiums paid | | | (454 | ) | | | (17,523 | ) | | | — | |
Prepaid expenses | | | (5,906 | ) | | | (9,683 | ) | | | 990 | |
| Increase (Decrease) in Liabilities: | | | | | | | | | |
Cash received: | | | | | | | | | | | | |
Collateral — OTC derivatives | | | (420,000 | ) | | | (500,000 | ) | | | (520,000 | ) |
Collateral — reverse repurchase agreements | | | (4,798,000 | ) | | | — | | | | — | |
Collateral — TBA sale commitments | | | — | | | | — | | | | 11,000 | |
Payables: | | | | | | | | | | | | |
Investment advisory fees | | | (28,308 | ) | | | (98,104 | ) | | | (31,618 | ) |
Interest expense and fees | | | 1,820,319 | | | | 46,260 | | | | (49,944 | ) |
Administration fees | | | — | | | | — | | | | (7,399 | ) |
Trustees’ and Officer’s | | | (2,081 | ) | | | (1,252 | ) | | | 1,604 | |
Variation margin on futures contracts | | | 18,321 | | | | 28,059 | | | | 23,357 | |
Variation margin on centrally cleared swaps | | | 109,179 | | | | 53,869 | | | | — | |
Swaps | | | 207,805 | | | | 68,653 | | | | — | |
Other accrued expenses | | | 20,302 | | | | 438 | | | | (1,827 | ) |
Swap premiums received | | | (34,378 | ) | | | (90,172 | ) | | | (13,701 | ) |
| | | | | | | | | | | | |
Net cash provided by (used for) operating activities | | | (55,799,204 | ) | | | 43,871,383 | | | | 25,367,454 | |
| | | | | | | | | | | | |
| | | |
CASH PROVIDED BY (USED FOR) FINANCING ACTIVITIES | | | | | | | | | | | | |
Payments on redemption of Common Shares | | | — | | | | (2,528,386 | ) | | | (501,548 | ) |
Net borrowing of reverse repurchase agreements | | | 77,911,301 | | | | — | | | | (14,998,806 | ) |
Proceeds from bank borrowings | | | — | | | | 303,000,000 | | | | — | |
Payments for bank borrowings | | | — | | | | (289,000,000 | ) | | | — | |
Cash dividends paid to Common Shareholders | | | (21,030,166 | ) | | | (52,959,622 | ) | | | (10,164,637 | ) |
Increase in bank overdraft | | | — | | | | — | | | | 270,397 | |
| | | | | | | | | | | | |
Net cash (provided by) used for financing activities | | | 56,881,135 | | | | (41,488,008 | ) | | | (25,394,594 | ) |
| | | | | | | | | | | | |
| | | |
CASH IMPACT FROM FOREIGN EXCHANGE FLUCTUATIONS | | | | | | | | | | | | |
Cash impact from foreign exchange fluctuations | | $ | 8,771 | | | $ | (2,502 | ) | | $ | — | |
| | | | | | | | | | | | |
| | | |
CASH AND FOREIGN CURRENCY | | | | | | | | | | | | |
Net increase (decrease) in cash and foreign currency at value | | | 1,090,702 | | | | 2,380,873 | | | | (27,140 | ) |
Cash and foreign currency at value at beginning of period | | | 1,336,637 | | | | 209,173 | | | | 27,140 | |
| | | | | | | | | | | | |
Cash and foreign currency at value at end of period | | $ | 2,427,339 | | | $ | 2,590,046 | | | $ | — | |
| | | | | | | | | | | | |
| | | |
SUPPLEMENTAL DISCLOSURE OF CASH FLOW INFORMATION | | | | | | | | | | | | |
Cash paid during the period for interest expense | | $ | 768,057 | | | $ | 6,965,042 | | | $ | 1,291,254 | |
| | | | | | | | | | | | |
| (a) | Consolidated Statement of Cash Flows. |
See notes to financial statements.
Financial Highlights
(For a share outstanding throughout each period)
| | | | | | | | | | | | | | | | | | | | | | | | | | | | |
| | | BHK | |
| | | Six Months Ended
02/28/18
(Unaudited) | | | | | | Year Ended August 31, | |
| | | | 2017 | | | 2016 | | | 2015 | | | 2014 | | | 2013 | |
Net asset value, beginning of period | | $ | 14.96 | | | | | | | $ | 15.25 | | | $ | 14.29 | | | $ | 15.24 | | | $ | 14.05 | | | $ | 15.21 | |
| | | | | | | | | | | | | | | | | | | | | | | | | | | | |
Net investment income(a) | | | 0.36 | | | | | | | | 0.76 | | | | 0.79 | | | | 0.86 | | | | 0.87 | | | | 0.89 | |
Net realized and unrealized gain (loss) | | | (0.61 | ) | | | | | | | (0.27 | ) | | | 1.01 | | | | (0.73 | ) | | | 1.23 | | | | (1.11 | ) |
| | | | | | | | | | | | | | | | | | | | | | | | | | | | |
Net increase (decrease) from investment operations | | | (0.25 | ) | | | | | | | 0.49 | | | | 1.80 | | | | 0.13 | | | | 2.10 | | | | (0.22 | ) |
| | | | | | | | | | | | | | | | | | | | | | | | | | | | |
| Distributions:(b) | | | | | | | | | | | | | | | | | | | | | |
From net investment income | | | (0.39 | ) | | | | | | | (0.78 | ) | | | (0.84 | ) | | | (1.04 | ) | | | (0.91 | ) | | | (0.94 | ) |
In excess of net investment income(c) | | | — | | | | | | | | — | | | | — | | | | (0.04 | ) | | | — | | | | — | |
| | | | | | | | | | | | | | | | | | | | | | | | | | | | |
Total distributions | | | (0.39 | ) | | | | | | | (0.78 | ) | | | (0.84 | ) | | | (1.08 | ) | | | (0.91 | ) | | | (0.94 | ) |
| | | | | | | | | | | | | | | | | | | | | | | | | | | | |
Net asset value, end of period | | $ | 14.32 | | | | | | | $ | 14.96 | | | $ | 15.25 | | | $ | 14.29 | | | $ | 15.24 | | | $ | 14.05 | |
| | | | | | | | | | | | | | | | | | | | | | | | | | | | |
Market price, end of period | | $ | 13.21 | | | | | | | $ | 14.10 | | | $ | 14.33 | | | $ | 12.63 | | | $ | 13.64 | | | $ | 12.50 | |
| | | | | | | | | | | | | | | | | | | | | | | | | | | | |
| | | | | | | |
Total Return(d) | | | | | | | | | | | | | | | | | | | | | | | | | | | | |
Based on net asset value | | | (1.55 | )%(e) | | | | | | | 3.88 | % | | | 13.67 | % | | | 1.62 | % | | | 16.09 | %(f) | | | (1.42 | )% |
| | | | | | | | | | | | | | | | | | | | | | | | | | | | |
Based on market price | | | (3.64 | )%(e) | | | | | | | 4.20 | % | | | 20.85 | % | | | 0.35 | % | | | 16.78 | % | | | (13.43 | )% |
| | | | | | | | | | | | | | | | | | | | | | | | | | | | |
| | | | | | | |
Ratios to Average Net Assets | | | | | | | | | | | | | | | | | | | | | | | | | | | | |
Total expenses | | | 1.46 | %(g) | | | | | | | 1.16 | % | | | 0.97 | % | | | 0.95 | %(h) | | | 1.06 | %(h) | | | 1.03 | % |
| | | | | | | | | | | | | | | | | | | | | | | | | | | | |
Total expenses after fees waived | | | 1.46 | %(g) | | | | | | | 1.16 | % | | | 0.97 | % | | | 0.95 | %(h) | | | 1.02 | %(h) | | | 0.98 | % |
| | | | | | | | | | | | | | | | | | | | | | | | | | | | |
Total expenses after fees waived and excluding interest expense | | | 0.80 | %(g) | | | | | | | 0.78 | % | | | 0.78 | % | | | 0.82 | %(h) | | | 0.91 | %(h) | | | 0.86 | % |
| | | | | | | | | | | | | | | | | | | | | | | | | | | | |
Net investment income | | | 4.92 | %(g) | | | | | | | 5.19 | % | | | 5.48 | % | | | 5.83 | % | | | 5.94 | % | | | 5.92 | % |
| | | | | | | | | | | | | | | | | | | | | | | | | | | | |
| | | | | | | |
Supplemental Data | | | | | | | | | | | | | | | | | | | | | | | | | | | | |
Net assets applicable to Common Shareholders, end of period (000) | | $ | 772,175 | | | | | | | $ | 806,848 | | | $ | 822,549 | | | $ | 770,822 | | | $ | 412,078 | | | $ | 379,913 | |
| | | | | | | | | | | | | | | | | | | | | | | | | | | | |
Borrowings outstanding, end of period (000) | | $ | 368,810 | | | | | | | $ | 289,078 | | | $ | 288,239 | | | $ | 303,651 | | | $ | 168,301 | | | $ | 172,537 | |
| | | | | | | | | | | | | | | | | | | | | | | | | | | | |
Portfolio turnover rate(i) | | | 11 | % | | | | | | | 32 | % | | | 35 | % | | | 55 | % | | | 82 | % | | | 100 | % |
| | | | | | | | | | | | | | | | | | | | | | | | | | | | |
| (a) | Based on average shares outstanding. |
| (b) | Distributions for annual periods determined in accordance with U.S. federal income tax regulations. |
| (c) | Taxable distribution. |
| (d) | Total returns based on market price, which can be significantly greater or less than the net asset value, may result in substantially different returns. Where applicable, excludes the effects of any sales charges and assumes the reinvestment of distributions at actual reinvestment prices. |
| (e) | Aggregate total return. |
| (f) | Includes proceeds received from a settlement of litigation, which impacted the Trust’s total return. Excluding these proceeds, the total return would have been 16.01%. |
| (h) | Includes reorganization costs associated with the Trust’s merger. Without these costs, total expenses, total expenses after fees waived and paid indirectly, and total expenses after fees waived and paid indirectly and excluding interest expense would have been 0.94%, 0.94% and 0.82% for the year ended August 31, 2015 and 1.00%, 0.96% and 0.85% for the year ended August 31, 2014, respectively. |
| (i) | Includes mortgage dollar roll transactions (“MDRs”). Additional information regarding portfolio turnover rate is as follows: |
| | | | | | | | | | | | | | | | | | | | | | | | | | | | | | | | | | | | | | | | | | | | | | | | |
| | | Six Months Ended
02/28/18
(Unaudited) | | | | | | Year Ended August 31, | |
| | | | | | | 2017 | | | | | | 2016 | | | | | | 2015 | | | | | | 2014 | | | | | | 2013 | | | | |
Portfolio turnover rate (excluding MDRs) | | | 11 | % | | | | | | | 32 | % | | | | | | | 35 | % | | | | | | | 51 | % | | | | | | | 48 | % | | | | | | | 63 | % | | | | |
| | | | | | | | | | | | | | | | | | | | | | | | | | | | | | | | | | | | | | | | | | | | | | | | |
See notes to financial statements.
| | |
| 86 | | 2018 BLACKROCK SEMI-ANNUAL REPORTTO SHAREHOLDERS |
Consolidated Financial Highlights
(For a share outstanding throughout each period)
| | | | | | | | | | | | | | | | | | | | | | | | | | | | |
| | | HYT | |
| | | Six Months Ended
02/28/18
(Unaudited) | | | | | | Year Ended August 31, | |
| | | | | 2017 | | | 2016 | | | 2015 | | | 2014 | | | 2013 | |
Net asset value, beginning of period | | $ | 12.22 | | | | | | | $ | 11.79 | | | $ | 12.06 | | | $ | 13.47 | | | $ | 12.62 | | | $ | 12.32 | |
| | | | | | | | | | | | | | | | | | | | | | | | | | | | |
Net investment income(a) | | | 0.42 | | | | | | | | 0.85 | | | | 0.82 | | | | 0.87 | | | | 0.98 | | | | 1.00 | |
Net realized and unrealized gain (loss) | | | (0.18 | ) | | | | | | | 0.47 | | | | (0.10 | ) | | | (1.31 | ) | | | 0.91 | | | | 0.41 | |
| | | | | | | | | | | | | | | | | | | | | | | | | | | | |
Net increase (decrease) from investment operations | | | 0.24 | | | | | | | | 1.32 | | | | 0.72 | | | | (0.44 | ) | | | 1.89 | | | | 1.41 | |
| | | | | | | | | | | | | | | | | | | | | | | | | | | | |
Distributions from net investment income(b) | | | (0.42 | ) | | | | | | | (0.89 | ) | | | (0.99 | ) | | | (0.97 | ) | | | (1.04 | ) | | | (1.11 | ) |
| | | | | | | | | | | | | | | | | | | | | | | | | | | | |
Net asset value, end of period | | $ | 12.04 | | | | | | | $ | 12.22 | | | $ | 11.79 | | | $ | 12.06 | (c) | | $ | 13.47 | | | $ | 12.62 | |
| | | | | | | | | | | | | | | | | | | | | | | | | | | | |
Market price, end of period | | $ | 10.56 | | | | | | | $ | 11.13 | | | $ | 10.88 | | | $ | 9.97 | | | $ | 12.07 | | | $ | 11.37 | |
| | | | | | | | | | | | | | | | | | | | | | | | | | | | |
| | | | | | | |
Total Return(d) | | | | | | | | | | | | | | | | | | | | | | | | | | | | |
Based on net asset value | | | 2.33 | %(e) | | | | | | | 12.41 | %(f) | | | 7.76 | % | | | (2.40 | )%(c) | | | 16.21 | % | | | 11.90 | % |
| | | | | | | | | | | | | | | | | | | | | | | | | | | | |
Based on market price | | | (1.45 | )%(e) | | | | | | | 10.94 | % | | | 20.29 | % | | | (9.96 | )% | | | 15.58 | % | | | (4.16 | )% |
| | | | | | | | | | | | | | | | | | | | | | | | | | | | |
| | | | | | | |
Ratios to Average Net Assets | | | | | | | | | | | | | | | | | | | | | | | | | | | | |
Total expenses(g) | | | 1.85 | %(h) | | | | | | | 1.54 | % | | | 1.39 | %(g) | | | 1.37 | % | | | 1.35 | %(i) | | | 1.54 | %(j) |
| | | | | | | | | | | | | | | | | | | | | | | | | | | | |
Total expenses after fees waived(g) | | | 1.84 | %(h) | | | | | | | 1.54 | % | | | 1.39 | % | | | 1.37 | % | | | 1.35 | %(i) | | | 1.54 | %(j) |
| | | | | | | | | | | | | | | | | | | | | | | | | | | | |
Total expenses after fees waived and excluding interest expense(g) | | | 0.92 | %(h) | | | | | | | 0.91 | % | | | 0.93 | % | | | 0.96 | % | | | 0.98 | %(i) | | | 1.16 | %(j)(k) |
| | | | | | | | | | | | | | | | | | | | | | | | | | | | |
Net investment income(g) | | | 6.97 | %(h) | | | | | | | 7.04 | % | | | 7.30 | % | | | 6.88 | % | | | 7.40 | % | | | 7.83 | % |
| | | | | | | | | | | | | | | | | | | | | | | | | | | | |
| | | | | | | |
Supplemental Data | | | | | | | | | | | | | | | | | | | | | | | | | | | | |
Net assets, end of period (000) | | $ | 1,518,810 | | | | | | | $ | 1,545,622 | | | $ | 1,492,948 | | | $ | 1,527,307 | | | $ | 1,705,422 | | | $ | 446,847 | |
| | | | | | | | | | | | | | | | | | | | | | | | | | | | |
Borrowings outstanding, end of period (000) | | $ | 663,000 | | | | | | | $ | 649,000 | | | $ | 604,000 | | | $ | 631,000 | | | $ | 723,000 | | | $ | 191,000 | |
| | | | | | | | | | | | | | | | | | | | | | | | | | | | |
Asset coverage, end of period per $1,000 of bank borrowing | | $ | 3,292 | | | | | | | $ | 3,382 | | | $ | 3,472 | | | $ | 3,419 | | | $ | 3,359 | | | $ | 3,340 | |
| | | | | | | | | | | | | | | | | | | | | | | | | | | | |
Portfolio turnover rate | | | 33 | % | | | | | | | 75 | % | | | 66 | % | | | 57 | % | | | 64 | % | | | 77 | % |
| | | | | | | | | | | | | | | | | | | | | | | | | | | | |
| (a) | Based on average shares outstanding. |
| (b) | Distributions for annual periods determined in accordance with U.S. federal income tax regulations. |
| (c) | For financial reporting purposes, the market value of certain total return swaps were adjusted as of report date. Accordingly, the net asset value (“NAV”) per share and total return performance based on net asset value presented herein are different than the information previously published on August 31, 2015. |
| (d) | Total returns based on market price, which can be significantly greater or less than the net asset value, may result in substantially different returns. Where applicable, excludes the effects of any sales charges and assumes the reinvestment of distributions at actual reinvestment prices. |
| (e) | Aggregate total return. |
| (f) | Includes payment received from an affiliate, which had no impact on the Trust’s total return. |
| (g) | Excludes expenses incurred indirectly as a result of investments in underlying funds as follows: |
| | | | | | | | | | | | | | | | | | | | | | | | | | | | | | | | | | | | | | | | | | | | | | | | |
| | | Six Months Ended
02/28/18
(unaudited) | | | | | | Year Ended August 31, | |
| | | | | | | 2017 | | | | | | 2016 | | | | | | 2015 | | | | | | 2014 | | | | | | 2013 | | | | |
Investments in underlying funds | | | 0.01 | % | | | | | | | 0.04 | % | | | | | | | 0.11 | % | | | | | | | — | % | | | | | | | — | % | | | | | | | — | % | | | | |
| | | | | | | | | | | | | | | | | | | | | | | | | | | | | | | | | | | | | | | | | | | | | | | | |
| (i) | Includes reorganization costs. Without these costs, total expenses, total expenses after fees waived and paid indirectly, and total expenses after fees waived and paid indirectly and excluding interest expense would have been 1.34%, 1.34% and 0.97%, respectively. |
| (j) | Includes reorganization costs. Without these costs, total expenses, total expenses after fees waived and paid indirectly, and total expenses after fees waived and paid indirectly and excluding interest expense would have been 1.50%, 1.50% and 1.12%, respectively. |
| (k) | For the year ended August 31, 2013, the total expense ratio after fees waived and paid indirectly and excluding interest expense, borrowing costs and income tax was 1.15%. |
Financial Highlights (continued)
(For a share outstanding throughout each period)
| | | | | | | | | | | | | | | | | | | | | | | | | | | | |
| | | BKT | |
| | | Six Months Ended
02/28/18
(Unaudited) | | | | | | Year Ended August 31, | |
| | | | | | 2017 | | | 2016 | | | 2015 | | | 2014 | | | 2013 | |
Net asset value, beginning of period | | $ | 6.74 | | | | | | | $ | 6.96 | | | $ | 7.08 | | | $ | 7.27 | | | $ | 7.32 | | | $ | 7.94 | |
| | | | | | | | | | | | | | | | | | | | | | | | | | | | |
Net investment income(a) | | | 0.12 | | | | | | | | 0.25 | | | | 0.28 | | | | 0.32 | | | | 0.35 | | | | 0.32 | |
Net realized and unrealized gain (loss) | | | (0.25 | ) | | | | | | | (0.15 | ) | | | (0.05 | ) | | | (0.11 | ) | | | 0.03 | | | | (0.46 | ) |
| | | | | | | | | | | | | | | | | | | | | | | | | | | | |
Net increase (decrease) from investment operations | | | (0.13 | ) | | | | | | | 0.10 | | | | 0.23 | | | | 0.21 | | | | 0.38 | | | | (0.14 | ) |
| | | | | | | | | | | | | | | | | | | | | | | | | | | | |
Distributions from net investment income(b) | | | (0.16 | ) | | | | | | | (0.32 | ) | | | (0.35 | ) | | | (0.40 | ) | | | (0.43 | ) | | | (0.48 | ) |
| | | | | | | | | | | | | | | | | | | | | | | | | | | | |
Net asset value, end of period | | $ | 6.45 | | | | | | | $ | 6.74 | | | $ | 6.96 | | | $ | 7.08 | | | $ | 7.27 | | | $ | 7.32 | |
| | | | | | | | | | | | | | | | | | | | | | | | | | | | |
Market price, end of period | | $ | 5.91 | | | | | | | $ | 6.31 | | | $ | 6.60 | | | $ | 6.30 | | | $ | 6.42 | | | $ | 6.40 | |
| | | | | | | | | | | | | | | | | | | | | | | | | | | | |
| | | | | | | |
Total Return(c) | | | | | | | | | | | | | | | | | | | | | | | | | | | | |
Based on net asset value | | | (1.80 | )%(d) | | | | | | | 1.82 | % | | | 3.64 | % | | | 3.56 | % | | | 6.05 | % | | | (1.45 | )% |
| | | | | | | | | | | | | | | | | | | | | | | | | | | | |
Based on market price | | | (3.89 | )%(d) | | | | | | | 0.53 | % | | | 10.44 | % | | | 4.35 | % | | | 7.12 | % | | | (10.34 | )% |
| | | | | | | | | | | | | | | | | | | | | | | | | | | | |
| | | | | | | |
Ratios to Average Net Assets | | | | | | | | | | | | | | | | | | | | | | | | | | | | |
Total expenses | | | 1.52 | %(e) | | | | | | | 1.29 | %(f) | | | 1.08 | % | | | 0.99 | %(g) | | | 1.02 | %(g) | | | 1.00 | % |
| | | | | | | | | | | | | | | | | | | | | | | | | | | | |
Total expenses after fees waived | | | 1.52 | %(e) | | | | | | | 1.28 | %(f) | | | 1.08 | % | | | 0.99 | %(g) | | | 1.02 | %(g) | | | 1.00 | % |
| | | | | | | | | | | | | | | | | | | | | | | | | | | | |
Total expenses after fees waived and excluding interest expense | | | 0.92 | %(e) | | | | | | | 0.90 | %(f) | | | 0.89 | % | | | 0.90 | %(g) | | | 0.96 | %(g) | | | 0.90 | % |
| | | | | | | | | | | | | | | | | | | | | | | | | | | | |
Net investment income | | | 3.63 | %(e) | | | | | | | 3.63 | %(f) | | | 4.01 | % | | | 4.48 | % | | | 4.74 | % | | | 4.18 | % |
| | | | | | | | | | | | | | | | | | | | | | | | | | | | |
| | | | | | | |
Supplemental Data | | | | | | | | | | | | | | | | | | | | | | | | | | | | |
Net assets, end of period (000) | | $ | 411,377 | | | | | | | $ | 430,830 | | | $ | 444,882 | | | $ | 452,616 | | | $ | 464,933 | | | $ | 467,948 | |
| | | | | | | | | | | | | | | | | | | | | | | | | | | | |
Borrowings outstanding, end of period (000) | | $ | 170,721 | | | | | | | $ | 185,769 | | | $ | 152,859 | | | $ | 173,695 | | | $ | 205,415 | | | $ | 148,344 | |
| | | | | | | | | | | | | | | | | | | | | | | | | | | | |
Portfolio turnover rate(h) | | | 197 | % | | | | | | | 346 | % | | | 141 | % | | | 191 | % | | | 256 | % | | | 358 | % |
| | | | | | | | | | | | | | | | | | | | | | | | | | | | |
| (a) | Based on average shares outstanding. |
| (b) | Distributions for annual periods determined in accordance with U.S. federal income tax regulations. |
| (c) | Total returns based on market price, which can be significantly greater or less than the net asset value, may result in substantially different returns. Where applicable, excludes the effects of any sales charges and assumes the reinvestment of distributions at actual reinvestment prices. |
| (d) | Aggregate total return. |
| (f) | Excludes 0.01% of expenses incurred indirectly as a result of investments in underlying funds. |
| (g) | Includes reorganization costs. Without these costs, total expenses, total expenses after fees waived, and total expenses after fees waived and excluding interest expense would have been 0.99%, 0.99% and 0.89% for the year ended August 31, 2015 and 0.97%, 0.97% and 0.90% for the year ended August 31, 2014, respectively. |
| (h) | Includes MDRs. Additional information regarding portfolio turnover rate is as follows:. |
| | | | | | | | | | | | | | | | | | | | | | | | | | | | | | | | | | | | | | | | | | | | | | | | |
| | | Six Months Ended
02/28/18
(Unaudited) | | | | | | Year Ended August 31, | |
| | | | | | | 2017 | | | | | | 2016 | | | | | | 2015 | | | | | | 2014 | | | | | | 2013 | | | | |
Portfolio turnover rate (excluding MDRs) | | | 85 | % | | | | | | | 161 | % | | | | | | | 63 | % | | | | | | | 78 | % | | | | | | | 125 | % | | | | | | | 196 | % | | | | |
| | | | | | | | | | | | | | | | | | | | | | | | | | | | | | | | | | | | | | | | | | | | | | | | |
See notes to financial statements.
| | |
| 88 | | 2018 BLACKROCK SEMI-ANNUAL REPORTTO SHAREHOLDERS |
Notes to Financial Statements
The following are registered under the Investment Company Act of 1940, as amended (the “1940 Act”), as closed-end management investment companies and are referred to herein collectively as the “Trusts”, or individually as a “Trust”:
| | | | | | |
| Trust Name | | Herein Referred to As | | Organized | | Diversification
Classification |
BlackRock Core Bond Trust | | BHK | | Delaware | | Diversified |
BlackRock Corporate High Yield Trust, Inc. | | HYT | | Maryland | | Diversified |
BlackRock Income Trust, Inc. | | BKT | | Maryland | | Diversified |
The Boards of Directors and Board of Trustees of the Trusts are collectively referred to throughout this report as the “Board of Trustees” or the “Board,” and the directors/trustees thereof are collectively referred to throughout this report as “Trustees.” The Trusts determine and make available for publication the net asset value (“NAV”) of their Common Shares on a daily basis.
The Trusts, together with certain other registered investment companies advised by BlackRock Advisors, LLC (the “Manager”) or its affiliates, is included in a complex of closed-end funds referred to as the Closed-End Complex.
Basis of Consolidation: The accompanying consolidated financial statements of HYT include the accounts of BLK HYT (Luxembourg) Investments, S.a.r.l., BLK HYV (Luxembourg) Investments, S.a.r.l., BLK COY (Luxembourg) Investments, S.a.r.l. and BLK CYE (Luxembourg) Investments, S.a.r.l. (collectively, the “Taxable Subsidiaries”), which are wholly-owned taxable subsidiaries of HYT which hold shares of private Canadian companies, Laricina Energy Ltd. and Osum Oil Sands Corp. Gains on the sale of such shares will generally not be subject to capital gains taxes in Canada. Income earned on the investment held by the Taxable Subsidiary may be taxable to such subsidiary in Luxembourg. A tax provision, if any, is included in expenses in the Consolidated Statements of Operations for HYT. The net assets of the Taxable Subsidiaries as of period end were $731,493, which is less than 0.1% of HYT’s consolidated net assets. Intercompany accounts and transactions, if any, have been eliminated. The Taxable Subsidiaries are subject to the same investment policies and restrictions that apply to HYT.
| 2. | SIGNIFICANT ACCOUNTING POLICIES |
The financial statements are prepared in conformity with accounting principles generally accepted in the United States of America (“U.S. GAAP”), which may require management to make estimates and assumptions that affect the reported amounts of assets and liabilities in the financial statements, disclosure of contingent assets and liabilities at the date of the financial statements and the reported amounts of increases and decreases in net assets from operations during the reporting period. Actual results could differ from those estimates. Each Trust is considered an investment company under U.S. GAAP and follows the accounting and reporting guidance applicable to investment companies. Below is a summary of significant accounting policies:
Investment Transactions and Income Recognition: For financial reporting purposes, investment transactions are recorded on the dates the transactions are entered into (the “trade dates”). Realized gains and losses on investment transactions are determined on the identified cost basis. Dividend income is recorded on the ex-dividend date. Dividends from foreign securities where the ex-dividend date may have passed are subsequently recorded when the Trusts are informed of the ex-dividend date. Under the applicable foreign tax laws, a withholding tax at various rates may be imposed on capital gains, dividends and interest. Upon notification from issuers, some of the dividend income received from a real estate investment trust may be redesignated as a reduction of cost of the related investment and/or realized gain. Interest income, including amortization and accretion of premiums and discounts on debt securities, is recognized on an accrual basis.
Foreign Currency Translation: Each Trust’s books and records are maintained in U.S. dollars. Securities and other assets and liabilities denominated in foreign currencies are translated into U.S. dollars using exchange rates determined as of the close of trading on the New York Stock Exchange (“NYSE”). Purchases and sales of investments are recorded at the rates of exchange prevailing on the respective dates of such transactions. Generally, when the U.S. dollar rises in value against a foreign currency, the investments denominated in that currency will lose value; the opposite effect occurs if the U.S. dollar falls in relative value.
Each Trust does not isolate the portion of the results of operations arising as a result of changes in the exchange rates from the changes in the market prices of investments held or sold for financial reporting purposes. Accordingly, the effects of changes in exchange rates on investments are not segregated in the Statements of Operations from the effects of changes in market prices of those investments, but are included as a component of net realized and unrealized gain (loss) from investments. Each Trust reports realized currency gains (losses) on foreign currency related transactions as components of net realized gain (loss) for financial reporting purposes, whereas such components are generally treated as ordinary income for U.S. federal income tax purposes.
Segregation and Collateralization: In cases where a Trust enters into certain investments (e.g., dollar rolls, To-be-announced (“TBA”) sale commitments, futures contracts, forward foreign currency exchange contracts, options written, swaps and short sales) or certain borrowings (e.g., reverse repurchase transactions,) that would be treated as “senior securities” for 1940 Act purposes, a Trust may segregate or designate on its books and records cash or liquid assets having a market value at least equal to the amount of its future obligations under such investments or borrowings. Doing so allows the investment or borrowing to be excluded from treatment as a “senior security.” Furthermore, if required by an exchange or counterparty agreement, the Trusts may be required to deliver/deposit cash and/or securities to/with an exchange, or broker-dealer or custodian as collateral for certain investments or obligations.
Distributions: Distributions from net investment income are declared and paid monthly. Distributions of capital gains are recorded on the ex-dividend date and made at least annually. The character and timing of distributions are determined in accordance with U.S. federal income tax regulations, which may differ from U.S. GAAP.
Deferred Compensation Plan: Under the Deferred Compensation Plan (the “Plan”) approved by each Trust’s Board, the independent Trustees (“Independent Trustees”) may defer a portion of their annual complex-wide compensation. Deferred amounts earn an approximate return as though equivalent dollar amounts had been invested in
| | | | |
| NOTESTO FINANCIAL STATEMENTS | | | 89 | |
Notes to Financial Statements (continued)
common shares of certain other BlackRock Closed-End Funds selected by the Independent Trustees. This has the same economic effect for the Independent Trustees as if the Independent Trustees had invested the deferred amounts directly in certain other BlackRock Closed-End Funds.
The Plan is not funded and obligations thereunder represent general unsecured claims against the general assets of each Trust, if applicable. Deferred compensation liabilities are included in the Trustees’ and Officer’s fees payable in the Statements of Assets and Liabilities and will remain as a liability of the Trusts until such amounts are distributed in accordance with the Plan.
Recent Accounting Standards: In November 2016, the Financial Accounting Standards Board issued Accounting Standards Update “Restricted Cash” which will require entities to include the total of cash, cash equivalents, restricted cash, and restricted cash equivalents in the beginning and ending cash balances in the Statements of Cash Flows. The guidance will be applied retrospectively and is effective for fiscal years beginning after December 15, 2017, and interim periods within those years. Management is evaluating the impact, if any, of this guidance on the Trusts’ presentation in the Statements of Cash Flows.
In March 2017, the Financial Accounting Standards Board issued Accounting Standards Update “Premium Amortization of Purchased Callable Debt Securities” which amends the amortization period for certain purchased callable debt securities. Under the new guidance, the premium amortization of purchased callable debt securities that have explicit, non-contingent call features and are callable at fixed prices will be amortized to the earliest call date. The guidance will be applied on a modified retrospective basis and is effective for fiscal years, and their interim periods, beginning after December 15, 2018. Management is currently evaluating the impact of this guidance to the Trusts.
Indemnifications: In the normal course of business, a Trust enters into contracts that contain a variety of representations that provide general indemnification. A Trust’s maximum exposure under these arrangements is unknown because it involves future potential claims against a Trust, which cannot be predicted with any certainty.
Other: Expenses directly related to a Trust are charged to that Trust. Other operating expenses shared by several trusts, including other trusts managed by the Manager, are prorated among those trusts on the basis of relative net assets or other appropriate methods.
| 3. | INVESTMENT VALUATION AND FAIR VALUE MEASUREMENTS |
Investment Valuation Policies: The Trusts’ investments are valued at fair value (also referred to as “market value” within the financial statements) as of the close of trading on the NYSE (generally 4:00 p.m., Eastern time). U.S. GAAP defines fair value as the price the Trusts would receive to sell an asset or pay to transfer a liability in an orderly transaction between market participants at the measurement date. The Trusts determine the fair values of their financial instruments using various independent dealers or pricing services under policies approved by the Board. The BlackRock Global Valuation Methodologies Committee (the “Global Valuation Committee”) is the committee formed by management to develop global pricing policies and procedures and to oversee the pricing function for all financial instruments.
Fair Value Inputs and Methodologies: The following methods and inputs are used to establish the fair value of each Trust’s assets and liabilities:
| | • | | Equity investments traded on a recognized securities exchange are valued at the official closing price each day, if available. For equity investments traded on more than one exchange, the official closing price on the exchange where the stock is primarily traded is used. Equity investments traded on a recognized exchange for which there were no sales on that day may be valued at the last available bid (long positions) or ask (short positions) price. |
| | • | | Fixed-income securities for which market quotations are readily available are generally valued using the last available bid prices or current market quotations provided by independent dealers or third party pricing services. Floating rate loan interests are valued at the mean of the bid prices from one or more independent brokers or dealers as obtained from a third party pricing service. Pricing services generally value fixed-income securities assuming orderly transactions of an institutional round lot size, but a trust may hold or transact in such securities in smaller, odd lot sizes. Odd lots may trade at lower prices than institutional round lots. The pricing services may use matrix pricing or valuation models that utilize certain inputs and assumptions to derive values, including transaction data (e.g., recent representative bids and offers), credit quality information, perceived market movements, news, and other relevant information. Certain fixed-income securities, including asset-backed and mortgage related securities may be valued based on valuation models that consider the estimated cash flows of each tranche of the entity, establish a benchmark yield and develop an estimated tranche specific spread to the benchmark yield based on the unique attributes of the tranche. The amortized cost method of valuation may be used with respect to debt obligations with sixty days or less remaining to maturity unless the Manager determines such method does not represent fair value. |
Generally, trading in foreign instruments is substantially completed each day at various times prior to the close of trading on the NYSE. Occasionally, events affecting the values of such instruments may occur between the foreign market close and the close of trading on the NYSE that may not be reflected in the computation of the Trusts’ net assets. Each business day, the Trusts use a pricing service to assist with the valuation of certain foreign exchange-traded equity securities and foreign exchange-traded over-the-counter (“OTC”) options (the “Systematic Fair Value Price”). Using current market factors, the Systematic Fair Value Price is designed to value such foreign securities and foreign options at fair value as of the close of trading on the NYSE, which follows the close of the local markets.
| | • | | Municipal investments (including commitments to purchase such investments on a “when-issued” basis) are valued on the basis of prices provided by dealers or pricing services. In determining the value of a particular investment, pricing services may use certain information with respect to transactions in such investments, quotations from dealers, pricing matrixes, market transactions in comparable investments and information with respect to various relationships between investments. |
| | • | | Investments in open-end U.S. mutual funds are valued at NAV each business day. |
| | • | | Futures contracts traded on exchanges are valued at their last sale price. |
| | |
| 90 | | 2018 BLACKROCK SEMI-ANNUAL REPORTTO SHAREHOLDERS |
Notes to Financial Statements (continued)
| | • | | Forward foreign currency exchange contracts are valued at the mean between the bid and ask prices and are determined as of the close of trading on the NYSE. Interpolated values are derived when the settlement date of the contract is an interim date for which quotations are not available. |
| | • | | Exchange-traded options are valued at the mean between the last bid and ask prices at the close of the options market in which the options trade. An exchange-traded option for which there is no mean price is valued at the last bid (long positions) or ask (short positions) price. If no bid or ask price is available, the prior day’s price will be used, unless it is determined that the prior day’s price no longer reflects the fair value of the option. OTC options and options on swaps (“swaptions”) are valued by an independent pricing service using a mathematical model, which incorporates a number of market data factors, such as the trades and prices of the underlying instruments. |
| | • | | Swap agreements are valued utilizing quotes received daily by the Trusts’ pricing service or through brokers, which are derived using daily swap curves and models that incorporate a number of market data factors, such as discounted cash flows, trades and values of the underlying reference instruments. |
| | • | | TBA commitments are valued on the basis of last available bid prices or current market quotations provided by pricing services. |
If events (e.g., a company announcement, market volatility or a natural disaster) occur that are expected to materially affect the value of such investments, or in the event that the application of these methods of valuation results in a price for an investment that is deemed not to be representative of the market value of such investment, or if a price is not available, the investment will be valued by the Global Valuation Committee, or its delegate, in accordance with a policy approved by the Board as reflecting fair value (“Fair Valued Investments”). The fair valuation approaches that may be used by the Global Valuation Committee will include market approach, income approach and cost approach. Valuation techniques such as discounted cash flow, use of market comparables and matrix pricing are types of valuation approaches and are typically used in determining fair value. When determining the price for Fair Valued Investments, the Global Valuation Committee, or its delegate, seeks to determine the price that each Trust might reasonably expect to receive or pay from the current sale or purchase of that asset or liability in an arm’s-length transaction. Fair value determinations shall be based upon all available factors that the Global Valuation Committee, or its delegate, deems relevant and consistent with the principles of fair value measurement.
The Global Valuation Committee, or its delegate, employs various methods for calibrating valuation approaches for investments where an active market does not exist, including regular due diligence of each Trust’s pricing vendors, regular reviews of key inputs and assumptions, transactional back-testing or disposition analysis to compare unrealized gains and losses to realized gains and losses, reviews of missing or stale prices and large movements in market values and reviews of any market related activity. The pricing of all Fair Valued Investments is subsequently reported to the Board or a committee thereof on a quarterly basis. As a result of the inherent uncertainty in valuation of these investments, the fair values may differ from the values that would have been used had an active market existed.
For investments in equity or debt issued by privately held companies or funds (“Private Company” or collectively, the “Private Companies”) and other Fair Valued Investments, the fair valuation approaches that are used by third party pricing services utilize one or a combination of, but not limited to, the following inputs.
| | |
| | | Standard Inputs Generally Considered By Third Party Pricing Services |
Market approach | | (i) recent market transactions, including subsequent rounds of financing, in the underlying investment or comparable issuers; (ii) recapitalizations and other transactions across the capital structure; and (iii) market multiples of comparable issuers. |
Income approach | | (i) future cash flows discounted to present and adjusted as appropriate for liquidity, credit, and/or market risks; (ii) quoted prices for similar investments or assets in active markets; and (iii) other risk factors, such as interest rates, yield curves, volatilities, prepayment speeds, loss severities, credit risks, recovery rates, liquidation amounts and/or default rates. |
Cost approach | | (i) audited or unaudited financial statements, investor communications and financial or operational metrics issued by the Private Company; (ii) changes in the valuation of relevant indices or publicly traded companies comparable to the Private Company; (iii) relevant news and other public sources; and (iv) known secondary market transactions in the Private Company’s interests and merger or acquisition activity in companies comparable to the Private Company. |
Investments in series of preferred stock issued by Private Companies are typically valued utilizing market approach in determining the enterprise value of the company. Such investments often contain rights and preferences that differ from other series of preferred and common stock of the same issuer. Valuation techniques such as an option pricing model (“OPM”), a probability weighted expected return model (“PWERM”) or a hybrid of those techniques are used in allocating enterprise value of the company, as deemed appropriate under the circumstances. The use of OPM and PWERM techniques involve a determination of the exit scenarios of the investment in order to appropriately allocate the enterprise value of the company among the various parts of its capital structure.
The Private Companies are not subject to the public company disclosure, timing, and reporting standards as other investments held by a Trust. Typically, the most recently available information by a Private Company is as of a date that is earlier than the date a Trust is calculating its NAV. This factor may result in a difference between the value of the investment and the price a Trust could receive upon the sale of the investment.
Fair Value Hierarchy: Various inputs are used in determining the fair value of investments and derivative financial instruments. These inputs to valuation techniques are categorized into a fair value hierarchy consisting of three broad levels for financial statement purposes as follows:
| | • | | Level 1 — Unadjusted price quotations in active markets/exchanges for identical assets or liabilities that each Trust has the ability to access |
| | • | | Level 2 — Other observable inputs (including, but not limited to, quoted prices for similar assets or liabilities in markets that are active, quoted prices for identical or similar assets or liabilities in markets that are not active, inputs other than quoted prices that are observable for the assets or liabilities (such as interest rates, yield curves, volatilities, prepayment speeds, loss severities, credit risks and default rates) or other market–corroborated inputs) |
| | | | |
| NOTESTO FINANCIAL STATEMENTS | | | 91 | |
Notes to Financial Statements (continued)
| | • | | Level 3 — Unobservable inputs based on the best information available in the circumstances, to the extent observable inputs are not available (including each Trust’s own assumptions used in determining the fair value of investments and derivative financial instruments) |
The hierarchy gives the highest priority to unadjusted quoted prices in active markets for identical assets or liabilities (Level 1 measurements) and the lowest priority to unobservable inputs (Level 3 measurements). Accordingly, the degree of judgment exercised in determining fair value is greatest for instruments categorized in Level 3. The inputs used to measure fair value may fall into different levels of the fair value hierarchy. In such cases, for disclosure purposes, the fair value hierarchy classification is determined based on the lowest level input that is significant to the fair value measurement in its entirety. Investments classified within Level 3 have significant unobservable inputs used by the Global Valuation Committee in determining the price for Fair Valued Investments. Level 3 investments include equity or debt issued by Private Companies. There may not be a secondary market, and/or there are a limited number of investors. Level 3 investments may also be adjusted to reflect illiquidity and/or non-transferability, with the amount of such discount estimated by the Global Valuation Committee in the absence of market information.
Changes in valuation techniques may result in transfers into or out of an assigned level within the hierarchy. In accordance with each Trust’s policy, transfers between different levels of the fair value hierarchy are deemed to have occurred as of the beginning of the reporting period. The categorization of a value determined for investments and derivative financial instruments is based on the pricing transparency of the investments and derivative financial instruments and is not necessarily an indication of the risks associated with investing in those securities.
As of February 28, 2018, certain investments of HYT were valued using NAV per share as no quoted market value is available and therefore have been excluded from the fair value hierarchy.
| 4. | SECURITIES AND OTHER INVESTMENTS |
Asset-Backed and Mortgage-Backed Securities: Asset-backed securities are generally issued as pass-through certificates or as debt instruments. Asset-backed securities issued as pass-through certificates represent undivided fractional ownership interests in an underlying pool of assets. Asset-backed securities issued as debt instruments, which are also known as collateralized obligations, are typically issued as the debt of a special purpose entity organized solely for the purpose of owning such assets and issuing such debt. Asset-backed securities are often backed by a pool of assets representing the obligations of a number of different parties. The yield characteristics of certain asset-backed securities may differ from traditional debt securities. One such major difference is that all or a principal part of the obligations may be prepaid at any time because the underlying assets (i.e., loans) may be prepaid at any time. As a result, a decrease in interest rates in the market may result in increases in the level of prepayments as borrowers, particularly mortgagors, refinance and repay their loans. An increased prepayment rate with respect to an asset-backed security will have the effect of shortening the maturity of the security. In addition, a trust may subsequently have to reinvest the proceeds at lower interest rates. If a trust has purchased such an asset-backed security at a premium, a faster than anticipated prepayment rate could result in a loss of principal to the extent of the premium paid.
For mortgage pass-through securities (the “Mortgage Assets”) there are a number of important differences among the agencies and instrumentalities of the U.S. Government that issue mortgage-related securities and among the securities that they issue. For example, mortgage-related securities guaranteed by Ginnie Mae are guaranteed as to the timely payment of principal and interest by Ginnie Mae and such guarantee is backed by the full faith and credit of the United States. However, mortgage-related securities issued by Freddie Mac and Fannie Mae, including Freddie Mac and Fannie Mae guaranteed mortgage pass-through certificates, which are solely the obligations of Freddie Mac and Fannie Mae, are not backed by or entitled to the full faith and credit of the United States, but are supported by the right of the issuer to borrow from the U.S. Treasury.
Non-agency mortgage-backed securities are securities issued by non-governmental issuers and have no direct or indirect government guarantees of payment and are subject to various risks. Non-agency mortgage loans are obligations of the borrowers thereunder only and are not typically insured or guaranteed by any other person or entity. The ability of a borrower to repay a loan is dependent upon the income or assets of the borrower. A number of factors, including a general economic downturn, acts of God, terrorism, social unrest and civil disturbances, may impair a borrower’s ability to repay its loans.
Collateralized Debt Obligations: Collateralized debt obligations (“CDOs”), including collateralized bond obligations (“CBOs”) and collateralized loan obligations (“CLOs”), are types of asset-backed securities. A CDO is an entity that is backed by a diversified pool of debt securities (CBOs) or syndicated bank loans (CLOs). The cash flows of the CDO can be split into multiple segments, called “tranches,” which will vary in risk profile and yield. The riskiest segment is the subordinated or “equity” tranche. This tranche bears the greatest risk of defaults from the underlying assets in the CDO and serves to protect the other, more senior, tranches from default in all but the most severe circumstances. Since it is shielded from defaults by the more junior tranches, a “senior” tranche will typically have higher credit ratings and lower yields than their underlying securities, and often receive investment grade ratings from one or more of the nationally recognized rating agencies. Despite the protection from the more junior tranches, senior tranches can experience substantial losses due to actual defaults, increased sensitivity to future defaults and the disappearance of one or more protecting tranches as a result of changes in the credit profile of the underlying pool of assets.
Multiple Class Pass-Through Securities: Multiple class pass-through securities, including collateralized mortgage obligations (“CMOs”) and commercial mortgage-backed securities, may be issued by Ginnie Mae, U.S. Government agencies or instrumentalities or by trusts formed by private originators of, or investors in, mortgage loans. In general, CMOs are debt obligations of a legal entity that are collateralized by a pool of residential or commercial mortgage loans or Mortgage Assets. The payments on these are used to make payments on the CMOs or multiple pass-through securities. Multiple class pass-through securities represent direct ownership interests in the Mortgage Assets. Classes of CMOs include interest only (“IOs”), principal only (“POs”), planned amortization classes and targeted amortization classes. IOs and POs are stripped mortgage-backed securities representing interests in a pool of mortgages, the cash flow from which has been separated into interest and principal components. IOs receive the interest portion of the cash flow while POs receive the principal portion. IOs and POs can be extremely volatile in response to changes in interest rates. As interest rates rise and fall, the value of IOs tends to move in the same direction as interest rates. POs perform best when prepayments on the underlying mortgages rise since this increases the rate at which the principal is returned and the yield to maturity on the PO. When payments on mortgages underlying a PO are slower than anticipated, the life of the PO is lengthened and the yield to maturity is reduced. If the underlying Mortgage Assets experience greater than anticipated prepayments of principal, a trust’s initial investment in the IOs may not fully recoup.
Stripped Mortgage-Backed Securities: Stripped mortgage-backed securities are typically issued by the U.S. Government, its agencies and instrumentalities. Stripped mortgage-backed securities are usually structured with two classes that receive different proportions of the interest (IOs) and principal (POs) distributions on a pool of Mortgage Assets. Stripped mortgage-backed securities may be privately issued.
| | |
| 92 | | 2018 BLACKROCK SEMI-ANNUAL REPORTTO SHAREHOLDERS |
Notes to Financial Statements (continued)
Zero-Coupon Bonds: Zero-coupon bonds are normally issued at a significant discount from face value and do not provide for periodic interest payments. These bonds may experience greater volatility in market value than other debt obligations of similar maturity which provide for regular interest payments.
Capital Securities and Trust Preferred Securities: Capital securities, including trust preferred securities, are typically issued by corporations, generally in the form of interest-bearing notes with preferred securities characteristics. In the case of trust preferred securities, an affiliated business trust of a corporation issues these securities, generally in the form of beneficial interests in subordinated debentures or similarly structured securities. The securities can be structured with either a fixed or adjustable coupon that can have either a perpetual or stated maturity date. For trust preferred securities, the issuing bank or corporation pays interest to the trust, which is then distributed to holders of these securities as a dividend. Dividends can be deferred without creating an event of default or acceleration, although maturity cannot take place unless all cumulative payment obligations have been met. The deferral of payments does not affect the purchase or sale of these securities in the open market. These securities generally are rated below that of the issuing company’s senior debt securities and are freely callable at the issuer’s option.
Preferred Stocks: Preferred stock has a preference over common stock in liquidation (and generally in receiving dividends as well), but is subordinated to the liabilities of the issuer in all respects. As a general rule, the market value of preferred stock with a fixed dividend rate and no conversion element varies inversely with interest rates and perceived credit risk, while the market price of convertible preferred stock generally also reflects some element of conversion value. Because preferred stock is junior to debt securities and other obligations of the issuer, deterioration in the credit quality of the issuer will cause greater changes in the value of a preferred stock than in a more senior debt security with similar stated yield characteristics. Unlike interest payments on debt securities, preferred stock dividends are payable only if declared by the issuer’s board of directors. Preferred stock also may be subject to optional or mandatory redemption provisions.
Warrants: Warrants entitle a trust to purchase a specified number of shares of common stock and are non-income producing. The purchase price and number of shares are subject to adjustment under certain conditions until the expiration date of the warrants, if any. If the price of the underlying stock does not rise above the strike price before the warrant expires, the warrant generally expires without any value and a trust will lose any amount it paid for the warrant. Thus, investments in warrants may involve more risk than investments in common stock. Warrants may trade in the same markets as their underlying stock; however, the price of the warrant does not necessarily move with the price of the underlying stock.
Floating Rate Loan Interests: Floating rate loan interests are typically issued to companies (the “borrower”) by banks, other financial institutions, or privately and publicly offered corporations (the “lender”). Floating rate loan interests are generally non-investment grade, often involve borrowers whose financial condition is troubled or uncertain and companies that are highly leveraged or in bankruptcy proceedings. In addition, transactions in floating rate loan interests may settle on a delayed basis, which may result in proceeds from the sale not being readily available for a trust to make additional investments or meet its redemption obligations. Floating rate loan interests may include fully funded term loans or revolving lines of credit. Floating rate loan interests are typically senior in the corporate capital structure of the borrower. Floating rate loan interests generally pay interest at rates that are periodically determined by reference to a base lending rate plus a premium. Since the rates reset only periodically, changes in prevailing interest rates (and particularly sudden and significant changes) can be expected to cause some fluctuations in the NAV of a trust to the extent that it invests in floating rate loan interests. The base lending rates are generally the lending rate offered by one or more European banks, such as the London Interbank Offered Rate (“LIBOR”), the prime rate offered by one or more U.S. banks or the certificate of deposit rate. Floating rate loan interests may involve foreign borrowers, and investments may be denominated in foreign currencies. These investments are treated as investments in debt securities for purposes of a trust’s investment policies.
When a trust purchases a floating rate loan interest, it may receive a facility fee and when it sells a floating rate loan interest, it may pay a facility fee. On an ongoing basis, a trust may receive a commitment fee based on the undrawn portion of the underlying line of credit amount of a floating rate loan interest. Facility and commitment fees are typically amortized to income over the term of the loan or term of the commitment, respectively. Consent and amendment fees are recorded to income as earned. Prepayment penalty fees, which may be received by a trust upon the prepayment of a floating rate loan interest by a borrower, are recorded as realized gains. A trust may invest in multiple series or tranches of a loan. A different series or tranche may have varying terms and carry different associated risks.
Floating rate loan interests are usually freely callable at the borrower’s option. A trust may invest in such loans in the form of participations in loans (“Participations”) or assignments (“Assignments”) of all or a portion of loans from third parties. Participations typically will result in a trust having a contractual relationship only with the lender, not with the borrower. A trust has the right to receive payments of principal, interest and any fees to which it is entitled only from the lender selling the Participation and only upon receipt by the lender of the payments from the borrower. In connection with purchasing Participations, a trust generally will have no right to enforce compliance by the borrower with the terms of the loan agreement, nor any rights of offset against the borrower. A trust may not benefit directly from any collateral supporting the loan in which it has purchased the Participation. As a result, a trust assumes the credit risk of both the borrower and the lender that is selling the Participation. A trust’s investment in loan participation interests involves the risk of insolvency of the financial intermediaries who are parties to the transactions. In the event of the insolvency of the lender selling the Participation, a trust may be treated as a general creditor of the lender and may not benefit from any offset between the lender and the borrower. Assignments typically result in a trust having a direct contractual relationship with the borrower, and a trust may enforce compliance by the borrower with the terms of the loan agreement.
In connection with floating rate loan interests, certain trusts may also enter into unfunded floating rate loan interests (“commitments”). In connection with these commitments, a trust earns a commitment fee, typically set as a percentage of the commitment amount. Such fee income, which is included in interest income in the Statements of Operations, is recognized ratably over the commitment period. Unfunded floating rate loan interests are marked-to-market daily, and any unrealized appreciation (depreciation) is included in the Statements of Assets and Liabilities and Statements of Operations. As of period end, the trusts had the following unfunded floating rate loan interests:
| | | | | | | | | | | | | | | | | | |
| Trust | | Borrower | | Par | | | Commitment
Amount | | | Value | | | Unrealized
Appreciation | |
BHK | | Convergint Technologies LLC | | | 4,111 | | | $ | 4,100 | | | $ | 4,103 | | | $ | 3 | |
| | Mitchell International, Inc. | | | 7,931 | | | | 7,891 | | | | 7,949 | | | | 58 | |
HYT | | Convergint Technologies LLC | | | 38,026 | | | | 37,929 | | | | 37,953 | | | | 24 | |
| | | Mitchell International, Inc. | | | 75,901 | | | | 75,521 | | | | 76,077 | | | | 556 | |
| | | | |
| NOTESTO FINANCIAL STATEMENTS | | | 93 | |
Notes to Financial Statements (continued)
Forward Commitments and When-Issued Delayed Delivery Securities: Certain trusts may purchase securities on a when-issued basis and may purchase or sell securities on a forward commitment basis. Settlement of such transactions normally occurs within a month or more after the purchase or sale commitment is made. A trust may purchase securities under such conditions with the intention of actually acquiring them, but may enter into a separate agreement to sell the securities before the settlement date. Since the value of securities purchased may fluctuate prior to settlement, a trust may be required to pay more at settlement than the security is worth. In addition, a trust is not entitled to any of the interest earned prior to settlement. When purchasing a security on a delayed delivery basis, a trust assumes the rights and risks of ownership of the security, including the risk of price and yield fluctuations. In the event of default by the counterparty, a trust’s maximum amount of loss is the unrealized appreciation of unsettled when-issued transactions.
TBA Commitments: TBA commitments are forward agreements for the purchase or sale of mortgage-backed securities for a fixed price, with payment and delivery on an agreed upon future settlement date. The specific securities to be delivered are not identified at the trade date. However, delivered securities must meet specified terms, including issuer, rate and mortgage terms. When entering into TBA commitments, a trust may take possession of or deliver the underlying mortgage-backed securities but can extend the settlement or roll the transaction. TBA commitments involve a risk of loss if the value of the security to be purchased or sold declines or increases, respectively, prior to settlement date.
In order to better define contractual rights and to secure rights that will help a trust mitigate their counterparty risk, TBA commitments may be entered into by a trust under Master Securities Forward Transaction Agreements (each, an “MSFTA”). An MSFTA typically contains, among other things, collateral posting terms and netting provisions in the event of default and/or termination event. The collateral requirements are typically calculated by netting the mark-to-market amount for each transaction under such agreement and comparing that amount to the value of the collateral currently pledged by a trust and the counterparty. Cash collateral that has been pledged to cover the obligations of a trust and cash collateral received from the counterparty, if any, is reported separately on the Statements of Assets and Liabilities as cash pledged as collateral for TBA commitments or cash received as collateral for TBA commitments, respectively. Non-cash collateral pledged by a trust, if any, is noted in the Schedules of Investments. Typically, a trust is permitted to sell, re-pledge or use the collateral it receives; however, the counterparty is not permitted to do so. To the extent amounts due to a trust is not fully collateralized, contractually or otherwise, a trust bears the risk of loss from counterparty non-performance.
Mortgage Dollar Roll Transactions: Certain trusts may sell TBA mortgage-backed securities and simultaneously contract to repurchase substantially similar (i.e., same type, coupon and maturity) securities on a specific future date at an agreed upon price. During the period between the sale and repurchase, a trust is not entitled to receive interest and principal payments on the securities sold. Mortgage dollar roll transactions are treated as purchases and sales and realize gains and losses on these transactions. Mortgage dollar rolls involve the risk that the market value of the securities that a trust is required to purchase may decline below the agreed upon repurchase price of those securities.
Borrowed Bond Agreements: Repurchase agreements may be referred to as borrowed bond agreements when entered into in connection with short sales of bonds. In a borrowed bond agreement, a trust borrows a bond from a counterparty in exchange for cash collateral. The agreement contains a commitment that the security and the cash will be returned to the counterparty and a trust at a mutually agreed upon date. Certain agreements have no stated maturity and can be terminated by either party at any time. Earnings on cash collateral and compensation to the lender of the bond are based on agreed upon rates between a trust and the counterparty. The value of the underlying cash collateral approximates the market value and accrued interest of the borrowed bond. To the extent that a borrowed bond transaction exceeds one business day, the value of the cash collateral in the possession of the counterparty is monitored on a daily basis to ensure the adequacy of the collateral. As the market value of the borrowed bond changes, the cash collateral is periodically increased or decreased with a frequency and in amounts prescribed in the borrowed bond agreement. A trust may also experience delays in gaining access to the collateral.
Reverse Repurchase Agreements: Reverse repurchase agreements are agreements with qualified third party broker dealers in which a trust sells securities to a bank or broker-dealer and agrees to repurchase the same securities at a mutually agreed upon date and price. A trust receives cash from the sale to use for other investment purposes. During the term of the reverse repurchase agreement, a trust continues to receive the principal and interest payments on the securities sold. Certain agreements have no stated maturity and can be terminated by either party at any time. Interest on the value of the reverse repurchase agreements issued and outstanding is based upon competitive market rates determined at the time of issuance. A trust may utilize reverse repurchase agreements when it is anticipated that the interest income to be earned from the investment of the proceeds of the transaction is greater than the interest expense of the transaction. Reverse repurchase agreements involve leverage risk. If a trust suffers a loss on its investment of the transaction proceeds from a reverse repurchase agreement, a trust would still be required to pay the full repurchase price. Further, a trust remains subject to the risk that the market value of the securities repurchased declines below the repurchase price. In such cases, a trust would be required to return a portion of the cash received from the transaction or provide additional securities to the counterparty.
Cash received in exchange for securities delivered plus accrued interest due to the counterparty is recorded as a liability in the Statements of Assets and Liabilities at face value including accrued interest. Due to the short-term nature of the reverse repurchase agreements, face value approximates fair value. Interest payments made by a trust to the counterparties are recorded as a component of interest expense in the Statements of Operations. In periods of increased demand for the security, a trust may receive a fee for the use of the security by the counterparty, which may result in interest income to a trust.
For the six months ended February 28, 2018, the average amount of reverse repurchase agreements outstanding and the daily weighted average interest rates for the Trusts were as follows:
| | | | | | | | |
| | | Average Amount
Outstanding | | | Daily Weighted Average
Interest Rate | |
BHK | | $ | 338,379,828 | | | | 1.54 | % |
BKT | | | 180,449,493 | | | | 1.39 | |
Borrowed bond agreements and reverse repurchase transactions are entered into by a trust under Master Repurchase Agreements (each, an “MRA”), which permit a trust, under certain circumstances, including an event of default (such as bankruptcy or insolvency), to offset payables and/or receivables under the MRA with collateral held and/or posted to the counterparty and create one single net payment due to or from a trust. With borrowed bond agreements and reverse repurchase transactions,
| | |
| 94 | | 2018 BLACKROCK SEMI-ANNUAL REPORTTO SHAREHOLDERS |
Notes to Financial Statements (continued)
typically a trust and counterparty under an MRA are permitted to sell, re-pledge, or use the collateral associated with the transaction. Bankruptcy or insolvency laws of a particular jurisdiction may impose restrictions on or prohibitions against such a right of offset in the event of the MRA counterparty’s bankruptcy or insolvency. Pursuant to the terms of the MRA, a trust receives or posts securities and cash as collateral with a market value in excess of the repurchase price to be paid or received by a trust upon the maturity of the transaction. Upon a bankruptcy or insolvency of the MRA counterparty, a trust is considered an unsecured creditor with respect to excess collateral and, as such, the return of excess collateral may be delayed.
As of period end, the following table is a summary of BHK’s open reverse repurchase agreements by counterparty which are subject to offset under an MRA on a net basis:
| | | | | | | | | | | | | | | | |
| BHK | | | | | | | | | | | | |
| Counterparty | | Reverse Repurchase
Agreements | | | Fair Value of Non-cash Collateral
Pledged Including
Accrued Interest (a) | | | Cash Collateral
Pledged/Received | | | Net Amount | |
Barclays Capital, Inc. | | $ | 390,942 | | | $ | (390,942 | ) | | $ | — | | | $ | — | |
BNP Paribas Securities Corp. | | | 80,580,621 | | | | (80,580,621 | ) | | | — | | | | — | |
Citigroup GlobalMarket, Inc. | | | 1,006,447 | | | | (1,006,447 | ) | | | — | | | | — | |
Credit Suisse Securities (USA) LLC | | | 8,377,594 | | | | (8,377,594 | ) | | | — | | | | — | |
Deutsche Bank AG | | | 22,893,627 | | | | (22,148,336 | ) | | | (745,291 | ) | | | — | |
HSBC Securities (USA), Inc. | | | 85,317,767 | | | | (85,317,767 | ) | | | — | | | | — | |
J.P. Morgan Securities LLC | | | 8,423,344 | | | | (8,423,344 | ) | | | — | | | | — | |
Merrill Lynch, Pierce, Fenner & Smith, Inc. | | | 2,027,261 | | | | (2,027,261 | ) | | | — | | | | — | |
Nomura Securities International, Inc. | | | 28,945,767 | | | | (26,495,802 | ) | | | (2,449,965 | ) | | | — | |
RBC Capital Markets LLC | | | 120,127,570 | | | | (120,127,570 | ) | | | — | | | | — | |
UBS Securities LLC | | | 10,718,718 | | | | (10,718,718 | ) | | | — | | | | — | |
| | | | | | | | | | | | | | | | |
| | $ | 368,809,658 | | | $ | (365,614,402 | ) | | $ | (3,195,256 | ) | | $ | — | |
| | | | | | | | | | | | | | | | |
| | (a) | Net collateral, including accrued interest, with a value of $387,401,872 has been pledged/received in connection with open reverse repurchase agreements. Excess of net collateral pledged to the individual counterparty is not shown for financial reporting purposes. | |
As of period end, the following table is a summary of BKT’s open borrowed bond agreements and reverse repurchase agreements by counterparty which are subject to offset under an MRA on a net basis:
| | | | | | | | | | | | | | | | | | | | | | | | | | | | | | | | | | | | | | | | |
| BKT | | | | | | | | | | | | | | | | | | | | | | | | | | | | | | |
| Counterparty | | Borrowed Bonds Agreements (a) | | | Reverse
Repurchase
Agreements | | | Borrowed Bonds at Value including Accrued Interest (b) | | | Net Amount before Collateral | | | Non-cash Collateral Received | | | Cash Collateral Received | | | Fair Value
Noncash Collateral Pledged Including Accrued
Interest (c) | | | Cash Collateral Pledged | | | Net Collateral Received) / Pledged | | | Net Exposure Due (to) /from Counterparty (d) | |
HSBC Securities (USA), Inc. | | $ | — | | | $ | (170,720,769 | ) | | $ | — | | | $ | (170,720,769 | ) | | $ | — | | | $ | — | | | $ | 170,720,769 | | | $ | — | | | $ | — | | | $ | — | |
Credit Suisse Securities (USA) LLC | | | 925,024 | | | | — | | | | (867,394 | ) | | | 57,630 | | | | — | | | | — | | | | — | | | | — | | | | — | | | | 57,630 | |
| | | | | | | | | | | | | | | | | | | | | | | | | | | | | | | | | | | | | | | | |
| | $ | 925,024 | | | $ | 170,720,769 | | | $ | (867,394 | ) | | $ | (170,663,139 | ) | | $ | — | | | $ | — | | | $ | 170,720,769 | | | $ | — | | | $ | — | | | $ | 57,630 | |
| | | | | | | | | | | | | | | | | | | | | | | | | | | | | | | | | | | | | | | | |
| | (a) | Included in Investments at value-unaffiliated in the Statements of Assets and Liabilities. | |
| | (b) | Includes accrued interest on borrowed bonds in the amount of $7,384 which is included in interest expense payable in the Statements of Assets and Liabilities. | |
| | (c) | Net collateral with a value of $176,518,638 has been pledged in connection with open reverse repurchase agreements. Excess of net collateral pledged to the individual counterparty is not shown for financial reporting purposes. | |
| | (d) | Net exposure represents the net receivable (payable) that would be due from/to the counterparty in the event of default. | |
In the event the counterparty of securities under an MRA files for bankruptcy or becomes insolvent, a trust’s use of the proceeds from the agreement may be restricted while the counterparty, or its trustee or receiver, determines whether or not to enforce a trust’s obligation to repurchase the securities.
Short Sale Transactions: In short sale transactions, a trust sells a security it does not hold in anticipation of a decline in the market price of that security. When a trust makes a short sale, it will borrow the security sold short (borrowed bond) and deliver the fixed-income security to the counterparty to which it sold the security short. An amount equal to the proceeds received by a trust is reflected as an asset and an equivalent liability. The amount of the liability is subsequently marked-to-market to reflect the market value of the short sale. A trust is required to repay the counterparty interest on the security sold short, which, if applicable, is included in interest expense in the Statements of Operations. A trust is exposed to market risk based on the amount, if any, that the market value of the security increases beyond the market value at which the position was sold. Thus, a short sale of a security involves the risk that instead of declining, the price of the security sold short will rise. The short sale of securities involves the possibility of an unlimited loss since there is an unlimited potential for the market price of the security sold short to increase. A gain is limited to the price at which a trust sold the security short. A realized gain or loss is recognized upon the termination of a short sale if the market price is either less than or greater than the proceeds originally received. There is no assurance that a trust will be able to close out a short position at a particular time or at an acceptable price.
| | | | |
| NOTESTO FINANCIAL STATEMENTS | | | 95 | |
Notes to Financial Statements (continued)
| 5. | DERIVATIVE FINANCIAL INSTRUMENTS |
The Trusts engage in various portfolio investment strategies using derivative contracts both to increase the returns of the Trusts and/or to manage their exposure to certain risks such as credit risk, equity risk, interest rate risk, foreign currency exchange rate risk, commodity price risk or other risks (e.g., inflation risk). Derivative financial instruments categorized by risk exposure are included in the Schedules of Investments. These contracts may be transacted on an exchange or OTC.
Futures Contracts: Futures contracts are purchased or sold to gain exposure to, or manage exposure to, changes in interest rates (interest rate risk), changes in the value of equity securities (equity risk) or foreign currencies (foreign currency exchange rate risk).
Futures contracts are agreements between the Trusts and a counterparty to buy or sell a specific quantity of an underlying instrument at a specified price and on a specified date. Depending on the terms of a contract, it is settled either through physical delivery of the underlying instrument on the settlement date or by payment of a cash amount on the settlement date. Upon entering into a futures contract, the Trusts are required to deposit initial margin with the broker in the form of cash or securities in an amount that varies depending on a contract’s size and risk profile. The initial margin deposit must then be maintained at an established level over the life of the contract.
Securities deposited as initial margin are designated in the Schedules of Investments and cash deposited, if any, is shown as cash pledged for futures contracts in the Statements of Assets and Liabilities. Pursuant to the contract, the Trusts agree to receive from or pay to the broker an amount of cash equal to the daily fluctuation in market value of the contract (“variation margin”). Variation margin is recorded as unrealized appreciation (depreciation) and, if any, shown as variation margin receivable (or payable) on futures contracts in the Statements of Assets and Liabilities. When the contract is closed, a realized gain or loss is recorded in the Statements of Operations equal to the difference between the notional amount of the contract at the time it was opened and the notional amount at the time it was closed. The use of futures contracts involves the risk of an imperfect correlation in the movements in the price of futures contracts and interest, foreign currency exchange rates or underlying assets.
Forward Foreign Currency Exchange Contracts: Forward foreign currency exchange contracts are entered into to gain or reduce exposure to foreign currencies (foreign currency exchange rate risk).
A forward foreign currency exchange contract is an agreement between two parties to buy and sell a currency at a set exchange rate on a specified date. These contracts help to manage the overall exposure to the currencies in which some of the investments held by the Trusts are denominated and in some cases, may be used to obtain exposure to a particular market.
The contract is marked-to-market daily and the change in market value is recorded as unrealized appreciation (depreciation) in the Statements of Assets and Liabilities. When a contract is closed, a realized gain or loss is recorded in the Statements of Operations equal to the difference between the value at the time it was opened and the value at the time it was closed. Non-deliverable forward foreign currency exchange contracts are settled with the counterparty in cash without the delivery of foreign currency. The use of forward foreign currency exchange contracts involves the risk that the value of a forward foreign currency exchange contract changes unfavorably due to movements in the value of the referenced foreign currencies.
Options: Certain Trusts purchase and write call and put options to increase or decrease their exposure to the risks of underlying instruments, including equity risk, interest rate risk and/or commodity price risk and/or, in the case of options written, to generate gains from options premiums.
A call option gives the purchaser (holder) of the option the right (but not the obligation) to buy, and obligates the seller (writer) to sell (when the option is exercised) the underlying instrument at the exercise or strike price at any time or at a specified time during the option period. A put option gives the holder the right to sell and obligates the writer to buy the underlying instrument at the exercise or strike price at any time or at a specified time during the option period.
Premiums paid on options purchased and premiums received on options written, as well as the daily fluctuation in market value, are included in investments at value — unaffiliated and options written at value, respectively, in the Statements of Assets and Liabilities. When an instrument is purchased or sold through the exercise of an option, the premium is offset against the cost or proceeds of the underlying instrument. When an option expires, a realized gain or loss is recorded in the Statements of Operations to the extent of the premiums received or paid. When an option is closed or sold, a gain or loss is recorded in the Statements of Operations to the extent the cost of the closing transaction exceeds the premiums received or paid. When the Trusts write a call option, such option is typically “covered,” meaning that they hold the underlying instrument subject to being called by the option counterparty. When the Trusts write a put option, such option is covered by cash in an amount sufficient to cover the obligation.
| | • | | Swaptions — Certain Trusts purchase and write options on swaps (“swaptions”) primarily to preserve a return or spread on a particular investment or portion of the Trusts’ holdings, as a duration management technique or to protect against an increase in the price of securities it anticipates purchasing at a later date. The purchaser and writer of a swaption is buying or granting the right to enter into a previously agreed upon interest rate or credit default swap agreement (interest rate risk and/or credit risk) at any time before the expiration of the option. |
| | • | | Foreign currency options — Certain Trusts purchase and write foreign currency options, foreign currency futures and options on foreign currency futures to gain or reduce exposure to foreign currencies (foreign currency exchange rate risk). Foreign currency options give the purchaser the right to buy from or sell to the writer a foreign currency at any time before the expiration of the option. |
In purchasing and writing options, the Trusts bear the risk of an unfavorable change in the value of the underlying instrument or the risk that they may not be able to enter into a closing transaction due to an illiquid market. Exercise of a written option could result in the Trusts purchasing or selling a security when it otherwise would not, or at a price different from the current market value.
Swaps: Swap contracts are entered into to manage exposure to issuers, markets and securities. Such contracts are agreements between the Trusts and a counterparty to make periodic net payments on a specified notional amount or a net payment upon termination. Swap agreements are privately negotiated in the OTC market and may be entered into as a bilateral contract (“OTC swaps”) or centrally cleared (“centrally cleared swaps”).
| | |
| 96 | | 2018 BLACKROCK SEMI-ANNUAL REPORTTO SHAREHOLDERS |
Notes to Financial Statements (continued)
For OTC swaps, any upfront premiums paid and any upfront fees received are shown as swap premiums paid and swap premiums received, respectively, in the Statements of Assets and Liabilities and amortized over the term of the contract. The daily fluctuation in market value is recorded as unrealized appreciation (depreciation) on OTC Swaps in the Statements of Assets and Liabilities. Payments received or paid are recorded in the Statements of Operations as realized gains or losses, respectively. When an OTC swap is terminated, a realized gain or loss is recorded in the Statements of Operations equal to the difference between the proceeds from (or cost of) the closing transaction and the Trusts’ basis in the contract, if any. Generally, the basis of the contract is the premium received or paid.
In a centrally cleared swap, immediately following execution of the swap contract, the swap contract is novated to a central counterparty (the “CCP”) and the Trusts’ counterparty on the swap agreement becomes the CCP. The Trusts are required to interface with the CCP through the broker. Upon entering into a centrally cleared swap, the Trusts are required to deposit initial margin with the broker in the form of cash or securities in an amount that varies depending on the size and risk profile of the particular swap. Securities deposited as initial margin are designated in the Schedules of Investments and cash deposited is shown as cash pledged for centrally cleared swaps in the Statements of Assets and Liabilities. Pursuant to the contract, the Trusts agree to receive from or pay to the broker an amount of cash equal to the daily fluctuation in market value of the contract (“variation margin”). Variation margin is recorded as unrealized appreciation (depreciation) and shown as variation margin receivable (or payable) on centrally cleared swaps in the Statements of Assets and Liabilities. Payments received from (paid to) the counterparty, including at termination, are recorded as realized gains (losses) in the Statements of Operations.
| | • | | Credit default swaps — Credit default swaps are entered into to manage exposure to the market or certain sectors of the market, to reduce risk exposure to defaults of corporate and/or sovereign issuers or to create exposure to corporate and/or sovereign issuers to which a trust is not otherwise exposed (credit risk). |
The Trusts may either buy or sell (write) credit default swaps on single-name issuers (corporate or sovereign), a combination or basket of single-name issuers or traded indexes. Credit default swaps are agreements in which the protection buyer pays fixed periodic payments to the seller in consideration for a promise from the protection seller to make a specific payment should a negative credit event take place with respect to the referenced entity (e.g., bankruptcy, failure to pay, obligation acceleration, repudiation, moratorium or restructuring). As a buyer, if an underlying credit event occurs, the Trusts will either (i) receive from the seller an amount equal to the notional amount of the swap and deliver the referenced security or underlying securities comprising the index, or (ii) receive a net settlement of cash equal to the notional amount of the swap less the recovery value of the security or underlying securities comprising the index. As a seller (writer), if an underlying credit event occurs, the Trusts will either pay the buyer an amount equal to the notional amount of the swap and take delivery of the referenced security or underlying securities comprising the index or pay a net settlement of cash equal to the notional amount of the swap less the recovery value of the security or underlying securities comprising the index.
| | • | | Total return swaps — Total return swaps are entered into to obtain exposure to a security or market without owning such security or investing directly in such market or to exchange the risk/return of one market (e.g., fixed-income) with another market (e.g., equity or commodity prices) (equity risk, commodity price risk and/or interest rate risk). |
Total return swaps are agreements in which there is an exchange of cash flows whereby one party commits to make payments based on the total return (distributions plus capital gains/losses) of an underlying instrument in exchange for fixed or floating rate interest payments. If the total return of the instrument or index underlying the transaction exceeds or falls short of the offsetting fixed or floating interest rate obligation, the Trusts receive payment from or make a payment to the counterparty.
| | • | | Interest rate swaps — Interest rate swaps are entered into to gain or reduce exposure to interest rates or to manage duration, the yield curve or interest rate (interest rate risk). |
Interest rate swaps are agreements in which one party pays a stream of interest payments, either fixed or floating, in exchange for another party’s stream of interest payments, either fixed or floating, on the same notional amount for a specified period of time. In more complex interest rate swaps, the notional principal amount may decline (or amortize) over time.
| | • | | Forward swaps — Certain Trusts enter into forward interest rate swaps and forward total return swaps. In a forward swap, each Trust and the counterparty agree to make periodic net payments beginning on a specified date or a net payment at termination. |
Swap transactions involve, to varying degrees, elements of interest rate, credit and market risk in excess of the amounts recognized in the Statements of Assets and Liabilities. Such risks involve the possibility that there will be no liquid market for these agreements, that the counterparty to the agreements may default on its obligation to perform or disagree as to the meaning of the contractual terms in the agreements, and that there may be unfavorable changes in interest rates and/or market values associated with these transactions.
Master Netting Arrangements: In order to define their contractual rights and to secure rights that will help them mitigate their counterparty risk, the Trusts may enter into an International Swaps and Derivatives Association, Inc. Master Agreement (“ISDA Master Agreement”) or similar agreement with their counterparties. An ISDA Master Agreement is a bilateral agreement between each Trust and a counterparty that governs certain OTC derivatives and typically contains, among other things, collateral posting terms and netting provisions in the event of a default and/or termination event. Under an ISDA Master Agreement, each Trust may, under certain circumstances, offset with the counterparty certain derivative financial instruments’ payables and/or receivables with collateral held and/or posted and create one single net payment. The provisions of the ISDA Master Agreement typically permit a single net payment in the event of default including the bankruptcy or insolvency of the counterparty. Bankruptcy or insolvency laws of a particular jurisdiction may restrict or prohibit the right of offset in bankruptcy, insolvency or other events.
Collateral Requirements: For derivatives traded under an ISDA Master Agreement, the collateral requirements are typically calculated by netting the mark-to-market amount for each transaction under such agreement and comparing that amount to the value of any collateral currently pledged by the Trust and the counterparty.
Cash collateral that has been pledged to cover obligations of the Trusts and cash collateral received from the counterparty, if any, is reported separately on the Statements of Assets and Liabilities as cash pledged as collateral and cash received as collateral, respectively. Non-cash collateral pledged by the Trusts, if any, is noted in the Schedules of Investments. Generally, the amount of collateral due from or to a counterparty is subject to a certain minimum transfer amount threshold before a transfer is required, which is determined at the close of business of the Trusts. Any additional required collateral is delivered to/pledged by the Trusts on the next business day.
| | | | |
| NOTESTO FINANCIAL STATEMENTS | | | 97 | |
Notes to Financial Statements (continued)
Typically, the counterparty is not permitted to sell, re-pledge or use cash and non-cash collateral it receives. A Trust generally agrees not to use non-cash collateral that it receives but may, absent default or certain other circumstances defined in the underlying ISDA Master Agreement, be permitted to use cash collateral received. In such cases, interest may be paid pursuant to the collateral arrangement with the counterparty. To the extent amounts due to the Trusts from their counterparties are not fully collateralized, they bear the risk of loss from counterparty non-performance. Likewise, to the extent the Trusts have delivered collateral to a counterparty and stand ready to perform under the terms of their agreement with such counterparty, they bear the risk of loss from a counterparty in the amount of the value of the collateral in the event the counterparty fails to return such collateral. Based on the terms of agreements, collateral may not be required for all derivative contracts.
For financial reporting purposes, the Trusts do not offset derivative assets and derivative liabilities that are subject to netting arrangements, if any, in the Statements of Assets and Liabilities.
| 6. | INVESTMENT ADVISORY AGREEMENT AND OTHER TRANSACTIONS WITH AFFILIATES |
The PNC Financial Services Group, Inc. is the largest stockholder and an affiliate of BlackRock, Inc. (“BlackRock”) for 1940 Act purposes.
Investment Advisory: Each Trust entered into an Investment Advisory Agreement with the Manager, the Trusts’ investment adviser, an indirect, wholly-owned subsidiary of BlackRock, to provide investment advisory and administrative services. The Manager is responsible for the management of each Trust’s portfolio and provides the personnel, facilities, equipment and certain other services necessary to the operations of each Trust.
For such services, BHK pays the Manager a monthly fee based on an annual rate of 0.50% of the average weekly value of the Trust’s managed assets. For purposes of calculating this fee, “managed assets” means the total assets of the Trust minus the sum of its accrued liabilities (other than the aggregate indebtedness constituting financial leverage).
For such services, HYT pays the Manager a monthly fee at an annual rate equal to 0.60% of the average daily value of the Trust’s net assets, plus the proceeds of any debt securities or outstanding borrowings used for leverage. For purposes of calculating this fee, “net assets” means the total assets of the Trust minus the sum of its accrued liabilities.
For such services, BKT pays the Manager a monthly fee at an annual rate equal to 0.65% of the average weekly value of the Trust’s net assets. For purposes of calculating this fee, “net assets” means the total assets of the Trust minus the sum of its accrued liabilities (including the aggregate indebtedness constituting financial leverage).
The Manager provides investment management and other services to the Taxable Subsidiaries. The Manager does not receive separate compensation from the Taxable Subsidiaries for providing investment management or administrative services. However, HYT pays the Manager based on HYT’s net assets, plus the proceeds of any debt securities or outstanding borrowings used for leverage, which includes the assets of the Taxable Subsidiaries.
Distribution Fees: HYT had entered into a Distribution Agreement with BlackRock Investments, LLC (“BRIL”), an affiliate of the Manager, to provide for distribution of HYT’s common shares on a reasonable best efforts basis through an equity shelf offering (a “Shelf Offering”) (the “Distribution Agreement”); however, HYT no longer actively engaged in a Shelf Offering, has no effective registration statement or current prospectus, and the Distribution Agreement has been terminated.
Administration: BKT has an Administration Agreement with the Manager. The administration fee paid monthly to the Manager is computed at an annual rate of 0.15% of BKT’s average weekly net assets. For BKT, the Manager may reduce or discontinue these arrangements at any time without notice.
Expense Waivers: The Manager voluntarily agreed to waive its investment advisory fees by the amount of investment advisory fees each Trust pays to the Manager indirectly through its investment in affiliated money market funds (the “affiliated money market fund waiver”). These amounts are included in fees waived and/or reimbursed by the Manager in the Statements of Operations. For the six months ended February 28, 2018, the amounts waived were as follows:
| | | | | | | | | | | | |
| | | BHK | | | HYT | | | BKT | |
Amounts waived | | $ | 2,855 | | | $ | 971 | | | $ | 3,356 | |
The Manager contractually agreed to waive its investment advisory fee with respect to any portion of each Trust’s assets invested in affiliated equity and fixed-income mutual funds and affiliated exchange-traded funds that have a contractual management fee through June 30, 2018. The agreement can be renewed for annual periods thereafter, and may be terminated on 90 days’ notice, each subject to approval by a majority of the Trusts’ Independent Trustees. For the six months ended February 28, 2018, HYT waived $71,006 in investment advisory fees pursuant to these arrangements.
Trustees and Officers: Certain trustees and/or officers of the Trusts are directors and/or officers of BlackRock or its affiliates. The Trusts reimburse the Manager for a portion of the compensation paid to the Trusts’ Chief Compliance Officer, which is included in Trustees and Officer in the Statements of Operations.
Other Transactions: The Trusts may purchase securities from, or sell securities to, an affiliated fund provided the affiliation is due solely to having a common investment adviser, common officers, or common trustees. For the six months ended February 28, 2018, the purchase and sale transactions and any net realized gains (losses) with an affiliated fund in compliance with Rule 17a-7 under the 1940 Act were as follows:
| | | | | | | | | | | | |
| | | Purchases | | | Sales | | | Net Realized Gain | |
BHK | | $ | 1,401,542 | | | $ | 247,549 | | | $ | 4,354 | |
HYT | | | 15,348,520 | | | | — | | | | — | |
| | |
| 98 | | 2018 BLACKROCK SEMI-ANNUAL REPORTTO SHAREHOLDERS |
Notes to Financial Statements (continued)
For the six months ended February 28, 2018, purchases and sales of investments, including paydowns and mortgage dollar rolls and excluding short-term securities, were as follows:
| | | | | | | | | | | | |
| Purchases | |
| | | BHK | | | HYT | | | BKT | |
Non-U.S. Government Securities | | $ | 191,704,737 | | | $ | 758,794,661 | | | $ | 1,025,511,309 | |
U.S. Government Securities | | | 12,801,394 | | | | — | | | | — | |
| | | | | | | | | | | | |
| | $ | 204,506,131 | | | $ | 758,794,661 | | | $ | 1,025,511,309 | |
| | | | | | | | | | | | |
| | | | | | | | | | | | |
| Sales | |
| | | BHK | | | HYT | | | BKT | |
Non-U.S. Government Securities | | $ | 126,685,412 | | | $ | 722,914,977 | | | $ | 1,016,048,020 | |
U.S. Government Securities | | | — | | | | — | | | | 12,563,222 | |
| | | | | | | | | | | | |
| | $ | 126,685,412 | | | $ | 722,914,977 | | | $ | 1,028,611,242 | |
| | | | | | | | | | | | |
For the six months ended February 28, 2018, purchases and sales related to mortgage dollar rolls for BKT were $584,944,858 and $584,474,047, respectively.
It is each Trust’s policy to comply with the requirements of the Internal Revenue Code of 1986, as amended, applicable to regulated investment companies, and to distribute substantially all of its taxable income to its shareholders. Therefore, no U.S. federal income tax provision is required, except with respect to any taxes related to the Taxable Subsidiaries.
Each Trust files U.S. federal and various state and local tax returns. No income tax returns are currently under examination. The statute of limitations on each Trust’s U.S. federal tax returns generally remains open for each of the four years ended August 31, 2017. The statutes of limitations on each Trust’s state and local tax returns may remain open for an additional year depending upon the jurisdiction.
Management has analyzed tax laws and regulations and their application to the Trusts as of February 28, 2018, inclusive of the open tax return years, and does not believe that there are any uncertain tax positions that require recognition of a tax liability in the Trusts’ financial statements.
As of August 31, 2017, the Trusts had capital loss carryforwards available to offset future realized capital gains through the indicated expiration dates as follows:
| | | | | | | | | | | | |
| Expires | | BHK | | | HYT | | | BKT | |
No expiration date(a) | | $ | 6,194,640 | | | $ | 75,431,788 | | | $ | 41,910,926 | |
2018 | | | — | | | | 55,665,607 | | | | — | |
| | | | | | | | | | | | |
| | $ | 6,194,640 | | | $ | 131,097,395 | | | $ | 41,910,926 | |
| | | | | | | | | | | | |
| | (a) | Must be utilized prior to losses subject to expiration. | |
As of February 28, 2018, gross unrealized appreciation and depreciation for investments and derivatives based on cost for U.S. federal income tax purposes were as follows:
| | | | | | | | | | | | |
| | | BHK | | | HYT | | | BKT | |
Tax cost | | $ | 1,114,390,482 | | | $ | 2,227,194,547 | | | $ | 641,039,354 | |
| | | | | | | | | | | | |
Gross unrealized appreciation | | $ | 50,138,584 | | | $ | 58,243,048 | | | $ | 14,898,710 | |
Gross unrealized depreciation | | | (32,811,740 | ) | | | (98,243,382 | ) | | | (47,133,634 | ) |
| | | | | | | | | | | | |
Net unrealized appreciation (depreciation) | | $ | 17,326,844 | | | $ | (40,000,334 | ) | | $ | (32,234,924 | ) |
| | | | | | | | | | | | |
HYT is party to a senior committed secured, 360-day rolling line of credit facility and a separate security agreement (the “SSB Agreement”) with State Street Bank and Trust Company (“SSB”). SSB may elect to terminate its commitment upon 360-days written notice to HYT. As of period end, HYT has not received any notice to terminate. HYT has granted a security interest in substantially all of its assets to SSB.
The SSB Agreement allows for the maximum commitment of $732,000,000 for HYT.
Advances will be made by SSB to HYT, at HYT’s option of (a) the higher of (i) 0.80% above the Fed Funds rate and (ii) 0.80% above Overnight LIBOR or (b) 0.80% above 7-day, 30-day, 60-day or 90-day LIBOR. Overnight LIBOR and LIBOR rates are subject to a 0% floor.
In addition, HYT paid a commitment fee (based on the daily unused portion of the commitments). The fees associated with each of the agreements are included in the Statements of Operations as borrowing costs, if any. Advances to HYT as of period end are shown in the Statements of Assets and Liabilities as bank borrowings payable. Based on the short-term nature of the borrowings under the line of credit and the variable interest rate, the carrying amount of the borrowings approximates fair value.
| | | | |
| NOTESTO FINANCIAL STATEMENTS | | | 99 | |
Notes to Financial Statements (continued)
HYT may not declare dividends or make other distributions on shares or purchase any such shares if, at the time of the declaration, distribution or purchase, asset coverage with respect to the outstanding short-term borrowings is less than 300%.
For the six months ended February 28, 2018, the average amount of bank borrowings and the daily weighted average interest rates for HYT for loans under the revolving credit agreements were $659,441,989 and 2.14%, respectively.
Many municipalities insure repayment of their bonds, which may reduce the potential for loss due to credit risk. The market value of these bonds may fluctuate for other reasons, including market perception of the value of such insurance, and there is no guarantee that the insurer will meet its obligation.
Inventories of municipal bonds held by brokers and dealers may decrease, which would lessen their ability to make a market in these securities. Such a reduction in market making capacity could potentially decrease a Trust’s ability to buy or sell bonds. As a result, a Trust may sell a security at a lower price, sell other securities to raise cash, or give up an investment opportunity, any of which could have a negative impact on performance. If a Trust needed to sell large blocks of bonds, those sales could further reduce the bonds’ prices and impact performance.
In the normal course of business, certain Trusts invest in securities or other instruments and may enter into certain transactions, and such activities subject each Trust to various risks, including among others, fluctuations in the market (market risk) or failure of an issuer to meet all of its obligations. The value of securities or other instruments may also be affected by various factors, including, without limitation: (i) the general economy; (ii) the overall market as well as local, regional or global political and/or social instability; (iii) regulation, taxation or international tax treaties between various countries; or (iv) currency, interest rate and price fluctuations.
Each Trust may be exposed to prepayment risk, which is the risk that borrowers may exercise their option to prepay principal earlier than scheduled during periods of declining interest rates, which would force each Trust to reinvest in lower yielding securities. Each Trust may also be exposed to reinvestment risk, which is the risk that income from each Trust’s portfolio will decline if each Trust invests the proceeds from matured, traded or called fixed-income securities at market interest rates that are below each Trust portfolio’s current earnings rate.
Valuation Risk: The market values of equities, such as common stocks and preferred securities or equity related investments, such as futures and options, may decline due to general market conditions which are not specifically related to a particular company. They may also decline due to factors which affect a particular industry or industries. A Trust may invest in illiquid investments and may experience difficulty in selling those investments in a timely manner at the price that it believes the investments are worth. Prices may fluctuate widely over short or extended periods in response to company, market or economic news. Markets also tend to move in cycles, with periods of rising and falling prices. This volatility may cause each Trust’s NAV to experience significant increases or decreases over short periods of time. If there is a general decline in the securities and other markets, the NAV of a Trust may lose value, regardless of the individual results of the securities and other instruments in which a Trust invests.
The price a Trust could receive upon the sale of any particular portfolio investment may differ from a Trust’s valuation of the investment, particularly for securities that trade in thin or volatile markets or that are valued using a fair valuation technique or a price provided by an independent pricing service. Changes to significant unobservable inputs and assumptions (i.e., publicly traded company multiples, growth rate, time to exit) due to the lack of observable inputs may significantly impact the resulting fair value and therefore a Trust’s results of operations. As a result, the price received upon the sale of an investment may be less than the value ascribed by a Trust, and a Trust could realize a greater than expected loss or lesser than expected gain upon the sale of the investment. A Trust’s ability to value its investments may also be impacted by technological issues and/or errors by pricing services or other third party service providers.
Counterparty Credit Risk: The Trusts may be exposed to counterparty credit risk, or the risk that an entity may fail to or be unable to perform on its commitments related to unsettled or open transactions. The Trusts manage counterparty credit risk by entering into transactions only with counterparties that the Manager believes have the financial resources to honor their obligations and by monitoring the financial stability of those counterparties. Financial assets, which potentially expose the Trusts to market, issuer and counterparty credit risks, consist principally of financial instruments and receivables due from counterparties. The extent of the Trusts’ exposure to market, issuer and counterparty credit risks with respect to these financial assets is approximately their value recorded in the Statements of Assets and Liabilities, less any collateral held by the Trusts.
A derivative contract may suffer a mark-to-market loss if the value of the contract decreases due to an unfavorable change in the market rates or values of the underlying instrument. Losses can also occur if the counterparty does not perform under the contract.
A Trust’s risk of loss from counterparty credit risk on OTC derivatives is generally limited to the aggregate unrealized gain less the value of any collateral held by such Trust.
For OTC options purchased, each Trust bears the risk of loss in the amount of the premiums paid plus the positive change in market values net of any collateral held by the Trusts should the counterparty fail to perform under the contracts. Options written by the Trusts do not typically give rise to counterparty credit risk, as options written generally obligate the Trusts, and not the counterparty, to perform. The Trusts may be exposed to counterparty credit risk with respect to options written to the extent the Trusts deposit collateral with its counterparty to a written option.
With exchange-traded options purchased and futures and centrally cleared swaps, there is less counterparty credit risk to the Trusts since the exchange or clearinghouse, as counterparty to such instruments, guarantees against a possible default. The clearinghouse stands between the buyer and the seller of the contract; therefore, credit risk is limited to failure of the clearinghouse. While offset rights may exist under applicable law, a Trust does not have a contractual right of offset against a clearing broker or clearinghouse in the event of a default (including the bankruptcy or insolvency). Additionally, credit risk exists in exchange-traded futures and centrally cleared swaps with respect to initial and variation margin that is held in a clearing broker’s customer accounts. While clearing brokers are required to segregate customer margin from their own assets, in the event that a clearing broker becomes insolvent or goes into bankruptcy and at that time there is a shortfall in the aggregate amount of margin held by the clearing broker for all its clients, typically the shortfall would be allocated on a pro rata basis across all the clearing broker’s customers, potentially resulting in losses to the Trusts.
| | |
| 100 | | 2018 BLACKROCK SEMI-ANNUAL REPORTTO SHAREHOLDERS |
Notes to Financial Statements (continued)
Concentration Risk: Certain Trusts may invest in securities that are rated below investment grade quality (sometimes called “junk bonds”), which are predominantly speculative, have greater credit risk and generally are less liquid and have more volatile prices than higher quality securities.
Certain Trusts invest a significant portion of their assets in fixed-income securities and/or use derivatives tied to the fixed-income markets. Changes in market interest rates or economic conditions may affect the value and/or liquidity of such investments. Interest rate risk is the risk that prices of bonds and other fixed-income securities will increase as interest rates fall and decrease as interest rates rise.
Certain Trusts invest a significant portion of their assets in securities backed by commercial or residential mortgage loans or in issuers that hold mortgage and other asset-backed securities. Investment percentages in these securities are presented in the Schedules of Investments. Changes in economic conditions, including delinquencies and/or defaults on assets underlying these securities, can affect the value, income and/or liquidity of such positions.
| 11. | CAPITAL SHARE TRANSACTIONS |
BHK is authorized to issue an unlimited number of shares, par value $0.001, all of which were initially classified as Common Shares. HYT is authorized to issue 200 million shares, par value $0.10, all of which were initially classified as Common Shares. BKT is authorized to issue 200 million shares, par value $0.01, all of which were initially classified as Common Shares. The Board is authorized, however, to reclassify any unissued Common Shares to Preferred Shares without the approval of Common Shareholders.
Common Shares: The Board previously approved each Trust’s participation in an open market share repurchase program that allowed each Trust to purchase, at prevailing market prices, up to 5% of its common shares outstanding as of the close of business on October 28, 2016 through November 30, 2017, subject to certain conditions. On September 6, 2017, the Board approved a renewal of this program. Commencing December 1, 2017, each Trust may purchase through November 30, 2018, up to 5% of its common shares outstanding as of the close of business on November 30, 2017, subject to certain conditions. The total amount of repurchases is reflected in the Trusts’ Statements of Changes in Net Assets.
For the periods shown, shares repurchased and cost, including transaction costs were as follows:
| | | | | | | | | | | | | | | | | | | | |
| | | HYT | | | | | | BKT | |
| | | Shares | | | Amount | | | | | | Shares | | | Amount | |
Six Months Ended February 28, 2018 | | | 333,901 | | | $ | 3,562,736 | | | | | | | | 119,661 | | | $ | 702,494 | |
Year Ended August 31, 2017 | | | 140,680 | | | | 1,553,292 | | | | | | | | — | | | | — | |
For the six months ended February 28, 2018 and year ended August 31, 2017, shares issued and outstanding remained constant for BHK.
In May 2015, the Motors Liquidation Company Avoidance Action Trust, as the Trust Administrator and Trustee of the General Motors bankruptcy estate, began serving amended complaints on defendants, which include former holders of certain General Motors debt (the “Debt”), in an adversary proceeding in the United States Bankruptcy Court for the Southern District of New York. In addition to HYT, the lawsuit also names over five hundred other institutional investors as defendants, some of which are also managed by BlackRock Advisors, LLC or its affiliates. The plaintiffs are seeking an order that HYT and other defendants return proceeds received in 2009 in full payment of the principal and interest on the Debt. The holders received a full repayment of a term loan pursuant to a court order in the General Motors bankruptcy proceeding with the understanding that the Debt was fully secured at the time of repayment. The plaintiffs contend that HYT and other defendants were not secured creditors at the time of the 2009 payments and therefore not entitled to the payments in full. HYT cannot predict the outcome of the lawsuit, or the effect, if any, on HYT’s NAV. As such, no liability for litigation related to this matter is reflected in the financial statements. Management cannot determine the amount of loss that will be realized by HYT but does not expect the loss to exceed the payment received in 2009. The amount of the proceeds received in 2009 is $3,528,671.
Management’s evaluation of the impact of all subsequent events on the Trusts’ financial statements was completed through the date the financial statements were issued and the following items were noted:
| | | | | | | | |
| | | Common Dividend
Per Share | |
| | | Paid (a) | | | Declared (b) | |
BHK | | $ | 0.0650 | | | $ | 0.0650 | |
HYT | | | 0.0700 | | | | 0.0700 | |
BKT | | | 0.0265 | | | | 0.0265 | |
| | (a) | Net investment income dividend paid on March 29, 2018 to Common Shareholders of record on March 15, 2018. | |
| | (b) | Net investment income dividend declared on April 2, 2018, payable to Common Shareholders of record on April 16, 2018. | |
| | | | |
| NOTESTO FINANCIAL STATEMENTS | | | 101 | |
Trustee and Officer Information
Richard E. Cavanagh, Chair of the Board and Trustee
Karen P. Robards, Vice Chair of the Board and Trustee
Michael J. Castellano, Trustee
Cynthia L. Egan, Trustee
Frank J. Fabozzi, Trustee
R. Glenn Hubbard, Trustee
W. Carl Kester, Trustee
Catherine A. Lynch, Trustee
Robert Fairbairn, Trustee
John M. Perlowski, Trustee, President and Chief Executive Officer
Jonathan Diorio, Vice President
Neal J. Andrews, Chief Financial Officer
Jay M. Fife, Treasurer
Charles Park, Chief Compliance Officer
Janey Ahn, Secretary
Effective December 31, 2017, Jerrold B. Harris retired as a Trustee of the Funds.
Effective February 16, 2018, Barbara G. Novick resigned, and Robert Fairbairn was appointed, as an interested Trustee of the Funds.
| | |
| Investment Adviser | | Transfer Agent
|
| BlackRock Advisors, LLC | | Computershare Trust Company, N.A. |
| Wilmington, DE 19809 | | Canton, MA 02021 |
| | |
| Distributor | | Legal Counsel |
| BlackRock Investments, LLC(a) | | Skadden, Arps, Slate, Meagher & Flom LLP |
| New York, NY 10022 | | Boston, MA 02116 |
| | |
| Accounting Agent and Custodian | | Independent Registered Public Accounting Firm |
| State Street Bank and Trust Company | | Deloitte & Touche LLP |
| Boston, MA 02111 | | Boston, MA 02116 |
| | |
| | Address of the Trusts |
| | 100 Bellevue Parkway |
| | Wilmington, DE 19809 |
| | |
| 102 | | 2018 BLACKROCK SEMI-ANNUAL REPORTTO SHAREHOLDERS |
Additional Information
Trust Certification
The Trusts are listed for trading on the NYSE and have filed with the NYSE their annual chief executive officer certification regarding compliance with the NYSE’s listing standards. The Trusts filed with the U.S. Securities and Exchange Commission (“SEC”) the certification of its chief executive officer and chief financial officer required by section 302 of the Sarbanes-Oxley Act.
Dividend Policy
Each Trust’s dividend policy is to distribute all or a portion of its net investment income to its shareholders on a monthly basis. In order to provide shareholders with a more stable level of dividend distributions, the distributions paid by the Trusts for any particular month may be more or less than the amount of net investment income earned by the Trusts during such month. The portion of distributions that exceeds a Trust’s current and accumulated earnings and profits, which are measured on a tax basis, will constitute a nontaxable return of capital. Distributions in excess of a Trust’s taxable income and net capital gains, but not in excess of a Trust’s earnings and profits, will be taxable to shareholders as ordinary income and will not constitute a nontaxable return of capital. The Trusts’ current accumulated but undistributed net investment income, if any, is disclosed in the Statements of Assets and Liabilities, which comprises part of the financial information included in this report.
General Information
The Trusts do not make available copies of their Statements of Additional Information because the Trusts’ shares are not continuously offered, which means that the Statement of Additional Information of each Trust has not been updated after the completion of the respective Trust’s offerings and the information contained in each Trust’s Statement of Additional Information may have become outdated.
In accordance with Section 23(c) of the Investment Company Act of 1940, as amended, the Trusts from time to time may purchase shares of its Common Shares in the open market or in private transactions.
Except as described below, during the period, there were no material changes in the Trusts’ investment objectives or policies or to the Trusts’ charters or by-laws that would delay or prevent a change of control of the Trusts that were not approved by the shareholders or in the principal risk factors associated with investment in the Trusts. Other than as reported on page 110, there have been no changes in the persons who are primarily responsible for the day-to-day management of the Trusts’ portfolios.
On January 30, 2018, the Board of BKT received a non-binding shareholder proposal for the annual meeting requesting that the Board authorize a self-tender offer for all outstanding shares of common stock of the Trust.
Quarterly performance, semi-annual and annual reports, current net asset value and other information regarding the Trusts may be found on BlackRock’s website, which can be accessed at http://www.blackrock.com. Any reference to BlackRock’s website in this report is intended to allow investors public access to information regarding the Trusts and does not, and is not intended to, incorporate BlackRock’s website in this report.
Electronic Delivery
Shareholders can sign up for e-mail notifications of quarterly statements, annual and semi-annual shareholder reports by enrolling in the Trusts’ electronic delivery program. Electronic copies of shareholder reports are available on BlackRock’s website.
To enroll in electronic delivery:
Shareholders Who Hold Accounts with Investment Advisers, Banks or Brokerages:
Please contact your financial advisor. Please note that not all investment advisers, banks or brokerages may offer this service.
Householding
The Trusts will mail only one copy of shareholder documents, including annual and semi-annual reports and proxy statements, to shareholders with multiple accounts at the same address. This practice is commonly called “householding” and is intended to reduce expenses and eliminate duplicate mailings of shareholder documents. Mailings of your shareholder documents may be householded indefinitely unless you instruct us otherwise. If you do not want the mailing of these documents to be combined with those for other members of your household, please call the Trusts at (800) 882-0052.
Availability of Quarterly Schedule of Investments
The Trusts file their complete schedule of portfolio holdings with the SEC for the first and third quarters of each fiscal year on Form N-Q. The Trusts’ Forms N-Q are available on the SEC’s website at http://www.sec.gov and may also be reviewed and copied at the SEC’s Public Reference Room in Washington, D.C. Information on the operation of the Public Reference Room or how to access documents on the SEC’s website without charge may be obtained by calling (800) SEC-0330. The Trusts’ Forms N-Q may also be obtained upon request and without charge by calling (800) 882-0052.
Availability of Proxy Voting Policies and Procedures
A description of the policies and procedures that the Trusts use to determine how to vote proxies relating to portfolio securities is available upon request and without charge (1) by calling (800) 882-0052; (2) at http://www.blackrock.com; and (3) on the SEC’s website at http://www.sec.gov.
| | | | |
| ADDITIONAL INFORMATION | | | 103 | |
Additional Information (continued)
Availability of Proxy Voting Record
Information about how the Trusts voted proxies relating to securities held in the Trusts’ portfolios during the most recent 12-month period ended June 30 is available upon request and without charge (1) at http://www.blackrock.com or by calling (800) 882-0052; and (2) on the SEC’s website at http://www.sec.gov.
Availability of Trust Updates
BlackRock will update performance and certain other data for the Trusts on a monthly basis on its website in the “Closed-end Funds” section of http://www.blackrock.com as well as certain other material information as necessary from time to time. Investors and others are advised to check the website for updated performance information and the release of other material information about the Trusts. This reference to BlackRock’s website is intended to allow investors public access to information regarding the Trusts and does not, and is not intended to, incorporate BlackRock’s website in this report.
Section 19(a) Notices
BHK’s amounts and sources of distributions reported are estimates and are being provided to you pursuant to regulatory requirements and are not being provided for tax reporting purposes. The actual amounts and sources for tax reporting purposes will depend upon the Trust’s investment experience during the remainder of the fiscal year and may be subject to changes based on tax regulations. The Trust will provide a Form 1099-DIV each calendar year that will tell you how to report these distributions for U.S. federal income tax purposes.
February 28, 2018
| | | | | | | | | | | | | | | | | | | | | | | | | | | | | | | | | | | | | | | | |
| | | Total Fiscal Year to Date
Cumulative Distributions by Character | | | % of Fiscal Year to Date
Cumulative Distributions by Character | |
| | | Net
Investment
Income | | | Net Realized
Capital Gains
Short Term | | | Net Realized
Capital Gains
Long Term | | | Return of
Capital | | | Total Per
Common
Share | | | Net
Investment
Income | | | Net Realized
Capital Gains
Short Term | | | Net Realized
Capital Gains
Long Term | | | Return of
Capital | | | Total Per
Common
Share | |
BHK | | $ | 0.390000 | | | $ | — | | | $ | — | | | $ | — | | | $ | 0.390000 | | | | 100 | % | | | 0 | % | | | 0 | % | | | 0 | % | | | 100 | % |
The Trust estimates that it has distributed more than the amount of earned income and net realized gains; therefore, a portion of the distribution may be a return of capital. A return of capital may occur, for example, when some or all of the shareholder's investment in the Trust is returned to the shareholder. A return of capital does not necessarily reflect the Trust's investment performance and should not be confused with "yield" or "income". When distributions exceed total return performance, the difference will incrementally reduce the Trust's net asset value per share.
Section 19(a) notices for the Trusts, as applicable, are available on the BlackRock website http://www.blackrock.com.
BlackRock Privacy Principles
BlackRock is committed to maintaining the privacy of its current and former fund investors and individual clients (collectively, “Clients”) and to safeguarding their non-public personal information. The following information is provided to help you understand what personal information BlackRock collects, how we protect that information and why in certain cases we share such information with select parties.
If you are located in a jurisdiction where specific laws, rules or regulations require BlackRock to provide you with additional or different privacy-related rights beyond what is set forth below, then BlackRock will comply with those specific laws, rules or regulations.
BlackRock obtains or verifies personal non-public information from and about you from different sources, including the following: (i) information we receive from you or, if applicable, your financial intermediary, on applications, forms or other documents; (ii) information about your transactions with us, our affiliates, or others; (iii) information we receive from a consumer reporting agency; and (iv) from visits to our websites.
BlackRock does not sell or disclose to non-affiliated third parties any non-public personal information about its Clients, except as permitted by law or as is necessary to respond to regulatory requests or to service Client accounts. These non-affiliated third parties are required to protect the confidentiality and security of this information and to use it only for its intended purpose.
We may share information with our affiliates to service your account or to provide you with information about other BlackRock products or services that may be of interest to you. In addition, BlackRock restricts access to non-public personal information about its Clients to those BlackRock employees with a legitimate business need for the information. BlackRock maintains physical, electronic and procedural safeguards that are designed to protect the non-public personal information of its Clients, including procedures relating to the proper storage and disposal of such information.
| | |
| 104 | | 2018 BLACKROCK SEMI-ANNUAL REPORTTO SHAREHOLDERS |
Glossary of Terms Used in this Report
| | |
| Currency Abbreviations |
| |
| ARS | | Argentine Peso |
| AUD | | Australian Dollar |
| CAD | | Canadian Dollar |
| EUR | | Euro |
| GBP | | British Pound |
| NZD | | New Zealand Dollar |
| USD | | U.S. Dollar |
| | |
| Portfolio Abbreviations |
| |
| CLO | | Collateralized Loan Obligation |
| ETF | | Exchange-Traded Fund |
| FHLMC | | Federal Home Loan Mortgage Corp. |
| FNMA | | Federal National Mortgage Association |
| GO | | General Obligation Bonds |
| IO | | Interest Only |
| LIBOR | | London Interbank Offered Rate |
| MTN | | Medium-Term Note |
| PIK | | Payment-In-Kind |
| RB | | Revenue Bonds |
| | | | |
| GLOSSARYOF TERMS USEDINTHIS REPORT | | | 105 | |
This report is intended for current holders. It is not a prospectus. Past performance results shown in this report should not be considered a representation of future performance. The Trusts have leveraged their Common Shares, which creates risks for Common Shareholders, including the likelihood of greater volatility of net asset value and market price of the Common Shares, and the risk that fluctuations in short-term interest rates may reduce the Common Shares’ yield. Statements and other information herein are as dated and are subject to change.

| | |
| CEFBHK-2/18-SAR | |  |
| Item 2 – | Code of Ethics – Not Applicable to this semi-annual report |
| Item 3 – | Audit Committee Financial Expert – Not Applicable to this semi-annual report |
| Item 4 – | Principal Accountant Fees and Services – Not Applicable to this semi-annual report |
| Item 5 – | Audit Committee of Listed Registrants – Not Applicable to this semi-annual report |
| | (a) The registrant’s Schedule of Investments is included as part of the Report to Stockholders filed under Item 1 of this Form. |
| | (b) Not Applicable due to no such divestments during the semi-annual period covered since the previous Form N-CSR filing. |
| Item 7 – | Disclosure of Proxy Voting Policies and Procedures for Closed-End Management Investment Companies – Not Applicable to this semi-annual report |
| Item 8 – | Portfolio Managers of Closed-End Management Investment Companies |
| | (a) | Not Applicable to this semi-annual report. |
| | (b) | As of the date of this filing, there have been no changes in any of the portfolio managers identified in the most recent annual report on Form N-CSR. |
| Item 9 – | Purchases of Equity Securities by Closed-End Management Investment Company and Affiliated Purchasers |
| | | | | | | | |
| Period | | (a) Total
Number of
Shares
Purchased | | (b) Average
Price Paid per
Share | | (c) Total Number of Shares Purchased as Part of Publicly Announced
Plans or Programs | | (d) Maximum Number of
Shares that May Yet Be
Purchased Under the Plans or Programs1 |
September 1-30, 2017 | | N/A | | N/A | | N/A | | 6,189,303 |
October 1-31, 2017 | | N/A | | N/A | | N/A | | 6,189,303 |
November 1-30, 2017 | | N/A | | N/A | | N/A | | 6,189,303 |
December 1-31, 2017 | | N/A | | N/A | | N/A | | 6,322,949 |
January 1-31, 2018 | | N/A | | N/A | | N/A | | 6,322,949 |
February 1-28, 2018 | | 333,901 | | $10.6600 | | 333,901 | | 5,989,048 |
Total: | | 333,901 | | $10.6600 | | 333,901 | | 5,989,048 |
1The Fund announced an open market share repurchase program on October 28, 2016 pursuant to which the Fund was authorized to repurchase, through November 30, 2017, up to 5% of its outstanding common shares based on common shares outstanding on October 28, 2016 (6,329,983 common shares), in open market transactions. On September 6, 2017, the Fund announced a continuation of the open market share repurchase program, which commenced on December 1, 2017. The Fund may repurchase up to 5% of its outstanding shares based on common shares outstanding on November 30, 2017, in open market transactions, subject to certain conditions.
| Item 10 – | Submission of Matters to a Vote of Security Holders – There have been no material changes to these procedures. |
| Item 11 – | Controls and Procedures |
| | (a) – The registrant’s principal executive and principal financial officers, or persons performing similar functions, have concluded that the registrant’s disclosure controls and procedures (as defined in Rule 30a-3(c) under the Investment Company Act of 1940, as amended (the “1940 Act”)) are effective as of a date |
2
| | within 90 days of the filing of this report based on the evaluation of these controls and procedures required by Rule 30a-3(b) under the 1940 Act and Rule 13a-15(b) under the Securities Exchange Act of 1934, as amended. |
| | (b) – There were no changes in the registrant’s internal control over financial reporting (as defined in Rule 30a-3(d) under the 1940 Act) that occurred during the second fiscal quarter of the period covered by this report that have materially affected, or are reasonably likely to materially affect, the registrant’s internal control over financial reporting. |
| Item 12 – | Disclosure of Securities Lending Activities for Closed-End Management Investment Companies |
| | (a) The following table shows the dollar amounts of income, and dollar amounts of fees and/or compensation paid, relating to the Fund’s securities lending activities during the semi-annual period ended February 28, 2018. The Fund did not engage in any securities lending activity during the semi-annual period ended February 28, 2018. |
| | | | | | | | |
| | | BlackRock Corporate High Yield Fund, Inc. |
| (1) | | Gross income from securities lending activities | | | | $0 |
| (2) | | Fees and/or compensation for securities lending activities and related services | | | | |
| | (a) | | Securities lending income paid to BIM for services as securities lending agent | | $0 | | |
| | (b) | | Collateral management expenses (including fees deducted from a polled cash collateral vehicle) not included in (a) | | $0 | | |
| | (c) | | Administrative fees not included in (a) | | $0 | | |
| | (d) | | Indemnification fees not included in (a) | | $0 | | |
| | (e) | | Rebate (paid to borrowers) | | $0 | | |
| | (f) | | Other fees not included in (a) | | $0 | | |
| (3) | | Aggregate fees/compensation for securities lending activities | | | | $0 |
| (4) | | Net income from securities lending activities | | | | $0 |
| | (b) BlackRock Investment Management, LLC (“BIM”) serves as securities lending agent for the Fund and in that role administers the Fund’s securities lending program pursuant to the terms of a securities lending agency agreement entered into between the Fund and BIM. |
| Item 13 – | Exhibits attached hereto |
| | (a)(1) – Code of Ethics – Not Applicable to this semi-annual report |
| | (a)(2) – Certifications – Attached hereto |
| | (b) – Certifications – Attached hereto |
3
Pursuant to the requirements of the Securities Exchange Act of 1934 and the Investment Company Act of 1940, the registrant has duly caused this report to be signed on its behalf by the undersigned, thereunto duly authorized.
BlackRock Corporate High Yield Fund, Inc.
| | |
By: | | /s/ John M. Perlowski |
| | John M. Perlowski |
| | Chief Executive Officer (principal executive officer) of |
| | BlackRock Corporate High Yield Fund, Inc. |
Date: May 4, 2018
Pursuant to the requirements of the Securities Exchange Act of 1934 and the Investment Company Act of 1940, this report has been signed below by the following persons on behalf of the registrant and in the capacities and on the dates indicated.
| | |
| By: | | /s/ John M. Perlowski |
| | John M. Perlowski |
| | Chief Executive Officer (principal executive officer) of |
| | BlackRock Corporate High Yield Fund, Inc. |
Date: May 4, 2018
| | |
| By: | | /s/ Neal J. Andrews |
| | Neal J. Andrews |
| | Chief Financial Officer (principal financial officer) of |
| | BlackRock Corporate High Yield Fund, Inc. |
Date: May 4, 2018
4