Exhibit 99.1
INLAND WESTERN RETAIL REAL ESTATE TRUST, INC.Annual Stockholders Meeting October 10, 2006 |

INLAND WESTERN RETAIL REAL ESTATE TRUST, INC. TABLE OF CONTENTS Agenda List of Directors and Executive Officers REIT Portfolio Performance Overview Strategic Business Plan History of Inland Western Retail Real Estate Trust, Inc. Notes |
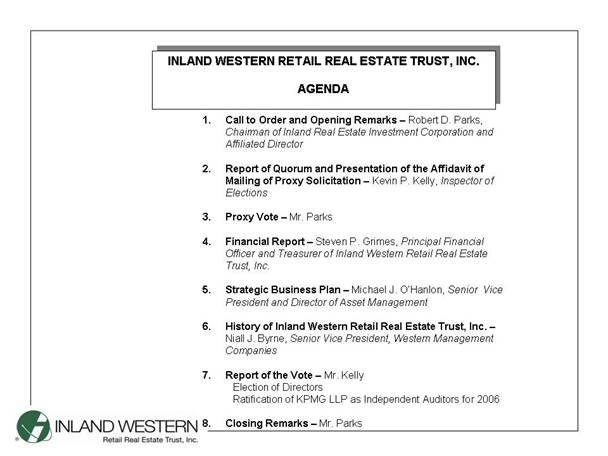
INLAND WESTERN RETAIL REAL ESTATE TRUST, INC. AGENDACall to Order and Opening Remarks – Robert D. Parks, Chairman of Inland Real Estate Investment Corporation and Affiliated Director Report of Quorum and Presentation of the Affidavit of Mailing of Proxy Solicitation – Kevin P. Kelly,Inspector of Elections Proxy Vote – Mr. Parks Financial Report – Steven P. Grimes,Principal Financial Officer and Treasurer of Inland Western Retail Real Estate Trust, Inc. Strategic Business Plan – Michael J. O’Hanlon, Senior Vice President and Director of Asset Management History of Inland Western Retail Real Estate Trust, Inc. – Niall J. Byrne,Senior Vice President, Western Management Companies Report of the Vote – Mr. KellyElection of Directors Ratification of KPMG LLP as Independent Auditors for 2006 8. Closing Remarks – Mr. Parks |
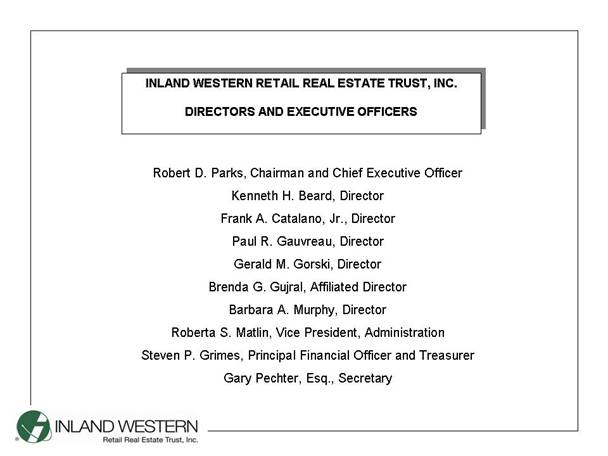
INLAND WESTERN RETAIL REAL ESTATE TRUST, INC. DIRECTORS AND EXECUTIVE OFFICERSRobert D. Parks, Chairman and Chief Executive Officer Kenneth H. Beard, Director Frank A. Catalano, Jr., Director Paul R. Gauvreau, Director Gerald M. Gorski, Director Brenda G. Gujral, Affiliated Director Barbara A. Murphy, Director Roberta S. Matlin, Vice President, Administration Steven P. Grimes, Principal Financial Officer and Treasurer Gary Pechter, Esq., Secretary |
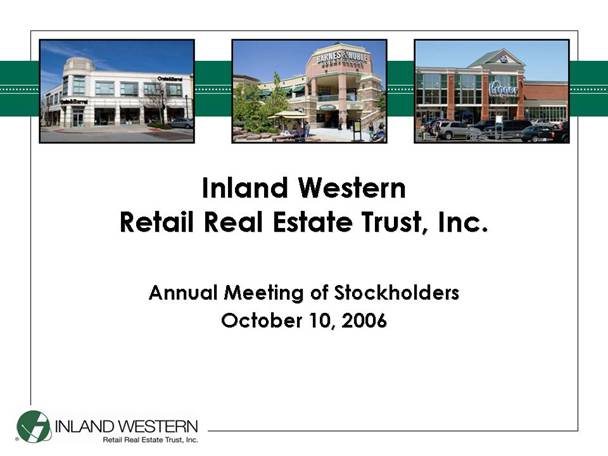
Inland Western Retail Real Estate Trust, Inc. Annual Meeting of Stockholders October 10, 2006 |
This presentation may contain forward-looking statements. Forward-looking statements are statements that are not historical, including statements regarding management's intentions, beliefs, expectations, representations, plans or predictions of the future, and are typically identified by such words as "believe," "expect," "anticipate," "intend," "estimate," "may," "will," "should" and "could." We intend that such forward-looking statements be subject to the safe harbor provisions created by Section 27A of the Securities Act of 1933 and Section 21E of the Securities Exchange Act of 1934, and the Federal Private Securities Litigation Reform Act of 1995, and we include this statement for the purpose of complying with such safe harbor provisions. Future events and actual results, performance, transactions or achievements, financial or otherwise, may differ materially from the results, performance, transactions or achievements expressed or implied by the forward-looking statements. Risks, uncertainties and other factors that might cause such differences, some of which could be material, include, but are not limited to: National or local economic business, real estate and other market conditions, including the ability of the general economy to recover timely from economic downturns; The effect of inflation and other factors on operating expenses and real estate taxes; Risks of joint venture activities; The competitive environment in which we operate and the supply of and demand for retail goods and services in our markets; Financial risks, such as the inability to renew existing tenant leases or obtain debt or equity financing on favorable terms; The level and volatility of interest rates, including the recent trend towards rising interest rates; The increases in property and liability insurance costs; Financial stability of tenants, including the ability of tenants to pay rent, the decision of tenants to close stores and the effect of bankruptcy laws; The ability to maintain our status as a REIT for federal income tax purposes; The effects of hurricanes and other natural disasters; Environmental/safety requirements and costs; Risks of acquiring real estate, including continued competition for new properties and the downward affect on capitalization rates; Risks of real estate development, including the failure of pending developments and redevelopments to be completed on time and within budget and the failure of newly acquired or developed properties to perform as expected; and Other risks identified in our quarterly and annual reports and in other reports we file with the Securities and Exchange Commission (SEC). We disclaim any intention or obligation to update or revise any forward-looking statement whether as a result of new information, future events or otherwise. Readers are cautioned not to place undue reliance on these forward-looking statements, which speak only as of June 30th, 2006. This presentation should also be read in conjunction with our Prospectus and our quarterly and annual reports filed with the SEC. Forward-Looking Statements 1 |
Inland Western Retail Real Estate Trust, Inc. Financial Report Steven P. Grimes Principal Financial Officer |
Inland Western Retail Real Estate Trust, Inc. Company Overview Formed in 2003 Began raising capital in the 3rd Quarter of 2003 Acquires, owns, develops and manages primarily multi-tenant retail shopping centers and single-user net lease properties Properties located in 38 states and in one Canadian province Management team with average experience of 18 years Consistent distribution history Average age of properties built or rehabbed in the portfolio is 4 to 6 years 3 |
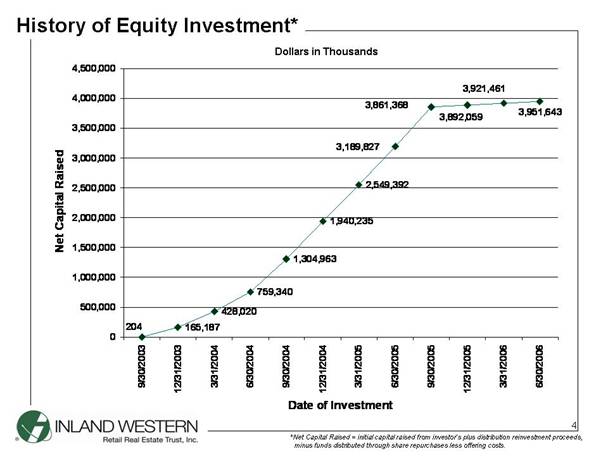
History of Equity Investment* *Net Capital Raised = initial capital raised from investor’s plus distribution reinvestment proceeds, minus funds distributed through share repurchases less offering costs. Dollars in Thousands 4 165,187428,020759,3401,304,9631,940,2352,549,3923,951,6433,921,4613,861,3683,892,0593,189,8272040500,0001,000,0001,500,0002,000,0002,500,0003,000,0003,500,0004,000,0004,500,0009/30/200312/31/20033/31/20046/30/20049/30/200412/31/20043/31/20056/30/20059/30/200512/31/20053/31/20066/30/2006Date of InvestmentNet Capital Raised* |
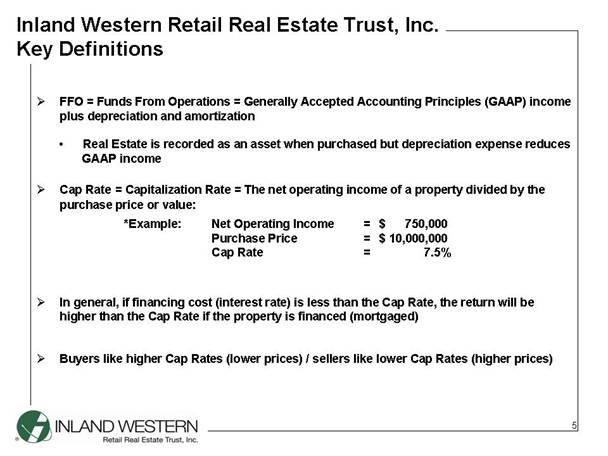
Inland Western Retail Real Estate Trust, Inc. Key Definitions FFO = Funds From Operations = Generally Accepted Accounting Principles (GAAP) income plus depreciation and amortization • Real Estate is recorded as an asset when purchased but depreciation expense reduces GAAP income Cap Rate= Capitalization Rate = The net operating income of a property divided by the purchase price or value: *Example: Net Operating Income = $ 750,000 Purchase Price = $ 10,000,000 Cap Rate = 7.5% In general, if financing cost (interest rate) is less than the Cap Rate, the return will be higher than the Cap Rate if the property is financed (mortgaged) Buyers like higher Cap Rates (lower prices) / sellers like lower Cap Rates (higher prices) 5 |
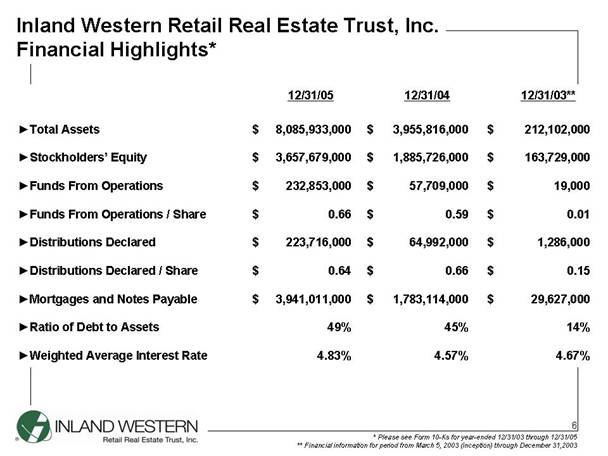
Inland Western Retail Real Estate Trust, Inc. Financial Highlights*4.67% 4.57% 4.83% Weighted Average Interest Rate 14% 45% 49% Ratio of Debt to Assets 29,627,000 $ 1,783,114,000 $ 3,941,011,000 $ Mortgages and Notes Payable 0.15 $ 0.66 $ 0.64 $ Distributions Declared / Share 1,286,000 $ 64,992,000 $ 223,716,000 $ Distributions Declared 0.01 $ 0.59 $ 0.66 $ Funds From Operations / Share 19,000 $ 57,709,000 $ ;232,853,000 $ Funds From Operations 163,729,000 $ 1,885,726,000 $ 3,657,679,000 $ Stockholders’ Equity 212,102,000 $ 3,955,816,000 $ 8,085,933,000 $ Total Assets 12/31/03** 12/31/ 04 12/31/05 * Please see Form 10-Ks for year-ended 12/31/03 through 12/31/05 ** Financial information for period from March 5, 2003 (inception) through December 31,2003 6 |
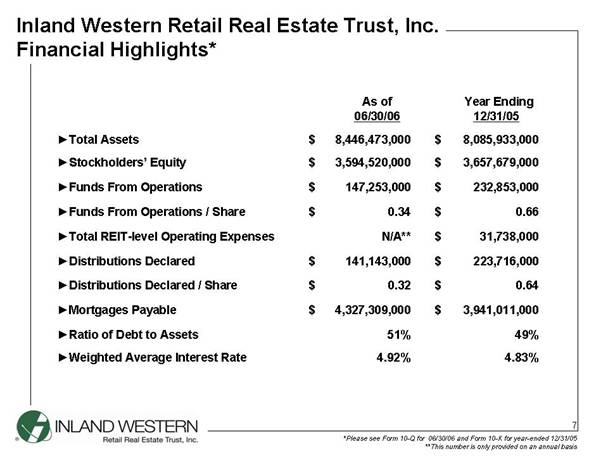
Inland Western Retail Real Estate Trust, Inc. Financial Highlights* 31,738,000 $ N/A** Total REIT-level Operating Expenses 4.83% 4.92% Weighted Average Interest Rate 49% 51% Ratio of Debt to Assets 3,941,011,000 $ 4,327,309,000 $ Mortgages Payable 0.64 $ 0.32 $ Distributions Declared / Share 223,716,000 $ 141,143,000 $ ��Distributions Declared 0.66 $ 0.34 $ Funds From Operations / Share 232,853,000 $ 147,253,000 $ Funds From Operations 3,657,679,000 $ 3,594,520,000 $ &nb sp;Stockholders’ Equity 8,085,933,000 $ 8,446,473,000 $ Total Assets Year Ending 12/31/05 As of 06/30/06 *Please see Form 10-Q for 06/30/06 and Form 10-K for year-ended 12/31/05 **This number is only provided on an annual basis 7 |
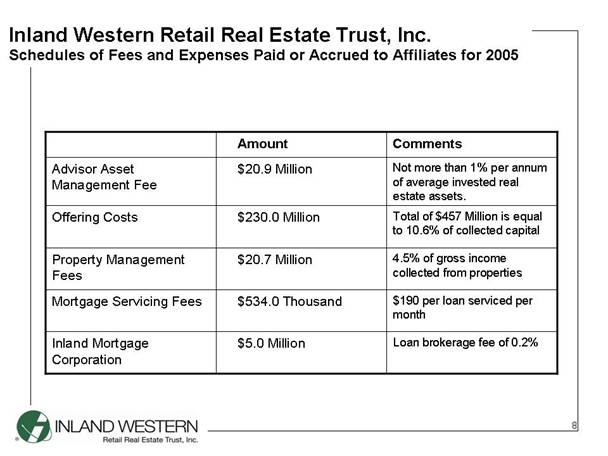
Inland Western Retail Real Estate Trust, Inc. Schedules of Fees and Expenses Paid or Accrued to Affiliates for 2005 Loan brokerage fee of 0.2% $5.0 Million Inland Mortgage Corporation $190 per loan serviced per month $534.0 Thousand Mortgage Servicing Fees 4.5% of gross income collected from properties $20.7 Million Property Management Fees Total of $457 Million is equal to 10.6% of collected capital $230.0 Million Offering Costs Not more than 1% per annum of average invested real estate assets. $20.9 Million Advisor Asset Management Fee Comments Amount 8 |
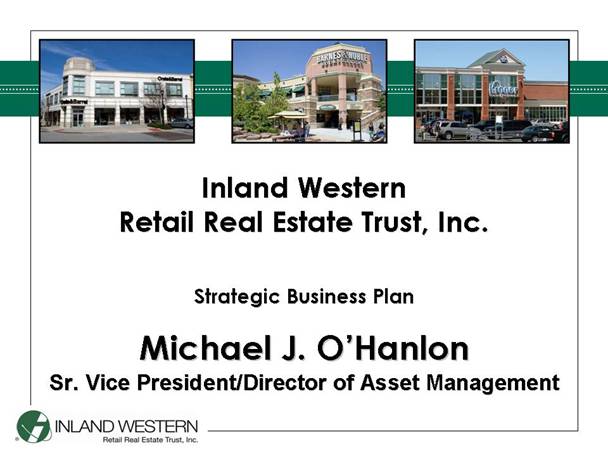
Inland Western Retail Real Estate Trust, Inc. Strategic Business Plan Michael J. O’Hanlon Sr. Vice President/Director of Asset Management |
Inland Western Retail Real Estate Trust, Inc. Strategic Business Plan Increase revenues through: Expanding joint venture activity Pursuing development and redevelopment projects Focused asset management Evaluating portfolio for selective property sales 10 |
Inland Western Retail Real Estate Trust, Inc. Joint Venture AnalysisAcquisition activity increases through additional equity received from JV Partners Planned joint venture expected to pay fees to Inland Western Retail Real Estate Trust, Inc • Acquisition fee • Property management fee • Asset management fee Institutional JV model provides greater return • 80/20 Split (80-JV Partner/20 - IWEST) •More fees earned on less capital investedPossibility of future joint venturedevelopment projects 11 |
Inland Western Retail Real Estate Trust, Inc. 2006 Acquisition Activity Through JuneTotal acquisition of 14 properties Acquisition cost of approximately $380 Million One new mortgage receivable funding for $18 Million One development Joint Venture commenced 12 |
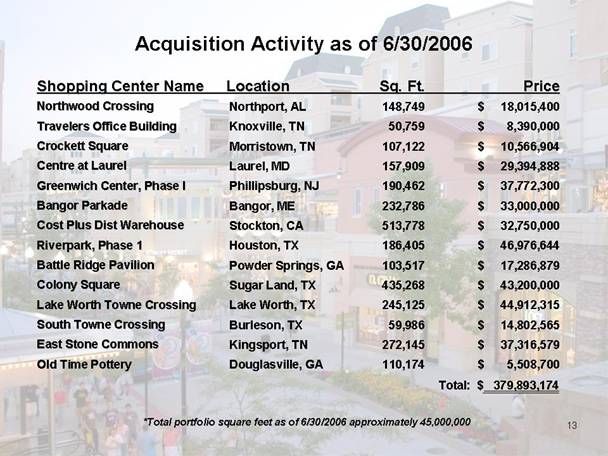
Acquisition Activity as of 6/30/2006 *Total portfolio square feet as of 6/30/2006approximately 45,000,000 Shopping Center Name Location Sq. Ft. Price Northwood Crossing Travelers Office Building Crockett Square Centre at Laurel Greenwich Center, Phase I Bangor Parkade Cost Plus Dist Warehouse Riverpark, Phase 1 Battle Ridge Pavilion Colony Square Lake Worth Towne Crossing South Towne Crossing East Stone Commons Old Time Pottery Northport, AL Knoxville, TN Morristown, TN Laurel, MD Phillipsburg, NJ Bangor, ME Stockton, CA Houston, TX Powder Springs, GA Sugar Land, TX Lake Worth, TX Burleson, TX Kingsport, TN Douglasville, GA $ 18,015,400 $ 8,390,000 $ 10,566,904 $ 29,394,888 $ 37,772,300 $ 33,000,000 $ 32,750,000 $ 46,976,644 $ 17,286,879 $ 43,200,000 $ 44,912,315 $ 14,802,565 $ 37,316,579 $ 5,508,700 148,749 50,759 107,122 157,909 190,462 232,786 513,778 186,405 103,517 435,268 245,125 59,986 272,145 110,174 13 Total: $ 379,893,174 |
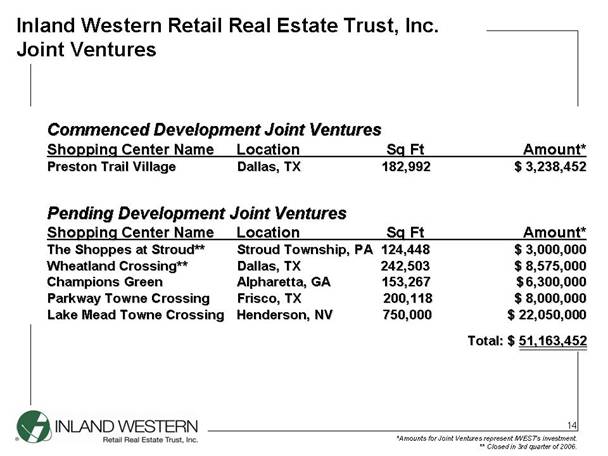
Inland Western Retail Real Estate Trust, Inc. Joint Ventures Commenced Development Joint Ventures Shopping Center Name Location Sq Ft Amount* Preston Trail Village Dallas, TX 182,992 $3,238,452 Pending Development Joint Ventures Shopping Center Name Location Sq Ft Amount* The Shoppes at Stroud** Stroud Township, PA 124,448 $3,000,000 Wheatland Crossing** Dallas, TX 242,503 $ 8,575,000 Champions Green Alpharetta, GA 153,267 $6,300,000 Parkway Towne Crossing Frisco, TX 200,118 $ 8,000,000 Lake Mead Towne CrossingHenderson, NV 750,000$ 22,050,000 *Amounts for Joint Ventures represent IWEST’s investment. ** Closed in 3rd quarter of 2006. 14 Total: $ 51,163,452 |
Inland Western Retail Real Estate Trust, Inc. History of Inland Western Retail Real Estate Trust, Inc. Niall J. Byrne Senior Vice President, Western Management Companies |

History of Properties Under Management Number of Properties Acquired 302 Total Properties as of June 30, 2006 2003 2004 2005 2006 7 113 290 302 16 0501001502002503003501234 |
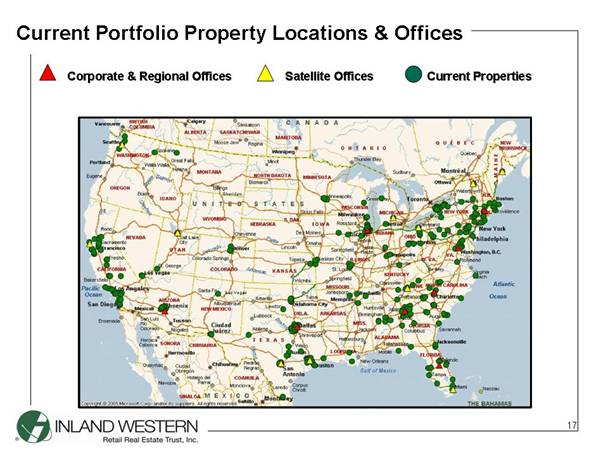
Current Portfolio Property Locations & Offices Current Properties Satellite Offices Corporate & Regional Offices 17 |
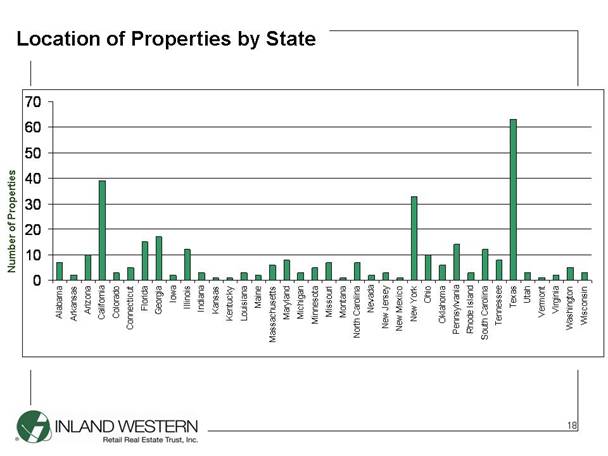
Location of Properties by State Number of Properties 18 010203040506070AlabamaArkansasArizonaCa liforniaColoradoConnecticutFloridaGeorgiaIowaIllinoisIndianaKansasKentuckyLouisianaMaineMassachusettsMarylandMichiganMinnesotaMissouriMontanaNorth CarolinaNevadaNew JerseyNew MexicoNew YorkOhioOklahomaPennsylvaniaRhode IslandSouth CarolinaTennesseeTexasUtahVermontVirginiaWashingtonWisconsin |
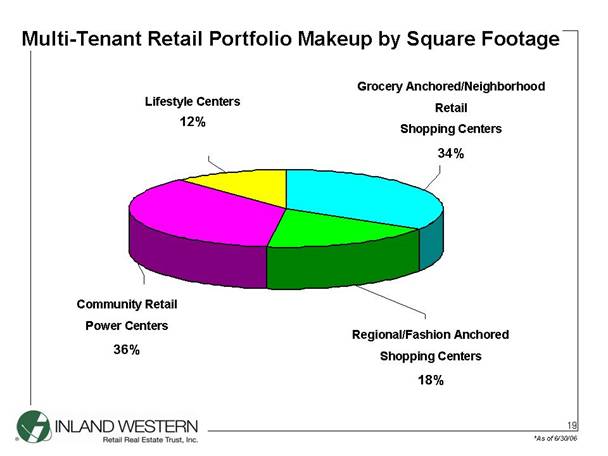
Multi-Tenant Retail Portfolio Makeup by Square Footage Lifestyle Centers 12%Grocery Anchored/Neighborhood Retail Shopping Centers 34% Regional/Fashion Anchored Shopping Centers 18% Community Retail Power Centers 36% *As of 6/30/06 19 Grocery Anchored/ Neighborhood Retail Shopping Centers34%Lifestyle/ Other Centers12%Community Retail/ Power Centers36%Regional/ Fashion Anchored Shopping Centers18% |
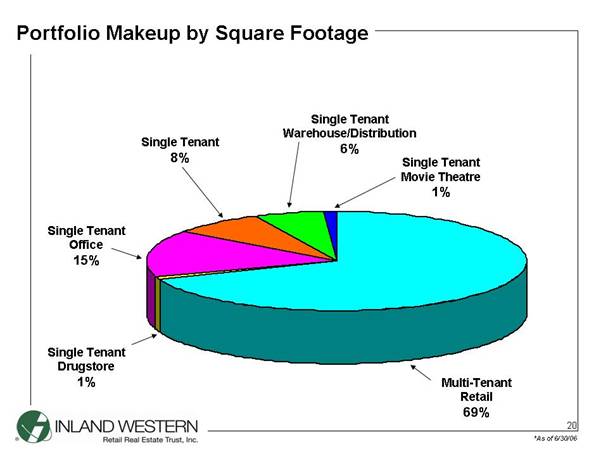
Portfolio Makeup by Square Footage Single Tenant Warehouse/Distribution 6% Single Tenant 8% Single Tenant Office 15% Single Tenant Drugstore 1% Multi-Tenant Retail 69% Single Tenant Movie Theatre 1% *As of 6/30/06 20 |
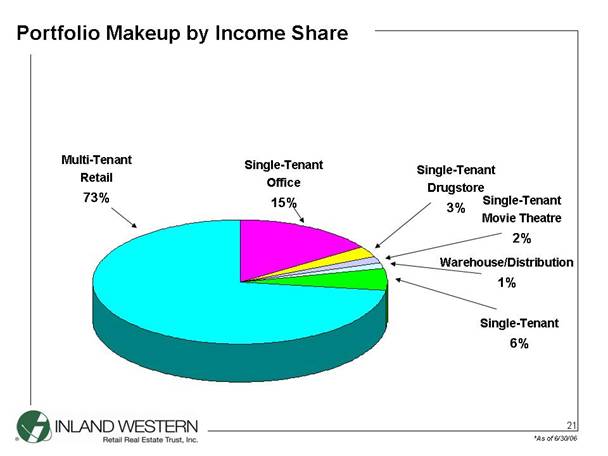
Portfolio Makeup by Income Share Warehouse/Distribution 1% Single-Tenant 6% Single-Tenant Office 15% Single-Tenant Drugstore 3% Multi-Tenant Retail 73% Single-Tenant Movie Theatre 2% *As of 6/30/06 21 |
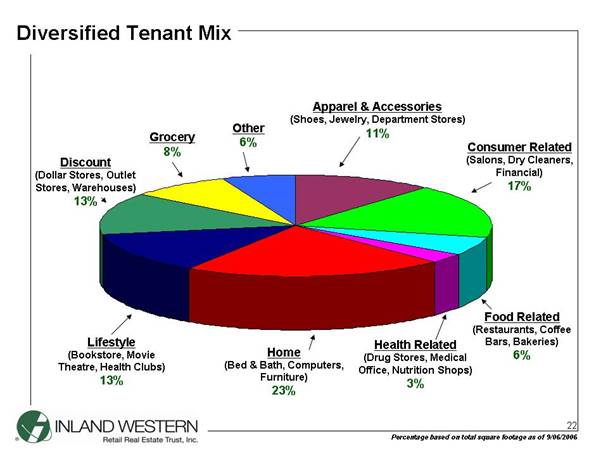
Diversified Tenant Mix Percentage based on total square footage as of 9/06/2006 Apparel & Accessories (Shoes, Jewelry, Department Stores) 11% Consumer Related (Salons, Dry Cleaners, Financial) 17% Other 6% Grocery 8% Discount (Dollar Stores, Outlet Stores, Warehouses) 13% Lifestyle (Bookstore, Movie Theatre, Health Clubs) 13% Home (Bed & Bath, Computers, Furniture) 23% Food Related (Restaurants, Coffee Bars, Bakeries) 6% Health Related (Drug Stores, Medical Office, Nutrition Shops) 3% 22 |
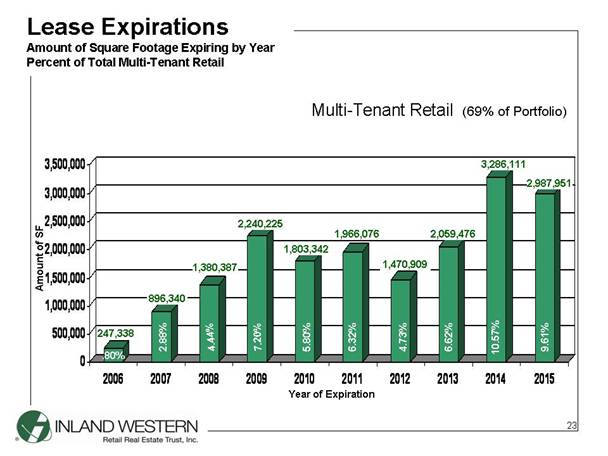
Lease Expirations Amount of Square Footage Expiring by Year Percent of Total Multi-Tenant Retail Multi-Tenant Retail (69% of Portfolio) 247,338 896,340 1,380,387 2,240,225 1,803,342 1,966,076 1,470,909 2,059,476 3,286,111 2,987,951 .80% 2.88% 4.44% 7.20% 5.80% 6.32% 4.73% 6.62% 10.57% 9.61% Year of Expiration Amount of SF 23 0500,0001,000,0001,500,0002,000,0002,500,0003,000,0003,500,0002006200720082009201020112012201320142015 |
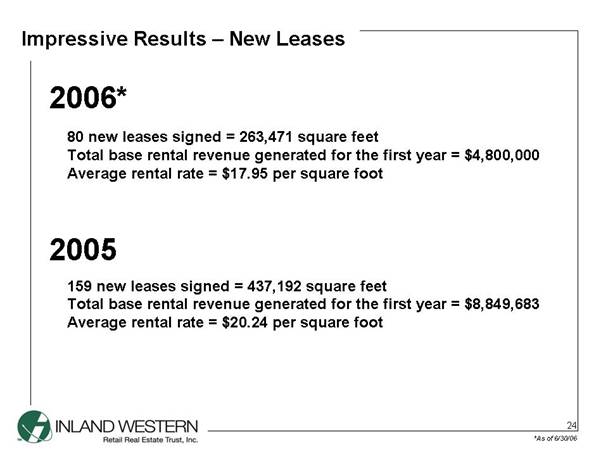
Impressive Results – New Leases Impressive Results – New Leases 2006* 2005 159 new leases signed = 437,192 square feet Total base rental revenue generated for the first year = $8,849,683 Average rental rate = $20.24 per square foot 80 new leases signed = 263,471 square feet Total base rental revenue generated for the first year = $4,800,000 Average rental rate = $17.95 per square foot *As of 6/30/06 24 |
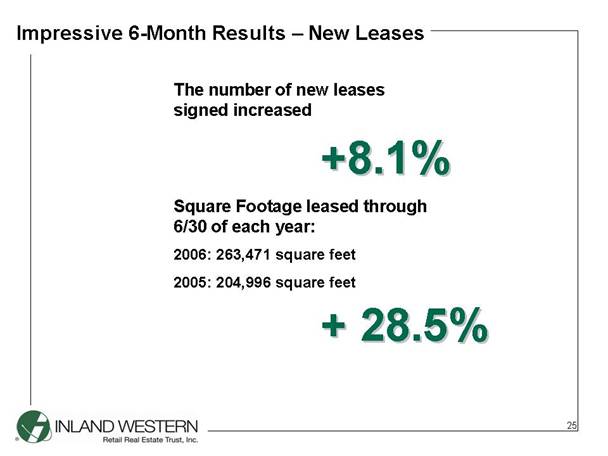
Impressive 6-Month Results – New Leases Square Footage leased through 6/30 of each year: 2006: 263,471 square feet 2005: 204,996 square feet The number of new leases signed increased + 28.5% +8.1% 25 |
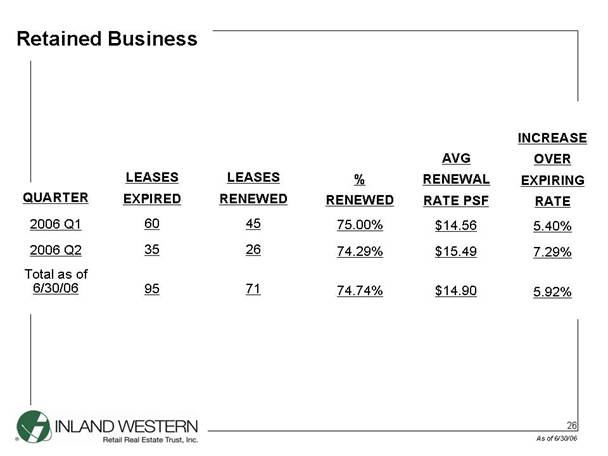
Retained Business As of 6/30/06 26 Total as of 6/30/06 LEASES EXPIRED 60 35 95 LEASES RENEWED 45 26 71 % RENEWED 75.00% 74.29% 74.74% AVG RENEWAL RATE PSF $14.56 $15.49 $14.90 INCREASE OVER EXPIRING RATE 5.40% 7.29% 5.92% QUARTER 2006 Q1 2006 Q2 |
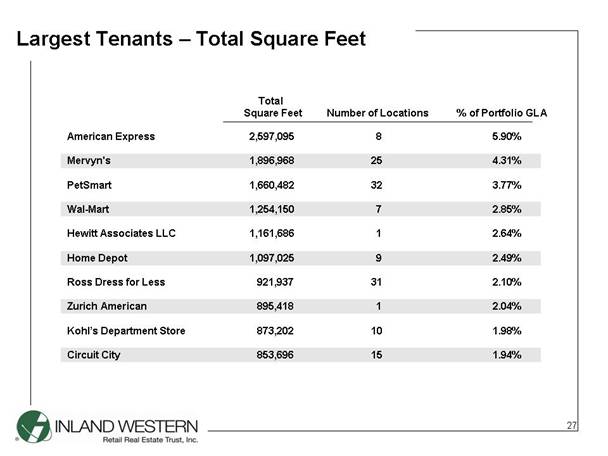
Largest Tenants – Total Square Feet American Express 2,597,095 8 5.90% Mervyn's 1,896,968 25 4.31% PetSmart 1,660,482 32 3.77% Wal-Mart 1,254,150 7 2.85% Hewitt Associates LLC 1,161,686 1 2.64% Home Depot 1,097,025 9 2.49% Ross Dress for Less 921,937 31 2.10% Zurich American 895,418 1 2.04% Kohl’s Department Store 873,202 10 1.98% Circuit City 853,696 15 1.94%Total Square Feet Number of Locations % of Portfolio GLA 27 |
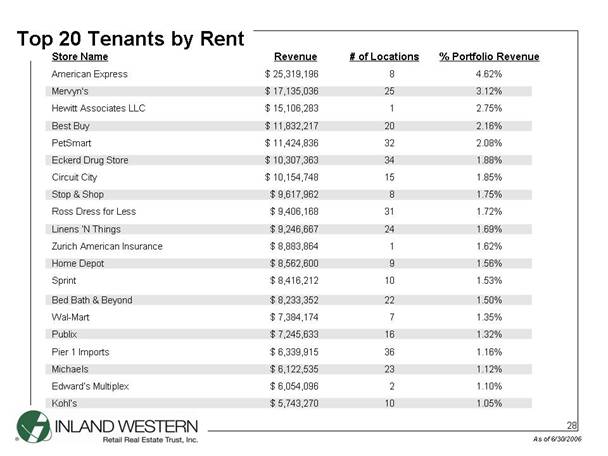
Top 20 Tenants by Rent As of 6/30/2006 1.56% 9 $ 8,562,600 Home Depot 1.69% 24 $ 9,246,667 Linens ‘N Things 1.32% 16 $ 7,245,633 Publix 1.16% 36 $ 6,339,915 Pier 1 Imports 1.12% 23 $ 6,122,535 Michaels 1.10% 2 $ 6,054,096 Edward’s Multiplex 1.05% 10 $ 5,743,270 Kohl’s 1.35% 7 $ 7,384,174 Wal-Mart 1.50% 22 $ 8,233,352 Bed Bath & Beyond 1.53% 10 $ 8,416,212 Sprint 1.62% 1 $ 8,883,864 Zurich American Insurance 1.72% 31 $ 9,406,168 Ross Dress for Less 1.75% 8 $ 9,617,962 Stop & Shop 1.85% 15 $ 10,154,748 Circuit City 1.88% 34 $ 10,307,363 Eckerd Drug Store 2.08% 32 $ 11,424,836 PetSmart 2.16% 20 $ 11,832,217 Best Buy 2.75% 1 $ 15,106,283 Hewitt Associates LLC 3.12% 25 $ 17,135,036 Mervyn's 4.62% 8 $ 25,319,196 American Express % Portfolio Revenue# of LocationsRevenueStore Name 28 |
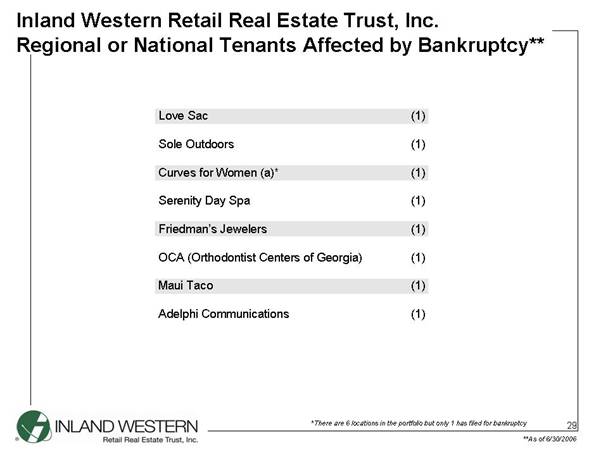
Love Sac (1) Sole Outdoors (1) Curves for Women (a)* (1) Serenity Day Spa (1) Friedman’s Jewelers (1) OCA (Orthodontist Centers of Georgia) (1) Maui Taco (1) Adelphi Communications (1) Inland Western Retail Real Estate Trust, Inc. Regional or National Tenants Affected by Bankruptcy** **As of 6/30/2006 *There are 6 locations in the portfolio but only 1 has filed for bankruptcy 29 |
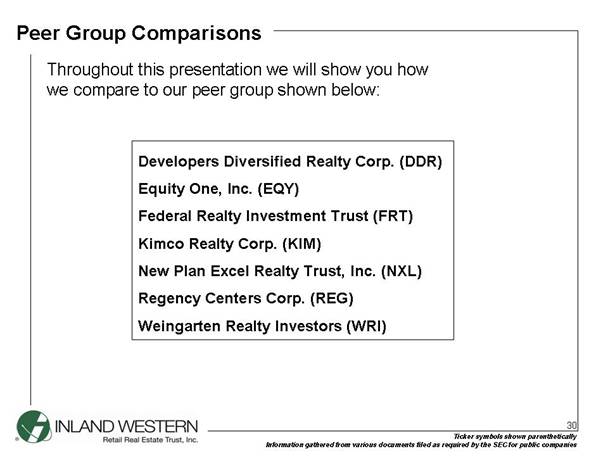
Peer Group Comparisons Throughout this presentation we will show you how we compare to our peer group shown below: Developers Diversified Realty Corp. (DDR)Equity One, Inc. (EQY)Federal Realty Investment Trust (FRT)Kimco Realty Corp. (KIM)New Plan Excel Realty Trust, Inc. (NXL)Regency Centers Corp. (REG)Weingarten Realty Investors (WRI) Ticker symbols shown parenthetically Information gathered from various documents filed as required by the SEC for public companies 30 |
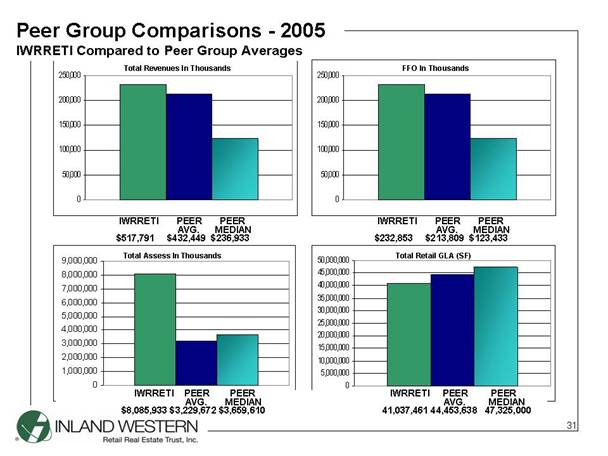
Peer Group Comparisons - 2005 IWRRETI Compared to Peer Group Averages IWRRETI PEER PEER AVG. MEDIAN $517,791 $432,449 $236,933 IWRRETI PEER PEER AVG. MEDIAN $8,085,933 $3,229,672 $3,659,610 IWRRETI PEER PEER AVG. MEDIAN $232,853 $213,809 $123,433 IWRRETI PEER PEER AVG. MEDIAN 41,037,461 44,453,638 47,325,000 Total Revenues In Thousands FFO In Thousands Total Assess In Thousands Total Retail GLA (SF) 31 05,000,00010,000,00015,000,00020,000,00025,000,00030,000,00035,000,00040,000,00045,000,00050,000,000050,000100,000150,000200,000250,000050,000100,000150,000200,000250,00001,000,0002,000,0003,000,0004,000,0005,000,0006,000,0007,000,0008,000,0009,000,000 |
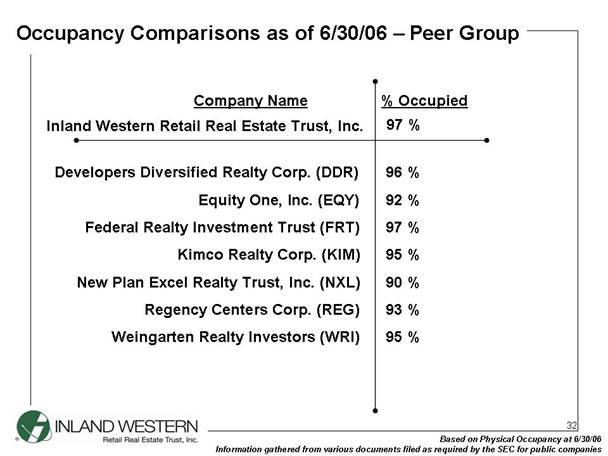
Occupancy Comparisons as of 6/30/06 – Peer Group Developers Diversified Realty Corp. (DDR)Equity One, Inc. (EQY)Federal Realty Investment Trust (FRT)Kimco Realty Corp. (KIM)New Plan Excel Realty Trust, Inc. (NXL)Regency Centers Corp. (REG)Weingarten Realty Investors (WRI)Inland Western Retail Real Estate Trust, Inc.Company Name% Occupied Based on Physical Occupancy at 6/30/06 Information gathered from various documents filed as required by the SEC for public companies 97 % 96 % 92 % 97 % 95 % 90 % 93 % 95 % 32 |
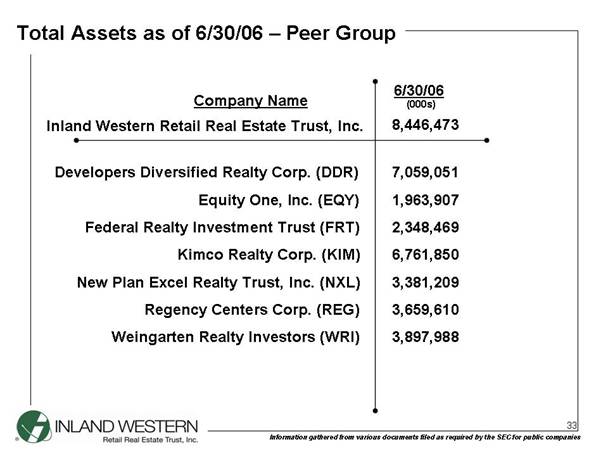
Total Assets as of 6/30/06 – Peer Group Developers Diversified Realty Corp. (DDR)Equity One, Inc. (EQY)Federal Realty Investment Trust (FRT)Kimco Realty Corp. (KIM)New Plan Excel Realty Trust, Inc. (NXL)Regency Centers Corp. (REG)Weingarten Realty Investors (WRI)Inland Western Retail Real Estate Trust, Inc.Company Name6/30/06 Information gathered from various documents filed as required by the SEC for public companies 8,446,473 7,059,051 1,963,907 2,348,469 6,761,850 3,381,209 3,659,610 3,897,988 (000s) 33 |
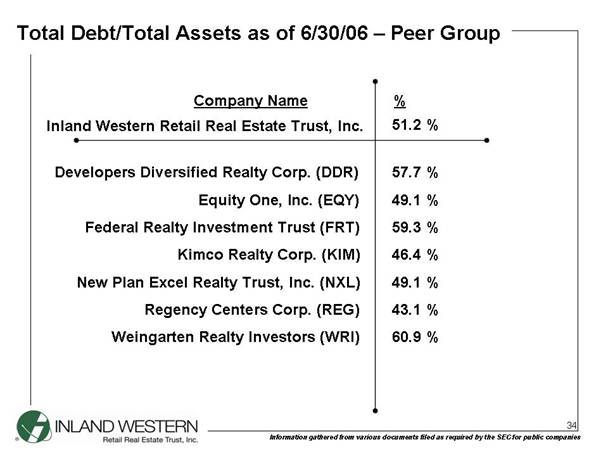
Total Debt/Total Assets as of 6/30/06 – Peer Group Developers Diversified Realty Corp. (DDR)Equity One, Inc. (EQY)Federal Realty Investment Trust (FRT)Kimco Realty Corp. (KIM)New Plan Excel Realty Trust, Inc. (NXL)Regency Centers Corp. (REG)Weingarten Realty Investors (WRI)Inland Western Retail Real Estate Trust, Inc.Company Name% Information gathered from various documents filed as required by the SEC for public companies 51.2 % 57.7 % 49.1 % 59.3 % 46.4 % 49.1 % 43.1 % 60.9 % 34 |
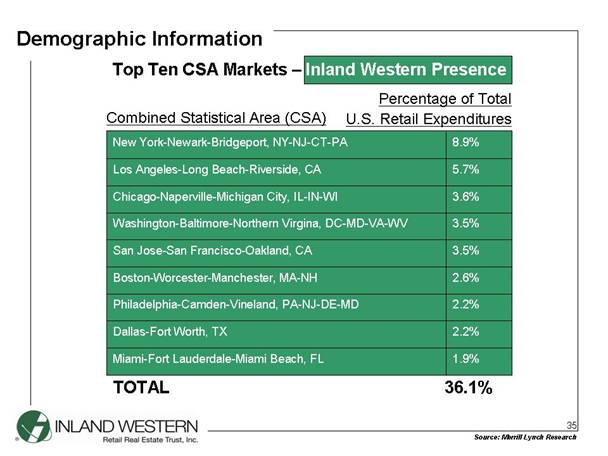
Top Ten CSA Markets – Inland Western Presence 1.9% Miami-Fort Lauderdale-Miami Beach, FL 2.2% Dallas-Fort Worth, TX 2.2% Philadelphia-Camden-Vineland, PA-NJ-DE-MD 2.6% Boston-Worcester-Manchester, MA-NH 3.5% San Jose-San Francisco-Oakland, CA 3.5% Washington-Baltimore-Northern Virgina, DC-MD-VA-WV 3.6% Chicago-Naperville-Michigan City, IL-IN-WI 5.7% Los Angeles-Long Beach-Riverside, CA 8.9% New York-Newark-Bridgeport, NY-NJ-CT-PA Demographic Information TOTAL 36.1% Source: Merrill Lynch Research Combined Statistical Area (CSA) Percentage of Total U.S. Retail Expenditures 35 |
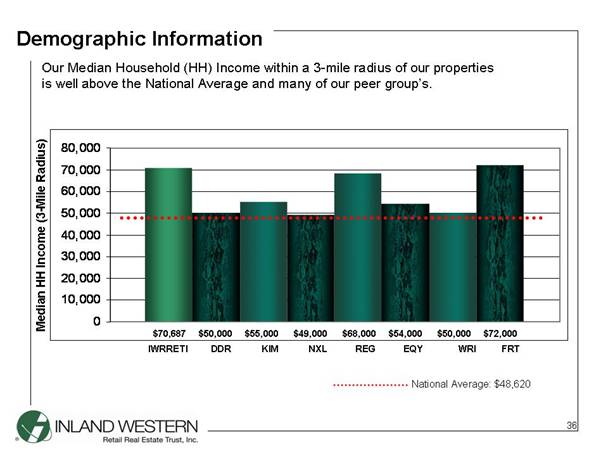
Demographic Information Median HH Income (3-Mile Radius) National Average: $48,620 IWRRETI DDR KIM NXL REG EQY WRI FRT Our Median Household (HH) Income within a 3-mile radius of our properties is well above the National Average and many of our peer group’s. $70,687 $50,000 $55,000 $49,000 $68,000 $54,000 $50,000 $72,000 36 010,00020,00030,00040,00050,00060,00070,00080,000 |
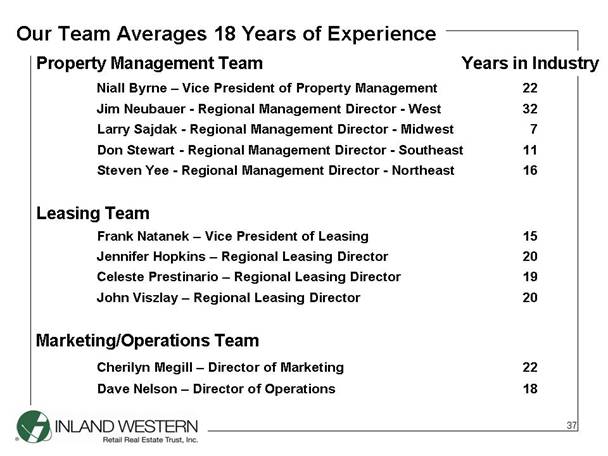
Our Team Averages 18 Years of Experience Property Management Team Years in IndustryNiall Byrne – Vice President of Property Management 22 Jim Neubauer - Regional Management Director - West 32 Larry Sajdak - Regional Management Director - Midwest 7 Don Stewart - Regional Management Director- Southeast 11 Steven Yee - Regional Management Director- Northeast 16 Leasing TeamFrank Natanek – Vice President of Leasing 15 Jennifer Hopkins – Regional Leasing Director20 Celeste Prestinario – Regional Leasing Director19 John Viszlay – Regional Leasing Director 20 Marketing/Operations Team Cherilyn Megill – Director of Marketing 22 Dave Nelson – Director of Operations 18 37 |
Marketing Initiatives – What Sets Us Apart Experienced Marketing Team Market Research/Analysis Demographics/Psychographics Intercept Tenant Surveys Advertising Programs Direct Mail Program Newspaper Radio Directories Outdoor Advertising Consumer Websites Multi-million dollar gift card program with American Express 38 |
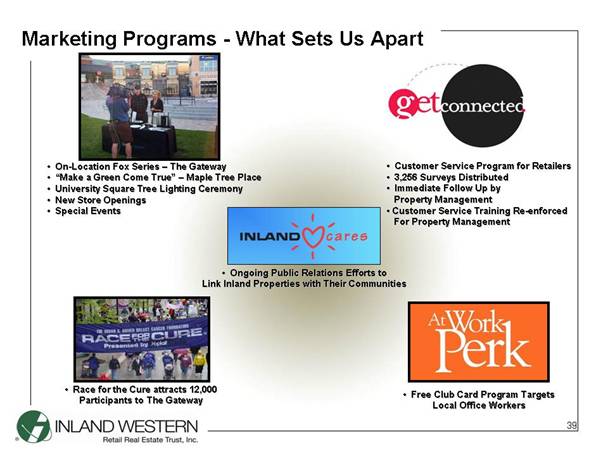
Marketing Programs - What Sets Us Apart Free Club Card Program Targets Local Office Workers Customer Service Program for Retailers 3,256 Surveys Distributed Immediate Follow Up by Property Management Customer Service Training Re-enforced For Property Management Ongoing Public Relations Efforts to Link Inland Properties with Their CommunitiesOn-Location Fox Series – The Gateway “Make a Green Come True” – Maple Tree Place University Square Tree Lighting Ceremony New Store Openings Special Events Race for the Cure attracts 12,000 Participants to The Gateway 39 |
Awards & Recognition The Gateway, Salt Lake City UT – MAXI Merit for Public Relations (2005) (Intl. MAXI Awards Competition Recognizes Excellence in Marketing) – SASI Award (Shop America’s Excellence in Tourism Marketing Award) Maple Tree Place, Williston VT –2006 Maxi Award Finalist – (Public Relations) Pleasant Run Town Crossing, Cedar Hill TX –Awarded City’s “Property of the Month” 40 |
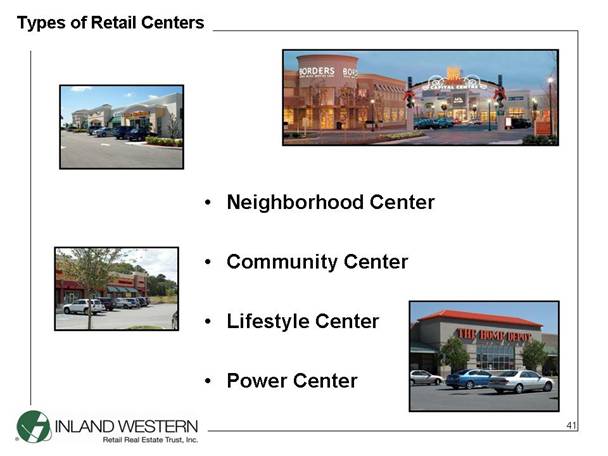
Types of Retail Centers Neighborhood Center Community Center Lifestyle Center Power Center 41 |
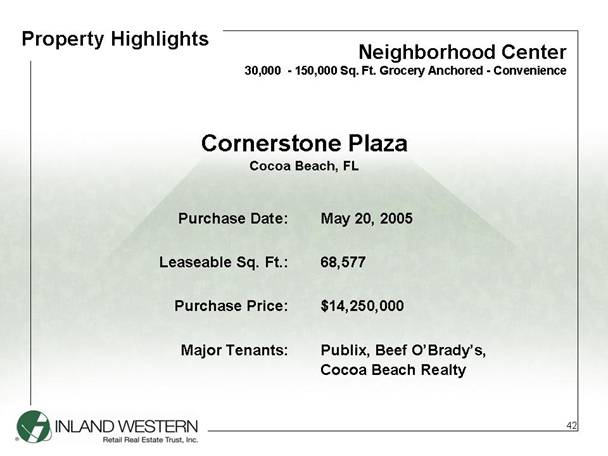
Property Highlights Purchase Date: Leaseable Sq. Ft.: Purchase Price: Major Tenants: Cornerstone Plaza Cocoa Beach, FL Neighborhood Center 30,000 - 150,000 Sq. Ft. Grocery Anchored - ConvenienceMay 20, 2005 68,577 $14,250,000 Publix, Beef O’Brady’s, Cocoa Beach Realty 42 |
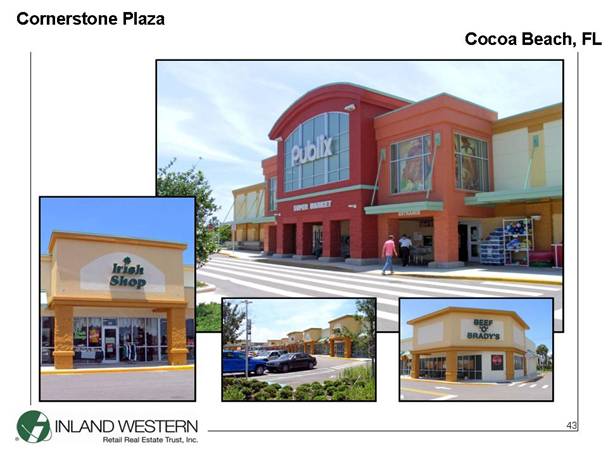
Cornerstone Plaza Cocoa Beach, FL 43 |
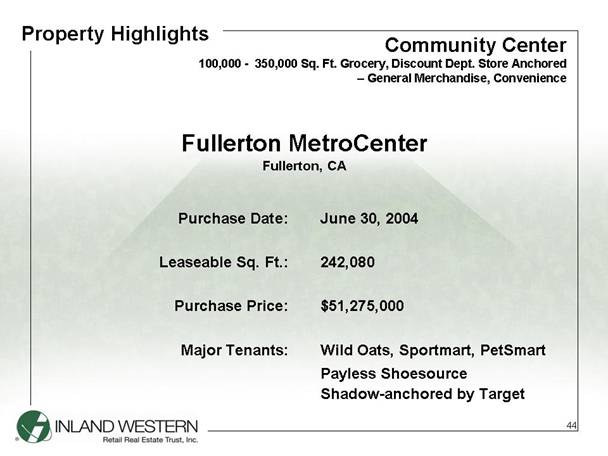
Purchase Date: Leaseable Sq. Ft.: Purchase Price: Major Tenants: Fullerton MetroCenter Fullerton, CA June 30, 2004 242,080 $51,275,000 Wild Oats, Sportmart, PetSmart Shadow-anchored by Target Payless Shoesource 44 Community Center 100,000 - 350,000 Sq. Ft. Grocery, Discount Dept. Store Anchored – General Merchandise, Convenience Property Highlights |
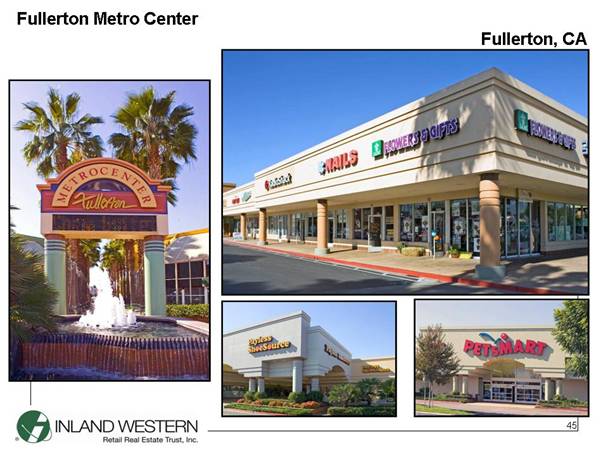
Fullerton Metro Center Fullerton, CA 45 |
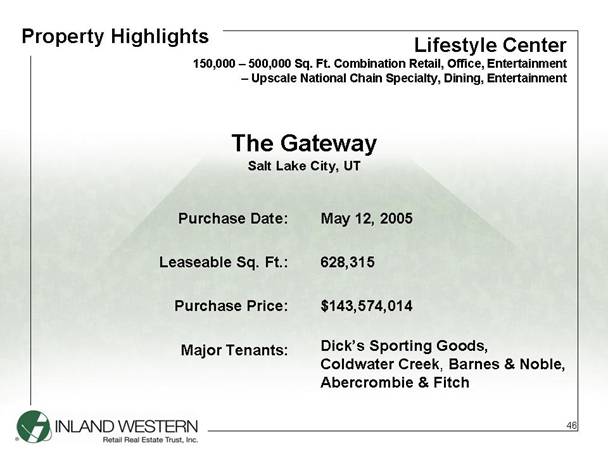
Purchase Date: Leaseable Sq. Ft.: Purchase Price: Major Tenants: The Gateway Salt Lake City, UT May 12, 2005 628,315 $143,574,014 Dick’s Sporting Goods, Coldwater Creek, Barnes & Noble, Abercrombie & Fitch Lifestyle Center 150,000 – 500,000 Sq. Ft. Combination Retail, Office, Entertainment – Upscale National Chain Specialty, Dining, Entertainment Property Highlights 46 |
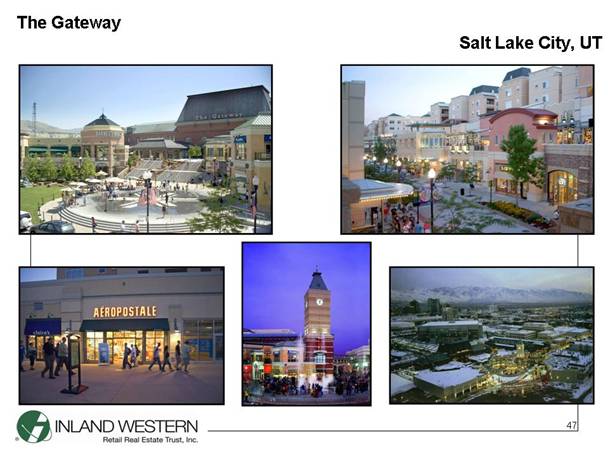
The Gateway Salt Lake City, UT 47 |
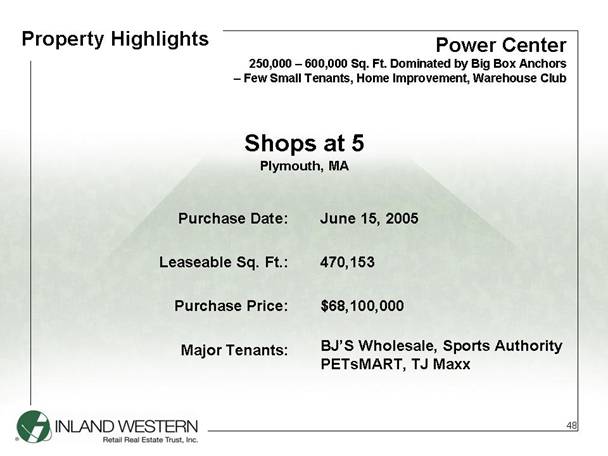
Property Highlights Purchase Date: Leaseable Sq. Ft.: Purchase Price: Major Tenants: Shops at 5 Plymouth, MA June 15, 2005 470,153 $68,100,000 BJ’S Wholesale, Sports Authority PETsMART, TJ Maxx Power Center 250,000 – 600,000 Sq. Ft. Dominated by Big Box Anchors – Few Small Tenants, Home Improvement, Warehouse Club 48 |
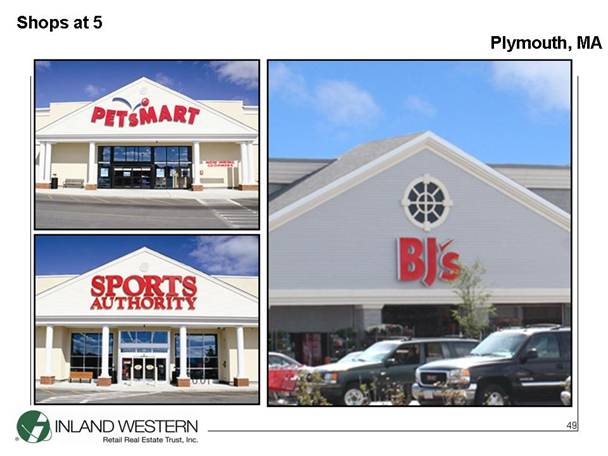
Shops at 5 Plymouth, MA 49 |
For a complete list of all of our properties go to: www.inlandgroup.com Choose “Leasing and Management” Choose “Inland has Retail Space Available” Choose one of our three management companies: Inland Pacific Property Services LLC Retail space available in CaliforniaInland Southwest Management LLC Retail space available in various states including Arizona, Colorado, Louisiana, Nevada, New Mexico, Texas, and Utah Inland US Management LLC Retail space available in various states around the country For More Information: 50 |

Inland Western Retail Real Estate Trust, Inc. Annual Meeting of Stockholders October 10, 2006 |
NOTES |