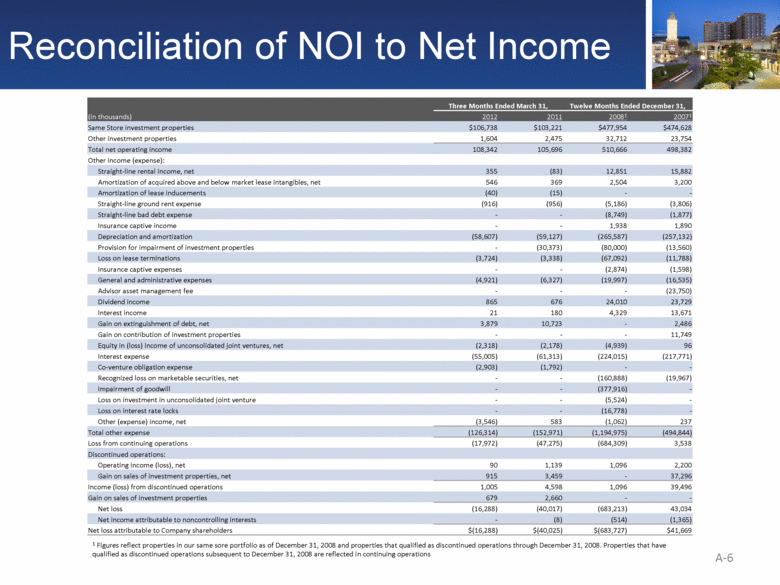
| Reconciliation of NOI to Net Income A-6 Three Months Ended March 31, Twelve Months Ended December 31, (in thousands) 2012 2011 20081 20071 Same Store investment properties $106,738 $103,221 $477,954 $474,628 Other investment properties 1,604 2,475 32,712 23,754 Total net operating income 108,342 105,696 510,666 498,382 Other income (expense): Straight-line rental income, net 355 (83) 12,851 15,882 Amortization of acquired above and below market lease intangibles, net 546 369 2,504 3,200 Amortization of lease inducements (40) (15) - - Straight-line ground rent expense (916) (956) (5,186) (3,806) Straight-line bad debt expense - - (8,749) (1,877) Insurance captive income - - 1,938 1,890 Depreciation and amortization (58,607) (59,127) (265,587) (257,132) Provision for impairment of investment properties - (30,373) (80,000) (13,560) Loss on lease terminations (3,724) (3,338) (67,092) (11,788) Insurance captive expenses - - (2,874) (1,598) General and administrative expenses (4,921) (6,327) (19,997) (16,535) Advisor asset management fee - - - (23,750) Dividend income 865 676 24,010 23,729 Interest income 21 180 4,329 13,671 Gain on extinguishment of debt, net 3,879 10,723 - 2,486 Gain on contribution of investment properties - - - 11,749 Equity in (loss) income of unconsolidated joint ventures, net (2,318) (2,178) (4,939) 96 Interest expense (55,005) (61,313) (224,015) (217,771) Co-venture obligation expense (2,903) (1,792) - - Recognized loss on marketable securities, net - - (160,888) (19,967) Impairment of goodwill - - (377,916) - Loss on investment in unconsolidated joint venture - - (5,524) - Loss on interest rate locks - - (16,778) - Other (expense) income, net (3,546) 583 (1,062) 237 Total other expense (126,314) (152,971) (1,194,975) (494,844) Loss from continuing operations (17,972) (47,275) (684,309) 3,538 Discontinued operations: Operating income (loss), net 90 1,139 1,096 2,200 Gain on sales of investment properties, net 915 3,459 - 37,296 Income (loss) from discontinued operations 1,005 4,598 1,096 39,496 Gain on sales of investment properties 679 2,660 - - Net loss (16,288) (40,017) (683,213) 43,034 Net income attributable to noncontrolling interests - (8) (514) (1,365) Net loss attributable to Company shareholders $(16,288) $(40,025) $(683,727) $41,669 1 Figures reflect properties in our same sore portfolio as of December 31, 2008 and properties that qualified as discontinued operations through December 31, 2008. Properties that have qualified as discontinued operations subsequent to December 31, 2008 are reflected in continuing operations |


