Exhibit 99.2
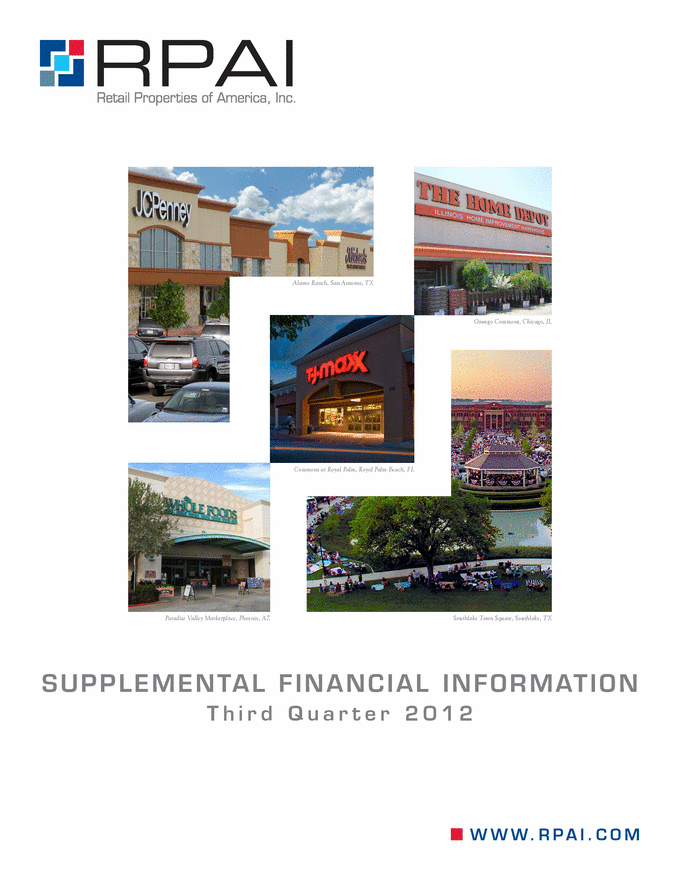
| Southlake Town Square, Southlake, TX Commons at Royal Palm, Royal Palm Beach, FL Paradise Valley Marketplace, Phoenix, AZ Oswego Commons, Chicago, IL Alamo Ranch, San Antonio, TX www. r pai.com Supplemental financial information t h i r d Q u a r t e r 2 0 1 2 |
| Earnings Release i-vii Financial Summary Condensed Consolidated Balance Sheets 1 Condensed Consolidated Statements of Operations 2 Funds From Operations 3 Supplemental Financial Statement Detail 4 Capitalization 5 Unsecured Credit Facility Covenants 6 Consolidated Debt Summary 7 Transaction Summary Acquisitions and Dispositions 8 Portfolio Summary Property Overview 9 State/Regional Summary 10 Retail Operating Portfolio Occupancy 11 Top Tenants 12 Retail Leasing Activity Summary 13 Retail Lease Expirations 14 Unconsolidated Joint Venture Summary Unconsolidated Joint Venture Combined Financial Statements 15-17 Unconsolidated Joint Venture Overview and Debt Summary 18 Other Information Non-GAAP Financial Measures and Reconciliations 19-22 table of contentS 2901 butterfield road | oak brook, i l 60523 | www r paicom |

RETAIL PROPERTIES OF AMERICA, INC. REPORTS
THIRD QUARTER RESULTS
Oak Brook, IL – November 5, 2012 – Retail Properties of America, Inc. (NYSE: RPAI) today reported financial and operating results for the quarter and nine months ended September 30, 2012.
FINANCIAL RESULTS
For the quarter ended September 30, 2012, Retail Properties of America reported:
■ | Operating Funds From Operations (Operating FFO) of $49.6 million, or $0.21 per share, compared to $45.2 million, or $0.23 per share for the same period in 2011; |
■ | Funds From Operations (FFO) of $57.2 million, or $0.25 per share, compared to $46.1 million, or $0.24 per share for the same period in 2011; |
■ | Net loss of $(16.0) million, or $(0.07) per share, compared to a net loss of $(5.0) million, or $(0.03) per share for the same period in 2011. |
For the nine months ended September 30, 2012, the Company reported:
■ | Operating FFO of $149.7 million, or $0.69 per share, compared to $126.1 million, or $0.66 per share for the same period in 2011; |
■ | FFO of $175.8 million, or $0.81 per share, compared to $146.6 million, or $0.76 per share for the same period in 2011; |
■ | Net loss of $(14.6) million, or $(0.07) per share, compared to a net loss of $(58.8) million, or $(0.31) per share for the same period in 2011. |
OPERATING RESULTS
For the quarter ended September 30, 2012, Retail Properties of America’s results for its consolidated portfolio were as follows:
■ | 0.8% increase in total same store net operating income (NOI) over the comparable period in 2011, based on same-store occupancy of 90.1% at September 30, 2012, up 90 basis points from 89.2% at September 30, 2011; |
■ | Total portfolio percent leased, including leases signed but not commenced: 91.8% at September 30, 2012, up 20 basis points from 91.6% at June 30, 2012 and up 220 basis points from 89.6% at September 30, 2011; |
■ | Retail portfolio percent leased, including leases signed but not commenced: 91.1% at September 30, 2012, up 10 basis points from 91.0% at June 30, 2012 and up 250 basis points from 88.6% at September 30, 2011; |
■ | 1,023,000 square feet of retail leasing transactions comprised of 166 new and renewal leases, including the Company’s pro rata share of unconsolidated joint ventures; and |
■ | Positive comparable leasing spreads, including the Company’s pro rata share of joint ventures, on a cash basis, with new leases at 12.7% and renewal leases at 5.0%, for a blended spread of 5.9%. |
| | | | | |
| Retail Properties of America, Inc. |
| |
| | T: 855.646.7724 | | | |
| | www.rpai.com | | 2901 Butterfield Road |
| | | | Oak Brook, IL 60523 |
| | | | | | | | |
“During the third quarter we continued to make measurable progress towards accomplishing the strategic initiatives we set out at our IPO in April,” stated Steve Grimes, President and CEO. “We are realizing the positive results of our intense leasing focus, with strong velocity in the third quarter, resulting in a 250 basis point improvement in our retail leased percentage over the past year. With our retail portfolio over 91% leased and three consecutive quarters of positive leasing spreads we are well on our way to our stabilized occupancy goal. Additionally, our successful execution of asset sales and related debt repayments have provided us with an improved risk profile and postitioned us to drive long-term shareholder value. As a result, we are confident in our ability to achieve all of our stated 2012 objectives.”
INVESTMENT ACTIVITY
During the quarter, the Company completed the sale of 18 non-core and non-strategic assets in its consolidated portfolio for a gross sales price of $190.5 million. This includes the sale of 13 former Mervyns locations in California for $100.4 million and the sale of the Cost Plus distribution center in Stockton, CA, for $63.0 million. Proceeds from the transactions were used to repay $132.7 million in related mortgage debt with additional net proceeds further reducing leverage.
Year-to-date the Company has completed $262.3 million in asset sales. Sales for the year-to-date period also include earnouts, pad sales, a deed-in-lieu transaction, and three single-tenant retail properties that were sold subsequent to quarter end for a gross sales price of $33.4 million.
CAPITAL MARKETS AND BALANCE SHEET ACTIVITY
As of September 30, 2012, the Company had $2.9 billion of consolidated indebtedness outstanding at a weighted average interest rate of 5.77% and a weighted average maturity of 5.5 years.
During the quarter, the Company repaid $282.1 million of mortgage loans, excluding amortization. These repayments included $149.4 million of maturing mortgage loans on nine properties that are now unencumbered. The Company also repaid a $13.9 million mezzanine note payable. The mortgages and note repaid during the quarter had a weighted average interest rate of 5.73%. As of October 1, 2012, all 2012 debt maturities have been addressed.
During the quarter, the Company entered into a $300 million interest rate swap transaction to fix the variable rate portion of its term loan to a fixed rate of 0.54% from July 31, 2012 through February 24, 2016, the maturity date of the Company’s unsecured term loan. The margin on the unsecured term loan is based on a leverage grid and ranges from 1.75% to 2.50%. The applicable margin was 2.25% as of September 30, 2012, a decrease of 25 basis points from the previous quarter.
ii
DIVIDEND
On September 10, 2012, the Board of Directors of Retail Properties of America declared the third quarter distribution of $0.165625 per share, payable on October 10, 2012 to stockholders of record at the close of business on September 28, 2012.
B-1 SHARE CONVERSION
Subsequent to quarter end, on October 5, 2012, each share of Class B-1 common stock automatically converted into one share of Class A common stock. The Class B-2 and B-3 common shares are set to automatically convert on April 5, 2013 and October 5, 2013, respectively.
GUIDANCE
Retail Properties of America has revised its guidance for 2012 Operating FFO per share and net loss per share. The Company currently expects 2012 Operating FFO per share of $0.84 to $0.87, versus prior guidance of $0.83 to $0.87 and 2012 net loss per share of $(0.12) to $(0.09), versus prior guidance of $(0.15) to $(0.11).
WEBCAST AND SUPPLEMENTAL INFORMATION
Retail Properties of America’s management team will hold a webcast, on Tuesday, November 6, 2012 at 11:00 AM EST, to discuss its quarterly financial results and operating performance, business highlights and outlook. In addition, the Company may discuss business and financial developments and trends and other matters affecting the Company, some of which may not have been previously disclosed. To participate in the online webcast on the Company’s website please go to www.rpai.com under the investor relations section of the website and follow the directions. A replay of the webcast will be available. To listen to the replay, please go to www.rpai.com under the investor relations section of the website and follow the directions.
The Company has also posted supplemental financial and operating information and other data on the investor relations section of its website.
ABOUT RPAI
Retail Properties of America, Inc. is a fully integrated, self-administered and self-managed real estate company that owns and operates high quality, strategically located shopping centers across 35 states. The Company is one of the largest owners and operators of shopping centers in the United States. The Company is publicly traded on the New York Stock Exchange under the ticker symbol RPAI. Additional information about the Company is available at www.rpai.com.
SAFE HARBOR LANGUAGE
The statements and certain other information contained in this press release, which can be identified by the use of forward-looking terminology such as “may,” “expect,” “continue,” “remains,” “intend,” “aim,” “should,” “prospects,” “could,” “future,” “potential,” “believes,” “plans,” “likely,” “anticipate,” and “probable,” or the negative thereof or other variations thereon or comparable terminology, constitute “forward-looking statements” within the meaning of Section 27A of the Securities Act of 1933, as amended, and Section 21E of
iii
the Securities Exchange Act of 1934, as amended, and are subject to the safe harbors created thereby. These forward-looking statements reflect our current views about our plans, intentions, expectations, strategies and prospects, which are based on the information currently available to us and on assumptions we have made. Although we believe that our plans, intentions, expectations, strategies and prospects as reflected in or suggested by those forward-looking statements are reasonable, we can give no assurance that such plans, intentions, expectations or strategies will be attained or achieved. Furthermore, these forward-looking statements should be considered as subject to the many risks and uncertainties that exist in the Company’s operations and business environment. Such risks and uncertainties could cause actual results to differ materially from those projected. These uncertainties include, but are not limited to, general economic, business and financial conditions, changes in the Company’s industry and changes in the real estate markets in particular, market demand for and pricing of the Company’s common stock, general volatility of the capital and credit markets, competitive and cost factors, the ability of the Company to enter into new leases or renew leases on favorable terms, defaults on, early terminations of or non-renewal of leases by tenants, bankruptcy or insolvency of a major tenant or a significant number of smaller tenants, the effects of declining real estate valuations and impairment charges on the Company’s operating results, increased interest rates and operating costs, decreased rental rates or increased vacancy rates, the uncertainties of real estate acquisitions, dispositions and redevelopment activity, the Company’s failure to successfully execute its non-core disposition program and capital recycling efforts, the Company’s ability to create long-term shareholder value, the Company’s ability to manage its growth effectively, the availability, terms and deployment of capital, regulatory changes and other risk factors, including those detailed in the sections of the Company’s most recent Form 10-K and Form 10-Qs filed with the SEC titled “Risk Factors”. We assume no obligation to update publicly any forward-looking statements, whether as a result of new information, future events or otherwise.
iv
NON-GAAP FINANCIAL MEASURES
As defined by the National Association of Real Estate Investment Trusts (NAREIT), an industry trade group, FFO means net (loss) income computed in accordance with generally accepted accounting principles (GAAP), excluding gains (or losses) from sales of investment properties, plus depreciation and amortization and impairment charges on investment properties, including adjustments for unconsolidated joint ventures in which the Company holds an interest. The Company has adopted the NAREIT definition in its computation of FFO and believes that FFO, which is a non-GAAP performance measure, provides an additional and useful means to assess the operating performance of real estate investment trusts (REITs). Management believes that, subject to the following limitations, FFO provides a basis for comparing the Company’s performance and operations to those of other REITs. Depreciation and amortization related to investment properties for purposes of calculating FFO include loss on lease terminations, which encompasses the write-off of tenant-related assets, including tenant improvements and in-place lease values, as a result of early lease terminations. Loss on lease terminations included in depreciation and amortization for FFO excludes the write-off of tenant-related above and below market lease intangibles that are otherwise included in “Loss on lease terminations” in the Company’s condensed consolidated statements of operations. The Company also reports Operating FFO, which is defined as FFO excluding the impact of gains and losses from the early extinguishment of debt and other items as denoted within the calculation that management does not believe are representative of the operating results of the Company’s core business platform. Management considers Operating FFO a meaningful, additional measure of operating performance primarily because it excludes the effects of transactions and other events which management does not consider representative of the operating results of the Company’s core business platform. Further, comparison of the Company’s presentation of Operating FFO to similarly titled measures for other REITs may not necessarily be meaningful due to possible differences in definition and application by such REITs. FFO and Operating FFO are not intended to be alternatives to “Net Income” as indicators of the Company’s performance, nor alternatives to “Cash Flows from Operating Activities” as determined by GAAP as measures of the Company’s capacity to fund cash needs, including the payment of dividends.. The Company also reports same store NOI. The Company defines NOI as operating revenues (rental income, tenant recovery income, other property income, excluding straight-line rental income, amortization of lease inducements and amortization of acquired above and below market lease intangibles) less property operating expenses (real estate tax expense and property operating expense, excluding straight-line ground rent expense and straight-line bad debt expense). Same store NOI represents NOI from the Company’s same store portfolio consisting of 250 operating properties acquired or place in service prior to January 1, 2011, but excluding University Square, the property for which we have ceased making the monthly debt service payment and for which we have attempted to negotiate with the lender, due to the uncertainty of the timing of transfer of ownership of this property. Management believes that NOI and same store NOI are useful measures of the Company’s operating performance. Other REITs may use different methodologies for calculating NOI, and accordingly, the Company’s NOI may not be comparable to other REITs. Management believes that NOI and same store NOI provide an operating perspective not immediately apparent from GAAP operating income or net (loss) income.
v
Management uses NOI and same store NOI to evaluate the Company’s performance on a property-by-property basis because these measures allow management to evaluate the impact that factors such as lease structure, lease rates and tenant base, which vary by property, have on the Company’s operating results. However, these measures should only be used as an alternative measure of the Company’s financial performance.
CONTACT INFORMATION
Sarah Byrnes, VP Investor Relations
Retail Properties of America, Inc.
630.586.6313
vi
Retail Properties of America, Inc.
FFO and Operating FFO Guidance (a)
| | | Per Share Guidance Range
Full Year 2012 | |
| | | Low | | | | High | |
| | | | | | | | |
Net loss attributable to Company shareholders | | | $ | (0.12 | ) | | | $ | (0.09 | ) |
Depreciation and amortization | | | 1.15 | | | | 1.15 | |
Provision for impairment of investment properties | | | 0.11 | | | | 0.11 | |
Gain on sales of investment properties | | | (0.18 | ) | | | (0.18 | ) |
Noncontrolling interests’ share of depreciation related to consolidated joint ventures | | | - | | | | - | |
FFO | | | $ | 0.96 | | | | $ | 0.99 | |
| | | | | | | | |
Debt prepayment penalties | | | 0.01 | | | | 0.01 | |
Excise tax accrual | | | 0.02 | | | | 0.02 | |
Gain on extinguishment of debt | | | (0.02 | ) | | | (0.02 | ) |
Mortgage premium write-off | | | (0.05 | ) | | | (0.05 | ) |
Recognized gain on marketable securities | | | (0.07 | ) | | | (0.07 | ) |
Other | | | (0.01 | ) | | | (0.01 | ) |
Operating FFO | | | $ | 0.84 | | | | $ | 0.87 | |
(a) Includes amounts from discontinued operations.
vii
Retail Properties of America, Inc.
Condensed Consolidated Balance Sheets
(amounts in thousands, except par value amounts)
(unaudited)
| | | September 30, | | | | December 31, | |
| | | 2012 | | | | 2011 | |
Assets | | | | | | | | |
Investment properties: | | | | | | | | |
Land | | | $ | 1,255,881 | | | | $ | 1,334,363 | |
Building and other improvements | | | 4,896,652 | | | | 5,057,252 | |
Developments in progress | | | 49,433 | | | | 49,940 | |
| | | 6,201,966 | | | | 6,441,555 | |
Less accumulated depreciation | | | (1,284,426 | ) | | | (1,180,767 | ) |
Net investment properties | | | 4,917,540 | | | | 5,260,788 | |
| | | | | | | | |
Cash and cash equivalents | | | 107,423 | | | | 136,009 | |
Investment in marketable securities, net | | | 9,347 | | | | 30,385 | |
Investment in unconsolidated joint ventures | | | 53,617 | | | | 81,168 | |
Accounts and notes receivable (net of allowances of $6,564 and $8,231, respectively) | | | 79,709 | | | | 94,922 | |
Acquired lease intangibles, net | | | 139,442 | | | | 174,404 | |
Investment properties held for sale | | | 8,633 | | | | - | |
Other assets, net | | | 166,877 | | | | 164,218 | |
Total assets | | | $ | 5,482,588 | | | | $ | 5,941,894 | |
| | | | | | | | |
Liabilities and Equity | | | | | | | | |
Liabilities: | | | | | | | | |
Mortgages and notes payable (includes unamortized premium of $0 and $10,858, respectively, and unamortized discount of $(1,619) and $(2,003), respectively) | | | $ | 2,396,899 | | | | $ | 2,926,218 | |
Credit facility | | | 535,000 | | | | 555,000 | |
Accounts payable and accrued expenses | | | 87,725 | | | | 83,012 | |
Distributions payable | | | 38,200 | | | | 31,448 | |
Acquired below market lease intangibles, net | | | 77,103 | | | | 81,321 | |
Other financings | | | - | | | | 8,477 | |
Co-venture obligation | | | - | | | | 52,431 | |
Liabilities associated with investment properties held for sale | | | 228 | | | | - | |
Other liabilities | | | 68,858 | | | | 66,944 | |
Total liabilities | | | 3,204,013 | | | | 3,804,851 | |
| | | | | | | | |
Redeemable noncontrolling interests | | | - | | | | 525 | |
| | | | | | | | |
Commitments and contingencies | | | | | | | | |
| | | | | | | | |
Equity (a): | | | | | | | | |
Preferred stock, $0.001 par value, 10,000 shares authorized, none issued or outstanding | | | - | | | | - | |
Class A common stock, $0.001 par value, 475,000 shares authorized, 85,088 and 48,382 shares issued and outstanding at September 30, 2012 and December 31, 2011, respectively | | | 85 | | | | 48 | |
Class B-1 common stock, $0.001 par value, 55,000 shares authorized, 48,518 and 48,382 shares issued and outstanding at September 30, 2012 and December 31, 2011, respectively | | | 48 | | | | 48 | |
Class B-2 common stock, $0.001 par value, 55,000 shares authorized, 48,518 and 48,382 shares issued and outstanding at September 30, 2012 and December 31, 2011, respectively | | | 49 | | | | 49 | |
Class B-3 common stock, $0.001 par value, 55,000 shares authorized, 48,519 and 48,383 shares issued and outstanding at September 30, 2012 and December 31, 2011, respectively | | | 49 | | | | 49 | |
Additional paid-in capital | | | 4,705,024 | | | | 4,427,977 | |
Accumulated distributions in excess of earnings | | | (2,436,010 | ) | | | (2,312,877 | ) |
Accumulated other comprehensive income | | | 7,836 | | | | 19,730 | |
Total shareholders’ equity | | | 2,277,081 | | | | 2,135,024 | |
Noncontrolling interests | | | 1,494 | | | | 1,494 | |
Total equity | | | 2,278,575 | | | | 2,136,518 | |
Total liabilities and equity | | | $ | 5,482,588 | | | | $ | 5,941,894 | |
(a) | On March 20, 2012, we effectuated a ten-to-one reverse stock split of our then outstanding common stock. Immediately following the reverse stock split, we redesignated all of our common stock as Class A common stock. On March 21, 2012, we paid a stock dividend pursuant to which each then outstanding share of our Class A common stock received one share of Class B-1 common stock, one share of Class B-2 common stock and one share of Class B-3 common stock. These transactions are referred to as the Recapitalization. All common stock share amounts and related dollar amounts give retroactive effect to the Recapitalization. |
3rd Quarter 2012 Supplemental Information | 1 |
Retail Properties of America, Inc.
Condensed Consolidated Statements of Operations
(amounts in thousands, except per share amounts)
(unaudited)
| | | Three Months Ended
September 30, | | | | Nine Months Ended
September 30, | |
| | | 2012 | | | | 2011 | | | | 2012 | | | | 2011 | |
Revenues: | | | | | | | | | | | | | | | | |
Rental income | | | $ | 116,811 | | | | $ | 116,062 | | | | $ | 350,390 | | | | $ | 349,828 | |
Tenant recovery income | | | 26,519 | | | | 27,703 | | | | 79,486 | | | | 79,692 | |
Other property income | | | 1,962 | | | | 2,280 | | | | 7,532 | | | | 7,861 | |
Total revenues | | | 145,292 | | | | 146,045 | | | | 437,408 | | | | 437,381 | |
| | | | | | | | | | | | | | | | |
Expenses: | | | | | | | | | | | | | | | | |
Property operating expenses | | | 23,089 | | | | 23,077 | | | | 70,860 | | | | 74,673 | |
Real estate taxes | | | 19,503 | | | | 19,273 | | | | 57,972 | | | | 57,196 | |
Depreciation and amortization | | | 56,527 | | | | 57,286 | | | | 170,009 | | | | 171,601 | |
Provision for impairment of investment properties | | | 10,660 | | | | - | | | | 11,983 | | | | - | |
Loss on lease terminations | | | 1,689 | | | | 1,392 | | | | 6,550 | | | | 8,085 | |
General and administrative expenses | | | 7,227 | | | | 5,011 | | | | 18,691 | | | | 16,382 | |
Total expenses | | | 118,695 | | | | 106,039 | | | | 336,065 | | | | 327,937 | |
| | | | | | | | | | | | | | | | |
Operating income | | | 26,597 | | | | 40,006 | | | | 101,343 | | | | 109,444 | |
| | | | | | | | | | | | | | | | |
Dividend income | | | 302 | | | | 578 | | | | 1,782 | | | | 1,776 | |
Interest income | | | 16 | | | | 157 | | | | 56 | | | | 507 | |
Gain on extinguishment of debt | | | - | | | | 991 | | | | 3,879 | | | | 15,429 | |
Equity in loss of unconsolidated joint ventures, net | | | (1,863 | ) | | | (1,869 | ) | | | (5,467 | ) | | | (6,028 | ) |
Interest expense | | | (49,456 | ) | | | (56,903 | ) | | | (142,333 | ) | | | (170,121 | ) |
Co-venture obligation expense | | | - | | | | (1,791 | ) | | | (3,300 | ) | | | (5,375 | ) |
Recognized gain on marketable securities | | | 9,108 | | | | - | | | | 16,373 | | | | 277 | |
Other income (expense), net | | | 726 | | | | 567 | | | | (342 | ) | | | 1,323 | |
Loss from continuing operations | | | (14,570 | ) | | | (18,264 | ) | | | (28,009 | ) | | | (52,768 | ) |
| | | | | | | | | | | | | | | | |
Discontinued operations: | | | | | | | | | | | | | | | | |
Loss, net | | | (11,788 | ) | | | (378 | ) | | | (9,725 | ) | | | (28,830 | ) |
Gain on sales of investment properties, net | | | 8,756 | | | | 14,517 | | | | 16,518 | | | | 18,678 | |
(Loss) income from discontinued operations | | | (3,032 | ) | | | 14,139 | | | | 6,793 | | | | (10,152 | ) |
Gain (loss) on sales of investment properties, net | | | 1,650 | | | | (891 | ) | | | 6,652 | | | | 4,171 | |
Net loss | | | (15,952 | ) | | | (5,016 | ) | | | (14,564 | ) | | | (58,749 | ) |
Net income attributable to noncontrolling interests | | | - | | | | (7 | ) | | | - | | | | (23 | ) |
Net loss attributable to Company shareholders | | | $ | (15,952 | ) | | | $ | (5,023 | ) | | | $ | (14,564 | ) | | | $ | (58,772 | ) |
| | | | | | | | | | | | | | | | |
(Loss) earnings per common share - basic and diluted (a): | | | | | | | | | | | | | | | | |
Continuing operations | | | $ | (0.06 | ) | | | $ | (0.10 | ) | | | $ | (0.10 | ) | | | $ | (0.25 | ) |
Discontinued operations | | | (0.01 | ) | | | 0.07 | | | | 0.03 | | | | (0.06 | ) |
Net loss per common share attributable to Company shareholders | | | $ | (0.07 | ) | | | $ | (0.03 | ) | | | $ | (0.07 | ) | | | $ | (0.31 | ) |
| | | | | | | | | | | | | | | | |
Weighted average number of common shares outstanding - basic and diluted (a) | | | 230,597 | | | | 192,779 | | | | 217,087 | | | | 192,127 | |
(a) | All common stock share amounts and per share amounts give retroactive effect to the Recapitalization. |
3rd Quarter 2012 Supplemental Information | 2 |
Retail Properties of America, Inc.
Funds From Operations (FFO), Operating FFO and Additional Information
(amounts in thousands, except per share amounts and percentages)
(unaudited)
FFO, Operating FFO and Dividend Ratios (a) (b)
| | | Three Months Ended
September 30, | | | | Nine Months Ended
September 30, | |
| | | 2012 | | | | 2011 | | | | 2012 | | | | 2011 | |
| | | | | | | | | | | | | | | | |
Net loss attributable to Company shareholders | | | $ | (15,952 | ) | | | $ | (5,023 | ) | | | $ | (14,564 | ) | | | $ | (58,772 | ) |
Depreciation and amortization | | | 61,219 | | | | 63,549 | | | | 188,600 | | | | 193,385 | |
Provision for impairment of investment properties | | | 22,377 | | | | 1,379 | | | | 24,930 | | (c) | | 35,649 | |
Gain on sales of investment properties | | | (10,406 | ) | | | (13,626 | ) | | | (23,170 | ) | | | (22,849 | ) |
Noncontrolling interests’ share of depreciation related to consolidated joint ventures | | | - | | | | (132 | ) | | | - | | | | (812 | ) |
FFO | | | $ | 57,238 | | | | $ | 46,147 | | | | $ | 175,796 | | | | $ | 146,601 | |
| | | | | | | | | | | | | | | | |
FFO per common share outstanding | | | $ | 0.25 | | | | $ | 0.24 | | | | $ | 0.81 | | | | $ | 0.76 | |
| | | | | | | | | | | | | | | | |
FFO | | | $ | 57,238 | | | | $ | 46,147 | | | | $ | 175,796 | | | | $ | 146,601 | |
Debt prepayment penalties | | | 1,443 | | | | - | | | | 1,443 | | | | - | |
Excise tax accrual | | | - | | | | - | | | | 4,594 | | | | - | |
Gain on extinguishment of debt | | | - | | | | (991 | ) | | | (3,879 | ) | | | (15,429 | ) |
Mortgage premium write-off | | | - | | | | - | | | | (10,295 | ) | | | (4,750 | ) |
Recognized gain on marketable securities | | | (9,108 | ) | | | - | | | | (16,373 | ) | | | (277 | ) |
Other | | | - | | | | - | | | | (1,627 | ) | | | - | |
Operating FFO | | | $ | 49,573 | | | | $ | 45,156 | | | | $ | 149,659 | | | | $ | 126,145 | |
| | | | | | | | | | | | | | | | |
Operating FFO per common share outstanding | | | $ | 0.21 | | | | $ | 0.23 | | | | $ | 0.69 | | | | $ | 0.66 | |
| | | | | | | | | | | | | | | | |
Weighted average number of common shares outstanding | | | 230,597 | | | | 192,779 | | | | 217,087 | | | | 192,127 | |
| | | | | | | | | | | | | | | | |
Dividends declared per common share | | | $ | 0.16563 | | | | $ | 0.15938 | | (d) | | $ | 0.49688 | | | | $ | 0.46406 | |
| | | | | | | | | | | | | | | | |
Additional Information (e) | | | | | | | | | | | | | | | | |
Operating property maintenance capital expenditures (f) | | | $ | 2,967 | | | | $ | 1,613 | | | | $ | 7,231 | | | | $ | 4,320 | |
Operating property lease-related expenditures (g) | | | $ | 37,803 | | | | $ | 7,174 | | | | $ | 57,183 | | | | $ | 22,245 | |
Straight-line rental income, net | | | $ | 486 | | | | $ | 456 | | | | $ | 1,169 | | | | $ | 271 | |
Amortization of above and below market leases and lease inducements | | | $ | (295 | ) | | | $ | 200 | | | | $ | 481 | | | | $ | 929 | |
Straight-line ground rent expense | | | $ | 1,036 | | | | $ | 948 | | | | $ | 2,862 | | | | $ | 2,852 | |
(a) Refer to page 19 for definitions of FFO and Operating FFO.
(b) Includes amounts from discontinued operations.
(c) Excludes $88, which represents the amount by which our pro rata share of the impairment charges included in losses recorded at our Hampton unconsolidated joint venture during the nine months ended September 30, 2012, exceeded the carrying value of our investment in such joint venture.
(d) Distribution for the third quarter of 2011 was declared on October 3, 2011.
(e) Reported totals are inclusive of our pro rata share from our investment property unconsolidated joint ventures.
(f) Consists of payments for building and site improvements.
(g) Consists of payments for tenant improvements, lease commissions and lease inducements. Totals for the three and nine months ended September 30, 2012 are inclusive of $29,127 of lease-related expenditures to extend the terms of leases on approximately 819,000 square feet at our Aon single-tenant office property located in Lincolnshire, Illinois.
3rd Quarter 2012 Supplemental Information | 3 |
Retail Properties of America, Inc.
Supplemental Financial Statement Detail
(amounts in thousands)
(unaudited)
Supplemental Balance Sheet Detail | | September 30, | | December 31, | |
| | 2012 | | 2011 | |
Accounts and Notes Receivable | | | | | |
Accounts receivable (net of allowances of $5,455 and $5,975, respectively) | | $ | 25,656 | | $ | 36,105 | |
Straight-line receivables (net of allowances of $809 and $1,956, respectively) | | 54,053 | | 58,817 | |
Notes receivable (net of allowances of $300) | | - | | - | |
Total | | $ | 79,709 | | $ | 94,922 | |
| | | | | |
Other Assets, net | | | | | |
Deferred costs, net | | $ | 80,291 | | $ | 51,862 | |
Restricted cash and escrows | | 69,909 | | 91,533 | |
Other assets, net | | 16,677 | | 20,823 | |
Total | | $ | 166,877 | | $ | 164,218 | |
| | | | | |
Other Liabilities | | | | | |
Unearned income | | $ | 13,365 | | $ | 19,057 | |
Straight-line ground rent liability | | 31,669 | | 28,872 | |
Fair value of derivatives | | 3,482 | | 2,891 | |
Other liabilities | | 20,342 | | 16,124 | |
Total | | $ | 68,858 | | $ | 66,944 | |
| | | | | |
Developments in Progress | | | | | |
Active developments | | $ | 3,092 | | $ | 3,599 | |
Property available for future development | | 46,341 | | 46,341 | |
Total | | $ | 49,433 | | $ | 49,940 | |
Supplemental Statements of Operations Detail | | Three Months Ended | | Nine Months Ended | |
| | September 30, | | September 30, | |
| | 2012 | | 2011 | | 2012 | | 2011 | |
Rental Income | | | | | | | | | |
Base rent | | $ | 115,023 | | $ | 114,422 | | $ | 343,902 | | $ | 344,214 | |
Percentage and specialty rent | | 1,609 | | 1,861 | | 4,969 | | 4,871 | |
Straight-line rent | | 417 | | (658) | | 920 | | (486) | |
Amortization of above and below market leases and lease inducements | | (238) | | 437 | | 599 | | 1,229 | |
Total | | $ | 116,811 | | $ | 116,062 | | $ | 350,390 | | $ | 349,828 | |
| | | | | | | | | |
Other Property Income | | | | | | | | | |
Lease termination income | | $ | 113 | | $ | 112 | | $ | 1,640 | | $ | 883 | |
Other property income | | 1,849 | | 2,168 | | 5,892 | | 6,978 | |
Total | | $ | 1,962 | | $ | 2,280 | | $ | 7,532 | | $ | 7,861 | |
| | | | | | | | | |
Loss on Lease Terminations | | | | | | | | | |
Write-off of tenant-related tenant improvements and in-place lease values | | $ | 970 | | $ | 2,067 | | $ | 5,823 | | $ | 9,042 | |
Write-off of tenant-related above & below market lease intangibles and lease inducements | | 719 | | (675) | | 727 | | (957) | |
Total | | $ | 1,689 | | $ | 1,392 | | $ | 6,550 | | $ | 8,085 | |
| | | | | | | | | |
Bad Debt Expense | | $ | (158) | | $ | (387) | | $ | 280 | | $ | 1,434 | |
| | | | | | | | | |
Straight-line Ground Rent Expense | | $ | 1,036 | | $ | 948 | | $ | 2,862 | | $ | 2,852 | |
| | | | | | | | | |
Management Fee Income from Joint Ventures (a) | | $ | 700 | | $ | 574 | | $ | 2,179 | | $ | 1,582 | |
| | | | | | | | | |
Capitalized Interest | | $ | - | | $ | 53 | | $ | - | | $ | 197 | |
| | | | | | | | | |
Net Operating Income (NOI) | | | | | | | | | |
| | | | | | | | | |
Same Store NOI (b) | | | | | | | | | |
Rental income | | $ | 114,222 | | $ | 112,886 | | $ | 341,873 | | $ | 338,070 | |
Tenant recovery income | | 26,023 | | 27,077 | | 78,153 | | 77,410 | |
Other property income | | 1,869 | | 2,215 | | 7,142 | | 7,608 | |
Property operating expenses | | (21,243) | | (21,954) | | (66,014) | | (68,274) | |
Real estate taxes | | (18,374) | | (18,551) | | (54,024) | | (54,578) | |
Same Store NOI (c) | | $ | 102,497 | | $ | 101,673 | | $ | 307,130 | | $ | 300,236 | |
NOI from Other Investment Properties (b) (d) | | $ | 1,060 | | $ | 2,126 | | $ | 2,789 | | $ | 7,187 | |
Total NOI (b) | | $ | 103,557 | | $ | 103,799 | | $ | 309,919 | | $ | 307,423 | |
| | | | | | | | | |
Combined NOI (b) (e) | | $ | 107,052 | | $ | 106,075 | | $ | 319,759 | | $ | 313,699 | |
| | | | | | | | | |
NOI from Discontinued Operations (b) | | $ | 2,360 | | $ | 4,743 | | $ | 10,503 | | $ | 16,227 | |
(a) | Amounts are included in “Other income (expense), net” in the Condensed Consolidated Statements of Operations. |
(b) | Refer to pages 19 - 22 for definitions and reconciliations of non-GAAP financial measures. |
(c) | Same Store NOI includes NOI of $187 and net operating loss (NOL) of $(24) for the three months ended September 30, 2012 and 2011, respectively and NOI of $347 and NOL of $(623) for the nine months ended September 30, 2012 and 2011, respectively, from the eight former Mervyns properties that were not sold or classified as held for sale as of September 30, 2012. |
(d) | NOI from Other Investment Properties includes NOL of $(547) and NOI of $80 for the three months ended September 30, 2012 and 2011, respectively and NOL of $(2,351) and NOI of $325 for the nine months ended September 30, 2012 and 2011, respectively, from University Square, the property securing the $26,865 mortgage that had matured in 2010, and which remains outstanding as of September 30, 2012. |
(e) | Combined data and ratios include our pro rata share of unconsolidated joint ventures in addition to our wholly-owned and consolidated portfolio. |
3rd Quarter 2012 Supplemental Information | 4 |
Retail Properties of America, Inc.
Capitalization
(amounts in thousands, except ratios)
Capitalization Data
| | September 30, | | December 31, | |
| | 2012 | | 2011 | |
Equity Capitalization | | | | | |
Common stock shares outstanding (a) | | 230,643 | | 193,529 | |
Common share price at September 30, 2012 | | $ | 11.32 | | n/a | |
| | $ | 2,610,879 | | n/a | |
| | | | | |
Debt Capitalization | | | | | |
Fixed rate mortgages | | 2,260,953 | | 2,700,178 | |
Variable rate mortgages | | 10,946 | | 79,599 | |
Total mortgage debt | | 2,271,899 | | 2,779,777 | |
| | | | | |
Notes payable | | 125,000 | | 138,900 | |
Margin payable | | - | | 7,541 | |
Credit facility | | 535,000 | | 555,000 | |
Total consolidated debt capitalization (includes unamortized premium of $0 and $10,858, respectively, and unamortized discount of $(1,619) and $(2,003), respectively) | | 2,931,899 | | 3,481,218 | |
Pro rata share of our investment property unconsolidated joint ventures’ total debt (includes unamortized premium of $2,458 and $3,423, respectively, and unamortized discount of $(208) and $(245), respectively) | | 108,553 | | 114,382 | |
Combined debt capitalization (b) | | 3,040,452 | | 3,595,600 | |
| | | | | |
Total capitalization at end of period | | $ | 5,651,331 | | $ | 3,595,600 | (c) |
| | | | | | | |
Reconciliation of Debt to Total Net Debt and Combined Net Debt
| | September 30, | | December 31, | |
| | 2012 | | 2011 | |
| | | | | |
Total debt | | $ | 2,931,899 | | $ | 3,481,218 | �� |
Less: cash and cash equivalents | | (107,423) | | (136,009) | |
Net debt | | 2,824,476 | | 3,345,209 | |
Adjusted EBITDA (d) (e) | | 385,260 | | 406,944 | |
Net debt to Adjusted EBITDA | | 7.3 | x | 8.2 | x |
| | | | | |
Net debt | | 2,824,476 | | 3,345,209 | |
Add: pro rata share of our investment property unconsolidated joint ventures total debt | | 108,553 | | 114,382 | |
Less: pro rata share of our investment property unconsolidated joint ventures’ cash and cash equivalents | | (4,574) | | (13,238) | |
Combined net debt (b) | | 2,928,455 | | 3,446,353 | |
Combined Adjusted EBITDA (b) (d) (e) | | 401,308 | | 421,780 | |
Combined net debt to combined Adjusted EBITDA (b) | | 7.3 | x | 8.2 | x |
| | | | | | | |
(a) | All common stock share amounts give retroactive effect to the Recapitalization. |
(b) | Combined data and ratios include our pro rata share of unconsolidated joint ventures in addition to our wholly-owned and consolidated portfolio. |
(c) | Amount does not include any equity capitalization. |
(d) | For purposes of these ratio calculations, annualized three months ended figures were used. |
(e) | Refer to pages 19 - 22 for definitions and reconciliations of non-GAAP financial measures. |
3rd Quarter 2012 Supplemental Information | 5 |
Retail Properties of America, Inc.
Unsecured Credit Facility Covenants (a)
(amounts in thousands, except percentages and ratios)
| | | | September 30, | |
| | Covenant | | 2012 | |
| | | | | |
Leverage ratio | | < 60% | (b) (c) | 51.45% | |
| | | | | |
Fixed charge coverage ratio | | > 1.45x | (d) | 1.73x | |
| | | | | |
Secured indebtedness as a percentage of Total Asset Value | | < 52.50% | (c) (e) | 40.57% | |
| | | | | |
Guaranteed and recourse indebtedness | | < $100,000 | | $17,030 | |
| | | | | |
Unsecured asset pool covenants: | | | | | |
| | | | | |
Leverage ratio | | < 60% | (c) | 39.59% | |
| | | | | |
Debt service coverage | | > 1.50x | | 2.37x | |
(a) | For a complete listing of all covenants related to our unsecured credit facility as well as covenant definitions, refer to the Second Amended and Restated Credit Agreement filed as Exhibit 10.4 to Amendment No. 5 of our Form S-11, dated March 9, 2012. |
(b) | This ratio may be increased once to 62.5% for two consecutive quarters, if necessary. |
(c) | Based upon a capitalization rate of 7.5%. |
(d) | This ratio will be increased to 1.50x beginning on the date of issuance of our financial statements for the quarter ending December 31, 2012. |
(e) | This ratio will be decreased to 50% on the date of issuance of our financial statements for the quarter ending March 31, 2013 and further reduced to 45% on the date of issuance of our financial statements for the quarter ending March 31, 2014. |
3rd Quarter 2012 Supplemental Information | 6 |
Retail Properties of America, Inc.
Consolidated Debt Summary as of September 30, 2012
(dollar amounts in thousands)
| | Balance | | Contractual
Interest Rate /
Weighted Average
(WA) Contractual
Interest Rate | | Years to
Maturity/WA
Years to Maturity | |
Fixed rate: | | | | | | | |
Mortgages payable (a) | | $ | 1,774,490 | | 5.74% | | 5.7 years | |
IW JV mortgages payable | | 488,082 | | 7.50% | | 7.2 years | |
IW JV senior mezzanine note | | 85,000 | | 12.24% | | 7.2 years | (b) |
IW JV junior mezzanine note | | 40,000 | | 14.00% | | 7.2 years | (b) |
| | 2,387,572 | | | | | |
Variable rate: | | | | | | | |
Construction loan | | 10,946 | | 2.50% | | 2.1 years | |
| | | | | | | |
Total mortgages and notes payable | | 2,398,518 | | | | | |
| | | | | | | |
Unsecured credit facility: | | | | | | | |
Fixed rate term loan (c) | | 300,000 | | 2.79% | | 3.4 years | |
Variable rate revolving line of credit | | 235,000 | | 2.50% | | 2.4 years | |
Total unsecured credit facility | | 535,000 | | 2.66% | | 3.0 years | |
| | | | | | | |
Total consolidated indebtedness | | $ | 2,933,518 | | 5.77% | (d) | 5.5 years | |
Consolidated Debt Maturity Schedule as of September 30, 2012
Year | | Fixed Rate | | Variable Rate | | Total (a) | | % of Total | | WA Rates on
Total Debt | |
| | | | | | | | | | | |
2012 | | $ | 62,230 | | $ | - | | $ | 62,230 | | 2.1% | | 7.60% | |
2013 | | 276,324 | | - | | 276,324 | | 9.4% | | 5.21% | |
2014 | | 195,777 | | 10,946 | | 206,723 | | 7.0% | | 6.84% | |
2015 | | 471,439 | | 235,000 | | 706,439 | | 24.1% | | 4.68% | |
2016 | | 348,214 | | - | | 348,214 | | 11.9% | | 3.23% | |
2017 | | 296,552 | | - | | 296,552 | | 10.1% | | 5.71% | |
2018 | | 23,877 | | - | | 23,877 | | 0.8% | | 6.06% | |
2019 | | 651,920 | | - | | 651,920 | | 22.2% | | 8.47% | |
2020 | | 35,159 | | - | | 35,159 | | 1.2% | | 6.68% | |
2021 | | 16,744 | | - | | 16,744 | | 0.6% | | 5.08% | |
Thereafter | | 309,336 | | - | | 309,336 | | 10.6% | | 4.77% | |
Total | | $ | 2,687,572 | | $ | 245,946 | | $ | 2,933,518 | | 100.0% | | 5.77% | (d) |
(a) | Balance does not include mortgage discount of $1,619, net of accumulated amortization, that was outstanding as of September 30, 2012. Balance includes the University Square mortgage of $26,865, which is included in the 2012 row in the Consolidated Debt Maturity Schedule. |
| |
(b) | Notes payable can be prepaid beginning in February 2013 for a fee ranging from 1% to 5% of the outstanding principal balance depending on the date the prepayment is made. |
| |
(c) | In July 2012, we entered into a $300,000 interest rate swap transaction to fix the variable rate portion of our term loan to a fixed rate of 0.54% from July 31, 2012 through February 24, 2016, the maturity date of the unsecured term loan. The margin on the unsecured term loan is based on a leverage grid and ranges from 1.75% to 2.50%. The applicable margin was 2.25% as of September 30, 2012. |
| |
(d) | Interest rates presented exclude the impact of discount amortization, capitalized loan fee amortization and the increase in contractual interest rates for mortgages where we have triggered the hyper-amortization provisions of the loan agreement. As of September 30, 2012, our overall weighted average interest rate for consolidated debt including the impact of discount amortization, loan fee amortization and the higher hyper-amortization interest rates was 6.29%. |
3rd Quarter 2012 Supplemental Information | 7 |
Retail Properties of America, Inc.
Acquisitions and Dispositions for the Nine Months Ended September 30, 2012
(amounts in thousands, except square footage amounts)
Acquisitions:
| | | | | | | | Gross (at 100%) | | Pro Rata Share | |
Property Name | | Acquisition Date | | Joint Venture (a) | | Property Type | | Gross Leasable
Area (GLA) | | Purchase Price | | Mortgage Debt
Incurred | | GLA | | Purchase Price | | Mortgage Debt
Incurred | |
Consolidated | | | | n/a | | n/a | | - | | $ | - | | $ | - | | - | | $ | - | | $ | - | |
| | | | | | | | | | | | | | | | | | | |
Unconsolidated | | | | n/a | | n/a | | - | | $ | - | | $ | - | | - | | $ | - | | $ | - | |
| | | | | | | | | | | | | | | | | | | |
| | | | | | | | | | | | | | | | | | | |
Dispositions: | | | | | | | | | | | | | | | | | | | |
| | | | | | | | | | | | | | | | | | | |
| | | | | | | | Gross (at 100%) | | Pro Rata Share | |
Property Name | | Disposition Date | | Joint Venture (a) | | Property Type | | GLA | | Consideration | | Mortgage Debt
Extinguished | | GLA | | Consideration | | Mortgage Debt
Extinguished | |
Consolidated | | | | | | | | | | | | | | | | | | | |
CVS - Jacksonville | | February 1, 2012 | | n/a | | Single-user retail | | 13,800 | | $ | 5,800 | | $ | - | | 13,800 | | $ | 5,800 | | $ | - | |
GMAC Insurance Building | | April 10, 2012 (b) | | n/a | | Single-user office | | 501,000 | | 23,570 | | 23,570 | | 501,000 | | 23,570 | | 23,570 | |
Cost Plus Distribution Center | | August 17, 2012 | | n/a | | Single-user industrial | | 1,035,800 | | 63,000 | | 16,300 | | 1,035,800 | | 63,000 | | 16,300 | |
Various (c) | | September 18, 2012 | | n/a | | Single-user retail | | 1,000,400 | | 100,400 | | 97,253 | | 1,000,400 | | 100,400 | | 97,253 | |
Various (d) | | September 25, 2012 | | n/a | | Multi-tenant retail | | 132,600 | | 19,050 | | - | | 132,600 | | 19,050 | | - | |
Winco - Ventura (former Mervyns) | | September 28, 2012 | | n/a | | Single-user retail | | 75,200 | | 8,015 | | - | | 75,200 | | 8,015 | | - | |
Other (e) | | Various | | n/a | | Various | | - | | 9,039 | | - | | - | | 9,039 | | - | |
| | | | | | | | 2,758,800 | | $ | 228,874 | | $ | 137,123 | | 2,758,800 | | $ | 228,874 | | $ | 137,123 | |
| | | | | | | | | | | | | | | | | | | |
Unconsolidated | | | | | | | | | | | | | | | | | | | |
Westminster, CO | | May 7, 2012 | | Hampton | | Single-user retail | | 43,200 | | $ | 2,000 | | $ | 1,853 | | 41,400 | | $ | 1,918 | | $ | 1,777 | |
Lakewood, CO | | July 18, 2012 | | Hampton | | Multi-tenant retail | | 43,500 | | 3,450 | | 3,182 | | 41,700 | | 3,309 | | 3,052 | |
| | | | | | | | 86,700 | | $ | 5,450 | | $ | 5,035 | | 83,100 | | $ | 5,227 | | $ | 4,829 | |
| | | | | | | | | | | | | | | | | | | |
Transactions Between RPAI Entities: | | | | | | | | | | | | | | | |
| | | | | | | | Gross (at 100%) | | Pro Rata Share | |
Property Name | | Transaction Date | | Acquiring Joint
Venture (a) | | Property Type | | GLA | | Consideration | | Mortgage Debt
Incurred | | GLA | | Consideration | | Mortgage Debt
Incurred | |
Southlake Corners | | February 23, 2012 | | RioCan (f) | | Multi-tenant retail | | 134,900 | | $ | 35,366 | | $ | 20,945 | | 26,980 | | $ | 7,073 | | $ | 4,189 | |
(a) | As of September 30, 2012, we held 20.0%, 20.0% and 95.9% ownership interests in our RioCan, MS Inland and Hampton unconsolidated joint ventures, respectively. |
(b) | On April 10, 2012, we transferred this property to the lender through a deed-in-lieu of foreclosure transaction. |
(c) | We sold 13 former Mervyns properties located throughout California in a single transaction on September 18, 2012. No gain or loss was recognized upon disposition as we recorded an impairment charge of $1,100 based upon the negotiated sales price less costs to sell. Proceeds from the sale, along with restricted escrows held by the lender, were used to pay off, in its entirety, the $116,400 outstanding loan secured by our entire porfolio of 23 former Mervyns properties. |
(d) | The terms of the sale of three properties located near Dallas, Texas were negotiated as a single transaction. No gain or loss was recognized upon disposition as we recognized an impairment charge of $5,528 based upon the negotiated sales price less costs to sell. |
(e) | Includes proceeds from earnouts, the sale of parcels/outlots at certain operating properties and condemnation awards. |
(f) | Our RioCan joint venture acquired Southlake Corners from our MS Inland joint venture. MS Inland used proceeds from the transaction to pay off the $20,625 mortgage on the property, of which our pro rata share was $4,125. Subsequent to acquisition, RioCan obtained mortgage debt in the amount of $20,945 on the property, of which our pro rata share was $4,189. |
3rd Quarter 2012 Supplemental Information | 8 |
Retail Properties of America, Inc.
Property Overview as of September 30, 2012
(dollar amounts and square footage in thousands)
Consolidated Operating Properties at 100%:
Property Type/Region | | | | Number of
Properties | | GLA | | % of Total
GLA (a) | | Occupancy
(b) | | % Leased
Including
Signed (c) | | Annualized
Base Rent
(ABR) | | % of Total
ABR (a) | | ABR Per
Occupied
Sq. Ft. | |
Retail: | | | | | | | | | | | | | | | | | | | |
North | | | | 83 | | 10,629 | | 31.7% | | 91.1% | | 92.3% | | $ 136,340 | | 32.1% | | $ | 14.07 | |
East | | | | 67 | | 8,568 | | 25.6% | | 91.9% | | 93.9% | | 102,172 | | 24.1% | | 12.97 | |
West (d) | | | | 36 | | 6,883 | | 20.5% | | 80.6% | | 88.0% | | 83,709 | | 19.7% | | 15.09 | |
South | | | | 55 | | 7,457 | | 22.2% | | 87.6% | | 89.0% | | 102,088 | | 24.1% | | 15.62 | |
Total - Retail | | | | 241 | | 33,537 | | 100.0% | | 88.4% | | 91.1% | | 424,309 | | 100.0% | | 14.31 | |
| | | | | | | | | | | | | | | | | | | |
Other: | | | | | | | | | | | | | | | | | | | |
Office (d) | | | | 10 | | 2,716 | | | | 100.0% | | 100.0% | | 33,652 | | | | 12.39 | |
Industrial | | | | 2 | | 287 | | | | 100.0% | | 100.0% | | 1,610 | | | | 5.61 | |
Total Other | | | | 12 | | 3,003 | | | | 100.0% | | 100.0% | | 35,262 | | | | 11.74 | |
| | | | | | | | | | | | | | | | | | | |
Total Consolidated Operating Portfolio | | 253 | | 36,540 | | | | 89.4% | | 91.8% | | $ 459,571 | | | | $ | 14.08 | |
Unconsolidated Operating Properties at 100%:
Property Type/Region | | RPAI
Ownership % | | Number of
Properties | | GLA | | % of Total
GLA (a) | | Occupancy
(b) | | % Leased
Including
Signed (c) | | ABR | | % of Total
ABR (a) | | ABR Per
Occupied
Sq. Ft. | |
Retail: | | | | | | | | | | | | | | | | | | | |
North | | 20.0% | | 1 | | 221 | | 5.0% | | 99.4% | | 99.4% | | $ | 4,496 | | 6.8% | | $ | 20.50 | |
East | | 20.0% | | 3 | | 538 | | 12.2% | | 94.2% | | 94.2% | | 7,226 | | 11.0% | | 14.26 | |
West | | 95.9% | | 2 | | 97 | | 2.2% | | 100.0% | | 100.0% | | 1,271 | | 1.9% | | 13.12 | |
South | | 20.0% | | 16 | | 3,565 | | 80.6% | | 94.7% | | 96.0% | | 52,940 | | 80.3% | | 15.68 | |
Total - Retail | | | | 22 | | 4,421 | | 100.0% | | 95.0% | | 96.0% | | $ | 65,933 | | 100.0% | | $ | 15.70 | |
Total Pro Rata Operating Portfolio (e):
Property Type/Region | | | | Number of
Properties | | GLA | | % of Total
GLA (a) | | Occupancy
(b) | | % Leased
Including
Signed (c) | | ABR | | % of Total
ABR (a) | | ABR Per
Occupied
Sq. Ft. | |
Retail: | | | | | | | | | | | | | | | | | | | |
North | | | | 84 | | 10,673 | | 30.9% | | 91.2% | | 92.3% | | $ | 137,239 | | 31.3% | | $ | 14.10 | |
East | | | | 70 | | 8,676 | | 25.2% | | 92.0% | | 94.0% | | 103,617 | | 23.6% | | 12.99 | |
West (d) | | | | 38 | | 6,976 | | 20.2% | | 80.9% | | 88.2% | | 84,928 | | 19.4% | | 15.06 | |
South | | | | 71 | | 8,170 | | 23.7% | | 88.3% | | 89.6% | | 112,676 | | 25.7% | | 15.63 | |
Total - Retail | | | | 263 | | 34,495 | | 100.0% | | 88.6% | | 91.3% | | 438,460 | | 100.0% | | 14.35 | |
| | | | | | | | | | | | | | | | | | | |
Other: | | | | | | | | | | | | | | | | | | | |
Office (d) | | | | 10 | | 2,716 | | | | 100.0% | | 100.0% | | 33,652 | | | | 12.39 | |
Industrial | | | | 2 | | 287 | | | | 100.0% | | 100.0% | | 1,610 | | | | 5.61 | |
Total Other | | | | 12 | | 3,003 | | | | 100.0% | | 100.0% | | 35,262 | | | | 11.74 | |
| | | | | | | | | | | | | | | | | | | |
Total Pro Rata Share | | | | 275 | | 37,498 | | | | 89.5% | | 92.0% | | $ | 473,722 | | | | $ | 14.11 | |
(a) | Percentages are only provided for our retail operating portfolio. |
| |
(b) | Based on leases commenced as of September 30, 2012 and calculated as occupied GLA divided by total GLA. |
| |
(c) | Includes leases signed as of September 30, 2012 but not commenced and calculated as leased GLA divided by total GLA. |
| |
(d) | Excludes one single-user retail and one single-user office property classified as held for sale as of September 30, 2012. |
| |
(e) | Includes our consolidated operating properties plus our pro rata share of unconsolidated operating properties. |
3rd Quarter 2012 Supplemental Information | | 9 |
Retail Properties of America, Inc.
State/Regional Summary as of September 30, 2012
(dollar amounts and square footage in thousands)
Total Pro Rata Operating Portfolio (a):
Property Type/Region | | Number of
Properties | | GLA | | % of Total
GLA (b) | | Occupancy
(c) | | % Leased
Including
Signed (d) | | ABR | | % of Total
ABR (b) | | ABR Per
Occupied
Sq. Ft. | |
Retail | | | | | | | | | | | | | | | | | |
North | | | | | | | | | | | | | | | | | |
Connecticut | | 5 | | 449 | | 1.3% | | 89.7% | | 98.0% | | $ | 7,038 | | 1.6% | | $ | 17.50 | |
Indiana | | 4 | | 653 | | 1.9% | | 92.2% | | 92.2% | | 5,474 | | 1.2% | | 9.09 | |
Massachusetts | | 5 | | 1,183 | | 3.4% | | 90.2% | | 93.2% | | 12,211 | | 2.8% | | 11.45 | |
Maryland | | 8 | | 2,299 | | 6.7% | | 92.9% | | 93.4% | | 33,059 | | 7.5% | | 15.48 | |
Maine | | 2 | | 423 | | 1.2% | | 89.9% | | 95.4% | | 3,769 | | 0.9% | | 9.91 | |
Michigan | | 2 | | 467 | | 1.3% | | 96.1% | | 96.1% | | 7,957 | | 1.8% | | 17.74 | |
New Jersey | | 3 | | 449 | | 1.3% | | 92.4% | | 92.4% | | 4,688 | | 1.1% | | 11.30 | |
New York | | 32 | | 1,552 | | 4.5% | | 97.8% | | 97.8% | | 24,618 | | 5.6% | | 16.22 | |
Ohio | | 7 | | 1,106 | | 3.2% | | 77.0% | | 77.0% | | 11,144 | | 2.5% | | 13.09 | |
Pennsylvania | | 12 | | 1,335 | | 3.9% | | 94.0% | | 94.1% | | 16,416 | | 3.8% | | 13.08 | |
Rhode Island | | 3 | | 271 | | 0.8% | | 84.7% | | 87.1% | | 3,333 | | 0.8% | | 14.50 | |
Vermont | | 1 | | 486 | | 1.4% | | 87.9% | | 89.3% | | 7,532 | | 1.7% | | 17.63 | |
Subtotal - North | | 84 | | 10,673 | | 30.9% | | 91.2% | | 92.3% | | 137,239 | | 31.3% | | 14.10 | |
| | | | | | | | | | | | | | | | | |
East | | | | | | | | | | | | | | | | | |
Alabama | | 6 | | 372 | | 1.1% | | 95.6% | | 96.8% | | 4,613 | | 1.0% | | 12.98 | |
Florida | | 14 | | 1,596 | | 4.6% | | 91.0% | | 91.7% | | 20,634 | | 4.7% | | 14.21 | |
Georgia | | 14 | | 1,857 | | 5.4% | | 92.9% | | 94.3% | | 20,015 | | 4.6% | | 11.61 | |
Illinois | | 7 | | 990 | | 2.9% | | 92.5% | | 95.0% | | 15,938 | | 3.6% | | 17.41 | |
Missouri | | 5 | | 812 | | 2.3% | | 80.6% | | 86.6% | | 7,201 | | 1.6% | | 11.00 | |
North Carolina | | 3 | | 680 | | 2.0% | | 99.7% | | 99.7% | | 6,927 | | 1.6% | | 10.21 | |
South Carolina | | 12 | | 1,271 | | 3.7% | | 93.8% | | 95.4% | | 13,851 | | 3.2% | | 11.62 | |
Tennessee | | 7 | | 712 | | 2.1% | | 89.6% | | 93.8% | | 7,284 | | 1.7% | | 11.42 | |
Virginia | | 2 | | 386 | | 1.1% | | 95.7% | | 97.0% | | 7,154 | | 1.6% | | 19.34 | |
Subtotal - East | | 70 | | 8,676 | | 25.2% | | 92.0% | | 94.0% | | 103,617 | | 23.6% | | 12.99 | |
| | | | | | | | | | | | | | | | | |
West | | | | | | | | | | | | | | | | | |
Arizona | | 4 | | 772 | | 2.2% | | 86.4% | | 93.5% | | 10,857 | | 2.5% | | 16.27 | |
California (e) | | 15 | | 1,745 | | 5.0% | | 70.8% | | 85.7% | | 22,525 | | 5.1% | | 18.24 | |
Colorado | | 4 | | 572 | | 1.7% | | 90.1% | | 92.3% | | 5,788 | | 1.3% | | 11.24 | |
Iowa | | 1 | | 134 | | 0.4% | | 93.2% | | 93.2% | | 1,533 | | 0.3% | | 12.25 | |
Kansas | | 1 | | 237 | | 0.7% | | 90.7% | | 100.0% | | 2,076 | | 0.5% | | 9.68 | |
Montana | | 1 | | 162 | | 0.5% | | 87.7% | | 100.0% | | 1,629 | | 0.4% | | 11.48 | |
New Mexico | | 1 | | 224 | | 0.6% | | 88.3% | | 97.9% | | 2,982 | | 0.7% | | 15.06 | |
Nevada | | 3 | | 614 | | 1.8% | | 75.3% | | 80.3% | | 8,007 | | 1.8% | | 17.32 | |
Utah | | 2 | | 717 | | 2.1% | | 81.2% | | 86.1% | | 11,064 | | 2.5% | | 18.99 | |
Washington | | 4 | | 1,376 | | 4.0% | | 81.7% | | 84.7% | | 13,862 | | 3.2% | | 12.34 | |
Wisconsin | | 2 | | 423 | | 1.2% | | 88.7% | | 91.8% | | 4,605 | | 1.1% | | 12.28 | |
Subtotal - West | | 38 | | 6,976 | | 20.2% | | 80.9% | | 88.2% | | 84,928 | | 19.4% | | 15.06 | |
| | | | | | | | | | | | | | | | | |
South | | | | | | | | | | | | | | | | | |
Louisiana | | 3 | | 311 | | 0.9% | | 100.0% | | 100.0% | | 3,822 | | 0.9% | | 12.27 | |
Oklahoma | | 6 | | 164 | | 0.5% | | 100.0% | | 100.0% | | 2,357 | | 0.5% | | 14.40 | |
Texas | | 62 | | 7,695 | | 22.3% | | 87.5% | | 89.0% | | 106,497 | | 24.3% | | 15.81 | |
Subtotal - South | | 71 | | 8,170 | | 23.7% | | 88.3% | | 89.6% | | 112,676 | | 25.7% | | 15.63 | |
| | | | | | | | | | | | | | | | | |
Total - Pro Rata Retail | | 263 | | 34,495 | | 100.0% | | 88.6% | | 91.3% | | 438,460 | | 100.0% | | 14.35 | |
| | | | | | | | | | | | | | | | | |
Other | | | | | | | | | | | | | | | | | |
Office (e) | | 10 | | 2,716 | | | | 100.0% | | 100.0% | | 33,652 | | | | 12.39 | |
Industrial | | 2 | | 287 | | | | 100.0% | | 100.0% | | 1,610 | | | | 5.61 | |
Total - Pro Rata Other | | 12 | | 3,003 | | | | 100.0% | | 100.0% | | 35,262 | | | | 11.74 | |
| | | | | | | | | | | | | | | | | |
Total Pro Rata Operating Portfolio | | 275 | | 37,498 | | | | 89.5% | | 92.0% | | $ | 473,722 | | | | $ | 14.11 | |
(a) | Includes our consolidated operating properties plus our pro rata share of unconsolidated operating properties. |
| |
(b) | Percentages are only provided for our retail operating portfolio. |
| |
(c) | Based on leases commenced as of September 30, 2012 and calculated as occupied GLA divided by total GLA. |
| |
(d) | Includes leases signed as of September 30, 2012 but not commenced and calculated as leased GLA divided by total GLA. |
| |
(e) | Excludes one single-user retail and one single-user office property classified as held for sale as of September 30, 2012. |
3rd Quarter 2012 Supplemental Information | | 10 |
Retail Properties of America, Inc.
Retail Operating Portfolio Occupancy Breakdown as of September 30, 2012
(square footage amounts in thousands)
Consolidated Retail Operating Properties at 100%:
| | | | Total | | 25,000+ sq ft | | 10,000-24,999 sq ft | | 5,000-9,999 sq ft | | 0-4,999 sq ft | |
Property Type/Region | | Number of
Properties | | GLA | | Occupancy
(a) | | GLA | | Occupancy
(a) | | GLA | | Occupancy
(a) | | GLA | | Occupancy
(a) | | GLA | | Occupancy
(a) | |
Retail | | | | | | | | | | | | | | | | | | | | | | | |
North | | 83 | | 10,629 | | 91.1% | | 6,566 | | 95.3% | | 1,900 | | 91.8% | | 945 | | 82.7% | | 1,218 | | 74.4% | |
East | | 67 | | 8,568 | | 91.9% | | 4,637 | | 97.2% | | 1,611 | | 92.5% | | 768 | | 90.6% | | 1,552 | | 76.2% | |
West (b) | | 36 | | 6,883 | | 80.6% | | 3,811 | | 82.6% | | 1,254 | | 81.3% | | 719 | | 76.5% | | 1,099 | | 75.5% | |
South | | 55 | | 7,457 | | 87.6% | | 3,295 | | 92.2% | | 1,433 | | 88.8% | | 1,024 | | 86.5% | | 1,705 | | 78.4% | |
Total - Consolidated at 100% | | 241 | | 33,537 | | 88.4% | | 18,309 | | 92.6% | | 6,198 | | 89.2% | | 3,456 | | 84.3% | | 5,574 | | 76.4% | |
| | | | | | | | | | | | | | | | | | | | | | | |
Total - % Leased including Signed (c) | | 241 | | 33,537 | | 91.1% | | 18,309 | | 94.8% | | 6,198 | | 94.4% | | 3,456 | | 86.2% | | 5,574 | | 78.4% | |
| | | | | | | | | | | | | | | | | | | | | | | |
| | | | | | | | | | | | | | | | | | | | | | | |
Unconsolidated Retail Operating Properties at 100%: |
| | | | | | | | | | | | | | | | | | | | | | | |
| | | | Total | | 25,000+ sq ft | | 10,000-24,999 sq ft | | 5,000-9,999 sq ft | | 0-4,999 sq ft | |
Property Type/Region | | Number of
Properties | | GLA | | Occupancy
(a) | | GLA | | Occupancy
(a) | | GLA | | Occupancy
(a) | | GLA | | Occupancy
(a) | | GLA | | Occupancy
(a) | |
Retail | | | | | | | | | | | | | | | | | | | | | | | |
North | | 1 | | 221 | | 99.4% | | 73 | | 100.0% | | 128 | | 100.0% | | 6 | | 100.0% | | 14 | | 90.1% | |
East | | 3 | | 538 | | 94.2% | | 274 | | 100.0% | | 116 | | 100.0% | | 46 | | 87.6% | | 102 | | 75.0% | |
West | | 2 | | 97 | | 100.0% | | 80 | | 100.0% | | 14 | | 100.0% | | - | | - | | 3 | | 100.0% | |
South | | 16 | | 3,565 | | 94.7% | | 1,761 | | 100.0% | | 457 | | 95.0% | | 488 | | 86.2% | | 859 | | 88.5% | |
Total - Unconsolidated at 100% | | 22 | | 4,421 | | 95.0% | | 2,188 | | 100.0% | | 715 | | 96.8% | | 540 | | 86.5% | | 978 | | 87.2% | |
| | | | | | | | | | | | | | | | | | | | | | | |
Total - % Leased including Signed (c) | | 22 | | 4,421 | | 96.0% | | 2,188 | | 100.0% | | 715 | | 100.0% | | 540 | | 86.5% | | 978 | | 89.4% | |
| | | | | | | | | | | | | | | | | | | | | | | |
| | | | | | | | | | | | | | | | | | | | | | | |
Total Pro Rata Retail Operating Portfolio (d): | | | | | | | | | | | | | | | | | | | | | |
| | | | | | | | | | | | | | | | | | | | | | | |
| | | | Total | | 25,000+ sq ft | | 10,000-24,999 sq ft | | 5,000-9,999 sq ft | | 0-4,999 sq ft | |
Property Type/Region | | Number of
Properties | | GLA | | Occupancy
(a) | | GLA | | Occupancy
(a) | | GLA | | Occupancy
(a) | | GLA | | Occupancy
(a) | | GLA | | Occupancy
(a) | |
Retail | | | | | | | | | | | | | | | | | | | | | | | |
North | | 84 | | 10,673 | | 91.2% | | 6,581 | | 95.3% | | 1,926 | | 91.9% | | 946 | | 82.7% | | 1,220 | | 74.4% | |
East | | 70 | | 8,676 | | 92.0% | | 4,692 | | 97.3% | | 1,634 | | 92.6% | | 777 | | 90.6% | | 1,573 | | 76.2% | |
West (b) | | 38 | | 6,976 | | 80.9% | | 3,888 | | 83.0% | | 1,267 | | 81.5% | | 719 | | 76.5% | | 1,102 | | 75.6% | |
South | | 71 | | 8,170 | | 88.3% | | 3,647 | | 93.0% | | 1,524 | | 89.2% | | 1,122 | | 86.5% | | 1,877 | | 79.4% | |
Total - Pro Rata Share | | 263 | | 34,495 | | 88.6% | | 18,808 | | 92.8% | | 6,351 | | 89.3% | | 3,564 | | 84.4% | | 5,772 | | 76.7% | |
| | | | | | | | | | | | | | | | | | | | | | | |
Total - % Leased including Signed (c) | | 263 | | 34,495 | | 91.3% | | 18,808 | | 94.9% | | 6,351 | | 94.6% | | 3,564 | | 86.2% | | 5,772 | | 78.8% | |
(a) | Based on leases commenced as of September 30, 2012 and calculated as occupied GLA divided by total GLA. |
| |
(b) | Excludes one wholly-owned single-user retail property classified as held for sale as of September 30, 2012. |
| |
(c) | Includes leases signed as of September 30, 2012 but not commenced and calculated as leased GLA divided by total GLA. |
| |
(d) | Includes our consolidated retail operating properties plus our pro rata share of unconsolidated retail operating properties. |
3rd Quarter 2012 Supplemental Information | | 11 |
Retail Properties of America, Inc.
Top Tenants as of September 30, 2012
(dollar amounts and square footage in thousands)
The following table sets forth information regarding the 20 largest tenants in our retail operating portfolio, including our pro rata share of unconsolidated joint ventures, based on ABR as of September 30, 2012. Dollars (other than per square foot information) and square feet of GLA are presented in thousands.
Tenant (a) | | Primary DBA | | Number
of Stores | | Occupied
GLA | | % of
Occupied
GLA (b) | | ABR | | % of Total
ABR (c) | | ABR per
Occupied
Sq. Ft. | |
Best Buy Co, Inc. | | Best Buy, Pacific Sales | | 30 | | 1,070 | | 3.5% | | $ | 14,569 | | 3.3% | | $ | 13.62 | |
| | | | | | | | | | | | | | | |
Ahold USA, Inc. | | Giant Foods, Stop & Shop | | 11 | | 661 | | 2.2% | | 13,004 | | 3.0% | | 19.67 | |
| | | | | | | | | | | | | | | |
The TJX Companies Inc. | | HomeGoods, Marshalls, TJ Maxx | | 47 | | 1,241 | | 4.1% | | 11,771 | | 2.6% | | 9.49 | |
| | | | | | | | | | | | | | | |
Bed Bath & Beyond Inc. | | Bed Bath & Beyond, Buy Buy Baby, The Christmas Tree Shops, Cost Plus Inc. | | 36 | | 872 | | 2.9% | | 11,309 | | 2.6% | | 12.97 | |
| | | | | | | | | | | | | | | |
Rite Aid Corporation | | | | 35 | | 425 | | 1.4% | | 10,399 | | 2.4% | | 24.47 | |
| | | | | | | | | | | | | | | |
Ross Stores, Inc. | | | | 40 | | 1,038 | | 3.4% | | 10,270 | | 2.3% | | 9.89 | |
| | | | | | | | | | | | | | | |
PetSmart, Inc. | | | | 39 | | 707 | | 2.3% | | 9,839 | | 2.2% | | 13.92 | |
| | | | | | | | | | | | | | | |
The Home Depot, Inc. | | | | 9 | | 1,097 | | 3.6% | | 9,135 | | 2.1% | | 8.33 | |
| | | | | | | | | | | | | | | |
The Sports Authority, Inc. | | | | 17 | | 690 | | 2.3% | | 7,952 | | 1.8% | | 11.52 | |
| | | | | | | | | | | | | | | |
SUPERVALU INC. | | Acme, Jewel-Osco, Save-A-Lot, Shaw’s Supermarkets, Shop N Save, Shoppers Food Warehouse | | 10 | | 562 | | 1.7% | | 7,705 | | 1.7% | | 13.71 | |
| | | | | | | | | | | | | | | |
Pier 1 Imports, Inc. | | | | 37 | | 378 | | 1.2% | | 7,055 | | 1.6% | | 18.66 | |
| | | | | | | | | | | | | | | |
Michaels Stores, Inc. | | | | 30 | | 611 | | 2.0% | | 6,859 | | 1.6% | | 11.23 | |
| | | | | | | | | | | | | | | |
Publix Super Markets Inc. | | | | 15 | | 634 | | 2.1% | | 6,703 | | 1.5% | | 10.57 | |
| | | | | | | | | | | | | | | |
Edwards Theaters, Inc. | | | | 2 | | 219 | | 0.7% | | 6,558 | | 1.5% | | 29.95 | |
| | | | | | | | | | | | | | | |
Dicks Sporting Goods, Inc. | | Dick’s Sporting Goods, Golf Galaxy | | 13 | | 568 | | 1.9% | | 6,525 | | 1.5% | | 11.49 | |
| | | | | | | | | | | | | | | |
Wal-Mart Stores, Inc. | | Wal-Mart, Sam’s Club | | 6 | | 903 | | 2.9% | | 5,984 | | 1.4% | | 6.63 | |
| | | | | | | | | | | | | | | |
Kohl’s Corporation | | | | 10 | | 849 | | 2.8% | | 5,826 | | 1.3% | | 6.86 | |
| | | | | | | | | | | | | | | |
Office Depot, Inc. | | | | 21 | | 420 | | 1.4% | | 5,512 | | 1.3% | | 13.12 | |
| | | | | | | | | | | | | | | |
Staples, Inc. | | | | 18 | | 342 | | 1.1% | | 4,687 | | 1.1% | | 13.70 | |
| | | | | | | | | | | | | | | |
Rave Cinemas, LLC | | | | 2 | | 162 | | 0.5% | | 4,626 | | 1.1% | | 28.56 | |
Total Top Tenants | | | | 428 | | 13,449 | | 44.0% | | $ | 166,288 | | 37.9% | | $ | 12.36 | |
(a) | Excludes two office tenants, Aon Corporation consisting of 1,162 of GLA and $15,106 of ABR and Zurich American Insurance Company, consisting of 895 of GLA and $10,476 of ABR. |
| |
(b) | Represents the percentage of total occupied GLA of our retail operating portfolio including our pro rata share of unconsolidated joint ventures. |
| |
(c) | Represents the percentage of total annualized base rent from our retail operating portfolio including our pro rata share of unconsolidated joint ventures. |
3rd Quarter 2012 Supplemental Information | | 12 |
Retail Properties of America, Inc.
Retail Leasing Activity Summary
(square footage amounts in thousands)
The following table summarizes the leasing activity in our retail operating portfolio including our pro rata share of unconsolidated joint ventures as of September 30, 2012 and for the preceding four quarters. Leases of less than 12 months have been excluded.
Total Leases
| | Number of
Leases Signed | | GLA Signed | | New Contractual
Rent per Square
Foot (PSF) (a) | | Prior
Contractual
Rent PSF (a) | | % Change
over Prior
ABR (a) | | WA Lease
Term | | Tenant
Improvements
PSF |
Q3 2012 | | 166 | | 1,023 | | $ | 16.94 | | $ | 16.00 | | 5.88% | | 5.54 | | $ | 7.70 |
Q2 2012 | | 174 | | 727 | | $ | 18.59 | | $ | 17.70 | | 5.03% | | 6.00 | | $ | 10.31 |
Q1 2012 | | 154 | | 729 | | $ | 19.49 | | $ | 19.44 | | 0.26% | | 6.74 | | $ | 19.01 |
Q4 2011 | | 144 | | 1,104 | | $ | 14.49 | | $ | 14.52 | | (0.21%) | | 7.59 | | $ | 11.19 |
Total - 12 months | | 638 | | 3,583 | | $ | 17.02 | | $ | 16.52 | | 3.03% | | 6.44 | | $ | 11.61 |
Comparable Renewal Leases
| | Number of
Leases Signed | | GLA Signed | | New Contractual
Rent PSF | | Prior
Contractual
Rent PSF | | % Change
over Prior
ABR | | WA Lease
Term | | Tenant
Improvements
PSF |
Q3 2012 | | 113 | | 737 | | $ | 16.42 | | $ | 15.64 | | 4.99% | | 4.65 | | $ | 0.90 |
Q2 2012 | | 101 | | 345 | | $ | 18.79 | | $ | 18.02 | | 4.27% | | 4.18 | | $ | 1.02 |
Q1 2012 | | 81 | | 257 | | $ | 22.10 | | $ | 21.09 | | 4.79% | | 4.64 | | $ | 1.04 |
Q4 2011 | | 79 | | 586 | | $ | 14.54 | | $ | 14.31 | | 1.61% | | 7.70 | | $ | 4.54 |
Total - 12 months | | 374 | | 1,925 | | $ | 17.03 | | $ | 16.39 | | 3.90% | | 5.35 | | $ | 2.05 |
Comparable New Leases
| | Number of
Leases Signed | | GLA Signed | | New Contractual
Rent PSF | | Prior
Contractual
Rent PSF | | % Change
over Prior
ABR | | WA Lease
Term | | Tenant
Improvements
PSF |
Q3 2012 | | 19 | | 83 | | $ | 21.59 | | $ | 19.16 | | 12.68% | | 7.85 | | $ | 29.88 |
Q2 2012 | | 17 | | 106 | | $ | 17.93 | | $ | 16.68 | | 7.49% | | 8.51 | | $ | 32.85 |
Q1 2012 | | 24 | | 158 | | $ | 15.25 | | $ | 16.77 | | (9.06%) | | 9.10 | | $ | 37.91 |
Q4 2011 | | 13 | | 77 | | $ | 14.09 | | $ | 16.11 | | (12.54%) | | 8.22 | | $ | 23.10 |
Total - 12 months | | 73 | | 424 | | $ | 16.95 | | $ | 17.09 | | (0.82%) | | 8.50 | | $ | 32.40 |
Non-Comparable New and Renewal Leases (b)
| | Number of
Leases Signed | | GLA Signed | | New Contractual
Rent PSF | | Prior
Contractual
Rent PSF | | % Change
over Prior
ABR | | WA Lease
Term | | Tenant
Improvements
PSF |
Q3 2012 | | 34 | | 203 | | $ | 13.27 | | n/a | | n/a | | 7.92 | | $ | 23.36 |
Q2 2012 | | 56 | | 276 | | $ | 15.51 | | n/a | | n/a | | 7.74 | | $ | 13.22 |
Q1 2012 | | 49 | | 314 | | $ | 13.43 | | n/a | | n/a | | 8.17 | | $ | 24.20 |
Q4 2011 | | 52 | | 441 | | $ | 10.75 | | n/a | | n/a | | 7.25 | | $ | 17.96 |
Total - 12 months | | 191 | | 1,234 | | $ | 12.84 | | n/a | | n/a | | 7.74 | | $ | 19.38 |
(a) | Total excludes the impact of Non-Comparable Leases. |
| |
(b) | Includes leases signed on units that were vacant for over 12 months, leases signed without fixed rental payments and leases signed where the previous and the current lease do not have a matching lease structure. |
3rd Quarter 2012 Supplemental Information | | 13 |
Retail Properties of America, Inc.
Retail Lease Expirations as of September 30, 2012
(dollar amounts and square footage in thousands)
The following tables set forth a summary, as of September 30, 2012, of lease expirations scheduled to occur during the remainder of 2012 and each of the ten calendar years from 2013 to 2022 and thereafter, assuming no exercise of renewal options or early termination rights for all leases in our retail operating portfolio including our pro rata share of unconsolidated joint ventures. The following tables are based on leases commenced as of September 30, 2012. Dollars (other than per square foot information) and square feet of GLA are presented in thousands in the table.
Lease Expiration Year | | GLA | | % of
Occupied
GLA | | % of Total
GLA | | ABR | | % of Total
ABR | | ABR per
Occupied
Sq. Ft. | | ABR at Exp. (a) | | ABR Per
Occupied Sq.
Ft. at Exp. (b) |
2012 | | 339 | | 1.1% | | 1.0% | | $ | 6,627 | | 1.5% | | $ | 19.55 | | $ | 6,627 | | $ | 19.55 |
2013 | | 2,178 | | 7.1% | | 6.3% | | 36,900 | | 8.5% | | 16.94 | | 37,150 | | 17.06 |
2014 | | 4,129 | | 13.5% | | 12.0% | | 64,097 | | 14.6% | | 15.52 | | 64,639 | | 15.65 |
2015 | | 3,449 | | 11.3% | | 10.0% | | 50,323 | | 11.5% | | 14.59 | | 51,312 | | 14.88 |
2016 | | 2,799 | | 9.2% | | 8.2% | | 44,453 | | 10.1% | | 15.88 | | 45,828 | | 16.37 |
2017 | | 2,733 | | 8.9% | | 7.9% | | 40,560 | | 9.3% | | 14.84 | | 42,299 | | 15.48 |
2018 | | 1,804 | | 5.9% | | 5.2% | | 27,027 | | 6.1% | | 14.98 | | 29,424 | | 16.31 |
2019 | | 1,851 | | 6.1% | | 5.4% | | 26,759 | | 6.1% | | 14.46 | | 28,366 | | 15.32 |
2020 | | 2,147 | | 7.1% | | 6.2% | | 25,244 | | 5.7% | | 11.76 | | 26,842 | | 12.50 |
2021 | | 1,732 | | 5.6% | | 5.0% | | 25,007 | | 5.7% | | 14.44 | | 27,138 | | 15.67 |
2022 | | 2,053 | | 6.7% | | 5.9% | | 24,589 | | 5.6% | | 11.98 | | 26,143 | | 12.73 |
Thereafter | | 5,203 | | 17.0% | | 15.1% | | 64,744 | | 14.8% | | 12.44 | | 69,682 | | 13.39 |
Month to month | | 144 | | 0.5% | | 0.4% | | 2,130 | | 0.5% | | 14.79 | | 2,130 | | 14.79 |
Leased Total | | 30,561 | | 100.0% | | 88.6% | | $ | 438,460 | | 100.0% | | 14.35 | | $ | 457,580 | | $ | 14.97 |
| | | | | | | | | | | | | | | | |
Leases signed but not commenced | | 916 | | - | | 2.7% | | $ | 13,296 | | - | | $ | 14.52 | | $ | 15,121 | | $ | 16.51 |
Available | | 3,018 | | - | | 8.7% | | | | | | | | | | |
The following tables break down the above information into anchor (10,000 sf and above) and non-anchor (under 10,000 sf) details for our retail operating portfolio. Dollars (other than per square foot information) and square feet of GLA are presented in thousands in the table.
Anchor
Lease Expiration Year | | GLA | | % of
Occupied
GLA | | % of Total
GLA | | ABR | | % of Total
ABR | | ABR per
Occupied
Sq. Ft. | | ABR at Exp. (a) | | ABR Per
Occupied Sq.
Ft. at Exp. (b) |
2012 | | 71 | | 0.2% | | 0.2% | | $ | 1,415 | | 0.3% | | $ | 19.93 | | $ | 1,415 | | $ | 19.93 |
2013 | | 932 | | 3.0% | | 2.7% | | 9,559 | | 2.2% | | 10.26 | | 9,749 | | 10.46 |
2014 | | 2,590 | | 8.5% | | 7.5% | | 29,872 | | 6.8% | | 11.53 | | 29,812 | | 11.51 |
2015 | | 2,410 | | 7.9% | | 7.0% | | 27,618 | | 6.3% | | 11.46 | | 27,796 | | 11.53 |
2016 | | 1,979 | | 6.5% | | 5.8% | | 25,002 | | 5.7% | | 12.63 | | 25,541 | | 12.91 |
2017 | | 1,890 | | 6.1% | | 5.5% | | 20,211 | | 4.7% | | 10.69 | | 20,461 | | 10.83 |
2018 | | 1,380 | | 4.5% | | 4.0% | | 17,227 | | 3.9% | | 12.48 | | 18,398 | | 13.33 |
2019 | | 1,615 | | 5.3% | | 4.7% | | 21,228 | | 4.8% | | 13.14 | | 22,300 | | 13.81 |
2020 | | 1,942 | | 6.4% | | 5.6% | | 20,270 | | 4.6% | | 10.44 | | 21,335 | | 10.99 |
2021 | | 1,482 | | 4.8% | | 4.3% | | 19,658 | | 4.5% | | 13.26 | | 21,102 | | 14.24 |
2022 | | 1,877 | | 6.1% | | 5.4% | | 20,381 | | 4.6% | | 10.86 | | 21,268 | | 11.33 |
Thereafter | | 4,917 | | 16.1% | | 14.3% | | 57,343 | | 13.1% | | 11.66 | | 60,556 | | 12.32 |
Month to month | | 30 | | 0.1% | | 0.1% | | 273 | | 0.1% | | 9.10 | | 273 | | 9.10 |
Leased Total | | 23,115 | | 75.5% | | 67.1% | | $ | 270,057 | | 61.6% | | $ | 11.68 | | $ | 280,006 | | $ | 12.11 |
| | | | | | | | | | | | | | | | |
Leases signed but not commenced | | 732 | | - | | 2.2% | | $ | 9,050 | | - | | $ | 12.36 | | $ | 10,382 | | $ | 14.18 |
| | | | | | | | | | | | | | | | | | | | | |
Non-Anchor
Lease Expiration Year | | GLA | | % of
Occupied
GLA | | % of Total
GLA | | ABR | | % of Total
ABR | | ABR per
Occupied
Sq. Ft. | | ABR at Exp. (a) | | ABR Per
Occupied Sq.
Ft. at Exp. (b) |
2012 | | 268 | | 0.9% | | 0.8% | | $ | 5,212 | | 1.2% | | $ | 19.45 | | $ | 5,212 | | $ | 19.45 |
2013 | | 1,246 | | 4.1% | | 3.6% | | 27,341 | | 6.3% | | 21.94 | | 27,401 | | 21.99 |
2014 | | 1,539 | | 5.0% | | 4.5% | | 34,225 | | 7.8% | | 22.24 | | 34,827 | | 22.63 |
2015 | | 1,039 | | 3.4% | | 3.0% | | 22,705 | | 5.2% | | 21.85 | | 23,516 | | 22.63 |
2016 | | 820 | | 2.7% | | 2.4% | | 19,451 | | 4.4% | | 23.72 | | 20,287 | | 24.74 |
2017 | | 843 | | 2.8% | | 2.4% | | 20,349 | | 4.6% | | 24.14 | | 21,838 | | 25.91 |
2018 | | 424 | | 1.4% | | 1.2% | | 9,800 | | 2.2% | | 23.11 | | 11,026 | | 26.00 |
2019 | | 236 | | 0.8% | | 0.7% | | 5,531 | | 1.3% | | 23.44 | | 6,066 | | 25.70 |
2020 | | 205 | | 0.7% | | 0.6% | | 4,974 | | 1.1% | | 24.26 | | 5,507 | | 26.86 |
2021 | | 250 | | 0.8% | | 0.7% | | 5,349 | | 1.2% | | 21.40 | | 6,036 | | 24.14 |
2022 | | 176 | | 0.6% | | 0.5% | | 4,208 | | 1.0% | | 23.91 | | 4,875 | | 27.70 |
Thereafter | | 286 | | 0.9% | | 0.8% | | 7,401 | | 1.7% | | 25.88 | | 9,126 | | 31.91 |
Month to month | | 114 | | 0.4% | | 0.3% | | 1,857 | | 0.4% | | 16.29 | | 1,857 | | 16.29 |
Leased Total | | 7,446 | | 24.5% | | 21.5% | | $ | 168,403 | | 38.4% | | $ | 22.62 | | $ | 177,574 | | $ | 23.85 |
| | | | | | | | | | | | | | | | |
Leases signed but not commenced | | 184 | | - | | 0.5% | | $ | 4,246 | | - | | $ | 23.08 | | $ | 4,739 | | $ | 25.76 |
| | | | | | | | | | | | | | | | | | | | | | |
(a) | Represents annualized base rent at the scheduled expiration of the lease giving effect to contractual increases in base rent. Does not reflect contractual increases based on the Consumer Price Index. |
| |
(b) | Represents annualized base rent at the scheduled expiration of the lease, giving effect to contractual increases in base rent, divided by occupied GLA. Does not reflect contractual increases based on the Consumer Price Index. |
3rd Quarter 2012 Supplemental Information | | 14 |
Retail Properties of America, Inc.
Unconsolidated Joint Venture Combined Financial Statements
(amounts in thousands)
Total Unconsolidated Joint Venture Combined Balance Sheets (a)
| | September 30, | | December 31, |
| | 2012 | | 2011 |
| | | | | | |
Real estate assets | | $ | 719,175 | | | $ | 729,429 | |
Less: accumulated depreciation | | (60,729 | ) | | (49,903 | ) |
Real estate, net | | 658,446 | | | 679,526 | |
| | | | | | |
Cash and cash equivalents | | 22,698 | | | 66,007 | |
Receivables, net | | 9,873 | | | 8,443 | |
Acquired lease intangibles, net | | 135,666 | | | 155,706 | |
Other assets, net | | 16,182 | | | 13,444 | |
Total assets | | $ | 842,865 | | | $ | 923,126 | |
| | | | | | |
Mortgage debt (includes unamortized premium of $3,421 and $4,769, respectively, and unamortized discount of $(1,040) and $(1,225), respectively) | | $ | 485,108 | | | $ | 491,398 | |
Accounts payable and accrued expenses | | 12,795 | | | 12,485 | |
Acquired below market lease intangibles, net | | 15,315 | | | 16,513 | |
Other liabilities | | 25,425 | | | 31,767 | |
Total liabilities | | 538,643 | | | 552,163 | |
| | | | | | |
Total equity | | 304,222 | | | 370,963 | |
Total liabilities and equity | | $ | 842,865 | | | $ | 923,126 | |
RPAI Pro Rata Unconsolidated Joint Venture Combined Balance Sheets (b)
| | September 30, | | December 31, |
| | 2012 | | 2011 |
| | | | | | |
Real estate assets | | $ | 154,690 | | | $ | 162,220 | |
Less: accumulated depreciation | | (13,775 | ) | | (11,652 | ) |
Real estate, net | | 140,915 | | | 150,568 | |
| | | | | | |
Cash and cash equivalents | | 4,574 | | | 13,238 | |
Receivables, net | | 2,281 | | | 2,156 | |
Acquired lease intangibles, net | | 27,133 | | | 31,141 | |
Other assets, net | | 3,825 | | | 3,340 | |
Total assets | | $ | 178,728 | | | $ | 200,443 | |
| | | | | | |
Mortgage debt (includes unamortized premium of $2,458 and $3,423, respectively, and unamortized discount of $(208) and $(245), respectively) | | $ | 108,553 | | | $ | 114,382 | |
Accounts payable and accrued expenses | | 2,715 | | | 2,812 | |
Acquired below market lease intangibles, net | | 3,063 | | | 3,303 | |
Other liabilities | | 5,096 | | | 6,364 | |
Total liabilities | | 119,427 | | | 126,861 | |
| | | | | | |
Total equity | | 59,301 | | | 73,582 | |
Total liabilities and equity | | $ | 178,728 | | | $ | 200,443 | |
(a) | Represents combined balance sheets of our RioCan, MS Inland and Hampton unconsolidated joint ventures. |
| |
(b) | Represents our pro rata share of the combined balance sheets of our RioCan, MS Inland and Hampton unconsolidated joint ventures. |
3rd Quarter 2012 Supplemental Information | | 15 |
Retail Properties of America, Inc.
Unconsolidated Joint Venture Combined Financial Statements
(amounts in thousands)
Total Unconsolidated Joint Venture Combined Statements of Operations (a)
| | Three Months Ended
September 30, | | Nine Months Ended
September 30, |
| | 2012 | | 2011 | | 2012 | | 2011 |
| | | | | | | | | | | | |
Rental income | | $ | 16,512 | | | $ | 10,506 | | | $ | 49,340 | | | $ | 28,382 | |
Tenant recovery income | | 5,344 | | | 3,593 | | | 16,426 | | | 9,201 | |
Other property income | | 62 | | | 86 | | | 276 | | | 390 | |
Total revenues | | 21,918 | | | 14,185 | | | 66,042 | | | 37,973 | |
| | | | | | | | | | | | |
Property operating expenses | | 3,051 | | | 1,639 | | | 10,025 | | | 4,967 | |
Real estate taxes | | 3,732 | | | 2,394 | | | 11,227 | | | 6,269 | |
Depreciation and amortization | | 12,467 | | | 7,746 | | | 37,659 | | | 19,811 | |
Provision for impairment of investment properties | | - | | | - | | | - | | | - | |
Loss on lease terminations | | 933 | | | 1,505 | | | 1,955 | | | 1,641 | |
General and administrative expenses | | 308 | | | 471 | | | 1,065 | | | 862 | |
Other operating expenses | | - | | | - | | | 842 | | | - | |
Total expenses | | 20,491 | | | 13,755 | | | 62,773 | | | 33,550 | |
| | | | | | | | | | | | |
Operating income | | 1,427 | | | 430 | | | 3,269 | | | 4,423 | |
| | | | | | | | | | | | |
Interest expense | | (5,269 | ) | | (4,144 | ) | | (15,712 | ) | | (11,089 | ) |
Other (expense) income, net | | (134 | ) | | 1 | | | 42 | | | 4 | |
Loss from continuing operations | | (3,976 | ) | | (3,713 | ) | | (12,401 | ) | | (6,662 | ) |
| | | | | | | | | | | | |
Discontinued operations: | | | | | | | | | | | | |
Loss, net | | (88 | ) | | (378 | ) | | (2,074 | ) | | (4,978 | ) |
Gain (loss) on sales of investment properties | | 149 | | | (29 | ) | | 2,593 | | | (29 | ) |
Income (loss) from discontinued operations | | 61 | | | (407 | ) | | 519 | | | (5,007 | ) |
| | | | | | | | | | | | |
Net loss | | $ | (3,915 | ) | | $ | (4,120 | ) | | $ | (11,882 | ) | | $ | (11,669 | ) |
| | | | | | | | | | | | |
Funds From Operations (FFO) (b) | | | | | | | | | | | | |
Net loss | | $ | (3,915 | ) | | $ | (4,120 | ) | | $ | (11,882 | ) | | $ | (11,669 | ) |
Depreciation and amortization | | 13,267 | | | 8,783 | | | 39,762 | | | 21,668 | |
Provision for impairment of investment properties | | 71 | | | - | | | 1,593 | | | 4,067 | |
(Gain) loss on sales of investment properties | | (149 | ) | | 29 | | | (2,593 | ) | | 29 | |
FFO | | $ | 9,274 | | | $ | 4,692 | | | $ | 26,880 | | | $ | 14,095 | |
(a) | Represents combined statements of operations of our RioCan, MS Inland and Hampton unconsolidated joint ventures. |
| |
(b) | Refer to page 19 for definition of FFO. |
3rd Quarter 2012 Supplemental Information | 16 |
Retail Properties of America, Inc.
Unconsolidated Joint Venture Combined Financial Statements
(amounts in thousands)
RPAI Pro Rata Unconsolidated Joint Venture Combined Statements of Operations (a) (b)
| | Three Months Ended
September 30, | | Nine Months Ended
September 30, |
| | 2012 | | 2011 | | 2012 | | 2011 |
| | | | | | | | | | | | |
Rental income | | $ | 3,548 | | | $ | 2,434 | | | $ | 10,664 | | | $ | 6,622 | |
Tenant recovery income | | 1,129 | | | 812 | | | 3,480 | | | 2,092 | |
Other property income | | 12 | | | 17 | | | 70 | | | 78 | |
Total revenues | | 4,689 | | | 3,263 | | | 14,214 | | | 8,792 | |
| | | | | | | | | | | | |
Property operating expenses | | 499 | | | 382 | | | 1,628 | | | 1,180 | |
Real estate taxes | | 785 | | | 542 | | | 2,377 | | | 1,428 | |
Depreciation and amortization | | 2,603 | | | 1,715 | | | 7,904 | | | 4,460 | |
Provision for impairment of investment properties | | - | | | - | | | - | | | - | |
Loss on lease terminations | | 187 | | | 301 | | | 391 | | | 328 | |
General and administrative expenses | | 62 | | | 98 | | | 221 | | | 201 | |
Other operating expenses | | - | | | - | | | - | | | - | |
Total expenses | | 4,136 | | | 3,038 | | | 12,521 | | | 7,597 | |
| | | | | | | | | | | | |
Operating income | | 553 | | | 225 | | | 1,693 | | | 1,195 | |
| | | | | | | | | | | | |
Interest expense | | (974 | ) | | (864 | ) | | (3,006 | ) | | (2,343 | ) |
Other (expense) income, net | | (27 | ) | | - | | | (1 | ) | | 1 | |
Loss from continuing operations | | (448 | ) | | (639 | ) | | (1,314 | ) | | (1,147 | ) |
| | | | | | | | | | | | |
Discontinued operations: | | | | | | | | | | | | |
Loss, net | | (79 | ) | | (159 | ) | | (1,802 | ) | | (3,965 | ) |
Gain (loss) on sales of investment properties | | - | | | (28 | ) | | - | | | (28 | ) |
Loss from discontinued operations | | (79 | ) | | (187 | ) | | (1,802 | ) | | (3,993 | ) |
| | | | | | | | | | | | |
Net loss | | $ | (527 | ) | | $ | (826 | ) | | $ | (3,116 | ) | | $ | (5,140 | ) |
RPAI ownership adjustments (c) | | (1,336 | ) | | (1,043 | ) | | (2,351 | ) | | (888 | ) |
Net loss attributable to RPAI’s ownership interests | | $ | (1,863 | ) | | $ | (1,869 | ) | | $ | (5,467 | ) | | $ | (6,028 | ) |
| | | | | | | | | | | | |
Funds From Operations (FFO) (d) | | | | | | | | | | | | |
Net loss attributable to RPAI’s ownership interests | | $ | (1,863 | ) | | $ | (1,869 | ) | | $ | (5,467 | ) | | $ | (6,028 | ) |
Depreciation and amortization | | 2,769 | | | 1,903 | | | 8,346 | | | 4,779 | |
Provision for impairment of investment properties | | 210 | | | - | | | 1,440 | | | 3,897 | |
(Gain) loss on sales of investment properties | | - | | | - | | | - | | | - | |
FFO | | $ | 1,116 | | | $ | 34 | | | $ | 4,319 | | | $ | 2,648 | |
(a) | Represents our pro rata share of the combined net loss of our RioCan, MS Inland and Hampton unconsolidated joint ventures. |
| |
(b) | Amounts shown net of intercompany eliminations and GAAP adjustments for a real estate transaction between joint ventures due to our continuing involvement in the property. |
| |
(c) | Represents adjustments to reflect RPAI’s investment basis and other unconsolidated joint venture activity, inclusive of outside basis amortization, deferral of loss recognition pursuant to GAAP requirements and activity of our captive insurance plan, Oak Property and Casualty LLC. |
| |
(d) | Refer to page 19 for definition of FFO. |
3rd Quarter 2012 Supplemental Information | 17 |
Retail Properties of America, Inc.
Unconsolidated Joint Venture Overview and Debt Summary as of September 30, 2012
(dollar amounts and square footage in thousands)
Unconsolidated Joint Venture Overview
| | | | | | At 100% | | Pro Rata Share |
| | | | Number | | | | | | | | | | | | | | | | |
| | Ownership | | of Operating | | | | | | | | | | | | | | | | |
Joint Venture | | Interest | | Properties | | GLA | | ABR | | Debt (a) | | GLA | | ABR | | Debt (b) |
| | | | | | | | | | | | | | | | | | | | |
MS Inland | | 20.0% | | 6 | | 1,195 | | $ | 19,990 | | | $ | 156,617 | | | 239 | | $ | 3,998 | | | $ | 31,323 | |
Hampton Retail Colorado | | 95.9% | | 2 | | 97 | | 1,271 | | | 12,856 | | | 93 | | 1,219 | | | 12,329 | |
RioCan | | 20.0% | | 14 | | 3,129 | | 44,673 | | | 313,254 | | | 626 | | 8,935 | | | 62,651 | |
| | | | 22 | | 4,421 | | $ | 65,934 | | | $ | 482,727 | | | 958 | | $ | 14,152 | | | $ | 106,303 | |
Unconsolidated Joint Venture Debt Summary
| | At 100% | | Pro Rata Share |
| | Debt (a) | | Interest
Rate/WA
Interest Rate | | Years to
Maturity/WA
Years to Maturity | | Debt (b) | | Interest
Rate/WA
Interest Rate | | Years to
Maturity/WA
Years to Maturity |
Fixed rate: | | | | | | | | | | | | | | | | | |
Mortgages payable | | $ | 365,521 | | | 4.97% | | | 5.1 years | | $ | 73,104 | | | 4.97% | | | 5.1 years | |
Construction loans | | 12,856 | | | 6.15% | | | 1.9 years | | 12,329 | | | 6.15% | | | 1.9 years | |
| | 378,377 | | | 5.01% | | | 5.0 years | | 85,433 | | | 5.14% | | | 4.7 years | |
Variable rate: | | | | | | | | | | | | | | | | | |
Mortgages payable | | 104,350 | | | 2.55% | | | 2.2 years | | 20,870 | | | 2.55% | | | 2.2 years | |
Total | | $ | 482,727 | | | 4.48% | | | 4.4 years | | $ | 106,303 | | | 4.63% | | | 4.2 years | |
Total Unconsolidated Joint Venture Debt Maturity Schedule as of September 30, 2012
Year | | Fixed Rate | | Variable Rate | | Total (a) | | % of Total | | WA Rates on
Total Debt | |
| | | | | | | | | | | |
2012 | | $ | 13,527 | | $ | - | | $ | 13,527 | | 2.8% | | 6.82% | |
2013 | | 36,927 | | - | | 36,927 | | 7.6% | | 5.74% | |
2014 | | 15,410 | | 104,350 | | 119,760 | | 24.8% | | 2.99% | |
2015 | | 82,004 | | - | | 82,004 | | 17.0% | | 5.47% | |
2016 | | 31,748 | | - | | 31,748 | | 6.6% | | 3.68% | |
2017 | | 46,575 | | - | | 46,575 | | 9.6% | | 4.44% | |
2018 | | 58,257 | | - | | 58,257 | | 12.1% | | 4.54% | |
Thereafter | | 93,929 | | - | | 93,929 | | 19.5% | | 4.93% | |
Total | | $ | 378,377 | | $ | 104,350 | | $ | 482,727 | | 100.0% | | 4.48% | |
RPAI Pro Rata Unconsolidated Joint Venture Debt Maturity Schedule as of September 30, 2012
Year | | Fixed Rate | | Variable Rate | | Total (b) | | % of Total | | WA Rates on
Total Debt | |
| | | | | | | | | | | |
2012 | | $ | 2,705 | | $ | - | | $ | 2,705 | | 2.5% | | 6.82% | |
2013 | | 7,386 | | - | | 7,386 | | 6.9% | | 5.74% | |
2014 | | 12,840 | | 20,870 | | 33,710 | | 31.7% | | 3.90% | |
2015 | | 16,401 | | - | | 16,401 | | 15.4% | | 5.47% | |
2016 | | 6,350 | | - | | 6,350 | | 6.0% | | 3.68% | |
2017 | | 9,315 | | - | | 9,315 | | 8.8% | | 4.44% | |
2018 | | 11,651 | | - | | 11,651 | | 11.0% | | 4.54% | |
Thereafter | | 18,785 | | - | | 18,785 | | 17.7% | | 4.93% | |
Total | | $ | 85,433 | | $ | 20,870 | | $ | 106,303 | | 100.0% | | 4.63% | |
(a) | Does not include any premium or discount, of which $3,421 and $(1,040), net of accumulated amortization, respectively, is outstanding as of September 30, 2012. |
| |
(b) | Does not include our pro rata share of premium or discount, of which $2,458 and $(208), net of accumulated amortization, respectively, is outstanding as of September 30, 2012. |
3rd Quarter 2012 Supplemental Information | 18 |
Retail Properties of America, Inc.
Non-GAAP Financial Measures
Funds From Operations (FFO)
As defined by the National Association of Real Estate Investment Trusts (NAREIT), an industry trade group, Funds from Operations (FFO) means net (loss) income computed in accordance with generally accepted accounting principles (GAAP), excluding gains (or losses) from sales of investment properties, plus depreciation and amortization and impairment charges on investment properties, including adjustments for unconsolidated joint ventures in which we hold an interest. We have adopted the NAREIT definition in our computation of FFO and believe that FFO, which is a non-GAAP performance measure, provides an additional and useful means to assess the operating performance of real estate investment trusts (REITs). We believe that, subject to the following limitations, FFO provides a basis for comparing our performance and operations to those of other REITs. FFO is not intended to be an alternative to “Net Income” as an indicator of our performance, nor an alternative to “Cash Flows from Operating Activities” as determined by GAAP as a measure of our capacity to fund cash needs, including the payment of dividends.
Depreciation and amortization related to investment properties for purposes of calculating FFO include loss on lease terminations, which encompasses the write-off of tenant-related assets, including tenant improvements and in-place lease values, as a result of early lease terminations. Loss on lease terminations included in depreciation and amortization for FFO excludes the write-off of tenant-related above and below market lease intangibles that are otherwise included in “Loss on lease terminations” in our condensed consolidated statements of operations.
Operating FFO
Operating FFO is defined as FFO excluding the impact of gains and losses from the early extinguishment of debt and other items as denoted within the calculation that we do not believe are representative of the operating results of our core business platform. We consider Operating FFO a meaningful, additional measure of operating performance primarily because it excludes the effects of transactions and other events which we do not consider representative of the operating results of our core business platform. Operating FFO does not represent an alternative to “Net Income” as an indicator of our performance, nor an alternative to “Cash Flows from Operating Activities” as determined by GAAP as a measure of our capacity to fund cash needs, including the payment of dividends. Further, comparison of our presentation of Operating FFO to similarly titled measures for other REITs may not necessarily be meaningful due to possible differences in definition and application by such REITs.
Net Operating Income (NOI) and Combined NOI
We define Net Operating Income (NOI) as operating revenues (rental income, tenant recovery income, other property income, excluding straight-line rental income, amortization of lease inducements and amortization of acquired above and below market lease intangibles) less property operating expenses (real estate tax expense and property operating expense, excluding straight-line ground rent expense and straight-line bad debt expense). Combined NOI represents NOI plus our pro rata share of NOI from our investment property unconsolidated joint ventures, including discontinued operations associated with those ventures. We believe that NOI and Combined NOI are useful measures of our operating performance. Other REITs may use different methodologies for calculating NOI, and accordingly, our NOI may not be comparable to other REITs. We believe that NOI and Combined NOI provide an operating perspective not immediately apparent from GAAP operating income or net (loss) income. We use NOI and Combined NOI to evaluate our performance on a property-by-property basis because these measures allow management to evaluate the impact that factors such as lease structure, lease rates and tenant base, which vary by property, have on our operating results. However, these measures should only be used as an alternative measure of our financial performance.
Same Store NOI, NOI from Other Investment Properties and NOI from Discontinued Operations
Same Store NOI represents NOI from our same store portfolio consisting of 250 operating properties acquired or placed in service prior to January 1, 2011, except for the two operating properties that were held for sale as of September 30, 2012, which are accounted for as discountinued operations. NOI from Other Investment Properties represents NOI primarily from our development properties, two additional phases of existing properties acquired during the third quarter of 2011, two non-stabilized operating properties and one property that was partially sold to our RioCan joint venture during the third quarter of 2011, which did not qualify for discontinued operations accounting treatment. In addition, we have included University Square, the property for which we have ceased making the monthly debt service payment and for which we have attempted to negotiate with and made offers to the lender (however, no assurance can be provided that negotiations will result in a favorable outcome), in “Other investment properties” due to the uncertainty of the timing of transfer of ownership of this property. Prior to the quarter ended June 30, 2012, we had included University Square in the same store portfolio. NOI consists of the sum of Same Store NOI and NOI from Other Investment Properties. NOI from Discontinued Operations represents NOI associated with properties accounted for as discontinued operations.
Adjusted EBITDA and Combined Adjusted EBITDA
Adjusted EBITDA represents net income (loss) before interest, income taxes, depreciation and amortization, as further adjusted to eliminate the impact of certain items that we do not consider indicative of our ongoing performance. Combined Adjusted EBITDA represents Adjusted EBITDA plus our pro rata share of the EBITDA adjustments from our investment property unconsolidated joint ventures, including discontinued operations associated with those ventures. We believe that Adjusted EBITDA and Combined Adjusted EBITDA are useful because they allow investors and management to evaluate and compare our performance from period to period in a meaningful and consistent manner in addition to standard financial measurements under GAAP. Adjusted EBITDA and Combined Adjusted EBITDA are not measurements of financial performance under GAAP and should not be considered as alternatives to net income, as an indicator of operating performance or any measure of performance derived in accordance with GAAP. Our calculations of Adjusted EBITDA and Combined Adjusted EBITDA may be different from the calculation used by other companies and, accordingly, comparability may be limited.
Net Debt to Adjusted EBITDA and Combined Net Debt to Combined Adjusted EBITDA
Net Debt to Adjusted EBITDA represents (i) our total debt less cash and cash equivalents divided by (ii) Adjusted EBITDA for the prior 3 months, annualized. Combined Net Debt to Combined Adjusted EBITDA represents (i) the sum of (A) our total debt less cash and cash equivalents plus (B) our pro rata share of our investment property unconsolidated joint ventures’ total debt less our pro rata share of these joint ventures’ cash and cash equivalents divided by (ii) Combined Adjusted EBITDA for the prior 3 months, annualized. We believe that these ratios are useful because they provide investors with information regarding total debt net of cash and cash equivalents, which could be used to repay debt, compared to our performance as measured using Adjusted EBITDA and Combined Adjusted EBITDA.
3rd Quarter 2012 Supplemental Information | 19 |
Retail Properties of America, Inc.
Reconciliation of Non-GAAP Financial Measures
(amounts in thousands)
Reconciliation of Net Loss to NOI
| | Three Months Ended
September 30, | | Nine Months Ended
September 30, | |
| | 2012 | | 2011 | | 2012 | | 2011 | |
Revenues: | | | | | | | | | |
Same store investment properties (250 properties): | | | | | | | | | |
Rental income | | $ | 114,222 | | $ | 112,886 | | $ | 341,873 | | $ | 338,070 | |
Tenant recovery income | | 26,023 | | 27,077 | | 78,153 | | 77,410 | |
Other property income | | 1,869 | | 2,215 | | 7,142 | | 7,608 | |
Other investment properties: | | | | | | | | | |
Rental income | | 2,410 | | 3,397 | | 6,998 | | 11,015 | |
Tenant recovery income | | 496 | | 626 | | 1,333 | | 2,282 | |
Other property income | | 93 | | 65 | | 390 | | 253 | |
Expenses: | | | | | | | | | |
Same store investment properties (250 properties): | | | | | | | | | |
Property operating expenses | | (21,243) | | (21,954) | | (66,014) | | (68,274) | |
Real estate taxes | | (18,374) | | (18,551) | | (54,024) | | (54,578) | |
Other investment properties: | | | | | | | | | |
Property operating expenses | | (810) | | (1,240) | | (1,984) | | (3,745) | |
Real estate taxes | | (1,129) | | (722) | | (3,948) | | (2,618) | |
| | | | | | | | | |
Net operating income: | | | | | | | | | |
Same store investment properties | | 102,497 | | 101,673 | | 307,130 | | 300,236 | |
Other investment properties | | 1,060 | | 2,126 | | 2,789 | | 7,187 | |
Total net operating income | | 103,557 | | 103,799 | | 309,919 | | 307,423 | |
| | | | | | | | | |
Other income (expense): | | | | | | | | | |
Straight-line rental income, net | | 417 | | 407 | | 920 | | (288) | |
Amortization of acquired above and below market lease intangibles, net | | 286 | | 437 | | 1,206 | | 1,229 | |
Amortization of lease inducements | | (524) | | - | | (607) | | - | |
Straight-line ground rent expense | | (1,036) | | (948) | | (2,862) | | (2,852) | |
Depreciation and amortization | | (56,527) | | (57,286) | | (170,009) | | (171,601) | |
Provision for impairment of investment properties | | (10,660) | | - | | (11,983) | | - | |
Loss on lease terminations | | (1,689) | | (1,392) | | (6,550) | | (8,085) | |
General and administrative expenses | | (7,227) | | (5,011) | | (18,691) | | (16,382) | |
Dividend income | | 302 | | 578 | | 1,782 | | 1,776 | |
Interest income | | 16 | | 157 | | 56 | | 507 | |
Gain on extinguishment of debt | | - | | 991 | | 3,879 | | 15,429 | |
Equity in loss of unconsolidated joint ventures, net | | (1,863) | | (1,869) | | (5,467) | | (6,028) | |
Interest expense | | (49,456) | | (56,903) | | (142,333) | | (170,121) | |
Co-venture obligation expense | | - | | (1,791) | | (3,300) | | (5,375) | |
Recognized gain on marketable securities | | 9,108 | | - | | 16,373 | | 277 | |
Other income (expense), net | | 726 | | 567 | | (342) | | 1,323 | |
Total other expense | | (118,127) | | (122,063) | | (337,928) | | (360,191) | |
| | | | | | | | | |
Loss from continuing operations | | (14,570) | | (18,264) | | (28,009) | | (52,768) | |
| | | | | | | | | |
Discontinued operations: | | | | | | | | | |
Loss, net | | (11,788) | | (378) | | (9,725) | | (28,830) | |
Gain on sales of investment properties, net | | 8,756 | | 14,517 | | 16,518 | | 18,678 | |
(Loss) income from discontinued operations | | (3,032) | | 14,139 | | 6,793 | | (10,152) | |
Gain (loss) on sales of investment properties | | 1,650 | | (891) | | 6,652 | | 4,171 | |
Net loss | | (15,952) | | (5,016) | | (14,564) | | (58,749) | |
Net income attributable to noncontrolling interests | | - | | (7) | | - | | (23) | |
Net loss attributable to Company shareholders | | $ | (15,952) | | $ | (5,023) | | $ | (14,564) | | $ | (58,772) | |
3rd Quarter 2012 Supplemental Information | 20 |
Retail Properties of America, Inc.
Reconciliation of Non-GAAP Financial Measures
(amounts in thousands)
Reconciliation of Net Loss to Adjusted EBITDA and Combined Adjusted EBITDA
| | | | Three Months Ended | | | |
| | | | September 30, 2012 | | December 31, 2011 | | | |
Net loss | | | | $ | (15,952) | | $ | (13,829) | | | |
Interest expense | | | | 49,456 | | 55,421 | | | |
Interest expense (discontinued operations) | | | | 1,709 | | 1,612 | | | |
Depreciation and amortization | | | | 56,527 | | 56,645 | | | |
Depreciation and amortization (discontinued operations) | | | | 952 | | 1,923 | | | |
Gain on sales of investment properties | | | | (1,650) | | (1,735) | | | |
Gain on sales of investment properties, net (discontinued operations) | | | | (8,756) | | (5,831) | | | |
Gain on extinguishment of debt, net | | | | - | | 84 | | | |
Gain on extinguishment of debt, net (discontinued operations) | | | | - | | (1,360) | | | |
Loss on lease terminations (a) | | | | 970 | | 555 | | | |
Loss on lease terminations (a) (discontinued operations) | | | | - | | 22 | | | |
Provision for impairment of investment properties | | | | 10,660 | | 7,650 | | | |
Provision for impairment of investment properties (discontinued operations) | | 11,507 | | 579 | | | |
Recognized gain on marketable securities | | | | (9,108) | | - | | | |
Adjusted EBITDA | | | | $ | 96,315 | | $ | 101,736 | | | |
Annualized | | | | $ | 385,260 | | $ | 406,944 | | | |
| | | | | | | |
Pro rata share of adjustments from investment property unconsolidated joint ventures (b): | | | | | | | |
Interest expense | | | | 974 | | 967 | | | |
Depreciation and amortization | | | | 2,610 | | 2,431 | | | |
Loss on sales of investment properties | | | | - | | - | | | |
Loss on lease terminations (a) | | | | 159 | | 222 | | | |
Provision for impairment of investment properties | | | | 210 | | 59 | | | |
Amortization of basis | | | | 59 | | 30 | | | |
Combined Adjusted EBITDA (c) | | | | $ | 100,327 | | $ | 105,445 | | | |
Annualized | | | | $ | 401,308 | | $ | 421,780 | | | |
| | | | | | | | | | | | | |
Reconciliation of NOI to Combined NOI
| | Three Months Ended September 30, | | Nine Months Ended September 30, | |
| | 2012 | | 2011 | | 2012 | | 2011 | |
| | | | | | | | | |
Total net loss from investment property unconsolidated joint ventures | | $ | (3,915) | | $ | (4,120) | | $ | (11,882) | | $ | (11,669) | |
Adjustments: | | | | | | | | | |
Straight-line rental income, net | | (166) | | (6) | | (827) | | (178) | |
Amortization of acquired above and below market lease intangibles, net | | 97 | | 176 | | 232 | | 310 | |
Amortization of lease inducements | | - | | - | | 7 | | - | |
Interest income | | (3) | | (1) | | (6) | | (6) | |
Depreciation and amortization | | 12,476 | | 8,088 | | 37,971 | | 20,842 | |
Provision for impairment of investment properties | | 71 | | - | | 1,593 | | 4,067 | |
Loss on lease terminations | | 933 | | 1,505 | | 1,955 | | 1,641 | |
General and administrative expenses | | 308 | | 471 | | 1,066 | | 862 | |
Interest expense | | 5,270 | | 4,450 | | 15,881 | | 12,005 | |
(Gain) loss on sales of investment properties | | (149) | | 29 | | (2,593) | | 29 | |
Other expense | | 136 | | 2 | | 15 | | 2 | |
Total NOI from investment property unconsolidated joint ventures | | $ | 15,058 | | $ | 10,594 | | $ | 43,412 | | $ | 27,905 | |
| | | | | | | | | |
Pro rata share of NOI from investment property unconsolidated joint ventures (b) | | $ | 3,495 | | $ | 2,276 | | $ | 9,840 | | $ | 6,276 | |
Total NOI | | 103,557 | | 103,799 | | 309,919 | | 307,423 | |
Combined NOI (c) | | $ | 107,052 | | $ | 106,075 | | $ | 319,759 | | $ | 313,699 | |
(a) Loss on lease terminations in the EBITDA reconciliation above excludes the write-off of tenant-related above and below market lease intangibles and lease inducements that are otherwise included in “Loss on lease terminations” in the condensed consolidated statements of operations.
(b) Amounts shown net of intercompany eliminations.
(c) Combined data and ratios include our pro rata share of unconsolidated joint ventures in addition to our wholly-owned and consolidated portfolio.
3rd Quarter 2012 Supplemental Information | 21 |
Retail Properties of America, Inc.
Reconciliation of Non-GAAP Financial Measures
(amounts in thousands)
Reconciliation of Operating Loss from Discontinued Operations to NOI from Discontinued Operations
| | Three Months Ended
September 30, | | Nine Months Ended
September 30, | |
| | 2012 | | 2011 | | 2012 | | 2011 | |
Revenues: | | | | | | | | | |
Rental income | | $ | 2,720 | | $ | 5,521 | | $ | 11,802 | | $ | 18,569 | |
Tenant recovery income | | (565) | | 687 | | 165 | | 2,095 | |
Other property income | | 34 | | 15 | | 59 | | 68 | |
Expenses: | | | | | | | | | |
Property operating expenses | | (332) | | (993) | | (1,197) | | (2,373) | |
Real estate taxes | | 503 | | (487) | | (326) | | (2,132) | |
Net operating income from discontinued operations | | 2,360 | | 4,743 | | 10,503 | | 16,227 | |
| | | | | | | | | |
Other income (expense): | | | | | | | | | |
Straight-line rental income | | 30 | | 55 | | 110 | | 482 | |
Amortization of acquired above and below market lease intangibles, net | | 1 | | 5 | | 3 | | 18 | |
Amortization of lease inducements | | (10) | | (45) | | (40) | | (93) | |
Depreciation and amortization | | (952) | | (2,206) | | (4,380) | | (7,851) | |
Provision for impairment of investment properties | | (11,507) | | (1,379) | | (11,507) | | (31,752) | |
Loss on lease terminations | | - | | (85) | | (40) | | (87) | |
General and administrative expenses | | - | | - | | - | | (34) | |
Interest expense | | (1,709) | | (1,465) | | (4,374) | | (5,736) | |
Other expense | | (1) | | (1) | | - | | (4) | |
Total other expense | | (14,148) | | (5,121) | | (20,228) | | (45,057) | |
| | | | | | | | | |
Operating loss from discontinued operations | | $ | (11,788) | | $ | (378) | | $ | (9,725) | | $ | (28,830) | |
3rd Quarter 2012 Supplemental Information | 22 |