ISSUER FREE WRITING PROSPECTUS
Dated March 6, 2012
Filed Pursuant to Rule 433
Registration No. 333-172237
 Anticipated NYSE Listing and Concurrent Anticipated NYSE Listing and Concurrent Equity Offering Presentation Equity Offering Presentation March 6, 2012 |
 Basis of Presentation Unless otherwise indicated, all financial information in this presentation is as of December 31, 2011 and all property information contained in this prospectus is for our consolidated retail operating properties as of December 31, 2011 excluding seasonal leases and non-stabilized operating properties, which are properties that have not achieved 90% or greater occupancy since their development and have been operational for less than one year. Unless otherwise indicated, “annualized base rent” or “ABR” as of a specified date means monthly base rent as of the specified date, before abatements, under leases which have commenced as of the specified date multiplied by 12. Annualized base rent (i) does not include tenant reimbursements or expenses borne by the tenants in triple net or modified gross leases, such as the expenses for real estate taxes and insurance and common area and other operating expenses, (ii) does not reflect amounts due per percentage rent lease terms, where applicable, and (iii) is calculated on a cash basis and differs from how we calculate rent in accordance with generally accepted accounting principles in the United States of America, or GAAP, for purposes of our financial statements. This presentation contains “forward-looking statements” within the meaning of the federal securities laws. For important information regarding such forward-looking statements, including how to identify such statements and factors that could cause actual results and future events to differ materially from those set forth or contemplated in the forward-looking statements, see the attached Appendix. Additionally, in this presentation, we refer to certain non-GAAP financial measures, such as funds from operations. For non-GAAP financial measures, you can find a definition and a tabular reconciliation to the most directly comparable GAAP number in the attached Appendix. We have filed a registration statement (including a prospectus) with the Securities and Exchange Commission for the offering to which this communication relates. Before you invest, you should read the prospectus in that registration statement and other documents the issuer has filed with the Securities and Exchange Commission for more complete information about us and this offering. You may get these documents for free by visiting EDGAR on the Securities and Exchange Commission’s website at www.sec.gov. Alternatively, the Company, any underwriter or any dealer participating in the offering will arrange to send you the prospectus if you request it by calling J.P. Morgan Securities LLC at (866) 803- 9204, Citigroup Global Markets Inc. at (800) 831-9146, Deutsche Bank Securities Inc. at (800) 503-4611 or KeyBanc Capital Markets Inc. at (800) 859-1783. To review the preliminary prospectus click the following hyperlink: http://www.inland-western.com/pdf/S-11.pdf 2 |
 Anticipated NYSE Listing & Anticipated NYSE Listing & Concurrent Equity Offering Concurrent Equity Offering www.inland-western.com |
 Anticipated NYSE Listing and Concurrent Equity Offering The Company expects to pursue a listing on the NYSE in the coming months At the same time we expect to pursue a concurrent equity offering, to further improve the Company’s balance sheet and position the Company for growth Why now? To take advantage of market conditions To provide the Company with access to the equity markets which should enable management to continue to grow the Company and should ultimately create additional value for all shareholders To provide full liquidity to existing shareholders over an 18 month period, at their discretion 4 |
 Preparation for Listing In preparation for a potential listing, the Company will effectuate a reverse stock split and a stock dividend to existing shareholders Rationale: The rationale for the reverse stock split is to reduce the amount of shares outstanding and reset the price per share. On a stand-alone basis, the reverse stock split will have no impact on the aggregate value of the Company or any individual shareholder’s percentage ownership of the Company’s common stock The rationale for the stock dividend is to provide for the Company’s phased-in liquidity program, which has been designed to assist in the creation of an orderly and liquid trading market for our shares post-listing All of our shares of common stock will be converted into listed shares within 18 months of the initial listing 5 |
 What Will the Reverse Stock Split Mean for Shareholders? Reverse stock split A reverse stock split is a combination of all of our outstanding shares of common stock into a fewer number of shares This will affect all shareholders in the same manner - on a stand-alone basis, the reverse stock split will have no effect on the aggregate value of the Company, your proportional ownership interest in the Company, your voting rights, your right to receive dividends (if and when declared), the total amount of your dividends (if and when declared), or your rights upon liquidation Example: 6 100,000 shares Common Stock 482MM shares outstanding = .0207% ownership 10 to one reverse stock split 10,000 Shares Common Stock 48.2 MM shares outstanding = .0207% ownership = 100,000/10 |
 What Will the Phased-In Liquidity Program Mean for Shareholders? Phased-In Liquidity Program (Class B-1, Class B-2, Class B-3) Each split adjusted share of common stock will be redesignated as Class A common stock Existing shareholders will receive a stock dividend consisting of three new Class B shares for every split-adjusted share Shareholders will then have four total shares for every split adjusted share Example: 7 Class A redesignation and stock dividend 10,000 Shares Common Stock 10,000 Shares Class A Common Stock 10,000 Shares Class B-1 Common Stock 10,000 Shares Class B-2 Common Stock 10,000 Shares Class B-3 Common Stock |
 What Will Be the Total Impact of the Reverse Split and Phased-in Liquidity Program? The cumulative impact of the reverse stock split and phased-in liquidity program would be the equivalent of a 2.5 to one reverse stock split Example: If you own 100,000 shares today you will own 40,000 shares after the implementation of these programs (100,000/2.5= 40,000) 8 Today 100,000 Shares Total Ownership = .0207% Reverse Split 10,000 Shares Total Ownership = .0207% Phased-In Liquidity 10,000 Shares Class A 10,000 Shares Class B-1 10,000 Shares Class B-2 10,000 Shares Class B-3 Total Ownership = .0207% |
 Phased-In Liquidity Timing & Process 9 Class A shares are expected to be listed on the NYSE Class B-1 shares will convert into Class A shares 6 months after the listing of Class A shares Class B-2 shares will convert into Class A shares 12 months after the listing of Class A shares Class B-3 shares will convert into Class A shares 18 months after the listing of Class A shares The net effect of the phased-in liquidity program is that over the 18 month period after initial listing of the Class A shares, your Class B shares will gradually convert to Class A shares that are expected to be listed on the NYSE and publicly tradable |
 IWEST as a Publicly Listed Company 10 IWEST expects to remain a company with: A large, diversified, high quality retail portfolio A diversified base of value-oriented retail tenants A demonstrated leasing and property management platform A capital structure positioned for growth An experienced management team with a proven track record IWEST expects to become a company with: Liquidity for its shareholders Greater potential for access to multiple sources of capital An expanded ability to prudently grow the Company and potentially create additional shareholder value over time |
 Business and Growth Strategies of IWEST Maximize net operating income through internal growth Preserve and strengthen our portfolio through active property management Recycle capital through dispositions of non-core and non-strategic assets Acquire high quality, multi-tenant retail properties Pursue strategic joint ventures to leverage management platform 11 |
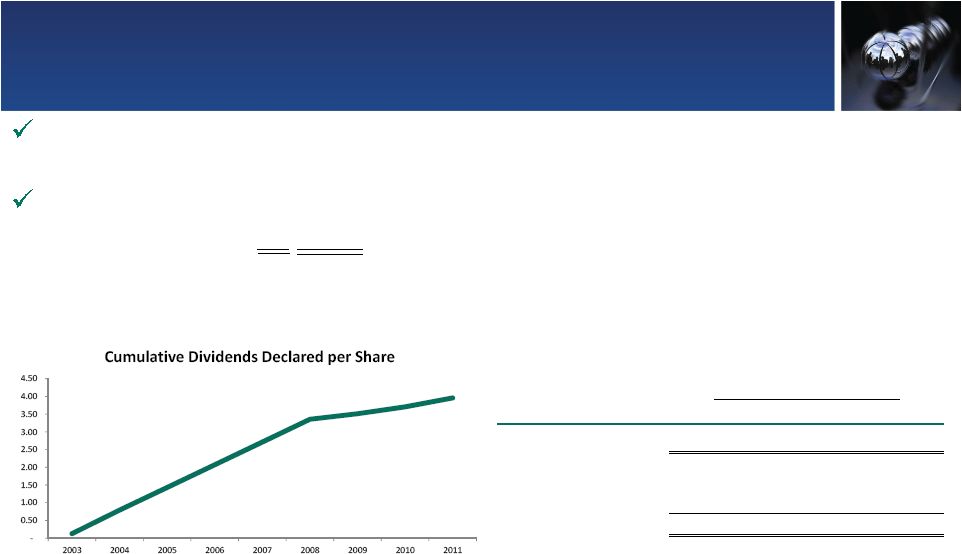 IWEST has Provided Significant Dividends to Existing Shareholders Over Time 12 IWEST has paid a dividend since inception in 2003, for a total of $3.9579 per share On a stand-alone basis, the reverse stock split and phased-in liquidity program will have no effect on your right to receive dividends (if and when declared), or the total amount of your dividends (if and when declared) For the Three Months Ended (in thousands) 12/31/11 9/30/11 6/30/11 3/31/11 Funds from Operations¹ $ 48,504 $46,147 $ 48,988 $ 51,466 Cash Flow From Operations $ 46,220 $43,376 $ 53,156 $ 31,855 Distributions Declared 31,445 30,738 30,031 28,433 Excess $ 14,775 $12,638 $ 23,125 $ 3,422 1 Funds from operations is a non-GAAP measure; See Appendix for calculation |
 Benefits for Existing Shareholders 13 Overall the anticipated NYSE listing and concurrent equity offering are expected to: Provide greater liquidity to shareholders Provide flexibility to manage exit timing Permit ongoing investment if desired Provide for orderly entry into the market as a result of the phased-in liquidity program Result in no impact on shareholder’s right to receive dividends or the total amount of dividends, if and when declared Provide opportunity to purchase additional shares in the open market Broaden the investor base, which is expected to assist in the creation of an orderly and liquid trading market for our shares post-listing |
 IWEST Company Overview IWEST Company Overview |
 Large, Diversified Retail Portfolio High geographic diversity 67% of multi-tenant ABR located in top 50 metropolitan statistical areas (“MSAs”) Strong multi-tenant demographics in top 50 MSAs, with average 3-mile population of 92,274 and average household income of $83,545 1 Over 89% of multi-tenant assets located in markets outside of the top 50 MSAs, based on ABR, are anchored by Best Buy, Target, Home Depot, Kohl’s, Wal-Mart, Lowe’s, or a national or regional grocer Significant presence in top MSAs Diversified Retail Portfolio (based on GLA) 15 Consolidated Retail Property Summary¹ Properties 259 Total Square Footage (000’s) 34,649 Occupancy 2 90.4% ABR of Leases as of 12/31/11 3 $440,353 ABR per Square Foot $14.06 1 Consolidated retail portfolio as of December 31, 2011 2 Includes leases signed but not commenced as of December 31, 2011 for approximately 843,000 square feet of GLA representing $9.9 million of annualized base rent as of lease commencement. 3 Annualized Base Rent (ABR) excludes $1.4 million from consolidated development properties. Rental abatements for leases commenced as of 12/31/11, which are excluded, were $0.1 million for our retail operating portfolio for the 12 months ending 12/31/12. ABR does not reflect scheduled lease expirations for the 12 months ending December 31, 2012. The portion of the ABR for our consolidated operating portfolio attributable to leases scheduled to expire during the 12 months ending December 31, 2012, including month-to-month leases, is approximately $33.6 million 1 Based on information derived and interpreted by the Company as a result of its ownanalysis from data provided by the Nielsen Company |
 Diversified Base of Value-Oriented Retail Tenants Top 20 retail tenants represent 36.9% of retail ABR (1) Represents retail GLA; GLA numbers in 000s square feet (2) Represents the percentage of our retail annualized base rentas of December 31, 2011 16 Rank Tenant # of Stores GLA (1) ABR % of Retail ABR (2) 1 Best Buy Co., Inc. 27 1,047 $14,147 3.3% 2 TJX Companies, Inc. 37 1,120 10,498 2.4% 3 Rite Aid Corporation 34 421 10,320 2.4% 4 Stop & Shop 10 479 10,007 2.3% 5 Ross Stores, Inc. 31 925 9,197 2.1% 6 The Home Depot, Inc. 9 1,097 9,137 2.1% 7 Bed Bath & Beyond, Inc. 26 714 9,110 2.1% 8 PetSmart, Inc. 30 643 8,675 2.0% 9 Kohl's Corporation 14 1,143 8,095 1.9% 10 The Sports Authority 16 682 7,793 1.8% 11 SUPERVALU INC. 9 505 7,188 1.7% 12 Pier 1 Imports Inc. 38 388 7,188 1.7% 13 Publix Super Markets, Inc. 16 635 6,724 1.6% 14 Edwards Theatres 2 219 6,558 1.5% 15 Dick's Sporting Goods, Inc. 12 558 6,381 1.5% 16 Michaels 24 551 6,093 1.4% 17 Office Depot, Inc. 22 458 6,050 1.4% 18 Wal-Mart Stores, Inc. 5 861 5,876 1.4% 19 Gap, Inc. 25 374 5,048 1.2% 20 Rave Cinemas 2 162 4,626 1.1% Total 389 12,982 $158,711 36.9% |
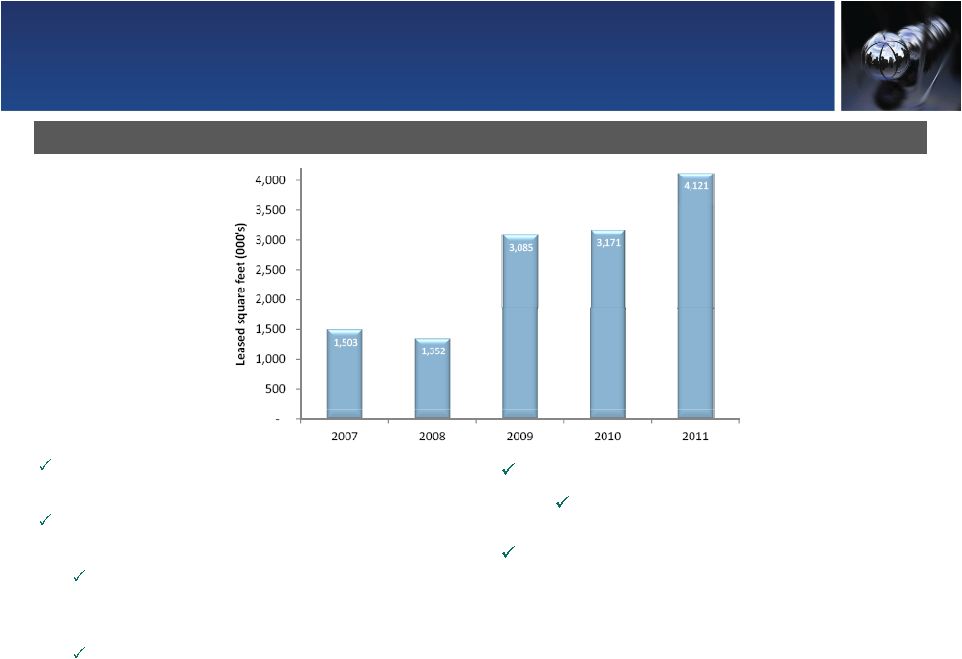 Demonstrated Leasing and Property Management Platform Strong leasing volume 17 3.2 Million SF of GLA was returned via big box retailer bankruptcies during 2008/2009 Including active negotiations, we’ve addressed 82.5% of vacated space, totaling 2.7 million SF 2.3 million SF leased, primarily to existing tenants such as Kohl’s, TJX Companies, Best Buy, hhGregg and Big Lots 0.3 million SF sold or in negotiations Strong momentum expected to continue into 2012 Annualized base rent impact from leases signed but not commenced totals $9.9 million Proactive management of tenant relationships has resulted in tenant retention rates of approximately 78%, based on expiring GLA, since the beginning of 2009 |
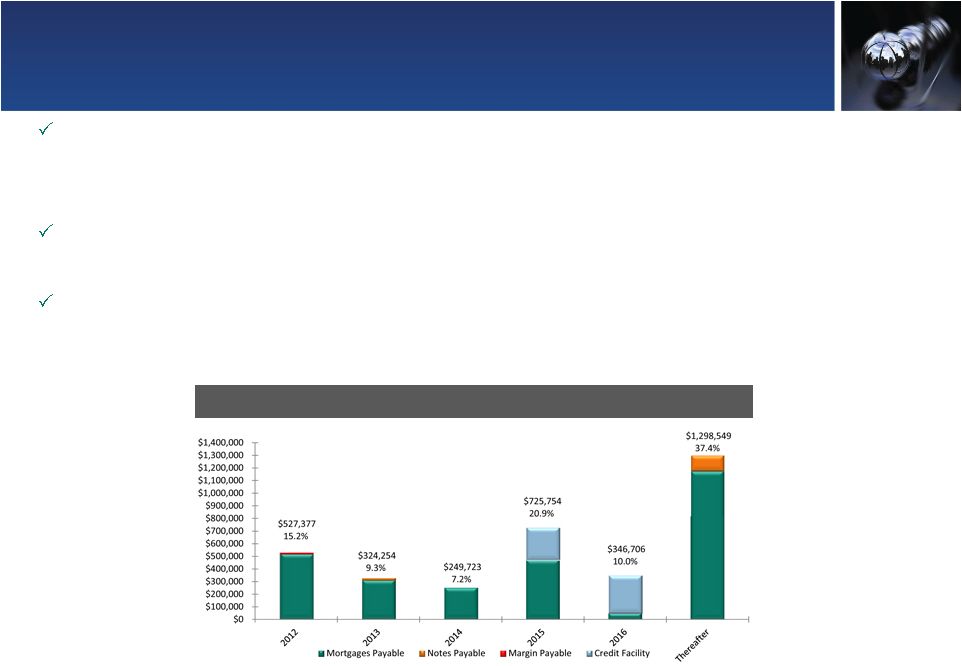 Capital Structure Positioned for Growth 18 At the end of 2008, management took aggressive action to preserve cash as a result of the ongoing global financial crisis, including reducing the dividend and suspending the Company’s stock repurchase program The combination of these two efforts has resulted in significant additional retained cash flow, which the Company has utilized to fund capital expenditures and to reduce leverage Further progress on the deleveraging front is expected to come from the continued lease-up of the portfolio, the execution of the non-core disposition program, and proceeds from the anticipated concurrent equity offering Manageable Near Term Debt Maturities Note: Debt balances as of December 31, 2011; Percentages based on portion of total debt outstanding; Credit facility extended as of February 24, 2012 ; All dollar values rounded to thousands |
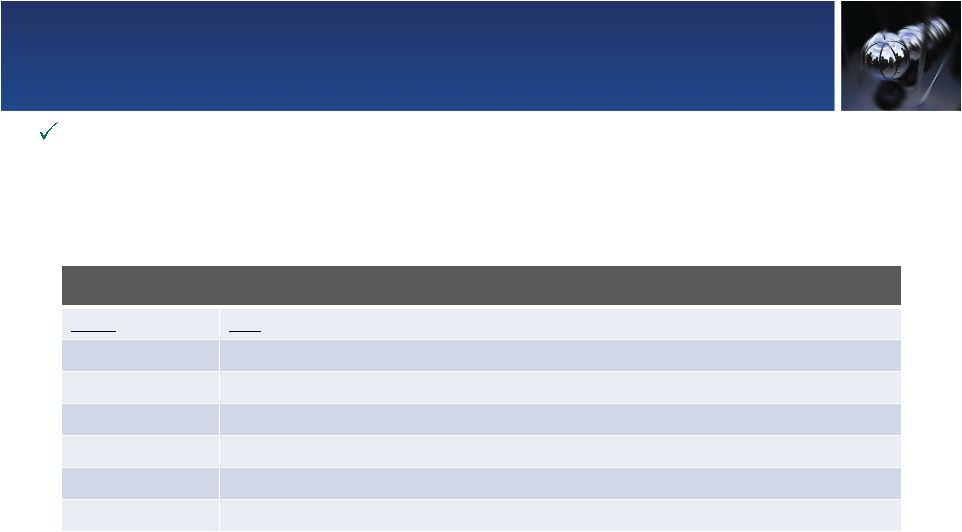 Experienced Management Team with a Proven Track Record 19 Our senior management team has an average of over 22 years of real estate industry experience, through several real estate, credit and retail cycles Executive Officers Name Title Steven P. Grimes President and Chief Executive Officer Shane C. Garrison Executive Vice President, Chief Operating Officer and Chief Investment Officer Angela M. Aman Executive Vice President, Chief Financial Officer and Treasurer Niall J. Byrne Executive Vice President, President of Property Management Dennis K. Holland Executive Vice President, General Counsel and Secretary James W. Kleifges Executive Vice President and Chief Accounting Officer |
 Appendix Appendix |
 Forward Looking Statements 21 This presentation contains “forward-looking statements” within the meaning of the safe harbor from civil liability provided for such statements by the Private Securities Litigation Reform Act of 1995 (set forth in Section 27A of the Securities Act of 1933, as amended, or the Securities Act, and Section 21E of the Securities Exchange Act of 1934, as amended, or the Exchange Act). In particular, statements pertaining to our potential listing on the New York Stock Exchange, expected equity offering, expected impact of the reverse stock split and phased-in liquidity program, capital resources, portfolio size, quality and performance, ability to create additional shareholder value, dividend policy and results of operations contain forward-looking statements. Forward- looking statements involve numerous risks and uncertainties and you should not rely on them as predictions of future events. Forward-looking statements depend on assumptions, data or methods which may be incorrect or imprecise and we may not be able to realize them. We do not guarantee that the transactions and events described will happen as described (or that they will happen at all). You can identify forward-looking statements by the use of forward-looking terminology such as “believes,” “expects,” “may,” “will,” “should,” “seeks,” “approximately,” “intends,” “plans,” “pro forma,” “estimates,” “contemplates,” “aims,” “continues,” “would” or “anticipates” or the negative of these words and phrases or similar words or phrases. You can also identify forward-looking statements by discussions of strategies, plans or intentions. The following factors, among others, could cause actual results and future events to differ materially from those set forth or contemplated in the forward-looking statements: general economic, business and financial conditions, and changes in our industry and changes in the real estate markets in particular; adverse economic and other developments in the Dallas-Fort Worth-Arlington area, where we have a high concentration of properties; general volatility of the capital and credit markets and the demand for and market price of our common stock; ability to broaden our investor base; changes in our business strategy; defaults on, early terminations of or non-renewal of leases by tenants; bankruptcy or insolvency of a major tenant or a significant number of smaller tenants; increased interest rates and operating costs; declining real estate valuations and impairment charges; availability, terms and deployment of capital; our failure to obtain necessary outside financing; our expected leverage; decreased rental rates or increased vacancy rates; our failure to generate sufficient cash flows to service our outstanding indebtedness; difficulties in identifying properties to acquire and completing acquisitions; risks of real estate acquisitions, dispositions and redevelopment, including the cost of construction delays and cost overruns; our failure to successfully operate acquired properties and operations; our failure to successfully dispose of our non-core and non-strategic assets; our projected operating results; our ability to manage our growth effectively; our failure to successfully redevelop properties; estimates relating to our ability to make distributions to our shareholders in the future; impact of changes in governmental regulations, tax law and rates and similar matters; our failure to qualify as a REIT; future terrorist attacks in the U.S.; environmental uncertainties and risks related to natural disasters; lack or insufficient amounts of insurance; financial market fluctuations; availability of and our ability to attract and retain qualified personnel; retention of our senior management team; our understanding of our competition; changes in real estate and zoning laws and increases in real property tax rates; and our ability to comply with the laws, rules and regulations applicable to companies and, in particular, public companies. You should not place undue reliance on any forward-looking statements, which are based only on information currently available to us (or to third parties making the forward-looking statements). We undertake no obligation to publicly release any revisions to such forward-looking statements to reflect events or circumstances after the date of this presentation, except as required by applicable law. |
 Non-GAAP Reconciliations 22 Funds From Operations For the Three Months Ended (in thousands) 12/31/11 9/30/11 6/30/11 3/31/11 Net loss attributable to Company shareholders $(13,837) $ (5,023) $(13,724) $(40,025) Add: Depreciation and amortization 61,797 63,549 64,389 65,447 Add: Provision for impairment of investment properties 8,288 1,379 1,523 32,747 Less: Gain on sales of investment properties (7,566) (13,626) (3,104) (6,119) Less: Noncontrolling interests' share of depreciation related to consolidated joint ventures (178) (132) (96) (584) Funds from operations $ 48,504 $46,147 $ 48,988 $ 51,466 Due to certain unique operating characteristics of real estate companies, the National Association of Real Estate Investment Trusts, or NAREIT, an industry trade group, has promulgated a standard known as funds from operations, or FFO. FFO means net (loss) income computed in accordance with GAAP, excluding gains (or losses) from sales of investment properties, plus depreciation and amortization and impairment charges on investment properties, including adjustments for unconsolidated joint ventures. We have adopted the NAREIT definition of FFO. The following table shows the reconciliation of FFO to net loss attributable to Company shareholders for the periods presented: |