Investor
Presentation
Fourth Quarter 2012 Update
Disclaimer
This presentation contains "forward-looking statements" within the meaning of the safe harbor from civil liability provided for such statements by the Private Securities Litigation Reform Act of 1995 (set forth in Section 27A of the
Securities Act of 1933, as amended, or the Securities Act, and Section 21E of the Securities Exchange Act of 1934, as amended, or the Exchange Act). In particular, statements pertaining to our capital resources, portfolio size, quality
and performance, dividend policy and results of operations contain forward-looking statements. Forward-looking statements involve numerous risks and uncertainties and you should not rely on them as predictions of future events.
Forward-looking statements depend on assumptions, data or methods which may be incorrect or imprecise and we may not be able to realize them. We do not guarantee that the transactions and events described will happen as
described (or that they will happen at all). You can identify forward-looking statements by the use of forward-looking terminology such as "believes," "expects," "may," "should," "seeks," "approximately, ""intends," "plans," "pro
forma," "estimates," "focus," "contemplates," "aims," "continues," "would" or "anticipates" or the negative of these words and phrases or similar words or phrases. You can also identify forward-looking statements by discussions of
strategies, plans or intentions. The following factors, among others, could cause actual results and future events to differ materially from those set forth or contemplated in the forward-looking statements:
general economic, business and financial conditions, and changes in our industry and changes in the real estate markets in particular;
adverse economic and other developments in the Dallas-Fort Worth-Arlington area, where we have a high concentration of properties;
general volatility of the capital and credit markets and the demand for and market price of our Class A common stock;
changes in our business strategy;
defaults on, early terminations of or non-renewal of leases by tenants;
bankruptcy or insolvency of a major tenant or a significant number of smaller tenants;
increased interest rates or operating costs;
declining real estate valuations and impairment charges;
availability, terms and deployment of capital;
our failure to obtain necessary outside financing;
our expected leverage;
decreased rental rates or increased vacancy rates;
our failure to generate sufficient cash flows to service our outstanding indebtedness;
difficulties in identifying properties to acquire and completing acquisitions;
risks of real estate acquisitions, dispositions and redevelopment, including the cost of construction delays and cost overruns;
our failure to successfully operate acquired properties and operations;
our projected operating results;
our ability to manage our growth effectively;
our ability to successfully transition certain corporate office functions from previously-related parties to third parties or to us;
estimates relating to our ability to make distributions to our shareholders in the future;
impact of changes in governmental regulations, tax law and rates and similar matters;
our failure to qualify as a REIT;
future terrorist attacks in the U.S.;
environmental uncertainties and risks related to natural disasters;
lack or insufficient amounts of insurance;
availability of and our ability to attract and retain qualified personnel;
retention of our senior management team;
changes in real estate and zoning laws and increases in real property tax rates;
our ability to comply with the laws, rules and regulations applicable to companies; and
other risk factors, including those detailed in the sections of our most recent form 10-K and form 10-Q filed with the SEC titled "Risk Factors."
You should not place undue reliance on any forward-looking statements, which are based only on information currently available to us (or to third parties making the forward-looking statements). We undertake no obligation to publicly
release any revisions to such forward-looking statements to reflect events or circumstances after the date of this presentation, except as required by applicable law.
All information presented on a pro rata basis and as of 12/31/12, unless otherwise noted
Investment Highlights
The Company’s primary objectives are to continue to lease-up the
portfolio, generate strong internal growth, continue to migrate the
balance sheet to investment grade, and refocus the portfolio on
high quality, multi-tenant retail assets in strategic markets.
Large, diversified, high quality retail portfolio
Diversified base of value-oriented retail tenants
Reliable NOI growth with near term upside from occupancy
gains
Opportunity to enhance portfolio through dispositions of non-
core and non-strategic assets
Substantial progress made to date on goal of becoming an
investment grade borrower
Capital structure positioned for growth—poised to begin on-
balance sheet acquisitions for the first time since 2008
Experienced management team with proven track record
3
NYSE: RPAI
April 2012: Initial Public Offering
264 properties, 39 million
square feet under management
~1,500 tenants
~3,600 leases
Average age of portfolio: ~ 10
years
12/31/12 percent leased: 92.9%
Total Capitalization: $5.6 billion
Attractive dividend yield: 4.7%1
Total shareholder return since
IPO: +80%1
(1): Based on February 25, 2013 closing price of $14.17. Dividend yield represents an annualized dividend of $0.6625 per share based on the fourth quarter 2012 dividend of $0.165625 per share.
Large Diversified Retail Portfolio
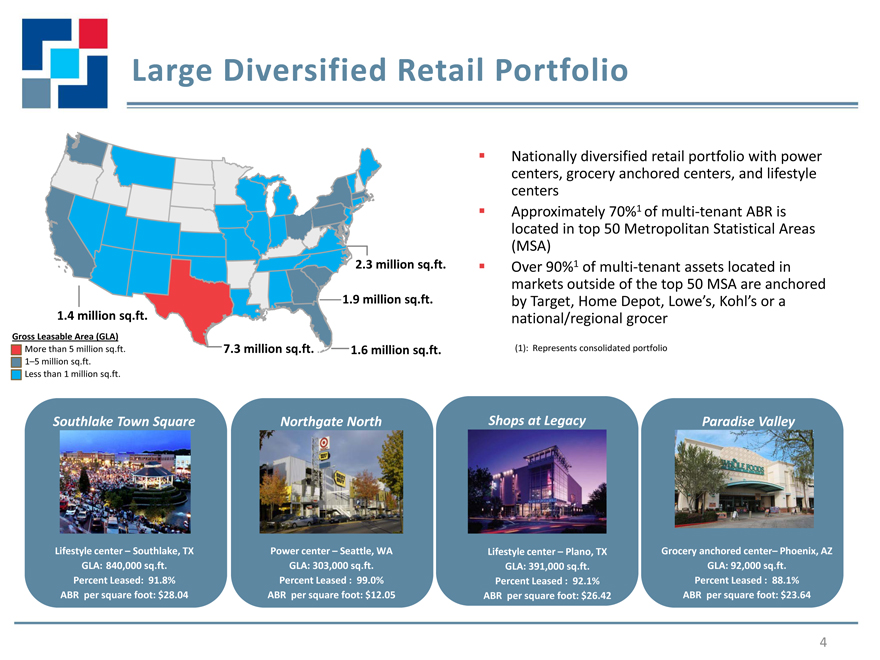
Gross Leasable Area (GLA)
More than 5 million sq.ft.
1–5 million sq.ft.
Less than 1 million sq.ft.
1.4 million sq.ft.
7.3 million sq.ft.
1.9 million sq.ft.
1.6 million sq.ft.
2.3 million sq.ft.
Nationally diversified retail portfolio with power
centers, grocery anchored centers, and lifestyle
centers
Approximately 70%1 of multi-tenant ABR is
located in top 50 Metropolitan Statistical Areas
(MSA)
Over 90%1 of multi-tenant assets located in
markets outside of the top 50 MSA are anchored
by Target, Home Depot, Lowe’s, Kohl’s or a
national/regional grocer
Grocery anchored center– Phoenix, AZ
GLA: 92,000 sq.ft.
Percent Leased : 88.1%
ABR per square foot: $23.64
Lifestyle center – Southlake, TX
GLA: 840,000 sq.ft.
Percent Leased: 91.8%
ABR per square foot: $28.04
Power center – Seattle, WA
GLA: 303,000 sq.ft.
Percent Leased : 99.0%
ABR per square foot: $12.05
Lifestyle center – Plano, TX
GLA: 391,000 sq.ft.
Percent Leased : 92.1%
ABR per square foot: $26.42
Southlake Town Square
Paradise Valley
Northgate North
Shops at Legacy
(1): Represents consolidated portfolio
<P><B>Searchable text for slide0005:</B><HR size=1>
Largest tenant represents approximately 3.3% of ABR
74 of the multi-tenant retail properties are anchored or
shadow-anchored by a grocery store
Annual grocer sales average $500 per square foot
44 of the multi-tenant retail centers are anchored or shadow-
anchored by Target
Retailer Diversity
Largest tenant represents approximately 3.3% of ABR
74 of the multi-tenant retail properties are anchored or shadow-anchored by a grocery store
Annual grocer sales average $500 per square foot
44 of the multi-tenant retail centers are anchored or shadow-anchored by Target
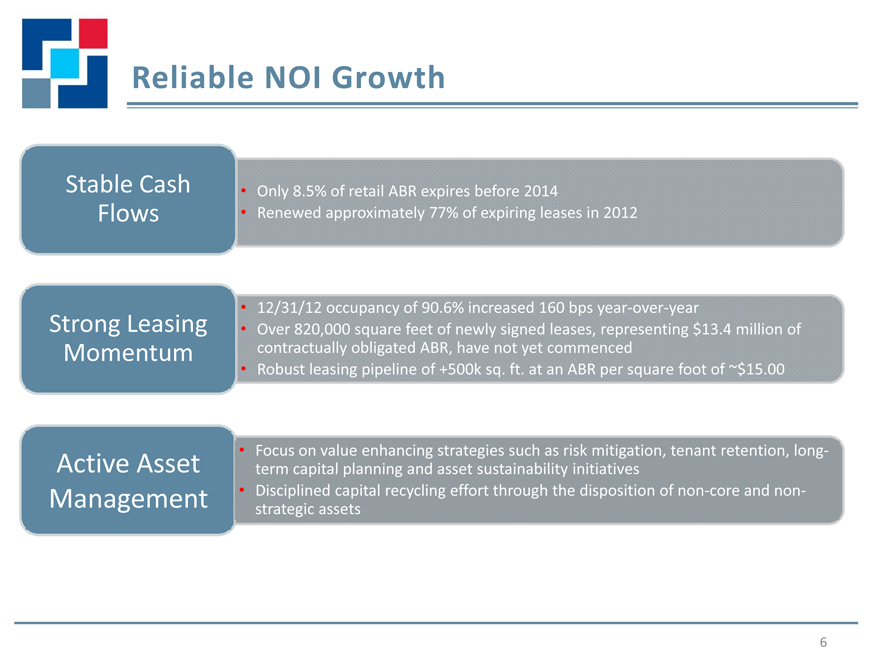
Reliable NOI Growth
Strong Leasing
Momentum
Stable Cash
Flows
Active Asset
Management
Only 8.5% of retail ABR expires before 2014
Renewed approximately 77% of expiring leases in 2012
12/31/12 occupancy of 90.6% increased 160 bps year-over-year
Over 820,000 square feet of newly signed leases, representing $13.4 million of
contractually obligated ABR, have not yet commenced
Robust leasing pipeline of +500k sq. ft. at an ABR per square foot of ~$15.00
Focus on value enhancing strategies such as risk mitigation, tenant retention, long-
term capital planning and asset sustainability initiatives
Disciplined capital recycling effort through the disposition of non-core and non-
strategic assets
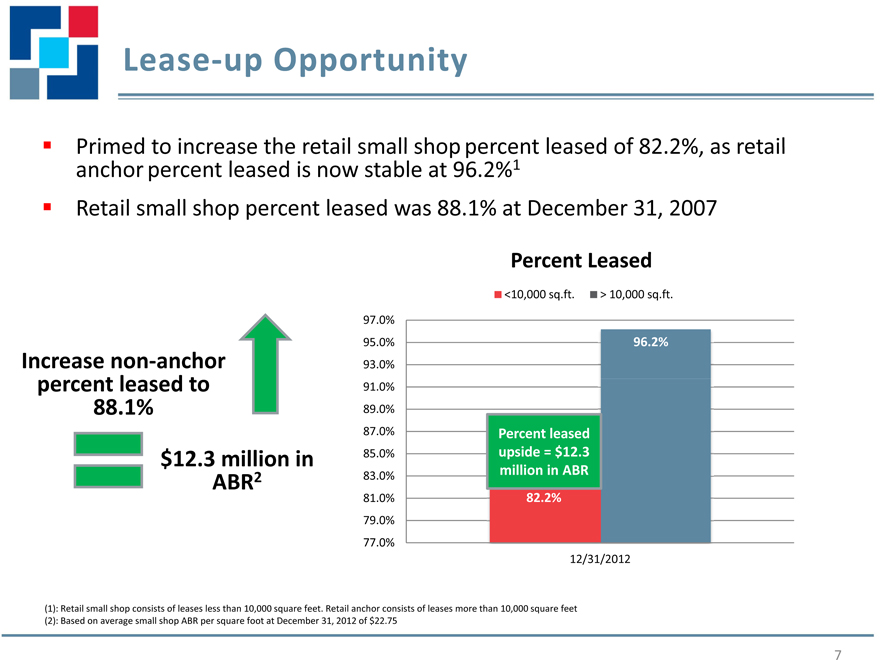
Primed to increase the retail small shop percent leased of 82 2% as retail anchor percent leased is now stable at 96 2%1 Retail small shop percent leased was 88 1% at December 31 2007
Increase non anchor percent leased to 88.1%
$12 3 million in ABR2
Percent Leased
<10,000 sq.ft. > 10,000 sq.ft.
97.0%
95 0% 96 2%
93.0%
91 0%
89.0%
87 0% Percent leased
85.0% upside = $12.3
83 0% million in ABR
81.0% 82.2%
79 0%
77.0%
12/31/2012
(1): Retail small shop consists of leases less than 10 000 square feet Retail anchor consists of leases more than 10 000 square feet (2): Based on average small shop ABR per square foot at December 31, 2012 of $22.75
7
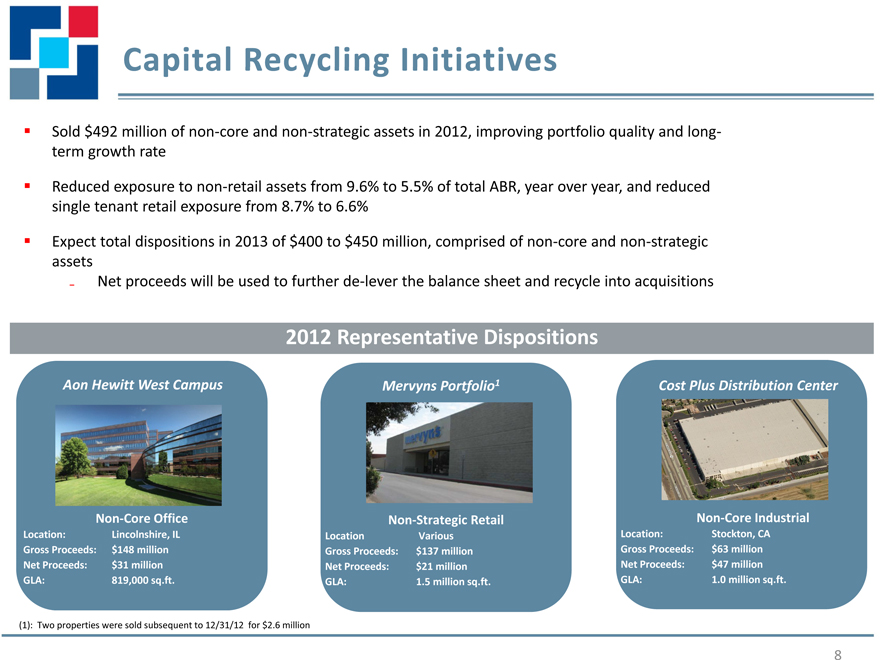
Sold $492 million of non-core and non-strategic assets in 2012, improving portfolio quality and long-term growth rate
Reduced exposure to non-retail assets from 9.6% to 5.5% of total ABR, year over year, and reduced single tenant retail exposure from 8 7% to 6 6%
Expect total dispositions in 2013 of $400 to $450 million, comprised of non-core and non-strategic assets
2012 Representative Dispositions
Aon Hewitt West Campus Northgate North Mervyns Portfolio1 Shops at Legacy Cost Plus Distribution Paradise Valley Center
Non-Core Office Power center – Seattle,WA Non-Strategic RetailLi festyle center – Plano TX Grocery Non-anchored Core Industrial center– Phoenix, AZ Location: Lincolnshire, IL GLA: 303,000 Location sq.ft. Various GLA: 391,000 sq.ft. Location: Stockton, GLA: 92,000 CA sq.ft.
Gross Proceeds: $148 million Percent Gross Leased Proceeds: : 99.0% $137 million Percent Leased : 92.1% Gross Proceeds: $63 Percent million Leased : 88.1% Net Proceeds: $31 million ABR per square Net Proceeds: foot: $12 05 $21 million ABR per square foot: $26 42 Net Proceeds: ABR $47per million square foot: $23 64 GLA: 819,000 sq.ft. GLA: 1.5 million sq.ft. GLA: 1.0 million sq.ft.
(1): Two properties were sold subsequent to 12/31/12 for $2.6 million
8
Capital Structure Positioned for Growth
9
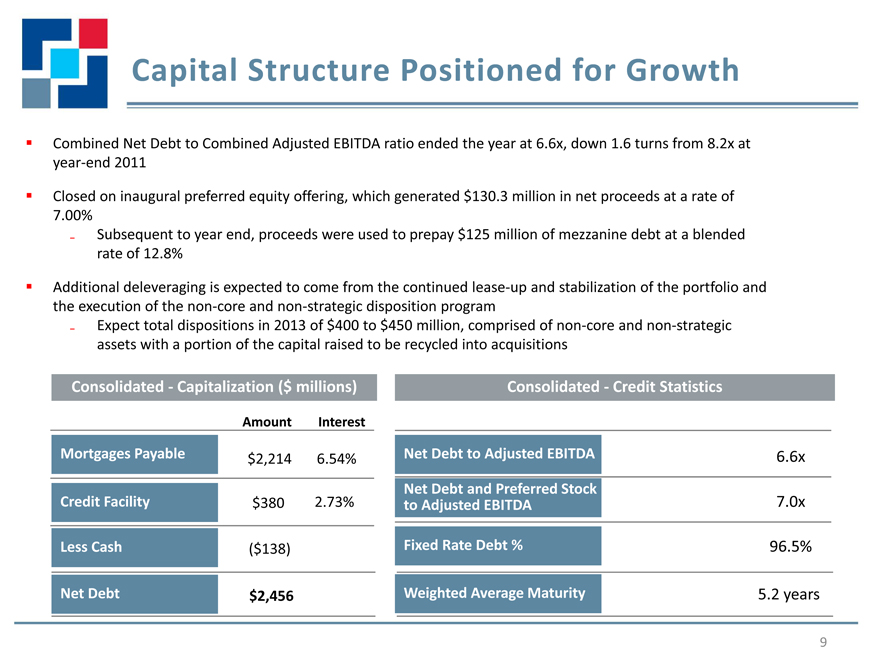
Combined Net Debt to Combined Adjusted EBITDA ratio ended the year at 6.6x, down 1.6 turns from 8.2x at
year-end 2011
Closed on inaugural preferred equity offering, which generated $130.3 million in net proceeds at a rate of
7.00%
Subsequent to year end, proceeds were used to prepay $125 million of mezzanine debt at a blended
rate of 12.8%
Additional deleveraging is expected to come from the continued lease-up and stabilization of the portfolio and
the execution of the non-core and non-strategic disposition program
Expect total dispositions in 2013 of $400 to $450 million, comprised of non-core and non-strategic
assets with a portion of the capital raised to be recycled into acquisitions
Amount
Interest
Consolidated—Capitalization ($ millions)
Consolidated—Credit Statistics
Mortgages Payable
($138)
Less Cash
$2,456
Net Debt
Net Debt to Adjusted EBITDA
6.6x
Fixed Rate Debt %
96.5%
Weighted Average Maturity
5.2 years
$2,214
6.54%
Net Debt and Preferred Stock
to Adjusted EBITDA
7.0x
Credit Facility
$380
2.73%
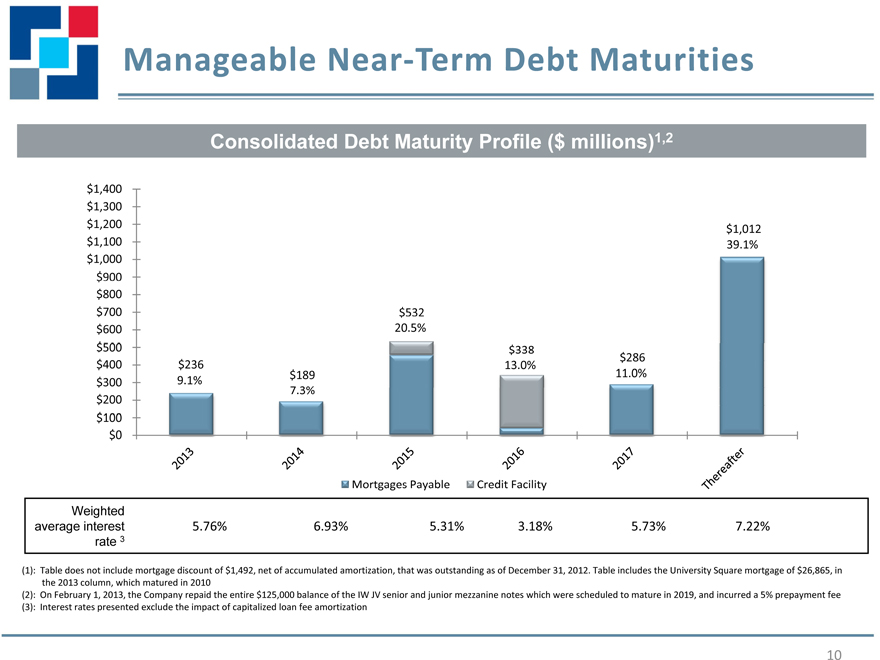
Consolidated Debt Maturity Profile ($ millions)12
$1,400 $1,300 $1,200 $1,012 $1,100 39 1% $1,000 $900 $800 $700 $532 $600 20.5% $500 $338 $286 $400 $236 13.0% $189 11.0% $300 9.1% 7.3% $200 $100 $0
Mortgages Payable Credit Facility
Mortgages Payable Credit Facility
Weighted
average interest 5.76% 6.93% 5.31% 3.18% 5.73% 7.22%
rate 3
(1): Table does not include mortgage discount of $1,492, net of accumulated amortization, that was outstanding as of December 31, 2012. Table includes the University Square mortgage of $26,865, in
the 2013 column which matured in 2010
(2): On February 1, 2013, the Company repaid the entire $125,000 balance of the IW JV senior and junior mezzanine notes which were scheduled to mature in 2019, and incurred a 5% prepayment fee
(3): Interest rates presented exclude the impact of capitalized loan fee amortization
10
Strong Fourth Quarter 2012 Operational and
Financial Results
11
Reported fourth quarter 2012 Operating FFO of $0.22 per share
Reported consolidated same store NOI growth of 0.6% in the fourth quarter or 1.7% for the full
year
Increased retail portfolio percent leased 210 bps year-over-year to 92.5% and increased retail
portfolio occupancy 210 bps year-over-year to 90.0%
Executed 178 new and renewal retail leases for 1.1 million square feet of space
Generated positive comparable retail cash leasing spreads of 7.7% on renewal leases and negative
5.1 % on new leases, for a blended spread of 5.5%
Completed the sale of 12 non-core and non-strategic assets for $258.0 million. For the full year, the
Company has completed the sale of 36 assets for $492.2 million1
Issued 5.4 million shares of 7.00% Series A Cumulative Redeemable Preferred Stock resulting in net
proceeds of $130.3 million
Combined Net Debt to Combined Adjusted EBITDA ratio ended the year at 6.6x, down 1.6 turns
from 8.2x at year-end 2011
The Class B-1 common shares converted to Class A common shares on October 5, 2012
(1): Also includes earnouts, pad sales and a deed-in-lieu transaction
2013 Guidance
12
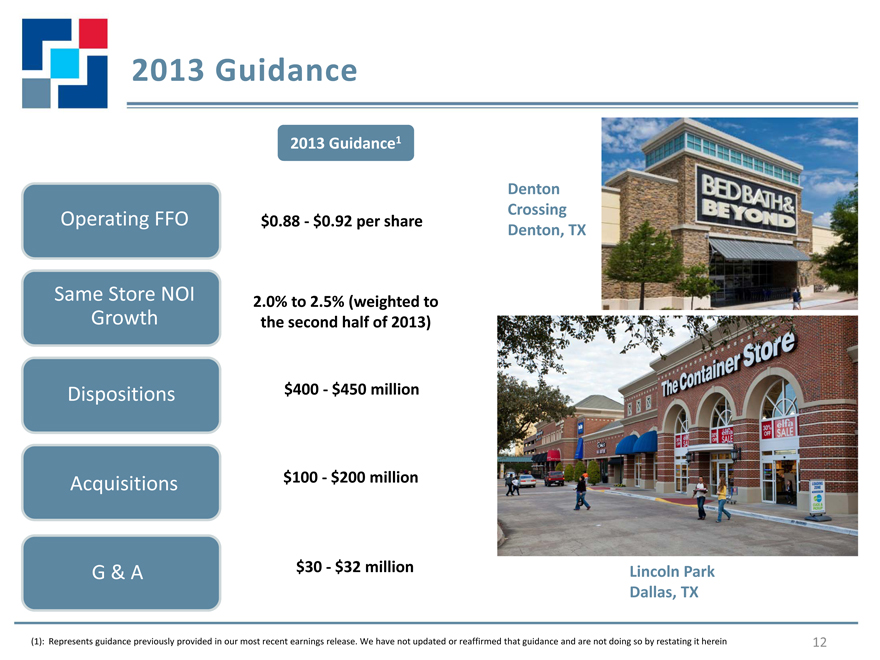
2013 Guidance1
$0.88—$0.92 per share
2.0% to 2.5% (weighted to
the second half of 2013)
$100—$200 million
Operating FFO
Same Store NOI
Growth
G & A
Dispositions
Acquisitions
$400—$450 million
$30—$32 million
(1): Represents guidance previously provided in our most recent earnings release. We have not updated or reaffirmed that guidance and are not doing so by restating it herein
Denton
Crossing
Denton, TX
Lincoln Park
Dallas, TX

Experienced Management Team
13
Executive Experience
Steven P. Grimes President& Chief Executive Officer Former experience as Chief Operating Officer & Chief Financial Officer Director with the mortgage brokerage firm of Cohen FinancialSenior Manager with Deloitte & ToucheNamed to the Board in March 2011
Shane C. Garrison EVPChief Operating Officer & Chief Investment Officer Vice President of Asset Management of RPAI HOLDCO Management LLCHead of Asset Management for ECI PropertiesGeneral Manager of the Midwest region for Circuit City
Angela Aman EVPChief Financial Officer& Treasurer Former Director of Capital MarketsPortfolio Manager at RREEFInvestment Banker for Deutsche Bank
Niall J. Byrne EVP & President of Property Management Senior Vice President of RPAI HOLDCO Management LLCVice President of Asset Management of American Landmark Properties, Ltd.Senior Vice President / Director of Operations for Providence Management Company, LLC
Dennis K. Holland EVP General Counsel & Secretary Deputy General Counsel with Heller Financial, Inc.Subsequently employed by GE Capital following the acquisition of Heller Financial
Average 23+ years of real
estate industry experience
Successfully navigated most
recent economic crisis
Senior executive focus on
operations
In-house management and
leasing
Dedicated
Management Team
<P><B>Searchable text for slide0014:</B><HR size=1>
About RPAI
Retail Properties of America, Inc. is a self-managed REIT focused on the acquisition,
development and management of strategically located retail assets. As of December 31,
2012 our portfolio consists of 264 properties nationally, both wholly and partially
owned, totaling 36 million square feet, including lifestyle, power and community
centers, as well as single-tenant net lease properties, in locations demonstrating strong
demographics.
Our experienced team offers a fresh vision to leasing, innovative and award-winning
marketing, and hands-on attention to every property in our portfolio, bringing
motivated tenants and consumers to yield proven results. When people look for the
very best in retail, they come to RPAI.
14
Retail Properties of America, Inc. is a self-managed REIT focused on the acquisition, development and management of strategically located retail assets. As of December 31, 2012 our portfolio consists of 264 properties nationally, both wholly and partially owned, totaling 36 million square feet, including lifestyle, power and community centers, as well as single-tenant net lease properties, in locations demonstrating strong demographics.
Our experienced team offers a fresh vision to leasing, innovative and award-winning marketing, and hands-on attention to every property in our portfolio, bringing motivated tenants and consumers to yield proven results. When people look for the very best in retail, they come to RPAI.
About RPAI
Appendix
Non-GAAP Reconciliations
15
Non-GAAP Financial Measures and Other
Definitions
Funds From Operation (FFO)
As defined by the National Association of Real Estate Investment Trusts (NAREIT), an industry trade group, Funds from Operations (FFO) means net (loss) income computed in
accordance with generally accepted accounting principles (GAAP), excluding gains (or losses) from sales of depreciable investment properties, plus depreciation and amortization and
impairment charges on depreciable investment properties, including adjustments for unconsolidated joint ventures in which we hold an interest. We have adopted the NAREIT
definition in our computation of FFO and believe that FFO, which is a non-GAAP performance measure, provides an additional and useful means to assess the operating performance
of real estate investment trusts (REITs). We believe that, subject to the following limitations, FFO provides a basis for comparing our performance and operations to those of other
REITs. FFO is not intended to be an alternative to “Net Income” as an indicator of our performance, nor an alternative to “Cash Flows from Operating Activities” as determined by
GAAP as a measure of our capacity to fund cash needs, including the payment of dividends. Depreciation and amortization related to investment properties for purposes of calculating
FFO includes loss on lease terminations, which encompasses the write-off of tenant-related assets, including tenant improvements and in-place lease values, as a result of early lease
terminations. Loss on lease terminations included in depreciation and amortization for FFO excludes the write-off of tenant-related above and below market lease intangibles that are
otherwise included in “Loss on lease terminations” in our Consolidated Statements of Operations.
Operating FFO
Operating FFO is defined as FFO excluding the impact on earnings from the early extinguishment of debt and other items as denoted within the calculation that we do not believe are
representative of the operating results of our core business platform. We consider Operating FFO a meaningful, additional measure of operating performance primarily because it
excludes the effects of transactions and other events which we do not consider representative of the operating results of our core business platform. Operating FFO does not
represent an alternative to “Net Income” as an indicator of our performance, nor an alternative to “Cash Flows from Operating Activities” as determined by GAAP as a measure of our
capacity to fund cash needs, including the payment of dividends. Further, comparison of our presentation of Operating FFO to similarly titled measures for other REITs may not
necessarily be meaningful due to possible differences in definition and application by such REITs.
Net Operating Income (NOI)
We define Net Operating Income (NOI) as operating revenues (rental income, tenant recovery income, other property income, excluding straight-line rental income, amortization of
lease inducements and amortization of acquired above and below market lease intangibles) less property operating expenses (real estate tax expense and property operating expense,
excluding straight-line ground rent expense and straight-line bad debt expense). Combined NOI represents NOI plus our pro rata share of NOI from our investment property
unconsolidated joint ventures, including discontinued operations associated with those ventures. We believe that NOI and Combined NOI are useful measures of our operating
performance. Other REITs may use different methodologies for calculating NOI, and accordingly, our NOI may not be comparable to other REITs. We believe that NOI and Combined
NOI provide an operating perspective not immediately apparent from GAAP operating income or net (loss) income. We use NOI and Combined NOI to evaluate our performance on a
property-by-property basis because these measures allow management to evaluate the impact that factors such as lease structure, lease rates and tenant base, which vary by
property, have on our operating results. However, these measures should only be used as an alternative measure of our financial performance.
Same Store NOI and NOI from Other Investment Properties
Same Store NOI represents NOI from our same store portfolio consisting of 239 operating properties acquired or placed in service prior to January 1, 2011, except for the three
operating properties that were classified as held for sale as of December 31, 2012, which are accounted for as discontinued operations. NOI from Other Investment Properties
represents NOI primarily from our development properties, two additional phases of existing properties acquired during the third quarter of 2011, two non-stabilized operating
properties and one property that was partially sold to our RioCan joint venture during the third quarter of 2011, which did not qualify for discontinued operations accounting
treatment. In addition, we have included University Square, the property for which we have ceased making the monthly debt service payment and for which we have attempted to
negotiate with and made offers to the lender (however, no assurance can be provided that negotiations will result in a favorable outcome), in "Other investment properties" due to
the uncertainty of the timing of transfer of ownership of this property. Prior to the quarter ended June 30, 2012, we had included University Square in the same store portfolio. NOI
consists of the sum of Same Store NOI and NOI from Other Investment Properties. NOI from Discontinued Operations represents NOI associated with properties accounted for as
discontinued operations. We believe that Same Store NOI, NOI from Other Investment Properties and NOI from Discontinued Operations are useful measures of our operating
performance. Other REITs may use different methodologies for calculating these metrics, and accordingly, our NOI metrics may not be comparable to other REITs. We believe that
these metrics provide an operating perspective not immediately apparent from GAAP operating income or net (loss) income. We use these metrics to evaluate our performance on a
property-by-property basis because these measures allow management to evaluate the impact that factors such as lease structure, lease rates and tenant base, which vary by
property, have on our operating results. However, these measures should only be used as an alternative measure of our financial performance.
16
Non-GAAP Financial Measures and Other
Definitions (Continued)
Adjusted EBITDA and Combined Adjusted EBITDA
Adjusted EBITDA represents net income (loss) before interest, income taxes, depreciation and amortization, as further adjusted to eliminate the impact of certain
items that we do not consider indicative of our ongoing performance. Combined Adjusted EBITDA represents Adjusted EBITDA plus our pro rata share of the EBITDA
adjustments from our investment property unconsolidated joint ventures, including discontinued operations associated with those ventures. We believe that
Adjusted EBITDA and Combined Adjusted EBITDA are useful because they allow investors and management to evaluate and compare our performance from period
to period in a meaningful and consistent manner in addition to standard financial measurements under GAAP. Adjusted EBITDA and Combined Adjusted EBITDA are
not measurements of financial performance under GAAP and should not be considered as alternatives to net income, as an indicator of operating performance or
any measure of performance derived in accordance with GAAP. Our calculations of Adjusted EBITDA and Combined Adjusted EBITDA may be different from the
calculation used by other companies and, accordingly, comparability may be limited.
Net Debt to Adjusted EBITDA and Combined Net Debt to Combined Adjusted EBITDA
Net Debt to Adjusted EBITDA represents (i) our total debt less cash and cash equivalents divided by (ii) Adjusted EBITDA for the prior three months, annualized.
Combined Net Debt to Combined Adjusted EBITDA represents (i) the sum of (A) our total debt less cash and cash equivalents plus (B) our pro rata share of our
investment property unconsolidated joint ventures’ total debt less our pro rata share of these joint ventures’ cash and cash equivalents divided by (ii) Combined
Adjusted EBITDA for the prior three months, annualized. We believe that these ratios are useful because they provide investors with information regarding total
debt net of cash and cash equivalents, which could be used to repay debt, compared to our performance as measured using Adjusted EBITDA and Combined
Adjusted EBITDA.
Net Debt and Preferred Stock to Adjusted EBITDA and Combined Net Debt and Preferred Stock to Combined Adjusted EBITDA
Net Debt and Preferred Stock to Adjusted EBITDA represents (i) our total debt, plus preferred stock, less cash and cash equivalents divided by (ii) Adjusted EBITDA
for the prior three months, annualized. Combined Net Debt and Preferred Stock to Combined Adjusted EBITDA represents (i) the sum of (A) our total debt, plus
preferred stock, less cash and cash equivalents plus (B) our pro rata share of our investment property unconsolidated joint ventures’ total debt less our pro rata
share of these joint ventures’ cash and cash equivalents divided by (ii) Combined Adjusted EBITDA for the prior three months, annualized. We believe that these
ratios are useful because they provide investors with information regarding total debt and preferred stock, net of cash and cash equivalents, which could be used to
repay debt, compared to our performance as measured using Adjusted EBITDA and Combined Adjusted EBITDA.
17
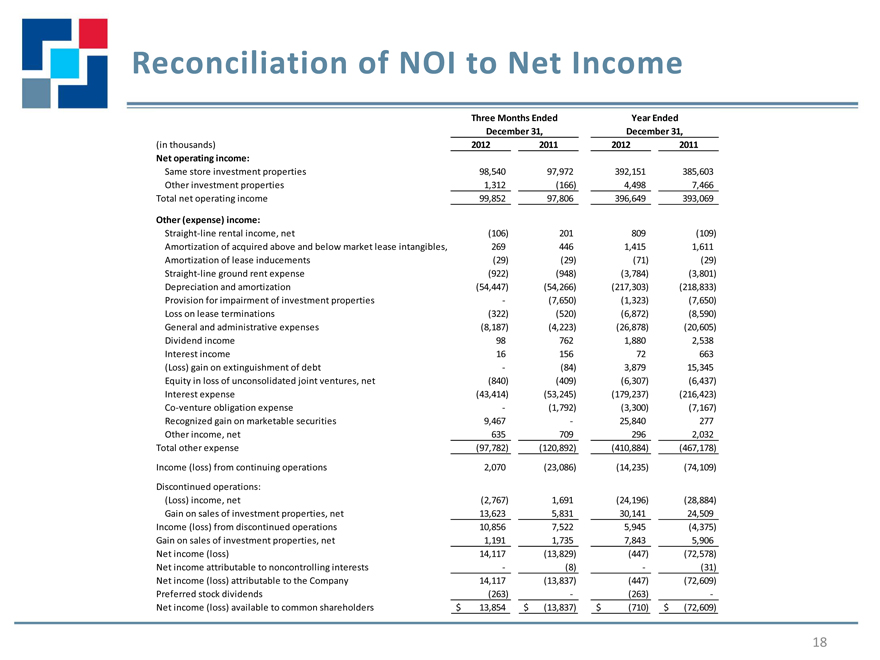
Reconciliation of NOI to Net Income
Three Months Ended Year Ended
December 31, December 31,
(in thousands) 2012 2011 2012 2011
Net operating income:
Same store investment properties 98,540 97,972 392,151 385,603
Other investment properties 1,312 (166) 4,498 7,466
Total net operating income 99,852 97,806 396,649 393,069
Other (expense) income:
Straight-line rental income, net (106) 201 809 (109)
Amortization of acquired above and below market lease intangibles, 269 446 1,415 1,611
Amortization of lease inducements (29) (29) (71) (29)
Straight-line ground rent expense (922) (948) (3,784) (3,801)
Depreciation and amortization (54,447) (54,266) (217,303) (218,833)
Provision for impairment of investment properties - (7,650) (1,323) (7,650)
Loss on lease terminations (322) (520) (6,872) (8,590)
General and administrative expenses (8,187) (4,223) (26,878) (20,605)
Dividend income 98 762 1,880 2,538
Interest income 16 156 72 663
(Loss) gain on extinguishment of debt - (84) 3,879 15,345
Equity in loss of unconsolidated joint ventures, net (840) (409) (6,307) (6,437)
Interest expense (43,414) (53,245) (179,237) (216,423)
Co-venture obligation expense - (1,792) (3,300) (7,167)
Recognized gain on marketable securities 9,467 - 25,840 277
Other income, net 635 709 296 2,032
Total other expense (97,782) (120,892) (410,884) (467,178)
Income (loss) from continuing operations 2,070 (23,086) (14,235) (74,109)
Discontinued operations:
(Loss) income, net (2,767) 1,691 (24,196) (28,884)
Gain on sales of investment properties, net 13,623 5,831 30,141 24,509
Income (loss) from discontinued operations 10,856 7,522 5,945 (4,375)
Gain on sales of investment properties, net 1,191 1,735 7,843 5,906
Net income (loss) 14,117 (13,829) (447) (72,578)
Net income attributable to noncontrolling interests - (8) - (31)
Net income (loss) attributable to the Company 14,117 (13,837) (447) (72,609)
Preferred stock dividends (263) - (263) -
Net income (loss) available to common shareholders $ 13,854 $ (13,837) $ (710) $ (72,609)
18
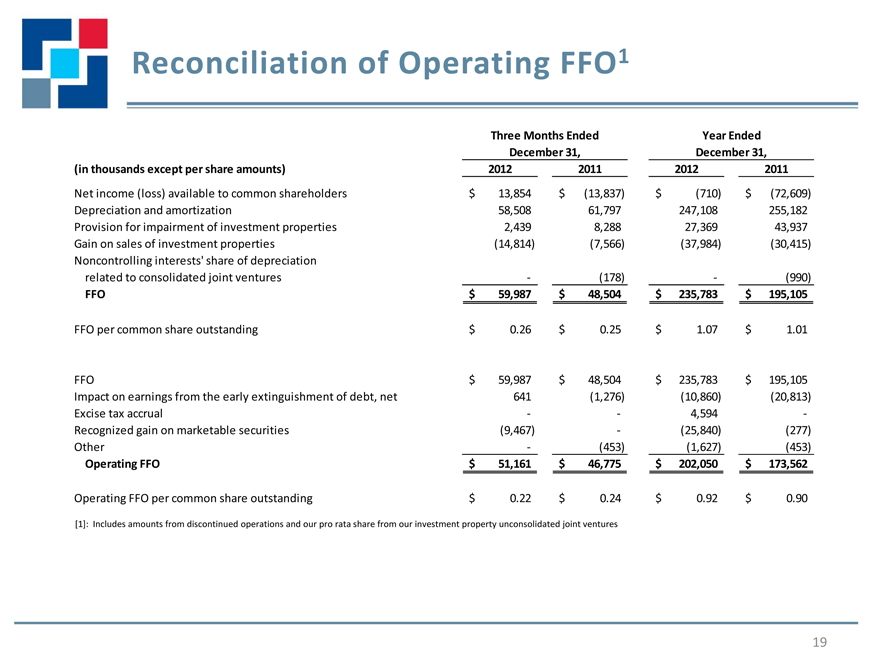
Reconciliation of Operating FFO1
Three Months Ended Year Ended
December 31, December 31,
(in thousands except per share amounts) 2012 2011 2012 2011
Net income (loss) available to common shareholders $ 13,854 $ (13,837) $ (710) $ (72,609)
Depreciation and amortization 58,508 61,797 247,108 255,182
Provision for impairment of investment properties 2,439 8,288 27,369 43,937
Gain on sales of investment properties (14,814) (7,566) (37,984) (30,415)
Noncontrolling interests’ share of depreciation
related to consolidated joint ventures - (178) - (990)
FFO $ 59,987 $ 48,504 $ 235,783 $ 195,105
FFO per common share outstanding $ 0.26 $ 0.25 $ 1.07 $ 1.01
FFO $ 59,987 $ 48,504 $ 235,783 $ 195,105
Impact on earnings from the early extinguishment of debt, net 641 (1,276) (10,860) (20,813)
Excise tax accrual - - 4,594 -
Recognized gain on marketable securities (9,467) - (25,840) (277)
Other - (453) (1,627) (453)
Operating FFO $ 51,161 $ 46,775 $ 202,050 $ 173,562
Operating FFO per common share outstanding $ 0.22 $ 0.24 $ 0.92 $ 0.90
[1]: Includes amounts from discontinued operations and our pro rata share from our investment property unconsolidated joint ventures
[1]: Includes amounts from discontinued operations and our pro rata share from our investment property unconsolidated joint ventures
19
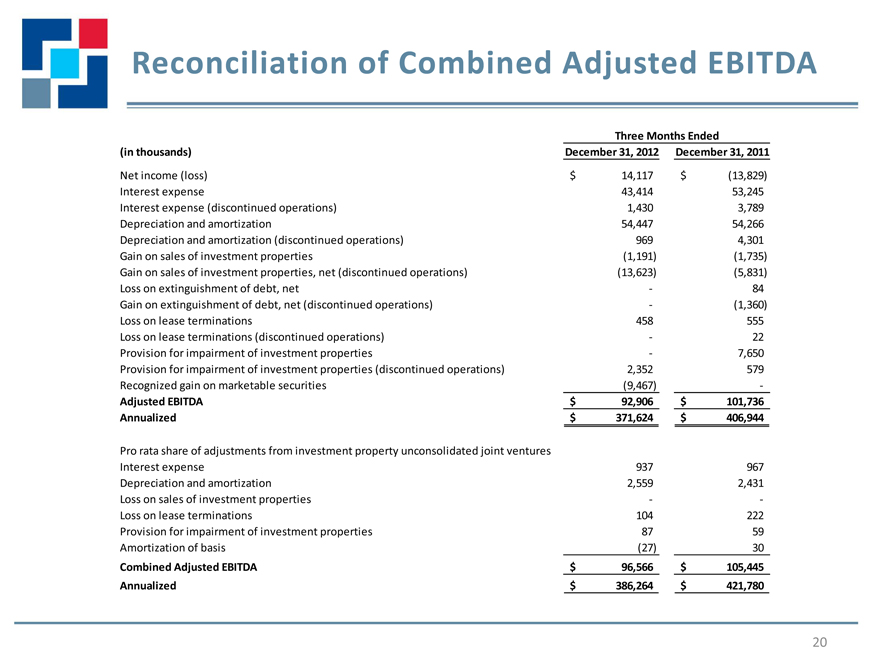
Reconciliation of Combined Adjusted EBITDA
Three Months Ended
(in thousands) December 31, 2012 December 31, 2011
Net income (loss) $ 14,117 $ (13,829)
Interest expense 43,414 53,245
Interest expense (discontinued operations) 1,430 3,789
Depreciation and amortization 54,447 54,266
Depreciation and amortization (discontinued operations) 969 4,301
Gain on sales of investment properties (1,191) (1,735)
Gain on sales of investment properties, net (discontinued operations) (13,623) (5,831)
Loss on extinguishment of debt, net - 84
Gain on extinguishment of debt, net (discontinued operations) - (1,360)
Loss on lease terminations 458 555
Loss on lease terminations (discontinued operations) - 22
Provision for impairment of investment properties - 7,650
Provision for impairment of investment properties (discontinued operations) 2,352 579
Recognized gain on marketable securities (9,467) -
Adjusted EBITDA $ 92,906 $ 101,736
Annualized $ 371,624 $ 406,944
Pro rata share of adjustments from investment property unconsolidated joint ventures
Interest expense 937 967
Depreciation and amortization 2,559 2,431
Loss on sales of investment properties - -
Loss on lease terminations 104 222
Provision for impairment of investment properties 87 59
Amortization of basis (27) 30
Combined Adjusted EBITDA $ 96,566 $ 105,445
Annualized $ 386,264 $ 421,780
20
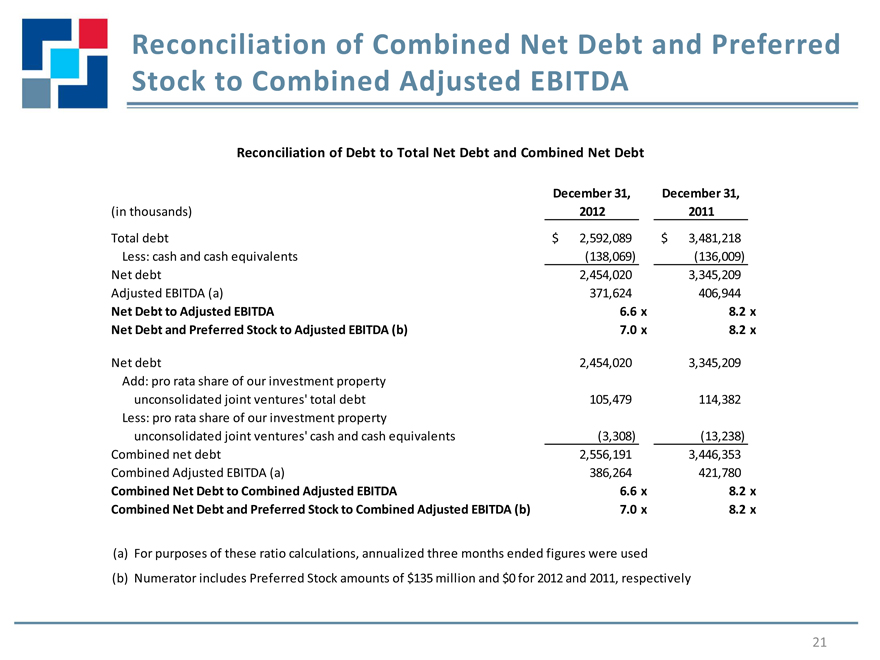
Reconciliation of Combined Net Debt and Preferred
Stock to Combined Adjusted EBITDA
Reconciliation of Debt to Total Net Debt and Combined Net Debt
December 31, December 31,
(in thousands) 2012 2011
Total debt $ 2,592,089 $ 3,481,218
Less: cash and cash equivalents (138,069) (136,009)
Net debt 2,454,020 3,345,209
Adjusted EBITDA (a) 371,624 406,944
Net Debt to Adjusted EBITDA 6.6 x 8.2 x
Net Debt and Preferred Stock to Adjusted EBITDA (b) 7.0 x 8.2 x
Net debt 2,454,020 3,345,209
Add: pro rata share of our investment property
unconsolidated joint ventures’ total debt 105,479 114,382
Less: pro rata share of our investment property
unconsolidated joint ventures’ cash and cash equivalents (3,308) (13,238)
Combined net debt 2,556,191 3,446,353
Combined Adjusted EBITDA (a) 386,264 421,780
Combined Net Debt to Combined Adjusted EBITDA 6.6 x 8.2 x
Combined Net Debt and Preferred Stock to Combined Adjusted EBITDA (b) 7.0 x 8.2 x
(a) For purposes of these ratio calculations, annualized three months ended figures were used
(b) Numerator includes Preferred Stock amounts of $135 million and $0 for 2012 and 2011, respectively
21