Exhibit 99.1
|

I N V E S T O R D A Y
S E P T E M B E R 2 1 , 2 0 1 6 | T Y S O N S C O R N E R , V A
|
Forward-Looking Statements
This presentation contains “forward-looking statements” within the meaning of the safe harbor from civil liability provided for such statements by the Private Securities Litigation Reform Act of 1995
(set forth in Section 27A of the Securities Act of 1933, as amended, or the Securities Act, and Section 21E of the Securities Exchange Act of 1934, as amended, or the Exchange Act). Forward-looking
statements involve numerous risks and uncertainties and you should not rely on them as predictions of future events. Forward-looking statements depend on assumptions, data or methods which may
be incorrect or imprecise and we may not be able to realize them. We do not guarantee that the transactions and events described will happen as described (or that they will happen at all). You can
identify forward-looking statements by the use of forward-looking terminology such as “believes,” “expects,” “may,” “should,” “intends,” “plans,” “estimates” or “anticipates” and variations of such
words or similar expressions or the negative of such words. You can also identify forward-looking statements by discussions of strategies, vision, plans or intentions. Risks, uncertainties and changes
in the following factors, among others, could cause actual results and future events to differ materially from those set forth or contemplated in the forward-looking statements:
economic, business and financial conditions, and changes in our industry and changes in the real estate markets in particular;
economic and other developments in the state of Texas and in other markets where we have a high concentration of properties;
our business strategy;
our projected operating results;
rental rates and/or vacancy rates;
frequency and magnitude of defaults on, early terminations of or non-renewal of leases by tenants;
bankruptcy or insolvency of a major tenant or a significant number of smaller tenants;
interest rates or operating costs;
real estate and zoning laws and changes in real property tax rates;
real estate valuations;
our leverage;
our ability to generate sufficient cash flows to service our outstanding indebtedness;
our ability to obtain necessary outside financing;
the availability, terms and deployment of capital;
general volatility of the capital and credit markets and the market price of our Class A common stock;
risks generally associated with real estate acquisitions, dispositions and redevelopment, including the impact of construction delays and cost overruns and our ability to lease redeveloped space;
our ability to identify and pursue acquisition, disposition and redevelopment opportunities;
composition of members of our senior management team;
our ability to attract and retain qualified personnel;
our ability to continue to qualify as a real estate investment trust (REIT);
governmental regulations, tax laws and rates and similar matters;
our compliance with laws, rules and regulations;
environmental uncertainties and exposure to natural disasters;
insurance coverage;
the likelihood or actual occurrence of terrorist attacks in the U.S.; and
other risk factors, including those detailed in the section titled “Risk Factors” of our most recent Form 10-K and Form 10-Q filed with the SEC.
You should not place undue reliance on any forward-looking statements, which are based only on information currently available to us (or to third parties making the forward-looking statements). We
undertake no obligation to publicly release any revisions to such forward-looking statements to reflect events or circumstances after the date of this presentation, except as required by applicable law.
All information is presented on a consolidated basis and is as of June 30, 2016, unless otherwise noted
All 2013 information is presented on a consolidated basis, including our pro rata share of unconsolidated joint ventures, and is as of March 31, 2013, unless otherwise noted
All demographic information is sourced from The Nielsen Company, unless otherwise noted
All 2013 peer metric information is sourced from company filings as of March 31, 2013, unless otherwise noted
All 2016 peer metric information is sourced from company filings as of June 30, 2016, unless otherwise noted
2 |
|
|

OUR SPEAKERS
RPAI’s Playbook
SHANE GARRISON
EVP, COO & CIO
Balance Sheet
& Roadmap
HEATH FEAR
EVP, CFO & Treasurer
STEVE GRIMES
President and CEO
Opening & Closing Remarks
TIMOTHY STEFFAN
President—Eastern Division
Regional Experience
3
|

SENIOR LEADERSHIP
Paula Maggio
EVP, General Counsel & Secretary
Julie Swinehart
SVP, Chief Accounting Officer
Gerry Wright
President—Western Division
Maria Pope Toliopoulos
SVP, Dir. of National Retail Leasing & Services
LEASING
Greg Goldberg
VP, Leasing Director—Eastern Division
Ann Smith
VP, Sr. Leasing Director—Eastern Division
Stacy Short
VP, Leasing Director—Western Division
INVESTMENTS / DEVELOPMENT
Matthew Beverly
SVP, Dir. of Investments—Eastern Division
Mike Hazinski
VP, Dir. of Investments—Western Division
Nick Over
VP, Director of Development
CAPITAL MARKETS / INVESTOR RELATIONS
Mike Fitzmaurice
VP, Finance
4
|

O P E N I N G R E M A R K S
Steve Grimes
5 |
|
|
Our Strategy
We generate long-term shareholder value through the
ownership, operation and redevelopment of high
quality, multi-tenant retail assets in our target markets
We believe real estate is a local business and that our
approach combined with scale provides for the best
value creation over the long term
We believe in maintaining an investment grade rated
balance sheet through adhering to a simple, low
leverage model
We believe in maintaining a best-in-class operating
platform through an intense focus on talent
development and the innovative use of technology and
systems
6 |
|
|

N Y S E : R P A I
T O TA L C A P I TA L I Z AT I O N
$6.4B1
I N V E S T M E N T G R A D E
BBB- Baa3
S & P Moody’s
7 |
|
|
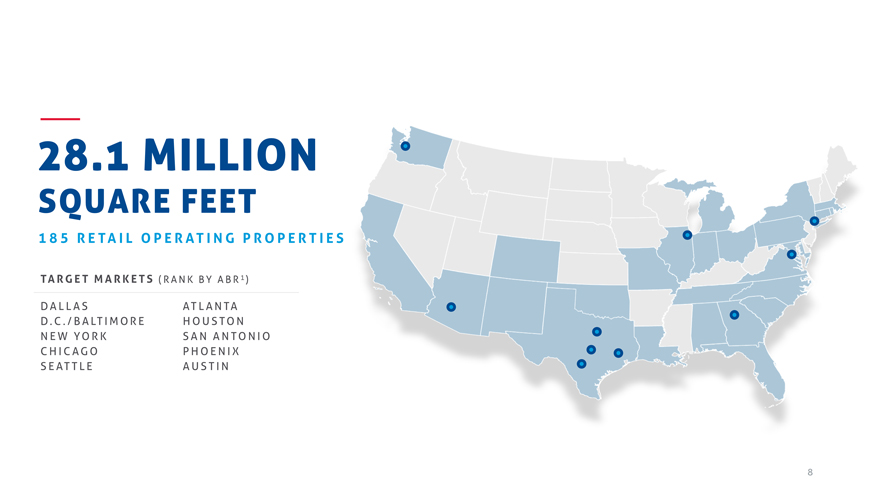
28.1 MILLION
SQUARE FEET
1 8 5 R E TA I L O P E R AT I N G P R O P E R T I E S
TA R G E T M A R K E T S ( R A N K B Y A B R 1 )
D A L L A S
AT L A N TA
D. C . / B A LT I M O R E
H O U S TO N
N E W YO R K
S A N A N TO N I O
C H I C AG O
P H O E N I X
S E AT T L E
A U S T I N
8
|
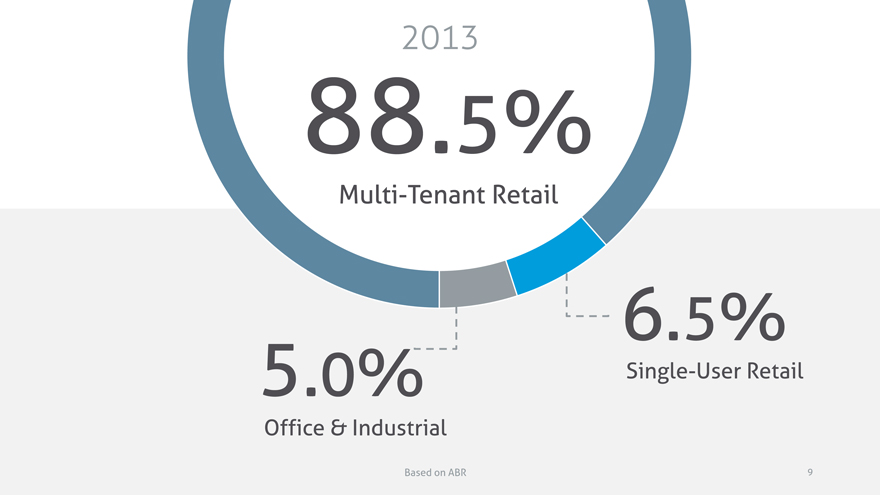
2013
88.5%
Multi-Tenant Retail
6.5%
5.0% Single-User Retail Office & Industrial
Based on ABR
9
|
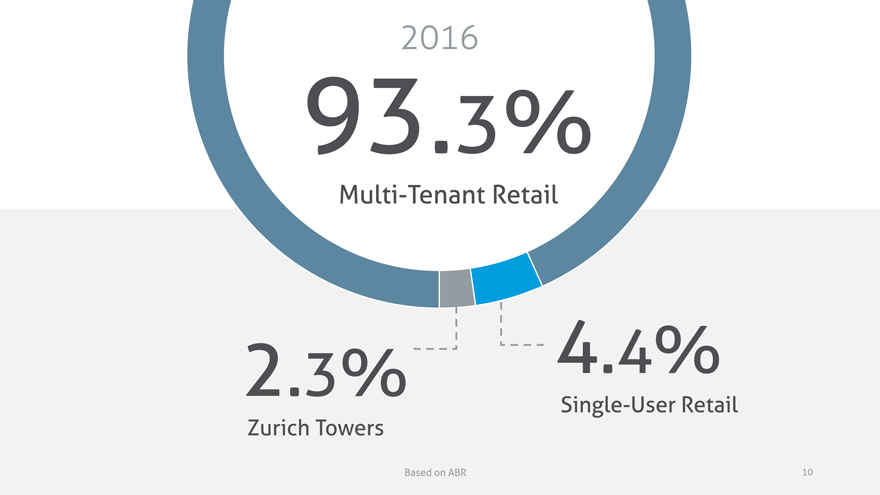
2016
93.3%
Multi-Tenant Retail
2.3% 4.4%
Single-User Retail Zurich Towers
Based on ABR 10
|
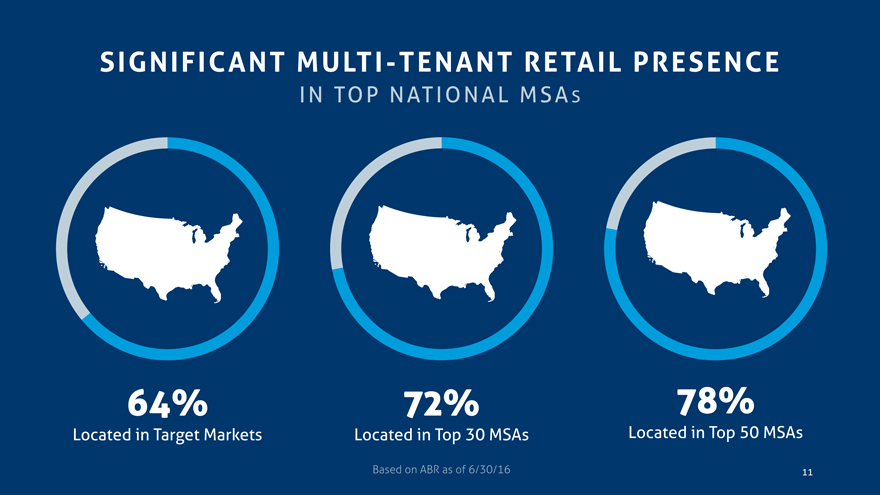
SIGNIFICANT MULTI-TENANT RETAIL PRESENCE
IN TOP NATIONAL MSA S
64% 72% 78%
Located in Target Markets Located in Top 30 MSAs Located in Top 50 MSAs
Based on ABR as of 6/30/16
11
|
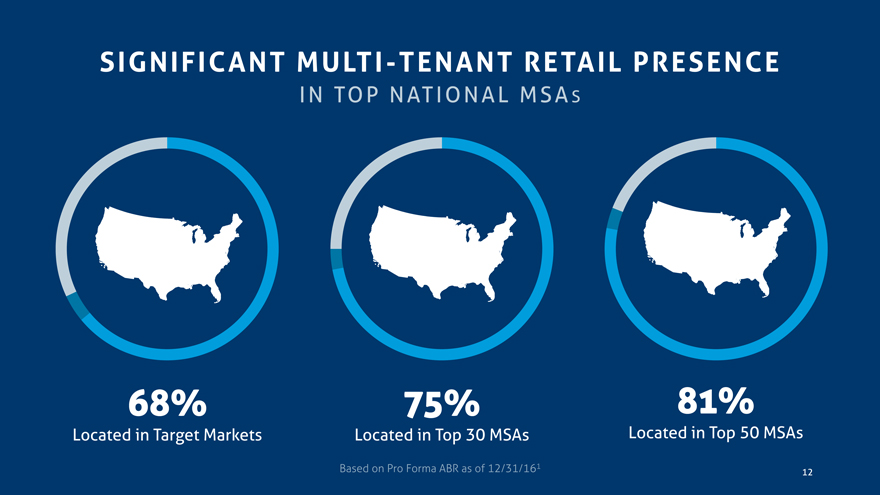
SIGNIFICANT MULTI-TENANT RETAIL PRESENCE
IN TOP NATIONAL MSA S
68% 75% 81%
Located in Target Markets Located in Top 30 MSAs Located in Top 50 MSAs
Based on Pro Forma ABR as of 12/31/161
12
|
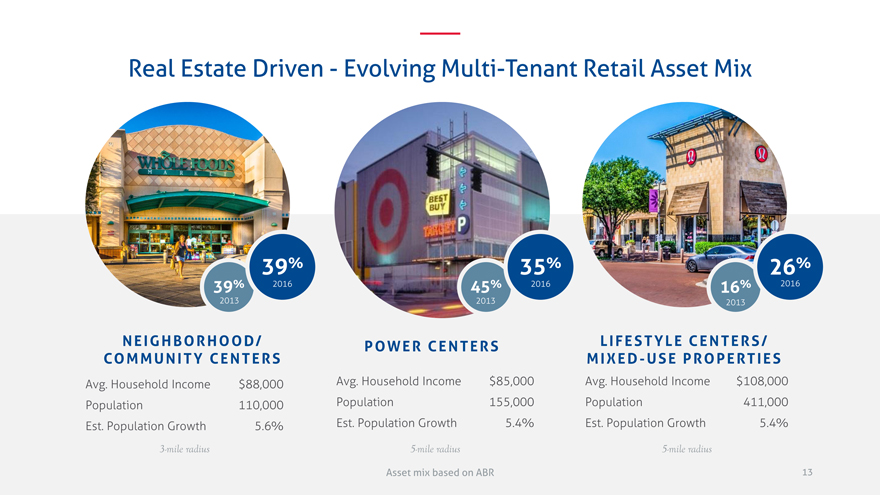
Real Estate Driven—Evolving Multi-Tenant Retail Asset Mix
39% 35% 26%
39% 2016 45% 2016 16% 2016 2013 2013 2013
NEIGHBORHOOD/ COMMUNITY CENTERS
Avg. Household Income $88,000
Population 110,000
Est. Population Growth 5.6%
3-mile radius
POWER CENTERS
Avg. Household Income $85,000 Population 155,000
Est. Population Growth 5.4%
5-mile radius
Asset mix based on ABR
LIFESTYLE CENTERS/ MIXED-USE PROPERTIES
Avg. Household Income $108,000 Population 411,000
Est. Population Growth 5.4%
5-mile radius
13
|
2 0 1 3
INVESTOR DAY
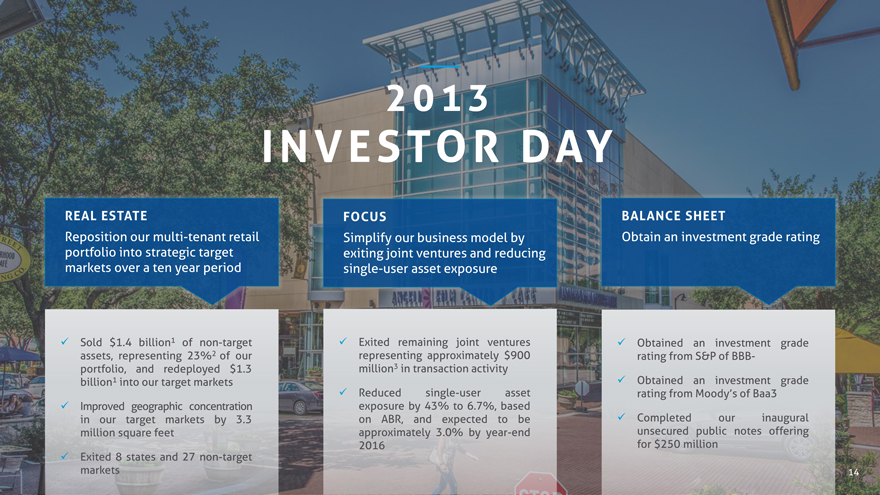
REAL ESTATE
Reposition our multi-tenant retail portfolio into strategic target markets over a ten year period
Sold $1.4 billion1 of non-target assets, representing 23%2 of our portfolio, and redeployed $1.3 billion1 into our target markets
Improved geographic concentration in our target markets by 3.3 million square feet
Exited 8 states and 27 non-target markets
FOCUS
Simplify our business model by exiting joint ventures and reducing single-user asset exposure
Exited remaining joint ventures
representing approximately $900
million3 in transaction activity
Reduced single-user asset
exposure by 43% to 6.7%, based
on ABR, and expected to be
approximately 3.0% by year-end
2016
BALANCE SHEET
Obtain an investment grade rating
Obtained an investment grade
rating from S&P of BBB-
Obtained an investment grade
rating from Moody’s of Baa3
Completed our inaugural
unsecured public notes offering
for $250 million
14
|
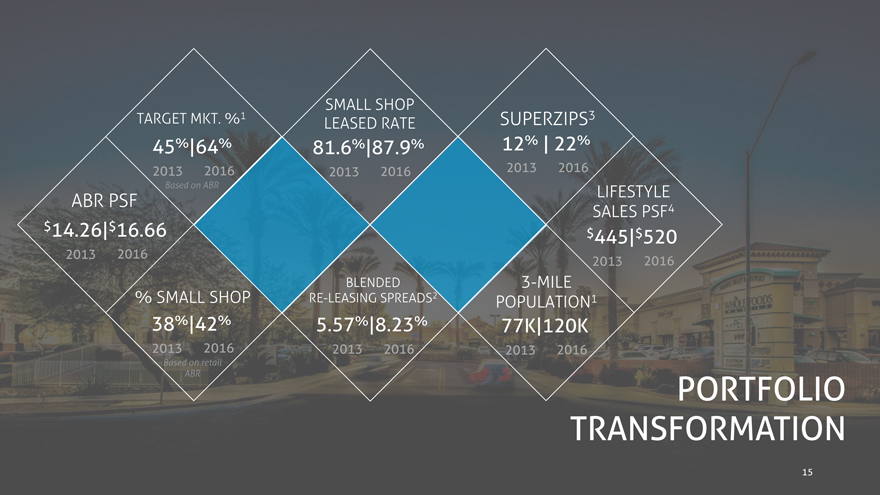
1 SMALL SHOP
TARGET MKT. % SUPERZIPS3
LEASED RATE
45%|64% 81.6%|87.9% 12% | 22%
2013 2016 2013 2016 2013 2016
Based on ABR LIFESTYLE
ABR PSF
SALES PSF4
$14.26|$16.66 $445|$520
2013 2016
2013 2016
BLENDED 3-MILE
% SMALL SHOP RE-LEASING SPREADS2 POPULATION1
38%|42% 5.57%|8.23% 77K|120K
2013 2016 2013 2016 2013 2016
Based on retail
ABR PORTFOLIO TRANSFORMATION
15
|
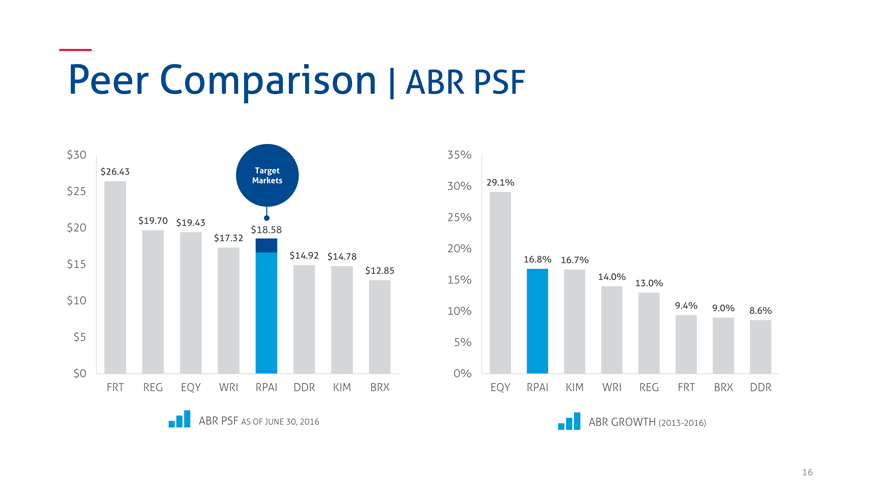
Peer Comparison | ABR PSF
$30
$26.43 Target
Markets
$25
$19.70 $19.43
$20 $18.58
$17.32
$14.92 $14.78
$15 $12.85
$10
$5
$0
FRT REG EQY WRI RPAI DDR KIM BRX
ABR PSF AS OF JUNE 30, 2016
35%
30% 29.1%
25%
20%
16.8% 16.7%
15% 14.0% 13.0%
10% 9.4% 9.0% 8.6%
5%
0%
EQY RPAI KIM WRI REG FRT BRX DDR
ABR GROWTH (2013-2016)
16
|
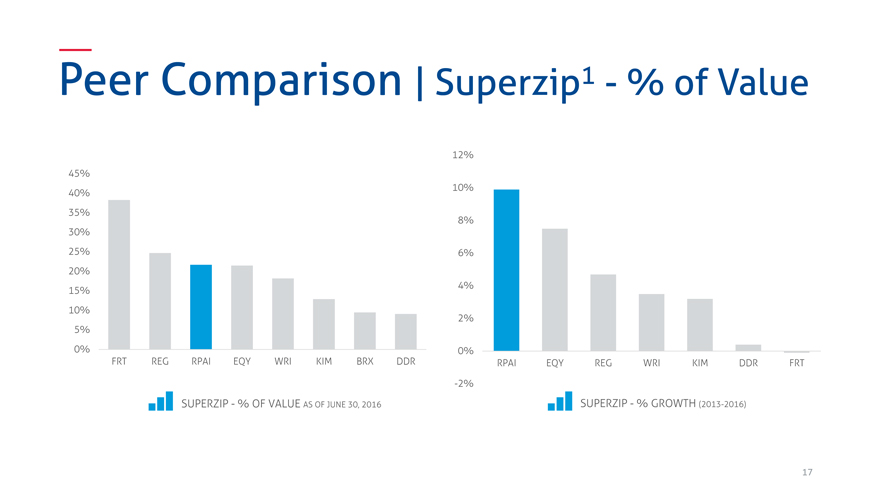
Peer Comparison | Superzip1—% of Value
45%
40%
35%
30%
25%
20%
15%
10%
5%
0%
FRT REG RPAI EQY WRI KIM BRX DDR
SUPERZIP—% OF VALUE AS OF JUNE 30, 2016
12%
10%
8%
6%
4%
2%
0%
RPAI EQY REG WRI KIM DDR FRT
-2%
SUPERZIP—% GROWTH (2013-2016)
17
|

MULTI-TENANT
RETAIL PORTFOLIO
2013
35 STATES, 84 MARKETS
18
|
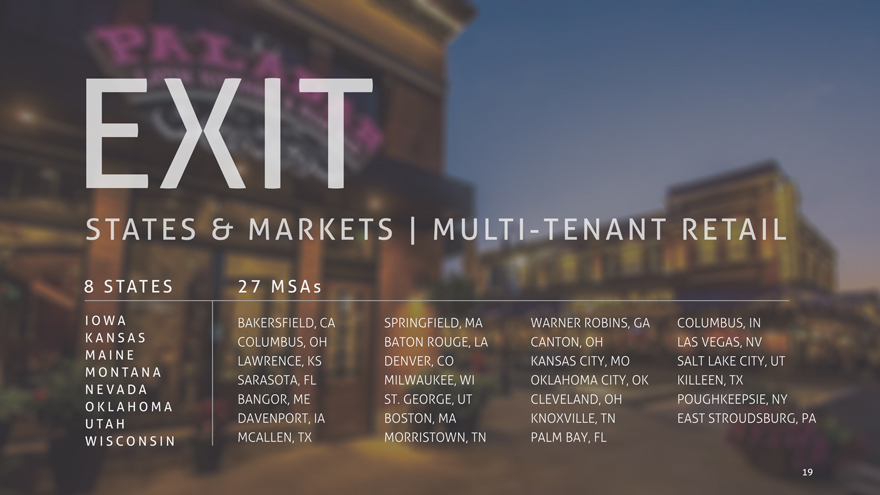
8 S TAT E S 2 7 M S A s
I O W A BAKERSFIELD, CA SPRINGFIELD, MA WARNER ROBINS, GA COLUMBUS, IN K A N S A S COLUMBUS, OH BATON ROUGE, LA CANTON, OH LAS VEGAS, NV
M A I N E
LAWRENCE, KS DENVER, CO KANSAS CITY, MO SALT LAKE CITY, UT
M O N T A N A
SARASOTA, FL MILWAUKEE, WI OKLAHOMA CITY, OK KILLEEN, TX
N E V A D A
BANGOR, ME ST. GEORGE, UT CLEVELAND, OH POUGHKEEPSIE, NY O K L A H O M A DAVENPORT, IA BOSTON, MA KNOXVILLE, TN EAST STROUDSBURG, PA
U T A H
W I S C O N S I N MCALLEN, TX MORRISTOWN, TN PALM BAY, FL
19
|

MULTI-TENANT
RETAIL PORTFOLIO
2016
27 STATES, 58 MARKETS
Avg. 1.4 assets remaining per non-target market
20
|
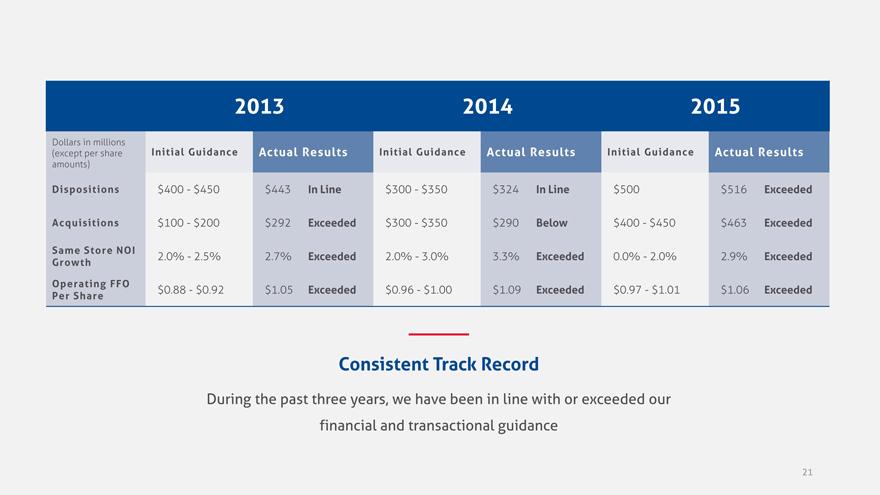
2013 2014 2015
Dollars in millions
(except per share Initial Guidance Actual Results Initial Guidance Actual Results Initial Guidance Actual Results
amounts)
Dispositions $400—$450 $443 In Line $300—$350 $324 In Line $500 $516 Exceeded
Acquisitions $100—$200 $292 Exceeded $300—$350 $290 Below $400—$450 $463 Exceeded
Same Store NOI 2.0%—2.5% 2.7% Exceeded 2.0%—3.0% 3.3% Exceeded 0.0%—2.0% 2.9% Exceeded
Growth
Operating FFO $0.88—$0.92 $1.05 Exceeded $0.96—$1.00 $1.09 Exceeded $0.97—$1.01 $1.06 Exceeded
Per Share
Consistent Track Record
During the past three years, we have been in line with or exceeded our
financial and transactional guidance
21
|

2 0 1 6
INVESTOR DAY
How does RPAI think about acquisitions, leasing and redevelopment?
How does RPAI think about its balance sheet?
What is the revised timeline for our strategic plan?
22
|

10 YEAR PLAN
2014 2015 2016 2017 2018
2019 2020 2021 2022 2023
23
|

5 YEAR PLAN
2014 2015 2016 2017 2018
2019 2020 2021 2022 2023
24
|

ONLY 2 YEARS LEFT
2014 2015 2016 2017 2018
25
|

R P A I ’ S P L A Y B O O K
Great real estate is the foundation of our future success
Shane Garrison
26
|
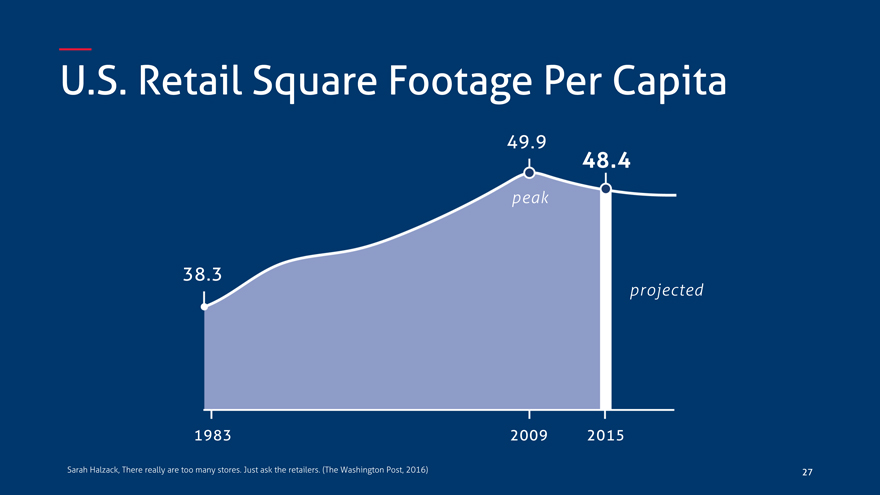
U.S. Retail Square Footage Per Capita
49.9
48.4
peak
38 projected
1983 2009 2015
Sarah Halzack, There really are too many stores. Just ask the retailers. (The Washington Post, 2016)
27
|
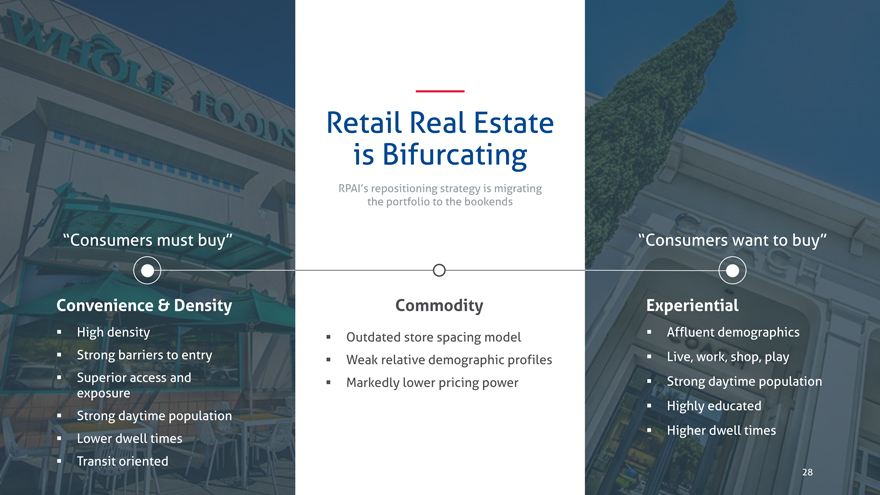
Retail Real Estate
is Bifurcating
RPAI’s repositioning strategy is migrating
the portfolio to the bookends
“Consumers must buy” “Consumers want to buy”
Convenience & Density Commodity Experiential
High density Outdated store spacing model Affluent demographics
Strong barriers to entry Weak relative demographic profiles Live, work, shop, play
Superior access and Markedly lower pricing power Strong daytime population
exposure
Highly educated
Strong daytime population
Lower dwell times Higher dwell times
Transit oriented
28
|
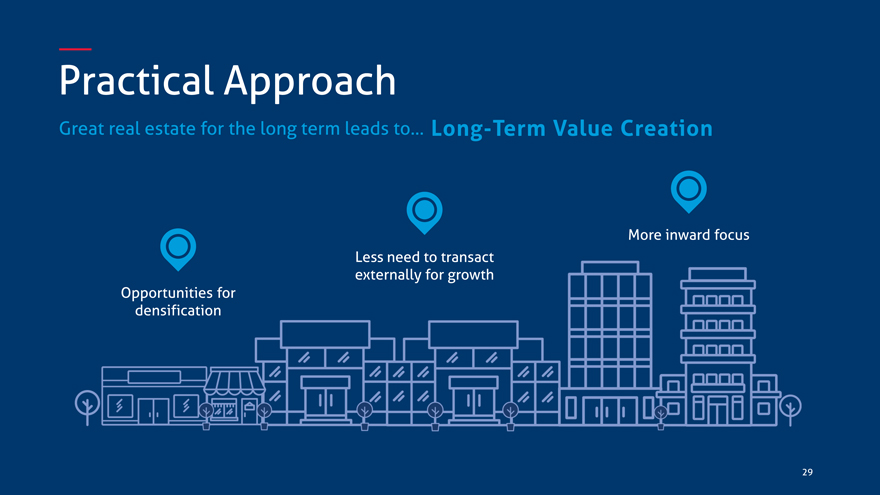
Practical Approach
Great real estate for the long term leads to… Long-Term Value Creation
More inward focus Less need to transact externally for growth Opportunities for densification
29
|

A C Q U I S I T I O N S P O T L I G H T
Shane Garrison
30
|
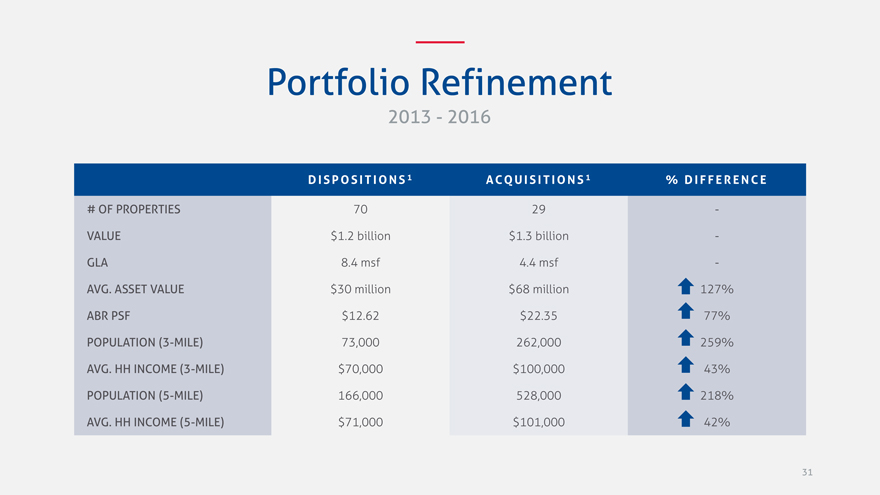
Portfolio Refinement
2013—2016
D I S P O S I T I O N S 1 ACQ U I S I T I O N S 1% D I F F E R E N C E
# OF PROPERTIES 70 29 -
VALUE $1.2 billion $1.3 billion -
GLA 8.4 msf 4.4 msf -
AVG. ASSET VALUE $30 million $68 million 127%
ABR PSF $12.62 $22.35 77%
POPULATION (3-MILE) 73,000 262,000 259%
AVG. HH INCOME (3-MILE) $70,000 $100,000 43%
POPULATION (5-MILE) 166,000 528,000 218%
AVG. HH INCOME (5-MILE) $71,000 $101,000 42%
31
|
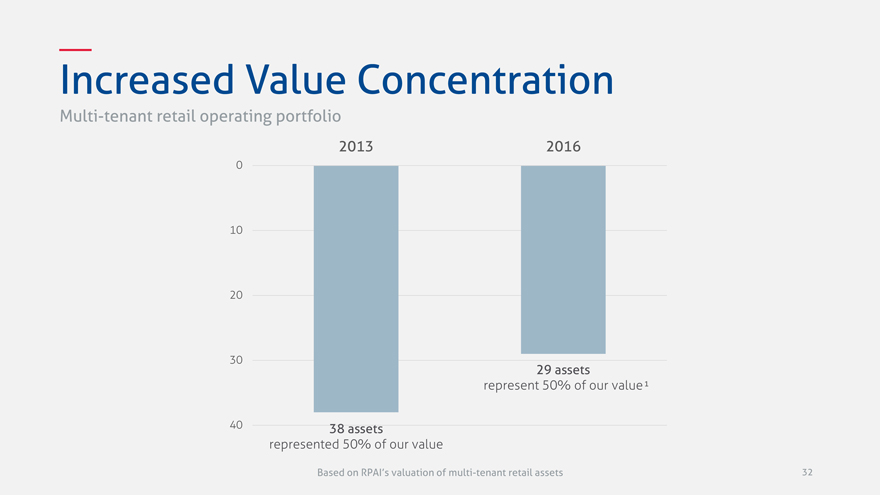
Increased Value Concentration
Multi-tenant retail operating portfolio
2013 2016
0
10
20
30
29 assets
represent 50% of our value 1
40 38 assets
represented 50% of our value
Based on RPAI’s valuation of multi-tenant retail assets
32
|
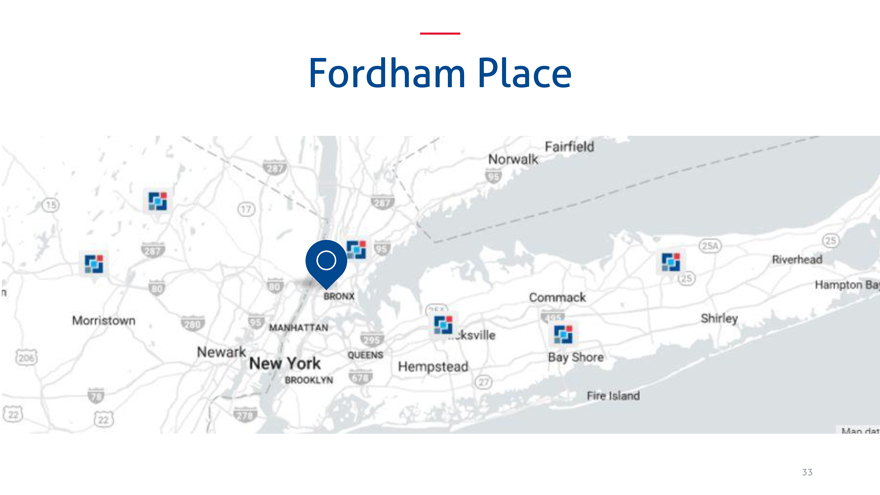
Fordham Place
33
|
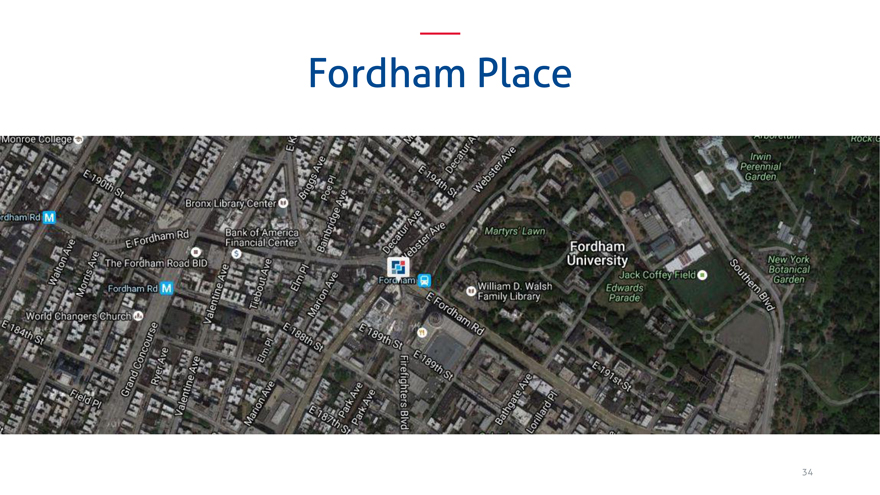
Fordham Place
34
|
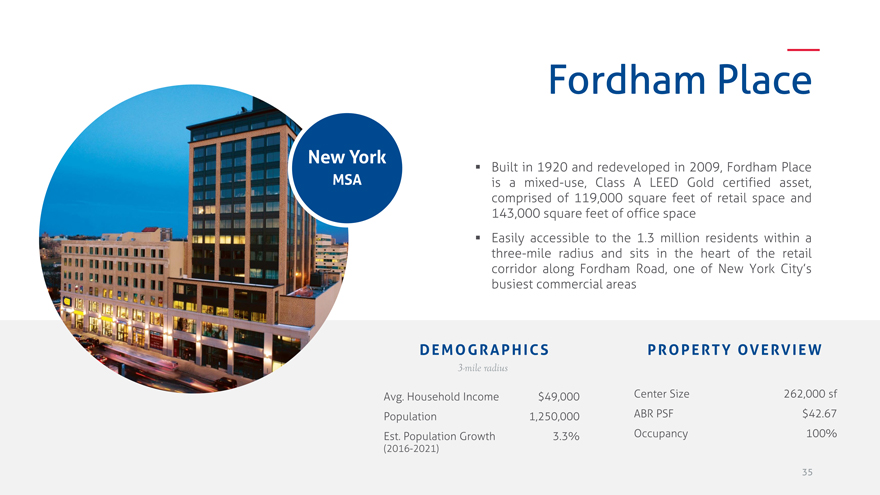
Fordham Place
New York
MSA
Built in 1920 and redeveloped in 2009, Fordham Place is a mixed-use, Class A LEED Gold certified asset, comprised of 119,000 square feet of retail space and 143,000 square feet of office space Easily accessible to the 1.3 million residents within a three-mile radius and sits in the heart of the retail corridor along Fordham Road, one of New York City’s busiest commercial areas
DEMOGRAPHICS
3-mile radius
Avg. Household Income $49,000
Population 1,250,000
Est. Population Growth 3.3%
(2016-2021)
PROPERTY OVERVIEW
Center Size 262,000 sf
ABR PSF $42.67
Occupancy 100%
35
|
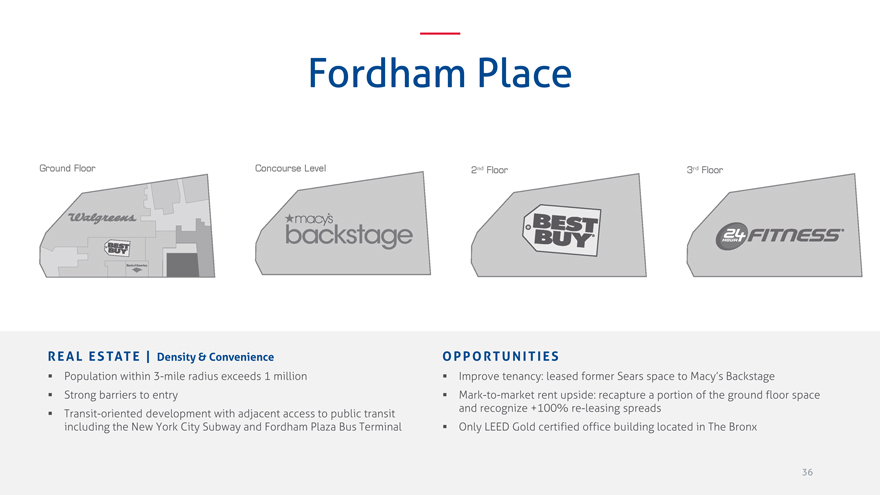
Fordham Place
REAL ESTATE | Density & Convenience
Population within 3-mile radius exceeds 1 million
Strong barriers to entry
Transit-oriented development with adjacent access to public transit
including the New York City Subway and Fordham Plaza Bus Terminal
OPPORTUNITIES
Improve tenancy: leased former Sears space to Macy’s Backstage
Mark-to-market rent upside: recapture a portion of the ground floor space
and recognize +100% re-leasing spreads
Only LEED Gold certified office building located in The Bronx
36
|
Eastside
37
|
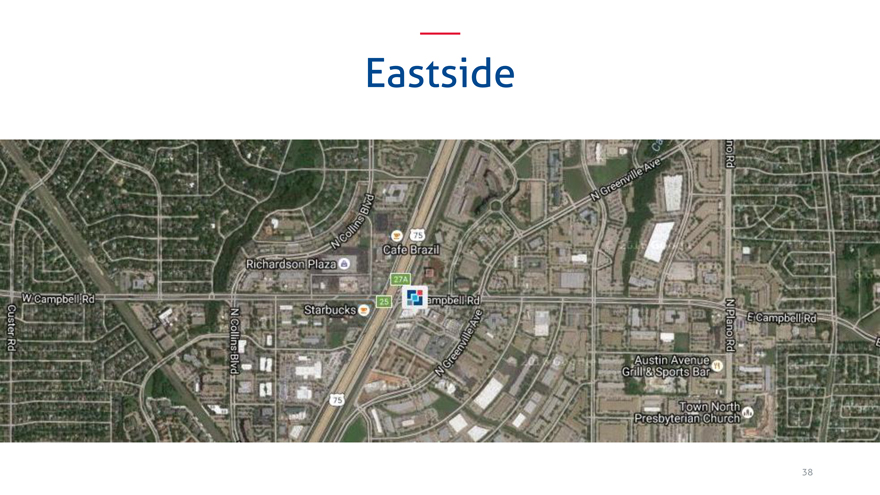
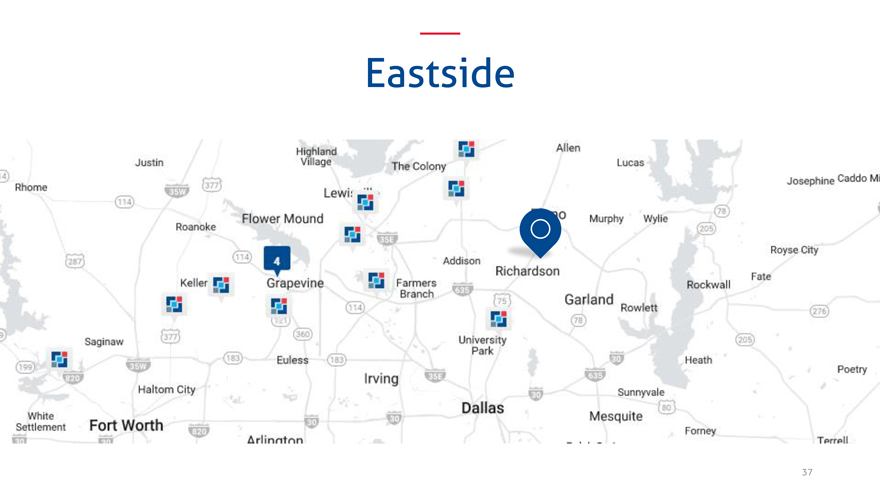
Eastside
38
|
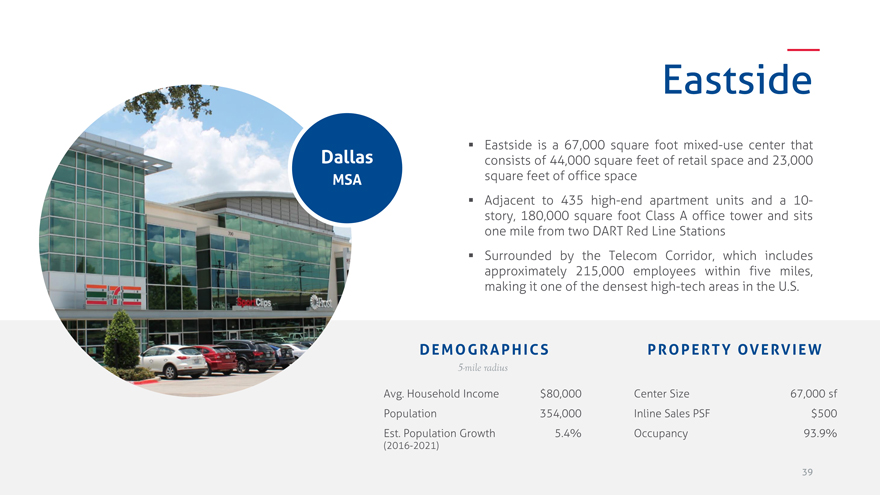
Eastside
Dallas
MSA
Eastside is a 67,000 square foot mixed-use center that consists of 44,000 square feet of retail space and 23,000 square feet of office space Adjacent to 435 high-end apartment units and a 10-story, 180,000 square foot Class A office tower and sits one mile from two DART Red Line Stations Surrounded by the Telecom Corridor, which includes approximately 215,000 employees within five miles, making it one of the densest high-tech areas in the U.S.
DEMOGRAPHICS
5-mile radius
Avg. Household Income $80,000
Population 354,000
Est. Population Growth 5.4%
(2016-2021)
PROPERTY OVERVIEW
Center Size 67,000 sf
Inline Sales PSF $500
Occupancy 93.9%
39
|
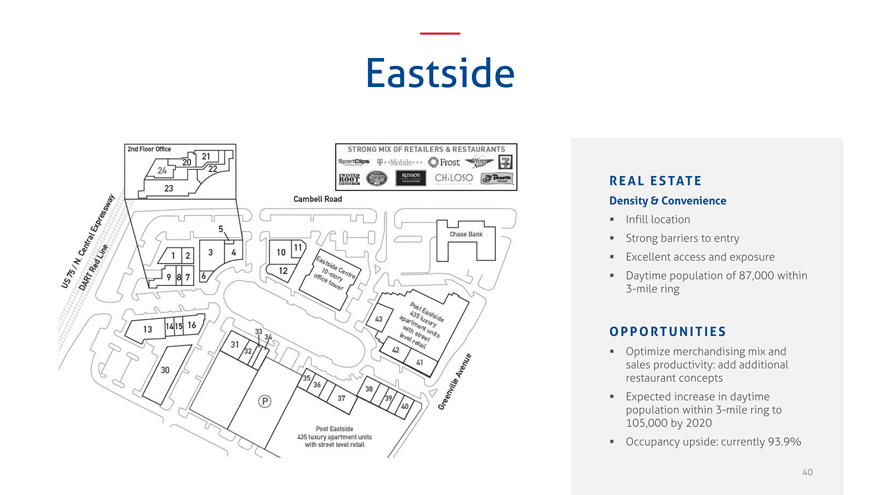
Eastside
REAL ESTATE
Density & Convenience
Infill location
Strong barriers to entry
Excellent access and exposure
Daytime population of 87,000 within 3-mile ring
OPPORTUNITIES
Optimize merchandising mix and sales productivity: add additional restaurant concepts
Expected increase in daytime population within 3-mile ring to 105,000 by 2020
Occupancy upside: currently 93.9%
40
|
Woodinville Plaza
41
|
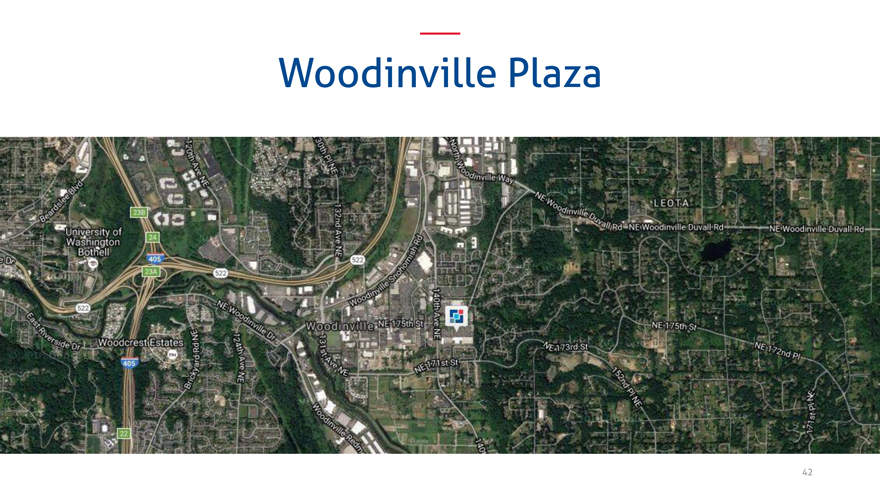
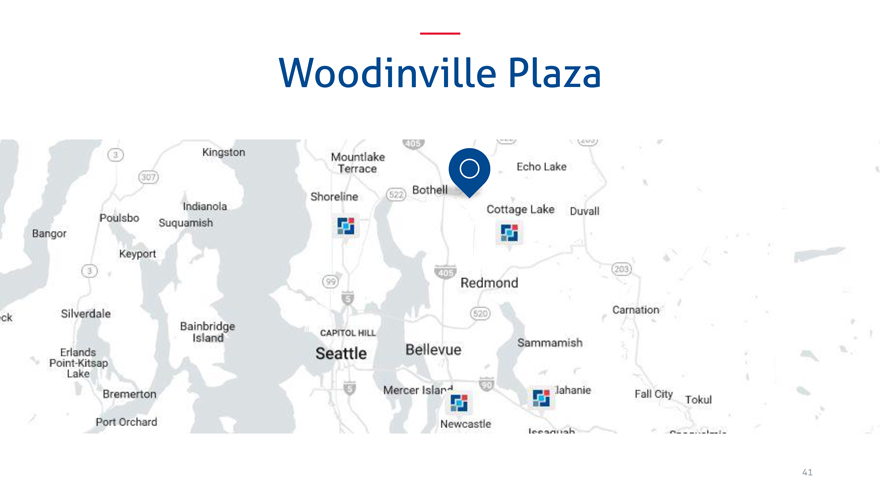
Woodinville Plaza
42
|
Woodinville Plaza
Seattle
MSA
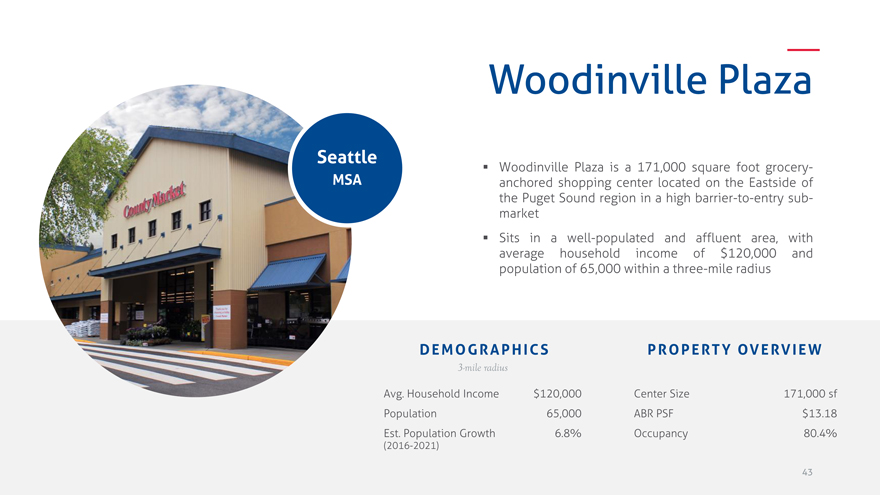
Woodinville Plaza is a 171,000 square foot grocery-anchored shopping center located on the Eastside of the Puget Sound region in a high barrier-to-entry sub-market Sits in a well-populated and affluent area, with average household income of $120,000 and population of 65,000 within a three-mile radius
DEMOGRAPHICS
3-mile radius
Avg. Household Income $120,000 Population 65,000 Est. Population Growth 6.8%
(2016-2021)
PROPERTY OVERVIEW
Center Size 171,000 sf ABR PSF $13.18 Occupancy 80.4%
43
|
Woodinville Plaza
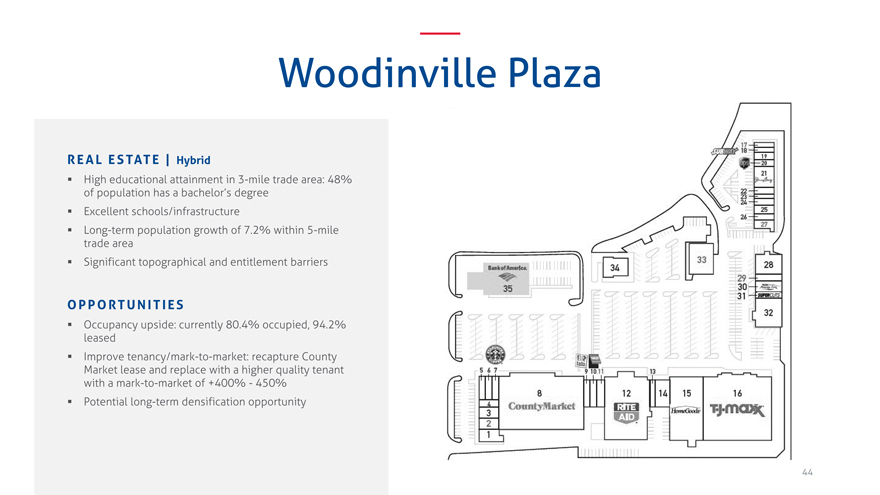
REAL ESTATE | Hybrid
High educational attainment in 3-mile trade area: 48%
of population has a bachelor’s degree
Excellent schools/infrastructure
Long-term population growth of 7.2% within 5-mile
trade area
Significant topographical and entitlement barriers
OPPORTUNITIES
Occupancy upside: currently 80.4% occupied, 94.2%
leased
Improve tenancy/mark-to-market: recapture County
Market lease and replace with a higher quality tenant
with a mark-to-market of +400%—450%
Potential long-term densification opportunity
44
|
The Shoppes at Union Hill
45
|
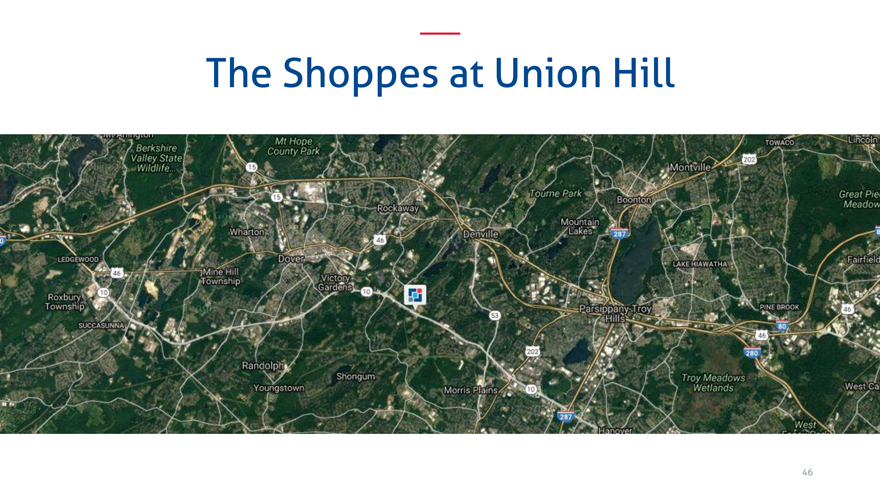
The Shoppes at Union Hill
46
|
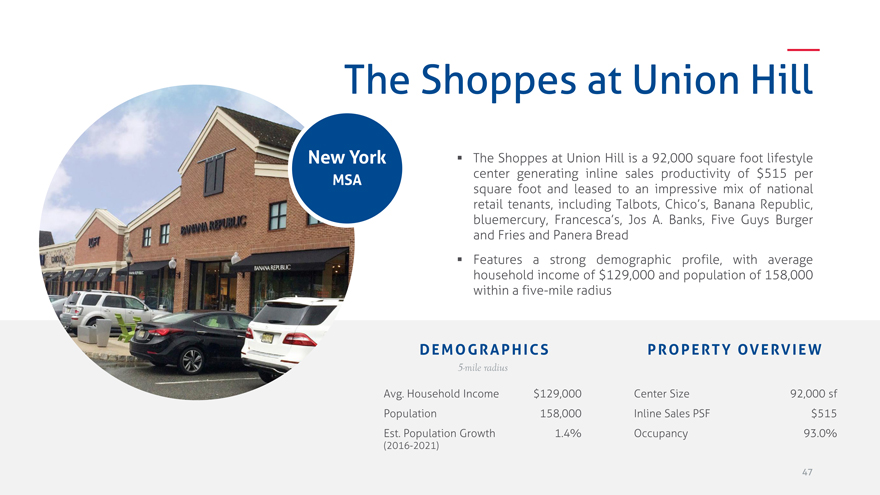
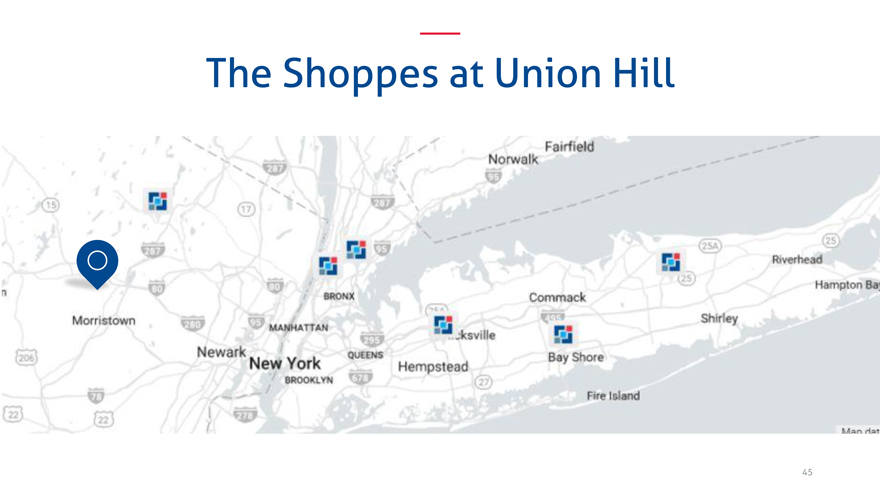
The Shoppes at Union Hill
New York
MSA
The Shoppes at Union Hill is a 92,000 square foot lifestyle center generating inline sales productivity of $515 per square foot and leased to an impressive mix of national retail tenants, including Talbots, Chico’s, Banana Republic, bluemercury, Francesca’s, Jos A. Banks, Five Guys Burger and Fries and Panera Bread Features a strong demographic profile, with average household income of $129,000 and population of 158,000 within a five-mile radius
DEMOGRAPHICS
5-mile radius
Avg. Household Income $129,000 Population 158,000 Est. Population Growth 1.4%
(2016-2021)
PROPERTY OVERVIEW
Center Size 92,000 sf Inline Sales PSF $515 Occupancy 93.0%
47
|
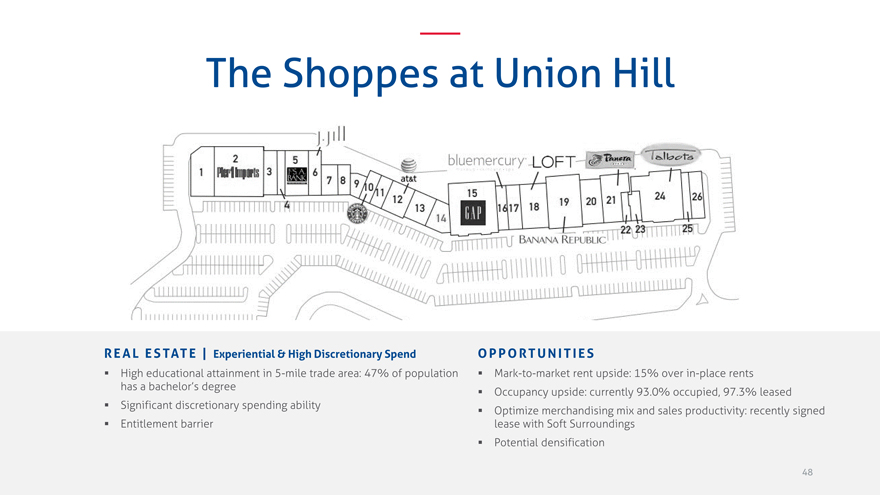
The Shoppes at Union Hill
REAL ESTATE | Experiential & High Discretionary Spend
High educational attainment in 5-mile trade area: 47% of population
has a bachelor’s degree
Significant discretionary spending ability
Entitlement barrier
OPPORTUNITIES
Mark-to-market rent upside: 15% over in-place rents
Occupancy upside: currently 93.0% occupied, 97.3% leased
Optimize merchandising mix and sales productivity: recently signed
lease with Soft Surroundings
Potential densification
48
|

D E V E L O P M E N T S P O T L I G H T
Shane Garrison
49
|
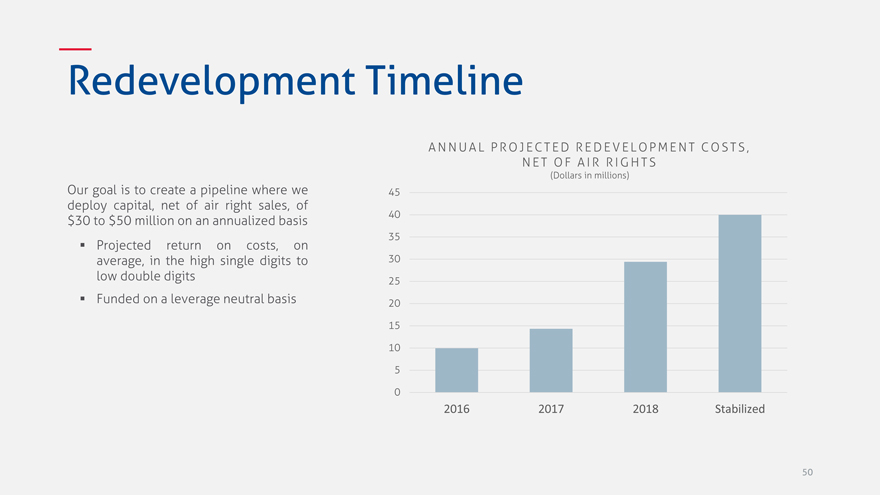
Redevelopment Timeline
Our goal is to create a pipeline where we
deploy capital, net of air right sales, of
$30 to $50 million on an annualized basis
Projected return on costs, on
average, in the high single digits to
low double digits
Funded on a leverage neutral basis
A N N U A L P R O J E C T E D R E D E V E L O P M E N T C O S T S ,
N E T O F A I R R I G H T S
(Dollars in millions)
45
40
35
30
25
20
15
10
5
0
2016 2017 2018 Stabilized
50
|
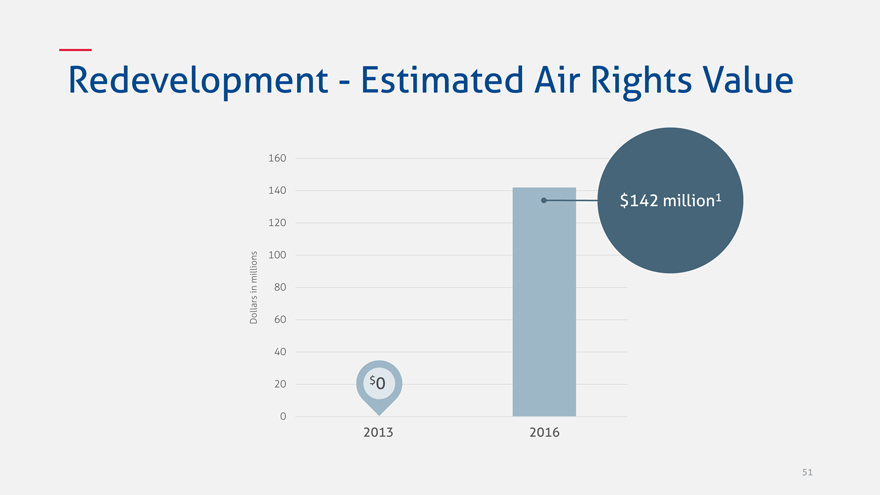
Redevelopment—Estimated Air Rights Value
160
140
$142 million1
120
millions 100
in 80
Dollars 60
40
20 $0
0
2013 2016
51
|
R E G I O N A L E X P E R I E N C E
Timothy Steffan
52
|

MARKET EXPERTISE
Timothy Steffan
President—Eastern Division
Former Senior Vice President, Asset Management and
Commercial Leasing for Macerich’s Eastern region
Greg Goldberg
Vice President, Leasing Director—Eastern Division
Former Retail Specialist for Uniwest Commercial Realty located in the
Greater Washington, D.C. area
Former Retail Specialist for Starwood Ceruzzi – Mid-Atlantic Region
Ann Smith
Vice President, Senior Leasing Director—Eastern Division
Owner and founder of Smith and Bucci Real Estate and Auctions
Former Director of Leasing for Tricor Development
Nick Over
Vice President, Director of Development
Former Development Manager at Federal Realty Investment Trust
Former Retail Development Manager and Leasing at Peterson Companies
53
|
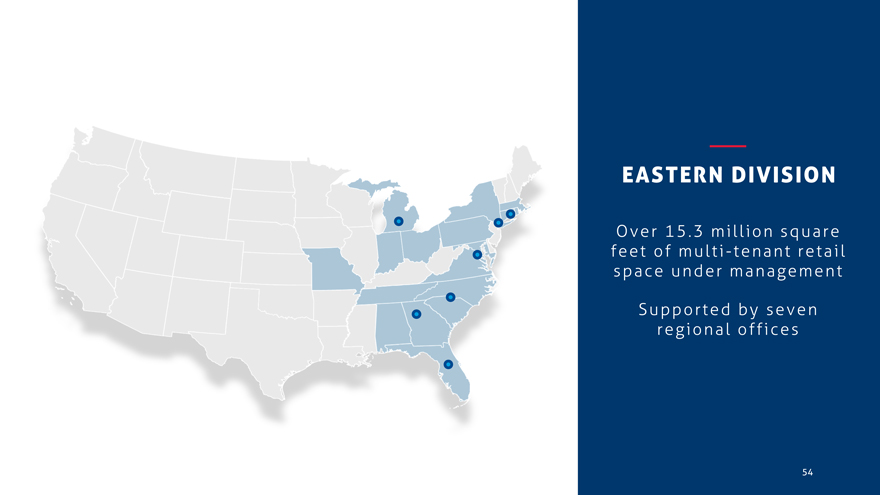
EASTERN DIVISION
Over 15.3 million square feet of multi-tenant retail space under management
Supported by seven regional offices
54
|

Local Knowledge
Ability to Play Offense and Defense
OUR
LOCAL PRESENCE
offers a unique opportunity to maximize growth within our target markets
Regional / Local Relationships
Re/Development Opportunities
55
|
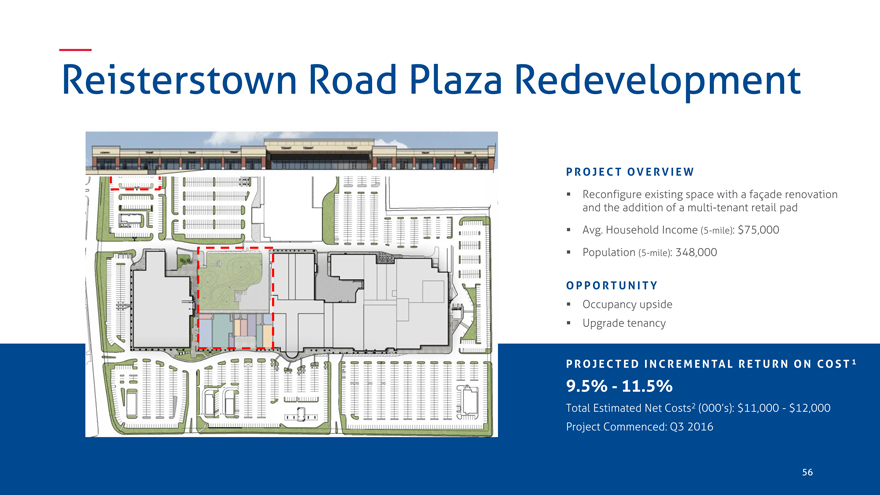
Reisterstown Road Plaza Redevelopment
P R O J E C T OV E R V I E W
Reconfigure existing space with a façade renovation
and the addition of a multi-tenant retail pad
Avg. Household Income (5-mile): $75,000
Population (5-mile): 348,000
O P P O R T U N I T Y
Occupancy upside
Upgrade tenancy
P R O J E C T E D I N C R E M E N TA L R E T U R N O N CO S T 1
9.5%—11.5%
Total Estimated Net Costs2 (000’s): $11,000—$12,000
Project Commenced: Q3 2016
56 |
|
|
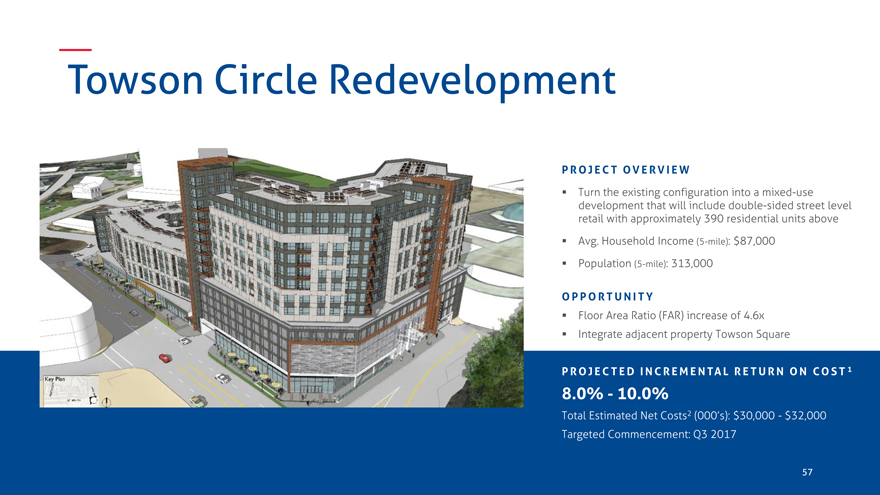
Towson Circle Redevelopment
P R O J E C T OV E R V I E W
Turn the existing configuration into a mixed-use
development that will include double-sided street level
retail with approximately 390 residential units above
Avg. Household Income (5-mile): $87,000
Population (5-mile): 313,000
O P P O R T U N I T Y
Floor Area Ratio (FAR) increase of 4.6x
Integrate adjacent property Towson Square
P R O J E C T E D I N C R E M E N TA L R E T U R N O N CO S T 1
8.0%—10.0%
Total Estimated Net Costs2 (000’s): $30,000—$32,000
Targeted Commencement: Q3 2017
57 |
|
|
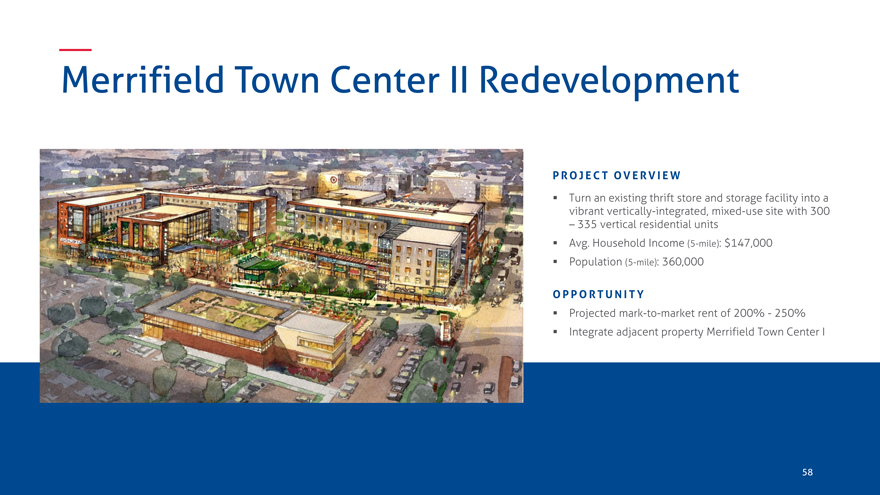
Merrifield Town Center II Redevelopment
P R O J E C T OV E R V I E W
Turn an existing thrift store and storage facility into a
vibrant vertically-integrated, mixed-use site with 300
– 335 vertical residential units
Avg. Household Income (5-mile): $147,000
Population (5-mile): 360,000
O P P O R T U N I T Y
Projected mark-to-market rent of 200%—250%
Integrate adjacent property Merrifield Town Center I
58 |
|
|

L O O K I N G F O R W A R D
Shane Garrison
59
|
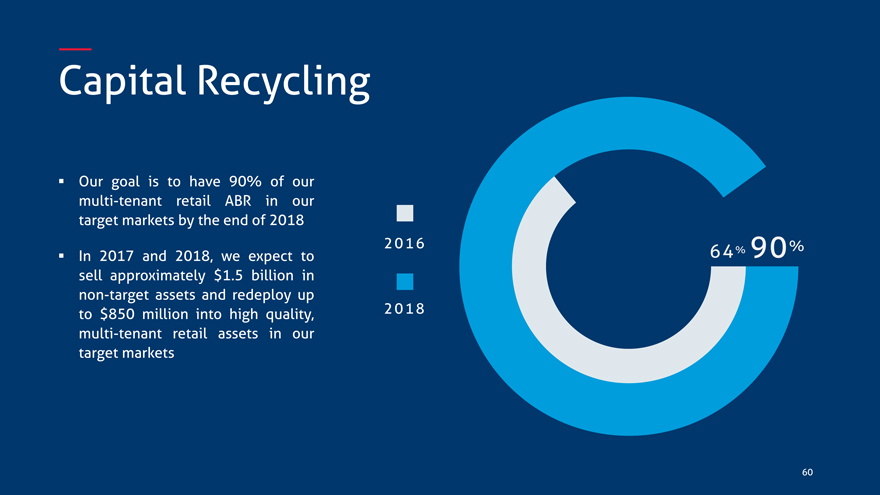
Capital Recycling
Our goal is to have 90% of our
multi-tenant retail ABR in our
target markets by the end of 2018
In 2017 and 2018, we expect to
sell approximately $1.5 billion in
non-target assets and redeploy up
to $850 million into high quality,
multi-tenant retail assets in our
target markets
2016 %
64% 90
2018
60
|
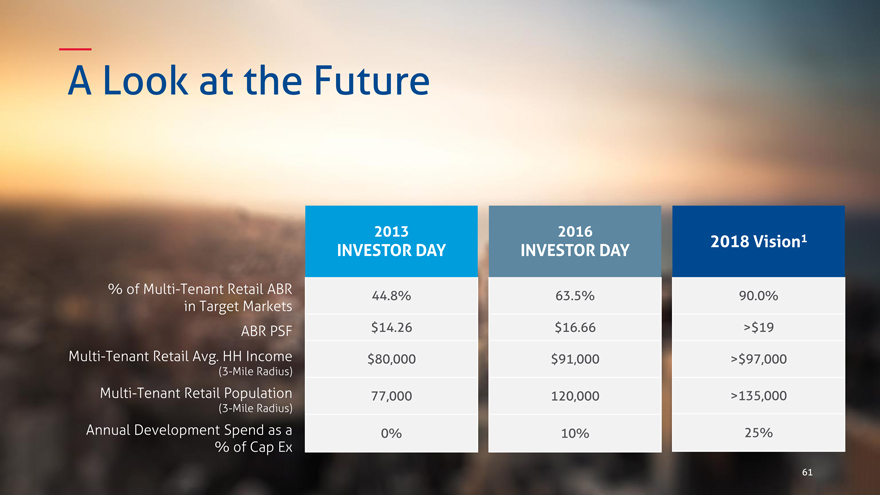
A Look at the Future
2013 2016
INVESTOR DAY INVESTOR DAY 2018 Vision1
% of Multi-Tenant Retail ABR 44.8% 63.5% 90.0%
in Target Markets
ABR PSF $14.26 $16.66 >$19
Multi-Tenant Retail Avg. HH Income $80,000 $91,000 >$97,000
(3-Mile Radius)
Multi-Tenant Retail Population 77,000 120,000 >135,000
(3-Mile Radius)
Annual Development Spend as a 0% 10% 25%
% of Cap Ex
61 |
|
|
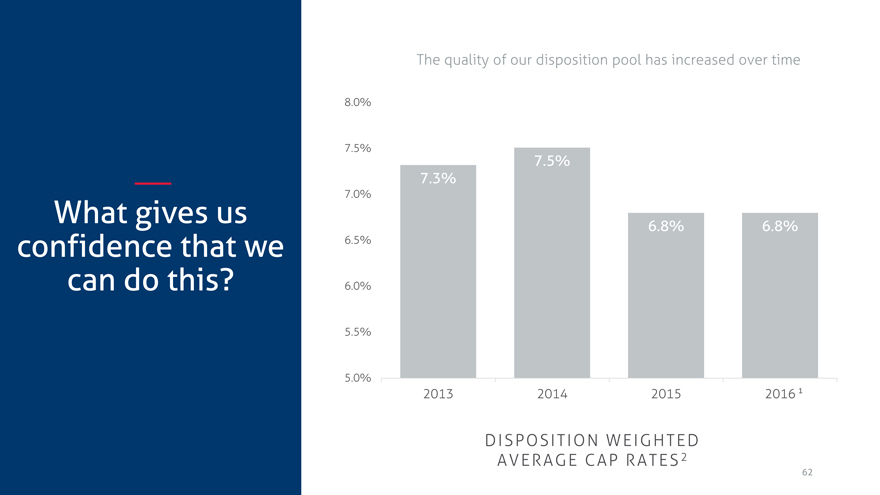
What gives us confidence that we can do this?
The quality of our disposition pool has increased over time
8.0%
7.5%
7.5%
7.3%
7.0%
6.8% |
| 6.8% |
6.5%
6.0%
5.5%
5.0%
2013 2014 2015 2016 1
DISPOSITION WEIGHTED
AVERAGE CAP RATES 2
62 |
|
|
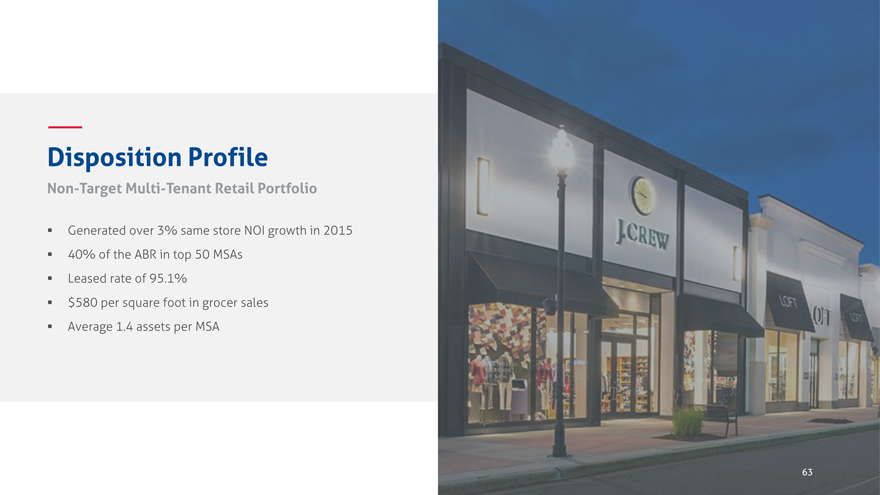
Disposition Profile
Non-Target Multi-Tenant Retail Portfolio
Generated over 3% same store NOI growth in 2015
40% of the ABR in top 50 MSAs
Leased rate of 95.1%
$580 per square foot in grocer sales
Average 1.4 assets per MSA
63
|

S A M E S T O R E N O I G R O W T H P R O F I L E
Shane Garrison
64
|
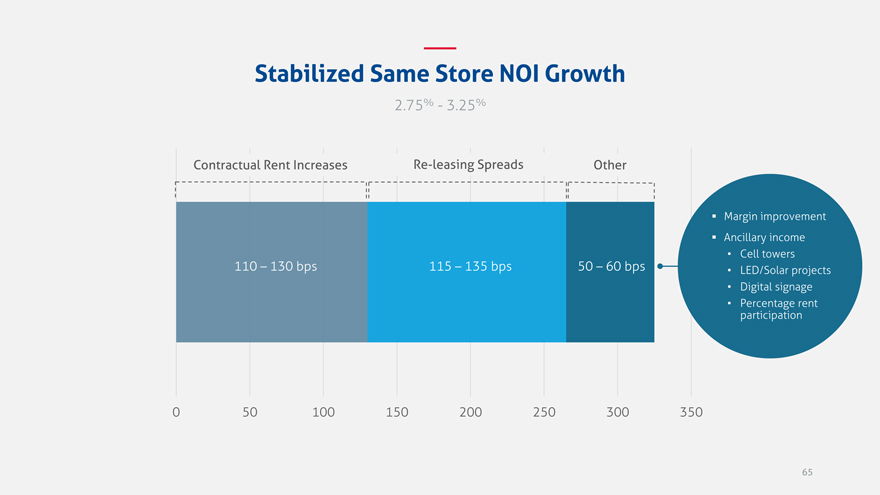
Stabilized Same Store NOI Growth
2.75%—3.25%
Contractual Rent Increases Re-leasing Spreads Other
Margin improvement
Ancillary income
Cell towers
110 – 130 bps 115 – 135 bps 50 – 60 bps LED/Solar projects
Digital signage
Percentage rent
participation
0 50 100 150 200 250 300 350
65
|
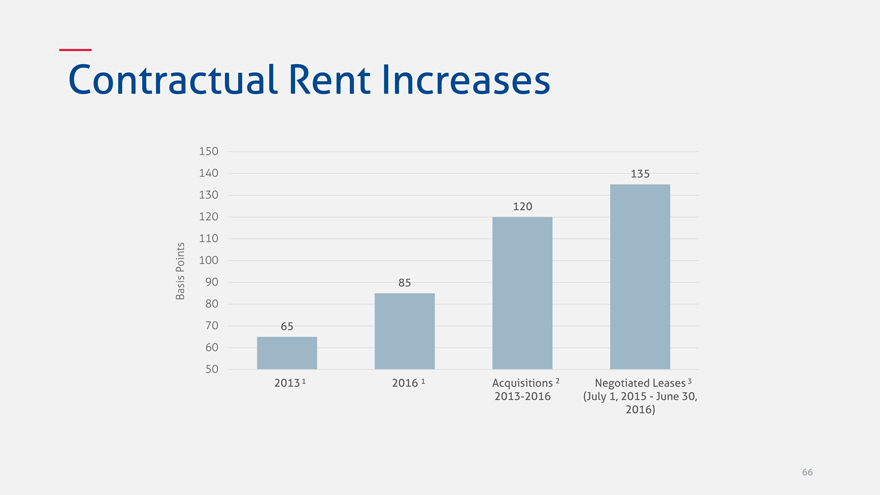
Contractual Rent Increases
150
140 135
130
120
120
110
Points 100
Basis 90 85
80 |
|
70 |
| 65 |
60 |
|
50 |
|
2013 1 2016 1 Acquisitions 2 Negotiated Leases 3
2013-2016(July 1, 2015—June 30,
2016)
66
|
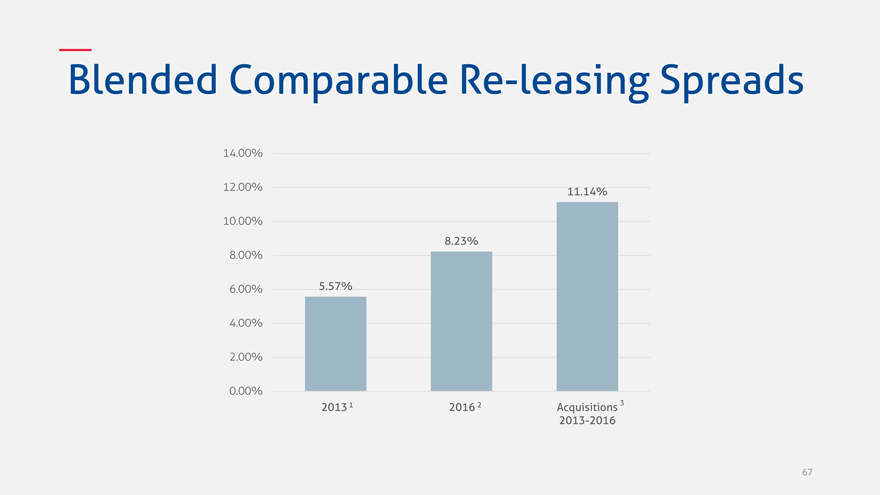
Blended Comparable Re-leasing Spreads
14.00%
12.00% 11.14%
10.00%
8.23%
8.00%
6.00% 5.57%
4.00%
2.00%
0.00%
20131 2016 2 Acquisitions 3 2013-2016
67
|
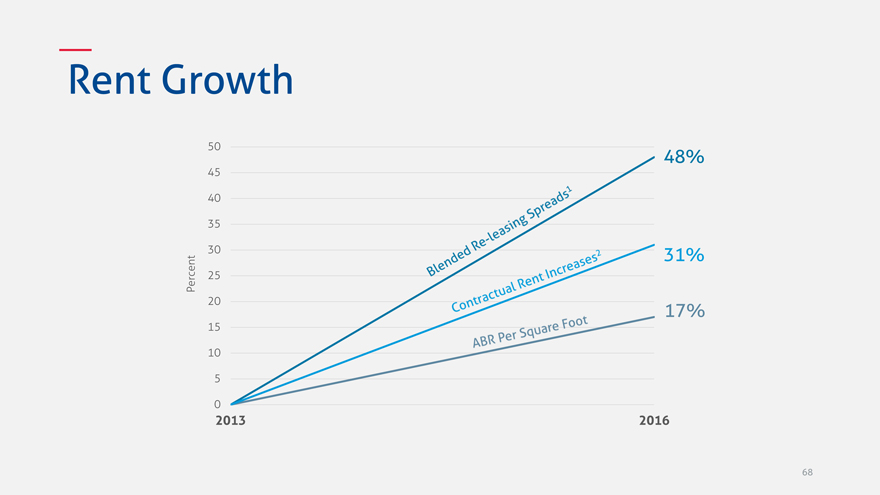
Rent Growth
50
48%
45 40 35
30 31%
Percent 25 20
17%
15 10 5
0
2013 2016
68
|

B A L A N C E S H E E T & R O A D M A P
Heath Fear
69
|
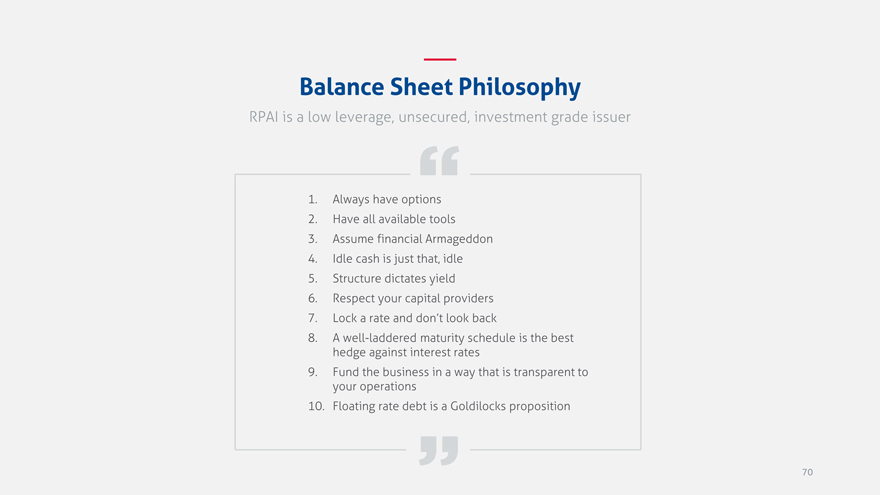
Balance Sheet Philosophy
RPAI is a low leverage, unsecured, investment grade issuer
1. Always have options
2. Have all available tools
3. Assume financial Armageddon
4. Idle cash is just that, idle
5. Structure dictates yield
6. Respect your capital providers
7. Lock a rate and don’t look back
8. A well-laddered maturity schedule is the best hedge against interest rates
9. Fund the business in a way that is transparent to your operations 10. Floating rate debt is a Goldilocks proposition
70
|
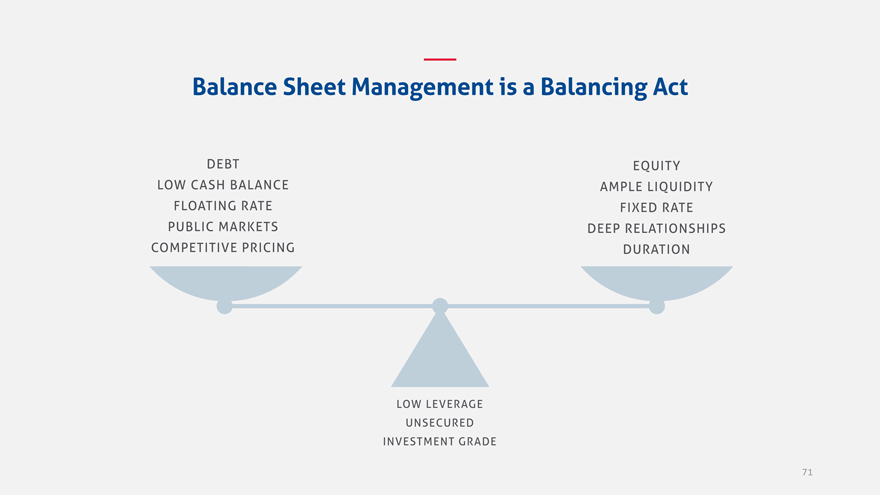
Balance Sheet Management is a Balancing Act
DEBT LOW CASH BALANCE
FLOATING RATE PUBLIC MARKETS
COMPETITIVE PRICING
EQUITY AMPLE LIQUIDITY
FIXED RATE DEEP RELATIONSHIPS
DURATION
LOW LEVERAGE UNSECURED
INVESTMENT GRADE
71
|
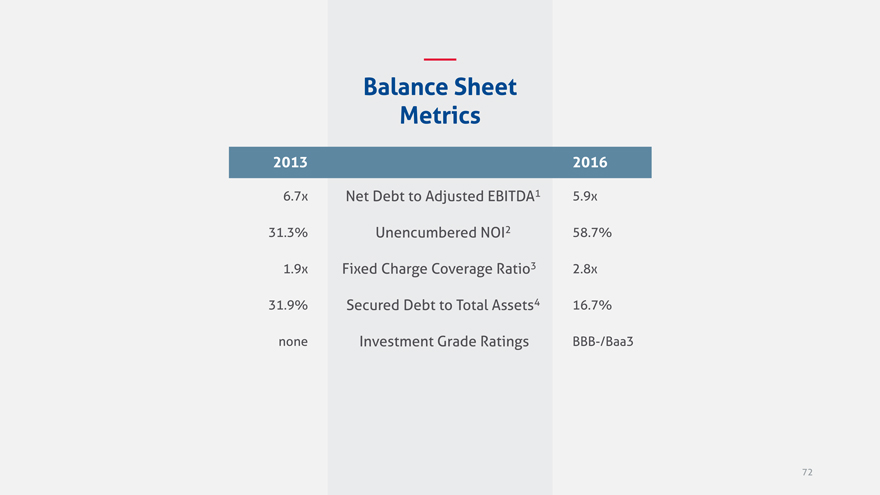
Balance Sheet Metrics
2013 2016
6.7x Net Debt to Adjusted EBITDA1 5.9x 31.3% Unencumbered NOI2 58.7% 1.9x Fixed Charge Coverage Ratio3 2.8x 31.9% Secured Debt to Total Assets4 16.7% none Investment Grade Ratings BBB-/Baa3
72
|
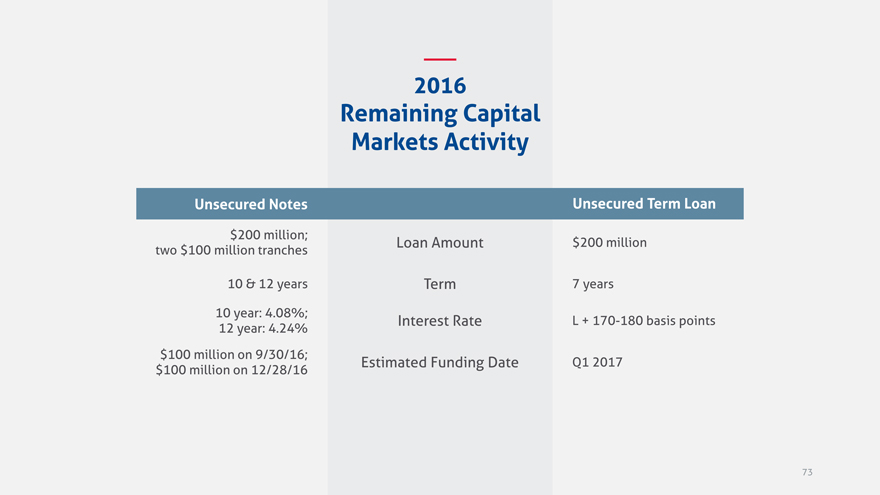
2016
Remaining Capital Markets Activity
Unsecured Notes Unsecured Term Loan
$200 million; Loan Amount $200 million
two $100 million tranches
10 & 12 years Term 7 years
10 year: 4.08%; Interest Rate L + 170-180 basis points
12 year: 4.24%
$100 million on 9/30/16; Estimated Funding Date Q1 2017
$100 million on 12/28/16
73
|
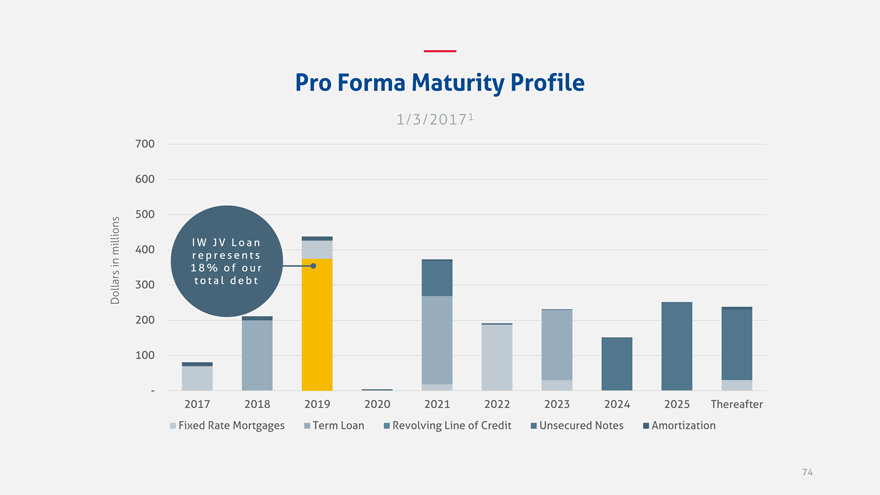
Pro Forma Maturity Profile
1/3/20171
700
600
500
millions 400 I W J V L o a n
r e p r e s e n t s
in 1 8 % o f o u r
Dollars 300 t o t a l d e b t
200
100
-
2017 2018 2019 2020 2021 2022 2023 2024 2025 Thereafter
Fixed Rate Mortgages Term Loan Revolving Line of Credit Unsecured Notes Amortization
74 |
|
|
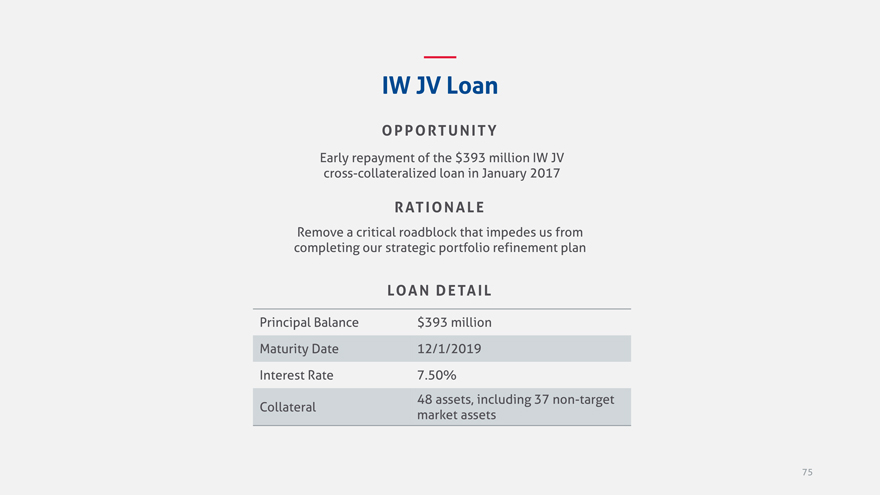
IW JV Loan
OPPORTUNITY
Early repayment of the $393 million IW JV cross-collateralized loan in January 2017
RATIONALE
Remove a critical roadblock that impedes us from completing our strategic portfolio refinement plan
LOAN DETAIL
Principal Balance $393 million
Maturity Date 12/1/2019
Interest Rate 7.50%
Collateral 48 assets, including 37 non-target
market assets
75
|
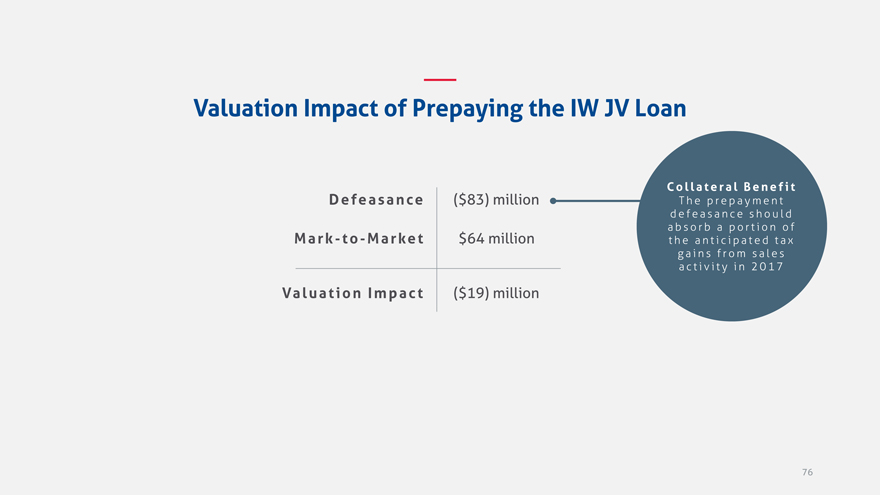
Valuation Impact of Prepaying the IW JV Loan
Defeasance ($83) million
Mark-to-Market $64 million
Valuation Impact ($19) million
C o l l a t e ra l B e n e f i t
T h e p r e p a y m e n t d e f e a s a n c e s h o u l d a b s o r b a p o r t i o n o f t h e a n t i c i p a t e d t a x g a i n s f r o m s a l e s a c t i v i t y i n 2 0 1 7
76
|

Transactional Assumptions—Roadmap
(Dollars in millions)
I N V E S T M E N T S
2H 2016 Cap Rate Timing 2017 Cap Rate Timing 2018 Cap Rate Timing Inflows Outflows
Acquisitions $1451 5.5%—6.0% Ratable $425 5.5%—6.0% Ratable $425 5.5%—6.0% Ratable $995
Dispositions $4881 6.5%—7.0% Ratable $660 6.5%—7.0% Ratable $750 6.5%—7.0% Ratable $1,898
Zurich Towers Net Proceeds $80—$100 n/a Q4 2017 $80—$100
C A P I TA L M A R K E T S
Interest
2H 2016 Interest Rate Timing 2017 Interest Rate Timing 2018 Timing Inflows Outflows
Rate
$100: 4.08% $100: 9/30/16
New—Unsecured Notes $200 $200
$100: 4.24% $100: 12/28/16
New—Unsecured Term Loan $200 L + 170-180 bps Q1 2017 $200
Scheduled Debt Payments $35 4.12% 2H 2016 $86 4.81% 2017 $5 5.41% 2018 $126
Early Debt Repayments2 $169 5.17% 2H 2016 $20 4.82% 2017 $8 7.70% 2018 $197
IW JV Loan Early Repayment3 $466 7.50% Q1 2017 $466
Preferred Equity Redemption $135 7.00% Q4 2017 $135
2018 Term Loan Early $200 1.91% 2017 $200
Repayment
2021 Term Loan Early
Repayment $100 1.97% 2018 $100
Unsecured Revolving
Line of Credit $230
Total $2.4 billion $2.4 billion
77
|
2018 Vision
The reality of going faster
Two calendar years are necessary to manage
through $400-$500 million of taxable gains
and “Prohibited Transaction” rules
Current discount to NAV makes special
dividend less attractive
Current portfolio sale discount of 50-100 bps
in cap rate means RPAI would be leaving
approximately $100-$200 million on the
table
78
|
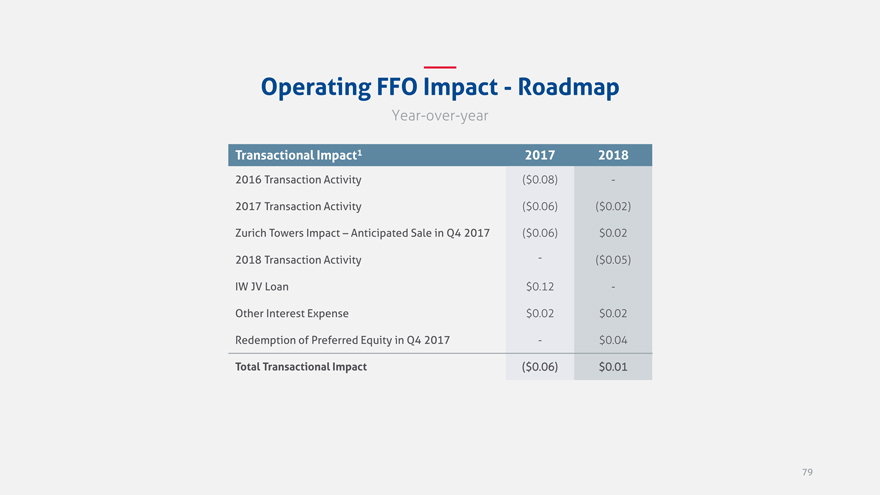
Operating FFO Impact—Roadmap
Year-over-year
Transactional Impact1 2017 2018
2016 Transaction Activity($0.08) -
2017 Transaction Activity($0.06)($0.02)
Zurich Towers Impact – Anticipated Sale in Q4 2017($0.06) $0.02
2018 Transaction Activity -($0.05)
IW JV Loan $0.12 -
Other Interest Expense $0.02 $0.02
Redemption of Preferred Equity in Q4 2017—$0.04
Total Transactional Impact($ 0.06) $ 0.01
79 |
|
|
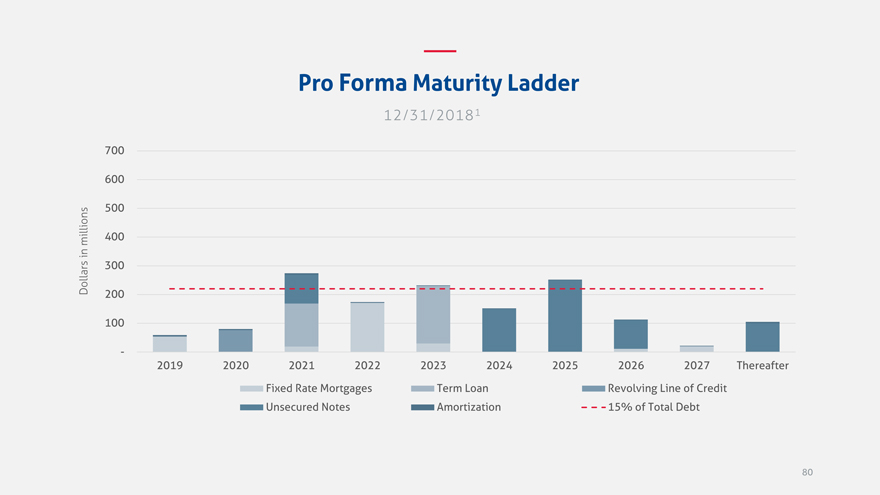
Pro Forma Maturity Ladder
12/31/2018 1
700
600
500
millions 400
in
Dollars 300
200
100
-
2019 2020 2021 2022 2023 2024 2025 2026 2027 Thereafter
Fixed Rate Mortgages Term Loan Revolving Line of Credit
Unsecured Notes Amortization 15% of Total Debt
80 |
|
|
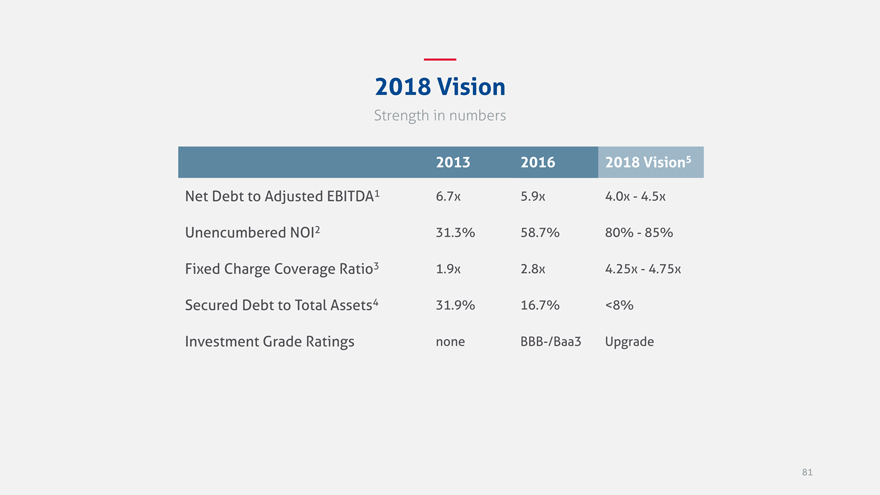
2018 Vision
Strength in numbers
2013 2016 2018 Vision5
Net Debt to Adjusted EBITDA1 6.7x 5.9x 4.0x—4.5x
Unencumbered NOI2 31.3% 58.7% 80%—85%
Fixed Charge Coverage Ratio3 1.9x 2.8x 4.25x—4.75x
Secured Debt to Total Assets4 31.9% 16.7% <8%
Investment Grade Ratings none BBB-/Baa3 Upgrade
81 |
|
|
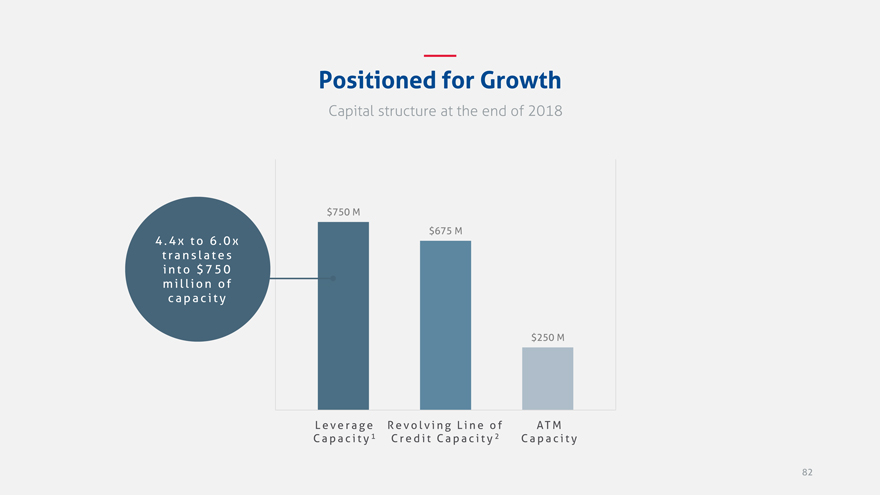
Positioned for Growth
Capital structure at the end of 2018
$750 M
$675 M
4 . 4 x t o 6 . 0 x
t r a n s l a t e s
i n t o $ 7 5 0
m i l l i o n o f
c a p a c i t y
$250 M
L e v e r a g e R e v o l v i n g L i n e o f AT M
C a p a c i t y 1 C r e d i t C a p a c i t y 2 C a p a c i t y
82
|

Balance Sheet Philosophy
RPAI is a low leverage, unsecured, investment grade issuer
Always have options
Have all available tools
Assume financial Armageddon
Idle cash is just that, idle
Structure dictates yield
Respect your capital providers
Lock a rate and don’t look back
A well-laddered maturity schedule is the best
hedge against interest rates
Fund the business in a way that is transparent to
your operations
Floating rate debt is a Goldilocks proposition
83 |
|
|

C L O S I N G R E M A R K S
Steve Grimes
84
|
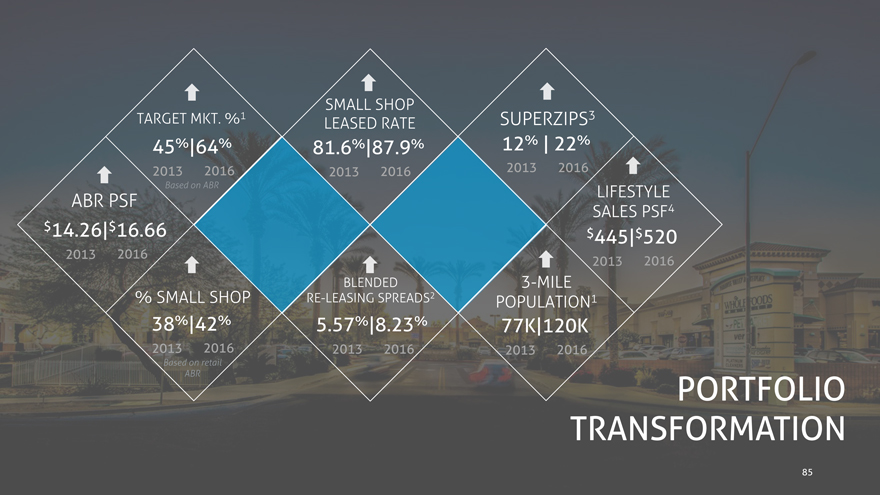
1 SMALL SHOP
TARGET MKT. % SUPERZIPS3
LEASED RATE
45%|64% 81.6%|87.9% 12% | 22%
2013 2016 2013 2016 2013 2016
Based on ABR LIFESTYLE
ABR PSF
SALES PSF4
$14.26|$16.66 $445|$520
2013 2016
2013 2016
BLENDED 3-MILE
% SMALL SHOP RE-LEASING SPREADS2 POPULATION1
38%|42% 5.57%|8.23% 77K|120K
2013 2016 2013 2016 2013 2016
Based on retail
ABR PORTFOLIO TRANSFORMATION
85
|
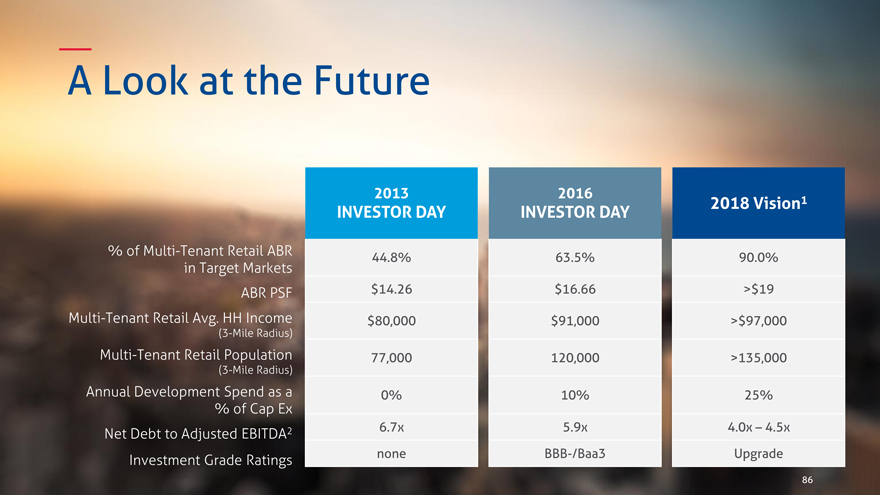
A Look at the Future
2013 2016
INVESTOR DAY INVESTOR DAY 2018 Vision1
% of Multi-Tenant Retail ABR 44.8% 63.5% 90.0%
in Target Markets
ABR PSF $14.26 $16.66 >$19
Multi-Tenant Retail Avg. HH Income $80,000 $91,000 >$97,000
(3-Mile Radius)
Multi-Tenant Retail Population 77,000 120,000 >135,000
(3-Mile Radius)
Annual Development Spend as a 0% 10% 25%
% of Cap Ex
Net Debt to Adjusted EBITDA2 6.7x 5.9x 4.0x – 4.5x
Investment Grade Ratings none BBB-/Baa3 Upgrade
86
|
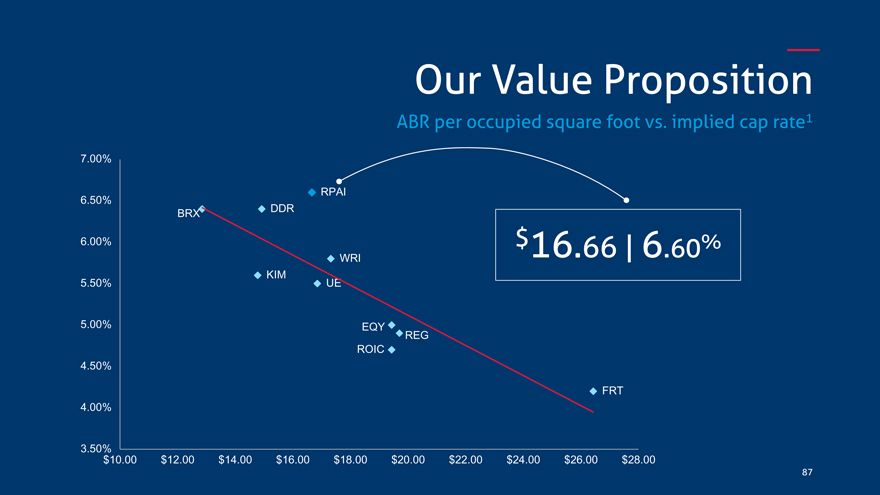
Our Value Proposition
ABR per occupied square foot vs. implied cap rate1
7.00%
6.50% RPAI DDR
BRX
6.00% $16.66 | 6.60% WRI
5.50% KIM UE
5.00% EQY REG
ROIC 4.50%
FRT 4.00%
3.50% $10.00 $12.00 $14.00 $16.00 $18.00 $20.00 $22.00 $24.00 $26.00 $28.00
87
|

THANK YOU
Today’s Takeaways
Since 2013, we have made tremendous Our local presence is at the heart of our target progress toward transforming our portfolio market strategy and our balance sheet
Our transaction thesis is solid and based on We will move faster, but not at the expense of our long-term view of the retail real estate our balance sheet philosophy and landscape transactional discipline
Good real estate densifies over time and our Our posture has moved from defensive to redevelopment pipeline has grown offensive and we are only getting stronger exponentially
88
|
Footnotes
Slide 7
1 Based on our common stock price of $16.90 as of June 30, 2016
Slide 8
1 Represents our multi-tenant retail operating portfolio
Slide 12
1 Adjusted for 2016 planned transaction activity
Slide 14
1 Represents all transactions from April 1, 2013 through June 30, 2016
2 Based on total capitalization of $6.2 billion as of March 31, 2013 3 Represents the gross value of joint ventures we have exited
Slide 15
1 Represents our multi-tenant retail operating portfolio
2 2013 represents leasing activity in our retail operating portfolio as of March 31, 2013 and for the preceding four quarters and 2016 represents leasing activity in our retail operating portfolio as of June 30, 2016 and for the preceding four quarters
3 Charles Murray, Coming Apart: The State of White America, 1960-2010 (Crown Forum, 2012). Information attributed to analysis provided by Green Street Advisors
4 Excludes three of our anticipated redevelopments, Boulevard at the Capital Centre, Reisterstown Road Plaza and Towson Circle, in addition to The Gateway which we sold during the first quarter of 2016
Slide 17
1 Charles Murray, Coming Apart: The State of White America, 1960-2010 (Crown Forum, 2012). Information attributed to analysis performed by Green Street Advisors.
Slide 31
1 Represents consolidated retail transactions from April 1, 2013 through June 30, 2016
Slide 32
1 Includes the impact of our 2016 planned transaction activity
Slide 51
1 Includes One Loudoun Downtown which is under contract
Slide 56 and 57
1 Projected Incremental Return on Cost (ROC) generally reflects only the unleveraged incremental NOI generated by the project upon stabilization and is calculated as incremental NOI divided by incremental cost. Incremental NOI is the difference between NOI expected to be generated by the stabilized project and the NOI generated prior to the commencement of active redevelopment. ROC does not include peripheral impacts, such as the impact on future lease rollover at the property or the impact on the long-term value of the property
2 Total Estimated Net Costs represent our estimated share of the project costs, net of proceeds from land sales, reimbursement from third parties and contributions from project partners, as applicable
Slide 61
1 Based on the assumptions provided in this presentation within slide 77 titled “Transactional Assumptions—Roadmap”
89
|
Footnotes (continued)
Slide 62
1 Based on the mid-point of our expected 2016 weighted average cap rate range of 6.5%—7.0%
2 All weighted average cap rates for dispositions, except for 2016, are calculated based on NOI for the trailing twelve months prior to the sale date of the disposition
Slide 66
1 Represents our multi-tenant retail operating portfolio, excluding The Gateway which we sold during the first quarter of 2016
2 Represents third-party assets acquired from April 1, 2013 through June 30, 2016
3 Represents signed new and renewal leases, excluding tenant-exercised options, from properties in our multi-tenant retail operating portfolio as of June 30, 2016
Slide 67
1 Represents leasing activity in our retail operating portfolio as of March 31, 2013 and for the preceding four quarters
2 Represents leasing activity in our retail operating portfolio as of June 30, 2016 and for the preceding four quarters
3 Represents leasing activity as of June 30, 2016 and for the preceding four quarters for third-party assets acquired from April 1, 2013 through June 30, 2016
Slide 68
1 Based on 2013 and 2016 blended comparable re-leasing spreads as reported on slide 67
2 Based on 2013 and 2016 contractual rent increases as reported on slide 66
Slide 72
1 For purposes of the Net Debt to Adjusted EBITDA ratio, EBITDA is calculated on a current quarter annualized basis and Net Debt is calculated as notional debt less cash and cash equivalents
2 For purposes of the Unencumbered NOI ratio, Unencumbered NOI is calculated based on the definitions in the agreement that governs our Unsecured Credit Facility
3 The Fixed Charge Coverage Ratio is calculated in accordance with the agreement that governs our Unsecured Credit Facility and is required to be greater than or equal to 1.50x. We include this ratio to demonstrate the extent by which we exceeded the requirement and it should not be viewed as a measure of our historical or future financial performance, financial position or cash flow
4 Secured Debt represents notional secured debt and Total Assets is calculated as GAAP book value of total assets excluding the effect of accumulated depreciation
Slide 74
1 Based on the following assumptions: unsecured private placement notes offering of $200 million, consisting of $100 million funded in September 2016 and $100 million funded in December 2016; unsecured term loan of $200 million funded in January 2017; $35 million of scheduled debt payments in the second half of 2016; $168 million of early debt repayments in the second half of 2016; and the unsecured revolving line of credit is anticipated to be zero as of 1/3/2017
Slide 77
1 2016 acquisitions and dispositions are based on the mid-point of guidance less acquisition and disposition activity during the first half of 2016
2 Includes estimate for yield maintenance of approximately $3 million and defeasance of approximately $1 million in total
3 Includes estimate for defeasance of approximately $82 million
Slide 79
1 Based on the assumptions provided in this presentation within slide 77 titled “Transactional Assumptions—Roadmap”
Slide 80
1 Based on the following assumptions: unsecured private placement notes offering of $200 million, consisting of $100 million funded in September 2016 and $100 million funded in December 2016; unsecured term loan of $200 million funded in January 2017; $35 million of scheduled debt payments in the second half of 2016, $86 million of scheduled debt payments in 2017 and $5 million of scheduled debt payments in 2018; $168 million of early debt repayments in the second half of 2016, $401 million of early debt repayments in 2017, including $384 million related to IW JV, and $7 million of early debt repayments in 2018; $200 million early repayment of the 2018 term loan in 2017; $100 million partial early repayment of the 2021 term loan in 2018; and the unsecured revolving line of credit is anticipated to be $75 million as of 12/31/2018
90
|
Footnotes (continued)
Slide 81
1 For purposes of the Net Debt to Adjusted EBITDA ratio, EBITDA is calculated on a current quarter annualized basis and Net Debt is calculated as notional debt less cash and cash equivalents
2 For purposes of the Unencumbered NOI ratio, Unencumbered NOI is calculated based on the definitions in the agreement that governs our Unsecured Credit Facility
3 The Fixed Charge Coverage Ratio is calculated in accordance with the agreement that governs our Unsecured Credit Facility and is required to be greater than or equal to 1.50x. We include this ratio to demonstrate the extent by which we exceeded and expect to exceed the requirement and it should not be viewed as a measure of our historical or future financial performance, financial position or cash flow
4 Secured Debt represents notional secured debt and Total Assets is calculated as GAAP book value of total assets excluding the effect of accumulated depreciation
5 Based on the assumptions provided in this presentation within slide 77 titled “Transaction Assumption – Roadmap”
Slide 82
1 Based on acquiring assets of similar quality to recent acquisitions
2 Our unsecured revolving line of credit has total capacity of $750 million, of which $75 million is anticipated to be drawn as of 12/31/2018
Slide 85 (see footnotes for slide 15) Slide 86
1 Based on the assumptions provided in this presentation within slide 77 titled “Transactional Assumptions—Roadmap”
2 For purposes of the Net Debt to Adjusted EBITDA ratio, EBITDA is calculated on a current quarter annualized basis and Net Debt is calculated as notional debt less cash and cash equivalents
Slide 87
1 Implied cap rates are sourced from Green Street Advisors as of September 12, 2016
91
|
Non-GAAP Financial Measures & Other Definitions
Gross Leasable Area (GLA)
Gross Leasable Area (GLA) is defined as the aggregate number of square feet available for lease. GLA excludes square footage attributable to third-party managed storage units, of which we owned 62,000 square feet as of June 30, 2016.
Occupancy
Occupancy is defined, for a property or group of properties, as the ratio, expressed as a percentage, of (a) the number of square feet of such property economically occupied by tenants under leases with an initial term of greater than one year, to (b) the aggregate number of square feet for such property.
Percent Leased Including Signed (Leased)
Percent Leased Including Signed (Leased) is defined, for a property or group of properties, as the ratio, expressed as a percentage, of (a) the sum of occupied square feet (pursuant to the definition above) of such property and vacant square feet for which a lease with an initial term of greater than one year has been signed, but rent has not yet commenced, to (b) the aggregate number of square feet for such property.
Funds From Operations (FFO) Attributable to Common Shareholders
As defined by the National Association of Real Estate Investment Trusts (NAREIT), an industry trade group, Funds From Operations (FFO) means net income (loss) computed in accordance with generally accepted accounting principles (GAAP), excluding gains (or losses) from sales of depreciable real estate, plus depreciation and amortization and impairment charges on depreciable real estate. We have adopted the NAREIT definition in our computation of FFO attributable to common shareholders. Management believes that, subject to the following limitations, FFO attributable to common shareholders provides a basis for comparing our performance and operations to those of other real estate investment trusts (REITs). We believe that FFO attributable to common shareholders, which is a supplemental non-GAAP financial measure, provides an additional and useful means to assess the operating performance of REITs. FFO attributable to common shareholders does not represent an alternative to (i) “Net income” or “Net income attributable to common shareholders” as an indicator of our financial performance, or (ii) “Cash flows from operating activities” in accordance with GAAP as a measure of our capacity to fund cash needs, including the payment of dividends.
Operating FFO Attributable to Common Shareholders
Operating FFO attributable to common shareholders is defined as FFO attributable to common shareholders excluding the impact of discrete non-operating transactions and other events which we do not consider representative of the comparable operating results of our core business platform, our real estate operating portfolio. Specific examples of discrete non-operating transactions and other events include, but are not limited to, the financial statement impact of gains or losses associated with the early extinguishment of debt or other liabilities, impairment charges to write down the carrying value of assets other than depreciable real estate, actual or anticipated settlement of litigation involving the Company and executive and realignment separation charges, which are otherwise excluded from our calculation of FFO attributable to common shareholders. We believe that Operating FFO attributable to common shareholders, which is a supplemental non-GAAP financial measure, provides an additional and useful means to assess the operating performance of REITs. Operating FFO attributable to common shareholders does not represent an alternative to (i) “Net income” or “Net income attributable to common shareholders” as an indicator of our financial performance, or (ii) “Cash flows from operating activities” in accordance with GAAP as a measure of our capacity to fund cash needs, including the payment of dividends. Comparison of our presentation of Operating FFO attributable to common shareholders to similarly titled measures for other REITs may not necessarily be meaningful due to possible differences in definition and application by such REITs.
92
|
Non-GAAP Financial Measures & Other Definitions (continued)
Net Operating Income (NOI)
We define Net Operating Income (NOI) as all revenues other than straight-line rental income, amortization of lease inducements, amortization of acquired above and below market lease intangibles and lease termination fee income, less real estate taxes and all operating expenses other than straight-line ground rent expense and amortization of acquired ground lease intangibles, which are non-cash items. NOI consists of Same Store NOI and NOI from Other Investment Properties. We believe that NOI, which is a supplemental non-GAAP financial measure, provides an additional and useful operating perspective not immediately apparent from “Operating income” or “Net income attributable to common shareholders” in accordance with GAAP. We use NOI to evaluate our performance on a property-by-property basis because this measure allows management to evaluate the impact that factors such as lease structure, lease rates and tenant base have on our operating results. NOI does not represent an alternative to “Net income” or “Net income attributable to common shareholders” in accordance with GAAP as an indicator of our financial performance. Comparison of our presentation of NOI to similarly titled measures for other REITs may not necessarily be meaningful due to possible differences in definition and application by such REITs.
Same Store NOI and NOI from Other Investment Properties
Same Store NOI for the year ended December 31, 2013 represents NOI from our same store portfolio consisting of 223 operating properties acquired or placed in service prior to January 1, 2012, excluding one operating property that was classified as held for sale as of December 31, 2013, which is accounted for within discontinued operations. NOI from Other Investment Properties for the year ended December 31, 2013 represents NOI primarily from properties acquired in 2013, our development properties and one former development property that was not classified within our operating property portfolio for both periods presented.
Same Store NOI for the year ended December 31, 2014 represents NOI from our same store portfolio consisting of 197 operating properties acquired or placed in service and stabilized prior to January 1, 2013. NOI from Other Investment Properties for the year ended December 31, 2014 represents NOI primarily from properties acquired during 2013 and 2014, our development properties, a property where we have begun activities in anticipation of future redevelopment, the investment properties that were sold or held for sale in 2014 that did not qualify for discontinued operations treatment, and the historical ground rent expense related to an existing same store investment property that was subject to a ground lease with a third party prior to our acquisition of the fee interest during 2014.
Same Store NOI for the year ended December 31, 2015 represents NOI from our same store portfolio consisting of 180 operating properties acquired or placed in service and stabilized prior to January 1, 2014. NOI from Other Investment Properties for the year ended December 31, 2015 represents NOI primarily from properties acquired during 2014 and 2015, our development property, two properties where we have begun activities in anticipation of future redevelopment, one property that was impaired below its debt balance during 2014, the properties that were sold or held for sale in 2014 and 2015 that did not qualify for discontinued operations treatment and the historical ground rent expense related to an existing same store investment property that was subject to a ground lease with a third party prior to our acquisition of the fee interest during the first quarter of 2014. In addition, the financial results reported in Other Investment Properties for the year ended December 31, 2015 include the net income from our wholly-owned captive insurance company, which was formed on December 1, 2014, and the financial results reported in Other Investment Properties for the year ended December 31, 2014 include the historical intercompany expense elimination related to our former insurance captive unconsolidated joint venture investment, in which we terminated our participation effective December 1, 2014. For the year ended December 31, 2014, the historical captive insurance expense related to our portfolio was recorded in equity in loss of unconsolidated joint ventures, net.
We believe that Same Store NOI and NOI from Other Investment Properties, which are supplemental non-GAAP financial measures, provide an additional and useful operating perspective not immediately apparent from “Operating income” or “Net income attributable to common shareholders” in accordance with GAAP. We use these measures to evaluate our performance on a property-by-property basis because they allow management to evaluate the impact that factors such as lease structure, lease rates and tenant base have on our operating results. Same Store NOI and NOI from Other Investment Properties do not represent alternatives to “Net income” or “Net income attributable to common shareholders” in accordance with GAAP as indicators of our financial performance. Comparison of our presentation of Same Store NOI and NOI from Other Investment Properties to similarly titled measures for other REITs may not necessarily be meaningful due to possible differences in definition and application by such REITs.
93
|
Non-GAAP Financial Measures & Other Definitions (continued)
Non-target market multi-tenant retail same store NOI, Target market multi-tenant retail same store NOI and Other same store NOI
Non-target market multi-tenant retail same store NOI for the year ended December 31, 2015 represents same store NOI from the multi-tenant retail same store properties located outside of our target markets. Target market multi-tenant retail same store NOI represents same store NOI from the multi-tenant retail same store properties located within our target markets. Other same store NOI represents same store NOI from our same store single-user retail properties and our one remaining office property.
We believe that non-target market multi-tenant retail same store NOI, target market multi-tenant retail same store NOI and other same store NOI, which are supplemental non-GAAP financial measures, provide an additional and useful operating perspective not immediately apparent from “Operating income” or “Net income attributable to common shareholders” in accordance with GAAP. We use these measures to evaluate our performance on a property-by-property basis because they allow management to evaluate the impact that factors such as lease structure, lease rates and tenant base have on our operating results. Non-target market multi-tenant retail same store NOI, target market multi-tenant retail same store NOI and other same store NOI do not represent alternatives to “Net income” or “Net income attributable to common shareholders” in accordance with GAAP as indicators of our financial performance. Comparison of our presentation of non-target market multi-tenant retail same store NOI, target market multi-tenant retail same store NOI and other same store NOI to similarly titled measures for other REITs may not necessarily be meaningful due to possible differences in definition and application by such REITs.
Adjusted EBITDA
Adjusted EBITDA is a supplemental non-GAAP financial measure and represents net income attributable to common shareholders before interest, income taxes, depreciation and amortization, as further adjusted to eliminate the impact of certain items that we do not consider indicative of our ongoing performance. We believe that Adjusted EBITDA is useful because it allows investors and management to evaluate and compare our performance from period to period in a meaningful and consistent manner in addition to standard financial measurements under GAAP. Adjusted EBITDA should not be considered an alternative to “Net income attributable to common shareholders” as an indicator of our financial performance. Comparison of our presentation of Adjusted EBITDA to similarly titled measures for other REITs may not necessarily be meaningful due to possible differences in definition and application by such REITs.
Net Debt to Adjusted EBITDA
Net Debt to Adjusted EBITDA is a supplemental non-GAAP financial measure and represents (i) our total notional debt, excluding unamortized premium, discount and capitalized loan fees, less cash and cash equivalents divided by (ii) Adjusted EBITDA for the prior three months, annualized. We believe that this ratio is useful because it provides investors with information regarding our total notional debt net of cash and cash equivalents, which could be used to repay debt, compared to our performance as measured using Adjusted EBITDA. Comparison of our presentation of Net Debt to Adjusted EBITDA to similarly titled measures for other REITs may not necessarily be meaningful due to possible differences in definition and application by such REITs.
Unencumbered NOI ratio
Unencumbered NOI ratio is a supplemental non-GAAP financial measure and represents (i) NOI from the unencumbered properties in our portfolio, as defined by the agreement that governs our Unsecured Credit Facility (comprised of the unsecured term loans and unsecured revolving line of credit) in effect at the end of the given period, for the trailing twelve month period, divided by (ii) total NOI, as defined by the agreement that governs our Unsecured Credit Facility in effect at the end of the given period, for the same trailing twelve month period. We believe that this ratio is useful because it allows investors and management to understand and evaluate our progress in unencumbering our portfolio. Unencumbered NOI ratio should not be considered an alternative to “Net income attributable to common shareholders” as an indicator of our financial performance. Comparison of our presentation of Unencumbered NOI ratio to similarly titled measures for other REITs may not necessarily be meaningful due to possible differences in definition and application by such REITs. For a complete listing of definitions related to our Unsecured Credit Facility, refer to the Fourth Amended and Restated Credit Agreement filed as Exhibit 10.8 to our Annual Report on Form 10-K for the year ended December 31, 2015, filed on February 17, 2016, the Third Amended and Restated Credit Agreement filed as Exhibit 10.1 to our Current Report on Form 8-K, dated May 13, 2013, and the Second Amended and Restated Credit Agreement filed as Exhibit 10.4 to Amendment No. 5 of our Form S-11, dated March 9, 2012.
94
|
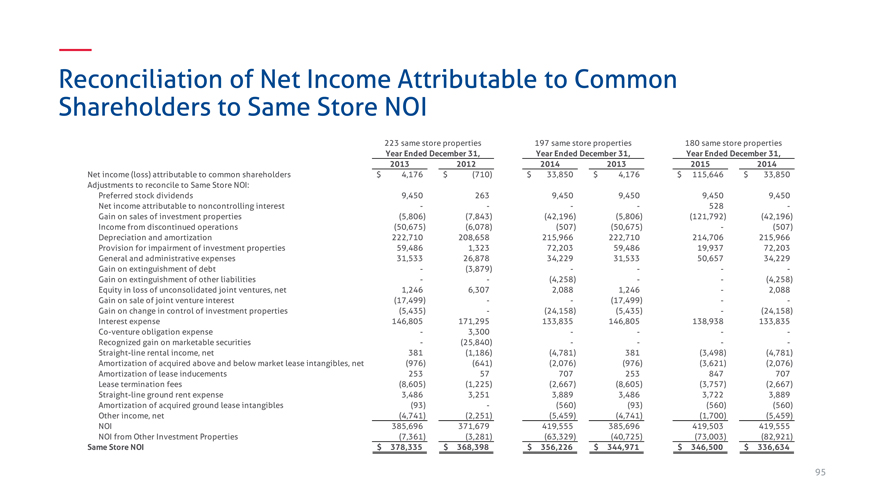
Reconciliation of Net Income Attributable to Common
Shareholders to Same Store NOI
223 same store properties 197 same store properties 180 same store properties
Year Ended December 31, Year Ended December 31, Year Ended December 31,
2013 2012 2014 2013 2015 2014
Net income (loss) attributable to common shareholders $ 4,176 $ (710) $ 33,850 $ 4,176 $ 115,646 $ 33,850
Adjustments to reconcile to Same Store NOI:
Preferred stock dividends 9,450 263 9,450 9,450 9,450 9,450
Net income attributable to noncontrolling interest — — 528 -
Gain on sales of investment properties(5,806)(7,843)(42,196)(5,806)(121,792)(42,196)
Income from discontinued operations(50,675)(6,078)(507)(50,675) -(507)
Depreciation and amortization 222,710 208,658 215,966 222,710 214,706 215,966
Provision for impairment of investment properties 59,486 1,323 72,203 59,486 19,937 72,203
General and administrative expenses 31,533 26,878 34,229 31,533 50,657 34,229
Gain on extinguishment of debt -(3,879) — —
Gain on extinguishment of other liabilities —(4,258) —(4,258)
Equity in loss of unconsolidated joint ventures, net 1,246 6,307 2,088 1,246—2,088
Gain on sale of joint venture interest(17,499) —(17,499) —
Gain on change in control of investment properties(5,435) -(24,158)(5,435) -(24,158)
Interest expense 146,805 171,295 133,835 146,805 138,938 133,835
Co-venture obligation expense—3,300 — —
Recognized gain on marketable securities -(25,840) — —
Straight-line rental income, net 381(1,186)(4,781) 381(3,498)(4,781)
Amortization of acquired above and below market lease intangibles, net(976)(641)(2,076)(976)(3,621)(2,076)
Amortization of lease inducements 253 57 707 253 847 707
Lease termination fees(8,605)(1,225)(2,667)(8,605)(3,757)(2,667)
Straight-line ground rent expense 3,486 3,251 3,889 3,486 3,722 3,889
Amortization of acquired ground lease intangibles(93) -(560)(93)(560)(560)
Other income, net(4,741)(2,251)(5,459)(4,741)(1,700)(5,459)
NOI 385,696 371,679 419,555 385,696 419,503 419,555
NOI from Other Investment Properties(7,361)(3,281)(63,329)(40,725)(73,003)(82,921)
Same Store NOI $ 378,335 $ 368,398 $ 356,226 $ 344,971 $ 346,500 $ 336,634
95 |
|
|
Reconciliation of Net Income Attributable to Common
Shareholders to FFO Attributable to Common Shareholders and
Operating FFO Attributable to Common Shareholders
Year Ended December 31,
2013 2014 2015
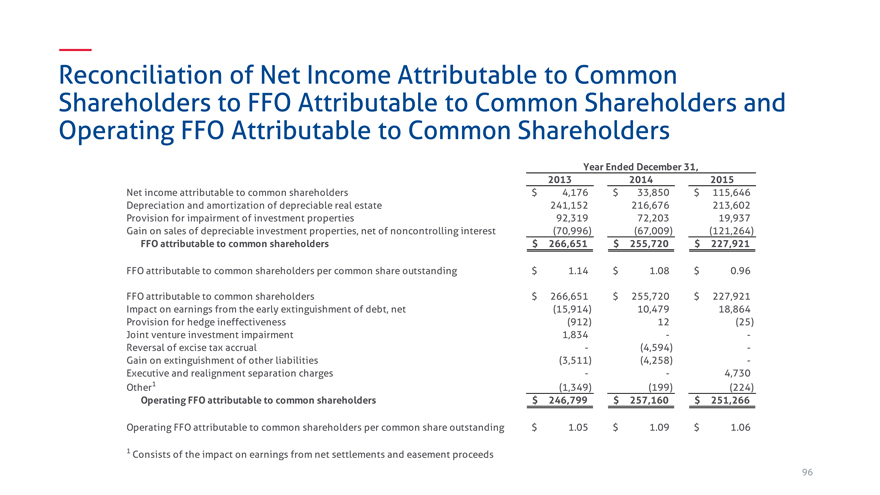
Net income attributable to common shareholders $ 4,176 $ 33,850 $ 115,646
Depreciation and amortization of depreciable real estate 241,152 216,676 213,602
Provision for impairment of investment properties 92,319 72,203 19,937
Gain on sales of depreciable investment properties, net of noncontrolling interest(70,996)(67,009)(121,264)
FFO attributable to common shareholders $ 266,651 $ 255,720 $ 227,921
FFO attributable to common shareholders per common share outstanding $ 1.14 $ 1.08 $ 0.96
FFO attributable to common shareholders $ 266,651 $ 255,720 $ 227,921
Impact on earnings from the early extinguishment of debt, net(15,914) 10,479 18,864
Provision for hedge ineffectiveness(912) 12(25)
Joint venture investment impairment 1,834 —
Reversal of excise tax accrual -(4,594) -
Gain on extinguishment of other liabilities(3,511)(4,258) -
Executive and realignment separation charges — 4,730
Other1(1,349)(199)(224)
Operating FFO attributable to common shareholders $ 246,799 $ 257,160 $ 251,266
Operating FFO attributable to common shareholders per common share outstanding $ 1.05 $ 1.09 $ 1.06
1 |
| Consists of the impact on earnings from net settlements and easement proceeds |
96 |
|
|
Reconciliation of Net Income Attributable to Common
Shareholders to Non-Target Market Multi-Tenant Retail
Same Store NOI
Year Ended December 31,
2015 2014
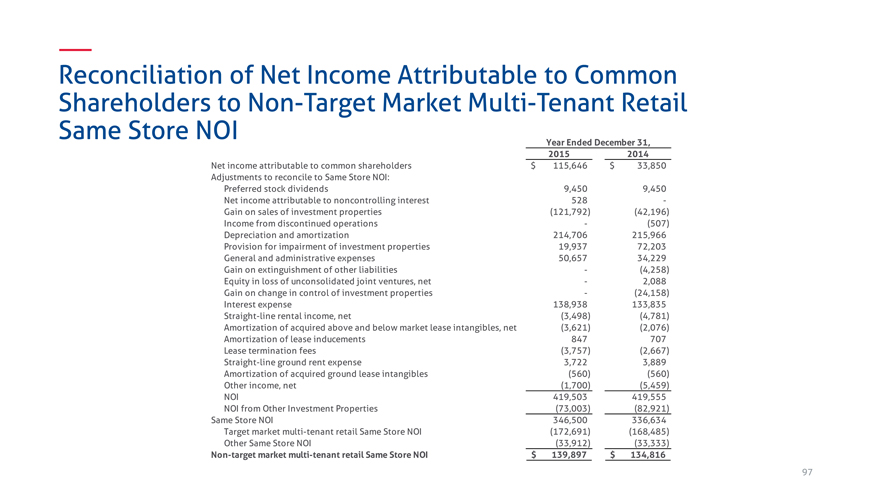
Net income attributable to common shareholders $ 115,646 $ 33,850
Adjustments to reconcile to Same Store NOI:
Preferred stock dividends 9,450 9,450
Net income attributable to noncontrolling interest 528 -
Gain on sales of investment properties(121,792)(42,196)
Income from discontinued operations -(507)
Depreciation and amortization 214,706 215,966
Provision for impairment of investment properties 19,937 72,203
General and administrative expenses 50,657 34,229
Gain on extinguishment of other liabilities -(4,258)
Equity in loss of unconsolidated joint ventures, net—2,088
Gain on change in control of investment properties -(24,158)
Interest expense 138,938 133,835
Straight-line rental income, net(3,498)(4,781)
Amortization of acquired above and below market lease intangibles, net(3,621)(2,076)
Amortization of lease inducements 847 707
Lease termination fees(3,757)(2,667)
Straight-line ground rent expense 3,722 3,889
Amortization of acquired ground lease intangibles(560)(560)
Other income, net(1,700)(5,459)
NOI 419,503 419,555
NOI from Other Investment Properties(73,003)(82,921)
Same Store NOI 346,500 336,634
Target market multi-tenant retail Same Store NOI(172,691)(168,485)
Other Same Store NOI(33,912)(33,333)
Non-target market multi-tenant retail Same Store NOI $ 139,897 $ 134,816
97 |
|
|
Reconciliation of Net Income Attributable to Common Shareholders to Adjusted
EBITDA and Reconciliation of Mortgages and Notes Payable, Net, Unsecured Notes
Payable, Net, Unsecured Term Loans, Net and Unsecured Revolving Line of Credit
to Total Net Debt
Three Months Ended
June 30, March 31,
2016 2013
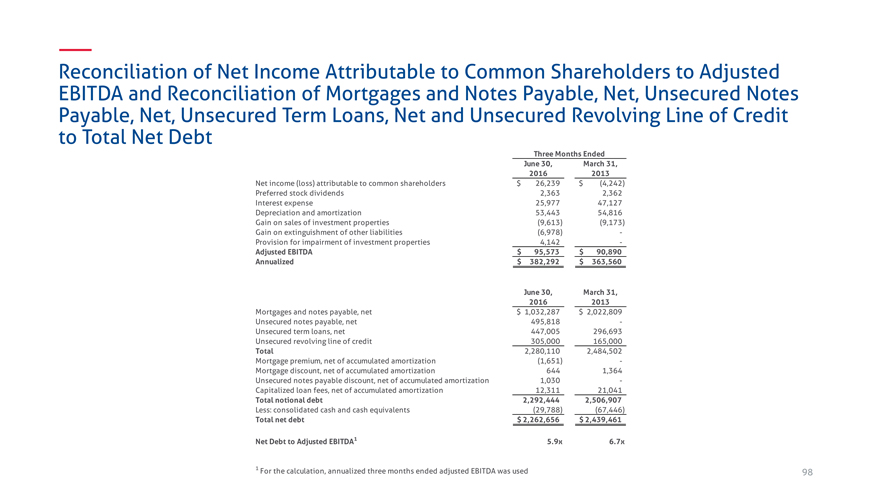
Net income (loss) attributable to common shareholders $ 26,239 $(4,242)
Preferred stock dividends 2,363 2,362
Interest expense 25,977 47,127
Depreciation and amortization 53,443 54,816
Gain on sales of investment properties(9,613)(9,173)
Gain on extinguishment of other liabilities(6,978) -
Provision for impairment of investment properties 4,142 -
Adjusted EBITDA $ 95,573 $ 90,890
Annualized $ 382,292 $ 363,560
June 30, March 31,
2016 2013
Mortgages and notes payable, net $ 1,032,287 $ 2,022,809
Unsecured notes payable, net 495,818 -
Unsecured term loans, net 447,005 296,693
Unsecured revolving line of credit 305,000 165,000
Total 2,280,110 2,484,502
Mortgage premium, net of accumulated amortization(1,651) -
Mortgage discount, net of accumulated amortization 644 1,364
Unsecured notes payable discount, net of accumulated amortization 1,030 -
Capitalized loan fees, net of accumulated amortization 12,311 21,041
Total notional debt 2,292,444 2,506,907
Less: consolidated cash and cash equivalents(29,788)(67,446)
Total net debt $ 2,262,656 $ 2,439,461
Net Debt to Adjusted EBITDA1 5.9x 6.7x
1 |
| For the calculation, annualized three months ended adjusted EBITDA was used 98 |
|
Reconciliation of Net Income Attributable to Common
Shareholders to Unencumbered NOI
TTM
June 30, March 31,
2016 2013
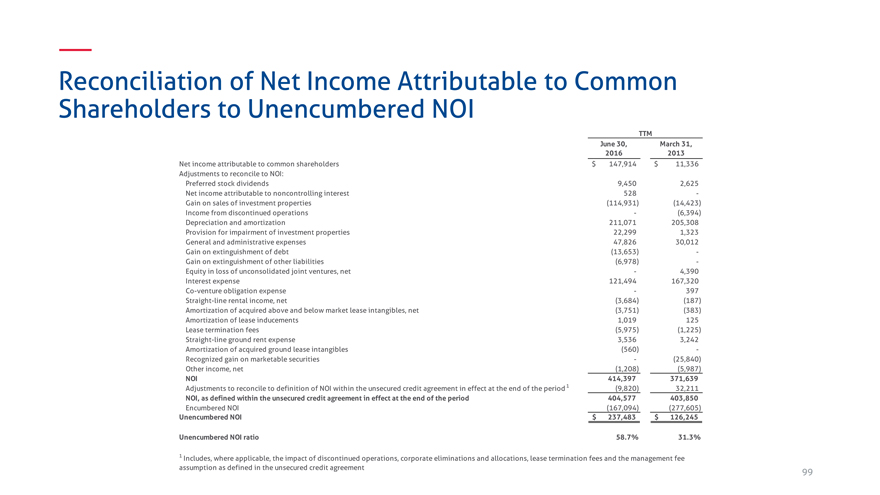
Net income attributable to common shareholders $ 147,914 $ 11,336
Adjustments to reconcile to NOI:
Preferred stock dividends 9,450 2,625
Net income attributable to noncontrolling interest 528 -
Gain on sales of investment properties(114,931)(14,423)
Income from discontinued operations -(6,394)
Depreciation and amortization 211,071 205,308
Provision for impairment of investment properties 22,299 1,323
General and administrative expenses 47,826 30,012
Gain on extinguishment of debt(13,653) -
Gain on extinguishment of other liabilities(6,978) -
Equity in loss of unconsolidated joint ventures, net—4,390
Interest expense 121,494 167,320
Co-venture obligation expense—397
Straight-line rental income, net(3,684)(187)
Amortization of acquired above and below market lease intangibles, net(3,751)(383)
Amortization of lease inducements 1,019 125
Lease termination fees(5,975)(1,225)
Straight-line ground rent expense 3,536 3,242
Amortization of acquired ground lease intangibles(560) -
Recognized gain on marketable securities -(25,840)
Other income, net(1,208)(5,987)
NOI 414,397 371,639
Adjustments to reconcile to definition of NOI within the unsecured credit agreement in effect at the end of the period 1(9,820) 32,211
NOI, as defined within the unsecured credit agreement in effect at the end of the period 404,577 403,850
Encumbered NOI(167,094)(277,605)
Unencumbered NOI $ 237,483 $ 126,245
Unencumbered NOI ratio 58.7% 31.3%
1 Includes, where applicable, the impact of discontinued operations, corporate eliminations and allocations, lease termination fees and the management fee
assumption as defined in the unsecured credit agreement 99
|
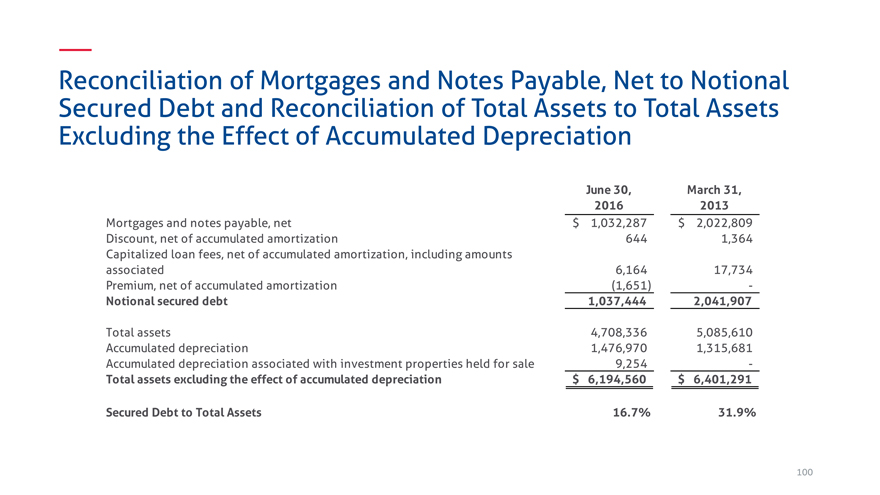
Reconciliation of Mortgages and Notes Payable, Net to Notional
Secured Debt and Reconciliation of Total Assets to Total Assets
Excluding the Effect of Accumulated Depreciation
June 30, March 31,
2016 2013
Mortgages and notes payable, net $ 1,032,287 $ 2,022,809
Discount, net of accumulated amortization 644 1,364
Capitalized loan fees, net of accumulated amortization, including amounts
associated 6,164 17,734
Premium, net of accumulated amortization(1,651) -
Notional secured debt 1,037,444 2,041,907
Total assets 4,708,336 5,085,610
Accumulated depreciation 1,476,970 1,315,681
Accumulated depreciation associated with investment properties held for sale 9,254 -
Total assets excluding the effect of accumulated depreciation $ 6,194,560 $ 6,401,291
Secured Debt to Total Assets 16.7% 31.9%
100