T A B L E O F C O N T E N T S
|
| | | | | | |
| | | | | | |
| 1 |
| | | E A R N I N G S R E L E A S E.......................................................................... | |
| | | | | | |
| 2 |
| | | | | |
| | | F I N A N C I A L S U M M A R Y | |
| | | | Condensed Consolidated Balance Sheets................................................. | |
| | | | Condensed Consolidated Statements of Operations................................ | |
| | | | Funds From Operations Attributable to Common Shareholders, Operating FFO Attributable to Common Shareholders and Additional Information....................................................................... | |
| | | |
| | | | Supplemental Financial Statement Detail................................................. | |
| | | | Same Store Net Operating Income............................................................ | |
| | | | Capitalization............................................................................................. | |
| | | | Covenants.................................................................................................. | |
| | | | Summary of Indebtedness........................................................................ | |
| | | | | | |
| 3 |
| | | | | |
| | | T R A N S A C T I O N S U M M A R Y | |
| | | | Development Projects............................................................................... | |
| | | | Acquisitions and Dispositions.................................................................... | |
| | | | | | |
| 4 |
| | | | | |
| | | P O R T F O L I O S U M M A R Y | |
| | | | Retail Market Summary............................................................................. | |
| | | | Retail Operating Portfolio Occupancy....................................................... | |
| | | | Top Retail Tenants..................................................................................... | |
| | | | Retail Leasing Activity Summary................................................................ | |
| | | | Retail Lease Expirations............................................................................. | |
| | | | | | |
| 5 |
| | | | | |
| | | O T H E R I N F O R M A T I O N | |
| | | | Non-GAAP Financial Measures and Reconciliations.................................. | |
| | | | | |
| | | | | | |
Retail Properties of America, Inc. | 2021 Spring Road, Suite 200 | Oak Brook, Illinois 60523 | 855.247.RPAI | www.rpai.com
RETAIL PROPERTIES OF AMERICA, INC. REPORTS
THIRD QUARTER AND YEAR TO DATE 2019 RESULTS
Oak Brook, IL – October 29, 2019 – Retail Properties of America, Inc. (NYSE: RPAI) (the “Company”) today reported financial and operating results for the quarter and nine months ended September 30, 2019.
FINANCIAL RESULTS
For the quarter ended September 30, 2019, the Company reported:
| |
| ▪ | Net loss attributable to common shareholders of $(28.2) million, or $(0.13) per diluted share, compared to net income attributable to common shareholders of $12.8 million, or $0.06 per diluted share, for the same period in 2018; |
| |
| ▪ | Funds from operations (FFO) attributable to common shareholders of $48.2 million, or $0.23 per diluted share, compared to $53.0 million, or $0.24 per diluted share, for the same period in 2018; and |
| |
| ▪ | Operating funds from operations (Operating FFO) attributable to common shareholders of $57.0 million, or $0.27 per diluted share, compared to $58.0 million, or $0.26 per diluted share, for the same period in 2018. |
For the nine months ended September 30, 2019, the Company reported:
| |
| ▪ | Net income attributable to common shareholders of $16.2 million, or $0.07 per diluted share, compared to $65.5 million, or $0.30 per diluted share, for the same period in 2018; |
| |
| ▪ | FFO attributable to common shareholders of $161.1 million, or $0.76 per diluted share, compared to $160.8 million, or $0.73 per diluted share, for the same period in 2018; and |
| |
| ▪ | Operating FFO attributable to common shareholders of $171.2 million, or $0.80 per diluted share, compared to $168.8 million, or $0.77 per diluted share, for the same period in 2018, growth of 3.9% per diluted share. |
OPERATING RESULTS
For the quarter ended September 30, 2019, the Company’s portfolio results were as follows:
| |
| ▪ | 2.3% increase in same store net operating income (NOI) over the comparable period in 2018; |
| |
| ▪ | Total same store portfolio percent leased, including leases signed but not commenced: 95.4% at September 30, 2019, up 80 basis points from 94.6% at June 30, 2019 and up 150 basis points from 93.9% at September 30, 2018; |
| |
| ▪ | Retail portfolio occupancy: 93.7% at September 30, 2019, up 130 basis points from 92.4% at June 30, 2019 and up 160 basis points from 92.1% at September 30, 2018; |
| |
| ▪ | Retail portfolio percent leased, including leases signed but not commenced: 95.5% at September 30, 2019, the highest since becoming a publicly traded company, up 80 basis points from 94.7% at June 30, 2019 and up 150 basis points from 94.0% at September 30, 2018; |
| |
| ▪ | Retail anchor tenant occupancy: 96.1% at September 30, 2019, the highest since December 31, 2016, up 170 basis points from 94.4% at June 30, 2019 and up 270 basis points from 93.4% at September 30, 2018; |
n Retail Properties of America, Inc.
T: 855.247.RPAI
www.rpai.com 2021 Spring Road, Suite 200
Oak Brook, IL 60523
| |
| ▪ | Retail anchor tenant percent leased, including leases signed but not commenced: 98.2% at September 30, 2019, the highest since December 31, 2014, up 100 basis points from 97.2% at June 30, 2019 and up 250 basis points from 95.7% at September 30, 2018; |
| |
| ▪ | Retail portfolio annualized base rent (ABR) per occupied square foot of $19.38 at September 30, 2019, up 0.6% from $19.27 ABR per occupied square foot at June 30, 2019 and up 0.1% from $19.36 ABR per occupied square foot at September 30, 2018; |
| |
| ▪ | 1,108,000 square feet of retail leasing transactions comprised of 129 new and renewal leases; |
| |
| ▪ | Positive comparable cash leasing spreads of 46.4% on new leases and 5.3% on renewal leases for a blended re-leasing spread of 10.8%; |
| |
| ▪ | Added Ulta Beauty, Inc., a growing national retailer with a debt-free balance sheet, to the Company’s top 20 retail tenant roster; and |
| |
| ▪ | Top 20 retail tenant concentration of total ABR: 26.7% at September 30, 2019, the lowest since becoming a publicly traded company, down 20 basis points from 26.9% at June 30, 2019 and down 200 basis points from 28.7% at September 30, 2018. |
For the nine months ended September 30, 2019, the Company’s portfolio results were as follows:
| |
| ▪ | 2.7% increase in same store NOI over the comparable period in 2018; |
| |
| ▪ | 2,482,000 square feet of retail leasing transactions comprised of 366 new and renewal leases; and |
| |
| ▪ | Positive comparable cash leasing spreads of 22.1% on new leases and 5.5% on renewal leases for a blended re-leasing spread of 8.4%. |
“Our team sustained the broad-based execution strength of the first half of the year in the third quarter, once again driving above-plan performance,” stated Steve Grimes, chief executive officer. “Our execution remains a top priority as we advance our robust rent-start agenda in the fourth quarter.”
INVESTMENT ACTIVITY
Expansions and Redevelopments
The Company, along with its best-in-class joint venture and business partners AvalonBay Communities, Inc., KETTLER, Trammell Crow Company and Fore Property Company, continues to make progress on the execution of its active expansion and redevelopment projects.
One Loudoun Downtown
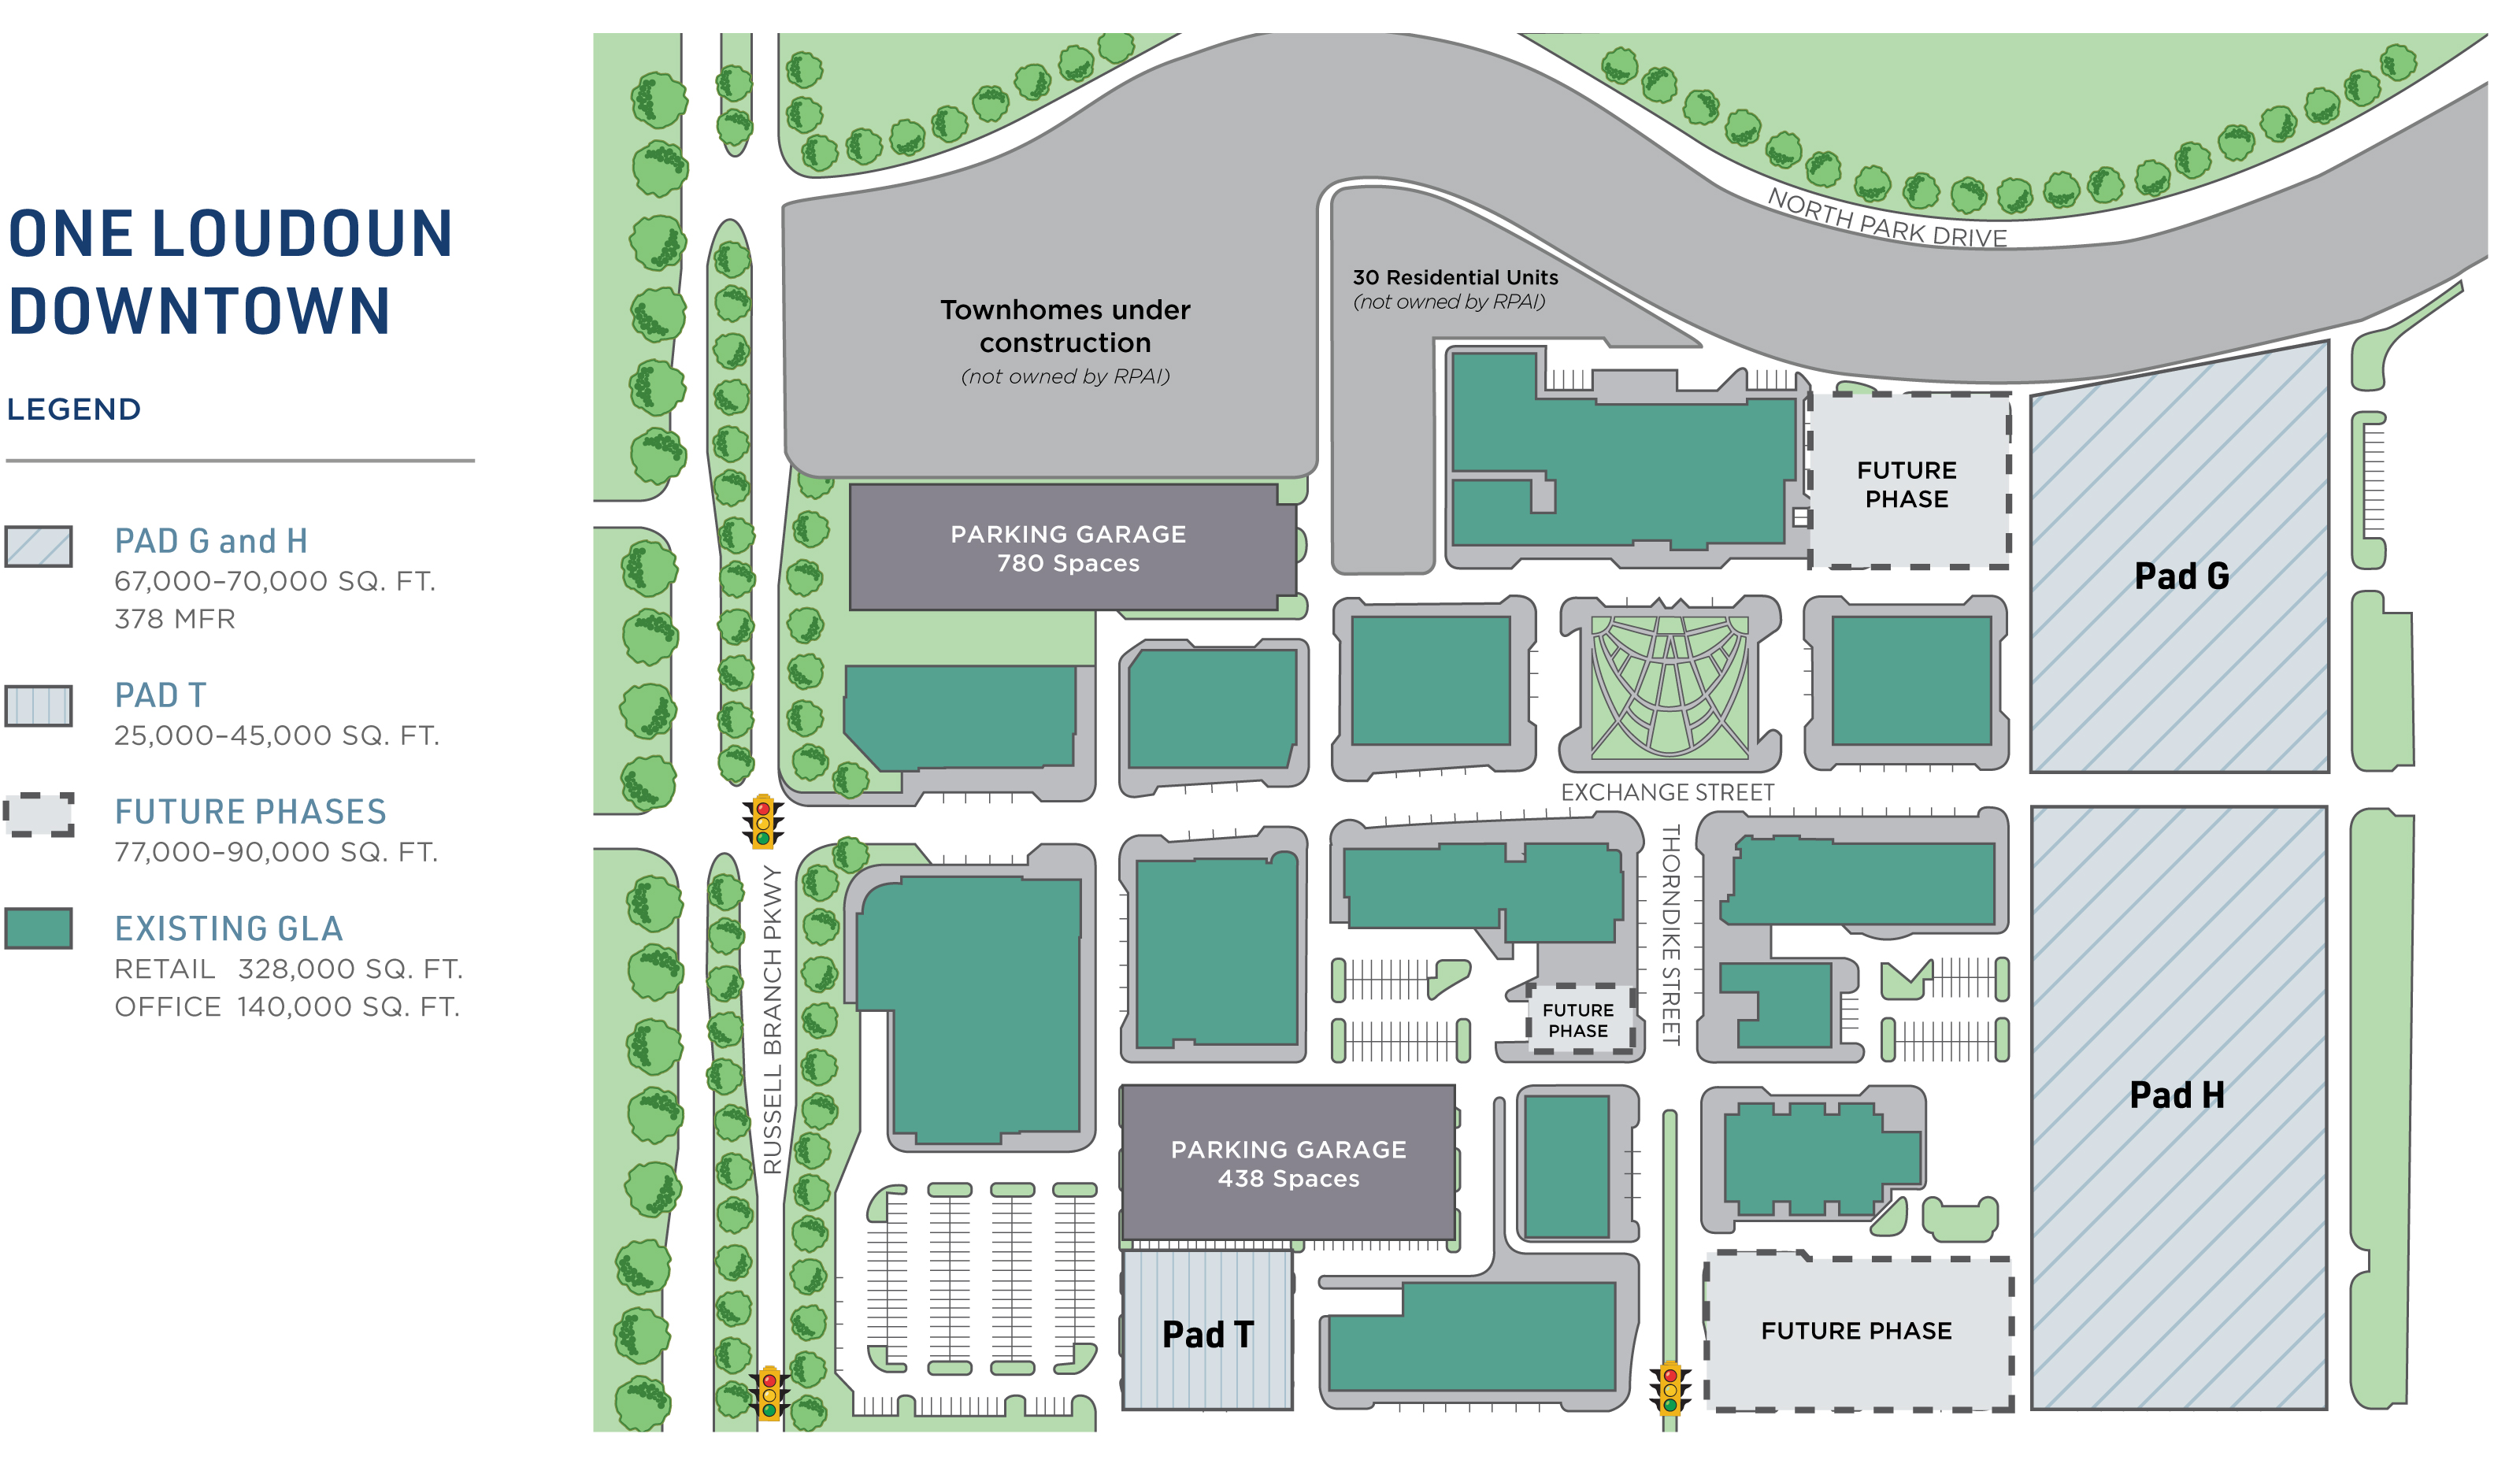
During the quarter, the Company and KETTLER, its joint venture partner, continued construction on the mixed-use expansion of Pads G & H at its One Loudoun Downtown multi-tenant retail operating property located in the Washington, D.C. metropolitan statistical area (MSA). This expansion project consists of up to 70,000 square feet of commercial space and 378 one- and two-bedroom multi-family rental units, which will become One Loudoun’s first apartment community, Vyne, and is anticipated to open in late spring 2021. The expansion project complements and enhances the Company’s approximately 468,000 square foot mixed-use community anchor asset, One Loudoun Downtown, which boasts a five-mile population of nearly 190,000, average household incomes of nearly $175,000 and sits in the county with the highest median income per capita in the United States with a projected five-year population growth rate of more than 8%.
Carillon
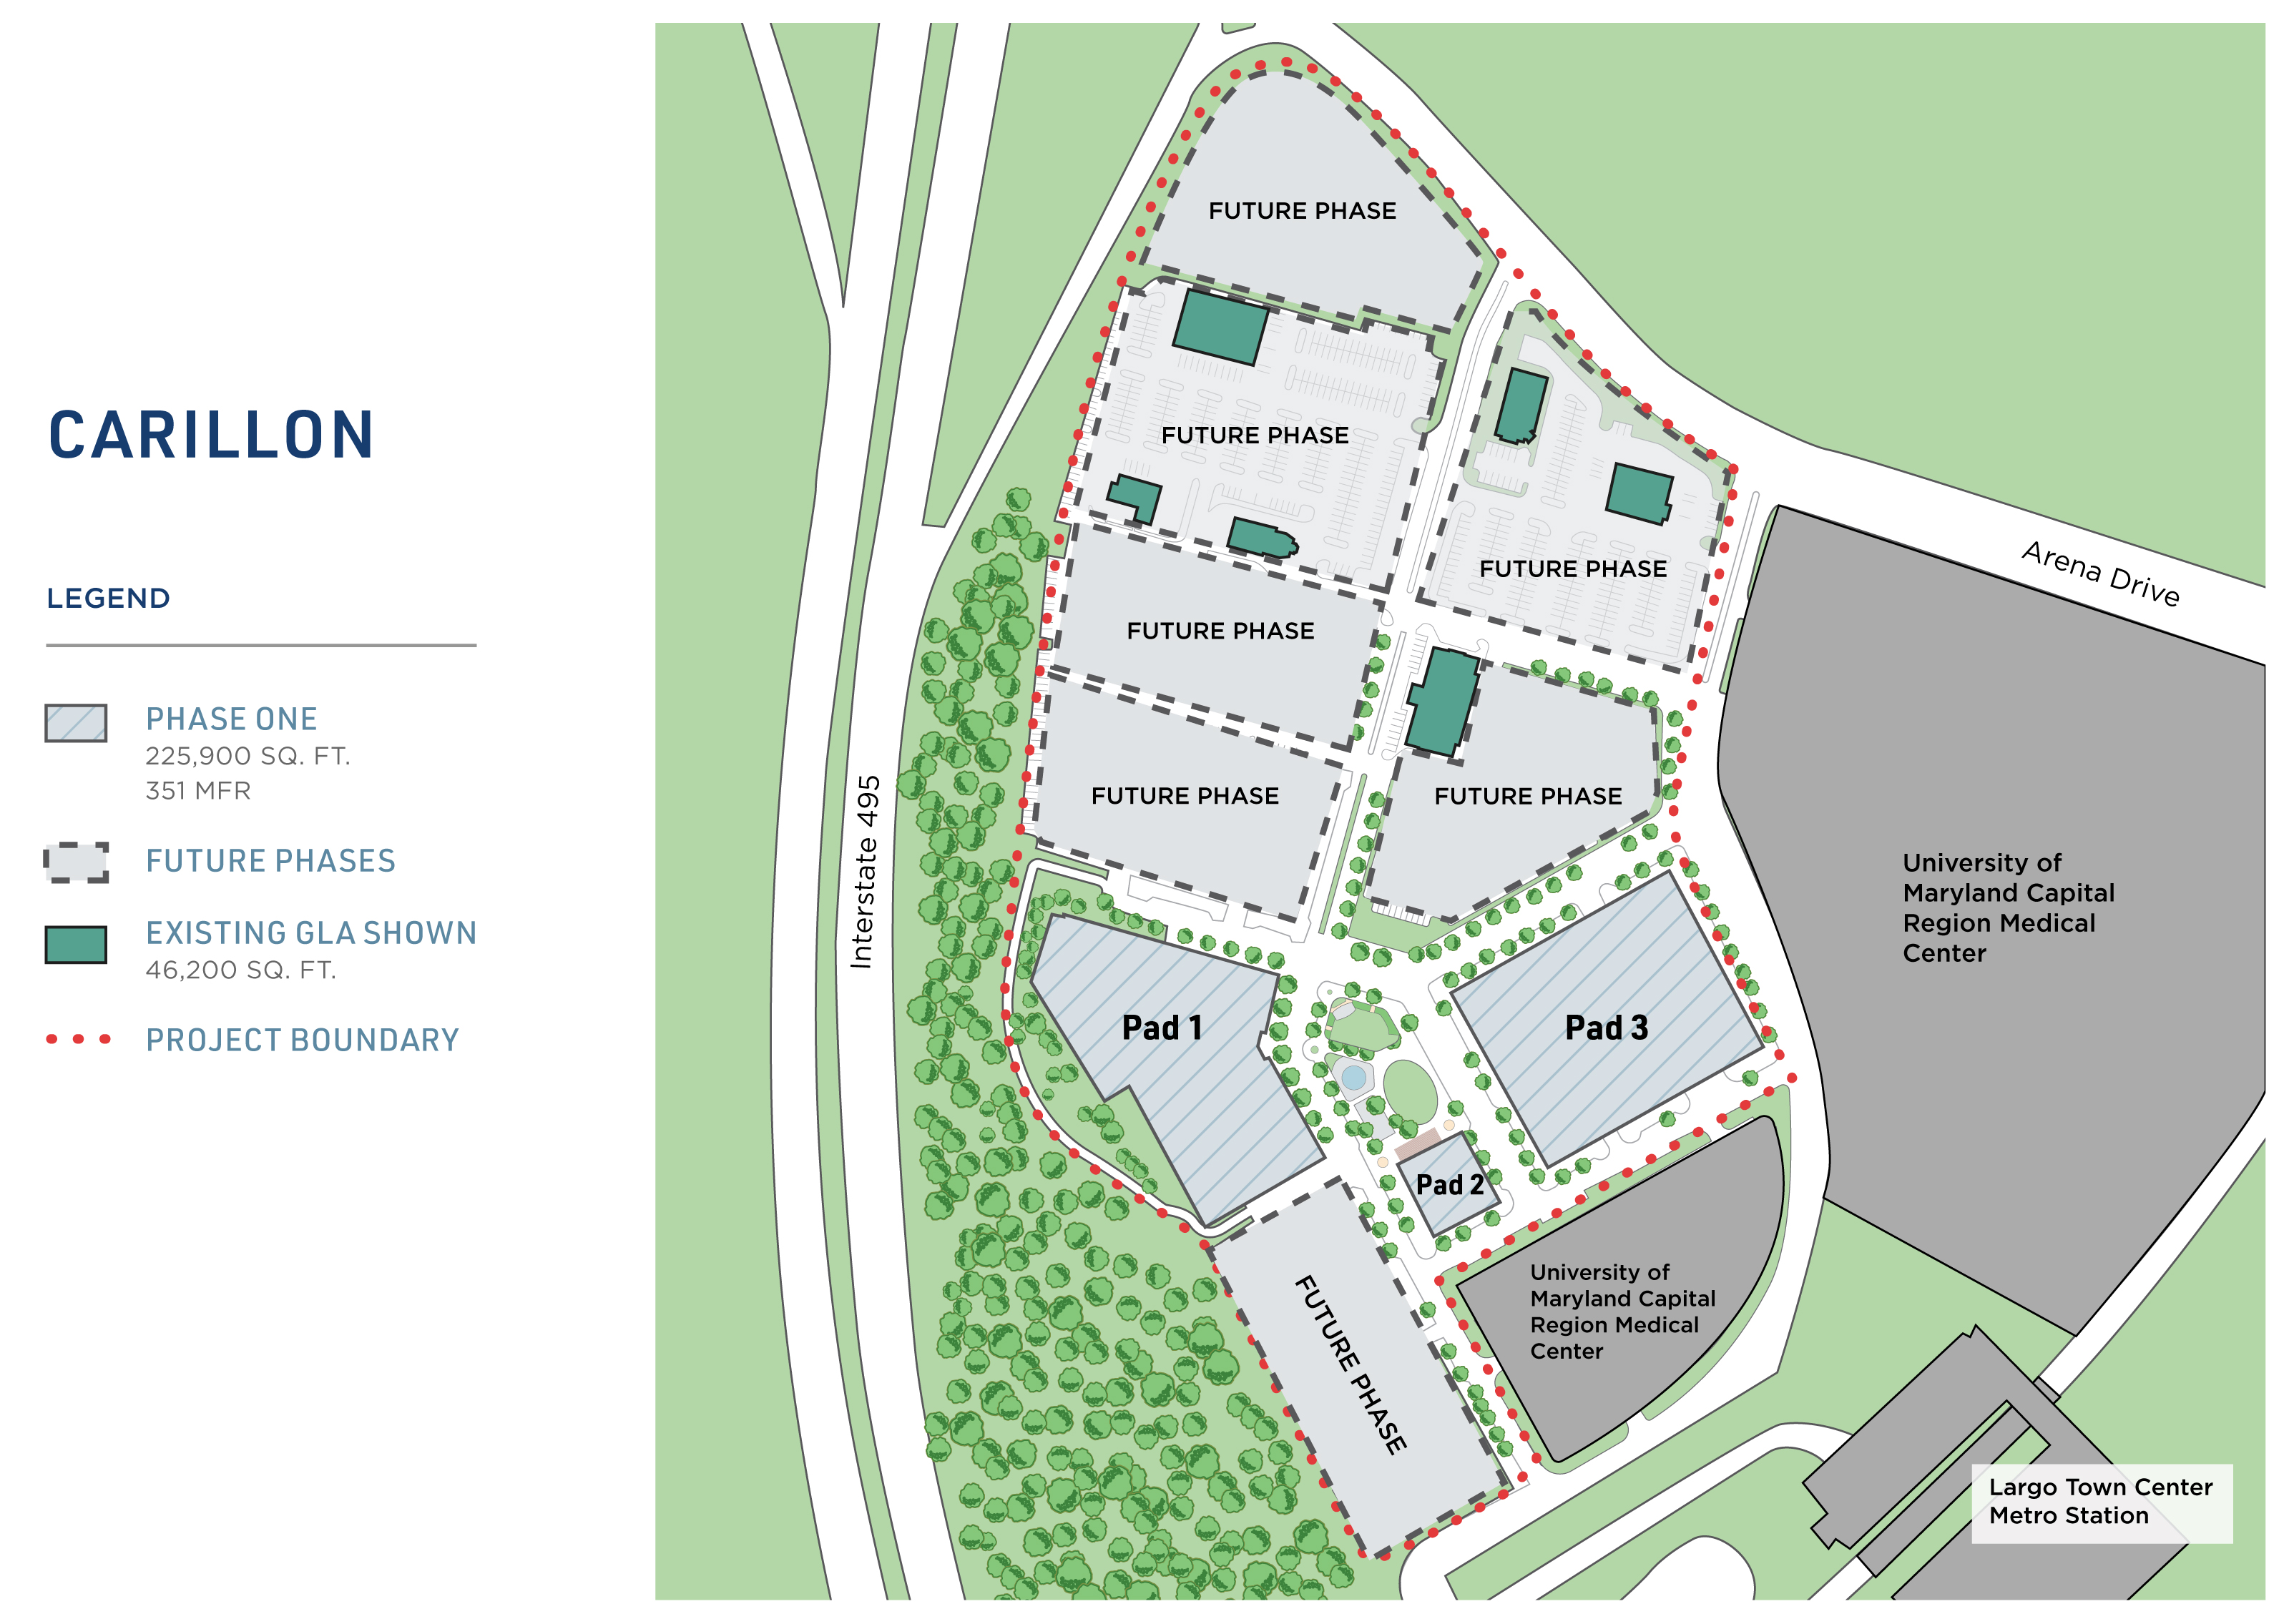
During the quarter, the Company completed the demolition of approximately 290,000 square feet of vacant retail gross leasable area and is currently grading the site in preparation for construction to begin at Carillon – phase one, its mixed-use redevelopment project located in the Washington, D.C. MSA. In connection with the demolition, the Company recorded approximately $26.3 million of accelerated depreciation related to the write-off of the demolished assets during the quarter.
The Company and Trammell Crow Company, its joint venture partner for the roughly 100,000 square foot medical office building portion of the project, have received multiple inquiries from potential healthcare tenants. These medical office facilities will be located adjacent to the University of Maryland Capital Region Medical Center, a teaching hospital that is currently under construction, and will complement the roughly 130,000 square foot balance of the commercial portion of the project, the retail component of which the Company has pre-leased 37% as of September 30, 2019. The Company continues to progress with Fore Property Company, its joint venture partner, on pre-construction activities for the multi-family component of the project, which will include approximately 351 multi-family rental units.
Circle East
The Company is engaged in late stage lease negotiations with multiple leading regional and national retailers at its mixed-use project Circle East located in Towson, Maryland within the Baltimore MSA. Subsequent to quarter end, the Company signed Shake Shack to a 3,200 square foot lease at a prominent corner location in the 80,000 square foot dual-sided street level retail portion of the project. Additionally, AvalonBay continues to expect initial tenant move-ins in the first quarter of 2020 to the approximately 370 AvalonBay-owned multi-family rental units that also form a portion of the project.
Other Projects
In order to enhance development optionality and increase balance sheet flexibility, the Company has updated the timing of planned commencements for expansion projects at Main Street Promenade, a mixed-use project in the Chicago MSA, and Downtown Crown, a mixed-use project in the Washington, D.C. MSA. The Company continues to evaluate the optimal start date for these projects, which benefit from six-figure average household incomes and population growth in the surrounding demographics.
Dispositions
During the quarter, as previously reported, the Company completed the sale of land and the rights to develop the remaining 12 residential units at One Loudoun Downtown for a gross sales price of $2.8 million.
Acquisitions
During the quarter, the Company closed on the acquisition of a single-user parcel at Southlake Town Square, its existing mixed-use, multi-tenant retail operating property in the Dallas MSA, for a gross purchase price of $3.3 million.
BALANCE SHEET AND CAPITAL MARKETS ACTIVITY
As of September 30, 2019, the Company had approximately $1.6 billion of consolidated indebtedness with a weighted average contractual interest rate of 3.88%, a weighted average maturity of 5.0 years and a net debt to adjusted EBITDAre ratio of 5.5x.
During the quarter, as previously reported, the Company entered into a term loan agreement with a group of financial institutions for a five-year $120.0 million unsecured term loan (Term Loan Due 2024) and a seven-year $150.0 million unsecured term loan (Term Loan Due 2026). The term loans bear interest at a rate of London Interbank Offered Rate (LIBOR) plus a credit spread based on a leverage grid ranging from 1.20% to 1.70% for the Term Loan Due 2024 and 1.50% to 2.20% for the Term Loan Due 2026. Both term loans currently bear interest at the lowest point of the leverage grid. In accordance with the term loan agreement, the Company may elect to convert to an investment grade pricing grid. Also, as previously reported, the Company entered into agreements to swap $120.0 million of LIBOR-based variable rate debt to a fixed interest rate of 1.68% through
July 2024 and $150.0 million of LIBOR-based variable rate debt to a fixed interest rate of 1.77% through July 2026, each with an effective date of August 15, 2019.
Additionally, during the quarter, the Company prepaid four mortgages with an aggregate principal balance of $107.7 million and a weighted average interest rate of 4.91%, incurring prepayment penalties of $8.2 million. These prepayments contributed to lowering the Company’s overall weighted average interest rate and reduced its secured indebtedness outstanding. Following these prepayments, the Company holds just five mortgages, its only secured debt obligations, with an aggregate outstanding principal balance of $95.5 million as of September 30, 2019.
2019 GUIDANCE
The Company expects to generate net income attributable to common shareholders of $0.14 to $0.16 per diluted share in 2019. The Company is updating its 2019 Operating FFO attributable to common shareholders guidance range to $1.05 to $1.07 per diluted share from $1.04 to $1.07 per diluted share, based, in part, on the following assumptions:
| |
| ▪ | Increased same store NOI growth range by 25 basis points at the midpoint to 2.25% to 2.75% from 1.75% to 2.75%; |
| |
| ▪ | Maintained general and administrative expenses range of $40 to $43 million; |
| |
| ▪ | Additional acquisitions and property dispositions evaluated and executed opportunistically; and |
| |
| ▪ | No additional issuances of unsecured debt capital beyond the already closed aggregate issuances of $370 million, proceeds from which were primarily used to repay outstanding indebtedness. |
DIVIDEND
On October 23, 2019, the Company declared the fourth quarter 2019 quarterly cash dividend of $0.165625 per share on its outstanding Class A common stock, which will be paid on January 10, 2020 to Class A common shareholders of record on December 26, 2019.
WEBCAST AND CONFERENCE CALL INFORMATION
The Company’s management team will hold a webcast on Wednesday, October 30, 2019 at 12:00 PM (ET), to discuss its quarterly financial results and operating performance, as well as business highlights and outlook. In addition, the Company may discuss business and financial developments and trends and other matters affecting the Company, some of which may not have been previously disclosed.
A live webcast will be available online on the Company’s website at www.rpai.com in the INVEST section. A replay of the webcast will be available. To listen to the replay, please go to www.rpai.com in the INVEST section of the website and follow the instructions.
The conference call can be accessed by dialing (877) 705-6003 or (201) 493-6725 for international participants. Please dial in at least ten minutes prior to the start of the call to register. A replay of the call will be available from 3:00 PM (ET) on October 30, 2019 until midnight (ET) on November 13, 2019. The replay can be accessed by dialing (844) 512-2921 or (412) 317-6671 for international callers and entering pin number 13693889.
SUPPLEMENTAL INFORMATION
The Company has posted supplemental financial and operating information and other data in the INVEST section of its website.
ABOUT RPAI
Retail Properties of America, Inc. is a REIT that owns and operates high quality, strategically located open-air shopping centers, including properties with a mixed-use component. As of September 30,
2019, the Company owned 104 retail operating properties in the United States representing 20.0 million square feet. The Company is publicly traded on the New York Stock Exchange under the ticker symbol RPAI. Additional information about the Company is available at www.rpai.com.
SAFE HARBOR LANGUAGE
The statements and certain other information contained in this press release, which can be identified by the use of forward-looking terminology such as “believes,” “expects,” “may,” “should,” “intends,” “plans,” “estimates” or “anticipates” and variations of such words or similar expressions or the negative of such words, constitute “forward-looking statements” within the meaning of Section 27A of the Securities Act of 1933, as amended, and Section 21E of the Securities Exchange Act of 1934, as amended, and are subject to the safe harbors created thereby. These forward-looking statements reflect the Company’s current views about its plans, intentions, expectations, strategies and prospects, which are based on the information currently available to the Company and on assumptions it has made. Although the Company believes that its plans, intentions, expectations, strategies and prospects as reflected in or suggested by those forward-looking statements are reasonable, the Company can give no assurance that such plans, intentions, expectations or strategies will be attained or achieved. Furthermore, these forward-looking statements should be considered as subject to the many risks and uncertainties that exist in the Company’s operations and business environment. Such risks and uncertainties could cause actual results to differ materially from those projected. These uncertainties include, but are not limited to, economic, business and financial conditions, and changes in the Company’s industry and changes in the real estate markets in particular, economic and other developments in markets where the Company has a high concentration of properties, the Company’s business strategy, the Company’s projected operating results, rental rates and/or vacancy rates, frequency and magnitude of defaults on, early terminations of or non-renewal of leases by tenants, bankruptcy or insolvency of a major tenant or a significant number of smaller tenants, adverse impact of e-commerce developments and shifting consumer retail behavior on tenants, interest rates or operating costs, the potential discontinuation of LIBOR, real estate and zoning laws and changes in real property tax rates, real estate valuations, the Company’s leverage, the Company’s ability to generate sufficient cash flows to service outstanding indebtedness and make distributions to shareholders, the Company’s ability to obtain necessary outside financing, the availability, terms and deployment of capital, general volatility of the capital and credit markets and the market price of the Company’s Class A common stock, risks generally associated with real estate acquisitions and dispositions, including the Company’s ability to identify and pursue acquisition and disposition opportunities, risks generally associated with redevelopment, including the impact of construction delays and cost overruns and the Company’s ability to lease redeveloped space and identify and pursue redevelopment opportunities, the Company’s ability to enter into new leases or renew leases on favorable terms, the Company’s ability to create long-term shareholder value, regulatory changes and other risk factors, including those detailed in the sections of the Company’s most recent Forms 10-K and 10-Q filed with the SEC titled “Risk Factors.” The Company assumes no obligation to update publicly any forward-looking statements, whether as a result of new information, future events or otherwise.
NON-GAAP FINANCIAL MEASURES
As defined by the National Association of Real Estate Investment Trusts (NAREIT), an industry trade group, Funds From Operations (FFO) means net income computed in accordance with generally accepted accounting principles (GAAP), excluding (i) depreciation and amortization related to real estate, (ii) gains from sales of real estate assets, (iii) gains and losses from change in control and (iv) impairment write-downs of real estate assets and investments in entities directly attributable to decreases in the value of real estate held by the entity. The Company has adopted the NAREIT definition in its computation of FFO attributable to common shareholders. The Company believes that, subject to the following limitations, FFO attributable to common shareholders provides a basis for comparing its performance and operations to those of other real estate investment trusts (REITs). The Company believes that FFO attributable to common shareholders, which is a supplemental non-GAAP financial measure, provides an additional and useful means to assess the operating performance of REITs. FFO attributable to common shareholders does not represent an alternative to (i) “Net income” or “Net income attributable to common shareholders” as an indicator of the Company’s financial performance, or (ii) “Cash flows from operating activities” in accordance with GAAP as a measure of the Company’s capacity to fund cash needs, including the payment of dividends.
The Company also reports Operating FFO attributable to common shareholders, which is defined as FFO attributable to common shareholders excluding the impact of discrete non-operating transactions and other events which the Company does not consider representative of the comparable operating results of its real estate operating portfolio, which is its core business platform. Specific examples of discrete non-operating transactions and other events include, but are not limited to, the impact on earnings from gains or losses associated with the early extinguishment of debt or other liabilities, litigation involving the Company, the impact on earnings from executive separation and the excess of redemption value over carrying value of preferred stock redemption, which are not otherwise adjusted in the Company’s calculation of FFO attributable to common shareholders. The Company believes that Operating FFO attributable to common shareholders, which is a supplemental non-GAAP financial measure, provides an additional and useful means to assess the operating performance of REITs. Operating FFO attributable to common shareholders does not represent an alternative to (i) “Net income” or “Net income attributable to common shareholders” as an indicator of the Company’s
financial performance, or (ii) “Cash flows from operating activities” in accordance with GAAP as a measure of the Company’s capacity to fund cash needs, including the payment of dividends. Comparison of the Company’s presentation of Operating FFO attributable to common shareholders to similarly titled measures for other REITs may not necessarily be meaningful due to possible differences in definition and application by such REITs.
The Company also reports Net Operating Income (NOI), which it defines as all revenues other than (i) straight-line rental income (non-cash), (ii) amortization of lease inducements, (iii) amortization of acquired above and below market lease intangibles and (iv) lease termination fee income, less real estate taxes and all operating expenses other than lease termination fee expense and non-cash ground rent expense, which is comprised of straight-line ground rent expense and amortization of acquired ground lease intangibles for the three and nine months ended September 30, 2018 and amortization of right-of-use lease assets and amortization of lease liabilities for the three and nine months ended September 30, 2019. NOI consists of Same Store NOI and NOI from Other Investment Properties. Same Store NOI for the three and nine months ended September 30, 2019 represents NOI from the Company’s same store portfolio consisting of 102 retail operating properties acquired or placed in service and stabilized prior to January 1, 2018. NOI from Other Investment Properties for the three and nine months ended September 30, 2019 represents NOI primarily from (i) properties acquired or placed in service during 2018 and 2019, including Reisterstown Road Plaza, which was reclassified from active redevelopment into the Company’s retail operating portfolio during 2018, (ii) the multi-family rental units at Plaza del Lago, a redevelopment project that was placed in service during the three months ended September 30, 2019, (iii) Circle East, which is in active redevelopment, (iv) One Loudoun Downtown – Pads G & H, which are in active redevelopment, (v) Carillon, which is in active redevelopment, (vi) properties that were sold or held for sale during 2018 and 2019, and (vii) the net income from the Company’s wholly-owned captive insurance company. The Company believes that NOI, Same Store NOI and NOI from Other Investment Properties, which are supplemental non-GAAP financial measures, provide an additional and useful operating perspective not immediately apparent from “Net income” or “Net income attributable to common shareholders” in accordance with GAAP. The Company uses these measures to evaluate its performance on a property-by-property basis because they allow management to evaluate the impact that factors such as lease structure, lease rates and tenant base have on the Company’s operating results. NOI, Same Store NOI and NOI from Other Investment Properties do not represent alternatives to “Net income” or “Net income attributable to common shareholders” in accordance with GAAP as indicators of the Company’s financial performance. Comparison of the Company’s presentation of NOI, Same Store NOI and NOI from Other Investment Properties to similarly titled measures for other REITs may not necessarily be meaningful due to possible differences in definition and application by such REITs.
As defined by NAREIT, EBITDA for real estate (EBITDAre) means net income (loss) computed in accordance with GAAP, plus (i) interest expense, (ii) income tax expense, (iii) depreciation and amortization, (iv) impairment charges on investment property and (v) impairment charges on investments in unconsolidated affiliates if caused by a decrease in the value of depreciable property in the affiliate, plus or minus (i) gains from sales of investment property, including gains (or losses) on change in control, and (ii) adjustments to reflect the entity’s share of EBITDAre of unconsolidated affiliates. The Company reports Adjusted EBITDAre, which excludes the impact of certain discrete non-operating transactions and other events such as the impact on earnings from executive separation. The Company believes that Adjusted EBITDAre is useful because it allows investors and management to evaluate and compare the Company’s performance from period to period in a meaningful and consistent manner in addition to standard financial measurements under GAAP. EBITDAre and Adjusted EBITDAre are supplemental non-GAAP financial measures and should not be considered alternatives to “Net income” or “Net income attributable to common shareholders” as indicators of the Company’s financial performance. Comparison of the Company’s presentation of EBITDAre and Adjusted EBITDAre to similarly titled measures for other REITs may not necessarily be meaningful due to possible differences in definition and application by such REITs.
Net Debt to Adjusted EBITDAre is a supplemental non-GAAP financial measure and represents (i) the Company’s total debt principal, which excludes unamortized premium, discount and capitalized loan fees, less (ii) cash and cash equivalents divided by (iii) Adjusted EBITDAre for the prior three months, annualized (Annualized Adjusted EBITDAre). The Company believes that this ratio is useful because it provides investors with information regarding its total debt principal net of cash and cash equivalents, which could be used to repay debt, compared to its performance as measured using Annualized Adjusted EBITDAre. Comparison of the Company’s presentation of Net Debt to Adjusted EBITDAre to similarly titled measures for other REITs may not necessarily be meaningful due to possible differences in definition and application by such REITs.
CONTACT INFORMATION
Michael Gaiden
Vice President – Investor Relations
Retail Properties of America, Inc.
(630) 634-4233
Retail Properties of America, Inc.
FFO Attributable to Common Shareholders and
Operating FFO Attributable to Common Shareholders Guidance
|
| | | | | | | | |
| | | Per Share Guidance Range Full Year 2019 |
| | | Low | | High |
| | | | | |
| Net income attributable to common shareholders | | $ | 0.14 |
| | $ | 0.16 |
|
| Depreciation and amortization of real estate | | 0.90 |
| | 0.90 |
|
| Provision for impairment of investment properties | | 0.05 |
| | 0.05 |
|
| Gain on sales of investment properties | | (0.09 | ) | | (0.09 | ) |
| FFO attributable to common shareholders | | $ | 1.00 |
| | $ | 1.02 |
|
| | | | | |
| Impact on earnings from the early extinguishment of debt | | 0.04 |
| | 0.04 |
|
| Other | | 0.01 |
| | 0.01 |
|
| Operating FFO attributable to common shareholders | | $ | 1.05 |
| | $ | 1.07 |
|
Retail Properties of America, Inc.
Condensed Consolidated Balance Sheets
(amounts in thousands, except par value amounts)
(unaudited)
|
| | | | | | | | |
| | | September 30,
2019 | | December 31,
2018 |
| Assets | | |
| | |
|
| Investment properties: | | |
| | |
|
| Land | | $ | 1,022,151 |
| | $ | 1,036,901 |
|
| Building and other improvements | | 3,527,330 |
| | 3,607,484 |
|
| Developments in progress | | 100,079 |
| | 48,369 |
|
| | | 4,649,560 |
| | 4,692,754 |
|
| Less accumulated depreciation | | (1,346,831 | ) | | (1,313,602 | ) |
Net investment properties (includes $8,312 and $0 from consolidated variable interest entities, respectively) | | 3,302,729 |
| | 3,379,152 |
|
| | | | | |
| Cash and cash equivalents | | 17,076 |
| | 14,722 |
|
| Accounts and notes receivable, net | | 76,619 |
| | 78,398 |
|
| Acquired lease intangible assets, net | | 84,639 |
| | 97,090 |
|
| Right-of-use lease assets | | 50,405 |
| | — |
|
Other assets, net (includes $287 and $1,264 from consolidated variable interest entities, respectively) | | 69,072 |
| | 78,108 |
|
| Total assets | | $ | 3,600,540 |
| | $ | 3,647,470 |
|
| | | | | |
| Liabilities and Equity | | |
| | |
|
| Liabilities: | | |
| | |
|
Mortgages payable, net (includes unamortized premium of $0 and $775, respectively, unamortized discount of $(504) and $(536), respectively, and unamortized capitalized loan fees of $(272) and $(369), respectively) | | $ | 94,757 |
| | $ | 205,320 |
|
Unsecured notes payable, net (includes unamortized discount of $(645) and $(734), respectively, and unamortized capitalized loan fees of $(3,281) and $(2,904), respectively) | | 796,074 |
| | 696,362 |
|
Unsecured term loans, net (includes unamortized capitalized loan fees of $(3,746) and $(2,633), respectively) | | 716,254 |
| | 447,367 |
|
| Unsecured revolving line of credit | | 24,000 |
| | 273,000 |
|
| Accounts payable and accrued expenses | | 70,457 |
| | 82,942 |
|
| Distributions payable | | 35,387 |
| | 35,387 |
|
| Acquired lease intangible liabilities, net | | 65,415 |
| | 86,543 |
|
| Lease liabilities | | 90,942 |
| | — |
|
Other liabilities (includes $2,926 and $428 from consolidated variable interest entities, respectively) | | 60,496 |
| | 73,540 |
|
| Total liabilities | | 1,953,782 |
| | 1,900,461 |
|
| | | | | |
| Commitments and contingencies | | |
| | |
|
| | | | | |
| Equity: | | |
| | |
|
| Preferred stock, $0.001 par value, 10,000 shares authorized, none issued or outstanding | | — |
| | — |
|
Class A common stock, $0.001 par value, 475,000 shares authorized, 213,655 and 213,176 shares issued and outstanding as of September 30, 2019 and December 31, 2018, respectively | | 214 |
| | 213 |
|
| Additional paid-in capital | | 4,509,337 |
| | 4,504,702 |
|
| Accumulated distributions in excess of earnings | | (2,846,718 | ) | | (2,756,802 | ) |
| Accumulated other comprehensive loss | | (18,495 | ) | | (1,522 | ) |
| Total shareholders' equity | | 1,644,338 |
| | 1,746,591 |
|
| Noncontrolling interests | | 2,420 |
| | 418 |
|
| Total equity | | 1,646,758 |
| | 1,747,009 |
|
| Total liabilities and equity | | $ | 3,600,540 |
| | $ | 3,647,470 |
|
|
| | |
| 3rd Quarter 2019 Supplemental Information | | 1 |
Retail Properties of America, Inc.
Condensed Consolidated Statements of Operations
(amounts in thousands, except per share amounts)
(unaudited)
|
| | | | | | | | | | | | | | | |
| | Three Months Ended September 30, | | Nine Months Ended September 30, |
| | 2019 | | 2018 | | 2019 | | 2018 |
| Revenues: | | | | | |
| | |
|
| Lease income | $ | 119,717 |
| | $ | 119,137 |
| | $ | 360,869 |
| | $ | 363,143 |
|
| | | | | | | | |
| Expenses: | | | | | |
| | |
|
| Operating expenses | 16,088 |
| | 17,596 |
| | 50,903 |
| | 57,235 |
|
| Real estate taxes | 18,583 |
| | 18,037 |
| | 55,520 |
| | 56,206 |
|
| Depreciation and amortization | 67,460 |
| | 43,169 |
| | 153,609 |
| | 132,107 |
|
| Provision for impairment of investment properties | 11,177 |
| | — |
| | 11,177 |
| | 1,316 |
|
| General and administrative expenses | 10,334 |
| | 9,160 |
| | 30,186 |
| | 31,929 |
|
| Total expenses | 123,642 |
| | 87,962 |
| | 301,395 |
| | 278,793 |
|
| | | | | | | | |
| Other (expense) income: | | | | | | | |
| Interest expense | (25,084 | ) | | (21,336 | ) | | (59,877 | ) | | (56,918 | ) |
| Gain on sales of investment properties | 1,969 |
| | 2,692 |
| | 18,872 |
| | 37,211 |
|
| Other (expense) income, net | (1,113 | ) | | 303 |
| | (2,244 | ) | | 853 |
|
| Net (loss) income | (28,153 | ) | | 12,834 |
| | 16,225 |
| | 65,496 |
|
| Net income attributable to noncontrolling interests | — |
| | — |
| | — |
| | — |
|
| Net (loss) income attributable to common shareholders | $ | (28,153 | ) | | $ | 12,834 |
| | $ | 16,225 |
| | $ | 65,496 |
|
| | | | | | | | |
| (Loss) earnings per common share – basic and diluted: | | | | | |
| | |
|
| Net (loss) income per common share attributable to common shareholders | $ | (0.13 | ) | | $ | 0.06 |
| | $ | 0.07 |
| | $ | 0.30 |
|
| | | | | | | | |
| Weighted average number of common shares outstanding – basic | 212,995 |
| | 218,808 |
| | 212,932 |
| | 218,879 |
|
| | | | | | | | |
| Weighted average number of common shares outstanding – diluted | 212,995 |
| | 219,021 |
| | 213,056 |
| | 219,277 |
|
|
| | |
| 3rd Quarter 2019 Supplemental Information | | 2 |
Retail Properties of America, Inc.
Funds From Operations (FFO) Attributable to Common Shareholders,
Operating FFO Attributable to Common Shareholders and Additional Information
(dollar amounts in thousands, except per share amounts)
(unaudited)
|
| | | | | | | | | | | | | | | |
| FFO attributable to common shareholders and Operating FFO attributable to common shareholders (a) | | |
| | | | | | | | |
| | Three Months Ended September 30, | | Nine Months Ended September 30, |
| | 2019 | | 2018 | | 2019 | | 2018 |
| | | | | | | | |
| Net (loss) income attributable to common shareholders | $ | (28,153 | ) | | $ | 12,834 |
| | $ | 16,225 |
| | $ | 65,496 |
|
| Depreciation and amortization of real estate (b) | 67,116 |
| | 42,861 |
| | 152,560 |
| | 131,226 |
|
| Provision for impairment of investment properties | 11,177 |
| | — |
| �� | 11,177 |
| | 1,316 |
|
| Gain on sales of investment properties (c) | (1,969 | ) | | (2,692 | ) | | (18,872 | ) | | (37,211 | ) |
| FFO attributable to common shareholders (c) | $ | 48,171 |
| | $ | 53,003 |
| | $ | 161,090 |
| | $ | 160,827 |
|
FFO attributable to common shareholders per common share outstanding – diluted (c) | $ | 0.23 |
| | $ | 0.24 |
| | $ | 0.76 |
| | $ | 0.73 |
|
| | | | | | | | |
| FFO attributable to common shareholders | $ | 48,171 |
| | $ | 53,003 |
| | $ | 161,090 |
| | $ | 160,827 |
|
| Impact on earnings from the early extinguishment of debt, net | 7,581 |
| | 4,892 |
| | 7,581 |
| | 5,944 |
|
| Impact on earnings from executive separation (d) | — |
| | — |
| | — |
| | 1,737 |
|
| Other (e) | 1,241 |
| | 100 |
| | 2,521 |
| | 323 |
|
| Operating FFO attributable to common shareholders | $ | 56,993 |
| | $ | 57,995 |
| | $ | 171,192 |
| | $ | 168,831 |
|
Operating FFO attributable to common shareholders per common share outstanding – diluted | $ | 0.27 |
| | $ | 0.26 |
| | $ | 0.80 |
| | $ | 0.77 |
|
| | | | | | | | |
| Weighted average number of common shares outstanding – diluted | 212,995 |
| | 219,021 |
| | 213,056 |
| | 219,277 |
|
| Dividends declared per common share | $ | 0.165625 |
| | $ | 0.165625 |
| | $ | 0.496875 |
| | $ | 0.496875 |
|
| | | | | | | | |
| Additional Information (f) | | | | | |
| | |
|
| Lease-related expenditures (g) | | | | | | | |
| Same store | $ | 8,489 |
| | $ | 11,338 |
| | $ | 26,852 |
| | $ | 24,632 |
|
| Other investment properties (h) | $ | 135 |
| | $ | (106 | ) | | $ | 1,377 |
| | $ | 7,637 |
|
| | | | | | | | |
| Capital expenditures (i) | | | | | | | |
| Same store | $ | 11,183 |
| | $ | 7,726 |
| | $ | 30,242 |
| | $ | 20,016 |
|
| Other investment properties (h) | $ | 1,119 |
| | $ | 117 |
| | $ | 2,236 |
| | $ | 2,239 |
|
| Predevelopment costs | $ | 871 |
| | $ | 1,635 |
| | $ | 6,144 |
| | $ | 2,799 |
|
| | | | | | | | |
| Straight-line rental income, net | $ | 581 |
| | $ | 946 |
| | $ | 2,697 |
| | $ | 4,826 |
|
Amortization of above and below market lease intangibles and lease inducements | $ | 1,127 |
| | $ | 281 |
| | $ | 3,557 |
| | $ | 3,002 |
|
| Non-cash ground rent expense, net | $ | 333 |
| | $ | 440 |
| | $ | 1,023 |
| | $ | 1,405 |
|
| | | | | | | | |
Adjusted EBITDAre (a) | $ | 73,599 |
| | $ | 74,647 |
| | $ | 222,016 |
| | $ | 220,363 |
|
| |
| (a) | Refer to pages 20 – 23 for definitions and reconciliations related to FFO attributable to common shareholders, Operating FFO attributable to common shareholders and Adjusted EBITDAre. |
| |
| (b) | Includes $26,330 of accelerated depreciation recorded in connection with the write-off of assets taken out of service due to the demolition of existing structures at the Company's Carillon redevelopment during the three and nine months ended September 30, 2019. |
| |
| (c) | The Company adopted the National Association of Real Estate Investment Trusts' "NAREIT Funds From Operations White Paper – 2018 Restatement" effective January 1, 2019 on a retrospective basis. As a result, all gains on sale and impairments of real estate are excluded from FFO, whereas the Company previously only excluded gains on sale and impairments of depreciable investment properties. The Company restated FFO attributable to common shareholders for the three and nine months ended September 30, 2018 to exclude the gain on sale of non-depreciable investment property of $1,285 and $3,464, respectively. As this gain was previously excluded from Operating FFO attributable to common shareholders, there was no change to Operating FFO attributable to common shareholders for the three and nine months ended September 30, 2018. |
| |
| (d) | Reflected as an increase within "General and administrative expenses" in the condensed consolidated statements of operations. |
| |
| (e) | Primarily consists of the impact on earnings from litigation involving the Company, which is included within "Other (expense) income, net" in the condensed consolidated statements of operations. |
| |
| (f) | The same store portfolio for the three and nine months ended September 30, 2019 consists of 102 retail operating properties. Refer to pages 20 – 23 for definitions and reconciliations of non-GAAP financial measures. |
| |
| (g) | Consists of payments for tenant improvements, lease commissions and lease inducements and excludes active development projects which are included within "Developments in progress" in the condensed consolidated balance sheets. |
| |
| (h) | 2018 expenditures are primarily associated with Schaumburg Towers prior to its disposition on May 31, 2018. |
| |
| (i) | Capital expenditures consist of payments for building, site and other improvements, net of anticipated recoveries, and exclude active development projects which are included within "Developments in progress" in the condensed consolidated balance sheets. Predevelopment costs consist of payments related to future redevelopment and expansion projects incurred before each project is considered active and are included within "Other assets, net" in the condensed consolidated balance sheets. |
|
| | |
| 3rd Quarter 2019 Supplemental Information | | 3 |
Retail Properties of America, Inc.
Supplemental Financial Statement Detail
(amounts in thousands)
(unaudited)
|
| | | | | | | | |
| Supplemental Balance Sheet Detail | | September 30,
2019 | | December 31,
2018 |
| Developments in Progress | | | | |
| Active developments/redevelopments (a) | | $ | 74,629 |
| | $ | 22,919 |
|
| Land held for future development | | 25,450 |
| | 25,450 |
|
| Total | | $ | 100,079 |
| | $ | 48,369 |
|
| | | | | |
| Accounts and Notes Receivable, Net | | |
| | |
|
| Accounts and notes receivable, net | | $ | 26,404 |
| | $ | 30,592 |
|
| Straight-line receivables, net | | 50,215 |
| | 47,806 |
|
| Total | | $ | 76,619 |
| | $ | 78,398 |
|
| | | | | |
| Other Assets, Net | | |
| | |
|
| Deferred costs, net | | $ | 37,002 |
| | $ | 34,419 |
|
| Restricted cash (b) | | 5,427 |
| | 4,879 |
|
| Fair value of derivatives | | — |
| | 2,324 |
|
| Other assets, net | | 26,643 |
| | 36,486 |
|
| Total | | $ | 69,072 |
| | $ | 78,108 |
|
| | | | | |
| Other Liabilities | | |
| | |
|
| Unearned income | | $ | 17,034 |
| | $ | 16,565 |
|
| Straight-line ground rent liabilities (c) | | — |
| | 31,030 |
|
| Fair value of derivatives | | 18,495 |
| | 3,846 |
|
| Other liabilities (c) | | 24,967 |
| | 22,099 |
|
| Total | | $ | 60,496 |
| | $ | 73,540 |
|
|
| | | | | | | | | | | | | | | |
| Supplemental Statements of Operations Detail | | | | | | | |
| | Three Months Ended September 30, | | Nine Months Ended September 30, |
| | 2019 | | 2018 | | 2019 | | 2018 |
| Lease Income (c) | |
| | |
| | |
| | |
|
| Base rent | $ | 89,754 |
| | $ | 88,762 |
| | $ | 267,823 |
| | $ | 267,047 |
|
| Percentage and specialty rent | 610 |
| | 986 |
| | 2,612 |
| | 3,201 |
|
| Tenant recoveries | 26,323 |
| | 26,817 |
| | 79,029 |
| | 80,090 |
|
| Lease termination fee income (c) | 331 |
| | 196 |
| | 1,751 |
| | 1,423 |
|
| Other lease-related income (c) | 1,560 |
| | 1,149 |
| | 4,446 |
| | 3,554 |
|
| Bad debt, net (c) | (569 | ) | | — |
| | (1,046 | ) | | — |
|
| Straight-line rent | 581 |
| | 946 |
| | 2,697 |
| | 4,826 |
|
Amortization of above and below market lease intangibles and lease inducements | 1,127 |
| | 281 |
| | 3,557 |
| | 3,002 |
|
| Total | $ | 119,717 |
| | $ | 119,137 |
| | $ | 360,869 |
| | $ | 363,143 |
|
| | | | | | | | |
| Operating Expense Supplemental Information | | | | | | | |
| Bad debt, net (c) | $ | — |
| | $ | 598 |
| | $ | — |
| | $ | 1,448 |
|
| Non-cash ground rent expense, net (c) | $ | 333 |
| | $ | 440 |
| | $ | 1,023 |
| | $ | 1,405 |
|
| Lease termination fee expense (d) | $ | — |
| | $ | — |
| | $ | — |
| | $ | 1,900 |
|
| | | | | | | | |
| General and Administrative Expense Supplemental Information | | | | | | | |
| Non-cash amortization of stock-based compensation | $ | 1,849 |
| | $ | 1,599 |
| | $ | 5,672 |
| | $ | 5,328 |
|
| | | | | | | | |
| Additional Supplemental Information | | | | | | | |
| Capitalized compensation costs – development and capital projects | $ | 1,045 |
| | $ | 790 |
| | $ | 3,070 |
| | $ | 1,960 |
|
| Capitalized internal leasing incentives | $ | 111 |
| | $ | 71 |
| | $ | 247 |
| | $ | 241 |
|
| Capitalized interest | $ | 570 |
| | $ | 98 |
| | $ | 940 |
| | $ | 348 |
|
| |
| (a) | As of September 30, 2019, the Company has active redevelopments at Circle East, One Loudoun Downtown and Carillon. See page 9 for further details. |
| |
| (b) | Consists of funds restricted through lender or other agreements. |
| |
| (c) | The Company adopted ASU 2016-02, Leases, effective January 1, 2019 and as a result, the Company (i) recorded lease liabilities and right-of-use lease (ROU) assets, which were initially measured at the present value of future lease payments; (ii) reclassified the previously existing straight-line rent liabilities related to long-term ground and office leases (previously presented within "Other liabilities") and acquired ground lease intangible liability (previously presented within "Acquired lease intangible liabilities, net") to be presented net of the ROU assets in the condensed consolidated balance sheets; (iii) retrospectively presented all lease-related revenue within "Lease income" in the condensed consolidated statements of operations (lease termination fee income and other lease-related income were previously presented within "Other property income"); and (iv) prospectively presented bad debt as an adjustment to revenue whereas it is included within operating expenses for periods prior to adoption. Non-cash ground rent expense consists of straight-line ground rent expense and amortization of acquired ground lease intangibles for the three and nine months ended September 30, 2018 and amortization of ROU assets and amortization of lease liabilities for the three and nine months ended September 30, 2019. |
| |
| (d) | Represents termination fee recorded during the second quarter of 2018 within "Operating expenses" in the condensed consolidated statements of operations related to the Toys "R" Us auction process whereby the Company was the winning bidder on two leases. |
|
| | |
| 3rd Quarter 2019 Supplemental Information | | 4 |
Retail Properties of America, Inc.
Same Store Net Operating Income (NOI)
(dollar amounts in thousands)
(unaudited)
|
| | | | | | | | | |
| Same store portfolio (a) | | | | | | |
| | | Based on Same store portfolio as of September 30, 2019 |
| | | 2019 | | 2018 | | Change |
| | | | | | | |
| Number of retail operating properties in same store portfolio | | 102 |
| | 102 |
| | — |
|
| | | | | | | |
| Occupancy | | 93.6 | % | | 92.0 | % | | 1.6 | % |
| | | | | | | |
| Percent leased (b) | | 95.4 | % | | 93.9 | % | | 1.5 | % |
| | | | | | | |
|
| | | | | | | | | | | | | | | | | | | | | |
| Same Store NOI (c) | | | | | | | | | | | |
| | Three Months Ended September 30, | | Nine Months Ended September 30, |
| | 2019 | | 2018 | | Change | | 2019 | | 2018 | | Change |
| | | | | | | | | | | | |
| Base rent | $ | 86,647 |
| | $ | 84,417 |
| | | | $ | 257,518 |
| | $ | 251,778 |
| | |
| Percentage and specialty rent | 601 |
| | 887 |
| | | | 2,436 |
| | 2,720 |
| | |
| Tenant recoveries | 25,631 |
| | 25,783 |
| | | | 77,103 |
| | 76,956 |
| | |
| Other lease-related income | 1,424 |
| | 1,125 |
| | | | 4,163 |
| | 3,390 |
| | |
| Bad debt, net | (690 | ) | | (561 | ) | | | | (1,175 | ) | | (1,389 | ) | | |
| Property operating expenses (d) | (15,050 | ) | | (15,157 | ) | | | | (45,743 | ) | | (45,816 | ) | | |
| Real estate taxes | (18,073 | ) | | (17,837 | ) | | | | (54,229 | ) | | (53,864 | ) | | |
| Same Store NOI (c) | $ | 80,490 |
| | $ | 78,657 |
| | 2.3 | % | | $ | 240,073 |
| | $ | 233,775 |
| | 2.7 | % |
| |
| (a) | For the three and nine months ended September 30, 2019, the Company's same store portfolio consists of 102 retail operating properties and excludes (i) properties acquired or placed in service and stabilized during 2018 and 2019, including Reisterstown Road Plaza, which was reclassified from active redevelopment into the Company's retail operating portfolio during 2018, (ii) the multi-family rental units at Plaza del Lago, a redevelopment project that was placed in service during the three months ended September 30, 2019, (iii) Circle East, which is in active redevelopment, (iv) One Loudoun Downtown – Pads G & H, which are in active redevelopment, (v) Carillon, which is in active redevelopment, and (vi) properties that were sold or held for sale during 2018 and 2019. |
| |
| (b) | Includes leases signed but not commenced. |
| |
| (c) | Refer to pages 20 – 23 for definitions and reconciliations of non-GAAP financial measures. Comparison of the Company's presentation of Same Store NOI to similarly titled measures for other REITs may not necessarily be meaningful due to possible differences in definition and application by such REITs. |
| |
| (d) | Consists of all property operating items included within "Operating expenses" in the condensed consolidated statements of operations, which includes all items other than (i) lease termination fee expense, (ii) bad debt for the three and nine months ended September 30, 2018, and (iii) non-cash ground rent expense, which is comprised of straight-line ground rent expense and amortization of acquired ground lease intangibles for the three and nine months ended September 30, 2018 and amortization of right-of-use lease assets and amortization of lease liabilities for the three and nine months ended September 30, 2019. |
|
| | |
| 3rd Quarter 2019 Supplemental Information | | 5 |
Retail Properties of America, Inc.
Capitalization
(dollar amounts in thousands, except share price and ratio)
|
| | | | | | | | |
| Capitalization Data | | | | |
| | | September 30,
2019 | | December 31,
2018 |
| Equity Capitalization | | |
| | |
|
| Common stock shares outstanding (a) | | 213,655 |
| | 213,176 |
|
| Common stock share price | | $ | 12.32 |
| | $ | 10.85 |
|
| Total equity capitalization | | $ | 2,632,230 |
| | $ | 2,312,960 |
|
| | | | | |
| Debt Capitalization | | |
| | |
|
| Mortgages payable (b) | | $ | 95,533 |
| | $ | 205,450 |
|
| Unsecured notes payable (c) | | 800,000 |
| | 700,000 |
|
| Unsecured term loans (d) | | 720,000 |
| | 450,000 |
|
| Unsecured revolving line of credit | | 24,000 |
| | 273,000 |
|
| Total debt capitalization | | $ | 1,639,533 |
| | $ | 1,628,450 |
|
| | | | | |
| Total capitalization at end of period | | $ | 4,271,763 |
| | $ | 3,941,410 |
|
Calculation of Net Debt to Adjusted EBITDAre Ratio (e)
|
| | | | | | | | |
| | | September 30,
2019 | | December 31,
2018 |
| | | | | |
| Total debt principal | | $ | 1,639,533 |
| | $ | 1,628,450 |
|
| Less: consolidated cash and cash equivalents | | (17,076 | ) | | (14,722 | ) |
| Total net debt | | $ | 1,622,457 |
| | $ | 1,613,728 |
|
Annualized Adjusted EBITDAre | | $ | 294,396 |
| | $ | 294,420 |
|
Net Debt to Adjusted EBITDAre (f) | | 5.5x |
| | 5.5x |
|
| |
| (a) | Excludes performance restricted stock units and options outstanding, which could potentially convert into common stock in the future. |
| |
| (b) | Mortgages payable excludes mortgage premium of $0 and $775, discount of $(504) and $(536), and capitalized loan fees of $(272) and $(369), net of accumulated amortization, as of September 30, 2019 and December 31, 2018, respectively. |
| |
| (c) | Unsecured notes payable excludes discount of $(645) and $(734) and capitalized loan fees of $(3,281) and $(2,904), net of accumulated amortization, as of September 30, 2019 and December 31, 2018, respectively. |
| |
| (d) | Unsecured term loans exclude capitalized loan fees of $(3,746) and $(2,633), net of accumulated amortization, as of September 30, 2019 and December 31, 2018, respectively. |
| |
| (e) | Refer to pages 20 – 23 for definitions and reconciliations of non-GAAP financial measures. |
| |
| (f) | For purposes of this ratio calculation, annualized three months ended figures were used. |
|
| | |
| 3rd Quarter 2019 Supplemental Information | | 6 |
Retail Properties of America, Inc.
Covenants
|
| | | | | |
| Unsecured Credit Facility, Term Loans Due 2023, 2024 and 2026 and Notes Due 2021, 2024, 2026, 2028 and 2029 (a) |
| | | | | |
| | | Covenant | | September 30, 2019 |
| | | | | |
|
| Leverage ratio (b) | Unsecured Credit Facility, Term Loans Due 2023, 2024 and 2026 and Notes Due 2026, 2028 and 2029:
Notes Due 2021 and 2024: | ≤ 60.0% ≤ 60.0% | | 31.9%
33.7% |
|
| | | | | |
| Secured leverage ratio (b) | Unsecured Credit Facility and Term Loans Due 2023, 2024 and 2026:
Notes Due 2021, 2024, 2026, 2028 and 2029: |
≤ 45.0%
≤ 40.0% | |
1.9% |
|
| | | | | |
| Fixed charge coverage ratio (c) | | ≥ 1.50x | | 3.9x |
|
| | | | | |
|
| Interest coverage ratio (d) | | ≥ 1.50x | | 4.1x |
|
| | | | | |
| Unencumbered leverage ratio (b) | | ≤ 60.0% | | 31.7 | % |
| | | | | |
|
| Unencumbered interest coverage ratio | | ≥ 1.75x | | 4.8x |
|
|
| | | | |
| Notes Due 2025 (e) | | | |
| | Covenant | | September 30, 2019 |
| | | | |
|
| Leverage ratio (f) | ≤ 60.0% | | 35.5 | % |
| | | | |
|
| Secured leverage ratio (f) | ≤ 40.0% | | 2.0 | % |
| | | | |
| Debt service coverage ratio (g) | ≥ 1.50x | | 4.3x |
|
| | | | |
| Unencumbered assets to unsecured debt ratio | ≥ 150% | | 302 | % |
| |
| (a) | For a complete listing of all covenants related to the Company's Unsecured Credit Facility (comprised of the unsecured term loan due 2021 and the unsecured revolving line of credit) as well as covenant definitions, refer to the Fifth Amended and Restated Credit Agreement filed as Exhibit 10.2 to the Company's Quarterly Report on Form 10-Q for the quarter ended March 31, 2018, filed on May 2, 2018. For a complete listing of all covenants as well as covenant definitions related to the Company's Term Loan Due 2023, refer to the credit agreement filed as Exhibit 10.1 to the Company's Current Report on Form 8-K, dated November 29, 2016, the First Amendment to the Term Loan Agreement filed as Exhibit 10.4 to the Company's Quarterly Report on Form 10-Q for the quarter ended June 30, 2018, filed on August 1, 2018 and the Second Amendment to the Term Loan Agreement filed as Exhibit 10.10 to the Company's Annual Report on Form 10-K for the year ended December 31, 2018, filed on February 13, 2019. For a complete listing of all covenants as well as covenant definitions related to the Company's Term Loan Due 2024 and Term Loan Due 2026, refer to the Term Loan Agreement filed as Exhibit 10.1 to the Company's Current Report on Form 8-K, dated July 17, 2019. For a complete listing of all covenants related to the Company's 4.12% senior unsecured notes due 2021 and 4.58% senior unsecured notes due 2024 (Notes Due 2021 and 2024) as well as covenant definitions, refer to the Note Purchase Agreement filed as Exhibit 10.1 to the Company's Current Report on Form 8-K, dated May 22, 2014. For a complete listing of all covenants related to the Company's 4.08% senior unsecured notes due 2026 and 4.24% senior unsecured notes due 2028 (Notes Due 2026 and 2028) as well as covenant definitions, refer to the Note Purchase Agreement filed as Exhibit 10.1 to the Company's Current Report on Form 8-K, dated October 5, 2016. For a complete listing of all covenants related to the Company's 4.82% senior unsecured notes due 2029 (Notes Due 2029) as well as covenant definitions, refer to the Note Purchase Agreement filed as Exhibit 10.1 to the Company's Current Report on Form 8-K, dated April 5, 2019. |
| |
| (b) | Based upon a capitalization rate of 6.50%. |
| |
| (c) | Applies only to the Company's Unsecured Credit Facility, Term Loan Due 2023, Term Loan Due 2024, Term Loan Due 2026, Notes Due 2026 and 2028 and Notes Due 2029. This ratio is based upon consolidated debt service, including interest expense and principal amortization, excluding interest expense related to defeasance costs and prepayment premiums. |
| |
| (d) | Applies only to the Notes Due 2021 and 2024, Notes Due 2026 and 2028 and Notes Due 2029. |
| |
| (e) | For a complete listing of all covenants related to the Company's 4.00% senior unsecured notes due 2025 (Notes Due 2025) as well as covenant definitions, refer to the First Supplemental Indenture filed as Exhibit 4.2 to the Company's Current Report on Form 8-K, dated March 12, 2015. |
| |
| (f) | Based upon the book value of Total Assets as defined in the First Supplemental Indenture referenced in footnote (e) above. |
| |
| (g) | Based upon interest expense and excludes principal amortization. This ratio is calculated on a pro forma basis with the assumption that debt and property transactions occurred on the first day of the preceding four-quarter period. |
|
| | |
| 3rd Quarter 2019 Supplemental Information | | 7 |
Retail Properties of America, Inc.
Summary of Indebtedness as of September 30, 2019
(dollar amounts in thousands)
|
| | | | | | | | | | | | |
| Description | | Balance | | Interest Rate (a) | | Maturity Date | | WA Years to Maturity | | Type |
| Consolidated Indebtedness | | | | | | | | | | |
| Ashland & Roosevelt (bank pad) | | $ | 503 |
| | 7.48% | | 02/25/22 | | 2.4 years | | Fixed/Secured |
| Peoria Crossings | | 24,131 |
| | 4.82% | | 04/01/22 | | 2.5 years | | Fixed/Secured |
| Gateway Village | | 32,900 |
| | 4.14% | | 01/01/23 | | 3.3 years | | Fixed/Secured |
| Northgate North | | 24,932 |
| | 4.50% | | 06/01/27 | | 7.7 years | | Fixed/Secured |
| The Shoppes at Union Hill | | 13,067 |
| | 3.75% | | 06/01/31 | | 11.7 years | | Fixed/Secured |
| Mortgages payable (b) | | 95,533 |
| | 4.37% | | 02/08/25 | | 5.4 years | | |
| | | | | | | | | | | |
| Senior notes – 4.12% due 2021 | | 100,000 |
| | 4.12% | | 06/30/21 | | 1.8 years | | Fixed/Unsecured |
| Senior notes – 4.58% due 2024 | | 150,000 |
| | 4.58% | | 06/30/24 | | 4.8 years | | Fixed/Unsecured |
| Senior notes – 4.00% due 2025 | | 250,000 |
| | 4.00% | | 03/15/25 | | 5.5 years | | Fixed/Unsecured |
| Senior notes – 4.08% due 2026 | | 100,000 |
| | 4.08% | | 09/30/26 | | 7.0 years | | Fixed/Unsecured |
| Senior notes – 4.24% due 2028 | | 100,000 |
| | 4.24% | | 12/28/28 | | 9.3 years | | Fixed/Unsecured |
| Senior notes – 4.82% due 2029 | | 100,000 |
| | 4.82% | | 06/28/29 | | 9.8 years | | Fixed/Unsecured |
| Unsecured notes payable (b) | | 800,000 |
| | 4.27% | | 10/22/25 | | 6.1 years | | |
| | | | | | | | | | | |
| Term loan due 2021 (b) | | 250,000 |
| | 3.20% | (c) | 01/05/21 | | 1.3 years | | Fixed/Unsecured |
| Revolving line of credit | | 24,000 |
| | 3.09% | (d) | 04/22/22 | | 2.6 years | | Variable/Unsecured |
| Unsecured credit facility | | 274,000 |
| | 3.19% | | 02/15/21 | | 1.4 years | | |
| | | | | | | | | | | |
| Term Loan Due 2023 | | 200,000 |
| | 4.05% | (e) | 11/22/23 | | 4.1 years | | Fixed/Unsecured |
| Term Loan Due 2024 | | 120,000 |
| | 2.88% | (f) | 07/17/24 | | 4.8 years | | Fixed/Unsecured |
| Term Loan Due 2026 | | 150,000 |
| | 3.27% | (g) | 07/17/26 | | 6.8 years | | Fixed/Unsecured |
| Unsecured term loans (b) | | 470,000 |
| | 3.50% | | 11/25/24 | | 5.2 years | | |
| | | | | | | | | | | |
| Total consolidated indebtedness | | $ | 1,639,533 |
| | 3.88% | | 09/22/24 | | 5.0 years | | |
|
| | | | | | | | | | | | | | | | | | | | | | | | |
| Consolidated Debt Maturity Schedule as of September 30, 2019 |
| | | | | | | | | | | | | | | |
| Year | | Fixed Rate (b) | | WA Rates on Fixed Debt | | Variable Rate | | WA Rates on Variable Debt (d) | | Total | | % of Total | | WA Rates on Total Debt (a) |
| | | | | | | | | | | | | | | |
| 2019 | | $ | 613 |
| | 4.34 | % | | $ | — |
| | — |
| | $ | 613 |
| | — | % | | 4.34 | % |
| 2020 | | 2,510 |
| | 4.35 | % | | — |
| | — |
| | 2,510 |
| | 0.1 | % | | 4.35 | % |
| 2021 | | 352,626 |
| | 3.47 | % | | — |
| | — |
| | 352,626 |
| | 21.5 | % | | 3.47 | % |
| 2022 | | 26,678 |
| | 4.81 | % | | 24,000 |
| | 3.09 | % | | 50,678 |
| | 3.1 | % | | 4.00 | % |
| 2023 | | 231,758 |
| | 4.06 | % | | — |
| | — |
| | 231,758 |
| | 14.1 | % | | 4.06 | % |
| 2024 | | 271,737 |
| | 3.83 | % | | — |
| | — |
| | 271,737 |
| | 16.6 | % | | 3.83 | % |
| 2025 | | 251,809 |
| | 4.00 | % | | — |
| | — |
| | 251,809 |
| | 15.4 | % | | 4.00 | % |
| 2026 | | 251,884 |
| | 3.60 | % | | — |
| | — |
| | 251,884 |
| | 15.4 | % | | 3.60 | % |
| 2027 | | 21,409 |
| | 4.46 | % | | — |
| | — |
| | 21,409 |
| | 1.3 | % | | 4.46 | % |
| 2028 | | 101,229 |
| | 4.23 | % | | — |
| | — |
| | 101,229 |
| | 6.2 | % | | 4.23 | % |
| Thereafter | | 103,280 |
| | 4.79 | % | | — |
| | — |
| | 103,280 |
| | 6.3 | % | | 4.79 | % |
| Total | | $ | 1,615,533 |
| | 3.89 | % | | $ | 24,000 |
| | 3.09 | % | | $ | 1,639,533 |
| | 100.0 | % | | 3.88 | % |
| |
| (a) | Interest rates presented exclude the impact of the discount and capitalized loan fee amortization. As of September 30, 2019, the Company's overall weighted average interest rate for consolidated debt including the impact of the discount and capitalized loan fee amortization was 4.09%. |
| |
| (b) | Mortgages payable excludes mortgage discount of $(504) and capitalized loan fees of $(272), net of accumulated amortization, as of September 30, 2019. Unsecured notes payable excludes discount of $(645) and capitalized loan fees of $(3,281), net of accumulated amortization, as of September 30, 2019. Unsecured term loans exclude capitalized loan fees of $(3,746), net of accumulated amortization, as of September 30, 2019. In the consolidated debt maturity schedule, maturity amounts for each year include scheduled principal amortization payments. |
| |
| (c) | Reflects $250,000 of LIBOR-based variable rate debt that has been swapped to a fixed rate of 2.00% plus a credit spread based on a leverage grid ranging from 1.20% to 1.70% through January 5, 2021. The applicable credit spread was 1.20% as of September 30, 2019. |
| |
| (d) | Represents interest rate as of September 30, 2019. |
| |
| (e) | Reflects $200,000 of LIBOR-based variable rate debt that has been swapped to a fixed rate of 2.85% plus a credit spread based on a leverage grid ranging from 1.20% to 1.85% through November 22, 2023. The applicable credit spread was 1.20% as of September 30, 2019. |
| |
| (f) | Reflects $120,000 of LIBOR-based variable rate debt that has been swapped to a fixed rate of 1.68% plus a credit spread based on a leverage grid ranging from 1.20% to 1.70% through July 17, 2024. The applicable credit spread was 1.20% as of September 30, 2019. |
| |
| (g) | Reflects $150,000 of LIBOR-based variable rate debt that has been swapped to a fixed rate of 1.77% plus a credit spread based on a leverage grid ranging from 1.50% to 2.20% through July 17, 2026. The applicable credit spread was 1.50% as of September 30, 2019. |
|
| | |
| 3rd Quarter 2019 Supplemental Information | | 8 |
Retail Properties of America, Inc.
Development Projects as of September 30, 2019
(dollar amounts in thousands)
|
| | | | | | | | | | | | | | | | | | | | | | |
Property Name and Metropolitan Statistical Area (MSA) | | Estimated Project Commercial GLA | | Estimated Project Multi-Family Rental Units (MFR) | | JV / Air Rights | | Estimated Net RPAI Project Investment (a) | | Net RPAI Project Investment Inception to Date | | Estimated Incremental Return on Investment (b) | | Anticipated Commencement | | Targeted
Stabilization (c) | | Property Included in Same Store Portfolio (d) | | Project Description |
| | | | | | | | | | | | | | | | | | | | | |
| Active Projects | | | | | | | | | | | | | | | | | | | | |
Circle East (e) (Baltimore MSA) | | 80,000 | | 370 | | MFR: Air rights sale | | $36,000–$38,000 | | $ | 19,466 |
| (f) | 8.0%–10.0% | | Active | | Q4 2020 | | No (e) | | Mixed-use redevelopment that will include dual-sided street level retail with approx. 370 third-party-owned MFR above |
One Loudoun Downtown – Pads G & H (Washington, D.C. MSA) | | 67,000–70,000 | | 378 | | MFR: 90%/10% JV | | $125,000–$135,000 (g) | | $ | 6,527 |
| (g) | 6.0%–7.0% | | Active | | Q2–Q3 2022 | | No (h) | | Vacant pad development; Groundbreaking held June 13, 2019. See site plan on page 12 |
Carillon – phase one (i) (Washington, D.C. MSA) | | 225,900 | | 351 | | MFR: 95%/5% JV MOB: 95%/5% JV | | $194,000–$215,000 (g) | | $ | 4,848 |
| (g) | 6.0%–7.0% | | Active | | Q3–Q4 2022 | | No | | Phased project that will include retail, MFR and medical office use. Phase One retail is 37% pre-leased. See site plan on page 13 |
| | | | | | | | | | | | | | | | | | | | | |
| Future Projects | | | | | | | | | | | | | | | | | | | | |
Main Street Promenade (j) (Chicago MSA) | | 18,900 | | 74 | | TBD | | $25,000–$30,000 | | n/a | | 6.5%–8.0% | | TBD | | TBD | | Yes | | Vacant pad development |
Downtown Crown (Washington, D.C. MSA) | | 36,000 | | — | | n/a | | $13,000–$15,000 | | n/a | | 6.0%–7.0% | | TBD | | TBD | | Yes | | Vacant pad development |
| |
| (a) | Net project investment represents the Company's estimated share of the project costs, net of proceeds from land sales, sales of air rights, reimbursement from third parties and excludes contributions from project partners, as applicable. |
| |
| (b) | Estimated Incremental Return on Investment (ROI) generally reflects only the unleveraged incremental NOI generated by the project upon stabilization and is calculated as incremental NOI divided by net project investment. Incremental NOI is the difference between NOI expected to be generated by the stabilized project and the NOI generated prior to the commencement of active redevelopment, development or expansion of the space. ROI does not include peripheral impacts, such as the impact on future lease rollover at the property or the impact on the long-term value of the property. |
| |
| (c) | Targeted stabilization represents the projected date of the redevelopment reaching 90% occupancy, but generally no later than one year from the completion of major construction activity. |
| |
| (d) | The Company's same store portfolio consists of retail operating properties acquired or placed in service and stabilized prior to January 1, 2018. A property is removed from the Company's same store portfolio if the project is considered to significantly impact the existing property's NOI and activities have begun in anticipation of the project. Expansions and pad developments are generally not considered to significantly impact the existing property's NOI, and therefore, the existing properties have not been removed from the Company's same store portfolio if they otherwise met the criteria to be included in the Company's same store portfolio as of September 30, 2019. |
| |
| (e) | Circle East is the Company's rebranded redevelopment at Towson Circle (which has been excluded from the Company's same store portfolio due to the ongoing redevelopment). |
| |
| (f) | Net project investment inception to date is net of proceeds of $11,820 received in the first quarter of 2018 from the sale of air rights to a third party to develop the MFR. |
| |
| (g) | Project investment includes an allocation of infrastructure costs. |
| |
| (h) | The property is comprised of the redevelopment project (which has been excluded from the Company's same store portfolio due to the ongoing redevelopment) and the remaining retail operating portion of the property (which is included in the Company's same store portfolio as of September 30, 2019). |
| |
| (i) | Carillon – phase one includes two separate joint venture (JV) arrangements. The JV agreements related to the MFR and medical office building (MOB) have been executed and are 95% owned by the Company. |
| |
| (j) | Project remains subject to the approval of the Company's Investment Committee and/or Board of Directors. |
The Company cannot guarantee that (i) ROI will be generated at the percentage listed or at all, (ii) total actual net investment associated with these projects will be equal to the total estimated net project investment, (iii) project commencement or stabilization will occur when anticipated or (iv) that the Company will ultimately complete any or all of these projects. The ROI and total estimated net project investment reflect the Company's best estimate based upon current information, may change over time and are subject to certain conditions which are beyond the Company's control, including, without limitation, general economic conditions, market conditions and other business factors.
|
| | |
| 3rd Quarter 2019 Supplemental Information | | 9 |
Retail Properties of America, Inc.
Development Projects as of September 30, 2019 (continued)
(dollar amounts in thousands)
The Company has identified the following potential development, redevelopment, expansion and pad development opportunities to develop or redevelop significant portions of the property, add stand-alone buildings, convert previously under-utilized space or develop additional commercial GLA at existing properties. Executing on these opportunities may be subject to certain conditions which are beyond the Company's control, including, without limitation, government approvals, tenant consents as well as general economic, market and other conditions and, therefore, the Company can provide no assurances that any of the development, redevelopment, expansion and pad development opportunities (i) will be executed on, (ii) will commence when anticipated or (iii) will ultimately be realized.
|
| | | | | | | | | | |
| Property Name | | MSA | | Included in Same store portfolio (a) | | Estimated Project Commercial GLA | | Estimated Project MFR | | Developable Acreage |
| | | | | | | | | | | |
| Development, Redevelopment, Expansion and Pad Development Opportunities | | | | | | | | |
| One Loudoun Uptown – land held for future development | | Washington, D.C. | | No | | 2,300,000 | | | | 32 |
| Carillon – future phases (b) | | Washington, D.C. | | No | | 975,000 | | 2,650 | | |
| Southlake Town Square | | Dallas | | Yes | | 275,000 | | | | |
| One Loudoun Downtown – Pad T and future phases (c) | | Washington, D.C. | | Yes | | 102,000 – 135,000 | | | | |
| Merrifield Town Center II (b) | | Washington, D.C. | | Yes | | 80,000 – 100,000 | | 350 – 400 | | |
| Tysons Corner (b) | | Washington, D.C. | | Yes | | 50,000 – 75,000 | | 350 – 450 | | |
| Plaza del Lago – future phase | | Chicago | | Yes | | 20,600 | | | | |
| Reisterstown Road Plaza | | Baltimore | | No (d) | | 8,000 – 12,000 | | | | |
| Lakewood Towne Center | | Seattle | | Yes | | 10,500 | | | | |
| Gateway Plaza | | Dallas | | Yes | | 8,000 | | | | |
| Humblewood Shopping Center | | Houston | | Yes | | 5,000 | | | | |
| Watauga Pavilion | | Dallas | | Yes | | 5,000 | | | | |
| Edwards Multiplex – Ontario, CA | | Riverside-San Bernadino | | Yes | | 3,000 | | | | |
| |
| (a) | See footnote (d) on page 9 regarding the Company's same store portfolio. |
| |
| (b) | Project may require demolition of a portion of the property's existing GLA. |
| |
| (c) | One Loudoun Downtown – future phases includes three vacant parcels that have been identified as future pad development opportunities of up to 135,000 square feet of commercial GLA. |
| |
| (d) | The property was reclassified from active redevelopment into the Company's retail operating portfolio during the three months ended December 31, 2018 and is expected to be included in the Company's same store portfolio beginning in the first quarter of 2020 as it will be considered operating for the entirety of 2020 and 2019. |
|
| | |
| 3rd Quarter 2019 Supplemental Information | | 10 |
Retail Properties of America, Inc.
Development Projects as of September 30, 2019 (continued)
(dollar amounts in thousands)
|
| | | | | | | | | | | | | | | | | | | | |
| Property Name and MSA | | Project Commercial GLA | | Project
MFR | | Estimated Net RPAI Project Investment (a) | | Net RPAI Project Investment Inception to Date | | Estimated Incremental Return on Investment (a) | | Stabilization
(a) | | Property Included in Same Store Portfolio (a) | | Project Description |
| | | | | | | | | | | | | | | | | |
| Completed Redevelopment Projects | | | | | | | | | | | | | | | | |
Reisterstown Road Plaza (Baltimore MSA) | | 40,500 | | — | | $ | 10,500 |
| | $ | 9,758 |
| | 10.5%–11.0% | | Q4 2018 | | No (b) | | Reconfigured existing space and facade renovation; redevelopment GLA is 100% leased and 89% occupied |
Plaza del Lago – MFR (Chicago MSA) | | — | | 18 | | $1,350–$1,400 |
| | $ | 1,377 |
| | 8.5%–9.0% | | Q4 2019 | | No (c) | | Reconfiguration of 18 MFR, which are 72% leased; major construction was completed in Q2 2019 |
|
| | | | | | | | | | | | | | |
| Property Name and MSA | | Project Commercial GLA | | Net RPAI Investment (a) | | Incremental Return on Investment (a) | | Completion | | Property Included in Same Store Portfolio (a) | | Project Description |
| | | | | | | | | | | | | |
| Completed Expansions and Pad Developments | | | | | | | | | | | | |
Lake Worth Towne Crossing – Parcel (Dallas MSA) | | 15,030 | | $ | 2,872 |
| | 11.3% | | Q4 2015 | | Yes | | 15,030 sq. ft. multi-tenant retail |
Parkway Towne Crossing (Dallas MSA) | | 21,000 | | $ | 3,468 |
| | 9.9% | | Q3 2016 | | Yes | | 21,000 sq. ft. multi-tenant retail |
Heritage Square (Seattle MSA) | | 4,200 | | $ | 1,507 |
| | 11.2% | | Q3 2016 | | Yes | | 4,200 sq. ft. redevelopment of outparcel for new tenant, Corner Bakery |
Pavilion at King's Grant (Charlotte MSA) | | 32,500 | | $ | 2,470 |
| | 14.7% | | Q2 2017 | | Yes | | 32,500 sq. ft. multi-tenant retail |
Shops at Park Place (Dallas MSA) | | 25,040 | | $ | 3,956 |
| | 9.1% | | Q2 2017 | | Yes | | 25,040 sq. ft. pad development |
Lakewood Towne Center (Seattle MSA) | | 4,500 | | $ | 1,900 |
| | 7.3% | | Q3 2017 | | Yes | | 4,500 sq. ft. pad development |
| |
| (a) | See footnote (a), (b), (c) and (d) on page 9 regarding the net RPAI project investment, incremental return on investment, stabilization and same store portfolio, respectively. |
| |
| (b) | The property was reclassified from active redevelopment into the Company's retail operating portfolio during the three months ended December 31, 2018 and is expected to be included in the Company's same store portfolio beginning in the first quarter of 2020 as it will be considered operating for the entirety of 2020 and 2019. |
| |
| (c) | The property is comprised of the multi-family rental units, which were placed in service during the three months ended September 30, 2019 and are excluded from the Company's same store portfolio, and the remaining retail operating portion of the property, which is included in the Company's same store portfolio as of September 30, 2019. |
|
| | |
| 3rd Quarter 2019 Supplemental Information | | 11 |
Retail Properties of America, Inc.
Development Projects as of September 30, 2019 (continued)
One Loudoun Downtown Site Plan
|
| | |
| 3rd Quarter 2019 Supplemental Information | | 12 |
Retail Properties of America, Inc.
Development Projects as of September 30, 2019 (continued)
Carillon Site Plan
|
| | |
| 3rd Quarter 2019 Supplemental Information | | 13 |
Retail Properties of America, Inc.
Acquisitions and Dispositions for the Nine Months Ended September 30, 2019
(amounts in thousands, except square footage amounts)
Acquisitions
|
| | | | | | | | | | | | | |
| Property Name | | Acquisition Date | | MSA | | Property Type | | GLA | | Purchase Price |
| | | | | | | | | | | |
| North Benson Center | | March 7, 2019 | | Seattle | | Multi-tenant retail | | 70,500 |
| | $ | 25,340 |
|
| Paradise Valley Marketplace – Parcel | | June 10, 2019 | | Phoenix | | Land (a) | | — |
| | 1,343 |
|
| Southlake Town Square – Parcel | | August 13, 2019 | | Dallas | | Single-user parcel (b) | | 3,100 |
| | 3,293 |
|
| | | | | | | | | | | |
| | | Total 2019 acquisitions (through September 30, 2019) | | 73,600 |
| | $ | 29,976 |
|
| |
| (a) | The Company acquired a parcel adjacent to its Paradise Valley Marketplace multi-tenant retail operating property. The total number of properties in the Company's portfolio was not affected by this transaction. |
| |
| (b) | The Company acquired a single-user parcel at its Southlake Town Square multi-tenant retail operating property. The total number of properties in the Company's portfolio was not affected by this transaction. |
Property Dispositions
|
| | | | | | | | | | | | | | | | | | | |
| Property Name | | Disposition Date | | Property Type | | GLA | | Consideration | | Debt Repaid | | Prepayment Premium |
| | | | | | | | | | | | | |
| Edwards Multiplex – Fresno, CA | | March 8, 2019 | | Single-user retail | | 94,600 |
| | $ | 25,850 |
| | $ | — |
| | $ | — |
|
| North Rivers Towne Center | | June 28, 2019 | | Multi-tenant retail | | 141,500 |
| | 18,900 |
| | — |
| | — |
|
| | | | | | | | | | | | | |
| Total 2019 property dispositions (through September 30, 2019) | | 236,100 |
| | $ | 44,750 |
| | $ | — |
| | $ | — |
|
Development Transactions
|
| | | | | | | | |
| Property Name | | Transaction Date | | Transaction | | Consideration |
| | | | | | | |
| One Loudoun Downtown | | May 2, 2019 | | Sale of land parcel and development rights (c) | | $ | 2,306 |
|
| One Loudoun Downtown | | July 12, 2019 | | Sale of land parcel and development rights (c) | | 2,783 |
|
| | | | | | | |
| Total development transactions (through September 30, 2019) | | $ | 5,089 |
|
| |
| (c) | During the three months ended June 30, 2019, the Company disposed of the second phase of a land parcel and the rights to develop 10 residential units. During the three months ended September 30, 2019, the Company sold the final phase consisting of land and the rights to develop 12 residential units. |
There have been no acquisitions or dispositions subsequent to September 30, 2019.
|
| | |
| 3rd Quarter 2019 Supplemental Information | | 14 |
Retail Properties of America, Inc.
Retail Market Summary as of September 30, 2019
|
| | | | | | | | | | | | | | | | | | | | | | | | | | |
| Property Type/Market | | Number of Properties | | Annualized Base Rent (ABR) (a) (in thousands) | | % of Total Multi-Tenant Retail ABR (a) | | ABR per Occupied Sq. Ft. | | GLA (a) (in thousands) | | % of Total Multi-Tenant Retail GLA (a) | | Occupancy | | % Leased Including Signed |
| | | | | | | | | | | | | | | | | |
| Multi-Tenant Retail: | | | | | | | | | | | | | | | | |
| Top 25 MSAs | | | | | | | | | | | | | | | | |
| Dallas | | 19 |
| | $ | 81,702 |
| | 22.9 | % | | $ | 22.67 |
| | 3,942 |
| | 20.0 | % | | 91.4 | % | | 93.3 | % |
| Washington, D.C. | | 8 |
| | 39,040 |
| | 10.9 | % | | 29.21 |
| | 1,387 |
| | 7.0 | % | | 96.3 | % | | 96.5 | % |
| New York | | 9 |
| | 36,780 |
| | 10.3 | % | | 29.60 |
| | 1,292 |
| | 6.6 | % | | 96.2 | % | | 97.5 | % |
| Chicago | | 8 |
| | 28,779 |
| | 8.1 | % | | 23.72 |
| | 1,358 |
| | 6.9 | % | | 89.3 | % | | 91.1 | % |
| Seattle | | 9 |
| | 23,167 |
| | 6.5 | % | | 16.27 |
| | 1,548 |
| | 7.9 | % | | 92.0 | % | | 95.2 | % |
| Baltimore | | 5 |
| | 22,122 |
| | 6.2 | % | | 15.33 |
| | 1,604 |
| | 8.1 | % | | 89.9 | % | | 97.6 | % |
| Atlanta | | 9 |
| | 20,337 |
| | 5.7 | % | | 13.80 |
| | 1,513 |
| | 7.7 | % | | 97.4 | % | | 98.2 | % |
| Houston | | 9 |
| | 15,929 |
| | 4.5 | % | | 15.01 |
| | 1,141 |
| | 5.8 | % | | 93.0 | % | | 95.7 | % |
| San Antonio | | 3 |
| | 12,819 |
| | 3.6 | % | | 18.00 |
| | 722 |
| | 3.7 | % | | 98.7 | % | | 98.7 | % |
| Phoenix | | 3 |
| | 10,855 |
| | 3.0 | % | | 17.76 |
| | 632 |
| | 3.2 | % | | 96.8 | % | | 96.9 | % |
| Los Angeles | | 1 |
| | 5,583 |
| | 1.5 | % | | 25.60 |
| | 241 |
| | 1.2 | % | | 90.4 | % | | 93.8 | % |
| Riverside | | 1 |
| | 4,624 |
| | 1.3 | % | | 15.81 |
| | 292 |
| | 1.5 | % | | 100.0 | % | | 100.0 | % |
| St. Louis | | 1 |
| | 4,204 |
| | 1.2 | % | | 9.77 |
| | 453 |
| | 2.3 | % | | 95.0 | % | | 98.3 | % |
| Charlotte | | 1 |
| | 3,964 |
| | 1.1 | % | | 13.68 |
| | 320 |
| | 1.6 | % | | 90.6 | % | | 90.6 | % |
| Tampa | | 1 |
| | 2,379 |
| | 0.7 | % | | 19.51 |
| | 126 |
| | 0.6 | % | | 97.0 | % | | 97.0 | % |
| Subtotal | | 87 |
| | 312,284 |
| | 87.5 | % | | 20.18 |
| | 16,571 |
| | 84.1 | % | | 93.4 | % | | 95.5 | % |
| | | | | | | | | | | | | | | | | |
| Non-Top 25 MSAs by State | | | | | | | | | | | | | | | | |
| Texas | | 7 |
| | 14,141 |
| | 4.0 | % | | 14.56 |
| | 1,002 |
| | 5.1 | % | | 96.9 | % | | 96.9 | % |
| Michigan | | 1 |
| | 7,483 |
| | 2.1 | % | | 24.17 |
| | 332 |
| | 1.7 | % | | 93.3 | % | | 93.3 | % |
| Massachusetts | | 2 |
| | 7,161 |
| | 2.0 | % | | 11.94 |
| | 643 |
| | 3.3 | % | | 93.2 | % | | 93.2 | % |
| Virginia | | 1 |
| | 5,050 |
| | 1.4 | % | | 18.07 |
| | 308 |
| | 1.5 | % | | 90.8 | % | | 90.8 | % |
| Washington | | 1 |
| | 4,547 |
| | 1.3 | % | | 12.52 |
| | 378 |
| | 1.9 | % | | 96.1 | % | | 96.1 | % |
| Tennessee | | 2 |
| | 4,158 |
| | 1.1 | % | | 11.67 |
| | 364 |
| | 1.8 | % | | 97.8 | % | | 97.8 | % |
| Maryland | | 1 |
| | 2,077 |
| | 0.6 | % | | 20.67 |
| | 113 |
| | 0.6 | % | | 88.9 | % | | 88.9 | % |
| Subtotal | | 15 |
| | 44,617 |
| | 12.5 | % | | 14.97 |
| | 3,140 |
| | 15.9 | % | | 94.9 | % | | 94.9 | % |
| | | | | | | | | | | | | | | | | |
| Total Multi-Tenant Retail | | 102 |
| | 356,901 |
| | 100.0 | % | | 19.34 |
| | 19,711 |
| | 100.0 | % | | 93.6 | % | | 95.4 | % |
| | | | | | | | | | | | | | | | | |
| Single-User Retail | | 2 |
| | 5,865 |
| | | | 22.49 |
| | 260 |
| | | | 100.0 | % | | 100.0 | % |
| | | | | | | | | | | | | | | | | |
Total Retail Operating Portfolio (b) | | 104 |
| | $ | 362,766 |
| | | | $ | 19.38 |
| | 19,971 |
| | | | 93.7 | % | | 95.5 | % |
| |
| (a) | Excludes $1,898 of multi-tenant retail ABR and 106 square feet of multi-tenant retail GLA attributable to Circle East and Carillon, both of which are in active redevelopment and are located in the Baltimore and Washington, D.C. MSAs, respectively. Including these amounts, 87.6% of the Company's multi-tenant retail ABR and 84.2% of the Company's multi-tenant retail GLA is located in the top 25 MSAs. |
| |
| (b) | Excludes the 18 multi-family rental units at Plaza del Lago, which were placed in service during the three months ended September 30, 2019. As of September 30, 2019, 13 multi-family rental units were leased at an average monthly rental rate per unit of $1,288. |
|
| | |
| 3rd Quarter 2019 Supplemental Information | | 15 |
Retail Properties of America, Inc.
Retail Operating Portfolio Occupancy Breakdown as of September 30, 2019
(square footage in thousands)
|
| | | | | | | | | | | | | | | | | | | | | | | | | | | | | | | | |
| Total Retail Operating Portfolio: | | | | | | | | | | | | | | | | | | | |
| | | | | | | | | | | | | | | | | | | | | | |
| | Top 25 MSAs | | Non-Top 25 MSAs | | Total Multi-Tenant Retail | | Single-User Retail | | Total Retail |
| Number of Properties | 87 | | 15 | | 102 | | 2 | | 104 |
| | GLA | | Occupancy | | GLA | | Occupancy | | GLA | | Occupancy | | GLA | | Occupancy | | GLA | | Occupancy | | % Leased Including Signed |
| | | | | | | | | | | | | | | | | | | | | | |
| 25,000+ sq ft | 7,646 |
| | 97.0 | % | | 1,507 |
| | 97.5 | % | | 9,153 |
| | 97.0 | % | | 260 |
| | 100.0 | % | | 9,413 |
| | 97.1 | % | | 98.2 | % |
| 10,000-24,999 sq ft | 3,260 |
| | 92.7 | % | | 588 |
| | 98.0 | % | | 3,848 |
| | 93.5 | % | | — |
| | — | % | | 3,848 |
| | 93.5 | % | | 98.4 | % |
| Anchor | 10,906 |
| | 95.7 | % | | 2,095 |
| | 97.7 | % | | 13,001 |
| | 96.0 | % | | 260 |
| | 100.0 | % | | 13,261 |
| | 96.1 | % | | 98.2 | % |
| | | | | | | | | | | | | | | | | | | | | | |
| 5,000-9,999 sq ft | 2,262 |
| | 89.4 | % | | 376 |
| | 94.0 | % | | 2,638 |
| | 90.1 | % | | — |
| | — |
| | 2,638 |
| | 90.1 | % | | 91.5 | % |
| 0-4,999 sq ft | 3,403 |
| | 88.6 | % | | 669 |
| | 86.7 | % | | 4,072 |
| | 88.3 | % | | — |
| | — |
| | 4,072 |
| | 88.3 | % | | 89.2 | % |
| Non-Anchor | 5,665 |
| | 88.9 | % | | 1,045 |
| | 89.4 | % | | 6,710 |
| | 89.0 | % | | — |
| | — |
| | 6,710 |
| | 89.0 | % | | 90.1 | % |
| | | | | | | | | | | | | | | | | | | | | | |
| Total | 16,571 |
| | 93.4 | % | | 3,140 |
| | 94.9 | % | | 19,711 |
| | 93.6 | % | | 260 |
| | 100.0 | % | | 19,971 |
| | 93.7 | % | | 95.5 | % |
|
| | |
| 3rd Quarter 2019 Supplemental Information | | 16 |
Retail Properties of America, Inc.
Top Retail Tenants as of September 30, 2019
The following table sets forth information regarding the 20 largest tenants in the Company's retail operating portfolio based on ABR as of September 30, 2019. Dollars (other than per square foot information) and square feet of GLA are presented in thousands.
|
| | | | | | | | | | | | | | | | | | | | | | |
| Tenant | | Primary DBA/Number of Stores | | Number of Stores | | ABR (in thousands) | | % of Total ABR | | ABR per Occupied Sq. Ft. | | Occupied GLA (in thousands) | | % of Occupied GLA |
| | | | | | | | | | | | | | | |
| Best Buy Co., Inc. | | Best Buy (11), Pacific Sales (1) | | 12 |
| | $ | 8,857 |
| | 2.4 | % | | $ | 18.04 |
| | 491 |
| | 2.6 | % |
| | | | | | | | | | | | | | | |
| The TJX Companies, Inc. | | T.J. Maxx (11), Marshalls (7), HomeGoods (6) | | 24 |
| | 7,632 |
| | 2.1 | % | | 10.81 |
| | 706 |
| | 3.8 | % |
| | | | | | | | | | | | | | | |
| AB Acquisition LLC | | Safeway (4), Jewel-Osco (3), Tom Thumb (2) | | 9 |
| | 6,674 |
| | 1.8 | % | | 13.73 |
| | 486 |
| | 2.6 | % |
| | | | | | | | | | | | | | | |
| Bed Bath & Beyond Inc. | | Bed Bath & Beyond (12), Cost Plus World Market (3), buybuy BABY (2) | | 17 |
| | 6,344 |
| | 1.7 | % | | 14.04 |
| | 452 |
| | 2.4 | % |
| | | | | | | | | | | | | | | |
| Ross Stores, Inc. | | Ross Dress for Less | | 18 |
| | 6,097 |
| | 1.7 | % | | 11.55 |
| | 528 |
| | 2.8 | % |
| | | | | | | | | | | | | | | |
| PetSmart, Inc. | | | | 17 |
| | 5,751 |
| | 1.6 | % | | 16.62 |
| | 346 |
| | 1.8 | % |
| | | | | | | | | | | | | | | |
| Ahold U.S.A. Inc. | | Stop & Shop (3), Giant Eagle (1) | | 4 |
| | 5,419 |
| | 1.5 | % | | 22.39 |
| | 242 |
| | 1.3 | % |
| | | | | | | | | | | | | | | |
| Gap Inc. | | Old Navy (12), The Gap (4), Banana Republic (3), Janie & Jack (2), Athleta (1), Gap Factory Store (1) | | 23 |
| | 4,987 |
| | 1.4 | % | | 19.56 |
| | 255 |
| | 1.4 | % |
| | | | | | | | | | | | | | | |
| Michaels Stores, Inc. | | Michaels | | 16 |
| | 4,855 |
| | 1.3 | % | | 12.88 |
| | 377 |
| | 2.0 | % |
| | | | | | | | | | | | | | | |
| BJ's Wholesale Club, Inc. | | | | 2 |
| | 4,659 |
| | 1.3 | % | | 19.02 |
| | 245 |
| | 1.3 | % |
| | | | | | | | | | | | | | | |
| Ascena Retail Group, Inc. | | Lane Bryant (10), Catherine's (5), Dress Barn (5), Justice (5), LOFT (5), Ann Taylor (4) | | 34 |
| | 4,062 |
| | 1.1 | % | | 22.82 |
| | 178 |
| | 1.0 | % |
| | | | | | | | | | | | | | | |
| Lowe's Companies, Inc. | | | | 4 |
| | 3,944 |
| | 1.1 | % | | 6.47 |
| | 610 |
| | 3.2 | % |
| | | | | | | | | | | | | | | |
| Regal Entertainment Group | | Edwards Cinema | | 1 |
| | 3,882 |
| | 1.1 | % | | 31.06 |
| | 125 |
| | 0.7 | % |
| | | | | | | | | | | | | | | |
| The Kroger Co. | | Kroger (5), Harris Teeter (1), QFC (1) | | 7 |
| | 3,639 |
| | 1.0 | % | | 10.43 |
| | 349 |
| | 1.9 | % |
| | | | | | | | | | | | | | | |
| Barnes & Noble, Inc. | | | | 7 |
| | 3,592 |
| | 1.0 | % | | 20.88 |
| | 172 |
| | 0.9 | % |
| | | | | | | | | | | | | | | |
| The Home Depot, Inc. | | | | 3 |
| | 3,484 |
| | 1.0 | % | | 9.60 |
| | 363 |
| | 1.9 | % |
| | | | | | | | | | | | | | | |
| Party City Holdings Inc. | | | | 16 |
| | 3,365 |
| | 0.9 | % | | 14.08 |
| | 239 |
| | 1.3 | % |
| | | | | | | | | | | | | | | |
| Office Depot, Inc. | | Office Depot (8), OfficeMax (2) | | 10 |
| | 3,357 |
| | 0.9 | % | | 14.53 |
| | 231 |
| | 1.2 | % |
| | | | | | | | | | | | | | | |
| Ulta Beauty, Inc. | | | | 14 |
| | 3,183 |
| | 0.9 | % | | 21.36 |
| | 149 |
| | 0.8 | % |
| | | | | | | | | | | | | | | |
| Petco Animal Supplies, Inc. | | | | 13 |
| | 3,155 |
| | 0.9 | % | | 17.63 |
| | 179 |
| | 1.0 | % |
| Total Top Retail Tenants | | | | 251 |
| | $ | 96,938 |
| | 26.7 | % | | $ | 14.42 |
| | 6,723 |
| | 35.9 | % |
|
| | |
| 3rd Quarter 2019 Supplemental Information | | 17 |
Retail Properties of America, Inc.
Retail Leasing Activity Summary
(square footage amounts in thousands)
The following table summarizes the leasing activity in the Company's retail operating portfolio as of September 30, 2019 and for the preceding four quarters. Leases of less than 12 months have been excluded.
|
| | | | | | | | | | | | | | | | | | | | | | | | |
| Total Leases | | | | | | | | | | | | | | |
| | | Number of Leases Signed | | GLA Signed | | New Contractual Rent per Square Foot (PSF) (a) | | Prior Contractual Rent PSF (a) | | % Change over Prior ABR (a) | | WA Lease Term | | Tenant Allowances PSF |
| Q3 2019 | | 129 |
| | 1,108 |
| | $ | 19.05 |
| | $ | 17.20 |
| | 10.8 | % | | 6.1 |
| | $ | 15.31 |
|
| Q2 2019 | | 120 |
| | 519 |
| | $ | 24.34 |
| | $ | 22.49 |
| | 8.2 | % | | 6.0 |
| | $ | 13.78 |
|
| Q1 2019 | | 117 |
| | 855 |
| | $ | 23.08 |
| | $ | 21.82 |
| | 5.8 | % | | 6.3 |
| | $ | 18.75 |
|
| Q4 2018 | | 147 |
| | 1,082 |
| | $ | 17.45 |
| | $ | 16.42 |
| | 6.3 | % | | 6.1 |
| | $ | 12.47 |
|
| Total – 12 months | | 513 |
| | 3,564 |
| | $ | 20.27 |
| | $ | 18.80 |
| | 7.8 | % | | 6.1 |
| | $ | 15.05 |
|
| | | | | | | | | | | | | | | |
| Comparable Renewal Leases | | | | |
| | |
| | |
| | |
| | |
|
| | | Number of Leases Signed | | GLA Signed | | New Contractual Rent PSF | | Prior Contractual Rent PSF | | % Change over Prior ABR | | WA Lease Term | | Tenant Allowances PSF |
| Q3 2019 | | 84 |
| | 749 |
| | $ | 18.34 |
| | $ | 17.42 |
| | 5.3 | % | | 4.6 |
| | $ | 0.87 |
|
| Q2 2019 | | 72 |
| | 351 |
| | $ | 22.71 |
| | $ | 21.24 |
| | 6.9 | % | | 5.3 |
| | $ | 2.13 |
|
| Q1 2019 | | 74 |
| | 501 |
| | $ | 22.51 |
| | $ | 21.48 |
| | 4.8 | % | | 5.1 |
| | $ | 4.27 |
|
| Q4 2018 | | 93 |
| | 718 |
| | $ | 17.59 |
| | $ | 17.07 |
| | 3.0 | % | | 5.1 |
| | $ | 1.00 |
|
| Total – 12 months | | 323 |
| | 2,319 |
| | $ | 19.67 |
| | $ | 18.77 |
| | 4.8 | % | | 5.0 |
| | $ | 1.83 |
|
| | | | | | | | | | | | | | | |
| Comparable New Leases | | | | |
| | |
| | |
| | |
| | |
|
| | | Number of Leases Signed | | GLA Signed | | New Contractual Rent PSF | | Prior Contractual Rent PSF | | % Change over Prior ABR | | WA Lease Term | | Tenant Allowances PSF |
| Q3 2019 | | 16 |
| | 125 |
| | $ | 23.27 |
| | $ | 15.90 |
| | 46.4 | % | | 10.4 |
| | $ | 75.11 |
|
| Q2 2019 | | 27 |
| | 67 |
| | $ | 32.89 |
| | $ | 29.05 |
| | 13.2 | % | | 7.7 |
| | $ | 39.52 |
|
| Q1 2019 | | 16 |
| | 109 |
| | $ | 25.69 |
| | $ | 23.36 |
| | 10.0 | % | | 9.5 |
| | $ | 60.12 |
|
| Q4 2018 | | 16 |
| | 114 |
| | $ | 16.62 |
| | $ | 12.32 |
| | 34.9 | % | | 8.5 |
| | $ | 33.49 |
|
| Total – 12 months | | 75 |
| | 415 |
| | $ | 23.62 |
| | $ | 18.98 |
| | 24.4 | % | | 9.1 |
| | $ | 54.00 |
|
| | | | | | | | | | | | | | | |
| Non-Comparable New and Renewal Leases (b) | | |
| | |
| | |
| | |
| | |
|
| | | Number of Leases Signed | | GLA Signed | | New Contractual Rent PSF | | Prior Contractual Rent PSF | | % Change over Prior ABR | | WA Lease Term | | Tenant Allowances PSF |
| Q3 2019 | | 29 |
| | 234 |
| | $ | 15.68 |
| | n/a | | n/a | | 8.1 |
| | $ | 29.54 |
|
| Q2 2019 | | 21 |
| | 101 |
| | $ | 32.71 |
| | n/a | | n/a | | 6.6 |
| | $ | 37.24 |
|
| Q1 2019 | | 27 |
| | 245 |
| | $ | 18.55 |
| | n/a | | n/a | | 7.3 |
| | $ | 29.91 |
|
| Q4 2018 | | 38 |
| | 250 |
| | $ | 16.81 |
| | n/a | | n/a | | 8.0 |
| | $ | 35.79 |
|
| Total – 12 months | | 115 |
| | 830 |
| | $ | 18.95 |
| | n/a | | n/a | | 7.5 |
| | $ | 32.47 |
|
| |
| (a) | Excludes the impact of Non-Comparable New and Renewal Leases. |
| |
| (b) | Includes (i) leases signed on units that were vacant for over 12 months, (ii) leases signed without fixed rental payments and (iii) leases signed where the previous and the current lease do not have a consistent lease structure. |
|
| | |
| 3rd Quarter 2019 Supplemental Information | | 18 |
Retail Properties of America, Inc.
Retail Lease Expirations as of September 30, 2019
The following tables set forth a summary, as of September 30, 2019, of lease expirations scheduled to occur during the remainder of 2019 and each of the nine calendar years from 2020 to 2028 and thereafter, assuming no exercise of renewal options or early termination rights for all leases in the Company's retail operating portfolio. The following tables are based on leases commenced as of September 30, 2019. Dollars (other than per square foot information) and square feet of GLA are presented in thousands in the table.
|
| | | | | | | | | | | | | | | | | | | | | | | | | | | | | | | |
| Lease Expiration Year | | Lease Count | | ABR (in thousands) | | % of Total ABR | | ABR per Occupied Sq. Ft. | | ABR at Exp. (a) (in thousands) | | ABR per Occupied Sq. Ft. at Exp. | | GLA (in thousands) | | % of Occupied GLA | | % of Total GLA |
| 2019 | | 83 |
| | $ | 6,718 |
| | 1.9 | % | | $ | 19.88 |
| | $ | 6,718 |
| | $ | 19.88 |
| | 338 |
| | 1.8 | % | | 1.7 | % |
| 2020 | | 310 |
| | 26,445 |
| | 7.3 | % | | 22.35 |
| | 26,606 |
| | 22.49 |
| | 1,183 |
| | 6.3 | % | | 5.9 | % |
| 2021 | | 310 |
| | 46,307 |
| | 12.7 | % | | 20.04 |
| | 46,843 |
| | 20.27 |
| | 2,311 |
| | 12.4 | % | | 11.6 | % |
| 2022 | | 346 |
| | 51,150 |
| | 14.1 | % | | 16.80 |
| | 52,285 |
| | 17.17 |
| | 3,045 |
| | 16.3 | % | | 15.2 | % |
| 2023 | | 343 |
| | 50,584 |
| | 14.0 | % | | 19.81 |
| | 52,297 |
| | 20.48 |
| | 2,553 |
| | 13.7 | % | | 12.8 | % |
| 2024 | | 402 |
| | 59,579 |
| | 16.4 | % | | 19.75 |
| | 62,277 |
| | 20.64 |
| | 3,017 |
| | 16.2 | % | | 15.1 | % |
| 2025 | | 147 |
| | 30,501 |
| | 8.4 | % | | 17.23 |
| | 32,855 |
| | 18.56 |
| | 1,770 |
| | 9.4 | % | | 8.9 | % |
| 2026 | | 92 |
| | 17,678 |
| | 4.9 | % | | 21.30 |
| | 20,310 |
| | 24.47 |
| | 830 |
| | 4.4 | % | | 4.2 | % |
| 2027 | | 82 |
| | 13,038 |
| | 3.6 | % | | 15.92 |
| | 14,659 |
| | 17.90 |
| | 819 |
| | 4.3 | % | | 4.1 | % |
| 2028 | | 81 |
| | 18,657 |
| | 5.1 | % | | 23.21 |
| | 21,172 |
| | 26.33 |
| | 804 |
| | 4.3 | % | | 4.0 | % |
| Thereafter | | 146 |
| | 41,328 |
| | 11.4 | % | | 20.60 |
| | 48,860 |
| | 24.36 |
| | 2,006 |
| | 10.7 | % | | 10.0 | % |
| Month to month | | 21 |
| | 781 |
| | 0.2 | % | | 20.55 |
| | 781 |
| | 20.55 |
| | 38 |
| | 0.2 | % | | 0.2 | % |
| Leased Total | | 2,363 |
| | $ | 362,766 |
| | 100.0 | % | | $ | 19.38 |
| | $ | 385,663 |
| | $ | 20.61 |
| | 18,714 |
| | 100.0 | % | | 93.7 | % |
| | | | | | | | | | | | | | | | | | | |
| Leases signed but not commenced | | 38 |
| | $ | 7,676 |
| | — |
| | $ | 21.44 |
| | $ | 8,733 |
| | $ | 24.39 |
| | 358 |
| | — |
| | 1.8 | % |
| Available | | |
| | |
| | |
| | |
| | |
| | |
| | 899 |
| | — |
| | 4.5 | % |
| | | | | | | | | | | | | | | | | | | |
| The following tables break down the above information into anchor (10,000 sf and above) and non-anchor (under 10,000 sf) details for the Company's retail operating portfolio. Dollars (other than per square foot information) and square feet of GLA are presented in thousands in the tables. |
| Anchor | | |
| | |
| | |
| | |
| | |
| | |
| | |
| | |
| | |
|
| Lease Expiration Year | | Lease Count | | ABR (in thousands) | | % of Total ABR | | ABR per Occupied Sq. Ft. | | ABR at Exp. (a) (in thousands) | | ABR per Occupied Sq. Ft. at Exp. | | GLA (in thousands) | | % of Occupied GLA | | % of Total GLA |
| 2019 | | 5 |
| | $ | 981 |
| | 0.3 | % | | $ | 8.46 |
| | $ | 981 |
| | $ | 8.46 |
| | 116 |
| | 0.6 | % | | 0.6 | % |
| 2020 | | 17 |
| | 5,391 |
| | 1.5 | % | | 13.97 |
| | 5,391 |
| | 13.97 |
| | 386 |
| | 2.0 | % | | 1.9 | % |
| 2021 | | 52 |
| | 24,817 |
| | 6.8 | % | | 16.03 |
| | 25,004 |
| | 16.15 |
| | 1,548 |
| | 8.3 | % | | 7.8 | % |
| 2022 | | 63 |
| | 27,372 |
| | 7.5 | % | | 12.32 |
| | 27,602 |
| | 12.42 |
| | 2,222 |
| | 11.9 | % | | 11.1 | % |
| 2023 | | 59 |
| | 23,884 |
| | 6.6 | % | | 14.39 |
| | 24,194 |
| | 14.57 |
| | 1,660 |
| | 8.9 | % | | 8.3 | % |
| 2024 | | 69 |
| | 27,998 |
| | 7.7 | % | | 13.89 |
| | 28,363 |
| | 14.07 |
| | 2,016 |
| | 10.8 | % | | 10.1 | % |
| 2025 | | 45 |
| | 18,751 |
| | 5.2 | % | | 13.46 |
| | 19,751 |
| | 14.18 |
| | 1,393 |
| | 7.4 | % | | 7.0 | % |
| 2026 | | 26 |
| | 9,354 |
| | 2.6 | % | | 16.67 |
| | 10,211 |
| | 18.20 |
| | 561 |
| | 3.0 | % | | 2.8 | % |
| 2027 | | 15 |
| | 6,033 |
| | 1.7 | % | | 10.30 |
| | 6,557 |
| | 11.19 |
| | 586 |
| | 3.1 | % | | 2.9 | % |
| 2028 | | 20 |
| | 10,558 |
| | 2.9 | % | | 18.36 |
| | 11,504 |
| | 20.01 |
| | 575 |
| | 3.1 | % | | 2.9 | % |
| Thereafter | | 49 |
| | 30,550 |
| | 8.4 | % | | 18.18 |
| | 35,460 |
| | 21.11 |
| | 1,680 |
| | 9.0 | % | | 8.4 | % |
| Month to month | | — |
| | — |
| | — | % | | — |
| | — |
| | — |
| | — |
| | — | % | | — | % |
| Leased Total | | 420 |
| | $ | 185,689 |
| | 51.2 | % | | $ | 14.57 |
| | $ | 195,018 |
| | $ | 15.30 |
| | 12,743 |
| | 68.1 | % | | 63.8 | % |
| | | | | | | | | | | | | | | | | | | |
| Leases signed but not commenced | | 14 |
| | $ | 5,478 |
| | — |
| | $ | 19.22 |
| | $ | 6,141 |
| | $ | 21.55 |
| | 285 |
| | — |
| | 1.4 | % |
| Available | | | | | | | | | | | | | | 233 |
| | — |
| | 1.2 | % |
| | | | | | | | | | | | | | | | | | | |
| Non-Anchor | | | | | | | | | | | | | | | | | | |
| Lease Expiration Year | | Lease Count | | ABR (in thousands) | | % of Total ABR | | ABR per Occupied Sq. Ft. | | ABR at Exp. (a) (in thousands) | | ABR per Occupied Sq. Ft. at Exp. | | GLA (in thousands) | | % of Occupied GLA | | % of Total GLA |
| 2019 | | 78 |
| | $ | 5,737 |
| | 1.6 | % | | $ | 25.84 |
| | $ | 5,737 |
| | $ | 25.84 |
| | 222 |
| | 1.2 | % | | 1.1 | % |
| 2020 | | 293 |
| | 21,054 |
| | 5.8 | % | | 26.42 |
| | 21,215 |
| | 26.62 |
| | 797 |
| | 4.3 | % | | 4.0 | % |
| 2021 | | 258 |
| | 21,490 |
| | 5.9 | % | | 28.17 |
| | 21,839 |
| | 28.62 |
| | 763 |
| | 4.1 | % | | 3.8 | % |
| 2022 | | 283 |
| | 23,778 |
| | 6.6 | % | | 28.89 |
| | 24,683 |
| | 29.99 |
| | 823 |
| | 4.4 | % | | 4.1 | % |
| 2023 | | 284 |
| | 26,700 |
| | 7.4 | % | | 29.90 |
| | 28,103 |
| | 31.47 |
| | 893 |
| | 4.8 | % | | 4.5 | % |
| 2024 | | 333 |
| | 31,581 |
| | 8.7 | % | | 31.55 |
| | 33,914 |
| | 33.88 |
| | 1,001 |
| | 5.4 | % | | 5.0 | % |
| 2025 | | 102 |
| | 11,750 |
| | 3.2 | % | | 31.17 |
| | 13,104 |
| | 34.76 |
| | 377 |
| | 2.0 | % | | 1.9 | % |
| 2026 | | 66 |
| | 8,324 |
| | 2.3 | % | | 30.94 |
| | 10,099 |
| | 37.54 |
| | 269 |
| | 1.4 | % | | 1.4 | % |
| 2027 | | 67 |
| | 7,005 |
| | 1.9 | % | | 30.06 |
| | 8,102 |
| | 34.77 |
| | 233 |
| | 1.2 | % | | 1.2 | % |
| 2028 | | 61 |
| | 8,099 |
| | 2.2 | % | | 35.37 |
| | 9,668 |
| | 42.22 |
| | 229 |
| | 1.2 | % | | 1.1 | % |
| Thereafter | | 97 |
| | 10,778 |
| | 3.0 | % | | 33.06 |
| | 13,400 |
| | 41.10 |
| | 326 |
| | 1.7 | % | | 1.6 | % |
| Month to month | | 21 |
| | 781 |
| | 0.2 | % | | 20.55 |
| | 781 |
| | 20.55 |
| | 38 |
| | 0.2 | % | | 0.2 | % |
| Leased Total | | 1,943 |
| | $ | 177,077 |
| | 48.8 | % | | $ | 29.66 |
| | $ | 190,645 |
| | $ | 31.93 |
| | 5,971 |
| | 31.9 | % | | 29.9 | % |
| | | | | | | | | | | | | | | | | | | |
| Leases signed but not commenced | | 24 |
| | $ | 2,198 |
| | — |
| | $ | 30.11 |
| | $ | 2,592 |
| | $ | 35.51 |
| | 73 |
| | — |
| | 0.4 | % |
| Available | | | | | | | | | | | | | | 666 |
| | — |
| | 3.3 | % |
| |
| (a) | Represents annualized base rent at the scheduled expiration of the lease giving effect to fixed contractual increases in base rent. |
|
| | |
| 3rd Quarter 2019 Supplemental Information | | 19 |
Retail Properties of America, Inc.
Non-GAAP Financial Measures and Other Definitions
Gross Leasable Area (GLA)
Gross Leasable Area (GLA) is defined as the aggregate number of square feet available for lease. GLA excludes square footage attributable to third-party managed storage units and multi-family rental units, of which the Company owned 62,000 square feet of managed storage space and 18 multi-family rental units as of September 30, 2019.
Occupancy
Occupancy is defined, for a property or group of properties, as the ratio, expressed as a percentage, of (a) the number of square feet of such property economically occupied by tenants under leases with an initial term of greater than one year, to (b) the aggregate number of square feet for such property.
Percent Leased Including Signed
Percent Leased Including Signed is defined, for a property or group of properties, as the ratio, expressed as a percentage, of (a) the sum of occupied square feet (pursuant to the definition above) of such property and vacant square feet for which a lease with an initial term of greater than one year has been signed, but rent has not yet commenced, to (b) the aggregate number of square feet for such property.
Metropolitan Statistical Area (MSA)
Metropolitan Statistical Area (MSA) information is sourced from the United States Census Bureau and rank is determined based on the most recently available population estimates.
Funds From Operations (FFO) Attributable to Common Shareholders
As defined by the National Association of Real Estate Investment Trusts (NAREIT), an industry trade group, Funds From Operations (FFO) means net income computed in accordance with generally accepted accounting principles (GAAP), excluding (i) depreciation and amortization related to real estate, (ii) gains from sales of real estate assets, (iii) gains and losses from change in control and (iv) impairment write-downs of real estate assets and investments in entities directly attributable to decreases in the value of real estate held by the entity. The Company has adopted the NAREIT definition in its computation of FFO attributable to common shareholders. The Company believes that, subject to the following limitations, FFO attributable to common shareholders provides a basis for comparing its performance and operations to those of other real estate investment trusts (REITs). The Company believes that FFO attributable to common shareholders, which is a supplemental non-GAAP financial measure, provides an additional and useful means to assess the operating performance of REITs. FFO attributable to common shareholders does not represent an alternative to (i) "Net income" or "Net income attributable to common shareholders" as an indicator of the Company's financial performance, or (ii) "Cash flows from operating activities" in accordance with GAAP as a measure of the Company's capacity to fund cash needs, including the payment of dividends.
Operating FFO Attributable to Common Shareholders
Operating FFO attributable to common shareholders is defined as FFO attributable to common shareholders excluding the impact of discrete non-operating transactions and other events which the Company does not consider representative of the comparable operating results of its real estate operating portfolio, which is its core business platform. Specific examples of discrete non-operating transactions and other events include, but are not limited to, the impact on earnings from gains or losses associated with the early extinguishment of debt or other liabilities, litigation involving the Company, the impact on earnings from executive separation and the excess of redemption value over carrying value of preferred stock redemption, which are not otherwise adjusted in the Company's calculation of FFO attributable to common shareholders. The Company believes that Operating FFO attributable to common shareholders, which is a supplemental non-GAAP financial measure, provides an additional and useful means to assess the operating performance of REITs. Operating FFO attributable to common shareholders does not represent an alternative to (i) "Net income" or "Net income attributable to common shareholders" as an indicator of the Company's financial performance, or (ii) "Cash flows from operating activities" in accordance with GAAP as a measure of the Company's capacity to fund cash needs, including the payment of dividends. Comparison of the Company's presentation of Operating FFO attributable to common shareholders to similarly titled measures for other REITs may not necessarily be meaningful due to possible differences in definition and application by such REITs.
Net Operating Income (NOI)
The Company defines Net Operating Income (NOI) as all revenues other than (i) straight-line rental income (non-cash), (ii) amortization of lease inducements, (iii) amortization of acquired above and below market lease intangibles and (iv) lease termination fee income, less real estate taxes and all operating expenses other than lease termination fee expense and non-cash ground rent expense, which is comprised of straight-line ground rent expense and amortization of acquired ground lease intangibles for the three and nine months ended September 30, 2018 and amortization of right-of-use lease assets and amortization of lease liabilities for the three and nine months ended September 30, 2019. NOI consists of Same Store NOI and NOI from Other Investment Properties. The Company believes that NOI, which is a supplemental non-GAAP financial measure, provides an additional and useful operating perspective not immediately apparent from "Net income" or "Net income attributable to common shareholders" in accordance with GAAP. The Company uses NOI to evaluate its performance on a property-by-property basis because this measure allows management to evaluate the impact that factors such as lease structure, lease rates and tenant base have on the Company's operating results. NOI does not represent an alternative to "Net income" or "Net income attributable to common shareholders" in accordance with GAAP as an indicator of the Company's financial performance. Comparison of the Company's presentation of NOI to similarly titled measures for other REITs may not necessarily be meaningful due to possible differences in definition and application by such REITs.
|
| | |
| 3rd Quarter 2019 Supplemental Information | | 20 |
Retail Properties of America, Inc.
Non-GAAP Financial Measures and Other Definitions (continued)
Same Store NOI and NOI from Other Investment Properties
Same Store NOI for the three and nine months ended September 30, 2019 represents NOI from the Company's same store portfolio consisting of 102 retail operating properties acquired or placed in service and stabilized prior to January 1, 2018. NOI from Other Investment Properties for the three and nine months ended September 30, 2019 represents NOI primarily from (i) properties acquired or placed in service during 2018 and 2019, including Reisterstown Road Plaza, which was reclassified from active redevelopment into the Company's retail operating portfolio during 2018, (ii) the multi-family rental units at Plaza del Lago, a redevelopment project that was placed in service during the three months ended September 30, 2019, (iii) Circle East, which is in active redevelopment, (iv) One Loudoun Downtown – Pads G & H, which are in active redevelopment, (v) Carillon, which is in active redevelopment, (vi) properties that were sold or held for sale during 2018 and 2019, and (vii) the net income from the Company's wholly-owned captive insurance company.
The Company believes that Same Store NOI and NOI from Other Investment Properties, which are supplemental non-GAAP financial measures, provide an additional and useful operating perspective not immediately apparent from "Net income" or "Net income attributable to common shareholders" in accordance with GAAP. The Company uses these measures to evaluate its performance on a property-by-property basis because they allow management to evaluate the impact that factors such as lease structure, lease rates and tenant base have on the Company's operating results. Same Store NOI and NOI from Other Investment Properties do not represent alternatives to "Net income" or "Net income attributable to common shareholders" in accordance with GAAP as indicators of the Company's financial performance. Comparison of the Company's presentation of Same Store NOI and NOI from Other Investment Properties to similarly titled measures for other REITs may not necessarily be meaningful due to possible differences in definition and application by such REITs.
EBITDAre and Adjusted EBITDAre
As defined by NAREIT, EBITDA for real estate (EBITDAre) means net income (loss) computed in accordance with GAAP, plus (i) interest expense, (ii) income tax expense, (iii) depreciation and amortization, (iv) impairment charges on investment property and (v) impairment charges on investments in unconsolidated affiliates if caused by a decrease in the value of depreciable property in the affiliate, plus or minus (i) gains from sales of investment property, including gains (or losses) on change in control, and (ii) adjustments to reflect the entity's share of EBITDAre of unconsolidated affiliates. The Company has adopted the NAREIT definition in its computation of EBITDAre as it believes it provides a basis for comparing the Company's performance to that of other REITs. The Company also reports Adjusted EBITDAre, which excludes the impact of certain discrete non-operating transactions and other events such as the impact on earnings from executive separation. The Company believes that Adjusted EBITDAre is useful because it allows investors and management to evaluate and compare the Company's performance from period to period in a meaningful and consistent manner in addition to standard financial measurements under GAAP. EBITDAre and Adjusted EBITDAre are supplemental non-GAAP financial measures and should not be considered alternatives to "Net income" or "Net income attributable to common shareholders" as indicators of the Company's financial performance. Comparison of the Company's presentation of EBITDAre and Adjusted EBITDAre to similarly titled measures for other REITs may not necessarily be meaningful due to possible differences in definition and application by such REITs.
Net Debt to Adjusted EBITDAre
Net Debt to Adjusted EBITDAre is a supplemental non-GAAP financial measure and represents (i) the Company's total debt principal, which excludes unamortized premium, discount and capitalized loan fees, less (ii) cash and cash equivalents divided by (iii) Adjusted EBITDAre for the prior three months, annualized (Annualized Adjusted EBITDAre). The Company believes that this ratio is useful because it provides investors with information regarding its total debt principal net of cash and cash equivalents, which could be used to repay debt, compared to its performance as measured using Annualized Adjusted EBITDAre. Comparison of the Company's presentation of Net Debt to Adjusted EBITDAre to similarly titled measures for other REITs may not necessarily be meaningful due to possible differences in definition and application by such REITs.
|
| | |
| 3rd Quarter 2019 Supplemental Information | | 21 |
Retail Properties of America, Inc.
Reconciliation of Non-GAAP Financial Measures
(amounts in thousands)
(unaudited)
Reconciliation of Net (Loss) Income Attributable to Common Shareholders to Same Store NOI
|
| | | | | | | | | | | | | | | |
| | Three Months Ended September 30, | | Nine Months Ended September 30, |
| | 2019 | | 2018 | | 2019 | | 2018 |
| | |
| | |
| | |
| | |
|
| Net (loss) income attributable to common shareholders | $ | (28,153 | ) | | $ | 12,834 |
| | $ | 16,225 |
| | $ | 65,496 |
|
| Adjustments to reconcile to Same Store NOI: | |
| | |
| | |
| | |
|
| Gain on sales of investment properties | (1,969 | ) | | (2,692 | ) | | (18,872 | ) | | (37,211 | ) |
| Depreciation and amortization | 67,460 |
| | 43,169 |
| | 153,609 |
| | 132,107 |
|
| Provision for impairment of investment properties | 11,177 |
| | — |
| | 11,177 |
| | 1,316 |
|
| General and administrative expenses | 10,334 |
| | 9,160 |
| | 30,186 |
| | 31,929 |
|
| Interest expense | 25,084 |
| | 21,336 |
| | 59,877 |
| | 56,918 |
|
| Straight-line rental income, net | (581 | ) | | (946 | ) | | (2,697 | ) | | (4,826 | ) |
| Amortization of acquired above and below market lease intangibles, net | (1,470 | ) | | (540 | ) | | (4,515 | ) | | (3,748 | ) |
| Amortization of lease inducements | 343 |
| | 259 |
| | 958 |
| | 746 |
|
| Lease termination fees, net | (331 | ) | | (196 | ) | | (1,751 | ) | | 477 |
|
| Non-cash ground rent expense, net | 333 |
| | 440 |
| | 1,023 |
| | 1,405 |
|
| Other expense (income), net | 1,113 |
| | (303 | ) | | 2,244 |
| | (853 | ) |
| NOI | 83,340 |
| | 82,521 |
| | 247,464 |
| | 243,756 |
|
| NOI from Other Investment Properties | (2,850 | ) | | (3,864 | ) | | (7,391 | ) | | (9,981 | ) |
| Same Store NOI | $ | 80,490 |
| | $ | 78,657 |
| | $ | 240,073 |
| | $ | 233,775 |
|
|
| | |
| 3rd Quarter 2019 Supplemental Information | | 22 |
Retail Properties of America, Inc.
Reconciliation of Non-GAAP Financial Measures (continued)
(amounts in thousands)
(unaudited)
Reconciliation of Mortgages Payable, Net, Unsecured Notes Payable, Net,
Unsecured Term Loans, Net and Unsecured Revolving Line of Credit to Total Net Debt
|
| | | | | | | | |
| | | September 30,
2019 | | December 31,
2018 |
| | | | | |
| Mortgages payable, net | | $ | 94,757 |
| | $ | 205,320 |
|
| Unsecured notes payable, net | | 796,074 |
| | 696,362 |
|
| Unsecured term loans, net | | 716,254 |
| | 447,367 |
|
| Unsecured revolving line of credit | | 24,000 |
| | 273,000 |
|
| Total | | 1,631,085 |
| | 1,622,049 |
|
| Mortgage premium, net of accumulated amortization | | — |
| | (775 | ) |
| Mortgage discount, net of accumulated amortization | | 504 |
| | 536 |
|
| Unsecured notes payable discount, net of accumulated amortization | | 645 |
| | 734 |
|
| Capitalized loan fees, net of accumulated amortization | | 7,299 |
| | 5,906 |
|
| Total debt principal | | 1,639,533 |
| | 1,628,450 |
|
| Less: consolidated cash and cash equivalents | | (17,076 | ) | | (14,722 | ) |
| Total net debt | | $ | 1,622,457 |
| | $ | 1,613,728 |
|
Reconciliation of Net (Loss) Income to Adjusted EBITDAre
|
| | | | | | | | | | | | | | | | | | | |
| | Three Months Ended | | Nine Months Ended |
| | September 30, 2019 | | September 30, 2018 | | December 31, 2018 | | September 30, 2019 | | September 30, 2018 |
| | | | | | | | | | |
| Net (loss) income | $ | (28,153 | ) | | $ | 12,834 |
| | $ | 12,144 |
| | $ | 16,225 |
| | $ | 65,496 |
|
| Interest expense | 25,084 |
| | 21,336 |
| | 16,828 |
| | 59,877 |
| | 56,918 |
|
| Depreciation and amortization | 67,460 |
| | 43,169 |
| | 43,870 |
| | 153,609 |
| | 132,107 |
|
| Gain on sales of investment properties | (1,969 | ) | | (2,692 | ) | | — |
| | (18,872 | ) | | (37,211 | ) |
| Provision for impairment of investment properties | 11,177 |
| | — |
| | 763 |
| | 11,177 |
| | 1,316 |
|
EBITDAre (a) | $ | 73,599 |
| | $ | 74,647 |
| | $ | 73,605 |
| | $ | 222,016 |
| | $ | 218,626 |
|
| Impact on earnings from executive separation | — |
| | — |
| | — |
| | — |
| | 1,737 |
|
Adjusted EBITDAre | $ | 73,599 |
| | $ | 74,647 |
| | $ | 73,605 |
| | $ | 222,016 |
| | $ | 220,363 |
|
Annualized Adjusted EBITDAre | $ | 294,396 |
| | $ | 298,588 |
| | $ | 294,420 |
| | $ | 296,021 |
| | $ | 293,817 |
|
| |
| (a) | EBITDAre for the three and nine months ended September 30, 2018 has been restated to exclude $1,285 and $3,464, respectively, of gain on sale of non-depreciable investment property in connection with the Company's adoption of "NAREIT Funds From Operations White Paper – 2018 Restatement" effective January 1, 2019 on a retrospective basis. As the gain on sale of non-depreciable investment property was previously excluded from Adjusted EBITDAre, there was no change to Adjusted EBITDAre. |
|
| | |
| 3rd Quarter 2019 Supplemental Information | | 23 |