UNITED STATES
SECURITIES AND EXCHANGE COMMISSION
Washington, D.C. 20549
Form N-CSR
CERTIFIED SHAREHOLDER REPORT OF REGISTERED
MANAGEMENT INVESTMENT COMPANIES
Investment Company Act File Number: 811-21323
Eaton Vance Limited Duration Income Fund
(Exact Name of Registrant as Specified in Charter)
Two International Place, Boston, Massachusetts 02110
(Address of Principal Executive Offices)
Maureen A. Gemma
Two International Place, Boston, Massachusetts 02110
(Name and Address of Agent for Services)
(617) 482-8260
(Registrant’s Telephone Number)
March 31
Date of Fiscal Year End
September 30, 2012
Date of Reporting Period
Item 1. Reports to Stockholders
| | |
Eaton Vance Limited Duration Income Fund (EVV) Semiannual Report September 30, 2012 | | 
|

Fund shares are not insured by the FDIC and are not deposits or other obligations of, or guaranteed by, any depository institution. Shares are subject to investment risks, including possible loss of principal invested.
Semiannual Report September 30, 2012
Eaton Vance
Limited Duration Income Fund
Table of Contents
| | | | |
Performance | | | 2 | |
| |
Fund Profile | | | 2 | |
| |
Endnotes and Additional Disclosures | | | 3 | |
| |
Financial Statements | | | 4 | |
| |
Board of Trustees’ Contract Approval | | | 49 | |
| |
Officers and Trustees | | | 52 | |
| |
Important Notices | | | 53 | |
Eaton Vance
Limited Duration Income Fund
September 30, 2012
Performance1
Portfolio Managers Scott H. Page, CFA, Payson F. Swaffield, CFA, Mark S. Venezia, CFA, Michael W. Weilheimer, CFA, Catherine C. McDermott and Andrew Szczurowski, CFA
| | | | | | | | | | | | | | | | | | | | |
| % Average Annual Total Returns | | Inception Date | | | Six Months | | | One Year | | | Five Years | | | Since Inception | |
Fund at NAV | | | 5/30/2003 | | | | 5.01 | % | | | 14.15 | % | | | 8.72 | % | | | 7.74 | % |
Fund at Market Price | | | — | | | | 9.90 | | | | 25.26 | | | | 10.47 | | | | 7.91 | |
| | | | | |
| | | | | | | | | | | | | | | | | | | | |
| % Premium/Discount to NAV | | | | | | | | | | | | | | | |
| | | | | | | | | | | | | | | | | | | 1.49 | % |
| | | | | |
| | | | | | | | | | | | | | | | | | | | |
| Distributions2 | | | | | | | | | | | | | | | |
Total Distributions per share for the period | | | | | | | | | | | | | | | | | | $ | 0.625 | |
Distribution Rate at NAV | | | | | | | | | | | | | | | | | | | 7.47 | % |
Distribution Rate at Market Price | | | | | | | | | | | | | | | | | | | 7.36 | % |
| | | | | |
| | | | | | | | | | | | | | | | | | | | |
| % Total Leverage3 | | | | | | | | | | | | | | | |
Auction Preferred Shares (APS) | | | | | | | | | | | | | | | | | | | 9.85 | % |
Borrowings | | | | | | | | | | | | | | | | | | | 17.51 | |
Fund Profile
See Endnotes and Additional Disclosures in this report.
Past performance is no guarantee of future results. Returns are historical and are calculated by determining the percentage change in net asset value (NAV) or market price (as applicable) with all distributions reinvested. Fund performance at market price will differ from its results at NAV due to factors such as changing perceptions about the Fund, market conditions, fluctuations in supply and demand for Fund shares, or changes in Fund distributions. Investment return and principal value will fluctuate so that shares, when sold, may be worth more or less than their original cost. Performance less than one year is cumulative. Performance is for the stated time period only; due to market volatility, current Fund performance may be lower or higher than the quoted return. For performance as of the most recent month end, please refer to www.eatonvance.com.
Eaton Vance
Limited Duration Income Fund
September 30, 2012
Endnotes and Additional Disclosures
| 1 | Performance results reflect the effects of leverage. |
| 2 | The Distribution Rate is based on the Fund’s last regular distribution per share in the period (annualized) divided by the Fund’s NAV or market price at the end of the period. The Fund’s distributions may be composed of ordinary income, tax-exempt income, net realized capital gains and return of capital. |
| 3 | Leverage represents the liquidation value of the Fund’s APS and borrowings outstanding as a percentage of Fund net assets applicable to common shares plus APS and borrowings outstanding. Use of leverage creates an opportunity for income, but creates risks including greater price volatility. The cost of leverage rises and falls with changes in short-term interest rates. The Fund is required to maintain prescribed asset coverage for its APS and borrowings, which could be reduced if Fund asset values decline. |
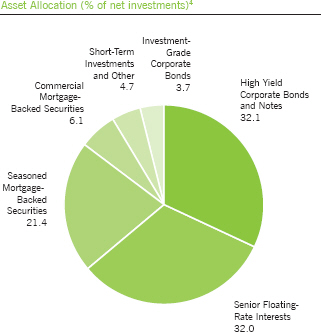
| 4 | Asset allocation as a percentage of the Fund’s net assets amounted to 137.7%. |
| | Fund profile subject to change due to active management. |
Eaton Vance
Limited Duration Income Fund
September 30, 2012
Portfolio of Investments (Unaudited)
| | | | | | | | | | |
| Senior Floating-Rate Interests — 44.1%(1) | |
| | | |
| | | | | | | | | | |
| Borrower/Tranche Description | | Principal
Amount*
(000’s omitted) | | | Value | |
| | | | | | | | | | |
| | | |
Aerospace and Defense — 0.7% | | | | | | | | | | |
AVIO S.p.A. | | | | | | | | | | |
Term Loan, 3.09%, Maturing June 14, 2017 | | | | | 650 | | | $ | 633,209 | |
Term Loan, 3.87%, Maturing December 14, 2017 | | EUR | | | 575 | | | | 738,904 | |
Term Loan, 3.97%, Maturing December 14, 2017 | | | | | 700 | | | | 681,917 | |
Booz Allen Hamilton Inc. | | | | | | | | | | |
Term Loan, 4.50%, Maturing July 31, 2019 | | | | | 900 | | | | 906,281 | |
DAE Aviation Holdings, Inc. | | | | | | | | | | |
Term Loan, 5.45%, Maturing July 31, 2014 | | | | | 1,366 | | | | 1,365,651 | |
Term Loan, 5.45%, Maturing July 31, 2014 | | | | | 1,438 | | | | 1,438,037 | |
Ducommun Incorporated | | | | | | | | | | |
Term Loan, 5.50%, Maturing June 28, 2017 | | | | | 538 | | | | 543,597 | |
IAP Worldwide Services, Inc. | | | | | | | | | | |
Term Loan, 9.25%, Maturing December 28, 2012 | | | | | 971 | | | | 823,257 | |
Sequa Corporation | | | | | | | | | | |
Term Loan, 3.72%, Maturing December 3, 2014 | | | | | 2,191 | | | | 2,190,070 | |
Term Loan, 6.25%, Maturing December 3, 2014 | | | | | 273 | | | | 274,984 | |
TASC, Inc. | | | | | | | | | | |
Term Loan, 4.50%, Maturing December 18, 2015 | | | | | 1,528 | | | | 1,531,734 | |
Transdigm, Inc. | | | | | | | | | | |
Term Loan, 4.00%, Maturing February 14, 2017 | | | | | 819 | | | | 825,465 | |
Wesco Aircraft Hardware Corp. | | | | | | | | | | |
Term Loan, 4.25%, Maturing April 7, 2017 | | | | | 367 | | | | 368,480 | |
Wyle Services Corporation | | | | | | | | | | |
Term Loan, 5.00%, Maturing March 27, 2017 | | | | | 879 | | | | 879,090 | |
| | | | | | | | | | | |
| | | | | | | | $ | 13,200,676 | |
| | | | | | | | | | | |
| | | |
Air Transport — 0.1% | | | | | | | | | | |
Evergreen International Aviation, Inc. | | | | | | | | | | |
Term Loan, 11.50%, Maturing June 30, 2015 | | | | | 907 | | | $ | 852,920 | |
Orbitz Worldwide Inc. | | | | | | | | | | |
Term Loan, 3.22%, Maturing July 25, 2014 | | | | | 1,654 | | | | 1,608,803 | |
| | | | | | | | | | | |
| | | | | | | | $ | 2,461,723 | |
| | | | | | | | | | | |
| | | |
Automotive — 2.6% | | | | | | | | | | |
Allison Transmission, Inc. | | | | | | | | | | |
Term Loan, 2.72%, Maturing August 7, 2014 | | | | | 2,965 | | | $ | 2,975,192 | |
Term Loan, 4.25%, Maturing August 23, 2019 | | | | | 3,367 | | | | 3,382,345 | |
Autoparts Holdings Limited | | | | | | | | | | |
Term Loan, 6.50%, Maturing July 28, 2017 | | | | | 992 | | | | 992,481 | |
Chrysler Group LLC | | | | | | | | | | |
Term Loan, 6.00%, Maturing May 24, 2017 | | | | | 7,907 | | | | 8,078,202 | |
| | | | | | | | | | |
| Borrower/Tranche Description | | Principal
Amount*
(000’s omitted) | | | Value | |
| | | | | | | | | | |
| | | |
Automotive (continued) | | | | | | | | | | |
Delphi Corporation | | | | | | | | | | |
Term Loan, 3.50%, Maturing March 31, 2017 | | | | | 1,994 | | | $ | 2,003,235 | |
Federal-Mogul Corporation | | | | | | | | | | |
Term Loan, 2.17%, Maturing December 29, 2014 | | | | | 3,999 | | | | 3,910,735 | |
Term Loan, 2.16%, Maturing December 28, 2015 | | | | | 3,553 | | | | 3,474,704 | |
Goodyear Tire & Rubber Company (The) | | | | | | | | | | |
Term Loan - Second Lien, 4.75%, Maturing April 30, 2019 | | | | | 6,775 | | | | 6,845,575 | |
HHI Holdings LLC | | | | | | | | | | |
Term Loan, 7.00%, Maturing March 21, 2017 | | | | | 1,663 | | | | 1,663,076 | |
Metaldyne Company LLC | | | | | | | | | | |
Term Loan, 5.25%, Maturing May 18, 2017 | | | | | 3,082 | | | | 3,131,908 | |
SRAM, LLC | | | | | | | | | | |
Term Loan, 4.77%, Maturing June 7, 2018 | | | | | 2,736 | | | | 2,770,497 | |
Tomkins LLC | | | | | | | | | | |
Term Loan, 4.25%, Maturing September 29, 2016 | | | | | 5,124 | | | | 5,161,493 | |
TriMas Corporation | | | | | | | | | | |
Term Loan, 4.25%, Maturing June 21, 2017 | | | | | 1,086 | | | | 1,088,652 | |
Veyance Technologies, Inc. | | | | | | | | | | |
Term Loan, 2.47%, Maturing July 31, 2014 | | | | | 291 | | | | 288,329 | |
Term Loan, 2.47%, Maturing July 31, 2014 | | | | | 2,034 | | | | 2,013,007 | |
Term Loan, 5.50%, Maturing July 31, 2014 | | | | | 348 | | | | 348,685 | |
Term Loan - Second Lien, 5.98%, Maturing July 31, 2015 | | | | | 4,100 | | | | 3,936,000 | |
| | | | | | | | | | | |
| | | | | | | | $ | 52,064,116 | |
| | | | | | | | | | | |
| | | |
Beverage and Tobacco — 0.0%(2) | | | | | | | | | | |
Maine Beverage Company | | | | | | | | | | |
Term Loan, 2.21%, Maturing March 31, 2013 | | | | | 73 | | | $ | 71,966 | |
| | | | | | | | | | | |
| | | | | | | | $ | 71,966 | |
| | | | | | | | | | | |
| | | |
Building and Development — 0.2% | | | | | | | | | | |
Preferred Proppants, LLC | | | | | | | | | | |
Term Loan, 7.50%, Maturing December 15, 2016 | | | | | 720 | | | $ | 685,383 | |
RE/MAX International, Inc. | | | | | | | | | | |
Term Loan, 5.50%, Maturing April 15, 2016 | | | | | 2,090 | | | | 2,105,319 | |
Realogy Corporation | | | | | | | | | | |
Term Loan, 3.25%, Maturing October 10, 2013 | | | | | 97 | | | | 93,465 | |
Summit Materials Companies I, LLC | | | | | | | | | | |
Term Loan, 6.00%, Maturing January 30, 2019 | | | | | 498 | | | | 502,351 | |
| | | | | | | | | | | |
| | | | | | | | $ | 3,386,518 | |
| | | | | | | | | | | |
| | | | |
| | 4 | | See Notes to Financial Statements. |
Eaton Vance
Limited Duration Income Fund
September 30, 2012
Portfolio of Investments (Unaudited) — continued
| | | | | | | | | | |
| Borrower/Tranche Description | | Principal
Amount*
(000’s omitted) | | | Value | |
| | | | | | | | | | |
| | | |
Business Equipment and Services — 4.0% | | | | | | | | | | |
ACCO Brands Corporation | | | | | | | | | | |
Term Loan, 4.25%, Maturing April 30, 2019 | | | | | 1,493 | | | $ | 1,505,094 | |
Acosta, Inc. | | | | | | | | | | |
Term Loan, 5.00%, Maturing March 1, 2018 | | | | | 3,884 | | | | 3,908,093 | |
Advantage Sales & Marketing, Inc. | | | | | | | | | | |
Term Loan, 5.25%, Maturing December 18, 2017 | | | | | 3,107 | | | | 3,115,825 | |
Affinion Group, Inc. | | | | | | | | | | |
Term Loan, 5.00%, Maturing July 16, 2015 | | | | | 5,491 | | | | 5,058,911 | |
Allied Security Holdings, LLC | | | | | | | | | | |
Term Loan, 5.25%, Maturing February 3, 2017 | | | | | 542 | | | | 543,782 | |
Altegrity, Inc. | | | | | | | | | | |
Term Loan, 2.97%, Maturing February 21, 2015 | | | | | 2,556 | | | | 2,383,683 | |
BAR/BRI Review Courses, Inc. | | | | | | | | | | |
Term Loan, 6.00%, Maturing June 16, 2017 | | | | | 675 | | | | 676,907 | |
Brand Energy & Infrastructure Services, Inc. | | | | | | | | | | |
Term Loan, 2.50%, Maturing February 7, 2014 | | | | | 910 | | | | 899,186 | |
Term Loan, 3.68%, Maturing February 7, 2014 | | | | | 983 | | | | 975,090 | |
Brickman Group Holdings Inc. | | | | | | | | | | |
Term Loan, 5.50%, Maturing October 14, 2016 | | | | | 1,569 | | | | 1,584,469 | |
Brock Holdings III, Inc. | | | | | | | | | | |
Term Loan, 6.01%, Maturing March 16, 2017 | | | | | 1,027 | | | | 1,040,098 | |
Catalina Marketing Corporation | | | | | | | | | | |
Term Loan, 2.97%, Maturing October 1, 2014 | | | | | 1,958 | | | | 1,950,651 | |
ClientLogic Corporation | | | | | | | | | | |
Term Loan, 7.21%, Maturing January 30, 2017 | | | | | 1,171 | | | | 1,077,408 | |
Corporate Executive Board Company, The | | | | | | | | | | |
Term Loan, 5.00%, Maturing July 2, 2019 | | | | | 550 | | | | 553,094 | |
CPM Acquisition Corp. | | | | | | | | | | |
Term Loan, 6.25%, Maturing August 29, 2017 | | | | | 525 | | | | 527,625 | |
Education Management LLC | | | | | | | | | | |
Term Loan, 8.25%, Maturing March 29, 2018 | | | | | 2,113 | | | | 1,874,669 | |
EIG Investors Corp. | | | | | | | | | | |
Term Loan, 7.75%, Maturing April 20, 2018 | | | | | 2,469 | | | | 2,488,101 | |
Expert Global Solutions, Inc. | | | | | | | | | | |
Term Loan, 8.00%, Maturing April 3, 2018 | | | | | 1,990 | | | | 2,008,242 | |
Genesys Telecom Holdings, U.S., Inc. | | | | | | | | | | |
Term Loan, 6.75%, Maturing January 31, 2019 | | | | | 647 | | | | 654,296 | |
Genpact International, Inc. | | | | | | | | | | |
Term Loan, 4.25%, Maturing August 30, 2019 | | | | | 1,700 | | | | 1,707,438 | |
Go Daddy Operating Company, LLC | | | | | | | | | | |
Term Loan, 5.50%, Maturing December 17, 2018 | | | | | 3,798 | | | | 3,787,248 | |
KAR Auction Services, Inc. | | | | | | | | | | |
Term Loan, 5.00%, Maturing May 19, 2017 | | | | | 3,061 | | | | 3,081,020 | |
| | | | | | | | | | |
| Borrower/Tranche Description | | Principal
Amount*
(000’s omitted) | | | Value | |
| | | | | | | | | | |
| | | |
Business Equipment and Services (continued) | | | | | | | | | | |
Kronos, Inc. | | | | | | | | | | |
Term Loan, 5.11%, Maturing June 9, 2017 | | | | | 1,445 | | | $ | 1,456,608 | |
Term Loan, 6.25%, Maturing December 28, 2017 | | | | | 868 | | | | 881,464 | |
Meritas LLC | | | | | | | | | | |
Term Loan, 7.50%, Maturing July 28, 2017 | | | | | 766 | | | | 765,625 | |
Mitchell International, Inc. | | | | | | | | | | |
Term Loan - Second Lien, 5.63%, Maturing March 30, 2015 | | | | | 2,500 | | | | 2,462,500 | |
Monitronics International Inc. | | | | | | | | | | |
Term Loan, 5.50%, Maturing March 16, 2018 | | | | | 896 | | | | 907,253 | |
Quintiles Transnational Corp. | | | | | | | | | | |
Term Loan, 5.00%, Maturing June 8, 2018 | | | | | 4,518 | | | | 4,550,567 | |
Sabre, Inc. | | | | | | | | | | |
Term Loan, 2.22%, Maturing September 30, 2014 | | | | | 1,755 | | | | 1,752,202 | |
Sensus USA Inc. | | | | | | | | | | |
Term Loan, 4.75%, Maturing May 9, 2017 | | | | | 714 | | | | 716,803 | |
SunGard Data Systems, Inc. | | | | | | | | | | |
Term Loan, 3.91%, Maturing February 26, 2016 | | | | | 9,552 | | | | 9,587,691 | |
Term Loan, 3.98%, Maturing February 28, 2017 | | | | | 314 | | | | 315,127 | |
SymphonyIRI Group, Inc. | | | | | | | | | | |
Term Loan, 5.00%, Maturing December 1, 2017 | | | | | 891 | | | | 891,000 | |
Trans Union, LLC | | | | | | | | | | |
Term Loan, 5.50%, Maturing February 12, 2018 | | | | | 1,977 | | | | 1,998,206 | |
Travelport LLC | | | | | | | | | | |
Term Loan, 4.86%, Maturing August 21, 2015 | | | | | 446 | | | | 426,221 | |
Term Loan, 4.96%, Maturing August 21, 2015 | | | | | 1,563 | | | | 1,493,458 | |
Term Loan, 4.96%, Maturing August 21, 2015 | | | | | 1,649 | | | | 1,575,689 | |
Term Loan, 5.06%, Maturing August 21, 2015 | | EUR | | | 739 | | | | 889,524 | |
U.S. Security Holdings, Inc. | | | | | | | | | | |
Term Loan, 6.00%, Maturing July 28, 2017 | | | | | 130 | | | | 130,883 | |
Term Loan, 6.00%, Maturing July 28, 2017 | | | | | 663 | | | | 668,706 | |
West Corporation | | | | | | | | | | |
Term Loan, 5.50%, Maturing July 15, 2016 | | | | | 1,331 | | | | 1,343,602 | |
Term Loan, 5.50%, Maturing July 15, 2016 | | | | | 3,786 | | | | 3,822,655 | |
Term Loan, 5.75%, Maturing June 29, 2018 | | | | | 1,222 | | | | 1,234,921 | |
| | | | | | | | | | | |
| | | | | | | | $ | 79,271,635 | |
| | | | | | | | | | | |
| | | |
Cable and Satellite Television — 2.1% | | | | | | | | | | |
Atlantic Broadband Finance, LLC | | | | | | | | | | |
Term Loan, 5.25%, Maturing April 4, 2019 | | | | | 1,347 | | | $ | 1,355,282 | |
Term Loan - Second Lien, 9.75%, Maturing October 4, 2019 | | | | | 775 | | | | 812,781 | |
Bragg Communications Incorporated | | | | | | | | | | |
Term Loan, 4.00%, Maturing February 28, 2018 | | | | | 398 | | | | 399,990 | |
| | | | |
| | 5 | | See Notes to Financial Statements. |
Eaton Vance
Limited Duration Income Fund
September 30, 2012
Portfolio of Investments (Unaudited) — continued
| | | | | | | | | | |
| Borrower/Tranche Description | | Principal
Amount*
(000’s omitted) | | | Value | |
| | | | | | | | | | |
| | | |
Cable and Satellite Television (continued) | | | | | | | | | | |
Cequel Communications, LLC | | | | | | | | | | |
Term Loan, 4.00%, Maturing February 14, 2019 | | | | | 5,497 | | | $ | 5,526,582 | |
Charter Communications Operating, LLC | | | | | | | | | | |
Term Loan, 4.00%, Maturing May 15, 2019 | | | | | 995 | | | | 1,001,592 | |
Crown Media Holdings, Inc. | | | | | | | | | | |
Term Loan, 5.75%, Maturing July 14, 2018 | | | | | 497 | | | | 499,778 | |
CSC Holdings, Inc. | | | | | | | | | | |
Term Loan, 1.97%, Maturing March 29, 2016 | | | | | 2,604 | | | | 2,602,710 | |
Kabel Deutschland GMBH | | | | | | | | | | |
Term Loan, 4.25%, Maturing February 1, 2019 | | | | | 1,100 | | | | 1,103,241 | |
Lavena Holdings 4 GmbH | | | | | | | | | | |
Term Loan, 2.95%, Maturing March 6, 2015 | | EUR | | | 2,045 | | | | 2,446,952 | |
Term Loan, 3.32%, Maturing March 4, 2016 | | EUR | | | 2,045 | | | | 2,446,952 | |
Term Loan, 7.70%, Maturing March 6, 2017(3) | | EUR | | | 540 | | | | 558,115 | |
Term Loan - Second Lien, 4.45%, Maturing September 2, 2016 | | EUR | | | 452 | | | | 518,761 | |
MCC Iowa LLC | | | | | | | | | | |
Term Loan, 1.94%, Maturing January 30, 2015 | | | | | 2,311 | | | | 2,270,116 | |
Mediacom Broadband LLC | | | | | | | | | | |
Term Loan, 4.50%, Maturing October 23, 2017 | | | | | 1,808 | | | | 1,799,333 | |
Mediacom Illinois, LLC | | | | | | | | | | |
Term Loan, 1.69%, Maturing January 30, 2015 | | | | | 4,561 | | | | 4,427,505 | |
Mediacom LLC | | | | | | | | | | |
Term Loan, 4.50%, Maturing October 23, 2017 | | | | | 1,002 | | | | 991,167 | |
P7S1 Broadcasting Holding II B.V. | | | | | | | | | | |
Term Loan, 2.81%, Maturing July 1, 2016 | | EUR | | | 1,235 | | | | 1,539,676 | |
UPC Broadband Holding B.V. | | | | | | | | | | |
Term Loan, 3.87%, Maturing December 31, 2016 | | EUR | | | 4,531 | | | | 5,780,145 | |
Term Loan, 4.12%, Maturing December 29, 2017 | | EUR | | | 1,962 | | | | 2,505,960 | |
UPC Financing Partnership | | | | | | | | | | |
Term Loan, 3.73%, Maturing December 30, 2016 | | | | | 239 | | | | 238,121 | |
Term Loan, 3.73%, Maturing December 29, 2017 | | | | | 1,815 | | | | 1,810,102 | |
Term Loan, 4.75%, Maturing December 29, 2017 | | | | | 400 | | | | 403,000 | |
WaveDivision Holdings, LLC | | | | | | | | | | |
Term Loan, Maturing August 9, 2019(4) | | | | | 350 | | | | 353,062 | |
| | | | | | | | | | | |
| | | | | | | | $ | 41,390,923 | |
| | | | | | | | | | | |
| | | |
Chemicals and Plastics — 1.8% | | | | | | | | | | |
Ashland, Inc. | | | | | | | | | | |
Term Loan, 3.75%, Maturing August 23, 2018 | | | | | 1,665 | | | $ | 1,679,379 | |
AZ Chem US Inc. | | | | | | | | | | |
Term Loan, 7.25%, Maturing December 22, 2017 | | | | | 1,083 | | | | 1,106,405 | |
| | | | | | | | | | |
| Borrower/Tranche Description | | Principal
Amount*
(000’s omitted) | | | Value | |
| | | | | | | | | | |
| | | |
Chemicals and Plastics (continued) | | | | | | | | | | |
Celanese U.S. Holdings LLC | | | | | | | | | | |
Term Loan, 2.87%, Maturing October 31, 2016 | | EUR | | | 1,338 | | | $ | 1,724,226 | |
Term Loan, 3.21%, Maturing October 31, 2016 | | | | | 2,081 | | | | 2,096,481 | |
Chemtura Corp | | | | | | | | | | |
Term Loan, Maturing August 27, 2016(4) | | | | | 275 | | | | 278,008 | |
Emerald Performance Materials, LLC | | | | | | | | | | |
Term Loan, 6.75%, Maturing May 18, 2018 | | | | | 748 | | | | 755,606 | |
General Chemical Corporation | | | | | | | | | | |
Term Loan, 5.00%, Maturing October 6, 2015 | | | | | 592 | | | | 594,620 | |
Harko C.V. | | | | | | | | | | |
Term Loan, 5.75%, Maturing August 2, 2017 | | | | | 545 | | | | 548,244 | |
Houghton International, Inc. | | | | | | | | | | |
Term Loan, 6.75%, Maturing January 29, 2016 | | | | | 1,787 | | | | 1,804,116 | |
Huntsman International, LLC | | | | | | | | | | |
Term Loan, 2.79%, Maturing April 19, 2017 | | | | | 2,123 | | | | 2,118,730 | |
Ineos US Finance LLC | | | | | | | | | | |
Term Loan, 6.50%, Maturing May 4, 2018 | | | | | 6,622 | | | | 6,698,596 | |
MacDermid, Inc. | | | | | | | | | | |
Term Loan, 2.32%, Maturing April 11, 2014 | | EUR | | | 729 | | | | 930,044 | |
Momentive Performance Materials Inc. | | | | | | | | | | |
Term Loan, 3.75%, Maturing May 29, 2015 | | | | | 672 | | | | 651,476 | |
Momentive Performance Materials USA Inc. | | | | | | | | | | |
Term Loan, 3.75%, Maturing May 5, 2015 | | | | | 1,258 | | | | 1,218,678 | |
Momentive Specialty Chemicals Inc. | | | | | | | | | | |
Term Loan, 4.00%, Maturing May 5, 2015 | | | | | 848 | | | | 843,136 | |
Term Loan, 4.13%, Maturing May 5, 2015 | | | | | 383 | | | | 381,013 | |
Term Loan, 4.25%, Maturing May 5, 2015 | | | | | 2,245 | | | | 2,188,657 | |
OEP Pearl Dutch Acquisition B.V. | | | | | | | | | | |
Term Loan, 6.50%, Maturing March 30, 2018 | | | | | 101 | | | | 101,751 | |
Schoeller Arca Systems Holding B.V. | | | | | | | | | | |
Term Loan, 4.78%, Maturing November 16, 2015 | | EUR | | | 289 | | | | 260,006 | |
Term Loan, 4.78%, Maturing November 16, 2015 | | EUR | | | 824 | | | | 741,325 | |
Term Loan, 4.78%, Maturing November 16, 2015 | | EUR | | | 887 | | | | 797,738 | |
Sonneborn LLC | | | | | | | | | | |
Term Loan, 6.50%, Maturing March 30, 2018 | | | | | 571 | | | | 576,590 | |
Styron S.A.R.L., LLC | | | | | | | | | | |
Term Loan, 8.00%, Maturing August 2, 2017 | | | | | 1,659 | | | | 1,595,222 | |
Taminco Global Chemical Corporation | | | | | | | | | | |
Term Loan, 5.25%, Maturing February 15, 2019 | | | | | 398 | | | | 402,975 | |
Tronox Pigments (Netherlands) B.V. | | | | | | | | | | |
Term Loan, 4.25%, Maturing February 8, 2018 | | | | | 182 | | | | 183,504 | |
Term Loan, 4.25%, Maturing February 8, 2018 | | | | | 666 | | | | 672,849 | |
| | | | |
| | 6 | | See Notes to Financial Statements. |
Eaton Vance
Limited Duration Income Fund
September 30, 2012
Portfolio of Investments (Unaudited) — continued
| | | | | | | | | | |
| Borrower/Tranche Description | | Principal
Amount*
(000’s omitted) | | | Value | |
| | | | | | | | | | |
| | | |
Chemicals and Plastics (continued) | | | | | | | | | | |
Univar Inc. | | | | | | | | | | |
Term Loan, 5.00%, Maturing June 30, 2017 | | | | | 3,968 | | | $ | 3,959,189 | |
| | | | | | | | | | | |
| | | | | | | | $ | 34,908,564 | |
| | | | | | | | | | | |
| | | |
Clothing / Textiles — 0.1% | | | | | | | | | | |
Ascena Retail Group, Inc. | | | | | | | | | | |
Term Loan, 4.75%, Maturing June 14, 2018 | | | | | 948 | | | $ | 956,312 | |
Phillips-Van Heusen Corporation | | | | | | | | | | |
Term Loan, 3.50%, Maturing May 6, 2016 | | | | | 677 | | | | 680,415 | |
Wolverine Worldwide, Inc. | | | | | | | | | | |
Term Loan, Maturing July 31, 2019(4) | | | | | 575 | | | | 582,547 | |
| | | | | | | | | | | |
| | | | | | | | $ | 2,219,274 | |
| | | | | | | | | | | |
| | | |
Conglomerates — 0.7% | | | | | | | | | | |
Jarden Corporation | | | | | | | | | | |
Term Loan, 3.22%, Maturing March 30, 2018 | | | | | 842 | | | $ | 844,860 | |
Jason Incorporated | | | | | | | | | | |
Term Loan, 8.25%, Maturing September 21, 2014 | | | | | 245 | | | | 245,360 | |
Term Loan, 7.75%, Maturing September 22, 2014 | | | | | 223 | | | | 223,333 | |
Term Loan, 8.25%, Maturing September 22, 2014 | | | | | 99 | | | | 98,837 | |
Rexnord Corporation | | | | | | | | | | |
Term Loan, 5.00%, Maturing April 2, 2018 | | | | | 4,392 | | | | 4,417,891 | |
RGIS Services, LLC | | | | | | | | | | |
Term Loan, 4.61%, Maturing October 18, 2016 | | | | | 1,984 | | | | 1,964,478 | |
Term Loan, 5.50%, Maturing October 18, 2017 | | | | | 1,468 | | | | 1,465,790 | |
Rocket Software, Inc. | | | | | | | | | | |
Term Loan, 7.00%, Maturing February 8, 2018 | | | | | 447 | | | | 447,742 | |
Spectrum Brands, Inc. | | | | | | | | | | |
Term Loan, 5.02%, Maturing June 17, 2016 | | | | | 546 | | | | 549,297 | |
Walter Energy, Inc. | | | | | | | | | | |
Term Loan, 4.00%, Maturing April 2, 2018 | | | | | 2,956 | | | | 2,949,283 | |
| | | | | | | | | | | |
| | | | | | | | $ | 13,206,871 | |
| | | | | | | | | | | |
| | | |
Containers and Glass Products — 0.8% | | | | | | | | | | |
Berry Plastics Holding Corporation | | | | | | | | | | |
Term Loan, 2.22%, Maturing April 3, 2015 | | | | | 5,429 | | | $ | 5,407,227 | |
BWAY Corporation | | | | | | | | | | |
Term Loan, 4.25%, Maturing February 23, 2018 | | | | | 278 | | | | 279,173 | |
Term Loan, 4.25%, Maturing February 23, 2018 | | | | | 2,757 | | | | 2,770,093 | |
Pelican Products, Inc. | | | | | | | | | | |
Term Loan, 7.00%, Maturing July 11, 2018 | | | | | 499 | | | | 498,750 | |
Reynolds Group Holdings Inc. | | | | | | | | | | |
Term Loan, Maturing September 20, 2018(4) | | | | | 5,175 | | | | 5,202,474 | |
| | | | | | | | | | |
| Borrower/Tranche Description | | Principal
Amount*
(000’s omitted) | | | Value | |
| | | | | | | | | | |
| | | |
Containers and Glass Products (continued) | | | | | | | | | | |
Sealed Air Corporation | | | | | | | | | | |
Term Loan, 4.75%, Maturing October 3, 2018 | | | | | 686 | | | $ | 691,451 | |
TricorBraun, Inc. | | | | | | | | | | |
Term Loan, 5.50%, Maturing May 3, 2018 | | | | | 675 | | | | 680,063 | |
| | | | | | | | | | | |
| | | | | | | | $ | 15,529,231 | |
| | | | | | | | | | | |
| | | |
Cosmetics / Toiletries — 0.3% | | | | | | | | | | |
Bausch & Lomb, Inc. | | | | | | | | | | |
Term Loan, 5.25%, Maturing May 17, 2019 | | | | | 3,167 | | | $ | 3,205,859 | |
Huish Detergents, Inc. | | | | | | | | | | |
Term Loan, 2.22%, Maturing April 25, 2014 | | | | | 1,208 | | | | 1,155,210 | |
KIK Custom Products, Inc. | | | | | | | | | | |
Term Loan - Second Lien, 5.23%, Maturing November 28, 2014 | | | | | 1,900 | | | | 1,464,900 | |
Prestige Brands, Inc. | | | | | | | | | | |
Term Loan, 5.27%, Maturing January 31, 2019 | | | | | 449 | | | | 454,648 | |
| | | | | | | | | | | |
| | | | | | | | $ | 6,280,617 | |
| | | | | | | | | | | |
| | | |
Drugs — 0.5% | | | | | | | | | | |
Aptalis Pharma, Inc. | | | | | | | | | | |
Term Loan, 5.50%, Maturing February 10, 2017 | | | | | 995 | | | $ | 998,109 | |
Term Loan, 5.50%, Maturing February 10, 2017 | | | | | 1,742 | | | | 1,741,780 | |
Endo Pharmaceuticals Holdings Inc. | | | | | | | | | | |
Term Loan, 4.00%, Maturing June 18, 2018 | | | | | 373 | | | | 374,383 | |
Warner Chilcott Company, LLC | | | | | | | | | | |
Term Loan, 3.75%, Maturing March 17, 2016 | | | | | 700 | | | | 703,282 | |
Term Loan, 4.25%, Maturing March 15, 2018 | | | | | 983 | | | | 986,137 | |
Warner Chilcott Corporation | | | | | | | | | | |
Term Loan, 4.25%, Maturing March 15, 2018 | | | | | 747 | | | | 748,982 | |
Term Loan, 4.25%, Maturing March 15, 2018 | | | | | 1,967 | | | | 1,972,274 | |
WC Luxco S.a.r.l. | | | | | | | | | | |
Term Loan, 4.25%, Maturing March 15, 2018 | | | | | 1,352 | | | | 1,355,938 | |
| | | | | | | | | | | |
| | | | | | | | $ | 8,880,885 | |
| | | | | | | | | | | |
| | | |
Ecological Services and Equipment — 0.1% | | | | | | | | | | |
ADS Waste Holdings | | | | | | | | | | |
Term Loan, Maturing September 11, 2019(4) | | | | | 2,125 | | | $ | 2,142,708 | |
Envirotest Systems Holding Corp. | | | | | | | | | | |
Term Loan - Second Lien, 15.50%, Maturing March 31, 2017(5) | | | | | 95 | | | | 97,681 | |
Viking Consortium Borrower Limited | | | | | | | | | | |
Term Loan - Second Lien, 7.31%, Maturing March 31, 2016(3) (5) | | GBP | | | 523 | | | | 232,330 | |
| | | | | | | | | | | |
| | | | | | | | $ | 2,472,719 | |
| | | | | | | | | | | |
| | | | |
| | 7 | | See Notes to Financial Statements. |
Eaton Vance
Limited Duration Income Fund
September 30, 2012
Portfolio of Investments (Unaudited) — continued
| | | | | | | | | | |
| Borrower/Tranche Description | | Principal
Amount*
(000’s omitted) | | | Value | |
| | | | | | | | | | |
| | | |
Electronics / Electrical — 3.1% | | | | | | | | | | |
Aeroflex Incorporated | | | | | | | | | | |
Term Loan, 5.75%, Maturing May 9, 2018 | | | | | 1,469 | | | $ | 1,467,760 | |
Aspect Software, Inc. | | | | | | | | | | |
Term Loan, 6.25%, Maturing May 6, 2016 | | | | | 2,806 | | | | 2,770,629 | |
Attachmate Corporation | | | | | | | | | | |
Term Loan, 7.25%, Maturing November 22, 2017 | | | | | 3,238 | | | | 3,268,482 | |
Cinedigm Digital Funding I, LLC | | | | | | | | | | |
Term Loan, 5.25%, Maturing April 29, 2016 | | | | | 549 | | | | 553,590 | |
CommScope, Inc. | | | | | | | | | | |
Term Loan, 4.25%, Maturing January 12, 2018 | | | | | 3,266 | | | | 3,287,612 | |
Dealer Computer Services, Inc. | | | | | | | | | | |
Term Loan, 3.75%, Maturing April 20, 2018 | | | | | 1,553 | | | | 1,561,736 | |
DG FastChannel, Inc. | | | | | | | | | | |
Term Loan, 5.75%, Maturing July 26, 2018 | | | | | 1,639 | | | | 1,597,868 | |
Eagle Parent, Inc. | | | | | | | | | | |
Term Loan, 5.00%, Maturing May 16, 2018 | | | | | 2,765 | | | | 2,786,429 | |
Edwards (Cayman Islands II) Limited | | | | | | | | | | |
Term Loan, 5.50%, Maturing May 31, 2016 | | | | | 2,029 | | | | 2,043,989 | |
Freescale Semiconductor, Inc. | | | | | | | | | | |
Term Loan, 4.48%, Maturing December 1, 2016 | | | | | 4,321 | | | | 4,232,479 | |
InfoGroup Inc. | | | | | | | | | | |
Term Loan, 5.75%, Maturing May 25, 2018 | | | | | 972 | | | | 875,247 | |
Infor (US), Inc. | | | | | | | | | | |
Term Loan, 5.25%, Maturing April 5, 2018 | | | | | 5,212 | | | | 5,239,081 | |
Magic Newco LLC | | | | | | | | | | |
Term Loan, 7.25%, Maturing December 12, 2018 | | | | | 1,500 | | | | 1,508,907 | |
Microsemi Corporation | | | | | | | | | | |
Term Loan, 4.00%, Maturing February 2, 2018 | | | | | 1,601 | | | | 1,612,633 | |
NeuStar, Inc. | | | | | | | | | | |
Term Loan, 5.00%, Maturing November 8, 2018 | | | | | 1,015 | | | | 1,024,898 | |
Nxp B.V. | | | | | | | | | | |
Term Loan, 4.50%, Maturing March 3, 2017 | | | | | 2,536 | | | | 2,564,909 | |
Term Loan, 5.50%, Maturing March 3, 2017 | | | | | 1,089 | | | | 1,110,326 | |
Term Loan, 5.25%, Maturing March 19, 2019 | | | | | 1,667 | | | | 1,688,846 | |
Open Solutions, Inc. | | | | | | | | | | |
Term Loan, 2.58%, Maturing January 23, 2014 | | | | | 2,316 | | | | 2,239,939 | |
Rovi Solutions Corporation | | | | | | | | | | |
Term Loan, 4.00%, Maturing March 29, 2019 | | | | | 846 | | | | 818,263 | |
SafeNet Inc. | | | | | | | | | | |
Term Loan, 2.72%, Maturing April 12, 2014 | | | | | 888 | | | | 885,372 | |
Semtech Corp. | | | | | | | | | | |
Term Loan, 4.25%, Maturing March 20, 2017 | | | | | 424 | | | | 427,382 | |
Sensata Technologies Finance Company, LLC | | | | | | | | | | |
Term Loan, 4.00%, Maturing May 11, 2018 | | | | | 3,728 | | | | 3,753,184 | |
| | | | | | | | | | |
| Borrower/Tranche Description | | Principal
Amount*
(000’s omitted) | | | Value | |
| | | | | | | | | | |
| | | |
Electronics / Electrical (continued) | | | | | | | | | | |
Serena Software, Inc. | | | | | | | | | | |
Term Loan, 4.23%, Maturing March 10, 2016 | | | | | 3,206 | | | $ | 3,174,040 | |
Term Loan, 5.00%, Maturing March 10, 2016 | | | | | 350 | | | | 348,250 | |
Shield Finance Co. S.A.R.L. | | | | | | | | | | |
Term Loan, 6.50%, Maturing May 10, 2019 | | | | | 1,047 | | | | 1,053,921 | |
SkillSoft Corporation | | | | | | | | | | |
Term Loan, Maturing May 26, 2017(4) | | | | | 1,247 | | | | 1,247,280 | |
Sophia, L.P. | | | | | | | | | | |
Term Loan, 6.25%, Maturing July 19, 2018 | | | | | 1,423 | | | | 1,442,788 | |
SS&C Technologies Inc. | | | | | | | | | | |
Term Loan, 5.00%, Maturing June 7, 2019 | | | | | 142 | | | | 144,294 | |
Term Loan, 5.00%, Maturing June 7, 2019 | | | | | 1,374 | | | | 1,389,046 | |
VeriFone Inc. | | | | | | | | | | |
Term Loan, 4.25%, Maturing December 28, 2018 | | | | | 294 | | | | 295,200 | |
Vertafore, Inc. | | | | | | | | | | |
Term Loan, 5.25%, Maturing July 29, 2016 | | | | | 2,041 | | | | 2,049,719 | |
Web.com Group, Inc. | | | | | | | | | | |
Term Loan, 7.00%, Maturing October 27, 2017 | | | | | 3,116 | | | | 3,144,742 | |
| | | | | | | | | | | |
| | | $ | 61,608,841 | |
| | | | | | | | | | | |
| | | |
Equipment Leasing — 0.3% | | | | | | | | | | |
BakerCorp International, Inc. | | | | | | | | | | |
Term Loan, 5.00%, Maturing June 1, 2018 | | | | | 891 | | | $ | 895,010 | |
Delos Aircraft Inc. | | | | | | | | | | |
Term Loan, 4.75%, Maturing April 12, 2016 | | | | | 1,300 | | | | 1,314,625 | |
Flying Fortress Inc. | | | | | | | | | | |
Term Loan, 5.00%, Maturing June 30, 2017 | | | | | 3,475 | | | | 3,522,781 | |
| | | | | | | | | | | |
| | | $ | 5,732,416 | |
| | | | | | | | | | | |
| | | |
Financial Intermediaries — 1.6% | | | | | | | | | | |
American Capital Holdings, Inc. | | | | | | | | | | |
Term Loan, 5.50%, Maturing July 19, 2016 | | | | | 875 | | | $ | 883,750 | |
Asset Acceptance Capital Corp. | | | | | | | | | | |
Term Loan, 8.75%, Maturing November 14, 2017 | | | | | 1,323 | | | | 1,339,980 | |
CB Richard Ellis Services, Inc. | | | | | | | | | | |
Term Loan, 3.47%, Maturing March 5, 2018 | | | | | 648 | | | | 648,597 | |
Term Loan, 3.72%, Maturing September 4, 2019 | | | | | 612 | | | | 612,564 | |
Citco III Limited | | | | | | | | | | |
Term Loan, 5.50%, Maturing June 29, 2018 | | | | | 2,767 | | | | 2,788,231 | |
First Data Corp. | | | | | | | | | | |
Term Loan, 2.97%, Maturing September 24, 2014 | | | | | 44 | | | | 44,222 | |
Term Loan, 2.97%, Maturing September 24, 2014 | | | | | 104 | | | | 103,614 | |
Term Loan, 2.97%, Maturing September 24, 2014 | | | | | 118 | | | | 117,271 | |
Term Loan, Maturing September 30, 2018(4) | | | | | 1,350 | | | | 1,328,625 | |
| | | | |
| | 8 | | See Notes to Financial Statements. |
Eaton Vance
Limited Duration Income Fund
September 30, 2012
Portfolio of Investments (Unaudited) — continued
| | | | | | | | | | |
| Borrower/Tranche Description | | Principal
Amount*
(000’s omitted) | | | Value | |
| | | | | | | | | | |
| | | |
Financial Intermediaries (continued) | | | | | | | | | | |
Grosvenor Capital Management Holdings, LLP | | | | | | | | | | |
Term Loan, 4.25%, Maturing December 5, 2016 | | | | | 605 | | | $ | 595,506 | |
Hamilton Lane Advisors, LLC | | | | | | | | | | |
Term Loan, 6.50%, Maturing February 23, 2018 | | | | | 756 | | | | 755,625 | |
iPayment, Inc. | | | | | | | | | | |
Term Loan, 5.75%, Maturing May 8, 2017 | | | | | 987 | | | | 982,065 | |
LPL Holdings, Inc. | | | | | | | | | | |
Term Loan, 2.72%, Maturing March 29, 2017 | | | | | 804 | | | | 794,320 | |
Term Loan, 4.00%, Maturing March 29, 2019 | | | | | 3,109 | | | | 3,122,979 | |
Mercury Payment Systems Canada, LLC | | | | | | | | | | |
Term Loan, 5.50%, Maturing July 3, 2017 | | | | | 716 | | | | 723,097 | |
MIP Delaware, LLC | | | | | | | | | | |
Term Loan, 5.50%, Maturing July 12, 2018 | | | | | 728 | | | | 731,494 | |
Nuveen Investments, Inc. | |
Term Loan, 5.90%, Maturing May 12, 2017 | | | | | 3,653 | | | | 3,652,036 | |
Term Loan, 5.90%, Maturing May 13, 2017 | | | | | 2,542 | | | | 2,543,241 | |
Term Loan, 7.25%, Maturing May 13, 2017 | | | | | 550 | | | | 552,200 | |
Oz Management LP | |
Term Loan, 1.72%, Maturing November 15, 2016 | | | | | 1,368 | | | | 1,210,338 | |
RJO Holdings Corp. | |
Term Loan, 6.22%, Maturing December 10, 2015(5) | | | | | 32 | | | | 26,494 | |
Term Loan, 6.97%, Maturing December 10, 2015(5) | | | | | 1,022 | | | | 797,141 | |
RPI Finance Trust | |
Term Loan, 4.00%, Maturing May 9, 2018 | | | | | 3,722 | | | | 3,735,782 | |
Term Loan, 4.00%, Maturing November 9, 2018 | | | | | 1,991 | | | | 2,006,561 | |
Vantiv, LLC | |
Term Loan, 3.75%, Maturing March 27, 2019 | | | | | 498 | | | | 499,677 | |
| | | | | | | | | | | |
| | | $ | 30,595,410 | |
| | | | | | | | | | | |
| | | |
Food Products — 1.9% | | | | | | | | | | |
Blue Buffalo Company, Ltd. | | | | | | | | | | |
Term Loan, 6.50%, Maturing August 8, 2019 | | | | | 1,225 | | | $ | 1,227,297 | |
Clearwater Seafoods Limited Partnership | |
Term Loan, 6.75%, Maturing June 6, 2018 | | | | | 1,150 | | | | 1,152,875 | |
Dean Foods Company | |
Term Loan, 1.60%, Maturing April 2, 2014 | | | | | 3,628 | | | | 3,615,558 | |
Del Monte Foods Company | |
Term Loan, 4.50%, Maturing March 8, 2018 | | | | | 5,848 | | | | 5,850,870 | |
Dole Food Company Inc. | |
Term Loan, 5.04%, Maturing July 6, 2018 | | | | | 1,054 | | | | 1,059,208 | |
Hearthside Food Solutions, LLC | |
Term Loan, 6.50%, Maturing June 5, 2018 | | | | | 1,275 | | | | 1,278,187 | |
High Liner Foods Incorporated | |
Term Loan, 7.00%, Maturing December 19, 2017 | | | | | 670 | | | | 676,637 | |
| | | | | | | | | | |
| Borrower/Tranche Description | | Principal
Amount*
(000’s omitted) | | | Value | |
| | | | | | | | | | |
| | | |
Food Products (continued) | | | | | | | | | | |
JBS USA Holdings Inc. | |
Term Loan, 4.25%, Maturing May 25, 2018 | | | | | 3,049 | | | $ | 3,041,172 | |
Michael Foods Group, Inc. | |
Term Loan, 4.25%, Maturing February 23, 2018 | | | | | 1,437 | | | | 1,448,371 | |
NBTY, Inc. | |
Term Loan, 4.25%, Maturing October 2, 2017 | | | | | 6,321 | | | | 6,354,120 | |
Pierre Foods, Inc. | |
Term Loan, 7.00%, Maturing September 30, 2016 | | | | | 2,338 | | | | 2,351,771 | |
Pinnacle Foods Finance LLC | |
Term Loan, 4.75%, Maturing October 17, 2018 | | | | | 299 | | | | 299,495 | |
Term Loan, 4.75%, Maturing October 17, 2018 | | | | | 6,608 | | | | 6,629,089 | |
Solvest Ltd. | |
Term Loan, 5.02%, Maturing July 6, 2018 | | | | | 1,886 | | | | 1,895,427 | |
| | | | | | | | | | | |
| | | $ | 36,880,077 | |
| | | | | | | | | | | |
| | | |
Food Service — 1.8% | | | | | | | | | | |
Aramark Corporation | | | | | | | | | | |
Term Loan, 3.46%, Maturing July 26, 2016 | | | | | 246 | | | $ | 246,311 | |
Term Loan, 3.46%, Maturing July 26, 2016 | | | | | 137 | | | | 137,099 | |
Term Loan, 3.47%, Maturing July 26, 2016 | | | | | 3,742 | | | | 3,745,318 | |
Term Loan, 3.57%, Maturing July 26, 2016 | | | | | 1,696 | | | | 1,697,040 | |
Term Loan, 3.97%, Maturing July 26, 2016 | | GBP | | | 950 | | | | 1,510,409 | |
Brasa Holdings, Inc. | |
Term Loan, 7.50%, Maturing July 19, 2019 | | | | | 475 | | | | 473,812 | |
Buffets, Inc. | |
Term Loan, 0.24%, Maturing April 22, 2015 | | | | | 137 | | | | 137,036 | |
Burger King Corporation | |
Term Loan, Maturing September 27, 2019(4) | | | | | 2,650 | | | | 2,658,281 | |
DineEquity, Inc. | |
Term Loan, 4.30%, Maturing October 19, 2017 | | | | | 1,787 | | | | 1,802,219 | |
Dunkin’ Brands, Inc. | |
Term Loan, 4.00%, Maturing November 23, 2017 | | | | | 2,262 | | | | 2,262,529 | |
Landry’s, Inc. | |
Term Loan, 6.50%, Maturing April 24, 2018 | | | | | 1,368 | | | | 1,388,989 | |
NPC International, Inc. | |
Term Loan, 5.25%, Maturing December 28, 2018 | | | | | 697 | | | | 705,206 | |
OSI Restaurant Partners, LLC | |
Revolving Loan, 2.50%, Maturing June 14, 2013 | | | | | 547 | | | | 545,771 | |
Term Loan, 2.50%, Maturing June 14, 2014 | | | | | 5,999 | | | | 5,980,505 | |
P.F. Chang’s China Bistro Inc. | |
Term Loan, 6.25%, Maturing July 2, 2019 | | | | | 450 | | | | 455,062 | |
Sagittarius Restaurants, LLC | |
Term Loan, 7.50%, Maturing May 18, 2015 | | | | | 471 | | | | 471,544 | |
| | | | |
| | 9 | | See Notes to Financial Statements. |
Eaton Vance
Limited Duration Income Fund
September 30, 2012
Portfolio of Investments (Unaudited) — continued
| | | | | | | | | | |
| Borrower/Tranche Description | | Principal
Amount*
(000’s omitted) | | | Value | |
| | | | | | | | | | |
| | | |
Food Service (continued) | | | | | | | | | | |
US Foods, Inc. | |
Term Loan, 2.72%, Maturing July 3, 2014 | | | | | 673 | | | $ | 667,116 | |
Term Loan, 5.75%, Maturing March 31, 2017 | | | | | 4,283 | | | | 4,236,779 | |
Weight Watchers International, Inc. | |
Term Loan, 4.00%, Maturing March 15, 2019 | | | | | 3,367 | | | | 3,370,771 | |
Wendy’s International, Inc. | |
Term Loan, 4.75%, Maturing May 15, 2019 | | | | | 2,050 | | | | 2,070,820 | |
| | | | | | | | | | | |
| | | $ | 34,562,617 | |
| | | | | | | | | | | |
| | | |
Food / Drug Retailers — 1.5% | | | | | | | | | | |
Alliance Boots Holdings Limited | | | | | | | | | | |
Term Loan, 3.09%, Maturing July 9, 2015 | | EUR | | | 1,000 | | | $ | 1,243,942 | |
Term Loan, 3.51%, Maturing July 9, 2015 | | GBP | | | 5,950 | | | | 9,200,915 | |
General Nutrition Centers, Inc. | |
Term Loan, 5.25%, Maturing March 2, 2018 | | | | | 4,898 | | | | 4,906,520 | |
Pantry, Inc. (The) | |
Term Loan, 5.75%, Maturing August 2, 2019 | | | | | 475 | | | | 478,364 | |
Rite Aid Corporation | |
Term Loan, 1.97%, Maturing June 4, 2014 | | | | | 5,681 | | | | 5,643,070 | |
Term Loan, 4.50%, Maturing March 2, 2018 | | | | | 5,040 | | | | 5,033,440 | |
Sprouts Farmers Markets Holdings, LLC | |
Term Loan, 6.00%, Maturing April 18, 2018 | | | | | 746 | | | | 747,145 | |
Term Loan, 6.00%, Maturing April 18, 2018 | | | | | 1,347 | | | | 1,356,725 | |
| | | | | | | | | | | |
| | | $ | 28,610,121 | |
| | | | | | | | | | | |
| | | |
Health Care — 5.4% | | | | | | | | | | |
Alere, Inc. | | | | | | | | | | |
Term Loan, 4.75%, Maturing June 30, 2017 | | | | | 473 | | | $ | 474,496 | |
Term Loan, 4.75%, Maturing June 30, 2017 | | | | | 596 | | | | 598,943 | |
Term Loan, 4.75%, Maturing June 30, 2017 | | | | | 3,270 | | | | 3,289,389 | |
Alkermes, Inc. | |
Term Loan, Maturing September 18, 2019(4) | | | | | 750 | | | | 754,688 | |
Alliance Healthcare Services, Inc. | |
Term Loan, 7.25%, Maturing June 1, 2016 | | | | | 1,906 | | | | 1,858,648 | |
Ardent Medical Services, Inc. | |
Term Loan, 6.50%, Maturing September 15, 2015 | | | | | 710 | | | | 713,287 | |
Aveta, Inc. | |
Term Loan, 8.50%, Maturing April 4, 2017 | | | | | 1,275 | | | | 1,291,254 | |
Term Loan, 8.50%, Maturing April 4, 2017 | | | | | 1,275 | | | | 1,291,254 | |
Biomet Inc. | |
Term Loan, 3.31%, Maturing March 25, 2015 | | | | | 3,002 | | | | 3,007,402 | |
BSN Medical Acquisition Holding GmbH | |
Term Loan, 6.00%, Maturing July 27, 2019 | | | | | 625 | | | | 629,948 | |
| | | | | | | | | | |
| Borrower/Tranche Description | | Principal
Amount*
(000’s omitted) | | | Value | |
| | | | | | | | | | |
| | | |
Health Care (continued) | | | | | | | | | | |
Catalent Pharma Solutions Inc. | |
Term Loan, 4.12%, Maturing September 15, 2016 | | EUR | | | 1,895 | | | $ | 2,444,301 | |
Term Loan, 4.22%, Maturing September 15, 2016 | | | | | 1,086 | | | | 1,089,860 | |
Term Loan, 5.25%, Maturing September 15, 2017 | | | | | 645 | | | | 651,584 | |
CDRL MS, Inc. | |
Term Loan, 6.75%, Maturing October 3, 2016 | | | | | 783 | | | | 785,499 | |
Community Health Systems, Inc. | |
Term Loan, 3.92%, Maturing January 25, 2017 | | | | | 7,104 | | | | 7,146,144 | |
Convatec Inc. | |
Term Loan, 5.75%, Maturing December 22, 2016 | | | | | 1,495 | | | | 1,502,151 | |
CRC Health Corporation | |
Term Loan, 4.86%, Maturing November 16, 2015 | | | | | 1,160 | | | | 1,103,084 | |
DaVita, Inc. | |
Term Loan, Maturing September 2, 2019(4) | | | | | 3,325 | | | | 3,337,469 | |
DJO Finance LLC | |
Term Loan, 5.22%, Maturing November 1, 2016 | | | | | 1,494 | | | | 1,496,633 | |
Term Loan, 6.25%, Maturing September 15, 2017 | | | | | 423 | | | | 424,989 | |
Drumm Investors LLC | |
Term Loan, 5.00%, Maturing May 4, 2018 | | | | | 1,974 | | | | 1,910,235 | |
Emdeon, Inc. | |
Term Loan, 5.00%, Maturing November 2, 2018 | | | | | 846 | | | | 853,150 | |
Emergency Medical Services Corporation | |
Term Loan, 5.25%, Maturing May 25, 2018 | | | | | 3,473 | | | | 3,495,176 | |
Fenwal, Inc. | |
Term Loan, 2.67%, Maturing February 28, 2014 | | | | | 136 | | | | 135,996 | |
Term Loan, 2.67%, Maturing February 28, 2014 | | | | | 795 | | | | 793,016 | |
Fresenius US Finance I Inc. | |
Term Loan, 3.50%, Maturing September 10, 2014 | | | | | 353 | | | | 354,119 | |
Term Loan, 3.50%, Maturing September 10, 2014 | | | | | 617 | | | | 619,608 | |
Grifols Inc. | |
Term Loan, 4.50%, Maturing June 1, 2017 | | | | | 3,207 | | | | 3,239,440 | |
HCA, Inc. | |
Term Loan, 3.61%, Maturing March 31, 2017 | | | | | 5,961 | | | | 5,980,741 | |
Term Loan, 3.47%, Maturing May 1, 2018 | | | | | 2,152 | | | | 2,158,399 | |
Health Management Associates, Inc. | |
Term Loan, 4.50%, Maturing November 16, 2018 | | | | | 4,249 | | | | 4,286,300 | |
Hologic Inc. | |
Term Loan, 4.50%, Maturing August 1, 2019 | | | | | 2,025 | | | | 2,051,325 | |
Iasis Healthcare LLC | |
Term Loan, 5.00%, Maturing May 3, 2018 | | | | | 1,773 | | | | 1,780,757 | |
inVentiv Health, Inc. | |
Term Loan, 6.50%, Maturing August 4, 2016 | | | | | 3,455 | | | | 3,351,398 | |
Term Loan, 6.75%, Maturing May 15, 2018 | | | | | 2,333 | | | | 2,268,964 | |
| | | | |
| | 10 | | See Notes to Financial Statements. |
Eaton Vance
Limited Duration Income Fund
September 30, 2012
Portfolio of Investments (Unaudited) — continued
| | | | | | | | | | |
| Borrower/Tranche Description | | Principal
Amount*
(000’s omitted) | | | Value | |
| | | | | | | | | | |
| | | |
Health Care (continued) | | | | | | | | | | |
Kindred Healthcare, Inc. | |
Term Loan, 5.25%, Maturing June 1, 2018 | | | | | 1,728 | | | $ | 1,707,042 | |
Term Loan, Maturing June 1, 2018(4) | | | | | 850 | | | | 839,630 | |
Kinetic Concepts, Inc. | |
Term Loan, 7.00%, Maturing May 4, 2018 | | | | | 3,722 | | | | 3,780,029 | |
LHP Hospital Group, Inc. | |
Term Loan, 9.00%, Maturing July 3, 2018 | | | | | 599 | | | | 605,981 | |
MedAssets, Inc. | |
Term Loan, 5.25%, Maturing November 16, 2016 | | | | | 795 | | | | 802,619 | |
Medpace, Inc. | |
Term Loan, 6.51%, Maturing June 16, 2017 | | | | | 853 | | | | 821,157 | |
Multiplan, Inc. | |
Term Loan, 4.75%, Maturing August 26, 2017 | | | | | 3,333 | | | | 3,348,899 | |
MX USA, Inc. | |
Term Loan, 6.50%, Maturing April 28, 2017 | | | | | 597 | | | | 594,015 | |
One Call Medical, Inc. | |
Term Loan, 7.00%, Maturing August 16, 2019 | | | | | 950 | | | | 950,000 | |
Onex Carestream Finance LP | |
Term Loan, 5.00%, Maturing February 25, 2017 | | | | | 2,437 | | | | 2,415,466 | |
Par Pharmaceutical Companies, Inc. | |
Term Loan, 5.00%, Maturing September 30, 2019 | | | | | 1,275 | | | | 1,274,203 | |
Pharmaceutical Product Development, Inc. | |
Term Loan, 6.25%, Maturing December 5, 2018 | | | | | 2,059 | | | | 2,080,891 | |
Physiotherapy Associates Holdings, Inc. | |
Term Loan, 6.01%, Maturing April 30, 2018 | | | | | 324 | | | | 324,188 | |
Radnet Management, Inc. | |
Term Loan, 5.75%, Maturing April 6, 2016 | | | | | 2,328 | | | | 2,323,602 | |
Select Medical Corporation | |
Term Loan, 5.50%, Maturing June 1, 2018 | | | | | 3,209 | | | | 3,231,439 | |
Sheridan Holdings, Inc. | |
Term Loan, 6.00%, Maturing June 29, 2018 | | | | | 623 | | | | 630,062 | |
Sunrise Medical Holdings B.V. | |
Term Loan, 6.75%, Maturing May 13, 2014 | | EUR | | | 706 | | | | 891,304 | |
TriZetto Group, Inc. (The) | |
Term Loan, 4.75%, Maturing May 2, 2018 | | | | | 1,555 | | | | 1,550,939 | |
Truven Health Analytics Inc. | |
Term Loan, 6.75%, Maturing June 6, 2019 | | | | | 2,993 | | | | 3,018,684 | |
Universal Health Services, Inc. | |
Term Loan, 3.75%, Maturing November 15, 2016 | | | | | 507 | | | | 508,439 | |
Valeant Pharmaceuticals International, Inc. | |
Term Loan, 4.75%, Maturing February 13, 2019 | | | | | 873 | | | | 879,904 | |
Term Loan, 4.75%, Maturing February 13, 2019 | | | | | 1,020 | | | | 1,027,949 | |
Term Loan, Maturing September 27, 2019(4) | | | | | 2,150 | | | | 2,153,584 | |
Vanguard Health Holding Co. II, LLC | |
Term Loan, 5.00%, Maturing January 29, 2016 | | | | | 1,225 | | | | 1,233,947 | |
| | | | | | | | | | |
| Borrower/Tranche Description | | Principal
Amount*
(000’s omitted) | | | Value | |
| | | | | | | | | | |
| | | |
Health Care (continued) | | | | | | | | | | |
VWR Funding, Inc. | |
Term Loan, 2.72%, Maturing June 30, 2014 | | | | | 1,125 | | | $ | 1,126,125 | |
Term Loan, 4.47%, Maturing April 3, 2017 | | | | | 1,125 | | | | 1,131,045 | |
| | | | | | | | | | | |
| | | $ | 106,420,790 | |
| | | | | | | | | | | |
| | | |
Home Furnishings — 0.5% | | | | | | | | | | |
Hunter Fan Company | | | | | | | | | | |
Term Loan, 2.72%, Maturing April 16, 2014 | | | | | 467 | | | $ | 446,457 | |
Term Loan - Second Lien, 6.97%, Maturing October 16, 2014 | | | | | 500 | | | | 425,000 | |
National Bedding Company LLC | |
Term Loan, 6.00%, Maturing November 28, 2013 | | | | | 3,214 | | | | 3,212,247 | |
Term Loan - Second Lien, 7.25%, Maturing February 28, 2014 | | | | | 2,550 | | | | 2,543,625 | |
Oreck Corporation | |
Term Loan - Second Lien, 3.88%, Maturing March 19, 2016(5) | | | | | 527 | | | | 475,649 | |
Serta Simmons Holdings, LLC | |
Term Loan, Maturing September 19, 2019(4) | | | | | 1,775 | | | | 1,770,405 | |
Sofia III S.a.r.l. | |
Term Loan, 2.62%, Maturing June 24, 2016 | | EUR | | | 374 | | | | 424,488 | |
| | | | | | | | | | | |
| | | $ | 9,297,871 | |
| | | | | | | | | | | |
| | | |
Industrial Equipment — 0.6% | | | | | | | | | | |
Colfax Corporation | | | | | | | | | | |
Term Loan, 4.50%, Maturing January 11, 2019 | | | | | 1,340 | | | $ | 1,350,343 | |
Generac Power Systems, Inc. | | | | | | | | | | |
Term Loan, 6.25%, Maturing February 8, 2019 | | | | | 1,650 | | | | 1,685,062 | |
Grede LLC | | | | | | | | | | |
Term Loan, 7.00%, Maturing April 3, 2017 | | | | | 833 | | | | 834,562 | |
Husky Injection Molding Systems Ltd. | | | | | | | | | | |
Term Loan, 5.75%, Maturing June 29, 2018 | | | | | 1,931 | | | | 1,949,771 | |
Kion Group GMBH | | | | | | | | | | |
Term Loan, 3.37%, Maturing December 23, 2014(3) | | EUR | | | 1,311 | | | | 1,642,285 | |
Term Loan, 3.47%, Maturing December 23, 2014(3) | | | | | 260 | | | | 253,477 | |
Term Loan, 3.97%, Maturing December 23, 2015(3) | | | | | 260 | | | | 253,477 | |
Term Loan, 3.87%, Maturing December 29, 2015(3) | | EUR | | | 1,311 | | | | 1,642,285 | |
Manitowoc Company, Inc. (The) | | | | | | | | | | |
Term Loan, 4.25%, Maturing November 13, 2017 | | | | | 602 | | | | 606,414 | |
Tank Holding Corp. | | | | | | | | | | |
Term Loan, 6.75%, Maturing July 9, 2019 | | | | | 1,059 | | | | 1,061,295 | |
Unifrax Corporation | | | | | | | | | | |
Term Loan, 6.50%, Maturing November 28, 2018 | | | | | 1,095 | | | | 1,107,057 | |
| | | | | | | | | | | |
| | | $ | 12,386,028 | |
| | | | | | | | | | | |
| | | | |
| | 11 | | See Notes to Financial Statements. |
Eaton Vance
Limited Duration Income Fund
September 30, 2012
Portfolio of Investments (Unaudited) — continued
| | | | | | | | | | |
| Borrower/Tranche Description | | Principal
Amount*
(000’s omitted) | | | Value | |
| | | | | | | | | | |
| | | |
Insurance — 1.2% | | | | | | | | | | |
Alliant Holdings I, Inc. | | | | | | | | | | |
Term Loan, 3.36%, Maturing August 21, 2014 | | | | | 2,632 | | | $ | 2,641,411 | |
AmWINS Group, Inc. | | | | | | | | | | |
Term Loan, 5.75%, Maturing June 6, 2019 | | | | | 1,047 | | | | 1,051,303 | |
Term Loan - Second Lien, 9.25%, Maturing December 6, 2019 | | | | | 3,475 | | | | 3,485,137 | |
Applied Systems, Inc. | | | | | | | | | | |
Term Loan, 5.50%, Maturing December 8, 2016 | | | | | 622 | | | | 623,430 | |
Term Loan, 5.50%, Maturing December 8, 2016 | | | | | 950 | | | | 952,287 | |
Asurion LLC | | | | | | | | | | |
Term Loan, 5.50%, Maturing May 24, 2018 | | | | | 8,474 | | | | 8,530,647 | |
Term Loan - Second Lien, 9.00%, Maturing
May 24, 2019 | | | | | 524 | | | | 542,876 | |
CNO Financial Group, Inc. | | | | | | | | | | |
Term Loan, Maturing September 20, 2016(4) | | | | | 1,125 | | | | 1,133,437 | |
Hub International Limited | | | | | | | | | | |
Term Loan, 4.72%, Maturing June 13, 2017 | | | | | 1,138 | | | | 1,149,403 | |
Sedgwick CMS Holdings, Inc. | | | | | | | | | | |
Term Loan, 5.00%, Maturing December 30, 2016 | | | | | 658 | | | | 655,959 | |
USI Holdings Corporation | |
Term Loan, 2.72%, Maturing May 5, 2014 | | | | | 2,588 | | | | 2,592,775 | |
Term Loan, 7.00%, Maturing May 5, 2014 | | | | | 970 | | | | 975,658 | |
| | | | | | | | | | | |
| | | $ | 24,334,323 | |
| | | | | | | | | | | |
| | | |
Leisure Goods / Activities / Movies — 2.0% | | | | | | | | | | |
Alpha D2 Limited | | | | | | | | | | |
Term Loan, 5.75%, Maturing April 28, 2017 | | | | | 2,090 | | | $ | 2,112,790 | |
AMC Entertainment, Inc. | | | | | | | | | | |
Term Loan, 4.25%, Maturing December 15, 2016 | | | | | 1,646 | | | | 1,655,811 | |
Term Loan, 4.75%, Maturing February 22, 2018 | | | | | 1,017 | | | | 1,025,044 | |
AMC Networks Inc. | | | | | | | | | | |
Term Loan, 4.00%, Maturing December 31, 2018 | | | | | 1,457 | | | | 1,457,776 | |
Bombardier Recreational Products, Inc. | | | | | | | | | | |
Term Loan, 4.47%, Maturing June 28, 2016 | | | | | 2,825 | | | | 2,845,964 | |
Bright Horizons Family Solutions, Inc. | | | | | | | | | | |
Term Loan, 4.22%, Maturing May 28, 2015 | | | | | 237 | | | | 237,803 | |
Cedar Fair, L.P. | | | | | | | | | | |
Term Loan, 4.00%, Maturing December 15, 2017 | | | | | 2,360 | | | | 2,377,809 | |
Cinemark USA, Inc. | | | | | | | | | | |
Term Loan, 3.48%, Maturing April 29, 2016 | | | | | 3,615 | | | | 3,638,405 | |
Clubcorp Club Operations, Inc. | | | | | | | | | | |
Term Loan, 6.00%, Maturing November 30, 2016 | | | | | 1,980 | | | | 1,997,172 | |
Live Nation Entertainment, Inc. | | | | | | | | | | |
Term Loan, 4.50%, Maturing November 7, 2016 | | | | | 5,623 | | | | 5,646,134 | |
| | | | | | | | | | |
| Borrower/Tranche Description | | Principal
Amount*
(000’s omitted) | | | Value | |
| | | | | | | | | | |
| | | |
Leisure Goods / Activities / Movies (continued) | | | | | | | | | | |
Regal Cinemas, Inc. | | | | | | | | | | |
Term Loan, 3.25%, Maturing August 23, 2017 | | | | | 3,930 | | | $ | 3,945,791 | |
Revolution Studios Distribution Company, LLC | | | | | | | | | | |
Term Loan, 3.97%, Maturing December 21, 2014(5) | | | | | 1,246 | | | | 1,014,616 | |
Term Loan - Second Lien, 7.22%, Maturing June 21, 2015(5) | | | | | 2,050 | | | | 873,505 | |
SeaWorld Parks & Entertainment, Inc. | | | | | | | | | | |
Term Loan, 2.93%, Maturing February 17, 2016 | | | | | 948 | | | | 945,932 | |
Term Loan, 4.00%, Maturing August 17, 2017 | | | | | 1,529 | | | | 1,536,981 | |
Six Flags Theme Parks, Inc. | | | | | | | | | | |
Term Loan, 4.25%, Maturing December 20, 2018 | | | | | 4,700 | | | | 4,735,231 | |
Town Sports International Inc. | | | | | | | | | | |
Term Loan, 5.75%, Maturing May 11, 2018 | | | | | 916 | | | | 929,013 | |
Zuffa LLC | | | | | | | | | | |
Term Loan, 2.25%, Maturing June 19, 2015 | | | | | 1,443 | | | | 1,417,643 | |
Term Loan, 7.50%, Maturing June 19, 2015 | | | | | 1,492 | | | | 1,503,574 | |
| | | | | | | | | | | |
| | | $ | 39,896,994 | |
| | | | | | | | | | | |
| | | |
Lodging and Casinos — 0.7% | | | | | | | | | | |
Affinity Gaming, LLC | | | | | | | | | | |
Term Loan, 5.50%, Maturing November 9, 2017 | | | | | 1,692 | | | $ | 1,716,872 | |
Ameristar Casinos, Inc. | | | | | | | | | | |
Term Loan, 4.00%, Maturing April 16, 2018 | | | | | 980 | | | | 986,914 | |
Caesars Entertainment Operating Company | | | | | | | | | | |
Term Loan, 5.47%, Maturing January 26, 2018 | | | | | 3,683 | | | | 3,357,188 | |
Gala Group LTD | | | | | | | | | | |
Term Loan, 5.52%, Maturing May 30, 2018 | | GBP | | | 1,775 | | | | 2,640,949 | |
Isle of Capri Casinos, Inc. | | | | | | | | | | |
Term Loan, 4.75%, Maturing March 24, 2017 | | | | | 862 | | | | 869,237 | |
Las Vegas Sands LLC | | | | | | | | | | |
Term Loan, 2.72%, Maturing November 23, 2016 | | | | | 613 | | | | 611,015 | |
Term Loan, 2.72%, Maturing November 23, 2016 | | | | | 2,249 | | | | 2,243,925 | |
LodgeNet Entertainment Corporation | | | | | | | | | | |
Term Loan, 6.50%, Maturing April 4, 2014 | | | | | 529 | | | | 401,528 | |
Penn National Gaming, Inc. | | | | | | | | | | |
Term Loan, 3.75%, Maturing July 16, 2018 | | | | | 711 | | | | 714,894 | |
Pinnacle Entertainment, Inc. | | | | | | | | | | |
Term Loan, 4.00%, Maturing March 19, 2019 | | | | | 597 | | | | 601,104 | |
Tropicana Entertainment Inc. | | | | | | | | | | |
Term Loan, 7.50%, Maturing March 16, 2018 | | | | | 149 | | | | 150,929 | |
| | | | | | | | | | | |
| | | $ | 14,294,555 | |
| | | | | | | | | | | |
| | | | |
| | 12 | | See Notes to Financial Statements. |
Eaton Vance
Limited Duration Income Fund
September 30, 2012
Portfolio of Investments (Unaudited) — continued
| | | | | | | | | | |
| Borrower/Tranche Description | | Principal
Amount*
(000’s omitted) | | | Value | |
| | | | | | | | | | |
| | | |
Nonferrous Metals / Minerals — 0.6% | | | | | | | | | | |
Arch Coal Inc. | | | | | | | | | | |
Term Loan, 5.75%, Maturing May 16, 2018 | | | | | 2,519 | | | $ | 2,542,293 | |
Fairmount Minerals LTD | | | | | | | | | | |
Term Loan, 5.25%, Maturing March 15, 2017 | | | | | 3,611 | | | | 3,607,829 | |
Noranda Aluminum Acquisition Corporation | | | | | | | | | | |
Term Loan, 5.75%, Maturing February 24, 2019 | | | | | 1,045 | | | | 1,058,136 | |
Novelis, Inc. | | | | | | | | | | |
Term Loan, 4.00%, Maturing March 10, 2017 | | | | | 693 | | | | 695,235 | |
Term Loan, 4.00%, Maturing March 10, 2017 | | | | | 2,063 | | | | 2,069,904 | |
Oxbow Carbon and Mineral Holdings LLC | | | | | | | | | | |
Term Loan, 3.72%, Maturing May 8, 2016 | | | | | 1,380 | | | | 1,386,423 | |
| | | | | | | | | | | |
| | | $ | 11,359,820 | |
| | | | | | | | | | | |
| | | |
Oil and Gas — 1.1% | | | | | | | | | | |
Buffalo Gulf Coast Terminals LLC | | | | | | | | | | |
Term Loan, 7.50%, Maturing October 31, 2017 | | | | | 594 | | | $ | 605,880 | |
Citgo Petroleum Corporation | | | | | | | | | | |
Term Loan, 8.00%, Maturing June 24, 2015 | | | | | 474 | | | | 481,219 | |
Term Loan, 9.00%, Maturing June 23, 2017 | | | | | 489 | | | | 498,525 | |
Crestwood Holdings LLC | | | | | | | | | | |
Term Loan, 9.75%, Maturing March 26, 2018 | | | | | 1,145 | | | | 1,163,346 | |
Energy Transfer Equity, L.P. | | | | | | | | | | |
Term Loan, 3.75%, Maturing March 24, 2017 | | | | | 2,725 | | | | 2,727,461 | |
Frac Tech International LLC | | | | | | | | | | |
Term Loan, 8.50%, Maturing May 6, 2016 | | | | | 1,380 | | | | 1,332,268 | |
Gibson Energy ULC | | | | | | | | | | |
Term Loan, 4.75%, Maturing June 15, 2018 | | | | | 2,463 | | | | 2,485,712 | |
MEG Energy Corp. | | | | | | | | | | |
Term Loan, 4.00%, Maturing March 16, 2018 | | | | | 1,139 | | | | 1,145,221 | |
Obsidian Holdings LLC | | | | | | | | | | |
Term Loan, 6.75%, Maturing November 2, 2015 | | | | | 1,932 | | | | 1,932,253 | |
Obsidian Natural Gas Trust | | | | | | | | | | |
Term Loan, 7.00%, Maturing November 2, 2015 | | | | | 912 | | | | 916,834 | |
Samson Investment Company | | | | | | | | | | |
Term Loan - Second Lien, 6.00%, Maturing September 13, 2018 | | | | | 900 | | | | 906,937 | |
Sheridan Production Partners I, LLC | | | | | | | | | | |
Term Loan, 6.50%, Maturing April 20, 2017 | | | | | 133 | | | | 133,529 | |
Term Loan, 6.50%, Maturing April 20, 2017 | | | | | 218 | | | | 218,611 | |
Term Loan, 6.50%, Maturing April 20, 2017 | | | | | 2,184 | | | | 2,192,965 | |
Term Loan, Maturing September 14, 2019(4) | | | | | 541 | | | | 535,509 | |
Term Loan, Maturing September 25, 2019(4) | | | | | 44 | | | | 43,944 | |
Term Loan, Maturing September 25, 2019(4) | | | | | 72 | | | | 71,945 | |
| | | | | | | | | | |
| Borrower/Tranche Description | | Principal
Amount*
(000’s omitted) | | | Value | |
| | | | | | | | | | |
| | | |
Oil and Gas (continued) | | | | | | | | | | |
Tervita Corporation | | | | | | | | | | |
Term Loan, 6.50%, Maturing October 17, 2014 | | | | | 546 | | | $ | 547,694 | |
Term Loan, 3.22%, Maturing November 14, 2014 | | | | | 3,071 | | | | 3,043,977 | |
| | | | | | | | | | | |
| | | $ | 20,983,830 | |
| | | | | | | | | | | |
| | | |
Publishing — 1.5% | | | | | | | | | | |
Ascend Learning, Inc. | | | | | | | | | | |
Term Loan, 5.75%, Maturing May 23, 2017 | | | | | 2,045 | | | $ | 2,049,961 | |
Aster Zweite Beteiligungs GmbH | | | | | | | | | | |
Term Loan, 5.95%, Maturing December 31, 2014 | | EUR | | | 429 | | | | 533,921 | |
Term Loan, 5.95%, Maturing December 31, 2014 | | EUR | | | 479 | | | | 596,776 | |
Term Loan, 5.97%, Maturing December 31, 2014 | | | | | 243 | | | | 233,553 | |
Term Loan, 5.97%, Maturing December 31, 2014 | | | | | 655 | | | | 629,395 | |
Term Loan, 8.20%, Maturing June 30, 2016 | | EUR | | | 1,503 | | | | 1,612,431 | |
Cengage Learning Acquisitions, Inc. | | | | | | | | | | |
Term Loan, 2.47%, Maturing July 3, 2014 | | | | | 1,646 | | | | 1,569,600 | |
GateHouse Media Operating, Inc. | | | | | | | | | | |
Term Loan, 2.22%, Maturing August 28, 2014 | | | | | 2,909 | | | | 946,168 | |
Term Loan, 2.22%, Maturing August 28, 2014 | | | | | 4,131 | | | | 1,343,340 | |
Term Loan, 2.47%, Maturing August 28, 2014 | | | | | 960 | | | | 312,206 | |
Getty Images, Inc. | | | | | | | | | | |
Term Loan, 3.97%, Maturing November 2, 2015 | | | | | 563 | | | | 564,586 | |
Term Loan, 5.25%, Maturing November 7, 2016 | | | | | 1,806 | | | | 1,810,626 | |
Interactive Data Corp. | | | | | | | | | | |
Term Loan, 4.50%, Maturing February 12, 2018 | | | | | 3,097 | | | | 3,118,241 | |
Laureate Education, Inc. | | | | | | | | | | |
Term Loan, 5.25%, Maturing June 18, 2018 | | | | | 6,285 | | | | 6,213,948 | |
Medianews Group | | | | | | | | | | |
Term Loan, 8.50%, Maturing March 19, 2014 | | | | | 128 | | | | 124,359 | |
Merrill Communications, LLC | | | | | | | | | | |
Term Loan, 9.75%, Maturing December 24, 2012 | | | | | 1,382 | | | | 1,356,016 | |
Nelson Education Ltd. | | | | | | | | | | |
Term Loan, 2.86%, Maturing July 3, 2014 | | | | | 624 | | | | 524,141 | |
Nielsen Finance LLC | | | | | | | | | | |
Term Loan, 3.48%, Maturing May 2, 2016 | | | | | 1,970 | | | | 1,980,444 | |
Penton Media, Inc. | | | | | | | | | | |
Term Loan, 5.00%, Maturing August 1, 2014(3) | | | | | 968 | | | | 788,665 | |
SGS International, Inc. | | | | | | | | | | |
Term Loan, 5.75%, Maturing September 30, 2013 | | | | | 569 | | | | 569,806 | |
Source Interlink Companies, Inc. | | | | | | | | | | |
Term Loan, 15.00%, Maturing March 18, 2014(3)(5) | | | | | 924 | | | | 554,391 | |
Term Loan - Second Lien, 10.75%, Maturing June 18, 2013 | | | | | 1,111 | | | | 1,066,178 | |
| | | | |
| | 13 | | See Notes to Financial Statements. |
Eaton Vance
Limited Duration Income Fund
September 30, 2012
Portfolio of Investments (Unaudited) — continued
| | | | | | | | | | |
| Borrower/Tranche Description | | Principal
Amount*
(000’s omitted) | | | Value | |
| | | | | | | | | | |
| | | |
Publishing (continued) | | | | | | | | | | |
Star Tribune Company (The) | | | | | | | | | | |
Term Loan, 8.00%, Maturing September 28, 2014 | | | | | 19 | | | $ | 17,916 | |
Term Loan, 8.00%, Maturing September 29, 2014 | | | | | 25 | | | | 23,889 | |
| | | | | | | | | | | |
| | | | | | | | $ | 28,540,557 | |
| | | | | | | | | | | |
| | | |
Radio and Television — 1.3% | | | | | | | | | | |
Clear Channel Communications, Inc. | | | | | | | | | | |
Term Loan, 3.87%, Maturing January 28, 2016 | | | | | 984 | | | $ | 807,098 | |
Cumulus Media Holdings Inc. | | | | | | | | | | |
Term Loan - Second Lien, Maturing
September 16, 2019(4) | | | | | 1,000 | | | | 1,012,500 | |
Cumulus Media, Inc. | | | | | | | | | | |
Term Loan, 5.75%, Maturing September 17, 2018 | | | | | 4,512 | | | | 4,543,650 | |
Entercom Radio, LLC | | | | | | | | | | |
Term Loan, 6.25%, Maturing November 23, 2018 | | | | | 566 | | | | 569,913 | |
Foxco Acquisition Sub, LLC | | | | | | | | | | |
Term Loan, 5.50%, Maturing July 31, 2017 | | | | | 1,500 | | | | 1,515,000 | |
Gray Television, Inc. | | | | | | | | | | |
Term Loan, 3.74%, Maturing December 31, 2014 | | | | | 1,726 | | | | 1,724,841 | |
LIN Television Corp. | | | | | | | | | | |
Term Loan, 5.00%, Maturing December 21, 2018 | | | | | 596 | | | | 602,944 | |
Local TV Finance, LLC | | | | | | | | | | |
Term Loan, 4.22%, Maturing May 7, 2015 | | | | | 1,712 | | | | 1,727,003 | |
Mission Broadcasting, Inc. | | | | | | | | | | |
Term Loan, 5.00%, Maturing September 30, 2016 | | | | | 648 | | | | 649,703 | |
Nexstar Broadcasting, Inc. | | | | | | | | | | |
Term Loan, 5.00%, Maturing September 30, 2016 | | | | | 2,984 | | | | 2,991,055 | |
Raycom TV Broadcasting, Inc. | | | | | | | | | | |
Term Loan, 4.50%, Maturing May 31, 2017 | | | | | 913 | | | | 908,870 | |
Sinclair Television Group Inc. | | | | | | | | | | |
Term Loan, 4.00%, Maturing October 28, 2016 | | | | | 757 | | | | 762,116 | |
Tyrol Acquisitions 2 SAS | | | | | | | | | | |
Term Loan, 4.12%, Maturing January 29, 2016 | | EUR | | | 758 | | | | 885,292 | |
Term Loan, 4.12%, Maturing January 29, 2016 | | EUR | | | 758 | | | | 885,292 | |
Univision Communications Inc. | | | | | | | | | | |
Term Loan, 4.47%, Maturing March 31, 2017 | | | | | 5,725 | | | | 5,681,517 | |
Weather Channel | | | | | | | | | | |
Term Loan, 4.25%, Maturing February 13, 2017 | | | | | 1,249 | | | | 1,258,653 | |
| | | | | | | | | | | |
| | | | | | | | $ | 26,525,447 | |
| | | | | | | | | | | |
| | | |
Rail Industries — 0.0%(2) | | | | | | | | | | |
RailAmerica, Inc. | | | | | | | | | | |
Term Loan, 4.00%, Maturing March 1, 2019 | | | | | 796 | | | $ | 796,498 | |
| | | | | | | | | | | |
| | | | | | | | $ | 796,498 | |
| | | | | | | | | | | |
| | | | | | | | | | |
| Borrower/Tranche Description | | Principal
Amount*
(000’s omitted) | | | Value | |
| | | | | | | | | | |
| | | |
Retailers (Except Food and Drug) — 1.4% | | | | | | | | | | |
99 Cents Only Stores | | | | | | | | | | |
Term Loan, 5.25%, Maturing January 11, 2019 | | | | | 521 | | | $ | 527,582 | |
Evergreen Acqco 1 LP | | | | | | | | | | |
Term Loan, 6.25%, Maturing July 9, 2019 | | | | | 723 | | | | 733,131 | |
FTD, Inc. | | | | | | | | | | |
Term Loan, 4.75%, Maturing June 11, 2018 | | | | | 1,300 | | | | 1,306,187 | |
Harbor Freight Tools USA, Inc. | | | | | | | | | | |
Term Loan, 5.50%, Maturing November 14, 2017 | | | | | 1,050 | | | | 1,055,906 | |
J Crew Group, Inc. | | | | | | | | | | |
Term Loan, 4.75%, Maturing March 7, 2018 | | | | | 2,666 | | | | 2,670,535 | |
Jo-Ann Stores, Inc. | | | | | | | | | | |
Term Loan, 4.75%, Maturing March 16, 2018 | | | | | 2,613 | | | | 2,623,674 | |
Michaels Stores, Inc. | | | | | | | | | | |
Term Loan, 4.91%, Maturing July 29, 2016 | | | | | 926 | | | | 934,692 | |
National Vision, Inc. | | | | | | | | | | |
Term Loan, 7.00%, Maturing August 2, 2018 | | | | | 848 | | | | 852,114 | |
Neiman Marcus Group, Inc. (The) | | | | | | | | | | |
Term Loan, 4.75%, Maturing May 16, 2018 | | | | | 3,250 | | | | 3,273,452 | |
Ollie’s Bargain Outlet, Inc. | | | | | | | | | | |
Term Loan, Maturing September 27, 2019(4) | | | | | 525 | | | | 522,375 | |
Pep Boys-Manny, Moe & Jack (The) | | | | | | | | | | |
Term Loan, Maturing October 17, 2018(4) | | | | | 500 | | | | 496,250 | |
Petco Animal Supplies, Inc. | | | | | | | | | | |
Term Loan, 4.50%, Maturing November 24, 2017 | | | | | 2,440 | | | | 2,455,504 | |
Pilot Travel Centers LLC | | | | | | | | | | |
Term Loan, 4.25%, Maturing March 30, 2018 | | | | | 1,676 | | | | 1,683,989 | |
Term Loan, 4.25%, Maturing August 7, 2019 | | | | | 575 | | | | 578,594 | |
ServiceMaster Company | | | | | | | | | | |
Term Loan, 4.48%, Maturing January 31, 2017 | | | | | 3,179 | | | | 3,195,209 | |
Visant Holding Corp. | | | | | | | | | | |
Term Loan, 5.25%, Maturing December 22, 2016 | | | | | 1,295 | | | | 1,254,151 | |
Vivarte SA | | | | | | | | | | |
Term Loan, 3.07%, Maturing March 9, 2015 | | EUR | | | 31 | | | | 33,406 | |
Term Loan, 3.07%, Maturing March 9, 2015 | | EUR | | | 122 | | | | 129,913 | |
Term Loan, 3.07%, Maturing March 9, 2015 | | EUR | | | 781 | | | | 834,410 | |
Term Loan, 3.57%, Maturing March 8, 2016 | | EUR | | | 31 | | | | 33,406 | |
Term Loan, 3.57%, Maturing March 8, 2016 | | EUR | | | 122 | | | | 129,913 | |
Term Loan, 3.57%, Maturing March 8, 2016 | | EUR | | | 781 | | | | 834,410 | |
Wilton Brands LLC | | | | | | | | | | |
Term Loan, 7.50%, Maturing August 30, 2018 | | | | | 675 | | | | 682,594 | |
| | | | | | | | | | | |
| | | | | | | | $ | 26,841,397 | |
| | | | | | | | | | | |
| | | | |
| | 14 | | See Notes to Financial Statements. |
Eaton Vance
Limited Duration Income Fund
September 30, 2012
Portfolio of Investments (Unaudited) — continued
| | | | | | | | | | |
| Borrower/Tranche Description | | Principal
Amount*
(000’s omitted) | | | Value | |
| | | | | | | | | | |
| | | |
Steel — 0.3% | | | | | | | | | | |
Essar Steel Algoma, Inc. | | | | | | | | | | |
Term Loan, 8.75%, Maturing September 19, 2014 | | | | | 1,850 | | | $ | 1,868,500 | |
JMC Steel Group, Inc. | | | | | | | | | | |
Term Loan, 4.75%, Maturing April 3, 2017 | | | | | 640 | | | | 644,659 | |
Patriot Coal Corporation | | | | | | | | | | |
Term Loan, 9.25%, Maturing October 4, 2013 | | | | | 875 | | | | 882,656 | |
SunCoke Energy, Inc. | | | | | | | | | | |
Term Loan, 4.00%, Maturing July 26, 2018 | | | | | 543 | | | | 545,842 | |
Waupaca Foundry, Inc. | | | | | | | | | | |
Term Loan, 8.50%, Maturing June 29, 2017 | | | | | 1,200 | | | | 1,212,000 | |
WireCo WorldGroup, Inc. | | | | | | | | | | |
Term Loan, 6.00%, Maturing February 15, 2017 | | | | | 700 | | | | 707,875 | |
| | | | | | | | | | | |
| | | | | | | | $ | 5,861,532 | |
| | | | | | | | | | | |
| | | |
Surface Transport — 0.3% | | | | | | | | | | |
Hertz Corporation, (The) | | | | | | | | | | |
Term Loan, 3.75%, Maturing March 9, 2018 | | | | | 3,300 | | | $ | 3,297,394 | |
Swift Transportation Co. Inc. | | | | | | | | | | |
Term Loan, 3.98%, Maturing December 21, 2016 | | | | | 1,270 | | | | 1,275,991 | |
Term Loan, 5.00%, Maturing December 21, 2017 | | | | | 1,858 | | | | 1,870,294 | |
| | | | | | | | | | | |
| | | | | | | | $ | 6,443,679 | |
| | | | | | | | | | | |
| | | |
Telecommunications — 2.1% | | | | | | | | | | |
Cellular South, Inc. | | | | | | | | | | |
Revolving Loan, 4.50%, Maturing July 27, 2017 | | | | | 916 | | | $ | 923,763 | |
Crown Castle International Corporation | | | | | | | | | | |
Term Loan, 4.00%, Maturing January 31, 2019 | | | | | 1,911 | | | | 1,919,997 | |
Eircom Finco S.a.r.l | | | | | | | | | | |
Term Loan, 4.27%, Maturing September 30, 2017 | | EUR | | | 3,069 | | | | 2,770,640 | |
Intelsat Jackson Holdings S.A. | | | | | | | | | | |
Term Loan, 5.25%, Maturing April 2, 2018 | | | | | 10,418 | | | | 10,469,570 | |
IPC Systems, Inc. | | | | | | | | | | |
Term Loan, 2.85%, Maturing May 31, 2014 | | GBP | | | 1,326 | | | | 2,116,836 | |
Macquarie UK Broadcast Limited | | | | | | | | | | |
Term Loan, 3.02%, Maturing December 1, 2014 | | GBP | | | 1,071 | | | | 1,611,246 | |
MetroPCS Wireless, Inc. | | | | | | | | | | |
Term Loan, 4.00%, Maturing March 16, 2018 | | | | | 7,097 | | | | 7,117,466 | |
NTELOS Inc. | | | | | | | | | | |
Term Loan, 4.00%, Maturing August 7, 2015 | | | | | 1,208 | | | | 1,212,904 | |
Oberthur Technologies Holding SAS | | | | | | | | | | |
Term Loan, 6.25%, Maturing March 30, 2019 | | | | | 575 | | | | 568,531 | |
SBA Finance | | | | | | | | | | |
Term Loan, 3.75%, Maturing June 29, 2018 | | | | | 1,012 | | | | 1,014,402 | |
Term Loan, Maturing September 20, 2019(4) | | | | | 475 | | | | 477,672 | |
| | | | | | | | | | |
| Borrower/Tranche Description | | Principal
Amount*
(000’s omitted) | | | Value | |
| | | | | | | | | | |
| | | |
Telecommunications (continued) | | | | | | | | | | |
Syniverse Holdings, Inc. | | | | | | | | | | |
Term Loan, 5.00%, Maturing April 23, 2019 | | | | | 1,945 | | | $ | 1,952,419 | |
Telesat LLC | | | | | | | | | | |
Term Loan, 4.25%, Maturing March 28, 2019 | | | | | 3,940 | | | | 3,954,900 | |
TowerCo Finance LLC | | | | | | | | | | |
Term Loan, 5.75%, Maturing February 2, 2017 | | | | | 640 | | | | 641,851 | |
Windstream Corporation | | | | | | | | | | |
Term Loan, 3.15%, Maturing December 17, 2015 | | | | | 3,605 | | | | 3,608,177 | |
Term Loan, 4.00%, Maturing August 8, 2019 | | | | | 998 | | | | 1,003,310 | |
| | | | | | | | | | | |
| | | | | | | | $ | 41,363,684 | |
| | | | | | | | | | | |
| | | |
Utilities — 0.9% | | | | | | | | | | |
AES Corporation | | | | | | | | | | |
Term Loan, 4.25%, Maturing June 1, 2018 | | | | | 2,733 | | | $ | 2,751,924 | |
Calpine Corporation | | | | | | | | | | |
Term Loan, 4.50%, Maturing April 2, 2018 | | | | | 1,012 | | | | 1,015,802 | |
Term Loan, 4.50%, Maturing April 2, 2018 | | | | | 2,610 | | | | 2,621,372 | |
Dynegy Midwest Generation LLC | | | | | | | | | | |
Term Loan, 9.25%, Maturing August 4, 2016 | | | | | 545 | | | | 565,599 | |
Dynegy Power, LLC | | | | | | | | | | |
Term Loan, 9.25%, Maturing August 4, 2016 | | | | | 990 | | | | 1,040,051 | |
Invenergy LLC | | | | | | | | | | |
Term Loan, 9.00%, Maturing November 21, 2017 | | | | | 749 | | | | 754,785 | |
LSP Madison Funding, LLC | | | | | | | | | | |
Term Loan, 5.50%, Maturing June 28, 2019 | | | | | 1,222 | | | | 1,234,157 | |
NRG Energy, Inc. | | | | | | | | | | |
Term Loan, 4.00%, Maturing July 2, 2018 | | | | | 4,691 | | | | 4,721,700 | |
Texas Competitive Electric Holdings Company, LLC | | | | | | | | | | |
Term Loan, 4.76%, Maturing October 10, 2017 | | | | | 5,000 | | | | 3,456,766 | |
| | | | | | | | | | | |
| | | | | | | | $ | 18,162,156 | |
| | | | | | | | | | | |
| | | |
Total Senior Floating-Rate Interests
(identified cost $871,060,939) | | | | | | | | $ | 866,844,361 | |
| | | | | | | | | | | |
|
| Corporate Bonds & Notes — 49.4% | |
| | | |
| | | | | | | | | | |
| Security | | | | Principal
Amount*
(000’s omitted) | | | Value | |
| | | |
Aerospace and Defense — 0.5% | | | | | | | | | | |
Alliant Techsystems, Inc. | | | | | | | | | | |
6.875%, 9/15/20 | | | | | 760 | | | $ | 832,200 | |
| | | | |
| | 15 | | See Notes to Financial Statements. |
Eaton Vance
Limited Duration Income Fund
September 30, 2012
Portfolio of Investments (Unaudited) — continued
| | | | | | | | | | |
| Security | | | | Principal
Amount*
(000’s omitted) | | | Value | |
| | | | | | | | | | |
| | | |
Aerospace and Defense (continued) | | | | | | | | | | |
Huntington Ingalls Industries, Inc. | | | | | | | | | | |
6.875%, 3/15/18 | | | | | 825 | | | $ | 898,219 | |
7.125%, 3/15/21 | | | | | 2,025 | | | | 2,189,531 | |
TransDigm, Inc. | | | | | | | | | | |
7.75%, 12/15/18 | | | | | 5,030 | | | | 5,583,300 | |
| | | | | | | | | | | |
| | | | | | | | $ | 9,503,250 | |
| | | | | | | | | | | |
| | | |
Agriculture — 0.1% | | | | | | | | | | |
Lorillard Tobacco Co., Sr. Notes | | | | | | | | | | |
6.875%, 5/1/20 | | | | | 1,000 | | | $ | 1,229,714 | |
| | | | | | | | | | | |
| | | | | | | | $ | 1,229,714 | |
| | | | | | | | | | | |
| | | |
Automotive — 0.9% | | | | | | | | | | |
Affinia Group, Inc., Sr. Notes | | | | | | | | | | |
10.75%, 8/15/16(6) | | | | | 2,635 | | | $ | 2,862,269 | |
Allison Transmission, Inc. | | | | | | | | | | |
7.125%, 5/15/19(6) | | | | | 1,040 | | | | 1,120,600 | |
American Axle & Manufacturing, Inc., Sr. Notes | | | | | | | | | | |
9.25%, 1/15/17(6) | | | | | 1,044 | | | | 1,171,890 | |
Chrysler Group, LLC, Sr. Notes | | | | | | | | | | |
8.25%, 6/15/21 | | | | | 1,835 | | | | 1,963,450 | |
General Motors Financial Co., Inc., Sr. Notes | | | | | | | | | | |
4.75%, 8/15/17(6) | | | | | 1,615 | | | | 1,658,024 | |
Kia Motors Corp., Sr. Notes | | | | | | | | | | |
3.625%, 6/14/16(6) | | | | | 1,400 | | | | 1,473,902 | |
Meritor, Inc. | | | | | | | | | | |
10.625%, 3/15/18 | | | | | 2,055 | | | | 2,178,300 | |
Tomkins, LLC/Tomkins, Inc. | | | | | | | | | | |
9.00%, 10/1/18 | | | | | 803 | | | | 899,360 | |
Tower Automotive Holdings USA, LLC/TA Holding Finance, Inc., Sr. Notes | | | | | | | | | | |
10.625%, 9/1/17(6) | | | | | 2,821 | | | | 3,053,732 | |
Visteon Corp. | | | | | | | | | | |
6.75%, 4/15/19 | | | | | 1,355 | | | | 1,429,525 | |
| | | | | | | | | | | |
| | | | | | | | $ | 17,811,052 | |
| | | | | | | | | | | |
| | | |
Banks and Thrifts — 0.6% | | | | | | | | | | |
Bank of America NA, Sr. Notes | | | | | | | | | | |
7.625%, 6/1/19 | | | | | 400 | | | $ | 500,250 | |
5.625%, 7/1/20 | | | | | 1,030 | | | | 1,176,618 | |
Bank One Michigan | | | | | | | | | | |
8.25%, 11/1/24 | | | | | 1,375 | | | | 1,865,401 | |
Barclays Bank PLC | | | | | | | | | | |
6.05%, 12/4/17(6) | | | | | 550 | | | | 594,609 | |
| | | | | | | | | | |
| Security | | | | Principal
Amount*
(000’s omitted) | | | Value | |
| | | | | | | | | | |
| | | |
Banks and Thrifts (continued) | | | | | | | | | | |
Citigroup, Inc. | | | | | | | | | | |
6.625%, 6/15/32 | | | | | 800 | | | $ | 919,674 | |
Discover Bank | | | | | | | | | | |
8.70%, 11/18/19 | | | | | 500 | | | | 646,602 | |
Fifth Third Bancorp | | | | | | | | | | |
8.25%, 3/1/38 | | | | | 360 | | | | 523,654 | |
HBOS PLC | | | | | | | | | | |
6.75%, 5/21/18(6) | | | | | 435 | | | | 443,700 | |
HSBC Holdings PLC | | | | | | | | | | |
6.50%, 5/2/36 | | | | | 825 | | | | 970,608 | |
Regions Bank | | | | | | | | | | |
6.45%, 6/26/37 | | | | | 450 | | | | 461,250 | |
Regions Financial Corp., Sr. Notes | | | | | | | | | | |
5.75%, 6/15/15 | | | | | 450 | | | | 484,304 | |
Royal Bank of Scotland Group PLC | | | | | | | | | | |
5.05%, 1/8/15 | | | | | 340 | | | | 352,927 | |
Standard Chartered Bank, Sr. Notes | | | | | | | | | | |
6.40%, 9/26/17(6) | | | | | 1,075 | | | | 1,235,465 | |
Zions Bancorporation | | | | | | | | | | |
6.00%, 9/15/15 | | | | | 1,600 | | | | 1,678,461 | |
| | | | | | | | | | | |
| | | | | | | | $ | 11,853,523 | |
| | | | | | | | | | | |
| | | |
Beverage and Tobacco — 0.2% | | | | | | | | | | |
Constellation Brands, Inc., Sr. Notes | | | | | | | | | | |
6.00%, 5/1/22 | | | | | 1,530 | | | $ | 1,748,025 | |
4.625%, 3/1/23 | | | | | 1,625 | | | | 1,665,625 | |
Diageo Investment Corp., Sr. Notes | | | | | | | | | | |
4.25%, 5/11/42 | | | | | 335 | | | | 366,499 | |
Innovation Ventures LLC/Innovation Ventures Finance Corp., Sr. Notes | | | | | | | | | | |
9.50%, 8/15/19(6) | | | | | 1,145 | | | | 1,110,650 | |
| | | | | | | | | | | |
| | | | | | | | $ | 4,890,799 | |
| | | | | | | | | | | |
| | | |
Broadcast Radio and Television — 0.3% | | | | | | | | | | |
Clear Channel Worldwide Holdings, Inc. | | | | | | | | | | |
9.25%, 12/15/17 | | | | | 1,550 | | | $ | 1,677,875 | |
7.625%, 3/15/20 | | | | | 470 | | | | 453,550 | |
LBI Media, Inc., Sr. Notes | | | | | | | | | | |
9.25%, 4/15/19(6) | | | | | 1,830 | | | | 1,729,350 | |
Starz, LLC/Starz Finance Corp., Sr. Notes | | | | | | | | | | |
5.00%, 9/15/19(6) | | | | | 1,470 | | | | 1,510,425 | |
| | | | | | | | | | | |
| | | | | | | | $ | 5,371,200 | |
| | | | | | | | | | | |
| | | | |
| | 16 | | See Notes to Financial Statements. |
Eaton Vance
Limited Duration Income Fund
September 30, 2012
Portfolio of Investments (Unaudited) — continued
| | | | | | | | | | |
| Security | | | | Principal
Amount*
(000’s omitted) | | | Value | |
| | | | | | | | | | |
|
Brokers, Dealers and Investment Houses — 0.4% | |
Alliance Data Systems Corp., Sr. Notes | | | | | | | | | | |
6.375%, 4/1/20(6) | | | | | 1,210 | | | $ | 1,312,850 | |
BP Capital Markets PLC, Sr. Notes | | | | | | | | | | |
3.561%, 11/1/21 | | | | | 800 | | | | 867,256 | |
Macquarie Bank, Ltd. | | | | | | | | | | |
6.625%, 4/7/21(6) | | | | | 550 | | | | 589,632 | |
Morgan Stanley, Sr. Notes | | | | | | | | | | |
7.30%, 5/13/19 | | | | | 1,100 | | | | 1,299,946 | |
Neuberger Berman Group, LLC/Neuberger Berman Finance Corp., Sr. Notes | | | | | | | | | | |
5.625%, 3/15/20(6) | | | | | 4,335 | | | | 4,638,450 | |
| | | | | | | | | | | |
| | | | | | | | $ | 8,708,134 | |
| | | | | | | | | | | |
|
Building and Development — 1.3% | |
Building Materials Corp. of America, Sr. Notes | | | | | | | | | | |
6.75%, 5/1/21(6) | | | | | 3,945 | | | $ | 4,329,637 | |
CB Richard Ellis Service, Inc., Sr. Notes | | | | | | | | | | |
11.625%, 6/15/17 | | | | | 9,415 | | | | 10,591,875 | |
6.625%, 10/15/20 | | | | | 3,270 | | | | 3,588,825 | |
Interface, Inc., Sr. Notes | | | | | | | | | | |
7.625%, 12/1/18 | | | | | 860 | | | | 937,400 | |
Isabelle Acquisition Sub, Inc., Sr. Notes | | | | | | | | | | |
10.00%, 11/15/18(6) | | | | | 2,950 | | | | 3,211,813 | |
Nortek, Inc., Sr. Notes | | | | | | | | | | |
10.00%, 12/1/18 | | | | | 1,905 | | | | 2,114,550 | |
8.50%, 4/15/21 | | | | | 820 | | | | 877,400 | |
NVR, Inc., Sr. Notes | | | | | | | | | | |
3.95%, 9/15/22 | | | | | 600 | | | | 616,624 | |
| | | | | | | | | | | |
| | | | | | | | $ | 26,268,124 | |
| | | | | | | | | | | |
|
Business Equipment and Services — 2.6% | |
Avis Budget Car Rental, LLC/Avis Budget Finance, Inc., Sr. Notes | | | | | | | | | | |
8.25%, 1/15/19 | | | | | 550 | | | $ | 601,563 | |
9.75%, 3/15/20 | | | | | 4,410 | | | | 5,060,475 | |
Carlson Wagonlit BV | | | | | | | | | | |
6.875%, 6/15/19(6) | | | | | 2,400 | | | | 2,532,000 | |
Catalina Marketing Corp. | | | | | | | | | | |
10.50%, 10/1/15(6) | | | | | 3,255 | | | | 3,287,550 | |
11.625%, 10/1/17(6) | | | | | 4,150 | | | | 4,025,500 | |
Education Management, LLC, Sr. Notes | | | | | | | | | | |
8.75%, 6/1/14 | | | | | 6,365 | | | | 5,044,262 | |
MDC Holdings, Inc. | | | | | | | | | | |
5.625%, 2/1/20 | | | | | 555 | | | | 608,098 | |
| | | | | | | | | | |
| Security | | | | Principal
Amount*
(000’s omitted) | | | Value | |
| | | | | | | | | | |
|
Business Equipment and Services (continued) | |
MDC Partners, Inc. | | | | | | | | | | |
11.00%, 11/1/16 | | | | | 1,145 | | | $ | 1,253,775 | |
RSC Equipment Rental, Inc./RSC Holdigs III, LLC, Sr. Notes | | | | | | | | | | |
10.25%, 11/15/19 | | | | | 1,525 | | | | 1,746,125 | |
8.25%, 2/1/21 | | | | | 440 | | | | 485,100 | |
Sitel, LLC/Sitel Finance Corp., Sr. Notes | | | | | | | | | | |
11.50%, 4/1/18 | | | | | 915 | | | | 667,950 | |
SSI Investments II, Ltd./SSI Co-Issuer, LLC, Sr. Notes | | | | | | | | | | |
11.125%, 6/1/18 | | | | | 4,605 | | | | 5,226,675 | |
TransUnion Holding Co., Inc., Sr. Notes | | | | | | | | | | |
9.625%, 6/15/18(3)(6) | | | | | 3,925 | | | | 4,297,875 | |
TransUnion LLC/TransUnion Financing Corp. | | | | | | | | | | |
11.375%, 6/15/18 | | | | | 3,880 | | | | 4,588,100 | |
UR Merger Sub Corp., Sr. Notes | | | | | | | | | | |
10.875%, 6/15/16 | | | | | 3,460 | | | | 3,866,550 | |
7.375%, 5/15/20(6) | | | | | 4,375 | | | | 4,714,062 | |
7.625%, 4/15/22(6) | | | | | 2,960 | | | | 3,248,600 | |
| | | | | | | | | | | |
| | | | | | | | $ | 51,254,260 | |
| | | | | | | | | | | |
|
Cable and Satellite Television — 1.3% | |
Cablevision Systems Corp., Sr. Notes | | | | | | | | | | |
7.75%, 4/15/18 | | | | | 1,055 | | | $ | 1,173,688 | |
CCO Holdings, LLC/CCO Holdings Capital Corp., Sr. Notes | | | | | | | | | | |
7.875%, 4/30/18 | | | | | 1,425 | | | | 1,549,687 | |
7.00%, 1/15/19 | | | | | 420 | | | | 456,750 | |
8.125%, 4/30/20 | | | | | 365 | | | | 414,275 | |
5.25%, 9/30/22 | | | | | 4,295 | | | | 4,337,950 | |
Comcast Corp. | | | | | | | | | | |
6.95%, 8/15/37 | | | | | 595 | | | | 813,661 | |
CSC Holdings, LLC, Sr. Notes | | | | | | | | | | |
6.75%, 11/15/21(6) | | | | | 2,780 | | | | 3,078,850 | |
DISH DBS Corp., Sr. Notes | | | | | | | | | | |
5.875%, 7/15/22(6) | | | | | 1,960 | | | | 2,018,800 | |
Mediacom Broadband Corp., Sr. Notes | | | | | | | | | | |
8.50%, 10/15/15 | | | | | 3,290 | | | | 3,350,207 | |
Mediacom, LLC/Mediacom Capital Corp., Sr. Notes | | | | | | | | | | |
9.125%, 8/15/19 | | | | | 785 | | | | 871,350 | |
Time Warner Cable, Inc. | | | | | | | | | | |
8.75%, 2/14/19 | | | | | 1,055 | | | | 1,438,506 | |
UPCB Finance V, Ltd., Sr. Notes | | | | | | | | | | |
7.25%, 11/15/21(6) | | | | | 3,055 | | | | 3,337,587 | |
| | | | |
| | 17 | | See Notes to Financial Statements. |
Eaton Vance
Limited Duration Income Fund
September 30, 2012
Portfolio of Investments (Unaudited) — continued
| | | | | | | | | | |
| Security | | | | Principal
Amount*
(000’s omitted) | | | Value | |
| | | | | | | | | | |
|
Cable and Satellite Television (continued) | |
UPCB Finance VI, Ltd., Sr. Notes | | | | | | | | | | |
6.875%, 1/15/22(6) | | | | | 2,025 | | | $ | 2,156,625 | |
| | | | | | | | | | | |
| | | | | | | | $ | 24,997,936 | |
| | | | | | | | | | | |
|
Chemicals and Plastics — 1.5% | |
Ashland, Inc., Sr. Notes | | | | | | | | | | |
4.75%, 8/15/22(6) | | | | | 760 | | | $ | 780,900 | |
Celanese US Holdings, LLC | | | | | | | | | | |
6.625%, 10/15/18 | | | | | 880 | | | | 968,000 | |
5.875%, 6/15/21 | | | | | 940 | | | | 1,053,975 | |
CF Industries, Inc., Sr. Notes | | | | | | | | | | |
6.875%, 5/1/18 | | | | | 865 | | | | 1,054,219 | |
Chemtura Corp. | | | | | | | | | | |
7.875%, 9/1/18 | | | | | 2,185 | | | | 2,387,112 | |
Ineos Finance PLC, Sr. Notes | | | | | | | | | | |
7.25%, 2/15/19 | | EUR | | | 1,000 | | | | 1,304,325 | |
8.375%, 2/15/19(6) | | | | | 3,700 | | | | 3,908,125 | |
7.50%, 5/1/20(6) | | | | | 850 | | | | 867,000 | |
Kraton Polymers, LLC, Sr. Notes | | | | | | | | | | |
6.75%, 3/1/19 | | | | | 940 | | | | 972,900 | |
LyondellBasell Industries N.V., Sr. Notes | | | | | | | | | | |
5.00%, 4/15/19 | | | | | 5,010 | | | | 5,348,175 | |
5.75%, 4/15/24 | | | | | 4,350 | | | | 4,969,875 | |
NOVA Chemicals Corp., Sr. Notes | | | | | | | | | | |
8.375%, 11/1/16 | | | | | 1,960 | | | | 2,175,600 | |
Polymer Group, Inc., Sr. Notes | | | | | | | | | | |
7.75%, 2/1/19 | | | | | 320 | | | | 342,400 | |
PolyOne Corp., Sr. Notes | | | | | | | | | | |
7.375%, 9/15/20 | | | | | 585 | | | | 636,188 | |
Polypore International, Inc., Sr. Notes | | | | | | | | | | |
7.50%, 11/15/17 | | | | | 760 | | | | 822,700 | |
Scotts Miracle-Gro Co. (The) | | | | | | | | | | |
7.25%, 1/15/18 | | | | | 785 | | | | 845,838 | |
Taminco Global Chemical Corp., Sr. Sub. Notes | | | | | | | | | | |
9.75%, 3/31/20(6) | | | | | 550 | | | | 596,750 | |
| | | | | | | | | | | |
| | | | | | | | $ | 29,034,082 | |
| | | | | | | | | | | |
|
Clothing / Textiles — 0.2% | |
Phillips-Van Heusen Corp., Sr. Notes | | | | | | | | | | |
7.75%, 11/15/23 | | | | | 3,740 | | | $ | 4,354,101 | |
| | | | | | | | | | | |
| | | | | | | | $ | 4,354,101 | |
| | | | | | | | | | | |
| | | | | | | | | | |
| Security | | | | Principal
Amount*
(000’s omitted) | | | Value | |
| | | | | | | | | | |
|
Conglomerates — 0.4% | |
Amsted Industries, Inc., Sr. Notes | | | | | | | | | | |
8.125%, 3/15/18(6) | | | | | 3,220 | | | $ | 3,493,700 | |
Belden, Inc., Sr. Sub. Notes | | | | | | | | | | |
5.50%, 9/1/22(6) | | | | | 1,080 | | | | 1,109,700 | |
Spectrum Brands, Inc., Sr. Notes | | | | | | | | | | |
9.50%, 6/15/18(6) | | | | | 1,090 | | | | 1,234,425 | |
6.75%, 3/15/20(6) | | | | | 1,645 | | | | 1,704,631 | |
| | | | | | | | | | | |
| | | | | | | | $ | 7,542,456 | |
| | | | | | | | | | | |
|
Containers and Glass Products — 0.8% | |
Ball Corp., Sr. Notes | | | | | | | | | | |
5.00%, 3/15/22 | | | | | 1,250 | | | $ | 1,310,937 | |
BWAY Holding Co., Sr. Notes | | | | | | | | | | |
10.00%, 6/15/18 | | | | | 620 | | | | 700,600 | |
Reynolds Group Holdings, Inc., Sr. Notes | | | | | | | | | | |
7.125%, 4/15/19 | | | | | 2,665 | | | | 2,824,900 | |
9.00%, 4/15/19 | | | | | 1,020 | | | | 1,045,500 | |
7.875%, 8/15/19 | | | | | 1,225 | | | | 1,329,125 | |
9.875%, 8/15/19 | | | | | 3,020 | | | | 3,227,625 | |
Sealed Air Corp., Sr. Notes | | | | | | | | | | |
8.375%, 9/15/21(6) | | | | | 4,260 | | | | 4,792,500 | |
Smurfit Kappa Acquisitions | | | | | | | | | | |
4.875%, 9/15/18(6) | | | | | 1,270 | | | | 1,258,888 | |
| | | | | | | | | | | |
| | | | | | | | $ | 16,490,075 | |
| | | | | | | | | | | |
|
Cosmetics / Toiletries — 0.2% | |
Party City Holdings, Inc., Sr. Notes | | | | | | | | | | |
8.875%, 8/1/20(6) | | | | | 2,735 | | | $ | 2,926,450 | |
| | | | | | | | | | | |
| | | | | | | | $ | 2,926,450 | |
| | | | | | | | | | | |
|
Diversified Financial Services — 0.4% | |
Capital One Bank (USA), NA | | | | | | | | | | |
8.80%, 7/15/19 | | | | | 1,000 | | | $ | 1,321,810 | |
Discover Financial Services, Sr. Notes | | | | | | | | | | |
6.45%, 6/12/17 | | | | | 1,000 | | | | 1,136,657 | |
FICS Prudential Financial, Inc. | | | | | | | | | | |
0.00%, 6/1/14 | | | | | 1,661 | | | | 1,594,500 | |
General Electric Capital Corp. | | | | | | | | | | |
5.30%, 2/11/21 | | | | | 2,350 | | | | 2,701,972 | |
General Electric Capital Corp., Sr. Notes | | | | | | | | | | |
2.95%, 5/9/16 | | | | | 250 | | | | 264,623 | |
Goldman Sachs Group, Inc. (The) | | | | | | | | | | |
5.95%, 1/15/27 | | | | | 600 | | | | 630,120 | |
Jefferies Group, Inc., Sr. Notes | | | | | | | | | | |
8.50%, 7/15/19 | | | | | 190 | | | | 218,975 | |
| | | | | | | | | | | |
| | | | | | | | $ | 7,868,657 | |
| | | | | | | | | | | |
| | | | |
| | 18 | | See Notes to Financial Statements. |
Eaton Vance
Limited Duration Income Fund
September 30, 2012
Portfolio of Investments (Unaudited) — continued
| | | | | | | | | | |
| Security | | | | Principal
Amount*
(000’s omitted) | | | Value | |
| | | | | | | | | | |
|
Diversified Manufacturing Operations — 0.1% | |
Hutchison Whampoa International, Ltd. | | | | | | | | | | |
6.25%, 1/24/14(6) | | | | | 500 | | | $ | 534,014 | |
7.45%, 11/24/33(6) | | | | | 400 | | | | 581,498 | |
LVMH Moet Hennessy Louis Vuitton SA, Sr. Notes | | | | | | | | | | |
1.625%, 6/29/17(6) | | | | | 1,000 | | | | 1,009,877 | |
| | | | | | | | | | | |
| | | | | | | | $ | 2,125,389 | |
| | | | | | | | | | | |
|
Drugs — 0.8% | |
Cardinal Health, Inc., Sr. Notes | | | | | | | | | | |
4.625%, 12/15/20 | | | | | 1,250 | | | $ | 1,425,004 | |
Endo Pharmaceuticals Holdings, Inc. | | | | | | | | | | |
7.00%, 7/15/19 | | | | | 1,260 | | | | 1,363,950 | |
7.00%, 12/15/20 | | | | | 1,275 | | | | 1,380,187 | |
7.25%, 1/15/22 | | | | | 555 | | | | 602,175 | |
Patheon, Inc., Sr. Notes | | | | | | | | | | |
8.625%, 4/15/17(6) | | | | | 1,305 | | | | 1,337,625 | |
Pharmaceutical Product Development, Inc., Sr. Notes | |
9.50%, 12/1/19(6) | | | | | 5,050 | | | | 5,693,875 | |
Warner Chilcott Co., LLC | | | | | | | | | | |
7.75%, 9/15/18 | | | | | 3,720 | | | | 3,989,700 | |
| | | | | | | | | | | |
| | | | | | | | $ | 15,792,516 | |
| | | | | | | | | | | |
|
Ecological Services and Equipment — 0.3% | |
Casella Waste Systems, Inc., Sr. Sub. Notes | | | | | | | | | | |
11.00%, 7/15/14 | | | | | 845 | | | $ | 896,756 | |
7.75%, 2/15/19 | | | | | 470 | | | | 462,950 | |
Clean Harbors, Inc., Sr. Notes | | | | | | | | | | |
5.25%, 8/1/20(6) | | | | | 1,095 | | | | 1,133,325 | |
Covanta Holding Corp., Sr. Notes | | | | | | | | | | |
6.375%, 10/1/22 | | | | | 2,085 | | | | 2,277,456 | |
Environmental Systems Product Holdings, Inc., Jr. Notes | |
18.00%, 3/31/15(5)(6) | | | | | 184 | | | | 156,179 | |
| | | | | | | | | | | |
| | | | | | | | $ | 4,926,666 | |
| | | | | | | | | | | |
|
Electronics / Electrical — 1.2% | |
Advanced Micro Devices, Inc., Sr. Notes | | | | | | | | | | |
8.125%, 12/15/17 | | | | | 1,670 | | | $ | 1,766,159 | |
7.75%, 8/1/20 | | | | | 175 | | | | 178,500 | |
Agilent Technologies, Inc., Sr. Notes | | | | | | | | | | |
5.50%, 9/14/15 | | | | | 1,100 | | | | 1,235,432 | |
Amphenol Corp. | | | | | | | | | | |
4.00%, 2/1/22 | | | | | 1,000 | | | | 1,057,819 | |
| | | | | | | | | | |
| Security | | | | Principal
Amount*
(000’s omitted) | | | Value | |
| | | | | | | | | | |
|
Electronics / Electrical (continued) | |
Brocade Communications Systems, Inc., Sr. Notes | | | | | | | | | | |
6.625%, 1/15/18 | | | | | 700 | | | $ | 729,750 | |
6.875%, 1/15/20 | | | | | 890 | | | | 965,650 | |
Comision Federal de Electricidad | | | | | | | | | | |
4.875%, 5/26/21(6) | | | | | 1,100 | | | | 1,240,250 | |
Dominion Resources, Inc., Sr. Notes | | | | | | | | | | |
5.15%, 7/15/15 | | | | | 1,155 | | | | 1,288,497 | |
Duke Energy Corp., Sr. Notes | | | | | | | | | | |
3.55%, 9/15/21 | | | | | 1,000 | | | | 1,066,432 | |
Energizer Holdings, Inc. | | | | | | | | | | |
4.70%, 5/19/21 | | | | | 860 | | | | 912,612 | |
Entergy Corp., Sr. Notes | | | | | | | | | | |
3.625%, 9/15/15 | | | | | 1,340 | | | | 1,410,617 | |
Exelon Corp., Sr. Notes | | | | | | | | | | |
5.625%, 6/15/35 | | | | | 400 | | | | 458,401 | |
Infor US, Inc., Sr. Notes | | | | | | | | | | |
9.375%, 4/1/19(6) | | | | | 1,965 | | | | 2,190,975 | |
MidAmerican Energy Holdings Co., Sr. Notes | | | | | | | | | | |
5.75%, 4/1/18 | | | | | 800 | | | | 963,124 | |
Midamerican Funding, LLC | | | | | | | | | | |
6.927%, 3/1/29 | | | | | 345 | | | | 461,499 | |
Nuance Communications, Inc., Sr. Notes | | | | | | | | | | |
5.375%, 8/15/20(6) | | | | | 885 | | | | 918,187 | |
PPL Energy Supply, LLC, Sr. Notes | | | | | | | | | | |
6.50%, 5/1/18 | | | | | 730 | | | | 865,168 | |
Seagate HDD Cayman, Sr. Notes | | | | | | | | | | |
7.00%, 11/1/21 | | | | | 3,340 | | | | 3,590,500 | |
South Carolina Electric & Gas Co. | | | | | | | | | | |
6.05%, 1/15/38 | | | | | 350 | | | | 459,231 | |
Southern Power Co., Sr. Notes | | | | | | | | | | |
4.875%, 7/15/15 | | | | | 700 | | | | 771,152 | |
5.15%, 9/15/41 | | | | | 300 | | | | 345,654 | |
Tyco Electronics Group SA | | | | | | | | | | |
5.95%, 1/15/14 | | | | | 500 | | | | 533,132 | |
7.125%, 10/1/37 | | | | | 400 | | | | 537,196 | |
| | | | | | | | | | | |
| | | | | | | | $ | 23,945,937 | |
| | | | | | | | | | | |
|
Equipment Leasing — 1.0% | |
Aircastle, Ltd., Sr. Notes | | | | | | | | | | |
6.75%, 4/15/17 | | | | | 65 | | | $ | 70,363 | |
AWAS Aviation Capital, Ltd., Sr. Notes | | | | | | | | | | |
7.00%, 10/17/16(6) | | | | | 4,682 | | | | 4,986,671 | |
International Lease Finance Corp., Sr. Notes | | | | | | | | | | |
5.875%, 5/1/13 | | | | | 705 | | | | 724,388 | |
5.65%, 6/1/14 | | | | | 3,650 | | | | 3,841,990 | |
8.75%, 3/15/17 | | | | | 1,525 | | | | 1,791,875 | |
| | | | |
| | 19 | | See Notes to Financial Statements. |
Eaton Vance
Limited Duration Income Fund
September 30, 2012
Portfolio of Investments (Unaudited) — continued
| | | | | | | | | | |
| Security | | | | Principal
Amount*
(000’s omitted) | | | Value | |
| | | | | | | | | | |
|
Equipment Leasing (continued) | |
International Lease Finance Corp., Sr. Notes (continued) | | | | | | | | |
6.25%, 5/15/19 | | | | | 1,930 | | | $ | 2,084,400 | |
8.25%, 12/15/20 | | | | | 3,275 | | | | 3,905,437 | |
8.625%, 1/15/22 | | | | | 2,615 | | | | 3,170,687 | |
| | | | | | | | | | | |
| | | | | | | | $ | 20,575,811 | |
| | | | | | | | | | | |
|
Financial Intermediaries — 3.1% | |
Ally Financial, Inc., Sr. Notes | | | | | | | | | | |
2.618%, 12/1/14(7) | | | | | 765 | | | $ | 755,841 | |
4.625%, 6/26/15 | | | | | 6,170 | | | | 6,331,358 | |
5.50%, 2/15/17 | | | | | 5,000 | | | | 5,232,485 | |
6.25%, 12/1/17 | | | | | 3,295 | | | | 3,576,966 | |
8.00%, 11/1/31 | | | | | 4,485 | | | | 5,251,935 | |
CIT Group, Inc., Sr. Notes | | | | | | | | | | |
4.75%, 2/15/15(6) | | | | | 8,540 | | | | 8,945,650 | |
5.25%, 3/15/18 | | | | | 645 | | | | 694,988 | |
8.50%, 5/22/19 | | | | | 615 | | | | 814,558 | |
E*TRADE Financial Corp., Sr. Notes | | | | | | | | | | |
12.50%, 11/30/17(3) | | | | | 3,860 | | | | 4,405,225 | |
First Data Corp., Sr. Notes | | | | | | | | | | |
7.375%, 6/15/19(6) | | | | | 3,105 | | | | 3,217,556 | |
6.75%, 11/1/20(6) | | | | | 5,415 | | | | 5,408,231 | |
Ford Motor Credit Co., LLC, Sr. Notes | | | | | | | | | | |
12.00%, 5/15/15 | | | | | 3,380 | | | | 4,216,550 | |
8.00%, 12/15/16 | | | | | 4,975 | | | | 5,960,169 | |
8.125%, 1/15/20 | | | | | 1,530 | | | | 1,928,313 | |
5.875%, 8/2/21 | | | | | 1,980 | | | | 2,244,488 | |
General Motors Financial Co., Inc., Sr. Notes | | | | | | | | | | |
6.75%, 6/1/18 | | | | | 1,365 | | | | 1,521,232 | |
Janus Capital Group, Inc., Sr. Notes | | | | | | | | | | |
6.70%, 6/15/17 | | | | | 100 | | | | 113,320 | |
XLIT, Ltd., Sr. Notes | | | | | | | | | | |
5.75%, 10/1/21 | | | | | 600 | | | | 691,939 | |
| | | | | | | | | | | |
| | | | | | | | $ | 61,310,804 | |
| | | | | | | | | | | |
|
Financial Services — 0.1% | |
UBS AG/Stamford, CT, MTN | | | | | | | | | | |
5.875%, 7/15/16 | | | | | 1,325 | | | $ | 1,450,675 | |
| | | | | | | | | | | |
| | | | | | | | $ | 1,450,675 | |
| | | | | | | | | | | |
|
Food Products — 0.9% | |
ASG Consolidated, LLC/ASG Finance, Inc., Sr. Notes | | | | | | | | | | |
15.00%, 5/15/17(6) | | | | | 2,338 | | | $ | 1,918,786 | |
| | | | | | | | | | |
| Security | | | | Principal
Amount*
(000’s omitted) | | | Value | |
| | | | | | | | | | |
|
Food Products (continued) | |
ASG Consolidated, LLC/ASG Finance, Inc., Sr. Sub. Notes | |
10.75%, 5/15/16(6) | | | | | 5,465 | | | $ | 5,560,638 | |
Bunge, Ltd. Finance Corp. | | | | | | | | | | |
8.50%, 6/15/19 | | | | | 1,000 | | | | 1,268,905 | |
Corn Products International, Inc., Sr. Notes | | | | | | | | | | |
6.625%, 4/15/37 | | | | | 325 | | | | 405,435 | |
Michael Foods, Inc., Sr. Notes | | | | | | | | | | |
9.75%, 7/15/18 | | | | | 4,360 | | | | 4,883,200 | |
Ralcorp Holdings, Inc., Sr. Notes | | | | | | | | | | |
6.625%, 8/15/39 | | | | | 1,440 | | | | 1,532,586 | |
Smithfield Foods, Inc., Sr. Notes | | | | | | | | | | |
6.625%, 8/15/22 | | | | | 2,175 | | | | 2,262,000 | |
| | | | | | | | | | | |
| | | | | | | | $ | 17,831,550 | |
| | | | | | | | | | | |
|
Food Service — 0.4% | |
Aramark Holdings Corp., Sr. Notes | | | | | | | | | | |
8.625%, 5/1/16(3)(6) | | | | | 1,030 | | | $ | 1,058,335 | |
NPC International, Inc., Sr. Notes | | | | | | | | | | |
10.50%, 1/15/20 | | | | | 3,405 | | | | 3,932,775 | |
Ruby Tuesday, Inc., Sr. Notes | | | | | | | | | | |
7.625%, 5/15/20(6) | | | | | 2,915 | | | | 2,812,975 | |
| | | | | | | | | | | |
| | | | | | | | $ | 7,804,085 | |
| | | | | | | | | | | |
|
Forest Products — 0.3% | |
Boise Paper Holdings, LLC, Sr. Notes | | | | | | | | | | |
9.00%, 11/1/17 | | | | | 370 | | | $ | 408,850 | |
8.00%, 4/1/20 | | | | | 605 | | | | 667,012 | |
Domtar Corp., Sr. Notes | | | | | | | | | | |
10.75%, 6/1/17 | | | | | 2,995 | | | | 3,902,767 | |
| | | | | | | | | | | |
| | | | | | | | $ | 4,978,629 | |
| | | | | | | | | | | |
|
Health Care — 3.6% | |
Accellent, Inc., Sr. Notes | | | | | | | | | | |
8.375%, 2/1/17 | | | | | 3,655 | | | $ | 3,773,787 | |
Air Medical Group Holdings, Inc. | | | | | | | | | | |
9.25%, 11/1/18 | | | | | 1,845 | | | | 2,020,275 | |
Alere, Inc., Sr. Notes | | | | | | | | | | |
7.875%, 2/1/16 | | | | | 3,585 | | | | 3,764,250 | |
American Renal Holdings, Sr. Notes | | | | | | | | | | |
8.375%, 5/15/18 | | | | | 600 | | | | 636,000 | |
Bausch & Lomb, Inc., Sr. Notes | | | | | | | | | | |
9.875%, 11/1/15 | | | | | 1,875 | | | | 1,938,281 | |
| | | | |
| | 20 | | See Notes to Financial Statements. |
Eaton Vance
Limited Duration Income Fund
September 30, 2012
Portfolio of Investments (Unaudited) — continued
| | | | | | | | | | |
| Security | | | | Principal
Amount*
(000’s omitted) | | | Value | |
| | | | | | | | | | |
|
Health Care (continued) | |
CHS/Community Health Systems, Inc., Sr. Notes | | | | | | | | | | |
5.125%, 8/15/18 | | | | | 4,900 | | | $ | 5,096,000 | |
Community Health Systems, Inc., Sr. Notes | | | | | | | | | | |
7.125%, 7/15/20 | | | | | 2,785 | | | | 2,974,728 | |
ConvaTec Healthcare E SA, Sr. Notes | | | | | | | | | | |
10.50%, 12/15/18(6) | | | | | 1,835 | | | | 2,000,150 | |
DJO Finance, LLC/DJO Finance Corp. | | | | | | | | | | |
8.75%, 3/15/18(6) | | | | | 1,045 | | | | 1,116,844 | |
Emergency Medical Services Corp. | | | | | | | | | | |
8.125%, 6/1/19 | | | | | 1,255 | | | | 1,336,575 | |
Fresenius Medical Care US Finance II, Inc. | | | | | | | | | | |
5.625%, 7/31/19(6) | | | | | 1,640 | | | | 1,750,700 | |
5.875%, 1/31/22(6) | | | | | 1,365 | | | | 1,463,963 | |
Fresenius US Finance II, Inc., Sr. Notes | | | | | | | | | | |
9.00%, 7/15/15(6) | | | | | 1,400 | | | | 1,620,500 | |
HCA Holdings, Inc., Sr. Notes | | | | | | | | | | |
7.75%, 5/15/21 | | | | | 795 | | | | 870,525 | |
HCA, Inc., Sr. Notes | | | | | | | | | | |
9.875%, 2/15/17 | | | | | 2,330 | | | | 2,516,400 | |
6.50%, 2/15/20 | | | | | 2,985 | | | | 3,328,275 | |
7.50%, 2/15/22 | | | | | 2,930 | | | | 3,332,875 | |
Hillenbrand, Inc., Sr. Notes | | | | | | | | | | |
5.50%, 7/15/20 | | | | | 1,800 | | | | 2,003,310 | |
Hologic, Inc., Sr. Notes | | | | | | | | | | |
6.25%, 8/1/20(6) | | | | | 5,490 | | | | 5,846,850 | |
Kinetic Concepts, Inc./KCI USA, Inc. | | | | | | | | | | |
10.50%, 11/1/18(6) | | | | | 3,115 | | | | 3,309,688 | |
12.50%, 11/1/19(6) | | | | | 1,900 | | | | 1,805,000 | |
Multiplan, Inc. | | | | | | | | | | |
9.875%, 9/1/18(6) | | | | | 4,060 | | | | 4,506,600 | |
Physio-Control International, Inc., Sr. Notes | | | | | | | | | | |
9.875%, 1/15/19(6) | | | | | 1,575 | | | | 1,732,500 | |
PSS World Medical, Inc. | | | | | | | | | | |
6.375%, 3/1/22 | | | | | 1,385 | | | | 1,480,219 | |
Rural/Metro Corp., Sr. Notes | | | | | | | | | | |
10.125%, 7/15/19(6) | | | | | 830 | | | | 832,075 | |
Stewart Enterprises, Inc., Sr. Notes | | | | | | | | | | |
6.50%, 4/15/19 | | | | | 555 | | | | 599,400 | |
STHI Holding Corp. | | | | | | | | | | |
8.00%, 3/15/18(6) | | | | | 1,375 | | | | 1,471,250 | |
Teleflex, Inc., Sr. Sub. Notes | | | | | | | | | | |
6.875%, 6/1/19 | | | | | 540 | | | | 583,200 | |
| | | | | | | | | | |
| Security | | | | Principal
Amount*
(000’s omitted) | | | Value | |
| | | | | | | | | | |
|
Health Care (continued) | |
United Surgical Partners International, Inc., Sr. Notes | | | | | | | | | | |
9.00%, 4/1/20(6) | | | | | 1,880 | | | $ | 2,049,200 | |
VWR Funding, Inc., Sr. Notes | | | | | | | | | | |
7.25%, 9/15/17(6) | | | | | 3,215 | | | | 3,269,253 | |
Wyeth, LLC | | | | | | | | | | |
6.50%, 2/1/34 | | | | | 720 | | | | 1,004,546 | |
| | | | | | | | | | | |
| | | | | | | | $ | 70,033,219 | |
| | | | | | | | | | | |
|
Home Furnishings — 0.2% | |
Libbey Glass, Inc., Sr. Notes | | | | | | | | | | |
6.875%, 5/15/20(6) | | | | | 1,570 | | | $ | 1,695,600 | |
Mead Products, LLC/ACCO Brands Corp., Sr. Notes | | | | | | | | | | |
6.75%, 4/30/20(6) | | | | | 2,915 | | | | 3,053,462 | |
| | | | | | | | | | | |
| | | | | | | | $ | 4,749,062 | |
| | | | | | | | | | | |
|
Industrial Equipment — 0.2% | |
CNH Capital, LLC, Sr. Notes | | | | | | | | | | |
6.25%, 11/1/16(6) | | | | | 2,055 | | | $ | 2,242,519 | |
Kennametal, Inc., Sr. Notes | | | | | | | | | | |
3.875%, 2/15/22 | | | | | 970 | | | | 1,016,798 | |
Manitowoc Co., Inc. (The), Sr. Notes | | | | | | | | | | |
9.50%, 2/15/18 | | | | | 800 | | | | 900,000 | |
| | | | | | | | | | | |
| | | | | | | | $ | 4,159,317 | |
| | | | | | | | | | | |
|
Insurance — 0.4% | |
Aflac, Inc., Sr. Notes | | | | | | | | | | |
3.45%, 8/15/15 | | | | | 690 | | | $ | 741,042 | |
6.45%, 8/15/40 | | | | | 490 | | | | 606,214 | |
Alliant Holdings I, Inc. | | | | | | | | | | |
11.00%, 5/1/15(6) | | | | | 1,600 | | | | 1,656,000 | |
American International Group, Inc., Sr. Notes | | | | | | | | | | |
5.60%, 10/18/16 | | | | | 800 | | | | 912,385 | |
6.25%, 5/1/36 | | | | | 300 | | | | 385,718 | |
Hub International, Ltd. | | | | | | | | | | |
8.125%, 10/15/18(6) | | | | | 1,530 | | | | 1,556,775 | |
Principal Financial Group, Inc., Sr. Notes | | | | | | | | | | |
6.05%, 10/15/36 | | | | | 340 | | | | 415,030 | |
QBE Insurance Group, Ltd., Sr. Notes | | | | | | | | | | |
9.75%, 3/14/14(6) | | | | | 1,235 | | | | 1,348,574 | |
USI Holdings Corp., Sr. Notes | | | | | | | | | | |
4.31%, 11/15/14(6)(7) | | | | | 905 | | | | 880,113 | |
| | | | | | | | | | | |
| | | | | | | | $ | 8,501,851 | |
| | | | | | | | | | | |
| | | | |
| | 21 | | See Notes to Financial Statements. |
Eaton Vance
Limited Duration Income Fund
September 30, 2012
Portfolio of Investments (Unaudited) — continued
| | | | | | | | | | |
| Security | | | | Principal
Amount*
(000’s omitted) | | | Value | |
| | | | | | | | | | |
|
Investment Services — 0.0%(2) | |
Temasek Financial I, Ltd., Sr. Notes | | | | | | | | | | |
2.375%, 1/23/23(6) | | | | | 540 | | | $ | 542,249 | |
| | | | | | | | | | | |
| | | | | | | | $ | 542,249 | |
| | | | | | | | | | | |
|
Leisure Goods / Activities / Movies — 1.4% | |
AMC Entertainment, Inc., Sr. Notes | | | | | | | | | | |
8.75%, 6/1/19 | | | | | 1,145 | | | $ | 1,268,087 | |
AMC Networks, Inc., Sr. Notes | | | | | | | | | | |
7.75%, 7/15/21 | | | | | 1,100 | | | | 1,248,500 | |
Cinemark USA, Inc., Sr. Sub. Notes | | | | | | | | | | |
7.375%, 6/15/21 | | | | | 685 | | | | 765,488 | |
Hasbro, Inc., Sr. Notes | | | | | | | | | | |
6.35%, 3/15/40 | | | | | 450 | | | | 537,649 | |
NAI Entertainment Holdings, LLC, Sr. Notes | | | | | | | | | | |
8.25%, 12/15/17 | | | | | 846 | | | | 947,520 | |
National CineMedia, LLC, Sr. Notes | | | | | | | | | | |
6.00%, 4/15/22(6) | | | | | 2,015 | | | | 2,135,900 | |
NCL Corp., Ltd., Sr. Notes | | | | | | | | | | |
11.75%, 11/15/16 | | | | | 3,615 | | | | 4,184,362 | |
9.50%, 11/15/18 | | | | | 2,790 | | | | 3,103,875 | |
Regal Cinemas Corp., Sr. Notes | | | | | | | | | | |
8.625%, 7/15/19 | | | | | 220 | | | | 245,300 | |
Regal Entertainment Group, Sr. Notes | | | | | | | | | | |
9.125%, 8/15/18 | | | | | 875 | | | | 982,188 | |
Royal Caribbean Cruises, Sr. Notes | | | | | | | | | | |
7.00%, 6/15/13 | | | | | 2,205 | | | | 2,287,687 | |
6.875%, 12/1/13 | | | | | 1,400 | | | | 1,480,500 | |
11.875%, 7/15/15 | | | | | 530 | | | | 654,550 | |
7.25%, 6/15/16 | | | | | 660 | | | | 740,850 | |
7.25%, 3/15/18 | | | | | 1,680 | | | | 1,894,200 | |
Seven Seas Cruises, S. de R.L. | | | | | | | | | | |
9.125%, 5/15/19 | | | | | 3,285 | | | | 3,432,825 | |
Vail Resorts, Inc. | | | | | | | | | | |
6.50%, 5/1/19 | | | | | 685 | | | | 748,363 | |
| | | | | | | | | | | |
| | | | | | | | $ | 26,657,844 | |
| | | | | | | | | | | |
|
Lodging and Casinos — 3.1% | |
Boyd Acquisition Sub LLC/Boyd Acquisition Finance Corp., Sr. Notes | | | | | | | | |
8.375%, 2/15/18(6) | | | | | 1,090 | | | $ | 1,139,050 | |
Buffalo Thunder Development Authority, Sr. Notes | | | | | | | | | | |
9.375%, 12/15/14(6)(8) | | | | | 4,300 | | | | 1,591,000 | |
Caesars Entertainment Operating Co., Inc. | | | | | | | | | | |
10.00%, 12/15/15 | | | | | 1,190 | | | | 1,044,225 | |
12.75%, 4/15/18 | | | | | 1,355 | | | | 1,009,475 | |
| | | | | | | | | | |
| Security | | | | Principal
Amount*
(000’s omitted) | | | Value | |
| | | | | | | | | | |
|
Lodging and Casinos (continued) | |
Caesars Entertainment Operating Co., Inc., Sr. Notes | | | | | | | | | | |
5.375%, 12/15/13 | | | | | 2,385 | | | $ | 2,301,525 | |
5.625%, 6/1/15 | | | | | 7,310 | | | | 6,049,025 | |
11.25%, 6/1/17 | | | | | 4,615 | | | | 4,984,200 | |
8.50%, 2/15/20(6) | | | | | 6,150 | | | | 6,165,375 | |
Inn of the Mountain Gods Resort & Casino, Sr. Notes | | | | | | | | | | |
8.75%, 11/30/20(6) | | | | | 1,053 | | | | 1,042,470 | |
MCE Finance, Ltd., Sr. Notes | | | | | | | | | | |
10.25%, 5/15/18 | | | | | 2,205 | | | | 2,508,187 | |
MGM Resorts International, Sr. Notes | | | | | | | | | | |
6.75%, 4/1/13 | | | | | 2,110 | | | | 2,165,388 | |
5.875%, 2/27/14 | | | | | 2,280 | | | | 2,382,600 | |
10.375%, 5/15/14 | | | | | 1,655 | | | | 1,870,150 | |
11.125%, 11/15/17 | | | | | 1,715 | | | | 1,905,794 | |
9.00%, 3/15/20 | | | | | 755 | | | | 846,544 | |
7.75%, 3/15/22 | | | | | 3,005 | | | | 3,155,250 | |
Mohegan Tribal Gaming Authority | | | | | | | | | | |
10.50%, 12/15/16(6) | | | | | 2,150 | | | | 1,978,000 | |
Mohegan Tribal Gaming Authority, Sr. Sub. Notes | | | | | | | | | | |
11.00%, 9/15/18(6) | | | | | 7,120 | | | | 5,055,200 | |
Peninsula Gaming, LLC | | | | | | | | | | |
8.375%, 8/15/15 | | | | | 1,325 | | | | 1,391,250 | |
10.75%, 8/15/17 | | | | | 3,220 | | | | 3,654,700 | |
Starwood Hotels & Resorts Worldwide, Inc. | | | | | | | | | | |
6.75%, 5/15/18 | | | | | 850 | | | | 1,019,335 | |
SugarHouse HSP Gaming Property, LP/SugarHouse HSP
Gaming Finance Corp. | |
8.625%, 4/15/16(6) | | | | | 740 | | | | 797,350 | |
Tunica-Biloxi Gaming Authority, Sr. Notes | | | | | | | | | | |
9.00%, 11/15/15(6) | | | | | 3,565 | | | | 3,208,500 | |
Waterford Gaming, LLC, Sr. Notes | | | | | | | | | | |
8.625%, 9/15/14(5)(6) | | | | | 3,352 | | | | 1,816,599 | |
Wynn Las Vegas, LLC/Wynn Las Vegas Capital Corp. | | | | | | | | | | |
7.75%, 8/15/20 | | | | | 1,945 | | | | 2,173,537 | |
| | | | | | | | | | | |
| | | | | | | | $ | 61,254,729 | |
| | | | | | | | | | | |
|
Nonferrous Metals / Minerals — 1.9% | |
Barrick International Barbados Corp. | | | | | | | | | | |
6.35%, 10/15/36(6) | | | | | 500 | | | $ | 595,918 | |
BHP Billiton Finance USA, Ltd., Sr. Notes | | | | | | | | | | |
5.25%, 12/15/15 | | | | | 500 | | | | 569,589 | |
4.125%, 2/24/42 | | | | | 100 | | | | 107,143 | |
CII Carbon, LLC, Sr. Notes | | | | | | | | | | |
8.00%, 12/1/18 | | | | | 2,805 | | | | 2,875,125 | |
| | | | |
| | 22 | | See Notes to Financial Statements. |
Eaton Vance
Limited Duration Income Fund
September 30, 2012
Portfolio of Investments (Unaudited) — continued
| | | | | | | | | | |
| Security | | | | Principal
Amount*
(000’s omitted) | | | Value | |
| | | | | | | | | | |
|
Nonferrous Metals / Minerals (continued) | |
CONSOL Energy, Inc., Sr. Notes | | | | | | | | | | |
8.00%, 4/1/17 | | | | | 1,785 | | | $ | 1,874,250 | |
FMG Resources (August 2006) Pty, Ltd., Sr. Notes | | | | | | | | | | |
7.00%, 11/1/15(6) | | | | | 7,525 | | | | 7,525,000 | |
Molycorp, Inc., Sr. Notes | | | | | | | | | | |
10.00%, 6/1/20(6) | | | | | 2,415 | | | | 2,402,925 | |
New Gold, Inc., Sr. Notes | | | | | | | | | | |
7.00%, 4/15/20(6) | | | | | 950 | | | | 1,011,750 | |
Novelis, Inc. | | | | | | | | | | |
8.375%, 12/15/17 | | | | | 1,565 | | | | 1,717,587 | |
8.75%, 12/15/20 | | | | | 3,010 | | | | 3,348,625 | |
Peabody Energy Corp., Sr. Notes | | | | | | | | | | |
6.00%, 11/15/18(6) | | | | | 4,770 | | | | 4,793,850 | |
6.25%, 11/15/21(6) | | | | | 4,090 | | | | 4,090,000 | |
Penn Virginia Resource Partners, LP/Penn Virginia Resource
Finance Corp. II, Sr. Notes | |
8.375%, 6/1/20(6) | | | | | 1,165 | | | | 1,208,688 | |
Quadra FNX Mining, Ltd., Sr. Notes | |
7.75%, 6/15/19(6) | | | | | 3,730 | | | | 3,860,550 | |
Teck Resources, Ltd., Sr. Notes | |
4.75%, 1/15/22 | | | | | 900 | | | | 965,654 | |
Vale, Inc., Sr. Notes | |
5.70%, 10/15/15 | | | | | 500 | | | | 549,792 | |
6.875%, 11/21/36 | | | | | 500 | | | | 582,022 | |
| | |
| | | | | | | | $ | 38,078,468 | |
| | |
|
Oil and Gas — 5.8% | |
AmeriGas Finance LLC/AmeriGas Finance Corp., Sr. Notes | |
6.75%, 5/20/20 | | | | | 2,605 | | | $ | 2,787,350 | |
7.00%, 5/20/22 | | | | | 3,260 | | | | 3,520,800 | |
AmeriGas Partners LP/AmeriGas Finance Corp., Sr. Notes | |
6.25%, 8/20/19 | | | | | 1,570 | | | | 1,640,650 | |
Anadarko Finance Co., Sr. Notes | |
7.50%, 5/1/31 | | | | | 465 | | | | 624,917 | |
Anadarko Petroleum Corp., Sr. Notes | |
6.375%, 9/15/17 | | | | | 920 | | | | 1,110,616 | |
Atwood Oceanics, Inc., Sr. Notes | |
6.50%, 2/1/20 | | | | | 1,305 | | | | 1,402,875 | |
Berry Petroleum Co., Sr. Notes | |
6.375%, 9/15/22 | | | | | 3,375 | | | | 3,569,062 | |
Calfrac Holdings, LP, Sr. Notes | |
7.50%, 12/1/20(6) | | | | | 955 | | | | 950,225 | |
Cameron International Corp., Sr. Notes | |
7.00%, 7/15/38 | | | | | 700 | | | | 922,169 | |
| | | | | | | | | | |
| Security | | | | Principal
Amount*
(000’s omitted) | | | Value | |
| | | | | | | | | | |
|
Oil and Gas (continued) | |
Chesapeake Oilfield Operating, LLC/Chesapeake Oilfield
Finance, Inc. | |
6.625%, 11/15/19(6) | | | | | 1,100 | | | $ | 1,061,500 | |
Coffeyville Resources, LLC/Coffeyville Finance, Inc., Sr. Notes | |
9.00%, 4/1/15(6) | | | | | 5,266 | | | | 5,647,785 | |
Concho Resources, Inc., Sr. Notes | |
7.00%, 1/15/21 | | | | | 1,800 | | | | 2,025,000 | |
6.50%, 1/15/22 | | | | | 685 | | | | 758,638 | |
Continental Resources, Inc. | |
7.125%, 4/1/21 | | | | | 735 | | | | 830,550 | |
5.00%, 9/15/22(6) | | | | | 2,030 | | | | 2,126,425 | |
5.00%, 9/15/22 | | | | | 6,360 | | | | 6,654,150 | |
Denbury Resources, Inc., Sr. Sub. Notes | |
9.75%, 3/1/16 | | | | | 3,285 | | | | 3,539,587 | |
8.25%, 2/15/20 | | | | | 1,674 | | | | 1,895,805 | |
Eagle Rock Energy Partners, LP/Eagle Rock Energy Finance
Corp., Sr. Notes | |
8.375%, 6/1/19(6) | | | | | 555 | | | | 548,063 | |
EP Energy, LLC/EP Energy Finance, Inc. | |
6.875%, 5/1/19(6) | | | | | 4,180 | | | | 4,477,825 | |
9.375%, 5/1/20(6) | | | | | 3,055 | | | | 3,333,769 | |
EP Energy, LLC/Everest Acquisition Finance, Inc., Sr. Notes | |
7.75%, 9/1/22(6) | | | | | 815 | | | | 833,338 | |
FMC Technologies, Inc., Sr. Notes | |
3.45%, 10/1/22 | | | | | 720 | | | | 732,615 | |
Frontier Oil Corp., Sr. Notes | |
6.875%, 11/15/18 | | | | | 610 | | | | 652,700 | |
FTS International Services, LLC/FTS International Bonds,
Inc., Sr. Notes | |
8.125%, 11/15/18(6) | | | | | 4,000 | | | | 4,280,000 | |
Halcon Resources Corp., Sr. Notes | |
9.75%, 7/15/20(6) | | | | | 2,230 | | | | 2,285,750 | |
Harvest Operations Corp. | |
6.875%, 10/1/17 | | | | | 920 | | | | 1,012,000 | |
Holly Corp., Sr. Notes | |
9.875%, 6/15/17 | | | | | 1,435 | | | | 1,580,294 | |
Holly Energy Partners LP/Holly Energy Finance Corp. | |
6.50%, 3/1/20(6) | | | | | 615 | | | | 647,288 | |
Kinder Morgan Energy Partners, LP, Sr. Notes | |
3.50%, 3/1/16 | | | | | 650 | | | | 697,512 | |
6.95%, 1/15/38 | | | | | 500 | | | | 642,171 | |
Kodiak Oil & Gas Corp., Sr. Notes | |
8.125%, 12/1/19(6) | | | | | 3,630 | | | | 3,852,337 | |
Laredo Petroleum, Inc., Sr. Notes | |
7.375%, 5/1/22 | | | | | 1,380 | | | | 1,497,300 | |
| | | | |
| | 23 | | See Notes to Financial Statements. |
Eaton Vance
Limited Duration Income Fund
September 30, 2012
Portfolio of Investments (Unaudited) — continued
| | | | | | | | | | |
| Security | | | | Principal
Amount*
(000’s omitted) | | | Value | |
| | | | | | | | | | |
|
Oil and Gas (continued) | |
MarkWest Energy Partners, LP/MarkWest Energy Finance
Corp., Sr. Notes | |
5.50%, 2/15/23 | | | | | 1,080 | | | $ | 1,134,000 | |
MEG Energy Corp., Sr. Notes | |
6.375%, 1/30/23(6) | | | | | 2,210 | | | | 2,361,937 | |
Oasis Petroleum, Inc., Sr. Notes | |
6.50%, 11/1/21 | | | | | 955 | | | | 1,012,300 | |
6.875%, 1/15/23 | | | | | 3,030 | | | | 3,226,950 | |
OGX Austria GmbH | |
8.50%, 6/1/18(6) | | | | | 1,920 | | | | 1,737,600 | |
Oil States International, Inc. | |
6.50%, 6/1/19 | | | | | 2,685 | | | | 2,866,237 | |
PBF Holding Co., LLC/PBF Finance Corp., Sr. Notes | |
8.25%, 2/15/20(6) | | | | | 125 | | | | 131,875 | |
PetroBakken Energy, Ltd., Sr. Notes | |
8.625%, 2/1/20(6) | | | | | 1,765 | | | | 1,840,012 | |
Petrobras International Finance Co. | |
6.875%, 1/20/40 | | | | | 700 | | | | 884,325 | |
Petroleum Development Corp., Sr. Notes | |
12.00%, 2/15/18 | | | | | 1,870 | | | | 2,047,650 | |
Precision Drilling Corp., Sr. Notes | |
6.625%, 11/15/20 | | | | | 1,150 | | | | 1,230,500 | |
6.50%, 12/15/21 | | | | | 2,390 | | | | 2,563,275 | |
Range Resources Corp., Sr. Sub. Notes | |
6.75%, 8/1/20 | | | | | 1,815 | | | | 2,005,575 | |
Rockies Express Pipeline, LLC, Sr. Notes | |
3.90%, 4/15/15(6) | | | | | 600 | | | | 594,000 | |
6.85%, 7/15/18(6) | | | | | 500 | | | | 513,750 | |
Rosetta Resources, Inc. | |
9.50%, 4/15/18 | | | | | 1,115 | | | | 1,237,650 | |
Rowan Cos., Inc., Sr. Notes | |
7.875%, 8/1/19 | | | | | 1,000 | | | | 1,241,675 | |
SESI, LLC, Sr. Notes | |
6.875%, 6/1/14 | | | | | 345 | | | | 345,431 | |
6.375%, 5/1/19 | | | | | 3,365 | | | | 3,617,375 | |
SM Energy Co., Sr. Notes | |
6.50%, 1/1/23(6) | | | | | 1,745 | | | | 1,834,431 | |
Southwestern Energy Co., Sr. Notes | |
7.50%, 2/1/18 | | | | | 4,200 | | | | 5,070,618 | |
Targa Resources Partners, LP/Targa Resources Partners
Finance Corp. | |
6.375%, 8/1/22(6) | | | | | 655 | | | | 697,575 | |
Transocean, Inc., Sr. Notes | |
4.95%, 11/15/15 | | | | | 400 | | | | 438,232 | |
6.80%, 3/15/38 | | | | | 400 | | | | 483,098 | |
| | | | | | | | | | |
| Security | | | | Principal
Amount*
(000’s omitted) | | | Value | |
| | | | | | | | | | |
|
Oil and Gas (continued) | |
Venoco, Inc., Sr. Notes | |
11.50%, 10/1/17 | | | | | 545 | | | $ | 564,075 | |
8.875%, 2/15/19 | | | | | 1,745 | | | | 1,526,875 | |
Weatherford Bermuda | |
4.50%, 4/15/22 | | | | | 1,025 | | | | 1,074,249 | |
WPX Energy, Inc., Sr. Notes | |
5.25%, 1/15/17(6) | | | | | 770 | | | | 835,450 | |
6.00%, 1/15/22(6) | | | | | 3,405 | | | | 3,677,400 | |
| | | | | | | | | | | |
| | | | | | | | $ | 114,935,186 | |
| | | | | | | | | | | |
|
Publishing — 1.8% | |
Laureate Education, Inc. | |
11.00%, 8/15/15(6) | | | | | 8,540 | | | $ | 8,838,900 | |
11.25%, 8/15/15(6) | | | | | 9,109 | | | | 9,427,442 | |
12.75%, 8/15/17(6) | | | | | 11,030 | | | | 11,746,950 | |
9.25%, 9/1/19(6) | | | | | 3,480 | | | | 3,514,800 | |
Nielsen Finance, LLC, Sr. Notes | |
11.625%, 2/1/14 | | | | | 105 | | | | 118,913 | |
11.50%, 5/1/16 | | | | | 1,139 | | | | 1,278,527 | |
| | | | | | | | | | | |
| | | | | | | | $ | 34,925,532 | |
| | | | | | | | | | | |
|
Radio and Television — 0.5% | |
Crown Media Holdings, Inc. | |
10.50%, 7/15/19 | | | | | 940 | | | $ | 1,057,500 | |
WMG Acquisition Corp., Sr. Notes | |
9.50%, 6/15/16 | | | | | 600 | | | | 656,250 | |
9.50%, 6/15/16 | | | | | 3,660 | | | | 4,012,275 | |
11.50%, 10/1/18 | | | | | 3,755 | | | | 4,243,150 | |
| | | | | | | | | | | |
| | | | | | | | $ | 9,969,175 | |
| | | | | | | | | | | |
|
Rail Industries — 0.2% | |
American Railcar Industry, Sr. Notes | |
7.50%, 3/1/14 | | | | | 1,285 | | | $ | 1,310,700 | |
Kansas City Southern Mexico, Sr. Notes | |
8.00%, 2/1/18 | | | | | 860 | | | | 967,500 | |
6.125%, 6/15/21 | | | | | 740 | | | | 834,350 | |
| | | | | | | | | | | |
| | | | | | | | $ | 3,112,550 | |
| | | | | | | | | | | |
|
Real Estate Investment Trusts (REITs) — 0.2% | |
DDR Corp., Sr. Notes | |
9.625%, 3/15/16 | | | | | 945 | | | $ | 1,177,475 | |
DuPont Fabros Technology, LP | |
8.50%, 12/15/17 | | | | | 895 | | | | 991,212 | |
| | | | |
| | 24 | | See Notes to Financial Statements. |
Eaton Vance
Limited Duration Income Fund
September 30, 2012
Portfolio of Investments (Unaudited) — continued
| | | | | | | | | | |
| Security | | | | Principal
Amount*
(000’s omitted) | | | Value | |
| | | | | | | | | | |
|
Real Estate Investment Trusts (REITs) (continued) | |
Goodman Funding PTY, Ltd., Sr. Notes | |
6.375%, 4/15/21(6) | | | | | 560 | | | $ | 615,843 | |
Vornado Realty, LP, Sr. Notes | |
5.00%, 1/15/22 | | | | | 1,000 | | | | 1,108,846 | |
| | | | | | | | | | | |
| | | | | | | | $ | 3,893,376 | |
| | | | | | | | | | | |
|
Retailers (Except Food and Drug) — 3.0% | |
Academy, Ltd./Academy Finance Corp. | |
9.25%, 8/1/19(6) | | | | | 3,000 | | | $ | 3,311,250 | |
Claire’s Stores, Inc. | |
9.00%, 3/15/19(6) | | | | | 1,520 | | | | 1,584,600 | |
Dollar General Corp., Sr. Notes | |
4.125%, 7/15/17 | | | | | 1,785 | | | | 1,874,250 | |
Express, LLC/Express Finance Corp. | |
8.75%, 3/1/18 | | | | | 6,915 | | | | 7,606,500 | |
HD Supply, Inc., Sr. Notes | |
8.125%, 4/15/19(6) | | | | | 825 | | | | 897,188 | |
J. Crew Group, Inc., Sr. Notes | |
8.125%, 3/1/19 | | | | | 1,655 | | | | 1,741,887 | |
Kohl’s Corp. | |
4.00%, 11/1/21 | | | | | 1,000 | | | | 1,090,104 | |
Limited Brands, Inc. | |
8.50%, 6/15/19 | | | | | 3,325 | | | | 4,023,250 | |
6.625%, 4/1/21 | | | | | 6,135 | | | | 6,993,900 | |
5.625%, 2/15/22 | | | | | 4,210 | | | | 4,557,325 | |
Macy’s Retail Holdings, Inc. | |
5.90%, 12/1/16 | | | | | 310 | | | | 362,329 | |
6.90%, 4/1/29 | | | | | 400 | | | | 473,561 | |
Michaels Stores, Inc. | |
11.375%, 11/1/16 | | | | | 1,280 | | | | 1,344,128 | |
7.75%, 11/1/18 | | | | | 2,695 | | | | 2,903,862 | |
Pantry, Inc., Sr. Notes | |
8.375%, 8/1/20(6) | | | | | 1,635 | | | | 1,679,962 | |
PETCO Animal Supplies, Inc. | |
9.25%, 12/1/18(6) | | | | | 4,475 | | | | 4,989,625 | |
Sally Holdings, LLC/Sally Capital, Inc., Sr. Notes | |
6.875%, 11/15/19 | | | | | 125 | | | | 139,688 | |
5.75%, 6/1/22 | | | | | 4,750 | | | | 5,082,500 | |
ServiceMaster Company, Sr. Notes | |
8.00%, 2/15/20 | | | | | 1,275 | | | | 1,357,875 | |
Target Corp., Sr. Notes | |
6.50%, 10/15/37 | | | | | 460 | | | | 648,835 | |
Total Capital International SA | |
2.70%, 1/25/23 | | | | | 960 | | | | 980,973 | |
| | | | | | | | | | |
| Security | | | | Principal
Amount*
(000’s omitted) | | | Value | |
| | | | | | | | | | |
|
Retailers (Except Food and Drug) (continued) | |
Toys “R” Us, Inc., Sr. Notes | |
7.375%, 9/1/16(6) | | | | | 3,010 | | | $ | 3,077,725 | |
10.375%, 8/15/17(6) | | | | | 705 | | | | 724,388 | |
Walgreen Co. | |
5.25%, 1/15/19 | | | | | 670 | | | | 787,609 | |
| | | | | | | | | | | |
| | | | | | | | $ | 58,233,314 | |
| | | | | | | | | | | |
|
Software and Services — 0.1% | |
Fiserv, Inc. | |
3.50%, 10/1/22 | | | | | 960 | | | $ | 965,621 | |
| | | | | | | | | | | |
| | | | | | | | $ | 965,621 | |
| | | | | | | | | | | |
|
Steel — 0.2% | |
JMC Steel Group, Inc., Sr. Notes | |
8.25%, 3/15/18(6) | | | | | 1,895 | | | $ | 1,942,375 | |
SunCoke Energy, Inc., Sr. Notes | |
7.625%, 8/1/19 | | | | | 1,365 | | | | 1,392,300 | |
| | | | | | | | | | | |
| | | | | | | | $ | 3,334,675 | |
| | | | | | | | | | | |
|
Surface Transport — 0.2% | |
CEVA Group PLC, Sr. Notes | |
11.625%, 10/1/16(6) | | | | | 1,250 | | | $ | 1,287,500 | |
8.375%, 12/1/17(6) | | | | | 2,510 | | | | 2,444,113 | |
Hertz Corp., Sr. Notes | |
7.50%, 10/15/18 | | | | | 25 | | | | 27,125 | |
Ryder System, Inc. | |
2.50%, 3/1/17 | | | | | 975 | | | | 992,999 | |
| | | | | | | | | | | |
| | | | | | | | $ | 4,751,737 | |
| | | | | | | | | | | |
|
Technology — 0.2% | |
International Game Technology, Sr. Notes | |
7.50%, 6/15/19 | | | | | 1,170 | | | $ | 1,405,527 | |
Western Union Co. (The) | |
6.20%, 11/17/36 | | | | | 500 | | | | 571,779 | |
Xerox Corp., Sr. Notes MTN, | |
7.20%, 4/1/16 | | | | | 1,165 | | | | 1,356,389 | |
| | | | | | | | | | | |
| | | | | | | | $ | 3,333,695 | |
| | | | | | | | | | | |
|
Telecommunications — 5.0% | |
America Movil SAB de CV | |
5.00%, 10/16/19 | | | | | 600 | | | $ | 704,115 | |
| | | | |
| | 25 | | See Notes to Financial Statements. |
Eaton Vance
Limited Duration Income Fund
September 30, 2012
Portfolio of Investments (Unaudited) — continued
| | | | | | | | | | |
| Security | | | | Principal
Amount*
(000’s omitted) | | | Value | |
| | | | | | | | | | |
|
Telecommunications (continued) | |
American Tower Corp., Sr. Notes | |
5.05%, 9/1/20 | | | | | 2,240 | | | $ | 2,504,470 | |
AT&T, Inc., Sr. Notes | |
5.80%, 2/15/19 | | | | | 2,150 | | | | 2,678,414 | |
Avaya, Inc., Sr. Notes | |
9.75%, 11/1/15 | | | | | 1,860 | | | | 1,660,050 | |
10.125%, 11/1/15(3) | | | | | 6,715 | | | | 6,026,511 | |
7.00%, 4/1/19(6) | | | | | 1,130 | | | | 1,056,550 | |
Cellco Partnership/Verizon Wireless Capital, LLC, Sr. Notes | |
8.50%, 11/15/18 | | | | | 1,250 | | | | 1,754,005 | |
CenturyLink, Inc., Sr. Notes | |
6.45%, 6/15/21 | | | | | 2,600 | | | | 2,939,667 | |
Digicel Group, Ltd., Sr. Notes | |
12.00%, 4/1/14(6) | | | | | 5,100 | | | | 5,712,000 | |
8.875%, 1/15/15(6) | | | | | 1,740 | | | | 1,786,980 | |
9.125%, 1/15/15(6) | | | | | 2,970 | | | | 3,051,972 | |
8.25%, 9/1/17(6) | | | | | 3,655 | | | | 3,983,950 | |
Equinix, Inc., Sr. Notes | |
7.00%, 7/15/21 | | | | | 1,340 | | | | 1,505,825 | |
GCI, Inc., Sr. Notes | |
6.75%, 6/1/21 | | | | | 660 | | | | 663,300 | |
Hughes Satellite Systems Corp., Sr. Notes | |
6.50%, 6/15/19 | | | | | 3,235 | | | | 3,477,625 | |
Intelsat Jackson Holdings, Ltd., Sr. Notes | |
7.25%, 10/15/20(6) | | | | | 2,350 | | | | 2,538,000 | |
Intelsat Luxembourg SA | |
11.50%, 2/4/17(3) | | | | | 6,188 | | | | 6,582,285 | |
IPCS, Inc. | |
2.57%, 5/1/13(7) | | | | | 550 | | | | 550,000 | |
News America, Inc. | |
8.00%, 10/17/16 | | | | | 950 | | | | 1,196,991 | |
Nextel Communications, Inc., Sr. Notes | |
5.95%, 3/15/14 | | | | | 8,125 | | | | 8,165,625 | |
7.375%, 8/1/15 | | | | | 1,631 | | | | 1,641,194 | |
SBA Telecommunications, Inc., Sr. Notes | |
8.25%, 8/15/19 | | | | | 640 | | | | 718,400 | |
5.75%, 7/15/20(6) | | | | | 1,985 | | | | 2,091,694 | |
Sprint Nextel Corp., Sr. Notes | |
6.00%, 12/1/16 | | | | | 1,760 | | | | 1,821,600 | |
9.125%, 3/1/17 | | | | | 1,225 | | | | 1,393,437 | |
9.00%, 11/15/18(6) | | | | | 8,950 | | | | 10,762,375 | |
7.00%, 8/15/20 | | | | | 4,810 | | | | 5,020,437 | |
| | | | | | | | | | |
| Security | | | | Principal
Amount*
(000’s omitted) | | | Value | |
| | | | | | | | | | |
|
Telecommunications (continued) | |
Telefonica Emisiones SAU | |
5.877%, 7/15/19 | | | | | 600 | | | $ | 604,500 | |
Telesat Canada/Telesat, LLC, Sr. Sub. Notes | |
12.50%, 11/1/17 | | | | | 6,830 | | | | 7,632,525 | |
Wind Acquisition Finance SA, Sr. Notes | |
12.25%, 7/15/17(6) | | | | | 4,485 | | | | 3,449,394 | |
Windstream Corp., Sr. Notes | |
8.125%, 9/1/18 | | | | | 2,490 | | | | 2,701,650 | |
7.75%, 10/1/21 | | | | | 675 | | | | 730,688 | |
7.50%, 6/1/22 | | | | | 1,870 | | | | 1,991,550 | |
| | | | | | | | | | | |
| | | | | | | | $ | 99,097,779 | |
| | | | | | | | | | | |
|
Utilities — 1.5% | |
Calpine Construction Finance Co. LP/CCFC Finance Corp.,
Sr. Notes | |
8.00%, 6/1/16(6) | | | | | 4,275 | | | $ | 4,617,000 | |
DPL, Inc. | |
6.50%, 10/15/16(6) | | | | | 2,075 | | | | 2,287,687 | |
7.25%, 10/15/21(6) | | | | | 5,575 | | | | 6,383,375 | |
Duquesne Light Holdings, Inc., Sr. Notes | |
5.90%, 12/1/21(6) | | | | | 1,800 | | | | 2,103,847 | |
Edison Mission Energy, Sr. Notes | |
7.50%, 6/15/13 | | | | | 1,355 | | | | 752,025 | |
Energy Future Intermediate Holding Co., LLC/EFIH Finance,
Inc., Sr. Notes | |
6.875%, 8/15/17(6) | | | | | 765 | | | | 795,600 | |
Exelon Generation Co., LLC, Sr. Notes | |
5.35%, 1/15/14 | | | | | 1,200 | | | | 1,265,410 | |
NRG Energy, Inc. | |
8.25%, 9/1/20 | | | | | 3,910 | | | | 4,281,450 | |
7.875%, 5/15/21 | | | | | 2,015 | | | | 2,201,388 | |
Reliant Energy, Inc., Sr. Notes | |
7.625%, 6/15/14 | | | | | 360 | | | | 386,100 | |
Southwestern Electric Power Co., Sr. Notes | |
6.20%, 3/15/40 | | | | | 565 | | | | 724,739 | |
Texas Competitive Electric Holdings Co., LLC, Sr. Notes | |
11.50%, 10/1/20(6) | | | | | 3,580 | | | | 2,819,250 | |
| | | | | | | | | | | |
| | | | | | | | $ | 28,617,871 | |
| | | | | | | | | | | |
| |
Total Corporate Bonds & Notes
(identified cost $906,360,395) | | | $ | 969,993,125 | |
| | |
| | | | |
| | 26 | | See Notes to Financial Statements. |
Eaton Vance
Limited Duration Income Fund
September 30, 2012
Portfolio of Investments (Unaudited) — continued
| | | | | | | | | | |
| Foreign Government Securities — 0.1% | |
| | | |
| | | | | | | | | | |
| Security | | | | Principal
Amount
(000’s omitted) | | | Value | |
| | | | | | | | | | |
Government of Bermuda, Sr. Note | |
5.603%, 7/20/20(6) | | | | $ | 1,000 | | | $ | 1,161,868 | |
| | | | | | | | | | | |
| |
Total Foreign Government Securities
(identified cost $1,118,784) | | | $ | 1,161,868 | |
| | | | | | | | | | | |
|
| Mortgage Pass-Throughs — 24.5% | |
| | | |
| | | | | | | | | | |
| Security | | | | Principal
Amount
(000’s omitted) | | | Value | |
| | | | | | | | | | |
Federal Home Loan Mortgage Corp.: | |
5.00%, with various maturities to 2023(9) | | | | $ | 18,939 | | | $ | 20,446,286 | |
5.50%, with various maturities to 2032(10) | | | | | 5,999 | | | | 6,583,699 | |
6.00%, with various maturities to 2031(9) | | | | | 5,598 | | | | 6,091,064 | |
6.50%, with various maturities to 2032(9) | | | | | 32,815 | | | | 37,405,774 | |
7.00%, with various maturities to 2036(9) | | | | | 23,989 | | | | 28,053,278 | |
7.13%, with maturity at 2023 | | | | | 356 | | | | 419,953 | |
7.50%, with various maturities to 2029 | | | | | 13,972 | | | | 16,672,912 | |
7.65%, with maturity at 2022 | | | | | 498 | | | | 588,619 | |
7.70%, with maturity at 2022 | | | | | 9 | | | | 9,411 | |
8.00%, with various maturities to 2030 | | | | | 9,242 | | | | 11,024,185 | |
8.25%, with maturity at 2020 | | | | | 263 | | | | 301,320 | |
8.30%, with maturity at 2020 | | | | | 772 | | | | 906,097 | |
8.50%, with various maturities to 2031 | | | | | 7,400 | | | | 9,156,062 | |
9.00%, with various maturities to 2031 | | | | | 2,105 | | | | 2,434,397 | |
9.50%, with various maturities to 2025 | | | | | 1,696 | | | | 1,981,648 | |
10.00%, with maturity at 2020 | | | | | 250 | | | | 290,834 | |
10.50%, with maturity at 2020 | | | | | 220 | | | | 258,427 | |
12.00%, with maturity at 2020 | | | | | 138 | | | | 148,719 | |
13.00%, with maturity at 2015 | | | | | 12 | | | | 12,780 | |
| | | | | | | | | | | |
| | | | | | | | $ | 142,785,465 | |
| | | | | | | | | | | |
Federal National Mortgage Association: | |
2.384%, with maturity at 2022(11) | | | | $ | 1,775 | | | $ | 1,833,479 | |
2.893%, with maturity at 2036(11) | | | | | 3,371 | | | | 3,476,906 | |
5.00%, with various maturities to 2018 | | | | | 8,594 | | | | 9,325,382 | |
5.50%, with various maturities to 2033 | | | | | 9,484 | | | | 10,543,627 | |
6.00%, with various maturities to 2033 | | | | | 15,795 | | | | 17,719,050 | |
6.325%, with maturity at 2032(11) | | | | | 10,330 | | | | 11,274,015 | |
6.50%, with various maturities to 2036(9) | | | | | 85,381 | | | | 98,441,740 | |
6.75%, with maturity at 2023 | | | | | 274 | | | | 323,680 | |
7.00%, with various maturities to 2036 | | | | | 40,062 | | | | 47,423,005 | |
7.50%, with various maturities to 2035 | | | | | 15,555 | | | | 18,903,509 | |
8.00%, with various maturities to 2031 | | | | | 6,058 | | | | 7,269,185 | |
8.239%, with maturity at 2027(12) | | | | | 1,496 | | | | 1,851,018 | |
| | | | | | | | | | |
| Security | | | | Principal
Amount
(000’s omitted) | | | Value | |
| | | | | | | | | | |
Federal National Mortgage Association: (continued) | |
8.25%, with maturity at 2018 | | | | $ | 13 | | | $ | 15,220 | |
8.438%, with maturity at 2028(12) | | | | | 565 | | | | 671,089 | |
8.473%, with maturity at 2029(12) | | | | | 417 | | | | 508,397 | |
8.50%, with various maturities to 2030 | | | | | 6,791 | | | | 8,190,900 | |
8.554%, with maturity at 2024(12) | | | | | 71 | | | | 76,489 | |
8.618%, with maturity at 2027(12) | | | | | 533 | | | | 644,547 | |
9.00%, with various maturities to 2027 | | | | | 8,810 | | | | 10,605,056 | |
9.237%, with maturity at 2018(12) | | | | | 274 | | | | 303,449 | |
9.50%, with various maturities to 2030 | | | | | 2,470 | | | | 2,966,190 | |
9.813%, with maturity at 2025(12) | | | | | 449 | | | | 513,565 | |
10.00%, with various maturities to 2020 | | | | | 658 | | | | 759,480 | |
10.223%, with maturity at 2019(12) | | | | | 330 | | | | 368,981 | |
10.50%, with maturity at 2021 | | | | | 559 | | | | 655,962 | |
11.50%, with maturity at 2016 | | | | | 79 | | | | 85,194 | |
| | | | | | | | | | | |
| | | | | | | | $ | 254,749,115 | |
| | | | | | | | | | | |
Government National Mortgage Association: | |
6.00%, with maturity at 2024 | | | | $ | 1,727 | | | $ | 1,970,414 | |
6.50%, with various maturities to 2032 | | | | | 14,909 | | | | 17,301,186 | |
7.00%, with various maturities to 2033 | | | | | 9,430 | | | | 11,310,364 | |
7.50%, with various maturities to 2032 | | | | | 20,357 | | | | 24,697,914 | |
8.00%, with various maturities to 2034 | | | | | 12,938 | | | | 15,833,317 | |
8.30%, with maturity at 2020 | | | | | 459 | | | | 541,628 | |
8.50%, with various maturities to 2022 | | | | | 779 | | | | 924,862 | |
9.00%, with various maturities to 2026 | | | | | 3,755 | | | | 4,479,287 | |
9.50%, with various maturities to 2026 | | | | | 5,338 | | | | 6,495,188 | |
10.00%, with maturity at 2019 | | | | | 286 | | | | 334,678 | |
| | | | | | | | | | | |
| | | | | | | | $ | 83,888,838 | |
| | | | | | | | | | | |
| |
Total Mortgage Pass-Throughs
(identified cost $451,554,344) | | | $ | 481,423,418 | |
| | |
|
| Collateralized Mortgage Obligations — 5.0% | |
| | | |
| | | | | | | | | | |
| Security | | | | Principal
Amount
(000’s omitted) | | | Value | |
| | | | | | | | | | |
Federal Home Loan Mortgage Corp.: | |
Series 24, Class J, 6.25%, 11/25/23 | | | | $ | 1,064 | | | $ | 1,174,293 | |
Series 1497, Class K, 7.00%, 4/15/23 | | | | | 1,097 | | | | 1,167,900 | |
Series 1529, Class Z, 7.00%, 6/15/23 | | | | | 1,776 | | | | 1,892,403 | |
Series 1620, Class Z, 6.00%, 11/15/23 | | | | | 1,469 | | | | 1,599,939 | |
Series 1677, Class Z, 7.50%, 7/15/23 | | | | | 917 | | | | 1,072,362 | |
Series 1702, Class PZ, 6.50%, 3/15/24 | | | | | 12,078 | | | | 13,061,899 | |
Series 2113, Class QG, 6.00%, 1/15/29 | | | | | 2,609 | | | | 2,854,452 | |
Series 2122, Class K, 6.00%, 2/15/29 | | | | | 429 | | | | 467,685 | |
Series 2130, Class K, 6.00%, 3/15/29 | | | | | 291 | | | | 320,514 | |
| | | | |
| | 27 | | See Notes to Financial Statements. |
Eaton Vance
Limited Duration Income Fund
September 30, 2012
Portfolio of Investments (Unaudited) — continued
| | | | | | | | | | |
| Security | | | | Principal
Amount
(000’s omitted) | | | Value | |
| | | | | | | | | | |
Federal Home Loan Mortgage Corp.: (continued) | |
Series 2167, Class BZ, 7.00%, 6/15/29 | | | | $ | 279 | | | $ | 297,967 | |
Series 2182, Class ZB, 8.00%, 9/15/29 | | | | | 2,452 | | | | 2,834,306 | |
Series 2198, Class ZA, 8.50%, 11/15/29 | | | | | 3,389 | | | | 3,679,112 | |
Series 2245, Class A, 8.00%, 8/15/27 | | | | | 7,969 | | | | 9,295,078 | |
Series 2458, Class ZB, 7.00%, 6/15/32 | | | | | 2,826 | | | | 3,266,216 | |
| | | | | | | | | | | |
| | | | | | | | $ | 42,984,126 | |
| | | | | | | | | | | |
Federal National Mortgage Association: | |
Series G92-44, Class Z, 8.00%, 7/25/22 | | | | $ | 247 | | | $ | 273,066 | |
Series G92-44, Class ZQ, 8.00%, 7/25/22 | | | | | 402 | | | | 442,618 | |
Series G92-46, Class Z, 7.00%, 8/25/22 | | | | | 712 | | | | 808,283 | |
Series G92-60, Class Z, 7.00%, 10/25/22 | | | | | 1,127 | | | | 1,266,293 | |
Series G93-35, Class ZQ, 6.50%, 11/25/23 | | | | | 13,297 | | | | 15,207,581 | |
Series G93-40, Class H, 6.40%, 12/25/23 | | | | | 2,997 | | | | 3,421,364 | |
Series 1988-14, Class I, 9.20%, 6/25/18 | | | | | 188 | | | | 212,355 | |
Series 1989-1, Class D, 10.30%, 1/25/19 | | | | | 165 | | | | 182,722 | |
Series 1989-34, Class Y, 9.85%, 7/25/19 | | | | | 330 | | | | 386,122 | |
Series 1990-17, Class G, 9.00%, 2/25/20 | | | | | 223 | | | | 259,096 | |
Series 1990-27, Class Z, 9.00%, 3/25/20 | | | | | 122 | | | | 141,874 | |
Series 1990-29, Class J, 9.00%, 3/25/20 | | | | | 114 | | | | 132,477 | |
Series 1990-43, Class Z, 9.50%, 4/25/20 | | | | | 515 | | | | 605,276 | |
Series 1991-98, Class J, 8.00%, 8/25/21 | | | | | 205 | | | | 236,765 | |
Series 1992-77, Class ZA, 8.00%, 5/25/22 | | | | | 1,399 | | | | 1,639,834 | |
Series 1992-103, Class Z, 7.50%, 6/25/22 | | | | | 92 | | | | 106,593 | |
Series 1992-113, Class Z, 7.50%, 7/25/22 | | | | | 164 | | | | 190,283 | |
Series 1992-185, Class ZB, 7.00%, 10/25/22 | | | | | 355 | | | | 406,133 | |
Series 1993-16, Class Z, 7.50%, 2/25/23 | | | | | 898 | | | | 1,045,081 | |
Series 1993-22, Class PM, 7.40%, 2/25/23 | | | | | 697 | | | | 812,417 | |
Series 1993-25, Class J, 7.50%, 3/25/23 | | | | | 1,078 | | | | 1,255,770 | |
Series 1993-30, Class PZ, 7.50%, 3/25/23 | | | | | 1,909 | | | | 2,229,495 | |
Series 1993-42, Class ZQ, 6.75%, 4/25/23 | | | | | 2,374 | | | | 2,719,593 | |
Series 1993-56, Class PZ, 7.00%, 5/25/23 | | | | | 388 | | | | 445,032 | |
Series 1993-156, Class ZB, 7.00%, 9/25/23 | | | | | 452 | | | | 526,028 | |
Series 1994-45, Class Z, 6.50%, 2/25/24 | | | | | 3,228 | | | | 3,682,591 | |
Series 1994-89, Class ZQ, 8.00%, 7/25/24 | | | | | 1,824 | | | | 2,170,898 | |
Series 1996-57, Class Z, 7.00%, 12/25/26 | | | | | 1,852 | | | | 2,163,907 | |
Series 1997-77, Class Z, 7.00%, 11/18/27 | | | | | 832 | | | | 968,008 | |
Series 1998-44, Class ZA, 6.50%, 7/20/28 | | | | | 789 | | | | 920,205 | |
Series 1999-45, Class ZG, 6.50%, 9/25/29 | | | | | 307 | | | | 354,569 | |
Series 2000-22, Class PN, 6.00%, 7/25/30 | | | | | 2,456 | | | | 2,774,431 | |
Series 2001-37, Class GA, 8.00%, 7/25/16 | | | | | 320 | | | | 343,233 | |
Series 2002-1, Class G, 7.00%, 7/25/23 | | | | | 590 | | | | 673,557 | |
Series 2002-21, Class PE, 6.50%, 4/25/32 | | | | | 2,542 | | | | 2,902,879 | |
| | | | | | | | | | | |
| | | | | | | | $ | 51,906,429 | |
| | | | | | | | | | | |
| | | | | | | | | | |
| Security | | | | Principal
Amount
(000’s omitted) | | | Value | |
Government National Mortgage Association: | |
Series 2002-45, Class PG, 6.00%, 3/17/32 | | | | $ | 2,873 | | | $ | 3,122,272 | |
Series 2005-72, Class E, 12.00%, 11/16/15 | | | | | 136 | | | | 146,465 | |
| | | | | | | | | | | |
| | | | | | | | $ | 3,268,737 | |
| | | | | | | | | | | |
| |
Total Collateralized Mortgage Obligations
(identified cost $91,637,465) | | | $ | 98,159,292 | |
| | | | | | | | | | | |
|
| Commercial Mortgage-Backed Securities — 8.4% | |
| | | |
| | | | | | | | | | |
| Security | | | | Principal
Amount
(000’s omitted) | | | Value | |
| | | | | | | | | | |
BACM, Series 2004-1, Class A4, 4.76%, 11/10/39 | | | | $ | 22,300 | | | $ | 23,259,982 | |
BACM, Series 2004-6, Class A5, 4.811%, 12/10/42 | | | | | 820 | | | | 881,428 | |
BACM, Series 2006-3, Class A4, 5.889%, 7/10/44(12) | | | | | 2,000 | | | | 2,306,465 | |
BSCMS, Series 2002-TOP8, Class C, 5.22%, 8/15/38(12) | | | | | 2,000 | | | | 2,052,231 | |
BSCMS, Series 2004-PWR3, Class A4, 4.715%, 2/11/41 | | | | | 1,250 | | | | 1,300,823 | |
BSCMS, Series 2005-PW10, Class A4, 5.405%, 12/11/40(12) | | | | | 3,352 | | | | 3,783,634 | |
BSCMS, Series 2005-PWR7, Class A3, 5.116%, 2/11/41(12) | | | | | 2,361 | | | | 2,581,753 | |
CGCMT, Series 2004-C1, Class A3, 5.251%, 4/15/40(12) | | | | | 1,401 | | | | 1,423,408 | |
CGCMT, Series 2004-C1, Class A4, 5.534%, 4/15/40(12) | | | | | 12,215 | | | | 13,003,295 | |
CGCMT, Series 2012-GC8, Class A2, 1.813%, 9/10/45 | | | | | 3,113 | | | | 3,199,215 | |
COMM, Series 2004-LB2A, Class A4, 4.715%, 3/10/39 | | | | | 22,372 | | | | 23,422,845 | |
COMM, Series 2012-CR2, Class AM, 3.791%, 8/15/45 | | | | | 295 | | | | 315,074 | |
COMM, Series 2012-LC4, Class C, 5.825%, 12/10/44 | | | | | 500 | | | | 563,677 | |
CSFB, Series 2003-C3, Class A5, 3.936%, 5/15/38 | | | | | 2,707 | | | | 2,737,657 | |
CSFB, Series 2003-C3, Class D, 4.131%, 5/15/38 | | | | | 710 | | | | 716,411 | |
CSFB, Series 2003-C5, Class D, 5.116%, 12/15/36 | | | | | 3,270 | | | | 3,287,828 | |
CSFB, Series 2004-C1, Class A4, 4.75%, 1/15/37(12) | | | | | 12,132 | | | | 12,634,099 | |
CSFB, Series 2004-C3, Class A5, 5.113%, 7/15/36(12) | | | | | 1,577 | | | | 1,681,713 | |
DDR, Series 2009-DDR1, Class C, 6.223%, 10/14/22(6) | | | | | 1,000 | | | | 1,079,766 | |
ESAT, Series 2010-ESHA, Class B, 4.221%, 11/5/27(6) | | | | | 3,220 | | | | 3,247,212 | |
ESAT, Series 2010-ESHA, Class C, 4.86%, 11/5/27(6) | | | | | 670 | | | | 677,688 | |
FMBT, Series 2012-FBLU, Class A, 2.887%, 5/5/27(6) | | | | | 2,350 | | | | 2,452,707 | |
GECMC, Series 2005-C1, Class A3, 4.578%, 6/10/48 | | | | | 1,032 | | | | 1,048,067 | |
GMACC, Series 2002-C3, Class A2, 4.93%, 7/10/39 | | | | | 259 | | | | 259,095 | |
GMACC, Series 2004-C3, Class A5, 4.864%, 12/10/41 | | | | | 750 | | | | 803,021 | |
| | | | |
| | 28 | | See Notes to Financial Statements. |
Eaton Vance
Limited Duration Income Fund
September 30, 2012
Portfolio of Investments (Unaudited) — continued
| | | | | | | | | | |
| Security | | | | Principal
Amount
(000’s omitted) | | | Value | |
| | | | | | | | | | |
GSMS, Series 2003-C1, Class A3, 4.608%, 1/10/40 | | | | $ | 1,303 | | | $ | 1,305,465 | |
GSMS, Series 2004-GG2, Class A6, 5.396%, 8/10/38(12) | | | | | 3,365 | | | | 3,607,081 | |
JPMCC, Series 2004-CBX, Class A5, 4.654%, 1/12/37 | | | | | 425 | | | | 435,070 | |
JPMCC, Series 2005-LDP3, Class A3, 4.959%, 8/15/42 | | | | | 2,009 | | | | 2,036,957 | |
JPMCC, Series 2005-LDP4, Class A4, 4.918%, 10/15/42(12) | | | | | 3,000 | | | | 3,291,693 | |
JPMCC, Series 2005-LDP5, Class A3, 5.388%, 12/15/44(12) | | | | | 10,000 | | | | 10,354,770 | |
JPMCC, Series 2005-LDP5, Class AJ, 5.48%, 12/15/44(12) | | | | | 1,000 | | | | 1,069,963 | |
JPMCC, Series 2006-LDP7, Class A4, 6.061%, 4/15/45(12) | | | | | 1,275 | | | | 1,474,603 | |
JPMCC, Series 2011-C3, Class A2, 3.673%, 2/15/46(6) | | | | | 2,000 | | | | 2,175,655 | |
JPMCC, Series 2012-CBX, Class A2, 1.81%, 6/16/45 | | | | | 4,500 | | | | 4,646,358 | |
JPMCC, Series 2012-CBX, Class AS, 4.271%, 6/16/45 | | | | | 1,000 | | | | 1,104,656 | |
LB-UBS, Series 2003-C1, Class A4, 4.394%, 3/15/32 | | | | | 903 | | | | 911,303 | |
LB-UBS, Series 2003-C7, Class A4, 4.931%, 9/15/35(12) | | | | | 5,000 | | | | 5,153,577 | |
MLMT, Series 2003-KEY1, Class A4, 5.236%, 11/12/35(12) | | | | | 3,775 | | | | 3,930,611 | |
MLMT, Series 2004-BPC1, Class A5, 4.855%, 10/12/41(12) | | | | | 3,000 | | | | 3,224,449 | |
MSC, Series 2003-T11, Class B, 5.467%, 6/13/41(12) | | | | | 750 | | | | 772,959 | |
MSC, Series 2004-IQ7, Class A3, 5.35%, 6/15/38(12) | | | | | 239 | | | | 238,959 | |
MSC, Series 2004-IQ8, Class A5, 5.11%, 6/15/40(12) | | | | | 652 | | | | 688,008 | |
ORES, Series 2012-LV1, Class A, 4.00%, 9/25/44(6) | | | | | 150 | | | | 150,938 | |
RBSCF, Series 2010-MB1, Class B, 4.80%, 4/15/24(6)(12) | | | | | 3,005 | | | | 3,230,450 | |
RBSCF, Series 2010-MB1, Class C,
4.833%, 4/15/24(6)(12) | | | | | 500 | | | | 524,787 | |
RIAL, Series 2012-LT1A, Class A, 4.75%, 2/15/25(6) | | | | | 92 | | | | 91,940 | |
WBCMT, Series 2003-C6, Class F, 5.125%, 8/15/35(6)(12) | | | | | 965 | | | | 982,364 | |
WBCMT, Series 2004-C11, Class A5, 5.215%, 1/15/41(12) | | | | | 1,185 | | | | 1,261,214 | |
WBCMT, Series 2004-C12, Class A4, 5.489%, 7/15/41(12) | | | | | 250 | | | | 267,030 | |
WBCMT, Series 2006-C28, Class A4, 5.572%, 10/15/48 | | | | | 2,750 | | | | 3,178,213 | |
WF-RBS, Series 2012-C6, Class B, 4.697%, 4/15/45 | | | | | 1,200 | | | | 1,302,777 | |
| | | | | | | | | | | |
| | | |
Total Commercial Mortgage-Backed Securities
(identified cost $162,413,866) | | | | | | | | $ | 166,130,944 | |
| | | | | | | | | | | |
| | | | | | | | | | |
| Asset-Backed Securities — 0.2% | |
| | | |
| | | | | | | | | | |
| Security | | | | Principal
Amount
(000’s omitted) | | | Value | |
Alzette European CLO SA, Series 2004-1A, Class E2, 6.968%, 12/15/20(7) | | | | $ | 296 | | | $ | 263,104 | |
Avalon Capital Ltd. 3, Series 1A, Class D, 2.381%, 2/24/19(6)(7) | | | | | 589 | | | | 514,234 | |
Babson Ltd., Series 2005-1A, Class C1, 2.405%, 4/15/19(6)(7) | | | | | 753 | | | | 626,608 | |
Centurion CDO 8 Ltd., Series 2005-8A, Class D, 5.908%, 3/8/17(7) | | | | | 985 | | | | 945,032 | |
Centurion CDO 9 Ltd., Series 2005-9A, Class D1, 5.205%, 7/17/19(7) | | | | | 500 | | | | 444,607 | |
Comstock Funding Ltd., Series 2006-1A, Class D, 4.673%, 5/30/20(6)(7) | | | | | 1,844 | | | | 1,597,241 | |
| | | | | | | | | | | |
| |
Total Asset-Backed Securities
(identified cost $4,600,760) | | | $ | 4,390,826 | |
| | | | | | | | | | | |
|
| U.S. Government Agency Obligations — 1.7% | |
| | | |
| | | | | | | | | | |
| Security | | | | Principal
Amount
(000’s omitted) | | | Value | |
| | | | | | | | | | |
Federal Home Loan Bank: | |
4.125%, 12/13/19 | | | | $ | 3,975 | | | $ | 4,743,666 | |
5.25%, 12/9/22 | | | | | 9,000 | | | | 11,757,213 | |
5.375%, 5/15/19(9) | | | | | 6,585 | | | | 8,343,122 | |
5.375%, 8/15/24 | | | | | 5,740 | | | | 7,662,642 | |
| | | | | | | | | | | |
| | | |
Total U.S. Government Agency Obligations
(identified cost $29,695,779) | | | | | | | | $ | 32,506,643 | |
| | | | | | | | | | | |
|
| Common Stocks — 0.9% | |
| | | |
| | | | | | | | | | |
| Security | | | | Shares | | | Value | |
|
Automotive — 0.0%(2) | |
Dayco Products, LLC(5)(13)(14) | | | | | 25,372 | | | $ | 697,730 | |
| | |
| | | | | | | | $ | 697,730 | |
| | |
|
Building and Development — 0.3% | |
Panolam Holdings Co.(5)(13)(15) | | | | | 3,677 | | | $ | 5,993,878 | |
United Subcontractors, Inc.(5)(13)(14) | | | | | 1,231 | | | | 50,030 | |
| | |
| | | | | | | | $ | 6,043,908 | |
| | |
|
Ecological Services and Equipment — 0.0%(2) | |
Environmental Systems Products Holdings, Inc.(5)(13)(15) | | | | | 2,484 | | | $ | 226,044 | |
| | | | | | | | | | | |
| | | | | | | | $ | 226,044 | |
| | | | | | | | | | | |
| | | | |
| | 29 | | See Notes to Financial Statements. |
Eaton Vance
Limited Duration Income Fund
September 30, 2012
Portfolio of Investments (Unaudited) — continued
| | | | | | | | | | |
| Security | | | | Shares | | | Value | |
| | | | | | | | | | |
|
Financial Intermediaries — 0.0%(2) | |
RTS Investor Corp.(5)(13)(14) | | | | | 357 | | | $ | 34,113 | |
| | | | | | | | | | | |
| | | | | | | | $ | 34,113 | |
| | | | | | | | | | | |
|
Food Service — 0.0%(2) | |
Buffets Restaurants Holdings, Inc.(5)(13)(14) | | | | | 55,884 | | | $ | 507,986 | |
| | | | | | | | | | | |
| | | | | | | | $ | 507,986 | |
| | | | | | | | | | | |
|
Home Furnishings — 0.1% | |
Oreck Corp.(5)(13)(14) | | | | | 9,399 | | | $ | 539,502 | |
Sanitec Europe Oy B Units(5)(13)(14) | | | | | 26,249 | | | | 163,597 | |
Sanitec Europe Oy E Units(5)(13)(14) | | | | | 25,787 | | | | 0 | |
| | | | | | | | | | | |
| | | $ | 703,099 | |
| | | | | | | | | | | |
|
Leisure Goods / Activities / Movies — 0.1% | |
Metro-Goldwyn-Mayer Holdings, Inc.(13)(14) | | | | | 72,419 | | | $ | 2,303,830 | |
| | | | | | | | | | | |
| | | | | | | | $ | 2,303,830 | |
| | | | | | | | | | | |
|
Lodging and Casinos — 0.1% | |
Affinity Gaming, LLC(13)(14) | | | | | 46,819 | | | $ | 530,616 | |
Greektown Superholdings, Inc.(13) | | | | | 828 | | | | 42,228 | |
Tropicana Entertainment, Inc.(5)(13)(14) | | | | | 17,051 | | | | 245,108 | |
| | | | | | | | | | | |
| | | $ | 817,952 | |
| | | | | | | | | | | |
|
Nonferrous Metals / Minerals — 0.0%(2) | |
Euramax International, Inc.(13)(14) | | | | | 1,636 | | | $ | 364,032 | |
| | | | | | | | | | | |
| | | | | | | | $ | 364,032 | |
| | | | | | | | | | | |
|
Oil and Gas — 0.0%(2) | |
SemGroup Corp.(13) | | | | | 15,874 | | | $ | 584,957 | |
| | | | | | | | | | | |
| | | | | | | | $ | 584,957 | |
| | | | | | | | | | | |
|
Publishing — 0.2% | |
Ion Media Networks, Inc.(5)(14) | | | | | 5,187 | | | $ | 3,298,932 | |
MediaNews Group, Inc.(5)(13)(14) | | | | | 14,016 | | | | 294,050 | |
Source Interlink Companies, Inc.(5)(13)(14) | | | | | 2,862 | | | | 16,800 | |
| | | | | | | | | | | |
| | | $ | 3,609,782 | |
| | | | | | | | | | | |
|
Radio and Television — 0.1% | |
New Young Broadcasting Holding Co., Inc.(5)(13)(14) | | | | | 632 | | | $ | 2,275,200 | |
| | | | | | | | | | | |
| | | | | | | | $ | 2,275,200 | |
| | | | | | | | | | | |
| |
Total Common Stocks
(identified cost $9,475,512) | | | $ | 18,168,633 | |
| | | | | | | | | | | |
| | | | | | | | | | |
| Convertible Bonds — 0.0%(2) | |
| | |
| | | | | | | |
| Security | | | | Principal
Amount
(000’s omitted) | | | Value | |
| | | | | | | | | | |
|
Business Equipment and Services — 0.0%(2) | |
Mood Media Corp., 10.00%, 10/31/15(5)(15) | | | | $ | 75 | | | $ | 81,750 | |
| | | | | | | | | | | |
| |
Total Convertible Bonds
(identified cost $0) | | | $ | 81,750 | |
| | | | | | | | | | | |
|
| Preferred Stocks — 0.1% | |
| | |
| | | | | | | |
| Security | | | | Shares | | | Value | |
|
Ecological Services and Equipment — 0.0%(2) | |
Environmental Systems Products Holdings, Inc., Series A(5)(13)(15) | | | | | 569 | | | $ | 35,847 | |
| | | | | | | | | | | |
| | | $ | 35,847 | |
| | | | | | | | | | | |
|
Financial Intermediaries — 0.0%(2) | |
GMAC Capital Trust I, 8.125% | | | | | 20,465 | | | $ | 513,876 | |
| | | | | | | | | | | |
| | | $ | 513,876 | |
| | | | | | | | | | | |
|
Financial Services — 0.1% | |
Texas Capital Bancshares, Inc., 6.50% | | | | | 20,000 | | | $ | 515,250 | |
| | | | | | | | | | | |
| | | $ | 515,250 | |
| | | | | | | | | | | |
|
Oil, Gas & Consumable Fuels — 0.0%(2) | |
Chesapeake Energy Corp., 4.50%, Convertible | | | | | 6,331 | | | $ | 512,874 | |
| | | | | | | | | | | |
| | | $ | 512,874 | |
| | | | | | | | | | | |
| |
Total Preferred Stocks
(identified cost $1,651,354) | | | $ | 1,577,847 | |
| | | | | | | | | | | |
|
| Warrants — 0.0%(2) | |
| | |
| | | | | | | |
| Security | | | | Shares | | | Value | |
| | | | | | | | | | |
|
Chemicals and Plastics — 0.0% | |
Foamex, Series A, Expires 12/31/13(5)(13)(14) | | | | | 663 | | | $ | 0 | |
Foamex, Series B, Expires 12/31/15(5)(13)(14) | | | | | 663 | | | | 0 | |
| | | | | | | | | | | |
| | | $ | 0 | |
| | | | | | | | | | | |
|
Food Products — 0.0%(2) | |
ASG Consolidated, LLC/ASG Finance, Inc., Expires 5/15/18(13) | | | | | 1,745 | | | $ | 52,350 | |
| | | | | | | | | | | |
| | | $ | 52,350 | |
| | | | | | | | | | | |
| | | | |
| | 30 | | See Notes to Financial Statements. |
Eaton Vance
Limited Duration Income Fund
September 30, 2012
Portfolio of Investments (Unaudited) — continued
| | | | | | | | | | |
| Security | | | | Shares | | | Value | |
| | | | | | | | | | |
|
Oil and Gas — 0.0%(2) | |
SemGroup Corp., Expires 11/30/14(13) | | | | | 16,708 | | | $ | 222,049 | |
| | | | | | | | | | | |
| | | $ | 222,049 | |
| | | | | | | | | | | |
|
Publishing — 0.0% | |
Reader’s Digest Association, Inc. (The), Expires 2/19/14(5)(13)(14) | | | | | 23,833 | | | $ | 0 | |
| | | | | | | | | | | |
| | | $ | 0 | |
| | | | | | | | | | | |
|
Radio and Television — 0.0%(2) | |
New Young Broadcasting Holding Co., Inc., Expires 12/24/24(5)(13)(14) | | | | | 4 | | | $ | 14,400 | |
| | | | | | | | | | | |
| | | $ | 14,400 | |
| | | | | | | | | | | |
|
Telecommunications — 0.0% | |
ERC Luxembourg Holdings, Ltd., Expires 06/11/32(5)(13) | | | | | 7,168 | | | $ | 0 | |
| | | | | | | | | | | |
| | | $ | 0 | |
| | | | | | | | | | | |
| | | |
Total Warrants
(identified cost $7,041) | | | | | | | | $ | 288,799 | |
| | | | | | | | | | | |
|
| Miscellaneous — 0.0%(2) | |
| | | |
| | | | | | | | | | |
| Security | | | | Shares | | | Value | |
|
Cable and Satellite Television — 0.0%(2) | |
Adelphia Recovery Trust(5)(13) | | | | | 2,786,444 | | | $ | 0 | |
Adelphia, Inc., Escrow Certificate(13) | | | | | 300,000 | | | | 2,655 | |
Adelphia, Inc., Escrow Certificate(13) | | | | | 2,500,000 | | | | 22,125 | |
| | | | | | | | | | | |
| | | | | | | | $ | 24,780 | |
| | | | | | | | | | | |
|
Health Care — 0.0%(2) | |
US Oncology, Inc., Escrow Certificate(13) | | | | | 1,815,000 | | | $ | 31,763 | |
| | | | | | | | | | | |
| | | $ | 31,763 | |
| | | | | | | | | | | |
| | | | | | | | | | |
|
Oil and Gas — 0.0%(2) | |
SemGroup Corp., Escrow Certificate(13) | | | | | 6,135,000 | | | $ | 276,075 | |
| | | | | | | | | | | |
| | | $ | 276,075 | |
| | | | | | | | | | | |
| | | |
Total Miscellaneous
(identified cost $2,510,306) | | | | | | | | $ | 332,618 | |
| | | | | | | | | | | |
| | | | | | | | | | | | | | | | |
| Interest Rate Swaptions — 0.1% | |
| | | | |
| | | | | | | | | | | | | | | | |
| Description | | Counterparty | | | Expiration
Date | | | Notional
Amount
(000’s omitted) | | | Value | |
Options to receive 3-month USD-LIBOR-BBA Rate and pay 5.25% | | | Citibank NA | | | | 2/28/17 | | | $ | 52,500 | | | $ | 1,351,927 | |
Options to receive 3-month USD-LIBOR-BBA Rate and pay 5.25% | |
| Credit Suisse
International |
| | | 2/28/17 | | | | 52,500 | | | | 1,351,928 | |
| | | | | | | | | | | | | | | | | |
| |
Total Interest Rate Swaptions
(identified cost $5,071,500) | | | $ | 2,703,855 | |
| | | | | | | | | | | | | | | | | |
| | | | | | | | | | |
| Short-Term Investments — 3.2% | |
| | | |
| | | | | | | | | | |
| Description | | | | Interest/
Principal
Amount
(000’s omitted) | | | Value | |
| | | | | | | | | | |
Eaton Vance Cash Reserves Fund, LLC, 0.12%(16) | | $ | 46,006 | | | $ | 46,006,321 | |
State Street Bank and Trust Euro Time Deposit, 0.01%, 10/1/12 | | | | | 17,587 | | | | 17,586,623 | |
| | | | | | | | | | | |
| |
Total Short-Term Investments
(identified cost $63,592,944) | | | $ | 63,592,944 | |
| | | | | | | | | | | |
| |
Total Investments — 137.7%
(identified cost $2,600,750,989) | | | $ | 2,707,356,923 | |
| | | | | | | | | | | |
| |
Other Assets, Less Liabilities — (24.2)% | | | $ | (474,917,106 | ) |
| | | | | | | | | | | |
| |
Auction Preferred Shares Plus Cumulative Unpaid Dividends — (13.5)% | | | $ | (266,628,330 | ) |
| | | | | | | | | | | |
| |
Net Assets Applicable to Common Shares — 100.0% | | | $ | 1,965,811,487 | |
| | | | | | | | | | | |
| | | | |
| | 31 | | See Notes to Financial Statements. |
Eaton Vance
Limited Duration Income Fund
September 30, 2012
Portfolio of Investments (Unaudited) — continued
The percentage shown for each investment category in the Portfolio of Investments is based on net assets applicable to common shares.
| | | | |
| BACM | | – | | Bank of America Commercial Mortgage, Inc. |
| BSCMS | | – | | Bear Stearns Commercial Mortgage Securities, Inc. |
| CGCMT | | – | | Citigroup Commercial Mortgage Trust |
| COMM | | – | | Commercial Mortgage Pass-Through Certificates |
| CSFB | | – | | Credit Suisse First Boston Mortgage Securities Corp. |
| DDR | | – | | Developers Diversified Realty Corp. |
| ESAT | | – | | Extended Stay America Trust |
| FMBT | | – | | Fontainebleau Miami Beach Trust |
| GECMC | | – | | General Electric Commercial Mortgage Corp. |
| GMACC | | – | | GMAC Commercial Mortgage Securities, Inc. |
| GSMS | | – | | Goldman Sachs Mortgage Securities Corp. II |
| JPMCC | | – | | JPMorgan Chase Commercial Mortgage Securities Corp. |
| LB-UBS | | – | | LB-UBS Commercial Mortgage Trust |
| MLMT | | – | | Merrill Lynch Mortgage Trust |
| MSC | | – | | Morgan Stanley Capital I |
| MTN | | – | | Medium-Term Note |
| ORES | | – | | Oaktree Real Estate Investments/Sabal |
| RBSCF | | – | | Royal Bank of Scotland Commercial Funding |
| RIAL | | – | | Rialto Real Estate Fund LP |
| WBCMT | | – | | Wachovia Bank Commercial Mortgage Trust |
| WF-RBS | | – | | WF-RBS Commercial Mortgage Trust |
| | |
| EUR | | – | | Euro |
| GBP | | – | | British Pound Sterling |
| | * | In U.S. dollars unless otherwise indicated. |
| | (1) | Senior floating-rate interests (Senior Loans) often require prepayments from excess cash flows or permit the borrowers to repay at their election. The degree to which borrowers repay, whether as a contractual requirement or at their election, cannot be predicted with accuracy. As a result, the actual remaining maturity may be substantially less than the stated maturities shown. However, Senior Loans will have an expected average life of approximately two to four years. The stated interest rate represents the weighted average interest rate of all contracts within the senior loan facility and includes commitment fees on unfunded loan commitments, if any. Senior Loans typically have rates of interest which are redetermined either daily, monthly, quarterly or semi-annually by reference to a base lending rate, plus a premium. These base lending rates are primarily the London Interbank Offered Rate (“LIBOR”) and secondarily, the prime rate offered by one or more major United States banks (the “Prime Rate”) and the certificate of deposit (“CD”) rate or other base lending rates used by commercial lenders. |
| | (2) | Amount is less than 0.05%. |
| | (3) | Represents a payment-in-kind security which may pay all or a portion of interest in additional par. |
| | (4) | This Senior Loan will settle after September 30, 2012, at which time the interest rate will be determined. |
| | (5) | For fair value measurement disclosure purposes, security is categorized as Level 3 (See Note 13). |
| | (6) | Security exempt from registration pursuant to Rule 144A under the Securities Act of 1933. These securities may be sold in certain transactions (normally to qualified institutional buyers) and remain exempt from registration. At September 30, 2012, the aggregate value of these securities is $404,594,281 or 20.6% of the Fund’s net assets. |
| | (7) | Variable rate security. The stated interest rate represents the rate in effect at September 30, 2012. |
| | (8) | Currently the issuer is in default with respect to interest payments. For a variable rate security, interest rate has been adjusted to reflect non-accrued status. |
| | (9) | Security (or a portion thereof) has been pledged for the benefit of the counterparty for reverse repurchase agreements. |
| (10) | Security (or a portion thereof) has been pledged to cover margin requirements on open financial futures contracts. |
| (11) | Adjustable rate mortgage security. Rate shown is the rate at September 30, 2012. |
| (12) | Weighted average fixed-rate coupon that changes/updates monthly. |
| (13) | Non-income producing security. |
| (14) | Security was acquired in connection with a restructuring of a Senior Loan and may be subject to restrictions on resale. |
| (15) | Restricted security (see Note 8). |
| (16) | Affiliated investment company available to Eaton Vance portfolios and funds which invests in high quality, U.S. dollar denominated money market instruments. The rate shown is the annualized seven-day yield as of September 30, 2012. |
| | | | |
| | 32 | | See Notes to Financial Statements. |
Eaton Vance
Limited Duration Income Fund
September 30, 2012
Statement of Assets and Liabilities (Unaudited)
| | | | |
| Assets | | September 30, 2012 | |
Unaffiliated investments, at value (identified cost, $2,554,744,668) | | $ | 2,661,350,602 | |
Affiliated investment, at value (identified cost, $46,006,321) | | | 46,006,321 | |
Cash | | | 1,323,110 | |
Foreign currency, at value (identified cost, $193,509) | | | 192,141 | |
Interest receivable | | | 25,919,761 | |
Interest receivable from affiliated investment | | | 2,970 | |
Receivable for investments sold | | | 10,922,841 | |
Receivable for open forward foreign currency exchange contracts | | | 558 | |
Prepaid expenses | | | 787,900 | |
Other assets | | | 217,143 | |
Total assets | | $ | 2,746,723,347 | |
| |
| Liabilities | | | | |
Notes payable | | $ | 414,200,000 | |
Payable for reverse repurchase agreements, including accrued interest of $5,093 | | | 59,532,093 | |
Payable for investments purchased | | | 36,680,221 | |
Payable for variation margin on open financial futures contracts | | | 8,754 | |
Payable for open forward foreign currency exchange contracts | | | 1,300,444 | |
Payable to affiliates: | | | | |
Investment adviser fee | | | 1,670,254 | |
Accrued expenses | | | 891,764 | |
Total liabilities | | $ | 514,283,530 | |
Auction preferred shares (10,665 shares outstanding) at liquidation value plus cumulative unpaid dividends | | $ | 266,628,330 | |
Net assets applicable to common shares | | $ | 1,965,811,487 | |
| |
| Sources of Net Assets | | | | |
Common shares, $0.01 par value, unlimited number of shares authorized, 117,414,786 shares issued and outstanding | | $ | 1,174,148 | |
Additional paid-in capital | | | 2,245,893,793 | |
Accumulated net realized loss | | | (374,540,731 | ) |
Accumulated distributions in excess of net investment income | | | (11,689,640 | ) |
Net unrealized appreciation | | | 104,973,917 | |
Net assets applicable to common shares | | $ | 1,965,811,487 | |
| |
| Net Asset Value Per Common Share | | | | |
($1,965,811,487 ÷ 117,414,786 common shares issued and outstanding) | | $ | 16.74 | |
| | | | |
| | 33 | | See Notes to Financial Statements. |
Eaton Vance
Limited Duration Income Fund
September 30, 2012
Statement of Operations (Unaudited)
| | | | |
| Investment Income | | Six Months Ended
September 30, 2012 | |
Interest and other income | | $ | 78,275,112 | |
Dividends | | | 1,121,234 | |
Interest allocated from affiliated investment | | | 15,234 | |
Expenses allocated from affiliated investment | | | (1,916 | ) |
Total investment income | | $ | 79,409,664 | |
| |
| Expenses | | | | |
Investment adviser fee | | $ | 10,264,393 | |
Trustees’ fees and expenses | | | 34,000 | |
Custodian fee | | | 374,030 | |
Transfer and dividend disbursing agent fees | | | 11,212 | |
Legal and accounting services | | | 113,373 | |
Printing and postage | | | 268,385 | |
Interest expense and fees | | | 4,536,247 | |
Preferred shares service fee | | | 196,769 | |
Miscellaneous | | | 88,610 | |
Total expenses | | $ | 15,887,019 | |
Deduct — | | | | |
Reduction of custodian fee | | $ | 524 | |
Total expense reductions | | $ | 524 | |
| |
Net expenses | | $ | 15,886,495 | |
| |
Net investment income | | $ | 63,523,169 | |
| |
| Realized and Unrealized Gain (Loss) | | | | |
Net realized gain (loss) — | | | | |
Investment transactions | | $ | 16,633,050 | |
Investment transactions allocated from affiliated investment | | | 186 | |
Financial futures contracts | | | (1,612,714 | ) |
Foreign currency and forward foreign currency exchange contract transactions | | | 3,311,849 | |
Net realized gain | | $ | 18,332,371 | |
Change in unrealized appreciation (depreciation) — | | | | |
Investments | | $ | 17,041,494 | |
Financial futures contracts | | | (804,109 | ) |
Foreign currency and forward foreign currency exchange contracts | | | (1,336,612 | ) |
Net change in unrealized appreciation (depreciation) | | $ | 14,900,773 | |
| |
Net realized and unrealized gain | | $ | 33,233,144 | |
| |
Distributions to preferred shareholders | | | | |
From net investment income | | $ | (250,380 | ) |
| |
Net increase in net assets from operations | | $ | 96,505,933 | |
| | | | |
| | 34 | | See Notes to Financial Statements. |
Eaton Vance
Limited Duration Income Fund
September 30, 2012
Statements of Changes in Net Assets
| | | | | | | | | | | | |
| Increase (Decrease) in Net Assets | | Six Months Ended
September 30, 2012
(Unaudited) | | | Period Ended
March 31, 2012(1) | | | Year Ended
April 30, 2011 | |
From operations — | | | | | | | | | | | | |
Net investment income | | $ | 63,523,169 | | | $ | 118,134,350 | | | $ | 131,132,130 | |
Net realized gain (loss) from investment transactions, financial futures contracts, and foreign currency and forward foreign currency exchange contract transactions | | | 18,332,371 | | | | (31,938,449 | ) | | | 14,699,052 | |
Net change in unrealized appreciation (depreciation) from investments, financial futures contracts, foreign currency and forward foreign currency exchange contracts | | | 14,900,773 | | | | (11,190,997 | ) | | | 66,903,839 | |
Distributions to preferred shareholders — | | | | | | | | | | | | |
From net investment income | | | (250,380 | ) | | | (368,804 | ) | | | (839,072 | ) |
Net increase in net assets from operations | | $ | 96,505,933 | | | $ | 74,636,100 | | | $ | 211,895,949 | |
Distributions to common shareholders — | | | | | | | | | | | | |
From net investment income | | $ | (73,372,200 | ) | | $ | (129,435,941 | ) | | $ | (154,723,619 | ) |
Tax return of capital | | | — | | | | (5,063,927 | ) | | | (6,947,700 | ) |
Total distributions to common shareholders | | $ | (73,372,200 | ) | | $ | (134,499,868 | ) | | $ | (161,671,319 | ) |
Capital share transactions — | | | | | | | | | | | | |
Reinvestment of distributions to common shareholders | | $ | 1,173,442 | | | $ | — | | | $ | 964,004 | |
Net increase in net assets from capital share transactions | | $ | 1,173,442 | | | $ | — | | | $ | 964,004 | |
| | | |
Net increase (decrease) in net assets | | $ | 24,307,175 | | | $ | (59,863,768 | ) | | $ | 51,188,634 | |
|
| Net Assets Applicable to Common Shares | |
At beginning of period | | $ | 1,941,504,312 | | | $ | 2,001,368,080 | | | $ | 1,950,179,446 | |
At end of period | | $ | 1,965,811,487 | | | $ | 1,941,504,312 | | | $ | 2,001,368,080 | |
|
Accumulated distributions in excess of net investment income
included in net assets applicable to common shares | |
At end of period | | $ | (11,689,640 | ) | | $ | (1,590,229 | ) | | $ | (459,081 | ) |
| (1) | For the eleven months ended March 31, 2012. |
| | | | |
| | 35 | | See Notes to Financial Statements. |
Eaton Vance
Limited Duration Income Fund
September 30, 2012
Statement of Cash Flows (Unaudited)
| | | | |
| Cash Flows From Operating Activities | | Six Months Ended
September 30, 2012 | |
Net increase in net assets from operations | | $ | 96,505,933 | |
Distributions to preferred shareholders | | | 250,380 | |
Net increase in net assets from operations excluding distributions to preferred shareholders | | $ | 96,756,313 | |
Adjustments to reconcile net increase in net assets from operations to net cash provided by operating activities: | | | | |
Investments purchased | | | (560,755,823 | ) |
Investments sold and principal repayments | | | 615,281,924 | |
Increase in short-term investments, net | | | (25,643,665 | ) |
Net amortization/accretion of premium (discount) | | | 5,269,004 | |
Amortization of structuring fee on notes payable | | | 717,194 | |
Decrease in interest and dividends receivable | | | 1,642,843 | |
Increase in interest receivable from affiliated investment | | | (1,526 | ) |
Decrease in receivable for open forward foreign currency exchange contracts | | | 228,095 | |
Decrease in receivable for closed forward foreign currency exchange contracts | | | 6,728 | |
Decrease in tax claim receivable | | | 11,519 | |
Decrease in receivable for variation margin on open financial futures contracts | | | 169,603 | |
Increase in prepaid expenses | | | (11,114 | ) |
Decrease in other assets | | | 271,982 | |
Increase in payable for variation margin on open financial futures contracts | | | 8,754 | |
Increase in payable for open forward foreign currency exchange contracts | | | 1,082,476 | |
Decrease in payable to affiliate for investment adviser fee | | | (62,088 | ) |
Decrease in accrued expenses and accrued interest on reverse repurchase agreements | | | (21,234 | ) |
Decrease in unfunded loan commitments | | | (484,196 | ) |
Net change in unrealized (appreciation) depreciation from investments | | | (17,041,494 | ) |
Net realized gain from investments | | | (16,633,050 | ) |
Net cash provided by operating activities | | $ | 100,792,245 | |
| |
| Cash Flows From Financing Activities | | | | |
Distributions paid to common shareholders, net of reinvestments | | $ | (72,198,758 | ) |
Cash distributions to preferred shareholders | | | (249,220 | ) |
Proceeds from notes payable | | | 125,000,000 | |
Repayment of notes payable | | | (150,000,000 | ) |
Repayment of reverse repurchase agreements, net | | | (3,235,000 | ) |
Net cash used in financing activities | | $ | (100,682,978 | ) |
| |
Net increase in cash* | | $ | 109,267 | |
| |
Cash at beginning of period(1) | | $ | 1,405,984 | |
| |
Cash at end of period(1) | | $ | 1,515,251 | |
| |
| Supplemental disclosure of cash flow information: | | | | |
Noncash financing activities not included herein consist of: | | | | |
Reinvestment of dividends and distributions | | $ | 1,173,442 | |
Cash paid for interest and fees on borrowings | | | 3,897,666 | |
| (1) | Balance includes foreign currency, at value. |
| * | Includes net change in unrealized appreciation (depreciation) on foreign currency of $(3,438). |
| | | | |
| | 36 | | See Notes to Financial Statements. |
Eaton Vance
Limited Duration Income Fund
September 30, 2012
Financial Highlights
Selected data for a common share outstanding during the periods stated
| | | | | | | | | | | | | | | | | | | | | | | | |
| | | Six Months Ended
September 30, 2012
(Unaudited) | | | Period Ended
March 31, 2012(1) | | | Year Ended April 30, | |
| | | | | 2011 | | | 2010 | | | 2009 | | | 2008 | |
Net asset value — Beginning of period (Common shares) | | $ | 16.550 | | | $ | 17.060 | | | $ | 16.630 | | | $ | 12.960 | | | $ | 16.330 | | | $ | 18.320 | |
| | | | | | |
| Income (Loss) From Operations | | | | | | | | | | | | | | | | | | | | | | | | |
Net investment income(2)(3) | | $ | 0.541 | | | $ | 1.007 | | | $ | 1.118 | | | $ | 1.213 | | | $ | 1.348 | | | $ | 1.700 | |
Net realized and unrealized gain (loss)(3) | | | 0.276 | | | | (0.368 | ) | | | 0.697 | | | | 3.809 | | | | (3.290 | ) | | | (1.817 | ) |
Distributions to preferred shareholders from net investment income(2) | | | (0.002 | ) | | | (0.003 | ) | | | (0.007 | ) | | | (0.007 | ) | | | (0.058 | ) | | | (0.360 | ) |
| | | | | | |
Total income (loss) from operations | | $ | 0.815 | | | $ | 0.636 | | | $ | 1.808 | | | $ | 5.015 | | | $ | (2.000 | ) | | $ | (0.477 | ) |
| | | | | | |
| Less Distributions to Common Shareholders | | | | | | | | | | | | | | | | | | | | | | | | |
From net investment income | | $ | (0.625 | ) | | $ | (1.103 | ) | | $ | (1.319 | ) | | $ | (1.345 | ) | | $ | (1.347 | ) | | $ | (1.513 | ) |
Tax return of capital | | | — | | | | (0.043 | ) | | | (0.059 | ) | | | — | | | | (0.023 | ) | | | — | |
| | | | | | |
Total distributions to common shareholders | | $ | (0.625 | ) | | $ | (1.146 | ) | | $ | (1.378 | ) | | $ | (1.345 | ) | | $ | (1.370 | ) | | $ | (1.513 | ) |
| | | | | | |
Net asset value — End of period (Common shares) | | $ | 16.740 | | | $ | 16.550 | | | $ | 17.060 | | | $ | 16.630 | | | $ | 12.960 | | | $ | 16.330 | |
| | | | | | |
Market value — End of period (Common shares) | | $ | 16.980 | | | $ | 16.050 | | | $ | 16.080 | | | $ | 16.600 | | | $ | 11.580 | | | $ | 15.300 | |
| | | | | | |
Total Investment Return on Net Asset Value(4) | | | 5.01 | %(5) | | | 4.44 | %(5) | | | 11.68 | % | | | 40.73 | % | | | (10.71 | )% | | | (1.99 | )% |
| | | | | | |
Total Investment Return on Market Value(4) | | | 9.90 | %(5) | | | 7.40 | %(5) | | | 5.52 | % | | | 57.21 | % | | | (14.85 | )% | | | (10.04 | )% |
| | | | |
| | 37 | | See Notes to Financial Statements. |
Eaton Vance
Limited Duration Income Fund
September 30, 2012
Financial Highlights — continued
Selected data for a common share outstanding during the periods stated
| | | | | | | | | | | | | | | | | | | | | | | | |
| | | Six Months Ended
September 30, 2012
(Unaudited) | | | Period Ended
March 31, 2012(1) | | | Year Ended April 30, | |
| Ratios/Supplemental Data | | | | 2011 | | | 2010 | | | 2009 | | | 2008 | |
Net assets applicable to common shares, end of period (000’s omitted) | | $ | 1,965,811 | | | $ | 1,941,504 | | | $ | 2,001,368 | | | $ | 1,950,179 | | | $ | 1,456,963 | | | $ | 1,836,391 | |
Ratios (as a percentage of average daily net assets applicable to common shares):(6) | | | | | | | | | | | | | | | | | | | | | | | | |
Expenses excluding interest and fees(7) | | | 1.16 | %(8) | | | 1.19 | %(8) | | | 1.15 | % | | | 1.02 | % | | | 1.09 | % | | | 1.07 | % |
Interest and fee expense(9) | | | 0.47 | %(8) | | | 0.52 | %(8) | | | 0.61 | % | | | 1.04 | % | | | 1.37 | % | | | — | |
Total expenses | | | 1.63 | %(8) | | | 1.71 | %(8) | | | 1.76 | % | | | 2.06 | % | | | 2.46 | % | | | 1.07 | % |
Net investment income | | | 6.52 | %(8) | | | 6.68 | %(8) | | | 6.73 | % | | | 7.90 | % | | | 9.91 | % | | | 9.89 | % |
Portfolio Turnover | | | 34 | %(5) | | | 42 | %(5) | | | 46 | % | | | 46 | % | | | 27 | % | | | 39 | % |
The ratios reported above are based on net assets applicable solely to common shares. The ratios based on net assets, including amounts related to preferred shares and borrowings under the credit agreement, are as follows: | |
Ratios (as a percentage of average daily net assets applicable to common shares plus preferred shares and borrowings):(6) | | | | | | | | | | | | | | | | | | | | | | | | |
Expenses excluding interest and fees(7) | | | 0.84 | %(8) | | | 0.86 | %(8) | | | 0.83 | % | | | 0.69 | % | | | 0.71 | % | | | 0.76 | % |
Interest and fee expense(9) | | | 0.34 | %(8) | | | 0.38 | %(8) | | | 0.44 | % | | | 0.70 | % | | | 0.90 | % | | | — | |
Total expenses | | | 1.18 | %(8) | | | 1.24 | %(8) | | | 1.27 | % | | | 1.39 | % | | | 1.61 | % | | | 0.76 | % |
Net investment income | | | 4.74 | %(8) | | | 4.82 | %(8) | | | 4.85 | % | | | 5.31 | % | | | 6.48 | % | | | 7.00 | % |
Senior Securities: | | | | | | | | | | | | | | | | | | | | | | | | |
Total notes payable outstanding (in 000’s) | | $ | 414,200 | | | $ | 439,200 | | | $ | 418,200 | | | $ | 526,200 | | | $ | 619,200 | | | $ | — | |
Asset coverage per $1,000 of notes payable(10) | | $ | 6,390 | | | $ | 6,028 | | | $ | 6,423 | | | $ | 5,213 | | | $ | 3,784 | | | $ | — | |
Total preferred shares outstanding | | | 10,665 | | | | 10,665 | | | | 10,665 | | | | 10,665 | | | | 10,665 | | | | 32,000 | |
Asset coverage per preferred share | | $ | 97,185 | (11) | | $ | 93,767 | (11) | | $ | 98,061 | (11) | | $ | 86,494 | (11) | | $ | 66,119 | (11) | | $ | 82,395 | (12) |
Involuntary liquidation preference per preferred share(13) | | $ | 25,000 | | | $ | 25,000 | | | $ | 25,000 | | | $ | 25,000 | | | $ | 25,000 | | | $ | 25,000 | |
Approximate market value per preferred share(13) | | $ | 25,000 | | | $ | 25,000 | | | $ | 25,000 | | | $ | 25,000 | | | $ | 25,000 | | | $ | 25,000 | |
| | (1) | For the eleven months ended March 31, 2012. The Fund changed its fiscal year-end from April 30 to March 31. |
| | (2) | Computed using average common shares outstanding. |
| | (3) | For federal income tax purposes, net investment income per share was $0.619, $1.147, $1.253, $1.342, $1.395 and $1.787, and net realized and unrealized gain (loss) per share was $0.198, $(0.508), $0.562, $3.680, $(3.337) and $(1.904) for the six months ended September 30, 2012, the period ended March 31, 2012 and the years ended April 30, 2011, 2010, 2009 and 2008, respectively. |
| | (4) | Returns are historical and are calculated by determining the percentage change in net asset value or market value with all distributions reinvested. |
| | (6) | Ratios do not reflect the effect of dividend payments to preferred shareholders. |
| | (7) | Excludes the effect of custody fee credits, if any, of less than 0.005%. |
| | (9) | Interest and fee expense relates to the notes payable incurred to partially redeem the Fund’s APS (see Note 10), the reverse repurchase agreements (see Note 11), and/or other borrowings. |
| (10) | Calculated by subtracting the Fund’s total liabilities (not including the notes payable and preferred shares) from the Fund’s total assets, and dividing the result by the notes payable balance in thousands. |
| (11) | Calculated by subtracting the Fund’s total liabilities (not including the notes payables and preferred shares) from the Fund’s total assets, dividing the result by the sum of the value of the notes payable and liquidation value of the preferred shares, and multiplying the result by the liquidation value of one preferred share. Such amount equates to 389%, 375%, 392%, 346% and 264% at September 30, 2012, March 31, 2012 and at April 30, 2011, 2010 and 2009, respectively. |
| (12) | Calculated by subtracting the Fund’s total liabilities (not including the preferred shares) from the Fund’s total assets, and dividing the result by the number of preferred shares outstanding. |
| (13) | Plus accumulated and unpaid dividends. |
| | | | |
| | 38 | | See Notes to Financial Statements. |
Eaton Vance
Limited Duration Income Fund
September 30, 2012
Notes to Financial Statements (Unaudited)
1 Significant Accounting Policies
Eaton Vance Limited Duration Income Fund (the Fund) is a Massachusetts business trust registered under the Investment Company Act of 1940, as amended (the 1940 Act), as a diversified, closed-end management investment company. The Fund’s primary investment objective is to provide a high level of current income. The Fund may, as a secondary objective, also seek capital appreciation to the extent it is consistent with its primary objective.
The following is a summary of significant accounting policies of the Fund. The policies are in conformity with accounting principles generally accepted in the United States of America.
A Investment Valuation — Interests in senior floating-rate loans (Senior Loans) for which reliable market quotations are readily available are valued generally at the average mean of bid and ask quotations obtained from a third party pricing service. Other Senior Loans are valued at fair value by the investment adviser under procedures approved by the Trustees. In fair valuing a Senior Loan, the investment adviser utilizes one or more of the valuation techniques described in (i) through (iii) below to assess the likelihood that the borrower will make a full repayment of the loan underlying such Senior Loan relative to yields on other Senior Loans issued by companies of comparable credit quality. If the investment adviser believes that there is a reasonable likelihood of full repayment, the investment adviser will determine fair value using a matrix pricing approach that considers the yield on the Senior Loan. If the investment adviser believes there is not a reasonable likelihood of full repayment, the investment adviser will determine fair value using analyses that include, but are not limited to: (i) a comparison of the value of the borrower’s outstanding equity and debt to that of comparable public companies; (ii) a discounted cash flow analysis; or (iii) when the investment adviser believes it is likely that a borrower will be liquidated or sold, an analysis of the terms of such liquidation or sale. In certain cases, the investment adviser will use a combination of analytical methods to determine fair value, such as when only a portion of a borrower’s assets are likely to be sold. In conducting its assessment and analyses for purposes of determining fair value of a Senior Loan, the investment adviser will use its discretion and judgment in considering and appraising relevant factors. Fair value determinations are made by the portfolio managers of the Fund based on information available to such managers. The portfolio managers of other funds managed by the investment adviser that invest in Senior Loans may not possess the same information about a Senior Loan borrower as the portfolio managers of the Fund. At times, the fair value of a Senior Loan determined by the portfolio managers of other funds managed by the investment adviser that invest in Senior Loans may vary from the fair value of the same Senior Loan determined by the portfolio managers of the Fund. The fair value of each Senior Loan is periodically reviewed and approved by the investment adviser’s Valuation Committee and by the Trustees based upon procedures approved by the Trustees. Junior Loans (i.e., subordinated loans and second lien loans) are valued in the same manner as Senior Loans.
Debt obligations (including short-term obligations with a remaining maturity of more than sixty days and excluding most seasoned, fixed-rate 30-year mortgage-backed securities as noted below) are generally valued on the basis of valuations provided by third party pricing services, as derived from such services’ pricing models. Inputs to the models may include, but are not limited to, reported trades, executable bid and asked prices, broker/dealer quotations, prices or yields of securities with similar characteristics, benchmark curves or information pertaining to the issuer, as well as industry and economic events. The pricing services may use a matrix approach, which considers information regarding securities with similar characteristics to determine the valuation for a security. Most seasoned, fixed-rate 30-year mortgage-backed securities are valued through the use of the investment adviser’s matrix pricing system, which takes into account bond prices, yield differentials, anticipated prepayments and interest rates provided by dealers. The value of preferred debt securities that are valued by a pricing service on an equity basis will be adjusted by an income factor, to be determined by the investment adviser, to reflect the next anticipated regular dividend. Short-term obligations purchased with a remaining maturity of sixty days or less are generally valued at amortized cost, which approximates market value.
Equity securities (including common shares of closed-end investment companies) listed on a U.S. securities exchange generally are valued at the last sale or closing price on the day of valuation or, if no sales took place on such date, at the mean between the closing bid and asked prices therefore on the exchange where such securities are principally traded. Equity securities listed on the NASDAQ Global or Global Select Market generally are valued at the NASDAQ official closing price. Unlisted or listed securities for which closing sales prices or closing quotations are not available are valued at the mean between the latest available bid and asked prices or, in the case of preferred equity securities that are not listed or traded in the over-the-counter market, by a third party pricing service that will use various techniques that consider factors including, but not limited to, prices or yields of securities with similar characteristics, benchmark yields, broker/dealer quotes, quotes of underlying common stock, issuer spreads, as well as industry and economic events. Interest rate swaps and options on interest rate swaps (“swaptions”) are normally valued using valuations provided by a third party pricing service. Such pricing service valuations are based on the present value of fixed and projected floating rate cash flows over the term of the swap contract. Future cash flows are discounted to their present value using swap rates provided by electronic data services or by broker/dealers. Alternatively, swaptions may be valued at the valuation provided by the counterparty, so determined using the same techniques as those employed by the pricing service. Financial futures contracts are valued at the closing settlement price established by the board of trade or exchange on which they are traded. Forward foreign currency exchange contracts are generally valued at the mean of the average bid and average asked prices that are reported by currency dealers to a third party pricing service at the valuation time. Such third party pricing service valuations are supplied for specific settlement periods and the Fund’s forward foreign currency exchange contracts are valued at an interpolated rate between the closest preceding and subsequent settlement period reported by the third party pricing service. Foreign securities and currencies are valued in U.S. dollars, based on foreign currency exchange rate quotations supplied by a third party pricing service. The pricing service uses a proprietary model to determine the exchange rate. Inputs to the model include reported trades and implied bid/ask spreads. Investments for which valuations or market quotations are not readily available or are deemed unreliable are valued at fair value using methods determined in good faith by or at the direction of the Trustees of the Fund in a manner that fairly reflects the security’s value, or the amount that the Fund might reasonably expect to receive for the security upon its current sale in the ordinary course. Each such determination is based on a consideration of relevant factors, which are likely to vary from one pricing context to another. These factors may include, but are not limited to, the type of
Eaton Vance
Limited Duration Income Fund
September 30, 2012
Notes to Financial Statements (Unaudited) — continued
security, the existence of any contractual restrictions on the security’s disposition, the price and extent of public trading in similar securities of the issuer or of comparable companies or entities, quotations or relevant information obtained from broker/dealers or other market participants, information obtained from the issuer, analysts, and/or the appropriate stock exchange (for exchange-traded securities), an analysis of the company’s or entity’s financial condition, and an evaluation of the forces that influence the issuer and the market(s) in which the security is purchased and sold.
The Fund may invest in Eaton Vance Cash Reserves Fund, LLC (Cash Reserves Fund), an affiliated investment company managed by Eaton Vance Management (EVM). Cash Reserves Fund generally values its investment securities utilizing the amortized cost valuation technique in accordance with Rule 2a-7 under the 1940 Act. This technique involves initially valuing a portfolio security at its cost and thereafter assuming a constant amortization to maturity of any discount or premium. If amortized cost is determined not to approximate fair value, Cash Reserves Fund may value its investment securities in the same manner as debt obligations described above.
B Investment Transactions — Investment transactions for financial statement purposes are accounted for on a trade date basis. Realized gains and losses on investments sold are determined on the basis of identified cost.
C Income — Interest income is recorded on the basis of interest accrued, adjusted for amortization of premium or accretion of discount. Fees associated with loan amendments are recognized immediately. Dividend income is recorded on the ex-dividend date for dividends received in cash and/or securities.
D Federal Taxes — The Fund’s policy is to comply with the provisions of the Internal Revenue Code applicable to regulated investment companies and to distribute to shareholders each year substantially all of its net investment income, and all or substantially all of its net realized capital gains. Accordingly, no provision for federal income or excise tax is necessary.
At March 31, 2012, the Fund, for federal income tax purposes, had a capital loss carryforward of $321,472,726 and deferred capital losses of $46,667,739, which will reduce its taxable income arising from future net realized gains on investment transactions, if any, to the extent permitted by the Internal Revenue Code, and thus will reduce the amount of distributions to shareholders, which would otherwise be necessary to relieve the Fund of any liability for federal income or excise tax. The capital loss carryforward will expire on March 31, 2013 ($40,885,552), March 31, 2014 ($28,843,098), March 31, 2015 ($18,927,766), March 31, 2016 ($31,018,401), March 31, 2017 ($112,795,908), March 31, 2018 ($67,565,640), and March 31, 2019 ($21,436,361). The deferred capital losses are treated as arising on the first day of the Fund’s next taxable year and are treated as realized prior the utilization of the capital loss carryforward.
As of September 30, 2012, the Fund had no uncertain tax positions that would require financial statement recognition, de-recognition, or disclosure. The Fund files a U.S. federal income tax return annually after its fiscal year-end which is subject to examination by the Internal Revenue Service for a period of three years from the date of filing.
E Expense Reduction — State Street Bank and Trust Company (SSBT) serves as custodian of the Fund. Pursuant to the custodian agreement, SSBT receives a fee reduced by credits, which are determined based on the average daily cash balance the Fund maintains with SSBT. All credit balances, if any, used to reduce the Fund’s custodian fees are reported as a reduction of expenses in the Statement of Operations.
F Foreign Currency Translation — Investment valuations, other assets, and liabilities initially expressed in foreign currencies are translated each business day into U.S. dollars based upon current exchange rates. Purchases and sales of foreign investment securities and income and expenses denominated in foreign currencies are translated into U.S. dollars based upon currency exchange rates in effect on the respective dates of such transactions. Recognized gains or losses on investment transactions attributable to changes in foreign currency exchange rates are recorded for financial statement purposes as net realized gains and losses on investments. That portion of unrealized gains and losses on investments that results from fluctuations in foreign currency exchange rates is not separately disclosed.
G Unfunded Loan Commitments — The Fund may enter into certain credit agreements all or a portion of which may be unfunded. The Fund is obligated to fund these commitments at the borrower’s discretion. These commitments are disclosed in the accompanying Portfolio of Investments. At September 30, 2012, the Fund had sufficient cash and/or securities to cover these commitments.
H Use of Estimates — The preparation of the financial statements in conformity with accounting principles generally accepted in the United States of America requires management to make estimates and assumptions that affect the reported amounts of assets and liabilities at the date of the financial statements and the reported amounts of income and expense during the reporting period. Actual results could differ from those estimates.
I Indemnifications — Under the Fund’s organizational documents, its officers and Trustees may be indemnified against certain liabilities and expenses arising out of the performance of their duties to the Fund. Under Massachusetts law, if certain conditions prevail, shareholders of a Massachusetts business trust (such as the Fund) could be deemed to have personal liability for the obligations of the Fund. However, the Fund’s Declaration of Trust contains an express disclaimer of liability on the part of Fund shareholders and the By-laws provide that the Fund shall assume the defense on behalf of any Fund shareholders. Moreover, the By-laws also provide for indemnification out of Fund property of any shareholder held personally liable solely by reason of being or having been a shareholder for all loss or expense arising from such liability. Additionally, in the normal course of business, the Fund enters into agreements with service providers that may contain indemnification clauses. The Fund’s maximum exposure under these arrangements is unknown as this would involve future claims that may be made against the Fund that have not yet occurred.
Eaton Vance
Limited Duration Income Fund
September 30, 2012
Notes to Financial Statements (Unaudited) — continued
J Financial Futures Contracts — Upon entering into a financial futures contract, the Fund is required to deposit with the broker, either in cash or securities, an amount equal to a certain percentage of the purchase price (initial margin). Subsequent payments, known as variation margin, are made or received by the Fund each business day, depending on the daily fluctuations in the value of the underlying security, and are recorded as unrealized gains or losses by the Fund. Gains (losses) are realized upon the expiration or closing of the financial futures contracts. Should market conditions change unexpectedly, the Fund may not achieve the anticipated benefits of the financial futures contracts and may realize a loss. Futures contracts have minimal counterparty risk as they are exchange traded and the clearinghouse for the exchange is substituted as the counterparty, guaranteeing counterparty performance.
K Forward Foreign Currency Exchange Contracts — The Fund may enter into forward foreign currency exchange contracts for the purchase or sale of a specific foreign currency at a fixed price on a future date. The forward foreign currency exchange contracts are adjusted by the daily exchange rate of the underlying currency and any gains or losses are recorded as unrealized until such time as the contracts have been closed or offset by another contract with the same broker for the same settlement date and currency. Risks may arise upon entering these contracts from the potential inability of counterparties to meet the terms of their contracts and from movements in the value of a foreign currency relative to the U.S. dollar.
L Swaptions — A purchased swaption contract grants the Fund, in return for payment of the purchase price, the right, but not the obligation, to enter into an interest rate swap, at preset terms, with the seller on the expiration date of the contract. The Fund pays a premium to the writer, which is recorded as an investment and subsequently marked to market to reflect the current value of the swaption. Premiums paid for swaptions that expire are treated as realized losses. Premiums paid for swaptions that are exercised or closed are added to the amounts paid or offset against the proceeds on the underlying swap transaction to determine the realized gain or loss. The writer of the swaption bears the risk of unfavorable changes in the preset rate of the underlying interest rate swap. The Fund’s risk is limited to the premium paid.
M Reverse Repurchase Agreements — Under a reverse repurchase agreement, the Fund temporarily transfers possession of a portfolio security to another party, such as a bank or broker/dealer, in return for cash. At the same time, the Fund agrees to repurchase the security at an agreed upon time and price, which reflects an interest payment. Because the Fund retains effective control over the transferred security, the transaction is accounted for as a secured borrowing. The Fund may enter into such agreements when it is able to invest the cash acquired at a rate higher than the cost of the agreement, which would increase earned income. When the Fund enters into a reverse repurchase agreement, any fluctuations in the market value of either the securities transferred to another party or the securities in which the proceeds may be invested would affect the market value of the Fund’s assets. Because reverse repurchase agreements may be considered to be the practical equivalent of borrowing funds, they constitute a form of leverage. The Fund segregates cash or liquid assets equal to its obligation to repurchase the security during the term of the agreement. In the event the counterparty to a reverse repurchase agreement becomes insolvent, recovery of the security transferred by the Fund may be delayed or the Fund may incur a loss equal to the amount by which the value of the security transferred by the Fund exceeds the repurchase price payable by the Fund.
N Statement of Cash Flows — The cash amount shown in the Statement of Cash Flows of the Fund is the amount included in the Fund’s Statement of Assets and Liabilities and represents the cash on hand at its custodian and does not include any short-term investments.
O Interim Financial Statements — The interim financial statements relating to September 30, 2012 and for the six months then ended have not been audited by an independent registered public accounting firm, but in the opinion of the Fund’s management, reflect all adjustments, consisting only of normal recurring adjustments, necessary for the fair presentation of the financial statements.
2 Auction Preferred Shares
The Fund issued Auction Preferred Shares (APS) on July 25, 2003 in a public offering. The underwriting discount and other offering costs incurred in connection with the offering were recorded as a reduction of the paid-in capital of the common shares. Dividends on the APS, which accrue daily, are cumulative at rates which are reset every seven days by an auction, unless a special dividend period has been set. Series of APS are identical in all respects except for the reset dates of the dividend rates. If the APS auctions do not successfully clear, the dividend payment rate over the next period for the APS holders is set at a specified maximum applicable rate until such time as the APS auctions are successful. Auctions have not cleared since February 13, 2008 and the rate since that date has been the maximum applicable rate (see Note 3). The maximum applicable rate on the APS is 150% of the “AA” Financial Composite Commercial Paper Rate on the date of the auction. The stated spread over the reference benchmark rate is determined based on the credit rating of the APS.
The number of APS issued and outstanding as of September 30, 2012 is as follows:
| | | | |
| | | APS Issued and
Outstanding | |
| |
Series A | | | 2,133 | |
Series B | | | 2,133 | |
Series C | | | 2,133 | |
Series D | | | 2,133 | |
Series E | | | 2,133 | |
Eaton Vance
Limited Duration Income Fund
September 30, 2012
Notes to Financial Statements (Unaudited) — continued
The APS are redeemable at the option of the Fund at a redemption price equal to $25,000 per share, plus accumulated and unpaid dividends, on any dividend payment date. The APS are also subject to mandatory redemption at a redemption price equal to $25,000 per share, plus accumulated and unpaid dividends, if the Fund is in default for an extended period on its asset maintenance requirements with respect to the APS. If the dividends on the APS remain unpaid in an amount equal to two full years’ dividends, the holders of the APS as a class have the right to elect a majority of the Board of Trustees. In general, the holders of the APS and the common shares have equal voting rights of one vote per share, except that the holders of the APS, as a separate class, have the right to elect at least two members of the Board of Trustees. The APS have a liquidation preference of $25,000 per share, plus accumulated and unpaid dividends. The Fund is required to maintain certain asset coverage with respect to the APS as defined in the Fund’s By-Laws and the 1940 Act. The Fund pays an annual fee up to 0.15% of the liquidation value of the APS to broker/dealers as a service fee if the auctions are unsuccessful; otherwise, the annual fee is 0.25%.
3 Distributions to Shareholders
The Fund intends to make monthly distributions of net investment income to common shareholders, after payment of any dividends on any outstanding APS. In addition, at least annually, the Fund intends to distribute all or substantially all of its net realized capital gains (reduced by available capital loss carryforwards from prior years, if any). Distributions to common shareholders are recorded on the ex-dividend date. Distributions to preferred shareholders are recorded daily and are payable at the end of each dividend period. The dividend rates for the APS at September 30, 2012, and the amount of dividends accrued (including capital gains, if any) to APS shareholders, average APS dividend rates (annualized), and dividend rate ranges for the six months then ended were as follows:
| | | | | | | | | | | | | | | | |
| | | APS Dividend
Rates at
September 30, 2012 | | | Dividends
Accrued to APS
Shareholders | | | Average APS
Dividend
Rates | | | Dividend
Rate
Ranges (%) | |
| | | | |
Series A | | | 0.15 | % | | $ | 47,483 | | | | 0.18 | % | | | 0.08–0.24 | |
Series B | | | 0.14 | | | | 54,421 | | | | 0.20 | | | | 0.09–0.39 | |
Series C | | | 0.15 | | | | 48,361 | | | | 0.18 | | | | 0.05–0.24 | |
Series D | | | 0.14 | | | | 48,679 | | | | 0.18 | | | | 0.05–0.23 | |
Series E | | | 0.18 | | | | 51,436 | | | | 0.19 | | | | 0.05–0.29 | |
Beginning February 13, 2008 and consistent with the patterns in the broader market for auction-rate securities, the Fund’s APS auctions were unsuccessful in clearing due to an imbalance of sell orders over bids to buy the APS. As a result, the dividend rates of the APS were reset to the maximum applicable rate. The table above reflects such maximum dividend rate for each series as of September 30, 2012.
The Fund distinguishes between distributions on a tax basis and a financial reporting basis. Accounting principles generally accepted in the United States of America require that only distributions in excess of tax basis earnings and profits be reported in the financial statements as a return of capital. Permanent differences between book and tax accounting relating to distributions are reclassified to paid-in capital. For tax purposes, distributions from short-term capital gains are considered to be from ordinary income.
4 Investment Adviser Fee and Other Transactions with Affiliates
The investment adviser fee is earned by EVM as compensation for management and investment advisory services rendered to the Fund. The fee is computed at an annual rate of 0.75% of the Fund’s average weekly gross assets and is payable monthly. Gross assets as referred to herein represent net assets plus obligations attributable to investment leverage. The Fund invests its cash in Cash Reserves Fund. EVM does not currently receive a fee for advisory services provided to Cash Reserves Fund. For the six months ended September 30, 2012, the Fund’s investment adviser fee totaled $10,264,393. EVM also serves as administrator of the Fund, but receives no compensation.
Trustees and officers of the Fund who are members of EVM’s organization receive remuneration for their services to the Fund out of the investment adviser fee. Trustees of the Fund who are not affiliated with EVM may elect to defer receipt of all or a percentage of their annual fees in accordance with the terms of the Trustees Deferred Compensation Plan. For the six months ended September 30, 2012, no significant amounts have been deferred. Certain officers and Trustees of the Fund are officers of EVM.
Eaton Vance
Limited Duration Income Fund
September 30, 2012
Notes to Financial Statements (Unaudited) — continued
5 Purchases and Sales of Investments
Purchases and sales of investments, other than short-term obligations and including maturities, paydowns and principal repayments on Senior Loans, for the six months ended September 30, 2012 were as follows:
| | | | | | | | |
| | | Purchases | | | Sales | |
| | |
Investments (non-U.S. Government) | | $ | 518,096,615 | | | $ | 528,636,698 | |
U.S. Government and Agency Securities | | | 9,247,040 | | | | 78,676,836 | |
| | |
| | | $ | 527,343,655 | | | $ | 607,313,534 | |
6 Common Shares of Beneficial Interest
The Fund may issue common shares pursuant to its dividend reinvestment plan. Transactions in common shares were as follows:
| | | | | | | | | | | | |
| | | Six Months Ended
September 30, 2012 | | | Eleven Months Ended
March 31, 2012 | | | Year Ended
April 30, 2011 | |
Issued to shareholders electing to receive payments of distributions in Fund shares | | | 70,633 | | | | — | | | | 58,781 | |
| | | |
Net increase | | | 70,633 | | | | — | | | | 58,781 | |
7 Federal Income Tax Basis of Investments
The cost and unrealized appreciation (depreciation) of investments of the Fund at September 30, 2012, as determined on a federal income tax basis, were as follows:
| | | | |
| |
Aggregate cost | | $ | 2,626,794,773 | |
| |
Gross unrealized appreciation | | $ | 115,677,648 | |
Gross unrealized depreciation | | | (35,115,498 | ) |
| |
Net unrealized appreciation | | $ | 80,562,150 | |
8 Restricted Securities
At September 30, 2012, the Fund owned the following securities (representing 0.3% of net assets applicable to common shares) which were restricted as to public resale and not registered under the Securities Act of 1933 (excluding Rule 144A securities). The Fund has various registration rights (exercisable
Eaton Vance
Limited Duration Income Fund
September 30, 2012
Notes to Financial Statements (Unaudited) — continued
under a variety of circumstances) with respect to these securities. The value of these securities is determined based on valuations provided by brokers when available, or if not available, they are valued at fair value using methods determined in good faith by or at the direction of the Trustees.
| | | | | | | | | | | | | | | | |
| Description | | Date of
Acquisition | | | Principal
Amount/
Shares | | | Cost | | | Value | |
| | | | |
Convertible Bonds | | | | | | | | | | | | | | | | |
Mood Media Corp. | | | 7/30/12 | | | | 75,000 | | | $ | 0 | | | $ | 81,750 | |
| | | | |
Total Convertible Bonds | | | | | | | | | | $ | 0 | | | $ | 81,750 | |
| | | | |
Common Stocks | | | | | | | | | | | | | | | | |
Environmental Systems Products Holdings, Inc. | | | 10/25/07 | | | | 2,484 | | | $ | 0 | | | $ | 226,044 | |
Panolam Holdings Co. | | | 12/30/09 | | | | 3,677 | | | | 2,020,511 | | | | 5,993,878 | |
| | | | |
Total Common Stocks | | | | | | | | | | $ | 2,020,511 | | | $ | 6,219,922 | |
| | | | |
Preferred Stocks | | | | | | | | | | | | | | | | |
Environmental Systems Products Holdings, Inc., Series A | | | 10/25/07 | | | | 569 | | | $ | 9,958 | | | $ | 35,847 | |
| | | | |
Total Preferred Stocks | | | | | | | | | | $ | 9,958 | | | $ | 35,847 | |
| | | | |
Total Restricted Securities | | | | | | | | | | $ | 2,030,469 | | | $ | 6,337,519 | |
9 Financial Instruments
The Fund may trade in financial instruments with off-balance sheet risk in the normal course of its investing activities. These financial instruments may include forward foreign currency exchange contracts and financial futures contracts and may involve, to a varying degree, elements of risk in excess of the amounts recognized for financial statement purposes. The notional or contractual amounts of these instruments represent the investment the Fund has in particular classes of financial instruments and do not necessarily represent the amounts potentially subject to risk. The measurement of the risks associated with these instruments is meaningful only when all related and offsetting transactions are considered.
A summary of obligations under these financial instruments at September 30, 2012 is as follows:
| | | | | | | | | | |
| Forward Foreign Currency Exchange Contracts | | | | | |
| | | | |
| | | | | | | | | | |
Sales | |
| Settlement Date | | Deliver | | In Exchange For | | Counterparty | | Net Unrealized
Appreciation
(Depreciation) | |
| | | | |
| 10/31/12 | | British Pound Sterling
4,275,581 | | United States Dollar
6,722,175 | | HSBC Bank USA | | $ | (181,430 | ) |
| 11/30/12 | | British Pound Sterling
3,726,762 | | United States Dollar
5,897,340 | | JPMorgan Chase Bank | | | (119,569 | ) |
| 11/30/12 | | Euro
31,784,861 | | United States Dollar
39,870,135 | | Citibank NA | | | (999,445 | ) |
| 12/31/12 | | British Pound Sterling
2,669,302 | | United States Dollar
4,309,895 | | Goldman Sachs International | | | 558 | |
| | | | |
| | | | | | | | | $ | (1,299,886 | ) |
Eaton Vance
Limited Duration Income Fund
September 30, 2012
Notes to Financial Statements (Unaudited) — continued
| | | | | | | | | | | | | | | | |
| Futures Contracts | |
Expiration
Month/Year | | Contracts | | Position | | Aggregate Cost | | | Value | | | Net Unrealized
Appreciation
(Depreciation) | |
| | | | | |
| 12/12 | | 150
U.S. 2-Year Treasury Note | | Short | | $ | (33,056,250 | ) | | $ | (33,079,688 | ) | | $ | (23,438 | ) |
| 12/12 | | 200
U.S. 5-Year Treasury Note | | Short | | | (24,829,688 | ) | | | (24,926,563 | ) | | | (96,875 | ) |
| 12/12 | | 200
U.S. 10-Year Treasury Note | | Short | | | (26,603,125 | ) | | | (26,696,875 | ) | | | (93,750 | ) |
| 12/12 | | 30
U.S. 30-Year Treasury Bond | | Short | | | (4,494,141 | ) | | | (4,481,250 | ) | | | 12,891 | |
| | | | | |
| | | | | | | | | | | | | | | $ | (201,172 | ) |
At September 30, 2012, the Fund had sufficient cash and/or securities to cover commitments under these contracts.
In the normal course of pursuing its investment objective, the Fund is subject to the following risks:
Foreign Exchange Risk: Because the Fund holds foreign currency denominated investments, the value of these investments and related receivables and payables may change due to future changes in foreign currency exchange rates. To hedge against this risk, the Fund enters into forward foreign currency exchange contracts. The Fund also enters into such contracts to hedge the currency risk of investments it anticipates purchasing.
Interest Rate Risk: The Fund utilizes various interest rate derivatives including futures contracts and interest rate swaptions to manage the duration of its portfolio and to hedge against fluctuations in securities price due to interest rates.
The Fund enters into forward foreign currency exchange contracts that may contain provisions whereby the counterparty may terminate the contract under certain conditions, including but not limited to a decline in the Fund’s net assets below a certain level over a certain period of time, which would trigger a payment by the Fund for those derivatives in a liability position. At September 30, 2012 the fair value of derivatives with credit-related contingent features in a net liability position was $1,300,444.
The non-exchange traded derivatives in which the Fund invests, including forward foreign currency exchange contracts and swaptions contracts are subject to the risk that the counterparty to the contract fails to perform its obligations under the contract. At September 30, 2012, the maximum amount of loss the Fund would incur due to counterparty risk was $2,704,413 representing the fair value of such derivatives in an asset position, with the highest amount from any one counterparty being $1,351,928. To mitigate this risk, the Fund has entered into master netting agreements with substantially all its derivative counterparties, which allows it and a counterparty to aggregate amounts owed by each of them for derivative transactions under the agreement into a single net amount payable by either the Fund or the counterparty. At September 30, 2012, the maximum amount of loss the Fund would incur due to counterparty risk would be reduced by approximately $999,445 due to master netting agreements. Counterparties may be required to pledge collateral in the form of cash, U.S. Government securities or highly-rated bonds for the benefit of the Fund if the net amount due from the counterparty with respect to a derivative contract exceeds a certain threshold. The amount of collateral posted by the counterparties with respect to such contracts would also reduce the amount of any loss incurred.
The fair value of open derivative instruments (not considered to be hedging instruments for accounting disclosure purposes) by risk exposure at September 30, 2012 was as follows:
| | | | | | | | | | |
| | | | | Fair Value | |
| Risk | | Derivative | | Asset Derivative | | | Liability Derivative | |
| | | |
Foreign Exchange | | Forward Foreign Currency Exchange Contracts | | $ | 558 | (1) | | $ | (1,300,444 | )(2) |
Interest Rate | | Financial Futures Contracts | | $ | 12,891 | (3) | | $ | (214,063 | )(3) |
Interest Rate | | Interest Rate Swaptions | | $ | 2,703,855 | (4) | | $ | — | |
| (1) | Statement of Assets and Liabilities location: Receivable for open forward foreign currency exchange contracts; Net unrealized appreciation. |
| (2) | Statement of Assets and Liabilities location: Payable for open forward foreign currency exchange contracts; Net unrealized appreciation. |
| (3) | Amount represents cumulative unrealized appreciation or (depreciation) on futures contracts in the Futures Contracts table above. Only the current day’s variation margin on open futures contracts is reported within the Statement of Assets and Liabilities as Receivable or Payable for variation margin, as applicable. |
| (4) | Statement of Assets and Liabilities location: Unaffiliated investments, at value. |
Eaton Vance
Limited Duration Income Fund
September 30, 2012
Notes to Financial Statements (Unaudited) — continued
The effect of derivative instruments (not considered to be hedging instruments for accounting disclosure purposes) on the Statement of Operations by risk exposure for the six months ended September 30, 2012 was as follows:
| | | | | | | | | | |
| Risk | | Derivative | | Realized Gain (Loss)
on Derivatives Recognized
in Income(1) | | | Change in Unrealized
Appreciation (Depreciation) on
Derivatives Recognized in Income(2) | |
| | | |
Foreign Exchange | | Forward Foreign Currency Exchange Contracts | | $ | 3,006,039 | | | $ | (1,310,571 | ) |
Interest rate | | Financial Futures Contracts | | | (1,612,714 | ) | | | (804,109 | ) |
Interest Rate | | Interest Rate Swaptions | | | — | | | | (1,897,350 | ) |
| | | |
Total | | | | $ | 1,393,325 | | | $ | (4,012,030 | ) |
| (1) | Statement of Operations location: Net realized gain (loss) – Foreign currency and forward foreign currency exchange contract transactions and Financial futures contracts, respectively. |
| (2) | Statement of Operations location: Change in unrealized appreciation (depreciation) – Foreign currency and forward foreign currency exchange contracts, Financial futures contracts and Investment transactions, respectively. |
The average notional amounts of forward foreign currency exchange contracts, financial futures contracts and swaptions outstanding during the six months ended September 30, 2012, which are indicative of the volume of these derivative types, were approximately $57,744,000, $75,071,000, and $105,000,000, respectively.
10 Revolving Credit and Security Agreement
Effective April 11, 2008, the Fund entered into a Revolving Credit and Security Agreement, as amended (the Agreement) with conduit lenders and a bank to borrow up to a limit of $715,625,000 for a period of five years, the proceeds of which were primarily used to partially redeem the Fund’s APS. The Agreement provides for a renewable 364-day backstop financing arrangement, which ensures that alternate financing will continue to be available to the Fund should the conduits be unable to place their commercial paper. The Agreement was renewed effective March 23, 2012. Borrowings under the Agreement are secured by the assets of the Fund. Interest is charged at a rate above the conduits’ commercial paper issuance rate and is payable monthly. Under the terms of the Agreement, the Fund pays a monthly program fee of 0.65% per annum on its outstanding borrowings to administer the facility and a monthly liquidity fee of 0.35% per annum on the borrowing limit under the Agreement (0.45% per annum if the Fund’s outstanding borrowings are equal to or less than 50% of the borrowing limit). The Fund also paid an initial structuring fee of $7,156,250 which is being amortized to interest expense over a period of five years. The unamortized structuring fee at September 30, 2012 is approximately $752,000 and is included in prepaid expenses on the Statement of Assets and Liabilities. The Fund is required to maintain certain net asset levels during the term of the Agreement. At September 30, 2012, the Fund had borrowings outstanding under the Agreement of $414,200,000 at an interest rate of 0.25%. The carrying amount of the borrowings at September 30, 2012 approximated its fair value. If measured at fair value, borrowings under the Agreement would have been considered as Level 2 in the fair value hierarchy (see Note 13) at September 30, 2012. For the six months ended September 30, 2012, the average borrowings under the Agreement and the average annual interest rate were $465,648,087 and 0.38%, respectively.
11 Reverse Repurchase Agreements
Reverse repurchase agreements outstanding as of September 30, 2012 were as follows:
| | | | | | | | | | | | | | | | |
| Counterparty | | Trade
Date | | | Maturity
Date | | | Interest
Rate | | Principal
Amount | | Principal Amount Including Accrued
Interest | |
| | | | | |
| Bank of America | | | 9/24/12 | | | | 10/24/12 | | | 0.44% | | $59,527,000 | | $ | 59,532,093 | |
For the six months ended September 30, 2012, the average borrowings under reverse repurchase agreements and the average annual interest rate were $58,889,574 and 0.40%, respectively. At September 30, 2012, the market value of securities pledged for the benefit of the counterparty for reverse repurchase agreement was $61,702,426. Based on the short-term nature of the borrowings under the reverse repurchase agreements, the carrying value of the payable for reverse repurchase agreements approximated its fair value at September 30, 2012. If measured at fair value, borrowings under reverse repurchase agreements would have been considered as Level 2 in the fair value hierarchy (see Note 13) at September 30, 2012.
Eaton Vance
Limited Duration Income Fund
September 30, 2012
Notes to Financial Statements (Unaudited) — continued
12 Risks Associated with Foreign Investments
Investing in securities issued by companies whose principal business activities are outside the United States may involve significant risks not present in domestic investments. For example, there is generally less publicly available information about foreign companies, particularly those not subject to the disclosure and reporting requirements of the U.S. securities laws. Certain foreign issuers are generally not bound by uniform accounting, auditing, and financial reporting requirements and standards of practice comparable to those applicable to domestic issuers. Investments in foreign securities also involve the risk of possible adverse changes in investment or exchange control regulations, expropriation or confiscatory taxation, limitation on the removal of funds or other assets of the Fund, political or financial instability or diplomatic and other developments which could affect such investments. Foreign securities markets, while growing in volume and sophistication, are generally not as developed as those in the United States, and securities of some foreign issuers (particularly those located in developing countries) may be less liquid and more volatile than securities of comparable U.S. companies. In general, there is less overall governmental supervision and regulation of foreign securities markets, broker/dealers and issuers than in the United States.
13 Fair Value Measurements
Under generally accepted accounting principles for fair value measurements, a three-tier hierarchy to prioritize the assumptions, referred to as inputs, is used in valuation techniques to measure fair value. The three-tier hierarchy of inputs is summarized in the three broad levels listed below.
| Ÿ | | Level 1 – quoted prices in active markets for identical investments |
| Ÿ | | Level 2 – other significant observable inputs (including quoted prices for similar investments, interest rates, prepayment speeds, credit risk, etc.) |
| Ÿ | | Level 3 – significant unobservable inputs (including a fund’s own assumptions in determining the fair value of investments) |
In cases where the inputs used to measure fair value fall in different levels of the fair value hierarchy, the level disclosed is determined based on the lowest level input that is significant to the fair value measurement in its entirety. The inputs or methodology used for valuing securities are not necessarily an indication of the risk associated with investing in those securities.
At September 30, 2012, the hierarchy of inputs used in valuing the Fund’s investments and open derivative instruments, which are carried at value, were as follows:
| | | | | | | | | | | | | | | | |
| Asset Description | |
Level 1 | | |
Level 2 | | |
Level 3* | | | Total | |
| | | | |
Senior Floating-Rate Interests | | $ | — | | | $ | 862,772,554 | | | $ | 4,071,807 | | | $ | 866,844,361 | |
Corporate Bonds & Notes | | | — | | | | 968,020,347 | | | | 1,972,778 | | | | 969,993,125 | |
Foreign Government Securities | | | — | | | | 1,161,868 | | | | — | | | | 1,161,868 | |
Mortgage Pass-Throughs | | | — | | | | 481,423,418 | | | | — | | | | 481,423,418 | |
Collateralized Mortgage Obligations | | | — | | | | 98,159,292 | | | | — | | | | 98,159,292 | |
Commercial Mortgage-Backed Securities | | | — | | | | 166,130,944 | | | | — | | | | 166,130,944 | |
Asset-Backed Securities | | | — | | | | 4,390,826 | | | | — | | | | 4,390,826 | |
U.S. Government Agency Obligations | | | — | | | | 32,506,643 | | | | — | | | | 32,506,643 | |
Common Stocks | | | 584,957 | | | | 3,240,706 | | | | 14,342,970 | | | | 18,168,633 | |
Convertible Bonds | | | — | | | | — | | | | 81,750 | | | | 81,750 | |
Preferred Stocks | | | 1,026,750 | | | | 515,250 | | | | 35,847 | | | | 1,577,847 | |
Warrants | | | — | | | | 274,399 | | | | 14,400 | | | | 288,799 | |
Miscellaneous | | | — | | | | 332,618 | | | | 0 | | | | 332,618 | |
Interest Rate Swaptions | | | — | | | | 2,703,855 | | | | — | | | | 2,703,855 | |
Short-Term Investments | | | — | | | | 63,592,944 | | | | — | | | | 63,592,944 | |
| | | | |
Total Investments | | $ | 1,611,707 | | | $ | 2,685,225,664 | | | $ | 20,519,552 | | | $ | 2,707,356,923 | |
| | | | |
Forward Foreign Currency Exchange Contracts | | $ | — | | | $ | 558 | | | $ | — | | | $ | 558 | |
Futures Contracts | | | 12,891 | | | | — | | | | — | | | | 12,891 | |
| | | | |
Total | | $ | 1,624,598 | | | $ | 2,685,226,222 | | | $ | 20,519,552 | | | $ | 2,707,370,372 | |
| | | | |
Liability Description | | | | | | | | | | | | | | | | |
| | | | |
Forward Foreign Currency Exchange Contracts | | $ | — | | | $ | (1,300,444 | ) | | $ | — | | | $ | (1,300,444 | ) |
Futures Contracts | | | (214,063 | ) | | | — | | | | — | | | | (214,063 | ) |
| | | | |
Total | | $ | (214,063 | ) | | $ | (1,300,444 | ) | | $ | — | | | $ | (1,514,507 | ) |
| * | None of the unobservable inputs for Level 3 assets, individually or collectively, had a material impact on the Fund. |
Eaton Vance
Limited Duration Income Fund
September 30, 2012
Notes to Financial Statements (Unaudited) — continued
Level 3 investments at the beginning and/or end of the period in relation to net assets were not significant and accordingly, a reconciliation of Level 3 assets for the six months ended September 30, 2012 is not presented.
At September 30, 2012, there were no investments transferred between Level 1 and Level 2 during the six months then ended.
Eaton Vance
Limited Duration Income Fund
September 30, 2012
Board of Trustees’ Contract Approval
Overview of the Contract Review Process
The Investment Company Act of 1940, as amended (the “1940 Act”), provides, in substance, that each investment advisory agreement between a fund and its investment adviser will continue in effect from year to year only if its continuation is approved at least annually by the fund’s board of trustees, including by a vote of a majority of the trustees who are not “interested persons” of the fund (“Independent Trustees”), cast in person at a meeting called for the purpose of considering such approval.
At a meeting of the Boards of Trustees (each a “Board”) of the Eaton Vance group of mutual funds (the “Eaton Vance Funds”) held on April 23, 2012, the Board, including a majority of the Independent Trustees, voted to approve continuation of existing advisory and sub-advisory agreements for the Eaton Vance Funds for an additional one-year period. In voting its approval, the Board relied upon the affirmative recommendation of the Contract Review Committee of the Board, which is a committee comprised exclusively of Independent Trustees. Prior to making its recommendation, the Contract Review Committee reviewed information furnished by each adviser to the Eaton Vance Funds (including information specifically requested by the Board) for a series of meetings of the Contract Review Committee held between February and April 2012, as well as information considered during prior meetings of the committee. Such information included, among other things, the following:
Information about Fees, Performance and Expenses
| Ÿ | | An independent report comparing the advisory and related fees paid by each fund with fees paid by comparable funds; |
| Ÿ | | An independent report comparing each fund’s total expense ratio and its components to comparable funds; |
| Ÿ | | An independent report comparing the investment performance of each fund (including, where relevant, yield data, Sharpe ratios and information ratios) to the investment performance of comparable funds over various time periods; |
| Ÿ | | Data regarding investment performance in comparison to benchmark indices and customized peer groups, in each case as approved by the Board with respect to the funds; |
| Ÿ | | For each fund, comparative information concerning the fees charged and the services provided by each adviser in managing other accounts (including mutual funds, other collective investment funds and institutional accounts) using investment strategies and techniques similar to those used in managing such fund; |
| Ÿ | | Profitability analyses for each adviser with respect to each fund; |
Information about Portfolio Management and Trading
| Ÿ | | Descriptions of the investment management services provided to each fund, including the investment strategies and processes employed, and any changes in portfolio management processes and personnel; |
| Ÿ | | Information about the allocation of brokerage and the benefits received by each adviser as a result of brokerage allocation, including information concerning the acquisition of research through client commission arrangements and the fund’s policies with respect to “soft dollar” arrangements; |
| Ÿ | | Data relating to portfolio turnover rates of each fund; |
| Ÿ | | The procedures and processes used to determine the fair value of fund assets and actions taken to monitor and test the effectiveness of such procedures and processes; |
| Ÿ | | Information about each adviser’s processes for monitoring best execution of portfolio transactions, and other policies and practices of each adviser with respect to trading; |
Information about each Adviser
| Ÿ | | Reports detailing the financial results and condition of each adviser; |
| Ÿ | | Descriptions of the qualifications, education and experience of the individual investment professionals whose responsibilities include portfolio management and investment research for the funds, and information relating to their compensation and responsibilities with respect to managing other mutual funds and investment accounts; |
| Ÿ | | Copies of the Codes of Ethics of each adviser and its affiliates, together with information relating to compliance with and the administration of such codes; |
| Ÿ | | Copies of or descriptions of each adviser’s policies and procedures relating to proxy voting, the handling of corporate actions and class actions; |
| Ÿ | | Information concerning the resources devoted to compliance efforts undertaken by each adviser and its affiliates on behalf of the funds (including descriptions of various compliance programs) and their record of compliance with investment policies and restrictions, including policies with respect to market-timing, late trading and selective portfolio disclosure, and with policies on personal securities transactions; |
| Ÿ | | Descriptions of the business continuity and disaster recovery plans of each adviser and its affiliates; |
| Ÿ | | A description of Eaton Vance Management’s procedures for overseeing third party advisers and sub-advisers, including with respect to regulatory and compliance issues, investment management and other matters; |
Eaton Vance
Limited Duration Income Fund
September 30, 2012
Board of Trustees’ Contract Approval — continued
Other Relevant Information
| Ÿ | | Information concerning the nature, cost and character of the administrative and other non-investment management services provided by Eaton Vance Management and its affiliates; |
| Ÿ | | Information concerning management of the relationship with the custodian, subcustodians and fund accountants by each adviser or the funds’ administrator; and |
| Ÿ | | The terms of each advisory agreement. |
In addition to the information identified above, the Contract Review Committee considered information provided from time to time by each adviser throughout the year at meetings of the Board and its committees. Over the course of the twelve-month period ended April 30, 2012, with respect to one or more funds, the Board met ten times and the Contract Review Committee, the Audit Committee, the Governance Committee, the Portfolio Management Committee and the Compliance Reports and Regulatory Matters Committee, each of which is a Committee comprised solely of Independent Trustees, met ten, nineteen, seven, eight and fourteen times respectively. At such meetings, the Trustees participated in investment and performance reviews with the portfolio managers and other investment professionals of each adviser relating to each fund. The Board and its Committees considered the investment and trading strategies used in pursuing each fund’s investment objective, including, where relevant, the use of derivative instruments, as well as risk management techniques. The Board and its Committees also evaluated issues pertaining to industry and regulatory developments, compliance procedures, fund governance and other issues with respect to the funds, and received and participated in reports and presentations provided by Eaton Vance Management and other fund advisers with respect to such matters.
For funds that invest through one or more underlying portfolios, the Board considered similar information about the portfolio(s) when considering the approval of advisory agreements. In addition, in cases where the fund’s investment adviser has engaged a sub-adviser, the Board considered similar information about the sub-adviser when considering the approval of any sub-advisory agreement.
The Contract Review Committee was assisted throughout the contract review process by Goodwin Procter LLP, legal counsel for the Independent Trustees. The members of the Contract Review Committee relied upon the advice of such counsel and their own business judgment in determining the material factors to be considered in evaluating each advisory and sub-advisory agreement and the weight to be given to each such factor. The conclusions reached with respect to each advisory and sub-advisory agreement were based on a comprehensive evaluation of all the information provided and not any single factor. Moreover, each member of the Contract Review Committee may have placed varying emphasis on particular factors in reaching conclusions with respect to each advisory and sub-advisory agreement.
Results of the Process
Based on its consideration of the foregoing, and such other information as it deemed relevant, including the factors and conclusions described below, the Contract Review Committee concluded that the continuation of the investment advisory agreement of Eaton Vance Limited Duration Income Fund (the “Fund”) with Eaton Vance Management (the “Adviser”), including its fee structure, is in the interests of shareholders and, therefore, the Contract Review Committee recommended to the Board approval of the agreement. The Board accepted the recommendation of the Contract Review Committee as well as the factors considered and conclusions reached by the Contract Review Committee with respect to the agreement. Accordingly, the Board, including a majority of the Independent Trustees, voted to approve continuation of the investment advisory agreement for the Fund.
Nature, Extent and Quality of Services
In considering whether to approve the investment advisory agreement of the Fund, the Board evaluated the nature, extent and quality of services provided to the Fund by the Adviser.
The Board considered the Adviser’s management capabilities and investment process with respect to the types of investments held by the Fund, including the education, experience and number of its investment professionals and other personnel who provide portfolio management, investment research, and similar services to the Fund, including recent changes to such personnel. In particular, the Board considered, where relevant, the abilities and experience of such investment personnel in analyzing factors such as credit risk and special considerations relevant to investing in senior secured floating rate loans, mortgage-backed securities and high-yield bonds. The Board considered the resources available to personnel of the Adviser, including research services. The Board also took into account the resources dedicated to portfolio management and other services, including the compensation methods of the Adviser to recruit and retain investment personnel, and the time and attention devoted to the Fund by senior management.
The Board reviewed the compliance programs of the Adviser and relevant affiliates thereof. Among other matters, the Board considered compliance and reporting matters relating to personal trading by investment personnel, selective disclosure of portfolio holdings, late trading, frequent trading, portfolio valuation, business continuity and the allocation of investment opportunities. The Board also evaluated the responses of the Adviser and its affiliates to requests in recent years from regulatory authorities such as the Securities and Exchange Commission and the Financial Industry Regulatory Authority.
The Board considered shareholder and other administrative services provided or managed by Eaton Vance Management and its affiliates, including transfer agency and accounting services. The Board evaluated the benefits to shareholders of investing in a fund that is a part of a large family of funds.
Eaton Vance
Limited Duration Income Fund
September 30, 2012
Board of Trustees’ Contract Approval — continued
After consideration of the foregoing factors, among others, the Board concluded that the nature, extent and quality of services provided by the Adviser, taken as a whole, are appropriate and consistent with the terms of the investment advisory agreement.
Fund Performance
The Board compared the Fund’s investment performance to a relevant universe of similarly managed funds identified by an independent data provider as well as a customized peer group of similarly managed funds and appropriate benchmark indices. The Board reviewed comparative performance data for the one-, three- and five-year periods ended September 30, 2011 for the Fund. The Board concluded that the performance of the Fund was satisfactory.
Management Fees and Expenses
The Board reviewed contractual investment advisory fee rates payable by the Fund (referred to as “management fees”). As part of its review, the Board considered the management fees and the Fund’s total expense ratio for the year ended September 30, 2011, as compared to a group of similarly managed funds selected by an independent data provider. In considering the Fund’s total expense ratio and management fees, the Board noted the impact of the Fund’s use of leverage. The Board considered the fact that the Adviser had waived fees and/or paid expenses for the Fund. The Board also considered factors that had an impact on Fund expense ratios, as identified by management in response to inquiries from the Contract Review Committee, as well as actions taken by management in recent years to reduce expenses at the Eaton Vance fund complex level, including the negotiation of reduced fees for transfer agency and custody services.
After reviewing the foregoing information, and in light of the nature, extent and quality of the services provided by the Adviser, the Board concluded that the management fees charged for advisory and related services are reasonable.
Profitability
The Board reviewed the level of profits realized by the Adviser and relevant affiliates thereof in providing investment advisory and administrative services to the Fund and to all Eaton Vance Funds as a group. The Board considered the level of profits realized without regard to revenue sharing or other payments by the Adviser and its affiliates to third parties in respect of distribution services. The Board also considered other direct or indirect benefits received by the Adviser and its affiliates in connection with their relationships with the Fund, including the benefits of research services that may be available to the Adviser as a result of securities transactions effected for the Fund and other investment advisory clients.
The Board concluded that, in light of the foregoing factors and the nature, extent and quality of the services rendered, the profits realized by the Adviser and its affiliates are reasonable.
Economies of Scale
In reviewing management fees and profitability, the Board also considered the extent to which the Adviser and its affiliates, on the one hand, and the Fund, on the other hand, can expect to realize benefits from economies of scale as the assets of the Fund increase. The Board acknowledged the difficulty in accurately measuring the benefits resulting from the economies of scale with respect to the management of any specific fund or group of funds. The Board reviewed data summarizing the increases and decreases in the assets of the Fund and of all Eaton Vance Funds as a group over various time periods, and evaluated the extent to which the total expense ratio of the Fund and the profitability of the Adviser and its affiliates may have been affected by such increases or decreases. Based upon the foregoing, the Board concluded that the Fund currently shares in the benefits from economies of scale. The Board also considered the fact that the Fund is not continuously offered and concluded that, in light of the level of the Adviser’s profits with respect to the Fund, the implementation of breakpoints in the advisory fee schedule is not appropriate at this time.
Eaton Vance
Limited Duration Income Fund
September 30, 2012
Officers and Trustees
Officers of Eaton Vance Limited Duration Income Fund
Payson F. Swaffield
President
Barbara E. Campbell
Treasurer
Maureen A. Gemma
Vice President, Secretary and Chief Legal Officer
Paul M. O’Neil
Chief Compliance Officer
Trustees of Eaton Vance Limited Duration Income Fund
Ralph F. Verni
Chairman
Scott E. Eston
Benjamin C. Esty
Thomas E. Faust Jr.*
Allen R. Freedman
William H. Park
Ronald A. Pearlman
Helen Frame Peters
Lynn A. Stout
Harriett Tee Taggart
Number of Employees
The Fund is organized as a Massachusetts business trust and is registered under the Investment Company Act of 1940, as amended, as a closed-end management investment company and has no employees.
Number of Shareholders
As of September 30, 2012, Fund records indicate that there are 347 registered shareholders and approximately 88,247 shareholders owning the Fund shares in street name, such as through brokers, banks, and financial intermediaries.
If you are a street name shareholder and wish to receive Fund reports directly, which contain important information about the Fund, please write or call:
Eaton Vance Distributors, Inc.
Two International Place
Boston, MA 02110
1-800-262-1122
NYSE MKT symbol
The NYSE MKT symbol is EVV.
Eaton Vance Funds
IMPORTANT NOTICES
Privacy. The Eaton Vance organization is committed to ensuring your financial privacy. Each of the financial institutions identified below has in effect the following policy (“Privacy Policy”) with respect to nonpublic personal information about its customers:
| Ÿ | | Only such information received from you, through application forms or otherwise, and information about your Eaton Vance fund transactions will be collected. This may include information such as name, address, social security number, tax status, account balances and transactions. |
| Ÿ | | None of such information about you (or former customers) will be disclosed to anyone, except as permitted by law (which includes disclosure to employees necessary to service your account). In the normal course of servicing a customer’s account, Eaton Vance may share information with unaffiliated third parties that perform various required services such as transfer agents, custodians and broker-dealers. |
| Ÿ | | Policies and procedures (including physical, electronic and procedural safeguards) are in place that are designed to protect the confidentiality of such information. |
| Ÿ | | We reserve the right to change our Privacy Policy at any time upon proper notification to you. Customers may want to review our Privacy Policy periodically for changes by accessing the link on our homepage: www.eatonvance.com. |
Our pledge of privacy applies to the following entities within the Eaton Vance organization: the Eaton Vance Family of Funds, Eaton Vance Management, Eaton Vance Investment Counsel, Eaton Vance Distributors, Inc., Eaton Vance Trust Company, Eaton Vance Management’s Real Estate Investment Group and Boston Management and Research. In addition, our Privacy Policy applies only to those Eaton Vance customers who are individuals and who have a direct relationship with us. If a customer’s account (i.e., fund shares) is held in the name of a third-party financial advisor/broker-dealer, it is likely that only such advisor’s privacy policies apply to the customer. This notice supersedes all previously issued privacy disclosures. For more information about Eaton Vance’s Privacy Policy, please call 1-800-262-1122.
Delivery of Shareholder Documents. The Securities and Exchange Commission (SEC) permits funds to deliver only one copy of shareholder documents, including prospectuses, proxy statements and shareholder reports, to fund investors with multiple accounts at the same residential or post office box address. This practice is often called “householding” and it helps eliminate duplicate mailings to shareholders. Eaton Vance, or your financial advisor, may household the mailing of your documents indefinitely unless you instruct Eaton Vance, or your financial advisor, otherwise. If you would prefer that your Eaton Vance documents not be householded, please contact Eaton Vance at 1-800-262-1122, or contact your financial advisor. Your instructions that householding not apply to delivery of your Eaton Vance documents will be effective within 30 days of receipt by Eaton Vance or your financial advisor.
Portfolio Holdings. Each Eaton Vance Fund and its underlying Portfolio(s) (if applicable) will file a schedule of portfolio holdings on Form N-Q with the SEC for the first and third quarters of each fiscal year. The Form N-Q will be available on the Eaton Vance website at www.eatonvance.com, by calling Eaton Vance at 1-800-262-1122 or in the EDGAR database on the SEC’s website at www.sec.gov. Form N-Q may also be reviewed and copied at the SEC’s public reference room in Washington, D.C. (call 1-800-732-0330 for information on the operation of the public reference room).
Proxy Voting. From time to time, funds are required to vote proxies related to the securities held by the funds. The Eaton Vance Funds or their underlying Portfolios (if applicable) vote proxies according to a set of policies and procedures approved by the Funds’ and Portfolios’ Boards. You may obtain a description of these policies and procedures and information on how the Funds or Portfolios voted proxies relating to portfolio securities during the most recent 12-month period ended June 30, without charge, upon request, by calling 1-800-262-1122 and by accessing the SEC’s website at www.sec.gov.
Additional Notice to Shareholders. A Fund also may purchase shares of its common stock in the open market when they trade at a discount to net asset value or at other times if the Fund determines such purchases are advisable. There can be no assurance that a Fund will take such action or that such purchases would reduce the discount. If applicable, a Fund may also redeem or purchase its outstanding auction preferred shares (APS) in order to maintain compliance with regulatory requirements, borrowing or rating agency requirements or for other purposes as it deems appropriate or necessary.
Closed-End Fund Information. The Eaton Vance closed-end funds make certain fund performance data and information about portfolio characteristics (such as top holdings and asset allocation) available on the Eaton Vance website after the end of each month. Certain fund performance data for the funds, including total returns, are posted to the website shortly after the end of each month. Portfolio holdings for the most recent month-end are also posted to the website approximately 30 days following the end of the month. This information is available at www.eatonvance.com on the fund information pages under “Individual Investors — Closed-End Funds”.
This Page Intentionally Left Blank
This Page Intentionally Left Blank
This Page Intentionally Left Blank
Investment Adviser and Administrator
Eaton Vance Management
Two International Place
Boston, MA 02110
Custodian
State Street Bank and Trust Company
200 Clarendon Street
Boston, MA 02116
Transfer Agent
American Stock Transfer & Trust Company
59 Maiden Lane
Plaza Level
New York, NY 10038
Fund Offices
Two International Place
Boston, MA 02110
Item 2. Code of Ethics
Not required in this filing.
Item 3. Audit Committee Financial Expert
The registrant’s Board has designated William H. Park, an independent trustee, as its audit committee financial expert. Mr. Park is a certified public accountant who is a consultant and private investor. Previously, he served as the Chief Financial Officer of Aveon Group, L.P. (an investment management firm), as the Vice Chairman of Commercial Industrial Finance Corp. (specialty finance company), as President and Chief Executive Officer of Prizm Capital Management, LLC (investment management firm), as Executive Vice President and Chief Financial Officer of United Asset Management Corporation (an institutional investment management firm) and as a Senior Manager at Price Waterhouse (now PricewaterhouseCoopers) (an independent registered public accounting firm).
Item 4. Principal Accountant Fees and Services
Not required in this filing.
Item 5. Audit Committee of Listed Registrants
Not required in this filing.
Item 6. Schedule of Investments
Please see schedule of investments contained in the Report to Stockholders included under Item 1 of this Form N-CSR.
Item 7. Disclosure of Proxy Voting Policies and Procedures for Closed-End Management Investment Companies
Not required in this filing.
Item 8. Portfolio Managers of Closed-End Management Investment Companies
Not required in this filing.
Item 9. Purchases of Equity Securities by Closed-End Management Investment Company and Affiliated Purchasers
No such purchases this period.
Item 10. Submission of Matters to a Vote of Security Holders
No Material Changes.
Item 11. Controls and Procedures
(a) It is the conclusion of the registrant’s principal executive officer and principal financial officer that the effectiveness of the registrant’s current disclosure controls and procedures (such disclosure controls and procedures having been evaluated within 90 days of the date of this filing) provide reasonable assurance that the information required to be disclosed by the registrant has been recorded, processed, summarized and reported within the time period specified in the Commission’s rules and forms and that the information required to be disclosed by the registrant has been accumulated and communicated to the registrant’s principal executive officer and principal financial officer in order to allow timely decisions regarding required disclosure.
(b) There have been no changes in the registrant’s internal controls over financial reporting during the second fiscal quarter of the period covered by this report that has materially affected, or is reasonably likely to materially affect, the registrant’s internal control over financial reporting.
Item 12. Exhibits
| | |
| (a)(1) | | Registrant’s Code of Ethics – Not applicable (please see Item 2). |
| |
| (a)(2)(i) | | Treasurer’s Section 302 certification. |
| |
| (a)(2)(ii) | | President’s Section 302 certification. |
| |
| (b) | | Combined Section 906 certification. |
Signatures
Pursuant to the requirements of the Securities Exchange Act of 1934 and the Investment Company Act of 1940, the registrant has duly caused this report to be signed on its behalf by the undersigned, thereunto duly authorized.
Eaton Vance Limited Duration Income Fund
| | |
| By: | | /s/ Payson F. Swaffield |
| | Payson F. Swaffield |
| | President |
| |
| Date: | | November 9, 2012 |
Pursuant to the requirements of the Securities Exchange Act of 1934 and the Investment Company Act of 1940, this report has been signed below by the following persons on behalf of the registrant and in the capacities and on the dates indicated.
| | |
| By: | | /s/ Barbara E. Campbell |
| | Barbara E. Campbell |
| | Treasurer |
| |
| Date: | | November 9, 2012 |
| | |
| By: | | /s/ Payson F. Swaffield |
| | Payson F. Swaffield |
| | President |
| |
| Date: | | November 9, 2012 |