UNITED STATES
SECURITIES AND EXCHANGE COMMISSION
Washington, D.C. 20549
Form N-CSR
CERTIFIED SHAREHOLDER REPORT OF REGISTERED
MANAGEMENT INVESTMENT COMPANIES
Investment Company Act File Number: 811-21323
Eaton Vance Limited Duration Income Fund
(Exact Name of Registrant as Specified in Charter)
Two International Place, Boston, Massachusetts 02110
(Address of Principal Executive Offices)
Maureen A. Gemma
Two International Place, Boston, Massachusetts 02110
(Name and Address of Agent for Services)
(617) 482-8260
(Registrant’s Telephone Number)
March 31
Date of Fiscal Year End
September 30, 2016
Date of Reporting Period
Item 1. Reports to Stockholders

Eaton Vance
Limited Duration Income Fund (EVV)
Semiannual Report
September 30, 2016

Commodity Futures Trading Commission Registration. Effective December 31, 2012, the Commodity Futures Trading Commission (“CFTC”) adopted certain regulatory changes that subject registered investment companies and advisers to regulation by the CFTC if a fund invests more than a prescribed level of its assets in certain CFTC-regulated instruments (including futures, certain options and swap agreements) or markets itself as providing investment exposure to such instruments. The Fund has claimed an exclusion from the definition of the term “commodity pool operator” under the Commodity Exchange Act. Accordingly, neither the Fund nor the adviser with respect to the operation of the Fund is subject to CFTC regulation. Because of its management of other strategies, the Fund’s adviser is registered with the CFTC as a commodity pool operator and a commodity trading advisor.
Fund shares are not insured by the FDIC and are not deposits or other obligations of, or guaranteed by, any depository institution. Shares are subject to investment risks, including possible loss of principal invested.
Semiannual Report September 30, 2016
Eaton Vance
Limited Duration Income Fund
Table of Contents
| | | | |
Performance | | | 2 | |
| |
Fund Profile | | | 2 | |
| |
Endnotes and Additional Disclosures | | | 3 | |
| |
Financial Statements | | | 4 | |
| |
Board of Trustees’ Contract Approval | | | 60 | |
| |
Officers and Trustees | | | 63 | |
| |
Important Notices | | | 64 | |
Eaton Vance
Limited Duration Income Fund
September 30, 2016
Performance1
Portfolio Managers Scott H. Page, CFA, Payson F. Swaffield, CFA, Michael W. Weilheimer, CFA, Catherine McDermott, Andrew Szczurowski, CFA, and Eric A. Stein, CFA
| | | | | | | | | | | | | | | | | | | | |
| % Average Annual Total Returns | | Inception Date | | | Six Months | | | One Year | | | Five Years | | | Ten Years | |
Fund at NAV | | | 05/30/2003 | | | | 8.81 | % | | | 10.79 | % | | | 7.55 | % | | | 7.28 | % |
Fund at Market Price | | | — | | | | 8.69 | | | | 18.51 | | | | 7.14 | | | | 6.49 | |
| | | | | |
| | | | | | | | | | | | | | | | | | | | |
| % Premium/Discount to NAV2 | | | | | | | | | | | | | | | |
| | | | | | | | | | | | | | | | | | | –9.27 | % |
| | | | | |
| | | | | | | | | | | | | | | | | | | | |
| Distributions3 | |
Total Distributions per share for the period | | | | | | | | | | | | | | | | | | | $0.595 | |
Distribution Rate at NAV | | | | | | | | | | | | | | | | | | | 6.89 | % |
Distribution Rate at Market Price | | | | | | | | | | | | | | | | | | | 7.59 | % |
| | | | | |
| | | | | | | | | | | | | | | | | | | | |
| % Total Leverage4 | |
Auction Preferred Shares (APS) | | | | | | | | | | | | | | | | | | | 9.66 | % |
Borrowings | | | | | | | | | | | | | | | | | | | 26.73 | |
Fund Profile
Asset Allocation (% of total investments)5
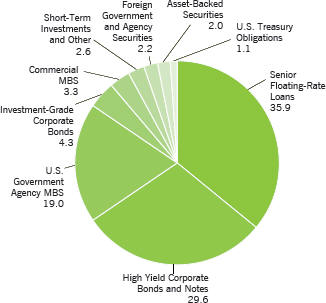
MBS refers to Mortgage-Backed Securities
See Endnotes and Additional Disclosures in this report.
Past performance is no guarantee of future results. Returns are historical and are calculated by determining the percentage change in net asset value (NAV) or market price (as applicable) with all distributions reinvested and include management fees and other expenses. Fund performance at market price will differ from its results at NAV due to factors such as changing perceptions about the Fund, market conditions, fluctuations in supply and demand for Fund shares, or changes in Fund distributions. Investment return and principal value will fluctuate so that shares, when sold, may be worth more or less than their original cost. Performance less than or equal to one year is cumulative. Performance is for the stated time period only; due to market volatility, current Fund performance may be lower or higher than the quoted return. For performance as of the most recent month-end, please refer to eatonvance.com.
Eaton Vance
Limited Duration Income Fund
September 30, 2016
Endnotes and Additional Disclosures
| 1 | Performance results reflect the effects of leverage. The Fund’s performance for certain periods reflects the effects of expense reductions. Absent these reductions, performance would have been lower. |
| 2 | The shares of the Fund often trade at a discount or premium from their net asset value. The discount or premium of the Fund may vary over time and may be higher or lower than what is quoted in this report. For up-to-date premium/discount information, please refer to http://eatonvance.com/closedend. |
| 3 | The Distribution Rate is based on the Fund’s last regular distribution per share in the period (annualized) divided by the Fund’s NAV or market price at the end of the period. The Fund’s distributions may be comprised of amounts characterized for federal income tax purposes as qualified and non-qualified ordinary dividends, capital gains and nondividend distributions, also known as return of capital. For additional information about nondividend distributions, please refer to Eaton Vance Closed-End Fund Distribution Notices (19a) posted on our website, eatonvance.com. The Fund will determine the federal income tax character of distributions paid to a shareholder after the end of the calendar year. This is reported on the IRS form 1099-DIV and provided to the shareholder shortly after each year-end. For information about the tax character of distributions made in prior calendar years, please refer to Performance-Tax Character of Distributions on the Fund’s webpage available at eatonvance.com. The Fund’s distributions are determined by the investment adviser based on its current assessment of the Fund’s long-term return potential. Fund distributions may be affected by numerous factors including changes in Fund performance, the cost of financing for leverage, portfolio holdings, realized and projected returns, and other factors. As portfolio and market conditions change, the rate of distributions paid by the Fund could change. |
| 4 | Leverage represents the liquidation value of the Fund’s APS and borrowings outstanding as a percentage of Fund net assets applicable to common shares plus APS and borrowings outstanding. Use of leverage creates an opportunity for income, but creates risks including greater price volatility. The cost of leverage rises and falls with changes in short-term interest rates. The Fund may be required to maintain prescribed asset coverage for its leverage and may be required to reduce its leverage at an inopportune time. |
| 5 | Asset allocation as a percentage of the Fund’s net assets amounted to 158.4%. |
| | Fund profile subject to change due to active management. |
Eaton Vance
Limited Duration Income Fund
September 30, 2016
Portfolio of Investments (Unaudited)
| | | | | | | | | | | | |
| Senior Floating-Rate Loans — 56.9%(1) | |
| | | |
| | | | | | | | | | | | |
| Borrower/Tranche Description | | | | | Principal Amount* (000’s omitted) | | | Value | |
| | | | | | | | | | | | |
|
Aerospace and Defense — 0.7% | |
IAP Worldwide Services, Inc. | | | | | | | | | | | | |
Revolving Loan, 2.30%, Maturing July 18, 2018(2) | | | | | | | 172 | | | $ | 161,684 | |
Term Loan - Second Lien, 8.00%, Maturing July 18, 2019(3) | | | | | | | 233 | | | | 186,435 | |
Silver II US Holdings, LLC | | | | | | | | | | | | |
Term Loan, 4.00%, Maturing December 13, 2019 | | | | | | | 4,741 | | | | 4,444,436 | |
TransDigm, Inc. | | | | | | | | | | | | |
Term Loan, 3.82%, Maturing February 28, 2020 | | | | | | | 1,424 | | | | 1,426,507 | |
Term Loan, 3.83%, Maturing June 4, 2021 | | | | | | | 2,395 | | | | 2,397,308 | |
Term Loan, 3.75%, Maturing June 9, 2023 | | | | | | | 3,334 | | | | 3,336,105 | |
Wesco Aircraft Hardware Corp. | | | | | | | | | | | | |
Term Loan, Maturing September 23, 2021(4) | | | | | | | 1,150 | | | | 1,144,250 | |
| | | | | | | | | | | | | |
| | | | | | | | | | $ | 13,096,725 | |
| | | | | | | | | | | | | |
|
Air Transport — 0.2% | |
Virgin America, Inc. | | | | | | | | | | | | |
Term Loan, 4.50%, Maturing April 4, 2019 | | | | | | | 3,075 | | | $ | 3,122,047 | |
| | | | | | | | | | | | | |
| | | | | | | | | | $ | 3,122,047 | |
| | | | | | | | | | | | | |
|
Automotive — 1.9% | |
Allison Transmission, Inc. | | | | | | | | | | | | |
Term Loan, 3.25%, Maturing September 8, 2022 | | | | | | | 1,801 | | | $ | 1,815,611 | |
CS Intermediate Holdco 2, LLC | | | | | | | | | | | | |
Term Loan, 4.00%, Maturing April 4, 2021 | | | | | | | 3,297 | | | | 3,318,245 | |
Dayco Products, LLC | | | | | | | | | | | | |
Term Loan, 5.25%, Maturing December 12, 2019 | | | | | | | 1,292 | | | | 1,298,334 | |
FCA US, LLC | | | | | | | | | | | | |
Term Loan, 3.50%, Maturing May 24, 2017 | | | | | | | 3,331 | | | | 3,341,489 | |
Term Loan, 3.25%, Maturing December 31, 2018 | | | | | | | 1,597 | | | | 1,601,112 | |
Federal-Mogul Holdings Corporation | | | | | | | | | | | | |
Term Loan, 4.75%, Maturing April 15, 2021 | | | | | | | 5,121 | | | | 4,960,484 | |
Goodyear Tire & Rubber Company (The) | | | | | | | | | | | | |
Term Loan - Second Lien, 3.86%, Maturing April 30, 2019 | | | | | | | 3,388 | | | | 3,413,814 | |
Horizon Global Corporation | | | | | | | | | | | | |
Term Loan, 8.50%, Maturing June 30, 2021 | | | | | | | 964 | | | | 973,703 | |
MPG Holdco I, Inc. | | | | | | | | | | | | |
Term Loan, 3.75%, Maturing October 20, 2021 | | | | | | | 6,069 | | | | 6,092,003 | |
TI Group Automotive Systems, LLC | | | | | | | | | | | | |
Term Loan, 4.50%, Maturing June 30, 2022 | | | EUR | | | | 941 | | | | 1,060,252 | |
Term Loan, 4.50%, Maturing June 30, 2022 | | | | | | | 1,411 | | | | 1,417,793 | |
| | | | | | | | | | | | |
| Borrower/Tranche Description | | | | | Principal Amount* (000’s omitted) | | | Value | |
| | | | | | | | | | | | |
|
Automotive (continued) | |
Tower Automotive Holdings USA, LLC | | | | | | | | | | | | |
Term Loan, 4.00%, Maturing April 23, 2020 | | | | | | | 3,216 | | | $ | 3,217,915 | |
| | | | | | | | | | | | | |
| | | | | | | | | | $ | 32,510,755 | |
| | | | | | | | | | | | | |
|
Beverage and Tobacco — 0.1% | |
Flavors Holdings, Inc. | | | | | | | | | | | | |
Term Loan, 6.75%, Maturing April 3, 2020 | | | | | | | 945 | | | $ | 803,250 | |
Term Loan - Second Lien, 11.00%, Maturing October 3, 2021 | | | | | | | 1,000 | | | | 805,000 | |
| | | | | | | | | | | | | |
| | | | | | | | | | $ | 1,608,250 | |
| | | | | | | | | | | | | |
|
Brokerage / Securities Dealers / Investment Houses — 0.2% | |
Aretec Group, Inc. | | | | | | | | | | | | |
Term Loan, 8.00%, Maturing May 25, 2023 | | | | | | | 639 | | | $ | 639,844 | |
Term Loan - Second Lien, 6.50%, (2.00% Cash, 4.50% PIK), Maturing May 23, 2021 | | | | | | | 2,239 | | | | 1,746,566 | |
Salient Partners L.P. | | | | | | | | | | | | |
Term Loan, 9.50%, Maturing May 19, 2021 | | | | | | | 909 | | | | 870,208 | |
| | | | | | | | | | | | | |
| | | | | | | | | | $ | 3,256,618 | |
| | | | | | | | | | | | | |
|
Building and Development — 1.0% | |
ABC Supply Co., Inc. | | | | | | | | | | | | |
Term Loan, 3.50%, Maturing April 16, 2020 | | | | | | | 1,130 | | | $ | 1,134,392 | |
Americold Realty Operating Partnership L.P. | | | | | | | | | | | | |
Term Loan, 5.75%, Maturing December 1, 2022 | | | | | | | 524 | | | | 528,924 | |
Auction.com, LLC | | | | | | | | | | | | |
Term Loan, 5.53%, Maturing May 12, 2019 | | | | | | | 1,231 | | | | 1,238,945 | |
Capital Automotive L.P. | | | | | | | | | | | | |
Term Loan, 4.00%, Maturing April 10, 2019 | | | | | | | 1,389 | | | | 1,396,338 | |
CPG International, Inc. | | | | | | | | | | | | |
Term Loan, 4.75%, Maturing September 30, 2020 | | | | | | | 1,744 | | | | 1,749,528 | |
DTZ U.S. Borrower, LLC | | | | | | | | | | | | |
Term Loan, 4.25%, Maturing November 4, 2021 | | | | | | | 3,806 | | | | 3,809,415 | |
Headwaters, Incorporated | | | | | | | | | | | | |
Term Loan, 4.00%, Maturing March 24, 2022 | | | | | | | 496 | | | | 498,570 | |
Henry Company, LLC | | | | | | | | | | | | |
Term Loan, Maturing September 28, 2023(4) | | | | | | | 375 | | | | 373,125 | |
Quikrete Holdings, Inc. | | | | | | | | | | | | |
Term Loan, 4.00%, Maturing September 28, 2020 | | | | | | | 1,333 | | | | 1,344,574 | |
RE/MAX International, Inc. | | | | | | | | | | | | |
Term Loan, 4.00%, Maturing July 31, 2020 | | | | | | | 1,741 | | | | 1,741,152 | |
Realogy Corporation | | | | | | | | | | | | |
Term Loan, 3.75%, Maturing July 20, 2022 | | | | | | | 933 | | | | 939,978 | |
| | | | |
| | 4 | | See Notes to Financial Statements. |
Eaton Vance
Limited Duration Income Fund
September 30, 2016
Portfolio of Investments (Unaudited) — continued
| | | | | | | | | | | | |
| Borrower/Tranche Description | | | | | Principal Amount* (000’s omitted) | | | Value | |
| | | | | | | | | | | | |
|
Building and Development (continued) | |
Summit Materials Companies I, LLC | | | | | | | | | | | | |
Term Loan, 4.00%, Maturing July 17, 2022 | | | | | | | 716 | | | $ | 719,405 | |
WireCo WorldGroup, Inc. | | | | | | | | | | | | |
Term Loan, Maturing July 13, 2023(4) | | | | | | | 700 | | | | 703,500 | |
Term Loan - Second Lien, Maturing July 20, 2024(4) | | | | | | | 1,650 | | | | 1,658,250 | |
| | | | | | | | | | | | | |
| | | | | | | | | | $ | 17,836,096 | |
| | | | | | | | | | | | | |
|
Business Equipment and Services — 4.1% | |
Acosta Holdco, Inc. | | | | | | | | | | | | |
Term Loan, 4.25%, Maturing September 26, 2021 | | | | | | | 3,774 | | | $ | 3,604,092 | |
AlixPartners, LLP | | | | | | | | | | | | |
Term Loan, 4.50%, Maturing July 28, 2022 | | | | | | | 2,405 | | | | 2,413,486 | |
Altisource Solutions S.a.r.l. | | | | | | | | | | | | |
Term Loan, 4.50%, Maturing December 9, 2020 | | | | | | | 1,530 | | | | 1,437,806 | |
Brock Holdings III, Inc. | | | | | | | | | | | | |
Term Loan, 7.00%, Maturing March 16, 2017 | | | | | | | 953 | | | | 943,357 | |
Camelot UK Holdco Limited | | | | | | | | | | | | |
Term Loan, Maturing September 7, 2023(4) | | | | | | | 1,375 | | | | 1,377,364 | |
CCC Information Services, Inc. | | | | | | | | | | | | |
Term Loan, 4.00%, Maturing December 20, 2019 | | | | | | | 482 | | | | 482,064 | |
Ceridian, LLC | | | | | | | | | | | | |
Term Loan, 4.50%, Maturing September 15, 2020 | | | | | | | 734 | | | | 720,542 | |
Corporate Capital Trust, Inc. | | | | | | | | | | | | |
Term Loan, 4.13%, Maturing May 20, 2019 | | | | | | | 2,235 | | | | 2,238,286 | |
CPM Holdings, Inc. | | | | | | | | | | | | |
Term Loan, 6.00%, Maturing April 11, 2022 | | | | | | | 346 | | | | 347,785 | |
Crossmark Holdings, Inc. | | | | | | | | | | | | |
Term Loan, 4.50%, Maturing December 20, 2019 | | | | | | | 2,000 | | | | 1,309,979 | |
Donnelley Financial Solutions, Inc. | | | | | | | | | | | | |
Term Loan, Maturing September 23, 2023(4) | | | | | | | 625 | | | | 628,906 | |
Education Management, LLC | | | | | | | | | | | | |
Term Loan, 5.50%, Maturing July 2, 2020 | | | | | | | 466 | | | | 128,068 | |
Term Loan, 8.50%, (2.00% Cash, 6.50% PIK), Maturing July 2, 2020 | | | | | | | 856 | | | | 47,100 | |
EIG Investors Corp. | | | | | | | | | | | | |
Term Loan, 6.48%, Maturing November 9, 2019 | | | | | | | 4,975 | | | | 4,837,757 | |
Term Loan, Maturing February 9, 2023(4) | | | | | | | 3,000 | | | | 2,799,375 | |
Emdeon Business Services, LLC | | | | | | | | | | | | |
Term Loan, 3.75%, Maturing November 2, 2018 | | | | | | | 2,476 | | | | 2,482,311 | |
Extreme Reach, Inc. | | | | | | | | | | | | |
Term Loan, 7.25%, Maturing February 7, 2020 | | | | | | | 1,868 | | | | 1,876,517 | |
Garda World Security Corporation | | | | | | | | | | | | |
Term Loan, 4.75%, Maturing November 6, 2020 | | | CAD | | | | 5,776 | | | | 4,182,368 | |
Term Loan, Maturing November 6, 2020(4) | | | | | | | 296 | | | | 293,411 | |
Term Loan, Maturing November 6, 2020(4) | | | | | | | 1,704 | | | | 1,689,088 | |
| | | | | | | | | | | | |
| Borrower/Tranche Description | | | | | Principal Amount* (000’s omitted) | | | Value | |
| | | | | | | | | | | | |
|
Business Equipment and Services (continued) | |
Global Payments, Inc. | | | | | | | | | | | | |
Term Loan, 4.02%, Maturing April 22, 2023 | | | | | | | 798 | | | $ | 806,853 | |
IG Investment Holdings, LLC | | | | | | | | | | | | |
Term Loan, 6.00%, Maturing October 29, 2021 | | | | | | | 2,511 | | | | 2,529,779 | |
Information Resources, Inc. | | | | | | | | | | | | |
Term Loan, 4.75%, Maturing September 30, 2020 | | | | | | | 2,509 | | | | 2,515,778 | |
ION Trading Finance Limited | | | | | | | | | | | | |
Term Loan, 4.25%, Maturing August 11, 2023 | | | | | | | 546 | | | | 546,899 | |
Term Loan, 4.25%, Maturing August 11, 2023 | | | EUR | | | | 1,353 | | | | 1,536,041 | |
J.D. Power and Associates | | | | | | | | | | | | |
Term Loan, 5.25%, Maturing September 7, 2023 | | | | | | | 875 | | | | 883,750 | |
KAR Auction Services, Inc. | | | | | | | | | | | | |
Term Loan, 4.06%, Maturing March 11, 2021 | | | | | | | 3,364 | | | | 3,385,030 | |
Kronos Incorporated | | | | | | | | | | | | |
Term Loan, 4.50%, Maturing October 30, 2019 | | | | | | | 5,032 | | | | 5,052,861 | |
Term Loan - Second Lien, 9.75%, Maturing April 30, 2020 | | | | | | | 2,396 | | | | 2,448,252 | |
MCS AMS Sub-Holdings, LLC | | | | | | | | | | | | |
Term Loan, 7.50%, Maturing October 15, 2019 | | | | | | | 1,422 | | | | 1,283,242 | |
Monitronics International, Inc. | | | | | | | | | | | | |
Term Loan, 6.50%, Maturing September 30, 2022 | | | | | | | 2,964 | | | | 2,956,112 | |
PGX Holdings, Inc. | | | | | | | | | | | | |
Term Loan, 5.75%, Maturing September 29, 2020 | | | | | | | 1,638 | | | | 1,639,328 | |
Prime Security Services Borrower, LLC | | | | | | | | | | | | |
Term Loan, 4.75%, Maturing May 2, 2022 | | | | | | | 1,372 | | | | 1,387,207 | |
Sensus USA, Inc. | | | | | | | | | | | | |
Term Loan, 6.50%, Maturing April 5, 2023 | | | | | | | 1,421 | | | | 1,430,914 | |
ServiceMaster Company | | | | | | | | | | | | |
Term Loan, 4.25%, Maturing July 1, 2021 | | | | | | | 4,128 | | | | 4,178,074 | |
Spin Holdco, Inc. | | | | | | | | | | | | |
Term Loan, 4.25%, Maturing November 14, 2019 | | | | | | | 3,987 | | | | 3,966,550 | |
TransUnion, LLC | | | | | | | | | | | | |
Term Loan, 3.59%, Maturing April 9, 2021 | | | | | | | 298 | | | | 299,068 | |
Travelport Finance (Luxembourg) S.a.r.l. | | | | | | | | | | | | |
Term Loan, 5.00%, Maturing September 2, 2021 | | | | | | | 1,514 | | | | 1,522,263 | |
WASH Multifamily Laundry Systems, LLC | | | | | | | | | | | | |
Term Loan, 4.25%, Maturing May 14, 2022 | | | | | | | 315 | | | | 315,912 | |
| | | | | | | | | | | | | |
| | | | | | | | | | $ | 72,523,575 | |
| | | | | | | | | | | | | |
|
Cable and Satellite Television — 1.8% | |
Altice US Finance I Corporation | | | | | | | | | | | | |
Term Loan, 4.25%, Maturing December 14, 2022 | | | | | | | 5,015 | | | $ | 5,051,844 | |
Atlantic Broadband Finance, LLC | | | | | | | | | | | | |
Term Loan, 3.25%, Maturing November 30, 2019 | | | | | | | 799 | | | | 799,912 | |
| | | | |
| | 5 | | See Notes to Financial Statements. |
Eaton Vance
Limited Duration Income Fund
September 30, 2016
Portfolio of Investments (Unaudited) — continued
| | | | | | | | | | | | |
| Borrower/Tranche Description | | | | | Principal Amount* (000’s omitted) | | | Value | |
| | | | | | | | | | | | |
|
Cable and Satellite Television (continued) | |
Block Communications, Inc. | | | | | | | | | | | | |
Term Loan, 4.09%, Maturing November 7, 2021 | | | | | | | 294 | | | $ | 295,659 | |
Charter Communications Operating, LLC | | | | | | | | | | | | |
Term Loan, 3.00%, Maturing July 1, 2020 | | | | | | | 362 | | | | 363,039 | |
Term Loan, 3.50%, Maturing January 24, 2023 | | | | | | | 2,413 | | | | 2,431,138 | |
CSC Holdings, LLC | | | | | | | | | | | | |
Term Loan, 5.00%, Maturing October 9, 2022 | | | | | | | 4,663 | | | | 4,680,800 | |
Term Loan, Maturing October 11, 2024(4) | | | | | | | 1,000 | | | | 1,003,542 | |
MCC Iowa, LLC | | | | | | | | | | | | |
Term Loan, 3.25%, Maturing January 29, 2021 | | | | | | | 1,113 | | | | 1,117,666 | |
Term Loan, 3.75%, Maturing June 30, 2021 | | | | | | | 1,149 | | | | 1,154,484 | |
Mediacom Illinois, LLC | | | | | | | | | | | | |
Term Loan, 3.50%, Maturing June 30, 2021 | | | | | | | 637 | | | | 641,114 | |
Numericable Group SA | | | | | | | | | | | | |
Term Loan, 4.56%, Maturing July 31, 2022 | | | | | | | 447 | | | | 449,091 | |
Term Loan, 4.00%, Maturing July 31, 2023 | | | EUR | | | | 819 | | | | 929,844 | |
Numericable U.S., LLC | | | | | | | | | | | | |
Term Loan, 5.00%, Maturing January 15, 2024 | | | | | | | 1,022 | | | | 1,032,343 | |
Telenet International Finance S.a.r.l. | | | | | | | | | | | | |
Term Loan, 4.36%, Maturing June 30, 2024 | | | | | | | 2,240 | | | | 2,263,101 | |
Virgin Media Investment Holdings Limited | | | | | | | | | | | | |
Term Loan, 3.65%, Maturing June 30, 2023 | | | | | | | 4,719 | | | | 4,743,150 | |
Term Loan, 4.25%, Maturing June 30, 2023 | | | GBP | | | | 1,800 | | | | 2,344,151 | |
Ziggo Secured Finance BV | | | | | | | | | | | | |
Term Loan, 3.75%, Maturing August 31, 2024 | | | EUR | | | | 2,725 | | | | 3,074,137 | |
| | | | | | | | | | | | | |
| | | | | | | | | | $ | 32,375,015 | |
| | | | | | | | | | | | | |
|
Chemicals and Plastics — 2.8% | |
Aruba Investments, Inc. | | | | | | | | | | | | |
Term Loan, 4.50%, Maturing February 2, 2022 | | | | | | | 372 | | | $ | 371,454 | |
Axalta Coating Systems US Holdings, Inc. | | | | | | | | | | | | |
Term Loan, 3.75%, Maturing February 1, 2020 | | | | | | | 3,620 | | | | 3,647,742 | |
Chemours Company (The) | | | | | | | | | | | | |
Term Loan, 3.75%, Maturing May 12, 2022 | | | | | | | 825 | | | | 818,451 | |
Emerald Performance Materials, LLC | | | | | | | | | | | | |
Term Loan, 4.50%, Maturing August 1, 2021 | | | | | | | 649 | | | | 652,744 | |
Term Loan - Second Lien, 7.75%, Maturing August 1, 2022 | | | | | | | 725 | | | | 725,000 | |
Flint Group GmbH | | | | | | | | | | | | |
Term Loan, 4.50%, Maturing September 7, 2021 | | | | | | | 195 | | | | 194,633 | |
Flint Group US, LLC | | | | | | | | | | | | |
Term Loan, 4.50%, Maturing September 7, 2021 | | | | | | | 1,177 | | | | 1,172,952 | |
GCP Applied Technologies, Inc. | | | | | | | | | | | | |
Term Loan, 4.09%, Maturing February 3, 2022 | | | | | | | 647 | | | | 656,451 | |
| | | | | | | | | | | | |
| Borrower/Tranche Description | | | | | Principal Amount* (000’s omitted) | | | Value | |
| | | | | | | | | | | | |
|
Chemicals and Plastics (continued) | |
Gemini HDPE, LLC | | | | | | | | | | | | |
Term Loan, 4.75%, Maturing August 7, 2021 | | | | | | | 2,058 | | | $ | 2,074,762 | |
Huntsman International, LLC | | | | | | | | | | | | |
Term Loan, 3.58%, Maturing April 19, 2019 | | | | | | | 1,521 | | | | 1,527,165 | |
Term Loan, 3.75%, Maturing October 1, 2021 | | | | | | | 2,505 | | | | 2,520,490 | |
Term Loan, 4.25%, Maturing April 1, 2023 | | | | | | | 647 | | | | 652,005 | |
Ineos Finance PLC | | | | | | | | | | | | |
Term Loan, 4.25%, Maturing March 31, 2022 | | | EUR | | | | 517 | | | | 586,550 | |
Ineos US Finance, LLC | | | | | | | | | | | | |
Term Loan, 3.75%, Maturing May 4, 2018 | | | | | | | 6,446 | | | | 6,471,219 | |
Term Loan, 4.25%, Maturing March 31, 2022 | | | | | | | 837 | | | | 841,355 | |
Kraton Polymers, LLC | | | | | | | | | | | | |
Term Loan, 6.00%, Maturing January 6, 2022 | | | | | | | 1,650 | | | | 1,664,051 | |
Kronos Worldwide, Inc. | | | | | | | | | | | | |
Term Loan, 4.00%, Maturing February 18, 2020 | | | | | | | 390 | | | | 380,738 | |
MacDermid, Inc. | | | | | | | | | | | | |
Term Loan, 5.50%, Maturing June 7, 2020 | | | | | | | 668 | | | | 671,711 | |
Term Loan, 5.50%, Maturing June 7, 2020 | | | | | | | 1,606 | | | | 1,611,205 | |
Term Loan, 5.50%, Maturing June 7, 2020 | | | | | | | 2,250 | | | | 2,256,502 | |
Minerals Technologies, Inc. | | | | | | | | | | | | |
Term Loan, 3.75%, Maturing May 9, 2021 | | | | | | | 1,410 | | | | 1,419,779 | |
Orion Engineered Carbons GmbH | | | | | | | | | | | | |
Term Loan, 3.75%, Maturing July 25, 2021 | | | EUR | | | | 1,106 | | | | 1,259,687 | |
Term Loan, 3.84%, Maturing July 25, 2021 | | | | | | | 760 | | | | 763,203 | |
OXEA Finance, LLC | | | | | | | | | | | | |
Term Loan, 4.25%, Maturing January 15, 2020 | | | | | | | 1,239 | | | | 1,183,545 | |
PolyOne Corporation | | | | | | | | | | | | |
Term Loan, 3.50%, Maturing November 11, 2022 | | | | | | | 596 | | | | 599,412 | |
PQ Corporation | | | | | | | | | | | | |
Term Loan, 5.75%, Maturing November 4, 2022 | | | | | | | 1,471 | | | | 1,483,267 | |
Solenis International L.P. | | | | | | | | | | | | |
Term Loan, 4.25%, Maturing July 31, 2021 | | | | | | | 392 | | | | 391,319 | |
Term Loan, 4.50%, Maturing July 31, 2021 | | | EUR | | | | 1,274 | | | | 1,444,948 | |
Sonneborn Refined Products B.V. | | | | | | | | | | | | |
Term Loan, 4.75%, Maturing December 10, 2020 | | | | | | | 83 | | | | 83,666 | |
Sonneborn, LLC | | | | | | | | | | | | |
Term Loan, 4.75%, Maturing December 10, 2020 | | | | | | | 473 | | | | 474,105 | |
Tata Chemicals North America, Inc. | | | | | | | | | | | | |
Term Loan, 3.75%, Maturing August 7, 2020 | | | | | | | 1,112 | | | | 1,110,420 | |
Trinseo Materials Operating S.C.A. | | | | | | | | | | | | |
Term Loan, 4.25%, Maturing November 5, 2021 | | | | | | | 2,864 | | | | 2,879,501 | |
Tronox Pigments (Netherlands) B.V. | | | | | | | | | | | | |
Term Loan, 4.50%, Maturing March 19, 2020 | | | | | | | 2,415 | | | | 2,393,561 | |
Univar, Inc. | | | | | | | | | | | | |
Term Loan, 4.25%, Maturing July 1, 2022 | | | | | | | 3,812 | | | | 3,817,854 | |
| | | | |
| | 6 | | See Notes to Financial Statements. |
Eaton Vance
Limited Duration Income Fund
September 30, 2016
Portfolio of Investments (Unaudited) — continued
| | | | | | | | | | | | |
| Borrower/Tranche Description | | | | | Principal Amount* (000’s omitted) | | | Value | |
| | | | | | | | | | | | |
|
Chemicals and Plastics (continued) | |
Zep, Inc. | | | | | | | | | | | | |
Term Loan, 5.50%, Maturing June 27, 2022 | | | | | | | 395 | | | $ | 396,481 | |
| | | | | | | | | | | | | |
| | | | | | | | | | $ | 49,197,928 | |
| | | | | | | | | | | | | |
|
Clothing / Textiles — 0.1% | |
Ascena Retail Group, Inc. | | | | | | | | | | | | |
Term Loan, 5.25%, Maturing August 21, 2022 | | | | | | | 1,780 | | | $ | 1,723,603 | |
| | | | | | | | | | | | | |
| | | | | | | | | | $ | 1,723,603 | |
| | | | | | | | | | | | | |
|
Conglomerates — 0.4% | |
Bestway UK Holdco Limited | | | | | | | | | | | | |
Term Loan, 4.77%, Maturing October 6, 2021 | | | GBP | | | | 1,103 | | | $ | 1,434,147 | |
RGIS Services, LLC | | | | | | | | | | | | |
Term Loan, 5.50%, Maturing October 18, 2017 | | | | | | | 3,289 | | | | 3,042,667 | |
Spectrum Brands, Inc. | | | | | | | | | | | | |
Term Loan, 3.50%, Maturing June 23, 2022 | | | | | | | 1,803 | | | | 1,812,353 | |
| | | | | | | | | | | | | |
| | | | | | | | | | $ | 6,289,167 | |
| | | | | | | | | | | | | |
|
Containers and Glass Products — 1.8% | |
Berry Plastics Holding Corporation | | | | | | | | | | | | |
Term Loan, 3.50%, Maturing February 8, 2020 | | | | | | | 2,509 | | | $ | 2,515,664 | |
Term Loan, 3.50%, Maturing January 6, 2021 | | | | | | | 6,670 | | | | 6,680,445 | |
Term Loan, 3.75%, Maturing October 1, 2022 | | | | | | | 1,178 | | | | 1,183,130 | |
Hilex Poly Co., LLC | | | | | | | | | | | | |
Term Loan, 6.00%, Maturing December 5, 2021 | | | | | | | 3,708 | | | | 3,741,262 | |
Horizon Holdings III SAS | | | | | | | | | | | | |
Term Loan, 4.50%, Maturing August 1, 2022 | | | EUR | | | | 1,925 | | | | 2,191,935 | |
Libbey Glass, Inc. | | | | | | | | | | | | |
Term Loan, 3.75%, Maturing April 9, 2021 | | | | | | | 519 | | | | 519,956 | |
Owens-Illinois, Inc. | | | | | | | | | | | | |
Term Loan, 3.50%, Maturing September 1, 2022 | | | | | | | 1,457 | | | | 1,467,335 | |
Pelican Products, Inc. | | | | | | | | | | | | |
Term Loan, 5.25%, Maturing April 10, 2020 | | | | | | | 360 | | | | 354,126 | |
Reynolds Group Holdings, Inc. | | | | | | | | | | | | |
Term Loan, 4.25%, Maturing February 5, 2023 | | | | | | | 10,142 | | | | 10,185,677 | |
SIG Combibloc US Acquisition, Inc. | | | | | | | | | | | | |
Term Loan, 4.00%, Maturing March 13, 2022 | | | | | | | 2,916 | | | | 2,923,720 | |
TricorBraun, Inc. | | | | | | | | | | | | |
Term Loan, 4.00%, Maturing May 3, 2018 | | | | | | | 618 | | | | 620,701 | |
| | | | | | | | | | | | | |
| | | | | | | | | | $ | 32,383,951 | |
| | | | | | | | | | | | | |
| | | | | | | | | | | | |
| Borrower/Tranche Description | | | | | Principal Amount* (000’s omitted) | | | Value | |
| | | | | | | | | | | | |
|
Cosmetics / Toiletries — 0.4% | |
Coty, Inc. | | | | | | | | | | | | |
Term Loan, 3.75%, Maturing October 27, 2022 | | | | | | | 1,045 | | | $ | 1,049,538 | |
Galleria Co. | | | | | | | | | | | | |
Term Loan, 3.75%, Maturing January 26, 2023 | | | | | | | 2,100 | | | | 2,113,100 | |
KIK Custom Products, Inc. | | | | | | | | | | | | |
Term Loan, 6.00%, Maturing August 26, 2022 | | | | | | | 1,832 | | | | 1,834,553 | |
Prestige Brands, Inc. | | | | | | | | | | | | |
Term Loan, 3.53%, Maturing September 3, 2021 | | | | | | | 647 | | | | 650,645 | |
Revlon Consumer Products Corporation | | | | | | | | | | | | |
Term Loan, 4.25%, Maturing September 7, 2023 | | | | | | | 650 | | | | 652,554 | |
| | | | | | | | | | | | | |
| | | | | | | | | | $ | 6,300,390 | |
| | | | | | | | | | | | | |
|
Drugs — 2.4% | |
Albany Molecular Research, Inc. | | | | | | | | | | | | |
Term Loan, 5.75%, Maturing July 16, 2021 | | | | | | | 2,857 | | | $ | 2,878,526 | |
Alkermes, Inc. | | | | | | | | | | | | |
Term Loan, 3.59%, Maturing September 25, 2019 | | | | | | | 1,153 | | | | 1,154,524 | |
AMAG Pharmaceuticals, Inc. | | | | | | | | | | | | |
Term Loan, 4.75%, Maturing August 13, 2021 | | | | | | | 1,847 | | | | 1,851,361 | |
Amneal Pharmaceuticals, LLC | | | | | | | | | | | | |
Term Loan, 4.50%, Maturing November 1, 2019 | | | | | | | 2,664 | | | | 2,671,153 | |
Arbor Pharmaceuticals, Inc. | | | | | | | | | | | | |
Term Loan, 6.00%, Maturing June 28, 2023 | | | | | | | 1,975 | | | | 1,984,875 | |
DPx Holdings B.V. | | | | | | | | | | | | |
Term Loan, 4.25%, Maturing March 11, 2021 | | | | | | | 2,141 | | | | 2,141,394 | |
Endo Luxembourg Finance Company I S.a.r.l. | | | | | | | | | | | | |
Term Loan, 3.75%, Maturing September 26, 2022 | | | | | | | 3,598 | | | | 3,594,600 | |
Horizon Pharma, Inc. | | | | | | | | | | | | |
Term Loan, 4.50%, Maturing May 7, 2021 | | | | | | | 272 | | | | 270,205 | |
Jaguar Holding Company II | | | | | | | | | | | | |
Term Loan, 4.25%, Maturing August 18, 2022 | | | | | | | 6,528 | | | | 6,556,694 | |
Mallinckrodt International Finance S.A. | | | | | | | | | | | | |
Term Loan, 3.34%, Maturing March 19, 2021 | | | | | | | 1,974 | | | | 1,973,603 | |
Term Loan, 3.59%, Maturing March 19, 2021 | | | | | | | 1,470 | | | | 1,471,493 | |
Quintiles Transnational Corp. | | | | | | | | | | | | |
Term Loan, 3.25%, Maturing May 12, 2022 | | | | | | | 2,197 | | | | 2,199,934 | |
Valeant Pharmaceuticals International, Inc. | | | | | | | | | | | | |
Term Loan, 4.28%, Maturing October 20, 2018 | | | | | | | 370 | | | | 369,941 | |
Term Loan, 5.25%, Maturing December 11, 2019 | | | | | | | 3,329 | | | | 3,337,582 | |
Term Loan, 5.25%, Maturing August 5, 2020 | | | | | | | 5,505 | | | | 5,513,736 | |
Term Loan, 5.50%, Maturing April 1, 2022 | | | | | | | 3,301 | | | | 3,315,231 | |
| | | | | | | | | | | | | |
| | | | | | | | | | $ | 41,284,852 | |
| | | | | | | | | | | | | |
| | | | |
| | 7 | | See Notes to Financial Statements. |
Eaton Vance
Limited Duration Income Fund
September 30, 2016
Portfolio of Investments (Unaudited) — continued
| | | | | | | | | | | | |
| Borrower/Tranche Description | | | | | Principal Amount* (000’s omitted) | | | Value | |
| | | | | | | | | | | | |
|
Ecological Services and Equipment — 0.5% | |
ADS Waste Holdings, Inc. | | | | | | | | | | | | |
Term Loan, 3.75%, Maturing October 9, 2019 | | | | | | | 5,039 | | | $ | 5,052,853 | |
EnergySolutions, LLC | | | | | | | | | | | | |
Term Loan, 6.75%, Maturing May 29, 2020 | | | | | | | 2,186 | | | | 2,183,033 | |
GFL Environmental Inc. | | | | | | | | | | | | |
Term Loan, Maturing September 23, 2023(4) | | | | | | | 975 | | | | 976,828 | |
Term Loan, Maturing September 27, 2023(4) | | | CAD | | | | 1,600 | | | | 1,220,321 | |
| | | | | | | | | | | | | |
| | | | | | | | | | $ | 9,433,035 | |
| | | | | | | | | | | | | |
|
Electronics / Electrical — 5.7% | |
Answers Corporation | | | | | | | | | | | | |
Term Loan, 6.25%, Maturing October 3, 2021(3) | | | | | | | 1,498 | | | $ | 786,614 | |
Applied Systems, Inc. | | | | | | | | | | | | |
Term Loan, 4.00%, Maturing January 25, 2021 | | | | | | | 2,040 | | | | 2,047,084 | |
Avago Technologies Cayman Ltd. | | | | | | | | | | | | |
Term Loan, 3.52%, Maturing February 1, 2023 | | | | | | | 7,354 | | | | 7,450,967 | |
Avast Software B.V. | | | | | | | | | | | | |
Term Loan, Maturing July 19, 2022(4) | | | | | | | 2,400 | | | | 2,416,001 | |
Campaign Monitor Finance Pty. Limited | | | | | | | | | | | | |
Term Loan, 6.25%, Maturing March 18, 2021 | | | | | | | 905 | | | | 882,744 | |
CommScope, Inc. | | | | | | | | | | | | |
Term Loan, 3.75%, Maturing December 29, 2022 | | | | | | | 2,081 | | | | 2,099,030 | |
Cypress Semiconductor Corporation | | | | | | | | | | | | |
Term Loan, 6.50%, Maturing July 5, 2021 | | | | | | | 1,350 | | | | 1,366,875 | |
Deltek, Inc. | | | | | | | | | | | | |
Term Loan, 5.00%, Maturing June 25, 2022 | | | | | | | 1,592 | | | | 1,601,286 | |
Term Loan - Second Lien, 9.50%, Maturing June 25, 2023 | | | | | | | 475 | | | | 481,531 | |
Electrical Components International, Inc. | | | | | | | | | | | | |
Term Loan, 5.75%, Maturing May 28, 2021 | | | | | | | 1,441 | | | | 1,443,704 | |
Entegris, Inc. | | | | | | | | | | | | |
Term Loan, 3.50%, Maturing April 30, 2021 | | | | | | | 366 | | | | 367,824 | |
Excelitas Technologies Corp. | | | | | | | | | | | | |
Term Loan, 6.00%, Maturing October 31, 2020 | | | | | | | 1,991 | | | | 1,960,287 | |
Eze Castle Software, Inc. | | | | | | | | | | | | |
Term Loan, 4.00%, Maturing April 6, 2020 | | | | | | | 733 | | | | 732,151 | |
Go Daddy Operating Company, LLC | | | | | | | | | | | | |
Term Loan, 4.25%, Maturing May 13, 2021 | | | | | | | 4,993 | | | | 5,025,188 | |
Hyland Software, Inc. | | | | | | | | | | | | |
Term Loan, 4.75%, Maturing July 1, 2022 | | | | | | | 2,691 | | | | 2,706,967 | |
Term Loan - Second Lien, 8.25%, Maturing July 1, 2023 | | | | | | | 675 | | | | 679,500 | |
Infor (US), Inc. | | | | | | | | | | | | |
Term Loan, 3.75%, Maturing June 3, 2020 | | | | | | | 9,844 | | | | 9,786,043 | |
| | | | | | | | | | | | |
| Borrower/Tranche Description | | | | | Principal Amount* (000’s omitted) | | | Value | |
| | | | | | | | | | | | |
|
Electronics / Electrical (continued) | |
Informatica Corporation | | | | | | | | | | | | |
Term Loan, 4.50%, Maturing August 5, 2022 | | | | | | | 3,638 | | | $ | 3,543,397 | |
Lattice Semiconductor Corporation | | | | | | | | | | | | |
Term Loan, 5.25%, Maturing March 10, 2021 | | | | | | | 686 | | | | 685,334 | |
M/A-COM Technology Solutions Holdings, Inc. | | | | | | | | | | | | |
Term Loan, 4.50%, Maturing May 7, 2021 | | | | | | | 1,059 | | | | 1,068,057 | |
MA FinanceCo., LLC | | | | | | | | | | | | |
Term Loan, 4.50%, Maturing November 20, 2019 | | | | | | | 2,258 | | | | 2,267,385 | |
Term Loan, 4.50%, Maturing November 20, 2021 | | | | | | | 2,537 | | | | 2,554,513 | |
Magic Newco, LLC | | | | | | | | | | | | |
Term Loan, 5.00%, Maturing December 12, 2018 | | | | | | | 2,841 | | | | 2,851,132 | |
MH Sub I, LLC | | | | | | | | | | | | |
Term Loan, 4.75%, Maturing July 8, 2021 | | | | | | | 1,569 | | | | 1,572,563 | |
Microsemi Corporation | | | | | | | | | | | | |
Term Loan, 3.75%, Maturing January 15, 2023 | | | | | | | 597 | | | | 603,268 | |
MTS Systems Corporation | | | | | | | | | | | | |
Term Loan, 5.00%, Maturing July 5, 2023 | | | | | | | 1,600 | | | | 1,616,000 | |
NXP B.V. | | | | | | | | | | | | |
Term Loan, 3.34%, Maturing January 11, 2020 | | | | | | | 2,522 | | | | 2,535,399 | |
Term Loan, 3.41%, Maturing December 7, 2020 | | | | | | | 1,133 | | | | 1,139,868 | |
ON Semiconductor Corporation | | | | | | | | | | | | |
Term Loan, 3.78%, Maturing March 31, 2023 | | | | | | | 1,325 | | | | 1,332,178 | |
Renaissance Learning, Inc. | | | | | | | | | | | | |
Term Loan, 4.50%, Maturing April 9, 2021 | | | | | | | 902 | | | | 900,372 | |
Term Loan - Second Lien, 8.00%, Maturing April 11, 2022 | | | | | | | 300 | | | | 295,875 | |
RP Crown Parent, LLC | | | | | | | | | | | | |
Term Loan, 6.00%, Maturing December 21, 2018 | | | | | | | 5,085 | | | | 5,083,693 | |
SGS Cayman L.P. | | | | | | | | | | | | |
Term Loan, 6.00%, Maturing April 23, 2021 | | | | | | | 259 | | | | 258,094 | |
SkillSoft Corporation | | | | | | | | | | | | |
Term Loan, 5.75%, Maturing April 28, 2021 | | | | | | | 5,150 | | | | 4,560,438 | |
Smart Technologies ULC | | | | | | | | | | | | |
Term Loan, 12.50%, Maturing January 31, 2018 | | | | | | | 567 | | | | 575,242 | |
Southwire Company | | | | | | | | | | | | |
Term Loan, 3.00%, Maturing February 10, 2021 | | | | | | | 1,287 | | | | 1,281,272 | |
SS&C Technologies, Inc. | | | | | | | | | | | | |
Term Loan, 4.00%, Maturing July 8, 2022 | | | | | | | 257 | | | | 259,284 | |
Term Loan, 4.00%, Maturing July 8, 2022 | | | | | | | 2,068 | | | | 2,086,453 | |
SunEdison Semiconductor B.V. | | | | | | | | | | | | |
Term Loan, 6.50%, Maturing May 27, 2019 | | | | | | | 907 | | | | 909,564 | |
SurveyMonkey, Inc. | | | | | | | | | | | | |
Term Loan, 6.25%, Maturing February 5, 2019 | | | | | | | 2,979 | | | | 2,956,350 | |
Sutherland Global Services, Inc. | | | | | | | | | | | | |
Term Loan, 6.00%, Maturing April 23, 2021 | | | | | | | 1,113 | | | | 1,108,761 | |
| | | | |
| | 8 | | See Notes to Financial Statements. |
Eaton Vance
Limited Duration Income Fund
September 30, 2016
Portfolio of Investments (Unaudited) — continued
| | | | | | | | | | | | |
| Borrower/Tranche Description | | | | | Principal Amount* (000’s omitted) | | | Value | |
| | | | | | | | | | | | |
|
Electronics / Electrical (continued) | |
Uber Technologies | | | | | | | | | | | | |
Term Loan, 5.00%, Maturing July 13, 2023 | | | | | | | 3,650 | | | $ | 3,657,223 | |
Veritas US, Inc. | | | | | | | | | | | | |
Term Loan, 6.63%, Maturing January 27, 2023 | | | | | | | 2,770 | | | | 2,595,290 | |
Versum Materials, Inc. | | | | | | | | | | | | |
Term Loan, Maturing September 20, 2023(4) | | | | | | | 725 | | | | 730,211 | |
Vertafore, Inc. | | | | | | | | | | | | |
Term Loan, 4.75%, Maturing June 30, 2023 | | | | | | | 2,825 | | | | 2,837,580 | |
Wall Street Systems Delaware, Inc. | | | | | | | | | | | | |
Term Loan, 4.75%, Maturing August 23, 2023 | | | | | | | 1,511 | | | | 1,518,697 | |
Western Digital Corporation | | | | | | | | | | | | |
Term Loan, 4.50%, Maturing April 29, 2023 | | | | | | | 2,713 | | | | 2,746,268 | |
Zebra Technologies Corporation | | | | | | | | | | | | |
Term Loan, 4.09%, Maturing October 27, 2021 | | | | | | | 2,352 | | | | 2,382,227 | |
| | | | | | | | | | | | | |
| | | | | | | | | | $ | 100,345,784 | |
| | | | | | | | | | | | | |
|
Equipment Leasing — 0.5% | |
Delos Finance S.a.r.l. | | | | | | | | | | | | |
Term Loan, 3.59%, Maturing March 6, 2021 | | | | | | | 3,275 | | | $ | 3,300,791 | |
Flying Fortress, Inc. | | | | | | | | | | | | |
Term Loan, 3.59%, Maturing April 30, 2020 | | | | | | | 4,712 | | | | 4,744,059 | |
| | | | | | | | | | | | | |
| | | | | | | | | | $ | 8,044,850 | |
| | | | | | | | | | | | | |
|
Financial Intermediaries — 2.1% | |
Armor Holding II, LLC | | | | | | | | | | | | |
Term Loan, 5.75%, Maturing June 26, 2020 | | | | | | | 1,742 | | | $ | 1,712,741 | |
Term Loan - Second Lien, 10.25%, Maturing December 26, 2020 | | | | | | | 2,475 | | | | 2,423,438 | |
Aspen Merger Sub, Inc. | | | | | | | | | | | | |
Term Loan, Maturing September 27, 2023(4) | | | | | | | 525 | | | | 529,598 | |
Citco Funding, LLC | | | | | | | | | | | | |
Term Loan, 4.25%, Maturing June 29, 2018 | | | | | | | 3,161 | | | | 3,171,520 | |
Clipper Acquisitions Corp. | | | | | | | | | | | | |
Term Loan, 3.09%, Maturing February 6, 2020 | | | | | | | 1,589 | | | | 1,587,586 | |
First Data Corporation | | | | | | | | | | | | |
Term Loan, 4.28%, Maturing July 8, 2022 | | | | | | | 5,550 | | | | 5,589,699 | |
Grosvenor Capital Management Holdings, LLP | | | | | | | | | | | | |
Term Loan, 3.75%, Maturing January 4, 2021 | | | | | | | 1,192 | | | | 1,185,638 | |
Guggenheim Partners, LLC | | | | | | | | | | | | |
Term Loan, 4.48%, Maturing July 22, 2020 | | | | | | | 3,545 | | | | 3,565,210 | |
Harbourvest Partners, LLC | | | | | | | | | | | | |
Term Loan, 3.25%, Maturing February 4, 2021 | | | | | | | 817 | | | | 812,473 | |
LPL Holdings, Inc. | | | | | | | | | | | | |
Term Loan, 4.25%, Maturing March 29, 2021 | | | | | | | 3,889 | | | | 3,918,061 | |
| | | | | | | | | | | | |
| Borrower/Tranche Description | | | | | Principal Amount* (000’s omitted) | | | Value | |
| | | | | | | | | | | | |
|
Financial Intermediaries (continued) | |
Medley, LLC | | | | | | | | | | | | |
Term Loan, 6.50%, Maturing June 15, 2019 | | | | | | | 488 | | | $ | 502,661 | |
MIP Delaware, LLC | | | | | | | | | | | | |
Term Loan, 4.00%, Maturing March 9, 2020 | | | | | | | 338 | | | | 339,418 | |
NXT Capital, Inc. | | | | | | | | | | | | |
Term Loan, 6.25%, Maturing September 4, 2018 | | | | | | | 171 | | | | 171,029 | |
Term Loan, 6.25%, Maturing September 4, 2018 | | | | | | | 763 | | | | 765,106 | |
Term Loan, 6.25%, Maturing September 4, 2018 | | | | | | | 897 | | | | 899,493 | |
Ocwen Financial Corporation | | | | | | | | | | | | |
Term Loan, 5.50%, Maturing February 15, 2018 | | | | | | | 1,962 | | | | 1,961,761 | |
Sesac Holdco II, LLC | | | | | | | | | | | | |
Term Loan, 5.25%, Maturing February 8, 2019 | | | | | | | 1,864 | | | | 1,863,527 | |
Starwood Property Trust, Inc. | | | | | | | | | | | | |
Term Loan, 3.50%, Maturing April 17, 2020 | | | | | | | 1,259 | | | | 1,260,540 | |
Walker & Dunlop, Inc. | | | | | | | | | | | | |
Term Loan, 5.25%, Maturing December 11, 2020 | | | | | | | 838 | | | | 840,110 | |
Walter Investment Management Corp. | | | | | | | | | | | | |
Term Loan, 4.75%, Maturing December 19, 2020 | | | | | | | 4,979 | | | | 4,580,704 | |
| | | | | | | | | | | | | |
| | | | | | | | | | $ | 37,680,313 | |
| | | | | | | | | | | | | |
|
Food Products — 1.7% | |
AdvancePierre Foods, Inc. | | | | | | | | | | | | |
Term Loan, 4.50%, Maturing June 2, 2023 | | | | | | | 2,906 | | | $ | 2,928,059 | |
Blue Buffalo Company Ltd. | | | | | | | | | | | | |
Term Loan, 3.75%, Maturing August 8, 2019 | | | | | | | 1,344 | | | | 1,351,168 | |
Charger OpCo B.V. | | | | | | | | | | | | |
Term Loan, 4.25%, Maturing July 2, 2022 | | | EUR | | | | 427 | | | | 485,770 | |
Clearwater Seafoods Limited Partnership | | | | | | | | | | | | |
Term Loan, 4.75%, Maturing June 26, 2019 | | | | | | | 939 | | | | 942,091 | |
Del Monte Foods, Inc. | | | | | | | | | | | | |
Term Loan, 4.25%, Maturing February 18, 2021 | | | | | | | 1,686 | | | | 1,590,035 | |
Dole Food Company, Inc. | | | | | | | | | | | | |
Term Loan, 4.51%, Maturing November 1, 2018 | | | | | | | 2,514 | | | | 2,524,062 | |
High Liner Foods Incorporated | | | | | | | | | | | | |
Term Loan, 4.25%, Maturing April 24, 2021 | | | | | | | 1,005 | | | | 999,699 | |
JBS USA, LLC | | | | | | | | | | | | |
Term Loan, 3.75%, Maturing May 25, 2018 | | | | | | | 3,667 | | | | 3,671,120 | |
Term Loan, 3.75%, Maturing September 18, 2020 | | | | | | | 1,940 | | | | 1,940,000 | |
Term Loan, 4.00%, Maturing October 30, 2022 | | | | | | | 794 | | | | 795,976 | |
Keurig Green Mountain, Inc. | | | | | | | | | | | | |
Term Loan, 5.25%, Maturing March 3, 2023 | | | | | | | 1,204 | | | | 1,221,440 | |
NBTY, Inc. | | | | | | | | | | | | |
Term Loan, 5.00%, Maturing May 5, 2023 | | | | | | | 4,564 | | | | 4,588,283 | |
Term Loan, 6.25%, Maturing May 5, 2023 | | | GBP | | | | 998 | | | | 1,301,221 | |
| | | | |
| | 9 | | See Notes to Financial Statements. |
Eaton Vance
Limited Duration Income Fund
September 30, 2016
Portfolio of Investments (Unaudited) — continued
| | | | | | | | | | | | |
| Borrower/Tranche Description | | | | | Principal Amount* (000’s omitted) | | | Value | |
| | | | | | | | | | | | |
|
Food Products (continued) | |
Oak Tea, Inc. | | | | | | | | | | | | |
Term Loan, 4.25%, Maturing July 2, 2022 | | | | | | | 2,523 | | | $ | 2,557,901 | |
Pinnacle Foods Finance, LLC | | | | | | | | | | | | |
Term Loan, 3.25%, Maturing April 29, 2020 | | | | | | | 825 | | | | 829,211 | |
R&R Ice Cream PLC | | | | | | | | | | | | |
Term Loan, Maturing September 26, 2023(4) | | | EUR | | | | 1,500 | | | | 1,711,142 | |
| | | | | | | | | | | | | |
| | | | | | | | | | $ | 29,437,178 | |
| | | | | | | | | | | | | |
|
Food Service — 1.3% | |
1011778 B.C. Unlimited Liability Company | | | | | | | | | | | | |
Term Loan, 3.75%, Maturing December 10, 2021 | | | | | | | 6,245 | | | $ | 6,292,034 | |
Centerplate, Inc. | | | | | | | | | | | | |
Term Loan, 4.75%, Maturing November 26, 2019 | | | | | | | 1,137 | | | | 1,125,481 | |
Landry’s, Inc. | | | | | | | | | | | | |
Term Loan, 4.00%, Maturing April 24, 2018 | | | | | | | 2,118 | | | | 2,123,314 | |
Term Loan, Maturing October 4, 2023(4) | | | | | | | 3,050 | | | | 3,034,750 | |
Manitowoc Foodservice, Inc. | | | | | | | | | | | | |
Term Loan, 5.75%, Maturing March 3, 2023 | | | | | | | 2,065 | | | | 2,094,920 | |
NPC International, Inc. | | | | | | | | | | | | |
Term Loan, 4.75%, Maturing December 28, 2018 | | | | | | | 668 | | | | 671,140 | |
P.F. Chang’s China Bistro, Inc. | | | | | | | | | | | | |
Term Loan, 4.53%, Maturing July 2, 2019 | | | | | | | 891 | | | | 880,069 | |
Seminole Hard Rock Entertainment, Inc. | | | | | | | | | | | | |
Term Loan, 3.60%, Maturing May 14, 2020 | | | | | | | 314 | | | | 315,617 | |
Weight Watchers International, Inc. | | | | | | | | | | | | |
Term Loan, 4.00%, Maturing April 2, 2020 | | | | | | | 7,673 | | | | 5,866,519 | |
Yum! Brands, Inc. | | | | | | | | | | | | |
Term Loan, 3.28%, Maturing June 16, 2023 | | | | | | | 1,197 | | | | 1,208,328 | |
| | | | | | | | | | | | | |
| | | | | | | | | | $ | 23,612,172 | |
| | | | | | | | | | | | | |
|
Food / Drug Retailers — 0.7% | |
Albertsons, LLC | | | | | | | | | | | | |
Term Loan, 4.50%, Maturing August 25, 2021 | | | | | | | 3,989 | | | $ | 4,017,843 | |
Term Loan, 4.75%, Maturing December 21, 2022 | | | | | | | 698 | | | | 705,145 | |
Term Loan, 4.75%, Maturing June 22, 2023 | | | | | | | 3,275 | | | | 3,309,503 | |
Rite Aid Corporation | | | | | | | | | | | | |
Term Loan - Second Lien, 5.75%, Maturing August 21, 2020 | | | | | | | 550 | | | | 552,321 | |
Term Loan - Second Lien, 4.88%, Maturing June 21, 2021 | | | | | | | 700 | | | | 702,538 | |
Supervalu, Inc. | | | | | | | | | | | | |
Term Loan, 5.50%, Maturing March 21, 2019 | | | | | | | 2,692 | | | | 2,697,739 | |
| | | | | | | | | | | | | |
| | | | | | | | | | $ | 11,985,089 | |
| | | | | | | | | | | | | |
| | | | | | | | | | | | |
| Borrower/Tranche Description | | | | | Principal Amount* (000’s omitted) | | | Value | |
| | | | | | | | | | | | |
|
Health Care — 5.9% | |
Acadia Healthcare Company, Inc. | | | | | | | | | | | | |
Term Loan, 3.75%, Maturing February 11, 2022 | | | | | | | 295 | | | $ | 296,869 | |
ADMI Corp. | | | | | | | | | | | | |
Term Loan, 5.25%, Maturing April 30, 2022 | | | | | | | 1,884 | | | | 1,897,233 | |
Akorn, Inc. | | | | | | | | | | | | |
Term Loan, 5.25%, Maturing April 16, 2021 | | | | | | | 1,115 | | | | 1,128,489 | |
Alere, Inc. | | | | | | | | | | | | |
Term Loan, 4.25%, Maturing June 18, 2022 | | | | | | | 1,887 | | | | 1,875,824 | |
Alliance Healthcare Services, Inc. | | | | | | | | | | | | |
Term Loan, 4.25%, Maturing June 3, 2019 | | | | | | | 1,363 | | | | 1,301,726 | |
AmSurg Corp. | | | | | | | | | | | | |
Term Loan, 3.50%, Maturing July 16, 2021 | | | | | | | 782 | | | | 783,857 | |
Ardent Legacy Acquisitions, Inc. | | | | | | | | | | | | |
Term Loan, 6.50%, Maturing August 4, 2021 | | | | | | | 1,313 | | | | 1,312,991 | |
Auris Luxembourg III S.a.r.l. | | | | | | | | | | | | |
Term Loan, 4.25%, Maturing January 15, 2022 | | | | | | | 985 | | | | 988,109 | |
Beaver-Visitec International, Inc. | | | | | | | | | | | | |
Term Loan, 6.00%, Maturing August 21, 2023 | | | | | | | 975 | | | | 972,563 | |
BSN Medical, Inc. | | | | | | | | | | | | |
Term Loan, 4.00%, Maturing August 28, 2019 | | | | | | | 618 | | | | 615,253 | |
CareCore National, LLC | | | | | | | | | | | | |
Term Loan, 5.50%, Maturing March 5, 2021 | | | | | | | 3,498 | | | | 3,441,490 | |
CeramTec Acquisition Corporation | | | | | | | | | | | | |
Term Loan, 4.25%, Maturing August 30, 2020 | | | | | | | 174 | | | | 175,124 | |
CHG Healthcare Services, Inc. | | | | | | | | | | | | |
Term Loan, 4.75%, Maturing June 7, 2023 | | | | | | | 2,388 | | | | 2,405,697 | |
Community Health Systems, Inc. | | | | | | | | | | | | |
Term Loan, 4.08%, Maturing December 31, 2018 | | | | | | | 1,685 | | | | 1,678,027 | |
Term Loan, 3.75%, Maturing December 31, 2019 | | | | | | | 2,907 | | | | 2,854,867 | |
Concentra, Inc. | | | | | | | | | | | | |
Term Loan, 4.00%, Maturing June 1, 2022 | | | | | | | 620 | | | | 621,006 | |
Convatec, Inc. | | | | | | | | | | | | |
Term Loan, 4.25%, Maturing June 15, 2020 | | | | | | | 1,318 | | | | 1,323,470 | |
CPI Buyer, LLC | | | | | | | | | | | | |
Term Loan, 5.50%, Maturing August 15, 2021 | | | | | | | 1,303 | | | | 1,296,434 | |
DaVita HealthCare Partners, Inc. | | | | | | | | | | | | |
Term Loan, 3.50%, Maturing June 24, 2021 | | | | | | | 4,154 | | | | 4,184,237 | |
DJO Finance, LLC | | | | | | | | | | | | |
Term Loan, 4.25%, Maturing June 8, 2020 | | | | | | | 2,599 | | | | 2,552,461 | |
Envision Healthcare Corporation | | | | | | | | | | | | |
Term Loan, 4.25%, Maturing May 25, 2018 | | | | | | | 4,157 | | | | 4,168,516 | |
Faenza Acquisition GmbH | | | | | | | | | | | | |
Term Loan, 4.25%, Maturing August 30, 2020 | | | | | | | 480 | | | | 482,902 | |
Term Loan, 4.25%, Maturing August 30, 2020 | | | | | | | 1,571 | | | | 1,579,936 | |
| | | | |
| | 10 | | See Notes to Financial Statements. |
Eaton Vance
Limited Duration Income Fund
September 30, 2016
Portfolio of Investments (Unaudited) — continued
| | | | | | | | | | | | |
| Borrower/Tranche Description | | | | | Principal Amount* (000’s omitted) | | | Value | |
| | | | | | | | | | | | |
|
Health Care (continued) | |
Global Healthcare Exchange, LLC | | | | | | | | | | | | |
Term Loan, 5.25%, Maturing August 14, 2023 | | | | | | | 1,262 | | | $ | 1,267,418 | |
Greatbatch Ltd. | | | | | | | | | | | | |
Term Loan, 5.25%, Maturing October 27, 2022 | | | | | | | 2,141 | | | | 2,118,355 | |
Grifols Worldwide Operations USA, Inc. | | | | | | | | | | | | |
Term Loan, 3.45%, Maturing February 27, 2021 | | | | | | | 6,143 | | | | 6,205,995 | |
Iasis Healthcare, LLC | | | | | | | | | | | | |
Term Loan, 4.50%, Maturing May 3, 2018 | | | | | | | 3,195 | | | | 3,165,864 | |
IMS Health Incorporated | | | | | | | | | | | | |
Term Loan, 3.50%, Maturing March 17, 2021 | | | | | | | 5,790 | | | | 5,819,865 | |
Indivior Finance S.a.r.l. | | | | | | | | | | | | |
Term Loan, 7.00%, Maturing December 19, 2019 | | | | | | | 1,163 | | | | 1,166,346 | |
inVentiv Health, Inc. | | | | | | | | | | | | |
Term Loan, 7.75%, Maturing May 15, 2018 | | | | | | | 1,249 | | | | 1,252,002 | |
Term Loan, 7.75%, Maturing May 15, 2018 | | | | | | | 4,116 | | | | 4,128,573 | |
Kindred Healthcare, Inc. | | | | | | | | | | | | |
Term Loan, 4.25%, Maturing April 9, 2021 | | | | | | | 3,318 | | | | 3,315,952 | |
Kinetic Concepts, Inc. | | | | | | | | | | | | |
Term Loan, 5.00%, Maturing November 4, 2020 | | | | | | | 6,655 | | | | 6,720,935 | |
KUEHG Corp. | | | | | | | | | | | | |
Term Loan, 6.00%, Maturing August 13, 2022 | | | | | | | 1,312 | | | | 1,321,588 | |
MMM Holdings, Inc. | | | | | | | | | | | | |
Term Loan, 9.75%, Maturing December 12, 2017 | | | | | | | 1,227 | | | | 1,125,514 | |
MPH Acquisition Holdings, LLC | | | | | | | | | | | | |
Term Loan, 5.00%, Maturing June 7, 2023 | | | | | | | 2,846 | | | | 2,885,536 | |
MSO of Puerto Rico, Inc. | | | | | | | | | | | | |
Term Loan, 9.75%, Maturing December 12, 2017 | | | | | | | 892 | | | | 818,243 | |
National Mentor Holdings, Inc. | | | | | | | | | | | | |
Term Loan, 4.25%, Maturing January 31, 2021 | | | | | | | 683 | | | | 684,313 | |
New Millennium Holdco, Inc. | | | | | | | | | | | | |
Term Loan, 7.55%, Maturing December 21, 2020 | | | | | | | 860 | | | | 409,359 | |
Onex Carestream Finance L.P. | | | | | | | | | | | | |
Term Loan, 5.00%, Maturing June 7, 2019 | | | | | | | 2,826 | | | | 2,630,173 | |
Opal Acquisition, Inc. | | | | | | | | | | | | |
Term Loan, 5.00%, Maturing November 27, 2020 | | | | | | | 2,298 | | | | 2,146,088 | |
Ortho-Clinical Diagnostics, Inc. | | | | | | | | | | | | |
Term Loan, 4.75%, Maturing June 30, 2021 | | | | | | | 4,106 | | | | 4,032,800 | |
PRA Holdings, Inc. | | | | | | | | | | | | |
Term Loan, 4.50%, Maturing September 23, 2020 | | | | | | | 4,575 | | | | 4,601,610 | |
Quality Care Properties, Inc. | | | | | | | | | | | | |
Term Loan, Maturing September 12, 2022(4) | | | | | | | 3,075 | | | | 3,013,500 | |
RadNet, Inc. | | | | | | | | | | | | |
Term Loan, 4.77%, Maturing July 1, 2023 | | | | | | | 1,750 | | | | 1,751,094 | |
Select Medical Corporation | | | | | | | | | | | | |
Term Loan, 6.00%, Maturing June 1, 2018 | | | | | | | 1,381 | | | | 1,387,456 | |
| | | | | | | | | | | | |
| Borrower/Tranche Description | | | | | Principal Amount* (000’s omitted) | | | Value | |
| | | | | | | | | | | | |
|
Health Care (continued) | |
Sterigenics-Nordion Holdings, LLC | | | | | | | | | | | | |
Term Loan, 4.25%, Maturing May 15, 2022 | | | | | | | 842 | | | $ | 842,531 | |
Steward Health Care System, LLC | | | | | | | | | | | | |
Term Loan, 6.75%, Maturing April 12, 2020 | | | | | | | 1,379 | | | | 1,379,515 | |
Tecomet, Inc. | | | | | | | | | | | | |
Term Loan, 5.75%, Maturing December 5, 2021 | | | | | | | 1,474 | | | | 1,459,934 | |
| | | | | | | | | | | | | |
| | | | | | | | | | $ | 103,587,640 | |
| | | | | | | | | | | | | |
|
Home Furnishings — 0.4% | |
Serta Simmons Holdings, LLC | | | | | | | | | | | | |
Term Loan, 4.25%, Maturing October 1, 2019 | | | | | | | 6,487 | | | $ | 6,514,973 | |
| | | | | | | | | | | | | |
| | | | | | | | | | $ | 6,514,973 | |
| | | | | | | | | | | | | |
|
Industrial Equipment — 2.6% | |
Apex Tool Group, LLC | | | | | | | | | | | | |
Term Loan, 4.50%, Maturing January 31, 2020 | | | | | | | 3,342 | | | $ | 3,299,163 | |
Blount International, Inc. | | | | | | | | | | | | |
Term Loan, 7.25%, Maturing April 12, 2023 | | | | | | | 1,150 | | | | 1,165,812 | |
Delachaux S.A. | | | | | | | | | | | | |
Term Loan, 4.50%, Maturing October 28, 2021 | | | | | | | 552 | | | | 534,292 | |
Doosan Infracore International, Inc. | | | | | | | | | | | | |
Term Loan, 4.50%, Maturing May 28, 2021 | | | | | | | 1,079 | | | | 1,092,220 | |
EWT Holdings III Corp. | | | | | | | | | | | | |
Term Loan, 4.75%, Maturing January 15, 2021 | | | | | | | 511 | | | | 511,839 | |
Term Loan, 5.50%, Maturing January 15, 2021 | | | | | | | 697 | | | | 699,982 | |
Filtration Group Corporation | | | | | | | | | | | | |
Term Loan, 4.25%, Maturing November 21, 2020 | | | | | | | 1,620 | | | | 1,626,913 | |
Term Loan - Second Lien, 8.25%, Maturing November 21, 2021 | | | | | | | 262 | | | | 262,525 | |
Gardner Denver, Inc. | | | | | | | | | | | | |
Term Loan, 4.25%, Maturing July 30, 2020 | | | | | | | 4,769 | | | | 4,630,343 | |
Term Loan, 4.75%, Maturing July 30, 2020 | | | EUR | | | | 461 | | | | 507,786 | |
Gates Global, Inc. | | | | | | | | | | | | |
Term Loan, 4.25%, Maturing July 6, 2021 | | | | | | | 7,022 | | | | 6,928,201 | |
Generac Power Systems, Inc. | | | | | | | | | | | | |
Term Loan, 3.50%, Maturing May 31, 2020 | | | | | | | 1,630 | | | | 1,632,286 | |
Husky Injection Molding Systems Ltd. | | | | | | | | | | | | |
Term Loan, 4.25%, Maturing June 30, 2021 | | | | | | | 3,583 | | | | 3,581,189 | |
Term Loan - Second Lien, 7.25%, Maturing June 30, 2022 | | | | | | | 573 | | | | 573,862 | |
Milacron, LLC | | | | | | | | | | | | |
Term Loan, 4.25%, Maturing September 28, 2020 | | | | | | | 1,387 | | | | 1,393,924 | |
Paladin Brands Holding, Inc. | | | | | | | | | | | | |
Term Loan, 7.25%, Maturing August 16, 2019 | | | | | | | 2,726 | | | | 2,473,557 | |
| | | | |
| | 11 | | See Notes to Financial Statements. |
Eaton Vance
Limited Duration Income Fund
September 30, 2016
Portfolio of Investments (Unaudited) — continued
| | | | | | | | | | | | |
| Borrower/Tranche Description | | | | | Principal Amount* (000’s omitted) | | | Value | |
| | | | | | | | | | | | |
|
Industrial Equipment (continued) | |
Paternoster Holding IV GmbH | | | | | | | | | | | | |
Term Loan, 7.13%, Maturing February 10, 2022 | | | EUR | | | | 1,100 | | | $ | 1,235,463 | |
Rexnord, LLC | | | | | | | | | | | | |
Term Loan, 4.00%, Maturing August 21, 2020 | | | | | | | 7,714 | | | | 7,727,261 | |
Signode Industrial Group US, Inc. | | | | | | | | | | | | |
Term Loan, 3.75%, Maturing May 1, 2021 | | | | | | | 1,084 | | | | 1,084,381 | |
STS Operating, Inc. | | | | | | | | | | | | |
Term Loan, 4.75%, Maturing February 12, 2021 | | | | | | | 381 | | | | 342,178 | |
Tank Holding Corp. | | | | | | | | | | | | |
Term Loan, 5.25%, Maturing March 16, 2022 | | | | | | | 780 | | | | 759,929 | |
Terex Corporation | | | | | | | | | | | | |
Term Loan, 3.50%, Maturing August 13, 2021 | | | EUR | | | | 2,058 | | | | 2,315,899 | |
Unifrax Corporation | | | | | | | | | | | | |
Term Loan, 4.25%, Maturing November 28, 2018 | | | | | | | 507 | | | | 504,304 | |
| | | | | | | | | | | | | |
| | | | | | | | | | $ | 44,883,309 | |
| | | | | | | | | | | | | |
|
Insurance — 1.9% | |
Alliant Holdings I, Inc. | | | | | | | | | | | | |
Term Loan, 4.75%, Maturing August 12, 2022 | | | | | | | 2,197 | | | $ | 2,200,129 | |
Term Loan, 5.25%, Maturing August 12, 2022 | | | | | | | 623 | | | | 627,724 | |
AmWINS Group, LLC | | | | | | | | | | | | |
Term Loan, 4.75%, Maturing September 6, 2019 | | | | | | | 4,939 | | | | 4,975,459 | |
AssuredPartners, Inc. | | | | | | | | | | | | |
Term Loan, 5.75%, Maturing October 21, 2022 | | | | | | | 1,117 | | | | 1,125,049 | |
Term Loan - Second Lien, 10.00%, Maturing October 20, 2023 | | | | | | | 875 | | | | 871,719 | |
Asurion, LLC | | | | | | | | | | | | |
Term Loan, 5.00%, Maturing May 24, 2019 | | | | | | | 3,134 | | | | 3,146,449 | |
Term Loan, 5.00%, Maturing August 4, 2022 | | | | | | | 6,077 | | | | 6,112,288 | |
Term Loan - Second Lien, 8.50%, Maturing March 3, 2021 | | | | | | | 2,850 | | | | 2,837,887 | |
Cunningham Lindsey U.S., Inc. | | | | | | | | | | | | |
Term Loan, 5.00%, Maturing December 10, 2019 | | | | | | | 2,621 | | | | 2,228,261 | |
Term Loan - Second Lien, 9.25%, Maturing June 10, 2020 | | | | | | | 572 | | | | 467,888 | |
Hub International Limited | | | | | | | | | | | | |
Term Loan, 4.00%, Maturing October 2, 2020 | | | | | | | 4,468 | | | | 4,472,737 | |
USI, Inc. | | | | | | | | | | | | |
Term Loan, 4.25%, Maturing December 27, 2019 | | | | | | | 3,813 | | | | 3,819,028 | |
| | | | | | | | | | | | | |
| | | | | | | | | | $ | 32,884,618 | |
| | | | | | | | | | | | | |
|
Leisure Goods / Activities / Movies — 2.5% | |
Ancestry.com, Inc. | | | | | | | | | | | | |
Term Loan, 5.00%, Maturing August 17, 2022 | | | | | | | 2,772 | | | $ | 2,780,951 | |
| | | | | | | | | | | | |
| Borrower/Tranche Description | | | | | Principal Amount* (000’s omitted) | | | Value | |
| | | | | | | | | | | | |
|
Leisure Goods / Activities / Movies (continued) | |
Bombardier Recreational Products, Inc. | | | | | | | | | | | | |
Term Loan, 3.75%, Maturing June 30, 2023 | | | | | | | 5,450 | | | $ | 5,468,737 | |
Bright Horizons Family Solutions, Inc. | | | | | | | | | | | | |
Term Loan, 3.75%, Maturing January 30, 2020 | | | | | | | 217 | | | | 217,781 | |
CDS US Intermediate Holdings, Inc. | | | | | | | | | | | | |
Term Loan, 5.00%, Maturing July 8, 2022 | | | | | | | 1,984 | | | | 1,988,681 | |
ClubCorp Club Operations, Inc. | | | | | | | | | | | | |
Term Loan, 4.00%, Maturing December 15, 2022 | | | | | | | 3,350 | | | | 3,366,227 | |
Emerald Expositions Holding, Inc. | | | | | | | | | | | | |
Term Loan, 4.75%, Maturing June 17, 2020 | | | | | | | 1,064 | | | | 1,063,663 | |
Fender Musical Instruments Corporation | | | | | | | | | | | | |
Term Loan, 5.75%, Maturing April 3, 2019 | | | | | | | 299 | | | | 297,847 | |
Kasima, LLC | | | | | | | | | | | | |
Term Loan, 3.33%, Maturing May 17, 2021 | | | | | | | 579 | | | | 580,311 | |
Lindblad Expeditions, Inc. | | | | | | | | | | | | |
Term Loan, 5.50%, Maturing May 8, 2021 | | | | | | | 274 | | | | 274,704 | |
Term Loan, 5.50%, Maturing May 8, 2021 | | | | | | | 2,124 | | | | 2,128,955 | |
Live Nation Entertainment, Inc. | | | | | | | | | | | | |
Term Loan, 3.59%, Maturing August 16, 2020 | | | | | | | 6,867 | | | | 6,907,724 | |
LTF Merger Sub, Inc. | | | | | | | | | | | | |
Term Loan, 4.25%, Maturing June 10, 2022 | | | | | | | 2,074 | | | | 2,078,693 | |
Match Group, Inc. | | | | | | | | | | | | |
Term Loan, 5.50%, Maturing November 16, 2022 | | | | | | | 683 | | | | 688,472 | |
National CineMedia, LLC | | | | | | | | | | | | |
Term Loan, 3.28%, Maturing November 26, 2019 | | | | | | | 575 | | | | 575,719 | |
Nord Anglia Education Finance, LLC | | | | | | | | | | | | |
Term Loan, 5.00%, Maturing March 31, 2021 | | | | | | | 3,663 | | | | 3,681,557 | |
Sabre, Inc. | | | | | | | | | | | | |
Term Loan, 4.00%, Maturing February 19, 2019 | | | | | | | 1,161 | | | | 1,167,382 | |
SeaWorld Parks & Entertainment, Inc. | | | | | | | | | | | | |
Term Loan, 3.09%, Maturing May 14, 2020 | | | | | | | 2,271 | | | | 2,230,904 | |
Sonifi Solutions, Inc. | | | | | | | | | | | | |
Term Loan, 6.75%, Maturing March 28, 2018(3) | | | | | | | 559 | | | | 223,425 | |
SRAM, LLC | | | | | | | | | | | | |
Term Loan, 4.01%, Maturing April 10, 2020 | | | | | | | 2,017 | | | | 1,966,668 | |
Steinway Musical Instruments, Inc. | | | | | | | | | | | | |
Term Loan, 4.75%, Maturing September 19, 2019 | | | | | | | 2,452 | | | | 2,403,053 | |
UFC Holdings, LLC | | | | | | | | | | | | |
Term Loan, 5.00%, Maturing August 18, 2023 | | | | | | | 2,425 | | | | 2,444,919 | |
WMG Acquisition Corp. | | | | | | | | | | | | |
Term Loan, 3.75%, Maturing July 1, 2020 | | | | | | | 878 | | | | 878,051 | |
| | | | | | | | | | | | | |
| | | | | | | | | | $ | 43,414,424 | |
| | | | | | | | | | | | | |
| | | | |
| | 12 | | See Notes to Financial Statements. |
Eaton Vance
Limited Duration Income Fund
September 30, 2016
Portfolio of Investments (Unaudited) — continued
| | | | | | | | | | | | |
| Borrower/Tranche Description | | | | | Principal Amount* (000’s omitted) | | | Value | |
| | | | | | | | | | | | |
|
Lodging and Casinos — 2.3% | |
Amaya Holdings B.V. | | | | | | | | | | | | |
Term Loan, 5.00%, Maturing August 1, 2021 | | | | | | | 5,236 | | | $ | 5,237,447 | |
Term Loan - Second Lien, 8.00%, Maturing August 1, 2022 | | | | | | | 1,006 | | | | 1,008,138 | |
Boyd Gaming Corporation | | | | | | | | | | | | |
Term Loan, 4.00%, Maturing August 14, 2020 | | | | | | | 183 | | | | 183,737 | |
Term Loan, 3.53%, Maturing September 15, 2023 | | | | | | | 1,000 | | | | 1,008,000 | |
Caesars Entertainment Operating Company | | | | | | | | | | | | |
Term Loan, 0.00%, Maturing March 1, 2017(5) | | | | | | | 1,594 | | | | 1,747,108 | |
CityCenter Holdings, LLC | | | | | | | | | | | | |
Term Loan, 4.25%, Maturing October 16, 2020 | | | | | | | 2,027 | | | | 2,042,366 | |
ESH Hospitality, Inc. | | | | | | | | | | | | |
Term Loan, 3.75%, Maturing August 30, 2023 | | | | | | | 2,400 | | | | 2,420,357 | |
Four Seasons Holdings, Inc. | | | | | | | | | | | | |
Term Loan - Second Lien, 6.25%, Maturing December 27, 2020 | | | | | | | 3,100 | | | | 3,123,250 | |
Gala Group Finance PLC | | | | | | | | | | | | |
Term Loan, 4.77%, Maturing May 27, 2018 | | | GBP | | | | 2,775 | | | | 3,607,979 | |
Golden Nugget, Inc. | | | | | | | | | | | | |
Term Loan, 4.50%, Maturing November 21, 2019 | | | | | | | 508 | | | | 511,105 | |
Term Loan, 4.50%, Maturing November 21, 2019 | | | | | | | 1,186 | | | | 1,192,579 | |
Hilton Worldwide Finance, LLC | | | | | | | | | | | | |
Term Loan, 3.50%, Maturing October 26, 2020 | | | | | | | 589 | | | | 592,677 | |
Term Loan, 3.14%, Maturing October 25, 2023 | | | | | | | 6,025 | | | | 6,076,536 | |
La Quinta Intermediate Holdings, LLC | | | | | | | | | | | | |
Term Loan, 3.75%, Maturing April 14, 2021 | | | | | | | 2,269 | | | | 2,262,401 | |
MGM Growth Properties Operating Partnership L.P. | | | | | | | | | | | | |
Term Loan, 4.00%, Maturing April 25, 2023 | | | | | | | 2,588 | | | | 2,614,132 | |
Playa Resorts Holding B.V. | | | | | | | | | | | | |
Term Loan, 4.00%, Maturing August 9, 2019 | | | | | | | 2,567 | | | | 2,574,676 | |
RHP Hotel Properties L.P. | | | | | | | | | | | | |
Term Loan, 3.59%, Maturing January 15, 2021 | | | | | | | 855 | | | | 861,594 | |
Scientific Games International, Inc. | | | | | | | | | | | | |
Term Loan, 6.00%, Maturing October 18, 2020 | | | | | | | 4,085 | | | | 4,102,006 | |
| | | | | | | | | | | | | |
| | | | | | | | | | $ | 41,166,088 | |
| | | | | | | | | | | | | |
|
Nonferrous Metals / Minerals — 0.9% | |
Alpha Natural Resources, LLC | | | | | | | | | | | | |
Term Loan, 11.00%, Maturing July 25, 2019 | | | | | | | 575 | | | $ | 592,308 | |
Arch Coal, Inc. | | | | | | | | | | | | |
DIP Loan, 5.00%, Maturing January 31, 2017(2) | | | | | | | 700 | | | | 703,063 | |
Term Loan, 7.50%, Maturing May 16, 2018 | | | | | | | 2,993 | | | | 2,282,208 | |
Dynacast International, LLC | | | | | | | | | | | | |
Term Loan, 4.50%, Maturing January 28, 2022 | | | | | | | 838 | | | | 842,186 | |
| | | | | | | | | | | | |
| Borrower/Tranche Description | | | | | Principal Amount* (000’s omitted) | | | Value | |
| | | | | | | | | | | | |
|
Nonferrous Metals / Minerals (continued) | |
Fairmount Santrol, Inc. | | | | | | | | | | | | |
Term Loan, 4.50%, Maturing July 15, 2018 | | | | | | | 244 | | | $ | 230,344 | |
Term Loan, 4.50%, Maturing September 5, 2019 | | | | | | | 3,140 | | | | 2,821,405 | |
Global Brass & Copper, Inc. | | | | | | | | | | | | |
Term Loan, 5.25%, Maturing July 18, 2023 | | | | | | | 1,025 | | | | 1,039,734 | |
Murray Energy Corporation | | | | | | | | | | | | |
Term Loan, 7.75%, Maturing April 16, 2017 | | | | | | | 369 | | | | 357,344 | |
Term Loan, 8.25%, Maturing April 16, 2020 | | | | | | | 2,341 | | | | 2,004,213 | |
Noranda Aluminum Acquisition Corporation | | | | | | | | | | | | |
Term Loan, 0.00%, Maturing February 28, 2019(3)(5) | | | | | | | 579 | | | | 72,335 | |
Novelis, Inc. | | | | | | | | | | | | |
Term Loan, 4.00%, Maturing June 2, 2022 | | | | | | | 3,777 | | | | 3,798,434 | |
Oxbow Carbon, LLC | | | | | | | | | | | | |
Term Loan, 4.25%, Maturing July 19, 2019 | | | | | | | 104 | | | | 104,560 | |
Term Loan - Second Lien, 8.00%, Maturing January 17, 2020 | | | | | | | 1,425 | | | | 1,382,250 | |
United Central Industrial Supply Company, LLC | | | | | | | | | | | | |
Term Loan - Second Lien, 15.00%, (0.00% Cash, 15.00% PIK), Maturing April 9, 2019(3) | | | | | | | 519 | | | | 215,484 | |
| | | | | | | | | | | | | |
| | | | | | | | | | $ | 16,445,868 | |
| | | | | | | | | | | | | |
|
Oil and Gas — 1.4% | |
Ameriforge Group, Inc. | | | | | | | | | | | | |
Term Loan, 5.00%, Maturing December 19, 2019 | | | | | | | 3,061 | | | $ | 1,530,487 | |
Bronco Midstream Funding, LLC | | | | | | | | | | | | |
Term Loan, 5.00%, Maturing August 15, 2020 | | | | | | | 1,737 | | | | 1,611,454 | |
CITGO Holding, Inc. | | | | | | | | | | | | |
Term Loan, 9.50%, Maturing May 12, 2018 | | | | | | | 993 | | | | 1,005,862 | |
CITGO Petroleum Corporation | | | | | | | | | | | | |
Term Loan, 4.50%, Maturing July 29, 2021 | | | | | | | 1,773 | | | | 1,764,419 | |
Crestwood Holdings, LLC | | | | | | | | | | | | |
Term Loan, 9.00%, Maturing June 19, 2019 | | | | | | | 933 | | | | 866,540 | |
Drillships Ocean Ventures, Inc. | | | | | | | | | | | | |
Term Loan, 5.50%, Maturing July 25, 2021 | | | | | | | 572 | | | | 398,494 | |
Energy Transfer Equity L.P. | | | | | | | | | | | | |
Term Loan, 3.29%, Maturing December 2, 2019 | | | | | | | 2,200 | | | | 2,182,675 | |
Fieldwood Energy, LLC | | | | | | | | | | | | |
Term Loan, 3.88%, Maturing October 1, 2018 | | | | | | | 1,296 | | | | 1,140,425 | |
Term Loan, 8.00%, Maturing August 31, 2020 | | | | | | | 275 | | | | 227,906 | |
Term Loan, 8.38%, Maturing September 30, 2020 | | | | | | | 363 | | | | 263,503 | |
Term Loan - Second Lien, 8.38%, Maturing September 30, 2020(3) | | | | | | | 512 | | | | 214,850 | |
MEG Energy Corp. | | | | | | | | | | | | |
Term Loan, 3.75%, Maturing March 31, 2020 | | | | | | | 6,542 | | | | 6,094,047 | |
| | | | |
| | 13 | | See Notes to Financial Statements. |
Eaton Vance
Limited Duration Income Fund
September 30, 2016
Portfolio of Investments (Unaudited) — continued
| | | | | | | | | | | | |
| Borrower/Tranche Description | | | | | Principal Amount* (000’s omitted) | | | Value | |
| | | | | | | | | | | | |
|
Oil and Gas (continued) | |
Paragon Offshore Finance Company | | | | | | | | | | | | |
Term Loan, 5.25%, Maturing July 18, 2021 | | | | | | | 1,111 | | | $ | 276,809 | |
Samson Investment Company | | | | | | | | | | | | |
Term Loan - Second Lien, 0.00%, Maturing September 25, 2018(5) | | | | | | | 1,900 | | | | 528,438 | |
Seadrill Partners Finco, LLC | | | | | | | | | | | | |
Term Loan, 4.00%, Maturing February 21, 2021 | | | | | | | 4,011 | | | | 2,019,444 | |
Sheridan Investment Partners II L.P. | | | | | | | | | | | | |
Term Loan, 4.34%, Maturing December 16, 2020 | | | | | | | 47 | | | | 29,124 | |
Term Loan, 4.34%, Maturing December 16, 2020 | | | | | | | 125 | | | | 78,092 | |
Term Loan, 4.34%, Maturing December 16, 2020 | | | | | | | 898 | | | | 561,378 | |
Sheridan Production Partners I, LLC | | | | | | | | | | | | |
Term Loan, 4.25%, Maturing October 1, 2019 | | | | | | | 257 | | | | 166,551 | |
Term Loan, 4.25%, Maturing October 1, 2019 | | | | | | | 421 | | | | 272,675 | |
Term Loan, 4.25%, Maturing October 1, 2019 | | | | | | | 3,178 | | | | 2,057,796 | |
Southcross Holdings Borrower L.P. | | | | | | | | | | | | |
Term Loan, 9.00%, (3.50% Cash, 5.50% PIK), Maturing April 13, 2023 | | | | | | | 70 | | | | 59,559 | |
Tervita Corporation | | | | | | | | | | | | |
Term Loan, 6.25%, Maturing May 15, 2018 | | | | | | | 980 | | | | 973,044 | |
| | | | | | | | | | | | | |
| | | | | | | | | | $ | 24,323,572 | |
| | | | | | | | | | | | | |
|
Publishing — 1.1% | |
682534 N.B., Inc. | | | | | | | | | | | | |
Term Loan, 12.00%, (8.00% Cash, 4.00% PIK), Maturing October 1, 2020(3) | | | | | | | 451 | | | $ | 361,057 | |
Getty Images, Inc. | | | | | | | | | | | | |
Term Loan, 4.75%, Maturing October 18, 2019 | | | | | | | 8,281 | | | | 6,986,770 | |
Laureate Education, Inc. | | | | | | | | | | | | |
Term Loan, 5.00%, Maturing June 15, 2018 | | | | | | | 4,628 | | | | 4,616,215 | |
LSC Communications, Inc. | | | | | | | | | | | | |
Term Loan, Maturing September 26, 2022(4) | | | | | | | 1,425 | | | | 1,410,750 | |
Merrill Communications, LLC | | | | | | | | | | | | |
Term Loan, 6.25%, Maturing June 1, 2022 | | | | | | | 692 | | | | 650,937 | |
Penton Media, Inc. | | | | | | | | | | | | |
Term Loan, 4.75%, Maturing October 3, 2019 | | | | | | | 754 | | | | 755,337 | |
ProQuest, LLC | | | | | | | | | | | | |
Term Loan, 5.75%, Maturing October 24, 2021 | | | | | | | 1,879 | | | | 1,883,850 | |
Springer Science+Business Media Deutschland GmbH | | | | | | | | | | | | |
Term Loan, 4.75%, Maturing August 14, 2020 | | | | | | | 2,650 | | | | 2,577,030 | |
| | | | | | | | | | | | | |
| | | | | | | | | | $ | 19,241,946 | |
| | | | | | | | | | | | | |
| | | | | | | | | | | | |
| Borrower/Tranche Description | | | | | Principal Amount* (000’s omitted) | | | Value | |
| | | | | | | | | | | | |
|
Radio and Television — 1.5% | |
ALM Media Holdings, Inc. | | | | | | | | | | | | |
Term Loan, 5.50%, Maturing July 31, 2020 | | | | | | | 546 | | | $ | 535,598 | |
AP NMT Acquisition B.V. | | | | | | | | | | | | |
Term Loan, 6.75%, Maturing August 13, 2021 | | | | | | | 588 | | | | 526,260 | |
Cumulus Media Holdings, Inc. | | | | | | | | | | | | |
Term Loan, 4.25%, Maturing December 23, 2020 | | | | | | | 5,477 | | | | 3,847,296 | |
Entercom Radio, LLC | | | | | | | | | | | | |
Term Loan, 4.01%, Maturing November 23, 2018 | | | | | | | 1,310 | | | | 1,311,987 | |
Entravision Communications Corporation | | | | | | | | | | | | |
Term Loan, 3.50%, Maturing May 31, 2020 | | | | | | | 1,128 | | | | 1,128,826 | |
Gray Television, Inc. | | | | | | | | | | | | |
Term Loan, 3.94%, Maturing June 13, 2021 | | | | | | | 334 | | | | 335,991 | |
Hubbard Radio, LLC | | | | | | | | | | | | |
Term Loan, 4.25%, Maturing May 27, 2022 | | | | | | | 701 | | | | 688,394 | |
iHeartCommunications, Inc. | | | | | | | | | | | | |
Term Loan, 7.27%, Maturing January 30, 2019 | | | | | | | 1,066 | | | | 821,257 | |
Term Loan, 8.02%, Maturing July 30, 2019 | | | | | | | 1,682 | | | | 1,294,185 | |
MGOC, Inc. | | | | | | | | | | | | |
Term Loan, 4.00%, Maturing July 31, 2020 | | | | | | | 1,569 | | | | 1,571,492 | |
Mission Broadcasting, Inc. | | | | | | | | | | | | |
Term Loan, 3.75%, Maturing October 1, 2020 | | | | | | | 921 | | | | 922,412 | |
Nexstar Broadcasting, Inc. | | | | | | | | | | | | |
Term Loan, 3.75%, Maturing October 1, 2020 | | | | | | | 1,044 | | | | 1,046,029 | |
Raycom TV Broadcasting, LLC | | | | | | | | | | | | |
Term Loan, 3.75%, Maturing August 4, 2021 | | | | | | | 3,354 | | | | 3,347,764 | |
Sinclair Television Group, Inc. | | | | | | | | | | | | |
Term Loan, 3.00%, Maturing April 9, 2020 | | | | | | | 507 | | | | 508,426 | |
Townsquare Media, Inc. | | | | | | | | | | | | |
Term Loan, 4.25%, Maturing April 1, 2022 | | | | | | | 2,406 | | | | 2,404,753 | |
Univision Communications, Inc. | | | | | | | | | | | | |
Term Loan, 4.00%, Maturing March 1, 2020 | | | | | | | 6,486 | | | | 6,502,471 | |
| | | | | | | | | | | | | |
| | | | | | | | | | $ | 26,793,141 | |
| | | | | | | | | | | | | |
|
Retailers (Except Food and Drug) — 2.6% | |
B&M Retail Limited | | | | | | | | | | | | |
Term Loan, 3.02%, Maturing May 21, 2019 | | | GBP | | | | 475 | | | $ | 611,273 | |
Term Loan, 3.52%, Maturing April 28, 2020 | | | GBP | | | | 375 | | | | 483,799 | |
Bass Pro Group, LLC | | | | | | | | | | | | |
Term Loan, 4.00%, Maturing June 5, 2020 | | | | | | | 3,104 | | | | 3,105,664 | |
CDW, LLC | | | | | | | | | | | | |
Term Loan, 3.00%, Maturing August 4, 2023 | | | | | | | 2,577 | | | | 2,585,943 | |
Coinamatic Canada, Inc. | | | | | | | | | | | | |
Term Loan, 4.25%, Maturing May 14, 2022 | | | | | | | 55 | | | | 55,326 | |
| | | | |
| | 14 | | See Notes to Financial Statements. |
Eaton Vance
Limited Duration Income Fund
September 30, 2016
Portfolio of Investments (Unaudited) — continued
| | | | | | | | | | | | |
| Borrower/Tranche Description | | | | | Principal Amount* (000’s omitted) | | | Value | |
| | | | | | | | | | | | |
|
Retailers (Except Food and Drug) (continued) | |
David’s Bridal, Inc. | | | | | | | | | | | | |
Term Loan, 5.00%, Maturing October 11, 2019 | | | | | | | 2,662 | | | $ | 2,518,143 | |
Dollar Tree, Inc. | | | | | | | | | | | | |
Term Loan, 3.06%, Maturing July 6, 2022 | | | | | | | 817 | | | | 822,137 | |
Evergreen Acqco 1 L.P. | | | | | | | | | | | | |
Term Loan, 5.00%, Maturing July 9, 2019 | | | | | | | 1,933 | | | | 1,777,074 | |
Harbor Freight Tools USA, Inc. | | | | | | | | | | | | |
Term Loan, 4.00%, Maturing August 19, 2023 | | | | | | | 3,125 | | | | 3,146,206 | |
J. Crew Group, Inc. | | | | | | | | | | | | |
Term Loan, 4.00%, Maturing March 5, 2021 | | | | | | | 3,863 | | | | 3,066,841 | |
Jo-Ann Stores, Inc. | | | | | | | | | | | | |
Term Loan, 4.00%, Maturing March 16, 2018 | | | | | | | 2,819 | | | | 2,821,506 | |
Men’s Wearhouse, Inc. (The) | | | | | | | | | | | | |
Term Loan, 4.50%, Maturing June 18, 2021 | | | | | | | 1,120 | | | | 1,115,320 | |
Michaels Stores, Inc. | | | | | | | | | | | | |
Term Loan, 3.75%, Maturing January 27, 2023 | | | | | | | 5,478 | | | | 5,502,462 | |
Neiman Marcus Group, Inc. (The) | | | | | | | | | | | | |
Term Loan, 4.25%, Maturing October 25, 2020 | | | | | | | 3,338 | | | | 3,093,757 | |
Party City Holdings, Inc. | | | | | | | | | | | | |
Term Loan, 4.47%, Maturing August 19, 2022 | | | | | | | 4,136 | | | | 4,153,226 | |
PetSmart, Inc. | | | | | | | | | | | | |
Term Loan, 4.25%, Maturing March 11, 2022 | | | | | | | 5,826 | | | | 5,844,457 | |
PFS Holding Corporation | | | | | | | | | | | | |
Term Loan, 4.50%, Maturing January 31, 2021 | | | | | | | 2,289 | | | | 2,151,722 | |
Pier 1 Imports (U.S.), Inc. | | | | | | | | | | | | |
Term Loan, 4.50%, Maturing April 30, 2021 | | | | | | | 660 | | | | 602,079 | |
Rent-A-Center, Inc. | | | | | | | | | | | | |
Term Loan, 3.84%, Maturing March 19, 2021 | | | | | | | 577 | | | | 570,993 | |
Toys ‘R’ Us Property Company I, LLC | | | | | | | | | | | | |
Term Loan, 6.00%, Maturing August 21, 2019 | | | | | | | 2,230 | | | | 2,118,832 | |
Wilton Brands, LLC | | | | | | | | | | | | |
Term Loan, 8.50%, Maturing August 30, 2018 | | | | | | | 458 | | | | 382,728 | |
| | | | | | | | | | | | | |
| | | | | | | | | | $ | 46,529,488 | |
| | | | | | | | | | | | | |
|
Steel — 0.5% | |
FMG Resources (August 2006) Pty. Ltd. | | | | | | | | | | | | |
Term Loan, 3.75%, Maturing June 30, 2019 | | | | | | | 5,199 | | | $ | 5,200,207 | |
Neenah Foundry Company | | | | | | | | | | | | |
Term Loan, 6.75%, Maturing April 26, 2017 | | | | | | | 1,953 | | | | 1,943,694 | |
Zekelman Industries, Inc. | | | | | | | | | | | | |
Term Loan, 6.00%, Maturing June 14, 2021 | | | | | | | 1,191 | | | | 1,210,834 | |
| | | | | | | | | | | | | |
| | | | | | | | | | $ | 8,354,735 | |
| | | | | | | | | | | | | |
| | | | | | | | | | | | |
| Borrower/Tranche Description | | | | | Principal Amount* (000’s omitted) | | | Value | |
| | | | | | | | | | | | |
|
Surface Transport — 0.2% | |
Hertz Corporation (The) | | | | | | | | | | | | |
Term Loan, 3.50%, Maturing June 30, 2023 | | | | | | | 1,272 | | | $ | 1,282,033 | |
Kenan Advantage Group, Inc. | | | | | | | | | | | | |
Term Loan, 1.50%, Maturing January 31, 2017(2) | | | | | | | 30 | | | | 30,170 | |
Term Loan, 4.00%, Maturing July 31, 2022 | | | | | | | 133 | | | | 132,188 | |
Term Loan, 4.00%, Maturing July 31, 2022 | | | | | | | 432 | | | | 430,470 | |
Stena International S.a.r.l. | | | | | | | | | | | | |
Term Loan, 4.24%, Maturing March 3, 2021 | | | | | | | 2,048 | | | | 1,742,935 | |
| | | | | | | | | | | | | |
| | | | | | | | | | $ | 3,617,796 | |
| | | | | | | | | | | | | |
|
Telecommunications — 1.6% | |
Ciena Corporation | | | | | | | | | | | | |
Term Loan, 3.75%, Maturing July 15, 2019 | | | | | | | 1,740 | | | $ | 1,742,478 | |
Consolidated Communications, Inc. | | | | | | | | | | | | |
Term Loan, Maturing September 30, 2023(4) | | | | | | | 500 | | | | 504,063 | |
Intelsat Jackson Holdings S.A. | | | | | | | | | | | | |
Term Loan, 3.75%, Maturing June 30, 2019 | | | | | | | 10,100 | | | | 9,641,894 | |
IPC Corp. | | | | | | | | | | | | |
Term Loan, 5.50%, Maturing August 6, 2021 | | | | | | | 2,069 | | | | 1,965,075 | |
Mitel US Holdings, Inc. | | | | | | | | | | | | |
Term Loan, 5.50%, Maturing April 29, 2022 | | | | | | | 2,830 | | | | 2,851,439 | |
Syniverse Holdings, Inc. | | | | | | | | | | | | |
Term Loan, 4.00%, Maturing April 23, 2019 | | | | | | | 2,345 | | | | 2,079,133 | |
Term Loan, 4.00%, Maturing April 23, 2019 | | | | | | | 2,776 | | | | 2,461,778 | |
Telesat Canada | | | | | | | | | | | | |
Term Loan, 3.50%, Maturing March 28, 2019 | | | | | | | 5,708 | | | | 5,724,330 | |
Windstream Corporation | | | | | | | | | | | | |
Term Loan, 3.50%, Maturing August 8, 2019 | | | | | | | 960 | | | | 958,743 | |
| | | | | | | | | | | | | |
| | | | | | | | | | $ | 27,928,933 | |
| | | | | | | | | | | | | |
|
Utilities — 1.1% | |
Calpine Construction Finance Company L.P. | | | | | | | | | | | | |
Term Loan, 3.09%, Maturing May 3, 2020 | | | | | | | 1,209 | | | $ | 1,203,707 | |
Term Loan, 3.34%, Maturing January 31, 2022 | | | | | | | 3,213 | | | | 3,193,965 | |
Calpine Corporation | | | | | | | | | | | | |
Term Loan, 3.59%, Maturing May 27, 2022 | | | | | | | 3,728 | | | | 3,742,373 | |
Dayton Power & Light Company (The) | | | | | | | | | | | | |
Term Loan, 4.00%, Maturing August 24, 2022 | | | | | | | 675 | | | | 685,125 | |
Dynegy Holdings, Inc. | | | | | | | | | | | | |
Term Loan, 4.00%, Maturing April 23, 2020 | | | | | | | 4,101 | | | | 4,117,743 | |
Granite Acquisition, Inc. | | | | | | | | | | | | |
Term Loan, 5.00%, Maturing December 19, 2021 | | | | | | | 143 | | | | 141,432 | |
Term Loan, 5.00%, Maturing December 19, 2021 | | | | | | | 3,200 | | | | 3,158,116 | |
| | | | |
| | 15 | | See Notes to Financial Statements. |
Eaton Vance
Limited Duration Income Fund
September 30, 2016
Portfolio of Investments (Unaudited) — continued
| | | | | | | | | | | | |
| Borrower/Tranche Description | | | | | Principal Amount* (000’s omitted) | | | Value | |
| | | | | | | | | | | | |
|
Utilities (continued) | |
Invenergy Thermal Operating I, LLC | | | | | | | | | | | | |
Term Loan, 6.50%, Maturing October 19, 2022 | | | | | | | 218 | | | $ | 210,389 | |
Lonestar Generation, LLC | | | | | | | | | | | | |
Term Loan, 5.47%, Maturing February 22, 2021 | | | | | | | 1,329 | | | | 1,086,342 | |
Longview Power, LLC | | | | | | | | | | | | |
Term Loan, 7.00%, Maturing April 13, 2021 | | | | | | | 346 | | | | 304,150 | |
TPF II Power, LLC | | | | | | | | | | | | |
Term Loan, 5.00%, Maturing October 2, 2021 | | | | | | | 1,701 | | | | 1,722,627 | |
| | | | | | | | | | | | | |
| | | | | | | | | | $ | 19,565,969 | |
| | | | | | | | | | | | | |
| |
Total Senior Floating-Rate Loans
(identified cost $1,020,366,129) | | | $ | 999,299,893 | |
| | | | | | | | | | | | | |
|
| Corporate Bonds & Notes — 53.7% | |
| | | |
| | | | | | | | | | | | |
| Security | | | | | Principal Amount* (000’s omitted) | | | Value | |
|
Aerospace and Defense — 0.7% | |
CBC Ammo, LLC/CBC FinCo, Inc. | | | | | | | | | | | | |
7.25%, 11/15/21(6) | | | | | | | 2,415 | | | $ | 2,366,700 | |
Hexcel Corp. | | | | | | | | | | | | |
4.70%, 8/15/25 | | | | | | | 369 | | | | 401,998 | |
Huntington Ingalls Industries, Inc. | | | | | | | | | | | | |
5.00%, 11/15/25(6) | | | | | | | 675 | | | | 715,500 | |
Orbital ATK, Inc. | | | | | | | | | | | | |
5.25%, 10/1/21 | | | | | | | 1,515 | | | | 1,579,387 | |
TransDigm, Inc. | | | | | | | | | | | | |
7.50%, 7/15/21 | | | | | | | 460 | | | | 487,888 | |
6.00%, 7/15/22 | | | | | | | 2,850 | | | | 3,021,000 | |
6.50%, 7/15/24 | | | | | | | 2,785 | | | | 2,945,137 | |
VistaJet Malta Finance PLC/VistaJet Co. Finance, LLC | | | | | | | | | | | | |
7.75%, 6/1/20(6) | | | | | | | 2,490 | | | | 1,115,022 | |
| | | | | | | | | | | | | |
| | | | | | | | | | $ | 12,632,632 | |
| | | | | | | | | | | | | |
|
Air Transport — 0.1% | |
WestJet Airlines, Ltd. | | | | | | | | | | | | |
3.50%, 6/16/21(6) | | | | | | | 2,000 | | | $ | 2,051,890 | |
| | | | | | | | | | | | | |
| | | | | | | | | | $ | 2,051,890 | |
| | | | | | | | | | | | | |
|
Automotive — 1.0% | |
Adient Global Holdings Co. | | | | | | | | | | | | |
3.50%, 8/15/24(7) | | | EUR | | | | 690 | | | $ | 775,615 | |
| | | | | | | | | | | | |
| Security | | | | | Principal Amount* (000’s omitted) | | | Value | |
| | | | | | | | | | | | |
|
Automotive (continued) | |
American Axle & Manufacturing, Inc. | | | | | | | | | | | | |
5.125%, 2/15/19 | | | | | | | 660 | | | $ | 670,912 | |
Deck Chassis Acquisition, Inc. | | | | | | | | | | | | |
10.00%, 6/15/23(6) | | | | | | | 1,840 | | | | 1,936,600 | |
FTE Verwaltungs GmbH | | | | | | | | | | | | |
9.00%, 7/15/20(7) | | | EUR | | | | 400 | | | | 473,694 | |
General Motors Co. | | | | | | | | | | | | |
5.00%, 4/1/35 | | | | | | | 1,095 | | | | 1,138,839 | |
General Motors Financial Co., Inc. | | | | | | | | | | | | |
4.75%, 8/15/17 | | | | | | | 1,615 | | | | 1,659,018 | |
6.75%, 6/1/18 | | | | | | | 1,365 | | | | 1,469,558 | |
Jaguar Land Rover Automotive PLC | | | | | | | | | | | | |
5.00%, 2/15/22(7) | | | GBP | | | | 400 | | | | 571,602 | |
Navistar International Corp. | | | | | | | | | | | | |
8.25%, 11/1/21 | | | | | | | 1,345 | | | | 1,338,275 | |
Schaeffler Holding Finance B.V. | | | | | | | | | | | | |
6.875%, 8/15/18(6)(8) | | | | | | | 1,785 | | | | 1,820,879 | |
6.75%, 11/15/22(6)(8) | | | | | | | 2,334 | | | | 2,678,206 | |
ZF North America Capital, Inc. | | | | | | | | | | | | |
4.00%, 4/29/20(6) | | | | | | | 1,200 | | | | 1,278,000 | |
4.50%, 4/29/22(6) | | | | | | | 720 | | | | 764,100 | |
4.75%, 4/29/25(6) | | | | | | | 630 | | | | 663,863 | |
| | | | | | | | | | | | | |
| | | | | | | | | | $ | 17,239,161 | |
| | | | | | | | | | | | | |
|
Banks and Thrifts — 1.0% | |
Australia and New Zealand Banking Group, Ltd. | | | | | | | | | | | | |
4.40%, 5/19/26(6) | | | | | | | 1,000 | | | $ | 1,064,130 | |
Banco do Brasil SA | | | | | | | | | | | | |
9.00% to 6/18/24(6)(9)(10) | | | | | | | 523 | | | | 454,330 | |
BankUnited, Inc. | | | | | | | | | | | | |
4.875%, 11/17/25 | | | | | | | 1,815 | | | | 1,880,872 | |
Capital One Financial Corp. | | | | | | | | | | | | |
3.75%, 7/28/26 | | | | | | | 995 | | | | 1,002,356 | |
Compass Bank | | | | | | | | | | | | |
3.875%, 4/10/25 | | | | | | | 1,220 | | | | 1,196,196 | |
Development Bank of Mongolia, LLC | | | | | | | | | | | | |
5.75%, 3/21/17(7) | | | | | | | 617 | | | | 609,281 | |
Fifth Third Bancorp | | | | | | | | | | | | |
Series H, 5.10% to 6/30/23(9)(10) | | | | | | | 478 | | | | 461,270 | |
First Horizon National Corp. | | | | | | | | | | | | |
3.50%, 12/15/20 | | | | | | | 1,900 | | | | 1,941,211 | |
First Midwest Bancorp, Inc. | | | | | | | | | | | | |
5.875%, 9/29/26 | | | | | | | 1,000 | | | | 1,033,621 | |
| | | | |
| | 16 | | See Notes to Financial Statements. |
Eaton Vance
Limited Duration Income Fund
September 30, 2016
Portfolio of Investments (Unaudited) — continued
| | | | | | | | | | | | |
| Security | | | | | Principal Amount* (000’s omitted) | | | Value | |
| | | | | | | | | | | | |
|
Banks and Thrifts (continued) | |
First Republic Bank | | | | | | | | | | | | |
4.375%, 8/1/46 | | | | | | | 1,000 | | | $ | 1,000,082 | |
Flagstar Bancorp, Inc. | | | | | | | | | | | | |
6.125%, 7/15/21(6) | | | | | | | 650 | | | | 662,821 | |
Lloyds Banking Group PLC | | | | | | | | | | | | |
4.582%, 12/10/25(6) | | | | | | | 1,715 | | | | 1,761,168 | |
Santander Issuances SAU | | | | | | | | | | | | |
5.179%, 11/19/25 | | | | | | | 1,000 | | | | 1,021,265 | |
Toronto-Dominion Bank (The) | | | | | | | | | | | | |
3.625% to 9/15/26, 9/15/31(9) | | | | | | | 1,000 | | | | 1,005,381 | |
Zions Bancorporation | | | | | | | | | | | | |
5.65% to 11/15/18, 11/15/23(9) | | | | | | | 1,890 | | | | 1,941,975 | |
| | | | | | | | | | | | | |
| | | | | | | | | | $ | 17,035,959 | |
| | | | | | | | | | | | | |
|
Beverage and Tobacco — 0.3% | |
Constellation Brands, Inc. | | | | | | | | | | | | |
6.00%, 5/1/22 | | | | | | | 1,530 | | | $ | 1,765,238 | |
4.25%, 5/1/23 | | | | | | | 2,910 | | | | 3,095,512 | |
| | | | | | | | | | | | | |
| | | | | | | | | | $ | 4,860,750 | |
| | | | | | | | | | | | | |
|
Brokerage / Securities Dealers / Investment Houses — 0.1% | |
Alliance Data Systems Corp. | | | | | | | | | | | | |
6.375%, 4/1/20(6) | | | | | | | 1,435 | | | $ | 1,467,288 | |
| | | | | | | | | | | | | |
| | | | | | | | | | $ | 1,467,288 | |
| | | | | | | | | | | | | |
|
Building and Development — 2.0% | |
Builders FirstSource, Inc. | | | | | | | | | | | | |
10.75%, 8/15/23(6) | | | | | | | 745 | | | $ | 858,613 | |
5.625%, 9/1/24(6) | | | | | | | 1,360 | | | | 1,400,800 | |
Greystar Real Estate Partners, LLC | | | | | | | | | | | | |
8.25%, 12/1/22(6) | | | | | | | 1,855 | | | | 1,975,575 | |
HD Supply, Inc. | | | | | | | | | | | | |
7.50%, 7/15/20 | | | | | | | 3,650 | | | | 3,791,437 | |
5.25%, 12/15/21(6) | | | | | | | 1,545 | | | | 1,639,631 | |
5.75%, 4/15/24(6) | | | | | | | 225 | | | | 236,813 | |
Hillman Group, Inc. (The) | | | | | | | | | | | | |
6.375%, 7/15/22(6) | | | | | | | 2,665 | | | | 2,511,762 | |
LSF9 Balta Issuer S.A. | | | | | | | | | | | | |
7.75%, 9/15/22(7) | | | EUR | | | | 407 | | | | 492,211 | |
MDC Holdings, Inc. | | | | | | | | | | | | |
6.00%, 1/15/43 | | | | | | | 657 | | | | 596,556 | |
NVR, Inc. | | | | | | | | | | | | |
3.95%, 9/15/22 | | | | | | | 1,000 | | | | 1,066,307 | |
| | | | | | | | | | | | |
| Security | | | | | Principal Amount* (000’s omitted) | | | Value | |
| | | | | | | | | | | | |
|
Building and Development (continued) | |
Owens Corning | | | | | | | | | | | | |
3.40%, 8/15/26 | | | | | | | 1,000 | | | $ | 1,007,325 | |
Reliance Intermediate Holdings, L.P. | | | | | | | | | | | | |
6.50%, 4/1/23(6) | | | | | | | 4,610 | | | | 4,863,550 | |
Rexel SA | | | | | | | | | | | | |
5.25%, 6/15/20(6) | | | | | | | 2,710 | | | | 2,826,327 | |
Standard Industries, Inc. | | | | | | | | | | | | |
5.375%, 11/15/24(6) | | | | | | | 2,825 | | | | 2,923,875 | |
6.00%, 10/15/25(6) | | | | | | | 2,510 | | | | 2,698,250 | |
TRI Pointe Group, Inc./TRI Pointe Homes, Inc. | | | | | | | | | | | | |
4.375%, 6/15/19 | | | | | | | 1,725 | | | | 1,783,219 | |
5.875%, 6/15/24 | | | | | | | 2,235 | | | | 2,341,163 | |
USG Corp. | | | | | | | | | | | | |
5.875%, 11/1/21(6) | | | | | | | 870 | | | | 911,325 | |
5.50%, 3/1/25(6) | | | | | | | 345 | | | | 371,306 | |
| | | | | | | | | | | | | |
| | | | | | | | | | $ | 34,296,045 | |
| | | | | | | | | | | | | |
|
Business Equipment and Services — 0.7% | |
Acosta, Inc. | | | | | | | | | | | | |
7.75%, 10/1/22(6) | | | | | | | 2,135 | | | $ | 1,766,713 | |
FTI Consulting, Inc. | | | | | | | | | | | | |
6.00%, 11/15/22 | | | | | | | 3,974 | | | | 4,187,602 | |
Prime Security Services Borrower, LLC/Prime Finance, Inc. | | | | | | | | | | | | |
9.25%, 5/15/23(6) | | | | | | | 200 | | | | 218,500 | |
ServiceMaster Co., LLC (The) | | | | | | | | | | | | |
7.45%, 8/15/27 | | | | | | | 1,975 | | | | 2,109,300 | |
United Rentals North America, Inc. | | | | | | | | | | | | |
7.625%, 4/15/22 | | | | | | | 3,665 | | | | 3,921,550 | |
6.125%, 6/15/23 | | | | | | | 225 | | | | 237,375 | |
| | | | | | | | | | | | | |
| | | | | | | | | | $ | 12,441,040 | |
| | | | | | | | | | | | | |
|
Cable and Satellite Television — 3.0% | |
Cablevision Systems Corp. | | | | | | | | | | | | |
7.75%, 4/15/18 | | | | | | | 1,055 | | | $ | 1,120,938 | |
8.00%, 4/15/20 | | | | | | | 635 | | | | 666,750 | |
CCO Holdings, LLC/CCO Holdings Capital Corp. | | | | | | | | | | | | |
5.25%, 9/30/22 | | | | | | | 4,295 | | | | 4,499,012 | |
5.75%, 1/15/24 | | | | | | | 1,980 | | | | 2,108,700 | |
5.875%, 4/1/24(6) | | | | | | | 230 | | | | 245,962 | |
5.375%, 5/1/25(6) | | | | | | | 3,605 | | | | 3,789,756 | |
5.75%, 2/15/26(6) | | | | | | | 1,885 | | | | 2,002,812 | |
| | | | |
| | 17 | | See Notes to Financial Statements. |
Eaton Vance
Limited Duration Income Fund
September 30, 2016
Portfolio of Investments (Unaudited) — continued
| | | | | | | | | | | | |
| Security | | | | | Principal Amount* (000’s omitted) | | | Value | |
| | | | | | | | | | | | |
|
Cable and Satellite Television (continued) | |
Cequel Communications Holdings I, LLC/Cequel Capital Corp. | | | | | | | | | | | | |
6.375%, 9/15/20(6) | | | | | | | 225 | | | $ | 232,594 | |
5.125%, 12/15/21(6) | | | | | | | 105 | | | | 105,264 | |
Charter Communications Operating, LLC/Charter Communications Operating Capital Corp. | | | | | | | | | | | | |
6.384%, 10/23/35(6) | | | | | | | 452 | | | | 534,830 | |
CSC Holdings, LLC | | | | | | | | | | | | |
8.625%, 2/15/19 | | | | | | | 190 | | | | 212,682 | |
6.75%, 11/15/21 | | | | | | | 2,780 | | | | 2,946,800 | |
5.25%, 6/1/24 | | | | | | | 355 | | | | 338,138 | |
DISH DBS Corp. | | | | | | | | | | | | |
6.75%, 6/1/21 | | | | | | | 2,165 | | | | 2,338,200 | |
5.875%, 7/15/22 | | | | | | | 3,055 | | | | 3,154,287 | |
5.875%, 11/15/24 | | | | | | | 1,815 | | | | 1,799,119 | |
7.75%, 7/1/26(6) | | | | | | | 180 | | | | 191,700 | |
IAC/InterActiveCorp | | | | | | | | | | | | |
4.875%, 11/30/18 | | | | | | | 1,534 | | | | 1,572,350 | |
Neptune Finco Corp. | | | | | | | | | | | | |
10.125%, 1/15/23(6) | | | | | | | 2,880 | | | | 3,330,000 | |
10.875%, 10/15/25(6) | | | | | | | 3,350 | | | | 3,927,875 | |
Numericable-SFR S.A. | | | | | | | | | | | | |
6.00%, 5/15/22(6) | | | | | | | 3,820 | | | | 3,910,725 | |
6.25%, 5/15/24(6) | | | | | | | 555 | | | | 553,447 | |
UPCB Finance VI, Ltd. | | | | | | | | | | | | |
6.875%, 1/15/22(6) | | | | | | | 1,620 | | | | 1,701,000 | |
Virgin Media Receivables Financing Notes I DAC | | | | | | | | | | | | |
5.50%, 9/15/24(7)(11) | | | GBP | | | | 485 | | | | 630,047 | |
Virgin Media Secured Finance PLC | | | | | | | | | | | | |
5.50%, 1/15/25(6) | | | | | | | 725 | | | | 744,031 | |
5.25%, 1/15/26(6) | | | | | | | 2,430 | | | | 2,478,600 | |
VTR Finance B.V. | | | | | | | | | | | | |
6.875%, 1/15/24(6) | | | | | | | 1,575 | | | | 1,634,063 | |
Ziggo Bond Finance B.V. | | | | | | | | | | | | |
5.875%, 1/15/25(6) | | | | | | | 930 | | | | 934,650 | |
6.00%, 1/15/27(6) | | | | | | | 2,410 | | | | 2,397,950 | |
Ziggo Secured Finance B.V. | | | | | | | | | | | | |
5.50%, 1/15/27(6) | | | | | | | 1,995 | | | | 1,995,000 | |
| | | | | | | | | | | | | |
| | | | | | | | | | $ | 52,097,282 | |
| | | | | | | | | | | | | |
|
Capital Goods — 0.1% | |
Valmont Industries, Inc. | | | | | | | | | | | | |
5.00%, 10/1/44 | | | | | | | 1,000 | | | $ | 975,449 | |
| | | | | | | | | | | | | |
| | | | | | | | | | $ | 975,449 | |
| | | | | | | | | | | | | |
| | | | | | | | | | | | |
| Security | | | | | Principal Amount* (000’s omitted) | | | Value | |
| | | | | | | | | | | | |
|
Chemicals and Plastics — 0.8% | |
Air Liquide Finance | | | | | | | | | | | | |
1.75%, 9/27/21(6) | | | | | | | 1,500 | | | $ | 1,498,365 | |
INEOS Group Holdings SA | | | | | | | | | | | | |
5.625%, 8/1/24(6) | | | | | | | 1,515 | | | | 1,490,381 | |
Monitchem HoldCo 2 SA | | | | | | | | | | | | |
6.875%, 6/15/22(7) | | | EUR | | | | 400 | | | | 391,478 | |
Platform Specialty Products Corp. | | | | | | | | | | | | |
10.375%, 5/1/21(6) | | | | | | | 660 | | | | 714,450 | |
6.50%, 2/1/22(6) | | | | | | | 2,325 | | | | 2,272,688 | |
Scotts Miracle-Gro Co. (The) | | | | | | | | | | | | |
6.00%, 10/15/23(6) | | | | | | | 670 | | | | 716,900 | |
Tronox Finance, LLC | | | | | | | | | | | | |
6.375%, 8/15/20 | | | | | | | 3,475 | | | | 3,223,062 | |
7.50%, 3/15/22(6) | | | | | | | 1,030 | | | | 945,025 | |
Valvoline, Inc. | | | | | | | | | | | | |
5.50%, 7/15/24(6) | | | | | | | 375 | | | | 393,750 | |
W.R. Grace & Co. | | | | | | | | | | | | |
5.125%, 10/1/21(6) | | | | | | | 2,170 | | | | 2,311,050 | |
5.625%, 10/1/24(6) | | | | | | | 490 | | | | 535,938 | |
| | | | | | | | | | | | | |
| | | | | | | | | | $ | 14,493,087 | |
| | | | | | | | | | | | | |
|
Clothing / Textiles — 0.3% | |
BiSoho SAS | | | | | | | | | | | | |
5.875%, 5/1/23(7) | | | EUR | | | | 200 | | | $ | 239,170 | |
Hanesbrands Finance Luxembourg SCA | | | | | | | | | | | | |
3.50%, 6/15/24(7) | | | EUR | | | | 435 | | | | 507,654 | |
PVH Corp. | | | | | | | | | | | | |
7.75%, 11/15/23 | | | | | | | 3,740 | | | | 4,347,750 | |
| | | | | | | | | | | | | |
| | | | | | | | | | $ | 5,094,574 | |
| | | | | | | | | | | | | |
|
Commercial Services — 0.1% | |
Block Financial, LLC | | | | | | | | | | | | |
5.25%, 10/1/25 | | | | | | | 1,110 | | | $ | 1,200,347 | |
CEB, Inc. | | | | | | | | | | | | |
5.625%, 6/15/23(6) | | | | | | | 710 | | | | 701,125 | |
Verisure Holding AB | | | | | | | | | | | | |
6.00%, 11/1/22(6) | | | EUR | | | | 400 | | | | 486,354 | |
| | | | | | | | | | | | | |
| | | | | | | | | | $ | 2,387,826 | |
| | | | | | | | | | | | | |
|
Computers — 0.1% | |
Seagate HDD Cayman | | | | | | | | | | | | |
4.875%, 6/1/27 | | | | | | | 1,939 | | | $ | 1,725,289 | |
| | | | | | | | | | | | | |
| | | | | | | | | | $ | 1,725,289 | |
| | | | | | | | | | | | | |
| | | | |
| | 18 | | See Notes to Financial Statements. |
Eaton Vance
Limited Duration Income Fund
September 30, 2016
Portfolio of Investments (Unaudited) — continued
| | | | | | | | | | | | |
| Security | | | | | Principal Amount* (000’s omitted) | | | Value | |
| | | | | | | | | | | | |
|
Conglomerates — 0.3% | |
Spectrum Brands, Inc. | | | | | | | | | | | | |
5.75%, 7/15/25 | | | | | | | 2,745 | | | $ | 2,978,325 | |
4.00%, 10/1/26(7) | | | EUR | | | | 250 | | | | 286,256 | |
TMS International Corp. | | | | | | | | | | | | |
7.625%, 10/15/21(6) | | | | | | | 2,160 | | | | 1,857,600 | |
| | | | | | | | | | | | | |
| | | | | | | | | | $ | 5,122,181 | |
| | | | | | | | | | | | | |
|
Consumer Products — 0.3% | |
Central Garden & Pet Co. | | | | | | | | | | | | |
6.125%, 11/15/23 | | | | | | | 880 | | | $ | 948,200 | |
HRG Group, Inc. | | | | | | | | | | | | |
7.875%, 7/15/19 | | | | | | | 3,780 | | | | 3,987,900 | |
| | | | | | | | | | | | | |
| | | | | | | | | | $ | 4,936,100 | |
| | | | | | | | | | | | | |
|
Containers and Glass Products — 1.0% | |
Ardagh Packaging Finance PLC/Ardagh Holdings USA, Inc. | | | | | | | | | | | | |
3.85%, 12/15/19(6)(12) | | | | | | | 1,020 | | | $ | 1,036,626 | |
7.00%, 11/15/20(6) | | | | | | | 784 | | | | 813,827 | |
6.00%, 6/30/21(6) | | | | | | | 615 | | | | 638,063 | |
6.75%, 5/15/24(7) | | | EUR | | | | 425 | | | | 501,593 | |
Ball Corp. | | | | | | | | | | | | |
4.375%, 12/15/20 | | | | | | | 2,375 | | | | 2,547,188 | |
4.375%, 12/15/23 | | | EUR | | | | 800 | | | | 1,005,959 | |
Berry Plastics Corp. | | | | | | | | | | | | |
6.00%, 10/15/22 | | | | | | | 970 | | | | 1,028,200 | |
Beverage Packaging Holdings Luxembourg II SA/Beverage Packaging Holdings II Issuer, Inc. | | | | | | | | | | | | |
5.625%, 12/15/16(6) | | | | | | | 385 | | | | 385,481 | |
Owens-Brockway Glass Container, Inc. | | | | | | | | | | | | |
5.875%, 8/15/23(6) | | | | | | | 1,345 | | | | 1,446,716 | |
6.375%, 8/15/25(6) | | | | | | | 625 | | | | 689,453 | |
Reynolds Group Holdings, Inc. | | | | | | | | | | | | |
9.875%, 8/15/19 | | | | | | | 4,150 | | | | 4,279,687 | |
5.75%, 10/15/20 | | | | | | | 250 | | | | 258,125 | |
5.125%, 7/15/23(6) | | | | | | | 1,185 | | | | 1,224,994 | |
7.00%, 7/15/24(6) | | | | | | | 1,485 | | | | 1,595,447 | |
Smurfit Kappa Acquisitions | | | | | | | | | | | | |
2.75%, 2/1/25(7) | | | EUR | | | | 400 | | | | 471,717 | |
| | | | | | | | | | | | | |
| | | | | | | | | | $ | 17,923,076 | |
| | | | | | | | | | | | | |
| | | | | | | | | | | | |
| Security | | | | | Principal Amount* (000’s omitted) | | | Value | |
| | | | | | | | | | | | |
|
Cosmetics / Toiletries — 0.1% | |
Revlon Consumer Products Corp. | | | | | | | | | | | | |
6.25%, 8/1/24(6) | | | | | | | 1,015 | | | $ | 1,050,525 | |
| | | | | | | | | | | | | |
| | | | | | | | | | $ | 1,050,525 | |
| | | | | | | | | | | | | |
|
Distribution & Wholesale — 0.1% | |
American Tire Distributors, Inc. | | | | | | | | | | | | |
10.25%, 3/1/22(6) | | | | | | | 1,875 | | | $ | 1,715,625 | |
| | | | | | | | | | | | | |
| | | | | | | | | | $ | 1,715,625 | |
| | | | | | | | | | | | | |
|
Diversified Financial Services — 1.1% | |
AerCap Ireland Capital, Ltd./AerCap Global Aviation Trust | | | | | | | | | | | | |
4.625%, 10/30/20 | | | | | | | 730 | | | $ | 768,325 | |
3.95%, 2/1/22 | | | | | | | 800 | | | | 821,000 | |
Argos Merger Sub, Inc. | | | | | | | | | | | | |
7.125%, 3/15/23(6) | | | | | | | 4,365 | | | | 4,594,163 | |
BPCE SA | | | | | | | | | | | | |
4.625%, 7/11/24(6) | | | | | | | 775 | | | | 792,806 | |
Cadence Financial Corp. | | | | | | | | | | | | |
4.875%, 6/28/19(6) | | | | | | | 1,375 | | | | 1,306,250 | |
Double Eagle Acquisition Sub, Inc. | | | | | | | | | | | | |
7.50%, 10/1/24(6)(11) | | | | | | | 2,340 | | | | 2,389,725 | |
FBM Finance, Inc. | | | | | | | | | | | | |
8.25%, 8/15/21(6) | | | | | | | 1,415 | | | | 1,485,750 | |
Legg Mason, Inc. | | | | | | | | | | | | |
4.75%, 3/15/26 | | | | | | | 985 | | | | 1,066,960 | |
Leucadia National Corp. | | | | | | | | | | | | |
6.625%, 10/23/43 | | | | | | | 683 | | | | 679,755 | |
Och-Ziff Finance Co., LLC | | | | | | | | | | | | |
4.50%, 11/20/19(6) | | | | | | | 1,509 | | | | 1,459,586 | |
OM Asset Management PLC | | | | | | | | | | | | |
4.80%, 7/27/26 | | | | | | | 945 | | | | 948,696 | |
Quicken Loans, Inc. | | | | | | | | | | | | |
5.75%, 5/1/25(6) | | | | | | | 760 | | | | 758,100 | |
Raymond James Financial, Inc. | | | | | | | | | | | | |
3.625%, 9/15/26 | | | | | | | 671 | | | | 686,377 | |
Royal Bank of Canada | | | | | | | | | | | | |
4.65%, 1/27/26 | | | | | | | 1,790 | | | | 1,955,895 | |
| | | | | | | | | | | | | |
| | | | | | | | | | $ | 19,713,388 | |
| | | | | | | | | | | | | |
|
Drugs — 1.4% | |
ConvaTec Finance International SA | | | | | | | | | | | | |
8.25%, 1/15/19(6)(8) | | | | | | | 4,815 | | | $ | 4,810,185 | |
| | | | |
| | 19 | | See Notes to Financial Statements. |
Eaton Vance
Limited Duration Income Fund
September 30, 2016
Portfolio of Investments (Unaudited) — continued
| | | | | | | | | | | | |
| Security | | | | | Principal Amount* (000’s omitted) | | | Value | |
| | | | | | | | | | | | |
|
Drugs (continued) | |
Jaguar Holding Co. II/Pharmaceutical Product Development, LLC | | | | | | | | | | | | |
6.375%, 8/1/23(6) | | | | | | | 5,605 | | | $ | 5,843,212 | |
Mallinckrodt International Finance S.A./Mallinckrodt CB, LLC | | | | | | | | | | | | |
4.875%, 4/15/20(6) | | | | | | | 1,210 | | | | 1,240,250 | |
5.625%, 10/15/23(6) | | | | | | | 2,605 | | | | 2,507,312 | |
5.50%, 4/15/25(6) | | | | | | | 1,215 | | | | 1,160,325 | |
Valeant Pharmaceuticals International, Inc. | | | | | | | | | | | | |
6.375%, 10/15/20(6) | | | | | | | 425 | | | | 400,563 | |
7.50%, 7/15/21(6) | | | | | | | 1,615 | | | | 1,568,569 | |
5.625%, 12/1/21(6) | | | | | | | 1,165 | | | | 1,045,588 | |
5.875%, 5/15/23(6) | | | | | | | 3,855 | | | | 3,351,653 | |
6.125%, 4/15/25(6) | | | | | | | 3,350 | | | | 2,893,562 | |
| | | | | | | | | | | | | |
| | | | | | | | | | $ | 24,821,219 | |
| | | | | | | | | | | | | |
|
Ecological Services and Equipment — 0.3% | |
Advanced Disposal Services, Inc. | | | | | | | | | | | | |
8.25%, 10/1/20 | | | | | | | 765 | | | $ | 804,206 | |
Clean Harbors, Inc. | | | | | | | | | | | | |
5.25%, 8/1/20 | | | | | | | 1,095 | | | | 1,128,398 | |
5.125%, 6/1/21 | | | | | | | 900 | | | | 924,750 | |
Covanta Holding Corp. | | | | | | | | | | | | |
6.375%, 10/1/22 | | | | | | | 1,960 | | | | 2,038,400 | |
5.875%, 3/1/24 | | | | | | | 900 | | | | 906,750 | |
GFL Environmental, Inc. | | | | | | | | | | | | |
9.875%, 2/1/21(6) | | | | | | | 225 | | | | 247,500 | |
| | | | | | | | | | | | | |
| | | | | | | | | | $ | 6,050,004 | |
| | | | | | | | | | | | | |
|
Electric Utilities — 0.2% | |
E.CL SA | | | | | | | | | | | | |
4.50%, 1/29/25(6) | | | | | | | 637 | | | $ | 670,345 | |
NRG Yield Operating, LLC | | | | | | | | | | | | |
5.375%, 8/15/24 | | | | | | | 1,080 | | | | 1,115,100 | |
5.00%, 9/15/26(6) | | | | | | | 1,795 | | | | 1,763,587 | |
Southern Water Greensand Financing PLC | | | | | | | | | | | | |
8.50%, 4/15/19(7) | | | GBP | | | | 204 | | | | 301,475 | |
| | | | | | | | | | | | | |
| | | | | | | | | | $ | 3,850,507 | |
| | | | | | | | | | | | | |
|
Electronics / Electrical — 2.2% | |
AES Panama SA | | | | | | | | | | | | |
6.00%, 6/25/22(6) | | | | | | | 263 | | | $ | 276,808 | |
Anixter, Inc. | | | | | | | | | | | | |
5.50%, 3/1/23 | | | | | | | 1,890 | | | | 1,986,862 | |
| | | | | | | | | | | | |
| Security | | | | | Principal Amount* (000’s omitted) | | | Value | |
| | | | | | | | | | | | |
|
Electronics / Electrical (continued) | |
Avnet, Inc. | | | | | | | | | | | | |
4.625%, 4/15/26 | | | | | | | 985 | | | $ | 1,022,280 | |
Comision Federal de Electricidad | | | | | | | | | | | | |
4.875%, 5/26/21(6) | | | | | | | 1,001 | | | | 1,056,055 | |
CommScope, Inc. | | | | | | | | | | | | |
4.375%, 6/15/20(6) | | | | | | | 825 | | | | 851,812 | |
Exelon Corp. | | | | | | | | | | | | |
5.625%, 6/15/35 | | | | | | | 819 | | | | 983,440 | |
FLIR Systems, Inc. | | | | | | | | | | | | |
3.125%, 6/15/21 | | | | | | | 925 | | | | 955,812 | |
Fortive Corp. | | | | | | | | | | | | |
3.15%, 6/15/26(6) | | | | | | | 945 | | | | 974,443 | |
Infor (US), Inc. | | | | | | | | | | | | |
5.75%, 8/15/20(6) | | | | | | | 965 | | | | 1,016,869 | |
5.75%, 5/15/22 | | | EUR | | | | 475 | | | | 522,350 | |
6.50%, 5/15/22 | | | | | | | 1,760 | | | | 1,790,800 | |
Informatica, LLC | | | | | | | | | | | | |
7.125%, 7/15/23(6) | | | | | | | 515 | | | | 481,525 | |
Ingram Micro, Inc. | | | | | | | | | | | | |
4.95%, 12/15/24 | | | | | | | 869 | | | | 881,283 | |
Jabil Circuit, Inc. | | | | | | | | | | | | |
4.70%, 9/15/22 | | | | | | | 1,015 | | | | 1,069,181 | |
Midamerican Funding, LLC | | | | | | | | | | | | |
6.927%, 3/1/29 | | | | | | | 314 | | | | 441,989 | |
Nuance Communications, Inc. | | | | | | | | | | | | |
5.375%, 8/15/20(6) | | | | | | | 310 | | | | 318,525 | |
NXP B.V./NXP Funding, LLC | | | | | | | | | | | | |
4.625%, 6/1/23(6) | | | | | | | 715 | | | | 783,819 | |
Senvion Holding GmbH | | | | | | | | | | | | |
6.625%, 11/15/20(7) | | | EUR | | | | 400 | | | | 470,126 | |
SS&C Technologies Holdings, Inc. | | | | | | | | | | | | |
5.875%, 7/15/23 | | | | | | | 2,650 | | | | 2,802,375 | |
Trimble Navigation, Ltd. | | | | | | | | | | | | |
4.75%, 12/1/24 | | | | | | | 855 | | | | 901,161 | |
Veritas US, Inc./Veritas Bermuda, Ltd. | | | | | | | | | | | | |
7.50%, 2/1/23(6) | | | | | | | 2,445 | | | | 2,359,425 | |
Versum Materials, Inc. | | | | | | | | | | | | |
5.50%, 9/30/24(6) | | | | | | | 695 | | | | 715,850 | |
Western Digital Corp. | | | | | | | | | | | | |
7.375%, 4/1/23(6) | | | | | | | 3,635 | | | | 3,998,500 | |
10.50%, 4/1/24(6) | | | | | | | 4,745 | | | | 5,521,994 | |
Zebra Technologies Corp. | | | | | | | | | | | | |
7.25%, 10/15/22 | | | | | | | 5,175 | | | | 5,640,750 | |
| | | | | | | | | | | | | |
| | | | | | | | | | $ | 37,824,034 | |
| | | | | | | | | | | | | |
| | | | |
| | 20 | | See Notes to Financial Statements. |
Eaton Vance
Limited Duration Income Fund
September 30, 2016
Portfolio of Investments (Unaudited) — continued
| | | | | | | | | | | | |
| Security | | | | | Principal Amount* (000’s omitted) | | | Value | |
| | | | | | | | | | | | |
|
Energy — 0.1% | |
Ultrapar International S.A. | | | | | | | | | | | | |
5.25%, 10/6/26(6)(11) | | | | | | | 1,000 | | | $ | 1,002,700 | |
| | | | | | | | | | | | | |
| | | | | | | | | | $ | 1,002,700 | |
| | | | | | | | | | | | | |
|
Entertainment — 0.0%(13) | |
CPUK Finance, Ltd. | | | | | | | | | | | | |
7.00%, 2/28/42(6) | | | GBP | | | | 400 | | | $ | 549,438 | |
| | | | | | | | | | | | | |
| | | | | | | | | | $ | 549,438 | |
| | | | | | | | | | | | | |
|
Equipment Leasing — 0.5% | |
Air Lease Corp. | | | | | | | | | | | | |
3.375%, 6/1/21 | | | | | | | 945 | | | $ | 982,441 | |
International Lease Finance Corp. | | | | | | | | | | | | |
8.75%, 3/15/17 | | | | | | | 1,525 | | | | 1,570,581 | |
6.25%, 5/15/19 | | | | | | | 1,025 | | | | 1,113,406 | |
8.25%, 12/15/20 | | | | | | | 1,990 | | | | 2,368,100 | |
8.625%, 1/15/22 | | | | | | | 2,275 | | | | 2,803,937 | |
| | | | | | | | | | | | | |
| | | | | | | | | | $ | 8,838,465 | |
| | | | | | | | | | | | | |
|
Financial Intermediaries — 2.7% | |
Ally Financial, Inc. | | | | | | | | | | | | |
5.50%, 2/15/17 | | | | | | | 5,000 | | | $ | 5,067,075 | |
6.25%, 12/1/17 | | | | | | | 3,295 | | | | 3,430,919 | |
8.00%, 12/31/18 | | | | | | | 250 | | | | 276,250 | |
5.75%, 11/20/25 | | | | | | | 950 | | | | 997,500 | |
CIT Group, Inc. | | | | | | | | | | | | |
5.25%, 3/15/18 | | | | | | | 8,780 | | | | 9,153,150 | |
First Data Corp. | | | | | | | | | | | | |
6.75%, 11/1/20(6) | | | | | | | 3,932 | | | | 4,070,371 | |
7.00%, 12/1/23(6) | | | | | | | 6,630 | | | | 7,027,800 | |
5.00%, 1/15/24(6) | | | | | | | 815 | | | | 830,281 | |
Icahn Enterprises, L.P./Icahn Enterprises Finance Corp. | | | | | | | | | | | | |
3.50%, 3/15/17 | | | | | | | 1,500 | | | | 1,505,550 | |
6.00%, 8/1/20 | | | | | | | 1,685 | | | | 1,697,638 | |
Janus Capital Group, Inc. | | | | | | | | | | | | |
4.875%, 8/1/25 | | | | | | | 1,894 | | | | 2,034,584 | |
JPMorgan Chase & Co. | | | | | | | | | | | | |
3.375%, 5/1/23 | | | | | | | 1,150 | | | | 1,183,828 | |
Series S, 6.75% to 2/1/24(9)(10) | | | | | | | 2,640 | | | | 2,946,900 | |
Navient Corp. | | | | | | | | | | | | |
5.50%, 1/15/19 | | | | | | | 3,125 | | | | 3,179,688 | |
4.875%, 6/17/19 | | | | | | | 215 | | | | 214,731 | |
8.00%, 3/25/20 | | | | | | | 2,943 | | | | 3,163,725 | |
| | | | | | | | | | | | |
| Security | | | | | Principal Amount* (000’s omitted) | | | Value | |
| | | | | | | | | | | | |
|
Financial Intermediaries (continued) | |
5.00%, 10/26/20 | | | | | | | 995 | | | $ | 983,806 | |
7.25%, 1/25/22 | | | | | | | 215 | | | | 220,106 | |
| | | | | | | | | | | | | |
| | | | | | | | | | $ | 47,983,902 | |
| | | | | | | | | | | | | |
|
Financial Services — 0.3% | |
Santander Holdings USA, Inc. | | | | | | | | | | | | |
4.50%, 7/17/25 | | | | | | | 1,445 | | | $ | 1,505,012 | |
Sensata Technologies UK Financing Co. PLC | | | | | | | | | | | | |
6.25%, 2/15/26(6) | | | | | | | 2,735 | | | | 2,981,150 | |
Solera, LLC/Solera Finance, Inc. | | | | | | | | | | | | |
10.50%, 3/1/24(6) | | | | | | | 1,035 | | | | 1,159,200 | |
| | | | | | | | | | | | | |
| | | | | | | | | | $ | 5,645,362 | |
| | | | | | | | | | | | | |
|
Food Products — 1.0% | |
Albertsons Cos., LLC/Safeway, Inc./New Albertson’s, Inc./Albertson’s, LLC | | | | | | | | | | | | |
6.625%, 6/15/24(6) | | | | | | | 225 | | | $ | 234,563 | |
5.75%, 3/15/25(6) | | | | | | | 2,110 | | | | 2,110,000 | |
BRF GmbH | | | | | | | | | | | | |
4.35%, 9/29/26(6) | | | | | | | 1,200 | | | | 1,180,800 | |
BRF SA | | | | | | | | | | | | |
3.95%, 5/22/23(6) | | | | | | | 1,250 | | | | 1,234,375 | |
Dean Foods Co. | | | | | | | | | | | | |
6.50%, 3/15/23(6) | | | | | | | 1,875 | | | | 1,992,187 | |
Delhaize Group SA | | | | | | | | | | | | |
5.70%, 10/1/40 | | | | | | | 500 | | | | 608,647 | |
Iceland Bondco PLC | | | | | | | | | | | | |
4.778%, 7/15/20(6)(12) | | | GBP | | | | 1,500 | | | | 1,808,128 | |
Ingredion, Inc. | | | | | | | | | | | | |
3.20%, 10/1/26 | | | | | | | 500 | | | | 512,446 | |
NBTY, Inc. | | | | | | | | | | | | |
7.625%, 5/15/21(6) | | | | | | | 225 | | | | 230,585 | |
Post Holdings, Inc. | | | | | | | | | | | | |
6.75%, 12/1/21(6) | | | | | | | 570 | | | | 614,181 | |
7.75%, 3/15/24(6) | | | | | | | 1,495 | | | | 1,681,875 | |
8.00%, 7/15/25(6) | | | | | | | 745 | | | | 856,284 | |
5.00%, 8/15/26(6) | | | | | | | 2,025 | | | | 2,019,937 | |
US Foods, Inc. | | | | | | | | | | | | |
5.875%, 6/15/24(6) | | | | | | | 1,870 | | | | 1,954,150 | |
WhiteWave Foods Co. (The) | | | | | | | | | | | | |
5.375%, 10/1/22 | | | | | | | 855 | | | | 974,700 | |
| | | | | | | | | | | | | |
| | | | | | | | | | $ | 18,012,858 | |
| | | | | | | | | | | | | |
| | | | |
| | 21 | | See Notes to Financial Statements. |
Eaton Vance
Limited Duration Income Fund
September 30, 2016
Portfolio of Investments (Unaudited) — continued
| | | | | | | | | | | | |
| Security | | | | | Principal Amount* (000’s omitted) | | | Value | |
| | | | | | | | | | | | |
|
Food Service — 0.8% | |
1011778 B.C. Unlimited Liability Company/New Red Finance, Inc. | | | | | | | | | | | | |
4.625%, 1/15/22(6) | | | | | | | 2,410 | | | $ | 2,512,425 | |
6.00%, 4/1/22(6) | | | | | | | 4,775 | | | | 5,013,750 | |
Landry’s, Inc. | | | | | | | | | | | | |
6.75%, 10/15/24(6)(11) | | | | | | | 700 | | | | 714,000 | |
Manitowoc Foodservice, Inc. | | | | | | | | | | | | |
9.50%, 2/15/24 | | | | | | | 115 | | | | 131,675 | |
NPC International, Inc./NPC Quality Burgers, Inc./NPC Operating Company B, Inc. | | | | | | | | | | | | |
10.50%, 1/15/20 | | | | | | | 4,405 | | | | 4,625,250 | |
Yum! Brands, Inc. | | | | | | | | | | | | |
5.30%, 9/15/19 | | | | | | | 425 | | | | 461,125 | |
3.75%, 11/1/21 | | | | | | | 705 | | | | 718,219 | |
3.875%, 11/1/23 | | | | | | | 190 | | | | 187,862 | |
| | | | | | | | | | | | | |
| | | | | | | | | | $ | 14,364,306 | |
| | | | | | | | | | | | | |
|
Food / Drug Retailers — 0.4% | |
CVS Health Corp. | | | | | | | | | | | | |
3.375%, 8/12/24 | | | | | | | 925 | | | $ | 981,105 | |
ESAL GmbH | | | | | | | | | | | | |
6.25%, 2/5/23(6) | | | | | | | 1,000 | | | | 975,000 | |
Rite Aid Corp. | | | | | | | | | | | | |
6.125%, 4/1/23(6) | | | | | | | 4,230 | | | | 4,573,687 | |
| | | | | | | | | | | | | |
| | | | | | | | | | $ | 6,529,792 | |
| | | | | | | | | | | | | |
|
Forest Products — 0.1% | |
Domtar Corp. | | | | | | | | | | | | |
10.75%, 6/1/17 | | | | | | | 677 | | | $ | 716,045 | |
Lecta S.A. | | | | | | | | | | | | |
6.50%, 8/1/23(7) | | | EUR | | | | 410 | | | | 456,359 | |
| | | | | | | | | | | | | |
| | | | | | | | | | $ | 1,172,404 | |
| | | | | | | | | | | | | |
|
Health Care — 4.3% | |
Aetna, Inc. | | | | | | | | | | | | |
4.375%, 6/15/46 | | | | | | | 940 | | | $ | 990,996 | |
Alere, Inc. | | | | | | | | | | | | |
7.25%, 7/1/18 | | | | | | | 485 | | | | 496,216 | |
6.50%, 6/15/20 | | | | | | | 1,425 | | | | 1,432,125 | |
6.375%, 7/1/23(6) | | | | | | | 3,400 | | | | 3,485,000 | |
AmSurg Corp. | | | | | | | | | | | | |
5.625%, 11/30/20 | | | | | | | 1,865 | | | | 1,920,950 | |
5.625%, 7/15/22 | | | | | | | 1,690 | | | | 1,734,362 | |
| | | | | | | | | | | | |
| Security | | | | | Principal Amount* (000’s omitted) | | | Value | |
| | | | | | | | | | | | |
|
Health Care (continued) | |
Capsugel SA | | | | | | | | | | | | |
7.00%, 5/15/19(6)(8) | | | | | | | 603 | | | $ | 604,886 | |
Centene Corp. | | | | | | | | | | | | |
4.75%, 5/15/22 | | | | | | | 870 | | | | 902,625 | |
6.125%, 2/15/24 | | | | | | | 200 | | | | 217,500 | |
Cerberus Nightingale 1 S.a.r.l. | | | | | | | | | | | | |
8.25%, 2/1/20(7) | | | EUR | | | | 400 | | | | 463,943 | |
CHS/Community Health Systems, Inc. | | | | | | | | | | | | |
5.125%, 8/15/18 | | | | | | | 2,748 | | | | 2,775,755 | |
7.125%, 7/15/20 | | | | | | | 2,785 | | | | 2,602,582 | |
6.875%, 2/1/22 | | | | | | | 1,975 | | | | 1,708,375 | |
Concordia International Corp. | | | | | | | | | | | | |
9.50%, 10/21/22(6) | | | | | | | 2,000 | | | | 1,395,000 | |
ConvaTec Healthcare E SA | | | | | | | | | | | | |
10.50%, 12/15/18(6) | | | | | | | 2,235 | | | | 2,274,112 | |
DJO Finco, Inc./DJO Finance, LLC/DJO Finance Corp. | | | | | | | | | | | | |
8.125%, 6/15/21(6) | | | | | | | 1,145 | | | | 1,067,713 | |
Fresenius Medical Care US Finance II, Inc. | | | | | | | | | | | | |
5.625%, 7/31/19(6) | | | | | | | 1,640 | | | | 1,785,550 | |
5.875%, 1/31/22(6) | | | | | | | 1,365 | | | | 1,552,688 | |
Grifols Worldwide Operations, Ltd. | | | | | | | | | | | | |
5.25%, 4/1/22 | | | | | | | 1,235 | | | | 1,284,400 | |
HCA Holdings, Inc. | | | | | | | | | | | | |
6.25%, 2/15/21 | | | | | | | 1,710 | | | | 1,859,625 | |
HCA, Inc. | | | | | | | | | | | | |
6.50%, 2/15/20 | | | | | | | 3,215 | | | | 3,568,650 | |
7.50%, 2/15/22 | | | | | | | 2,930 | | | | 3,369,500 | |
4.75%, 5/1/23 | | | | | | | 1,125 | | | | 1,175,625 | |
5.875%, 2/15/26 | | | | | | | 2,705 | | | | 2,887,587 | |
4.50%, 2/15/27 | | | | | | | 705 | | | | 709,406 | |
Hill-Rom Holdings, Inc. | | | | | | | | | | | | |
5.75%, 9/1/23(6) | | | | | | | 1,030 | | | | 1,104,469 | |
Hologic, Inc. | | | | | | | | | | | | |
5.25%, 7/15/22(6) | | | | | | | 2,835 | | | | 3,019,275 | |
Kinetic Concepts, Inc./KCI USA, Inc. | | | | | | | | | | | | |
10.50%, 11/1/18 | | | | | | | 3,115 | | | | 3,275,422 | |
7.875%, 2/15/21(6) | | | | | | | 1,405 | | | | 1,524,425 | |
9.625%, 10/1/21(6) | | | | | | | 1,720 | | | | 1,724,300 | |
MEDNAX, Inc. | | | | | | | | | | | | |
5.25%, 12/1/23(6) | | | | | | | 2,105 | | | | 2,218,144 | |
MPH Acquisition Holdings, LLC | | | | | | | | | | | | |
7.125%, 6/1/24(6) | | | | | | | 400 | | | | 431,000 | |
Opal Acquisition, Inc. | | | | | | | | | | | | |
8.875%, 12/15/21(6) | | | | | | | 1,960 | | | | 1,617,000 | |
| | | | |
| | 22 | | See Notes to Financial Statements. |
Eaton Vance
Limited Duration Income Fund
September 30, 2016
Portfolio of Investments (Unaudited) — continued
| | | | | | | | | | | | |
| Security | | | | | Principal Amount* (000’s omitted) | | | Value | |
| | | | | | | | | | | | |
|
Health Care (continued) | |
Surgical Care Affiliates, Inc. | | | | | | | | | | | | |
6.00%, 4/1/23(6) | | | | | | | 1,475 | | | $ | 1,556,125 | |
TeamHealth, Inc. | | | | | | | | | | | | |
7.25%, 12/15/23(6) | | | | | | | 3,360 | | | | 3,624,600 | |
Teleflex, Inc. | | | | | | | | | | | | |
5.25%, 6/15/24 | | | | | | | 790 | | | | 827,525 | |
Tenet Healthcare Corp. | | | | | | | | | | | | |
6.00%, 10/1/20 | | | | | | | 1,795 | | | | 1,902,700 | |
8.125%, 4/1/22 | | | | | | | 5,520 | | | | 5,547,600 | |
6.75%, 6/15/23 | | | | | | | 620 | | | | 578,150 | |
Unilabs Subholding AB | | | | | | | | | | | | |
8.50%, 7/15/18(7) | | | EUR | | | | 750 | | | | 863,575 | |
WellCare Health Plans, Inc. | | | | | | | | | | | | |
5.75%, 11/15/20 | | | | | | | 4,015 | | | | 4,147,997 | |
| | | | | | | | | | | | | |
| | | | | | | | | | $ | 76,227,478 | |
| | | | | | | | | | | | | |
|
Home Furnishings — 0.2% | |
Harman International Industries, Inc. | | | | | | | | | | | | |
4.15%, 5/15/25 | | | | | | | 940 | | | $ | 974,695 | |
Newell Rubbermaid, Inc. | | | | | | | | | | | | |
4.20%, 4/1/26 | | | | | | | 945 | | | | 1,031,015 | |
Tempur Sealy International, Inc. | | | | | | | | | | | | |
5.625%, 10/15/23 | | | | | | | 1,445 | | | | 1,535,313 | |
| | | | | | | | | | | | | |
| | | | | | | | | | $ | 3,541,023 | |
| | | | | | | | | | | | | |
|
Homebuilders / Real Estate — 0.0%(13) | |
Beazer Homes USA, Inc. | | | | | | | | | | | | |
8.75%, 3/15/22(6) | | | | | | | 350 | | | $ | 370,125 | |
Bormioli Rocco Holdings SA | | | | | | | | | | | | |
10.00%, 8/1/18(7) | | | EUR | | | | 400 | | | | 462,887 | |
| | | | | | | | | | | | | |
| | | | | | | | | | $ | 833,012 | |
| | | | | | | | | | | | | |
|
Industrial Equipment — 0.4% | |
BlueLine Rental Finance Corp. | | | | | | | | | | | | |
7.00%, 2/1/19(6) | | | | | | | 2,690 | | | $ | 2,360,475 | |
CNH Industrial Capital, LLC | | | | | | | | | | | | |
6.25%, 11/1/16 | | | | | | | 2,055 | | | | 2,061,547 | |
3.625%, 4/15/18 | | | | | | | 2,500 | | | | 2,550,000 | |
Erickson Air-Crane, Inc., Promissory Note | | | | | | | | | | | | |
6.00%, 11/2/20(3)(14) | | | | | | | 56 | | | | 14,042 | |
Vander Intermediate Holding II Corp. | | | | | | | | | | | | |
9.75%, 2/1/19(6)(8) | | | | | | | 1,716 | | | | 876,625 | |
| | | | | | | | | | | | | |
| | | | | | | | | | $ | 7,862,689 | |
| | | | | | | | | | | | | |
| | | | | | | | | | | | |
| Security | | | | | Principal Amount* (000’s omitted) | | | Value | |
| | | | | | | | | | | | |
|
Insurance — 0.7% | |
Aflac, Inc. | | | | | | | | | | | | |
3.625%, 11/15/24 | | | | | | | 1,000 | | | $ | 1,077,107 | |
Hanover Insurance Group, Inc. (The) | | | | | | | | | | | | |
4.50%, 4/15/26 | | | | | | | 1,550 | | | | 1,614,898 | |
Hub Holdings, LLC/Hub Holdings Finance, Inc. | | | | | | | | | | | | |
8.125%, 7/15/19(6)(8) | | | | | | | 1,695 | | | | 1,661,100 | |
Hub International, Ltd. | | | | | | | | | | | | |
7.875%, 10/1/21(6) | | | | | | | 2,325 | | | | 2,377,312 | |
Principal Financial Group, Inc. | | | | | | | | | | | | |
6.05%, 10/15/36 | | | | | | | 309 | | | | 386,912 | |
USI, Inc. | | | | | | | | | | | | |
7.75%, 1/15/21(6) | | | | | | | 2,670 | | | | 2,723,400 | |
Wayne Merger Sub, LLC | | | | | | | | | | | | |
8.25%, 8/1/23(6) | | | | | | | 1,655 | | | | 1,686,031 | |
XLIT, Ltd. | | | | | | | | | | | | |
4.45%, 3/31/25 | | | | | | | 1,575 | | | | 1,602,418 | |
| | | | | | | | | | | | | |
| | | | | | | | | | $ | 13,129,178 | |
| | | | | | | | | | | | | |
|
Internet Software & Services — 0.3% | |
Edreams Odigeo SA | | | | | | | | | | | | |
8.50%, 8/1/21(7)(11) | | | EUR | | | | 405 | | | $ | 463,514 | |
Netflix, Inc. | | | | | | | | | | | | |
5.50%, 2/15/22 | | | | | | | 1,825 | | | | 1,973,281 | |
Riverbed Technology, Inc. | | | | | | | | | | | | |
8.875%, 3/1/23(6) | | | | | | | 1,995 | | | | 2,142,132 | |
| | | | | | | | | | | | | |
| | | | | | | | | | $ | 4,578,927 | |
| | | | | | | | | | | | | |
|
Leisure Goods / Activities / Movies — 0.8% | |
Activision Blizzard, Inc. | | | | | | | | | | | | |
2.30%, 9/15/21(6) | | | | | | | 1,000 | | | $ | 1,003,692 | |
AMC Entertainment, Inc. | | | | | | | | | | | | |
5.75%, 6/15/25 | | | | | | | 250 | | | | 253,750 | |
Match Group, Inc. | | | | | | | | | | | | |
6.375%, 6/1/24 | | | | | | | 200 | | | | 217,750 | |
National CineMedia, LLC | | | | | | | | | | | | |
6.00%, 4/15/22 | | | | | | | 3,625 | | | | 3,797,187 | |
NCL Corp., Ltd. | | | | | | | | | | | | |
5.25%, 11/15/19(6) | | | | | | | 985 | | | | 999,775 | |
4.625%, 11/15/20(6) | | | | | | | 1,870 | | | | 1,879,350 | |
Nord Anglia Education Finance, LLC | | | | | | | | | | | | |
5.75%, 7/15/22(7) | | | CHF | | | | 600 | | | | 648,482 | |
Regal Entertainment Group | | | | | | | | | | | | |
5.75%, 3/15/22 | | | | | | | 780 | | | | 805,350 | |
| | | | |
| | 23 | | See Notes to Financial Statements. |
Eaton Vance
Limited Duration Income Fund
September 30, 2016
Portfolio of Investments (Unaudited) — continued
| | | | | | | | | | | | |
| Security | | | | | Principal Amount* (000’s omitted) | | | Value | |
| | | | | | | | | | | | |
|
Leisure Goods / Activities / Movies (continued) | |
Royal Caribbean Cruises, Ltd. | | | | | | | | | | | | |
7.25%, 3/15/18 | | | | | | | 1,680 | | | $ | 1,808,100 | |
Sabre GLBL, Inc. | | | | | | | | | | | | |
5.375%, 4/15/23(6) | | | | | | | 855 | | | | 882,788 | |
Viking Cruises, Ltd. | | | | | | | | | | | | |
8.50%, 10/15/22(6) | | | | | | | 1,065 | | | | 1,096,950 | |
6.25%, 5/15/25(6) | | | | | | | 1,690 | | | | 1,588,600 | |
| | | | | | | | | | | | | |
| | | | | | | | | | $ | 14,981,774 | |
| | | | | | | | | | | | | |
|
Lodging and Casinos — 1.7% | |
Buffalo Thunder Development Authority | | | | | | | | | | | | |
11.00%, 12/9/22(6) | | | | | | | 2,006 | | | $ | 1,053,192 | |
Caesars Entertainment Operating Co., Inc. | | | | | | | | | | | | |
8.50%, 2/15/20(5) | | | | | | | 2,175 | | | | 2,283,750 | |
ESH Hospitality, Inc. | | | | | | | | | | | | |
5.25%, 5/1/25(6) | | | | | | | 1,260 | | | | 1,264,725 | |
GLP Capital, L.P./GLP Financing II, Inc. | | | | | | | | | | | | |
4.875%, 11/1/20 | | | | | | | 2,650 | | | | 2,868,625 | |
Hilton Domestic Operating Co., Inc. | | | | | | | | | | | | |
4.25%, 9/1/24(6) | | | | | | | 1,735 | | | | 1,778,375 | |
Hilton Worldwide Finance, LLC/Hilton Worldwide Finance Corp. | | | | | | | | | | | | |
5.625%, 10/15/21 | | | | | | | 3,645 | | | | 3,754,616 | |
MGM Growth Properties Operating Partnership, L.P./MGP Escrow Co-Issuer, Inc. | | | | | | | | | | | | |
4.50%, 9/1/26(6) | | | | | | | 1,060 | | | | 1,065,300 | |
MGM Resorts International | | | | | | | | | | | | |
6.625%, 12/15/21 | | | | | | | 2,455 | | | | 2,774,150 | |
7.75%, 3/15/22 | | | | | | | 3,970 | | | | 4,615,125 | |
6.00%, 3/15/23 | | | | | | | 2,460 | | | | 2,675,250 | |
NH Hotel Group SA | | | | | | | | | | | | |
3.75%, 10/1/23(7) | | | EUR | | | | 250 | | | | 284,074 | |
RHP Hotel Properties, L.P./RHP Finance Corp. | | | | | | | | | | | | |
5.00%, 4/15/23 | | | | | | | 1,215 | | | | 1,239,300 | |
Rivers Pittsburgh Borrower, L.P./Rivers Pittsburgh Finance Corp. | | | | | | | | | | | | |
6.125%, 8/15/21(6) | | | | | | | 900 | | | | 931,500 | |
Studio City Finance, Ltd. | | | | | | | | | | | | |
8.50%, 12/1/20(6) | | | | | | | 905 | | | | 936,675 | |
Tunica-Biloxi Gaming Authority | | | | | | | | | | | | |
9.00%, 11/15/15(5)(6) | | | | | | | 3,565 | | | | 1,604,250 | |
| | | | | | | | | | | | | |
| | | | | | | | | | $ | 29,128,907 | |
| | | | | | | | | | | | | |
| | | | | | | | | | | | |
| Security | | | | | Principal Amount* (000’s omitted) | | | Value | |
| | | | | | | | | | | | |
|
Machinery — 0.1% | |
Cloud Crane, LLC | | | | | | | | | | | | |
10.125%, 8/1/24(6) | | | | | | | 1,280 | | | $ | 1,331,200 | |
| | | | | | | | | | | | | |
| | | | | | | | | | $ | 1,331,200 | |
| | | | | | | | | | | | | |
|
Manufacturing — 0.2% | |
Novelis Corp. | | | | | | | | | | | | |
6.25%, 8/15/24(6) | | | | | | | 1,065 | | | $ | 1,134,225 | |
5.875%, 9/30/26(6) | | | | | | | 1,530 | | | | 1,570,163 | |
| | | | | | | | | | | | | |
| | | | | | | | | | $ | 2,704,388 | |
| | | | | | | | | | | | | |
|
Media — 0.3% | |
McGraw-Hill Global Education Holdings, LLC/McGraw-Hill Global Education Finance | | | | | | | | | | | | |
7.875%, 5/15/24(6) | | | | | | | 225 | | | $ | 243,844 | |
Unitymedia Hessen GmbH & Co. KG/Unitymedia NRW GmbH | | | | | | | | | | | | |
5.50%, 1/15/23(6) | | | | | | | 4,295 | | | | 4,461,431 | |
4.00%, 1/15/25(7) | | | EUR | | | | 500 | | | | 579,227 | |
| | | | | | | | | | | | | |
| | | | | | | | | | $ | 5,284,502 | |
| | | | | | | | | | | | | |
|
Metals / Mining — 0.3% | |
Alcoa Nederland Holding B.V. | | | | | | | | | | | | |
6.75%, 9/30/24(6) | | | | | | | 670 | | | $ | 697,638 | |
7.00%, 9/30/26(6) | | | | | | | 350 | | | | 362,688 | |
Freeport-McMoRan, Inc. | | | | | | | | | | | | |
3.55%, 3/1/22 | | | | | | | 1,000 | | | | 915,000 | |
Glencore Funding, LLC | | | | | | | | | | | | |
4.00%, 4/16/25(6) | | | | | | | 1,300 | | | | 1,273,264 | |
Newcrest Finance Pty. Ltd. | | | | | | | | | | | | |
5.75%, 11/15/41(6) | | | | | | | 794 | | | | 824,645 | |
Southern Copper Corp. | | | | | | | | | | | | |
5.25%, 11/8/42 | | | | | | | 753 | | | | 717,248 | |
| | | | | | | | | | | | | |
| | | | | | | | | | $ | 4,790,483 | |
| | | | | | | | | | | | | |
|
Nonferrous Metals / Minerals — 0.8% | |
Eldorado Gold Corp. | | | | | | | | | | | | |
6.125%, 12/15/20(6) | | | | | | | 3,685 | | | $ | 3,729,220 | |
Imperial Metals Corp. | | | | | | | | | | | | |
7.00%, 3/15/19(6) | | | | | | | 880 | | | | 831,600 | |
Kissner Milling Co., Ltd. | | | | | | | | | | | | |
7.25%, 6/1/19(6) | | | | | | | 4,245 | | | | 4,436,025 | |
New Gold, Inc. | | | | | | | | | | | | |
6.25%, 11/15/22(6) | | | | | | | 2,055 | | | | 2,111,513 | |
| | | | |
| | 24 | | See Notes to Financial Statements. |
Eaton Vance
Limited Duration Income Fund
September 30, 2016
Portfolio of Investments (Unaudited) — continued
| | | | | | | | | | | | |
| Security | | | | | Principal Amount* (000’s omitted) | | | Value | |
| | | | | | | | | | | | |
|
Nonferrous Metals / Minerals (continued) | |
SunCoke Energy Partners, L.P./SunCoke Energy Partners Finance Corp. | | | | | | | | | | | | |
7.375%, 2/1/20 | | | | | | | 2,330 | | | $ | 2,190,200 | |
SunCoke Energy, Inc. | | | | | | | | | | | | |
7.625%, 8/1/19 | | | | | | | 92 | | | | 87,400 | |
| | | | | | | | | | | | | |
| | | | | | | | | | $ | 13,385,958 | |
| | | | | | | | | | | | | |
|
Oil and Gas — 6.8% | |
AmeriGas Finance, LLC/AmeriGas Finance Corp. | | | | | | | | | | | | |
7.00%, 5/20/22 | | | | | | | 4,620 | | | $ | 4,908,750 | |
AmeriGas Partners, L.P./AmeriGas Finance Corp. | | | | | | | | | | | | |
5.625%, 5/20/24 | | | | | | | 380 | | | | 403,750 | |
5.875%, 8/20/26 | | | | | | | 940 | | | | 998,750 | |
Antero Resources Corp. | | | | | | | | | | | | |
6.00%, 12/1/20 | | | | | | | 473 | | | | 489,555 | |
5.375%, 11/1/21 | | | | | | | 3,515 | | | | 3,576,512 | |
5.125%, 12/1/22 | | | | | | | 1,360 | | | | 1,377,000 | |
5.625%, 6/1/23 | | | | | | | 1,270 | | | | 1,300,163 | |
Apache Corp. | | | | | | | | | | | | |
6.00%, 1/15/37 | | | | | | | 479 | | | | 549,208 | |
Blue Racer Midstream, LLC/Blue Racer Finance Corp. | | | | | | | | | | | | |
6.125%, 11/15/22(6) | | | | | | | 700 | | | | 687,750 | |
Bonanza Creek Energy, Inc. | | | | | | | | | | | | |
6.75%, 4/15/21 | | | | | | | 2,010 | | | | 939,675 | |
Callon Petroleum Co. | | | | | | | | | | | | |
6.125%, 10/1/24(6)(11) | | | | | | | 490 | | | | 508,375 | |
Canbriam Energy, Inc. | | | | | | | | | | | | |
9.75%, 11/15/19(6) | | | | | | | 1,870 | | | | 1,972,850 | |
Cheniere Corpus Christi Holdings, LLC | | | | | | | | | | | | |
7.00%, 6/30/24(6) | | | | | | | 340 | | | | 368,900 | |
Chesapeake Energy Corp. | | | | | | | | | | | | |
8.00%, 12/15/22(6) | | | | | | | 500 | | | | 507,500 | |
Concho Resources, Inc. | | | | | | | | | | | | |
6.50%, 1/15/22 | | | | | | | 685 | | | | 712,400 | |
5.50%, 4/1/23 | | | | | | | 5,200 | | | | 5,388,500 | |
ConocoPhillips Holding Co. | | | | | | | | | | | | |
6.95%, 4/15/29 | | | | | | | 850 | | | | 1,084,051 | |
Continental Resources, Inc. | | | | | | | | | | | | |
4.50%, 4/15/23 | | | | | | | 100 | | | | 96,500 | |
CrownRock, L.P./CrownRock Finance, Inc. | | | | | | | | | | | | |
7.125%, 4/15/21(6) | | | | | | | 2,840 | | | | 2,982,000 | |
7.75%, 2/15/23(6) | | | | | | | 2,450 | | | | 2,639,875 | |
CVR Refining, LLC/Coffeyville Finance, Inc. | | | | | | | | | | | | |
6.50%, 11/1/22 | | | | | | | 5,210 | | | | 4,741,100 | |
| | | | | | | | | | | | |
| Security | | | | | Principal Amount* (000’s omitted) | | | Value | |
| | | | | | | | | | | | |
|
Oil and Gas (continued) | |
Denbury Resources, Inc. | | | | | | | | | | | | |
9.00%, 5/15/21(6) | | | | | | | 880 | | | $ | 926,200 | |
5.50%, 5/1/22 | | | | | | | 675 | | | | 487,688 | |
Devon Energy Corp. | | | | | | | | | | | | |
5.00%, 6/15/45 | | | | | | | 1,240 | | | | 1,213,641 | |
Encana Corp. | | | | | | | | | | | | |
6.50%, 5/15/19 | | | | | | | 2,218 | | | | 2,400,741 | |
Endeavor Energy Resources, L.P./EER Finance, Inc. | | | | | | | | | | | | |
7.00%, 8/15/21(6) | | | | | | | 3,275 | | | | 3,381,437 | |
8.125%, 9/15/23(6) | | | | | | | 975 | | | | 1,043,250 | |
Energy Transfer Equity, L.P. | | | | | | | | | | | | |
7.50%, 10/15/20 | | | | | | | 1,950 | | | | 2,149,875 | |
5.875%, 1/15/24 | | | | | | | 1,965 | | | | 2,048,512 | |
EP Energy, LLC/Everest Acquisition Finance, Inc. | | | | | | | | | | | | |
7.75%, 9/1/22 | | | | | | | 2,065 | | | | 1,239,000 | |
ESC Chesapeake Oil Field | | | | | | | | | | | | |
6.625%, 11/15/19(5) | | | | | | | 1,100 | | | | 0 | |
Extraction Oil & Gas Holdings, LLC/Extraction Finance Corp. | | | | | | | | | | | | |
7.875%, 7/15/21(6) | | | | | | | 480 | | | | 500,400 | |
Great Western Petroleum, LLC/Great Western Finance, Inc. | | | | | | | | | | | | |
9.00%, 9/30/21(6) | | | | | | | 2,060 | | | | 2,070,300 | |
Gulfport Energy Corp. | | | | | | | | | | | | |
7.75%, 11/1/20 | | | | | | | 4,585 | | | | 4,779,862 | |
6.625%, 5/1/23 | | | | | | | 2,420 | | | | 2,492,600 | |
Holly Energy Partners, L.P./Holly Energy Finance Corp. | | | | | | | | | | | | |
6.50%, 3/1/20 | | | | | | | 615 | | | | 637,294 | |
6.00%, 8/1/24(6) | | | | | | | 525 | | | | 546,000 | |
Kerr-McGee Corp. | | | | | | | | | | | | |
6.95%, 7/1/24 | | | | | | | 1,000 | | | | 1,204,564 | |
Matador Resources Co. | | | | | | | | | | | | |
6.875%, 4/15/23 | | | | | | | 2,675 | | | | 2,782,000 | |
Murphy Oil Corp. | | | | | | | | | | | | |
6.875%, 8/15/24 | | | | | | | 495 | | | | 512,487 | |
Noble Energy, Inc. | | | | | | | | | | | | |
5.625%, 5/1/21 | | | | | | | 782 | | | | 815,499 | |
Oasis Petroleum, Inc. | | | | | | | | | | | | |
6.50%, 11/1/21 | | | | | | | 420 | | | | 403,200 | |
6.875%, 3/15/22 | | | | | | | 110 | | | | 105,875 | |
Pacific Drilling SA | | | | | | | | | | | | |
5.375%, 6/1/20(6) | | | | | | | 1,274 | | | | 358,313 | |
Pacific Exploration and Production Corp. | | | | | | | | | | | | |
5.625%, 1/19/25(5)(6) | | | | | | | 910 | | | | 172,900 | |
| | | | |
| | 25 | | See Notes to Financial Statements. |
Eaton Vance
Limited Duration Income Fund
September 30, 2016
Portfolio of Investments (Unaudited) — continued
| | | | | | | | | | | | |
| Security | | | | | Principal Amount* (000’s omitted) | | | Value | |
| | | | | | | | | | | | |
|
Oil and Gas (continued) | |
Paramount Resources, Ltd. | | | | | | | | | | | | |
6.875%, 6/30/23(6) | | | | | | | 1,250 | | | $ | 1,303,125 | |
Parsley Energy, LLC/Parsley Finance Corp. | | | | | | | | | | | | |
6.25%, 6/1/24(6) | | | | | | | 345 | | | | 357,938 | |
PBF Holding Co., LLC/PBF Finance Corp. | | | | | | | | | | | | |
8.25%, 2/15/20 | | | | | | | 2,545 | | | | 2,637,892 | |
PBF Logistics, L.P./PBF Logistics Finance Corp. | | | | | | | | | | | | |
6.875%, 5/15/23 | | | | | | | 1,800 | | | | 1,743,750 | |
PDC Energy, Inc. | | | | | | | | | | | | |
6.125%, 9/15/24(6) | | | | | | | 350 | | | | 364,875 | |
Petrobras Global Finance B.V. | | | | | | | | | | | | |
3.00%, 1/15/19 | | | | | | | 980 | | | | 962,850 | |
7.875%, 3/15/19 | | | | | | | 940 | | | | 1,019,900 | |
Precision Drilling Corp. | | | | | | | | | | | | |
6.625%, 11/15/20 | | | | | | | 260 | | | | 242,450 | |
RSP Permian, Inc. | | | | | | | | | | | | |
6.625%, 10/1/22 | | | | | | | 3,090 | | | | 3,252,225 | |
Sabine Pass Liquefaction, LLC | | | | | | | | | | | | |
5.625%, 2/1/21 | | | | | | | 3,640 | | | | 3,890,250 | |
5.625%, 4/15/23 | | | | | | | 4,451 | | | | 4,773,697 | |
5.75%, 5/15/24 | | | | | | | 1,645 | | | | 1,778,656 | |
5.625%, 3/1/25 | | | | | | | 2,885 | | | | 3,112,194 | |
5.00%, 3/15/27(6) | | | | | | | 1,740 | | | | 1,787,850 | |
Seven Generations Energy, Ltd. | | | | | | | | | | | | |
8.25%, 5/15/20(6) | | | | | | | 4,390 | | | | 4,691,812 | |
6.75%, 5/1/23(6) | | | | | | | 2,435 | | | | 2,538,487 | |
Seventy Seven Energy, Inc. | | | | | | | | | | | | |
6.50%, 7/15/22(5) | | | | | | | 1,255 | | | | 0 | |
Shell International Finance B.V. | | | | | | | | | | | | |
3.25%, 5/11/25 | | | | | | | 1,010 | | | | 1,065,829 | |
SM Energy Co. | | | | | | | | | | | | |
6.125%, 11/15/22 | | | | | | | 870 | | | | 874,350 | |
6.50%, 1/1/23 | | | | | | | 1,995 | | | | 2,024,925 | |
6.75%, 9/15/26 | | | | | | | 695 | | | | 703,253 | |
Southwestern Energy Co. | | | | | | | | | | | | |
5.80%, 1/23/20 | | | | | | | 375 | | | | 375,938 | |
4.10%, 3/15/22 | | | | | | | 175 | | | | 159,688 | |
6.70%, 1/23/25 | | | | | | | 425 | | | | 426,594 | |
Sunoco, L.P./Sunoco Finance Corp. | | | | | | | | | | | | |
6.375%, 4/1/23(6) | | | | | | | 1,835 | | | | 1,894,638 | |
Tesoro Logistics, L.P./Tesoro Logistics Finance Corp. | | | | | | | | | | | | |
5.50%, 10/15/19 | | | | | | | 630 | | | | 674,100 | |
6.25%, 10/15/22 | | | | | | | 1,505 | | | | 1,614,113 | |
| | | | | | | | | | | | |
| Security | | | | | Principal Amount* (000’s omitted) | | | Value | |
| | | | | | | | | | | | |
|
Oil and Gas (continued) | |
Triangle USA Petroleum Corp. | | | | | | | | | | | | |
6.75%, 7/15/22(5)(6) | | | | | | | 1,375 | | | $ | 309,375 | |
Whiting Petroleum Corp. | | | | | | | | | | | | |
5.00%, 3/15/19 | | | | | | | 390 | | | | 379,275 | |
Williams Cos., Inc. (The) | | | | | | | | | | | | |
3.70%, 1/15/23 | | | | | | | 1,605 | | | | 1,564,875 | |
4.55%, 6/24/24 | | | | | | | 1,240 | | | | 1,270,442 | |
5.75%, 6/24/44 | | | | | | | 1,295 | | | | 1,340,325 | |
Williams Partners, L.P./ACMP Finance Corp. | | | | | | | | | | | | |
4.875%, 3/15/24 | | | | | | | 385 | | | | 389,729 | |
Woodside Finance, Ltd. | | | | | | | | | | | | |
3.70%, 9/15/26(6) | | | | | | | 1,000 | | | | 1,007,934 | |
| | | | | | | | | | | | | |
| | | | | | | | | | $ | 119,038,136 | |
| | | | | | | | | | | | | |
|
Packaging & Containers — 0.1% | |
ARD Finance SA | | | | | | | | | | | | |
6.625%, 9/15/23(7)(8) | | | EUR | | | | 550 | | | $ | 596,218 | |
7.125%, 9/15/23(6)(8) | | | | | | | 1,075 | | | | 1,072,313 | |
Horizon Holdings I SASU | | | | | | | | | | | | |
7.25%, 8/1/23(6) | | | EUR | | | | 500 | | | | 605,204 | |
| | | | | | | | | | | | | |
| | | | | | | | | | $ | 2,273,735 | |
| | | | | | | | | | | | | |
|
Pharmaceuticals — 0.2% | |
Actavis Funding SCS | | | | | | | | | | | | |
3.00%, 3/12/20 | | | | | | | 480 | | | $ | 495,226 | |
4.55%, 3/15/35 | | | | | | | 500 | | | | 533,765 | |
Baxalta, Inc. | | | | | | | | | | | | |
4.00%, 6/23/25 | | | | | | | 750 | | | | 799,767 | |
Shire Acquisitions Investments Ireland DAC | | | | | | | | | | | | |
2.40%, 9/23/21 | | | | | | | 1,500 | | | | 1,505,886 | |
Teva Pharmaceutical Finance Netherlands III BV | | | | | | | | | | | | |
2.80%, 7/21/23 | | | | | | | 945 | | | | 949,197 | |
Vizient, Inc. | | | | | | | | | | | | |
10.375%, 3/1/24(6) | | | | | | | 110 | | | | 126,500 | |
| | | | | | | | | | | | | |
| | | | | | | | | | $ | 4,410,341 | |
| | | | | | | | | | | | | |
|
Pipelines — 0.3% | |
Antero Midstream Partners L.P./Antero Midstream Finance Corp. | | | | | | | | | | | | |
5.375%, 9/15/24(6) | | | | | | | 695 | | | $ | 705,425 | |
Georgian Oil and Gas Corp. JSC | | | | | | | | | | | | |
6.75%, 4/26/21(7) | | | | | | | 615 | | | | 648,825 | |
Plains All America Pipeline, L.P./PAA Finance Corp. | | | | | | | | | | | | |
4.65%, 10/15/25 | | | | | | | 1,000 | | | | 1,041,437 | |
| | | | |
| | 26 | | See Notes to Financial Statements. |
Eaton Vance
Limited Duration Income Fund
September 30, 2016
Portfolio of Investments (Unaudited) — continued
| | | | | | | | | | | | |
| Security | | | | | Principal Amount* (000’s omitted) | | | Value | |
| | | | | | | | | | | | |
|
Pipelines (continued) | |
Regency Energy Partners, L.P./Regency Energy Finance Corp. | | | | | | | | | | | | |
5.00%, 10/1/22 | | | | | | | 2,002 | | | $ | 2,115,812 | |
Transcanada Trust | | | | | | | | | | | | |
5.875% to 8/15/26, 8/15/76(9) | | | | | | | 500 | | | | 530,250 | |
| | | | | | | | | | | | | |
| | | | | | | | | | $ | 5,041,749 | |
| | | | | | | | | | | | | |
|
Publishing — 1.0% | |
Laureate Education, Inc. | | | | | | | | | | | | |
9.25%, 9/1/19(6) | | | | | | | 13,900 | | | $ | 13,399,600 | |
MHGE Parent, LLC/MHGE Parent Finance, Inc. | | | | | | | | | | | | |
8.50%, 8/1/19(6)(8) | | | | | | | 1,020 | | | | 1,037,850 | |
Tribune Media Co. | | | | | | | | | | | | |
5.875%, 7/15/22 | | | | | | | 2,390 | | | | 2,430,331 | |
| | | | | | | | | | | | | |
| | | | | | | | | | $ | 16,867,781 | |
| | | | | | | | | | | | | |
|
Radio and Television — 0.7% | |
Clear Channel Worldwide Holdings, Inc. | | | | | | | | | | | | |
Series A, 7.625%, 3/15/20 | | | | | | | 470 | | | $ | 453,550 | |
Series A, 6.50%, 11/15/22 | | | | | | | 1,100 | | | | 1,113,750 | |
Series B, 6.50%, 11/15/22 | | | | | | | 2,130 | | | | 2,228,512 | |
iHeartCommunications, Inc. | | | | | | | | | | | | |
9.00%, 12/15/19 | | | | | | | 226 | | | | 179,670 | |
11.25%, 3/1/21 | | | | | | | 1,505 | | | | 1,170,138 | |
Nielsen Co. Luxembourg S.a.r.l. (The) | | | | | | | | | | | | |
5.50%, 10/1/21(6) | | | | | | | 1,250 | | | | 1,306,250 | |
Sirius XM Radio, Inc. | | | | | | | | | | | | |
6.00%, 7/15/24(6) | | | | | | | 2,830 | | | | 3,024,562 | |
Starz, LLC/Starz Finance Corp. | | | | | | | | | | | | |
5.00%, 9/15/19 | | | | | | | 1,470 | | | | 1,491,705 | |
Univision Communications, Inc. | | | | | | | | | | | | |
5.125%, 5/15/23(6) | | | | | | | 1,260 | | | | 1,282,050 | |
| | | | | | | | | | | | | |
| | | | | | | | | | $ | 12,250,187 | |
| | | | | | | | | | | | | |
|
Real Estate Investment Trusts (REITs) — 0.1% | |
CBL & Associates, L.P. | | | | | | | | | | | | |
4.60%, 10/15/24 | | | | | | | 403 | | | $ | 394,679 | |
Communications Sales & Leasing, Inc./CSL Capital, LLC | | | | | | | | | | | | |
8.25%, 10/15/23 | | | | | | | 485 | | | | 511,427 | |
DDR Corp. | | | | | | | | | | | | |
3.625%, 2/1/25 | | | | | | | 455 | | | | 461,074 | |
| | | | | | | | | | | | | |
| | | | | | | | | | $ | 1,367,180 | |
| | | | | | | | | | | | | |
| | | | | | | | | | | | |
| Security | | | | | Principal Amount* (000’s omitted) | | | Value | |
| | | | | | | | | | | | |
|
Retail — 0.0%(13) | |
Douglas GmbH | | | | | | | | | | | | |
6.25%, 7/15/22(6) | | | EUR | | | | 500 | | | $ | 605,485 | |
| | | | | | | | | | | | | |
| | | | | | | | | | $ | 605,485 | |
| | | | | | | | | | | | | |
|
Retailers (Except Food and Drug) — 2.7% | |
Best Buy Co., Inc. | | | | | | | | | | | | |
5.50%, 3/15/21 | | | | | | | 1,115 | | | $ | 1,237,650 | |
Chinos Intermediate Holdings A, Inc. | | | | | | | | | | | | |
7.75%, 5/1/19(6)(8) | | | | | | | 1,569 | | | | 544,869 | |
Dollar Tree, Inc. | | | | | | | | | | | | |
5.25%, 3/1/20 | | | | | | | 1,905 | | | | 1,985,963 | |
5.75%, 3/1/23 | | | | | | | 4,400 | | | | 4,757,500 | |
Gap, Inc. (The) | | | | | | | | | | | | |
5.95%, 4/12/21 | | | | | | | 1,102 | | | | 1,177,801 | |
Hot Topic, Inc. | | | | | | | | | | | | |
9.25%, 6/15/21(6) | | | | | | | 4,740 | | | | 5,048,100 | |
L Brands, Inc. | | | | | | | | | | | | |
8.50%, 6/15/19 | | | | | | | 3,325 | | | | 3,898,563 | |
6.625%, 4/1/21 | | | | | | | 6,135 | | | | 7,101,262 | |
5.625%, 2/15/22 | | | | | | | 790 | | | | 883,813 | |
6.875%, 11/1/35 | | | | | | | 2,110 | | | | 2,310,450 | |
Macy’s Retail Holdings, Inc. | | | | | | | | | | | | |
6.70%, 7/15/34 | | | | | | | 785 | | | | 867,848 | |
4.30%, 2/15/43 | | | | | | | 641 | | | | 546,585 | |
Michaels Stores, Inc. | | | | | | | | | | | | |
5.875%, 12/15/20(6) | | | | | | | 1,775 | | | | 1,843,781 | |
Murphy Oil USA, Inc. | | | | | | | | | | | | |
6.00%, 8/15/23 | | | | | | | 4,165 | | | | 4,399,281 | |
Party City Holdings, Inc. | | | | | | | | | | | | |
6.125%, 8/15/23(6) | | | | | | | 3,215 | | | | 3,444,069 | |
Sally Holdings, LLC/Sally Capital, Inc. | | | | | | | | | | | | |
5.75%, 6/1/22 | | | | | | | 1,225 | | | | 1,283,188 | |
5.625%, 12/1/25 | | | | | | | 2,385 | | | | 2,578,781 | |
Signet UK Finance PLC | | | | | | | | | | | | |
4.70%, 6/15/24 | | | | | | | 1,321 | | | | 1,274,519 | |
Vista Outdoor, Inc. | | | | | | | | | | | | |
5.875%, 10/1/23(6) | | | | | | | 1,620 | | | | 1,701,000 | |
| | | | | | | | | | | | | |
| | | | | | | | | | $ | 46,885,023 | |
| | | | | | | | | | | | | |
|
Road & Rail — 0.1% | |
Watco Cos., LLC/Watco Finance Corp. | | | | | | | | | | | | |
6.375%, 4/1/23(6) | | | | | | | 1,990 | | | $ | 2,019,850 | |
| | | | | | | | | | | | | |
| | | | | | | | | | $ | 2,019,850 | |
| | | | | | | | | | | | | |
| | | | |
| | 27 | | See Notes to Financial Statements. |
Eaton Vance
Limited Duration Income Fund
September 30, 2016
Portfolio of Investments (Unaudited) — continued
| | | | | | | | | | | | |
| Security | | | | | Principal Amount* (000’s omitted) | | | Value | |
| | | | | | | | | | | | |
|
Software and Services — 0.4% | |
Camelot Finance SA | | | | | | | | | | | | |
7.875%, 10/15/24(6)(11) | | | | | | | 700 | | | $ | 723,625 | |
Cengage Learning, Inc. | | | | | | | | | | | | |
9.50%, 6/15/24(6) | | | | | | | 150 | | | | 153,000 | |
Electronic Arts, Inc. | | | | | | | | | | | | |
4.80%, 3/1/26 | | | | | | | 990 | | | | 1,092,897 | |
IHS Markit, Ltd. | | | | | | | | | | | | |
5.00%, 11/1/22(6) | | | | | | | 2,240 | | | | 2,381,344 | |
Infor Software Parent, LLC/Infor Software Parent, Inc. | | | | | | | | | | | | |
7.125%, 5/1/21(6)(8) | | | | | | | 2,090 | | | | 2,037,750 | |
JDA Escrow LLC/JDA Bond Finance, Inc. | | | | | | | | | | | | |
7.375%, 10/15/24(6)(11) | | | | | | | 355 | | | | 365,650 | |
| | | | | | | | | | | | | |
| | | | | | | | | | $ | 6,754,266 | |
| | | | | | | | | | | | | |
|
Steel — 0.3% | |
ArcelorMittal | | | | | | | | | | | | |
7.25%, 2/25/22 | | | | | | | 4,000 | | | $ | 4,560,000 | |
Steel Dynamics, Inc. | | | | | | | | | | | | |
6.375%, 8/15/22 | | | | | | | 500 | | | | 528,750 | |
| | | | | | | | | | | | | |
| | | | | | | | | | $ | 5,088,750 | |
| | | | | | | | | | | | | |
|
Surface Transport — 0.3% | |
Debt and Asset Trading Corp. | | | | | | | | | | | | |
1.00%, 10/10/25(7) | | | | | | | 2,000 | | | $ | 1,157,500 | |
Hertz Corp. (The) | | | | | | | | | | | | |
6.25%, 10/15/22 | | | | | | | 435 | | | | 450,225 | |
XPO Logistics, Inc. | | | | | | | | | | | | |
6.50%, 6/15/22(6) | | | | | | | 3,035 | | | | 3,182,956 | |
6.125%, 9/1/23(6) | | | | | | | 705 | | | | 726,150 | |
| | | | | | | | | | | | | |
| | | | | | | | | | $ | 5,516,831 | |
| | | | | | | | | | | | | |
|
Technology — 0.4% | |
Abengoa Finance S.A.U. | | | | | | | | | | | | |
7.75%, 2/1/20(5)(6) | | | | | | | 1,125 | | | $ | 67,500 | |
Diamond 1 Finance Corp./Diamond 2 Finance Corp. | | | | | | | | | | | | |
5.875%, 6/15/21(6) | | | | | | | 100 | | | | 106,293 | |
7.125%, 6/15/24(6) | | | | | | | 100 | | | | 110,048 | |
6.02%, 6/15/26(6) | | | | | | | 200 | | | | 219,784 | |
International Game Technology PLC | | | | | | | | | | | | |
6.50%, 2/15/25(6) | | | | | | | 720 | | | | 779,400 | |
Israel Electric Corp, Ltd. | | | | | | | | | | | | |
5.00%, 11/12/24(6)(7) | | | | | | | 1,000 | | | | 1,100,000 | |
| | | | | | | | | | | | |
| Security | | | | | Principal Amount* (000’s omitted) | | | Value | |
| | | | | | | | | | | | |
|
Technology (continued) | |
KLA-Tencor Corp. | | | | | | | | | | | | |
4.65%, 11/1/24 | | | | | | | 1,625 | | | $ | 1,789,577 | |
Micron Technology, Inc. | | | | | | | | | | | | |
5.25%, 8/1/23(6) | | | | | | | 585 | | | | 576,225 | |
5.625%, 1/15/26(6) | | | | | | | 1,080 | | | | 1,044,900 | |
Total System Services, Inc. | | | | | | | | | | | | |
4.80%, 4/1/26 | | | | | | | 1,075 | | | | 1,193,327 | |
Western Union Co. (The) | | | | | | | | | | | | |
6.20%, 11/17/36 | | | | | | | 637 | | | | 672,953 | |
| | | | | | | | | | | | | |
| | | | | | | | | | $ | 7,660,007 | |
| | | | | | | | | | | | | |
|
Telecommunications — 6.1% | |
Altice Financing SA | | | | | | | | | | | | |
6.625%, 2/15/23(6) | | | | | | | 2,580 | | | $ | 2,657,400 | |
Altice Luxembourg SA | | | | | | | | | | | | |
7.25%, 5/15/22(7) | | | EUR | | | | 304 | | | | 361,390 | |
7.75%, 5/15/22(6) | | | | | | | 1,710 | | | | 1,831,837 | |
7.625%, 2/15/25(6) | | | | | | | 1,290 | | | | 1,331,925 | |
Avaya, Inc. | | | | | | | | | | | | |
9.00%, 4/1/19(6) | | | | | | | 2,250 | | | | 1,693,125 | |
CenturyLink, Inc. | | | | | | | | | | | | |
5.80%, 3/15/22 | | | | | | | 210 | | | | 216,038 | |
6.75%, 12/1/23 | | | | | | | 1,695 | | | | 1,769,156 | |
Cincinnati Bell, Inc. | | | | | | | | | | | | |
7.00%, 7/15/24(6) | | | | | | | 700 | | | | 719,250 | |
Colombia Telecomunicaciones SA ESP | | | | | | | | | | | | |
8.50% to 3/30/20(6)(9)(10) | | | | | | | 754 | | | | 659,750 | |
CommScope Technologies Finance, LLC | | | | | | | | | | | | |
6.00%, 6/15/25(6) | | | | | | | 1,765 | | | | 1,890,756 | |
Digicel, Ltd. | | | | | | | | | | | | |
6.00%, 4/15/21(6) | | | | | | | 1,450 | | | | 1,297,750 | |
6.75%, 3/1/23(6) | | | | | | | 2,230 | | | | 1,995,850 | |
eircom Finance DAC | | | | | | | | | | | | |
4.50%, 5/31/22(7) | | | EUR | | | | 124 | | | | 142,048 | |
Equinix, Inc. | | | | | | | | | | | | |
5.875%, 1/15/26 | | | | | | | 2,725 | | | | 2,936,187 | |
Frontier Communications Corp. | | | | | | | | | | | | |
6.25%, 9/15/21 | | | | | | | 1,600 | | | | 1,546,000 | |
10.50%, 9/15/22 | | | | | | | 685 | | | | 728,669 | |
7.625%, 4/15/24 | | | | | | | 285 | | | | 267,900 | |
6.875%, 1/15/25 | | | | | | | 1,845 | | | | 1,639,744 | |
11.00%, 9/15/25 | | | | | | | 2,190 | | | | 2,291,287 | |
Hughes Satellite Systems Corp. | | | | | | | | | | | | |
6.50%, 6/15/19 | | | | | | | 2,912 | | | | 3,195,920 | |
| | | | |
| | 28 | | See Notes to Financial Statements. |
Eaton Vance
Limited Duration Income Fund
September 30, 2016
Portfolio of Investments (Unaudited) — continued
| | | | | | | | | | | | |
| Security | | | | | Principal Amount* (000’s omitted) | | | Value | |
| | | | | | | | | | | | |
|
Telecommunications (continued) | |
5.25%, 8/1/26(6) | | | | | | | 1,065 | | | $ | 1,054,350 | |
6.625%, 8/1/26(6) | | | | | | | 705 | | | | 682,088 | |
Intelsat Jackson Holdings S.A. | | | | | | | | | | | | |
7.25%, 10/15/20 | | | | | | | 2,535 | | | | 1,977,300 | |
7.50%, 4/1/21 | | | | | | | 220 | | | | 167,200 | |
5.50%, 8/1/23 | | | | | | | 385 | | | | 268,538 | |
8.00%, 2/15/24(6) | | | | | | | 490 | | | | 493,675 | |
Intelsat Luxembourg S.A. | | | | | | | | | | | | |
7.75%, 6/1/21 | | | | | | | 2,550 | | | | 860,625 | |
8.125%, 6/1/23 | | | | | | | 4,100 | | | | 1,404,250 | |
Interoute Finco PLC | | | | | | | | | | | | |
7.375%, 10/15/20(7) | | | EUR | | | | 400 | | | | 479,783 | |
Juniper Networks, Inc. | | | | | | | | | | | | |
4.35%, 6/15/25 | | | | | | | 730 | | | | 762,735 | |
Level 3 Financing, Inc. | | | | | | | | | | | | |
5.375%, 1/15/24 | | | | | | | 1,000 | | | | 1,044,375 | |
Matterhorn Telecom SA | | | | | | | | | | | | |
3.875%, 5/1/22(7) | | | EUR | | | | 625 | | | | 701,588 | |
Sprint Communications, Inc. | | | | | | | | | | | | |
9.125%, 3/1/17 | | | | | | | 1,225 | | | | 1,257,156 | |
9.00%, 11/15/18(6) | | | | | | | 13,520 | | | | 14,956,500 | |
7.00%, 8/15/20 | | | | | | | 4,810 | | | | 4,858,100 | |
6.00%, 11/15/22 | | | | | | | 250 | | | | 235,313 | |
Sprint Corp. | | | | | | | | | | | | |
7.25%, 9/15/21 | | | | | | | 2,060 | | | | 2,080,600 | |
7.875%, 9/15/23 | | | | | | | 9,915 | | | | 10,063,725 | |
7.625%, 2/15/25 | | | | | | | 1,870 | | | | 1,860,650 | |
T-Mobile USA, Inc. | | | | | | | | | | | | |
5.25%, 9/1/18 | | | | | | | 4,725 | | | | 4,795,875 | |
6.25%, 4/1/21 | | | | | | | 1,100 | | | | 1,158,437 | |
6.633%, 4/28/21 | | | | | | | 1,735 | | | | 1,832,594 | |
6.731%, 4/28/22 | | | | | | | 620 | | | | 653,325 | |
6.625%, 4/1/23 | | | | | | | 1,670 | | | | 1,799,425 | |
6.375%, 3/1/25 | | | | | | | 1,395 | | | | 1,520,550 | |
6.50%, 1/15/26 | | | | | | | 610 | | | | 677,863 | |
Verizon Communications, Inc. | | | | | | | | | | | | |
4.50%, 9/15/20 | | | | | | | 664 | | | | 729,360 | |
6.00%, 4/1/41 | | | | | | | 431 | | | | 546,043 | |
Virgin Media Finance PLC | | | | | | | | | | | | |
6.375%, 4/15/23(6) | | | | | | | 10,705 | | | | 11,293,775 | |
5.75%, 1/15/25(6) | | | | | | | 2,015 | | | | 2,047,744 | |
Wind Acquisition Finance SA | | | | | | | | | | | | |
4.954%, 4/30/19(6)(12) | | | EUR | | | | 600 | | | | 684,760 | |
3.705%, 7/15/20(6)(12) | | | EUR | | | | 625 | | | | 703,708 | |
4.75%, 7/15/20(6) | | | | | | | 3,800 | | | | 3,866,500 | |
| | | | | | | | | | | | |
| Security | | | | | Principal Amount* (000’s omitted) | | | Value | |
| | | | | | | | | | | | |
|
Telecommunications (continued) | |
Zayo Group, LLC/Zayo Capital, Inc. | | | | | | | | | | | | |
6.375%, 5/15/25 | | | | | | | 200 | | | $ | 213,750 | |
| | | | | | | | | | | | | |
| | | | | | | | | | $ | 106,904,242 | |
| | | | | | | | | | | | | |
|
Utilities — 0.9% | |
AES Corp. (The) | | | | | | | | | | | | |
5.50%, 3/15/24 | | | | | | | 760 | | | $ | 790,400 | |
AES Gener SA | | | | | | | | | | | | |
5.25%, 8/15/21(6) | | | | | | | 660 | | | | 702,756 | |
8.375% to 6/18/19,
12/18/73(6)(9) | | | | | | | 637 | | | | 676,813 | |
Calpine Corp. | | | | | | | | | | | | |
5.375%, 1/15/23 | | | | | | | 1,905 | | | | 1,907,381 | |
5.75%, 1/15/25 | | | | | | | 610 | | | | 603,900 | |
Dynegy, Inc. | | | | | | | | | | | | |
6.75%, 11/1/19 | | | | | | | 3,130 | | | | 3,223,900 | |
7.375%, 11/1/22 | | | | | | | 2,490 | | | | 2,471,325 | |
7.625%, 11/1/24 | | | | | | | 2,120 | | | | 2,092,440 | |
Enel SpA | | | | | | | | | | | | |
8.75% to 9/24/23, 9/24/73(6)(9) | | | | | | | 1,092 | | | | 1,279,005 | |
ITC Holdings Corp. | | | | | | | | | | | | |
5.30%, 7/1/43 | | | | | | | 660 | | | | 787,109 | |
NRG Energy, Inc. | | | | | | | | | | | | |
7.875%, 5/15/21 | | | | | | | 555 | | | | 582,750 | |
Southwestern Electric Power Co. | | | | | | | | | | | | |
6.20%, 3/15/40 | | | | | | | 696 | | | | 899,523 | |
| | | | | | | | | | | | | |
| | | | | | | | | | $ | 16,017,302 | |
| | | | | | | | | | | | | |
| |
Total Corporate Bonds & Notes
(identified cost $929,828,819) | | | $ | 942,384,542 | |
| | | | | | | | | | | | | |
|
| Foreign Government and Agency Securities — 3.5% | |
| | | |
| | | | | | | | | | | | |
| Security | | | | | Principal Amount* (000’s omitted) | | | Value | |
|
Albania — 0.2% | |
Republic of Albania | | | | | | | | | | | | |
5.75%, 11/12/20(7) | | | EUR | | | | 2,270 | | | $ | 2,830,248 | |
| | | | | | | | | | | | | |
Total Albania | | | | | | | | | | $ | 2,830,248 | |
| | | | | | | | | | | | | |
|
Angola — 0.0%(13) | |
Republic of Angola Via Northern Lights III B.V. | | | | | | | | | | | | |
7.00%, 8/16/19(7) | | | | | | | 290 | | | $ | 290,948 | |
| | | | | | | | | | | | | |
Total Angola | | | | | | | | | | $ | 290,948 | |
| | | | | | | | | | | | | |
| | | | |
| | 29 | | See Notes to Financial Statements. |
Eaton Vance
Limited Duration Income Fund
September 30, 2016
Portfolio of Investments (Unaudited) — continued
| | | | | | | | | | | | |
| Security | | | | | Principal Amount* (000’s omitted) | | | Value | |
| | | | | | | | | | | | |
|
Argentina — 0.1% | |
City of Buenos Aires | | | | | | | | | | | | |
7.50%, 6/1/27(7) | | | | | | | 1,292 | | | $ | 1,410,218 | |
Republic of Argentina | | | | | | | | | | | | |
2.50% to 3/31/19, 12/31/38(15) | | | | | | | 1,325 | | | | 947,375 | |
| | | | | | | | | | | | | |
Total Argentina | | | | | | | | | | $ | 2,357,593 | |
| | | | | | | | | | | | | |
|
Armenia — 0.1% | |
Republic of Armenia | | | | | | | | | | | | |
6.00%, 9/30/20(7) | | | | | | | 200 | | | $ | 207,790 | |
7.15%, 3/26/25(7) | | | | | | | 950 | | | | 1,014,315 | |
| | | | | | | | | | | | | |
Total Armenia | | | | | | | | | | $ | 1,222,105 | |
| | | | | | | | | | | | | |
|
Barbados — 0.2% | |
Barbados Government International Bond | | | | | | | | | | | | |
6.625%, 12/5/35(7) | | | | | | | 4,200 | | | $ | 3,559,500 | |
| | | | | | | | | | | | | |
Total Barbados | | | | | | | | | | $ | 3,559,500 | |
| | | | | | | | | | | | | |
|
Belarus — 0.1% | |
Republic of Belarus | | | | | | | | | | | | |
8.95%, 1/26/18(7) | | | | | | | 2,097 | | | $ | 2,211,287 | |
| | | | | | | | | | | | | |
Total Belarus | | | | | | | | | | $ | 2,211,287 | |
| | | | | | | | | | | | | |
|
Brazil — 0.1% | |
Federative Republic of Brazil | | | | | | | | | | | | |
6.00%, 1/17/17 | | | | | | | 1,408 | | | $ | 1,427,712 | |
| | | | | | | | | | | | | |
Total Brazil | | | | | | | | | | $ | 1,427,712 | |
| | | | | | | | | | | | | |
|
Congo — 0.1% | |
Republic of Congo | | | | | | | | | | | | |
4.00% to 6/30/17, 6/30/29(7)(15) | | | | | | | 1,675 | | | $ | 1,175,509 | |
| | | | | | | | | | | | | |
Total Congo | | | | | | | | | | $ | 1,175,509 | |
| | | | | | | | | | | | | |
|
Croatia — 0.1% | |
Croatia Government International Bond | | | | | | | | | | | | |
3.875%, 5/30/22(7) | | | EUR | | | | 601 | | | $ | 731,483 | |
6.25%, 4/27/17(7) | | | | | | | 1,300 | | | | 1,332,591 | |
| | | | | | | | | | | | | |
Total Croatia | | | | | | | | | | $ | 2,064,074 | |
| | | | | | | | | | | | | |
|
Cyprus — 0.2% | |
Republic of Cyprus | | | | | | | | | | | | |
3.75%, 7/26/23(7) | | | EUR | | | | 57 | | | $ | 66,032 | |
3.875%, 5/6/22(7) | | | EUR | | | | 1,615 | | | | 1,894,579 | |
| | | | | | | | | | | | |
| Security | | | | | Principal Amount* (000’s omitted) | | | Value | |
| | | | | | | | | | | | |
|
Cyprus (continued) | |
4.25%, 11/4/25(7) | | | EUR | | | | 68 | | | $ | 81,677 | |
4.625%, 2/3/20(6)(7) | | | EUR | | | | 120 | | | | 146,232 | |
4.75%, 6/25/19(7) | | | EUR | | | | 415 | | | | 504,091 | |
| | | | | | | | | | | | | |
Total Cyprus | | | | | | | | | | $ | 2,692,611 | |
| | | | | | | | | | | | | |
|
Dominican Republic — 0.1% | |
Dominican Republic International Bond | | | | | | | | | | | | |
8.625%, 4/20/27(7) | | | | | | | 2,000 | | | $ | 2,490,000 | |
| | | | | | | | | | | | | |
Total Dominican Republic | | | | | | | | | | $ | 2,490,000 | |
| | | | | | | | | | | | | |
|
Ecuador — 0.2% | |
Republic of Ecuador | | | | | | | | | | | | |
10.50%, 3/24/20(6) | | | | | | | 1,965 | | | $ | 2,009,212 | |
10.50%, 3/24/20(7) | | | | | | | 1,000 | | | | 1,022,500 | |
10.75%, 3/28/22(7) | | | | | | | 325 | | | | 332,313 | |
| | | | | | | | | | | | | |
Total Ecuador | | | | | | | | | | $ | 3,364,025 | |
| | | | | | | | | | | | | |
|
El Salvador — 0.2% | |
Republic of El Salvador | | | | | | | | | | | | |
7.75%, 1/24/23(7) | | | | | | | 1,800 | | | $ | 2,011,500 | |
8.25%, 4/10/32(7) | | | | | | | 875 | | | | 978,906 | |
| | | | | | | | | | | | | |
Total El Salvador | | | | | | | | | | $ | 2,990,406 | |
| | | | | | | | | | | | | |
|
Fiji — 0.1% | |
Republic of Fiji | | | | | | | | | | | | |
6.625%, 10/2/20(7) | | | | | | | 2,443 | | | $ | 2,447,937 | |
| | | | | | | | | | | | | |
Total Fiji | | | | | | | | | | $ | 2,447,937 | |
| | | | | | | | | | | | | |
|
Georgia — 0.0%(13) | |
Republic of Georgia | | | | | | | | | | | | |
6.875%, 4/12/21(7) | | | | | | | 559 | | | $ | 626,080 | |
| | | | | | | | | | | | | |
Total Georgia | | | | | | | | | | $ | 626,080 | |
| | | | | | | | | | | | | |
|
Honduras — 0.1% | |
Honduras Government International Bond | | | | | | | | | | | | |
7.50%, 3/15/24(7) | | | | | | | 200 | | | $ | 228,000 | |
8.75%, 12/16/20(7) | | | | | | | 950 | | | | 1,094,875 | |
| | | | | | | | | | | | | |
Total Honduras | | | | | | | | | | $ | 1,322,875 | |
| | | | | | | | | | | | | |
| | | | |
| | 30 | | See Notes to Financial Statements. |
Eaton Vance
Limited Duration Income Fund
September 30, 2016
Portfolio of Investments (Unaudited) — continued
| | | | | | | | | | | | |
| Security | | | | | Principal Amount* (000’s omitted) | | | Value | |
| | | | | | | | | | | | |
|
Iraq — 0.1% | |
Republic of Iraq | | | | | | | | | | | | |
5.80%, 1/15/28(7) | | | | | | | 2,413 | | | $ | 1,971,711 | |
| | | | | | | | | | | | | |
Total Iraq | | | | | | | | | | $ | 1,971,711 | |
| | | | | | | | | | | | | |
|
Kazakhstan — 0.1% | |
Kazakhstan Government International Bond | | | | | | | | | | | | |
5.125%, 7/21/25(6) | | | | | | | 1,452 | | | $ | 1,641,486 | |
6.50%, 7/21/45(6) | | | | | | | 220 | | | | 275,098 | |
| | | | | | | | | | | | | |
Total Kazakhstan | | | | | | | | | | $ | 1,916,584 | |
| | | | | | | | | | | | | |
|
Kenya — 0.0%(13) | |
Republic of Kenya | | | | | | | | | | | | |
6.875%, 6/24/24(7) | | | | | | | 465 | | | $ | 458,046 | |
| | | | | | | | | | | | | |
Total Kenya | | | | | | | | | | $ | 458,046 | |
| | | | | | | | | | | | | |
|
Lebanon — 0.1% | |
Lebanese Republic | | | | | | | | | | | | |
6.75%, 11/29/27(7) | | | | | | | 1,800 | | | $ | 1,784,736 | |
| | | | | | | | | | | | | |
Total Lebanon | | | | | | | | | | $ | 1,784,736 | |
| | | | | | | | | | | | | |
|
Macedonia — 0.2% | |
Republic of Macedonia | | | | | | | | | | | | |
3.975%, 7/24/21(7) | | | EUR | | | | 2,500 | | | $ | 2,884,915 | |
4.875%, 12/1/20(6) | | | EUR | | | | 485 | | | | 578,590 | |
4.875%, 12/1/20(7) | | | EUR | | | | 203 | | | | 242,173 | |
| | | | | | | | | | | | | |
Total Macedonia | | | | | | | | | | $ | 3,705,678 | |
| | | | | | | | | | | | | |
|
Nigeria — 0.1% | |
Republic of Nigeria | | | | | | | | | | | | |
5.125%, 7/12/18(7) | | | | | | | 1,800 | | | $ | 1,818,090 | |
| | | | | | | | | | | | | |
Total Nigeria | | | | | | | | | | $ | 1,818,090 | |
| | | | | | | | | | | | | |
|
Russia — 0.0%(13) | |
Russian Foreign Bond - Eurobond | | | | | | | | | | | | |
4.75%, 5/27/26(7) | | | | | | | 400 | | | $ | 431,920 | |
| | | | | | | | | | | | | |
Total Russia | | | | | | | | | | $ | 431,920 | |
| | | | | | | | | | | | | |
|
Rwanda — 0.1% | |
Republic of Rwanda | | | | | | | | | | | | |
6.625%, 5/2/23(7) | | | | | | | 2,196 | | | $ | 2,226,744 | |
| | | | | | | | | | | | | |
Total Rwanda | | | | | | | | | | $ | 2,226,744 | |
| | | | | | | | | | | | | |
| | | | | | | | | | | | |
| Security | | | | | Principal Amount* (000’s omitted) | | | Value | |
| | | | | | | | | | | | |
|
Serbia — 0.2% | |
Republic of Serbia | | | | | | | | | | | | |
4.875%, 2/25/20(7) | | | | | | | 600 | | | $ | 628,452 | |
5.25%, 11/21/17(7) | | | | | | | 1,500 | | | | 1,551,000 | |
5.875%, 12/3/18(7) | | | | | | | 980 | | | | 1,040,392 | |
| | | | | | | | | | | | | |
Total Serbia | | | | | | | | | | $ | 3,219,844 | |
| | | | | | | | | | | | | |
|
Seychelles — 0.1% | |
Republic of Seychelles | | | | | | | | | | | | |
7.00% to 1/1/18, 1/1/26(7)(15) | | | | | | | 1,425 | | | $ | 1,439,250 | |
| | | | | | | | | | | | | |
Total Seychelles | | | | | | | | | | $ | 1,439,250 | |
| | | | | | | | | | | | | |
|
South Africa — 0.0%(13) | |
Republic of South Africa | | | | | | | | | | | | |
5.00%, 10/12/46(11) | | | | | | | 201 | | | $ | 201,000 | |
| | | | | | | | | | | | | |
Total South Africa | | | | | | | | | | $ | 201,000 | |
| | | | | | | | | | | | | |
|
Sri Lanka — 0.2% | |
Republic of Sri Lanka | | | | | | | | | | | | |
6.125%, 6/3/25(7) | | | | | | | 3,280 | | | $ | 3,363,712 | |
| | | | | | | | | | | | | |
Total Sri Lanka | | | | | | | | | | $ | 3,363,712 | |
| | | | | | | | | | | | | |
|
Tanzania — 0.2% | |
United Republic of Tanzania | | | | | | | | | | | | |
7.25%, 3/9/20(7)(12) | | | | | | | 2,717 | | | $ | 2,845,831 | |
| | | | | | | | | | | | | |
Total Tanzania | | | | | | | | | | $ | 2,845,831 | |
| | | | | | | | | | | | | |
|
Turkey — 0.1% | |
Republic of Turkey | | | | | | | | | | | | |
7.00%, 6/5/20 | | | | | | | 1,790 | | | $ | 1,984,126 | |
| | | | | | | | | | | | | |
Total Turkey | | | | | | | | | | $ | 1,984,126 | |
| | | | | | | | | | | | | |
|
Zambia — 0.1% | |
Republic of Zambia | | | | | | | | | | | | |
5.375%, 9/20/22(7) | | | | | | | 200 | | | $ | 176,792 | |
8.50%, 4/14/24(6) | | | | | | | 614 | | | | 604,790 | |
8.97%, 7/30/27(6) | | | | | | | 211 | | | | 209,154 | |
| | | | | | | | | | | | | |
Total Zambia | | | | | | | | | | $ | 990,736 | |
| | | | | | | | | | | | | |
| |
Total Foreign Government and Agency Securities
(identified cost $59,558,651) | | | $ | 61,430,918 | |
| | | | | | | | | | | | | |
| | | | |
| | 31 | | See Notes to Financial Statements. |
Eaton Vance
Limited Duration Income Fund
September 30, 2016
Portfolio of Investments (Unaudited) — continued
| | | | | | | | | | | | |
| Sovereign Loans — 0.1% | |
| | | |
| | | | | | | | | | | | |
| Borrower | | | | | Principal Amount (000’s omitted) | | | Value | |
| | | | | | | | | | | | |
|
Kenya — 0.1% | |
Government of Kenya | | | | | | | | | | | | |
Term Loan, 5.95%, Maturing October 28, 2017(16) | | | | | | $ | 1,150 | | | $ | 1,147,125 | |
| | | | | | | | | | | | | |
Total Kenya | | | | | | | | | | $ | 1,147,125 | |
| | | | | | | | | | | | | |
|
Suriname — 0.0%(13) | |
Republic of Suriname | | | | | | | | | | | | |
Term Loan, 8.57%, Maturing September 30, 2017(3)(17) | | | | | | $ | 315 | | | $ | 319,363 | |
| | | | | | | | | | | | | |
Total Suriname | | | | | | | | | | $ | 319,363 | |
| | | | | | | | | | | | | |
| |
Total Sovereign Loans
(identified cost $1,454,569) | | | $ | 1,466,488 | |
| | | | | | | | | | | | | |
|
| Mortgage Pass-Throughs — 12.0% | |
| | | |
| | | | | | | | | | | | |
| Security | | | | | Principal Amount (000’s omitted) | | | Value | |
Federal Home Loan Mortgage Corp.: | |
5.00%, with various maturities to 2019(18) | | | | | | $ | 2,724 | | | $ | 2,815,364 | |
5.50%, with various maturities to 2032 | | | | | | | 1,440 | | | | 1,586,917 | |
6.00%, with various maturities to 2031 | | | | | | | 460 | | | | 500,750 | |
6.50%, with various maturities to 2036 | | | | | | | 8,199 | | | | 9,480,892 | |
7.00%, with various maturities to 2036(18) | | | | | | | 8,269 | | | | 9,681,196 | |
7.13%, with maturity at 2023 | | | | | | | 148 | | | | 162,828 | |
7.50%, with various maturities to 2035 | | | | | | | 5,667 | | | | 6,609,119 | |
7.65%, with maturity at 2022 | | | | | | | 129 | | | | 140,262 | |
8.00%, with various maturities to 2034 | | | | | | | 3,036 | | | | 3,487,920 | |
8.25%, with maturity at 2020 | | | | | | | 70 | | | | 74,008 | |
8.30%, with maturity at 2020 | | | | | | | 273 | | | | 289,732 | |
8.50%, with various maturities to 2031 | | | | | | | 2,057 | | | | 2,360,733 | |
9.00%, with various maturities to 2031 | | | | | | | 347 | | | | 388,954 | |
9.50%, with various maturities to 2025 | | | | | | | 364 | | | | 382,735 | |
10.00%, with maturity at 2020 | | | | | | | 30 | | | | 31,892 | |
10.50%, with maturity at 2020 | | | | | | | 31 | | | | 33,085 | |
| | | | | | | | | | | | | |
| | | | | | | | | | $ | 38,026,387 | |
| | | | | | | | | | | | | |
Federal National Mortgage Association: | |
2.422%, with maturity at 2037(19) | | | | | | $ | 2,716 | | | $ | 2,818,857 | |
2.632%, with maturity at 2036(19) | | | | | | | 1,492 | | | | 1,508,685 | |
2.727%, with maturity at 2036(19) | | | | | | | 15,914 | | | | 16,827,633 | |
2.745%, with maturity at 2022(19) | | | | | | | 340 | | | | 345,902 | |
4.50%, with maturity at 2042(18) | | | | | | | 12,761 | | | | 14,032,349 | |
5.00%, with various maturities to 2040(18) | | | | | | | 15,263 | | | | 16,978,293 | |
| | | | | | | | | | | | |
| Security | | | | | Principal Amount (000’s omitted) | | | Value | |
| | | | | | | | | | | | |
Federal National Mortgage Association: (continued) | |
5.50%, with various maturities to 2033 | | | | | | $ | 1,549 | | | $ | 1,767,546 | |
6.00%, with various maturities to 2033 | | | | | | | 4,423 | | | | 4,913,496 | |
6.318%, with maturity at 2032(19) | | | | | | | 4,714 | | | | 5,192,597 | |
6.50%, with various maturities to 2036(18) | | | | | | | 33,627 | | | | 38,908,023 | |
6.75%, with maturity at 2023 | | | | | | | 79 | | | | 87,573 | |
7.00%, with various maturities to 2037 | | | | | | | 15,403 | | | | 17,973,675 | |
7.50%, with various maturities to 2035 | | | | | | | 6,535 | | | | 7,796,748 | |
7.937%, with maturity at 2027(20) | | | | | | | 471 | | | | 546,270 | |
8.00%, with various maturities to 2034 | | | | | | | 2,148 | | | | 2,519,018 | |
8.173%, with maturity at 2029(20) | | | | | | | 155 | | | | 180,390 | |
8.263%, with maturity at 2018(20) | | | | | | | 5 | | | | 5,560 | |
8.293%, with maturity at 2024(20) | | | | | | | 24 | | | | 27,199 | |
8.298%, with maturity at 2028(20) | | | | | | | 127 | | | | 148,534 | |
8.50%, with various maturities to 2037 | | | | | | | 2,022 | | | | 2,355,663 | |
8.507%, with maturity at 2027(20) | | | | | | | 179 | | | | 208,240 | |
9.00%, with various maturities to 2032 | | | | | | | 3,331 | | | | 3,805,806 | |
9.493%, with maturity at 2025(20) | | | | | | | 59 | | | | 64,372 | |
9.50%, with various maturities to 2030 | | | | | | | 1,274 | | | | 1,436,413 | |
9.915%, with maturity at 2019(20) | | | | | | | 19 | | | | 20,138 | |
10.00%, with various maturities to 2020 | | | | | | | 96 | | | | 101,144 | |
10.50%, with maturity at 2021 | | | | | | | 117 | | | | 129,985 | |
| | | | | | | | | | | | | |
| | | | | | | | | | $ | 140,700,109 | |
| | | | | | | | | | | | | |
Government National Mortgage Association: | |
6.00%, with maturity at 2024 | | | | | | $ | 787 | | | $ | 871,420 | |
6.50%, with various maturities to 2032(18) | | | | | | | 6,073 | | | | 6,856,166 | |
7.00%, with various maturities to 2033 | | | | | | | 4,398 | | | | 5,212,643 | |
7.50%, with various maturities to 2032(18) | | | | | | | 8,604 | | | | 9,900,026 | |
8.00%, with various maturities to 2034(18) | | | | | | | 5,056 | | | | 5,961,859 | |
8.30%, with maturity at 2020 | | | | | | | 114 | | | | 122,053 | |
8.50%, with various maturities to 2022 | | | | | | | 251 | | | | 280,220 | |
9.00%, with various maturities to 2025 | | | | | | | 998 | | | | 1,150,175 | |
9.50%, with various maturities to 2026 | | | | | | | 1,507 | | | | 1,704,973 | |
10.00%, with maturity at 2019 | | | | | | | 55 | | | | 58,259 | |
| | | | | | | | | | | | | |
| | | | | | | | | | $ | 32,117,794 | |
| | | | | | | | | | | | | |
| |
Total Mortgage Pass-Throughs
(identified cost $202,226,979) | | | $ | 210,844,290 | |
| | | | | | | | | | | | | |
|
| Collateralized Mortgage Obligations — 16.2% | |
| | | |
| | | | | | | | | | | | |
| Security | | | | | Principal Amount (000’s omitted) | | | Value | |
| | | | | | | | | | | | |
Federal Home Loan Mortgage Corp.: | |
Series 24, Class J, 6.25%, 11/25/23 | | | | | | $ | 445 | | | $ | 489,351 | |
| | | | |
| | 32 | | See Notes to Financial Statements. |
Eaton Vance
Limited Duration Income Fund
September 30, 2016
Portfolio of Investments (Unaudited) — continued
| | | | | | | | | | | | |
| Security | | | | | Principal Amount (000’s omitted) | | | Value | |
| | | | | | | | | | | | |
Federal Home Loan Mortgage Corp.: (continued) | |
Series 242, (Principal Only), Class PO, 0.00%, 11/15/36(21) | | | | | | $ | 8,775 | | | $ | 8,425,911 | |
Series 259, (Principal Only), Class PO, 0.00%, 4/15/39(21) | | | | | | | 5,162 | | | | 4,917,224 | |
Series 267, (Interest Only), Class S5, 5.476%, 8/15/42(22)(23) | | | | | | | 10,824 | | | | 2,493,589 | |
Series 284, (Interest Only), Class S6, 5.576%, 10/15/42(22)(23) | | | | | | | 5,932 | | | | 1,360,182 | |
Series 1497, Class K, 7.00%, 4/15/23 | | | | | | | 415 | | | | 463,957 | |
Series 1529, Class Z, 7.00%, 6/15/23 | | | | | | | 598 | | | | 671,564 | |
Series 1620, Class Z, 6.00%, 11/15/23 | | | | | | | 507 | | | | 558,231 | |
Series 1677, Class Z, 7.50%, 7/15/23 | | | | | | | 345 | | | | 391,933 | |
Series 1702, Class PZ, 6.50%, 3/15/24 | | | | | | | 4,168 | | | | 4,650,746 | |
Series 2113, Class QG, 6.00%, 1/15/29 | | | | | | | 906 | | | | 1,031,287 | |
Series 2122, Class K, 6.00%, 2/15/29 | | | | | | | 168 | | | | 191,386 | |
Series 2130, Class K, 6.00%, 3/15/29 | | | | | | | 114 | | | | 129,667 | |
Series 2167, Class BZ, 7.00%, 6/15/29 | | | | | | | 114 | | | | 131,962 | |
Series 2182, Class ZB, 8.00%, 9/15/29 | | | | | | | 1,235 | | | | 1,484,301 | |
Series 2198, Class ZA, 8.50%, 11/15/29 | | | | | | | 1,494 | | | | 1,778,311 | |
Series 2245, Class A, 8.00%, 8/15/27 | | | | | | | 3,663 | | | | 4,393,265 | |
Series 2458, Class ZB, 7.00%, 6/15/32 | | | | | | | 1,229 | | | | 1,470,689 | |
Series 3606, (Principal Only), Class PO, 0.00%, 12/15/39(21) | | | | | | | 5,203 | | | | 4,636,652 | |
Series 3727, (Interest Only), Class PS, 6.176%, 11/15/38(22)(23) | | | | | | | 5,205 | | | | 192,334 | |
Series 3762, Class SH, 8.954%, 11/15/40(22) | | | | | | | 784 | | | | 999,122 | |
Series 3780, (Interest Only), Class PS, 5.926%, 8/15/35(22)(23) | | | | | | | 1,283 | | | | 7,185 | |
Series 3973, (Interest Only), Class SG, 6.126%, 4/15/30(22)(23) | | | | | | | 5,914 | | | | 499,032 | |
Series 4067, (Interest Only), Class JI, 3.50%, 6/15/27(23) | | | | | | | 6,978 | | | | 738,418 | |
Series 4070, (Interest Only), Class S, 5.576%, 6/15/32(22)(23) | | | | | | | 12,327 | | | | 2,252,162 | |
Series 4088, (Interest Only), Class EI, 3.50%, 9/15/41(23) | | | | | | | 15,494 | | | | 1,260,664 | |
Series 4094, (Interest Only), Class CS, 5.476%, 8/15/42(22)(23) | | | | | | | 6,510 | | | | 1,328,839 | |
Series 4095, (Interest Only), Class HS, 5.576%, 7/15/32(22)(23) | | | | | | | 4,825 | | | | 798,225 | |
Series 4097, Class PE, 3.00%, 11/15/40 | | | | | | | 2,643 | | | | 2,703,276 | |
Series 4109, (Interest Only), Class ES, 5.626%, 12/15/41(22)(23) | | | | | | | 95 | | | | 13,675 | |
Series 4109, (Interest Only), Class KS, 5.576%, 5/15/32(22)(23) | | | | | | | 6,227 | | | | 225,032 | |
Series 4110, (Interest Only), Class SA, 5.126%, 9/15/42(22)(23) | | | | | | | 8,000 | | | | 1,401,782 | |
Series 4149, (Interest Only), Class S, 5.726%, 1/15/33(22)(23) | | | | | | | 5,938 | | | | 1,160,806 | |
| | | | | | | | | | | | |
| Security | | | | | Principal Amount (000’s omitted) | | | Value | |
| | | | | | | | | | | | |
Federal Home Loan Mortgage Corp.: (continued) | |
Series 4186, (Interest Only), Class IQ, 4.00%, 12/15/28(23) | | | | | | $ | 5,696 | | | $ | 143,395 | |
Series 4188, (Interest Only), Class AI, 3.50%, 4/15/28(23) | | | | | | | 4,892 | | | | 476,768 | |
Series 4203, (Interest Only), Class QS, 5.726%, 5/15/43(22)(23) | | | | | | | 11,180 | | | | 1,991,652 | |
Series 4233, (Interest Only), Class GI, 3.50%, 3/15/25(23) | | | | | | | 4,519 | | | | 155,112 | |
Series 4273, Class PU, 4.00%, 11/15/43 | | | | | | | 4,365 | | | | 4,539,629 | |
Series 4273, Class SP, 10.605%, 11/15/43(22) | | | | | | | 970 | | | | 1,235,879 | |
Series 4313, Class SY, 10.602%, 3/15/44(22) | | | | | | | 15 | | | | 15,376 | |
Series 4316, (Interest Only), Class JS, 5.576%, 1/15/44(22)(23) | | | | | | | 4,379 | | | | 589,467 | |
Series 4326, Class TS, 12.086%, 4/15/44(22) | | | | | | | 1,092 | | | | 1,108,976 | |
Series 4336, Class GU, 3.50%, 2/15/53 | | | | | | | 2,477 | | | | 2,501,669 | |
Series 4337, Class YT, 3.50%, 4/15/49 | | | | | | | 8,589 | | | | 8,762,255 | |
Series 4407, Class LN, 8.101%, 12/15/43(22) | | | | | | | 995 | | | | 1,020,100 | |
Series 4416, Class SU, 7.554%, 12/15/44(22) | | | | | | | 13,904 | | | | 14,463,147 | |
Series 4417, (Principal Only), Class KO, 0.00%, 12/15/43(21) | | | | | | | 971 | | | | 881,825 | |
Series 4452, Class ZJ, 3.00%, 11/15/44 | | | | | | | 3,614 | | | | 3,592,617 | |
Series 4478, (Principal Only), Class PO, 0.00%, 5/15/45(21) | | | | | | | 5,347 | | | | 4,945,518 | |
Series 4550, Class ZT, 2.00%, 1/15/45 | | | | | | | 1,957 | | | | 1,956,321 | |
Series 4568, Class ZM, 4.00%, 4/15/46 | | | | | | | 1,339 | | | | 1,341,843 | |
Series 4583, Class CZ, 3.50%, 5/15/46 | | | | | | | 7,640 | | | | 7,675,066 | |
Series 4584, Class PM, 3.00%, 5/15/46 | | | | | | | 10,158 | | | | 10,476,237 | |
Series 4617, Class CZ, 3.50%, 5/15/46 | | | | | | | 18,104 | | | | 18,167,030 | |
| | | | | | | | | | | | | |
| | | | | | | | | | $ | 139,290,642 | |
| | | | | | | | | | | | | |
Federal National Mortgage Association: | |
Series G92-44, Class Z, 8.00%, 7/25/22 | | | | | | $ | 10 | | | $ | 10,796 | |
Series G92-44, Class ZQ, 8.00%, 7/25/22 | | | | | | | 17 | | | | 17,568 | |
Series G92-46, Class Z, 7.00%, 8/25/22 | | | | | | | 215 | | | | 235,779 | |
Series G92-60, Class Z, 7.00%, 10/25/22 | | | | | | | 305 | | | | 333,270 | |
Series G93-35, Class ZQ, 6.50%, 11/25/23 | | | | | | | 5,584 | | | | 6,169,921 | |
Series G93-40, Class H, 6.40%, 12/25/23 | | | | | | | 1,172 | | | | 1,289,638 | |
Series 1988-14, Class I, 9.20%, 6/25/18 | | | | | | | 18 | | | | 18,881 | |
Series 1989-34, Class Y, 9.85%, 7/25/19 | | | | | | | 74 | | | | 79,650 | |
Series 1990-17, Class G, 9.00%, 2/25/20 | | | | | | | 40 | | | | 42,611 | |
Series 1990-27, Class Z, 9.00%, 3/25/20 | | | | | | | 34 | | | | 36,563 | |
Series 1990-29, Class J, 9.00%, 3/25/20 | | | | | | | 39 | | | | 42,499 | |
Series 1990-43, Class Z, 9.50%, 4/25/20 | | | | | | | 148 | | | | 160,145 | |
Series 1991-98, Class J, 8.00%, 8/25/21 | | | | | | | 90 | | | | 100,064 | |
Series 1992-77, Class ZA, 8.00%, 5/25/22 | | | | | | | 565 | | | | 626,916 | |
Series 1992-103, Class Z, 7.50%, 6/25/22 | | | | | | | 35 | | | | 38,646 | |
Series 1992-113, Class Z, 7.50%, 7/25/22 | | | | | | | 70 | | | | 77,865 | |
| | | | |
| | 33 | | See Notes to Financial Statements. |
Eaton Vance
Limited Duration Income Fund
September 30, 2016
Portfolio of Investments (Unaudited) — continued
| | | | | | | | | | | | |
| Security | | | | | Principal Amount (000’s omitted) | | | Value | |
| | | | | | | | | | | | |
Federal National Mortgage Association: (continued) | |
Series 1992-185, Class ZB, 7.00%, 10/25/22 | | | | | | $ | 118 | | | $ | 129,857 | |
Series 1993-16, Class Z, 7.50%, 2/25/23 | | | | | | | 340 | | | | 379,310 | |
Series 1993-22, Class PM, 7.40%, 2/25/23 | | | | | | | 284 | | | | 314,927 | |
Series 1993-25, Class J, 7.50%, 3/25/23 | | | | | | | 364 | | | | 410,746 | |
Series 1993-30, Class PZ, 7.50%, 3/25/23 | | | | | | | 650 | | | | 732,455 | |
Series 1993-42, Class ZQ, 6.75%, 4/25/23 | | | | | | | 934 | | | | 1,032,033 | |
Series 1993-56, Class PZ, 7.00%, 5/25/23 | | | | | | | 139 | | | | 155,344 | |
Series 1993-156, Class ZB, 7.00%, 9/25/23 | | | | | | | 157 | | | | 176,666 | |
Series 1994-45, Class Z, 6.50%, 2/25/24 | | | | | | | 1,177 | | | | 1,299,164 | |
Series 1994-89, Class ZQ, 8.00%, 7/25/24 | | | | | | | 747 | | | | 853,007 | |
Series 1996-57, Class Z, 7.00%, 12/25/26 | | | | | | | 724 | | | | 834,245 | |
Series 1997-77, Class Z, 7.00%, 11/18/27 | | | | | | | 332 | | | | 376,258 | |
Series 1998-44, Class ZA, 6.50%, 7/20/28 | | | | | | | 354 | | | | 404,119 | |
Series 1999-45, Class ZG, 6.50%, 9/25/29 | | | | | | | 112 | | | | 125,875 | |
Series 2000-22, Class PN, 6.00%, 7/25/30 | | | | | | | 1,101 | | | | 1,253,199 | |
Series 2002-1, Class G, 7.00%, 7/25/23 | | | | | | | 210 | | | | 232,991 | |
Series 2002-21, Class PE, 6.50%, 4/25/32 | | | | | | | 885 | | | | 1,017,280 | |
Series 2005-75, Class CS, 22.099%, 9/25/35(22) | | | | | | | 948 | | | | 2,064,039 | |
Series 2006-8, (Principal Only), Class WQ, 0.00%, 3/25/36(21) | | | | | | | 6,781 | | | | 6,097,502 | |
Series 2007-74, Class AC, 5.00%, 8/25/37 | | | | | | | 9,569 | | | | 10,484,114 | |
Series 2010-99, (Interest Only), Class NS, 6.075%, 3/25/39(22)(23) | | | | | | | 4,736 | | | | 292,631 | |
Series 2010-119, (Interest Only), Class SK, 5.475%, 4/25/40(22)(23) | | | | | | | 1,665 | | | | 42,224 | |
Series 2010-124, (Interest Only), Class SJ,
5.525%, 11/25/38(22)(23) | | | | | | | 4,667 | | | | 409,799 | |
Series 2010-151, (Interest Only), Class PI, 4.00%, 5/25/28(23) | | | | | | | 5,722 | | | | 54,360 | |
Series 2011-45, (Interest Only), Class SA, 6.125%, 1/25/29(22)(23) | | | | | | | 3,737 | | | | 169,449 | |
Series 2011-49, Class NT, 6.00%, 6/25/41(22) | | | | | | | 1,206 | | | | 1,346,558 | |
Series 2011-101, (Interest Only), Class IC, 3.50%, 10/25/26(23) | | | | | | | 17,218 | | | | 1,628,438 | |
Series 2011-101, (Interest Only), Class IE, 3.50%, 10/25/26(23) | | | | | | | 5,599 | | | | 528,450 | |
Series 2011-109, Class PE, 3.00%, 8/25/41 | | | | | | | 5,293 | | | | 5,425,876 | |
Series 2012-24, (Interest Only), Class S, 4.975%, 5/25/30(22)(23) | | | | | | | 4,351 | | | | 348,205 | |
Series 2012-33, (Interest Only), Class CI, 3.50%, 3/25/27(23) | | | | | | | 9,305 | | | | 878,130 | |
Series 2012-56, (Interest Only), Class SU, 6.225%, 8/25/26(22)(23) | | | | | | | 4,106 | | | | 275,276 | |
Series 2012-103, (Interest Only), Class GS, 5.575%, 2/25/40(22)(23) | | | | | | | 12,118 | | | | 1,328,436 | |
Series 2012-124, (Interest Only), Class IO, 1.688%, 11/25/42(20)(23) | | | | | | | 12,033 | | | | 663,845 | |
Series 2012-134, Class ZT, 2.00%, 12/25/42 | | | | | | | 5,053 | | | | 4,765,787 | |
| | | | | | | | | | | | |
| Security | | | | | Principal Amount (000’s omitted) | | | Value | |
| | | | | | | | | | | | |
Federal National Mortgage Association: (continued) | |
Series 2012-150, (Interest Only), Class SK,
5.625%, 1/25/43(22)(23) | | | | | | $ | 7,935 | | | $ | 1,616,166 | |
Series 2013-6, Class TA, 1.50%, 1/25/43 | | | | | | | 9,178 | | | | 9,036,286 | |
Series 2013-12, (Interest Only), Class SP,
5.125%, 11/25/41(22)(23) | | | | | | | 4,416 | | | | 546,980 | |
Series 2013-15, (Interest Only), Class DS,
5.675%, 3/25/33(22)(23) | | | | | | | 16,345 | | | | 3,453,365 | |
Series 2013-16, (Interest Only), Class SY,
5.625%, 3/25/43(22)(23) | | | | | | | 3,666 | | | | 705,294 | |
Series 2013-52, Class MD, 1.25%, 6/25/43 | | | | | | | 10,179 | | | | 9,870,604 | |
Series 2013-54, (Interest Only), Class HS,
5.775%, 10/25/41(22)(23) | | | | | | | 5,945 | | | | 796,625 | |
Series 2013-64, (Interest Only), Class PS,
5.725%, 4/25/43(22)(23) | | | | | | | 6,524 | | | | 1,135,909 | |
Series 2013-67, Class NF, 1.525%, 7/25/43(22) | | | | | | | 2,784 | | | | 2,707,951 | |
Series 2013-75, (Interest Only), Class SC,
5.725%, 7/25/42(22)(23) | | | | | | | 16,055 | | | | 2,419,246 | |
Series 2014-32, (Interest Only), Class EI, 4.00%, 6/25/44(23) | | | | | | | 2,606 | | | | 317,298 | |
Series 2014-36, (Interest Only), Class ID, 4.00%, 6/25/44(23) | | | | | | | 2,720 | | | | 288,096 | |
Series 2014-55, (Interest Only), Class IN, 3.50%, 7/25/44(23) | | | | | | | 6,786 | | | | 802,399 | |
Series 2014-64, Class PA, 3.00%, 3/25/44 | | | | | | | 10,561 | | | | 10,804,013 | |
Series 2014-72, Class CS, 8.108%, 11/25/44(22) | | | | | | | 309 | | | | 312,139 | |
Series 2014-89, (Interest Only), Class IO, 3.50%, 1/25/45(23) | | | | | | | 8,599 | | | | 1,124,579 | |
Series 2015-17, (Interest Only), Class SA,
5.675%, 11/25/43(22)(23) | | | | | | | 10,603 | | | | 1,228,419 | |
Series 2015-43, Class ZA, 4.00%, 6/25/45 | | | | | | | 889 | | | | 889,780 | |
Series 2015-52, (Interest Only), Class MI, 3.50%, 7/25/45(23) | | | | | | | 7,843 | | | | 941,064 | |
Series 2015-89, Class ZB, 3.00%, 5/25/54 | | | | | | | 6,671 | | | | 6,621,503 | |
Series 2015-95, (Interest Only), Class SB, 5.475%, 1/25/46(22)(23) | | | | | | | 21,235 | | | | 4,665,337 | |
Series 2016-1, (Interest Only), Class SJ, 5.625%, 2/25/46(22)(23) | | | | | | | 32,181 | | | | 6,552,457 | |
Series 2016-22, Class ZE, 3.00%, 6/25/44 | | | | | | | 2,419 | | | | 2,426,743 | |
| | | | | | | | | | | | | |
| | | | | | | | | | $ | 125,073,660 | |
| | | | | | | | | | | | | |
Government National Mortgage Association: | |
Series 2002-45, Class PG, 6.00%, 3/17/32 | | | | | | $ | 676 | | | $ | 693,573 | |
Series 2011-156, Class GA, 2.00%, 12/16/41 | | | | | | | 1,151 | | | | 1,124,090 | |
Series 2014-146, Class S, 5.352%, 10/20/44(22) | | | | | | | 75 | | | | 75,224 | |
Series 2015-79, Class CS, 5.091%, 5/20/45(22) | | | | | | | 643 | | | | 647,232 | |
Series 2015-113, Class SU, 4.936%, 7/20/45(22) | | | | | | | 752 | | | | 755,999 | |
Series 2016-58, Class ZC, 2.00%, 10/20/43 | | | | | | | 1,276 | | | | 1,275,425 | |
Series 2016-75, Class LZ, 2.25%, 10/20/39 | | | | | | | 926 | | | | 925,466 | |
Series 2016-75, Class WZ, 2.25%, 11/16/43 | | | | | | | 2,106 | | | | 2,104,791 | |
| | | | |
| | 34 | | See Notes to Financial Statements. |
Eaton Vance
Limited Duration Income Fund
September 30, 2016
Portfolio of Investments (Unaudited) — continued
| | | | | | | | | | | | |
| Security | | | | | Principal Amount (000’s omitted) | | | Value | |
| | | | | | | | | | | | |
Government National Mortgage Association: (continued) | |
Series 2016-81, Class CZ, 2.25%, 3/16/45 | | | | | | $ | 3,253 | | | $ | 3,240,904 | |
Series 2016-129, Class ZC, 2.00%, 6/20/45 | | | | | | | 10,000 | | | | 9,847,500 | |
| | | | | | | | | | | | | |
| | | | | | | | | | $ | 20,690,204 | |
| | | | | | | | | | | | | |
| |
Total Collateralized Mortgage Obligations
(identified cost $289,950,096) | | | $ | 285,054,506 | |
| | | | | | | | | | | | | |
|
| Commercial Mortgage-Backed Securities — 5.2% | |
| | | |
| | | | | | | | | | | | |
| Security | | | | | Principal Amount (000’s omitted) | | | Value | |
A10 Securitization, LLC | |
Series 2013-1, Class A, 2.40%, 11/15/25(6) | | | | | | $ | 24 | | | $ | 24,430 | |
Series 2015-1, Class A2, 3.13%, 4/15/34(6) | | | | | | | 2,400 | | | | 2,409,869 | |
Americold LLC Trust | |
Series 2010-ARTA, Class D, 7.443%, 1/14/29(6) | | | | | | | 3,000 | | | | 3,355,670 | |
Banc of America Commercial Mortgage Trust | |
Series 2006-3, Class A4, 5.889%, 7/10/44(20) | | | | | | | 32 | | | | 31,859 | |
Series 2006-5, Class AM, 5.448%, 9/10/47 | | | | | | | 2,694 | | | | 2,692,712 | |
Banc of America Merrill Lynch Large Loan, Inc. | |
Series 2013-DSNY, Class E, 3.124%, 9/15/26(6)(20) | | | | | | | 1,500 | | | | 1,493,549 | |
Bear Stearns Commercial Mortgage Securities Trust | |
Series 2006-PW14, Class A4, 5.201%, 12/11/38 | | | | | | | 481 | | | | 480,410 | |
CD Commercial Mortgage Trust | |
Series 2006-CD3, Class A5, 5.617%, 10/15/48 | | | | | | | 78 | | | | 78,197 | |
Citigroup Commercial Mortgage Trust | |
Series 2012-GC8, Class A2, 1.813%, 9/10/45 | | | | | | | 3,258 | | | | 3,265,332 | |
Series 2015-P1, Class D, 3.225%, 9/15/48(6) | | | | | | | 1,500 | | | | 1,193,006 | |
COMM Mortgage Trust | |
Series 2012-CR2, Class AM, 3.791%, 8/15/45 | | | | | | | 395 | | | | 425,421 | |
Series 2012-CR2, Class D, 5.017%, 8/15/45(6)(20) | | | | | | | 1,650 | | | | 1,717,101 | |
Series 2012-LC4, Class AM, 4.063%, 12/10/44 | | | | | | | 750 | | | | 815,756 | |
Series 2013-CR10, Class D, 4.949%, 8/10/46(6)(20) | | | | | | | 1,700 | | | | 1,490,722 | |
Series 2013-CR11, Class D, 5.337%, 10/10/46(6)(20) | | | | | | | 2,500 | | | | 2,361,494 | |
Series 2014-CR21, Class D, 4.065%, 12/10/47(6)(20) | | | | | | | 2,500 | | | | 2,040,078 | |
Series 2014-UBS2, Class A2, 2.82%, 3/10/47 | | | | | | | 2,200 | | | | 2,251,184 | |
Series 2015-CR22, Class D, 4.264%, 3/10/48(6)(20) | | | | | | | 3,000 | | | | 2,462,111 | |
DBUBS Mortgage Trust | |
Series 2011-LC1A, Class A1, 3.742%, 11/10/46(6) | | | | | | | 14 | | | | 13,645 | |
JPMBB Commercial Mortgage Securities Trust | |
Series 2014-C19, Class A2, 3.046%, 4/15/47 | | | | | | | 2,448 | | | | 2,536,608 | |
Series 2014-C19, Class D, 4.83%, 4/15/47(6)(20) | | | | | | | 1,425 | | | | 1,242,785 | |
Series 2014-C21, Class D, 4.816%, 8/15/47(6)(20) | | | | | | | 1,000 | | | | 850,448 | |
Series 2014-C22, Class C, 4.712%, 9/15/47(20) | | | | | | | 730 | | | | 748,801 | |
| | | | | | | | | | | | |
| Security | | | | | Principal Amount (000’s omitted) | | | Value | |
| | | | | | | | | | | | |
JPMBB Commercial Mortgage Securities Trust (continued) | |
Series 2014-C22, Class D, 4.712%, 9/15/47(6)(20) | | | | | | $ | 4,500 | | | $ | 3,695,682 | |
Series 2014-C23, Class C, 4.608%, 9/15/47(20) | | | | | | | 500 | | | | 527,159 | |
Series 2014-C25, Class D, 4.097%, 11/15/47(6)(20) | | | | | | | 2,100 | | | | 1,652,843 | |
Series 2015-C29, Class D, 3.842%, 5/15/48(20) | | | | | | | 2,000 | | | | 1,492,848 | |
JPMorgan Chase Commercial Mortgage Securities Trust | |
Series 2006-LDP9, Class A3, 5.336%, 5/15/47 | | | | | | | 491 | | | | 491,452 | |
Series 2006-LDP9, Class AM, 5.372%, 5/15/47 | | | | | | | 3,000 | | | | 3,009,462 | |
Series 2010-C2, Class D, 5.734%, 11/15/43(6)(20) | | | | | | | 3,247 | | | | 3,453,996 | |
Series 2011-C5, Class D, 5.562%, 8/15/46(6)(20) | | | | | | | 3,000 | | | | 3,108,966 | |
Series 2012-CBX, Class AS, 4.271%, 6/15/45 | | | | | | | 1,000 | | | | 1,095,554 | |
Series 2013-C13, Class D, 4.189%, 1/15/46(6)(20) | | | | | | | 3,000 | | | | 2,883,954 | |
Series 2013-LC11, Class AS, 3.216%, 4/15/46 | | | | | | | 1,110 | | | | 1,156,503 | |
Series 2014-DSTY, Class B, 3.771%, 6/10/27(6) | | | | | | | 2,600 | | | | 2,666,706 | |
Morgan Stanley Bank of America Merrill Lynch Trust | |
Series 2014-C15, Class D, 5.058%, 4/15/47(6)(20) | | | | | | | 2,450 | | | | 2,168,528 | |
Series 2015-C23, Class D, 4.273%, 7/15/50(6)(20) | | | | | | | 2,000 | | | | 1,647,109 | |
Morgan Stanley Capital I Trust | |
Series 2007-IQ15, Class A4, 6.103%, 6/11/49(20) | | | | | | | 3,704 | | | | 3,803,777 | |
Series 2007-IQ16, Class A4, 5.809%, 12/12/49 | | | | | | | 625 | | | | 643,082 | |
Motel 6 Trust | |
Series 2015-MTL6, Class D, 4.532%, 2/5/30(6) | | | | | | | 2,500 | | | | 2,513,618 | |
UBS Commercial Mortgage Trust | |
Series 2012-C1, Class D, 5.731%, 5/10/45(6)(20) | | | | | | | 3,000 | | | | 3,089,872 | |
UBS-Citigroup Commercial Mortgage Trust | |
Series 2011-C1, Class D, 6.266%, 1/10/45(6)(20) | | | | | | | 2,850 | | | | 3,165,869 | |
Wachovia Bank Commercial Mortgage Trust | |
Series 2006-C29, Class A4, 5.308%, 11/15/48 | | | | | | | 115 | | | | 114,685 | |
Wells Fargo Commercial Mortgage Trust | |
Series 2013-LC12, Class D, 4.432%, 7/15/46(6)(20) | | | | | | | 3,000 | | | | 2,750,794 | |
Series 2015-C29, Class D, 4.366%, 6/15/48(20) | | | | | | | 3,000 | | | | 2,422,398 | |
Series 2015-C31, Class D, 3.852%, 11/15/48 | | | | | | | 2,475 | | | | 1,894,616 | |
Series 2015-LC22, Class C, 4.691%, 9/15/58(20) | | | | | | | 1,250 | | | | 1,303,330 | |
Series 2015-NXS1, Class D, 4.241%, 5/15/48(20) | | | | | | | 2,500 | | | | 2,073,409 | |
Series 2015-SG1, Class C, 4.62%, 12/15/47(20) | | | | | | | 1,575 | | | | 1,589,034 | |
WF-RBS Commercial Mortgage Trust | |
Series 2013-C13, Class AS, 3.345%, 5/15/45 | | | | | | | 660 | | | | 690,332 | |
Series 2014-LC14, Class D, 4.586%, 3/15/47(6)(20) | | | | | | | 3,000 | | | | 2,482,354 | |
| | | | | | | | | | | | | |
| |
Total Commercial Mortgage-Backed Securities
(identified cost $92,568,862) | | | $ | 91,569,120 | |
| | | | | | | | | | | | | |
| | | | |
| | 35 | | See Notes to Financial Statements. |
Eaton Vance
Limited Duration Income Fund
September 30, 2016
Portfolio of Investments (Unaudited) — continued
| | | | | | | | | | | | |
| Asset-Backed Securities — 3.1% | |
| | | |
| | | | | | | | | | | | |
| Security | | | | | Principal Amount (000’s omitted) | | | Value | |
| | | | | | | | | | | | |
American Homes 4 Rent | |
Series 2014-SFR1, Class C, 2.281%, 6/17/31(6)(12) | | | | | | $ | 2,875 | | | $ | 2,869,936 | |
Series 2014-SFR1, Class D, 2.631%, 6/17/31(6)(12) | | | | | | | 1,790 | | | | 1,792,885 | |
Apidos CLO XVII | |
Series 2014-17A, Class C, 3.979%, 4/17/26(6)(12) | | | | | | | 1,000 | | | | 956,320 | |
Series 2014-17A, Class D, 5.429%, 4/17/26(6)(12) | | | | | | | 1,000 | | | | 864,219 | |
Avis Budget Rental Car Funding, LLC | |
Series 2013-2A, Class B, 3.66%, 2/20/20(6) | | | | | | | 450 | | | | 458,988 | |
Centurion CDO IX Ltd. | |
Series 2005-9A, Class D1, 5.429%, 7/17/19(6)(12) | | | | | | | 500 | | | | 500,020 | |
Colony American Homes | |
Series 2014-1A, Class C, 2.381%, 5/17/31(6)(12) | | | | | | | 2,740 | | | | 2,745,910 | |
Series 2014-1A, Class D, 2.681%, 5/17/31(6)(12) | | | | | | | 500 | | | | 501,125 | |
DB Master Finance, LLC | |
Series 2015-1A, Class A2I, 3.262%, 2/20/45(6) | | | | | | | 1,665 | | | | 1,677,654 | |
Dell Equipment Finance Trust | |
Series 2014-1, Class C, 1.80%, 6/22/20(6) | | | | | | | 710 | | | | 710,258 | |
Series 2015-1, Class C, 2.42%, 3/23/20(6) | | | | | | | 1,950 | | | | 1,968,177 | |
Series 2016-1, Class B, 2.03%, 7/22/21(6) | | | | | | | 1,750 | | | | 1,761,816 | |
First Investors Auto Owner Trust | |
Series 2015-1A, Class C, 2.71%, 6/15/21(6) | | | | | | | 1,400 | | | | 1,412,078 | |
Series 2016-2A, Class A1, 1.53%, 11/16/20(6) | | | | | | | 1,000 | | | | 1,000,627 | |
FirstKey Lending Trust | |
Series 2015-SFR1, Class A, 2.553%, 3/9/47(6) | | | | | | | 1,451 | | | | 1,460,838 | |
Ford Credit Auto Owner Trust | |
Series 2014-1, Class B, 2.41%, 11/15/25(6) | | | | | | | 3,600 | | | | 3,643,505 | |
GMF Floorplan Owner Revolving Trust | |
Series 2015-1, Class B, 1.97%, 5/15/20(6) | | | | | | | 255 | | | | 254,926 | |
Invitation Homes Trust | |
Series 2013-SFR1, Class C, 2.396%, 12/17/30(6)(12) | | | | | | | 1,250 | | | | 1,250,946 | |
Series 2013-SFR1, Class D, 2.696%, 12/17/30(6)(12) | | | | | | | 1,000 | | | | 1,000,746 | |
Series 2015-SFR2, Class C, 2.527%, 6/17/32(6)(12) | | | | | | | 2,000 | | | | 2,005,724 | |
MVW Owner Trust | |
Series 2014-1A, Class A, 2.25%, 9/22/31(6) | | | | | | | 1,179 | | | | 1,180,151 | |
Nextgear Floorplan Master Owner Trust | |
Series 2015-2A, Class A, 2.38%, 10/15/20(6) | | | | | | | 1,600 | | | | 1,597,418 | |
Octagon Investment Partners XVI Ltd. | |
Series 2013-1A, Class D, 4.029%, 7/17/25(6)(12) | | | | | | | 1,075 | | | | 1,045,704 | |
Series 2013-1A, Class E, 5.179%, 7/17/25(6)(12) | | | | | | | 1,300 | | | | 1,158,009 | |
OneMain Financial Issuance Trust | |
Series 2014-1A, Class A, 2.43%, 6/18/24(6) | | | | | | | 623 | | | | 623,339 | |
Series 2014-1A, Class B, 3.24%, 6/18/24(6) | | | | | | | 1,200 | | | | 1,208,858 | |
Series 2015-1A, Class B, 3.85%, 3/18/26(6) | | | | | | | 1,200 | | | | 1,221,087 | |
| | | | | | | | | | | | |
| Security | | | | | Principal Amount (000’s omitted) | | | Value | |
| | | | | | | | | | | | |
Sierra Receivables Funding Co., LLC | |
Series 2014-1A, Class B, 2.42%, 3/20/30(6) | | | | | | $ | 631 | | | $ | 628,345 | |
Series 2015-1A, Class B, 3.05%, 3/22/32(6) | | | | | | | 1,256 | | | | 1,266,045 | |
Silver Bay Realty Trust | |
Series 2014-1, Class C, 2.581%, 9/17/31(6)(12) | | | | | | | 2,700 | | | | 2,700,919 | |
SpringCastle Funding Trust | |
Series 2014-AA, Class B, 4.61%, 10/25/27(6) | | | | | | | 2,500 | | | | 2,501,255 | |
Synchrony Credit Card Master Note Trust | |
Series 2015-3, Class A, 1.74%, 9/15/21 | | | | | | | 1,000 | | | | 1,007,992 | |
Taco Bell Funding, LLC | |
Series 2016-1A, Class A2I, 3.832%, 5/25/46(6) | | | | | | | 2,990 | | | | 3,040,264 | |
Tricon American Homes | |
Series 2015-SFR1, Class D, 2.731%, 5/17/32(6)(12) | | | | | | | 1,000 | | | | 991,688 | |
Verizon Owner Trust | |
Series 2016-1A, Class A, 1.42%, 1/20/21(6) | | | | | | | 2,400 | | | | 2,408,429 | |
Wendys Funding, LLC | |
Series 2015-1A, Class A2I, 3.371%, 6/15/45(6) | | | | | | | 3,168 | | | | 3,191,643 | |
| | | | | | | | | | | | | |
| |
Total Asset-Backed Securities
(identified cost $54,437,491) | | | $ | 54,607,844 | |
| | | | | | | | | | | | | |
|
| U.S. Government Agency Obligations — 1.9% | |
| | | |
| | | | | | | | | | | | |
| Security | | | | | Principal Amount (000’s omitted) | | | Value | |
Federal Farm Credit Bank | |
3.25%, 7/1/30(18) | | | | | | $ | 5,000 | | | $ | 5,483,620 | |
| | | | | | | | | | | | | |
| | | | | | | | | | $ | 5,483,620 | |
| | | | | | | | | | | | | |
Federal Home Loan Bank | |
4.125%, 12/13/19(18) | | | | | | $ | 3,975 | | | $ | 4,355,491 | |
5.25%, 12/9/22(18) | | | | | | | 9,000 | | | | 10,967,148 | |
5.375%, 5/15/19(18) | | | | | | | 6,585 | | | | 7,330,257 | |
5.50%, 7/15/36 | | | | | | | 4,000 | | | | 5,828,200 | |
| | | | | | | | | | | | | |
| | | | | | | | | | $ | 28,481,096 | |
| | | | | | | | | | | | | |
| |
Total U.S. Government Agency Obligations
(identified cost $31,452,647) | | | $ | 33,964,716 | |
| | | | | | | | | | | | | |
|
| U.S. Treasury Obligations — 1.7% | |
| | | |
| | | | | | | | | | | | |
| Security | | | | | Principal Amount (000’s omitted) | | | Value | |
U.S. Treasury Bond,
8.875%, 2/15/19(18) | | | | | | $ | 25,000 | | | $ | 29,773,925 | |
| | | | | | | | | | | | | |
| |
Total U.S. Treasury Obligations
(identified cost $29,725,669) | | | $ | 29,773,925 | |
| | | | | | | | | | | | | |
| | | | |
| | 36 | | See Notes to Financial Statements. |
Eaton Vance
Limited Duration Income Fund
September 30, 2016
Portfolio of Investments (Unaudited) — continued
| | | | | | | | | | | | |
| Common Stocks — 0.4% | |
| | | |
| | | | | | | | | | | | |
| Security | | | | | Shares | | | Value | |
| | | | | | | | | | | | |
|
Aerospace and Defense — 0.0%(13) | |
IAP Global Services, LLC(3)(14)(24) | | | | | | | 31 | | | $ | 356,854 | |
| | | | | | | | | | | | | |
| | | | | | | | | | $ | 356,854 | |
| | | | | | | | | | | | | |
|
Automotive — 0.1% | |
Dayco Products, LLC(14)(24) | | | | | | | 27,250 | | | $ | 763,000 | |
| | | | | | | | | | | | | |
| | | | | | | | | | $ | 763,000 | |
| | | | | | | | | | | | | |
|
Business Equipment and Services — 0.0%(13) | |
Education Management Corp.(14)(24) | | | | | | | 5,580,468 | | | $ | 349,337 | |
RCS Capital Corp.(3)(14)(24) | | | | | | | 37,523 | | | | 281,423 | |
| | | | | | | | | | | | | |
| | | | | | | | | | $ | 630,760 | |
| | | | | | | | | | | | | |
|
Energy — 0.0%(13) | |
Contura Energy, Inc.(14)(24) | | | | | | | 7,320 | | | $ | 230,580 | |
| | | | | | | | | | | | | |
| | | | | | | | | | $ | 230,580 | |
| | | | | | | | | | | | | |
|
Health Care — 0.0%(13) | |
New Millennium Holdco, Inc.(14)(24) | | | | | | | 42,216 | | | $ | 27,968 | |
| | | | | | | | | | | | | |
| | | | | | | | | | $ | 27,968 | |
| | | | | | | | | | | | | |
|
Lodging and Casinos — 0.1% | |
Affinity Gaming, LLC(3)(14)(24) | | | | | | | 46,819 | | | $ | 819,336 | |
Tropicana Entertainment, Inc.(14)(24) | | | | | | | 17,051 | | | | 404,961 | |
| | | | | | | | | | | | | |
| | | | | | | | | | $ | 1,224,297 | |
| | | | | | | | | | | | | |
|
Nonferrous Metals / Minerals — 0.0% | |
ASP United/GHX Holding, LLC(3)(14)(24) | | | | | | | 704 | | | $ | 0 | |
| | | | | | | | | | | | | |
| | | | | | | | | | $ | 0 | |
| | | | | | | | | | | | | |
|
Oil and Gas — 0.0%(13) | |
Seventy Seven Energy, Inc.(14)(24) | | | | | | | 38,014 | | | $ | 716,564 | |
Southcross Holdings Group, LLC(3)(14)(24) | | | | | | | 78 | | | | 0 | |
Southcross Holdings L.P., Class A(14)(24) | | | | | | | 78 | | | | 29,055 | |
| | | | | | | | | | | | | |
| | | | | | | | | | $ | 745,619 | |
| | | | | | | | | | | | | |
|
Publishing — 0.2% | |
ION Media Networks, Inc.(3)(14)(24) | | | | | | | 5,187 | | | $ | 2,944,556 | |
MediaNews Group, Inc.(3)(14)(24) | | | | | | | 14,016 | | | | 481,301 | |
| | | | | | | | | | | | |
| Security | | | | | Shares | | | Value | |
| | | | | | | | | | | | |
|
Publishing (continued) | |
Nelson Education Ltd.(3)(14)(24) | | | | | | | 73,690 | | | $ | 0 | |
| | | | | | | | | | | | | |
| | | | | | | | | | $ | 3,425,857 | |
| | | | | | | | | | | | | |
| |
Total Common Stocks
(identified cost $3,730,497) | | | $ | 7,404,935 | |
| | | | | | | | | | | | | |
|
| Convertible Bonds — 0.0%(13) | |
| | | |
| | | | | | | | | | | | |
| Security | | | | | Principal Amount (000’s omitted) | | | Value | |
|
Utilities — 0.0%(13) | |
NRG Yield, Inc., 3.25%, 6/1/20(6) | | | | | | $ | 225 | | | $ | 221,484 | |
| | | | | | | | | | | | | |
| |
Total Convertible Bonds
(identified cost $217,226) | | | $ | 221,484 | |
| | | | | | | | | | | | | |
|
| Convertible Preferred Stocks — 0.0%(13) | |
| | | |
| | | | | | | | | | | | |
| Security | | | | | Shares | | | Value | |
|
Business Equipment and Services — 0.0%(13) | |
Education Management Corp., Series A-1, 7.50%(3)(14)(24) | | | | | | | 6,209 | | | $ | 2,484 | |
| | | | | | | | | | | | | |
| |
Total Convertible Preferred Stocks
(identified cost $438,211) | | | $ | 2,484 | |
| | | | | | | | | | | | | |
|
| Preferred Stocks — 0.1% | |
| | | |
| | | | | | | | | | | | |
| Security | | | | | Shares | | | Value | |
|
Banks and Thrifts — 0.1% | |
Farm Credit Bank of Texas, 6.75% to 9/15/23(9)(10) | | | | | | | 8,000 | | | $ | 860,250 | |
| | | | | | | | | | | | | |
| | | | | | | | | | $ | 860,250 | |
| | | | | | | | | | | | | |
|
Nonferrous Metals / Minerals — 0.0%(13) | |
Alpha Natural Resources Holdings, Inc., Class A(14)(24) | | | | | | | 5,438 | | | $ | 2,699 | |
ANR, Inc., Class A(3)(14)(24) | | | | | | | 5,438 | | | | 17,456 | |
| | | | | | | | | | | | | |
| | | | | | | | | | $ | 20,155 | |
| | | | | | | | | | | | | |
| |
Total Preferred Stocks
(identified cost $818,832) | | | $ | 880,405 | |
| | | | | | | | | | | | | |
| | | | |
| | 37 | | See Notes to Financial Statements. |
Eaton Vance
Limited Duration Income Fund
September 30, 2016
Portfolio of Investments (Unaudited) — continued
| | | | | | | | | | | | |
| Closed-End Funds — 1.2% | |
| | | |
| | | | | | | | | | | | |
| Security | | | | | Shares | | | Value | |
| | | | | | | | | | | | |
BlackRock Corporate High Yield Fund, Inc. | | | | | | | 1,946,653 | | | $ | 21,062,786 | |
| | | | | | | | | | | | | |
| |
Total Closed-End Funds
(identified cost $23,805,085) | | | $ | 21,062,786 | |
| | | | | | | | | | | | | |
|
| Warrants — 0.0%(13) | |
| | | |
| | | | | | | | | | | | |
| Security | | | | | Shares | | | Value | |
|
Food Products — 0.0% | |
ASG Consolidated, LLC/ASG Finance, Inc., Expires 5/15/18(3)(24) | | | | | | | 1,745 | | | $ | 0 | |
| | | | | | | | | | | | | |
| | | | | | | | | | $ | 0 | |
| | | | | | | | | | | | | |
|
Oil and Gas — 0.0%(13) | |
Seventy Seven Energy, Inc., Expires 8/1/21(14)(24) | | | | | | | 10,827 | | | $ | 58,195 | |
| | | | | | | | | | | | | |
| | | | | | | | | | $ | 58,195 | |
| | | | | | | | | | | | | |
| |
Total Warrants
(identified cost $779,001) | | | $ | 58,195 | |
| | | | | | | | | | | | | |
|
| Miscellaneous — 0.0%(13) | |
| | | |
| | | | | | | | | | | | |
| Security | | | | | Principal
Amount/Shares | | | Value | |
|
Cable and Satellite Television — 0.0%(13) | |
ACC Claims Holdings, LLC(24) | | | | | | | 2,257,600 | | | $ | 13,545 | |
| | | | | | | | | | | | | |
| | | | | | | | | | $ | 13,545 | |
| | | | | | | | | | | | | |
|
Lodging and Casinos — 0.0%(13) | |
Buffalo Thunder Development Authority, Residual Claim Certificates, Expires 11/15/29(6)(24) | | | | | | $ | 889,622 | | | $ | 445 | |
| | | | | | | | | | | | | |
| | | | | | | | | | $ | 445 | |
| | | | | | | | | | | | | |
|
Oil and Gas — 0.0% | |
SemGroup Corp., Escrow
Certificate(3)(24) | | | | | | | 6,135,000 | | | $ | 0 | |
| | | | | | | | | | | | | |
| | | | | | | | | | $ | 0 | |
| | | | | | | | | | | | | |
|
Utilities — 0.0%(13) | |
EME Reorganization Trust(24) | | | | | | | 1,099,749 | | | $ | 5,059 | |
| | | | | | | | | | | | | |
| | | | | | | | | | $ | 5,059 | |
| | | | | | | | | | | | | |
| |
Total Miscellaneous
(identified cost $203,413) | | | $ | 19,049 | |
| | | | | | | | | | | | | |
| | | | | | | | | | | | |
| Short-Term Investments — 2.4% | |
|
| U.S. Treasury Obligations — 0.0%(13) | |
| | | |
| | | | | | | | | | | | |
| Security | | | | | Principal Amount (000’s omitted) | | | Value | |
| | | | | | | | | | | | |
U.S. Treasury Bill,
0.00%, 11/25/16(25) | | | | | | $ | 500 | | | $ | 499,900 | |
| | | | | | | | | | | | | |
| |
Total U.S. Treasury Obligations
(identified cost $499,981) | | | $ | 499,900 | |
| | | | | | | | | | | | | |
|
| Other — 2.4% | |
| | | |
| | | | | | | | | | | | |
| Description | | | | | Interest (000’s omitted) | | | Value | |
Eaton Vance Cash Reserves Fund, LLC, 0.64%(26) | | | | | | $ | 41,062 | | | $ | 41,061,701 | |
| | | | | | | | | | | | | |
| |
Total Other
(identified cost $41,061,701) | | | $ | 41,061,701 | |
| | | | | | | | | | | | | |
| |
Total Short-Term Investments
(identified cost $41,561,682) | | | $ | 41,561,601 | |
| | | | | | | | | | | | | |
| |
Total Investments — 158.4%
(identified cost $2,783,123,859) | | | $ | 2,781,607,181 | |
| | | | | | | | | | | | | |
| |
Less Unfunded Loan Commitments — (0.0)%(13) | | | $ | (868,094 | ) |
| | | | | | | | | | | | | |
| |
Net Investments — 158.4%
(identified cost $2,782,255,765) | | | $ | 2,780,739,087 | |
| | | | | | | | | | | | | |
| |
Other Assets, Less Liabilities — (43.2)% | | | $ | (758,494,771 | ) |
| | | | | | | | | | | | | |
| |
Auction Preferred Shares Plus Cumulative Unpaid Dividends — (15.2)% | | | $ | (266,640,476 | ) |
| | | | | | | | | | | | | |
| |
Net Assets Applicable to Common Shares — 100.0% | | | $ | 1,755,603,840 | |
| | | | | | | | | | | | | |
The percentage shown for each investment category in the Portfolio of Investments is based on net assets applicable to common shares.
| | * | In U.S. dollars unless otherwise indicated. |
| | (1) | Senior floating-rate loans (Senior Loans) often require prepayments from excess cash flows or permit the borrowers to repay at their election. The degree to which borrowers repay, whether as a contractual requirement or at their election, cannot be predicted with accuracy. As a result, the actual remaining maturity may be substantially less than the stated maturities shown. However, Senior Loans will typically have an expected average life of approximately two to four years. The stated interest rate represents the weighted average interest rate of all contracts within the senior loan facility and includes commitment fees on unfunded loan commitments, if any. Senior Loans typically have rates of interest which are redetermined either daily, monthly, quarterly or semi-annually by reference to a base lending rate, plus a premium. These base lending rates are primarily the London Interbank Offered Rate (“LIBOR”) and secondarily, the prime rate offered by one or more major United States |
| | | | |
| | 38 | | See Notes to Financial Statements. |
Eaton Vance
Limited Duration Income Fund
September 30, 2016
Portfolio of Investments (Unaudited) — continued
| | banks (the “Prime Rate”) and the certificate of deposit (“CD”) rate or other base lending rates used by commercial lenders. |
| | (2) | Unfunded or partially unfunded loan commitments. See Note 1F for description. |
| | (3) | For fair value measurement disclosure purposes, security is categorized as Level 3 (see Note 11). |
| | (4) | This Senior Loan will settle after September 30, 2016, at which time the interest rate will be determined. |
| | (5) | Currently the issuer is in default with respect to interest and/or principal payments. For a variable rate security, interest rate has been adjusted to reflect non-accrual status. |
| | (6) | Security exempt from registration pursuant to Rule 144A under the Securities Act of 1933, as amended. These securities may be sold in certain transactions in reliance on an exemption from registration (normally to qualified institutional buyers). At September 30, 2016, the aggregate value of these securities is $541,484,293 or 30.8% of the Fund’s net assets applicable to common shares. |
| | (7) | Security exempt from registration under Regulation S of the Securities Act of 1933, which exempts from registration securities offered and sold outside the United States. Security may not be offered or sold in the United States except pursuant to an exemption from, or in a transaction not subject to, the registration requirements of the Securities Act of 1933. At September 30, 2016, the aggregate value of these securities is $67,683,707 or 3.9% of the Fund’s net assets applicable to common shares. |
| | (8) | Represents a payment-in-kind security which may pay interest in additional principal at the issuer’s discretion. For corporate bonds, the interest rate paid in additional principal is generally higher than the indicated cash rate. |
| | (9) | Security converts to floating rate after the indicated fixed-rate coupon period. |
| (10) | Perpetual security with no stated maturity date but may be subject to calls by the issuer. |
| (11) | When-issued security. |
| (12) | Variable rate security. The stated interest rate represents the rate in effect at September 30, 2016. |
| (13) | Amount is less than 0.05% or (0.05)%, as applicable. |
| (14) | Security was acquired in connection with a restructuring of a Senior Loan and may be subject to restrictions on resale. |
| (15) | Multi-step coupon bond. Interest rate represents the rate in effect at September 30, 2016. |
| (16) | Variable interest rate that updates semiannually based on changes to the LIBOR. The stated interest rate represents the rate in effect at September 30, 2016. |
| (17) | Loan is subject to scheduled mandatory prepayments. Maturity date shown reflects the final maturity date. |
| (18) | Security (or a portion thereof) has been pledged for the benefit of the counterparty for reverse repurchase agreements. |
| (19) | Adjustable rate mortgage security. Rate shown is the rate at September 30, 2016. |
| (20) | Weighted average fixed-rate coupon that changes/updates monthly. Rate shown is the rate at September 30, 2016. |
| (21) | Principal only security that entitles the holder to receive only principal payments on the underlying mortgages. |
| (22) | Inverse floating-rate security whose coupon varies inversely with changes in the interest rate index. The stated interest rate represents the coupon rate in effect at September 30, 2016. |
| (23) | Interest only security that entitles the holder to receive only interest payments on the underlying mortgages. Principal amount shown is the notional amount of the underlying mortgages on which coupon interest is calculated. |
| (24) | Non-income producing security. |
| (25) | Security (or a portion thereof) has been pledged to cover margin requirements on open financial futures contracts. |
| (26) | Affiliated investment company, available to Eaton Vance portfolios and funds, which invests in high quality, U.S. dollar denominated money market instruments. The rate shown is the annualized seven-day yield as of September 30, 2016. |
| | | | | | | | | | | | | | | | | | | | | | | | |
| Forward Foreign Currency Exchange Contracts | |
| Currency Purchased | | | Currency Sold | | | Counterparty | | Settlement Date | | | Unrealized Appreciation | | | Unrealized (Depreciation) | |
| | | | | | | |
| EUR | | | 397,297 | | | USD | | | 444,845 | | | State Street Bank and Trust Company | | | 10/4/16 | | | $ | 1,458 | | | $ | — | |
| USD | | | 683,326 | | | EUR | | | 608,613 | | | State Street Bank and Trust Company | | �� | 10/4/16 | | | | — | | | | (359 | ) |
| USD | | | 21,912 | | | EUR | | | 19,297 | | | Goldman Sachs International | | | 10/5/16 | | | | 234 | | | | — | |
| USD | | | 6,089 | | | EUR | | | 5,364 | | | Goldman Sachs International | | | 10/5/16 | | | | 63 | | | | — | |
| USD | | | 32,240 | | | EUR | | | 28,648 | | | Goldman Sachs International | | | 10/5/16 | | | | 57 | | | | — | |
| USD | | | 10,260 | | | EUR | | | 9,088 | | | Goldman Sachs International | | | 10/5/16 | | | | 50 | | | | — | |
| USD | | | 14,036 | | | EUR | | | 12,472 | | | Goldman Sachs International | | | 10/5/16 | | | | 25 | | | | — | |
| USD | | | 10,489 | | | EUR | | | 9,328 | | | Goldman Sachs International | | | 10/5/16 | | | | 10 | | | | — | |
| USD | | | 20,778 | | | EUR | | | 18,491 | | | Goldman Sachs International | | | 10/5/16 | | | | 5 | | | | — | |
| USD | | | 3,441 | | | EUR | | | 3,084 | | | Goldman Sachs International | | | 10/5/16 | | | | — | | | | (24 | ) |
| USD | | | 28,630 | | | EUR | | | 25,643 | | | Goldman Sachs International | | | 10/5/16 | | | | — | | | | (178 | ) |
| USD | | | 133,904 | | | EUR | | | 120,000 | | | Goldman Sachs International | | | 10/5/16 | | | | — | | | | (904 | ) |
| USD | | | 2,418,179 | | | EUR | | | 2,177,559 | | | Goldman Sachs International | | | 10/5/16 | | | | — | | | | (28,092 | ) |
| EUR | | | 103,366 | | | USD | | | 115,929 | | | Goldman Sachs International | | | 10/21/16 | | | | 279 | | | | — | |
| EUR | | | 80,729 | | | USD | | | 91,287 | | | Goldman Sachs International | | | 10/21/16 | | | | — | | | | (528 | ) |
| | | | |
| | 39 | | See Notes to Financial Statements. |
Eaton Vance
Limited Duration Income Fund
September 30, 2016
Portfolio of Investments (Unaudited) — continued
| | | | | | | | | | | | | | | | | | | | | | | | |
| Forward Foreign Currency Exchange Contracts (continued) | |
| Currency Purchased | | | Currency Sold | | | Counterparty | | Settlement Date | | | Unrealized Appreciation | | | Unrealized (Depreciation) | |
| EUR | | | 79,988 | | | USD | | | 90,688 | | | Goldman Sachs International | | | 10/21/16 | | | $ | — | | | $ | (762 | ) |
| EUR | | | 239,923 | | | USD | | | 271,870 | | | Goldman Sachs International | | | 10/21/16 | | | | — | | | | (2,141 | ) |
| EUR | | | 384,480 | | | USD | | | 436,419 | | | Goldman Sachs International | | | 10/21/16 | | | | — | | | | (4,174 | ) |
| USD | | | 432,908 | | | EUR | | | 391,452 | | | Goldman Sachs International | | | 10/21/16 | | | | — | | | | (7,175 | ) |
| USD | | | 548,237 | | | EUR | | | 497,034 | | | Goldman Sachs International | | | 10/21/16 | | | | — | | | | (10,546 | ) |
| CHF | | | 14,000 | | | USD | | | 14,533 | | | State Street Bank and Trust Company | | | 10/31/16 | | | | — | | | | (99 | ) |
| EUR | | | 240,251 | | | USD | | | 269,153 | | | Deutsche Bank AG | | | 10/31/16 | | | | 1,071 | | | | — | |
| EUR | | | 324,860 | | | USD | | | 364,110 | | | State Street Bank and Trust Company | | | 10/31/16 | | | | 1,280 | | | | — | |
| EUR | | | 608,613 | | | USD | | | 684,202 | | | State Street Bank and Trust Company | | | 10/31/16 | | | | 340 | | | | — | |
| USD | | | 648,125 | | | CHF | | | 640,900 | | | State Street Bank and Trust Company | | | 10/31/16 | | | | — | | | | (12,629 | ) |
| USD | | | 4,856,845 | | | EUR | | | 4,401,469 | | | Goldman Sachs International | | | 10/31/16 | | | | — | | | | (93,748 | ) |
| USD | | | 918,579 | | | EUR | | | 820,000 | | | State Street Bank and Trust Company | | | 10/31/16 | | | | — | | | | (3,724 | ) |
| USD | | | 613,509 | | | EUR | | | 550,000 | | | State Street Bank and Trust Company | | | 10/31/16 | | | | — | | | | (5,109 | ) |
| USD | | | 769,674 | | | EUR | | | 690,000 | | | State Street Bank and Trust Company | | | 10/31/16 | | | | — | | | | (6,409 | ) |
| USD | | | 440,264 | | | EUR | | | 400,000 | | | State Street Bank and Trust Company | | | 10/31/16 | | | | — | | | | (9,640 | ) |
| USD | | | 11,593,813 | | | EUR | | | 10,504,135 | | | State Street Bank and Trust Company | | | 10/31/16 | | | | — | | | | (220,809 | ) |
| USD | | | 1,454,769 | | | GBP | | | 1,106,591 | | | State Street Bank and Trust Company | | | 10/31/16 | | | | 19,665 | | | | — | |
| USD | | | 629,326 | | | GBP | | | 485,000 | | | State Street Bank and Trust Company | | | 10/31/16 | | | | 345 | | | | — | |
| USD | | | 33,955 | | | GBP | | | 26,000 | | | State Street Bank and Trust Company | | | 10/31/16 | | | | 236 | | | | — | |
| USD | | | 331,739 | | | EUR | | | 292,492 | | | Deutsche Bank AG | | | 11/21/16 | | | | 2,457 | | | | — | |
| USD | | | 200,432 | | | EUR | | | 176,360 | | | Deutsche Bank AG | | | 11/21/16 | | | | 1,889 | | | | — | |
| USD | | | 199,824 | | | EUR | | | 176,105 | | | Deutsche Bank AG | | | 11/21/16 | | | | 1,569 | | | | — | |
| EUR | | | 701,391 | | | USD | | | 787,044 | | | State Street Bank and Trust Company | | | 11/30/16 | | | | 2,869 | | | | — | |
| EUR | | | 316,952 | | | USD | | | 357,643 | | | State Street Bank and Trust Company | | | 11/30/16 | | | | — | | | | (688 | ) |
| USD | | | 4,224,274 | | | CAD | | | 5,530,377 | | | Goldman Sachs International | | | 11/30/16 | | | | 7,131 | | | | — | |
| USD | | | 1,223,909 | | | CAD | | | 1,600,000 | | | HSBC Bank USA, N.A. | | | 11/30/16 | | | | 3,842 | | | | — | |
| USD | | | 620,690 | | | EUR | | | 550,000 | | | Deutsche Bank AG | | | 11/30/16 | | | | 1,274 | | | | — | |
| USD | | | 405,248 | | | EUR | | | 360,000 | | | Deutsche Bank AG | | | 11/30/16 | | | | — | | | | (188 | ) |
| USD | | | 1,688,681 | | | EUR | | | 1,500,000 | | | Deutsche Bank AG | | | 11/30/16 | | | | — | | | | (635 | ) |
| USD | | | 512,631 | | | EUR | | | 455,855 | | | Deutsche Bank AG | | | 11/30/16 | | | | — | | | | (758 | ) |
| USD | | | 2,532,689 | | | EUR | | | 2,258,015 | | | Deutsche Bank AG | | | 11/30/16 | | | | — | | | | (10,311 | ) |
| USD | | | 14,244,097 | | | EUR | | | 12,573,683 | | | State Street Bank and Trust Company | | | 11/30/16 | | | | 83,484 | | | | — | |
| USD | | | 512,598 | | | EUR | | | 453,158 | | | State Street Bank and Trust Company | | | 11/30/16 | | | | 2,248 | | | | — | |
| USD | | | 282,020 | | | EUR | | | 250,000 | | | State Street Bank and Trust Company | | | 11/30/16 | | | | 467 | | | | — | |
| USD | | | 281,349 | | | EUR | | | 250,000 | | | State Street Bank and Trust Company | | | 11/30/16 | | | | — | | | | (204 | ) |
| USD | | | 445,815 | | | EUR | | | 397,297 | | | State Street Bank and Trust Company | | | 11/30/16 | | | | — | | | | (1,625 | ) |
| USD | | | 6,076,045 | | | GBP | | | 4,589,595 | | | HSBC Bank USA, N.A. | | | 11/30/16 | | | | 121,018 | | | | — | |
| USD | | | 786,439 | | | EUR | | | 691,576 | | | Goldman Sachs International | | | 12/7/16 | | | | 7,331 | | | | — | |
| USD | | | 175,707 | | | EUR | | | 156,000 | | | Goldman Sachs International | | | 12/7/16 | | | | — | | | | (37 | ) |
| USD | | | 2,793,618 | | | EUR | | | 2,483,958 | | | Goldman Sachs International | | | 12/7/16 | | | | — | | | | (4,732 | ) |
| USD | | | 2,741,875 | | | EUR | | | 2,428,974 | | | Citibank, N.A. | | | 1/13/17 | | | | 268 | | | | — | |
| | | | | | | |
| | | | | | | | | | | | | | | | | | | $ | 260,965 | | | $ | (426,228 | ) |
| | | | |
| | 40 | | See Notes to Financial Statements. |
Eaton Vance
Limited Duration Income Fund
September 30, 2016
Portfolio of Investments (Unaudited) — continued
| | | | | | | | | | | | | | | | | | | | | | | | |
| Futures Contracts | |
| Description | | Contracts | | | Position | | | Expiration Month/Year | | | Aggregate Cost | | | Value | | | Net Unrealized Appreciation
(Depreciation) | |
| | | | | | |
Interest Rate Futures | | | | | | | | | | | | | | | | | | | | | | | | |
| Euro-Bobl | | | 54 | | | | Short | | | | Dec-16 | | | $ | (7,984,183 | ) | | $ | (8,012,694 | ) | | $ | (28,511 | ) |
| U.S. 2-Year Treasury Note | | | 88 | | | | Short | | | | Dec-16 | | | | (19,223,875 | ) | | | (19,225,250 | ) | | | (1,375 | ) |
| U.S. 5-Year Deliverable Interest Rate Swap | | | 30 | | | | Short | | | | Dec-16 | | | | (3,040,031 | ) | | | (3,040,312 | ) | | | (281 | ) |
| U.S. 5-Year Treasury Note | | | 305 | | | | Short | | | | Dec-16 | | | | (37,050,076 | ) | | | (37,062,266 | ) | | | (12,190 | ) |
| U.S. 10-Year Deliverable Interest Rate Swap | | | 157 | | | | Short | | | | Dec-16 | | | | (15,964,679 | ) | | | (16,048,344 | ) | | | (83,665 | ) |
| U.S. 10-Year Treasury Note | | | 165 | | | | Short | | | | Dec-16 | | | | (21,656,250 | ) | | | (21,635,625 | ) | | | 20,625 | |
| | | | | | |
| | | | | | | | | | | | | | | | | | | | | | | $ | (105,397 | ) |
Euro-Bobl: Medium-term debt securities issued by the Federal Republic of Germany with a term to maturity of 4.5 to 5 years.
| | | | | | | | | | | | | | | | | | | | | | | | |
| Centrally Cleared Interest Rate Swaps | |
| Counterparty | | Notional Amount (000’s omitted) | | | Fund Pays/Receives Floating Rate | | | Floating Rate | | Annual Fixed Rate | | | Termination Date | | | Net
Unrealized Appreciation
(Depreciation) | |
| | | | | | | |
| CME Group, Inc.(1) | | USD | | | 119 | | | | Receives | | | 3-month USD-LIBOR-BBA | | | 2.25 | %(2) | | | 12/21/46 | | | $ | 827 | |
| LCH.Clearnet(1) | | EUR | | | 1,227 | | | | Receives | | | 6-month Euro Interbank Offered Rate | | | 0.25 | (2) | | | 12/21/21 | | | | (3,317 | ) |
| LCH.Clearnet(1) | | EUR | | | 82 | | | | Receives | | | 6-month Euro Interbank Offered Rate | | | 0.75 | (2) | | | 12/21/26 | | | | (907 | ) |
| | | | | | | |
| | | | | | | | | | | | | | | | | | | | | | | $ | (3,397 | ) |
| (1) | Effective date, which represents the date on which the Fund and the counterparty to the interest rate swap begin interest payment accrual, is after September 30, 2016. |
| (2) | Upfront payment is exchanged with the counterparty as a result of the standardized trading coupon. |
| | | | | | | | | | | | | | | | | | | | | | | | | | | | | | | | |
| Credit Default Swaps — Sell Protection | |
Reference Entity | | Counterparty | | | Notional Amount* (000’s omitted) | | | Contract Annual Fixed Rate** | | | Termination Date | | | Current Market Annual Fixed Rate*** | | | Market Value | | | Unamortized Upfront Payments Received | | | Net Unrealized Appreciation | |
| | | | | | | | |
| Bahamas | | | Deutsche Bank AG | | | $ | 1,150 | | | | 1.00 | %(1) | | | 6/20/22 | | | | 3.05 | % | | $ | (117,849 | ) | | $ | 118,136 | | | $ | 287 | |
| Brazil | | | Deutsche Bank AG | | | | 1,800 | | | | 1.00 | (1) | | | 9/20/20 | | | | 2.03 | | | | (69,098 | ) | | | 96,931 | | | | 27,833 | |
| Brazil | | | Goldman Sachs International | | | | 600 | | | | 1.00 | (1) | | | 9/20/20 | | | | 2.03 | | | | (23,032 | ) | | | 42,521 | | | | 19,489 | |
| Russia | | | Citibank, N.A. | | | | 1,000 | | | | 1.00 | (1) | | | 6/20/21 | | | | 1.98 | | | | (43,356 | ) | | | 54,888 | | | | 11,532 | |
| Russia | | | Deutsche Bank AG | | | | 1,200 | | | | 1.00 | (1) | | | 9/20/20 | | | | 1.70 | | | | (31,647 | ) | | | 103,577 | | | | 71,930 | |
| Russia | | | Goldman Sachs International | | | | 600 | | | | 1.00 | (1) | | | 9/20/20 | | | | 1.70 | | | | (15,823 | ) | | | 58,094 | | | | 42,271 | |
| Turkey | | | Deutsche Bank AG | | | | 1,780 | | | | 1.00 | (1) | | | 9/20/19 | | | | 1.66 | | | | (33,662 | ) | | | 43,192 | | | | 9,530 | |
| | | | | | | | |
Total | | | | | | $ | 8,130 | | | | | | | | | | | | | | | $ | (334,467 | ) | | $ | 517,339 | | | $ | 182,872 | |
| * | If the Fund is the seller of credit protection, the notional amount is the maximum potential amount of future payments the Fund could be required to make if a credit event, as defined in the credit default swap agreement, were to occur. At September 30, 2016, such maximum potential amount for all open credit default swaps in which the Fund is the seller was $8,130,000. |
| ** | The contract annual fixed rate represents the fixed rate of interest received by the Fund (as a seller of protection) on the notional amount of the credit default swap contract. |
| | | | |
| | 41 | | See Notes to Financial Statements. |
Eaton Vance
Limited Duration Income Fund
September 30, 2016
Portfolio of Investments (Unaudited) — continued
| *** | Current market annual fixed rates, utilized in determining the net unrealized appreciation or depreciation as of period end, serve as an indicator of the market’s perception of the current status of the payment/performance risk associated with the credit derivative. The current market annual fixed rate of a particular reference entity reflects the cost, as quoted by the pricing vendor, of selling protection against default of that entity as of period end and may include upfront payments required to be made to enter into the agreement. The higher the fixed rate, the greater the market perceived risk of a credit event involving the reference entity. A rate identified as “Defaulted” indicates a credit event has occurred for the reference entity. |
| (1) | Upfront payment is exchanged with the counterparty as a result of the standardized trading coupon. |
Abbreviations:
| | | | |
| DIP | | – | | Debtor In Possession |
| PIK | | – | | Payment In Kind |
Currency Abbreviations:
| | | | |
| CAD | | – | | Canadian Dollar |
| CHF | | – | | Swiss Franc |
| EUR | | – | | Euro |
| GBP | | – | | British Pound Sterling |
| USD | | – | | United States Dollar |
| | | | |
| | 42 | | See Notes to Financial Statements. |
Eaton Vance
Limited Duration Income Fund
September 30, 2016
Statement of Assets and Liabilities (Unaudited)
| | | | |
| Assets | | September 30, 2016 | |
Unaffiliated investments, at value (identified cost, $2,741,194,064) | | $ | 2,739,677,386 | |
Affiliated investment, at value (identified cost, $41,061,701) | | | 41,061,701 | |
Cash | | | 3,666,968 | |
Restricted cash* | | | 1,638,799 | |
Foreign currency, at value (identified cost, $2,724,958) | | | 2,737,605 | |
Interest receivable | | | 24,021,937 | |
Interest receivable from affiliated investment | | | 27,091 | |
Receivable for investments sold | | | 12,256,979 | |
Receivable for variation margin on open financial futures contracts | | | 232,245 | |
Receivable for open forward foreign currency exchange contracts | | | 260,965 | |
Receivable for open swap contracts | | | 182,872 | |
Receivable for closed swap contracts | | | 131,739 | |
Tax reclaims receivable | | | 2,417 | |
Prepaid upfront fees on notes payable | | | 1,167,286 | |
Prepaid expenses | | | 28,193 | |
Total assets | | $ | 2,827,094,183 | |
| |
| Liabilities | | | | |
Notes payable | | $ | 596,000,000 | |
Payable for reverse repurchase agreements, including accrued interest of $51,994 | | | 141,756,403 | |
Payable for investments purchased | | | 55,567,105 | |
Payable for when-issued securities | | | 6,860,604 | |
Payable for variation margin on open centrally cleared swap contracts | | | 12,288 | |
Payable for open forward foreign currency exchange contracts | | | 426,228 | |
Premium received on open non-centrally cleared swap contracts | | | 517,339 | |
Payable to affiliates: | | | | |
Investment adviser fee | | | 1,700,537 | |
Accrued expenses | | | 2,009,363 | |
Total liabilities | | $ | 804,849,867 | |
Auction preferred shares (10,665 shares outstanding) at liquidation value plus cumulative unpaid dividends | | $ | 266,640,476 | |
Net assets applicable to common shares | | $ | 1,755,603,840 | |
| |
| Sources of Net Assets | | | | |
Common shares, $0.01 par value, unlimited number of shares authorized, 116,147,018 shares issued and outstanding | | $ | 1,161,470 | |
Additional paid-in capital | | | 2,072,902,289 | |
Accumulated net realized loss | | | (300,561,693 | ) |
Accumulated distributions in excess of net investment income | | | (16,122,745 | ) |
Net unrealized depreciation | | | (1,775,481 | ) |
Net assets applicable to common shares | | $ | 1,755,603,840 | |
| |
| Net Asset Value Per Common Share | | | | |
($1,755,603,840 ÷ 116,147,018 common shares issued and outstanding) | | $ | 15.12 | |
| * | Represents restricted cash on deposit at the custodian and brokers for open derivative contracts. |
| | | | |
| | 43 | | See Notes to Financial Statements. |
Eaton Vance
Limited Duration Income Fund
September 30, 2016
Statement of Operations (Unaudited)
| | | | |
| Investment Income | | Six Months Ended September 30, 2016 | |
Interest and other income (net of foreign taxes, $164) | | $ | 70,846,145 | |
Dividends | | | 844,595 | |
Interest allocated from affiliated investment | | | 136,134 | |
Expenses allocated from affiliated investment | | | (3,497 | ) |
Total investment income | | $ | 71,823,377 | |
| |
| Expenses | | | | |
Investment adviser fee | | $ | 10,414,411 | |
Trustees’ fees and expenses | | | 34,000 | |
Custodian fee | | | 399,419 | |
Transfer and dividend disbursing agent fees | | | 9,032 | |
Legal and accounting services | | | 213,942 | |
Printing and postage | | | 262,888 | |
Interest expense and fees | | | 6,156,231 | |
Preferred shares service fee | | | 150,765 | |
Miscellaneous | | | 93,719 | |
Total expenses | | $ | 17,734,407 | |
| |
Net investment income | | $ | 54,088,970 | |
| |
| Realized and Unrealized Gain (Loss) | | | | |
Net realized gain (loss) — | | | | |
Investment transactions | | $ | (3,267,631 | ) |
Investment transactions allocated from affiliated investment | | | 755 | |
Financial futures contracts | | | (1,111,215 | ) |
Swap contracts | | | 88,175 | |
Foreign currency and forward foreign currency exchange contract transactions | | | 866,348 | |
Net realized loss | | $ | (3,423,568 | ) |
Change in unrealized appreciation (depreciation) — | | | | |
Investments | | $ | 88,360,384 | |
Financial futures contracts | | | (31,729 | ) |
Swap contracts | | | 168,720 | |
Foreign currency and forward foreign currency exchange contracts | | | 1,388,064 | |
Net change in unrealized appreciation (depreciation) | | $ | 89,885,439 | |
| |
Net realized and unrealized gain | | $ | 86,461,871 | |
| |
Distributions to preferred shareholders | | | | |
From net investment income | | $ | (832,565 | ) |
| |
Net increase in net assets from operations | | $ | 139,718,276 | |
| | | | |
| | 44 | | See Notes to Financial Statements. |
Eaton Vance
Limited Duration Income Fund
September 30, 2016
Statements of Changes in Net Assets
| | | | | | | | |
| Increase (Decrease) in Net Assets | | Six Months Ended September 30, 2016 (Unaudited) | | | Year Ended March 31, 2016 | |
From operations — | | | | | | | | |
Net investment income | | $ | 54,088,970 | | | $ | 114,289,361 | |
Net realized loss from investment transactions, written swaptions, financial futures contracts, swap contracts, and foreign currency and forward foreign currency exchange contract transactions | | | (3,423,568 | ) | | | (34,311,012 | ) |
Net change in unrealized appreciation (depreciation) from investments, written swaptions, financial futures contracts, swap contracts, foreign currency and forward foreign currency exchange contracts | | | 89,885,439 | | | | (115,124,307 | ) |
Distributions to preferred shareholders — | | | | | | | | |
From net investment income | | | (832,565 | ) | | | (805,466 | ) |
Net increase (decrease) in net assets from operations | | $ | 139,718,276 | | | $ | (35,951,424 | ) |
Distributions to common shareholders — | | | | | | | | |
From net investment income | | $ | (69,130,706 | ) | | $ | (130,062,758 | ) |
Tax return of capital | | | — | | | | (12,378,448 | ) |
Total distributions to common shareholders | | $ | (69,130,706 | ) | | $ | (142,441,206 | ) |
Capital share transactions — | | | | | | | | |
Cost of shares repurchased (see Note 6) | | $ | — | | | $ | (18,579,420 | ) |
Net decrease in net assets from capital share transactions | | $ | — | | | $ | (18,579,420 | ) |
| | |
Net increase (decrease) in net assets | | $ | 70,587,570 | | | $ | (196,972,050 | ) |
| | |
| Net Assets Applicable to Common Shares | | | | | | | | |
At beginning of period | | $ | 1,685,016,270 | | | $ | 1,881,988,320 | |
At end of period | | $ | 1,755,603,840 | | | $ | 1,685,016,270 | |
| | |
Accumulated distributions in excess of net investment income
included in net assets applicable to common shares | | | | | | | | |
At end of period | | $ | (16,122,745 | ) | | $ | (248,444 | ) |
| | | | |
| | 45 | | See Notes to Financial Statements. |
Eaton Vance
Limited Duration Income Fund
September 30, 2016
Statement of Cash Flows (Unaudited)
| | | | |
| Cash Flows From Operating Activities | | Six Months Ended September 30, 2016 | |
Net increase in net assets from operations | | $ | 139,718,276 | |
Distributions to preferred shareholders | | | 832,565 | |
Net increase in net assets from operations excluding distributions to preferred shareholders | | $ | 140,550,841 | |
Adjustments to reconcile net increase in net assets from operations to net cash provided by operating activities: | | | | |
Investments purchased | | | (575,331,094 | ) |
Investments sold and principal repayments | | | 646,113,449 | |
Decrease in short-term investments, net | | | 3,424,930 | |
Net amortization/accretion of premium (discount) | | | 9,177,000 | |
Amortization of prepaid upfront fees on notes payable | | | 261,750 | |
Increase in restricted cash | | | (47,070 | ) |
Decrease in interest receivable | | | 2,689,920 | |
Increase in interest receivable from affiliated investment | | | (9,637 | ) |
Increase in receivable for variation margin on open financial futures contracts | | | (232,245 | ) |
Increase in receivable for open forward foreign currency exchange contracts | | | (199,719 | ) |
Increase in receivable for open swap contracts | | | (110,888 | ) |
Increase in receivable for closed swap contracts | | | (131,739 | ) |
Decrease in tax reclaims receivable | | | 1,078 | |
Decrease in prepaid expenses | | | 1,633 | |
Decrease in payable for variation margin on open financial futures contracts | | | (182,929 | ) |
Increase in payable for variation margin on open centrally cleared swap contracts | | | 12,204 | |
Decrease in payable for open forward foreign currency exchange contracts | | | (1,222,856 | ) |
Decrease in payable for open swap contracts | | | (59,762 | ) |
Increase in premium received on open non-centrally cleared swap contracts | | | 85,159 | |
Decrease in payable to affiliate for investment adviser fee | | | (45,409 | ) |
Increase in accrued expenses | | | 153,101 | |
Increase in accrued interest on reverse repurchase agreements | | | 11,007 | |
Increase in unfunded loan commitments | | | 113,328 | |
Net change in unrealized (appreciation) depreciation from investments | | | (88,360,384 | ) |
Net realized (gain) loss from investments | | | 3,267,631 | |
Net cash provided by operating activities | | $ | 139,929,299 | |
| |
| Cash Flows From Financing Activities | | | | |
Distributions paid to common shareholders, net of reinvestments | | $ | (69,130,706 | ) |
Cash distributions paid to preferred shareholders | | | (830,206 | ) |
Proceeds from notes payable | | | 40,000,000 | |
Repayments of notes payable | | | (104,000,000 | ) |
Proceeds from reverse repurchase agreements, net | | | (9,124,905 | ) |
Net cash used in financing activities | | $ | (143,085,817 | ) |
| |
Net decrease in cash* | | $ | (3,156,518 | ) |
| |
Cash at beginning of period(1) | | $ | 9,561,091 | |
| |
Cash at end of period(1) | | $ | 6,404,573 | |
| |
| Supplemental disclosure of cash flow information: | | | | |
Cash paid for interest and fees on borrowings and reverse repurchase agreements | | $ | 5,952,184 | |
| * | Includes net change in unrealized appreciation (depreciation) on foreign currency of $1,150. |
| (1) | Balance includes foreign currency, at value. |
| | | | |
| | 46 | | See Notes to Financial Statements. |
Eaton Vance
Limited Duration Income Fund
September 30, 2016
Financial Highlights
Selected data for a common share outstanding during the periods stated
| | | | | | | | | | | | | | | | | | | | | | | | | | | | |
| | | Six Months Ended
September 30, 2016
(Unaudited) | | | Year Ended March 31, | | | Period Ended
March 31, 2012(1) | | | Year Ended
April 30, 2011 | |
| | | | 2016 | | | 2015 | | | 2014 | | | 2013 | | | |
Net asset value — Beginning of period (Common shares) | | $ | 14.510 | | | $ | 16.010 | | | $ | 16.600 | | | $ | 16.860 | | | $ | 16.550 | | | $ | 17.060 | | | $ | 16.630 | |
| | | | | | | |
| Income (Loss) From Operations | | | | | | | | | | | | | | | | | | | | | | | | | | | | |
Net investment income(2) | | $ | 0.466 | | | $ | 0.979 | | | $ | 1.044 | | | $ | 1.018 | | | $ | 1.041 | | | $ | 1.007 | | | $ | 1.118 | |
Net realized and unrealized gain (loss) | | | 0.746 | | | | (1.278 | ) | | | (0.411 | ) | | | (0.055 | ) | | | 0.516 | | | | (0.368 | ) | | | 0.697 | |
Distributions to preferred shareholders | | | | | | | | | | | | | | | | | | | | | | | | | | | | |
From net investment income(2) | | | (0.007 | ) | | | (0.007 | ) | | | (0.003 | ) | | | (0.003 | ) | | | (0.004 | ) | | | (0.003 | ) | | | (0.007 | ) |
| | | | | | | |
Total income (loss) from operations | | $ | 1.205 | | | $ | (0.306 | ) | | $ | 0.630 | | | $ | 0.960 | | | $ | 1.553 | | | $ | 0.636 | | | $ | 1.808 | |
| | | | | | | |
| Less Distributions to Common Shareholders | | | | | | | | | | | | | | | | | | | | | | | | | | | | |
From net investment income | | $ | (0.595 | ) | | $ | (1.114 | ) | | $ | (1.197 | ) | | $ | (1.178 | ) | | $ | (1.210 | ) | | $ | (1.103 | ) | | $ | (1.319 | ) |
Tax return of capital | | | — | | | | (0.106 | ) | | | (0.023 | ) | | | (0.042 | ) | | | (0.033 | ) | | | (0.043 | ) | | | (0.059 | ) |
| | | | | | | |
Total distributions to common shareholders | | $ | (0.595 | ) | | $ | (1.220 | ) | | $ | (1.220 | ) | | $ | (1.220 | ) | | $ | (1.243 | ) | | $ | (1.146 | ) | | $ | (1.378 | ) |
| | | | | | | |
Anti-dilutive effect of share repurchase program
(see Note 6)(2) | | $ | — | | | $ | 0.026 | | | $ | — | | | $ | — | | | $ | — | | | $ | — | | | $ | — | |
| | | | | | | |
Net asset value — End of period (Common shares) | | $ | 15.120 | | | $ | 14.510 | | | $ | 16.010 | | | $ | 16.600 | | | $ | 16.860 | | | $ | 16.550 | | | $ | 17.060 | |
| | | | | | | |
Market value — End of period (Common shares) | | $ | 13.710 | | | $ | 13.180 | | | $ | 14.390 | | | $ | 15.250 | | | $ | 17.100 | | | $ | 16.050 | | | $ | 16.080 | |
| | | | | | | |
Total Investment Return on Net Asset Value(3) | | | 8.81 | %(4) | | | (0.62 | )% | | | 4.73 | % | | | 6.50 | % | | | 9.80 | % | | | 4.44 | %(4) | | | 11.68 | % |
| | | | | | | |
Total Investment Return on Market Value(3) | | | 8.69 | %(4) | | | 0.44 | % | | | 2.47 | % | | | (3.53 | )% | | | 14.83 | % | | | 7.40 | %(4) | | | 5.52 | % |
| | | | |
| | 47 | | See Notes to Financial Statements. |
Eaton Vance
Limited Duration Income Fund
September 30, 2016
Financial Highlights — continued
Selected data for a common share outstanding during the periods stated
| | | | | | | | | | | | | | | | | | | | | | | | | | | | |
| | | Six Months Ended
September 30, 2016
(Unaudited) | | | Year Ended March 31, | | | Period Ended
March 31, 2012(1) | | | Year Ended
April 30, 2011 | |
| Ratios/Supplemental Data | | | 2016 | | | 2015 | | | 2014 | | | 2013 | | | |
Net assets applicable to common shares, end of period
(000’s omitted) | | $ | 1,755,604 | | | $ | 1,685,016 | | | $ | 1,881,988 | | | $ | 1,950,819 | | | $ | 1,980,817 | | | $ | 1,941,504 | | | $ | 2,001,368 | |
Ratios (as a percentage of average daily net assets applicable to common shares):(5)† | | | | | | | | | | | | | | | | | | | | | | | | | | | | |
Expenses excluding interest
and fees(6) | | | 1.34 | %(7) | | | 1.37 | % | | | 1.35 | % | | | 1.27 | % | | | 1.16 | % | | | 1.19 | %(7) | | | 1.15 | % |
Interest and fee expense(8) | | | 0.71 | %(7) | | | 0.63 | % | | | 0.54 | % | | | 0.44 | % | | | 0.44 | % | | | 0.52 | %(7) | | | 0.61 | % |
Total expenses(6) | | | 2.05 | %(7) | | | 2.00 | % | | | 1.89 | % | | | 1.71 | % | | | 1.60 | % | | | 1.71 | %(7) | | | 1.76 | % |
Net investment income | | | 6.26 | %(7) | | | 6.49 | % | | | 6.44 | % | | | 6.16 | % | | | 6.25 | % | | | 6.68 | %(7) | | | 6.73 | % |
Portfolio Turnover | | | 22 | %(4) | | | 33 | % | | | 35 | % | | | 37 | % | | | 46 | % | | | 42 | %(4) | | | 46 | % |
Senior Securities: | | | | | | | | | | | | | | | | | | | | | | | | | | | | |
Total notes payable outstanding (in 000’s) | | $ | 596,000 | | | $ | 660,000 | | | $ | 803,200 | | | $ | 828,200 | | | $ | 496,200 | | | $ | 439,200 | | | $ | 418,200 | |
Asset coverage per $1,000 of notes payable(9) | | $ | 4,393 | | | $ | 3,957 | | | $ | 3,675 | | | $ | 3,677 | | | $ | 5,529 | | | $ | 6,028 | | | $ | 6,423 | |
Total preferred shares outstanding | | | 10,665 | | | | 10,665 | | | | 10,665 | | | | 10,665 | | | | 10,665 | | | | 10,665 | | | | 10,665 | |
Asset coverage per preferred share(10) | | $ | 75,880 | | | $ | 70,461 | | | $ | 68,979 | | | $ | 69,546 | | | $ | 89,917 | | | $ | 93,767 | | | $ | 98,061 | |
Involuntary liquidation preference per preferred share(11) | | $ | 25,000 | | | $ | 25,000 | | | $ | 25,000 | | | $ | 25,000 | | | $ | 25,000 | | | $ | 25,000 | | | $ | 25,000 | |
Approximate market value per preferred share(11) | | $ | 25,000 | | | $ | 25,000 | | | $ | 25,000 | | | $ | 25,000 | | | $ | 25,000 | | | $ | 25,000 | | | $ | 25,000 | |
| (1) | For the eleven months ended March 31, 2012. The Fund changed its fiscal year-end from April 30 to March 31. |
| (2) | Computed using average shares outstanding. |
| (3) | Returns are historical and are calculated by determining the percentage change in net asset value or market value with all distributions reinvested. Distributions are assumed to be reinvested at prices obtained under the Fund’s dividend reinvestment plan. |
| (5) | Ratios do not reflect the effect of dividend payments to preferred shareholders. |
| (6) | Excludes the effect of custody fee credits, if any, of less than 0.005%. Effective September 1, 2015, custody fee credits, which were earned on cash deposit balances, were discontinued by the custodian. |
| (8) | Interest and fee expense relates to the notes payable, a portion of which was incurred to partially redeem the Fund’s APS (see Note 8), and the reverse repurchase agreements (see Note 9). |
| (9) | Calculated by subtracting the Fund’s total liabilities (not including the notes payable and preferred shares) from the Fund’s total assets, and dividing the result by the notes payable balance in thousands. |
| (10) | Calculated by subtracting the Fund’s total liabilities (not including the notes payable and preferred shares) from the Fund’s total assets, dividing the result by the sum of the value of the notes payable and liquidation value of the preferred shares, and multiplying the result by the liquidation value of one preferred share. Such amount equates to 304%, 282%, 276%, 278%, 360%, 375% and 392% at September 30, 2016, March 31, 2016, 2015, 2014, 2013 and 2012 and at April 30, 2011, respectively. |
| (11) | Plus accumulated and unpaid dividends. |
| † | Ratios based on net assets applicable to common shares plus preferred shares and borrowings are presented below. Ratios do not reflect the effect of dividend payments to preferred shareholders and exclude the effect of custody fee credits, if any. Ratios for periods less than one year are annualized. |
| | | | | | | | | | | | | | | | | | | | | | | | | | | | |
| | | Six Months Ended
September 30, 2016
(Unaudited) | | | Year Ended March 31, | | | Period Ended March 31, 2012 | | | Year Ended
April 30, 2011 | |
| | | | 2016 | | | 2015 | | | 2014 | | | 2013 | | | |
Expenses excluding interest and fees | | | 0.88 | % | | | 0.88 | % | | | 0.86 | % | | | 0.86 | % | | | 0.85 | % | | | 0.86 | % | | | 0.83 | % |
Interest and fee expense | | | 0.47 | % | | | 0.40 | % | | | 0.34 | % | | | 0.30 | % | | | 0.32 | % | | | 0.38 | % | | | 0.44 | % |
Total expenses | | | 1.35 | % | | | 1.28 | % | | | 1.20 | % | | | 1.16 | % | | | 1.17 | % | | | 1.24 | % | | | 1.27 | % |
Net investment income | | | 4.11 | % | | | 4.15 | % | | | 4.10 | % | | | 4.16 | % | | | 4.57 | % | | | 4.82 | % | | | 4.85 | % |
| | | | |
| | 48 | | See Notes to Financial Statements. |
Eaton Vance
Limited Duration Income Fund
September 30, 2016
Notes to Financial Statements (Unaudited)
1 Significant Accounting Policies
Eaton Vance Limited Duration Income Fund (the Fund) is a Massachusetts business trust registered under the Investment Company Act of 1940, as amended (the 1940 Act), as a diversified, closed-end management investment company. The Fund’s primary investment objective is to provide a high level of current income. The Fund may, as a secondary objective, also seek capital appreciation to the extent it is consistent with its primary objective.
The following is a summary of significant accounting policies of the Fund. The policies are in conformity with accounting principles generally accepted in the United States of America (U.S. GAAP). The Fund is an investment company and follows accounting and reporting guidance in the Financial Accounting Standards Board (“FASB”) Accounting Standards Codification Topic 946.
A Investment Valuation — The following methodologies are used to determine the market value or fair value of investments.
Senior Floating-Rate Loans. Interests in senior floating-rate loans (Senior Loans) for which reliable market quotations are readily available are valued generally at the average mean of bid and ask quotations obtained from a third party pricing service. Other Senior Loans are valued at fair value by the investment adviser under procedures approved by the Trustees. In fair valuing a Senior Loan, the investment adviser utilizes one or more of the valuation techniques described in (i) through (iii) below to assess the likelihood that the borrower will make a full repayment of the loan underlying such Senior Loan relative to yields on other Senior Loans issued by companies of comparable credit quality. If the investment adviser believes that there is a reasonable likelihood of full repayment, the investment adviser will determine fair value using a matrix pricing approach that considers the yield on the Senior Loan. If the investment adviser believes there is not a reasonable likelihood of full repayment, the investment adviser will determine fair value using analyses that include, but are not limited to: (i) a comparison of the value of the borrower’s outstanding equity and debt to that of comparable public companies; (ii) a discounted cash flow analysis; or (iii) when the investment adviser believes it is likely that a borrower will be liquidated or sold, an analysis of the terms of such liquidation or sale. In certain cases, the investment adviser will use a combination of analytical methods to determine fair value, such as when only a portion of a borrower’s assets are likely to be sold. In conducting its assessment and analyses for purposes of determining fair value of a Senior Loan, the investment adviser will use its discretion and judgment in considering and appraising relevant factors. Fair value determinations are made by the portfolio managers of the Fund based on information available to such managers. The portfolio managers of other funds managed by the investment adviser that invest in Senior Loans may not possess the same information about a Senior Loan borrower as the portfolio managers of the Fund. At times, the fair value of a Senior Loan determined by the portfolio managers of other funds managed by the investment adviser that invest in Senior Loans may vary from the fair value of the same Senior Loan determined by the portfolio managers of the Fund. The fair value of each Senior Loan is periodically reviewed and approved by the investment adviser’s Valuation Committee and by the Trustees based upon procedures approved by the Trustees. Junior Loans (i.e., subordinated loans and second lien loans) are valued in the same manner as Senior Loans.
Debt Obligations. Debt obligations (including short-term obligations with a remaining maturity of more than sixty days) are generally valued on the basis of valuations provided by third party pricing services, as derived from such services’ pricing models. Inputs to the models may include, but are not limited to, reported trades, executable bid and asked prices, broker/dealer quotations, prices or yields of securities with similar characteristics, interest rates, anticipated prepayments, benchmark curves or information pertaining to the issuer, as well as industry and economic events. The pricing services may use a matrix approach, which considers information regarding securities with similar characteristics to determine the valuation for a security. Short-term obligations purchased with a remaining maturity of sixty days or less are generally valued at amortized cost, which approximates market value.
Equity Securities. Equity securities listed on a U.S. securities exchange generally are valued at the last sale or closing price on the day of valuation or, if no sales took place on such date, at the mean between the closing bid and asked prices therefore on the exchange where such securities are principally traded. Equity securities listed on the NASDAQ Global or Global Select Market generally are valued at the NASDAQ official closing price. Unlisted or listed securities for which closing sales prices or closing quotations are not available are valued at the mean between the latest available bid and asked prices or, in the case of preferred equity securities that are not listed or traded in the over-the-counter market, by a third party pricing service that uses various techniques that consider factors including, but not limited to, prices or yields of securities with similar characteristics, benchmark yields, broker/dealer quotes, quotes of underlying common stock, issuer spreads, as well as industry and economic events.
Derivatives. Financial futures contracts are valued at the closing settlement price established by the board of trade or exchange on which they are traded. Forward foreign currency exchange contracts are generally valued at the mean of the average bid and average asked prices that are reported by currency dealers to a third party pricing service at the valuation time. Such third party pricing service valuations are supplied for specific settlement periods and the Fund’s forward foreign currency exchange contracts are valued at an interpolated rate between the closest preceding and subsequent settlement period reported by the third party pricing service. Swaps (other than centrally cleared) are normally valued using valuations provided by a third party pricing service. Such pricing service valuations are based on the present value of fixed and projected floating rate cash flows over the term of the swap contract, and in the case of credit default swaps, based on credit spread quotations obtained from broker/dealers and expected default recovery rates determined by the pricing service using proprietary models. Future cash flows on swaps are discounted to their present value using swap rates provided by electronic data services or by broker/dealers. Centrally cleared swaps are valued at the daily settlement price provided by the central clearing counterparty.
Foreign Securities and Currencies. Foreign securities and currencies are valued in U.S. dollars, based on foreign currency exchange rate quotations supplied by a third party pricing service. The pricing service uses a proprietary model to determine the exchange rate. Inputs to the model include reported trades and implied bid/ask spreads. The daily valuation of exchange-traded foreign securities generally is determined as of the close of trading on the principal exchange on which such securities trade. Events occurring after the close of trading on foreign exchanges may result in adjustments to the valuation of foreign securities to more accurately reflect their fair value as of the close of regular trading on the New York Stock Exchange. When valuing foreign equity securities that meet certain criteria, the Fund’s Trustees have approved the use of a fair value service that values such securities to reflect
Eaton Vance
Limited Duration Income Fund
September 30, 2016
Notes to Financial Statements (Unaudited) — continued
market trading that occurs after the close of the applicable foreign markets of comparable securities or other instruments that have a strong correlation to the fair-valued securities.
Affiliated Fund. The Fund may invest in Eaton Vance Cash Reserves Fund, LLC (Cash Reserves Fund), an affiliated investment company managed by Eaton Vance Management (EVM). The value of the Fund’s investment in Cash Reserves Fund reflects the Fund’s proportionate interest in its net assets. Cash Reserves Fund generally values its investment securities utilizing the amortized cost valuation technique in accordance with Rule 2a-7 under the 1940 Act. This technique involves initially valuing a portfolio security at its cost and thereafter assuming a constant amortization to maturity of any discount or premium. If amortized cost is determined not to approximate fair value, Cash Reserves Fund may value its investment securities in the same manner as debt obligations described above. To comply with amendments to Rule 2a-7, on or before October 14, 2016 the Cash Reserves Fund began calculating a net asset value (NAV) per share and valuing its securities in the same manner as debt obligations described above.
Fair Valuation. Investments for which valuations or market quotations are not readily available or are deemed unreliable are valued at fair value using methods determined in good faith by or at the direction of the Trustees of the Fund in a manner that fairly reflects the security’s value, or the amount that the Fund might reasonably expect to receive for the security upon its current sale in the ordinary course. Each such determination is based on a consideration of relevant factors, which are likely to vary from one pricing context to another. These factors may include, but are not limited to, the type of security, the existence of any contractual restrictions on the security’s disposition, the price and extent of public trading in similar securities of the issuer or of comparable companies or entities, quotations or relevant information obtained from broker/dealers or other market participants, information obtained from the issuer, analysts, and/or the appropriate stock exchange (for exchange-traded securities), an analysis of the company’s or entity’s financial condition, and an evaluation of the forces that influence the issuer and the market(s) in which the security is purchased and sold.
B Investment Transactions — Investment transactions for financial statement purposes are accounted for on a trade date basis. Realized gains and losses on investments sold are determined on the basis of identified cost.
C Income — Interest income is recorded on the basis of interest accrued, adjusted for amortization of premium or accretion of discount. Fees associated with loan amendments are recognized immediately. Dividend income is recorded on the ex-dividend date for dividends received in cash and/or securities. Withholding taxes on foreign interest have been provided for in accordance with the Fund’s understanding of the applicable countries’ tax rules and rates. Distributions from investment companies are recorded as dividend income, capital gains or return of capital based on the nature of the distribution.
D Federal Taxes — The Fund’s policy is to comply with the provisions of the Internal Revenue Code applicable to regulated investment companies and to distribute to shareholders each year substantially all of its net investment income, and all or substantially all of its net realized capital gains. Accordingly, no provision for federal income or excise tax is necessary.
As of September 30, 2016, the Fund had no uncertain tax positions that would require financial statement recognition, de-recognition, or disclosure. The Fund files a U.S. federal income tax return annually after its fiscal year-end, which is subject to examination by the Internal Revenue Service for a period of three years from the date of filing.
E Foreign Currency Translation — Investment valuations, other assets, and liabilities initially expressed in foreign currencies are translated each business day into U.S. dollars based upon current exchange rates. Purchases and sales of foreign investment securities and income and expenses denominated in foreign currencies are translated into U.S. dollars based upon currency exchange rates in effect on the respective dates of such transactions. Recognized gains or losses on investment transactions attributable to changes in foreign currency exchange rates are recorded for financial statement purposes as net realized gains and losses on investments. That portion of unrealized gains and losses on investments that results from fluctuations in foreign currency exchange rates is not separately disclosed.
F Unfunded Loan Commitments — The Fund may enter into certain loan agreements all or a portion of which may be unfunded. The Fund is obligated to fund these commitments at the borrower’s discretion. These commitments are disclosed in the accompanying Portfolio of Investments. At September 30, 2016, the Fund had sufficient cash and/or securities to cover these commitments.
G Use of Estimates — The preparation of the financial statements in conformity with U.S. GAAP requires management to make estimates and assumptions that affect the reported amounts of assets and liabilities at the date of the financial statements and the reported amounts of income and expense during the reporting period. Actual results could differ from those estimates.
H Indemnifications — Under the Fund’s organizational documents, its officers and Trustees may be indemnified against certain liabilities and expenses arising out of the performance of their duties to the Fund. Under Massachusetts law, if certain conditions prevail, shareholders of a Massachusetts business trust (such as the Fund) could be deemed to have personal liability for the obligations of the Fund. However, the Fund’s Declaration of Trust contains an express disclaimer of liability on the part of Fund shareholders and the By-laws provide that the Fund shall assume the defense on behalf of any Fund shareholders. Moreover, the By-laws also provide for indemnification out of Fund property of any shareholder held personally liable solely by reason of being or having been a shareholder for all loss or expense arising from such liability. Additionally, in the normal course of business, the Fund enters into agreements with service providers that may contain indemnification clauses. The Fund’s maximum exposure under these arrangements is unknown as this would involve future claims that may be made against the Fund that have not yet occurred.
I Financial Futures Contracts — Upon entering into a financial futures contract, the Fund is required to deposit with the broker, either in cash or securities, an amount equal to a certain percentage of the contract amount (initial margin). Subsequent payments, known as variation margin, are made or received
Eaton Vance
Limited Duration Income Fund
September 30, 2016
Notes to Financial Statements (Unaudited) — continued
by the Fund each business day, depending on the daily fluctuations in the value of the underlying security, and are recorded as unrealized gains or losses by the Fund. Gains (losses) are realized upon the expiration or closing of the financial futures contracts. Should market conditions change unexpectedly, the Fund may not achieve the anticipated benefits of the financial futures contracts and may realize a loss. Futures contracts have minimal counterparty risk as they are exchange traded and the clearinghouse for the exchange is substituted as the counterparty, guaranteeing counterparty performance.
J Forward Foreign Currency Exchange Contracts — The Fund may enter into forward foreign currency exchange contracts for the purchase or sale of a specific foreign currency at a fixed price on a future date. The forward foreign currency exchange contracts are adjusted by the daily exchange rate of the underlying currency and any gains or losses are recorded as unrealized until such time as the contracts have been closed. Risks may arise upon entering these contracts from the potential inability of counterparties to meet the terms of their contracts and from movements in the value of a foreign currency relative to the U.S. dollar.
K Interest Rate Swaps — Swap contracts are privately negotiated agreements between the Fund and a counterparty. Certain swap contracts may be centrally cleared (“centrally cleared swaps”), whereby all payments made or received by the Fund pursuant to the contract are with a central clearing party (CCP) rather than the original counterparty. The CCP guarantees the performance of the original parties to the contract. Upon entering into centrally cleared swaps, the Fund is required to deposit with the CCP, either in cash or securities, an amount of initial margin determined by the CCP, which is subject to adjustment.
Pursuant to interest rate swap agreements, the Fund either makes floating-rate payments to the counterparty (or CCP in the case of centrally cleared swaps) based on a benchmark interest rate in exchange for fixed-rate payments or the Fund makes fixed-rate payments to the counterparty (or CCP in the case of a centrally cleared swap) in exchange for payments on a floating benchmark interest rate. Payments received or made are recorded as realized gains or losses. During the term of the outstanding swap agreement, changes in the underlying value of the swap are recorded as unrealized gains or losses. For centrally cleared swaps, the daily change in valuation is recorded as a receivable or payable for variation margin and settled in cash with the CCP daily. The value of the swap is determined by changes in the relationship between two rates of interest. The Fund is exposed to credit loss in the event of non-performance by the swap counterparty. In the case of centrally cleared swaps, counterparty risk is minimal due to protections provided by the CCP. Risk may also arise from movements in interest rates.
L Credit Default Swaps — When the Fund is the buyer of a credit default swap contract, the Fund is entitled to receive the par (or other agreed-upon) value of a referenced debt obligation (or basket of debt obligations) from the counterparty to the contract if a credit event by a third party, such as a U.S. or foreign corporate issuer or sovereign issuer, on the debt obligation occurs. In return, the Fund pays the counterparty a periodic stream of payments over the term of the contract provided that no credit event has occurred. If no credit event occurs, the Fund would have spent the stream of payments and received no proceeds from the contract. When the Fund is the seller of a credit default swap contract, it receives the stream of payments, but is obligated to pay to the buyer of the protection an amount up to the notional amount of the swap and in certain instances take delivery of securities of the reference entity upon the occurrence of a credit event, as defined under the terms of that particular swap agreement. Credit events are contract specific but may include bankruptcy, failure to pay, restructuring, obligation acceleration and repudiation/moratorium. If the Fund is a seller of protection and a credit event occurs, the maximum potential amount of future payments that the Fund could be required to make would be an amount equal to the notional amount of the agreement. This potential amount would be partially offset by any recovery value of the respective referenced obligation, or net amount received from the settlement of a buy protection credit default swap agreement entered into by the Fund for the same referenced obligation. As the seller, the Fund may create economic leverage to its portfolio because, in addition to its total net assets, the Fund is subject to investment exposure on the notional amount of the swap. The interest fee paid or received on the swap contract, which is based on a specified interest rate on a fixed notional amount, is accrued daily as a component of unrealized appreciation (depreciation) and is recorded as realized gain upon receipt or realized loss upon payment. The Fund also records an increase or decrease to unrealized appreciation (depreciation) in an amount equal to the daily valuation. Upfront payments or receipts, if any, are recorded as other assets or other liabilities, respectively, and amortized over the life of the swap contract as realized gains or losses. For financial reporting purposes, unamortized upfront payments, if any, are netted with unrealized appreciation or depreciation on swap contracts to determine the market value of swaps as presented in Notes 7 and 11. The Fund segregates assets in the form of cash or liquid securities in an amount equal to the notional amount of the credit default swaps of which it is the seller. The Fund segregates assets in the form of cash or liquid securities in an amount equal to any unrealized depreciation of the credit default swaps of which it is the buyer, marked-to-market on a daily basis. These transactions involve certain risks, including the risk that the seller may be unable to fulfill the transaction.
M When-Issued Securities and Delayed Delivery Transactions — The Fund may purchase or sell securities on a delayed delivery or when-issued basis. Payment and delivery may take place after the customary settlement period for that security. At the time the transaction is negotiated, the price of the security that will be delivered is fixed. The Fund maintains cash and/or security positions for these commitments such that sufficient liquid assets will be available to make payments upon settlement. Securities purchased on a delayed delivery or when-issued basis are marked-to-market daily and begin earning interest on settlement date. Losses may arise due to changes in the market value of the underlying securities or if the counterparty does not perform under the contract.
N Reverse Repurchase Agreements — Under a reverse repurchase agreement, the Fund temporarily transfers possession of a portfolio security to another party, such as a bank or broker/dealer, in return for cash. At the same time, the Fund agrees to repurchase the security at an agreed upon time and price, which reflects an interest payment. In periods of increased demand for a security, the Fund may receive a payment from the counterparty for the use of the security, which is recorded as interest income. Because the Fund retains effective control over the transferred security, the transaction is accounted for as a secured borrowing. The Fund may enter into such agreements when it believes it is able to invest the cash acquired at a rate higher than the cost of the
Eaton Vance
Limited Duration Income Fund
September 30, 2016
Notes to Financial Statements (Unaudited) — continued
agreement, which would increase earned income. When the Fund enters into a reverse repurchase agreement, any fluctuations in the market value of either the securities transferred to another party or the securities in which the proceeds may be invested would affect the market value of the Fund’s assets. Because reverse repurchase agreements may be considered to be the practical equivalent of borrowing funds (and the counterparty making a loan), they constitute a form of leverage. The Fund segregates cash or liquid assets equal to its obligation to repurchase the security. During the term of the agreement, the Fund may also be obligated to pledge additional cash and/or securities in the event of a decline in the fair value of the transferred security. In the event the counterparty to a reverse repurchase agreement becomes insolvent, recovery of the security transferred by the Fund may be delayed or the Fund may incur a loss equal to the amount by which the value of the security transferred by the Fund exceeds the repurchase price payable by the Fund.
O Stripped Mortgage-Backed Securities — The Fund may invest in Interest Only (IO) and Principal Only (PO) securities, a form of stripped mortgage-backed securities, whereby the IO security receives all the interest and the PO security receives all the principal on a pool of mortgage assets. The yield to maturity on an IO security is extremely sensitive to the rate of principal payments (including prepayments) on the related underlying mortgage assets, and a rapid rate of principal payments may have a material adverse effect on the yield to maturity from these securities. If the underlying mortgages experience greater than anticipated prepayments of principal, the Fund may fail to recoup its initial investment in an IO security. The market value of IO and PO securities can be unusually volatile due to changes in interest rates.
P Statement of Cash Flows — The cash amount shown in the Statement of Cash Flows of the Fund is the amount included in the Fund’s Statement of Assets and Liabilities and represents the unrestricted cash on hand at its custodian and does not include any short-term investments.
Q Interim Financial Statements — The interim financial statements relating to September 30, 2016 and for the six months then ended have not been audited by an independent registered public accounting firm, but in the opinion of the Fund’s management, reflect all adjustments, consisting only of normal recurring adjustments, necessary for the fair presentation of the financial statements.
2 Auction Preferred Shares
The Fund issued Auction Preferred Shares (APS) on July 25, 2003 in a public offering. Dividends on the APS, which accrue daily, are cumulative at rates which are reset every seven days by an auction, unless a special dividend period has been set. Series of APS are identical in all respects except for the reset dates of the dividend rates. If the APS auctions do not successfully clear, the dividend payment rate over the next period for the APS holders is set at a specified maximum applicable rate until such time as the APS auctions are successful. Auctions have not cleared since February 13, 2008 and the rate since that date has been the maximum applicable rate (see Note 3). The maximum applicable rate on the APS is 150% of the “AA” Financial Composite Commercial Paper Rate at the date of the auction. The stated spread over the reference benchmark rate is determined based on the credit rating of the APS.
The number of APS issued and outstanding as of September 30, 2016 is as follows:
| | | | |
| | | APS Issued and Outstanding | |
| |
Series A | | | 2,133 | |
Series B | | | 2,133 | |
Series C | | | 2,133 | |
Series D | | | 2,133 | |
Series E | | | 2,133 | |
The APS are redeemable at the option of the Fund at a redemption price equal to $25,000 per share, plus accumulated and unpaid dividends, on any dividend payment date. The APS are also subject to mandatory redemption at a redemption price equal to $25,000 per share, plus accumulated and unpaid dividends, if the Fund is in default for an extended period on its asset maintenance requirements with respect to the APS. If the dividends on the APS remain unpaid in an amount equal to two full years’ dividends, the holders of the APS as a class have the right to elect a majority of the Board of Trustees. In general, the holders of the APS and the common shares have equal voting rights of one vote per share, except that the holders of the APS, as a separate class, have the right to elect at least two members of the Board of Trustees. The APS have a liquidation preference of $25,000 per share, plus accumulated and unpaid dividends. The Fund is required to maintain certain asset coverage with respect to the APS as defined in the Fund’s By-Laws and the 1940 Act. The Fund pays an annual fee up to 0.15% of the liquidation value of the APS to broker/dealers as a service fee if the auctions are unsuccessful; otherwise, the annual fee is 0.25%.
3 Distributions to Shareholders and Income Tax Information
The Fund intends to make monthly distributions of net investment income to common shareholders, after payment of any dividends on any outstanding APS. In addition, at least annually, the Fund intends to distribute all or substantially all of its net realized capital gains (reduced by available capital loss
carryforwards from prior years). Distributions to common shareholders are recorded on the ex-dividend date. Distributions to preferred shareholders are
Eaton Vance
Limited Duration Income Fund
September 30, 2016
Notes to Financial Statements (Unaudited) — continued
recorded daily and are payable at the end of each dividend period. The dividend rates for the APS at September 30, 2016, and the amount of dividends accrued (including capital gains, if any) to APS shareholders, average APS dividend rates (annualized), and dividend rate ranges for the six months then ended were as follows:
| | | | | | | | | | | | | | | | |
| | | APS Dividend Rates at
September 30, 2016 | | | Dividends
Accrued to APS
Shareholders | | | Average APS
Dividend
Rates | | | Dividend
Rate
Ranges (%) | |
| | | | |
Series A | | | 0.65 | % | | $ | 166,575 | | | | 0.62 | % | | | 0.50–0.77 | |
Series B | | | 0.71 | | | | 165,905 | | | | 0.62 | | | | 0.48–0.72 | |
Series C | | | 0.71 | | | | 161,709 | | | | 0.60 | | | | 0.42–0.71 | |
Series D | | | 0.71 | | | | 171,731 | | | | 0.64 | | | | 0.48–0.78 | |
Series E | | | 0.72 | | | | 166,645 | | | | 0.62 | | | | 0.48–0.72 | |
Beginning February 13, 2008 and consistent with the patterns in the broader market for auction-rate securities, the Fund’s APS auctions were unsuccessful in clearing due to an imbalance of sell orders over bids to buy the APS. As a result, the dividend rates of the APS were reset to the maximum applicable rates. The table above reflects such maximum dividend rate for each series as of September 30, 2016.
Distributions to shareholders are determined in accordance with income tax regulations, which may differ from U.S. GAAP. As required by U.S. GAAP, only distributions in excess of tax basis earnings and profits are reported in the financial statements as a return of capital. Permanent differences between book and tax accounting relating to distributions are reclassified to paid-in capital. For tax purposes, distributions from short-term capital gains are considered to be from ordinary income.
Distributions in any year may include a return of capital component. For the six months ended September 30, 2016, the amount of distributions estimated to be a tax return of capital was approximately $8,990,000. The final determination of tax characteristics of the Fund’s distributions will occur at the end of the year, at which time it will be reported to the shareholders.
At March 31, 2016, the Fund, for federal income tax purposes, had capital loss carryforwards of $201,797,909 and deferred capital losses of $72,685,363, which would reduce its taxable income arising from future net realized gains on investment transactions, if any, to the extent permitted by the Internal Revenue Code, and thus would reduce the amount of distributions to shareholders, which would otherwise be necessary to relieve the Fund of any liability for federal income or excise tax. Such capital loss carryforwards will expire on March 31, 2017 ($112,795,908), March 31, 2018 ($67,565,640) and March 31, 2019 ($21,436,361) and their character is short-term. Under tax regulations, capital losses incurred in taxable years beginning after December 2010 are considered deferred capital losses and are treated as arising on the first day of the Fund’s next taxable year, retaining the same short-term or long-term character as when originally deferred. Deferred capital losses are required to be used prior to capital loss carryforwards, which carry an expiration date. As a result of this ordering rule, capital loss carryforwards may be more likely to expire unused. Of the deferred capital losses at March 31, 2016, $9,401,490 are short-term and $63,283,873 are long-term.
Capital loss carryforwards of $17,523,307 included in the amounts above are available to the Fund as a result of a reorganization which occured in a prior year. Utilization of these capital loss carryforwards may be limited in accordance with certain income tax regulations.
Additionally, at March 31, 2016, the Fund had a late year ordinary loss of $65,971 which it has elected to defer to the following taxable year pursuant to income tax regulations. Late year ordinary losses represent certain specified losses realized in that portion of a taxable year after October 31 that are treated as ordinary for tax purposes plus ordinary losses attributable to that portion of a taxable year after December 31.
The cost and unrealized appreciation (depreciation) of investments of the Fund at September 30, 2016, as determined on a federal income tax basis, were as follows:
| | | | |
| |
Aggregate cost | | $ | 2,803,946,590 | |
| |
Gross unrealized appreciation | | $ | 64,969,302 | |
Gross unrealized depreciation | | | (88,176,805 | ) |
| |
Net unrealized depreciation | | $ | (23,207,503 | ) |
4 Investment Adviser Fee and Other Transactions with Affiliates
The investment adviser fee is earned by EVM as compensation for management and investment advisory services rendered to the Fund. The fee is computed at an annual rate of 0.75% of the Fund’s average weekly gross assets and is payable monthly. Gross assets as referred to herein represent net
Eaton Vance
Limited Duration Income Fund
September 30, 2016
Notes to Financial Statements (Unaudited) — continued
assets plus obligations attributable to investment leverage. For the six months ended September 30, 2016, the Fund’s investment adviser fee amounted to $10,414,411. The Fund invests its cash in Cash Reserves Fund. EVM does not currently receive a fee for advisory services provided to Cash Reserves Fund. EVM also serves as administrator of the Fund, but receives no compensation.
Trustees and officers of the Fund who are members of EVM’s organization receive remuneration for their services to the Fund out of the investment adviser fee. Trustees of the Fund who are not affiliated with EVM may elect to defer receipt of all or a percentage of their annual fees in accordance with the terms of the Trustees Deferred Compensation Plan. For the six months ended September 30, 2016, no significant amounts have been deferred. Certain officers and Trustees of the Fund are officers of EVM.
5 Purchases and Sales of Investments
Purchases and sales of investments, other than short-term obligations and including maturities, paydowns and principal repayments on Senior Loans, for the six months ended September 30, 2016 were as follows:
| | | | | | | | |
| | | Purchases | | | Sales | |
| | |
Investments (non-U.S. Government) | | $ | 420,830,714 | | | $ | 544,659,305 | |
U.S. Government and Agency Securities | | | 166,009,687 | | | | 107,984,671 | |
| | |
| | | $ | 586,840,401 | | | $ | 652,643,976 | |
6 Common Shares of Beneficial Interest
The Fund may issue common shares pursuant to its dividend reinvestment plan. There were no common shares issued by the Fund for the six months ended September 30, 2016 and the year ended March 31, 2016.
On November 11, 2013, the Board of Trustees of the Fund authorized the repurchase by the Fund of up to 10% of its then currently outstanding common shares in open-market transactions at a discount to net asset value. The repurchase program does not obligate the Fund to purchase a specific amount of shares. There were no repurchases of common shares by the Fund for the six months ended September 30, 2016. During the year ended March 31, 2016, the Fund repurchased 1,400,000 of its common shares under the share repurchase program at a cost, including brokerage commissions, of $18,579,420 and an average price per share of $13.27. The weighted average discount per share to NAV on these repurchases amounted to 13.92% for the year ended March 31, 2016.
7 Financial Instruments
The Fund may trade in financial instruments with off-balance sheet risk in the normal course of its investing activities. These financial instruments may include forward foreign currency exchange contracts, financial futures contracts and swap contracts and may involve, to a varying degree, elements of risk in excess of the amounts recognized for financial statement purposes. The notional or contractual amounts of these instruments represent the investment the Fund has in particular classes of financial instruments and do not necessarily represent the amounts potentially subject to risk. The measurement of the risks associated with these instruments is meaningful only when all related and offsetting transactions are considered. A summary of obligations under these financial instruments at September 30, 2016 is included in the Portfolio of Investments. At September 30, 2016, the Fund had sufficient cash and/or securities to cover commitments under these contracts.
In the normal course of pursuing its investment objectives, the Fund is subject to the following risks:
Credit Risk: The Fund enters into credit default swap contracts to enhance total return and/or as a substitute for the purchase of securities.
Foreign Exchange Risk: The Fund holds foreign currency denominated investments. The value of these investments and related receivables and payables may change due to future changes in foreign currency exchange rates. To hedge against this risk, the Fund enters into forward foreign currency exchange contracts.
Interest Rate Risk: The Fund utilizes various interest rate derivatives including futures contracts and interest rate swaps to manage the duration of its portfolio and to hedge against fluctuations in securities prices due to interest rates.
The Fund enters into over-the-counter (OTC) derivatives that may contain provisions whereby the counterparty may terminate the contract under certain conditions, including but not limited to a decline in the Fund’s net assets below a certain level over a certain period of time, which would trigger a payment by the Fund for those derivatives in a liability position. At September 30, 2016, the fair value of derivatives with credit-related contingent features in a net liability position was $760,695. The aggregate fair value of assets pledged as collateral by the Fund for such liability was $740,000 at September 30, 2016.
Eaton Vance
Limited Duration Income Fund
September 30, 2016
Notes to Financial Statements (Unaudited) — continued
The OTC derivatives in which the Fund invests are subject to the risk that the counterparty to the contract fails to perform its obligations under the contract. To mitigate this risk, the Fund has entered into an International Swaps and Derivatives Association, Inc. Master Agreement (“ISDA Master Agreement”) or similar agreement with substantially all its derivative counterparties. An ISDA Master Agreement is a bilateral agreement between the Fund and a counterparty that governs certain OTC derivatives and typically contains, among other things, set-off provisions in the event of a default and/or termination event as defined under the relevant ISDA Master Agreement. Under an ISDA Master Agreement, the Fund may, under certain circumstances, offset with the counterparty certain derivative financial instruments’ payables and/or receivables with collateral held and/or posted and create one single net payment. The provisions of the ISDA Master Agreement typically permit a single net payment in the event of default including the bankruptcy or insolvency of the counterparty. However, bankruptcy or insolvency laws of a particular jurisdiction may impose restrictions on or prohibitions against the right of offset in bankruptcy or insolvency. Certain ISDA Master Agreements allow counterparties to OTC derivatives to terminate derivative contracts prior to maturity in the event the Fund’s net assets decline by a stated percentage or the Fund fails to meet the terms of its ISDA Master Agreements, which would cause the counterparty to accelerate payment by the Fund of any net liability owed to it.
The collateral requirements for derivatives traded under an ISDA Master Agreement are governed by a Credit Support Annex to the ISDA Master Agreement. Collateral requirements are determined at the close of business each day and are typically based on changes in market values for each transaction under an ISDA Master Agreement and netted into one amount for such agreement. Generally, the amount of collateral due from or to a counterparty is subject to a minimum transfer threshold amount before a transfer is required, which may vary by counterparty. Collateral pledged for the benefit of the Fund and/or counterparty is held in segregated accounts by the Fund’s custodian and cannot be sold, re-pledged, assigned or otherwise used while pledged. The portion of such collateral representing cash, if any, is reflected as restricted cash and, in the case of cash pledged by a counterparty for the benefit of the Fund, a corresponding liability on the Statement of Assets and Liabilities. Securities pledged by the Fund as collateral, if any, are identified as such in the Portfolio of Investments.
The fair value of open derivative instruments (not considered to be hedging instruments for accounting disclosure purposes) by risk exposure at September 30, 2016 was as follows:
| | | | | | | | | | | | | | | | |
| | | Fair Value | |
| Statement of Assets and Liabilities Caption | | Credit | | | Foreign
Exchange | | | Interest Rate | | | Total | |
| | | | |
Net unrealized depreciation* | | $ | — | | | $ | — | | | $ | 21,452 | | | $ | 21,452 | |
Receivable for open forward foreign currency exchange contracts | | | — | | | | 260,965 | | | | — | | | | 260,965 | |
| | | | |
Total Asset Derivatives | | $ | — | | | $ | 260,965 | | | $ | 21,452 | | | $ | 282,417 | |
| | | | |
Derivatives not subject to master netting or similar agreements | | $ | — | | | $ | — | | | $ | 21,452 | | | $ | 21,452 | |
| | | | |
Total Asset Derivatives subject to master netting or similar agreements | | $ | — | | | $ | 260,965 | | | $ | — | | | $ | 260,965 | |
| | | | |
| | | | | | | | | | | | | | | | |
| | | Credit | | | Foreign
Exchange | | | Interest Rate | | | Total | |
| | | | |
Net unrealized depreciation* | | $ | — | | | $ | — | | | $ | (130,246 | ) | | $ | (130,246 | ) |
Payable for open forward foreign currency exchange contracts | | | — | | | | (426,228 | ) | | | — | | | | (426,228 | ) |
Receivable for open swap contracts; Premium received on open non-centrally cleared swap contracts | | | (334,467 | ) | | | — | | | | — | | | | (334,467 | ) |
| | | | |
Total Liability Derivatives | | $ | (334,467 | ) | | $ | (426,228 | ) | | $ | (130,246 | ) | | $ | (890,941 | ) |
| | | | |
Derivatives not subject to master netting or similar agreements | | $ | — | | | $ | — | | | $ | (130,246 | ) | | $ | (130,246 | ) |
| | | | |
Total Liability Derivatives subject to master netting or similar agreements | | $ | (334,467 | ) | | $ | (426,228 | ) | | $ | — | | | $ | (760,695 | ) |
| * | Amount represents cumulative unrealized appreciation or (depreciation) on futures contracts and centrally cleared swap contracts. Only the current day’s variation margin on open futures contracts and centrally cleared swap contracts is reported within the Statement of Assets and Liabilities as Receivable or Payable for variation margin, as applicable. |
The Fund’s derivative assets and liabilities at fair value by risk, which are reported gross in the Statement of Assets and Liabilities, are presented in the table above. The following tables present the Fund’s derivative assets and liabilities by counterparty, net of amounts available for offset under a master
Eaton Vance
Limited Duration Income Fund
September 30, 2016
Notes to Financial Statements (Unaudited) — continued
netting agreement and net of the related collateral received by the Fund for such assets and pledged by the Fund for such liabilities as of September 30, 2016.
| | | | | | | | | | | | | | | | | | | | |
| Counterparty | | Derivative Assets Subject to Master Netting Agreement | | | Derivatives Available for Offset | | | Non-cash Collateral Received(a) | | | Cash Collateral Received(a) | | | Net Amount of Derivative Assets(b) | |
| | | | | |
Citibank, N.A. | | $ | 268 | | | $ | (268 | ) | | $ | — | | | $ | — | | | $ | — | |
Deutsche Bank AG | | | 8,260 | | | | (8,260 | ) | | | — | | | | — | | | | — | |
Goldman Sachs International | | | 15,185 | | | | (15,185 | ) | | | — | | | | — | | | | — | |
HSBC Bank USA, N.A. | | | 124,860 | | | | — | | | | — | | | | — | | | | 124,860 | |
State Street Bank and Trust Company | | | 112,392 | | | | (112,392 | ) | | | — | | | | — | | | | — | |
| | | | | |
| | | $ | 260,965 | | | $ | (136,105 | ) | | $ | — | | | $ | — | | | $ | 124,860 | |
| | | | | |
| | | | | | | | | | | | | | | | | | | | |
| Counterparty | | Derivative Liabilities Subject to Master Netting Agreement | | | Derivatives Available for Offset | | | Non-cash Collateral Pledged(a) | | | Cash Collateral Pledged(a) | | | Net Amount of Derivative Liabilities(c) | |
| | | | | |
Citibank, N.A. | | $ | (43,356 | ) | | $ | 268 | | | $ | — | | | $ | — | | | $ | (43,088 | ) |
Deutsche Bank AG | | | (264,148 | ) | | | 8,260 | | | | — | | | | 255,888 | | | | — | |
Goldman Sachs International | | | (191,896 | ) | | | 15,185 | | | | — | | | | — | | | | (176,711 | ) |
State Street Bank and Trust Company | | | (261,295 | ) | | | 112,392 | | | | — | | | | 148,903 | | | | — | |
| | | | | |
| | | $ | (760,695 | ) | | $ | 136,105 | | | $ | — | | | $ | 404,791 | | | $ | (219,799 | ) |
| (a) | In some instances, the actual collateral received and/or pledged may be more than the amount shown due to overcollateralization. |
| (b) | Net amount represents the net amount due from the counterparty in the event of default. |
| (c) | Net amount represents the net amount payable to the counterparty in the event of default. |
Information with respect to reverse repurchase agreements at September 30, 2016 is included at Note 9.
The effect of derivative instruments (not considered to be hedging instruments for accounting disclosure purposes) on the Statement of Operations by risk exposure for the six months ended September 30, 2016 was as follows:
| | | | | | | | | | | | |
| Statement of Operations Caption | | Credit | | | Foreign
Exchange | | | Interest
Rate | |
Net realized gain (loss) — | | | | | | | | | | | | |
Financial futures contracts | | $ | — | | | $ | — | | | $ | (1,111,215 | ) |
Swap contracts | | | 100,122 | | | | — | | | | (11,947 | ) |
| | | |
Foreign currency and forward foreign currency exchange contract transactions | | | — | | | | 806,252 | | | | — | |
| | | |
Total | | $ | 100,122 | | | $ | 806,252 | | | $ | (1,123,162 | ) |
Change in unrealized appreciation (depreciation) — | | | | | | | | | | | | |
Financial futures contracts | | $ | — | | | $ | — | | | $ | (31,729 | ) |
Swap contracts | | | 170,650 | | | | — | | | | (1,930 | ) |
| | | |
Foreign currency and forward foreign currency exchange contracts | | | — | | | | 1,422,575 | | | | — | |
| | | |
Total | | $ | 170,650 | | | $ | 1,422,575 | | | $ | (33,659 | ) |
Eaton Vance
Limited Duration Income Fund
September 30, 2016
Notes to Financial Statements (Unaudited) — continued
The average notional amounts of derivative contracts outstanding during the six months ended September 30, 2016, which are indicative of the volume of these derivative types, were as follows:
| | | | | | | | | | |
Futures
Contracts — Short | | | Forward
Foreign Currency
Exchange Contracts | | | Swap
Contracts | |
| | |
| | $102,629,000 | | | $ | 67,350,000 | | | $ | 8,110,000 | |
8 Credit Agreement
Effective December 22, 2015, the Fund entered into a Credit Agreement (the Agreement) with major financial institutions to borrow up to $900 million. Borrowings under the Agreement are secured by the assets of the Fund. Interest is charged at a rate above the London Interbank Offered Rate (LIBOR) and is payable monthly. Under the terms of the Agreement, in effect through December 21, 2018, the Fund pays a facility fee of 0.25% (0.35% if the Fund’s outstanding borrowings are less than 65% of the borrowing limit) per annum on the borrowing limit. The Fund also paid an upfront fee of $1,620,000, which is being amortized to interest expense over a period of three years through December 2018. The unamortized balance at September 30, 2016 is approximately $1,167,000 and is included in prepaid upfront fees on notes payable in the Statement of Assets and Liabilities. The Fund is required to maintain certain net asset levels during the term of the Agreement. At September 30, 2016, the Fund had borrowings outstanding under the Agreement of $596,000,000 at an interest rate of 1.35%. Based on the short-term nature of the borrowings under the Agreement and the variable interest rate, the carrying amount of the borrowings at September 30, 2016 approximated its fair value. If measured at fair value, borrowings under the Agreement would have been considered as Level 2 in the fair value hierarchy (see Note 11) at September 30, 2016. Facility fees for the six months ended September 30, 2016 totaled $1,143,750 and are included in interest expense and fees on the Statement of Operations. For the six months ended September 30, 2016, the average borrowings under the Agreement and the average annual interest rate (excluding fees) were $633,289,617 and 1.34%, respectively.
9 Reverse Repurchase Agreements
Reverse repurchase agreements outstanding as of September 30, 2016 were as follows:
| | | | | | | | | | | | | | | | | | | | | | | | |
| Counterparty | | Trade
Date | | | Maturity
Date | | | Interest
Rate | | | Principal
Amount | | | Value Including Accrued Interest | | | U.S. Treasury and Agency Securities Pledged as
Collateral | |
Bank of America | | | 9/14/16 | | | | 10/18/16 | | | | 0.70 | % | | $ | 29,400,000 | | | $ | 29,411,107 | | | $ | 29,773,925 | |
Bank of America | | | 9/14/16 | | | | 10/18/16 | | | | 0.80 | | | | 57,992,905 | | | | 58,014,813 | | | | 59,756,076 | |
KGS Alpha Capital | | | 9/13/16 | | | | 10/18/16 | | | | 0.74 | | | | 54,311,504 | | | | 54,330,483 | | | | 56,536,332 | |
| | | | | |
Total | | | | | | | | | | $ | 141,704,409 | | | $ | 141,756,403 | | | $ | 146,066,333 | |
At September 30, 2016, the remaining contractual maturity of all reverse repurchase agreements was less than 30 days.
For the six months ended September 30, 2016, the average borrowings under settled reverse repurchase agreements and the average annual interest rate were $146,923,851 and 0.67%, respectively. The reverse repurchase agreements entered into by the Fund are subject to Master Repurchase Agreements (MRA), which permit the Fund, under certain circumstances, including an event of default (such as bankruptcy or insolvency), to offset payables and/or receivables under the MRA with collateral held and/or posted to the counterparty and create one single net payment due to or from the Fund. At September 30, 2016, the market value of securities pledged for the benefit of counterparties for reverse repurchase agreements exceeded the amount of borrowings for each counterparty. Based on the short-term nature of the borrowings under the reverse repurchase agreements, the carrying value of the payable for reverse repurchase agreements approximated its fair value at September 30, 2016. If measured at fair value, borrowings under the reverse repurchase agreements would have been considered as Level 2 in the fair value hierarchy (see Note 11) at September 30, 2016.
10 Risks Associated with Foreign Investments
Investing in securities issued by companies or entities whose principal business activities are outside the United States may involve significant risks not present in domestic investments. For example, there is generally less publicly available information about foreign companies, particularly those not subject to the disclosure and reporting requirements of the U.S. securities laws. Certain foreign issuers are generally not bound by uniform accounting, auditing,
Eaton Vance
Limited Duration Income Fund
September 30, 2016
Notes to Financial Statements (Unaudited) — continued
and financial reporting requirements and standards of practice comparable to those applicable to domestic issuers. Investments in foreign securities also involve the risk of possible adverse changes in investment or exchange control regulations, expropriation or confiscatory taxation, limitation on the removal
of funds or other assets of the Fund, political or financial instability or diplomatic and other developments which could affect such investments. Foreign securities markets, while growing in volume and sophistication, are generally not as developed as those in the United States, and securities of some foreign issuers (particularly those located in developing countries) may be less liquid and more volatile than securities of comparable U.S. companies. In general, there is less overall governmental supervision and regulation of foreign securities markets, broker/dealers and issuers than in the United States.
11 Fair Value Measurements
Under generally accepted accounting principles for fair value measurements, a three-tier hierarchy to prioritize the assumptions, referred to as inputs, is used in valuation techniques to measure fair value. The three-tier hierarchy of inputs is summarized in the three broad levels listed below.
| • | | Level 1 – quoted prices in active markets for identical investments |
| • | | Level 2 – other significant observable inputs (including quoted prices for similar investments, interest rates, prepayment speeds, credit risk, etc.) |
| • | | Level 3 – significant unobservable inputs (including a fund’s own assumptions in determining the fair value of investments) |
In cases where the inputs used to measure fair value fall in different levels of the fair value hierarchy, the level disclosed is determined based on the lowest level input that is significant to the fair value measurement in its entirety. The inputs or methodology used for valuing securities are not necessarily an indication of the risk associated with investing in those securities.
At September 30, 2016, the hierarchy of inputs used in valuing the Fund’s investments and open derivative instruments, which are carried at value, were as follows:
| | | | | | | | | | | | | | | | |
| Asset Description | | Level 1 | | | Level 2 | | | Level 3* | | | Total | |
| | | | |
Senior Floating-Rate Loans (Less Unfunded Loan Commitments) | | $ | — | | | $ | 996,371,599 | | | $ | 2,060,200 | | | $ | 998,431,799 | |
Corporate Bonds & Notes | | | — | | | | 942,370,500 | | | | 14,042 | | | | 942,384,542 | |
Foreign Government and Agency Securities | | | — | | | | 61,430,918 | | | | — | | | | 61,430,918 | |
Sovereign Loans | | | — | | | | 1,147,125 | | | | 319,363 | | | | 1,466,488 | |
Mortgage Pass-Throughs | | | — | | | | 210,844,290 | | | | — | | | | 210,844,290 | |
Collateralized Mortgage Obligations | | | — | | | | 285,054,506 | | | | — | | | | 285,054,506 | |
Commercial Mortgage-Backed Securities | | | — | | | | 91,569,120 | | | | — | | | | 91,569,120 | |
Asset-Backed Securities | | | — | | | | 54,607,844 | | | | — | | | | 54,607,844 | |
U.S. Government Agency Obligations | | | — | | | | 33,964,716 | | | | — | | | | 33,964,716 | |
U.S. Treasury Obligations | | | — | | | | 29,773,925 | | | | — | | | | 29,773,925 | |
Common Stocks | | | 1,121,525 | | | | 1,399,940 | | | | 4,883,470 | | | | 7,404,935 | |
Convertible Bonds | | | — | | | | 221,484 | | | | — | | | | 221,484 | |
Convertible Preferred Stocks | | | — | | | | — | | | | 2,484 | | | | 2,484 | |
Preferred Stocks | | | — | | | | 862,949 | | | | 17,456 | | | | 880,405 | |
Closed-End Funds | | | 21,062,786 | | | | — | | | | — | | | | 21,062,786 | |
Warrants | | | — | | | | 58,195 | | | | 0 | | | | 58,195 | |
Miscellaneous | | | 5,059 | | | | 13,990 | | | | 0 | | | | 19,049 | |
Short-Term Investments — | | | | | | | | | | | | | | | | |
U.S. Treasury Obligations | | | — | | | | 499,900 | | | | — | | | | 499,900 | |
Other | | | — | | | | 41,061,701 | | | | — | | | | 41,061,701 | |
| | | | |
Total Investments | | $ | 22,189,370 | | | $ | 2,751,252,702 | | | $ | 7,297,015 | | | $ | 2,780,739,087 | |
Forward Foreign Currency Exchange Contracts | | $ | — | | | $ | 260,965 | | | $ | — | | | $ | 260,965 | |
Futures Contracts | | | 20,625 | | | | — | | | | — | | | | 20,625 | |
Swap Contracts | | | — | | | | 827 | | | | — | | | | 827 | |
| | | | |
Total | | $ | 22,209,995 | | | $ | 2,751,514,494 | | | $ | 7,297,015 | | | $ | 2,781,021,504 | |
Eaton Vance
Limited Duration Income Fund
September 30, 2016
Notes to Financial Statements (Unaudited) — continued
| | | | | | | | | | | | | | | | |
| Liability Description | | Level 1 | | | Level 2 | | | Level 3* | | | Total | |
| | | | |
Forward Foreign Currency Exchange Contracts | | $ | — | | | $ | (426,228 | ) | | $ | — | | | $ | (426,228 | ) |
Futures Contracts | | | (126,022 | ) | | | — | | | | — | | | | (126,022 | ) |
Swap Contracts | | | — | | | | (338,691 | ) | | | — | | | | (338,691 | ) |
| | | | |
Total | | $ | (126,022 | ) | | $ | (764,919 | ) | | $ | — | | | $ | (890,941 | ) |
| * | None of the unobservable inputs for Level 3 assets, individually or collectively, had a material impact on the Fund. |
Level 3 investments at the beginning and/or end of the period in relation to net assets were not significant and accordingly, a reconciliation of Level 3 assets for the six months ended September 30, 2016 is not presented.
At September 30, 2016, the value of investments transferred between Level 1 and Level 2 during the six months then ended was not significant.
12 Legal Proceedings
In May 2015, the Fund was served with an amended complaint filed in an adversary proceeding in the United States Bankruptcy Court for the Southern District of New York. The adversary proceeding was filed by the Motors Liquidation Company Avoidance Action Trust (“AAT”) against the former holders of a $1.5 billion term loan issued by General Motors Corp. (“GM”) in 2006 (the “Term Loan Lenders”) who received a full repayment of the term loan pursuant to a court order in the GM bankruptcy proceeding. The court order was made with the understanding that the term loan was fully secured at the time of GM’s bankruptcy filing in June 2009. The AAT is seeking (1) a determination from the Bankruptcy Court that the security interest held by the Term Loan Lenders was not perfected at the time GM filed for Chapter 11 Bankruptcy protection and thus the Term Loan Lenders should have been treated in the same manner as GM’s unsecured creditors, (2) disgorgement of any interest payments made to the Term Loan Lenders within ninety days of GM’s filing for Chapter 11 Bankruptcy protection, and (3) disgorgement of the $1.5 billion term loan repayment that was made to the Term Loan Lenders. The value of the payment received under the term loan agreement by the Fund is approximately $4,460,000 (equal to 0.25% of net assets applicable to common shares at September 30, 2016). The Fund cannot predict the outcome of these proceedings or the effect, if any, on the Fund’s net asset value. The attorneys’ fees and costs related to these actions are expensed by the Fund as incurred.
Eaton Vance
Limited Duration Income Fund
September 30, 2016
Board of Trustees’ Contract Approval
Overview of the Contract Review Process
The Investment Company Act of 1940, as amended (the “1940 Act”), provides, in substance, that each investment advisory agreement between a fund and its investment adviser will continue in effect from year to year only if its continuation is approved at least annually by the fund’s board of trustees, including by a vote of a majority of the trustees who are not “interested persons” of the fund (“Independent Trustees”), cast in person at a meeting called for the purpose of considering such approval.
At a meeting of the Boards of Trustees (each a “Board”) of the registered investment companies advised, administered and/or distributed by Eaton Vance Management or its affiliates (the “Eaton Vance Funds”) held on April 26, 2016, the Board, including a majority of the Independent Trustees, voted to approve continuation of existing investment advisory and sub-advisory agreements for the Eaton Vance Funds for an additional one-year period. In voting its approval, the Board relied upon the affirmative recommendation of its Contract Review Committee, which is a committee comprised exclusively of Independent Trustees. Prior to making its recommendation, the Contract Review Committee reviewed information furnished by each adviser to the Eaton Vance Funds (including information specifically requested by the Board) for a series of meetings of the Contract Review Committee held between February and April 2016. The Contract Review Committee also considered information received at prior meetings of the Board and its committees, as relevant to its annual evaluation of the investment advisory and sub-advisory agreements.
The information that the Board considered included, among other things, the following (for funds that invest through one or more underlying portfolio(s), references to “each fund” in this section may include information that was considered at the portfolio-level):
Information about Fees, Performance and Expenses
| • | | A report from an independent data provider comparing the advisory and related fees paid by each fund with fees paid by comparable funds as identified by the independent data provider (“comparable funds”); |
| • | | A report from an independent data provider comparing each fund’s total expense ratio and its components to comparable funds; |
| • | | A report from an independent data provider comparing the investment performance of each fund (including, where relevant, yield data, Sharpe ratios and information ratios) to the investment performance of comparable funds over various time periods; |
| • | | Data regarding investment performance in comparison to benchmark indices and customized groups of peer funds identified by the adviser in consultation with the Board; |
| • | | For each fund, comparative information concerning the fees charged and the services provided by each adviser in managing other accounts (including mutual funds, other collective investment funds and institutional accounts) using investment strategies and techniques similar to those used in managing such fund; |
| • | | Profitability analyses for each adviser with respect to each fund; |
Information about Portfolio Management and Trading
| • | | Descriptions of the investment management services provided to each fund, including the investment strategies and processes it employs; |
| • | | The procedures and processes used to determine the fair value of fund assets and actions taken to monitor and test the effectiveness of such procedures and processes; |
| • | | Information about each adviser’s policies and practices with respect to trading, including each adviser’s processes for monitoring best execution of portfolio transactions; |
| • | | Information about the allocation of brokerage transactions and the benefits received by each adviser as a result of brokerage allocation, including information concerning the acquisition of research through client commission arrangements and policies with respect to “soft dollars”; |
| • | | Data relating to portfolio turnover rates of each fund; |
Information about each Adviser
| • | | Reports detailing the financial results and condition of each adviser; |
| • | | Descriptions of the qualifications, education and experience of the individual investment professionals whose responsibilities include portfolio management and investment research for the funds, and information relating to their compensation and responsibilities with respect to managing other mutual funds and investment accounts; |
| • | | The Code of Ethics of each adviser and its affiliates, together with information relating to compliance with and the administration of such codes; |
| • | | Policies and procedures relating to proxy voting and the handling of corporate actions and class actions; |
| • | | Information concerning the resources devoted to compliance efforts undertaken by each adviser and its affiliates (including descriptions of various compliance programs) and their record of compliance; |
| • | | Information concerning the business continuity and disaster recovery plans of each adviser and its affiliates; |
| • | | A description of Eaton Vance Management’s procedures for overseeing third party advisers and sub-advisers, including with respect to regulatory and compliance issues, investment management and other matters; |
Eaton Vance
Limited Duration Income Fund
September 30, 2016
Board of Trustees’ Contract Approval — continued
Other Relevant Information
| • | | Information concerning the nature, cost and character of the administrative and other non-investment advisory services provided by Eaton Vance Management and its affiliates; |
| • | | Information concerning management of the relationship with the custodian, subcustodians and fund accountants by each adviser or the funds’ administrator; and |
| • | | The terms of each investment advisory agreement. |
Over the course of the twelve-month period ended April 30, 2016, with respect to one or more funds, the Board met ten times and the Contract Review Committee, the Audit Committee, the Governance Committee, the Portfolio Management Committee and the Compliance Reports and Regulatory Matters Committee, each of which is a Committee comprised solely of Independent Trustees, met seven, sixteen, four, nine and eleven times, respectively. At such meetings, the Trustees participated in investment and performance reviews with the portfolio managers and other investment professionals of each investment adviser relating to each fund, and considered various investment and trading strategies used in pursuing each fund’s investment objective, such as the use of derivative instruments, as well as risk management techniques. The Board and its Committees also evaluated issues pertaining to industry and regulatory developments, compliance procedures, fund governance and other issues with respect to the funds, and received and participated in reports and presentations provided by Eaton Vance Management and other fund advisers with respect to such matters. In addition to the formal meetings of the Board and its Committees, the Independent Trustees hold regular teleconferences in between meetings to discuss, among other topics, matters relating to the continuation of investment advisory and sub-advisory agreements.
For funds that invest through one or more underlying portfolios, the Board considered similar information about the portfolio(s) when considering the approval of investment advisory agreements. In addition, in cases where the fund’s investment adviser has engaged a sub-adviser, the Board considered similar information about the sub-adviser when considering the approval of any sub-advisory agreement.
The Contract Review Committee was assisted throughout the contract review process by Goodwin Procter LLP, independent legal counsel for the Independent Trustees. The members of the Contract Review Committee relied upon the advice of such counsel and their own business judgment in determining the material factors to be considered in evaluating each investment advisory and sub-advisory agreement and the weight to be given to each such factor. The conclusions reached with respect to each investment advisory and sub-advisory agreement were based on a comprehensive evaluation of all the information provided and not any single factor. Moreover, each member of the Contract Review Committee may have placed varying emphasis on particular factors in reaching conclusions with respect to each investment advisory and sub-advisory agreement. In evaluating each investment advisory and sub-advisory agreement, including the specific fee structures and other terms of the agreements, the Contract Review Committee was informed by multiple years of analysis and discussion among the Independent Trustees and the Eaton Vance Funds’ advisers and sub-advisers.
Results of the Process
Based on its consideration of the foregoing, and such other information as it deemed relevant, including the factors and conclusions described below, the Contract Review Committee concluded that the continuation of the investment advisory agreement of Eaton Vance Limited Duration Income Fund (the “Fund”) with Eaton Vance Management (the “Adviser”), including its fee structure, is in the interests of shareholders and, therefore, the Contract Review Committee recommended to the Board approval of the agreement. The Board accepted the recommendation of the Contract Review Committee based on the material factors considered and conclusions reached by the Contract Review Committee with respect to the agreement. Accordingly, the Board, including a majority of the Independent Trustees, voted to approve continuation of the investment advisory agreement for the Fund.
Nature, Extent and Quality of Services
In considering whether to approve the investment advisory agreement of the Fund, the Board evaluated the nature, extent and quality of services provided to the Fund by the Adviser.
The Board considered the Adviser’s management capabilities and investment process with respect to the types of investments held by the Fund, including the education, experience and number of its investment professionals and other personnel who provide portfolio management, investment research, and similar services to the Fund. In particular, the Board considered the abilities and experience of such investment professionals in analyzing factors such as credit risk and special considerations relevant to investing in senior secured floating rate loans, mortgage-backed securities and high-yield bonds. The Board considered the resources available to investment professionals of the Adviser. The Board also took into account the resources dedicated to portfolio management and other services, as well as the compensation methods of the Adviser and other factors, such as the reputation and resources of the Adviser to recruit and retain highly qualified research, advisory and supervisory investment professionals. In addition, the Board considered the time and attention devoted to the Eaton Vance Funds, including the Fund, by senior management, as well as the infrastructure, operational capabilities and support staff in place to assist in the portfolio management and operations of the Fund, including the provision of administrative services.
The Board considered the compliance programs of the Adviser and relevant affiliates thereof. Among other matters, the Board considered compliance and reporting matters relating to personal trading by investment professionals, selective disclosure of portfolio holdings, late trading, frequent trading, portfolio valuation, business continuity and the allocation of investment opportunities. The Board also considered the responses of the Adviser and its affiliates to requests in recent years from regulatory authorities such as the Securities and Exchange Commission and the Financial Industry Regulatory Authority.
Eaton Vance
Limited Duration Income Fund
September 30, 2016
Board of Trustees’ Contract Approval — continued
The Board considered shareholder and other administrative services provided or managed by Eaton Vance Management and its affiliates, including transfer agency and accounting services. The Board evaluated the benefits to shareholders of investing in a fund that is a part of a large fund complex offering exposure to a variety of asset classes and investment disciplines.
After consideration of the foregoing factors, among others, the Board concluded that the nature, extent and quality of services provided by the Adviser, taken as a whole, are appropriate and consistent with the terms of the investment advisory agreement.
Fund Performance
The Board compared the Fund’s investment performance to that of comparable funds and appropriate benchmark indices, as well as a customized peer group of similarly managed funds. The Board’s review included comparative performance data for the one-, three-, five- and ten-year periods ended September 30, 2015 for the Fund. The Board concluded that the performance of the Fund was satisfactory.
Management Fees and Expenses
The Board considered contractual fee rates payable by the Fund for advisory and administrative services (referred to collectively as “management fees”). As part of its review, the Board considered the Fund’s management fees and total expense ratio for the one year period ended September 30, 2015, as compared to those of comparable funds, before and after giving effect to any undertaking to waive fees or reimburse expenses. The Board also considered factors that had an impact on Fund expense ratios relative to comparable funds.
After considering the foregoing information, and in light of the nature, extent and quality of the services provided by the Adviser, the Board concluded that the management fees charged for advisory and related services are reasonable.
Profitability and Other “Fall-Out” Benefits
The Board considered the level of profits realized by the Adviser and relevant affiliates thereof in providing investment advisory and administrative services to the Fund and to all Eaton Vance Funds as a group. The Board considered the level of profits realized without regard to marketing support or other payments by the Adviser and its affiliates to third parties in respect of distribution services. The Board also considered other direct or indirect fall-out benefits received by the Adviser and its affiliates in connection with their relationships with the Fund, including the benefits of research services that may be available to the Adviser as a result of securities transactions effected for the Fund and other investment advisory clients.
The Board concluded that, in light of the foregoing factors and the nature, extent and quality of the services rendered, the profits realized by the Adviser and its affiliates are deemed not to be excessive.
Economies of Scale
In reviewing management fees and profitability, the Board also considered the extent to which the Adviser and its affiliates, on the one hand, and the Fund, on the other hand, can expect to realize benefits from economies of scale as the assets of the Fund increase. The Board acknowledged the difficulty in accurately measuring the benefits resulting from economies of scale, if any, with respect to the management of any specific fund or group of funds. The Board reviewed data summarizing the increases and decreases in the assets of the Fund and of all Eaton Vance Funds as a group over various time periods, and evaluated the extent to which the total expense ratio of the Fund and the profitability of the Adviser and its affiliates may have been affected by such increases or decreases. Based upon the foregoing, the Board concluded that the Fund currently shares in any benefits from economies of scale. The Board also considered the fact that the Fund is not continuously offered and that the Fund’s assets are not expected to increase materially in the foreseeable future. The Board concluded that, in light of the level of the Adviser’s profits with respect to the Fund, the implementation of breakpoints in the advisory fee schedule is not warranted at this time.
Eaton Vance
Limited Duration Income Fund
September 30, 2016
Officers and Trustees
Officers of Eaton Vance Limited Duration Income Fund
Payson F. Swaffield
President
Maureen A. Gemma
Vice President, Secretary and
Chief Legal Officer
James F. Kirchner
Treasurer
Paul M. O’Neil
Chief Compliance Officer
Trustees of Eaton Vance Limited Duration Income Fund
William H. Park
Chairperson
Scott E. Eston
Thomas E. Faust Jr.*
Mark R. Fetting**
Cynthia E. Frost
George J. Gorman
Valerie A. Mosley
Helen Frame Peters
Susan J. Sutherland
Harriett Tee Taggart
Ralph F. Verni
Scott E. Wennerholm**
| ** | Messrs. Fetting and Wennerholm began serving as Trustees effective September 1, 2016. |
Number of Employees
The Fund is organized as a Massachusetts business trust and is registered under the Investment Company Act of 1940, as amended, as a closed-end management investment company and has no employees.
Number of Shareholders
As of September 30, 2016, Fund records indicate that there are 80 registered shareholders and approximately 76,309 shareholders owning the Fund shares in street name, such as through brokers, banks, and financial intermediaries.
If you are a street name shareholder and wish to receive Fund reports directly, which contain important information about the Fund, please write or call:
Eaton Vance Distributors, Inc.
Two International Place
Boston, MA 02110
1-800-262-1122
NYSE MKT symbol
The NYSE MKT symbol is EVV.
Eaton Vance Funds
IMPORTANT NOTICES
Privacy. The Eaton Vance organization is committed to ensuring your financial privacy. Each of the financial institutions identified below has in effect the following policy (“Privacy Policy”) with respect to nonpublic personal information about its customers:
| • | | Only such information received from you, through application forms or otherwise, and information about your Eaton Vance fund transactions will be collected. This may include information such as name, address, social security number, tax status, account balances and transactions. |
| • | | None of such information about you (or former customers) will be disclosed to anyone, except as permitted by law (which includes disclosure to employees necessary to service your account). In the normal course of servicing a customer’s account, Eaton Vance may share information with unaffiliated third parties that perform various required services such as transfer agents, custodians and broker-dealers. |
| • | | Policies and procedures (including physical, electronic and procedural safeguards) are in place that are designed to protect the confidentiality of such information. |
| • | | We reserve the right to change our Privacy Policy at any time upon proper notification to you. Customers may want to review our Privacy Policy periodically for changes by accessing the link on our homepage: www.eatonvance.com. |
Our pledge of privacy applies to the following entities within the Eaton Vance organization: the Eaton Vance Family of Funds, Eaton Vance Management, Eaton Vance Investment Counsel, Eaton Vance Distributors, Inc., Eaton Vance Trust Company, Eaton Vance Management (International) Limited, Eaton Vance Management’s Real Estate Investment Group and Boston Management and Research. In addition, our Privacy Policy applies only to those Eaton Vance customers who are individuals and who have a direct relationship with us. If a customer’s account (i.e., fund shares) is held in the name of a third-party financial advisor/broker-dealer, it is likely that only such advisor’s privacy policies apply to the customer. This notice supersedes all previously issued privacy disclosures. For more information about Eaton Vance’s Privacy Policy, please call 1-800-262-1122.
Delivery of Shareholder Documents. The Securities and Exchange Commission (SEC) permits funds to deliver only one copy of shareholder documents, including prospectuses, proxy statements and shareholder reports, to fund investors with multiple accounts at the same residential or post office box address. This practice is often called “householding” and it helps eliminate duplicate mailings to shareholders. American Stock Transfer and Trust Company, LLC (“AST”), the closed-end funds transfer agent, or your financial advisor, may household the mailing of your documents indefinitely unless you instruct AST, or your financial advisor, otherwise. If you would prefer that your Eaton Vance documents not be householded, please contact AST or your financial advisor. Your instructions that householding not apply to delivery of your Eaton Vance documents will typically be effective within 30 days of receipt by AST or your financial advisor.
Portfolio Holdings. Each Eaton Vance Fund and its underlying Portfolio(s) (if applicable) will file a schedule of portfolio holdings on Form N-Q with the SEC for the first and third quarters of each fiscal year. The Form N-Q will be available on the Eaton Vance website at www.eatonvance.com, by calling Eaton Vance at 1-800-262-1122 or in the EDGAR database on the SEC’s website at www.sec.gov. Form N-Q may also be reviewed and copied at the SEC’s public reference room in Washington, D.C. (call 1-800-732-0330 for information on the operation of the public reference room).
Proxy Voting. From time to time, funds are required to vote proxies related to the securities held by the funds. The Eaton Vance Funds or their underlying Portfolios (if applicable) vote proxies according to a set of policies and procedures approved by the Funds’ and Portfolios’ Boards. You may obtain a description of these policies and procedures and information on how the Funds or Portfolios voted proxies relating to portfolio securities during the most recent 12-month period ended June 30, without charge, upon request, by calling 1-800-262-1122 and by accessing the SEC’s website at www.sec.gov.
Share Repurchase Program. The Fund’s Board of Trustees has approved a share repurchase program authorizing the Fund to repurchase up to 10% of its outstanding common shares as of the approved date in open-market transactions at a discount to net asset value. The repurchase program does not obligate the Fund to purchase a specific amount of shares. The Fund’s repurchase activity, including the number of shares purchased, average price and average discount to net asset value, is disclosed in the Fund’s annual and semi-annual reports to shareholders.
Additional Notice to Shareholders. If applicable, a Fund may also redeem or purchase its outstanding preferred shares in order to maintain compliance with regulatory requirements, borrowing or rating agency requirements or for other purposes as it deems appropriate or necessary.
Closed-End Fund Information. Eaton Vance closed-end funds make fund performance data and certain information about portfolio characteristics available on the Eaton Vance website shortly after the end of each month. Other information about the funds is available on the website. The funds’ net asset value per share is readily accessible on the Eaton Vance website. Portfolio holdings for the most recent month-end are also posted to the website approximately 30 days following the end of the month. This information is available at www.eatonvance.com on the fund information pages under “Individual Investors — Closed-End Funds”.
Investment Adviser and Administrator
Eaton Vance Management
Two International Place
Boston, MA 02110
Custodian
State Street Bank and Trust Company
State Street Financial Center, One Lincoln Street
Boston, MA 02111
Transfer Agent
American Stock Transfer & Trust Company, LLC
6201 15th Avenue
Brooklyn, NY 11219
Fund Offices
Two International Place
Boston, MA 02110
7731 9.30.16
Item 2. Code of Ethics
Not required in this filing.
Item 3. Audit Committee Financial Expert
Not required in this filing.
Item 4. Principal Accountant Fees and Services
Rule 2-01(c)(1)(ii)(A) of Regulation S-X (the “Loan Rule”) prohibits an accounting firm, such as the Fund’s principal accountant, Deloitte & Touche LLP (“D&T”), from having certain financial relationships with their audit clients and affiliated entities. Specifically, the Loan Rule provides, in relevant part, that an accounting firm generally would not be independent if it receives a loan from a lender that is a “record or beneficial owner of more than ten percent of the audit client’s equity securities.” Based on information provided to the Audit
Committee of the Board of Trustees (the “Audit Committee”) of the Eaton Vance family of funds by D&T, certain relationships between D&T and its affiliates (“Deloitte Entities”) and its lenders who are record owners of shares of one or more funds within the Eaton Vance family of funds (the “Funds”) implicate the Loan Rule, calling into question D&T’s independence with respect to the Funds. The Funds are providing this disclosure to explain the facts and circumstances as well as D&T’s conclusions concerning D&T’s objectivity and impartiality with respect to the audits of the Funds.
D&T advised the Audit Committee of its conclusion that, in light of the facts surrounding its lending relationships, D&T’s objectivity and impartiality in the planning and conduct of the audits of the Funds financial statements will not be compromised, D&T is in a position to continue as the auditor for the Funds and no actions need to be taken with respect to previously issued reports by D&T. D&T has advised the Audit Committee that these conclusions were based in part on the following considerations: (1) Deloitte Entity personnel responsible for managing the lending relationships have had no interactions with the audit engagement team; (2) the lending relationships are in good standing and the principal and interest payments are up-to-date; (3) the lending relationships are not significant to the Deloitte Entities or to D&T.
On June 20, 2016, the U.S. Securities and Exchange Commission (the “SEC”) issued no-action relief to another mutual fund complex (see Fidelity Management & Research Company et al., No-Action Letter (June 20, 2016) (the “No-Action Letter”)) related to the auditor independence issue described above. In the No-Action Letter, the SEC indicated that it would not recommend enforcement action against the fund group if the auditor is not in compliance with the Loan Rule provided that: (1) the auditor has complied with PCAOB Rule 3526(b)(1) and 3526(b)(2); (2) the auditor’s non-compliance under the Loan Rule is with respect to certain lending relationships; and (3) notwithstanding such non-compliance, the auditor has concluded that it is objective and impartial with respect to the issues encompassed within its engagement as auditor of the funds. Based on information provided by D&T, the requirements of the No-Action Letter appear to be met with respect to D&T’s lending relationships described above. After giving consideration to the guidance provided in the No-Action Letter, D&T affirmed to the Audit Committee that D&T is an independent accountant with respect to the Funds within the meaning of the rules and standards of the PCAOB and the securities laws and regulations administered by the SEC. The SEC has indicated that the no-action relief will expire 18 months from its issuance.
Item 5. Audit Committee of Listed Registrants
Not required in this filing.
Item 6. Schedule of Investments
Please see schedule of investments contained in the Report to Stockholders included under Item 1 of this Form N-CSR.
Item 7. Disclosure of Proxy Voting Policies and Procedures for Closed-End Management Investment Companies
Not required in this filing.
Item 8. Portfolio Managers of Closed-End Management Investment Companies
Not required in this filing.
Item 9. Purchases of Equity Securities by Closed-End Management Investment Company and Affiliated Purchasers
No such purchases this period.
Item 10. Submission of Matters to a Vote of Security Holders
No material changes.
Item 11. Controls and Procedures
(a) It is the conclusion of the registrant’s principal executive officer and principal financial officer that the effectiveness of the registrant’s current disclosure controls and procedures (such disclosure controls and procedures having been evaluated within 90 days of the date of this filing) provide reasonable assurance that the information required to be disclosed by the registrant has been recorded, processed, summarized and reported within the time period specified in the Commission’s rules and forms and that the information required to be disclosed by the registrant has been accumulated and communicated to the registrant’s principal executive officer and principal financial officer in order to allow timely decisions regarding required disclosure.
(b) There have been no changes in the registrant’s internal controls over financial reporting during the second fiscal quarter of the period covered by this report that has materially affected, or is reasonably likely to materially affect, the registrant’s internal control over financial reporting.
Item 12. Exhibits
| | |
| (a)(1) | | Registrant’s Code of Ethics – Not applicable (please see Item 2). |
| |
| (a)(2)(i) | | Treasurer’s Section 302 certification. |
| |
| (a)(2)(ii) | | President’s Section 302 certification. |
| |
| (b) | | Combined Section 906 certification. |
Signatures
Pursuant to the requirements of the Securities Exchange Act of 1934 and the Investment Company Act of 1940, the registrant has duly caused this report to be signed on its behalf by the undersigned, thereunto duly authorized.
Eaton Vance Limited Duration Income Fund
| | |
| By: | | /s/ Payson F. Swaffield |
| | Payson F. Swaffield |
| | President |
| |
Date: | | November 17, 2016 |
Pursuant to the requirements of the Securities Exchange Act of 1934 and the Investment Company Act of 1940, this report has been signed below by the following persons on behalf of the registrant and in the capacities and on the dates indicated.
| | |
| By: | | /s/ James F. Kirchner |
| | James F. Kirchner |
| | Treasurer |
| |
| Date: | | November 17, 2016 |
| |
| By: | | /s/ Payson F. Swaffield |
| | Payson F. Swaffield |
| | President |
| |
| Date: | | November 17, 2016 |