UNITED STATES
SECURITIES AND EXCHANGE COMMISSION
Washington, D.C. 20549
Form N-CSR
CERTIFIED SHAREHOLDER REPORT OF REGISTERED
MANAGEMENT INVESTMENT COMPANIES
Investment Company Act File Number: 811-21323
Eaton Vance Limited Duration Income Fund
(Exact Name of Registrant as Specified in Charter)
Two International Place, Boston, Massachusetts 02110
(Address of Principal Executive Offices)
Deidre E. Walsh
Two International Place, Boston, Massachusetts 02110
(Name and Address of Agent for Services)
(617) 482-8260
(Registrant’s Telephone Number)
March 31
Date of Fiscal Year End
September 30, 2023
Date of Reporting Period
Item 1. Reports to Stockholders

Fund (EVV)

| % Average Annual Total Returns1,2 | Inception Date | Six Months | One Year | Five Years | Ten Years |
| Fund at NAV | 05/30/2003 | 2.25% | 11.17% | 2.32% | 4.14% |
| Fund at Market Price | — | (3.49) | 9.65 | 2.81 | 3.33 |
| Bloomberg U.S. Aggregate Bond Index | — | (4.05)% | 0.64% | 0.10% | 1.13% |
| Blended Index | — | 1.57 | 7.97 | 2.15 | 2.97 |
| % Premium/Discount to NAV3 | |
| As of period end | (11.46)% |
| Distributions 4 | |
| Total Distributions per share for the period | $0.470 |
| Distribution Rate at NAV | 9.20% |
| Distribution Rate at Market Price | 10.39 |
| % Total Leverage5 | |
| Auction Preferred Shares (APS) | 12.44% |
| Borrowings | 19.18 |
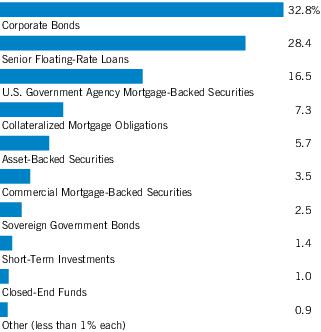
| Asset Allocation (% of total investments)1 |
| 1 | Including the Fund’s use of leverage, Asset Allocation as a percentage of the Fund's net assets amounted to 164.3%. |
| 1 | Bloomberg U.S. Aggregate Bond Index is an unmanaged index of domestic investment-grade bonds, including corporate, government and mortgage-backed securities. The Blended Index consists of 33.33% Morningstar® LSTA® US Leveraged Loan IndexSM, 33.33% ICE BofA Single-B U.S. High Yield Index and 33.34% ICE BofA U.S. Mortgage-Backed Securities Index, rebalanced monthly. Morningstar® LSTA® US Leveraged Loan IndexSM is an unmanaged index of the institutional leveraged loan market. Morningstar® LSTA® Leveraged Loan indices are a product of Morningstar, Inc. (“Morningstar”) and have been licensed for use. Morningstar® is a registered trademark of Morningstar licensed for certain use. Loan Syndications and Trading Association® and LSTA® are trademarks of the LSTA licensed for certain use by Morningstar, and further sublicensed by Morningstar for certain use. Neither Morningstar nor LSTA guarantees the accuracy and/or completeness of the Morningstar® LSTA® US Leveraged Loan IndexSM or any data included therein, and shall have no liability for any errors, omissions, or interruptions therein. Prior to August 29, 2022, the index name was S&P/LSTA Leveraged Loan Index. ICE BofA Single-B U.S. High Yield Index is an unmanaged index of below-investment grade U.S. corporate bonds with a credit quality rating of B. ICE BofA U.S. Mortgage-Backed Securities Index is an unmanaged index of fixed rate residential mortgage pass-through securities issued by U.S. agencies. ICE® BofA® indices are not for redistribution or other uses; provided “as is”, without warranties, and with no liability. Eaton Vance has prepared this report and ICE Data Indices, LLC does not endorse it, or guarantee, review, or endorse Eaton Vance’s products. BofA® is a licensed registered trademark of Bank of America Corporation in the United States and other countries. Unless otherwise stated, index returns do not reflect the effect of any applicable sales charges, commissions, expenses, taxes or leverage, as applicable. It is not possible to invest directly in an index. |
| 2 | Performance results reflect the effects of leverage. Included in the average annual total return at NAV for the five- and ten-year periods is the impact of the 2018 tender and repurchase of a portion of the Fund’s Auction Preferred Shares (APS) at 92% of the Fund’s APS per share liquidation preference. Had this transaction not occurred, the total return at NAV would be lower for the Fund. Performance reflects expenses waived and/or reimbursed, if applicable. Without such waivers and/or reimbursements, performance would have been lower. Pursuant to the Fund’s Dividend Reinvestment Plan, if the NAV per share on the distribution payment date is equal to or less than the market price per share plus estimated brokerage commissions, then new shares are issued. The number of shares shall be determined by the greater of the NAV per share or 95% of the market price. Otherwise, shares generally are purchased on the open market by the Plan’s agent. |
| 3 | The shares of the Fund often trade at a discount or premium to their net asset value. The discount or premium may vary over time and may be higher or lower than what is quoted in this report. For up-to-date premium/discount information, please refer to https://funds.eatonvance.com/closed-end-fund-prices.php. |
| 4 | The Distribution Rate is based on the Fund’s last regular distribution per share in the period (annualized) divided by the Fund’s NAV or market price at the end of the period. The Fund’s distributions in any period may be more or less than the net return earned by the Fund on its investments, and therefore should not be used as a measure of performance or confused with “yield” or “income.” Distributions in excess of Fund returns may include a return of capital which, over time, will cause the Fund’s net assets and net asset value per share to erode. When the Fund’s distributions include amounts from sources other than net investment income, shareholders are notified. The final determination of the tax characteristics of Fund distributions will occur after the end of the year, at which time that determination will be reported to shareholders. |
| 5 | Leverage represents the liquidation value of the Fund’s APS and borrowings outstanding as a percentage of Fund net assets applicable to common shares plus APS and borrowings outstanding. Use of leverage creates an opportunity for income, but creates risks including greater price volatility. The cost of leverage rises and falls with changes in short-term interest rates. The Fund may be required to maintain prescribed asset coverage for its leverage and may be required to reduce its leverage at an inopportune time. |
| Fund profile subject to change due to active management. | |
| Important Notice to Shareholders | |
| Effective October 18, 2023, the Fund’s portfolio management team includes Catherine C. McDermott, Kelley Gerrity, Tara O’Brien and Andrew Szczurowski. | |
| On January 26, 2023, the Fund’s Board of Trustees voted to exempt, on a going forward basis, all prior and, until further notice, new acquisitions of Fund shares that otherwise might be deemed “Control Share Acquisitions” under the Fund’s By-Laws from the Control Share Provisions of the Fund’s By-Laws. |
| Asset-Backed Securities — 9.4% |
| Security | Principal Amount (000's omitted) | Value | |
| Alinea CLO, Ltd., Series 2018-1A, Class E, 11.588%, (3 mo. SOFR + 6.26%), 7/20/31(1)(2) | $ | 1,000 | $ 920,195 |
| AMMC CLO 15, Ltd., Series 2014-15A, Class ERR, 12.48%, (3 mo. SOFR + 7.17%), 1/15/32(1)(2) | 500 | 439,478 | |
| AMMC CLO XII, Ltd., Series 2013-12A, Class ER, 11.807%, (3 mo. SOFR + 6.44%), 11/10/30(1)(2) | 2,000 | 1,675,814 | |
| Ares XXXIV CLO, Ltd., Series 2015-2A, Class ER, 12.42%, (3 mo. SOFR + 7.11%), 4/17/33(1)(2) | 2,000 | 1,823,496 | |
| Ares XXXVR CLO, Ltd., Series 2015-35RA, Class E, 11.27%, (3 mo. SOFR + 5.96%), 7/15/30(1)(2) | 2,000 | 1,745,634 | |
| Benefit Street Partners CLO XVI, Ltd., Series 2018-16A, Class E, 12.27%, (3 mo. SOFR + 6.96%), 1/17/32(1)(2) | 3,000 | 2,932,233 | |
| Benefit Street Partners CLO XVII, Ltd., Series 2019-17A, Class ER, 11.92%, (3 mo. SOFR + 6.61%), 7/15/32(1)(2) | 3,000 | 2,812,476 | |
| Benefit Street Partners CLO XVIII, Ltd., Series 2019-18A, Class ER, 12.32%, (3 mo. SOFR + 7.01%), 10/15/34(1)(2) | 4,500 | 4,443,318 | |
| Benefit Street Partners CLO XXII, Ltd., Series 2020-22A, Class ER, 12.256%, (3 mo. SOFR + 6.93%), 4/20/35(1)(2) | 2,000 | 1,856,466 | |
| BlueMountain CLO XXIV, Ltd., Series 2019-24A, Class ER, 12.428%, (3 mo. SOFR + 7.10%), 4/20/34(1)(2) | 1,000 | 918,616 | |
| BlueMountain CLO XXV, Ltd., Series 2019-25A, Class ER, 12.82%, (3 mo. SOFR + 7.51%), 7/15/36(1)(2) | 2,000 | 1,812,930 | |
| BlueMountain CLO XXVI, Ltd., Series 2019-26A, Class ER, 12.718%, (3 mo. SOFR + 7.39%), 10/20/34(1)(2) | 2,500 | 2,387,172 | |
| BlueMountain CLO XXX, Ltd., Series 2020-30A, Class ER, 12.008%, (3 mo. SOFR + 6.70%), 4/15/35(1)(2) | 2,000 | 1,826,774 | |
| BlueMountain CLO XXXIV, Ltd., Series 2022-34A, Class E, 12.876%, (3 mo. SOFR + 7.55%), 4/20/35(1)(2) | 1,000 | 966,839 | |
| BlueMountain CLO, Ltd.: | |||
| Series 2016-3A, Class ER, 11.576%, (3 mo. SOFR + 6.21%), 11/15/30(1)(2) | 2,000 | 1,678,650 | |
| Series 2018-1A, Class E, 11.581%, (3 mo. SOFR + 6.21%), 7/30/30(1)(2) | 1,000 | 814,648 | |
| Bryant Park Funding, Ltd., Series 2023- 21A, Class D, 10/18/36(1)(2)(3) | 3,000 | 3,011,760 | |
| Canyon Capital CLO, Ltd.: | |||
| Series 2016-2A, Class ER, 11.57%, (3 mo. SOFR + 6.26%), 10/15/31(1)(2) | 3,350 | 2,996,093 | |
| Series 2019-2A, Class ER, 12.32%, (3 mo. SOFR + 7.01%), 10/15/34(1)(2) | 1,000 | 931,639 | |
| Security | Principal Amount (000's omitted) | Value | |
| Carlyle CLO C17, Ltd., Series C17A, Class DR, 11.631%, (3 mo. SOFR + 6.26%), 4/30/31(1)(2) | $ | 1,750 | $ 1,523,646 |
| Carlyle Global Market Strategies CLO, Ltd.: | |||
| Series 2012-3A, Class DR2, 12.073%, (3 mo. SOFR + 6.76%), 1/14/32(1)(2) | 2,000 | 1,666,938 | |
| Series 2014-4RA, Class D, 11.22%, (3 mo. SOFR + 5.91%), 7/15/30(1)(2) | 1,250 | 1,074,589 | |
| Series 2015-5A, Class DR, 12.288%, (3 mo. SOFR + 6.96%), 1/20/32(1)(2) | 1,000 | 873,597 | |
| Cedar Funding X CLO, Ltd., Series 2019-10A, Class ER, 12.088%, (3 mo. SOFR + 6.76%), 10/20/32(1)(2) | 1,500 | 1,347,312 | |
| Clover CLO, Ltd., Series 2019-1A, Class ER, 12.01%, (3 mo. SOFR + 6.70%), 4/18/35(1)(2) | 2,877 | 2,801,246 | |
| Dryden Senior Loan Fund: | |||
| Series 2015-41A, Class ER, 10.87%, (3 mo. SOFR + 5.56%), 4/15/31(1)(2) | 2,000 | 1,687,374 | |
| Series 2016-42A, Class ER, 11.12%, (3 mo. SOFR + 5.81%), 7/15/30(1)(2) | 1,000 | 863,217 | |
| Elmwood CLO 14, Ltd., Series 2022-1A, Class E, 11.676%, (3 mo. SOFR + 6.35%), 4/20/35(1)(2) | 1,000 | 988,095 | |
| Elmwood CLO 17, Ltd., Series 2022-4A, Class E, 12.458%, (3 mo. SOFR + 7.15%), 7/17/35(1)(2) | 2,000 | 1,988,686 | |
| Galaxy XIX CLO, Ltd., Series 2015-19A, Class D2R, 12.607%, (3 mo. SOFR + 7.26%), 7/24/30(1)(2) | 1,600 | 1,393,083 | |
| Galaxy XV CLO, Ltd., Series 2013-15A, Class ER, 12.215%, (3 mo. SOFR + 6.91%), 10/15/30(1)(2) | 3,275 | 3,061,218 | |
| Galaxy XXI CLO, Ltd., Series 2015-21A, Class ER, 10.838%, (3 mo. SOFR + 5.51%), 4/20/31(1)(2) | 1,100 | 993,704 | |
| Galaxy XXV CLO, Ltd., Series 2018-25A, Class E, 11.563%, (3 mo. SOFR + 6.21%), 10/25/31(1)(2) | 1,000 | 925,913 | |
| Golub Capital Partners CLO 37B, Ltd., Series 2018-37A, Class E, 11.338%, (3 mo. SOFR + 6.01%), 7/20/30(1)(2) | 3,000 | 2,966,961 | |
| Golub Capital Partners CLO 50B-R, Ltd., Series 2020-50A, Class ER, 12.426%, (3 mo. SOFR + 7.10%), 4/20/35(1)(2) | 2,000 | 1,868,880 | |
| Madison Park Funding XVII, Ltd., Series 2015-17A, Class ER, 12.095%, (3 mo. SOFR + 6.76%), 7/21/30(1)(2) | 2,000 | 1,907,526 | |
| Madison Park Funding XXXVI, Ltd., Series 2019-36A, Class ER, 12.358%, (3 mo. SOFR + 7.05%), 4/15/35(1)(2) | 3,000 | 2,973,426 | |
| Madison Park Funding XXXVII, Ltd., Series 2019-37A, Class ER, 11.72%, (3 mo. SOFR + 6.41%), 7/15/33(1)(2) | 3,500 | 3,387,447 | |
| Neuberger Berman CLO XXII, Ltd., Series 2016-22A, Class ER, 11.63%, (3 mo. SOFR + 6.32%), 10/17/30(1)(2) | 1,500 | 1,364,708 | |
| Neuberger Berman Loan Advisers CLO 30, Ltd., Series 2018-30A, Class ER, 11.788%, (3 mo. SOFR + 6.46%), 1/20/31(1)(2) | 2,000 | 1,887,790 | |
| Security | Principal Amount (000's omitted) | Value | |
| Neuberger Berman Loan Advisers CLO 31, Ltd., Series 2019-31A, Class ER, 12.088%, (3 mo. SOFR + 6.76%), 4/20/31(1)(2) | $ | 1,000 | $ 955,667 |
| Neuberger Berman Loan Advisers CLO 48, Ltd., Series 2022-48A, Class E, 11.851%, (3 mo. SOFR + 6.50%), 4/25/36(1)(2) | 2,000 | 1,941,898 | |
| NRZ Excess Spread-Collateralized Notes, Series 2021-GNT1, Class A, 3.474%, 11/25/26(1) | 3,241 | 2,923,676 | |
| Octagon 68, Ltd.: | |||
| Series 2023-1A, Class D, 10/20/36(1)(2)(3) | 5,000 | 5,000,000 | |
| Series 2023-1A, Class E, 10/20/36(1)(2)(3) | 2,000 | 1,970,000 | |
| Palmer Square CLO, Ltd.: | |||
| Series 2013-2A, Class DRR, 11.42%, (3 mo. SOFR + 6.11%), 10/17/31(1)(2) | 2,000 | 1,871,944 | |
| Series 2018-2A, Class D, 11.17%, (3 mo. SOFR + 5.86%), 7/16/31(1)(2) | 1,000 | 968,651 | |
| Series 2019-1A, Class DR, 12.131%, (3 mo. SOFR + 6.76%), 11/14/34(1)(2) | 2,000 | 1,954,884 | |
| Series 2021-3A, Class E, 11.72%, (3 mo. SOFR + 6.41%), 1/15/35(1)(2) | 2,500 | 2,448,702 | |
| RAD CLO 5, Ltd., Series 2019-5A, Class E, 12.307%, (3 mo. SOFR + 6.96%), 7/24/32(1)(2) | 4,550 | 4,429,875 | |
| Regatta IX Funding, Ltd., Series 2017-1A, Class E, 11.57%, (3 mo. SOFR + 6.26%), 4/17/30(1)(2) | 450 | 422,736 | |
| Regatta XII Funding, Ltd., Series 2019-1A, Class ER, 11.92%, (3 mo. SOFR + 6.61%), 10/15/32(1)(2) | 2,000 | 1,978,980 | |
| Regatta XIII Funding, Ltd., Series 2018-2A, Class D, 11.52%, (3 mo. SOFR + 6.21%), 7/15/31(1)(2) | 2,000 | 1,740,790 | |
| Regatta XIV Funding, Ltd., Series 2018-3A, Class E, 11.563%, (3 mo. SOFR + 6.21%), 10/25/31(1)(2) | 1,000 | 923,209 | |
| Regatta XVI Funding, Ltd., Series 2019-2A, Class E, 12.57%, (3 mo. SOFR + 7.26%), 1/15/33(1)(2) | 1,800 | 1,808,926 | |
| Vibrant CLO IX, Ltd., Series 2018-9A, Class D, 11.838%, (3 mo. SOFR + 6.51%), 7/20/31(1)(2) | 1,000 | 771,718 | |
| Vibrant CLO XI, Ltd., Series 2019-11A, Class D, 12.358%, (3 mo. SOFR + 7.03%), 7/20/32(1)(2) | 575 | 498,664 | |
| Voya CLO, Ltd.: | |||
| Series 2015-3A, Class DR, 11.788%, (3 mo. SOFR + 6.46%), 10/20/31(1)(2) | 3,000 | 2,404,833 | |
| Series 2016-3A, Class DR, 11.652%, (3 mo. SOFR + 6.34%), 10/18/31(1)(2) | 1,400 | 1,110,876 | |
| Wellfleet CLO, Ltd., Series 2020-1A, Class D, 12.81%, (3 mo. SOFR + 7.50%), 4/15/33(1)(2) | 2,000 | 1,806,828 | |
| Total Asset-Backed Securities (identified cost $118,647,387) | $ 111,472,444 | ||
| Closed-End Funds — 1.6% |
| Security | Shares | Value | |
| BlackRock Corporate High Yield Fund, Inc. | 2,188,579 | $ 18,887,437 | |
| Total Closed-End Funds (identified cost $26,062,179) | $ 18,887,437 | ||
| Collateralized Mortgage Obligations — 12.0% |
| Security | Principal Amount (000's omitted) | Value | |
| Cascade MH Asset Trust, Series 2022-MH1, Class A, 4.25% to 7/25/27, 8/25/54(1)(4) | $ | 2,835 | $ 2,492,939 |
| Federal Home Loan Mortgage Corp.: | |||
| Series 24, Class J, 6.25%, 11/25/23 | 0 (5) | 333 | |
| Series 1620, Class Z, 6.00%, 11/15/23 | 1 | 517 | |
| Series 1702, Class PZ, 6.50%, 3/15/24 | 51 | 50,746 | |
| Series 2113, Class QG, 6.00%, 1/15/29 | 136 | 134,616 | |
| Series 2122, Class K, 6.00%, 2/15/29 | 27 | 26,400 | |
| Series 2130, Class K, 6.00%, 3/15/29 | 18 | 18,102 | |
| Series 2167, Class BZ, 7.00%, 6/15/29 | 21 | 21,394 | |
| Series 2182, Class ZB, 8.00%, 9/15/29 | 202 | 205,356 | |
| Series 2198, Class ZA, 8.50%, 11/15/29 | 190 | 192,406 | |
| Series 2458, Class ZB, 7.00%, 6/15/32 | 327 | 332,794 | |
| Series 3762, Class SH, 0.00%, (9.77% - 30-day average SOFR x 2.00, Floor 0.00%), 11/15/40(6) | 379 | 274,012 | |
| Series 4273, Class PU, 4.00%, 11/15/43 | 2,263 | 1,956,784 | |
| Series 4273, Class SP, 0.00%, (11.69% - 30-day average SOFR x 2.67, Floor 0.00%), 11/15/43(6) | 503 | 370,818 | |
| Series 4678, Class PC, 3.00%, 1/15/46 | 2,336 | 2,116,136 | |
| Series 5028, Class TZ, 2.00%, 10/25/50 | 2,644 | 1,267,524 | |
| Series 5035, Class AZ, 2.00%, 11/25/50 | 8,105 | 3,484,348 | |
| Series 5083, Class SK, 0.00%, (3.87% - 30-day average SOFR x 1.33, Floor 0.00%), 3/25/51(6) | 2,047 | 1,091,377 | |
| Series 5327, Class B, 6.00%, 8/25/53 | 5,000 | 4,903,176 | |
| Interest Only:(7) | |||
| Series 284, Class S6, 0.672%, (5.99% - 30-day average SOFR), 10/15/42(6) | 1,044 | 86,916 | |
| Series 362, Class C7, 3.50%, 9/15/47 | 4,322 | 788,544 | |
| Series 362, Class C11, 4.00%, 12/15/47 | 4,018 | 833,353 | |
| Series 4067, Class JI, 3.50%, 6/15/27 | 541 | 21,561 | |
| Series 4070, Class S, 0.672%, (5.99% - 30-day average SOFR), 6/15/32(6) | 2,318 | 117,435 | |
| Series 4088, Class EI, 3.50%, 9/15/41 | 20 | 29 | |
| Series 4094, Class CS, 0.572%, (5.89% - 30-day average SOFR), 8/15/42(6) | 612 | 49,035 | |
| Series 4095, Class HS, 0.672%, (5.99% - 30-day average SOFR), 7/15/32(6) | 474 | 14,653 | |
| Series 4109, Class ES, 0.722%, (6.04% - 30-day average SOFR), 12/15/41(6) | 81 | 6,749 | |
| Security | Principal Amount (000's omitted) | Value | |
| Interest Only: (continued) | |||
| Series 4110, Class SA, 0.222%, (5.54% - 30-day average SOFR), 9/15/42(6) | $ | 1,965 | $ 105,772 |
| Series 4149, Class S, 0.822%, (6.14% - 30-day average SOFR), 1/15/33(6) | 1,239 | 67,441 | |
| Series 4188, Class AI, 3.50%, 4/15/28 | 431 | 15,211 | |
| Series 4203, Class QS, 0.822%, (6.14% - 30-day average SOFR), 5/15/43(6) | 2,265 | 116,046 | |
| Series 4408, Class IP, 3.50%, 4/15/44 | 1,421 | 190,027 | |
| Series 4435, Class BI, 3.50%, 7/15/44 | 2,965 | 460,107 | |
| Series 4629, Class QI, 3.50%, 11/15/46 | 1,187 | 240,485 | |
| Series 4644, Class TI, 3.50%, 1/15/45 | 1,290 | 191,919 | |
| Series 4744, Class IO, 4.00%, 11/15/47 | 2,073 | 408,655 | |
| Series 4749, Class IL, 4.00%, 12/15/47 | �� 923 | 182,568 | |
| Series 4793, Class SD, 0.772%, (6.09% - 30-day average SOFR), 6/15/48(6) | 4,402 | 396,570 | |
| Series 4966, Class SY, 0.621%, (5.94% - 30-day average SOFR), 4/25/50(6) | 11,455 | 1,123,274 | |
| Principal Only:(8) | |||
| Series 242, Class PO, 0.00%, 11/15/36 | 1,784 | 1,381,230 | |
| Series 259, Class PO, 0.00%, 4/15/39 | 1,126 | 857,748 | |
| Series 3606, Class PO, 0.00%, 12/15/39 | 1,197 | 890,785 | |
| Series 4417, Class KO, 0.00%, 12/15/43 | 184 | 113,287 | |
| Series 4478, Class PO, 0.00%, 5/15/45 | 564 | 394,273 | |
| Federal National Mortgage Association: | |||
| Series G93-35, Class ZQ, 6.50%, 11/25/23 | 5 | 5,073 | |
| Series G93-40, Class H, 6.40%, 12/25/23 | 3 | 2,554 | |
| Series 1994-45, Class Z, 6.50%, 2/25/24 | 1 | 785 | |
| Series 1994-89, Class ZQ, 8.00%, 7/25/24 | 34 | 33,974 | |
| Series 1996-57, Class Z, 7.00%, 12/25/26 | 82 | 81,401 | |
| Series 1997-77, Class Z, 7.00%, 11/18/27 | 52 | 52,523 | |
| Series 1998-44, Class ZA, 6.50%, 7/20/28 | 66 | 66,062 | |
| Series 1999-45, Class ZG, 6.50%, 9/25/29 | 19 | 18,718 | |
| Series 2000-22, Class PN, 6.00%, 7/25/30 | 259 | 256,540 | |
| Series 2002-21, Class PE, 6.50%, 4/25/32 | 183 | 186,839 | |
| Series 2005-75, Class CS, 2.482%, (23.74% - 30-day average SOFR x 4.00), 9/25/35(6) | 541 | 558,153 | |
| Series 2007-74, Class AC, 5.00%, 8/25/37 | 2,102 | 2,061,128 | |
| Series 2011-49, Class NT, 6.00%, (64.86% - 30-day average SOFR x 10.00, Cap 6.00%), 6/25/41(6) | 212 | 196,154 | |
| Series 2012-134, Class ZT, 2.00%, 12/25/42 | 1,307 | 1,007,291 | |
| Series 2013-6, Class TA, 1.50%, 1/25/43 | 1,195 | 1,007,327 | |
| Series 2013-67, Class NF, 5.00%, (30-day average SOFR + 1.11%), 7/25/43(2) | 947 | 854,135 | |
| Series 2017-15, Class LE, 3.00%, 6/25/46 | 456 | 438,620 | |
| Series 2017-48, Class LG, 2.75%, 5/25/47 | 1,346 | 1,128,548 | |
| Interest Only:(7) | |||
| Series 2011-101, Class IC, 3.50%, 10/25/26 | 1,242 | 36,174 | |
| Security | Principal Amount (000's omitted) | Value | |
| Interest Only: (continued) | |||
| Series 2011-101, Class IE, 3.50%, 10/25/26 | $ | 400 | $ 11,414 |
| Series 2012-33, Class CI, 3.50%, 3/25/27 | 634 | 13,117 | |
| Series 2012-118, Class IN, 3.50%, 11/25/42 | 2,883 | 571,606 | |
| Series 2012-124, Class IO, 1.484%, 11/25/42(9) | 1,239 | 56,353 | |
| Series 2012-125, Class IG, 3.50%, 11/25/42 | 9,042 | 1,921,091 | |
| Series 2012-150, Class SK, 0.721%, (6.04% - 30-day average SOFR), 1/25/43(6) | 1,695 | 139,915 | |
| Series 2013-12, Class SP, 0.221%, (5.54% - 30-day average SOFR), 11/25/41(6) | 301 | 3,191 | |
| Series 2013-15, Class DS, 0.771%, (6.09% - 30-day average SOFR), 3/25/33(6) | 3,752 | 166,590 | |
| Series 2013-16, Class SY, 0.721%, (6.04% - 30-day average SOFR), 3/25/43(6) | 902 | 102,227 | |
| Series 2013-54, Class HS, 0.871%, (6.19% - 30-day average SOFR), 10/25/41(6) | 12 | 18 | |
| Series 2013-64, Class PS, 0.821%, (6.14% - 30-day average SOFR), 4/25/43(6) | 1,246 | 67,021 | |
| Series 2013-75, Class SC, 0.821%, (6.14% - 30-day average SOFR), 7/25/42(6) | 1,586 | 27,562 | |
| Series 2014-32, Class EI, 4.00%, 6/25/44 | 339 | 59,381 | |
| Series 2014-55, Class IN, 3.50%, 7/25/44 | 726 | 148,369 | |
| Series 2014-89, Class IO, 3.50%, 1/25/45 | 963 | 207,261 | |
| Series 2015-52, Class MI, 3.50%, 7/25/45 | 838 | 168,785 | |
| Series 2018-21, Class IO, 3.00%, 4/25/48 | 3,872 | 684,973 | |
| Series 2019-1, Class AS, 0.571%, (5.89% - 30-day average SOFR), 2/25/49(6) | 6,286 | 342,832 | |
| Series 2019-33, Class SK, 0.621%, (5.94% - 30-day average SOFR), 7/25/49(6) | 4,083 | 303,714 | |
| Series 2020-23, Class SP, 0.621%, (5.94% - 30-day average SOFR), 2/25/50(6) | 3,549 | 351,728 | |
| Principal Only:(8) | |||
| Series 379, Class 1, 0.00%, 5/25/37 | 1,116 | 847,313 | |
| Series 2006-8, Class WQ, 0.00%, 3/25/36 | 1,869 | 1,480,084 | |
| Government National Mortgage Association: | |||
| Series 2017-121, Class DF, 5.00%, (1 mo. SOFR + 0.61%), 8/20/47(2) | 3,119 | 2,945,530 | |
| Series 2017-137, Class AF, 5.00%, (1 mo. SOFR + 0.61%), 9/20/47(2) | 1,635 | 1,542,999 | |
| Series 2018-6, Class JZ, 4.00%, 1/20/48 | 5,204 | 4,557,477 | |
| Series 2021-160, Class NZ, 3.00%, 9/20/51 | 1,514 | 787,629 | |
| Series 2021-165, Class MZ, 2.50%, 9/20/51 | 9,209 | 4,941,949 | |
| Series 2022-189, Class US, 3.248%, (22.73% - 30-day average SOFR x 3.667), 11/20/52(6) | 4,486 | 4,163,383 | |
| Series 2023-56, Class ZE, 6.00%, 4/20/53 | 10,253 | 9,491,032 | |
| Series 2023-63, Class S, 3.064%, (22.55% - 30-day average SOFR x 3.667), 5/20/53(6) | 4,936 | 4,500,195 | |
| Series 2023-65, Class SD, 3.064%, (22.55% - 30-day average SOFR x 3.667), 5/20/53(6) | 5,968 | 5,704,395 | |
| Series 2023-96, Class BL, 6.00%, 7/20/53 | 4,326 | 4,236,292 | |
| Series 2023-96, Class DB, 6.00%, 7/20/53 | 2,500 | 2,444,831 | |
| Security | Principal Amount (000's omitted) | Value | |
| Government National Mortgage Association: (continued) | |||
| Series 2023-97, Class CB, 6.00%, 7/20/53 | $ | 10,000 | $ 9,907,751 |
| Series 2023-99, Class AL, 6.00%, 7/20/53 | 2,500 | 2,445,172 | |
| Series 2023-102, Class SG, 2.742%, (22.55% - 30-day average SOFR x 3.727), 7/20/53(6) | 8,398 | 7,630,503 | |
| Series 2023-115, Class AL, 6.00%, 8/20/53 | 8,500 | 8,333,922 | |
| Series 2023-116, Class CY, 6.00%, 8/20/53 | 5,000 | 4,890,295 | |
| Series 2023-133, Class S, 5.66%, (21.60% - 30-day average SOFR x 3.00), 9/20/53(6) | 4,300 | 4,153,351 | |
| Series 2023-149, Class S, (21.45% - 30-day average SOFR x 3.00), 10/20/53(3)(6) | 5,000 | 4,986,570 | |
| Interest Only:(7) | |||
| Series 2017-104, Class SD, 0.761%, (6.08% - 1 mo. SOFR), 7/20/47(6) | 2,424 | 204,935 | |
| Series 2020-151, Class AI, 2.00%, 10/20/50 | 11,645 | 1,427,132 | |
| Series 2020-154, Class PI, 2.50%, 10/20/50 | 10,573 | 1,415,781 | |
| Series 2020-176, Class HI, 2.50%, 11/20/50 | 12,354 | 1,661,957 | |
| Series 2021-131, Class QI, 3.00%, 7/20/51 | 10,035 | 1,260,257 | |
| Series 2021-193, Class IU, 3.00%, 11/20/49 | 21,186 | 2,843,528 | |
| Series 2021-209, Class IW, 3.00%, 11/20/51 | 13,848 | 1,789,428 | |
| Total Collateralized Mortgage Obligations (identified cost $193,000,760) | $ 141,926,289 | ||
| Commercial Mortgage-Backed Securities — 5.8% |
| Security | Principal Amount (000's omitted) | Value | |
| BAMLL Commercial Mortgage Securities Trust: | |||
| Series 2019-BPR, Class ENM, 3.843%, 11/5/32(1)(9) | $ | 910 | $ 301,055 |
| Series 2019-BPR, Class FNM, 3.843%, 11/5/32(1)(9) | 3,505 | 775,904 | |
| BBCMS Mortgage Trust, Series 2017-C1, Class D, 3.709%, 2/15/50(1)(9) | 2,200 | 1,458,403 | |
| BX Commercial Mortgage Trust, Series 2021-VOLT, Class C, 6.547%, (1 mo. SOFR + 1.214%), 9/15/36(1)(2) | 2,000 | 1,925,011 | |
| CFCRE Commercial Mortgage Trust: | |||
| Series 2016-C3, Class C, 4.911%, 1/10/48(9) | 1,300 | 1,118,091 | |
| Series 2016-C3, Class D, 3.052%, 1/10/48(1)(9) | 3,500 | 2,679,251 | |
| Series 2016-C7, Class D, 4.514%, 12/10/54(1)(9) | 1,675 | 1,157,300 | |
| CGMS Commercial Mortgage Trust, Series 2015-P1, Class D, 3.225%, 9/15/48(1) | 1,100 | 883,357 | |
| COMM Mortgage Trust: | |||
| Series 2013-CR11, Class D, 4.828%, 8/10/50(1)(9) | 7,400 | 6,635,487 | |
| Series 2014-CR21, Class C, 4.564%, 12/10/47(9) | 2,000 | 1,848,232 | |
| Series 2015-CR22, Class D, 4.203%, 3/10/48(1)(9) | 4,100 | 3,232,593 | |
| Security | Principal Amount (000's omitted) | Value | |
| CSMC Trust: | |||
| Series 2016-NXSR, Class C, 4.574%, 12/15/49(9) | $ | 2,770 | $ 1,944,848 |
| Series 2016-NXSR, Class D, 4.574%, 12/15/49(1)(9) | 3,000 | 1,904,133 | |
| Series 2020-TMIC, Class A, 8.948%, (1 mo. SOFR + 3.614%), 12/15/35(1)(2) | 2,100 | 2,098,510 | |
| Series 2021-WEHO, Class A, 9.417%, (1 mo. SOFR + 4.083%), 4/15/26(1)(2) | 72 | 70,502 | |
| Federal National Mortgage Association Multifamily Connecticut Avenue Securities Trust, Series 2019-01, Class M10, 8.679%, (30-day average SOFR + 3.364%), 10/25/49(1)(2) | 1,497 | 1,463,722 | |
| JPMBB Commercial Mortgage Securities Trust: | |||
| Series 2014-C22, Class D, 4.70%, 9/15/47(1)(9) | 5,276 | 3,567,039 | |
| Series 2014-C23, Class D, 4.129%, 9/15/47(1)(9) | 3,488 | 2,899,475 | |
| Series 2014-C25, Class D, 4.081%, 11/15/47(1)(9) | 4,400 | 1,863,864 | |
| Series 2015-C29, Class D, 3.827%, 5/15/48(9) | 2,000 | 1,311,879 | |
| JPMorgan Chase Commercial Mortgage Securities Trust: | |||
| Series 2013-C13, Class D, 4.116%, 1/15/46(1)(9) | 608 | 559,721 | |
| Series 2013-C16, Class D, 5.10%, 12/15/46(1)(9) | 3,500 | 3,017,870 | |
| Series 2014-DSTY, Class B, 3.771%, 6/10/27(1) | 2,600 | 380,835 | |
| Series 2021-MHC, Class C, 6.747%, (1 mo. SOFR + 1.414%), 4/15/38(1)(2) | 1,900 | 1,869,625 | |
| Morgan Stanley Bank of America Merrill Lynch Trust: | |||
| Series 2014-C16, Class B, 4.438%, 6/15/47(9)(10) | 363 | 328,827 | |
| Series 2015-C23, Class D, 4.276%, 7/15/50(1)(9)(10) | 2,670 | 2,253,613 | |
| Series 2016-C29, Class D, 3.00%, 5/15/49(1)(10) | 3,577 | 2,569,828 | |
| Series 2016-C32, Class D, 3.396%, 12/15/49(1)(9)(10) | 1,600 | 1,057,262 | |
| Morgan Stanley Capital I Trust: | |||
| Series 2016-UBS12, Class D, 3.312%, 12/15/49(1)(10) | 4,489 | 2,372,598 | |
| Series 2019-BPR, Class C, 8.972%, (1 mo. SOFR + 3.642%), 5/15/36(1)(2)(10) | 1,845 | 1,746,482 | |
| UBS-Barclays Commercial Mortgage Trust, Series 2013-C6, Class D, 4.103%, 4/10/46(1)(9) | 4,398 | 3,645,737 | |
| VMC Finance, LLC, Series 2021-HT1, Class B, 9.945%, (1 mo. SOFR + 4.614%), 1/18/37(1)(2) | 6,000 | 5,691,163 | |
| Wells Fargo Commercial Mortgage Trust: | |||
| Series 2013-LC12, Class D, 4.087%, 7/15/46(1)(9) | 3,000 | 598,417 | |
| Series 2015-C31, Class D, 3.852%, 11/15/48 | 2,475 | 1,873,748 | |
| Series 2016-C35, Class D, 3.142%, 7/15/48(1) | 1,850 | 1,316,033 | |
| Series 2016-C36, Class D, 2.942%, 11/15/59(1) | 1,500 | 869,149 | |
| Total Commercial Mortgage-Backed Securities (identified cost $86,349,267) | $ 69,289,564 | ||
| Common Stocks — 0.6% |
| Security | Shares | Value | |
| Aerospace and Defense — 0.0% | |||
| IAP Worldwide Services, LLC(11)(12)(13) | 30 | $ 0 | |
| $ 0 | |||
| Chemicals — 0.0% | |||
| Flint Campfire Topco, Ltd.(12)(13) | 43,048 | $ 0 | |
| $ 0 | |||
| Commercial Services & Supplies — 0.1% | |||
| Monitronics International, Inc.(12)(13) | 26,092 | $ 547,932 | |
| Phoenix Services International, LLC(12)(13) | 17,026 | 170,260 | |
| Phoenix Services International, LLC(12)(13) | 1,554 | 15,540 | |
| $ 733,732 | |||
| Containers and Glass Products — 0.1% | |||
| LG Parent Holding Co.(12)(13) | 166,175 | $ 1,262,930 | |
| $ 1,262,930 | |||
| Electronics/Electrical — 0.0%(14) | |||
| Skillsoft Corp.(12)(13) | 143,062 | $ 126,810 | |
| $ 126,810 | |||
| Entertainment — 0.0%(14) | |||
| New Cineworld, Ltd.(12)(13) | 12,854 | $ 304,212 | |
| $ 304,212 | |||
| Health Care — 0.0% | |||
| Akorn Holding Company, LLC, Class A(11)(12)(13) | 42,374 | $ 0 | |
| $ 0 | |||
| Household Durables — 0.3% | |||
| Serta Simmons Bedding, Inc.(12)(13) | 246,099 | $ 3,645,341 | |
| Serta SSB Equipment Co.(12)(13) | 246,099 | 0 | |
| $ 3,645,341 | |||
| Investment Companies — 0.0%(14) | |||
| Aegletes B.V.(13) | 11,215 | $ 27,056 | |
| Jubilee Topco, Ltd., Class A(11)(12)(13) | 807,124 | 0 | |
| $ 27,056 | |||
| Security | Shares | Value | |
| Media — 0.1% | |||
| National CineMedia, Inc.(12)(13) | 147,914 | $ 664,134 | |
| $ 664,134 | |||
| Nonferrous Metals/Minerals — 0.0%(14) | |||
| ACNR Holdings, Inc., Class A(12)(13) | 3,818 | $ 342,348 | |
| $ 342,348 | |||
| Oil and Gas — 0.0%(14) | |||
| AFG Holdings, Inc.(11)(12)(13) | 29,751 | $ 61,287 | |
| McDermott International, Ltd.(12)(13) | 93,940 | 23,955 | |
| $ 85,242 | |||
| Pharmaceuticals — 0.0%(14) | |||
| Covis Midco 1 S.a.r.l., Class A(12)(13) | 560 | $ 285 | |
| Covis Midco 1 S.a.r.l., Class B(12)(13) | 560 | 285 | |
| Covis Midco 1 S.a.r.l., Class C(12)(13) | 560 | 286 | |
| Covis Midco 1 S.a.r.l., Class D(12)(13) | 560 | 286 | |
| Covis Midco 1 S.a.r.l., Class E(12)(13) | 560 | 286 | |
| $ 1,428 | |||
| Retailers (Except Food and Drug) — 0.0%(14) | |||
| David’s Bridal, LLC(11)(12)(13) | 40,851 | $ 0 | |
| Phillips Feed Service, Inc.(11)(12)(13) | 582 | 27,774 | |
| $ 27,774 | |||
| Telecommunications — 0.0% | |||
| Global Eagle Entertainment(11)(12)(13) | 37,259 | $ 0 | |
| $ 0 | |||
| Utilities — 0.0%(14) | |||
| Longview Intermediate Holdings, LLC, Class A(12)(13) | 10,730 | $ 86,591 | |
| $ 86,591 | |||
| Total Common Stocks (identified cost $9,739,632) | $ 7,307,598 | ||
| Convertible Bonds — 0.2% |
| Security | Principal Amount (000's omitted) | Value | |
| Energy — 0.1% | |||
| NextEra Energy Partners, L.P., 2.50%, 6/15/26(1) | $ | 1,440 | $ 1,228,320 |
| $ 1,228,320 | |||
| Transportation — 0.1% | |||
| CryoPort, Inc., 0.75%, 12/1/26(1) | $ | 2,335 | $ 1,856,325 |
| $ 1,856,325 | |||
| Total Convertible Bonds (identified cost $3,191,481) | $ 3,084,645 | ||
| Corporate Bonds — 53.8% |
| Security | Principal Amount* (000's omitted) | Value | |
| Aerospace and Defense — 1.4% | |||
| Boeing Co., 5.04%, 5/1/27 | 475 | $ 463,969 | |
| Bombardier, Inc.: | |||
| 7.125%, 6/15/26(1) | 736 | 713,784 | |
| 7.875%, 4/15/27(1) | 1,795 | 1,753,009 | |
| Moog, Inc., 4.25%, 12/15/27(1) | 955 | 863,344 | |
| Rolls-Royce PLC: | |||
| 5.75%, 10/15/27(1) | 2,954 | 2,853,293 | |
| 5.75%, 10/15/27(15) | GBP | 200 | 232,372 |
| Spirit AeroSystems, Inc.: | |||
| 4.60%, 6/15/28 | 567 | 442,573 | |
| 9.375%, 11/30/29(1) | 220 | 224,155 | |
| TransDigm, Inc.: | |||
| 5.50%, 11/15/27 | 2,552 | 2,392,104 | |
| 6.25%, 3/15/26(1) | 2,408 | 2,368,161 | |
| 6.75%, 8/15/28(1) | 1,812 | 1,786,158 | |
| 7.50%, 3/15/27 | 2,862 | 2,870,351 | |
| $ 16,963,273 | |||
| Agriculture — 0.2% | |||
| Darling Ingredients, Inc., 6.00%, 6/15/30(1) | 1,277 | $ 1,210,414 | |
| Imperial Brands Finance PLC: | |||
| 3.125%, 7/26/24(1) | 300 | 292,419 | |
| 6.125%, 7/27/27(1) | 475 | 473,936 | |
| Philip Morris International, Inc., 5.125%, 11/17/27 | 750 | 734,816 | |
| $ 2,711,585 | |||
| Security | Principal Amount* (000's omitted) | Value | |
| Air Transport — 0.9% | |||
| Air France-KLM: | |||
| 7.25%, 5/31/26(15) | EUR | 100 | $ 108,499 |
| 8.125%, 5/31/28(15) | EUR | 100 | 110,453 |
| American Airlines, Inc., 7.25%, 2/15/28(1) | 478 | 457,492 | |
| American Airlines, Inc./AAdvantage Loyalty IP, Ltd.: | |||
| 5.50%, 4/20/26(1) | 1,789 | 1,749,168 | |
| 5.75%, 4/20/29(1) | 1,952 | 1,817,068 | |
| Delta Air Lines, Inc./SkyMiles IP, Ltd., 4.75%, 10/20/28(1) | 1,016 | 965,924 | |
| Deutsche Lufthansa AG: | |||
| 2.875%, 5/16/27(15) | EUR | 100 | 96,420 |
| 3.50%, 7/14/29(15) | EUR | 300 | 281,921 |
| 4.382% to 2/12/26, 8/12/75(15)(16) | EUR | 200 | 198,022 |
| Gatwick Airport Finance PLC, 4.375%, 4/7/26(15) | GBP | 300 | 340,542 |
| Heathrow Finance PLC, 4.75% to 12/1/23, 3/1/24(4)(15) | GBP | 225 | 271,777 |
| Mileage Plus Holdings, LLC/Mileage Plus Intellectual Property Assets, Ltd., 6.50%, 6/20/27(1) | 1,811 | 1,796,245 | |
| United Airlines, Inc.: | |||
| 4.375%, 4/15/26(1) | 835 | 773,031 | |
| 4.625%, 4/15/29(1) | 1,276 | 1,098,094 | |
| $ 10,064,656 | |||
| Airlines — 0.2% | |||
| Air Canada: | |||
| 3.875%, 8/15/26(1) | 2,039 | $ 1,852,489 | |
| 4.625%, 8/15/29(1) | CAD | 717 | 466,186 |
| $ 2,318,675 | |||
| Auto Components — 0.4% | |||
| Daimler Truck Finance North America, LLC, 2.00%, 12/14/26(1) | 550 | $ 491,653 | |
| General Motors Financial Co., Inc.: | |||
| 1.50%, 6/10/26 | 1,125 | 994,558 | |
| 5.80%, 6/23/28 | 475 | 464,305 | |
| Hyundai Capital America, 1.30%, 1/8/26(1) | 350 | 315,294 | |
| Mercedes-Benz Finance North America, LLC, 3.30%, 5/19/25(1) | 500 | 482,309 | |
| Nissan Motor Acceptance Co., LLC, 6.95%, 9/15/26(1) | 450 | 453,479 | |
| Volkswagen Group of America Finance, LLC: | |||
| 0.875%, 11/22/23(1) | 975 | 968,481 | |
| 1.25%, 11/24/25(1) | 525 | 476,799 | |
| $ 4,646,878 | |||
| Security | Principal Amount* (000's omitted) | Value | |
| Automotive — 1.7% | |||
| Asbury Automotive Group, Inc.: | |||
| 4.625%, 11/15/29(1) | 512 | $ 440,425 | |
| 4.75%, 3/1/30 | 1,134 | 971,285 | |
| 5.00%, 2/15/32(1) | 217 | 180,048 | |
| Clarios Global, L.P./Clarios U.S. Finance Co.: | |||
| 4.375%, 5/15/26(15) | EUR | 400 | 407,457 |
| 6.25%, 5/15/26(1) | 1,504 | 1,473,317 | |
| 6.75%, 5/15/25(1) | 432 | 429,188 | |
| 8.50%, 5/15/27(1) | 3,484 | 3,480,538 | |
| Dana Financing Luxembourg S.a.r.l., 8.50%, 7/15/31(15) | EUR | 200 | 214,692 |
| Dornoch Debt Merger Sub, Inc., 6.625%, 10/15/29(1) | 1,263 | 1,045,653 | |
| Ford Motor Co.: | |||
| 3.25%, 2/12/32 | 2,825 | 2,179,893 | |
| 4.75%, 1/15/43 | 1,274 | 931,264 | |
| 7.45%, 7/16/31 | 457 | 474,602 | |
| 9.625%, 4/22/30 | 201 | 229,841 | |
| Forvia SE: | |||
| 2.375%, 6/15/29(15) | EUR | 100 | 86,438 |
| 2.75%, 2/15/27(15) | EUR | 260 | 248,283 |
| 3.75%, 6/15/28(15) | EUR | 100 | 95,256 |
| Goodyear Europe B.V., 2.75%, 8/15/28(15) | EUR | 100 | 87,755 |
| IHO Verwaltungs GmbH: | |||
| 6.375%, (6.375% cash or 7.125% PIK), 5/15/29(1)(17) | 200 | 180,610 | |
| 8.75%, (8.75% cash or 9.50% PIK), 5/15/28(15)(17) | EUR | 100 | 109,309 |
| Jaguar Land Rover Automotive PLC, 2.20%, 1/15/24(15) | EUR | 100 | 104,842 |
| Lithia Motors, Inc.: | |||
| 3.875%, 6/1/29(1) | 651 | 549,379 | |
| 4.375%, 1/15/31(1) | 1,171 | 969,936 | |
| 4.625%, 12/15/27(1) | 514 | 469,896 | |
| Real Hero Merger Sub 2, Inc., 6.25%, 2/1/29(1) | 1,453 | 1,123,903 | |
| Renault S.A.: | |||
| 2.375%, 5/25/26(15) | EUR | 100 | 98,176 |
| 2.50%, 6/2/27(15) | EUR | 500 | 479,731 |
| Sonic Automotive, Inc.: | |||
| 4.625%, 11/15/29(1) | 1,297 | 1,076,904 | |
| 4.875%, 11/15/31(1) | 1,081 | 861,779 | |
| TI Automotive Finance PLC, 3.75%, 4/15/29(15) | EUR | 112 | 96,935 |
| Volkswagen International Finance N.V., 3.875% to 6/17/29(15)(16)(18) | EUR | 200 | 174,975 |
| Wheel Pros, Inc., 6.50%, 5/15/29(1) | �� 1,069 | 359,451 | |
| ZF Europe Finance B.V., 6.125%, 3/13/29(15) | EUR | 200 | 211,741 |
| ZF Finance GmbH: | |||
| 2.00%, 5/6/27(15) | EUR | 100 | 92,847 |
| Security | Principal Amount* (000's omitted) | Value | |
| Automotive (continued) | |||
| ZF Finance GmbH: (continued) | |||
| 5.75%, 8/3/26(15) | EUR | 100 | $ 105,732 |
| $ 20,042,081 | |||
| Banks — 1.3% | |||
| ABN AMRO Bank NV, 6.339% to 9/18/26, 9/18/27(1)(16) | 400 | $ 399,171 | |
| AIB Group PLC, 6.608% to 9/13/28, 9/13/29(1)(16) | 200 | 199,298 | |
| Australia & New Zealand Banking Group, Ltd., 4.829%, 2/3/25(1) | 900 | 892,307 | |
| Bank of New York Mellon Corp. (The), 4.947% to 4/26/26, 4/26/27(16) | 600 | 585,791 | |
| Banque Federative du Credit Mutuel S.A., 2.375%, 11/21/24(1) | 1,025 | 983,441 | |
| Canadian Imperial Bank of Commerce: | |||
| 3.30%, 4/7/25 | 500 | 480,727 | |
| 5.144%, 4/28/25 | 650 | 641,684 | |
| Citizens Bank N.A., 6.064% to 10/24/24, 10/24/25(16) | 700 | 675,678 | |
| Danske Bank A/S, 6.259% to 9/22/25, 9/22/26(1)(16) | 500 | 499,996 | |
| Deutsche Bank AG: | |||
| 0.962%, 11/8/23 | 975 | 969,209 | |
| 7.146% to 7/13/26, 7/13/27(16) | 150 | 151,072 | |
| Discover Bank, 2.45%, 9/12/24 | 1,000 | 961,417 | |
| Fifth Third Bancorp, 6.339% to 7/27/28, 7/27/29(16) | 100 | 98,840 | |
| Intesa Sanpaolo SpA, 7.00%, 11/21/25(1) | 925 | 936,641 | |
| KeyBank N.A., 4.15%, 8/8/25 | 500 | 471,063 | |
| National Bank of Canada, 0.55% to 11/15/23, 11/15/24(16) | 1,000 | 992,619 | |
| National Securities Clearing Corp., 5.00%, 5/30/28(1) | 675 | 660,784 | |
| Santander UK Group Holdings PLC, 6.833% to 11/21/25, 11/21/26(16) | 1,900 | 1,911,400 | |
| Sumitomo Mitsui Trust Bank, Ltd., 5.55%, 9/14/28(1) | 350 | 348,208 | |
| Toronto-Dominion Bank (The): | |||
| 5.523%, 7/17/28 | 750 | 740,694 | |
| 8.125% to 10/31/27, 10/31/82(16) | 450 | 448,809 | |
| U.S. Bancorp, 5.775% to 6/12/28, 6/12/29(16) | 1,475 | 1,436,554 | |
| UBS Group AG, 6.442% to 8/11/27, 8/11/28(1)(16) | 475 | 474,798 | |
| $ 15,960,201 | |||
| Banks and Thrifts — 0.6% | |||
| American Express Co., 2.55%, 3/4/27 | 525 | $ 473,589 | |
| BPCE S.A., 5.15%, 7/21/24(1) | 950 | 935,126 | |
| Capital One Financial Corp.: | |||
| 3.273% to 3/1/29, 3/1/30(16) | 395 | 330,648 | |
| 6.312% to 6/8/28, 6/8/29(16) | 350 | 342,235 | |
| Security | Principal Amount* (000's omitted) | Value | |
| Banks and Thrifts (continued) | |||
| HSBC Holdings PLC, 6.161% to 3/9/28, 3/9/29(16) | 1,350 | $ 1,337,148 | |
| Swedbank AB, 3.356%, 4/4/25(1) | 975 | 938,456 | |
| Synchrony Bank, 5.625%, 8/23/27 | 1,300 | 1,214,177 | |
| Texas Capital Bancshares, Inc., 4.00% to 5/6/26, 5/6/31(16) | 1,500 | 1,245,702 | |
| United Overseas Bank, Ltd., 3.863% to 10/7/27, 10/7/32(1)(16) | 686 | 630,729 | |
| $ 7,447,810 | |||
| Beverage and Tobacco — 0.1% | |||
| BAT Capital Corp., 3.557%, 8/15/27 | 277 | $ 253,564 | |
| JDE Peet's NV, 0.80%, 9/24/24(1) | 800 | 759,533 | |
| $ 1,013,097 | |||
| Biotechnology — 0.0%(14) | |||
| Royalty Pharma PLC, 1.20%, 9/2/25 | 525 | $ 477,383 | |
| $ 477,383 | |||
| Building and Development — 1.6% | |||
| Ashton Woods USA, LLC/Ashton Woods Finance Co.: | |||
| 4.625%, 8/1/29(1) | 392 | $ 331,230 | |
| 4.625%, 4/1/30(1) | 390 | 319,679 | |
| Builders FirstSource, Inc.: | |||
| 4.25%, 2/1/32(1) | 2,118 | 1,739,377 | |
| 5.00%, 3/1/30(1) | 1,085 | 968,658 | |
| Castle UK Finco PLC, 9.031%, (3 mo. EURIBOR + 5.25%), 5/15/28(2)(15) | EUR | 200 | 183,475 |
| Emerald Debt Merger Sub, LLC: | |||
| 6.375%, 12/15/30(15) | EUR | 200 | 211,135 |
| 6.625%, 12/15/30(1) | 379 | 365,327 | |
| James Hardie International Finance DAC, 3.625%, 10/1/26(15) | EUR | 400 | 407,553 |
| KB Home: | |||
| 4.00%, 6/15/31 | 86 | 69,419 | |
| 4.80%, 11/15/29 | 556 | 489,880 | |
| Masonite International Corp., 5.375%, 2/1/28(1) | 570 | 530,847 | |
| MIWD Holdco II, LLC/MIWD Finance Corp., 5.50%, 2/1/30(1) | 760 | 628,706 | |
| Mohawk Industries, Inc., 5.85%, 9/18/28 | 275 | 273,105 | |
| Patrick Industries, Inc.: | |||
| 4.75%, 5/1/29(1) | 1,187 | 992,457 | |
| 7.50%, 10/15/27(1) | 225 | 215,677 | |
| PGT Innovations, Inc., 4.375%, 10/1/29(1) | 1,456 | 1,344,140 | |
| Smyrna Ready Mix Concrete, LLC, 6.00%, 11/1/28(1) | 3,078 | 2,845,152 | |
| Security | Principal Amount* (000's omitted) | Value | |
| Building and Development (continued) | |||
| SRS Distribution, Inc.: | |||
| 6.00%, 12/1/29(1) | 692 | $ 582,052 | |
| 6.125%, 7/1/29(1) | 1,195 | 1,018,892 | |
| Standard Industries, Inc.: | |||
| 2.25%, 11/21/26(15) | EUR | 450 | 421,377 |
| 3.375%, 1/15/31(1) | 1,634 | 1,265,102 | |
| 4.375%, 7/15/30(1) | 1,779 | 1,475,225 | |
| 5.00%, 2/15/27(1) | 457 | 424,064 | |
| Taylor Morrison Communities, Inc., 5.875%, 6/15/27(1) | 808 | 769,031 | |
| Victoria PLC, 3.625%, 8/24/26(15) | EUR | 275 | 230,056 |
| White Cap Buyer, LLC, 6.875%, 10/15/28(1) | 719 | 636,341 | |
| White Cap Parent, LLC, 8.25%, (8.25% cash or 9.00% PIK), 3/15/26(1)(17) | 691 | 667,563 | |
| $ 19,405,520 | |||
| Business Equipment and Services — 0.8% | |||
| Adtalem Global Education, Inc., 5.50%, 3/1/28(1) | 1,900 | $ 1,742,404 | |
| Allied Universal Holdco, LLC/Allied Universal Finance Corp.: | |||
| 6.625%, 7/15/26(1) | 2,443 | 2,318,187 | |
| 9.75%, 7/15/27(1) | 1,148 | 1,028,469 | |
| Allied Universal Holdco, LLC/Allied Universal Finance Corp./Atlas Luxco 4 S.a.r.l.: | |||
| 3.625%, 6/1/28(15) | EUR | 300 | 262,459 |
| 4.625%, 6/1/28(1) | 776 | 645,315 | |
| 4.625%, 6/1/28(1) | 549 | 458,308 | |
| 4.875%, 6/1/28(15) | GBP | 100 | 97,654 |
| GEMS MENASA Cayman, Ltd./GEMS Education Delaware, LLC: | |||
| 7.125%, 7/31/26(1) | 2,576 | 2,508,676 | |
| 7.125%, 7/31/26(15) | 350 | 340,853 | |
| Techem Verwaltungsgesellschaft 675 mbH, 2.00%, 7/15/25(15) | EUR | 100 | 102,336 |
| $ 9,504,661 | |||
| Cable and Satellite Television — 1.6% | |||
| Altice Financing S.A.: | |||
| 3.00%, 1/15/28(15) | EUR | 100 | $ 89,472 |
| 5.00%, 1/15/28(1) | 814 | 696,200 | |
| Altice France S.A.: | |||
| 2.125%, 2/15/25(15) | EUR | 100 | 99,923 |
| 2.50%, 1/15/25(15) | EUR | 100 | 100,427 |
| 5.125%, 7/15/29(1) | 767 | 546,415 | |
| 5.50%, 1/15/28(1) | 841 | 649,056 | |
| 5.875%, 2/1/27(15) | EUR | 100 | 91,374 |
| Security | Principal Amount* (000's omitted) | Value | |
| Cable and Satellite Television (continued) | |||
| CCO Holdings, LLC/CCO Holdings Capital Corp.: | |||
| 4.25%, 2/1/31(1) | 2,263 | $ 1,803,642 | |
| 4.50%, 8/15/30(1) | 2,140 | 1,759,333 | |
| 4.50%, 5/1/32 | 771 | 605,908 | |
| 4.75%, 3/1/30(1) | 1,789 | 1,504,006 | |
| 4.75%, 2/1/32(1) | 1,044 | 836,364 | |
| 5.00%, 2/1/28(1) | 1,755 | 1,595,704 | |
| 5.375%, 6/1/29(1) | 595 | 534,452 | |
| 6.375%, 9/1/29(1) | 1,974 | 1,842,671 | |
| Charter Communications Operating, LLC/Charter Communications Operating Capital, 4.908%, 7/23/25 | 950 | 928,605 | |
| DISH Network Corp., 11.75%, 11/15/27(1) | 1,293 | 1,304,561 | |
| UPC Holding B.V., 5.50%, 1/15/28(1) | 593 | 526,940 | |
| Virgin Media Finance PLC: | |||
| 3.75%, 7/15/30(15) | EUR | 125 | 105,731 |
| 5.00%, 7/15/30(1) | 946 | 744,837 | |
| Virgin Media Secured Finance PLC, 5.25%, 5/15/29(15) | GBP | 200 | 211,077 |
| Virgin Media Vendor Financing Notes III DAC, 4.875%, 7/15/28(15) | GBP | 525 | 534,805 |
| Virgin Media Vendor Financing Notes IV DAC, 5.00%, 7/15/28(1) | 1,091 | 942,711 | |
| VZ Vendor Financing II B.V., 2.875%, 1/15/29(15) | EUR | 100 | 81,870 |
| Ziggo B.V., 4.875%, 1/15/30(1) | 628 | 512,381 | |
| Ziggo Bond Co., B.V.: | |||
| 3.375%, 2/28/30(15) | EUR | 230 | 179,712 |
| 6.00%, 1/15/27(1) | 745 | 682,972 | |
| $ 19,511,149 | |||
| Capital Goods — 0.1% | |||
| BWX Technologies, Inc.: | |||
| 4.125%, 6/30/28(1) | 948 | $ 839,118 | |
| 4.125%, 4/15/29(1) | 733 | 643,735 | |
| $ 1,482,853 | |||
| Chemicals — 0.1% | |||
| Calderys Financing, LLC, 11.25%, 6/1/28(1) | 1,444 | $ 1,480,904 | |
| $ 1,480,904 | |||
| Chemicals and Plastics — 1.1% | |||
| ASP Unifrax Holdings, Inc., 5.25%, 9/30/28(1) | 1,242 | $ 886,428 | |
| Avient Corp., 7.125%, 8/1/30(1) | 1,551 | 1,525,584 | |
| Celanese US Holdings, LLC, 6.35%, 11/15/28 | 725 | 716,261 | |
| Herens Holdco S.a.r.l., 4.75%, 5/15/28(1) | 545 | 423,867 | |
| Herens Midco S.a.r.l., 5.25%, 5/15/29(15) | EUR | 400 | 243,811 |
| Security | Principal Amount* (000's omitted) | Value | |
| Chemicals and Plastics (continued) | |||
| INEOS Finance PLC: | |||
| 2.875%, 5/1/26(15) | EUR | 100 | $ 98,391 |
| 3.375%, 3/31/26(15) | EUR | 100 | 99,942 |
| INEOS Quattro Finance 2 PLC, 2.50%, 1/15/26(15) | EUR | 154 | 148,657 |
| Italmatch Chemicals SpA, 10.00%, 2/6/28(15) | EUR | 200 | 206,652 |
| NOVA Chemicals Corp.: | |||
| 4.25%, 5/15/29(1) | 1,242 | 967,864 | |
| 4.875%, 6/1/24(1) | 1,276 | 1,254,837 | |
| Nufarm Australia, Ltd./Nufarm Americas, Inc., 5.00%, 1/27/30(1) | 1,759 | 1,554,261 | |
| Olympus Water US Holding Corp.: | |||
| 3.875%, 10/1/28(15) | EUR | 110 | 97,666 |
| 9.75%, 11/15/28(1) | 2,204 | 2,201,991 | |
| Valvoline, Inc., 3.625%, 6/15/31(1) | 802 | 622,170 | |
| W.R. Grace Holdings, LLC: | |||
| 4.875%, 6/15/27(1) | 1,472 | 1,352,308 | |
| 7.375%, 3/1/31(1) | 611 | 592,953 | |
| $ 12,993,643 | |||
| Clothing/Textiles — 0.1% | |||
| William Carter Co. (The), 5.625%, 3/15/27(1) | 811 | $ 780,847 | |
| $ 780,847 | |||
| Commercial Services — 1.5% | |||
| Abertis Infraestructuras Finance B.V., 3.248% to 11/24/25(15)(16)(18) | EUR | 600 | $ 581,433 |
| APi Group DE, Inc., 4.75%, 10/15/29(1) | 1,510 | 1,327,772 | |
| Arena Luxembourg Finance S.a.r.l., 1.875%, 2/1/28(15) | EUR | 200 | 175,664 |
| BCP V Modular Services Finance II PLC, 4.75%, 11/30/28(15) | EUR | 100 | 88,874 |
| Global Payments, Inc., 4.95%, 8/15/27 | 475 | 456,802 | |
| GTCR W-2 Merger Sub, LLC, 7.50%, 1/15/31(1)(3) | 1,328 | 1,331,552 | |
| GTCR W-2 Merger Sub, LLC/GTCR W Dutch Finance Sub B.V., 8.50%, 1/15/31(3)(15) | GBP | 100 | 124,900 |
| HealthEquity, Inc., 4.50%, 10/1/29(1) | 1,974 | 1,702,822 | |
| IPD 3 B.V., 8.00%, 6/15/28(15) | EUR | 200 | 213,903 |
| Korn Ferry, 4.625%, 12/15/27(1) | 1,355 | 1,248,063 | |
| LABL, Inc.: | |||
| 5.875%, 11/1/28(1) | 507 | 456,094 | |
| 8.25%, 11/1/29(1) | 1,016 | 831,215 | |
| Loxam S.A.S., 2.875%, 4/15/26(15) | EUR | 100 | 97,896 |
| Metis Merger Sub, LLC, 6.50%, 5/15/29(1) | 2,923 | 2,472,671 | |
| Mooney Group SpA, 7.742%, (3 mo. EURIBOR + 3.875%), 12/17/26(2)(15) | EUR | 110 | 116,094 |
| NESCO Holdings II, Inc., 5.50%, 4/15/29(1) | 1,282 | 1,126,501 | |
| Security | Principal Amount* (000's omitted) | Value | |
| Commercial Services (continued) | |||
| PROG Holdings, Inc., 6.00%, 11/15/29(1) | 1,085 | $ 947,965 | |
| Spectrum Brands, Inc., 4.00%, 10/1/26(15) | EUR | 200 | 203,982 |
| Verisure Holding AB, 3.25%, 2/15/27(15) | EUR | 400 | 381,139 |
| Verisure Midholding AB, 5.25%, 2/15/29(15) | EUR | 175 | 162,995 |
| VT Topco, Inc., 8.50%, 8/15/30(1) | 1,824 | 1,808,596 | |
| WASH Multifamily Acquisition, Inc., 5.75%, 4/15/26(1) | 2,060 | 1,925,894 | |
| $ 17,782,827 | |||
| Computers — 1.0% | |||
| Booz Allen Hamilton, Inc.: | |||
| 3.875%, 9/1/28(1) | 1,341 | $ 1,202,770 | |
| 4.00%, 7/1/29(1) | 717 | 633,261 | |
| Dell International, LLC/EMC Corp., 5.25%, 2/1/28 | 200 | 197,039 | |
| Hewlett Packard Enterprise Co., 5.90%, 10/1/24 | 754 | 753,596 | |
| Kyndryl Holdings, Inc., 2.70%, 10/15/28 | 600 | 493,623 | |
| McAfee Corp., 7.375%, 2/15/30(1) | 1,841 | 1,543,426 | |
| NCR Corp.: | |||
| 5.125%, 4/15/29(1) | 926 | 816,819 | |
| 5.25%, 10/1/30(1) | 843 | 727,318 | |
| Presidio Holdings, Inc., 8.25%, 2/1/28(1) | 3,176 | 3,039,263 | |
| Seagate HDD Cayman: | |||
| 4.091%, 6/1/29 | 418 | 360,969 | |
| 9.625%, 12/1/32(1) | 1,800 | 1,941,311 | |
| $ 11,709,395 | |||
| Containers and Glass Products — 0.4% | |||
| Ardagh Metal Packaging Finance USA, LLC/Ardagh Metal Packaging Finance PLC: | |||
| 3.00%, 9/1/29(15) | EUR | 400 | $ 322,241 |
| 4.00%, 9/1/29(1) | 1,408 | 1,103,768 | |
| Ardagh Packaging Finance PLC/Ardagh Holdings USA, Inc.: | |||
| 2.125%, 8/15/26(15) | EUR | 100 | 94,245 |
| 2.125%, 8/15/26(15) | EUR | 400 | 376,161 |
| Berry Global, Inc., 5.50%, 4/15/28(1) | 175 | 169,167 | |
| Canpack S.A./Canpack US, LLC, 3.875%, 11/15/29(1) | 2,027 | 1,658,779 | |
| Crown Americas, LLC/Crown Americas Capital Corp. V, 4.25%, 9/30/26 | 660 | 621,043 | |
| Crown Americas, LLC/Crown Americas Capital Corp. VI, 4.75%, 2/1/26 | 750 | 721,118 | |
| $ 5,066,522 | |||
| Cosmetics/Toiletries — 0.1% | |||
| Edgewell Personal Care Co.: | |||
| 4.125%, 4/1/29(1) | 441 | $ 375,532 | |
| Security | Principal Amount* (000's omitted) | Value | |
| Cosmetics/Toiletries (continued) | |||
| Edgewell Personal Care Co.: (continued) | |||
| 5.50%, 6/1/28(1) | 1,067 | $ 986,916 | |
| $ 1,362,448 | |||
| Distribution & Wholesale — 0.8% | |||
| BCPE Empire Holdings, Inc., 7.625%, 5/1/27(1) | 2,799 | $ 2,661,765 | |
| Parts Europe S.A.: | |||
| 6.50%, 7/16/25(15) | EUR | 100 | 105,725 |
| 7.705%, (3 mo. EURIBOR + 4.00%), 7/20/27(2)(15) | EUR | 428 | 452,503 |
| Performance Food Group, Inc.: | |||
| 4.25%, 8/1/29(1) | 2,429 | 2,101,251 | |
| 5.50%, 10/15/27(1) | 935 | 886,703 | |
| Rexel S.A., 5.25%, 9/15/30(15) | EUR | 150 | 156,962 |
| Ritchie Bros Holdings, Inc.: | |||
| 6.75%, 3/15/28(1) | 558 | 557,414 | |
| 7.75%, 3/15/31(1) | 996 | 1,012,185 | |
| Windsor Holdings III, LLC, 8.50%, 6/15/30(1) | 2,067 | 2,041,668 | |
| $ 9,976,176 | |||
| Diversified Financial Services — 1.6% | |||
| AerCap Ireland Capital DAC/AerCap Global Aviation Trust: | |||
| 1.65%, 10/29/24 | 599 | $ 570,009 | |
| 2.45%, 10/29/26 | 525 | 470,500 | |
| AG TTMT Escrow Issuer, LLC, 8.625%, 9/30/27(1) | 1,308 | 1,317,176 | |
| Air Lease Corp., 0.80%, 8/18/24 | 750 | 715,346 | |
| American AgCredit Corp., Series A, 5.25% to 6/15/26(1)(16)(18) | 410 | 376,687 | |
| Aviation Capital Group, LLC: | |||
| 6.25%, 4/15/28(1) | 275 | 269,182 | |
| 6.375%, 7/15/30(1) | 250 | 242,308 | |
| Charles Schwab Corp. (The), 5.643% to 5/19/28, 5/19/29(16) | 525 | 514,455 | |
| CI Financial Corp., 3.20%, 12/17/30 | 1,000 | 759,277 | |
| Enact Holdings, Inc., 6.50%, 8/15/25(1) | 708 | 698,049 | |
| Encore Capital Group, Inc., 7.913%, (3 mo. EURIBOR + 4.25%), 1/15/28(2)(15) | EUR | 100 | 106,121 |
| Intrum AB, 4.875%, 8/15/25(15) | EUR | 225 | 216,714 |
| Jane Street Group/JSG Finance, Inc., 4.50%, 11/15/29(1) | 1,905 | 1,639,366 | |
| Jefferies Financial Group, Inc., 5.875%, 7/21/28 | 400 | 391,696 | |
| Jefferson Capital Holdings, LLC, 6.00%, 8/15/26(1) | 1,275 | 1,129,287 | |
| Jerrold Finco PLC, 4.875%, 1/15/26(15) | GBP | 200 | 229,185 |
| Louvre Bidco S.A.S., 6.50%, 9/30/24(15) | EUR | 333 | 346,511 |
| Macquarie Airfinance Holdings, Ltd., 8.125%, 3/30/29(1) | 805 | 806,590 | |
| Security | Principal Amount* (000's omitted) | Value | |
| Diversified Financial Services (continued) | |||
| Oxford Finance, LLC/Oxford Finance Co-Issuer II, Inc., 6.375%, 2/1/27(1) | 1,209 | $ 1,124,920 | |
| PRA Group, Inc., 7.375%, 9/1/25(1) | 1,292 | 1,259,604 | |
| ProGroup AG, 3.00%, 3/31/26(15) | EUR | 400 | 390,594 |
| Radian Group, Inc., 6.625%, 3/15/25 | 475 | 472,630 | |
| Rocket Mortgage, LLC/Rocket Mortgage Co.-Issuer, Inc.: | |||
| 3.625%, 3/1/29(1) | 2,290 | 1,895,640 | |
| 4.00%, 10/15/33(1) | 225 | 170,223 | |
| Sherwood Financing PLC, 6.00%, 11/15/26(15) | GBP | 150 | 156,249 |
| Synchrony Financial, 4.50%, 7/23/25 | 225 | 214,324 | |
| Unifin Financiera SAB de CV, 7.375%, 2/12/26(1)(19) | 620 | 13,950 | |
| VistaJet Malta Finance PLC/Vista Management Holding, Inc.: | |||
| 6.375%, 2/1/30(1) | 2,192 | 1,696,663 | |
| 9.50%, 6/1/28(1) | 953 | 837,974 | |
| $ 19,031,230 | |||
| Drugs — 0.5% | |||
| Endo DAC/Endo Finance, LLC/Endo Finco, Inc., 5.875%, 10/15/24(1)(19) | 649 | $ 455,372 | |
| Endo Luxembourg Finance Co. I S.a.r.l./Endo US, Inc., 6.125%, 4/1/29(1)(19) | 1,550 | 1,103,507 | |
| Gruenenthal GmbH, 3.625%, 11/15/26(15) | EUR | 310 | 311,950 |
| Jazz Securities DAC, 4.375%, 1/15/29(1) | 1,371 | 1,196,443 | |
| Perrigo Finance Unlimited Co.: | |||
| 4.65%, 6/15/30 | 2,255 | 1,925,253 | |
| 4.90%, 12/15/44 | 588 | 436,446 | |
| $ 5,428,971 | |||
| Ecological Services and Equipment — 0.8% | |||
| Clean Harbors, Inc.: | |||
| 4.875%, 7/15/27(1) | 551 | $ 519,837 | |
| 5.125%, 7/15/29(1) | 332 | 305,816 | |
| 6.375%, 2/1/31(1) | 308 | 299,872 | |
| Covanta Holding Corp.: | |||
| 4.875%, 12/1/29(1) | 1,536 | 1,262,461 | |
| 5.00%, 9/1/30 | 319 | 255,256 | |
| GFL Environmental, Inc.: | |||
| 3.50%, 9/1/28(1) | 1,679 | 1,446,971 | |
| 3.75%, 8/1/25(1) | 776 | 736,359 | |
| 4.375%, 8/15/29(1) | 2,000 | 1,739,750 | |
| 4.75%, 6/15/29(1) | 3,095 | 2,755,102 | |
| Paprec Holding S.A.: | |||
| 3.50%, 7/1/28(15) | EUR | 129 | 122,406 |
| Security | Principal Amount* (000's omitted) | Value | |
| Ecological Services and Equipment (continued) | |||
| Paprec Holding S.A.: (continued) | |||
| 4.00%, 3/31/25(15) | EUR | 300 | $ 312,341 |
| $ 9,756,171 | |||
| Electric Utilities — 1.3% | |||
| Dominion Energy, Inc., 1.45%, 4/15/26 | 800 | $ 720,176 | |
| DTE Energy Co., 4.875%, 6/1/28 | 500 | 483,570 | |
| Edison International, 4.70%, 8/15/25 | 500 | 486,874 | |
| EDP - Energias de Portugal S.A., 4.496% to 1/30/24, 4/30/79(15)(16) | EUR | 600 | 632,325 |
| EDP Finance B.V., 6.30%, 10/11/27(1) | 700 | 710,519 | |
| Electricite de France S.A., 7.50% to 9/6/28(15)(16)(18) | EUR | 400 | 431,419 |
| Energizer Gamma Acquisition B.V., 3.50%, 6/30/29(15) | EUR | 1,100 | 934,328 |
| Fells Point Funding Trust, 3.046%, 1/31/27(1) | 525 | 476,353 | |
| FirstEnergy Corp.: | |||
| 2.65%, 3/1/30 | 410 | 334,653 | |
| Series B, 4.15%, 7/15/27 | 1,630 | 1,516,431 | |
| ITC Holdings Corp., 4.95%, 9/22/27(1) | 600 | 584,983 | |
| Metropolitan Edison Co., 5.20%, 4/1/28(1) | 225 | 219,672 | |
| NextEra Energy Capital Holdings, Inc.: | |||
| 4.625%, 7/15/27 | 475 | 458,094 | |
| 5.749%, 9/1/25 | 325 | 324,193 | |
| 6.051%, 3/1/25 | 175 | 175,327 | |
| Pacific Gas & Electric Co., 6.10%, 1/15/29 | 475 | 464,315 | |
| PacifiCorp, 2.70%, 9/15/30 | 575 | 469,931 | |
| Pattern Energy Operations, L.P./Pattern Energy Operations, Inc., 4.50%, 8/15/28(1) | 1,112 | 967,017 | |
| Pennsylvania Electric Co., 5.15%, 3/30/26(1) | 200 | 196,353 | |
| Public Power Corp S.A., 4.375%, 3/30/26(15) | EUR | 300 | 309,200 |
| Southern Co. (The), 5.113%, 8/1/27 | 994 | 974,852 | |
| TransAlta Corp., 7.75%, 11/15/29 | 1,045 | 1,059,040 | |
| Wec Energy Group, Inc., 5.00%, 9/27/25 | 475 | 468,307 | |
| WESCO Distribution, Inc.: | |||
| 7.125%, 6/15/25(1) | 1,024 | 1,027,503 | |
| 7.25%, 6/15/28(1) | 915 | 920,345 | |
| $ 15,345,780 | |||
| Electronic Equipment, Instruments & Components — 0.1% | |||
| Vontier Corp., 1.80%, 4/1/26 | 800 | $ 718,617 | |
| $ 718,617 | |||
| Electronics/Electrical — 0.8% | |||
| Coherent Corp., 5.00%, 12/15/29(1) | 1,777 | $ 1,543,165 | |
| Imola Merger Corp., 4.75%, 5/15/29(1) | 3,165 | 2,776,927 | |
| Jabil, Inc., 5.45%, 2/1/29 | 450 | 438,217 | |
| Security | Principal Amount* (000's omitted) | Value | |
| Electronics/Electrical (continued) | |||
| Open Text Corp., 3.875%, 2/15/28(1) | 1,009 | $ 882,395 | |
| Open Text Holdings, Inc., 4.125%, 2/15/30(1) | 883 | 739,682 | |
| RWE AG, 6.625% to 3/30/26, 7/30/75(15)(16) | 266 | 264,894 | |
| Sensata Technologies B.V., 5.00%, 10/1/25(1) | 447 | 433,826 | |
| Sensata Technologies, Inc.: | |||
| 3.75%, 2/15/31(1) | 1,660 | 1,345,181 | |
| 4.375%, 2/15/30(1) | 627 | 542,076 | |
| SS&C Technologies, Inc., 5.50%, 9/30/27(1) | 517 | 488,392 | |
| $ 9,454,755 | |||
| Energy — 0.5% | |||
| Enviva Partners, L.P./Enviva Partners Finance Corp., 6.50%, 1/15/26(1) | 2,651 | $ 2,164,727 | |
| New Fortress Energy, Inc., 6.50%, 9/30/26(1) | 1,974 | 1,819,658 | |
| Sunoco, L.P./Sunoco Finance Corp., 4.50%, 4/30/30 | 1,692 | 1,467,366 | |
| $ 5,451,751 | |||
| Engineering & Construction — 0.4% | |||
| Brundage-Bone Concrete Pumping Holdings, Inc., 6.00%, 2/1/26(1) | 1,038 | $ 988,565 | |
| Cellnex Finance Co. S.A., 1.00%, 9/15/27(15) | EUR | 100 | 91,731 |
| Dycom Industries, Inc., 4.50%, 4/15/29(1) | 1,389 | 1,202,909 | |
| TopBuild Corp., 4.125%, 2/15/32(1) | 1,562 | 1,269,979 | |
| VM Consolidated, Inc., 5.50%, 4/15/29(1) | 1,899 | 1,711,453 | |
| $ 5,264,637 | |||
| Entertainment — 1.5% | |||
| Allwyn Entertainment Financing UK, PLC: | |||
| 7.25%, 4/30/30(15) | EUR | 325 | $ 348,191 |
| 7.875%, 4/30/29(1) | 1,565 | 1,586,519 | |
| Boyne USA, Inc., 4.75%, 5/15/29(1) | 1,719 | 1,505,561 | |
| Caesars Entertainment, Inc.: | |||
| 4.625%, 10/15/29(1) | 529 | 448,716 | |
| 6.25%, 7/1/25(1) | 2,521 | 2,488,713 | |
| 7.00%, 2/15/30(1) | 800 | 779,297 | |
| 8.125%, 7/1/27(1) | 1,589 | 1,597,782 | |
| CDI Escrow Issuer, Inc., 5.75%, 4/1/30(1) | 1,751 | 1,584,162 | |
| Cirsa Finance International S.a.r.l., 4.50%, 3/15/27(15) | EUR | 200 | 195,463 |
| CPUK Finance, Ltd.: | |||
| 4.50%, 8/28/27(15) | GBP | 100 | 106,027 |
| 4.875%, 2/28/47(15) | GBP | 435 | 504,206 |
| 6.50%, 8/28/26(15) | GBP | 100 | 116,670 |
| Esc Cb National Cineme, 5.75%, 8/15/26 | 1,186 | 0 | |
| Jacobs Entertainment, Inc., 6.75%, 2/15/29(1) | 1,721 | 1,529,186 | |
| Light & Wonder International, Inc., 7.00%, 5/15/28(1) | 1,647 | 1,620,533 | |
| Security | Principal Amount* (000's omitted) | Value | |
| Entertainment (continued) | |||
| Live Nation Entertainment, Inc., 4.75%, 10/15/27(1) | 1,226 | $ 1,123,874 | |
| Lottomatica SpA, 7.928%, 6/1/28(2)(15) | EUR | 100 | 106,927 |
| Pinewood Finance Co., Ltd., 3.25%, 9/30/25(15) | GBP | 300 | 344,323 |
| Speedway Motorsports, LLC/Speedway Funding II, Inc., 4.875%, 11/1/27(1) | 1,515 | 1,376,423 | |
| WarnerMedia Holdings, Inc., 3.755%, 3/15/27 | 1,050 | 969,835 | |
| $ 18,332,408 | |||
| Environmental — 0.0%(14) | |||
| Waste Management, Inc., 0.75%, 11/15/25 | 525 | $ 476,297 | |
| $ 476,297 | |||
| Equipment Leasing — 0.0%(14) | |||
| Ashtead Capital, Inc., 4.25%, 11/1/29(1) | 526 | $ 466,156 | |
| $ 466,156 | |||
| Financial Intermediaries — 1.9% | |||
| Ally Financial, Inc.: | |||
| 4.625%, 3/30/25 | 1,225 | $ 1,183,217 | |
| Series B, 4.70% to 5/15/26(16)(18) | 1,647 | 1,135,385 | |
| Alpha Holding S.A. de CV: | |||
| 9.00%, 2/10/25(1)(19) | 721 | 10,818 | |
| 10.00%, 12/19/22(1)(19) | 188 | 2,827 | |
| Citigroup, Inc.: | |||
| 3.887% to 1/10/27, 1/10/28(16) | 975 | 909,379 | |
| 5.61% to 9/29/25, 9/29/26(16) | 935 | 925,691 | |
| Compass Group Diversified Holdings, LLC, 5.25%, 4/15/29(1) | 1,657 | 1,450,361 | |
| Ford Motor Credit Co., LLC: | |||
| 2.90%, 2/16/28 | 420 | 358,122 | |
| 3.37%, 11/17/23 | 513 | 510,477 | |
| 3.625%, 6/17/31 | 2,307 | 1,866,588 | |
| 3.815%, 11/2/27 | 1,984 | 1,768,750 | |
| 4.00%, 11/13/30 | 995 | 831,955 | |
| 4.125%, 8/17/27 | 2,739 | 2,496,943 | |
| 4.271%, 1/9/27 | 476 | 440,134 | |
| 4.867%, 8/3/27 | EUR | 200 | 209,090 |
| 5.125%, 6/16/25 | 938 | 908,850 | |
| 5.584%, 3/18/24 | 257 | 255,630 | |
| 6.125%, 5/15/28 | EUR | 550 | 599,296 |
| Goldman Sachs Group, Inc. (The), 3.615% to 3/15/27, 3/15/28(16) | 1,496 | 1,380,871 | |
| JPMorgan Chase & Co.: | |||
| Series HH, 4.60% to 2/1/25(16)(18) | 1,674 | 1,570,194 | |
| 5.546%, 12/15/25(16) | 1,400 | 1,390,820 | |
| Security | Principal Amount* (000's omitted) | Value | |
| Financial Intermediaries (continued) | |||
| MSCI, Inc.: | |||
| 3.625%, 9/1/30(1) | 520 | $ 436,457 | |
| 3.875%, 2/15/31(1) | 899 | 762,829 | |
| Synovus Financial Corp., 5.90% to 2/7/24, 2/7/29(16) | 1,011 | 941,059 | |
| $ 22,345,743 | |||
| Financial Services — 0.6% | |||
| Bank of America Corp.: | |||
| 1.734% to 7/22/26, 7/22/27(16) | 1,625 | $ 1,440,446 | |
| 4.376% to 4/27/27, 4/27/28(16) | 1,500 | 1,416,802 | |
| 5.08% to 1/20/26, 1/20/27(16) | 975 | 953,236 | |
| Nationwide Building Society, 4.00%, 9/14/26(1) | 525 | 487,300 | |
| Vietnam Debt and Asset Trading Corp., 1.00%, 10/10/25(15) | 2,600 | 2,210,000 | |
| $ 6,507,784 | |||
| Food Products — 0.4% | |||
| Bellis Acquisition Co. PLC, 3.25%, 2/16/26(15) | GBP | 200 | $ 212,695 |
| Casino Guichard Perrachon SA, 4.498%, 3/7/24(15) | EUR | 100 | 1,493 |
| Chobani, LLC/Chobani Finance Corp., Inc., 7.50%, 4/15/25(1) | 1,619 | 1,605,303 | |
| Ingles Markets, Inc., 4.00%, 6/15/31(1) | 854 | 702,270 | |
| Nomad Foods Bondco PLC, 2.50%, 6/24/28(15) | EUR | 236 | 217,520 |
| Pilgrim's Pride Corp., 3.50%, 3/1/32 | 1,979 | 1,532,631 | |
| Premier Foods Financing PLC, 3.50%, 10/15/26(15) | GBP | 125 | 139,390 |
| $ 4,411,302 | |||
| Food Service — 0.7% | |||
| 1011778 B.C. Unlimited Liability Company/New Red Finance, Inc.: | |||
| 3.875%, 1/15/28(1) | 1,906 | $ 1,711,341 | |
| 4.00%, 10/15/30(1) | 2,705 | 2,250,949 | |
| 4.375%, 1/15/28(1) | 1,014 | 914,935 | |
| 5.75%, 4/15/25(1) | 372 | 369,517 | |
| Elior Group S.A., 3.75%, 7/15/26(15) | EUR | 100 | 83,842 |
| IRB Holding Corp., 7.00%, 6/15/25(1) | 615 | 615,849 | |
| US Foods, Inc., 4.75%, 2/15/29(1) | 1,837 | 1,644,019 | |
| Yum! Brands, Inc., 3.625%, 3/15/31 | 238 | 196,169 | |
| $ 7,786,621 | |||
| Food/Drug Retailers — 0.3% | |||
| Albertsons Cos., Inc./Safeway, Inc./New Albertsons, L.P./Albertsons, LLC: | |||
| 4.875%, 2/15/30(1) | 1,595 | $ 1,439,247 | |
| Security | Principal Amount* (000's omitted) | Value | |
| Food/Drug Retailers (continued) | |||
| Albertsons Cos., Inc./Safeway, Inc./New Albertsons, L.P./Albertsons, LLC: (continued) | |||
| 5.875%, 2/15/28(1) | 2,145 | $ 2,066,844 | |
| $ 3,506,091 | |||
| Forest Products & Paper — 0.0%(14) | |||
| Georgia-Pacific, LLC, 1.75%, 9/30/25(1) | 525 | $ 485,463 | |
| $ 485,463 | |||
| Health Care — 3.6% | |||
| AHP Health Partners, Inc., 5.75%, 7/15/29(1) | 610 | $ 515,355 | |
| Avantor Funding, Inc.: | |||
| 2.625%, 11/1/25(15) | EUR | 300 | 303,764 |
| 3.875%, 7/15/28(15) | EUR | 100 | 97,478 |
| Bausch & Lomb Escrow Corp., 8.375%, 10/1/28(1) | 1,295 | 1,300,465 | |
| Cerba Healthcare SACA, 3.50%, 5/31/28(15) | EUR | 450 | 396,066 |
| Chrome Holdco S.A.S., 5.00%, 5/31/29(15) | EUR | 400 | 321,869 |
| Encompass Health Corp.: | |||
| 4.625%, 4/1/31 | 683 | 579,818 | |
| 4.75%, 2/1/30 | 639 | 566,228 | |
| Fortrea Holdings, Inc., 7.50%, 7/1/30(1) | 1,849 | 1,801,416 | |
| Grifols S.A.: | |||
| 1.625%, 2/15/25(15) | EUR | 200 | 204,415 |
| 3.20%, 5/1/25(15) | EUR | 350 | 356,855 |
| 3.875%, 10/15/28(15) | EUR | 494 | 444,095 |
| 4.75%, 10/15/28(1) | 2,051 | 1,751,154 | |
| HCA, Inc.: | |||
| 5.25%, 6/15/26 | 475 | 465,148 | |
| 5.625%, 9/1/28 | 1,472 | 1,436,175 | |
| 5.875%, 2/15/26 | 2,705 | 2,690,669 | |
| Heartland Dental, LLC/Heartland Dental Finance Corp., 10.50%, 4/30/28(1) | 3,006 | 3,028,545 | |
| IQVIA, Inc.: | |||
| 2.25%, 1/15/28(15) | EUR | 450 | 418,152 |
| 2.25%, 3/15/29(15) | EUR | 100 | 88,757 |
| 2.875%, 6/15/28(15) | EUR | 100 | 94,483 |
| 5.00%, 10/15/26(1) | 850 | 813,523 | |
| 5.00%, 5/15/27(1) | 685 | 646,385 | |
| 6.50%, 5/15/30(1) | 825 | 808,516 | |
| Legacy LifePoint Health, LLC, 4.375%, 2/15/27(1) | 989 | 851,747 | |
| LifePoint Health, Inc.: | |||
| 5.375%, 1/15/29(1) | 2,888 | 2,020,175 | |
| 9.875%, 8/15/30(1) | 825 | 799,739 | |
| Medline Borrower, L.P., 5.25%, 10/1/29(1) | 3,821 | 3,307,099 | |
| Security | Principal Amount* (000's omitted) | Value | |
| Health Care (continued) | |||
| ModivCare Escrow Issuer, Inc., 5.00%, 10/1/29(1) | 981 | $ 705,516 | |
| ModivCare, Inc., 5.875%, 11/15/25(1) | 1,377 | 1,310,257 | |
| Molina Healthcare, Inc.: | |||
| 3.875%, 11/15/30(1) | 1,330 | 1,102,268 | |
| 3.875%, 5/15/32(1) | 1,450 | 1,164,706 | |
| Option Care Health, Inc., 4.375%, 10/31/29(1) | 1,991 | 1,722,066 | |
| RegionalCare Hospital Partners Holdings, Inc./LifePoint Health, Inc., 9.75%, 12/1/26(1) | 702 | 680,613 | |
| Team Health Holdings, Inc., 6.375%, 2/1/25(1) | 1,890 | 1,459,832 | |
| Tenet Healthcare Corp.: | |||
| 4.375%, 1/15/30 | 187 | 161,082 | |
| 4.875%, 1/1/26 | 1,607 | 1,541,137 | |
| 5.125%, 11/1/27 | 1,607 | 1,497,129 | |
| 6.125%, 10/1/28 | 1,593 | 1,496,910 | |
| 6.875%, 11/15/31 | 878 | 842,736 | |
| US Acute Care Solutions, LLC, 6.375%, 3/1/26(1) | 2,637 | 2,271,973 | |
| Varex Imaging Corp., 7.875%, 10/15/27(1) | 896 | 899,096 | |
| $ 42,963,412 | |||
| Health Care Providers & Services — 0.2% | |||
| Boston Scientific Corp., 1.90%, 6/1/25 | 525 | $ 493,552 | |
| Catalent Pharma Solutions, Inc.: | |||
| 2.375%, 3/1/28(15) | EUR | 100 | 88,809 |
| 3.50%, 4/1/30(1) | 2,084 | 1,718,539 | |
| $ 2,300,900 | |||
| Home Furnishings — 0.2% | |||
| CD&R Smokey Buyer, Inc., 6.75%, 7/15/25(1) | 789 | $ 761,263 | |
| Tempur Sealy International, Inc., 3.875%, 10/15/31(1) | 1,475 | 1,139,706 | |
| $ 1,900,969 | |||
| Homebuilders/Real Estate — 0.0%(14) | |||
| M/I Homes, Inc., 4.95%, 2/1/28 | 459 | $ 414,234 | |
| $ 414,234 | |||
| Hotels, Restaurants & Leisure — 0.3% | |||
| Resorts World Las Vegas, LLC/RWLV Capital, Inc.: | |||
| 4.625%, 4/6/31(15) | 800 | $ 597,235 | |
| 8.45%, 7/27/30(1) | 600 | 578,143 | |
| SeaWorld Parks & Entertainment, Inc.: | |||
| 5.25%, 8/15/29(1) | 1,479 | 1,301,121 | |
| 8.75%, 5/1/25(1) | 1,090 | 1,105,723 | |
| $ 3,582,222 | |||
| Security | Principal Amount* (000's omitted) | Value | |
| Industrial Equipment — 0.2% | |||
| Madison IAQ, LLC, 5.875%, 6/30/29(1) | 2,000 | $ 1,612,964 | |
| TK Elevator Holdco GmbH, 6.625%, 7/15/28(15) | EUR | 90 | 83,552 |
| TK Elevator Midco GmbH: | |||
| 4.375%, 7/15/27(15) | EUR | 425 | 407,982 |
| 8.413%, (3 mo. EURIBOR + 4.75%), 7/15/27(2)(15) | EUR | 100 | 105,825 |
| $ 2,210,323 | |||
| Insurance — 0.8% | |||
| Alliant Holdings Intermediate, LLC/Alliant Holdings Co-Issuer, 6.75%, 10/15/27(1) | 1,615 | $ 1,503,656 | |
| AmWINS Group, Inc., 4.875%, 6/30/29(1) | 1,010 | 886,309 | |
| Assurant, Inc., 6.10%, 2/27/26 | 200 | 199,142 | |
| AssuredPartners, Inc., 5.625%, 1/15/29(1) | 450 | 390,123 | |
| Athene Global Funding, 2.514%, 3/8/24(1) | 650 | 638,594 | |
| BroadStreet Partners, Inc., 5.875%, 4/15/29(1) | 2,209 | 1,951,471 | |
| F&G Annuities & Life, Inc., 7.40%, 1/13/28 | 575 | 574,458 | |
| Galaxy Finco, Ltd., 9.25%, 7/31/27(15) | GBP | 575 | 631,402 |
| GTCR AP Finance, Inc., 8.00%, 5/15/27(1) | 820 | 806,796 | |
| Jones DesLauriers Insurance Management, Inc., 10.50%, 12/15/30(1) | 1,539 | 1,568,640 | |
| Principal Life Global Funding II, 5.50%, 6/28/28(1) | 475 | 466,327 | |
| $ 9,616,918 | |||
| Internet Software & Services — 0.7% | |||
| Amazon.com, Inc., 3.30%, 4/13/27 | 1,025 | $ 964,882 | |
| Arches Buyer, Inc.: | |||
| 4.25%, 6/1/28(1) | 655 | 559,237 | |
| 6.125%, 12/1/28(1) | 2,045 | 1,662,452 | |
| Cars.com, Inc., 6.375%, 11/1/28(1) | 1,770 | 1,610,054 | |
| Match Group Holdings II, LLC, 3.625%, 10/1/31(1) | 1,727 | 1,364,460 | |
| Science Applications International Corp., 4.875%, 4/1/28(1) | 1,487 | 1,351,341 | |
| United Group B.V., 3.125%, 2/15/26(15) | EUR | 350 | 339,232 |
| $ 7,851,658 | |||
| Leisure Goods/Activities/Movies — 1.7% | |||
| Acushnet Co., 7.375%, 10/15/28(1)(3) | 400 | $ 403,500 | |
| Carnival Corp., 5.75%, 3/1/27(1) | 1,316 | 1,192,413 | |
| Cinemark USA, Inc.: | |||
| 5.25%, 7/15/28(1) | 1,481 | 1,316,357 | |
| 5.875%, 3/15/26(1) | 414 | 397,954 | |
| 8.75%, 5/1/25(1) | 182 | 183,310 | |
| LHMC Finco 2 S.a.r.l., 7.25%, (7.25% cash or 8.00% PIK), 10/2/25(15)(17) | EUR | 262 | 271,612 |
| Security | Principal Amount* (000's omitted) | Value | |
| Leisure Goods/Activities/Movies (continued) | |||
| Life Time, Inc.: | |||
| 5.75%, 1/15/26(1) | 1,268 | $ 1,229,769 | |
| 8.00%, 4/15/26(1) | 846 | 832,096 | |
| Lindblad Expeditions Holdings, Inc., 9.00%, 5/15/28(1) | 761 | 760,151 | |
| Lindblad Expeditions, LLC, 6.75%, 2/15/27(1) | 599 | 561,443 | |
| NCL Corp., Ltd.: | |||
| 3.625%, 12/15/24(1) | 439 | 421,932 | |
| 5.875%, 3/15/26(1) | 2,162 | 1,998,559 | |
| 5.875%, 2/15/27(1) | 517 | 492,134 | |
| 7.75%, 2/15/29(1) | 433 | 402,362 | |
| NCL Finance, Ltd., 6.125%, 3/15/28(1) | 1,000 | 883,665 | |
| Piaggio & C SpA, 6.50%, 10/5/30(3)(15) | EUR | 100 | 105,873 |
| Pinnacle Bidco PLC, 5.50%, 2/15/25(15) | EUR | 200 | 214,056 |
| Playtika Holding Corp., 4.25%, 3/15/29(1) | 1,511 | 1,263,226 | |
| Royal Caribbean Cruises, Ltd., 11.625%, 8/15/27(1) | 1,612 | 1,749,863 | |
| Viking Cruises, Ltd.: | |||
| 5.875%, 9/15/27(1) | 2,472 | 2,258,741 | |
| 6.25%, 5/15/25(1) | 1,690 | 1,655,718 | |
| 7.00%, 2/15/29(1) | 658 | 606,061 | |
| Viking Ocean Cruises Ship VII, Ltd., 5.625%, 2/15/29(1) | 422 | 382,355 | |
| $ 19,583,150 | |||
| Lodging and Casinos — 0.3% | |||
| Accor S.A.: | |||
| 2.625% to 1/30/25(15)(16)(18) | EUR | 100 | $ 100,584 |
| 4.375% to 1/30/24(15)(16)(18) | EUR | 300 | 315,386 |
| Hyatt Hotels Corp., 5.75%, 1/30/27 | 650 | 646,137 | |
| MGM Resorts International: | |||
| 4.75%, 10/15/28 | 1,138 | 1,003,899 | |
| 5.50%, 4/15/27 | 453 | 423,081 | |
| 5.75%, 6/15/25 | 948 | 926,891 | |
| $ 3,415,978 | |||
| Machinery — 0.3% | |||
| Chart Industries, Inc., 9.50%, 1/1/31(1) | 1,984 | $ 2,110,383 | |
| IMA Industria Macchine Automatiche SpA, 3.75%, 1/15/28(15) | EUR | 121 | 113,654 |
| Ingersoll Rand, Inc., 5.40%, 8/14/28 | 475 | 467,361 | |
| John Deere Capital Corp., 4.95%, 7/14/28 | 350 | 345,318 | |
| Renk AG, 5.75%, 7/15/25(15) | EUR | 200 | 210,604 |
| $ 3,247,320 | |||
| Media — 0.4% | |||
| Beasley Mezzanine Holdings, LLC, 8.625%, 2/1/26(1) | 1,595 | $ 1,025,461 | |
| Security | Principal Amount* (000's omitted) | Value | |
| Media (continued) | |||
| iHeartCommunications, Inc.: | |||
| 6.375%, 5/1/26 | 179 | $ 154,554 | |
| 8.375%, 5/1/27 | 324 | 233,234 | |
| Outfront Media Capital, LLC/Outfront Media Capital Corp.: | |||
| 4.625%, 3/15/30(1) | 925 | 728,243 | |
| 6.25%, 6/15/25(1) | 807 | 792,583 | |
| Univision Communications, Inc.: | |||
| 4.50%, 5/1/29(1) | 1,032 | 841,399 | |
| 7.375%, 6/30/30(1) | 391 | 357,815 | |
| Urban One, Inc., 7.375%, 2/1/28(1) | 1,006 | 864,340 | |
| $ 4,997,629 | |||
| Metals/Mining — 1.2% | |||
| BHP Billiton Finance USA, Ltd., 4.75%, 2/28/28 | 675 | $ 657,583 | |
| Cleveland-Cliffs, Inc., 6.75%, 3/15/26(1) | 2,658 | 2,653,178 | |
| Compass Minerals International, Inc., 6.75%, 12/1/27(1) | 3,216 | 3,051,051 | |
| Constellium N.V.: | |||
| 5.625%, 6/15/28(1) | 630 | 593,552 | |
| 5.875%, 2/15/26(1) | 408 | 399,367 | |
| Freeport-McMoRan, Inc., 5.45%, 3/15/43 | 1,600 | 1,366,240 | |
| Glencore Funding, LLC, 4.125%, 3/12/24(1) | 475 | 470,995 | |
| Hudbay Minerals, Inc.: | |||
| 4.50%, 4/1/26(1) | 1,085 | 1,016,609 | |
| 6.125%, 4/1/29(1) | 489 | 453,004 | |
| Novelis Corp.: | |||
| 3.25%, 11/15/26(1) | 690 | 617,092 | |
| 4.75%, 1/30/30(1) | 1,068 | 925,731 | |
| Novelis Sheet Ingot GmbH, 3.375%, 4/15/29(15) | EUR | 700 | 641,931 |
| Roller Bearing Co. of America, Inc., 4.375%, 10/15/29(1) | 1,513 | 1,303,317 | |
| $ 14,149,650 | |||
| Nonferrous Metals/Minerals — 0.3% | |||
| Eldorado Gold Corp., 6.25%, 9/1/29(1) | 1,333 | $ 1,152,216 | |
| First Quantum Minerals, Ltd., 7.50%, 4/1/25(1) | 1,042 | 1,041,333 | |
| New Gold, Inc., 7.50%, 7/15/27(1) | 1,379 | 1,289,274 | |
| $ 3,482,823 | |||
| Oil and Gas — 2.7% | |||
| Aethon United BR, L.P./Aethon United Finance Corp., 8.25%, 2/15/26(1) | 1,570 | $ 1,559,120 | |
| Callon Petroleum Co.: | |||
| 7.50%, 6/15/30(1) | 601 | 583,482 | |
| Security | Principal Amount* (000's omitted) | Value | |
| Oil and Gas (continued) | |||
| Callon Petroleum Co.: (continued) | |||
| 8.00%, 8/1/28(1) | 788 | $ 789,827 | |
| CenterPoint Energy Resources Corp., 5.25%, 3/1/28 | 500 | 493,790 | |
| Chord Energy Corp., 6.375%, 6/1/26(1) | 1,111 | 1,090,458 | |
| Continental Resources, Inc., 2.268%, 11/15/26(1) | 550 | 487,550 | |
| CrownRock, L.P./CrownRock Finance, Inc., 5.00%, 5/1/29(1) | 1,519 | 1,424,822 | |
| CVR Energy, Inc., 5.75%, 2/15/28(1) | 1,905 | 1,725,965 | |
| Marathon Petroleum Corp., 4.70%, 5/1/25 | 475 | 465,326 | |
| Nabors Industries, Ltd., 7.50%, 1/15/28(1) | 665 | 615,566 | |
| National Fuel Gas Co., 3.95%, 9/15/27 | 650 | 596,408 | |
| Neptune Energy Bondco PLC, 6.625%, 5/15/25(1) | 2,882 | 2,857,503 | |
| NiSource, Inc., 5.25%, 3/30/28 | 950 | 931,669 | |
| Occidental Petroleum Corp., 7.50%, 5/1/31 | 425 | 451,506 | |
| Parkland Corp.: | |||
| 4.50%, 10/1/29(1) | 376 | 322,433 | |
| 4.625%, 5/1/30(1) | 1,501 | 1,281,515 | |
| Permian Resources Operating, LLC: | |||
| 5.375%, 1/15/26(1) | 232 | 222,346 | |
| 5.875%, 7/1/29(1) | 2,252 | 2,121,339 | |
| 7.00%, 1/15/32(1) | 1,214 | 1,198,512 | |
| 7.75%, 2/15/26(1) | 1,166 | 1,174,621 | |
| Petroleos Mexicanos: | |||
| 5.95%, 1/28/31 | 1,170 | 838,603 | |
| 6.35%, 2/12/48 | 161 | 92,016 | |
| 6.875%, 8/4/26 | 171 | 157,779 | |
| Precision Drilling Corp.: | |||
| 6.875%, 1/15/29(1) | 932 | 883,691 | |
| 7.125%, 1/15/26(1) | 500 | 495,622 | |
| Repsol International Finance B.V., 4.50% to 3/25/25, 3/25/75(15)(16) | EUR | 100 | 104,394 |
| Seadrill Finance, Ltd., 8.375%, 8/1/30(1) | 513 | 522,778 | |
| Shelf Drilling Holdings, Ltd.: | |||
| 8.25%, 2/15/25(1) | 1,535 | 1,565,969 | |
| 8.875%, 11/15/24(1) | 441 | 441,276 | |
| Southwestern Energy Co., 4.75%, 2/1/32 | 1,485 | 1,276,162 | |
| Transocean Poseidon, Ltd., 6.875%, 2/1/27(1) | 801 | 789,442 | |
| Transocean, Inc., 8.75%, 2/15/30(1) | 672 | 687,360 | |
| UGI International, LLC, 2.50%, 12/1/29(15) | EUR | 100 | 87,682 |
| Var Energi ASA, 7.50%, 1/15/28(1) | 600 | 616,729 | |
| Vital Energy, Inc., 9.75%, 10/15/30 | 1,026 | 1,049,801 | |
| Weatherford International, Ltd., 8.625%, 4/30/30(1) | 1,355 | 1,366,572 | |
| Wintershall Dea Finance 2 B.V., Series NC5, 2.499% to 4/20/26(15)(16)(18) | EUR | 500 | 461,913 |
| $ 31,831,547 | |||
| Security | Principal Amount* (000's omitted) | Value | |
| Packaging & Containers — 0.5% | |||
| Ball Corp., 6.875%, 3/15/28 | 474 | $ 477,368 | |
| Kleopatra Finco S.a.r.l., 4.25%, 3/1/26(15) | EUR | 350 | 310,615 |
| Owens-Brockway Glass Container, Inc., 7.25%, 5/15/31(1) | 2,035 | 1,991,756 | |
| Schoeller Packaging B.V., 6.375%, 11/1/24(15) | EUR | 200 | 192,420 |
| Sealed Air Corp./Sealed Air Corp. U.S., 6.125%, 2/1/28(1) | 626 | 606,961 | |
| Silgan Holdings, Inc., 1.40%, 4/1/26(1) | 550 | 488,357 | |
| Trivium Packaging Finance B.V.: | |||
| 3.75%, 8/15/26(15) | EUR | 200 | 196,099 |
| 5.50%, 8/15/26(1) | 424 | 395,818 | |
| 7.531%, (3 mo. EURIBOR + 3.75%), 8/15/26(2)(15) | EUR | 200 | 208,952 |
| 8.50%, 8/15/27(1) | 810 | 741,194 | |
| $ 5,609,540 | |||
| Pharmaceuticals — 0.8% | |||
| Abbvie, Inc., 3.80%, 3/15/25 | 725 | $ 704,946 | |
| Bayer AG, 5.375% to 6/25/30, 3/25/82(15)(16) | EUR | 400 | 389,282 |
| BellRing Brands, Inc., 7.00%, 3/15/30(1) | 2,444 | 2,409,746 | |
| Cheplapharm Arzneimittel GmbH: | |||
| 3.50%, 2/11/27(15) | EUR | 125 | 120,775 |
| 8.531%, (3 mo. EURIBOR + 4.75%), 5/15/30(2)(15) | EUR | 145 | 155,409 |
| CVS Health Corp., 3.75%, 4/1/30 | 525 | 464,268 | |
| Herbalife Nutrition, Ltd./HLF Financing, Inc., 7.875%, 9/1/25(1) | 1,383 | 1,319,589 | |
| Horizon Therapeutics USA, Inc., 5.50%, 8/1/27(1) | 1,105 | 1,135,387 | |
| P&L Development, LLC/PLD Finance Corp., 7.75%, 11/15/25(1) | 1,595 | 1,166,599 | |
| Pfizer Investment Enterprises Pte., Ltd., 4.45%, 5/19/28 | 450 | 434,029 | |
| PRA Health Sciences, Inc., 2.875%, 7/15/26(1) | 410 | 370,347 | |
| Rossini S.a.r.l., 7.589%, (3 mo. EURIBOR + 3.875%), 10/30/25(2)(15) | EUR | 300 | 317,422 |
| $ 8,987,799 | |||
| Pipelines — 2.1% | |||
| Antero Midstream Partners, L.P./Antero Midstream Finance Corp.: | |||
| 5.75%, 3/1/27(1) | 1,874 | $ 1,790,323 | |
| 7.875%, 5/15/26(1) | 879 | 886,085 | |
| Cheniere Energy Partners, L.P.: | |||
| 4.00%, 3/1/31 | 2,706 | 2,316,339 | |
| 4.50%, 10/1/29 | 1,722 | 1,561,153 | |
| Columbia Pipelines Holding Co., LLC: | |||
| 6.042%, 8/15/28(1) | 200 | 199,110 | |
| 6.055%, 8/15/26(1) | 50 | 50,176 | |
| Security | Principal Amount* (000's omitted) | Value | |
| Pipelines (continued) | |||
| DT Midstream, Inc., 4.125%, 6/15/29(1) | 1,449 | $ 1,254,648 | |
| Energy Transfer, L.P., 5.00%, 5/15/50 | 1,094 | 859,553 | |
| Enterprise Products Operating, LLC, 5.05%, 1/10/26 | 125 | 123,682 | |
| EQM Midstream Partners, L.P.: | |||
| 4.50%, 1/15/29(1) | 1,355 | 1,207,370 | |
| 4.75%, 1/15/31(1) | 1,086 | 936,017 | |
| 6.00%, 7/1/25(1) | 257 | 253,247 | |
| 6.50%, 7/1/27(1) | 702 | 686,189 | |
| 7.50%, 6/1/30(1) | 1,010 | 1,015,406 | |
| Kinetik Holdings, L.P., 5.875%, 6/15/30(1) | 2,308 | 2,166,404 | |
| Midwest Connector Capital Co., LLC, 4.625%, 4/1/29(1) | 1,269 | 1,160,690 | |
| ONEOK, Inc., 5.65%, 11/1/28 | 250 | 246,854 | |
| Plains All American Pipeline, L.P., Series B, 9.736%, (3 mo. USD LIBOR + 4.11%)(2)(18) | 1,462 | 1,386,934 | |
| Sabine Pass Liquefaction, LLC, 5.75%, 5/15/24 | 183 | 182,649 | |
| Venture Global Calcasieu Pass, LLC: | |||
| 3.875%, 11/1/33(1) | 665 | 517,044 | |
| 4.125%, 8/15/31(1) | 992 | 815,058 | |
| Venture Global LNG, Inc.: | |||
| 8.125%, 6/1/28(1) | 1,174 | 1,163,285 | |
| 8.375%, 6/1/31(1) | 1,878 | 1,848,031 | |
| Western Midstream Operating, L.P.: | |||
| 4.05%, 2/1/30 | 1,187 | 1,038,841 | |
| 4.50%, 3/1/28 | 148 | 137,851 | |
| 4.75%, 8/15/28 | 150 | 140,425 | |
| Williams Cos., Inc. (The): | |||
| 4.55%, 6/24/24 | 950 | 939,939 | |
| 5.30%, 8/15/28 | 200 | 195,755 | |
| $ 25,079,058 | |||
| Publishing — 0.2% | |||
| McGraw-Hill Education, Inc.: | |||
| 5.75%, 8/1/28(1) | 423 | $ 365,497 | |
| 8.00%, 8/1/29(1) | 1,879 | 1,631,987 | |
| $ 1,997,484 | |||
| Radio and Television — 0.4% | |||
| Audacy Capital Corp., 6.75%, 3/31/29(1) | 1,627 | $ 32,833 | |
| Clear Channel Outdoor Holdings, Inc.: | |||
| 5.125%, 8/15/27(1) | 740 | 657,836 | |
| 7.75%, 4/15/28(1) | 2,088 | 1,670,237 | |
| CMG Media Corp., 8.875%, 12/15/27(1) | 1,567 | 1,228,896 | |
| Townsquare Media, Inc., 6.875%, 2/1/26(1) | 1,492 | 1,410,836 | |
| $ 5,000,638 | |||
| Security | Principal Amount* (000's omitted) | Value | |
| Real Estate Investment Trusts (REITs) — 1.7% | |||
| Adler Financing S.a.r.l., 12.50%, 6/30/25(17) | EUR | 200 | $ 226,011 |
| Akelius Residential Property AB, 2.249% to 2/17/26, 5/17/81(15)(16) | EUR | 200 | 174,314 |
| CTR Partnership, L.P./CareTrust Capital Corp., 3.875%, 6/30/28(1) | 1,591 | 1,362,165 | |
| Cushman & Wakefield U.S. Borrower, LLC, 8.875%, 9/1/31(1) | 868 | 840,567 | |
| Emeria SASU: | |||
| 3.375%, 3/31/28(15) | EUR | 200 | 169,854 |
| 7.75%, 3/31/28(15) | EUR | 150 | 147,611 |
| EPR Properties: | |||
| 3.60%, 11/15/31 | 600 | 445,319 | |
| 3.75%, 8/15/29 | 565 | 454,405 | |
| Equinix, Inc., 1.00%, 9/15/25 | 525 | 477,266 | |
| Extra Space Storage, L.P., 5.70%, 4/1/28 | 450 | 445,149 | |
| Greystar Real Estate Partners, LLC, 7.75%, 9/1/30(1) | 1,840 | 1,819,634 | |
| HAT Holdings I, LLC/HAT Holdings II, LLC: | |||
| 3.375%, 6/15/26(1) | 1,316 | 1,171,119 | |
| 3.75%, 9/15/30(1) | 1,816 | 1,391,972 | |
| Heimstaden Bostad AB: | |||
| 3.00% to 10/29/27(15)(16)(18) | EUR | 102 | 47,732 |
| 3.248% to 11/19/24(15)(16)(18) | EUR | 300 | 178,738 |
| 3.375% to 1/15/26(15)(16)(18) | EUR | 250 | 128,952 |
| Newmark Group, Inc., 6.125%, 11/15/23 | 2,126 | 2,124,097 | |
| VICI Properties, L.P./VICI Note Co., Inc.: | |||
| 3.75%, 2/15/27(1) | 323 | 293,380 | |
| 4.125%, 8/15/30(1) | 1,108 | 943,545 | |
| 4.25%, 12/1/26(1) | 1,653 | 1,541,639 | |
| 4.50%, 9/1/26(1) | 895 | 841,680 | |
| 4.625%, 12/1/29(1) | 2,359 | 2,095,500 | |
| 5.625%, 5/1/24(1) | 480 | 477,380 | |
| 5.75%, 2/1/27(1) | 2,073 | 2,008,857 | |
| $ 19,806,886 | |||
| Retail — 1.1% | |||
| Arko Corp., 5.125%, 11/15/29(1) | 2,074 | $ 1,675,191 | |
| B&M European Value Retail S.A., 3.625%, 7/15/25(15) | GBP | 100 | 118,240 |
| Dufry One B.V.: | |||
| 2.00%, 2/15/27(15) | EUR | 200 | 187,149 |
| 2.50%, 10/15/24(15) | EUR | 200 | 207,193 |
| 3.375%, 4/15/28(15) | EUR | 139 | 131,779 |
| Evergreen AcqCo 1, L.P./TVI, Inc., 9.75%, 4/26/28(1) | 1,993 | 2,054,036 | |
| Ferrellgas, L.P./Ferrellgas Finance Corp., 5.875%, 4/1/29(1) | 1,582 | 1,424,399 | |
| Security | Principal Amount* (000's omitted) | Value | |
| Retail (continued) | |||
| Fertitta Entertainment, LLC/Fertitta Entertainment Finance Co., Inc., 4.625%, 1/15/29(1) | 745 | $ 632,203 | |
| Group 1 Automotive, Inc., 4.00%, 8/15/28(1) | 1,328 | 1,154,260 | |
| Ken Garff Automotive, LLC, 4.875%, 9/15/28(1) | 957 | 818,322 | |
| Kohl's Corp., 4.625%, 5/1/31 | 851 | 573,106 | |
| LCM Investments Holdings II, LLC: | |||
| 4.875%, 5/1/29(1) | 1,652 | 1,406,547 | |
| 8.25%, 8/1/31(1) | 262 | 254,739 | |
| Macy's Retail Holdings, LLC, 5.875%, 4/1/29(1) | 606 | 531,186 | |
| Michaels Cos., Inc., 5.25%, 5/1/28(1) | 1,259 | 1,006,929 | |
| Midco GB SASU, 7.75%, (7.75% cash or 8.50% PIK), 11/1/27(15)(17) | EUR | 130 | 132,596 |
| PEU Fin PLC, 7.25%, 7/1/28(15) | EUR | 200 | 202,463 |
| Punch Finance PLC, 6.125%, 6/30/26(15) | GBP | 125 | 135,233 |
| Stonegate Pub Co. Financing 2019 PLC, 8.25%, 7/31/25(15) | GBP | 100 | 115,802 |
| Suburban Propane Partners, L.P./Suburban Energy Finance Corp., 5.00%, 6/1/31(1) | 824 | 688,844 | |
| $ 13,450,217 | |||
| Retailers (Except Food and Drug) — 0.9% | |||
| Bath & Body Works, Inc.: | |||
| 6.625%, 10/1/30(1) | 479 | $ 449,580 | |
| 6.75%, 7/1/36 | 437 | 383,384 | |
| 6.95%, 3/1/33 | 1,027 | 920,102 | |
| 7.60%, 7/15/37 | ��� 488 | 428,847 | |
| 9.375%, 7/1/25(1) | 182 | 189,470 | |
| Dave & Buster's, Inc., 7.625%, 11/1/25(1) | 2,417 | 2,418,370 | |
| Murphy Oil USA, Inc.: | |||
| 4.75%, 9/15/29 | 170 | 153,476 | |
| 5.625%, 5/1/27 | 560 | 541,018 | |
| PetSmart, Inc./PetSmart Finance Corp.: | |||
| 4.75%, 2/15/28(1) | 1,290 | 1,130,883 | |
| 7.75%, 2/15/29(1) | 2,469 | 2,303,536 | |
| Superior Plus, L.P./Superior General Partner, Inc., 4.50%, 3/15/29(1) | 1,532 | 1,333,039 | |
| $ 10,251,705 | |||
| Semiconductors & Semiconductor Equipment — 0.3% | |||
| Broadcom Corp./Broadcom Cayman Finance, Ltd., 3.875%, 1/15/27 | 700 | $ 657,956 | |
| Intel Corp., 4.875%, 2/10/28 | 1,000 | 981,380 | |
| Marvell Technology, Inc., 5.75%, 2/15/29 | 450 | 446,060 | |
| Security | Principal Amount* (000's omitted) | Value | |
| Semiconductors & Semiconductor Equipment (continued) | |||
| NXP B.V./NXP Funding, LLC/NXP USA, Inc., 2.70%, 5/1/25 | 550 | $ 522,557 | |
| ON Semiconductor Corp., 3.875%, 9/1/28(1) | 1,544 | 1,368,694 | |
| $ 3,976,647 | |||
| Software — 0.5% | |||
| Central Parent, LLC/CDK Global II, LLC/CDK Financing Co., Inc., 8.00%, 6/15/29(1) | 1,071 | $ 1,068,001 | |
| Clarivate Science Holdings Corp., 4.875%, 7/1/29(1) | 2,105 | 1,796,759 | |
| Cloud Software Group, Inc.: | |||
| 6.50%, 3/31/29(1) | 988 | 874,717 | |
| 9.00%, 9/30/29(1) | 1,136 | 988,758 | |
| Concentrix Corp., 6.65%, 8/2/26 | 425 | 422,598 | |
| Oracle Corp.: | |||
| 3.25%, 11/15/27 | 500 | 455,865 | |
| 5.80%, 11/10/25 | 475 | 476,886 | |
| $ 6,083,584 | |||
| Software and Services — 0.3% | |||
| Black Knight InfoServ, LLC, 3.625%, 9/1/28(1) | 825 | $ 741,469 | |
| Fair Isaac Corp., 4.00%, 6/15/28(1) | 1,248 | 1,117,114 | |
| Gartner, Inc.: | |||
| 3.625%, 6/15/29(1) | 427 | 365,720 | |
| 3.75%, 10/1/30(1) | 660 | 554,514 | |
| 4.50%, 7/1/28(1) | 908 | 829,457 | |
| Playtech PLC, 4.25%, 3/7/26(15) | EUR | 200 | 205,149 |
| $ 3,813,423 | |||
| Specialty Retail — 0.0%(14) | |||
| Fiber Bidco SpA: | |||
| 9.952%, (3 mo. EURIBOR + 6.00%), 10/25/27(2)(15) | EUR | 300 | $ 320,347 |
| 11.00%, 10/25/27(15) | EUR | 100 | 113,157 |
| $ 433,504 | |||
| Steel — 0.3% | |||
| Allegheny Ludlum, LLC, 6.95%, 12/15/25 | 465 | $ 466,755 | |
| ATI, Inc., 5.875%, 12/1/27 | 320 | 303,653 | |
| Big River Steel, LLC/BRS Finance Corp., 6.625%, 1/31/29(1) | 1,147 | 1,134,423 | |
| Nucor Corp., 3.95%, 5/23/25 | 500 | 485,193 | |
| TMS International Corp., 6.25%, 4/15/29(1) | 1,365 | 1,130,369 | |
| $ 3,520,393 | |||
| Security | Principal Amount* (000's omitted) | Value | |
| Surface Transport — 0.1% | |||
| Hertz Corp. (The): | |||
| 4.625%, 12/1/26(1) | 218 | $ 193,473 | |
| 5.00%, 12/1/29(1) | 1,771 | 1,389,007 | |
| $ 1,582,480 | |||
| Technology — 0.6% | |||
| athenahealth Group, Inc., 6.50%, 2/15/30(1) | 2,297 | $ 1,924,064 | |
| International Game Technology PLC: | |||
| 4.125%, 4/15/26(1) | 892 | 839,917 | |
| 5.25%, 1/15/29(1) | 2,500 | 2,306,365 | |
| 6.25%, 1/15/27(1) | 976 | 956,271 | |
| 6.50%, 2/15/25(1) | 513 | 512,699 | |
| $ 6,539,316 | |||
| Telecommunications — 2.2% | |||
| AT&T, Inc., 1.65%, 2/1/28 | 825 | $ 696,695 | |
| Ciena Corp., 4.00%, 1/31/30(1) | 1,883 | 1,595,475 | |
| Connect Finco S.a.r.l./Connect US Finco, LLC, 6.75%, 10/1/26(1) | 2,698 | 2,519,791 | |
| Iliad Holding SASU: | |||
| 5.125%, 10/15/26(15) | EUR | 400 | 403,370 |
| 6.50%, 10/15/26(1) | 1,389 | 1,306,484 | |
| 7.00%, 10/15/28(1) | 811 | 739,102 | |
| LCPR Senior Secured Financing DAC: | |||
| 5.125%, 7/15/29(1) | 840 | 676,729 | |
| 6.75%, 10/15/27(1) | 1,482 | 1,363,084 | |
| Level 3 Financing, Inc., 4.25%, 7/1/28(1) | 400 | 249,825 | |
| Lorca Telecom Bondco S.A., 4.00%, 9/18/27(15) | EUR | 843 | 830,224 |
| Matterhorn Telecom S.A., 3.125%, 9/15/26(15) | EUR | 500 | 493,273 |
| NBN Co., Ltd., 1.45%, 5/5/26(1) | 1,075 | 966,281 | |
| PLT VII Finance S.a.r.l.: | |||
| 4.625%, 1/5/26(15) | EUR | 500 | 513,097 |
| 8.288%, 1/5/26(2)(15) | EUR | 100 | 105,992 |
| Rogers Communications, Inc., 2.95%, 3/15/25 | 500 | 477,034 | |
| Sprint Capital Corp., 6.875%, 11/15/28 | 2,379 | 2,458,390 | |
| Sprint Spectrum Co., LLC/Sprint Spectrum Co. II, LLC/Sprint Spectrum Co. III, LLC, 5.152%, 9/20/29(1) | 428 | 420,109 | |
| Sprint, LLC: | |||
| 7.625%, 2/15/25 | 1,785 | 1,812,541 | |
| 7.625%, 3/1/26 | 993 | 1,021,293 | |
| Stagwell Global, LLC, 5.625%, 8/15/29(1) | 1,173 | 948,629 | |
| Summer (BC) Bidco B, LLC, 5.50%, 10/31/26(1) | 907 | 814,380 | |
| Summer (BC) Holdco A S.a.r.l., 9.25%, 10/31/27(15) | EUR | 135 | 117,192 |
| Security | Principal Amount* (000's omitted) | Value | |
| Telecommunications (continued) | |||
| Summer (BC) Holdco B S.a.r.l., 5.75%, 10/31/26(15) | EUR | 150 | $ 145,901 |
| Telecom Italia Finance S.A., 7.75%, 1/24/33 | EUR | 95 | 106,964 |
| Telecom Italia SpA: | |||
| 1.625%, 1/18/29(15) | EUR | 100 | 83,061 |
| 2.75%, 4/15/25(15) | EUR | 356 | 360,136 |
| 3.00%, 9/30/25(15) | EUR | 120 | 120,799 |
| 5.303%, 5/30/24(1) | 1,118 | 1,100,300 | |
| 7.875%, 7/31/28(15) | EUR | 100 | 109,766 |
| Telefonica Europe B.V.: | |||
| 2.88% to 2/24/28(15)(16)(18) | EUR | 200 | 180,721 |
| 4.375% to 12/14/24(15)(16)(18) | EUR | 700 | 726,055 |
| 7.125% to 8/23/28(15)(16)(18) | EUR | 300 | 326,294 |
| Viasat, Inc., 5.625%, 4/15/27(1) | 476 | 412,930 | |
| Viavi Solutions, Inc., 3.75%, 10/1/29(1) | 868 | 706,509 | |
| Vmed O2 UK Financing I PLC: | |||
| 3.25%, 1/31/31(15) | EUR | 200 | 173,811 |
| 4.50%, 7/15/31(15) | GBP | 100 | 95,933 |
| Vodafone Group PLC: | |||
| 2.625% to 5/27/26, 8/27/80(15)(16) | EUR | 400 | 386,511 |
| 4.875% to 7/3/25, 10/3/78(15)(16) | GBP | 350 | 402,726 |
| Wp/ap Telecom Holdings III B.V., 5.50%, 1/15/30(15) | EUR | 250 | 216,663 |
| $ 26,184,070 | |||
| Transportation — 0.3% | |||
| Cargo Aircraft Management, Inc., 4.75%, 2/1/28(1) | 1,528 | $ 1,365,902 | |
| Fenix Marine Service Holdings, Ltd., 8.00%, 1/15/24 | 150 | 151,064 | |
| Penske Truck Leasing Co., L.P./PTL Finance Corp., 6.20%, 6/15/30(1) | 450 | 443,824 | |
| Seaspan Corp., 5.50%, 8/1/29(1) | 1,654 | 1,329,419 | |
| SMBC Aviation Capital Finance DAC, 5.45%, 5/3/28(1) | 450 | 435,284 | |
| $ 3,725,493 | |||
| Utilities — 1.2% | |||
| Calpine Corp.: | |||
| 4.50%, 2/15/28(1) | 1,073 | $ 968,132 | |
| 4.625%, 2/1/29(1) | 680 | 570,362 | |
| 5.00%, 2/1/31(1) | 910 | 736,927 | |
| 5.125%, 3/15/28(1) | 1,511 | 1,347,182 | |
| 5.25%, 6/1/26(1) | 344 | 334,330 | |
| Leeward Renewable Energy Operations, LLC, 4.25%, 7/1/29(1) | 838 | 689,810 | |
| NextEra Energy Operating Partners, L.P.: | |||
| 4.25%, 9/15/24(1) | 60 | 57,666 | |
| 4.50%, 9/15/27(1) | 1,207 | 1,095,476 | |
| Security | Principal Amount* (000's omitted) | Value | |
| Utilities (continued) | |||
| NRG Energy, Inc.: | |||
| 3.375%, 2/15/29(1) | 664 | $ 538,061 | |
| 3.625%, 2/15/31(1) | 1,107 | 841,088 | |
| 3.875%, 2/15/32(1) | 1,466 | 1,102,234 | |
| 5.25%, 6/15/29(1) | 673 | 594,810 | |
| 10.25% to 3/15/28(1)(16)(18) | 1,413 | 1,385,325 | |
| TerraForm Power Operating, LLC, 5.00%, 1/31/28(1) | 1,497 | 1,360,272 | |
| Vistra Operations Co., LLC: | |||
| 4.375%, 5/1/29(1) | 939 | 808,063 | |
| 5.00%, 7/31/27(1) | 1,278 | 1,176,320 | |
| $ 13,606,058 | |||
| Total Corporate Bonds (identified cost $691,503,289) | $ 638,669,389 | ||
| Preferred Stocks — 0.1% |
| Security | Shares | Value | |
| Financial Services — 0.0% | |||
| DBI Investors, Inc., Series A-1(11)(12)(13) | 1,932 | $ 0 | |
| $ 0 | |||
| Nonferrous Metals/Minerals — 0.1% | |||
| ACNR Holdings, Inc., 15.00% (PIK)(12)(13) | 1,803 | $ 982,635 | |
| $ 982,635 | |||
| Retailers (Except Food and Drug) — 0.0% | |||
| David’s Bridal, LLC: | |||
| Series A, 8.00% (PIK)(11)(12)(13) | 1,136 | $ 0 | |
| Series B, 10.00% (PIK)(11)(12)(13) | 4,631 | 0 | |
| $ 0 | |||
| Total Preferred Stocks (identified cost $374,926) | $ 982,635 | ||
| Senior Floating-Rate Loans — 46.6%(20) |
| Borrower/Description | Principal Amount* (000's omitted) | Value | |
| Aerospace and Defense — 1.3% | |||
| Aernnova Aerospace S.A.U.: | |||
| Term Loan, 6.783%, (3 mo. EURIBOR + 3.00%), 2/26/27 | EUR | 796 | $ 828,512 |
| Borrower/Description | Principal Amount* (000's omitted) | Value | |
| Aerospace and Defense (continued) | |||
| Aernnova Aerospace S.A.U.: (continued) | |||
| Term Loan, 6.934%, (3 mo. EURIBOR + 3.00%), 2/26/27 | EUR | 204 | $ 212,439 |
| AI Convoy (Luxembourg) S.a.r.l., Term Loan, 7.078%, (6 mo. EURIBOR + 3.50%), 1/18/27 | EUR | 1,000 | 1,040,863 |
| Dynasty Acquisition Co., Inc.: | |||
| Term Loan, 9.316%, (SOFR + 4.00%), 8/24/28 | 1,160 | 1,160,051 | |
| Term Loan, 9.316%, (SOFR + 4.00%), 8/24/28 | 497 | 497,165 | |
| IAP Worldwide Services, Inc., Term Loan - Second Lien, 12.152%, (SOFR + 6.50%), 7/18/23(11) | 216 | 166,770 | |
| TransDigm, Inc.: | |||
| Term Loan, 8.64%, (SOFR + 3.25%), 2/22/27 | 1,330 | 1,332,735 | |
| Term Loan, 8.64%, (SOFR + 3.25%), 8/24/28 | 4,587 | 4,593,389 | |
| WP CPP Holdings, LLC, Term Loan, 9.27%, (SOFR + 3.75%), 4/30/25 | 6,425 | 6,066,312 | |
| $ 15,898,236 | |||
| Airlines — 0.2% | |||
| Mileage Plus Holdings, LLC, Term Loan, 10.798%, (SOFR + 5.25%), 6/21/27 | 563 | $ 585,422 | |
| SkyMiles IP, Ltd., Term Loan, 9.076%, (SOFR + 3.75%), 10/20/27 | 1,658 | 1,721,728 | |
| $ 2,307,150 | |||
| Apparel & Luxury Goods — 0.0%(14) | |||
| Hanesbrands, Inc., Term Loan, 9.066%, (SOFR + 3.75%), 3/8/30 | 373 | $ 366,595 | |
| $ 366,595 | |||
| Auto Components — 1.1% | |||
| Adient US, LLC, Term Loan, 8.681%, (SOFR + 3.25%), 4/10/28 | 556 | $ 556,468 | |
| Clarios Global, L.P.: | |||
| Term Loan, 7.108%, (1 mo. EURIBOR + 3.25%), 4/30/26 | EUR | 913 | 962,902 |
| Term Loan, 9.066%, (SOFR + 3.75%), 5/6/30 | 2,611 | 2,611,326 | |
| DexKo Global, Inc.: | |||
| Term Loan, 7.972%, (3 mo. EURIBOR + 4.00%), 10/4/28 | EUR | 96 | 99,533 |
| Term Loan, 7.972%, (3 mo. EURIBOR + 4.00%), 10/4/28 | EUR | 309 | 321,683 |
| Term Loan, 7.972%, (3 mo. EURIBOR + 4.00%), 10/4/28 | EUR | 595 | 618,589 |
| Term Loan, 9.402%, (SOFR + 3.75%), 10/4/28 | 813 | 794,214 | |
| Garrett LX I S.a.r.l., Term Loan, 8.881%, (SOFR + 3.25%), 4/30/28 | 637 | 635,408 | |
| Borrower/Description | Principal Amount* (000's omitted) | Value | |
| Auto Components (continued) | |||
| Garrett Motion, Inc., Term Loan, 10.131%, (SOFR + 4.50%), 4/30/28 | 1,375 | $ 1,378,438 | |
| LSF12 Badger Bidco, LLC, Term Loan, 11.316%, (SOFR + 6.00%), 8/30/30 | 300 | 299,625 | |
| LTI Holdings, Inc.: | |||
| Term Loan, 8.931%, (SOFR + 3.50%), 9/6/25 | 3,330 | 3,251,642 | |
| Term Loan, 10.181%, (SOFR + 4.75%), 7/24/26 | 707 | 691,989 | |
| RealTruck Group, Inc., Term Loan, 1/31/28(21) | 675 | 661,500 | |
| $ 12,883,317 | |||
| Automobiles — 0.2% | |||
| MajorDrive Holdings IV, LLC: | |||
| Term Loan, 9.652%, (SOFR + 4.00%), 6/1/28 | 440 | $ 436,576 | |
| Term Loan, 11.04%, (SOFR + 5.50%), 6/1/29 | 1,625 | 1,621,187 | |
| Thor Industries, Inc., Term Loan, 8.431%, (SOFR + 3.00%), 2/1/26 | 313 | 313,858 | |
| $ 2,371,621 | |||
| Beverages — 0.0%(14) | |||
| City Brewing Company, LLC, Term Loan, 9.07%, (SOFR + 3.50%), 4/5/28 | 636 | $ 422,559 | |
| $ 422,559 | |||
| Biotechnology — 0.1% | |||
| Alkermes, Inc., Term Loan, 7.945%, (SOFR + 2.50%), 3/12/26 | 1,079 | $ 1,065,614 | |
| Alltech, Inc., Term Loan, 9.431%, (SOFR + 4.00%), 10/13/28 | 467 | 453,853 | |
| $ 1,519,467 | |||
| Building Products — 0.3% | |||
| Janus International Group, LLC, Term Loan, 8.677%, (SOFR + 3.25%), 7/25/30 | 250 | $ 249,531 | |
| LHS Borrower, LLC, Term Loan, 10.06%, (SOFR + 4.75%), 2/16/29 | 1,131 | 1,035,929 | |
| Oscar AcquisitionCo, LLC, Term Loan, 9.99%, (SOFR + 4.50%), 4/29/29 | 891 | 882,313 | |
| Standard Industries, Inc., Term Loan, 7.938%, (SOFR + 2.50%), 9/22/28 | 1,105 | 1,106,975 | |
| $ 3,274,748 | |||
| Capital Markets — 1.4% | |||
| Advisor Group, Inc., Term Loan, 9.816%, (SOFR + 4.50%), 8/17/28 | 1,134 | $ 1,135,765 | |
| Aretec Group, Inc.: | |||
| Term Loan, 9.666%, (SOFR + 4.25%), 10/1/25 | 2,294 | 2,296,125 | |
| Borrower/Description | Principal Amount* (000's omitted) | Value | |
| Capital Markets (continued) | |||
| Aretec Group, Inc.: (continued) | |||
| Term Loan, 9.916%, (SOFR + 4.50%), 8/9/30 | 723 | $ 719,391 | |
| Brookfield Property REIT, Inc., Term Loan, 7.892%, (SOFR + 2.50%), 8/27/25 | 766 | 760,908 | |
| CeramTec AcquiCo GmbH, Term Loan, 7.283%, (3 mo. EURIBOR + 3.50%), 3/16/29 | EUR | 760 | 795,926 |
| Citadel Securities, L.P., Term Loan, 7.931%, (SOFR + 2.50%), 7/29/30 | 723 | 722,623 | |
| EIG Management Company, LLC, Term Loan, 9.166%, (SOFR + 3.75%), 2/22/25 | 260 | 259,875 | |
| FinCo I, LLC, Term Loan, 8.369%, (SOFR + 3.00%), 6/27/29 | 1,222 | 1,224,228 | |
| Focus Financial Partners, LLC: | |||
| Term Loan, 8.566%, (SOFR + 3.25%), 6/30/28 | 3,223 | 3,222,992 | |
| Term Loan, 8.816%, (SOFR + 3.50%), 6/30/28 | 600 | 600,375 | |
| Franklin Square Holdings, L.P., Term Loan, 7.666%, (SOFR + 2.25%), 8/1/25 | 522 | 523,803 | |
| HighTower Holdings, LLC, Term Loan, 9.612%, (SOFR + 4.00%), 4/21/28 | 744 | 742,443 | |
| Hudson River Trading, LLC, Term Loan, 8.631%, (SOFR + 3.00%), 3/20/28 | 2,171 | 2,161,449 | |
| Mariner Wealth Advisors, LLC, Term Loan, 8.901%, (SOFR + 3.25%), 8/18/28 | 786 | 779,790 | |
| Victory Capital Holdings, Inc., Term Loan, 7.619%, (SOFR + 2.25%), 7/1/26 | 891 | 891,504 | |
| $ 16,837,197 | |||
| Chemicals — 2.3% | |||
| Aruba Investments, Inc., Term Loan, 7.858%, (1 mo. EURIBOR + 4.00%), 11/24/27 | EUR | 975 | $ 987,009 |
| Campfire Bidco Limited, Term Loan, 10.606%, (SOFR + 5.00%), 9.856% cash, 0.75% PIK, 12/31/26 | 75 | 70,744 | |
| Campfire TopCo Limited: | |||
| Term Loan, 12.606%, (SOFR + 7.00%), 5.706% cash, 6.90% PIK, 12/31/27 | 36 | 25,299 | |
| Term Loan - Second Lien, 12.606%, (SOFR + 7.00%), 5.706% cash, 6.90% PIK, 12/31/27 | 48 | 10,082 | |
| Groupe Solmax, Inc., Term Loan, 10.30%, (SOFR + 4.75%), 5/29/28(22) | 196 | 184,067 | |
| INEOS Enterprises Holdings II Limited: | |||
| Term Loan, 7.033%, (3 mo. EURIBOR + 3.25%), 8/31/26 | EUR | 200 | 210,287 |
| Term Loan, 7.783%, (3 mo. EURIBOR + 4.00%), 7/8/30 | EUR | 300 | 314,796 |
| INEOS Enterprises Holdings US Finco, LLC, Term Loan, 9.273%, (SOFR + 3.75%), 6/23/30 | 475 | 473,219 | |
| INEOS Finance PLC, Term Loan, 7.858%, (1 mo. EURIBOR + 4.00%), 11/8/27 | EUR | 1,194 | 1,258,585 |
| Borrower/Description | Principal Amount* (000's omitted) | Value | |
| Chemicals (continued) | |||
| INEOS Quattro Holdings UK, Ltd.: | |||
| Term Loan, 6.608%, (1 mo. EURIBOR + 2.75%), 1/29/26 | EUR | 1,000 | $ 1,046,678 |
| Term Loan, 9.166%, (SOFR + 3.75%), 3/14/30 | 424 | 423,408 | |
| INEOS Styrolution Group GmbH, Term Loan, 5.858%, (1 mo. EURIBOR + 2.00%), 1/29/27 | EUR | 1,000 | 1,032,405 |
| INEOS Styrolution US Holding, LLC, Term Loan, 8.181%, (SOFR + 2.75%), 1/29/26 | 2,297 | 2,292,818 | |
| INEOS US Finance, LLC: | |||
| Term Loan, 7.916%, (SOFR + 2.50%), 11/8/28 | 616 | 611,173 | |
| Term Loan, 8.916%, (SOFR + 3.50%), 2/18/30 | 773 | 769,197 | |
| Term Loan, 9.166%, (SOFR + 3.75%), 11/8/27 | 1,016 | 1,012,999 | |
| Kraton Corporation, Term Loan, 8.921%, (SOFR + 3.25%), 3/15/29 | 443 | 437,848 | |
| Kraton Polymers Holdings B.V., Term Loan, 6.938%, (1 mo. EURIBOR + 3.25%), 3/15/29 | EUR | 500 | 513,757 |
| Lonza Group AG: | |||
| Term Loan, 7.897%, (3 mo. EURIBOR + 3.93%), 7/3/28 | EUR | 1,000 | 951,129 |
| Term Loan, 9.415%, (SOFR + 3.93%), 7/3/28 | 1,713 | 1,524,981 | |
| Messer Industries GmbH, Term Loan, 8.152%, (SOFR + 2.50%), 3/2/26 | 1,157 | 1,158,186 | |
| Momentive Performance Materials, Inc., Term Loan, 9.816%, (SOFR + 4.50%), 3/29/28 | 796 | 776,763 | |
| Nouryon Finance B.V., Term Loan, 7.949%, (1 mo. EURIBOR + 4.25%), 4/3/28 | EUR | 750 | 791,104 |
| Olympus Water US Holding Corporation: | |||
| Term Loan, 9.99%, (SOFR + 4.50%), 11/9/28 | 369 | 368,394 | |
| Term Loan, 10.39%, (SOFR + 5.00%), 11/9/28 | 2,400 | 2,399,400 | |
| Orion Engineered Carbons GmbH: | |||
| Term Loan, 6.372%, (3 mo. EURIBOR + 2.40%), 9/24/28 | EUR | 1,000 | 1,051,964 |
| Term Loan, 7.64%, (SOFR + 2.15%), 9/24/28 | 368 | 365,433 | |
| Rohm Holding GmbH: | |||
| Term Loan, 8.472%, (6 mo. EURIBOR + 4.50%), 7/31/26 | EUR | 500 | 490,035 |
| Term Loan, 10.881%, (SOFR + 5.00%), 7/31/26 | 919 | 865,072 | |
| SCUR-Alpha 1503 GmbH, Term Loan, 10.869%, (SOFR + 5.50%), 3/29/30 | 920 | 853,653 | |
| Starfruit Finco B.V., Term Loan, 8.427%, (SOFR + 3.00%), 10/1/25 | 1,330 | 1,332,651 | |
| Tronox Finance, LLC: | |||
| Term Loan, 8.114%, (SOFR + 2.50%), 3/10/28(22) | 1,318 | 1,297,435 | |
| Term Loan, 8.832%, (SOFR + 3.50%), 8/16/28 | 475 | 471,289 | |
| W.R. Grace & Co.-Conn., Term Loan, 9.402%, (SOFR + 3.75%), 9/22/28 | 1,105 | 1,101,997 | |
| $ 27,473,857 | |||
| Borrower/Description | Principal Amount* (000's omitted) | Value | |
| Commercial Services & Supplies — 1.6% | |||
| Allied Universal Holdco, LLC: | |||
| Term Loan, 7.593%, (1 mo. EURIBOR + 3.75%), 5/12/28 | EUR | 980 | $ 1,013,348 |
| Term Loan, 9.166%, (SOFR + 3.75%), 5/12/28 | 2,686 | 2,599,600 | |
| Asplundh Tree Expert, LLC, Term Loan, 7.166%, (SOFR + 1.75%), 9/7/27 | 1,091 | 1,091,420 | |
| Belfor Holdings, Inc., Term Loan, 9.566%, (SOFR + 4.25%), 4/6/26 | 298 | 299,235 | |
| EnergySolutions, LLC, Term Loan, 9.324%, (SOFR + 4.00%), 9/22/30 | 4,437 | 4,414,950 | |
| Foundever, Term Loan, 7.61%, (1 mo. EURIBOR + 3.75%), 8/28/28 | EUR | 500 | 518,603 |
| Harsco Corporation, Term Loan, 7.681%, (SOFR + 2.25%), 3/10/28 | 391 | 387,579 | |
| LABL, Inc., Term Loan, 10.416%, (SOFR + 5.00%), 10/29/28 | 712 | 711,624 | |
| Monitronics International, Inc., Term Loan, 13.078%, (SOFR + 7.50%), 6/30/28 | 1,438 | 1,454,331 | |
| PECF USS Intermediate Holding III Corporation, Term Loan, 9.881%, (SOFR + 4.25%), 12/15/28 | 639 | 514,526 | |
| Phoenix Services International, LLC, Term Loan, 11.416%, (SOFR + 6.10%), 6/30/28 | 204 | 190,618 | |
| Prime Security Services Borrower, LLC, Term Loan, 8.192%, (SOFR + 2.75%), 9/23/26 | 1,506 | 1,505,389 | |
| SITEL Worldwide Corporation, Term Loan, 9.181%, (SOFR + 3.75%), 8/28/28 | 1,862 | 1,814,674 | |
| Tempo Acquisition, LLC, Term Loan, 8.066%, (SOFR + 3.00%), 8/31/28 | 826 | 827,179 | |
| TMF Group Holding B.V.: | |||
| Term Loan, 8.161%, (2 mo. EURIBOR + 4.50%), 5/3/28 | EUR | 1,000 | 1,060,266 |
| Term Loan, 10.37%, (SOFR + 5.00%), 5/3/28 | 375 | 376,406 | |
| $ 18,779,748 | |||
| Communications Equipment — 0.2% | |||
| CommScope, Inc., Term Loan, 8.568%, (SOFR + 3.25%), 4/6/26 | 1,752 | $ 1,604,540 | |
| Digi International, Inc., Term Loan, 10.431%, (SOFR + 5.00%), 11/1/28 | 336 | 335,696 | |
| $ 1,940,236 | |||
| Construction Materials — 0.4% | |||
| Quikrete Holdings, Inc.: | |||
| Term Loan, 8.056%, (SOFR + 2.63%), 2/1/27 | 2,892 | $ 2,891,587 | |
| Term Loan, 8.181%, (SOFR + 2.75%), 3/19/29 | 2,142 | 2,144,607 | |
| $ 5,036,194 | |||
| Borrower/Description | Principal Amount* (000's omitted) | Value | |
| Consumer Staples Distribution & Retail — 0.1% | |||
| Cardenas Markets, Inc., Term Loan, 12.24%, (SOFR + 6.75%), 8/1/29 | 398 | $ 398,197 | |
| Peer Holding III B.V., Term Loan, 7.722%, (3 mo. EURIBOR + 3.75%), 9/29/28 | EUR | 500 | 528,790 |
| $ 926,987 | |||
| Containers & Packaging — 0.8% | |||
| Berlin Packaging, LLC, Term Loan, 9.204%, (SOFR + 3.75%), 3/11/28(22) | 1,225 | $ 1,214,062 | |
| Clydesdale Acquisition Holdings, Inc., Term Loan, 9.591%, (SOFR + 4.18%), 4/13/29 | 568 | 560,797 | |
| Kouti B.V., Term Loan, 7.458%, (3 mo. EURIBOR + 3.68%), 8/31/28 | EUR | 2,000 | 2,079,082 |
| Pregis TopCo Corporation, Term Loan, 9.066%, (SOFR + 3.75%), 7/31/26 | 626 | 625,674 | |
| Pretium PKG Holdings, Inc.: | |||
| Term Loan, 9.509%, (SOFR + 4.00%), 10/2/28(22) | 614 | 379,491 | |
| Term Loan - Second Lien, 12.236%, (SOFR + 6.75%), 10/1/29(22) | 350 | 112,583 | |
| Proampac PG Borrower, LLC, Term Loan, 9.305%, (SOFR + 3.75%), 11/3/25 | 562 | 559,561 | |
| Reynolds Group Holdings, Inc.: | |||
| Term Loan, 8.681%, (SOFR + 3.25%), 2/5/26 | 782 | 781,931 | |
| Term Loan, 8.681%, (SOFR + 3.25%), 9/24/28 | 955 | 955,500 | |
| Trident TPI Holdings, Inc.: | |||
| Term Loan, 9.652%, (SOFR + 4.00%), 9/15/28 | 785 | 782,969 | |
| Term Loan, 9.89%, (SOFR + 4.50%), 9/15/28 | 1,328 | 1,328,233 | |
| $ 9,379,883 | |||
| Distributors — 0.1% | |||
| Autokiniton US Holdings, Inc., Term Loan, 9.931%, (SOFR + 4.50%), 4/6/28 | 513 | $ 503,565 | |
| Phillips Feed Service, Inc., Term Loan, 12.32%, (SOFR + 7.00%), 11/13/24(11) | 106 | 84,587 | |
| Winterfell Financing S.a.r.l., Term Loan, 8.765%, (3 mo. EURIBOR + 5.00%), 5/4/28 | EUR | 500 | 524,495 |
| $ 1,112,647 | |||
| Diversified Consumer Services — 0.3% | |||
| Ascend Learning, LLC, Term Loan, 8.916%, (SOFR + 3.50%), 12/11/28 | 639 | $ 609,887 | |
| Fugue Finance B.V., Term Loan, 1/31/28(21) | EUR | 1,000 | 1,061,215 |
| KUEHG Corp., Term Loan, 10.39%, (SOFR + 5.00%), 6/12/30 | 1,300 | 1,303,900 | |
| Borrower/Description | Principal Amount* (000's omitted) | Value | |
| Diversified Consumer Services (continued) | |||
| Sotheby's, Term Loan, 10.07%, (SOFR + 4.50%), 1/15/27 | 813 | $ 794,603 | |
| Spring Education Group, Inc., Term Loan, 9/29/30(21) | 350 | 345,625 | |
| $ 4,115,230 | |||
| Diversified Financial Services — 0.3% | |||
| Concorde Midco, Ltd., Term Loan, 7.892%, (6 mo. EURIBOR + 4.00%), 3/1/28 | EUR | 1,000 | $ 1,054,277 |
| Sandy BidCo B.V., Term Loan, 7.338%, (3 mo. EURIBOR + 3.75%), 8/17/29 | EUR | 1,000 | 1,050,211 |
| Zephyr Bidco Limited, Term Loan, 9.968%, (SONIA + 4.75%), 7/23/25 | GBP | 775 | 938,091 |
| $ 3,042,579 | |||
| Diversified Telecommunication Services — 1.5% | |||
| Altice France S.A., Term Loan, 10.808%, (SOFR + 5.50%), 8/15/28 | 1,074 | $ 974,703 | |
| CenturyLink, Inc., Term Loan, 7.681%, (SOFR + 2.25%), 3/15/27 | 2,504 | 1,789,877 | |
| eircom Finco S.a.r.l., Term Loan, 6.92%, (1 mo. EURIBOR + 3.25%), 5/15/26 | EUR | 1,786 | 1,882,783 |
| GEE Holdings 2, LLC: | |||
| Term Loan, 13.50%, (SOFR + 8.00%), 3/24/25 | 329 | 322,237 | |
| Term Loan - Second Lien, 13.75%, (SOFR + 8.25%), 3/23/26 | 741 | 444,656 | |
| Telenet International Finance S.a.r.l., Term Loan, 5.925%, (1 mo. EURIBOR + 2.25%), 4/30/29 | EUR | 1,750 | 1,823,073 |
| UPC Broadband Holding B.V.: | |||
| Term Loan, 6.175%, (1 mo. EURIBOR + 2.50%), 4/30/29 | EUR | 1,500 | 1,569,025 |
| Term Loan, 6.60%, (1 mo. EURIBOR + 2.93%), 1/31/29 | EUR | 3,000 | 3,139,256 |
| Virgin Media Bristol, LLC, Term Loan, 8.697%, (SOFR + 3.25%), 1/31/29 | 1,150 | 1,125,832 | |
| Virgin Media Ireland Limited, Term Loan, 7.138%, (1 mo. EURIBOR + 3.46%), 7/15/29 | EUR | 1,000 | 1,048,219 |
| Virgin Media SFA Finance Limited: | |||
| Term Loan, 6.175%, (1 mo. EURIBOR + 2.50%), 1/31/29 | EUR | 600 | 618,491 |
| Term Loan, 8.468%, (SONIA + 3.25%), 11/15/27 | GBP | 1,500 | 1,809,052 |
| Zayo Group Holdings, Inc., Term Loan, 7.108%, (1 mo. EURIBOR + 3.25%), 3/9/27 | EUR | 965 | 779,942 |
| $ 17,327,146 | |||
| Borrower/Description | Principal Amount* (000's omitted) | Value | |
| Electrical Equipment — 0.0%(14) | |||
| AZZ, Inc., Term Loan, 9.066%, (SOFR + 3.75%), 5/13/29 | 357 | $ 357,925 | |
| $ 357,925 | |||
| Electronic Equipment, Instruments & Components — 0.7% | |||
| Chamberlain Group, Inc., Term Loan, 8.661%, (SOFR + 3.25%), 11/3/28 | 1,523 | $ 1,503,046 | |
| Creation Technologies, Inc., Term Loan, 11.03%, (SOFR + 5.50%), 10/5/28 | 963 | 914,672 | |
| II-VI Incorporated, Term Loan, 8.181%, (SOFR + 2.75%), 7/2/29 | 914 | 914,723 | |
| Minimax Viking GmbH, Term Loan, 6.608%, (1 mo. EURIBOR + 2.75%), 7/31/25 | EUR | 940 | 997,647 |
| Mirion Technologies, Inc., Term Loan, 8.402%, (SOFR + 2.75%), 10/20/28 | 586 | 586,195 | |
| Robertshaw US Holding Corp.: | |||
| Term Loan, 13.49%, (SOFR + 8.00%), 8.49% cash, 5.00% PIK, 2/28/27 | 235 | 237,360 | |
| Term Loan - Second Lien, 12.40%, (SOFR + 7.00%), 2/28/27 | 993 | 868,448 | |
| Verifone Systems, Inc., Term Loan, 9.653%, (SOFR + 4.00%), 8/20/25 | 1,216 | 1,133,943 | |
| Verisure Holding AB, Term Loan, 6.972%, (3 mo. EURIBOR + 3.00%), 3/27/28 | EUR | 1,000 | 1,048,254 |
| $ 8,204,288 | |||
| Energy Equipment & Services — 0.1% | |||
| Ameriforge Group, Inc.: | |||
| Term Loan, 16.713%, (SOFR + 13.00%), 12/29/23(11)(23) | 110 | $ 88,151 | |
| Term Loan, 18.444%, (SOFR + 13.00%), 13.444% cash, 5.00% PIK, 12/29/23(11) | 867 | 691,695 | |
| GIP Pilot Acquisition Partners L.P., Term Loan, 9/18/30(21) | 475 | 474,406 | |
| Lealand Finance Company B.V., Term Loan, 12.431%, (SOFR + 7.00%), 9.431% cash, 3.00% PIK, 6/30/25 | 233 | 122,169 | |
| $ 1,376,421 | |||
| Engineering & Construction — 0.2% | |||
| Aegion Corporation, Term Loan, 10.181%, (SOFR + 4.75%), 5/17/28 | 466 | $ 464,182 | |
| American Residential Services, LLC, Term Loan, 9.152%, (SOFR + 3.50%), 10/15/27 | 559 | 558,489 | |
| Borrower/Description | Principal Amount* (000's omitted) | Value | |
| Engineering & Construction (continued) | |||
| APi Group DE, Inc., Term Loan, 7.931%, (SOFR + 2.50%), 10/1/26 | 1,305 | $ 1,309,442 | |
| Northstar Group Services, Inc., Term Loan, 10.931%, (SOFR + 5.50%), 11/12/26 | 213 | 213,920 | |
| $ 2,546,033 | |||
| Entertainment — 0.7% | |||
| City Football Group Limited, Term Loan, 8.439%, (SOFR + 3.00%), 7/21/28 | 1,351 | $ 1,348,405 | |
| Crown Finance US, Inc., Term Loan, 14.381%, (SOFR + 8.50%), 7/31/28 | 274 | 281,148 | |
| EP Purchaser, LLC, Term Loan, 9.152%, (SOFR + 3.50%), 11/6/28 | 419 | 413,915 | |
| Playtika Holding Corp., Term Loan, 8.181%, (SOFR + 2.75%), 3/13/28 | 2,165 | 2,165,075 | |
| Renaissance Holding Corp.: | |||
| Term Loan, 10.066%, (SOFR + 4.75%), 4/5/30 | 950 | 943,865 | |
| Term Loan - Second Lien, 12.416%, (SOFR + 7.00%), 5/29/26 | 9 | 8,991 | |
| UFC Holdings, LLC, Term Loan, 8.369%, (SOFR + 2.75%), 4/29/26 | 2,744 | 2,744,683 | |
| Vue International Bidco PLC: | |||
| Term Loan, 11.086%, (6 mo. EURIBOR + 8.00%), 6/30/27 | EUR | 121 | 124,976 |
| Term Loan, 11.859%, (6 mo. EURIBOR + 8.00%), 5.359% cash, 6.50% PIK, 12/31/27 | EUR | 817 | 413,336 |
| $ 8,444,394 | |||
| Equity Real Estate Investment Trusts (REITs) — 0.1% | |||
| Iron Mountain, Inc., Term Loan, 7.181%, (SOFR + 1.75%), 1/2/26 | 874 | $ 873,579 | |
| $ 873,579 | |||
| Financial Services — 0.5% | |||
| Ditech Holding Corporation, Term Loan, 0.00%, 6/30/24(19) | 2,173 | $ 239,052 | |
| GTCR W Merger Sub, LLC: | |||
| Term Loan, 9/20/30(21) | 2,875 | 2,876,127 | |
| Term Loan, 9/20/30(21) | EUR | 1,500 | 1,591,492 |
| NCR Atleos, LLC, Term Loan, 3/27/29(21) | 1,300 | 1,253,688 | |
| $ 5,960,359 | |||
| Food & Staples Retailing — 0.1% | |||
| US Foods, Inc., Term Loan, 7.431%, (SOFR + 2.00%), 9/13/26 | 1,288 | $ 1,289,841 | |
| $ 1,289,841 | |||
| Borrower/Description | Principal Amount* (000's omitted) | Value | |
| Food Products — 1.2% | |||
| 8th Avenue Food & Provisions, Inc., Term Loan, 10.181%, (SOFR + 4.75%), 10/1/25 | 588 | $ 565,950 | |
| Badger Buyer Corp., Term Loan, 8.931%, (SOFR + 3.50%), 9/30/24 | 376 | 318,660 | |
| CHG PPC Parent, LLC: | |||
| Term Loan, 8.358%, (1 mo. EURIBOR + 4.50%), 12/8/28 | EUR | 2,000 | 2,114,500 |
| Term Loan, 8.431%, (SOFR + 3.00%), 12/8/28 | 468 | 465,797 | |
| Del Monte Foods, Inc., Term Loan, 9.674%, (SOFR + 4.25%), 5/16/29 | 447 | 435,041 | |
| Froneri International, Ltd.: | |||
| Term Loan, 6.097%, (6 mo. EURIBOR + 2.13%), 1/29/27 | EUR | 1,275 | 1,328,255 |
| Term Loan, 7.666%, (SOFR + 2.25%), 1/29/27 | 2,129 | 2,117,011 | |
| Monogram Food Solutions, LLC, Term Loan, 9.431%, (SOFR + 4.00%), 8/28/28 | 540 | 532,945 | |
| Nomad Foods Europe Midco Limited, Term Loan, 6.445%, (6 mo. EURIBOR + 2.50%), 6/24/28 | EUR | 3,000 | 3,185,909 |
| Shearer's Foods, Inc., Term Loan, 8.931%, (SOFR + 3.50%), 9/23/27 | 388 | 388,108 | |
| Sovos Brands Intermediate, Inc., Term Loan, 9.131%, (SOFR + 3.50%), 6/8/28 | 497 | 498,156 | |
| United Petfood Group B.V., Term Loan, 6.466%, (3 mo. EURIBOR + 2.75%), 4/23/28 | EUR | 750 | 780,383 |
| Valeo F1 Company Limited (Ireland), Term Loan, 8.136%, (6 mo. EURIBOR + 4.00%), 9/29/28 | EUR | 1,000 | 961,040 |
| $ 13,691,755 | |||
| Health Care Equipment & Supplies — 0.4% | |||
| Artivion, Inc., Term Loan, 8.931%, (SOFR + 3.50%), 6/1/27 | 518 | $ 504,443 | |
| Bayou Intermediate II, LLC, Term Loan, 9.966%, (SOFR + 4.50%), 8/2/28 | 737 | 718,453 | |
| Gloves Buyer, Inc., Term Loan, 10.431%, (SOFR + 5.00%), 12/29/27 | 625 | 602,344 | |
| Journey Personal Care Corp., Term Loan, 9.981%, (6 mo. USD LIBOR + 4.25%), 3/1/28 | 1,521 | 1,436,689 | |
| Medline Borrower, L.P., Term Loan, 7.358%, (1 mo. EURIBOR + 3.50%), 10/23/28 | EUR | 1,000 | 1,055,048 |
| $ 4,316,977 | |||
| Health Care Providers & Services — 3.1% | |||
| AEA International Holdings (Lux) S.a.r.l., Term Loan, 9.402%, (SOFR + 3.75%), 9/7/28 | 1,056 | $ 1,054,207 | |
| Biogroup-LCD, Term Loan, 6.754%, (3 mo. EURIBOR + 3.00%), 2/9/28 | EUR | 750 | 765,020 |
| BW NHHC Holdco, Inc., Term Loan - Second Lien, 13.39%, (SOFR + 8.00%), 1/15/26 | 3,729 | 3,187,881 | |
| Borrower/Description | Principal Amount* (000's omitted) | Value | |
| Health Care Providers & Services (continued) | |||
| CCRR Parent, Inc., Term Loan, 9.181%, (SOFR + 3.75%), 3/6/28 | 512 | $ 489,832 | |
| Cerba Healthcare S.A.S., Term Loan, 7.558%, (1 mo. EURIBOR + 3.70%), 6/30/28 | EUR | 1,250 | 1,278,521 |
| CHG Healthcare Services, Inc.: | |||
| Term Loan, 8.681%, (SOFR + 3.25%), 9/29/28 | 1,078 | 1,074,631 | |
| Term Loan, 9/29/28(21) | 400 | 400,417 | |
| CNT Holdings I Corp., Term Loan, 8.80%, (SOFR + 3.50%), 11/8/27 | 683 | 681,525 | |
| Covis Finco S.a.r.l., Term Loan, 12.04%, (SOFR + 6.50%), 2/18/27 | 690 | 497,613 | |
| Dedalus Finance GmbH, Term Loan, 7.712%, (6 mo. EURIBOR + 3.75%), 7/17/27 | EUR | 500 | 513,262 |
| Electron BidCo, Inc., Term Loan, 8.431%, (SOFR + 3.00%), 11/1/28 | 788 | 785,960 | |
| Elsan S.A.S., Term Loan, 7.39%, (6 mo. EURIBOR + 3.35%), 6/16/28 | EUR | 1,500 | 1,565,308 |
| Ensemble RCM, LLC, Term Loan, 9.219%, (SOFR + 3.75%), 8/3/26 | 1,654 | 1,658,175 | |
| Envision Healthcare Corporation: | |||
| Term Loan, 0.00%, 3/31/27(19) | 1,023 | 1,225,507 | |
| Term Loan - Second Lien, 0.00%, 3/31/27(19) | 7,224 | 1,679,472 | |
| IVC Acquisition, Ltd., Term Loan, 9.204%, (SONIA + 4.50%), 2/13/26 | GBP | 1,000 | 1,213,237 |
| LSCS Holdings, Inc., Term Loan, 9.931%, (SOFR + 4.61%), 12/16/28 | 712 | 702,964 | |
| Medical Solutions Holdings, Inc., Term Loan, 8.773%, (SOFR + 3.25%), 11/1/28 | 1,454 | 1,411,150 | |
| Mehilainen Yhtiot Oy, Term Loan, 7.497%, (3 mo. EURIBOR + 3.53%), 8/8/25 | EUR | 1,000 | 1,058,158 |
| Midwest Physician Administrative Services, LLC, Term Loan, 8.902%, (SOFR + 3.25%), 3/12/28 | 463 | 435,999 | |
| National Mentor Holdings, Inc.: | |||
| Term Loan, 9.181%, (SOFR + 3.75%), 3/2/28(22) | 2,031 | 1,833,473 | |
| Term Loan, 9.24%, (SOFR + 3.75%), 3/2/28 | 58 | 52,648 | |
| Option Care Health, Inc., Term Loan, 8.181%, (SOFR + 2.75%), 10/27/28 | 418 | 419,128 | |
| Pacific Dental Services, LLC, Term Loan, 8.933%, (SOFR + 3.50%), 5/5/28 | 689 | 688,320 | |
| Phoenix Guarantor, Inc.: | |||
| Term Loan, 8.681%, (SOFR + 3.25%), 3/5/26 | 1,867 | 1,858,488 | |
| Term Loan, 8.931%, (SOFR + 3.50%), 3/5/26 | 1,291 | 1,284,313 | |
| Radiology Partners, Inc., Term Loan, 10.179%, (SOFR + 4.25%), 7/9/25 | 1,194 | 906,134 | |
| Radnet Management, Inc., Term Loan, 8.431%, (SOFR + 3.00%), 4/21/28 | 1,002 | 1,001,781 | |
| Ramsay Generale de Sante S.A., Term Loan, 6.648%, (3 mo. EURIBOR + 2.95%), 4/22/27 | EUR | 500 | 530,182 |
| Borrower/Description | Principal Amount* (000's omitted) | Value | |
| Health Care Providers & Services (continued) | |||
| Select Medical Corporation, Term Loan, 8.316%, (SOFR + 3.00%), 3/6/27 | 2,961 | $ 2,961,773 | |
| Sound Inpatient Physicians, Term Loan, 8.631%, (SOFR + 3.00%), 6/27/25 | 474 | 225,031 | |
| Surgery Center Holdings, Inc., Term Loan, 9.189%, (SOFR + 3.75%), 8/31/26 | 943 | 944,364 | |
| Synlab Bondco PLC, Term Loan, 6.392%, (6 mo. EURIBOR + 2.50%), 7/1/27 | EUR | 500 | 528,460 |
| U.S. Anesthesia Partners, Inc., Term Loan, 9.694%, (SOFR + 4.25%), 10/1/28 | 1,493 | 1,375,117 | |
| $ 36,288,051 | |||
| Health Care Technology — 0.5% | |||
| Imprivata, Inc., Term Loan, 9.566%, (SOFR + 4.25%), 12/1/27 | 222 | $ 223,021 | |
| MedAssets Software Intermediate Holdings, Inc., Term Loan, 9.431%, (SOFR + 4.00%), 12/18/28 | 1,084 | 883,052 | |
| Navicure, Inc., Term Loan, 9.431%, (SOFR + 4.00%), 10/22/26 | 1,645 | 1,649,230 | |
| Project Ruby Ultimate Parent Corp., Term Loan, 8.681%, (SOFR + 3.25%), 3/10/28 | 1,024 | 1,012,489 | |
| Verscend Holding Corp., Term Loan, 9.431%, (SOFR + 4.00%), 8/27/25 | 2,185 | 2,188,103 | |
| $ 5,955,895 | |||
| Hotels, Restaurants & Leisure — 1.8% | |||
| Bally's Corporation, Term Loan, 8.838%, (SOFR + 3.25%), 10/2/28 | 1,154 | $ 1,133,958 | |
| Carnival Corporation: | |||
| Term Loan, 7.608%, (1 mo. EURIBOR + 3.75%), 6/30/25 | EUR | 1,466 | 1,556,218 |
| Term Loan, 8.681%, (SOFR + 3.25%), 10/18/28 | 2,653 | 2,643,630 | |
| ClubCorp Holdings, Inc., Term Loan, 8.181%, (SOFR + 2.75%), 9/18/24 | 1,880 | 1,854,934 | |
| Fertitta Entertainment, LLC, Term Loan, 9.316%, (SOFR + 4.00%), 1/27/29 | 4,149 | 4,115,481 | |
| Four Seasons Hotels Limited, Term Loan, 7.916%, (SOFR + 2.50%), 11/30/29 | 1,014 | 1,016,901 | |
| GVC Holdings (Gibraltar) Limited, Term Loan, 7.722%, (3 mo. EURIBOR + 3.75%), 6/30/28 | EUR | 1,850 | 1,955,388 |
| IRB Holding Corp., Term Loan, 8.416%, (SOFR + 3.00%), 12/15/27 | 295 | 294,698 | |
| Ontario Gaming GTA L.P., Term Loan, 9.64%, (SOFR + 4.25%), 8/1/30 | 400 | 400,781 | |
| Oravel Stays Singapore Pte., Ltd., Term Loan, 13.908%, (SOFR + 8.25%), 6/23/26 | 538 | 465,046 | |
| Playa Resorts Holding B.V., Term Loan, 9.581%, (SOFR + 4.25%), 1/5/29 | 1,315 | 1,316,930 | |
| Borrower/Description | Principal Amount* (000's omitted) | Value | |
| Hotels, Restaurants & Leisure (continued) | |||
| Scientific Games Holdings, L.P., Term Loan, 7.587%, (3 mo. EURIBOR + 4.00%), 4/4/29 | EUR | 1,000 | $ 1,054,387 |
| SeaWorld Parks & Entertainment, Inc., Term Loan, 8.431%, (SOFR + 3.00%), 8/25/28 | 882 | 881,265 | |
| SMG US Midco 2, Inc., Term Loan, 8.131%, (SOFR + 2.50%), 1/23/25 | 236 | 236,562 | |
| Stars Group Holdings B.V. (The), Term Loan, 7.902%, (SOFR + 2.25%), 7/21/26 | 2,229 | 2,231,047 | |
| Wyndham Hotels & Resorts, Inc., Term Loan, 7.666%, (SOFR + 2.25%), 5/24/30 | 773 | 774,926 | |
| $ 21,932,152 | |||
| Household Durables — 1.3% | |||
| ACProducts, Inc., Term Loan, 9.902%, (SOFR + 4.25%), 5/17/28 | 1,735 | $ 1,439,234 | |
| Libbey Glass, Inc., Term Loan, 11.924%, (SOFR + 3.75%), 11/22/27 | 9,654 | 9,219,929 | |
| Serta Simmons Bedding, LLC, Term Loan, 12.90%, (SOFR + 7.50%), 6/29/28 | 3,630 | 3,635,229 | |
| Solis IV B.V., Term Loan, 7.826%, (3 mo. EURIBOR + 4.00%), 2/26/29 | EUR | 1,000 | 1,033,021 |
| $ 15,327,413 | |||
| Household Products — 0.1% | |||
| Kronos Acquisition Holdings, Inc., Term Loan, 11.567%, (SOFR + 6.00%), 12/22/26 | 393 | $ 393,491 | |
| Nobel Bidco B.V., Term Loan, 7.27%, (6 mo. EURIBOR + 3.50%), 9/1/28 | EUR | 1,000 | 1,020,436 |
| $ 1,413,927 | |||
| Industrial Conglomerates — 0.1% | |||
| Ammeraal Beltech Holding B.V., Term Loan, 8.972%, (3 mo. EURIBOR + 5.00%), 12/30/28 | EUR | 500 | $ 527,469 |
| Rain Carbon GmbH, Term Loan, 8.787%, (3 mo. EURIBOR + 5.00%), 10/31/28 | EUR | 1,025 | 1,074,199 |
| $ 1,601,668 | |||
| Insurance — 1.7% | |||
| Alliant Holdings Intermediate, LLC, Term Loan, 8.831%, (SOFR + 3.50%), 11/5/27 | 1,505 | $ 1,504,278 | |
| AmWINS Group, Inc.: | |||
| Term Loan, 7.681%, (SOFR + 2.25%), 2/19/28 | 3,768 | 3,748,470 | |
| Term Loan, 8.181%, (SOFR + 2.75%), 2/19/28 | 670 | 670,655 | |
| AssuredPartners, Inc., Term Loan, 8.931%, (SOFR + 3.50%), 2/12/27 | 168 | 168,362 | |
| Financiere CEP S.A.S., Term Loan, 7.722%, (3 mo. EURIBOR + 3.75%), 6/18/27 | EUR | 750 | 790,675 |
| Borrower/Description | Principal Amount* (000's omitted) | Value | |
| Insurance (continued) | |||
| HUB International Limited, Term Loan, 9.584%, (SOFR + 4.25%), 6/20/30 | 5,353 | $ 5,375,586 | |
| NFP Corp., Term Loan, 8.681%, (SOFR + 3.25%), 2/16/27 | 3,075 | 3,042,049 | |
| Ryan Specialty Group, LLC, Term Loan, 8.416%, (SOFR + 3.00%), 9/1/27 | 1,673 | 1,676,561 | |
| USI, Inc., Term Loan, 9.14%, (SOFR + 3.75%), 11/22/29 | 3,057 | 3,059,012 | |
| $ 20,035,648 | |||
| Interactive Media & Services — 0.3% | |||
| Adevinta ASA: | |||
| Term Loan, 6.472%, (3 mo. EURIBOR + 2.50%), 6/26/28 | EUR | 1,367 | $ 1,447,621 |
| Term Loan, 8.322%, (SOFR + 2.75%), 6/26/28 | 168 | 168,260 | |
| Buzz Finco, LLC: | |||
| Term Loan, 8.166%, (SOFR + 2.75%), 1/29/27 | 555 | 554,528 | |
| Term Loan, 8.666%, (SOFR + 3.25%), 1/29/27 | 60 | 60,314 | |
| Foundational Education Group, Inc., Term Loan, 9.881%, (SOFR + 4.25%), 8/31/28 | 540 | 513,356 | |
| Getty Images, Inc., Term Loan, 9.99%, (SOFR + 4.50%), 2/19/26 | 676 | 679,037 | |
| Match Group, Inc., Term Loan, 7.298%, (SOFR + 1.75%), 2/13/27 | 675 | 673,312 | |
| $ 4,096,428 | |||
| IT Services — 1.8% | |||
| Asurion, LLC: | |||
| Term Loan, 8.681%, (SOFR + 3.25%), 12/23/26 | 3,073 | $ 3,021,669 | |
| Term Loan, 8.681%, (SOFR + 3.25%), 7/31/27 | 1,082 | 1,053,925 | |
| Term Loan, 9.416%, (SOFR + 4.00%), 8/19/28 | 1,005 | 975,852 | |
| Term Loan - Second Lien, 10.681%, (SOFR + 5.25%), 1/31/28 | 1,350 | 1,215,844 | |
| Cyxtera DC Holdings, Inc.: | |||
| DIP Loan, 13.942%, (SOFR + 8.61%), 12/7/23 | 248 | 250,521 | |
| Term Loan, 0.00%, 5/1/24(19) | 895 | 526,592 | |
| Endure Digital, Inc., Term Loan, 8.792%, (SOFR + 3.50%), 2/10/28 | 2,737 | 2,666,295 | |
| Gainwell Acquisition Corp., Term Loan, 9.49%, (SOFR + 4.00%), 10/1/27 | 3,064 | 2,995,283 | |
| Indy US Bidco, LLC, Term Loan, 7.608%, (1 mo. EURIBOR + 3.75%), 3/6/28 | EUR | 731 | 748,911 |
| Informatica, LLC, Term Loan, 8.181%, (SOFR + 2.75%), 10/27/28 | 2,635 | 2,631,992 | |
| NAB Holdings, LLC, Term Loan, 8.54%, (SOFR + 3.00%), 11/23/28 | 1,105 | 1,103,536 | |
| Borrower/Description | Principal Amount* (000's omitted) | Value | |
| IT Services (continued) | |||
| Rackspace Technology Global, Inc., Term Loan, 8.194%, (SOFR + 2.75%), 2/15/28 | 1,316 | $ 606,874 | |
| Sedgwick Claims Management Services, Inc., Term Loan, 9.066%, (SOFR + 3.75%), 2/24/28 | 1,218 | 1,216,548 | |
| Skopima Merger Sub, Inc., Term Loan, 9.431%, (SOFR + 4.00%), 5/12/28 | 1,470 | 1,433,488 | |
| team.blue Finco S.a.r.l., Term Loan, 7.058%, (1 mo. EURIBOR + 3.20%), 3/30/28 | EUR | 1,000 | 1,035,577 |
| $ 21,482,907 | |||
| Leisure Products — 0.3% | |||
| Accell Group N.V., Term Loan, 8.653%, (3 mo. EURIBOR + 4.90%), 6/14/29 | EUR | 500 | $ 481,049 |
| Amer Sports Oyj, Term Loan, 7.648%, (6 mo. EURIBOR + 4.00%), 3/30/26 | EUR | 1,550 | 1,635,519 |
| Fender Musical Instruments Corporation, Term Loan, 9.424%, (SOFR + 4.00%), 12/1/28 | 320 | 312,475 | |
| Recess Holdings, Inc., Term Loan, 9.383%, (SOFR + 4.00%), 3/17/27 | 600 | 600,000 | |
| $ 3,029,043 | |||
| Life Sciences Tools & Services — 0.6% | |||
| Avantor Funding, Inc., Term Loan, 6.358%, (1 mo. EURIBOR + 2.50%), 6/12/28 | EUR | 978 | $ 1,034,207 |
| Catalent Pharma Solutions, Inc., Term Loan, 7.438%, (SOFR + 2.00%), 2/22/28 | 814 | 798,878 | |
| Curia Global, Inc., Term Loan, 9.219%, (SOFR + 3.75%), 8/30/26 | 243 | 202,425 | |
| IQVIA, Inc., Term Loan, 7.402%, (SOFR + 1.75%), 1/17/25 | 1,363 | 1,366,796 | |
| LGC Group Holdings, Ltd., Term Loan, 7.108%, (1 mo. EURIBOR + 3.25%), 4/21/27 | EUR | 1,000 | 1,038,252 |
| Loire Finco Luxembourg S.a.r.l., Term Loan, 8.916%, (SOFR + 3.50%), 4/21/27 | 339 | 334,976 | |
| Packaging Coordinators Midco, Inc., Term Loan, 9.152%, (SOFR + 3.50%), 11/30/27 | 1,342 | 1,338,617 | |
| Star Parent, Inc., Term Loan, 9/19/30(21) | 1,375 | 1,346,179 | |
| $ 7,460,330 | |||
| Machinery — 2.6% | |||
| Albion Financing 3 S.a.r.l.: | |||
| Term Loan, 10.857%, (SOFR + 5.25%), 8/17/26 | 1,523 | $ 1,527,317 | |
| Term Loan, 10.883%, (SOFR + 5.50%), 8/17/26 | 299 | 299,246 | |
| Alliance Laundry Systems, LLC, Term Loan, 8.901%, (SOFR + 3.50%), 10/8/27 | 1,038 | 1,039,259 | |
| American Trailer World Corp., Term Loan, 9.166%, (SOFR + 3.75%), 3/3/28 | 612 | 589,682 | |
| Borrower/Description | Principal Amount* (000's omitted) | Value | |
| Machinery (continued) | |||
| Apex Tool Group, LLC, Term Loan, 10.674%, (SOFR + 5.25%), 2/8/29 | 3,321 | $ 3,046,679 | |
| Barnes Group, Inc., Term Loan, 8.416%, (SOFR + 3.00%), 9/3/30 | 500 | 501,340 | |
| Conair Holdings, LLC, Term Loan, 9.402%, (SOFR + 3.75%), 5/17/28 | 1,519 | 1,456,341 | |
| CPM Holdings, Inc., Term Loan, 9.90%, (SOFR + 4.50%), 9/22/28 | 302 | 301,987 | |
| Delachaux Group S.A., Term Loan, 9.869%, (SOFR + 4.50%), 4/16/26 | 333 | 327,651 | |
| EMRLD Borrower L.P., Term Loan, 8.316%, (SOFR + 3.00%), 5/31/30 | 1,075 | 1,074,832 | |
| Engineered Machinery Holdings, Inc.: | |||
| Term Loan, 7.722%, (3 mo. EURIBOR + 3.75%), 5/21/28 | EUR | 980 | 1,033,838 |
| Term Loan, 9.152%, (SOFR + 3.50%), 5/19/28 | 2,325 | 2,315,606 | |
| Filtration Group Corporation: | |||
| Term Loan, 8.108%, (1 mo. EURIBOR + 4.25%), 10/21/28 | EUR | 1,340 | 1,411,395 |
| Term Loan, 8.931%, (SOFR + 3.50%), 10/21/28 | 735 | 733,239 | |
| Gates Global, LLC, Term Loan, 7.816%, (SOFR + 2.50%), 3/31/27 | 3,909 | 3,905,010 | |
| Icebox Holdco III, Inc., Term Loan, 9.402%, (SOFR + 3.75%), 12/22/28 | 838 | 835,009 | |
| INNIO Group Holding GmbH, Term Loan, 6.339%, (6 mo. EURIBOR + 3.00%), 10/31/25 | EUR | 750 | 791,663 |
| Roper Industrial Products Investment Company, LLC: | |||
| Term Loan, 8.972%, (3 mo. EURIBOR + 5.25%), 11/22/29 | EUR | 498 | 525,160 |
| Term Loan, 9.89%, (SOFR + 4.50%), 11/22/29 | 597 | 598,972 | |
| SPX Flow, Inc., Term Loan, 9.916%, (SOFR + 4.50%), 4/5/29 | 1,176 | 1,175,948 | |
| Titan Acquisition Limited, Term Loan, 8.652%, (SOFR + 3.00%), 3/28/25 | 3,000 | 2,978,116 | |
| TK Elevator Topco GmbH, Term Loan, 7.597%, (6 mo. EURIBOR + 3.63%), 7/30/27 | EUR | 1,500 | 1,581,712 |
| Vertical US Newco, Inc., Term Loan, 9.381%, (SOFR + 3.50%), 7/30/27 | 1,189 | 1,187,512 | |
| Zephyr German BidCo GmbH, Term Loan, 7.462%, (3 mo. EURIBOR + 3.85%), 3/10/28 | EUR | 1,500 | 1,559,539 |
| $ 30,797,053 | |||
| Media — 1.1% | |||
| Axel Springer SE, Term Loan, 8.684%, (3 mo. EURIBOR + 4.75%), 12/18/26 | EUR | 1,000 | $ 1,058,572 |
| Gray Television, Inc.: | |||
| Term Loan, 7.944%, (SOFR + 2.50%), 1/2/26 | 637 | 634,179 | |
| Term Loan, 8.444%, (SOFR + 3.00%), 12/1/28 | 933 | 911,207 | |
| Borrower/Description | Principal Amount* (000's omitted) | Value | |
| Media (continued) | |||
| Hubbard Radio, LLC, Term Loan, 9.69%, (SOFR + 4.25%), 3/28/25 | 616 | $ 560,504 | |
| iHeartCommunications, Inc., Term Loan, 8.431%, (SOFR + 3.00%), 5/1/26 | 444 | 399,788 | |
| Magnite, Inc., Term Loan, 10.532%, (SOFR + 5.00%), 4/28/28(22) | 635 | 638,949 | |
| MJH Healthcare Holdings, LLC, Term Loan, 8.916%, (SOFR + 3.50%), 1/28/29 | 271 | 270,367 | |
| Nexstar Broadcasting, Inc., Term Loan, 7.931%, (SOFR + 2.50%), 9/18/26 | 267 | 267,409 | |
| Recorded Books, Inc., Term Loan, 9.316%, (SOFR + 4.00%), 8/29/25 | 954 | 954,783 | |
| Sinclair Television Group, Inc.: | |||
| Term Loan, 7.931%, (SOFR + 2.50%), 9/30/26 | 624 | 543,469 | |
| Term Loan, 8.431%, (SOFR + 3.00%), 4/1/28 | 403 | 287,820 | |
| Univision Communications, Inc., Term Loan, 8.681%, (SOFR + 3.25%), 3/15/26 | 6,768 | 6,763,471 | |
| $ 13,290,518 | |||
| Metals/Mining — 0.4% | |||
| Arsenal AIC Parent, LLC, Term Loan, 9.879%, (SOFR + 4.50%), 8/18/30 | 750 | $ 749,812 | |
| Dynacast International, LLC: | |||
| Term Loan, 10.017%, (SOFR + 4.50%), 7/22/25 | 1,042 | 974,589 | |
| Term Loan, 14.517%, (SOFR + 9.00%), 10/22/25 | 402 | 309,792 | |
| PMHC II, Inc., Term Loan, 9.699%, (SOFR + 4.25%), 4/23/29 | 995 | 944,121 | |
| WireCo WorldGroup, Inc., Term Loan, 9.695%, (SOFR + 4.25%), 11/13/28 | 446 | 446,482 | |
| Zekelman Industries, Inc., Term Loan, 7.445%, (SOFR + 2.00%), 1/24/27 | 1,099 | 1,099,884 | |
| $ 4,524,680 | |||
| Oil, Gas & Consumable Fuels — 0.5% | |||
| Freeport LNG Investments, LLP, Term Loan, 9.088%, (SOFR + 3.50%), 12/21/28 | 660 | $ 654,674 | |
| Matador Bidco S.a.r.l., Term Loan, 9.916%, (SOFR + 4.50%), 10/15/26 | 1,529 | 1,537,803 | |
| Oryx Midstream Services Permian Basin, LLC, Term Loan, 8.692%, (SOFR + 3.25%), 10/5/28 | 1,026 | 1,027,624 | |
| Oxbow Carbon, LLC, Term Loan, 9.453%, (SOFR + 4.00%), 5/10/30(22) | 524 | 523,360 | |
| QuarterNorth Energy Holding, Inc., Term Loan - Second Lien, 13.431%, (SOFR + 8.00%), 8/27/26 | 782 | 780,344 | |
| UGI Energy Services, LLC, Term Loan, 8.666%, (SOFR + 3.25%), 2/22/30 | 1,476 | 1,476,747 | |
| $ 6,000,552 | |||
| Borrower/Description | Principal Amount* (000's omitted) | Value | |
| Personal Products — 0.2% | |||
| HLF Financing S.a.r.l., Term Loan, 7.931%, (SOFR + 2.50%), 8/18/25 | 957 | $ 953,496 | |
| Rainbow Finco S.a.r.l., Term Loan, 7.701%, (6 mo. EURIBOR + 3.75%), 2/23/29 | EUR | 1,000 | 1,049,321 |
| Sunshine Luxembourg VII S.a.r.l.: | |||
| Term Loan, 7.472%, (3 mo. EURIBOR + 3.50%), 10/1/26 | EUR | 550 | 580,478 |
| Term Loan, 9.24%, (SOFR + 3.75%), 10/1/26 | 195 | 194,973 | |
| $ 2,778,268 | |||
| Pharmaceuticals — 1.3% | |||
| Aenova Holding GmbH, Term Loan, 8.205%, (3 mo. EURIBOR + 4.50%), 3/6/26 | EUR | 1,000 | $ 1,057,470 |
| AI Sirona (Luxembourg) Acquisition S.a.r.l., Term Loan, 8.858%, (1 mo. EURIBOR + 5.00%), 9/30/28 | EUR | 1,000 | 1,057,421 |
| Bausch Health Companies, Inc., Term Loan, 10.674%, (SOFR + 5.25%), 2/1/27 | 2,939 | 2,398,049 | |
| Horizon Therapeutics USA, Inc.: | |||
| Term Loan, 7.184%, (SOFR + 1.75%), 3/15/28 | 1,901 | 1,901,963 | |
| Term Loan, 7.434%, (SOFR + 2.00%), 5/22/26 | 654 | 654,692 | |
| Jazz Financing Lux S.a.r.l., Term Loan, 8.931%, (SOFR + 3.50%), 5/5/28 | 1,431 | 1,432,273 | |
| Mallinckrodt International Finance S.A.: | |||
| DIP Loan, 13.441%, (SOFR + 8.00%), 8/28/24 | 348 | 361,513 | |
| Term Loan, 12.689%, (SOFR + 7.25%), 9/30/27 | 3,297 | 2,469,104 | |
| Term Loan, 12.939%, (SOFR + 7.50%), 9/30/27 | 1,890 | 1,423,082 | |
| PharmaZell GmbH, Term Loan, 7.972%, (3 mo. EURIBOR + 4.00%), 5/12/27 | EUR | 1,000 | 1,032,140 |
| Recipharm AB, Term Loan, 6.737%, (3 mo. EURIBOR + 2.95%), 2/17/28 | EUR | 1,000 | 1,029,056 |
| $ 14,816,763 | |||
| Professional Services — 1.8% | |||
| AlixPartners, LLP: | |||
| Term Loan, 6.972%, (3 mo. EURIBOR + 3.00%), 2/4/28 | EUR | 975 | $ 1,025,879 |
| Term Loan, 8.181%, (SOFR + 2.75%), 2/4/28 | 1,938 | 1,938,909 | |
| APFS Staffing Holdings, Inc., Term Loan, 9.316%, (SOFR + 4.00%), 12/29/28 | 271 | 267,701 | |
| Apleona Holding GmbH, Term Loan, 6.764%, (3 mo. EURIBOR + 2.95%), 4/28/28 | EUR | 1,000 | 1,046,678 |
| ASGN Incorporated, Term Loan, 7.566%, (SOFR + 2.25%), 8/30/30 | 375 | 376,563 | |
| Camelot U.S. Acquisition, LLC: | |||
| Term Loan, 8.431%, (SOFR + 3.00%), 10/30/26 | 1,510 | 1,510,946 | |
| Term Loan, 8.431%, (SOFR + 3.00%), 10/30/26 | 886 | 886,587 | |
| Borrower/Description | Principal Amount* (000's omitted) | Value | |
| Professional Services (continued) | |||
| CoreLogic, Inc., Term Loan, 8.931%, (SOFR + 3.50%), 6/2/28 | 3,861 | $ 3,577,400 | |
| Corporation Service Company, Term Loan, 8.666%, (SOFR + 3.25%), 11/2/29 | 333 | 333,750 | |
| Deerfield Dakota Holding, LLC, Term Loan, 9.14%, (SOFR + 3.75%), 4/9/27 | 2,059 | 2,015,637 | |
| Employbridge Holding Company, Term Loan, 10.259%, (SOFR + 4.75%), 7/19/28 | 2,327 | 2,105,140 | |
| First Advantage Holdings, LLC, Term Loan, 8.181%, (SOFR + 2.75%), 1/31/27 | 606 | 607,371 | |
| Genuine Financial Holdings, LLC, Term Loan, 9/20/30(21) | 400 | 396,333 | |
| Neptune Bidco US, Inc., Term Loan, 10.399%, (SOFR + 5.00%), 4/11/29 | 1,895 | 1,710,124 | |
| Rockwood Service Corporation, Term Loan, 9.431%, (SOFR + 4.00%), 1/23/27 | 966 | 971,065 | |
| Saphilux S.a.r.l., Term Loan, 7/18/28(21) | EUR | 500 | 529,409 |
| Techem Verwaltungsgesellschaft 675 mbH, Term Loan, 6.275%, (6 mo. EURIBOR + 2.38%), 7/15/25 | EUR | 826 | 872,339 |
| Trans Union, LLC, Term Loan, 7.681%, (SOFR + 2.25%), 12/1/28 | 1,469 | 1,470,255 | |
| Vaco Holdings, LLC, Term Loan, 10.393%, (SOFR + 5.00%), 1/21/29 | 270 | 260,618 | |
| $ 21,902,704 | |||
| Real Estate Management & Development — 0.4% | |||
| Cushman & Wakefield U.S. Borrower, LLC: | |||
| Term Loan, 8.181%, (SOFR + 2.75%), 8/21/25 | 142 | $ 141,853 | |
| Term Loan, 8.666%, (SOFR + 3.25%), 1/31/30 | 2,997 | 2,950,185 | |
| Term Loan, 9.316%, (SOFR + 4.00%), 1/31/30 | 1,232 | 1,224,701 | |
| Greystar Real Estate Partners, LLC, Term Loan, 9.147%, (SOFR + 3.75%), 8/21/30 | 600 | 600,000 | |
| $ 4,916,739 | |||
| Road & Rail — 0.6% | |||
| Grab Holdings, Inc., Term Loan, 9.931%, (SOFR + 4.50%), 1/29/26 | 947 | $ 954,528 | |
| Hertz Corporation (The): | |||
| Term Loan, 8.681%, (SOFR + 3.25%), 6/30/28 | 1,028 | 1,028,828 | |
| Term Loan, 8.681%, (SOFR + 3.25%), 6/30/28 | 198 | 198,358 | |
| Kenan Advantage Group, Inc., Term Loan, 9.477%, (SOFR + 3.75%), 3/24/26 | 2,188 | 2,185,731 | |
| Uber Technologies, Inc., Term Loan, 8.159%, (SOFR + 2.75%), 3/3/30 | 2,396 | 2,398,447 | |
| $ 6,765,892 | |||
| Borrower/Description | Principal Amount* (000's omitted) | Value | |
| Semiconductors & Semiconductor Equipment — 0.3% | |||
| Altar Bidco, Inc., Term Loan, 8.142%, (SOFR + 3.10%), 2/1/29(22) | 1,259 | $ 1,256,702 | |
| Bright Bidco B.V., Term Loan, 14.366%, (SOFR + 9.00%), 6.366% cash, 8.00% PIK, 10/31/27 | 347 | 141,278 | |
| MaxLinear, Inc., Term Loan, 7.681%, (SOFR + 2.25%), 6/23/28 | 286 | 284,286 | |
| MKS Instruments, Inc., Term Loan, 6.858%, (1 mo. EURIBOR + 3.00%), 8/17/29 | EUR | 990 | 1,047,659 |
| Synaptics Incorporated, Term Loan, 7.914%, (SOFR + 2.25%), 12/2/28 | 392 | 391,326 | |
| Ultra Clean Holdings, Inc., Term Loan, 9.181%, (SOFR + 3.75%), 8/27/25 | 570 | 572,148 | |
| $ 3,693,399 | |||
| Software — 6.3% | |||
| Applied Systems, Inc., Term Loan, 9.89%, (SOFR + 4.50%), 9/18/26 | 5,117 | $ 5,138,119 | |
| AppLovin Corporation, Term Loan, 8.416%, (SOFR + 3.10%), 8/14/30 | 1,579 | 1,575,944 | |
| Aptean, Inc.: | |||
| Term Loan, 9.568%, (SOFR + 4.25%), 4/23/26 | 816 | 813,214 | |
| Term Loan - Second Lien, 12.416%, (SOFR + 7.00%), 4/23/27 | 1,450 | 1,353,938 | |
| Astra Acquisition Corp.: | |||
| Term Loan, 10.902%, (SOFR + 5.25%), 10/25/28 | 1,069 | 806,151 | |
| Term Loan - Second Lien, 14.527%, (SOFR + 8.88%), 10/25/29 | 1,650 | 977,390 | |
| Banff Merger Sub, Inc.: | |||
| Term Loan, 7.858%, (1 mo. EURIBOR + 4.00%), 10/2/25 | EUR | 483 | 510,107 |
| Term Loan, 9.181%, (SOFR + 3.75%), 10/2/25 | 2,682 | 2,681,916 | |
| Term Loan - Second Lien, 10.931%, (SOFR + 5.50%), 2/27/26 | 900 | 900,000 | |
| CDK Global, Inc., Term Loan, 9.64%, (SOFR + 4.25%), 7/6/29 | 2,258 | 2,260,995 | |
| Cegid Group SAS, Term Loan, 7/10/28(21) | EUR | 1,000 | 1,055,664 |
| CentralSquare Technologies, LLC, Term Loan, 9.29%, (SOFR + 3.75%), 8/29/25 | 1,406 | 1,336,691 | |
| Ceridian HCM Holding, Inc., Term Loan, 7.931%, (SOFR + 2.50%), 4/30/25 | 1,473 | 1,476,181 | |
| Cloud Software Group, Inc., Term Loan, 9.99%, (SOFR + 4.50%), 3/30/29(22) | 1,493 | 1,438,116 | |
| Cloudera, Inc.: | |||
| Term Loan, 9.166%, (SOFR + 3.75%), 10/8/28 | 2,758 | 2,727,662 | |
| Term Loan - Second Lien, 11.416%, (SOFR + 6.00%), 10/8/29 | 775 | 738,833 | |
| Borrower/Description | Principal Amount* (000's omitted) | Value | |
| Software (continued) | |||
| Constant Contact, Inc., Term Loan, 9.561%, (SOFR + 4.00%), 2/10/28 | 1,719 | $ 1,671,424 | |
| Cornerstone OnDemand, Inc., Term Loan, 9.181%, (SOFR + 3.75%), 10/16/28 | 1,330 | 1,268,249 | |
| Delta TopCo, Inc.: | |||
| Term Loan, 9.069%, (SOFR + 3.75%), 12/1/27 | 1,369 | 1,357,389 | |
| Term Loan - Second Lien, 12.569%, (SOFR + 7.25%), 12/1/28 | 1,950 | 1,867,125 | |
| ECI Macola Max Holding, LLC, Term Loan, 9.402%, (SOFR + 3.75%), 11/9/27 | 1,265 | 1,263,610 | |
| Epicor Software Corporation: | |||
| Term Loan, 8.681%, (SOFR + 3.25%), 7/30/27 | 770 | 770,553 | |
| Term Loan, 7/30/27(21) | 825 | 827,063 | |
| Fiserv Investment Solutions, Inc., Term Loan, 9.383%, (SOFR + 4.00%), 2/18/27 | 508 | 479,154 | |
| GoTo Group, Inc., Term Loan, 10.269%, (SOFR + 4.75%), 8/31/27 | 1,775 | 1,188,571 | |
| Greeneden U.S. Holdings II, LLC: | |||
| Term Loan, 7.964%, (3 mo. EURIBOR + 4.25%), 12/1/27 | EUR | 731 | 774,909 |
| Term Loan, 9.431%, (SOFR + 4.00%), 12/1/27 | 804 | 805,995 | |
| IGT Holding IV AB, Term Loan, 7.122%, (3 mo. EURIBOR + 3.15%), 3/31/28 | EUR | 1,000 | 1,046,017 |
| Ivanti Software, Inc., Term Loan, 9.758%, (SOFR + 4.25%), 12/1/27 | 1,445 | 1,253,875 | |
| Magenta Buyer, LLC: | |||
| Term Loan, 10.631%, (SOFR + 5.00%), 7/27/28 | 2,507 | 1,882,043 | |
| Term Loan - Second Lien, 13.881%, (SOFR + 8.25%), 7/27/29 | 1,050 | 488,250 | |
| Marcel LUX IV S.a.r.l.: | |||
| Term Loan, 7.087%, (3 mo. EURIBOR + 3.50%), 3/16/26 | EUR | 1,500 | 1,589,840 |
| Term Loan, 9.436%, (SOFR + 4.00%), 12/31/27 | 95 | 94,668 | |
| McAfee, LLC: | |||
| Term Loan, 7.714%, (3 mo. EURIBOR + 4.00%), 3/1/29 | EUR | 987 | 1,038,627 |
| Term Loan, 9.18%, (SOFR + 3.75%), 3/1/29 | 2,765 | 2,707,972 | |
| Mediaocean, LLC, Term Loan, 8.916%, (SOFR + 3.50%), 12/15/28 | 616 | 591,000 | |
| Mosel Bidco SE: | |||
| Term Loan, 9/16/30(21) | 250 | 250,313 | |
| Term Loan, 9/16/30(21) | EUR | 750 | 791,460 |
| Open Text Corporation, Term Loan, 8.166%, (SOFR + 2.75%), 1/31/30 | 1,365 | 1,365,968 | |
| Polaris Newco, LLC: | |||
| Term Loan, 7.714%, (3 mo. EURIBOR + 4.00%), 6/2/28 | EUR | 980 | 988,185 |
| Term Loan, 9.431%, (SOFR + 4.00%), 6/2/28 | 2,794 | 2,682,282 | |
| Borrower/Description | Principal Amount* (000's omitted) | Value | |
| Software (continued) | |||
| Proofpoint, Inc., Term Loan, 8.681%, (SOFR + 3.25%), 8/31/28 | 2,456 | $ 2,438,680 | |
| Quartz Acquireco, LLC, Term Loan, 8.818%, (SOFR + 3.50%), 6/28/30 | 750 | 750,000 | |
| Quest Software US Holdings, Inc., Term Loan, 9.769%, (SOFR + 4.25%), 2/1/29 | 997 | 834,322 | |
| RealPage, Inc., Term Loan, 8.431%, (SOFR + 3.00%), 4/24/28 | 2,818 | 2,788,933 | |
| Sabre GLBL, Inc., Term Loan, 9.666%, (SOFR + 4.25%), 6/30/28 | 1,100 | 972,400 | |
| SolarWinds Holdings, Inc., Term Loan, 9.066%, (SOFR + 3.75%), 2/5/27 | 1,692 | 1,695,632 | |
| Sophia, L.P., Term Loan, 8.916%, (SOFR + 3.50%), 10/7/27 | 389 | 388,768 | |
| Turing Midco, LLC, Term Loan, 7.931%, (SOFR + 2.50%), 3/24/28 | 166 | 165,690 | |
| Ultimate Software Group, Inc. (The): | |||
| Term Loan, 8.618%, (SOFR + 3.25%), 5/4/26 | 3,842 | 3,838,208 | |
| Term Loan, 9.219%, (SOFR + 3.75%), 5/4/26 | 1,656 | 1,656,797 | |
| Veritas US, Inc.: | |||
| Term Loan, 8.608%, (3 mo. EURIBOR + 4.75%), 9/1/25 | EUR | 970 | 900,701 |
| Term Loan, 10.431%, (SOFR + 5.00%), 9/1/25 | 2,401 | 2,087,943 | |
| Vision Solutions, Inc., Term Loan, 9.613%, (SOFR + 4.00%), 4/24/28 | 418 | 406,322 | |
| VS Buyer, LLC, Term Loan, 8.666%, (SOFR + 3.25%), 2/28/27 | 1,062 | 1,058,846 | |
| $ 74,818,705 | |||
| Specialty Retail — 1.3% | |||
| Belron Finance US, LLC, Term Loan, 8.057%, (SOFR + 2.43%), 4/13/28 | 829 | $ 828,361 | |
| Belron Luxembourg S.a.r.l., Term Loan, 6.147%, (3 mo. EURIBOR + 2.43%), 4/13/28 | EUR | 900 | 952,219 |
| Boels Topholding B.V., Term Loan, 7.015%, (EURIBOR + 3.25%), 2/6/27(22) | EUR | 862 | 912,562 |
| David's Bridal, Inc.: | |||
| Term Loan, 0.00%, 6/23/24(11)(19) | 581 | 0 | |
| Term Loan, 0.00%, 12/31/24(11)(19) | 704 | 0 | |
| Etraveli Holding AB, Term Loan, 7.972%, (3 mo. EURIBOR + 4.00%), 8/2/24 | EUR | 937 | 990,170 |
| Great Outdoors Group, LLC, Term Loan, 9.402%, (SOFR + 3.75%), 3/6/28 | 2,383 | 2,381,503 | |
| Harbor Freight Tools USA, Inc., Term Loan, 8.181%, (SOFR + 2.75%), 10/19/27 | 1,859 | 1,847,196 | |
| Hoya Midco, LLC, Term Loan, 8.619%, (SOFR + 3.25%), 2/3/29 | 981 | 982,676 | |
| Borrower/Description | Principal Amount* (000's omitted) | Value | |
| Specialty Retail (continued) | |||
| Les Schwab Tire Centers, Term Loan, 8.692%, (SOFR + 3.25%), 11/2/27 | 2,873 | $ 2,865,867 | |
| Mattress Firm, Inc., Term Loan, 9.95%, (6 mo. USD LIBOR + 4.25%), 9/25/28 | 1,181 | 1,174,083 | |
| PetSmart, Inc., Term Loan, 9.166%, (SOFR + 3.75%), 2/11/28 | 1,299 | 1,296,742 | |
| Speedster Bidco GmbH, Term Loan, 6.886%, (6 mo. EURIBOR + 2.75%), 3/31/27 | EUR | 1,000 | 1,033,297 |
| $ 15,264,676 | |||
| Technology Hardware, Storage & Peripherals — 0.1% | |||
| NCR Corporation, Term Loan, 7.931%, (SOFR + 2.50%), 8/28/26 | 908 | $ 908,463 | |
| $ 908,463 | |||
| Trading Companies & Distributors — 1.4% | |||
| American Builders & Contractors Supply Co., Inc., Term Loan, 7.416%, (SOFR + 2.00%), 1/15/27 | 2,352 | $ 2,352,612 | |
| Electro Rent Corporation, Term Loan, 11.002%, (SOFR + 5.50%), 11/1/24 | 1,784 | 1,726,027 | |
| Hillman Group, Inc. (The), Term Loan, 8.181%, (SOFR + 2.75%), 7/14/28 | 270 | 270,680 | |
| Patagonia Bidco Limited, Term Loan, 10.181%, (SONIA + 5.25%), 11/1/28 | GBP | 1,000 | 1,054,166 |
| PEARLS (Netherlands) Bidco B.V., Term Loan, 7.214%, (3 mo. EURIBOR + 3.50%), 2/26/29 | EUR | 1,000 | 1,046,488 |
| Quimper AB, Term Loan, 6.509%, (3 mo. EURIBOR + 2.93%), 2/16/26 | EUR | 1,875 | 1,965,018 |
| Spin Holdco, Inc., Term Loan, 9.664%, (SOFR + 4.00%), 3/4/28 | 3,803 | 3,299,262 | |
| SRS Distribution, Inc.: | |||
| Term Loan, 8.916%, (SOFR + 3.50%), 6/2/28 | 369 | 366,374 | |
| Term Loan, 8.931%, (SOFR + 3.50%), 6/2/28 | 980 | 972,037 | |
| White Cap Buyer, LLC, Term Loan, 9.066%, (SOFR + 3.75%), 10/19/27 | 2,043 | 2,041,484 | |
| Windsor Holdings III, LLC: | |||
| Term Loan, 8.154%, (1 mo. EURIBOR + 4.50%), 8/1/30 | EUR | 500 | 527,832 |
| Term Loan, 9.83%, (SOFR + 4.50%), 8/1/30 | 1,025 | 1,021,584 | |
| $ 16,643,564 | |||
| Transportation Infrastructure — 0.1% | |||
| Brown Group Holding, LLC: | |||
| Term Loan, 8.068%, (SOFR + 2.75%), 6/7/28 | 220 | $ 218,651 | |
| Term Loan, 9.121%, (SOFR + 3.75%), 7/2/29(22) | 248 | 247,616 | |
| Borrower/Description | Principal Amount* (000's omitted) | Value | |
| Transportation Infrastructure (continued) | |||
| KKR Apple Bidco, LLC, Term Loan, 8.181%, (SOFR + 2.75%), 9/22/28 | 172 | $ 171,042 | |
| $ 637,309 | |||
| Wireless Telecommunication Services — 0.4% | |||
| Digicel International Finance Limited, Term Loan, 8.902%, (SOFR + 3.25%), 5/28/24 | 4,775 | $ 4,326,892 | |
| $ 4,326,892 | |||
| Total Senior Floating-Rate Loans (identified cost $580,279,462) | $ 552,786,608 | ||
| Sovereign Government Bonds — 4.2% |
| Security | Principal Amount* (000's omitted) | Value | |
| Albania — 0.1% | |||
| Albania Government International Bond: | |||
| 3.50%, 10/9/25(15) | EUR | 101 | $ 103,106 |
| 5.90%, 6/9/28(15) | EUR | 978 | 1,009,414 |
| $ 1,112,520 | |||
| Angola — 0.0%(14) | |||
| Angolan Government International Bond, 8.75%, 4/14/32(15) | 528 | $ 425,824 | |
| $ 425,824 | |||
| Argentina — 0.0%(14) | |||
| Republic of Argentina: | |||
| 1.00%, 7/9/29 | 400 | $ 112,001 | |
| 4.25% to 7/9/24, 1/9/38(4) | 1,200 | 354,455 | |
| $ 466,456 | |||
| Bahrain — 0.1% | |||
| Kingdom of Bahrain: | |||
| 5.45%, 9/16/32(15) | 200 | $ 174,606 | |
| 5.625%, 5/18/34(15) | 200 | 171,672 | |
| 6.75%, 9/20/29(15) | 300 | 295,578 | |
| 7.00%, 10/12/28(15) | 300 | 304,878 | |
| 7.375%, 5/14/30(15) | 590 | 593,617 | |
| $ 1,540,351 | |||
| Security | Principal Amount* (000's omitted) | Value | |
| Barbados — 0.1% | |||
| Government of Barbados, 6.50%, 10/1/29(1) | 913 | $ 853,120 | |
| $ 853,120 | |||
| Benin — 0.1% | |||
| Benin Government International Bond: | |||
| 4.875%, 1/19/32(15) | EUR | 406 | $ 319,286 |
| 4.95%, 1/22/35(15) | EUR | 200 | 145,558 |
| 6.875%, 1/19/52(15) | EUR | 1,158 | 820,480 |
| $ 1,285,324 | |||
| Brazil — 0.2% | |||
| Federative Republic of Brazil: | |||
| 3.875%, 6/12/30 | 371 | $ 323,921 | |
| 4.625%, 1/13/28 | 1,100 | 1,059,244 | |
| 5.00%, 1/27/45 | 600 | 445,659 | |
| $ 1,828,824 | |||
| Chile — 0.1% | |||
| Chile Government International Bond: | |||
| 2.45%, 1/31/31 | 465 | $ 383,439 | |
| 2.55%, 7/27/33 | 600 | 462,179 | |
| 3.24%, 2/6/28 | 260 | 238,913 | |
| 3.50%, 1/25/50 | 845 | 564,892 | |
| $ 1,649,423 | |||
| Costa Rica — 0.0%(14) | |||
| Costa Rica Government International Bond, 6.55%, 4/3/34(15) | 460 | $ 448,428 | |
| $ 448,428 | |||
| Croatia — 0.0%(14) | |||
| Croatia Government International Bond, 1.75%, 3/4/41(15) | EUR | 212 | $ 151,618 |
| $ 151,618 | |||
| Dominican Republic — 0.1% | |||
| Dominican Republic: | |||
| 4.50%, 1/30/30(15) | 430 | $ 365,476 | |
| 4.875%, 9/23/32(15) | 380 | 309,637 | |
| 6.40%, 6/5/49(15) | 150 | 119,368 | |
| 6.85%, 1/27/45(15) | 300 | 256,176 | |
| 7.45%, 4/30/44(15) | 300 | 274,874 | |
| $ 1,325,531 | |||
| Security | Principal Amount* (000's omitted) | Value | |
| Ecuador — 0.1% | |||
| Republic of Ecuador: | |||
| 1.50%, 7/31/40(15) | 382 | $ 92,977 | |
| 2.50%, 7/31/40(15) | 2,576 | 627,315 | |
| $ 720,292 | |||
| Egypt — 0.1% | |||
| Arab Republic of Egypt: | |||
| 5.25%, 10/6/25(1) | 200 | $ 154,361 | |
| 5.80%, 9/30/27(15) | 427 | 282,206 | |
| 7.50%, 2/16/61(15) | 260 | 132,093 | |
| 8.70%, 3/1/49(15) | 452 | 243,639 | |
| 8.875%, 5/29/50(15) | 355 | 193,457 | |
| $ 1,005,756 | |||
| El Salvador — 0.1% | |||
| Republic of El Salvador: | |||
| 5.875%, 1/30/25(15) | 57 | $ 51,947 | |
| 6.375%, 1/18/27(15) | 211 | 172,899 | |
| 7.125%, 1/20/50(15) | 150 | 97,950 | |
| 7.65%, 6/15/35(15) | 17 | 12,079 | |
| 8.25%, 4/10/32(15) | 513 | 409,547 | |
| $ 744,422 | |||
| Ethiopia — 0.1% | |||
| Ethiopia Government International Bond, 6.625%, 12/11/24(15) | 970 | $ 630,432 | |
| $ 630,432 | |||
| Gabon — 0.0%(14) | |||
| Gabon Government International Bond, 6.625%, 2/6/31(15) | 200 | $ 149,250 | |
| $ 149,250 | |||
| Ghana — 0.1% | |||
| Ghana Government International Bond: | |||
| 7.625%, 5/16/29(15)(19) | 349 | $ 155,575 | |
| 7.75%, 4/7/29(15)(19) | 200 | 89,061 | |
| 8.125%, 3/26/32(15)(19) | 200 | 88,629 | |
| 8.627%, 6/16/49(15)(19) | 740 | 316,625 | |
| 8.75%, 3/11/61(15)(19) | 597 | 256,199 | |
| $ 906,089 | |||
| Security | Principal Amount* (000's omitted) | Value | |
| Guatemala — 0.1% | |||
| Guatemala Government International Bond, 5.375%, 4/24/32(15) | 538 | $ 493,252 | |
| $ 493,252 | |||
| Hungary — 0.1% | |||
| Hungary Government International Bond: | |||
| 2.125%, 9/22/31(15) | 815 | $ 602,566 | |
| 5.375%, 9/12/33(15) | EUR | 87 | 88,935 |
| 6.25%, 9/22/32(1) | 400 | 390,782 | |
| 6.25%, 9/22/32(15) | 300 | 293,086 | |
| $ 1,375,369 | |||
| India — 0.1% | |||
| Export-Import Bank of India: | |||
| 2.25%, 1/13/31(15) | 600 | $ 466,356 | |
| 5.50%, 1/18/33(1) | 230 | 220,665 | |
| $ 687,021 | |||
| Indonesia — 0.2% | |||
| Indonesia Government International Bond: | |||
| 3.55%, 3/31/32 | 1,613 | $ 1,394,698 | |
| 4.65%, 9/20/32 | 455 | 426,292 | |
| 4.85%, 1/11/33 | 840 | 801,274 | |
| $ 2,622,264 | |||
| Iraq — 0.0%(14) | |||
| Republic of Iraq, 5.80%, 1/15/28(15) | 141 | $ 130,410 | |
| $ 130,410 | |||
| Ivory Coast — 0.1% | |||
| Ivory Coast Government International Bond: | |||
| 5.25%, 3/22/30(15) | EUR | 257 | $ 228,117 |
| 6.625%, 3/22/48(15) | EUR | 1,162 | 848,038 |
| 6.875%, 10/17/40(15) | EUR | 512 | 402,379 |
| $ 1,478,534 | |||
| Jordan — 0.0%(14) | |||
| Kingdom of Jordan: | |||
| 5.85%, 7/7/30(15) | 300 | $ 267,220 | |
| 7.375%, 10/10/47(15) | 200 | 165,599 | |
| $ 432,819 | |||
| Security | Principal Amount* (000's omitted) | Value | |
| Kazakhstan — 0.1% | |||
| Kazakhstan Government International Bond, 6.50%, 7/21/45(15) | 500 | $ 509,906 | |
| $ 509,906 | |||
| Kuwait — 0.0%(14) | |||
| Kuwait International Government Bond, 3.50%, 3/20/27(15) | 247 | $ 234,464 | |
| $ 234,464 | |||
| Lebanon — 0.0%(14) | |||
| Lebanese Republic: | |||
| 5.80%, 4/14/20(15)(19) | 57 | $ ���4,739 | |
| 6.10%, 10/4/22(15)(19) | 972 | 80,608 | |
| 6.15%, 6/19/20(19) | 75 | 6,207 | |
| 6.375%, 3/9/20(19) | 1,110 | 92,274 | |
| 6.40%, 5/26/23(19) | 13 | 1,072 | |
| 6.65%, 11/3/28(15)(19) | 147 | 12,060 | |
| 6.85%, 5/25/29(19) | 3 | 247 | |
| 8.20%, 5/17/33(19) | 156 | 12,736 | |
| 8.25%, 5/17/34(19) | 129 | 10,857 | |
| $ 220,800 | |||
| Mexico — 0.2% | |||
| Mexico Government International Bond: | |||
| 4.875%, 5/19/33 | 1,089 | $ 977,986 | |
| 5.00%, 4/27/51 | 755 | 582,759 | |
| 5.40%, 2/9/28 | 1,003 | 989,905 | |
| $ 2,550,650 | |||
| Mongolia — 0.0%(14) | |||
| Mongolia Government International Bond, 5.125%, 4/7/26(1) | 200 | $ 187,021 | |
| $ 187,021 | |||
| Morocco — 0.0%(14) | |||
| Morocco Government International Bond, 3.00%, 12/15/32(15) | 365 | $ 278,633 | |
| $ 278,633 | |||
| Nigeria — 0.1% | |||
| Nigeria Government International Bond: | |||
| 7.375%, 9/28/33(15) | 930 | $ 690,167 | |
| 7.625%, 11/28/47(15) | 200 | 133,802 | |
| 7.696%, 2/23/38(15) | 400 | 281,100 | |
| Security | Principal Amount* (000's omitted) | Value | |
| Nigeria (continued) | |||
| Nigeria Government International Bond: (continued) | |||
| 8.25%, 9/28/51(15) | 400 | $ 278,070 | |
| $ 1,383,139 | |||
| North Macedonia — 0.2% | |||
| North Macedonia Government International Bond: | |||
| 1.625%, 3/10/28(15) | EUR | 905 | $ 779,877 |
| 3.675%, 6/3/26(15) | EUR | 136 | 135,525 |
| 6.96%, 3/13/27(15) | EUR | 884 | 953,795 |
| $ 1,869,197 | |||
| Oman — 0.1% | |||
| Oman Government International Bond: | |||
| 5.375%, 3/8/27(15) | 470 | $ 458,732 | |
| 6.25%, 1/25/31(15) | 483 | 478,083 | |
| 6.75%, 1/17/48(15) | 230 | 212,093 | |
| 7.375%, 10/28/32(15) | 457 | 484,363 | |
| $ 1,633,271 | |||
| Panama — 0.1% | |||
| Panama Bonos del Tesoro, 6.375%, 7/25/33(15) | 83 | $ 78,767 | |
| Panama Government International Bond, 6.70%, 1/26/36 | 1,400 | 1,387,977 | |
| $ 1,466,744 | |||
| Paraguay — 0.1% | |||
| Republic of Paraguay: | |||
| 4.95%, 4/28/31(15) | 577 | $ 535,366 | |
| 5.40%, 3/30/50(15) | 209 | 165,449 | |
| $ 700,815 | |||
| Peru — 0.1% | |||
| Peruvian Government International Bond: | |||
| 2.783%, 1/23/31 | 926 | $ 760,601 | |
| 3.00%, 1/15/34 | 250 | 193,328 | |
| 3.30%, 3/11/41 | 447 | 310,331 | |
| $ 1,264,260 | |||
| Romania — 0.2% | |||
| Romania Government International Bond: | |||
| 1.75%, 7/13/30(15) | EUR | 657 | $ 527,225 |
| 2.00%, 1/28/32(15) | EUR | 15 | 11,449 |
| 2.00%, 4/14/33(15) | EUR | 95 | 69,307 |
| 2.124%, 7/16/31(15) | EUR | 25 | 19,653 |
| Security | Principal Amount* (000's omitted) | Value | |
| Romania (continued) | |||
| Romania Government International Bond: (continued) | |||
| 3.375%, 1/28/50(15) | EUR | 518 | $ 325,465 |
| 3.624%, 5/26/30(15) | EUR | 8 | 7,296 |
| 3.75%, 2/7/34(15) | EUR | 49 | 41,034 |
| 4.625%, 4/3/49(15) | EUR | 1,115 | 877,062 |
| 6.625%, 9/27/29(15) | EUR | 650 | 707,821 |
| $ 2,586,312 | |||
| Serbia — 0.1% | |||
| Serbia Government International Bond, 2.125%, 12/1/30(15) | 1,536 | $ 1,131,336 | |
| $ 1,131,336 | |||
| Sri Lanka — 0.1% | |||
| Sri Lanka Government International Bond: | |||
| 5.75%, 4/18/23(15)(19) | 858 | $ 414,171 | |
| 6.20%, 5/11/27(15)(19) | 800 | 373,632 | |
| 6.35%, 6/28/24(15)(19) | 760 | 364,149 | |
| 6.825%, 7/18/26(15)(19) | 200 | 96,483 | |
| 6.85%, 3/14/24(15)(19) | 230 | 110,503 | |
| 6.85%, 11/3/25(15)(19) | 400 | 193,548 | |
| $ 1,552,486 | |||
| Suriname — 0.4% | |||
| Republic of Suriname, 9.25%, 10/26/26(15)(19) | 5,467 | $ 4,715,288 | |
| $ 4,715,288 | |||
| Ukraine — 0.1% | |||
| Ukraine Government International Bond: | |||
| 0.00%, GDP-Linked, 8/1/41(15)(24) | 189 | $ 87,364 | |
| 7.75%, 9/1/24(15)(19) | 614 | 211,899 | |
| 7.75%, 9/1/25(15)(19) | 609 | 202,119 | |
| 7.75%, 9/1/28(15)(19) | 318 | 92,864 | |
| $ 594,246 | |||
| United Arab Emirates — 0.2% | |||
| Finance Department Government of Sharjah: | |||
| 4.375%, 3/10/51(15) | 1,275 | $ 799,189 | |
| 6.50%, 11/23/32(1) | 660 | 659,267 | |
| 6.50%, 11/23/32(15) | 640 | 639,290 | |
| $ 2,097,746 | |||
| Security | Principal Amount* (000's omitted) | Value | |
| Uruguay — 0.1% | |||
| Uruguay Government International Bond: | |||
| 4.375%, 1/23/31 | 350 | $ 335,466 | |
| 5.10%, 6/18/50 | 470 | 417,728 | |
| 5.75%, 10/28/34 | 310 | 316,285 | |
| $ 1,069,479 | |||
| Uzbekistan — 0.1% | |||
| Republic of Uzbekistan: | |||
| 3.90%, 10/19/31(15) | 564 | $ 440,977 | |
| 4.75%, 2/20/24(15) | 355 | 351,511 | |
| 5.375%, 2/20/29(15) | 300 | 269,320 | |
| $ 1,061,808 | |||
| Zambia — 0.0%(14) | |||
| Zambia Government International Bond, 8.50%, 4/14/24(15)(19) | 200 | $ 110,308 | |
| $ 110,308 | |||
| Total Sovereign Government Bonds (identified cost $56,868,898) | $ 49,681,238 | ||
| Sovereign Loans — 0.5% |
| Borrower/Description | Principal Amount (000's omitted) | Value | |
| Kenya — 0.1% | |||
| Government of Kenya, Term Loan, 12.203%, (3 mo. USD LIBOR + 6.45%), 6/29/25(2) | $ | 1,248 | $ 1,204,948 |
| $ 1,204,948 | |||
| Nigeria — 0.0%(14) | |||
| Bank of Industry Limited, Term Loan, 11.67%, (3 mo. USD LIBOR + 6.00%), 12/11/23(2)(25) | $ | 251 | $ 251,845 |
| $ 251,845 | |||
| Tanzania — 0.4% | |||
| Government of the United Republic of Tanzania, Term Loan, 11.672%, (6 mo. USD LIBOR + 6.30%), 4/28/31(2) | $ | 4,151 | $ 4,050,517 |
| $ 4,050,517 | |||
| Total Sovereign Loans (identified cost $5,648,155) | $ 5,507,310 | ||
| U.S. Government Agency Mortgage-Backed Securities — 27.2% |
| Security | Principal Amount (000's omitted) | Value | |
| Federal Home Loan Mortgage Corp.: | |||
| 5.00%, with various maturities to 2052 | $ | 50,898 | $ 48,193,197 |
| 5.50%, 5/1/32 | 232 | 232,096 | |
| 6.50%, with various maturities to 2036 | 1,382 | 1,405,410 | |
| 7.00%, with various maturities to 2036 | 1,125 | 1,157,530 | |
| 7.50%, with various maturities to 2035 | 559 | 571,361 | |
| 8.00%, with various maturities to 2030 | 63 | 65,713 | |
| 9.00%, with various maturities to 2031 | 13 | 13,113 | |
| Federal National Mortgage Association: | |||
| 4.326%, (COF + 1.31%), 10/1/36(26) | 369 | 360,325 | |
| 4.402%, (6 mo. USD LIBOR + 1.54%), 9/1/37(26) | 475 | 478,871 | |
| 4.50%, 7/1/42 | 2,610 | 2,499,180 | |
| 5.00%, with various maturities to 2052 | 4,539 | 4,408,292 | |
| 5.105%, (1 yr. CMT + 2.27%), 8/1/36(26) | 2,347 | 2,378,968 | |
| 5.50%, 30-Year, TBA(27) | 4,650 | 4,495,971 | |
| 5.50%, with various maturities to 2033 | 305 | 304,356 | |
| 6.00%, with various maturities to 2029 | 88 | 87,052 | |
| 6.334%, (COF + 2.00%), 7/1/32(26) | 458 | 469,111 | |
| 6.50%, with various maturities to 2036 | 5,711 | 5,797,125 | |
| 7.00%, with various maturities to 2037 | 1,234 | 1,263,919 | |
| 7.50%, with various maturities to 2035 | 623 | 645,885 | |
| 8.00%, with various maturities to 2027 | 24 | 24,275 | |
| 8.047%, 9/15/27(9) | 23 | 23,426 | |
| 8.177%, 9/20/28(9) | 6 | 6,024 | |
| 8.213%, 10/15/29(9) | 6 | 6,289 | |
| 8.29%, 6/15/27(9) | 11 | 10,650 | |
| 8.50%, with various maturities to 2037 | 127 | 132,418 | |
| 9.00%, with various maturities to 2032 | 106 | 108,073 | |
| 9.50%, with various maturities to 2030 | 16 | 16,043 | |
| Government National Mortgage Association: | |||
| 4.00%, 9/20/49 | 219 | 198,225 | |
| 4.50%, with various maturities to 2052 | 2,472 | 2,294,952 | |
| 5.00%, 6/20/52 | 14,572 | 13,818,403 | |
| 5.50%, 30-Year, TBA(27) | 93,900 | 91,159,622 | |
| 6.00%, 30-Year, TBA(27) | 98,500 | 97,637,761 | |
| 6.00%, with various maturities to 2053 | 8,239 | 8,189,368 | |
| 6.50%, 30-Year, TBA(27) | 27,538 | 27,713,445 | |
| 6.50%, with various maturities to 2053 | 5,025 | 5,084,534 | |
| 7.00%, 4/20/26 | 36 | 36,466 | |
| 7.50%, with various maturities to 2032 | 576 | 587,001 | |
| 8.00%, with various maturities to 2034 | 672 | 687,993 | |
| Security | Principal Amount (000's omitted) | Value | |
| Government National Mortgage Association: (continued) | |||
| 9.00%, 12/15/25 | $ | 41 | $ 41,014 |
| Total U.S. Government Agency Mortgage-Backed Securities (identified cost $332,792,411) | $ 322,603,457 | ||
| Warrants — 0.0% |
| Security | Shares | Value | |
| Retailers (Except Food and Drug) — 0.0% | |||
| David’s Bridal, LLC, Exp. 12/31/28(11)(12)(13) | 7,886 | $ 0 | |
| Total Warrants (identified cost $0) | $ 0 | ||
| Miscellaneous — 0.0%(14) |
| Security | Principal Amount/ Shares | Value | |
| Cable and Satellite Television — 0.0% | |||
| ACC Claims Holdings, LLC(11)(13) | 2,257,600 | $ 0 | |
| $ 0 | |||
| Financial Intermediaries — 0.0% | |||
| Alpha Holding S.A., Escrow Certificates(11)(12) | 400,000 | $ 0 | |
| Alpha Holding S.A., Escrow Certificates(11)(12) | 1,530,000 | 0 | |
| $ 0 | |||
| Surface Transport — 0.0%(14) | |||
| Hertz Corp., Escrow Certificates(12) | $ | 364,000 | $ 32,760 |
| $ 32,760 | |||
| Total Miscellaneous (identified cost $0) | $ 32,760 | ||
| Short-Term Investments — 2.3% |
| Affiliated Fund — 2.3% |
| Security | Shares | Value | |
| Morgan Stanley Institutional Liquidity Funds - Government Portfolio, Institutional Class, 5.27%(28) | 26,743,497 | $ 26,743,497 | |
| Total Affiliated Fund (identified cost $26,743,497) | $ 26,743,497 | ||
| U.S. Treasury Obligations — 0.0%(14) |
| Security | Principal Amount (000's omitted) | Value | |
| U.S. Treasury Bill, 0.00%, 10/12/23(29) | $ | 500 | $ 499,268 |
| Total U.S. Treasury Obligations (identified cost $499,210) | $ 499,268 | ||
| Total Short-Term Investments (identified cost $27,242,707) | $ 27,242,765 | ||
| Total Investments — 164.3% (identified cost $2,131,700,554) | $1,949,474,139 | ||
| Less Unfunded Loan Commitments — (0.0)%(14) | $ (10,364) | ||
| Net Investments — 164.3% (identified cost $2,131,690,190) | $1,949,463,775 | ||
| Other Assets, Less Liabilities — (46.1)% | $ (546,635,138) | ||
| Auction Preferred Shares Plus Cumulative Unpaid Dividends — (18.2)% | $ (216,210,651) | ||
| Net Assets Applicable to Common Shares — 100.0% | $1,186,617,986 | ||
| The percentage shown for each investment category in the Portfolio of Investments is based on net assets applicable to common shares. | |
| * | In U.S. dollars unless otherwise indicated. |
| (1) | Security exempt from registration under Rule 144A of the Securities Act of 1933, as amended. These securities may be sold in certain transactions in reliance on an exemption from registration (normally to qualified institutional buyers). At September 30, 2023, the aggregate value of these securities is $642,187,827 or 54.1% of the Fund's net assets applicable to common shares. |
| (2) | Variable rate security. The stated interest rate represents the rate in effect at September 30, 2023. |
| (3) | When-issued security. For a variable rate security interest rate will be determined after September 30, 2023. |
| (4) | Step coupon security. Interest rate represents the rate in effect at September 30, 2023. |
| (5) | Principal amount is less than $500. |
| (6) | Inverse floating-rate security whose coupon varies inversely with changes in the interest rate index. The stated interest rate represents the coupon rate in effect at September 30, 2023. |
| (7) | Interest only security that entitles the holder to receive only interest payments on the underlying mortgages. Principal amount shown is the notional amount of the underlying mortgages on which coupon interest is calculated. |
| (8) | Principal only security that entitles the holder to receive only principal payments on the underlying mortgages. |
| (9) | Weighted average fixed-rate coupon that changes/updates monthly. Rate shown is the rate at September 30, 2023. |
| (10) | Represents an investment in an issuer that may be deemed to be an affiliate (see Note 9). |
| (11) | For fair value measurement disclosure purposes, security is categorized as Level 3 (see Note 10). |
| (12) | Non-income producing security. |
| (13) | Security was acquired in connection with a restructuring of a Senior Loan and may be subject to restrictions on resale. |
| (14) | Amount is less than 0.05% or (0.05)%, as applicable. |
| (15) | Security exempt from registration under Regulation S of the Securities Act of 1933, as amended, which exempts from registration securities offered and sold outside the United States. Security may not be offered or sold in the United States except pursuant to an exemption from, or in a transaction not subject to, the registration requirements of the Securities Act of 1933, as amended. At September 30, 2023, the aggregate value of these securities is $74,257,779 or 6.3% of the Fund's net assets applicable to common shares. |
| (16) | Security converts to variable rate after the indicated fixed-rate coupon period. |
| (17) | Represents a payment-in-kind security which may pay interest in additional principal at the issuer’s discretion. |
| (18) | Perpetual security with no stated maturity date but may be subject to calls by the issuer. |
| (19) | Issuer is in default with respect to interest and/or principal payments or has declared bankruptcy. For a variable rate security, interest rate has been adjusted to reflect non-accrual status. |
| (20) | Senior floating-rate loans (Senior Loans) often require prepayments from excess cash flows or permit the borrowers to repay at their election. The degree to which borrowers repay, whether as a contractual requirement or at their election, cannot be predicted with accuracy. As a result, the actual remaining maturity may be substantially less than the stated maturities shown. However, Senior Loans will typically have an expected average life of approximately two to four years. Senior Loans typically have rates of interest which are redetermined periodically by reference to a base lending rate, plus a spread. These base lending rates are primarily the Secured Overnight Financing Rate (“SOFR”) (or the London Interbank Offered Rate (“LIBOR”) for those loans whose rates reset prior to the discontinuance of LIBOR on June 30, 2023) and secondarily, the prime rate offered by one or more major United States banks (the “Prime Rate”). Base lending rates may be subject to a floor, or minimum rate. Rates for SOFR are generally 1 or 3-month tenors and may also be subject to a credit spread adjustment. Senior Loans are generally subject to contractual restrictions that must be satisfied before they can be bought or sold. |
| (21) | This Senior Loan will settle after September 30, 2023, at which time the interest rate will be determined. |
| (22) | The stated interest rate represents the weighted average interest rate at September 30, 2023 of contracts within the senior loan facility. Interest rates on contracts are primarily redetermined either monthly or quarterly by reference to the indicated base lending rate and spread and the reset period. |
| (23) | Unfunded or partially unfunded loan commitments. The stated interest rate reflects the weighted average of the reference rate and spread for the funded portion, if any, and the commitment fees on the portion of the loan that is unfunded. At September 30, 2023, the total value of unfunded loan commitments is $8,284. See Note 1F for description. |
| (24) | Amounts payable in respect of the security are contingent upon and determined by reference to Ukraine’s GDP and Real GDP Growth Rate. Principal amount represents the notional amount used to calculate payments due to the security holder and does not represent an entitlement for payment. |
| (25) | Loan is subject to scheduled mandatory prepayments. Maturity date shown reflects the final maturity date. |
| (26) | Adjustable rate mortgage security whose interest rate generally adjusts monthly based on a weighted average of interest rates on the underlying mortgages. The coupon rate may not reflect the applicable index value as interest rates on the underlying mortgages may adjust on various dates and at various intervals and may be subject to lifetime ceilings and lifetime floors and lookback periods. Rate shown is the coupon rate at September 30, 2023. |
| (27) | TBA (To Be Announced) securities are purchased on a forward commitment basis with an approximate principal amount and maturity date. The actual principal amount and maturity date are determined upon settlement. |
| (28) | May be deemed to be an affiliated investment company. The rate shown is the annualized seven-day yield as of September 30, 2023. |
| (29) | Security (or a portion thereof) has been pledged to cover margin requirements on open derivative contracts. |
| Forward Foreign Currency Exchange Contracts (Centrally Cleared) | |||||
| Currency Purchased | Currency Sold | Settlement Date | Value/Unrealized Appreciation (Depreciation) | ||
| EUR | 1,142,237 | USD | 1,223,130 | 12/20/23 | $ (11,073) |
| USD | 3,778,623 | EUR | 3,528,719 | 12/20/23 | 34,206 |
| USD | 2,001,380 | EUR | 1,869,016 | 12/20/23 | 18,118 |
| USD | 1,710,626 | EUR | 1,597,492 | 12/20/23 | 15,486 |
| USD | 1,622,920 | EUR | 1,515,586 | 12/20/23 | 14,692 |
| USD | 1,037,365 | EUR | 968,758 | 12/20/23 | 9,391 |
| $ 80,820 | |||||
| Forward Foreign Currency Exchange Contracts (OTC) | |||||||
| Currency Purchased | Currency Sold | Counterparty | Settlement Date | Unrealized Appreciation | Unrealized (Depreciation) | ||
| USD | 45,820,826 | EUR | 42,161,465 | Standard Chartered Bank | 10/3/23 | $ 1,245,613 | $ — |
| GBP | 100,000 | USD | 122,526 | Bank of America, N.A. | 10/4/23 | — | (515) |
| USD | 105,578 | EUR | 100,000 | Bank of America, N.A. | 10/5/23 | — | (156) |
| EUR | 90,613 | USD | 97,350 | Citibank, N.A. | 10/6/23 | — | (1,539) |
| EUR | 307,323 | USD | 330,335 | Citibank, N.A. | 10/6/23 | — | (5,378) |
| USD | 715,326 | EUR | 666,539 | Citibank, N.A. | 10/6/23 | 10,542 | — |
| USD | 170,771 | EUR | 159,014 | Citibank, N.A. | 10/6/23 | 2,633 | — |
| USD | 81,802 | EUR | 76,317 | HSBC Bank USA, N.A. | 10/6/23 | 1,106 | — |
| USD | 198,833 | EUR | 186,087 | State Street Bank and Trust Company | 10/6/23 | 2,068 | — |
| CAD | 20,400 | USD | 15,228 | HSBC Bank USA, N.A. | 10/31/23 | — | (203) |
| EUR | 13,898 | USD | 14,971 | HSBC Bank USA, N.A. | 10/31/23 | — | (260) |
| EUR | 17,228 | USD | 18,522 | HSBC Bank USA, N.A. | 10/31/23 | — | (287) |
| EUR | 252,294 | USD | 274,361 | HSBC Bank USA, N.A. | 10/31/23 | — | (7,316) |
| EUR | 155,189 | USD | 166,867 | State Street Bank and Trust Company | 10/31/23 | — | (2,605) |
| GBP | 11,598 | USD | 14,508 | State Street Bank and Trust Company | 10/31/23 | — | (354) |
| USD | 497,417 | CAD | 655,597 | HSBC Bank USA, N.A. | 10/31/23 | 14,552 | — |
| USD | 3,341 | CAD | 4,403 | The Toronto-Dominion Bank | 10/31/23 | 98 | — |
| Forward Foreign Currency Exchange Contracts (OTC) (continued) | |||||||
| Currency Purchased | Currency Sold | Counterparty | Settlement Date | Unrealized Appreciation | Unrealized (Depreciation) | ||
| USD | 1,088,588 | EUR | 1,000,000 | Australia and New Zealand Banking Group Limited | 10/31/23 | $ 30,122 | $ — |
| USD | 550,290 | EUR | 500,000 | Australia and New Zealand Banking Group Limited | 10/31/23 | 21,056 | — |
| USD | 760,910 | EUR | 709,043 | Bank of America, N.A. | 10/31/23 | 10,411 | — |
| USD | 9,082 | EUR | 8,224 | Bank of America, N.A. | 10/31/23 | 378 | — |
| USD | 153,820 | EUR | 142,061 | Citibank, N.A. | 10/31/23 | 3,453 | — |
| USD | 110,979 | EUR | 102,469 | Citibank, N.A. | 10/31/23 | 2,518 | — |
| USD | 672,041 | EUR | 613,225 | Goldman Sachs International | 10/31/23 | 22,962 | — |
| USD | 17,141 | EUR | 15,641 | Goldman Sachs International | 10/31/23 | 586 | — |
| USD | 12,732,992 | EUR | 11,514,289 | HSBC Bank USA, N.A. | 10/31/23 | 545,498 | — |
| USD | 10,185,676 | EUR | 9,221,669 | HSBC Bank USA, N.A. | 10/31/23 | 424,845 | — |
| USD | 9,734,440 | EUR | 8,813,998 | HSBC Bank USA, N.A. | 10/31/23 | 405,116 | — |
| USD | 315,121 | EUR | 284,960 | HSBC Bank USA, N.A. | 10/31/23 | 13,500 | — |
| USD | 252,080 | EUR | 228,222 | HSBC Bank USA, N.A. | 10/31/23 | 10,514 | — |
| USD | 240,911 | EUR | 218,132 | HSBC Bank USA, N.A. | 10/31/23 | 10,026 | — |
| USD | 1,095,441 | EUR | 1,000,000 | NatWest Group PLC | 10/31/23 | 36,974 | — |
| USD | 596,183 | EUR | 550,000 | Standard Chartered Bank | 10/31/23 | 14,027 | — |
| USD | 551,182 | EUR | 500,000 | State Street Bank and Trust Company | 10/31/23 | 21,948 | — |
| USD | 232,075 | GBP | 189,390 | Bank of America, N.A. | 10/31/23 | 961 | — |
| USD | 48,604 | GBP | 37,765 | Citibank, N.A. | 10/31/23 | 2,519 | — |
| USD | 1,300 | GBP | 1,010 | Citibank, N.A. | 10/31/23 | 67 | — |
| USD | 4,927,808 | GBP | 3,837,146 | Goldman Sachs International | 10/31/23 | 245,301 | — |
| USD | 325,031 | GBP | 253,093 | Goldman Sachs International | 10/31/23 | 16,180 | — |
| USD | 90,616 | GBP | 71,168 | Goldman Sachs International | 10/31/23 | 3,769 | — |
| USD | 5,555 | GBP | 4,363 | Goldman Sachs International | 10/31/23 | 231 | — |
| USD | 44,692,852 | EUR | 42,161,465 | Standard Chartered Bank | 11/2/23 | 62,650 | — |
| USD | 11,268,331 | EUR | 10,314,857 | Bank of America, N.A. | 11/30/23 | 336,262 | — |
| USD | 6,102,438 | EUR | 5,588,322 | Bank of America, N.A. | 11/30/23 | 179,727 | — |
| USD | 7,035,467 | EUR | 6,444,597 | State Street Bank and Trust Company | 11/30/23 | 205,243 | — |
| USD | 482,286 | EUR | 441,817 | The Toronto-Dominion Bank | 11/30/23 | 14,031 | — |
| USD | 5,503,643 | GBP | 4,361,147 | State Street Bank and Trust Company | 11/30/23 | 180,904 | — |
| USD | 194,180 | EUR | 183,975 | Australia and New Zealand Banking Group Limited | 12/29/23 | — | (1,155) |
| USD | 5,272,655 | EUR | 5,000,000 | Australia and New Zealand Banking Group Limited | 12/29/23 | — | (36,089) |
| USD | 5,274,930 | EUR | 5,000,000 | Goldman Sachs International | 12/29/23 | — | (33,814) |
| USD | 5,272,611 | EUR | 5,000,000 | State Street Bank and Trust Company | 12/29/23 | — | (36,133) |
| USD | 5,810,731 | EUR | 5,511,638 | State Street Bank and Trust Company | 12/29/23 | — | (41,244) |
| USD | 5,810,342 | EUR | 5,511,638 | State Street Bank and Trust Company | 12/29/23 | — | (41,634) |
| $4,098,391 | $(208,682) | ||||||
| Futures Contracts | |||||
| Description | Number of Contracts | Position | Expiration Date | Notional Amount | Value/Unrealized Appreciation (Depreciation) |
| Interest Rate Futures | |||||
| U.S. 2-Year Treasury Note | 141 | Long | 12/29/23 | $ 28,582,242 | $ (72,566) |
| U.S. 5-Year Treasury Note | 933 | Long | 12/29/23 | 98,300,297 | 94,040 |
| U.S. Ultra 10-Year Treasury Note | 18 | Long | 12/19/23 | 2,008,125 | (58,781) |
| Euro-Bobl | (21) | Short | 12/7/23 | (2,569,911) | 26,865 |
| Euro-Bund | (12) | Short | 12/7/23 | (1,632,056) | 31,960 |
| Euro-Buxl | (12) | Short | 12/7/23 | (1,552,381) | 105,490 |
| U.S. 2-Year Treasury Note | (3) | Short | 12/29/23 | (608,133) | 2,109 |
| U.S. 5-Year Treasury Note | (68) | Short | 12/29/23 | (7,164,438) | 59,333 |
| U.S. 10-Year Treasury Note | (102) | Short | 12/19/23 | (11,022,375) | 190,901 |
| U.S. Long Treasury Bond | (149) | Short | 12/19/23 | (16,953,406) | 30,310 |
| U.S. Ultra 10-Year Treasury Note | (16) | Short | 12/19/23 | (1,785,000) | 50,101 |
| U.S. Ultra-Long Treasury Bond | (134) | Short | 12/19/23 | (15,904,125) | 277,797 |
| $737,559 | |||||
| Credit Default Swaps - Sell Protection (OTC) | ||||||||
| Reference Entity | Counterparty | Notional Amount* (000's omitted) | Contract Annual Fixed Rate** | Current Market Annual Fixed Rate*** | Termination Date | Value | Unamortized Upfront Receipts (Payments) | Unrealized Appreciation (Depreciation) |
| Mexico | Citibank, N.A. | $ 2,041 | 1.00% (pays quarterly)(1) | 1.79% | 12/20/31 | $ (104,890) | $ 74,992 | $ (29,898) |
| Total | $2,041 | $(104,890) | $74,992 | $(29,898) | ||||
| * | If the Fund is the seller of credit protection, the notional amount is the maximum potential amount of future payments the Fund could be required to make if a credit event, as defined in the credit default swap agreement, were to occur. At September 30, 2023, such maximum potential amount for all open credit default swaps in which the Fund is the seller was $2,041,000. |
| ** | The contract annual fixed rate represents the fixed rate of interest received by the Fund (as a seller of protection) or paid by the Fund (as a buyer of protection) on the notional amount of the credit default swap contract. |
| *** | Current market annual fixed rates, utilized in determining the net unrealized appreciation or depreciation as of period end, serve as an indicator of the market’s perception of the current status of the payment/performance risk associated with the credit derivative. The current market annual fixed rate of a particular reference entity reflects the cost, as quoted by the pricing vendor, of selling protection against default of that entity as of period end and may include upfront payments required to be made to enter into the agreement. The higher the fixed rate, the greater the market perceived risk of a credit event involving the reference entity. A rate identified as “Defaulted” indicates a credit event has occurred for the reference entity. |
| (1) | Upfront payment is exchanged with the counterparty as a result of the standardized trading coupon. |
| Abbreviations: | |
| CMT | – Constant Maturity Treasury |
| COF | – Cost of Funds 11th District |
| DIP | – Debtor In Possession |
| EURIBOR | – Euro Interbank Offered Rate |
| GDP | – Gross Domestic Product |
| LIBOR | – London Interbank Offered Rate |
| OTC | – Over-the-counter |
| PIK | – Payment In Kind |
| SOFR | – Secured Overnight Financing Rate |
| SONIA | – Sterling Overnight Interbank Average |
| TBA | – To Be Announced |
| Currency Abbreviations: | |
| CAD | – Canadian Dollar |
| EUR | – Euro |
| GBP | – British Pound Sterling |
| USD | – United States Dollar |
| September 30, 2023 | |
| Assets | |
| Unaffiliated investments, at value (identified cost $2,092,642,791) | $ 1,912,391,668 |
| Affiliated investments, at value (identified cost $39,047,399) | 37,072,107 |
| Cash | 6,733,956 |
| Deposits for derivatives collateral: | |
| Futures contracts | 1,161,459 |
| Centrally cleared derivatives | 508,659 |
| OTC derivatives | 3,305,400 |
| Deposits for forward commitment securities | 2,076,000 |
| Foreign currency, at value (identified cost $8,066,504) | 8,012,210 |
| Interest receivable | 20,549,511 |
| Interest and dividends receivable from affiliated investments | 171,287 |
| Receivable for investments sold | 3,468,449 |
| Receivable for variation margin on open futures contracts | 13,516 |
| Receivable for open forward foreign currency exchange contracts | 4,098,391 |
| Tax reclaims receivable | 7,315 |
| Prepaid upfront fees on notes payable | 607,956 |
| Trustees' deferred compensation plan | 262,583 |
| Prepaid expenses | 8,890 |
| Total assets | $2,000,449,357 |
| Liabilities | |
| Notes payable | $ 333,000,000 |
| Cash collateral due to brokers | 3,210,000 |
| Payable for investments purchased | 15,466,977 |
| Payable for when-issued/delayed delivery/forward commitment securities | 241,065,146 |
| Payable for variation margin on open centrally cleared derivatives | 19,807 |
| Payable for open forward foreign currency exchange contracts | 208,682 |
| Payable for open swap contracts | 29,898 |
| Upfront receipts on open non-centrally cleared swap contracts | 74,992 |
| Payable to affiliates: | |
| Investment adviser fee | 1,072,884 |
| Trustees' deferred compensation plan | 262,583 |
| Accrued expenses | 3,209,751 |
| Total liabilities | $ 597,620,720 |
| Auction preferred shares (8,640 shares outstanding) at liquidation value plus cumulative unpaid dividends | $ 216,210,651 |
| Net assets applicable to common shares | $1,186,617,986 |
| Sources of Net Assets | |
| Common shares, $0.01 par value, unlimited number of shares authorized | $ 1,162,035 |
| Additional paid-in capital | 1,627,248,324 |
| Accumulated loss | (441,792,373) |
| Net assets applicable to common shares | $1,186,617,986 |
| Common Shares Issued and Outstanding | 116,203,460 |
| Net Asset Value Per Common Share | |
| Net assets ÷ common shares issued and outstanding | $ 10.21 |
| Six Months Ended | |
| September 30, 2023 | |
| Investment Income | |
| Dividend income | $ 1,060,535 |
| Dividend income from affiliated investments | 808,415 |
| Interest and other income | 63,253,214 |
| Interest income from affiliated investments | 343,696 |
| Total investment income | $ 65,465,860 |
| Expenses | |
| Investment adviser fee | $ 6,467,390 |
| Trustees’ fees and expenses | 54,250 |
| Custodian fee | 317,971 |
| Transfer and dividend disbursing agent fees | 11,059 |
| Legal and accounting services | 120,465 |
| Printing and postage | 195,377 |
| Interest expense and fees | 11,080,392 |
| Preferred shares service fee | 113,612 |
| Miscellaneous | 104,887 |
| Total expenses | $ 18,465,403 |
| Deduct: | |
| Waiver and/or reimbursement of expenses by affiliates | $ 21,815 |
| Total expense reductions | $ 21,815 |
| Net expenses | $ 18,443,588 |
| Net investment income | $ 47,022,272 |
| Realized and Unrealized Gain (Loss) | |
| Net realized gain (loss): | |
| Investment transactions | $ (30,698,346) |
| Futures contracts | 758,808 |
| Swap contracts | (17,129) |
| Foreign currency transactions | (186,088) |
| Forward foreign currency exchange contracts | (185,572) |
| Net realized loss | $(30,328,327) |
| Change in unrealized appreciation (depreciation): | |
| Investments | $ 5,233,345 |
| Investments - affiliated investments | 352,004 |
| Futures contracts | 1,300,889 |
| Swap contracts | 20,527 |
| Foreign currency | (12,708) |
| Forward foreign currency exchange contracts | 5,530,917 |
| Net change in unrealized appreciation (depreciation) | $ 12,424,974 |
| Net realized and unrealized loss | $(17,903,353) |
| Distributions to preferred shareholders | $ (9,110,069) |
| Net increase in net assets from operations | $ 20,008,850 |
| Six Months Ended September 30, 2023 (Unaudited) | Year Ended March 31, 2023 | |
| Increase (Decrease) in Net Assets | ||
| From operations: | ||
| Net investment income | $ 47,022,272 | $ 81,866,574 |
| Net realized loss | (30,328,327) | (48,404,601) |
| Net change in unrealized appreciation (depreciation) | 12,424,974 | (91,991,826) |
| Distributions to preferred shareholders | (9,110,069) | (9,997,733) |
| Net increase (decrease) in net assets from operations | $ 20,008,850 | $ (68,527,586) |
| Distributions to common shareholders | $ (54,569,145)* | $ (83,662,686) |
| Tax return of capital to common shareholders | $ — | $ (55,781,466) |
| Net decrease in net assets | $ (34,560,295) | $ (207,971,738) |
| Net Assets Applicable to Common Shares | ||
| At beginning of period | $ 1,221,178,281 | $ 1,429,150,019 |
| At end of period | $1,186,617,986 | $1,221,178,281 |
| * | A portion of the distributions may be deemed a tax return of capital at year-end. See Note 3. |
| Six Months Ended | |
| September 30, 2023 | |
| Cash Flows From Operating Activities | |
| Net increase in net assets from operations | $ 20,008,850 |
| Distributions to preferred shareholders | 9,110,069 |
| Net increase in net assets from operations excluding distributions to preferred shareholders | $ 29,118,919 |
| Adjustments to reconcile net increase in net assets from operations to net cash provided by operating activities: | |
| Investments purchased | (2,098,949,849) |
| Investments sold and principal repayments | 2,102,236,046 |
| Increase in short-term investments, net | (676,320) |
| Net amortization/accretion of premium (discount) | (659,930) |
| Amortization of prepaid upfront fees on notes payable | 251,550 |
| Increase in interest receivable | (1,116,533) |
| Increase in interest and dividends receivable from affiliated investments | (1,358) |
| Increase in receivable for variation margin on open futures contracts | (13,516) |
| Decrease in receivable for variation margin on open centrally cleared derivatives | 39,799 |
| Decrease in tax reclaims receivable | 3,708 |
| Increase in Trustees’ deferred compensation plan | (262,583) |
| Increase in cash collateral due to brokers | 2,952,236 |
| Increase in payable for variation margin on open centrally cleared derivatives | 19,807 |
| Decrease in payable for variation margin on open futures contracts | (82,432) |
| Decrease in payable for open swap contracts | (5,995) |
| Decrease in upfront receipts on open non-centrally cleared swap contracts | (4,571) |
| Decrease in payable to affiliate for investment adviser fee | (36,079) |
| Increase in payable to affiliate for Trustees' deferred compensation plan | 262,583 |
| Increase in accrued expenses | 260,278 |
| Decrease in unfunded loan commitments | (90,369) |
| Net change in unrealized (appreciation) depreciation from investments | (5,585,349) |
| Net change in unrealized (appreciation) depreciation from forward foreign currency exchange contracts (OTC) | (5,359,337) |
| Net realized loss from investments | 30,698,346 |
| Net cash provided by operating activities | $ 52,999,051 |
| Cash Flows From Financing Activities | |
| Cash distributions paid to common shareholders | $ (54,569,145) |
| Cash distributions paid to preferred shareholders | (9,037,716) |
| Proceeds from notes payable | 69,000,000 |
| Repayments of notes payable | (50,000,000) |
| Net cash used in financing activities | $ (44,606,861) |
| Net increase in cash and restricted cash* | $ 8,392,190 |
| Cash and restricted cash at beginning of period (including foreign currency) | $ 13,405,494 |
| Cash and restricted cash at end of period (including foreign currency) | $ 21,797,684 |
| Supplemental disclosure of cash flow information: | |
| Cash paid for interest and fees on borrowings | $ 10,218,775 |
| * | Includes net change in unrealized appreciation (depreciation) on foreign currency of $(63,732). |
| September 30, 2023 | |
| Cash | $ 6,733,956 |
| Deposits for derivatives collateral: | |
| Futures contracts | 1,161,459 |
| Centrally cleared derivatives | 508,659 |
| OTC derivatives | 3,305,400 |
| Deposits for forward commitment securities | 2,076,000 |
| Foreign currency | 8,012,210 |
| Total cash and restricted cash as shown on the Statement of Cash Flows | $21,797,684 |
| Six Months Ended September 30, 2023 (Unaudited) | Year Ended March 31, | |||||
| 2023 | 2022 | 2021 | 2020 | 2019 | ||
| Net asset value — Beginning of period (Common shares) | $ 10.510 | $ 12.300 | $ 13.570 | $ 11.750 | $ 14.450 | $ 14.740 |
| Income (Loss) From Operations | ||||||
| Net investment income(1) | $ 0.405 | $ 0.705 | $ 0.640 | $ 0.756 | $ 0.762 | $ 0.826 |
| Net realized and unrealized gain (loss) | (0.157) | (1.209) | (0.707) | 2.271 | (2.390) | (0.267) |
| Distributions to preferred shareholders: From net investment income(1) | (0.078) | (0.086) | (0.003) | (0.007) | (0.055) | (0.066) |
| Discount on redemption and repurchase of auction preferred shares(1) | — | — | — | — | — | 0.035 |
| Total income (loss) from operations | $ 0.170 | $ (0.590) | $ (0.070) | $ 3.020 | $ (1.683) | $ 0.528 |
| Less Distributions to Common Shareholders | ||||||
| From net investment income | $ (0.470)* | $ (0.720) | $ (0.681) | $ (0.789) | $ (0.839) | $ (0.818) |
| Tax return of capital | — | (0.480) | (0.519) | (0.411) | (0.178) | — |
| Total distributions to common shareholders | $ (0.470) | $ (1.200) | $ (1.200) | $ (1.200) | $ (1.017) | $ (0.818) |
| Net asset value — End of period (Common shares) | $10.210 | $10.510 | $12.300 | $13.570 | $11.750 | $14.450 |
| Market value — End of period (Common shares) | $ 9.040 | $ 9.850 | $11.700 | $12.630 | $10.570 | $12.650 |
| Total Investment Return on Net Asset Value(2) | 2.25% (3) | (3.98)% | (0.42)% | 27.62% | (11.69)% | 4.57% (4) |
| Total Investment Return on Market Value(2) | (3.49)% (3) | (5.30)% | 1.70% | 32.25% | (9.33)% | 3.70% |
| Six Months Ended September 30, 2023 (Unaudited) | Year Ended March 31, | |||||
| 2023 | 2022 | 2021 | 2020 | 2019 | ||
| Ratios/Supplemental Data | ||||||
| Net assets applicable to common shares, end of period (000’s omitted) | $1,186,618 | $1,221,178 | $1,429,150 | $1,575,692 | $1,365,197 | $1,678,459 |
| Ratios (as a percentage of average daily net assets applicable to common shares):(5)† | ||||||
| Expenses excluding interest and fees | 1.22% (6) | 1.29% | 1.24% | 1.33% | 1.29% | 1.31% |
| Interest and fee expense(7) | 1.84% (6) | 1.43% | 0.53% | 0.58% | 1.33% | 1.43% |
| Total expenses | 3.06% (6)(8) | 2.72% (8) | 1.77% | 1.91% | 2.62% | 2.74% |
| Net investment income | 7.79% (6) | 6.47% | 4.83% | 5.73% | 5.33% | 5.71% |
| Portfolio Turnover | 109% (3)(9) | 201% (9) | 137% (9) | 57% (9) | 49% | 34% |
| Senior Securities: | ||||||
| Total notes payable outstanding (in 000’s) | $ 333,000 | $ 314,000 | $ 578,000 | $ 570,000 | $ 525,000 | $ 595,000 |
| Asset coverage per $1,000 of notes payable(10) | $ 5,213 | $ 5,577 | $ 3,846 | $ 4,143 | $ 4,012 | $ 4,184 |
| Total preferred shares outstanding | 8,640 | 8,640 | 8,640 | 8,640 | 8,640 | 8,640 |
| Asset coverage per preferred share(11) | $ 79,045 | $ 82,609 | $ 69,999 | $ 75,118 | $ 71,062 | $ 76,744 |
| Involuntary liquidation preference per preferred share(12) | $ 25,000 | $ 25,000 | $ 25,000 | $ 25,000 | $ 25,000 | $ 25,000 |
| Approximate market value per preferred share(12) | $ 25,000 | $ 25,000 | $ 25,000 | $ 25,000 | $ 25,000 | $ 25,000 |
| (1) | Computed using average common shares outstanding. |
| (2) | Returns are historical and are calculated by determining the percentage change in net asset value or market value with all distributions reinvested. Distributions are assumed to be reinvested at prices obtained under the Fund's dividend reinvestment plan. |
| (3) | Not annualized. |
| (4) | The total return based on net asset value reflects the impact of the tender and repurchase by the Fund of a portion of its Auction Preferred Shares at 92% of the per share liquidation preference. Absent this transaction, the total return based on net asset value would have been 4.31%. |
| (5) | Ratios do not reflect the effect of dividend payments to preferred shareholders. |
| (6) | Annualized. |
| (7) | Interest and fee expense relates to the notes payable, a portion of which was incurred to partially redeem the Fund’s Auction Preferred Shares (see Note 2). |
| (8) | Includes a reduction by the investment adviser of a portion of its adviser fee due to the Fund’s investment in the Liquidity Fund (equal to less than 0.005% and 0.01% of average daily net assets for the six months ended September 30, 2023 and the year ended March 31, 2023, respectively). |
| (9) | Includes the effect of To-Be-Announced (TBA) transactions. |
| (10) | Calculated by subtracting the Fund's total liabilities (not including the notes payable and preferred shares) from the Fund's total assets, and dividing the result by the notes payable balance in thousands. |
| (11) | Calculated by subtracting the Fund’s total liabilities (not including the notes payable and preferred shares) from the Fund’s total assets, dividing the result by the sum of the value of the notes payable and liquidation value of the preferred shares, and multiplying the result by the liquidation value of one preferred share. Such amount equates to 316%, 330%, 280%, 300%, 284% and 307% at September 30, 2023 and March 31, 2023, 2022, 2021, 2020 and 2019, respectively. |
| (12) | Plus accumulated and unpaid dividends. |
| * | A portion of the distributions may be deemed a tax return of capital at year-end. See Note 3. |
| † | Ratios based on net assets applicable to common shares plus preferred shares and borrowings are presented below. Ratios do not reflect the effect of dividend payments to preferred shareholders. |
| Six Months Ended September 30, 2023 (Unaudited) | Year Ended March 31, | |||||
| 2023 | 2022 | 2021 | 2020 | 2019 | ||
| Expenses excluding interest and fees | 0.86% | 0.85% | 0.83% | 0.88% | 0.86% | 0.87% |
| Interest and fee expense | 1.28% | 0.94% | 0.36% | 0.38% | 0.89% | 0.95% |
| Total expenses | 2.14% | 1.79% | 1.19% | 1.26% | 1.75% | 1.82% |
| Net investment income | 5.45% | 4.24% | 3.25% | 3.79% | 3.57% | 3.79% |
backed securities, whereby the IO security receives all the interest and the PO security receives all the principal on a pool of mortgage assets. The yield to maturity on an IO security is extremely sensitive to the rate of principal payments (including prepayments) on the related underlying mortgage assets, and a rapid rate of principal payments may have a material adverse effect on the yield to maturity from these securities. If the underlying mortgages experience greater than anticipated prepayments of principal, the Fund may fail to recoup its initial investment in an IO security. The market value of IO and PO securities can be unusually volatile due to changes in interest rates.
| APS Issued and Outstanding | |
| Series A | 1,728 |
| Series B | 1,728 |
| Series C | 1,728 |
| Series D | 1,728 |
| Series E | 1,728 |
| APS Dividend Rates at September 30, 2023 | Dividends Accrued to APS Shareholders | Average APS Dividend Rates | Dividend Rate Ranges (%) | |
| Series A | 8.73% | $1,821,677 | 8.43% | 7.73-8.73 |
| Series B | 8.73 | 1,820,650 | 8.43 | 7.73-8.73 |
| Series C | 8.68 | 1,822,862 | 8.44 | 7.73-8.73 |
| Series D | 8.68 | 1,825,825 | 8.45 | 7.74-8.73 |
| Series E | 8.73 | 1,819,055 | 8.42 | 7.74-8.73 |
| Aggregate cost | $2,129,405,527 |
| Gross unrealized appreciation | $ 16,516,472 |
| Gross unrealized depreciation | (191,780,034) |
| Net unrealized depreciation | $ (175,263,562) |
| Purchases | Sales | |
| Investments (non-U.S. Government) | $ 207,063,729 | $ 223,921,396 |
| U.S. Government and Agency Securities | 1,909,318,079 | 1,875,322,577 |
| $2,116,381,808 | $2,099,243,973 |
| Fair Value | ||||
| Statement of Assets and Liabilities Caption | Credit | Foreign Exchange | Interest Rate | Total |
| Accumulated loss | $ — | $ 91,893 | $ 868,906* | $ 960,799 |
| Receivable for open forward foreign currency exchange contracts | — | 4,098,391 | — | 4,098,391 |
| Total Asset Derivatives | $ — | $4,190,284 | $ 868,906 | $5,059,190 |
| Derivatives not subject to master netting or similar agreements | $ — | $ 91,893 | $ 868,906 | $ 960,799 |
| Total Asset Derivatives subject to master netting or similar agreements | $ — | $4,098,391 | $ — | $4,098,391 |
| Accumulated loss | $ — | $ (11,073) | $ (131,347) | $ (142,420) |
| Payable for open forward foreign currency exchange contracts | — | (208,682) | — | (208,682) |
| Payable for open swap contracts; Upfront receipts on open non-centrally cleared swap contracts | (104,890) | — | — | (104,890) |
| Total Liability Derivatives | $(104,890) | $ (219,755) | $(131,347) | $ (455,992) |
| Derivatives not subject to master netting or similar agreements | $ — | $ (11,073) | $(131,347) | $ (142,420) |
| Total Liability Derivatives subject to master netting or similar agreements | $(104,890) | $ (208,682) | $ — | $ (313,572) |
| * | For futures contracts and centrally cleared derivatives, amount represents value as shown in the Portfolio of Investments. Only the current day’s variation margin on open futures contracts and centrally cleared derivatives is reported within the Statement of Assets and Liabilities as Receivable or Payable for variation margin on open futures contracts and centrally cleared derivatives, as applicable. |
| Counterparty | Derivative Assets Subject to Master Netting Agreement | Derivatives Available for Offset | Non-cash Collateral Received(a) | Cash Collateral Received(a) | Net Amount of Derivative Assets(b) | Total Cash Collateral Received |
| Australia and New Zealand Banking Group Limited | $ 51,178 | $ (37,244) | $ — | $ — | $ 13,934 | $ — |
| Bank of America, N.A. | 527,739 | (671) | — | (527,068) | — | 780,000 |
| Citibank, N.A. | 21,732 | (21,732) | — | — | — | — |
| Goldman Sachs International | 289,029 | (33,814) | — | (250,000) | 5,215 | 250,000 |
| HSBC Bank USA, N.A. | 1,425,157 | (8,066) | (1,417,091) | — | — | — |
| NatWest Group PLC | 36,974 | — | — | — | 36,974 | — |
| Standard Chartered Bank | 1,322,290 | — | — | (1,322,290) | — | 1,500,000 |
| State Street Bank and Trust Company | 410,163 | (121,970) | (288,193) | — | — | 680,000 |
| The Toronto-Dominion Bank | 14,129 | — | — | — | 14,129 | — |
| $4,098,391 | $(223,497) | $(1,705,284) | $(2,099,358) | $70,252 | $3,210,000 |
| Counterparty | Derivative Liabilities Subject to Master Netting Agreement | Derivatives Available for Offset | Non-cash Collateral Pledged(a) | Cash Collateral Pledged(a) | Net Amount of Derivative Liabilities(c) | Total Cash Collateral Pledged |
| Australia and New Zealand Banking Group Limited | $ (37,244) | $ 37,244 | $ — | $ — | $ — | $ — |
| Bank of America, N.A. | (671) | 671 | — | — | — | — |
| Citibank, N.A. | (111,807) | 21,732 | 80,582 | 9,493 | — | 95,400 |
| Goldman Sachs International | (33,814) | 33,814 | — | — | — | — |
| HSBC Bank USA, N.A. | (8,066) | 8,066 | — | — | — | — |
| State Street Bank and Trust Company | (121,970) | 121,970 | — | — | — | — |
| $(313,572) | $223,497 | $80,582 | $9,493 | $ — | $ 95,400 | |
| Total — Deposits for derivatives collateral — OTC derivatives | $3,305,400 | |||||
| (a) | In some instances, the total collateral received and/or pledged may be more than the amount shown due to overcollateralization. |
| (b) | Net amount represents the net amount due from the counterparty in the event of default. |
| (c) | Net amount represents the net amount payable to the counterparty in the event of default. |
| Statement of Operations Caption | Credit | Foreign Exchange | Interest Rate | Total |
| Net realized gain (loss): | ||||
| Futures contracts | $ — | $ — | $ 758,808 | $ 758,808 |
| Swap contracts | (17,129) | — | — | (17,129) |
| Forward foreign currency exchange contracts | — | (185,572) | — | (185,572) |
| Total | $(17,129) | $ (185,572) | $ 758,808 | $ 556,107 |
| Change in unrealized appreciation (depreciation): | ||||
| Futures contracts | $ — | $ — | $ 1,300,889 | $ 1,300,889 |
| Swap contracts | 20,527 | — | — | 20,527 |
| Forward foreign currency exchange contracts | — | 5,530,917 | — | 5,530,917 |
| Total | $ 20,527 | $5,530,917 | $1,300,889 | $6,852,333 |
| Futures Contracts — Long | Futures Contracts — Short | Forward Foreign Currency Exchange Contracts* | Swap Contracts |
| $37,467,000 | $35,096,000 | $200,137,000 | $2,832,000 |
| * | The average notional amount for forward foreign currency exchange contracts is based on the absolute value of notional amounts of currency purchased and currency sold. |
| Name | Value, beginning of period | Purchases | Sales proceeds | Net realized gain (loss) | Change in unrealized appreciation (depreciation) | Value, end of period | Interest/ Dividend income | Principal amount/ Shares, end of period |
| Commercial Mortgage-Backed Securities | ||||||||
| Morgan Stanley Bank of America Merrill Lynch Trust: | ||||||||
| Series 2014-C16, Class B, 4.438%, 6/15/47 | $ 342,690 | $ — | $ — | $ — | $ (14,532) | $ 328,827 | $ 8,683 | $ 363,000 |
| Series 2015-C23, Class D, 4.276%, 7/15/50 | 2,054,435 | — | — | — | 192,021 | 2,253,613 | 63,939 | 2,670,000 |
| Series 2016-C29, Class D, 3.00%, 5/15/49 | 2,540,356 | — | — | — | 19,006 | 2,569,828 | 64,127 | 3,577,365 |
| Series 2016-C32, Class D, 3.396%, 12/15/49 | 1,054,795 | — | — | — | (4,930) | 1,057,262 | 34,565 | 1,600,000 |
| Morgan Stanley Capital I Trust: | ||||||||
| Series 2016-UBS12, Class D, 3.312%, 12/15/49 | 2,198,211 | — | — | — | 157,110 | 2,372,598 | 91,610 | 4,488,667 |
| Series 2019-BPR, Class C, 8.972%, (1 mo. SOFR + 3.642%), 5/15/36 | 1,743,153 | — | — | — | 3,329 | 1,746,482 | 80,772 | 1,845,000 |
| Short-Term Investments | ||||||||
| Liquidity Fund | 26,067,123 | 299,857,183 | (299,180,809) | — | — | 26,743,497 | 808,415 | 26,743,497 |
| Total | $ — | $352,004 | $37,072,107 | $1,152,111 | ||||
| • | Level 1 – quoted prices in active markets for identical investments |
| • | Level 2 – other significant observable inputs (including quoted prices for similar investments, interest rates, prepayment speeds, credit risk, etc.) |
| • | Level 3 – significant unobservable inputs (including a fund's own assumptions in determining the fair value of investments) |
| Asset Description | Level 1 | Level 2 | Level 3* | Total |
| Asset-Backed Securities | $ — | $ 111,472,444 | $ — | $ 111,472,444 |
| Closed-End Funds | 18,887,437 | — | — | 18,887,437 |
| Collateralized Mortgage Obligations | — | 141,926,289 | — | 141,926,289 |
| Commercial Mortgage-Backed Securities | — | 69,289,564 | — | 69,289,564 |
| Common Stocks | 790,944 | 6,427,593 | 89,061 | 7,307,598 |
| Convertible Bonds | — | 3,084,645 | — | 3,084,645 |
| Corporate Bonds | — | 638,669,389 | — | 638,669,389 |
| Preferred Stocks | — | 982,635 | 0 | 982,635 |
| Senior Floating-Rate Loans (Less Unfunded Loan Commitments) | — | 551,745,041 | 1,031,203 | 552,776,244 |
| Sovereign Government Bonds | — | 49,681,238 | — | 49,681,238 |
| Sovereign Loans | — | 5,507,310 | — | 5,507,310 |
| U.S. Government Agency Mortgage-Backed Securities | — | 322,603,457 | — | 322,603,457 |
| Warrants | — | — | 0 | 0 |
| Miscellaneous | — | 32,760 | 0 | 32,760 |
| Short-Term Investments: | ||||
| Affiliated Fund | 26,743,497 | — | — | 26,743,497 |
| U.S. Treasury Obligations | — | 499,268 | — | 499,268 |
| Total Investments | $ 46,421,878 | $ 1,901,921,633 | $ 1,120,264 | $ 1,949,463,775 |
| Forward Foreign Currency Exchange Contracts | $ — | $ 4,190,284 | $ — | $ 4,190,284 |
| Futures Contracts | 868,906 | — | — | 868,906 |
| Total | $ 47,290,784 | $ 1,906,111,917 | $ 1,120,264 | $ 1,954,522,965 |
| Liability Description | ||||
| Forward Foreign Currency Exchange Contracts | $ — | $ (219,755) | $ — | $ (219,755) |
| Futures Contracts | (131,347) | — | — | (131,347) |
| Swap Contracts | — | (104,890) | — | (104,890) |
| Total | $ (131,347) | $ (324,645) | $ — | $ (455,992) |
| * | None of the unobservable inputs for Level 3 assets, individually or collectively, had a material impact on the Fund. |
| Officers | |
| Kenneth A. Topping President | Nicholas S. Di Lorenzo Secretary |
| Deidre E. Walsh Vice President and Chief Legal Officer | Richard F. Froio Chief Compliance Officer |
| James F. Kirchner Treasurer | |
| Trustees |
| George J. Gorman Chairperson | |
| Alan C. Bowser1 | |
| Mark R. Fetting | |
| Cynthia E. Frost | |
| Valerie A. Mosley | |
| Anchal Pachnanda*2 |
| Keith Quinton | |
| Marcus L. Smith | |
| Susan J. Sutherland | |
| Scott E. Wennerholm | |
| Nancy A. Wiser |
| * | Interested Trustee |
| (1) | Mr. Bowser began serving as Trustee effective January 4, 2023. |
| (2) | Ms. Pachnanda began serving as Trustee effective April 1, 2023. |
| Privacy Notice | April 2021 |
| FACTS | WHAT DOES EATON VANCE DO WITH YOUR PERSONAL INFORMATION? |
| Why? | Financial companies choose how they share your personal information. Federal law gives consumers the right to limit some but not all sharing. Federal law also requires us to tell you how we collect, share, and protect your personal information. Please read this notice carefully to understand what we do. |
| What? | The types of personal information we collect and share depend on the product or service you have with us. This information can include:■ Social Security number and income ■ investment experience and risk tolerance ■ checking account number and wire transfer instructions |
| How? | All financial companies need to share customers’ personal information to run their everyday business. In the section below, we list the reasons financial companies can share their customers’ personal information; the reasons Eaton Vance chooses to share; and whether you can limit this sharing. |
| Reasons we can share your personal information | Does Eaton Vance share? | Can you limit this sharing? |
| For our everyday business purposes — such as to process your transactions, maintain your account(s), respond to court orders and legal investigations, or report to credit bureaus | Yes | No |
| For our marketing purposes — to offer our products and services to you | Yes | No |
| For joint marketing with other financial companies | No | We don’t share |
| For our investment management affiliates’ everyday business purposes — information about your transactions, experiences, and creditworthiness | Yes | Yes |
| For our affiliates’ everyday business purposes — information about your transactions and experiences | Yes | No |
| For our affiliates’ everyday business purposes — information about your creditworthiness | No | We don’t share |
| For our investment management affiliates to market to you | Yes | Yes |
| For our affiliates to market to you | No | We don’t share |
| For nonaffiliates to market to you | No | We don’t share |
| To limit our sharing | Call toll-free 1-800-262-1122 or email: EVPrivacy@eatonvance.comPlease note:If you are a new customer, we can begin sharing your information 30 days from the date we sent this notice. When you are no longer our customer, we continue to share your information as described in this notice. However, you can contact us at any time to limit our sharing. |
| Questions? | Call toll-free 1-800-262-1122 or email: EVPrivacy@eatonvance.com |
| Privacy Notice — continued | April 2021 |
| Who we are | |
| Who is providing this notice? | Eaton Vance Management, Eaton Vance Distributors, Inc., Eaton Vance Trust Company, Eaton Vance Management (International) Limited, Eaton Vance Advisers International Ltd., Eaton Vance Global Advisors Limited, Eaton Vance Management’s Real Estate Investment Group, Boston Management and Research, Calvert Research and Management, Eaton Vance and Calvert Fund Families and our investment advisory affiliates (“Eaton Vance”) (see Investment Management Affiliates definition below) |
| What we do | |
| How does Eaton Vance protect my personal information? | To protect your personal information from unauthorized access and use, we use security measures that comply with federal law. These measures include computer safeguards and secured files and buildings. We have policies governing the proper handling of customer information by personnel and requiring third parties that provide support to adhere to appropriate security standards with respect to such information. |
| How does Eaton Vance collect my personal information? | We collect your personal information, for example, when you■ open an account or make deposits or withdrawals from your account ■ buy securities from us or make a wire transfer ■ give us your contact informationWe also collect your personal information from others, such as credit bureaus, affiliates, or other companies. |
| Why can’t I limit all sharing? | Federal law gives you the right to limit only■ sharing for affiliates’ everyday business purposes — information about your creditworthiness ■ affiliates from using your information to market to you ■ sharing for nonaffiliates to market to youState laws and individual companies may give you additional rights to limit sharing. See below for more on your rights under state law. |
| Definitions | |
| Investment Management Affiliates | Eaton Vance Investment Management Affiliates include registered investment advisers, registered broker- dealers, and registered and unregistered funds. Investment Management Affiliates does not include entities associated with Morgan Stanley Wealth Management, such as Morgan Stanley Smith Barney LLC and Morgan Stanley & Co. |
| Affiliates | Companies related by common ownership or control. They can be financial and nonfinancial companies.■ Our affiliates include companies with a Morgan Stanley name and financial companies such as Morgan Stanley Smith Barney LLC and Morgan Stanley & Co. |
| Nonaffiliates | Companies not related by common ownership or control. They can be financial and nonfinancial companies.■ Eaton Vance does not share with nonaffiliates so they can market to you. |
| Joint marketing | A formal agreement between nonaffiliated financial companies that together market financial products or services to you.■ Eaton Vance doesn’t jointly market. |
| Other important information | |
| Vermont: Except as permitted by law, we will not share personal information we collect about Vermont residents with Nonaffiliates unless you provide us with your written consent to share such information.California: Except as permitted by law, we will not share personal information we collect about California residents with Nonaffiliates and we will limit sharing such personal information with our Affiliates to comply with California privacy laws that apply to us. | |
Two International Place
Boston, MA 02110
One Congress Street, Suite 1
Boston, MA 02114-2016
6201 15th Avenue
Brooklyn, NY 11219
Boston, MA 02110
Item 2. Code of Ethics
Not required in this filing.
Item 3. Audit Committee Financial Expert
Not required in this filing.
Item 4. Principal Accountant Fees and Services
Not required in this filing.
Item 5. Audit Committee of Listed Registrants
Not required in this filing.
Item 6. Schedule of Investments
Please see schedule of investments contained in the Report to Stockholders included under Item 1 of this Form N-CSR.
Item 7. Disclosure of Proxy Voting Policies and Procedures for Closed-End Management Investment Companies
Not required in this filing.
Item 8. Portfolio Managers of Closed-End Management Investment Companies
Eaton Vance Management (“EVM” or “Eaton Vance”) is the investment adviser of the Fund. Kelley Gerrity, Tara O’Brien, Catherine McDermott, Andrew Szczurowski, CFA and Eric Stein, CFA are the portfolio managers of Eaton Vance Limited Duration Income Fund. Mmes. Gerrity and McDermott and Messrs. Szczurowski and Stein are Vice President of EVM, manage other Eaton Vance portfolios and have been members of the Eaton Vance organization for more than five years. Ms. O’Brien became a portfolio manager of the Fund in June 2023. Ms. O’Brien is a Vice President of EVM and has been a member of the Eaton Vance organization for more than five years. This information is provided as of the date of filing this report.
The following table shows, as of September 30, 2023, the number of accounts each portfolio manager managed in each of the listed categories and the total assets (in millions of dollars) in the accounts managed within each category. The table also shows the number of accounts with respect to which the advisory fee is based on the performance of the account, if any, and the total assets (in millions of dollars) in those accounts.
| Number of All Accounts | Total Assets of All Accounts | Number of Accounts Paying a Performance Fee | Total Assets of Accounts Paying a Performance Fee | |||||||||||||
Kelley Gerrity(1) | ||||||||||||||||
Registered Investment Companies | 7 | $ | 10,612.3 | 0 | $ | 0 | ||||||||||
Other Pooled Investment Vehicles | 1 | $ | 20.6 | 0 | $ | 0 | ||||||||||
Other Accounts | 0 | $ | 0 | 0 | $ | 0 | ||||||||||
Catherine C. McDermott | ||||||||||||||||
Registered Investment Companies | 6 | $ | 3,759.8 | 0 | $ | 0 | ||||||||||
Other Pooled Investment Vehicles | 0 | $ | 0 | 0 | $ | 0 | ||||||||||
Other Accounts | 0 | $ | 0 | 0 | $ | 0 | ||||||||||
Eric A. Stein, CFA(1) | ||||||||||||||||
Registered Investment Companies | 3 | $ | 6,262.7 | 0 | $ | 0 | ||||||||||
Other Pooled Investment Vehicles | 1 | $ | 61.6 | 0 | $ | 0 | ||||||||||
Other Accounts | 0 | $ | 0 | 0 | $ | 0 | ||||||||||
Andrew Szczurowski, CFA(1) | ||||||||||||||||
Registered Investment Companies | 6 | $ | 11,337.5 | 0 | $ | 0 | ||||||||||
Other Pooled Investment Vehicles | 2 | $ | 84.9 | 0 | $ | 0 | ||||||||||
Other Accounts | 0 | $ | 0 | 0 | $ | 0 | ||||||||||
Tara O’Brien | ||||||||||||||||
Registered Investment Companies | 1 | $ | 2,044.9 | 0 | $ | 0 | ||||||||||
Other Pooled Investment Vehicles | 0 | $ | 0 | 0 | $ | 0 | ||||||||||
Other Accounts | 0 | $ | 0 | 0 | $ | 0 | ||||||||||
| (1) | This portfolio manager serves as portfolio manager of one or more registered investment companies and/or pooled investment vehicles that invest or may invest in one or more underlying registered investment companies and/or separate pooled investment vehicles in the Eaton Vance family of funds. The underlying investment companies may be managed by this portfolio manager or another portfolio manager. |
The following table shows the dollar range of Fund shares beneficially owned by each portfolio manager as of September 30, 2023.
Portfolio Manager | Dollar Range of Equity Securities Beneficially Owned in the Fund | |
Kelley Gerrety | None | |
Catherine C. McDermott | None | |
Eric A. Stein, CFA | $1 - $10,000 | |
Andrew Szczurowski, CFA | $10,001 - $50,000 | |
Tara O’Brien | None |
Potential for Conflicts of Interest. It is possible that conflicts of interest may arise in connection with a portfolio manager’s management of the Fund’s investments on the one hand and the investments of other accounts for which a portfolio manager is responsible on the other. For example, a portfolio manager may have conflicts of interest in allocating management time, resources and investment opportunities among the Fund and other accounts he or she advises. In addition, due to differences in the investment strategies or restrictions between the Fund and the other accounts, the portfolio manager may take action with respect to another account that differs from the action taken with respect to the Fund. In some cases, another account managed by a portfolio manager may compensate the investment adviser based on the performance of the securities held by that account. The existence of such a performance based fee may create additional conflicts of interest for the portfolio manager in the allocation of management time, resources and investment opportunities. Whenever conflicts of interest arise, the portfolio manager will endeavor to exercise his or her discretion in a manner that he or she believes is equitable to all interested persons. EVM has adopted several policies and procedures designed to address these potential conflicts including a code of ethics and policies that govern the investment adviser’s trading practices, including among other things the aggregation and allocation of trades among clients, brokerage allocations, cross trades and best execution.
Compensation Structure for EVM
The compensation structure of Eaton Vance and its affiliates that are investment advisers (for purposes of this section “Eaton Vance”) is based on a total reward system of base salary and incentive compensation, which is paid either in the form of cash bonus, or for employees meeting the specified deferred compensation eligibility threshold, partially as a cash bonus and partially as mandatory deferred compensation. Deferred compensation granted to Eaton Vance employees is generally granted as a mix of deferred cash awards under the Investment Management Alignment Plan (IMAP) and equity-based awards in the form of stock units. The portion of incentive compensation granted in the form of a deferred compensation award and the terms of such awards are determined annually by the Compensation, Management Development and Succession Committee of Morgan Stanley.
Base salary compensation. Generally, portfolio managers receive base salary compensation based on the level of their position with the adviser.
Incentive compensation. In addition to base compensation, portfolio managers may receive discretionary year-end compensation. Incentive compensation may include:
| • | Cash bonus |
| • | Deferred compensation: |
| • | A mandatory program that defers a portion of incentive compensation into restricted stock units or other awards based on Morgan Stanley common stock or other plans that are subject to vesting and other conditions. |
| • | IMAP is a cash-based deferred compensation plan designed to increase the alignment of participants’ interests with the interests of clients. For eligible employees, a portion of their deferred compensation is mandatorily deferred into IMAP on an annual basis. Awards granted under IMAP are notionally invested in referenced funds available pursuant to the plan, which are funds advised by MSIM and its affiliates that are investment advisers. Portfolio managers are required to notionally invest a minimum of 40% of their account balance in the designated funds that they manage and are included in the IMAP notional investment fund menu. |
| • | Deferred compensation awards are typically subject to vesting over a multi-year period and are subject to cancellation through the payment date for competition, cause (i.e., any act or omission that constitutes a breach of obligation to the Funds, including failure to comply with internal compliance, ethics or risk management standards, and failure or refusal to perform duties satisfactorily, including supervisory and management duties), disclosure of proprietary information, and solicitation of employees or clients. Awards are also subject to clawback through the payment date if an employee’s act or omission (including with respect to direct supervisory responsibilities) causes a restatement of the firm’s consolidated financial results, constitutes a violation of the firm’s global risk management principles, policies and standards, or causes a loss of revenue associated with a position on which the employee was paid and the employee operated outside of internal control policies. |
Eaton Vance compensates employees based on principles of pay-for-performance, market competitiveness and risk management. Eligibility for, and the amount of any, discretionary compensation is subject to a multi-dimensional process. Specifically, consideration is given to one or more of the following factors, which can vary by portfolio management team and circumstances:
| • | Revenue and profitability of the business and/or each fund/account managed by the portfolio manager |
| • | Revenue and profitability of the Firm |
| • | Return on equity and risk factors of both the business units and Morgan Stanley |
| • | Assets managed by the portfolio manager |
| • | External market conditions |
| • | New business development and business sustainability |
| • | Contribution to client objectives |
| • | Team, product and/or MSIM and its affiliates that are investment advisers (including Eaton Vance) performance |
| • | The pre-tax investment performance of the funds/accounts managed by the portfolio manager (which may, in certain cases, be measured against the applicable benchmark(s) and/or peer group(s) over one, three and five-year periods) |
| • | Individual contribution and performance |
Further, the firm’s Global Incentive Compensation Discretion Policy requires compensation managers to consider Further the only legitimate, business related factors when exercising discretion in determining variable incentive compensation, including adherence to Morgan Stanley’s core values, conduct, disciplinary actions in the current performance year, risk management and risk outcomes.
Item 9. Purchases of Equity Securities by Closed-End Management Investment Company and Affiliated Purchasers
No such purchases this period.
Item 10. Submission of Matters to a Vote of Security Holders
No material changes.
Item 11. Controls and Procedures
(a) It is the conclusion of the registrant’s principal executive officer and principal financial officer that the effectiveness of the registrant’s current disclosure controls and procedures (such disclosure controls and procedures having been evaluated within 90 days of the date of this filing) provide reasonable assurance that the information required to be disclosed by the registrant has been recorded, processed, summarized and reported within the time period specified in the Commission’s rules and forms and that the information required to be disclosed by the registrant has been accumulated and communicated to the registrant’s principal executive officer and principal financial officer in order to allow timely decisions regarding required disclosure.
(b) There have been no changes in the registrant’s internal controls over financial reporting during the period covered by this report that has materially affected, or is reasonably likely to materially affect, the registrant’s internal control over financial reporting.
Item 12. Disclosure of Securities Lending Activities for Closed-End Management Investment Companies
No activity to report for the registrant’s most recent fiscal year end.
Item 13. Exhibits
| (a)(1) | Registrant’s Code of Ethics – Not applicable (please see Item 2). | |
| (a)(2)(i) | Treasurer’s Section 302 certification. | |
| (a)(2)(ii) | President’s Section 302 certification. | |
| (b) | Combined Section 906 certification. |
Signatures
Pursuant to the requirements of the Securities Exchange Act of 1934 and the Investment Company Act of 1940, the registrant has duly caused this report to be signed on its behalf by the undersigned, thereunto duly authorized.
| Eaton Vance Limited Duration Income Fund | ||
| By: | /s/ Kenneth A. Topping | |
| Kenneth A. Topping | ||
| President | ||
Date: November 21, 2023
Pursuant to the requirements of the Securities Exchange Act of 1934 and the Investment Company Act of 1940, this report has been signed below by the following persons on behalf of the registrant and in the capacities and on the dates indicated.
| By: | /s/ James F. Kirchner | |
| James F. Kirchner | ||
| Treasurer |
Date: November 21, 2023
| By: | /s/ Kenneth A. Topping | |
| Kenneth A. Topping | ||
| President |
Date: November 21, 2023