Pioneer Municipal High Income Trust
Semiannual Report | October 31, 2020
Ticker Symbol: MHI
Beginning in or after April 2021, as permitted by regulations adopted by the Securities and Exchange Commission, paper copies of the Trust’s shareholder reports like this one will no longer be sent by mail, unless you specifically request paper copies of the reports from the Trust or from your financial intermediary, such as a broker-dealer, bank or insurance company. Instead, the reports will be made available on the Trust’s website, and you will be notified by mail each time a report is posted and provided with a website link to access the report.
If you already elected to receive shareholder reports electronically, you will not be affected by this change and you need not take any action. You may elect to receive shareholder reports and other communications electronically by contacting your financial intermediary or, if you invest directly with the Trust, by calling 1-800-710-0935.
You may elect to receive all future reports in paper free of charge. If you invest directly with the Trust, you can inform the Trust that you wish to continue receiving paper copies of your shareholder reports by calling 1-800-710-0935. If you invest through a financial intermediary, you can contact your financial intermediary to request that you continue to receive paper copies of your shareholder reports. Your election to receive reports in paper will apply to all funds held in your account if you invest through your financial intermediary or all funds held within the Pioneer Fund complex if you invest directly.
visit us: www.amundipioneer.com/us
Pioneer Municipal High Income Trust | Semiannual Report | 10/31/20 1
President’s LetterDear Shareholders,
The new decade has arrived delivering a calendar year that will go down in the history books. The beginning of 2020 seemed to extend the positive market environment of 2019. Then, March roared in like a lion and the COVID-19 pandemic became a global crisis impacting lives and life as we know it. As the fourth quarter of 2020 got underway, it appeared that the long-anticipated “second wave” of COVID-19 cases was occurring, both in some U.S. states and in Europe. In response, some governments began retightening restrictions on both business and personal activities.
However, as the fourth quarter continued, we began to read some encouraging news on the vaccine front, as multiple pharmaceutical companies announced successful clinical trials for their COVID-19 vaccinations and applied for emergency-use approval for the drugs with the Food and Drug Administration. Government officials followed up on the positive news by announcing that deployment of at least one of the vaccines to frontline workers could begin even before the end of this calendar year, with the potential for widespread distribution by mid-2021.
While there may finally be a light visible at the end of the pandemic tunnel as 2020 comes to a close, the long-term impact on the global economy from COVID-19, while currently unknown, is likely to be considerable. It is clear that several industries have already felt greater effects than others, and the markets, which do not thrive on uncertainty, have been volatile, delivering significantly negative performance in the first quarter, and then recovering most of those losses throughout the following quarters. Despite the rebound, volatility has remained elevated, with momentum rising and falling on seemingly every bit of positive or negative news about the virus, from vaccines to spikes in the number of cases as well as rising hospitalization rates in some areas. In addition, the U.S. Presidential Election was in high gear as we entered the fourth quarter. This election contributed to the market volatility as investors pondered the possible outcomes and their potential effects on the economic outlook.
With the advent of COVID-19 last winter, we implemented our business continuity plan according to the new COVID-19 guidelines, and most of our employees have been working remotely since March. To date, our operating environment has faced no interruption. I am proud of the careful planning that has taken place and confident we can maintain this environment for as long as is prudent. History in the making for a company that first opened its doors way back in 1928.
2 Pioneer Municipal High Income Trust | Semiannual Report | 10/31/20
Since 1928, Amundi’s investment process has been built on a foundation of fundamental research and active management, principles which have guided our investment decisions for more than 90 years. We believe active management – that is, making active investment decisions – can help mitigate the risks during periods of market volatility. As 2020 has reminded us, investment risk can arise from a number of factors in today’s global economy, including slower or stagnating growth, changing U.S. Federal Reserve policy, oil price shocks, political and geopolitical factors and, unfortunately, major public health concerns such as a viral pandemic.
At Amundi, active management begins with our own fundamental, bottom-up research process. Our team of dedicated research analysts and portfolio managers analyzes each security under consideration, communicating directly with the management teams of the companies issuing the securities and working together to identify those securities that best meet our investment criteria for our family of funds. Our risk management approach begins with each and every security, as we strive to carefully understand the potential opportunity, while considering any and all risk factors.
Today, as investors, we have many options. It is our view that active management can serve shareholders well, not only when markets are thriving, but also during periods of market stress.
As you consider your long-term investment goals, we encourage you to work with your financial professional to develop an investment plan that paves the way for you to pursue both your short-term and long-term goals.
We remain confident that the current crisis, like others in human history, will pass, and we greatly appreciate the trust you have placed in us and look forward to continuing to serve you in the future.
Sincerely,
Lisa M. Jones
Head of the Americas, President and CEO of U.S.
Amundi Pioneer Asset Management USA, Inc.
December 18, 2020
Any information in this shareowner report regarding market or economic trends or the factors influencing the Trust’s historical or future performance are statements of opinion as of the date of this report. Past performance is no guarantee of future results.
Pioneer Municipal High Income Trust | Semiannual Report | 10/31/20 3
Portfolio Management Discussion |
10/31/20 During the six-month period ended October 31, 2020, the municipal bond market staged a steady and strong recovery from the disruptions and volatility that had beset global financial markets earlier this year with the onset of the COVID-19 pandemic and the resulting economic downturn. In the following interview, David Eurkus and Jonathan Chirunga discuss the factors that influenced the performance of Pioneer Municipal High Income Trust during the six-month period. Mr. Eurkus, Director of Municipals, U.S., a senior vice president, and a portfolio manager at Amundi Pioneer Asset Management, Inc. (Amundi)*, and Mr. Chirunga, a Managing Director, Deputy Director of Municipals, and a portfolio manager at Amundi, are responsible for the day-to-day management of the Trust.
Q How did Pioneer Municipal High Income Trust perform during the six-month period ended October 31, 2020?
A Pioneer Municipal High Income Trust returned 7.16% at net asset value (NAV) and 7.26% at market price during the six-month period ended October 31, 2020. During the same six-month period, the Trust’s benchmarks, the Bloomberg Barclays U.S. Municipal High Yield Bond Index and the Bloomberg Barclays Municipal Bond Index, returned 11.74% and 4.99% at NAV, respectively. The Bloomberg Barclays U.S. Municipal High Yield Bond Index is an unmanaged measure of the performance of lower-rated municipal bonds, while the Bloomberg Barclays Municipal Bond Index is an unmanaged measure of the performance of investment-grade municipal bonds. Unlike the Trust, the two indices do not use leverage. While use of leverage increases investment opportunity, it also increases investment risk.
During the same six-month period, the average return at NAV of the 19 closed-end funds in Morningstar’s High Yield Municipal Debt Closed End Funds category (which may or may not be leveraged) was 9.90%, while the average return at market price in the same closed-end funds Morningstar category was 10.22%.
The shares of the Trust were selling at a 12.0% discount to NAV on October 31, 2020. Comparatively, the shares of the Trust were selling at a 12.1% discount to NAV on April 30, 2020.
* See Notes to Financial Statements Note 6.
4 Pioneer Municipal High Income Trust | Semiannual Report | 10/31/20
On October 31, 2020, the standardized 30-day SEC yield of the Trust’s shares was 2.07%**.
Q How would you describe the investment environment in the municipal bond market during the six-month period ended October 31, 2020?
A Early this year, the environment for municipal bonds was largely favorable. Declines in U.S. Treasury medium- and longer-term interest rates, the U.S. Federal Reserve System’s (Fed’s) accommodative stance on monetary policy, healthy demand for tax-free bonds with limited supply, as well as the longer-term effects on the municipal market from the federal tax overhaul legislation passed in late 2017, all combined to support performance in the municipal bond market. The federal tax overhaul passed in 2017 has boosted the performance of tax-free bonds given the fact that, under the law, income earned by investors on advance-refunding bonds, formerly treated as tax-exempt, is now treated as taxable income. (An advance-refunding bond is issued to retire, or pre-refund, another outstanding bond more than 90 days in advance of the original bond’s maturity date.) This change in the law has served to remove approximately one quarter of the prior municipal supply from the tax-exempt marketplace, which in turn has helped to boost tax-free bond prices. In addition, the concurrently enacted federal limits on state and local tax deductions have significantly increased demand for municipal investments in high tax states.
In March 2020, however, the investment environment for tax-exempt bonds as well as in the financial markets in general turned swiftly and dramatically negative. News of a number of emerging “hot spots” for the spread of the COVID-19 virus, which had emerged in China, then spread through Asia and Europe before eventually landing in the United States, roiled the markets as Americans began focusing on the serious public health implications of what quickly became a global pandemic. In fact, the COVID-19 outbreak had already begun to have a negative impact on U.S. economic activity as early as the middle of February. While public health officials provided guidance on how to deal with the outbreak, many governors and mayors in U.S. states and cities shut down businesses deemed non-essential and directed “shelter-in-place” and other quarantine-like efforts for individuals. Those measures, along with swift public recognition of the need for staying at home, working from
** The 30-day SEC yield is a standardized formula that is based on the hypothetical annualized earning power (investment income only) of the Trust’s portfolio securities during the period indicated.
Pioneer Municipal High Income Trust | Semiannual Report | 10/31/20 5
home, and social distancing, dramatically curtailed activities in the U.S. transportation, retail sales, manufacturing, and services industries. Financial markets, including the municipal bond market, experienced intense volatility at times as investors looked for so-called “safe havens,” such as U.S. Treasuries, and tried to ascertain some levels of certainty regarding the near-term and medium-term paths for the U.S. economy during a very uncertain time.
In an attempt to mitigate the very serious economic effects from COVID-19 on individuals, states, municipalities, and the United States overall, the Fed as well as Congress and the White House undertook a large number of monetary and fiscal measures. In short order, the Fed reduced the federal funds rate’s target range to near zero, reintroduced lending facilities from the 2008-2009 financial crisis-era, instituted new lending facilities, and rebooted quantitative easing (that is, injecting massive liquidity into the economy by purchasing Treasury, agency, mortgage, and taxable corporate bonds in significant quantities). Federal lawmakers also approved two large aid packages in the form of loans and grants to individuals, small businesses, medical systems, and higher-education institutions in light of the sudden freeze-up in economic activity and continuously rising unemployment figures. Taken together, those measures helped to calm financial markets, including the municipal bond market, to some degree. However, investments considered higher risk, including high-yield municipal bonds, continued to weather persistent market volatility.
At the end of March, following significant forced selling and fund outflows industry-wide, tax-equivalent yields for investment-grade municipal bonds rose to as much as 200 basis points (bps) higher than Treasury securities of similar maturity, triggering significant tax-exempt bond purchases from domestic and global investors, and providing substantial relief to the municipal bond market. (A basis point is equal to 1/100th of a percentage point.)
Through the Trust’s most recent six-month period, the tax-exempt bond market generally continued its recovery, as domestic and global investors were aggressive purchasers of these bonds, and recent yield increases reversed themselves as municipal bond prices rose. At the same time, the stunning contraction in economic activity across the country due to COVID-19 – especially within the tourism, transportation, retail, and service industries – as well as dramatic reductions in federal, state, and
6 Pioneer Municipal High Income Trust | Semiannual Report | 10/31/20
local tax revenues, continued to overshadow the municipal bond market. Toward the end of the six-month period, amid robust demand from buyers, the municipal market experienced a rush of tax-exempt and taxable issuance in advance of the presidential election.
During the past six months, the tax-exempt high-yield bond market received solid support from demand from traditional investors, but also demand from non-traditional buyers looking for relative safety, a lower default rate, and attractive bond valuations as compared with taxable bonds.
Q What factors affected the Trust’s performance relative to the Bloomberg Barclays municipal bond indices during the six-month period ended October 31, 2020?
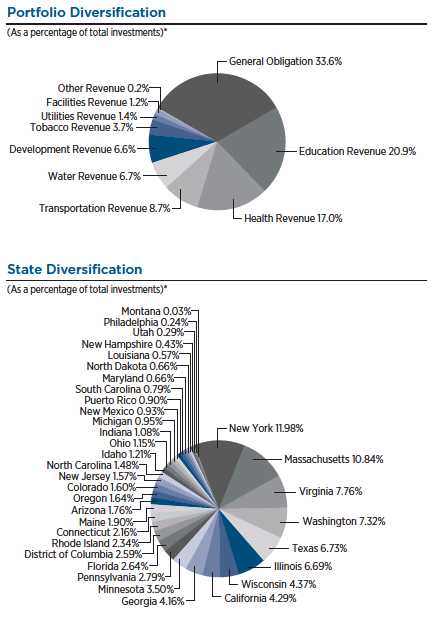
A We maintained a well-diversified*** portfolio during the six-month period, with exposures to both investment-grade and high-yield municipal bonds.
The portfolio’s holdings of tobacco settlement bonds issued by California, Massachusetts Development Authority bonds, and North Carolina Turnpike Authority bonds were among the top positive contributors to the Trust’s relative performance during the six-month period, while positions in Carmel (Indiana) Continuing Care Facility bonds, Rhode Island Detention Center bonds, and State of Illinois Continuing Care Facility bonds were some of the largest detractors from benchmark-relative returns.
Q Did the Trust’s distributions**** to shareholders change during the six-month period ended October 31, 2020?
A No, during the six-month period, the Trust’s distributions remained stable at $0.045 per share/per month.
Q Did the level of leverage in the Trust change during the six-month period ended October 31, 2020?
A The level of leverage in the Trust remained consistent during the six-month period. As of October 31, 2020, 29.9% of the Trust’s total managed assets were financed by leverage obtained through the issuance of Variable Rate Muni Fund Term Preferred Shares, compared with 30.3% of the Trust’s total managed assets financed by leverage at the start of the period on May 1, 2020. The change in the percentage of the Trust's total managed assets financed by leverage during the six-month period was the result of an increase in the value of the Trust's total managed assets.
*** Diversification does not assure a profit nor protect against loss.
**** Distributions are not guaranteed.
Pioneer Municipal High Income Trust | Semiannual Report | 10/31/20 7
Q Did the Trust have any exposure to derivative securities during the six-month period ended October 31, 2020?
A No, the Trust’s portfolio had no exposure to derivative securities during the six-month period.
Q What is your investment outlook?
A Because of the lack of any resurgence in U.S. inflation, as well as the clear pronouncements from the Fed that it plans to keep short-term interest rates at or near zero for the next few years, at least, we are optimistic regarding the path of interest rates going forward. Additionally, in light of the continued low default rate for the municipal bond asset class, and a favorable supply/demand environment, given the ongoing shrinking of supply and persistently strong demand from various categories of investors, we believe that current prospects for the tax-exempt bond market are favorable. Lastly, given the enormous and continued need for economic assistance of all sorts in order to help businesses and individuals cope with the effects of the COVID-19 situation, the U.S. government may eventually need to face the reality of its rising debt levels, in part by raising taxes, which, in our view, would likely further increase demand for municipal bonds.
With regard to the Trust’s positioning, we have continued to identify opportunities created by large investors having to sell strong credit bonds out of their portfolios, particularly sales related to weak-credit purchases of bonds issued in the summer of 2017. We also have been exploring opportunities in areas of the tax-exempt market that have felt significant effects from the recent COVID-19-related economic slowdown, including municipal issues in the transportation and senior living center segments.
Consistent with our investment discipline in managing the Trust, we intend to continue to focus on intensive, fundamental research into individual bond issues, while maintaining a close watch on any economic factors that could influence the high-yield and investment-grade municipal markets. Based on those factors, we do not anticipate making any significant changes to the portfolio’s positioning and structure in the near future.
8 Pioneer Municipal High Income Trust | Semiannual Report | 10/31/20
Please refer to the Schedule of Investments on pages 15–25 for a full listing of Trust securities.
All investments are subject to risk, including the possible loss of principal. In the past several years, financial markets have experienced increased volatility and heightened uncertainty. The market prices of securities may go up or down, sometimes rapidly or unpredictably, due to general market conditions, such as real or perceived adverse economic, political, or regulatory conditions, recessions, inflation, changes in interest or currency rates, lack of liquidity in the bond markets, the spread of infectious illness or other public health issues or adverse investor sentiment. These conditions may continue, recur, worsen or spread.
Investments in high-yield or lower-rated securities are subject to greater-than-average risk.
The Trust may invest in securities of issuers that are in default or that are in bankruptcy.
A portion of income may be subject to state, federal, and/or alternative minimum tax. Capital gains, if any, are subject to a capital gains tax.
When interest rates rise, the prices of debt securities held by the Trust will generally fall. Conversely, when interest rates fall the prices of debt securities held by the Trust generally will rise.
A general rise in interest rates could adversely affect the price and liquidity of fixed income securities.
By concentrating in municipal securities, the Trust is more susceptible to adverse economic, political or regulatory developments than is a portfolio that invests more broadly.
Investments in the Trust are subject to possible loss due to the financial failure of the issuers of the underlying securities and the issuers’ inability to meet their debt obligations.
The Trust may invest up to 20% of its total assets in illiquid securities. Illiquid securities may be difficult to dispose of at a price reflective of their value at the times when the Trust believes it is desirable to do so, and the market price of illiquid securities is generally more volatile than that of more liquid securities. Illiquid securities are also more difficult to value and investment of the Trust’s assets in illiquid securities may restrict the Trust’s ability to take advantage of market opportunities.
The Trust uses leverage through the issuance of preferred shares. Leverage creates significant risks, including the risk that the Trust’s incremental income or capital appreciation for investments purchased with the proceeds of leverage will not be sufficient to cover the cost of the leverage, which may adversely affect the return for the holders of common shares.
Pioneer Municipal High Income Trust | Semiannual Report | 10/31/20 9
The Trust is required to maintain certain regulatory, rating agency and other asset coverage requirements in connection with its outstanding preferred shares. In order to maintain required asset coverage levels, the Trust may be required to alter the composition of its investment portfolio or take other actions, such as redeeming preferred shares with the proceeds from portfolio transactions, at what might be inopportune times in the market. Such actions could reduce the net earnings or returns to holders of the Trust’s common shares over time, which is likely to result in a decrease in the market value of the Trust’s shares.
These risks may increase share price volatility.
Any information in this shareholder report regarding market or economic trends or the factors influencing the Trust’s historical or future performance are statements of opinion as of the date of this report. Past performance is no guarantee of future results.
10 Pioneer Municipal High Income Trust | Semiannual Report | 10/31/20
Portfolio Summary |
10/31/20 Pioneer Municipal High Income Trust | Semiannual Report | 10/31/20 11
Portfolio Summary | 10/31/20 (continued)
10 Largest Holdings
(As a percentage of total investments)*
| | | |
| 1. | Metropolitan Pier & Exposition Authority, McCormick Place, 5.65%, | |
| 6/15/22 (NATL-RE Insured) | 3.92% |
| 2. | State of Washington, Motor Vehicle Sales Tax, Series C, 6/1/22 (NATL Insured) | 3.42 |
| 3. | Massachusetts Development Finance Agency, WGBH Foundation, | |
| Series A, 5.75%, 1/1/42 (AMBAC Insured) | 2.66 |
| 4. | New York State Dormitory Authority, Series A, 4.0%, 7/1/41 | 2.17 |
| 5. | New York State Dormitory Authority, Series C, 5.0%, 3/15/39 | 2.03 |
| 6. | Brookhaven Development Authority, 4.0%, 7/1/49 | 1.91 |
| 7. | New York State Dormitory Authority, 5.0%, 10/1/50 | 1.89 |
| 8. | Massachusetts Development Finance Agency, Harvard University, | |
| Series A, 5.0%, 7/15/40 | 1.79 |
| 9. | State of Minnesota, Series B, 4.0%, 8/1/27 | 1.74 |
| 10. | Massachusetts Bay Transportation Authority, Series A, 7/1/28 | 1.50 |
* Excludes temporary cash investments and all derivative contracts except for options purchased. The Trust is actively managed, and current holdings may be different. The holdings listed should not be considered recommendations to buy or sell any securities.
12 Pioneer Municipal High Income Trust | Semiannual Report | 10/31/20
Prices and Distributions |
10/31/20 Market Value per Common Share^
| | | |
| 10/31/20 | 4/30/20 |
Market Value | $11.34 | $10.82 |
Discount | (12.02)% | (12.10)% |
Net Asset Value per Common Share^
| | | |
| 10/31/20 | 4/30/20 |
Net Asset Value | $12.89 | $12.31 |
Distributions per Common Share:
| | | | |
| Net | | |
| Investment | Short-Term | Long-Term |
| Income | Capital Gains | Capital Gains |
5/1/20 – 10/31/20 | $0.2700 | $ — | $ — |
Yields
| | | |
| 10/31/20 | 4/30/20 |
30-Day SEC Yield | 2.07% | 2.67% |
The data shown above represents past performance, which is no guarantee of future results.
^ Net asset value and market value are published in Barron’s on Saturday, The Wall Street Journal on Monday and The New York Times on Monday and Saturday. Net asset value and market value are published daily on the Trust's website at www.amundipioneer.com/us.
Pioneer Municipal High Income Trust | Semiannual Report | 10/31/20 13
Performance Update |
10/31/20 Investment Returns
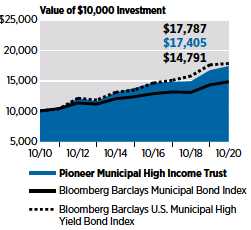
The mountain chart on the right shows the change in market value, including reinvestment of dividends and distributions, of a $10,000 investment made in common shares of Pioneer Municipal High Income Trust during the periods shown, compared to that of the Bloomberg Barclays Municipal Bond Index and Bloomberg Barclays U.S. Municipal High Yield Bond Index.
| | | | | |
| Average Annual Total Returns | |
(As of October 31, 2020) | | |
| | | | BBG |
| | | BBG | Barclays |
| Net | | Barclays | U.S. |
| Asset | | Municipal | Municipal
|
| Value | Market | Bond
| High Yield |
| Period | (NAV) | Price
| Index | Bond Index |
10 years | 5.70%
| 3.76% | 3.99% | 5.93% |
5 years | 4.76 | 2.34 | 3.70 | 5.78 |
1 year | 4.15 | -2.10 | 3.59 | 1.23 |
Call 1-800-225-6292 or visit www.amundipioneer.com/us for the most recent month-end performance results. Current performance may be lower or higher than the performance data quoted.
Performance data shown represents past performance. Past performance is no guarantee of future results. Investment return and market price will fluctuate, and your shares may trade below NAV due to such factors as interest rate changes and the perceived credit quality of borrowers.
Total investment return does not reflect broker sales charges or commissions. All performance is for common shares of the Trust.
Shares of closed-end funds, unlike open-end funds, are not continuously offered. There is a one-time public offering and, once issued, shares of closed-end funds are bought and sold in the open market through a stock exchange and frequently trade at prices lower than their NAV. NAV per common share is total assets less total liabilities, which include preferred shares or borrowings, as applicable, divided by the number of common shares outstanding.
When NAV is lower than market price, dividends are assumed to be reinvested at the greater of NAV or 95% of the market price. When NAV is higher, dividends are assumed to be reinvested at prices obtained through open-market purchases under the Trust’s dividend reinvestment plan.
The performance table and graph do not reflect the deduction of fees and taxes that a shareowner would pay on Trust distributions or the sale of Trust shares. Had these fees and taxes been reflected, performance would have been lower.
The Bloomberg Barclays Municipal Bond Index is an unmanaged, broad measure of the municipal bond market. The Bloomberg Barclays High Yield Municipal Bond Index is unmanaged, totals over $26 billion in market value and maintains over 1,300 securities. Municipal bonds in this index have the following requirements: maturities of one year or greater, sub investment grade (below Baa or non-rated), fixed coupon rate, issued after 12/31/90, deal size over $20 million, and maturity size of at least $3 million. Index returns are calculated monthly, assume reinvestment of dividends and, unlike Trust returns, do not reflect any fees, expenses or sales charges. The indices do not use leverage. It is not possible to invest directly in the indices.
Please refer to the financial highlights for a more current total return ratio.
14 Pioneer Municipal High Income Trust | Semiannual Report | 10/31/20
Schedule of Investments |
10/31/20 (unaudited)
| | | | |
| Principal | | | |
| Amount | | | |
| USD ($) | | | Value |
| | | UNAFFILIATED ISSUERS — 141.2% | |
| | | COLLATERALIZED MORTGAGE OBLIGATION — | |
| | | 0.3% of Net Assets | |
| 996,387 | | Texas Department of Housing & Community Affairs, | |
| | | 2.3%, 7/1/37 (FNMA HUD SECT 8 Insured) | $ 991,364 |
| | | TOTAL COLLATERALIZED MORTGAGE OBLIGATION | |
| | | (Cost $996,386) | $ 991,364 |
| | | MUNICIPAL BONDS — 140.9% of Net Assets(a) | |
| | | Arizona — 2.5% | |
| 4,000,000(b) | | City of Phoenix, 5.0%, 7/1/27 | $ 4,948,240 |
| 2,230,000 | | City of Phoenix, Industrial Development Authority, | |
| | 3rd & Indian School Assisted Living Project, | |
| | | 5.4%, 10/1/36 | 2,304,884 |
| 24,000 | | County of Pima, Industrial Development Authority, | |
| | Arizona Charter Schools Project, Series C, | |
| | | 6.75%, 7/1/31 | 24,080 |
| | | Total Arizona | $ 7,277,204 |
| | | California — 6.1% | |
| 1,000,000 | | California County Tobacco Securitization Agency, | |
| | | 5.0%, 6/1/49 | $ 1,177,220 |
| 10,000,000(c) | | California County Tobacco Securitization Agency, | |
| | | Capital Appreciation, Stanislaus County, Subordinated, | |
| | | Series A, 6/1/46 | 2,290,000 |
| 2,000,000 | | California Educational Facilities Authority, Stanford | |
| | | University, Series U-7, 5.0%, 6/1/46 | 3,090,900 |
| 1,450,000 | | California Enterprise Development Authority, | |
| | | Sunpower Corp., 8.5%, 4/1/31 | 1,468,386 |
| 530,000 | | California Municipal Finance Authority, Santa Rosa | |
| | | Academy Project, Series A, 5.75%, 7/1/30 | 550,097 |
| 1,590,000(d) | | California School Finance Authority, Classical | |
| | | Academies Project, Series A, 7.375%, 10/1/43 | 1,807,528 |
| 1,400,000 | | California Statewide Communities Development | |
| | | Authority, Lancer Plaza Project, 5.625%, 11/1/33 | 1,411,592 |
| 2,000,000(b) | | Los Angeles Community College District, Series G, | |
| | | 4.0%, 8/1/39 | 2,236,780 |
| 1,605,000 | | Los Angeles County Metropolitan Transportation | |
| | | Authority, Series A, 5.0%, 7/1/30 | 2,053,389 |
| 1,500,000(b) | | State of California, 3.0%, 10/1/33 | 1,686,210 |
| | | Total California | $ 17,772,102 |
The accompanying notes are an integral part of these financial statements.
Pioneer Municipal High Income Trust | Semiannual Report | 10/31/20 15
Schedule of Investments | 10/31/20
(unaudited) (continued)
| | | | |
| Principal | | | |
| Amount | | | |
| USD ($) | | | Value |
| | | Colorado — 2.3% | |
| 2,180,000 | | Board of Water Commissioners City & County of | |
| | | Denver, 4.0%, 9/15/42 | $ 2,471,270 |
| 1,500,000(d) | | Colorado Educational & Cultural Facilities Authority, | |
| | Rocky Mountain Classical Academy Project, | |
| | | 8.0%, 9/1/43 | 1,826,685 |
| 1,665,000(e) | | Tender Option Bond Trust Receipts/Certificates, | |
| | | RIB, 0.0%, 6/1/39 (144A) | 2,331,399 |
| | | Total Colorado | $ 6,629,354 |
| | | Connecticut — 3.1% | |
| 3,470,000 | | Mohegan Tribal Finance Authority, 7.0%, 2/1/45 (144A) | $ 3,498,801 |
| 5,000,000(b) | | State of Connecticut, Series E, 4.0%, 9/1/30 | 5,458,350 |
| | | Total Connecticut | $ 8,957,151 |
| | | District of Columbia — 3.7% | |
| 2,380,000 | | District of Columbia Tobacco Settlement Financing | |
| | | Corp., Asset-Backed, 6.5%, 5/15/33 | $ 2,551,027 |
| 6,000,000 | | District of Columbia Tobacco Settlement Financing | |
| | | Corp., Asset-Backed, 6.75%, 5/15/40 | 6,120,000 |
| 10,000,000(c) | | District of Columbia Tobacco Settlement Financing | |
| | Corp., Capital Appreciation, Asset-Backed, | |
| | | Series A, 6/15/46 | 2,047,000 |
| | | Total District of Columbia | $ 10,718,027 |
| | | Florida — 3.7% | |
| 5,000,000 | | County of Miami-Dade, Water & Sewer System | |
| | | Revenue, Series A, 4.0%, 10/1/44 | $ 5,574,700 |
| 5,000,000 | | Florida’s Turnpike Enterprise, Department of | |
| | | Transportation, Series A, 4.0%, 7/1/34 | 5,366,450 |
| | | Total Florida | $ 10,941,150 |
| | | Georgia — 5.9% | |
| 7,010,000 | | Brookhaven Development Authority, 4.0%, 7/1/49 | $ 7,907,981 |
| 2,333,423 | | Clayton County Development Authority, Delta Air | |
| | | Lines, Series A, 8.75%, 6/1/29 | 2,350,597 |
| 2,500,000 | | County of Fulton GA Water & Sewerage Revenue, | |
| | | 2.25%, 1/1/42 | 2,502,025 |
| 4,000,000 | | Private Colleges & Universities Authority, Emory | |
| | | University, Series A, 5.0%, 10/1/43 | 4,462,800 |
| | | Total Georgia | $ 17,223,403 |
| | | Idaho — 1.7% | |
| 5,000,000 | | Power County Industrial Development Corp., FMC Corp. | |
| | | Project, 6.45%, 8/1/32 | $ 5,030,300 |
| | | Total Idaho | $ 5,030,300 |
The accompanying notes are an integral part of these financial statements.
16 Pioneer Municipal High Income Trust | Semiannual Report | 10/31/20
| | | | |
| Principal | | | |
| Amount | | | |
| USD ($) | | | Value |
| | | Illinois — 9.5% | |
| 2,087,000(e)(g) | | Illinois Finance Authority, Clare Oaks Project, Series B, | |
| | | 4.0%, 11/15/52 | $ 1,460,900 |
| 1,305,000(c) | | Illinois Finance Authority, Clare Oaks Project, | |
| | | Series C-1, 11/15/52 | 6,525 |
| 261,000 | | Illinois Finance Authority, Clare Oaks Project, | |
| | | Series C-2, 4.0%, 11/15/52 | 1,305 |
| 261,000(g) | | Illinois Finance Authority, Clare Oaks Project, | |
| | | Series C-3, 0.0%, 11/15/52 | 1,305 |
| 3,500,000 | | Illinois Finance Authority, The Admiral at the Lake | |
| | | Project, 5.25%, 5/15/42 | 3,125,570 |
| 4,000,000 | | Illinois Finance Authority, The Admiral at the Lake | |
| | | Project, 5.5%, 5/15/54 | 3,559,960 |
| 1,610,000(f) | | Metropolitan Pier & Exposition Authority, McCormick | |
| | | Place, 5.65%, 6/15/22 (NATL-RE Insured) | 1,745,932 |
| 13,785,000 | | Metropolitan Pier & Exposition Authority, McCormick | |
| | | Place, 5.65%, 6/15/22 (NATL-RE Insured) | 14,506,645 |
| 1,000,000 | | Metropolitan Pier & Exposition Authority, McCormick | |
| | | Place, Series B, 5.0%, 6/15/52 (ST APPROP Insured) | 1,026,350 |
| 1,485,000(f) | | Metropolitan Pier & Exposition Authority, McCormick | |
| | | Place, Series B, 5.65%, 6/15/22 (NATL-RE Insured) | 1,625,080 |
| 695,000 | | Southwestern Illinois Development Authority, Village of | |
| | | Sauget Project, 5.625%, 11/1/26 | 660,264 |
| | �� | Total Illinois | $ 27,719,836 |
| | | Indiana — 1.5% | |
| 250,000(g) | | City of Carmel, Barrington Carmel Project, Series A, | |
| | | 7.0%, 11/15/32 | $ 7,187 |
| 750,000(g) | | City of Carmel, Barrington Carmel Project, Series A, | |
| | | 7.125%, 11/15/42 | 21,563 |
| 500,000(g) | | City of Carmel, Barrington Carmel Project, Series A, | |
| | | 7.125%, 11/15/47 | 14,375 |
| 2,000,000 | | City of Evansville, Silver Birch Evansville Project, | |
| | | 5.45%, 1/1/38 | 1,889,920 |
| 1,500,000 | | City of Mishawaka, Silver Birch Mishawaka Project, | |
| | | 5.375%, 1/1/38 (144A) | 1,501,200 |
| 1,000,000 | | Indiana Finance Authority, Multipurpose Educational | |
| | | Facilities, Avondale Meadows Academy Project, | |
| | | 5.375%, 7/1/47 | 1,034,110 |
| | | Total Indiana | $ 4,468,355 |
| | | Louisiana — 0.8% | |
| 2,260,000(d) | | Jefferson Parish Hospital Service District No. 2, East | |
| | | Jefferson General Hospital, 6.375%, 7/1/41 | $ 2,346,807 |
| | | Total Louisiana | $ 2,346,807 |
The accompanying notes are an integral part of these financial statements.
Pioneer Municipal High Income Trust | Semiannual Report | 10/31/20 17
Schedule of Investments | 10/31/20
(unaudited) (continued)
| | | | |
| Principal | | | |
| Amount | | | |
| USD ($) | | | Value |
| | | Maine — 2.7% | |
| 1,400,000 | | City of Portland ME General Airport Revenue, | |
| | | 4.0%, 1/1/40 | $ 1,564,878 |
| 1,500,000 | | Maine Health & Higher Educational Facilities Authority, | |
| | | Maine General Medical Center, 7.5%, 7/1/32 | 1,539,765 |
| 4,480,000 | | Maine Turnpike Authority, Series A, 5.0%, 7/1/42 | 4,760,448 |
| | | Total Maine | $ 7,865,091 |
| | | Maryland — 0.9% | |
| 1,350,000 | | Maryland Health & Higher Educational Facilities | |
| | | Authority, City Neighbors, Series A, 6.75%, 7/1/44 | $ 1,433,619 |
| 1,250,000 | | Washington Suburban Sanitary Commission, 3.0%, | |
| | | 6/1/47 (CNTY GTD Insured) | 1,314,463 |
| | | Total Maryland | $ 2,748,082 |
| | | Massachusetts — 15.3% | |
| 2,000,000(b) | | City of Boston, Series A, 5.0%, 3/1/39 | $ 2,527,640 |
| 4,000,000(b) | | Commonwealth of Massachusetts, 3.0%, 3/1/49 | 4,231,360 |
| 7,000,000(c) | | Massachusetts Bay Transportation Authority, | |
| | | Series A, 7/1/28 | 6,210,680 |
| 1,550,000 | | Massachusetts Development Finance Agency, Harvard | |
| | | University, Series A, 5.0%, 7/15/36 | 2,243,920 |
| 5,000,000 | | Massachusetts Development Finance Agency, Harvard | |
| | | University, Series A, 5.0%, 7/15/40 | 7,422,950 |
| 1,000,000 | | Massachusetts Development Finance Agency, Partners | |
| | | Healthcare System, 4.0%, 7/1/41 | 1,097,310 |
| 5,000,000 | | Massachusetts Development Finance Agency, Partner’s | |
| | | Healthcare System, Series S-1, 4.0%, 7/1/41 | 5,532,050 |
| 7,100,000 | | Massachusetts Development Finance Agency, WGBH | |
| | | Foundation, Series A, 5.75%, 1/1/42 (AMBAC Insured) | 11,037,589 |
| 115,000 | | Massachusetts Educational Financing Authority, Series I, | |
| | | 6.0%, 1/1/28 | 115,555 |
| 3,100,000 | | Massachusetts Health & Educational Facilities Authority, | |
| | | Massachusetts Institute of Technology, Series K, | |
| | | 5.5%, 7/1/32 | 4,502,006 |
| | | Total Massachusetts | $ 44,921,060 |
| | | Michigan — 1.3% | |
| 1,000,000 | | David Ellis Academy, 5.25%, 6/1/45 | $ 1,000,000 |
| 2,640,000 | | Michigan State University, Series A, 5.0%, 8/15/41 | 2,916,830 |
| | | Total Michigan | $ 3,916,830 |
| | | Minnesota — 4.9% | |
| 1,840,000 | | Bloomington Port Authority, Radisson Blu Mall of | |
| | | America, 9.0%, 12/1/35 | $ 1,840,110 |
| 1,000,000 | | City of Ham Lake, DaVinci Academy, Series A, | |
| | | 5.0%, 7/1/47 | 1,006,790 |
The accompanying notes are an integral part of these financial statements.
18 Pioneer Municipal High Income Trust | Semiannual Report | 10/31/20
| | | | |
| Principal | | | |
| Amount | | | |
| USD ($) | | | Value |
| | | Minnesota — (continued) | |
| 1,000,000 | | City of Rochester, Health Care Facilities, Mayo Clinic, | |
| | | 4.0%, 11/15/48 | $ 1,111,990 |
| 2,300,000 | | City of Rochester, Mayo Clinic, Series B, 5.0%, 11/15/35 | 3,348,892 |
| 6,000,000(b) | | State of Minnesota, Series B, 4.0%, 8/1/27 | 7,195,560 |
| | | Total Minnesota | $ 14,503,342 |
| | | Montana — 0.1% | |
| 1,600,000(g) | | Two Rivers Authority, Inc., 7.375%, 11/1/27 | $ 122,560 |
| | | Total Montana | $ 122,560 |
| | | New Hampshire — 0.6% | |
| 1,000,000 | | New Hampshire Health & Education Facilities Authority | |
| | | Act, 5.0%, 8/1/59 | $ 1,420,940 |
| 375,000 | | New Hampshire Health & Education Facilities Authority | |
| | | Act, Catholic Medical Centre, 3.75%, 7/1/40 | 381,518 |
| | | Total New Hampshire | $ 1,802,458 |
| | | New Jersey — 2.2% | |
| 1,000,000 | | New Jersey Economic Development Authority, Charter | |
| | | Marion P Thomas, 5.375%, 10/1/50 (144A) | $ 1,031,460 |
| 3,000,000 | | New Jersey Economic Development Authority, | |
| | | Continental Airlines, 5.25%, 9/15/29 | 3,059,910 |
| 2,500,000 | | New Jersey Economic Development Authority, | |
| | | Continental Airlines, 5.75%, 9/15/27 | 2,402,775 |
| | | Total New Jersey | $ 6,494,145 |
| | | New Mexico — 1.3% | |
| 955,000 | | County of Otero, Otero County Jail Project, | |
| | | 9.0%, 4/1/23 | $ 943,072 |
| 2,960,000(e) | | County of Otero, Otero County Jail Project, | |
| | | 9.0%, 4/1/28 | 2,923,000 |
| | | Total New Mexico | $ 3,866,072 |
| | | New York — 16.9% | |
| 3,000,000 | | Metropolitan Transportation Authority, 4.0%, 11/15/45 | $ 2,990,580 |
| 2,000,000 | | Metropolitan Transportation Authority, 4.0%, 11/15/48 | 1,973,400 |
| 2,500,000 | | Metropolitan Transportation Authority, 5.0%, 11/15/33 | 2,728,175 |
| 2,000,000 | | Metropolitan Transportation Authority, 5.25%, 11/15/55 | 2,189,880 |
| 2,500,000 | | New York State Dormitory Authority, 3.0%, 3/15/41 | 2,589,350 |
| 4,865,000 | | New York State Dormitory Authority, 5.0%, 10/1/50 | 7,810,952 |
| 8,000,000 | | New York State Dormitory Authority, Series A, | |
| | | 4.0%, 7/1/41 | 8,976,400 |
| 2,500,000 | | New York State Dormitory Authority, Series A, | |
| | | 5.0%, 3/15/41 | 3,038,800 |
| 7,500,000 | | New York State Dormitory Authority, Series C, | |
| | | 5.0%, 3/15/39 | 8,400,525 |
The accompanying notes are an integral part of these financial statements.
Pioneer Municipal High Income Trust | Semiannual Report | 10/31/20 19
Schedule of Investments | 10/31/20
(unaudited) (continued)
| | | | |
| Principal | | | |
| Amount | | | |
| USD ($) | | | Value |
| | | New York — (continued) | |
| 1,500,000 | | New York State Dormitory Authority, Trustees of | |
| | | Columbia University, 5.0%, 10/1/45 | $ 2,333,445 |
| 3,000,000 | | New York State Urban Development Corp., | |
| | | 3.0%, 3/15/49 | 3,079,080 |
| 1,000,000 | | Troy Capital Resource Corp., 4.0%, 9/1/40 | 1,076,240 |
| 2,312,177 | | Westchester County Healthcare Corp., Series A, | |
| | | 5.0%, 11/1/44 | 2,464,619 |
| | | Total New York | $ 49,651,446 |
| | | North Carolina — 2.1% | |
| 4,225,000(e) | | Tender Option Bond Trust Receipts/Certificates, | |
| | | RIB, 0.0%, 1/1/38 (144A) | $ 6,129,799 |
| | | Total North Carolina | $ 6,129,799 |
| | | North Dakota — 0.9% | |
| 2,525,000(d) | | County of Burleigh, St. Alexius Medical Center, | |
| | | 5.0%, 7/1/38 | $ 2,714,122 |
| | | Total North Dakota | $ 2,714,122 |
| | | Ohio — 1.6% | |
| 1,000,000 | | Buckeye Tobacco Settlement Financing Authority, | |
| | | 4.0%, 6/1/48 | $ 1,083,750 |
| 1,000,000 | | Ohio Housing Finance Agency, Sanctuary Springboro | |
| | | Project, 5.45%, 1/1/38 (144A) | 990,030 |
| 2,500,000(b)(d) | | State of Ohio, Common Schools, Series B, 5.0%, 6/15/29 | 2,693,975 |
| | | Total Ohio | $ 4,767,755 |
| | | Oregon — 2.3% | |
| 1,000,000 | | Oregon Health & Science University, Series A, | |
| | | 5.0%, 7/1/42 | $ 1,220,210 |
| 5,190,000(d) | | Oregon Health & Science University, Series E, | |
| | | 5.0%, 7/1/32 | 5,582,779 |
| | | Total Oregon | $ 6,802,989 |
| | | Pennsylvania — 3.9% | |
| 3,000,000 | | Geisinger Authority, Geisinger Health System, | |
| | | series A-1, 5.0%, 2/15/45 | $ 3,519,180 |
| 1,500,000 | | Pennsylvania Turnpike Commission, 5.25%, 12/1/44 | 1,874,505 |
| 500,000 | | Philadelphia Authority for Industrial Development, 5.5%, | |
| | | 6/1/49 (144A) | 514,465 |
| 460,000 | | Philadelphia Authority for Industrial Development, | |
| | | Greater Philadelphia Health Action, Inc., Project, | |
| | | Series A, 6.625%, 6/1/50 | 474,297 |
| 2,000,000 | | Philadelphia Authority for Industrial Development, | |
| | | Nueva Esperanze, Inc., 8.2%, 12/1/43 | 2,151,020 |
The accompanying notes are an integral part of these financial statements.
20 Pioneer Municipal High Income Trust | Semiannual Report | 10/31/20
| | | | |
| Principal | | | |
| Amount | | | |
| USD ($) | | | Value |
| | | Pennsylvania — (continued) | |
| 1,000,000 | | Philadelphia Authority for Industrial Development, | |
| | Performing Arts Charter School Project, 6.5%, | |
| | | 6/15/33 (144A) | $ 1,003,070 |
| 2,000,000 | | Philadelphia Authority for Industrial Development, | |
| | Performing Arts Charter School Project, 6.75%, | |
| | | 6/15/43 (144A) | 2,006,320 |
| | | Total Pennsylvania | $ 11,542,857 |
| | | Philadelphia — 0.3% | |
| 1,000,000 | | Philadelphia Authority for Industrial Development, | |
| | | 5.0%, 11/15/50 | $ 999,990 |
| | | Total Philadelphia | $ 999,990 |
| | | Puerto Rico — 1.3% | |
| 6,255,000(b)(g) | | Commonwealth of Puerto Rico, 8.0%, 7/1/35 | $ 3,737,363 |
| | | Total Puerto Rico | $ 3,737,363 |
| | | Rhode Island — 3.3% | |
| 5,900,000(g) | | Central Falls Detention Facility Corp., 7.25%, 7/15/35 | $ 1,062,000 |
| 2,000,000 | | Rhode Island Health & Educational Building Corp., | |
| | | Brown University, Series A, 4.0%, 9/1/37 | 2,304,360 |
| 1,500,000(d) | | Rhode Island Health & Educational Building Corp., | |
| | | Tockwatten Home Issue, 8.375%, 1/1/46 | 1,520,385 |
| 1,000,000 | | Rhode Island Turnpike & Bridge Authority, 4.0%, 10/1/44 | 1,152,790 |
| 2,500,000(e) | | Tender Option Bond Trust Receipts/Certificates, | |
| | | RIB, 0.0%, 9/1/47 (144A) | 3,671,400 |
| | | Total Rhode Island | $ 9,710,935 |
| | | South Carolina — 1.1% | |
| 2,850,000 | | City of Charleston SC Waterworks & Sewer System | |
| | | Revenue, 4.0%, 1/1/49 | $ 3,293,945 |
| | | Total South Carolina | $ 3,293,945 |
| | | Texas — 9.2% | |
| 500,000 | | Arlington Higher Education Finance Corp., 5.45%, | |
| | | 3/1/49 (144A) | $ 531,515 |
| 1,000,000 | | Arlington Higher Education Finance Corp., Universal | |
| | | Academy, Series A, 7.0%, 3/1/34 | 1,084,420 |
| 2,500,000(d) | | Central Texas Regional Mobility Authority, Sub Lien, | |
| | | 6.75%, 1/1/41 | 2,528,200 |
| 1,250,000 | | City of Houston TX Combined Utility System Revenue, | |
| | | 4.0%, 11/15/35 | 1,510,062 |
| 1,490,000(b) | | County of Harris, Series A, 5.0%, 10/1/26 | 1,828,126 |
| 5,000,000(b) | | Goose Creek Consolidated Independent School District, | |
| | | Series C, 4.0%, 2/15/26 (PSF-GTD Insured) | 5,577,650 |
| 3,785,000 | | North Texas Tollway Authority, Series A, 5.0%, 1/1/35 | 4,355,702 |
| 1,500,000(d) | | Red River Health Facilities Development Corp., MRC | |
| | | Crestview, Series A, 8.0%, 11/15/41 | 1,620,645 |
The accompanying notes are an integral part of these financial statements.
Pioneer Municipal High Income Trust | Semiannual Report | 10/31/20 21
Schedule of Investments | 10/31/20
(unaudited) (continued)
| | | | |
| Principal | | | |
| Amount | | | |
| USD ($) | | | Value |
| | | Texas — (continued) | |
| 3,960,000(g) | | Sanger Industrial Development Corp., Texas Pellets | |
| | | Project, Series B, 8.0%, 7/1/38 | $ 975,150 |
| 1,000,000(g) | | Tarrant County Cultural Education Facilities Finance | |
| | | Corp., Mirador Project, Series A, 4.875%, 11/15/48 | 100 |
| 1,000,000(g) | | Tarrant County Cultural Education Facilities Finance | |
| | | Corp., Mirador Project, Series A, 5.0%, 11/15/55 | 100 |
| 2,000,000(d) | | Tarrant County Cultural Education Facilities Finance | |
| | | Corp., MRC Crestview Project, 8.0%, 11/15/34 | 2,005,240 |
| 2,000,000 | | Texas Water Development Board, 4.0%, 10/15/44 | 2,366,200 |
| 2,500,000(d) | | Travis County Health Facilities Development Corp., | |
| | | Longhorn Village Project, 7.125%, 1/1/46 | 2,529,425 |
| | | Total Texas | $ 26,912,535 |
| | | Utah — 0.4% | |
| 1,000,000 | | Salt Lake City Corp., Airport Revenue, Series B, | |
| | | 5.0%, 7/1/35 | $ 1,215,400 |
| | | Total Utah | $ 1,215,400 |
| | | Virginia — 11.0% | |
| 5,000,000(b) | | City of Alexandria VA, 3.0%, 7/15/46 (ST AID | |
| | | WITHHLDG Insured) | $ 5,378,400 |
| 1,000,000 | | City of Richmond VA Public Utility Revenue, | |
| | | 3.0%, 1/15/45 | 1,077,870 |
| 2,200,000(b) | | County of Arlington, 4.0%, 8/15/35 | 2,524,214 |
| 1,415,000(b) | | County of Fairfax, Series A, 4.0%, 10/1/33 (ST AID | |
| | | WITHHLDG Insured) | 1,627,363 |
| 5,000,000 | | University of Virginia, Series A, 5.0%, 4/1/42 | 6,179,450 |
| 4,000,000 | | Upper Occoquan Sewage Authority, 4.0%, 7/1/41 | 4,409,760 |
| 5,000,000 | | Virginia College Building Authority, Series A, | |
| | | 3.0%, 2/1/36 | 5,413,800 |
| 4,000,000 | | Virginia Commonwealth Transportation Board, Capital | |
| | | Projects, 3.0%, 5/15/37 | 4,343,440 |
| 1,000,000 | | Virginia Public Building Authority, 4.0%, 8/1/39 | 1,194,320 |
| | | Total Virginia | $ 32,148,617 |
| | | Washington — 10.3% | |
| 3,745,000 | | City of Seattle, Water System Revenue, 4.0%, 8/1/32 | $ 4,290,197 |
| 2,500,000(b) | | King County, Issaquah School District No. 411, | |
| | | 4.0%, 12/1/31 (SCH BD GTY Insured) | 2,862,300 |
| 14,315,000(b)(c) | | State of Washington, Motor Vehicle Sales Tax, | |
| | | Series C, 6/1/22 (NATL Insured) | 14,162,545 |
| 3,285,000(e) | | Tender Option Bond Trust Receipts/Certificates, | |
| | | RIB, 0.0%, 1/1/45 (144A) | 4,823,628 |
| 2,500,000 | | University of Washington, Series B, 5.0%, 6/1/29 | 2,992,200 |
| 1,150,000 | | Washington State Housing Finance Commission, | |
| | | Mirabella Project, Series A, 6.75%, 10/1/47 (144A) | 1,192,631 |
| | | Total Washington | $ 30,323,501 |
The accompanying notes are an integral part of these financial statements.
22 Pioneer Municipal High Income Trust | Semiannual Report | 10/31/20
| | | | |
| Principal | | | |
| Amount | | | |
| USD ($) | | | Value |
| | | Wisconsin — 6.2% | |
| 1,500,000 | | Public Finance Authority, Gardner Webb University, | |
| | | 5.0%, 7/1/31 (144A) | $ 1,612,920 |
| 5,000,000 | | Public Finance Authority, Glenridge Palmer Ranch, | |
| | | Series A, 8.25%, 6/1/46 (144A) | 5,238,250 |
| 750,000 | | Public Finance Authority, Roseman University Health | |
| | | Sciences Project, 5.875%, 4/1/45 | 779,857 |
| 1,000,000 | | Public Finance Authority, SearStone CCRC Project, | |
| | | Series A, 5.3%, 6/1/47 | 1,001,600 |
| 1,465,000(d) | | Public Finance Authority, SearStone CCRC Project, | |
| | | Series A, 8.625%, 6/1/47 | 1,645,825 |
| 5,000,000 | | Wisconsin Department of Transportation, Series A, | |
| | | 5.0%, 7/1/28 | 5,769,850 |
| 2,000,000 | | Wisconsin Housing & Economic Development Authority, | |
| | | 2.95%, 3/1/42 (FNMA COLL Insured) | 2,056,981 |
| | | Total Wisconsin | $ 18,105,283 |
| | | TOTAL MUNICIPAL BONDS | |
| | | (Cost $397,391,247) | $ 413,379,866 |
| | | TOTAL INVESTMENTS IN UNAFFILIATED ISSUERS — 141.2% | |
| | | (Cost $398,387,633) | $ 414,371,230 |
| | | OTHER ASSETS AND LIABILITIES — (41.2)% | $ (120,871,033) |
| | | NET ASSETS APPLICABLE TO COMMON | |
| | | SHAREOWNERS — 100.0% | $ 293,500,197 |
| | |
RIB | Residual Interest Bond is purchased in a secondary market. The interest rate is subject to |
| change periodically and inversely based upon prevailing market rates. The interest rate |
| shown is the rate at October 31, 2020. |
(144A) | Security is exempt from registration under Rule 144A of the Securities Act of 1933. Such |
| securities may be resold normally to qualified institutional buyers in a transaction exempt |
| from registration. At October 31, 2020, the value of these securities amounted to |
| $36,076,888, or 12.3% of net assets applicable to common shareowners. |
(a) | Consists of Revenue Bonds unless otherwise indicated. |
(b) | Represents a General Obligation Bond. |
(c) | Security issued with a zero coupon. Income is recognized through accretion of discount. |
(d) | Prerefunded bonds have been collateralized by U.S. Treasury or U.S. Government |
| Agency securities which are held in escrow to pay interest and principal on the tax |
| exempt issue and to retire the bonds in full at the earliest refunding date. |
(e) | The interest rate is subject to change periodically. The interest rate and/or reference |
| index and spread shown at October 31, 2020. |
(f) | Escrow to maturity. |
(g) | Security is in default. |
The accompanying notes are an integral part of these financial statements.
Pioneer Municipal High Income Trust | Semiannual Report | 10/31/20 23
Schedule of Investments | 10/31/20
(unaudited) (continued)
Purchases and sales of securities (excluding temporary cash investments) for the six months ended October 31, 2020, aggregated $32,604,038 and $25,440,427, respectively.
The Trust is permitted to engage in purchase and sale transactions (“cross trades”) with certain funds and accounts for which Amundi Pioneer Asset Management, Inc. (the “Adviser”) serves as the Trust’s investment adviser, as set forth in Rule 17a-7 under the Investment Company Act of 1940, pursuant to procedures adopted by the Board of Trustees. Under these procedures, cross trades are effected at current market prices. During the six months ended October 31, 2020, the Trust did not engage in any cross trade activity.
At October 31, 2020, the net unrealized appreciation on investments based on cost for federal tax purposes of $396,420,712 was as follows:
| | | | |
| Aggregate gross unrealized appreciation for all investments in which | | | |
| there is an excess of value over tax cost | | $ | 30,753,899 | |
| Aggregate gross unrealized depreciation for all investments in which | | | | |
| there is an excess of tax cost over value | | | (12,803,381 | ) |
| Net unrealized appreciation | | $ | 17,950,518 | |
Various inputs are used in determining the value of the Trust’s investments. These inputs are summarized in the three broad levels below.
Level 1 – quoted prices in active markets for identical securities.
Level 2 – other significant observable inputs (including quoted prices for similar securities, interest rates, prepayment speeds, credit risks, etc.). See Notes to Financial Statements — Note 1A.
Level 3 – significant unobservable inputs (including the Trust’s own assumptions in determining fair value of investments). See Notes to Financial Statements — Note 1A.
The following is a summary of the inputs used as of October 31, 2020, in valuing the Trust’s investments:
| | | | | | | | | | | | | |
| | Level 1 | | | Level 2 | | | Level 3 | | | Total | |
| Collateralized Mortgage Obligation | | $ | — | | | $ | 991,364 | | | $ | — | | | $ | 991,364 | |
Municipal Bonds | | | — | | | | 413,379,866 | | | | — | | | | 413,379,866 | |
| Total Investments in Securities | | $ | — | | | $ | 414,371,230 | | | $ | — | | | $ | 414,371,230 | |
| Other Financial Instruments | | | | | | | | | | | | | | | | |
Variable Rate MuniFund Term | | | | | | | | | | | | | | | | |
Preferred Shares(a) | | $ | — | | | $ | (125,000,000 | ) | | $ | — | | | $ | (125,000,000 | ) |
| Total Other | | | | | | | | | | | | | | | | |
| Financial Instruments | | $ | — | | | $ | (125,000,000 | ) | | $ | — | | | $ | (125,000,000 | ) |
(a) The Trust may hold liabilities in which the fair value approximates the carrying amount for financial statement purposes.
During the six months ended October 31, 2020, there were no transfers between Levels 1, 2 and 3.
The accompanying notes are an integral part of these financial statements.
24 Pioneer Municipal High Income Trust | Semiannual Report | 10/31/20
Statement of Assets and Liabilities |
10/31/20 (unaudited)
| | | | |
| ASSETS: | | | |
| Investments in unaffiliated issuers, at value (cost $398,387,633) | | $ | 414,371,230 | |
| Cash | | | 6,479,118 | |
| Receivables — | | | | |
| Investment securities sold | | | 150,007 | |
| Interest | | | 5,173,434 | |
| Due from the Adviser | | | 158,981 | |
| Other assets | | | 14,964 | |
| Total assets | | $ | 426,347,734 | |
| LIABILITIES: | | | | |
| Variable Rate MuniFund Term Preferred Shares* | | $ | 125,000,000 | |
| Payables — | | | | |
| Investment securities purchased | | | 7,718,755 | |
| Interest expense | | | 1,061 | |
| Distributions | | | 25 | |
| Trustees’ fees | | | 2,147 | |
| Due to affiliates | | | 3,125 | |
| Accrued expenses | | | 122,424 | |
| Total liabilities | | $ | 132,847,537 | |
| NET ASSETS APPLICABLE TO COMMON SHAREOWNERS: | | | | |
| Paid-in capital | | $ | 300,996,046 | |
| Distributable earnings (loss) | | | (7,495,849 | ) |
| Net assets applicable to common shareowners | | $ | 293,500,197 | |
| NET ASSET VALUE PER COMMON SHARE: | | | | |
| No par value | | | | |
| Based on $293,500,197/22,771,349 common shares | | $ | 12.89 | |
* $100,000 liquidation value per share applicable to 1,250 shares. |
The accompanying notes are an integral part of these financial statements.
Pioneer Municipal High Income Trust | Semiannual Report | 10/31/20 25
Statement of Operations (unaudited)
FOR THE SIX MONTHS ENDED 10/31/20
| | | | | | | |
| INVESTMENT INCOME: | | | | | | |
| Interest from unaffiliated issuers | | $ | 8,823,142 | | | | |
| Total investment income | | | | | | $ | 8,823,142 | |
| EXPENSES: | | | | | | | | |
| Management fees | | $ | 1,268,966 | | | | | |
| Administrative expense | | | 98,575 | | | | | |
| Transfer agent fees | | | 5,779 | | | | | |
| Distribution fees | | | | | | | | |
| Shareowner communications expense | | | 15,098 | | | | | |
| Custodian fees | | | 2,525 | | | | | |
| Registration fees | | | 7,356 | | | | | |
| Professional fees | | | 177,817 | | | | | |
| Printing expense | | | 6,653 | | | | | |
| Pricing fees | | | 3,425 | | | | | |
| Trustees’ fees | | | 10,615 | | | | | |
| Insurance expense | | | 2,461 | | | | | |
| Interest expense | | | 660,600 | | | | | |
| Miscellaneous | | | 44,630 | | | | | |
| Total expenses | | | | | | $ | 2,304,500 | |
| Net investment income | | | | | | $ | 6,518,642 | |
| REALIZED AND UNREALIZED GAIN (LOSS) ON INVESTMENTS: | | | | | |
| Net realized gain (loss) on: | | | | | | | | |
| Investments in unaffiliated issuers | | $ | 2,207,584 | | | | | |
| Change in net unrealized appreciation (depreciation) on: | | | | | | | | |
| Investments in unaffiliated issuers | | | 10,664,448 | | | | | |
| Net realized and unrealized gain (loss) on investments | | | | | | $ | 12,872,032 | |
| Net increase in net assets resulting from operations | | | | | | $ | 19,390,674 | |
The accompanying notes are an integral part of these financial statements.
26 Pioneer Municipal High Income Trust | Semiannual Report | 10/31/20
Statements of Changes in Net Assets
| | | | | | | |
| | Six Months | | | | |
| | Ended | | | Year | |
| | 10/31/20 | | | Ended | |
| | (unaudited) | | | 4/30/20 | |
| FROM OPERATIONS: | | | | | | |
Net investment income (loss) | | $ | 6,518,642 | | | $ | 12,469,533 | |
Net realized gain (loss) on investments | | | 2,207,584 | | | | 1,931,953 | |
Change in net unrealized appreciation (depreciation) | | | | | | | | |
| on investments | | | 10,664,448 | | | | (9,109,466 | ) |
| Net increase in net assets resulting from operations | | $ | 19,390,674 | | | $ | 5,292,020 | |
| DISTRIBUTIONS TO COMMON SHAREOWNERS: | | | | | | | | |
($0.27 and $0.57 per share, respectively) | | $ | (6,148,264 | ) | | $ | (12,979,669 | ) |
| Total distributions to common shareowners | | $ | (6,148,264 | ) | | $ | (12,979,669 | ) |
| Net increase (decrease) in net assets | | | | | | | | |
| applicable to common shareowners | | $ | 13,242,410 | | | $ | (7,687,649 | ) |
| NET ASSETS APPLICABLE TO COMMON SHAREOWNERS: | | | | | | | | |
Beginning of period | | $ | 280,257,787 | | | $ | 287,945,436 | |
End of period | | $ | 293,500,197 | | | $ | 280,257,787 | |
The accompanying notes are an integral part of these financial statements.
Pioneer Municipal High Income Trust | Semiannual Report | 10/31/20 27
Statement of Cash Flows
FOR THE SIX MONTHS ENDED 10/31/20
| | | | |
| Cash Flows From Operating Activities: | | | |
| Net Increase in net assets resulting from operations | | $ | 19,390,674 | |
| Adjustments to reconcile net decrease in net assets resulting | | | | |
| from operations to net cash, restricted cash and foreign | | | | |
| currencies from operating activities: | | | | |
| Purchases of investment securities | | $ | (27,978,734 | ) |
| Proceeds from disposition and maturity of investment securities | | | 26,290,401 | |
| Net (accretion) and amortization of discount/premium on investment securities | | | 219,909 | |
| Change in unrealized depreciation on investments in unaffiliated issuers | | | (10,664,448 | ) |
| Net realized gain on investments in unaffiliated issuers | | | (2,207,584 | ) |
| Decrease in interest receivable | | | 358,837 | |
| Decrease in other assets | | | 92,330 | |
| Decrease in due from advisor | | | 7,551 | |
| Increase in due to affiliates | | | 384 | |
| Increase in trustees’ fees payable | | | 2,101 | |
| Increase in accrued expenses payable | | | 33,566 | |
| Decrease in interest expense payable | | | (27,489 | ) |
| Net cash provided by operating activities | | $ | 5,517,498 | |
| Cash Flows Used in Financing Activities: | | | | |
| Distributions to shareowners | | $ | (6,148,264 | ) |
| Net cash and foreign currencies used in financing activities | | $ | (6,148,264 | ) |
| Cash, restricted cash and foreign currencies: | | | | |
| Beginning of the period | | $ | 7,109,884 | |
| End of the period | | $ | 6,479,118 | |
| Cash Flow Information: | | | | |
| Cash paid for interest | | $ | 660,600 | |
The accompanying notes are an integral part of these financial statements.
28 Pioneer Municipal High Income Trust | Semiannual Report | 10/31/20
| | | | | | | | | | | | | | | | | | | |
| | Six Months | | | | | | | | | | | | | | | | |
| | Ended | | | Year | | | Year | | | Year | | | Year | | | Year | |
| | 10/31/20 | | | Ended | | | Ended | | | Ended | | | Ended | | | Ended | |
| | (unaudited) | | | 4/30/20 | | | 4/30/19 | | | 4/30/18 | | | 4/30/17* | | | 4/30/16* | |
| Per Share Operating Performance | | | | | | | | | | | | | | | | | | |
Net asset value, beginning of period | | $ | 12.31 | | | $ | 12.65 | | | $ | 12.50 | | | $ | 12.72 | | | $ | 13.49 | | | $ | 13.31 | |
Increase (decrease) from investment operations: (a) | | | | | | | | | | | | | | | | | | | | | | | | |
| Net investment income | | $ | 0.29 | | | $ | 0.55 | | | $ | 0.74 | | | $ | 0.78 | | | $ | 0.73 | | | $ | 0.83 | |
| Net realized and unrealized gain (loss) on investments | | | 0.56 | | | | (0.32 | ) | | | 0.19 | | | | (0.29 | ) | | | (0.76 | ) | | | 0.20 | |
Distributions to preferred shareowners from: | | | | | | | | | | | | | | | | | | | | | | | | |
| Net investment income | | $ | — | | | $ | — | | | $ | (0.15 | ) | | $ | (0.09 | ) | | $ | (0.05 | ) | | $ | (0.01 | ) |
| Net increase (decrease) from investment operations | | $ | 0.85 | | | $ | 0.23 | | | $ | 0.78 | | | $ | 0.40 | | | $ | (0.08 | ) | | $ | 1.02 | |
Distributions to shareowners from: | | | | | | | | | | | | | | | | | | | | | | | | |
| Net investment income and previously undistributed | | | | | | | | | | | | | | | | | | | | | | | | |
| net investment income | | $ | (0.27 | ) | | $ | (0.57 | ) | | $ | (0.63 | ) | | $ | (0.62 | ) | | $ | (0.69 | ) | | $ | (0.84 | )** |
| Net increase (decrease) in net asset value | | $ | 0.58 | | | $ | (0.34 | ) | | $ | 0.15 | | | $ | (0.22 | ) | | $ | (0.77 | ) | | $ | 0.18 | |
Net asset value, end of period | | $ | 12.89 | | | $ | 12.31 | | | $ | 12.65 | | | $ | 12.50 | | | $ | 12.72 | | | $ | 13.49 | |
Market value, end of period | | $ | 11.34 | | | $ | 10.82 | | | $ | 11.91 | | | $ | 11.25 | | | $ | 11.75 | | | $ | 14.07 | |
| Total return at net asset value (b) | | | 7.16 | %(c) | | | 2.00 | %(d) | | | 6.93 | % | | | 3.53 | % | | | (0.45 | )% | | | 8.12 | % |
| Total return at market value (b) | | | 7.26 | %(c) | | | (4.77 | )% | | | 11.86 | % | | | 0.87 | % | | | (11.83 | )% | | | 1.75 | % |
Ratios to average net assets of shareowners: | | | | | | | | | | | | | | | | | | | | | | | | |
| Total expenses plus interest expense (e) | | | 1.55 | %(f) | | | 2.13 | % | | | 1.03 | % | | | 1.01 | % | | | 1.00 | % | | | 1.05 | % |
| Net investment income before preferred share distributions | | | 4.39 | %(f) | | | 4.24 | % | | | 5.92 | % | | | 6.14 | % | | | 5.54 | % | | | 6.24 | % |
| Preferred share distributions | | | — | % | | | — | % | | | (1.23 | )% | | | 0.71 | % | | | 0.38 | % | | | 0.10 | % |
| Net investment income available to shareowners | | | 4.39 | %(f) | | | 4.24 | % | | | 4.69 | % | | | 5.44 | % | | | 5.16 | % | | | 6.14 | % |
Portfolio turnover rate | | | 6 | % | | | 17 | % | | | 16 | % | | | 20 | % | | | 19 | % | | | 9 | % |
Net assets, end of period (in thousands) | | $ | 293,500 | | | $ | 280,258 | | | $ | 287,945 | | | $ | 284,596 | | | $ | 289,741 | | | $ | 307,027 | |
The accompanying notes are an integral part of these financial statements.
Pioneer Municipal High Income Trust | Semiannual Report | 10/31/20 29
Financial Highlights (continued)
| | | | | | | | | | | | | | | | | | | |
| | Six Months | | | | | | | | | | | | | | | | |
| | Ended | | | Year | | | Year | | | Year | | | Year | | | Year | |
| | 10/31/20 | | | Ended | | | Ended | | | Ended | | | Ended | | | Ended | |
| | (unaudited) | | | 4/30/20 | | | 4/30/19 | | | 4/30/18 | | | 4/30/17* | | | 4/30/16* | |
Preferred shares outstanding (in thousands) (g)(h) | | $ | 125,000 | | | $ | 125,000 | | | $ | 125,000 | | | $ | 125,000 | | | $ | 101,000 | | | $ | 101,000 | |
Asset coverage per preferred share, end of period | | $ | 334,801 | | | $ | 324,229 | | | $ | 330,370 | | | $ | 327,672 | | | $ | 96,723 | | | $ | 100,998 | |
Average market value per preferred share (i) | | $ | 100,000 | | | $ | 100,000 | | | $ | 100,000 | | | $ | 100,000 | | | $ | 25,000 | | | $ | 25,000 | |
Liquidation value, including dividends payable, per preferred share | | $ | 100,001 | | | $ | 100,023 | | | $ | 100,014 | | | $ | 99,996 | | | $ | 25,006 | | | $ | 25,001 | |
| | |
* | The Trust was audited by an independent registered public accounting firm other than Ernst & Young LLP. |
** | The amount of distributions made to shareowners during the year were in excess of the net investment income earned by the Trust during the year. The Trust has accumulated undistributed net investment income which is part of the Trust’s NAV. A portion of the accumulated net investment income was distributed to shareowners during the year. |
(a) | The per common share data presented above is based upon the average common shares outstanding for the periods presented. |
(b) | Total investment return is calculated assuming a purchase of common shares at the current net asset value or market value on the first day and a sale at the current net asset value or market value on the last day of the periods reported. Dividends and distributions, if any, are assumed for purposes of this calculation to be reinvested at prices obtained under the Trust’s dividend reinvestment plan. Total investment return does not reflect brokerage commissions. Past performance is not a guarantee of future results. |
(c) | Not annualized. |
(d) | If the Fund had not recognized gains in settlement of class action lawsuits during the year ended April 30, 2020, the total return would have been 1.73%. |
(e) | Expense ratios do not reflect the effect of distribution payments to preferred shareowners. |
(f)
| Annualized.
|
(g) | Prior to February 9, 2018 there were 4,040 Auction Preferred Shares (“APS”) outstanding with a liquidation preference of $25,000 per share. The Trust redeemed all 2,000 outstanding Series A APS on February 14, 2018 and all 2,040 outstanding Series B APS on February 15, 2018. |
(h) | The Trust issued 1,250 Variable Rate MuniFund Term Preferred Shares, with a liquidation preference of $100,000 per share, on February 9, 2018. |
(i) | Market value is redemption value without an active market. |
The accompanying notes are an integral part of these financial statements.
30 Pioneer Municipal High Income Trust | Semiannual Report | 10/31/20
Notes to Financial Statements |
10/31/20 (unaudited)
1. Organization and Significant Accounting Policies
Pioneer Municipal High Income Trust (the “Trust”) was organized as a Delaware statutory trust on March 13, 2003. Prior to commencing operations on July 21, 2003, the Trust had no operations other than matters relating to its organization and registration as a diversified, closed-end management investment company under the Investment Company Act of 1940, as amended. The investment objective of the Trust is to seek a high level of current income exempt from regular federal income tax, and the Trust may, as a secondary objective, also seek capital appreciation to the extent that it is consistent with its primary investment objective.
Amundi Pioneer Asset Management, Inc., an indirect, wholly owned subsidiary of Amundi and Amundi’s wholly owned subsidiary, Amundi USA, Inc., serves as the Trust’s investment adviser (the “Adviser”). Amundi Pioneer Distributor, Inc., an affiliate of Amundi Pioneer Asset Management, Inc., serves as the Trust’s distributor (the “Distributor”).
During March 2017, the Financial Accounting Standards Board (FASB) issued an Accounting Standard Update, ASU 2017-08, Receivables-Nonrefundable Fees and Other Costs (Subtopic 310-20), Premium Amortization on Purchased Callable Debt Securities (“ASU 2017-08”), which shortens the amortization period for purchased non-contingently callable debt securities held at a premium. ASU 2017-08 specifies that the premium amortization period ends at the earliest call date, for certain purchased non-contingently callable debt securities. ASU 2017-08 is effective for fiscal years, and interim periods within those fiscal years, beginning after December 15, 2018. The Trust has adopted ASU 2017-08 as of April 30, 2020. The implementation of ASU 2017-08 did not have a material impact on the Trust’s Financial Statements.
In March 2020, FASB issued an Accounting Standard Update, ASU 2020-04, Reference Rate Reform (Topic 848) -- Facilitation of the Effects of Reference Rate Reform on Financial Reporting ("ASU 2020-04"), which provides optional, temporary relief with respect to the financial reporting of contracts subject to certain types of modifications due to the planned discontinuation of the London Interbank Offered Rate ("LIBOR") and other LIBOR-based reference rates at the end of 2021. The temporary relief provided by ASU 2020-04 is effective for certain reference rate-related contract modifications that occur during the period from March 12, 2020
Pioneer Municipal High Income Trust | Semiannual Report | 10/31/20 31
through December 31, 2022. Management is evaluating the impact of ASU 2020-04 on the Fund's investments, derivatives, debt and other contracts that will undergo reference rate-related modifications as a result of the reference rate reform.
The Trust is an investment company and follows investment company accounting and reporting guidance under U.S. Generally Accepted Accounting Principles (“U.S. GAAP”). U.S. GAAP requires the management of the Trust to make estimates and assumptions that affect the reported amounts of assets and liabilities, the disclosure of contingent assets and liabilities at the date of the financial statements, and the reported amounts of income, expenses and gain or loss on investments during the reporting period. Actual results could differ from those estimates.
The following is a summary of significant accounting policies followed by the Trust in the preparation of its financial statements:
A. Security Valuation
The net asset value of the Trust is computed once daily, on each day the New York Stock Exchange (“NYSE”) is open, as of the close of regular trading on the NYSE.
Fixed-income securities are valued by using prices supplied by independent pricing services, which consider such factors as market prices, market events, quotations from one or more brokers, Treasury spreads, yields, maturities and ratings, or may use a pricing matrix or other fair value methods or techniques to provide an estimated value of the security or instrument. A pricing matrix is a means of valuing a debt security on the basis of current market prices for other debt securities, historical trading patterns in the market for fixed-income securities and/or other factors. Non-U.S. debt securities that are listed on an exchange will be valued at the bid price obtained from an independent third party pricing service. When independent third party pricing services are unable to supply prices, or when prices or market quotations are considered to be unreliable, the value of that security may be determined using quotations from one or more broker-dealers
Securities for which independent pricing services or broker-dealers are unable to supply prices or for which market prices and/or quotations are not readily available or are considered to be unreliable are valued by a fair valuation team comprised of certain personnel of the Adviser pursuant to procedures adopted by the Trust’s Board of Trustees. The Adviser’s fair valuation team uses fair value methods approved by the Valuation
32 Pioneer Municipal High Income Trust | Semiannual Report | 10/31/20
Committee of the Board of Trustees. The Adviser’s fair valuation team is responsible for monitoring developments that may impact fair valued securities and for discussing and assessing fair values on an ongoing basis, and at least quarterly, with the Valuation Committee of the Board of Trustees.
Inputs used when applying fair value methods to value a security may include credit ratings, the financial condition of the company, current market conditions and comparable securities. The Trust may use fair value methods if it is determined that a significant event has occurred after the close of the exchange or market on which the security trades and prior to the determination of the Trust’s net asset value. Examples of a significant event might include political or economic news, corporate restructurings, natural disasters, terrorist activity or trading halts. Thus, the valuation of the Trust’s securities may differ significantly from exchange prices, and such differences could be material.
At October 31, 2020, no securities were valued using fair value methods (other than securities valued using prices supplied by independent pricing services, broker-dealers or using a third party insurance industry pricing model).
B. Investment Income and Transactions
Interest income, including interest on income-bearing cash accounts, is recorded on the accrual basis. Dividend and interest income are reported net of unrecoverable foreign taxes withheld at the applicable country rates and net of income accrued on defaulted securities.
Discounts and premiums on purchase prices of debt securities are accreted or amortized, respectively, daily, into interest income on an effective yield to maturity basis with a corresponding increase or decrease in the cost basis of the security. Premiums and discounts related to certain mortgage-backed securities are amortized or accreted in proportion to the monthly paydowns.
Interest and dividend income payable by delivery of additional shares is reclassified as PIK (payment-in-kind) income upon receipt and is included in interest and dividend income, respectively.
Security transactions are recorded as of trade date. Gains and losses on sales of investments are calculated on the identified cost method for both financial reporting and federal income tax purposes.
Pioneer Municipal High Income Trust | Semiannual Report | 10/31/20 33
C. Federal Income Taxes
It is the Trust’s policy to comply with the requirements of the Internal Revenue Code applicable to regulated investment companies and to distribute all of its net taxable income and net realized capital gains, if any, to its shareowners. Therefore, no provision for federal income taxes is required. As of April 30, 2020, the Trust did not accrue any interest or penalties with respect to uncertain tax positions, which, if applicable, would be recorded as an income tax expense on the Statement of Operations. Tax returns filed within the prior three years remain subject to examination by federal and state tax authorities.
The amount and character of income and capital gain distributions to shareowners are determined in accordance with federal income tax rules, which may differ from U.S. GAAP. Distributions in excess of net investment income or net realized gains are temporary over distributions for financial statement purposes resulting from differences in the recognition or classification of income or distributions for financial statement and tax purposes. Capital accounts within the financial statements are adjusted for permanent book/tax differences to reflect tax character, but are not adjusted for temporary differences.
The tax character of current year distributions payable will be determined at the end of the current taxable year. The tax character of distributions paid during the year ended April 30, 2020 was as follows:
| | | | |
| | | 2020 | |
| Distributions paid from: | | | |
| Tax Exempt Distributions | | $ | 15,198,352 | |
| Ordinary income | | | 1,011,767 | |
| Total | | $ | 16,210,119 | |
The following shows the components of distributable earnings (losses) on a federal income tax basis at April 30, 2020:
| | | | |
| | | 2020 | |
| Distributable earnings/(loss): | | | |
| Undistributed ordinary income | | $ | 305,366 | |
| Capital loss carryforward | | | (28,977,009 | ) |
| Other book/tax temporary differences | | | (28,575 | ) |
| Undistributed tax-exempt income | | | 675,889 | |
| Unrealized appreciation | | | 7,286,070 | |
| Total | | $ | (20,738,259 | ) |
34 Pioneer Municipal High Income Trust | Semiannual Report | 10/31/20
The difference between book-basis and tax-basis unrealized appreciation/depreciation is primarily attributable to the book/tax differences in the accrual of income on securities in default, the difference between book and tax amortization methods and discounts on fixed income securities.
D. Automatic Dividend Reinvestment Plan
All shareowners whose shares are registered in their own names automatically participate in the Automatic Dividend Reinvestment Plan (the “Plan”), under which participants receive all dividends and capital gain distributions (collectively, dividends) in full and fractional shares of the Trust in lieu of cash. Shareowners may elect not to participate in the Plan. Shareowners not participating in the Plan receive all dividends and capital gain distributions in cash. Participation in the Plan is completely voluntary and may be terminated or resumed at any time without penalty by notifying American Stock Transfer & Trust Company (“AST”), the agent for shareowners in administering the Plan (the “Plan Agent”), in writing prior to any dividend record date; otherwise such termination or resumption will be effective with respect to any subsequently declared dividend or other distribution.
If a shareowner’s shares are held in the name of a brokerage firm, bank or other nominee, the shareowner can ask the firm or nominee to participate in the Plan on the shareowner’s behalf. If the firm or nominee does not offer the Plan, dividends will be paid in cash to the shareowner of record. A firm or nominee may reinvest a shareowner’s cash dividends in shares of the Trust on terms that differ from the terms of the Plan.
Whenever the Trust declares a dividend on shares payable in cash, participants in the Plan will receive the equivalent in shares acquired by the Plan Agent either (i) through receipt of additional unissued but authorized shares from the Trust or (ii) by purchase of outstanding shares on the New York Stock Exchange or elsewhere. If, on the payment date for any dividend, the net asset value per share is equal to or less than the market price per share plus estimated brokerage trading fees (market premium), the Plan Agent will invest the dividend amount in newly issued shares. The number of newly issued shares to be credited to each account will be determined by dividing the dollar amount of the dividend by the net asset value per share on the date the shares are issued, provided that the maximum discount from the then current market price per share on the date of issuance does not exceed 5%. If, on the payment date for any
Pioneer Municipal High Income Trust | Semiannual Report | 10/31/20 35
dividend, the net asset value per share is greater than the market value (market discount), the Plan Agent will invest the dividend amount in shares acquired in open-market purchases. There are no brokerage charges with respect to newly issued shares. However, each participant will pay a pro rata share of brokerage trading fees incurred with respect to the Plan Agent’s open-market purchases. Participating in the Plan does not relieve shareowners from any federal, state or local taxes which may be due on dividends paid in any taxable year. Shareowners holding Plan shares in a brokerage account may be able to transfer the shares to another broker and continue to participate in the Plan.
E. Risks
The value of securities held by the Trust may go up or down, sometimes rapidly or unpredictably, due to general market conditions, such as real or perceived adverse economic, political or regulatory conditions, recessions, the spread of infectious illness or other public health issues, inflation, changes in interest rates, lack of liquidity in the bond markets or adverse investor sentiment. In the past several years, financial markets have experienced increased volatility, depressed valuations, decreased liquidity and heightened uncertainty. These conditions may continue, recur, worsen or spread. A general rise in interest rates could adversely affect the price and liquidity of fixed-income securities and could also result in increased redemptions from the Trust.
At times, the Trust’s investments may represent industries or industry sectors that are interrelated or have common risks, making the Trust more susceptible to any economic, political, or regulatory developments or other risks affecting those industries and sectors.
The municipal bond market can be susceptible to unusual volatility, particularly for lower-rated and unrated securities. Liquidity can be reduced unpredictably in response to overall economic conditions or credit tightening. Municipal issuers may be adversely affected by rising health care costs, increasing unfunded pension liabilities, and by the phasing out of federal programs providing financial support. Unfavorable conditions and developments relating to projects financed with municipal securities can result in lower revenues to issuers of municipal securities, potentially resulting in defaults. Issuers often depend on revenues from these projects to make principal and interest payments. The value of municipal securities can also be adversely affected by changes in the financial condition of one or more individual municipal issuers or insurers of municipal issuers, regulatory and political developments, tax law changes or other legislative
36 Pioneer Municipal High Income Trust | Semiannual Report | 10/31/20
actions, and by uncertainties and public perceptions concerning these and other factors. Municipal securities may be more susceptible to down-grades or defaults during recessions or similar periods of economic stress. In recent periods, an increasing number of municipal issuers in the United States have defaulted on obligations and commenced insolvency proceedings. Financial difficulties of municipal issuers may continue or get worse. To the extent the Trust invests significantly in a single state, including Massachusetts, Illinois, Virginia, Washington, New York and Texas, or in securities the payments on which are dependent upon a single project or source of revenues, or that relate to a sector or industry, including health care facilities, education, transportation, special revenues and pollution control, the Trust will be more susceptible to associated risks and developments.
The Trust invests in below-investment-grade (high-yield) debt securities and preferred stocks. Some of these high-yield securities may be convertible into equity securities of the issuer. Debt securities rated below-investment-grade are commonly referred to as “junk bonds” and are considered speculative. These securities involve greater risk of loss, are subject to greater price volatility, and are less liquid, especially during periods of economic uncertainty or change, than higher rated debt securities.
With the increased use of technologies such as the Internet to conduct business, the Trust is susceptible to operational, information security and related risks. While the Trust’s Adviser has established business continuity plans in the event of, and risk management systems to prevent, limit or mitigate, such cyber-attacks, there are inherent limitations in such plans and systems, including the possibility that certain risks have not been identified. Furthermore, the Trust cannot control the cybersecurity plans and systems put in place by service providers to the Trust such as Brown Brothers Harriman & Co., the Trust’s custodian and accounting agent, and American Stock Transfer & Trust Company (“AST”), the Trust’s transfer agent. In addition, many beneficial owners of Trust shares hold them through accounts at broker-dealers, retirement platforms and other financial market participants over which neither the Trust nor Amundi exercises control. Each of these may in turn rely on service providers to them, which are also subject to the risk of cyber-attacks. Cybersecurity failures or breaches at Amundi or the Trust’s service providers or intermediaries have the ability to cause disruptions and impact business operations, potentially resulting in financial losses, interference with the Trust’s ability to calculate its net asset value,
Pioneer Municipal High Income Trust | Semiannual Report | 10/31/20 37
impediments to trading, the inability of Trust shareowners to effect share purchases or redemptions or receive distributions, loss of or unauthorized access to private shareowner information and violations of applicable privacy and other laws, regulatory fines, penalties, reputational damage, or additional compliance costs. Such costs and losses may not be covered under any insurance. In addition, maintaining vigilance against cyber-attacks may involve substantial costs over time, and system enhancements may themselves be subject to cyber-attacks.
COVID-19
The respiratory illness COVID-19 caused by a novel coronavirus has resulted in a global pandemic and major disruption to economies and markets around the world, including the United States. Global financial markets have experienced extreme volatility and severe losses, and trading in many instruments has been disrupted. Liquidity for many instruments has been greatly reduced for periods of time. Some interest rates are very low and in some cases yields are negative. Some sectors of the economy and individual issuers have experienced particularly large losses. These circumstances may continue for an extended period of time, and may continue to affect adversely the value and liquidity of the Trust’s investments. The ultimate economic fallout from the pandemic, and the long-term impact on economies, markets, industries and individual issuers, are not known. Governments and central banks, including the Federal Reserve in the U.S., have taken extraordinary and unprecedented actions to support local and global economies and the financial markets. These actions have resulted in significant expansion of public debt, including in the U.S. The impact of these measures, and whether they will be effective to mitigate the economic and market disruption, will not be known for some time. The consequences of high public debt, including its future impact on the economy and securities markets, likewise may not be known for some time.
F. Statement of Cash Flows
Information on financial transactions which have been settled through the receipt or disbursement of cash or restricted cash is presented in the Statement of Cash Flows. Cash as presented in the Trust’s Statement of Assets and Liabilities includes cash on hand at the Trust’s custodian bank and does not include any short-term investments. As of and for the six months ended October 31, 2020, the Trust had no restricted cash presented on the Statement of Assets and Liabilities.
38 Pioneer Municipal High Income Trust | Semiannual Report | 10/31/20
2. Management Agreement
The Adviser manages the Trust’s portfolio. Management fees payable under the Trust’s Advisory Agreement with the Adviser are calculated daily and paid monthly at the annual rate of 0.60% of the Trust’s average daily managed assets. “Managed assets” means (a) the total assets of the Trust, including any form of investment leverage, minus (b) all accrued liabilities incurred in the normal course of operations, which shall not include any liabilities or obligations attributable to investment leverage obtained through (i) indebtedness of any type (including, without limitation, borrowing through a credit facility or the issuance of debt securities), (ii) the issuance of preferred stock or other similar preference securities, and/or (iii) any other means. For the six months ended October 31, 2020, the net management fee was 0.60% (annualized) of the Trust’s average daily managed assets, which was equivalent to 0.85% (annualized) of the Trust’s average daily net assets.
In addition, under the management and administration agreements, certain other services and costs, including accounting, regulatory reporting and insurance premiums, are paid by the Trust as administrative reimbursements. Included in “Due to affiliates” reflected on the Statement of Assets and Liabilities is $3,125 in management fees, administrative costs and certain other reimbursements payable to the Adviser at October 31, 2020.
3. Transfer Agent
AST serves as the transfer agent with respect to the Trust’s common shares. The Trust pays AST an annual fee, as is agreed to from time to time by the Trust and AST, for providing such services.
In addition, the Trust reimbursed the transfer agent for out-of-pocket expenses incurred by the transfer agent related to shareowner communications activities such as proxy and statement mailings, and outgoing phone calls.
4. Trust Shares
There are an unlimited number of common shares of beneficial interest authorized.
Transactions in common shares of beneficial interest for the six months ended October 31, 2020 and year ended April 30, 2020 were as follows:
| | | | | | | |
| | 10/31/20 | | | 4/30/20 | |
Shares outstanding at beginning of period | | | 22,771,349 | | | | 22,771,349 | |
| Shares outstanding at end of period | | | 22,771,349 | | | | 22,771,349 | |
Pioneer Municipal High Income Trust | Semiannual Report | 10/31/20 39
The Trust may classify or reclassify any unissued shares of beneficial interest into one or more series of preferred shares of beneficial interest.
As of October 31, 2020, the Trust has outstanding 1,250 Variable Rate MuniFund Term Preferred Shares Series 2021 (“Series 2021 VMTP Shares or “VMTP Shares”). The Trust issued the VMTP Shares on February 9, 2018. See Note 5 for additional information.
5. Variable Rate MuniFund Term Preferred Shares
The Trust has 1,250 shares issued and outstanding of Series 2021 VMTP Shares, with a liquidation preference of $100,000 per share. VMTP Shares are issued via private placement and are not publicly available.
The Trust is obligated to redeem its VMTP Shares by the date as specified in its offering document (“Term Redemption Date”), unless earlier redeemed by the Trust. VMTP Shares are subject to optional and mandatory redemption in certain circumstances. The VMTP Shares may be redeemed at the option of the Trust, subject to payment of premium for approximately one year following the date of issuance (“Optional Redemption Date”), and at the redemption price per share thereafter. The redemption price per share is equal to the sum of the liquidation preference per share plus any accumulated but unpaid dividends. The Trust may be obligated to redeem a certain amount of the VMTP Shares if it fails to maintain certain asset coverage and leverage ratio requirements and such failures are not cured by the applicable cure date. The Term Redemption Date for the Trust’s Series 2021 VMTP Shares is August 2, 2021.
VMTP Shares are subject to restrictions on transfer, generally do not trade, and market quotations are generally not available. VMTP Shares are short-term or short/intermediate-term instruments that pay a variable dividend rate tied to a short-term index, plus an additional fixed “spread” amount established at the time of issuance. For financial reporting purposes, the liquidation preference of VMTP Shares is a liability and is recognized as a component of “Variable Rate MuniFund Term Preferred Shares” on the Statement of Assets and Liabilities since the shares have a stated mandatory redemption date.
40 Pioneer Municipal High Income Trust | Semiannual Report | 10/31/20
Dividends on the VMTP Shares (which are treated as interest payments for financial reporting purposes and are recorded as interest expense on the Statement of Operations) are declared daily and recorded as incurred. For the six months ended October 31, 2020, interest expense on VMTP Shares amounted to $660,600. The dividend rate for the VMTP Shares is determined weekly. Unpaid dividends on VMTP Shares are recognized as a component of “Interest expense payable” on the Statement of Assets and Liabilities. For the six months ended October 31, 2020, interest expense payable on VMTP Shares amounted to $1,061. From April 30, 2020, through October 31, 2020, the Series 2021 VMTP Shares paid an average dividend rate of 1.09% and the average liquidation value outstanding of VMTP Shares for the Trust during the six months ended October 31, 2020, was $125,000,000.
Costs incurred in connection with the Trust’s offering of VMTP Shares are recorded as a deferred charge, which are being amortized over a three year period from the date of issuance. The Trust did not incur any offering costs as a result of the offering in February 9, 2018.
Transactions in the Series 2021 VMTP Shares during the Trust’s current and prior reporting periods were as follows:
| | | | | | | | | | | | | |
| | Six Months Ended 10/31/20 | | | Year Ended 4/30/20 | |
| | Shares | | | Amount | | | Shares | | | Amount | |
VMTP Shares issued | | | 1,250 | | | $ | 125,000,000 | | | | 1,250 | | | $ | 125,000,000 | |
VMTP Shares exchanged | | | — | | | | — | | | | — | | | | — | |
Net increase | | | 1,250 | | | $ | 125,000,000 | | | | 1,250 | | | $ | 125,000,000 | |
6. Subsequent Events
A monthly dividend was declared on November 5, 2020 from undistributed and accumulated net investment income of $0.0525 per common share payable November 30, 2020, to common shareowners of record on November 17, 2020.
Subsequent to October 31, 2020, dividends declared and paid on VMTP Shares totaled $108,709 through November 27, 2020.
Pioneer Municipal High Income Trust | Semiannual Report | 10/31/20 41
On November 19, 2020, Amundi Pioneer Asset Management announced it will be rebranding the US business of Amundi as Amundi US effective January 1, 2021. The new brand identity will replace Amundi Pioneer, which was first adopted in July 2017 following the acquisition of Pioneer Investments by Amundi. In connection with these changes, Amundi Pioneer Asset Management. Inc., the investment adviser to the Pioneer funds, will change its name to Amundi Asset Management US, Inc. In addition, Amundi Pioneer Distributor, Inc., the Pioneer funds’ distributor, will change its name to Amundi Distributor US, Inc. The names of the Pioneer funds will not change in connection with this rebranding.
42 Pioneer Municipal High Income Trust | Semiannual Report | 10/31/20
Additional Information (unaudited)
Notice is hereby given in accordance with Section 23(c) of the Investment Company Act of 1940 that the Trust may purchase, from time to time, its hares in the open market.
Results of Shareholder Meeting
At an annual meeting held on September 16, 2020, shareholders of the Trust were asked to consider the proposal described below.
A report of the total votes cast by the Trust's shareholders follows:
Proposal 1 - To elect three Class II Trustees
| | | |
| Nominee | For | Withhold |
Diane Durnin | 19,264,580 | 786,329 |
Benjamin M. Friedman | 18,238,108 | 1,812,801 |
Kenneth J. Taubes | 19,264,583 | 786,326 |
Pioneer Municipal High Income Trust | Semiannual Report | 10/31/20 43
Approval of Investment Management Agreement
Amundi Pioneer Asset Management, Inc. (“APAM”) serves as the investment adviser to Pioneer Municipal High Income Trust (the “Trust”) pursuant to an investment management agreement between APAM and the Trust. In order for APAM to remain the investment adviser of the Trust, the Trustees of the Trust must determine annually whether to renew the investment management agreement for the Trust.
The contract review process began in January 2020 as the Trustees of the Trust agreed on, among other things, an overall approach and timeline for the process. Contract review materials were provided to the Trustees in March 2020, July 2020 and September 2020. In addition, the Trustees reviewed and discussed the Trust’s performance at regularly scheduled meetings throughout the year, and took into account other information related to the Trust provided to the Trustees at regularly scheduled meetings, in connection with the review of the Trust’s investment management agreement.
In March 2020, the Trustees, among other things, discussed the memorandum provided by Fund counsel that summarized the legal standards and other considerations that are relevant to the Trustees in their deliberations regarding the renewal of the investment management agreement, and reviewed and discussed the qualifications of the investment management teams for the Trust, as well as the level of investment by the Trust’s portfolio managers in the Trust. In July 2020, the Trustees, among other things, reviewed the Trust’s management fees and total expense ratios, the financial statements of APAM and its parent companies, profitability analyses provided by APAM, and analyses from APAM as to possible economies of scale. The Trustees also reviewed the profitability of the institutional business of APAM and APAM’s affiliate, Amundi Pioneer Institutional Asset Management, Inc. (“APIAM” and, together with APAM, “Amundi Pioneer”), as compared to that of APAM’s fund management business, and considered the differences between the fees and expenses of the Trust and the fees and expenses of APAM’s and APIAM’s institutional accounts, as well as the different services provided by APAM to the Trust and by APAM and APIAM to the institutional accounts. The Trustees further considered contract review materials, including additional materials received in response to the Trustees’ request, in September 2020.
At a meeting held on September 15, 2020, based on their evaluation of the information provided by APAM and third parties, the Trustees of the Trust, including the Independent Trustees voting separately, unanimously approved the renewal of the investment management agreement for another
44 Pioneer Municipal High Income Trust | Semiannual Report | 10/31/20
year. In approving the renewal of the investment management agreement, the Trustees considered various factors that they determined were relevant, including the factors described below. The Trustees did not identify any single factor as the controlling factor in determining to approve the renewal of the agreement.
Nature, Extent and Quality of Services
The Trustees considered the nature, extent and quality of the services that had been provided by APAM to the Trust, taking into account the investment objective and strategy of the Trust. The Trustees also reviewed APAM’s investment approach for the Trust and its research process. The Trustees considered the resources of APAM and the personnel of APAM who provide investment management services to the Trust. They also reviewed the amount of non-Trust assets managed by the portfolio managers of the Trust. They considered the non-investment resources and personnel of APAM that are involved in APAM’s services to the Trust, including APAM’s compliance, risk management, and legal resources and personnel. The Trustees noted the substantial attention and high priority given by APAM’s senior management to the Pioneer Fund complex. The Trustees considered the implementation and effectiveness of APAM’s business continuity plan in response to the COVID-19 pandemic.
The Trustees considered that APAM supervises and monitors the performance of the Trust’s service providers and provides the Trust with personnel (including Trust officers) and other resources that are necessary for the Trust’s business management and operations. The Trustees also considered that, as administrator, APAM is responsible for the administration of the Trust’s business and other affairs. The Trustees considered the fees paid to APAM for the provision of administration services.
Based on these considerations, the Trustees concluded that the nature, extent and quality of services that had been provided by APAM to the Trust were satisfactory and consistent with the terms of the investment management agreement.
Performance of the Trust
In considering the Trust’s performance, the Trustees regularly review and discuss throughout the year data prepared by APAM and information comparing the Trust’s performance with the performance of its peer group of funds, as classified by Morningstar, Inc. (Morningstar), and with the performance of the Trust’s benchmark index. The Trustees also regularly consider the Trust’s returns at market value relative to its peers, as well as the discount at which the Trust’s shares trade on the New York Stock Exchange compared to its net asset value per share. They also discuss the
Pioneer Municipal High Income Trust | Semiannual Report | 10/31/20 45
Trust’s performance with APAM on a regular basis. The Trustees’ regular reviews and discussions were factored into the Trustees’ deliberations concerning the renewal of the investment management agreement.
Management Fee and Expenses
The Trustees considered information showing the fees and expenses of the Trust in comparison to the management fees and expense ratios of a peer group of funds selected on the basis of criteria determined by the Independent Trustees for this purpose using data provided by Strategic Insight Mutual Fund Research and Consulting, LLC (Strategic Insight), an independent third party. The peer group comparisons referred to below are organized in quintiles. Each quintile represents one-fifth of the peer group. In all peer group comparisons referred to below, first quintile is most favorable to the Trust’s shareowners.
The Trustees considered that the Trust’s management fee (based on managed assets) for the most recent fiscal year was in the third quintile relative to the management fees paid by other funds in its Strategic Insight peer group for the comparable period. The Trustees considered that the expense ratio (based on managed assets) of the Trust’s common shares for the most recent fiscal year was in the first quintile relative to its Strategic Insight peer group for the comparable period.
The Trustees reviewed management fees charged by APAM and APIAM to institutional and other clients, including publicly offered European funds sponsored by APAM’s affiliates, unaffiliated U.S. registered investment companies (in a sub-advisory capacity), and unaffiliated foreign and domestic separate accounts. The Trustees also considered APAM’s costs in providing services to the Trust and APAM’s and APIAM’s costs in providing services to the other clients and considered the differences in management fees and profit margins for fund and non-fund services. In evaluating the fees associated with APAM’s and APIAM’s client accounts, the Trustees took into account the respective demands, resources and complexity associated with the Trust and other client accounts. The Trustees noted that, in some instances, the fee rates for those clients were lower than the management fee for the Trust and considered that, under the investment management agreement with the Trust, APAM performs additional services for the Trust that it does not provide to those other clients or services that are broader in scope, including oversight of the Trust’s other service providers and activities related to compliance and the extensive regulatory and tax regimes to which the Trust is subject. The Trustees also considered the entrepreneurial risks associated with APAM’s management of the Trust.
46 Pioneer Municipal High Income Trust | Semiannual Report | 10/31/20
The Trustees concluded that the management fee payable by the Trust to APAM was reasonable in relation to the nature and quality of the services provided by APAM.
Profitability
The Trustees considered information provided by APAM regarding the profitability of APAM with respect to the advisory services provided by APAM to the Trust, including the methodology used by APAM in allocating certain of its costs to the management of the Trust. The Trustees also considered APAM’s profit margin in connection with the overall operation of the Trust. They further reviewed the financial results, including the profit margins, realized by APAM and APIAM from non-fund businesses. The Trustees considered APAM’s profit margins in comparison to the limited industry data available and noted that the profitability of any adviser was affected by numerous factors, including its organizational structure and method for allocating expenses. The Trustees concluded that APAM’s profitability with respect to the management of the Trust was not unreasonable.
Economies of Scale
The Trustees considered the extent to which APAM may realize economies of scale or other efficiencies in managing and supporting the Trust. Since the Trust is a closed-end fund that has not raised additional capital, the Trustees concluded that economies of scale were not a relevant consideration in the renewal of the investment advisory agreement.
Other Benefits
The Trustees considered the other benefits that APAM enjoys from its relationship with the Trust. The Trustees considered the character and amount of fees paid or to be paid by the Trust, other than under the investment management agreement, for services provided by APAM and its affiliates. The Trustees further considered the revenues and profitability of APAM’s businesses other than the Fund business. To the extent applicable, the Trustees also considered the benefits to the Trust and to APAM and its affiliates from the use of “soft” commission dollars generated by the Trust to pay for research and brokerage services.
The Trustees considered that Amundi Pioneer is the principal U.S. asset management business of Amundi, which is one of the largest asset managers globally. Amundi’s worldwide asset management business manages over $1.7 trillion in assets (including the Pioneer Funds). The Trustees considered that APAM’s relationship with Amundi creates potential opportunities for APAM, APIAM and Amundi that derive from
Pioneer Municipal High Income Trust | Semiannual Report | 10/31/20 47
APAM’s relationships with the Trust, including Amundi’s ability to market the services of APAM globally. The Trustees noted that APAM has access to additional research and portfolio management capabilities as a result of its relationship with Amundi and Amundi’s enhanced global presence that may contribute to an increase in the resources available to APAM. The Trustees considered that APAM and the Trust receive reciprocal intangible benefits from the relationship, including mutual brand recognition and, for the Trust, direct and indirect access to the resources of a large global asset manager. The Trustees concluded that any such benefits received by APAM as a result of its relationship with the Trust were reasonable.
Conclusion
After consideration of the factors described above as well as other factors, the Trustees, including the Independent Trustees, concluded that the investment management agreement for the Trust, including the fees payable thereunder, was fair and reasonable and voted to approve the proposed renewal of the investment management agreement.
48 Pioneer Municipal High Income Trust | Semiannual Report | 10/31/20
Trustees, Officers and Service Providers
| | |
| Trustees | Officers |
Thomas J. Perna, Chairman | Lisa M. Jones, President and |
John E. Baumgardner, Jr. | Chief Executive Officer |
Diane Durnin | Mark E. Bradley, Treasurer and |
Benjamin M. Friedman | Chief Financial and |
Lisa M. Jones | Accounting Officer |
Lorraine H. Monchak | Christopher J. Kelley, Secretary and |
Marguerite A. Piret | Chief Legal Officer |
Fred J. Ricciardi | |
Kenneth J. Taubes | |
Investment Adviser and Administrator
Amundi Pioneer Asset Management, Inc.
Custodian and Sub-Administrator
Brown Brothers Harriman & Co.
Legal Counsel
Morgan, Lewis & Bockius LLP
Transfer Agent
American Stock Transfer & Trust Company
Proxy Voting Policies and Procedures of the Trust are available without charge, upon request, by calling our toll free number (1-800-710-0935). Information regarding how the Trust voted proxies relating to portfolio securities during the most recent 12-month period ended June 30 is publicly available to shareowners at www.amundipioneer.com/us. This information is also available on the Securities and Exchange Commission’s web site at www.sec.gov.
Pioneer Municipal High Income Trust | Semiannual Report | 10/31/20 49
This page was intentionally left blank.
50 Pioneer Municipal High Income Trust | Semiannual Report | 10/31/20
This page was intentionally left blank.
Pioneer Municipal High Income Trust | Semiannual Report | 10/31/20 51
This page was intentionally left blank.
52 Pioneer Municipal High Income Trust | Semiannual Report | 10/31/20
How to Contact Amundi
We are pleased to offer a variety of convenient ways for you to contact us for assistance or information.
| | |
| You can call American Stock Transfer & Trust Company (AST) for: |
| Account Information | 1-800-710-0935 |
|
| Or write to AST: | |
| For | Write to |
|
General inquiries, lost dividend checks, | American Stock |
change of address, lost stock certificates, | Transfer & Trust |
stock transfer | Operations Center |
| 6201 15th Ave. |
| Brooklyn, NY 11219 |
|
Dividend reinvestment plan (DRIP) | American Stock |
| Transfer & Trust |
| Wall Street Station |
| P.O. Box 922 |
| New York, NY 10269-0560 |
|
| Website | www.amstock.com |
For additional information, please contact your investment advisor or visit our web site www.amundipioneer.com/us.
The Trust files a complete schedule of portfolio holdings with the Securities and Exchange Commission for the first and third quarters of each fiscal year as an exhibit to its reports on Form N-PORT. Shareowners may view the filed Form N-PORT by visiting the Commission’s web site at https://www.sec.gov.
Amundi Pioneer Asset Management, Inc.
60 State Street
Boston, MA 02109
www.amundipioneer.com/us
Securities offered through Amundi Pioneer Distributor, Inc.
60 State Street, Boston, MA 02109
Underwriter of Pioneer Mutual Funds, Member SIPC
© 2020 Amundi Pioneer Asset Management 19442-14-1220