Exhibit 99.1
Investor Presentation April 2010 |
Safe harbor statement Today's presentation and discussion will contain forward-looking statements within the meaning of the Private Securities Litigation Reform Act of 1995. Words such as "expects," "anticipates," "intends," "estimates," or similar expressions are intended to identify these forward-looking statements. These statements are based on the current plans and expectations of Conn's, Inc. and involve risks and uncertainties that could cause future activities and results of operations to be materially different from those set forth in the forward-looking statements. For further information, please refer to Conn's Inc. reports and filings with the Securities and Exchange Commission, including, without limitation, the Form 10-K for the year ended January 31, 2010. |

Basis of presentation In accordance with the FASB's revised authoritative guidance issued in June 2009, companies with variable interest entities may be required to perform an analysis to determine whether the enterprise's variable interest or interests give it a controlling interest in a variable interest entity as qualified by both of the following characteristics The power to direct the activities of a variable interest entity that most significantly impact the entity's economic performance The obligation to absorb losses of the entity that could potentially be significant to the variable interest entity or the right to receive benefits from the entity that could potentially be significant to the variable interest entity Conn's has determined it will be required to adopt the new accounting treatment as of February 1, 2010, which it will reflect in historical and future financial statements presented in future filings The basis of this presentation reflects the consolidation of the QSPE on-balance sheet and the resulting impact on the Company's statement of operations, stockholders' equity and cash flow The financial data presented throughout this presentation is pro forma for this change in accounting and is subject to audit by the Company's public accountants FASB pronouncement February and March 2010 information Data presented is preliminary and subject to review and adjustment Trends and results of the two months presented may not be indicative of the full quarter results |
Business Overview Retail Program Overview Credit Operation Overview Financial Overview Appendix |
Who we are Distribu tion and Service Retail Credit Full control of customer contact In-house credit program drives traffic and sales Delivery and service enhance customer loyalty Founded in 1890 and headquartered in Beaumont, TX, Conn's, Inc. ("Conn's" or the "Company"), is a specialty retailer of consumer electronics, home appliances and furniture Conn's is traded on the NASDAQ exchange under the ticker CONN The Company operates 76 stores in Texas, Louisiana and Oklahoma The Company provides flexible in-house credit options for its customers In the last three years, Conn's has financed, on average, 61% of its retail sales For the FYE January 31, 2010, the Company reported $875.6mm and $60.71mm in revenues and EBITDA, respectively Company overview (1) EBITDA includes the addition of $4.85mm for the Texas AG settlement and $9.62mm for goodwill impairment. See appendix for reconciliation of EBITDA to GAAP |
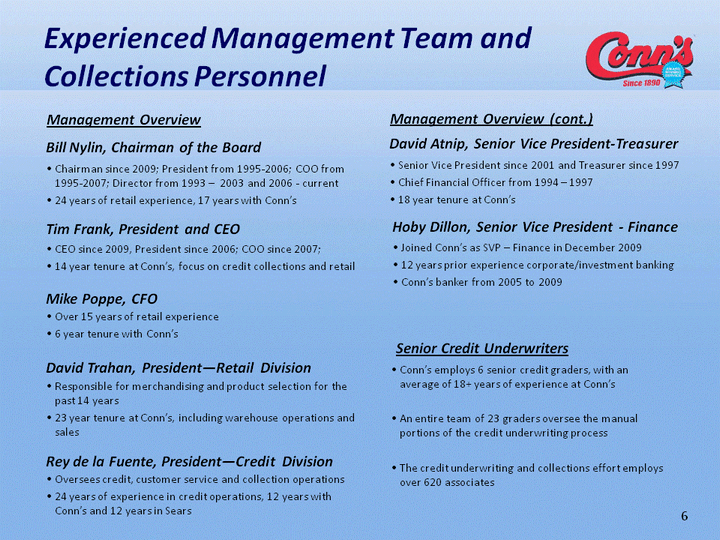
Experienced Management Team and Collections Personnel CEO since 2009, President since 2006; COO since 2007; 14 year tenure at Conn's, focus on credit collections and retail Tim Frank, President and CEO Chairman since 2009; President from 1995-2006; COO from 1995-2007; Director from 1993 - 2003 and 2006 - current 24 years of retail experience, 17 years with Conn's Bill Nylin, Chairman of the Board Over 15 years of retail experience 6 year tenure with Conn's Mike Poppe, CFO Responsible for merchandising and product selection for the past 14 years 23 year tenure at Conn's, including warehouse operations and sales David Trahan, President-Retail Division Oversees credit, customer service and collection operations 24 years of experience in credit operations, 12 years with Conn's and 12 years in Sears Rey de la Fuente, President-Credit Division Conn's employs 6 senior credit graders, with an average of 18+ years of experience at Conn's An entire team of 23 graders oversee the manual portions of the credit underwriting process The credit underwriting and collections effort employs over 620 associates Senior Credit Underwriters Management Overview Management Overview (cont.) Senior Vice President since 2001 and Treasurer since 1997 Chief Financial Officer from 1994 - 1997 18 year tenure at Conn's David Atnip, Senior Vice President-Treasurer Joined Conn's as SVP - Finance in December 2009 12 years prior experience corporate/investment banking Conn's banker from 2005 to 2009 Hoby Dillon, Senior Vice President - Finance |
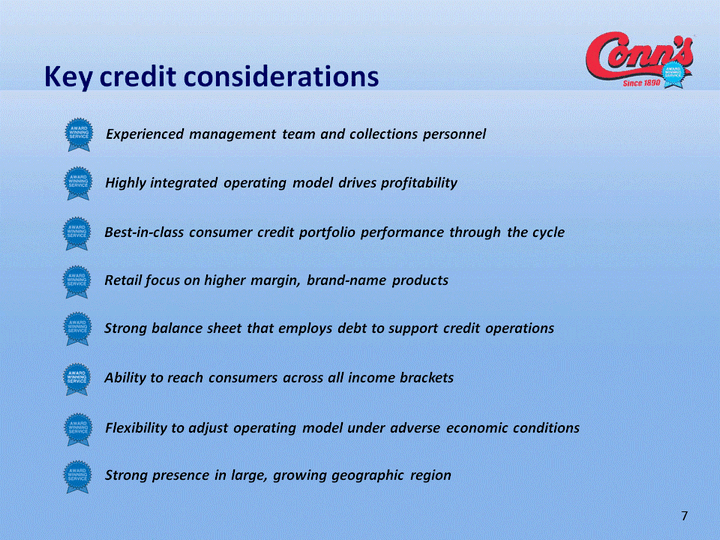
Key credit considerations Experienced management team and collections personnel Highly integrated operating model drives profitability Best-in-class consumer credit portfolio performance through the cycle Retail focus on higher margin, brand-name products Strong balance sheet that employs debt to support credit operations Ability to reach consumers across all income brackets Flexibility to adjust operating model under adverse economic conditions Strong presence in large, growing geographic region |
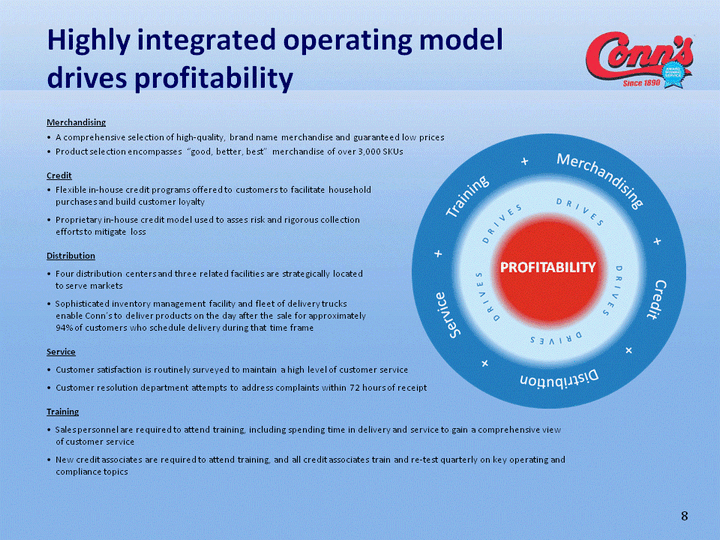
Merchandising A comprehensive selection of high-quality, brand name merchandise and guaranteed low prices Product selection encompasses "good, better, best" merchandise of over 3,000 SKUs Credit Flexible in-house credit programs offered to customers to facilitate household purchases and build customer loyalty Proprietary in-house credit model used to asses risk and rigorous collection efforts to mitigate loss Distribution Four distribution centers and three related facilities are strategically located to serve markets Sophisticated inventory management facility and fleet of delivery trucks enable Conn's to deliver products on the day after the sale for approximately 94% of customers who schedule delivery during that time frame Service Customer satisfaction is routinely surveyed to maintain a high level of customer service Customer resolution department attempts to address complaints within 72 hours of receipt Training Sales personnel are required to attend training, including spending time in delivery and service to gain a comprehensive view of customer service New credit associates are required to attend training, and all credit associates train and re-test quarterly on key operating and compliance topics Highly integrated operating model drives profitability PROFITABILITY |
History of long-term growth and profitability FY '05 566 FY '06 729.938 FY '00 292.1 FY '08 871 FY '09 960 FY '10 876 Q1'10 239 Q2'10 229 Q3'10 198 Q4'10 212 Total revenue - pro forma FY '05 58 FY '06 93.124 FY '00 43 FY '08 103 FY '09 103 FY '10 60.67 Q1'10 26.86 Q2'10 16.48 Q3'10 6.98 Q4'10 10.88 Total EBITDA - pro forma Credit portfolio EBITDA bridge - pro forma FY '05 429 FY '06 520 FY '00 195.2 FY '08 654.9 FY '09 753.5 FY '10 736.041 Q1'10 735 Q2'10 746 Q3'10 738 Q4'10 736 1 ($ millions) (1) EBITDA includes the addition of $4.85mm for the Texas AG settlement and $9.62mm for goodwill impairment. See appendix for reconciliation of EBITDA to GAAP Note: FY '00 ended July 31, 2000 Retail Credit Total FYE'09 EBITDA 45.5 57.9 103.5 Sales -82 -1.1 -83.1 COGS/ Bad Debt 45.4 -9.2 36.1 SG&A 10 -5.8 4.2 FYE'10 EBITDA 18.9 41.8 60.7 (2) Includes infrastructure/servicing, allocations, stock-based compensation, depreciation and amortization Note: see appendix for reconciliation of EBITDA to GAAP 2 |
Differentiated through proprietary in- house credit programs Based on credit risk, product risk, income, down payment and term The majority of all credit decisions are based on a manual evaluation supported by significant data Credit decisions are made independent of retail operations All customers are required to make monthly payments (no deferred payment options) For over 45 years, we have delivered flexible financing options to customers through our dynamic credit model unique to our industry and tailored to our customer base Proprietary credit underwriting model Customer-retention focused collection process Over 60% of credit purchases were repeat buyers 60% of customers paid in-store Multiple collection call centers Hands-on, active management Secured financing Conn's obtains a purchase money security interest in products being sold on credit Conn's products are used in everyday life (refrigerator, washer, dryer, TV), which creates a tangible attachment to the financed item thereby encouraging payment Credit insurance and repair service agreements reduce risk of non-payment Carefully monitored re-aging process decreases charge-offs and increases customer loyalty Portfolio re-aging is used to grant payment relief to a customer who may have temporary payment difficulty due to unforeseen circumstances (loss of job, divorce, etc.) An account remains classified as re-aged until it is paid in full Approximately 89% of re-aged balances are ultimately collected |
Fiscal 2010 portfolio yield Gross yield 18.3% Charge-offs 3.9% Financing cost 2.9% Net yield 7.5% Servicing cost1 4.0% (1) Based on the contractual servicing fee received under the ABS program |
Business Overview Retail Program Overview Credit Operation Overview Financial Overview Appendix |
Ability to reach consumers across all income brackets Conn's carries the latest in brand name electronics and major home appliances - which contribute ~70% of its product revenues The Conn's business model targets middle- to lower- middle class consumers with high verifiable income (Household income of $40,000 - $60,000) who may have limited credit experience or a moderate credit score Conn's is able to expand its customer reach by financing purchases for qualified customers in lower income brackets With a trained commissioned sales force, next day delivery and dedicated after-sale service, Conn's is able to compete with big box retailers Over the past 3 years, Conn's has financed approximately 61% of its retail sales Total sales1 financed Financed Retail Revenue Credit sales Cash sales FY'06 0.577 346.5 254 FY '07 0.58 380 274.5 FY '08 0.622 440.1 267.9 FY '09 0.626 490.8 293.1 FY '10 0.581 407.2 293.5 (1) Includes product sales and Repair Service Agreement ("RSA") commissions $600.5 $654.5 $708.0 $783.9 $700.7 |
Diversified revenue sources Through a targeted incentive structure, Conn's focuses its sales efforts on big ticket, higher margin items All sales personnel receive incentive compensation to help drive profitability This commission structure combined with Conn's affordable and convenient proprietary financing options maximize the Company's opportunities to "upsell" on the sales floor Domestic markets for furniture and consumer electronics are highly fragmented with total annual demand of $85.8bn and $126.2bn, respectively based on Department of Commerce1 and Twice2 The highly consolidated appliance market had approximate annual sales of $22.8bn according to Twice2 Retail focus on higher margin, brand- name products Superior product selection Consumer electronics 0.3 Home appliances 0.24 Track 0.11 Furniture & mattresses 0.08 Lawn & garden 0.02 Service 0.04 RPA 0.04 Finance 0.18 Slice 8 Slice 9 Slice 10 Slice 11 Slice 12 Slice 13 Slice 14 Slice 15 Slice 16 Finance & other 17% RSA3 4% Service 3% Lawn & garden 3% Furniture & mattresses 8% Track4 11% Home appliances 24% Consumer electronics 30% (1) Based on 2009 data (2) Based on 2008 data (3) Repair Service Agreement (4) Includes computers, video gaming and other small electronics and appliances FYE 2010 Revenue = $876mm Major Appliances Major Electronics Mattresses Lawn & Garden Furniture |
Same store sales trends Conn's annual same-store sales (FYE January 31) FY '06 0.169 FY '07 0.036 FY '08 0.032 FY '09 0.02 FY '10 -0.138 5-year Avg 0.024 FY '06 0.051 FY '07 0.041 FY '08 0.019 FY '09 -0.013 FY '10 0.017 5-year Avg 0.023 FY '06 0.017 FY '07 0.055 FY '08 0.048 FY '09 -0.083 FY '10 -0.08 5-year Avg -0.005 Best Buy annual same-store sales (FYE March 1) HH Gregg annual same-store sales (FYE March 31) 2 4 Comments Q4'10 Texas sales tax receipts decreased by 14% for the month of December 2009, the biggest retail month of the year Planned contraction in portfolio impacted sales Prior comps were artificially high due to the impacts of hurricanes Ike and Gustav FY 2009 - FY 2010 The Company faced challenging economic conditions as the recession began affecting Texas late in FYE 2010 The positive sales effects of the FY '09 hurricanes presented difficult comp periods to replicate FY 2005 - FY 2008 The Company benefited from long term growth trend of consistent positive comp store growth Conn's experienced high growth in sales resulting from the impacts of Hurricanes Katrina and Rita in FY '06, and Ike and Gustav in FY '09 1 Footnotes: (1) Includes the domestic segment only (2) Includes 53 weeks (3) From FY 2010 earnings release filed March 25, 2010 (4) Management guidance of -6% to -9% from third quarter earnings call transcript provided by CapitalIQ 3 |
Strong presence in a large and growing geographic region Texas is the second largest state by nominal GDP, and its population growth has exceeded the U.S. by 870 bps since 2000 (16.7% vs 8.0%) Texas' unemployment rate continues to trend below the national rate, 8.2% in Texas vs. 9.7% nationally as of February Headquartered in Beaumont, TX, Conn's operates 76 stores strategically located in areas serving the Company's core demographic Conn's maintains four regional distribution centers located in Houston, TX; San Antonio, TX; Dallas, TX; and Beaumont, TX; that enable it to deliver products on the day after the sale for approximately 94% of customers who scheduled delivery during that timeframe Texas US Line 3 Line 4 Line 5 Line 6 Line 7 Line 8 Line 9 Line 10 Line 11 Line 12 Line 13 Line 14 Line 15 Line 16 2005 0.028 0.031 75 100 2006 0.049 0.028 135 160 2007 0.044 0.02 70 95 2008 0.02 0.007 150 175 2009 -0.017 -0.024 GDP YoY growth: TX vs. US Texas US Line 3 Line 4 Line 5 Line 6 Line 7 Line 8 Line 9 Line 10 Line 11 Line 12 Line 13 Line 14 Line 15 Line 16 2000-2010 0.182 0.098 75 100 2010-2020 0.162 0.087 135 160 2020-2030 0.164 0.083 70 95 2000-2030 0.598 0.292 150 175 2009E 0.008 -0.022 Forecasted population growth: TX vs. US ~ 2x 76 Stores Store Locations Distribution & Service Sources: U.S. Census Bureau, U.S. Department of Labor, Bureau of Economic Analysis, Texas Comptroller |
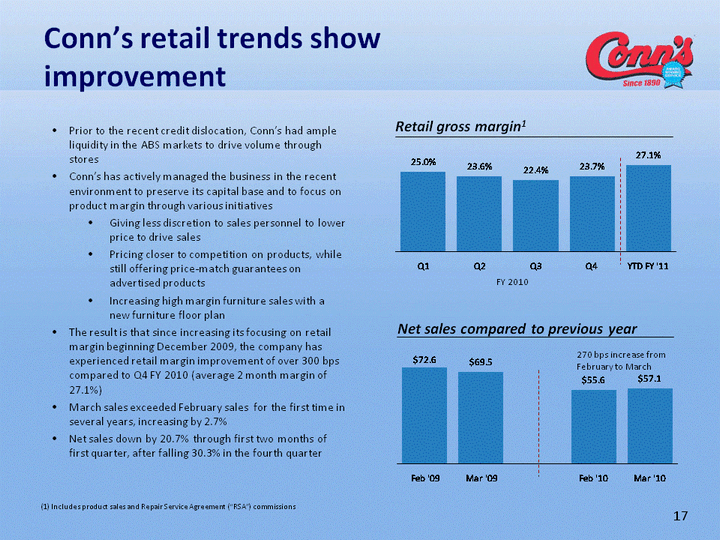
Conn's retail trends show improvement Retail gross margin1 Net sales compared to previous year Feb '09 72.6 Mar '09 69.5 Feb '10 55.6 Mar '10 57.1 FY 2010 Prior to the recent credit dislocation, Conn's had ample liquidity in the ABS markets to drive volume through stores Conn's has actively managed the business in the recent environment to preserve its capital base and to focus on product margin through various initiatives Giving less discretion to sales personnel to lower price to drive sales Pricing closer to competition on products, while still offering price-match guarantees on advertised products Increasing high margin furniture sales with a new furniture floor plan The result is that since increasing its focusing on retail margin beginning December 2009, the company has experienced retail margin improvement of over 300 bps compared to Q4 FY 2010 (average 2 month margin of 27.1%) March sales exceeded February sales for the first time in several years, increasing by 2.7% Net sales down by 20.7% through first two months of first quarter, after falling 30.3% in the fourth quarter 270 bps increase from February to March (1) Includes product sales and Repair Service Agreement ("RSA") commissions |
Business Overview Retail Program Overview Credit Operation Overview Financial Overview Appendix |
Credit program overview Program overview Conn's has been granting credit to customers for over 45 years In the last three fiscal years, Conn's has financed an average of 61% of its retail sales through its credit program All loans are secured, unlike typical credit cards Credit is granted on an installment (94.3% of balances) or a revolving (5.7% of balances) basis based on the proprietary credit model Security interest is on a discrete asset used in everyday life (refrigerator, washer, dryer, TV) Conn's targets a middle-class consumer with high verifiable income who may not have a very strong credit score or has limited credit history Customers are typically charged the statutory maximum rate (18%-24%) Origination score on Secondary portfolio improved from 537 in 2008 to 550 in 2010 due to tightening of credit standards Summary of portfolios - January 31, 2010 Gross margin FY '99 161 FY '05 429 FY '06 520 FY '07 569.6 FY '08 0.194 654.9 FY '09 0.19 753.5 FY '10 0.184 736.041 Credit portfolio balance % of sales financed: 59.2% 57.7% 58.0% 62.2% 62.6% 58.1% |
Column 1 Column 2 Column 3 Column 4 Column 5 Column 6 Column 7 Column 8 Column 9 Column 10 Column 11 Column 12 Column 13 Column 14 Column 15 Column 16 Target 0.061 Nordstrom 0.033 Cabela's 0.02 HSBC Finance 0.067 GE Capital CapitalOne 0.042 Amex 0.034 Discover 0.04 GMAC 0.033 Carmax 0.017 Ford Credit 0.013 Conn's 0.029 Column 1 Column 2 Column 3 Column 4 Column 5 Column 6 Column 7 Column 8 Column 9 Column 10 Column 11 Column 12 Column 13 Column 14 Column 15 Column 16 Target 0.144 Nordstrom 0.095 Cabela's 0.053 HSBC Finance 0.188 GE Capital 0.106 CapitalOne 0.096 Amex 0.075 Discover 0.09 GMAC 0.033 Carmax 0.017 Ford Credit 0.013 Conn's 0.048 Best-in-class credit portfolio management Source: Company public filings and press releases Note: Pre-recession figures shown on a comparable year-end basis Figures shown above are on a managed basis to the extent applicable Trailing 3-month net charge-offs Retailers 1 Consumer finance1,5 Median = 9.5% Median = 9.6% The Company is able to control delinquency/net charge-offs based on Comprehensive credit review program incorporating Customer risk Product risk Applicant income Down payment Rigorous collection process that includes Daily customer contact Multiple call centers 8 levels of customer contact The credit granting and collections processes are centrally managed and are entirely independent of sales personnel Purchase of credit insurance and a repair service agreement mitigate the potential losses in the credit portfolio Products financed are durable necessities for the home 3 year net charge-off average (pre-recession: 2005 - 2007) Retailers 9,10 Consumer finance11 Median = 3.3% Median = 4.1% n/a Comments Footnotes: (1) Annualized as of latest filing (2) Figure shown is for fiscal year 2009 ending January 30, 2010 (3) Figure shown is for three months ended January 30, 2010 (4) Figure shown is for three months ended January 2, 2010 (5) Figure shown is for three months ended December 31, 2009 except for Discover which is shown for February 28, 2010 (6) Figure shown for Cardmember loan segment (7) Figures shown for Credit card segment only (8) Gross rate shown for the U.S. installment and revolving credit segment (9) Average shown for fiscal year ending January 30th for Target and Nordstrom (10) Average shown for fiscal year ending December 31st for Cabela's (11) Average shown for fiscal year ending December 31st except for Discover which has a fiscal year ending November 30th 2 3 4 6 7 7 7 8 9 9 10 6 7 7 7 8 |
Portfolio performance Quarterly portfolio performance metrics + Results in Front end underwriting discipline Closely monitor portfolio to identify delinquent accounts early Daily customer contact Multiple call centers Hands-on management Lawyers/paralegals on staff 8 levels of customer contact Back end rigor in monitoring and collection Net charge-offs 60-day delinquency Line 4 Line 5 Line 6 Line 7 Line 8 Line 9 Line 10 Line 11 Line 12 Line 13 Line 14 Line 15 Line 16 4/30/2005 0.027 0.0416 7/31/2005 0.026 0.0487 10/31/2005 0.019 0.0681 1/31/2006 0.028 0.0684 4/30/2006 0.036 0.0592 7/31/2006 0.038 0.058 10/31/2006 0.029 0.0706 1/31/2007 0.0371 0.0661 Q1'08 0.027 0.06 Q2'08 0.023 0.065 Q3'08 0.032 0.077 Q4'08 0.032 0.076 Q1'09 0.032 0.064 Q2'09 0.028 0.07 Q3'09 0.034 0.081 Q4'09 0.034 0.073 Q1'10 0.03 0.069 Q2'10 0.034 0.076 Q3'10 0.043 0.093 Q4'10 0.048 0.1 Feb-Mar FY'11 0.047 0.088 Point of sale credit decision Review of credit bureau report Independent of sales operations Verification of customer information Use of down payment Product risk Note: Conn's defines charge-offs as 120 days past due and no payment for seven months February and March delinquencies show a 120 bps decline from year end February and March net-charge offs are in line with recent performance FY 2008 FY 2009 FY 2010 Q4 FY 2010 Charge-off = 4.8% 60 day = 10.0% as of FYE 2010 |
Servicing operation Servicing operation The credit programs are managed by a centralized credit underwriting department staff, entirely independent of sales operations The Company has 2 call centers - Beaumont, TX and San Antonio, TX At FYE 2010, Conn's employed over 620 full-time and part-time employees who focus on credit approval, collections and customer service Conn's maintains a 250-seat redundant business continuity center in Dallas, TX Accounts are charged-off when they are 120 days past due and no payment has been received in 7 months Collection activities have resulted in the recovery of ~11% of charged-off amounts over the past 3 years Underwriting policies are periodically adjusted based on historical credit performance and current portfolio and market trends In 2007, Conn's began obtaining updated Equifax scores for all customers who had not been scored in the last 120 days to assist in its credit strategies Skip-trace efforts utilized throughout the collection workflow to locate difficult to reach customers Portfolio re-aging Q1'08 0.027 Q2'08 0.023 Q3'08 0.032 Q4'08 0.032 Q1'09 0.032 Q2'09 0.028 Q3'09 0.034 Q4'09 0.034 Q1'10 0.03 Q2'10 0.034 Q3'10 0.043 Q4'10 0.048 Feb-Mar FY'11 0.047 Feb Monthly average gross collections by quarter Annualized quarterly charge-off Cash collections Q1'08 0.0622 Q2'08 0.0566 Q3'08 0.0555 Q4'08 0.0546 Q1'09 0.0619 Q2'09 0.0549 Q3'09 0.0514 Q4'09 0.0517 Q1'10 0.0581 Q2'10 0.051 Q3'10 0.05 Q4'10 0.05 Feb-Mar FY'11 0.0627 FY 2008 FY 2009 FY 2010 FY 2008 FY 2009 FY 2010 Cash collections have shown year-over-year improvement for February and March February and March net-charge offs are in line with recent performance |
Re-aging increases collection success Percent of total portfolio balance within the re-aging program Portfolio re-aging 2006 0.176 2007 0.178 Q1'08 0.168 Q2'08 0.164 Q3'08 0.166 Q4'08 0.166 2008 0.166 Q1'09 0.155 Q2'09 0.159 Q3'09 0.197 Q4'09 0.187 2009 0.187 Q1'10 0.188 Q2'10 0.189 Q3'10 0.188 Q4'10 0.196 Feb-Mar FY'11 0.193 Portfolio re-aging is a collection tool used to grant payment relief to a customer who may have temporary payment difficulty due to unforeseen circumstances (loss of job, divorce, etc.) Typically, a partial payment is required for an account to be re-aged Re-aging programs reduce ultimate net charge-offs and enhances our ability to collect the full amounts due to us from sales under our credit programs and allow us to build long-term relationships with those customers that help drive future sales An account remains classified as re-aged until it is paid in full Approximately 89% of re-aged balances are ultimately collected Increase related to impact of Hurricanes Ike and Gustav in September 2008 Re-aged receivables are down 30 bps ($7mm), while delinquencies continue to fall and amounts charged-off stabilize FY 2008 FY 2009 FY 2010 |
Q1 1868 Q2 2133 Q3 2699 Q4 2947 Feb '10 2831 Mar '10 2774 Portfolio trends improving Q1 0.0693 Q2 0.076 Q3 0.0928 Q4 0.1 Feb '10 0.094 Mar '10 0.088 60-day delinquency (% of total portfolio) Average monthly net charge-offs ($ in 000's) FY 2010 FY 2010 Current LTM (March '10) Previous LTM (March '09) 2/1/2008 0.0672 3/1/2008 0.062 4/1/2008 0.0564 5/1/2008 0.058 6/1/2008 0.0532 7/1/2008 0.0536 8/1/2008 0.0535 9/1/2008 0.0472 10/1/2008 0.0536 11/1/2008 0.0501 12/1/2008 0.0504 1/1/2009 0.0546 2/1/2009 0.0622 Mar 0.0594 0.062 Apr 0.0527 0.0564 May 0.0524 0.058 Jun 0.0499 0.0532 Jul 0.0506 0.0536 Aug 0.049 0.0535 Sep 0.0496 0.0472 Oct 0.0514 0.0536 Nov 0.0482 0.0501 Dec 0.0485 0.0504 Jan 0.0531 0.0546 Feb 0.0646 0.0622 Mar 0.0607 0.0594 Gross cash collections (monthly pay rate) Q1 0.188 Q2 0.189 Q3 0.188 Q4 0.196 Feb '10 0.196 Mar '10 0.193 Re-aged receivables (% of total portfolio) FY 2010 The Company has adjusted its approach to underwriting credit with enhanced due diligence requirements, which is resulting in improving credit metrics Cash collections have shown year-over-year improvement Re-aged receivables are down 30 bps ($7mm), while delinquencies continue to fall 60-day delinquency is down 120 bps from the end of FY 2010 On a dollar-value basis, net charge-offs are stabilizing and delinquency and re-age trends indicate improvement as Conn's approaches Q2 FY 2011 FY 2011 FY 2011 |
Improving credit metrics Portfolio distribution by current credit Score1 2009 2010 0 1-400 0.0097 0.0071 401-425 0.0289 0.0254 426-450 0.0535 0.0501 451-475 0.0703 0.0708 476-500 0.0808 0.0828 501-525 0.0861 0.0852 526-550 0.0976 0.0911 551-575 0.1078 0.1066 576-600 0.1193 0.1225 601-625 0.117 0.1218 626-650 0.0894 0.0977 651-675 0.055 0.0592 676-700 0.0301 0.0313 701-725 0.0186 0.0181 726-750 0.0145 0.0129 751-775 0.0121 0.0102 776-800 0.0084 0.0065 801-999 0.0008 0.0008 Factors impacting portfolio improvement 2009 2010 1-500 24.3% 23.6% 500-625 52.8% 52.7% 625-700 17.5% 18.8% >700 5.4% 4.9% Primary Secondary 2008 634 537 2009 633 533 2010 632 550 Secondary portfolio origination credit score Due to the challenging financing environment, Conn's has worked diligently on preserving asset quality and managing the overall portfolio balance Conn's has increased the use of third party program for cash- option plans, which typically have a higher overall credit score but do not generate interest income From FY 2009 to FY 2010, credit quality has improved with the strengthening of underwriting standards, especially as follows for the Secondary portfolio Increase in origination credit scores Decline in approval rates Increase in down payment from 20.5% in 2009 to 21.2% in 2010 Percent of sales financed decreased from 9.9% in 2009 to 6.0% in 2010 Primary Secondary 2008 634 0.298 2009 633 0.294 2010 632 0.202 Applications approved in Secondary portfolio (1) Excludes FICO scores of 0 |
Business Overview Retail Program Overview Credit Operation Overview Financial Overview Appendix |
Flexibility to adjust operating model under adverse economic conditions Focused management of working capital through the cycle As Conn's has adjusted its credit standards for the current economic environment, the resulting decrease in credit portfolio balances reduces the Company's use of cash for working capital Low capex need for maintenance of existing stores and opening of new stores The cost to open and stock a new store is approximately $1.4mm Maintenance capex of only $2mm in FY 2010 Acute focus on expenses Aggressive cost containment Price point discipline Maintaining gross margins and not cutting prices to drive additional sales EBITDA FY '99 161 FY '05 429 FY '06 520 FY '07 569.6 FY '08 654.9 FY '09 753.5 FY '10 736 FY '11 696.428 Credit portfolio balances Retail EBITDA FY '99 161 FY '05 429 FY '06 520 FY '07 569.6 FY '08 103 45.95 FY '09 104 45.63 FY '10 61 17.04 FY '11 42.83 15.26 (1) EBITDA includes the addition of $4.85mm for the Texas AG settlement and $9.62mm for goodwill impairment. See appendix for reconciliation of EBITDA to GAAP 1 |
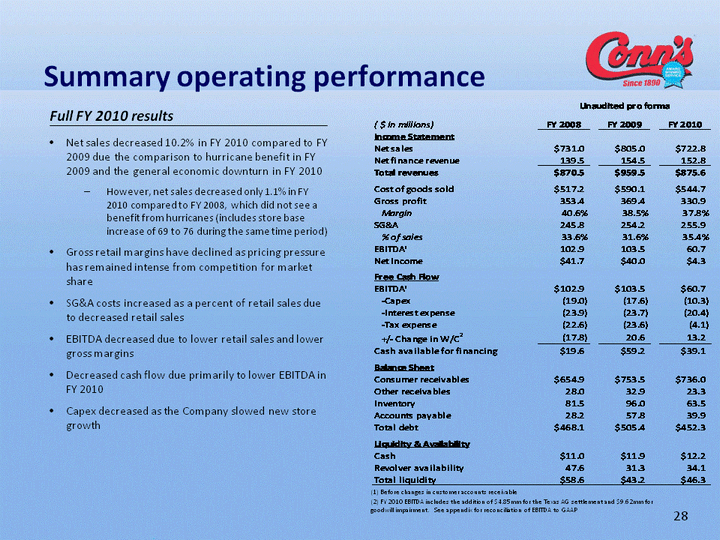
Summary operating performance Net sales decreased 10.2% in FY 2010 compared to FY 2009 due the comparison to hurricane benefit in FY 2009 and the general economic downturn in FY 2010 However, net sales decreased only 1.1% in FY 2010 compared to FY 2008, which did not see a benefit from hurricanes (includes store base increase of 69 to 76 during the same time period) Gross retail margins have declined as pricing pressure has remained intense from competition for market share SG&A costs increased as a percent of retail sales due to decreased retail sales EBITDA decreased due to lower retail sales and lower gross margins Decreased cash flow due primarily to lower EBITDA in FY 2010 Capex decreased as the Company slowed new store growth Full FY 2010 results (1) Before changes in customer accounts receivable (2) FY 2010 EBITDA includes the addition of $4.85mm for the Texas AG settlement and $9.62mm for goodwill impairment. See appendix for reconciliation of EBITDA to GAAP |
EBITDA/Interest Expense FY '07 4.47 FY '08 4.31 FY '09 4.36 FY '10 2.97 Historical credit metrics Leverage Asset coverage Interest coverage Inventory & PPE Consumer Receivables FY '07 0.334 1.3 FY '08 0.3007 1.4 FY '09 0.31365 1.5 FY '10 0.305 1.63 Leverage Ratio FY '06 4.47 FY '07 4.47 FY '08 1.9 FY '09 1.88 FY '10 1.61 FY '11E 7.26 FY '12E 5.24 FY '13E 5.21 Debt to capitalization Leverage Ratio FY '06 FY '07 FY '08 0.617 FY '09 0.603 FY '10 0.571 FY '11E FY '12E FY '13E Note: Total Liabilities / Tangible Net Worth Note: (Inventory + PPE + Consumer Receivables)/ Total Debt Note: EBITDA/ Interest Expense 1.7x 1.8x 1.9x |
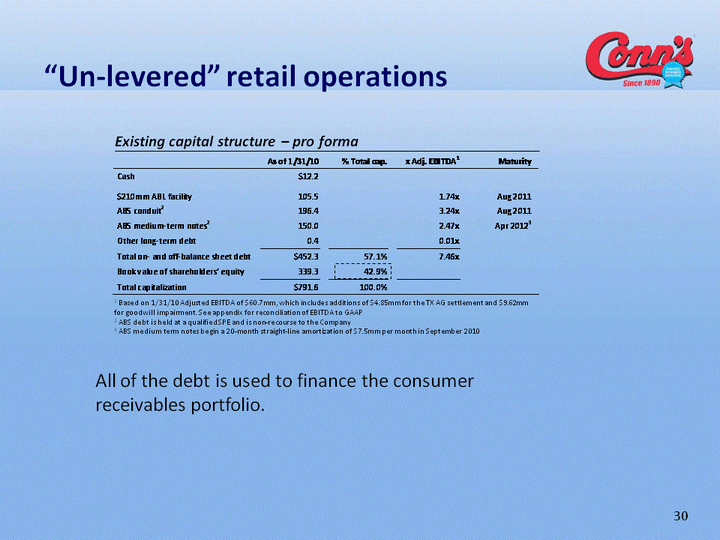
"Un-levered" retail operations 1 Based on 1/31/10 Adjusted EBITDA of $60.7mm, which includes additions of $4.85mm for the TX AG settlement and $9.62mm for goodwill impairment. See appendix for reconciliation of EBITDA to GAAP 2 ABS debt is held at a qualified SPE and is non-recourse to the Company 3 ABS medium term notes begin a 20-month straight-line amortization of $7.5mm per month in September 2010 Existing capital structure - pro forma All of the debt is used to finance the consumer receivables portfolio. |
Strong asset coverage Risk profile of the debt differs from that of a typical, unsecured credit card receivable Debt is secured by a purchase money security interest in products being sold on credit Products financed are used in everyday life (refrigerator, washer, dryer, TV), which creates a tangible attachment to the financed item thereby encouraging payment |
Business Overview Retail Program Overview Credit Operation Overview Financial Overview Appendix |
Company timeline Founded as a local plumbing company 1890 Company was acquired by Conn family and begins expansion into major home appliances and electronics Begins offering consumer credit Issues first term ABS 1998 Conn's begins using asset backed commercial paper to fund its credit receivables Management buyout sponsored by Stephens Group 2002 1934 1957 Conn's enters Houston market 1980 1992 1994 Thomas Frank selected as CEO 2003 2003 2006 Initial Public Offering Conn's enters Dallas/Fort Worth market Issues second term ABS 1993 Conn's enters San Antonio market Tim Frank selected as CEO 2008 Conn's puts in place $210mm ABL 2009 |
Portfolio comparison 52.1% of sales in FY '10 are financed through Primary portfolio Offered to customers with an established credit history and higher credit scores (weighted average FICO of 600) Option of installment plan or revolving credit Average accounts outstanding for 14 to 16 months Primary portfolio Dropped from 23.5% to 18.8% of the portfolio from January 2007 to 2010 6.0% of sales in FY 2010 are financed through Secondary portfolio Installment program offered to customers who do not qualify for credit under Conn's primary credit portfolio (weighted average FICO of 526) More extensive underwriting and application verification process Revolving charge and cash option/non-interest programs not offered to these customers Average account outstanding for 19 to 21 months Secondary portfolio Primary Secondary Total Total applicants approved 2003 1063 2004 1189 2005 1268 2006 1284 2007 1250 2008 1287 2009 1403 2010 1339 Total applicants approved 2003 1063 2004 1189 2005 1268 2006 1128 2007 1212 2008 1264 2009 1394 2010 1319 Total applicants approved 2003 1063 2004 1189 2005 1268 2006 1251 2007 1241 2008 1282 2009 1401 2010 1335 Total applicants approved 2003 1063 2004 1189 2005 1268 2006 421.6 2007 435.6 2008 511.6 2009 589.9 2010 597.36 Total applicants approved 2003 1063 2004 1189 2005 1268 2006 98.1 2007 133.9 2008 143.3 2009 163.6 2010 138.7 Total applicants approved 2003 1063 2004 1189 2005 1268 2006 519.7 2007 569.6 2008 654.9 2009 753.5 2010 736.041 Total applicants approved 2003 1063 2004 1189 2005 1268 2006 0.076 2007 0.106 2008 0.074 2009 0.059 2010 0.052 Total applicants approved 2003 1063 2004 1189 2005 1268 2006 0.264 2007 0.251 2008 0.246 2009 0.205 2010 0.212 Total applicants approved 2003 1063 2004 1189 2005 1268 2006 0.109 2007 0.137 2008 0.101 2009 0.082 2010 0.076 Average down payment Amount outstanding ($mm) Average customer balance |
Organizational chart CONN'S, INC. (Public Entity) (Delaware) Conn Appliances, Inc. (Texas) CAI HOLDING CO. (Delaware) CAIAIR, INC. (Delaware) Conn Funding II GP, LLC (Texas) Conn Appliances, LLC (Delaware) Conn Funding II, LP (Texas) CAICREDIT INSURANCE AGENCY, INC (Louisiana) Conn Credit Corporation, Inc. (Texas) Conn Lending, LLC (Delaware) Conn Credit I, LP (Texas) 100% 100% 100% 100% 100% 100% 100% 100% 1% 99% 1% 99% ABS QSPE |
Furniture and home furnishings stores Electronics and appliance stores Grocery stores Clothing and clothing access. stores Sporting goods stores Department stores1 Full service restaurants Retail Sales2 Line 11 Line 12 Line 13 Line 14 Line 15 Line 16 Jan -0.059 0.0096 0.0533 0.0062 0.0569 -0.0538 0.0307 0.0526 0.0359 Feb -0.0634 0.057 0.0448 0.0044 0.0424 -0.035 0.075 0.0865 0.0236 Mar -0.0623 0.0048 0.0589 -0.0053 0.012 -0.0516 0.0179 0.0007 0.0181 Apr -0.062 0.0459 0.0652 0.0178 0.0325 -0.0317 0.0337 0.0367 0.0272 May -0.0593 0.0568 0.054 0.0042 0.0201 -0.0324 0.0821 0.0361 0.0158 Jun -0.0644 0.0363 0.0618 0.0127 0.0243 -0.017 0.0197 -0.0081 0.0288 Jul -0.0729 0.051 0.0528 0.004 0.001 -0.0296 0.0453 0.0137 0.0168 Aug -0.0969 -0.0108 0.0671 0.0098 0.01 -0.0484 0.0577 0.0124 0.0106 Sep -0.1155 -0.0209 0.0552 -0.0403 -0.0201 -0.0588 0.0173 0.001 -0.0147 Oct -0.1189 -0.0527 0.0413 -0.0591 -0.0469 -0.0705 0.0364 0.0273 -0.0504 Nov -0.1313 -0.0745 0.0357 -0.0692 -0.0281 -0.0435 0.0305 0.0145 -0.0844 Dec -0.1332 -0.0946 0.0051 -0.0969 -0.0206 -0.075 -0.0115 -0.0048 -0.1062 Jan -0.142 -0.035 0.017 -0.073 -0.018 -0.073 0.068 0.027 -0.095 Feb -0.122 -0.03 0.007 -0.028 -0.008 -0.068 -0.005 -0.006 -0.082 Mar -0.142 -0.094 0.002 -0.07 -0.017 -0.059 0.006 0.021 -0.095 Apr -0.142 -0.109 -0.007 -0.071 -0.014 -0.067 0.01 0.026 -0.099 May -0.141 -0.134 0.003 -0.072 -0.046 -0.083 -0.002 0.023 -0.096 Jun -0.129064813 -0.123764458 -0.004902628 -0.079073784 -0.030711207 -0.086723264 -0.008083348 0.023410547 -0.089605297 July -0.125505618 -0.131900548 -0.009028833 -0.070440795 -0.028086839 -0.088172679 0.003294893 0.019032277 -0.084004194 Aug -0.11367039 -0.106670964 -0.011887073 -0.05645597 -0.010031178 -0.060242417 -0.030850821 -0.007144122 -0.057475711 Sep -0.083402245 -0.075054466 -0.002122327 -0.008213321 0.009286209 -0.042341679 0.005490601 0.003068486 -0.062386272 Oct -0.081381453 -0.061422054 -0.001200072 0.008653791 0.030780142 -0.028945085 0.020518225 -0.011170771 -0.020831632 Nov -0.062053084 -0.053435115 0.006684281 0.001318959 0.018379282 -0.054631686 -0.023365378 -0.005178291 0.019441656 Dec -0.03133448 -0.007630899 0.023835997 0.041011168 0.034040179 -0.018806623 -0.006642548 0.009426151 0.051655877 Jan -0.026 -0.054 0.017 0.018 0.014 -0.007 -0.023 0.01 0.041 Feb -0.021 -0.016 0.04 -0.007 0.032 0.001 -0.003 -0.003 0.039 Retail sector is stabilizing Year-over-year changes in retail sales components since January 2008 Source: U.S. Census Bureau, retail sales seasonally adjusted, as of February 2010 release; U.S. Department of Commerce - Bureau of Economic Analysis 1 Department stores exclude leased departments 2 Includes food services and auto y/y change Feb '10 (2.1)% 3.9% (0.3)% 0.1% 3.2% 2008 2010 2009 Volume Price Annotations Real consumer spending ($bn) YoY growth Real consumer spending 2008-Present 2008 2010 2009 |
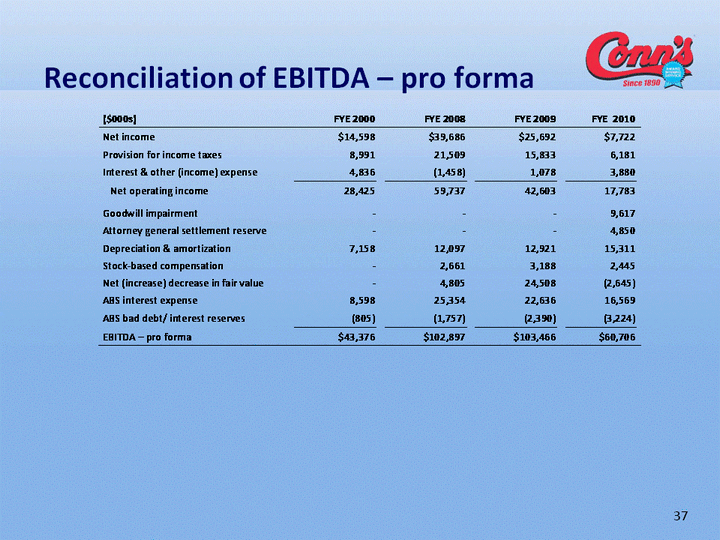
Reconciliation of EBITDA - pro forma |