Exhibit 99.1
NuStar Energy L.P. Analyst Day New York, New York September 9, 2013 |
2 Statements contained in this presentation that state management’s expectations or predictions of the future are forward-looking statements as defined by federal securities law. While these forward-looking statements, and any assumptions upon which they are based, are made in good faith and reflect our current judgment regarding the direction of our business, actual results will almost always vary, sometimes materially, from any estimates, predictions, projections, assumptions or other future performance suggested in this presentation. These forward-looking statements can generally be identified by the words “anticipates,” “believes,” “expects,” “plans,” “intends,” “estimates,” “forecasts,” “budgets,” “projects,” “could,” “should,” “may” and similar expressions. These statements reflect our current views with regard to future events and are subject to various risks, uncertainties and assumptions. We undertake no duty to update any forward-looking statement to conform the statement to actual results or changes in the company’s expectations. For more information concerning factors that could cause actual results to differ from those expressed or forecasted, see NuStar Energy L.P.’s annual report on Form 10-K and quarterly report on Form 10-Q, filed with the SEC and available on NuStar’s website at www.nustarenergy.com. We use financial measures in this presentation that are not calculated in accordance with generally accepted accounting principles (“non-GAAP”) and our reconciliations of non-GAAP financial measures to GAAP financial measures are located in the appendix to this presentation. These non-GAAP financial measures should not be considered an alternative to GAAP financial measures. Forward Looking Statements |
3 Today’s Agenda Topic Presenter Page # NuStar Overview (15 minutes) Curt Anastasio 4 Pipeline Segment Update (15 minutes) Doug Comeau 13 Storage Segment Update (10 minutes) Doug Comeau 20 Financing Update (10 minutes) Steve Blank 26 Closing Remarks and Q&A Curt Anastasio |
NuStar Overview Curt Anastasio President & CEO 4 |
5 Strategic Redirection and Change in Focus Initiated in Late 2012 Strategic redirection involved minimizing exposure to margin-based operations Sold 50% of asphalt business on September 28, 2012 Sold San Antonio refinery on January 1, 2013 and eliminated refinery hedges Proceeds from sales transactions used primarily for debt reduction, funding coverage ratio shortfall and investments in acquisitions and internal growth projects Currently focused on growing fee-based side of business Closed on Eagle Ford Shale crude oil pipeline acquisition in December 2012 Concentrating on internal growth projects in Eagle Ford Shale Continue to develop certain storage terminals Leasing idle storage tanks in certain markets Evaluating options for our Houston 12” pipeline system Evaluating divestitures of several underperforming terminal assets |
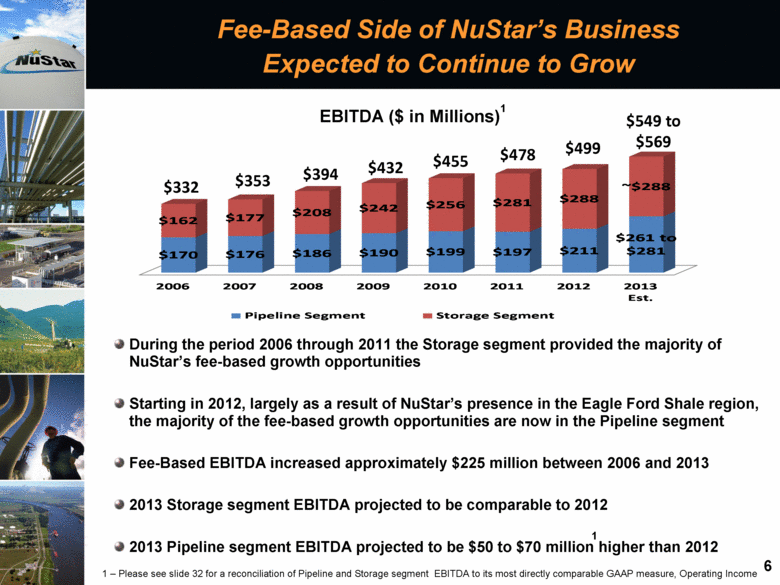
6 Fee-Based Side of NuStar’s Business Expected to Continue to Grow $332 $353 $394 $432 $455 $478 $499 $549 to $569 During the period 2006 through 2011 the Storage segment provided the majority of NuStar’s fee-based growth opportunities Starting in 2012, largely as a result of NuStar’s presence in the Eagle Ford Shale region, the majority of the fee-based growth opportunities are now in the Pipeline segment Fee-Based EBITDA increased approximately $225 million between 2006 and 2013 2013 Storage segment EBITDA projected to be comparable to 2012 2013 Pipeline segment EBITDA projected to be $50 to $70 million higher than 2012 1 – Please see slide 32 for a reconciliation of Pipeline and Storage segment EBITDA to its most directly comparable GAAP measure, Operating Income 1 EBITDA ($ in Millions) 1 2006 2007 2008 2009 2010 2011 2012 2013 Est. $170 $176 $186 $190 $199 $197 $211 $261 to $281 $162 $177 $208 $242 $256 $281 $288 ~$288 Pipeline Segment Storage Segment |
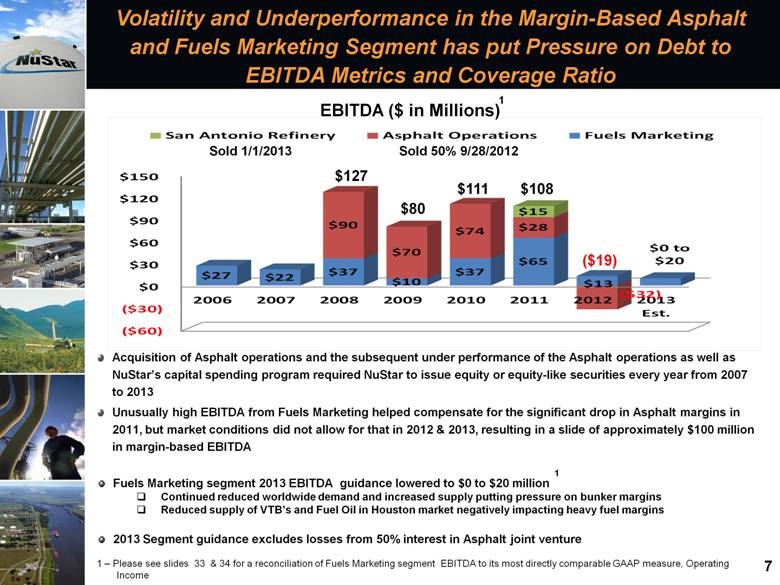
7 Volatility and Underperformance in the Margin-Based Asphalt and Fuels Marketing Segment has put Pressure on Debt to EBITDA Metrics and Coverage Ratio Acquisition of Asphalt operations and the subsequent under performance of the Asphalt operations as well as NuStar’s capital spending program required NuStar to issue equity or equity-like securities every year from 2007 to 2013 Margin-Based EBITDA basically flat from 2006 to 2013 but down around $120 million from 2008 to 2013 Fuels Marketing segment 2013 EBITDA guidance lowered to $0 to $20 million 1 Continued reduced worldwide demand and increased supply putting pressure on bunker margins Reduced supply of VTB’s and Fuel Oil in Houston market negatively impacting heavy fuel margins 2013 Segment guidance excludes losses from 50% interest in Asphalt joint venture 1 – Please see slides 33 & 34 for a reconciliation of Fuels Marketing segment EBITDA to its most directly comparable GAAP measure, Operating Income Sold 1/1/2013 Sold 50% 9/28/2012 $127 $80 $111 $108 ($19) EBITDA ($ in Millions) 1 ($60) ($30) $0 $30 $60 $90 $120 $150 2006 2007 2008 2009 2010 2011 2012 2013 Est. $27 $22 $37 $10 $37 $65 $13 $0 to $20 $90 $70 $74 $28 ($32) $15 San Antonio Refinery Asphalt Operations Fuels Marketing |
8 Going Forward Expect Less Volatility and Reduced Working Capital Requirements in Fuels Marketing Segment Segment is entirely composed of the remaining Fuels Marketing operations since January 1, 2013 sale of San Antonio refinery Operations remaining in the Fuels Marketing Segment include Bunkering and Fuel Oil Marketing Crude Oil Trading Product Supply which includes Butane Blending Recently entered into a back to back supply agreement for St. Eustatius Agreement reduced our working capital by $40 to $50 million Should improve results $5 to $10 million per year primarily via reduced expenses Full benefits should start being realized in fourth quarter of 2013 Fuels Marketing currently pays Storage Segment approximately $30 million in annual storage fees Represents around 5% of storage segments revenues |
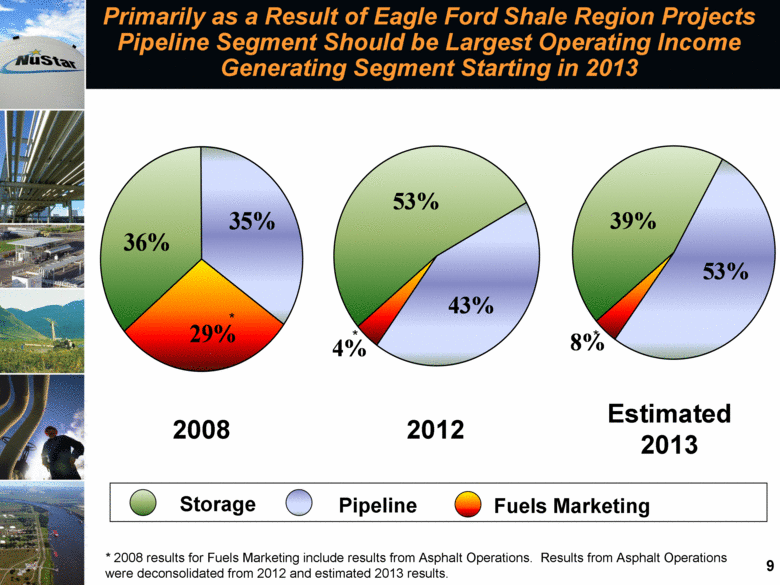
9 Primarily as a Result of Eagle Ford Shale Region Projects Pipeline Segment Should be Largest Operating Income Generating Segment Starting in 2013 Storage Pipeline Fuels Marketing 2008 2012 Estimated2013 * * 2008 results for Fuels Marketing include results from Asphalt Operations. Results from Asphalt Operations were deconsolidated from 2012 and estimated 2013 results. * * 36% 35% 29% 53% 43% 4% 39% 53% 8% |
10 Asphalt Joint Venture Update NuStar providing JV an unsecured, seven-year revolving credit facility for up to $250 million Current balance approximately $190 million, had recently been as high as $250 million Estimate year-end balance in $225 to $250 million range NuStar also providing credit support for the JV of up to $150 million, in the form of guarantees and letters of credit Approximately $110 million of guarantees and letters of credit have been issued Amended PDVSA Crude Oil Sales Agreement (the CSA) effective October 1, 2012 to reduce crude purchase obligations from PDVSA to 30,000 from 75,000 barrels per day Pursuing options regarding the divestiture of our remaining 50% ownership in the JV Asphalt JV’s results deconsolidated from NuStar’s financial statements beginning in September, 2012 |
11 As 2013 Winds to a Close & NuStar Moves into 2014 & 2015.... We expect storage demand to continue to be weak in certain markets Looking into divestitures for several of our underperforming terminals and terminals with limited growth potential Starting to receive inquiries into leasing tankage idled by our Bunker Operations Pursuing tank expansions and additional crude railcar offloading projects at certain terminals Completion of the construction of our dock in Corpus Christi should lead to increased throughputs on our Eagle Ford Shale region pipeline assets beginning in the second quarter of 2014 South Texas Crude Oil Project Open Season expected to support additional internal growth projects in 2014 and 2015 in the Eagle Ford Shale region Evaluating options for our Houston 12” pipeline system Implement strategies to improve profitability by reducing the working capital requirements and operating expenses associated with the Fuels Marketing Segment Continue to pursue alternatives to reduce our financial exposure to the Asphalt JV Potential divestiture of remaining 50% interest in JV |
12 As 2013 Winds to a Close & NuStar Moves into 2014 & 2015....(Continued) Internal growth projects, asset optimization, working capital reductions and cost reductions will be primary drivers for improvements in future distributable cash flows 2014 and 2015 financial guidance will be provided in the 4th quarter of 2013 After completion of 2014 Budget process and the completion of South Texas Crude Oil Pipeline System Open Season |
Pipeline Segment Update Doug Comeau Executive Vice President & COO 13 |
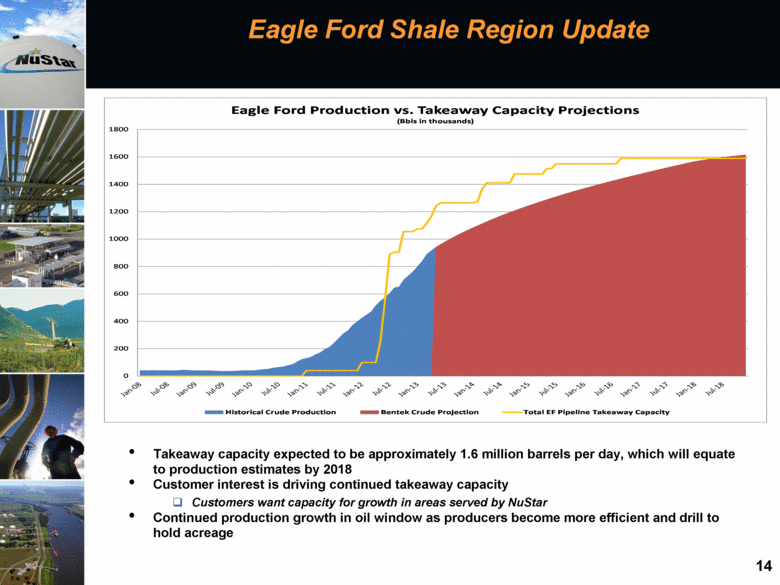
14 Eagle Ford Shale Region Update Takeaway capacity expected to be approximately 1.6 million barrels per day, which will equate to production estimates by 2018 Customer interest is driving continued takeaway capacity Customers want capacity for growth in areas served by NuStar Continued production growth in oil window as producers become more efficient and drill to hold acreage 0 200 400 600 800 1000 1200 1400 1600 1800 Eagle Ford Production vs. Takeaway Capacity Projections (Bbls in thousands) Historical Crude Production Bentek Crude Projection Total EF Pipeline Takeaway Capacity Jan-08 Jul-08 Jan-09 Jul-09 Jan-10 Jul-10 Jan-11 Jul-11 Jan-12 Jul-12 Jan-13 Jul-13 Jan-14 Jul-14 Jan-15 Jul-15 Jan-16 Jul-16 Jan-17 Jul-17 Jan-18 Jul-18 |
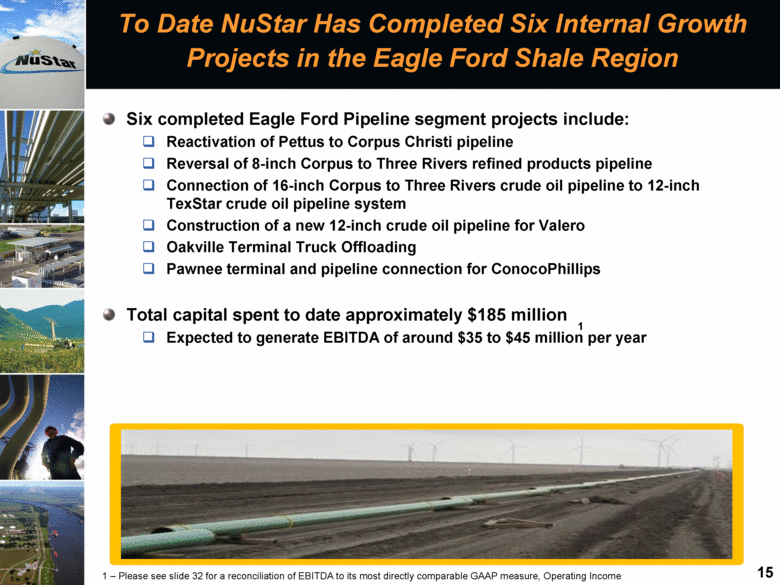
15 To Date NuStar Has Completed Six Internal Growth Projects in the Eagle Ford Shale Region Six completed Eagle Ford Pipeline segment projects include: Reactivation of Pettus to Corpus Christi pipeline Reversal of 8-inch Corpus to Three Rivers refined products pipeline Connection of 16-inch Corpus to Three Rivers crude oil pipeline to 12-inch TexStar crude oil pipeline system Construction of a new 12-inch crude oil pipeline for Valero Oakville Terminal Truck Offloading Pawnee terminal and pipeline connection for ConocoPhillips Total capital spent to date approximately $185 million Expected to generate EBITDA of around $35 to $45 million per year 1 1 – Please see slide 32 for a reconciliation of EBITDA to its most directly comparable GAAP measure, Operating Income |
16 Recently Completed First Phase of Eagle Ford Project For ConocoPhillips In August NuStar completed construction of a 100 thousand barrel terminal facility, truck offloading facilities and a pipeline connection to NuStar’s existing 12” Pettus line 12” Pettus line connects to NuStar’s Three Rivers to Corpus 16” line giving ConocoPhillips the ability to move Eagle Ford production to Corpus Christi Capacity of 12” Pettus line 100 thousand BPD Agreement provides ConocoPhillips with 30 to 60 thousand BPD of shipping capacity 10-year take or pay agreement supports this project Dock loading constraints at Corpus North Beach currently limiting ConocoPhillips throughputs until dock project completed in the 2nd quarter of 2014 Dock expansion at Corpus Christi North Beach Terminal will give ConocoPhillips and other customers more options to move Eagle Ford crude Recently received final dredging permits from Army Corp of Engineers Projected completion in the 2nd quarter of 2014 Completion of dock will relieve dock loading constraints and provide NuStar with three loading berths in Corpus Christi Total spending on ConocoPhillips project should be $120 to $140 million Should generate about $15 million of annual EBITDA Small benefit in 2013 but majority in 2014 and thereafter 1 1 – Please see slide 32 for a reconciliation of EBITDA to its most directly comparable GAAP measure, Operating Income |
17 Open Season for South Texas Crude Oil Pipeline System Project Initial Open Season commenced July 17, 2013 and ended August 30, 2013 At potential shippers’ request, NuStar has extended Open Season to September 30, 2013 which should allow shippers more time to obtain requisite approvals Assessing shipper interest in committed space to transport Eagle Ford Shale crude oil from several terminal locations on our South Texas Crude Oil Pipeline System to our Corpus Christi North Beach facility Proposed project includes pipeline capacity upgrades to segments of our South Texas Crude Oil Pipeline System Capacity upgrades would occur in two phases First phase would add incremental throughput capacity of approximately 35,000 barrels per day and should be available for service in the third quarter of 2014 Second phase would add incremental throughput capacity of approximately 65,000 barrels per day and should be available for service in the first quarter of 2015 |
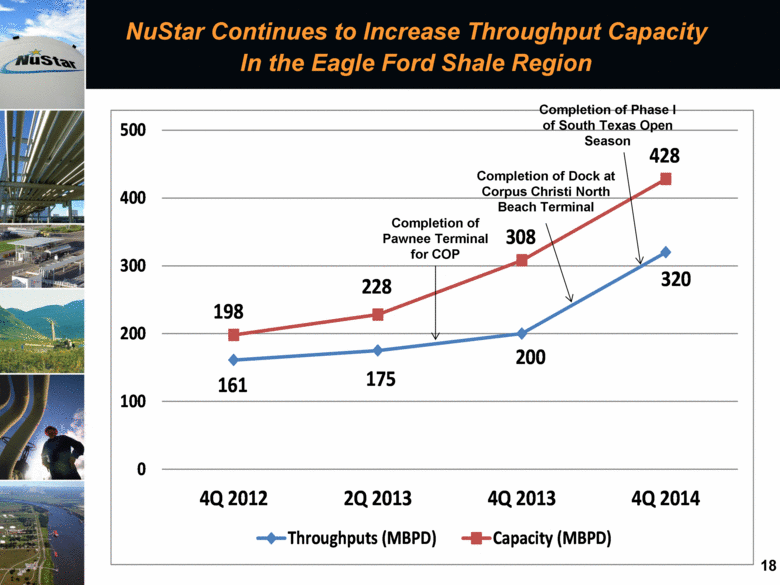
18 NuStar Continues to Increase Throughput Capacity In the Eagle Ford Shale Region Completion of Pawnee Terminal for COP Completion of Dock at Corpus Christi North Beach Terminal Completion of Phase I of South Texas Open Season 161 175 200 320 198 228 308 428 0 100 200 300 400 500 4Q 2012 2Q 2013 4Q 2013 4Q 2014 Throughputs (MBPD) Capacity (MBPD) |
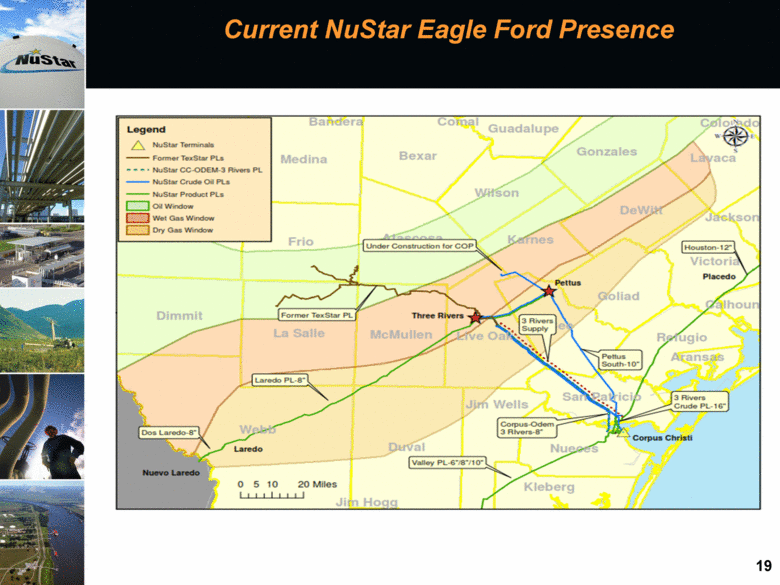
19 Current NuStar Eagle Ford Presence |
Storage Segment Update Doug Comeau Executive Vice President & COO 20 |
NuStar Overview 21 Storage Segment Being Negatively Impacted by Backwardation in Market Backwardation in the forward pricing curve and weak demand for storage putting downward pressure on storage rates in certain markets Offsetting benefits of first St. James rail car offloading facility completed in April 2012 and storage expansion projects completed in early 2013 at St. James and St. Eustatius terminals Approximately 35% of NuStar’s storage contracts come up for renewal in the next 12 months Renewal rates differ by market While we have achieved some renewals at slightly higher rates, most are renewing at rates that are 10% to 20% lower, due to backwardated market conditions 10% to 15% of storage capacity currently not leased Mainly Piney Point terminal and terminal facilities formerly leased to Bunker Operations Looking at all alternatives for Piney Point terminal Starting to receive inquiries into leasing tankage idled by our Bunker Operations Looking into divestitures for several of our underperforming terminals and terminals with limited growth potential |
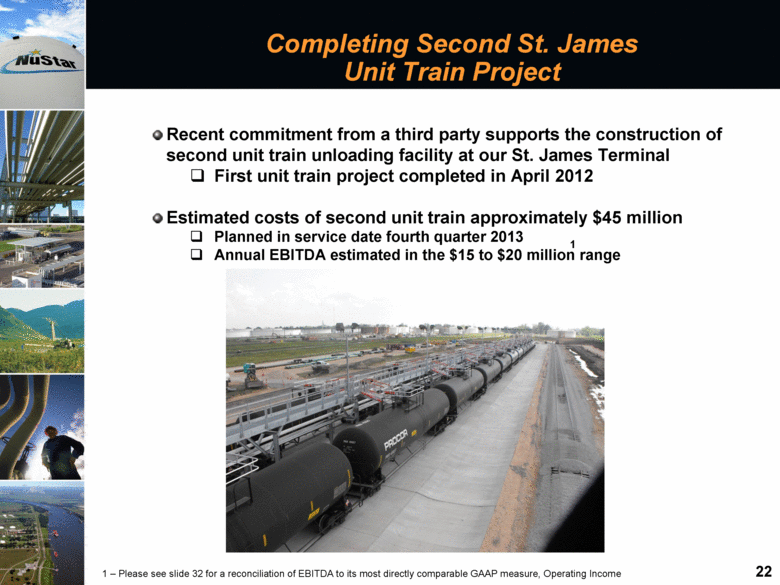
NuStar Overview 22 Completing Second St. James Unit Train Project Recent commitment from a third party supports the construction of second unit train unloading facility at our St. James Terminal First unit train project completed in April 2012 Estimated costs of second unit train approximately $45 million Planned in service date fourth quarter 2013 Annual EBITDA estimated in the $15 to $20 million range 1 1 – Please see slide 32 for a reconciliation of EBITDA to its most directly comparable GAAP measure, Operating Income |
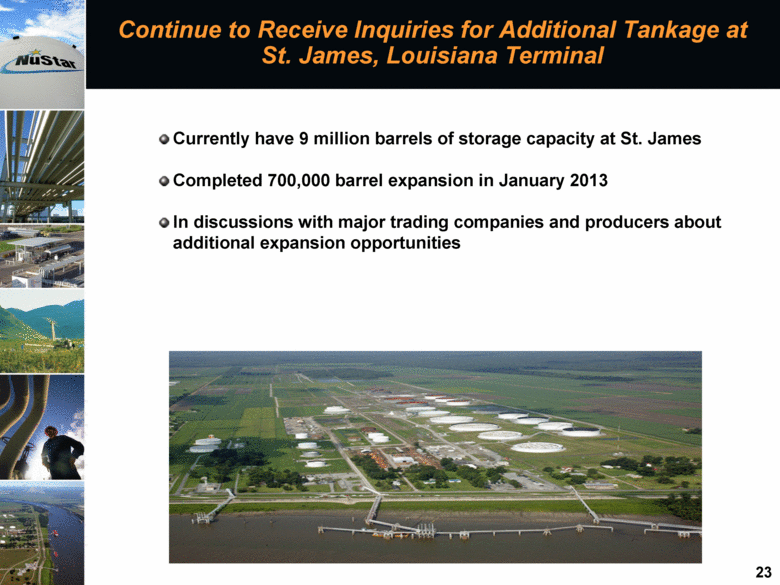
NuStar Overview 23 Continue to Receive Inquiries for Additional Tankage at St. James, Louisiana Terminal Currently have 9 million barrels of storage capacity at St. James Completed 700,000 barrel expansion in January 2013 In discussions with major trading companies and producers about additional expansion opportunities |
NuStar Overview 24 Storage Segment Also Benefitting from Eagle Ford Shale Region Growth Effective July 1, 2012 NuStar began to store and throughput Eagle Ford crude at NuStar’s Corpus Christi North Beach storage facility Throughput volumes should increase after dock expansion at Corpus Christi North Beach Terminal is completed early in the 2nd quarter of 2014 |
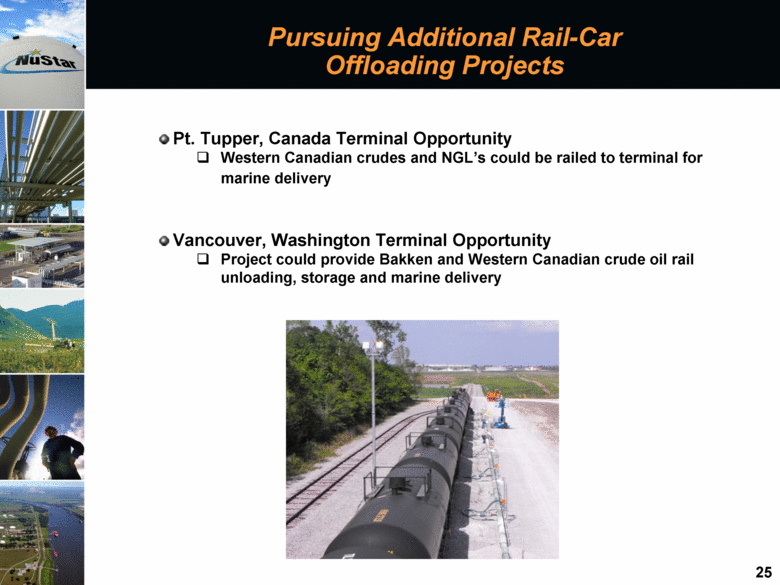
NuStar Overview 25 Pursuing Additional Rail-Car Offloading Projects Pt. Tupper, Canada Terminal Opportunity Western Canadian crudes and NGL’s could be railed to terminal for marine delivery Vancouver, Washington Terminal Opportunity Project could provide Bakken and Western Canadian crude oil rail unloading, storage and marine delivery |
Financing Update Steve Blank Executive Vice President & CFO 26 |
27 Financing Update Closed on $300 million senior note public offering on August 19, 2013 Coupon 6.75% Maturity February 2021 – 7.5 year deal Moody’s lowered outlook to Negative Next scheduled debt maturity is 21 million pound UK Term Loan Maturity December 2013 May look to issue some additional Junior Sub Notes depending on the size of our 2014 internal growth capital budget |
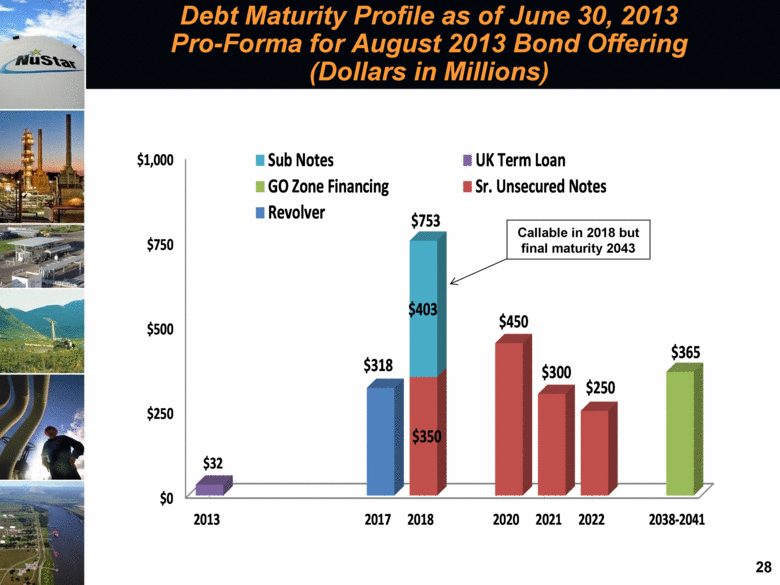
28 Debt Maturity Profile as of June 30, 2013 Pro-Forma for August 2013 Bond Offering (Dollars in Millions) Callable in 2018 but final maturity 2043 $0 $250 $500 $750 $1,000 2013 2017 2018 2020 2021 2022 2038-2041 $350 $450 $300 $250 $32 $403 Sub Notes UK Term Loan GO Zone Financing Sr. Unsecured Notes Revolver $365 $318 $753 |
NuStar Overview 29 2013 Internal Growth Spending Should be in the $350 to $375 Million Range (Dollars in Millions) $0 $100 $200 $300 $400 2009 2010 2011 2012 $164 $219 $294 $374 2009 - 2012 Internal Growth Project Spending |
Closing Remarks and Q&A Curt Anastasio President & CEO 30 |
Appendix 31 |
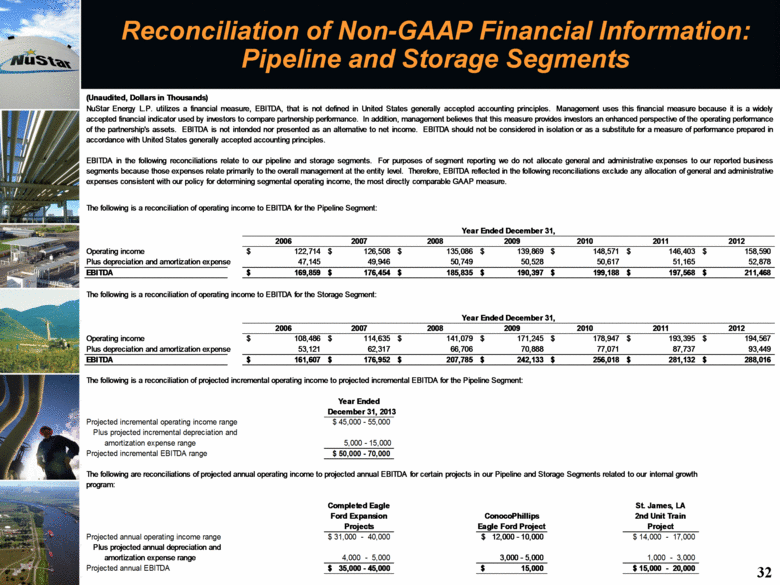
NuStar Overview 32 Reconciliation of Non-GAAP Financial Information: Pipeline and Storage Segments (Unaudited, Dollars in Thousands) The following is a reconciliation of operating income to EBITDA for the Pipeline Segment: 2006 2007 2008 2009 2010 2011 2012 Operating income 122,714 $ 126,508 $ 135,086 $ 139,869 $ 148,571 $ 146,403 $ 158,590 $ Plus depreciation and amortization expense 47,145 49,946 50,749 50,528 50,617 51,165 52,878 EBITDA 169,859 $ 176,454 $ 185,835 $ 190,397 $ 199,188 $ 197,568 $ 211,468 $ The following is a reconciliation of operating income to EBITDA for the Storage Segment: 2006 2007 2008 2009 2010 2011 2012 Operating income 108,486 $ 114,635 $ 141,079 $ 171,245 $ 178,947 $ 193,395 $ 194,567 $ Plus depreciation and amortization expense 53,121 62,317 66,706 70,888 77,071 87,737 93,449 EBITDA 161,607 $ 176,952 $ 207,785 $ 242,133 $ 256,018 $ 281,132 $ 288,016 $ Year Ended December 31, 2013 Projected incremental operating income range $ 45,000 - 55,000 Plus projected incremental depreciation and amortization expense range 5,000 - 15,000 Projected incremental EBITDA range $ 50,000 - 70,000 Completed Eagle Ford Expansion Projects ConocoPhillips Eagle Ford Project Projected annual operating income range $ 31,000 - 40,000 $ 12,000 - 10,000 $ 14,000 - 17,000 Plus projected annual depreciation and amortization expense range 4,000 - 5,000 3,000 - 5,000 1,000 - 3,000 Projected annual EBITDA $ 35,000 - 45,000 15,000 $ $ 15,000 - 20,000 The following is a reconciliation of projected incremental operating income to projected incremental EBITDA for the Pipeline Segment: The following are reconciliations of projected annual operating income to projected annual EBITDA for certain projects in our Pipeline and Storage Segments related to our internal growth program: St. James, LA 2nd Unit Train Project NuStar Energy L.P. utilizes a financial measure, EBITDA, that is not defined in United States generally accepted accounting principles. Management uses this financial measure because it is a widely accepted financial indicator used by investors to compare partnership performance. In addition, management believes that this measure provides investors an enhanced perspective of the operating performance of the partnership's assets. EBITDA is not intended nor presented as an alternative to net income. EBITDA should not be considered in isolation or as a substitute for a measure of performance prepared in accordance with United States generally accepted accounting principles. EBITDA in the following reconciliations relate to our pipeline and storage segments. For purposes of segment reporting we do not allocate general and administrative expenses to our reported business segments because those expenses relate primarily to the overall management at the entity level. Therefore, EBITDA reflected in the following reconciliations exclude any allocation of general and administrative expenses consistent with our policy for determining segmental operating income, the most directly comparable GAAP measure. Year Ended December 31, Year Ended December 31, |

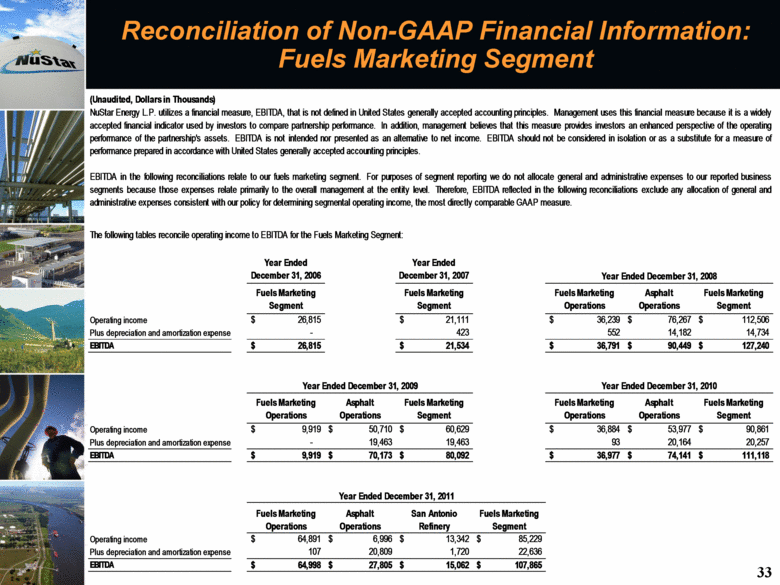
NuStar Overview 33 Reconciliation of Non-GAAP Financial Information: Fuels Marketing Segment (Unaudited, Dollars in Thousands) The following tables reconcile operating income to EBITDA for the Fuels Marketing Segment: Year Ended December 31, 2006 Year Ended December 31, 2007 Fuels Marketing Segment Fuels Marketing Segment Fuels Marketing Operations Asphalt Operations Fuels Marketing Segment Operating income 26,815 $ 21,111 $ 36,239 $ 76,267 $ 112,506 $ Plus depreciation and amortization expense - 423 552 14,182 14,734 EBITDA 26,815 $ 21,534 $ 36,791 $ 90,449 $ 127,240 $ Fuels Marketing Operations Asphalt Operations Fuels Marketing Segment Fuels Marketing Operations Asphalt Operations Fuels Marketing Segment Operating income 9,919 $ 50,710 $ 60,629 $ 36,884 $ 53,977 $ 90,861 $ Plus depreciation and amortization expense - 19,463 19,463 93 20,164 20,257 EBITDA 9,919 $ 70,173 $ 80,092 $ 36,977 $ 74,141 $ 111,118 $ Fuels Marketing Operations Asphalt Operations San Antonio Refinery Fuels Marketing Segment Operating income 64,891 $ 6,996 $ 13,342 $ 85,229 $ Plus depreciation and amortization expense 107 20,809 1,720 22,636 EBITDA 64,998 $ 27,805 $ 15,062 $ 107,865 $ NuStar Energy L.P. utilizes a financial measure, EBITDA, that is not defined in United States generally accepted accounting principles. Management uses this financial measure because it is a widely accepted financial indicator used by investors to compare partnership performance. In addition, management believes that this measure provides investors an enhanced perspective of the operating performance of the partnership's assets. EBITDA is not intended nor presented as an alternative to net income. EBITDA should not be considered in isolation or as a substitute for a measure of performance prepared in accordance with United States generally accepted accounting principles. EBITDA in the following reconciliations relate to our fuels marketing segment. For purposes of segment reporting we do not allocate general and administrative expenses to our reported business segments because those expenses relate primarily to the overall management at the entity level. Therefore, EBITDA reflected in the following reconciliations exclude any allocation of general and administrative expenses consistent with our policy for determining segmental operating income, the most directly comparable GAAP measure. Year Ended December 31, 2008 Year Ended December 31, 2009 Year Ended December 31, 2010 Year Ended December 31, 2011 |
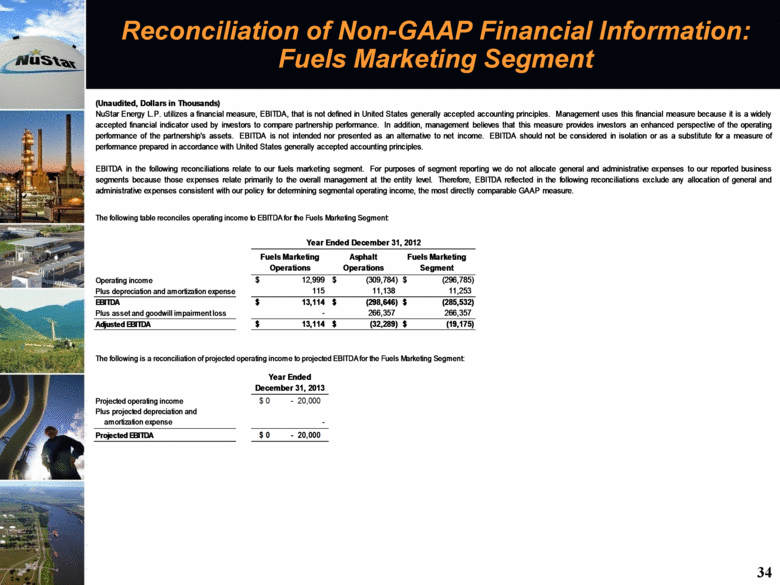
Reconciliation of Non-GAAP Financial Information: Fuels Marketing Segment 34 (Unaudited, Dollars in Thousands) The following table reconciles operating income to EBITDA for the Fuels Marketing Segment: Fuels Marketing Operations Asphalt Operations Fuels Marketing Segment Operating income 12,999 $ (309,784) $ (296,785) $ Plus depreciation and amortization expense 115 11,138 11,253 EBITDA 13,114 $ (298,646) $ (285,532) $ Plus asset and goodwill impairment loss - 266,357 266,357 Adjusted EBITDA 13,114 $ (32,289) $ (19,175) $ The following is a reconciliation of projected operating income to projected EBITDA for the Fuels Marketing Segment: Projected operating income $ 0 - 20,000 Plus projected depreciation and amortization expense - Projected EBITDA $ 0 - 20,000 Year Ended December 31, 2013 Year Ended December 31, 2012 NuStar Energy L.P. utilizes a financial measure, EBITDA, that is not defined in United States generally accepted accounting principles. Management uses this financial measure because it is a widely accepted financial indicator used by investors to compare partnership performance. In addition, management believes that this measure provides investors an enhanced perspective of the operating performance of the partnership's assets. EBITDA is not intended nor presented as an alternative to net income. EBITDA should not be considered in isolation or as a substitute for a measure of performance prepared in accordance with United States generally accepted accounting principles. EBITDA in the following reconciliations relate to our fuels marketing segment. For purposes of segment reporting we do not allocate general and administrative expenses to our reported business segments because those expenses relate primarily to the overall management at the entity level. Therefore, EBITDA reflected in the following reconciliations exclude any allocation of general and administrative expenses consistent with our policy for determining segmental operating income, the most directly comparable GAAP measure. |