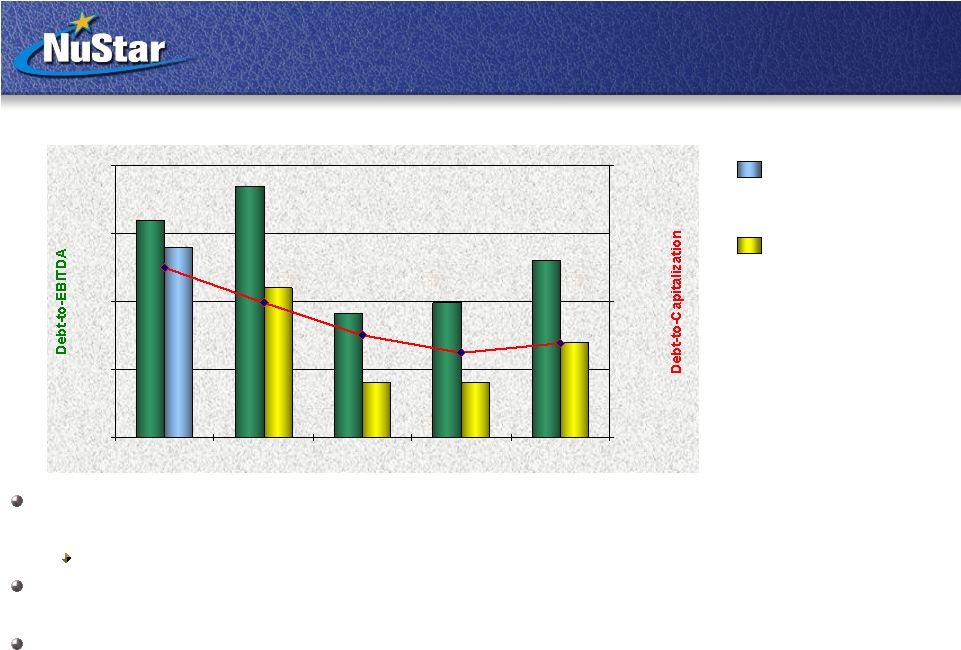
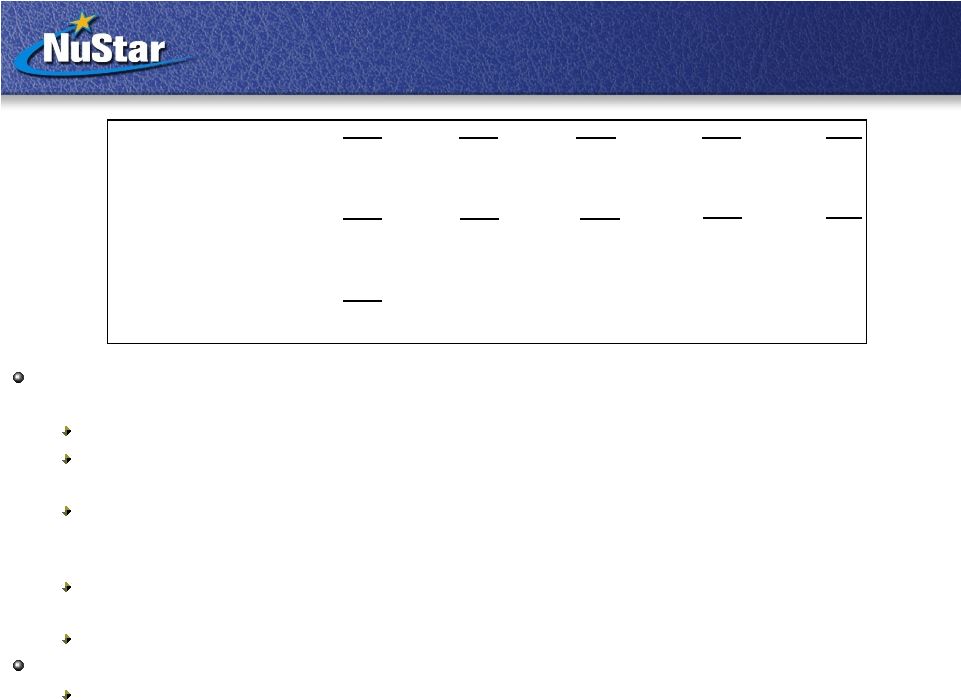
108 NuStar Energy L.P. utilizes two financial measures, EBITDA and distributable cash flow, which are not defined in United States generally accepted accounting principles. Management uses these financial measures because they are widely accepted financial indicators used by investors to compare partnership performance. In addition, management believes that these measures provide investors an enhanced perspective of the operating performance of the partnership's assets and the cash that the business is generating. Neither EBITDA nor distributable cash flow are intended to represent cash flows for the period, nor are they presented as an alternative to net income. They should not be considered in isolation or as substitutes for a measure of performance prepared in accordance with United States generally accepted accounting principles. Debt-to-EBITDA Reconciliation March 31,2008 June 30, 2008 September 30, 2008 December 31, 2008 March 31,2009 Net income 175,044 $ 149,437 $ 249,501 $ 254,018 $ 237,504 $ Plus interest expense, net 74,527 80,009 85,856 90,818 94,423 Plus income tax expense 12,318 14,253 13,473 11,006 12,970 Plus depreciation and amortization expense 116,997 123,967 129,576 135,709 141,652 EBITDA 378,886 367,666 478,406 491,551 486,549 Less equity earnings from joint ventures (7,423) (7,426) (7,935) (8,030) (8,142) Less other income, net (42,116) (25,647) (15,152) (37,739) (36,434) Less mark-to-market impact on all derivative transactions 6,336 5,505 (3,811) (9,781) (4,005) Plus distributions from joint ventures 1,044 500 500 2,835 3,835 Other adjustments allowed under debt agreements 142,708 109,906 72,908 36,492 5,219 EBITDA per debt agreements 479,435 450,504 524,916 475,328 447,022 Plus hedging loss in 2Q08 60,704 60,704 60,704 60,704 Adjusted EBITDA per debt agreements 479,435 $ 511,208 $ 585,620 $ 536,032 $ 507,726 $ Total Consolidated Debt 2,203,298 $ 2,182,813 $ 2,051,486 $ 1,894,848 $ 1,924,210 $ Less hedging loss in 2Q08 (60,704) (60,704) (60,704) (60,704) Less equity offering proceeds, net of final CARCO payment (89,252) Total Adjusted Consolidated Debt 2,114,046 $ 2,122,109 $ 1,990,782 $ 1,834,144 $ 1,863,506 $ Debt Coverage Ratio 4.6x 4.8x 3.9x 4.0x 4.3x Adjusted Debt Coverage Ratio 4.4x 4.2x 3.4x 3.4x 3.7x Maximum Debt Coverage Ratio per debt agreements 5.5x 5.5x 5.0x 5.0x 5.0x For the Twelve Months Ended The following is a reconciliation of net income to EBITDA and Adjusted EBITDA, as defined in our debt agreements: (Unaudited, Thousands of Dollars, Except Ratio) |