UNITED STATES
SECURITIES AND EXCHANGE COMMISSION
Washington, D.C. 20549
FORMN-CSR
CERTIFIED SHAREHOLDER REPORT OF REGISTERED
MANAGEMENT INVESTMENT COMPANIES
Investment Company Act File Number: 811-21326
Cohen & Steers REIT and Preferred and Income Fund, Inc.
(Exact name of registrant as specified in charter)
280 Park Avenue, New York, NY 10017
(Address of principal executive offices) (Zip code)
Dana A. DeVivo
Cohen & Steers Capital Management, Inc.
280 Park Avenue
New York, New York 10017
(Name and address of agent for service)
Registrant’s telephone number, including area code: (212)832-3232
Date of fiscal year end: December 31
Date of reporting period: December 31, 2019
Item 1. Reports to Stockholders.
COHEN & STEERS REITAND PREFERREDANDINCOME FUND, INC.
To Our Shareholders:
We would like to share with you our report for the year ended December 31, 2019. The total returns for Cohen & Steers REIT and Preferred and Income Fund, Inc. (the Fund) and its comparative benchmarks were:
| | | | | | | | |
| | | Six Months Ended
December 31, 2019 | | | Year Ended
December 31, 2019 | |
Cohen & Steers REIT and Preferred and Income Fund at Net Asset Valuea | | | 9.72 | % | | | 32.35 | % |
Cohen & Steers REIT and Preferred and Income Fund at Market Valuea | | | 13.50 | % | | | 42.92 | % |
Linked Benchmarkb | | | 7.87 | % | | | 27.74 | % |
ICE BofAML Fixed Rate Preferred Securities Indexb | | | 5.11 | % | | | 17.71 | % |
Linked Blended Benchmark | | | 6.50 | % | | | 22.70 | % |
S&P 500 Indexb | | | 10.92 | % | | | 31.49 | % |
The performance data quoted represent past performance. Past performance is no guarantee of future results. The investment return and the principal value of an investment will fluctuate and shares, if sold, may be worth more or less than their original cost. Current performance may be lower or higher than the performance data quoted. Performance results reflect the effects of leverage, resulting from borrowings under a credit agreement. Current total returns of the Fund can be obtained by visiting our website at cohenandsteers.com. The Fund’s returns assume the reinvestment of all dividends and distributions at prices obtained under the Fund’s dividend reinvestment plan. Index performance does not reflect the deduction of any fees, taxes or expenses. An investor cannot invest directly in an index. Performance figures for periods shorter than one year are not annualized.
Managed Distribution Policy
The Fund, acting in accordance with an exemptive order received from the U.S. Securities and Exchange Commission (SEC) and with approval of its Board of Directors (the Board), adopted a managed distribution policy under which the Fund intends to include long-term capital gains, where applicable, as part of the regular monthly cash distributions to its shareholders (the Plan).
| a | As a closed-end investment company, the price of the Fund’s exchange-traded shares will be set by market forces and can deviate from the net asset value (NAV) per share of the Fund. |
| b | The Linked Benchmark is represented by the performance of the FTSE Nareit Equity REITs Index through March 31, 2019 and the FTSE Nareit All Equity REITs Index thereafter. The Linked Blended Benchmark is represented by the performance of the blended benchmark consisting of—50% FTSE Nareit Equity REITs Index/50% ICE BofAML Fixed Rate Preferred Securities Index through March 31, 2019 and the blended benchmark consisting of 50% FTSE Nareit All Equity REITs Index/50% ICE BofAML Fixed Rate Preferred Securities Index thereafter. The FTSE Nareit Equity REITs Index contains alltax-qualified real estate investment trusts (REITs) except timber and infrastructure REITs with more than 50% of total assets in qualifying real estate assets other than mortgages secured by real property that also meet minimum size and liquidity criteria. The FTSE Nareit All Equity REITs Index contains all tax-qualified REITs with more than 50% of total assets in qualifying real estate assets other than mortgages secured by real property that also meet minimum size and liquidity criteria. ICE BofAML Fixed Rate Preferred Securities Index tracks the performance of fixed-rate U.S. dollar-denominated preferred securities issued in the U.S. domestic market. The S&P 500 Index is an unmanaged index of 500 large capitalization stocks that is frequently used as a general measure of U.S. stock market performance. Benchmark returns are shown for comparative purposes only and may not be representative of the Fund’s portfolio. |
1
COHEN & STEERS REITAND PREFERREDANDINCOME FUND, INC.
The Plan gives the Fund greater flexibility to realize long-term capital gains and to distribute those gains on a regular monthly basis. In accordance with the Plan, the Fund currently distributes $ 0.124 per share on a monthly basis.
The Fund may pay distributions in excess of the Fund’s investment company taxable income and net realized gains. This excess would be a return of capital distributed from the Fund’s assets. Distributions of capital decrease the Fund’s total assets and, therefore, could have the effect of increasing the Fund’s expense ratio. In addition, in order to make these distributions, the Fund may have to sell portfolio securities at a less than opportune time.
Shareholders should not draw any conclusions about the Fund’s investment performance from the amount of these distributions or from the terms of the Fund’s Plan. The Fund’s total return based on NAV is presented in the table above as well as in the Financial Highlights table.
The Plan provides that the Board of Directors may amend or terminate the Plan at any time without prior notice to Fund shareholders; however, at this time, there are no reasonably foreseeable circumstances that might cause the termination. The termination of the Plan could have the effect of creating a trading discount (if the Fund’s stock is trading at or above NAV) or widening an existing trading discount.
Market Review
U.S. REITs had exceptional overall returns in 2019, supported by generally healthy property fundamentals and declining interest rates. Prospects of slowing economic growth prompted the U.S. Federal Reserve to respond forcefully with rate cuts and other easing measures, driving meaningful gains in the equity market. A resilient economy—marked by a 50-year low in unemployment and 111 consecutive months of job growth—resulted in healthy demand for most property types, coinciding with peaking supply in many sectors. Companies also benefited from easy access to capital at historically low rates, providing a healthy environment for cash flow growth.
Preferred securities also had strong total returns. Fixed income markets were broadly supported by a decline in sovereign bond yields in the year amid concerns about slowing global growth, compounded by trade uncertainty. Low and declining rates encouraged investors to seek extra yield through more aggressive action (for example, by moving out on the duration spectrum or accepting more credit risk). In this environment, preferreds outpaced Treasuries and all but the longest-term corporate bonds and they even fared well compared with high-yield debt. High yield was held back by weakness in the energy and retailing segments, which have almost no representation in the preferred universe.
Fund Performance
The Fund had a strong total return in 2019 and outperformed its linked blended benchmark on both a NAV and market price basis.
The growing influence of e-commerce on real estate was a key driver of absolute and relative performance. Data centers and towers continued to benefit from rapid growth in data usage as well as increased capital spending on 5G infrastructure. The Fund’s overweight allocation to data centers contributed to relative performance during the year. Industrial landlords were another top-performing
2
COHEN & STEERS REITAND PREFERREDANDINCOME FUND, INC.
sector; supply struggled to keep pace with the demand for well-located distribution centers, as Amazon and other online retailers expanded supply-chain logistics capabilities. In our view, the earnings growth potential of industrial landlords did not warrant the sector’s high valuations. However, the market did not share our concerns, and our underweight allocation in the sector detracted from relative performance.
Escalating online sales and retail store closures pointed to continued challenges for retail landlords. Against this backdrop, regional malls were the only REIT sector to experience a negative return in 2019. The Fund’s underweight allocation to regional malls contributed to relative performance.
Residential housing continued to see favorable fundamentals due to a strong job market, a lack of new supply, worsening home affordability and positive demographic trends. Manufactured homes and single family homes were among the best performers during the year. Our overweight allocations to these sectors, along with our stock selection in single family homes, added to results. Returns for apartments were somewhat more modest, and our security selection in the sector—including an overweight position in UDR, Inc., which underperformed in part due to a subdued outlook from management—hindered relative performance.
The Fund’s investment in preferred securities contributed positively to relative performance compared with the linked blended benchmark. We were underweight preferreds as a group, which helped as they underperformed REITs in the period. In addition, security selection in preferreds was beneficial, led by outperformance of the Fund’s insurance and banking holdings.
Impact of Leverage on Fund Performance
The Fund employs leverage as part of a yield-enhancement strategy. Leverage, which can increase total return in rising markets (just as it can have the opposite effect in declining markets), significantly contributed to the Fund’s performance for the 12-month period ended December 31, 2019.
Impact of Derivatives on Fund Performance
The Fund used derivatives in the form of currency options for hedging purposes, as well as forward foreign currency exchange contracts for managing currency risk on certain Fund positions denominated in foreign currencies. These instruments did not have a material effect on the Fund’s total return for the 12-month period ended December 31, 2019.
The Fund also engaged in the buying and selling of single stock options with the intention of enhancing total returns and reducing overall volatility. These contracts did not have a material effect on the Fund’s total return for the 12-month period ended December 31, 2019.
In connection with its use of leverage, the Fund pays interest on a portion of its borrowings based on a floating rate under the terms of its credit agreement. To reduce the impact that an increase in interest rates could have on the performance of the Fund with respect to these borrowings, the Fund used interest rate swaps to exchange a portion of the floating rate for a fixed rate. The Fund’s use of swaps did not have a material impact on the Fund’s total return for the 12-month period ended December 31, 2019.
3
COHEN & STEERS REITAND PREFERREDANDINCOME FUND, INC.
Sincerely,
| | |
 | | 
|
| |
THOMAS N. BOHJALIAN | | WILLIAM F. SCAPELL |
Portfolio Manager | | Portfolio Manager |
| | |

| | 
|
| |
JASON YABLON | | MATHEW KIRSCHNER |
Portfolio Manager | | Portfolio Manager |
The views and opinions in the preceding commentary are subject to change without notice and are as of the date of the report. There is no guarantee that any market forecast set forth in the commentary will be realized. This material represents an assessment of the market environment at a specific point in time, should not be relied upon as investment advice and is not intended to predict or depict performance of any investment.
Visit Cohen & Steers online at cohenandsteers.com
For more information about the Cohen & Steers family of mutual funds, visit cohenandsteers.com. Here you will find fund net asset values, fund fact sheets and portfolio highlights, as well as educational resources and timely market updates.
Our website also provides comprehensive information about Cohen & Steers, including our most recent press releases, profiles of our senior investment professionals and their investment approach to each asset class. The Cohen & Steers family of mutual funds specializes in liquid real assets, including real estate securities, listed infrastructure and natural resource equities, as well as preferred securities and other income solutions.
4
COHEN & STEERS REITAND PREFERREDANDINCOME FUND, INC.
Our Leverage Strategy
(Unaudited)
Our current leverage strategy utilizes borrowings up to the maximum permitted by the Investment Company Act of 1940 to provide additional capital for the Fund, with an objective of increasing net income available for shareholders. As of December 31, 2019, leverage represented 23% of the Fund’s managed assets.
Through a combination of variable and fixed rate financing, the Fund has locked in interest rates on a significant portion of this additional capital through 2023 (where we effectively reduce our variable rate obligation and lock in our fixed rate obligation over various terms). Locking in a significant portion of our leveraging costs is designed to protect the dividend-paying ability of the Fund. The use of leverage increases the volatility of the Fund’s NAV in both up and down markets. However, we believe that locking in portions of the Fund’s leveraging costs for the various terms partially protects the Fund’s expenses from an increase in short-term interest rates.
Leverage Factsa,b
| | |
Leverage (as a % of managed assets) | | 23% |
% Variable Rate Financing | | 15% |
Variable Rate | | 2.6% |
% Fixed Rate Financingc,d | | 85% |
Weighted Average Rate on Fixed Financing | | 3.4% |
Weighted Average Term on Fixed Financing | | 2.9 years |
The Fund seeks to enhance its dividend yield through leverage. The use of leverage is a speculative technique and there are special risks and costs associated with leverage. The NAV of the Fund’s shares may be reduced by the issuance and ongoing costs of leverage. So long as the Fund is able to invest in securities that produce an investment yield that is greater than the total cost of leverage, the leverage strategy will produce higher current net investment income for shareholders. On the other hand, to the extent that the total cost of leverage exceeds the incremental income gained from employing such leverage, shareholders would realize lower net investment income. In addition to the impact on net income, the use of leverage will have an effect of magnifying capital appreciation or depreciation for shareholders. Specifically, in an up market, leverage will typically generate greater capital appreciation than if the Fund were not employing leverage. Conversely, in down markets, the use of leverage will generally result in greater capital depreciation than if the Fund had been unlevered. To the extent that the Fund is required or elects to reduce its leverage, the Fund may need to liquidate investments, including under adverse economic conditions which may result in capital losses potentially reducing returns to shareholders. There can be no assurance that a leveraging strategy will be successful during any period in which it is employed.
| a | Data as of December 31, 2019. Information is subject to change. |
| b | See Note 7 in Notes to Financial Statements. |
| c | Represents a combination of fixed rate borrowings and fixed payer interest rate swap contracts. |
| d | The Fund entered into a forward-starting interest rate swap contract with interest receipts and payments commencing on December 28, 2020 (effective date). |
5
COHEN & STEERS REITAND PREFERREDANDINCOME FUND, INC.
December 31, 2019
Top Ten Holdingsa
(Unaudited)
| | | | | | | | |
Security | | Value | | | % of
Managed
Assets | |
American Tower Corp. | | $ | 78,493,182 | | | | 5.1 | |
Prologis, Inc. | | | 51,295,167 | | | | 3.4 | |
Equinix, Inc. | | | 51,286,800 | | | | 3.4 | |
Welltower, Inc. | | | 36,848,023 | | | | 2.4 | |
Crown Castle International Corp. | | | 35,835,731 | | | | 2.4 | |
Essex Property Trust, Inc. | | | 35,096,222 | | | | 2.3 | |
Sun Communities, Inc. | | | 32,066,313 | | | | 2.1 | |
Extra Space Storage, Inc. | | | 30,493,128 | | | | 2.0 | |
UDR, Inc. | | | 29,045,298 | | | | 1.9 | |
VICI Properties, Inc. | | | 28,092,532 | | | | 1.8 | |
| a | Top ten holdings (excluding short-term investments) are determined on the basis of the value of individual securities held. The Fund may also hold positions in other securities issued by the companies listed above. See the Schedule of Investments for additional details on such other positions. |
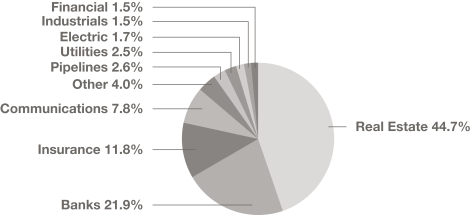
Sector Breakdown
(Based on Managed Assets)
(Unaudited)
6
COHEN & STEERS REITAND PREFERREDANDINCOME FUND, INC.
SCHEDULE OF INVESTMENTS
December 31, 2019
| | | | | | | | | | | | |
| | | | | | Shares | | | Value | |
COMMON STOCK | | | 66.2% | | | | | | | | | |
COMMUNICATIONS—TOWERS | | | 9.7% | | | | | | | | | |
American Tower Corp.a,b | | | | 341,542 | | | $ | 78,493,182 | |
Crown Castle International Corp.a | | | | 252,098 | | | | 35,835,731 | |
| | | | | | | | | | | | |
| | | | | | | | | | | 114,328,913 | |
| | | | | | | | | | | | |
REAL ESTATE | | | 56.5% | | | | | | | | | |
DATA CENTERS | | | 7.3% | | | | | | | | | |
CyrusOne, Inc.a | | | | 232,743 | | | | 15,228,374 | |
Digital Realty Trust, Inc.a,b | | | | 159,498 | | | | 19,098,291 | |
Equinix, Inc.a,b | | | | 87,865 | | | | 51,286,800 | |
| | | | | | | | | | | | |
| | | | | | | | | | | 85,613,465 | |
| | | | | | | | | | | | |
HEALTH CARE | | | 7.3% | | | | | | | | | |
Healthcare Trust of America, Inc., Class A | | | | 501,157 | | | | 15,175,034 | |
Healthpeak Properties, Inc. | | | | 235,902 | | | | 8,131,542 | |
Medical Properties Trust, Inc. | | | | 645,508 | | | | 13,626,674 | |
Sabra Health Care REIT, Inc.a,b | | | | 578,705 | | | | 12,349,565 | |
Welltower, Inc.a,b | | | | 450,575 | | | | 36,848,023 | |
| | | | | | | | | | | | |
| | | | | | | | | | | 86,130,838 | |
| | | | | | | | | | | | |
HOTEL | | | 2.7% | | | | | | | | | |
Host Hotels & Resorts, Inc.a,b | | | | 747,564 | | | | 13,867,312 | |
Pebblebrook Hotel Trusta,b | | | | 340,152 | | | | 9,119,475 | |
Sunstone Hotel Investors, Inc.a,b | | | | 620,774 | | | | 8,641,174 | |
| | | | | | | | | | | | |
| | | | | | | | | | | 31,627,961 | |
| | | | | | | | | | | | |
INDUSTRIALS | | | 4.4% | | | | | | | | | |
Prologis, Inc.a,b | | | | 575,445 | | | | 51,295,167 | |
| | | | | | | | | | | | |
NET LEASE | | | 7.4% | | | | | | | | | |
Four Corners Property Trust, Inc. | | | | 214,456 | | | | 6,045,515 | |
Realty Income Corp.a,b | | | | 245,473 | | | | 18,074,177 | |
Spirit Realty Capital, Inc.a,b | | | | 403,313 | | | | 19,834,933 | |
VEREIT, Inc. | | | | 1,677,454 | | | | 15,499,675 | |
VICI Properties, Inc.a,b | | | | 1,099,512 | | | | 28,092,532 | |
| | | | | | | | | | | | |
| | | | | | | | | | | 87,546,832 | |
| | | | | | | | | | | | |
OFFICE | | | 4.8% | | | | | | | | | |
Boston Properties, Inc.a | | | | 56,955 | | | | 7,851,817 | |
Douglas Emmett, Inc.a,b | | | | 231,178 | | | | 10,148,714 | |
See accompanying notes to financial statements.
7
COHEN & STEERS REITAND PREFERREDANDINCOME FUND, INC.
SCHEDULE OF INVESTMENTS—(Continued)
December 31, 2019
| | | | | | | | | | | | |
| | | | | | Shares | | | Value | |
Hudson Pacific Properties, Inc.a | | | | 278,968 | | | $ | 10,503,145 | |
Kilroy Realty Corp.a,b | | | | 276,411 | | | | 23,190,883 | |
Vornado Realty Trusta,b | | | | 69,178 | | | | 4,600,337 | |
| | | | | | | | | | | | |
| | | | 56,294,896 | |
| | | | | |
RESIDENTIAL | | | 13.5% | | | | | | | | | |
APARTMENT | | | 8.5% | | | | | | | | | |
Apartment Investment & Management Co., Class Aa,b | | | | 285,532 | | | | 14,747,728 | |
Equity Residentiala,b | | | | 258,968 | | | | 20,955,691 | |
Essex Property Trust, Inc.a,b | | | | 116,653 | | | | 35,096,222 | |
UDR, Inc.a,b | | | | 621,955 | | | | 29,045,298 | |
| | | | | | | | | | | | |
| | | | | | | | | | | 99,844,939 | |
| | | | | | | | | | | | |
MANUFACTURED HOME | | | 2.7% | | | | | | | | | |
Sun Communities, Inc.a,b | | | | 213,633 | | | | 32,066,313 | |
| | | | | | | | | | | | |
SINGLE FAMILY | | | 2.3% | | | | | | | | | |
Invitation Homes, Inc.a,b | | | | 877,170 | | | | 26,288,785 | |
| | | | | | | | | | | | |
TOTAL RESIDENTIAL | | | | | | | | 158,200,037 | |
| | | | | | | | |
SELF STORAGE | | | 3.5% | | | | | | | | | |
Extra Space Storage, Inc.a,b | | | | 288,706 | | | | 30,493,128 | |
Public Storage | | | | 52,498 | | | | 11,179,974 | |
| | | | | | | | | | | | |
| | | | 41,673,102 | |
| | | | | |
SHOPPING CENTERS | | | 4.3% | | | | | | | | | |
COMMUNITY CENTER | | | 1.3% | | | | | | | | | |
Regency Centers Corp.a,b | | | | 240,114 | | | | 15,148,792 | |
| | | | | | | | | | | | |
REGIONAL MALL | | | 3.0% | | | | | | | | | |
Macerich Co. (The) | | | | 425,012 | | | | 11,441,323 | |
Simon Property Group, Inc.a,b | | | | 163,391 | | | | 24,338,724 | |
| | | | | | | | | | | | |
| | | | | | | | | | | 35,780,047 | |
| | | | | | | | | | | | |
TOTAL SHOPPING CENTERS | | | | | | | | 50,928,839 | |
| | | | | | | | |
SPECIALTY | | | 0.7% | | | | | | | | | |
Lamar Advertising Co., Class Aa,b | | | | 91,788 | | | | 8,192,997 | |
| | | | | | | | | | | | |
See accompanying notes to financial statements.
8
COHEN & STEERS REITAND PREFERREDANDINCOME FUND, INC.
SCHEDULE OF INVESTMENTS—(Continued)
December 31, 2019
| | | | | | | | | | | | |
| | | | | | Shares | | | Value | |
TIMBER | | | 0.7% | | | | | | | | | |
Weyerhaeuser Co. | | | | 252,683 | | | $ | 7,631,026 | |
| | | | | | | | | | | | |
TOTAL REAL ESTATE | | | | | | | | 665,135,160 | |
| | | | | | | | |
TOTAL COMMON STOCK
(Identified cost—$527,291,649) | | | | | | | | 779,464,073 | |
| | | | | | | | |
PREFERRED SECURITIES—$25 PAR VALUE | | | 16.4% | | | | | | | | | |
BANKS | | | 4.3% | | | | | | | | | |
Bank of America Corp., 6.20%, Series CCa,c | | | | 87,981 | | | | 2,303,343 | |
Bank of America Corp., 6.00%, Series GGa,c | | | | 104,775 | | | | 2,880,265 | |
Bank of America Corp., 5.875%, Series HHc | | | | 129,000 | | | | 3,493,320 | |
Bank of America Corp., 5.375%, Series KKc | | | | 65,250 | | | | 1,735,650 | |
Citigroup, Inc., 6.875% to 11/15/23, Series Kc,d | | | | 159,391 | | | | 4,490,044 | |
Citigroup, Inc., 6.30%, Series Sa,b,c | | | | 189,006 | | | | 4,953,847 | |
Citizens Financial Group, Inc., 6.35% to 4/6/24, Series Dc,d | | | | 64,000 | | | | 1,810,560 | |
First Republic Bank/CA, 5.50%, Series Ic | | | | 28,277 | | | | 755,561 | |
GMAC Capital Trust I, 7.695% (3 Month US LIBOR + 5.785%), due 2/15/40, Series 2 (TruPS) (FRN)a,e | | | | 258,195 | | | | 6,725,980 | |
Huntington Bancshares, Inc., 6.25%, Series Da,c | | | | 110,273 | | | | 2,867,098 | |
JPMorgan Chase & Co., 6.15%, Series BBc | | | | 60,000 | | | | 1,544,400 | |
JPMorgan Chase & Co., 6.125%, Series Ya,c | | | | 58,861 | | | | 1,505,664 | |
New York Community Bancorp, Inc., 6.375% to 3/17/27, Series Ac,d | | | | 73,450 | | | | 2,053,662 | |
Regions Financial Corp., 6.375% to 9/15/24, Series Bc,d | | | | 51,426 | | | | 1,451,242 | |
Regions Financial Corp., 5.70% to 5/15/29, Series Cc,d | | | | 174,000 | | | | 4,852,860 | |
SVB Financial Group, 5.25%, Series Ac | | | | 1,801 | | | | 46,556 | |
Synovus Financial Corp., 5.875% to 7/1/24, Series Ec,d | | | | 80,000 | | | | 2,136,000 | |
TCF Financial Corp., 5.70%, Series Cc | | | | 73,000 | | | | 1,925,740 | |
Wells Fargo & Co., 5.85% to 9/15/23, Series Qc,d | | | | 122,748 | | | | 3,362,068 | |
| | | | | | | | | | | | |
| | | | | | | | | | | 50,893,860 | |
| | | | | | | | | | | | |
CONSUMER, CYCLICAL—AUTOMOBILES | | | 0.1% | | | | | | | | | |
Ford Motor Co., 6.20%, due 6/1/59 | | | | 32,993 | | | | 879,923 | |
| | | | | | | | | | | | |
ELECTRIC | | | 1.1% | | | | | | | | | |
CMS Energy Corp., 5.875%, due 3/1/79 | | | | 136,150 | | | | 3,718,256 | |
Duke Energy Corp., 5.75%, Series Ac | | | | 138,625 | | | | 3,841,299 | |
Integrys Holding, Inc., 6.00% to 8/1/23, due 8/1/73d | | | | 122,977 | | | | 3,335,751 | |
See accompanying notes to financial statements.
9
COHEN & STEERS REITAND PREFERREDANDINCOME FUND, INC.
SCHEDULE OF INVESTMENTS—(Continued)
December 31, 2019
| | | | | | | | | | | | |
| | | | | | Shares | | | Value | |
Southern Co./The, 5.25%, due 12/1/77 | | | | 89,435 | | | $ | 2,353,035 | |
| | | | | | | | | | | | |
| | | | | | | | | | | 13,248,341 | |
| | | | | | | | | | | | |
FINANCIAL | | | 1.8% | | | | | | | | | |
DIVERSIFIED FINANCIAL SERVICES | | | 0.5% | | | | | | | | | |
Apollo Global Management, Inc., 6.375%, Series Ac | | | | 29,288 | | | | 779,061 | |
Apollo Global Management, Inc., 6.375%, Series Bc | | | | 59,970 | | | | 1,623,388 | |
KKR & Co., Inc., 6.75%, Series Ac | | | | 34,264 | | | | 911,080 | |
National Rural Utilities Cooperative Finance Corp., 5.50%, due 5/15/64, Series US | | | | 8,599 | | | | 236,902 | |
Synchrony Financial, 5.625%, Series Ac | | | | 90,000 | | | | 2,299,500 | |
| | | | | | | | | | | | |
| | | | | | | | | | | 5,849,931 | |
| | | | | | | | | | | | |
INVESTMENT ADVISORY SERVICES | | | 0.2% | | | | | | | | | |
Ares Management Corp., 7.00%, Series Ac | | | | 69,506 | | | | 1,876,662 | |
| | | | | | | | | | | | |
INVESTMENT BANKER/BROKER | | | 1.1% | | | | | | | | | |
Morgan Stanley, 6.875% to 1/15/24, Series Fa,c,d | | | | 183,364 | | | | 5,189,201 | |
Morgan Stanley, 6.375% to 10/15/24, Series Ia,b,c,d | | | | 164,338 | | | | 4,629,402 | |
Morgan Stanley, 5.85% to 4/15/27, Series Kc,d | | | | 121,056 | | | | 3,433,148 | |
| | | | | | | | | | | | |
| | | | | | | | | | | 13,251,751 | |
| | | | | | | | | | | | |
TOTAL FINANCIAL | | | | | | | | 20,978,344 | |
| | | | | | | | |
INDUSTRIALS—CHEMICALS | | | 0.8% | | | | | | | | | |
CHS, Inc., 7.10% to 3/31/24, Series 2a,c,d | | | | 190,229 | | | | 5,181,838 | |
CHS, Inc., 6.75% to 9/30/24, Series 3c,d | | | | 90,453 | | | | 2,415,095 | |
CHS, Inc., 7.50%, Series 4c | | | | 74,495 | | | | 2,038,928 | |
| | | | | | | | | | | | |
| | | | | | | | | | | 9,635,861 | |
| | | | | | | | | | | | |
INSURANCE | | | 4.2% | | | | | | | | | |
LIFE/HEALTH INSURANCE | | | 1.6% | | | | | | | | | |
Athene Holding Ltd., 5.625%, Series Bc | | | | 77,542 | | | | 2,031,600 | |
Athene Holding Ltd., 6.35% to 6/30/29, Series Ac,d | | | | 173,727 | | | | 4,907,788 | |
AXA Equitable Holdings, Inc., 5.25%, Series Ac | | | | 75,800 | | | | 1,978,380 | |
MetLife, Inc., 5.625%, Series Ec | | | | 35,000 | | | | 956,550 | |
Prudential Financial, Inc., 5.625%, due 8/15/58 | | | | 55,913 | | | | 1,524,747 | |
Unum Group, 6.25%, due 6/15/58 | | | | 136,610 | | | | 3,688,470 | |
Voya Financial, Inc., 5.35% to 9/15/29, Series Bc,d | | | | 125,037 | | | | 3,374,749 | |
| | | | | | | | | | | | |
| | | | | | | | | | | 18,462,284 | |
| | | | | | | | | | | | |
See accompanying notes to financial statements.
10
COHEN & STEERS REITAND PREFERREDANDINCOME FUND, INC.
SCHEDULE OF INVESTMENTS—(Continued)
December 31, 2019
| | | | | | | | | | | | |
| | | | | | Shares | | | Value | |
MULTI-LINE | | | 1.2% | | | | | | | | | |
Allstate Corp./The, 5.10%, Series Hc | | | | 167,225 | | | $ | 4,371,262 | |
American Financial Group, Inc., 5.875%, due 3/30/59 | | | | 20,553 | | | | 563,563 | |
American International Group, Inc., 5.85%, Series Ac | | | | 85,000 | | | | 2,323,900 | |
WR Berkley Corp., 5.10%, due 12/30/59 | | | | 94,400 | | | | 2,377,936 | |
WR Berkley Corp., 5.70%, due 3/30/58 | | | | 55,932 | | | | 1,479,961 | |
WR Berkley Corp., 5.75%, due 6/1/56 | | | | 97,102 | | | | 2,544,072 | |
| | | | | | | | | | | | |
| | | | | | | | | | | 13,660,694 | |
| | | | | | | | | | | | |
MULTI-LINE—FOREIGN | | | 0.5% | | | | | | | | | |
Aegon Funding Co. LLC, 5.10%, due 12/15/49 (Netherlands) | | | | 185,000 | | | | 4,800,750 | |
PartnerRe Ltd., 6.50%, Series G (Bermuda)c | | | | 58,756 | | | | 1,549,983 | |
| | | | | | | | | | | | |
| | | | | | | | | | | 6,350,733 | |
| | | | | | | | | | | | |
PROPERTY CASUALTY—FOREIGN | | | 0.3% | | | | | | | | | |
Enstar Group Ltd., 7.00% to 9/1/28, Series D (Bermuda)c,d | | | | 132,981 | | | | 3,712,830 | |
| | | | | | | | | | | | |
REINSURANCE | | | 0.3% | | | | | | | | | |
Arch Capital Group Ltd., 5.25%, Series Ec | | | | 67,337 | | | | 1,715,747 | |
Arch Capital Group Ltd., 5.45%, Series Fc | | | | 82,593 | | | | 2,130,073 | |
| | | | | | | | | | | | |
| | | | | | | | | | | 3,845,820 | |
| | | | | | | | | | | | |
REINSURANCE—FOREIGN | | | 0.3% | | | | | | | | | |
RenaissanceRe Holdings Ltd., 5.75%, Series F (Bermuda)c | | | | 114,600 | | | | 3,097,638 | |
| | | | | | | | | | | | |
TOTAL INSURANCE | | | | | | | | 49,129,999 | |
| | | | | | | | |
INTEGRATED TELECOMMUNICATIONS SERVICES | | | 0.2% | | | | | | | | | |
AT&T, Inc., 5.625%, due 8/1/67 | | | | 35,000 | | | | 964,600 | |
AT&T, Inc., 5.00%, Series Ac | | | | 60,425 | | | | 1,589,178 | |
| | | | | | | | | | | | |
| | | | | | | | | | | 2,553,778 | |
| | | | | | | | | | | | |
PIPELINES | | | 0.5% | | | | | | | | | |
Energy Transfer Operating LP, 7.625% to 8/15/23, Series Dc,d | | | | 135,000 | | | | 3,350,700 | |
Energy Transfer Operating LP, 7.60% to 5/15/24, Series Ec,d | | | | 100,000 | | | | 2,532,000 | |
| | | | | | | | | | | | |
| | | | | | | | | | | 5,882,700 | |
| | | | | | | | | | | | |
See accompanying notes to financial statements.
11
COHEN & STEERS REITAND PREFERREDANDINCOME FUND, INC.
SCHEDULE OF INVESTMENTS—(Continued)
December 31, 2019
| | | | | | | | | | | | |
| | | | | | Shares | | | Value | |
PIPELINES—FOREIGN | | | 0.4% | | | | | | | | | |
Enbridge, Inc., 6.375% to 4/15/23, due 4/15/78, Series B (Canada)d | | | | 184,367 | | | $ | 5,084,842 | |
| | | | | | | | | | | | |
REAL ESTATE | | | 1.5% | | | | | | | | | |
DATA CENTERS | | | 0.2% | | | | | | | | | |
Digital Realty Trust, Inc., 6.35%, Series Ic | | | | 80,113 | | | | 2,067,717 | |
| | | | | | | | | | | | |
DIVERSIFIED | | | 0.4% | | | | | | | | | |
Lexington Realty Trust, 6.50%, Series C ($50 Par Value)a,c | | | | 76,536 | | | | 4,363,317 | |
| | | | | | | | | | | | |
INDUSTRIALS | | | 0.3% | | | | | | | | | |
Monmouth Real Estate Investment Corp., 6.125%, Series Cc | | | | 140,000 | | | | 3,488,800 | |
| | | | | | | | | | | | |
NET LEASE | | | 0.1% | | | | | | | | | |
VEREIT, Inc., 6.70%, Series Fa,c | | | | 47,638 | | | | 1,214,769 | |
| | | | | | | | | | | | |
OFFICE | | | 0.2% | | | | | | | | | |
Brookfield Property Partners LP, 6.375%, Series A2c | | | | 92,000 | | | | 2,440,760 | |
| | | | | | | | | | | | |
SELF STORAGE | | | 0.3% | | | | | | | | | |
National Storage Affiliates Trust, 6.00%, Series Ac | | | | 127,000 | † | | | 3,380,740 | |
| | | | | | | | | | | | |
TOTAL REAL ESTATE | | | | | | | | 16,956,103 | |
| | | | | | | | |
UTILITIES | | | 1.5% | | | | | | | | | |
ELECTRIC UTILITIES | | | 0.3% | | | | | | | | | |
NextEra Energy Capital Holdings, Inc., 5.65%, due 3/1/79, Series N | | | | 124,537 | | | | 3,416,050 | |
| | | | | | | | | | | | |
GAS UTILITIES | | | 0.7% | | | | | | | | | |
Sempra Energy, 5.750%, due 7/1/79 | | | | 87,200 | | | | 2,316,904 | |
South Jersey Industries, Inc., 5.625%, due 9/16/79 | | | | 136,000 | | | | 3,628,480 | |
Spire, Inc., 5.90%, Series Ac | | | | 80,475 | | | | 2,222,719 | |
| | | | | | | | | | | | |
| | | | | | | | | | | 8,168,103 | |
| | | | | | | | | | | | |
MULTI-UTILITIES | | | 0.2% | | | | | | | | | |
NiSource, Inc., 6.50% to 3/15/24, Series Bc,d | | | | 64,445 | | | | 1,796,727 | |
| | | | | | | | | | | | |
MULTI-UTILITIES—FOREIGN | | | 0.3% | | | | | | | | | |
Algonquin Power & Utilities Corp., 6.875% to 10/17/23, due 10/17/78 (Canada)d | | | | 31,625 | | | | 891,509 | |
See accompanying notes to financial statements.
12
COHEN & STEERS REITAND PREFERREDANDINCOME FUND, INC.
SCHEDULE OF INVESTMENTS—(Continued)
December 31, 2019
| | | | | | | | | | | | |
| | | | | | Shares | | | Value | |
Algonquin Power & Utilities Corp., 6.20% to 7/1/24, due 7/1/79, Series19-A (Canada)d | | | | 102,550 | | | $ | 2,891,910 | |
| | | | | | | | | | | | |
| | | | | | | | | | | 3,783,419 | |
| | | | | | | | | | | | |
TOTAL UTILITIES | | | | | | | | 17,164,299 | |
| | | | | | | | |
TOTAL PREFERRED SECURITIES—$25 PAR VALUE
(Identified cost—$176,476,650) | | | | | | | | 192,408,050 | |
| | | | | | | | |
| | | |
| | | | | | Principal
Amount | | | | |
PREFERRED SECURITIES—CAPITAL SECURITIES | | | 44.7% | | | | | | | | | |
BANKS | | | 9.0% | | | | | | | | | |
Bank of America Corp., 5.875% to 3/15/28, Series FFc,d | | | $ | 6,681,000 | | | | 7,413,906 | |
Bank of America Corp., 5.125% to 6/20/24, Series JJc,d | | | | 2,000,000 | | | | 2,118,100 | |
Bank of America Corp., 6.25% to 9/5/24, Series Xc,d | | | | 5,800,000 | | | | 6,449,397 | |
Bank of America Corp., 6.50% to 10/23/24, Series Za,c,d | | | | 5,713,000 | | | | 6,488,340 | |
Citigroup Capital III, 7.625%, due 12/1/36a | | | | 4,700,000 | | | | 6,492,157 | |
Citigroup, Inc., 5.90% to 2/15/23c,d | | | | 2,000,000 | | | | 2,126,430 | |
Citigroup, Inc., 5.95% to 1/30/23c,d | | | | 1,661,000 | | | | 1,759,854 | |
Citigroup, Inc., 6.25% to 8/15/26, Series Ta,b,c,d | | | | 4,825,000 | | | | 5,486,773 | |
Citigroup, Inc., 5.00% to 9/12/24, Series Uc,d | | | | 3,900,000 | | | | 4,087,688 | |
Citizens Financial Group, Inc., 6.375% to 4/6/24, Series Cc,d | | | | 1,800,000 | | | | 1,924,236 | |
CoBank ACB, 6.25% to 10/1/22, Series Fa,c,d | | | | 33,000 | † | | | 3,481,500 | |
CoBank ACB, 6.125%, Series Ga,c | | | | 46,500 | † | | | 4,766,250 | |
CoBank ACB, 6.25% to 10/1/26, Series Ia,c,d | | | | 4,334,000 | | | | 4,789,070 | |
Dresdner Funding Trust I, 8.151%, due 6/30/31, 144Aa,f | | | | 3,035,906 | | | | 4,094,891 | |
Farm Credit Bank of Texas, 6.75% to 9/15/23, 144Aa,b,c,d,f | | | | 63,000 | † | | | 6,772,500 | |
Farm Credit Bank of Texas, 10.00%, Series 1a,c | | | | 2,000 | † | | | 2,067,500 | |
Goldman Sachs Group, Inc./The, 5.50% to 8/10/24, Series Qc,d | | | | 2,390,000 | | | | 2,560,288 | |
Goldman Sachs Group, Inc./The, 4.95% to 2/10/25, Series Rc,d | | | | 1,640,000 | | | | 1,702,115 | |
JPMorgan Chase & Co., 5.406% (3 Month US LIBOR + 3.47%), Series I (FRN)c,e | | | | 320,000 | | | | 323,366 | |
JPMorgan Chase & Co., 6.75% to 2/1/24, Series Sa,c,d | | | | 5,650,000 | | | | 6,384,302 | |
Truist Financial Corp., 4.80% to 9/1/24, Series Nc,d | | | | 4,000,000 | | | | 4,135,000 | |
Truist Financial Corp., 5.125% to 12/15/27, Series Mc,d | | | | 4,500,000 | | | | 4,630,050 | |
See accompanying notes to financial statements.
13
COHEN & STEERS REITAND PREFERREDANDINCOME FUND, INC.
SCHEDULE OF INVESTMENTS—(Continued)
December 31, 2019
| | | | | | | | | | | | |
| | | | | | Principal
Amount | | | Value | |
Wells Fargo & Co., 5.664% (3 Month US LIBOR + 3.77%), Series K (FRN)c,e | | | $ | 6,598,000 | | | $ | 6,688,722 | |
Wells Fargo & Co., 5.875% to 6/15/25, Series Uc,d | | | | 4,330,000 | | | | 4,820,827 | |
Wells Fargo Capital X, 5.95%, due 12/1/36, (TruPS)a | | | | 3,700,000 | | | | 4,512,590 | |
| | | | | | | | | | | | |
| | | | | | | | | | | 106,075,852 | |
| | | | | | | | | | | | |
BANKS—FOREIGN | | | 15.1% | | | | | | | | | |
Banco Bilbao Vizcaya Argentaria SA, 6.50% to 3/5/25, Series 9 (Spain)c,d,g | | | | 4,400,000 | | | | 4,664,000 | |
Banco Comercial Portugues SA, 9.25% to 1/31/24 (Portugal)c,d,g,h | | | | 1,400,000 | | | | 1,747,134 | |
Bank of China Hong Kong Ltd., 5.90% to 9/14/23, 144A (Hong Kong)c,d,f | | | | 5,800,000 | | | | 6,283,669 | |
Barclays PLC, 7.125% to 6/15/25 (United Kingdom)c,d,g | | | | 1,800,000 | | | | 2,700,197 | |
Barclays PLC, 7.875% to 3/15/22 (United Kingdom)c,d,g,h | | | | 3,600,000 | | | | 3,889,458 | |
Barclays PLC, 8.00% to 6/15/24 (United Kingdom)c,d,g | | | | 3,400,000 | | | | 3,806,181 | |
BNP Paribas SA, 6.625% to 3/25/24, 144A (France)c,d,f,g | | | | 1,600,000 | | | | 1,729,144 | |
BNP Paribas SA, 7.00% to 8/16/28, 144A (France)c,d,f,g | | | | 1,800,000 | | | | 2,089,620 | |
BNP Paribas SA, 7.195% to 6/25/37, 144A (France)a,c,d,f | | | | 3,400,000 | | | | 3,779,423 | |
BNP Paribas SA, 7.375% to 8/19/25, 144A (France)c,d,f,g | | | | 4,500,000 | | | | 5,195,722 | |
BNP Paribas SA, 7.625% to 3/30/21, 144A (France)a,c,d,f,g | | | | 3,400,000 | | | | 3,588,190 | |
Commerzbank AG, 7.00% to 4/9/25 (Germany)c,d,g,h | | | | 2,200,000 | | | | 2,321,000 | |
Credit Agricole SA, 6.875% to 9/23/24, 144A (France)c,d,f,g | | | | 1,800,000 | | | | 1,983,537 | |
Credit Agricole SA, 7.875% to 1/23/24, 144A (France)c,d,f,g | | | | 3,200,000 | | | | 3,655,680 | |
Credit Agricole SA, 8.125% to 12/23/25, 144A (France)a,c,d,f,g | | | | 6,500,000 | | | | 7,903,187 | |
Credit Suisse Group AG, 7.125% to 7/29/22 (Switzerland)c,d,g,h | | | | 3,400,000 | | | | 3,660,593 | |
Credit Suisse Group AG, 6.375% to 8/21/26, 144A (Switzerland)c,d,f,g | | | | 4,500,000 | | | | 4,862,250 | |
Credit Suisse Group AG, 7.25% to 9/12/25, 144A (Switzerland)c,d,f,g | | | | 2,000,000 | | | | 2,234,210 | |
Credit Suisse Group AG, 7.50% to 7/17/23, 144A (Switzerland)c,d,f,g | | | | 7,000,000 | | | | 7,665,455 | |
DNB Bank ASA, 4.875% to 11/12/24 (Norway)c,d,g,h | | | | 3,800,000 | | | | 3,804,750 | |
See accompanying notes to financial statements.
14
COHEN & STEERS REITAND PREFERREDANDINCOME FUND, INC.
SCHEDULE OF INVESTMENTS—(Continued)
December 31, 2019
| | | | | | | | | | |
| | | | | Principal
Amount | | | Value | |
DNB Bank ASA, 6.50% to 3/26/22 (Norway)c,d,g,h | | $ | 3,300,000 | | | $ | 3,504,187 | |
FinecoBank Banca Fineco SpA, 5.875% to 12/3/24 (Italy)c,d,g,h | | | 2,200,000 | | | | 2,659,049 | |
HSBC Capital Funding Dollar 1 LP, 10.176% to 6/30/30, 144A (United Kingdom)a,c,d,f | | | 3,992,000 | | | | 6,590,393 | |
HSBC Holdings PLC, 6.375% to 3/30/25 (United Kingdom)a,b,c,d,g | | | 4,600,000 | | | | 5,005,789 | |
HSBC Holdings PLC, 6.50% to 3/23/28 (United Kingdom)c,d,g | | | 3,900,000 | | | | 4,293,510 | |
HSBC Holdings PLC, 6.875% to 6/1/21 (United Kingdom)c,d,g | | | 3,400,000 | | | | 3,566,940 | |
ING Groep N.V., 5.75% to 11/16/26 (Netherlands)c,d,g | | | 1,400,000 | | | | 1,475,075 | |
ING Groep N.V., 6.875% to 4/16/22 (Netherlands)c,d,g,h | | | 2,200,000 | | | | 2,356,596 | |
Intesa Sanpaolo SpA, 7.70% to 9/17/25, 144A (Italy)c,d,f,g | | | 1,400,000 | | | | 1,518,447 | |
Itau Unibanco Holding SA, 4.50% to 11/21/24, due 11/21/29, 144A (Brazil)d,f,g | | | 1,400,000 | | | | 1,435,014 | |
Lloyds Banking Group PLC, 7.50% to 6/27/24 (United Kingdom)a,c,d,g | | | 2,066,000 | | | | 2,286,597 | |
Lloyds Banking Group PLC, 7.50% to 9/27/25 (United Kingdom)c,d,g | | | 1,685,000 | | | | 1,890,747 | |
Nationwide Building Society, 10.25% (United Kingdom)c,h | | | 1,715,000 | | | | 3,771,003 | |
Nordea Bank Abp, 6.625% to 3/26/26, 144A (Finland)c,d,f,g | | | 1,800,000 | | | | 1,997,289 | |
RBS Capital Trust II, 6.425% to 1/3/34 (United Kingdom)c,d | | | 800,000 | | | | 1,126,278 | |
Royal Bank of Scotland Group PLC, 7.648% to 9/30/31 (United Kingdom)a,c,d | | | 4,141,000 | | | | 5,950,058 | |
Royal Bank of Scotland Group PLC, 8.00% to 8/10/25 (United Kingdom)c,d,g | | | 1,700,000 | | | | 1,960,143 | |
Royal Bank of Scotland Group PLC, 8.625% to 8/15/21 (United Kingdom)a,c,d,g | | | 2,000,000 | | | | 2,166,150 | |
Skandinaviska Enskilda Banken AB, 5.125% to 5/13/25 (Sweden)c,d,g,h | | | 1,800,000 | | | | 1,806,750 | |
Societe Generale SA, 6.75% to 4/6/28, 144A (France)c,d,f,g | | | 2,200,000 | | | | 2,430,230 | |
Societe Generale SA, 7.375% to 9/13/21, 144A (France)c,d,f,g | | | 4,600,000 | | | | 4,884,165 | |
See accompanying notes to financial statements.
15
COHEN & STEERS REITAND PREFERREDANDINCOME FUND, INC.
SCHEDULE OF INVESTMENTS—(Continued)
December 31, 2019
| | | | | | | | | | | | |
| | | | | | Principal
Amount | | | Value | |
Societe Generale SA, 8.00% to 9/29/25, 144A (France)c,d,f,g | | | $ | 2,400,000 | | | $ | 2,822,052 | |
Standard Chartered PLC, 7.50% to 4/2/22, 144A (United Kingdom)c,d,f,g | | | | 3,000,000 | | | | 3,239,055 | |
Standard Chartered PLC, 7.75% to 4/2/23, 144A (United Kingdom)c,d,f,g | | | | 2,500,000 | | | | 2,767,413 | |
Stichting AK Rabobank Certificaten, 6.50% (Netherlands)c,h | | | | 5,080,175 | | | | 7,265,672 | |
Svenska Handelsbanken AB, 6.25% to 3/1/24, Series EMTN (Sweden)c,d,g,h | | | | 3,000,000 | | | | 3,235,500 | |
UBS Group Funding Switzerland AG, 6.875% to 8/7/25 (Switzerland)c,d,g,h | | | | 2,000,000 | | | | 2,220,000 | |
UBS Group Funding Switzerland AG, 7.00% to 2/19/25 (Switzerland)c,d,g,h | | | | 2,200,000 | | | | 2,521,750 | |
UBS Group Funding Switzerland AG, 7.125% to 8/10/21 (Switzerland)c,d,g,h | | | | 3,200,000 | | | | 3,398,000 | |
UBS Group Funding Switzerland AG, 7.00% to 1/31/24, 144A (Switzerland)c,d,f,g | | | | 5,600,000 | | | | 6,125,000 | |
UniCredit SpA, 7.50% to 6/3/26 (Italy)c,d,g,h | | | | 2,400,000 | | | | 3,154,900 | |
| | | | | | | | | | | | |
| | | | | | | | | | | 176,987,152 | |
| | | | | | | | | | | | |
COMMUNICATIONS—TOWERS | | | 0.4% | | | | | | | | | |
Crown Castle International Corp., 6.875%, due 8/1/20, Series A (Convertible) | | | | 3,900 | † | | | 5,003,295 | |
| | | | | | | | | | | | |
ELECTRIC | | | 1.1% | | | | | | | | | |
CenterPoint Energy, Inc., 6.125% to 9/1/23, Series Ac,d | | | | 2,800,000 | | | | 2,963,002 | |
Dominion Energy, Inc., 4.65% to 12/15/24, Series Bc,d | | | | 4,480,000 | | | | 4,575,962 | |
Duke Energy Corp., 4.875% to 9/16/24c,d | | | | 3,850,000 | | | | 4,043,174 | |
Southern Co./The, 5.50% to 3/15/22, due 3/15/57, Series Bd | | | | 1,416,000 | | | | 1,483,797 | |
| | | | | | | | | | | | |
| | | | | | | | | | | 13,065,935 | |
| | | | | | | | | | | | |
FINANCIAL—DIVERSIFIED FINANCIAL SERVICES | | | 0.1% | | | | | | | | | |
Apollo Management Holdings LP, 4.95% to 12/17/24, due 1/14/50, 144Ad,f | | | | 1,424,000 | | | | 1,443,267 | |
| | | | | | | | | | | | |
See accompanying notes to financial statements.
16
COHEN & STEERS REITAND PREFERREDANDINCOME FUND, INC.
SCHEDULE OF INVESTMENTS—(Continued)
December 31, 2019
| | | | | | | | | | | | |
| | | | | | Principal
Amount | | | Value | |
FOOD | | | 1.3% | | | | | | | | | |
Dairy Farmers of America, Inc., 7.875%, 144Ac,f,i | | | $ | 52,100 | † | | $ | 5,178,636 | |
Dairy Farmers of America, Inc., 7.875%, Series B, 144Ac,f | | | | 82,000 | † | | | 8,150,636 | |
Land O’ Lakes, Inc., 7.00%, 144Ac,f | | | | 1,650,000 | | | | 1,537,594 | |
Land O’ Lakes, Inc., 7.25%, 144Ac,f | | | | 945,000 | | | | 905,721 | |
| | | | | | | | | | | | |
| | | | | | | | | | | 15,772,587 | |
| | | | | | | | | | | | |
INDUSTRIALS—DIVERSIFIED MANUFACTURING | | | 1.0% | | | | | | | | | |
General Electric Co., 5.00% to 1/21/21, Series Da,b,c,d | | | | 11,766,000 | | | | 11,542,211 | |
| | | | | | | | | | | | |
INSURANCE | | | 10.9% | | | | | | | | | |
LIFE/HEALTH INSURANCE | | | 3.5% | | | | | | | | | |
MetLife Capital Trust IV, 7.875%, due 12/15/37, 144A (TruPS)f | | | | 4,381,000 | | | | 5,855,623 | |
MetLife, Inc., 10.75%, due 8/1/39a | | | | 3,592,000 | | | | 6,005,339 | |
MetLife, Inc., 9.25%, due 4/8/38, 144Aa,f | | | | 9,265,000 | | | | 13,657,490 | |
MetLife, Inc., 5.875% to 3/15/28, Series Dc,d | | | | 1,671,000 | | | | 1,861,645 | |
Prudential Financial, Inc., 5.20% to 3/15/24, due 3/15/44d | | | | 2,000,000 | | | | 2,136,460 | |
Prudential Financial, Inc., 5.625% to 6/15/23, due 6/15/43a,d | | | | 3,464,000 | | | | 3,730,260 | |
Voya Financial, Inc., 5.65% to 5/15/23, due 5/15/53a,d | | | | 5,550,000 | | | | 5,909,252 | |
Voya Financial, Inc., 6.125% to 9/15/23, Series Ac,d | | | | 1,550,000 | | | | 1,667,358 | |
| | | | | | | | | | | | |
| | | | | | | | | | | 40,823,427 | |
| | | | | | | | | | | | |
LIFE/HEALTH INSURANCE—FOREIGN | | | 3.8% | | | | | | | | | |
Achmea BV, 4.625% to 3/24/29 (Netherlands)c,d,g,h | | | | 3,200,000 | | | | 3,741,266 | |
Aegon NV, 5.625% to 10/15/29 (Netherlands)c,d,g,h | | | | 2,200,000 | | | | 2,876,287 | |
Ageas, 3.875% to 12/10/29, (Belgium)c,d,g,h | | | | 1,200,000 | | | | 1,391,948 | |
ASR Nederland NV, 4.625% to 10/19/27 (Netherlands)c,d,g,h | | | | 1,600,000 | | | | 1,921,472 | |
Dai-ichi Life Insurance Co., Ltd., 4.00% to 7/24/26, 144A (Japan)c,d,f | | | | 3,900,000 | | | | 4,049,584 | |
Dai-ichi Life Insurance Co., Ltd., 5.10% to 10/28/24, 144A (Japan)a,c,d,f | | | | 4,400,000 | | | | 4,799,146 | |
Fukoku Mutual Life Insurance Co., 6.50% to 9/19/23 (Japan)c,d,h | | | | 3,064,000 | | | | 3,412,530 | |
See accompanying notes to financial statements.
17
COHEN & STEERS REITAND PREFERREDANDINCOME FUND, INC.
SCHEDULE OF INVESTMENTS—(Continued)
December 31, 2019
| | | | | | | | | | | | |
| | | | | | Principal
Amount | | | Value | |
Hanwha Life Insurance Co., Ltd., 4.70% to 4/23/23, 144A (South Korea)c,d,f | | | $ | 2,400,000 | | | $ | 2,450,761 | |
La Mondiale SAM, 4.375% to 4/24/29 (France)c,d,g,h | | | | 1,500,000 | | | | 1,808,677 | |
Legal & General Group PLC, 3.75% to 11/26/29, due 11/26/49, Series EMTN (United Kingdom)d,h | | | | 1,500,000 | | | | 2,014,213 | |
M&G PLC, 5.625% to 10/20/31, due 10/20/51 (United Kingdom)d,h | | | | 1,800,000 | | | | 2,736,509 | |
Meiji Yasuda Life Insurance Co., 5.10% to 4/26/28, due 4/26/48, 144A (Japan)d,f | | | | 2,000,000 | | | | 2,265,540 | |
Meiji Yasuda Life Insurance Co., 5.20% to 10/20/25, due 10/20/45, 144A (Japan)a,d,f | | | | 1,950,000 | | | | 2,165,027 | |
Nippon Life Insurance Co., 4.70% to 1/20/26, due 1/20/46, 144A (Japan)a,d,f | | | | 3,400,000 | | | | 3,685,668 | |
Nippon Life Insurance Co., 5.10% to 10/16/24, due 10/16/44, 144A (Japan)d,f | | | | 2,000,000 | | | | 2,188,040 | |
Sumitomo Life Insurance Co., 6.50% to 9/20/23, due 9/20/73, 144A (Japan)d,f | | | | 2,400,000 | | | | 2,676,648 | |
| | | | | | | | | | | | |
| | | | | | | | | | | 44,183,316 | |
| | | | | | | | | | | | |
MULTI-LINE | | | 0.7% | | | | | | | | | |
American International Group, Inc., 8.175% to 5/15/38, due 5/15/58d | | | | 3,400,000 | | | | 4,629,168 | |
American International Group, Inc., 5.75% to 4/1/28, due 4/1/48, SeriesA-9d | | | | 2,930,000 | | | | 3,225,871 | |
Hartford Financial Services Group, Inc./The, 4.035% (3 Month US LIBOR + 2.125%), due 2/12/47, 144A, Series ICON (FRN)e,f | | | | 1,000,000 | | | | 944,020 | |
| | | | | | | | | | | | |
| | | | | | | | | | | 8,799,059 | |
| | | | | | | | | | | | |
MULTI-LINE—FOREIGN | | | 0.5% | | | | | | | | | |
AXA SA, 6.379% to 12/14/36, 144A (France)c,d,f | | | | 4,999,000 | | | | 6,049,515 | |
| | | | | | | | | | | | |
PROPERTY CASUALTY | | | 0.7% | | | | | | | | | |
Assurant, Inc., 7.00% to 3/27/28, due 3/27/48d | | | | 3,550,000 | | | | 3,981,396 | |
Liberty Mutual Group, Inc., 3.625% to 5/23/24, due 5/23/59, 144Ad,f | | | | 3,400,000 | | | | 3,993,504 | |
| | | | | | | | | | | | |
| | | | | | | | | | | 7,974,900 | |
| | | | | | | | | | | | |
See accompanying notes to financial statements.
18
COHEN & STEERS REITAND PREFERREDANDINCOME FUND, INC.
SCHEDULE OF INVESTMENTS—(Continued)
December 31, 2019
| | | | | | | | | | | | |
| | | | | | Principal
Amount | | | Value | |
PROPERTY CASUALTY—FOREIGN | | | 1.5% | | | | | | | | | |
Mitsui Sumitomo Insurance Co., Ltd., 4.95% to 3/6/29, 144A (Japan)c,d,f | | | $ | 4,200,000 | | | $ | 4,650,030 | |
QBE Insurance Group Ltd., 6.75% to 12/2/24, due 12/2/44 (Australia)d,h | | | | 4,603,000 | | | | 5,162,357 | |
QBE Insurance Group Ltd., 5.875% to 6/17/26, due 6/17/46, Series EMTN (Australia)d,h | | | | 2,600,000 | | | | 2,855,114 | |
Swiss Re Finance Luxembourg SA, 5.00% to 4/2/29, due 4/2/49, 144A (Switzerland)d,f | | | | 1,200,000 | | | | 1,341,000 | |
VIVAT NV, 6.25% to 11/16/22 (Netherlands)c,d,h | | | | 3,200,000 | | | | 3,252,000 | |
| | | | | | | | | | | | |
| | | | | | | | | | | 17,260,501 | |
| | | | | | | | | | | | |
REINSURANCE | | | 0.2% | | | | | | | | | |
AXIS Specialty Finance LLC, 4.90% to 1/15/30, due 1/15/40d | | | | 2,550,000 | | | | 2,585,878 | |
| | | | | | | | | | | | |
TOTAL INSURANCE | | | | | | | | 127,676,596 | |
| | | | | | | | |
INTEGRATED TELECOMMUNICATIONS SERVICES—FOREIGN | | | 0.9% | | | | | | | | | |
Centaur Funding Corp., 9.08%, due 4/21/20, 144Aa,b,f | | | | 3,254 | † | | | 3,321,113 | |
Vodafone Group PLC, 7.00% to 1/4/29, due 4/4/79 (United Kingdom)d | | | | 6,150,000 | | | | 7,221,036 | |
| | | | | | | | | | | | |
| | | | | | | | | | | 10,542,149 | |
| | | | | | | | | | | | |
MATERIAL—METALS & MINING—FOREIGN | | | 0.6% | | | | | | | | | |
BHP Billiton Finance USA Ltd., 6.75% to 10/20/25, due 10/19/75, 144A (Australia)a,d,f | | | | 5,600,000 | | | | 6,583,864 | |
| | | | | | | | | | | | |
PIPELINES—FOREIGN | | | 2.5% | | | | | | | | | |
Enbridge, Inc., 6.25% to 3/1/28, due 3/1/78 (Canada)d | | | | 5,330,000 | | | | 5,788,966 | |
Enbridge, Inc., 6.00% to 1/15/27, due 1/15/77,Series 16-A (Canada)d | | | | 4,012,000 | | | | 4,254,004 | |
Transcanada Trust, 5.50% to 9/15/29, due 9/15/79 (Canada)d | | | | 8,510,000 | | | | 8,952,520 | |
Transcanada Trust, 5.625% to 5/20/25, due 5/20/75 (Canada)d | | | | 2,733,000 | | | | 2,853,307 | |
Transcanada Trust, 5.875% to 8/15/26, due 8/15/76,Series 16-A (Canada)a,d | | | | 7,002,000 | | | | 7,546,895 | |
| | | | | | | | | | | | |
| | | | | | | | | | | 29,395,692 | |
| | | | | | | | | | | | |
See accompanying notes to financial statements.
19
COHEN & STEERS REITAND PREFERREDANDINCOME FUND, INC.
SCHEDULE OF INVESTMENTS—(Continued)
December 31, 2019
| | | | | | | | | | | | |
| | | | | | Principal
Amount | | | Value | |
UTILITIES | | | 1.8% | | | | | | | | | |
ELECTRIC UTILITIES | | | 0.4% | | | | | | | | | |
NextEra Energy Capital Holdings, Inc., 5.65% to 5/1/29, due 5/1/79d | | | $ | 4,150,000 | | | $ | 4,596,873 | |
| | | | | | | | | | | | |
ELECTRIC UTILITIES—FOREIGN | | | 1.4% | | | | | | | | | |
Emera, Inc., 6.75% to 6/15/26, due 6/15/76,Series 16-A (Canada)a,d | | | | 9,100,000 | | | | 10,296,832 | |
Enel SpA, 8.75% to 9/24/23, due 9/24/73, 144A (Italy)a,d,f | | | | 5,710,000 | | | | 6,716,958 | |
| | | | | | | | | | | | |
| | | | | | | | | | | 17,013,790 | |
| | | | | | | | | | | | |
TOTAL UTILITIES | | | | | | | | 21,610,663 | |
| | | | | | | | |
TOTAL PREFERRED SECURITIES—CAPITAL SECURITIES
(Identified cost—$476,385,842) | | | | | | | | 525,699,263 | |
| | | | | | | | |
CORPORATE BONDS | | | 0.5% | | | | | | | | | |
INDUSTRIALS | | | 0.2% | | | | | | | | | |
General Electric Co., 5.875%, due 1/14/38, Series MTN | | | | 1,893,000 | | | | 2,293,629 | |
| | | | | | | | | | | | |
INSURANCE | | | 0.3% | | | | | | | | | |
Brighthouse Financial, Inc., 4.70%, due 6/22/47 | | | | 3,500,000 | | | | 3,244,696 | |
| | | | | | | | | | | | |
TOTAL CORPORATE BONDS
(Identified cost—$4,626,442) | | | | | | | | 5,538,325 | |
| | | | | | | | |
| | |
| | | | Shares | | | | |
SHORT-TERM INVESTMENTS | | | 1.2% | | | | | | | | | |
MONEY MARKET FUNDS | | | | | | | | | |
State Street Institutional Treasury Money Market Fund, Premier Class, 1.52%j | | | | 14,574,153 | | | | 14,574,153 | |
| | | | | | | | | | | | |
TOTAL SHORT-TERM INVESTMENTS
(Identified cost—$14,574,153) | | | | | | | | 14,574,153 | |
| | | | | | | | |
TOTAL INVESTMENTSIN SECURITIES
(Identified cost—$1,199,354,736) | | | 129.0% | | | | | | | | 1,517,683,864 | |
WRITTEN OPTION CONTRACTS | | | (0.0) | | | | | | | | (25,114 | ) |
LIABILITIESIN EXCESSOF OTHER ASSETS | | | (29.0) | | | | | | | | (341,139,327 | ) |
| | | | | | | | | | | | |
NET ASSETS (Equivalent to $24.73 per share based on 47,582,193 shares of common stock outstanding) | | | 100.0% | | | | | | | $ | 1,176,519,423 | |
| | | | | | | | | | | | |
See accompanying notes to financial statements.
20
COHEN & STEERS REITAND PREFERREDANDINCOME FUND, INC.
SCHEDULE OF INVESTMENTS—(Continued)
December 31, 2019
Exchange-Traded Option Contracts
Written Options
| | | | | | | | | | | | | | | | | | | | | | | | |
| | | | | | | |
| Description | | Exercise
Price | | | Expiration
Date | | | Number of
Contracts | | | Notional
Amountk | | | Premiums
Received | | | Value | |
Put—Simon Property Group, Inc. | | $ | 140 | | | | 1/17/20 | | | | (94 | ) | | $ | (1,400,224 | ) | | $ | (16,414 | ) | | $ | (4,606 | ) |
| |
Over-the-Counter Option Contracts
Written Options
| | | | | | | | | | | | | | | | | | | | | | | | | | |
| | | | | | | | |
| Description | | Counterparty | | Exercise
Price | | | Expiration
Date | | | Number of
Contracts | | | Notional
Amountk | | | Premiums
Received | | | Value | |
Put—Digital Realty Trust, Inc. | | Morgan Stanley & Co
International PLC | | | $110 | | | | 1/17/20 | | | | (530 | ) | | | $(6,346,220 | ) | | | $ (99,015 | ) | | | $(11,965 | ) |
Put—Simon Property Group, Inc. | | Goldman Sachs
International | | | 140 | | | | 1/17/20 | | | | (94 | ) | | | (1,400,224 | ) | | | (16,728 | ) | | | (5,715 | ) |
Put—Simon Property Group, Inc. | | Goldman Sachs
International | | | 135 | | | | 1/17/20 | | | | (94 | ) | | | (1,400,224 | ) | | | (9,191 | ) | | | (2,828 | ) |
| | | | | | | | | | | | | (718 | ) | | | $(9,146,668 | ) | | | $(124,934 | ) | | | $(20,508 | ) |
| | | | | |
Centrally Cleared Interest Rate Swap Contracts
| | | | | | | | | | | | | | | | | | | | | | | | |
| | | | | | | | | |
Notional
Amount | | | Fixed
Rate
Payablel | | Fixed
Payment
Frequency | | Floating Rate
Receivablel
(resets monthly)
| | Floating
Payment
Frequency | | Maturity Date | | Upfront
Payments
(Receipts) | | | Unrealized
Appreciation
(Depreciation) | | | Value | |
| | $87,500,000 | | | 1.46% | | Monthly | | 1 Month LIBOR | | Monthly | | 12/28/23 | | $ | — | | | $ | 265,759 | | | $ | 265,759 | |
| | | | | | | | | | |
The total amount of all interest rate swap contracts as presented in the table above are representative of the volume of activity for this derivative type during the period September 13, 2019 through December 31, 2019, which was the period the Fund had interest rate swap contracts outstanding.
See accompanying notes to financial statements.
21
COHEN & STEERS REITAND PREFERREDANDINCOME FUND, INC.
SCHEDULE OF INVESTMENTS—(Continued)
December 31, 2019
Forward Foreign Currency Exchange Contracts
| | | | | | | | | | | | | | | | | | | | |
| | | | | | |
| Counterparty | | Contracts to
Deliver | | | | | In Exchange
For | | | Settlement
Date | | | Unrealized
Appreciation
(Depreciation) | |
Brown Brothers Harriman | | EUR | | | 27,428,645 | | | USD | | | 30,301,658 | | | | 1/3/20 | | | $ | (465,051 | ) |
Brown Brothers Harriman | | EUR | | | 1,850,675 | | | USD | | | 2,057,534 | | | | 1/3/20 | | | | (18,368 | ) |
Brown Brothers Harriman | | GBP | | | 6,521,412 | | | USD | | | 8,448,731 | | | | 1/3/20 | | | | (189,530 | ) |
Brown Brothers Harriman | | GBP | | | 993,559 | | | USD | | | 1,302,037 | | | | 1/3/20 | | | | (14,031 | ) |
Brown Brothers Harriman | | GBP | | | 747,498 | | | USD | | | 997,579 | | | | 1/3/20 | | | | 7,443 | |
Brown Brothers Harriman | | USD | | | 31,173,816 | | | EUR | | | 27,769,052 | | | | 1/3/20 | | | | (25,271 | ) |
Brown Brothers Harriman | | USD | | | 10,944,632 | | | GBP | | | 8,262,469 | | | | 1/3/20 | | | | (167 | ) |
Brown Brothers Harriman | | USD | | | 1,689,869 | | | EUR | | | 1,510,268 | | | | 1/3/20 | | | | 4,199 | |
Brown Brothers Harriman | | EUR | | | 27,463,617 | | | USD | | | 30,889,429 | | | | 2/4/20 | | | | 22,240 | |
Brown Brothers Harriman | | GBP | | | 8,500,599 | | | USD | | | 11,269,542 | | | | 2/4/20 | | | | (680 | ) |
| | | | | | | | | | | | | | | | | | $ | (679,216 | ) |
| |
Glossary of Portfolio Abbreviations
| | |
EMTN | | Euro Medium Term Note |
EUR | | Euro Currency |
FRN | | Floating Rate Note |
GBP | | Great British Pound |
LIBOR | | London Interbank Offered Rate |
MTN | | Medium Term Note |
REIT | | Real Estate Investment Trust |
TruPS | | Trust Preferred Securities |
USD | | United States Dollar |
See accompanying notes to financial statements.
22
COHEN & STEERS REITAND PREFERREDANDINCOME FUND, INC.
SCHEDULE OF INVESTMENTS—(Continued)
December 31, 2019
Note: Percentages indicated are based on the net assets of the Fund.
| a | All or a portion of the security is pledged as collateral in connection with the Fund’s credit agreement. $723,185,879 in aggregate has been pledged as collateral. |
| b | A portion of the security has been rehypothecated in connection with the Fund’s credit agreement. $325,981,818 in aggregate has been rehypothecated. |
| c | Perpetual security. Perpetual securities have no stated maturity date, but they may be called/redeemed by the issuer. |
| d | Security converts to floating rate after the indicated fixed-rate coupon period. |
| e | Variable rate. Rate shown is in effect at December 31, 2019. |
| f | Securities exempt from registration under Rule 144A of the Securities Act of 1933. These securities may only be resold to qualified institutional buyers. Aggregate holdings amounted to $190,255,921 which represents 16.2% of the net assets of the Fund, of which 0.0% are illiquid. |
| g | Contingent Capital security (CoCo). CoCos are preferred securities with loss absorption characteristics built into the terms of the security for the benefit of the issuer. Aggregate holdings amounted to $153,960,306 which represents 13.1% of the net assets of the Fund (10.1% of the managed assets of the Fund). |
| h | Securities exempt from registration under Regulation S of the Securities Act of 1933. These securities are subject to resale restrictions. Aggregate holdings amounted to $82,488,715 which represents 7.0% of the net assets of the Fund, of which 0.0% are illiquid. |
| i | Security value is determined based on significant unobservable inputs (Level 3). |
| j | Rate quoted represents the annualizedseven-day yield. |
| k | Amount represents number of contracts multiplied by notional contract size multiplied by the underlying price. |
| l | Represents a forward-starting interest rate swap contract with interest receipts and payments commencing on December 28, 2020 (effective date). |
See accompanying notes to financial statements.
23
COHEN & STEERS REITAND PREFERREDANDINCOME FUND, INC.
STATEMENT OF ASSETS AND LIABILITIES
December 31, 2019
| | | | |
ASSETS: | |
Investments in securities, at valuea (Identified cost—$1,199,354,736) | | $ | 1,517,683,864 | |
Cash | | | 514,111 | |
Foreign currency, at value (Identified cost—$250,882) | | | 253,041 | |
Cash collateral pledged for interest rate swap contracts | | | 1,351,130 | |
Cash collateral pledged forover-the-counter option contracts | | | 40,000 | |
Receivable for: | | | | |
Dividends and interest | | | 10,310,437 | |
Investment securities sold | | | 433,657 | |
Variation margin on interest rate swap contracts | | | 57,089 | |
Unrealized appreciation on forward foreign currency exchange contracts | | | 33,882 | |
Other assets | | | 10,795 | |
| | | | |
Total Assets | | | 1,530,688,006 | |
| | | | |
LIABILITIES: | |
Unrealized depreciation on forward foreign currency exchange contracts | | | 713,098 | |
Written option contracts, at value (Premiums received—$141,348) | | | 25,114 | |
Payable for: | | | | |
Credit agreement | | | 350,000,000 | |
Investment securities purchased | | | 1,190,575 | |
Interest expense | | | 888,514 | |
Investment management fees | | | 834,780 | |
Dividends declared | | | 226,108 | |
Administration fees | | | 77,057 | |
Directors’ fees | | | 180 | |
Other liabilities | | | 213,157 | |
| | | | |
Total Liabilities | | | 354,168,583 | |
| | | | |
NET ASSETS | | $ | 1,176,519,423 | |
| | | | |
NET ASSETS consist of: | |
Paid-in capital | | $ | 806,399,044 | |
Total distributable earnings/(accumulated loss) | | | 370,120,379 | |
| | | | |
| | $ | 1,176,519,423 | |
| | | | |
NET ASSET VALUE PER SHARE: | |
($1,176,519,423 ÷ 47,582,193 shares outstanding) | | $ | 24.73 | |
| | | | |
MARKET PRICE PER SHARE | | $ | 23.79 | |
| | | | |
MARKET PRICE PREMIUM (DISCOUNT) TO NET ASSET VALUE PER SHARE | | | (3.80 | )% |
| | | | |
| a | Includes $723,185,879 pledged, of which $325,981,818 has been rehypothecated, in connection with the Fund’s credit agreement, as described in Note 7. |
See accompanying notes to financial statements.
24
COHEN & STEERS REITAND PREFERREDANDINCOME FUND, INC.
STATEMENT OF OPERATIONS
For the Year Ended December 31, 2019
| | | | |
Investment Income: | |
Dividend income (net of $3,712 of foreign withholding tax) | | $ | 36,332,700 | |
Interest income | | | 26,732,831 | |
Rehypothecation income | | | 73,867 | |
| | | | |
Total Investment Income | | | 63,139,398 | |
| | | | |
Expenses: | |
Interest expense | | | 10,447,607 | |
Investment management fees | | | 9,495,364 | |
Administration fees | | | 1,034,405 | |
Shareholder reporting expenses | | | 423,146 | |
Custodian fees and expenses | | | 95,836 | |
Professional fees | | | 94,433 | |
Directors’ fees and expenses | | | 51,575 | |
Transfer agent fees and expenses | | | 20,800 | |
Miscellaneous | | | 102,009 | |
| | | | |
Total Expenses | | | 21,765,175 | |
| | | | |
Net Investment Income (Loss) | | | 41,374,223 | |
| | | | |
Net Realized and Unrealized Gain (Loss): | |
Net realized gain (loss) on: | |
Investments in securities | | | 51,024,488 | |
Written option contracts | | | 1,044,381 | |
Interest rate swap contracts | | | 3,983 | |
Forward foreign currency exchange contracts | | | 1,142,967 | |
Foreign currency transactions | | | (31,974 | ) |
| | | | |
Net realized gain (loss) | | | 53,183,845 | |
| | | | |
Net change in unrealized appreciation (depreciation) on: | |
Investments in securities | | | 202,514,877 | |
Written option contracts | | | (120,839 | ) |
Interest rate swap contracts | | | 265,759 | |
Forward foreign currency exchange contracts | | | (624,364 | ) |
Foreign currency translations | | | 5,072 | |
| | | | |
Net change in unrealized appreciation (depreciation) | | | 202,040,505 | |
| | | | |
Net Realized and Unrealized Gain (Loss) | | | 255,224,350 | |
| | | | |
Net Increase (Decrease) in Net Assets Resulting from Operations | | $ | 296,598,573 | |
| | | | |
See accompanying notes to financial statements.
25
COHEN & STEERS REITAND PREFERREDANDINCOME FUND, INC.
STATEMENT OF CHANGES IN NET ASSETS
| | | | | | | | |
| | | For the Year Ended
December 31, 2019 | | | For the Year Ended
December 31, 2018 | |
Change in Net Assets: | | | | | | | | |
From Operations: | | | | | | | | |
Net investment income (loss) | | $ | 41,374,223 | | | $ | 41,643,913 | |
Net realized gain (loss) | | | 53,183,845 | | | | 49,573,158 | |
Net change in unrealized appreciation (depreciation) | | | 202,040,505 | | | | (154,822,184 | ) |
| | | | | | | | |
Net increase (decrease) in net assets resulting from operations | | | 296,598,573 | | | | (63,605,113 | ) |
| | | | | | | | |
Distributions to Shareholders | | | (70,781,999 | ) | | | (70,779,303 | ) |
| | | | | | | | |
Capital Stock Transactions: | | | | | | | | |
Increase (decrease) in net assets from Fund share transactions | | | 382,810 | | | | — | |
| | | | | | | | |
Total increase (decrease) in net assets | | | 226,199,384 | | | | (134,384,416 | ) |
Net Assets: | | | | | | | | |
Beginning of year | | | 950,320,039 | | | | 1,084,704,455 | |
| | | | | | | | |
End of year | | $ | 1,176,519,423 | | | $ | 950,320,039 | |
| | | | | | | | |
See accompanying notes to financial statements.
26
COHEN & STEERS REITAND PREFERREDANDINCOME FUND, INC.
STATEMENT OF CASH FLOWS
For the Year Ended December 31, 2019
| | | | |
Increase (Decrease) in Cash: | |
Cash Flows from Operating Activities: | |
Net increase (decrease) in net assets resulting from operations | | $ | 296,598,573 | |
Adjustments to reconcile net increase (decrease) in net assets resulting from operations to net cash provided by operating activities: | | | | |
Purchases of long-term investments | | | (758,057,685 | ) |
Proceeds from sales and maturities of long-term investments | | | 789,750,290 | |
Net purchases, sales and maturities of short-term investments | | | (4,583,380 | ) |
Net amortization of premium on investments in securities | | | 1,173,050 | |
Net increase in dividends and interest receivable and other assets | | | (815,477 | ) |
Net decrease in cash collateral received forover-the-counter options contracts | | | (410,000 | ) |
Net increase in interest expense payable, accrued expenses and other liabilities | | | 915,427 | |
Net increase in receivable for variation margin on interest rate swap contracts | | | (57,089 | ) |
Decrease in premiums received from written option contracts | | | (394,560 | ) |
Net change in unrealized depreciation on written option contracts | | | 120,839 | |
Net change in unrealized appreciation on investments in securities | | | (202,514,877 | ) |
Net change in unrealized depreciation on forward foreign currency exchange contracts | | | 624,364 | |
Net realized gain on investments in securities | | | (51,024,488 | ) |
| | | | |
Cash provided by operating activities | | | 71,324,987 | |
| | | | |
Cash Flows from Financing Activities: | |
Dividends and distributions paid | | | (70,426,223 | ) |
| | | | |
Increase (decrease) in cash and restricted cash | | | 898,764 | |
Cash and restricted cash at beginning of year | | | 1,259,518 | |
| | | | |
Cash and restricted cash at end of year (including foreign currency) | | $ | 2,158,282 | |
| | | | |
Supplemental Disclosure of Cash Flow Information andNon-Cash Activities:
During the year ended December 31, 2019, interest paid was $9,675,394.
For the year ended December 31, 2019, reinvestment of dividends was $382,810.
During the year ended December 31, 2019, as part of mergers of certain of the Fund’s investments, the Fund received shares of new securities valued at $6,916,942.
See accompanying notes to financial statements.
27
COHEN & STEERS REITAND PREFERREDANDINCOME FUND, INC.
STATEMENT OF CASH FLOWS—(Continued)
For the Year Ended December 31, 2019
The following table provides a reconciliation of cash and restricted cash reported within the Statement of Assets and Liabilities that sums to the total of such amounts shown on the Statement of Cash Flows.
| | | | |
Cash | | $ | 514,111 | |
Restricted cash | | | 1,391,130 | |
Foreign currency | | | 253,041 | |
| | | | |
Total cash and restricted cash shown on the Statement of Cash Flows | | $ | 2,158,282 | |
| | | | |
Restricted cash consists of cash that has been pledged to cover the Fund’s collateral or margin obligations under derivative contracts. It is reported on the Statement of Assets and Liabilities as cash collateral pledged for interest rate swap contracts and cash collateral pledged forover-the-counter option contracts.
See accompanying notes to financial statements.
28
COHEN & STEERS REITAND PREFERREDANDINCOME FUND, INC.
FINANCIAL HIGHLIGHTS
The following table includes selected data for a share outstanding throughout each year and otherperformance information derived from the financial statements. It should be read in conjunction with the financial statements and notes thereto.
| | | | | | | | | | | | | | | | | | | | |
| | | For the Year Ended December 31, | |
Per Share Operating Data: | | 2019 | | | 2018 | | | 2017 | | | 2016 | | | 2015 | |
Net asset value, beginning of year | | | $19.98 | | | | $22.80 | | | | $21.75 | | | | $21.63 | | | | $21.62 | |
| | | | | | | | | | | | | | | | | | | | |
Income (loss) from investment operations: | | | | | | | | | | | | | | | | | | | | |
| | | | | |
Net investment income (loss)a | | | 0.87 | | | | 0.88 | | | | 0.94 | | | | 1.03 | | | | 0.91 | |
Net realized and unrealized gain (loss) | | | 5.37 | | | | (2.21 | )b | | | 1.60 | | | | 0.57 | | | | 0.57 | |
| | | | | | | | | | | | | | | | | | | | |
Total from investment operations | | | 6.24 | | | | (1.33 | ) | | | 2.54 | | | | 1.60 | | | | 1.48 | |
| | | | | | | | | | | | | | | | | | | | |
Less dividends and distributions to shareholders from: | | | | | | | | | | | | | | | | | | | | |
| | | | | |
Net investment income | | | (0.85 | ) | | | (0.92 | ) | | | (0.92 | ) | | | (0.97 | ) | | | (1.48 | ) |
Net realized gain | | | (0.64 | ) | | | (0.57 | ) | | | (0.57 | ) | | | (0.51 | ) | | | — | |
| | | | | | | | | | | | | | | | | | | | |
Total dividends and distributions to shareholders | | | (1.49 | ) | | | (1.49 | ) | | | (1.49 | ) | | | (1.48 | ) | | | (1.48 | ) |
| | | | | | | | | | | | | | | | | | | | |
Anti-dilutive effect from the repurchase of shares | | | — | | | | — | | | | — | | | | — | | | | 0.01 | |
| | | | | | | | | | | | | | | | | | | | |
Net increase (decrease) in net asset value | | | 4.75 | | | | (2.82 | ) | | | 1.05 | | | | 0.12 | | | | 0.01 | |
| | | | | | | | | | | | | | | | | | | | |
Net asset value, end of year | | | $24.73 | | | | $19.98 | | | | $22.80 | | | | $21.75 | | | | $21.63 | |
| | | | | | | | | | | | | | | | | | | | |
Market value, end of year | | | $23.79 | | | | $17.80 | | | | $21.27 | | | | $19.12 | | | | $18.44 | |
| | | | | | | | | | | | | | | | | | | | |
|
| | |
Total net asset value returnc | | | 32.35 | % | | | –5.20 | %b | | | 12.65 | % | | | 8.43 | % | | | 8.45 | % |
| | | | | | | | | | | | | | | | | | | | |
Total market value returnc | | | 42.92 | % | | | –9.47 | % | | | 19.58 | % | | | 11.79 | % | | | 5.26 | % |
| | | | | | | | | | | | | | | | | | | | |
| | | | | |
| | | | | | | | | | | | | | | | | | | | | |
See accompanying notes to financial statements.
29
COHEN & STEERS REITAND PREFERREDANDINCOME FUND, INC.
FINANCIAL HIGHLIGHTS—(Continued)
| | | | | | | | | | | | | | | | | | | | |
| | | For the Year Ended December 31, | |
Ratios/Supplemental Data: | | 2019 | | | 2018 | | | 2017 | | | 2016 | | | 2015 | |
| | | | | |
Net assets, end of year (in millions) | | | $1,176.5 | | | | $950.3 | | | | $1,084.7 | | | | $1,034.6 | | | | $1,029.0 | |
| | | | | | | | | | | | | | | | | | | | |
Ratios to average daily net assets: | |
| | | | | |
Expenses | | | 1.96 | % | | | 1.93 | %b | | | 1.67 | % | | | 1.65 | % | | | 1.67 | % |
| | | | | | | | | | | | | | | | | | | | |
Expenses (excluding interest expense) | | | 1.02 | % | | | 1.05 | % | | | 1.01 | % | | | 1.01 | % | | | 1.03 | % |
| | | | | | | | | | | | | | | | | | | | |
Net investment income (loss) | | | 3.72 | % | | | 4.10 | % | | | 4.19 | % | | | 4.64 | % | | | 4.18 | % |
| | | | | | | | | | | | | | | | | | | | |
Ratio of expenses to average daily managed assetsd | | | 1.49 | % | | | 1.43 | % | | | 1.26 | % | | | 1.24 | % | | | 1.25 | % |
| | | | | | | | | | | | | | | | | | | | |
Portfolio turnover rate | | | 53 | % | | | 39 | % | | | 26 | % | | | 46 | % | | | 42 | % |
| | | | | | | | | | | | | | | | | | | | |
Credit Agreement | | | | | | | | | | | | | | | | | | | | |
Asset coverage ratio for credit agreement | | | 436 | % | | | 372 | % | | | 410 | % | | | 396 | % | | | 394 | % |
| | | | | | | | | | | | | | | | | | | | |
Asset coverage per $1,000 for credit agreement | | | $4,361 | | | | $3,715 | | | | $4,099 | | | | $3,956 | | | | $3,940 | |
| | | | | | | | | | | | | | | | | | | | |
| a | Calculation based on average shares outstanding. |
| b | During the reporting period the Fund settled legal claims against one issuer of securities previously held by the Fund. As a result, the net realized and unrealized gain (loss) on investments per share includes proceeds received from the settlement. Without these proceeds the net realized and unrealized gain (loss) on investments per share would have been $(2.22). Additionally, the expense ratio includes extraordinary expenses related to the direct action. Without these expenses, the ratio of expenses to average daily net assets would have been 1.92%. Excluding the proceeds from and expenses relating to the settlements, the total return on a NAV basis would have been –5.24%. |
| c | Total net asset value return measures the change in net asset value per share over the period indicated. Total market value return is computed based upon the Fund’s market price per share and excludes the effects of brokerage commissions. Dividends and distributions are assumed, for purposes of these calculations, to be reinvested at prices obtained under the Fund’s dividend reinvestment plan. |
| d | Average daily managed assets represent net assets plus the outstanding balance of the credit agreement. |
See accompanying notes to financial statements.
30
COHEN & STEERS REITAND PREFERREDANDINCOME FUND, INC.
NOTES TO FINANCIAL STATEMENTS
Note 1. Organization and Significant Accounting Policies
Cohen & Steers REIT and Preferred and Income Fund, Inc. (the Fund) was incorporated under the laws of the State of Maryland on March 25, 2003 and is registered under the Investment Company Act of 1940 (the 1940 Act) as a diversified,closed-end management investment company. The Fund’s primary investment objective is high current income. The Fund’s secondary investment objective is capital appreciation.
The following is a summary of significant accounting policies consistently followed by the Fund in the preparation of its financial statements. The Fund is an investment company and, accordingly, follows the investment company accounting and reporting guidance of the Financial Accounting Standards Board Accounting Standards Codification (ASC) Topic 946—Investment Companies. The accounting policies of the Fund are in conformity with accounting principles generally accepted in the United States of America (GAAP). The preparation of the financial statements in accordance with GAAP requires management to make estimates and assumptions that affect the reported amounts of assets and liabilities at the date of the financial statements and the reported amounts of income and expenses during the reporting period. Actual results could differ from those estimates.
Portfolio Valuation:Investments in securities that are listed on the New York Stock Exchange (NYSE) are valued, except as indicated below, at the last sale price reflected at the close of the NYSE on the business day as of which such value is being determined. If there has been no sale on such day, the securities are valued at the mean of the closing bid and ask prices on such day or, if no ask price is available, at the bid price. Centrally cleared interest rate swaps are valued at the price determined by the relevant exchange or clearinghouse. Exchange-traded options are valued at their last sale price as of the close of options trading on applicable exchanges on the valuation date. In the absence of a last sale price on such day, options are valued at the average of the quoted bid and ask prices as of the close of business.Over-the-counter (OTC) options are valued based upon prices provided by a third-party pricing service or counterparty. Forward contracts are valued daily at the prevailing forward exchange rate.
Securities not listed on the NYSE but listed on other domestic or foreign securities exchanges (including NASDAQ) are valued in a similar manner. Securities traded on more than one securities exchange are valued at the last sale price reflected at the close of the exchange representing the principal market for such securities on the business day as of which such value is being determined. If after the close of a foreign market, but prior to the close of business on the day the securities are being valued, market conditions change significantly, certainnon-U.S. equity holdings may be fair valued pursuant to procedures established by the Board of Directors.
Readily marketable securities traded in the OTC market, including listed securities whose primary market is believed by Cohen & Steers Capital Management, Inc. (the investment manager) to be OTC, are valued on the basis of prices provided by a third-party pricing service or third-party broker-dealers when such prices are believed by the investment manager, pursuant to delegation by the Board of Directors, to reflect the fair value of such securities.
Fixed-income securities are valued on the basis of prices provided by a third-party pricing service or third-party broker-dealers when such prices are believed by the investment manager, pursuant to delegation by the Board of Directors, to reflect the fair market value of such securities. The pricing
31
COHEN & STEERS REITAND PREFERREDANDINCOME FUND, INC.
NOTES TO FINANCIAL STATEMENTS—(Continued)
services or broker-dealers use multiple valuation techniques to determine fair value. In instances where sufficient market activity exists, the pricing services or broker-dealers may utilize a market-based approach through which quotes from market makers are used to determine fair value. In instances where sufficient market activity may not exist or is limited, the pricing services or broker-dealers also utilize proprietary valuation models which may consider market transactions in comparable securities and the various relationships between securities in determining fair value and/or characteristics such as benchmark yield curves, option-adjusted spreads, credit spreads, estimated default rates, coupon rates, anticipated timing of principal repayments, underlying collateral, and other unique security features which are then used to calculate the fair values.
Short-term debt securities with a maturity date of 60 days or less are valued at amortized cost, which approximates fair value. Investments inopen-end mutual funds are valued at net asset value (NAV).
The policies and procedures approved by the Fund’s Board of Directors delegate authority to make fair value determinations to the investment manager, subject to the oversight of the Board of Directors. The investment manager has established a valuation committee (Valuation Committee) to administer, implement and oversee the fair valuation process according to the policies and procedures approved annually by the Board of Directors. Among other things, these procedures allow the Fund to utilize independent pricing services, quotations from securities and financial instrument dealers and other market sources to determine fair value.
Securities for which market prices are unavailable, or securities for which the investment manager determines that the bid and/or ask price or a counterparty valuation does not reflect market value, will be valued at fair value, as determined in good faith by the Valuation Committee, pursuant to procedures approved by the Fund’s Board of Directors. Circumstances in which market prices may be unavailable include, but are not limited to, when trading in a security is suspended, the exchange on which the security is traded is subject to an unscheduled close or disruption or material events occur after the close of the exchange on which the security is principally traded. In these circumstances, the Fund determines fair value in a manner that fairly reflects the market value of the security on the valuation date based on consideration of any information or factors it deems appropriate. These may include, but are not limited to, recent transactions in comparable securities, information relating to the specific security and developments in the markets.
The Fund’s use of fair value pricing may cause the NAV of Fund shares to differ from the NAV that would be calculated using market quotations. Fair value pricing involves subjective judgments and it is possible that the fair value determined for a security may be materially different than the value that could be realized upon the sale of that security.
Fair value is defined as the price that the Fund would expect to receive upon the sale of an investment or expect to pay to transfer a liability in an orderly transaction with an independent buyer in the principal market or, in the absence of a principal market, the most advantageous market for the investment or liability. The hierarchy of inputs that are used in determining the fair value of the Fund’s investments is summarized below.
32
COHEN & STEERS REITAND PREFERREDANDINCOME FUND, INC.
NOTES TO FINANCIAL STATEMENTS—(Continued)
| | • | | Level 1—quoted prices in active markets for identical investments |
| | • | | Level 2—other significant observable inputs (including quoted prices for similar investments, interest rates, credit risk, etc.) |
| | • | | Level 3—significant unobservable inputs (including the Fund’s own assumptions in determining the fair value of investments) |
The inputs or methodology used for valuing investments may or may not be an indication of the risk associated with those investments. Changes in valuation techniques may result in transfers into or out of an assigned level within the disclosure hierarchy.
The following is a summary of the inputs used as of December 31, 2019 in valuing the Fund’s investments carried at value:
| | | | | | | | | | | | | | | | |
| | | Total | | | Quoted Prices
in Active
Markets for
Identical
Investments
(Level 1) | | | Other
Significant
Observable
Inputs
(Level 2) | | | Significant
Unobservable
Inputs
(Level 3) | |
Common Stock | | $ | 779,464,073 | | | $ | 779,464,073 | | | $ | — | | | $ | — | |
Preferred Securities—$25 Par Value: | | | | | | | | | | | | | | | | |
Electric | | | 13,248,341 | | | | 9,912,590 | | | | 3,335,751 | | | | — | |
Other Industries | | | 179,159,709 | | | | 179,159,709 | | | | — | | | | — | |
Preferred Securities—Capital Securities: | | | | | | | | | | | | | | | | |
Food | | | 15,772,587 | | | | — | | | | 10,593,951 | | | | 5,178,636 | |
Other Industries | | | 509,926,676 | | | | — | | | | 509,926,676 | | | | — | |
Corporate Bonds | | | 5,538,325 | | | | — | | | | 5,538,325 | | | | — | |
Short-Term Investments | | | 14,574,153 | | | | — | | | | 14,574,153 | | | | — | |
| | | | | | | | | | | | | | | | |
Total Investments in Securitiesa | | $ | 1,517,683,864 | | | $ | 968,536,372 | | | $ | 543,968,856 | | | $ | 5,178,636 | b |
| | | | | | | | | | | | | | | | |
Forward Foreign Currency Exchange Contracts | | $ | 33,882 | | | $ | — | | | $ | 33,882 | | | $ | — | |
Interest Rate Swap Contracts | | | 265,759 | | | | | | | | 265,759 | | | | | |
| | | | | | | | | | | | | | | | |
Total Derivative Assetsa | | $ | 299,641 | | | $ | — | | | $ | 299,641 | | | $ | — | |
| | | | | | | | | | | | | | | | |
Forward Foreign Currency Exchange Contracts | | $ | (713,098 | ) | | $ | — | | | $ | (713,098 | ) | | $ | — | |
Written Option Contracts | | $ | (25,114 | ) | | $ | (4,606 | ) | | $ | (20,508 | ) | | $ | — | |
| | | | | | | | | | | | | | | | |
Total Derivative Liabilitiesa | | $ | (738,212 | ) | | $ | (4,606 | ) | | $ | (733,606 | ) | | $ | — | |
| | | | | | | | | | | | | | | | |
| a | Portfolio holdings are disclosed individually on the Schedule of Investments. |
| b | Level 3 investments are valued by a third-party pricing service. The inputs for these securities are not readily available or cannot be reasonably estimated. A change in the significant unobservable inputs could result in a significantly lower or higher value in such Level 3 investments. |
33
COHEN & STEERS REITAND PREFERREDANDINCOME FUND, INC.
NOTES TO FINANCIAL STATEMENTS—(Continued)
The following is a reconciliation of investments for which significant unobservable inputs (Level 3) were used in determining fair value:
| | | | |
| | | Preferred Securities—
Capital Securities—Food | |
Balance as of December 31, 2018 | | $ | 5,196,975 | |
Change in unrealized appreciation (depreciation) | | | (18,339 | ) |
| | | | |
Balance as of December 31, 2019 | | $ | 5,178,636 | |
| | | | |
The change in unrealized appreciation (depreciation) attributable to securities owned on December 31, 2019 which were valued using significant unobservable inputs (Level 3) amounted to $(18,339).
Security Transactions and Investment Income:Security transactions are recorded on trade date. Realized gains and losses on investments sold are recorded on the basis of identified cost. Interest income, which includes the amortization of premiums and accretion of discounts, is recorded on the accrual basis. Dividend income is recorded on theex-dividend date, except for certain dividends on foreign securities, which are recorded as soon as the Fund is informed after theex-dividend date. Distributions from REITs are recorded as ordinary income, net realized capital gain or return of capital based on information reported by the REITs and management’s estimates of such amounts based on historical information. These estimates are adjusted when the actual source of distributions is disclosed by the REITs and actual amounts may differ from the estimated amounts.
Options:The Fund may purchase and write exchange-listed and OTC put or call options on securities, stock indices and other financial instruments for hedging purposes, to enhance portfolio returns and/or reduce overall volatility.
When the Fund writes (sells) an option, an amount equal to the premium received by the Fund is recorded on the Statement of Assets and Liabilities as a liability. The amount of the liability is subsequentlymarked-to-market to reflect the current market value of the option written. When an option expires, the Fund realizes a gain on the option to the extent of the premium received. Premiums received from writing options which are exercised or closed are added to or offset against the proceeds or amount paid on the transaction to determine the realized gain or loss. If a put option on a security is exercised, the premium reduces the cost basis of the security purchased by the Fund. If a call option is exercised, the premium is added to the proceeds of the security sold to determine the realized gain or loss. The Fund, as writer of an option, bears the market risk of an unfavorable change in the price of the underlying investment. Other risks include the possibility of an illiquid options market or the inability of the counterparties to fulfill their obligations under the contracts.
Put and call options purchased are accounted for in the same manner as portfolio securities. Premiums paid for purchasing options which expire are treated as realized losses. Premiums paid for purchasing options which are exercised or closed are added to the amounts paid or offset against the proceeds on the underlying investment transaction to determine the realized gain or loss when the underlying transaction is executed. The risk associated with purchasing an option is that the Fund pays
34
COHEN & STEERS REITAND PREFERREDANDINCOME FUND, INC.
NOTES TO FINANCIAL STATEMENTS—(Continued)
a premium whether or not the option is exercised. Additionally, the Fund bears the risk of loss of the premium and change in market value should the counterparty not perform under the contract.
Foreign Currency Translation:The books and records of the Fund are maintained in U.S. dollars. Investment securities and other assets and liabilities denominated in foreign currencies are translated into U.S. dollars based upon prevailing exchange rates on the date of valuation. Purchases and sales of investment securities and income and expense items denominated in foreign currencies are translated into U.S. dollars based upon prevailing exchange rates on the respective dates of such transactions. The Fund does not isolate that portion of the results of operations resulting from fluctuations in foreign exchange rates on investments from the fluctuations arising from changes in market prices of securities held. Such fluctuations are included with the net realized and unrealized gain or loss on investments.
Net realized foreign currency transaction gains or losses arise from sales of foreign currencies, (excluding gains and losses on forward foreign currency exchange contracts, which are presented separately, if any) currency gains or losses realized between the trade and settlement dates on securities transactions, and the difference between the amounts of dividends, interest, and foreign withholding taxes recorded on the Fund’s books and the U.S. dollar equivalent of the amounts actually received or paid. Net unrealized foreign currency translation gains and losses arise from changes in the values of assets and liabilities, other than investments in securities, on the date of valuation, resulting from changes in exchange rates. Pursuant to U.S. federal income tax regulations, certain foreign currency gains/losses included in realized and unrealized gains/losses are included in or are a reduction of ordinary income for federal income tax purposes.
Forward Foreign Currency Exchange Contracts:The Fund enters into forward foreign currency exchange contracts to hedge the currency exposure associated with certain of itsnon-U.S. dollar denominated securities. A forward foreign currency exchange contract is a commitment between two parties to purchase or sell foreign currency at a set price on a future date. The market value of a forward foreign currency exchange contract fluctuates with changes in foreign currency exchange rates. These contracts are marked to market daily and the change in value is recorded by the Fund as unrealized appreciation and/or depreciation on forward foreign currency exchange contracts. Realized gains or losses equal to the difference between the value of the contract at the time it was opened and the value at the time it was closed are included in net realized gain or loss on forward foreign currency exchange contracts. For federal income tax purposes, the Fund has made an election to treat gains and losses from forward foreign currency exchange contracts as capital gains and losses.
Forward foreign currency exchange contracts involve elements of market risk in excess of the amounts reflected on the Statement of Assets and Liabilities. The Fund bears the risk of an unfavorable change in the foreign exchange rate underlying the contract. Risks may also arise upon entering these contracts from the potential inability of the counterparties to meet the terms of their contracts. In connection with these contracts, securities may be identified as collateral in accordance with the terms of the respective contracts.
Centrally Cleared Interest Rate Swap Contracts:The Fund uses interest rate swaps in connection with borrowing under its revolving credit agreement. The interest rate swaps are intended to reduce interest rate risk by countering the effect that an increase in short-term interest rates could have on the performance of the Fund’s shares as a result of the structure of interest owed pursuant to the revolving
35
COHEN & STEERS REITAND PREFERREDANDINCOME FUND, INC.
NOTES TO FINANCIAL STATEMENTS—(Continued)
credit agreement. When entering into interest rate swaps, the Fund agrees to pay the other party to the interest rate swap (which is known as the counterparty) a fixed rate payment in exchange for the counterparty’s agreement to pay the Fund a variable rate payment that was intended to approximate the Fund’s variable rate payment obligation on the revolving credit agreement. The payment obligation is based on the notional amount of the swap. Depending on the state of interest rates in general, the use of interest rate swaps could enhance or harm the overall performance of the Fund. Swaps aremarked-to-market daily and changes in the value are recorded as unrealized appreciation (depreciation).
Immediately following execution of the swap agreement, the swap agreement is novated to a central counterparty (the CCP) and the Fund’s counterparty on the swap agreement becomes the CCP. The Fund is required to interface with the CCP through a broker. Upon entering into a centrally cleared swap, the Fund is required to deposit initial margin with the broker in the form of cash or securities in an amount that varies depending on the size and risk profile of the particular swap. Securities deposited as initial margin are designated on the Schedule of Investments and cash deposited is recorded as cash collateral pledged for interest rate swap contracts. The daily change in valuation of centrally cleared swaps is recorded as a receivable or payable for variation margin on interest rate swap contracts. Payments received from or paid to the counterparty, including at termination, are recorded as realized gain (loss).
Swap agreements involve, to varying degrees, elements of market and counterparty risk, and exposure to loss in excess of the related amounts reflected on the Schedule of Investments. Such risks involve the possibility that there will be no liquid market for these agreements, that the counterparty to the agreements may default on its obligation to perform or disagree as to the meaning of contractual terms in the agreements and that there may be unfavorable changes in interest rates.
Dividends and Distributions to Shareholders:Dividends from net investment income and capital gain distributions are determined in accordance with U.S. federal income tax regulations, which may differ from GAAP. Dividends from net investment income, if any, are typically declared quarterly and paid monthly. Net realized capital gains, unless offset by any available capital loss carryforward, are typically distributed to shareholders at least annually. Dividends and distributions to shareholders are recorded on theex-dividend date and are automatically reinvested in full and fractional shares of the Fund in accordance with the Fund’s Reinvestment Plan, unless the shareholder has elected to have them paid in cash.
The Fund has a managed distribution policy in accordance with exemptive relief issued by the U.S. Securities and Exchange Commission (SEC). The Plan gives the Fund greater flexibility to realize long-term capital gains throughout the year and to distribute those gains on a more regular basis to shareholders. Therefore, regular monthly distributions throughout the year may include a portion of estimated realized long-term capital gains, along with net investment income, short-term capital gains and return of capital, which is not taxable. In accordance with the Plan, the Fund is required to adhere to certain conditions in order to distribute long-term capital gains during the year. For the year ended December 31, 2019, the Fund paid distributions from net investment income and net realized gain.
36
COHEN & STEERS REITAND PREFERREDANDINCOME FUND, INC.
NOTES TO FINANCIAL STATEMENTS—(Continued)
Distributions Subsequent to December 31, 2019:The following distributions have been declared by the Fund’s Board of Directors and are payable subsequent to the period end of this report.
| | | | | | |
Ex-Date | | Record Date | | Payable Date | | Amount |
| 1/14/20 | | 1/15/20 | | 1/31/20 | | $0.124 |
| 2/11/20 | | 2/12/20 | | 2/28/20 | | $0.124 |
| 3/17/20 | | 3/18/20 | | 3/31/20 | | $0.124 |
Income Taxes:It is the policy of the Fund to continue to qualify as a regulated investment company (RIC), if such qualification is in the best interest of the shareholders, by complying with the requirements of Subchapter M of the Internal Revenue Code applicable to RICs, and by distributing substantially all of its taxable earnings to its shareholders. Also, in order to avoid the payment of any federal excise taxes, the Fund will distribute substantially all of its net investment income and net realized gains on a calendar year basis. Accordingly, no provision for federal income or excise tax is necessary. Dividend and interest income from holdings innon-U.S. securities is recorded net ofnon-U.S. taxes paid. Management has analyzed the Fund’s tax positions taken on federal and applicable state income tax returns as well as its tax positions innon-U.S. jurisdictions in which it trades for all open tax years and has concluded that as of December 31, 2019, no additional provisions for income tax are required in the Fund’s financial statements. The Fund’s tax positions for the tax years for which the applicable statutes of limitations have not expired are subject to examination by the Internal Revenue Service, state departments of revenue and by foreign tax authorities.
Note 2. Investment Management Fees, Administration Fees and Other Transactions with Affiliates
Investment Management Fees:Cohen & Steers Capital Management, Inc. serves as the Fund’s investment manager pursuant to an investment management agreement (the investment management agreement). Under the terms of the investment management agreement, the investment manager provides the Fund withday-to-day investment decisions and generally manages the Fund’s investments in accordance with the stated policies of the Fund, subject to the supervision of the Board of Directors.
For the services provided to the Fund, the investment manager receives a fee, accrued daily and paid monthly, at the annual rate of 0.65% of the average daily managed assets of the Fund. Managed assets are equal to the net assets plus the amount of any borrowings, used for leverage, outstanding.
Administration Fees:The Fund has entered into an administration agreement with the investment manager under which the investment manager performs certain administrative functions for the Fund and receives a fee, accrued daily and paid monthly, at the annual rate of 0.06% of the average daily managed assets of the Fund. For the year ended December 31, 2019, the Fund incurred $876,495 in fees under this administration agreement. Additionally, the Fund pays State Street Bank and Trust Company asco-administrator under a fund accounting and administration agreement.
Directors’ and Officers’ Fees:Certain directors and officers of the Fund are also directors, officers and/or employees of the investment manager. The Fund does not pay compensation to directors and officers affiliated with the investment manager except for the Chief Compliance Officer, who received compensation from the investment manager, which was reimbursed by the Fund, in the amount of $14,030 for the year ended December 31, 2019.
37
COHEN & STEERS REITAND PREFERREDANDINCOME FUND, INC.
NOTES TO FINANCIAL STATEMENTS—(Continued)
Note 3. Purchases and Sales of Securities
Purchases and sales of securities, excluding short-term investments, for the year ended December 31, 2019, totaled $758,902,201 and $784,314,756, respectively.
Note 4. Derivative Investments
The following tables present the value of derivatives held at December 31, 2019 and the effect of derivatives held during the year ended December 31, 2019, along with the respective location in the financial statements.
Statement of Assets and Liabilities
| | | | | | | | | | | | |
| | | Assets | | | Liabilities | |
Derivatives | | Location | | Fair Value | | | Location | | Fair Value | |
Interest Rate Risk: | | | | | | | | | | | | |
Interest Rate Swap Contractsa | | Receivable for variation margin on interest rate swap contracts | | $ | 265,759 | b | | — | | $ | — | |
| | | | |
Foreign Exchange Risk: | | | | | | | | | | | | |
Forward Foreign Currency Exchange Contractsc | | Unrealized appreciation | | $ | 33,882 | | | Unrealized depreciation | | $ | 713,098 | |
| | | | |
Equity Risk: | | | | | | | | | | | | |
Written Option Contracts—Exchange-Tradeda | | — | | | — | | | Written option contracts | | | 4,606 | |
Written Option Contracts—Over-the-Counter | | — | | | — | | | Written option contracts | | | 20,508 | |
| a | Not subject to a master netting agreement or another similar arrangement. |
| b | Amount represents the cumulative appreciation on interest rate swap contracts as reported on the Schedule of Investments. The Statement of Assets and Liabilities only reflects the current day variation margin receivable from the broker. |
| c | Forward foreign currency exchange contracts executed with Brown Brothers Harriman are not subject to a master netting arrangement or another similar agreement. |
Statement of Operations
| | | | | | | | | | |
Derivatives | | Location | | Realized
Gain (Loss) | | | Change in
Unrealized
Appreciation
(Depreciation) | |
Interest Rate Risk: | | | | | | | | | | |
Interest Rate Swap Contracts | | Net Realized and Unrealized Gain (Loss) | | $ | 3,983 | | | $ | 265,759 | |
38
COHEN & STEERS REITAND PREFERREDANDINCOME FUND, INC.
NOTES TO FINANCIAL STATEMENTS—(Continued)
| | | | | | | | | | |
Derivatives | | Location | | Realized
Gain (Loss) | | | Change in
Unrealized
Appreciation
(Depreciation) | |
| | | |
Foreign Exchange Risk: | | | | | | | | | | |
Forward Foreign Currency Exchange Contracts | | Net Realized and Unrealized Gain (Loss) | | | 1,142,967 | | | | (624,364 | ) |
Purchased Options
Contractsa | | Net Realized and Unrealized Gain (Loss) | | | (643,157 | ) | | | 380,284 | |
Written Option Contracts | | Net Realized and Unrealized Gain (Loss) | | | 423,893 | | | | (237,073 | ) |
Equity Risk: | | | | | | | | | | |
Purchased Options
Contractsa | | Net Realized and Unrealized Gain (Loss) | | | (88,161 | ) | | | — | |
Written Option Contracts | | Net Realized and Unrealized Gain (Loss) | | | 620,488 | | | | 116,234 | |
| a | Purchased options are included in net realized gain (loss) and change in unrealized appreciation (depreciation) on investments in securities. |
At December 31, 2019, the Fund’s derivative assets and liabilities (by type), which are subject to a master netting agreement, are as follows:
| | | | | | | | |
Derivative Financial Instruments | | Assets | | | Liabilities | |
Equity Risk: | | | | | | | | |
Written Option Contracts | | $ | — | | | $ | 20,508 | |
The following table presents the Fund’s derivative liabilities by counterparty net of amounts available for offset under a master netting agreement and net of the related collateral pledged by the Fund, if any, as of December 31, 2019:
| | | | | | | | | | | | | | | | |
Counterparty | | Gross Amount
of Liabilities
Presented
in the Statement
of Assets and
Liabilities | | | Financial
Instruments
and Derivatives
Available
for Offset | | | Collateral
Pledgeda | | | Net Amount
of Derivative
Liabilitiesb | |
Morgan Stanley & Co. International PLC | | $ | 11,965 | | | $ | — | | | $ | — | | | $ | 11,965 | |
Goldman Sachs International | | | 8,543 | | | | — | | | | (8,543 | ) | | | — | |
| a | Collateral received or pledged is limited to the net derivative asset or net derivative liability amounts. Actual collateral amounts received or pledged may be higher than amounts above. |
| b | Net amount represents the net payable due to the counterparty in the event of default. |
39
COHEN & STEERS REITAND PREFERREDANDINCOME FUND, INC.
NOTES TO FINANCIAL STATEMENTS—(Continued)
The following summarizes the volume of the Fund’s option contracts, forward foreign currency exchange contracts and interest rate swap contracts activity for the year ended December 31, 2019:
| | | | | | | | | | | | |
| | | Purchased
Option
Contractsa,b | | | Written
Option
Contractsa,b | | | Forward Foreign
Currency Exchange
Contracts | |
Average Notional Amount | | $ | 33,625,832 | | | $ | 14,595,296 | | | $ | 25,884,924 | |
| a | Average Notional amounts represent the average for all months in which the Fund had option contracts outstanding at month end. For the period, this represents one month and eleven months for purchased and written option contracts, respectively. |
| b | Notional amount is calculated using the number of contracts multiplied by notional contract size multiplied by the underlying price. |
Note 5. Income Tax Information
The tax character of dividends and distributions paid was as follows:
| | | | | | | | |
| | | For the Year Ended
November 30, | |
| | | 2019 | | | 2018 | |
Ordinary income | | $ | 40,471,719 | | | $ | 43,805,331 | |
Long-term capital gain | | | 30,310,280 | | | | 26,973,972 | |
| | | | | | | | |
Total dividends and distributions | | $ | 70,781,999 | | | $ | 70,779,303 | |
| | | | | | | | |
As of December 31, 2019, thetax-basis components of accumulated earnings, the federal tax cost and net unrealized appreciation (depreciation) in value of investments held were as follows:
| | | | |
Cost of investments in securities for federal income tax purposes | | $ | 1,196,749,297 | |
| | | | |
Gross unrealized appreciation on investments | | $ | 326,182,845 | |
Gross unrealized depreciation on investments | | | (4,885,221 | ) |
| | | | |
Net unrealized appreciation (depreciation) on investments | | $ | 321,297,624 | |
| | | | |
Undistributed ordinary income | | $ | 20,626,584 | |
| | | | |
Undistributed long-term capital gains | | $ | 26,057,393 | |
| | | | |
As of December 31, 2019, the Fund had temporary book/tax differences primarily attributable to wash sales on portfolio securities, certain REIT dividends and certain fixed income securities and permanent book/tax differences primarily attributable to certain fixed income securities. To reflect reclassifications arising from the permanent differences,paid-in capital was credited $1,166,320 and total distributable earnings/(accumulated loss) was charged $1,166,320. Net assets were not affected by this reclassification.
40
COHEN & STEERS REITAND PREFERREDANDINCOME FUND, INC.
NOTES TO FINANCIAL STATEMENTS—(Continued)
Note 6. Capital Stock
The Fund is authorized to issue 100 million shares of common stock at a par value of $0.001 per share.
During the year ended December 31, 2019, the Fund issued 15,457 shares of common stock at $382,810 for the reinvestment of dividends. During the year ended December 31, 2018, the Fund did not issue shares of common stock for the reinvestment of dividends.
The Board of Directors approved the continuation of the delegation of its authority to management to effect repurchases, pursuant to management’s discretion and subject to market conditions and investment considerations, of up to 10% of the Fund’s common shares outstanding (Share Repurchase Program) from January 1, 2020, through the fiscal year ended December 31, 2020.
During the years ended December 31, 2019 and December 31, 2018, the Fund did not effect any repurchases.
Note 7. Borrowings
The Fund has entered into an amended and restated credit agreement (the credit agreement) with BNP Paribas Prime Brokerage International, Ltd. (BNPP) in which the Fund pays a monthly financing charge based on a combination of LIBOR-based variable and fixed rates. The commitment amount of the credit agreement is $350,000,000. The Fund may pay a fee of 0.45% per annum on any unused portion of the credit agreement. BNPP may not change certain terms of the credit agreement except upon 360 days’ notice. Also, if the Fund violates certain conditions, the credit agreement may be terminated. The Fund is required to pledge portfolio securities as collateral in an amount up to two times the loan balance outstanding (or more depending on the terms of the credit agreement) and has granted a security interest in the securities pledged to, and in favor of, BNPP as security for the loan balance outstanding. If the Fund fails to meet certain requirements, or maintain other financial covenants required under the credit agreement, the Fund may be required to repay immediately, in part or in full, the loan balance outstanding under the credit agreement, necessitating the sale of portfolio securities at potentially inopportune times. The Fund may, upon prior written notice to BNPP, prepay all or a portion of the fixed and variable rate portions of the credit facility. The Fund may have to pay a breakage fee with respect to a prepayment of all or a portion of the fixed rate financing under the credit facility. The credit agreement also permits, subject to certain conditions, BNPP to rehypothecate portfolio securities pledged by the Fund up to the amount of the loan balance outstanding and the Fund will receive a portion of the fees earned by BNPP in connection with the rehypothecated securities. The Fund continues to receive dividends and interest on rehypothecated securities. The Fund also has the right under the credit agreement to recall the rehypothecated securities from BNPP on demand. If BNPP fails to deliver the recalled security in a timely manner, the Fund will be compensated by BNPP for any fees or losses related to the failed delivery or, in the event a recalled security will not be returned by BNPP, the Fund, upon notice to BNPP, may reduce the loan balance outstanding by the amount of the recalled security failed to be returned.
41
COHEN & STEERS REITAND PREFERREDANDINCOME FUND, INC.
NOTES TO FINANCIAL STATEMENTS—(Continued)
As of December 31, 2019, the Fund had outstanding borrowings of $350,000,000 at a weighted average rate of 3.2%. During the year ended December 31, 2019, the Fund borrowed an average daily balance of $350,000,000 at a weighted average borrowing cost of 3.0%.
Note 8. Other Risks
Common Stock Risk:While common stocks have historically generated higher average returns than fixed-income securities over the long-term, common stocks have also experienced significantly more volatility in those returns, although under certain market conditions, fixed-income investments may have comparable or greater price volatility. The value of common stocks and other equity securities will fluctuate in response to developments concerning the company, political and regulatory circumstances, the stock market, and the economy. In the short term, stock prices can fluctuate dramatically in response to these developments. Different parts of the market and different types of equity securities can react differently to these developments. For example, stocks of large companies can react differently than stocks of smaller companies, and value stocks (stocks of companies that are undervalued by various measures and have potential for long-term capital appreciation), can react differently from growth stocks (stocks of companies with attractive cash flow returns on invested capital and earnings that are expected to grow). These developments can affect a single company, all companies within the same industry, economic sector or geographic region, or the stock market as a whole.
Real Estate Market Risk:Since the Fund concentrates its assets in companies engaged in the real estate industry, an investment in the Fund will be closely linked to the performance of the real estate markets. Risks of investing in real estate securities include falling property values due to increasing vacancies, declining rents resulting from economic, legal, tax, political or technological developments, lack of liquidity, limited diversification, and sensitivity to certain economic factors such as interest-rate changes and market recessions. Real estate company prices also may drop because of the failure of borrowers to pay their loans and poor management, and residential developers, in particular, could be negatively impacted by falling home prices, slower mortgage origination and rising construction costs. The risks of investing in REITs are similar to those associated with direct investments in real estate securities.
REIT Risk:In addition to the risks of securities linked to the real estate industry, REITs are subject to certain other risks related to their structure and focus. REITs are dependent upon management skills and generally may not be diversified. REITs are also subject to heavy cash flow dependency, defaults by borrowers and self-liquidation. In addition, REITs could possibly fail to (i) qualify for pass-through of income under applicable tax law, or (ii) maintain their exemptions from registration under the 1940 Act. The above factors may also adversely affect a borrower’s or a lessee’s ability to meet its obligations to the REIT. In the event of a default by a borrower or lessee, the REIT may experience delays in enforcing its rights as a mortgagee or lessor and may incur substantial costs associated with protecting its investments.
Small- andMedium-Sized Companies Risk:Real estate companies in the industry tend to be small- tomedium-sized companies in relation to the equity markets as a whole. There may be less
42
COHEN & STEERS REITAND PREFERREDANDINCOME FUND, INC.
NOTES TO FINANCIAL STATEMENTS—(Continued)
trading in a smaller company’s stock, which means that buy and sell transactions in that stock could have a larger impact on the stock’s price than is the case with larger company stocks. Smaller companies also may have fewer lines of business so that changes in any one line of business may have a greater impact on a smaller company’s stock price than is the case for a larger company. Further, smaller company stocks may perform differently in different cycles than larger company stocks. Accordingly, real estate company shares can, and at times will, perform differently than large company stocks.
Preferred Securities Risk:Preferred securities are subject to credit risk, which is the risk that a security will decline in price, or the issuer of the security will fail to make dividend, interest or principal payments when due, because the issuer experiences a decline in its financial status. Preferred securities are also subject to interest rate risk and may decline in value because of changes in market interest rates. The Fund may be subject to a greater risk of rising interest rates than would normally be the case in an environment of low interest rates and the effect of potential government fiscal policy initiatives and resulting market reaction to those initiatives. In addition, an issuer may be permitted to defer or omit distributions. Preferred securities are also generally subordinated to bonds and other debt instruments in a company’s capital structure. During periods of declining interest rates, an issuer may be able to exercise an option to redeem (call) its issue at par earlier than scheduled, and the Fund may be forced to reinvest in lower yielding securities. Certain preferred securities may be substantially less liquid than many other securities, such as common stocks. Generally, preferred security holders have no voting rights with respect to the issuing company unless certain events occur. Certain preferred securities may give the issuers special redemption rights allowing the securities to be redeemed prior to a specified date if certain events occur, such as changes to tax or securities laws.
Contingent Capital Securities Risk:Contingent capital securities (sometimes referred to as “CoCos”) are debt or preferred securities with loss absorption characteristics built into the terms of the security, for example, a mandatory conversion into common stock of the issuer under certain circumstances, such as the issuer’s capital ratio falling below a certain level. Since the common stock of the issuer may not pay a dividend, investors in these instruments could experience a reduced income rate, potentially to zero, and conversion would deepen the subordination of the investor, hence worsening the investor’s standing in a bankruptcy. Some CoCos provide for a reduction in the value or principal amount of the security under such circumstances. In addition, most CoCos are considered to be high yield or “junk” securities and are therefore subject to the risks of investing in below investment-grade securities.
Credit and Below-Investment-Grade Securities Risk:Preferred securities may be rated below investment grade or may be unrated. Below-investment-grade securities, or equivalent unrated securities, which are commonly known as “high-yield bonds” or “junk bonds,” generally involve greater volatility of price and risk of loss of income and principal, and may be more susceptible to real or perceived adverse economic and competitive industry conditions than higher grade securities. It is reasonable to expect that any adverse economic conditions could disrupt the market for lower-rated securities, have an adverse impact on the value of those securities and adversely affect the ability of the issuers of those securities to repay principal and interest on those securities.
43
COHEN & STEERS REITAND PREFERREDANDINCOME FUND, INC.
NOTES TO FINANCIAL STATEMENTS—(Continued)
Leverage Risk:The use of leverage is a speculative technique and there are special risks and costs associated with leverage. The NAV of the Fund’s shares may be reduced by the issuance and ongoing costs of leverage. So long as the Fund is able to invest in securities that produce an investment yield that is greater than the total cost of leverage, the leverage strategy will produce higher current net investment income for the shareholders. On the other hand, to the extent that the total cost of leverage exceeds the incremental income gained from employing such leverage, shareholders would realize lower net investment income. In addition to the impact on net income, the use of leverage will have an effect of magnifying capital appreciation or depreciation for shareholders. Specifically, in an up market, leverage will typically generate greater capital appreciation than if the Fund were not employing leverage. Conversely, in down markets, the use of leverage will generally result in greater capital depreciation than if the Fund had been unlevered. To the extent that the Fund is required or elects to reduce its leverage, the Fund may need to liquidate investments, including under adverse economic conditions which may result in capital losses potentially reducing returns to shareholders. The use of leverage also results in the investment management fees payable to the investment manager being higher than if the Fund did not use leverage and can increase operating costs, which may reduce total return. There can be no assurance that a leveraging strategy will be successful during any period in which it is employed.
Liquidity Risk:Liquidity risk is the risk that particular investments of the Fund may become difficult to sell or purchase. The market for certain investments may become less liquid or illiquid due to adverse changes in the conditions of a particular issuer or due to adverse market or economic conditions. In addition, dealer inventories of certain securities, which provide an indication of the ability of dealers to engage in “market making,” are at, or near, historic lows in relation to market size, which has the potential to increase price volatility in the fixed income markets in which the Fund invests. Federal banking regulations may also cause certain dealers to reduce their inventories of certain securities, which may further decrease the Fund’s ability to buy or sell such securities. As a result of this decreased liquidity, the Fund may have to accept a lower price to sell a security, sell other securities to raise cash, or give up an investment opportunity, any of which could have a negative effect on performance. Further, transactions in less liquid or illiquid securities may entail transaction costs that are higher than those for transactions in liquid securities.
Foreign(Non-U.S.) Securities Risk: Risks of investing in foreign securities include currency risks, future political and economic developments and possible imposition of foreign withholding taxes on income or proceeds payable on the securities. In addition, there may be less publicly available information about a foreign issuer than about a domestic issuer, and foreign issuers may not be subject to the same accounting, auditing and financial recordkeeping standards and requirements as domestic issuers.
Investing in securities of companies in emerging markets may entail special risks relating to potential economic, political or social instability and the risks of expropriation, nationalization, confiscation, trade sanctions or embargoes or the imposition of restrictions on foreign investment, the lack of hedging instruments, and repatriation of capital invested. The securities and real estate markets of some emerging market countries have in the past experienced substantial market disruptions and may do so in the future.
44
COHEN & STEERS REITAND PREFERREDANDINCOME FUND, INC.
NOTES TO FINANCIAL STATEMENTS—(Continued)
Foreign Currency Risk:Although the Fund will report its NAV and pay dividends in U.S. dollars, foreign securities often are purchased with and make any dividend and interest payments in foreign currencies. Therefore, the Fund’s investments in foreign securities will be subject to foreign currency risk, which means that the Fund’s NAV could decline solely as a result of changes in the exchange rates between foreign currencies and the U.S. dollar. Certain foreign countries may impose restrictions on the ability of issuers of foreign securities to make payment of principal, dividends and interest to investors located outside the country, due to blockage of foreign currency exchanges or otherwise. The Fund may, but is not required to, engage in various investments that are designed to hedge the Fund’s foreign currency risks, and such investments are subject to the risks described under “Derivatives and Hedging Transactions Risk” below.
Derivatives and Hedging Transactions Risk:The Fund’s use of derivatives, including for the purpose of hedging interest rate or foreign currency risks, presents risks different from, and possibly greater than, the risks associated with investing directly in traditional securities. Among the risks presented are counterparty risk, financial leverage risk, liquidity risk, OTC trading risk and tracking risk. The use of derivatives can lead to losses because of adverse movements in the price or value of the underlying asset, index or rate, which may be magnified by certain features of the derivatives.
Options Risk:Gains on options transactions depend on the investment manager’s ability to predict correctly the direction of stock prices, indexes, interest rates, and other economic factors, and unanticipated changes may cause poorer overall performance for the Fund than if it had not engaged in such transactions. A rise in the value of the security or index underlying a call option written by the Fund exposes the Fund to possible loss or loss of opportunity to realize appreciation in the value of any portfolio securities underlying or otherwise related to the call option. By writing a put option, the Fund assumes the risk of a decline in the underlying security or index. There can be no assurance that a liquid market will exist when the Fund seeks to close out an option position, and for certain options not traded on an exchange no market usually exists. Trading could be interrupted, for example, because of supply and demand imbalances arising from a lack of either buyers or sellers, or an options exchange could suspend trading after the price has risen or fallen more than the maximum specified by the exchange.
Although the Fund may be able to offset to some extent any adverse effects of being unable to liquidate an option position, that Fund may experience losses in some cases as a result of such inability, may not be able to close its position and, in such an event would be unable to control its losses.
Geopolitical Risk:Occurrence of global events similar to those in recent years, such as war, terrorist attacks, natural or environmental disasters, country instability, infectious disease epidemics, market instability, debt crises and downgrades, embargoes, tariffs, sanctions and other trade barriers and other governmental trade or market control programs, the potential exit of a country from its respective union and related geopolitical events, may result in market volatility and may have long-lasting impacts on both the U.S. and global financial markets. Additionally, those events, as well as other changes in foreign and domestic political and economic conditions, could adversely affect individual issuers or related groups of issuers, securities markets, interest rates, secondary trading, credit ratings, inflation, investor sentiment and other factors affecting the value of the Fund’s investments.
45
COHEN & STEERS REITAND PREFERREDANDINCOME FUND, INC.
NOTES TO FINANCIAL STATEMENTS—(Continued)
In March 2017, the United Kingdom (UK) formally notified the European Council of its intention to leave the European Union (EU) and on January 31, 2020 withdrew from the EU (referred to as Brexit). Brexit has resulted in volatility in European and global markets and could have negative long-term impacts on financial markets in the UK and throughout Europe. There is considerable uncertainty about the potential consequences of Brexit, how negotiations of trade agreements will proceed, and how the financial markets will react. As this process unfolds, markets may be further disrupted. Given the size and importance of the UK’s economy, uncertainty about its legal, political and economic relationship with the remaining member states of the EU may continue to be a source of instability.
Growing tensions, including trade disputes, between the United States and other nations, or among foreign powers, and possible diplomatic, trade or other sanctions could adversely impact the global economy, financial markets and the Fund. The strengthening or weakening of the U.S. dollar relative to other currencies may, among other things, adversely affect the Fund’s investments denominated innon-U.S. dollar currencies. It is difficult to predict when similar events affecting the U.S. or global financial markets may occur, the effects that such events may have, and the duration of those effects.
Regulatory Risk:The U.S. government has proposed and adopted multiple regulations that could have a long-lasting impact on the Fund and on the mutual fund industry in general. The SEC’s final rules and amendments that modernize reporting and disclosure, along with other potential upcoming regulations, could, among other things, restrict the Fund’s ability to engage in transactions, and/or increase overall expenses of the Fund. In addition, the SEC, Congress, various exchanges and regulatory and self-regulatory authorities, both domestic and foreign, have undertaken reviews of the use of derivatives by registered investment companies, which could affect the nature and extent of instruments used by the Fund. While the full extent of all of these regulations is still unclear, these regulations and actions may adversely affect both the Fund and the instruments in which the Fund invests and its ability to execute its investment strategy. Similarly, regulatory developments in other countries may have an unpredictable and adverse impact on the Fund.
LIBOR Risk:Many financial instruments are tied to the London Interbank Offered Rate, or “LIBOR,” to determine payment obligations, financing terms, hedging strategies, or investment value. LIBOR is the offered rate for short-term Eurodollar deposits between major international banks. In 2017, the head of the UK Financial Conduct Authority announced a desire to phase out the use of LIBOR by the end of 2021. Alternatives to LIBOR are in development in many major financial markets. For example, the U.S. Federal Reserve has begun publishing a Secured Overnight Financing Rate (“SOFR”), a broad measure of secured overnight U.S. Treasury repo rates, as a possible replacement for U.S. dollar LIBOR. Bank working groups and regulators in other countries have suggested other alternatives for their markets, including the Sterling Overnight Interbank Average Rate (“SONIA”) in England, though global consensus on alternative rates is lacking. There remains uncertainty and risk regarding the willingness and ability of issuers to include enhanced provisions in new and existing contracts or instruments, and the process for amending existing contracts and instruments remains unclear. As such, the transition away from LIBOR may lead to increased volatility and illiquidity in markets that are tied to LIBOR, reduced values of LIBOR-related investments, and reduced effectiveness of hedging strategies, adversely affecting the Fund’s performance or NAV. In addition, any alternative reference rate may be
46
COHEN & STEERS REITAND PREFERREDANDINCOME FUND, INC.
NOTES TO FINANCIAL STATEMENTS—(Continued)
an ineffective substitute resulting in prolonged adverse market conditions for the Fund. Since the usefulness of LIBOR as a benchmark could deteriorate during the transition period, these effects could occur prior to the end of 2021.
Note 9. Other
In the normal course of business, the Fund enters into contracts that provide general indemnifications. The Fund’s maximum exposure under these arrangements is dependent on claims that may be made against the Fund in the future and, therefore, cannot be estimated; however, based on experience, the risk of material loss from such claims is considered remote.
Note 10. Subsequent Events
Management has evaluated events and transactions occurring after December 31, 2019 through the date that the financial statements were issued, and has determined that no additional disclosure in the financial statements is required.
47
COHEN & STEERS REITAND PREFERREDANDINCOME FUND, INC.
REPORT OF INDEPENDENT REGISTERED PUBLIC ACCOUNTING FIRM
To the Board of Directors and Shareholders of
Cohen & Steers REIT and Preferred and Income Fund, Inc.
Opinion on the Financial Statements
We have audited the accompanying statement of assets and liabilities, including the schedule of investments, of Cohen & Steers REIT and Preferred and Income Fund, Inc. (the “Fund”) as of December 31, 2019, the related statements of operations and cash flows for the year ended December 31, 2019, the statement of changes in net assets for each of the two years in the period ended December 31, 2019, including the related notes, and the financial highlights for each of the five years in the period ended December 31, 2019 (collectively referred to as the “financial statements”). In our opinion, the financial statements present fairly, in all material respects, the financial position of the Fund as of December 31, 2019, the results of its operations and its cash flows for the year then ended, the changes in its net assets for each of the two years in the period ended December 31, 2019 and the financial highlights for each of the five years in the period ended December 31, 2019 in conformity with accounting principles generally accepted in the United States of America.
Basis for Opinion
These financial statements are the responsibility of the Fund’s management. Our responsibility is to express an opinion on the Fund’s financial statements based on our audits. We are a public accounting firm registered with the Public Company Accounting Oversight Board (United States) (PCAOB) and are required to be independent with respect to the Fund in accordance with the U.S. federal securities laws and the applicable rules and regulations of the Securities and Exchange Commission and the PCAOB.
We conducted our audits of these financial statements in accordance with the standards of the PCAOB. Those standards require that we plan and perform the audit to obtain reasonable assurance about whether the financial statements are free of material misstatement, whether due to error or fraud.
Our audits included performing procedures to assess the risks of material misstatement of the financial statements, whether due to error or fraud, and performing procedures that respond to those risks. Such procedures included examining, on a test basis, evidence regarding the amounts and disclosures in the financial statements. Our audits also included evaluating the accounting principles used and significant estimates made by management, as well as evaluating the overall presentation of the financial statements. Our procedures included confirmation of securities owned as of December 31, 2019 by correspondence with the custodian, transfer agent and brokers; when replies were not received from brokers, we performed other auditing procedures. We believe that our audits provide a reasonable basis for our opinion.
/s/PricewaterhouseCoopers LLP
New York, New York
February 28, 2020
We have served as the auditor of one or more investment companies in the Cohen & Steers family of mutual funds since 1991.
48
COHEN & STEERS REITAND PREFERREDANDINCOME FUND, INC.
AVERAGE ANNUAL TOTAL RETURNS
(Periods ended December 31, 2019) (Unaudited)
| | | | | | | | | | | | | | | | | | | | | | | | | | | | | | | | | | |
| Based on Net Asset Value | | | | | | Based on Market Value | |
| One Year | | | Five Years | | | Ten Years | | | Since Inception
(6/27/03) | | | | | | One Year | | | Five Years | | | Ten Years | | | Since Inception
(6/27/03) | |
| | 32.35 | % | | | 10.70 | % | | | 15.04 | % | | | 10.28 | % | | | | | | | 42.92 | % | | | 12.73 | % | | | 17.09 | % | | | 9.72 | % |
The performance data quoted represent past performance. Past performance is no guarantee of future results. The investment return will vary and the principal value of an investment will fluctuate and shares, if sold, may be worth more or less than their original cost. Current performance may be lower or higher than the performance data quoted. Performance results reflect the effect of leverage from utilization of borrowings under a credit agreement and/or from the issuance of preferred shares. Current total returns of the Fund can be obtained by visiting our website at cohenandsteers.com. The Fund’s returns assume the reinvestment of all dividends and distributions at prices obtained under the Fund’s dividend reinvestment plan.
TAX INFORMATION—2019 (Unaudited)
For the calendar year ended December 31, 2019, for individual taxpayers, the Fund designates $27,036,081 as qualified dividend income eligible for reduced tax rates, long-term capital gain distributions of $30,310,280 taxable at the maximum 20% rate and $10,654,517 as qualified business income eligible for the 20% deduction. In addition, for corporate taxpayers, 31.99% of the ordinary dividends paid qualified for the dividends received deduction (DRD).
REINVESTMENT PLAN
The Fund has a dividend reinvestment plan commonly referred to as an“opt-out” plan (the Plan). Each common shareholder who participates in the Plan will have all distributions of dividends and capital gains (Dividends) automatically reinvested in additional common shares by Computershare as agent (the Plan Agent). Shareholders who elect not to participate in the Plan will receive all Dividends in cash paid by check mailed directly to the shareholder of record (or if the shares are held in street or other nominee name, then to the nominee) by the Plan Agent, as dividend disbursing agent. Shareholders whose common shares are held in the name of a broker or nominee should contact the broker or nominee to determine whether and how they may participate in the Plan.
The Plan Agent serves as agent for the shareholders in administering the Plan. After the Fund declares a Dividend, the Plan Agent will, as agent for the shareholders, either: (i) receive the cash payment and use it to buy common shares in the open market, on the NYSE or elsewhere, for the participants’ accounts or (ii) distribute newly issued common shares of the Fund on behalf of the participants.
The Plan Agent will receive cash from the Fund with which to buy common shares in the open market if, on the Dividend payment date, the NAV per share exceeds the market price per share plus estimated brokerage commissions on that date. The Plan Agent will receive the Dividend in newly issued common shares of the Fund if, on the Dividend payment date, the market price per share plus estimated brokerage commissions equals or exceeds the NAV per share of the Fund on that date. The number of shares to be issued will be computed at a per share rate equal to the greater of (i) the NAV or (ii) 95% of the closing market price per share on the payment date.
49
COHEN & STEERS REITAND PREFERREDANDINCOME FUND, INC.
If the market price per share is less than the NAV on a Dividend payment date, the Plan Agent will have until the last business day before the nextex-dividend date for the common stock, but in no event more than 30 days after the Dividend payment date (as the case may be, the Purchase Period), to invest the Dividend amount in shares acquired in open market purchases. If at the close of business on any day during the Purchase Period on which NAV is calculated the NAV equals or is less than the market price per share plus estimated brokerage commissions, the Plan Agent will cease making open market purchases and the uninvested portion of such Dividends shall be filled through the issuance of new shares of common stock from the Fund at the price set forth in the immediately preceding paragraph.
Participants in the Plan may withdraw from the Plan upon notice to the Plan Agent. Such withdrawal will be effective immediately if received not less than ten days prior to a Dividend record date; otherwise, it will be effective for all subsequent Dividends. If any participant elects to have the Plan Agent sell all or part of his or her shares and remit the proceeds, the Plan Agent is authorized to deduct a $15.00 fee plus $0.10 per share brokerage commissions.
The Plan Agent’s fees for the handling of reinvestment of Dividends will be paid by the Fund. However, each participant will pay a pro rata share of brokerage commissions incurred with respect to the Plan Agent’s open market purchases in connection with the reinvestment of Dividends. The automatic reinvestment of Dividends will not relieve participants of any income tax that may be payable or required to be withheld on such Dividends.
The Fund reserves the right to amend or terminate the Plan. All correspondence concerning the Plan should be directed to the Plan Agent at800-432-8224.
OTHER INFORMATION
A description of the policies and procedures that the Fund uses to determine how to vote proxies relating to portfolio securities is available (i) without charge, upon request, by calling 800-330-7348, (ii) on our website at cohenandsteers.com or (iii) on the SEC’s website at http://www.sec.gov. In addition, the Fund’s proxy voting record for the most recent12-month period ended June 30 is available by August 31 of each year (i) without charge, upon request, by calling 800-330-7348 or (ii) on the SEC’s website at http://www.sec.gov.
Disclosures of the Fund’s complete holdings are required to be made monthly on Form N-PORT, with every third month made available to the public by the SEC 60 days after the end of the Fund’s fiscal quarter. Previously, the Fund filed its complete schedule of portfolio holdings with the SEC for the first and third quarters of each fiscal year on Form N-Q, which has now been rescinded. Both the Fund’s Form N-Q and Form N-PORT are available (i) without charge, upon request, by calling 800-330-7348 or (ii) on the SEC’s website at http://www.sec.gov.
Please note that distributions paid by the Fund to shareholders are subject to recharacterization for tax purposes and are taxable up to the amount of the Fund’s investment company taxable income and net realized gains. Distributions in excess of the Fund’s investment company taxable income and net realized gains are a return of capital distributed from the Fund’s assets. To the extent this occurs, the Fund’s shareholders of record will be notified of the estimated amount of capital returned to shareholders for each such distribution and this information will also be available at cohenandsteers.com. The final tax treatment of all distributions is reported to shareholders on their 1099-DIV forms, which are mailed after the close of each calendar year. Distributions of capital
50
COHEN & STEERS REITAND PREFERREDANDINCOME FUND, INC.
decrease the Fund’s total assets and, therefore, could have the effect of increasing the Fund’s expense ratio. In addition, in order to make these distributions, the Fund may have to sell portfolio securities at a less than opportune time.
Notice is hereby given in accordance with Rule23c-1 under the 1940 Act that the Fund may purchase, from time to time, shares of its common stock in the open market.
Portfolio Manager Change
Effective September 30, 2019, Mathew Kirschner was added as a portfolio manager of the Fund. Tom Bohjalian, William Scapell and Jason Yablon remain as portfolio managers of the Fund.
51
COHEN & STEERS REITAND PREFERREDANDINCOME FUND, INC.
MANAGEMENT OF THE FUND
The business and affairs of the Fund are managed under the direction of the Board of Directors. The Board of Directors approves all significant agreements between the Fund and persons or companies furnishing services to it, including the Fund’s agreements with its investment advisor, administrator,co-administrator, custodian and transfer agent. The management of the Fund’sday-to-day operations is delegated to its officers, the investment advisor, administrator andco-administrator, subject always to the investment objective and policies of the Fund and to the general supervision of the Board of Directors.
The Board of Directors and officers of the Fund and their principal occupations during at least the past five years are set forth below.
| | | | | | | | | | | | |
Name, Address and Year of Birth1 | | Position(s) Held With Fund | | Term of Office2 | | Principal Occupation During At Least The Past 5 Years (Including Other Directorships Held) | | Number of Funds Within Fund Complex Overseen by Director (Including the Fund) | | | Length of Time Served3 |
| | | | | |
| Interested Directors4 | | | | | | | | | | | | |
| | | | | |
Robert H. Steers 1953 | | Director, Chairman | | Until Next Election of Directors | | Chief Executive Officer of Cohen & Steers Capital Management, Inc. (CSCM or the Advisor) and its parent, Cohen & Steers, Inc. (CNS) since 2014. Prior to that, Co- Chairman andCo-Chief Executive Officer of the Advisor since 2003 and CNS since 2004. Prior to that, Chairman of the Advisor; Vice President of Cohen & Steers Securities, LLC. | | | 20 | | | Since 1991 |
| | | | | |
Joseph M. Harvey 1963 | | Director | | Until Next Election of Directors | | President of the Advisor (since 2003) and President of CNS (since 2004). Chief Investment Officer of CSCM from 2003 to 2019. Prior to that, Senior Vice President and Director of Investment Research of CSCM. | | | 20 | | | Since 2014 |
(table continued on next page)
52
COHEN & STEERS REITAND PREFERREDANDINCOME FUND, INC.
(table continued from previous page)
| | | | | | | | | | | | |
Name, Address and Year of Birth1 | | Position(s) Held With Fund | | Term of Office2 | | Principal Occupation During At Least The Past 5 Years (Including Other Directorships Held) | | Number of Funds Within Fund Complex Overseen by Director (Including the Fund) | | | Length of Time Served3 |
| | | | |
| Disinterested Directors | | | | | | | | | | |
| | | | | |
Michael G. Clark 1965 | | Director | | Until Next Election of Directors | | CPA and CFA; From 2006 to 2011, President and Chief Executive Officer of DWS Funds and Managing Director of Deutsche Asset Management. | | | 20 | | | Since 2011 |
| | | | | |
George Grossman 1953 | | Director | | Until Next Election of Directors | | Attorney-at-law. | | | 20 | | | Since 1993 |
| | | | | |
Dean A. Junkans 1959 | | Director | | Until Next Election of Directors | | CFA; Advisor to SigFig (a registered investment advisor) since July, 2018; Adjunct Professor and Executive–In–Residence, Bethel University Since 2015; Chief Investment Officer at Wells Fargo Private Bank from 2004 to 2014 and Chief Investment Officer of the Wealth, Brokerage and Retirement group at Wells Fargo & Company from 2011 to 2014; former Member and Chair, Claritas Advisory Committee at the CFA Institute from 2013 to 2015; Board Member and Investment Committee Member, Bethel University Foundation since 2010; formerly Corporate Executive Board Member of the National Chief Investment Officers Circle, 2010 to 2015; formerly, Member of the Board of Governors of the University of Wisconsin Foundation, River Falls, 1996 to 2004; U.S. Army Veteran, Gulf War. | | | 20 | | | Since 2015 |
(table continued on next page)
53
COHEN & STEERS REITAND PREFERREDANDINCOME FUND, INC.
(table continued from previous page)
| | | | | | | | | | |
Name, Address and Year of Birth1 | | Position(s) Held With Fund | | Term of Office2 | | Principal Occupation During At Least The Past 5 Years (Including Other Directorships Held) | | Number of Funds Within Fund Complex Overseen by Director (Including the Fund) | | Length of Time Served3 |
| | | | | |
Gerald J. Maginnis 1955 | | Director | | Until Next Election of Directors | | Philadelphia Office Managing Partner, KPMG LLP from 2006 to 2015; Partner in Charge, KPMG Pennsylvania Audit Practice from 2002 to 2008; President, Pennsylvania Institute of Certified Public Accountants (PICPA) from 2014 to 2015; Member, PICPA Board of Directors from 2012 to 2016; Member, Council of the American Institute of Certified Public Accountants (AICPA) from 2013 to 2017; Member, Board of Trustees of AICPA Foundation since 2015. | | 20 | | Since 2015 |
| | | | | |
Jane F. Magpiong 1960 | | Director | | Until Next Election of Directors | | President, Untap Potential since 2013; Senior Managing Director, TIAA-CREF, from 2011 to 2013; National Head of Wealth Management, TIAA- CREF, from 2008 to 2011; and prior to that, President, Bank of America Private Bank from 2005 to 2008. | | 20 | | Since 2015 |
(table continued on next page)
54
COHEN & STEERS REITAND PREFERREDANDINCOME FUND, INC.
(table continued from previous page)
| | | | | | | | | | |
Name, Address and Year of Birth1 | | Position(s) Held With Fund | | Term of Office2 | | Principal Occupation During At Least The Past 5 Years (Including Other Directorships Held) | | Number of Funds Within Fund Complex Overseen by Director (Including the Fund) | | Length of Time Served3 |
| | | | | |
Daphne L. Richards 1966 | | Director | | Until Next Election of Directors | | Independent Director of Cartica Management, LLC since 2015; Investment Committee Member of the Berkshire Taconic Community Foundation since 2015 and Member of the Advisory Board of Northeast Dutchess Fund since 2016; President and CIO of Ledge Harbor Management since 2016; formerly at Bessemer Trust Company from 1999 to 2014; prior thereto, held investment positions at Frank Russell Company from 1996 to 1999, Union Bank of Switzerland from 1993 to 1996; Credit Suisse from 1990 to 1993; and Hambros International Venture Capital Fund from 1988 to 1989. | | 20 | | Since 2017 |
| | | | | |
C. Edward Ward, Jr 1946 | | Director | | Until Next Election of Directors | | Member of The Board of Trustees of Manhattan College, Riverdale, New York from 2004 to 2014; formerly, Director ofclosed-end fund management for the NYSE where he worked from 1979 to 2004. | | 20 | | Since 2004 |
| 1 | The address for each director is 280 Park Avenue, New York, NY 10017. |
| 2 | On March 12, 2008, the Board of Directors adopted a mandatory retirement policy stating a Director must retire from the Board on December 31st of the year in which he or she turns 75 years of age. |
| 3 | The length of time served represents the year in which the Director was first elected or appointed to any fund in the Cohen & Steers fund complex. |
| 4 | “Interested person” as defined in the 1940 Act, of the Fund because of affiliation with CSCM (Interested Directors). |
55
COHEN & STEERS REITAND PREFERREDANDINCOME FUND, INC.
The officers of the Fund (other than Messrs. Steers and Harvey, whose biographies are provided above), their address, their year of birth and their principal occupations for at least the past five years are set forth below.
| | | | | | |
Name, Address and Year of Birth1 | | Position(s) Held With Fund | | Principal Occupation During At Least the Past 5 Years | | Length of Time
Served2 |
| | | |
Adam M. Derechin 1964 | | President and Chief Executive Officer | | Chief Operating Officer of CSCM since 2003 and CNS since 2004. | | Since 2005 |
| | | |
James Giallanza 1966 | | Chief Financial Officer | | Executive Vice President of CSCM since 2014. Prior to that, Senior Vice President of CSCM since 2006. | | Since 2006 |
| | | |
Lisa D. Phelan 1968 | | Chief Compliance Officer | | Executive Vice President of CSCM since 2015. Prior to that, Senior Vice President of CSCM since 2008. Chief Compliance Officer of CSCM, the Cohen & Steers funds, Cohen & Steers Asia Limited and CSSL since 2007, 2006, 2005 and 2004, respectively. | | Since 2006 |
| | | |
Dana A. DeVivo 1981 | | Secretary and Chief Legal Officer | | Senior Vice President of CSCM since 2019. Prior to that, Vice President of CSCM since 2013. | | Since 2015 |
| | | |
Albert Laskaj 1977 | | Treasurer | | Senior Vice President of CSCM since 2019. Prior to that, Vice President of CSCM since 2015. Prior to that, Director of Legg Mason & Co. since 2013. | | Since 2015 |
| | | |
Stephen Murphy 1966 | | Vice President | | Senior Vice President of CSCM since 2019. Prior to that, Managing Director at Mirae Asset Securities (USA) Inc. since 2017. Prior to that, VP & Chief Compliance Officer of Weiss Multi-Strategy Adviser LLC since 2011. | | Since 2019 |
| | | |
Thomas N. Bohjalian 1965 | | Vice President | | Executive Vice President of CSCM since 2012. Prior to that, Senior Vice President of the CSCM since 2006. | | Since 2006 |
| | | |
Yigal D. Jhirad 1964 | | Vice President | | Senior Vice President of CSCM since 2007. | | Since 2007 |
| | | |
William F. Scapell 1968 | | Vice President | | Executive Vice President of CSCM since 2012. Prior to that, Senior Vice President of CSCM since 2003. | | Since 2003 |
| 1 | The address of each officer is 280 Park Avenue, New York, NY 10017. |
| 2 | Officers serve one-year terms. The length of time served represents the year in which the officer was first elected as an officer of any fund in the Cohen & Steers fund complex. All of the officers listed above are officers of one or more of the other funds in the complex. |
56
COHEN & STEERS REITAND PREFERREDANDINCOME FUND, INC.
Cohen & Steers Privacy Policy
| | |
| | |
| Facts | | What Does Cohen & Steers Do With Your Personal Information? |
| |
| Why? | | Financial companies choose how they share your personal information. Federal law gives consumers the right to limit some but not all sharing. Federal law also requires us to tell you how we collect, share, and protect your personal information. Please read this notice carefully to understand what we do. |
| |
| What? | | The types of personal information we collect and share depend on the product or service you have with us. This information can include: • Social Security number and account balances • Transaction history and account transactions • Purchase history and wire transfer instructions |
| |
| How? | | All financial companies need to share customers’ personal information to run their everyday business. In the section below, we list the reasons financial companies can share their customers’ personal information; the reasons Cohen & Steers chooses to share; and whether you can limit this sharing. |
| | | | |
| Reasons we can share your personal information | | Does Cohen & Steers
share? | | Can you limit this
sharing? |
| | |
For our everyday business purposes— such as to process your transactions, maintain your account(s), respond to court orders and legal investigations, or reports to credit bureaus | | Yes | | No |
| | |
For our marketing purposes— to offer our products and services to you | | Yes | | No |
| | |
| For joint marketing with other financial companies— | | No | | We don’t share |
| | |
For our affiliates’ everyday business purposes— information about your transactions and experiences | | No | | We don’t share |
| | |
For our affiliates’ everyday business purposes— information about your creditworthiness | | No | | We don’t share |
| | |
| For our affiliates to market to you— | | No | | We don’t share |
| | |
| For non-affiliates to market to you— | | No | | We don’t share |
| | |
| | | | |
| | | |
| Questions? Call 800.330.7348 | | | | |
57
COHEN & STEERS REITAND PREFERREDANDINCOME FUND, INC.
Cohen & Steers Privacy Policy—(Continued)
| | |
| | |
| Who we are | | |
| |
| Who is providing this notice? | | Cohen & Steers Capital Management, Inc., Cohen & Steers Asia Limited, Cohen & Steers Japan, LLC, Cohen & Steers UK Limited, Cohen & Steers Securities, LLC, Cohen & Steers Private Funds and Cohen & Steers Open and Closed-End Funds (collectively, Cohen & Steers). |
| |
| What we do | | |
| |
| How does Cohen & Steers protect my personal information? | | To protect your personal information from unauthorized access and use, we use security measures that comply with federal law. These measures include computer safeguards and secured files and buildings. We restrict access to your information to those employees who need it to perform their jobs, and also require companies that provide services on our behalf to protect your information. |
| |
| How does Cohen & Steers collect my personal information? | | We collect your personal information, for example, when you: • Open an account or buy securities from us • Provide account information or give us your contact information • Make deposits or withdrawals from your account We also collect your personal information from other companies. |
| |
| Why can’t I limit all sharing? | | Federal law gives you the right to limit only: • sharing for affiliates’ everyday business purposes—information about your creditworthiness • affiliates from using your information to market to you • sharing for non-affiliates to market to you State law and individual companies may give you additional rights to limit sharing. |
| |
| Definitions | | |
| |
| Affiliates | | Companies related by common ownership or control. They can be financial and nonfinancial companies. • Cohen & Steers does not share with affiliates. |
| |
| Non-affiliates | | Companies not related by common ownership or control. They can be financial and nonfinancial companies. • Cohen & Steers does not share with non-affiliates. |
| |
| Joint marketing | | A formal agreement between non-affiliated financial companies that together market financial products or services to you. • Cohen & Steers does not jointly market. |
58
COHEN & STEERS REITAND PREFERREDANDINCOME FUND, INC.
Cohen & Steers Open-End Mutual Funds
COHEN & STEERS REALTY SHARES
| • | | Designed for investors seeking total return, investing primarily in U.S. real estate securities |
| • | | Symbols: CSJAX, CSJCX, CSJIX, CSRSX, CSJRX, CSJZX |
COHEN & STEERS REAL ESTATE SECURITIES FUND
| • | | Designed for investors seeking total return, investing primarily in U.S. real estate securities |
| • | | Symbols: CSEIX, CSCIX, CREFX, CSDIX, CIRRX, CSZIX |
COHEN & STEERS INSTITUTIONAL REALTY SHARES
| • | | Designed for institutional investors seeking total return, investing primarily in U.S. real estate securities |
COHEN & STEERS GLOBAL REALTY SHARES
| • | | Designed for investors seeking total return, investing primarily in global real estate equity securities |
| • | | Symbols: CSFAX, CSFCX, CSSPX, GRSRX, CSFZX |
COHEN & STEERS INTERNATIONAL REALTY FUND
| • | | Designed for investors seeking total return, investing primarily in international(non-U.S.) real estate securities |
| • | | Symbols: IRFAX, IRFCX, IRFIX, IRFRX, IRFZX |
COHEN & STEERS REAL ASSETS FUND
| • | | Designed for investors seeking total return and the maximization of real returns during inflationary environments by investing primarily in real assets |
| • | | Symbols: RAPAX, RAPCX, RAPIX, RAPRX, RAPZX |
COHEN & STEERS PREFERRED SECURITIES
AND INCOME FUND
| • | | Designed for investors seeking total return (high current income and capital appreciation), investing primarily in preferred and debt securities issued by U.S. andnon-U.S. companies |
| • | | Symbols: CPXAX, CPXCX, CPXFX, CPXIX, CPRRX, CPXZX |
COHEN & STEERS LOW DURATION PREFERRED
AND INCOME FUND
| • | | Designed for investors seeking high current income and capital preservation by investing inlow-duration preferred and other income securities issued by U.S. andnon-U.S. companies |
| • | | Symbols: LPXAX, LPXCX, LPXIX, LPXRX, LPXZX |
COHEN & STEERS MLP & ENERGY OPPORTUNITY FUND
| • | | Designed for investors seeking total return, investing primarily in midstream energy master limited partnership (MLP) units and related stocks |
| • | | Symbols: MLOAX, MLOCX, MLOIX, MLORX, MLOZX |
COHEN & STEERS GLOBAL INFRASTRUCTURE FUND
| • | | Designed for investors seeking total return, investing primarily in global infrastructure securities |
| • | | Symbols: CSUAX, CSUCX, CSUIX, CSURX, CSUZX |
COHEN & STEERS ALTERNATIVE INCOME FUND
(FORMERLY COHEN & STEERS DIVIDEND VALUE FUND)
| • | | Designed for investors seeking high current income and capital appreciation, investing in equity, preferred and debt securities, focused on real assets and alternative income strategies |
| • | | Symbols: DVFAX, DVFCX, DVFIX, DVFRX, DVFZX |
Distributed by Cohen & Steers Securities, LLC.
Please consider the investment objectives, risks, charges and expenses of any Cohen & Steers U.S. registeredopen-end fund carefully before investing. A summary prospectus and prospectus containing this and other information can be obtained by calling800-330-7348 or by visiting cohenandsteers.com. Please read the summary prospectus and prospectus carefully before investing.
59
COHEN & STEERS REITAND PREFERREDANDINCOME FUND, INC.
OFFICERS AND DIRECTORS
Robert H. Steers
Director and Chairman
Joseph M. Harvey
Director and Vice President
Michael G. Clark
Director
George Grossman
Director
Dean A. Junkans
Director
Gerald J. Maginnis
Director
Jane F. Magpiong
Director
Daphne L. Richards
Director
C. Edward Ward, Jr.
Director
Adam M. Derechin
President and Chief Executive Officer
James Giallanza
Chief Financial Officer
Lisa D. Phelan
Chief Compliance Officer
Dana A. DeVivo
Secretary and Chief Legal Officer
Albert Laskaj
Treasurer
Stephen Murphy
Vice President
Thomas N. Bohjalian
Vice President
Yigal D. Jhirad
Vice President
William F. Scapell
Vice President
KEY INFORMATION
Investment Manager and Administrator
Cohen & Steers Capital Management, Inc.
280 Park Avenue
New York, NY 10017
(212) 832-3232
Co-administrator and Custodian
State Street Bank and Trust Company
One Lincoln Street
Boston, MA 02111
Transfer Agent
Computershare
150 Royall Street
Canton, MA 02021
(866) 227-0757
Legal Counsel
Ropes & Gray LLP
1211 Avenue of the Americas
New York, NY 10036
| | |
| New York Stock Exchange Symbol: | | RNP |
Website: cohenandsteers.com
This report is for shareholder information. This is not a prospectus intended for use in the purchase or sale of Fund shares. Performance data quoted represent past performance. Past performance is no guarantee of future results and your investment may be worth more or less at the time you sell your shares.
60
eDelivery AVAILABLE
Stop traditional mail delivery;
receive your shareholder reports
and prospectus online.
Sign up at cohenandsteers.com

Cohen & Steers
REIT and
Preferred and
Income Fund, Inc.
(RNP)
Annual Report December 31, 2019
Beginning on January 1, 2021, as permitted by regulations adopted by the U.S. Securities and Exchange Commission, paper copies of the Fund’s annual and semi-annual shareholder reports will no longer be sent by mail, unless you specifically request paper copies of the reports. Instead, the reports will be made available on the Fund’s website at www.cohenandsteers.com, and you will be notified by mail each time a report is posted and provided with a website link to access the report.
If you have already elected to receive shareholder reports electronically, you will not be affected by this change and you need not take any action. You may elect to receive shareholder reports and other communications from a Fund electronically anytime by contacting your financial intermediary or, if you are a direct investor, by signing up at www.cohenandsteers.com.
You may elect to receive all future reports in paper, free of charge, at anytime. If you invest through a financial intermediary, you can contact your financial intermediary or, if you are a direct investor, you can call (866) 227-0757 to let the Fund know you wish to continue receiving paper copies of your shareholder reports. Your election to receive reports in paper will apply to all Funds held in your account if you invest through your financial intermediary or all Funds held within the fund complex if you invest directly with the Fund.
RNPAR
Item 2. Code of Ethics.
The registrant has adopted an Amended and Restated Code of Ethics that applies to its Principal Executive Officer and Principal Financial Officer. The Code of Ethics was in effect during the reporting period. The registrant has not amended the Code of Ethics as described in FormN-CSR during the reporting period. The registrant has not granted any waiver, including an implicit waiver, from a provision of the Code of Ethics as described in FormN-CSR during the reporting period. A current copy of the Code of Ethics is available on the registrant’s website at https://www.cohenandsteers.com/assets/content/uploads/Code_of_Ethics_for_Principal_Executive_and_Principal_Financial_Officers_of_the_Funds.pdf. Upon request, a copy of the Code of Ethics can be obtained free of charge by calling800-330-7348 or writing to the Secretary of the Registrant, 280 Park Avenue, 10th floor, New York, NY 10017.
Item 3. Audit Committee Financial Expert.
The registrant’s board has determined that Gerald J. Maginnis qualifies as an audit committee financial expert based on his years of experience in the public accounting profession. The registrant’s board has determined that Michael G. Clark qualifies as an audit committee financial expert based on his years of experience in the public accounting profession and the investment management and financial services industry. Each of Messrs. Maginnis and Clark is a member of the board’s audit committee, and each is independent as such term is defined in FormN-CSR.
Item 4. Principal Accountant Fees and Services.
(a) – (d) Aggregate fees billed to the registrant for the last two fiscal years ended December 31, 2019 and December 31, 2018 for professional services rendered by the registrant’s principal accountant were as follows:
| | | | |
| | | 2019 | | 2018 |
Audit Fees | | $49,630 | | $46,400 |
Audit-Related Fees | | $0 | | $0 |
Tax Fees | | $5,940 | | $5,850 |
All Other Fees | | $0 | | $0 |
Tax fees were billed in connection with tax compliance services, including the preparation and review of federal and state tax returns and the computation of corporate and franchise tax amounts.
(e)(1) The registrant’s audit committee is required to pre-approve audit andnon-audit services performed for the registrant by the principal accountant. The audit committee also is required to pre-approvenon-audit services performed by the registrant’s principal accountant for the registrant’s investment advisor (not including anysub-advisor whose role is primarily portfolio management and is subcontracted with or overseen by another investment advisor) and/or to any entity controlling, controlled by or under common control with the registrant’s investment advisor that provides ongoing services to the registrant, if the engagement for services relates directly to the operations and financial reporting of the registrant.
The audit committee may delegate pre-approval authority to one or more of its members who are independent members of the board of directors of the registrant. The member or members to whom such authority is delegated shall report any pre-approval decisions to the audit committee at its next scheduled meeting. The audit committee may not delegate its responsibility topre-approve services to be performed by the registrant’s principal accountant to the investment advisor.
(e)(2) No services included in (b) – (d) above were approved by the audit committee pursuant to paragraphs (c)(7)(i)(C) of Rule2-01 of RegulationS-X.
(f) Not applicable.
(g) For the fiscal years ended December 31, 2019 and December 31, 2018, the aggregate fees billed by the registrant’s principal accountant fornon-audit services rendered to the registrant and fornon-audit services rendered to the registrant’s investment advisor (not including anysub-advisor whose role is primarily portfolio management and is subcontracted with or overseen by another investment advisor) and/or to any entity controlling, controlled by or under common control with the registrant’s investment advisor that provides ongoing services to the registrant were:
| | | | |
| | | 2019 | | 2018 |
Registrant | | $5,940 | | $5,850 |
Investment Advisor | | $0 | | $0 |
(h) The registrant’s audit committee considered whether the provision ofnon-audit services that were rendered to the registrant’s investment advisor (not including anysub-advisor whose role is primarily portfolio management and is subcontracted with or overseen by another investment advisor) and/or to any entity controlling, controlled by or under common control with the registrant’s investment advisor that provides ongoing services to the registrant that were not required to bepre-approved pursuant to paragraph (c)(7)(ii) of Rule2-01 of RegulationS-X was compatible with maintaining the principal accountant’s independence.
Item 5. Audit Committee of Listed Registrants.
The registrant has a separately-designated standing audit committee established in accordance with Section 3(a)(58)(A) of the Securities Exchange Act of 1934. The members of the committee are Gerald J. Maginnis (chairman), Michael G. Clark and George Grossman.
Item 6. Schedule of Investments.
Included in Item 1 above.
Item 7. Disclosure of Proxy Voting Policies and Procedures forClosed-End Management Investment Companies.
The registrant has delegated voting of proxies in respect of portfolio holdings to Cohen & Steers Capital Management, Inc. (“C&S”), in accordance with the policies and procedures set forth below.
COHEN & STEERS CAPITAL MANAGEMENT, INC.
STATEMENT OF POLICIES AND PROCEDURES REGARDING THE VOTING OF SECURITIES
This statement sets forth the policies and procedures that Cohen & Steers Capital Management, Inc. and its affiliated advisors (“Cohen & Steers”, “we” or “us”) follow in exercising voting rights with respect to securities held in its client portfolios. All proxy-voting rights that are exercised by Cohen & Steers shall be subject to this Statement of Policy and Procedures.
General Proxy Voting Guidelines
Objectives
Voting rights are an important component of corporate governance. Cohen & Steers has three overall objectives in exercising voting rights:
| | • | | Responsibility. Cohen & Steers shall seek to ensure that there is an effective means in place to hold companies accountable for their actions. While management must be accountable to its board, the board must be accountable to a company’s shareholders. Although accountability can be promoted in a variety of ways, protecting shareholder voting rights may be among our most important tools. |
| | • | | Rationalizing Management and Shareholder Concerns. Cohen & Steers seeks to ensure that the interests of a company’s management and board are aligned with those of the company’s shareholders. In this respect, compensation must be structured to reward the creation of shareholder value. |
| | • | | Shareholder Communication. Since companies are owned by their shareholders, Cohen & Steers seeks to ensure that management effectively communicates with its owners about the company’s business operations and financial performance. It is only with effective communication that shareholders will be able to assess the performance of management and to make informed decisions on when to buy, sell or hold a company’s securities. |
General Principles
In exercising voting rights, Cohen & Steers shall conduct itself in accordance with the general principles set forth below.
| | • | | The ability to exercise a voting right with respect to a security is a valuable right and, therefore, must be viewed as part of the asset itself. |
| | • | | In exercising voting rights, Cohen & Steers shall engage in a careful evaluation of issues that may materially affect the rights of shareholders and the value of the security. |
| | • | | Consistent with general fiduciary principles, the exercise of voting rights shall always be conducted with reasonable care, prudence and diligence. |
| | • | | In exercising voting rights on behalf of clients, Cohen & Steers shall conduct itself in the same manner as if Cohen & Steers were the constructive owner of the securities. |
| | • | | To the extent reasonably possible, Cohen & Steers shall participate in each shareholder voting opportunity. |
| | • | | Voting rights shall not automatically be exercised in favor of management-supported proposals. |
| | • | | Cohen & Steers, and its officers and employees, shall never accept any item of value in consideration of a favorable proxy voting decision. |
General Guidelines
Set forth below are general guidelines that Cohen & Steers shall follow in exercising proxy voting rights:
| | • | | Prudence. In making a proxy voting decision, Cohen & Steers shall give appropriate consideration to all relevant facts and circumstances, including the value of the securities to be voted and the likely effect any vote may have on that value. Since voting rights must be exercised on the basis of an informed judgment, investigation shall be a critical initial step. |
| | • | | Third Party Views. While Cohen & Steers may consider the views of third parties, Cohen & Steers shall never base a proxy voting decision solely on the opinion of a third party. Rather, decisions shall be based on a reasonable and good faith determination as to how best to maximize shareholder value. |
| | • | | Shareholder Value. Just as the decision whether to purchase or sell a security is a matter of judgment, determining whether a specific proxy resolution will increase the market value of a security is a matter of judgment as to which informed parties may differ. In determining how a proxy vote may affect the economic value of a security, Cohen & Steers shall consider both short-term and long-term views about a company’s business and prospects, especially in light of our projected holding period on the stock (e.g., Cohen & Steers may discount long-term views on a short-term holding). |
Specific Guidelines
A.Responsibility. Cohen & Steers shall seek to ensure that there is an effective means in place to hold companies accountable for their actions. While management must be accountable to its board, the board must be accountable to a company’s shareholders. Although accountability can be promoted in a variety of ways, protecting shareholder voting rights may be among our most important tools.
B.Rationalizing Management and Shareholder Concerns. Cohen & Steers seeks to ensure that the interests of a company’s management and board are aligned with those of the company’s shareholders. In this respect, compensation must be structured to reward the creation of shareholder value.
C.Shareholder Communication. Since companies are owned by their shareholders, Cohen & Steers seeks to ensure that management effectively communicates with its owners about the company’s business operations and financial performance. It is only with effective communication that shareholders will be able to assess the performance of management and to make informed decisions on when to buy, sell or hold a company’s securities.
In exercising voting rights, Cohen & Steers follows the general principles set forth below.
| • | | The ability to exercise a voting right with respect to a security is a valuable right and, therefore, must be viewed as part of the asset itself. |
| • | | In exercising voting rights, Cohen & Steers shall engage in a careful evaluation of issues that may materially affect the rights of shareholders and the value of the security. |
| • | | Consistent with general fiduciary principles, the exercise of voting rights shall always be conducted with reasonable care, prudence and diligence. |
| • | | In exercising voting rights on behalf of clients, Cohen & Steers shall conduct itself in the same manner as if Cohen & Steers were the beneficial owners of the securities. |
| • | | To the extent reasonably possible, Cohen & Steers shall participate in each shareholder voting opportunity. |
| • | | Voting rights shall not automatically be exercised in favor of management-supported proposals. |
| • | | Cohen & Steers, and their respective officers and employees, shall never accept any item of value in consideration of a favorable proxy vote. |
Set forth below are general guidelines followed by Cohen & Steers in exercising proxy voting rights:
Prudence.In making a proxy voting decision, Cohen & Steers shall give appropriate consideration to all relevant facts and circumstances, including the value of the securities to be voted and the likely effect any vote may have on that value. Since voting rights must be exercised on the basis of an informed judgment, investigation shall be a critical initial step.
Third Party Views.While Cohen & Steers may consider the views of third parties, Cohen & Steers shall never base a proxy voting decision solely on the opinion of a third party. Rather, decisions shall be based on a reasonable and good faith determination as to how best to maximize shareholder value.
Shareholder Value.Just as the decision whether to purchase or sell a security is a matter of judgment, determining whether a specific proxy resolution will increase the market value of a security is a matter of judgment as to which informed parties may differ. In determining how a proxy vote may affect the economic value of a security, Cohen & Steers shall consider both short-term and long-term views about a company’s business and prospects, especially in light of its projected holding period on the stock (e.g.,Cohen & Steers Capital Management, Inc. may discount long-term views on a short-term holding).
Voting for Directors Nominees in Uncontested Elections
Votes on director nominees are made on acase-by-case basis using a “mosaic” approach, where all factors are considered and no single factor is determinative. In evaluating director nominees, Cohen & Steers considers the following factors:
| • | | Whether the nominee attended less than 75 percent of the board and committee meetings without a valid excuse for the absences; |
| • | | Whether the nominee is an inside or affiliated outside director and sits on the audit, compensation, or nominating committees and/or the full board serves as the audit, compensation, or nominating committees or the company does not have one of these committees; |
| • | | Whether the board ignored a significant shareholder proposal that was approved by a majority of the votes cast in the previous year; |
| • | | Whether the board, without shareholder approval, to our knowledge instituted a new poison pill plan, extended an existing plan, or adopted a new plan upon the expiration of an existing plan during the past year; |
| • | | Whether the nominee is the chairman or CEO of a publicly-traded company who serves on more than two (2) public company boards; |
| • | | In the case of nominees other than the chairman or CEO, whether the nominee serves on more than four (4) public company boards; |
| • | | If the nominee is an incumbent director, the length of tenure taking into account tenure limits recommended by local corporate governance codes1; |
| • | | Whether the nominee has a material related party transaction or a material conflict of interest with the company; |
| • | | Whether the nominee (or the entire board) in our view has a record of making poor corporate or strategic decisions or has demonstrated an overall lack of good business judgment; |
| • | | Material failures of governance, stewardship, risk oversight2, or fiduciary responsibilities at the company; and |
| • | | Actions related to a nominee’s service on other boards that raise substantial doubt about his or her ability to effectively oversee management and serve the best interests of shareholders at any company. |
| 1 | For example, in the UK, independent directors of publicly traded companies with tenure exceeding nine (9) years are reclassified asnon-independent unless the company can explain why they remain independent. |
| 2 | Examples of failure of risk oversight include, but are not limited to: bribery; large or serial fines from regulatory bodies; significant adverse legal judgments or settlements; hedging of company stock by the employees or directors of a company; or a significant pledging of company stock in the aggregate by the officers and directors of a company. |
Voting for Director Nominees in Contested Elections
Votes in a contested election of directors are evaluated on acase-by-case basis considering the long-term financial performance of the company relative to its industry management’s track record, the qualifications of the nominees and other relevant factors.
The Majority Vote for Directors
Cohen & Steers generally votes for proposals asking for the board to amend the company’s governance documents (charter or bylaws) to provide that director nominees will be elected by the affirmative vote of the majority of votes cast at an annual meeting of shareholders.
Separation of Chairman and CEO
Cohen & Steers generally votes for proposals to separate the CEO and chairman positions. Cohen & Steers does recognize, however, that under certain circumstances, it may be in the company’s best interest for the CEO and chairman positions to be held by one person.
The Independent Chairman
Cohen & Steers reviews on acase-by-case basis proposals requiring the chairman’s position to be filled by an independent director, taking into account the company’s current board leadership and governance structure; company performance, and any other factors that may be relevant.
Lead Independent Directors
In cases where the CEO and chairman roles are combined or the chairman is not independent, Cohen & Steers vote for the appointment of a lead independent director.
Board Independence
Cohen & Steers believes that boards should have a majority of independent directors. Therefore, Cohen & Steers vote for proposals that require the board to be comprised of a majority of independent directors.
Generally, Cohen & Steers considers a director independent if the director satisfies the independence definition set forth in local corporate governance codes and/or the applicable listing standards of the exchange on which the company’s stock is listed.
In addition, Cohen & Steers generally considers a director independent if the director has no significant financial, familial or other ties with the company that may pose a conflict, and has not been employed by the company in an executive capacity.
Board Size
Cohen & Steers generally votes for proposals to limit the size of the board to 15 members or less.
Classified Boards
Cohen & Steers generally votes in favor of shareholder proposals to declassify a board of directors. In voting on proposals to declassify a board of directors, Cohen & Steers evaluates all facts and circumstances, including whether: (i) the current management and board have a history of making good corporate or strategic decisions and (ii) the proposal is in the best interests of shareholders.
Independent Committees
Cohen & Steers votes for proposals requesting that a board’s audit, compensation and nominating committees consist only of independent directors.
Non-Disclosure of Board Compensation
Cohen & Steers generally votes against the election of director nominees at companies if the compensation paid to such directors is not disclosed prior to the meeting. However, Cohen & Steers recognizes that companies in certain emerging markets may have legitimate reasons for not disclosing such compensation. In such cases, if a company discloses a legitimate reason why such compensation should not be disclosed, Cohen & Steers may vote for the nominees even if compensation is not disclosed.
Director and Officer Indemnification and Liability Protection
Cohen & Steers votes in favor of proposals providing indemnification for directors and officers for acts conducted in the normal course of business that is consistent with the law of the jurisdiction of formation. Cohen & Steers also vote in favor of proposals that expand coverage for directors and officers where, despite an unsuccessful legal defense, the director or officer acted in good faith and in the best interests of the company. Cohen & Steers votes against proposals that would expand indemnification beyond coverage of legal expenses to coverage of acts, such as gross negligence, that are violations of fiduciary obligations.
Compensation Proposals
Votes on Executive Compensation.“Say-on-Pay” votes are determined on acase-by-case basis taking into account the reasonableness of the company’s compensation structure and the adequacy of the disclosure.
Cohen & Steers generally votes against in cases where there are an unacceptable under of problematic pay practices including:
| • | | Poor linkage between the executives’ pay and the company’s performance and profitability; |
| • | | The presence of objectionable structural features in the compensation plan, such as excessive perquisites, golden parachutes,tax-gross up provisions, and automatic benchmarking of pay in the top half of the peer group; |
| • | | A lack of proportionality in the plan relative to the company’s size and peer group. |
Additional Disclosure on Executive and Director Pay. Cohen & Steers generally votes for shareholder proposals that seek additional disclosure of executive and director pay information.
Frequency of Shareholder Votes on Executive Compensation. Cohen & Steers generally votes for annual shareholder advisory votes to approve executive compensation.
Golden Parachutes. In general, Cohen & Steers votes against golden parachutes because they impede potential takeovers that shareholders should be free to consider. Cohen & Steers opposes the use of employment agreements that result in excessive cash payments and generally withhold our vote at the next shareholder meeting for directors who approved golden parachutes.
In the context of an acquisition, merger, consolidation, or proposed sale, Cohen & Steers votes on acase-by-case basis on proposals to approve golden parachute payments. Factors that may result to a vote against include:
| • | | Potentially excessive severance payments; |
| • | | Agreements that include excessive excise taxgross-up provisions; |
| • | | Single-trigger payments upon a Change in Control (“CIC”), including cash payments and the acceleration of performance-based equity despite the failure to achieve performance measures; |
| • | | Single-trigger vesting of equity based on a definition of change in control that requires only shareholder approval of the transaction (rather than consummation); |
| • | | Recent amendments or other changes that may make packages so attractive as to encourage transactions that may not be in the best interests of shareholders; or |
| • | | The company’s assertion that a proposed transaction is conditioned on shareholder approval of the golden parachute advisory vote. |
Equity Compensation Plans. Votes on proposals related to compensation plans are determined on acase-by-case basis taking into account plan features and equity grant practices, where positive factors may counterbalance negative factors (and vice versa), as evaluated based on three pillars:
| • | | Plan Cost: the total estimated cost of the company’s equity plans relative to industry/market cap peers measured by the company’s estimated shareholder value transfer (SVT) in relation to peers, considering: |
| | • | | SVT based on new shares requested plus shares remaining for future grants, plus outstanding unvested/unexercised grants; and |
| | • | | SVT based only on new shares requested plus shares remaining for future grants. |
| | • | | Automatic single-triggered award vesting upon CIC; |
| | • | | Discretionary vesting authority; |
| | • | | Liberal share recycling on various award types; and |
| | • | | Minimum vesting period for grants made under the plan. |
| | • | | The company’s three year burn rate relative to its industry/market cap peers; |
| | • | | Vesting requirements for most recent CEO equity grants(3-year look-back); |
| | • | | The estimated duration of the plan based on the sum of shares remaining available and the new shares requested divided by the average annual shares granted in the prior three years; |
| | • | | The proportion of the CEO’s most recent equity grants/awards subject to performance conditions; |
| | • | | Whether the company maintains a claw-back policy; and |
| | • | | Whether the company has established post exercise/vesting share-holding requirements. |
Cohen & Steers generally votes against compensation plan proposals if the combination of factors indicates that the plan is not, overall, in the shareholders’ interest, or if any of the following apply:
| • | | Awards may vest in connection with a liberal CIC; |
| • | | The plan would permitre-pricing or cash buyout of underwater options without shareholder approval; |
| • | | The plan is a vehicle for problematic pay practices or apay-for-performance disconnect; or |
| • | | Any other plan features that are determined to have a significant negative impact on shareholder interests. |
Transferable Stock Options. Cohen & Steers evaluates on acase-by-case basis proposals to grant transferable stock options or otherwise permit the transfer of outstanding stock options, including cost of proposal and alignment with shareholder interests.
Approval of Cash orCash-and-Stock Bonus Plans. Cohen & Steers votes to approve cash orcash-and-stock bonus plans that seek to exempt executive compensation from limits on deductibility imposed by Section 162(m) of the Internal Revenue Code.
Employee Stock Purchase Plans. Cohen & Steers votes for the approval of employee stock purchase plans, although Cohen & Steers generally believes the discounted purchase price should not exceed 15% of the current market price.
401(k) Employee Benefit Plans. Cohen & Steers votes for proposals to implement a 401(k) savings plan for employees.
Stock Ownership Requirements. Cohen & Steers supports proposals requiring senior executives and directors to hold a minimum amount of stock in a company (often expressed as a percentage of annual compensation), which may include restricted stock or restricted stock units.
Stock Holding Periods. Cohen & Steers generally votes against proposals requiring executives to hold stock received upon option exercise for a specific period of time.
Recovery of Incentive Compensation. Cohen & Steers generally votes for proposals to recover incentive bonuses or other incentive payments made to senior executives if it is later determined that fraud, misconduct, or negligence significantly contributed to a restatement of financial results that led to the award of incentive compensation.
Capital Structure Changes and Anti-Takeover Proposals
Increase to Authorized Shares. Cohen & Steers generally votes for increases in authorized shares, provided that the increase is not greater than three times the number of shares outstanding and reserved for issuance (including shares reserved for stock-related plans and securities convertible into common stock, but not shares reserved for any poison pill plan).
Blank Check Preferred Stock. Cohen & Steers generally votes against proposals authorizing the creation of new classes of preferred stock without specific voting, conversion, distribution and other rights, and proposals to increase the number of authorized blank check preferred shares. Cohen & Steers may vote in favor of these proposals if Cohen & Steers receives reasonable assurances that (i) the preferred stock was authorized by the board for legitimate capital formation purposes and not for anti-takeover purposes, and (ii) no preferred stock will be issued with voting power that is disproportionate to the economic interests of the preferred stock. These representations should be made either in the proxy statement or in a separate letter from the company to us.
Pre-emptive Rights. Cohen & Steers generally votes against the issuance of equity shares withpre-emptive rights. However, Cohen & Steers may vote for shareholderpre-emptive rights where suchpre-emptive rights are necessary taking in to account the best interests of the company’s shareholders. In addition, we acknowledge that international local practices may call for shareholderpre-emptive rights when a company seeks authority to issue shares (e.g., UK authority for the issuance of only up to 5% of outstanding shares withoutpre-emptive rights).
While Cohen & Steers prefers that companies be permitted to issue shares withoutpre-emptive rights, in deference to international local practices, Cohen & Steers will approve issuance requests withpre-emptive rights.
Dual Class Capitalizations. Because classes of common stock with unequal voting rights limit the rights of certain shareholders, we vote against adoption of a dual or multiple class capitalization structure. Cohen & Steers supports theone-share,one-vote principle for voting.
Restructurings/Recapitalizations. Cohen & Steers reviews proposals to increase common and/or preferred shares and to issue shares as part of a debt restructuring plan on acase-by-case basis. In voting, Cohen & Steers considers the following issues:
| • | | Dilution: how much will the ownership interest of existing shareholders be reduced, and how extreme will dilution to any future earnings be? |
| • | | Change in control: will the transaction result in a change in control of the company? |
| • | | Bankruptcy: generally, approve proposals that facilitate debt restructurings unless there are clear signs of self-dealing or other abuses. |
Share Repurchase Programs. Cohen & Steers generally votes in favor of such programs where the repurchase would be in the long-term best interests of shareholders and where we believe that this is a good use of the company’s cash.
Cohen & Steers will vote against such programs when shareholders’ interests could be better served by deployment of the cash for alternative uses, or where the repurchase is a defensive maneuver or an attempt to entrench management.
Targeted Share Placements. Cohen & Steers votes these proposals on acase-by-case basis. These proposals ask companies to seek shareholder approval before placing 10% or more of their voting stock with a single investor. The proposals are typically in reaction to the placement of a large block of voting stock in an employee stock option plan, parent capital fund or with a single friendly investor, with the aim of protecting the company against a hostile tender offer.
Shareholder Rights Plans.Cohen & Steers reviews on acase-by-case basis proposals to ratify shareholder rights plans taking into consideration the length of the plan.
Reincorporation Proposals. Proposals to change a company’s jurisdiction of incorporation are examined on acase-by-case basis. When evaluating such proposals, Cohen & Steers reviews management’s rationale for the proposal, changes to the charter/bylaws, and differences in the applicable laws governing the companies.
Voting on State Takeover Statutes. Cohen & Steers reviews on acase-by-case basis proposals to opt in or out of state takeover statutes (including control share acquisition statutes, control sharecash-out statutes,freeze-out provisions, fair price provisions, stakeholder laws, poison pill endorsements, severance pay and labor contract provisions and disgorgement provisions). In voting on these shareholder proposals, Cohen & Steers takes into account whether the proposal is in the long-term best interests of the company and whether it would be in the best interests of the company to thwart a shareholder’s attempt to control the board of directors.
Mergers and Corporate Restructurings
Mergers and Acquisitions. Votes on mergers and acquisitions should be considered on acase-by-case basis, taking into account the anticipated financial and operating benefits, offer price (cost vs. premium), prospects of the combined companies, how the deal was negotiated and changes in corporate governance and their impact on shareholder rights.
Cohen & Steers votes against proposals that require a super-majority of shareholders to approve a merger or other significant business combination.
Nonfinancial Effects of a Merger or Acquisition. Some companies have proposed charter provisions that specify that the board of directors may examine the nonfinancial effects of a merger or acquisition on the company. This provision would allow the board to evaluate the impact a proposed change in control would have on employees, host communities, suppliers and/or others. Cohen & Steers generally vote against proposals to adopt such charter provisions. Directors should base their decisions solely on the financial interests of the shareholders.
Spin-offs. Cohen & Steers evaluates spin-offs on acase-by-case basis taking into account the tax and regulatory advantages, planned use of sale proceeds, market focus, and managerial incentives.
Asset Sales. Cohen & Steers evaluates asset sales on acase-by-case basis taking into account the impact on the balance sheet/working capital, value received for the asset, and potential elimination of diseconomies.
Liquidations. Cohen & Steers evaluates liquidations on acase-by-case basis taking into account management’s efforts to pursue other alternatives, appraisal value of assets and the compensation plan for executives managing the liquidation.
Ratification of Auditors
Cohen & Steers generally votes for proposals to ratify auditors, auditor remuneration and/or proposals authorizing the board to fix audit fees, unless:
| • | | an auditor has a financial interest in or association with the company, and is therefore not independent; |
| • | | there is reason to believe that the independent auditor has rendered an opinion that is neither accurate nor indicative of the company’s financial position; |
| • | | the name of the proposed auditor and/or fees paid to the audit firm are not disclosed by the company prior to the meeting; |
| • | | the auditors are being changed without explanation; or |
| • | | fees paid fornon-audit related services are excessive and/or exceed fees paid for audit services or limits set in local best practice recommendations or law. |
Where fees fornon-audit services include fees related to significantone-time capital structure events, initial public offerings, bankruptcy emergence, and spinoffs, and the company makes public disclosure of the amount and nature of those fees, then such fees may be excluded from thenon-audit fees considered in determining whethernon-audit related fees are excessive.
Auditor Rotation
Cohen & Steers evaluates auditor rotation proposals on acase-by-case basis taking into account the following factors: the tenure of the audit firm; establishment and disclosure of a review process whereby the auditor is regularly evaluated for both audit quality and competitive price; length of the rotation period advocated in the proposal; and any significant audit related issues.
Auditor Indemnification
Cohen & Steers generally votes against auditor indemnification and limitation of liability. However, Cohen & Steers recognizes there may be situations where indemnification and limitations on liability may be appropriate.
Shareholder Access and Voting Proposals
Proxy Access. Cohen & Steers reviews proxy access proposals on acase-by-case basis taking into account the parameters of proxy access use in light of a company’s specific circumstances. Cohen & Steers generally supports proposals that provide shareholders with a reasonable opportunity to use the right without stipulating overly restrictive or onerous parameters for use and also provide assurances that the mechanism will not be subject to abuse by short-term investors, investors without a substantial investment in the company or investors seeking to take control of the board.
Bylaw Amendments. Cohen & Steers votes on acase-by-case basis on proposals requesting companies grant shareholders the ability to amend bylaws. Similar to proxy access, Cohen & Steers generally supports proposals that provide assurances that this right will not be subject to abuse by short-term investors or investors without a substantial investment in a company.
Reimbursement of Proxy Solicitation Expenses. In the absence of compelling reasons, the Advisor and the Subadvisors will generally not support such proposals.
Shareholder Ability to Call Special Meetings. Cohen & Steersvotes on acase-by-case basis on shareholder proposals requesting companies amend their governance documents (bylaws and/or charter) in order to allow shareholders to call special meetings.
Shareholder Ability to Act by Written Consent. Cohen & Steers generally votes against proposals to allow or facilitate shareholder action by written consent to provide reasonable protection of minority shareholder rights.
Shareholder Ability to Alter the Size of the Board. Cohen & Steers generally votes for proposals that seek to fix the size of the board and vote against proposals that give the board the ability to alter the size of the board without shareholder approval. While Cohen & Steers recognizes the importance of such proposals, these proposals may be set forth in order to promote the agenda(s) of certain special interest groups and could be disruptive to the management of the company.
Cumulative Voting. Having the ability to cumulate votes for the election of directors (i.e., to cast more than one vote for a director) generally increases shareholders’ rights to effect change in the management of a corporation. However, Cohen & Steers acknowledges that cumulative voting promotes special candidates who may not represent the interests of all, or even a majority, of shareholders. Therefore, when voting on proposals to institute cumulative voting, Cohen & Steers evaluates all facts and circumstances surrounding such proposal and generally vote against cumulative voting where the company has good corporate governance practices in place, including majority voting for board elections andde-classified boards.
Supermajority Vote Requirements. Cohen & Steers generally supports proposals that seek to lower supermajority voting requirements.
Confidential Voting. Cohen & Steers votes for shareholder proposals requesting that companies adopt confidential voting, use independent tabulators, and use independent inspectors of election as long as such proposals permit management to request that the dissident groups honor its confidential voting policy in the case of proxy contests.
Cohen & Steers also votes for management proposals to adopt confidential voting.
Date/Location of Meeting. Cohen & Steers votes against shareholder proposals to change the date or location of the shareholders’ meeting.
Adjourn Meeting if Votes are Insufficient. Cohen & Steers generally votes againstopen-end requests for adjournment of a shareholder meeting. However, where management specifically states the reason for requesting an adjournment and the requested adjournment is necessary to permit a proposal that would otherwise be supported under this policy to be carried out, the adjournment request will be supported.
Disclosure of Shareholder Proponents. Cohen & Steers votes for shareholder proposals requesting that companies disclose the names of shareholder proponents. Shareholders may wish to contact the proponents of a shareholder proposal for additional information.
Environmental and Social Proposals
Cohen & Steers believes that well-managed companies should be evaluating and assessing how environmental and social matters may enhance or protect shareholder value. However, because of the diverse nature of environmental and social proposals, we evaluate these proposals on acase-by-case basis. The principles guiding the evaluation of these proposals are whether implementation of a proposal is likely to enhance or protect shareholder value and whether a proposal can be implemented at a reasonable cost.
Environmental Proposals (SP).Cohen & Steers acknowledges that environmental considerations can pose significant investment risks and opportunities. Therefore, we generally vote in favor of proposals requesting a company disclose information that will aid in the determination of shareholder value creation or destruction, taking into consideration the following factors:
| • | | Whether the issues presented have already been effectively dealt with through governmental regulation or legislation; |
| • | | Whether the disclosure is available to shareholders from the company or from a publicly available source; and |
| • | | Whether implementation would reveal proprietary or confidential information that could place the company at a competitive disadvantage. |
Social Proposals (SP).Cohen & Steers believes board and workforce diversity are beneficial t the decision-making process and can enhance long-term profitability. Therefore, we generally vote in favor of proposals that seek to increase board and workforce diversity. We vote all other social proposals on acase-by-case basis, including, but not limited to, proposals related to political and charitable contributions, lobbying, and gender equality and the gender pay gap.
Miscellaneous Proposals
Bundled Proposals.Cohen & Steers reviews on acase-by-case basis bundled or “conditioned” proposals. For items that are conditioned upon each other, Cohen & Steers examines the benefits and costs of the bundled items. In instances where the combined effect of the conditioned items is not in shareholders’ best interests, Cohen & Steers votes against the proposals. If the combined effect is positive, Cohen & Steers supports such proposals. In the case of bundled director proposals, Cohen & Steers will vote for the entire slate only if Cohen & Steers would have otherwise voted for each director on an individual basis.
Other Business. Cohen & Steers generally votes against proposals to approve other business where Cohen & Steers cannot determine the exact nature of the proposal(s) to be voted on.
Item 8. Portfolio Managers ofClosed-End Investment Companies.
Information pertaining to the portfolio managers of the registrant, as of March 6, 2020 is set forth below.
| | |
Thomas N. Bohjalian • Vice President • Portfolio manager since 2006 | | Executive Vice President of C&S since 2012. Prior to that, Senior Vice President of C&S since 2006. |
| |
William F. Scapell • Vice President • Portfolio manager since inception | | Executive Vice President of C&S since 2014. Prior to that, Senior Vice President of C&S since 2003. |
| |
Jason A. Yablon • Vice President • Portfolio manager since 2012 | | Senior Vice President of C&S since 2014. Prior to that, Vice President of C&S since 2008. |
| |
Mathew Kirschner • Vice President • Portfolio manager since 2019 | | Senior Vice President of C&S since 2019. Prior to that, Vice President of C&S since 2010. |
C&S utilizes a team-based approach in managing the registrant. Mr. Bohjalian, Mr. Yablon and Mr. Kirschner direct and supervise the execution of the registrant’s investment strategy, and lead and guide the other members of the team. Mr. Scapell manages the registrant’s preferred securities investments.
Each portfolio manager listed above manages other investment companies and/or investment vehicles and accounts in addition to the registrant. The following tables show, as of December 31, 2019, the number of other accounts each portfolio manager managed in each of the listed categories and the total assets in the other accounts managed within each category. Two (2) of the 20 accounts managed by Mr. Bohjalian, and two (2) of the 8 accounts managed by Mr. Yablon, with total assets of $77 million, are subject to performance-based fees.
| | | | | | |
| Thomas Bohjalian | | Number of accounts | | Total assets | |
| | |
• Registered investment companies | | 7 | | $ | 17,665,908,004 | |
| | |
• Other pooled investment vehicles | | 16 | | $ | 10,517,413,428 | |
| | |
• Other accounts | | 20 | | $ | 3,323,303,483 | |
| | |
| William F. Scapell | | Number of accounts | | Total assets | |
| | |
• Registered investment companies | | 9 | | $ | 18,222,181,581 | |
| | |
• Other pooled investment vehicles | | 14 | | $ | 2,574,536,821 | |
| | |
• Other accounts | | 21 | | $ | 3,549,999,626 | |
| | |
| Jason A. Yablon | | Number of accounts | | Total assets | |
| | |
• Registered investment companies | | 6 | | $ | 17,049,366,028 | |
| | |
• Other pooled investment vehicles | | 9 | | $ | 637,835,054 | |
| | |
• Other accounts | | 8 | | $ | 3,974,905,085 | |
| | |
| Mathew Kirschner | | Number of accounts | | Total assets | |
| | |
• Registered investment companies | | 2 | | $ | 2,450,671,379 | |
| | |
• Other pooled investment vehicles | | 6 | | $ | 9,870,459,969 | |
| | |
• Other accounts | | -0- | | $ | 0 | |
Share Ownership. The following table indicates the dollar range of securities of the registrant owned by the registrant’s portfolio managers as of December 31, 2019:
| | |
| | | Dollar Range of Securities Owned |
Thomas N. Bohjalian | | None |
William F. Scapell | | $10,001–$50,000 |
Jason A. Yablon | | None |
Mathew Kirschner | | None |
Conflicts of Interest. It is possible that conflicts of interest may arise in connection with the portfolio manager’s management of the registrant’s investments on the one hand and the investments of other accounts or vehicles for which the portfolio managers are responsible on the other. For example, a portfolio manager may have conflicts of interest in allocating management
time, resources and investment opportunities among the registrant and the other accounts or vehicles he advises. In addition, due to differences in the investment strategies or restrictions among the registrant and the other accounts, a portfolio manager may take action with respect to another account that differs from the action taken with respect to the registrant.
In some cases, another account managed by a portfolio manager may provide more revenue to the registrant’s investment advisor. While this may appear to create additional conflicts of interest for the portfolio manager in the allocation of management time, resources and investment opportunities, the investment advisor strives to ensure that portfolio managers endeavor to exercise their discretion in a manner that is equitable to all interested persons. In this regard, in the absence of specific account-related impediments (such as client-imposed restrictions or lack of available cash), it is the policy of the investment advisor to allocate investment ideas pro rata to all accounts with the same primary investment objective.
In addition, certain of the portfolio managers may from time to time manage one or more accounts on behalf of the registrant’s investment advisor and its affiliated companies (the “CNS Accounts”). Certain securities held and traded in the CNS Accounts also may be held and traded in one or more client accounts. It is the policy of the investment advisor however not to put the interests of the CNS Accounts ahead of the interests of client accounts. The investment advisor may aggregate orders of client accounts with those of the CNS Accounts; however, under no circumstances will preferential treatment be given to the CNS Accounts. For all orders involving the CNS Accounts, purchases or sales will be allocated prior to trade placement, and orders that are only partially filled will be allocated across all accounts in proportion to the shares each account, including the CNS Accounts, was designated to receive prior to trading. As a result, it is expected that the CNS Accounts will receive the same average price as other accounts included in the aggregated order. Shares will not be allocated orre-allocated to the CNS Accounts after trade execution or after the average price is known. In the event so few shares of an order are executed that apro-rata allocation is not practical, a rotational system of allocation may be used; however, the CNS Accounts will never be part of that rotation or receive shares of a partially filled order other than on apro-rata basis.
Because certain CNS Accounts are managed with a cash management objective, it is possible that a security will be sold out of the CNS Accounts but continue to be held for one or more client accounts. In situations when this occurs, such security will remain in a client account only if the portfolio manager, acting in its reasonable judgment and consistent with its fiduciary duties, believes this is appropriate for, and consistent with the objectives and profile of, the client account.
Advisor Compensation Structure. Compensation of the investment advisor’s portfolio managers and other investment professionals has three primary components: (1) a base salary, (2) an annual cash bonus and (3) annual stock-based compensation consisting generally of restricted stock units of the investment advisor’s parent, CNS. The investment advisor’s investment professionals, including the portfolio managers, also receive certain retirement, insurance and other benefits that are broadly available to all of its employees. Compensation of the investment advisor’s investment professionals is reviewed primarily on an annual basis.
Method to Determine Compensation. The registrant’s investment advisor compensates its portfolio managers based primarily on the total return performance of funds and accounts managed by the portfolio manager versus appropriate peer groups or benchmarks. C&S uses a variety of benchmarks to evaluate each portfolio managers’ performance for compensation purposes, including the FTSE Nareit Equity REITs Index, the ICE BofA1-5 Year US Corporate Index and other broad based indexes based on the asset classes managed by each portfolio manager. In evaluating the performance of a portfolio manager, primary emphasis is normally placed onone- and three-year performance, with secondary consideration of performance over longer periods of time. Performance is evaluated on apre-tax andpre-expense basis. In addition to rankings within peer groups of funds on the basis of absolute performance, consideration may also be given to risk-adjusted performance. For funds and accounts with a primary investment objective of high current income, consideration will also be given to the fund’s and account’s success in achieving this objective. For portfolio managers responsible for multiple funds and accounts, investment performance is evaluated on an aggregate basis. The investment advisor has five funds or accounts with performance-based advisory fees. Portfolio managers are also evaluated on the basis of their success in managing their dedicated team of analysts. Base compensation for portfolio managers of the investment advisor varies in line with the portfolio manager’s seniority and position with the firm.
Salaries, bonuses and stock-based compensation are also influenced by the operating performance of the investment advisor and CNS. While the annual salaries of the investment advisor’s portfolio managers are fixed, cash bonuses and stock based compensation may fluctuate significantly from year to year, based on changes in manager performance and other factors.
Item 9. Purchases of Equity Securities byClosed-End Management Investment Company and Affiliated Purchasers.
None.
Note: On December 10, 2019, the Board of Directors of the Fund approved continuation of the delegation of its authority to management to effect repurchases, pursuant to management’s discretion and subject to market conditions and investment considerations, of up to 10% of the Fund’s common shares outstanding (“Share Repurchase Program”) as of January 1, 2020 through December 31, 2020.
Item 10. Submission of Matters to a Vote of Security Holders.
There have been no material changes to the procedures by which shareholders may recommend nominees to the registrant’s Board implemented after the registrant last provided disclosure in response to this Item.
Item 11. Controls and Procedures.
(a) The registrant’s principal executive officer and principal financial officer have concluded that the registrant’s disclosure controls and procedures are reasonably designed to ensure that information required to be disclosed by the registrant in this FormN-CSR was recorded,
processed, summarized and reported within the time periods specified in the Securities and Exchange Commission’s rules and forms, based upon such officers’ evaluation of these controls and procedures as of a date within 90 days of the filing date of this report.
(b) There were no changes in the registrant’s internal control over financial reporting that occurred during the period covered by this report that have materially affected, or are reasonably likely to materially affect, the registrant’s internal control over financial reporting.
Item 12. Disclosure of Securities Lending Activities forClosed-End Management Investment Companies.
(a) For the fiscal year ended December 31, 2019, the registrant had the following dollar amounts of income and fees/compensation related to its securities lending activities:
| | | | |
| | | Total | |
| Gross income from securities lending activities | | | $492,447 | |
| Fees and/or compensation for securities lending activities and related services | | | | |
Fees paid to securities lending agent from a revenue split | | | 418,580 | |
Fees paid for cash collateral management services (including fees deducted from a pooled cash collateral reinvestment vehicle) that are not included in the revenue split | | | — | |
Administrative fees that are not included in the revenue split | | | — | |
Indemnification fee not included in the revenue split | | | — | |
Rebates paid to borrowers; | | | — | |
Other fees relating to the securities lending program not included in the revenue split | | | — | |
| Aggregate fees/compensation for securities lending activities and related services | | | $418,580 | |
| Net income from securities lending activities | | | $73,867 | |
(b) During the registrants most recent fiscal year ended December 31, 2019, BNP Paribas (“BNPP”) served as the registrant’s securities lending agent.
As a securities lending agent, BNPP is responsible for the implementation and administration of the registrant’s securities lending program. Pursuant to its respective Securities Lending Agreement (“Securities Lending Agreement”) with the registrant, BNPP, as a general matter, performs various services, including the following:
| | • | | Monitoring daily the value of the loaned securities and collateral (i.e. the collateral posted by the party borrowing); |
| | • | | Negotiation of loan terms; |
| | • | | Selection of securities to be loaned; |
| | • | | Recordkeeping and account servicing; |
| | • | | Monitoring of dividend activity and material proxy votes relating to loaned securities, and; |
| | • | | Arranging for return of loaned securities to the registrant at loan termination. |
BNPP is compensated for the above-described services from its securities lending revenue split. The table above shows what the registrant earned and the fees and compensation it paid in connections with its securities lending activities during its most recent fiscal year.
Item 13. Exhibits.
(a)(1)Not applicable.
(a) (2)Certifications of principal executive officer and principal financial officer as required by Rule30a-2(a) under the Investment Company Act of 1940.
(a)(3) Not applicable.
(a)(4) Not applicable.
(b) Certifications of principal executive officer and principal financial officer as required byRule 30a-2(b) under the Investment Company Act of 1940.
(c) Registrant’s notices to shareholders pursuant to Registrant’s exemptive order granting an exemption from Section 19(b) of the 1940 Act and Rule19b-1 thereunder regarding distributions pursuant to the Registrant’s Managed Distribution Plan.
SIGNATURES
Pursuant to the requirements of the Securities Exchange Act of 1934 and the Investment Company Act of 1940, the registrant has duly caused this report to be signed on its behalf by the undersigned, thereunto duly authorized.
COHEN & STEERS REIT AND PREFERRED AND INCOME FUND, INC.
| | | | |
| | |
| | By: | | /s/ Adam M. Derechin |
| | | | Name: Adam M. Derechin Title: Principal Executive Officer (President and Chief Executive Officer) |
| |
| | Date: March 6, 2020 |
Pursuant to the requirements of the Securities Exchange Act of 1934 and the Investment Company Act of 1940, this report has been signed below by the following persons on behalf of the registrant and in the capacities and on the dates indicated.
| | | | |
| | |
| | By: | | /s/ Adam M. Derechin |
| | | | Name: Adam M. Derechin Title: Principal Executive Officer (President and Chief Executive Officer) |
| | |
| | By: | | /s/ James Giallanza |
| | | | Name: James Giallanza Title: Principal Financial Officer (Chief Financial Officer) |
| |
| | Date: March 6, 2020 |