UNITED STATES
SECURITIES AND EXCHANGE COMMISSION
Washington, D.C. 20549
FORM N-CSR
CERTIFIED SHAREHOLDER REPORT OF REGISTERED MANAGEMENT
INVESTMENT COMPANIES
Investment Company Act file number | 811-21327 |
| |
| BNY Mellon Investment Funds VI | |
| (Exact name of Registrant as specified in charter) | |
| | |
| c/o BNY Mellon Investment Adviser, Inc. 240 Greenwich Street New York, New York 10286 | |
| (Address of principal executive offices) (Zip code) | |
| | |
| Bennett A. MacDougall, Esq. 240 Greenwich Street New York, New York 10286 | |
| (Name and address of agent for service) | |
|
Registrant's telephone number, including area code: | (212) 922-6400 |
| |
Date of fiscal year end: | 11/30 | |
Date of reporting period: | 11/30/2019 | |
| | | | | | | |
The following N-CSR relates only to the Registrant's series listed below and does not relate to any series of the Registrant with a different fiscal year end and, therefore, different N-CSR reporting requirements. A separate N-CSR will be filed for any series with a different fiscal year end, as appropriate.
BNY Mellon Balanced Opportunity Fund
FORM N-CSR
Item 1. Reports to Stockholders.
BNY Mellon Balanced Opportunity Fund
| |
ANNUAL REPORT November 30, 2019 |
| |
Save time. Save paper. View your next shareholder report online as soon as it’s available. Log into www.bnymellonim.com/us and sign up for eCommunications. It’s simple and only takes a few minutes. |
| |
The views expressed in this report reflect those of the portfolio manager(s) only through the end of the period covered and do not necessarily represent the views of BNY Mellon Investment Adviser, Inc. or any other person in the BNY Mellon Investment Adviser, Inc. organization. Any such views are subject to change at any time based upon market or other conditions and BNY Mellon Investment Adviser, Inc. disclaims any responsibility to update such views. These views may not be relied on as investment advice and, because investment decisions for a fund in the BNY Mellon Family of Funds are based on numerous factors, may not be relied on as an indication of trading intent on behalf of any fund in the BNY Mellon Family of Funds. |
| |
Not FDIC-Insured • Not Bank-Guaranteed • May Lose Value |
Contents
THE FUND
FOR MORE INFORMATION
Back Cover
| | | | |
| |
BNY Mellon Balanced Opportunity Fund
| | The Fund |
A LETTER FROM THE PRESIDENT OF BNY MELLON INVESTMENT ADVISER, INC.
Dear Shareholder:
We are pleased to present this annual report for BNY Mellon Balanced Opportunity Fund (formerly, Dreyfus Opportunity Fund), covering the 12-month period from December 1, 2018 through November 30, 2019. For information about how the fund performed during the reporting period, as well as general market perspectives, we provide a Discussion of Fund Performance on the pages that follow.
In December 2018, stocks experienced a sharp sell-off, as it appeared that the U.S. Federal Reserve (the “Fed”) would maintain its hawkish stance on monetary policy. In January 2019, a pivot in stance from the Fed helped stimulate a rebound across equity markets that continued into the second quarter. Escalating trade tensions disrupted equity markets again in May. The dip was short-lived, as markets rose once again in June and July of 2019, when a trade deal appeared more likely, and the pace of U.S. economic growth remained steady. Nevertheless, concerns over slowing global growth persisted, resulting in bouts of market volatility in August 2019. Stocks rebounded in September and continued an upward path through most of October 2019, supported in part by central bank policy and consistent consumer spending. Near the end of the period, an announcement by President Trump that the first phase of a trade deal with China had been achieved sent U.S. markets to record highs.
In fixed-income markets, a risk-off mentality prevailed to start the period, fueled in part by equity market volatility. A flight to quality supported price increases for U.S. Treasuries, which continued through the end of 2018, leading to a flattening yield curve. After the Fed’s supportive statements in January 2019, other developed-market central banks followed suit and reiterated their abilities to bolster flagging growth by continuing accommodative policies. After taking into account the 25-basis-point increase in December 2018, there was a net decrease of 50 basis points in the federal funds rate during the reporting period. Rates across much of the Treasury curve saw a slight increase during the month of November. However, demand for fixed-income instruments during much of the reporting period was strong, which helped to support positive bond market returns.
We believe that over the near term, the outlook for the U.S. remains positive, but we will monitor relevant data for any signs of a change. As always, we encourage you to discuss the risks and opportunities in today’s investment environment with your financial advisor.
Thank you for your continued confidence and support.
Sincerely,

Renee LaRoche-Morris
President
BNY Mellon Investment Adviser, Inc.
December 16, 2019
2
DISCUSSION OF FUND PERFORMANCE(Unaudited)
For the period from December 1, 2018 through November 30, 2019, as provided by Vassilis Dagioglu and Torrey Zaches, Asset Allocation Portfolio Managers, Brian Ferguson, John C. Bailer, James A. Lydotes, CFA, and David Bowser, Portfolio Managers.
Market and Fund Performance Overview
For the 12-month period ended November 30, 2019, the BNY Mellon Balanced Opportunity Fund’s (formerly, Dreyfus Balanced Opportunity Fund) Class A shares, Class C shares, Class I shares, Class J shares, Class Y shares and Class Z shares produced total returns of 10.23%, 9.46%, 10.55%, 10.55%, 10.51% and 10.41%, respectively.1 In comparison, the S&P 500® Index and the Bloomberg Barclays U.S. Aggregate Bond Index (the “Bloomberg Index”), produced total returns of 15.85% and 10.79%, respectively, for the same period.2,3 Separately, a Customized Blended Index composed of 60% S&P 500® Index and 40% Bloomberg Index produced a total return of 14.42% for the same period.4
Stocks and bonds gained steadily over the reporting period, amid moderate growth, accommodative central bank policies and low interest rates. The fund underperformed the Customized Blended Index for the period, partly due to stock selection in the equity portfolio and short duration positioning within the bond sleeve.
The Fund’s Investment Approach
The fund seeks high total return through a combination of capital appreciation and current income. To pursue its goal, the fund invests in a diversified mix of stocks and fixed-income securities. The fund varies the mix of stocks and bonds, but normally the fund allocates between 25% and 50% to fixed-income securities and between 75% and 50% to equities. The fund has appointed an asset allocation manager who will allocate fund assets among the fund’s equity portfolio managers and the fund’s fixed-income portfolio managers—based on an assessment of the relative return and risk of each asset class and an analysis of several factors, including general economic conditions, anticipated future changes in interest rates, and the outlook for stocks generally.
In the equity portion of the fund’s portfolio, we strive to create a broadly diversified blend of growth and value stocks. Stock selection is made through extensive quantitative and fundamental research. The fund may invest up to 20% of its assets in foreign equity securities.
In the fixed-income portion of the fund’s portfolio, we may include corporate bonds, debentures, notes, mortgage-related securities, including collateralized mortgage obligations (CMOs), asset-backed securities, convertible securities, municipal obligations, zero coupon bonds and money market instruments.
Markets Pivot on Central Bank and Trade Activity
During the fourth quarter of 2018, many equity markets felt pressure from slowing global growth, escalating trade issues between U.S. and China, Brexit difficulties and additional geopolitical issues elsewhere in Europe and the emerging markets. In December 2018, equities reached new lows for the year, as economic and political news continued to unnerve investors. Investors also feared the European Central Bank (ECB) would proceed with its plan to conclude stimulus measures in January, despite moderating growth rates.
3
DISCUSSION OF FUND PERFORMANCE(Unaudited) (continued)
January 2019 marked a turnaround in the markets. Talk of a potential trade deal between the U.S. and China helped fuel investor optimism, as equity prices recovered. The ECB announced it would provide additional stimulus to support the eurozone economy. China also announced plans to stoke its slowing economic growth rate. At its first meeting of the year, the U.S. Federal Reserve (the “Fed”) emphasized its focus on data as a primary driver for rate-hike decisions, and its ability to suspend additional rate increases when the data is not supportive. These sentiments reassured investors of central bankers’ commitments to support flagging growth. The rebound continued throughout the month of January, and equity markets maintained an upward trajectory through April 2019. However, renewed trade tensions between the U.S. and China in May caused stocks to pull back once again. The dip was short-lived, as markets rose once again in June. At the end of July and again in September and October, the Fed cut the federal funds rate each time by 25 basis points. Supported by rate cuts, moderate economic growth and optimism regarding a preliminary trade agreement with China, equity markets went on to post solid gains the last several months of the period despite occasional pockets of volatility.
Bonds produced steady returns in an environment of moderate economic growth and falling interest rates. After a difficult December, corporate debt performed well starting in January, while mortgages and Treasury Inflation Protected Securities (TIPS) lagged the broader fixed-income market, as did mortgage-backed securities.
Stock Choices and Bond Duration Weigh on Relative Results
The fund’s asset allocation strategy contributed during the period. The fund had a relative overweight allocation to equities, which produced higher returns than bonds during the period.
However, the equity portfolio did mildly underperform its respective benchmark during the period. Security selection detracted from relative returns. Stock choices within the information technology, health care, materials and communication services sectors created the largest headwind. A modest overweight to the energy sector also weighed on relative results. Within information technology, reduced exposure to Apple and Microsoft constrained returns. Health care company CVS Health issued a profit warning early in the period and suffered a reduced stock price. Agricultural chemical company Mosaic was among the largest detractors from overall performance. Demand for the company’s products was stunted by a delayed planting season. Trade difficulties also affected demand for the company’s products. An overweight to Corning also hurt relative performance. Conversely, selections within the financials and consumer discretionary sectors were beneficial.
Despite strong absolute returns for fixed-income instruments, the fund’s bond portfolio slightly lagged its index for the reporting period. The main driver of the underperformance was short duration positioning, which reduced the portfolio’s sensitivity to falling interest rates when compared to the benchmark. The portfolio’s allocation to TIPS also detracted from relative results. Conversely, yield curve positioning was additive during the period. The U.S. Treasury yield curve flattened during parts of the period and owning debt with maturity profiles affected by this activity was beneficial. In addition, an underweight to mortgage-backed securities helped relative performance, as the asset class lagged the broader market during the year.
4
A Constructive Investment Posture
From an asset allocation perspective, we maintain a moderate overweight to equities. We expect the economy to continue to grow at a moderate level. Rates are low, which can provide stimulus to the economy. We maintain a slight underweight to bonds because we believe valuations are rich and yields on bonds have decreased, reducing the term premium for investors. We believe cash yields are providing a good amount of compensation for the level of risk. If bond yields start to rise, we may rotate part of the current cash position back into bonds.
Within the fund’s stock portfolio, we maintain a positive outlook on equities despite recent trade difficulties and pockets of volatility. We continue to look for attractive valuations and believe the low rate environment and moderate growth rates will continue to support a healthy equity market. Within bonds, we believe the economy is fundamentally sound. We maintain an underweight duration position and are using TIPS as a hedge against possible inflation. We have used the recent underperformance of the agency mortgage sector to add to our position, as we believe these securities are a source of high-quality yield.
December 16, 2019
1 Total return includes reinvestment of dividends and any capital gains paid and does not take into consideration the maximum initial sales charge in the case of Class A shares, or the applicable contingent deferred sales charge imposed on redemptions in the case of Class C shares. Had these charges been reflected, returns would have been lower. Past performance is no guarantee of future results. Share price and investment return fluctuate such that upon redemption, fund shares may be worth more or less than their original cost. Return figures for the fund provided reflect the absorption of certain fund expenses by BNY Mellon Investment Adviser, Inc. pursuant to an undertaking in effect through April 1, 2020, at which time it may be extended, terminated, or modified. Had these expenses not been absorbed, the fund’s returns would have been lower.
2 Source: Lipper Inc. — The S&P 500® Index is widely regarded as the best single gauge of large-cap, U.S. equities. The index includes 500 leading companies and captures approximately 80% coverage of available market capitalization. Investors cannot invest directly in any index.
3 Source: Lipper Inc. — The Bloomberg Barclays U.S. Aggregate Bond Index is a broad-based, flagship benchmark that measures the investment-grade, U.S. dollar-denominated, fixed-rate, taxable bond market. The index includes Treasuries, government-related and corporate securities, MBS (agency fixed-rate and hybrid ARM pass-throughs), ABS and CMBS (agency and nonagency). Investors cannot invest directly in any index.
4 The source for the Customized Blended Index is FactSet.
Equities are subject generally to market, market sector, market liquidity, issuer and investment style risks, among other factors, to varying degrees, all of which are more fully described in the fund’s prospectus.
Bonds are subject generally to interest-rate, credit, liquidity and market risks, to varying degrees, all of which are more fully described in the fund’s prospectus. Generally, all other factors being equal, bond prices are inversely related to interest-rate changes, and rate increases can cause price declines.
The fund may, but is not required to, use derivative instruments, such as options, futures, options on futures, forward contracts and other credit derivatives. A small investment in derivatives could have a potentially large impact on the fund’s performance. The use of derivatives involves risks different from, or possibly greater than, the risks associated with investing directly in the underlying assets.
5
FUND PERFORMANCE(Unaudited)
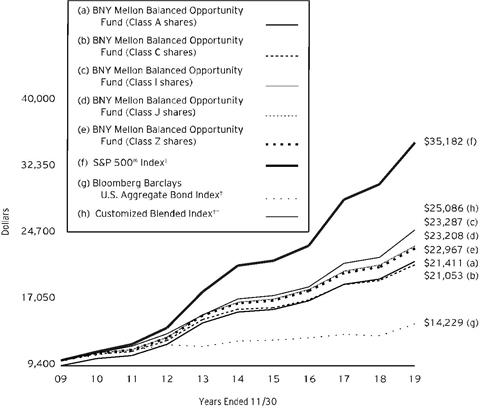
Comparison of change in value of a $10,000 investment in Class A shares, Class C shares, Class I shares, Class J shares and Class Z shares of BNY Mellon Balanced Opportunity Fund with a hypothetical investment of $10,000 in the S&P 500® Index, Bloomberg Barclays U.S. Aggregate Bond Index and an index comprised of 60% S&P 500® Index and 40% Bloomberg Barclays U.S. Aggregate Bond Index (the “Customized Blended Index”)
† Source: Lipper Inc.
†† Source: FactSet
Past performance is not predictive of future performance.
The above graph compares a hypothetical $10,000 investment made in Class A, Class C, Class I, Class J and Class Z shares of BNY Mellon Balanced Opportunity Fund on 11/30/09 to a hypothetical investment of $10,000 made in the S&P 500® Index, Bloomberg Barclays U.S. Aggregate Bond Index and Customized Blended Index on that date. All dividends and capital gain distributions are reinvested. Returns for the Customized Blended Index are re-balanced monthly.
The fund’s performance shown in the line graph above takes into account the maximum initial sales charge on Class A shares and all other applicable fees and expenses on all classes. The S&P 500® Index is widely regarded as the best single gauge of large-cap U.S. equities. The index includes 500 leading companies and captures approximately 80% coverage of available market capitalization. The Bloomberg Barclays U.S. Aggregate Bond Index is a broad-based flagship benchmark that measures the investment-grade, U.S. dollar-denominated, fixed-rate taxable bond market. The index includes Treasuries, government-related and corporate securities, MBS (agency fixed-rate and hybrid ARM pass-throughs), ABS and CMBS (agency and nonagency). Unlike a mutual fund, the indices are not subject to charges, fees and other expenses. Investors cannot invest directly in any index. Further information relating to fund performance, including expense reimbursements, if applicable, is contained in the Financial Highlights section of the prospectus and elsewhere in this report.
6
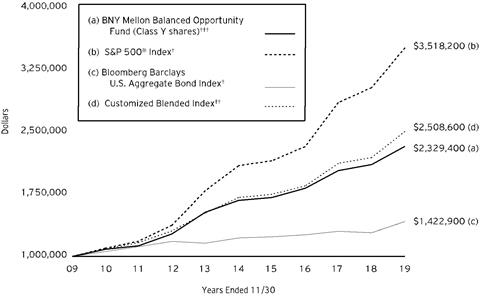
Comparison of change in value of a $1,000,000 investment in Class Y shares of BNY Mellon Balanced Opportunity Fund with a hypothetical investment of $1,000,000 in the S&P 500® Index, Bloomberg Barclays U.S. Aggregate Bond Index and an index comprised of 60% S&P 500® Index and 40% Bloomberg Barclays U.S. Aggregate Bond Index (the “Customized Blended Index”)
† Source: Lipper Inc.
†† Source: FactSet
††† The total return figures presented for Class Y shares of the fund reflect the performance of the fund’s Class I shares for the period prior to 9/30/16 (the inception date for Class Y shares).
Past performance is not predictive of future performance.
The above graph compares a hypothetical $1,000,000 investment made in Class Y shares of BNY Mellon Balanced Opportunity Fund on 11/30/09 to a hypothetical investment of $1,000,000 made in the S&P 500® Index, Bloomberg Barclays U.S. Aggregate Bond Index and Customized Blended Index on that date. All dividends and capital gain distributions are reinvested. Returns for the Customized Blended Index are re-balanced monthly.
The fund’s performance shown in the line graph above takes into account all other applicable fees and expenses of the fund’s Class Y Shares. The S&P 500® Index is widely regarded as the best single gauge of large-cap U.S. equities. The index includes 500 leading companies and captures approximately 80% coverage of available market capitalization. The Bloomberg Barclays U.S. Aggregate Bond Index is a broad-based flagship benchmark that measures the investment-grade, U.S. dollar-denominated, fixed-rate taxable bond market. The index includes Treasuries, government-related and corporate securities, MBS (agency fixed-rate and hybrid ARM pass-throughs), ABS and CMBS (agency and nonagency). Unlike a mutual fund, the indices are not subject to charges, fees and other expenses. Investors cannot invest directly in any index. Further information relating to fund performance, including expense reimbursements, if applicable, is contained in the Financial Highlights section of the prospectus and elsewhere in this report.
7
FUND PERFORMANCE(Unaudited) (continued)
| | | | | | |
Average Annual Total Returns as of 11/30/19 |
| | Inception
Date | 1 Year | 5 Years | 10 Years |
Class A shares | | | | | |
with maximum sales charge (5.75%) | | 1/30/04 | 3.87% | 5.28% | 7.91% |
without sales charge | | 1/30/04 | 10.23% | 6.53% | 8.55% |
Class C shares | | | | | |
with applicable redemption charge† | | 1/30/04 | 8.46% | 5.74% | 7.73% |
without redemption | | 1/30/04 | 9.46% | 5.74% | 7.73% |
Class I shares | | 1/30/04 | 10.55% | 6.80% | 8.82% |
Class J shares | | 3/16/87 | 10.55% | 6.80% | 8.78% |
Class Y shares | | 9/30/16 | 10.51% | 6.81%†† | 8.82%†† |
Class Z shares | | 12/17/04 | 10.41% | 6.71% | 8.67% |
S&P 500® Index | | | 15.85% | 10.92% | 13.40% |
Bloomberg Barclays U.S. Aggregate Bond Index | | | 10.79% | 3.08% | 3.59% |
Customized Blended Index | | | 14.42% | 7.96% | 9.63% |
† The maximum contingent deferred sales charge for Class C shares is 1% for shares redeemed within one year of the date of purchase.
†† The total return performance figures presented for Class Y shares of the fund reflect the performance of the fund’s Class I shares for the period prior to 9/30/16 (the inception date for Class Y shares).
The performance data quoted represents past performance, which is no guarantee of future results. Share price and investment return fluctuate and an investor’s shares may be worth more or less than original cost upon redemption. Current performance may be lower or higher than the performance quoted. Go to www.bnymellonim.com/us for the fund’s most recent month-end returns.
The fund’s performance shown in the graphs and table does not reflect the deduction of taxes that a shareholder would pay on fund distributions or the redemption of fund shares. In addition to the performance of Class A shares shown with and without a maximum sales charge, the fund’s performance shown in the table takes into account all other applicable fees and expenses on all classes.
8
UNDERSTANDING YOUR FUND’S EXPENSES(Unaudited)
As a mutual fund investor, you pay ongoing expenses, such as management fees and other expenses. Using the information below, you can estimate how these expenses affect your investment and compare them with the expenses of other funds. You also may pay one-time transaction expenses, including sales charges (loads) and redemption fees, which are not shown in this section and would have resulted in higher total expenses. For more information, see your fund’s prospectus or talk to your financial adviser.
Review your fund’s expenses
The table below shows the expenses you would have paid on a $1,000 investment in BNY Mellon Balanced Opportunity Fund from June 1, 2019 to November 30, 2019. It also shows how much a $1,000 investment would be worth at the close of the period, assuming actual returns and expenses.
| | | | | | | | | |
Expenses and Value of a $1,000 Investment | |
Assume actual returns for the six months ended November 30, 2019 | |
| | | | | | | | |
| | Class A | Class C | Class I | Class J | Class Y | Class Z | |
Expense paid per $1,000† | $6.31 | $10.24 | $5.00 | $5.00 | $5.00 | $5.37 | |
Ending value (after expenses) | $1,099.00 | $1,095.20 | $1,100.20 | $1,100.60 | $1,100.20 | $1,099.30 | |
COMPARING YOUR FUND’S EXPENSES
WITH THOSE OF OTHER FUNDS(Unaudited)
Using the SEC’s method to compare expenses
The Securities and Exchange Commission (“SEC”) has established guidelines to help investors assess fund expenses. Per these guidelines, the table below shows your fund’s expenses based on a $1,000 investment, assuming a hypothetical 5% annualized return. You can use this information to compare the ongoing expenses (but not transaction expenses or total cost) of investing in the fund with those of other funds. All mutual fund shareholder reports will provide this information to help you make this comparison. Please note that you cannot use this information to estimate your actual ending account balance and expenses paid during the period.
| | | | | | | | | |
Expenses and Value of a $1,000 Investment | |
Assuming a hypothetical 5% annualized return for the six months ended November 30, 2019 | |
| | | | | | | | |
| | Class A | Class C | Class I | Class J | Class Y | Class Z | |
Expense paid per $1,000† | $6.07 | $9.85 | $4.81 | $4.81 | $4.81 | $5.17 | |
Ending value (after expenses) | $1,019.05 | $1,015.29 | $1,020.31 | $1,020.31 | $1,020.31 | $1,019.95 | |
†Expenses are equal to the fund’s annualized expense ratio of 1.20% for Class A, 1.95% for Class C, .95% for Class I, .95% for Class J, .95% for Class Y and 1.02% for Class Z, multiplied by the average account value over the period, multiplied by 183/365 (to reflect the one-half year period). | |
9
STATEMENT OF INVESTMENTS
November 30, 2019
| | | | | | | | | | |
| |
Description | Coupon
Rate (%) | | Maturity
Date | | Principal
Amount ($) | | Value ($) | |
Bonds and Notes - 28.8% | | | | | |
Aerospace & Defense - .2% | | | | | |
The Boeing Company, Sr. Unscd. Notes | | 3.20 | | 3/1/2029 | | 280,000 | | 294,575 | |
United Technologies, Sr. Unscd. Notes | | 4.13 | | 11/16/2028 | | 200,000 | | 225,364 | |
| | 519,939 | |
Asset-Backed Certificates - .6% | | | | | |
CNH Equipment Trust, Ser. 2018-B, Cl. A4 | | 3.37 | | 5/15/2024 | | 495,000 | | 511,423 | |
Dell Equipment Finance Trust, Ser. 2017-2, Cl. A3 | | 2.19 | | 10/24/2022 | | 88,790 | a | 88,805 | |
HPEFS Equipment Trust, Ser. 2019-1A, Cl. A2 | | 2.19 | | 9/20/2029 | | 175,000 | a | 175,469 | |
HPEFS Equipment Trust, Ser. 2019-1A, Cl. A3 | | 2.21 | | 9/20/2029 | | 100,000 | a | 100,295 | |
SCF Equipment Leasing, Ser. 2019-1A, Cl. A2 | | 3.23 | | 10/20/2024 | | 100,000 | a | 100,852 | |
Verizon Owner Trust, Ser. 2017-3A, Cl. A1A | | 2.06 | | 4/20/2022 | | 354,939 | a | 355,559 | |
Verizon Owner Trust, Ser. 2018-1A, Cl. A1A | | 2.82 | | 9/20/2022 | | 360,000 | a | 362,518 | |
Verizon Owner Trust, Ser. 2019-C, Cl. A1A | | 1.94 | | 4/22/2024 | | 200,000 | | 199,944 | |
| | 1,894,865 | |
Asset-Backed Ctfs./Auto Receivables - .9% | | | | | |
Ally Auto Receivables Trust, Ser. 2019-3, CI. A3 | | 1.93 | | 5/15/2024 | | 330,000 | | 330,553 | |
AmeriCredit Automobile Receivables Trust, Ser. 2015-3, Cl. C | | 2.73 | | 3/8/2021 | | 19,518 | | 19,520 | |
AmeriCredit Automobile Receivables Trust, Ser. 2017-4, Cl. A3 | | 2.04 | | 7/18/2022 | | 333,482 | | 333,527 | |
CarMax Auto Owner Trust, Ser. 2017-4, Cl. A4 | | 2.33 | | 5/15/2023 | | 170,000 | | 170,947 | |
Enterprise Fleet Financing, Ser. 2017-3, Cl. A2 | | 2.13 | | 5/22/2023 | | 69,452 | a | 69,444 | |
Hyundai Auto Lease Securitization Trust, Ser. 2017-C, Cl. A3 | | 2.12 | | 2/16/2021 | | 133,076 | a | 133,089 | |
Hyundai Auto Lease Securitization Trust, Ser. 2017-C, Cl. A4 | | 2.21 | | 9/15/2021 | | 295,000 | a | 295,146 | |
Nissan Auto Receivables Owner Trust, Ser. 2019-A, Cl. A3 | | 2.90 | | 10/16/2023 | | 250,000 | | 254,146 | |
Oscar US Funding Trust IX, Ser. 2018-2A, Cl. A4 | | 3.63 | | 9/10/2025 | | 320,000 | a | 330,620 | |
10
| | | | | | | | | | |
| |
Description | Coupon
Rate (%) | | Maturity
Date | | Principal
Amount ($) | | Value ($) | |
Bonds and Notes - 28.8% (continued) | | | | | |
Asset-Backed Ctfs./Auto Receivables - .9% (continued) | | | | | |
Oscar US Funding Trust VII, Ser. 2017-2A, Cl. A3 | | 2.45 | | 12/10/2021 | | 34,908 | a | 34,955 | |
Oscar US Funding Trust VII, Ser. 2017-2A, Cl. A4 | | 2.76 | | 12/10/2024 | | 50,000 | a | 50,562 | |
Oscar US Funding Trust VIII, Ser. 2018-1A, Cl. A4 | | 3.50 | | 5/12/2025 | | 380,000 | a | 391,456 | |
OSCAR US Funding XI, Ser. 2019-2A, Cl. A4 | | 2.68 | | 9/10/2026 | | 370,000 | a | 373,905 | |
| | 2,787,870 | |
Asset-Backed Ctfs./Credit Cards - .1% | | | | | |
Delamare Cards MTN Issuer, Ser. 2018-1A, Cl. A1, 1 Month LIBOR +.70% | | 2.43 | | 11/19/2025 | | 425,000 | a,b | 425,759 | |
Automobiles & Components - .1% | | | | | |
Volkswagen Group of America Finance, Gtd. Notes | | 2.70 | | 9/26/2022 | | 200,000 | a | 201,941 | |
Banks - 2.3% | | | | | |
Banco Santander, Sr. Unscd. Notes | | 3.13 | | 2/23/2023 | | 200,000 | | 203,832 | |
Bank of America, Sr. Unscd. Notes | | 3.00 | | 12/20/2023 | | 229,000 | | 233,922 | |
Bank of America, Sr. Unscd. Notes | | 3.42 | | 12/20/2028 | | 105,000 | | 110,176 | |
Bank of America, Sr. Unscd. Notes | | 3.50 | | 5/17/2022 | | 60,000 | | 61,259 | |
Bank of America, Sr. Unscd. Notes | | 3.97 | | 2/7/2030 | | 250,000 | | 273,500 | |
Bank of America, Sr. Unscd. Notes | | 4.00 | | 4/1/2024 | | 68,000 | | 72,807 | |
Barclays, Sr. Unscd. Notes | | 3.93 | | 5/7/2025 | | 205,000 | | 213,832 | |
BB&T, Sr. Unscd. Notes | | 2.50 | | 8/1/2024 | | 265,000 | | 267,486 | |
Citigroup, Sr. Unscd. Notes | | 3.88 | | 10/25/2023 | | 325,000 | | 345,234 | |
Citigroup, Sr. Unscd. Notes | | 4.50 | | 1/14/2022 | | 180,000 | | 188,867 | |
Citigroup, Sr. Unscd. Notes | | 4.65 | | 7/30/2045 | | 260,000 | | 318,533 | |
Citizens Bank, Sr. Unscd. Notes | | 3.75 | | 2/18/2026 | | 250,000 | | 266,912 | |
ING Groep, Sr. Unscd. Notes | | 3.55 | | 4/9/2024 | | 200,000 | | 208,584 | |
JPMorgan Chase & Co., Sr. Unscd. Notes | | 3.96 | | 1/29/2027 | | 255,000 | | 275,721 | |
JPMorgan Chase & Co., Sr. Unscd. Notes | | 4.45 | | 12/5/2029 | | 185,000 | | 210,408 | |
JPMorgan Chase & Co., Sr. Unscd. Notes | | 4.50 | | 1/24/2022 | | 235,000 | | 246,561 | |
Keybank, Sr. Unscd. Bonds | | 2.50 | | 11/22/2021 | | 250,000 | | 252,388 | |
Kreditanstalt Fuer Wiederaufbau, Govt Gtd. Notes | | 2.38 | | 12/29/2022 | | 565,000 | | 577,155 | |
Morgan Stanley, Sr. Unscd. Notes | | 3.70 | | 10/23/2024 | | 85,000 | | 90,065 | |
Morgan Stanley, Sr. Unscd. Notes | | 3.75 | | 2/25/2023 | | 310,000 | | 324,612 | |
Morgan Stanley, Sr. Unscd. Notes | | 4.00 | | 7/23/2025 | | 75,000 | | 81,129 | |
Morgan Stanley, Sr. Unscd. Notes, 3 Month LIBOR +1.18% | | 3.15 | | 1/20/2022 | | 110,000 | b | 111,164 | |
PNC Bank, Sr. Unscd. Notes | | 2.23 | | 7/22/2022 | | 290,000 | | 290,971 | |
11
STATEMENT OF INVESTMENTS (continued)
| | | | | | | | | | |
| |
Description | Coupon
Rate (%) | | Maturity
Date | | Principal
Amount ($) | | Value ($) | |
Bonds and Notes - 28.8% (continued) | | | | | |
Banks - 2.3% (continued) | | | | | |
Royal Bank of Canada, Sr. Unscd. Notes | | 2.55 | | 7/16/2024 | | 230,000 | | 232,840 | |
Royal Bank of Scotland Group, Sr. Unscd. Notes | | 4.27 | | 3/22/2025 | | 250,000 | | 263,913 | |
The Goldman Sachs Group, Sr. Unscd. Notes | | 3.81 | | 4/23/2029 | | 190,000 | c | 203,459 | |
The Goldman Sachs Group, Sr. Unscd. Notes, 3 Month LIBOR +1.60% | | 3.51 | | 11/29/2023 | | 395,000 | b | 408,876 | |
The PNC Financial Services Group, Sr. Unscd. Notes | | 3.30 | | 3/8/2022 | | 210,000 | | 215,702 | |
U.S. Bancorp, Sr. Unscd. Notes | | 2.40 | | 7/30/2024 | | 205,000 | | 207,789 | |
Wells Fargo & Co., Sr. Unscd. Notes | | 3.07 | | 1/24/2023 | | 175,000 | | 178,344 | |
Wells Fargo & Co., Sub. Notes | | 4.30 | | 7/22/2027 | | 320,000 | | 351,287 | |
| | 7,287,328 | |
Beverage Products - .1% | | | | | |
Anheuser-Busch Inbev Worldwide, Gtd. Notes | | 4.00 | | 4/13/2028 | | 110,000 | | 121,435 | |
Anheuser-Busch Inbev Worldwide, Gtd. Notes | | 4.90 | | 2/1/2046 | | 180,000 | | 216,272 | |
Keurig Dr Pepper, Gtd. Notes | | 4.06 | | 5/25/2023 | | 35,000 | | 37,029 | |
| | 374,736 | |
Chemicals - .1% | | | | | |
Nutrien, Sr. Unscd. Notes | | 4.20 | | 4/1/2029 | | 70,000 | | 76,805 | |
The Dow Chemical Company, Sr. Unscd. Notes | | 4.63 | | 10/1/2044 | | 145,000 | | 158,189 | |
| | 234,994 | |
Collateralized Municipal-Backed Securities - .6% | | | | | |
Federal Home Loan Mortgage Corp. Multifamily Structured Pass Through Certificates, Ser. K089, Cl. A2 | | 3.56 | | 1/25/2029 | | 560,000 | d | 618,064 | |
Federal Home Loan Mortgage Corp. Multifamily Structured Pass Through Certificates, Ser. K090, Cl. A2 | | 3.42 | | 2/25/2029 | | 545,000 | d | 596,815 | |
Federal Home Loan Mortgage Corp. Multifamily Structured Pass Through Certificates, Ser. K095, Cl. A2 | | 2.79 | | 6/25/2029 | | 775,000 | d | 812,375 | |
| | 2,027,254 | |
Commercial & Professional Services - .2% | | | | | |
ERAC USA Finance, Gtd. Notes | | 7.00 | | 10/15/2037 | | 280,000 | a | 396,016 | |
PayPal Holdings, Sr. Unscd. Notes | | 2.65 | | 10/1/2026 | | 165,000 | | 165,666 | |
| | 561,682 | |
12
| | | | | | | | | | |
| |
Description | Coupon
Rate (%) | | Maturity
Date | | Principal
Amount ($) | | Value ($) | |
Bonds and Notes - 28.8% (continued) | | | | | |
Commercial Mortgage Pass-Through Ctfs. - 1.6% | | | | | |
CAMB Commercial Mortgage Trust, Ser. 2019-LIFE, Cl. A, 1 Month LIBOR +1.07% | | 2.84 | | 12/15/2037 | | 225,000 | a,b | 225,815 | |
Commercial Mortgage Trust, Ser. 2013-300P, Cl. A1 | | 4.35 | | 8/10/2030 | | 250,000 | a | 266,335 | |
Commercial Mortgage Trust, Ser. 2015-LC19, Cl. A4 | | 3.18 | | 2/10/2048 | | 555,000 | | 578,261 | |
Commercial Mortgage Trust, Ser. 2017-CD3, Cl. A4 | | 3.63 | | 2/10/2050 | | 465,000 | | 501,307 | |
DBCG Mortgage Trust, Ser. 2017-BBG, Cl. A, 1 Month LIBOR +.70% | | 2.47 | | 6/15/2034 | | 335,000 | a,b | 334,753 | |
GS Mortgage Securities Trust, Ser. 2013-GC13, CI. A5 | | 4.19 | | 7/10/2046 | | 210,000 | | 224,173 | |
Lanark Master Issuer, Ser. 2019-1A, Cl. 1A1, 3 Month LIBOR +.77% | | 2.69 | | 12/22/2069 | | 225,333 | a,b | 225,755 | |
Permanent Master Issuer, Ser. 2019-1A, Cl. 1A1, 3 Month LIBOR +.55% | | 2.54 | | 7/15/2058 | | 250,000 | a,b | 250,173 | |
Seasoned Credit Risk Transfer Trust, Ser. 2019-1, Cl. M55D | | 4.00 | | 7/25/2058 | | 425,824 | | 447,435 | |
Seasoned Credit Risk Transfer Trust, Ser. 2019-1, Cl. MA | | 3.50 | | 7/25/2058 | | 209,470 | | 216,941 | |
Seasoned Loans Structured Transaction, Ser. 2019-1, Cl. A2 | | 3.50 | | 5/25/2029 | | 165,000 | | 173,668 | |
Seasoned Loans Structured Transaction Trust, Ser. 2019-2, Cl. A2C | | 2.75 | | 9/25/2029 | | 265,000 | | 268,013 | |
Seasoned Loans Structured Transaction Trust, Ser. 2019-3, Cl. A2C | | 2.75 | | 11/25/2029 | | 255,000 | | 257,609 | |
Silverstone Master Issuer, Ser. 2019-1A, Cl. 1A, 3 Month LIBOR +.57% | | 2.54 | | 1/21/2070 | | 228,750 | a,b | 228,913 | |
Starwood Waypoint Homes Trust, Ser. 2017-1, Cl. A, 1 Month LIBOR +.95% | | 2.72 | | 1/17/2035 | | 356,442 | a,b | 356,792 | |
Tricon American Homes Trust, Ser. 2017-SFR2, Cl. A | | 2.93 | | 1/17/2036 | | 244,307 | a | 246,481 | |
VNDO Mortgage Trust, Ser. 2013-PENN, Cl. A | | 3.81 | | 12/13/2029 | | 250,000 | a | 254,056 | |
Wells Fargo Commercial Mortgage Trust, Ser. 2014-LC18, Cl. A4 | | 3.15 | | 12/15/2047 | | 200,000 | | 207,450 | |
| | 5,263,930 | |
Consumer Staples - .0% | | | | | |
The Estee Lauder Companies, Sr. Unscd. Notes | | 2.38 | | 12/1/2029 | | 115,000 | | 114,949 | |
Diversified Financials - .2% | | | | | |
American Express, Sr. Unscd. Notes | | 2.50 | | 7/30/2024 | | 130,000 | | 131,201 | |
American Express, Sr. Unscd. Notes | | 3.40 | | 2/22/2024 | | 180,000 | | 187,854 | |
13
STATEMENT OF INVESTMENTS (continued)
| | | | | | | | | | |
| |
Description | Coupon
Rate (%) | | Maturity
Date | | Principal
Amount ($) | | Value ($) | |
Bonds and Notes - 28.8% (continued) | | | | | |
Diversified Financials - .2% (continued) | | | | | |
Capital One Bank USA, Sub. Notes | | 3.38 | | 2/15/2023 | | 300,000 | | 308,758 | |
Visa, Sr. Unscd. Notes | | 3.15 | | 12/14/2025 | | 100,000 | | 106,027 | |
| | 733,840 | |
Energy - 1.1% | | | | | |
BP Capital Markets, Gtd. Bonds | | 2.32 | | 2/13/2020 | | 550,000 | | 550,407 | |
Cheniere Corpus Christi Holdings, Sr. Scd. Notes | | 3.70 | | 11/15/2029 | | 285,000 | a | 288,100 | |
Concho Resources, Gtd. Notes | | 4.88 | | 10/1/2047 | | 60,000 | | 67,000 | |
ConocoPhillips, Gtd. Notes | | 4.95 | | 3/15/2026 | | 280,000 | | 323,085 | |
Diamondback Energy, Gtd. Notes | | 2.88 | | 12/1/2024 | | 190,000 | | 189,839 | |
Enbridge, Gtd. Notes | | 3.13 | | 11/15/2029 | | 175,000 | | 176,687 | |
Energy Transfer Operating, Gtd. Notes | | 4.90 | | 2/1/2024 | | 225,000 | | 239,945 | |
Energy Transfer Operating, Gtd. Notes | | 5.95 | | 10/1/2043 | | 90,000 | | 98,937 | |
Equinor, Gtd. Notes | | 3.25 | | 11/18/2049 | | 130,000 | | 133,926 | |
Kinder Morgan Energy Partners, Gtd. Notes | | 5.00 | | 3/1/2043 | | 140,000 | | 152,008 | |
Kinder Morgan Energy Partners, Gtd. Notes | | 6.55 | | 9/15/2040 | | 210,000 | | 262,364 | |
MPLX, Sr. Unscd. Notes | | 4.13 | | 3/1/2027 | | 110,000 | | 114,216 | |
MPLX, Sr. Unscd. Notes | | 5.20 | | 3/1/2047 | | 210,000 | | 221,165 | |
Spectra Energy Partners, Gtd. Notes | | 4.75 | | 3/15/2024 | | 75,000 | | 81,509 | |
Total Capital International, Gtd. Notes | | 3.46 | | 2/19/2029 | | 260,000 | | 281,929 | |
Western Midstream Operating, Sr. Unscd. Notes | | 4.50 | | 3/1/2028 | | 65,000 | | 62,376 | |
Western Midstream Operating, Sr. Unscd. Notes | | 4.65 | | 7/1/2026 | | 175,000 | | 174,662 | |
| | 3,418,155 | |
Environmental Control - .1% | | | | | |
Republic Services, Sr. Unscd. Notes | | 2.50 | | 8/15/2024 | | 100,000 | | 101,019 | |
Waste Management, Gtd. Notes | | 3.15 | | 11/15/2027 | | 100,000 | | 105,030 | |
| | 206,049 | |
Food Products - .1% | | | | | |
Conagra Brands, Sr. Unscd. Notes | | 3.80 | | 10/22/2021 | | 200,000 | | 205,934 | |
Kraft Heinz Foods, Gtd. Notes | | 3.95 | | 7/15/2025 | | 145,000 | | 152,290 | |
| | 358,224 | |
Foreign Governmental - .2% | | | | | |
Colombia, Sr. Unscd. Notes | | 4.50 | | 3/15/2029 | | 200,000 | | 220,769 | |
Italy, Sr. Unscd. Notes | | 2.88 | | 10/17/2029 | | 225,000 | | 215,829 | |
Panama, Sr. Unscd. Bonds | | 4.00 | | 9/22/2024 | | 200,000 | | 214,202 | |
| | 650,800 | |
14
| | | | | | | | | | |
| |
Description | Coupon
Rate (%) | | Maturity
Date | | Principal
Amount ($) | | Value ($) | |
Bonds and Notes - 28.8% (continued) | | | | | |
Health Care - .9% | | | | | |
Abbott Laboratories, Sr. Unscd. Notes | | 4.90 | | 11/30/2046 | | 170,000 | | 225,679 | |
AbbVie, Sr. Unscd. Notes | | 3.20 | | 11/21/2029 | | 220,000 | a | 223,635 | |
AmerisourceBergen, Sr. Unscd. Notes | | 3.25 | | 3/1/2025 | | 130,000 | | 134,938 | |
Bristol-Myers Squibb, Sr. Unscd. Notes | | 3.20 | | 6/15/2026 | | 135,000 | a | 141,965 | |
Bristol-Myers Squibb, Sr. Unscd. Notes | | 3.40 | | 7/26/2029 | | 80,000 | a | 85,989 | |
Cigna, Gtd. Notes | | 3.05 | | 11/30/2022 | | 140,000 | a | 142,629 | |
CVS Health, Sr. Unscd. Notes | | 4.30 | | 3/25/2028 | | 225,000 | | 245,574 | |
DH Europe Finance II, Gtd. Notes | | 2.60 | | 11/15/2029 | | 180,000 | | 181,150 | |
Gilead Sciences, Sr. Unscd. Notes | | 3.65 | | 3/1/2026 | | 75,000 | | 80,655 | |
Gilead Sciences, Sr. Unscd. Notes | | 4.75 | | 3/1/2046 | | 110,000 | | 132,774 | |
Medtronic, Gtd. Notes | | 4.63 | | 3/15/2045 | | 50,000 | | 64,107 | |
Merck & Co., Sr. Unscd. Notes | | 2.90 | | 3/7/2024 | | 115,000 | | 119,470 | |
Merck & Co., Sr. Unscd. Notes | | 3.40 | | 3/7/2029 | | 60,000 | | 65,259 | |
Mylan, Gtd. Notes | | 3.15 | | 6/15/2021 | | 195,000 | | 197,257 | |
Pfizer, Sr. Unscd. Notes | | 2.95 | | 3/15/2024 | | 40,000 | | 41,613 | |
Pfizer, Sr. Unscd. Notes | | 3.20 | | 9/15/2023 | | 45,000 | | 46,922 | |
Pfizer, Sr. Unscd. Notes | | 3.45 | | 3/15/2029 | | 55,000 | c | 59,629 | |
Shire Acquisitions Investments Ireland, Gtd. Notes | | 2.88 | | 9/23/2023 | | 195,000 | | 198,581 | |
UnitedHealth Group, Sr. Unscd. Notes | | 2.88 | | 8/15/2029 | | 150,000 | | 154,640 | |
UnitedHealth Group, Sr. Unscd. Notes | | 4.75 | | 7/15/2045 | | 155,000 | | 192,347 | |
| | 2,734,813 | |
Industrial - .0% | | | | | |
John Deere Capital, Sr. Unscd. Notes | | 1.95 | | 6/13/2022 | | 140,000 | | 140,127 | |
Insurance - .7% | | | | | |
American International Group, Sr. Unscd. Notes | | 4.88 | | 6/1/2022 | | 460,000 | | 492,334 | |
Jackson National Life Global Funding, Scd. Notes | | 3.30 | | 2/1/2022 | | 145,000 | a | 148,972 | |
MassMutual Global Funding II, Scd. Notes | | 2.95 | | 1/11/2025 | | 200,000 | a | 205,642 | |
Metropolitan Life Global Funding I, Sr. Scd. Notes | | 2.40 | | 1/8/2021 | | 405,000 | a | 407,095 | |
Metropolitan Life Global Funding I, Sr. Scd. Notes | | 3.00 | | 9/19/2027 | | 545,000 | a | 567,303 | |
New York Life Global Funding, Scd. Notes | | 2.88 | | 4/10/2024 | | 250,000 | a | 257,976 | |
Pricoa Global Funding I, Scd. Notes | | 2.40 | | 9/23/2024 | | 155,000 | a | 156,512 | |
15
STATEMENT OF INVESTMENTS (continued)
| | | | | | | | | | |
| |
Description | Coupon
Rate (%) | | Maturity
Date | | Principal
Amount ($) | | Value ($) | |
Bonds and Notes - 28.8% (continued) | | | | | |
Insurance - .7% (continued) | | | | | |
Principal Financial Group, Gtd. Notes | | 4.30 | | 11/15/2046 | | 125,000 | | 142,037 | |
| | 2,377,871 | |
Internet Software & Services - .1% | | | | | |
Amazon.com, Sr. Unscd. Notes | | 4.05 | | 8/22/2047 | | 175,000 | | 209,310 | |
Media - .5% | | | | | |
Charter Communications Operating, Sr. Scd. Notes | | 4.91 | | 7/23/2025 | | 185,000 | | 202,966 | |
Comcast, Gtd. Notes | | 2.65 | | 2/1/2030 | | 335,000 | | 337,576 | |
Comcast, Gtd. Notes | | 6.50 | | 11/15/2035 | | 210,000 | | 296,065 | |
Sky, Gtd. Notes | | 3.75 | | 9/16/2024 | | 265,000 | a | 283,587 | |
The Walt Disney Company, Gtd. Notes | | 4.00 | | 10/1/2023 | | 55,000 | | 58,770 | |
The Walt Disney Company, Gtd. Notes | | 6.65 | | 11/15/2037 | | 245,000 | | 364,269 | |
| | 1,543,233 | |
Municipal Securities - .6% | | | | | |
California, GO | | 2.38 | | 10/1/2026 | | 230,000 | | 232,854 | |
Honolulu City & County Wastewater System, Revenue Bonds, Refunding, Ser. B | | 2.50 | | 7/1/2027 | | 25,000 | | 25,211 | |
Los Angeles Department of Water & Power System, Water and Power System Revenue Bonds (Build America Bonds) | | 5.72 | | 7/1/2039 | | 120,000 | | 165,536 | |
Massachusetts School Building Authority, Revenue Bonds, Refunding, Ser. B | | 2.44 | | 10/15/2027 | | 115,000 | | 114,893 | |
Massachusetts Water Resources Authority, Revenue Bonds, Refunding, Ser. F | | 2.16 | | 8/1/2026 | | 255,000 | | 252,677 | |
Metropolitan Transportation Authority, Revenue Bonds (Build America Bonds) | | 6.55 | | 11/15/2031 | | 225,000 | | 292,651 | |
Metropolitan Transportation Authority, Revenue Bonds (Build America Bonds) Ser. A2 | | 6.09 | | 11/15/2040 | | 10,000 | | 13,608 | |
Miami-Dade County Water & Sewer System, Revenue Bonds, Refunding, Ser. C | | 2.55 | | 10/1/2028 | | 250,000 | | 250,960 | |
New Jersey Economic Development Authority, Revenue Bonds, Refunding, Ser. YY | | 4.45 | | 6/15/2020 | | 425,000 | | 429,501 | |
New York City, GO (Build America Bonds) Ser. D | | 5.99 | | 12/1/2036 | | 135,000 | | 178,670 | |
| | 1,956,561 | |
16
| | | | | | | | | | |
| |
Description | Coupon
Rate (%) | | Maturity
Date | | Principal
Amount ($) | | Value ($) | |
Bonds and Notes - 28.8% (continued) | | | | | |
Real Estate - .5% | | | | | |
Alexandria Real Estate Equities, Gtd. Notes | | 3.80 | | 4/15/2026 | | 225,000 | | 240,386 | |
Alexandria Real Estate Equities, Gtd. Notes | | 4.50 | | 7/30/2029 | | 165,000 | | 186,605 | |
AvalonBay Communities, Sr. Unscd. Notes | | 3.30 | | 6/1/2029 | | 215,000 | | 227,897 | |
CyrusOne, Gtd. Notes | | 2.90 | | 11/15/2024 | | 35,000 | | 35,145 | |
CyrusOne, Gtd. Notes | | 3.45 | | 11/15/2029 | | 85,000 | | 85,774 | |
Healthcare Trust of America Holdings, Gtd. Notes | | 3.10 | | 2/15/2030 | | 235,000 | | 234,022 | |
SBA Tower Trust, Scd. Notes | | 2.84 | | 1/15/2025 | | 210,000 | a | 212,617 | |
Simon Property Group, Sr. Unscd. Notes | | 3.50 | | 9/1/2025 | | 300,000 | | 317,971 | |
Ventas Realty, Gtd. Notes | | 3.10 | | 1/15/2023 | | 210,000 | | 215,236 | |
| | 1,755,653 | |
Retailing - .2% | | | | | |
Dollar Tree, Sr. Unscd. Notes | | 4.20 | | 5/15/2028 | | 110,000 | | 117,752 | |
Target, Sr. Unscd. Notes | | 3.38 | | 4/15/2029 | | 250,000 | | 271,391 | |
Walmart, Sr. Unscd. Notes | | 3.05 | | 7/8/2026 | | 270,000 | | 284,724 | |
| | 673,867 | |
Semiconductors & Semiconductor Equipment - .1% | | | | | |
Broadcom, Gtd. Notes | | 3.00 | | 1/15/2022 | | 245,000 | | 247,812 | |
Supranational Bank - .4% | | | | | |
Asian Development Bank, Sr. Unscd. Notes | | 2.25 | | 1/20/2021 | | 315,000 | | 316,835 | |
Corp Andina de Fomento, Sr. Unscd. Notes | | 3.25 | | 2/11/2022 | | 175,000 | | 178,208 | |
European Investment Bank, Sr. Unscd. Notes | | 2.50 | | 3/15/2023 | | 310,000 | | 318,268 | |
Inter-American Development Bank, Sr. Unscd. Notes | | 2.50 | | 1/18/2023 | | 300,000 | | 307,330 | |
International Bank for Reconstruction & Development, Sr. Unscd. Notes | | 2.00 | | 1/26/2022 | | 320,000 | | 322,117 | |
| | 1,442,758 | |
Technology Hardware & Equipment - .2% | | | | | |
Apple, Sr. Unscd. Notes | | 2.05 | | 9/11/2026 | | 425,000 | | 420,527 | |
Dell International, Sr. Scd. Notes | | 6.02 | | 6/15/2026 | | 130,000 | a | 148,666 | |
Hewlett Packard Enterprise, Sr. Unscd. Notes | | 3.50 | | 10/5/2021 | | 35,000 | | 35,858 | |
Hewlett Packard Enterprise, Sr. Unscd. Notes | | 4.40 | | 10/15/2022 | | 145,000 | | 153,277 | |
| | 758,328 | |
Telecommunication Services - .6% | | | | | |
AT&T, Sr. Unscd. Notes | | 4.25 | | 3/1/2027 | | 375,000 | | 410,588 | |
17
STATEMENT OF INVESTMENTS (continued)
| | | | | | | | | | |
| |
Description | Coupon
Rate (%) | | Maturity
Date | | Principal
Amount ($) | | Value ($) | |
Bonds and Notes - 28.8% (continued) | | | | | |
Telecommunication Services - .6% (continued) | | | | | |
AT&T, Sr. Unscd. Notes | | 5.35 | | 9/1/2040 | | 85,000 | | 101,835 | |
AT&T, Sr. Unscd. Notes | | 5.35 | | 12/15/2043 | | 225,000 | | 268,772 | |
Cisco Systems, Sr. Unscd. Notes | | 2.50 | | 9/20/2026 | | 95,000 | | 97,453 | |
Corning, Sr. Unscd. Notes | | 4.38 | | 11/15/2057 | | 110,000 | | 110,077 | |
Sprint Spectrum, Sr. Scd. Notes | | 4.74 | | 3/20/2025 | | 200,000 | a | 212,583 | |
Telefonica Emisiones, Gtd. Notes | | 5.21 | | 3/8/2047 | | 150,000 | | 177,176 | |
Verizon Communications, Sr. Unscd. Notes | | 3.38 | | 2/15/2025 | | 47,000 | | 49,660 | |
Verizon Communications, Sr. Unscd. Notes | | 3.88 | | 2/8/2029 | | 140,000 | | 154,926 | |
Verizon Communications, Sr. Unscd. Notes | | 4.02 | | 12/3/2029 | | 305,000 | | 340,941 | |
| | 1,924,011 | |
Transportation - .3% | | | | | |
CSX, Sr. Unscd. Notes | | 2.60 | | 11/1/2026 | | 380,000 | | 388,028 | |
CSX, Sr. Unscd. Notes | | 3.35 | | 11/1/2025 | | 205,000 | | 215,979 | |
FedEx, Gtd. Notes | | 4.40 | | 1/15/2047 | | 205,000 | | 209,047 | |
Union Pacific, Sr. Unscd. Notes | | 3.15 | | 3/1/2024 | | 145,000 | | 151,035 | |
| | 964,089 | |
U.S. Government Agencies - .3% | | | | | |
Federal Home Loan Bank, Bonds | | 1.88 | | 11/29/2021 | | 445,000 | | 447,189 | |
Federal National Mortgage Association, Notes | | 2.38 | | 1/19/2023 | | 575,000 | d | 587,756 | |
| | 1,034,945 | |
U.S. Government Agencies Mortgage-Backed - 9.7% | | | | | |
Federal Home Loan Mortgage Corp.: | | | |
2.50%, 11/1/27 | | | 202,031 | d | 204,806 | |
3.00%, 12/1/33-12/1/46 | | | 1,363,974 | d | 1,398,187 | |
3.50%, 12/1/41-11/1/44 | | | 1,934,687 | d | 2,017,121 | |
5.50%, 4/1/22-1/1/36 | | | 70,694 | d | 78,696 | |
Federal National Mortgage Association: | | | |
2.50% | | | 1,150,000 | d,e | 1,159,920 | |
3.00%, 6/1/28-1/1/59 | | | 3,916,990 | d | 4,025,075 | |
3.00% | | | 2,545,000 | d,e | 2,580,988 | |
3.50%, 8/1/34-8/1/56 | | | 5,727,132 | d | 5,968,329 | |
3.50% | | | 1,605,000 | d,e | 1,651,556 | |
4.00% | | | 2,265,000 | d,e | 2,350,114 | |
4.00%, 7/1/42-6/1/47 | | | 2,081,333 | d | 2,211,547 | |
4.50%, 2/1/39-9/1/49 | | | 2,557,321 | d | 2,743,246 | |
4.50% | | | 900,000 | d,e | 945,633 | |
5.00%, 8/1/20-12/1/48 | | | 673,338 | d | 735,290 | |
5.50%, 9/1/34-5/1/39 | | | 58,749 | d | 66,330 | |
8.00%, 3/1/30 | | | 101 | d | 102 | |
18
| | | | | | | | | | |
| |
Description | Coupon
Rate (%) | | Maturity
Date | | Principal
Amount ($) | | Value ($) | |
Bonds and Notes - 28.8% (continued) | | | | | |
U.S. Government Agencies Mortgage-Backed - 9.7% (continued) | | | | | |
Government National Mortgage Association I: | | | |
5.50%, 4/15/33 | | | 16,101 | | 18,081 | |
Government National Mortgage Association II: | | | |
3.00%, 1/20/45-11/20/47 | | | 1,341,416 | | 1,383,987 | |
4.00%, 10/20/47-1/20/48 | | | 985,816 | | 1,027,522 | |
4.50%, 7/20/48 | | | 618,142 | | 651,178 | |
| | 31,217,708 | |
U.S. Treasury Securities - 4.3% | | | | | |
U.S. Treasury Bonds | | 2.88 | | 5/15/2049 | | 5,560,000 | | 6,361,639 | |
U.S. Treasury Bonds | | 3.00 | | 2/15/2049 | | 1,615,000 | | 1,889,834 | |
U.S. Treasury Floating Rate Notes, 3 Month U.S. T-BILL +.05% | | 1.61 | | 10/31/2020 | | 2,635,000 | b | 2,633,587 | |
U.S. Treasury Inflation Indexed Bonds, US CPI Urban Consumers Not Seasonally Adjusted | | 0.88 | | 2/15/2047 | | 175,504 | f | 191,534 | |
U.S. Treasury Inflation Indexed Notes, US CPI Urban Consumers Not Seasonally Adjusted | | 0.50 | | 4/15/2024 | | 951,867 | c,f | 962,482 | |
U.S. Treasury Notes | | 2.13 | | 7/31/2024 | | 390,000 | | 398,455 | |
U.S. Treasury Notes | | 2.38 | | 3/15/2022 | | 1,540,000 | | 1,566,619 | |
| | 14,004,150 | |
Utilities - .9% | | | | | |
Berkshire Hathaway Energy, Sr. Unscd. Notes | | 3.25 | | 4/15/2028 | | 95,000 | c | 100,078 | |
Dominion Energy, Sr. Unscd. Notes | | 3.90 | | 10/1/2025 | | 165,000 | | 176,688 | |
Duke Energy, Sr. Unscd. Notes | | 3.15 | | 8/15/2027 | | 275,000 | | 285,901 | |
Duke Energy Progress, First Mortgage Bonds | | 3.45 | | 3/15/2029 | | 245,000 | | 264,063 | |
Eversource Energy, Sr. Unscd. Notes, Ser. O | | 4.25 | | 4/1/2029 | | 215,000 | | 239,755 | |
Exelon Generation, Sr. Unscd. Notes | | 6.25 | | 10/1/2039 | | 440,000 | | 545,853 | |
Kentucky Utilities, First Mortgage Bonds | | 4.38 | | 10/1/2045 | | 105,000 | | 123,190 | |
Louisville Gas & Electric, First Mortgage Bonds | | 4.38 | | 10/1/2045 | | 125,000 | | 146,538 | |
NiSource, Sr. Unscd. Notes | | 5.65 | | 2/1/2045 | | 230,000 | | 297,042 | |
Sempra Energy, Sr. Unscd. Notes | | 3.40 | | 2/1/2028 | | 100,000 | | 103,695 | |
Sierra Pacific Power, Mortgage Notes, Ser. P | | 6.75 | | 7/1/2037 | | 25,000 | | 35,789 | |
Southern California Edison, First Mortgage Bonds, Ser. A | | 4.20 | | 3/1/2029 | | 235,000 | | 258,683 | |
19
STATEMENT OF INVESTMENTS (continued)
| | | | | | | | | | |
| |
Description | Coupon
Rate (%) | | Maturity
Date | | Principal
Amount ($) | | Value ($) | |
Bonds and Notes - 28.8% (continued) | | | | | |
Utilities - .9% (continued) | | | | | |
Xcel Energy, Sr. Unscd. Notes | | 2.60 | | 12/1/2029 | | 260,000 | | 257,921 | |
| | 2,835,196 | |
TotalBonds and Notes
(cost $90,038,828) | | 92,882,747 | |
Description | | | | | Shares | | Value ($) | |
Common Stocks - 67.3% | | | | | |
Advertising - .2% | | | | | |
Omnicom Group | | | | | | 6,732 | c | 535,059 | |
Aerospace & Defense - 2.9% | | | | | |
L3Harris Technologies | | | | | | 13,443 | | 2,703,253 | |
Northrop Grumman | | | | | | 2,809 | | 988,122 | |
United Technologies | | | | | | 38,284 | | 5,679,049 | |
| | 9,370,424 | |
Agriculture - .3% | | | | | |
Archer-Daniels-Midland | | | | | | 25,439 | | 1,092,096 | |
Airlines - .8% | | | | | |
Delta Air Lines | | | | | | 44,566 | | 2,554,077 | |
Automobiles & Components - .4% | | | | | |
General Motors | | | | | | 33,835 | | 1,218,060 | |
Banks - 6.1% | | | | | |
Bank of America | | | | | | 139,286 | | 4,641,009 | |
Citigroup | | | | | | 64,832 | | 4,870,180 | |
JPMorgan Chase & Co. | | | | | | 56,437 | | 7,436,139 | |
U.S. Bancorp | | | | | | 29,264 | | 1,756,718 | |
Wells Fargo & Co. | | | | | | 20,651 | | 1,124,653 | |
| | 19,828,699 | |
Beverage Products - .6% | | | | | |
CVS Health | | | | | | 8,315 | | 625,870 | |
PepsiCo | | | | | | 8,814 | | 1,197,206 | |
| | 1,823,076 | |
Chemicals - 4.2% | | | | | |
CF Industries Holdings | | | | | | 97,725 | | 4,515,872 | |
Dow | | | | | | 16,604 | | 886,155 | |
DuPont de Nemours | | | | | | 15,108 | | 979,149 | |
Martin Marietta Materials | | | | | | 8,712 | | 2,338,301 | |
The Mosaic Company | | | | | | 46,377 | | 883,482 | |
Vulcan Materials | | | | | | 27,988 | | 3,970,658 | |
| | 13,573,617 | |
Consumer Discretionary - 1.3% | | | | | |
Chipotle Mexican Grill | | | | | | 1,485 | g | 1,208,671 | |
Lennar, Cl. A | | | | | | 50,048 | | 2,985,363 | |
| | 4,194,034 | |
20
| | | | | | | | | | |
| |
Description | | | | | Shares | | Value ($) | |
Common Stocks - 67.3%(continued) | | | | | |
Consumer Durables & Apparel - .3% | | | | | |
PVH | | | | | | 10,014 | c | 970,957 | |
Consumer Staples - .3% | | | | | |
Colgate-Palmolive | | | | | | 15,521 | | 1,052,634 | |
Diversified Financials - 4.0% | | | | | |
Capital One Financial | | | | | | 5,467 | | 546,755 | |
E*TRADE Financial | | | | | | 30,663 | | 1,358,371 | |
LPL Financial Holdings | | | | | | 12,335 | | 1,139,137 | |
Morgan Stanley | | | | | | 65,178 | | 3,225,007 | |
Raymond James Financial | | | | | | 6,097 | | 547,633 | |
The Charles Schwab | | | | | | 12,198 | | 603,801 | |
The Goldman Sachs Group | | | | | | 11,160 | | 2,470,266 | |
Voya Financial | | | | | | 53,752 | | 3,132,667 | |
| | 13,023,637 | |
Electronic Components - 1.4% | | | | | |
Honeywell International | | | | | | 18,606 | | 3,322,101 | |
Quanta Services | | | | | | 26,810 | | 1,116,368 | |
| | 4,438,469 | |
Energy - 5.1% | | | | | |
Apergy | | | | | | 23,381 | g | 597,151 | |
Concho Resources | | | | | | 6,921 | | 502,188 | |
ConocoPhillips | | | | | | 19,107 | | 1,145,274 | |
Hess | | | | | | 69,690 | | 4,327,052 | |
Marathon Petroleum | | | | | | 76,836 | | 4,659,335 | |
Phillips 66 | | | | | | 20,782 | | 2,384,111 | |
Pioneer Natural Resources | | | | | | 4,906 | | 627,183 | |
Schlumberger | | | | | | 15,966 | | 577,969 | |
Valero Energy | | | | | | 16,321 | | 1,558,492 | |
| | 16,378,755 | |
Food & Staples Retailing - .3% | | | | | |
Walmart | | | | | | 8,874 | | 1,056,805 | |
Food Products - .8% | | | | | |
Conagra Brands | | | | | | 93,642 | | 2,703,445 | |
Food Service - .3% | | | | | |
McDonald's | | | | | | 5,337 | | 1,037,940 | |
Health Care - 8.1% | | | | | |
Alcon | | | | | | 18,030 | g | 996,879 | |
Anthem | | | | | | 7,941 | | 2,292,249 | |
Baxter International | | | | | | 9,160 | | 750,845 | |
Becton Dickinson and Co. | | | | | | 6,710 | | 1,734,535 | |
Biogen | | | | | | 1,905 | g | 571,138 | |
Bristol-Myers Squibb | | | | | | 9,968 | | 567,578 | |
Charles River Laboratories International | | | | | | 5,417 | g | 786,819 | |
21
STATEMENT OF INVESTMENTS (continued)
| | | | | | | | | | |
| |
Description | | | | | Shares | | Value ($) | |
Common Stocks - 67.3%(continued) | | | | | |
Health Care - 8.1% (continued) | | | | | |
Cigna | | | | | | 3,237 | | 647,141 | |
Humana | | | | | | 2,465 | | 841,132 | |
Medtronic | | | | | | 52,812 | | 5,882,729 | |
Merck & Co. | | | | | | 46,264 | | 4,033,296 | |
Pfizer | | | | | | 97,801 | | 3,767,295 | |
Sage Therapeutics | | | | | | 2,496 | c,g | 386,306 | |
Sarepta Therapeutics | | | | | | 5,965 | c,g | 671,003 | |
Vertex Pharmaceuticals | | | | | | 5,736 | g | 1,271,958 | |
Zoetis | | | | | | 6,947 | | 837,252 | |
| | 26,038,155 | |
Industrial - .7% | | | | | |
Gardner Denver Holdings | | | | | | 48,512 | g | 1,643,101 | |
Ingersoll-Rand | | | | | | 4,284 | | 561,675 | |
| | 2,204,776 | |
Information Technology - 5.0% | | | | | |
HubSpot | | | | | | 3,201 | g | 483,351 | |
International Business Machines | | | | | | 4,068 | | 546,943 | |
Microsoft | | | | | | 41,738 | | 6,318,298 | |
Salesforce.com | | | | | | 6,608 | g | 1,076,377 | |
ServiceNow | | | | | | 3,908 | g | 1,106,120 | |
Splunk | | | | | | 16,833 | g | 2,511,820 | |
SS&C Technologies Holdings | | | | | | 21,052 | | 1,264,173 | |
Visa, Cl. A | | | | | | 16,096 | c | 2,969,873 | |
| | 16,276,955 | |
Insurance - 5.1% | | | | | |
American International Group | | | | | | 56,085 | | 2,953,436 | |
Assurant | | | | | | 10,398 | | 1,381,582 | |
Berkshire Hathaway, Cl. B | | | | | | 35,131 | g | 7,739,359 | |
Chubb | | | | | | 10,765 | | 1,630,682 | |
The Hartford Financial Services Group | | | | | | 21,518 | | 1,331,103 | |
Willis Towers Watson | | | | | | 6,845 | | 1,344,632 | |
| | 16,380,794 | |
Internet Software & Services - 4.8% | | | | | |
Alphabet, Cl. A | | | | | | 1,268 | g | 1,653,586 | |
Alphabet, Cl. C | | | | | | 4,946 | g | 6,454,332 | |
Amazon.com | | | | | | 1,733 | g | 3,120,786 | |
Pinterest, Cl. A | | | | | | 26,550 | g | 517,194 | |
Proofpoint | | | | | | 21,401 | g | 2,540,085 | |
Shopify, Cl. A | | | | | | 3,916 | g | 1,318,713 | |
| | 15,604,696 | |
Media - .5% | | | | | |
Comcast, Cl. A | | | | | | 35,937 | | 1,586,619 | |
22
| | | | | | | | | | |
| |
Description | | | | | Shares | | Value ($) | |
Common Stocks - 67.3%(continued) | | | | | |
Metals & Mining - .7% | | | | | |
Freeport-McMoRan | | | | | | 96,265 | | 1,095,496 | |
Newmont Goldcorp | | | | | | 27,574 | | 1,058,842 | |
| | 2,154,338 | |
Real Estate - .2% | | | | | |
Outfront Media | | | | | | 29,290 | h | 731,664 | |
Retailing - .7% | | | | | |
Target | | | | | | 18,217 | | 2,277,307 | |
Semiconductors & Semiconductor Equipment - 3.4% | | | | | |
Advanced Micro Devices | | | | | | 79,236 | c,g | 3,102,089 | |
Applied Materials | | | | | | 23,432 | | 1,356,713 | |
Broadcom | | | | | | 10,528 | | 3,329,059 | |
Microchip Technology | | | | | | 9,617 | c | 909,191 | |
Micron Technology | | | | | | 11,482 | g | 545,510 | |
Texas Instruments | | | | | | 4,563 | | 548,518 | |
Xilinx | | | | | | 11,875 | | 1,101,762 | |
| | 10,892,842 | |
Technology Hardware & Equipment - 2.9% | | | | | |
Apple | | | | | | 2,323 | | 620,822 | |
Corning | | | | | | 96,524 | | 2,803,057 | |
Qualcomm | | | | | | 38,451 | | 3,212,581 | |
Western Digital | | | | | | 14,870 | | 748,407 | |
Zebra Technologies, Cl. A | | | | | | 7,484 | g | 1,878,035 | |
| | 9,262,902 | |
Telecommunication Services - 2.1% | | | | | |
AT&T | | | | | | 153,886 | | 5,752,259 | |
Cisco Systems | | | | | | 21,998 | | 996,729 | |
| | 6,748,988 | |
Transportation - .7% | | | | | |
Union Pacific | | | | | | 13,277 | | 2,336,619 | |
Utilities - 3.1% | | | | | |
Clearway Energy, Cl. C | | | | | | 59,690 | c | 1,183,653 | |
Edison International | | | | | | 47,280 | | 3,267,048 | |
PPL | | | | | | 162,678 | | 5,535,932 | |
| | 9,986,633 | |
TotalCommon Stocks
(cost $173,655,222) | | 217,335,072 | |
| | | | | | | | | |
Exchange-Traded Funds - .1% | | | | | |
Registered Investment Companies - .1% | | | | | |
iShares Russell 1000 Value ETF
(cost $251,342) | | | | | | 1,890 | c | 253,411 | |
23
STATEMENT OF INVESTMENTS (continued)
| | | | | | | | | | |
| |
Description | Annualized
Yield (%) | | Maturity
Date | | Principal
Amount ($) | | Value ($) | |
Short-Term Investments - .3% | | | | | |
U.S. Government Securities | | | | | |
U.S. Treasury Bills
(cost $944,474) | | 1.56 | | 4/16/2020 | | 950,000 | i,j | 944,460 | |
| | 1-Day
Yield (%) | | | | Shares | | | |
Investment Companies - 6.1% | | | | | |
Registered Investment Companies - 6.1% | | | | | |
Dreyfus Institutional Preferred Government Plus Money Market Fund
(cost $19,862,497) | | 1.63 | | | | 19,862,497 | k | 19,862,497 | |
| | | | | | | | | |
Investment of Cash Collateral for Securities Loaned - .1% | | | | | |
Registered Investment Companies - .1% | | | | | |
Dreyfus Institutional Preferred Government Plus Money Market Fund
(cost $369,900) | | 1.63 | | | | 369,900 | k | 369,900 | |
Total Investments(cost $285,122,263) | | 102.7% | 331,648,087 | |
Liabilities, Less Cash and Receivables | | (2.7%) | (8,814,747) | |
Net Assets | | 100.0% | 322,833,340 | |
ETF—Exchange-Traded Fund
LIBOR—London Interbank Offered Rate
a Security exempt from registration pursuant to Rule 144A under the Securities Act of 1933. These securities may be resold in transactions exempt from registration, normally to qualified institutional buyers. At November 30, 2019, these securities were valued at $9,758,735 or 3.02% of net assets.
b Variable rate security—rate shown is the interest rate in effect at period end.
c Security, or portion thereof, on loan. At November 30, 2019, the value of the fund’s securities on loan was $11,740,005 and the value of the collateral was $12,008,403, consisting of cash collateral of $369,900 and U.S. Government & Agency securities valued at $11,638,503.
d The Federal Housing Finance Agency (“FHFA”) placed the Federal Home Loan Mortgage Corporation and Federal National Mortgage Association into conservatorship with FHFA as the conservator. As such, the FHFA oversees the continuing affairs of these companies.
e Purchased on a forward commitment basis.
f Principal amount for accrual purposes is periodically adjusted based on changes in the Consumer Price Index.
g Non-income producing security.
h Investment in real estate investment trust within the United States.
i Held by a counterparty for open exchange traded derivative contracts.
j Security is a discount security. Income is recognized through the accretion of discount.
k Investment in affiliated issuer. The investment objective of this investment company is publicly available and can be found within the investment company’s prospectus.
24
| | |
Portfolio Summary (Unaudited)† | Value (%) |
Financial | 20.2 |
Mortgage Securities | 11.9 |
Consumer, Non-cyclical | 11.7 |
Technology | 9.8 |
Communications | 9.6 |
Industrial | 7.9 |
Investment Companies | 6.3 |
Government | 6.2 |
Energy | 6.1 |
Consumer, Cyclical | 4.4 |
Utilities | 4.0 |
Basic Materials | 3.0 |
Asset Backed Securities | 1.6 |
Beverages | .0 |
| | 102.7 |
† Based on net assets.
See notes to financial statements.
25
STATEMENT OF INVESTMENTS IN AFFILIATED ISSUERS
| | | | | | | |
Investment Companies | Value
11/30/18 ($) | Purchases ($) | Sales ($) | Value
11/30/19 ($) | Net
Assets (%) | Dividends/
Distributions ($) |
Registered Investment Companies: | | | | | |
Dreyfus Institutional Preferred Government Plus Money Market Fund | 24,739,980 | 65,939,041 | 70,816,524 | 19,862,497 | 6.1 | 310,913 |
Investment of Cash Collateral for
Securities Loaned:† | | | | | |
Dreyfus Institutional Preferred Government Money Market Fund, Institutional Shares | 1,036,358 | 1,311,791 | 2,348,149 | - | - | - |
Dreyfus Institutional Preferred Government Plus Money Market Fund | - | 12,523,819 | 12,153,919 | 369,900 | .1 | - |
Total | 25,776,338 | 79,774,651 | 85,318,592 | 20,232,397 | 6.2 | 310,913 |
† Effective January 2, 2019, cash collateral for securities lending was transferred from Dreyfus Institutional Preferred Government Money Market Fund, Institutional Shares to Dreyfus Institutional Preferred Government Plus Money Market Fund.
26
STATEMENT OF FUTURES
November 30, 2019
| | | | | | | |
Description | Number of
Contracts | Expiration | Notional
Value ($) | Value ($) | Unrealized Appreciation (Depreciation) ($) | |
Futures Long | | |
U.S. Treasury 2 Year Notes | 10 | 3/31/2020 | 2,157,109 | 2,155,859 | (1,250) | |
Futures Short | | |
Ultra 10 Year U.S. Treasury Notes | 15 | 3/20/2020 | 2,137,594 | 2,133,281 | 4,313 | |
Gross Unrealized Appreciation | | 4,313 | |
Gross Unrealized Depreciation | | (1,250) | |
See notes to financial statements.
27
STATEMENT OF ASSETS AND LIABILITIES
November 30, 2019
| | | | | | | |
| | | | | | |
| | | Cost | | Value | |
Assets ($): | | | | |
Investments in securities—See Statement of Investments
(including securities on loan, valued at $11,740,005)—Note 1(c): | | | |
Unaffiliated issuers | 264,889,866 | | 311,415,690 | |
Affiliated issuers | | 20,232,397 | | 20,232,397 | |
Cash denominated in foreign currency | | | 2,513 | | 2,418 | |
Dividends, interest and securities lending income receivable | | 877,391 | |
Receivable for shares of Beneficial Interest subscribed | | 93,395 | |
Receivable for futures variation margin—Note 4 | | 3,828 | |
Cash collateral held by broker—Note 4 | | 51 | |
Prepaid expenses | | | | | 70,737 | |
| | | | | 332,695,907 | |
Liabilities ($): | | | | |
Due to BNY Mellon Investment Adviser, Inc. and affiliates—Note 3(c) | | 289,491 | |
Cash overdraft due to Custodian | | | | | 3,752 | |
Payable for investment securities purchased | | 8,990,652 | |
Liability for securities on loan—Note 1(c) | | 369,900 | |
Payable for shares of Beneficial Interest redeemed | | 89,716 | |
Trustees’ fees and expenses payable | | 6,894 | |
Other accrued expenses | | | | | 112,162 | |
| | | | | 9,862,567 | |
Net Assets ($) | | | 322,833,340 | |
Composition of Net Assets ($): | | | | |
Paid-in capital | | | | | 268,964,529 | |
Total distributable earnings (loss) | | | | | 53,868,811 | |
Net Assets ($) | | | 322,833,340 | |
| | | | | | | | | |
Net Asset Value Per Share | Class A | Class C | Class I | Class J | Class Y | Class Z | |
Net Assets ($) | 246,553,623 | 12,838,266 | 11,250,989 | 13,809,948 | 5,392,002 | 32,988,512 | |
Shares Outstanding | 10,571,505 | 552,539.83 | 483,017 | 589,923 | 230,481 | 1,419,294 | |
Net Asset Value Per Share ($) | 23.32 | 23.24 | 23.29 | 23.41 | 23.39 | 23.24 | |
| | | | | | | |
See notes to financial statements. | | | | | | | |
28
STATEMENT OF OPERATIONS
Year Ended November 30, 2019
| | | | | | | |
| | | | | | |
| | | | | | |
Investment Income ($): | | | | |
Income: | | | | |
Dividends: | |
Unaffiliated issuers | | | 4,694,681 | |
Affiliated issuers | | | 310,913 | |
Interest | | | 2,848,108 | |
Income from securities lending—Note 1(c) | | | 13,223 | |
Total Income | | | 7,866,925 | |
Expenses: | | | | |
Management fee—Note 3(a) | | | 2,495,664 | |
Shareholder servicing costs—Note 3(c) | | | 904,510 | |
Professional fees | | | 108,309 | |
Registration fees | | | 99,071 | |
Distribution fees—Note 3(b) | | | 91,289 | |
Prospectus and shareholders’ reports | | | 39,319 | |
Trustees’ fees and expenses—Note 3(d) | | | 32,637 | |
Custodian fees—Note 3(c) | | | 22,425 | |
Loan commitment fees—Note 2 | | | 7,137 | |
Miscellaneous | | | 46,529 | |
Total Expenses | | | 3,846,890 | |
Less—reduction in expenses due to undertaking—Note 3(a) | | | (129,085) | |
Net Expenses | | | 3,717,805 | |
Investment Income—Net | | | 4,149,120 | |
Realized and Unrealized Gain (Loss) on Investments—Note 4 ($): | | |
Net realized gain (loss) on investments | 5,465,320 | |
Net realized gain (loss) on futures | 7,007 | |
Net Realized Gain (Loss) | | | 5,472,327 | |
Net change in unrealized appreciation (depreciation) on investments
and foreign currency transactions | 20,518,050 | |
Net change in unrealized appreciation (depreciation) on futures | 3,063 | |
Net Change in Unrealized Appreciation (Depreciation) | | | 20,521,113 | |
Net Realized and Unrealized Gain (Loss) on Investments | | | 25,993,440 | |
Net Increase in Net Assets Resulting from Operations | | 30,142,560 | |
| | | | | | |
See notes to financial statements. | | | | | |
29
STATEMENT OF CHANGES IN NET ASSETS
| | | | | | | | | | |
| | | | Year Ended November 30, |
| | | | 2019 | | 2018 | |
Operations ($): | | | | | | | | |
Investment income—net | | | 4,149,120 | | | | 3,254,078 | |
Net realized gain (loss) on investments | | 5,472,327 | | | | 22,730,156 | |
Net change in unrealized appreciation
(depreciation) on investments | | 20,521,113 | | | | (15,737,006) | |
Net Increase (Decrease) in Net Assets
Resulting from Operations | 30,142,560 | | | | 10,247,228 | |
Distributions ($): | |
Distributions to shareholders: | | | | | | | | |
Class A | | | (19,950,316) | | | | (11,614,705) | |
Class C | | | (946,380) | | | | (503,581) | |
Class I | | | (1,737,502) | | | | (721,852) | |
Class J | | | (1,408,547) | | | | (905,473) | |
Class Y | | | (11,223) | | | | (570) | |
Class Z | | | (2,804,517) | | | | (1,739,172) | |
Total Distributions | | | (26,858,485) | | | | (15,485,353) | |
Beneficial Interest Transactions ($): | |
Net proceeds from shares sold: | | | | | | | | |
Class A | | | 14,503,824 | | | | 32,757,703 | |
Class C | | | 3,099,072 | | | | 3,160,504 | |
Class I | | | 4,479,578 | | | | 16,090,044 | |
Class J | | | 385,223 | | | | 314,875 | |
Class Y | | | 5,028,578 | | | | - | |
Class Z | | | 988,417 | | | | 694,665 | |
Distributions reinvested: | | | | | | | | |
Class A | | | 19,016,184 | | | | 11,029,625 | |
Class C | | | 811,640 | | | | 420,894 | |
Class I | | | 1,662,840 | | | | 583,590 | |
Class J | | | 1,349,994 | | | | 866,126 | |
Class Y | | | 10,253 | | | | - | |
Class Z | | | 2,660,913 | | | | 1,652,497 | |
Cost of shares redeemed: | | | | | | | | |
Class A | | | (30,597,189) | | | | (31,130,074) | |
Class C | | | (3,055,016) | | | | (14,845,011) | |
Class I | | | (15,317,742) | | | | (9,478,136) | |
Class J | | | (4,425,117) | | | | (2,686,979) | |
Class Z | | | (4,131,274) | | | | (4,079,577) | |
Increase (Decrease) in Net Assets
from Beneficial Interest Transactions | (3,529,822) | | | | 5,350,746 | |
Total Increase (Decrease) in Net Assets | (245,747) | | | | 112,621 | |
Net Assets ($): | |
Beginning of Period | | | 323,079,087 | | | | 322,966,466 | |
End of Period | | | 322,833,340 | | | | 323,079,087 | |
30
| | | | | | | | | | |
| | | | Year Ended November 30, |
| | | | 2019 | | 2018 | |
Capital Share Transactions (Shares): | |
Class Aa | | | | | | | | |
Shares sold | | | 658,548 | | | | 1,394,363 | |
Shares issued for distributions reinvested | | | 950,387 | | | | 483,543 | |
Shares redeemed | | | (1,392,692) | | | | (1,336,283) | |
Net Increase (Decrease) in Shares Outstanding | 216,243 | | | | 541,623 | |
Class Ca | | | | | | | | |
Shares sold | | | 142,922 | | | | 135,211 | |
Shares issued for distributions reinvested | | | 40,430 | | | | 18,371 | |
Shares redeemed | | | (140,508) | | | | (629,414) | |
Net Increase (Decrease) in Shares Outstanding | 42,844 | | | | (475,832) | |
Class I | | | | | | | | |
Shares sold | | | 204,549 | | | | 686,253 | |
Shares issued for distributions reinvested | | | 83,510 | | | | 25,551 | |
Shares redeemed | | | (719,103) | | | | (408,972) | |
Net Increase (Decrease) in Shares Outstanding | (431,044) | | | | 302,832 | |
Class J | | | | | | | | |
Shares sold | | | 17,332 | | | | 13,389 | |
Shares issued for distributions reinvested | | | 67,373 | | | | 37,921 | |
Shares redeemed | | | (199,173) | | | | (115,462) | |
Net Increase (Decrease) in Shares Outstanding | (114,468) | | | | (64,152) | |
Class Y | | | | | | | | |
Shares sold | | | 229,527 | | | | - | |
Shares issued for distributions reinvested | | | 475 | | | | - | |
Net Increase (Decrease) in Shares Outstanding | 230,002 | | | | - | |
Class Z | | | | | | | | |
Shares sold | | | 44,602 | | | | 29,924 | |
Shares issued for distributions reinvested | | | 133,597 | | | | 72,765 | |
Shares redeemed | | | (189,477) | | | | (176,760) | |
Net Increase (Decrease) in Shares Outstanding | (11,278) | | | | (74,071) | |
| | | | | | | | | |
aDuring the period ended November 30, 2019, 3,570 Class C shares representing $78,511 were automatically converted to 3,569 Class A shares and during the period ended November 30, 2018, 63,866 Class C shares representing $1,512,815 were automatically converted to 63,650 Class A shares. | |
See notes to financial statements. | | | | | | | | |
31
FINANCIAL HIGHLIGHTS
The following tables describe the performance for each share class for the fiscal periods indicated. All information (except portfolio turnover rate) reflects financial results for a single fund share. Total return shows how much your investment in the fund would have increased (or decreased) during each period, assuming you had reinvested all dividends and distributions. These figures have been derived from the fund’s financial statements.
| | | | | | | | | | | | |
| | | | | |
| | |
| | Year Ended November 30, |
Class A Shares | | 2019 | 2018 | 2017 | 2016 | 2015 |
Per Share Data ($): | | | | | | |
Net asset value, beginning of period | | 23.22 | 23.61 | 21.42 | 21.35 | 22.86 |
Investment Operations: | | | | | | |
Investment income—neta | | .29 | .24 | .20 | .22 | .18 |
Net realized and unrealized
gain (loss) on investments | | 1.76 | .50 | 2.22 | 1.02 | .21 |
Total from Investment Operations | | 2.05 | .74 | 2.42 | 1.24 | .39 |
Distributions: | | | | | | |
Dividends from investment income—net | | (.26) | (.20) | (.23) | (.19) | (.18) |
Dividends from net realized
gain on investments | | (1.69) | (.93) | − | (.98) | (1.72) |
Total Distributions | | (1.95) | (1.13) | (.23) | (1.17) | (1.90) |
Net asset value, end of period | | 23.32 | 23.22 | 23.61 | 21.42 | 21.35 |
Total Return (%)b | | 10.23 | 3.24 | 11.42 | 6.25 | 1.84 |
Ratios/Supplemental Data (%): | | | | | | |
Ratio of total expenses
to average net assets | | 1.24 | 1.24 | 1.26 | 1.30 | 1.27 |
Ratio of net expenses
to average net assets | | 1.20 | 1.20 | 1.20 | 1.20 | 1.20 |
Ratio of net investment income
to average net assets | | 1.32 | 1.01 | .90 | 1.09 | .86 |
Portfolio Turnover Rate | | 109.36 | 98.95 | 97.15 | 105.77 | 114.35 |
Net Assets, end of period ($ x 1,000) | | 246,554 | 240,418 | 231,677 | 182,935 | 185,781 |
a Based on average shares outstanding.
b Exclusive of sales charge.
See notes to financial statements.
32
| | | | | | | | |
| | |
| | |
| | Year Ended November 30, |
Class C Shares | | 2019 | 2018 | 2017 | 2016 | 2015 |
Per Share Data ($): | | | | | | |
Net asset value, beginning of period | | 23.16 | 23.52 | 21.34 | 21.26 | 22.77 |
Investment Operations: | | | | | | |
Investment income—neta | | .12 | .05 | .03 | .07 | .02 |
Net realized and unrealized
gain (loss) on investments | | 1.78 | .52 | 2.22 | 1.02 | .21 |
Total from Investment Operations | | 1.90 | .57 | 2.25 | 1.09 | .23 |
Distributions: | | | | | | |
Dividends from investment income—net | | (.13) | − | (.07) | (.03) | (.02) |
Dividends from net realized
gain on investments | | (1.69) | (.93) | − | (.98) | (1.72) |
Total Distributions | | (1.82) | (.93) | (.07) | (1.01) | (1.74) |
Net asset value, end of period | | 23.24 | 23.16 | 23.52 | 21.34 | 21.26 |
Total Return (%)b | | 9.46 | 2.43 | 10.62 | 5.46 | 1.05 |
Ratios/Supplemental Data (%): | | | | | | |
Ratio of total expenses
to average net assets | | 2.01 | 1.99 | 2.02 | 2.05 | 2.02 |
Ratio of net expenses
to average net assets | | 1.95 | 1.95 | 1.95 | 1.95 | 1.95 |
Ratio of net investment income
to average net assets | | .57 | .22 | .14 | .34 | .11 |
Portfolio Turnover Rate | | 109.36 | 98.95 | 97.15 | 105.77 | 114.35 |
Net Assets, end of period ($ x 1,000) | | 12,838 | 11,805 | 23,183 | 28,203 | 32,403 |
a Based on average shares outstanding.
b Exclusive of sales charge.
See notes to financial statements.
33
FINANCIAL HIGHLIGHTS (continued)
| | | | | | | | | | | |
| | | | | |
| | |
| | Year Ended November 30, |
Class I Shares | | 2019 | 2018 | 2017 | 2016 | 2015 |
Per Share Data ($): | | | | | | |
Net asset value, beginning of period | | 23.30 | 23.68 | 21.49 | 21.41 | 22.93 |
Investment Operations: | | | | | | |
Investment income—neta | | .33 | .27 | .26 | .28 | .24 |
Net realized and unrealized
gain (loss) on investments | | 1.77 | .54 | 2.21 | 1.02 | .20 |
Total from Investment Operations | | 2.10 | .81 | 2.47 | 1.30 | .44 |
Distributions: | | | | | | |
Dividends from investment income—net | | (.42) | (.26) | (.28) | (.24) | (.24) |
Dividends from net realized
gain on investments | | (1.69) | (.93) | − | (.98) | (1.72) |
Total Distributions | | (2.11) | (1.19) | (.28) | (1.22) | (1.96) |
Net asset value, end of period | | 23.29 | 23.30 | 23.68 | 21.49 | 21.41 |
Total Return (%) | | 10.55 | 3.51 | 11.64 | 6.57 | 2.07 |
Ratios/Supplemental Data (%): | | | | | | |
Ratio of total expenses
to average net assets | | 1.01 | 1.00 | 1.06 | 1.06 | 1.02 |
Ratio of net expenses
to average net assets | | .95 | .95 | .95 | .95 | .95 |
Ratio of net investment income
to average net assets | | 1.59 | 1.22 | 1.14 | 1.39 | 1.11 |
Portfolio Turnover Rate | | 109.36 | 98.95 | 97.15 | 105.77 | 114.35 |
Net Assets, end of period ($ x 1,000) | | 11,251 | 21,301 | 14,476 | 8,433 | 4,860 |
a Based on average shares outstanding.
See notes to financial statements.
34
| | | | | | | | | | |
| | | | | |
| | |
| | Year Ended November 30, |
Class J Shares | | 2019 | 2018 | 2017 | 2016 | 2015 |
Per Share Data ($): | | | | | | |
Net asset value, beginning of period | | 23.30 | 23.68 | 21.49 | 21.41 | 22.93 |
Investment Operations: | | | | | | |
Investment income—neta | | .35 | .29 | .26 | .27 | .24 |
Net realized and unrealized
gain (loss) on investments | | 1.76 | .51 | 2.21 | 1.03 | .20 |
Total from Investment Operations | | 2.11 | .80 | 2.47 | 1.30 | .44 |
Distributions: | | | | | | |
Dividends from investment income—net | | (.31) | (.25) | (.28) | (.24) | (.24) |
Dividends from net realized
gain on investments | | (1.69) | (.93) | − | (.98) | (1.72) |
Total Distributions | | (2.00) | (1.18) | (.28) | (1.22) | (1.96) |
Net asset value, end of period | | 23.41 | 23.30 | 23.68 | 21.49 | 21.41 |
Total Return (%) | | 10.55 | 3.46 | 11.69 | 6.56 | 2.07 |
Ratios/Supplemental Data (%): | | | | | | |
Ratio of total expenses
to average net assets | | 1.00 | .99 | 1.00 | 1.04 | 1.00 |
Ratio of net expenses
to average net assets | | .95 | .95 | .95 | .95 | .95 |
Ratio of net investment income
to average net assets | | 1.58 | 1.25 | 1.15 | 1.34 | 1.11 |
Portfolio Turnover Rate | | 109.36 | 98.95 | 97.15 | 105.77 | 114.35 |
Net Assets, end of period ($ x 1,000) | | 13,810 | 16,415 | 18,203 | 17,725 | 17,879 |
a Based on average shares outstanding.
See notes to financial statements.
35
FINANCIAL HIGHLIGHTS (continued)
| | | | | | | | | | |
| |
| | | |
| | | | Year Ended November 30, |
Class Y Shares | | | 2019 | 2018 | 2017 | 2016a |
Per Share Data ($): | | | | | | |
Net asset value, beginning of period | | | 23.31 | 23.69 | 21.47 | 20.89 |
Investment Operations: | | | | | | |
Investment income—netb | | | .35 | . 29 | .26 | .04 |
Net realized and unrealized
gain (loss) on investments | | | 1.75 | .52 | 2.24 | .54 |
Total from Investment Operations | | | 2.10 | .81 | 2.50 | .58 |
Distributions: | | | | | | |
Dividends from investment income—net | | | (.33) | (.26) | (.28) | − |
Dividends from net realized
gain on investments | | | (1.69) | (.93) | − | − |
Total Distributions | | | (2.02) | (1.19) | (.28) | − |
Net asset value, end of period | | | 23.39 | 23.31 | 23.69 | 21.47 |
Total Return (%) | | | 10.51 | 3.52 | 11.74 | 2.83c |
Ratios/Supplemental Data (%): | | | | | | |
Ratio of total expenses
to average net assets | | | .96 | 1.09 | .93 | 1.08d |
Ratio of net expenses
to average net assets | | | .95 | .95 | .93 | .95d |
Ratio of net investment income
to average net assets | | | 1.49 | 1.26 | 1.17 | 1.00d |
Portfolio Turnover Rate | | | 109.36 | 98.95 | 97.15 | 105.77 |
Net Assets, end of period ($ x 1,000) | | | 5,392 | 11 | 11 | 10 |
a From September 30, 2016 (commencement of initial offering) to November 30, 2016.
b Based on average shares outstanding.
c Not annualized.
d Annualized.
See notes to financial statements.
36
| | | | | | | | | | | |
| | | | | |
| | |
| | Year Ended November 30, |
Class Z Shares | | 2019 | 2018 | 2017 | 2016 | 2015 |
Per Share Data ($): | | | | | | |
Net asset value, beginning of period | | 23.16 | 23.54 | 21.36 | 21.29 | 22.81 |
Investment Operations: | | | | | | |
Investment income—neta | | .32 | .28 | .24 | .26 | .22 |
Net realized and unrealized
gain (loss) on investments | | 1.75 | .50 | 2.21 | 1.01 | .21 |
Total from Investment Operations | | 2.07 | .78 | 2.45 | 1.27 | .43 |
Distributions: | | | | | | |
Dividends from investment income—net | | (.30) | (.23) | (.27) | (.22) | (.23) |
Dividends from net realized
gain on investments | | (1.69) | (.93) | − | (.98) | (1.72) |
Total Distributions | | (1.99) | (1.16) | (.27) | (1.20) | (1.95) |
Net asset value, end of period | | 23.24 | 23.16 | 23.54 | 21.36 | 21.29 |
Total Return (%) | | 10.41 | 3.44 | 11.59 | 6.51 | 1.96 |
Ratios/Supplemental Data (%): | | | | | | |
Ratio of total expenses
to average net assets | | 1.11 | 1.07 | 1.10 | 1.13 | 1.12 |
Ratio of net expenses
to average net assets | | 1.05 | 1.01 | 1.02 | 1.02 | 1.03 |
Ratio of net investment income
to average net assets | | 1.47 | 1.19 | 1.08 | 1.27 | 1.03 |
Portfolio Turnover Rate | | 109.36 | 98.95 | 97.15 | 105.77 | 114.35 |
Net Assets, end of period ($ x 1,000) | | 32,989 | 33,129 | 35,416 | 34,868 | 37,073 |
a Based on average shares outstanding.
See notes to financial statements.
37
NOTES TO FINANCIAL STATEMENTS
NOTE 1—Significant Accounting Policies:
BNY Mellon Balanced Opportunity Fund (the “fund”) is the sole series of BNY Mellon Investment Funds VI (the “Company”), which is registered under the Investment Company Act of 1940, as amended (the “Act”), as a diversified open-end management investment company. The fund’s investment objectiveis to seek a high total return through a combination of capital appreciation and current income.BNY Mellon Investment Adviser, Inc. (the “Adviser”), a wholly-owned subsidiary of The Bank of New York Mellon Corporation (“BNY Mellon”), serves as the fund’s investment adviser.
Effective June 3, 2019, the fund changed its name from Dreyfus Balanced Opportunity Fund to BNY Mellon Balanced Opportunity Fund and the Company changed its name from Dreyfus Manager Funds II to BNY Mellon Investment Funds VI. In addition, The Dreyfus Corporation, the fund’s investment adviser, changed its name to “BNY Mellon Investment Adviser, Inc.”, MBSC Securities Corporation, the fund’s distributor, changed its name to “BNY Mellon Securities Corporation” and Dreyfus Transfer, Inc., the fund’s transfer agent, changed its name to “BNY Mellon Transfer, Inc.”
BNY Mellon Securities Corporation (the “Distributor”), a wholly-owned subsidiary of the Adviser, is the distributor of the fund’s shares. The fund is authorized to issue an unlimited number of $.001 par value shares of Beneficial Interest in each of the following classes of shares: Class A, Class C, Class I, Class J, Class T, Class Y and Class Z. Class A and Class T shares generally are subject to a sales charge imposed at the time of purchase. Class C shares are subject to a contingent deferred sales charge (“CDSC”) imposed on Class C shares redeemed within one year of purchase. Class C shares automatically convert to Class A shares ten years after the date of purchase, without the imposition of a sales charge. Class I, Class J and Class Z shares are sold at net asset value per share generally to certain shareholders of the fund. Class I and Class Y shares are sold generally to institutional investors and Class J and Class Z shares generally are not available for new accounts. As of the date of this report, the fund did not offer Class T shares for purchase. Other differences between the classes include the services offered to and the expenses borne by each class, the allocation of certain transfer agency costs, and certain voting rights. Income, expenses (other than expenses attributable to a specific class), and realized and unrealized gains or losses on investments are allocated to each class of shares based on its relative net assets.
38
The Financial Accounting Standards Board (“FASB”) Accounting Standards Codification (“ASC”) is the exclusive reference of authoritative U.S. generally accepted accounting principles (“GAAP”) recognized by the FASB to be applied by nongovernmental entities. Rules and interpretive releases of the Securities and Exchange Commission (“SEC”) under authority of federal laws are also sources of authoritative GAAP for SEC registrants. The fund is an investment company and applies the accounting and reporting guidance of the FASB ASC Topic 946 Financial Services-Investment Companies. The fund’s financial statements are prepared in accordance with GAAP, which may require the use of management estimates and assumptions. Actual results could differ from those estimates.
The Companyenters into contracts that contain a variety of indemnifications. The fund’s maximum exposure under these arrangements is unknown. The fund does not anticipate recognizing any loss related to these arrangements.
(a) Portfolio valuation: The fair value of a financial instrument is the amount that would be received to sell an asset or paid to transfer a liability in an orderly transaction between market participants at the measurement date (i.e., the exit price). GAAP establishes a fair value hierarchy that prioritizes the inputs of valuation techniques used to measure fair value. This hierarchy gives the highest priority to unadjusted quoted prices in active markets for identical assets or liabilities (Level 1 measurements) and the lowest priority to unobservable inputs (Level 3 measurements).
Additionally, GAAP provides guidance on determining whether the volume and activity in a market has decreased significantly and whether such a decrease in activity results in transactions that are not orderly. GAAP requires enhanced disclosures around valuation inputs and techniques used during annual and interim periods.
Various inputs are used in determining the value of the fund’s investments relating to fair value measurements. These inputs are summarized in the three broad levels listed below:
Level 1—unadjusted quoted prices in active markets for identical investments.
Level 2—other significant observable inputs (including quoted prices for similar investments, interest rates, prepayment speeds, credit risk, etc.).
Level 3—significant unobservable inputs (including the fund’s own assumptions in determining the fair value of investments).
39
NOTES TO FINANCIAL STATEMENTS(continued)
The inputs or methodology used for valuing securities are not necessarily an indication of the risk associated with investing in those securities.
Changes in valuation techniques may result in transfers in or out of an assigned level within the disclosure hierarchy. Valuation techniques used to value the fund’s investments are as follows:
Investments in debt securities excluding short-term investments (other than U.S. Treasury Bills), and futures are valued each business day by one or more independent pricing services (each, a “Service”) approved by the Company’s Board of Trustees (the “Board”). Investments for which quoted bid prices are readily available and are representative of the bid side of the market in the judgment of the Service are valued at the mean between the quoted bid prices (as obtained by the Service from dealers in such securities) and asked prices (as calculated by a Service based upon its evaluation of the market for such securities). Securities are valued as determined by a Service, based on methods which include consideration of the following: yields or prices of securities of comparable quality, coupon, maturity and type; indications as to values from dealers; and general market conditions. These securities are generally categorized within Level 2 of the fair value hierarchy.
Investments in equity securities are valued at the last sales price on the securities exchange or national securities market on which such securities are primarily traded. Securities listed on the National Market System for which market quotations are available are valued at the official closing price or, if there is no official closing price that day, at the last sales price. For open short positions, asked prices are used for valuation purposes. Bid price is used when no asked price is available. Registered investment companies that are not traded on an exchange are valued at their net asset value. All of the preceding securities are generally categorized within Level 1 of the fair value hierarchy.
Securities not listed on an exchange or the national securities market, or securities for which there were no transactions, are valued at the average of the most recent bid and asked prices. These securities are generally categorized within Level 2 of the fair value hierarchy.
Each Service and independent valuation firm is engaged under the general oversight of the Board.
Fair valuing of securities may be determined with the assistance of a pricing service using calculations based on indices of domestic securities and other appropriate indicators, such as prices of relevant American Depository Receipts and futures. Utilizing these techniques may result in transfers between Level 1 and Level 2 of the fair value hierarchy.
40
When market quotations or official closing prices are not readily available, or are determined not to accurately reflect fair value, such as when the value of a security has been significantly affected by events after the close of the exchange or market on which the security is principally traded (for example, a foreign exchange or market), but before the fund calculates its net asset value, the fund may value these investments at fair value as determined in accordance with the procedures approved by the Board. Certain factors may be considered when fair valuing investments such as: fundamental analytical data, the nature and duration of restrictions on disposition, an evaluation of the forces that influence the market in which the securities are purchased and sold, and public trading in similar securities of the issuer or comparable issuers. These securities are either categorized within Level 2 or 3 of the fair value hierarchy depending on the relevant inputs used.
For restricted securities where observable inputs are limited, assumptions about market activity and risk are used and such securities are generally categorized within Level 3 of the fair value hierarchy.
Investments denominated in foreign currencies are translated to U.S. dollars at the prevailing rates of exchange.
Futures which are traded on an exchange, are valued at the last sales price on the securities exchange on which such securities are primarily traded or at the last sales price on the national securities market on each business day and are generally categorized within Level 1 of the fair value hierarchy.
The following is a summary of the inputs used as of November 30, 2019in valuing the fund’s investments:
| | | | | | |
| | Level 1 - Unadjusted Quoted Prices | Level 2 - Other Significant Observable Inputs | Level 3 - Significant Unobservable Inputs | Total |
Assets ($) |
Investments in Securities:† |
Asset-Backed | - | 5,108,494 | - | 5,108,494 |
Collateralized Municipal-Backed Securities | - | 2,027,254 | - | 2,027,254 |
Commercial Mortgage-Backed | - | 5,263,930 | - | 5,263,930 |
Corporate Bonds | - | 31,618,905 | - | 31,618,905 |
41
NOTES TO FINANCIAL STATEMENTS(continued)
| | | | | | |
| | Level 1 - Unadjusted Quoted Prices | Level 2 - Other Significant Observable Inputs | Level 3 - Significant Unobservable Inputs | Total |
Assets ($) |
Equity Securities―
Common Stocks | 217,335,072 | - | - | 217,335,072 |
Exchange-Traded Funds | 253,411 | - | - | 253,411 |
Foreign Governmental | - | 650,800 | - | 650,800 |
Investment Companies | 20,232,397 | - | - | 20,232,397 |
Municipal Securities | - | 1,956,561 | - | 1,956,561 |
U.S. Government Agencies | - | 1,034,945 | - | 1,034,945 |
U.S. Government Agencies Mortgage-Backed | - | 31,217,708 | - | 31,217,708 |
U.S. Treasury Securities | - | 14,948,610 | - | 14,948,610 |
Other Financial Instruments: | | | | |
Futures†† | 4,313 | - | - | 4,313 |
Liabilities ($) |
Other Financial Instruments: | | | | |
Futures†† | (1,250) | - | - | (1,250) |
† See Statement of Investments for additional detailed categorizations, if any.
†† Amount shown represents unrealized appreciation (depreciation) at period end, but only variation margin on exchanged traded and centrally cleared derivatives, if any, are reported in the Statement of Assets and Liabilities.
(b) Foreign currency transactions: The fund does not isolate that portion of the results of operations resulting from changes in foreign exchange rates on investments from the fluctuations arising from changes in the market prices of securities held. Such fluctuations are included with the net realized and unrealized gain or loss on investments.
Net realized foreign exchange gains or losses arise from sales of foreign currencies, currency gains or losses realized on securities transactions between trade and settlement date, and the difference between the amounts of dividends, interest and foreign withholding taxes recorded on the fund’s books and the U.S. dollar equivalent of the amounts actually received or paid. Net unrealized foreign exchange gains and losses arise from changes in the value of assets and liabilities other than investments resulting from changes in exchange rates. Foreign currency gains and losses on foreign currency transactions are also included with net realized and unrealized gain or loss on investments.
(c) Securities transactions and investment income: Securities transactions are recorded on a trade date basis. Realized gains and losses
42
from securities transactions are recorded on the identified cost basis. Interest income, adjusted for accretion of discount and amortization of premium on investments, is earned from settlement date and recognized on the accrual basis. Securities purchased or sold on a when issued or delayed delivery basis may be settled a month or more after the trade date.
Pursuant to a securities lending agreement with The Bank of New York Mellon, a subsidiary of BNY Mellon and an affiliate of the Adviser, the fund may lend securities to qualified institutions. It is the fund’s policy that, at origination, all loans are secured by collateral of at least 102% of the value of U.S. securities loaned and 105% of the value of foreign securities loaned. Collateral equivalent to at least 100% of the market value of securities on loan is maintained at all times. Collateral is either in the form of cash, which can be invested in certain money market mutual funds managed by the Adviser, or U.S. Government and Agency securities. The fund is entitled to receive all dividends, interest and distributions on securities loaned, in addition to income earned as a result of the lending transaction. Should a borrower fail to return the securities in a timely manner, The Bank of New York Mellon is required to replace the securities for the benefit of the fund or credit the fund with the market value of the unreturned securities and is subrogated to the fund’s rights against the borrower and the collateral. Additionally, the contractual maturity of security lending transactions are on an overnight and continuous basis. During the period ended November 30, 2019, The Bank of New York Mellon earned $2,576 from the lending of the fund’s portfolio securities, pursuant to the securities lending agreement.
(d) Affiliated issuers: Investments in other investment companies advised by the Adviser are considered “affiliated” under the Act.
(e) Dividends and distributions to shareholders: Dividends and distributions are recorded on the ex-dividend date. Dividends from investment income-net and dividends from net realized capital gains, if any, are normally declared and paid annually, but the fund may make distributions on a more frequent basis to comply with the distribution requirements of the Internal Revenue Code of 1986, as amended (the “Code”). To the extent that net realized capital gains can be offset by capital loss carryovers, it is the policy of the fund not to distribute such gains. Income and capital gain distributions are determined in accordance with income tax regulations, which may differ from GAAP.
(f) Federal income taxes: It is the policy of the fund to continue to qualify as a regulated investment company, if such qualification is in the best interests of its shareholders, by complying with the applicable provisions of the Code, and to make distributions of taxable income and
43
NOTES TO FINANCIAL STATEMENTS(continued)
net realized capital gain sufficient to relieve it from substantially all federal income and excise taxes.
As of and during the period ended November 30, 2019, the fund did not have any liabilities for any uncertain tax positions. The fund recognizes interest and penalties, if any, related to uncertain tax positions as income tax expense in the Statement of Operations. During the period ended November 30, 2019, the fund did not incur any interest or penalties.
Each tax year in the four-year period ended November 30, 2019 remains subject to examination by the Internal Revenue Service and state taxing authorities.
At November 30, 2019, the components of accumulated earnings on a tax basis were as follows: undistributed ordinary income $4,312,526, undistributed capital gains $6,687,994 and unrealized appreciation $42,868,291.
The tax character of distributions paid to shareholders during the fiscal periods ended November 30, 2019 and November 30, 2018 were as follows: ordinary income $6,985,498 and $4,984,112, and long-term capital gains $19,872,987 and $10,501,241, respectively.
(g) New Accounting Pronouncements: Effective June 1, 2019, the fund adopted Accounting Standards Update 2017-08, Receivables—Nonrefundable Fees and Other Costs (Subtopic 310-20): Premium Amortization On Purchased Callable Debt Securities (“ASU 2017-08”). The update shortens the amortization period for the premium on certain purchased callable debt securities to the earliest call date.
Also effective June 1, 2019, the fund adopted Accounting Standards Update 2018-13, Fair Value Measurement (Topic 820): Disclosure Framework—Changes to the Disclosure Requirements for Fair Value Measurement (“ASU 2018-13”). The update provides guidance that modifies certain disclosure requirements for fair value measurements. The adoption of ASU 2017-08 and ASU 2018-13 had no impact on the operations of the fund for the period ended November 30, 2019.
NOTE 2—Bank Lines of Credit:
The fund participates with other long-term open-end funds managed by the Adviser in a $1.030 billion unsecured credit facility led by Citibank, N.A. (the “Citibank Credit Facility”) and a $300 million unsecured credit facility provided by The Bank of New York Mellon (the “BNYM Credit Facility”), each to be utilized primarily for temporary or emergency purposes, including the financing of redemptions (each, a “Facility”). The Citibank Credit Facility is available in two tranches: (i) Tranche A is in an
44
amount equal to $830 million and is available to all long-term open-ended funds, including the fund, and (ii) Tranche B is in amount equal to $200 million and is available only to BNY Mellon Floating Rate Income Fund, a series of BNY Mellon Investment Funds IV, Inc. In connection therewith, the fund has agreed to pay its pro rata portion of commitment fees for Tranche A of the Citibank Credit Facility and the BNYM Credit Facility. Interest is charged to the fund based on rates determined pursuant to the terms of the respective Facility at the time of borrowing. During the period ended November 30, 2019, the fund did not borrow under the Facilities.
NOTE 3—Management Fee and Other Transactions with Affiliates:
(a)Pursuant to a management agreement with the Adviser, the management fee is computed at the annual rate of .80% of the value of the fund’s average daily net assets and is payable monthly. The Adviser has contractually agreed, from December 1, 2018 through April 1, 2020, to waive receipt of its fees and/or assume the direct expenses of the fund, so that the direct expenses of none of the classes (excluding Rule 12b-1 Distribution Plan fees, Shareholder Services Plan fees, taxes, interest expense, brokerage commissions, commitment fees on borrowings and extraordinary expenses) exceed .95% of the value of the fund’s average daily net assets. On or after April 1, 2020, The Adviser may terminate this expense limitation at any time. The reduction in expenses, pursuant to the undertaking, amounted to $129,085 during the period ended November 30, 2019.
During the period ended November 30, 2019, the Distributor retained $7,657 from commissions earned on sales of the fund’s Class A shares and $375 from CDSC fees on redemptions of the fund’s Class C shares.
(b) Under the Distribution Plan adopted pursuant to Rule 12b-1 under the Act, Class C shares pay the Distributor for distributing its shares at an annual rate of .75% of the value of its average daily net assets. During the period ended November 30, 2019, Class C shares were charged $91,289 pursuant to the Distribution Plan.
(c)Under the Shareholder Services Plan, Class A and Class C shares pay the Distributor at an annual rate of .25% of the value of their average daily net assets for the provision of certain services. The services provided may include personal services relating to shareholder accounts, such as answering shareholder inquiries regarding the fund and providing reports and other information, and services related to the maintenance of shareholder accounts. The Distributor may make payments to Service Agents (securities dealers, financial institutions or other industry
45
NOTES TO FINANCIAL STATEMENTS(continued)
professionals) with respect to these services. The Distributor determines the amounts to be paid to Service Agents. During the period ended November 30, 2019, Class A and Class C shares were charged $593,542and $30,430, respectively, pursuant to the Shareholder Services Plan.
Under the Shareholder Services Plan, Class Z shares reimburse the Distributor at an amount not to exceed an annual rate of .25% of the value of Class Z shares’ average daily net assets for the provision of certain services. The services provided may include personal services relating to shareholder accounts, such as answering shareholder inquiries regarding Class Z shares and providing reports and other information, and services related to the maintenance of shareholder accounts. During the period ended November 30, 2019,Class Z shares were charged $31,650 pursuant to the Shareholder Services Plan.
The fund has an arrangement with the transfer agent whereby the fund may receive earnings credits when positive cash balances are maintained, which are used to offset transfer agency fees. The fund had an arrangement with the custodian to receive earnings credits when positive cash balances were maintained, which were used to offset custody fees. Effective February 1, 2019, the arrangement with the custodian changed whereby the fund will no longer receive earnings credits to offset its custody fees and will receive interest income or overdraft fees going forward. For financial reporting purposes, the fund includes net earnings credits, if any, as an expense offset in the Statement of Operations.
The fund compensates BNY Mellon Transfer, Inc., a wholly-owned subsidiary of the Adviser, under a transfer agency agreement for providing transfer agency and cash management services for the fund. The majority of transfer agency fees are comprised of amounts paid on a per account basis, while cash management fees are related to fund subscriptions and redemptions. During the period ended November 30, 2019, the fund was charged $97,485 for transfer agency services. These fees are included in Shareholder servicing costs in the Statement of Operations.
The fund compensates The Bank of New York Mellon under a custody agreement for providing custodial services for the fund. These fees are determined based on net assets, geographic region and transaction activity. During the period ended November 30, 2019, the fund was charged $22,425 pursuant to the custody agreement.
During the period ended November 30, 2019, the fund was charged $13,991 for services performed by the Chief Compliance Officer and his staff. These fees are included in Miscellaneous in the Statement of Operations.
46
The components of “Due to BNY Mellon Investment Adviser, Inc. and affiliates” in the Statement of Assets and Liabilities consist of: management fees of $211,659, Distribution Plan fees of $7,824, Shareholder Services Plan fees of $56,144, custodian fees of $8,000, Chief Compliance Officer fees of $2,609 and transfer agency fees of $20,367, which are offset against an expense reimbursement currently in effect in the amount of $17,112.
(d) Each Board member also serves as a Board member of other funds in the BNY Mellon Family of Funds complex. Annual retainer fees and attendance fees are allocated to each fund based on net assets.
NOTE 4—Securities Transactions:
The aggregate amount of purchases and sales (including paydowns) of investment securities, excluding short-term securities and futures during the period ended November 30, 2019, amounted to $327,545,552 and $354,221,774, respectively.
Derivatives:A derivative is a financial instrument whose performance is derived from the performance of another asset. Each type of derivative instrument that was held by the fund during the period ended November 30, 2019 is discussed below.
Futures:In the normal course of pursuing its investment objective, the fund is exposed to market risk, including interest rate risk,as a result of changes in value of underlying financial instruments. The fund invests in futures in order to manage its exposure to or protect against changes in the market. A futures contract represents a commitment for the future purchase or a sale of an asset at a specified date. Upon entering into such contracts, these investments require initial margin deposits with a counterparty, which consist of cash or cash equivalents. The amount of these deposits is determined by the exchange or Board of Trade on which the contract is traded and is subject to change. Accordingly, variation margin payments are received or made to reflect daily unrealized gains or losses which are recorded in the Statement of Operations. When the contracts are closed, the fund recognizes a realized gain or loss which is reflected in the Statement of Operations. There is minimal counterparty credit risk to the fund with futures since they are exchange traded, and the exchange guarantees the futures against default. Futures open at November 30, 2019 are set forth in the Statement of Futures.
The following summarizes the average market value of derivatives outstanding duringthe period ended November 30, 2019:
| | | |
| | Average Market Value ($) |
Interest rate futures | | 654,475 |
| | |
47
NOTES TO FINANCIAL STATEMENTS(continued)
At November 30, 2019, the cost of investments for federal income tax purposes was $288,779,701; accordingly, accumulated net unrealized appreciation on investments was $42,868,386, consisting of $49,540,023 gross unrealized appreciation and $6,671,637 gross unrealized depreciation.
48
REPORT OF INDEPENDENT REGISTERED PUBLIC ACCOUNTING FIRM
To the Shareholders and the Board of Trustees of BNY Mellon Balanced Opportunity Fund (formerly, Dreyfus Balanced Opportunity Fund)
Opinion on the Financial Statements
We have audited the accompanying statement of assets and liabilities of BNY Mellon Balanced Opportunity Fund (the “Fund”) (formerly, Dreyfus Balanced Opportunity Fund) (the sole fund constituting BNY Mellon Investment Funds VI), including the statements of investments, investments in affiliated issuers and futures, as of November 30, 2019, and the related statement of operations for the year then ended, the statements of changes in net assets for each of the two years in the period then ended, the financial highlights for each of the five years in the period then ended and the related notes (collectively referred to as the “financial statements”). In our opinion, the financial statements present fairly, in all material respects, the financial position of the Fund (the sole fund constituting BNY Mellon Investment Funds VI) at November 30, 2019, the results of its operations for the year then ended, the changes in its net assets for each of the two years in the period then ended and its financial highlights for each of the five years in the period then ended, in conformity with U.S. generally accepted accounting principles.
Basis for Opinion
These financial statements are the responsibility of the Fund’s management. Our responsibility is to express an opinion on the Fund’s financial statements based on our audits. We are a public accounting firm registered with the Public Company Accounting Oversight Board (United States) (“PCAOB”) and are required to be independent with respect to the Fund in accordance with the U.S. federal securities laws and the applicable rules and regulations of the Securities and Exchange Commission and the PCAOB.
We conducted our audits in accordance with the standards of the PCAOB. Those standards require that we plan and perform the audit to obtain reasonable assurance about whether the financial statements are free of material misstatement, whether due to error or fraud. The Fund is not required to have, nor were we engaged to perform, an audit of the Fund’s internal control over financial reporting. As part of our audits, we are required to obtain an understanding of internal control over financial reporting, but not for the purpose of expressing an opinion on the effectiveness of the Fund’s internal control over financial reporting. Accordingly, we express no such opinion.
Our audits included performing procedures to assess the risks of material misstatement of the financial statements, whether due to error or fraud, and performing procedures that respond to those risks. Such procedures included examining, on a test basis, evidence regarding the amounts and disclosures in the financial statements. Our procedures included confirmation of securities owned as of November 30, 2019, by correspondence with the custodian and others or by other appropriate auditing procedures where replies from others were not received. Our audits also included evaluating the accounting principles used and significant estimates made by management, as well as evaluating the overall presentation of the financial statements. We believe that our audits provide a reasonable basis for our opinion.

We have served as the auditor of one or more investment companies in the BNY Mellon Family of Funds since at least 1957, but we are unable to determine the specific year.
New York, New York
January 28, 2020
49
IMPORTANT TAX INFORMATION(Unaudited)
For federal tax purposes the fund hereby reports 59.81% of the ordinary dividends paid during the fiscal year ended November 30, 2019 as qualifying for the corporate dividends received deduction. Also certain dividends paid by the fund may be subject to a maximum tax rate of 15%, as provided for by the Jobs and Growth Tax Relief Reconciliation Act of 2003. Of the distributions paid during the fiscal year, $4,057,933 represents the maximum amount that may be considered qualified dividend income. Shareholders will receive notification in early 2020 of the percentage applicable to the preparation of their 2019 income tax returns. Also, the fund hereby reports $.0013 per share as a short-term capital gain distribution and $.0593 per share as a long-term capital gain distribution paid on March 20, 2019 and also $.2405 per share as a short-term capital gain distribution and $1.3895 per share as a long-term capital gain distribution paid on December 31, 2018.
50
BOARD MEMBERS INFORMATION(Unaudited)
INDEPENDENT BOARD MEMBERS
Joseph S. DiMartino (76)
Chairman of the Board (2003)
Principal Occupation During Past 5 Years:
· Corporate Director and Trustee (1995-Present)
Other Public Company Board Memberships During Past 5 Years:
· CBIZ, Inc., a public company providing professional business services, products and solutions,Director (1997-Present)
No. of Portfolios for which Board Member Serves:120
———————
Peggy C. Davis (76)
Board Member (2006)
Principal Occupation During Past 5 Years:
· Shad Professor of Law, New York University School of Law (1983-present)
No. of Portfolios for which Board Member Serves: 44
———————
Gina D. France (61)
Board Member (2019)
Principal Occupation During Past 5 Years:
· Founder, President and Chief Executive Officer, France Strategic Partners, a strategy and advisory firm serving corporate clients across the United States (2003 –Present)
· Corporate Director and Trustee (2004 – Present)
Other Public Company Board Memberships During Past 5 Years:
· Huntington Bancshares, a bank holding company headquartered in Columbus, Ohio, Director (2016 – Present)
· Cedar Fair, L.P., a publicly-traded partnership that owns and operates amusement parks and hotels in the U.S. and Canada,Director (2011 – Present)
· CBIZ (formerly, Century Business Services, Inc.), a provider of outsourcing functions for small and medium size companies,Director(2015 – Present)
· Baldwin Wallace University,Trustee (2013- Present)
· FirstMerit Corporation, a diversified financial services company,Director (2004 – 2016)
No. of Portfolios for which Board Member Serves:30
———————
51
BOARD MEMBERS INFORMATION (Unaudited) (continued)
INDEPENDENT BOARD MEMBERS (continued)
Joan Gulley (72)
Board Member (2017)
Principal Occupation During Past 5 Years:
· PNC Financial Services Group, Inc.(1993-2014), Executive Vice President and Chief Human Resources Officer and Executive Committee Member (2008-2014)
· Director, Nantucket Library (2015-Present)
No. of Portfolios for which Board Member Serves:50
———————
Ehud Houminer (79)
Board Member (2006)
Principal Occupation During Past 5 Years:
· Board of Overseers at the Columbia Business School, Columbia University (1992-Present)
· Trustee, Ben Gurion University (2012-2018)
No. of Portfolios for which Board Member Serves:50
———————
Lynn Martin (79)
Board Member (2012)
Principal Occupation During Past 5 Years:
· Retired
No. of Portfolios for which Board Member Serves:30
———————
Robin A. Melvin (56)
Board Member (2012)
Principal Occupation During Past 5 Years:
· Co-chairman, Mentor Illinois, a non-profit organization dedicated to increasing the quantity and quality of mentoring services in Illinois; (2014-Present; Board member (2013-Present)
No. of Portfolios for which Board Member Serves:97
———————
Once elected all Board Members serve for an indefinite term, but achieve Emeritus status upon reaching age 80. The address of the Board Members and Officers is c/o BNY Mellon Investment Adviser, Inc. 240 Greenwich Street, New York, New York 10286. Additional information about the Board Members is available in the fund’s Statement of Additional Information which can be obtained from the Adviser free of charge by calling this toll free number: 1-800-373-9387.
David P. Feldman, Emeritus Board Member
James F. Henry, Emeritus Board Member
Dr. Martin Peretz, Emeritus Board Member
Philip L. Toia, Emeritus Board Member
52
OFFICERS OF THE FUND(Unaudited)
RENEE LAROCHE-MORRIS, President since May 2019.
President and a director of BNY Mellon Investment Adviser, Inc. since January 2018. She is an officer of 63 investment companies (comprised of 120 portfolios) managed by the Adviser. She is 48 years old and has been an employee of BNY Mellon since 2003.
JAMES WINDELS, Treasurer since September 2003.
Director- BNY Mellon Fund Administration, and an officer of 64 investment companies (comprised of 143 portfolios) managed by the Adviser. He is 61 years old and has been an employee of the Adviser since April 1985.
BENNETT A. MACDOUGALL, Chief Legal Officer since October 2015.
Chief Legal Officer of the Adviser and Associate General Counsel and Managing Director of BNY Mellon since June 2015; Director and Associate General Counsel of Deutsche Bank – Asset & Wealth Management Division from June 2005 to June 2015, and as Chief Legal Officer of Deutsche Investment Management Americas Inc. from June 2012 to May 2015. He is an officer of 64 investment companies (comprised of 143 portfolios) managed by the Adviser. He is 48 years old and has been an employee of the Adviser since June 2015.
DAVID DIPETRILLO, Vice President since May 2019.
Head of North America Product, BNY Mellon Investment Management since January 2018, Director of Product Strategy, BNY Mellon Investment Management from January 2016 to December 2017; Head of US Retail Product and Channel Marketing, BNY Mellon Investment Management from January 2014 to December 2015. He is an officer of 63 investment companies (comprised of 120 portfolios) managed by the Adviser. He is 41 years old and has been an employee of BNY Mellon since 2005.
JAMES BITETTO, Vice President since August 2005 and Secretary since February 2018.
Senior Managing Counsel of BNY Mellon since December 2019; Managing Counsel of BNY Mellon from April 2014 to December 2019; Secretary of the Adviser, and an officer of 64 investment companies (comprised of 143 portfolios) managed by the Adviser. He is 53 years old and has been an employee of the Adviser since December 1996.
SONALEE CROSS, Vice President and Assistant Secretary since March 2018.
Counsel of BNY Mellon since October 2016; Associate at Proskauer Rose LLP from April 2016 to September 2016; Attorney at EnTrust Capital from August 2015 to February 2016; Associate at Sidley Austin LLP from September 2013 to August 2015. She is an officer of 64 investment companies (comprised of 143 portfolios) managed by the Adviser. She is 32 years old and has been an employee of the Adviser since October 2016.
DEIRDRE CUNNANE, Vice President and Assistant Secretary since March 2019.
Counsel of BNY Mellon since August 2018; Senior Regulatory Specialist at BNY Mellon Investment Management Services from February 2016 to August 2018; Trustee Associate at BNY Mellon Trust Company (Ireland) Limited from August 2013 to February 2016. She is an officer of 64 investment companies (comprised of 143 portfolios) managed by the Adviser. She is 29 years old and has been an employee of the Adviser since August 2018.
SARAH S. KELLEHER, Vice President and Assistant Secretary since April 2014.
Managing Counsel of BNY Mellon since December 2017, Senior Counsel of BNY Mellon from March 2013 to December 2017. She is an officer of 64 investment companies (comprised of 143 portfolios) managed by the Adviser. She is 44 years old and has been an employee of the Adviser since March 2013.
JEFF PRUSNOFSKY, Vice President and Assistant Secretary since September 2003.
Senior Managing Counsel of BNY Mellon, and an officer of 64 investment companies (comprised of 143 portfolios) managed by the Adviser. He is 54 years old and has been an employee of the Adviser since October 1990.
PETER M. SULLIVAN, Vice President and Assistant Secretary since March 2019.
Managing Counsel of BNY Mellon, and an officer of 64 investment companies (comprised of 143 portfolios) managed by the Adviser. He is 51 years old and has been an employee of the Adviser since April 2004.
53
OFFICERS OF THE FUND (Unaudited)(continued)
NATALYA ZELENSKY, Vice President and Assistant Secretary since March 2017.
Managing Counsel of BNY Mellon since December 2019; Counsel of BNY Mellon from May 2016 to December 2019; Attorney at Wildermuth Endowment Strategy Fund/Wildermuth Advisory, LLC from November 2015 to May 2016 and Assistant General Counsel at RCS Advisory Services from July 2014 to November 2015. She is an officer of 64 investment companies (comprised of 143 portfolios) managed by the Adviser. She is 34 years old and has been an employee of the Adviser since May 2016.
GAVIN C. REILLY, Assistant Treasurer since December 2005.
Tax Manager - BNY Mellon Fund Administration, and an officer of 64 investment companies (comprised of 143 portfolios) managed by the Adviser. He is 51 years old and has been an employee of the Adviser since April 1991.
ROBERT S. ROBOL, Assistant Treasurer since August 2005.
Senior Accounting Manager- BNY Mellon Fund Administration, and an officer of 64 investment companies (comprised of 143 portfolios) managed by the Adviser. He is 55 years old and has been an employee of the Adviser since October 1988.
ROBERT SALVIOLO, Assistant Treasurer since July 2007.
Senior Accounting Manager – BNY Mellon Fund Administration, and an officer of 64 investment companies (comprised of 143 portfolios) managed by the Adviser. He is 52 years old and has been an employee of the Adviser since June 1989.
ROBERT SVAGNA, Assistant Treasurer since September 2002.
Senior Accounting Manager – BNY Mellon Fund Administration, and an officer of 64 investment companies (comprised of 143 portfolios) managed by the Adviser. He is 52 years old and has been an employee of the Adviser since November 1990.
JOSEPH W. CONNOLLY, Chief Compliance Officer since October 2004.
Chief Compliance Officer of the Adviser, the BNY Mellon Family of Funds and BNY Mellon Funds Trust (64 investment companies, comprised of 143 portfolios). He is 62 years old and has served in various capacities with the Adviser since 1980, including manager of the firm’s Fund Accounting Department from 1997 through October 2001.
CARIDAD M. CAROSELLA, Anti-Money Laundering Compliance Officer since January 2016.
Anti-Money Laundering Compliance Officer of the BNY Mellon Family of Funds and BNY Mellon Funds Trust since January 2016; from May 2015 to December 2015, Interim Anti-Money Laundering Compliance Officer of the BNY Mellon Family of Funds and BNY Mellon Funds Trust and the Distributor; from January 2012 to May 2015, AML Surveillance Officer of the Distributor. She is an officer of 57 investment companies (comprised of 136 portfolios) managed by the Adviser. She is 51 years old and has been an employee of the Distributor since 1997.
54
NOTES
55
NOTES
56
NOTES
57
BNY Mellon Balanced Opportunity Fund
240 Greenwich Street
New York, NY 10286
Adviser
BNY Mellon Investment Adviser, Inc.
240 Greenwich Street
New York, NY 10286
Custodian
The Bank of New York Mellon
240 Greenwich Street
New York, NY 10286
Transfer Agent &
Dividend Disbursing Agent
BNY Mellon Transfer, Inc.
240 Greenwich Street
New York, NY 10286
Distributor
BNY Mellon Securities Corporation
240 Greenwich Street
New York, NY 10286
| | |
Ticker Symbols: | Class A: DBOAX Class C: DBOCX Class I: DBORX
Class J: THPBX Class Y: DBOYX Class Z: DBOZX |
Telephone Call your financial representative or 1-800-373-9387
Mail The BNY Mellon Family of Funds, 144 Glenn Curtiss Boulevard, Uniondale, NY 11556-0144
E-mailSend your request toinfo@bnymellon.com
InternetInformation can be viewed online or downloaded atwww.bnymellonim.com/us
The fund files its complete schedule of portfolio holdings with the Securities and Exchange Commission (“SEC”) for the first and third quarters of each fiscal year on Form N-PORT. The fund’s Forms N-PORT are available on the SEC’s website atwww.sec.gov.
A description of the policies and procedures that the fund uses to determine how to vote proxies relating to portfolio securities and information regarding how the fund voted these proxies for the most recent 12-month period ended June 30 is available atwww.bnymellonim.com/us and on the SEC’s website atwww.sec.gov and without charge, upon request, by calling 1-800-373-9387.
| | |
© 2020 BNY Mellon Securities Corporation
6000AR1119 | 
|
Item 2. Code of Ethics.
The Registrant has adopted a code of ethics that applies to the Registrant's principal executive officer, principal financial officer, principal accounting officer or controller, or persons performing similar functions. There have been no amendments to, or waivers in connection with, the Code of Ethics during the period covered by this Report.
Item 3. Audit Committee Financial Expert.
The Registrant's Board has determined that Joseph DiMartino, a member of the Audit Committee of the Board, is an audit committee financial expert as defined by the Securities and Exchange Commission (the "SEC"). Mr. DiMartino is "independent" as defined by the SEC for purposes of audit committee financial expert determinations.
Item 4. Principal Accountant Fees and Services.
(a) Audit Fees. The aggregate fees billed for each of the last two fiscal years (the "Reporting Periods") for professional services rendered by the Registrant's principal accountant (the "Auditor") for the audit of the Registrant's annual financial statements or services that are normally provided by the Auditor in connection with the statutory and regulatory filings or engagements for the Reporting Periods, were $42,293 in 2018 and $43,533 in 2019.
(b) Audit-Related Fees. The aggregate fees billed in the Reporting Periods for assurance and related services by the Auditor that are reasonably related to the performance of the audit of the Registrant's financial statements and are not reported under paragraph (a) of this Item 4 were $12,604 in 2018 and $12,713 in 2019. These services consisted of one or more of the following: (i) agreed upon procedures related to compliance with Internal Revenue Code section 817(h), (ii) security counts required by Rule 17f-2 under the Investment Company Act of 1940, as amended, (iii) advisory services as to the accounting or disclosure treatment of Registrant transactions or events and (iv) advisory services to the accounting or disclosure treatment of the actual or potential impact to the Registrant of final or proposed rules, standards or interpretations by the Securities and Exchange Commission, the Financial Accounting Standards Boards or other regulatory or standard-setting bodies.
The aggregate fees billed in the Reporting Periods for non-audit assurance and related services by the Auditor to the Registrant's investment adviser (not including any sub-investment adviser whose role is primarily portfolio management and is subcontracted with or overseen by another investment adviser), and any entity controlling, controlled by or under common control with the investment adviser that provides ongoing services to the Registrant ("Service Affiliates"), that were reasonably related to the performance of the annual audit of the Service Affiliate, which required pre-approval by the Audit Committee were $0 in 2018 and $0 in 2019.
(c) Tax Fees. The aggregate fees billed in the Reporting Periods for professional services rendered by the Auditor for tax compliance, tax advice, and tax planning ("Tax Services") were $3,860 in 2018 and $3,653 in 2019. These services consisted of: (i) review or preparation of U.S. federal, state, local and excise tax returns; (ii) U.S. federal, state and local tax planning, advice and assistance regarding statutory, regulatory or administrative developments; (iii) tax advice regarding tax qualification matters and/or treatment of various financial instruments held or proposed to be acquired or held, and (iv) determination of Passive Foreign Investment Companies. The aggregate fees billed in the Reporting Periods for Tax Services by the Auditor to Service Affiliates, which required pre-approval by the Audit Committee were $0 in 2018 and $0 in 2019.
(d) All Other Fees. The aggregate fees billed in the Reporting Periods for products and services provided by the Auditor, other than the services reported in paragraphs (a) through (c) of this Item, were $1,653 in 2018 and $1,771 in 2019. These services consisted of a review of the Registrant's anti-money laundering program.
The aggregate fees billed in the Reporting Periods for Non-Audit Services by the Auditor to Service Affiliates, other than the services reported in paragraphs (b) through (c) of this Item, which required pre-approval by the Audit Committee, were $0 in 2018 and $0 in 2019.
(e)(1)Audit Committee Pre-Approval Policies and Procedures. The Registrant's Audit Committee has established policies and procedures (the "Policy") for pre-approval (within specified fee limits) of the Auditor's engagements for non-audit services to the Registrant and Service Affiliates without specific case-by-case consideration. The pre-approved services in the Policy can include pre-approved audit services, pre-approved audit-related services, pre-approved tax services and pre-approved all other services. Pre-approval considerations include whether the proposed services are compatible with maintaining the Auditor's independence. Pre-approvals pursuant to the Policy are considered annually.
(e)(2)Note. None of the services described in paragraphs (b) through (d) of this Item 4 were approved by the Audit Committee pursuant to paragraph (c)(7)(i)(C) of Rule 2-01 of Regulation S-X.
(f) None of the hours expended on the principal accountant's engagement to audit the registrant's financial statements for the most recent fiscal year were attributed to work performed by persons other than the principal accountant's full-time, permanent employees.
Non-Audit Fees. The aggregate non-audit fees billed by the Auditor for services rendered to the Registrant, and rendered to Service Affiliates, for the Reporting Periods were $673,321 in 2018 and $700,014 in 2019.
Auditor Independence. The Registrant's Audit Committee has considered whether the provision of non-audit services that were rendered to Service Affiliates, which were not pre-approved (not requiring pre-approval), is compatible with maintaining the Auditor's independence.
Item 5. Audit Committee of Listed Registrants.
Not applicable.
Item 6. Investments.
(a) Not applicable.
Item 7. Disclosure of Proxy Voting Policies and Procedures for Closed-End Management Investment Companies.
Not applicable.
Item 8. Portfolio Managers of Closed-End Management Investment Companies.
Not applicable.
Item 9. Purchases of Equity Securities by Closed-End Management Investment Companies and Affiliated Purchasers.
Not applicable.
Item 10. Submission of Matters to a Vote of Security Holders.
There have been no material changes to the procedures applicable to Item 10.
Item 11. Controls and Procedures.
(a) The Registrant's principal executive and principal financial officers have concluded, based on their evaluation of the Registrant's disclosure controls and procedures as of a date within 90 days of the filing date of this report, that the Registrant's disclosure controls and procedures are reasonably designed to ensure that information required to be disclosed by the Registrant on Form N-CSR is recorded, processed, summarized and reported within the required time periods and that information required to be disclosed by the Registrant in the reports that it files or submits on Form N-CSR is accumulated and communicated to the Registrant's management, including its principal executive and principal financial officers, as appropriate to allow timely decisions regarding required disclosure.
(b) There were no changes to the Registrant's internal control over financial reporting that occurred during the second fiscal quarter of the period covered by this report that have materially affected, or are reasonably likely to materially affect, the Registrant's internal control over financial reporting.
Item 12. Disclosure of Securities Lending Activities for Closed-End Management Investment Companies.
Not applicable.
Item 13. Exhibits.
(a)(1) Code of ethics referred to in Item 2.
(a)(2) Certifications of principal executive and principal financial officers as required by Rule 30a-2(a) under the Investment Company Act of 1940.
(a)(3) Not applicable.
(b) Certification of principal executive and principal financial officers as required by Rule 30a-2(b) under the Investment Company Act of 1940.
SIGNATURES
Pursuant to the requirements of the Securities Exchange Act of 1934 and the Investment Company Act of 1940, the Registrant has duly caused this Report to be signed on its behalf by the undersigned, thereunto duly authorized.
BNY Mellon Investment Funds VI
By: /s/ Renee LaRoche-Morris
Renee LaRoche-Morris
President (Principal Executive Officer)
Date: January 27, 2020
Pursuant to the requirements of the Securities Exchange Act of 1934 and the Investment Company Act of 1940, this Report has been signed below by the following persons on behalf of the Registrant and in the capacities and on the dates indicated.
By: /s/ Renee LaRoche-Morris
Renee LaRoche-Morris
President (Principal Executive Officer)
Date: January 27, 2020
By: /s/ James Windels
James Windels
Treasurer (Principal Financial Officer)
Date: January 24, 2020
EXHIBIT INDEX
(a)(1) Code of ethics referred to in Item 2.
(a)(2) Certifications of principal executive and principal financial officers as required by Rule 30a-2(a) under the Investment Company Act of 1940. (EX-99.CERT)
(b) Certification of principal executive and principal financial officers as required by Rule 30a-2(b) under the Investment Company Act of 1940. (EX-99.906CERT)
