
Third Quarter 2006
Financial and Operating Results
For the period ended September 30, 2006
Conseco, Inc.

Forward-Looking Statements
Cautionary Statement Regarding Forward-Looking Statements. Our statements, trend analyses and other information contained in
this press release relative to markets for Conseco’s products and trends in Conseco’s operations or financial results, as well as other
statements, contain forward-looking statements within the meaning of the federal securities laws and the Private Securities Litigation
Reform Act of 1995. Forward-looking statements typically are identified by the use of terms such as “anticipate,” “believe,” “plan,”
“estimate,” “expect,” “project,” “intend,” “may,” “will,” “would,” “contemplate,” “possible,” “attempt,” “seek,” “should,” “could,” “goal,”
“target,” “on track,” “comfortable with,” “optimistic” and similar words, although some forward-looking statements are expressed
differently. You should consider statements that contain these words carefully because they describe our expectations, plans, strategies
and goals and our beliefs concerning future business conditions, our results of operations, financial position, and our business outlook
or they state other ‘‘forward-looking’’ information based on currently available information. Assumptions and other important factors that
could cause our actual results to differ materially from those anticipated in our forward-looking statements include, among other things:
(i) our ability to achieve an upgrade of the financial strength ratings of our insurance company subsidiaries and the impact of prior rating
downgrades on our business; (ii) the ultimate outcome of lawsuits filed against us and other legal and regulatory proceedings to which
we are subject; (iii) our ability to obtain adequate and timely rate increases on our supplemental health products including our long-term
care business; (iv) mortality, morbidity, usage of health care services, persistency and other factors which may affect the profitability of
our insurance products; (v) our ability to achieve anticipated expense reductions and levels of operational efficiencies; (vi) the adverse
impact of our Predecessor’s bankruptcy proceedings on our business operations, and relationships with our customers, employees,
regulators, distributors and agents; (vii) performance of our investments; (viii) our ability to continue to recruit and retain productive
agents and distribution partners and customer response to new products, distribution channels and marketing initiatives; (ix) the risk
factors or uncertainties listed from time to time in our filings with the Securities and Exchange Commission; (x) general economic
conditions and other factors, including prevailing interest rate levels, stock and credit market performance and health care inflation,
which may affect (among other things) our ability to sell products and access capital on acceptable terms, the returns on and the market
value of our investments, and the lapse rate and profitability of policies; (xi) changes in the Federal income tax laws and regulations
which may affect or eliminate the relative tax advantages of some of our products; and (xii) regulatory changes or actions, including
those relating to regulation of the financial affairs of our insurance companies, such as the payment of dividends to us, regulation of
financial services affecting (among other things) bank sales and underwriting of insurance products, regulation of the sale, underwriting
and pricing of products, and health care regulation affecting health insurance products. Other factors and assumptions not identified
above are also relevant to the forward-looking statements, and if they prove incorrect, could also cause actual results to differ materially
from those projected. All written or oral forward-looking statements attributable to us are expressly qualified in their entirety by the
foregoing cautionary statement. Our forward-looking statements speak only as of the date made. We assume no obligation to update
or to publicly announce the results of any revisions to any of the forward-looking statements to reflect actual results, future events or
developments, changes in assumptions or changes in other factors affecting the forward-looking statements.
2

Non-GAAP Measures
This presentation contains the following financial measures that differ from the comparable measures under Generally Accepted
Accounting Principles (GAAP): operating earnings measures; book value excluding accumulated other comprehensive income (loss)
per diluted share; operating return measures; earnings before net realized investment gains (losses) and corporate interest and
taxes; debt to capital ratios, excluding accumulated other comprehensive income (loss); and interest-adjusted benefit ratios.
Reconciliations between those non-GAAP measures and the comparable GAAP measures are included in the Appendix, or on the
page such measure is presented.
While management believes these measures are useful to enhance understanding and comparability of our financial results, these
non-GAAP measures should not be considered substitutes for the most directly comparable GAAP measures.
3

A disappointing quarter, with poor experience in the Runoff LTC
book of business dragging down results
Earnings from Bankers Life were strong, with steady growth in sales
at both Bankers Life and Colonial Penn
Earnings from Conseco Insurance Group (CIG) were down, while
new business volumes showed spectacular growth
Financial Highlights
CNO
4
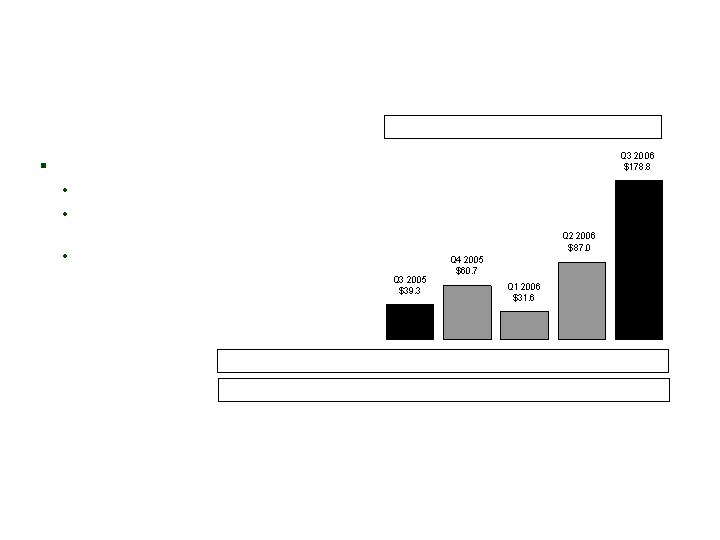
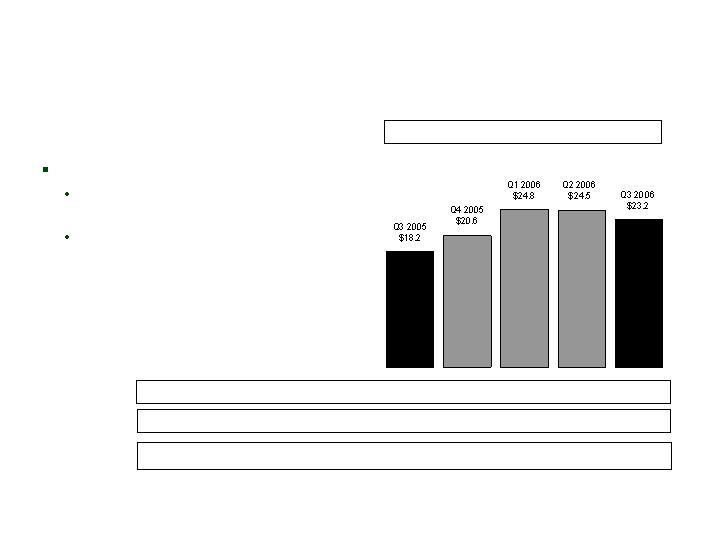
Business Highlights
CNO
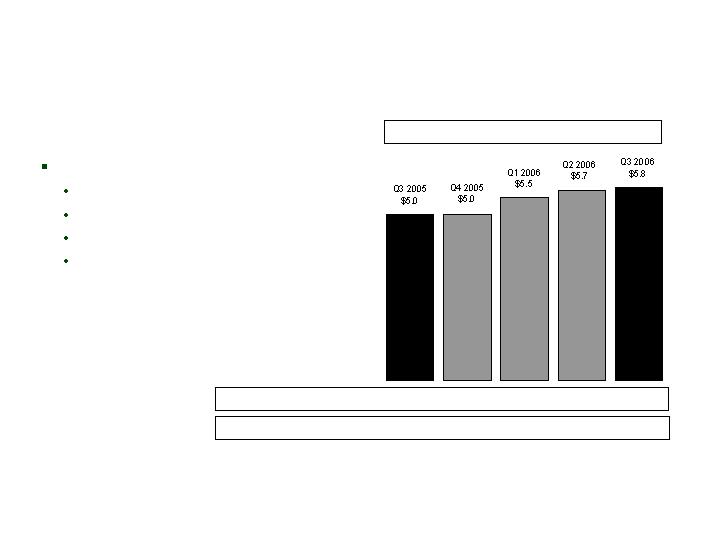
New business volumes*
(NAP – in millions)
A.M. Best ratings confirmed, long-term targets for metrics for an
upgrade laid out
New talent joining the firm – new health actuaries, claims and LTC
specialists
*New business volumes are measured by new annualized premium, which includes 6% of annuity premiums,
10% of single-premium whole life deposits and 100% of all other premiums.
5
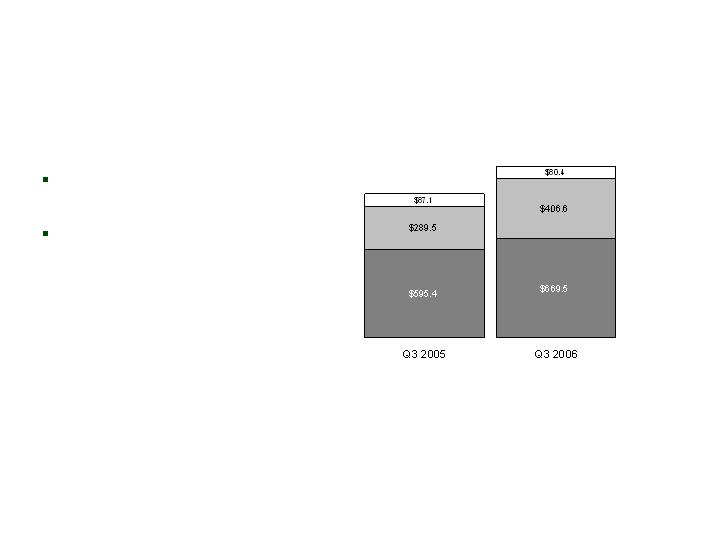
Collected Premium Growth
CNO
($ millions)
$972.0
$1,156.5
CIG
Bankers
Run-Off
Growth in all of our core
businesses
Consolidated premiums up
$185 million, or 19% from
Q3 2005
6
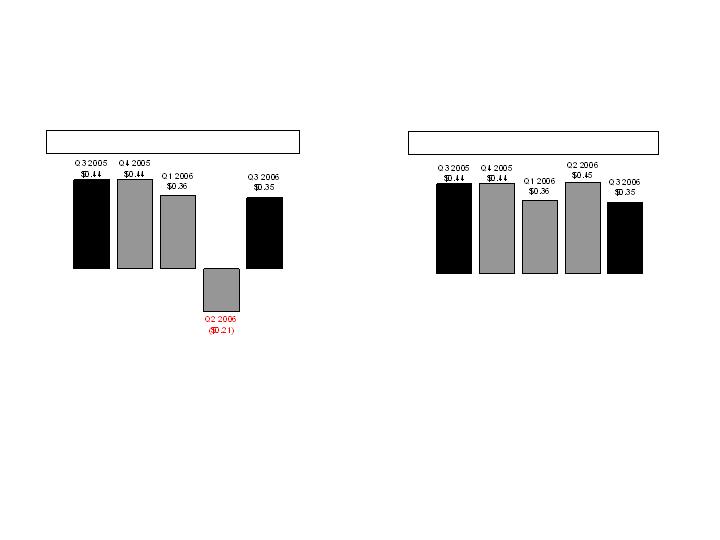
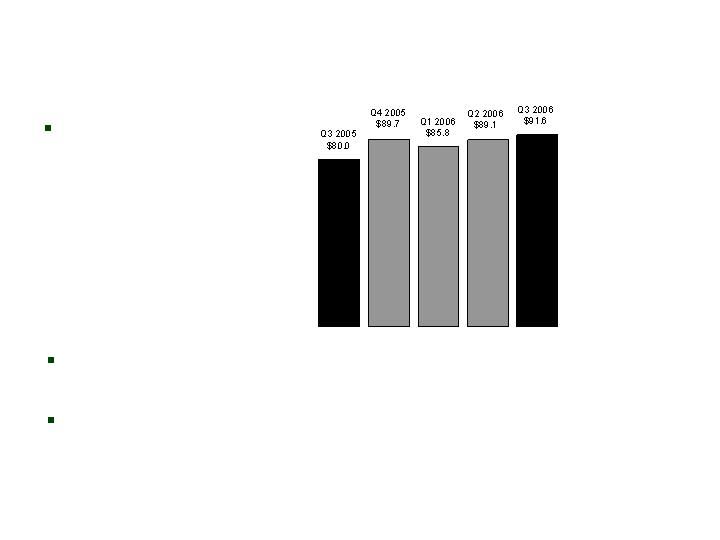
Operating EPS (Diluted)
CNO
Operating EPS, Before Q2 2006 Charge**
**Operating earnings per share, before Q2 2006
charge related to the tentative litigation settlement.
See Appendix for corresponding GAAP measure.
Operating EPS*
*Operating earnings per share exclude net realized
investment gains (losses). See Appendix for
corresponding GAAP measure.
7
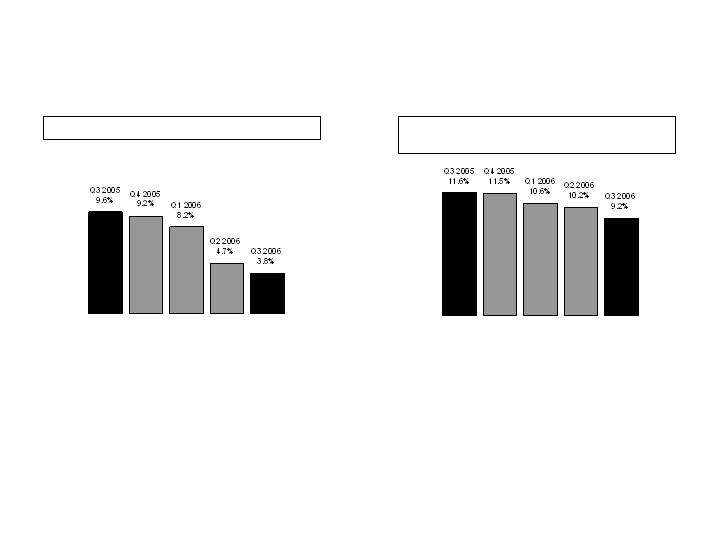
Operating ROE
CNO
Operating ROE*, Trailing 4 Quarters
Operating ROE (excl. Q2 2006 charge and
NOLs)**, Trailing 4 Quarters
*Operating return excludes net realized
investment gains (losses). Equity excludes
accumulated other comprehensive income
(loss). See Appendix for corresponding GAAP
measure.
**Operating return before Q2 2006 charge
related to the tentative litigation settlement.
Equity also excludes the value of net operating
loss carryforwards. See Appendix for
corresponding GAAP measure.
8

Q3 Earnings
CNO
*Management believes that an analysis of earnings before net realized investment gains (losses) and corporate
interest and taxes (“EBIT,” a non-GAAP financial measure) provides an alternative measure to compare the
operating results of the company quarter-over-quarter because it excludes: (1) corporate interest expense and
the effects of the 2005 issuance of convertible debentures and the amendment of our credit facility; and (2) net
realized gains (losses) that are unrelated to the company’s underlying fundamentals. The chart above provides
a reconciliation of EBIT to net income applicable to common stock.
($ millions)
9
Q3 2005
Q3 2006
Bankers Life
$60.4
$73.0
Conseco Insurance Group
67.1
58.5
Other Business in Run-Off
16.4
(13.0)
Corporate operations, excluding interest expense
(1.1)
(8.1)
Total EBIT*
142.8
110.4
Corporate interest expense and loss on extinguishment of debt
(15.8)
(12.5)
Income before net realized investment gains (losses) and taxes
127.0
97.9
Tax expense
45.4
35.6
Net income before net realized gains (losses)
81.6
62.3
Preferred stock dividends
9.5
9.5
Net operating income
72.1
52.8
Net realized investment gains (losses), net of related amortization and taxes
(3.7)
(13.9)
Net income applicable to common stock
$68.4
$38.9
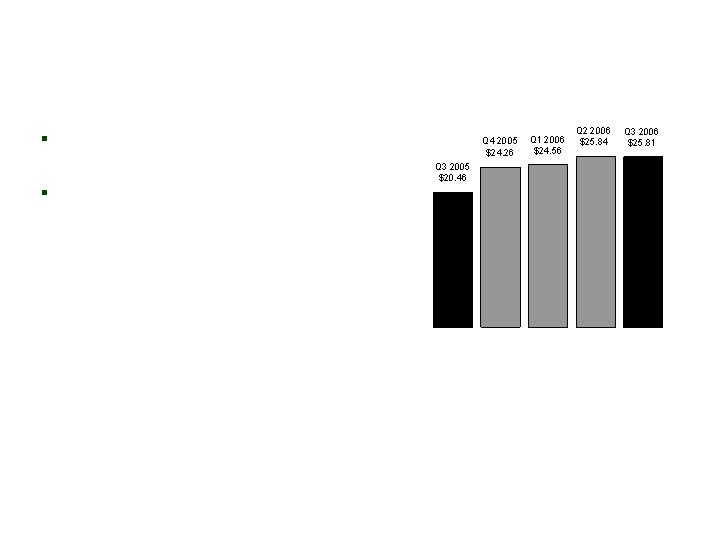
Book Value Per Diluted Share*
CNO
*Book value excludes accumulated other comprehensive income (loss). Shares outstanding assumes: (1)
conversion of convertible securities; and (2) the exercise of outstanding stock options and vesting of restricted
stock (each calculated using the treasury stock method). See Appendix for corresponding GAAP measure.
Reflects dilution as if our
preferred stock had converted
Slight decrease to $25.81 in Q3
2006 reflects increase in diluted
shares, partially offset by
earnings
10
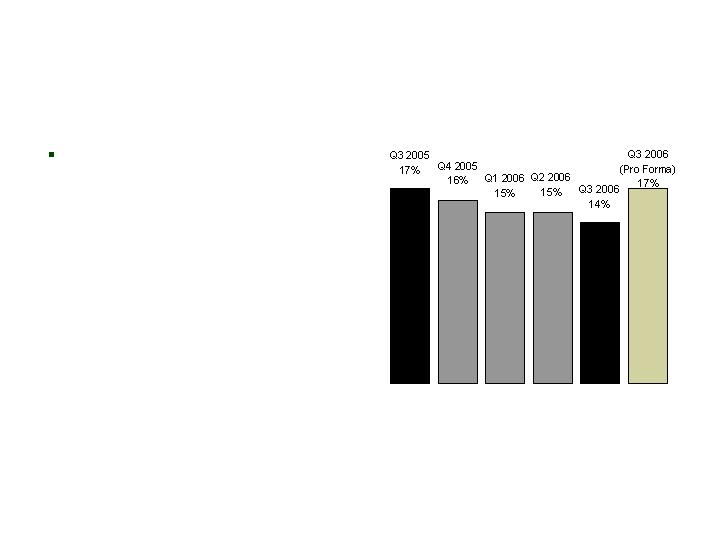
CNO
Debt to Total Capital Ratio*
Ratio will increase in Q4 2006
for the refinancing we
completed in October
*Excludes accumulated other comprehensive income (loss). See Appendix for corresponding GAAP measure.
Q3 2006 Pro Forma reflects the refinancing of our credit facility in October 2006.
11
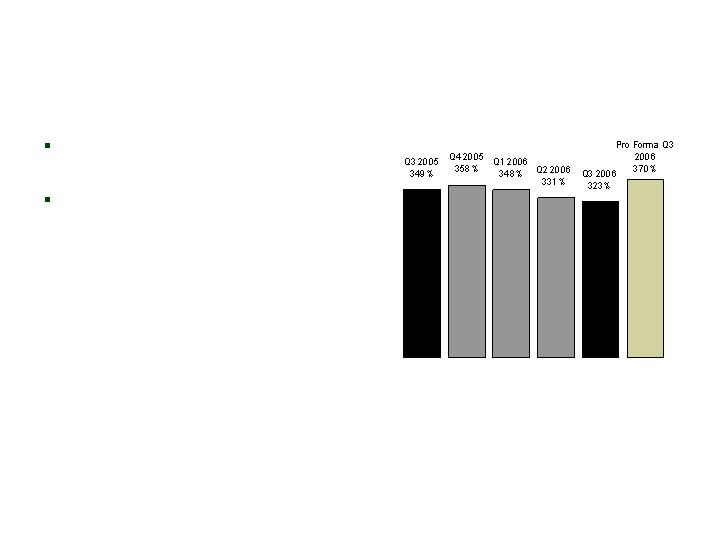
Consolidated RBC Ratio*
CNO
RBC ratios remain strong in Q3
2006
Contributions of the proceeds
from October refinancing will
increase ratio in Q4 2006
Q3 2006 is estimated; statutory results have not been finalized. Pro Forma Q3 2006 is estimated, based on use
of proceeds from the debt refinancing completed in October 2006.
*Risk-Based Capital (“RBC”) requirements provide a tool for insurance regulators to determine the levels of
statutory capital and surplus an insurer must maintain in relation to its insurance and investment risks. The RBC
ratio is the ratio of the statutory consolidated adjusted capital of our insurance subsidiaries to RBC.
12
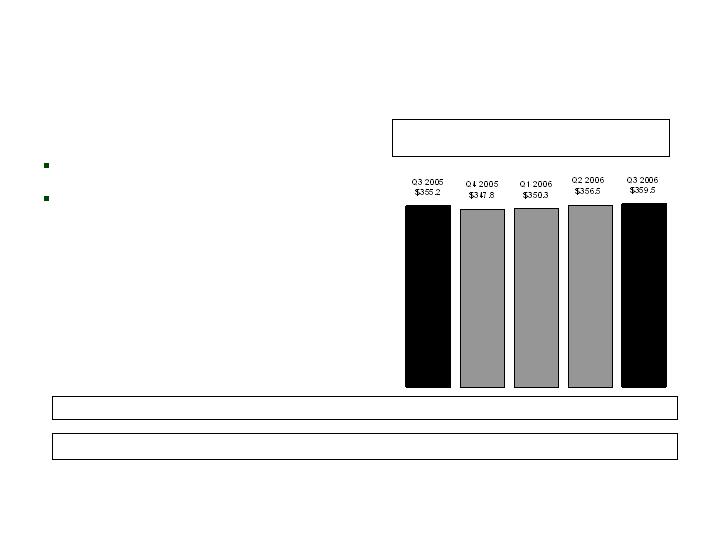
Net Investment Income
CNO
($ millions)
Yields have improved in 2006
Q3 2005 yield reflects significant
prepayment income, adding
approximately 23 basis points to
yield
Net investment income from the prepayment of securities: $14.0 $5.2 $1.2 $5.3 $0.5
General Account Investment Income,
Excluding Corporate Segment
5.88%
5.87%
5.81%
5.82%
6.03%
Yield:
13
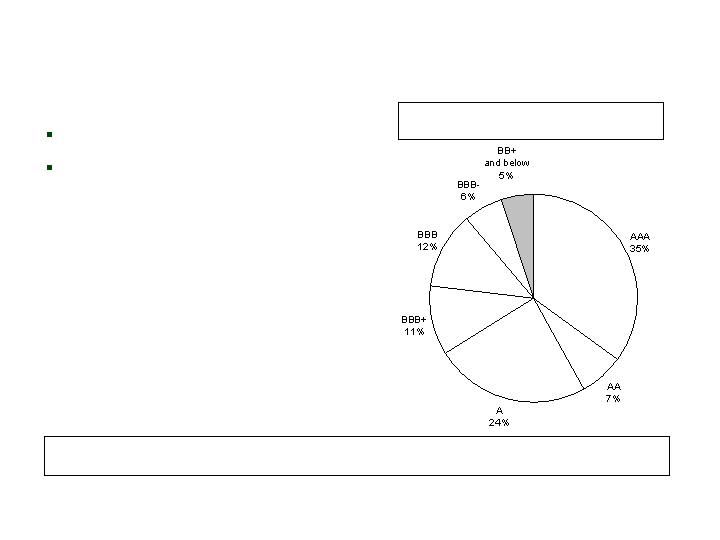
High-Quality Assets
CNO
Portfolio quality remains high
Less than 5% of portfolio is
below investment grade
Actively Managed Fixed Maturities by Rating at
9/30/06 (Market Value)
Q3 2006
95%
Q2 2006
95%
Q1 2006
95%
Q4 2005
96%
Q3 2005
97%
% of Bonds which are Investment Grade:
14
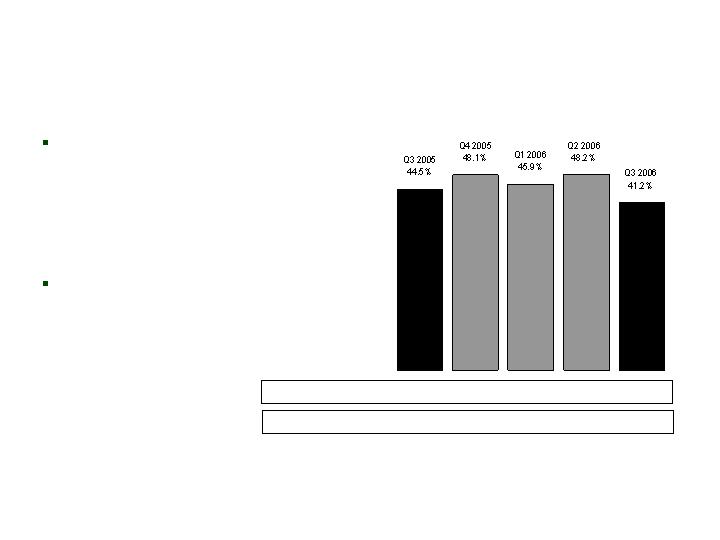
Aggregate Health Benefit Ratio*
CNO
Loss ratios in our core
businesses remain stable
Disappointing results in non-
core long-term care run-off block
caused ratios to increase
Aggregate Health Benefit Ratio – By Quarter
Core (BLC & CIG) Business
*We calculate benefit ratios by dividing insurance policy benefits by insurance policy income.
Aggregate Health Benefit Ratio – By Quarter
Run-Off Business
15

Expenses
CNO
($ millions)
Gross Operating Expenses*, Trailing 4 Quarters
*Gross operating expenses before capitalization of cost of policies produced, capitalization of software
development costs and other adjustments. Costs related to the tentative litigation settlement are not included in
our gross operating expenses. This measure is used by the Company to evaluate its progress in reducing gross
operating expenses.
16
Segment Performance
CIG
*Operating earnings exclude net realized gains (losses). Q2 2006 excludes tentative litigation settlement.
See Appendix for corresponding GAAP measure of our consolidated results of operations.
Continued emphasis on building
out distribution to offset the
normal erosion of the large
inforce block
PTOI-Trailing 4 Quarters: $258.6 $256.7 $234.2 $232.8 $224.2
Revenues-Quarterly: $457.8 $431.4 $438.8 $408.6 $436.0
Pre-Tax Operating Income*
Revenues-Tr. 4 Quarters: $1,816.2 $1,767.9 $1,772.0 $1,736.6 $1,714.8
($ millions)
17
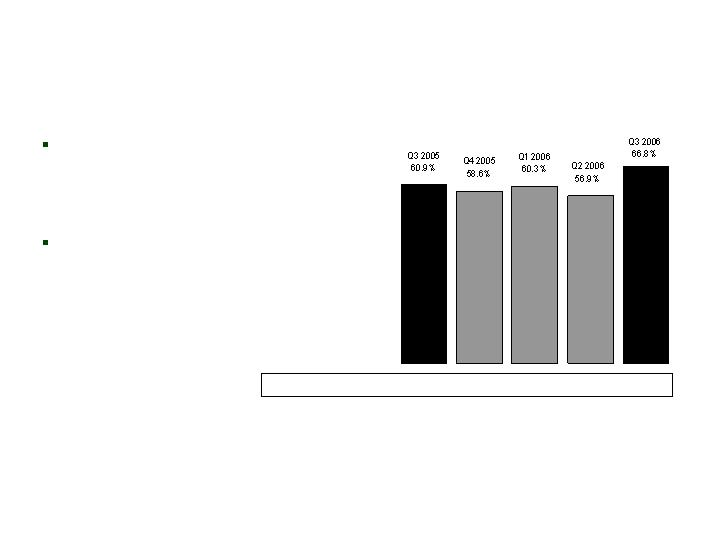
Benefit Ratio* –
Medicare Supplement
CIG
Benefit ratios in 2005 and first half
of 2006 benefited from release of
policy benefit reserves related to
increase in policyholder lapses
Persistency improved in Q3 2006;
we expected the benefit ratio to
increase, consistent with our
expectations for lower lapses
Trailing 4 Quarter Avg.: 61.2% 59.4% 60.8% 59.3% 60.6%
*We calculate benefit ratios by dividing insurance policy benefits by insurance policy income.
18
Interest-Adjusted Benefit Ratio* –
Specified Disease
CIG
Benefit ratio in Q4 2005 and first
half of 2006 reflected higher than
expected incurred claims, driven
primarily by continued incidence
of paid claims with old initial
incurred dates
Paid claims in Q3 2006 returned
to more normalized level
Trailing 4 Quarter Avg.: 43.6% 45.1% 45.4% 46.7% 45.9%
Non-interest adjusted: 75.8% 79.6% 77.5% 79.9% 73.6%
*We calculate interest-adjusted benefit ratios by dividing insurance policy benefits less interest income on
the accumulated assets backing the insurance liabilities by insurance policy income.
19
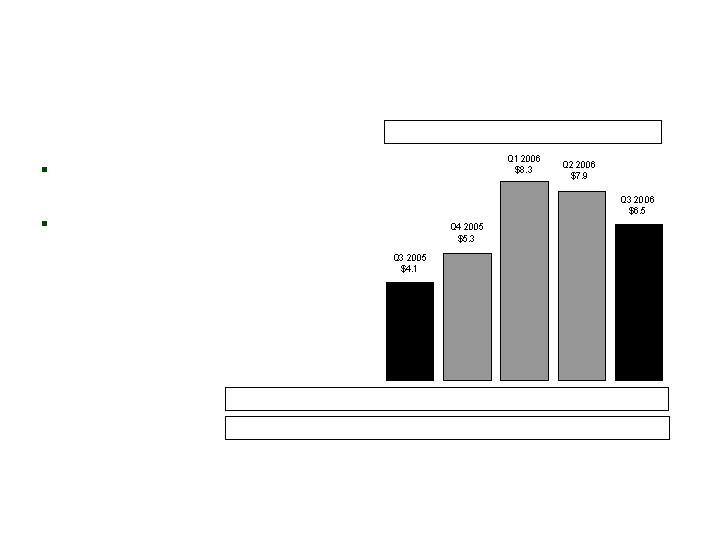
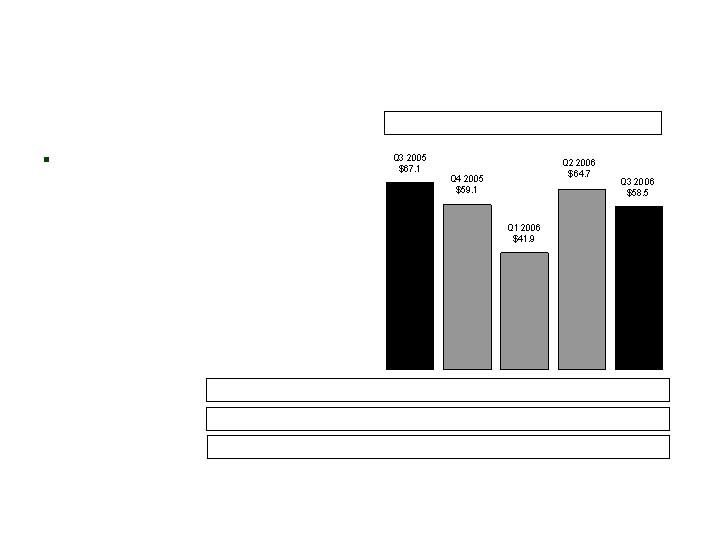
Premiums -
Medicare Supplement
CIG
($ millions)
59% increase in first-year
premiums over Q2 2005
NAP for 2006 to date well ahead
of last year
First-Year Prems.-Tr. 4 Qtrs: $14.1 $15.8 $21.0 $25.6 $28.0
Total Premiums-Quarterly: $68.5 $68.4 $65.9 $61.9 $54.6
Medicare Supplement – First-Year Premiums
20
Premiums –
Specified Disease
CIG
($ millions)
Successful recruiting results at
PMA (wholly owned distribution
subsidiary)
First-Year Prems.-Tr. 4 Qtrs: $31.1 $30.6 $29.7 $28.8 $28.4
Total Premiums-Quarterly: $88.5 $88.5 $91.4 $88.8 $88.1
Specified Disease – First-Year Premiums
21
Premiums –
Life Insurance
CIG
($ millions)
Line being revitalized
New channel leader hired in May
Three field VPs added
YTD improvements in:
IMO appointments (267%)
Submitted apps (6%)
Submitted premium (7%)
NAP (11%)
First-Year Prems.-Tr. 4 Qtrs: $10.1 $8.2 $7.1 $6.7 $6.7
Total Premiums-Quarterly: $86.0 $76.3 $84.1 $78.3 $78.3
Life – First-Year Premiums
22
Premiums –
Annuity
CIG
($ millions)
Continued rapid growth
Traditional IMO channel strong
Significant contribution from Legacy
Marketing Group relationship
Actuarial Development Services
partnership launches first product
First-Year Prems.-Tr. 4 Qtrs: $94.2 $141.9 $153.3 $218.6 $358.1
Total Premiums-Quarterly: $43.3 $65.0 $36.2 $92.4 $182.8
Annuity – First-Year Premiums
23

Segment Summary
CIG
Continued focus on:
Hiring the right people
Working with distribution to develop the right products
Building out Worksite
Improving our execution
24
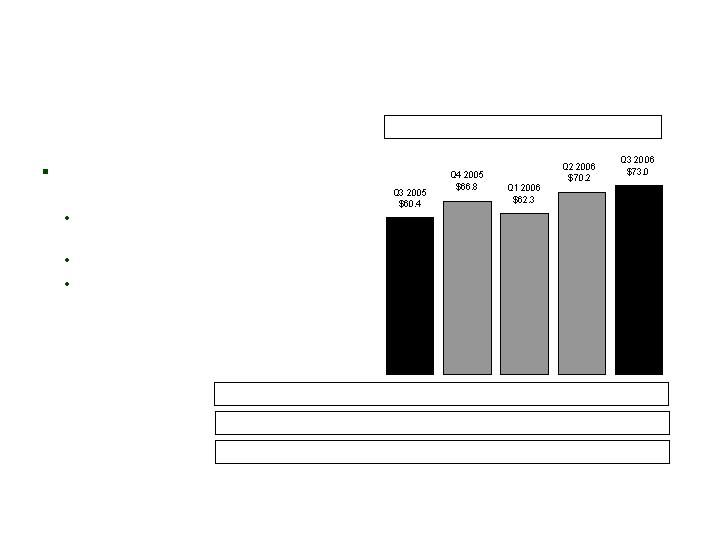
Segment Performance
Bankers
*Operating earnings exclude net realized gains (losses). See Appendix for corresponding GAAP measure of
our consolidated results of operations.
Q3 2005-Q3 2006 earnings
improvement driven by:
Improving Medicare Supplement
benefit ratio
Higher investment income
Lower operating expenses
PTOI-Trailing 4 Quarters: $250.6 $254.4 $257.9 $259.7 $272.3
Revenues-Quarterly: $512.8 $515.4 $544.1 $543.9 $564.3
Pre-Tax Operating Income*
Revenues -Tr. 4 Quarters: $1,956.5 $1,995.0 $2,065.7 $2,116.2 $2,167.7
($ millions)
25
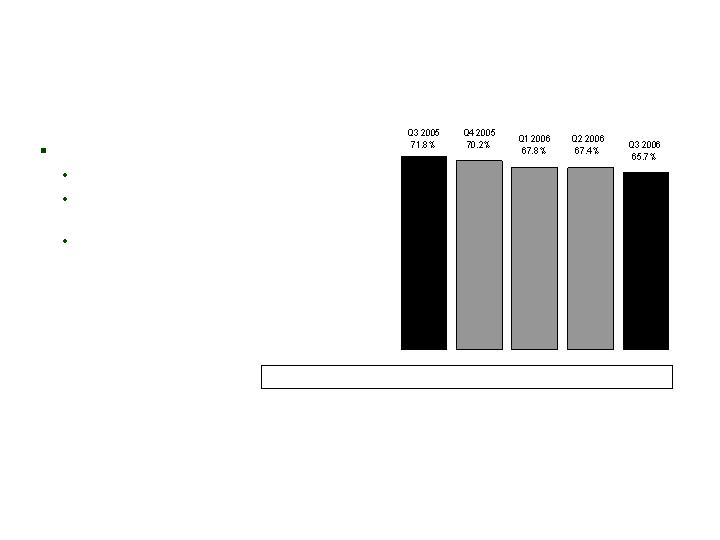
Benefit Ratio* –
Medicare Supplement
Bankers
Improving benefit ratio reflects:
Pricing action taken earlier this year
Claim redundancies for 2005 and
prior incurred claims
Improving loss ratio estimate for
2006 incurred claims
Trailing 4 Quarter Avg.: 71.8% 71.6% 70.5% 69.3% 67.8%
*We calculate benefit ratios by dividing insurance policy benefits by insurance policy income.
26
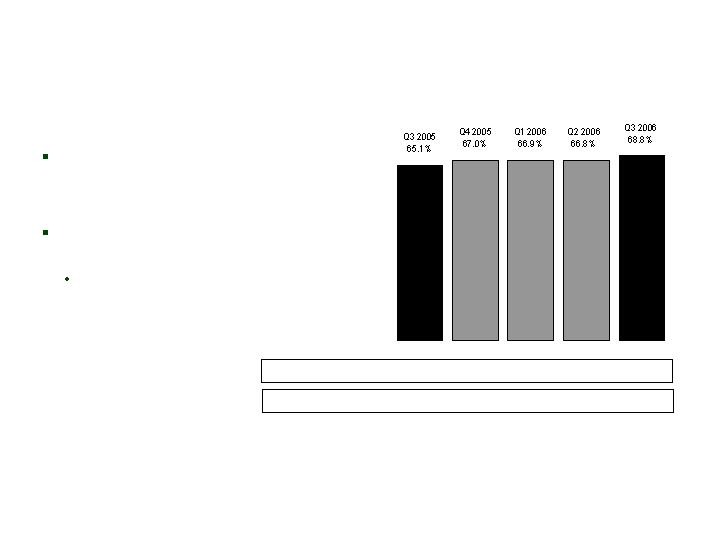
Interest-Adjusted Benefit Ratio* –
Long Term Care
Bankers
*We calculate interest-adjusted benefit ratios by dividing insurance policy benefits less interest income on
the accumulated assets backing the insurance liabilities by insurance policy income.
Interest-adjusted benefit ratio
relatively flat for past several
quarters
Increase in Q3 2006 ratio
reflects:
Higher incurred claims
Trailing 4 Quarter Avg.: 63.9% 65.1% 65.8% 66.4% 67.4%
Non-interest adjusted: 93.9% 96.1% 96.5% 96.2% 98.2%
27

Segment Summary
Bankers
Improving fundamentals in the business
Lower Medicare Supplement benefit ratio
Strong execution of LTC inforce re-rate actions
First-year collected premium
Q3 2006 - $364 million, up 26% over Q3 2005
YTD 2006 - $1,004 million, up 17% over YTD 2005
28
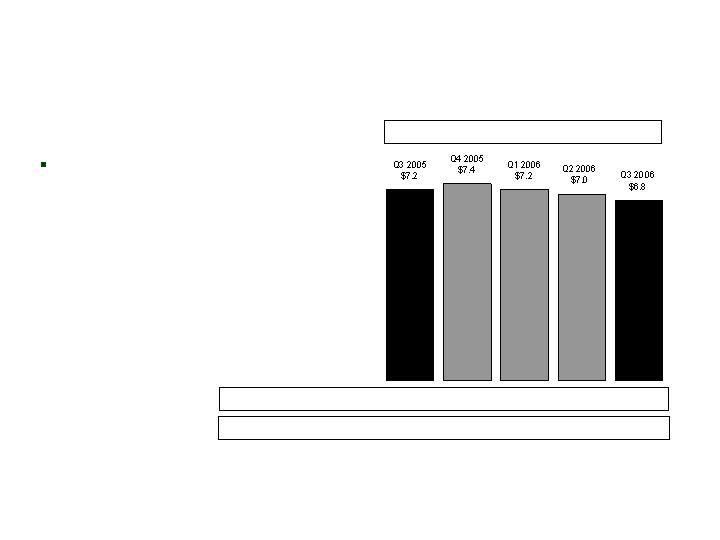
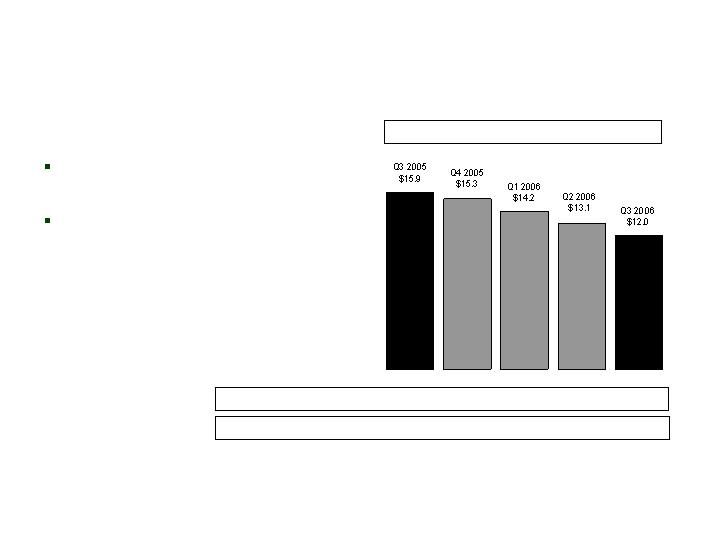
Premiums –
Medicare Supplement/PDP
Bankers
($ millions)
Strong sales
First-year premiums up 27% from
Q3 2005
Trailing 4 Qtrs premiums up 30%
from Q3 2005
Med. Supp. First-Year Prems.-Tr. 4 Qtrs: $71.7 $74.1 $81.2 $88.1 $93.1
Med. Supp. Total Premiums-Quarterly: $159.1 $162.5 $171.2 $159.5 $149.4
Medicare Supplement – First-Year Premiums
*Excluded from amounts presented above.
$20.8
$32.1
$6.0
--
--
PDP Premiums-Quarterly*:
29
Premiums –
Long-Term Care
Bankers
($ millions)
Steady decline in premiums over
the past five quarters
New sales are meeting our
pricing objectives
First-Year Prems.-Tr. 4 Qtrs: $66.8 $65.4 $62.5 $58.5 $54.6
Total Premiums-Quarterly: $140.8 $141.1 $145.7 $151.5 $145.0
Long-Term Care – First-Year Premiums
30
Premiums –
Life Insurance
Bankers
($ millions)
Growth driven by:
Continued focus on new agent
training
Expanded advanced life insurance
training for veteran agents
All product lines up: Universal Life,
Senior Whole Life and Single
Premium Whole Life
First-Year Prems.-Tr. 4 Qtrs: $61.4 $74.1 $84.2 $88.4 $90.4
Total Premiums-Quarterly: $43.0 $42.7 $43.2 $46.6 $47.8
Life – First-Year Premiums
31
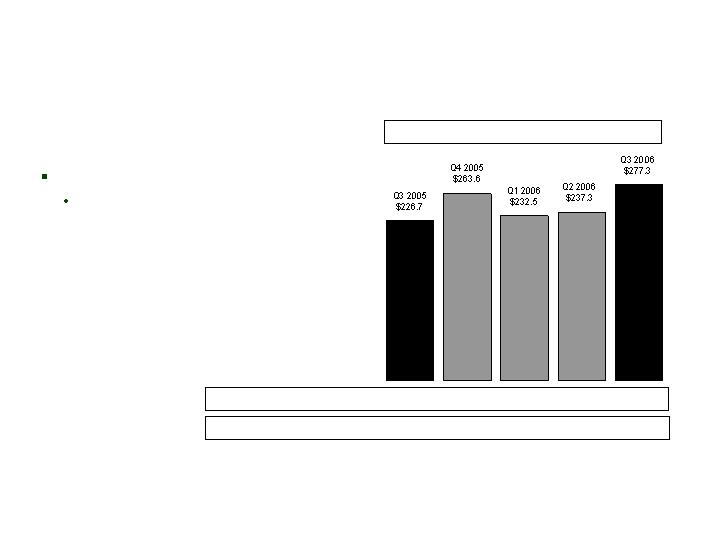
Premiums –
Annuity
Bankers
($ millions)
Growth driven principally by:
Increased sales of equity-indexed
annuities
First-Year Prems.-Tr. 4 Qtrs: $972.8 $948.3 $960.5 $960.1 $1,010.7
Total Premiums-Quarterly: $226.7 $264.1 $233.4 $238.3 $278.2
Annuity – First-Year Premiums
32
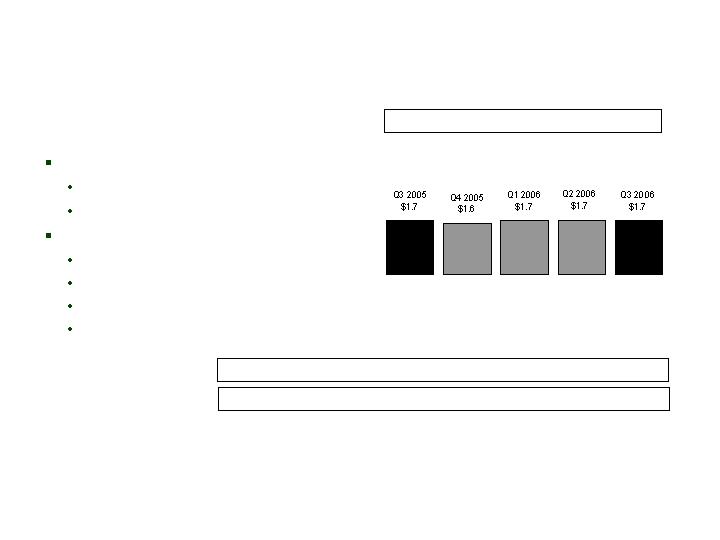
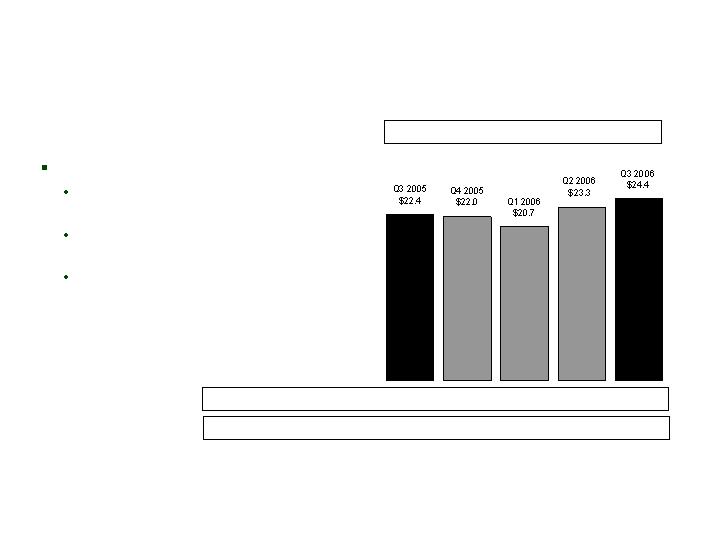
Premiums –
Life Insurance
Colonial Penn
($ millions)
Growth driven by:
Increased but focused ad spend
Expanding breadth of lead sources
Improving direct mail productivity
Improving telemarketing productivity
First-Year Prems.-Tr. 4 Qtrs: $18.9 $19.4 $20.2 $21.2 $22.0
Total Premiums-Quarterly: $22.8 $24.4 $23.4 $21.6 $25.4
Life – First-Year Premiums
33
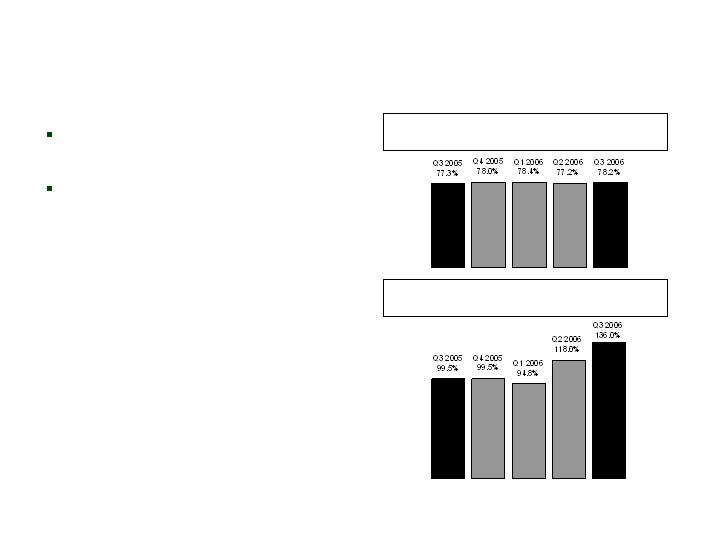
Interest-Adjusted Benefit Ratio* –
LTC Closed Block
Ratio has risen for the past two
quarters
Persistency exceeded
expectation in Q3
Inventory-adjusted paid claims
exceeded historical average in
Q2 and Q3
Inventory-adjusted paid claims
fell slightly in Q3
Trailing 4 Quarter Avg.: 49.9% 49.2% 48.4% 52.1% 60.1%
Non-interest adjusted: 99.5% 99.5% 94.8% 118.0% 136.0%
Run-Off Block
*We calculate interest-adjusted benefit ratios by dividing insurance policy benefits less interest income on
the accumulated assets backing the insurance liabilities by insurance policy income.
34

Progress continues on second quarter initiatives
Premium re-rates
Talent and organizational design
Technology
Claims management
Program for Improvement
Run-Off Block
35

Premium re-rates
357 rate filings are involved, seeking three successive years of
rate increase
Expected annualized Net Revenue Enhancement (NRE)
estimated at $35 million from the first round of rate increases
$8 million approved to date (22%); targeting one-third by end of
2006
Program for Improvement
Run-Off Block
36

Talent and organizational design
Three significant additions to leadership in last quarter
Dick Garner – product management – 20+ years of LTC experience
Brian Wegner – operations management – 7 years of LTC experience
David Vega – claims management – 7 years of LTC experience
Increased specialization through claim adjudication by region
Enhanced training/audit
LTC call center moved to LTC complex – only handles LTC
Program for Improvement
Run-Off Block
37

Technology
Workflow system on line this month
Improved policy/benefit repository (2007)
Program for Improvement
Run-Off Block
38

Claims management
Hired LifePlans for claims leakage study
Hired major actuarial firm for claims review and other
improvements
Program for Improvement
Run-Off Block
39

Summary
Progress is being made, but will take time to be reflected in
results
2007 will be transformational year
Segment Summary
Run-Off Block
40

Observations – First 50 Days
CNO
Distribution – a real strength
Bankers Life – a very solid franchise
CIG – making good inroads with IMOs, making its presence felt
Colonial Penn – great direct marketing platform
Distribution systems not particularly rating-sensitive
41

CNO Summary
Positive developments:
Good profitability at Bankers
Solid sales at CIG
Poor results in Run-Off LTC
Working aggressively to improve performance
Conseco remains committed to growth
Focused on attractive middle market
Unique sales machine
42

Questions and Answers

Appendix:
Information Related to Certain Non-GAAP Financial Measures
The following provides additional information regarding certain non-GAAP measures used in this presentation. While management believes these
measures are useful to enhance understanding and comparability of our financial results, these non-GAAP measures should not be considered as
substitutes for the most directly comparable GAAP measures. Also refer to our latest Form 10-K and Form 10-Q for information concerning non-
GAAP measures.
Operating earnings measures
Management believes that an analysis of net income applicable to common stock before net realized gains or losses (“net operating income”, a
non-GAAP financial measure) is important to evaluate the performance of the Company and is a key measure commonly used in the life insurance
industry. Management uses this measure to evaluate performance because realized investment gains or losses can be affected by events that
are unrelated to the Company’s underlying fundamentals.
In addition, our results for Q2 2006 were affected by an unusual and significant charge related to a tentative litigation settlement. Management
does not believe that a similar charge is likely to recur within two years, and there were no similar charges recognized within the prior two years.
Management believes an analysis of operating earnings before this charge is important to evaluate the performance of the Company prior to the
effect of this unusual and significant charge.
44

Appendix:
Information Related to Certain Non-GAAP Financial Measures
A reconciliation of net income applicable to common stock to the net operating income, excluding Q2 2006 charge related to tentative litigation
settlement (and related per share amounts) is as follows (dollars in millions, except per share amounts):
Q3 05
Q4 05
Q1 06
Q2 06
Q3 06
Net income (loss) applicable to common stock
68.4
$
67.6
$
55.1
$
(31.8)
$
38.9
$
Net realized investment losses, net of related
amortization and taxes
3.7
2.8
0.7
0.1
13.9
Net operating income (loss) (a non-GAAP
financial measure)
72.1
70.4
55.8
(31.7)
52.8
2Q2006 charge related to the tentative litigation
settlement, net of taxes
-
-
-
100.3
-
Net operating income before Q2 2006 charge related
to the tentative litigation settlement
(a non-GAAP financial measure)
72.1
$
70.4
$
55.8
$
68.6
$
52.8
$
Per diluted share:
Net income (loss)
0.42
$
0.42
$
0.35
$
(0.21)
$
0.26
$
Net realized investment losses, net of related
amortization and taxes
0.02
0.02
0.01
-
0.09
Net operating income (loss) (a non-GAAP
financial measure)
0.44
0.44
0.36
(0.21)
0.35
Q2 2006 charge related to the tentative litigation
settlement, net of taxes
-
-
-
0.66
-
Net operating income before Q2 2006 charge related
to the tentative litigation settlement
(a non-GAAP financial measure)
0.44
$
0.44
$
0.36
$
0.45
$
0.35
$
45

Appendix:
Information Related to Certain Non-GAAP Financial Measures
Book value, excluding accumulated other comprehensive income, per diluted share
This non-GAAP financial measure differs from book value per diluted share because accumulated other comprehensive income has been
excluded from the book value used to determine the measure. Management believes this non-GAAP financial measure is useful because it
removes the volatility that arises from changes in accumulated other comprehensive income. Such volatility is often caused by changes in the
estimated fair value of our investment portfolio resulting from changes in general market interest rates rather than the business decisions made
by management.
46

Appendix:
Information Related to Certain Non-GAAP Financial Measures
A reconciliation from book value per diluted share to book value per diluted share, excluding accumulated other comprehensive income (loss) is
as follows (dollars in millions, except per share amounts):
47
Q3 05
Q4 05
Q1 06
Q2 06
Q3 06
Total shareholders' equity
3,954.2
$
4,519.8
$
4,283.3
$
4,296.6
$
4,712.7
$
Less accumulated other comprehensive income (loss)
162.7
71.7
(224.2)
(445.6)
(71.8)
Total shareholders' equity excluding
accumulated other comprehensive income (loss)
(a non-GAAP financial measure)
3,791.5
$
4,448.1
$
4,507.5
$
4,742.2
$
4,784.5
$
Diluted shares outstanding for the period
185,337,142
183,319,806
183,532,954
183,554,073
185,354,251
Book value per diluted share
21.34
$
24.66
$
23.34
$
23.41
$
25.43
$
Less accumulated other comprehensive income (loss)
0.88
0.40
(1.22)
(2.43)
(0.38)
Book value, excluding accumulated other
comprehensive income (loss), per diluted share
(a non-GAAP financial measure)
20.46
$
24.26
$
24.56
$
25.84
$
25.81
$

Appendix:
Information Related to Certain Non-GAAP Financial Measures
Operating return measures
Management believes that an analysis of return before net realized gains or losses (“net operating income”, a non-GAAP financial measure) is
important to evaluate the performance of the Company and is a key measure commonly used in the life insurance industry. Management uses
this measure to evaluate performance because realized investment gains or losses can be affected by events that are unrelated to the
Company’s underlying fundamentals.
In addition, our return for Q2 2006 was affected by an unusual and significant charge related to a tentative litigation settlement. Management
does not believe that a similar charge is likely to recur within two years, and there were no similar charges recognized within the prior two years.
Management believes an analysis of return before this charge is important to evaluate the performance of the Company prior to the effect of this
unusual and significant charge.
This non-GAAP financial measure also differs from return on equity because accumulated other comprehensive income (loss) has been excluded
from the value of equity used to determine this ratio. Management believes this non-GAAP financial measure is useful because it removes the
volatility that arises from changes in accumulated other comprehensive income (loss). Such volatility is often caused by changes in the
estimated fair value of our investment portfolio resulting from changes in general market interest rates rather than the business decisions made
by management.
In addition, our equity includes the value of significant net operating loss carryforwards (included in income tax assets). In accordance with
GAAP, these assets are not discounted, and accordingly will not provide a return to shareholders (until after it is realized as a reduction to taxes
that would otherwise be paid). Management believes that excluding this value from the equity component of this measure enhances the
understanding of the effect these non-discounted assets have on operating returns and the comparability of these measures from period-to-
period. In addition, the Company plans to change the way compensation for its executives is determined in the future. Operating return
measures will be the primary manner of measuring the performance of our business units and will be used as a basis for incentive compensation.
48

Appendix:
Information Related to Certain Non-GAAP Financial Measures
A reconciliation of return on common equity to operating return (less Q2 2006 charge related to the tentative litigation settlement) on common
equity (excluding accumulated other comprehensive income (loss) and net operating loss carryforwards) is as follows (dollars in millions, except
per share amounts):
(continued on next page)
49
Q3 05
Q4 05
Q1 06
Q2 06
Q3 06
Net income (loss) applicable to common stock
68.4
$
67.6
$
55.1
$
(31.8)
$
38.9
$
Net realized investment (gains) losses, net of related
amortization and taxes
3.7
2.8
0.7
0.1
13.9
Net operating income (loss) (a non-GAAP
financial measure)
72.1
70.4
55.8
(31.7)
52.8
Q2 2006 charge related to the tentative litigation
settlement, net of taxes
-
-
-
100.3
-
Net operating income before Q2 2006 charge related
to the tentative litigation settlement
(a non-GAAP financial measure)
72.1
$
70.4
$
55.8
$
68.6
$
52.8
$
Total shareholders' equity
3,954.2
$
4,519.8
$
4,283.3
$
4,296.6
$
4,712.7
$
Less preferred stock
667.8
667.8
667.8
667.8
667.8
Common shareholders' equity
3,286.4
3,852.0
3,615.5
3,628.8
4,044.9
Less accumulated other comprehensive income (loss)
162.7
71.7
(224.2)
(445.6)
(71.8)
Common shareholder's equity, excluding accumulated other
comprehensive income (loss) (a non-GAAP
financial measure)
3,123.7
3,780.3
3,839.7
4,074.4
4,116.7
Less net operating loss carryforwards
620.8
1,118.3
1,112.1
1,346.6
1,346.7
Common shareholders' equity, excluding accumulated
other comprehensive income (loss) and net operating
loss carryforwards (a non-GAAP financial measure)
2,502.9
$
2,662.0
$
2,727.6
$
2,727.8
$
2,770.0
$

Appendix:
Information Related to Certain Non-GAAP Financial Measures
(continued from previous page)
50
Q3 05
Q4 05
Q1 06
Q2 06
Q3 06
Average common shareholders' equity
3,406.6
3,569.2
3,733.8
3,622.2
3,836.9
Average common shareholder's equity, excluding accumulated
other comprehensive income (loss)
(a non-GAAP financial measure)
3,088.5
3,452.0
3,810.0
3,957.1
4,095.6
Average common shareholders' equity, excluding
accumulated other comprehensive income
(loss) and net operating loss carryforwards
(a non-GAAP financial measure)
2,512.5
2,582.5
2,694.8
2,727.7
2,748.9
Return on equity ratios:
Return on common equity
8.0%
7.6%
5.9%
-3.5%
4.1%
Return on common equity, excluding accumulated
other comprehensive income (loss)
(a non-GAAP financial measure)
8.9%
7.8%
5.8%
-3.2%
3.8%
Operating return (less Q2 2006 charge related to the
tentative litigation settlement) on
common equity, excluding accumulated
other comprehensive income (loss)
(a non-GAAP financial measure)
9.3%
8.2%
5.9%
6.9%
5.2%
Operating return (less Q2 2006 charge related to the
tentative litigation settlement) on common
equity, excluding accumulated other
comprehensive income (loss) and
net operating loss carryforwards
(a non-GAAP financial measure)
11.5%
10.9%
8.3%
10.1%
7.7%

Appendix:
Information Related to Certain Non-GAAP Financial Measures
Debt to capital ratio, excluding accumulated other comprehensive income (loss)
This non-GAAP financial measure differs from the debt to capital ratio because accumulated other comprehensive income has been excluded
from the value of capital used to determine this measure. Management believes this non-GAAP financial measure is useful because it removes
the volatility that arises from changes in accumulated other comprehensive income. Such volatility is often caused by changes in the estimated
fair value of our investment portfolio resulting from changes in general market interest rates rather than the business decisions made by
management.
51

Appendix:
Information Related to Certain Non-GAAP Financial Measures
A reconciliation of the debt to capital ratio to debt to capital, excluding accumulated other comprehensive income (loss), is as follows (dollars in
millions):
52
Q3 05
Q4 05
Q1 06
Q2 06
Q3 06
Corporate notes payable
772.7
$
851.5
$
805.3
$
805.5
$
805.6
$
Total shareholders' equity
3,954.2
4,519.8
4,283.3
4,296.6
4,712.7
Total capital
4,726.9
5,371.3
5,088.6
5,102.1
5,518.3
Less accumulated other comprehensive income (loss)
(162.7)
(71.7)
224.2
445.6
71.8
Total capital, excluding accumulated other
comprehensive income (loss)
(a non-GAAP financial measure)
4,564.2
$
5,299.6
$
5,312.8
$
5,547.7
$
5,590.1
$
Corporate notes payable to capital ratios:
Corporate debt to total capital
16%
16%
16%
16%
15%
Corporate debt to total capital, excluding accum-
ulated other comprehensive income (loss)
(a non-GAAP financial measure)
17%
16%
15%
15%
14%