
Fourth Quarter 2006
Financial and Operating Results
For the period ended December 31, 2006
Conseco, Inc.

Forward-Looking Statements
Cautionary Statement Regarding Forward-Looking Statements. Our statements, trend analyses and other information contained in these
materials relative to markets for Conseco’s products and trends in Conseco’s operations or financial results, as well as other statements, contain
forward-looking statements within the meaning of the federal securities laws and the Private Securities Litigation Reform Act of 1995. Forward-
looking statements typically are identified by the use of terms such as “anticipate,” “believe,” “plan,” “estimate,” “expect,” “project,” “intend,” “may,”
“will,” “would,” “contemplate,” “possible,” “attempt,” “seek,” “should,” “could,” “goal,” “target,” “on track,” “comfortable with,” “optimistic” and similar
words, although some forward-looking statements are expressed differently. You should consider statements that contain these words carefully
because they describe our expectations, plans, strategies and goals and our beliefs concerning future business conditions, our results of operations,
financial position, and our business outlook or they state other ‘‘forward-looking’’ information based on currently available information. Assumptions
and other important factors that could cause our actual results to differ materially from those anticipated in our forward-looking statements include,
among other things: (i) our ability to obtain adequate and timely rate increases on our supplemental health products including our long-term care
business; (ii) mortality, morbidity, usage of health care services, persistency, the adequacy of our previous reserve estimates and other factors
which may affect the profitability of our insurance products; (iii) changes in our assumptions related to the cost of policies produced or the value of
policies inforce at the Effective Date; (iv) our ability to achieve anticipated expense reductions and levels of operational efficiencies including
improvements in claims adjudication and continued automation and rationalization of operating systems; (v) performance of our investments; (vi)
our ability to identify products and markets in which we can compete effectively against competitors with greater market share, higher ratings,
greater financial resources and stronger brand recognition; (vii) the ultimate outcome of lawsuits filed against us and other legal and regulatory
proceedings to which we are subject; (viii) our ability to continue to recruit and retain productive agents and distribution partners and customer
response to new products, distribution channels and marketing initiatives; (ix) our ability to achieve an upgrade of the financial strength ratings of
our insurance company subsidiaries as well as the potential impact of rating downgrades on our business; (x) the risk factors or uncertainties listed
from time to time in our filings with the Securities and Exchange Commission; (xi) regulatory changes or actions, including those relating to
regulation of the financial affairs of our insurance companies, such as the payment of dividends to us, regulation of financial services affecting
(among other things) bank sales and underwriting of insurance products, regulation of the sale, underwriting and pricing of products, and health care
regulation affecting health insurance products; (xii) general economic conditions and other factors, including prevailing interest rate levels, stock and
credit market performance and health care inflation, which may affect (among other things) our ability to sell products and access capital on
acceptable terms, the returns on and the market value of our investments, and the lapse rate and profitability of policies; and (xiii) changes in the
Federal income tax laws and regulations which may affect or eliminate the relative tax advantages of some of our products. Other factors and
assumptions not identified above are also relevant to the forward-looking statements, and if they prove incorrect, could also cause actual results to
differ materially from those projected. All written or oral forward-looking statements attributable to us are expressly qualified in their entirety by the
foregoing cautionary statement. Our forward-looking statements speak only as of the date made. We assume no obligation to update or to publicly
announce the results of any revisions to any of the forward-looking statements to reflect actual results, future events or developments, changes in
assumptions or changes in other factors affecting the forward-looking statements.
2

Non-GAAP Measures
This presentation contains the following financial measures that differ from the comparable measures
under Generally Accepted Accounting Principles (GAAP): operating earnings measures; book value
excluding accumulated other comprehensive income (loss) per diluted share; operating return measures;
earnings before net realized investment gains (losses) and corporate interest and taxes; debt to capital
ratios, excluding accumulated other comprehensive income (loss); and interest-adjusted benefit ratios.
Reconciliations between those non-GAAP measures and the comparable GAAP measures are included
in the Appendix, or on the page such measure is presented.
While management believes these measures are useful to enhance understanding and comparability of
our financial results, these non-GAAP measures should not be considered substitutes for the most
directly comparable GAAP measures.
3

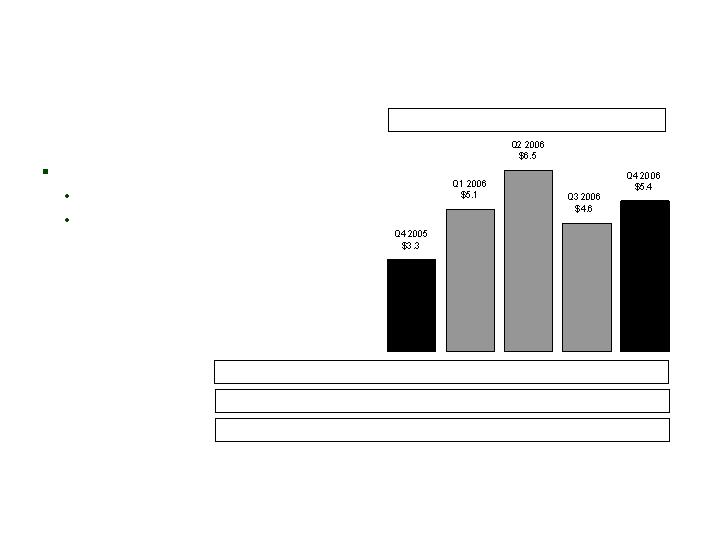
Pre-tax operating earnings from Bankers Life: $69.1 million, up from Q3 2006 and Q4 2005
Pre-tax operating earnings from Colonial Penn: $5.4 million, up from Q3 2006 and Q4 2005
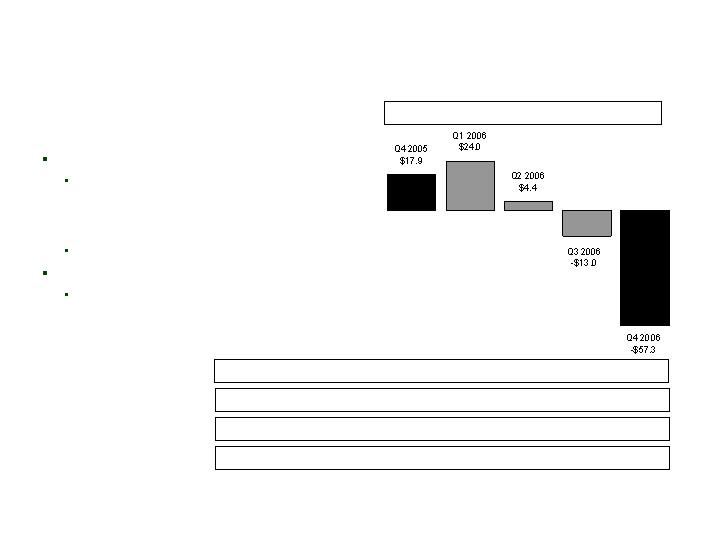
Results from the LTC Closed Block continue to be volatile: loss of $57.3 million in Q4 2006
Pre-tax operating earnings from Conseco Insurance Group (CIG): $23.9 million, down from Q3 2006
and Q4 2005
Unusual items decreasing (increasing) income:
Specified disease (CIG) $11.7 million
Life reserve and VOBA changes (CIG) $16.1 million
Annuity reserves (Bankers) ($7.4) million
Experience-related (Bankers) $8.4 million
LTC data refinements (LTC Closed Block) $7.1 million
Experience-related (LTC Closed Block) $54.1 million
Financial Highlights
CNO
4

In December, announced plans to consolidate certain back-office operations from
Chicago to Carmel
Expect to complete consolidation in 2007, reducing expense run rate by $25
million
Management changes to support reorganization: new company-wide operations
leader, new LTC leader
In December, announced plans to purchase up to $150 million of common equity
1.24 million shares purchased to date (approximate cost: $25 million)
Management’s Actions in Q4
CNO
5
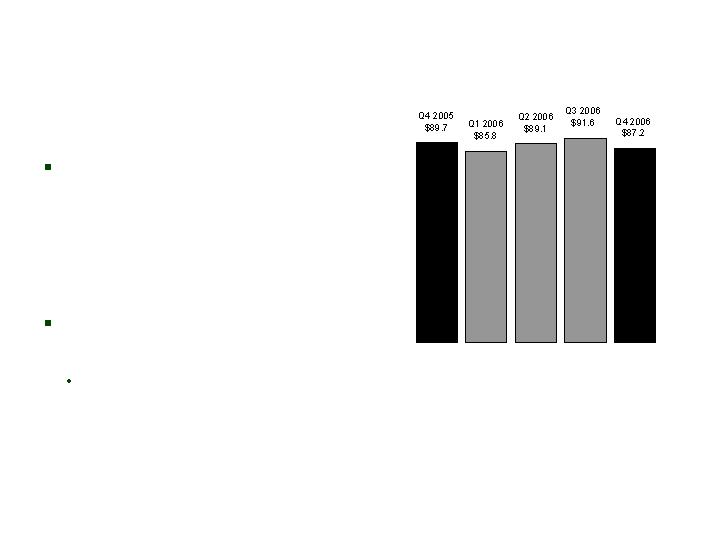
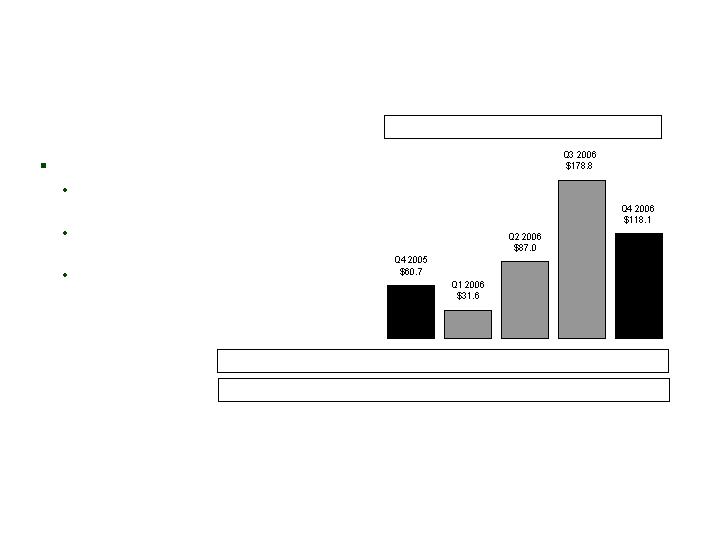
New Business
Volumes (NAP)
CNO Consolidated
(in millions)
Decrease from Q4 2005 due to
decline in Medicare supplement
sales, due primarily to competition
from Med Advantage and private
fee for service plans, partially
offset by increased annuity sales
Decrease from Q3 2006 due to
decline in annuity sales
Q3 2006 was strongest annuity
sales quarter of year
*New business volumes are measured by new annualized premium, which includes 6% of annuity premiums, 10%
of single-premium whole life deposits, and 100% of all other premiums. Excludes prescription drug sales (PDP).
6
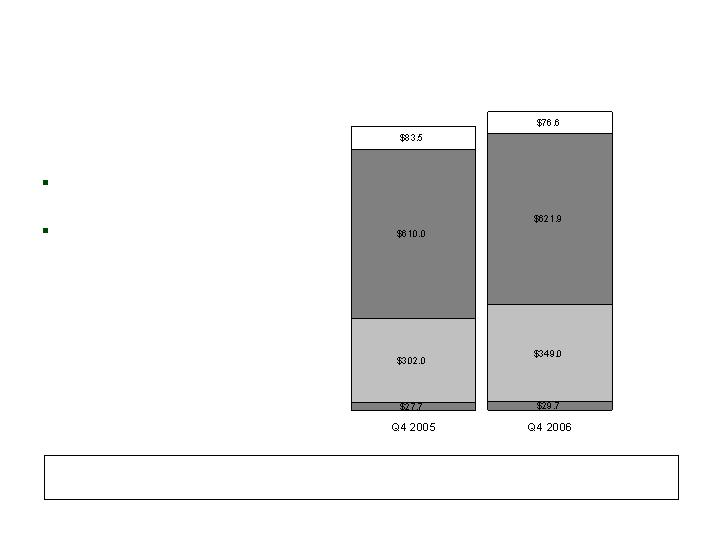
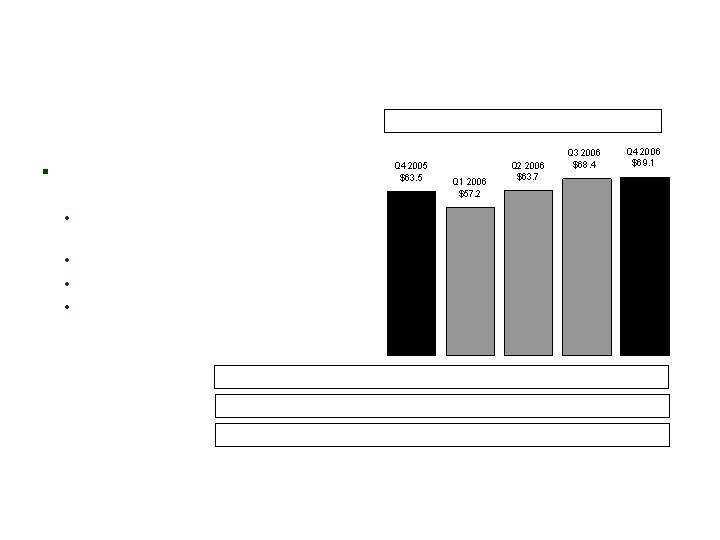
Collected
Premium Growth
CNO Consolidated
($ millions)
$1,023.2
$1,077.2
CIG*
Bankers*
Run-Off
Consolidated premiums up
$54 million (5%) vs. Q4 2005
Growth in all core businesses
Colonial Penn*
$3,958.7
$3,897.8
$3,706.6
$3,606.3
$3,574.0
Trailing 4 Qtrs. Collected Premium-Core Businesses*:
Q4 2006
Q3 2006
Q2 2006
Q1 2006
Q4 2005
7
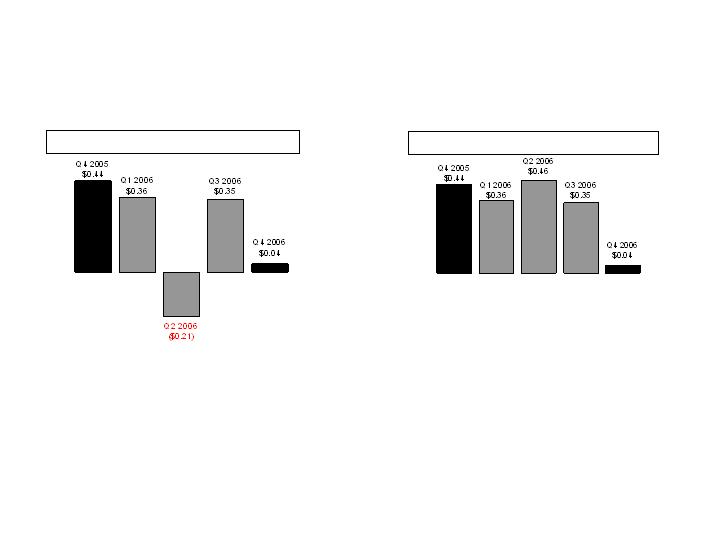
Operating EPS (Diluted)
CNO
Operating EPS, Before Q2 2006 Charge**
**Operating earnings per share, before Q2 2006
charge related to the tentative litigation settlement.
See Appendix for corresponding GAAP measure.
Operating EPS*
*Operating earnings per share exclude net realized
investment gains (losses). See Appendix for
corresponding GAAP measure.
8

Operating ROE
CNO
Operating ROE*, Trailing 4 Quarters
Operating ROE (excl. Q2 2006 charge and
NOLs)**, Trailing 4 Quarters
*Operating return excludes net realized
investment gains (losses). Equity excludes
accumulated other comprehensive income
(loss) and assumes conversion of preferred
stock. See Appendix for corresponding GAAP
measure.
**Operating return before Q2 2006 charge
related to the tentative litigation settlement.
Equity also excludes the value of net operating
loss carryforwards. See Appendix for
corresponding GAAP measure.
9

Q4 Earnings
CNO Consolidated
*Management believes that an analysis of earnings before net realized investment gains (losses) and corporate
interest and taxes (“EBIT,” a non-GAAP financial measure) provides an alternative measure to compare the
operating results of the company quarter-over-quarter because it excludes: (1) corporate interest expense and
the effects of the 2005 issuance of convertible debentures and the amendment of our credit facility; and (2) net
realized gains (losses) that are unrelated to the company’s underlying fundamentals. The chart above provides
a reconciliation of EBIT to net income applicable to common stock.
($ millions)
10
Q4 2005
Q4 2006
Bankers Life
$63.5
$69.1
Conseco Insurance Group
59.1
23.9
Colonial Penn
3.3
5.4
Other Business in Run-Off
17.9
(57.3)
Corporate operations, excluding interest expense
(13.6)
(0.4)
Total EBIT*
130.2
40.7
Corporate interest expense and loss on extinguishment of debt
(10.9)
(16.7)
Income before net realized investment losses and taxes
119.3
24.0
Tax expense
39.4
8.8
Net income before net realized losses
79.9
15.2
Preferred stock dividends
9.5
9.5
Net operating income
70.4
5.7
Net realized investment losses, net of related amortization and taxes
(2.8)
(9.4)
Net income (loss) applicable to common stock
$67.6
($3.7)

Q4 Earnings
Bankers
($ millions)
Management believes that an analysis of income (loss) before net realized investment gains (losses), net of
related amortization (a non-GAAP financial measure), is important to evaluate the financial performance of our
business, and is a measure commonly used in the life insurance industry. Management uses this measure to
evaluate performance because realized gains or losses can be affected by events that are unrelated to a
company’s underlying fundamentals. The chart on Page 10 reconciles the non-GAAP measure to the
corresponding GAAP measure. See Appendix for a reconciliation of the return on equity measure to the
corresponding GAAP measure.
11
2006 Return on Equity (before realized investment gains/(losses): 11.4%
Q4 2005
Q4 2006
Insurance policy income
$357.8
$387.8
Net investment income
118.3
145.3
Fee revenue and other income
0.9
1.2
Total revenues
477.0
534.3
Insurance policy benefits
285.3
309.8
Amounts added to policyholder account balances
43.2
56.4
Amortization related to operations
49.9
57.2
Other operating costs and expenses
35.1
41.8
Total benefits and expenses
413.5
465.2
Income before net realized investment losses, net of
related amortization and income taxes
$63.5
$69.1

Q4 Earnings
CIG
Management believes that an analysis of income (loss) before net realized investment gains (losses), net of
related amortization (a non-GAAP financial measure), is important to evaluate the financial performance of our
business, and is a measure commonly used in the life insurance industry. Management uses this measure to
evaluate performance because realized gains or losses can be affected by events that are unrelated to a
company’s underlying fundamentals. The chart on Page 10 reconciles the non-GAAP measure to the
corresponding GAAP measure. See Appendix for a reconciliation of the return on equity measure to the
corresponding GAAP measure.
($ millions)
2006 Return on Equity (before realized investment gains/(losses): 6.0%
12
Q4 2005
Q4 2006
Insurance policy income
$255.2
$245.1
Net investment income
175.9
200.7
Fee revenue and other income
0.3
(0.1)
Total revenues
431.4
445.7
Insurance policy benefits
189.9
209.8
Amounts added to policyholder account balances
68.9
98.4
Amortization related to operations
44.1
40.0
Other operating costs and expenses
69.4
73.6
Total benefits and expenses
372.3
421.8
Income before net realized investment gains (losses), net of
related amortization and income taxes
$59.1
$23.9

Q4 Earnings
Colonial Penn
Management believes that an analysis of income (loss) before net realized investment gains (losses), net of
related amortization (a non-GAAP financial measure), is important to evaluate the financial performance of our
business, and is a measure commonly used in the life insurance industry. Management uses this measure to
evaluate performance because realized gains or losses can be affected by events that are unrelated to a
company’s underlying fundamentals. The chart on Page 10 reconciles the non-GAAP measure to the
corresponding GAAP measure. See Appendix for a reconciliation of the return on equity measure to the
corresponding GAAP measure.
13
2006 Return on Equity (before realized investment gains/(losses): 12.0%
($ millions)
Q4 2005
Q4 2006
Insurance policy income
$28.5
$31.0
Net investment income
9.7
10.2
Fee revenue and other income
0.2
0.2
Total revenues
38.4
41.4
Insurance policy benefits
27.1
26.4
Amounts added to policyholder account balances
0.3
0.3
Amortization related to operations
3.6
4.6
Other operating costs and expenses
4.1
4.7
Total benefits and expenses
35.1
36.0
Income before net realized investment losses and income taxes
$3.3
$5.4

Q4 Earnings
Other Business in Run-off
Management believes that an analysis of income (loss) before net realized investment gains (losses), net of
related amortization (a non-GAAP financial measure), is important to evaluate the financial performance of our
business, and is a measure commonly used in the life insurance industry. Management uses this measure to
evaluate performance because realized gains or losses can be affected by events that are unrelated to a
company’s underlying fundamentals. The chart on Page 10 reconciles the non-GAAP measure to the
corresponding GAAP measure. See Appendix for a reconciliation of the return on equity measure to the
corresponding GAAP measure.
14
($ millions)
2006 Return on Equity (before realized investment gains/(losses): (11.9%)
Q4 2005
Q4 2006
Insurance policy income
$86.7
$82.2
Net investment income
44.2
45.6
Fee revenue and other income
0.1
0.1
Total revenues
131.0
127.9
Insurance policy benefits
86.3
162.7
Amortization related to operations
4.7
5.3
Other operating costs and expenses
22.1
17.2
Total benefits and expenses
113.1
185.2
Income (loss) before net realized investment losses and income taxes
$17.9
($57.3)
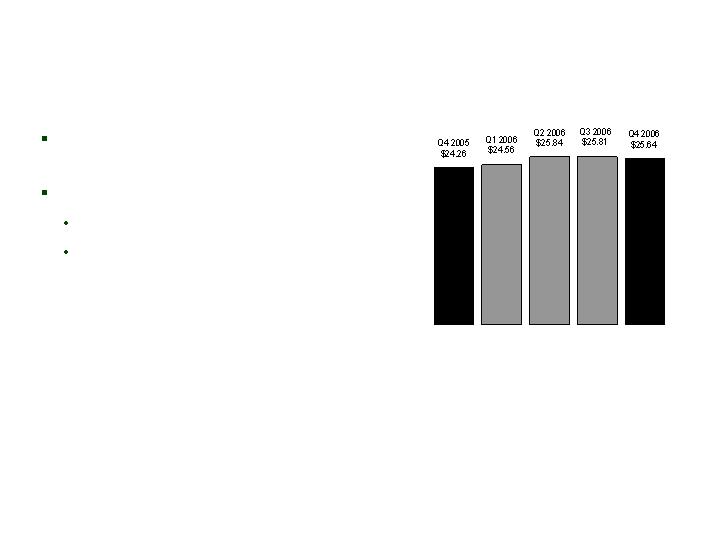
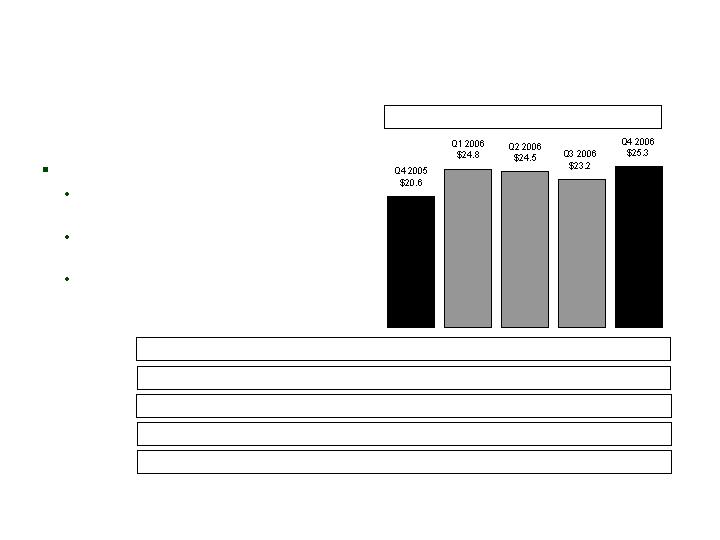
Book Value Per Diluted Share*
CNO
*Book value excludes accumulated other comprehensive income (loss). Shares outstanding assumes:
(1) conversion of convertible securities; and (2) the exercise of outstanding stock options and vesting of restricted
stock (each calculated using the treasury stock method). See Appendix for corresponding GAAP measure.
Reflects dilution as if our
preferred stock had converted
Change in Q4 2006 reflects:
Q4 net loss
Slight increase in diluted shares
outstanding
15
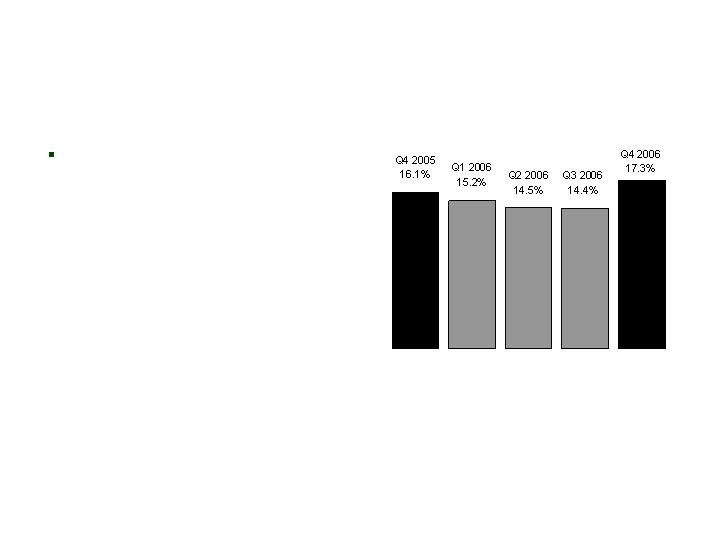
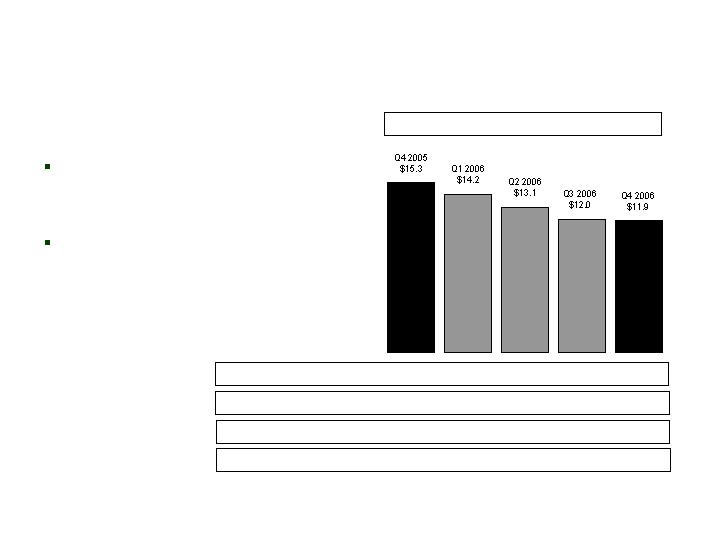
CNO
Debt to Total Capital Ratio*
Increase in Q4 2006 reflects
refinancing completed in
October
*Excludes accumulated other comprehensive income (loss). See Appendix for corresponding GAAP measure.
16
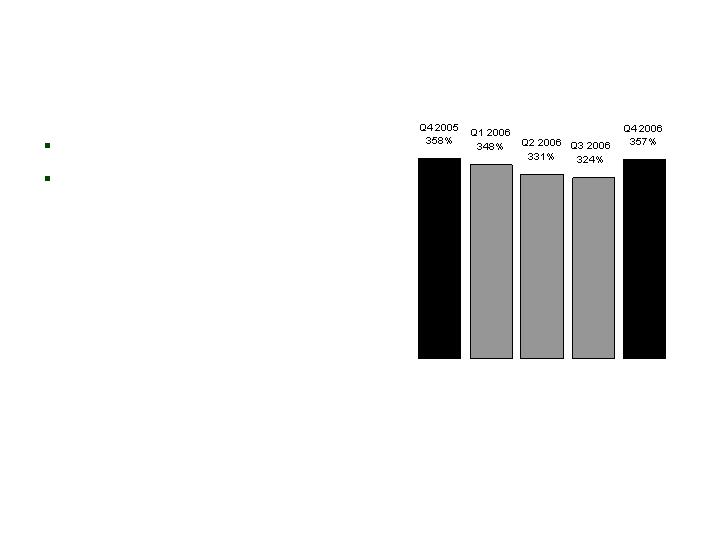
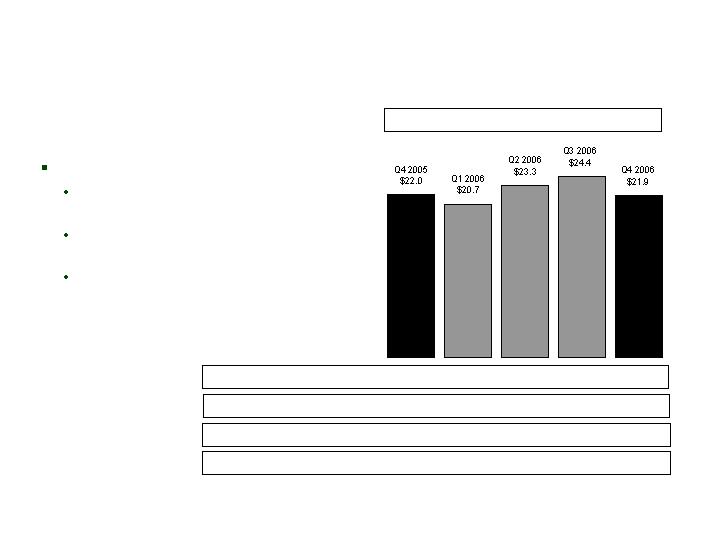
Consolidated RBC Ratio*
CNO
Ratio remains strong
Increase in Q4 2006 reflects
contribution of proceeds from
October refinancing
*Risk-Based Capital (“RBC”) requirements provide a tool for insurance regulators to determine the levels of
statutory capital and surplus an insurer must maintain in relation to its insurance and investment risks. The RBC
ratio is the ratio of the statutory consolidated adjusted capital of our insurance subsidiaries to RBC.
17
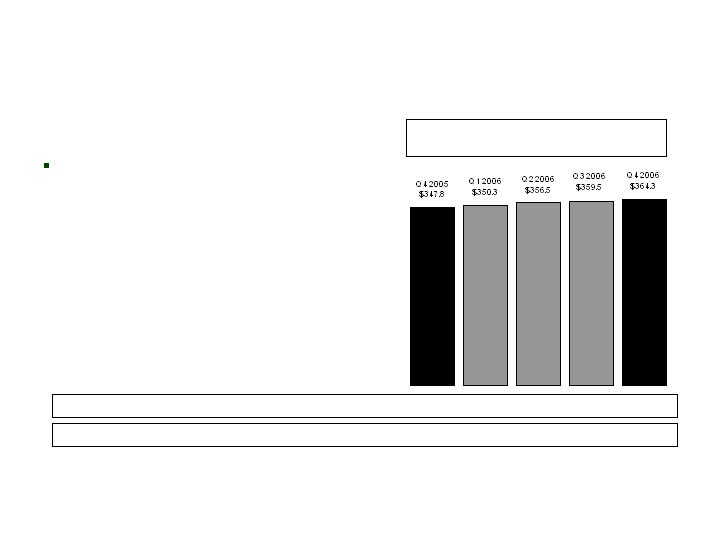
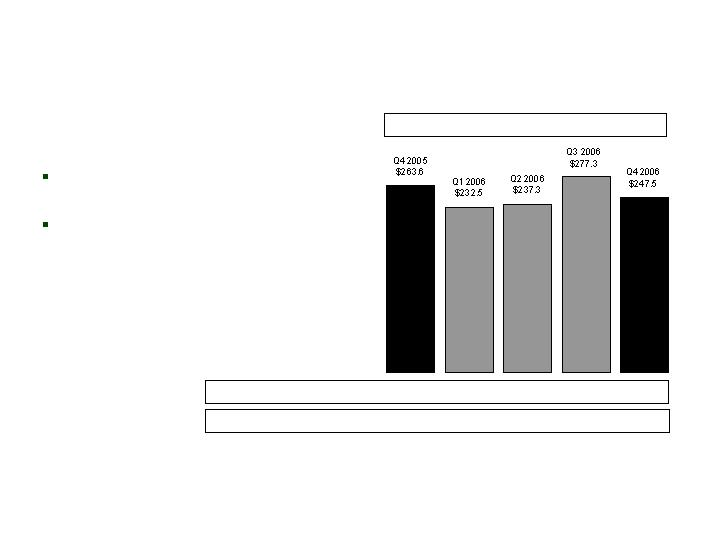
Net Investment Income
CNO
($ millions)
Yields increased by 7 bps
despite low market rate
environment
Net investment income from the prepayment of securities: $5.2 $1.2 $5.3 $0.5 $1.0
General Account Investment Income,
Excluding Corporate Segment
5.72%
5.72%
5.71%
5.64%
5.65%
Yield:
18
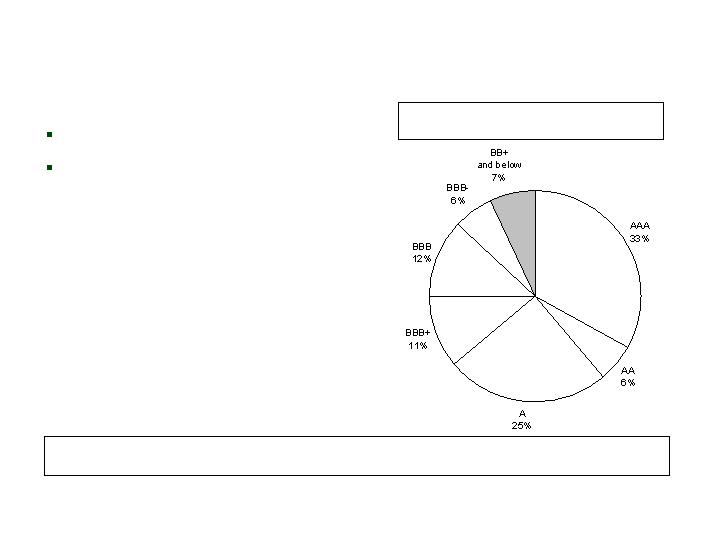
High-Quality Assets
CNO
Portfolio quality remains high
Less than 7% of portfolio is
below investment grade
Actively Managed Fixed Maturities by Rating at
12/31/06 (Market Value)
12/31/06
93%
9/30/06
95%
6/30/06
95%
3/31/06
95%
12/31/05
96%
% of Bonds which are Investment Grade:
19
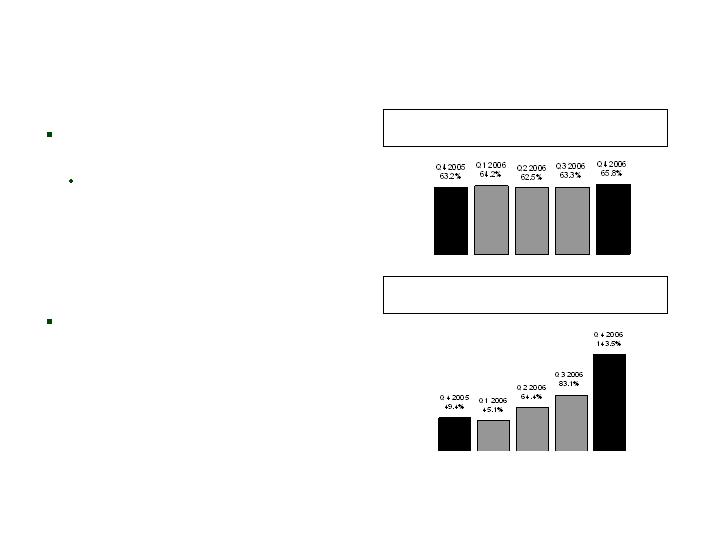
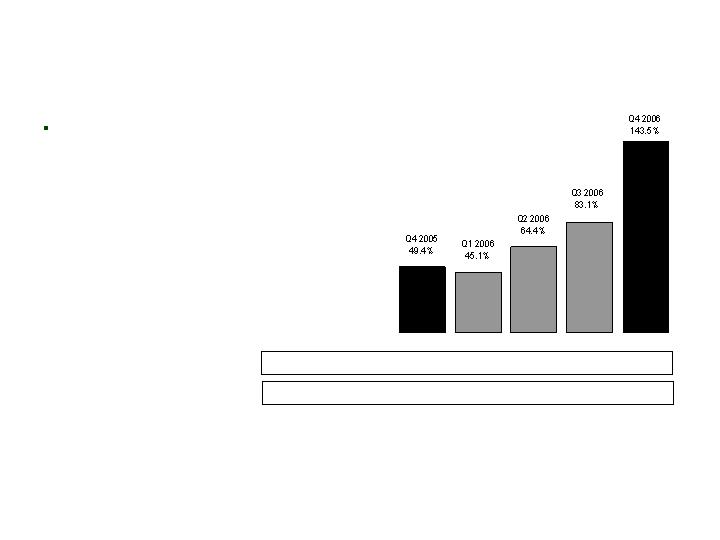
Aggregate Interest-Adjusted
Health Benefit Ratio*
CNO
Loss ratios in our core
businesses increased to 65.8%
Primarily driven by claim reserve
deficiencies of $8.9 million in the
Bankers Life segment and $11.7
million arising from the correction
of specified disease reserve
valuation errors in the Conseco
Insurance Group segment
Loss ratio in non-core LTC
Closed Block increased to
143.5%
Aggregate Health Benefit Ratio – By Quarter
Core (BLC, CIG & CP) Business
*We calculate interest-adjusted benefit ratios by dividing insurance policy benefits, less interest income on the
accumulated assets backing the insurance liabilities, by insurance policy income.
Aggregate Health Benefit Ratio – By Quarter
Run-Off Business
20
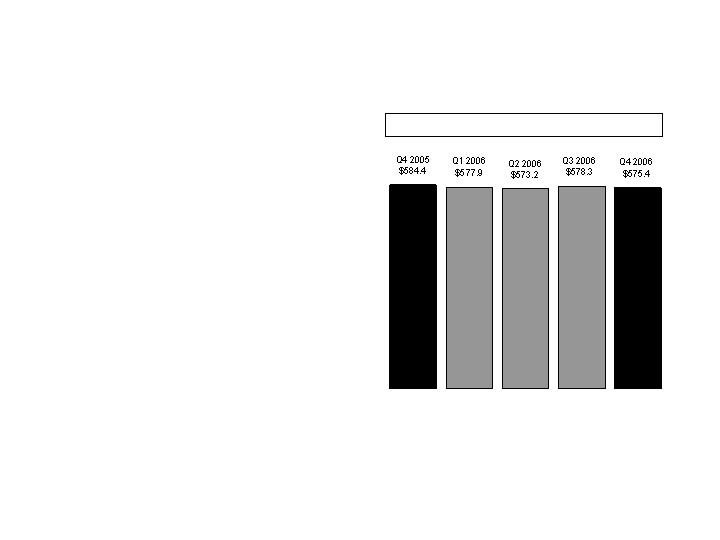
Expenses
CNO
($ millions)
Gross Operating Expenses*, Trailing 4 Quarters
*Gross operating expenses before capitalization of cost of policies produced, capitalization of software
development costs and other adjustments. Costs related to the tentative litigation settlement are not included in
our gross operating expenses. This measure is used by the Company to evaluate its progress in reducing gross
operating expenses.
21
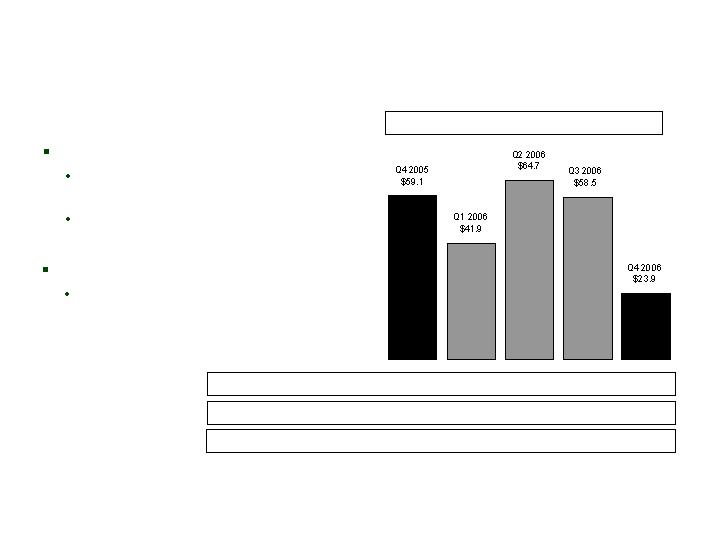
Segment Performance
CIG
*Operating earnings exclude net realized gains (losses). Q2 2006 excludes tentative litigation settlement.
See Appendix for corresponding GAAP measure of our consolidated results of operations.
Q4 2006 includes:
Correction of specified disease valuation
errors ($11.7 million, net of amortization)
$16.1 million related to reserves and
VOBA on life insurance policies
PTOI-Trailing 4 Quarters: $256.7 $234.2 $232.8 $224.2 $189.0
Revenues-Quarterly: $431.4 $438.8 $408.6 $436.0 $445.7
Pre-Tax Operating Income*
Revenues-Tr. 4 Quarters: $1,767.9 $1,772.0 $1,736.6 $1,714.8 $1,729.1
($ millions)
Q4 2005 included:
$8.8 million pre-tax gain on termination of
post-retirement benefit plan
22
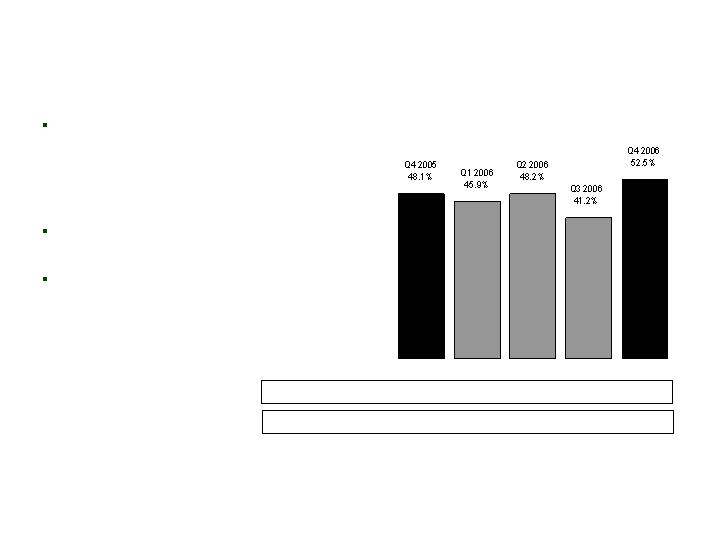
Benefit Ratio* –
Medicare Supplement
CIG
Benefit ratios in 2005 and first half
of 2006 benefited from release of
policy benefit reserves related to
increase in policyholder lapses
Persistency improved in Q3 and
Q4 2006
Trailing 4 Quarter Avg.: 59.4% 60.8% 59.3% 60.6% 61.9%
*We calculate benefit ratios by dividing insurance policy benefits by insurance policy income.
23
Interest-Adjusted Benefit Ratio* –
Specified Disease
CIG
Benefit ratio in Q4 2005 and first half
of 2006 reflected higher-than-expected
incurred claims, driven primarily by
continued incidence of paid claims
with old initial incurred dates
Paid base claims in Q4 2006 were
lowest we have seen since 2004
However, correction of valuation
errors resulted in higher benefit ratio
in Q4 2006 (Q4 benefit ratio would
compare favorably to prior quarters
without this adjustment)
Trailing 4 Quarter Avg.: 45.1% 45.4% 46.7% 45.9% 47.0%
Qtrly. non-int. adjusted: 79.6% 77.5% 79.9% 73.6% 84.9%
*We calculate interest-adjusted benefit ratios by dividing insurance policy benefits, less interest income on
the accumulated assets backing the insurance liabilities, by insurance policy income.
24
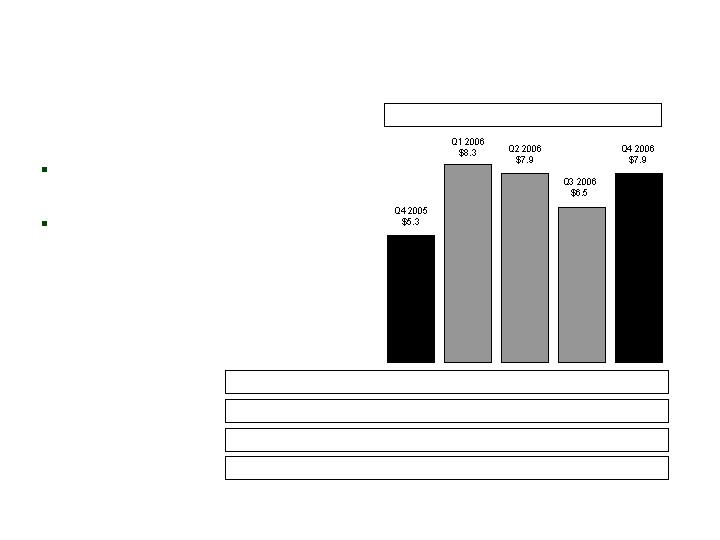
Premiums -
Medicare Supplement
CIG
($ millions)
49% increase in first-year
premiums vs. Q4 2005
94% increase in 2006 first-year
premiums vs. 2005
First-Year Prems.-Tr. 4 Qtrs: $15.8 $21.0 $25.6 $28.0 $30.6
Total Premiums-Quarterly: $68.4 $65.9 $61.9 $54.6 $61.8
Medicare Supplement – First-Year Premiums
NAP-Quarterly: $8.2 $10.5 $9.0 $6.2 $6.4
NAP-Trailing 4 Quarters: $22.5 $29.5 $34.3 $33.9 $32.1
25
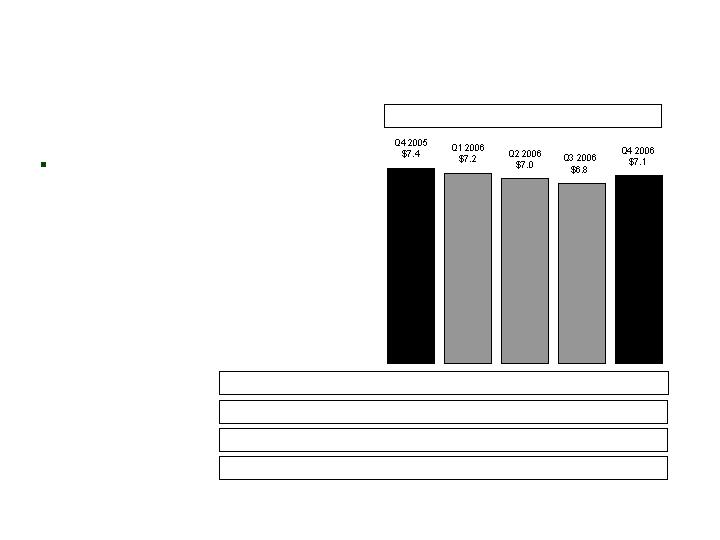
Premiums –
Specified Disease
CIG
($ millions)
NAP at PMA (wholly owned
distribution subsidiary)
gaining momentum
First-Year Prems.-Tr. 4 Qtrs: $30.6 $29.7 $28.8 $28.4 $28.1
Total Premiums-Quarterly: $88.5 $91.4 $88.8 $88.1 $89.4
Specified Disease – First-Year Premiums
NAP-Quarterly: $7.3 $6.2 $7.3 $7.7 $8.6
NAP-Trailing 4 Quarters: $31.5 $29.5 $27.9 $28.5 $29.8
26
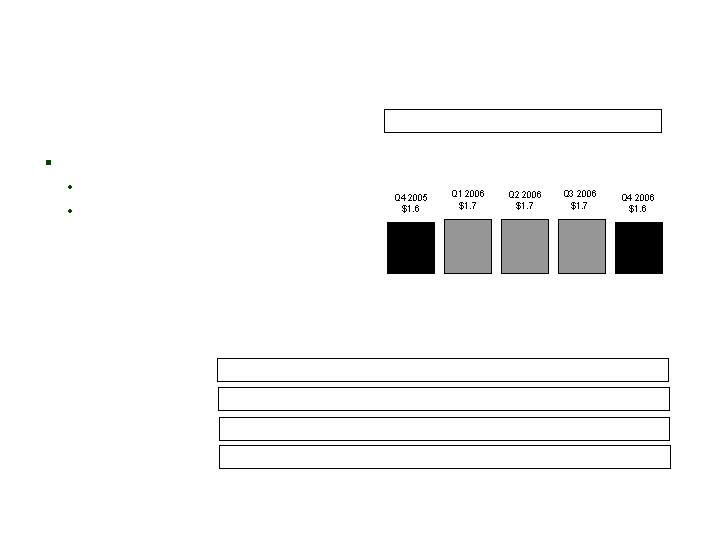
Premiums –
Life Insurance
CIG
($ millions)
Line being revitalized
New channel leader hired in May
3 field VPs added
First-Year Prems.-Tr. 4 Qtrs: $8.2 $7.1 $6.7 $6.7 $6.7
Total Premiums-Quarterly: $76.3 $84.1 $78.3 $78.3 $73.9
Life – First-Year Premiums
NAP-Quarterly: $2.2 $1.7 $1.1 $1.0 $1.8
NAP-Trailing 4 Quarters: $5.7 $6.5 $6.5 $6.0 $5.6
27
Premiums –
Annuity
CIG
($ millions)
Continued strength
First-year premiums up 95% for
quarter, 193% for year
TSA and IMO channels gaining
momentum
Significant contributions from our
national partners
First-Year Prems.-Tr. 4 Qtrs: $141.9 $153.3 $218.6 $358.1 $415.5
Total Premiums-Quarterly: $65.0 $36.2 $92.4 $182.8 $121.9
Annuity – First-Year Premiums
28

Segment Summary
CIG
Continued focus on:
Executing our Worksite strategy
Building our Life Insurance strategy
Establishing national partner relationships
Product development
Health Insurance producer recruiting
29
Segment Performance
Bankers
*Operating earnings exclude net realized gains (losses). See Appendix for corresponding GAAP measure of
our consolidated results of operations.
Q4 2005-Q4 2006 earnings
improvement driven by:
Improving Medicare Supplement
benefit ratio
Higher investment income
Coventry quota share/distribution fee
Offset by worsening loss experience
on LTC business
PTOI-Trailing 4 Quarters: $234.4 $238.9 $239.4 $252.8 $258.4
Revenues-Quarterly: $477.0 $507.9 $509.0 $525.9 $534.3
Pre-Tax Operating Income*
Revenues -Tr. 4 Quarters: $1,854.8 $1,922.3 $1,970.3 $2,019.8 $2,077.1
($ millions)
30
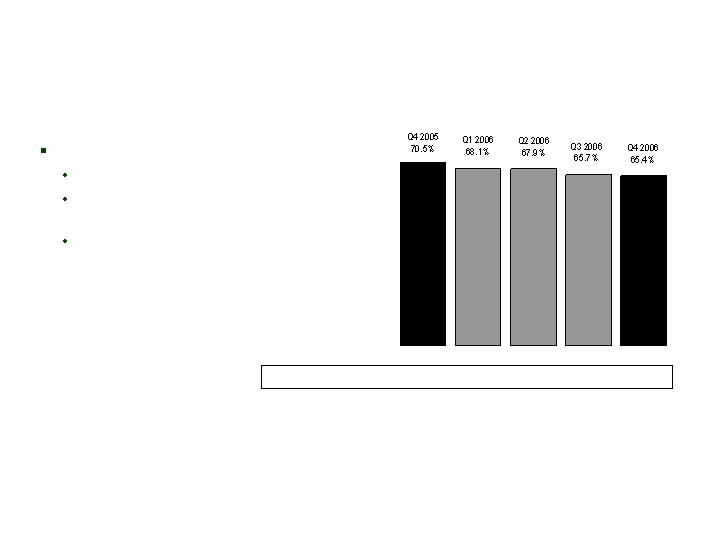
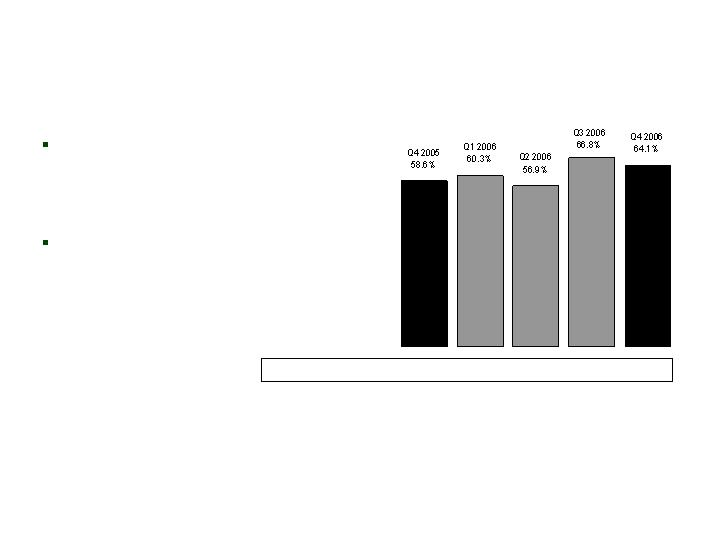
Benefit Ratio* –
Medicare Supplement
Bankers
Improving benefit ratio reflects:
Pricing action taken early in 2006
Claim redundancies for 2005 and
prior incurred claims
Claim experience continues to be
favorable
Trailing 4 Quarter Avg.: 71.7% 70.7% 69.6% 68.1% 66.8%
*We calculate benefit ratios by dividing insurance policy benefits by insurance policy income.
31
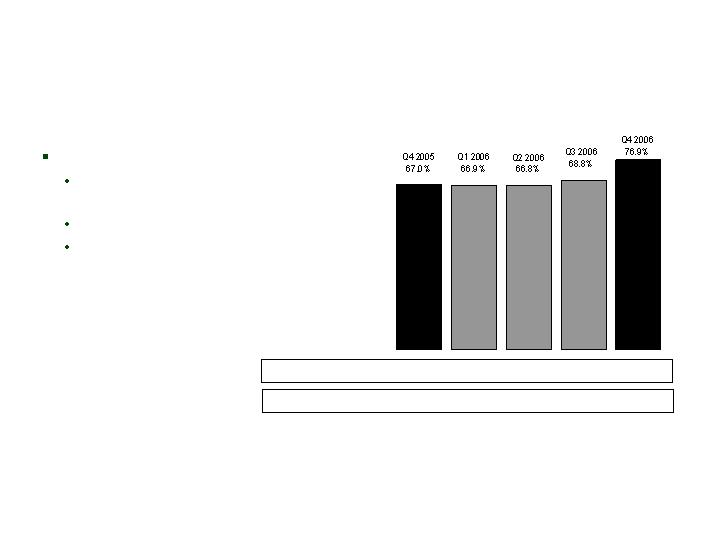
Interest-Adjusted Benefit Ratio* –
Long Term Care
Bankers
*We calculate interest-adjusted benefit ratios by dividing insurance policy benefits less interest income on
the accumulated assets backing the insurance liabilities by insurance policy income.
Increase in Q4 2006 ratio reflects:
Higher initial claims, particularly in
more expense-comprehensive policies
Higher persistency
Approximately $8.4 million of claim
reserve deficiencies in prior periods
recognized in Q4
Trailing 4 Quarter Avg.: 65.1% 65.8% 66.4% 67.4% 69.9%
Qtrly. non-int. adjusted: 96.1% 96.5% 96.2% 98.2% 106.7%
32
Premiums –
Medicare Supplement/PDP
Bankers
($ millions)
Strong sales
Q4 2006 first-year premiums up 23%
vs. Q4 2005
2006 first-year premiums up 32% vs.
2005
$77 million of PDP collected premium
in 2006
Med. Supp. First-Year Prems.-Tr. 4 Qtrs: $74.1 $81.2 $88.1 $93.1 $97.8
Med. Supp. Total Premiums-Quarterly: $159.5 $168.5 $156.7 $146.7 $157.2
Medicare Supplement – First-Year Premiums
*Excluded from amounts presented above.
$17.8
$20.8
$32.1
$6.0
--
PDP Premiums-Quarterly*:
Med. Supp. NAP-Quarterly: $21.8 $20.7 $18.4 $15.3 $18.4
Med. Supp. NAP-Trailing 4 Quarters: $71.9 $75.3 $76.7 $76.2 $72.8
33

New Product Rollout –
Medicare Advantage Private Fee
Bankers
Partnering with Coventry Health Care
Fee-based distribution agreement
Quota share reinsurance
Strong early indications
Enrolled 14,000 members through 12/31/06
66% of sales are new households
15% of sales replace an existing Bankers Medicare Supplement plan
Per policy profits expected to be substantially higher than Medicare Supplement
Activity will first be reflected in 2007 financials
34
Premiums –
Long-Term Care
Bankers
($ millions)
Steady decline in first-year
premiums over the past five
quarters
New sales are meeting our return
objectives
First-Year Prems.-Tr. 4 Qtrs: $65.4 $62.5 $58.5 $54.6 $51.2
Total Premiums-Quarterly: $141.1 $145.7 $151.5 $145.0 $150.2
Long-Term Care – First-Year Premiums
NAP-Quarterly: $13.8 $11.4 $12.7 $12.5 $11.0
NAP-Trailing 4 Quarters: $63.4 $57.1 $52.5 $50.4 $47.6
35
Premiums –
Life Insurance
Bankers
($ millions)
Growth driven by:
Continued focus on new agent
training
Expanded advanced life insurance
training for veteran agents
2006 first-year premiums up 22% vs.
2005
First-Year Prems.-Tr. 4 Qtrs: $74.1 $84.2 $88.4 $90.4 $90.3
Total Premiums-Quarterly: $42.7 $43.2 $46.6 $47.8 $46.6
Life – First-Year Premiums
NAP-Quarterly: $9.8 $10.9 $11.1 $12.9 $11.4
NAP-Trailing 4 Quarters: $41.4 $42.9 $42.8 $44.7 $46.3
36
Premiums –
Annuity
Bankers
($ millions)
Q4 2006 first-year premiums
down 6% vs. Q4 2005
2006 first-year premiums up 5%
over 2005
First-Year Prems.-Tr. 4 Qtrs: $948.3 $960.5 $960.1 $1,010.7 $994.6
Total Premiums-Quarterly: $264.1 $233.4 $238.3 $278.2 $247.6
Annuity – First-Year Premiums
37

Segment Summary
Bankers
Improving fundamentals in the business
65.4% Medicare Supplement benefit ratio
Execution of LTC inforce re-rate actions
First-year collected premium
Q4 2006 - $325 million, up 1% over Q4 2005
FY 2006 - $1,312 million, up 13% over 2005
38
Segment Performance
Colonial Penn
*Operating earnings exclude net realized gains (losses). See Appendix for corresponding GAAP measure of
our consolidated results of operations.
Earnings improvement driven by:
Premium growth
Favorable benefit ratios
PTOI-Trailing 4 Quarters: $20.0 $19.0 $20.3 $19.5 $21.6
Revenues-Quarterly: $38.4 $36.2 $34.9 $38.4 $41.4
Pre-Tax Operating Income*
Revenues -Tr. 4 Quarters: $140.2 $143.4 $145.9 $147.9 $150.9
($ millions)
39

Premiums –
Life Insurance
Colonial Penn
($ millions)
Growth driven by:
Increased but focused ad spend
Expanding breadth of lead sources
Improving direct mail productivity
Expanding product offerings
Improving telemarketing productivity
First-Year Prems.-Tr. 4 Qtrs: $19.4 $20.2 $21.2 $22.0 $22.9
Total Premiums-Quarterly: $24.4 $23.4 $21.6 $25.4 $26.8
Life – First-Year Premiums
NAP-Quarterly: $7.2 $8.4 $9.1 $8.3 $7.5
NAP-Trailing 4 Quarters: $30.2 $30.4 $32.2 $33.0 $33.3
40

Segment Summary
Colonial Penn
Focus on business fundamentals delivers profitable growth
At the core, a fact-based, financially disciplined approach
Fact-based management of the profit drivers of our business
Seek continuous improvement in marketing campaigns
Provide quality customer service experience
Treat every contact as a sales opportunity
Maintain rigorous expense discipline
Achieve organic growth at an acceptable ROE
41
Segment Performance
LTC Closed Block
*Operating earnings exclude net realized gains (losses). See Appendix for corresponding GAAP measure of
our consolidated results of operations.
Results adversely affected by:
$54.1 million from adverse claims
experience on claims incurred in previous
periods of which $24.5 million related to the
first three quarters of 2006
$7.1 million related to data refinements
Results favorably affected by:
$8.2 million for year-end adjustments to
expense and premium accruals
PTOI-Trailing 4 Quarters: $77.2 $79.7 $62.7 $33.3 ($41.9)
Revenues-Quarterly: $131.0 $133.7 $126.8 $128.1 $127.9
Pre-Tax Operating Income*
Revenues -Tr. 4 Quarters: $537.2 $536.1 $528.1 $519.6 $516.5
($ millions)
Collected Premiums-Quarterly: $83.5 $88.4 $82.4 $80.4 $76.6
42
Interest-Adjusted
Benefit Ratio*
Loss ratio has risen for past three
quarters
Trailing 4 Quarter Avg.: 49.2% 48.4% 52.1% 60.1% 83.2%
Qtrly. non-int. adjusted: 99.5% 94.8% 118.0% 136.0% 198.2%
LTC Closed Block
*We calculate interest-adjusted benefit ratios by dividing insurance policy benefits less interest income on
the accumulated assets backing the insurance liabilities by insurance policy income.
43

Progress continues on initiatives
Premium re-rates
Claims management
Technology
Talent and organizational design
Program for Improvement
LTC Closed Block
44
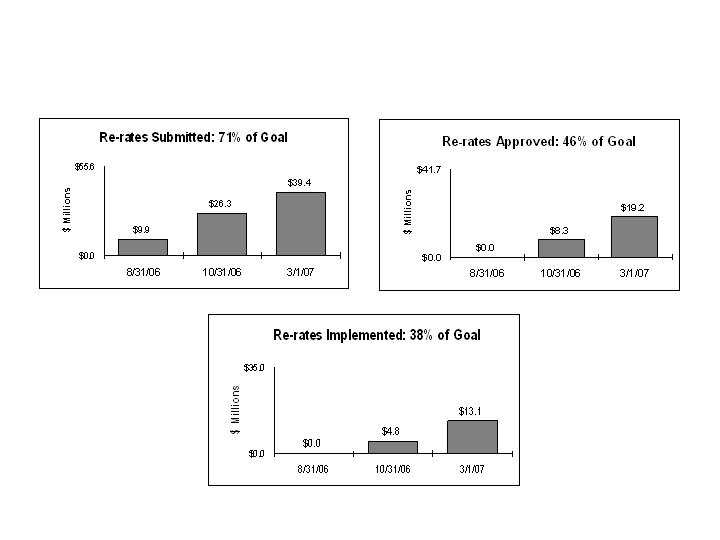
Premium Re-rates
LTC Closed Block
45
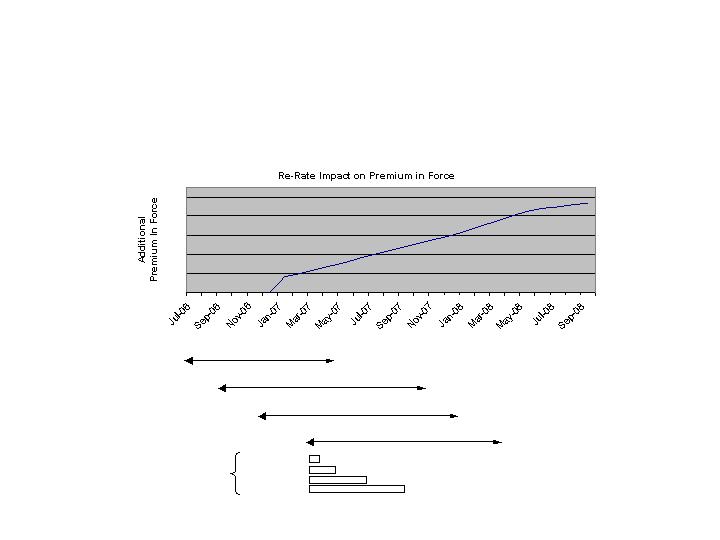
Re-rate revenue will build through 2007 and 2008;
not fully reflected until early 2009
Filings
Approvals
System Implementation
Monthly
Quarterly
Semi-Annual
Annual
Billing Cycle
Rate Effective Date
Premium Re-rates
LTC Closed Block
46

Claims management
Engaged two leading LTC administration companies to study our
current practices
Implemented significant changes to claim eligibility and care
management practices
Expect to reduce claims costs throughout 2007 and into 2008 as
result of more accurately paying claims according to policy
provisions
Program for Improvement
LTC Closed Block
47

Technology
Installed workflow system to better monitor incoming work and
inventories
Progressing on development of improved policy/benefit repository
and accumulator tool
Finalizing evaluation of strategic LTC system
Evaluating opportunities to automate manually-intensive
processes
Program for Improvement
LTC Closed Block
48

Talent and organizational design
Increased specialization of claim adjudication teams
Realigned training and audit areas with claim processing function
Continued focus on compliance has led to improved complaint-
handling process
Program for Improvement
LTC Closed Block
49

Disappointing financial results for the quarter
However, significant progress in:
$35 million premium re-rate program
Improved claims management practices
Implementation of system tools
Segment Summary
LTC Closed Block
50

CNO Summary
A messy quarter – significant one-time items
Ongoing volatility in LTC Run-off Block
Steps to improve earnings:
LTC Run-off: reduction in claims leakage of $10 million per
quarter by year-end
LTC Re-rates: re-rates adding in excess of $30 million per year
by year-end
Reorganization: $25 million per year in annual savings by year-
end
Continued growth of core business at Bankers, Colonial Penn
and CIG
51

Questions and Answers

Appendix:
Information Related to Certain Non-GAAP Financial Measures
The following provides additional information regarding certain non-GAAP measures used in this presentation. While management believes these
measures are useful to enhance understanding and comparability of our financial results, these non-GAAP measures should not be considered as
substitutes for the most directly comparable GAAP measures. Also refer to our latest Form 10-K and Form 10-Q for information concerning non-
GAAP measures.
Operating earnings measures
Management believes that an analysis of net income applicable to common stock before net realized gains or losses (“net operating income”, a
non-GAAP financial measure) is important to evaluate the performance of the Company and is a key measure commonly used in the life insurance
industry. Management uses this measure to evaluate performance because realized investment gains or losses can be affected by events that
are unrelated to the Company’s underlying fundamentals.
In addition, our results for Q2 2006 were affected by an unusual and significant charge related to a tentative litigation settlement. Management
does not believe that a similar charge is likely to recur within two years, and there were no similar charges recognized within the prior two years.
Management believes an analysis of operating earnings before this charge is important to evaluate the performance of the Company prior to the
effect of this unusual and significant charge.
53

Appendix:
Information Related to Certain Non-GAAP Financial Measures
A reconciliation of net income applicable to common stock to the net operating income, excluding Q2 2006 charge related to tentative litigation
settlement (and related per share amounts) is as follows (dollars in millions, except per share amounts):
Q4 05
Q1 06
Q2 06
Q3 06
Q4 06
Net income (loss) applicable to common stock
67.6
$
55.1
$
(31.8)
$
38.9
$
(3.7)
$
Net realized investment losses, net of related
amortization and taxes
2.8
0.7
0.1
13.9
9.4
Net operating income (loss) (a non-GAAP
financial measure)
70.4
55.8
(31.7)
52.8
5.7
2Q2006 charge related to the tentative litigation
settlement, net of taxes
-
-
102.1
-
-
Net operating income before Q2 2006 charge related
to the tentative litigation settlement
(a non-GAAP financial measure)
70.4
$
55.8
$
70.4
$
52.8
$
5.7
$
Per diluted share:
Net income (loss)
0.42
$
0.35
$
(0.21)
$
0.26
$
(0.02)
$
Net realized investment losses, net of related
amortization and taxes
0.02
0.01
-
0.09
0.06
Net operating income (loss) (a non-GAAP
financial measure)
0.44
0.36
(0.21)
0.35
0.04
Q2 2006 charge related to the tentative litigation
settlement, net of taxes
-
-
0.67
-
-
Net operating income before Q2 2006 charge related
to the tentative litigation settlement
(a non-GAAP financial measure)
0.44
$
0.36
$
0.46
$
0.35
$
0.04
$
54

Appendix:
Information Related to Certain Non-GAAP Financial Measures
Book value, excluding accumulated other comprehensive income, per diluted share
This non-GAAP financial measure differs from book value per diluted share because accumulated other comprehensive income has been
excluded from the book value used to determine the measure. Management believes this non-GAAP financial measure is useful because it
removes the volatility that arises from changes in accumulated other comprehensive income. Such volatility is often caused by changes in the
estimated fair value of our investment portfolio resulting from changes in general market interest rates rather than the business decisions made
by management.
55

Appendix:
Information Related to Certain Non-GAAP Financial Measures
A reconciliation from book value per diluted share to book value per diluted share, excluding accumulated other comprehensive income (loss) is
as follows (dollars in millions, except per share amounts):
56
Q4 05
Q1 06
Q2 06
Q3 06
Q4 06
Total shareholders' equity
4,519.8
$
4,283.3
$
4,296.6
$
4,712.7
$
4,713.1
$
Less accumulated other comprehensive income (loss)
71.7
(224.2)
(445.6)
(71.8)
(72.6)
Total shareholders' equity excluding
accumulated other comprehensive income (loss)
(a non-GAAP financial measure)
4,448.1
$
4,507.5
$
4,742.2
$
4,784.5
$
4,785.7
$
Diluted shares outstanding for the period
183,319,806
183,532,954
183,554,073
185,354,251
186,665,776
Book value per diluted share
24.66
$
23.34
$
23.41
$
25.43
$
25.25
$
Less accumulated other comprehensive income (loss)
0.40
(1.22)
(2.43)
(0.38)
(0.39)
Book value, excluding accumulated other
comprehensive income (loss), per diluted share
(a non-GAAP financial measure)
24.26
$
24.56
$
25.84
$
25.81
$
25.64
$

Appendix:
Information Related to Certain Non-GAAP Financial Measures
Operating return measures
Management believes that an analysis of return before net realized gains or losses (“net operating income”, a non-GAAP financial measure) is
important to evaluate the performance of the Company and is a key measure commonly used in the life insurance industry. Management uses
this measure to evaluate performance because realized investment gains or losses can be affected by events that are unrelated to the
Company’s underlying fundamentals.
In addition, our return for Q2 2006 was affected by an unusual and significant charge related to a tentative litigation settlement. Management
does not believe that a similar charge is likely to recur within two years, and there were no similar charges recognized within the prior two years.
Management believes an analysis of return before this charge is important to evaluate the performance of the Company prior to the effect of this
unusual and significant charge.
This non-GAAP financial measure also differs from return on equity because accumulated other comprehensive income (loss) has been excluded
from the value of equity used to determine this ratio. Management believes this non-GAAP financial measure is useful because it removes the
volatility that arises from changes in accumulated other comprehensive income (loss). Such volatility is often caused by changes in the
estimated fair value of our investment portfolio resulting from changes in general market interest rates rather than the business decisions made
by management.
In addition, our equity includes the value of significant net operating loss carryforwards (included in income tax assets). In accordance with
GAAP, these assets are not discounted, and accordingly will not provide a return to shareholders (until after it is realized as a reduction to taxes
that would otherwise be paid). Management believes that excluding this value from the equity component of this measure enhances the
understanding of the effect these non-discounted assets have on operating returns and the comparability of these measures from period-to-
period. Equity in all periods assumes the conversion of our 5.5% Class B Mandatorily Convertible Preferred Stock (which will occur in May
2007). In addition, the Company plans to change the way compensation for its executives is determined in the future. Operating return
measures will be the primary manner of measuring the performance of our business units and will be used as a basis for incentive compensation.
All references to segment operating return measures assume a 25% debt to total capital ratio at the segment level. Additionally, corporate
expenses have been allocated to the segments.
57

Appendix:
Information Related to Certain Non-GAAP Financial Measures
A reconciliation of return on common equity to operating return (less Q2 2006 charge related to the tentative litigation settlement) on common
equity (excluding accumulated other comprehensive income (loss) and net operating loss carryforwards) is as follows (dollars in millions, except
per share amounts):
(continued on next page)
58
Q4 05
Q1 06
Q2 06
Q3 06
Q4 06
Net income (loss) applicable to common stock
67.6
$
55.1
$
(31.8)
$
38.9
$
(3.7)
$
Net realized investment (gains) losses, net of related
amortization and taxes
2.8
0.7
0.1
13.9
9.4
Net operating income (loss) (a non-GAAP
financial measure)
70.4
55.8
(31.7)
52.8
5.7
Q2 2006 charge related to the tentative litigation
settlement, net of taxes
-
-
102.1
-
-
Add preferred stock dividends, assuming conversion
9.5
9.5
9.5
9.5
9.5
Net operating income before Q2 2006 charge related
to the tentative litigation settlement
(a non-GAAP financial measure)
79.9
$
65.3
$
79.9
$
62.3
$
15.2
$
Total shareholders' equity
4,519.8
$
4,283.3
$
4,296.6
$
4,712.7
$
4,713.1
$
Less preferred stock
667.8
667.8
667.8
667.8
667.8
Common shareholders' equity
3,852.0
3,615.5
3,628.8
4,044.9
4,045.3
Add preferred stock, assuming conversion
667.8
667.8
667.8
667.8
667.8
Less accumulated other comprehensive income (loss)
71.7
(224.2)
(445.6)
(71.8)
(72.6)
Common shareholder's equity, excluding accumulated
other comprehensive income (loss) (a non-GAAP
financial measure)
4,448.1
4,507.5
4,742.2
4,784.5
4,785.7
Less net operating loss carryforwards
1,118.3
1,112.1
1,346.6
1,346.7
1,340.0
Common shareholders' equity, excluding accumulated
other comprehensive income (loss) and net operating
loss carryforwards (a non-GAAP financial measure)
3,329.8
$
3,395.4
$
3,395.6
$
3,437.8
$
3,445.7
$

Appendix:
Information Related to Certain Non-GAAP Financial Measures
(continued from previous page)
59
Q4 05
Q1 06
Q2 06
Q3 06
Q4 06
Average common shareholders' equity
3,569.2
3,733.8
3,622.2
3,836.9
4,045.1
Average common shareholder's equity, excluding accumulated
other comprehensive income (loss)
(a non-GAAP financial measure)
4,119.8
4,477.8
4,624.9
4,763.4
4,785.1
Average common shareholders' equity, excluding
accumulated other comprehensive income
(loss) and net operating loss carryforwards
(a non-GAAP financial measure)
3,250.3
3,362.6
3,395.5
3,416.7
3,441.8
Return on equity ratios:
Return on common equity
7.6%
5.9%
-3.5%
4.1%
-0.4%
Operating return (less Q2 2006 charge related to the
tentative litigation settlement) on
common equity, excluding accumulated
other comprehensive income (loss)
(a non-GAAP financial measure)
7.8%
5.8%
6.9%
5.2%
1.3%
Operating return (less Q2 2006 charge related to the
tentative litigation settlement) on common
equity, excluding accumulated other
comprehensive income (loss) and
net operating loss carryforwards
(a non-GAAP financial measure)
9.8%
7.8%
9.4%
7.3%
1.8%

Appendix:
Information Related to Certain Non-GAAP Financial Measures
A reconciliation of pretax operating earnings (a non-GAAP financial measure) to segment operating income (loss) and consolidated net income
(loss) for the year ended December 31, 2006, is as follows (dollars in millions):
(Continued on next page)
60
Other Business
CIG
Bankers
Colonial Penn
in Run-off
Corporate
Total
Pretax operating earnings (a non-GAAP financial measure)
32.0
$
258.4
$
21.6
$
(41.9)
$
(80.7)
$
189.4
$
2Q2006 charge related to the tentative litigation
settlement
157.0
-
-
-
-
157.0
Allocation of interest expense, excess capital and corporate
expenses
(44.7)
(36.9)
(3.0)
(8.4)
93.0
-
Income tax (expense) benefit
(52.8)
(81.1)
(6.8)
18.4
(1.4)
(123.7)
Segment operating income (loss)
91.5
$
140.4
$
11.8
$
(31.9)
$
10.9
$
222.7
2Q2006 charge related to the tentative litigation settlement,
net of taxes
(102.1)
Net realized investment losses, net of related amortization and taxes
(24.1)
Net income
96.5
$

Appendix:
Information Related to Certain Non-GAAP Financial Measures
A reconciliation of common shareholders’ equity, excluding accumulated other comprehensive income (loss) and less income tax assets and
assuming conversion of the convertible preferred stock (a non-GAAP financial measure) to common shareholders’ equity is as follows (dollars in
millions):
(Continued on next page)
61
(Continued from previous page)
Other Business
CIG
Bankers
Colonial Penn
in Run-off
Corporate
Total
December 31, 2005
Common shareholders' equity, excluding accumulated
other comprehensive income (loss) and less income tax
assets representing net operating loss carryforwards
and assuming conversion of convertible preferred stock
(a non-GAAP financial measure)
1,518.8
$
1,194.2
$
92.6
$
246.4
$
277.8
$
3,329.8
$
Net operating loss carryforwards
1,118.3
-
-
-
-
1,118.3
Accumulated other comprehensive income (loss)
44.1
(2.2)
2.6
23.8
3.4
71.7
Allocation of capital
506.3
398.1
30.9
82.1
(1,017.4)
-
Total shareholders' equity
3,187.5
$
1,590.1
$
126.1
$
352.3
$
(736.2)
$
4,519.8
Less preferred stock
667.8
Common shareholders' equity
3,852.0
$
December 31, 2006
Common shareholders' equity, excluding accumulated
other comprehensive income (loss) and less income tax
assets representing net operating loss carryforwards
and assuming conversion of convertible preferred stock
(a non-GAAP financial measure)
1,546.5
$
1,274.3
$
103.6
$
290.3
$
231.0
$
3,445.7
$
Net operating loss carryforwards
1,340.0
1,340.0
Accumulated other comprehensive income (loss)
(25.6)
(41.6)
(1.2)
(7.3)
3.1
(72.6)
Allocation of capital
515.5
424.8
34.6
96.8
(1,071.7)
-
Total shareholders' equity
3,376.4
$
1,657.5
$
137.0
$
379.8
$
(837.6)
$
4,713.1
Less preferred stock
667.8
Common shareholders' equity
4,045.3
$

Appendix:
Information Related to Certain Non-GAAP Financial Measures
A reconciliation of average common shareholders’ equity, excluding accumulated other comprehensive income (loss) and less income tax assets
and assuming conversion of the convertible preferred stock (a non-GAAP financial measure) to average common shareholders’ equity at
December 31, 2006, is as follows (dollars in millions):
62
(Continued from previous page)
Other Business
CIG
Bankers
Colonial Penn
in Run-off
Corporate
Total
Average common shareholders' equity, excluding accumulated
other comprehensive income (loss) and less income tax
assets representing net operating loss carryforwards
and assuming conversion of convertible preferred stock
(a non-GAAP financial measure)
1,532.7
$
1,234.3
$
98.1
$
268.4
$
254.3
$
3,387.8
$
Average net operating loss carryforwards
1,229.2
Average accumulated other comprehensive income (loss)
(0.5)
Average total shareholders' equity
4,616.5
Average preferred stock
667.8
Average common shareholders' equity
3,948.7
Return on equity ratios:
Return on equity
2.4%
Operating return on equity (less 2Q2006 charge
related to the tentative litigation settlement),
excluding accumulated other
comprehensive income (loss) and less income tax
assets representing net operating loss carryforwards
and assuming conversion of convertible preferred stock
(a non-GAAP financial measure)
6.0%
11.4%
12.0%
-11.9%
4.3%
6.5%

Appendix:
Information Related to Certain Non-GAAP Financial Measures
Debt to capital ratio, excluding accumulated other comprehensive income (loss)
This non-GAAP financial measure differs from the debt to capital ratio because accumulated other comprehensive income has been excluded
from the value of capital used to determine this measure. Management believes this non-GAAP financial measure is useful because it removes
the volatility that arises from changes in accumulated other comprehensive income. Such volatility is often caused by changes in the estimated
fair value of our investment portfolio resulting from changes in general market interest rates rather than the business decisions made by
management.
63

Appendix:
Information Related to Certain Non-GAAP Financial Measures
A reconciliation of the debt to capital ratio to debt to capital, excluding accumulated other comprehensive income (loss), is as follows (dollars in
millions):
64
Q4 05
Q1 06
Q2 06
Q3 06
Q4 06
Corporate notes payable
851.5
$
805.3
$
805.5
$
805.6
$
1,000.8
$
Total shareholders' equity
4,519.8
4,283.3
4,296.6
4,712.7
4,713.1
Total capital
5,371.3
5,088.6
5,102.1
5,518.3
5,713.9
Less accumulated other comprehensive income (loss)
(71.7)
224.2
445.6
71.8
72.6
Total capital, excluding accumulated other
comprehensive income (loss)
(a non-GAAP financial measure)
5,299.6
$
5,312.8
$
5,547.7
$
5,590.1
$
5,786.5
$
Corporate notes payable to capital ratios:
Corporate debt to total capital
15.9%
15.8%
15.8%
14.6%
17.5%
Corporate debt to total capital, excluding accum-
ulated other comprehensive income (loss)
(a non-GAAP financial measure)
16.1%
15.2%
14.5%
14.4%
17.3%