
First Quarter 2007
Financial and Operating Results
For the period ended March 31, 2007
Conseco, Inc.

Forward-Looking Statements
Cautionary Statement Regarding Forward-Looking Statements. Our statements, trend analyses and other information contained in these
materials relative to markets for Conseco’s products and trends in Conseco’s operations or financial results, as well as other statements, contain
forward-looking statements within the meaning of the federal securities laws and the Private Securities Litigation Reform Act of 1995. Forward-
looking statements typically are identified by the use of terms such as “anticipate,” “believe,” “plan,” “estimate,” “expect,” “project,” “intend,”
“may,” “will,” “would,” “contemplate,” “possible,” “attempt,” “seek,” “should,” “could,” “goal,” “target,” “on track,” “comfortable with,” “optimistic” and
similar words, although some forward-looking statements are expressed differently. You should consider statements that contain these words
carefully because they describe our expectations, plans, strategies and goals and our beliefs concerning future business conditions, our results
of operations, financial position, and our business outlook or they state other ‘‘forward-looking’’ information based on currently available
information. Assumptions and other important factors that could cause our actual results to differ materially from those anticipated in our forward-
looking statements include, among other things: (i) our ability to obtain adequate and timely rate increases on our supplemental health products
including our long-term care business; (ii) mortality, morbidity, usage of health care services, persistency, the adequacy of our previous reserve
estimates and other factors which may affect the profitability of our insurance products; (iii) changes in our assumptions related to the cost of
policies produced or the value of policies inforce at the Effective Date; (iv) our ability to achieve anticipated expense reductions and levels of
operational efficiencies including improvements in claims adjudication and continued automation and rationalization of operating systems; (v)
performance of our investments; (vi) our ability to identify products and markets in which we can compete effectively against competitors with
greater market share, higher ratings, greater financial resources and stronger brand recognition; (vii) the ultimate outcome of lawsuits filed
against us and other legal and regulatory proceedings to which we are subject; (viii) our ability to remediate the material weakness in internal
controls over the actuarial reporting process that we identified at year-end 2006 and to maintain effective controls over financial reporting; (ix)
our ability to continue to recruit and retain productive agents and distribution partners and customer response to new products, distribution
channels and marketing initiatives; (x) our ability to achieve an upgrade of the financial strength ratings of our insurance company subsidiaries
as well as the potential impact of rating downgrades on our business; (xi) the risk factors or uncertainties listed from time to time in our filings
with the Securities and Exchange Commission; (xii) regulatory changes or actions, including those relating to regulation of the financial affairs of
our insurance companies, such as the payment of dividends to us, regulation of financial services affecting (among other things) bank sales and
underwriting of insurance products, regulation of the sale, underwriting and pricing of products, and health care regulation affecting health
insurance products; (xiii) general economic conditions and other factors, including prevailing interest rate levels, stock and credit market
performance and health care inflation, which may affect (among other things) our ability to sell products and access capital on acceptable terms,
the returns on and the market value of our investments, and the lapse rate and profitability of policies; and (xiv) changes in the Federal income
tax laws and regulations which may affect or eliminate the relative tax advantages of some of our products. Other factors and assumptions not
identified above are also relevant to the forward-looking statements, and if they prove incorrect, could also cause actual results to differ
materially from those projected. All written or oral forward-looking statements attributable to us are expressly qualified in their entirety by the
foregoing cautionary statement. Our forward-looking statements speak only as of the date made. We assume no obligation to update or to
publicly announce the results of any revisions to any of the forward-looking statements to reflect actual results, future events or developments,
changes in assumptions or changes in other factors affecting the forward-looking statements.
2

Non-GAAP Measures
This presentation contains the following financial measures that differ from the comparable measures
under Generally Accepted Accounting Principles (GAAP): operating earnings measures; book value
excluding accumulated other comprehensive income (loss) per diluted share; operating return measures;
earnings before net realized investment gains (losses) and corporate interest and taxes; debt to capital
ratios, excluding accumulated other comprehensive income (loss); and interest-adjusted benefit ratios.
Reconciliations between those non-GAAP measures and the comparable GAAP measures are included
in the Appendix, or on the page such measure is presented.
While management believes these measures are useful to enhance understanding and comparability of
our financial results, these non-GAAP measures should not be considered substitutes for the most
directly comparable GAAP measures.
3

Progress in executing plan
Strong sales growth at Bankers and Colonial Penn, better sales mix at CIG
On plan with Run-off LTC in improving claims management and in re-rates
Announcement of sale of $3 billion block of Fixed and EIA annuities
Board approval of increase in stock buyback program to $350 million
$30 million repurchased to date
Quarterly results
Earnings from Core Businesses down principally due to higher mortality
costs in CIG and higher lapse rates of Med Supp at Bankers
Continued volatility in Run-off LTC earnings, with claims reserve
strengthening of $22.0 million
Q1 2007 Summary
CNO
4
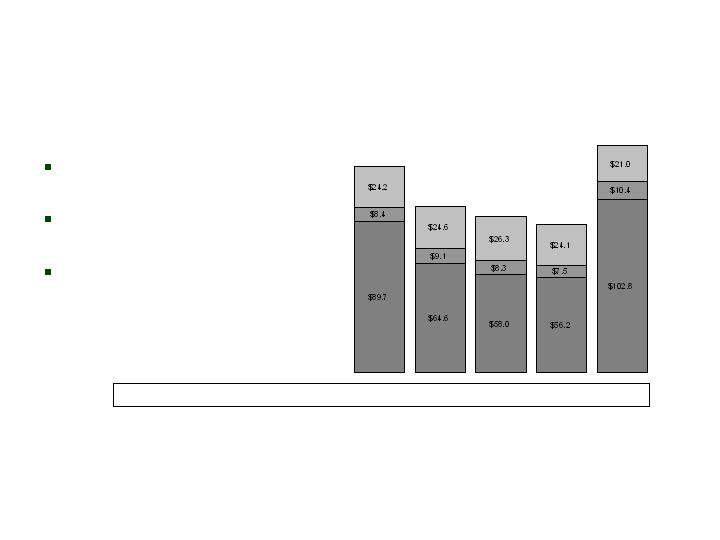
New Business
Volumes (NAP)
CNO Consolidated
(in millions)
Record quarterly sales for
BLC
Strong growth in sales for
CP, stronger growth in leads
CIG sales mix improvement
New business volumes are measured by new annualized premium, which includes 6% of annuity premiums, 10%
of single-premium whole life deposits, and 100% of all other premiums. Includes prescription drug sales (PDP)
and private-fee-for-service (PFFS) sales.
Q1 2006
$122.3
Q2 2006
$98.3
Q3 2006
$92.6
Q4 2006
$87.8
Q1 2007
$134.2
Col. Penn
Bankers
CIG
Trailing 4 Quarters NAP: $374.9 $390.4 $403.0 $401.0 $412.9
5
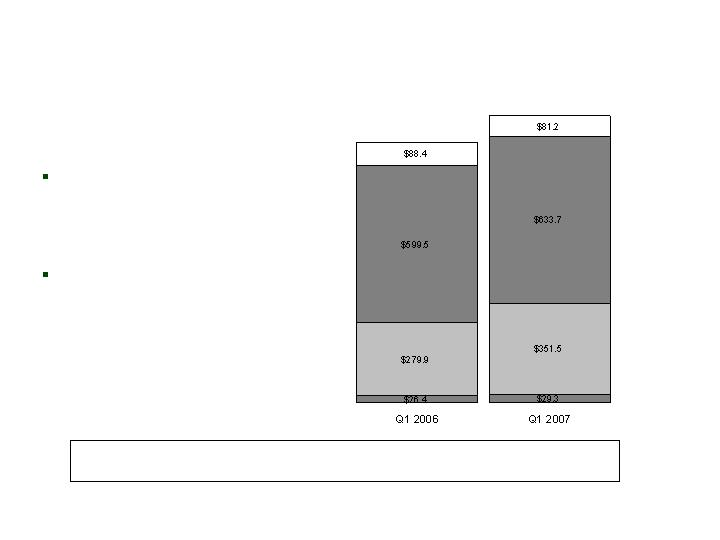
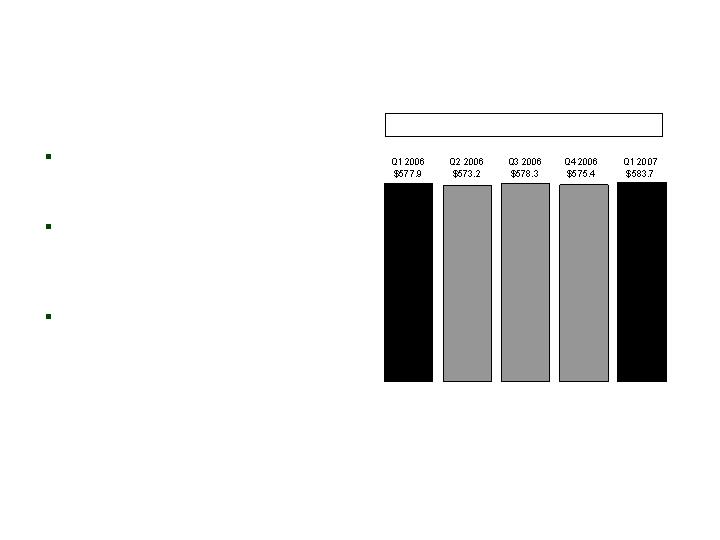
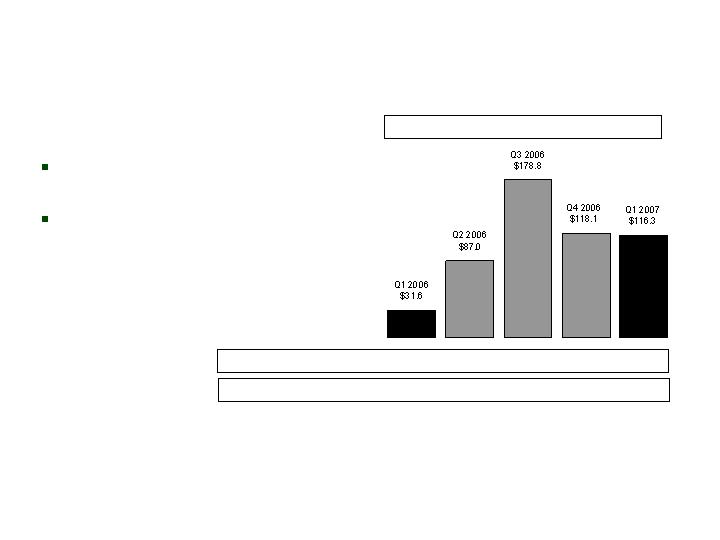
Collected
Premium Growth
CNO Consolidated
($ millions)
$994.2
CIG*
Bankers*
Run-Off
Collected premium on core
businesses increased 12%
from the same quarter in the
prior year
Collected premium is up 13%
from the four quarters ending
on March 31, 2007 versus the
comparable period in the prior
year
Colonial Penn*
$1,095.7
$4,067.4
$3,958.7
$3,897.8
$3,706.6
$3,606.3
Tr. 4 Qtrs. Col. Prem.-Core Businesses*:
Q1 2007
Q4 2006
Q3 2006
Q2 2006
Q1 2006
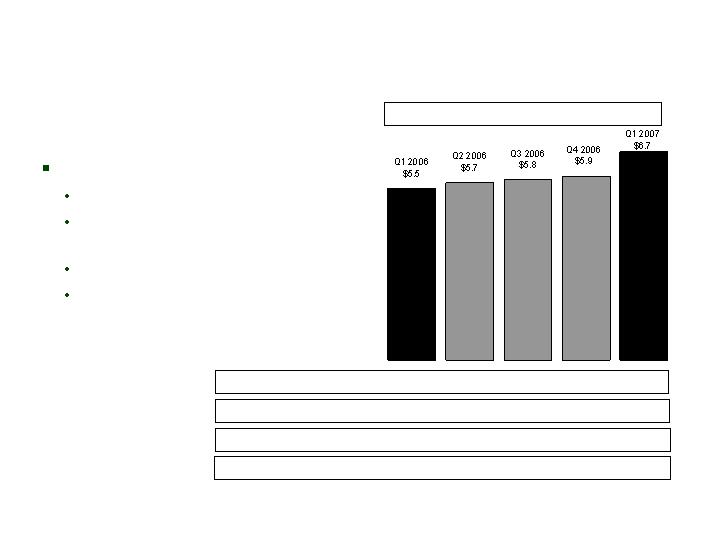
6
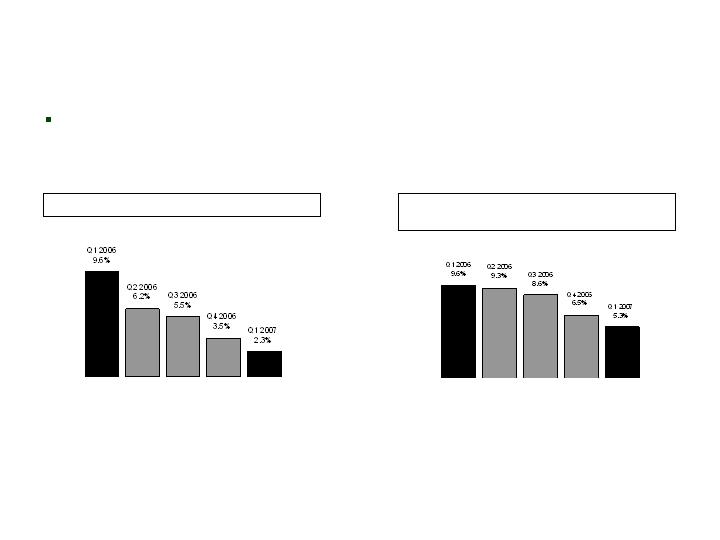
Operating ROE
CNO
Operating ROE*, Trailing 4 Quarters
Operating ROE (excl. Q2 2006 charge)**,
Trailing 4 Quarters
*Operating return excludes net realized
investment gains (losses). Equity excludes
accumulated other comprehensive income
(loss) and the value of net operating loss
carryforwards, and assumes conversion of
preferred stock. See Appendix for
corresponding GAAP measure.
**Operating return, as calculated and defined
on the left side of this page, but before Q2 2006
charge related to the tentative litigation
settlement. See Appendix for corresponding
GAAP measure.
Conseco has set a long-term goal of improving its Operating ROE –
after-tax earnings divided by equity (excluding our NOL deferred tax
asset from equity and other adjustments below) – to 11% in 2009
7

Q1 Earnings
CNO Consolidated
*Management believes that an analysis of earnings before net realized investment gains (losses) and corporate
interest and taxes (“EBIT,” a non-GAAP financial measure) provides an alternative measure to compare the
operating results of the company quarter-over-quarter because it excludes: (1) corporate interest expense; and
(2) net realized gains (losses) that are unrelated to the company’s underlying fundamentals. The chart above
provides a reconciliation of EBIT to net income applicable to common stock.
Q1 2006
Q1 2007
Bankers Life
$57.2
$42.8
Conseco Insurance Group
41.9
51.5
Colonial Penn
5.1
4.6
Other Business in Run-Off
24.0
(30.9)
Corporate operations, excluding interest expense
(13.6)
(14.7)
Total EBIT*
114.6
53.3
Corporate interest expense
(12.4)
(16.1)
Income before net realized investment losses and taxes
102.2
37.2
Tax expense
36.9
13.1
Net income before net realized losses
65.3
24.1
Preferred stock dividends
9.5
9.5
Net operating income
55.8
14.6
Net realized investment losses, net of related amortization and taxes
(0.7)
(13.7)
Net income applicable to common stock
$55.1
$0.9
8
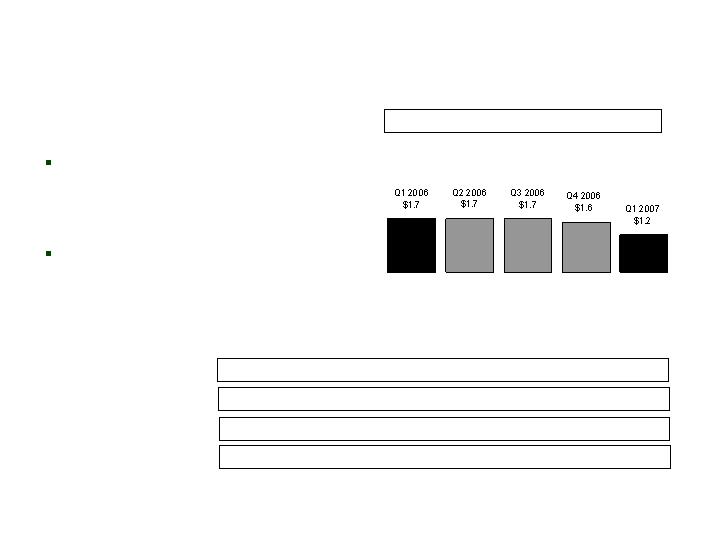
($ millions)
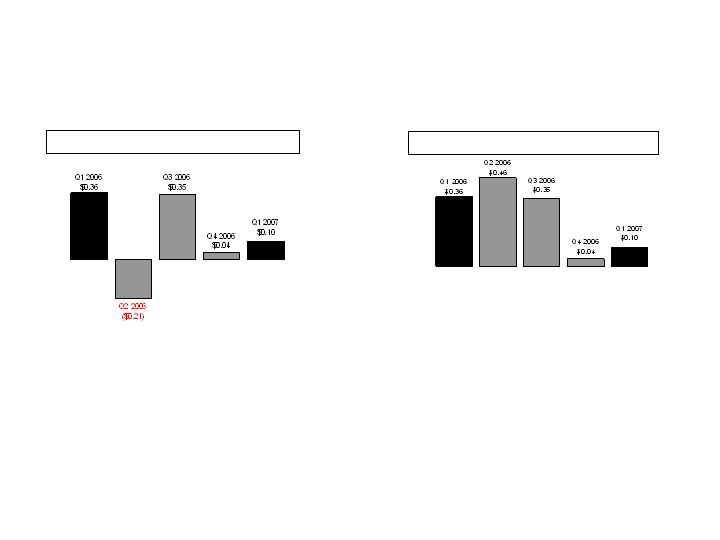
Operating EPS (Diluted)
CNO
Operating EPS, Before Q2 2006 Charge**
**Operating earnings per share, before Q2 2006
charge related to the tentative litigation settlement.
See Appendix for corresponding GAAP measure.
Operating EPS*
*Operating earnings per share exclude net
realized investment gains (losses). See Appendix
for corresponding GAAP measure.
9

Q1 Earnings
LTC Closed Block
Q1 2006
Q1 2007
Insurance policy income
$88.9
$79.5
Net investment income
44.7
47.0
Fee revenue and other income
0.1
0.1
�� Total revenues
133.7
126.6
Insurance policy benefits
84.3
130.0
Amortization related to operations
3.5
5.7
Other operating costs and expenses
21.9
21.8
Total benefits and expenses
109.7
157.5
Income (loss) before net realized investment gains (losses) and income taxes
$24.0
($30.9)
10
Management believes that an analysis of income (loss) before net realized investment gains (losses), net of
related amortization (a non-GAAP financial measure), is important to evaluate the financial performance of our
business, and is a measure commonly used in the life insurance industry. Management uses this measure to
evaluate performance because realized gains or losses can be affected by events that are unrelated to a
company’s underlying fundamentals. The chart on Page 8 reconciles the non-GAAP measure to the
corresponding GAAP measure. See Appendix for a reconciliation of the return on equity measure to the
corresponding GAAP measure.
($ millions)
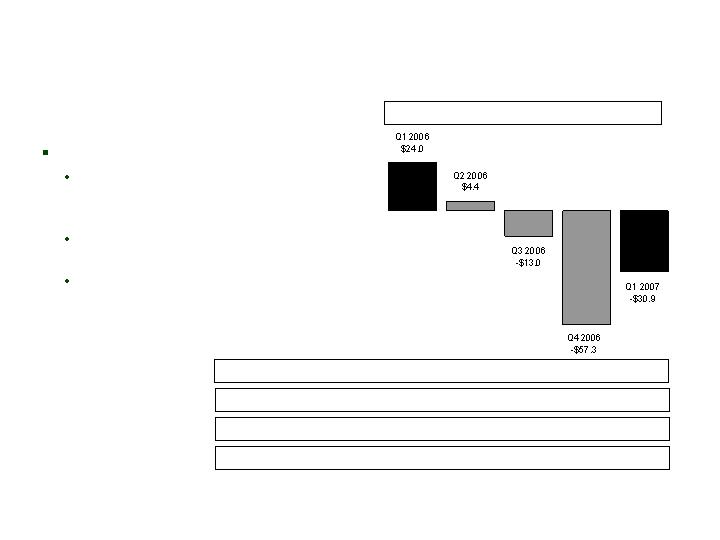
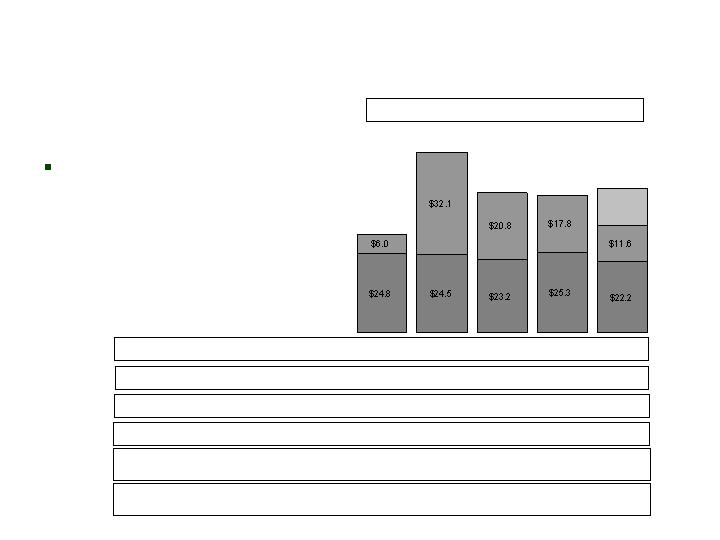
Segment
Performance
LTC Closed Block
*Operating earnings exclude net realized gains (losses). See Appendix for corresponding GAAP measure of
our consolidated results of operations.
Results adversely affected by:
$22.0 million claim reserve
strengthening in Transport block of
business
Claims on larger American Travellers
block developed as expected
Reduced volume of initial claims
contributed to improvement from Q4
2006
PTOI-Trailing 4 Quarters: $79.7 $62.7 $33.3 ($41.9) ($96.8)
Revenues-Quarterly: $133.7 $126.8 $128.1 $127.9 $126.6
Pre-Tax Operating Income*
Revenues -Tr. 4 Quarters: $536.1 $528.1 $519.6 $516.5 $509.4
($ millions)
Collected Premiums-Quarterly: $88.4 $82.4 $80.4 $76.6 $81.2
11
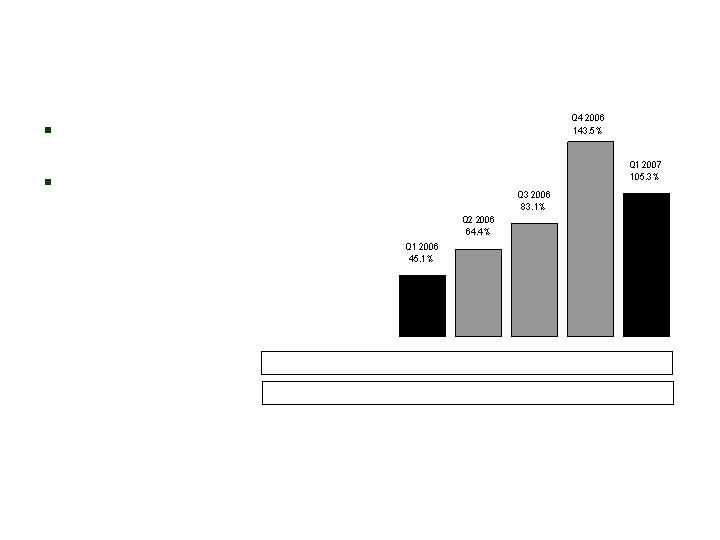
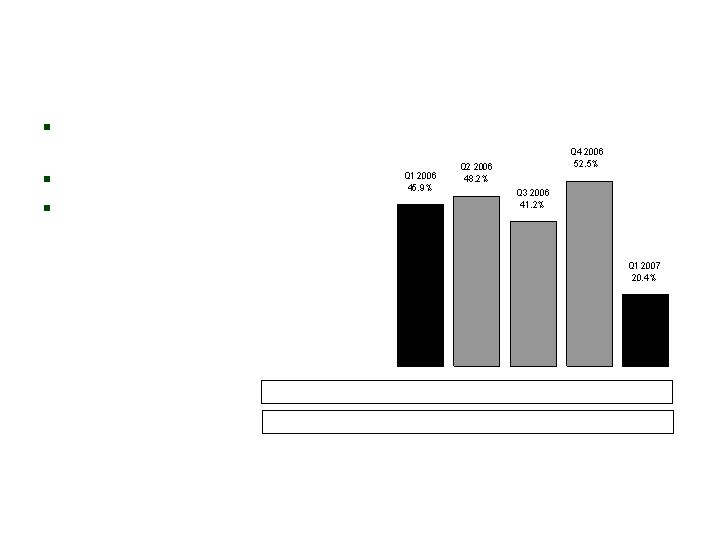
Interest-Adjusted
Benefit Ratio*
Loss ratio improved vs. prior
quarter
Excluding $22 million of claim
reserve strengthening in
Transport block, Q1 2007
interest-adjusted benefit ratio
was 77.6%
Trailing 4 Quarter Avg.: 48.4% 52.1% 60.1% 83.2% 99.0%
Qtrly. non-int. adjusted: 94.8% 118.0% 136.0% 198.2% 163.5%
LTC Closed Block
*We calculate interest-adjusted benefit ratios by dividing insurance policy benefits less interest income on
the accumulated assets backing the insurance liabilities by insurance policy income.
12

Program for improvement gaining traction
Premium re-rates
Claims management
Technology
Q1 2007 Summary
LTC Closed Block
13
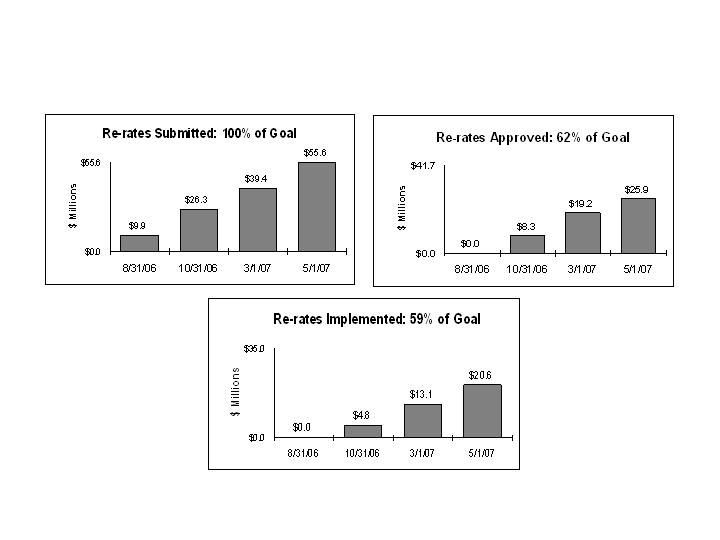
Premium Re-rates
LTC Closed Block
14

Claims management
Improved claim processes resulting in more accurate payments
consistent with policy language, and better customer experience
Closing of Florida case management operation, effective by end
of Q2 2007, to save $1.5 million in expenses per year
Claim appeal and claim review panels strengthening ongoing
compliance process
Continuing to retain industry-leading LTC experts to improve
processes
Program for
Improvement
LTC Closed Block
15

Technology
Improved policy/benefit repository and accumulator tool on track
for mid-2007 implementation
Implemented tool for streamlining manually-intensive policy
administration processes
Approaching completion of strategic LTC system selection
process
Program for
Improvement
LTC Closed Block
16

Financial results affected by experience and related claim
reserve strengthening on subset of block
However, progress on key initiatives:
Achieved re-rate filing goal in $35 million program
Improved claims management processes gaining traction
Progress on systems tools
Segment Summary
LTC Closed Block
17

Book value per diluted share
$25.24 at 3/31/07 vs $24.56 a year earlier and $25.64 at YE 2006
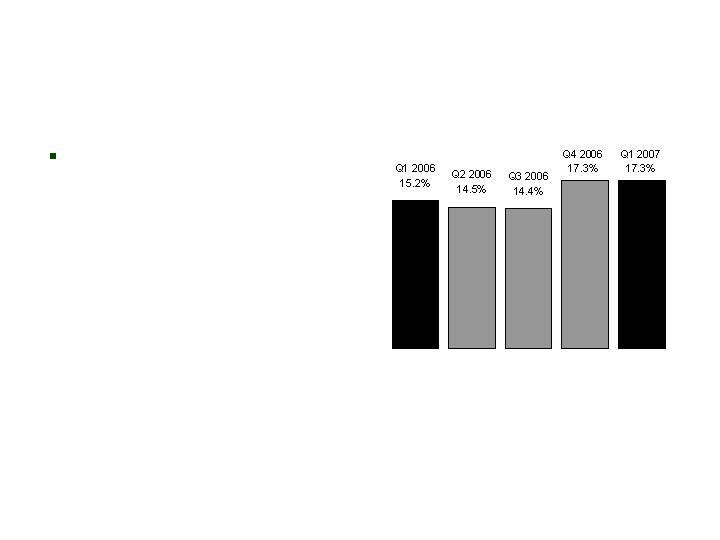
Debt to total capital ratio
17.3% at 3/31/07 vs 15.2% a year earlier and 17.3% at YE 2006
Consolidated RBC ratio
342% at 3/31/07 vs 348% a year earlier and 357% at YE 2006
Net investment income
$376.8 million in Q1 2007 vs $350.3 million in Q1 2006
Earned yield of 5.83% in Q1 2007 vs 5.64% a year earlier
Investment quality
93% of bonds investment grade at 3/31/07 vs 93% at 12/31/06 and 95% at
3/31/06
Essentially no exposure to subprime market
Financial Indicators*
CNO
*See appendix for detail on these indicators, including notes describing non-GAAP measures.
18

Aggregate Interest-Adjusted
Health Benefit Ratio*
CNO
Reduction in Benefit ratio due to
$19.3 million adjustment in
Specified Disease return of
premium reserves
Aggregate Health Benefit Ratio – By Quarter
Core (BLC, CIG & CP) Business
*We calculate interest-adjusted benefit ratios by dividing insurance policy benefits, less interest income on the
accumulated assets backing the insurance liabilities, by insurance policy income.
Aggregate Health Benefit Ratio – By Quarter
Run-Off Business
19
Expenses
CNO
($ millions)
Gross Operating Expenses*, Trailing 4 Quarters
*Gross operating expenses before capitalization of cost of policies produced, capitalization of software
development costs and other adjustments. Costs related to the tentative litigation settlement are not included in
our gross operating expenses. This measure is used by the Company to evaluate its progress in reducing gross
operating expenses.
Operating expenses remain
relatively flat despite increases
in collected premium
Back-office consolidation on
track to produce annual cost
savings of $25 million beginning
in 2008
Q1 2007 reflects litigation
settlement and higher marketing
and sales expenses
20

Record sales of $102.8 million
Sales driven by new sales of private-fee-for-service through our partnership
with Coventry
Lower earnings driven by:
Higher amortization of Medicare Supplement insurance intangibles, partially
offset by improvements in margin due to higher revenue and improved loss
ratio
Reduction in long-term care margins due to higher amortization of
insurance intangibles due to changes in assumptions for future rate
increases
Q1 2007 Summary
Bankers
21

Q1 Earnings
Bankers
Q1 2006
Q1 2007
Insurance policy income
$383.0
$412.0
Net investment income
123.5
140.9
Fee revenue and other income
1.4
1.2
Total revenues
507.9
554.1
Insurance policy benefits
312.7
345.9
Amounts added to policyholder account balances
44.3
47.1
Amortization related to operations
57.4
81.4
Other operating costs and expenses
36.3
36.9
Total benefits and expenses
450.7
511.3
Income before net realized investment losses, net of
related amortization and income taxes
$57.2
$42.8
22
Management believes that an analysis of income (loss) before net realized investment gains (losses), net of
related amortization (a non-GAAP financial measure), is important to evaluate the financial performance of our
business, and is a measure commonly used in the life insurance industry. Management uses this measure to
evaluate performance because realized gains or losses can be affected by events that are unrelated to a
company’s underlying fundamentals. The chart on Page 8 reconciles the non-GAAP measure to the
corresponding GAAP measure. See Appendix for a reconciliation of the return on equity measure to the
corresponding GAAP measure.
Q1 2007 Return on Equity (before realized investment gains/(losses): 5.9%
($ millions)

Segment Performance
Bankers
*Operating earnings exclude net realized gains (losses). See Appendix for corresponding GAAP measure of
our consolidated results of operations.
2007 decrease driven by:
Higher Med Supp amortization due to
higher lapses in Q1, partially offset by
improvements in margin due to higher
revenue and improved benefit ratios
Higher amortization of LTC intangibles
due to changes in assumptions for
future rate increases
PTOI-Trailing 4 Quarters: $238.9 $239.4 $252.8 $258.4 �� $244.0
Revenues-Quarterly: $507.9 $509.0 $525.9 $534.3 $554.1
Pre-Tax Operating Income*
Revenues -Tr. 4 Quarters: $1,922.3 $1,970.3 $2,019.8 $2,077.1 $2,123.3
($ millions)
23
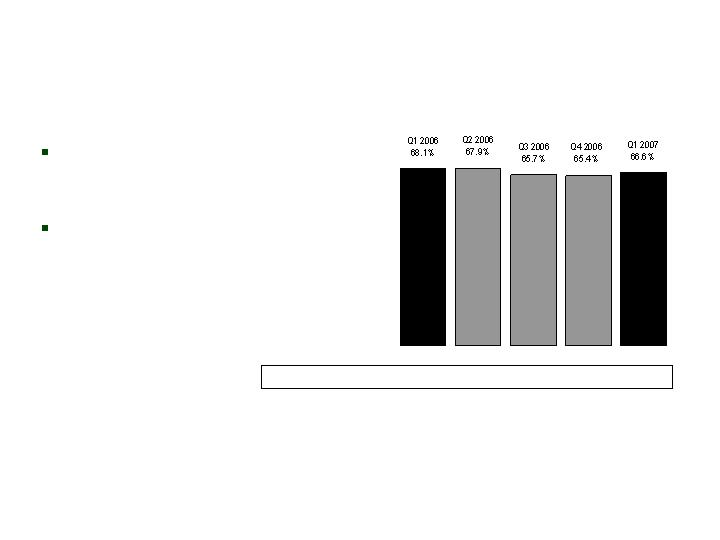
Benefit Ratio* –
Medicare Supplement
Bankers
Continued favorable claim
experience contributed to
improving benefit ratio
Trailing four quarter benefit
ratio has shown steady
improvement from Q1 2006
Trailing 4 Quarter Avg.: 70.7% 69.6% 68.1% 66.8% 66.4%
*We calculate benefit ratios by dividing insurance policy benefits by insurance policy income.
24

Q1 2007 sales were $46.8 million
Most of sales were to enrollees who previously had no policy with Bankers
Has delivered a chance to cross-sell into new households
Has also helped agent recruiting
PFFS
Bankers
25
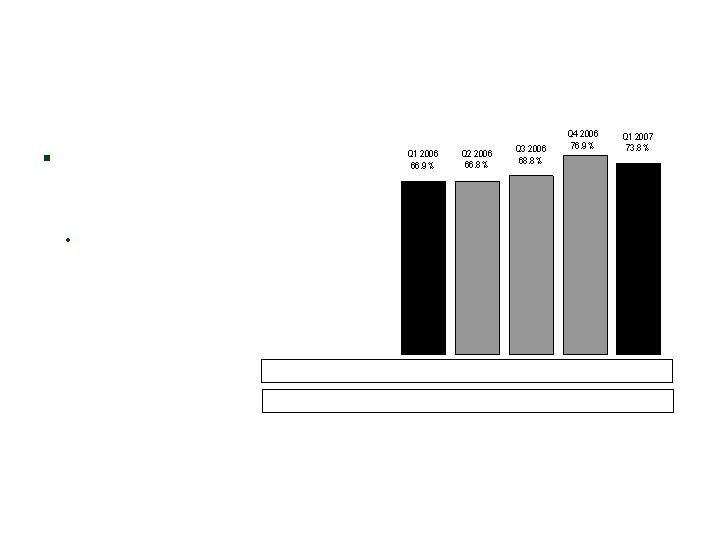
Interest-Adjusted Benefit Ratio* –
Long Term Care
Bankers
*We calculate interest-adjusted benefit ratios by dividing insurance policy benefits less interest income on
the accumulated assets backing the insurance liabilities by insurance policy income.
Q1 2007 benefit ratio improved
from prior quarter, but higher
than Q1 2006 due to:
Increased claim activity, higher
persistency and lower new
business volume
Trailing 4 Quarter Avg.: 65.8% 66.4% 67.4% 69.9% 71.6%
Qtrly. non-int. adjusted: 96.5% 96.2% 98.2% 106.7% 104.3%
26

Earnings up 23% vs Q1 2006
Primarily driven by release of return of premium reserves on certain
specified disease policies, partially offset by decline in life insurance margin
and increase in reserve for R-factor matter tentatively settled in 2006
Sales down 13% from Q1 2006 (up 2% excluding PDP)
Strong sales gains in annuities and specified disease partly offset
decreases in Medicare Supplement and PDP
Recently signed agreement with largest distributor of Medicare Supplement
Increased resources in worksite sales to expand distribution of specified
disease products
Q1 2007 Summary
CIG
27

Q1 Earnings
CIG
Management believes that an analysis of income (loss) before net realized investment gains (losses), net of
related amortization (a non-GAAP financial measure), is important to evaluate the financial performance of our
business, and is a measure commonly used in the life insurance industry. Management uses this measure to
evaluate performance because realized gains or losses can be affected by events that are unrelated to a
company’s underlying fundamentals. The chart on Page 8 reconciles the non-GAAP measure to the
corresponding GAAP measure. See Appendix for a reconciliation of the return on equity measure to the
corresponding GAAP measure.
Q1 2006
Q1 2007
Insurance policy income
$256.4
$242.0
Net investment income
182.0
175.4
Fee revenue and other income
0.4
0.2
Total revenues
438.8
417.6
Insurance policy benefits
195.9
185.4
Amounts added to policyholder account balances
66.5
67.0
Amortization related to operations
55.5
38.2
Other operating costs and expenses
79.0
75.5
Total benefits and expenses
396.9
366.1
Income before net realized investment gains (losses), net of
related amortization and income taxes
$41.9
$51.5
28
Q1 2007 Return on Equity (before realized investment gains/(losses): 5.9%
($ millions)
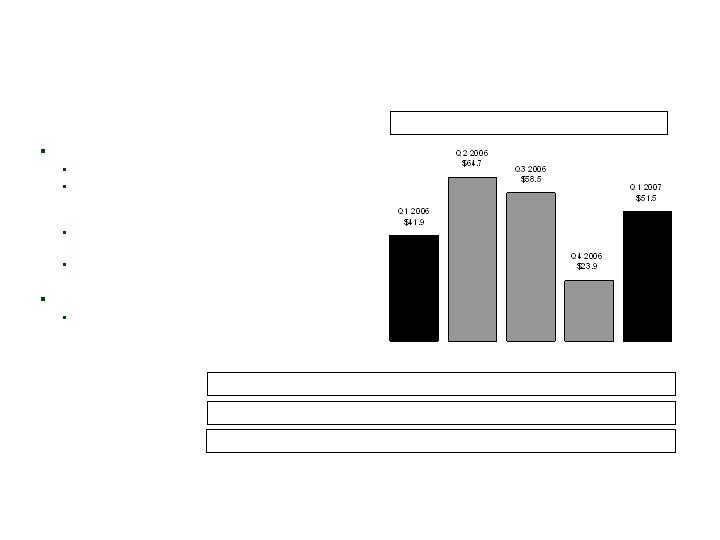
Segment Performance
CIG
*Operating earnings exclude net realized gains (losses). Q2 2006 excludes tentative litigation settlement.
See Appendix for corresponding GAAP measure of our consolidated results of operations.
Q1 2007 includes:
Adverse life claim experience
Specified disease margins (excluding the $19.3
million release of return of premium reserve)
continued to improve
Lower supplemental health amortization due to better
persistency
Expenses totaling $6.5 million related to certain
litigation reserves
Q1 2006 includes:
Expenses totaling $8.8 million related to certain
litigation reserves
PTOI-Trailing 4 Quarters: $234.2 $232.8 $224.2 $189.0 $198.4
Revenues-Quarterly: $438.8 $408.6 $436.0 $445.7 $417.6
Pre-Tax Operating Income*
Revenues-Tr. 4 Quarters: $1,772.0 $1,736.6 $1,714.8 $1,729.1 $1,707.9
($ millions)
29
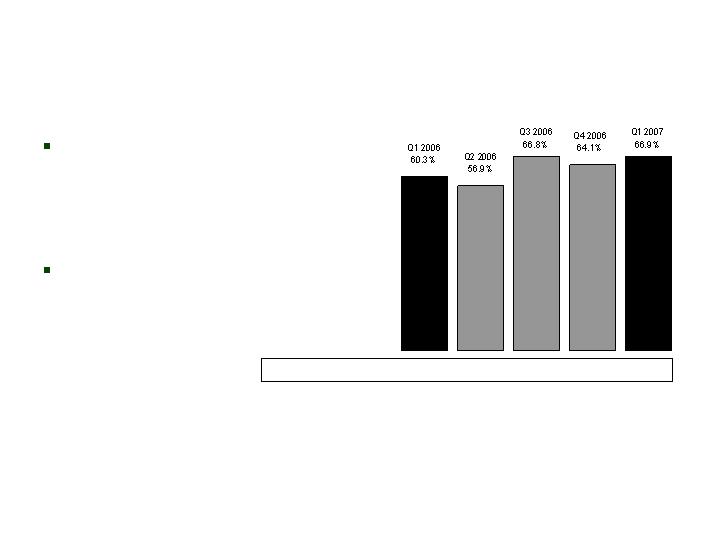
Benefit Ratio* –
Medicare Supplement
CIG
Benefit ratios in Q1 and Q2
2006 benefited from release of
policy benefit reserves related
to increase in policyholder
lapses
Persistency has improved
Trailing 4 Quarter Avg.: 60.8% 59.3% 60.6% 61.9% 63.6%
*We calculate benefit ratios by dividing insurance policy benefits by insurance policy income.
30
Interest-Adjusted Benefit Ratio* –
Specified Disease
CIG
Q1 2007 reflected paid claims
as expected
Persistency has improved
$19.3 million release of return
of premium reserve
Trailing 4 Quarter Avg.: 45.4% 46.7% 45.9% 47.0% 40.6%
Qtrly. non-int. adjusted: 77.5% 79.9% 73.6% 84.9% 53.2%
*We calculate interest-adjusted benefit ratios by dividing insurance policy benefits, less interest income on
the accumulated assets backing the insurance liabilities, by insurance policy income.
31

Q1 Earnings
Colonial Penn
Q1 2006
Q1 2007
Insurance policy income
$26.4
$29.3
Net investment income
9.7
9.5
Fee revenue and other income
0.1
0.2
Total revenues
36.2
39.0
Insurance policy benefits
22.8
25.6
Amounts added to policyholder account balances
0.3
0.3
Amortization related to operations
4.2
4.8
Other operating costs and expenses
3.8
3.7
Total benefits and expenses
31.1
34.4
Income before net realized investment losses and income taxes
$5.1
$4.6
32
Management believes that an analysis of income (loss) before net realized investment gains (losses), net of
related amortization (a non-GAAP financial measure), is important to evaluate the financial performance of our
business, and is a measure commonly used in the life insurance industry. Management uses this measure to
evaluate performance because realized gains or losses can be affected by events that are unrelated to a
company’s underlying fundamentals. The chart on Page 8 reconciles the non-GAAP measure to the
corresponding GAAP measure. See Appendix for a reconciliation of the return on equity measure to the
corresponding GAAP measure.
Q1 2007 Return on Equity (before realized investment gains/(losses): 8.7%
($ millions)
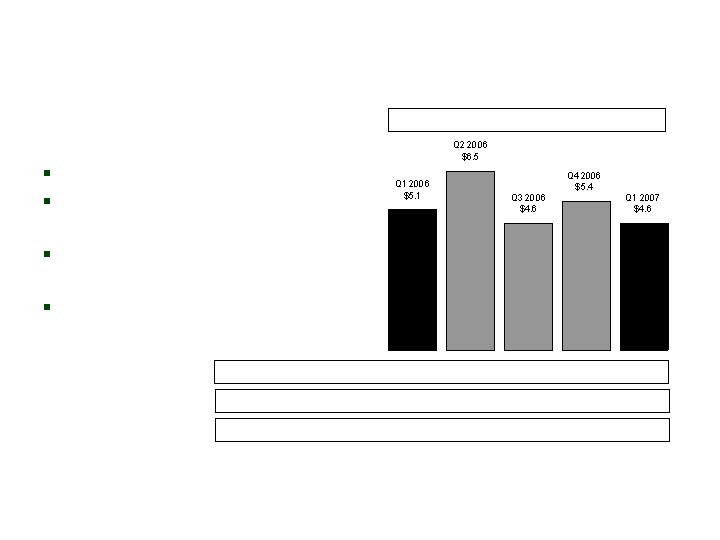
Segment Performance
Colonial Penn
*Operating earnings exclude net realized gains (losses). See Appendix for corresponding GAAP measure of
our consolidated results of operations.
Q1 07 sales up 24% vs Q1 06
Strong growth in lead
development
Solid growth in re-activation
campaigns
Continued stable earnings
PTOI-Trailing 4 Quarters: $19.0 $20.3 $19.5 �� $21.6 $21.1
Revenues-Quarterly: $36.2 $34.9 $38.4 $41.4 $39.0
Pre-Tax Operating Income*
Revenues -Tr. 4 Quarters: $143.4 $145.9 $147.9 $150.9 $153.7
($ millions)
33

Sale of Older CIG Annuity Block:
Transaction Summary
100% coinsurance agreement
134,000 policies, 77% of CIG deferred annuity account value
Policies sold in ’80s and ’90s
Relatively low ROE due to number of admin systems and
inefficient expense structure
Transaction eliminates four admin systems entirely, and all
annuities from two other systems
Expected to close in 2007
Requires approvals from Illinois, Indiana, California, Texas
and Wisconsin
34

Sale of Older CIG Annuity Block:
Financial Impact
Ceding commission of approximately $76.5 million plus capital
backing block of $175 million available to enhance Conseco’s
return on equity:
Repurchase of Conseco common stock
Invest in other high-ROE products and businesses
GAAP carrying value in excess of ceding commission will
generate an after-tax GAAP loss of approximately $65 million,
plus the block’s earnings between the effective date and the
close of the transaction
We realized $8.7 million of these charges in Q1 2007, related to
impairment losses on assets that are expected to be
transferred at closing and are in an unrealized loss position at
March 31, 2007
35

CNO Summary
Steady growth in core businesses
Improvements in earnings run-rate by yearend:
$40 million due to better LTC claims management
$35 million in re-rates
$25 million in operational efficiencies
Increase in share buyback program
Performance shares align interests of shareholders and
management
Payment on 60% of performance shares based on 2007-2009 total
return to shareholders vs peer group
Payment on 40% of performance shares based on 2009 operating return
on equity vs target of 11%
36

Questions and Answers

Appendix
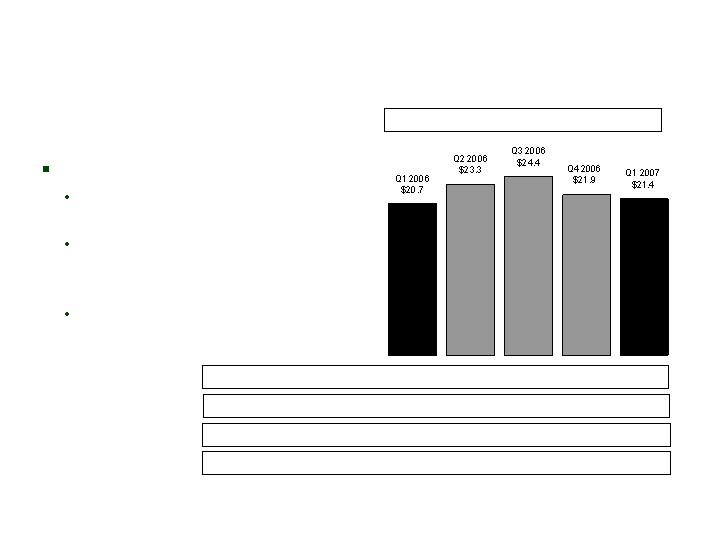
Premiums –
Medicare Supplement/PDP/PFFS
Bankers
(in millions)
Strong sales driven by
PFFS
Q1 2006
$30.8
Q2 2006
$56.6
Q3 2006
$44.0
Q4 2006
$43.1
Q1 2007
$45.3
PDP
Med Supp
PFFS
Medicare Supplement – First-Year Premiums
Med. Supp. First-Year Prems.-Tr. 4 Qtrs: $81.2 $88.1 $93.1 $97.8 $106.7
Med. Supp. Total Premiums-Quarterly: $168.5 $156.7 $146.7 $157.2 $178.5
Med. Supp. NAP-Quarterly: $20.7 $18.4 $15.3 $18.4 $14.7
Med. Supp. NAP-Trailing 4 Quarters: $75.3 $76.7 $76.2 $72.8 $66.8
$11.5
$4.3
$0.5
$0.7
$8.2
$32.8
PDP NAP-Quarterly:
$46.8
-
-
-
-
PFFS NAP-Quarterly:
39
Premiums –
Long-Term Care
Bankers
($ millions)
Steady decline in first-year
premiums over the past five
quarters
New sales are meeting our
return objectives
First-Year Prems.-Tr. 4 Qtrs: $62.5 $58.5 $54.6 $51.2 $48.6
Total Premiums-Quarterly: $145.7 $151.5 $145.0 $150.2 $158.2
Long-Term Care – First-Year Premiums
NAP-Quarterly: $11.4 $12.7 $12.5 $11.0 $11.7
NAP-Trailing 4 Quarters: $57.1 $52.5 $50.4 $47.6 $47.9
40
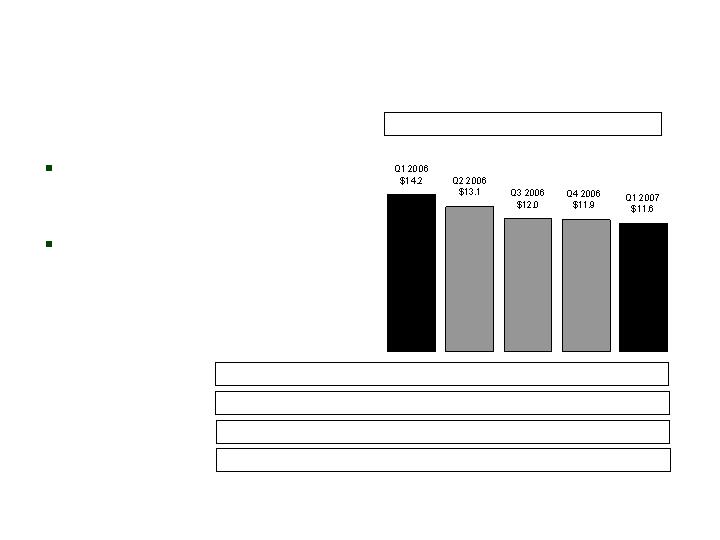
Premiums –
Life Insurance
Bankers
($ millions)
Growth driven by:
Continued focus on new agent
training
Expanded advanced life
insurance training for veteran
agents
Q1 2007 NAP up 17% vs. Q1
2006
First-Year Prems.-Tr. 4 Qtrs: $84.2 $88.4 $90.4 $90.3 $91.0
Total Premiums-Quarterly: $43.2 $46.6 $47.8 $46.6 $48.1
Life – First-Year Premiums
NAP-Quarterly: $10.9 $11.1 $12.9 $11.4 $12.7
NAP-Trailing 4 Quarters: $42.9 $42.8 $44.7 $46.3 $48.1
41
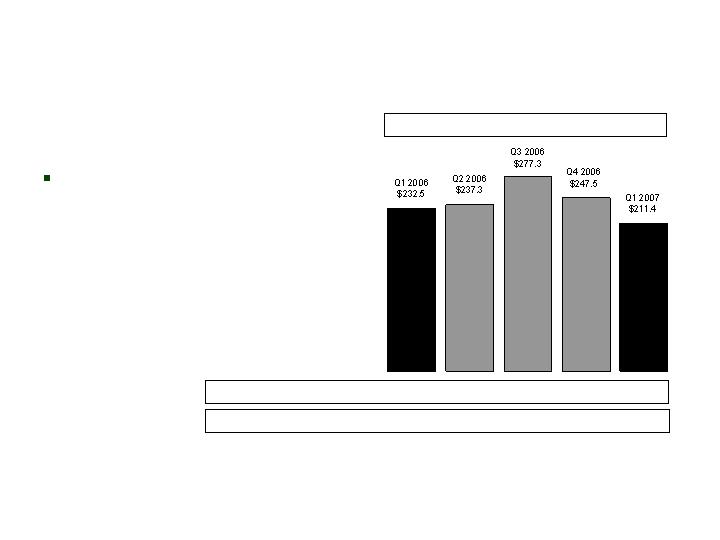
Premiums –
Annuity
Bankers
($ millions)
Trailing four quarters first-
year premiums up slightly
from comparable prior-year
period
First-Year Prems.-Tr. 4 Qtrs: $960.5 $960.1 $1,010.7 $994.6 $973.5
Total Premiums-Quarterly: $233.4 $238.3 $278.2 $247.6 $212.2
Annuity – First-Year Premiums
42
Premiums -
Medicare Supplement
CIG
($ millions)
Decline in sales expected to
turn around with new
national distribution
agreement
First-Year Prems.-Tr. 4 Qtrs: $21.0 $25.6 $28.0 $30.6 $28.9
Total Premiums-Quarterly: $65.9 $61.9 $54.6 $61.8 $59.8
Medicare Supplement – First-Year Premiums
NAP-Quarterly: $10.5 $9.0 $6.2 $6.4 $4.9
NAP-Trailing 4 Quarters: $29.5 $34.3 $33.9 $32.1 $26.5
43
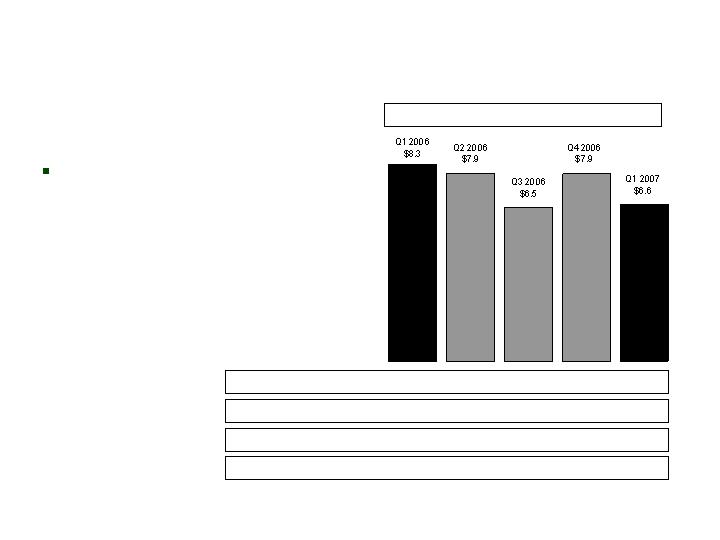
Premiums –
Specified Disease
CIG
($ millions)
Sales continue to gain
momentum from refocus of
PMA and introduction of new
Cancer Secure product
26% increase in NAP vs Q1
2006
First-Year Prems.-Tr. 4 Qtrs: $29.7 $28.8 $28.4 $28.1 $28.2
Total Premiums-Quarterly: $91.4 $88.8 $88.1 $89.4 $92.1
Specified Disease – First-Year Premiums
NAP-Quarterly: $6.2 $7.3 $7.7 $8.6 $7.8
NAP-Trailing 4 Quarters: $29.5 $27.9 $28.5 $29.8 $31.4
44
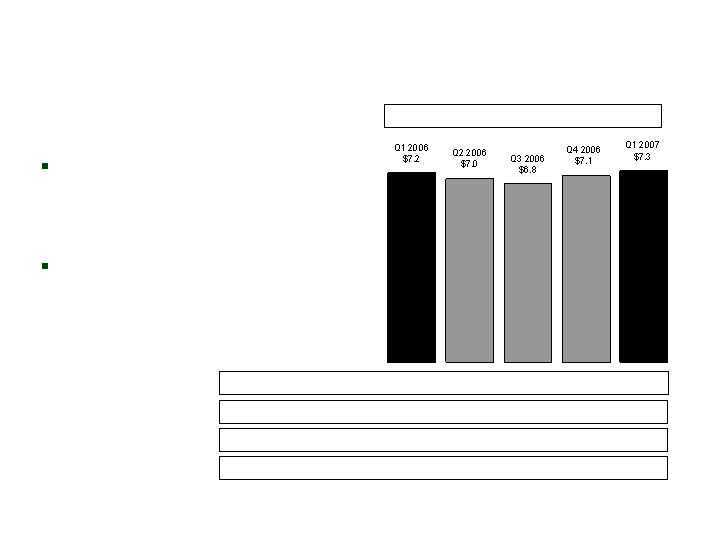
Premiums –
Life Insurance
CIG
($ millions)
In process of rebuilding life
portfolio with new indexed UL
products being introduced in
late 2007
Worksite beginning to contribute
to life sales
First-Year Prems.-Tr. 4 Qtrs: $7.1 $6.7 $6.7 $6.7 $6.2
Total Premiums-Quarterly: $84.1 $78.3 $78.3 $73.9 $77.2
Life – First-Year Premiums
NAP-Quarterly: $1.7 $1.1 $1.0 $1.8 $0.9
NAP-Trailing 4 Quarters: $6.5 $6.5 $6.0 $5.6 $4.8
45
Premiums –
Annuity
CIG
($ millions)
268% increase in first-year
premiums vs Q1 2006
Significant contribution from
our national partners and
TSA business
First-Year Prems.-Tr. 4 Qtrs: $153.3 $218.6 $358.1 $415.5 $500.2
Total Premiums-Quarterly: $36.2 $92.4 $182.8 $121.9 $120.1
Annuity – First-Year Premiums
46
Premiums –
Life Insurance
Colonial Penn
($ millions)
Growth driven by:
Expanded lead generation
Refocused attention to national
cable segment
Refreshed commercials
Natural growth in direct mail
programs
First-Year Prems.-Tr. 4 Qtrs: $20.2 $21.2 $22.0 $22.9 $24.1
Total Premiums-Quarterly: $23.4 $21.6 $25.4 $26.8 $26.7
Life – First-Year Premiums
NAP-Quarterly: $8.4 $9.1 $8.3 $7.5 $10.4
NAP-Trailing 4 Quarters: $30.4 $32.2 $33.0 $33.3 $35.3
47

Information Related to Certain Non-GAAP Financial Measures
The following provides additional information regarding certain non-GAAP measures used in this presentation. While management believes these
measures are useful to enhance understanding and comparability of our financial results, these non-GAAP measures should not be considered as
substitutes for the most directly comparable GAAP measures. Also refer to our latest Form 10-K and Form 10-Q for information concerning non-
GAAP measures.
Operating earnings measures
Management believes that an analysis of net income applicable to common stock before net realized gains or losses (“net operating income”, a
non-GAAP financial measure) is important to evaluate the performance of the Company and is a key measure commonly used in the life insurance
industry. Management uses this measure to evaluate performance because realized investment gains or losses can be affected by events that
are unrelated to the Company’s underlying fundamentals.
In addition, our results for Q2 2006 were affected by an unusual and significant charge related to a tentative litigation settlement. Management
does not believe that a similar charge is likely to recur within two years, and there were no similar charges recognized within the prior two years.
Management believes an analysis of operating earnings before this charge is important to evaluate the performance of the Company prior to the
effect of this unusual and significant charge.
48
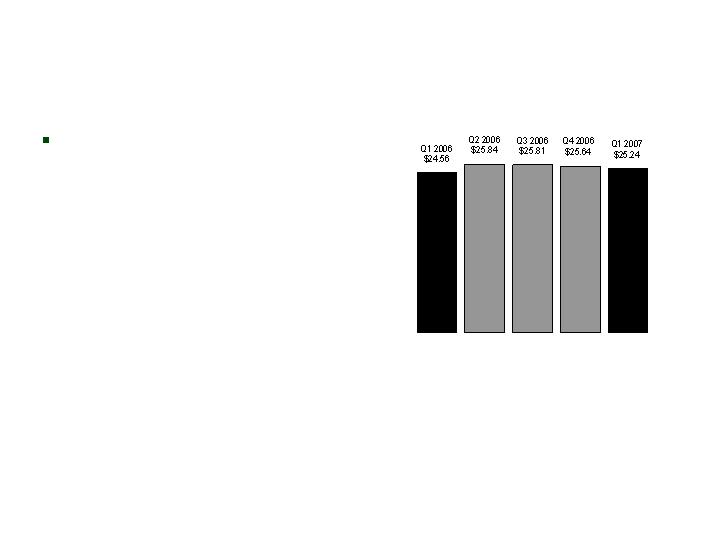
Book Value Per Diluted Share*
CNO
*Book value excludes accumulated other comprehensive income (loss). Shares outstanding assumes:
(1) conversion of convertible securities; and (2) the exercise of outstanding stock options and vesting of restricted
stock (each calculated using the treasury stock method). See Appendix for corresponding GAAP measure.
Decrease from Q4 2006
primarily due to additional
shares included for
mandatorily convertible
preferred stock
49
CNO
Debt to Total Capital Ratio*
Level of debt remains flat
with Q4 2006
*Excludes accumulated other comprehensive income (loss). See Appendix for corresponding GAAP measure.
50
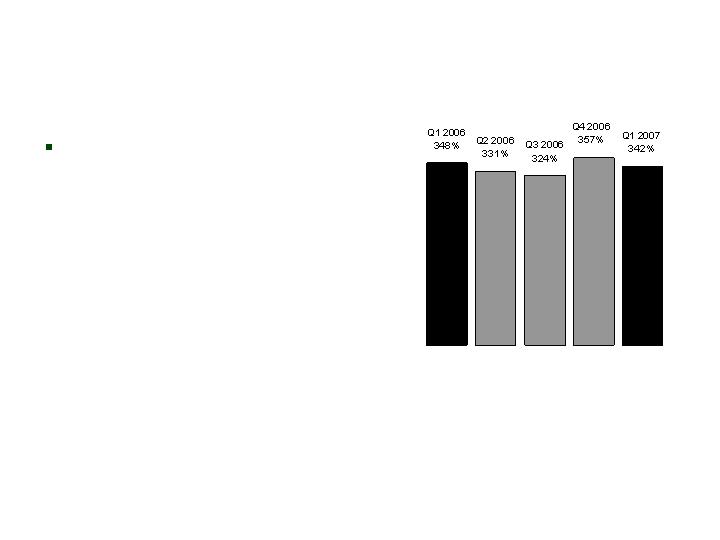
Consolidated RBC Ratio*
CNO
Decrease primarily due to
increase in required capital
on CIG annuity block
*Risk-Based Capital (“RBC”) requirements provide a tool for insurance regulators to determine the levels of
statutory capital and surplus an insurer must maintain in relation to its insurance and investment risks. The RBC
ratio is the ratio of the statutory consolidated adjusted capital of our insurance subsidiaries to RBC.
51
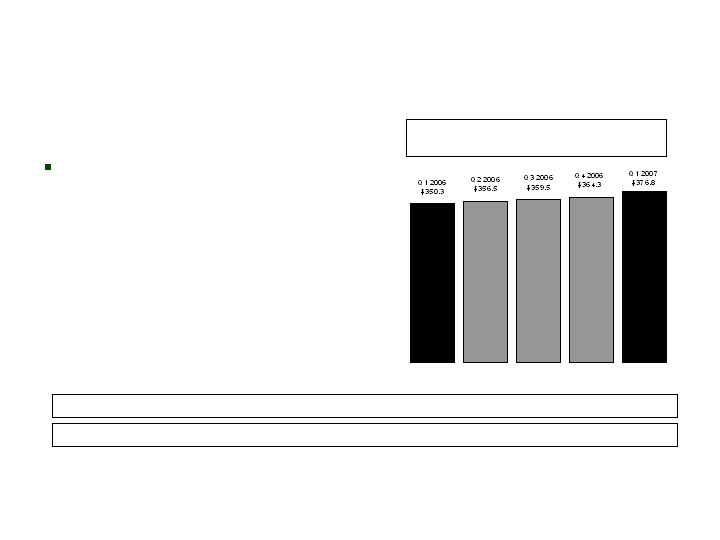
Net Investment Income
CNO
($ millions)
Increase from Q4 2006 due to
increase in prepayment
income and higher portfolio
yield
Net investment income from the prepayment of securities: $1.2 $5.3 $0.5 $1.0 $5.0
General Account Investment Income,
Excluding Corporate Segment
5.83%
5.72%
5.72%
5.71%
5.64%
Yield:
52
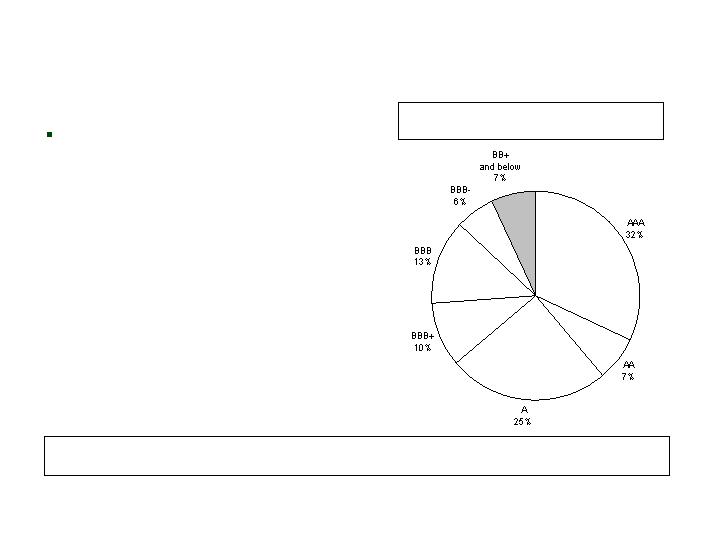
High-Quality Assets
CNO
Portfolio quality remains high
and has not significantly
changed since year-end 2006
Actively Managed Fixed Maturities by Rating at
3/31/07 (Market Value)
3/31/07
93%
12/31/06
93%
9/30/06
95%
6/30/06
95%
3/31/06
95%
% of Bonds which are Investment Grade:
53

Information Related to Certain Non-GAAP Financial Measures
A reconciliation of net income applicable to common stock to the net operating income, excluding Q2 2006 charge related to tentative litigation
settlement (and related per share amounts) is as follows (dollars in millions, except per share amounts):
54
Q1 06
Q2 06
Q3 06
Q4 06
Q1 07
Net income (loss) applicable to common stock
55.1
$
(31.8)
$
38.9
$
(3.7)
$
0.9
$
Net realized investment losses, net of related
amortization and taxes
0.7
0.1
13.9
9.4
13.7
Net operating income (loss) (a non-GAAP
financial measure)
55.8
(31.7)
52.8
5.7
14.6
2Q2006 charge related to the tentative litigation
settlement, net of taxes
-
102.1
-
-
-
Net operating income before Q2 2006 charge related
to the tentative litigation settlement
(a non-GAAP financial measure)
55.8
$
70.4
$
52.8
$
5.7
$
14.6
$
Per diluted share:
Net income (loss)
0.35
$
(0.21)
$
0.26
$
(0.02)
$
0.01
$
Net realized investment losses, net of related
amortization and taxes
0.01
-
0.09
0.06
0.09
Net operating income (loss) (a non-GAAP
financial measure)
0.36
(0.21)
0.35
0.04
0.10
Q2 2006 charge related to the tentative litigation
settlement, net of taxes
-
0.67
-
-
-
Net operating income before Q2 2006 charge related
to the tentative litigation settlement
(a non-GAAP financial measure)
0.36
$
0.46
$
0.35
$
0.04
$
0.10
$

Information Related to Certain Non-GAAP Financial Measures
Book value, excluding accumulated other comprehensive income, per diluted share
This non-GAAP financial measure differs from book value per diluted share because accumulated other comprehensive income has been
excluded from the book value used to determine the measure. Management believes this non-GAAP financial measure is useful because it
removes the volatility that arises from changes in accumulated other comprehensive income. Such volatility is often caused by changes in the
estimated fair value of our investment portfolio resulting from changes in general market interest rates rather than the business decisions made
by management.
55

Information Related to Certain Non-GAAP Financial Measures
A reconciliation from book value per diluted share to book value per diluted share, excluding accumulated other comprehensive income (loss) is
as follows (dollars in millions, except per share amounts):
56
Q1 06
Q2 06
Q3 06
Q4 06
Q1 07
Total shareholders' equity
4,283.3
$
4,296.6
$
4,712.7
$
4,713.1
$
4,724.0
$
Less accumulated other comprehensive income (loss)
(224.2)
(445.6)
(71.8)
(72.6)
(41.8)
Total shareholders' equity excluding
accumulated other comprehensive income (loss)
(a non-GAAP financial measure)
4,507.5
$
4,742.2
$
4,784.5
$
4,785.7
$
4,765.8
$
Diluted shares outstanding for the period
183,532,954
183,554,073
185,354,251
186,665,776
188,784,663
Book value per diluted share
23.34
$
23.41
$
25.43
$
25.25
$
25.02
$
Less accumulated other comprehensive income (loss)
(1.22)
(2.43)
(0.38)
(0.39)
(0.22)
Book value, excluding accumulated other
comprehensive income (loss), per diluted share
(a non-GAAP financial measure)
24.56
$
25.84
$
25.81
$
25.64
$
25.24
$

Information Related to Certain Non-GAAP Financial Measures
Operating return measures
Management believes that an analysis of return before net realized gains or losses (“net operating income”, a non-GAAP financial measure) is
important to evaluate the performance of the Company and is a key measure commonly used in the life insurance industry. Management uses
this measure to evaluate performance because realized investment gains or losses can be affected by events that are unrelated to the
Company’s underlying fundamentals.
In addition, our return for Q2 2006 was affected by an unusual and significant charge related to a tentative litigation settlement. Management
does not believe that a similar charge is likely to recur within two years, and there were no similar charges recognized within the prior two years.
Management believes an analysis of return before this charge is important to evaluate the performance of the Company prior to the effect of this
unusual and significant charge.
This non-GAAP financial measure also differs from return on equity because accumulated other comprehensive income (loss) has been excluded
from the value of equity used to determine this ratio. Management believes this non-GAAP financial measure is useful because it removes the
volatility that arises from changes in accumulated other comprehensive income (loss). Such volatility is often caused by changes in the
estimated fair value of our investment portfolio resulting from changes in general market interest rates rather than the business decisions made
by management.
In addition, our equity includes the value of significant net operating loss carryforwards (included in income tax assets). In accordance with
GAAP, these assets are not discounted, and accordingly will not provide a return to shareholders (until after it is realized as a reduction to taxes
that would otherwise be paid). Management believes that excluding this value from the equity component of this measure enhances the
understanding of the effect these non-discounted assets have on operating returns and the comparability of these measures from period-to-
period. Equity in all periods assumes the conversion of our 5.5% Class B Mandatorily Convertible Preferred Stock (which will occur in May
2007). In addition, the Company plans to change the way compensation for its executives is determined in the future. Operating return
measures will be the primary manner of measuring the performance of our business units and will be used as a basis for incentive compensation.
All references to segment operating return measures assume a 25% debt to total capital ratio at the segment level. Additionally, corporate
expenses have been allocated to the segments.
57

Information Related to Certain Non-GAAP Financial Measures
A reconciliation of return on common equity to operating return (less Q2 2006 charge related to the tentative litigation settlement) on common
equity (excluding accumulated other comprehensive income (loss) and net operating loss carryforwards) is as follows (dollars in millions, except
per share amounts):
(continued on next page)
58
Q1 06
Q2 06
Q3 06
Q4 06
Q1 07
Net income (loss) applicable to common stock
55.1
$
(31.8)
$
38.9
$
(3.7)
$
0.9
$
Net realized investment (gains) losses, net of related
amortization and taxes
0.7
0.1
13.9
9.4
13.7
Net operating income (loss) (a non-GAAP
financial measure)
55.8
(31.7)
52.8
5.7
14.6
Q2 2006 charge related to the tentative litigation
settlement, net of taxes
-
102.1
-
-
-
Add preferred stock dividends, assuming conversion
9.5
9.5
9.5
9.5
9.5
Net operating income before Q2 2006 charge related
to the tentative litigation settlement
(a non-GAAP financial measure)
65.3
$
79.9
$
62.3
$
15.2
$
24.1
$
Total shareholders' equity
4,283.3
$
4,296.6
$
4,712.7
$
4,713.1
$
4,724.0
$
Less preferred stock
667.8
667.8
667.8
667.8
667.8
Common shareholders' equity
3,615.5
3,628.8
4,044.9
4,045.3
4,056.2
Add preferred stock, assuming conversion
667.8
667.8
667.8
667.8
667.8
Less accumulated other comprehensive income (loss)
(224.2)
(445.6)
(71.8)
(72.6)
(41.8)
Common shareholder's equity, excluding accumulated
other comprehensive income (loss) (a non-GAAP
financial measure)
4,507.5
4,742.2
4,784.5
4,785.7
4,765.8
Less net operating loss carryforwards
1,112.1
1,346.6
1,346.7
1,340.0
1,334.1
Common shareholders' equity, excluding accumulated
other comprehensive income (loss) and net operating
loss carryforwards (a non-GAAP financial measure)
3,395.4
$
3,395.6
$
3,437.8
$
3,445.7
$
3,431.7
$

Information Related to Certain Non-GAAP Financial Measures
(continued from previous page)
59
Q1 06
Q2 06
Q3 06
Q4 06
Q1 07
Average common shareholders' equity
3,733.8
3,622.2
3,836.9
4,045.1
4,050.8
Average common shareholder's equity, excluding accumulated
other comprehensive income (loss)
(a non-GAAP financial measure)
4,477.8
4,624.9
4,763.4
4,785.1
4,775.8
Average common shareholders' equity, excluding
accumulated other comprehensive income
(loss) and net operating loss carryforwards
(a non-GAAP financial measure)
3,362.6
3,395.5
3,416.7
3,441.8
3,438.7
Return on equity ratios:
Return on common equity
5.9%
-3.5%
4.1%
-0.4%
0.1%
Operating return (less Q2 2006 charge related to the
tentative litigation settlement) on
common equity, excluding accumulated
other comprehensive income (loss)
(a non-GAAP financial measure)
5.8%
6.9%
5.2%
1.3%
2.0%
Operating return (less Q2 2006 charge related to the
tentative litigation settlement) on common
equity, excluding accumulated other
comprehensive income (loss) and
net operating loss carryforwards
(a non-GAAP financial measure)
7.8%
9.4%
7.3%
1.8%
2.8%

Information Related to Certain Non-GAAP Financial Measures
A reconciliation of pretax operating earnings (a non-GAAP financial measure) to segment operating income (loss) and consolidated net income
(loss) for the three months ended March 31, 2007, is as follows (dollars in millions):
(Continued on next page)
60
Other Business
CIG
Bankers
Colonial Penn
in Run-off
Corporate
Total
Pretax operating earnings (a non-GAAP financial measure)
51.5
$
42.8
$
4.6
$
(30.9)
$
(30.8)
$
37.2
$
Allocation of interest expense, excess capital and corporate
expenses
(16.2)
(13.4)
(1.0)
(2.9)
33.5
-
Income tax (expense) benefit
(12.5)
(10.4)
(1.3)
11.9
(0.8)
(13.1)
Segment operating income (loss)
22.8
$
19.0
$
2.3
$
(21.9)
$
1.9
$
24.1
Net realized investment losses, net of related amortization and taxes
(13.7)
Net income
10.4
$

Information Related to Certain Non-GAAP Financial Measures
A reconciliation of common shareholders’ equity, excluding accumulated other comprehensive income (loss) and less income tax assets and
assuming conversion of the convertible preferred stock (a non-GAAP financial measure) to common shareholders’ equity is as follows (dollars in
millions):
(Continued on next page)
(Continued from previous page)
61
Other Business
CIG
Bankers
Colonial Penn
in Run-off
Corporate
Total
December 31, 2006
Common shareholders' equity, excluding accumulated
other comprehensive income (loss) and less income tax
assets representing net operating loss carryforwards
and assuming conversion of convertible preferred stock
(a non-GAAP financial measure)
1,546.5
$
1,274.3
$
103.6
$
290.3
$
231.0
$
3,445.7
$
Net operating loss carryforwards
1,340.0
-
-
-
-
1,340.0
Accumulated other comprehensive income (loss)
(25.6)
(41.6)
(1.2)
(7.3)
3.1
(72.6)
Allocation of capital
515.5
424.8
34.6
96.8
(1,071.7)
-
Total shareholders' equity
3,376.4
$
1,657.5
$
137.0
$
379.8
$
(837.6)
$
4,713.1
Less preferred stock
667.8
Common shareholders' equity
4,045.3
$
March 31, 2007
Common shareholders' equity, excluding accumulated
other comprehensive income (loss) and less income tax
assets representing net operating loss carryforwards
and assuming conversion of convertible preferred stock
(a non-GAAP financial measure)
1,568.1
$
1,290.8
$
105.7
$
275.3
$
191.8
$
3,431.7
$
Net operating loss carryforwards
1,334.1
1,334.1
Accumulated other comprehensive income (loss)
(8.1)
(30.7)
(0.2)
(7.8)
5.0
(41.8)
Allocation of capital
522.7
430.3
35.3
91.7
(1,080.0)
-
Total shareholders' equity
3,416.8
$
1,690.4
$
140.8
$
359.2
$
(883.2)
$
4,724.0
Less preferred stock
667.8
Common shareholders' equity
4,056.2
$

Information Related to Certain Non-GAAP Financial Measures
A reconciliation of average common shareholders’ equity, excluding accumulated other comprehensive income (loss) and less income tax assets
and assuming conversion of the convertible preferred stock (a non-GAAP financial measure) to average common shareholders’ equity at March
31, 2007, is as follows (dollars in millions):
62
(Continued from previous page)
Other Business
CIG
Bankers
Colonial Penn
in Run-off
Corporate
Total
Average common shareholders' equity, excluding accumulated
other comprehensive income (loss) and less income tax
assets representing net operating loss carryforwards
and assuming conversion of convertible preferred stock
(a non-GAAP financial measure)
1,557.3
$
1,282.6
$
104.7
$
282.8
$
211.3
$
3,438.7
$
Average net operating loss carryforwards
1,337.1
Average accumulated other comprehensive income (loss)
(57.2)
Average total shareholders' equity
4,718.6
Average preferred stock
667.8
Average common shareholders' equity
4,050.8
Return on equity ratios:
Return on equity
1.0%
Operating return on equity, excluding accumulated other
comprehensive income (loss) and less income tax
assets representing net operating loss carryforwards
and assuming conversion of convertible preferred stock
(a non-GAAP financial measure)
5.9%
5.9%
8.7%
-31.1%
3.5%
2.8%

Information Related to Certain Non-GAAP Financial Measures
Debt to capital ratio, excluding accumulated other comprehensive income (loss)
This non-GAAP financial measure differs from the debt to capital ratio because accumulated other comprehensive income has been excluded
from the value of capital used to determine this measure. Management believes this non-GAAP financial measure is useful because it removes
the volatility that arises from changes in accumulated other comprehensive income. Such volatility is often caused by changes in the estimated
fair value of our investment portfolio resulting from changes in general market interest rates rather than the business decisions made by
management.
63

Information Related to Certain Non-GAAP Financial Measures
A reconciliation of the debt to capital ratio to debt to capital, excluding accumulated other comprehensive income (loss), is as follows (dollars in
millions):
Q1 06
Q2 06
Q3 06
Q4 06
Q1 07
Corporate notes payable
805.3
$
805.5
$
805.6
$
1,000.8
$
999.3
$
Total shareholders' equity
4,283.3
4,296.6
4,712.7
4,713.1
4,724.0
Total capital
5,088.6
5,102.1
5,518.3
5,713.9
5,723.3
Less accumulated other comprehensive income (loss)
224.2
445.6
71.8
72.6
41.8
Total capital, excluding accumulated other
comprehensive income (loss)
(a non-GAAP financial measure)
5,312.8
$
5,547.7
$
5,590.1
$
5,786.5
$
5,765.1
$
Corporate notes payable to capital ratios:
Corporate debt to total capital
15.8%
15.8%
14.6%
17.5%
17.5%
Corporate debt to total capital, excluding accum-
ulated other comprehensive income (loss)
(a non-GAAP financial measure)
15.2%
14.5%
14.4%
17.3%
17.3%
64