
A Primer on Conseco’s Long-term Care Business
August 2007

A refresher on the typical features of
long-term care policies
Provide benefits for either care provided in a long-term care facility or care received in one’s
home (“home health care”) or both during the contract term.
Premiums are generally determined based on the age of the insured at issuance and are not
scheduled to increase as insured ages.
Cannot be canceled, but are subject to certain conditions (regulatory approval and adverse
morbidity experience), premium rates may be increased (guaranteed renewable).
Provide benefits while the insured is confined in a nursing home, assisted living facility, (but not
a hospital) or receiving home health care services or both.
Policies that include coverage for long-term care facilities provide benefits for confinement to
licensed nursing facilities, and in some cases, assisted living facilities.
May be subject to a waiting period (such as 90 days) and a limit of covered benefits (for a
specified period, such as 2 years, or amount, such as $200,000).
2

Some more details on benefits provided
under these policies
Eligibility for benefits generally require that the insured need assistance with at least two activities of daily living
or have cognitive impairment that makes it unsafe for the insured to live unsupervised. Alternatively, eligibility
under many older policies may be based on a physician’s determination that care is medically necessary.
Benefits are generally paid on an expensed-incurred basis, subject to a daily maximum.
Benefits are paid for as long as insured remains eligible, or until the policy’s maximum period or dollar amount
has been exhausted.
Most policies include a waiver of premium benefits that waive the premium payable for the duration of the claim
once the insured has received benefits.
Many policies include restoration of benefit feature that permit benefits of the policy to be replenished after the
insured has recovered and has been independent for a specified period of time.
Some policies include an inflation feature, purchased as a rider to the base policy, which is intended to allow the
benefit amounts purchased to keep pace with the rising cost of care.
3

The life cycle of a block of long-term care
business
Premiums are recognized as revenue when due.
Incurred claims are expected to be small in the early policy years and grow as policies age.
A substantial part of premiums collected are required to fund benefits payable in future periods and
become part of the active life reserves.
Active life reserves essentially hold back a portion of premiums that would otherwise be reported as
profits.
Active life reserves grow over the early years of a block of policies, when morbidity is low; and are
released in the later years when morbidity is high.
The interest income earned on the assets supporting the reserves is an important factor in measuring
the profitability of long duration products.
If the assumptions used to determine active life reserves are correct, the increase in claim cost will
be offset by a comparable reduction in active life reserves plus investment income on the reserves.
4
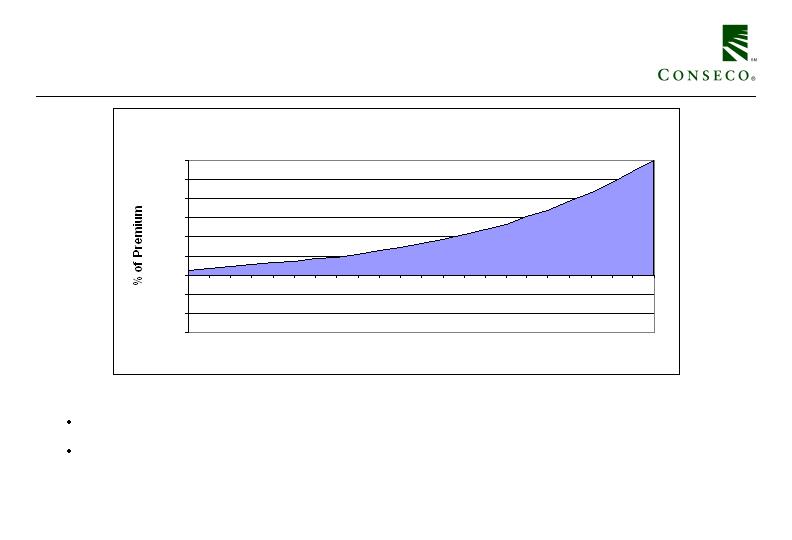
Long-term care business life cycle -
Incurred claim ratios
Incurred Claim Ratio (incurred claims / premium)
-150.0%
-100.0%
-50.0%
0.0%
50.0%
100.0%
150.0%
200.0%
250.0%
300.0%
3
4
5
6
7
8
9
10
11
12
13
14
15
16
17
18
19
20
21
22
23
24
25
Policy Year
Incurred claims are very low in the early years of a policy.
As the policies age, the incurred claims ratio will increase, eventually exceeding 100%.
5
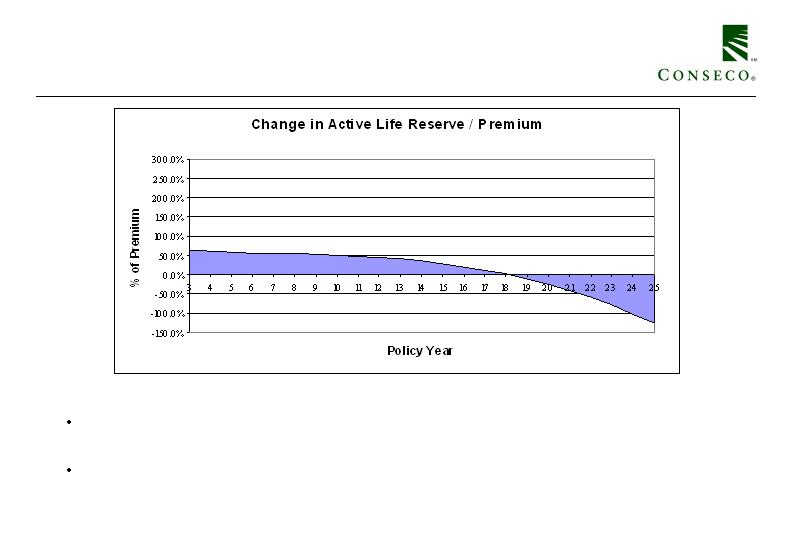
Long-term care business life cycle -
Change in active life reserve
A substantial part of the premium collected in early years is held back as active life reserves to
fund the claims that will be incurred in the future.
Eventually, active life reserves begin to be released (year 18 in this example). Such release will
offset a portion of the claims incurred as shown in the next slide.
6
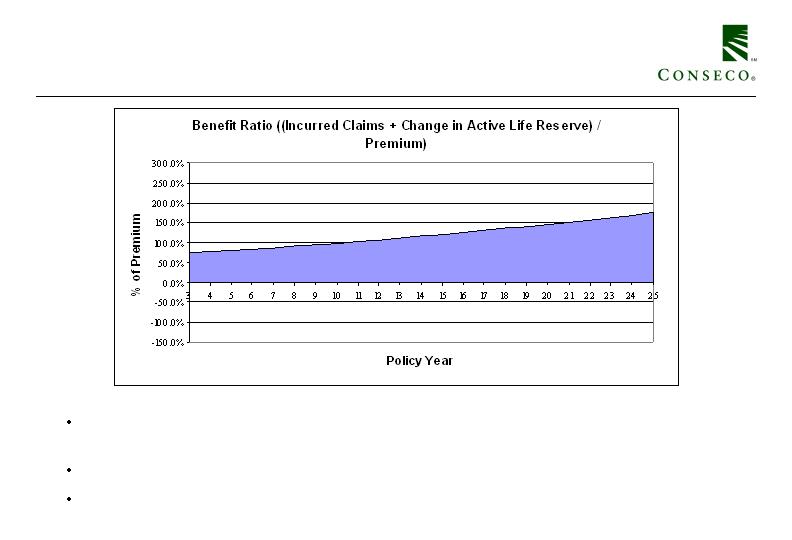
Long-term care business life cycle -
Total benefits incurred
When incurred claims and the change in active life reserves are combined, the increase over time
is less severe.
However, the benefit ratio will increase over time, eventually exceeding 100%.
This increase is substantially offset by investment income, as shown in the next slide.
7
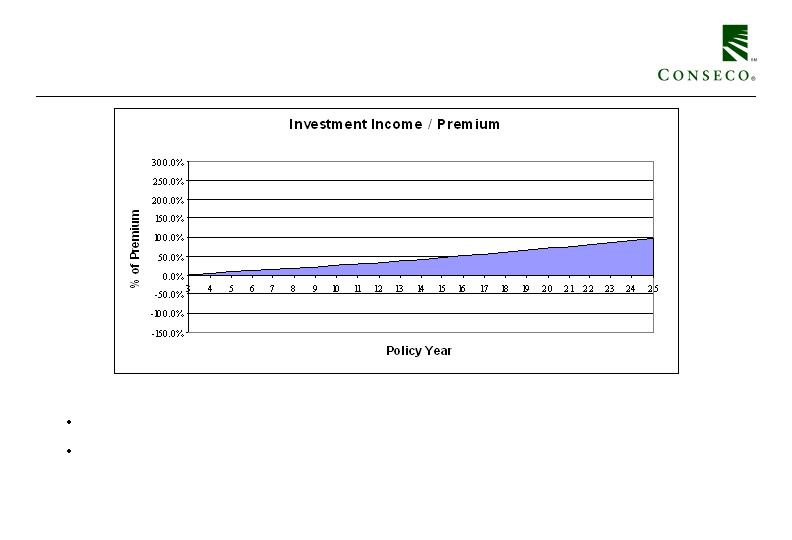
Long-term care business life cycle -
Investment income
Investment income is earned on the assets supporting the reserves.
Such income becomes an increasingly important component of revenue over time.
8
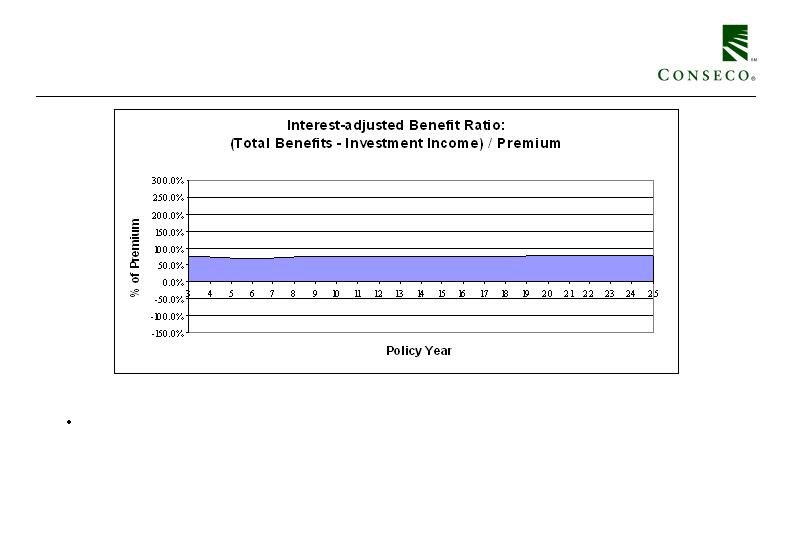
Long-term care business life cycle -
Interest-adjusted benefit ratio
The interest-adjusted benefit ratio, which includes the change in active life reserves and
investment income, is expected to be level over time.
9

Long-term care policies are subject to
changing experience
Benefits are expected to increase over time with the aging of the insured, and actual profitability is sensitive to
experience relating to several assumptions made in pricing. Our business, along with other blocks in the industry,
has experienced unfavorable development related to some of the following assumptions:
Incidence of claim – In some cases, more policyholders have received benefits than assumed in pricing, in
part due to people living longer.
Duration of claim – In some cases, benefits are being provided for longer periods of time than assumed in
pricing, often because policyholders are living longer while receiving care.
Persistency – In some cases, policyholders are not allowing their policies to lapse as frequently as assumed in
pricing. This results in higher than expected claims in later policy years.
Medical inflation – the cost of care has risen faster than expected.
As experience deteriorates, original expected profit margins decrease.
Rate increases are necessary to return the business to profitability (or in some cases, break even).
This change in experience has most materially affected the performance of the Other Business in Run-off segment,
as shown in the next slide.
Change in interest rates can also have an impact on earnings. However, interest rate changes have not been a
significant factor for our block in recent periods.
10
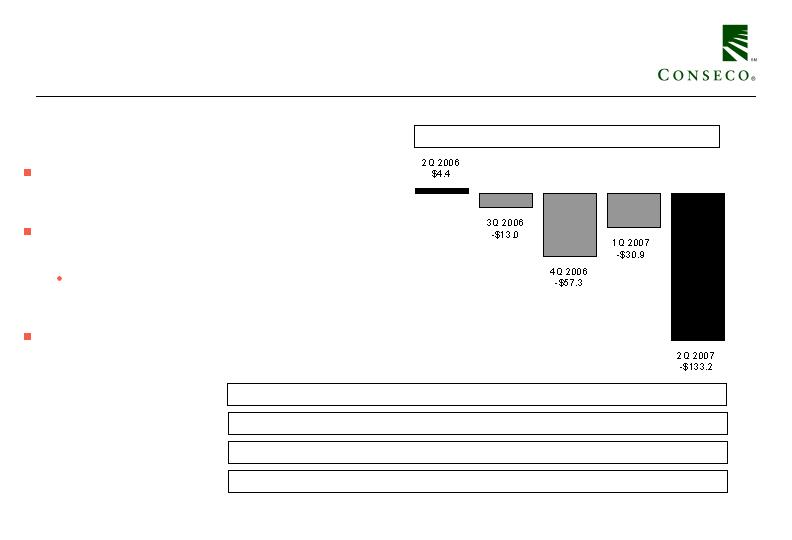
Other Business in Run-off –
Segment Performance
The recent experience from this block reflects
significant increases to reserves related to prior
period claim development.
For example, the experience in 2Q2007 reflects $118
million of increases to prior-period incurred claim
estimates.
Such amount includes $110 million of
strengthening adjustments to claim reserve
methods and assumptions.
The next several slides will summarize how long-term
care reserves are determined.
PTOI-Trailing 4 Quarters: $62.7 $33.3 ($41.9) ($96.8) ($234.4)
Revenues-Quarterly: $126.8 $128.1 $127.9 $126.6 $125.8
Pre-Tax Operating Income
Revenues -Tr. 4 Quarters: $528.1 $519.6 $516.5 $509.4 $508.4
($ millions)
Collected Premiums-Quarterly: $82.4 $80.4 $76.6 $81.2 $76.2
11

A refresher on how long-term care reserves
are determined
There are two components of policyholder liabilities.
Active life reserves – reserve for future policyholder benefits not yet incurred (calculated
as the present value of future benefits less future net premiums).
Claim reserves – liability for all future payments for any claim incurred as of the
valuation date, as well as payments due on valuation date (calculated as the present value
of future payments on known claims, plus a provision for amounts due, plus a provision
for unknown claims, referred to as incurred but not reported claims or “IBNR”).
12

Other Business in Run-off –
Balance Sheet Detail
Active life reserves account for the largest component of total reserves, but have not
been responsible for the recent volatility
Reserve increases in the last four quarters have related to claim reserves
2Q2007 claim reserve reflects expectation of continued adverse claim development
The claim reserve increase in 2Q2007 reflects $110 million of strengthening adjustments
to claim reserve methods and assumptions
Insurance acquisition cost balance is 5% of net liability and is declining rapidly
Balance remains recoverable under best estimate assumptions
($ millions)
Insurance Liabilities and Intangible Assets, Net of Reinsurance
Active Life Reserve
Claim Reserve
Insurance Acquisition Costs
Net Liability
Percent Change
2Q 2006
$2,413.3
731.4
(181.8)
$2,962.9
-
3Q 2006
$2,413.6
734.8
(176.2)
$2,972.2
0.3%
4Q 2006
$2,412.7
801.2
(170.9)
$3,043.0
2.4%
1Q 2007
$2,412.3
816.5
(165.2)
$3,063.6
0.7%
2Q 2007
$2,409.1
940.4
(159.5)
$3,190.0
4.1%
13

Active life reserves
These reserves are calculated utilizing assumptions estimated in the year a policy is issued (or for
business in force as of August 31, 2003, (the “fresh-start date”) the assumptions developed on that
date).
Assumptions include estimates for persistency, claim costs, morbidity, interest rates, expenses
and premium rate increases.
Once these assumptions are established, we are required under SFAS 60 to continue to use them
unless our assessment of premium adequacy indicates that future premiums are not adequate to cover
future benefits and expenses; or when our premium rate increases exceed original assumptions.
Our assessment of premium adequacy is based on our most recent assumptions for persistency,
morbidity, interest rates, expenses and premium rate increases, all or any of which may be different
than the assumptions utilized in establishing our active life reserves. If premiums plus net liabilities
(active life reserves plus claim reserves less insurance intangibles) were determined to be inadequate
to fund future benefits and expenses, we would be required to write off all or a portion of our
insurance acquisition costs.
When premium rate increases exceed original assumptions, reserve assumptions are updated using a
prospective method whereby the impact is graded in over time.
14

Claim reserves
These reserves are for benefits to be paid in the future for our current claims (both reported and
incurred but not reported claims). These reserves are determined using assumptions based on our
current best estimate.
The significant assumptions utilized in establishing claim reserves include expectations about the
duration, cost of care being reimbursed, the interest rate utilized to discount the claim reserves,
claims that have been incurred but not yet reported, claims that have been closed but are expected to
reopen and assumptions about which claims that are currently in their eligibility review stage will
eventually become claims that have payments associated with them.
We review “verified claim reserves” to determine the accuracy of past estimates, as described on the
following page.
15

Validation of claims incurred
during a period
Verified basis normalizes all periods for the impact of claim reserve deficiencies.
Expected incurred losses are paid out over subsequent periods.
At each reporting date, the incurred claims estimate for a particular period is restated or
“verified” as the total payments to date plus the current estimate of the claim reserve for
future payments (for claims incurred in that period).
16

Other Business in Run-off –
Verified Incurred Development
Developed
Deficiencies
in Periods
Prior to
2Q07
1Q07
2006
2005
2004
2003
Total Closed Block LTC
Reported Claims
221.5
119.7
433.4
396.0
370.8
Prior Period Development
(108.5)
(34.9)
(71.9)
(58.7)
(44.1)
Verified Claims as of Reporting Date
113.0
84.8
361.5
337.3
326.7
Developed through:
12/31/2004
326.7
44.1
12/31/2005
337.3
326.1
103.5
12/31/2006
361.5
365.0
337.6
136.1
3/31/2007
84.8
375.5
368.8
344.1
146.7
6/30/2007
113.0
104.2
418.1
388.9
356.2
160.9
Reporting Periods
Verified Claims
17
The experience related to the run-off block has been very volatile. Most of this
business was written by certain subsidiaries prior to their acquisition by Conseco in
1996 and 1997.

Bankers Life long-term care block –
Verified Incurred Development
Developed
Deficiencies
in Periods
Prior to
2Q07
1Q07
2006
2005
2004
2003
Total Bankers Life Block LTC
Reported Claims
108.0
104.2
398.3
341.2
294.1
Prior Period Development
-
3.3
(0.5)
(4.3)
(1.0)
Verified Claims as of Reporting Date
108.0
107.5
397.8
336.9
293.1
Developed through:
12/31/2004
293.1
1.0
12/31/2005
336.9
296.6
1.8
12/31/2006
397.8
334.0
295.3
6.5
3/31/2007
107.5
394.8
333.0
295.8
6.7
6/30/2007
108.0
107.7
389.7
334.9
297.5
8.0
Reporting Periods
Verified Claims
18
The experience related to the Banker Life long-term care block has not been as volatile
as the run-off block. This business was written through our career agency distribution
channel.

Other Business in Run-off –
2Q 2007 Earnings
($ millions)
As
Verified
2Q 2006
Reported
Basis
Insurance policy income
82.1
$
78.1
$
78.1
$
Net investment income
44.6
47.6
47.6
Fee revenue and other income
0.1
0.1
0.1
Total revenues
126.8
125.8
125.8
Insurance policy benefits
96.9
231.6
113.3
Amortization related to operations
3.5
5.8
5.8
Other operating costs and expenses
22.0
21.6
21.6
Total benefits and expenses
122.4
259.0
140.7
Income (loss) before net realized investment gains (losses) and income taxes
4.4
$
(133.2)
$
(14.9)
$
2Q 2007
19
Our 2Q2007 reported earnings were affected by prior period claim reserve development.
Verified basis earnings normalizes the impact of prior period deficiencies.
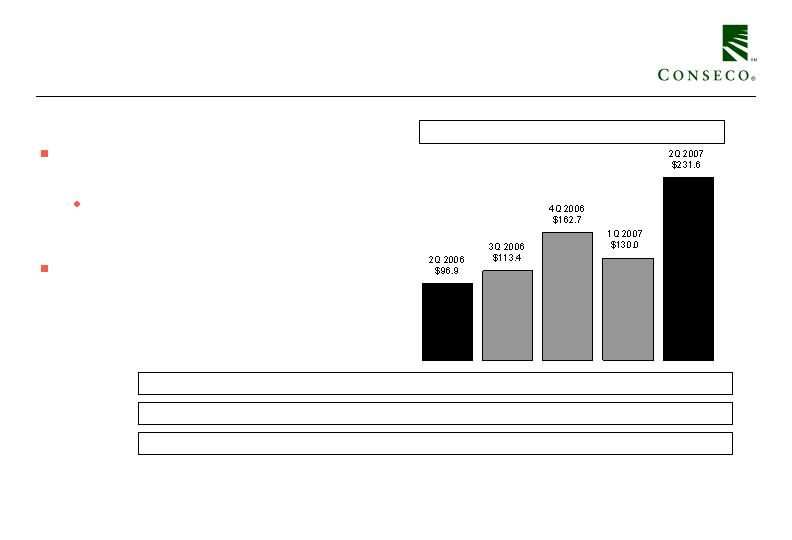
Other Business in Run-off –
Benefit Detail
Incurred claims in all periods reflect
volatility due to development of out-
of-period incurred claim estimates
Includes reserve strengthening
adjustments of $110 million in 2Q
2007
Increase (decrease) in active life
reserves varies with persistency; 2Q
2006 included $9.4 million release of
redundant reserves
Total benefits equal incurred claims plus increase in reserve for future benefits. Verified basis incurred claims adjust all
periods for claim reserve redundancies and deficiencies.
Total Benefits
($ millions)
$234.9
$126.7
$164.0
$113.5
$117.3
Incurred Claims
$(3.3)
$3.3
$(1.3)
$(0.1)
$(20.4)
Increase (decrease) in Active Life Reserve
$116.6
$114.4
$124.5
$119.6
$116.5
Verified Basis Incurred Claims
20
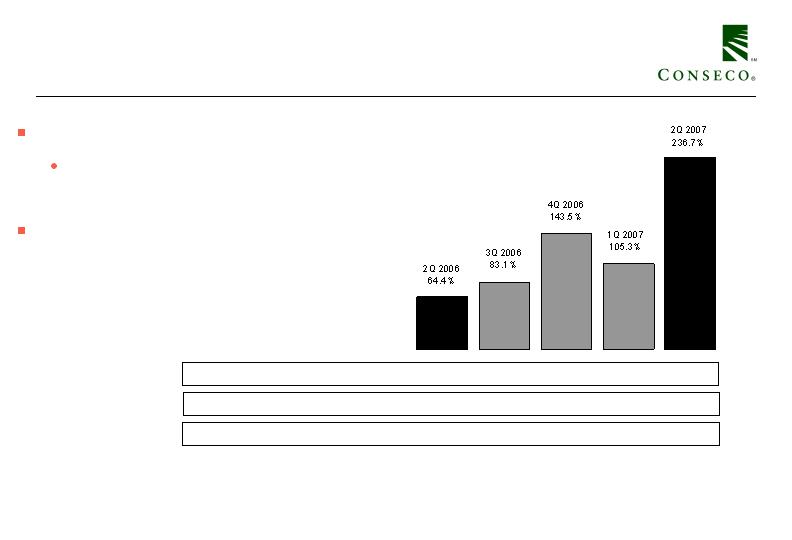
Other Business in Run-off –
Interest-Adjusted Benefit Ratio*
Verified basis normalizes all periods for
impact of claim reserve deficiencies
Prior period deficiencies increased
benefit ratio by 152 percentage points in
2Q 2007
2Q 2006 benefit reserve adjustment reduced
benefit ratio by 11 percentage points
Trailing 4 Quarter Avg.: 52.1% 60.1% 83.2% 99.0% 141.0%
Qtrly. non-int. adjusted: 118.0% 136.0% 198.2% 163.5% 296.7%
*We calculate interest-adjusted benefit ratios by dividing insurance policy benefits less interest income on the
accumulated assets backing the insurance liabilities by insurance policy income.
Qtrly. Verified Basis non-int. adjusted: 116.9% 143.5% 147.6% 148.1% 145.1%
21

Other Business in Run-off –
Claim Counts and Claims Paid
2Q05
3Q05
4Q05
1Q06
2Q06
3Q06
4Q06
1Q07
2Q07
Claims Paid
95.4
$
107.4
$
83.1
$
90.4
$
101.2
$
96.1
$
81.6
$
102.0
$
96.8
$
Claimant Counts
12,240
12,449
12,290
11,805
12,536
12,288
12,048
11,870
12,424
22
Claimant count estimates remain around 12,000 with paid claims near $100m (before inventory adjustments)

Other Business in Run-off –
LTC Persistency
3Q 05
4Q 05
1Q 06
2Q 06
3Q 06
4Q 06
1Q 07
2Q 07
Policy counts
202,804
201,649
197,585
194,080
190,134
187,123
183,655
179,952
Annualized termination rates
10.7%
2.3%
7.8%
6.9%
7.9%
6.2%
7.2%
7.8%
23
Our termination rates have exceeded expectations in recent periods due to rate increases.
However, we expect lower termination rates in future periods due to the large level of non-
forfeiture elections that will be applicable.