
Third Quarter 2007
Financial and Operating Results
For the period ended September 30, 2007
Conseco, Inc.

Forward-Looking Statements
Cautionary Statement Regarding Forward-Looking Statements. Our statements, trend analyses and other information contained in these
materials relative to markets for Conseco’s products and trends in Conseco’s operations or financial results, as well as other statements, contain
forward-looking statements within the meaning of the federal securities laws and the Private Securities Litigation Reform Act of 1995. Forward-
looking statements typically are identified by the use of terms such as “anticipate,” “believe,” “plan,” “estimate,” “expect,” “project,” “intend,”
“may,” “will,” “would,” “contemplate,” “possible,” “attempt,” “seek,” “should,” “could,” “goal,” “target,” “on track,” “comfortable with,” “optimistic” and
similar words, although some forward-looking statements are expressed differently. You should consider statements that contain these words
carefully because they describe our expectations, plans, strategies and goals and our beliefs concerning future business conditions, our results
of operations, financial position, and our business outlook or they state other ‘‘forward-looking’’ information based on currently available
information. Assumptions and other important factors that could cause our actual results to differ materially from those anticipated in our forward-
looking statements include, among other things: (i) our ability to obtain adequate and timely rate increases on our supplemental health products
including our long-term care business; (ii) mortality, morbidity, usage of health care services, persistency, the adequacy of our previous reserve
estimates and other factors which may affect the profitability of our insurance products; (iii) changes in our assumptions related to the cost of
policies produced or the value of policies inforce at the Effective Date; (iv) our ability to achieve anticipated expense reductions and levels of
operational efficiencies including improvements in claims adjudication and continued automation and rationalization of operating systems; (v)
performance of our investments; (vi) our ability to identify products and markets in which we can compete effectively against competitors with
greater market share, higher ratings, greater financial resources and stronger brand recognition; (vii) the ultimate outcome of lawsuits filed
against us and other legal and regulatory proceedings to which we are subject; (viii) our ability to remediate the material weakness in internal
controls over the actuarial reporting process that we identified at year-end 2006 and to maintain effective controls over financial reporting; (ix)
our ability to continue to recruit and retain productive agents and distribution partners and customer response to new products, distribution
channels and marketing initiatives; (x) our ability to achieve an upgrade of the financial strength ratings of our insurance company subsidiaries
as well as the potential impact of rating downgrades on our business; (xi) the risk factors or uncertainties listed from time to time in our filings
with the Securities and Exchange Commission; (xii) regulatory changes or actions, including those relating to regulation of the financial affairs of
our insurance companies, such as the payment of dividends to us, regulation of financial services affecting (among other things) bank sales and
underwriting of insurance products, regulation of the sale, underwriting and pricing of products, and health care regulation affecting health
insurance products; (xiii) general economic conditions and other factors, including prevailing interest rate levels, stock and credit market
performance and health care inflation, which may affect (among other things) our ability to sell products and access capital on acceptable terms,
the returns on and the market value of our investments, and the lapse rate and profitability of policies; and (xiv) changes in the Federal income
tax laws and regulations which may affect or eliminate the relative tax advantages of some of our products. Other factors and assumptions not
identified above are also relevant to the forward-looking statements, and if they prove incorrect, could also cause actual results to differ
materially from those projected. All written or oral forward-looking statements attributable to us are expressly qualified in their entirety by the
foregoing cautionary statement. Our forward-looking statements speak only as of the date made. We assume no obligation to update or to
publicly announce the results of any revisions to any of the forward-looking statements to reflect actual results, future events or developments,
changes in assumptions or changes in other factors affecting the forward-looking statements.
2

Non-GAAP Measures
This presentation contains the following financial measures that differ from the comparable measures
under Generally Accepted Accounting Principles (GAAP): operating earnings measures; book value
excluding accumulated other comprehensive income (loss) per diluted share; operating return measures;
earnings before net realized investment gains (losses) and corporate interest and taxes; debt to capital
ratios, excluding accumulated other comprehensive income (loss); and interest-adjusted benefit ratios.
Reconciliations between those non-GAAP measures and the comparable GAAP measures are included
in the Appendix, or on the page such measure is presented.
While management believes these measures are useful to enhance understanding and comparability of
our financial results, these non-GAAP measures should not be considered substitutes for the most
directly comparable GAAP measures.
Additional information concerning non-GAAP measures is included in our periodic filings with the
Securities and Exchange Commission that are available in the “Investor – SEC Filings” section of
Conseco’s website, www.conseco.com.
3

Operating earnings before litigation settlement and
loss on coinsurance transaction
Litigation settlement
Loss on coinsurance transaction
Operating losses
Net realized investment losses
Q3 2007 net loss
Q3 2007 Summary
CNO
$49.3
(16.4)
(76.5)
(43.6)
(43.2)
$(86.8)
Pre-Tax
(mils.)
$0.18
(0.06)
(0.26)
(0.14)
(0.15)
$(0.29)
$34.7
(10.6)
(49.7)
(25.6)
(28.1)
$(53.7)
After Tax
(mils.)
EPS
4

Bankers Life
Colonial Penn
Conseco Insurance Group*
LTC Closed Block**
Q3 2007
Operating Earnings by Segment
CNO
$66.3
7.0
(0.4)
(2.9)
$70.0
(Pre-tax earnings in millions)
*Unfavorably impacted by $18.3 million from remediation procedures related to material control weakness and $11
million of expenses related to operational initiatives and consolidation activities.
**Favorably impacted by $6.6 million decrease to our active life reserves (including $20.1 million of adjustments
identified by our remediation procedures, net of $13.5 million change to certain actuarial estimates).
The pre-tax operating earnings presented above are non-GAAP financial measures. The chart on Page 9
reconciles the non-GAAP measures to the GAAP measures.
5

Q3 2007 Summary
CNO
BLC and CP continue to have strong results
CIG results negatively affected by accounting remediation
activities and expenses related to operations consolidation
LTC Run-off block approaching breakeven; stability achieved
as result of Q2 2007 reserving activities
Sale of annuity block closed 10/12/07 (effective date 1/1/07)
Loss on sale consistent with previous communications
Agreement to recapture Colonial Penn block (effective 10/1/07)
$63 million investment; traditional life business
Share repurchases
Q3 2007: $34.7 million (2.4 million shares at average price of
$14.22/share)
6

New Business
Volumes (NAP)
CNO Consolidated
($ millions)
New business volumes are measured by new annualized premium, which includes 6% of annuity premiums, 10%
of single-premium whole life deposits, and 100% of all other premiums. Prescription drug sales (PDP) NAP equal
to $310 per enrolled policy and private-fee-for-service (PFFS) NAP equal to $2,100 per enrolled policy.
Bankers
Colonial Penn
Conseco Insurance Group
Total
$236.1
33.0
59.1
$328.2
$212.3
25.8
75.1
$313.2
$56.5
11.4
18.1
$86.0
$58.0
8.3
26.3
$92.6
YTD 07
YTD 06
Q3 06
Q3 07
7
Operating ROE
CNO
Operating ROE*, Trailing 4 Quarters
Operating ROE (excl. litigation settlement
charges and coinsurance transaction)**,
Trailing 4 Quarters
*Operating return excludes net realized
investment gains (losses). Equity excludes
accumulated other comprehensive income
(loss) and the value of net operating loss
carryforwards, and assumes conversion of
preferred stock. See Appendix for
corresponding GAAP measure.
**Operating return, as calculated and defined
on the left side of this page, but before: (1) Q2
2006 charge related to the litigation settlement
and refinements to such estimates recognized
in subsequent periods; and (2) Q3 2007 charge
related to a coinsurance transaction. See
Appendix for corresponding GAAP measure.
Conseco has set a long-term goal of improving its Operating ROE –
after-tax earnings divided by equity (excluding our NOL deferred tax
asset from equity and other adjustments below) – to 11% in 2009
8

Q3 Earnings
CNO Consolidated
*Management believes that an analysis of earnings before net realized investment gains (losses) and corporate
interest and taxes (“EBIT,” a non-GAAP financial measure) provides an alternative measure to compare the
operating results of the company quarter-over-quarter because it excludes: (1) corporate interest expense; and
(2) net realized gains (losses) that are unrelated to the company’s underlying fundamentals. The chart above
provides a reconciliation of EBIT to net income applicable to common stock.
Q3 2006
Q3 2007
Bankers Life
$68.4
$66.3
Conseco Insurance Group
58.5
(0.4)
Colonial Penn
4.6
7.0
Other Business in Run-Off
(13.0)
(2.9)
Corporate operations, excluding interest expense
(8.1)
(0.5)
EBIT, excluding costs related to the litigation settlement
and the loss related to a coinsurance transaction
110.4
69.5
Costs related to the litigation settlement
0.0
(16.4)
Loss related to coinsurance transaction
0.0
(76.5)
Total EBIT*
110.4
(23.4)
Corporate interest expense
(12.5)
(20.2)
Income (loss) before net realized investment losses and taxes
97.9
(43.6)
Tax expense (benefit)
35.6
(18.0)
Net income (loss) before net realized investment losses
62.3
(25.6)
Preferred stock dividends
9.5
0.0
Net operating income (loss)
52.8
(25.6)
Net realized investment losses, net of related amortization and taxes
(13.9)
(28.1)
Net income (loss) applicable to common stock
$38.9
($53.7)
9
($ millions)
Operating EPS (Diluted)
CNO
Operating EPS, Before Litigation Settlement
Charges and Coinsurance Transaction**
**Operating earnings per share, before: (1) Q2
2006 charge related to the litigation settlement and
refinements to such estimates recognized in
subsequent periods; and (2) Q3 2007 charge
related to a coinsurance transaction. See Appendix
for corresponding GAAP measure.
Operating EPS*
*Operating earnings per share exclude net
realized investment gains (losses). See Appendix
for corresponding GAAP measure.
10
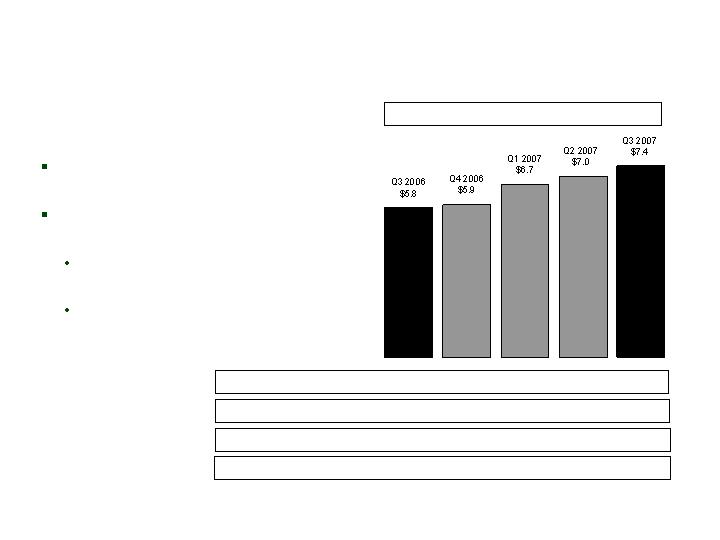
Expenses
CNO
($ millions)
Adjusted Operating Expenses*, Trailing 4 Quarters
*Adjusted operating expenses excluding primarily acquisition costs, capitalization of software development costs
and costs related to the R-factor litigation settlement. This measure is used by the Company to evaluate its
progress in reducing operating expenses.
Back-office consolidation on
track to produce annual cost
savings of more than $30
million beginning in 2008
Bankers Life policyholder
service now managed in Carmel
Additional savings resulting from
CIG Sales and Marketing
restructuring
11

Book value per diluted share (excluding accumulated other comprehensive loss)
$24.77 at 9/30/07 vs $25.81 a year earlier and $25.64 at YE 2006
Debt and preferred stock to total capital ratio (excluding accumulated other
comprehensive loss)
20.6% at 9/30/07 vs 26.4% a year earlier and 28.8% at YE 2006
Consolidated RBC ratio
330% at 9/30/07 (estimated) vs 324% a year earlier and 357% at YE 2006
Investments
$389.9 million of investment income in Q3 2007 vs $359.5 million in Q3 2006
Earned yield of 5.88% in Q3 2007 vs 5.72% in Q3 2006
94% of bonds investment grade at 9/30/07 vs 95% at 12/31/06 and 97% at 9/30/06**
During Q3 2007, significantly reduced exposure to sub-prime market
Corporate liquidity
Available liquidity exceeds $150 million at 9/30/07, excluding $80 million revolver
Financial Indicators*
CNO
*See appendix for detail on these indicators, including notes describing non-GAAP measures.
**Excludes investments from consolidated variable interest entity.
12

Increase core business ($50 million annual life premium)
Grow enterprise value
Eliminate reinsurance accounting and administration
Recapture fee (purchase price): $63 million
Effective date: 10/1/07 (expected to close by 12/31/07)
Accretive to earnings and ROE:
Colonial Penn Recapture:
Transaction Overview
CNO
Pretax Operating Income
ROE
+$7 mil.
+0.3%
2008
+$2 mil.
+0.1%
2007
13

Sales of $56.5 million, up 11% YTD, 2% below Q3 2006
Sales of PFFS voluntarily suspended in June by seven largest health
plans; resumed in September
Slightly lower earnings (vs Q3 2006) driven by:
Lower LTC margins, offset by
Improved spreads and higher PDP/PFFS income
Effective July 1, 2007, entered into a quota-share reinsurance
agreement related to certain group PFFS business sold by
Coventry
Adding $2.5 million of pretax earnings quarterly
Q3 2007 Summary
Bankers
14

Q3 Earnings
Bankers
Q3 2006
Q3 2007
Insurance policy income
$390.1
$473.6
Net investment income
134.4
144.2
Fee revenue and other income
1.4
3.8
Total revenues
525.9
621.6
Insurance policy benefits
313.3
404.6
Amounts added to policyholder account balances
51.7
54.9
Amortization related to operations
52.4
49.3
Other operating costs and expenses
40.1
46.5
Total benefits and expenses
457.5
555.3
Income before net realized investment gains (losses), net of
related amortization and income taxes
$68.4
$66.3
15
Management believes that an analysis of income (loss) before net realized investment gains (losses), net of
related amortization (a non-GAAP financial measure), is important to evaluate the financial performance of our
business, and is a measure commonly used in the life insurance industry. Management uses this measure to
evaluate performance because realized gains or losses can be affected by events that are unrelated to a
company’s underlying fundamentals. The chart on Page 9 reconciles the non-GAAP measure to the
corresponding GAAP measure. See Appendix for a reconciliation of the return on equity measure to the
corresponding GAAP measure.
2007 YTD Return on Equity (before realized investment gains/(losses): 10.4%
($ millions)
Segment Performance
Bankers
*Operating earnings exclude net realized gains (losses). See Appendix for corresponding GAAP measure of
our consolidated results of operations.
Higher earnings driven by:
Higher margins on Medicare-
related products, primarily driven
by PFFS
LTC margins negatively impacted
by higher persistency and lower
claim terminations
PTOI-Trailing 4 Quarters: $252.8 $258.4 $244.0 $245.8 $243.7
Revenues-Quarterly: $525.9 $534.3 $554.1 $581.8 $621.6
Pre-Tax Operating Income*
Revenues -Tr. 4 Quarters: $2,019.8 $2,077.1 $2,123.3 $2,196.1 $2,291.8
($ millions)
16
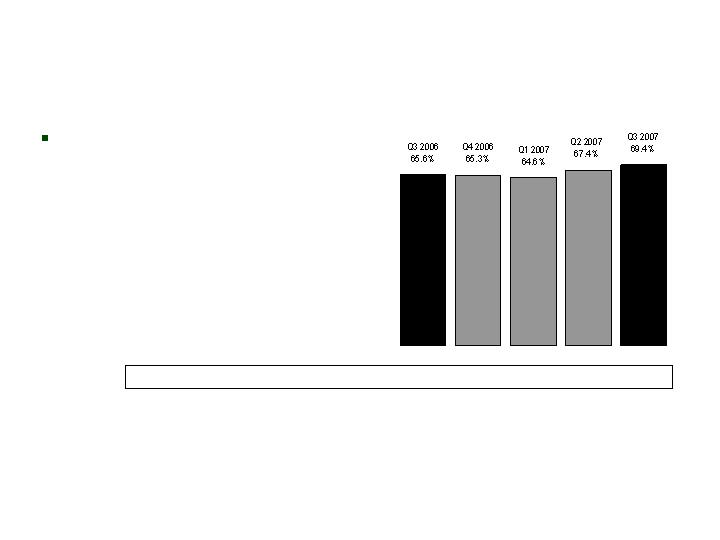
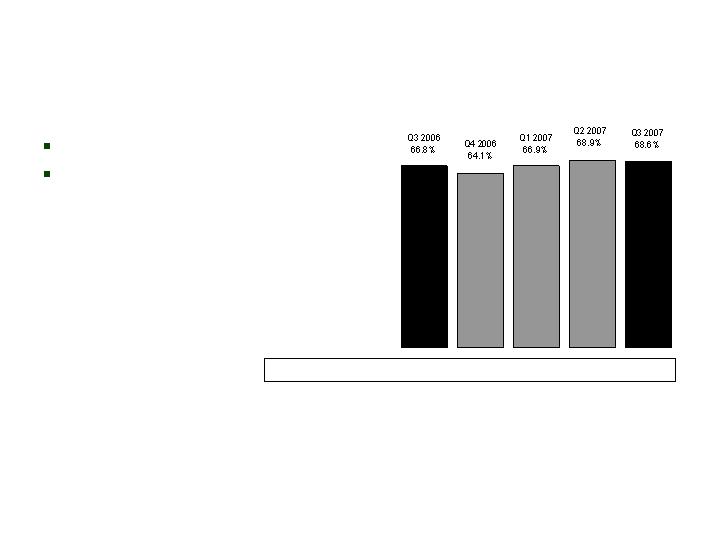
Benefit Ratio* –
Medicare Supplement
Bankers
Increase in benefit ratio from
Q2 2007 due to higher
persistency (offset by lower
amortization)
Trailing 4 Quarter Avg.: 67.9% 66.6% 65.8% 65.7% 66.6%
*We calculate benefit ratios by dividing insurance policy benefits by insurance policy income.
17
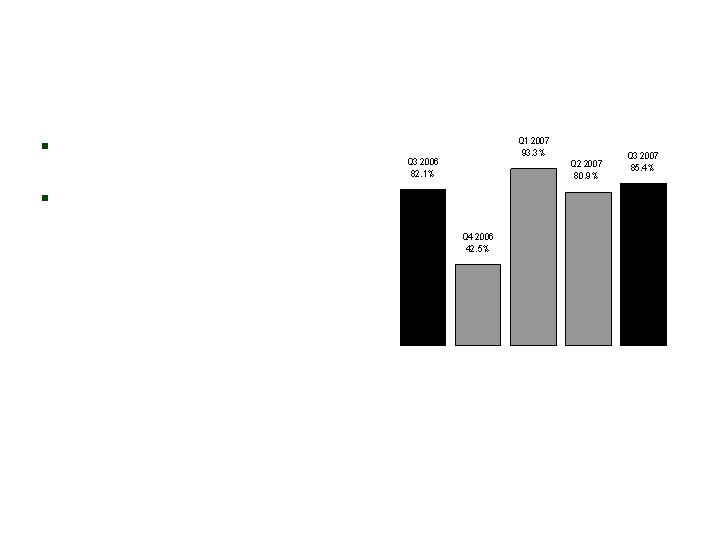
Benefit Ratio* –
PDP and PFFS Business
Bankers
PDP and PFFS continue to
trend as expected
Seasonality drives
fluctuations
*We calculate benefit ratios by dividing insurance policy benefits by insurance policy income.
18

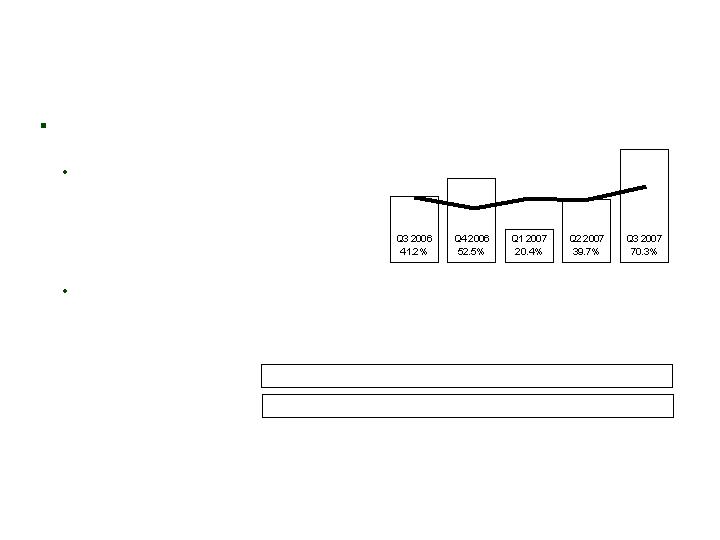
Interest-Adjusted Benefit Ratio* –
Long Term Care
Bankers
*We calculate interest-adjusted benefit ratios by dividing insurance policy benefits less interest income on
the accumulated assets backing the insurance liabilities by insurance policy income.
Q3 2007 negatively impacted by:
Fewer claims closed compared to prior
periods
Higher persistency compared to Q2
2007
Began implementation of premium
re-rates in Q3 2007 on more recent
business not previously re-rated;
expected $25-30 million additional
annual revenue
Trailing 4 Quarter Avg.: 67.4% 69.9% 71.6% 71.4% 72.8%
Qtrly. non-int. adjusted: 98.2% 106.7% 104.3% 96.8% 105.8%
19

Q3 Earnings
Colonial Penn
Q3 2006
Q3 2007
Insurance policy income
$29.1
$32.5
Net investment income
9.2
9.4
Fee revenue and other income
0.1
0.2
Total revenues
38.4
42.1
Insurance policy benefits
25.2
26.3
Amounts added to policyholder account balances
0.4
0.3
Amortization related to operations
4.4
5.1
Other operating costs and expenses
3.8
3.4
Total benefits and expenses
33.8
35.1
Income before net realized investment gains (losses) and income taxes,
net of related amortization
$4.6
$7.0
20
Management believes that an analysis of income (loss) before net realized investment gains (losses), net of
related amortization (a non-GAAP financial measure), is important to evaluate the financial performance of our
business, and is a measure commonly used in the life insurance industry. Management uses this measure to
evaluate performance because realized gains or losses can be affected by events that are unrelated to a
company’s underlying fundamentals. The chart on Page 9 reconciles the non-GAAP measure to the
corresponding GAAP measure. See Appendix for a reconciliation of the return on equity measure to the
corresponding GAAP measure.
2007 YTD Return on Equity (before realized investment gains/(losses): 13.8%
($ millions)
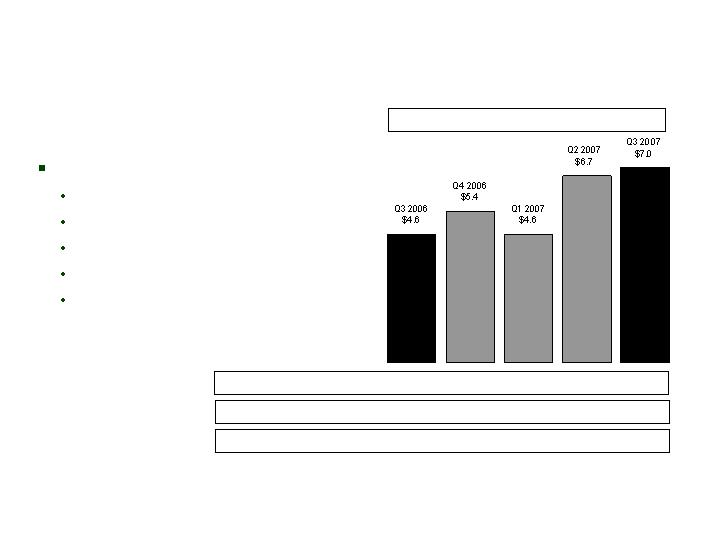
Segment Performance
Colonial Penn
*Operating earnings exclude net realized gains (losses). See Appendix for corresponding GAAP measure of
our consolidated results of operations.
Consistent and favorable trends:
Sales
Mortality
Expenses
Amortization of DAC/VOBA
Earnings
PTOI-Trailing 4 Quarters: $19.5 $21.6 $21.1 $21.3 $23.7
Revenues-Quarterly: $38.4 $41.4 $39.0 $38.9 $42.1
Pre-Tax Operating Income*
Revenues -Tr. 4 Quarters: $147.9 $150.9 $153.7 $157.7 $161.4
($ millions)
21

Sales down 31% from Q3 2006
Higher value from new business compared to Q3 2006, despite lower sales
Strong sales gains in specified disease, up 35% from Q3 2006
Decreases in Medicare supplement and annuities, consistent with CIG’s focus on
more profitable business
Lower earnings (vs Q3 2006) driven by:
Increase in death claims and amortization expense on interest-sensitive life products
Specified disease reserve correction
Expenses related to operational savings and marketing restructuring
Annuity coinsurance transaction closed in October
After tax charge of $49.7 million excluded from CIG’s earnings
Q3 2007 Summary
CIG
22

Q3 Earnings
CIG
Management believes that an analysis of income (loss) before net realized investment gains (losses), net of
related amortization (a non-GAAP financial measure), is important to evaluate the financial performance of our
business, and is a measure commonly used in the life insurance industry. Management uses this measure to
evaluate performance because realized gains or losses can be affected by events that are unrelated to a
company’s underlying fundamentals. The chart on Page 9 reconciles the non-GAAP measure to the
corresponding GAAP measure. See Appendix for a reconciliation of the return on equity measure to the
corresponding GAAP measure.
Q3 2006
Q3 2007
Insurance policy income
$245.9
$238.7
Net investment income
189.3
181.2
Fee revenue and other income
0.8
0.1
Total revenues
436.0
420.0
Insurance policy benefits
184.1
220.3
Amounts added to policyholder account balances
84.5
76.4
Amortization related to operations
42.3
41.2
Other operating costs and expenses
66.6
82.5
Total benefits and expenses
377.5
420.4
Income (loss) before net realized investment gains (losses),
net of related amortization and income taxes, excluding
costs related to the litigation settlement and the loss
related to a coinsurance transaction
$58.5
($0.4)
23
2007 YTD Return on Equity (before realized investment gains/(losses): 3.7%
($ millions)
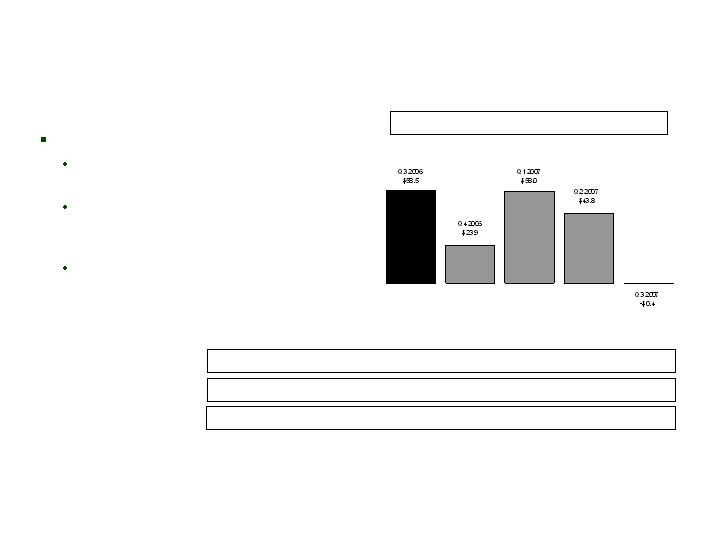
Segment Performance
CIG
*Operating earnings exclude: (1) net realized gains (losses); (2) the Q2 2006 charge related to the
litigation settlement and refinements to such estimates recognized in subsequent periods; and (3) the Q3
2007 charge related to a coinsurance transaction. See Appendix for corresponding GAAP measure of our
consolidated results of operations.
Q3 2007 includes:
Specified disease reserve correction of
$18.3 million
$11 million of expenses related to
operational savings or consolidation
activity
$11 million reduction (vs Q3 2006) in
interest-sensitive life earnings from
adverse mortality experience
PTOI-Trailing 4 Quarters: $224.2 $189.0 $205.1 $184.2 $125.3
Revenues-Quarterly: $436.0 $445.7 $417.6 $438.9 $420.0
Pre-Tax Operating Income*
Revenues-Tr. 4 Quarters: $1,714.8 $1,729.1 $1,707.9 $1,738.2 $1,722.2
($ millions)
24
Benefit Ratio* –
Medicare Supplement
CIG
Consistent with expectations
Higher persistency in Q3 2007
compared to Q3 2006 resulted
in slightly higher benefit ratio
Trailing 4 Quarter Avg.: 60.6% 61.9% 63.6% 66.6% 67.1%
*We calculate benefit ratios by dividing insurance policy benefits by insurance policy income.
25
Interest-Adjusted Benefit Ratio* –
Specified Disease
CIG
Reserve corrections have affected
benefit ratios in several periods:
Loss ratio would have been 50.1% in
Q3 2007 without $18.3 million
adjustment, 41.8% in Q1 2007 without
$19.3 million adjustment, and 37.7%
in Q4 2006 without $13.3 million
adjustment
Solid line indicates loss ratios without
these adjustments
Trailing 4 Quarter Avg.: 45.9% 47.0% 40.6% 38.4% 45.7%
Qtrly. non-int. adjusted: 73.6% 84.9% 53.2% 72.5% 103.2%
*We calculate interest-adjusted benefit ratios by dividing insurance policy benefits, less interest income on
the accumulated assets backing the insurance liabilities, by insurance policy income.
26

Financial results reflect prior-quarter reserve strengthening
and improving business fundamentals
Program for improvement initiatives providing a real impact
Completed implementation of $30 million in approved Round 1
rate increases; $21 million expected in Round 2
Improved claims management processes driving better business
fundamentals and customer experience
Expect decision in Q4 2007 on sourcing of system and select
claim functions to recognized industry leader
Working proactively with government leaders and regulators
Segment Summary
LTC Closed Block
27
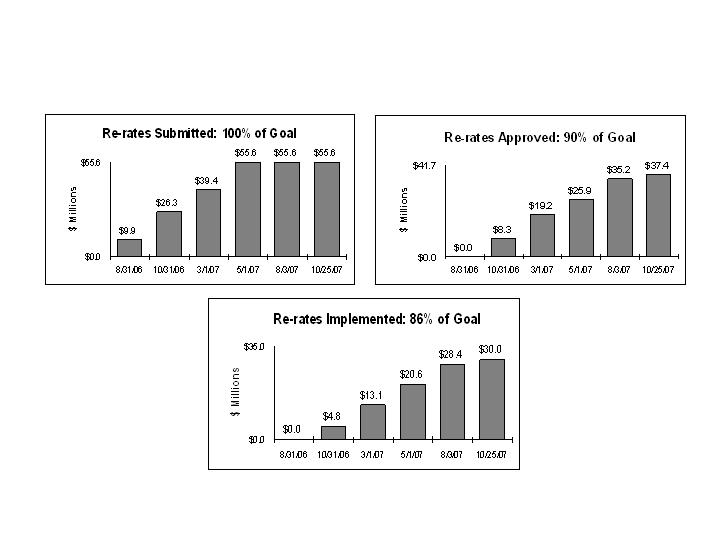
Premium Re-rates
Round 1
LTC Closed Block
28
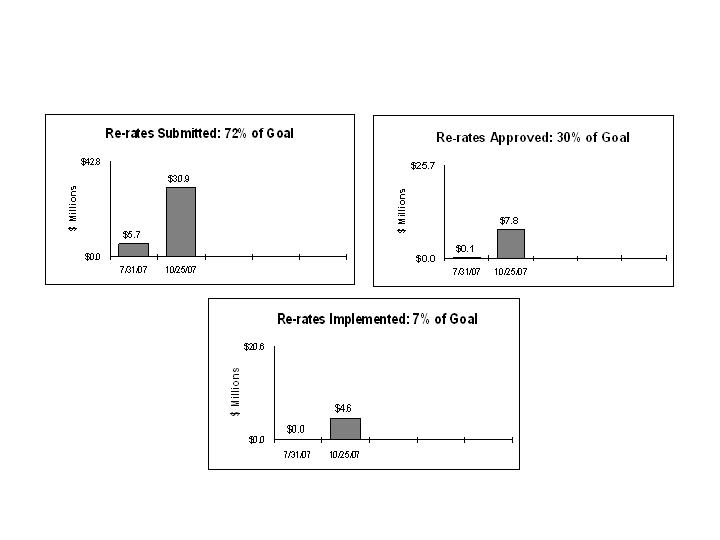
Premium Re-rates
Round 2
LTC Closed Block
29

Q3 Earnings
LTC Closed Block
Q3 2006
Q3 2007
Insurance policy income
$83.4
$77.2
Net investment income
44.6
48.8
Fee revenue and other income
0.1
0.1
Total revenues
128.1
126.1
Insurance policy benefits
113.4
106.0
Amortization related to operations
5.6
5.6
Other operating costs and expenses
22.1
17.4
Total benefits and expenses
141.1
129.0
Loss before net realized investment gains (losses) and income taxes
($13.0)
($2.9)
30
Management believes that an analysis of income (loss) before net realized investment gains (losses), net of
related amortization (a non-GAAP financial measure), is important to evaluate the financial performance of our
business, and is a measure commonly used in the life insurance industry. Management uses this measure to
evaluate performance because realized gains or losses can be affected by events that are unrelated to a
company’s underlying fundamentals. The chart on Page 9 reconciles the non-GAAP measure to the
corresponding GAAP measure. See Appendix for a reconciliation of the return on equity measure to the
corresponding GAAP measure.
($ millions)
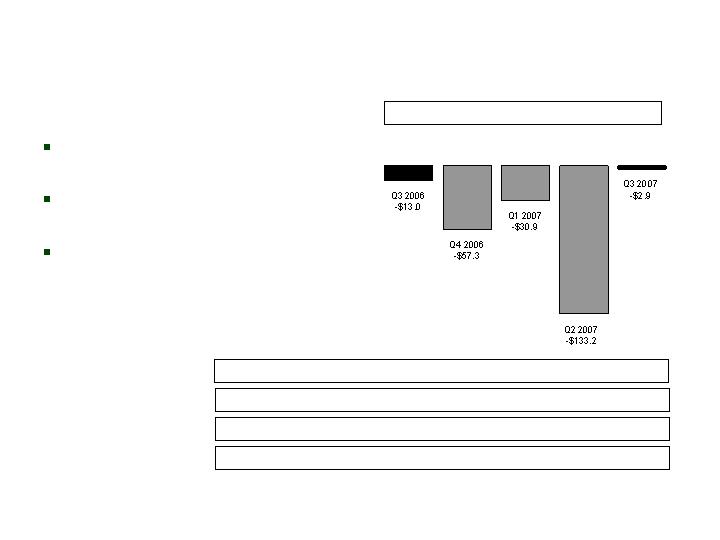
Segment Performance
LTC Closed Block
*Operating earnings exclude net realized gains (losses). See Appendix for corresponding GAAP measure of
our consolidated results of operations.
Stable prior-period claim
development
Meaningful impact from
improvement initiatives
Net $6.6 million favorable
adjustments to reserve for
future benefits
PTOI-Trailing 4 Quarters: $33.3 ($41.9) ($96.8) ($234.4) ($224.3)
Revenues-Quarterly: $128.1 $127.9 $126.6 $125.8 $126.1
Pre-Tax Operating Income*
Revenues -Tr. 4 Quarters: $519.6 $516.5 $509.4 $508.4 ��$506.4
($ millions)
Collected Premiums-Quarterly: $80.4 $76.6 $81.2 $76.2 $75.7
31
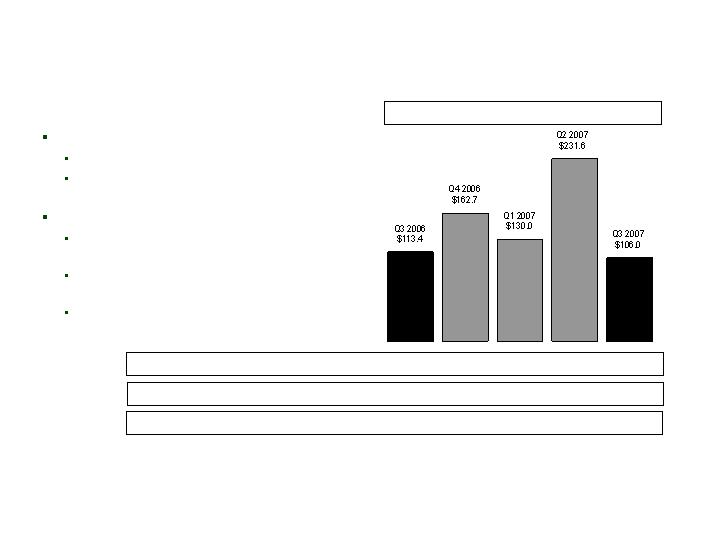
Benefit Detail
Q3 2007 incurred claims reflect:
Stable claim reserve development
Verified basis consistent with prior
periods
Q3 2007 increase in reserves:
$(20.1) million decrease related to prior-
period deaths and terminations
$13.5 million increase for reserve
estimate refinements
Reserve pivot for rate increases
Total benefits equal incurred claims plus increase in reserve for future benefits. Verified basis incurred claims
adjust all periods for claim reserve redundancies and deficiencies.
Increase in Reserves for Future Benefits $(0.1) $(1.3) $(0.5) $(3.3) $(6.9)
Verified Basis Incurred Claims $116.5 $124.4 $114.3 $116.4 $116.2
LTC Closed Block
Total Benefits
($ millions)
$112.9
$234.9
$130.5
$164.0
$113.5
Incurred Claims
32
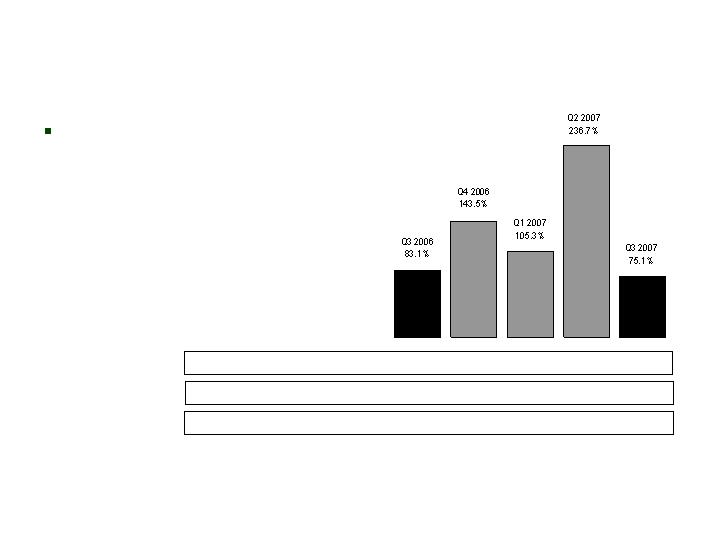
Interest-Adjusted
Benefit Ratio*
Benefit reserve adjustments
favorably impacted Q3 2007
by 8.5%
Trailing 4 Quarter Avg.: 60.1% 83.2% 99.0% 141.0% 140.2%
Qtrly. non-int. adjusted: 136.0% 198.2% 163.5% 296.7% 137.4%
LTC Closed Block
*We calculate interest-adjusted benefit ratios by dividing insurance policy benefits less interest income on
the accumulated assets backing the insurance liabilities by insurance policy income.
Qtrly. Verified Basis non-int. adjusted: 143.5% 147.6% 148.1% 145.1% 150.7%
33

Balance Sheet Detail
All balances reflect stability from Q2 2007 to Q3 2007
LTC Closed Block
($ millions)
Insurance Liabilities and Intangible Assets, Net of Reinsurance
Reserve for Future Benefits
Claim Reserve
Insurance Acquisition Costs
Net Liability
Percent Change
Q3 2007
$2,402.3
954.3
(153.9)
$3,202.7
0.0%
Q3 2006
$2,413.6
752.3
(176.2)
$2,989.7
0.2%
Q4 2006
$2,412.6
815.6
(170.9)
$3,057.3
2.3%
Q1 2007
$2,412.2
829.1
(165.2)
$3,076.1
0.6%
Q2 2007
$2,409.0
952.6
(159.5)
$3,202.1
4.1%
34

Q2 2007 claims reserving actions generated stability in Q3 2007:
Favorable prior-period development of $3.3 million
Verified claims for all periods stable from 6/30/07 to 9/30/07
Verified Incurred
Development*
*Excludes waiver-of-premium and return-of-premium benefits.
LTC Closed Block
Reported Claims
Prior Period Development
Verified Claims as of Reporting Date
Verified Claims Developed through:
12/31/04
12/31/05
12/31/06
3/31/07
6/30/07
9/30/07
($ millions)
Q3 2007
$100.7
3.3
104.0
104.0
Q2 2007
$212.0
(109.7)
102.3
102.3
103.1
Q1 2007
$119.7
(34.9)
84.8
84.8
104.2
103.5
2006
$433.4
(71.9)
361.5
361.5
375.5
418.1
414.7
2005
$396.0
(58.7)
337.3
337.3
365.0
368.8
388.9
388.8
2004
$370.8
(44.1)
326.7
326.7
326.1
337.6
344.1
356.2
356.5
Developed
Deficiencies
in Periods
Prior to 2004
$0.0
0
0
44.1
103.5
136.1
146.7
160.9
162.0
35

Claimant count estimates remain around 12,000, with paid claims near $100 million (before
inventory adjustments)
Operating Data
LTC Closed Block
Claims Paid (mils.)
Open Claimant Counts
In Force Policy Counts
Ann. Termination Rates
Q3 2005
$107.4
12,449
202,804
10.7%
Q3 2007 termination rate reflects prior-period deaths and terminations
Q4 2005
$83.1
12,290
201,649
2.3%
Q1 2006
$90.4
11,805
197,585
7.8%
Q2 2006
$101.2
12,536
194,080
6.9%
Q3 2006
$96.1
12,228
190,134
7.9%
Q4 2006
$81.64
12,048
187,123
6.2%
Q1 2007
$102.0
11,870
183,655
7.2%
Q2 2007
$96.8
12,424
179,952
7.8%
Q3 2007
$99.1
12,121
175,141
10.3%
36
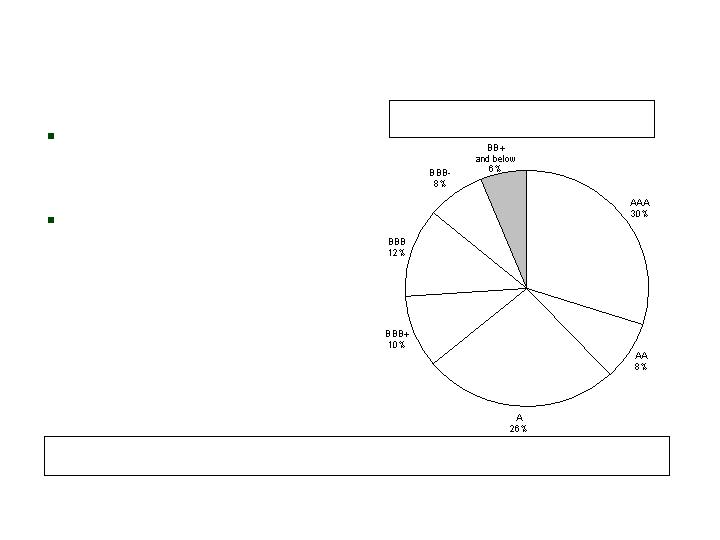
High-Quality Assets
CNO
Only 6% of total portfolio is in
below-investment grade
securities
Excludes investments from
variable interest entity we are
required to consolidate for
GAAP financial reporting
(such assets and the related
liabilities are legally isolated)
Actively Managed Fixed Maturities by Rating at
9/30/07 (Market Value)
9/30/07
94%
6/30/07
94%
3/31/07
95%
12/31/06
95%
9/30/06
97%
% of Bonds which are Investment Grade:
37

Structured securities and
asset-backed securities
represent 25% of total
actively managed fixed
maturity securities
Over 87% “AAA” rated
Structured Securities at 9/30/07
CNO
(Market value in millions)
Pass-throughs, sequentials and
equivalent securities
$2,117.1
41.2%
Planned amortization class, target
amortization class, and accretion-
directed bonds
$1,510.9
29.4%
Commercial
mortgage-backed
securities
$963.2
18.7%
Other
$64.5
1.2%
Asset-backed securities
$488.6
9.5%
38
Sub-Prime Home Equity ABS
CNO
Over 40% reduction of sub-prime exposure during Q3 2007, including 82% of
2007 vintage and 100% of 2006 vintage
As of 9/30/07, 0.57% of invested assets, compared to 1.2% at 6/30/07
Reduction in exposure reflects dispositions of $116 million of securities (at a loss
of $38 million) and decline in market value of $25 million for securities held at
quarter-end
Exposure by Vintage Year (Market Value in millions)
39

Sub-Prime Home Equity ABS
at 9/30/07
CNO
AAA
AA
A
<=BBB
Total
$32.2
$44.9
$62.7
$9.5
$149.3
$32.9
$49.7
$76.7
$21.9
$181.2
21.6%
30.0%
42.0%
6.4%
100.0%
0.12%
0.17%
0.24%
0.04%
0.57%
Market
Value (mil.)
Book
Value (mil.)
% of
Subprime*
% of
Portfolio*
Rating
0.57% of invested assets
No exposure to “affordability products” – negative amortization, option ARM
collateral, etc.
Only $9.5 million (market value) rated lower than A category
Current support in structures meets original expectations
Remaining portfolio generally reflects substantial margin for adverse development
646
640
641
609
640
Avg.
FICO
47.6%
28.4%
19.2%
5.9%
27.2%
Avg.
Support
8.2%
7.5%
6.6%
3.3%
7.0%
Avg. 60+
Delinq.
*% of market value.
40

Through Q3 2007, total of four downgraded sub-prime ABS
securities – par amount $17 million
No ABS CDO investments
No hedge fund investments
No exposure to substandard servicers
Nominal (<$10 million par) third-party CLO/structured credit
exposure
Highly developed cashflow and default analytic models, along
with rigorous management oversight processes
No “mark to model” structured securities
Sub-Prime Home Equity ABS
and Structured Credit
CNO
41

CNO Recap
Core businesses
Bankers Life and Colonial Penn – great results, focused on
growth
CIG
Greater focus on distinctive capabilities
Producing more economic value from lower sales
Runoff LTC block
Claims reserve volatility reduced
Run rate now at a small loss per quarter, expect profitability next
year
Continued progress on turnaround, increasingly visible
42

CNO Recap
Changing the portfolios of the business
Annuity coinsurance deal with Swiss Re closed; releases capital
from low-return business
Recapture of Colonial Penn life block from Swiss Re; higher-
return core business for CNO
Operations
Bulk of organizational realignment completed – Carmel now
handling all customer service calls
Real estate realignment to occur mostly in Q1 2008 – expect to
record pre-tax losses of approximately $20 million
Annual expense savings will exceed $30 million
43

Questions and Answers
44

Appendix
45
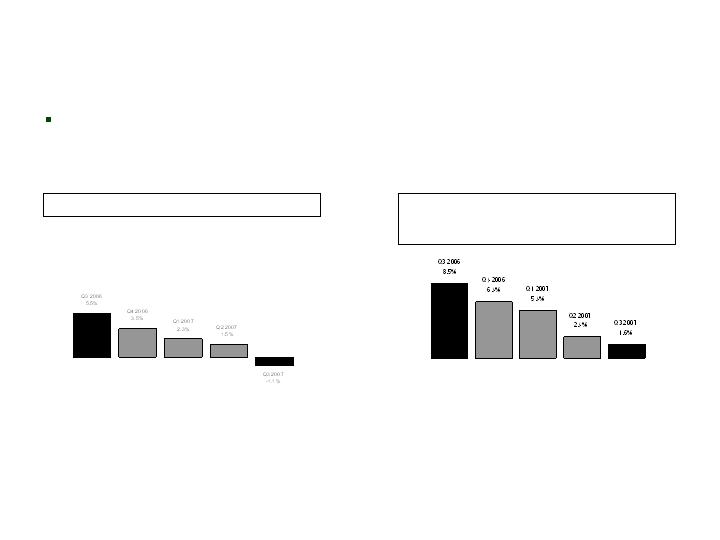
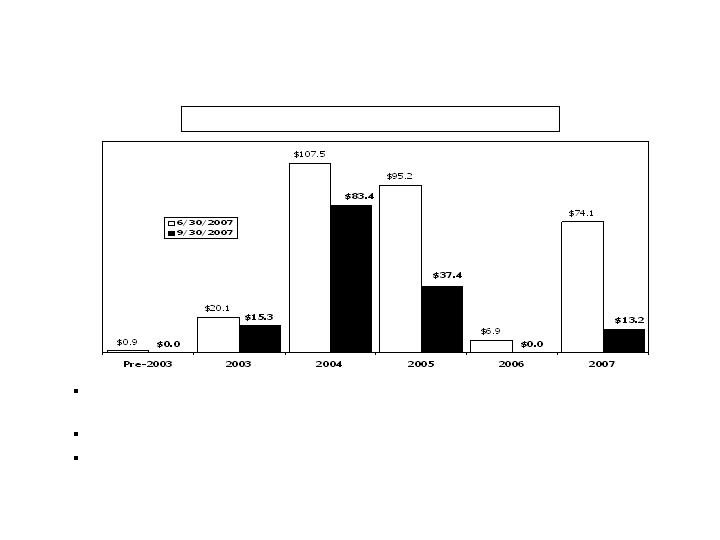
Premiums –
Medicare Supplement
Bankers
(in millions)
First-year premiums
continue downward trend,
reflecting migration to
PFFS plans
Medicare Supplement – First-Year Premiums
Med. Supp. First-Year Prems.-Tr. 4 Qtrs: $93.1 $97.8 $95.2 $90.7 $86.8
Med. Supp. Total Premiums-Quarterly: $146.7 $157.2 $167.0 $153.8 $152.9
Med. Supp. NAP-Quarterly: $15.3 $18.4 $14.7 $14.7 $16.1
Med. Supp. NAP-Trailing 4 Quarters: $76.2 $72.8 $66.8 $63.1 $63.9
46
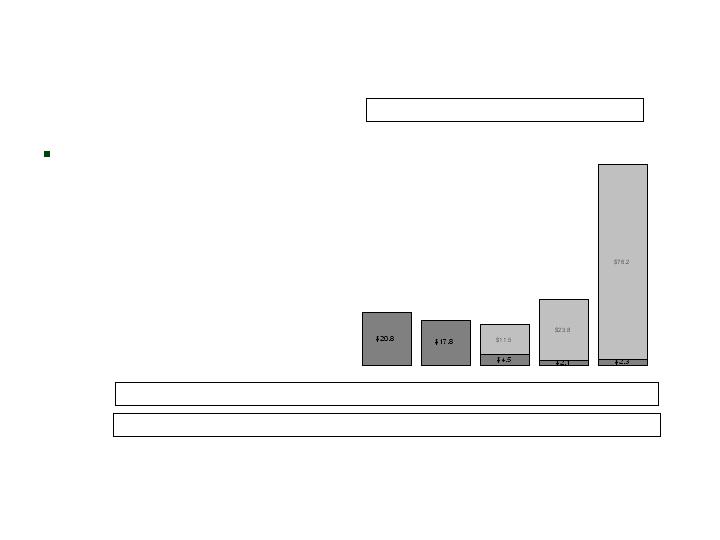
Premiums –
PDP/PFFS
Bankers
(in millions)
Significant increase in
PDP/PFFS premiums as result
of expansion of partnership
with Coventry
Q3 2006
$20.8
Q4 2006
$17.8
Q2 2007
$25.9
PDP
PFFS
PDP/PFFS – First-Year Premiums
Q1 2007
$16.0
Q3 2007
$78.5
$0.8
$0.7
$4.3
$0.5
$0.7
PDP NAP-Quarterly:
$(0.9)
$22.2
$46.8
-
-
PFFS NAP-Quarterly:
47
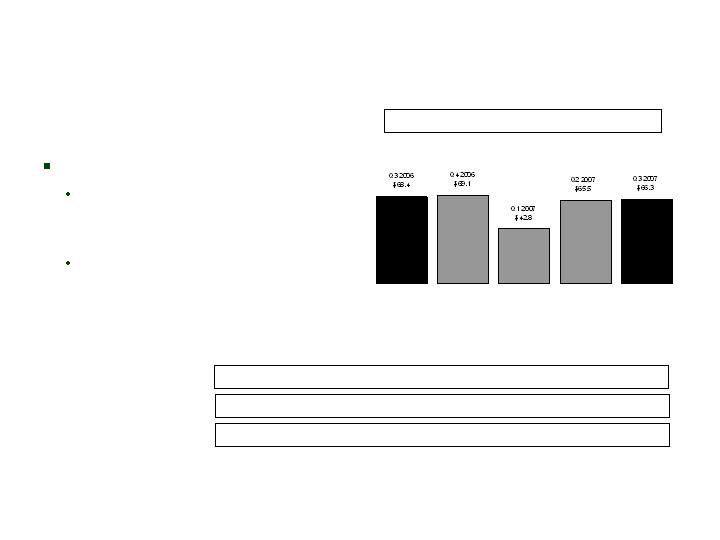
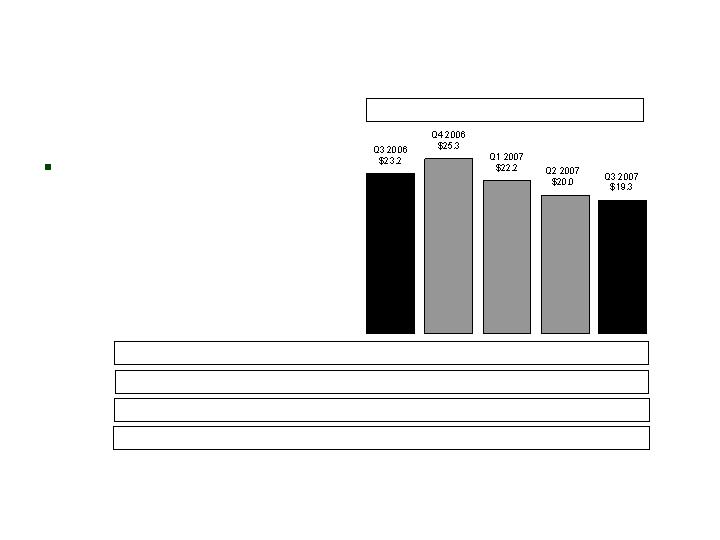
Premiums –
Long-Term Care
Bankers
($ millions)
Sales have stabilized
Increases in total premiums as
result of higher persistency
and rate increases
First-Year Prems.-Tr. 4 Qtrs: $54.6 $51.2 $48.6 $47.7 $47.4
Total Premiums-Quarterly: $145.0 $150.2 $158.2 $155.4 $154.5
Long-Term Care – First-Year Premiums
NAP-Quarterly: $12.5 $11.0 $11.7 $12.7 $11.7
NAP-Trailing 4 Quarters: $50.4 $47.6 $47.9 $47.9 $47.1
48
Premiums –
Life Insurance
Bankers
($ millions)
First-year premiums declined
from Q2 2007 due to lower
single-premium sales
Trailing 4-quarter sales
continue to increase
First-Year Prems.-Tr. 4 Qtrs: $90.4 $90.3 $91.0 $93.0 $89.8
Total Premiums-Quarterly: $47.8 $46.6 $48.1 $52.1 $49.1
Life – First-Year Premiums
NAP-Quarterly: $12.9 $11.4 $12.7 $14.5 $13.8
NAP-Trailing 4 Quarters: $44.7 $46.3 $48.1 $51.5 $52.4
49

Premiums –
Annuity
Bankers
($ millions)
Increase over Q2 2007 in first-
year premiums reflects higher
sales
Total trailing 4-quarter premiums
declined due to higher
terminations as result of difficult
interest rate environment
First-Year Prems.-Tr. 4 Qtrs: $1,010.7 $994.6 $973.5 $935.8 $909.0
Total Premiums-Quarterly: $278.2 $247.6 $212.2 $200.5 $250.9
Annuity – First-Year Premiums
50
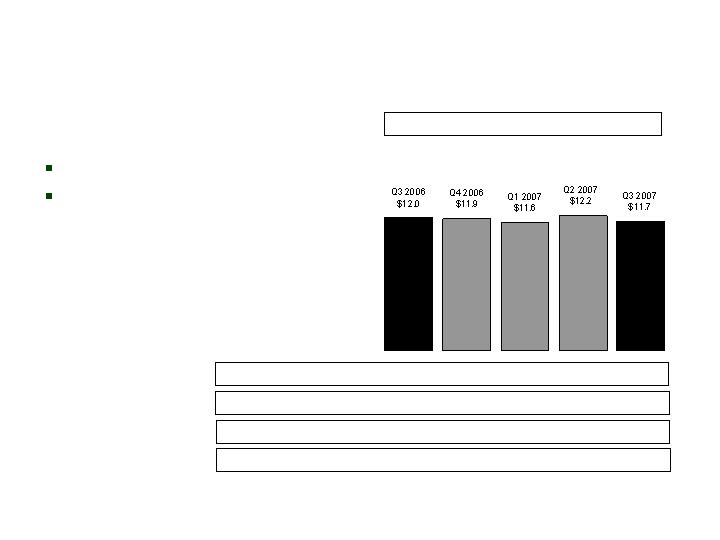
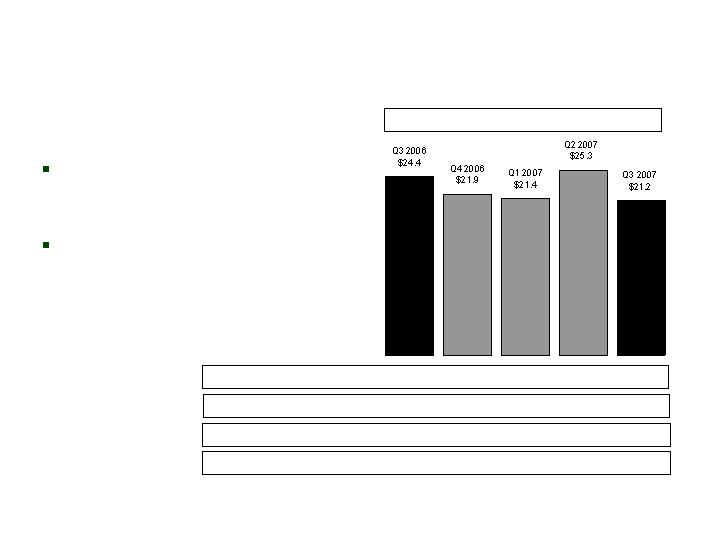
Premiums -
Medicare Supplement
CIG
($ millions)
Sales down 70% from Q3 2006:
Pursuing smaller, more profitable
block of Medicare supplement
First-Year Prems.-Tr. 4 Qtrs: $28.0 $30.6 $28.9 $26.2 $23.9
Total Premiums-Quarterly: $54.6 $61.8 $59.8 $56.1 $54.8
Medicare Supplement – First-Year Premiums
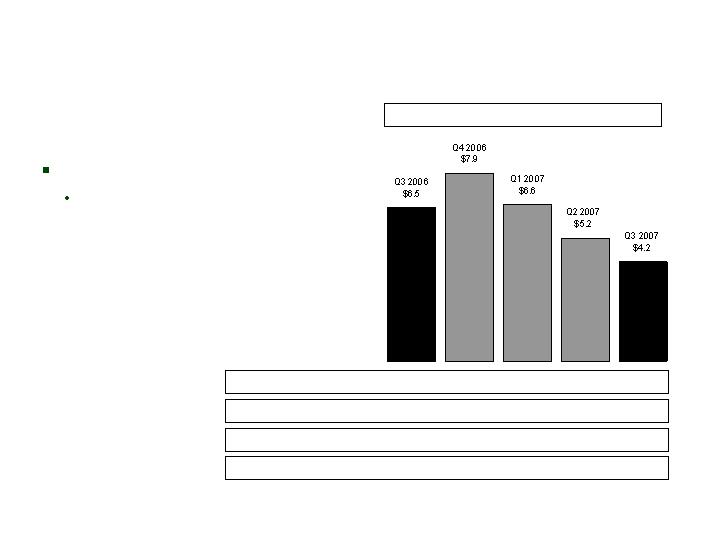
NAP-Quarterly: $6.2 $6.4 $4.9 $2.9 $1.9
NAP-Trailing 4 Quarters: $33.9 $32.1 $26.5 $20.4 $16.1
51
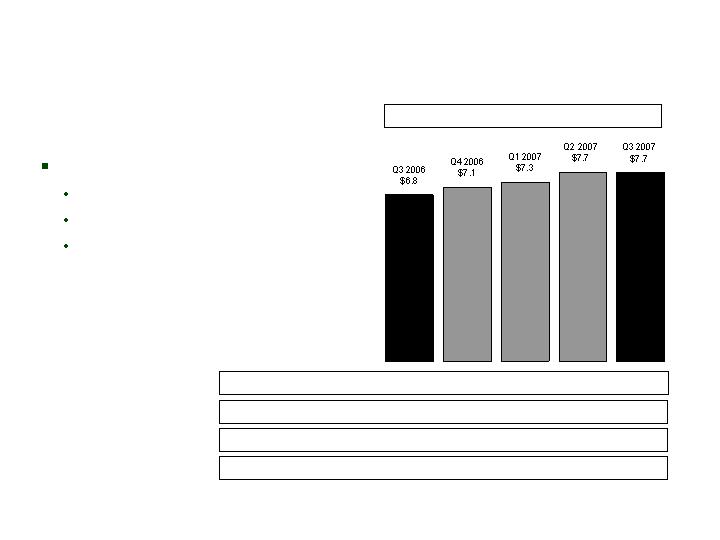
Premiums –
Specified Disease
CIG
($ millions)
Sales up 35% from Q3 2006:
New products
Increased focus within PMA
Recruitment of Health IMOs
First-Year Prems.-Tr. 4 Qtrs: $28.4 $28.1 $28.2 $28.9 $29.8
Total Premiums-Quarterly: $88.1 $89.4 $92.1 $89.1 $88.7
Supplemental Health – First-Year Premiums
NAP-Quarterly: $7.7 $8.6 $7.8 $9.6 $10.3
NAP-Trailing 4 Quarters: $28.5 $29.8 $31.4 $33.7 $36.3
52
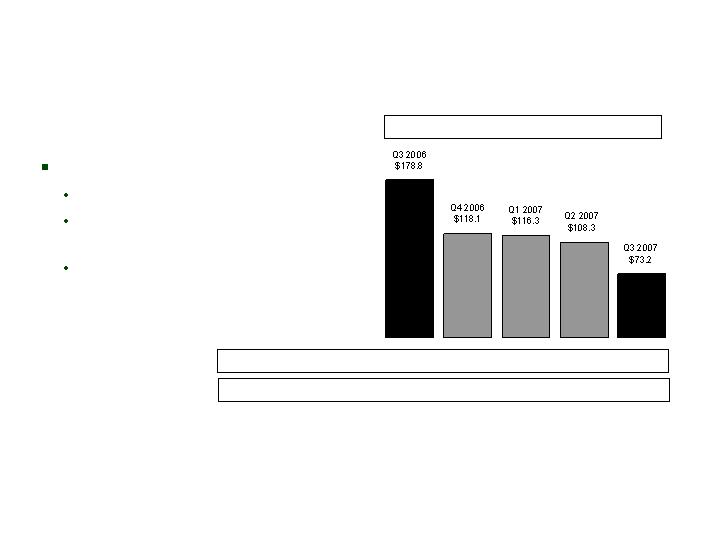
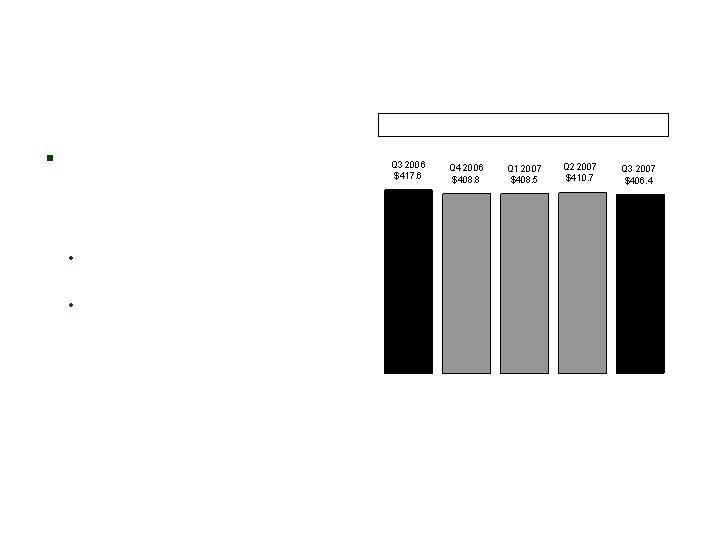
Premiums –
Annuity
CIG
($ millions)
Sales down 59% from Q3 2006:
Impact of ratings downgrade
Discontinuance of products
due to coinsurance transaction
Greater focus on profitability
First-Year Prems.-Tr. 4 Qtrs: $358.1 $415.5 $500.2 $521.5 $415.9
Total Premiums-Quarterly: $182.8 $121.9 $120.1 $113.0 $77.5
Annuity – First-Year Premiums
53
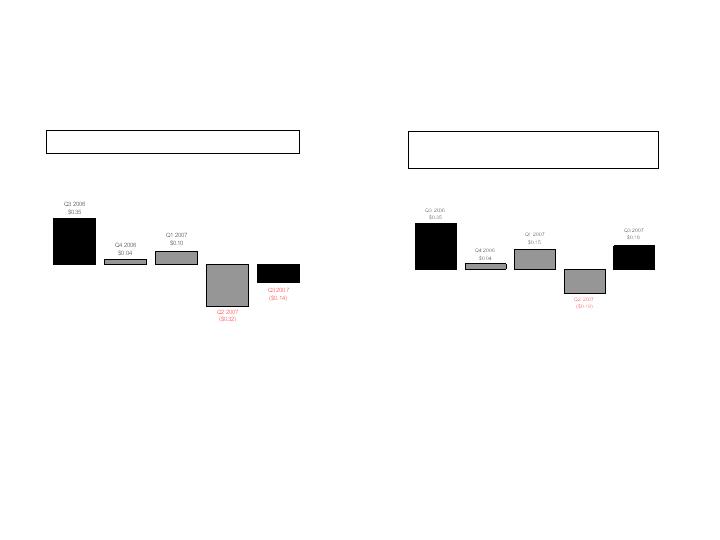
Premiums –
Life Insurance
Colonial Penn
($ millions)
Continued strong year-over-year
sales growth
Comparing the trailing four
quarters data:
NAP and first-year premium both
grew 23%
First-year premium consistently
grew 4-6% each quarter
First-Year Prems.-Tr. 4 Qtrs: $22.0 $22.9 $24.1 $25.4 $27.0
Total Premiums-Quarterly: $25.4 $26.8 $26.7 $26.0 $29.3
Life – First-Year Premiums
NAP-Quarterly: $8.3 $7.5 $10.4 $11.2 $11.4
NAP-Trailing 4 Quarters: $33.0 $33.3 $35.3 $37.4 $40.5
54
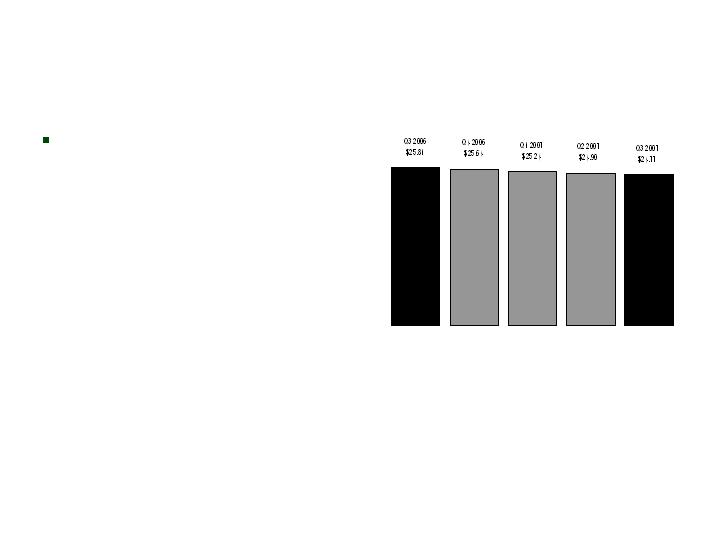
Book Value Per Diluted Share*
CNO
*Book value excludes accumulated other comprehensive income (loss). Shares outstanding assumes:
(1) conversion of convertible securities; and (2) the exercise of outstanding stock options and vesting of restricted
stock (each calculated using the treasury stock method). See Appendix for corresponding GAAP measure.
Decrease in Q3 2007 reflects
net loss for quarter, offset by
common share repurchases
55
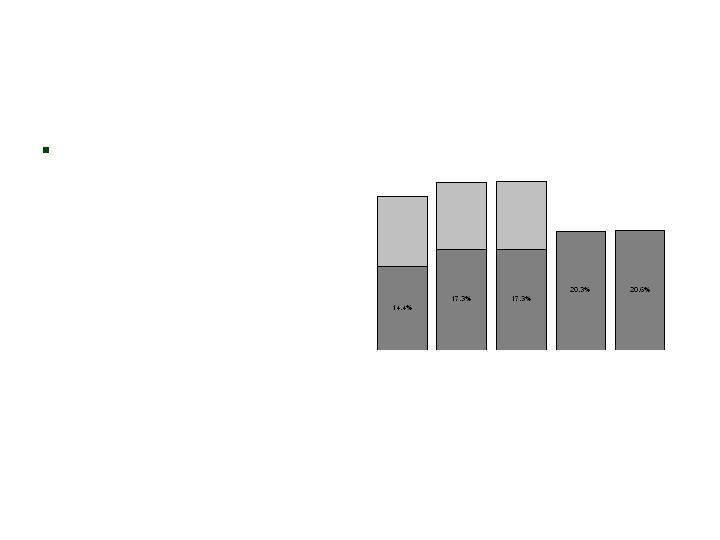
Debt and Preferred Stock
to Total Capital Ratio*
CNO
Increase in Q3 2007
reflects net loss for quarter
and effect of common
share repurchases
Q3 2006
26.4%
Q4 2006
28.8%
Q2 2007
20.3%
Debt
Preferred
Stock
Q1 2007
28.9%
*Excludes accumulated other comprehensive income (loss). See Appendix for corresponding GAAP measure.
Q3 2007
20.6%
56
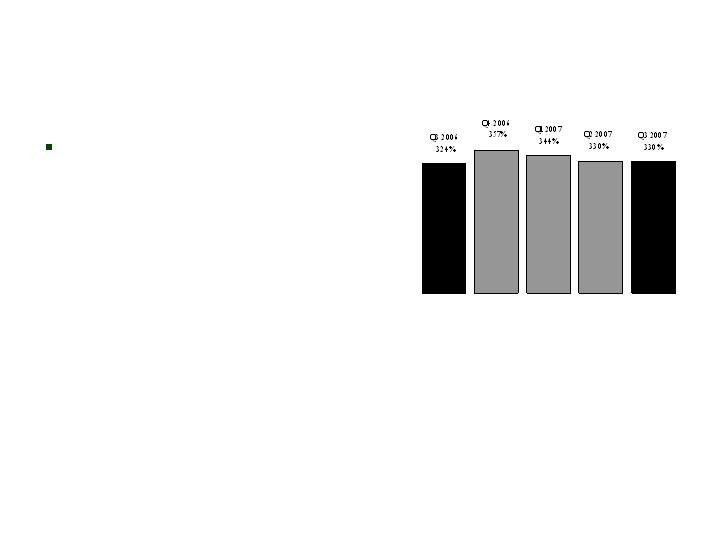
Consolidated RBC Ratio*
CNO
Continued strong RBC
*Risk-Based Capital (“RBC”) requirements provide a tool for insurance regulators to determine the levels of
statutory capital and surplus an insurer must maintain in relation to its insurance and investment risks. The RBC
ratio is the ratio of the statutory consolidated adjusted capital of our insurance subsidiaries to RBC.
57

Net Investment Income
CNO
($ millions)
Yield up 16 bps from Q3 2006
Net investment income from the prepayment of securities: $0.5 $1.0 $5.0 $1.1 $0.6
General Account Investment Income,
Excluding Corporate Segment
5.88%
5.83%
5.83%
5.72%
5.72%
Yield:
58

Information Related to Certain Non-GAAP Financial Measures
The following provides additional information regarding certain non-GAAP measures used in this presentation. A non-GAAP measure is a
numerical measure of a company’s performance, financial position, or cash flows that excludes or includes amounts that are normally excluded or
included in the most directly comparable measure calculated and presented in accordance with GAAP. While management believes these
measures are useful to enhance understanding and comparability of our financial results, these non-GAAP measures should not be considered as
substitutes for the most directly comparable GAAP measures. Additional information concerning non-GAAP measures is included in our periodic
filings with the Securities and Exchange Commission that are available in the “Investor – SEC Filings” section of Conseco’s website,
www.conseco.com.
Operating earnings measures
Management believes that an analysis of net income applicable to common stock before net realized gains or losses (“net operating income”, a
non-GAAP financial measure) is important to evaluate the performance of the Company and is a key measure commonly used in the life insurance
industry. Management uses this measure to evaluate performance because realized investment gains or losses can be affected by events that
are unrelated to the Company’s underlying fundamentals.
In addition, our results were affected by unusual and significant charges related to: (i) a litigation settlement in Q2 2006 and refinements to such
estimates recognized in subsequent periods; and (ii) a Q3 2007 charge related to a coinsurance transaction. Management does not believe that
similar charges are likely to recur within two years, and there were no similar charges recognized within the prior two years. Management
believes an analysis of operating earnings before these charges is important to evaluate the performance of the Company prior to the effect of
these unusual and significant charges.
59

Information Related to Certain Non-GAAP Financial Measures
A reconciliation of net income applicable to common stock to the net operating income, excluding: (i) Q2 2006 charge related to the litigation settlement and
refinements to such estimates recognized in subsequent periods; and (ii) a Q3 2007 charge related to a coinsurance transaction (and related per share amounts)
is as follows (dollars in millions, except per share amounts):
60
Q3 06
Q4 06
Q1 07
Q2 07
Q3 07
Net income (loss) applicable to common stock
38.9
$
(3.7)
$
0.9
$
(64.5)
$
(53.7)
$
Net realized investment losses, net of related amortization and taxes
13.9
9.4
13.7
10.1
28.1
Net operating income (loss) (a non-GAAP financial measure)
52.8
5.7
14.6
(54.4)
(25.6)
Q2 2006 charge related to the litigation settlement and refinements to such
estimates recognized in subsequent periods, net of taxes
-
-
8.5
22.8
10.6
Q3 2007 charge related to a coinsurance transaction, net of taxes
-
-
-
-
49.7
Net operating income before: (i) Q2 2006 charge related to the
litigation settlement and refinements to such estimates
recognized in subsequent periods; and (ii) a Q3 2007 charge
related to a coinsurance transaction (a non-GAAP financial measure)
52.8
$
5.7
$
23.1
$
(31.6)
$
34.7
$
Per diluted share:
Net income (loss)
0.26
$
(0.02)
$
0.01
$
(0.38)
$
(0.29)
$
Net realized investment losses, net of related amortization and taxes
0.09
0.06
0.09
0.06
0.15
Net operating income (loss) (a non-GAAP financial measure)
0.35
0.04
0.10
(0.32)
(0.14)
Q2 2006 charge related to the litigation settlement and refinements to such
estimates recognized in subsequent periods, net of taxes
-
-
0.05
0.13
0.06
Q3 2007 charge related to a coinsurance transaction, net of taxes
-
-
-
-
0.26
Net operating income before: (i) Q2 2006 charge related to the
litigation settlement and refinements to such estimates
recognized in subsequent periods; and (ii) a Q3 2007 charge
related to a coinsurance transaction (a non-GAAP financial measure)
0.35
$
0.04
$
0.15
$
(0.19)
$
0.18
$

Information Related to Certain Non-GAAP Financial Measures
Book value, excluding accumulated other comprehensive income, per diluted share
This non-GAAP financial measure differs from book value per diluted share because accumulated other comprehensive income has been
excluded from the book value used to determine the measure. Management believes this non-GAAP financial measure is useful because it
removes the volatility that arises from changes in accumulated other comprehensive income. Such volatility is often caused by changes in the
estimated fair value of our investment portfolio resulting from changes in general market interest rates rather than the business decisions made
by management.
61

Information Related to Certain Non-GAAP Financial Measures
A reconciliation from book value per diluted share to book value per diluted share, excluding accumulated other comprehensive income (loss) is
as follows (dollars in millions, except per share amounts):
62
Q3 06
Q4 06
Q1 07
Q2 07
Q3 07
Total shareholders' equity
4,712.7
$
4,713.1
$
4,724.0
$
4,375.3
$
4,303.7
$
Less accumulated other comprehensive income (loss)
(71.8)
(72.6)
(41.8)
(329.9)
(316.0)
Total shareholders' equity excluding
accumulated other comprehensive income (loss)
(a non-GAAP financial measure)
4,784.5
$
4,785.7
$
4,765.8
$
4,705.2
$
4,619.7
$
Diluted shares outstanding for the period
185,354,251
186,665,776
188,784,663
188,962,041
186,472,069
Book value per diluted share
25.43
$
25.25
$
25.02
$
23.15
$
23.08
$
Less accumulated other comprehensive income (loss)
(0.38)
(0.39)
(0.22)
(1.75)
1.69
Book value, excluding accumulated other
comprehensive income (loss), per diluted share
(a non-GAAP financial measure)
25.81
$
25.64
$
25.24
$
24.90
$
24.77
$

Information Related to Certain Non-GAAP Financial Measures
Operating return measures
Management believes that an analysis of return before net realized gains or losses (“net operating income”, a non-GAAP financial measure) is
important to evaluate the performance of the Company and is a key measure commonly used in the life insurance industry. Management uses
this measure to evaluate performance because realized investment gains or losses can be affected by events that are unrelated to the
Company’s underlying fundamentals.
In addition, our returns were affected by unusual and significant charges related to: (i) the litigation settlement in Q2 2006 and refinements to
such estimates recognized in subsequent periods; and (ii) a Q3 2007 charge related to a coinsurance transaction. Management does not believe
that similar charges are likely to recur within two years, and there were no similar charges recognized within the prior two years. Management
believes an analysis of return before these charges and subsequent refinements is important to evaluate the performance of the Company prior
to the effect of these unusual and significant charges.
This non-GAAP financial measure also differs from return on equity because accumulated other comprehensive income (loss) has been excluded
from the value of equity used to determine this ratio. Management believes this non-GAAP financial measure is useful because it removes the
volatility that arises from changes in accumulated other comprehensive income (loss). Such volatility is often caused by changes in the
estimated fair value of our investment portfolio resulting from changes in general market interest rates rather than the business decisions made
by management.
In addition, our equity includes the value of significant net operating loss carryforwards (included in income tax assets). In accordance with
GAAP, these assets are not discounted, and accordingly will not provide a return to shareholders (until after it is realized as a reduction to taxes
that would otherwise be paid). Management believes that excluding this value from the equity component of this measure enhances the
understanding of the effect these non-discounted assets have on operating returns and the comparability of these measures from period-to-
period. Equity in all periods assumes the conversion of our 5.5% Class B Mandatorily Convertible Preferred Stock (which occurred in May 2007).
Operating return measures are used in measuring the performance of our business units and are used as a basis for incentive compensation.
All references to segment operating return measures assume a 25% debt to total capital ratio at the segment level. Additionally, corporate
expenses have been allocated to the segments.
63

Information Related to Certain Non-GAAP Financial Measures
A reconciliation of return on common equity to operating return (less: (i) Q2 2006 charge related to the litigation settlement and refinements to such
estimates recognized in subsequent periods; and (ii) a Q3 2007 charge related to a coinsurance transaction) on common equity (excluding
accumulated other comprehensive income (loss) and net operating loss carryforwards) is as follows (dollars in millions, except per share amounts):
(continued on next page)
64
Q3 06
Q4 06
Q1 07
Q2 07
Q3 07
Net income (loss) applicable to common stock
38.9
$
(3.7)
$
0.9
$
(64.5)
$
(53.7)
$
Net realized investment (gains) losses, net of related amortization and taxes
13.9
9.4
13.7
10.1
28.1
Net operating income (loss) (a non-GAAP financial measure)
52.8
5.7
14.6
(54.4)
(25.6)
Q2 2006 charge related to the litigation settlement and refinements
to such estimates recognized in subsequent periods, net of taxes
-
-
8.5
22.8
10.6
Q3 2007 charge related to a coinsurance transaction, net of taxes
-
-
-
-
49.7
Add preferred stock dividends, assuming conversion
9.5
9.5
9.5
4.6
-
Net operating income before: (i) Q2 2006 charge related to the
litigation settlement and refinements to such estimates recognized
in subsequent periods; and (ii) a Q3 2007 charge related to a
coinsurance transaction (a non-GAAP financial measure)
62.3
$
15.2
$
32.6
$
(27.0)
$
34.7
$
Total shareholders' equity
4,712.7
$
4,713.1
$
4,724.0
$
4,375.3
$
4,303.7
$
Less preferred stock
667.8
667.8
667.8
-
-
Common shareholders' equity
4,044.9
4,045.3
4,056.2
4,375.3
4,303.7
Add preferred stock, assuming conversion
667.8
667.8
667.8
-
-
Less accumulated other comprehensive income (loss)
(71.8)
(72.6)
(41.8)
(329.9)
(316.0)
Common shareholder's equity, excluding accumulated other comprehensive
income (loss) (a non-GAAP financial measure)
4,784.5
4,785.7
4,765.8
4,705.2
4,619.7
Add Q2 2006 charge related to the litigation settlement and refinements
to such estimates recognized in subsequent periods
102.1
102.1
110.6
133.4
144.0
Add Q3 2007 charge related to a coinsurance transaction, net of taxes
-
-
-
-
49.7
Less net operating loss carryforwards
1,346.7
1,340.0
1,334.1
1,349.8
1,386.7
Common shareholders' equity, excluding accumulated other comprehensive
income (loss) and refinements to such estimates recognized in subsequent
periods and net operating loss carryforwards (a non-GAAP financial measure)
3,539.9
$
3,547.8
$
3,542.3
$
3,488.8
$
3,426.7
$

Information Related to Certain Non-GAAP Financial Measures
(continued from previous page)
65
Q3 06
Q4 06
Q1 07
Q2 07
Q3 07
Average common shareholders' equity
3,836.9
4,045.1
4,050.8
4,215.8
4,339.5
Average common shareholder's equity, excluding accumulated other
comprehensive income (loss) (a non-GAAP financial measure)
4,763.4
4,785.1
4,775.8
4,735.5
4,662.5
Average common shareholders' equity, excluding accumulated other
comprehensive income (loss), the Q2 2006 charge related to the
litigation settlement and refinements to such estimates
recognized in subsequent periods, the Q3 2007 charge related to a
coinsurance transaction, and net operating loss carryforwards
(a non-GAAP financial measure)
3,518.8
3,543.9
3,545.1
3,515.6
3,457.8
Return on equity ratios:
Return on common equity
4.1%
-0.4%
0.1%
-6.1%
-4.9%
Operating return (less: (i) Q2 2006 charge related to the
litigation settlement and refinements to such estimates
recognized in subsequent periods; and (ii) the Q3 2007 charge
related to a coinsurance transaction) on common equity,
excluding accumulated other comprehensive income (loss)
(a non-GAAP financial measure)
5.2%
1.3%
2.7%
-2.3%
3.0%
Operating return (less: (i) Q2 2006 charge related to the
litigation settlement and refinements to such estimates
recognized in subsequent periods; and (ii) the Q3 2007 charge
related to a coinsurance transaction) on common equity,
excluding accumulated other comprehensive income (loss)
and net operating loss carryforwards (a non-GAAP
financial measure)
7.1%
1.7%
3.7%
-3.1%
4.0%

Information Related to Certain Non-GAAP Financial Measures
A reconciliation of pretax operating earnings (a non-GAAP financial measure) to segment operating income (loss) and consolidated net income
(loss) for the nine months ended Sept. 30, 2007, is as follows (dollars in millions):
(Continued on next page)
66
Other Business
CIG
Bankers
Colonial Penn
in Run-off
Corporate
Total
Pretax operating earnings (a non-GAAP financial measure)
101.4
$
174.6
$
18.3
$
(167.0)
$
(69.9)
$
57.4
$
Allocation of interest expense, excess capital and corporate
expenses
(36.3)
(29.8)
(2.4)
(6.8)
75.3
-
Income tax (expense) benefit
(19.5)
(43.2)
(4.7)
51.9
(1.6)
(17.1)
Segment operating income (loss)
45.6
$
101.6
$
11.2
$
(121.9)
$
3.8
$
40.3
Refinements made to Q2 2006 charge related to the
litigation settlement, net of taxes
(41.9)
Q3 2007 charge related to a coinsurance transaction, net of taxes
(49.7)
Net realized investment losses, net of related amortization and taxes
(51.9)
Net loss
(103.2)
$

Information Related to Certain Non-GAAP Financial Measures
A reconciliation of common shareholders’ equity, excluding accumulated other comprehensive income (loss), the Q2 2006 charge related to the
litigation settlement and refinements to such estimates recognized in subsequent periods, the Q3 2007 charge related to a coinsurance
transaction, and less income tax assets and assuming conversion of the convertible preferred stock (a non-GAAP financial measure) to common
shareholders’ equity is as follows (dollars in millions):
(Continued on next page)
(Continued from previous page)
67
Other Business
CIG
Bankers
Colonial Penn
in Run-off
Corporate
Total
December 31, 2006
Common shareholders' equity, excluding accumulated other comprehensive
income (loss), the Q2 2006 charge related to the litigation
settlement and refinements to such estimates recognized in subsequent
periods, and less income tax assets representing net operating loss
carryforwards and assuming conversion of convertible preferred
stock (a non-GAAP financial measure)
1,623.1
$
1,274.3
$
103.6
$
290.3
$
256.5
$
3,547.8
$
Q2 2006 charge related to the litigation settlement and
refinements to such estimates recognized in subsequent periods
(102.1)
-
-
-
-
(102.1)
Net operating loss carryforwards
1,340.0
-
-
-
-
1,340.0
Accumulated other comprehensive income (loss)
(25.6)
(41.6)
(1.2)
(7.3)
3.1
(72.6)
Allocation of capital
541.0
424.8
34.6
96.8
(1,097.2)
-
Total shareholders' equity
3,376.4
$
1,657.5
$
137.0
$
379.8
$
(837.6)
$
4,713.1
Less preferred stock
667.8
Common shareholders' equity
4,045.3
$
September 30, 2007
Common shareholders' equity, excluding accumulated other comprehensive
income (loss), the Q2 2006 charge related to the litigation
settlement and refinements to such estimates recognized in subsequent
periods, the Q3 2007 charge related to a coinsurance transaction,
and less income tax assets representing net operating loss carry-
forwards and assuming conversion of convertible preferred stock
(a non-GAAP financial measure)
1,608.0
$
1,325.1
$
113.5
$
203.3
$
176.8
$
3,426.7
$
Q2 2006 charge related to the litigation settlement and
refinements to such estimates recognized in subsequent periods
(123.1)
-
-
-
(20.9)
(144.0)
Q3 2007 charge related to a coinsurance transaction
(49.7)
-
-
-
-
(49.7)
Net operating loss carryforwards
1,386.7
-
-
-
-
1,386.7
Accumulated other comprehensive income (loss)
(127.6)
(123.7)
(5.2)
(49.6)
(9.9)
(316.0)
Allocation of capital
536.0
441.7
37.8
67.8
(1,083.3)
-
Total shareholders' equity
3,230.3
$
1,643.1
$
146.1
$
221.5
$
(937.3)
$
4,303.7
Less preferred stock
-
Common shareholders' equity
4,303.7
$

Information Related to Certain Non-GAAP Financial Measures
A reconciliation of average common shareholders’ equity, excluding accumulated other comprehensive income (loss), the Q2 2006 charge
related to the litigation settlement and refinements to such estimates recognized in subsequent periods, the Q3 2007 charge related to a
coinsurance transaction, and less income tax assets and assuming conversion of the convertible preferred stock (a non-GAAP financial measure)
to average common shareholders’ equity at September 30, 2007, is as follows (dollars in millions):
(Continued from previous page)
68
Other Business
CIG
Bankers
Colonial Penn
in Run-off
Corporate
Total
Average common shareholders' equity, excluding accumulated other
comprehensive income (loss), the Q2 2006 charge related to the
litigation settlement and refinements to such estimates
recognized in subsequent periods, the Q3 2007 charge related
to a coinsurance transaction, and less income tax assets
representing net operating loss carryforwards and assuming
conversion of convertible preferred stock (a non-GAAP
financial measure)
1,639.0
$
1,305.8
$
107.9
$
242.9
$
210.6
$
3,506.2
$
Average litigation settlement charges and refinements
to such estimates recognized in subsequent periods
(122.4)
Average charge related to a coinsurance transaction
(8.3)
Average net operating loss carryforwards
1,349.1
Average accumulated other comprehensive income (loss)
(188.7)
Average total shareholders' equity
4,535.9
Average preferred stock
(333.9)
Average common shareholders' equity
4,202.0
$
Return on equity ratios:
Return on equity
0.0%
Operating return on equity, excluding accumulated other
comprehensive income (loss), the 2Q 2006 charge related to
the litigation settlement and refinements to such estimates
recognized in subsequent periods, the Q3 2007 charge
related to a coinsurance transaction, and less income tax
assets representing net operating loss carryforwards
and assuming conversion of convertible preferred stock
(a non-GAAP financial measure)
3.7%
10.4%
13.8%
-66.9%
2.4%
1.5%

Information Related to Certain Non-GAAP Financial Measures
Debt to capital ratio, excluding accumulated other comprehensive income (loss)
This non-GAAP financial measure differs from the debt to capital ratio because accumulated other comprehensive income has been excluded
from the value of capital used to determine this measure. Management believes this non-GAAP financial measure is useful because it removes
the volatility that arises from changes in accumulated other comprehensive income. Such volatility is often caused by changes in the estimated
fair value of our investment portfolio resulting from changes in general market interest rates rather than the business decisions made by
management.
69

Information Related to Certain Non-GAAP Financial Measures
Reconciliations of the: (i) debt to capital ratio to debt to capital, excluding accumulated other comprehensive loss; and (ii) debt and preferred
stock to capital ratio to debt and preferred stock to capital, excluding accumulated other comprehensive loss, are as follows (dollars in millions):
Q3 06
Q4 06
Q1 07
Q2 07
Q3 07
Corporate notes payable
805.6
$
1,000.8
$
999.3
$
1,197.8
$
1,195.7
$
Total shareholders' equity
4,712.7
4,713.1
4,724.0
4,375.3
4,303.7
Total capital
5,518.3
5,713.9
5,723.3
5,573.1
5,499.4
Less accumulated other comprehensive loss
71.8
72.6
41.8
329.9
316.0
Total capital, excluding accumulated other
comprehensive loss
(a non-GAAP financial measure)
5,590.1
$
5,786.5
$
5,765.1
$
5,903.0
$
5,815.4
$
Corporate notes payable
805.6
$
1,000.8
$
999.3
$
1,197.8
$
1,195.7
$
Preferred stock
667.8
667.8
667.8
-
-
Total notes payable and preferred stock
1,473.4
$
1,668.6
$
1,667.1
$
1,197.8
$
1,195.7
$
Corporate notes payable to capital ratios:
Corporate debt to total capital
14.6%
17.5%
17.5%
21.5%
21.7%
Corporate debt to total capital, excluding
accumulated other comprehensive loss
(a non-GAAP financial measure)
14.4%
17.3%
17.3%
20.3%
20.6%
Corporate debt and preferred stock
to total capital
26.7%
29.2%
29.1%
21.5%
21.7%
Corporate debt and preferred stock
to total capital, excluding accumulated
other comprehensive loss (a non-GAAP
financial measure)
26.4%
28.8%
28.9%
20.3%
20.6%
70