
Preliminary View of
Fourth Quarter 2007
Financial and Operating Results
Conseco, Inc.

Forward-Looking Statements
Cautionary Statement Regarding Forward-Looking Statements. Our statements, trend analyses and other information contained in these
materials relative to markets for Conseco’s products and trends in Conseco’s operations or financial results, as well as other statements, contain
forward-looking statements within the meaning of the federal securities laws and the Private Securities Litigation Reform Act of 1995. Forward-
looking statements typically are identified by the use of terms such as “anticipate,” “believe,” “plan,” “estimate,” “expect,” “project,” “intend,”
“may,” “will,” “would,” “contemplate,” “possible,” “attempt,” “seek,” “should,” “could,” “goal,” “target,” “on track,” “comfortable with,” “optimistic” and
similar words, although some forward-looking statements are expressed differently. You should consider statements that contain these words
carefully because they describe our expectations, plans, strategies and goals and our beliefs concerning future business conditions, our results
of operations, financial position, and our business outlook or they state other ‘‘forward-looking’’ information based on currently available
information. Assumptions and other important factors that could cause our actual results to differ materially from those anticipated in our forward-
looking statements include, among other things: (i) our ability to obtain adequate and timely rate increases on our supplemental health products
including our long-term care business; (ii) mortality, morbidity, usage of health care services, persistency, the adequacy of our previous reserve
estimates and other factors which may affect the profitability of our insurance products; (iii) changes in our assumptions related to the cost of
policies produced or the value of policies inforce at the Effective Date; (iv) the recoverability of our deferred tax asset; (v) changes in accounting
principles and the interpretation thereof; (vi) our ability to achieve anticipated expense reductions and levels of operational efficiencies including
improvements in claims adjudication and continued automation and rationalization of operating systems; (vii) performance of our investments;
(viii) our ability to identify products and markets in which we can compete effectively against competitors with greater market share, higher
ratings, greater financial resources and stronger brand recognition; (ix) the ultimate outcome of lawsuits filed against us and other legal and
regulatory proceedings to which we are subject; (x) our ability to remediate the material weakness in internal controls over the actuarial reporting
process that we identified at year-end 2006 and to maintain effective controls over financial reporting; (xi) our ability to continue to recruit and
retain productive agents and distribution partners and customer response to new products, distribution channels and marketing initiatives; (xii)
our ability to achieve eventual upgrades of the financial strength ratings of Conseco and our insurance company subsidiaries as well as the
potential impact of rating downgrades on our business; (xiii) the risk factors or uncertainties listed from time to time in our filings with the
Securities and Exchange Commission; (xiv) regulatory changes or actions, including those relating to regulation of the financial affairs of our
insurance companies, such as the payment of dividends to us, regulation of financial services affecting (among other things) bank sales and
underwriting of insurance products, regulation of the sale, underwriting and pricing of products, and health care regulation affecting health
insurance products; (xv) general economic conditions and other factors, including prevailing interest rate levels, stock and credit market
performance and health care inflation, which may affect (among other things) our ability to sell products and access capital on acceptable terms,
the returns on and the market value of our investments, and the lapse rate and profitability of policies; and (xvi) changes in the Federal income
tax laws and regulations which may affect or eliminate the relative tax advantages of some of our products. Other factors and assumptions not
identified above are also relevant to the forward-looking statements, and if they prove incorrect, could also cause actual results to differ
materially from those projected. All written or oral forward-looking statements attributable to us are expressly qualified in their entirety by the
foregoing cautionary statement. Our forward-looking statements speak only as of the date made. We assume no obligation to update or to
publicly announce the results of any revisions to any of the forward-looking statements to reflect actual results, future events or developments,
changes in assumptions or changes in other factors affecting the forward-looking statements.
2

Preliminary Results
As previously announced, the Company has been consulting with the staff of the SEC’s Office of the Chief Accountant
(the “SEC staff”) regarding its accounting policy for long-term care premium rate increases, as described in the Summary
of Significant Accounting Policies in Conseco’s 2006 Form 10-K. As previously disclosed, Conseco has used a method
which prospectively changes reserve assumptions for long-term care policies when premium rate increases differ from
original assumptions. On February 28, 2008, the SEC staff informed Conseco of their view that the use of this method is
not consistent with the guidance of Statement of Financial Accounting Standards No. 60, “Accounting and Reporting by
Insurance Enterprises.” The Company is continuing to evaluate the SEC staff’s view, including its effects on the
preliminary earnings reported herein and the possible effects in prior periods. Due to this ongoing evaluation, the
Company has not completed its financial statements for the year ended December 31, 2007. As a result, all financial
results described herein should be considered preliminary, and are subject to change to reflect any necessary adjustments
that are identified before the Company completes its financial statements and files its Form 10-K for the year ended
December 31, 2007.
This presentation contains the following financial measures that differ from the comparable measures under Generally
Accepted Accounting Principles (GAAP): operating earnings measures; and earnings before net realized investment
gains (losses). Reconciliations between those non-GAAP measures and the comparable GAAP measures are included in
the Appendix or the page such measure is presented.
While management believes these measures are useful to enhance understanding and comparability of our financial
results, these non-GAAP measures should not be considered substitutes for the most directly comparable GAAP
measures.
Additional information concerning non-GAAP measures is included in our periodic filings with the Securities and Exchange
Commission that are available in the “Investor – SEC Filings” section of Conseco’s website, www.conseco.com.
Non-GAAP Measures
3

Q4 2007
Preliminary Financial Summary
CNO
BLC and CP continue to have strong results
CP results negatively impacted by cost of expanding product
line with PFFS
CIG results negatively affected by unlocking adjustment in
interest-sensitive life block and other non-recurring
adjustments
LTC Closed Block: second stable quarter as a result of Q2
2007 reserve strengthening; approaching breakeven
No change in net NOL for 2007, nor in earnings outlook;
deferred tax valuation allowance increased by $68 million as a
result of 2007 operating and capital losses
Share repurchases
Q4 2007: $22.9 million (1.7 million shares at average of $13.29/share)
4

Financial Statement Status
Resolution outstanding on accounting for long-term care future loss reserves
Form 10-K will be filed as soon as practical (no later than 3/28)
Long-Term Care Reserves
Overall reserve adequacy (Gross Premium Valuation is positive)
Prospective unlocking: reserve pivot
Relates to additional Active Life Reserves which were set up corresponding to LTC rate
increases
SEC staff has indicated that pivoting is not consistent with FAS 60
Affected Bankers LTC for 2006 and 2007, and LTC Closed Block for 2007
Adjustments have been made back to 2006 as part of restatement
Future loss reserves under FAS 60 Paragraph 37
No impact on underlying economics
Impact relates to incidence of profits over the life of the business
The combination of releasing the previously established pivot reserve and recognition of a
future loss reserve is expected to be marginally accretive to our earnings
The Company currently estimates that adjustments to reflect the SEC staff’s view may have
the effect of reducing the preliminary loss reported for Q4 2007 by up to $5 million (or 3
cents per share)
Q4 2007
Summary of Other Issues
CNO
5
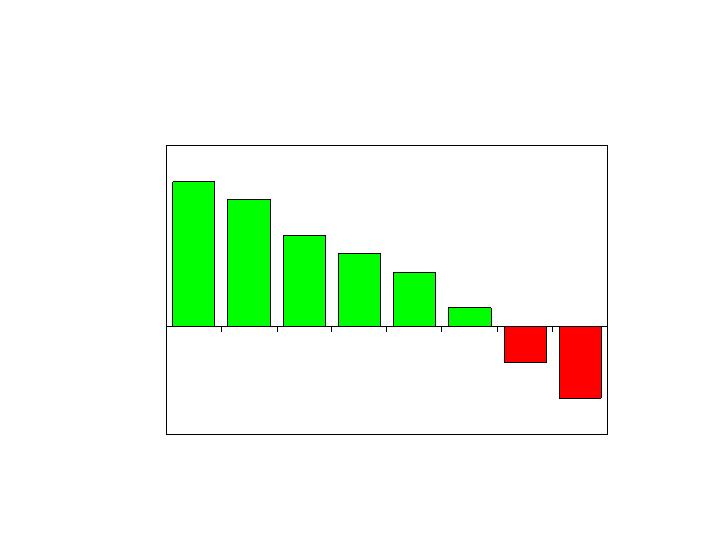
Before Effect of
Future Loss Reserve
CNO
Profit
Breakeven
Loss
Policy Year
1
2
3
4
5
6
7
8
Illustrative Example
6
Profit
Pivoting
CNO
Breakeven
Loss
Policy Year
1
2
3
4
5
6
7
8
Illustrative Example
7
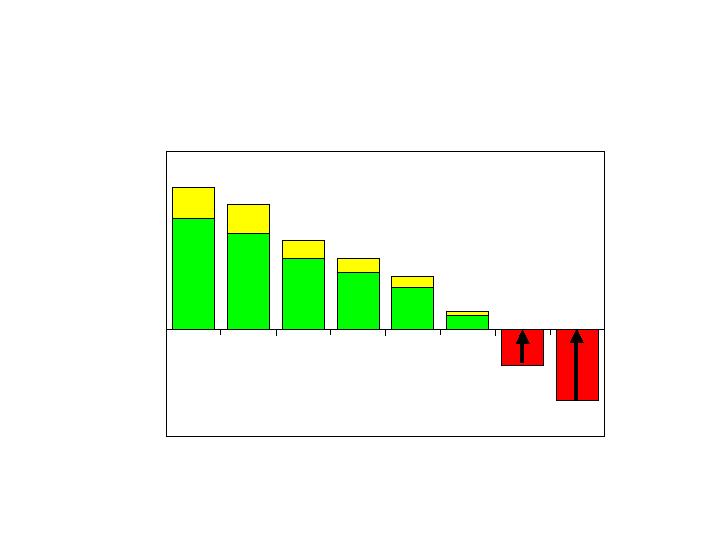
Profit
After Effect of
Future Loss Reserve
CNO
Breakeven
Loss
Policy Year
1
2
3
4
5
6
7
8
Illustrative Example
8

Profit
Pivot vs Future Loss Reserve
CNO
Breakeven
Loss
Policy Year
1
2
3
4
5
6
7
8
Illustrative Example
FLR
Pivot
9

Remediation
Material control weakness first disclosed in 2006 Form 10-K
2007 plan has been completed, plus additional items from scope
expansion
Examined more than 2,400 policy forms: Specified Disease, LTC, Life
Adjustments have been pushed back to corresponding periods with
restatement
2008 focus on sustainable, systematic control improvements
Restatement
Annual financial statements for 2005 and 2006
Quarterly financial information for 2006 and 2007
Selected consolidated financial data for 2003 and 2004
Primarily based upon the cumulative impact of errors identified in 2007
during the procedures performed in an effort to remediate the material
internal control weakness
Will provide a better basis for comparisons between periods
Q4 2007
Summary of Other Issues (cont.)
CNO
10

Bankers Life*
Colonial Penn
Conseco Insurance Group
LTC Closed Block*
Corporate and interest expense
Income before net realized investment losses***
Net realized investment losses
Total*
Earnings before net realized investment losses and
valuation allowance for deferred tax assets, per
diluted share (a non-GAAP measure)****
Q4 2007
Preliminary Summary of Results
CNO
$58.3
(0.2)
7.7
(11.3)
(22.0)
32.5
(35.4)
$(2.9)
Pre-Tax
After Tax**
EPS**
($ millions, except per share amounts)
$(49.2)
(23.0)
$(72.2)
$(0.27)
(0.12)
$(0.39)
$0.10
*Pending finalization of future loss reserves under FAS 60 Paragraph 37. The Company currently
estimates that adjustments to reflect the SEC staff’s view may have the effect of reducing the preliminary loss
reported for Q4 2007 by up to $5 million (or 3 cents per share).
**Income tax expense includes $68 million ($0.37 per share) increase in deferred tax valuation allowance.
***Management believes that an analysis of earnings before net realized investment gains (losses) and taxes (a
non-GAAP financial measure) provides an alternative measure of the operating results of the company
because it excludes net realized gains (losses) that are unrelated to the company’s underlying fundamentals.
The chart above provides a reconciliation to the corresponding GAAP measure.
****See the Appendix for a reconciliation to the corresponding GAAP measure.
11

Bankers Life*
Colonial Penn
Conseco Insurance Group
LTC Closed Block*
Corporate and interest expense
Cost related to litigation settlement
Loss related to coinsurance transaction
Income before net realized investment losses***
Net realized investment losses
Total*
Net operating income before: (1) refinements to a litigation
settlement; (2) a Q3 2007 charge related to a coinsurance
transaction; and (3) the Q4 2007 valuation allowance for
deferred tax assets per diluted share (a non-GAAP
measure)****
2007 Full Year
Preliminary Summary of Results
CNO
$233.0
18.1
102.7
(202.4)
(89.1)
(64.4)
(76.5)
(78.6)
(119.7)
$(198.3)
Pre-Tax
After Tax**
EPS**
($ millions, except per share amounts)
$(132.3)
(77.8)
$(210.1)
$(0.76)
(0.45)
$(1.21)
$0.16
*Pending finalization of future loss reserves under FAS 60 Paragraph 37. The Company currently estimates
that adjustments to reflect the SEC staff’s view may have the effect of reducing the preliminary loss
reported for the year ended December 31, 2007 by up to $15 million (or 9 cents per share).
**Income tax expense includes $68 million ($0.39 per share) increase in deferred tax valuation allowance.
***Management believes that an analysis of earnings before net realized investment gains (losses) and taxes (a
non-GAAP financial measure) provides an alternative measure of the operating results of the company
because its excludes net realized gains (losses) that are unrelated to the company’s underlying fundamentals.
The chart above provides a reconciliation to the corresponding GAAP measure.
****See the Appendix for a reconciliation to the corresponding GAAP measure.
12

Consolidated RBC ratio
296% at 12/31/07 vs 357% at 12/31/06
Investments
$362.7 million of investment income in Q4 2007
Earned yield of 5.95% in Q4 2007
94% of bonds investment grade at 12/31/07*
Corporate liquidity
Available holding company liquidity exceeds $90 million at 12/31/07;
plus $80 million revolver
Preliminary Financial Indicators
CNO
*Excludes investments from consolidated variable interest entity.
13
Collected Premiums
CNO
Strong, consistent
growth in Bankers
and Colonial Penn
Less consistent
growth in CIG due to
focus on more
profitable business
BLC
2004
$3,881.4
2005
$3,925.9
2006
$4,286.5
2007
$4,314.1
($ millions)
CP
CIG
Run-Off
14

Q4 2007 New Annualized Premium (NAP) of $58.3 million, 4%
above Q4 2006, total year NAP up 10%
Earnings driven by improved spreads and higher PDP/PFFS
income
Effective July 1, 2007, entered into a quota-share reinsurance
agreement related to certain group PFFS business sold by
Coventry
Adding $2.0 million of pretax earnings quarterly
LTC premium re-rates (as of 3/6/08):
Submitted: $45.6 million (100% of goal)
Approved: $20.1 million (63% of goal)
Implemented: $19.4 million (61% of goal)
Financial impact: $16.5 million (60% of goal)
Summary
Bankers
15

2007 Strong Distribution Results:
Growth in Key Metrics
Bankers
$294 million NAP = 10% growth
Strong Med Advantage and Life sales
Flat LTC
Lower Med Supp and Annuities
Improved agent productivity while growing quantity
4,480 agents at 12/31/07, up 10% vs 12/31/06
13% growth in new agent contracts
$67,000 average agent production = 4% growth
16
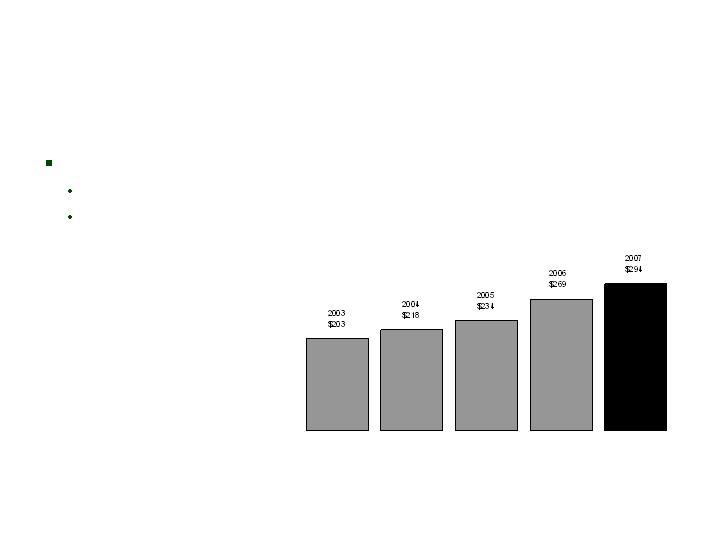
NAP Growth: 2003-2007
10% compound annual growth since 2003
Annual NAP up $90 million during period
Increases driven by agent productivity and growth plus
new product offerings (primarily Life/PDP/PFFS)
Bankers
($ millions)
17

Q4 2007 NAP of $9.3 million, 25% above Q4 2006, total year
NAP up 27%
Expanded product line into PFFS market in Q4 2007
$8.4 million of expenses charged to income
Agreement to recapture block of life insurance business
previously reinsured, effective 10/1/07
Recapture fee (purchase price): $63 million
Immediately accretive to income and ROE
Summary
Colonial Penn
18

Q4 2007 NAP of $19.7 million, 18% less than Q4 2006, total year NAP
down 21%
Decreases in Medicare supplement and annuities, consistent with CIG’s
focus on more profitable business
Higher value from new business compared to Q4 2006 and full year 2006,
despite lower sales
Strong sales gains in specified disease, up 30% from Q4 2006 and full year
2006
Q4 2007 earnings driven by:
Unlocking adjustments on the interest-sensitive life block of business
Slight increase in benefit ratios on health products
Loss of annuity profits from block coinsured in October 2007
Lower expenses
Summary
CIG
19
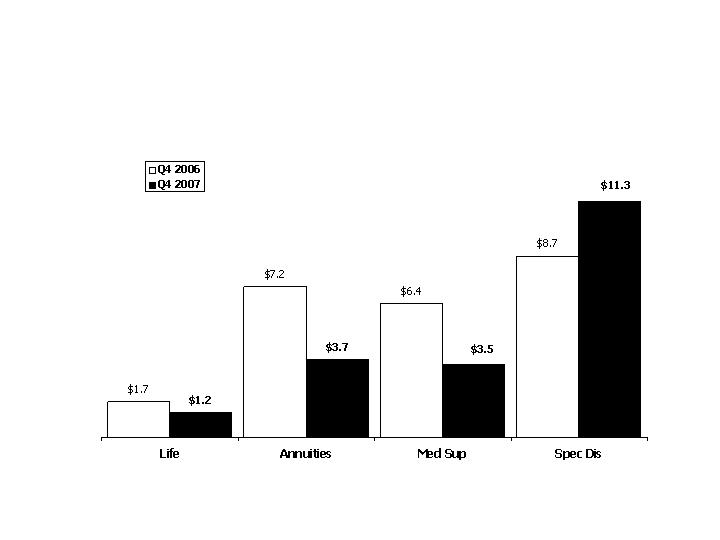
NAP: Q4 2006 vs Q4 2007
CIG
($ millions)
20

Significant reserve strengthening in Q2 2007 has stabilized
results
Active rate management, improved claims-paying practices and
expense efficiency improvements have contributed to reduced
losses
Earnings are approaching breakeven
Migration to LTCG system and processes on track
Summary
LTC Closed Block
21

Q2 2007 claims reserving actions generated stability in Q3 and Q4 2007:
Favorable prior-period development continues
Verified claims for all periods stable
Verified Incurred
Development*
*Excludes waiver-of-premium and return-of-premium benefits.
LTC Closed Block
Reported Claims
Prior Period Development
Verified Claims as of Reporting Date
Verified Claims Developed through:
12/31/04
12/31/05
12/31/06
3/31/07
6/30/07
9/30/07
12/31/07
($ millions)
Q3 2007
$100.7
3.3
104.0
104.0
102.3
Q2 2007
$212.0
(109.7)
102.3
102.3
103.0
107.1
Q1 2007
$119.7
(34.9)
84.7
84.7
104.2
103.6
106.3
2006
$433.3
(72.2)
361.1
361.1
375.1
418.3
414.4
412.2
2005
$396.0
(58.9)
337.2
337.2
365.0
368.8
389.2
388.7
391.0
2004
$370.8
(44.2)
326.6
326.6
326.0
337.7
344.2
356.5
356.6
356.6
Developed
Deficiencies
in Periods
Prior to 2004
$0.0
0
0
44.2
103.7
136.4
147.1
161.4
162.3
165.0
Q4 2007
$104.7
1.8
106.5
106.5
22

Increase in claims paid in Q4 2007 driven by inventory reduction
Claimant count estimates remain around 12,000, with paid claims continuing near $100 million
Q3 2007 termination rate reflects prior-period deaths and terminations
Operating Data
LTC Closed Block
Claims Paid (mils.)
Open Claimant Counts
In Force Policy Counts
Ann. Termination Rates
Q4 2005
$83.1
12,290
201,649
2.3%
Q1 2006
$90.4
11,805
197,585
7.8%
Q2 2006
$101.2
12,536
194,080
6.9%
Q3 2006
$96.1
12,228
190,134
7.9%
Q4 2006
$81.64
12,048
187,123
6.2%
Q1 2007
$102.0
11,870
183,655
7.2%
Q2 2007
$96.8
12,424
179,952
7.8%
Q3 2007
$99.1
12,121
175,685
8.9%
Q4 2007
$104.9
12,338
172,222
7.7%
23

Premium Re-rates
(as of 3/13/08)
LTC Closed Block
Round 1 - exceeded each goal:
Re-rates submitted: $64.0 million (115% of goal)
Re-rates approved: $45.8 million (110% of goal)
Re-rates implemented: $44.4 million (106% of goal)
Re-rates financial impact: $37.3 million (106% of goal)
Round 2 – on track to achieve goals:
Re-rates submitted: $41.8 million (98% of goal)
Re-rates approved: $16.7 million (65% of goal)
Re-rates implemented: $13.5 million (53% of goal)
Re-rates financial impact: $10.8 million (52% of goal)
24

Continue working within the regulatory environment to
achieve equitable and actuarially justified rate increases
Continue progress on claims-paying improvements and
expense efficiencies
Reduce future exposure and volatility of this block
What We Have Left to Do
LTC Closed Block
25
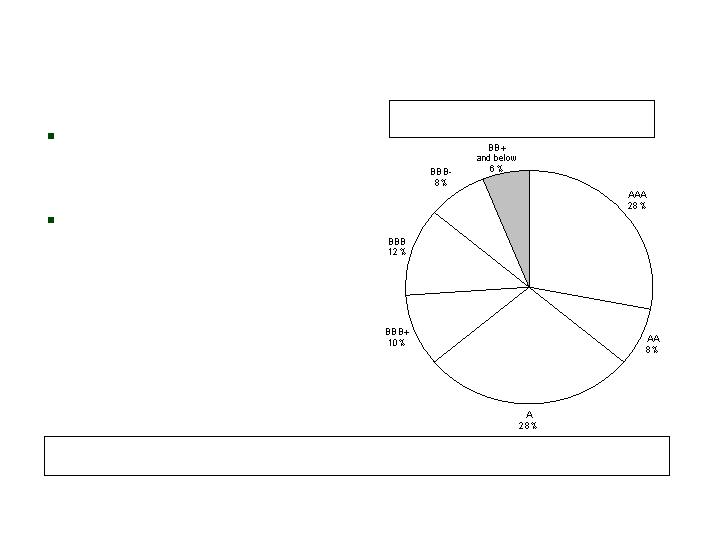
Investment Quality*
CNO
Below-investment grade
securities represent 6% of
total portfolio
Limited new money
allocation to below-
investment grade securities
Actively Managed Fixed Maturities by Rating at
12/31/07 (Market Value)
12/31/07
94%
9/30/07
94%
6/30/07
94%
3/31/07
95%
12/31/06
95%
% of Bonds which are Investment Grade:
*Consistent with prior quarters’ presentations, excludes investments from variable interest entity we are required
to consolidate for GAAP financial reporting (such assets and the related liabilities are legally separated)
26

Structured securities and
asset-backed securities
represent 25% of total
actively managed fixed
maturity securities
Over 88% “AAA” rated
Structured Securities at 12/31/07
CNO
(Market value in millions)
Pass-throughs, sequentials and
equivalent securities
$2,048.0
40.1%
Planned amortization class, target
amortization class, and accretion-
directed bonds
$1,596.1
31.3%
Commercial
mortgage-backed
securities
$965.5
18.9%
Other
$58.5
1.1%
Asset-backed securities
$440.2
8.6%
27
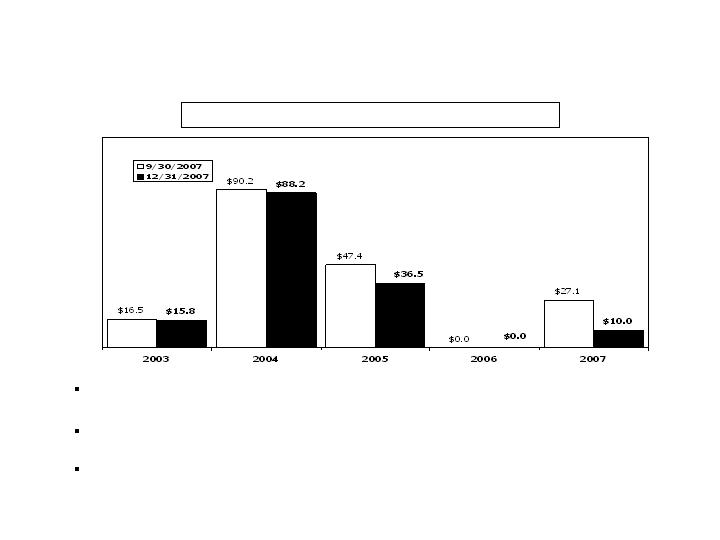
Sub-Prime Home Equity ABS
CNO
Market value represents 0.52% of invested assets at 12/31/07, compared to 0.57% at
9/30/07 and 0.70% at 12/31/06
Reduced sub-prime exposure by over 17% during Q4 2007, including 63% of 2007 vintage,
and over 51% during 2007
Reduction of exposure in Q4 2007 reflects dispositions of $28.3 million and writedowns of
$10.4 million for securities held at year-end
Exposure by Vintage Year (Book Value in millions)
28

Sub-Prime Home Equity ABS
at 12/31/07
CNO
AAA
AA
A
BBB
Total
$39.9
$40.8
$41.9
$0.5
$123.1
$42.5
$48.9
$58.6
$0.5
$150.5
32.4%
33.1%
34.0%
0.5%
100.0%
0.17%
0.17%
0.18%
0.00%
0.52%
Market
Value (mil.)
Book
Value (mil.)
% of
Subprime*
% of
Portfolio*
Rating
No exposure to “affordability products” – negative amortization, option ARM
collateral, etc.
Only $0.5 million (market value) rated lower than A category
Current support in structures meets original expectations
Remaining portfolio generally reflects substantial margin for adverse development
of cash flows/delinquencies
646
641
643
664
643
Avg.
FICO
41.6%
28.6%
19.4%
44.8%
28.7%
Avg.
Support
9.2%
9.0%
7.1%
23.6%
8.4%
Avg. 60+
Delinq.
*% of market value.
29

No ABS CDO investments
No hedge fund investments
No “mark to model” structured securities
No NIM securities
No CDO Squared Investments
Nominal (<$10 million par) third-party CLO/structured credit
exposure
Highly developed cashflow and default analytic models, along
with rigorous management oversight processes
Sub-Prime Home Equity ABS
and Structured Credit
CNO
30
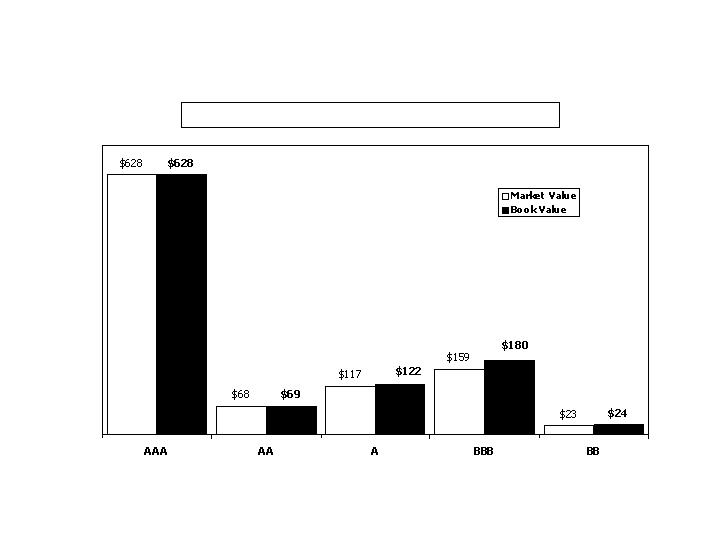
CMBS Exposure Summary
at 12/31/07
CNO
Exposure by Rating Category (in millions)
$995
$1,023
31

CNO Recap
Core businesses
Bankers Life and Colonial Penn – continued strong results, focused
on profitable growth
CIG
Greater focus on distinctive capabilities
Producing more economic value from refocused sales efforts
Run-off LTC block
Claims reserve volatility reduced
Run rate losses per quarter, trending toward breakeven
Continued progress on turnaround, increasingly visible
Stage being set to pursue reduction in LTC exposure
32

CNO Recap (cont.)
Changing the portfolios of the business
Annuity coinsurance deal with Swiss Re closed; released capital
from low-return business
Recapture of Colonial Penn life block from Swiss Re; higher-
return core business for CNO
Operations
Bulk of organizational realignment completed
Remaining real estate realignment (Chicago) to occur in Q2 2008
– expect to record pre-tax loss of approximately $15 million
33

Q4 2007
Normalization of Preliminary Earnings
CNO
Q4 2007 pre-tax income (loss) – as reported*
Loss on termination of interest-rate swaps
Cost of initial marketing of PFFS product
through direct distribution channel
Excess expense related to consolidation of
operations
Unlocking adjustments on interest-sensitive life
Other non-recurring
Q4 2007 pre-tax income (loss) - adjusted
BLC
$58.3
-
-
-
-
-
$58.3
($ millions)
CP
$(0.2)
-
8.4
-
-
-
$8.2
CIG
$7.7
4.2
-
3.3
17.0
1.4
$33.6
LTC
Run-Off
$(11.3)
-
-
-
-
-
$(11.3)
Corp.
$(22.0)
-
-
-
-
-
$(22.0)
Consol.
$32.5
4.2
8.4
3.3
17.0
1.4
$66.8
Factors impacting 2008
Expense savings
Vacating Mart
Operations consolidation
LTC re-rates
*Refer to page 11 for a reconciliation to the corresponding GAAP measure.
34

Next Steps/Expectations
Complete evaluation and calculation of future loss reserves
Filing of 10-K
Full earnings release call and investor deck presentation
35

Questions and Answers

Appendix

Information Related to Certain Non-GAAP Financial Measures
The following provides additional information regarding certain non-GAAP measures used in this presentation. A non-GAAP measure is a
numerical measure of a company’s performance, financial position, or cash flows that excludes or includes amounts that are normally excluded or
included in the most directly comparable measure calculated and presented in accordance with GAAP. While management believes these
measures are useful to enhance understanding and comparability of our financial results, these non-GAAP measures should not be considered as
substitutes for the most directly comparable GAAP measures. Additional information concerning non-GAAP measures is included in our periodic
filings with the Securities and Exchange Commission that are available in the “Investor – SEC Filings” section of Conseco’s website,
www.conseco.com.
Operating earnings measures
Management believes that an analysis of net income applicable to common stock before net realized gains or losses (“net operating income”, a
non-GAAP financial measure) is important to evaluate the performance of the Company and is a key measure commonly used in the life insurance
industry. Management uses this measure to evaluate performance because realized investment gains or losses can be affected by events that
are unrelated to the Company’s underlying fundamentals.
In addition, our results were affected by unusual and significant charges related to: (i) a litigation settlement in Q2 2006 and refinements to such
estimates recognized in subsequent periods; (ii) a Q3 2007 charge related to a coinsurance transaction; and (iii) a Q4 2007 valuation allowance for
deferred tax assets. Management does not believe that similar charges are likely to recur within two years, and there were no similar charges
recognized within the prior two years. Management believes an analysis of operating earnings before these charges is important to evaluate the
performance of the Company prior to the effect of these unusual and significant charges.
38

Information Related to Certain Non-GAAP Financial Measures
A reconciliation of net income applicable to common stock to the net operating income, excluding: (i) Q2 2006 charge related to the litigation settlement and
refinements to such estimates recognized in subsequent periods; (ii) a Q3 2007 charge related to a coinsurance transaction; and (iii) a Q4 2007 valuation
allowance for deferred tax assets (and related per share amounts) is as follows (dollars in millions, except per share amounts):
Q4 2007
YTD 2007
Net loss applicable to common stock
(72.2)
$
(210.1)
$
Net realized investment losses, net of related amortization and taxes
23.0
77.8
Net operating loss (a non-GAAP financial measure)
(49.2)
(132.3)
Q2 2006 charge related to the litigation settlement and refinements to such
estimates recognized in subsequent periods, net of taxes
-
41.9
Q3 2007 charge related to a coinsurance transaction, net of taxes
-
49.7
Q4 2007 valuation allowance for deferred tax assets
68.0
68.0
Net operating income before: (i) Q2 2006 charge related to the
litigation settlement and refinements to such estimates
recognized in subsequent periods; (ii) a Q3 2007 charge related to
a coinsurance transaction; and (iii) a Q4 2007 valuation allowance
for deferred tax assets (a non-GAAP financial measure)
18.8
$
27.3
$
Per diluted share:
Net loss
(0.39)
$
(1.21)
$
Net realized investment losses, net of related amortization and taxes
0.12
0.45
Net operating loss (a non-GAAP financial measure)
(0.27)
(0.76)
Q2 2006 charge related to the litigation settlement and refinements to such
estimates recognized in subsequent periods, net of taxes
-
0.24
Q3 2007 charge related to a coinsurance transaction, net of taxes
-
0.29
Q4 2007 valuation allowance for deferred tax assets
0.37
0.39
Net operating income before: (i) Q2 2006 charge related to the
litigation settlement and refinements to such estimates
recognized in subsequent periods; (ii) a Q3 2007 charge related to
a coinsurance transaction; and (iii) a Q4 2007 valuation allowance
for deferred tax assets (a non-GAAP financial measure)
0.10
$
0.16
$
39