
First Quarter 2008
Financial and Operating Results
For the period ended March 31, 2008
Conseco, Inc.

Forward-Looking Statements
Cautionary Statement Regarding Forward-Looking Statements. Our statements, trend analyses and other information contained in these
materials relative to markets for Conseco’s products and trends in Conseco’s operations or financial results, as well as other statements, contain
forward-looking statements within the meaning of the federal securities laws and the Private Securities Litigation Reform Act of 1995. Forward-
looking statements typically are identified by the use of terms such as “anticipate,” “believe,” “plan,” “estimate,” “expect,” “project,” “intend,”
“may,” “will,” “would,” “contemplate,” “possible,” “attempt,” “seek,” “should,” “could,” “goal,” “target,” “on track,” “comfortable with,” “optimistic” and
similar words, although some forward-looking statements are expressed differently. You should consider statements that contain these words
carefully because they describe our expectations, plans, strategies and goals and our beliefs concerning future business conditions, our results
of operations, financial position, and our business outlook or they state other ‘‘forward-looking’’ information based on currently available
information. Assumptions and other important factors that could cause our actual results to differ materially from those anticipated in our forward-
looking statements include, among other things: (i) our ability to obtain adequate and timely rate increases on our supplemental health products
including our long-term care business; (ii) mortality, morbidity, usage of health care services, persistency, the adequacy of our previous reserve
estimates and other factors which may affect the profitability of our insurance products; (iii) changes in our assumptions related to the cost of
policies produced or the value of policies inforce at the Effective Date; (iv) the recoverability of our deferred tax asset; (v) changes in accounting
principles and the interpretation thereof; (vi) our ability to achieve anticipated expense reductions and levels of operational efficiencies including
improvements in claims adjudication and continued automation and rationalization of operating systems; (vii) performance of our investments;
(viii) our ability to identify products and markets in which we can compete effectively against competitors with greater market share, higher
ratings, greater financial resources and stronger brand recognition; (ix) the ultimate outcome of lawsuits filed against us and other legal and
regulatory proceedings to which we are subject; (x) our ability to remediate the material weakness in internal controls over the actuarial reporting
process that we identified at year-end 2006 and to maintain effective controls over financial reporting; (xi) our ability to continue to recruit and
retain productive agents and distribution partners and customer response to new products, distribution channels and marketing initiatives; (xii)
our ability to achieve eventual upgrades of the financial strength ratings of Conseco and our insurance company subsidiaries as well as the
potential impact of rating downgrades on our business; (xiii) the risk factors or uncertainties listed from time to time in our filings with the
Securities and Exchange Commission; (xiv) regulatory changes or actions, including those relating to regulation of the financial affairs of our
insurance companies, such as the payment of dividends to us, regulation of financial services affecting (among other things) bank sales and
underwriting of insurance products, regulation of the sale, underwriting and pricing of products, and health care regulation affecting health
insurance products; (xv) general economic conditions and other factors, including prevailing interest rate levels, stock and credit market
performance and health care inflation, which may affect (among other things) our ability to sell products and access capital on acceptable terms,
the returns on and the market value of our investments, and the lapse rate and profitability of policies; and (xvi) changes in the Federal income
tax laws and regulations which may affect or eliminate the relative tax advantages of some of our products. Other factors and assumptions not
identified above are also relevant to the forward-looking statements, and if they prove incorrect, could also cause actual results to differ
materially from those projected. All written or oral forward-looking statements attributable to us are expressly qualified in their entirety by the
foregoing cautionary statement. Our forward-looking statements speak only as of the date made. We assume no obligation to update or to
publicly announce the results of any revisions to any of the forward-looking statements to reflect actual results, future events or developments,
changes in assumptions or changes in other factors affecting the forward-looking statements.
2

Non-GAAP Measures
This presentation contains the following financial measures that differ from the comparable measures
under Generally Accepted Accounting Principles (GAAP): operating earnings measures; book value
excluding accumulated other comprehensive income (loss) per diluted share; operating return measures;
earnings before net realized investment gains (losses) and corporate interest and taxes; debt to capital
ratios, excluding accumulated other comprehensive income (loss); and interest-adjusted benefit ratios.
Reconciliations between those non-GAAP measures and the comparable GAAP measures are included
in the Appendix, or on the page such measure is presented.
While management believes these measures are useful to enhance understanding and comparability of
our financial results, these non-GAAP measures should not be considered substitutes for the most
directly comparable GAAP measures.
Additional information concerning non-GAAP measures is included in our periodic filings with the
Securities and Exchange Commission that are available in the “Investor – SEC Filings” section of
Conseco’s website, www.conseco.com.
3

Q1 2008 Summary
CNO
Highest quarterly sales for CNO
Record sales quarter at Bankers
Strong Colonial Penn sales growth from core products (22%) and new
products
CIG sales down, but specified disease up 23%
Continued improved performance in LTC Closed Block
Investment portfolio continues to perform, with other-than-
temporary impairment losses consistent with industry and
market conditions
Accounting for equity indexed products also affected results
EIAs hedged on economic basis
Accounting treatment causing volatility
4

Q1 2008 Issues Update
CNO
Results less volatile after choppy 2007
No significant out of period adjustments
No extraordinary DAC or VOBA (intangibles) charges
Third consecutive stable quarter in LTC Closed Block
Multi-state examination agreement
Chicago facilities consolidation on track for completion in Q2;
expect pre-tax charge of approximately $15 million
Continuing to explore strategic alternatives
5

Settlement of Multistate Examination
CNO
Conclusion of exam and settlement a positive step for CNO
No finding of practice of improper claims denials
Settlement requires:
Fine of up to $2.3 million, and up to $10 million if performance
benchmarks are not achieved
Review of certain claims from 2005-early 2007 ($4 million)
Implementation of detailed plan to improve timely processing of claims,
complaints and other processes ($26 million gross – no incremental
operating expenses)
6

Bankers Life
Colonial Penn
Conseco Insurance Group
LTC Run-off Block
Corporate and interest expense
Income before net realized investment losses*
Net realized investment losses
Total
Q1 2008
Summary of Results
CNO
$29.1
3.7
23.3
(1.3)
(23.1)
31.7
(40.8)
$(9.1)
Pre-Tax
After Tax
EPS
($ millions, except per share amounts)
$20.7
(26.5)
$(5.8)
$0.11
(0.14)
$(0.03)
*Management believes that an analysis of earnings before net realized investment gains (losses) and taxes (a
non-GAAP financial measure) provides an alternative measure of the operating results of the company
because it excludes net realized gains (losses) that are unrelated to the company’s underlying fundamentals.
The chart above provides a reconciliation to the corresponding GAAP measure.
7

Q1 Earnings
CNO Consolidated
*Management believes that an analysis of earnings before net realized investment gains (losses) and corporate
interest and taxes (“EBIT,” a non-GAAP financial measure) provides an alternative measure to compare the
operating results of the company quarter-over-quarter because it excludes: (1) corporate interest expense; and
(2) net realized gains (losses) that are unrelated to the company’s underlying fundamentals. The chart above
provides a reconciliation of EBIT to net income applicable to common stock.
8
($ millions)
Q1 2007
(Restated)
Q1 2008
Bankers Life
$45.5
$29.1
Colonial Penn
4.6
3.7
Conseco Insurance Group
33.5
23.3
Other Business in Run-Off
(26.1)
(1.3)
Corporate operations, excluding interest expense
(8.2)
(6.7)
EBIT, excluding costs related to a litigation settlement
49.3
48.1
Costs related to a litigation settlement
(13.0)
0.0
Total EBIT*
36.3
48.1
Corporate interest expense
(16.1)
(16.4)
Income before net realized investment losses and taxes
20.2
31.7
Tax expense
7.0
11.0
Net income before net realized investment losses
13.2
20.7
Preferred stock dividends
(9.5)
0.0
Net operating income
3.7
20.7
Net realized investment losses, net of related amortization and taxes
(13.7)
(26.5)
Net loss applicable to common stock
($10.0)
($5.8)

CNO fully hedges its current-year exposure to equity volatility (with future periods
subject to product repricing)
Hedge positions periodically adjusted for terminations
Terminations result in modestly overhedged position
Financial impact from overhedged position based on market performance
Accounting
FAS 157 fair value measurement adopted during Q1 2008
Liabilities include value of future option credits, which are not hedged in the current
period
Fluctuation in financial results a result of liability revaluation under FAS 133, not hedge
or asset performance
Fluctuation will continue over time – differences are temporary and balance out over
the life of the contracts
Equity Indexed Products
CNO
9
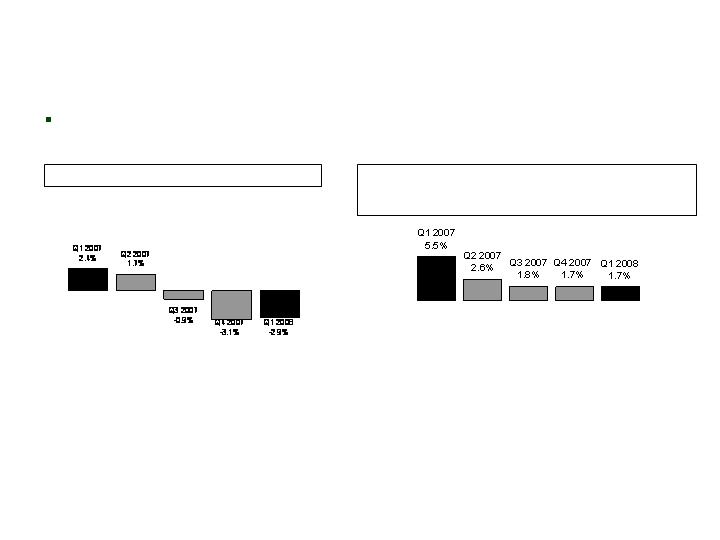
Operating ROE
CNO
Operating ROE*, Trailing 4 Quarters
Operating ROE (Before Litigation Settlement Charges,
Coinsurance Transaction and Valuation Allowance)**,
Trailing 4 Quarters
*Operating return excludes net realized
investment gains (losses). Equity excludes
accumulated other comprehensive income
(loss) and the value of net operating loss
carryforwards, and assumes conversion of
preferred stock. See Appendix for
corresponding GAAP measure.
**Operating return, as calculated and defined
on the left side of this page, but before: (1) Q2
2006 charge related to the litigation settlement
and refinements to such estimates recognized
in subsequent periods; (2) Q3 2007 charge
related to a coinsurance transaction; and (3) Q4
2007 valuation allowance for deferred tax
assets. See Appendix for corresponding GAAP
measure.
Conseco’s goal is to improve Operating ROE to 11% in 2009
10
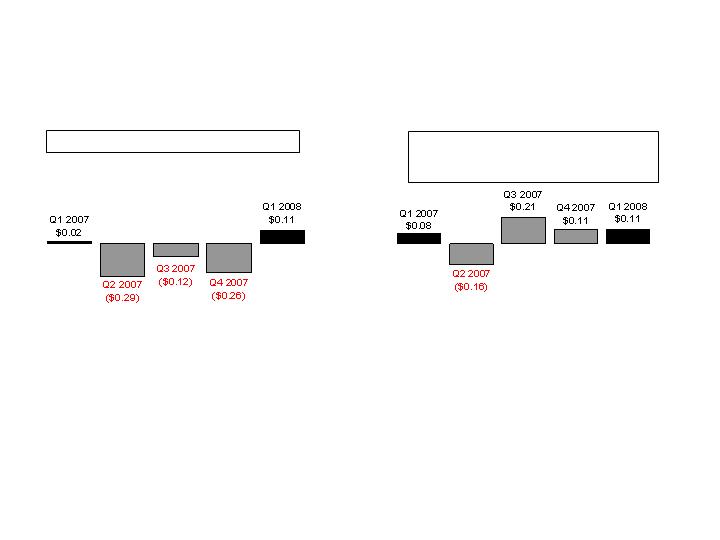
Operating EPS (Diluted)
CNO
Operating EPS (Before Litigation Settlement
Charges, Coinsurance Transaction and Tax
Valuation Allowance)**
**Operating earnings per share, before: (1) Q2
2006 charge related to the litigation settlement and
refinements to such estimates recognized in
subsequent periods; (2) Q3 2007 charge related to
a coinsurance transaction; and (3) Q4 2007
valuation allowance for deferred tax assets. See
Appendix for corresponding GAAP measure.
Operating EPS*
*Operating earnings per share exclude net
realized investment gains (losses). See Appendix
for corresponding GAAP measure.
11

Book value per diluted share (excluding accumulated other comprehensive loss)
$24.40 at 3/31/08 vs $24.41 at 12/31/07
Debt to total capital ratio (excluding accumulated other comprehensive loss)
21% at both 3/31/08 and 12/31/07
Consolidated RBC ratio
281% at 3/31/08 vs 296% at 12/31/07
Investments
$352.2 million of investment income in Q1 2008
Earned yield of 5.83% in Q1 2008
95% of bonds investment grade at 3/31/08**
Key indicators consistent with expectations
Financial Indicators*
CNO
*See appendix for detail on these indicators, including notes describing non-GAAP measures.
**Excludes investments from consolidated variable interest entity.
12
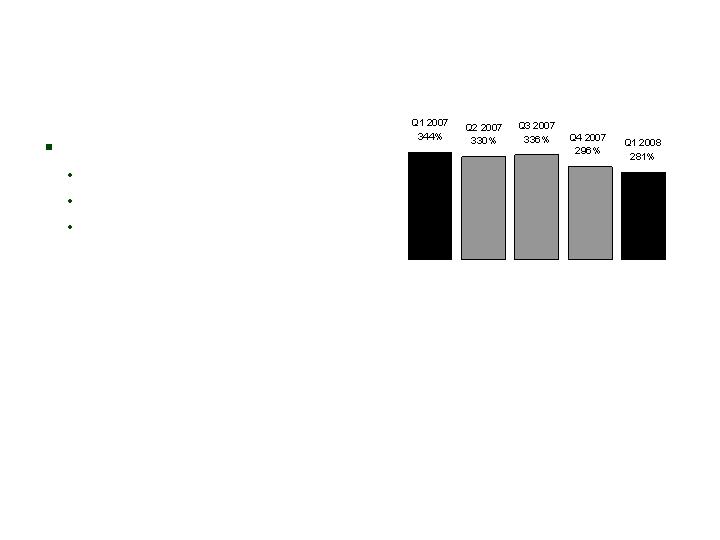
Consolidated RBC Ratio*
CNO
Decrease due primarily to:
Business growth
Statutory reserve pivoting
Changes in interest rate
environment
*Risk-Based Capital (“RBC”) requirements provide a tool for insurance regulators to determine the levels of
statutory capital and surplus an insurer must maintain in relation to its insurance and investment risks. The RBC
ratio is the ratio of the statutory consolidated adjusted capital of our insurance subsidiaries to RBC.
13
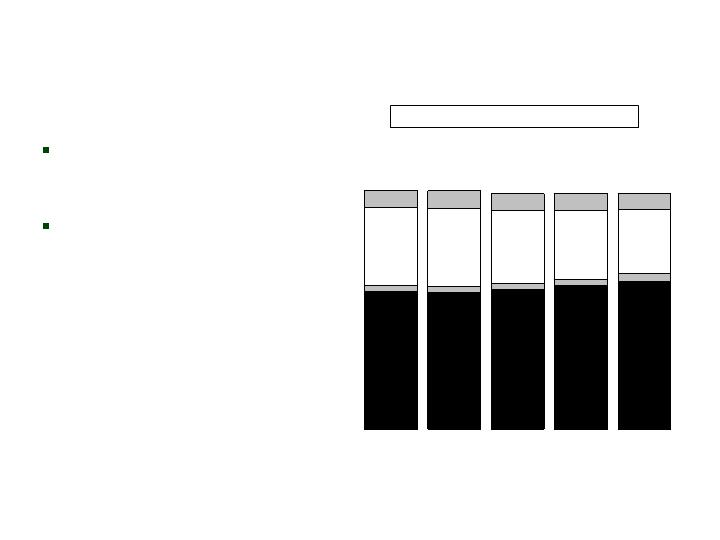
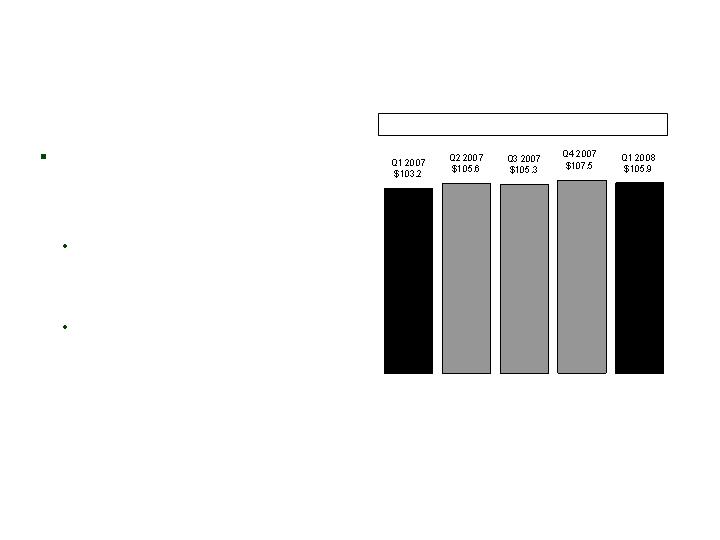
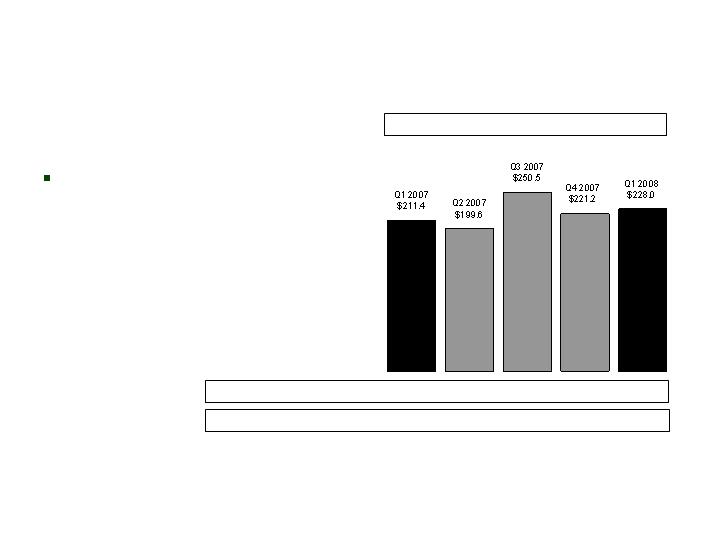
Collected Premiums
CNO
Strong, consistent
growth in Bankers
and Colonial Penn
Decline in CIG due
to sale of annuity
block and focus on
more profitable
business
BLC
Q2 2007
$4,366.8
Q3 2007
$4,315.1
Q4 2007
$4,314.1
Q1 2008
$4,322.3
($ millions)
CP
CIG
Run-Off
Q1 2007
$4,380.9
Collected Premiums-Trailing 4 Quarters
14

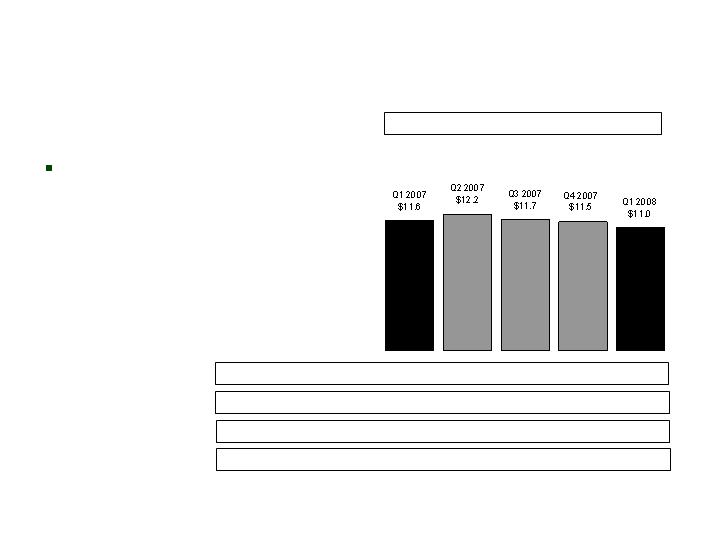
Corporate liquidity
Available holding company liquidity in excess of $100 million at 3/31/08,
plus $80 million revolver
Sources of and uses of funds, excluding insurance subsidiary dividends
Liquidity: Holding Company
Sources and Uses of Funds
CNO
($ millions)
Sources:
Interest on Surplus Debentures
Net Fees for Services Provided Under Intercompany Agreements
Uses:
Interest Expense on Corporate Debt
Operating Expenses
Net Impact
2007
$69.9
92.9
(72.3)
(42.9)
$47.6
Q1 2008
$16.3
21.9
(16.4)
(10.8)
$11.0
15

Q1 2008 New Annualized Premium (NAP) of $115 million, 11%
above Q1 2007
Earnings affected by:
Increase in interest-adjusted benefit ratio on LTC policies driven by
higher claim expenses
Accounting fluctuations related to equity indexed annuities
Reduction related to company-owned life insurance policies
LTC premium re-rates (as of 4/30/08):
Submitted: $45.6 million (100% of goal)
Approved: $20.2 million (63% of goal)
Implemented: $20.2 million (63% of goal)
Financial impact: $17.2 million (62% of goal)
Evaluating need for additional LTC re-rates
Q1 Summary
Bankers
16

LTC earnings driven by unfavorable claims experience
Increased number of initial claims
Higher than expected payments on continuing claims
What are we doing about LTC profitability?
Active rate management
Implementing improved underwriting tools
Reviewing claims management practices
Expense management
LTC Summary
Bankers
17

Q1 Earnings
Bankers
18
Management believes that an analysis of income (loss) before net realized investment gains (losses), net of
related amortization (a non-GAAP financial measure), is important to evaluate the financial performance of our
business, and is a measure commonly used in the life insurance industry. Management uses this measure to
evaluate performance because realized gains or losses can be affected by events that are unrelated to a
company’s underlying fundamentals. The chart on Page 8 reconciles the non-GAAP measure to the
corresponding GAAP measure. See Appendix for a reconciliation of the return on equity measure to the
corresponding GAAP measure.
Trailing 4 Quarter Operating Return on Equity: 9.5%
($ millions)
Q1 2007
(Restated)
Q1 2008
Insurance policy income
$412.0
$497.0
Net investment income
140.9
129.3
Fee revenue and other income
1.2
1.6
Total revenues
554.1
627.9
Insurance policy benefits
342.6
438.5
Amounts added to policyholder account balances
47.1
41.2
Amortization related to operations
82.0
75.0
Other operating costs and expenses
36.9
44.1
Total benefits and expenses
508.6
598.8
Income before net realized investment gains (losses), net of
related amortization and income taxes
$45.5
$29.1

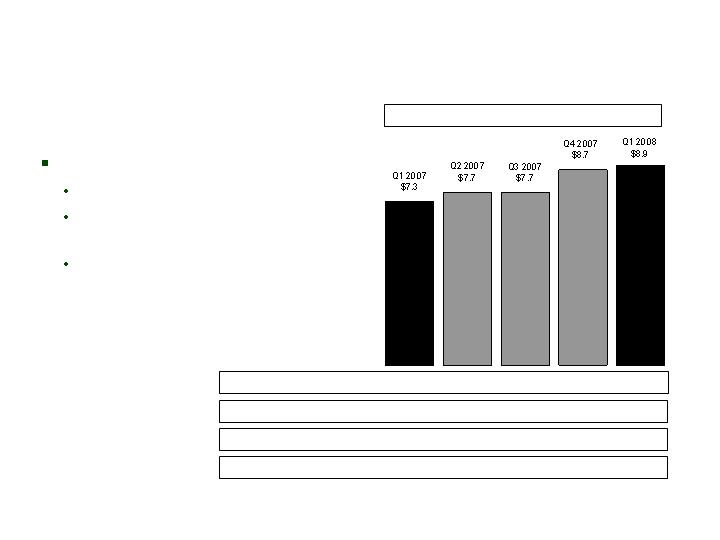
Q1 2008 Distribution Results:
Strong Growth in Key Metrics
Bankers
$115 million NAP = 11% growth
Strong Med Advantage, Med Supp and Annuity sales
Lower LTC and Life sales
Improved agent productivity while growing quantity
4,759 agents at 3/31/08, up 6% vs 3/31/07
7% growth in new agents
4% growth in agent productivity
19

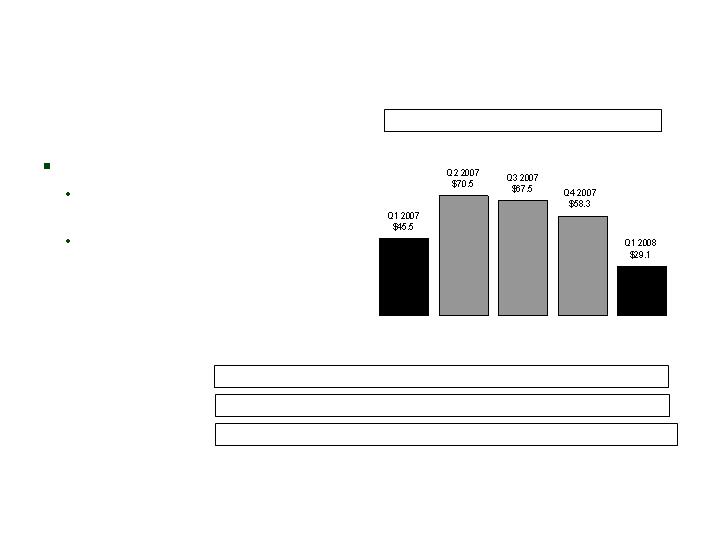
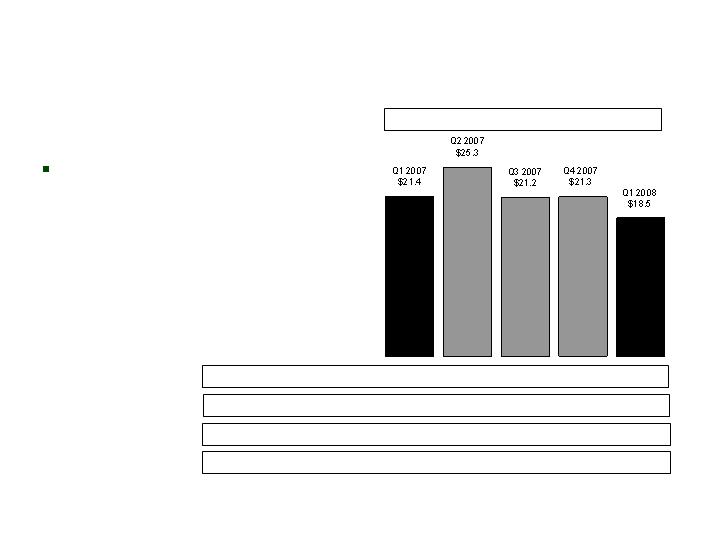
NAP Growth
Q1 2008 record NAP results
10% compound annual
growth since 2003
Increases driven by agent
productivity and growth
plus new product offerings
Building a strong premium
base for future earnings
growth
Bankers
($ millions)
NAP-Trailing 4 Quarters
NAP-Quarterly: $102.8 $76.8 $56.6 $58.3 $114.6
20

Q1 2008 NAP of $17 million, 67% above Q1 2007
Continued strong growth in core life products, up 22% over
Q1 2007
Launched new PFFS sales campaign in Q4 2007; generated
$4.7 million of NAP in Q1 2008
Earnings down from Q1 2007
Higher marketing expenses related to investment in our growth
initiatives
Q1 Summary
Colonial Penn
21

Q1 Earnings
Colonial Penn
22
Management believes that an analysis of income (loss) before net realized investment gains (losses), net of
related amortization (a non-GAAP financial measure), is important to evaluate the financial performance of our
business, and is a measure commonly used in the life insurance industry. Management uses this measure to
evaluate performance because realized gains or losses can be affected by events that are unrelated to a
company’s underlying fundamentals. The chart on Page 8 reconciles the non-GAAP measure to the
corresponding GAAP measure. See Appendix for a reconciliation of the return on equity measure to the
corresponding GAAP measure.
Trailing 4 Quarter Operating Return on Equity: 8.4%
($ millions)
Q1 2007
Q1 2008
Insurance policy income
$29.3
$44.4
Net investment income
9.5
9.2
Fee revenue and other income
0.2
0.3
Total revenues
39.0
53.9
Insurance policy benefits
25.6
35.0
Amounts added to policyholder account balances
0.3
0.3
Amortization related to operations
4.8
7.4
Other operating costs and expenses
3.7
7.5
Total benefits and expenses
34.4
50.2
Income before net realized investment gains (losses) and income taxes,
net of related amortization
$4.6
$3.7

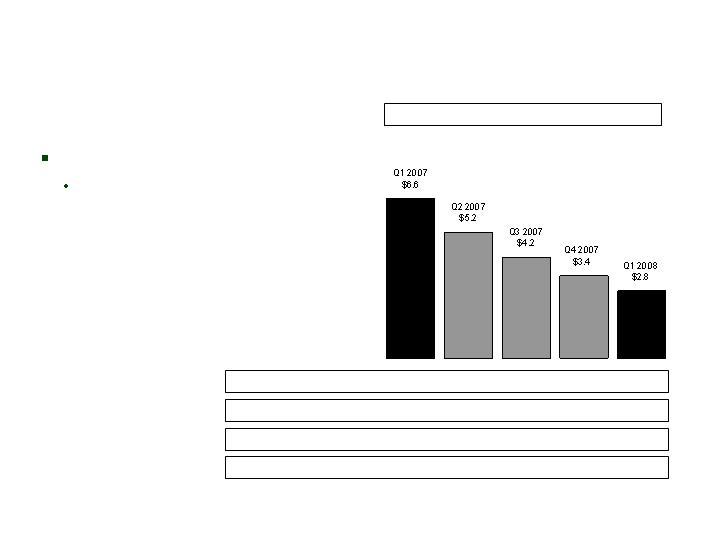
Q1 2008 NAP of $17 million, 21% less than Q1 2007
Strong sales gains in specified disease, up 23% from Q1 2007
Decreases in Medicare supplement and annuities, consistent with
CIG’s focus on more profitable business
Higher value from new business compared to Q1 2007, despite
lower sales
Q1 2008 earnings driven by:
Increase in benefit ratios on specified disease products driven by
lower policy terminations
Accounting fluctuations related to equity indexed annuities
Q1 Summary
CIG
23

Q1 Earnings
CIG
Management believes that an analysis of income (loss) before net realized investment gains (losses), net of
related amortization (a non-GAAP financial measure), is important to evaluate the financial performance of our
business, and is a measure commonly used in the life insurance industry. Management uses this measure to
evaluate performance because realized gains or losses can be affected by events that are unrelated to a
company’s underlying fundamentals. The chart on Page 8 reconciles the non-GAAP measure to the
corresponding GAAP measure. See Appendix for a reconciliation of the return on equity measure to the
corresponding GAAP measure.
24
Trailing 4 Quarter Operating Return on Equity: 2.0%
($ millions)
Q1 2007
(Restated)
Q1 2008
Insurance policy income
$242.0
$234.3
Net investment income
175.4
129.3
Fee revenue and other income
0.2
0.7
Total revenues
417.6
364.3
Insurance policy benefits
209.9
199.4
Amounts added to policyholder account balances
67.0
40.8
Amortization related to operations
38.2
30.1
Other operating costs and expenses
69.0
70.7
Total benefits and expenses
384.1
341.0
Income before net realized investment gains (losses),
net of related amortization and income taxes, and excluding
costs related to the litigation settlement
$33.5
$23.3
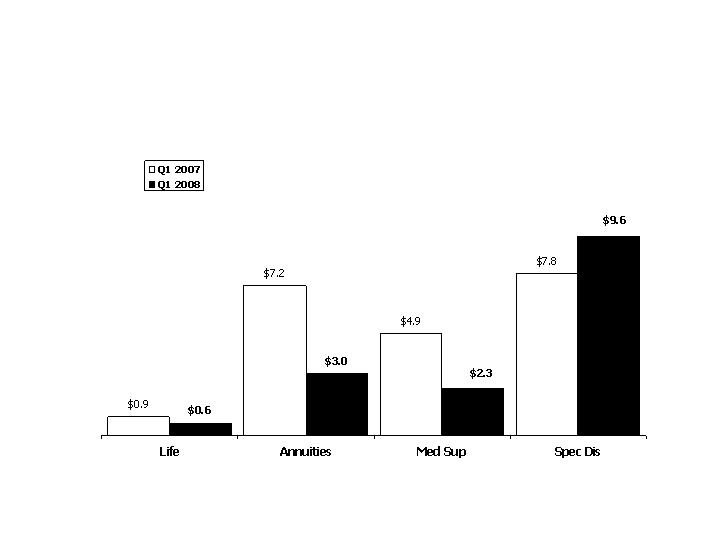
NAP: Q1 2007 vs Q1 2008
CIG
($ millions)
25

Third consecutive stable quarter; continued reserve adequacy
Earnings close to breakeven
Premium rate management, improved claims management
practices and expense efficiency improvements have
contributed to earnings trend
Migration to LTCG system and processes progressing on plan
Q1 Summary
LTC Closed Block
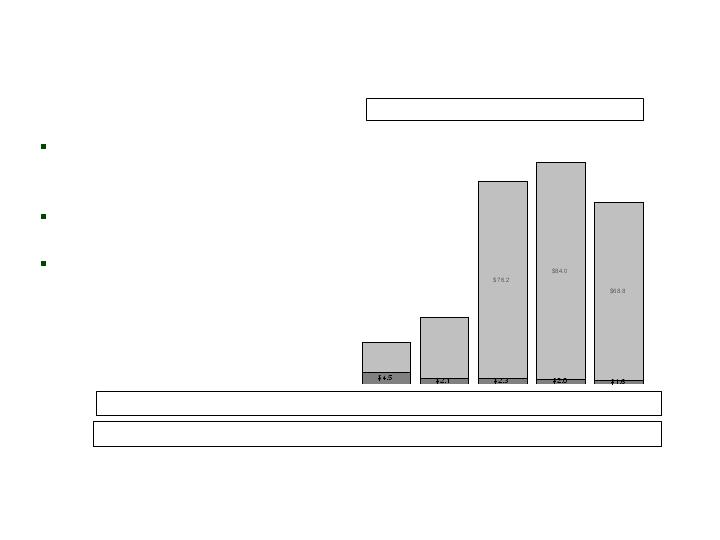
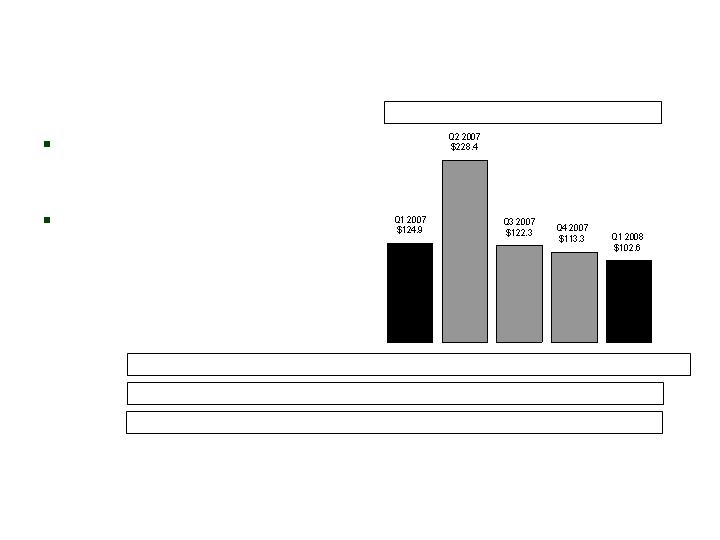
26
Segment Performance
LTC Closed Block
*Operating earnings exclude net realized gains (losses). See Appendix for corresponding GAAP measure of
our consolidated results of operations.
Continued reserve stability
Favorable prior-period
development
Increasing impact from
improvement initiatives
PTOI-Trailing 4 Quarters: $(76.2) $(213.3) $(221.0) $(185.9) $(161.1)
Revenues-Quarterly: $126.6 $125.8 $126.1 $127.9 $126.1
Pre-Tax Operating Income*
Revenues -Tr. 4 Quarters: $509.4 $508.4 $506.4 $506.4 $505.9
($ millions)
Collected Premiums-Quarterly: $81.2 $76.2 $75.7 $75.0 $76.3
27

Q1 Earnings
LTC Closed Block
28
Management believes that an analysis of income (loss) before net realized investment gains (losses), net of
related amortization (a non-GAAP financial measure), is important to evaluate the financial performance of our
business, and is a measure commonly used in the life insurance industry. Management uses this measure to
evaluate performance because realized gains or losses can be affected by events that are unrelated to a
company’s underlying fundamentals. The chart on Page 8 reconciles the non-GAAP measure to the
corresponding GAAP measure. See Appendix for a reconciliation of the return on equity measure to the
corresponding GAAP measure.
($ millions)
Q1 2007
(Restated)
Q1 2008
Insurance policy income
$79.5
$75.5
Net investment income
47.0
50.5
Fee revenue and other income
0.1
0.1
Total revenues
126.6
126.1
Insurance policy benefits
124.9
102.6
Amortization related to operations
6.0
5.4
Other operating costs and expenses
21.8
19.4
Total benefits and expenses
152.7
127.4
Loss before net realized investment gains (losses) and income taxes
($26.1)
($1.3)

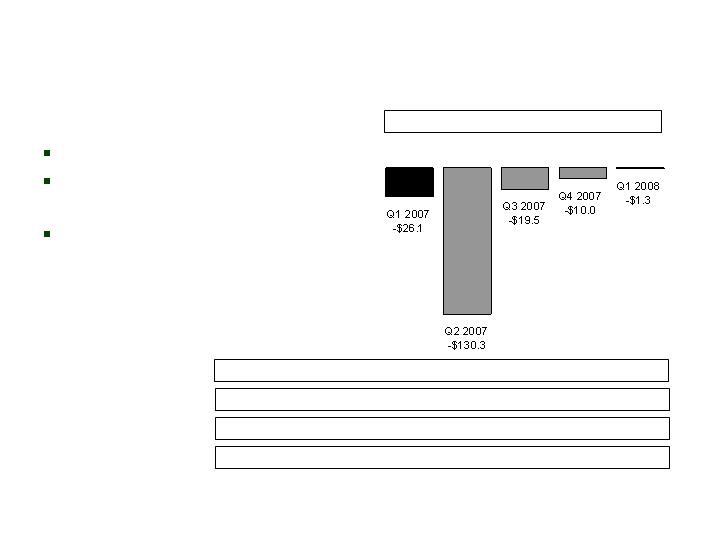
Q2 2007 claims reserving actions generated stability in the remainder of 2007 and Q1 2008:
Favorable prior-period development continues
Verified claims for all periods stable
Verified Incurred
Development*
*Excludes waiver-of-premium and return-of-premium benefits.
LTC Closed Block
Reported Claims
Prior Period Development
Verified Claims as of Reporting Date
Verified Claims Developed through:
12/31/04
12/31/05
12/31/06
3/31/07
6/30/07
9/30/07
12/31/07
3/31/08
($ millions)
Q3 2007
$100.7
3.3
104.0
104.0
102.3
101.9
Q2 2007
$212.0
(109.7)
102.3
102.3
103.0
107.1
103.9
Q1 2007
$119.7
(34.9)
84.7
84.7
104.2
103.6
106.3
101.4
2006
$433.3
(72.2)
361.1
361.1
375.1
418.3
414.4
412.2
408.2
2005
$396.0
(58.9)
337.2
337.2
365.0
368.8
389.2
388.7
391.0
390.8
2004
$370.8
(44.2)
326.6
326.6
326.0
337.7
344.2
356.5
356.6
356.6
361.0
Developed
Deficiencies
in Periods
Prior to 2004
$0.0
0
0
44.2
103.7
136.4
147.1
161.4
162.3
165.0
162.2
Q4 2007
$104.7
1.8
106.5
106.5
104.9
Q1 2008
$89.1
12.8
101.9
101.9
29

Higher claims paid in Q4 2007 related to inventory reduction
Q1 2008 termination rate consistent with average for past two years
Operating Data
LTC Closed Block
Claims Paid (mils.)
Open Claimant Counts
In Force Policy Counts
Ann. Termination Rates
Q1 2006
$90.4
11,805
197,585
7.8%
Q2 2006
$101.2
12,536
194,080
6.9%
Q3 2006
$96.1
12,228
190,134
7.9%
Q4 2006
$81.6
12,048
187,123
6.2%
Q1 2007
$102.0
11,870
183,655
7.2%
Q2 2007
$96.8
12,424
179,952
7.8%
Q3 2007
$97.7
12,121
175,685
8.9%
Q4 2007
$104.9
12,338
172,222
7.7%
Q1 2008
$93.6
11,783
168,799
7.7%
30

Premium Re-rates
(as of 5/1/08)
LTC Closed Block
Round 1 - exceeded each goal:
Re-rates submitted: $64.0 million (115% of goal)
Re-rates approved: $46.0 million (110% of goal)
Re-rates implemented: $44.6 million (107% of goal)
Re-rates financial impact: $37.4 million (107% of goal)
Round 2 – on track to achieve goals:
Re-rates submitted: $41.9 million (98% of goal)
Re-rates approved: $20.8 million (81% of goal)
Re-rates implemented: $19.3 million (75% of goal)
Re-rates financial impact: $15.5 million (75% of goal)
Round 3
Goal is to have Round 3 analysis done by end of June
Filings likely to begin in July; to run the next year or more
31

Continue working within the regulatory environment to achieve
equitable and actuarially justified rate increases
Continue progress on claims management improvements and
expense efficiencies
Meet multistate performance standards:
Prompt pay compliance
Complaint handling timeliness
Implement claims remediation plan
Actively pursue reducing LTC exposure
What We Have Left to Do
LTC Closed Block
32
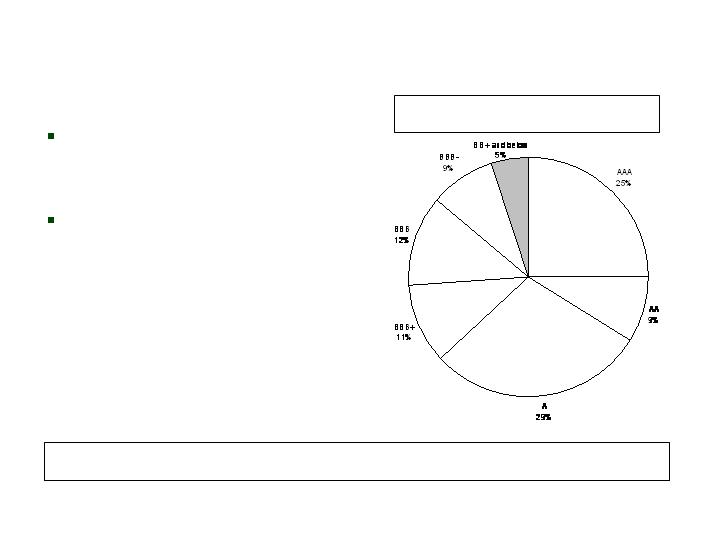
Investment Quality*
CNO
Below-investment grade
securities represent 5% of
total portfolio
Limiting the new money
allocated to below-
investment grade securities
Actively Managed Fixed Maturities by Rating at
3/31/08 (Market Value)
3/31/08
95%
12/31/07
94%
9/30/07
94%
6/30/07
94%
3/31/07
95%
% of Bonds which are Investment Grade:
*Excludes investments from a variable interest entity which we consolidate under GAAP (though the related
liabilities are non-recourse to Conseco).
33

Q1 2008
Other-than-Temporary Impairments
CNO
Total Q1 2008 gross realized losses included other-than-
temporary impairment losses on investments of $41.3 million
$29.8 million (74%) in mortgage products, particularly Prime Jumbo
CMOs
$10.5 million (26%) in Corporate Bonds, including $5.4 million (13%) in
VIE consolidated for GAAP purposes
$1.0 million of other writedowns
Substantial Q1 spread widening across numerous credit
markets, with most significant impact in structured securities,
including CMBS, and in high yield and financials
Elevated level of impairments may persist through Q2 2008;
overall portfolio quality expected to be resilient in the long
term despite volatile market conditions
34

Structured securities and
asset-backed securities
represent 24% of total
actively managed fixed
maturity securities
Over 89% AAA rated
71% CMOs, including 54%
Agencies
Predominantly “Level Two”
FAS 157 pricing
Structured Securities and ABS
at 3/31/08
CNO
(Market value in millions)
Pass-throughs, sequentials and
equivalent securities
$2,002.5
41.2%
Planned amortization class, target
amortization class, and accretion-
directed bonds
$1,494.2
30.8%
Commercial
mortgage-backed
securities
$913.3
18.8%
Other
$41.8
0.8%
Asset-backed
securities
$406.2
8.4%
35
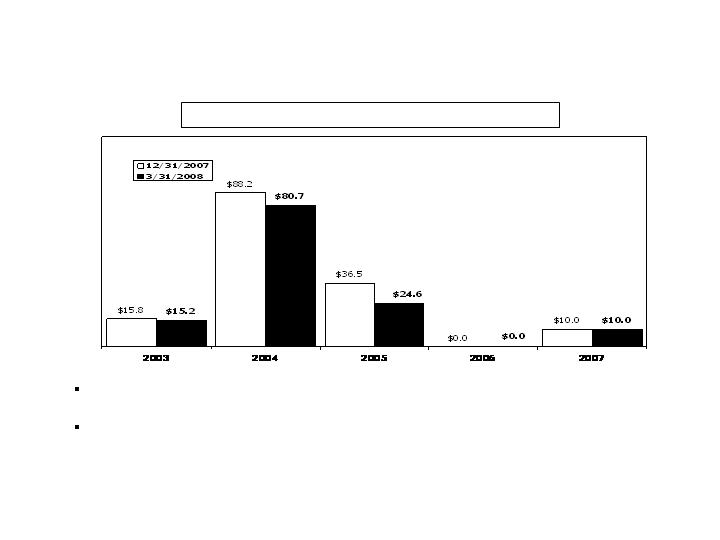
Sub-Prime Home Equity ABS
CNO
Market value represents 0.44% of invested assets at 3/31/08, compared to 0.52% at
12/31/07
Despite poor market conditions, current collateral seasoning and credit support suggest we
are adequately protected
Exposure by Vintage Year (Book Value in millions)
36

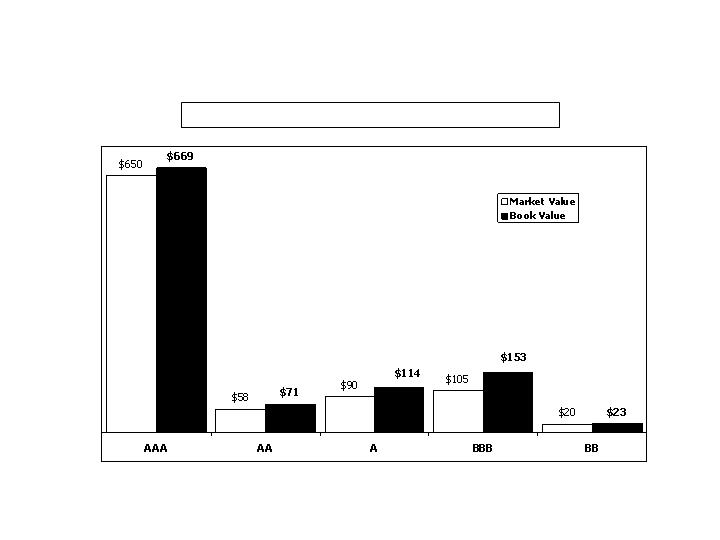
Sub-Prime Home Equity ABS
at 3/31/08
CNO
AAA
AA
A
BBB
Total
$31.8
$33.6
$37.1
$0.4
$102.9
$36.0
$45.4
$48.7
$0.4
$130.5
30.9%
32.6%
36.1%
0.4%
100.0%
0.14%
0.14%
0.16%
0.00%
0.44%
Market
Value (mil.)
Book
Value (mil.)
% of
Subprime*
% of
Portfolio*
Rating
No exposure to “affordability products” – negative amortization, option ARM
collateral, etc.
Only $0.4 million (market value) rated lower than A category
Current support in structures meets original expectations
Remaining portfolio generally reflects satisfactory margin for adverse development
of cash flows/delinquencies
641
640
645
665
642
Avg.
FICO
31.0%
25.6%
28.6%
36.9%
28.2%
Avg.
Support
11.5%
10.3%
7.6%
21.8%
9.6%
Avg. 60+
Delinq.
*% of market value.
37

No ABS CDO investments
No hedge fund investments
No “mark to model” structured securities
No NIM securities
No CDO Squared Investments
Highly developed cashflow and default analytic models, along
with rigorous management oversight processes
Sub-Prime Home Equity ABS
and Structured Credit
CNO
38
CMBS Exposure Summary*
at 3/31/08
CNO
Exposure by Rating Category (in millions)
$923
$1,030
*Includes exposure held in our trading portfolios.
39

CNO Summary
Continued strong growth in new business
Bankers Life – continuing to grow at 10% plus
Colonial Penn
Growth in excess of 20% in core products
Broadening product line
CIG
Greater focus on distinctive capabilities
Producing more economic value from refocused sales efforts
Improved earnings stability
CIG profitability restored
LTC Run-off block claims reserve volatility reduced
40

CNO Summary (cont.)
Strategic alternatives
Goal to increase shareholder value
On track to complete analysis by late summer/early fall
Operations
Bulk of organizational realignment completed
On track to complete transfer of administration of $3 billion coinsured
annuity block in Q2 2008
Remaining real estate realignment (Chicago) to occur in Q2 2008 –
expect to record pre-tax loss of approximately $15 million
41

Questions and Answers
42

Appendix
43
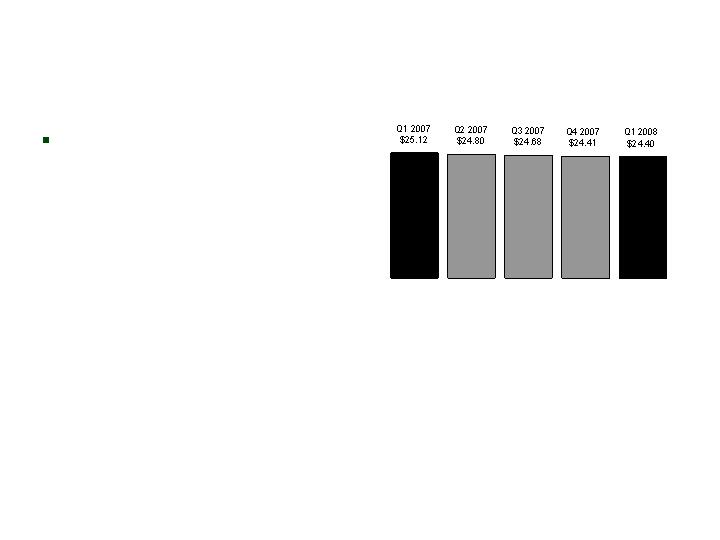
Book Value Per Diluted Share*
CNO
*Book value excludes accumulated other comprehensive income (loss). Shares outstanding assumes:
(1) conversion of convertible securities; and (2) the exercise of outstanding stock options and vesting of restricted
stock (each calculated using the treasury stock method). See Appendix for corresponding GAAP measure.
Consistent with prior quarter
44
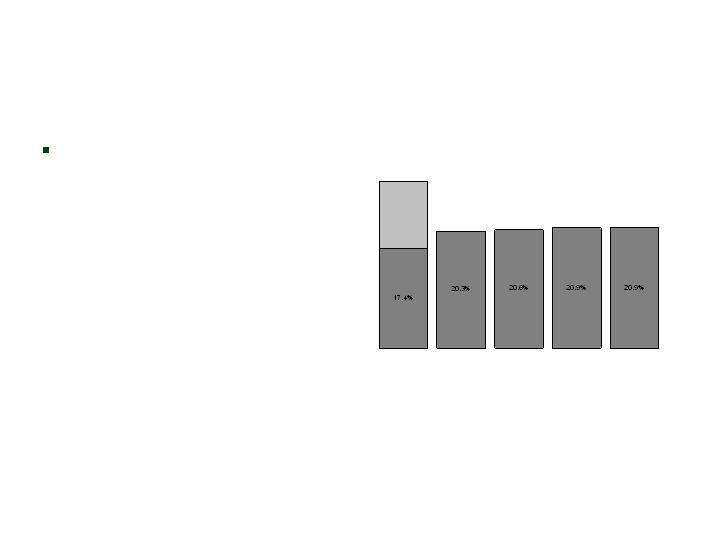
Ratio of Debt and Preferred Stock
to Total Capital*
CNO
Consistent with prior quarter
Q2 2007
20.4%
Debt
Preferred
Stock
Q1 2007
29.0%
*Excludes accumulated other comprehensive income (loss). See Appendix for corresponding GAAP measure.
Q3 2007
20.6%
Q4 2007
20.9%
Q1 2008
20.9%
45

In compliance with all
financial covenants
Key Debt Covenants
CNO
Q1 2008*
($ millions)
Q4 2007
Q4 2006
25.0%
16.2%
2.00X
2.06X
$1,270
$1,747
245%
358%
Q4 2005
30.0%
17.4%
2.00X
2.06X
$1,270
$1,734
250%
357%
30.0%
21.0%
2.00X
3.34X
$1,270
$1,497
250%
296%
30.0%
21.0%
2.00X
3.30X
$1,270
$1,489
250%
281%
Debt/Capital Ratio
Covenant Maximum
Actual
Interest Coverage**
Covenant Minimum
Actual
Statutory Capital
Covenant Minimum
Actual
RBC Ratio
Covenant Minimum
Actual
*Preliminary calculations.
**Q405 and Q406 reflect fixed charge coverage, as required under prior bank agreement.
46
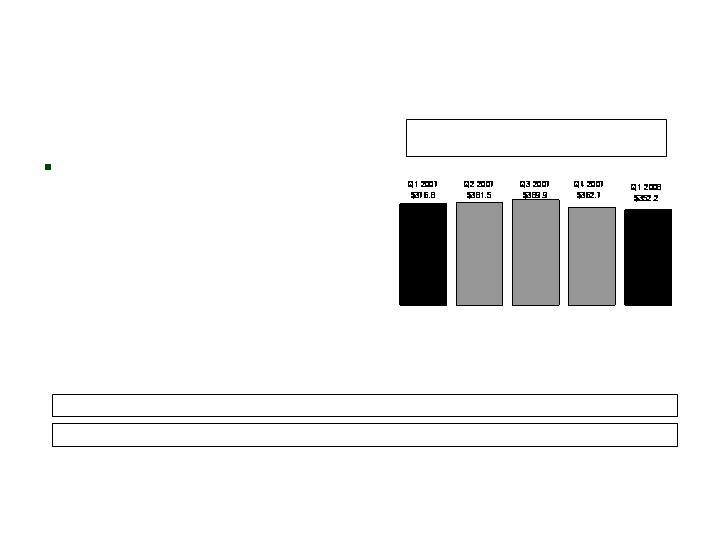
Net Investment Income
CNO
($ millions)
Yield unchanged from Q1 2007
Net investment income from the prepayment of securities: $5.0 $1.1 $0.6 $5.0 $1.5
General Account Investment Income,
Excluding Corporate Segment
5.83%
5.95%
5.88%
5.83%
5.83%
Yield:
47
Expenses
CNO
($ millions)
Adjusted Operating Expenses*
*Adjusted operating expenses excluding primarily acquisition costs, capitalization of software development costs,
initial PFFS marketing costs and costs related to the R-factor litigation settlement. This measure is used by the
Company to evaluate its progress in reducing operating expenses.
Back-office consolidation when
completed expected to produce run-
rate savings of $25 million annually
by YE 2008
Approximately $11 million in savings
realized in 2007; additional $9 million
expected in 2008; remaining $5 million
expected in 2009
Q1 2008 expenses reflect increased
investment in business growth at
Bankers and Colonial Penn
48
Segment Performance
Bankers
*Operating earnings exclude net realized gains (losses). See Appendix for corresponding GAAP measure of
our consolidated results of operations.
Lower earnings driven by:
Lower margins on LTC as a result
of higher incurred claims
Increased investment volatility
PTOI-Trailing 4 Quarters: $252.8 $257.9 $251.0 $241.8 $225.4
Revenues-Quarterly: $554.1 $581.8 $621.6 $606.8 $627.9
Pre-Tax Operating Income*
Revenues -Tr. 4 Quarters: $2,123.3 $2,196.1 $2,291.8 $2,364.3 $2,438.1
($ millions)
49
Premiums –
Medicare Supplement
Bankers
(in millions)
Strong sales of Medicare
Supplement continue,
along with our distribution
of PFFS products
Medicare Supplement – First-Year Premiums
Med. Supp. First-Year Prems.-Tr. 4 Qtrs: $95.2 $90.7 $86.8 $82.5 $79.4
Med. Supp. Total Premiums-Quarterly: $167.0 $153.8 $152.9 $162.4 $159.9
Med. Supp. NAP-Quarterly: $14.7 $14.7 $16.1 $23.0 $17.1
Med. Supp. NAP-Trailing 4 Quarters: $66.8 $63.1 $63.9 $68.5 $70.9
50
Premiums –
PDP/PFFS
Bankers
(in millions)
Q1 2007-Q1 2008 growth reflects
strong overall growth of
membership
Q1 2007-Q1 2008 NAP growth of
26% reflects successful OEP
Decrease from Q4 2007-Q1 2008
driven by timing of member
enrollment impacting number of
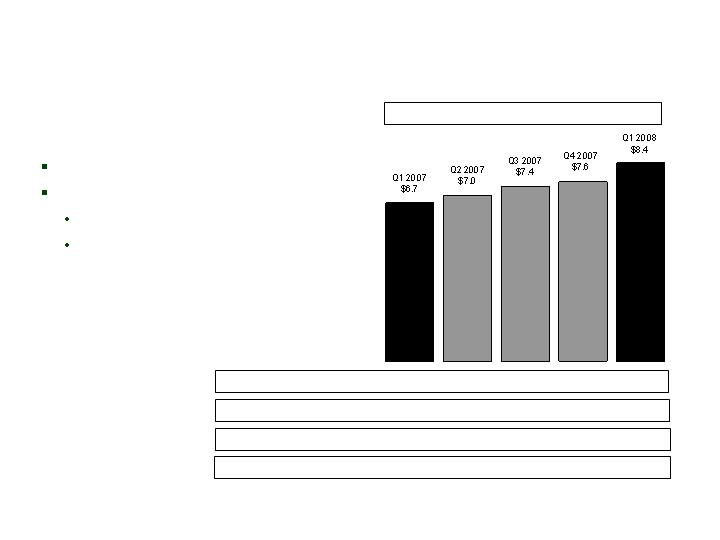
first-year member months within
the quarter
Q2 2007
$25.9
PDP
PFFS
PDP/PFFS – First-Year Premiums
Q1 2007
$16.0
Q3 2007
$78.5
Q4 2007
$86.0
$23.8
Q1 2008
$70.4
$11.5
$59.1
$(2.6)
$(0.9)
$22.2
$46.8
PFFS NAP-Quarterly:
$3.6
$0.6
$0.8
$0.7
$4.3
PDP NAP-Quarterly:
51
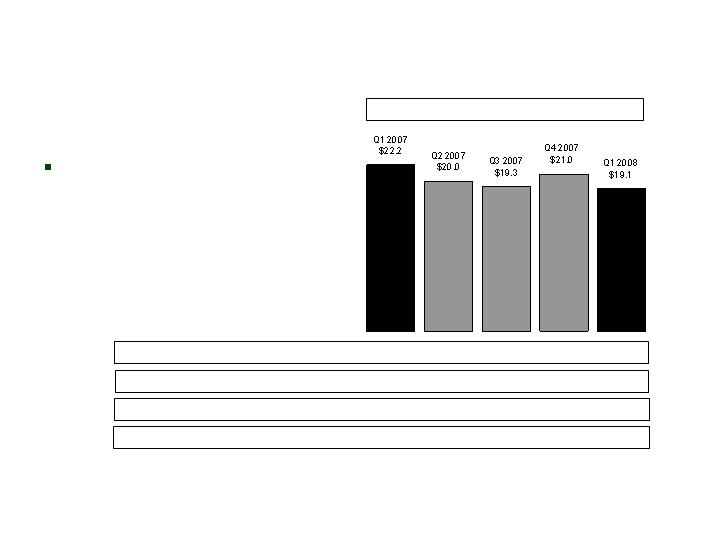
Premiums –
Long-Term Care
Bankers
($ millions)
Decline in NAP due to shift to
lower-premium Short Term
Care product
First-Year Prems.-Tr. 4 Qtrs: $48.6 $47.7 $47.4 $47.0 $46.4
Total Premiums-Quarterly: $158.2 $155.4 $154.5 $154.3 $156.6
Long-Term Care – First-Year Premiums
NAP-Quarterly: $11.7 $12.7 $11.7 $10.8 $9.4
NAP-Trailing 4 Quarters: $47.9 $47.9 $47.1 $46.9 $44.6
52
Premiums –
Life Insurance
Bankers
($ millions)
Fluctuations in life insurance
premiums primarily reflect
variance in sales of single
premium life insurance
policies
First-Year Prems.-Tr. 4 Qtrs: $91.0 $93.0 $89.8 $89.2 $86.3
Total Premiums-Quarterly: $48.1 $52.1 $49.1 $50.7 $48.0
Life – First-Year Premiums
NAP-Quarterly: $12.7 $14.5 $13.8 $13.1 $11.7
NAP-Trailing 4 Quarters: $48.1 $51.5 $52.4 $54.1 $53.1
53
Premiums –
Annuity
Bankers
($ millions)
Increase in first-year
premiums reflects higher
sales
First-Year Prems.-Tr. 4 Qtrs: $973.5 $935.8 $909.0 $882.7 $899.3
Total Premiums-Quarterly: $212.2 $200.5 $250.9 $221.9 $229.1
Annuity – First-Year Premiums
54
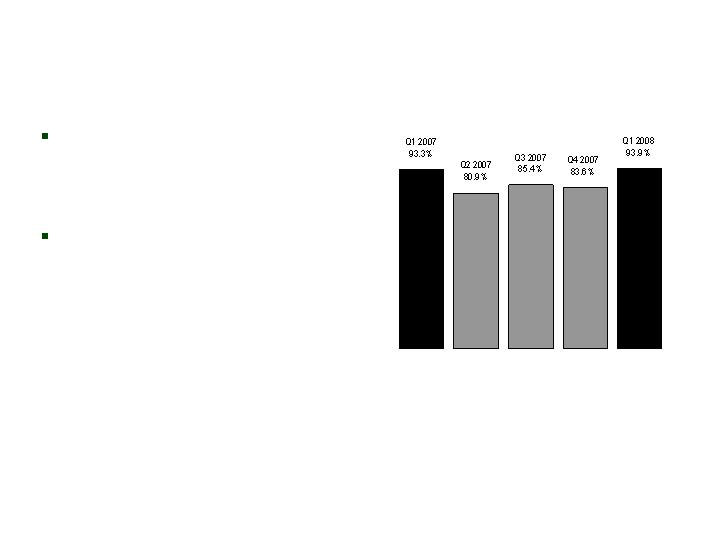
Benefit Ratio* –
Medicare Supplement
Bankers
Trailing 4 Quarter Avg.: 65.8% 65.7% 66.6% 67.2% 67.3%
*We calculate benefit ratios by dividing insurance policy benefits by insurance policy income.
Benefit ratio is consistent
with our expectations
55
Benefit Ratio* –
PDP and PFFS Business
Bankers
PDP and individual PFFS
continue to trend as expected,
factoring in seasonal
fluctuations
Q3/Q4 2007 and Q1 2008
include large group case
premiums/losses, which has a
higher loss ratio, but
correspondingly lower expense
ratio
*We calculate benefit ratios by dividing insurance policy benefits by insurance policy income.
56
Interest-Adjusted Benefit Ratio* –
Long Term Care
Bankers
*We calculate interest-adjusted benefit ratios by dividing insurance policy benefits less interest income on
the accumulated assets backing the insurance liabilities by insurance policy income.
Q1 2008 negatively impacted by:
Higher levels of incurred claims
Began implementation of
premium re-rates in Q3 2007 on
more recent business not
previously re-rated; expected
$25-30 million additional annual
revenue
Trailing 4 Quarter Avg.: 66.3% 66.2% 71.0% 70.8% 72.5%
Qtrly. non-int. adjusted: 102.7% 95.4% 106.5% 103.3% 111.6%
57

Segment Performance
Colonial Penn
*Operating earnings exclude net realized gains (losses). See Appendix for corresponding GAAP measure of
our consolidated results of operations.
Higher marketing expenses
related to growth initiatives
resulted in lower Q4 2007 and
Q1 2008 earnings
PTOI-Trailing 4 Quarters: $21.1 $21.3 $23.7 $18.1 $17.2
Revenues-Quarterly: $39.0 $38.9 $42.1 $44.3 $53.9
Pre-Tax Operating Income*
Revenues -Tr. 4 Quarters: $153.7 $157.7 $161.4 $164.3 $179.2
($ millions)
58
Premiums –
Life Insurance
Colonial Penn
($ millions)
Continued strong sales growth
Trailing four quarters data:
NAP grew 22%
First-year premium grew 25%
First-Year Prems.-Tr. 4 Qtrs: $24.1 $25.4 $27.0 $28.7 $30.4
Total Premiums-Quarterly: $26.7 $26.0 $29.3 $31.7 $42.9
Life – First-Year Premiums
NAP-Quarterly: $10.4 $11.2 $11.4 $9.3 $12.7
NAP-Trailing 4 Quarters: $35.3 $37.4 $40.5 $42.3 $44.6
59
Segment Performance
CIG
*Operating earnings exclude: (1) net realized gains (losses); (2) the Q2 2006 charge related to the
litigation settlement and refinements to such estimates recognized in subsequent periods; and (3) the Q3
2007 charge related to a coinsurance transaction. See Appendix for corresponding GAAP measure of our
consolidated results of operations.
Unlocking adjustment on interest-
sensitive life block of $14.8 million
in Q4 2007
PTOI-Trailing 4 Quarters: $181.1 $161.3 $122.9 $102.7 $92.5
Revenues-Quarterly: $417.6 $438.9 $420.0 $362.7 $364.3
Pre-Tax Operating Income*
Revenues-Tr. 4 Quarters: $1,707.9 $1,738.2 $1,722.2 $1,639.2 $1,585.9
($ millions)
60
Premiums -
Medicare Supplement
CIG
($ millions)
Sales down 53% from Q1 2007:
We continue to focus on the
profitability of this business rather
than increased sales
First-Year Prems.-Tr. 4 Qtrs: $28.9 $26.2 $23.9 $19.4 $15.6
Total Premiums-Quarterly: $59.8 $56.1 $54.8 $55.2 $53.1
Medicare Supplement – First-Year Premiums
NAP-Quarterly: $4.9 $2.9 $1.9 $3.5 $2.3
NAP-Trailing 4 Quarters: $26.5 $20.4 $16.1 $13.2 $10.6
61
Premiums –
Specified Disease
CIG
($ millions)
Sales up 23% from Q1 2007:
New products
Increased PMA focus on
specified disease products
Recruitment of Health IMOs
First-Year Prems.-Tr. 4 Qtrs: $28.2 $28.9 $29.8 $31.4 $33.0
Total Premiums-Quarterly: $92.1 $89.1 $88.7 $89.3 $93.6
Specified Disease – First-Year Premiums
NAP-Quarterly: $7.8 $9.6 $10.3 $11.3 $9.6
NAP-Trailing 4 Quarters: $31.4 $33.7 $36.3 $39.0 $40.8
62
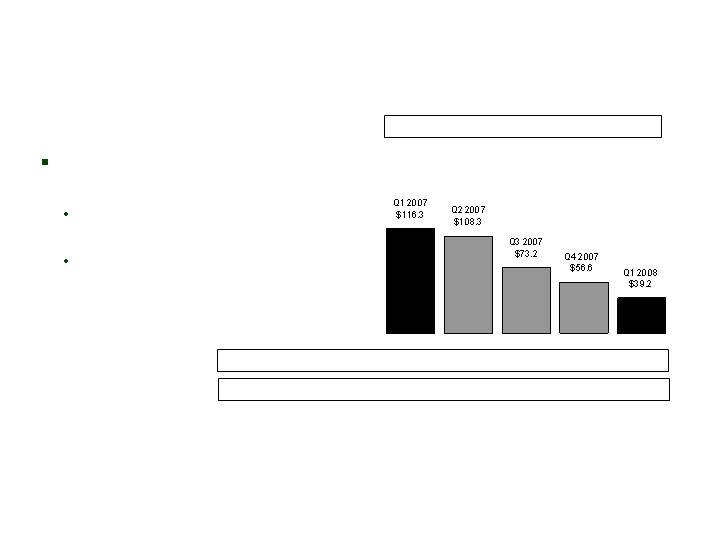
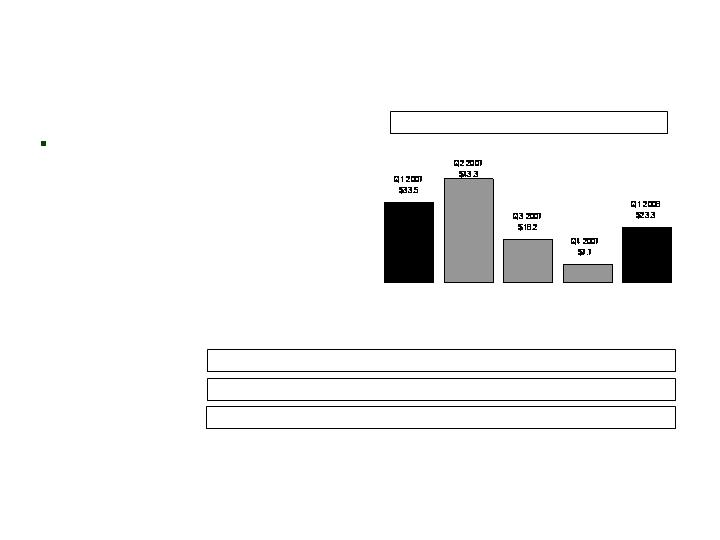
Premiums –
Annuity
CIG
($ millions)
Collections down 65% from
Q1 2007:
Discontinuance of products due
to coinsurance transaction
Focus on profitable products
First-Year Prems.-Tr. 4 Qtrs: $500.2 $521.5 $415.9 $354.4 $277.3
Total Premiums-Quarterly: $120.1 $113.0 $77.5 $58.0 $41.6
Annuity – First-Year Premiums
63
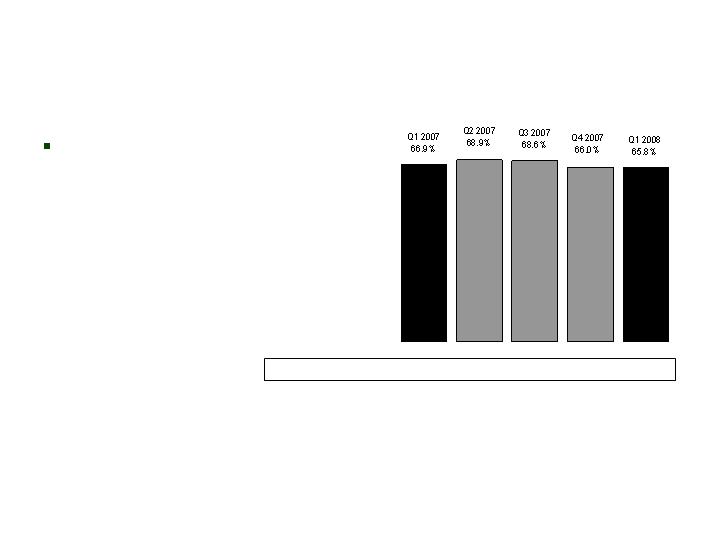
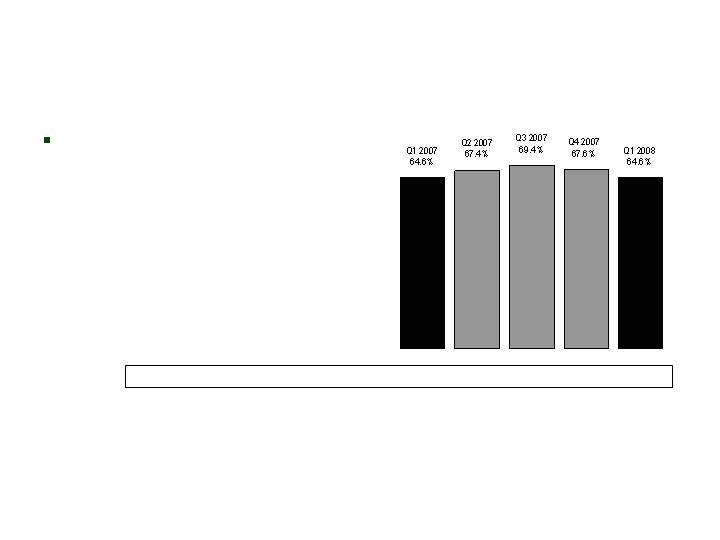
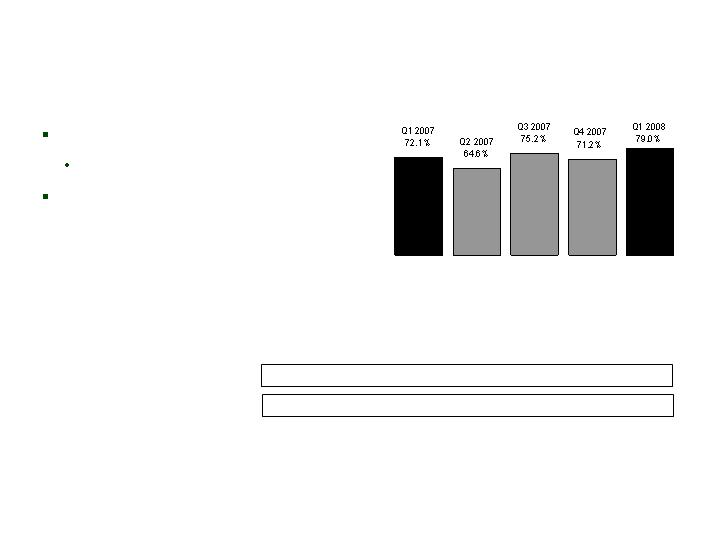
Benefit Ratio* –
Medicare Supplement
CIG
Consistent with expectations
Trailing 4 Quarter Avg.: 63.6% 66.6% 67.1% 67.6% 67.4%
*We calculate benefit ratios by dividing insurance policy benefits by insurance policy income.
64

Interest-Adjusted Benefit Ratio* –
Specified Disease
CIG
Trailing 4 Quarter Avg.: 44.2% 41.8% 43.2% 44.7% 46.0%
Qtrly. non-int. adjusted: 75.7% 73.2% 81.9% 80.6% 81.9%
*We calculate interest-adjusted benefit ratios by dividing insurance policy benefits, less interest income on
the accumulated assets backing the insurance liabilities, by insurance policy income.
Q1 2008 increase primarily
driven by lower policy
terminations
65

Balance Sheet Detail
Continued stability since reserve strengthening in Q2 2007
LTC Closed Block
($ millions)
Insurance Liabilities and Intangible Assets, Net of Reinsurance
Reserve for Future Benefits
Claim Reserve
Insurance Acquisition Costs
Net Liability
Percent Change
Q3 2007
$2,402.3
954.3
(153.9)
$3,202.7
0.0%
Q1 2007
$2,412.2
829.1
(165.2)
$3,076.1
0.6%
Q2 2007
$2,409.0
952.6
(159.5)
$3,202.1
4.1%
Q4 2007
$2,392.7
962.1
(156.8)
$3,198.0
-0.1%
Q1 2008
$2,394.4
957.2
(151.4)
$3,200.2
0.1%
66
Benefit Detail
Third consecutive stable
quarter; continued reserve
adequacy
Q2 2007 total benefits and
incurred claims reflect $110
million claim reserve
strengthening
Total benefits equal incurred claims plus increase in reserve for future benefits. Verified basis incurred claims
adjust all periods for claim reserve redundancies and deficiencies.
Incurred Claims $130.4 $234.7 $112.9 $119.8 $100.9
Increase in Reserves for Future Benefits $(5.5) $(6.3) $9.4 $(6.4) $1.6
Verified Basis Incurred Claims $112.2 $117.2 $114.1 $122.3 $113.7
LTC Closed Block
Total Benefits
($ millions)
67
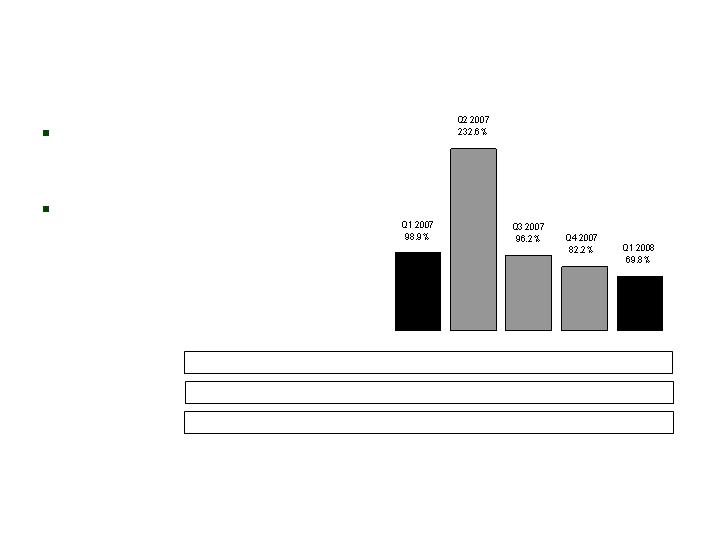
Interest-Adjusted
Benefit Ratio*
Third consecutive stable
quarter; continued reserve
adequacy
Q2 2007 benefit ratio reflects
$110 million claim reserve
strengthening
Trailing 4 Quarter Avg.: 92.3% 134.1% 138.8% 127.5% 120.8%
Qtrly. non-int. adjusted: 157.1% 292.4% 158.4% 146.6% 135.8%
LTC Closed Block
*We calculate interest-adjusted benefit ratios by dividing insurance policy benefits less interest income on
the accumulated assets backing the insurance liabilities by insurance policy income.
Qtrly. Verified Basis non-int. adjusted: 141.0% 150.1% 147.8% 158.1% 150.5%
68

Information Related to Certain Non-GAAP Financial Measures
The following provides additional information regarding certain non-GAAP measures used in this presentation. A non-GAAP measure is a
numerical measure of a company’s performance, financial position, or cash flows that excludes or includes amounts that are normally excluded or
included in the most directly comparable measure calculated and presented in accordance with GAAP. While management believes these
measures are useful to enhance understanding and comparability of our financial results, these non-GAAP measures should not be considered as
substitutes for the most directly comparable GAAP measures. Additional information concerning non-GAAP measures is included in our periodic
filings with the Securities and Exchange Commission that are available in the “Investor – SEC Filings” section of Conseco’s website,
www.conseco.com.
Operating earnings measures
Management believes that an analysis of net income applicable to common stock before net realized gains or losses (“net operating income”, a
non-GAAP financial measure) is important to evaluate the performance of the Company and is a key measure commonly used in the life insurance
industry. Management uses this measure to evaluate performance because realized investment gains or losses can be affected by events that
are unrelated to the Company’s underlying fundamentals.
In addition, our results were affected by unusual and significant charges related to: (i) a litigation settlement in Q2 2006 and refinements to such
estimates recognized in subsequent periods; (ii) a Q3 2007 charge related to a coinsurance transaction; and (iii) a Q4 2007 valuation allowance for
deferred tax assets. Management does not believe that similar charges are likely to recur within two years, and there were no similar charges
recognized within the prior two years. Management believes an analysis of operating earnings before these charges is important to evaluate the
performance of the Company prior to the effect of these unusual and significant charges.
69

Information Related to Certain Non-GAAP Financial Measures
A reconciliation of net income applicable to common stock to the net operating income, excluding: (i) Q2 2006 charge related to the litigation settlement and
refinements to such estimates recognized in subsequent periods; (ii) a Q3 2007 charge related to a coinsurance transaction; and (iii) a Q4 2007 valuation
allowance for deferred tax assets (and related per share amounts) is as follows (dollars in millions, except per share amounts):
70
Q1 2007
Q2 2007
Q3 2007
Q4 2007
Q1 2008
Net loss applicable to common stock
(10.0)
$
(59.8)
$
(52.7)
$
(71.5)
$
(5.8)
$
Net realized investment losses, net of related amortization and taxes
13.7
10.1
31.0
23.0
26.5
Net operating income (loss) (a non-GAAP financial measure)
3.7
(49.7)
(21.7)
(48.5)
20.7
Q2 2006 charge related to the litigation settlement and refinements to such
estimates recognized in subsequent periods, net of taxes
8.5
22.8
10.6
-
-
Q3 2007 charge related to a coinsurance transaction, net of taxes
-
-
49.7
-
-
Q4 2007 valuation allowance for deferred tax assets
-
-
-
68.0
-
Net operating income before: (i) Q2 2006 charge related to the
litigation settlement and refinements to such estimates
recognized in subsequent periods; (ii) a Q3 2007 charge related to
a coinsurance transaction; and (iii) a Q4 2007 valuation allowance
for deferred tax assets (a non-GAAP financial measure)
12.2
$
(26.9)
$
38.6
$
19.5
$
20.7
$
Per diluted share:
Net income (loss)
(0.07)
$
(0.35)
$
(0.28)
$
(0.38)
$
(0.03)
$
Net realized investment losses, net of related amortization and taxes
0.09
0.06
0.16
0.12
0.14
Net operating income (loss) (a non-GAAP financial measure)
0.02
(0.29)
(0.12)
(0.26)
0.11
Q2 2006 charge related to the litigation settlement and refinements to such
estimates recognized in subsequent periods, net of taxes
0.06
0.13
0.06
-
-
Q3 2007 charge related to a coinsurance transaction, net of taxes
-
-
0.27
-
-
Q4 2007 valuation allowance for deferred tax assets
-
-
-
0.37
-
Net operating income before: (i) Q2 2006 charge related to the
litigation settlement and refinements to such estimates
recognized in subsequent periods; (ii) a Q3 2007 charge related to
a coinsurance transaction; and (iii) a Q4 2007 valuation allowance
for deferred tax assets (a non-GAAP financial measure)
0.08
$
(0.16)
$
0.21
$
0.11
$
0.11
$

Information Related to Certain Non-GAAP Financial Measures
Book value, excluding accumulated other comprehensive income, per diluted share
This non-GAAP financial measure differs from book value per diluted share because accumulated other comprehensive income has been
excluded from the book value used to determine the measure. Management believes this non-GAAP financial measure is useful because it
removes the volatility that arises from changes in accumulated other comprehensive income. Such volatility is often caused by changes in the
estimated fair value of our investment portfolio resulting from changes in general market interest rates rather than the business decisions made
by management.
71

Information Related to Certain Non-GAAP Financial Measures
A reconciliation from book value per diluted share to book value per diluted share, excluding accumulated other comprehensive income (loss) is
as follows (dollars in millions, except per share amounts):
72
Q1 07
Q2 07
Q3 07
Q4 07
Q1 08
Total shareholders' equity
4,700.1
$
4,356.1
$
4,285.5
$
4,235.9
$
3,939.7
$
Less accumulated other comprehensive income (loss)
(41.8)
(329.9)
(316.0)
(273.3)
(565.6)
Total shareholders' equity excluding
accumulated other comprehensive income (loss)
(a non-GAAP financial measure)
4,741.9
$
4,686.0
$
4,601.5
$
4,509.2
$
4,505.3
$
Diluted shares outstanding for the period
188,784,663
188,962,041
186,472,069
184,708,727
184,681,243
Book value per diluted share
24.90
$
23.05
$
22.98
$
22.93
$
21.33
$
Less accumulated other comprehensive income (loss)
(0.22)
(1.75)
(1.70)
(1.48)
(3.07)
Book value, excluding accumulated other
comprehensive income (loss), per diluted share
(a non-GAAP financial measure)
25.12
$
24.80
$
24.68
$
24.41
$
24.40
$

Information Related to Certain Non-GAAP Financial Measures
Operating return measures
Management believes that an analysis of return before net realized gains or losses (“net operating income”, a non-GAAP financial measure) is
important to evaluate the performance of the Company and is a key measure commonly used in the life insurance industry. Management uses
this measure to evaluate performance because realized investment gains or losses can be affected by events that are unrelated to the
Company’s underlying fundamentals.
In addition, our returns were affected by unusual and significant charges related to: (i) the litigation settlement in Q2 2006 and refinements to
such estimates recognized in subsequent periods; (ii) a Q3 2007 charge related to a coinsurance transaction; and (iii) a Q4 2007 valuation
allowance for deferred tax assets. Management does not believe that similar charges are likely to recur within two years, and there were no
similar charges recognized within the prior two years. Management believes an analysis of return before these charges and subsequent
refinements is important to evaluate the performance of the Company prior to the effect of these unusual and significant charges.
This non-GAAP financial measure also differs from return on equity because accumulated other comprehensive income (loss) has been excluded
from the value of equity used to determine this ratio. Management believes this non-GAAP financial measure is useful because it removes the
volatility that arises from changes in accumulated other comprehensive income (loss). Such volatility is often caused by changes in the
estimated fair value of our investment portfolio resulting from changes in general market interest rates rather than the business decisions made
by management.
In addition, our equity includes the value of significant net operating loss carryforwards (included in income tax assets). In accordance with
GAAP, these assets are not discounted, and accordingly will not provide a return to shareholders (until after it is realized as a reduction to taxes
that would otherwise be paid). Management believes that excluding this value from the equity component of this measure enhances the
understanding of the effect these non-discounted assets have on operating returns and the comparability of these measures from period-to-
period. Equity in all periods assumes the conversion of our 5.5% Class B Mandatorily Convertible Preferred Stock (which occurred in May 2007).
Operating return measures are used in measuring the performance of our business units and are used as a basis for incentive compensation.
All references to segment operating return measures assume a 25% debt to total capital ratio at the segment level. Additionally, corporate
expenses have been allocated to the segments.
73

Information Related to Certain Non-GAAP Financial Measures
A reconciliation of return on common equity to operating return (less: (i) Q2 2006 charge related to the litigation settlement and refinements to such
estimates recognized in subsequent periods; (ii) a Q3 2007 charge related to a coinsurance transaction; and (iii) a Q4 2007 valuation allowance for
deferred tax assets) on common equity (excluding accumulated other comprehensive income (loss) and net operating loss carryforwards) is as
follows (dollars in millions, except per share amounts):
(continued on next page)
74
Q1 07
Q2 07
Q3 07
Q4 07
Q1 08
Net income (loss) applicable to common stock
(10.0)
$
(59.8)
$
(52.7)
$
(71.5)
$
(5.8)
$
Net realized investment (gains) losses, net of related amortization and taxes
13.7
10.1
31.0
23.0
26.5
Net operating income (loss) (a non-GAAP financial measure)
3.7
(49.7)
(21.7)
(48.5)
20.7
Q2 2006 charge related to the litigation settlement and refinements
to such estimates recognized in subsequent periods, net of taxes
8.5
22.8
10.6
-
-
Q3 2007 charge related to a coinsurance transaction, net of taxes
-
-
49.7
-
-
Q4 2007 valuation allowance for deferred tax assets
-
-
-
68.0
-
Add preferred stock dividends, assuming conversion
9.5
4.6
-
-
-
Net operating income before: (i) Q2 2006 charge related to the
litigation settlement and refinements to such estimates recognized
in subsequent periods; (ii) a Q3 2007 charge related to a coin-
surince transaction; and (iii) a Q4 2007 valuation allowance for
deferred tax assets (a non-GAAP financial measure)
21.7
$
(22.3)
$
38.6
$
19.5
$
20.7
$
Total shareholders' equity
4,700.1
$
4,356.1
$
4,285.5
$
4,235.9
$
3,939.7
$
Less preferred stock
667.8
-
-
-
-
Common shareholders' equity
4,032.3
4,356.1
4,285.5
4,235.9
3,939.7
Add preferred stock, assuming conversion
667.8
-
-
-
-
Less accumulated other comprehensive income (loss)
(41.8)
(329.9)
(316.0)
(273.3)
(565.6)
Common shareholder's equity, excluding accumulated other comprehensive
income (loss) (a non-GAAP financial measure)
4,741.9
4,686.0
4,601.5
4,509.2
4,505.3
Add Q2 2006 charge related to the litigation settlement and refinements
to such estimates recognized in subsequent periods
110.6
133.4
144.0
144.0
144.0
Add Q3 2007 charge related to a coinsurance transaction, net of taxes
-
-
49.7
49.7
49.7
Add Q4 2007 valuation allowance for deferred tax assets
-
-
-
68.0
68.0
Less net operating loss carryforwards
1,334.1
1,349.8
1,386.7
1,426.7
1,435.1
Common shareholders' equity, excluding accumulated other comprehensive
income (loss) and: (1) Q2 2006 charge related to the litigation settlement
and refinements to such estimates recognized in subsequent periods; (ii) a
Q3 2007 charge related to a coinsurance transaction; and (iii) a Q4 2007
valuation allowance for deferred tax assets (a non-GAAP financial measure)
3,518.4
$
3,469.6
$
3,408.5
$
3,344.2
$
3,331.9
$

Information Related to Certain Non-GAAP Financial Measures
(continued from previous page)
75
Q1 07
Q2 07
Q3 07
Q4 07
Q1 08
Average common shareholders' equity
4,032.3
4,194.2
4,320.8
4,260.7
4,087.8
Average common shareholder's equity, excluding accumulated other
comprehensive income (loss) (a non-GAAP financial measure)
4,757.3
4,714.0
4,643.8
4,555.4
4,507.3
Average common shareholders' equity, excluding accumulated other
comprehensive income (loss), the Q2 2006 charge related to the litigation
settlement and refinements to such estimates recognized in subsequent
periods, the Q3 2007 charge related to a coinsurance transaction, the
Q4 2007 valuation allowance for deferred tax assets, and net operating
loss carryforwards (a non-GAAP financial measure)
3,526.6
3,494.0
3,439.1
3,376.4
3,338.1
Return on equity ratios:
Return on common equity
-1.0%
-5.7%
-4.9%
-6.7%
-0.6%
Operating return (less: (i) Q2 2006 charge related to the
litigation settlement and refinements to such estimates
recognized in subsequent periods; (ii) the Q3 2007 charge
related to a coinsurance transaction; and (iii) the Q4 2007
valuation allowance for deferred tax assets) on common equity,
excluding accumulated other comprehensive income (loss)
(a non-GAAP financial measure)
1.8%
-1.9%
3.3%
1.7%
1.8%
Operating return (less: (i) Q2 2006 charge related to the
litigation settlement and refinements to such estimates
recognized in subsequent periods; (ii) the Q3 2007 charge
related to a coinsurance transaction; and (iii) the Q4 2007
valuation allowance for deferred tax assets) on common equity,
excluding accumulated other comprehensive income (loss)
and net operating loss carryforwards (a non-GAAP
financial measure)
2.5%
-2.6%
4.5%
2.3%
2.5%

Information Related to Certain Non-GAAP Financial Measures
A reconciliation of pretax operating earnings (a non-GAAP financial measure) to segment operating income (loss) and consolidated net income
(loss) for the three months ended March 31, 2008, is as follows (dollars in millions):
76
(Continued on next page)
Other Business
CIG
Bankers
Colonial Penn
in Run-off
Corporate
Total
Pretax operating earnings (a non-GAAP financial measure)
23.3
$
29.1
$
3.7
$
(1.3)
$
(23.1)
$
31.7
$
Allocation of interest expense, excess capital and corporate
expenses
(11.3)
(9.4)
(0.8)
(1.8)
23.3
-
Income tax (expense) benefit
(4.2)
(6.7)
(1.0)
1.0
(0.1)
(11.0)
Segment operating income (loss)
7.8
$
13.0
$
1.9
$
(2.1)
$
0.1
$
20.7
Net realized investment losses, net of related amortization and taxes
(26.5)
Net loss
(5.8)
$

Information Related to Certain Non-GAAP Financial Measures
A reconciliation of common shareholders’ equity, excluding accumulated other comprehensive income (loss), the Q2 2006 charge related to the
litigation settlement and refinements to such estimates recognized in subsequent periods, the Q3 2007 charge related to a coinsurance
transaction, the Q4 2007 valuation allowance for deferred tax assets, and less income tax assets (a non-GAAP financial measure) to common
shareholders’ equity is as follows (dollars in millions):
77
(Continued from previous page)
(Continued on next page)
Other Business
CIG
Bankers
Colonial Penn
in Run-off
Corporate
Total
December 31, 2007
Common shareholders' equity, excluding accumulated other comprehensive
income (loss), the Q2 2006 charge related to the litigation settlement
and refinements to such estimates recognized in subsequent periiods, the
Q3 2007 charge related to a coinsurance transaction, the Q4 2007
valuation allowance for deferred tax assets, and less income tax assets
representing net operating loss carryforwards (a non-GAAP
financial measure)
1,567.2
$
1,299.8
$
109.7
$
191.7
$
175.8
$
3,344.2
$
Q2 2006 charge related to the litigation settlement and
refinements to such estimates recognized in subsequent periods
(123.1)
-
-
-
(20.9)
(144.0)
Q3 2007 charge related to a coinsurance transaction
(49.7)
-
-
-
-
(49.7)
Q4 2007 valuation allowance for deferred tax assets
-
-
-
-
(68.0)
(68.0)
Net operating loss carryforwards
1,426.7
-
-
-
-
1,426.7
Accumulated other comprehensive income (loss)
(106.7)
(106.7)
(4.1)
(42.2)
(13.6)
(273.3)
Allocation of capital
464.7
433.3
36.5
63.9
(998.4)
-
Common shareholders' equity
3,179.1
$
1,626.4
$
142.1
$
213.4
$
(925.1)
$
4,235.9
$
March 31, 2008
Common shareholders' equity, excluding accumulated other comprehensive
income (loss), the Q2 2006 charge related to the litigation settlement
and refinements to such estimates recognized in subsequent periiods, the
Q3 2007 charge related to a coinsurance transaction, the Q4 2007
valuation allowance for deferred tax assets, and less income tax assets
representing net operating loss carryforwards (a non-GAAP
financial measure)
1,562.2
$
1,301.2
$
110.8
$
191.2
$
166.5
$
3,331.9
$
Q2 2006 charge related to the litigation settlement and
refinements to such estimates recognized in subsequent periods
(123.1)
-
-
-
(20.9)
(144.0)
Q3 2007 charge related to a coinsurance transaction
(49.7)
-
-
-
-
(49.7)
Q4 2007 valuation allowance for deferred tax assets
-
-
-
-
(68.0)
(68.0)
Net operating loss carryforwards
1,435.1
-
-
-
-
1,435.1
Accumulated other comprehensive income (loss)
(229.0)
(204.0)
(10.6)
(95.0)
(27.0)
(565.6)
Allocation of capital
463.2
433.8
36.9
63.7
(997.6)
-
Common shareholders' equity
3,058.7
$
1,531.0
$
137.1
$
159.9
$
(947.0)
$
3,939.7
$

Information Related to Certain Non-GAAP Financial Measures
78
(Continued from previous page)
A reconciliation of average common shareholders’ equity, excluding accumulated other comprehensive income (loss), the Q2 2006 charge
related to the litigation settlement and refinements to such estimates recognized in subsequent periods, the Q3 2007 charge related to a
coinsurance transaction, the Q4 2007 valuation allowance for deferred tax assets, and less income tax assets (a non-GAAP financial measure) to
average common shareholders’ equity at March 31, 2008, is as follows (dollars in millions):
Other Business
CIG
Bankers
Colonial Penn
in Run-off
Corporate
Total
Average common shareholders' equity, excluding accumulated other
comprehensive income (loss), the Q2 2006 charge related to the
litigation settlement and refinements to such estimates
recognized in subsequent periods, the Q3 2007 charge related
to a coinsurance transaction, the Q4 2007 valuation allowance
for deferred tax assets, and less income tax assets representing
net operating loss carryforwards (a non-GAAP financial measure)
1,564.7
$
1,300.5
$
110.3
$
191.4
$
171.2
$
3,338.1
$
Average litigation settlement charges and refinements
to such estimates recognized in subsequent periods
(144.0)
Average charge related to a coinsurance transaction
(49.7)
Average charge related to valuation allowance for deferred tax assets
(68.0)
Average net operating loss carryforwards
1,430.9
Average accumulated other comprehensive income (loss)
(419.5)
Average common shareholders' equity
4,087.8
$
Return on equity ratios:
Return on equity
-0.6%
Operating return on equity, excluding accumulated other compre-
hensive income (loss), the 2Q 2006 charge related to the liti-
gation settlement and refinements to such estimates recognized
in subsequent periods, the Q3 2007 chargerelated to a coinsur-
ance transaction, the Q4 2007 valuation allowance for deferred
tax assets, and less income tax assets representing net opera-
ting loss carryforwards (a non-GAAP financial measure)
2.0%
4.0%
6.9%
-4.4%
0.2%
2.5%

Information Related to Certain Non-GAAP Financial Measures
Debt to capital ratio, excluding accumulated other comprehensive income (loss)
This non-GAAP financial measure differs from the debt to capital ratio because accumulated other comprehensive income has been excluded
from the value of capital used to determine this measure. Management believes this non-GAAP financial measure is useful because it removes
the volatility that arises from changes in accumulated other comprehensive income. Such volatility is often caused by changes in the estimated
fair value of our investment portfolio resulting from changes in general market interest rates rather than the business decisions made by
management.
79

Information Related to Certain Non-GAAP Financial Measures
Reconciliations of the: (i) debt to capital ratio to debt to capital, excluding accumulated other comprehensive loss; and (ii) debt and preferred
stock to capital ratio to debt and preferred stock to capital, excluding accumulated other comprehensive loss, are as follows (dollars in millions):
80
Q1 07
Q2 07
Q3 07
Q4 07
Q1 08
Corporate notes payable
999.3
$
1,197.8
$
1,195.7
$
1,193.7
$
1,191.7
$
Total shareholders' equity
4,700.1
4,356.1
4,285.5
4,235.9
3,939.7
Total capital
5,699.4
5,553.9
5,481.2
5,429.6
5,131.4
Less accumulated other comprehensive loss
41.8
329.9
316.0
273.3
565.6
Total capital, excluding accumulated other
comprehensive loss
(a non-GAAP financial measure)
5,741.2
$
5,883.8
$
5,797.2
$
5,702.9
$
5,697.0
$
Corporate notes payable
999.3
$
1,197.8
$
1,195.7
$
1,193.7
$
1,191.7
$
Preferred stock
667.8
-
-
-
-
Total notes payable and preferred stock
1,667.1
$
1,197.8
$
1,195.7
$
1,193.7
$
1,191.7
$
Corporate notes payable to capital ratios:
Corporate debt to total capital
17.5%
21.6%
21.8%
22.0%
23.2%
Corporate debt to total capital, excluding
accumulated other comprehensive loss
(a non-GAAP financial measure)
17.4%
20.4%
20.6%
20.9%
20.9%
Corporate debt and preferred stock
to total capital
29.3%
21.6%
21.8%
22.0%
23.2%
Corporate debt and preferred stock
to total capital, excluding accumulated
other comprehensive loss (a non-GAAP
financial measure)
29.0%
20.4%
20.6%
20.9%
20.9%